Embed Size (px)
Citation preview
QATAR UNIVERSITY
COLLEGE OF ENGINEERING
THERMODYNAMIC ANALYSIS OF FULL SCALE BASELOAD LNG CHAIN
BY
ZINEB BOUABIDI
A Thesis Submitted to
the Faculty of the College of Engineering
in Partial Fulfillment of the Requirements for the Degree of
Masters of Science in Environmental Engineering
June 2019
© 2019 Zineb Bouabidi. All Rights Reserved.
ii
COMMITTEE PAGE
The members of the Committee approve the Thesis of
Zineb Bouabidi defended on 21/04/2019.
Easa I. Al-musleh
Thesis/Dissertation Supervisor
Ramazan Kahraman
Thesis/Dissertation Supervisor
Iftikhar Karimi
Committee Member
Mohammed Ali H. Salah
Committee Member
Approved:
Abdel Magid Hamouda , Dean, College of Engineering
iii
ABSTRACT
BOAUBIDI, ZINEB BOUAZZA, Masters : June : 2019 Master of Science in
Environmental Engineering
Title: Thermodynamic Analysis of Full Scale Baseload LNG Chain
Supervisor of Thesis: Easa I. Al-musleh.
: Ramazan Kahraman.
The world’s growing energy demand and the need for low-carbon energy
sources are key factors that have made natural gas (NG) an attractive energy source
compared to other available fossil fuels (i.e. coal and oil). Being the most feasible NG
transportation method over long distances, the liquefied NG (LNG) demand is
significantly increasing. The LNG supply chain, consisting of production, liquefaction,
shipping, and regasification, is, however, an energy-intensive and thereby emission
intensive process. Therefore, the appropriate LNG production with least energy
consumption and maximum energy efficiency is of high importance. Thus, optimization
of LNG chains is essential from both economic and sustainability point of view.
Amongst energy efficiency optimization approaches, exergy analysis, based on the
second law of thermodynamics, is a powerful tool that has been widely used to quantify
exergy destructions and to determine exergy efficiencies and thereby, identify process
improvement opportunities.
In this thesis work, rigorous and detailed exergy analysis was performed on an
entire baseload LNG chain that was simulated using ProMax® and Aspen Plus®
simulation software for the delivery of 439 million standard cubic feet per day
iv
(MMSCFD). A comparison of the losses across the various units with and without
utilities was performed, and optimization opportunities within the chain were identified.
Findings of this study revealed that the LNG chain under consideration is
associated with total loss of near 647 MW and 1054 MW during holding and loading
operation modes, respectively. The main contributor to the exergy loss was found to be
the utility section accounting for 61% of the total exergy loss. Within the LNG process,
significant amounts of losses were found to occur in the sulfur recovery units,
liquefaction unit, and sweetening processes; accounting for 38%, 30% and 24% of the
total exergy loss, respectively. The compressors and their drivers (GTs), stream
generators, LNG flashing and storage, columns (absorbers, distillations) and heat
exchangers were found to be the main exergy consumers.

v
DEDICATION
Dedicated to my inspiring parents and sisters for their endless support and
encouragement

vi
ACKNOWLEDGMENTS
First, I would like to thank Allah Almighty for giving me the strength, ability,
knowledge and opportunity to undertake this study and to complete it satisfactorily. My
sincere thanks go to the thesis advisor, Prof. Ramazan Kahraman and to Dr. Easa I. Al-
musleh for their continuous support, motivations, patient and immense knowledge. I
would also like to acknowledge Mary Anna Katebah and Mohamed Mamoon Hussein
for their help through the process of researching this thesis. I thank Qatar Foundation
for the grant support under Award # NPRP 8-964-2-408. Very profound gratitude is
expressed to my parents and sisters for the continuous encouragement and unfailing
support through my years of study and this accomplishment would not have been
possible without them. Finally, I am in debt to all people who contributed in one way
or another in the accomplishment of this thesis.
vii
TABLE OF CONTENTS
DEDICATION ............................................................................................................... v
ACKNOWLEDGMENTS ............................................................................................ vi
LIST OF TABLES ........................................................................................................ ix
LIST OF FIGURES ....................................................................................................... x
CHAPTER 1: INTRODUCTION .................................................................................. 1
1.1 Introduction ..................................................................................................... 1
1.2 Motivation ....................................................................................................... 1
1.3 NG and LNG chain backgrounds .................................................................... 2
1.4 LNG chains and the environment.................................................................... 6
1.5 Research methodology .................................................................................... 8
1.6 Limitations ...................................................................................................... 9
1.7 Thesis outline .................................................................................................. 9
CHAPTER 2: EXERGY ANALYSIS ......................................................................... 11
2.1 Introduction ................................................................................................... 11
2.2 Exergy concept .............................................................................................. 12
2.3 Exergy Reference Environment .................................................................... 13
2.4 Exergy transfer .............................................................................................. 14
2.4.1 Exergy transfer by mass ............................................................................ 15
2.4.2 Exergy transfer by heat .............................................................................. 19
2.4.3 Exergy transfer by work ............................................................................ 19
viii
2.5 Exergy loss (destruction) ............................................................................... 20
2.6 Exergy balances............................................................................................. 21
2.7 Exegetic efficiency ........................................................................................ 23
CHAPTER 3: LITRATURE REVIEW ....................................................................... 25
3.1 Introduction ................................................................................................... 25
3.2 Review ........................................................................................................... 26
3.3 Conclusions ................................................................................................... 32
CHAPTER 4: PROCESS DESCRIPTION .................................................................. 33
4.1 LNG chain description .................................................................................. 33
CHAPTER 5: RESULTS AND DISCUSSIONS ........................................................ 38
5.1 Introduction ................................................................................................... 38
5.2 Overall results ............................................................................................... 38
5.3 Liquefaction process (C3MR) ....................................................................... 42
5.4 NG Sweetening and Acid Gas Enrichment ................................................... 47
5.5 SRU ............................................................................................................... 52
5.6 LNG storage, loading, and shipping ............................................................. 56
5.7 LNG Regasification....................................................................................... 60
5.8 Main process and export terminal utilities .................................................... 62
CHAPTER 6: CONCLUSIONS AND RECOMMENDATIONS ............................... 65
References .................................................................................................................... 69
ix
LIST OF TABLES
Table 2. 1: Exergy Reference Environment. Adapted From [55] ................................ 14
Table 2. 2: Exergy Loss Developed Equations ............................................................ 22
Table 3. 1: References Classified According to the Segment of the LNG Chain
on Which Exergy Analysis Was Applied .................................................................... 26
Table 5. 1: Exergy Transformation .............................................................................. 56
x
LIST OF FIGURES
Figure 1. 1: Share of NG in total energy-related emissions on major air pollutants and
CO2, adapted from [34] .................................................................................................. 3
Figure 1. 2: Electricity generation from selected fuels, adapted from [37] ................... 4
Figure 1. 3: NG consumption by sector, adapted from [37] .......................................... 5
Figure 1. 4: Global LNG capacity and demand [38] ..................................................... 6
Figure 1. 5: LNG supply chain ...................................................................................... 7
Figure 2. 1: an open system with different forms of flow across the system .............. 15
Figure 2. 2: Classification of exergy transferred by mass ........................................... 16
Figure 2. 3: Decomposition of thermomechanical exergy [56] ................................... 17
Figure 5. 1: Schematic overview of exergy streams entering and exiting the LNG
chain. ............................................................................................................................ 40
Figure 5. 2: Exergy flow rate variation across the chain ............................................. 41
Figure 5. 3: Percentage exergy destruction in main process units, without utilities .... 42
Figure 5. 4: NGL recovery unit integrated with the C3MR liquefaction process
schematic. Adapted from[49]with the kind permission of the authors ........................ 44
Figure 5. 5: Exergy destruction in the liquefaction unit. (a) without utilities losses, (b)
with utilities losses ....................................................................................................... 44
Figure 5. 6: Exergy destruction in heat exchangers ..................................................... 45
Figure 5. 7: Process scheme of the MDEA sweetening Unit (Step 1). Adapted
from[49]with the kind permission of the authors ........................................................ 48
Figure 5. 8: Flow diagram of the Sulfinol® sweetening process (Step 2). Adapted
from[49]with the kind permission of the authors ........................................................ 48
xi
Figure 5. 9: Flow diagram of the (AGEU) process. Adapted from[49]with the kind
permission of the authors ............................................................................................. 49
Figure 5. 10: Exergy destruction in sweetening unit. (a) Without utilities, (b) with
utilities.......................................................................................................................... 49
Figure 5. 11: Sweetening (a) heat and (b) exergy composite curves ........................... 52
Figure 5. 12: SRU (a) heat and (b) exergy composite curves ...................................... 52
Figure 5. 13: Process flow diagram of sulfur recovery unit (SRU). Adapted from [49]
with the kind permission of the authors. ...................................................................... 53
Figure 5. 14: Exergy destruction in SRUs. (a) Without utilities, (b) with utilities ...... 54
Figure 5. 15: Exporting terminal/shipping and receiving terminal. Adapted from [49]
with the kind permission of the authors ....................................................................... 57
Figure 5. 16: BOG generation contribution due to each factor .................................... 57
Figure 5. 17: Exergy destruction in the LNG regasification plant ............................... 62
Figure 5. 18: Main process and export terminal utility. Adapted from [49] with the
kind permission of the authors. .................................................................................... 63
Figure 5. 19: Exergy breakdown in the main process and export terminal utility ....... 64
1
CHAPTER 1: INTRODUCTION
1.1 Introduction
This chapter defines the research problem, the objective of the thesis and briefly
reviews the main aspects related to the research topic (i.e. NG, the market share,
liquefied NG (LNG), and exergy and its importance), then describes the methodology
and limitations and concludes with a thesis outline.
1.2 Motivation
With the predicted growth in the global energy demand that is driven by the
economic growth and population increase and the continuous argument concerning the
adverse environmental impact its consumptions brings along, NG is gaining a
privileged position among other fuels as it is recognized as an environmentally friendly
fuel [1-4]. The most feasible way to transport large quantities of NG over long
distances, from producing regions to consumption regions, is via liquefaction at -161℃.
This is owing to the fact that the liquefied NG (LNG) occupies about (1/600)th of the
volume of NG in its gaseous state making it easier and cost efficient for shipment and
storage. The LNG supply chain is, however, an energy-intensive process requiring
tremendous amounts of energy in various forms (e.g. heating, cooling, and
compression). Energy consumption and environmental impact are proportionally
related. This means the higher the energy consumption is, the higher the greenhouse
gas emissions (GHG), CO2 in particular, are that makes energy consumption a major
cause of global warming. Consequently, reducing energy consumption within the LNG
chains is important in order to reduce its negative environmental impact.
Improving the performance and optimizing the energy efficiency of LNG
production processes have been a popular subject in the academic society in the past
2
decades [5-11]. Among a large number of publications that deal with LNG chain, the
majority are concerned with the design, operation, and optimization of the liquefaction
process itself due to the fact that it is a major economic factor in the chain [6, 11-23].
Based on a thorough review, it was also found that the application of exergy analysis
was limited to specific segments of the LNG chain only [24-30]. To the best of our
knowledge, there is no comprehensive study that assesses a full-scale baseload LNG
chain using exergy analysis approach. Exergy analysis is an important tool to evaluate
the thermodynamic efficiency of various processes and it has been extensively
considered as useful methods in the design, evaluation, optimization, and improvement
of processing plants [31, 32].
Therefore, the ultimate objective of this thesis is to carry out rigorous exergy
analysis for an actual baseload LNG chain, from the wellhead to the end users that
delivers 439 MMSCFD of NG while taking into consideration the tanks/ships holding
and loading operating modes. The analysis helped in identifying critical components
that should be optimized to enhance chain performance.
1.3 NG and LNG chain backgrounds
With the current continuous population growth and economic development, the
global energy demand is projected to grow persistently with near 1.3% per annum over
the next decade [33]. While a wide variety of energy sources are available to support
the different industrial sectors (oil, coal, biomass, nuclear, renewables, and NG), NG
seems to have the highest growing demand share due to its availability and
environmentally friendly characteristics.
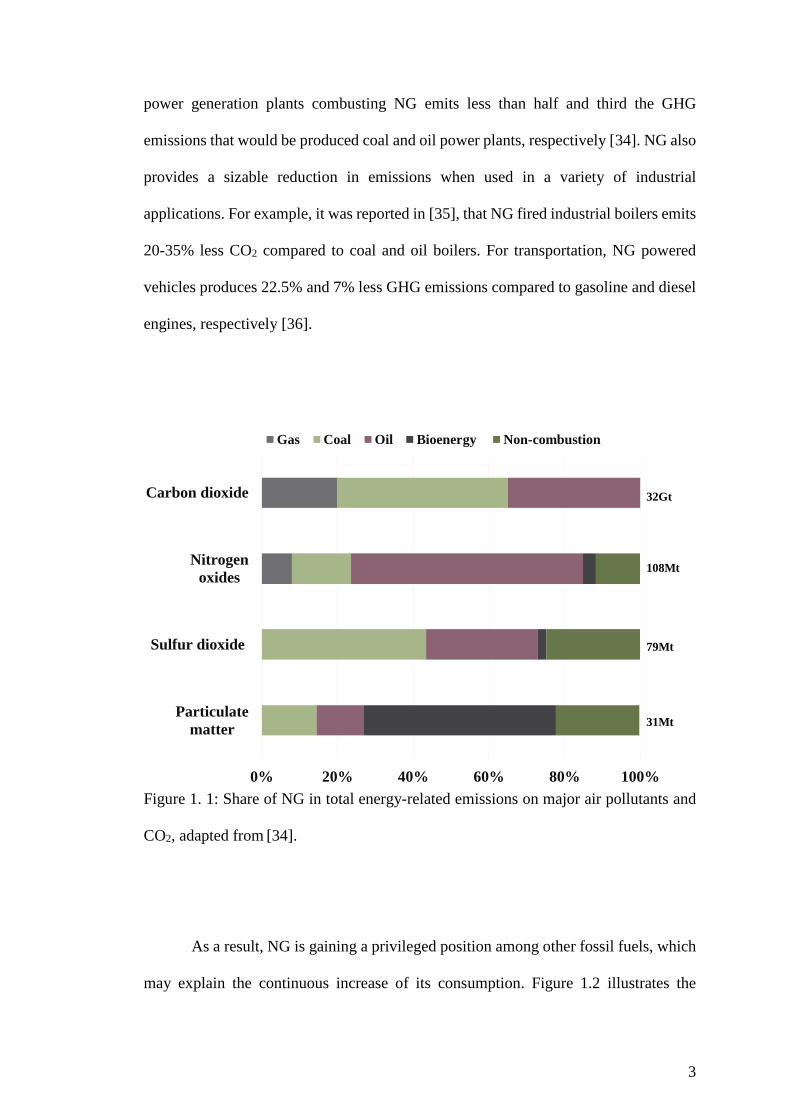
Referring to Figure 1.1, NG, composed primarily of methane, is the cleanest
burning fossil fuel, as its combustion to produce a given amount of energy produces the
least amount of (CO2) and other pollutants. For example, it has been estimated that
3
power generation plants combusting NG emits less than half and third the GHG
emissions that would be produced coal and oil power plants, respectively [34]. NG also
provides a sizable reduction in emissions when used in a variety of industrial
applications. For example, it was reported in [35], that NG fired industrial boilers emits
20-35% less CO2 compared to coal and oil boilers. For transportation, NG powered
vehicles produces 22.5% and 7% less GHG emissions compared to gasoline and diesel
engines, respectively [36].
Figure 1. 1: Share of NG in total energy-related emissions on major air pollutants and
CO2, adapted from [34].
As a result, NG is gaining a privileged position among other fossil fuels, which
may explain the continuous increase of its consumption. Figure 1.2 illustrates the
0% 20% 40% 60% 80% 100%
Particulate
matter
Sulfur dioxide
Nitrogen
oxides
Carbon dioxide
Gas Coal Oil Bioenergy Non-combustion
32Gt
108Mt
79Mt
31Mt
4
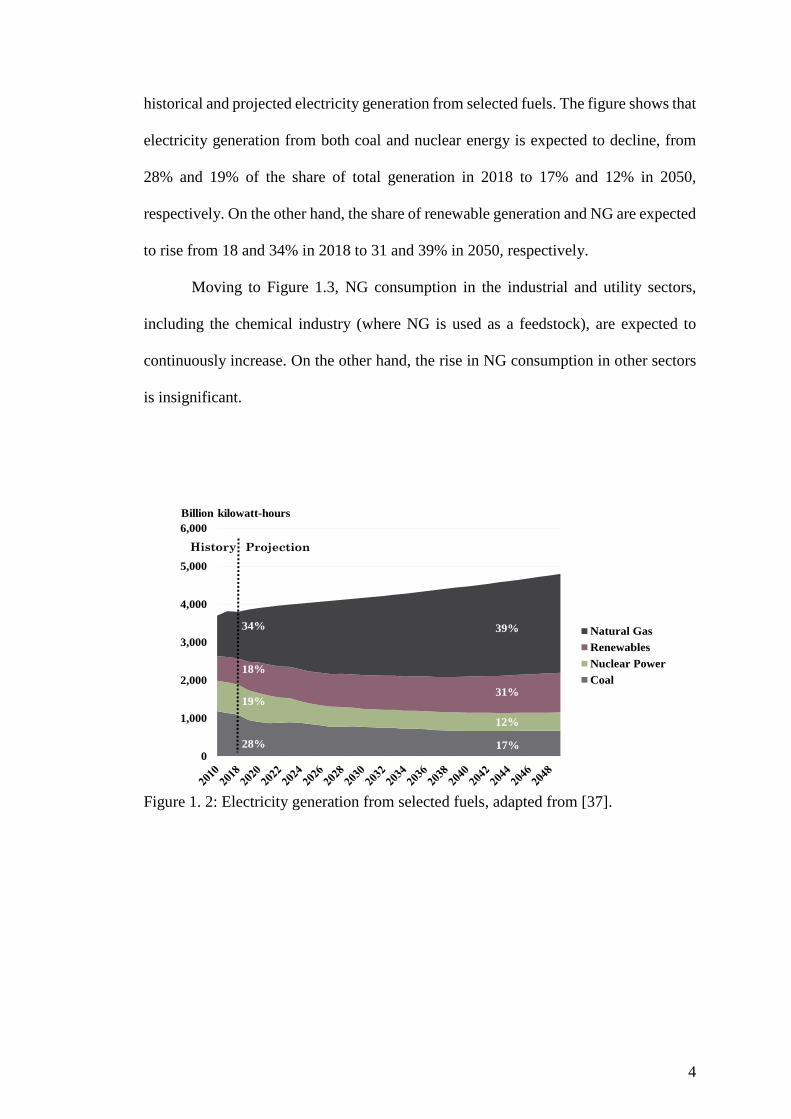
historical and projected electricity generation from selected fuels. The figure shows that
electricity generation from both coal and nuclear energy is expected to decline, from
28% and 19% of the share of total generation in 2018 to 17% and 12% in 2050,
respectively. On the other hand, the share of renewable generation and NG are expected
to rise from 18 and 34% in 2018 to 31 and 39% in 2050, respectively.
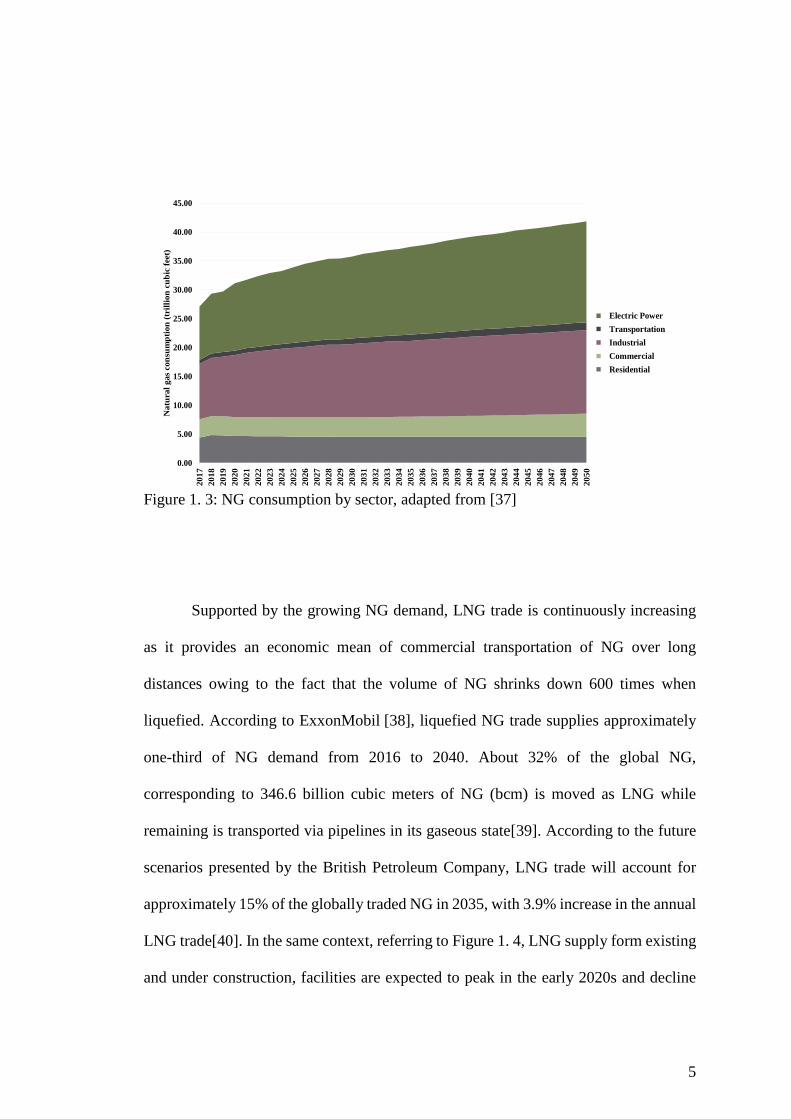
Moving to Figure 1.3, NG consumption in the industrial and utility sectors,
including the chemical industry (where NG is used as a feedstock), are expected to
continuously increase. On the other hand, the rise in NG consumption in other sectors
is insignificant.
Figure 1. 2: Electricity generation from selected fuels, adapted from [37].
0
1,000
2,000
3,000
4,000
5,000
6,000
Natural Gas
Renewables
Nuclear Power
Coal
Billion kilowatt-hours
17%
12%
31%
39%
28%
19%
18%
34%
History Projection
5
Figure 1. 3: NG consumption by sector, adapted from [37]
Supported by the growing NG demand, LNG trade is continuously increasing
as it provides an economic mean of commercial transportation of NG over long
distances owing to the fact that the volume of NG shrinks down 600 times when
liquefied. According to ExxonMobil [38], liquefied NG trade supplies approximately
one-third of NG demand from 2016 to 2040. About 32% of the global NG,
corresponding to 346.6 billion cubic meters of NG (bcm) is moved as LNG while
remaining is transported via pipelines in its gaseous state[39]. According to the future
scenarios presented by the British Petroleum Company, LNG trade will account for
approximately 15% of the globally traded NG in 2035, with 3.9% increase in the annual
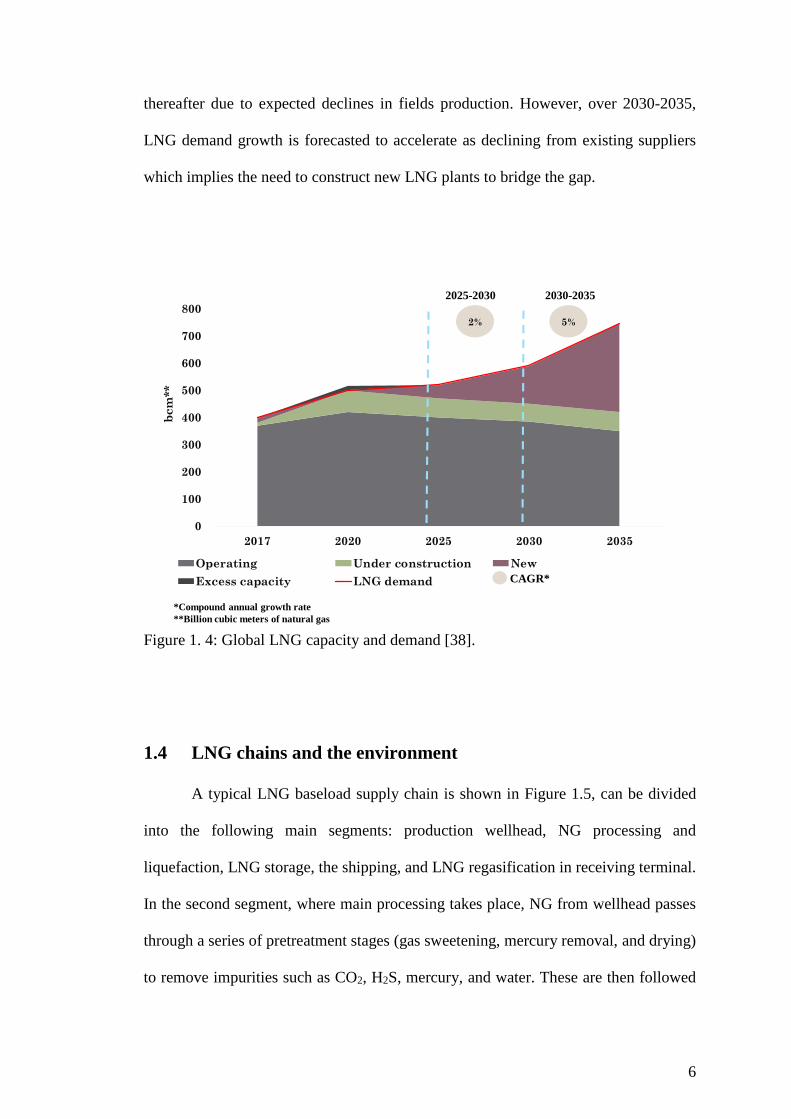
LNG trade[40]. In the same context, referring to Figure 1. 4, LNG supply form existing
and under construction, facilities are expected to peak in the early 2020s and decline
0.00
5.00
10.00
15.00
20.00
25.00
30.00
35.00
40.00
45.002
01
7
20
18
20
19
20
20
20
21
20
22
20
23
20
24
20
25
20
26
20
27
20
28
20
29
20
30
20
31
20
32
20
33
20
34
20
35
20
36
20
37
20
38
20
39
20
40
20
41
20
42
20
43
20
44
20
45
20
46
20
47
20
48
20
49
20
50
Na
tura
l g
as
co
nsu
mp
tio
n (
tril
lio
n c
ub
ic f
eet)
Electric Power
Transportation
Industrial
Commercial
Residential
6
thereafter due to expected declines in fields production. However, over 2030-2035,
LNG demand growth is forecasted to accelerate as declining from existing suppliers
which implies the need to construct new LNG plants to bridge the gap.
Figure 1. 4: Global LNG capacity and demand [38].
1.4 LNG chains and the environment
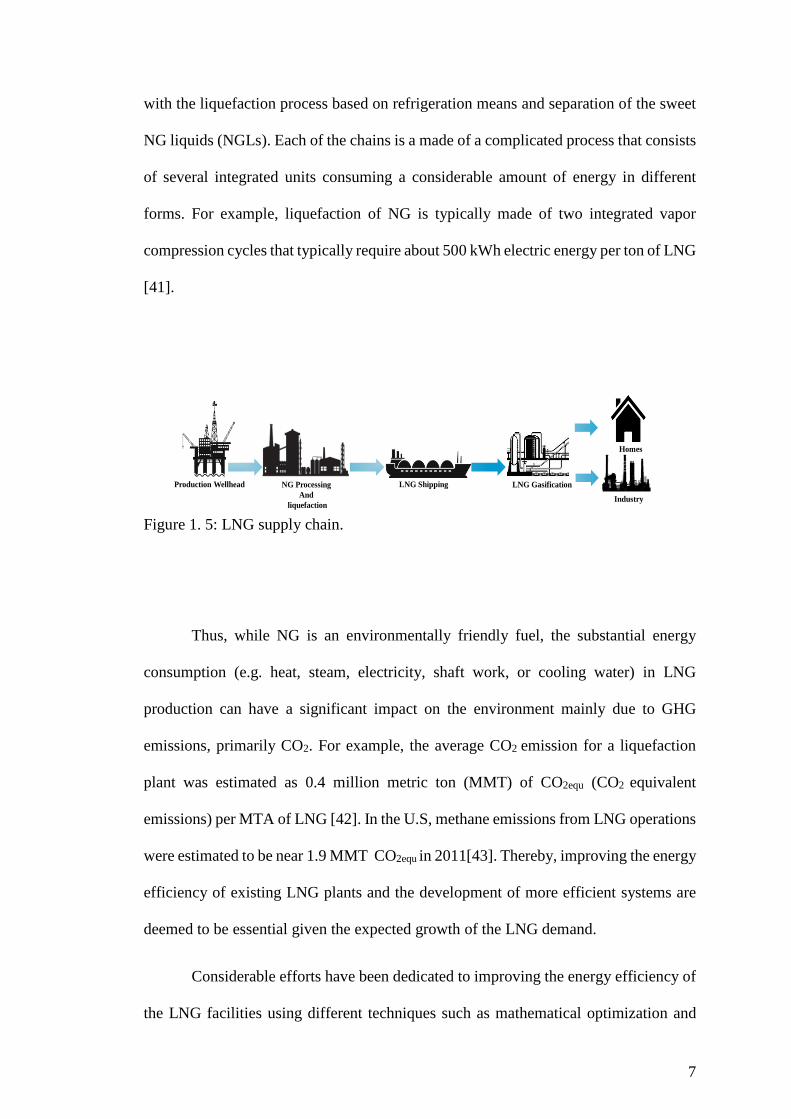
A typical LNG baseload supply chain is shown in Figure 1.5, can be divided
into the following main segments: production wellhead, NG processing and
liquefaction, LNG storage, the shipping, and LNG regasification in receiving terminal.
In the second segment, where main processing takes place, NG from wellhead passes
through a series of pretreatment stages (gas sweetening, mercury removal, and drying)
to remove impurities such as CO2, H2S, mercury, and water. These are then followed
0
100
200
300
400
500
600
700
800
2017 2020 2025 2030 2035
bcm
**
Operating Under construction New
Excess capacity LNG demand
2025-2030 2030-2035
2% 5%
CAGR*
*Compound annual growth rate
**Billion cubic meters of natural gas
7
with the liquefaction process based on refrigeration means and separation of the sweet
NG liquids (NGLs). Each of the chains is a made of a complicated process that consists
of several integrated units consuming a considerable amount of energy in different
forms. For example, liquefaction of NG is typically made of two integrated vapor
compression cycles that typically require about 500 kWh electric energy per ton of LNG
[41].
Figure 1. 5: LNG supply chain.
Thus, while NG is an environmentally friendly fuel, the substantial energy
consumption (e.g. heat, steam, electricity, shaft work, or cooling water) in LNG
production can have a significant impact on the environment mainly due to GHG
emissions, primarily CO2. For example, the average CO2 emission for a liquefaction
plant was estimated as 0.4 million metric ton (MMT) of CO2equ (CO2 equivalent
emissions) per MTA of LNG [42]. In the U.S, methane emissions from LNG operations
were estimated to be near 1.9 MMT CO2equ in 2011[43]. Thereby, improving the energy
efficiency of existing LNG plants and the development of more efficient systems are
deemed to be essential given the expected growth of the LNG demand.
Considerable efforts have been dedicated to improving the energy efficiency of
the LNG facilities using different techniques such as mathematical optimization and
LNG GasificationLNG Shipping NG Processing
And
liquefaction
Production Wellhead
Homes
Industry
8
process integration [9, 44-48]. While mathematical optimization is deemed to be
effective for process enhancements, it can be a challenging task owing to the
complexity of LNG systems. For example, a baseload LNG plant will typically have
more than 30 operating variables available for optimization. Thermodynamic analysis
can simplify this task, by identifying the most essential units that must be optimized to
enhance the overall performance of the chain.
Analysis based on the first law of thermodynamics (i.e. energy and mass
balance) is limited to energy quantity, not quality, where the latter represents how
energy is degraded in the process. On the other hand, the second law of
thermodynamics, entropy balance, takes into consideration the loss in energy quality
by quantifying entropy generation arising from irreversibilities in a process. However,
the entropy generation quantity does not provide an interpretation of the significance of
the magnitude of degraded energy quality. Thus, it is more adequate to measure the lost
work potential, exergy loss, owing to irreversibility, where this quantity is the product
of entropy generation rate and environmental temperature. Consequently, the exergy
and exergy analysis is practical representatives of entropy generation and entropy
balance, respectively. Such an approach could be used either in combination with
optimization to reduce the search space for optimization or stand-alone as pinpointing
tools for performance evaluation.
1.5 Research methodology
The LNG supply chain simulation reported in[49], described in details in
chapter 4, utilized as a basis for this research. Results of the simulation provided the
characteristics of equipment and streams in the chain. Which are needed to carry out
the rigorous exergy analysis to quantify the losses across the system. Thus, identifying
the main units that should be optimized to achieve overall economic and environmental
9
benefits. Exergy loss across each equipment in the flowsheet was calculated using the
steady-state exergy balance relation (see chapter 2), taking into consideration the three
forms of exergy transfer (to or from the system) which are: exergy transfer by material
flow, heat, and work. Taking into consideration all useful material streams out of the
different processing units as valuable streams, exergy efficiency of each unit and the
overall process was calculated.
1.6 Limitations
While exergy analysis pinpoints the processes and components with highest
irreversibilities, provides some insight to where efforts should be focused to enhance
the process, and where improvements should be allocated, it does not state whether the
possible improvements are practical and feasible. This is owing to the fact that the
exergy destruction in some of the plant components is unavoidable and limited by
physical, economic and technological constraints. Advanced exergy analysis would be
required to overcome these limitations as it takes into account splitting the exergy
destruction in a component into exogenous and endogenous, and thus providing more
insights about components interactions of the overall system. Advanced exergy analysis
also takes into consideration splitting the exergy destruction into avoidable and
unavoidable parts; thereby it shows the real potential of improvement of each
component as well as for the overall system.
1.7 Thesis outline
This thesis divided into 6 chapters. Chapter 1 gives a general description of the
main aspects related to the research topic. Chapter 2 describes the concept of exergy
and related fundamental terms and presents the basic equations of exergy analysis.
Chapter 3 provides a comprehensive review of literature related to the research problem

10
under consideration covering deficiencies of existing work on the application of exergy
analysis on LNG processes. In chapter 4, a detailed description of the overall LNG
chain is provided. Research findings, specifically the exergy losses across different
units of the LNG chain under consideration, and an in-depth discussion of results are
presented in chapter 5. Finally, chapter 6 summarizes the conducted work and provides
conclusions, recommendations, and future work.
11
CHAPTER 2: EXERGY ANALYSIS
This chapter addresses the fundamentals of exergy analysis. It first defines the
concept of exergy, then presents the different forms of exergy transfer (i.e. matter, heat,
and work), followed by the benefits and needed equations. Essential concepts related
to exergy analysis such as the reference environment state and exergy efficiency are
also discussed.
2.1 Introduction
Thermodynamics play a dominant role in chemical engineering as it determines
energy requirements, state of phase, physical and chemical equilibrium required for
designing different units operations. Thermodynamics can also be used to assess the
performance of a system in terms of energy. The first law of thermodynamics (law of
energy conservation of energy balances) adapted for thermodynamic systems to
identify input and output energy in a process. All processes must satisfy the energy
balance where the total energy of a system remains constant, such that energy across a
process is conserved even if it is transformed from one form to another. Energy balance,
therefore, is an interesting way to compare processes in terms of required energy. The
first law of thermodynamics, however, does not provide information on the energy
efficiency of a process. In other words, it does not quantify irreversibilities that degrade
the performance of the system. On the other hand, the second law of thermodynamics
states that processes occur in a certain direction and energy has quantity as well as
quantity [50]. Thus, it provides information on energy efficiency. The second law of
thermodynamics is based on the concept of entropy, which is a measure of molecular
disorder within a system, where a system with a high disorder degree such high-
temperature gas, has high entropy and vice versa. Entropy also assists in explaining the
natural direction of energy transformations and conversions. However, entropy is
12
practically not easy to use for interpretation consider for example its unit of
energy/temperature. Exergy, the unit of energy/time; however, is more of a useful
parameter.
2.2 Exergy concept
The term “exergy” was used for the first time by Rant in 1956 [51], referring to
the Greek words ex(external) and ergos (work). Another term that is used describing
exergy is “availability” referring to available energy [52]. Exergy is defined as the
maximum theoretical useful work that can be obtained by bringing the system at a given
state to thermodynamic equilibrium with the environment by means of a reversible
process in which the system interacts only with its environment [53]. Where the state
of a system is defined by its composition, pressure, and temperature. Exergy can be also
defined as the minimum theoretical work required to bring the system from equilibrium
with the environment to a given state [54]. Thus, exergy is a measure of the deviation
of a system at a particular state from the state of the environment. This means that both
the system and the environment attribute to exergy. It is to be noted that the
environment is large resulting in almost a uniform temperature, pressure, and
composition. Hence, the environment may be regarded as free of irreversibilities and
thus there is no exergy destruction within the environment [55]. However, all
significant irreversibilities are attributed to the system and its direct surrounding.
Exergy numerical values are dependent upon the state of the system and the
environment cannot be a negative value. When the process occurring between the
environment and the system is reversible, exergy is conserved. Conversely, when the
process is irreversible, exergy is destroyed. By definition, a system that is in equilibrium
with its environment has zero exergy since it has no ability to generate work with
respect to its environment, while a system that is not in equilibrium with its environment
13
has some quantity of exergy [50]. Consequently, exergy calculations will always be
dependent on the state of the environment and of the system.
2.3 Exergy Reference Environment
Exergy analysis is a function of a chosen reference state that is described by
intensive properties including temperature, pressure and chemical components
composition of a reference environment. The reference state must be specified upon
carrying on the exergy analysis such that exergy of a system or stream is always
measured with respect to the reference environment in order to attain consistent
analysis. The reference environment is defined as a large equilibrium system that acts
as a source and sink for heat and materials. Only internally reversible processes are
experienced in the reference environment where the state variables temperature 𝑇0 ,
pressure 𝑃0 and chemical potentials 𝜇𝑖0 (dependent upon the composition 𝑦𝑖0) of each
of the 𝑖 chemical components remain unaltered when heat and materials are exchanged
between the environment and another system through a thermodynamic process [52].
When a system or a stream of interest is in global equilibrium (i.e. mechanical, thermal
and chemical) with the reference environment, which means that the system is at rest
relative to the environment, the system is said to be at dead state. When the
system/stream is at dead state, there is no interaction between the system and the
environment and, thereby, no potential to develop work (i.e. zero exergy). The reference
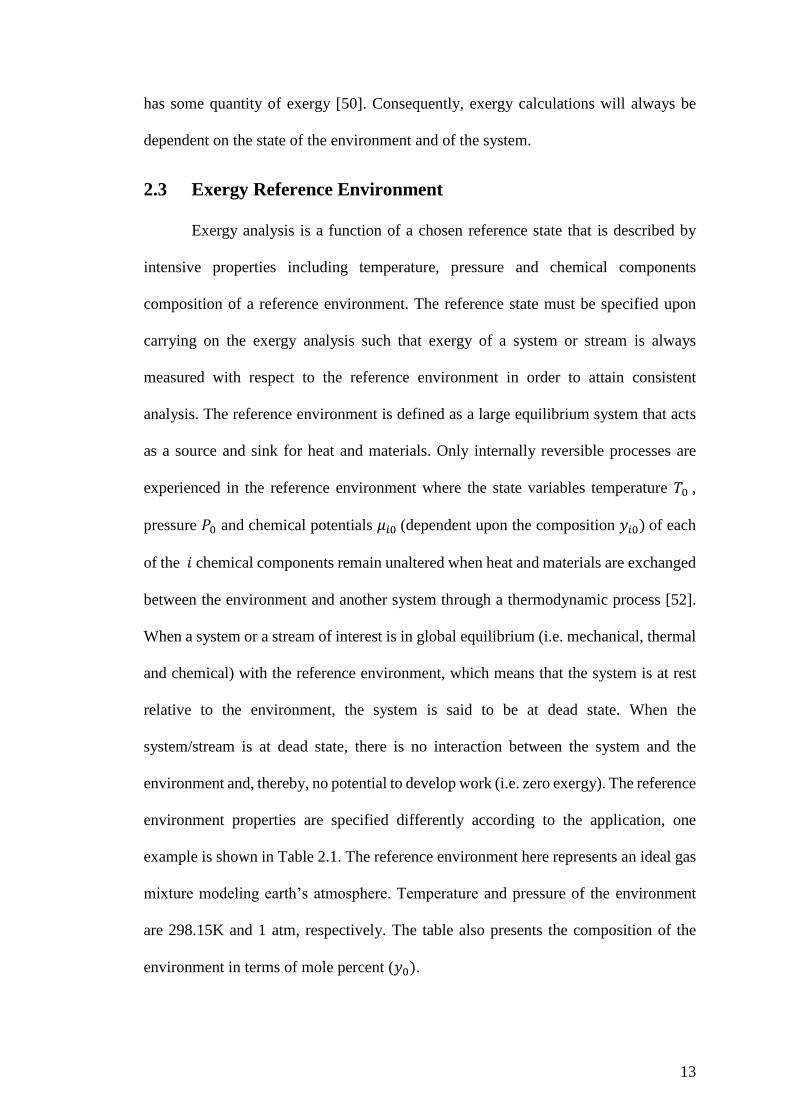
environment properties are specified differently according to the application, one
example is shown in Table 2.1. The reference environment here represents an ideal gas
mixture modeling earth’s atmosphere. Temperature and pressure of the environment
are 298.15K and 1 atm, respectively. The table also presents the composition of the
environment in terms of mole percent (𝑦0).
14
Table 2. 1: Exergy Reference Environment. Adapted From [55].
Temperature 298.15K (250C)
Pressure 1 atm
Composition
Component y0 (%)
N2 75.67
O2 20.35
H2O 3.12
CO2 0.03
Other 0.83
2.4 Exergy transfer
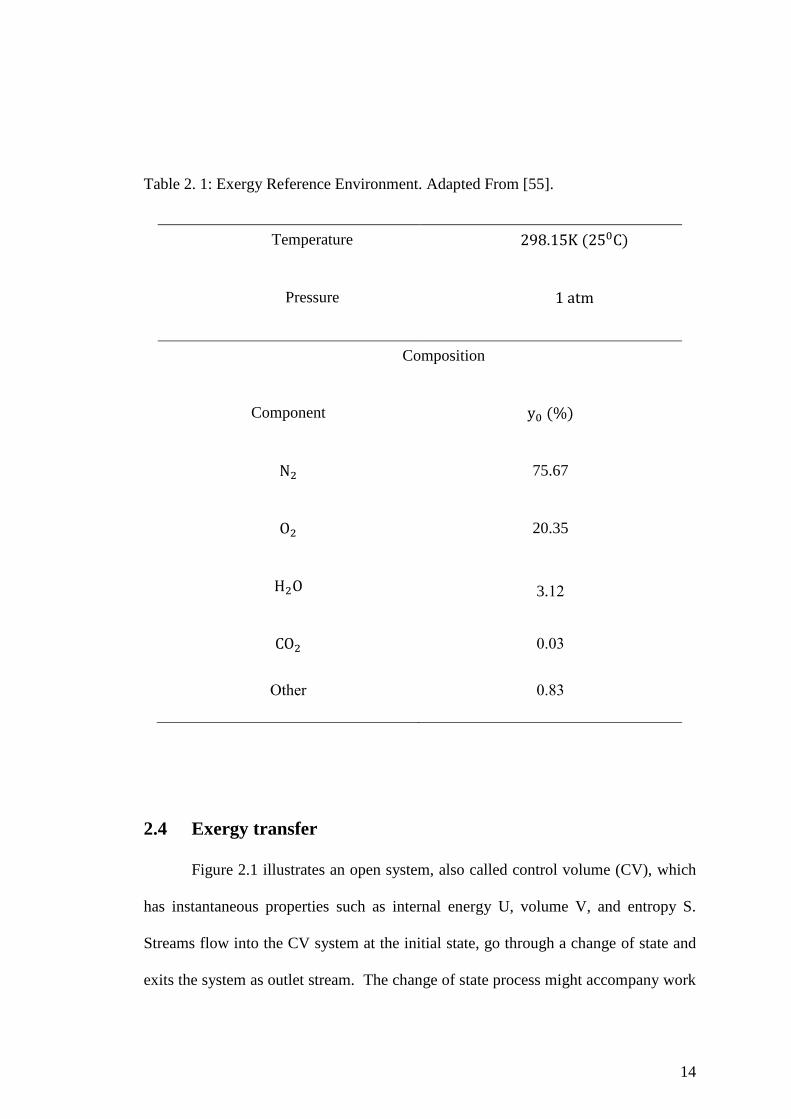
Figure 2.1 illustrates an open system, also called control volume (CV), which
has instantaneous properties such as internal energy U, volume V, and entropy S.
Streams flow into the CV system at the initial state, go through a change of state and
exits the system as outlet stream. The change of state process might accompany work
15
or heat transfer across the boundary of the system, where ��𝑖𝑛 is heat input from a heat
source (e.g. steam) at 𝑇ℎ , ��𝑜𝑢𝑡 is the heat output to a heat sink (e.g. seawater or air) at
𝑇𝑐, 𝑊𝑖𝑛 is the work supplied to the process (e.g. compression work) and 𝑊𝑜𝑢𝑡 is the
work generated (e.g. generated work in gas turbine). Mass, heat or work transfer across
boundaries of a system are accompanied with exergy transfer, and they represents
exergy gained or lost by the system during a process.
Figure 2. 1: an open system with different forms of flow across the system.
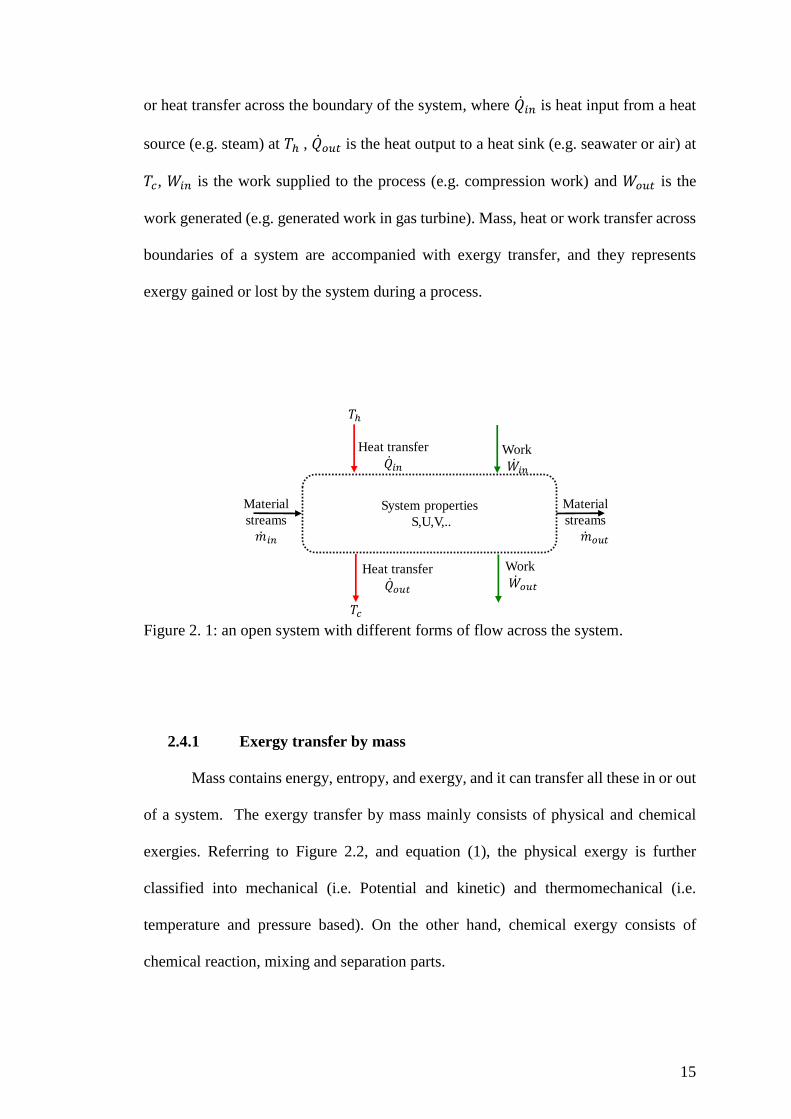
2.4.1 Exergy transfer by mass
Mass contains energy, entropy, and exergy, and it can transfer all these in or out
of a system. The exergy transfer by mass mainly consists of physical and chemical
exergies. Referring to Figure 2.2, and equation (1), the physical exergy is further
classified into mechanical (i.e. Potential and kinetic) and thermomechanical (i.e.
temperature and pressure based). On the other hand, chemical exergy consists of
chemical reaction, mixing and separation parts.
Material
streams
𝑖𝑛
System properties
S,U,V,..
Material
streams
𝑜𝑢𝑡
Heat transfer
��𝑖𝑛
Heat transfer
��𝑜𝑢𝑡
Work
��𝑖𝑛
Work
��𝑜𝑢𝑡
𝑇ℎ
𝑇𝑐
16
Figure 2. 2: Classification of exergy transferred by mass
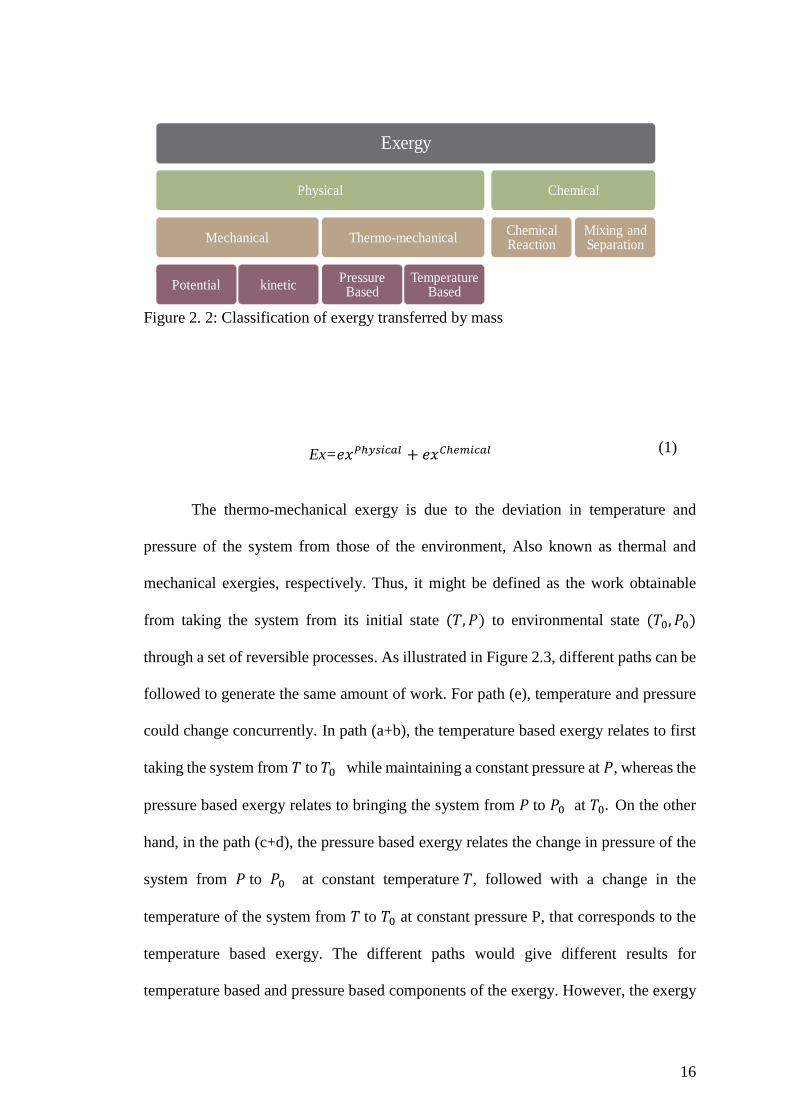
The thermo-mechanical exergy is due to the deviation in temperature and
pressure of the system from those of the environment, Also known as thermal and
mechanical exergies, respectively. Thus, it might be defined as the work obtainable
from taking the system from its initial state (𝑇, 𝑃) to environmental state (𝑇0, 𝑃0)
through a set of reversible processes. As illustrated in Figure 2.3, different paths can be
followed to generate the same amount of work. For path (e), temperature and pressure
could change concurrently. In path (a+b), the temperature based exergy relates to first
taking the system from 𝑇 to 𝑇0 while maintaining a constant pressure at 𝑃, whereas the
pressure based exergy relates to bringing the system from 𝑃 to 𝑃0 at 𝑇0. On the other
hand, in the path (c+d), the pressure based exergy relates the change in pressure of the
system from 𝑃 to 𝑃0 at constant temperature 𝑇, followed with a change in the
temperature of the system from 𝑇 to 𝑇0 at constant pressure P, that corresponds to the
temperature based exergy. The different paths would give different results for
temperature based and pressure based components of the exergy. However, the exergy
Ex=𝑒𝑥𝑃ℎ𝑦𝑠𝑖𝑐𝑎𝑙 + 𝑒𝑥𝐶ℎ𝑒𝑚𝑖𝑐𝑎𝑙 (1)
Exergy
Physical
Mechanical
Potential kinetic
Thermo-mechanical
Pressure Based
Temperature Based
Chemical
Chemical Reaction
Mixing and Separation
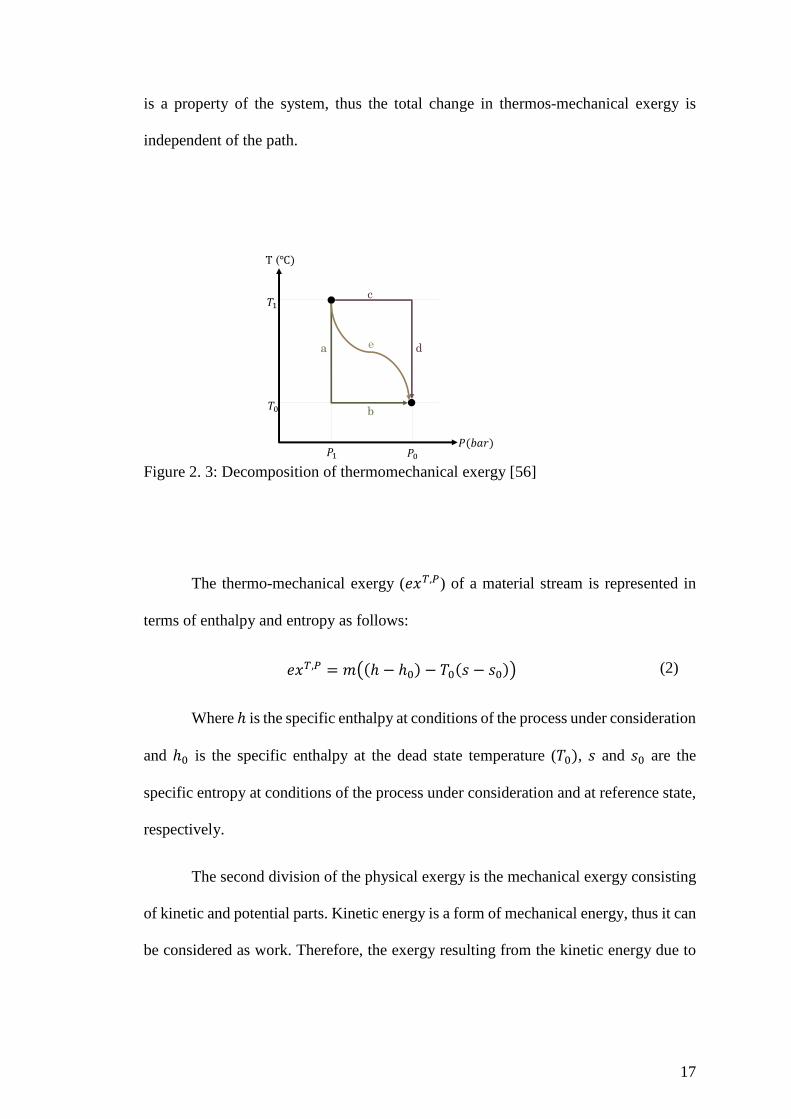
17
is a property of the system, thus the total change in thermos-mechanical exergy is
independent of the path.
Figure 2. 3: Decomposition of thermomechanical exergy [56]
The thermo-mechanical exergy (𝑒𝑥𝑇,𝑃) of a material stream is represented in
terms of enthalpy and entropy as follows:
𝑒𝑥𝑇,𝑃 = ((ℎ − ℎ0) − 𝑇0(𝑠 − 𝑠0)) (2)
Where ℎ is the specific enthalpy at conditions of the process under consideration
and ℎ0 is the specific enthalpy at the dead state temperature (𝑇0), 𝑠 and 𝑠0 are the
specific entropy at conditions of the process under consideration and at reference state,
respectively.
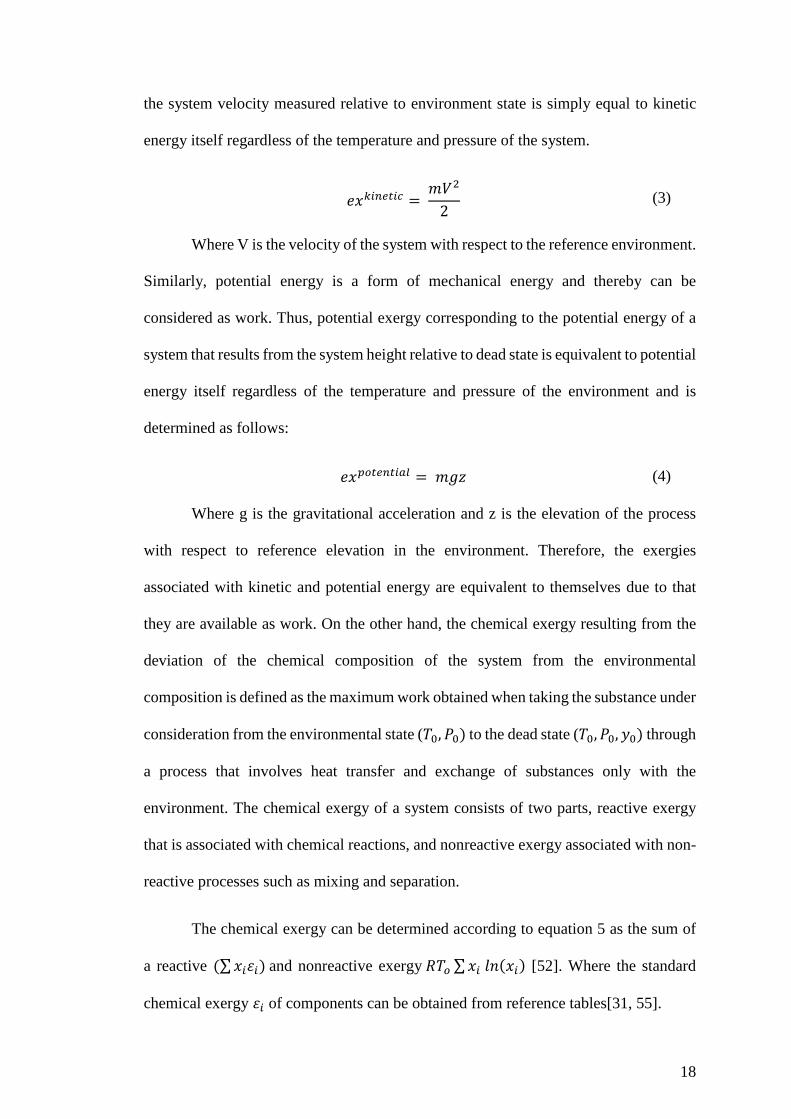
The second division of the physical exergy is the mechanical exergy consisting
of kinetic and potential parts. Kinetic energy is a form of mechanical energy, thus it can
be considered as work. Therefore, the exergy resulting from the kinetic energy due to
c
d
b
a e
𝑇
𝑇0
𝑃 𝑃0
(℃)
𝑃( )
18
the system velocity measured relative to environment state is simply equal to kinetic
energy itself regardless of the temperature and pressure of the system.
𝑒𝑥𝑘𝑖𝑛𝑒𝑡𝑖𝑐 = 𝑉2
2 (3)
Where V is the velocity of the system with respect to the reference environment.
Similarly, potential energy is a form of mechanical energy and thereby can be
considered as work. Thus, potential exergy corresponding to the potential energy of a
system that results from the system height relative to dead state is equivalent to potential
energy itself regardless of the temperature and pressure of the environment and is
determined as follows:
𝑒𝑥𝑝𝑜𝑡𝑒𝑛𝑡𝑖𝑎𝑙 = 𝑔𝑧 (4)
Where g is the gravitational acceleration and z is the elevation of the process
with respect to reference elevation in the environment. Therefore, the exergies
associated with kinetic and potential energy are equivalent to themselves due to that
they are available as work. On the other hand, the chemical exergy resulting from the
deviation of the chemical composition of the system from the environmental
composition is defined as the maximum work obtained when taking the substance under
consideration from the environmental state (𝑇0, 𝑃0) to the dead state (𝑇0, 𝑃0, 𝑦0) through
a process that involves heat transfer and exchange of substances only with the
environment. The chemical exergy of a system consists of two parts, reactive exergy
that is associated with chemical reactions, and nonreactive exergy associated with non-
reactive processes such as mixing and separation.
The chemical exergy can be determined according to equation 5 as the sum of
a reactive (∑𝑥𝑖𝜀𝑖) and nonreactive exergy 𝑅𝑇𝑜 ∑𝑥𝑖 𝑙𝑛(𝑥𝑖) [52]. Where the standard
chemical exergy 𝜀𝑖 of components can be obtained from reference tables[31, 55].
19
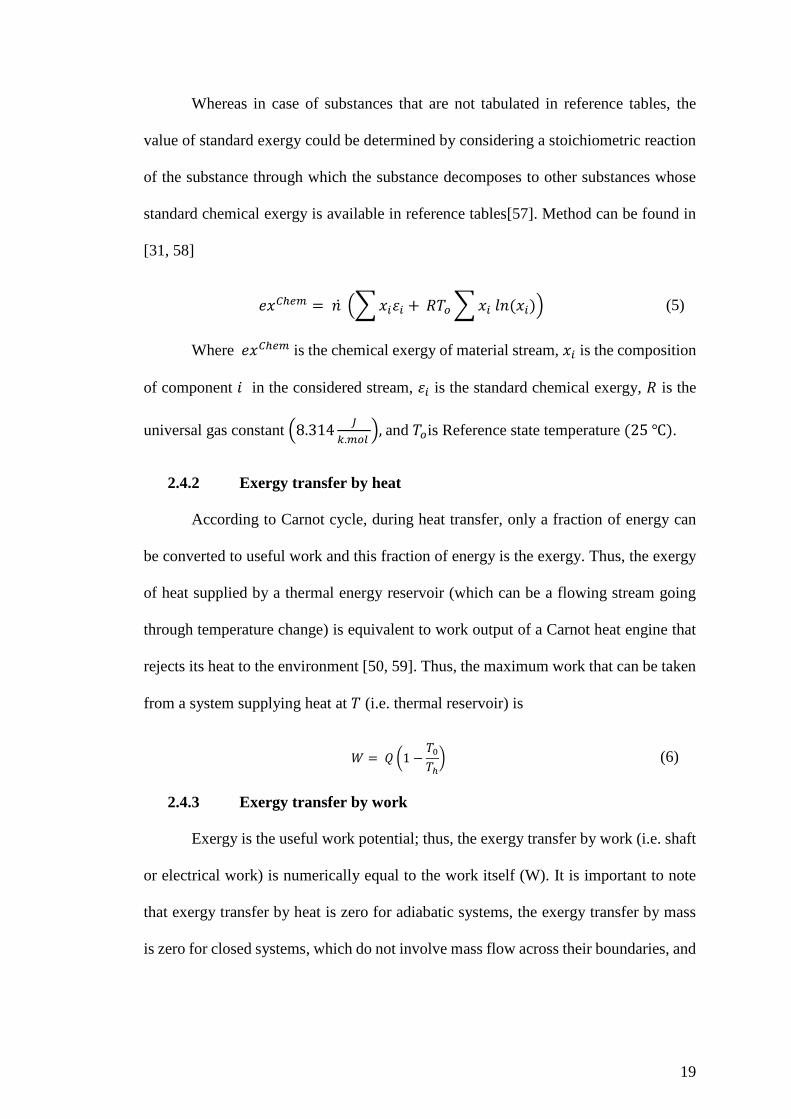
Whereas in case of substances that are not tabulated in reference tables, the
value of standard exergy could be determined by considering a stoichiometric reaction
of the substance through which the substance decomposes to other substances whose
standard chemical exergy is available in reference tables[57]. Method can be found in
[31, 58]
𝑒𝑥𝐶ℎ𝑒𝑚 = 𝑛 (∑𝑥𝑖𝜀𝑖 + 𝑅𝑇𝑜∑𝑥𝑖 𝑙𝑛(𝑥𝑖)) (5)
Where 𝑒𝑥𝐶ℎ𝑒𝑚 is the chemical exergy of material stream, 𝑥𝑖 is the composition
of component 𝑖 in the considered stream, 𝜀𝑖 is the standard chemical exergy, 𝑅 is the
universal gas constant (8.314𝐽
𝑘.𝑚𝑜𝑙 ), and 𝑇𝑜is Reference state temperature (25 ℃).
2.4.2 Exergy transfer by heat
According to Carnot cycle, during heat transfer, only a fraction of energy can
be converted to useful work and this fraction of energy is the exergy. Thus, the exergy
of heat supplied by a thermal energy reservoir (which can be a flowing stream going
through temperature change) is equivalent to work output of a Carnot heat engine that
rejects its heat to the environment [50, 59]. Thus, the maximum work that can be taken
from a system supplying heat at 𝑇 (i.e. thermal reservoir) is
𝑊 = 𝑄 (1 −𝑇0𝑇ℎ) (6)
2.4.3 Exergy transfer by work
Exergy is the useful work potential; thus, the exergy transfer by work (i.e. shaft
or electrical work) is numerically equal to the work itself (W). It is important to note
that exergy transfer by heat is zero for adiabatic systems, the exergy transfer by mass
is zero for closed systems, which do not involve mass flow across their boundaries, and
20
exergy transfer by work is zero for isobaric systems. Accordingly, for isolated systems
(i.e. no heat, work or mass transfer) the total exergy transfer is zero.
2.5 Exergy loss (destruction)
Exergy, unlike energy, is not conserved but destroyed within a system as a result
of entropy generation due to irreversibilities. Irreversibilities might be classified as
external or internal. External irreversibilities are due to heat transfer through a finite
temperature system while internal irreversibilities include unrestrained expansion,
chemical reaction, missing and friction. Exergy destruction within a system is
proportional to the entropy increase. Exergy destruction represents the loss in potential
work, and its value should be equal to or greater than zero. A positive value of exergy
destruction indicates that the process is irreversible; here, the larger the exergy
destruction the more irreversible the process is. In a reversible process, the exergy
destruction is zero; however, no process is reversible in practice. On the other hand,
negative exergy destruction indicates that the process is impossible. Hence, exergy
destruction can be used to determine whether a process is reversible, irreversible or
impossible.
As mentioned before, any process that generates entropy always results in
exergy destruction within the process. Thus, exergy destruction is proportional to the
entropy generated, and this is expressed in the following equation:
𝐸𝑥𝐷 = 𝑇0 𝑆𝑔𝑒𝑛 ≥0 (7)
Where 𝐸𝑥𝐷𝑒𝑠𝑟𝑜𝑦𝑒𝑑 the exergy is destructed within a process, 𝑇0 is the
temperature of the environment and 𝑆𝑔𝑒𝑛 is the generated entropy.
21
2.6 Exergy balances
Exergy concept is mainly applied to perform exergy balance for the analysis of
the thermal and chemical systems. Exergy, unlike entropy, cannot be generated but
can be destroyed on a process. Therefore, the change in total exergy of a system is
equal to difference between the net exergy transferred into a system
(𝑡𝑜𝑡 𝑙 𝑒𝑥𝑒 𝑔𝑦 𝑒𝑛𝑡𝑒 𝑖𝑛𝑔 𝑡ℎ𝑒 𝑠𝑦𝑠𝑡𝑒 − 𝑡𝑜𝑡 𝑙 𝑒𝑥𝑒 𝑔𝑦 𝑙𝑒 𝑣𝑖𝑛𝑔 𝑡ℎ𝑒 𝑠𝑦𝑠𝑡𝑒 ) and
exergy destroyed during the process due to irreversibilities. Then the exergy balance
is expressed as follows:
(
𝑇𝑜𝑡 𝑙𝑒𝑥𝑒 𝑔𝑦𝑒𝑛𝑡𝑒 𝑖𝑛𝑔
) − (
𝑇𝑜𝑡 𝑙𝑒𝑥𝑒 𝑔𝑦𝑙𝑒 𝑣𝑖𝑛𝑔
) − (
𝑇𝑜𝑡 𝑙𝑒𝑥𝑒 𝑔𝑦
𝑑𝑒𝑠𝑡 𝑜𝑦𝑒𝑑 ) = (
𝑇𝑜𝑡 𝑙𝑒𝑥𝑒 𝑔𝑦
𝑐ℎ 𝑛𝑔𝑒 𝑜𝑓 𝑡𝑒ℎ 𝑠𝑦𝑠𝑡𝑒 ) (8)
Explicitly, exergy balance for any system going through any process is expressed as
follows:
∑𝐸𝑥𝑖𝑛 − ∑𝐸𝑥𝑜𝑢𝑡 −∑𝐸𝑥𝐷 = ∆𝐸𝑥 (9)
Analysis of thermal plants and chemical systems in practice are mostly relevant
to open systems (i.e. control volumes) analysis more than closed systems analysis. In
addition, practically, most of the open systems in industrial processes such as
compressors, heat exchangers, nozzles, turbines, etc., operate steadily. Which means
they do not experience time variation in mass, energy, entropy, and exergy content.
Therefore, for such systems, the amount of exergy in form of mass, heat or work,
entering the system must be equal to the amount of exergy leaving the system plus the
destroyed exergy (i.e. exergy loss).
∑𝐸𝑥𝑖𝑛 = ∑𝐸𝑥𝑜𝑢𝑡 +∑𝐸𝑥𝐷 (10)
22
As mentioned earlier, exergy can be transferred to or from a system in three
forms: mass flow, heat, and work. Thus, the exergy balance of an open steady state
system can be expressed in the most general form as follows:
∑𝐸𝑥𝑖𝑛𝑚 +∑𝑄𝑖𝑛 (1 −
𝑇𝑎𝑚𝑏𝑖𝑛𝑒𝑡
𝑇ℎ) +𝑊𝑖𝑛 =∑𝐸𝑥𝑜𝑢𝑡
𝑚 +∑𝑄𝑜𝑢𝑡 (1 −𝑇𝑎𝑚𝑏𝑖𝑛𝑒𝑡
𝑇𝑐)
+𝑊𝑜𝑢𝑡 + Δ𝐸𝑥𝐷
(11)
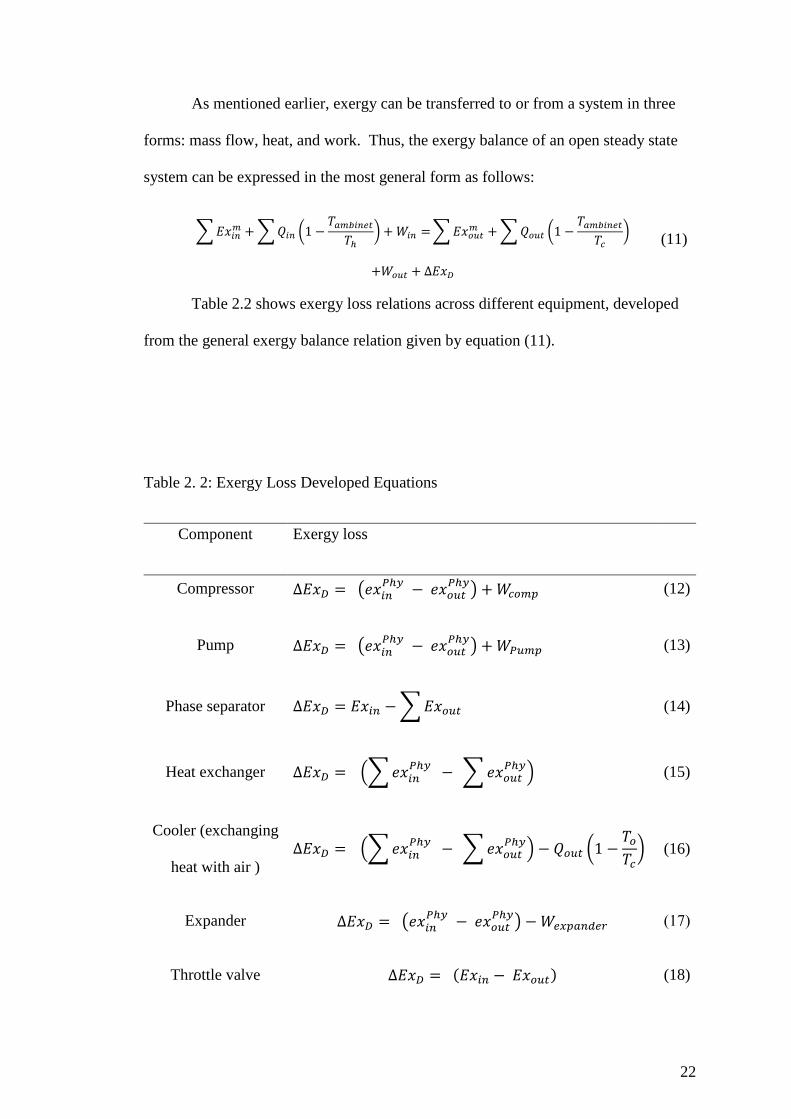
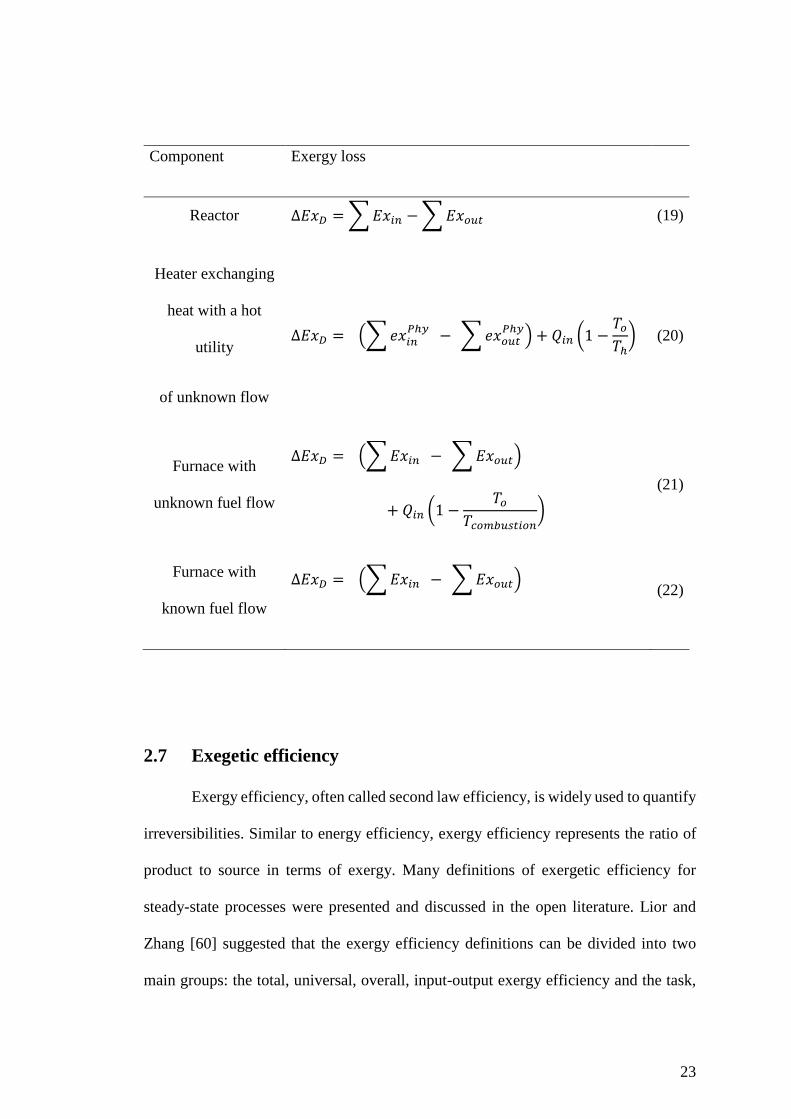
Table 2.2 shows exergy loss relations across different equipment, developed
from the general exergy balance relation given by equation (11).
Table 2. 2: Exergy Loss Developed Equations
Component Exergy loss
Compressor ∆𝐸𝑥𝐷 = (𝑒𝑥𝑖𝑛𝑃ℎ𝑦
− 𝑒𝑥𝑜𝑢𝑡𝑃ℎ𝑦
) +𝑊𝑐𝑜𝑚𝑝 (12)
Pump ∆𝐸𝑥𝐷 = (𝑒𝑥𝑖𝑛𝑃ℎ𝑦
− 𝑒𝑥𝑜𝑢𝑡𝑃ℎ𝑦
) +𝑊𝑃𝑢𝑚𝑝 (13)
Phase separator ∆𝐸𝑥𝐷 = 𝐸𝑥𝑖𝑛 −∑𝐸𝑥𝑜𝑢𝑡 (14)
Heat exchanger ∆𝐸𝑥𝐷 = (∑𝑒𝑥𝑖𝑛𝑃ℎ𝑦
− ∑𝑒𝑥𝑜𝑢𝑡𝑃ℎ𝑦
) (15)
Cooler (exchanging
heat with air )
∆𝐸𝑥𝐷 = (∑𝑒𝑥𝑖𝑛𝑃ℎ𝑦
− ∑𝑒𝑥𝑜𝑢𝑡𝑃ℎ𝑦
) − 𝑄𝑜𝑢𝑡 (1 −𝑇𝑜𝑇𝑐) (16)
Expander ∆𝐸𝑥𝐷 = (𝑒𝑥𝑖𝑛𝑃ℎ𝑦
− 𝑒𝑥𝑜𝑢𝑡𝑃ℎ𝑦
) −𝑊𝑒𝑥𝑝𝑎𝑛𝑑𝑒𝑟 (17)
Throttle valve ∆𝐸𝑥𝐷 = (𝐸𝑥𝑖𝑛 − 𝐸𝑥𝑜𝑢𝑡) (18)
23
Component Exergy loss
Reactor ∆𝐸𝑥𝐷 =∑𝐸𝑥𝑖𝑛 −∑𝐸𝑥𝑜𝑢𝑡 (19)
Heater exchanging
heat with a hot
utility
of unknown flow
∆𝐸𝑥𝐷 = (∑𝑒𝑥𝑖𝑛𝑃ℎ𝑦
− ∑𝑒𝑥𝑜𝑢𝑡𝑃ℎ𝑦
) + 𝑄𝑖𝑛 (1 −𝑇𝑜𝑇ℎ) (20)
Furnace with
unknown fuel flow
∆𝐸𝑥𝐷 = (∑𝐸𝑥𝑖𝑛 − ∑𝐸𝑥𝑜𝑢𝑡)
+ 𝑄𝑖𝑛 (1 −𝑇𝑜
𝑇𝑐𝑜𝑚𝑏𝑢𝑠𝑡𝑖𝑜𝑛)
(21)
Furnace with
known fuel flow
∆𝐸𝑥𝐷 = (∑𝐸𝑥𝑖𝑛 − ∑𝐸𝑥𝑜𝑢𝑡) (22)
2.7 Exegetic efficiency
Exergy efficiency, often called second law efficiency, is widely used to quantify
irreversibilities. Similar to energy efficiency, exergy efficiency represents the ratio of
product to source in terms of exergy. Many definitions of exergetic efficiency for
steady-state processes were presented and discussed in the open literature. Lior and
Zhang [60] suggested that the exergy efficiency definitions can be divided into two
main groups: the total, universal, overall, input-output exergy efficiency and the task,
24
consumed produced, functional, rational or utilitarian exergy efficiency. The first is
defined as the ratio of all output exergy to input exergy flows across the system. Thus,
for an open thermodynamic system at steady state, the total exergy efficiency is
expressed as the ratio of all exergy outflows to inflows [60, 61]:
ɳ = ∑𝐸𝑥𝑜𝑢𝑡∑𝐸𝑥𝑖𝑛
= 1 −𝐸𝑥𝐷∑𝐸𝑥𝑖𝑛
(23)
The total exergy efficiency described above is considered to be appropriate
when a major part of the exergy leaving the system is a useful product [60], the input
and output exergy flows are transformed to other exergy forms [61] and for dissipative
processes/devices [59, 60]. However, exergy outflows might include waste streams that
represent external exergy losses such as material waste, emissions, and heat losses,
which then implies that not all outputs of the system can be considered as useful
outputs. And thus, the total exergy efficiency has been criticized in literature in that it
takes into consideration all exergy flows without taking into account whether they are
consumed in the thermodynamic conversion. Therefore, it is more adequate to consider
the useable output exergy only to describe the efficiency of a system. The rational
efficiency distinguishes the exergy flows that are not altered (i.e. neither used nor
generated) from the exergy flows undergoing transformations. Thus, the rational exergy
efficiency is claimed to be more precise to evaluate a system in that it is defined as the
ratio of the produced exergy, that is exergy associated with generated products in the
system, to the consumed exergy, which is exergy associated with resources used to
produce these outputs. Rational efficiency can be then written:
Where 𝐸𝑥𝑝 is the exergy of the desired product and 𝐸𝑥𝑓 is the necessary input that is
often named as exergetic fuel [62].
ɳ = ∑𝐸𝑥𝑝∑𝐸𝑥𝑓
(24)
25
CHAPTER 3: LITRATURE REVIEW
This chapter provides a comprehensive review of the LNG chain exergy
literature. The aim is to summarize the present status of the field.
3.1 Introduction
The LNG chain, which comprises of NG treatment and purification,
liquefaction, storage, shipping, and regasification, is considered as one of the most
energy-intensive industrial processes and a minor efficiency improvement could reduce
the energy consumption significantly, which in turn may translate into huge economic
profits and significant reduction in environmental impact associated with the energy
consumption. It has been observed in the literature that there is a growing interest in
process optimization within the LNG chain. Most optimization studies have been
performed with the objective of improving the design, performance and minimizing
power consumption (i.e. Maximizing exergy efficiency). Thermodynamic tools, such
as exergy and pinch analysis, have been widely employed to assist the evaluation and
optimization of different processes. These approaches might be employed as
investigative tools for performance evaluation or in combination with optimization to
minimize the search effort for optimization approaches. The focus here is, however, the
exergy analysis. As mentioned earlier, all processes are, to some extent, irreversible in
practice. These irreversibilities can be recognized and quantified, in the form of exergy
destruction, using exergy analysis that was introduced by Kotas [31] and described in
chapter 2. Consequently, exergy analysis is primarily an indicative tool used to pinpoint
locations of highest irreversibilities, alternatively lowest exergy efficiency, and thus
locating opportunities for process improvement.
26
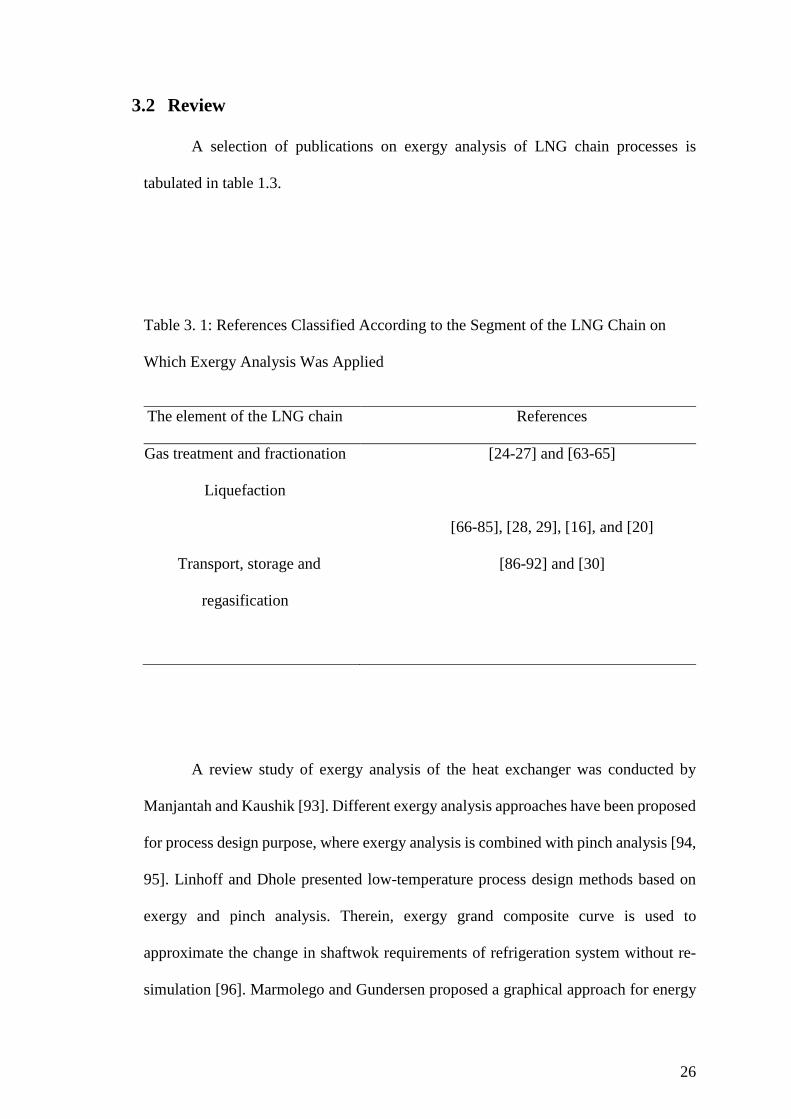
3.2 Review
A selection of publications on exergy analysis of LNG chain processes is
tabulated in table 1.3.
Table 3. 1: References Classified According to the Segment of the LNG Chain on
Which Exergy Analysis Was Applied
A review study of exergy analysis of the heat exchanger was conducted by
Manjantah and Kaushik [93]. Different exergy analysis approaches have been proposed
for process design purpose, where exergy analysis is combined with pinch analysis [94,
95]. Linhoff and Dhole presented low-temperature process design methods based on
exergy and pinch analysis. Therein, exergy grand composite curve is used to
approximate the change in shaftwok requirements of refrigeration system without re-
simulation [96]. Marmolego and Gundersen proposed a graphical approach for energy
The element of the LNG chain References
Gas treatment and fractionation [24-27] and [63-65]
Liquefaction
[66-85], [28, 29], [16], and [20]
Transport, storage and
regasification
[86-92] and [30]
27
targeting, applicable for low-temperature processes where the proposed procedure
combines exergy and pinch analysis. As a case study, the approach was used for a
nitrogen expander process design [97]. Rian and Ertesvag, performed exergy analysis
for the aim of evaluating a complete LNG plant where a mixed-refrigerant cascade
process was used for the liquefaction process [83]. Pellegrini et al. conducted energy
and exergy analysis to evaluate the thermodynamic performance of two acid gas
removal processes (MDEA and DPLT) in the LNG production chain. In this work, the
authors also considered different NG liquefaction technologies: Mixed Fluid Cascade
(MFC), Propane-Mixed Refrigerant (C3MR) and Single Mixed Refrigerant (SMR)
[24]. Ghorbani et al. employed exergy analysis to evaluate NG liquids (NGLs) recovery
integrated with NG liquefaction process. Here, replacing the pre-cooling stage of mixed
fluid cascade refrigeration system with an absorption system was also investigated.
Exergy analysis results showed that air coolers are associated with the highest exergy
destruction prior and after installing the absorption refrigeration cycle at a rate of
56.21% and 42.72%, respectively [25]. Lee et al. Performed detailed exergy analysis
for a cryogenic energy storage combined with LNG regasification process aiming to
identify opportunities to enhance process efficiency, such as optimizing operating
conditions or further possible cold energy recovery [98]. Morosuk et al. applied exergy
analysis to evaluate a single mixed refrigerant process (PRICO), that is operated
with compressors driven by a gas turbine system and is used for small scale LNG plant,
and highlight improvement opportunities of the PRICO process [66]. Kanoğlu
Performed exergy analysis on a multistage cascade refrigeration cycle that is used for
NG liquefaction where exergy destruction and energetic efficiency for the main cycle
components were developed [67]. Exergetic efficiency of the evaluated process is near
39% indicating a great improvement potential. Choi developed a new process for
28
reducing power consumption of the partial liquefaction process for LNG carriers using
exergy analysis [68]. Tirandazi et al. Assessed a multistage refrigeration cycle in
Ethane and heavier hydrocarbons (C2+) recovery plant in order to determine the
components causing major exergy destruction. Exergy efficiency of the investigated
refrigeration indicates a great potential of improvement, as it is determined to be near
43.5% [69]. Palizdar et al. conducted a thermodynamic evaluation based on
conventional and advanced exergy analysis of three mini-scale nitrogen single
expansion for natural liquefaction. The exergetic efficiency of the investigated process
is nearly 44%, which indicates a great improvement potential [70]. Tesch et al. applied
advanced and conventional exergy analysis to evaluate LNG regasification process
integrated with an air separation process [86]. Vatani et al. investigated five
conventional LNG process using exergy and energy analysis approaches. Namely, the
single mixed refrigerant (Linde and Air Products and Chemicals Inc), the propane
precooled mixed refrigerant, dual mixed refrigerant, and mixed fluid cascade [29].
Remeljej et al. evaluated three small scale LNG processes including two open loop
expandesr, two-stage expanders nitrogen refrigerant, and single-stage mixed
refrigerant. However, their work focused primarily on the cold section of small-scale
plants[71]. Samimi et al. performed exergy analysis for sulfur recovery unit (SRU)
aiming to allocate thermodynamic losses. Results of this work reveal that the exergetic
efficiency could be improved by minimizing the exergy losses; such that the exergy
efficiency in the Claus reaction furnace and incinerator could be increased from 11.22%
and 9.9% to 14.96% and 12.58% correspondingly [26]. Derbal et al. performed exergy
analysis of mixed refrigerant (MR) process in LNG plant to determine the performance
of the equipment constituting the MR process (main cryogenic heat exchanger and
centrifugal compressors) and control their operation [72]. Zargarzadeh et al. Developed
29
a tool, Olexan, using Visual Basic Application (VBA) to enable dynamic and online
exergy analysis in an interactive manner at various levels of the equipment and plant
[99]. Banat et al. Utilized exergy to show the units that are associated with high exergy
destruction within a gas-sweetening unit; results revealed that the absorber, followed
by heat exchangers and vessels were the units with the highest losses [63]. Khan et al.
performed energy and exergy analysis to enhance the efficiency of a three-stage
propane pre-cooling cycle, where the effect of changing operating conditions of
evaporators was analyzed considering energy consumption of the process, and exergy
losses and efficiencies were reported for several cases [73]. Sagia et al. carried out a
study to analyze irreversibilities in a one-stage refrigeration process that uses vapor
compression cycle; exergy balances were carried out on the system components, and
losses were calculated by an algorithm developed on a thermodynamic basis. Results
were presented through Grassmann diagrams while targeting the effect operating
temperatures have on the cycle’s exergy efficiency [28]. Chang et al. Investigated
combined Bryton-JT cycles with single-component refrigerants NG liquefaction,
namely N2-Brayton cycle with C2-JT and C3-JT, aiming to high efficiency, large
capacity and simple equipment. Therein, exergy efficiency was examined to evaluate
different LNG process concepts, where the methane cycle in conventional cascade
process is replaced with a nitrogen expander cycle [74]. Fábrega et al. Performed
exergy analysis of the refrigeration cycles in the ethylene and propylene production
process. In this study, the commercial simulator HYSYS© was used to generate process
data. Exergetic analysis results showed that the highest exergy destruction occurs in the
mixers, followed with compressors and then heat exchangers accounting for 40%, 22%
and 20% respectively. New operational data were proposed aiming to reduce exergy
losses, where 13% of the total exergy loss for the entire refrigeration system could be
30
reduced [100]. Gong et al. Performed exergy analysis to compare the performances of
a single mixed-refrigerant process and an auto-cascade mixed refrigerant process.
Results showed that the auto-cascade process provides better performance [75].
Tsatsaronis and Morosuk conducted a detailed advanced exergy analysis of a novel co-
generation concept that combines LNG regasification with the generation of electricity.
Results of the exergy analysis were confirmed with sensitivity analysis. This study also
provides developed suggestions for improving the overall system efficiency [87].
Tsatsaronis and Morosuk in another work, analyzed the improvement potential and
interactions among components in LNG-based cogeneration systems and showed the
advanced exergy analysis over the conventional one[88]. Tsatsaronis and Morosuk also
presented aan dvanced exergy-based evaluation of the same system, including
advanced exergetic exergoeconomic and exergoenvironmntal analysis to evaluate the
performance, economic and environmental aspects of the system. Further, the potenital
to improve the thermodynamic efficiency, reduce the overall environmental impact and
reduce overal cost was also determined. The main aim of this study is to demonstrate
the potentai for electricity generation during LNG regasification [89]. Panjeshahi et al.
have analyzed the south Pars NG Plant using exergy concept where the exergetic loss
and exergetic efficiency have been determined for the major unit operations. The
analyzed units involve the primary separation, sweetining, glycol recovery, condensate
stabilization, dehydration, mercury removal, mercaptan removal, sulfur recovery, sour
water treatment, liquid gas treatment, gas pressure compressopn, air centrifugal
compression, steam production, power production, mercaptan removal. Therein, some
modificatinos have been proposed aiming to lower the energy consumption [64].
Baccanelli et al. have been modeled three NG low-temperature purification techniques,
namely: the dual pressure low-temperature distillation process, the anti-sublimation
31
process and the hybrid configuration. In this study, the exery analysis was employed to
evaluate the performance of the modeled processes. Results of this work showed that
the dual pressure low-temperatre distillation schem provided the highest thermodynaic
performance (highest exergy efficiency) compared to other processes [65]. Ghorbani et
al. investiated an integral NG liquids (NGL) and liquefied NG (LNG) using exergy and
exergoeconomic analysis methods. Results reaveled that the air-coolers and multi-
stream heat exchangers were of the highest exergy efficiency. It has been shown that
the exergy destruction in the compressors directly affects their required power, thus,
any reduction in the exergy destruction would significanlr reduce the operating cost
[27]. Kanbur et al. have conducted exergy analysis for cthe onventional micro-
cogeneration system and a micro-cogeneration system that utilizes the liquefied NG
(LNG) aiming to detect the exergy destruction and loss ratios. Results showed that the
minimum exergy dstruction is associated with pumps and LNG vaporizers [90].
Pinch Analysis (PA) has also gained a high level of industrial application and
has been successfully applied for many process design aspects such as to improve heat
recovery, design better power, utility and heat systems [101]. Aspelund et al. analyzed
the design of sub-ambient processes using a new methodology based on pinch and
exergy analysis called ExPAnd that was developed in the LNG industry, in order to
minimize energy requirements in the NG liquefaction cycle. The efficiency of the
ExPAnd approach was verified by applying it to design of LNG process where exergy
efficiency could be increased from 49.7% to 85.7% compared to standard pinch
analysis [16]. Al-Sobhi et al. utilized process integration techniques to optimize an
LNG process without the sulfur recovery and detailed NG liquefaction systems. Pinch
analysis was employed to identify and enhance the inefficiencies of the process. It was
found that through heat integration, heating and cooling utilities could be reduced by
32
15% and 29%, respectively [102]. Malham et al. introduced a novel hybrid pinch-
exergy integration methodology to couple both analysis methods and overcome their
individual limitations. The proposed methodology is applied in a basic LNG process to
assess exergy losses and determine needed changes in operating conditions and process
structure [103]. Gourmelon et al. proposed a novel methodology that combines Pinch
and exergy analysis. The approach, referred to as PiXAR, is used for analysis and
retrofitting of existing industrial processes [104]. Wechsung et al. developed an
optimization formulation model that combines pinch analysis, exergy analysis, and
mathematical programming. Their model is used for the synthesis of heat exchanger
networks [85].
3.3 Conclusions
The literature review indicates that the research activity in the field of LNG
process optimization is increasing in last years, and is likely to continue in the future
owing to the expected growth in the LNG trade. As powerful thermodynamic tools that
aid the process optimization, exergy and pinch analysis have been widely employed to
improve the performance of LNG chains. The majority of published studies; however,
have been focused on the liquefaction process itself owing to its high capital and
operating costs, which in turn have a significant impact on the economy of the LNG
chain. On the other hand, thermodynamic analysis of other segments of the LNG chain
is still lack of research, specifically for the hot section of the chain (i.e. upstream of the
liquefaction process). Further, optimizing LNG baseload chain requires a
comprehensive evaluation of all units, yet, among the available studies, no work has
been considered a full LNG chain. This work, however, contributes to filling this gap.
33
CHAPTER 4: PROCESS DESCRIPTION
This chapter presents an overall description of the LNG chain used in this study
which was adopted from [49]. Detailed flowsheets are presented in chapters with the
permission of the authors.
4.1 LNG chain description
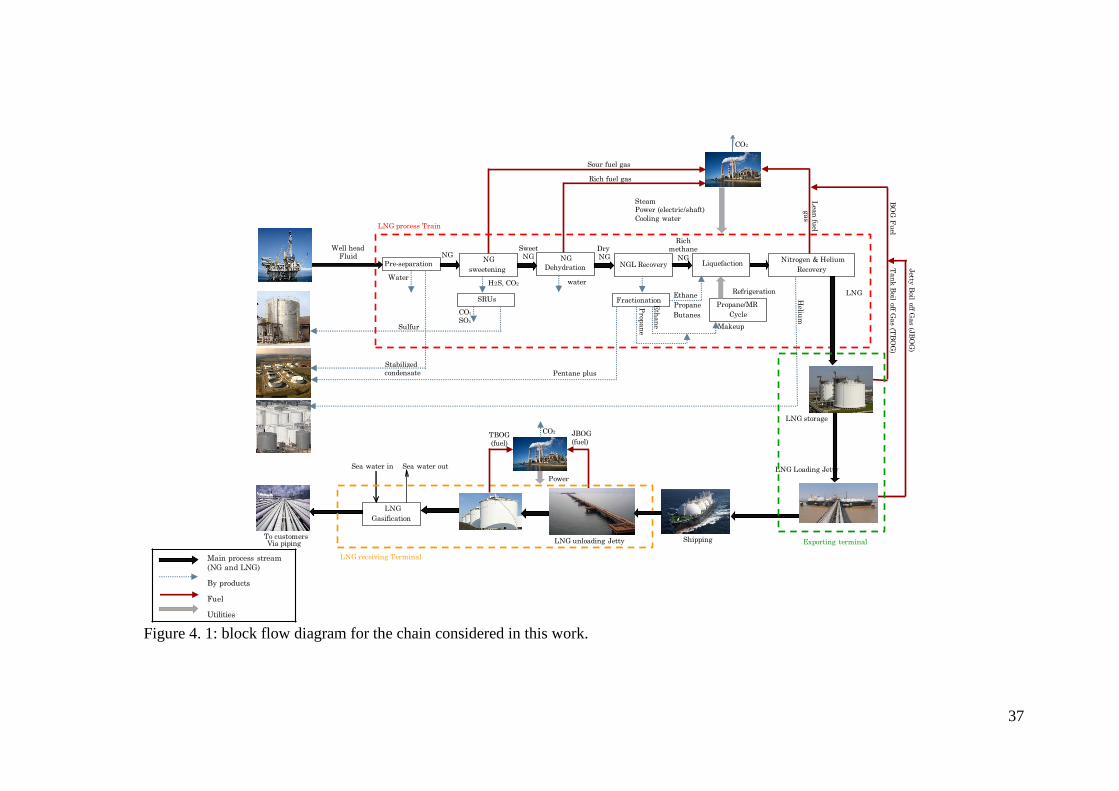
Figure 4.1 schematically illustrates the LNG supply chain considered in this
work; the chain consists of the following interdependent segments: LNG main process,
exporting terminal (i.e. LNG storage and loading), shipping and receiving terminal (i.e.
unloading and regasification). The main LNG process could be further divided based
on operating temperature into two sections, the hot section that requires energy in the
form of high heat to remove and transform impurities from NG and the cold section
that requires energy in the form of refrigeration. Raw NG enters the pre-separation unit
for gas, water, and pentane plus (condensate) separation. Condensate is then sent to
condensate stabilization for light hydrocarbon stripping. The aim of the condensate
stabilization is primarily to lower the vapor pressure of the condensate liquids, thus
avoid production of vapor phase upon flashing the condensate to atmospheric pressure
at storage tank [105]. Stabilized condensate is stored and sold as crude oil [106]. NG
leaving the pre-separation unit, referred to as sour gas that contains undesired impurities
(CO2, H2S , mercaptans, Benzene-Toluene-Xylene (BTX), mercury and water) that
should be removed for operation and products specifications purposes. The presence
of high freezing point and corrosive components might cause blockage in the
downstream cryogenic heat exchangers (used for NG liquefaction) which can cause
major disturbances. In addition, LNG should not contain more than 4 ppm and 57 ppm
of H2S and CO2, respectively [49]. Thus, the sour gas undergoes several treatment steps
before liquefaction. Sour gas first enters the Acid Gas Removal Units (AGRUs) where
34
H2S, CO2, and mercaptans (known as acid gas) are removed by means of absorption
processes with aqueous alkanoamine solutions. The considered LNG chain involves
two amine systems, methyldiethanolamin (MDEA) and Sulfinol unit. The last is
followed with an Acid Gas Enrichment Unit (AGEU) in order to increase the H2S
content in the acid gas to improve the subsequent sulfur recovery. Separated is sent to
the sulfur recovery unit (SRU). To produce elemental sulfur from H2S using the Claus
chemistry. The LNG chain under consideration involves two sulfur recovery units, a
Claus process for the acid gas leaving the MDEA unit and a SuperClaus process for the
acid gas leaving the AGE unit. The sweet NG from the sulfinol process is fed to the
dehydration unit where molecular sieves are used to remove water from the NG upon
liquefaction. Once NG is dried to the required level, mercury is removed from the NG
stream in the mercury removal unit to prevent its reaction with aluminum that is a
common material used for the construction of liquefaction cryogenic heat exchangers
[107]. After impurities are removed from the feed stream to the desired extent, NG is
liquefied in the liquefaction process, using propane pre-cooled mixed refrigerant C3MR
refrigeration cycle, integrated with the NGL recovery process. In the NGLs recovery
unit, heavier hydrocarbon liquids including ethane, propane, and butanes, are separated
by means of fractionation to yield a source of revenue, as NGLs are marketable products
of great value [108]. On the other hand, NG stream is delivered to the liquefaction
facility at elevated pressure, where it is subjected to a series of subsequent cooling
stages by indirect heat exchange with refrigerant until it is completely liquefied. Here,
both of the aforementioned units are cryogenic processes requiring refrigeration
systems, thus integrating them allows sharing the refrigeration system, thereby,
reducing the number of process equipment that results in economic advantage [109].
LNG is then sent to the nitrogen rejection unit integrated with the helium extraction
35
unit (NRU-HeXU). The purpose of NRU is to reduce the LNG nitrogen content to
increase its lower heating value. Helium extraction unit, however, is required to meet
product specification and to improve the economics of the plant as crude helium can be
sold separately. LNG is then sent for a storage facility. The tanks have two modes of
operation: holding (or LNG storage) and loading (ship loading). At the storage tank, a
portion of LNG is evaporated forming tankage boil off gas (TBOG), due to LNG
flashing to atmospheric pressure, heat leak through pipelines and tank walls, and vapor
displacement [110]. LNG is then loaded to an LNG ship and BOG is generated due to
the above-mentioned factors. The generated BOG during LNG loading process is
known as jetty BOG (JBOG). During LNG holding, generated TBOG is utilized as a
fuel. On the other hand, during the loading process, JBOG is generated in much higher
amounts than TBOG. Thus, a portion of it will be used to supply the fuel requirement
of the plant whereas excess JBOG is flared. Afterward, LNG is transported from the
production facility to the final destination (import region). BOG is also generated
during the shipping process. Once LNG carrier berth into the LNG importing terminal,
the LNG is unloaded from cargo tank into cryogenic storage tanks. Similar to exporting
terminal, BOG is also generated in the receiving terminal on the jetty area as well as in
the storage tank. LNG is then regasified using open rack vaporizer (ORVs) system
where LNG is vaporized using seawater. Gasified NG is then distributed to customers
via the gas grids.
The LNG main process units require a substantial amount of shaft work,
electrical power, cooling utility, and heating medium, all of which are generated and
supplied through the utility section of the plant which in turn consumes the fuel
generated in different units of the plant. Utilities in the utility section are generated
using steam-power cogeneration system and standalone gas turbines (GTs). With

36
seawater and air being the main cooling media. For the receiving terminal, in addition
to seawater electric power is needed and generated using standalone turbines.
37
Figure 4. 1: block flow diagram for the chain considered in this work.
Lea
n fu
el gas
Pre-separationNG
sweetening
NGL NGL Recovery Liquefaction
Nitrogen & Helium
Recovery
NG
Dehydration
SRUs Fractionation
Water
Stabilized condensate
H2S, CO2
Sulfur
Eth
an
e
Prop
an
e
Pentane plus
Well head Fluid NG
Ethane
Propane
Butanes
SteamPower (electric/shaft)
Cooling water
CO2
Heliu
mMakeup
Propane/MR
Cycle
Refrigeration
LNG
Gasification
Sea water in Sea water out
To customersVia piping
LNG
LNG storage
Sour fuel gas
Tan
k B
oil off Gas (T
BO
G)
LNG process Train
LNG receiving Terminal
Rich fuel gas
Sweet NG
DryNG
water
Rich methane
NG
LNG Loading Jetty
Exporting terminal
Jetty
Boil off G
as (J
BO
G)
BO
G F
uel
ShippingLNG unloading Jetty
TBOG(fuel)
JBOG (fuel)
Power
CO2
CO2
SOx
Main process stream
(NG and LNG)
By products
Fuel
Utilities
38
CHAPTER 5: RESULTS AND DISCUSSIONS
5.1 Introduction
Following the approach described in section 1.5, and fixing the environment
reference temperature and pressure at 25℃ (298.15 K) and 1.01325 bar, respectively,
exergy flows (i.e. material, heat, and work), exergy destructions within the plant, exergy
losses to the environment, and exergetic efficiencies across the LNG chain units were
calculated. In this chapter, the results of this exergy analysis are presented and discussed
with reference to the objective of the study that is to quantify and allocate
thermodynamic inefficiencies within the chain.
5.2 Overall results
Results of the exergy analysis including the exergy streams entering and leaving
the chain as well as the utility plant are presented in Figure 5.1. The figure shows that
the exergy content of the NG feed needed to deliver 439 MMSCFD of NG to the end
user pipeline grid is approximately 7.81GW. This amount flows through the various
processes making up the chain until it ends up in the final regasified LNG for which
exergy content is 4.77 GW. Additional exergy of 1.73 GW also leaves the chain in the
form of by-products (i.e. Helium, NGLs, Condensate, Fuel, etc.). Exergy flows into and
out of the LNG chain units in the form of heat, mass, and work are also shown in the
figure. The total exergy loss across the chain was identified to be almost 1.04 GW,
corresponding to near 13% of the exergy input. This translates into an overall chain
exergy efficiency of 87%. The total loss here combines the losses across the process
equipment in the main process train, LNG storage, utility section (the GTs and
cogeneration system), LNG shipping, and receiving terminal plus its utility (electric
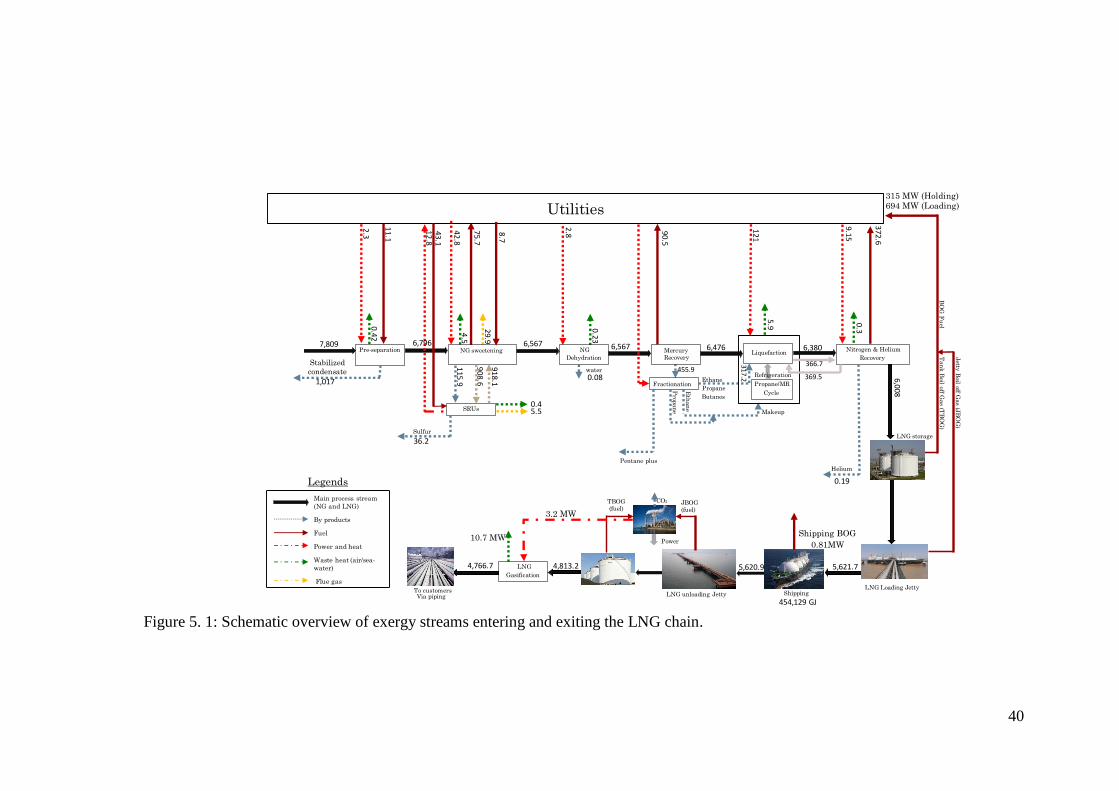
power). Figure 5. 1 shows the exergy flowrate of the main process stream (i.e. NG or
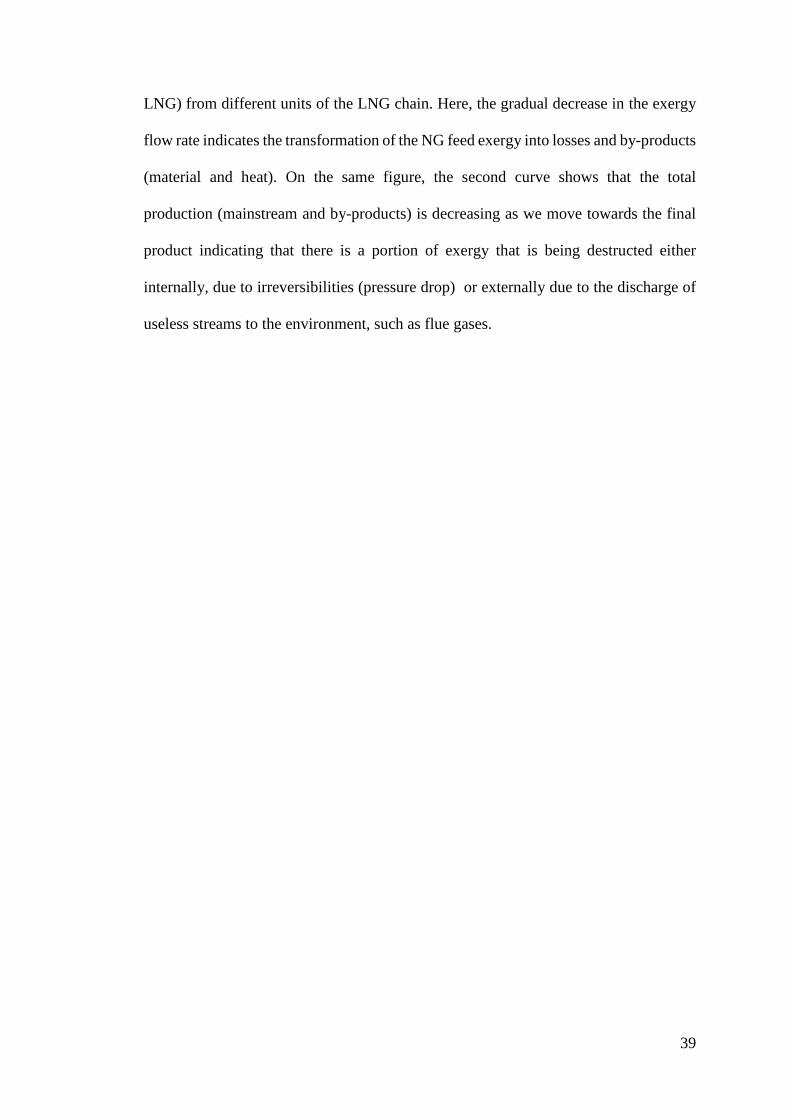
39
LNG) from different units of the LNG chain. Here, the gradual decrease in the exergy
flow rate indicates the transformation of the NG feed exergy into losses and by-products
(material and heat). On the same figure, the second curve shows that the total
production (mainstream and by-products) is decreasing as we move towards the final
product indicating that there is a portion of exergy that is being destructed either
internally, due to irreversibilities (pressure drop) or externally due to the discharge of
useless streams to the environment, such as flue gases.
40
Figure 5. 1: Schematic overview of exergy streams entering and exiting the LNG chain.
BO
G F
uel
2.30.42
75.7
4.542.8
29.9
8.7
12.843.1
90.5
0.2
3
5.9
121
0.3
Pre-separation NG sweetening NGL Mercury Recovery
LiquefactionNitrogen & Helium
Recovery
NG
Dehydration
SRUs
Fractionation
Stabilized
condensate
115.9
SulfurE
than
e
Prop
an
e
Pentane plus
Ethane
Propane
Butanes
Helium
Makeup
Propane/MR
Cycle
LNG
Gasification
To customersVia piping
LNG storage
Tan
k B
oil off Gas (T
BO
G)
water
LNG Loading Jetty
Jetty
Boil off G
as (J
BO
G)
ShippingLNG unloading Jetty
TBOG(fuel)
JBOG (fuel)
Power
CO2Main process stream
(NG and LNG)
By products
Fuel
Power and heat
Waste heat (air/sea-
water)
Flue gas
Utilities
Refrigeration
7,809
11.1
1,017
6,567
36.2
0.45.5
90
8.6
918.1
2.8
0.08
6,567 6,476 6,380
366.7
369.5455.9
317.2
372.6
9.15
0.19
6,008
315 MW (Holding)694 MW (Loading)
0.81MW
Shipping BOG
3.2 MW
10.7 MW
Legends
5,621.7 5,620.9 4,813.2 4,766.7
454,129 GJ
6,796
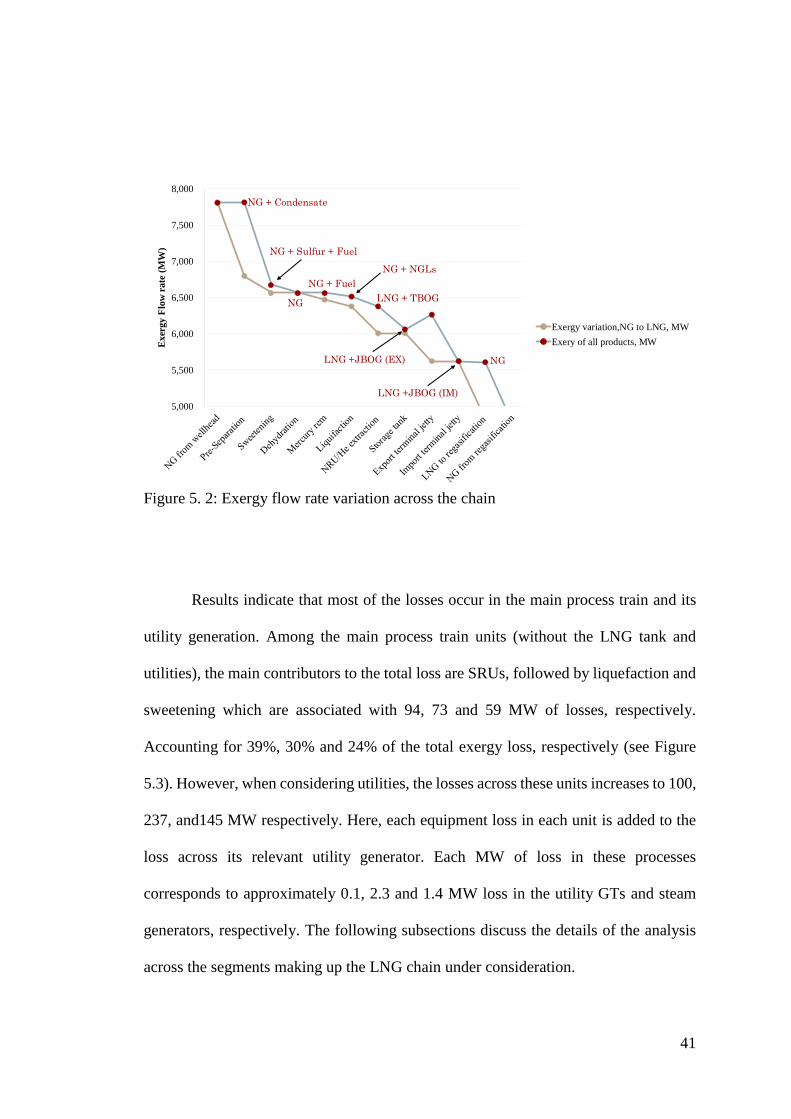
41
Figure 5. 2: Exergy flow rate variation across the chain
Results indicate that most of the losses occur in the main process train and its
utility generation. Among the main process train units (without the LNG tank and
utilities), the main contributors to the total loss are SRUs, followed by liquefaction and
sweetening which are associated with 94, 73 and 59 MW of losses, respectively.
Accounting for 39%, 30% and 24% of the total exergy loss, respectively (see Figure
5.3). However, when considering utilities, the losses across these units increases to 100,
237, and145 MW respectively. Here, each equipment loss in each unit is added to the
loss across its relevant utility generator. Each MW of loss in these processes
corresponds to approximately 0.1, 2.3 and 1.4 MW loss in the utility GTs and steam
generators, respectively. The following subsections discuss the details of the analysis
across the segments making up the LNG chain under consideration.
5,000
5,500
6,000
6,500
7,000
7,500
8,000
Exer
gy F
low
rate
(M
W)
Exergy variation,NG to LNG, MW
Exery of all products, MW
NG + Condensate
NG + Sulfur + Fuel
NG
NG + Fuel
NG + NGLs
LNG + TBOG
LNG +JBOG (EX)
LNG +JBOG (IM)
NG
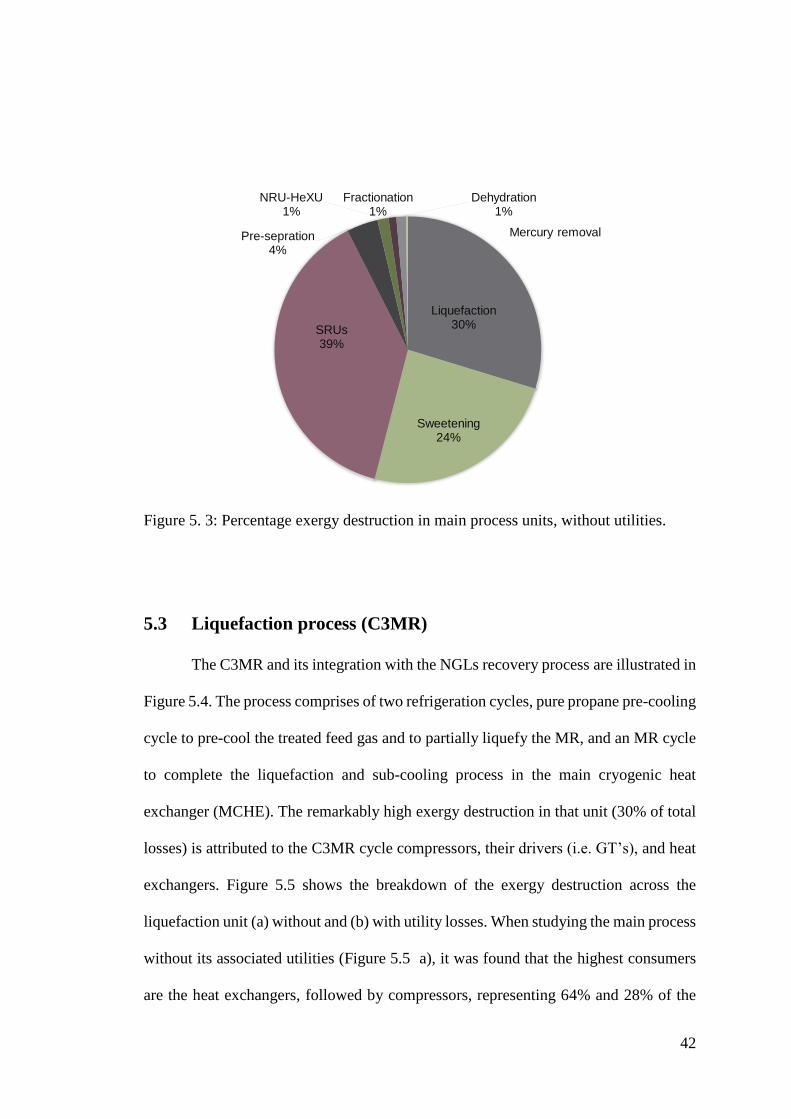
42
Figure 5. 3: Percentage exergy destruction in main process units, without utilities.
5.3 Liquefaction process (C3MR)
The C3MR and its integration with the NGLs recovery process are illustrated in
Figure 5.4. The process comprises of two refrigeration cycles, pure propane pre-cooling
cycle to pre-cool the treated feed gas and to partially liquefy the MR, and an MR cycle
to complete the liquefaction and sub-cooling process in the main cryogenic heat
exchanger (MCHE). The remarkably high exergy destruction in that unit (30% of total
losses) is attributed to the C3MR cycle compressors, their drivers (i.e. GT’s), and heat
exchangers. Figure 5.5 shows the breakdown of the exergy destruction across the
liquefaction unit (a) without and (b) with utility losses. When studying the main process
without its associated utilities (Figure 5.5 a), it was found that the highest consumers
are the heat exchangers, followed by compressors, representing 64% and 28% of the
Liquefaction 30%
Sweetening 24%
SRUs39%
Pre-sepration4%
NRU-HeXU1%
Fractionation 1%
Dehydration 1%
Mercury removal
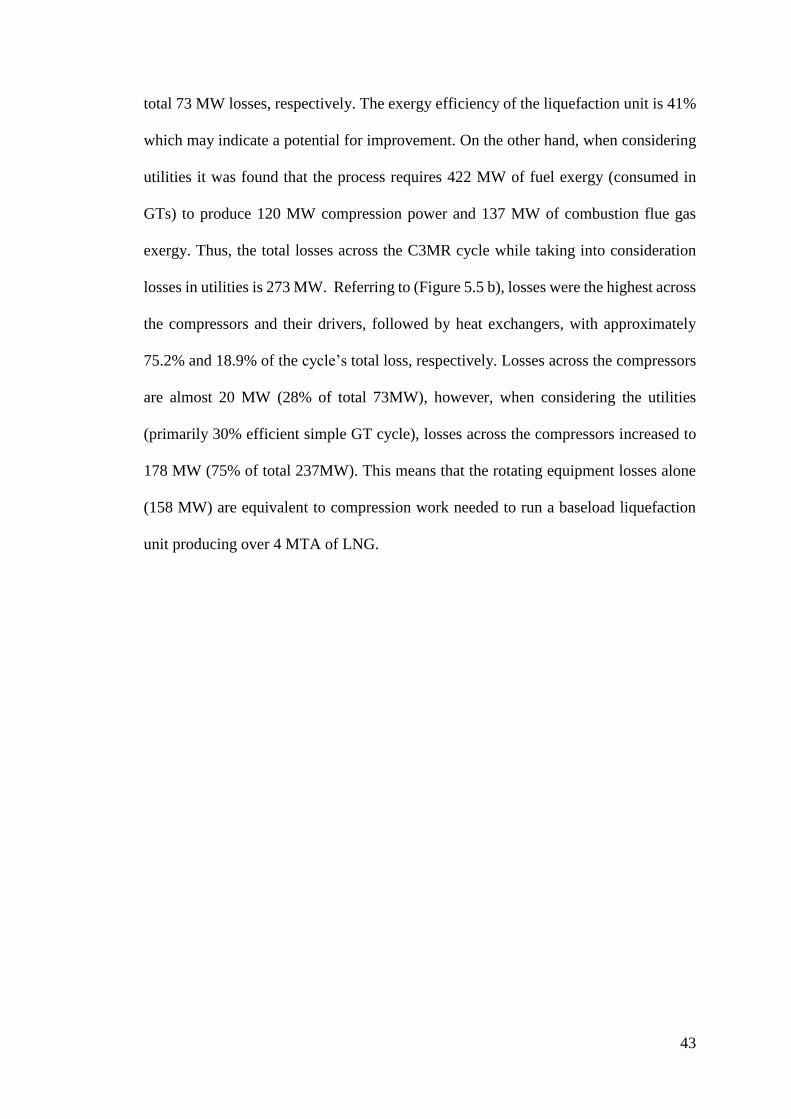
43
total 73 MW losses, respectively. The exergy efficiency of the liquefaction unit is 41%
which may indicate a potential for improvement. On the other hand, when considering
utilities it was found that the process requires 422 MW of fuel exergy (consumed in
GTs) to produce 120 MW compression power and 137 MW of combustion flue gas
exergy. Thus, the total losses across the C3MR cycle while taking into consideration
losses in utilities is 273 MW. Referring to (Figure 5.5 b), losses were the highest across
the compressors and their drivers, followed by heat exchangers, with approximately
75.2% and 18.9% of the cycle’s total loss, respectively. Losses across the compressors
are almost 20 MW (28% of total 73MW), however, when considering the utilities
(primarily 30% efficient simple GT cycle), losses across the compressors increased to
178 MW (75% of total 237MW). This means that the rotating equipment losses alone
(158 MW) are equivalent to compression work needed to run a baseload liquefaction
unit producing over 4 MTA of LNG.
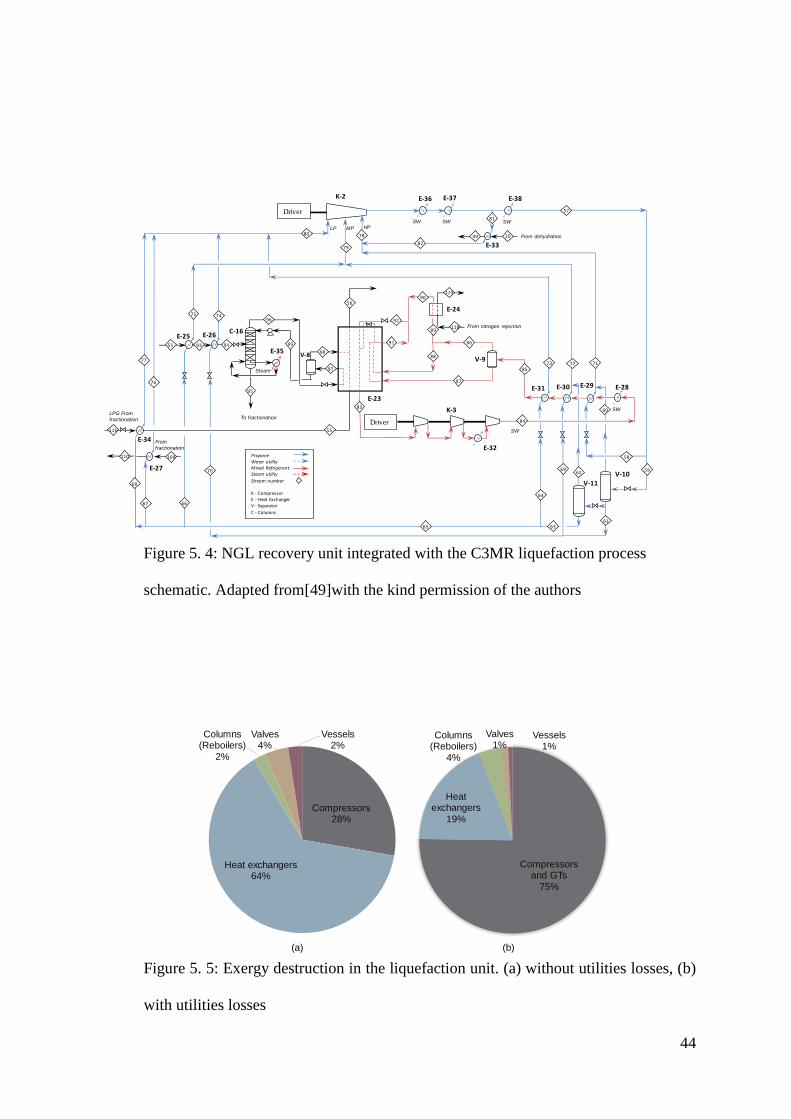
44
Figure 5. 4: NGL recovery unit integrated with the C3MR liquefaction process
schematic. Adapted from[49]with the kind permission of the authors
Figure 5. 5: Exergy destruction in the liquefaction unit. (a) without utilities losses, (b)
with utilities losses
LPG From
fractionation To fractionation
Driver
SW
SW
HPMPLP
From
fractionation
Driver
SW
SWSW
Steam
93
55
56
57
58
59
60
61
62
63
64
65
6667
68
717273
6970
7475
77
78
79
80
81
82
76
83
85
87
86
88
89
90
92
91
118
125
2049 From dehydration
94
95
96
97
98
99
K-2
K-3
C-16
E-23
V-8V-9
V-10V-11
E-24
E-25 E-26
E-27
E-28E-29E-30E-31
E-32
E-33
E-35
E-34
E-38E-36 E-37
From nitrogen rejection
115
109110
51
PropaneWater utilityMixed RefrigerantSteam utility
Stream number
K - CompressorE - Heat ExchangerV - Separator
C - Columns
84
Compressors and GTs
75%
Heat exchangers
19%
Columns (Reboilers)
4%
Valves1%
Vessels 1%
Compressors 28%
Heat exchangers 64%
Columns (Reboilers)
2%
Valves4%
Vessels 2%
(a) (b)
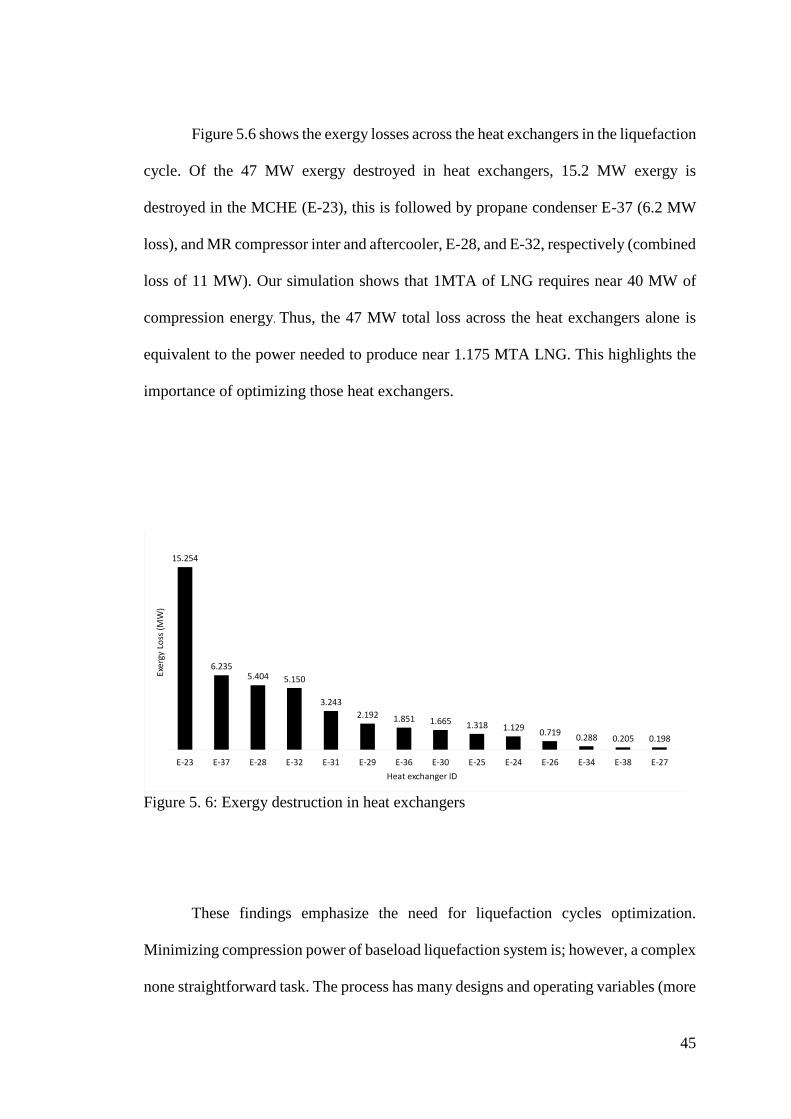
45
Figure 5.6 shows the exergy losses across the heat exchangers in the liquefaction
cycle. Of the 47 MW exergy destroyed in heat exchangers, 15.2 MW exergy is
destroyed in the MCHE (E-23), this is followed by propane condenser E-37 (6.2 MW
loss), and MR compressor inter and aftercooler, E-28, and E-32, respectively (combined
loss of 11 MW). Our simulation shows that 1MTA of LNG requires near 40 MW of
compression energy. Thus, the 47 MW total loss across the heat exchangers alone is
equivalent to the power needed to produce near 1.175 MTA LNG. This highlights the
importance of optimizing those heat exchangers.
Figure 5. 6: Exergy destruction in heat exchangers
These findings emphasize the need for liquefaction cycles optimization.
Minimizing compression power of baseload liquefaction system is; however, a complex
none straightforward task. The process has many designs and operating variables (more
15.254
6.2355.404 5.150
3.243
2.192 1.851 1.665 1.318 1.1290.719
0.288 0.205 0.198
E-23 E-37 E-28 E-32 E-31 E-29 E-36 E-30 E-25 E-24 E-26 E-34 E-38 E-27
Exe
rgy
Loss
(M
W)
Heat exchanger ID
Exergy loss in Liquefaction heat exchangers
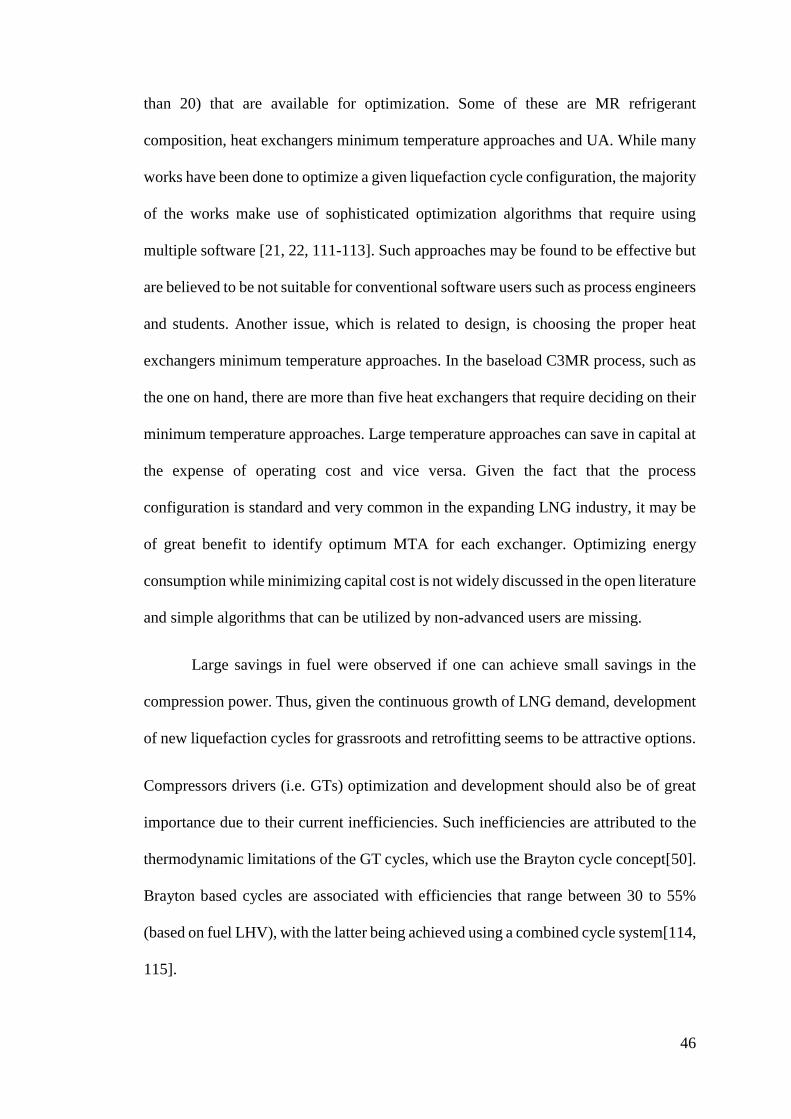
46
than 20) that are available for optimization. Some of these are MR refrigerant
composition, heat exchangers minimum temperature approaches and UA. While many
works have been done to optimize a given liquefaction cycle configuration, the majority
of the works make use of sophisticated optimization algorithms that require using
multiple software [21, 22, 111-113]. Such approaches may be found to be effective but
are believed to be not suitable for conventional software users such as process engineers
and students. Another issue, which is related to design, is choosing the proper heat
exchangers minimum temperature approaches. In the baseload C3MR process, such as
the one on hand, there are more than five heat exchangers that require deciding on their
minimum temperature approaches. Large temperature approaches can save in capital at
the expense of operating cost and vice versa. Given the fact that the process
configuration is standard and very common in the expanding LNG industry, it may be
of great benefit to identify optimum MTA for each exchanger. Optimizing energy
consumption while minimizing capital cost is not widely discussed in the open literature
and simple algorithms that can be utilized by non-advanced users are missing.
Large savings in fuel were observed if one can achieve small savings in the
compression power. Thus, given the continuous growth of LNG demand, development
of new liquefaction cycles for grassroots and retrofitting seems to be attractive options.
Compressors drivers (i.e. GTs) optimization and development should also be of great
importance due to their current inefficiencies. Such inefficiencies are attributed to the
thermodynamic limitations of the GT cycles, which use the Brayton cycle concept[50].
Brayton based cycles are associated with efficiencies that range between 30 to 55%
(based on fuel LHV), with the latter being achieved using a combined cycle system[114,
115].
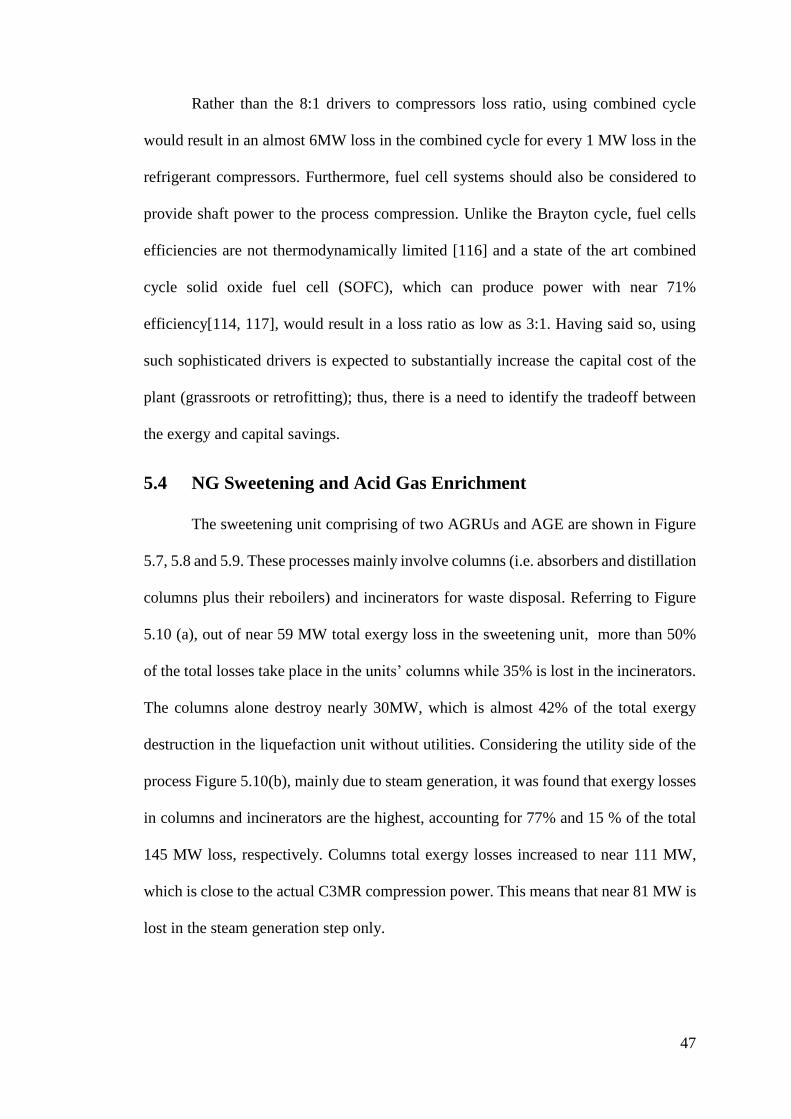
47
Rather than the 8:1 drivers to compressors loss ratio, using combined cycle
would result in an almost 6MW loss in the combined cycle for every 1 MW loss in the
refrigerant compressors. Furthermore, fuel cell systems should also be considered to
provide shaft power to the process compression. Unlike the Brayton cycle, fuel cells
efficiencies are not thermodynamically limited [116] and a state of the art combined
cycle solid oxide fuel cell (SOFC), which can produce power with near 71%
efficiency[114, 117], would result in a loss ratio as low as 3:1. Having said so, using
such sophisticated drivers is expected to substantially increase the capital cost of the
plant (grassroots or retrofitting); thus, there is a need to identify the tradeoff between
the exergy and capital savings.
5.4 NG Sweetening and Acid Gas Enrichment
The sweetening unit comprising of two AGRUs and AGE are shown in Figure
5.7, 5.8 and 5.9. These processes mainly involve columns (i.e. absorbers and distillation
columns plus their reboilers) and incinerators for waste disposal. Referring to Figure
5.10 (a), out of near 59 MW total exergy loss in the sweetening unit, more than 50%
of the total losses take place in the units’ columns while 35% is lost in the incinerators.
The columns alone destroy nearly 30MW, which is almost 42% of the total exergy
destruction in the liquefaction unit without utilities. Considering the utility side of the
process Figure 5.10(b), mainly due to steam generation, it was found that exergy losses
in columns and incinerators are the highest, accounting for 77% and 15 % of the total
145 MW loss, respectively. Columns total exergy losses increased to near 111 MW,
which is close to the actual C3MR compression power. This means that near 81 MW is
lost in the steam generation step only.
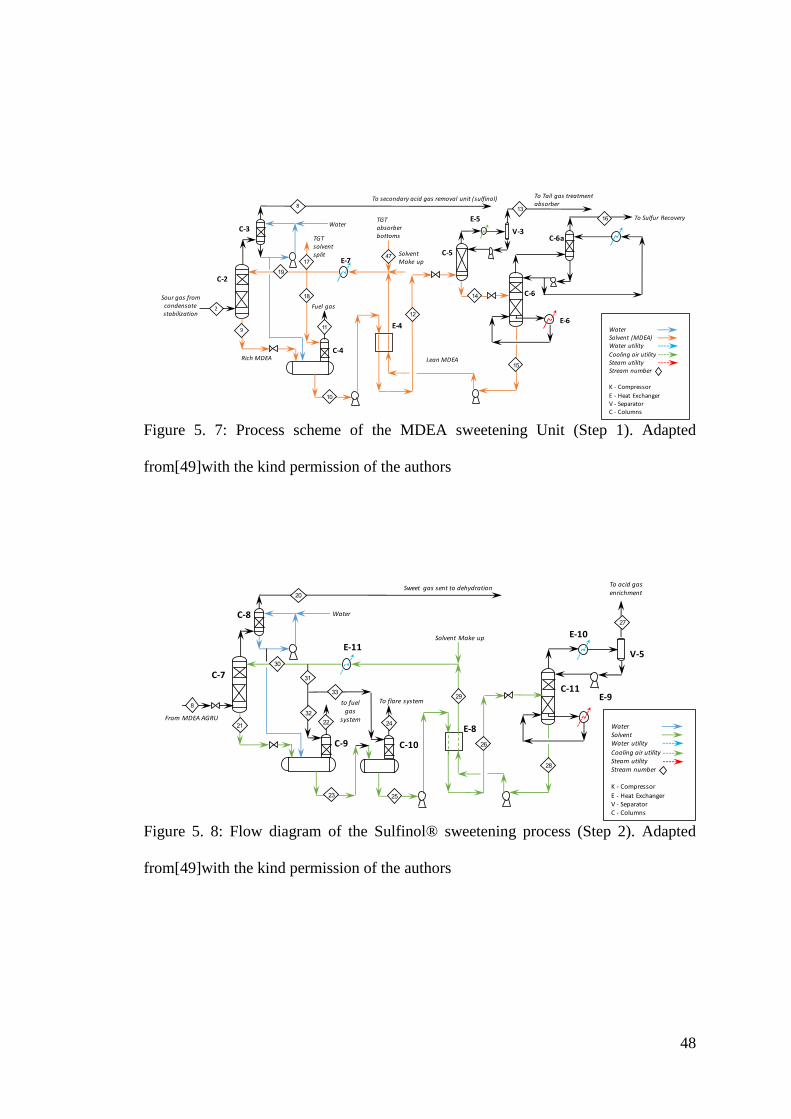
48
Figure 5. 7: Process scheme of the MDEA sweetening Unit (Step 1). Adapted
from[49]with the kind permission of the authors
Figure 5. 8: Flow diagram of the Sulfinol® sweetening process (Step 2). Adapted
from[49]with the kind permission of the authors
Solvent Make up
To Sulfur RecoveryWater
C-3
2
9
C-2
8To secondary acid gas removal unit (sulfinol)
Fuel gas
To Tail gas treatment absorber
Sour gas from condensate stabilization
TGT absorber bottoms
Rich MDEA Lean MDEA
TGT solvent split
C-4
C-5
C-6
V-3
E-4E-6
E-5
E-7
WaterSolvent (MDEA)Water utility
Cooling air utilitySteam utilityStream number
K - Compressor
E - Heat ExchangerV - SeparatorC - Columns
C-6a
Solvent Make up
To acid gas enrichment
Water
Sweet gas sent to dehydration
to fuel gas
system
From MDEA AGRU
To flare system
C-7
C-8
C-9 C-10
C-11
E-8
E-9
E-10
E-11V-5
WaterSolvent Water utility
Cooling air utilitySteam utilityStream number
K - Compressor
E - Heat ExchangerV - SeparatorC - Columns
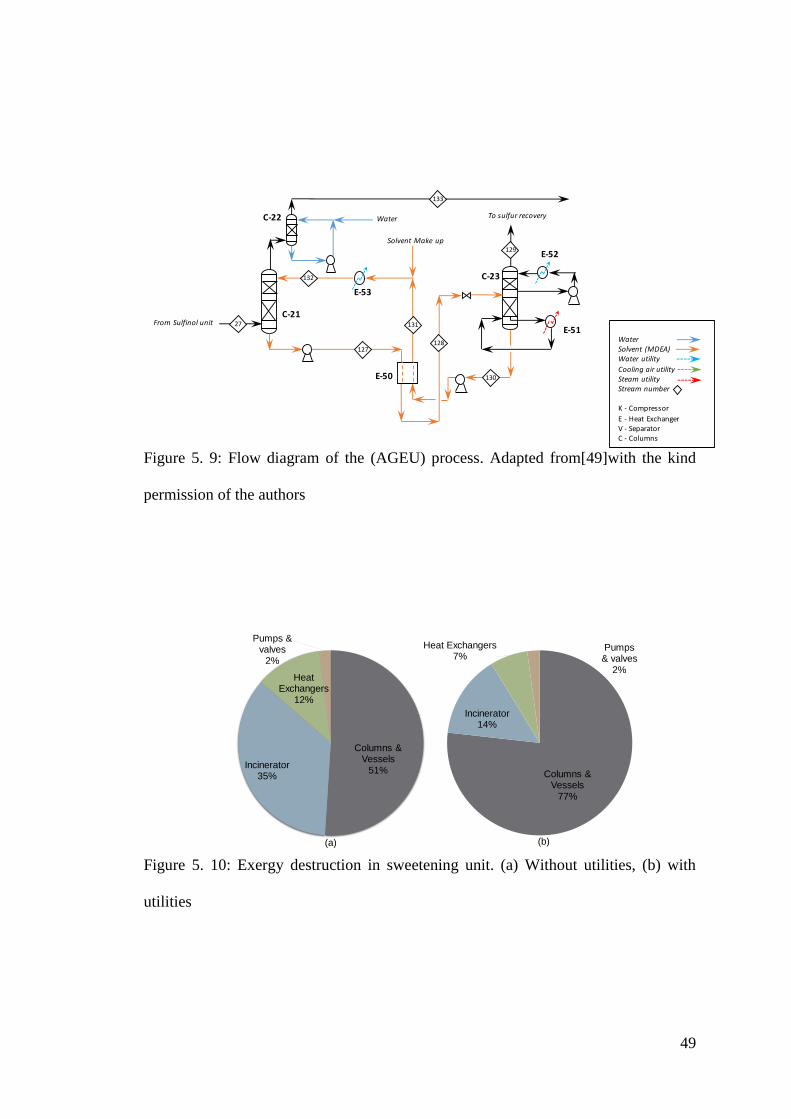
49
Figure 5. 9: Flow diagram of the (AGEU) process. Adapted from[49]with the kind
permission of the authors
Figure 5. 10: Exergy destruction in sweetening unit. (a) Without utilities, (b) with
utilities
Solvent Make up
Water
27
132
128
From Sulfinol unit
WaterSolvent (MDEA)Water utility
Cooling air utilitySteam utilityStream number
K - Compressor
E - Heat ExchangerV - SeparatorC - Columns
127
To sulfur recovery
129
130
131
133
E-50
E-51
E-52
E-53
C-21
C-22
C-23
Columns & Vessels
77%
Incinerator14%
Heat Exchangers7%
Pumps & valves
2%
Columns & Vessels
51%Incinerator
35%
Heat Exchangers
12%
Pumps & valves
2%
(a) (b)
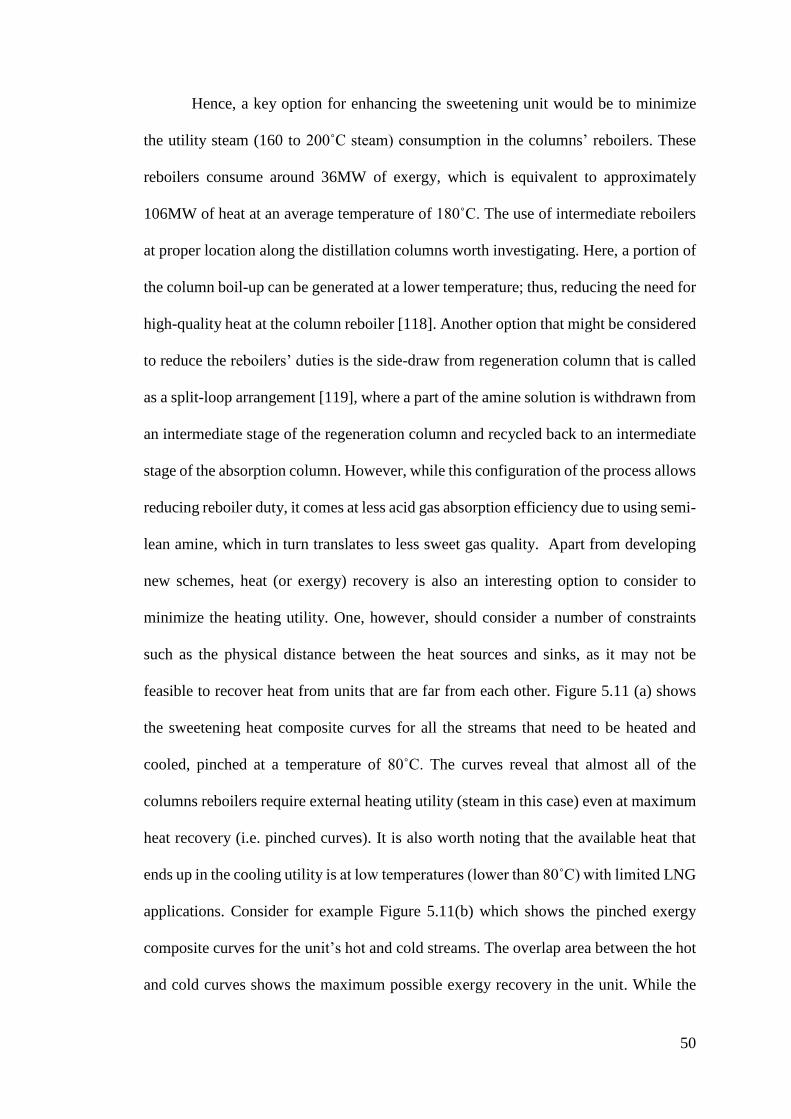
50
Hence, a key option for enhancing the sweetening unit would be to minimize
the utility steam (160 to 200˚C steam) consumption in the columns’ reboilers. These
reboilers consume around 36MW of exergy, which is equivalent to approximately
106MW of heat at an average temperature of 180˚C. The use of intermediate reboilers
at proper location along the distillation columns worth investigating. Here, a portion of
the column boil-up can be generated at a lower temperature; thus, reducing the need for
high-quality heat at the column reboiler [118]. Another option that might be considered
to reduce the reboilers’ duties is the side-draw from regeneration column that is called
as a split-loop arrangement [119], where a part of the amine solution is withdrawn from
an intermediate stage of the regeneration column and recycled back to an intermediate
stage of the absorption column. However, while this configuration of the process allows
reducing reboiler duty, it comes at less acid gas absorption efficiency due to using semi-
lean amine, which in turn translates to less sweet gas quality. Apart from developing
new schemes, heat (or exergy) recovery is also an interesting option to consider to
minimize the heating utility. One, however, should consider a number of constraints
such as the physical distance between the heat sources and sinks, as it may not be
feasible to recover heat from units that are far from each other. Figure 5.11 (a) shows
the sweetening heat composite curves for all the streams that need to be heated and
cooled, pinched at a temperature of 80˚C. The curves reveal that almost all of the
columns reboilers require external heating utility (steam in this case) even at maximum
heat recovery (i.e. pinched curves). It is also worth noting that the available heat that
ends up in the cooling utility is at low temperatures (lower than 80˚C) with limited LNG
applications. Consider for example Figure 5.11(b) which shows the pinched exergy
composite curves for the unit’s hot and cold streams. The overlap area between the hot
and cold curves shows the maximum possible exergy recovery in the unit. While the
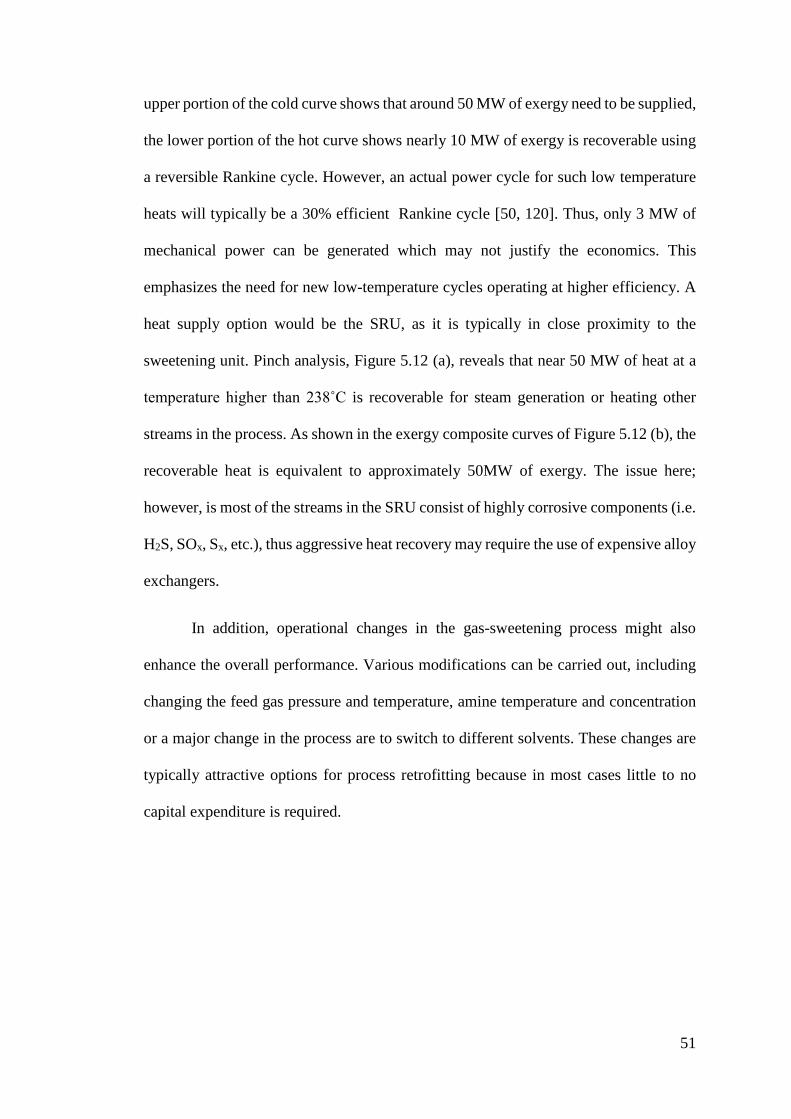
51
upper portion of the cold curve shows that around 50 MW of exergy need to be supplied,
the lower portion of the hot curve shows nearly 10 MW of exergy is recoverable using
a reversible Rankine cycle. However, an actual power cycle for such low temperature
heats will typically be a 30% efficient Rankine cycle [50, 120]. Thus, only 3 MW of
mechanical power can be generated which may not justify the economics. This
emphasizes the need for new low-temperature cycles operating at higher efficiency. A
heat supply option would be the SRU, as it is typically in close proximity to the
sweetening unit. Pinch analysis, Figure 5.12 (a), reveals that near 50 MW of heat at a
temperature higher than 238˚C is recoverable for steam generation or heating other
streams in the process. As shown in the exergy composite curves of Figure 5.12 (b), the
recoverable heat is equivalent to approximately 50MW of exergy. The issue here;
however, is most of the streams in the SRU consist of highly corrosive components (i.e.
H2S, SOx, Sx, etc.), thus aggressive heat recovery may require the use of expensive alloy
exchangers.
In addition, operational changes in the gas-sweetening process might also
enhance the overall performance. Various modifications can be carried out, including
changing the feed gas pressure and temperature, amine temperature and concentration
or a major change in the process are to switch to different solvents. These changes are
typically attractive options for process retrofitting because in most cases little to no
capital expenditure is required.
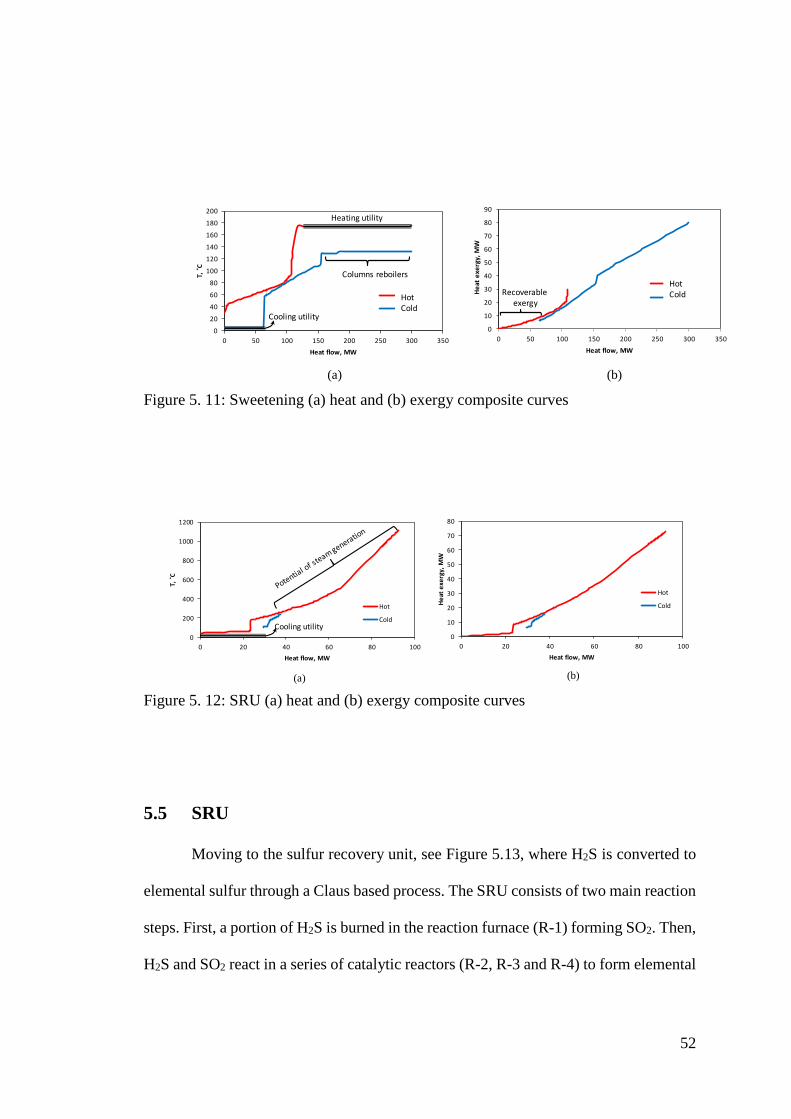
52
Figure 5. 11: Sweetening (a) heat and (b) exergy composite curves
Figure 5. 12: SRU (a) heat and (b) exergy composite curves
5.5 SRU
Moving to the sulfur recovery unit, see Figure 5.13, where H2S is converted to
elemental sulfur through a Claus based process. The SRU consists of two main reaction
steps. First, a portion of H2S is burned in the reaction furnace (R-1) forming SO2. Then,
H2S and SO2 react in a series of catalytic reactors (R-2, R-3 and R-4) to form elemental
0
20
40
60
80
100
120
140
160
180
200
0 50 100 150 200 250 300 350
T, ˚
C
Heat flow, MW
Series1
Series2
0
10
20
30
40
50
60
70
80
90
0 50 100 150 200 250 300 350
He
at e
xerg
y, M
W
Heat flow, MW
Series1
Series2
Heating utility
Cooling utility
Columns reboilers
a b
HotCold
HotColdRecoverable
exergy
(a) (b)
0
200
400
600
800
1000
1200
0 20 40 60 80 100
T, ˚
C
Heat flow, MW
Hot
Cold
0
10
20
30
40
50
60
70
80
0 20 40 60 80 100
He
at e
xerg
y, M
W
Heat flow, MW
Hot
Cold
Cooling utility
a b(a) (b)
53
sulfur (Sx). Liquid sulfur is recovered in the condensers downstream each catalytic
reactor while unconverted H2S and SO2 go to the following catalytic stage.
Near 94 MW of exergy is lost in the SRU without utilities. Referring to Figure
5.14 (a), most of the exergy loss takes place within the reaction stages, namely the
reaction furnace (R-1), incinerator (R-6), catalytic reactors (R-2, R-3, and R-4) and the
inline burner (R-5). Such high losses are attributed to the chemistry and combustion
nature of these unit operations. In other words, chemical reactions in SRU convert
higher chemical exergies materials to lower chemical exergies materials, while
releasing a considerable amount of heat due to the fact that the Claus reactions are
highly exothermic.
Figure 5. 13: Process flow diagram of sulfur recovery unit (SRU). Adapted from [49]
with the kind permission of the authors.
Steam
BFW
Air
CW CW
Liquid Sulfur
SteamSteamSteam
Sulfur
Storage
CW
Acid gas
Liquid SulfurWater
Solvent
Water utility
Cooling air utility
Steam utility
Stream number
K - Compressor
E - Heat Exchanger
V - Separator
C – Columns
R - ReactorsAir
Fuel
Steam
BFW
Steam
13
CW
From sweetening
Flashed gas from
sweetening
Back to
sweetening
To be
incineration
Air
Fuel
Inline burner
E-12
E-11
R-1
E-20
R-2 R-3
E-1
3
E-1
4
E-1
5
E-1
7
E-1
8
R-4
E-1
6
E-1
7
C-12
E-21
R-5
E-18
3415 37
36 39 40
35 38 41
44
42
43
45 36SteamCW
47
48
49
17
46
R-6
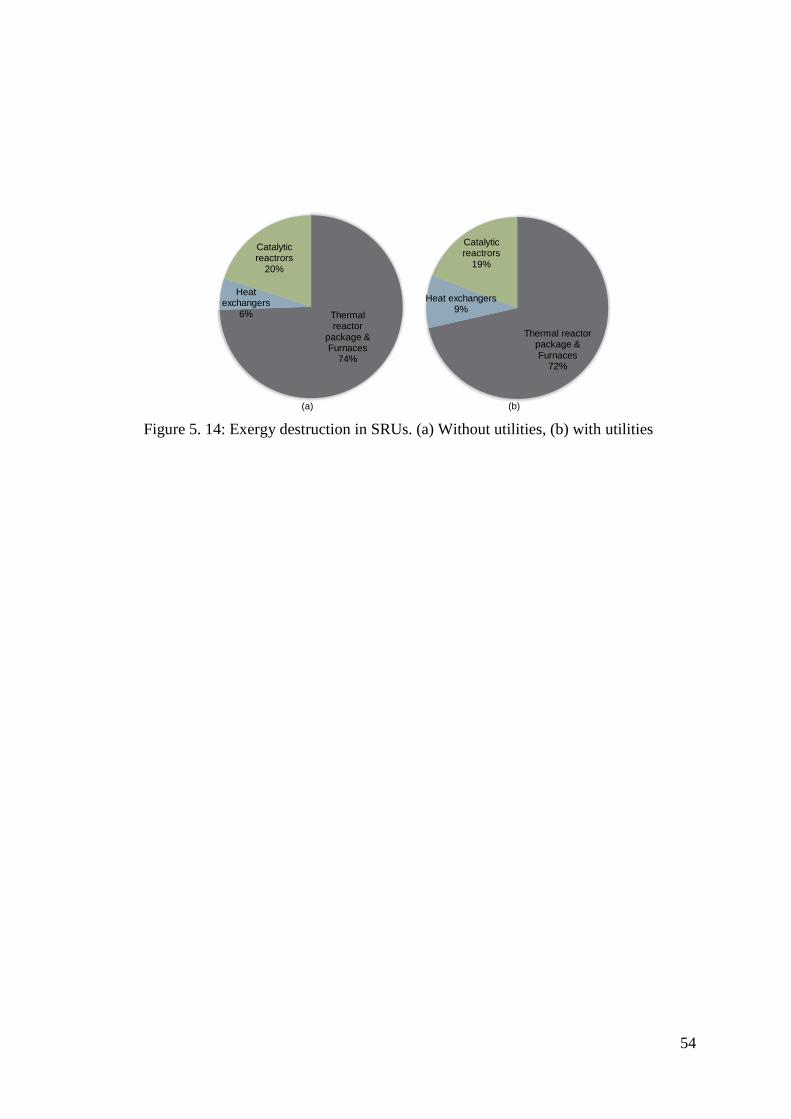
54
Figure 5. 14: Exergy destruction in SRUs. (a) Without utilities, (b) with utilities
Thermal reactor
package & Furnaces
74%
Heat exchangers
6%
Catalytic reactrors
20%
Thermal reactor package & Furnaces
72%
Heat exchangers 9%
Catalytic reactrors
19%
(a) (b)
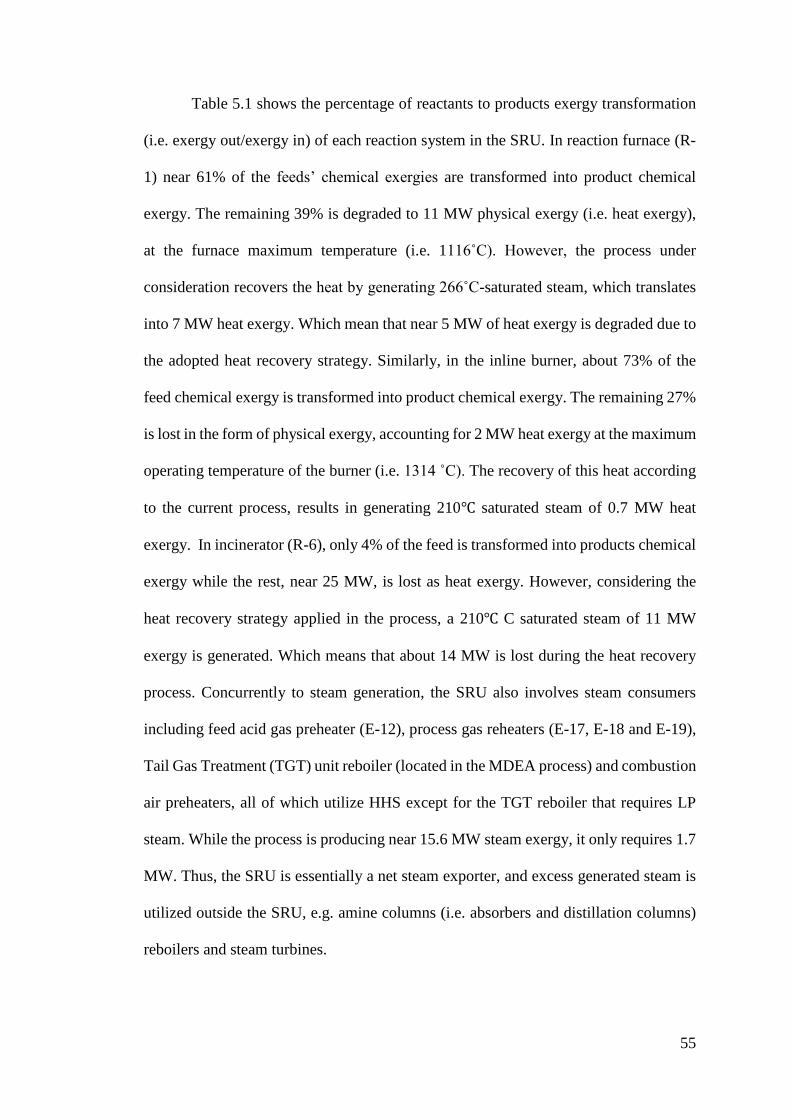
55
Table 5.1 shows the percentage of reactants to products exergy transformation
(i.e. exergy out/exergy in) of each reaction system in the SRU. In reaction furnace (R-
1) near 61% of the feeds’ chemical exergies are transformed into product chemical
exergy. The remaining 39% is degraded to 11 MW physical exergy (i.e. heat exergy),
at the furnace maximum temperature (i.e. 1116˚C). However, the process under
consideration recovers the heat by generating 266˚C-saturated steam, which translates
into 7 MW heat exergy. Which mean that near 5 MW of heat exergy is degraded due to
the adopted heat recovery strategy. Similarly, in the inline burner, about 73% of the
feed chemical exergy is transformed into product chemical exergy. The remaining 27%
is lost in the form of physical exergy, accounting for 2 MW heat exergy at the maximum
operating temperature of the burner (i.e. 1314 ˚C). The recovery of this heat according
to the current process, results in generating 210℃ saturated steam of 0.7 MW heat
exergy. In incinerator (R-6), only 4% of the feed is transformed into products chemical
exergy while the rest, near 25 MW, is lost as heat exergy. However, considering the
heat recovery strategy applied in the process, a 210℃ C saturated steam of 11 MW
exergy is generated. Which means that about 14 MW is lost during the heat recovery
process. Concurrently to steam generation, the SRU also involves steam consumers
including feed acid gas preheater (E-12), process gas reheaters (E-17, E-18 and E-19),
Tail Gas Treatment (TGT) unit reboiler (located in the MDEA process) and combustion
air preheaters, all of which utilize HHS except for the TGT reboiler that requires LP
steam. While the process is producing near 15.6 MW steam exergy, it only requires 1.7
MW. Thus, the SRU is essentially a net steam exporter, and excess generated steam is
utilized outside the SRU, e.g. amine columns (i.e. absorbers and distillation columns)
reboilers and steam turbines.
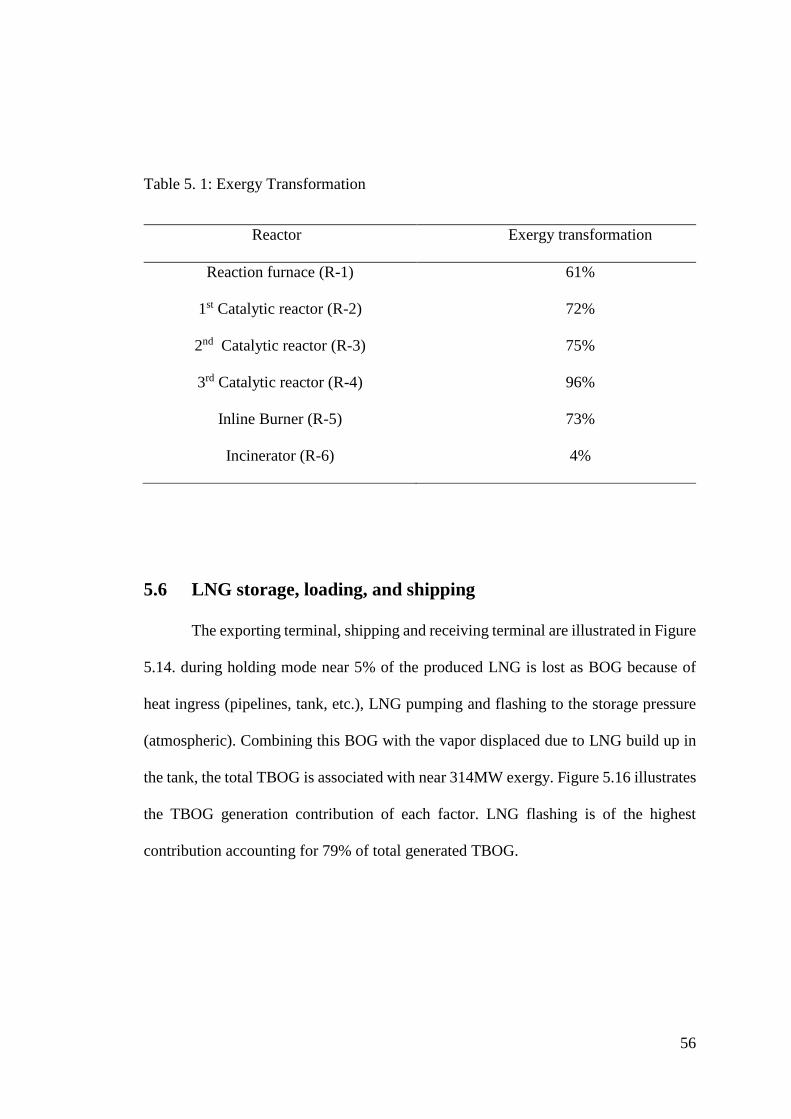
56
Table 5. 1: Exergy Transformation
Reactor Exergy transformation
Reaction furnace (R-1) 61%
1st Catalytic reactor (R-2) 72%
2nd Catalytic reactor (R-3) 75%
3rd Catalytic reactor (R-4) 96%
Inline Burner (R-5) 73%
Incinerator (R-6) 4%
5.6 LNG storage, loading, and shipping
The exporting terminal, shipping and receiving terminal are illustrated in Figure
5.14. during holding mode near 5% of the produced LNG is lost as BOG because of
heat ingress (pipelines, tank, etc.), LNG pumping and flashing to the storage pressure
(atmospheric). Combining this BOG with the vapor displaced due to LNG build up in
the tank, the total TBOG is associated with near 314MW exergy. Figure 5.16 illustrates
the TBOG generation contribution of each factor. LNG flashing is of the highest
contribution accounting for 79% of total generated TBOG.
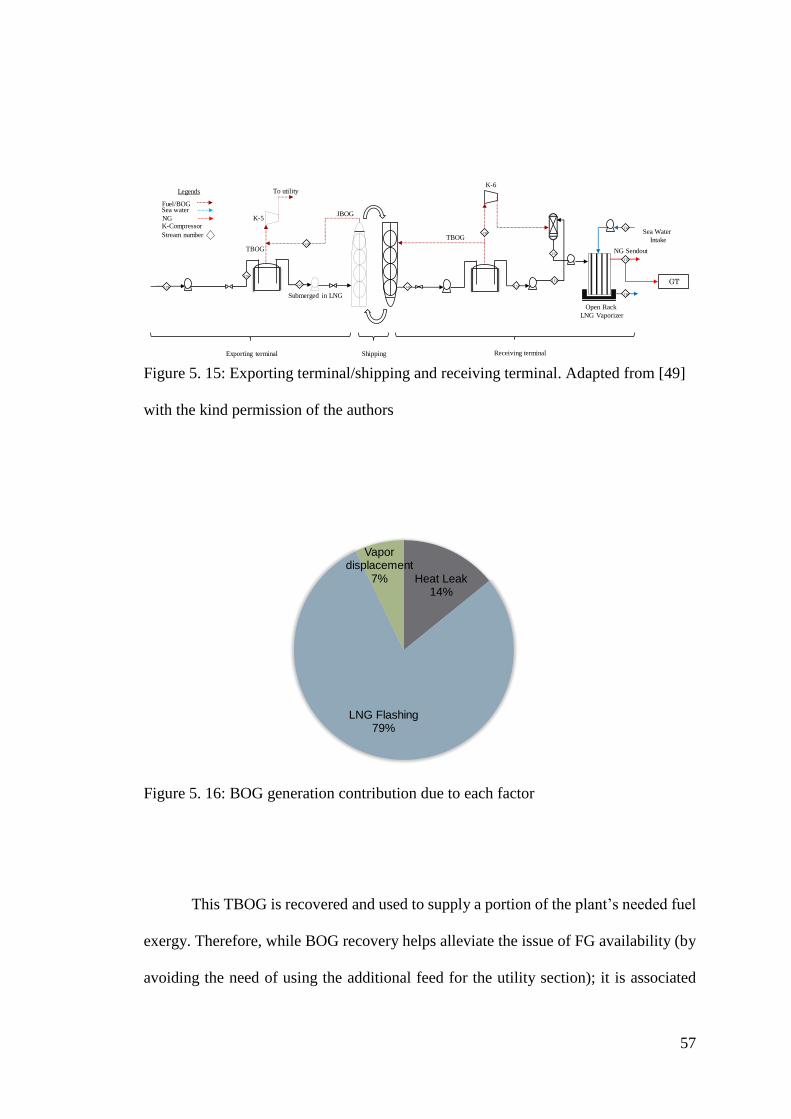
57
Figure 5. 15: Exporting terminal/shipping and receiving terminal. Adapted from [49]
with the kind permission of the authors
Figure 5. 16: BOG generation contribution due to each factor
This TBOG is recovered and used to supply a portion of the plant’s needed fuel
exergy. Therefore, while BOG recovery helps alleviate the issue of FG availability (by
avoiding the need of using the additional feed for the utility section); it is associated
Heat Leak 14%
LNG Flashing 79%
Vapor displacement
7%
To utility
Fuel/BOGSea water
Stream number
K-Compressor
Legends
Submerged in LNG
JBOG
TBOG
Open Rack
LNG Vaporizer
Sea Water
Intake
134
136
NG Sendout
Exporting terminal Shipping Receiving terminal
K-5
TBOG
119
126
127129
135
128
130
131
NG
132
133 GT
K-6
58
with losses embedded in the liquefaction step that needs to be taken into consideration.
This is explained by considering the liquefaction cycle of the LNG chain under
consideration. According to the simulated C3MR cycle (Figure 5.4) the production of
3.65 MTA LNG requires almost 120 MW of compression power. With BOG production
being 5% of the total LNG produced, it would have consumed close to 6 MW of
physical exergy (i.e. compression power) during liquefaction. Additionally, near 1 MW
of exergy is lost from the storage tank. These losses amplified by 1.99 MW when BOG
is compressed to the utility, as it would need to be supplied at almost 30 bar (typical
FG pressures). The total exergy loss is, therefore, close to 8 MW.
During LNG loading, the TBOG generation is reduced by 83%. Thus, reducing
the TBOG fuel exergy from 314 MW to 52 MW. The JBOG exergy, however, will be
46 % more than the plant fuel exergy requirement during loading. In this case, 11% of
the produced LNG is lost thus wasting near 13 MW of C3MR compression power. Total
loss from LNG tank, carrier, and compression is near 11 MW.
The same logic applies to the fuel generated in the NRU/He extraction. This
fuel is sourced from the high-pressure LNG leaving the main cryogenic heat exchanger
and accounts for almost 9.6% of the total flow. Liquefying this fuel portion consumes
compression power of around 11.52 MW and the fuel leaves the nitrogen rejection
column with physical exergy of 6.15 MW. Hence, by flashing the nitrogen-rich LNG
in the NRU, a portion of the liquefaction compression power was wasted. While one
might argue that not flashing the nitrogen-rich LNG while using fuel gas upstream of
the liquefaction step could decrease the loss, it would come at the price of higher
nitrogen content in the LNG and the need for higher pressure storage. These accentuate
the trade-off between exergy losses, product specification, and storage cost when
making such operational decisions. It also motivates the operators to investigate other
59
means of nitrogen removal from the LNG. In general, the avoidance of using fuel from
the downstream of the cold section of the plant (liquefaction and NRU/He extraction)
should result in lower exergy losses. The needed fuel may be taken before liquefaction
where less energy-intensive processing had taken place. Having said so, one here needs
to consider multiple issues including heavy hydrocarbon contents of the fuel. Selling
these hydrocarbons may be more beneficial than saving on exergy losses.
The foregoing findings and discussions emphasize the need to reduce the impact
of excessive BOG production, which in turn translates into more LNG production and
reduced plant energy consumption. This could be achieved via an optimal design of
LNG plant components to effectively handle the generated BOG during holding and
loading operating modes or via altering process conditions to reduce the BOG
generation rate.
During shipping, inevitable heat ingress to cargo tanks results in evaporating a
portion of LNG, that is called shipping BOG. Typically, the BOG ranges from 0.1 to
0.15% of the full content per day, depends on tanks type (i.e. moss or membrane), where
a ship’s voyage is of 21 days [121-123]. Recently developed classes of LNG carriers,
referred to as Q-Flex and Q-Max, have cargo capacity that varies from 210,000 to
270,000 cubic meter [110]. However, the filling capacity of each tank should be 98%
of its total volume for safety concerns [124]. These requirements are taken into account
to quantify the BOG generation during the ship’s voyage for the LNG chain under
consideration. Here, the total ship cargo capacity is 216,200 cubic meter. Thus, the
delivery of 3.58 MTA LNG will require 38 shipments. About 0.81 MW of the shipped
LNG exergy is lost as ship BOG; this means that near 31MW worth of BOG exergy is
annually lost. BOG can be utilized as fuel for the propulsion system, burn in a gas
combustion unit, vented to atmosphere or re-liquefied [121]. BOG has been utilized in
60
various proposed propulsion systems in the industry, where different prime movers are
considered (i.e. steam turbine, gas turbine, diesel engine, and dual fuel engine) [125].
A steam turbine propulsion system (or non-ideal Rankine cycle) will typically be 20 to
30% efficient. Thus, out of the 31 MW of BOG exergy, 6.2 to 9.3 MW of BOG exergy
will be utilized. If the propulsion system uses NGCC, with a 55% efficiency, the utilized
BOG exergy will be near 17.01 MW. If the ship BOG is to be liquefied using a simple
nitrogen expander cycle, total liquefaction power was identified to be 9kW/shipment.
Consuming 15.9% of the BOG to power the cycle compressors using a 30% GT. In
other words, onboard liquefaction of the ship BOG would consume near 7.6MW of
BOG exergy annually. Accordingly, BOG re-liquefaction and direction back to the
cargo tank leads to high efficiency and economy, which in turn enhance the profitability
significantly.
5.7 LNG Regasification
Moving to the receiving terminal (see Figure 5.15) LNG pumped to the
vaporizer, open rack vaporizer is considered here, for the regasification. As LNG is
evaporated, near 46 MW of the physical exergy (LNG cold energy) is wasted into
seawater due return the cold seawater from the vaporizer back to the sea without any
means of energy recovery. Percentage contribution to exergy loss in the LNG
regasification section is illustrated in Figure 5.17. Among the regasification
components, the heat exchange segment contributes the largest portion of the total
exergy loss, accounting for 82% of the total loss that corresponds to 38 MW exergy
loss. Up to date, more than 90% of the LNG regasification plants operate without any
mean of LNG cold exergy recovery concept [126]. However, different approaches have
been proposed to utilize LNG cold exergy by integrating the LNG regasification
process with other types of processes. Recovering this exergy could be achieved via
61
power generation through Brayton cycle [127], combined cycles [128-131], stiriling
cycles [132, 133], absorption power cycle [134], Rankine cycle [135-137] and the direct
expansion cycle [138].
For example, Reverse refrigeration cycles utilize the concept of Rankine cycle;
however, these are typically the maximum work (𝑊𝑚𝑎𝑥 = 𝐸𝑥𝑖𝑛 − 𝐸𝑥𝑜𝑢𝑡 +
𝑝𝑢 𝑝𝑖𝑛𝑔 𝑝𝑜𝑤𝑒 ) that can be generated from the evaporated LNG is around 13MW
for every 1 MTA LNG. With a 30% efficiency, this power would be almost
3.6MW/MTA LNG. For a large importer like Japan (imported near 84 MTA LNG
during 2017) [139], this would mean the generation of nearly 300 MW of shaft power.
Figure shows how much power can be produced if the cycle efficiency improved from
30 to 50% with 53% being the thermodynamic efficiency limit that can be achieved
with a reversible ideal cycle (Max. work/heat from evaporation). Use of LNG as cooling
media may be another attractive option at receiving terminals [140-142]. Such practice
should result in less exergy losses as the cold can be 100% recovered at slightly higher
temperatures, unlike the power generation, which at best case scenario will achieve
53% cold to work recovery in a reversible ideal cycle. The recovery of the cold energy
of LNG has been previously applied for other processes such as air separation process
[143], the freeze desalination process [144], and for CO2 liquefaction.
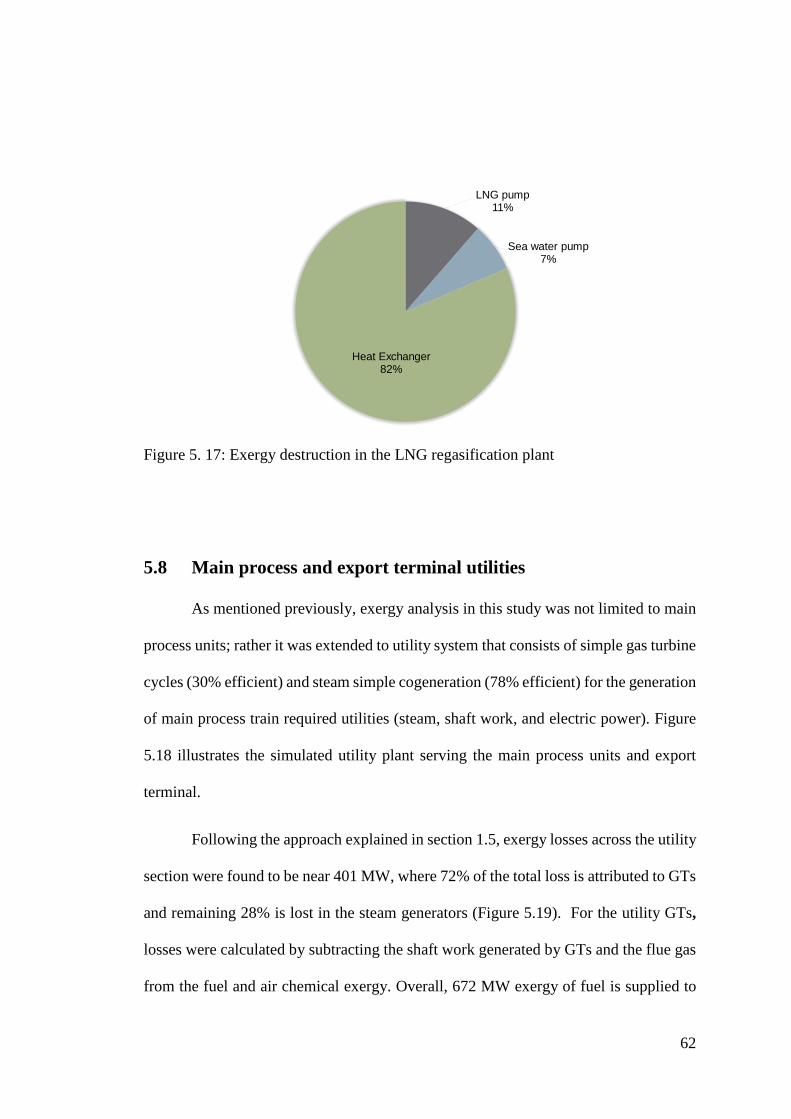
62
Figure 5. 17: Exergy destruction in the LNG regasification plant
5.8 Main process and export terminal utilities
As mentioned previously, exergy analysis in this study was not limited to main
process units; rather it was extended to utility system that consists of simple gas turbine
cycles (30% efficient) and steam simple cogeneration (78% efficient) for the generation
of main process train required utilities (steam, shaft work, and electric power). Figure
5.18 illustrates the simulated utility plant serving the main process units and export
terminal.
Following the approach explained in section 1.5, exergy losses across the utility
section were found to be near 401 MW, where 72% of the total loss is attributed to GTs
and remaining 28% is lost in the steam generators (Figure 5.19). For the utility GTs,
losses were calculated by subtracting the shaft work generated by GTs and the flue gas
from the fuel and air chemical exergy. Overall, 672 MW exergy of fuel is supplied to
LNG pump11%
Sea water pump7%
Heat Exchanger 82%
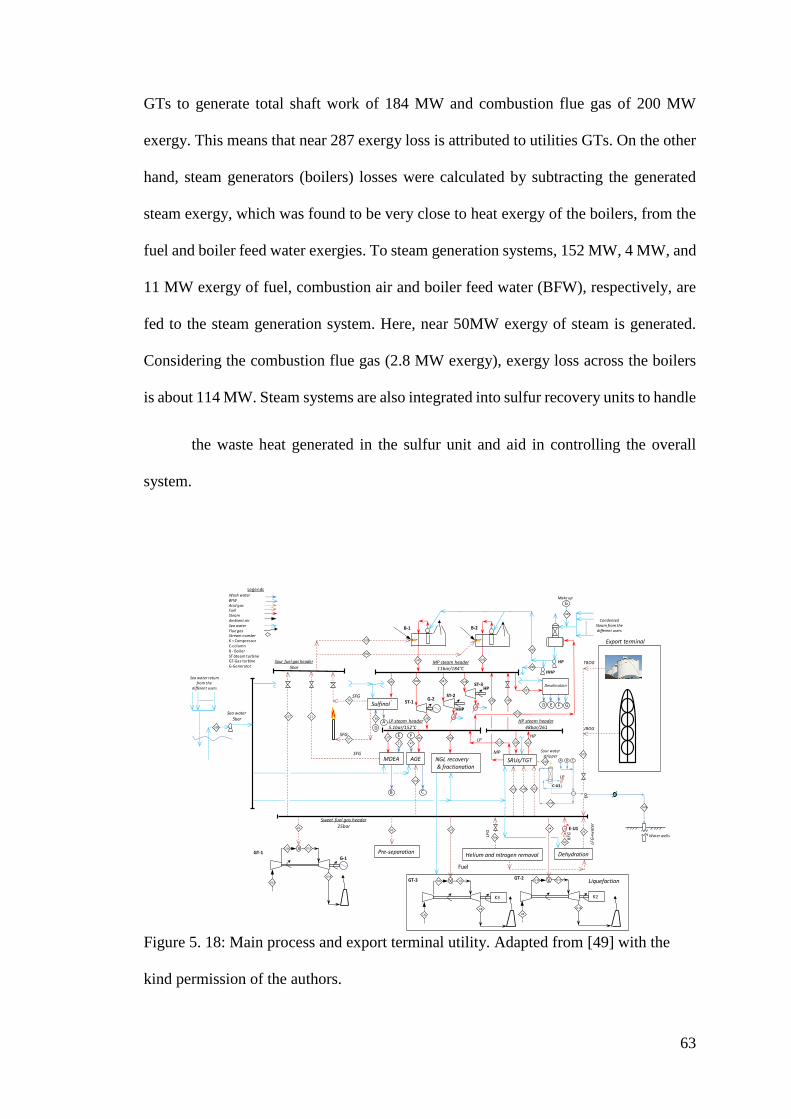
63
GTs to generate total shaft work of 184 MW and combustion flue gas of 200 MW
exergy. This means that near 287 exergy loss is attributed to utilities GTs. On the other
hand, steam generators (boilers) losses were calculated by subtracting the generated
steam exergy, which was found to be very close to heat exergy of the boilers, from the
fuel and boiler feed water exergies. To steam generation systems, 152 MW, 4 MW, and
11 MW exergy of fuel, combustion air and boiler feed water (BFW), respectively, are
fed to the steam generation system. Here, near 50MW exergy of steam is generated.
Considering the combustion flue gas (2.8 MW exergy), exergy loss across the boilers
is about 114 MW. Steam systems are also integrated into sulfur recovery units to handle
the waste heat generated in the sulfur unit and aid in controlling the overall
system.
Figure 5. 18: Main process and export terminal utility. Adapted from [49] with the
kind permission of the authors.
Sweet fuel gas header25bar
Sour fuel gas header
5bar
Pre-separation
Fuel
K3
U5
U6
U3
U7
U8
K2
U9
U10 U11
U12
MP steam header11bar/184 C
Wash waterBFWAcid gasFuelSteamAmbient airSea waterFlue gasStream numberK –CompressorC-columnB - BoilerST-Steam turbineGT-Gas turbineG-Generator
Legends
GT-1
GT-3 GT-2
B-1 B-2
Liquefaction
Helium and nitrogen removal
TBOG
Dehydration
RF
G
Export terminal
LFG
JBOG
U13
U14 U15
U16
G-1
LFG
+w
ate
r
75
HP steam header48bar/261
SRUs/TGT
SFG
Sulfinol®
MDEA
LP steam header5.1bar/152 C
G-2
NGL recovery& fractionation
AGE
U23 HP
MP
LP
69
11
26
27
70a
103
U1U2
U22 U24
U26 U27U25
U35
U41 U42
U39
U40
SFG
SFG
U19 U20
U18
Sea water
5bar
U38
U21
E-U1U4
Water wells
A
B C
A B C
Sour water stripper
…………
. Condensed Steam from the different users
Make up
U33 U34
Sea water returnfrom the
different users
………….
D
Desalination
E F G
38
D
E
21
F
47
G
U17
U28
U29
U30
U32
U37
U45
U43
Main process and export terminal utility
HP
HHPU46
U31
ST-1
U48ST-3
U47
HHP
ST-2
HP
LP
U36
C-U1
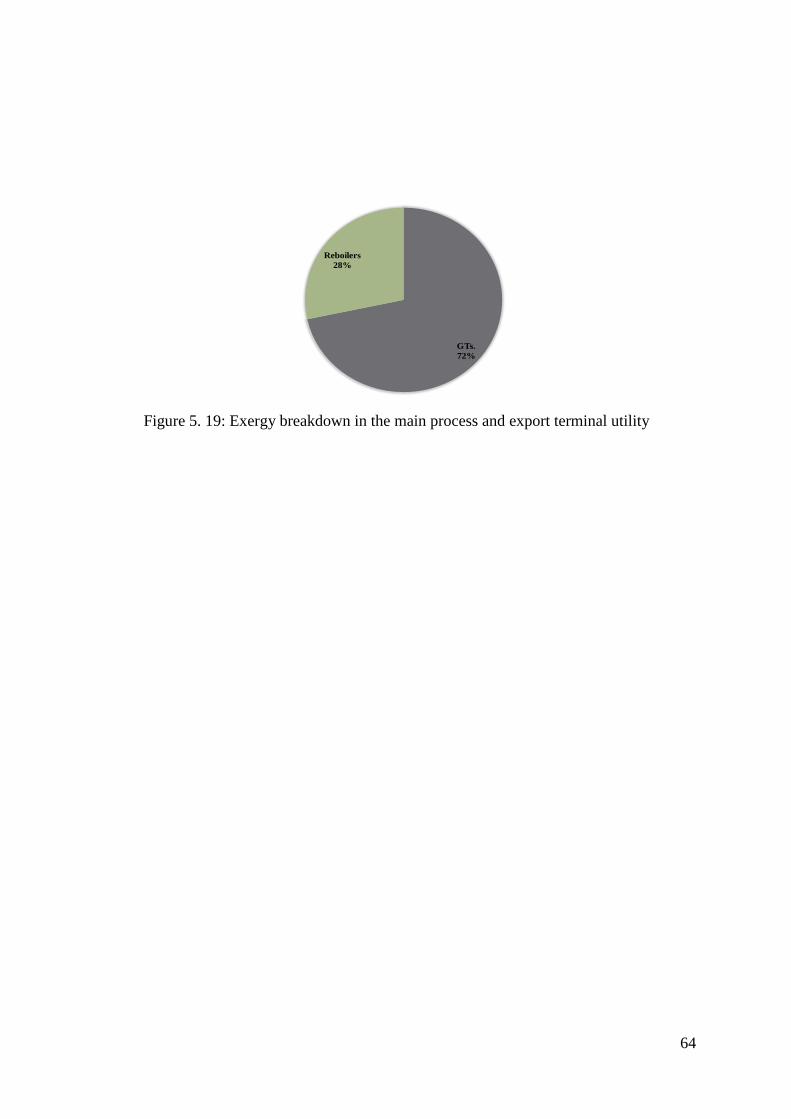
64
Figure 5. 19: Exergy breakdown in the main process and export terminal utility
GTs.
72%
Reboilers
28%
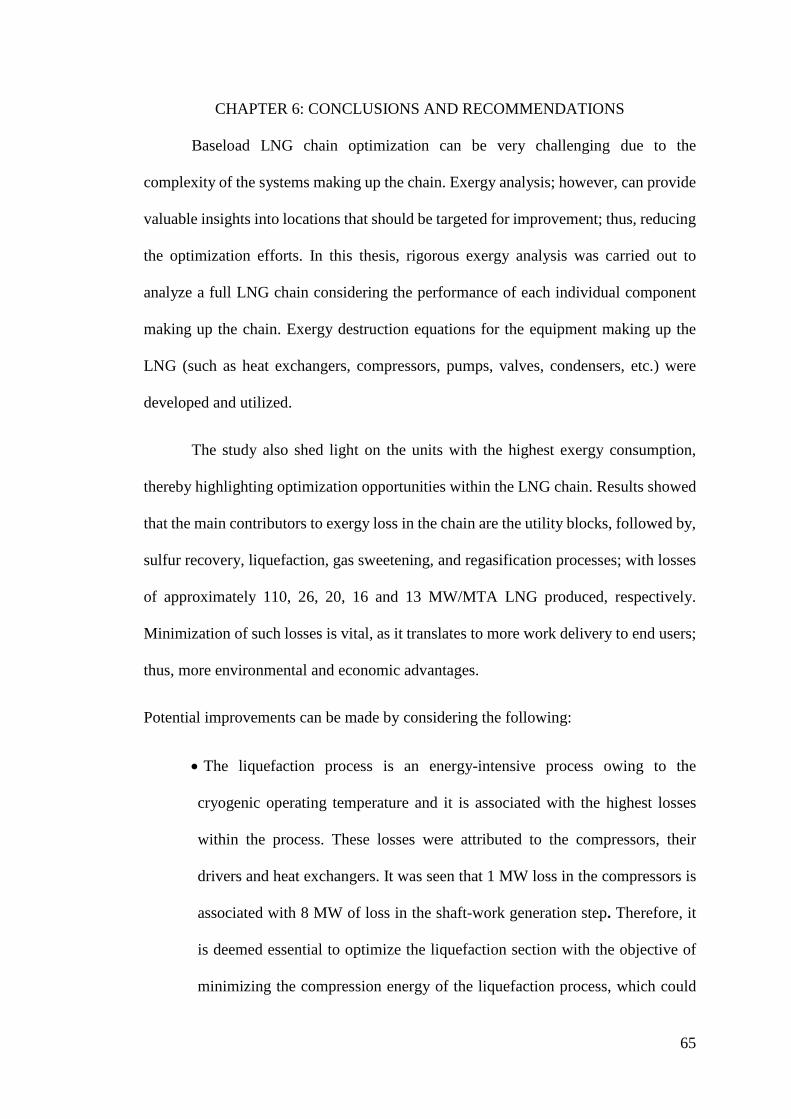
65
CHAPTER 6: CONCLUSIONS AND RECOMMENDATIONS
Baseload LNG chain optimization can be very challenging due to the
complexity of the systems making up the chain. Exergy analysis; however, can provide
valuable insights into locations that should be targeted for improvement; thus, reducing
the optimization efforts. In this thesis, rigorous exergy analysis was carried out to
analyze a full LNG chain considering the performance of each individual component
making up the chain. Exergy destruction equations for the equipment making up the
LNG (such as heat exchangers, compressors, pumps, valves, condensers, etc.) were
developed and utilized.
The study also shed light on the units with the highest exergy consumption,
thereby highlighting optimization opportunities within the LNG chain. Results showed
that the main contributors to exergy loss in the chain are the utility blocks, followed by,
sulfur recovery, liquefaction, gas sweetening, and regasification processes; with losses
of approximately 110, 26, 20, 16 and 13 MW/MTA LNG produced, respectively.
Minimization of such losses is vital, as it translates to more work delivery to end users;
thus, more environmental and economic advantages.
Potential improvements can be made by considering the following:
The liquefaction process is an energy-intensive process owing to the
cryogenic operating temperature and it is associated with the highest losses
within the process. These losses were attributed to the compressors, their
drivers and heat exchangers. It was seen that 1 MW loss in the compressors is
associated with 8 MW of loss in the shaft-work generation step. Therefore, it
is deemed essential to optimize the liquefaction section with the objective of
minimizing the compression energy of the liquefaction process, which could
66
result in significant energy savings within the chain. Examples include
optimization of MR refrigerant, compressor drivers, heat exchangers MTA and
UA while considering the trade-off between capital and operational
expenditure, CAPEX and OPEX, respectively, as it is vital to minimize the cost
of the system for optimal NG liquefaction system. Results also motivate the
development of new liquefaction cycle concepts for both existing (retrofitting)
and grass-root plants.
The NG sweetening unit is an energy-intensive process and is associated with
high exergy loss of 59 MW. Therefore, optimization of the sweetening unit is
of importance as it could result in remarkable minimization of energy
consumption and thus great economic benefits to the LNG chain. Over 50% of
the losses occur in the columns, this result in exergy destruction of around 30
MW, which compounds to 111 MW when considering utilities. Therefore,
minimizing utility steam, via recovery/ integration, could be a key option for
enhancing this process, while taking into consideration the physical distance
limitations between the heat source and sink. The SRU could be an option for
heat supply; however, most of its streams are considered highly corrosive, and
heat recovery would require the use of expensive allow exchangers. This gives
rise for the need of developing new and cost-effective materials of construction
for such environments.
The SRU is associated with significant exergy destruction of near 94 MW. The
thermal and catalytic reaction stages with the values of 75% and 20% have the
highest exergy destruction contribution in the unit respectively. The SRU is, in
overall, a steam exporter unit such that steam is generated via utilizing
generated heat due to the exothermic nature of the Claus reactions. In order to
67
improve the thermodynamic efficiency of the SRU, many heat recovery
strategies could be applied. For example, steam superheating, steam
superheating for power and heat cogeneration, and direct heat utilization to
heat process streams. However, energy consumption, implementation cost and
feasibly of these strategies should be studied.
Almost 5% of the produced LNG is lost due to flashing to storage pressures,
resulting in around 0.19 MW of exergy loss. While the BOG could be used as
fuel gas in the plant, considerable amounts of exergy would be lost when
compressing it to the desired pressure. BOG is also indirectly associated with
losses in the liquefaction process as almost 7.4 MW exergy is lost due to its
liquefaction as part of the feed NG. Therefore, minimizing the native impact
of excessive BOG production is important as it can translate into more LNG
production and reduced plant energy consumption. From an energy point of
view, it would be desirable to reduce BOG formation. This could be achieved
by further cooling the LNG leaving the MCHE; however, it comes at the price
of additional compression power and increased nitrogen content in the final
product. Evaluating other methods of nitrogen removal from the LNG could
help alleviate this issue. The main process and export terminal utility section
of the plant consumes 824 MW exergy of fuel generated in different units of
the plant to generate 50MW steam exergy using steam-power cogeneration
system and 184 MW compression work. While 203 MW is lost in the form of
combustion flue gas, the total exergy destruction in utility section is 401 MW
out of which 72% and 28% are lost in GTs and steam generators, respectively.
In the receiving facilities, 46 MW exergy (4% of total losses) was lost into
the sea due to LNG regasification indicating that there is a room for
68
improvements and optimization. This implies the need to analyze and
investigate different regasification process configurations or to develop
strategies for cold exergy recovery, all of which would result in minimizing
exergy destruction and losses. LNG cold exergy recovery could be achieved
via power generation through reverse refrigeration cycles or cold utilization
for cooling applications. Enhancing the efficiencies of reverse refrigeration
cycles could potentially result in over twice as much shaft power as that
produced using current technologies.
Accordingly, the results of exergy analysis performed in this work provide a
guideline to where the efforts should be focused in order to improve the LNG chain and
provides insights to possible further work related to the topic in hand. It is also
recommended to carry out advanced exergy analysis that aims to quantify avoidable
and unavoidable exergy destruction in order to gain more insight into the actual
potential of process improvements and to further develop the performance indicators.
69
REFERENCES
[1] R. Tilagone, S. Venturi, and G. Monnier, "Natural gas-an environmentally
friendly fuel for urban vehicles: the smart demonstrator approach", Oil & gas
science and technology, vol. 61, no. 1, pp. 155-164, 2006.
[2] M. I. Khan, T. Yasmin, and A. Shakoor, "International experience with
compressed natural gas (CNG) as environmental friendly fuel", Energy Systems,
vol. 6, no. 4, pp. 507-531, 2015.
[3] S. Faramawy, T. Zaki, and A.-E. Sakr, "Natural gas origin, composition, and
processing: A review", Journal of Natural Gas Science and Engineering, vol.
34, pp. 34-54, 2016.
[4] A.-H. Kakaee and A. Paykani, "Research and development of natural-gas fueled
engines in Iran", Renewable and Sustainable Energy Reviews, vol. 26, pp. 805-
821, 2013.
[5] E. I. Al-Musleh, "Efficient liquefaction cycles for natural gas", 2010.
[6] M. M. F. Hasan, I. A. Karimi, and H. E. Alfadala, "Optimizing Compressor
Operations in an LNG Plant", in Proceedings of the 1st Annual Gas Processing
Symposium, vol. 1, H. E. Alfadala, G. V. Rex Reklaitis, and M. M. El-Halwagi,
Eds. Amsterdam: Elsevier, 2009, pp. 179-184.
[7] S. Effendy, M. S. Khan, S. Farooq, and I. A. Karimi, "Dynamic modelling and
optimization of an LNG storage tank in a regasification terminal with semi-
analytical solutions for N2-free LNG", Computers & Chemical Engineering,
vol. 99, pp. 40-50, 2017.
[8] H. Nagesh Rao and I. A. Karimi, "Optimal design of boil-off gas reliquefaction
process in LNG regasification terminals", Computers & Chemical Engineering,
vol. 117, pp. 171-190, 2018.
70
[9] A. Bittante, F. Pettersson, and H. Saxén, "Optimization of a small-scale LNG
supply chain", Energy, vol. 148, pp. 79-89, 2018.
[10] M. Wang, R. Khalilpour, and A. Abbas, "Thermodynamic and economic
optimization of LNG mixed refrigerant processes", Energy Conversion and
Management, vol. 88, pp. 947-961, 2014.
[11] A. Aspelund, T. Gundersen, J. Myklebust, M. Nowak, and A. Tomasgard, "An
optimization-simulation model for a simple LNG process", Computers &
Chemical Engineering, vol. 34, no. 10, pp. 1606-1617, 2010.
[12] G. Lee, R. Smith, and X. Zhu, "Optimal synthesis of mixed-refrigerant systems
for low-temperature processes", Industrial & engineering chemistry research,
vol. 41, no. 20, pp. 5016-5028, 2002.
[13] Y. Shi, A. Gu, R. Wang, and G. Zhu, "Optimization analysis of peakshaving
cycle to liquefy the natural gas", in Proceedings of the Twentieth International
Cryogenic Engineering Conference (ICEC20), 2005, pp. 741-744: Elsevier.
[14] W. s. Cao, X. s. Lu, W. s. Lin, and A. z. Gu, "Parameter comparison of two
small-scale natural gas liquefaction processes in skid-mounted packages",
Applied Thermal Engineering, vol. 26, no. 8-9, pp. 898-904, 2006.
[15] J. B. Jensen and S. Skogestad, "Optimal operation of a mixed fluid cascade LNG
plant", in Computer Aided Chemical Engineering, vol. 21: Elsevier, 2006, pp.
1569-1574.
[16] A. Aspelund, D. O. Berstad, and T. Gundersen, "An extended pinch analysis
and design procedure utilizing pressure based exergy for subambient cooling",
Applied Thermal Engineering, vol. 27, no. 16, pp. 2633-2649, 2007.
71
[17] F. D. Nogal, J.-K. Kim, S. Perry, and R. Smith, "Optimal design of mixed
refrigerant cycles", Industrial & engineering chemistry research, vol. 47, no.
22, pp. 8724-8740, 2008.
[18] N. M. Shah, A. F. Hoadley, and G. Rangaiah, "Inherent safety analysis of a
propane precooled gas-phase liquified natural gas process", Industrial &
engineering chemistry research, vol. 48, no. 10, pp. 4917-4927, 2009.
[19] T. Gao, W. Lin, A. Gu, and M. Gu, "Optimization of coalbed methane
liquefaction process adopting mixed refrigerant cycle with propane pre-
cooling", Journal of chemical engineering of Japan, vol. 42, no. 12, pp. 893-
901, 2009.
[20] M. M. H. Shirazi and D. Mowla, "Energy optimization for liquefaction process
of natural gas in peak shaving plant", Energy, vol. 35, no. 7, pp. 2878-2885,
2010.
[21] A. Alabdulkarem, A. Mortazavi, Y. Hwang, R. Radermacher, and P. Rogers,
"Optimization of propane pre-cooled mixed refrigerant LNG plant", Applied
Thermal Engineering, vol. 31, no. 6-7, pp. 1091-1098, 2011.
[22] M. Wang, J. Zhang, Q. Xu, and K. Li, "Thermodynamic-analysis-based energy
consumption minimization for natural gas liquefaction", Industrial &
engineering chemistry research, vol. 50, no. 22, pp. 12630-12640, 2011.
[23] A. Morin, P. E. Wahl, and M. Mølnvik, "Using evolutionary search to optimise
the energy consumption for natural gas liquefaction", Chemical Engineering
Research and Design, vol. 89, no. 11, pp. 2428-2441, 2011.
[24] L. A. Pellegrini, G. De Guido, and V. Valentina, "Energy and exergy analysis
of acid gas removal processes in the LNG production chain", Journal of Natural
Gas Science and Engineering, vol. 61, pp. 303-319, 2019.
72
[25] B. Ghorbani, R. Shirmohammadi, and M. Mehrpooya, "A novel energy efficient
LNG/NGL recovery process using absorption and mixed refrigerant
refrigeration cycles–Economic and exergy analyses", Applied Thermal
Engineering, vol. 132, pp. 283-295, 2018.
[26] A. K. Samimi, S. S. Fard, and M. Z. Abyaneh, "Minimizing thermodynamic
losses in sulfur recovery unit: an exergy analysis approach", Petroleum & Coal,
vol. 56, no. 1, pp. 74-78, 2014.
[27] B. Ghorbani, M. Mehrpooya, M.-H. Hamedi, and M. Amidpour,
"Exergoeconomic analysis of integrated natural gas liquids (NGL) and liquefied
natural gas (LNG) processes", Applied Thermal Engineering, vol. 113, pp.
1483-1495, 2017.
[28] A. Stegou‐Sagia and N. Paignigiannis, "Exergy losses in refrigerating systems.
A study for performance comparisons in compressor and condenser",
International Journal of Energy Research, vol. 27, no. 12, pp. 1067-1078, 2003.
[29] A. Vatani, M. Mehrpooya, and A. Palizdar, "Energy and exergy analyses of five
conventional liquefied natural gas processes", International Journal of Energy
Research, vol. 38, no. 14, pp. 1843-1863, 2014.
[30] H. Sayyaadi and M. Babaelahi, "Exergetic optimization of a refrigeration cycle
for re-liquefaction of LNG boil-off gas", International Journal of
Thermodynamics, vol. 13, no. 4, p. 127, 2010.
[31] J. K. Tadeusz, "The exergy method of thermal plant analysis": Butterworth,
1985.
[32] P. Luis, "Exergy as a tool for measuring process intensification in chemical
engineering", Journal of Chemical Technology & Biotechnology, vol. 88, no.
11, pp. 1951-1958, 2013.
73
[33] B. Dudley, "BP energy outlook 2030", BP plc, 2011.
[34] I. E. Agency, "World Energy Outlook 2017", 2017.
[35] "Available and Emerging Technologies for Reducing Greenhouse Gas
Emissions from Industrial, Commercial, and Institutional Boilers",
Environmental Protection Agency, North Carolina 2010.
[36] N. E. Thinkstep, "Greenhouse Gas Intensity of Natural Gas", 2017, Available:
http://ngvemissionsstudy.eu/.
[37] U.S. Energy Information Administration - EIA - Independent Statistics and
Analysis. Available: https://www.eia.gov/tools/faqs/faq.php?id=73&t=11
[38] E. M. Corporation, "2018 Outlook for Energy: A View to 2040", Irving, Texas,
Available: https://corporate.exxonmobil.com/en/~/media/Global/Files/outlook-
for-energy/2018-Outlook-for-Energy-Glossary.pdf.
[39] B. P. Global, "BP statistical review of world energy June 2017", 2017.
[40] B. Petroleum, "BP energy outlook 2035", BP stats, Jan, 2014.
[41] M. Liu, N. Lior, N. Zhang, and W. Han, "Thermoeconomic analysis of a novel
zero-CO2-emission high-efficiency power cycle using LNG coldness", Energy
Conversion and Management, vol. 50, no. 11, pp. 2768-2781, 2009.
[42] (March 22, 2019, March 22, 2019). Grow in LNG, an Energy for the Future.
Available: https://www.ep.total.com/en/areas/liquefied-natural-gas/grow-lng-
energy-future
[43] "Liquefied natural gas (LNG) operations Consistent methodology for
estimating greenhouse gas emissions ", The American Petroleum Institute (API)
2015.
74
[44] B. Austbø, S. W. Løvseth, and T. Gundersen, "Annotated bibliography—Use of
optimization in LNG process design and operation", Computers & Chemical
Engineering, vol. 71, pp. 391-414, 2014.
[45] E. P. Schulz, M. S. Diaz, and J. A. Bandoni, "Supply chain optimization of
large-scale continuous processes", Computers & Chemical Engineering, vol.
29, no. 6, pp. 1305-1316, 2005.
[46] M. R. Pillarella, J. C. Bronfenbrenner, Y. Liu, and M. Roberts, "Large LNG
trains: Developing the optimal process cycle", vol. 14, pp. 1-8.
[47] J. B. Jensen and S. Skogestad, "Optimal operation of a simple LNG process",
IFAC Proceedings Volumes, vol. 39, no. 2, pp. 241-246, 2006.
[48] N. M. Shah, G. P. Rangaiah, and A. Hoadley, "Multi-objective optimization of
the dual independent expander gas-phase refrigeration process for LNG", pp. 4-
9.
[49] A. M. Katebaha, M. M. Hussein, A. R. Shazed, Z. Bouabidi, and E. I. Al-
musleh, "Simulation and environmental impact of an actual full scale LNG
chain", Under preparation, 2019.
[50] Y. A. Cengel and M. A. Boles, "Thermodynamics: An Engineering Approach,
-PDF": McGraw-Hill, 2008.
[51] Z. Rant, "Exergy, a new word for technical available work", Forsch. Ing. Wis,
vol. 22, no. 1, pp. 36-37, 1956.
[52] I. Dincer and M. A. Rosen, "Exergy: energy, environment and sustainable
development": Newnes, 2012.
[53] E. Sciubba and G. Wall, "A brief commented history of exergy from the
beginnings to 2004", International Journal of Thermodynamics, vol. 10, no. 1,
pp. 1-26, 2007.
75
[54] G. Tsatsaronis and F. Cziesla, "Exergy analysis of simple processes", Exergy,
Energy System Analysis and Optimization-Volume I: Exergy and
Thermodynamic Analysis, vol. 1, p. 79, 2009.
[55] M. J. Moran, H. N. Shapiro, D. D. Boettner, and M. B. Bailey, "Fundamentals
of engineering thermodynamics": John Wiley & Sons, 2010.
[56] T. Gundersen, "An introduction to the concept of exergy and energy quality",
Department of Energy and Process Engineering Norwegian University of
Science and Technology, Version, vol. 4, 2011.
[57] E. Querol, B. Gonzalez-Regueral, and J. L. Perez-Benedito, "Exergy concept
and determination", in Practical Approach to Exergy and Thermoeconomic
Analyses of Industrial Processes: Springer, 2013, pp. 9-28.
[58] S. Kaushik and O. K. Singh, "Estimation of chemical exergy of solid, liquid and
gaseous fuels used in thermal power plants", Journal of Thermal Analysis and
Calorimetry, vol. 115, no. 1, pp. 903-908, 2014.
[59] T. J. Kotas, "The exergy method of thermal plant analysis": Elsevier, 2013.
[60] N. Lior and N. Zhang, "Energy, exergy, and Second Law performance criteria",
Energy, vol. 32, no. 4, pp. 281-296, 2007.
[61] R. Cornelissen, "Thermodynamics and sustainable development", 1997.
[62] T. V. Nguyen, M. Voldsund, B. Elmegaard, I. S. Ertesvåg, and S. Kjelstrup, "On
the definition of exergy efficiencies for petroleum systems: Application to
offshore oil and gas processing", Energy, vol. 73, pp. 264-281, 2014.
[63] F. Banat, O. Younas, and I. Didarul, "Energy and exergical dissection of a
natural gas sweetening plant using methyldiethanol amine (MDEA) solution",
Journal of Natural Gas Science and Engineering, vol. 16, pp. 1-7, 2014.
76
[64] M. H. Panjeshahi, F. Harati, and M. M. Nouzari, "Improving energy efficiency
in natural gas refineries, using exergy analysis", CHEMICAL ENGINEERING,
vol. 21, 2010.
[65] M. Baccanelli, S. Langé, M. V. Rocco, L. A. Pellegrini, and E. Colombo, "Low
temperature techniques for natural gas purification and LNG production: An
energy and exergy analysis", Applied Energy, vol. 180, pp. 546-559, 2016.
[66] T. Morosuk, S. Tesch, A. Hiemann, G. Tsatsaronis, and N. B. Omar,
"Evaluation of the PRICO liquefaction process using exergy-based methods",
Journal of Natural Gas Science and Engineering, vol. 27, pp. 23-31, 2015.
[67] M. Kanoğlu, "Exergy analysis of multistage cascade refrigeration cycle used for
natural gas liquefaction", International Journal of Energy Research, vol. 26, no.
8, pp. 763-774, 2002.
[68] J. Choi, "Development of partial liquefaction system for liquefied natural gas
carrier application using exergy analysis", International Journal of Naval
Architecture and Ocean Engineering, 2018.
[69] B. Tirandazi, M. Mehrpooya, A. Vatani, and S. M. A. Moosavian, "Exergy
analysis of C2+ recovery plants refrigeration cycles", Chemical Engineering
Research and Design, vol. 89, no. 6, pp. 676-689, 2011.
[70] A. Palizdar, T. Ramezani, Z. Nargessi, S. AmirAfshar, M. Abbasi, and A.
Vatani, "Thermodynamic evaluation of three mini-scale nitrogen single
expansion processes for liquefaction of natural gas using advanced exergy
analysis", Energy Conversion and Management, vol. 150, pp. 637-650, 2017.
[71] C. W. Remeljej and A. F. A. Hoadley, "An exergy analysis of small-scale
liquefied natural gas (LNG) liquefaction processes", Energy, vol. 31, no. 12, pp.
2005-2019, 2006.
77
[72] C. Derbal, A. Haouam, and H. Mzad, "Energy efficiency enhancement of mixed
refrigerant process in LNG plant", Energy Procedia, vol. 153, pp. 154-160,
2018.
[73] N. B. N. Khan, A. Barifcani, M. Tade, and V. Pareek, "A case study:
Application of energy and exergy analysis for enhancing the process efficiency
of a three stage propane pre-cooling cycle of the cascade LNG process", Journal
of Natural Gas Science and Engineering, vol. 29, pp. 125-133, 2016.
[74] H. M. Chang, J. H. Park, S. Lee, and K. H. Choe, "Combined Brayton-JT cycles
with refrigerants for natural gas liquefaction", in AIP Conference Proceedings,
2012, vol. 1434, no. 1, pp. 1779-1786: AIP.
[75] M. Q. Gong, E. C. Luo, J. T. Liang, Y. Zhou, and J. F. Wu, "Thermodynamic
Analysis of a Mixed-Refrigerant Auto-Cascade JT Cryocooler with Distributed
Heat Loads", in Cryocoolers 11: Springer, 2002, pp. 523-530.
[76] A. Aspelund, S. P. Tveit, and T. Gundersen, "A liquefied energy chain for
transport and utilization of natural gas for power production with CO2 capture
and storage–Part 3: The combined carrier and onshore storage", Applied Energy,
vol. 86, no. 6, pp. 805-814, 2009.
[77] C. H. Chiu and C. L. Newton, "Second law analysis in cryogenic processes",
Energy, vol. 5, no. 8, pp. 899-904, 1980.
[78] L. Cipolato, M. C. Lirani, T. V. Costa, F. M. Fábrega, and J. V. d'Angelo,
"Exergetic optimization of a refrigeration cycle for natural gas liquefaction", in
Computer Aided Chemical Engineering, vol. 31: Elsevier, 2012, pp. 440-444.
[79] T. Gundersen, A. Aspelund, and P. I. Barton, "An Overview of New
Methodologies for the Design of Cryogenic Processes with an emphasis on
LNG", in Proceedings of the 1st Annual Gas Processing Symposium, vol. 1, H.
78
E. Alfadala, G. V. Rex Reklaitis, and M. M. El-Halwagi, Eds. Amsterdam:
Elsevier, 2009, pp. 104-112.
[80] Q. Y. Li and Y. L. Ju, "Design and analysis of liquefaction process for offshore
associated gas resources", Applied Thermal Engineering, vol. 30, no. 16, pp.
2518-2525, 2010.
[81] D. Marmolejo-Correa and T. Gundersen, "A comparison of exergy efficiency
definitions with focus on low temperature processes", Energy, vol. 44, no. 1,
pp. 477-489, 2012.
[82] D. Marmolejo-Correa and T. Gundersen, "A new graphical representation of
exergy applied to low temperature process design", in Computer Aided
Chemical Engineering, vol. 31, I. A. Karimi and R. Srinivasan, Eds.: Elsevier,
2012, pp. 1180-1184.
[83] A. B. Rian and I. S. Ertesvag, "Exergy Evaluation of the Arctic Snøhvit
Liquefied Natural Gas Processing Plant in Northern Norway Significance of
Ambient Temperature", Energy & Fuels, vol. 26, no. 2, pp. 1259-1267, 2012.
[84] G. Tsatsaronis and T. Morosuk, "Advanced exergetic analysis of a refrigeration
system for liquefaction of natural gas", International Journal of Energy and
Environmental Engineering, vol. 1, no. 1, pp. 1-18, 2010.
[85] A. Wechsung, A. Aspelund, T. Gundersen, and P. I. Barton, "Synthesis of heat
exchanger networks at subambient conditions with compression and expansion
of process streams", AIChE Journal, vol. 57, no. 8, pp. 2090-2108, 2011.
[86] S. Tesch, T. Morosuk, and G. Tsatsaronis, "Advanced exergy analysis applied
to the process of regasification of LNG (liquefied natural gas) integrated into an
air separation process", Energy, vol. 117, pp. 550-561, 2016.
79
[87] G. Tsatsaronis and T. Morosuk, "Advanced exergetic analysis of a novel system
for generating electricity and vaporizing liquefied natural gas", Energy, vol. 35,
no. 2, pp. 820-829, 2010.
[88] T. Morosuk and G. Tsatsaronis, "Comparative evaluation of LNG–based
cogeneration systems using advanced exergetic analysis", Energy, vol. 36, no.
6, pp. 3771-3778, 2011.
[89] T. Morosuk, G. Tsatsaronis, A. Boyano, and C. Gantiva, "Advanced exergy-
based analyses applied to a system including LNG regasification and electricity
generation", International Journal of Energy and Environmental Engineering,
vol. 3, no. 1, p. 1, 2012.
[90] B. B. Kanbur, L. Xiang, S. Dubey, C. F. Hoong, and F. Duan, "A Micro
Cogeneration System with LNG Cold Utilization-part 2: Exergy Analyses",
Energy Procedia, vol. 105, pp. 1910-1917, 2017.
[91] P. Nekså, E. Brendeng, M. Drescher, and B. Norberg, "Development and
analysis of a natural gas reliquefaction plant for small gas carriers", Journal of
Natural Gas Science and Engineering, vol. 2, no. 2, pp. 143-149, 2010.
[92] S. A. Nezhad, B. Shabani, and M. Soleimani, "Thermodynamic analysis of
liquefied natural gas (LNG) production cycle in APCI process", Journal of
Thermal Science, vol. 21, no. 6, pp. 564-571, 2012.
[93] K. Manjunath and S. Kaushik, "Second law thermodynamic study of heat
exchangers: a review", Renewable and Sustainable Energy Reviews, vol. 40, pp.
348-374, 2014.
[94] R. Smith, "Chemical process: design and integration": John Wiley & Sons,
2005.
80
[95] I. C. Kemp, "Pinch analysis and process integration: a user guide on process
integration for the efficient use of energy": Elsevier, 2011.
[96] B. Linnhoff and V. R. Dhole, "Shaftwork targets for low-temperature process
design", Chemical Engineering Science, vol. 47, no. 8, pp. 2081-2091, 1992.
[97] D. Marmolejo-Correa and T. Gundersen, "New Graphical Representation of
Exergy Applied to Low Temperature Process Design", Industrial & engineering
chemistry research, vol. 52, no. 22, pp. 7145-7156, 2013.
[98] I. Lee, J. Park, and I. Moon, "Conceptual design and exergy analysis of
combined cryogenic energy storage and LNG regasification processes: cold and
power integration", Energy, vol. 140, pp. 106-115, 2017.
[99] M. Zargarzadeh, I. A. Karimi, and H. Alfadala, "Olexan: a tool for online exergy
analysis".
[100] F. M. Fábrega, J. S. Rossi, and J. V. H. d'Angelo, "Exergetic analysis of the
refrigeration system in ethylene and propylene production process", Energy,
vol. 35, no. 3, pp. 1224-1231, 2010.
[101] A. Aspelund and T. Gundersen, "A new process synthesis methodology
utilizing pressure exergy in subambient processes", Computer Aided Chemical
Engineering, vol. 24, p. 1133, 2007.
[102] S. A. Al-Sobhi, H. E. Alfadala, and M. M. El-Halwagi, "Simulation and energy
integration of a Liquefied Natural Gas (LNG) plant", pp. 10-12.
[103] C. B. Malham, R. R. Tinoco, A. Zoughaib, D. Chretien, M. Riche, and N.
Guintrand, "A novel hybrid exergy/pinch process integration methodology",
Energy, vol. 156, pp. 586-596, 2018.
81
[104] S. Gourmelon, R. Hétreux, and P. Floquet, "PiXAR: Pinch and eXergy for the
Analysis and Retrofit design of industrial processes", in Computer Aided
Chemical Engineering, vol. 38: Elsevier, 2016, pp. 1941-1946.
[105] S. Mokhatab, W. A. Poe, and J. G. Speight, "Handbook of natural gas
transmission and processing", ed: Gulf Professional Pub., 2006.
[106] N. Rahmanian, I. B. Ilias, and K. Nasrifar, "Process simulation and assessment
of a back-up condensate stabilization unit", Journal of Natural Gas Science and
Engineering, vol. 26, pp. 730-736, 2015.
[107] S. Lee, Y. Seo, J. Lee, and D. Chang, "Economic evaluation of pressurized LNG
supply chain", Journal of Natural Gas Science and Engineering, vol. 33, pp.
405-418, 2016.
[108] H. Uwitonze, I. Lee, and K. S. Hwang, "Alternatives of integrated processes for
coproduction of LNG and NGLs recovery", Chemical Engineering and
Processing: Process Intensification, vol. 107, pp. 157-167, 2016.
[109] C. Jin and Y. Lim, "Optimization and economic evaluation of integrated natural
gas liquids (NGL) and liquefied natural gas (LNG) processing for lean feed
gas", Applied Thermal Engineering, vol. 149, pp. 1265-1273, 2019.
[110] Đ. Dobrota, B. Lalić, and I. Komar, "Problem of boil-off in LNG supply chain",
Transactions on maritime science, vol. 2, no. 02, pp. 91-100, 2013.
[111] C. Song, S. Tan, F. Qu, W. Liu, and Y. Wu, "Optimization of mixed refrigerant
system for LNG processes through graphically reducing exergy destruction of
cryogenic heat exchangers", Energy, vol. 168, pp. 200-206, 2019.
[112] M. Wang, J. Zhang, and Q. Xu, "Optimal design and operation of a C3MR
refrigeration system for natural gas liquefaction", Computers & Chemical
Engineering, vol. 39, pp. 84-95, 2012.
82
[113] D.-E. Helgestad, "Modelling and optimization of the C3MR process for
liquefaction of natural gas", Process Systems Engineering, vol. 44, 2009.
[114] E. I. Al-musleh, D. S. Mallapragada, and R. Agrawal, "Efficient electrochemical
refrigeration power plant using natural gas with ∼100% CO2 capture", Journal
of Power Sources, vol. 274, pp. 130-141, 2015.
[115] E. I. Al-musleh, "Efficient processes for power generation and energy storage",
2014.
[116] R. O'Hayre, S.-W. Cha, F. B. Prinz, and W. Colella, "Fuel cell fundamentals":
John Wiley & Sons, 2016.
[117] T. A. Adams Ii and P. I. Barton, "High-efficiency power production from
natural gas with carbon capture", Journal of Power Sources, vol. 195, no. 7, pp.
1971-1983, 2010.
[118] R. Agrawal and Z. T. Fidkowski, "On the use of intermediate reboilers in the
rectifying section and condensers in the stripping section of a distillation
column", Industrial & engineering chemistry research, vol. 35, no. 8, pp. 2801-
2807, 1996.
[119] P. Patil, Z. Malik, and M. Jobson, "Retrofit design for gas sweetening
processes", vol. 152, p. 460: Institution of Chemical Engineers; 1999.
[120] H. Öhman and P. Lundqvist, "Comparison and analysis of performance using
Low Temperature Power Cycles", Applied Thermal Engineering, vol. 52, no. 1,
pp. 160-169, 2013.
[121] W. M. Bahgat, "Proposed method for dealing with boil-off gas on board LNG
carriers during loaded passage", Int. J. of Multidisciplinary and Current
research, vol. 3, 2015.
83
[122] P. Głomski and R. Michalski, "Problems with determination of evaporation rate
and properties of boil-off gas on board LNG carriers", Journal of Polish
CIMAC, vol. 6, no. 1, pp. 133-140, 2011.
[123] R. Sedlaczek, "Boil-Off in Large and Small Scale LNG Chains", MS Petroleum
Engineering, Department of Petroleum Engineering and Applied Geophysics,
Norwegian University of Science and Technology, Trondheim, 2008.
[124] E. K. Boulougouris and M. L. E. Chrysinas, "LNG Fueled Vessels Design
Training", University of Strathclyde, Glasgow, 2015.
[125] I. A. Fernández, M. R. Gómez, J. R. Gómez, and Á. B. Insua, "Review of
propulsion systems on LNG carriers", Renewable and Sustainable Energy
Reviews, vol. 67, pp. 1395-1411, 2017.
[126] M. Mehrpooya, M. M. M. Sharifzadeh, and M. H. Katooli, "Thermodynamic
analysis of integrated LNG regasification process configurations", Progress in
energy and combustion science, vol. 69, pp. 1-27, 2018.
[127] D. A. Stradioto, M. F. Seelig, and P. S. Schneider, "Reprint of: Performance
analysis of a CCGT power plant integrated to a LNG regasification process",
Journal of Natural Gas Science and Engineering, vol. 27, pp. 18-22, 2015.
[128] Ł. Tomków and M. Cholewiński, "Improvement of the LNG (liquid natural gas)
regasification efficiency by utilizing the cold exergy with a coupled absorption
– ORC (organic Rankine cycle)", Energy, vol. 87, pp. 645-653, 2015.
[129] K. H. Kim and K. C. Kim, "Thermodynamic performance analysis of a
combined power cycle using low grade heat source and LNG cold energy",
Applied Thermal Engineering, vol. 70, no. 1, pp. 50-60, 2014.
84
[130] M. R. Gómez, R. F. Garcia, J. R. Gómez, and J. C. Carril, "Thermodynamic
analysis of a Brayton cycle and Rankine cycle arranged in series exploiting the
cold exergy of LNG (liquefied natural gas)", Energy, vol. 66, pp. 927-937, 2014.
[131] J. Ning, Z. Sun, Q. Dong, and X. Liu, "Performance study of supplying cooling
load and output power combined cycle using the cold energy of the small scale
LNG", Energy, vol. 172, pp. 36-44, 2019.
[132] H. Dong, L. Zhao, S. Zhang, A. Wang, and J. Cai, "Using cryogenic exergy of
liquefied natural gas for electricity production with the Stirling cycle", Energy,
vol. 63, pp. 10-18, 2013.
[133] K. Wang, S. Dubey, F. H. Choo, and F. Duan, "Thermoacoustic Stirling power
generation from LNG cold energy and low-temperature waste heat", Energy,
vol. 127, pp. 280-290, 2017.
[134] Y. Liu and K. Guo, "A novel cryogenic power cycle for LNG cold energy
recovery", Energy, vol. 36, no. 5, pp. 2828-2833, 2011.
[135] R. F. García, J. C. Carril, J. R. Gomez, and M. R. Gomez, "Combined cascaded
Rankine and direct expander based power units using LNG (liquefied natural
gas) cold as heat sink in LNG regasification", Energy, vol. 105, pp. 16-24, 2016.
[136] R. F. García, J. C. Carril, J. R. Gomez, and M. R. Gomez, "Power plant based
on three series Rankine cycles combined with a direct expander using LNG cold
as heat sink", Energy Conversion and Management, vol. 101, pp. 285-294,
2015.
[137] M. Soffiato, C. A. Frangopoulos, G. Manente, S. Rech, and A. Lazzaretto,
"Design optimization of ORC systems for waste heat recovery on board a LNG
carrier", Energy Conversion and Management, vol. 92, pp. 523-534, 2015.
85
[138] A. Franco and C. Casarosa, "Thermodynamic analysis of direct expansion
configurations for electricity production by LNG cold energy recovery",
Applied Thermal Engineering, vol. 78, pp. 649-657, 2015.
[139] (2018, 2/3/2019). Japan - Liquefied Natural Gas (LNG). Available:
https://www.export.gov/article?id=Japan-Liquefied-Natural-Gas-LNG
[140] V. La Rocca, "Cold recovery during regasification of LNG part one: Cold
utilization far from the regasification facility", Energy, vol. 35, no. 5, pp. 2049-
2058, 2010.
[141] V. La Rocca, "Cold recovery during regasification of LNG part two:
Applications in an Agro Food Industry and a Hypermarket", Energy, vol. 36,
no. 8, pp. 4897-4908, 2011.
[142] H. Tan, Y. Li, H. Tuo, M. Zhou, and B. Tian, "Experimental study on
liquid/solid phase change for cold energy storage of Liquefied Natural Gas
(LNG) refrigerated vehicle", Energy, vol. 35, no. 5, pp. 1927-1935, 2010.
[143] Z. Jieyu, L. Yanzhong, L. Guangpeng, and S. Biao, "Simulation of a novel
single-column cryogenic air separation process using LNG cold energy",
Physics Procedia, vol. 67, pp. 116-122, 2015.
[144] J. Chang, J. Zuo, K. J. Lu, and T. S. Chung, "Freeze desalination of seawater
using LNG cold energy", Water Research, vol. 102, pp. 282-293, 2016.


