Embed Size (px)
Citation preview
QATAR UNIVERSITY
COLLEGE OF ENGINEERING
RECYCLED WASTE TIRES MANAGEMENT IN CONSTRUCTION
BY
SALMA MOHAMED HAMID
A Thesis Submitted to
The College of Engineering
in Partial Fulfillment of the Requirements for the Degree of
Masters of Science in Engineering Management
June 2020
© 2020. Salma Mohamed Hamid. All Rights Reserved.
ii
COMMITTEE PAGE
The members of the Committee approve the Thesis of
Salma Mohamed Hamid defended on 06/05/2020.
Dr. Khalid Naji
Thesis Supervisor
Professor. Usama Ebead
Thesis Co-Supervisor Approved:
Khalid Kamal Naji, Dean, College of Engineering

iii
ABSTRACT
TYPE HAMID, SALMA, M., Masters: June : [2020:],
Masters of Science in Engineering Management
Title: Recycled Waste Tires Management in Constructions
Supervisor of Thesis: Dr. Khalid K. Naji, and Prof. Usama A. Ebead.
Concrete is one of the most commonly used materials in construction
worldwide. Yet the production of concrete from raw materials, such as cementitious
materials, water, sand, and natural aggregate, leads to the release of significant amounts
of CO2 and greenhouse gases. Therefore, there is a growing interest in producing
sustainable concrete using recycled materials. This study will focus on waste
management considering the incorporation of recycled tires as a replacement for fine
and coarse aggregate in structural concrete. These waste car and truck tires present
serious environmental challenges when dumped into landfills as they consume large
amounts of space, contaminate the air, soil, and water, and impact human health. The
reuse of rubber is therefore inevitable.
This study conducts a life cycle cost analysis (LCCA) to compare the cost-effectiveness
of a conventional concrete mix (RC1) with a rubberized concrete mix (RC2).
Furthermore, to promote the use of eco-friendly materials in concrete mixes, this study
suggests the use of seawater as a replacement for freshwater in both the conventional
mix and the rubberized concrete mix in order to eliminate the cost and energy consumed
during the desalination process. The LCCA results show that the rubberized concrete
(RC2), obtained by replacing 5% of aggregate and mixing it with seawater, is more
cost-effective than RC1, with a cost savings of 30%.
iv
LCCA data were acquired by investigating thirteen concrete mixes (a control mix; 5%,
10%, and 20% rubber aggregate substitutions mixed with freshwater; and 0%, 5%, and
10% rubber aggregate substitutions mixed with seawater). Moreover, the impact of
rubber and seawater was evaluated on fresh and hardened concrete characterizations.
The results show that as the rubber and seawater contents were increased, the
workability, density, and compressive strength were decreased; however, for durability
in terms of Rapid Chloride Permeability (RCP) and water absorption, rubberized and
seawater concrete mixes outperformed the control mix. Our selection of RC2 for LCCA
is based on its good fresh and mechanical characterizations in comparison to the other
rubberized concrete mixes. In its approach to its subject, this study is an example of
multidisciplinary research, as it synergizes construction management through life cycle
cost analysis with construction engineering materials area.

v
DEDICATION
I would like to dedicate this work to my family.

vi
ACKNOWLEDGMENTS
I would like to thank my supervisor Dr. Khalid Naji and co-supervisor Dr.
Usama Ebead for their guidance and support during this research. I would also like to
thank Dr. Adel Younis for his backup and support in accomplishing this research. Also,
I would like to acknowledge all the parties who made this thesis possible through their
support: Hassanesco Contracting Company for their patience during the preparation of
the mixes, Arab Centre for Engineering Studies (ACES) for conducting all the concrete
tests, and Modern Recycling Factory for providing the recycled tire material.

vii
TABLE OF CONTENTS
DEDICATION…. .......................................................................................................... v
ACKNOWLEDGMENTS ............................................................................................ vi
LIST OF TABLES ......................................................................................................... x
LIST OF FIGURES ...................................................................................................... xi
LIST OF EQUATIONS ............................................................................................... xii
CHAPTER 1: INTRODUCTION .................................................................................. 1
1.1 Background .......................................................................................................... 1
1.2 Literature Review ................................................................................................. 3
1.2.1 Life Cycle Cost Analysis ............................................................................... 3
1.2.2 Applications of Recycled Tires in Construction ............................................ 7
1.2.3 Seawater in Structural Concrete .................................................................. 11
1.3 Research Objectives ........................................................................................... 15
1.4 Thesis Outline .................................................................................................... 15
CHAPTER 2: SOLUTION FOR ACCOMMODATING RECYCLED TIRES IN
CONCRETE …… ...................................................................................................... 17
2.1 Materials ............................................................................................................. 17
2.1.1 Water ........................................................................................................... 17
2.1.2 Aggregate..................................................................................................... 18
2.1.3 Cementitious Materials ................................................................................ 23
viii
2.1.4 Concrete Mixture Proportions ..................................................................... 26
2.2 Assessment Methods for Concrete ..................................................................... 28
2.2.1 Fresh Concrete ............................................................................................. 28
2.2.2 Hardened Concrete ...................................................................................... 31
CHAPTER 3: MATERIALS PERFORMANCE OF RUBBERTIZED CONCRETE 36
3.1 Fresh Concrete.................................................................................................... 36
3.2 Hardened Concrete ............................................................................................. 37
3.2.1 Compressive Strength .................................................................................. 37
3.2.2 Rapid Chloride Permeability ....................................................................... 39
3.2.3 Water Absorption ........................................................................................ 40
CHAPTER 4: LIFE CYCLE COST ANALYSIS OF USING RECYCLED TIRES
AND SEAWATER IN CONCRETE ........................................................................... 42
4.1 Life Cycle Cost Model ....................................................................................... 42
4.1.1 Material Cost .............................................................................................. 44
4.1.2 Construction Cost ....................................................................................... 45
4.1.3Maintenance and Repair Cost ..................................................................... 45
4.1.4 End of Life Cost ......................................................................................... 46
4.1.5 Determination of LCCA ............................................................................. 47
4.2 LCCA Results .................................................................................................... 48
4.2.1 Sensitivity Analysis .................................................................................... 50
ix
CHAPTER 5: CONCLUSION AND FUTURE RECOMMENDATIONS ................. 53
5.1 Conclusion .......................................................................................................... 53
5.2 Future Recommendations ................................................................................... 55
REFERENCES….. ...................................................................................................... 57

x
LIST OF TABLES
Table 1. Some Facts about Rubber Recycling in the United States ............................... 8
Table 2. Chemical Characterizations of Freshwater and Seawater .............................. 18
Table 3. Physical and Mechanical Properties of Aggregate ........................................ 20
Table 4: Sieve Analysis for Sand, 10 mm and 20 mm Aggregate ............................... 21
Table 5. Fine Rubber Sieve Analysis ........................................................................... 23
Table 6. Physical and Chemical Properties of the Cement. ......................................... 25
Table 7. Physical and Chemical Properties for PC 350 ............................................... 26
Table 8. Concrete Mixes .............................................................................................. 28
Table 9: Workability Categorization According to the Slump Value ......................... 30
Table 10. Chloride Ions Penetration Based on Charge Passed (coulombs) ................. 33
Table 11: Fresh Concrete Test Results. ....................................................................... 36
Table 12. Compressive Strength Test Results ............................................................. 38
Table 13. RCP Test Results ......................................................................................... 40
Table 14. Water Absorption Test Results .................................................................... 41
Table 15: Summary of The Structural Design of Conventional Steel-reinforced
Concrete. ...................................................................................................................... 43
Table 16: Unit Costs .................................................................................................... 44
Table 17. Summary of LCC Results (using r = .7%) ................................................... 49

xi
LIST OF FIGURES
Figure 1: The Three Sizes of Rubber ........................................................................... 22
Figure 2: Three Slump Forms ...................................................................................... 30
Figure 3: Types of Cube Failure .................................................................................. 32
Figure 4: Compressive Strength Test Results at 28 days ............................................. 39
Figure 5: Life Cycle Cost Analysis Module ................................................................ 43
Figure 6: Cash Flow Diagram for Design Alternatives (future costs are not discounted)
...................................................................................................................................... 48
Figure 7: Life cycle Cost Results (where r = 0.7% and C is 150% of M). .................. 50
Figure 8: Sensitivity of the LCC Results to the Discount Rate (C= 1.5M) ................. 51
Figure 9: Sensitivity of the LCC results to the construction cost, C (r = 0.7%) .......... 52

xii
LIST OF EQUATIONS
Equation 1: NPV ............................................................................................................ 4
Equation 2: Compressive Strength............................................................................... 32
Equation 3: Water Absorption (%) .............................................................................. 34
Equation 4: Correction Factor ...................................................................................... 35
Equation 5: Sum of the LCC Module .......................................................................... 47
Equation 6: Present Value of LCC............................................................................... 47

xiii
GLOSSARY OF ABBREVIATIONS
1. United Nations Framework Convention on Climate Change (UNFCCC)
2. Life Cycle Cost Analysis (LCCA)
3. Life Cycle Cost (LCC)
4. Federal Highway Administration (FHWA)
5. Net Present Value (NPV)
6. Glass Fiber Reinforced Polymer (GFRP)
7. Fiber Reinforced Polymer (FRP)
8. Crumb Rubber Modified (CRM)
9. Qatar Statistics Authority (QSA)
10. Terminal Blend (TB)
11. Total Dissolved Solid (TDS)
12. American Society for Testing and Materials (ASTM)
13. British Standard (BS)
14. Qatar Construction Specifications (QCS)
15. Natural Aggregate (NA)
16. Modern Recycling Factory (MRF)
17. Rapid Chloride Permeability (RCP)
18. International Organization for Standardization (ISO)
19. Ordinary Portland Cement (OPC).
20. Portland Pozzolana Cement (PPC)
21. Sulphates Resisting Cement (SRC)
22. Micro Silica (MS)
1
CHAPTER 1: INTRODUCTION
1.1 Background
According to the United Nations’ World Commission on Environment and
Development, sustainability means “meeting the needs of the present without
compromising the ability of the future generations to meet their own needs” UNFCCC
COP9 Rep. 200 [1]. Due to population growth and urbanization, natural resources have
become threatened within the last century [2]. As a result, there has been growing
interest in reusing materials instead of disposing of them in landfills [3].
Concrete is the most common material used in the construction sector worldwide [4];
the prime components of concrete are cement, freshwater, sand, and aggregate. The
massive production of concrete for the purpose of using in residential and commercial
buildings and infrastructure projects exerts a negative impact on the environment
because these prime components are generally extracted from natural resources [5].
Fortunately, new concrete can make use of most construction and demolition waste,
such as aggregate [6], which can be treated and reused. Moreover, there is growing
interest in using green cement, which is produced from recycled materials, to reduce
the environmental impact of producing traditional cement [7].
Another material that could potentially be recycled for use in concrete is waste tires,
which mainly come from cars and trucks [8]. Tire recycling also mitigates their disposal
in landfills, which is causing serious environmental issues [9]. As tires remain in
landfills for long periods and the micro-organisms take more than 100 year to
biodegrade them [10] . In 2004, China generated 120 million waste tires, and this
number is increasing by 12% each year. Moreover, the United States has about 300
million waste tires stockpiled, with an increase of 290 million waste tires generated
each year [11]. Currently, there are different approaches to eliminating waste tires,
2
including reuse, rethreading, recycling/mechanical recycling, landfill engineering, and
energy recovery [12]. Waste rubber tires are already recycled and used a number of
civil engineering applications, and this is considered to have many environmental and
economic benefits, such as preserving natural resources, producing sustainable
materials, and reducing harmful pollution resulting from landfill disposal. This study
focuses on one specific civil application: the construction management of recycled
waste tires as a replacement for fine and coarse aggregate.
Our work also suggests the use of seawater as an alternative to the commonly used
freshwater for mixing concrete. This move is a response to the growing global concern
regarding freshwater scarcity [13]. Studies show that about two-thirds of the world’s
population is likely to suffer from water scarcity for at least one month every year [14].
In light of this, it is concerning that global concrete production consumes more than
two billion tons of freshwater every year [15]. Furthermore, the intensive desalinization
treatment of seawater has a significant negative environmental impact, and in the
Middle East two-thirds of the water produced from seawater desalination is based on
fossil fuel-powered thermal desalination. The seawater desalination process is also
costly [16,17].
3
1.2 Literature Review
1.2.1 Life Cycle Cost Analysis
Life cycle cost analysis (LCCA) is used for assessing the total cost of projects
[18]. When used for a construction project, it takes into account all associated costs
including investment, operations, and maintenance costs as well as eventual demolition
and disposal costs [19]. LCCA is commonly used in construction projects and is highly
effective, especially when there are many design alternatives [20]. For this reason, it is
often used to compare the entire costs of various alternatives from the initial stage up
to the demolition stage, enabling efficient decision-making in the early stages of the
project and thus increasing project savings [21].
There are several benefits of conducting LCC analysis. For instance, it enables
organizations to use the best alternatives and leads to the best long-term value [22].
Furthermore, while LCCA may lead to very high initial costs because it prompts
decision-makers to choose high-quality materials, it also leads to a correspondingly
lower risk of rework and maintenance costs [20]. Therefore, properly conducting LCCA
can even increase a building’s lifespan. In addition, LCCA enables the project team to
control the project throughout all its stages [23], as conducting LCCA in the early
project stage can determine the cost baseline that can be used to track the project, and
corrective actions can then be taken should any risk arise.
LCCA also has environmental benefits: it is mandatory for many green building
organizations, so using LCCA makes it easier for the project to obtain green building
certification [23]. While the construction of green buildings does cost considerably
more than the construction of conventional buildings [24] and this might deter
contractors from adopting green construction techniques, conducting LCCA in the
long-term analysis shows that green buildings yield savings in operation and
maintenance costs [25]. Yet despite both the cost benefits and the environmental

4
benefits, the many advantages of LCCA are still not fully exploited in the construction
sector, primarily due to owners’ lack of awareness of the benefits of LCCA, poor actual
cost and performance data on buildings, and uncertainty related to LCCA assumptions
[26–28].
Guidelines for using LCCA advise that it should be started as early as possible in project
development. For construction projects, the appropriate time is during the design stage
as soon as there are sufficient details for all design alternatives, allowing for cost
estimations and analysis [29]. The LCCA should be comprehensive enough to cover all
the long-term costs associated with the case study subject. For pavement construction,
for example, the LCCA policy of the US Federal Highway Administration (FHWA)
recommends using at least 35 years as the analysis period [30]. In high-rise buildings,
the analysis period can be assumed to be up to 100 years [31].
The LCCA determines all the costs that can be incurred during the analysis period. Most
likely, these include material costs, construction costs, and maintenance and repair
costs. Based on the area where the LCCA is applied, the costs may also include
demolition [31] and energy cost residual value [32].
Net present value (NPV) is the value of all future costs incurred at the end of each year
discounted to the present value; it is widely used to simplify the determination of the
NPV [33], as expressed by Equation (1).
𝑁𝑃𝑉 = 𝐴𝑡 ×1
(1 + 𝑑)𝑡
Equation 1: NPV
5
Where At is the cost at year (t), d is the discount rate, and t is the number of years [33].
The discount rate is used to express the costs predicted in the future as present costs
[34]; it should reflect the historical economical trend over a long-term period and the
inflation rate and vary according to the time and location where the LCCA is conducted
[35].
Sensitivity analysis is an important tool in LCCA, showing how the variance of key
input parameters influences the LCC value [36]. Based on the analysis inputs and
assumptions, the major parameter can be the discount rate, labor cost, material cost or
any other parameter [37]. The sensitivity analysis also allows a large number of inputs
to vary simultaneously [29].
A number of tools have been employed to conduct LCCA, including MicroBENCOST,
which was developed by the National Cooperative Highway Research Program in 1990
[38] and was used to conduct a cost-benefit analysis for seven project types. These types
included capacity enhancement, bypass, intersection or interchange improvement,
rehabilitation of pavements, bridge construction, safety, and highway-railroad grade
crossing [39]. MicroBENCOST was used to compare the LCC of conventional and
asphalt-rubber pavements [30]. However, the main disadvantages of MicroBENCOST
are that the input must be entered before the file can be saved and that the input may
not be automatically updated when the user changes it [40].
Another tool of conducting LCCA is by using the Fourth Highway Development and
Management Model (HDM-4). This program, developed by the World Bank, can apply
three LCCA tools, namely strategy analysis, program analysis, and project analysis.
However, the main disadvantage of this program is that since it was designed for
developing countries, users in other nations may have difficulty in conducting a high-
quality evaluation of the user costs for different design alternatives [30].
6
One specific consideration for our study is the cost analysis for rubber. In the
construction industry, modified rubber is often used in asphalt pavement mixes, more
so than in concrete mixes. The typical cost of a crumb rubber modified (CRM) asphalt
mix is between 1.5 to 2.0 times that of a conventional mix due to the rubber cost, use
of special aggregate, risk of uncertainty to the contractors, and change in the
construction operations [41]; however, this cost is only considered as an initial cost.
However, LCCAs include all the relevant costs of the asphalt mix, such as the initial,
construction, operation, and maintenance costs up to the demolition cost. Therefore
LCCA allows CRM to be thoroughly compared to conventional asphalt mixes and
shows the benefits of CRM; for example, it reduces the cracks in the hot asphalt mixes,
reduces the maintenance frequency, and provides smooth riding pavement with good
slip resistance [30].
Since the use of recycled rubber is more common in asphalt works than in building
works, many studies have conducted LCCA to investigate the cost-effectiveness of
using recycled rubber in an asphalt mix. J. Jung et al. [30] showed that rubberized
pavement is more cost-effective than conventional concrete pavement in terms of initial
cost and maintenance cost. In addition, rubberized pavement provides a longer service
life. Thus, based on annual equivalent costs, capital costs, and layer equivalencies, an
LCCA showed that a rubber modified asphalt mix is also more cost-effective than a
traditional asphalt mix, according to J. O’Brien et al. [42].
Seawater is another specific consideration in our study. It can be incorporated in a
concrete mix, replacing freshwater and thus eliminating the cost and energy
consumption resulting from water desalination [16]. In fact, the use of seawater in
reinforced concrete is considered to be more cost-effective than using conventional
reinforced concrete that uses freshwater [31]. However, seawater will cause corrosion

7
in black steel, so many studies have suggested the use of corrosion-resistant
reinforcement in lieu of black steel in seawater concrete [31,43]. Although corrosion-
resistant reinforcement has a high cost, in the long term it extends the service life of
seawater concrete and significantly reduces maintenance costs. Consequently, cost
savings of over 40% can be achieved by using seawater concrete, associated with non-
corrosive reinforcement, in place of conventional steel-reinforced concrete [31,44].
1.2.2 Applications of Recycled Tires in Construction
The recycling of waste materials is becoming inevitable in industrial sectors
[45]. Recycling addresses one of the negative results of economic growth, which is the
increasing generation of waste [46] that is usually disposed of in landfills, leading to
soil, air and water contamination from toxic substances, such as chemicals, heavy
metals, plastic materials, rubber, and asbestos [47]. Therefore, there is a growing
awareness of the need to recycle to protect natural resources, save them for the next
generation, and eliminate the harmful impact of waste on human health in the short-
and long-term [45].
Rubber is one of the materials that cause major environmental issues when stored in
landfills. It takes a long time to dissolve and emits toxic gases when burnt. The United
States alone has about 300 million scrap tires in landfills, with an increase of 270
million tires generated per year [48]. However, there is a growing concern about
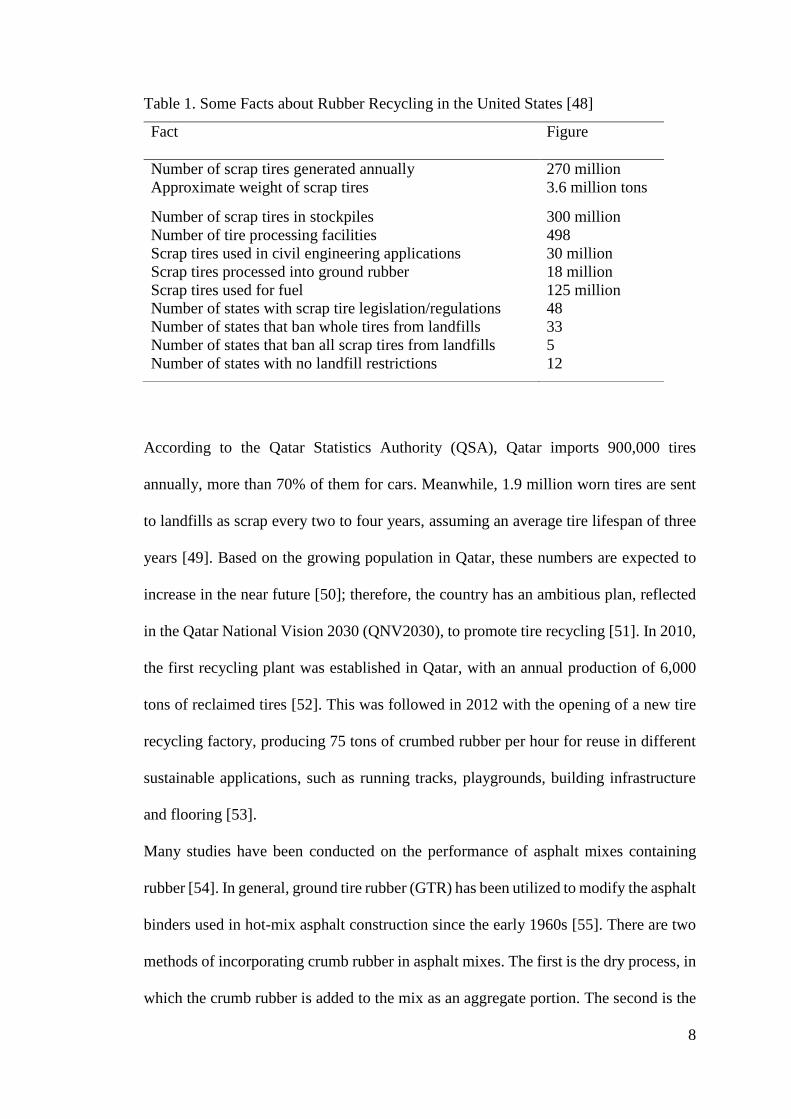
recycling rubber, both in the United States and worldwide. Table 1 shows how around
170 million tons of rubber have been reused in different industries.
8
Table 1. Some Facts about Rubber Recycling in the United States [48]
According to the Qatar Statistics Authority (QSA), Qatar imports 900,000 tires
annually, more than 70% of them for cars. Meanwhile, 1.9 million worn tires are sent
to landfills as scrap every two to four years, assuming an average tire lifespan of three
years [49]. Based on the growing population in Qatar, these numbers are expected to
increase in the near future [50]; therefore, the country has an ambitious plan, reflected
in the Qatar National Vision 2030 (QNV2030), to promote tire recycling [51]. In 2010,
the first recycling plant was established in Qatar, with an annual production of 6,000
tons of reclaimed tires [52]. This was followed in 2012 with the opening of a new tire
recycling factory, producing 75 tons of crumbed rubber per hour for reuse in different
sustainable applications, such as running tracks, playgrounds, building infrastructure
and flooring [53].
Many studies have been conducted on the performance of asphalt mixes containing
rubber [54]. In general, ground tire rubber (GTR) has been utilized to modify the asphalt
binders used in hot-mix asphalt construction since the early 1960s [55]. There are two
methods of incorporating crumb rubber in asphalt mixes. The first is the dry process, in
which the crumb rubber is added to the mix as an aggregate portion. The second is the
Fact Figure
Number of scrap tires generated annually 270 million
Approximate weight of scrap tires 3.6 million tons
Number of scrap tires in stockpiles 300 million
Number of tire processing facilities 498
Scrap tires used in civil engineering applications 30 million
Scrap tires processed into ground rubber 18 million
Scrap tires used for fuel 125 million
Number of states with scrap tire legislation/regulations 48
Number of states that ban whole tires from landfills 33
Number of states that ban all scrap tires from landfills 5
Number of states with no landfill restrictions 12
9
wet process, in which the crumb rubber is first incorporated into asphalt cement and
then incorporated into the mix [56].
N. Hassan et al. [57] reviewed crumb rubber modification considering dry-mixed
rubberized asphalt mixes. They concluded that generally, crumb rubber is often used in
asphalt mixes to improve the performance of the mix and to benefit the environment.
Also, rubber shows a greater elastic recovery characterization than conventional asphalt
mixes. Rubber has also been shown to improve fatigue, cracking, resistance, and
permanent deformation.
R. Salini [56] also conducted a study of the behavior of crumb rubber in an asphalt mix.
They incorporated the crumb rubber into the mix using the dry process, but also
followed up the structural development obtained with the wet process by keeping the
mix in an oven at 160 ℃. The study found that as a result of an increase in the rubber
in the mix, the density of the mix decreased, the void content increased, and the tensile
stress value decreased.
Using the wet process, L. Han et al. [58] investigated a terminal blend (TB) rubberized
binder. Compared to the traditional mix, TB uses finer rubber particles to obtain a
homogeneous mix. The study concluded that TB is a promising and environment-
friendly bituminous material that resembles a polymer-modified binder in terms of
manufacturing systems and performance properties as well as mix handling. The TB
binder can be performance-graded and its application covers hot-mix asphalt overlay
and surface treatment, such as chip seal.
In addition to studies of the applications of rubber in asphalt mixes, several studies have
focused on the application of rubber in concrete mixes and its performance in fresh and
in hardened concrete. Most of the research on incorporating rubber into concrete mixes
as a replacement for aggregate shows that the compressive strength is reduced [59–61]
10
therefore, rubber should be used in structures where strength is not critical, and the
maximum replacement of the rubber aggregate should range between 20% and 30% by
volume [11].
In one such study, H. Toutanji [62] conducted experiments to investigate the effect of
replacing mineral coarse aggregate with rubber, using rubber contents of 25%, 50%,
75% and 100% as replacement ratios. The results showed that an increase in the rubber
content led to a reduction in the compressive and flexural strength values. However,
the relationship between strength losses and increasing rubber content was not linear.
The toughness of rubberized concrete was higher in comparison to the conventional
concrete mix.
A. Sofi [63] evaluated the performance of rubberized concrete mix by replacing 5%,
7.5% and 10% (by weight) of aggregate and cement with rubber. The results showed
that the rubber mix had lower compressive strength, flexural tensile strength and depth
of water penetration than the control mix, while the abrasion resistance and water
absorption (up to 10% replacement) showed better results than the traditional mix
concrete. Hence, A. Sofi [63] recommended that rubber (up to 12.5% replacement of
fine aggregate) could be used in pavements, floors, hydraulic structures, concrete
highways or any structure that may be prone to brittle failure. M. Batayneh et al. [64]
also recommended using rubberized concrete in construction elements such as
pavements, partition walls, road barriers, and sidewalks, since these elements do not
require high compressive strength.
To improve the performance of ground rubber in concrete mixes, M.Balaha et al. [65]
suggested adding polyvinyl acetate (PVA), silica fume (SF), and sodium hydroxide
(NaOH) as a treatment. The treated rubber yielded better results than normal rubber in
terms of compressive strength and tensile strength; in the case of treated rubber, the
11
compressive strength reduction ranged from 14% to 17% compared to ordinary
concrete, while the reduction in the case of untreated rubber was 27% at the same
percentage of rubber aggregate replacement. On the other hand, there was an increase
in the tensile strength in the rubberized concrete incorporating the treated rubber when
compared to the untreated rubber counterpart.
The fresh properties of rubberized concrete were investigated by N. Deshpandeet al.
[66], who observed that while performing the slump test, increasing the rubber
aggregate content reduces the workability. However, the rubberized concrete mixes did
not show any problems in terms of finishing, casting or placement. A good quality
finish could be achieved, although additional effort was required to smooth the finished
surface.
N. Al-Akhraset al. [67] studied the properties of tire-rubber ash (TRA) mortar. As the
TRA content increased, the workability of the fresh mortar decreased, but both the
initial and final setting times increased with an increase in TRA content.
1.2.3 Seawater in Structural Concrete
In the near future, the water crisis is highly likely to be exacerbated as
freshwater is a limited natural resource and the amount of water generated by the
hydrological cycle will not increase overall [68]. Rain, snow, groundwater, and rivers
are the only sources of freshwater on the planet. Evaporation from land, bodies of water,
and plants transfers the water to the atmosphere, from which it returns to the earth as
snow or rain [69]. At present, there are major signs of water shortage with respect to
some main sources of freshwater. For example, some rivers are running dry, including
major rivers such as the Colorado River in North America, the Yellow River in China,
the Teesta River in India and the Murray River in Australia [69]. Another sign of water
shortage is the decline of water tables worldwide, including among the biggest
12
producers, namely China, India, and the United States. A groundwater survey found
that on the North China Plain, the water table has declined by about six to eight billion
tons every year since 2002 due to the long-term irrational consumption of water and
dry weather [70]. It is expected that within the next quarter of this century, freshwater
will become scarce and very difficult to obtain. The UN and the World Meteorological
Organization are predicting that 5 billion people will eventually face water shortages,
even of drinking water [71].
Water is a key element in construction, where it is used in a variety of activities and
products [72]; for example, the consumption of water in cement production ranges from
147 to 3,500 liters per ton of cement, and the production of a cubic meter of concrete
consumes between 100 and 240 liters of water [73].
According to S. Kaushik et al. [74], the need to use seawater in concrete already arises
in situations where there is no other source of water available or the transportation of
freshwater is costly. As 80% of the Earth’s surface is covered by oceans and seas, many
coastal buildings are exposed to the seawater; as a result, many studies have examined
the impact of seawater in construction as well as the durability of buildings exposed to
seawater [75].
Yet the substitution of seawater for freshwater in concrete does pose some unique
issues. This study, along with its focus on the use of recycled waste tires in construction,
will discuss the economic impact and technical aspects of using seawater in concrete,
and in so doing, it draws on a considerable body of existing work. The performance of
seawater in concrete has actually been a focus of debate since 1840, when J. Smeaton
and L. J. Vicat 1840 discussed this issue in a work titled “What is the trouble with
concrete in sea water” [13]. Thereafter, many studies and investigations were carried
out to test the performance of seawater in plain and reinforced concrete in terms of
13
durability, compressive, tensile, and flexural strength, and many other characterizations
in the short and long terms [13,71,76].
Generally, there is a common belief that seawater-mixed concrete should not be used
in reinforced-concrete structures; in the case of a lack of freshwater, the use of seawater
is recommended in plain concrete [13]. Since seawater contains a high amount of
chlorides, mixing concrete with such water will lead to an appreciable amount of free
chloride ions coming into contact with steel rebar within a short period. Along with
carbonate, even a low concentration of chloride weakens the reinforcement steel in the
concrete and causes corrosion [74]. As previously mentioned, to counter this corrosion
problem, many studies have suggested using corrosion-resistant reinforcement in
seawater concrete instead of black steel to extend the service life of reinforced concrete
and delay the corrosion process [31,43]. For this reason, the use of fiber-reinforced
polymer (FRP) reinforcement in concrete structures has rapidly increased due to its
corrosion-resistance, light weight, high tensile strength, adequate corrosion resistance,
and excellent non-magnetization properties [77].
However, these beneficial properties are no substitute for compressive strength, which
is the major characteristic tested in any concrete mix. P. Tiwari et al. [78] investigated
the impact of saltwater on the compressive strength of concrete by comparing the
compressive strength of ordinary concrete cubes cast and cured in freshwater with that
of other cubes cast and cured in seawater. The study found that there was some increase
in the strength when saltwater used for casting and curing concrete cubes. F. Wegian
[79] found that there was an appreciable increase in the strength of concrete specimens
mixed and cured in seawater compared with specimens mixed and cured in freshwater;
however, the rate of the strength increase was faster in the second specimen than in the
first specimen. The same result was obtained by M. Islam et al. [80], whereby the
14
seawater negatively affected the rate at which the concrete gained strength when it was
used for mixing. F. Wegian [79] conducted the split tensile test in concrete for two
specimens of concrete that were mixed and cured in seawater and another specimen
mixed and cured in freshwater. The study found that when the concrete was mixed and
cured with seawater as opposed to the conventional concrete mix, there was a decrease
in the tensile strength.
In terms of the impact of seawater on fresh concrete characterizations, seawater
decreases the setting time of cement by 30-75% as the concentration of the mixing
seawater increases, according to S. Kaushik et al. [74].
15
1.3 Research Objectives
The main objectives of this research can be summarized as follows:
Introduce the recycled waste tires as an alternative to produce green
concrete by reducing the consumption of natural resources in concrete
production and decreasing the growing volume of scrape tires in the
landfills. Also suggest the use of seawater as mixing water in rubberized
concrete as a sustainable material that eliminate the cost and energy
consumed during the desalination process.
Conduct life cycle cost analysis to evaluate the cost-effectiveness of
using recycled tire waste and seawater as a replacement for aggregate
and freshwater, respectively, in a concrete mix, in comparison with the
conventional concrete mix.
Ensure the validity of incorporating recycled rubber into the concrete
mix from the technical perspective (before conducting the LCCA) by
investigating the fresh and hardened concrete characterizations of
thirteen concrete mixes, including a conventional mix, rubberized
concrete mixes, and seawater mixes.
1.4 Thesis Outline
This study consists of five chapters:
1. Chapter 1 is the introduction, discussing the factors that have led to the
growing concern about using recycled materials in concrete and outlining the potential
benefits of using recycled rubber and seawater in the concrete mix. The chapter also
provides an extensive literature review of LCCA, the application of recycled rubber in
construction, and the use of seawater in plain concrete.
2. Chapter 2 provides the technical data that will be used as an input for the
16
LCCA. The chapter also discusses the properties of the materials, like water,
cementitious material, aggregate, and rubber that constitute the conventional concrete
mix, rubberized mix, and seawater mix.
3. Chapter 3 discusses the performance of recycled rubber and seawater in the
concrete mix to ensure the validity of using these materials as a replacement for
aggregate and freshwater, respectively, before conducting the LCCA.
4. Chapter 4 presents the LCCA, the tools and techniques that were used to
conduct the LCCA, and the main principles and assumptions that were adopted to
evaluate the cost-effectiveness of using recycled rubber and seawater in concrete.
5. Chapter 5 is a conclusion of the results obtained from LCCA and the
investigation of the materials. The chapter also lists recommendations for future
research.
17
CHAPTER 2: SOLUTION FOR ACCOMMODATING RECYCLED TIRES IN
CONCRETE
2.1 Materials
2.1.1 Water
The amount of water in a concrete mix significantly influences all the fresh
concrete and hard concrete properties, such as workability, compressive strength,
durability, shrinkage and cracking potential [81]. Therefore, controlling the amount of
water in the concrete mix is crucial during the construction stage and the operation of
the structure [82]. Generally, a low water to cement (W/C) ratio improves hardened
concrete proprieties by increasing the compressive strength of concrete, reducing
permeability, improving durability and increasing concrete density [83]. On the other
hand, a high W/C ratio is required to provide concrete with suitable workability during
mixing, transporting and casting.
In this study, among the thirteen concrete mixes, two types of water were used. Seven
mixes were mixed using freshwater, which is the common type of water used in
construction, and six mixes were mixed using seawater which is most likely used where
there is a lack of freshwater.
In Qatar, the freshwater used by the concrete plant was obtained from the normal
household water supply, which is originally seawater that was desalinated to become
drinking water. The seawater was pumped from the Gulf, from Al-Khor in the northern
coast of Qatar to a portable tank. The seawater was then pumped into 10-liter water
containers and stored at the concrete plant to be used for mixing. Chemical
characterization tests were conducted for both types of water to determine the chloride
and sulfate contents, alkalinity, total dissolved solids, and pH.
Table 2 shows the maximum limitation of the chemical contents as per Qatar
Construction Specifications (QCS 2014) [84], which is in line with ASTM D512, BS

18
1377 and BS 6068-2.51 standards [85–88]. The chloride (CL) content of seawater is
significantly high, as expected, and it is higher than the maximum limit allowable in
the standards; the chloride content in the seawater is responsible for the corrosion
commonly observed in reinforcement steel. The seawater also has extremely high
sulfate content and total dissolved solids (TDS) that exceed the maximum limits
according to the standards. However, the alkalinity and pH are comparable to
freshwater and are within allowable limits in both types of mixing water, with a slight
increase in seawater.
Table 2. Chemical Characterizations of Freshwater and Seawater
2.1.2 Aggregate
Aggregate constitutes as much as 60% to 80% of the volume and 70% to 80%
of the weight of a typical concrete mix, and it provides concrete with its compressive
strength [90]. Therefore, aggregate must be properly selected to ensure desirable
gradation and to confer other desirable characteristics such as, strength, workability,
and durability.
In terms of size, aggregate is classified into two types [91]:
Test Unit Method/Standard Maximum
Unit
Result
Freshwater Seawater
Chloride (Cl-) mg/L BS 1377 PART
3[85]
1000 14.09 18,600
Sulfate (SO4-2) mg/L BS 1377 PART
3[85]
2000 20.93 2359
Total alkalinity mg/L BS 6068-2.51[87] 500 69.51 149
Total dissolved
solids (TDS)
mg/L BS 1377 PART
2[86]
2000 62.00 30,300
pH (at 25 C) - BS 6068-2.50[89] 6.5–9.0 8.06 8.20
19
1. Fine aggregate, usually referring to sand and crushed stone with particles less
than 9.55 mm in diameter.
2. Coarse aggregate, which refers to particulates ranging between 9.55 mm and
37.5 mm in diameter.
However, in terms of origin, aggregate is classified into two types [92]:
1. Natural aggregate (NA), which has not exposed to any process and is taken from
natural resources, such as sand, gravel, riverbeds, quarries, and mines.
2. Artificial aggregate, which is commonly taken from engineering waste and then
treated to be suitable for construction activities. Sources of artificial aggregate
include recycled aggregate from demolished structures, industrial slag, and
burnt clay.
Three sizes of aggregate were used in this research: washed sand, 10 mm NA and 20
mm NA. The washed sand was mixed using water to remove any salt and clay and then
it was placed in the oven for about 24 hours – more or less, depending on the quantity
– until it returned to a dry condition.
According to Table 3, the physical and mechanical properties of the aggregate fulfill
QCS 2014 [84], which is in accordance with BS/EN and ASTM standards.

20
Table 3. Physical and Mechanical Properties of Aggregate
We performed a sieve analysis, which is a common test conducted on aggregate to
verify their size. The sieve analysis for sand and the two sizes of aggregate were done
in accordance with BS EN 932-1 standard, as shown in Table 4. More than 90% of the
three sampled aggregates passed through the sieve sizes of 2.00 mm, 10 mm and 20
mm for sand, 10 mm aggregate and 20 mm aggregate samples, respectively; these
results confirm the three aggregate sizes.
Requirement Standard Permissible Limits Result
Fine Coarse Fine Coarse
Grading BS 933 –
1[93]
Standar
d
Standard Standard Standard
Natural: materials finer
than 0.063 mm
BS 933 -
1[93]
3%
max
2% max 0.5% 0.3%
Crushed rock:
materials finer than
0.063 mm
BS 933 -
1[93]
7%
max
2% max 1% 0.3%
Fine quality: Structural
concrete sand
equivalent %
BS 933 –
8[94]
60%
min2
-- 30% min2 --
Fine quality: non-
structural concrete
methylene blue
adsorption value (0/2
mm)
BS 933 -
9[95]
1.0
(g/kg)
-- 0.7 (g/kg) ---
Clay lumps and friable
particles
ASTM:
C142[96]
2%
max
2% max 0.0% 0.0%
Water absorption BS 1097
– 6[97]
2.3%
max
2% max 0.6% 0.5%
Flakiness index BS 933 –
3[98]
35%
max
5%

21
Table 4: Sieve Analysis for Sand, 10 mm and 20 mm Aggregate
For the rubberized concrete, three sizes of recycled rubber replaced the sand, 10 mm
aggregate and 20 mm aggregate. The recycled rubber was collected from Modern
Recycling Factory (MRF) in Messaied City in Qatar; this factory specializes in
transforming recycled waste tires into flooring products and other products for
construction applications. The tires were a mixture of car and truck tires collected from
landfills. Prior to the recycling process, the inner tubes, debris or any other material that
may prevent or obstruct the grinding process were removed from the tires. The grinding
process was done using different types of grinding machines based on the type of the
final product and the size of the shredded tire required.
The fine rubber size is free of steel since it was processed through a machine that attracts
and extracts magnetic metals, but the non-magnetic content was 2% of the sample. The
fiber content was less than 0.5%. However, due to the greater complexity of producing
Sieve
size
(mm)
Sand 10 mm aggregate 20 mm aggregate
Retained
(gm)
Passing
(%)
Retained
(gm)
Passing
(%)
Retained
(gm)
Passing
(%)
Pan 2.8 -- 12.6 -- 10.4 --
.063 14.5 0.5 1.8 0.5 1.3 ,2
0.125 13.1 3 1.0 1 0.0 0
.150 86.8 5 1.0 1 0.0 0
.250 245.6 20 0.0 1 0.0 0
.500 134.5 61 0.0 1 0.0 0
1.000 49.5 84 2.6 1 0.0 0
2.000 29.3 92 42.9 1 0.0 0
4.00 17.2 97 690.6 2 2.5 0
6.30 0.0 100 848.5 29 30.9 0
8.00 830.8 63 234.2 1
10.00 124.8 95 971.9 5
12.50 0.0 100 879.1 24
14.00 879.4 41
16.0 1955.6 59
20.0 176.1 97
31.5 0.0 100
22
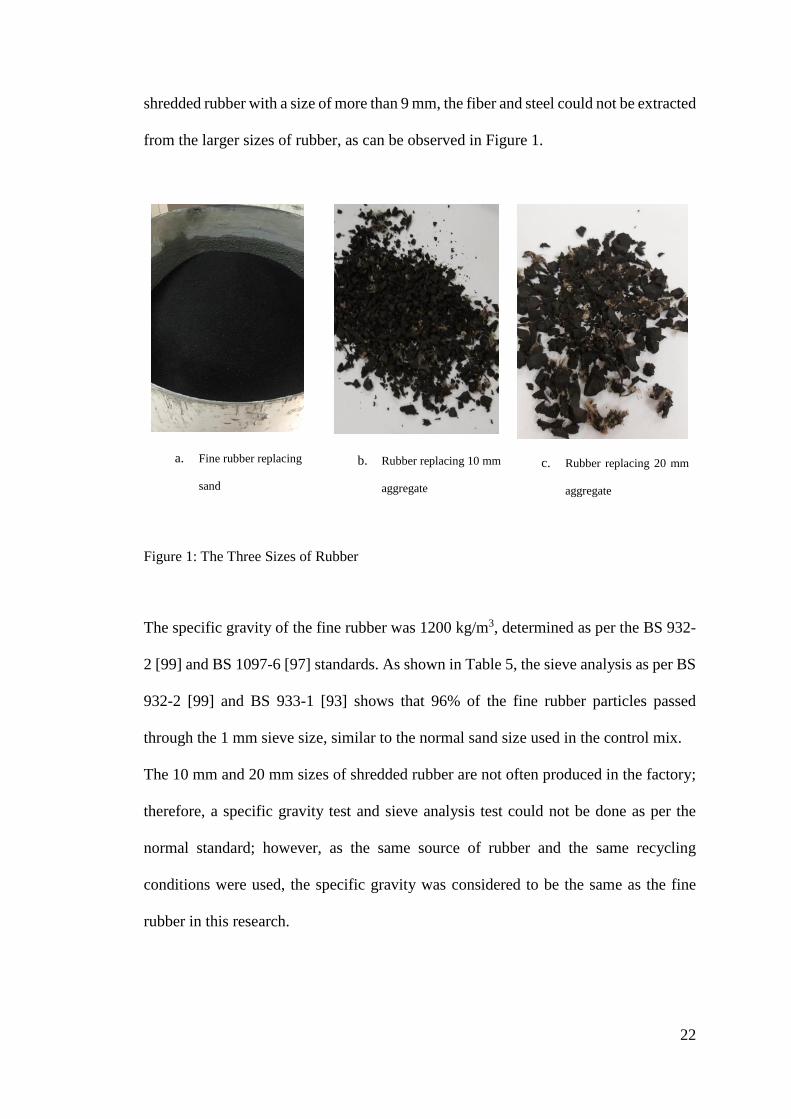
shredded rubber with a size of more than 9 mm, the fiber and steel could not be extracted
from the larger sizes of rubber, as can be observed in Figure 1.
a. Fine rubber replacing
sand
b. Rubber replacing 10 mm
aggregate
c. Rubber replacing 20 mm
aggregate
Figure 1: The Three Sizes of Rubber
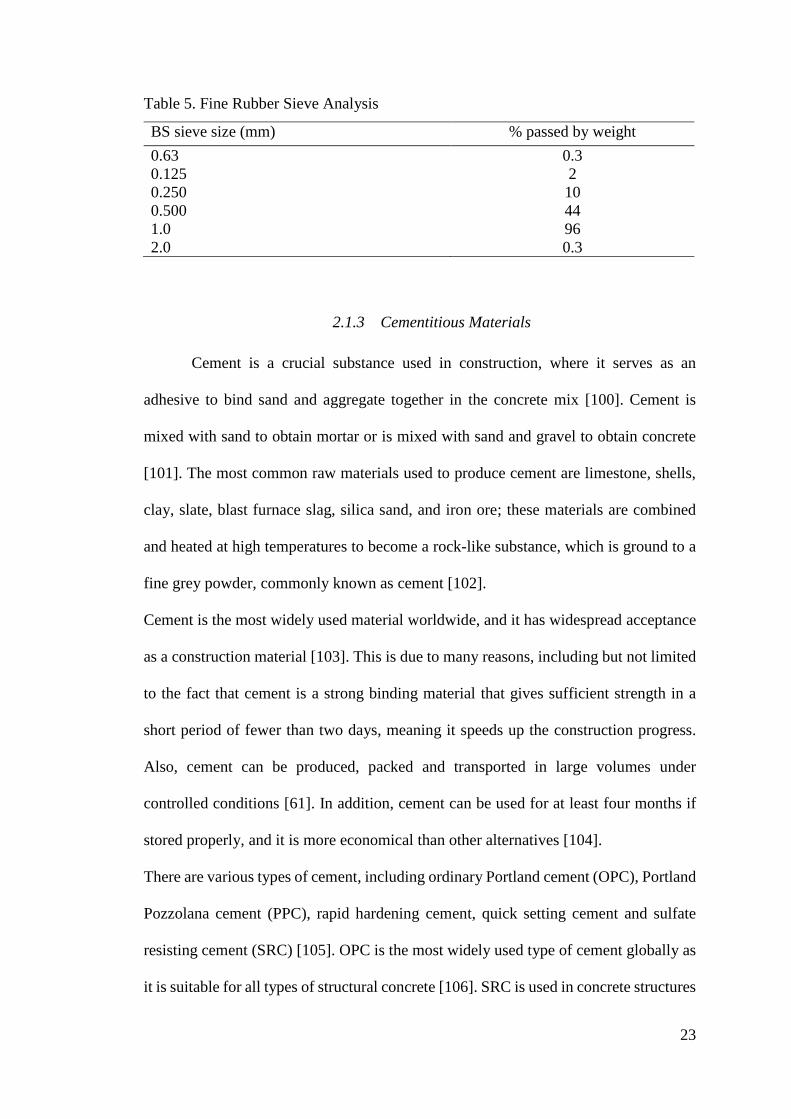
The specific gravity of the fine rubber was 1200 kg/m3, determined as per the BS 932-
2 [99] and BS 1097-6 [97] standards. As shown in Table 5, the sieve analysis as per BS
932-2 [99] and BS 933-1 [93] shows that 96% of the fine rubber particles passed
through the 1 mm sieve size, similar to the normal sand size used in the control mix.
The 10 mm and 20 mm sizes of shredded rubber are not often produced in the factory;
therefore, a specific gravity test and sieve analysis test could not be done as per the
normal standard; however, as the same source of rubber and the same recycling
conditions were used, the specific gravity was considered to be the same as the fine
rubber in this research.
23
Table 5. Fine Rubber Sieve Analysis
2.1.3 Cementitious Materials
Cement is a crucial substance used in construction, where it serves as an
adhesive to bind sand and aggregate together in the concrete mix [100]. Cement is
mixed with sand to obtain mortar or is mixed with sand and gravel to obtain concrete
[101]. The most common raw materials used to produce cement are limestone, shells,
clay, slate, blast furnace slag, silica sand, and iron ore; these materials are combined
and heated at high temperatures to become a rock-like substance, which is ground to a
fine grey powder, commonly known as cement [102].
Cement is the most widely used material worldwide, and it has widespread acceptance
as a construction material [103]. This is due to many reasons, including but not limited
to the fact that cement is a strong binding material that gives sufficient strength in a
short period of fewer than two days, meaning it speeds up the construction progress.
Also, cement can be produced, packed and transported in large volumes under
controlled conditions [61]. In addition, cement can be used for at least four months if
stored properly, and it is more economical than other alternatives [104].
There are various types of cement, including ordinary Portland cement (OPC), Portland
Pozzolana cement (PPC), rapid hardening cement, quick setting cement and sulfate
resisting cement (SRC) [105]. OPC is the most widely used type of cement globally as
it is suitable for all types of structural concrete [106]. SRC is used in concrete structures
BS sieve size (mm) % passed by weight
0.63 0.3
0.125 2
0.250 10
0.500 44
1.0 96
2.0 0.3
24
that are exposed to sulfates from the surrounding soil or groundwater, such as coastal
structures, pile foundations and sewage lines [107].
In this research, the cement used was OPC and was produced locally by Qatar National
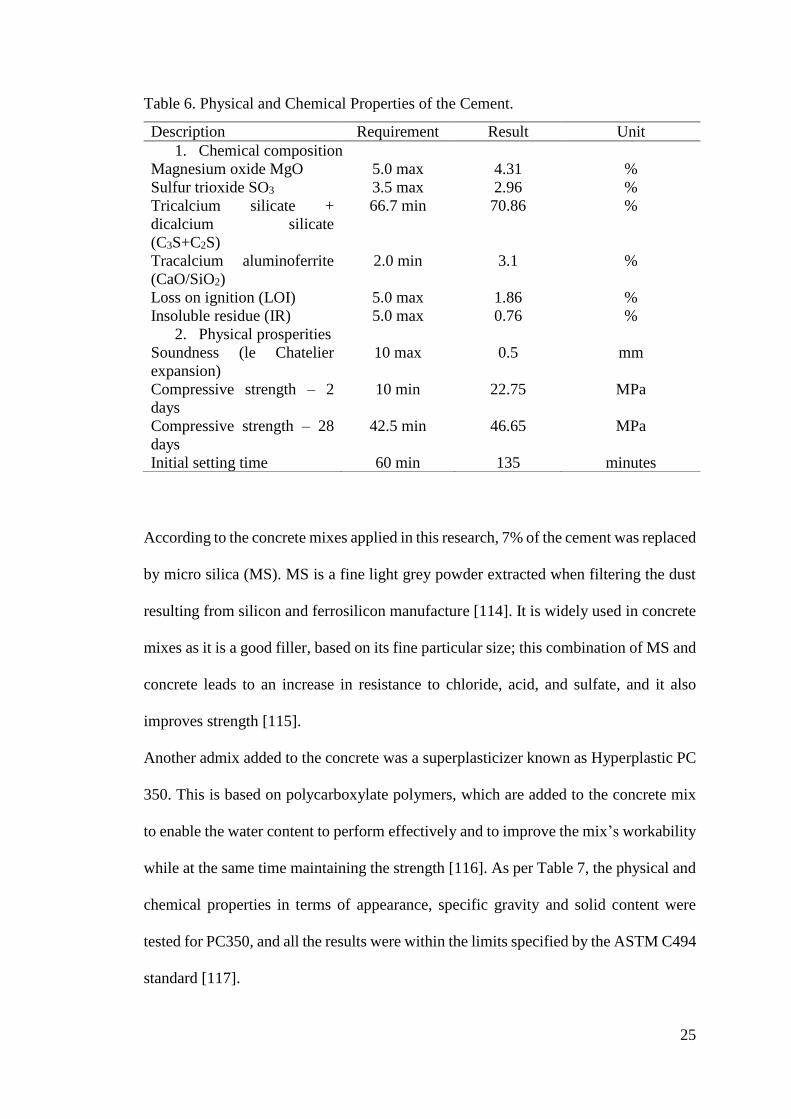
Cement Company. As shown in Table 6, we tested many of the chemical and physical
properties of cement. These include its magnesium oxide (MgO) content, which, in
accordance with BS 4027 [108], should be below 5% as a higher amount of MgO
slightly decreases the strength and extends the setting time [109]. Furthermore, an
excess amount of sulfur trioxide (SO3) can make cement unsound, while tricalcium
silicate (C3S) and calcium aluminoferrite (CaO/SiO2) cause hardening and an early
gaining of strength and initial setting [105]. Loss on ignition (LOI) determines the water
content in cement, and a high LOI value is usually due to poor storage conditions [110].
The insoluble residue (IR) refers to the content of non-cementing material that affects
the cement’s properties, especially its compressive strength [111]. As reported in Table
6, all chemical properties of the concrete in this study were within the limits required
by the BS 4027 [108] standard.
We also investigated the physical properties of the cement as per BS 4027 [108]. The
soundness test determines the ability of the cement to avoid shrinkage upon hardening
[112]. Compressive strength is the most commonly tested property of cement [113],
and this test was performed to ensure that the strength of the cement at compression at
an age of 2 days and 28 days is equal to or more than 10 and 45.5 MPa, respectively,
as per the BS 4027[62] standard. The initial setting time indicates the time in which the
cement paste starts to harden and loses plasticity [105]. As with the chemical properties,
the physical properties of the cement used in this study were all within the BS 4027
[108] standard’s requirements.
25
Table 6. Physical and Chemical Properties of the Cement.
According to the concrete mixes applied in this research, 7% of the cement was replaced
by micro silica (MS). MS is a fine light grey powder extracted when filtering the dust
resulting from silicon and ferrosilicon manufacture [114]. It is widely used in concrete
mixes as it is a good filler, based on its fine particular size; this combination of MS and
concrete leads to an increase in resistance to chloride, acid, and sulfate, and it also
improves strength [115].
Another admix added to the concrete was a superplasticizer known as Hyperplastic PC
350. This is based on polycarboxylate polymers, which are added to the concrete mix
to enable the water content to perform effectively and to improve the mix’s workability
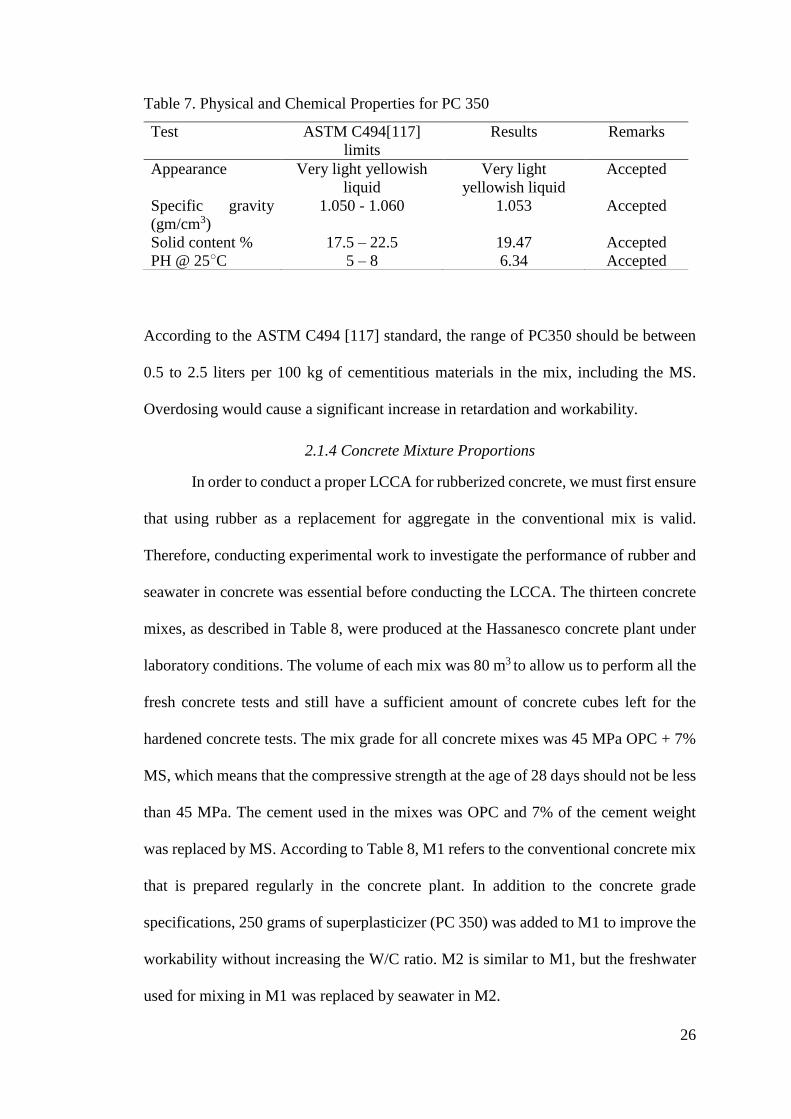
while at the same time maintaining the strength [116]. As per Table 7, the physical and
chemical properties in terms of appearance, specific gravity and solid content were
tested for PC350, and all the results were within the limits specified by the ASTM C494
standard [117].
Description Requirement Result Unit
1. Chemical composition
Magnesium oxide MgO 5.0 max 4.31 %
Sulfur trioxide SO3 3.5 max 2.96 %
Tricalcium silicate +
dicalcium silicate
(C3S+C2S)
66.7 min 70.86 %
Tracalcium aluminoferrite
(CaO/SiO2)
2.0 min 3.1 %
Loss on ignition (LOI) 5.0 max 1.86 %
Insoluble residue (IR) 5.0 max 0.76 %
2. Physical prosperities
Soundness (le Chatelier
expansion)
10 max 0.5 mm
Compressive strength – 2
days
10 min 22.75 MPa
Compressive strength – 28
days
42.5 min 46.65 MPa
Initial setting time 60 min 135 minutes
26
Table 7. Physical and Chemical Properties for PC 350
According to the ASTM C494 [117] standard, the range of PC350 should be between
0.5 to 2.5 liters per 100 kg of cementitious materials in the mix, including the MS.
Overdosing would cause a significant increase in retardation and workability.
2.1.4 Concrete Mixture Proportions
In order to conduct a proper LCCA for rubberized concrete, we must first ensure
that using rubber as a replacement for aggregate in the conventional mix is valid.
Therefore, conducting experimental work to investigate the performance of rubber and
seawater in concrete was essential before conducting the LCCA. The thirteen concrete
mixes, as described in Table 8, were produced at the Hassanesco concrete plant under
laboratory conditions. The volume of each mix was 80 m3 to allow us to perform all the
fresh concrete tests and still have a sufficient amount of concrete cubes left for the
hardened concrete tests. The mix grade for all concrete mixes was 45 MPa OPC + 7%
MS, which means that the compressive strength at the age of 28 days should not be less
than 45 MPa. The cement used in the mixes was OPC and 7% of the cement weight
was replaced by MS. According to Table 8, M1 refers to the conventional concrete mix
that is prepared regularly in the concrete plant. In addition to the concrete grade
specifications, 250 grams of superplasticizer (PC 350) was added to M1 to improve the
workability without increasing the W/C ratio. M2 is similar to M1, but the freshwater
used for mixing in M1 was replaced by seawater in M2.
Test ASTM C494[117]
limits
Results Remarks
Appearance Very light yellowish
liquid
Very light
yellowish liquid
Accepted
Specific gravity
(gm/cm3)
1.050 - 1.060 1.053 Accepted
Solid content % 17.5 – 22.5 19.47 Accepted
PH @ 25○C 5 – 8 6.34 Accepted
27
M3, M4, and M5 were rubberized concrete, whereby 5%, 10%, and 20%, respectively,
of the sand of the control mix was replaced with the equivalent volume of fine rubber
similar to the size of the sand. These mixes were classified into a & b according to the
type of mixing water, as shown in Table 8; (a) refers to freshwater (FW), while (b)
refers to seawater (SW). M6, M7, and M8 are additional rubberized mixes in which
5%, 10% and 20% of aggregate (10 mm and 20 mm), respectively, were replaced by
the equivalent volume of two types of rubber, similar to the size of the aggregate (10
mm and 20 mm); these rubberized concretes were also classified into (a) and (b)
according to the type of mixing water, the same as with the sand rubberized concrete
mixes. However, in all mixes, the curing water was freshwater.
The superplasticizer (PC 350) volume used in all concrete mixes was not the same, and
the dose of PC 350 was increased as a result of increasing the rubber volume in the mix
or due to the use of seawater. As we observed during the experimental work, the rubber
and seawater decreased the slump; however, we needed to maintain the same W/C ratio
for all mixes. Therefore, additional doses of PC350 were added to achieve a desirable
slump measurement (according to common practice in Qatar, the slump result for fresh
concrete, which is done immediately after the mixing process, should be at least 200
mm).

28
Table 8. Concrete Mixes
2.2 Assessment Methods for Concrete
2.2.1 Fresh Concrete
Workability is a common fresh concrete characteristic. It indicates how easily
concrete can be mixed, transported to the site, and laid while the concrete is in a plastic
state and with a minimal loss to homogeneity [118]. Workability has a direct impact on
concrete strength, shape and even the cost of labor during the laying and finishing
process.
The concrete mix design has a major impact on workability; for example, the W/C ratio
has a significant impact on workability, a higher amount of water usually allows the
concrete mix to consolidate and increase the workability, and a higher portion of
cementitious materials means an increase in the strength [119]. Therefore, the W/C ratio
should be carefully determined to balance the concrete workability and the required
strength. Moreover, the shape and surface of the aggregate also influence the
workability as a large surface area requires more cement paste to cover it; thus, a smaller
aggregate size provides less workability in comparison with a larger aggregate size.
Sr. no. Mix ref Mix sub.
ref
Remarks
1 M1 M1 Control mix – conventional mix
2 M2 M2 Conventional mix, mixed with seawater
Sand Replacement
3 M3 M3.a 5% of sand replaced by rubber (FW)
4 M3.b 5% of sand replaced by rubber (SW)
5 M4 M4.a 10% of sand replaced by rubber (FW)
6 M4.b 10% of sand replaced by rubber (SW)
7 M5 M5.a 20% of sand replaced by rubber (FW)
8 M5.b 20% of sand replaced by rubber (SW)
Aggregate Replacement
9 M6 M6.a 5% of aggregate replaced by rubber (FW)
10 M6.b 5% of aggregate replaced by rubber (SW)
11 M7 M7.a 10% of aggregate replaced by rubber (FW)
12 M7.b 10% of aggregate replaced by rubber (SW)
13 M8 M8.a 20% of aggregate replaced by rubber (FW)
29
Flaky, elongated and angular aggregate shapes are more difficult to mix and place, so
they lead to low workability [120]. Beyond the W/C ratio and aggregate shape, the
concrete admix, such as superplasticizers, decreases the attraction between the cement
and the aggregate and makes the mix more flow-able without reducing the strength
[118].
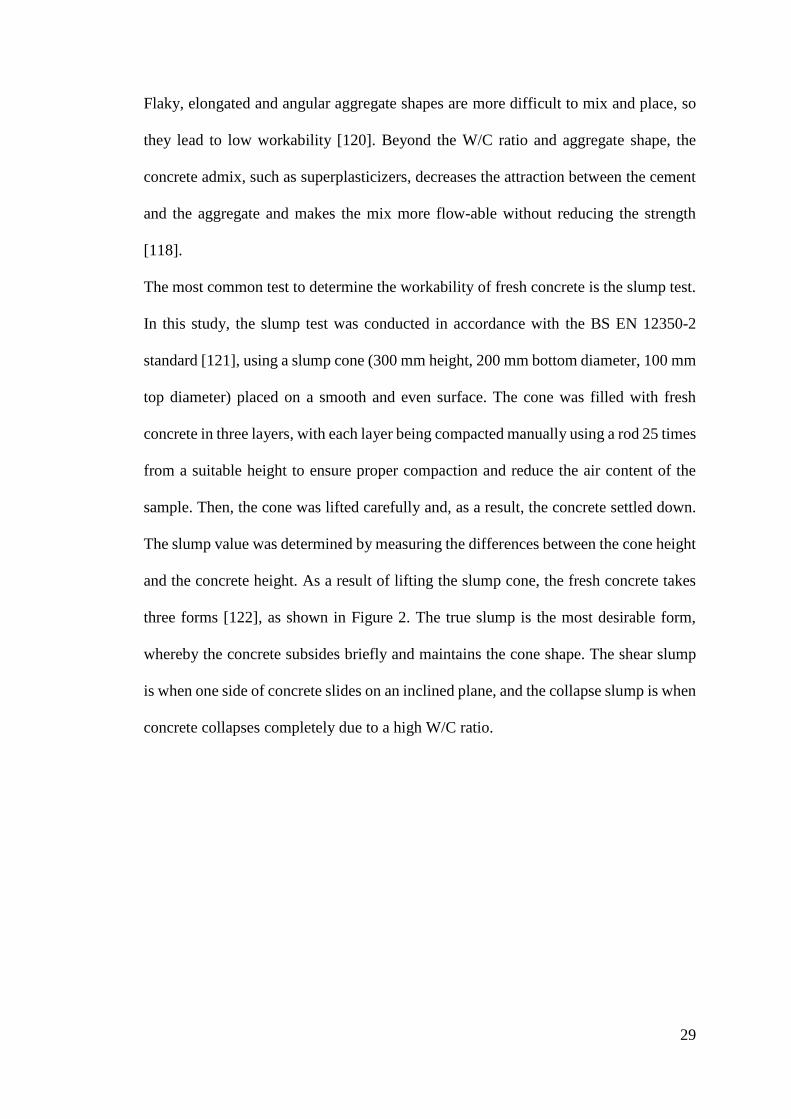
The most common test to determine the workability of fresh concrete is the slump test.
In this study, the slump test was conducted in accordance with the BS EN 12350-2
standard [121], using a slump cone (300 mm height, 200 mm bottom diameter, 100 mm
top diameter) placed on a smooth and even surface. The cone was filled with fresh
concrete in three layers, with each layer being compacted manually using a rod 25 times
from a suitable height to ensure proper compaction and reduce the air content of the
sample. Then, the cone was lifted carefully and, as a result, the concrete settled down.
The slump value was determined by measuring the differences between the cone height
and the concrete height. As a result of lifting the slump cone, the fresh concrete takes
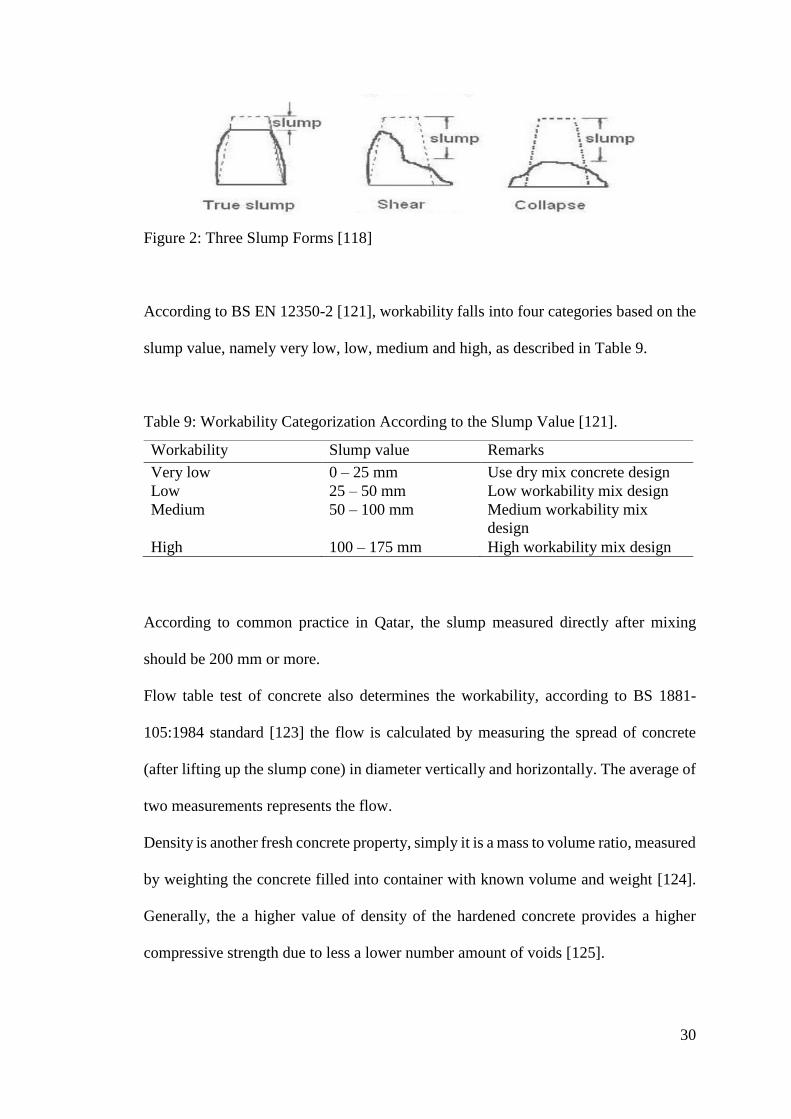
three forms [122], as shown in Figure 2. The true slump is the most desirable form,
whereby the concrete subsides briefly and maintains the cone shape. The shear slump
is when one side of concrete slides on an inclined plane, and the collapse slump is when
concrete collapses completely due to a high W/C ratio.
30
Figure 2: Three Slump Forms [118]
According to BS EN 12350-2 [121], workability falls into four categories based on the
slump value, namely very low, low, medium and high, as described in Table 9.
Table 9: Workability Categorization According to the Slump Value [121].
According to common practice in Qatar, the slump measured directly after mixing
should be 200 mm or more.
Flow table test of concrete also determines the workability, according to BS 1881-
105:1984 standard [123] the flow is calculated by measuring the spread of concrete
(after lifting up the slump cone) in diameter vertically and horizontally. The average of
two measurements represents the flow.
Density is another fresh concrete property, simply it is a mass to volume ratio, measured
by weighting the concrete filled into container with known volume and weight [124].
Generally, the a higher value of density of the hardened concrete provides a higher
compressive strength due to less a lower number amount of voids [125].
Workability Slump value Remarks
Very low 0 – 25 mm Use dry mix concrete design
Low 25 – 50 mm Low workability mix design
Medium 50 – 100 mm Medium workability mix
design
High 100 – 175 mm High workability mix design
31
2.2.2 Hardened Concrete
Several properties can be measured for hardened concrete, including
compressive strength, tensile strength, shrinkage, durability, creep, and density [126].
In this study, we conducted a compressive strength test, a rapid chloride permeability
test (RCP), and a water absorption test.
Concrete is strong in compression but weak in tension, and its compressive strength is
about ten times higher than its tensile strength [127]. The compressive strength is
defined as the resistance of concrete to failure under the action of compressive force; it
is an important parameter to determine the performance of structural concrete during
the operation stage of any structure [128]. Based on the structural design of the concrete
structure and the predicted loads, the designing engineer determines the strength
required for each structural element, then proportions the concrete mixes according to
the compressive strength required [129].
We measured compressive strength of the concrete at the ages of 7 days, 28 days and
56 days. In line with BS EN 12390-1[130], three cubes (150 × 150 ×150 mm) were
tested for each age. Each cube was filled in three layers and each layer was compacted
manually by a rod to reduce the air content and voids; each cube was prepared carefully
as any damaged cube not complying with the standard should not be tested.
Subsequently, the cubes were cured in freshwater for two or three days to obtain the
hardened form before sending them to the laboratory for testing. In the laboratory, the
cubes remain cured until the testing date. In accordance with BS EN 12390-3 [131], the
cubes were exposed to continuous load by a compression testing machine, with the load
increasing at a constant rate of 10% until the failure load. Upon the failure of the cube,
the failure load was recorded to determine the compressive strength. The compressive

32
strength (f), as shown in Equation (2), is given by dividing the maximum failure load
(F) in Newton (N) by the surface area of the cube in mm.
𝑓 = 𝐹
𝐴
Equation 2: Compressive Strength
The type of fracture was also recorded; Figure 3 shows examples of the satisfactory and
unsatisfactory failure forms of concrete cubes.
a. Satisfactory failures
b. Unsatisfactory failures
Figure 3: Types of Cube Failure [131]
Three cubes were tested for each concrete age (7, 28 and 56 days); the same procedures
were done for all the cubes. At the end, the average of the compressive strengths of the
cubes of a given age was taken as the compressive strength for that age.
We also tested the concrete’s resistance to chloride, since the corrosion of
reinforcement steel due to chloride is a common problem affecting structures and is
attracting growing attention because it occurs frequently and the repair cost is very high
[132]. Chloride attacks can occur from inside the concrete if seawater is used to mix
the concrete or the concrete mix ingredients include chloride; also, the chloride can
penetrate the concrete from the external environment [133]. Therefore, the
determination of chloride permeability is an important indicator of concrete durability.
33
In this research, the RCP test was used to determine the resistance of concrete to the
penetration of chloride ions. This test was conducted in accordance with ASTM C1202-
19 [134], whereby the chloride penetration was determined by monitoring the electrical
current passing through a concrete specimen cylinder (100 mm of diameter, 50 mm
thickness) over 6 hours. A 60-volt current was applied to one end of the cylinder, and
during the 6 hours there were differences in the electrical current at the other side of the
cylinder. According to ASTM C1202-19 [134], there is a relationship between the
charge passing through the specimen and the chloride penetration. Table 10 provides a
quantitative relationship between the charge pass and the chloride permeability of the
concrete specimen.
Table 10. Chloride Ions Penetration Based on Charge Passed (coulombs) [132]
The concrete specimens were sent to the laboratory as cubes (150 ×150 × 150 mm),
similar to compressive strength cubes, and these RCP cubes were also cured in
freshwater until the testing age (28 days). Before the testing, the concrete cubes were
cored into a cylinder shape (100 mm diameter, 50 mm thickness) to become suitable
for the test as per ASTM C1202-19 [134]. For each mix, three cubes were tested at the
age of 28 days and the average was taken to present the chloride penetration resistance
for the mix.
Water that penetrates an unsaturated concrete surface is considered to be a harmful
agent because it has a major negative impact on concrete durability [135]. Therefore,
Charge passed (coulombs) Chloride ion penetration
>4000 High
2000 - 4000 Moderate
1000 - 2000 Low
100 - 1000 Very low
<100 Negligible
34
measuring the concrete’s ability to absorb water is very important. The preparation of
the cubes for the water absorption test is similar to the case of the compressive strength
test and RCP test, in line with BS EN 12390-1[130]. Three cubes from each mix were
prepared for the water absorption test concrete at the age of 28 days. In accordance with
BS 1881-122[136], however, the drying of the cubes started at the age of 24 days. The
cubes were cored by a coring machine with a diamond edge into a cylinder (75 mm
diameter, 150 mm thickness). As per the BS 1881-122 [136] standard, the three cylinder
specimens were placed in a ventilated drying oven for about 72 hours at 105 ℃. Then,
the specimens were cooled in a dry, airtight vessel for 24 hours; immediately after
cooling, the weight of each specimen was recorded (W1). After that, the specimens
were completely immersed in a curing tank (at least 125 mm depth) at 20 ℃ for 30
minutes. Then, the free water on the specimen surface was removed with a cloth, and
the weight of each specimen was recorded (W2).
The water absorption value was determined as the percentage increase in the specimen
weight after immersing (W2 – W1) compared to the dry weight (W1) as per Equation
(3)
𝑊𝑎𝑡𝑒𝑟 𝐴𝑏𝑠𝑜𝑟𝑝𝑡𝑖𝑜𝑛 (%) =(𝑊2 − 𝑊1)
𝑊1
Equation 3: Water Absorption (%)
However, a correction factor based on the size of the specimen was applied to the
percentage of water observed to obtain the water absorption parameter; the correction
factor is given by Equation (4)
35
𝐶𝑜𝑟𝑟𝑒𝑐𝑡𝑖𝑜𝑛 𝑓𝑎𝑐𝑡𝑜𝑟 = 𝑉𝑜𝑙𝑢𝑚𝑒 (𝑚𝑚3)
𝑆𝑢𝑟𝑓𝑎𝑐𝑒 𝑎𝑟𝑒𝑎 (𝑚𝑚2) × 12.5
Equation 4: Correction Factor
According to the dimensions of our specimens, the correction factor in this study was
1.2. The final water absorption test value of the concrete mix was obtained by taking
the average value of the results of the three specimens.
36
CHAPTER 3: MATERIALS PERFORMANCE OF RUBBERTIZED CONCRETE
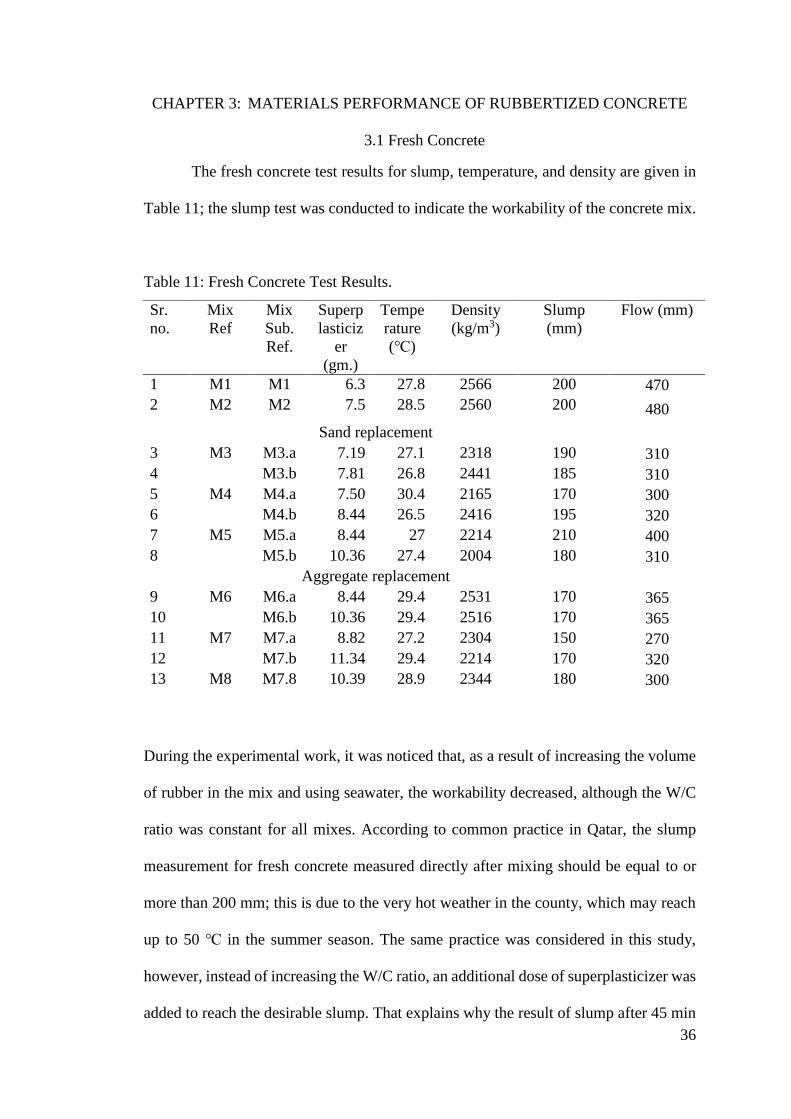
3.1 Fresh Concrete
The fresh concrete test results for slump, temperature, and density are given in
Table 11; the slump test was conducted to indicate the workability of the concrete mix.
Table 11: Fresh Concrete Test Results.
During the experimental work, it was noticed that, as a result of increasing the volume
of rubber in the mix and using seawater, the workability decreased, although the W/C
ratio was constant for all mixes. According to common practice in Qatar, the slump
measurement for fresh concrete measured directly after mixing should be equal to or
more than 200 mm; this is due to the very hot weather in the county, which may reach
up to 50 ℃ in the summer season. The same practice was considered in this study,
however, instead of increasing the W/C ratio, an additional dose of superplasticizer was
added to reach the desirable slump. That explains why the result of slump after 45 min
Sr.
no.
Mix
Ref
Mix
Sub.
Ref.
Superp
lasticiz
er
(gm.)
Tempe
rature
(℃)
Density
(kg/m3)
Slump
(mm)
Flow (mm)
1 M1 M1 6.3 27.8 2566 200 470
2 M2 M2 7.5 28.5 2560 200 480
Sand replacement
3 M3 M3.a 7.19 27.1 2318 190 310
4 M3.b 7.81 26.8 2441 185 310
5 M4 M4.a 7.50 30.4 2165 170 300
6 M4.b 8.44 26.5 2416 195 320
7 M5 M5.a 8.44 27 2214 210 400
8 M5.b 10.36 27.4 2004 180 310
Aggregate replacement
9 M6 M6.a 8.44 29.4 2531 170 365
10 M6.b 10.36 29.4 2516 170 365
11 M7 M7.a 8.82 27.2 2304 150 270
12 M7.b 11.34 29.4 2214 170 320
13 M8 M7.8 10.39 28.9 2344 180 300
37
(shown in Table 11) is high (> 150 mm), despite the negative impact of rubber and
seawater in workability.
The relationship between the volume of superplasticizer (PC 350) and rubber content
is not linear; therefore, we could not precisely specify the additional dose of PC 350
required for rubberized concrete. The highest slump for rubberized concrete was
recorded for M5.a; this might indicate that the PC 350 dose was slightly higher than the
ideal dose. Also, the lowest slump value, obtained for M7.a, might be related to the PC
350 dose as it could be slightly less than the ideal dose.
The flow of concrete also indicates the workability and influenced by the PC 350
volume. Similar to the slump measurements the highest flow was recorded for M2, M1
& M5.a and the lowest flow was obtained for M7.a.
Regarding the density of the fresh concrete, the highest density was found in the control
mix and the second-highest in M2; this indicates that increasing the percentage of
sand/aggregate replacement with rubber decreases the density, as the sand/aggregate
density is higher the rubber density. However, the densities of the aggregate
replacement mixes are higher than the corresponding sand replacement mixes.
It is important to note that all the mixes were prepared under lab conditions; therefore,
the temperature of the mix was changed slightly from one mix to another.
3.2 Hardened Concrete
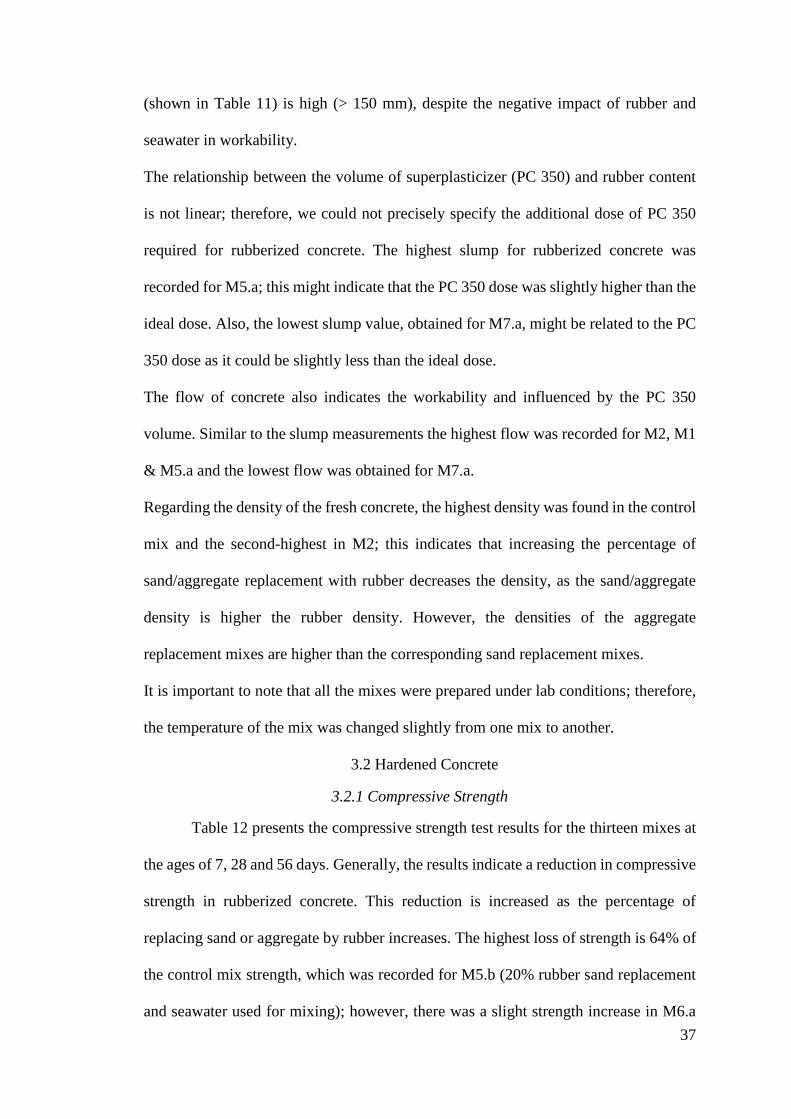
3.2.1 Compressive Strength
Table 12 presents the compressive strength test results for the thirteen mixes at
the ages of 7, 28 and 56 days. Generally, the results indicate a reduction in compressive
strength in rubberized concrete. This reduction is increased as the percentage of
replacing sand or aggregate by rubber increases. The highest loss of strength is 64% of
the control mix strength, which was recorded for M5.b (20% rubber sand replacement
and seawater used for mixing); however, there was a slight strength increase in M6.a
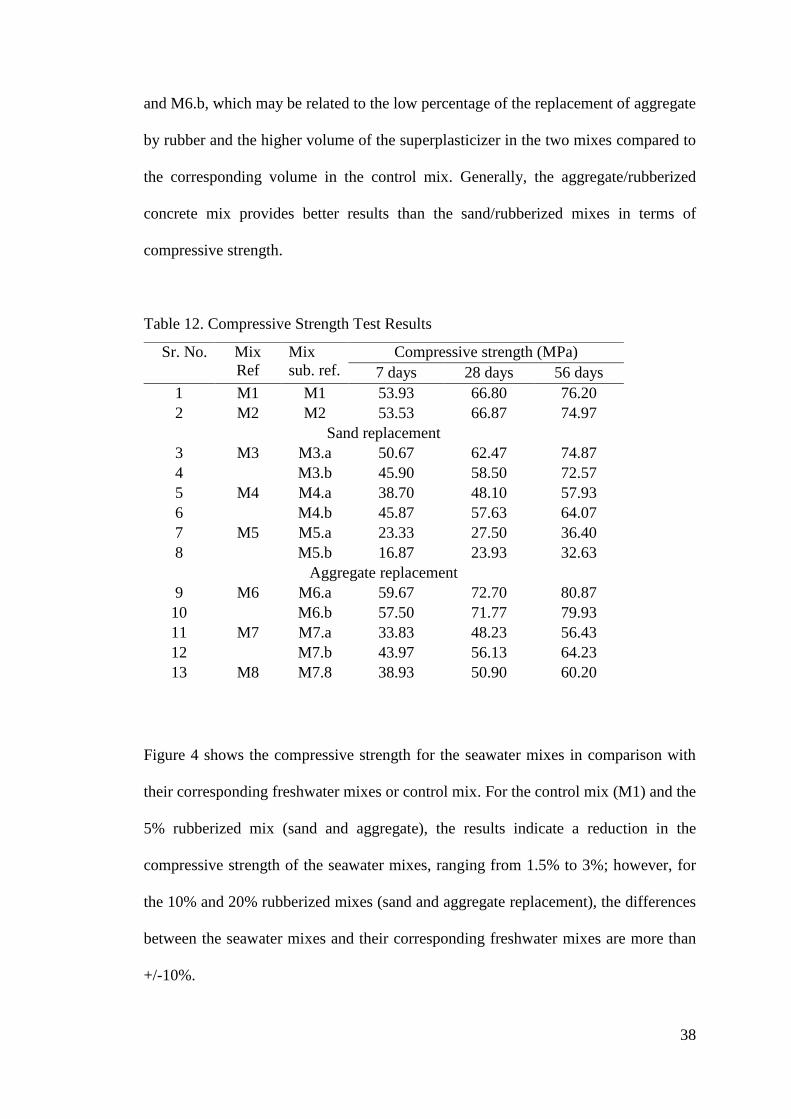
38
and M6.b, which may be related to the low percentage of the replacement of aggregate
by rubber and the higher volume of the superplasticizer in the two mixes compared to
the corresponding volume in the control mix. Generally, the aggregate/rubberized
concrete mix provides better results than the sand/rubberized mixes in terms of
compressive strength.
Table 12. Compressive Strength Test Results
Figure 4 shows the compressive strength for the seawater mixes in comparison with
their corresponding freshwater mixes or control mix. For the control mix (M1) and the
5% rubberized mix (sand and aggregate), the results indicate a reduction in the
compressive strength of the seawater mixes, ranging from 1.5% to 3%; however, for
the 10% and 20% rubberized mixes (sand and aggregate replacement), the differences
between the seawater mixes and their corresponding freshwater mixes are more than
+/-10%.
Sr. No. Mix
Ref
Mix
sub. ref.
Compressive strength (MPa)
7 days 28 days 56 days
1 M1 M1 53.93 66.80 76.20
2 M2 M2 53.53 66.87 74.97
Sand replacement
3 M3 M3.a 50.67 62.47 74.87
4 M3.b 45.90 58.50 72.57
5 M4 M4.a 38.70 48.10 57.93
6 M4.b 45.87 57.63 64.07
7 M5 M5.a 23.33 27.50 36.40
8 M5.b 16.87 23.93 32.63
Aggregate replacement
9 M6 M6.a 59.67 72.70 80.87
10 M6.b 57.50 71.77 79.93
11 M7 M7.a 33.83 48.23 56.43
12 M7.b 43.97 56.13 64.23
13 M8 M7.8 38.93 50.90 60.20
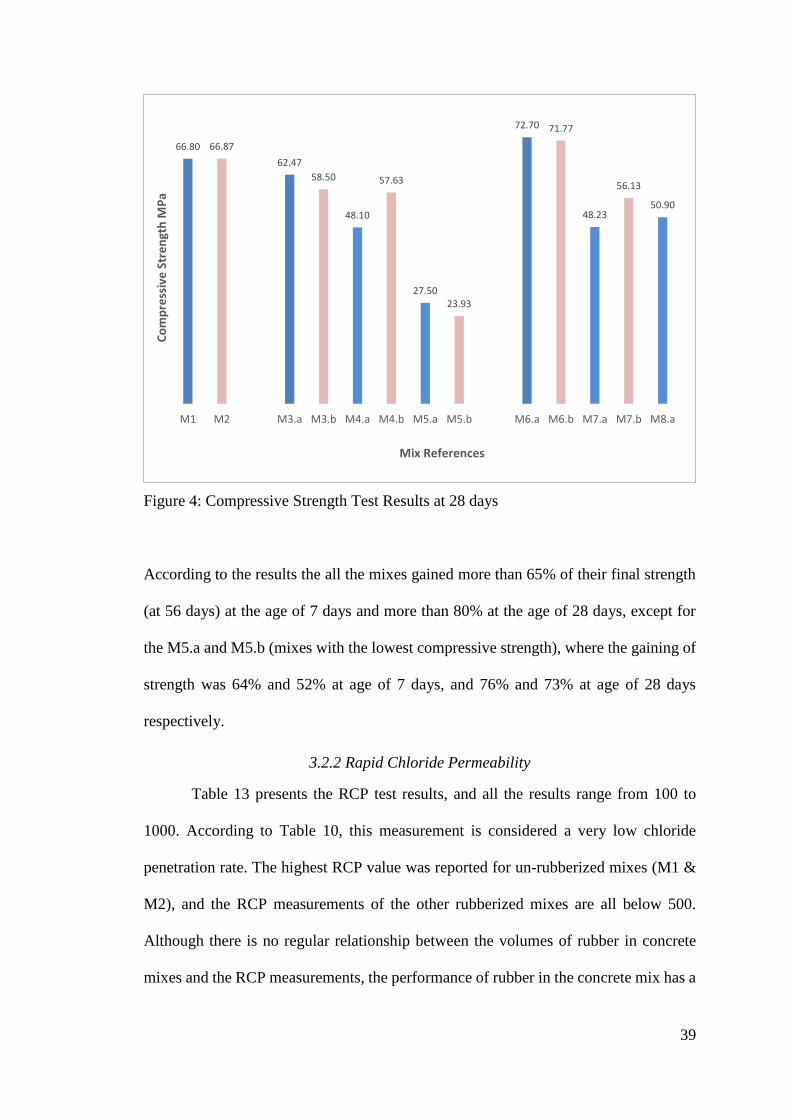
39
Figure 4: Compressive Strength Test Results at 28 days
According to the results the all the mixes gained more than 65% of their final strength
(at 56 days) at the age of 7 days and more than 80% at the age of 28 days, except for
the M5.a and M5.b (mixes with the lowest compressive strength), where the gaining of
strength was 64% and 52% at age of 7 days, and 76% and 73% at age of 28 days
respectively.
3.2.2 Rapid Chloride Permeability
Table 13 presents the RCP test results, and all the results range from 100 to
1000. According to Table 10, this measurement is considered a very low chloride
penetration rate. The highest RCP value was reported for un-rubberized mixes (M1 &
M2), and the RCP measurements of the other rubberized mixes are all below 500.
Although there is no regular relationship between the volumes of rubber in concrete
mixes and the RCP measurements, the performance of rubber in the concrete mix has a
66.80 66.87
62.47
58.50
48.10
57.63
27.5023.93
72.70 71.77
48.23
56.13
50.90
M1 M2 M3.a M3.b M4.a M4.b M5.a M5.b M6.a M6.b M7.a M7.b M8.a
Co
mp
ress
ive
Str
en
gth
MP
a
Mix References
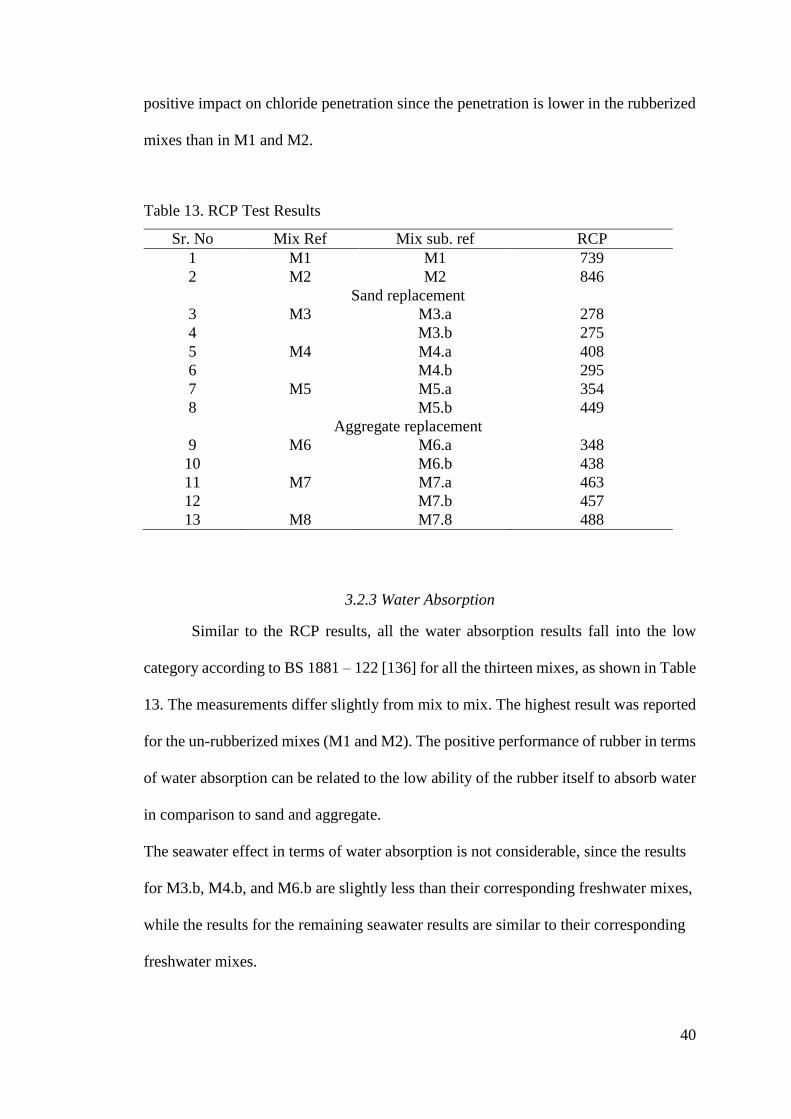
40
positive impact on chloride penetration since the penetration is lower in the rubberized
mixes than in M1 and M2.
Table 13. RCP Test Results
3.2.3 Water Absorption
Similar to the RCP results, all the water absorption results fall into the low
category according to BS 1881 – 122 [136] for all the thirteen mixes, as shown in Table
13. The measurements differ slightly from mix to mix. The highest result was reported
for the un-rubberized mixes (M1 and M2). The positive performance of rubber in terms
of water absorption can be related to the low ability of the rubber itself to absorb water
in comparison to sand and aggregate.
The seawater effect in terms of water absorption is not considerable, since the results
for M3.b, M4.b, and M6.b are slightly less than their corresponding freshwater mixes,
while the results for the remaining seawater results are similar to their corresponding
freshwater mixes.
Sr. No Mix Ref Mix sub. ref RCP
1 M1 M1 739
2 M2 M2 846
Sand replacement
3 M3 M3.a 278
4 M3.b 275
5 M4 M4.a 408
6 M4.b 295
7 M5 M5.a 354
8 M5.b 449
Aggregate replacement
9 M6 M6.a 348
10 M6.b 438
11 M7 M7.a 463
12 M7.b 457
13 M8 M7.8 488
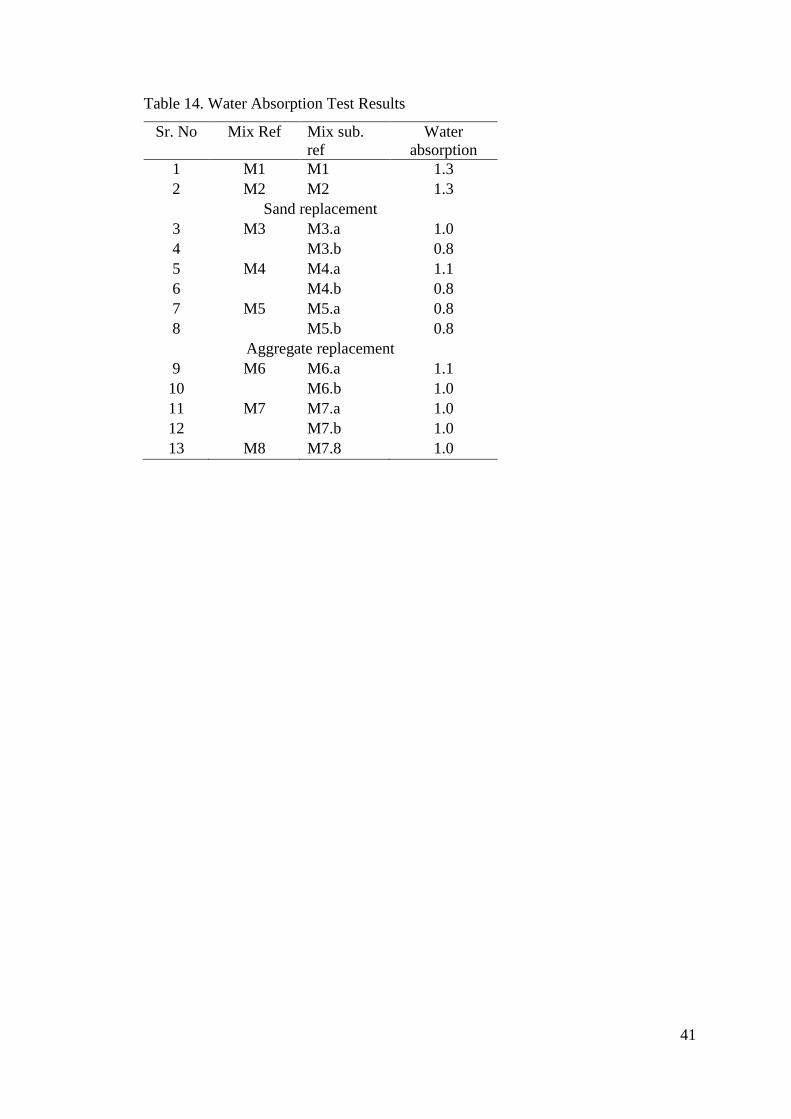
41
Table 14. Water Absorption Test Results
Sr. No Mix Ref Mix sub.
ref
Water
absorption
1 M1 M1 1.3
2 M2 M2 1.3
Sand replacement
3 M3 M3.a 1.0
4 M3.b 0.8
5 M4 M4.a 1.1
6 M4.b 0.8
7 M5 M5.a 0.8
8 M5.b 0.8
Aggregate replacement
9 M6 M6.a 1.1
10 M6.b 1.0
11 M7 M7.a 1.0
12 M7.b 1.0
13 M8 M7.8 1.0
42
CHAPTER 4: LIFE CYCLE COST ANALYSIS OF USING RECYCLED TIRE
AND SEAWATER IN CONCRETE
4.1 Life Cycle Cost Model
A life cycle cost analysis (LCCA) is conducted here to compare the cost-
effectiveness of using recycled tires and seawater in a structural concrete mix. The
analysis considers two concrete mixes, namely the conventional mix M1 (RC1) and the
M6.b (RC2) mix, in which 5% of coarse aggregate is replaced by rubber and seawater
is used in the mix.
The structural design for both alternatives is assumed to be the same, but the influence
of seawater on steel must be considered. Previous studies [31,44,137] suggested the
replacement of black steel, which is used in conventional reinforced concrete, with
glass fiber reinforced polymer (GFRP) to avoid the potential corrosion the may occur
due to seawater as GFRP is a corrosion-free material [138].
In addition to the previous assumption, LCCA is also based on the following
assumptions:
The proposed structure is a high-rise building consisting of 20 floors and located
in Doha, the capital of the State of Qatar.
According to the building design details described in Table 15, the concrete
volume in one square meter of the building is 0.27 m3 and the concrete
reinforcement ratio is 1.99%.
The LCCA considers the owner’s perspective.
The cost analysis will not include the mechanical, electrical and finishing
components of the building as the cost of these elements will not be affected by
the change to the structural concrete mix.
The study period is assumed to be 100 years. Commonly, the life cycle for such
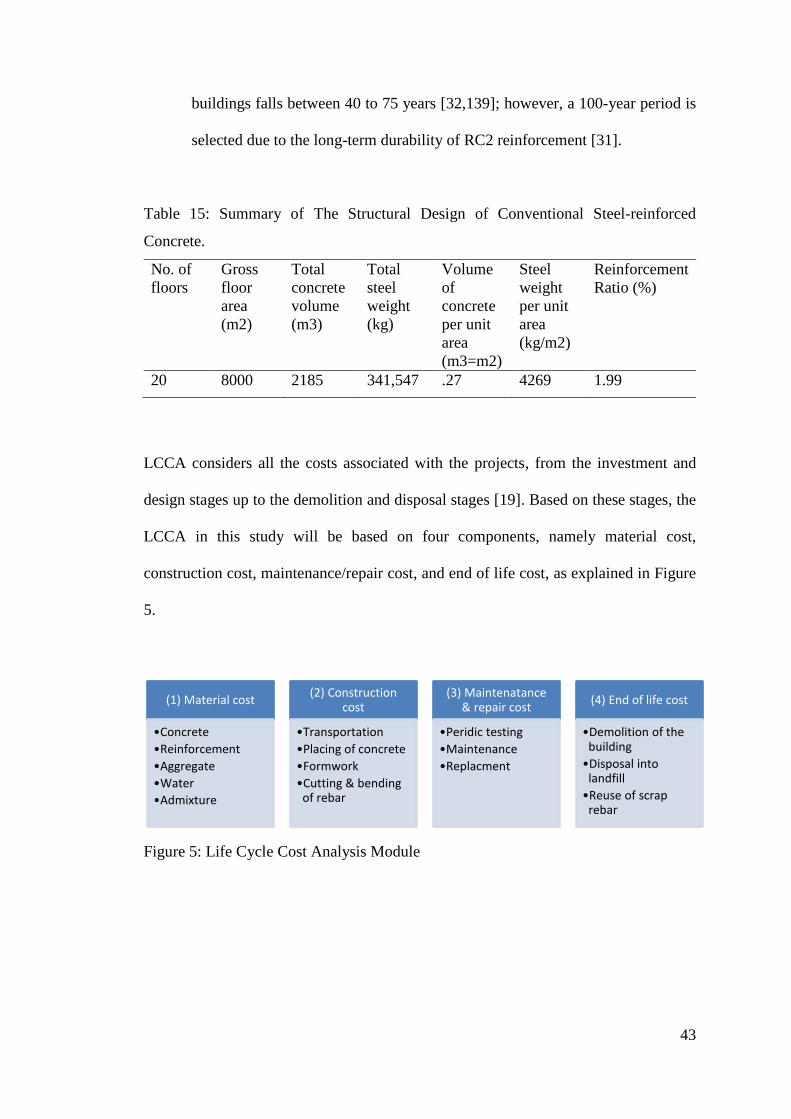
43
buildings falls between 40 to 75 years [32,139]; however, a 100-year period is
selected due to the long-term durability of RC2 reinforcement [31].
Table 15: Summary of The Structural Design of Conventional Steel-reinforced
Concrete.
LCCA considers all the costs associated with the projects, from the investment and
design stages up to the demolition and disposal stages [19]. Based on these stages, the
LCCA in this study will be based on four components, namely material cost,
construction cost, maintenance/repair cost, and end of life cost, as explained in Figure
5.
Figure 5: Life Cycle Cost Analysis Module
(1) Material cost
•Concrete
•Reinforcement
•Aggregate
•Water
•Admixture
(2) Construction cost
•Transportation
•Placing of concrete
•Formwork
•Cutting & bending of rebar
(3) Maintenatance & repair cost
•Peridic testing
•Maintenance
•Replacment
(4) End of life cost
•Demolition of the building
•Disposal into landfill
•Reuse of scrap rebar
No. of
floors
Gross
floor
area
(m2)
Total
concrete
volume
(m3)
Total
steel
weight
(kg)
Volume
of
concrete
per unit
area
(m3=m2)
Steel
weight
per unit
area
(kg/m2)
Reinforcement
Ratio (%)
20 8000 2185 341,547 .27 4269 1.99
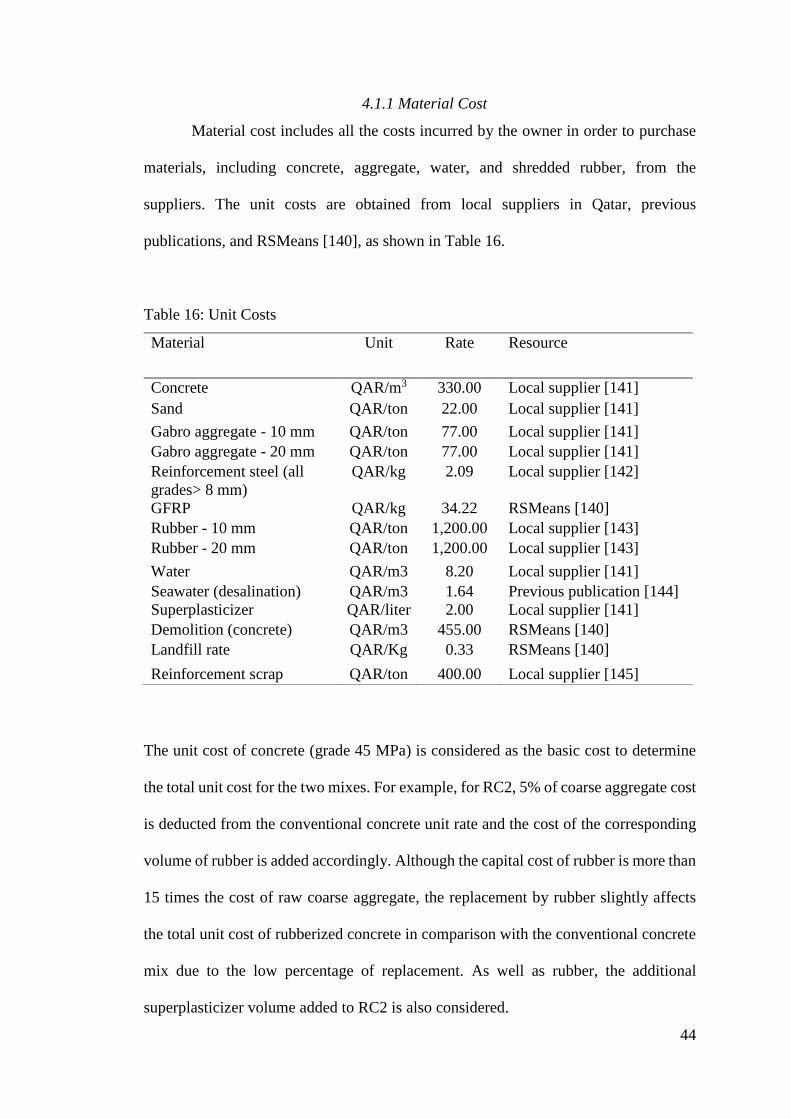
44
4.1.1 Material Cost
Material cost includes all the costs incurred by the owner in order to purchase
materials, including concrete, aggregate, water, and shredded rubber, from the
suppliers. The unit costs are obtained from local suppliers in Qatar, previous
publications, and RSMeans [140], as shown in Table 16.
Table 16: Unit Costs
The unit cost of concrete (grade 45 MPa) is considered as the basic cost to determine
the total unit cost for the two mixes. For example, for RC2, 5% of coarse aggregate cost
is deducted from the conventional concrete unit rate and the cost of the corresponding
volume of rubber is added accordingly. Although the capital cost of rubber is more than
15 times the cost of raw coarse aggregate, the replacement by rubber slightly affects
the total unit cost of rubberized concrete in comparison with the conventional concrete
mix due to the low percentage of replacement. As well as rubber, the additional
superplasticizer volume added to RC2 is also considered.
Material Unit Rate Resource
Concrete QAR/m3 330.00 Local supplier [141]
Sand QAR/ton 22.00 Local supplier [141]
Gabro aggregate - 10 mm QAR/ton 77.00 Local supplier [141]
Gabro aggregate - 20 mm QAR/ton 77.00 Local supplier [141]
Reinforcement steel (all
grades> 8 mm)
QAR/kg 2.09 Local supplier [142]
GFRP QAR/kg 34.22 RSMeans [140]
Rubber - 10 mm QAR/ton 1,200.00 Local supplier [143]
Rubber - 20 mm QAR/ton 1,200.00 Local supplier [143]
Water QAR/m3 8.20 Local supplier [141]
Seawater (desalination) QAR/m3 1.64 Previous publication [144]
Superplasticizer QAR/liter 2.00 Local supplier [141]
Demolition (concrete) QAR/m3 455.00 RSMeans [140]
Landfill rate QAR/Kg 0.33 RSMeans [140]
Reinforcement scrap QAR/ton 400.00 Local supplier [145]
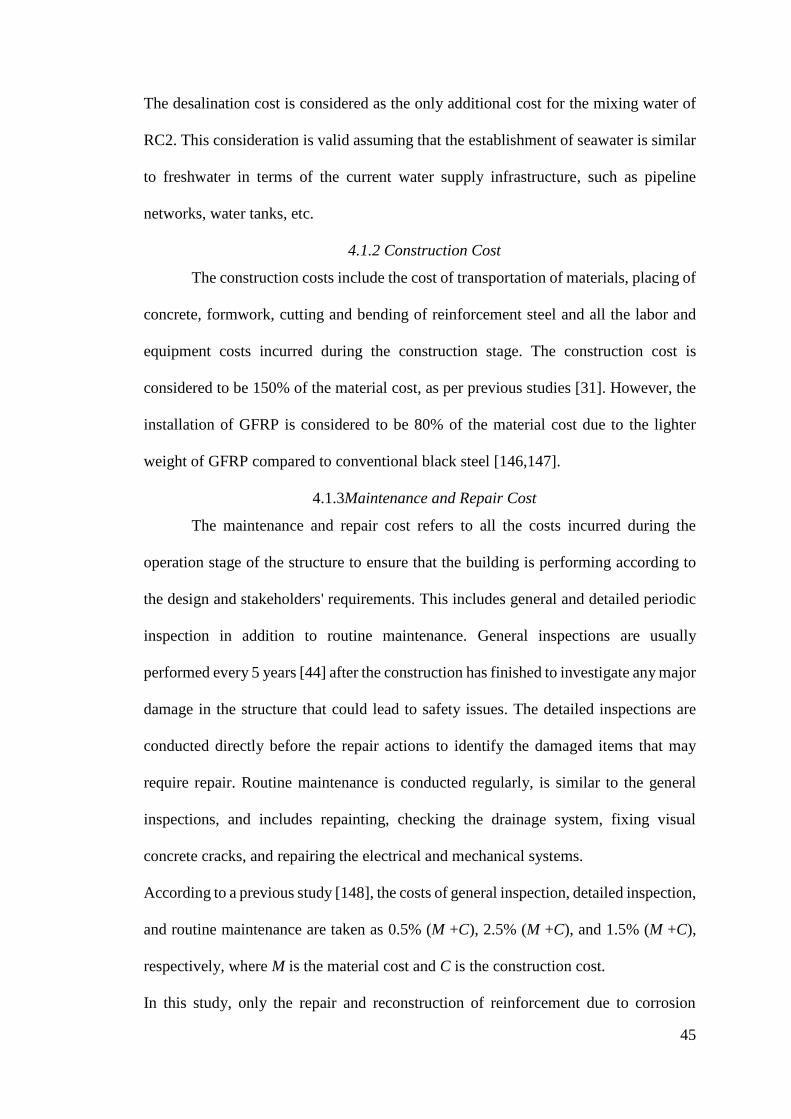
45
The desalination cost is considered as the only additional cost for the mixing water of
RC2. This consideration is valid assuming that the establishment of seawater is similar
to freshwater in terms of the current water supply infrastructure, such as pipeline
networks, water tanks, etc.
4.1.2 Construction Cost
The construction costs include the cost of transportation of materials, placing of
concrete, formwork, cutting and bending of reinforcement steel and all the labor and
equipment costs incurred during the construction stage. The construction cost is
considered to be 150% of the material cost, as per previous studies [31]. However, the
installation of GFRP is considered to be 80% of the material cost due to the lighter
weight of GFRP compared to conventional black steel [146,147].
4.1.3Maintenance and Repair Cost
The maintenance and repair cost refers to all the costs incurred during the
operation stage of the structure to ensure that the building is performing according to
the design and stakeholders' requirements. This includes general and detailed periodic
inspection in addition to routine maintenance. General inspections are usually
performed every 5 years [44] after the construction has finished to investigate any major
damage in the structure that could lead to safety issues. The detailed inspections are
conducted directly before the repair actions to identify the damaged items that may
require repair. Routine maintenance is conducted regularly, is similar to the general
inspections, and includes repainting, checking the drainage system, fixing visual
concrete cracks, and repairing the electrical and mechanical systems.
According to a previous study [148], the costs of general inspection, detailed inspection,
and routine maintenance are taken as 0.5% (M +C), 2.5% (M +C), and 1.5% (M +C),
respectively, where M is the material cost and C is the construction cost.
In this study, only the repair and reconstruction of reinforcement due to corrosion
46
actions are considered. As with the construction cost, the repair and reconstruction cost
is determined as a percentage of the material cost, assuming that at the time of repair,
10% of the structure will be affected and 50% of the material will require replacement
[149]. The cost of manpower and equipment is assumed to be 200% of the material
cost; however, the purchasing cost of raw materials remains the same.
The corrosion of reinforcement steel usually happens due to chloride attack, as
discussed in previous publications [31,44,149]. Life-365 software was used to predict
the repair scheduling of both traditional black steel and GFRP, taking into consideration
the location of the building in relation to seawater and the concrete cover assumed in
the design. Life-365 indicated the following:
Black steel requires repairs every 10 years during the life of the structure.
The end of service life for RC1 reinforcement is 50 years; thereafter,
reconstruction is required to maintain the same performance of the structure.
Since GFRP is unaffected by corrosion, no repair is conducted on RC2
throughout the life service of the building (100 years). Also, GFRP is thought
to maintain about 70% of its tensile strength, which is sufficient to avoid any
repair or reconstruction work until the demolition of the building.
The repair is assumed to be conducted with the same materials used in the
construction stage.
4.1.4 End of Life Cost
It is assumed that the building will be demolished at the age of 100 years
regardless of whether its performance is as per the requirements. The end of life cost
includes all the expenses incurred during the demolition stage, including demolition
and disposal, in addition to the value earned from the reuse of traditional black steel
scrap for RC1. According to local practice in Qatar, 100% of steel scrap can be reused;
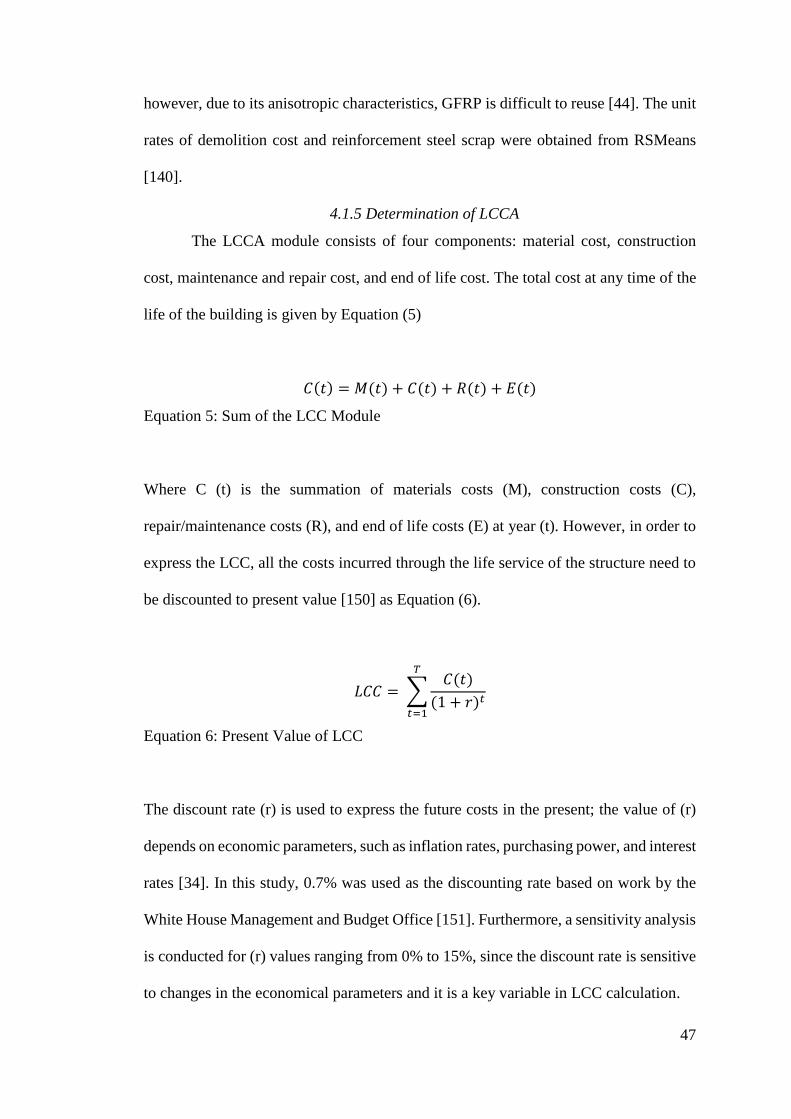
47
however, due to its anisotropic characteristics, GFRP is difficult to reuse [44]. The unit
rates of demolition cost and reinforcement steel scrap were obtained from RSMeans
[140].
4.1.5 Determination of LCCA
The LCCA module consists of four components: material cost, construction
cost, maintenance and repair cost, and end of life cost. The total cost at any time of the
life of the building is given by Equation (5)
𝐶(𝑡) = 𝑀(𝑡) + 𝐶(𝑡) + 𝑅(𝑡) + 𝐸(𝑡)
Equation 5: Sum of the LCC Module
Where C (t) is the summation of materials costs (M), construction costs (C),
repair/maintenance costs (R), and end of life costs (E) at year (t). However, in order to
express the LCC, all the costs incurred through the life service of the structure need to
be discounted to present value [150] as Equation (6).
𝐿𝐶𝐶 = ∑𝐶(𝑡)
(1 + 𝑟)𝑡
𝑇
𝑡=1
Equation 6: Present Value of LCC
The discount rate (r) is used to express the future costs in the present; the value of (r)
depends on economic parameters, such as inflation rates, purchasing power, and interest
rates [34]. In this study, 0.7% was used as the discounting rate based on work by the
White House Management and Budget Office [151]. Furthermore, a sensitivity analysis
is conducted for (r) values ranging from 0% to 15%, since the discount rate is sensitive
to changes in the economical parameters and it is a key variable in LCC calculation.

48
4.2 LCCA Results
The changes to the materials in concrete mixes of the two design alternatives
RC1 and RC2 seem to have a negligible impact on the unit cost. Although the cost of
shredded rubber is significantly higher than the cost of aggregate, due to the low
percentage of replacement (5%), the high cost of rubber does not affect the unit cost of
RC2 in comparison with the traditional mix (RC1). The unit cost of the design
alternatives is highly influenced by the type of reinforcement selected. Figure 6
illustrates the LCC cash flow throughout the study period before applying the
discounting for the future costs; it shows that the high purchasing cost of GFRP makes
RC2 about two times more costly than RC1 at the construction stage. However, the
regular repair and reconstruction cost (at year 50) due to the use of black steel makes
the overall LCC of RC1 higher than RC2.
Figure 6: Cash Flow Diagram for Design Alternatives (future costs are not
discounted)
44
5.8
1
4.4
6
4.4
6
28
.99
4.4
6
4.4
6
28
.99
4.4
6
4.4
6
28
.99
77
0.0
1
4.4
6
4.4
6
28
.99
4.4
6
4.4
6
28
.99
4.4
6
4.4
6
28
.99
32
4.2
1
77
0.1
6
4.4
6
4.4
6
4.4
6
4.4
6
4.4
6
4.4
6
4.4
6
4.4
6
4.4
6
4.4
6
4.4
6
4.4
6
4.4
6
4.4
6
4.4
6
4.4
6
4.4
6
4.4
6
4.4
6
34
2.7
1
0 5 1 0 1 5 2 0 2 5 3 0 3 5 4 0 4 5 5 0 5 5 6 0 6 5 7 0 7 5 8 0 8 5 9 0 9 5 1 0 0
UN
IT C
OST
(Q
AR
/M2
)
YEARS
RC1 RC2
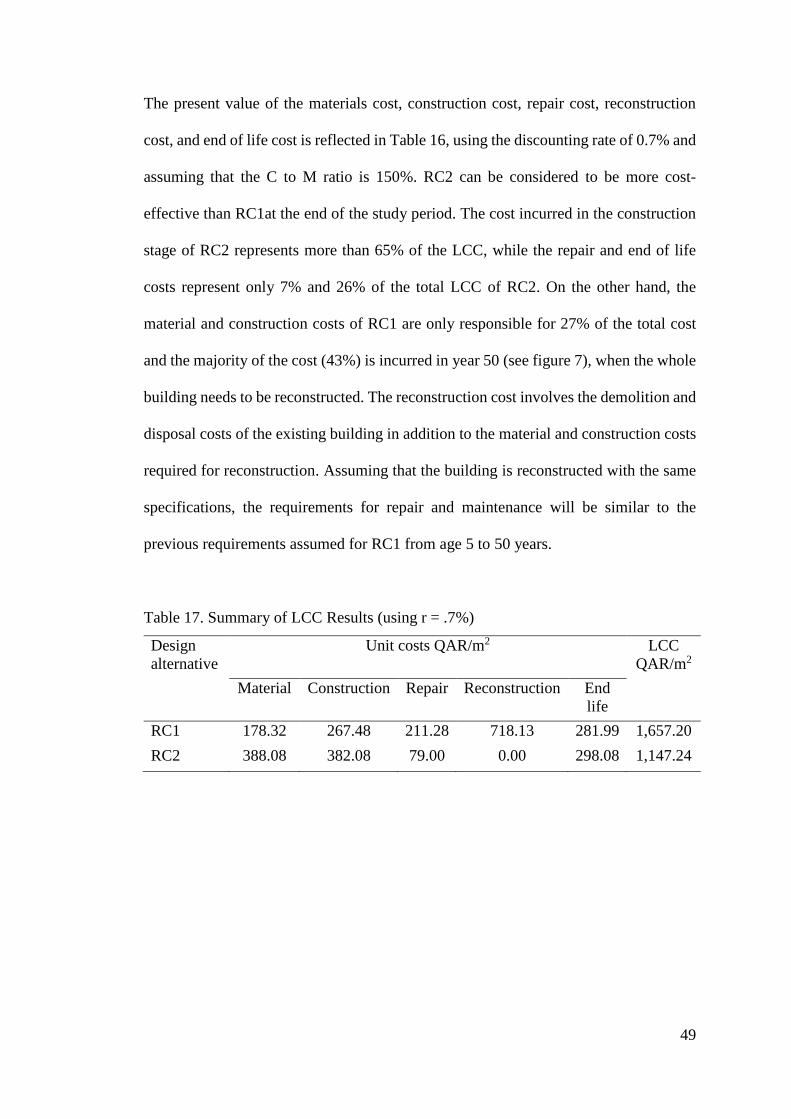
49
The present value of the materials cost, construction cost, repair cost, reconstruction
cost, and end of life cost is reflected in Table 16, using the discounting rate of 0.7% and
assuming that the C to M ratio is 150%. RC2 can be considered to be more cost-
effective than RC1at the end of the study period. The cost incurred in the construction
stage of RC2 represents more than 65% of the LCC, while the repair and end of life
costs represent only 7% and 26% of the total LCC of RC2. On the other hand, the
material and construction costs of RC1 are only responsible for 27% of the total cost
and the majority of the cost (43%) is incurred in year 50 (see figure 7), when the whole
building needs to be reconstructed. The reconstruction cost involves the demolition and
disposal costs of the existing building in addition to the material and construction costs
required for reconstruction. Assuming that the building is reconstructed with the same
specifications, the requirements for repair and maintenance will be similar to the
previous requirements assumed for RC1 from age 5 to 50 years.
Table 17. Summary of LCC Results (using r = .7%)
Design
alternative
Unit costs QAR/m2 LCC
QAR/m2
Material Construction Repair Reconstruction End
life
RC1 178.32 267.48 211.28 718.13 281.99 1,657.20
RC2 388.08 382.08 79.00 0.00 298.08 1,147.24

50
Figure 7: Life cycle Cost Results (where r = 0.7% and C is 150% of M).
4.2.1 Sensitivity Analysis
A sensitivity analysis is a financial module that determines how target values
are influenced by a change of other relevant variables [152]. In this study, the basic
assumption of determining the LCC is the value of the discounting rate, which is
assumed to be 0.7%. Since the value of r is predicted based on the changing financial
parameters in the future, changes to these parameters have an influence on LCC as well.
A sensitivity analysis was conducted for r considering the range from 0% to 15%, as
per Figure 8.

51
Figure 8: Sensitivity of the LCC Results to the Discount Rate (C= 1.5M)
Figure 8 shows that increasing r results in a decrease in LCC for both design
alternatives. The RC1 costs remain higher than RC2 for all values of r less than 10%.
Since there is a large range between the values of r assumed in this study (0.7% to 15%),
it is most likely that RC2 will be more cost-effective throughout the study period.
Similar to the discount rate, the LCC value is also influenced by the C/M ratio. The
basic assumption in this study is that the C/M ratio is 150%, but a sensitivity analysis
is also conducted to determine the LCC amount for C/M ratios ranging from 0% to
250%. The analysis shows that the cost of RC1 remains higher than the RC2 cost for
all the different C/M ratios, as presented in Figure 9.
0.00
200.00
400.00
600.00
800.00
1,000.00
1,200.00
1,400.00
1,600.00
1,800.00
2,000.00
0% 3% 6% 9% 12% 15%
LCC
QA
R/m
2
Discount rate %
r= 10%
RC1 RC2
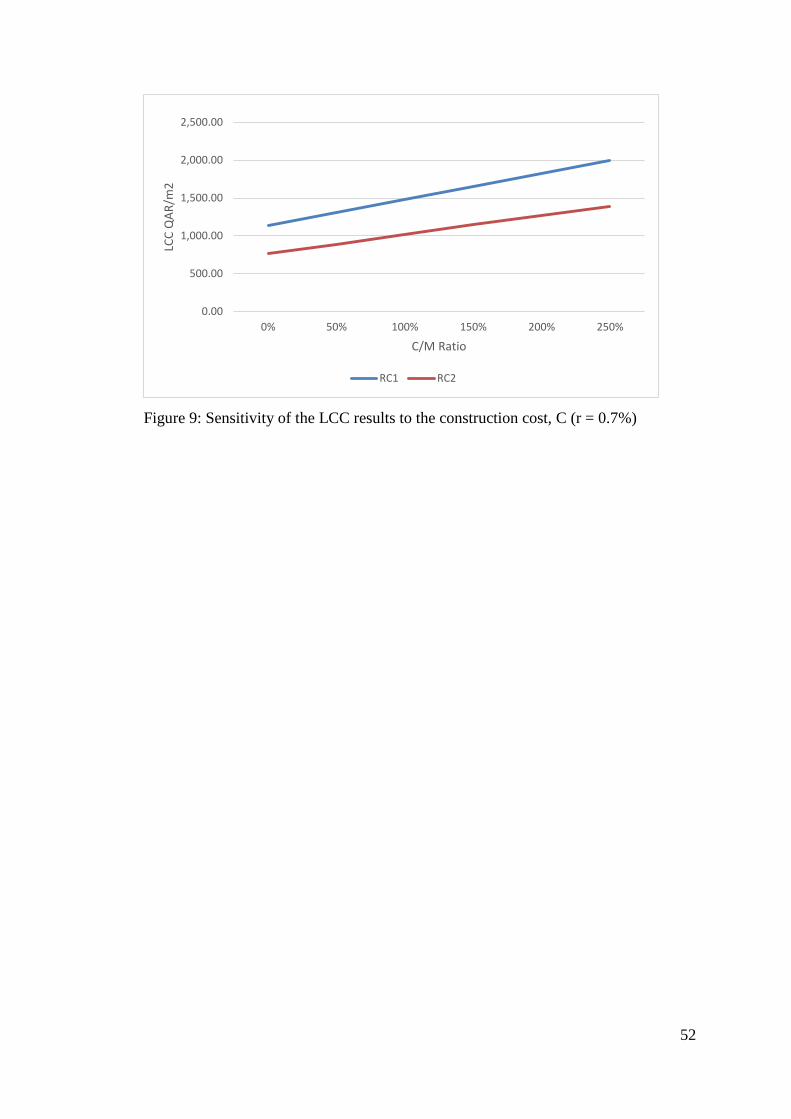
52
Figure 9: Sensitivity of the LCC results to the construction cost, C (r = 0.7%)
0.00
500.00
1,000.00
1,500.00
2,000.00
2,500.00
0% 50% 100% 150% 200% 250%
LCC
QA
R/m
2
C/M Ratio
RC1 RC2

53
CHAPTER 5: CONCLUSION AND FUTURE RECOMMENDATIONS
5.1 Conclusion
This study contributes to the management area body of knowledge in general
and in particular the construction and engineering management with an investigation of
the use rubberized RC in building construction and its sustainability. Life cycle cost
analysis has been conducted to compare between the rubberized and traditional
structural concrete. The economic and technical impact of using recycled tires as a
replacement for aggregate in structural concrete was investigated, as the use of recycled
materials could help reduce the construction industry’s consumption of natural
resources and also decrease the growing volume of tires in landfills. The performance
of rubber in fresh and hardened concrete was examined through twelve rubberized
concrete mixes with different volumes of shredded tires. Then, both fresh and hardened
characterizations of rubberized concrete mixes were made and compared with control
mix characterizations. Based on the assumptions made and the test results, we conclude
the following:
The compressive strength of concrete is decreased by increasing the volume of
rubber in concrete; the negative impact of rubber on concrete strength means
that the use of rubber in structural concrete is not recommended since
compressive strength is a key parameter in concrete structural design. However,
based on the results obtained from the rapid chloride penetration and water
absorption tests, we find that rubberized concrete is slightly more durable than
conventional concrete.
The fresh concrete characteristic of workability was investigated as well. The
slump measurements immediately after concrete mixing showed that as the
rubber volume in concrete increased, the workability was reduced. Therefore,
54
to achieve desirable slump results, the volume of superplasticizer in rubberized
concrete mixes should increase as the rubber volume increases.
Based on the technical data obtained from the experimental work, in the
economic analysis we conducted an LCCA for RC1 and RC2. RC1 represented
a traditional concrete mix. In RC2, 5% of aggregate was replaced by rubber,
and seawater was used for mixing; this provided good fresh and hardened
concrete characterizations for the rubberized concrete mixes.
The LCCA showed that RC2 is more cost-effective (30% cost savings) than
RC1, mainly due to its use of GFRP reinforcement instead of the traditional
black steel used in RC1. GFRP reinforcement was chosen because seawater can
cause corrosion in traditional reinforcement.
The cost of shredded rubber is considerably higher than sand and aggregate, yet
due to the low percentage of rubber/aggregate replacement in RC2, this had no
effect on the material cost of RC2 in comparison with RC1.
Despite the higher purchasing cost of GFRP, its durability and lower
maintenance cost of GFRP made RC2 more cost-effective than RC1 in the long-
term analysis.
A sensitivity analysis was conducted for two variables, namely the discount rate
and the material to construction cost ratio. The analysis showed that RC2
remains more cost-effective than RC1 for all discount rate values less than 10%;
thereafter, RC1 became more cost-effective. However, the RC2 costs remain
lower than RC1 for all C/M values ranging from 0% to 250%.

55
5.2 Future Recommendations
According to the materials used as well as the data, assumptions, and the
approach followed, we recommend the following possible paths for future studies in
relevant areas of research:
The long-term cost-effectiveness of using rubber and seawater in concrete
mixes may induce owners to adopt both materials in concrete manufacturing;
however, to build on our work and create a more substantial practical
foundation, more research is required using different assumptions and
approaches.
In addition to the technical and cost analyses for rubberized concrete, future
studies could also conduct an extensive environmental assessment to evaluate
the benefits obtained from using eco-friendly materials. The environmental
advantages of using recycled tires in concrete may include reducing landfill
volume, decreasing the use of natural resources in construction, and reducing
the CO2 emissions resulting from concrete production.
Due to the lower compressive strength of rubberized concrete, the use of rubber
may not be recommended in structural concrete, unless the shredded tires are
specially treated. The pre-treatment of rubber with magnesium oxychloride [48]
can improve the adhesion between rubber particles and other materials and can
significantly improve the performance of rubberized concrete by improving the
bonding characterizations of rubber.
Moreover, rubberized concrete can be used in structural elements where
compressive strength is not a key factor that is critical to structural performance,
such as wall partitions, crash barriers, roads, and highways.
56
To aid in legislation regarding the use of rubber and to suggest further potential
applications of rubberized concrete in construction, further research is needed
to investigate the split tensile strength, toughness, impact of resistance,
shrinkage, and other properties of rubberized mixes.
57
REFERENCES
[1] S. Peake, Delivering the Kyoto baby: UNFCCC COP9 report, Refocus, Int.
Renew. Energy Mag. (n.d.) 52–53.
[2] A. Idris, B. Inanc, M.N. Hassan, Overview of waste disposal and landfills/dumps
in Asian countries, J. Mater. Cycles Waste Manag. (2004).
[3] R.K. Guleria, S.P., Dutta, Study of flexural strength and leachate analysis of fly
ash-lime-gypsum composite mixed with treated tire chips, KSCE J. Civ. Eng.
Vol. (n.d.).
[4] P.J.M. Monteiro, S.A. Miller, A. Horvath, Towards sustainable concrete, Nat.
Mater. (2017).
[5] T.T. Kien, SUSTAINABILITY IN THE CONCRETE INDUSTRY FOR
CONSTRUCTION OF SUSTAINABILITY IN THE CONCRETE INDUSTRY,
(2014).
[6] A. Raoa, K. N.Jhab, S. Misra, Use of aggregates from recycled construction and
demolition waste in concrete, Resour. Conserv. Recycl. (2007) March.
[7] Construction Week, Green cement industry to reach $38.1bn by 2024, (2020).
https://www.constructionweekonline.com/business/263390-green-cement-
industry-to-reach-381bn-by-2024.
[8] M. Sienkiewicz, K. Borzędowska-Labuda, S. Zalewski, H. Janik, The effect of
tyre rubber grinding method on the rubber-asphalt binder properties, Constr.
Build. Mater. 154 (2017) 144–154.
https://doi.org/10.1016/j.conbuildmat.2017.07.170.
[9] D. Lo Presti, Recycled Tyre Rubber Modified Bitumens for road asphalt
mixtures: A literature review, Constr. Build. Mater. 49 (2013) 863–881.
https://doi.org/10.1016/j.conbuildmat.2013.09.007.
58
[10] S. Sgobba, G.C. Marano, M. Borsa, M. Molfetta, Use of rubber particles from
recycled tires as concrete aggregate for engineering applications, 2nd Int. Conf.
Sustain. Constr. Mater. Technol. i (2010) 465–475.
[11] H.S. M. A. Yazdi, J. Yang, L. Yihui, A Review on Application of Waste Tire in
Concrete, World Acad. Sci. Eng. Technol. Int. J. Civ. Environ. Eng. 9 (2015) 6.
[12] J.C. Colom X, F Carrillo, Composites reinforced with reused tyres: Surface
oxidant treatment to improve the interfacial compatibility, Appl. Sci. Manuf.
(2007).
[13] T.U. Mohammed, H. Hamada, T. Yamaji, Performance of seawater-mixed
concrete in the tidal environment, Cem. Concr. Res. 34 (2004) 593–601.
https://doi.org/10.1016/j.cemconres.2003.09.020.
[14] M.M. Mekonnen, A.Y. Hoekstra, Four billion people facing severe water
scarcity, Sci. Adv. (2016).
[15] S.A. Miller, A. Horvath, P.J.M. Monteiro, Impacts of booming concrete
production on water resources worldwide, Nat. Sustain. (2018).
[16] F. Kuepper, The Impacts of Relying on Desalination for Water, (2009).
[17] M. Walton, Desalinated water affects the energy equation in the Middle East,
(2019). https://www.iea.org/commentaries/desalinated-water-affects-the-
energy-equation-in-the-middle-east.
[18] Corporate Finance Institute, What is Life Cycle Cost Analysis?, (n.d.).
https://corporatefinanceinstitute.com/resources/knowledge/finance/life-cycle-
cost-analysis/.
[19] R. Schneiderova-Heralova, Importance of life cycle costing for construction
projects, Eng. Rural Dev. 17 (2018) 1223–1227.
https://doi.org/10.22616/ERDev2018.17.N405.
59
[20] A. C. Otegbulu, Economics of Green Design and Environmental Sustainability,
J. Sustain. Dev. 4 (2011) 97–109. https://doi.org/10.5539/jsd.v4n2p240.
[21] S. Fuller, Life-Cycle Cost Analysis (LCCA), Natl. Inst. Stand. Technol. (2016).
[22] S. Kubba, Green Design and Construction Economics, (n.d.).
[23] one click LCA, Life Cycle Costing in Construction: Reduce your building’s
lifetime costs, (n.d.).
[24] W. Achini Shanika, R. Thanuja, T. Niraj, Life cycle cost analysis: Green vs
conventional buildings in Sri Lanka, Assoc. Res. Constr. Manag. ARCOM - 33rd
Annu. Conf. 2017, Proceeding. (2017) 309–318.
[25] C. Hema, Life cycle cost analysis of green construction: A comparison with
conventional construction, J. Chem. Pharm. Sci. 9 (2016) E205–E208.
[26] A. Boussabaine, R. Kirkham, Whole Life-Cycle Costing: Risk and Risk
Responses, 2003.
[27] R. Flanagan, C. Jewell, Whole Life Appraisal for Construction, Blackwell
Publishing Ltd, 2004.
[28] R.J. Cole, E. Sterner, Reconciling theory and practice of life-cycle costing,
(2010).
[29] U.S Department of Transportation Fedral Highway Adminstration Connecticut
Department of Transportation, Life-Cycle Cost Analysis in Pavement Design,
1998.
[30] J.-S. Jung, K.E. Kaloush, G.B. Way, Life Cycle Cost Analysis Conventional
Versus Asphalt-Rubber Pavements, (2002) 23.
[31] A. Younis, U. Ebead, S. Judd, Life cycle cost analysis of structural concrete
using seawater, recycled concrete aggregate, and GFRP reinforcement, Constr.
Build. Mater. 175 (2018) 152–160.
60
https://doi.org/10.1016/j.conbuildmat.2018.04.183.
[32] J. Kneifel, Life-cycle carbon and cost analysis of energy efficiency measures in
new commercial buildings, Energy Build. 42 (2010) 333–340.
https://doi.org/10.1016/j.enbuild.2009.09.011.
[33] D.P. Breidenbach, Life cycle cost analysis, IEEE Proc. Natl. Aerosp. Electron.
Conf. 3 (1989) 1216–1220. https://doi.org/10.1201/9781420001044.ch5.
[34] C. Lee, E.-B. Lee, Prediction method of real discount rate to improve accuracy
of life-cycle cost analysis, Energy Build. (2017).
[35] P. Fernández, A. Ortiz, I.F. Acín, Discount Rate (Risk-Free Rate and Market
Risk Premium): a survey 2015, (2015).
[36] Pavement Interactive, Life-Cycle Cost Analysis, (n.d.).
https://pavementinteractive.org/.
[37] S. Marenjak, H. Krstić, SENSITIVITY ANALYSIS OF FACILITIES LIFE
CYCLE COSTS, (2010).
[38] U.S Department of Transportation Fedral Highway Adminstration Connecticut
Department of Transportation, Draft Environmental Impact and Section 4(f)
Evaluation, n.d.
[39] Transportation Economic Commitee, Transportation Benefit-Cost Analysis,
(n.d.). http://bca.transportationeconomics.org/models/microbencost.
[40] B.A. Roper, User Benefits of Railroad Grade Separation in a Small Community:
Practical Techniques for Applying Microbencost, J. Chem. Inf. Model. 53 (2019)
1689–1699. https://doi.org/10.1017/CBO9781107415324.004.
[41] E.A. Hunt, P.E. Research Coordinator, CRUMB RUBBER MODIFIED
ASPHALT CONCRETE IN OREGON Final Report SPR 355, (2002).
[42] J.S. O’Brien, P.Y. Julien, Title, J. Hydraul. Eng. 114 (1988) 877–887.
61
[43] H.W. Song, S.W. Pack, K.Y. Ann, Probabilistic assessment to predict the time
to corrosion of steel in reinforced concrete tunnel box exposed to sea water,
Constr. Build. Mater. 23 (2009) 3270–3278.
https://doi.org/10.1016/j.conbuildmat.2009.05.007.
[44] A. Younis, U. Ebead, P. Suraneni, A. Nanni, Cost effectiveness of reinforcement
alternatives for a concrete water chlorination tank, J. Build. Eng. 27 (2020)
100992. https://doi.org/10.1016/j.jobe.2019.100992.
[45] V.W.Y. Tam, M. Soomro, A.C.J. Evangelista, A review of recycled aggregate in
concrete applications (2000–2017), Constr. Build. Mater. 172 (2018) 272–292.
https://doi.org/10.1016/j.conbuildmat.2018.03.240.
[46] L.Y. Hee, Waste Management and Economic Growth, 2008. (n.d.).
https://www.csc.gov.sg/articles/waste-management-and-economic-growth.
[47] H.I. Abdel-Shafy, M.S.M. Mansour, Solid waste issue: Sources, composition,
disposal, recycling, and valorization, Egypt. J. Pet. 27 (2018) 1275–1290.
https://doi.org/10.1016/j.ejpe.2018.07.003.
[48] R. Siddique, T.R. Naik, Properties of concrete containing scrap-tire rubber - An
overview, Waste Manag. 24 (2004) 563–569.
https://doi.org/10.1016/j.wasman.2004.01.006.
[49] Quantum Engineering, Tyre recycling in Qatar, (n.d.). http://www.quantumeng-
qa.com/index.php/blog/item/47-tyre-recycling-in-qatar.
[50] Global Recycling, Qatar Intends to Increase Waste Management Plant Capacity,
(n.d.). https://global-recycling.info/archives/519.
[51] The Peninsula, Qatar’s efforts to promote use of scrap tire rubber and build up
tire recycling, (2019). https://weibold.com/qatars-efforts-to-promote-use-of-
scrap-tire-rubber-and-build-up-tire-recycling/.
62
[52] Bright Future Tyre Recycling Factory, Bright Future Tyre Recycling Factory,
(n.d.). http://brightfuturefactory.com/.
[53] MODERN RECYCLING FACTORY, MODERN RECYCLING FACTORY,
(n.d.). https://www.qatarmrf.com/.
[54] N.S. Mashaan, A.H. Ali, M.R. Karim, M. Abdelaziz, An overview of crumb
rubber modified asphalt, Int. J. Phys. Sci. 7 (2012) 166–170.
https://doi.org/10.5897/IJPSX11.007.
[55] G.L. Baumgardner, J.R. Hardee, I.I. Negulescu, E.R. Williams, I.L. Howard,
R.C. St. John, Quantitative analysis of functional polymer in recycled tire rubber
used in modified asphalt binders, Asph. Paving Technol. Assoc. Asph. Paving
Technol. Tech. Sess. 83 (2014) 583–611.
https://doi.org/10.1080/14680629.2014.927413.
[56] R. Salini, Study of Recycled Tyre Rubber in Asphalt Concrete Mixtures, (2016).
[57] N.A. Hassan, G.D. Airey, R.P. Jaya, N. Mashros, M.A. Aziz, A review of crumb
rubber modification in dry mixed rubberised asphalt mixtures, J. Teknol. 70
(2014) 127–134. https://doi.org/10.11113/jt.v70.3501.
[58] L. Han, M. Zheng, C. Wang, Current status and development of terminal blend
tyre rubber modified asphalt, Constr. Build. Mater. 128 (2016) 399–409.
https://doi.org/10.1016/j.conbuildmat.2016.10.080.
[59] A.A. Yasin, Using shredded tires as an aggregate in concrete, Contemp. Eng.
Sci. 5 (2012) 473–480.
[60] L. Lijuan, R. Shenghua, Z. Lan, Mechanical properties and constitutive
equations of concrete containing a low volume of tire rubber particles, Constr.
Build. Mater. (2014).
[61] A. Turatsinze, M. Garros, On the modulus of elasticity and strain capacity of

63
Self-Compacting Concrete incorporating rubber aggregates, Resour. Conserv.
Recycl. (2008).
[62] H.A. Toutanji, The use of rubber tire particles in concrete to replace mineral
aggregates, Cem. Concr. Compos. 18 (1996) 135–139.
https://doi.org/10.1016/0958-9465(95)00010-0.
[63] A. Sofi, Effect of waste tyre rubber on mechanical and durability properties of
concrete – A review, Ain Shams Eng. J. 9 (2018) 2691–2700.
https://doi.org/10.1016/j.asej.2017.08.007.
[64] M.K. Batayneh, I. Marie, I. Asi, Promoting the use of crumb rubber concrete in
developing countries, Waste Manag. 28 (2008) 2171–2176.
https://doi.org/10.1016/j.wasman.2007.09.035.
[65] M.M. Balaha, A.A.M. Badawy, M. Hashish, Effect of using ground waste tire
rubber as fine aggregate on the behaviour of concrete mixes, Indian J. Eng.
Mater. Sci. 14 (2007) 427–435.
[66] R. Thiruppathi, Discarded tyre rubber as concrete aggregate: A possible outlet
for used tyres, 2013 Int. Conf. Curr. Trends Eng. Technol. ICCTET 2013. 1
(2013) 202–207. https://doi.org/10.1109/ICCTET.2013.66759046.
[67] N M Al-Akhras; M M Smadi, PROPERTIES OF TYRE RUBBER ASH
MORTAR, (n.d.).
[68] National Georaphic, Freshwater Access, (n.d.).
https://www.nationalgeographic.org/encyclopedia/freshwater-access/.
[69] Web of Creation, Problem: Fresh Water and Oceans in Dangeritle, (n.d.).
http://www.webofcreation.org/Earth Problems/water.htm.
[70] Xinhua, Water table falling in China, (n.d.).
http://www.xinhuanet.com/english/2018-05/03/c_137153841.htm.
64
[71] Nobuaki Otsuki, Tsuyoshi Saito, Yutaka Tadokoro, Possibility of Sea Water as
Mixing Water in Concrete, J. Civ. Eng. Archit. 6 (2012).
https://doi.org/10.17265/1934-7359/2012.10.002.
[72] Ghar Expert, Water for Construction, (n.d.).
http://www.gharexpert.com/tips/articles/Construction/1837/Water-1837-Water-
Construction_0.
[73] S. Bezerra, Cement and concrete production are water intensive, (n.d.).
https://news.uoguelph.ca/2014/10/research-aims-to-reduce-water-use-in-
construction/.
[74] S.K. Kaushik, S. Islam, Suitability of sea water for mixing structural concrete
exposed to a marine environment, Cem. Concr. Compos. 17 (1995) 177–185.
https://doi.org/10.1016/0958-9465(95)00015-5.
[75] F. Adeyemi, G. Modupeola, The Effect of Sea Water on Compressive Strength
of Concrete, Int. J. Eng. Sci. Invent. 3 (2014) 23–31.
[76] A. Younis, U. Ebead, P. Suraneni, A. Nanni, Fresh and hardened properties of
seawater-mixed concrete, Constr. Build. Mater. 190 (2018) 276–286.
https://doi.org/10.1016/j.conbuildmat.2018.09.126.
[77] A. Perumalsamy Balaguru, and J.G. Nanni, FRP Composites for Reinforced and
Prestressed Concrete Structures, 2014.
[78] S. Auta, Dynamic effect of re-vibration on compressive strength of concrete,
Niger. J. Technol. Res. 6 (2013) 38–42. https://doi.org/10.4314/njtr.v6i2.90337.
[79] F.M. Wegian, Effect of seawater for mixing and curing on structural concrete,
IES J. Part A Civ. Struct. Eng. 3 (2010) 235–243.
https://doi.org/10.1080/19373260.2010.521048.
[80] M. Islam, S. Islam, M. Islam, Suitability of sea water on curing and compressive

65
strength of structural concrete, J. Civ. Eng. 40 (2012) 37–45.
[81] The Concrete Countertop Institute, The importance of water cement ratio in
concrete countertop mix design, (n.d.).
https://concretecountertopinstitute.com/free-training/the-importance-of-water-
cement-ratio-in-concrete-countertop-mix-design/.
[82] Aydos Construction Chemicals, Concrete Mixture Water, (n.d.).
http://www.aydos.com.tr/page/sectoral-solutions-detail/33/concrete-mixture-
water.
[83] P.P.F. KIM BASHAM, PHD PE FACIKIM BASHAM, Water in Concrete,
(n.d.). https://www.forconstructionpros.com/concrete/equipment-
products/article/11359846/water-in-concrete.
[84] QCS, Qatar Construction Specifications, 2014.
[85] BSI, BS 1377-3:2018 Methods of test for soils for civil engineering purposes.
Chemical and electro-chemical testing, 2018.
[86] BSI, BS 1377-2:1990: Methods of test for soils for civil engineering purposes.
Classification tests, 1990.
[87] BSI, BS 6068-2.51:1996: Water quality. Determination of alkalinity.
Determination of total and composite alkalinity, 1996.
[88] ASTM, ASTM D512 - 12: Standard Test Methods for Chloride Ion In Water,
2012.
[89] BSI, BS 6068-2.50:1995, ISO 10523:1994: Water quality. Physical, chemical
and biochemical methods. Determination of pH, 1995.
[90] G. Seegebrecht, THE ROLE OF AGGREGATE IN CONCRETE, (n.d.).
https://www.concretenetwork.com/aggregate/.
[91] Aggregates for Concrete, Green Spec. (n.d.).
66
http://www.greenspec.co.uk/building-design/aggregates-for-concrete/.
[92] Hintons, Classification of Aggregates, (2018).
https://www.hintonswaste.co.uk/news/classification-of-aggregates/.
[93] BSI, BS EN 933-1: Tests for geometrical properties of aggregates.
Determination of particle size distribution. Sieving method, 2012.
[94] BSI, BS EN 933-8:2012+A1:2015: Tests for geometrical properties of
aggregates. Assessment of fines. Sand equivalent test, 2012.
[95] BSI, BS EN 933-9:2009+A1:2013: Tests for geometrical properties of
aggregates. Assessment of fines. Methylene blue teste, 2010.
[96] ASTM, ASTM C142 / C142M - 17 : Standard Test Method for Clay Lumps and
Friable Particles in Aggregates, 2017.
[97] BSI, BS EN 1097-6:2013: Tests for mechanical and physical properties of
aggregates. Determination of particle density and water absorption, 2013.
[98] BSI, BS EN 933-3:2012: Tests for geometrical properties of aggregates.
Determination of particle shape. Flakiness index, 2012.
[99] BSI, BS EN 932-2:1999: Tests for general properties of aggregates. Methods for
reducing laboratory samples, 1999.
[100] Portland Cement Association (PCA), How Cement is Made, (n.d.).
https://www.cement.org/cement-concrete-applications/how-cement-is-made.
[101] D. Beaulieu, The Difference Between Cement, Concrete, and Mortar, (n.d.).
https://www.thespruce.com/difference-between-cement-concrete-and-mortar-
2130884.
[102] Wikipedia, Cement, (n.d.). https://en.wikipedia.org/wiki/Cement.
[103] L. Rodgers, Climate change: The massive CO2 emitter you may not know about,
BBC News. (n.d.).
67
[104] A. B, Cement Concrete: Advantages and Disadvantages | Concrete Technology,
(n.d.). http://www.engineeringenotes.com/concrete-technology/cement-
concrete-technology/cement-concrete-advantages-and-disadvantages-concrete-
technology/31074.
[105] Properties of Cement- Physical & Chemical, (n.d.). https://civiltoday.com/civil-
engineering-materials/cement/111-properties-of-cement-physical-chemical-
properties.
[106] Wikipedia, Portland cement, (n.d.).
https://en.wikipedia.org/wiki/Portland_cement.
[107] Total Concrete, THE BENEFITS OF SULPHATE-RESISTING CONCRETE,
(n.d.). https://www.totalconcrete.co.uk/news/the-benefits-of-sulphate-resisting-
concrete/.
[108] BSI, BS 4027:1996: Specification for sulfate-resisting Portland cement, 1996.
[109] L. Xiaocun, L. Yanjun, Effect of MgO on the composition and properties of alite-
sulphoaluminate cement, Elsevier. (2005).
[110] Wikipedia, Loss on ignition, (n.d.).
https://en.wikipedia.org/wiki/Loss_on_ignition.
[111] K. Kraiwood, J. Chai, T. Jatuphon, Effect of insoluble residue on properties of
Portland cement, Cem. Concr. Res. (2000).
[112] Sigma Test & Research Centre, Cement Testing, (n.d.).
https://www.sigmatest.org/Cement-Testing.html.
[113] COMPRESSIVE STRENGTH OF CEMENT, (n.d.).
http://www.iricen.gov.in/LAB/res/html/Test-23.html.
[114] G. Constantinides, Nanoscience and nanoengineering of cement-based materials,
Res. Gate. (2013).

68
[115] Wikipedia, Silica fume, (n.d.). https://en.wikipedia.org/wiki/Silica_fume.
[116] R. Rajapakse, Construction Engineering Design Calculations and Rules of
Thumb, 2017.
[117] ASTM, ASTM C494 / C494M - 17 : Standard Specification for Chemical
Admixtures for Concrete, 2017.
[118] Gilson Compay, What is Workability of Concrete?, (n.d.).
https://www.globalgilson.com/blog/what-is-workability-of-concrete.
[119] P. Bhattarai, EFFECT OF WATER CONTENT ON WORKABILITY OF
CONCRETE, (2019).
[120] Pennsylvaniya state colledge of Engineering, Workability, (n.d.).
https://www.engr.psu.edu/ce/courses/ce584/concrete/library/materials/aggregat
e/workability.htm.
[121] BSI, BS EN 12350-2:2009: Testing fresh concrete. Slump-test, 2009.
[122] Concrete @ your Fingertips: Slump test, (n.d.).
http://www.concrete.org.uk/fingertips-document.asp?id=559.
[123] BSI, BS 1881-105:1984 Testing concrete. Method for determination of flow,
1984.
[124] Aggregate Research, Understanding the Density of Concrete, (2009).
https://www.aggregateresearch.com/news/understanding-the-density-of-
concrete/.
[125] S. Iffat, Relation Between Density and Compressive Strength of Hardened
Concrete, Res. Gate. (2016).
[126] K. Konstantin, R. Nicolas, Properties of fresh and hardened concrete, Elsevier.
(2011).
[127] O. Alawode, O. Idowu, Effects of Water-Cement Ratios on the Compressive
69
Strength and Workability of Concrete and Lateritic Concrete Mixes, Pacific J.
Sci. …. 12 (2011) 99–105.
[128] Wikipedia, Compressive strength, (n.d.).
https://en.wikipedia.org/wiki/Compressive_strength.
[129] Civil Digital, Compressive Strength, (n.d.). https://civildigital.com/compressive-
strength-concrete-concrete-cubes/.
[130] BSI, BS EN 12390-1:2012: Testing hardened concrete. Shape, dimensions and
other requirements for specimens and moulds, 2012.
[131] BSI, BS EN 12390-3:2009 Testing hardened concrete. Compressive strength of
test specimens, 2009.
[132] P. Joshi, C. Chan, Rapid Chloride Permeability Testing, Concr. Constr. - World
Concr. 47 (2002) 37–43.
[133] The Constructor, Chloride Attack on Concrete Structures – Cause and
Prevention, (n.d.). https://theconstructor.org/concrete/chloride-attack-concrete-
structures-cause-prevention/7802/.
[134] ASTM, ASTM C1202 - 19 Standard Test Method for Electrical Indication of
Concrete’s Ability to Resist Chloride Ion Penetration, 2019.
[135] S. Kelham, A WATER ABSORPTION TEST FOR CONCRETE, Mag. Concr.
Res. (1988).
[136] BSI, BS 1881-122:2011: Testing concrete. Method for determination of water
absorption, 2011.
[137] A. Younis, U. Ebead, A. Nanni, A perspective on seawater/frp reinforcement in
concrete structures, ISEC 2017 - 9th Int. Struct. Eng. Constr. Conf. Resilient
Struct. Sustain. Constr. (2017). https://doi.org/10.14455/ISEC.res.2017.159.
[138] A.A.E. Maged A.Youssef,Mohamed E.Meshalyab, Ductile corrosion-free

70
GFRP-stainless steel reinforced concrete elements, Elsevier. (2017).
[139] I.Z. Bribián, A.A. Usón, S. Scarpellini, Life cycle assessment in buildings: State-
of-the-art and simplified LCA methodology as a complement for building
certification, Build. Environ. (2009).
[140] RSMeans, Construction and cost estimating data, (2019).
https://www.rsmeans.com/.
[141] Hassanesco Group, Concrete Supplier, (2020). http://www.hassanesco.com/.
[142] Public Work Authority (ASHGHAL), RAW MATERIAL PRICES, (2020).
http://www.ashghal.gov.qa/.
[143] Modern Recycling Factory, Rubber Prices, (2020). https://www.qatarmrf.com/.
[144] M.A. Darwish, H.K. Abdulrahim, A.S. Hassan, Realistic power and desalted
water production costs in Qatar, Desalin. Water Treat. 57 (2016) 4296–4302.
https://doi.org/10.1080/19443994.2014.992977.
[145] JMCI Qatar, Scrap Rates, (2020). https://jmciqatar.com/.
[146] L.S. Lee, R. Jain, The role of FRP composites in a sustainable world, Clean
Technol. Environ. Policy. (2009).
[147] Adam C. Berg, L.C. Bank, M.G. Oliva, J.S. Russell, Construction and cost
analysis of an FRP reinforced concrete bridge deck, Constr. Build. Mater.
(2006).
[148] X.Z. Cheung, Moe M.S.Kevin K.L. So, Life cycle cost management of concrete
structures relative to chloride-induced reinforcement corrosion, Res. Gate.
(2012).
[149] M. Mistry, C. Koffler, S. Wong, LCA and LCC of the world’s longest pier: a
case study on nickel-containing stainless steel rebar, Int. J. Life Cycle Assess. 21
(2016) 1637–1644. https://doi.org/10.1007/s11367-016-1080-2.
71
[150] International Organization for Standardization, ISO 15686-5:2008 Buildings and
constructed assets — Service-life planning — Part 5: Life-cycle costing, 2008.
[151] Office of Management and Budget Circular A-94 Appendix C: Discount Rates
for Cost-Effectiveness, Lease Purchase, and Related Analyses 2016 Washington
D.C., (n.d.).
[152] W. KENTON, Sensitivity Analysis, (2019).
https://www.investopedia.com/terms/s/sensitivityanalysis.asp.


