Embed Size (px)
Citation preview
High-throughput Experimental and
Computational Studies of Bacterial
Evolution
Lars Barquist
Queens’ College
University of Cambridge
A thesis submitted for the degree of
Doctor of Philosophy
23 August 2013


Arrakis teaches the attitude of the knife – chopping off what’s incomplete and saying:
“Now it’s complete because it’s ended here.”
Collected Sayings of Muad’dib

Declaration
High-throughput Experimental and Computational Studies of Bacterial
Evolution
The work presented in this dissertation was carried out at the Wellcome Trust Sanger
Institute between October 2009 and August 2013. This dissertation is the result of my
own work and includes nothing which is the outcome of work done in collaboration
except where specifically indicated in the text. This dissertation does not exceed the
limit of 60,000 words as specified by the Faculty of Biology Degree Committee. This
dissertation has been typeset in 12pt Computer Modern font using LATEX according to
the specifications set by the Board of Graduate Studies and the Faculty of Biology Degree
Committee. No part of this dissertation or anything substantially similar has been or is
being submitted for any other qualification at any other university.

Acknowledgements
I have been tremendously fortunate to spend the past four years on the Wellcome
Trust Genome Campus at the Sanger Institute and the European Bioinformatics Institute.
I would like to thank foremost my main collaborators on the studies described in this
thesis: Paul Gardner and Gemma Langridge. Their contributions and support have
been invaluable. I would also like to thank my supervisor, Alex Bateman, for giving
me the freedom to pursue a wide range of projects during my time in his group and for
advice. Many others have influenced my thinking through collaborations and discussions;
in no particular order: Amy Cain, Christine Boinett, Oscar Westesson (UC Berkeley),
Ian Holmes (UC Berkeley), Leo Parts, Zasha Weinberg (Yale University/HHMI), Nick
Thomson, Julian Parkhill, Chinyere Okoro, Sandra Reuter, Nick Croucher, Thomas Dan
Otto, Simon Harris, Rob Kingsley, Melissa Martin (London School of Hygiene & Tropical
Medicine), John Wain (University of East Anglia), Theresa Feltwell, Helena Seth-Smith,
Eric Nawrocki (Janelia Farm Research Campus), Sean Eddy (Janelia Farm Research
Campus), Anton Enright, Marija Buljan, Derek Pickard, Marco Punta, Fabian Schreiber,
Sarah Burge, John Marioni, Keith Turner, and Nick Feasey. I am sure I have forgotten
still more who deserve my thanks. Finally, I would like to especially thank Joanne Chung
and Gomi Jung.
It’s been a gas.
21 August 2013
Cambridge, UK

Abstract
The work in this thesis is concerned with the study of bacterial adaptation on short
and long timescales. In the first section, consisting of three chapters, I describe a
recently developed high-throughput technology for probing gene function, transposon-
insertion sequencing, and its application to the study of functional differences between two
important human pathogens, Salmonella enterica subspecies enterica serovars Typhi and
Typhimurium. In a first study, I use transposon-insertion sequencing to probe differences
in gene requirements during growth on rich laboratory media, revealing differences in
serovar requirements for genes involved in iron-utilization and cell-surface structure
biogenesis, as well as in requirements for non-coding RNA. In a second study I more
directly probe the genomic features responsible for differences in serovar pathogenicity by
analyzing transposon-insertion sequencing data produced following a two hour infection
of human macrophage, revealing large differences in the selective pressures felt by these
two closely related serovars in the same environment.
The second section, consisting of two chapters, uses statistical models of sequence
variation, i.e. covariance models, to examine the evolution of intrinsic termination across
the bacterial kingdom. A first collaborative study provides background and motivation in
the form of a method for identifying Rho-independent terminators using covariance models
built from deep alignments of experimentally-verified terminators from Escherichia coli
and Bacillus subtilis. In the course of the development of this method I discovered a novel
putative intrinsic terminator in Mycobacterium tuberculosis. In the final chapter, I extend
this approach to de novo discovery of intrinsic termination motifs across the bacterial
phylogeny. I present evidence for lineage-specific variations in canonical Rho-independent
terminator composition, as well as discover seven non-canonical putative termination
motifs. Using a collection of publicly available RNA-seq datasets, I provide evidence for
the function of some of these elements as bona fide transcriptional attenuators.

Contents
Declaration iii
Contents ix
List of Figures xiii
List of Tables xv
List of Symbols xxii
Introduction xxiii
1 Querying bacterial genomes with transposon-insertion sequencing 1
1.1 Introduction . . . . . . . . . . . . . . . . . . . . . . . . . . . . . . . . . . 1
1.2 Protocols . . . . . . . . . . . . . . . . . . . . . . . . . . . . . . . . . . . 7
1.2.1 Transposon mutagenesis . . . . . . . . . . . . . . . . . . . . . . . 8
1.2.2 Pool construction . . . . . . . . . . . . . . . . . . . . . . . . . . . 9
1.2.3 Enrichment of transposon-insertion junctions . . . . . . . . . . . . 9
1.2.4 Sequencing . . . . . . . . . . . . . . . . . . . . . . . . . . . . . . 10
1.3 Reproducibility, accuracy, and concordance with previous methods . . . . 11
1.4 Identifying gene requirements . . . . . . . . . . . . . . . . . . . . . . . . 12
1.5 Determining conditional gene requirements . . . . . . . . . . . . . . . . . 14
1.6 Monitoring ncRNA contributions to fitness . . . . . . . . . . . . . . . . . 16
1.7 Limitations . . . . . . . . . . . . . . . . . . . . . . . . . . . . . . . . . . 18
1.8 The future of transposon-insertion sequencing . . . . . . . . . . . . . . . 19
2 A comparison of dense transposon insertion libraries in the Salmonella
serovars Typhi and Typhimurium 21
2.1 Introduction . . . . . . . . . . . . . . . . . . . . . . . . . . . . . . . . . . 21
2.1.1 The genus Salmonella . . . . . . . . . . . . . . . . . . . . . . . . 22
2.1.2 Host adaptation and restriction . . . . . . . . . . . . . . . . . . . 25
2.1.3 Serovars Typhi and Typhimurium . . . . . . . . . . . . . . . . . . 26
2.2 Materials and Methods . . . . . . . . . . . . . . . . . . . . . . . . . . . . 29
2.2.1 Strains . . . . . . . . . . . . . . . . . . . . . . . . . . . . . . . . . 29
2.2.2 Annotation . . . . . . . . . . . . . . . . . . . . . . . . . . . . . . 29
2.2.3 Creation of S. Typhimurium transposon mutant library . . . . . . 29
2.2.4 DNA manipulations and sequencing . . . . . . . . . . . . . . . . . 30
2.2.5 Sequence analysis . . . . . . . . . . . . . . . . . . . . . . . . . . . 30
2.2.6 Statistical analysis of required genes . . . . . . . . . . . . . . . . 30
2.3 Results and Discussion . . . . . . . . . . . . . . . . . . . . . . . . . . . . 31
2.3.1 TraDIS assay of every Salmonella Typhimurium protein-coding gene 31
2.3.2 Cross-species comparison of genes required for growth . . . . . . . 33
2.3.3 Serovar-specific genes required for growth . . . . . . . . . . . . . . 38
2.3.4 TraDIS provides resolution sufficient to evaluate ncRNA contribu-
tions to fitness . . . . . . . . . . . . . . . . . . . . . . . . . . . . 51
2.3.5 sRNAs required for competitive growth . . . . . . . . . . . . . . . 55
2.4 Conclusions . . . . . . . . . . . . . . . . . . . . . . . . . . . . . . . . . . 57
3 Methods for the analysis of TraDIS experiments, with an application
to Salmonella macrophage invasion 61
3.1 Introduction . . . . . . . . . . . . . . . . . . . . . . . . . . . . . . . . . . 61
3.1.1 Salmonella interactions with macrophage . . . . . . . . . . . . . . 62
3.1.2 Conditional gene fitness . . . . . . . . . . . . . . . . . . . . . . . 63
3.2 Experimental methods . . . . . . . . . . . . . . . . . . . . . . . . . . . . 65
3.2.1 Strains and cell lines . . . . . . . . . . . . . . . . . . . . . . . . . 65
3.2.2 Preparation of THP-1 cells . . . . . . . . . . . . . . . . . . . . . . 65
3.2.3 Preparation of transposon libraries . . . . . . . . . . . . . . . . . 66
3.2.4 Infection assay . . . . . . . . . . . . . . . . . . . . . . . . . . . . 66
3.3 Analysis of conditional gene fitness using TraDIS . . . . . . . . . . . . . 67
3.3.1 Experimental design . . . . . . . . . . . . . . . . . . . . . . . . . 67
3.3.2 Mapping insertion sites . . . . . . . . . . . . . . . . . . . . . . . . 67
3.3.3 Quality control . . . . . . . . . . . . . . . . . . . . . . . . . . . . 68
3.3.4 Inter-library normalization . . . . . . . . . . . . . . . . . . . . . . 71
3.3.5 Identifying fitness effects . . . . . . . . . . . . . . . . . . . . . . . 72
3.3.5.1 Theory . . . . . . . . . . . . . . . . . . . . . . . . . . . 72
3.3.5.2 Application to macrophage infection data . . . . . . . . 75
3.3.6 Functional analysis of gene sets that affect fitness . . . . . . . . . 77
3.4 Results and Discussion . . . . . . . . . . . . . . . . . . . . . . . . . . . . 79
4 Detecting Rho-independent terminators in genomic sequence with co-
variance models 89
4.1 Introduction . . . . . . . . . . . . . . . . . . . . . . . . . . . . . . . . . . 89
4.1.1 Rho-independent termination . . . . . . . . . . . . . . . . . . . . 90
4.1.2 Previous approaches to identifying intrinsic terminators . . . . . . 91
4.1.3 Covariance models . . . . . . . . . . . . . . . . . . . . . . . . . . 93
4.2 Methods . . . . . . . . . . . . . . . . . . . . . . . . . . . . . . . . . . . . 95
4.2.1 Construction of a covariance model for Rho-independent terminators 95
4.2.2 RNIE run modes . . . . . . . . . . . . . . . . . . . . . . . . . . . 96
4.2.3 Definitions . . . . . . . . . . . . . . . . . . . . . . . . . . . . . . . 97
4.3 Results . . . . . . . . . . . . . . . . . . . . . . . . . . . . . . . . . . . . . 99
4.3.1 Alpha benchmark . . . . . . . . . . . . . . . . . . . . . . . . . . . 99
4.3.2 Beta benchmark . . . . . . . . . . . . . . . . . . . . . . . . . . . . 100
4.3.3 A novel termination motif in Mycobacterium tuberculosis . . . . . 102
5 Kingdom-wide discovery of bacterial intrinsic termination motifs 107
5.1 Introduction . . . . . . . . . . . . . . . . . . . . . . . . . . . . . . . . . . 107
5.2 Methods . . . . . . . . . . . . . . . . . . . . . . . . . . . . . . . . . . . . 108
5.2.1 Genome-wise motif discovery . . . . . . . . . . . . . . . . . . . . 108
5.2.2 Clustering covariance models . . . . . . . . . . . . . . . . . . . . . 109
5.2.3 Building consensus covariance models . . . . . . . . . . . . . . . . 110
5.2.4 Genome annotation . . . . . . . . . . . . . . . . . . . . . . . . . . 110
5.2.5 Analysis of expression data . . . . . . . . . . . . . . . . . . . . . . 111
5.3 Results . . . . . . . . . . . . . . . . . . . . . . . . . . . . . . . . . . . . . 112
5.3.1 Kingdom-wide motif discovery . . . . . . . . . . . . . . . . . . . . 112
5.3.2 Canonical RIT diversity . . . . . . . . . . . . . . . . . . . . . . . 117
5.3.2.1 Validating RIT activity with RNA-seq . . . . . . . . . . 118
5.3.2.2 Lineage-specific enrichment of canonical RIT clusters . . 119
5.3.3 Non-canonical putative attenuation motifs . . . . . . . . . . . . . 122
5.3.3.1 The Neisserial DNA uptake sequence TAM . . . . . . . 122
5.3.3.2 The Actinobacterial TAM . . . . . . . . . . . . . . . . . 124
5.3.3.3 Type 1 integron attC sites . . . . . . . . . . . . . . . . . 125
5.3.3.4 Other non-canonical TAMs . . . . . . . . . . . . . . . . 127
5.4 Discussion . . . . . . . . . . . . . . . . . . . . . . . . . . . . . . . . . . . 127
Publications 129
Appendix A: Supplementary data for chapters 2 and 3 133
Appendix B: Genomic sequences analyzed for termination motifs 135
References 161
List of Figures
1.1 Transposon-insertion sequencing protocols . . . . . . . . . . . . . . . . . 7
1.2 Applications of transposon-insertion sequencing to non-coding RNAs . . 17
2.1 Genomic acquisitions in the evolution of the salmonellae . . . . . . . . . 23
2.2 The distribution of gene-wise insertion indexes in S. Typhi . . . . . . . . 32
2.3 Genome-wide transposon mutagenesis of S. Typhimurium . . . . . . . . . 34
2.4 Comparison of required genes . . . . . . . . . . . . . . . . . . . . . . . . 35
2.5 Comparison of cell surface operon structure and requirements . . . . . . 44
2.6 H-NS enrichment across the SPI-2 locus . . . . . . . . . . . . . . . . . . 46
2.7 Proposed differences in sRNA utilization . . . . . . . . . . . . . . . . . . 56
3.1 Biogenesis of the Samonella containing vacuole . . . . . . . . . . . . . . 64
3.2 Principal component analysis of TraDIS macrophage infection assays . . 70
3.3 Smear plot of differences in logFC over macrophage infection between S.
Typhimurium and S. Typhi . . . . . . . . . . . . . . . . . . . . . . . . . 76
3.4 Smear plot of logFC in mutant prevalences over macrophage infection in
S. Typhimurium . . . . . . . . . . . . . . . . . . . . . . . . . . . . . . . . 77
3.5 Smear plot of logFC in mutant prevalences over macrophage infection in
S. Typhi . . . . . . . . . . . . . . . . . . . . . . . . . . . . . . . . . . . . 78
3.6 Walking hypergeometric test for depletion of insertions in the S. Ty-
phimurium flagellar subsystem . . . . . . . . . . . . . . . . . . . . . . . . 80
3.7 Mutant depletion in the S. Typhimurium flagellar subsystem . . . . . . . 82
4.1 Rho-independent termination . . . . . . . . . . . . . . . . . . . . . . . . 90
4.2 TransTermHP motif . . . . . . . . . . . . . . . . . . . . . . . . . . . . . 92
4.3 Covariance model architecture . . . . . . . . . . . . . . . . . . . . . . . . 94
4.4 Alpha benchmark . . . . . . . . . . . . . . . . . . . . . . . . . . . . . . . 100
4.5 Beta benchmark . . . . . . . . . . . . . . . . . . . . . . . . . . . . . . . . 102
4.6 Putative mycobacterial transcription termination motif . . . . . . . . . . 104
5.1 Example alignment of cluster consensus sequences . . . . . . . . . . . . . 114
5.2 Most informative sequences for nine canonical RIT clusters . . . . . . . . 117
5.3 Analysis of diverse RNA-seq datasets confirm canonical terminator activity119
5.4 Canonical RIT enrichment on the NCBI taxonomy . . . . . . . . . . . . 121
5.5 Neisserial DNA uptake sequence terminator . . . . . . . . . . . . . . . . 123
5.6 Actinobacterial TAM . . . . . . . . . . . . . . . . . . . . . . . . . . . . . 124
5.7 Type 1 integron attC sites . . . . . . . . . . . . . . . . . . . . . . . . . . 126
List of Tables
1.1 Summary of transposon-insertion sequencing studies to date . . . . . . . 4
2.1 Core genome functions in S. Typhimurium . . . . . . . . . . . . . . . . . 37
2.2 Phage elements in S. Typhimurium . . . . . . . . . . . . . . . . . . . . . 39
2.3 Phage elements in S. Typhi . . . . . . . . . . . . . . . . . . . . . . . . . 40
2.4 Genes uniquely required in S. Typhimurium . . . . . . . . . . . . . . . . 42
2.5 Candidate required genes affected by H-NS binding in S. Typhimurium . 48
2.6 Genes uniquely required in S. Typhi . . . . . . . . . . . . . . . . . . . . . 50
2.7 Candidate required ncRNAs . . . . . . . . . . . . . . . . . . . . . . . . . 54
3.1 Summary statistics for macrophage infection assay sequencing runs . . . 68
3.2 Pearson’s r between replicated TraDIS experiments . . . . . . . . . . . . 69
3.3 S. Typhimurium pathways putatively involved in macrophage infection . 81
3.4 Bacterial secretion system genes implicated in S. Typhimurium infection
of macrophages . . . . . . . . . . . . . . . . . . . . . . . . . . . . . . . . 83
3.5 Genes putatively involved in S. Typhi infection of macrophages . . . . . 84
4.1 Control genomes . . . . . . . . . . . . . . . . . . . . . . . . . . . . . . . 98

List of Symbols
Roman Symbols
A, C, G, T, U Adenine, Cytosine, Guanine, Thymine, Uracil
Fe(II) Ferrous iron
Fe(III) Ferric iron
Greek Symbols
λ Phage lambda
σE σ24, extracytoplasmic stress sigma factor
σS σ38, starvation/stationary phase sigma factor
Amino Acids
Ala, A Alanine
Arg, R Arginine
Asn, N Asparagine
Asp, D Aspartic acid (Aspartate)
Cys, C Cysteine
Gln, Q Glutamine
Glu, E Glutamic acid (Glutamate)
Gly, G Glycine
His, H Histidine
Ile, I Isoleucine
Leu, L Leucine
Lys, K Lysine
Met, M Methionine
Phe, F Phenylalanine
Pro, P Proline
Ser, S Serine
Thr, T Threonine
Trp, W Tryptophan
Tyr, Y Tyrosine
Val, V Valine
Acronyms and Abbreviations
BALB Bagg albino (mouse)
BLAST Basic local alignment search tool
bp Base pair
CCAL Creative Commons attribution license
CCD Charge-coupled device
CDP Cytidine diphosphate glucose
ChIP-seq Chromatin immunoprecipitation sequencing
cI Clear 1 (λ repressor protein)
CM Covariance model
CPM Counts per million (reads)
CYK Cocke-Younger-Kasami (algorithm)
ddNTP dideoxynucletoide
DeADMAn Designer microarrays for defined mutant analysis
DNA Deoxyribonucleic acid
dNTP deoxynucleotide
DSB Disulfide bond
DUS DNA uptake sequence
E-value Expect value
ECA Enterobacterial common antigen
EHEC Enterohemorrhagic Escherichia coli
EM Expectation-maximization
FASTA Fast alignment
FDR False discovery rate
FMN Flavin mononucleotide
FPR False positive rate
GEBA Genomic encyclopedia of bacteria and archea
GLM Generalized linear model
GO Gene ontology
HIRAN HIP116, Rad5p N-terminal
HITS High-throughput insertion tracking by deep sequencing
HMM Hidden Markov model
iid Independent identically distributed (random variable)
INSeq Insertion sequencing
kb Kilobase
KEGG Kyoto encyclopedia of genes and genomes
LEE Locus of enterocyte effacement
LLR log2-likelihood ratios
logFC Log2 fold-change
LPS Lipopolysaccharide
MATT Microarray tracking of transposon mutants
Mb Megabase
MCC Matthews correlation coefficient
MFE Minimum free energy
MIS Most informative sequence
ncRNA non-coding RNA
NOGD Nonorthologous gene displacement
OMP Outer membrane protein
ORF Open reading frame
PAGE Polyacrylamide gel electrophoresis
PBS Phosphate-buffered saline
PCA Principal component analysis
PCR Polymerase chain reaction
PMA Phorbol myristate acetate
PPV Positive predictive value
RIT Rho-independent terminator
RNA Ribonucleic acid
RNA-seq RNA sequencing
RNAP RNA polymerase
RNase Ribonuclease
RPMI Rosewell Park Memorial Institute (cell culture medium)
RSS Reciprocal similarity score
SAGE Serial analysis of gene expression
SCV Salmonella containing vacuole
SPI Salmonella pathogenicity island
SPV Salmonella plasmid virulence (genes)
sRNA Bacterial small RNA
SRP Signal recognition particle
STM Signature-tagged mutagenesis
T3SS Type III secretion system
TAM terminus associated motif
TMM Trimmed mean of M-values
tmRNA Transfer-messenger RNA
Tn-seq Transposon mutagenesis and sequencing
TNF-α Tumor necrosis factor α

TraDIS Transposon directed insertion sequencing
TraSH Transposon site hybridization
TRIT Tuberculosis Rho-independent terminator
tRNA Transfer RNA
Introduction
Bacteria possess a remarkable ability to adapt. This ability has allowed bacteria to
colonize almost every environment on Earth, from deep sea hydrothermal vents (Jørgensen
et al., 1992) to cryogenic brine lakes (Murray et al., 2012) to animal hosts (Finlay et al.,
1997). Indeed, the ability of bacteria to establish symbiotic relationships with host
cells was a critical step in the origin of so-called “higher” eukaryotic life (Sagan, 1967).
While the origins of some bacterial adaptations are buried in the deep time of over
1.5 billion years of evolution (Doolittle et al., 1996), such as the differing bauplans
observed across phyla, others are far more recent, such as the emergence of Yersinia
pestis as a human pathogen around 20,000 years ago (Achtman et al., 1999) or the
contemporary development of specialized invasive lineages of non-typhoidal Salmonella
in immunocompromised individuals in sub-Saharan Africa (Feasey et al., 2012; Okoro
et al., 2012). Many factors likely contribute to this continuous adaptation, including large
population sizes, short generation times, wide-spread homologous recombination between
related strains, and a capacity for horizontal gene transfer. These factors, particularly
homologous recombination and horizontal gene transfer, make the definition of species
in bacteria contentious (Achtman et al., 2008; Doolittle et al., 2009), and have led to
some questioning the viability of a bacterial species concept altogether. For the present
I will leave these matters to those better informed than myself, and work within the
established, though flawed, taxonomy.
The work in this thesis is concerned with the study of bacterial evolution and
adaptation on two very different time scales. In the first section, consisting of chapters
1, 2, and 3, I describe a recently emerged high-throughput technology for probing gene
function, transposon-insertion sequencing (Barquist et al., 2013a), and its application
to the study of functional differences in two important human pathogens, Salmonella
enterica subspecies enterica serovars Typhi and Typhimurium. These two serovars
diverged only approximately 50,000 years ago (Kidgell et al., 2002), yet have developed
very different host ranges and cause very different diseases, with S. Typhi causing a
life-threatening systemic disease exclusively in humans, and S. Typhi causing primarily a
mild gastrointestinal disease in a wide range of hosts. Chapter 2 uses transposon-insertion
sequencing to probe differences in gene requirements during growth on rich laboratory
media, revealing differences in requirements for genes involved in iron-utilization and
cell-surface structure biogenesis, as well as in requirements for non-coding RNA (Barquist
et al., 2013b). In chapter 3 I more directly probe the genomic features responsible for
differences in serovar pathogenicity by analyzing transposon-insertion sequencing data
produced following a two hour infection of human macrophage, revealing large differences
in the selective pressures felt by these two closely related strains in the same environment.
The second section, chapters 4 and 5, uses statistical models of sequence variation,
i.e. covariance models, to examine the evolution of intrinsic termination across the
bacterial kingdom. Chapter 4 provides background and motivation in the form of a
method for identifying Rho-independent terminators using covariance models built from
deep alignments of experimentally-verified terminators from Escherichia coli and Bacillus
subtilis (Gardner et al., 2011). In the course of the development of this method I
discovered a novel putative intrinsic terminator in Mycobacterium tuberculosis. In chapter
5, I extend this approach to de novo discovery of intrinsic termination motifs across
the bacterial phylogeny. I present evidence for lineage-specific variations in canonical
Rho-independent terminator composition, as well as discover seven non-canonical putative
termination motifs. Using a collection of publicly available RNA-seq datasets, I provide
evidence for the function of these elements as bona fide transcriptional attenuators.
Chapter 1
Querying bacterial genomes with
transposon-insertion sequencing
This chapter is an expansion of the previously published article “Approaches to querying
bacterial genomes using transposon-insertion sequencing” (Barquist et al., 2013a). Amy
K. Cain and Christine J. Boinett (Pathogen Genomics, Wellcome Trust Sanger Institute)
contributed to the research of the original article. All final language is my own.
1.1 Introduction
The study of gene essentiality has its roots in evolutionary theory, systems biology, and
comparative genomics, and has been instrumental in the development of the emerging
discipline of synthetic biology. Koonin summarizes the major scientific motivation
behind this line of research succinctly: “When reverse-engineering a complex machine,
one basic goal is to draw up a list of essential parts” (Koonin, 2003). The earliest
attempt at constructing such a minimal gene set involved a comparison between the first
two complete genomes sequenced: Mycoplasma genitalium and Haemophilus influenzae
(Mushegian et al., 1996). Both of these organisms are pathogens with highly reduced
genomes; however, they are derived from distant branches of the bacterial phylogeny
being Gram-positive and -negative, respectively. Orthology prediction based on sequence
similarity identified 240 genes shared between the two organisms. However, a number
of essential pathways were found to be incomplete in this set due to non-orthologous
1
Chapter 1. Querying bacterial genomes with transposon-insertion sequencing
gene displacement (NOGD), and a true minimal gene set was estimated to contain 256
genes. NOGD apparently occurs when an unrelated but functionally analogous gene
is introduced in a lineage, and subsequently the ancestral gene is lost. The sequencing
of complete genomes has shown that this phenomena is surprisingly wide-spread, and
only ∼60 genes appear to be universally conserved (Koonin, 2003). Rather obviously
in hindsight, it appears that gene essentiality is highly dependent on the evolutionary
and systems context in which the gene occurs - our essential parts list depends on the
machine we wish to build.
Large-scale experimental studies seem to confirm this. A range of approaches have
been taken to experimentally determining the ‘essential’ genes of a diverse array of
organisms. These include plasmid-insertion mutagenesis in Bacillus subtilis (Kobayashi
et al., 2003), antisense-mediated gene inactivation in Haemophilus influenzae (Akerley et
al., 2002), transposon mutagenesis in Pseudomonas aerguinosa (Jacobs et al., 2003), and
insertion-duplication mutagenesis in Salmonella enterica (Knuth et al., 2004). However,
the “gold standard” for the determination of gene essentiality is repeated failure to
generate targeted single gene deletions. Comprehensive single gene deletion libraries
libraries have been created for the γ-proteobacteria E. coli and Acinetobacter baylyi
(Baba et al., 2006; Berardinis et al., 2008) where λ-red mediated recombineering has
simplified the generation of defined deletions (Datsenko et al., 2000), though the process
is still extremely labor-intensive. Typical estimates for essential gene sets determined
by these various techniques range from less than 300 to 600 genes, depending on the
organism. This variability is likely dependent on a variety of factors, including false
positives and negatives due to experimental techniques, the growth conditions of the
experiment, intrinsic properties of the cell being manipulated, and accidents of evolution.
Now that it has become feasible to synthesize a viable bacterial chromosome (Gibson
et al., 2010), a deeper understanding of the factors affecting gene requirements in diverse
conditions is the next hurdle on the road to engineering truly synthetic life.
A common approach to identifying genomic regions required for survival under a
particular set of conditions is to screen large pools of mutants simultaneously. This can be
done with defined mutants (Baba et al., 2006; Hobbs et al., 2010), but this is both labor-
intensive and requires accurate genomic annotation, which can be particularly difficult to
define for non-coding regions. An alternative to defined libraries is the construction and
analysis of random transposon-insertion libraries. The original application of this method
2
Chapter 1. Querying bacterial genomes with transposon-insertion sequencing
used DNA hybridization to track uniquely tagged transposon-insertions in Salmonella
enterica serovar Typhimurium over the course of BALB/c mouse infection (Hensel et al.,
1995). DNA hybridization was eventually superseded by methods that used microarray
detection of the genomic DNA flanking insertion sites, variously known as TraSH, MATT,
and DeADMAn (reviewed in Mazurkiewicz et al., 2006). However, these methods suffered
from many of the problems microarrays generally suffer from: difficulty detecting low-
abundance transcripts, mis-hybridization, probe saturation, and difficulty identifying
insertion sites precisely.
The application of high-throughput sequencing to the challenge of determining
insertion location and prevalence solves many of these problems. Interestingly, the
first application of transposon-insertion sequencing, developed by Hutchison et al. (1999),
actually predates the development of microarray-based methods. However, this was
applied to libraries of only approximately 1000 transposon mutants in highly reduced
Mycoplasma genomes, and the difficulty of sequencing at the time prevented wide spread
adoption or high resolution. Modern high-throughput sequencing technology allows the
methods discussed in this chapter to routinely monitor as many as one million mutants
simultaneously in virtually any genetically tractable microorganism.
3
Chapter 1. Querying bacterial genomes with transposon-insertion sequencing
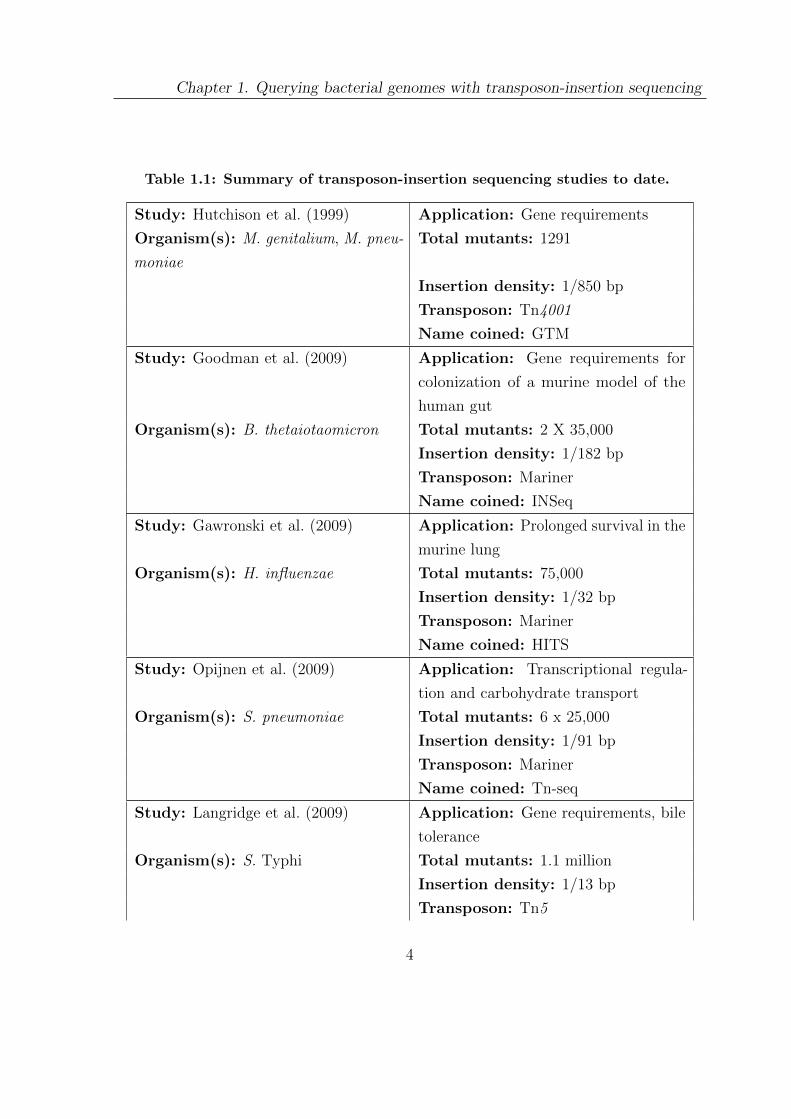
Table 1.1: Summary of transposon-insertion sequencing studies to date.
Study: Hutchison et al. (1999) Application: Gene requirements
Organism(s): M. genitalium, M. pneu-
moniae
Total mutants: 1291
Insertion density: 1/850 bp
Transposon: Tn4001
Name coined: GTM
Study: Goodman et al. (2009) Application: Gene requirements for
colonization of a murine model of the
human gut
Organism(s): B. thetaiotaomicron Total mutants: 2 X 35,000
Insertion density: 1/182 bp
Transposon: Mariner
Name coined: INSeq
Study: Gawronski et al. (2009) Application: Prolonged survival in the
murine lung
Organism(s): H. influenzae Total mutants: 75,000
Insertion density: 1/32 bp
Transposon: Mariner
Name coined: HITS
Study: Opijnen et al. (2009) Application: Transcriptional regula-
tion and carbohydrate transport
Organism(s): S. pneumoniae Total mutants: 6 x 25,000
Insertion density: 1/91 bp
Transposon: Mariner
Name coined: Tn-seq
Study: Langridge et al. (2009) Application: Gene requirements, bile
tolerance
Organism(s): S. Typhi Total mutants: 1.1 million
Insertion density: 1/13 bp
Transposon: Tn5
4
Chapter 1. Querying bacterial genomes with transposon-insertion sequencing
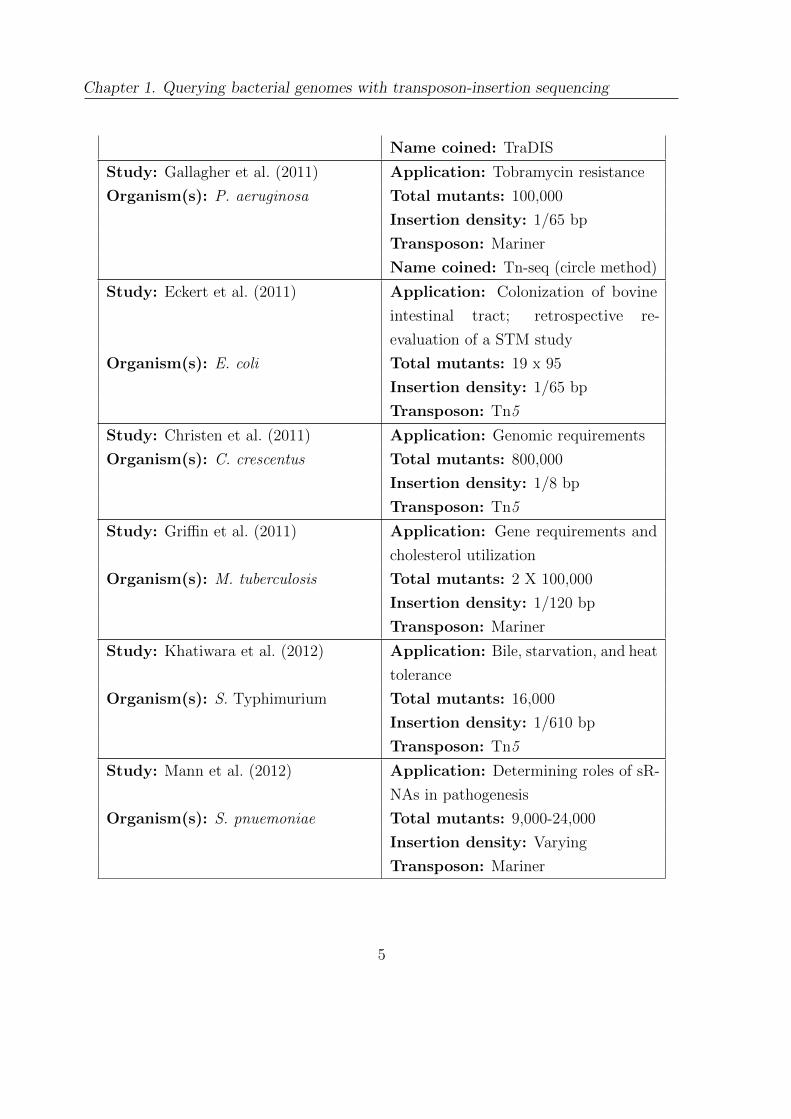
Name coined: TraDIS
Study: Gallagher et al. (2011) Application: Tobramycin resistance
Organism(s): P. aeruginosa Total mutants: 100,000
Insertion density: 1/65 bp
Transposon: Mariner
Name coined: Tn-seq (circle method)
Study: Eckert et al. (2011) Application: Colonization of bovine
intestinal tract; retrospective re-
evaluation of a STM study
Organism(s): E. coli Total mutants: 19 x 95
Insertion density: 1/65 bp
Transposon: Tn5
Study: Christen et al. (2011) Application: Genomic requirements
Organism(s): C. crescentus Total mutants: 800,000
Insertion density: 1/8 bp
Transposon: Tn5
Study: Griffin et al. (2011) Application: Gene requirements and
cholesterol utilization
Organism(s): M. tuberculosis Total mutants: 2 X 100,000
Insertion density: 1/120 bp
Transposon: Mariner
Study: Khatiwara et al. (2012) Application: Bile, starvation, and heat
tolerance
Organism(s): S. Typhimurium Total mutants: 16,000
Insertion density: 1/610 bp
Transposon: Tn5
Study: Mann et al. (2012) Application: Determining roles of sR-
NAs in pathogenesis
Organism(s): S. pnuemoniae Total mutants: 9,000-24,000
Insertion density: Varying
Transposon: Mariner
5
Chapter 1. Querying bacterial genomes with transposon-insertion sequencing
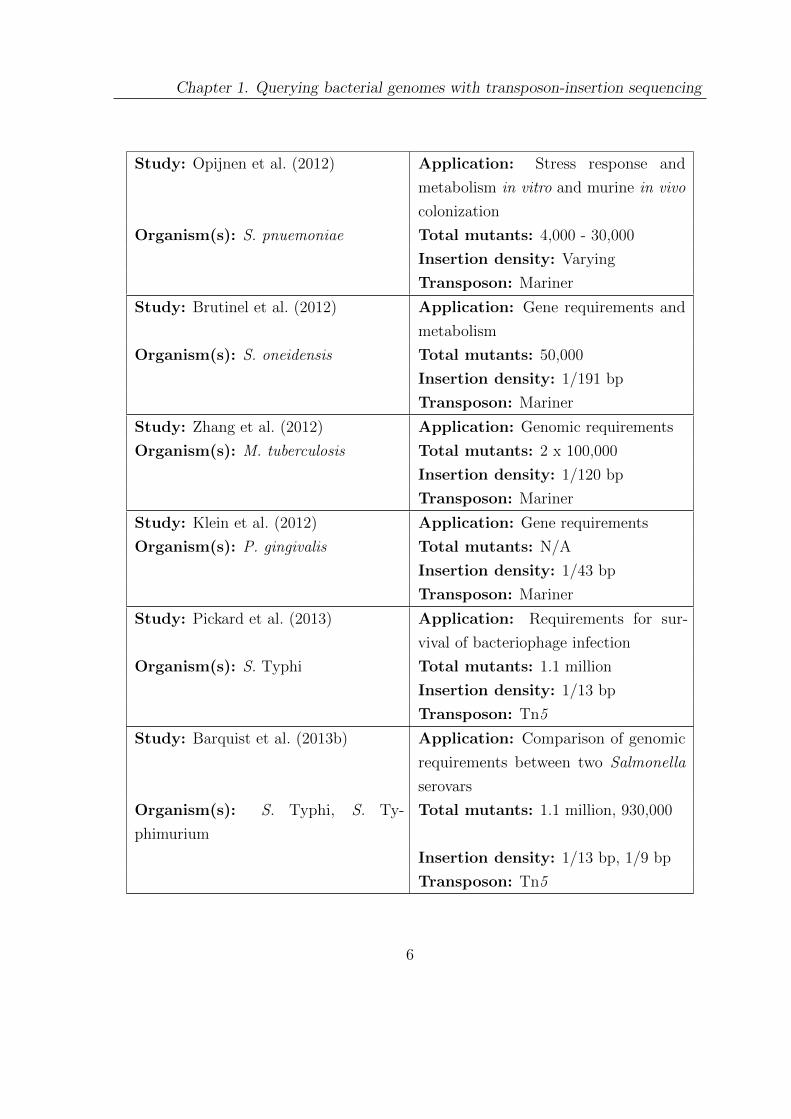
Study: Opijnen et al. (2012) Application: Stress response and
metabolism in vitro and murine in vivo
colonization
Organism(s): S. pnuemoniae Total mutants: 4,000 - 30,000
Insertion density: Varying
Transposon: Mariner
Study: Brutinel et al. (2012) Application: Gene requirements and
metabolism
Organism(s): S. oneidensis Total mutants: 50,000
Insertion density: 1/191 bp
Transposon: Mariner
Study: Zhang et al. (2012) Application: Genomic requirements
Organism(s): M. tuberculosis Total mutants: 2 x 100,000
Insertion density: 1/120 bp
Transposon: Mariner
Study: Klein et al. (2012) Application: Gene requirements
Organism(s): P. gingivalis Total mutants: N/A
Insertion density: 1/43 bp
Transposon: Mariner
Study: Pickard et al. (2013) Application: Requirements for sur-
vival of bacteriophage infection
Organism(s): S. Typhi Total mutants: 1.1 million
Insertion density: 1/13 bp
Transposon: Tn5
Study: Barquist et al. (2013b) Application: Comparison of genomic
requirements between two Salmonella
serovars
Organism(s): S. Typhi, S. Ty-
phimurium
Total mutants: 1.1 million, 930,000
Insertion density: 1/13 bp, 1/9 bp
Transposon: Tn5
6
Chapter 1. Querying bacterial genomes with transposon-insertion sequencing
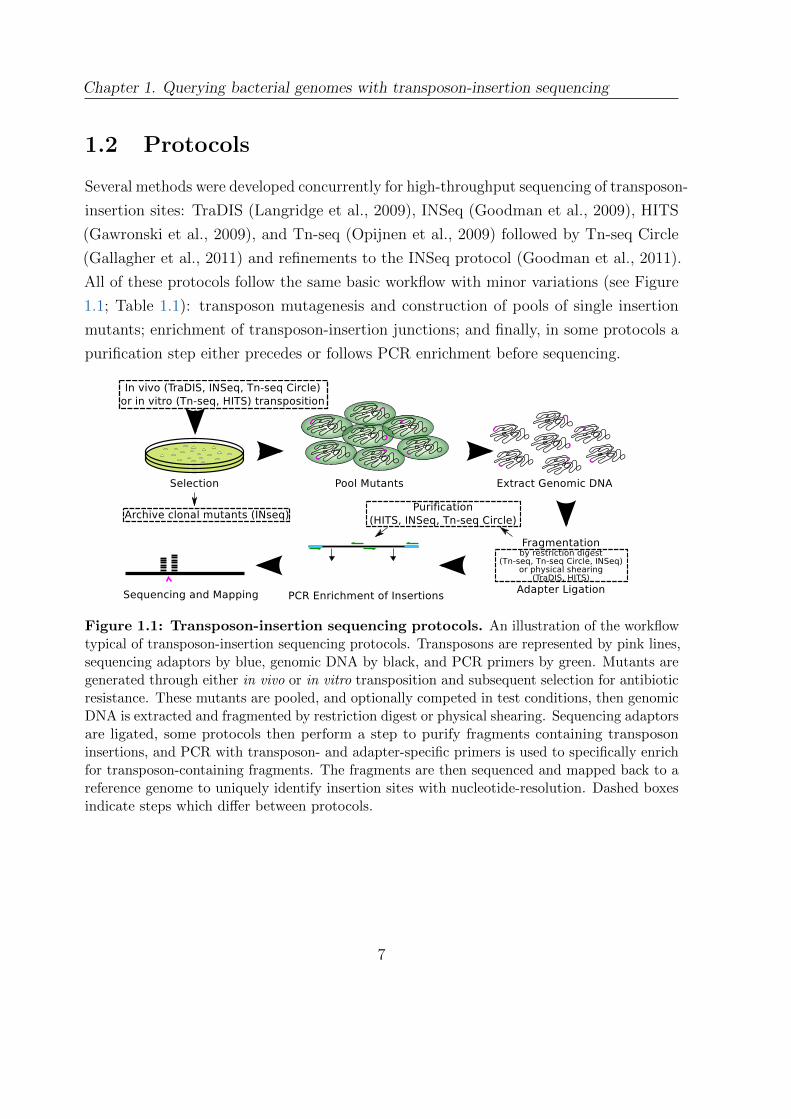
1.2 Protocols
Several methods were developed concurrently for high-throughput sequencing of transposon-
insertion sites: TraDIS (Langridge et al., 2009), INSeq (Goodman et al., 2009), HITS
(Gawronski et al., 2009), and Tn-seq (Opijnen et al., 2009) followed by Tn-seq Circle
(Gallagher et al., 2011) and refinements to the INSeq protocol (Goodman et al., 2011).
All of these protocols follow the same basic workflow with minor variations (see Figure
1.1; Table 1.1): transposon mutagenesis and construction of pools of single insertion
mutants; enrichment of transposon-insertion junctions; and finally, in some protocols a
purification step either precedes or follows PCR enrichment before sequencing.
Figure 1.1: Transposon-insertion sequencing protocols. An illustration of the workflowtypical of transposon-insertion sequencing protocols. Transposons are represented by pink lines,sequencing adaptors by blue, genomic DNA by black, and PCR primers by green. Mutants aregenerated through either in vivo or in vitro transposition and subsequent selection for antibioticresistance. These mutants are pooled, and optionally competed in test conditions, then genomicDNA is extracted and fragmented by restriction digest or physical shearing. Sequencing adaptorsare ligated, some protocols then perform a step to purify fragments containing transposoninsertions, and PCR with transposon- and adapter-specific primers is used to specifically enrichfor transposon-containing fragments. The fragments are then sequenced and mapped back to areference genome to uniquely identify insertion sites with nucleotide-resolution. Dashed boxesindicate steps which differ between protocols.
7
Chapter 1. Querying bacterial genomes with transposon-insertion sequencing
1.2.1 Transposon mutagenesis
Most studies have used either Tn5 or Mariner transposon derivatives. Tn5 originated as
a bacterial transposon which has been adapted for laboratory use. Large-scale studies
have shown that Tn5, while not showing any strong preference for regional GC-content,
does have a weak preference for a particular insertion motif (Shevchenko et al., 2002;
Adey et al., 2010; Green et al., 2012). Transposon-insertion sequencing studies performed
with Tn5 transposons in S. enterica serovars have reported a slight bias towards AT-rich
sequence regions (Langridge et al., 2009; Barquist et al., 2013b). However, this preference
does not appear to be a major obstacle to analysis given the extremely high insertion
densities obtained with this transposon (Langridge et al., 2009; Christen et al., 2011;
Barquist et al., 2013b) (see Table 1.1). Additionally, Tn5 has been shown to be active in
a wide range of bacterial species, though the number of transformants obtained can vary
significantly depending on the transformation efficiency of the host.
Mariner Himar1 transposons on the other hand originate from eukaryotic hosts and
have an absolute requirement for TA bases at their integration site (Lampe et al., 1998;
Rubin et al., 1999), with no other known bias besides a possible preference for bent
DNA (Lampe et al., 1998). This can be a disadvantage in that it limits the number of
potential insertion sites, particularly in GC-rich sequence. However, this specificity can
also be used in the prediction of gene essentiality in near-saturated libraries: as every
potential integration site is known and the probability of integration at any particular
site can be assumed to be roughly equal, it is straight-forward to calculate the probability
that any particular region lacks insertions by chance. Himar1 transposition can also be
conducted in vitro in the absence of any host factors (Lampe et al., 1996), and inserted
transposons can then be transferred to the genomes of naturally transformable bacteria
through homologous recombination (Johnsborg et al., 2007). This can be advantageous
when working with naturally transformable bacteria with poor electroporation efficiency
(Gawronski et al., 2009; Opijnen et al., 2009). It is worth noting that Tn5 is also capable
of transposition in vitro (Goryshin et al., 1998), and could potentially be used to increase
insertion density and hence the resolution of the assay, particularly in GC-rich genomic
regions.
8
Chapter 1. Querying bacterial genomes with transposon-insertion sequencing
1.2.2 Pool construction
Once mutants have been constructed, they are plated on an appropriate selective media for
the transposon chosen, and colonies are counted, picked, and pooled. A disadvantage of
this is that the mutants must be recreated for follow up or validation studies. Goodman
et al. introduced a clever way around this in the INSeq protocol: by individually
archiving mutants, then sequencing combinatorial mutant pools it is possible to uniquely
characterize 2n insertion mutants by sequencing only n pools (Goodman et al., 2009).
Each mutant is labelled with a unique binary string that indicates which pools it has been
added to. These binary strings can then be reconstructed for each insertion observed in
these pools by recording their presence or absence in sequencing data, providing a unique
pattern relating insertions to archived mutants. The authors control false identifications
due to errors in sequencing by requiring that each binary label have a minimum edit
distance to every other label, allowing for a robust association of labels with insertions
despite sometimes noisy sequencing data. As a proof of concept, the authors were able
to identify over 7,000 Bacteroides thetaiotaomicron mutants from only 24 sequenced
pools. This effectively uses methods for the generation of random transposon pools to
rapidly generate defined mutant arrays, though it is heavily dependent on liquid-handling
robotics.
1.2.3 Enrichment of transposon-insertion junctions
Once pools have been constructed they are grown in either selective or permissive condi-
tions, depending on the experiment, and then genomic DNA is extracted. Fragmentation
proceeds either through restriction digestion in the case of transposons modified to
contain appropriate sites (Goodman et al., 2009; Opijnen et al., 2009; Gallagher et al.,
2011) or via physical shearing (Langridge et al., 2009; Gawronski et al., 2009), then
sequencing adapters are ligated to the resulting fragments. PCR is performed on these
fragments using a transposon-specific primer and a sequencing adapter-specific primer to
enrich for fragments spanning the transposon-genomic DNA junction.
Some protocols purify fragments containing transposon insertions using biotinylated
primers (Gallagher et al., 2011; Goodman et al., 2011) or PAGE (Goodman et al.,
2009) before and/or after PCR enrichment. The purification step from the Tn-seq
Circle protocol is particularly unusual in that restriction digested fragments containing
9
Chapter 1. Querying bacterial genomes with transposon-insertion sequencing
transposon sequence are circularized before being treated with an exonuclease that
digests all fragments without transposon insertions, theoretically completely eliminating
background (Gallagher et al., 2011). Given the success of protocols that do not include a
purification step and the lack of systematic comparisons, it is currently unclear whether
including one provides any major advantages.
1.2.4 Sequencing
The protocol steps described so far are broadly similar to those used in microarray-
based studies of transposon mutant pools. The major advancement that has driven
transposon-insertion sequencing has been the recent development of second genera-
tion DNA sequencing technologies. For 30 years, DNA sequencing was dominated by
dideoxynucleotide, or Sanger, sequencing, first described by Sanger et al. (1977). Sanger
sequencing requires a clonal population of template DNA molecules, to which a primer
and a full complement of four deoxynucleotides (dNTPs) and a single species of dideoxynu-
cleotide (ddNTP) are added. DNA polymerase is then used to perform rounds of DNA
extension, with ddNTPs stochastically terminating the reaction, before the resulting
fragments are denatured and separated with gel electrophoresis. By running four such
reactions with each species of ddNTP, the sequence of the template molecule can be
determined by reading off bands on the gel. A number of advancements progressively
improved the throughput and decreased the cost of Sanger sequencing, including the
substitution of capillary electrophoresis for gel electrophoresis and the use of fluores-
cently labelled ddNTP (fluorescent dye-terminator sequencing) enabling sequencing in a
single reaction. However, even with these advances the throughput of Sanger sequencing
remained in the range of kilobases of sequence per hour, and costs remained high due to
requirements for template cloning and inherent limitations in the technology (Morozova
et al., 2008).
The development of second generation sequencing technologies in the early-mid 2000’s
broke these barriers to the adoption of sequencing as a routine experimental technique.
These technologies include Roche 454 pyrosequencing, Illumina/Solexa reversible termi-
nator sequencing, and ABI SOLiD parallel sequencing by ligation. While in principle any
of these technologies could be applicable to transposon-insertion sequencing, all studies
to date have used Solexa sequencing. Solexa sequencing is similar in principle to Sanger
10
Chapter 1. Querying bacterial genomes with transposon-insertion sequencing
sequencing, with two major innovations: the ability to generate arrayed clonal clusters
of template molecules on a glass flow cell (described by Fedurco et al. (2006)) allowing
for hundreds of thousands of simultaneous sequencing reactions, and the adoption of
reversible dye terminator chemistry (described by Bentley et al. (2008)) which allows
for fluorescently labelled terminators to be rapidly stripped of their fluorophore, their
termination reversed, and extension continued. By monitoring successive rounds of these
hundreds of thousands of parallel sequencing reactions with a CCD camera, the sequence
of a large population of template molecules can be determined quickly and simultaneously,
leading to current throughputs of megabases to gigabases of sequence per hour. As each
resulting read corresponds to a single template molecule, this technology is ideally suited
to monitoring populations of transposon mutants, providing an accurate digital count of
insertion prevalence.
1.3 Reproducibility, accuracy, and concordance with
previous methods
A number of studies have looked at the reproducibility of transposon-insertion sequencing.
Multiple studies using different protocol variations have repeatedly shown extremely
high reproducibility in the number of insertions per gene (correlations of 90%) in
replicates of the same library grown and sequenced independently (Goodman et al.,
2009; Opijnen et al., 2009; Gallagher et al., 2011), and good reproducibility (correlations
between 70-90%) in independently constructed unsaturated libraries (Opijnen et al., 2009;
Opijnen et al., 2012). Opijnen et al. (2012) compared traditional 1 X 1 competition
experiments between wild-type and mutant Streptococcus pneumoniae to results obtained
by transposon-insertion sequencing and showed that there was no significant difference in
results over a range of tested conditions. The accuracy of transposon-insertion sequencing
in determining library composition has also been assessed. Zhang et al. (2012) constructed
a library of identified transposon-insertion mutants in known relative quantities, and then
were able to recover the relative mutant prevalence with transposon-insertion sequencing.
Additionally, by estimating the number of PCR templates prior to enrichment, this study
showed that there is a high correlation between enrichment input and sequencing output.
Two studies have evaluated concordance between results obtained with transposon-
11
Chapter 1. Querying bacterial genomes with transposon-insertion sequencing
insertion sequencing and microarray monitoring of transposon insertions in order to
demonstrate the enhanced accuracy and dynamic range of sequencing over previous
methods. In the first, 19 libraries of 95 enterohemorrhagic Escherichia coli (EHEC)
transposon mutants that had previously been screened in cattle using signature-tagged
mutagenesis (STM) were pooled and re-evaluated using the TraDIS protocol (Eckert
et al., 2011). The original STM study had identified 13 insertions in 11 genes attenuating
intestinal colonization in a type III secretion system located in the locus of enterocyte
effacement (LEE) (Dziva et al., 2004). By applying sequencing to the same samples,
an additional 41 mutations in the LEE were identified, spanning a total of 21 genes.
Additional loci outside the LEE which have been previously implicated in intestinal
colonization but had not been detected by STM were also reported by TraDIS.
The second study re-evaluated genes required for optimal growth determined by TraSH
in Mycobacterium tuberculosis (Sassetti et al., 2003; Griffin et al., 2011). The greater
dynamic range of sequencing as compared to microarrays allowed easier discrimination
between insertions that were truly unviable and those that were only significantly
underrepresented. The authors estimate that genes called as required by sequencing
in their study are at least 100-fold underrepresented in the pool. In comparison, the
threshold in the previous microarray experiment reported genes that had log probe ratios
at least 5-fold lower than average between transposon-flanking DNA hybridization and
whole genomic DNA hybridization. Additionally, the nucleotide-resolution of insertion
sequencing allowed the authors to identify genes which had required regions, likely
corresponding to required protein domains (Zhang et al., 2012), but which tolerated
insertions in other regions. Altogether the authors increase the set of genes predicted
to be required for growth in laboratory conditions in M. tuberculosis by more than 25%
(from 614 to 774).
1.4 Identifying gene requirements
The earliest application of transposon-insertion sequencing, and indeed the earliest
genome-wide experimental study of gene essentiality, was to determine the minimal
set of genes necessary for the survival of Mycoplasma (Hutchison et al., 1999). This
essential genome is of great interest in synthetic and systems biology where it is seen as a
foundation for engineering cell metabolism as described previously, and also in infection
12
Chapter 1. Querying bacterial genomes with transposon-insertion sequencing
biology and medicine where it is seen as a promising target for therapies. However,
it is important to remember that essentiality is always relative to growth conditions:
a biosynthetic gene that is non-essential in a growth medium supplying a particular
nutrient may become essential in a medium that lacks it. Traditionally, gene essentiality
has been determined in clonal populations (Baba et al., 2006; Jacobs et al., 2003; Glass
et al., 2006); since the high-throughput transposon sequencing protocols described here
necessarily contain a short period of competitive growth before DNA extraction, many
of these studies prefer to refer to the required genome for the particular conditions under
evaluation.
Because of this short period of competitive growth, and because many otherwise
required genes tolerate insertions in their terminus (Goodman et al., 2009; Griffin et
al., 2011; Zomer et al., 2012) or outside essential domains (Zhang et al., 2012) the
determination of required genomic regions is not completely straight-forward and a
number of approaches have been taken to counter this. These include only calling
genes completely lacking insertions as required (Opijnen et al., 2009), or determining a
cut-off based on the empirical or theoretical distribution of gene-wise insertion densities
(Langridge et al., 2009; Barquist et al., 2013b; Griffin et al., 2011; Zomer et al., 2012).
Additionally, windowed methods have been developed which can be used to identify
essential regions in the absence of gene annotation (Zhang et al., 2012; DeJesus et al.,
2013), and have had success in identifying required protein domains, promoter regions,
and non-coding RNAs (ncRNAs). The organisms that have been evaluated for gene
requirements under standard laboratory conditions are summarized in Table 1.1. In
agreement with previous studies (Baba et al., 2006; Jacobs et al., 2003), many required
genes identified by transposon-insertion sequencing are involved in fundamental biological
processes such as cell division, DNA replication, transcription and translation (Langridge
et al., 2009; Goodman et al., 2009; Barquist et al., 2013b; Griffin et al., 2011), and many
of these requirements appear to be conserved between genera and classes (Barquist et al.,
2013b; Christen et al., 2011).
However, a recent study defining required gene sets in Salmonella serovars (described
in detail in the next chapter) has found that phage repressors, necessary for maintaining
the lysogenic state of the prophage, are also required (Barquist et al., 2013b), even
though mobile genetic elements such as phage are usually considered part of the accessory
genome. This study also highlights the need for temperance when interpreting the
13
Chapter 1. Querying bacterial genomes with transposon-insertion sequencing
results of high-throughput assays of gene requirements. For example, many genes in
Salmonella Pathogenicity Island 2 (SPI-2) did not exhibit transposon-insertions, despite
clear evidence from directed knockouts showing that these genes are non-essential for
viability or growth. Under laboratory conditions, SPI-2 is silenced by the nucleoid-forming
protein H-NS (Lucchini et al., 2006; Navarre et al., 2006), which acts by oligermerizing
along silenced regions of DNA blocking RNA polymerase access. A previous study
has shown that transposon insertion cold spots can be caused by competition between
high-density proteins and transposases for DNA (Manna et al., 2007). This suggests that
H-NS may be restricting transposase access to DNA, though this has not previously been
observed in transposon-insertion sequencing data, and will require additional work to
confirm.
1.5 Determining conditional gene requirements
One of the most valuable applications of the transposon-insertion sequencing method is
the ability to identify genes important in a condition of interest, by comparing differences
in the numbers of sequencing reads from input (control) mutant pools to output (test)
pools that have been subject to passaging in a certain growth condition. Insertion counts
are compared from cells in the input pool and those after passage, thereby identifying
genes that either enhance or detract from survival and/or growth in the given condition,
defined by decreased or increased insertion frequency, respectively. A further application
of this method involves comparing insertions between biologically linked conditions, such
as cellular stresses or different stages of a murine infection, to gain insight into complex
systems (Opijnen et al., 2012).
So far, transposon-insertion sequencing has been used to investigate a number of
interesting biologically relevant conditions: bile tolerance in S. Typhi (Langridge et al.,
2009) and S. Typhimurium (Khatiwara et al., 2012), bacteriophage infection of S. Typhi
(Pickard et al., 2013), antibiotic resistance in P. aeruginosa (Gallagher et al., 2011),
cholesterol utilization in M. tuberculosis (Griffin et al., 2011) and survival in number
of stress and nutrient conditions in S. pneumoniae (Opijnen et al., 2012). Transposon-
insertion sequencing of populations passed through murine models have been used to
assess genes required for H. influenzae infection (Gawronski et al., 2009). A further
extension of the method examined double mutant libraries, that is transposon mutant
14
Chapter 1. Querying bacterial genomes with transposon-insertion sequencing
libraries generated in a defined deletion background, to tease apart complex networks of
regulatory genes (Opijnen et al., 2009).
Two studies in particular illustrate the power of using transposon-insertion sequencing
to identify conditionally required genes. In the first, Goodman et al. (2009) set out to
determine the genes necessary for the establishment of the commensal B. thetaiotaomicron
in a murine model. First, the growth requirements of transposon mutant populations in the
cecum of germ-free mice was assessed, and genes required for growth in monoassociation
with the host were found to be enriched in functions such as energy production and amino
acid metabolism. By further comparing monoassociated transposon mutant libraries
with those grown in the presence of three defined communities of human gut-associated
bacteria, the authors identified a locus up-regulated by low levels of vitamin B12 that is
only required in the absence of other bacteria capable of synthesizing B12. This showed
that the gene requirements of any particular bacterium in the gut are at least partially
dependent on the metabolic capabilities of the entire community and emphasizes the
importance of testing in vivo conditions to complement in vitro study.
The second study, conducted by Opijnen et al. (2012), aimed to map the genetic
networks involved in a range of cellular stress responses in S. pneumoniae. Seventeen in
vitro conditions were tested, including: pH, nutrient limitation, temperature, antibiotic,
heavy metal, and hydrogen peroxide stress. Approximately 6% of disrupted genes resulted
in increased fitness in some condition, suggesting that some genes are maintained despite
being detrimental to the organism under particular conditions. These would be interesting
candidates for further functional and evolutionary study, as the maintenance of these
genes is presumably highly dependent on the conditions the bacteria faces, and may
have implications for our understanding of e.g. gene loss in the process of bacterial host
adaptation (Toft et al., 2010). Two additional in vivo experiments were performed in a
murine model, where cells were recovered from the lung and nasopharynx. Combining
this data, over 1,800 genotype-phenotype genetic interactions were identified. These
interactions were mapped and pathways identified. Between the two in vivo niches,
certain stress responses pathways were markedly different. For example, temperature
stress produced a distinct response in the lung, compared to the nasopharyanx, which is
perhaps to be expected as temperature varies greatly between these two sites. By further
examining sub-pathways required in the two different niches and comparing them to in
vitro requirements, the authors were able to draw conclusions regarding the condition
15
Chapter 1. Querying bacterial genomes with transposon-insertion sequencing
S. pneumoniae faces when establishing an infection. This comprehensive mapping of
genotype-phenotype relationships will serve as an important atlas for further studies of
the factors affecting S. pneumoniae carriage and virulence.
1.6 Monitoring ncRNA contributions to fitness
To date, four studies (including one described in detail in the next chapter) have
used transposon-insertion sequencing to examine the contribution of non-coding RNAs
(ncRNAs) and other non-coding regions to organismal fitness (see Table 1.1). Two of
these examined requirements for non-coding regions in the relatively under-explored
bacterial species Caulobacter crescentus (Christen et al., 2011) and M. tuberculosis (Zhang
et al., 2012). Both utilized analytical techniques that allowed for the identification of
putative required regions in the absence of genome annotation. Twenty-seven small RNAs
(sRNAs) had previously been detected in C. crescentus (Landt et al., 2008); 6 were found
to be depleted in transposon insertions indicating an important role in basic cellular
processes. Additionally, the well-characterized ncRNAs tmRNA and RNase P, as well
as 29 non-redundant tRNAs were found to be required. An additional 90 unannotated
non-disruptable regions were identified throughout the genome, implying an abundance
of unexplored functional non-coding sequence.
While the non-coding transcripts of M. tuberculosis have been explored more thor-
oughly than those of C. crescentus, most remain functionally uncharacterized, though
there are hints that some of these may be involved in pathogenicity (Arnvig et al.,
2012). Using a Mariner transposon-based assay and a windowed statistical analysis that
accounted for the distribution of potential TA integration sites, 35 intergenic regions
were identified as putatively required in the M. tuberculosis genome (Zhang et al., 2012).
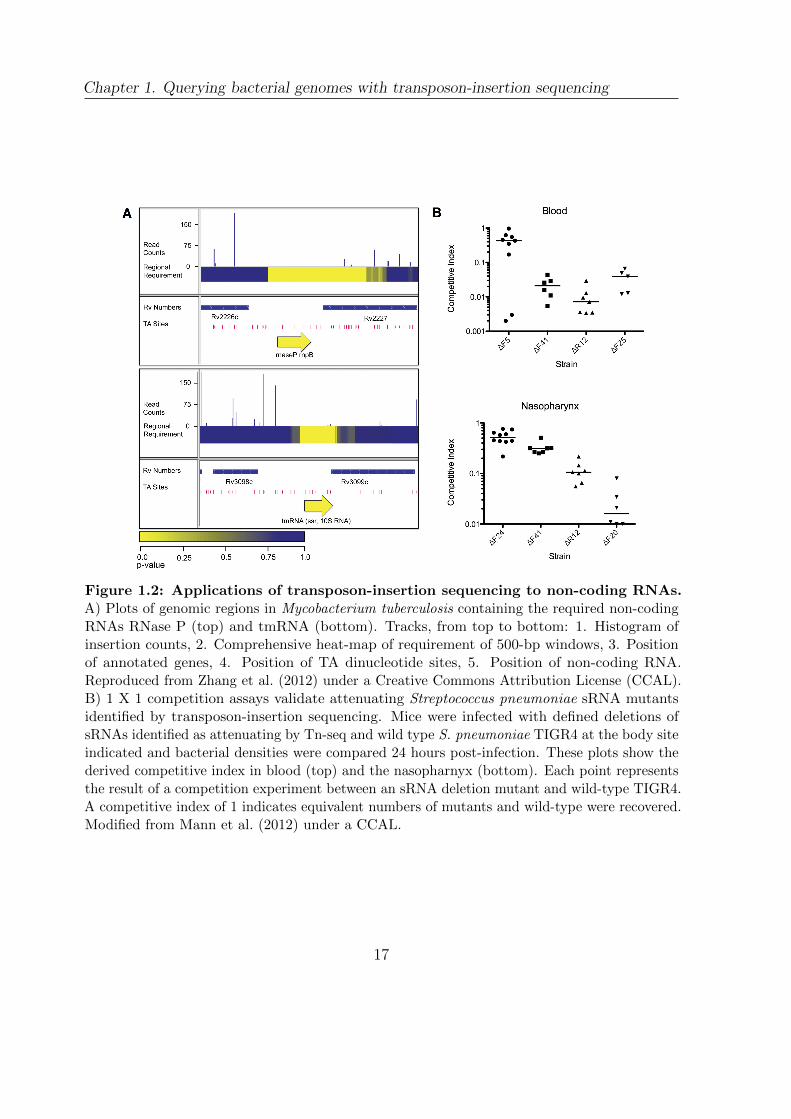
In common with the C. crescentus study, the RNA component of RNase P, required
for the maturation of tRNAs, and tmRNA, involved in the freeing of stalled ribosomes,
were identified as required (Figure 1.2 A) together with 10 non-redundant tRNAs and
potential promoter regions. However, due to the lower overall insertion density and lack
of TA sites in some GC-rich regions, there were some regions that could not be assayed
and the resolution was limited to 250 bases.
A particularly exciting study has been conducted in S. pneumoniae TIGR4 combining
RNA-seq with transposon-insertion sequencing (Mann et al., 2012). To identify sRNA
16
Chapter 1. Querying bacterial genomes with transposon-insertion sequencing
Figure 1.2: Applications of transposon-insertion sequencing to non-coding RNAs.A) Plots of genomic regions in Mycobacterium tuberculosis containing the required non-codingRNAs RNase P (top) and tmRNA (bottom). Tracks, from top to bottom: 1. Histogram ofinsertion counts, 2. Comprehensive heat-map of requirement of 500-bp windows, 3. Positionof annotated genes, 4. Position of TA dinucleotide sites, 5. Position of non-coding RNA.Reproduced from Zhang et al. (2012) under a Creative Commons Attribution License (CCAL).B) 1 X 1 competition assays validate attenuating Streptococcus pneumoniae sRNA mutantsidentified by transposon-insertion sequencing. Mice were infected with defined deletions ofsRNAs identified as attenuating by Tn-seq and wild type S. pneumoniae TIGR4 at the body siteindicated and bacterial densities were compared 24 hours post-infection. These plots show thederived competitive index in blood (top) and the nasopharnyx (bottom). Each point representsthe result of a competition experiment between an sRNA deletion mutant and wild-type TIGR4.A competitive index of 1 indicates equivalent numbers of mutants and wild-type were recovered.Modified from Mann et al. (2012) under a CCAL.
17
Chapter 1. Querying bacterial genomes with transposon-insertion sequencing
loci the authors first sequenced size-select RNA from wild type TIGR4 and three two-
component system knockouts, identifying 89 putative sRNAs, 56 of which were novel.
Fifteen of these candidates, selected on the basis of high expression and low predicted
folding free energy, were assayed for their ability to establish invasive disease in a murine
model. Of these 8 sRNA deletions showed a significant attenuation of disease. To
more broadly establish the roles of sRNAs in infecting particular organs, transposon
insertion libraries were administered directly to the nasopharnyx, lungs, or blood of
mice, and bacteria were harvested following disease progression. Twenty-six, 28, and 18
sRNAs were found to attenuate infection in the nasopharnyx, lung and blood respectively.
These results were then validated with targeted deletions of 11 sRNAs (Figure 1.2 B).
In addition to establishing the role of sRNAs in S. pneumoniae virulence, this study
illustrated the power of combining RNA-seq and transposon-insertion sequencing to
rapidly assign phenotypes to non-coding sequences.
1.7 Limitations
In this chapter, I have largely focused on the potential of transposon insertion sequencing.
However, this technology does have a number of important limitations. As discussed
previously, requirements for particular nucleotides at insertion sites, such as the TA
required by Mariner transposons, or preference for certain sequence composition, such
as the AT bias exhibited by Tn5, can limit the density of observed insertions in certain
genomic regions. This may impact any down-stream analysis, and can potentially bias
results, particularly the determination of gene requirements. Even if this bias has been
accounted for, transposon-insertion screens will always over-predict gene requirements
in comparison to targeted deletion libraries as discussed previously. However, this over-
prediction can be controlled either through careful consideration of known insertion biases
as in many Mariner-based studies, or by high insertion densities, such as those achieved
in several Tn5-based studies (Table 1.1). Once the library has been created, only regions
that have accumulated insertions in the conditions of library creation will be able to be
assayed for fitness effects in further conditions. This means that regions that lead to slow
growth phenotypes when disrupted in standard laboratory conditions may be difficult to
assay in other conditions. Additionally, the dynamic range of fitness effects detected will
depend on the complexity of the input library(s). The absence of insertions may be a
18
Chapter 1. Querying bacterial genomes with transposon-insertion sequencing
particular problem for assaying small genomic elements, such as sRNAs or short ORFs.
Finally, the validation of hypotheses derived from transposon-insertion sequencing will
require the construction of targeted deletions, as individual mutants cannot be recovered
from pools unless specialized protocols have been followed during library construction
(as in Goodman et al., 2009).
1.8 The future of transposon-insertion sequencing
Transposon-insertion sequencing is a robust and powerful technique for the rapid connec-
tion of genotype to phenotype in a wide range of bacterial species. Already, a number
of studies have demonstrated the effectiveness of this method and the results have
been far-reaching: enhancing our understanding of basic gene functions, establishing
requirements for colonization and infection, mapping complex metabolic pathways, and
exploring non-coding genomic dark matter. Due to the range of potential applications of
transposon-insertion sequencing, along with the decreasing cost and growing accessibil-
ity of next-generation sequencing, I believe that this method will become increasingly
common in the near future.
A number of bacterial species have already been subjected to transposon-insertion
sequencing (Table 1.1). Microarray-based approaches to monitoring transposon mutant
libraries have even been applied to eukaryotic systems (Ross-Macdonald et al., 1999), and
similarly transposon-insertion sequencing can potentially be applied to any system where
the creation of large-scale transposon mutant libraries is technologically feasible. Recently
the Genomic Encyclopedia of Bacteria and Archea (GEBA) (Wu et al., 2009) has been
expanding our knowledge of bacterial diversity through targeted genomic sequencing of
underexplored branches of the tree of life. Applying transposon-insertion sequencing in a
comparative manner across the bacterial phylogeny will provide an unprecedented view
of the determinants for survival in diverse environments - the next chapter describes a
study taking the first steps toward this eventual goal (Barquist et al., 2013b). While most
transposon-insertion sequencing studies to date have focused on pathogenic bacteria,
these techniques could also have applications in energy production, bioremediation, and
synthetic biology.
The combination of transposon-insertion sequencing with other high-throughput and
computational methods is already proving to be fertile ground for enhancing our under-
19

Chapter 1. Querying bacterial genomes with transposon-insertion sequencing
standing of bacterial systems. For instance, by using transposon-insertion sequencing
in a collection of relatively simple conditions combined with a computational pathway
analysis, Opijnen et al. (2012) were able to provide a holistic understanding of the genetic
subsystems involved in a complex process such as S. pneumoniae pathogenesis. In the
future, methods to assay phenotype in a high-throughput manner (Bochner, 2009; Nichols
et al., 2011) may be combined with transposon-insertion sequencing to provide exhaustive
simple genotype-phenotype associations with which to understand complex processes in
a systems biology framework.
20
Chapter 2
A comparison of dense transposon
insertion libraries in the Salmonella
serovars Typhi and Typhimurium
This chapter is a modified version of the previously published article “A comparison of
dense transposon insertion libraries in the Salmonella serovars Typhi and Typhimurium”
(Barquist et al., 2013b). This work is a result of collaboration with Gemma C. Langridge
(Pathogen Genomics, Wellcome Trust Sanger Institute), who constructed the Salmonella
Typhimurium transposon mutant library and contributed to a draft manuscript. In
particular, portions of the analyses in sections 2.3.1-3 have their origins in Langridge
(2010), though have been significantly elaborated on here.
2.1 Introduction
Salmonella enterica subspecies enterica serovars Typhi (S. Typhi1) and Typhimurium
(S. Typhimurium) are important, closely related, human pathogens with very different
lifestyles. In this chapter, I describe a study comparing dense transposon insertion libraries
created in these two serovars. The results of this study demonstrate that orthologous
genes can have dramatically different effects on the fitness of recently diverged organisms
1Note that the complicated Salmonella taxonomy and nomenclature make abbreviation difficult (andat times contentious). Here I have adopted the practice of referring to individual serovars as S. Serovaronce they have been introduced, following the advice of Brenner et al. (2000).
21
Chapter 2. A comparison of dense transposon insertion libraries in the Salmonellaserovars Typhi and Typhimurium
in rich media. These differences in fitness effects are indicative of changes in the network
architecture of the cell which may partially underlie the dramatically different diseases
caused by each organism and their different host ranges. Additionally, S. Typhimurium
has served as a model organism for the discovery and functional characterization of
ncRNAs. Comparing ncRNA requirements between it and a closely related serovar
provides a glimpse of the functional evolution of non-coding regulatory networks.
2.1.1 The genus Salmonella
Salmonella is a Gram-negative, γ-proteobacterial genus within the order Enterobacteriales,
consisting of two species: Salmonella enterica and Salmonella bongori, though a contested
third species, Salmonella subterranea, has recently been proposed (Shelobolina et al.,
2004). Based on phylogenetic analyses of 16S and conserved amino acid sequences,
Salmonella is most closely related to the genuses Escherichia, Shigella, and Citrobacter
(Paradis et al., 2005; Pham et al., 2007; Wu et al., 2009). Molecular clock analyses suggest
that Salmonella and Escherichia shared a common ancestor between 100 and 160 million
years ago (Ochman et al., 1987; Doolittle et al., 1996), though complete genetic isolation
of the two genera may have taken 70 million years (Retchless et al., 2007). During the
time since their divergence Escherichia has become established as a mammalian gut
commensal, though multiple independent origins of the Shigella and other pathogenic
phenotypes within the genus show that a disease phenotype can be developed fairly
easily through the horizontal acquisition of virulence determinants and the silencing of
anti-virulence loci (Kaper et al., 2004; Prosseda et al., 2012). Despite sharing the majority
of their genomes with Escherichia and having broadly similar metabolic capabilities
(AbuOun et al., 2009), the salmonellae exist primarily as pathogens, though are possibly
commensal in some reptiles (Mermin et al., 2004; Bauwens et al., 2006).
The difference in dominant phenotype between Escherichia and Salmonella appears
to be largely due to the acquisition of virulence determinants which opened new niches to
ancestral salmonellae (see figure 2.1). Many of the virulence determinants characteristic
of the salmonellae are encoded on large genomic islands with sizes between ∼6 and 140
kilobases, termed Salmonella Pathogenicity Islands (SPIs) (Hensel, 2004). These islands
encode a diverse array of pathogenicity-related functions including secretion systems,
toxins, antibiotic resistances, and lipopolysaccharide (LPS) and capsular modifications.
22
Chapter 2. A comparison of dense transposon insertion libraries in the Salmonellaserovars Typhi and Typhimurium
In particular, the acquisition of SPI-1, encoding a type 3 secretion system (T3SS),
and various fimbriae by the ancestral Salmonella likely enabled invasion of cells in
the intestinal epithelium and escape from competition with other members of the gut
microbiota (Baumler, 1997). S. bongori appears to have only acquired a single additional
SPI since its divergence from S. enterica and likely retains a lifestyle more similar to the
ancestral Salmonella, though there is evidence for additional adaptation to its niche in
the reptilian gut (Fookes et al., 2011).
S. enterica meanwhile has diversified into 6 distinct subspecies: enterica, salamae,
arizonae, diarizonae, houtenae, and indica. These subspecies are further divided into over
2000 serovars based on the cell-surface O, flagellar H, and capsular Vi antigens (Grimont
et al., 2007). The acquisition of SPI-2, involved in survival inside macrophages and an
enabling factor for systemic infection (Kuhle et al., 2004; Abrahams et al., 2006), by
the ancestral S. enterica is thought to have been a driving force in this diversification
(Baumler, 1997). Subspecies besides enterica are thought to be primarily restricted to
cold-blooded animals (Baumler, 1997), though sporadic reports of zoonotic disease show
these subspecies are capable of transiently colonizing the mammalian gut under certain
conditions (Mermin et al., 2004; Hilbert et al., 2012). However, here I will be primarily
concerned with the subspecies enterica and its adaptation to the mammalian, and more
specifically human, host.
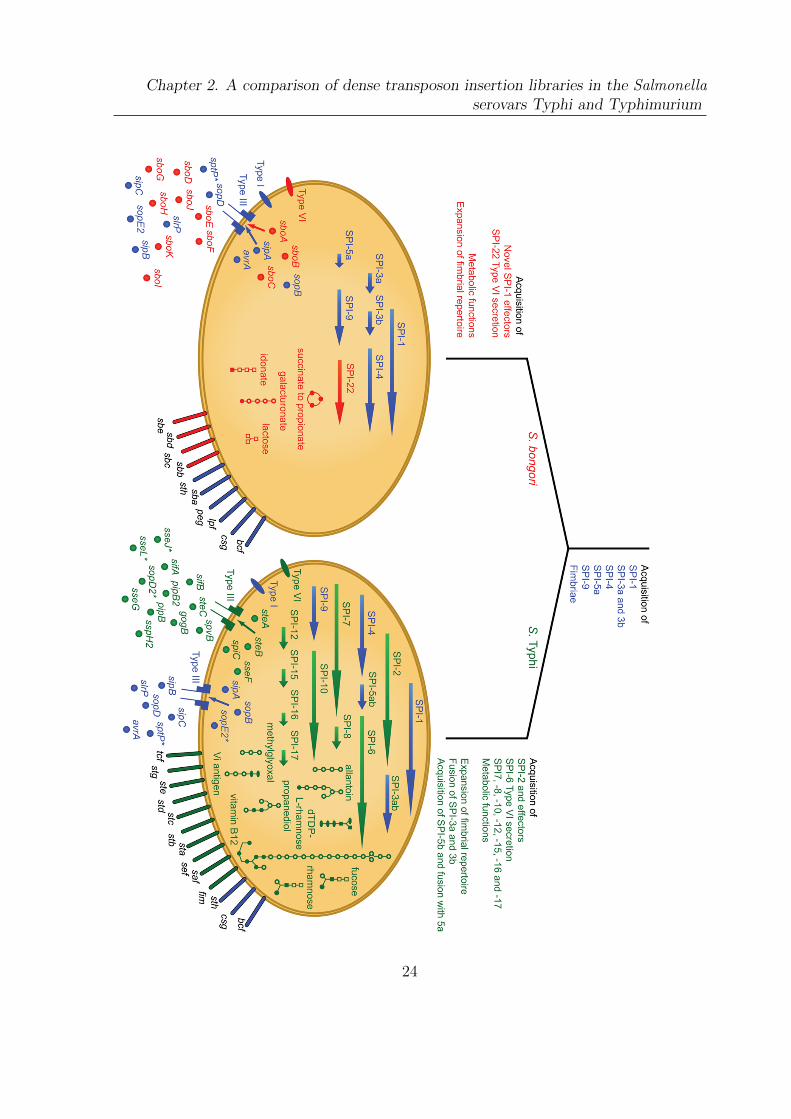
Figure 2.1 (following page): Genomic acquisitions in the evolution of the salmonel-lae. Traits shared by the common ancestor are depicted in blue; those unique to S. bongoriare shown in red and those unique to S. enterica subspecies enterica serovar Typhi in green.Arrows, Salmonella Pathogenicity Islands (SPIs); extended ovals, fimbriae; circles, effectors;small ovals and needle complexes, secretion systems. Metabolic pathways: lines, enzymaticreactions; open squares, carbohydrates; ovals, pyrimidines; open circles, other substrates; filledshapes, phosphorylated. Novel effectors acquired by S. bongori are secreted by the type IIIsecretion system encoded on SPI-1. SPI-3a and 3b carry the same genes in both organisms butare fused into one island in S. Typhi. SPI-5a also carries the same genes in both organisms,but a further 3 kb (termed SPI-5b) has fused to SPI-5a in S. Typhi. *indicates a pseudogene.Reproduced from Fookes et al. (2011) under a Creative Commons Attribution License (CCAL).
23
Chapter 2. A comparison of dense transposon insertion libraries in the Salmonellaserovars Typhi and Typhimurium
24
Chapter 2. A comparison of dense transposon insertion libraries in the Salmonellaserovars Typhi and Typhimurium
2.1.2 Host adaptation and restriction
Bacterial adaptation to a pathogenic lifestyle is a complex process involving both the
acquisition of virulence factors and gene loss through both passive decay and positive
selection (Pallen et al., 2007; Prosseda et al., 2012). In the previous section I discussed how
the acquisition of SPI-1 and -2, among other factors, have enabled S. enterica subspecies
enterica to establish a niche in the mammalian gut. Access to this new niche has enabled
serovars of subspecies enterica to explore a range of pathogenic modalities. The most
common form of disease caused by enterica serovars is a self-limiting gastroenteritis,
exemplified by the serovars Typhimurium and Enteriditis (Santos et al., 2009). These
serovars can infect a wide range of mammals and birds, but are only capable of causing
serious disease in the very young (Baumler et al., 1998), and are generally thought to
exhibit a phenotype similar to the ancestral enterica.
A number of subspecies enterica serovars have adapted to causing invasive disease
in specific organisms. These include Typhi and Paratyphi in humans, Dublin in cattle,
Gallinarum in chickens, Abortusovis in sheep, Choleraesuis in pigs, and Abortusequi
in horses. These adaptations appear to be the result of the acquisition of host-specific
virulence factors (Baumler et al., 1998). Interestingly, those serovars associated with the
most severe forms of disease appear to be most highly restricted in terms of host range.
This appears to be the result of three processes: positive selection against anti-virulence
loci (Pallen et al., 2007; Prosseda et al., 2012), and two more passive processes termed
“use it or lose it” and “use it, but lose it anyway” by Moran (2002).
Selection against anti-virulence loci presumably occurs during host-adaptation, and
generally involved the loss of loci that provoke an antigenic response or interfere with
the infective process. Once a bacterium has escaped competition in the gut microbiota
and gained access to a rich intracellular niche through horizontal acquisitions, the “use it
or lose it” principle leads to the loss of metabolic pathways no longer required in this
environment presumably due to the lifting of selective pressure for their maintenance. The
“use it, but lose it anyway” principle is a consequence of the severe bottleneck imposed
by adaptation to a particular host, which will often drastically reduce the effective
population size of the bacterium. This can cause fixation of inactivating mutations in
potentially beneficial genes simply as an accident of the adaptive process. Together these
processes may eventually prevent the bacterium from living independently of its host;
25
Chapter 2. A comparison of dense transposon insertion libraries in the Salmonellaserovars Typhi and Typhimurium
particularly extreme examples are Mycobacterium leprae with its thousands of inactivated
pseudogenes (Cole et al., 2001), Mycoplasma species with their highly reduced genomes
(Fraser et al., 1995), and most strikingly the endosymbiont-derived mitochondria and
plastid organelles (Sagan, 1967; Andersson et al., 1998). While no Salmonella serovars
appear to have been subject to this degree of genome degradation, it is not unusual for
as much as 7% of the protein-coding genes of host-restricted serovars to be inactivated
(Parkhill et al., 2001; Thomson et al., 2008; Holt et al., 2009; McClelland et al., 2004).
The serovars of S. enterica subspecies enterica exhibit a spectrum of pathogenic
lifestyles, from low-pathogenicity and wide host range to high-pathogenicity and narrow
host range. Recent studies examining host adaptation of Typhimurium strains to
immunocompromised populations (Feasey et al., 2012; Okoro et al., 2012) demonstrate
that the process of host-adaptation is both on-going and highly relevant to human health.
In this study, we have used transposon-insertion sequencing to examine two recently
diverged (circa 50,000 years ago (Kidgell et al., 2002)) serovars at extreme ends of this
pathogenicity spectrum: Typhi and Typhimurium.
2.1.3 Serovars Typhi and Typhimurium
Salmonella enterica subspecies enterica serovars Typhi (S. Typhi) and Typhimurium
(S. Typhimurium ) are important human pathogens with distinctly different lifestyles.
S. Typhi is host-restricted to humans and causes typhoid fever. This potentially fatal
systemic illness affects at least 21 million people annually, primarily in developing
countries (Crump et al., 2004; Bhutta et al., 2009; Kothari et al., 2008), and is capable
of colonizing the gall bladder creating asymptomatic carriers; such individuals are the
primary source of this human restricted infection, exemplified by the case of “Typhoid
Mary” (Soper, 1939). Mary Mallon was an Irish-American cook in New York City at the
turn of the twentieth century, and an (at least initially) unwitting carrier of Typhi. A
series of typhoid outbreaks were traced to her by city public health authorities. She was
offered removal of her gall bladder, which she refused, and was ordered to refrain from
working as a cook following release from three years of quarantine. After a number of
additional outbreaks – including several deaths – were traced to Mary, who had continued
working as a cook under a pseudonym, she was involuntarily quarantined on North
Brother Island in the East River for 23 years until her death.
26
Chapter 2. A comparison of dense transposon insertion libraries in the Salmonellaserovars Typhi and Typhimurium
S. Typhimurium, conversely, is a generalist, causing relatively mild disease in a
wide range of mammals and birds in addition to being a leading cause of foodborne
gastroenteritis in human populations. Control of S. Typhimurium infection in livestock
destined for the human food chain is of great economic importance, particularly in swine
and cattle (CDC, 2009; Majowicz et al., 2010). Additionally, S. Typhimurium causes an
invasive disease in mice, which has been used extensively as a model for pathogenicity in
general and human typhoid fever specifically (Santos et al., 2001).
Despite this long history of investigation, the genomic factors that contribute to
these differences in lifestyle remain unclear. Over 85% of predicted coding sequences are
conserved between the two serovars in sequenced genomes of multiple strains (McClelland
et al., 2001; Parkhill et al., 2001; Holt et al., 2008; Deng et al., 2003). The horizontal
acquisition of both plasmids and pathogenicity islands during the evolution of the
salmonellae is believed to have impacted upon their disease potential. A 100kb plasmid,
encoding the Salmonella plasmid virulence (SPV) genes, is found in some S. Typhimurium
strains and contributes significantly towards systemic infection in animal models (Gulig
et al., 1987; Gulig et al., 1993). S. Typhi is known to have harbored IncHI1 plasmids
conferring antibiotic resistance since the 1970s (Phan et al., 2009), and there is evidence
that these strains present a higher bacterial load in the blood during human infection
(Wain et al., 1998). Similar plasmids have been isolated from S. Typhimurium (Datta,
1962; Holt et al., 2007; Cain et al., 2012). Salmonella pathogenicity islands 1 and 2 are
common to all Salmonella enterica subspecies, and are required for invasion of epithelial
cells (reviewed in Darwin et al. (1999)) and survival inside macrophages respectively
(Ochman et al., 1996; Shea et al., 1996; Kuhle et al., 2004; Abrahams et al., 2006). S.
Typhi additionally incorporates SPI-7 and SPI-10, which contain the Vi surface antigen
and a number of other putative virulence factors (Pickard et al., 2003; Seth-Smith, 2008;
Townsend et al., 2001).
Acquisition of virulence determinants is not the sole explanation for the differing
disease phenotypes displayed in humans by S. Typhimurium and S. Typhi; genome
degradation is an important feature of the S. Typhi genome, in common with other
host-restricted serovars such as S. Paratyphi A (humans) and S. Gallinarum (chickens).
In each of these serovars, pseudogenes account for 4-7% of the genome (Parkhill et al.,
2001; Thomson et al., 2008; Holt et al., 2009; McClelland et al., 2004). Loss of function
has occurred in a number of S. Typhi genes that have been shown to encode intestinal
27
Chapter 2. A comparison of dense transposon insertion libraries in the Salmonellaserovars Typhi and Typhimurium
colonisation and persistence determinants in S. Typhimurium (Kingsley et al., 2003).
Numerous sugar transport and degradation pathways have also been interrupted (Parkhill
et al., 2001), but remain intact in S. Typhimurium, potentially underlying the restricted
host niche occupied by S. Typhi.
In addition to its history as a model organism for pathogenicity, S. Typhimurium has
recently served as a model organism for the elucidation of non-coding RNA (ncRNA)
function (Vogel, 2009). These include cis-acting switches, such as RNA-based temperature
and magnesium ion sensors (Waldminghaus et al., 2007; Cromie et al., 2006), together
with a host of predicted metabolite-sensing riboswitches. Additionally, a large number
of trans-acting small RNAs (sRNAs) have been identified within the S. Typhimurium
genome (Kroger et al., 2012), some with known roles in virulence (Hebrard et al., 2012).
These sRNAs generally control a regulon of mRNA transcripts through an antisense
binding mechanism mediated by the protein Hfq in response to stress. The functions of
these molecules have generally been explored in either S. Typhimurium or E. coli, and it
is unknown how stable these functions and regulons are over evolutionary time (Richter
et al., 2012).
Transposon mutagenesis has previously been used to assess the requirement of partic-
ular genes for cellular viability. The advent of next-generation sequencing has allowed
simultaneous identification of all transposon insertion sites within libraries of up to 1
million independent mutants (reviewed in Barquist et al. (2013a); see also the previous
chapter), enabling us to answer the basic question of which genes are required for in
vitro growth with extremely fine resolution. By using transposon mutant libraries of
this density, which in S. Typhi represents on average > 80 unique insertions per gene
(Langridge et al., 2009), shorter regions of the genome can be interrogated, including ncR-
NAs (Christen et al., 2011). In addition, once these libraries exist, they can be screened
through various selective conditions to further reveal which functions are required for
growth/survival.
Illumina-based transposon directed insertion-site sequencing (TraDIS (Langridge
et al., 2009)) with large mutant libraries of both S. Typhimurium and S. Typhi was used
to investigate whether these salmonellae require the same protein-coding and non-coding
RNA (ncRNA) gene sets for competitive growth under laboratory conditions, and whether
there are differences which reflect intrinsic differences in the pathogenic niches these
bacteria inhabit.
28
Chapter 2. A comparison of dense transposon insertion libraries in the Salmonellaserovars Typhi and Typhimurium
2.2 Materials and Methods
Gemma Langridge created the S. Typhimurium library described here, and performed all
the laboratory experiments described here. Duy Phan and Keith Turner created the S.
Typhi library. Duy Phan and Gemma Langridge performed the read mapping.
2.2.1 Strains
S. Typhimurium strain SL3261 was used to generate the transposon mutant library and
contains a deletion relative to the parent strain, SL1344. The 2166bp deletion ranges from
153bp within aroA (normally 1284bp) to the last 42bp of cmk, forming two pseudogenes
and deleting the intervening gene SL0916 completely. For comparison, our previously
generated S. Typhi Ty2 transposon library (Langridge et al., 2009) was used.
2.2.2 Annotation
For S. Typhimurium strain SL3261, I used feature annotations drawn from the SL1344
genome (EMBL-Bank accession FQ312003.1), ignoring the deleted aroA, ycaL, and cmk
genes. I re-analyzed the S. Typhi Ty2 transposon library with features drawn from
an updated genome annotation (EMBL-Bank accession AE014613.1.) I supplemented
the EMBL-Bank annotations with non-coding RNA annotations drawn from Rfam 10.1
(Burge et al., 2013), Sittka et al. (2008), Chinni et al. (2010), Raghavan et al. (2011),
and Kroger et al. (2012). Selected protein-coding gene annotations were supplemented
using the HMMER webserver (Finn et al., 2011) and Pfam (Punta et al., 2012).
2.2.3 Creation of S. Typhimurium transposon mutant library
S. Typhimurium was mutagenized using a Tn5-derived transposon as described previously
(Langridge et al., 2009; a detailed protocol is available in Langridge, 2010). Briefly, the
transposon was combined with the EZ-Tn5 transposase (Epicenter, Madison, USA) and
electroporated into S. Typhimurium. Transformants were selected by plating on LB
agar containing 15 µg/mL kanamycin and harvested directly from the plates following
overnight incubation. A typical electroporation experiment generated a batch of between
29
Chapter 2. A comparison of dense transposon insertion libraries in the Salmonellaserovars Typhi and Typhimurium
50,000 and 150,000 individual mutants. 10 batches were pooled together to create a
mutant library comprising approximately 930,000 transposon mutants.
2.2.4 DNA manipulations and sequencing
Genomic DNA was extracted from the library pool samples using tip-100g columns and
the genomic DNA buffer set from Qiagen (Crawley, UK). DNA was prepared for nucleotide
sequencing as described previously (Langridge et al., 2009). Prior to sequencing, a 22
cycle PCR was performed as previously described (Langridge et al., 2009). Sequencing
took place on a single end Illumina flowcell using an Illumina GAII sequencer, for 36
cycles of sequencing, using a custom sequencing primer and 2x Hybridization Buffer
(Langridge et al., 2009). The custom primer was designed such that the first 10 bp of
each read was transposon sequence.
2.2.5 Sequence analysis
The Illumina FASTQ sequence files were parsed for 100% identity to the 5′ 10bp of
the transposon (TAAGAGACAG). Sequence reads which matched were stripped of the
transposon tag and subsequently mapped to the S. Typhimurium SL1344 or S. Typhi
Ty2 chromosomes using MAQ version maq-0.6.8 (Li et al., 2008). Approximately 12
million sequence reads were generated from the sequencing run which used two lanes on
the Illumina flowcell. Precise insertion sites were determined using the output from the
Maq mapview command, which gives the first nucleotide position to which each read
mapped. The number and frequency of insertions mapping to each nucleotide in the
appropriate genome was then determined.
2.2.6 Statistical analysis of required genes
The number of insertion sites for any gene is dependent upon its length, so the values
were made comparable by dividing the number of insertion sites by the gene length, giving
an “insertion index” for each gene. As before (Langridge et al., 2009) the distribution of
insertion indices was bimodal, corresponding to the required (mode at 0) and non-required
distributions (See Figure 2.2). I fitted gamma distributions for the two modes using the R
MASS library (http://www.r-project.org). Log2-likelihood ratios (LLR) were calculated
30
Chapter 2. A comparison of dense transposon insertion libraries in the Salmonellaserovars Typhi and Typhimurium
between the required and non-required distributions and I called a gene required if it
had an LLR of less than -2, indicating it was at least 4 times more likely according to
the required model than the non-required model. “Non-required” genes were assigned
for an LLR of greater than 2. Genes falling between the two thresholds were considered
“ambiguous” for the purpose of this analysis. This procedure lead to genes being called as
required in S. Typhimurium when their insertion index was less than 0.020, or 1 insertion
in every 50 bases, and ambiguous between 0.020 and 0.027. The equivalent cut-offs for
the S. Typhi library are 0.0147 and 0.0186, respectively.
I calculated a p-value for the observed number of insertion sites per gene using a
Poisson approximation with rate R = NG
where N is the number of unique insert sites
(549,086) and G is the number of bases in the genome (4,878,012). The p-value for at
least X consecutive bases without an insert site is e(−RX), giving a 5% cut-off at 27 bp
and a 1% cut-off at 41 bp.
For every gene g with ng,A reads observed in S. Typhi and ng,B reads observed in
S. Typhimurium, I calculated the log2 fold change ratio Sg,A,B = log2(ng,A+100
ng,B+100). The
correction of 100 reads smoothes out the high scores for genes with very low numbers
of observed reads. I fitted a normal distribution to the mode +/- 2 sample standard
deviations of the distribution of SA,B, and calculated p-values for each gene according
to the fit. I considered genes with a p-value of 0.05 or less under the fitted normal
distribution to be uniquely required by one serovar.
2.3 Results and Discussion
2.3.1 TraDIS assay of every Salmonella Typhimurium protein-
coding gene
Approximately 930,000 mutants of S. Typhimurium were generated using a Tn5-derived
transposon. 549,086 unique insertion sites were recovered from the mutant library using
short-read sequencing with transposon-specific primers. This is a substantially higher
density than the 371,775 insertions recovered from S. Typhi previously (Langridge et al.,
2009). The S. Typhimurium library contains an average of one insertion every 9bp, or
over 100 unique inserts per gene (figure 2.3). The large number of unique insertion sites
allowed every gene to be assayed; assuming random insertion across the genome, a region
31
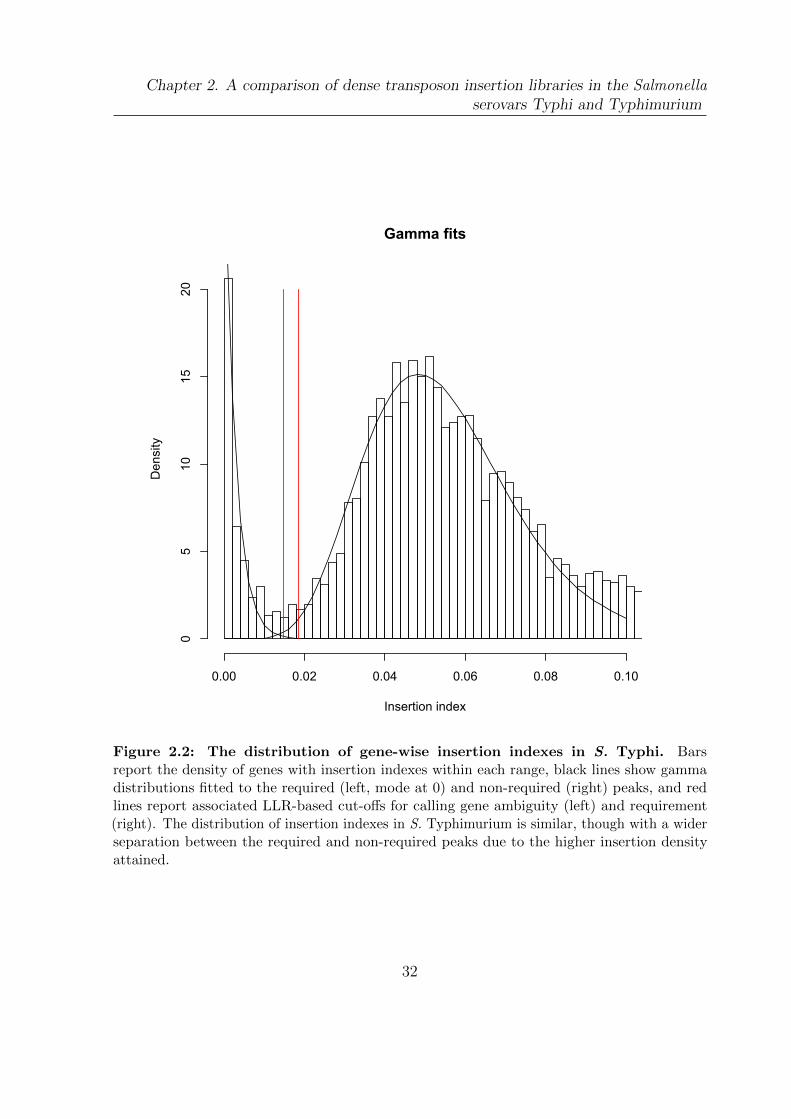
Chapter 2. A comparison of dense transposon insertion libraries in the Salmonellaserovars Typhi and Typhimurium
Gamma fits
Insertion index
Density
0.00 0.02 0.04 0.06 0.08 0.10
05
1015
20
Figure 2.2: The distribution of gene-wise insertion indexes in S. Typhi. Barsreport the density of genes with insertion indexes within each range, black lines show gammadistributions fitted to the required (left, mode at 0) and non-required (right) peaks, and redlines report associated LLR-based cut-offs for calling gene ambiguity (left) and requirement(right). The distribution of insertion indexes in S. Typhimurium is similar, though with a widerseparation between the required and non-required peaks due to the higher insertion densityattained.
32
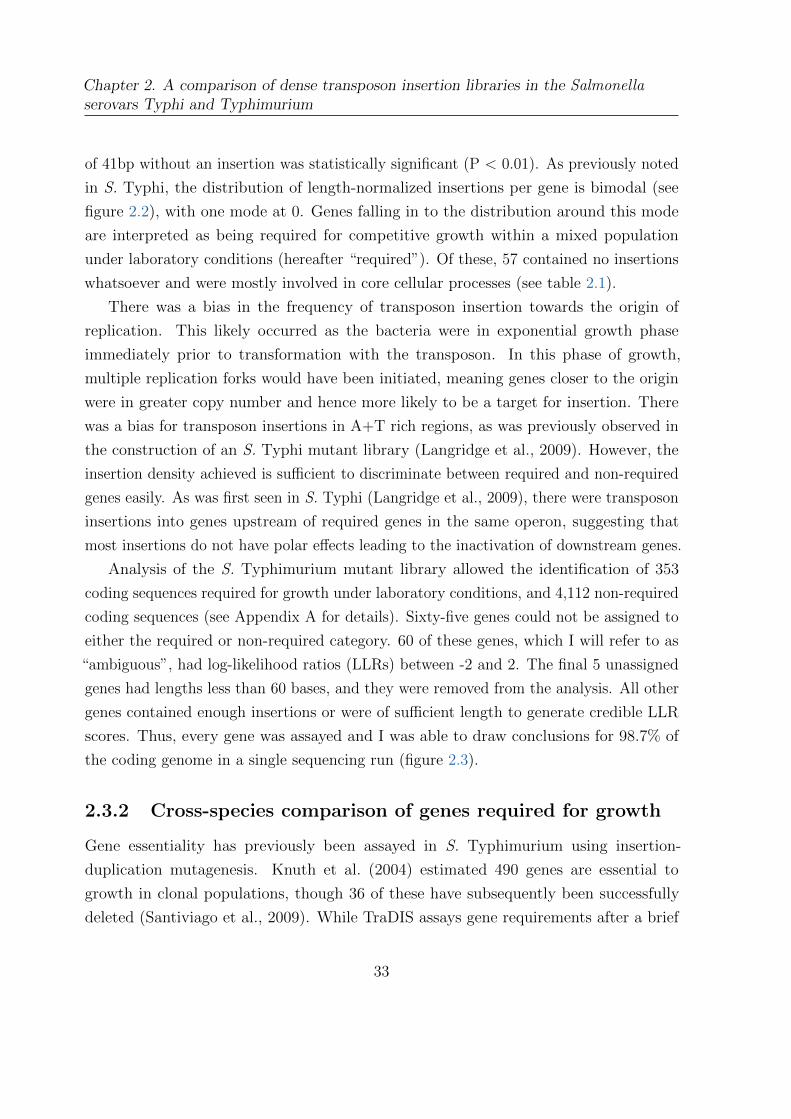
Chapter 2. A comparison of dense transposon insertion libraries in the Salmonellaserovars Typhi and Typhimurium
of 41bp without an insertion was statistically significant (P < 0.01). As previously noted
in S. Typhi, the distribution of length-normalized insertions per gene is bimodal (see
figure 2.2), with one mode at 0. Genes falling in to the distribution around this mode
are interpreted as being required for competitive growth within a mixed population
under laboratory conditions (hereafter “required”). Of these, 57 contained no insertions
whatsoever and were mostly involved in core cellular processes (see table 2.1).
There was a bias in the frequency of transposon insertion towards the origin of
replication. This likely occurred as the bacteria were in exponential growth phase
immediately prior to transformation with the transposon. In this phase of growth,
multiple replication forks would have been initiated, meaning genes closer to the origin
were in greater copy number and hence more likely to be a target for insertion. There
was a bias for transposon insertions in A+T rich regions, as was previously observed in
the construction of an S. Typhi mutant library (Langridge et al., 2009). However, the
insertion density achieved is sufficient to discriminate between required and non-required
genes easily. As was first seen in S. Typhi (Langridge et al., 2009), there were transposon
insertions into genes upstream of required genes in the same operon, suggesting that
most insertions do not have polar effects leading to the inactivation of downstream genes.
Analysis of the S. Typhimurium mutant library allowed the identification of 353
coding sequences required for growth under laboratory conditions, and 4,112 non-required
coding sequences (see Appendix A for details). Sixty-five genes could not be assigned to
either the required or non-required category. 60 of these genes, which I will refer to as
“ambiguous”, had log-likelihood ratios (LLRs) between -2 and 2. The final 5 unassigned
genes had lengths less than 60 bases, and they were removed from the analysis. All other
genes contained enough insertions or were of sufficient length to generate credible LLR
scores. Thus, every gene was assayed and I was able to draw conclusions for 98.7% of
the coding genome in a single sequencing run (figure 2.3).
2.3.2 Cross-species comparison of genes required for growth
Gene essentiality has previously been assayed in S. Typhimurium using insertion-
duplication mutagenesis. Knuth et al. (2004) estimated 490 genes are essential to
growth in clonal populations, though 36 of these have subsequently been successfully
deleted (Santiviago et al., 2009). While TraDIS assays gene requirements after a brief
33

Chapter 2. A comparison of dense transposon insertion libraries in the Salmonellaserovars Typhi and Typhimurium
Figure 2.3: Genome-wide transposon mutagenesis of S. Typhimurium. Circularplot showing gene content, distribution of required genes, and insertion density along the S.Typhimurium chromosome. The outer scale is marked in megabases. Circular tracks rangefrom 1 (outer track) to 5 (inner track). Track 1, Typhimurium non-required genes (grey); track2, S. Typhimurium required genes (red); track 3, 56 genes required by S. Typhimurium but notby S. Typhi (dark blue, see also table 1); track 4, transposon insertion density; track 5, GCbias (G−CG+C ), yellow indicates values >1; purple <1.
34
Chapter 2. A comparison of dense transposon insertion libraries in the Salmonellaserovars Typhi and Typhimurium
Figure 2.4: Comparison of required genes. Left, venn diagram showing the overlap ofall genes (outer circles, light colors) and required genes (inner circles, dark colors) between S.Typhimurium and S. Typhi (excluding genes required in one serovar only which do not havesignificantly different read-counts). Black numbers refer to all genes, white numbers to requiredgenes. Right, the overlap of all required genes between S. Typhimurium (blue), S. Typhi (green)and E. coli (purple). White numbers refer to genes with Keio essentiality scores >= 0.5.
period of competitive growth on rich media, I identify a smaller required set than Knuth
et al. (2004) of approximately 350 genes in each serovar, closer to current estimates of
approximately 300 essential genes in E. coli (Baba et al., 2006).
To demonstrate that TraDIS does identify genes known to have strong effects on
growth, as well as to test our predictive power for determining gene essentiality, I compared
our required gene sets in S. Typhimurium and S. Typhi to essential genes determined by
systematic single-gene knockouts in the Escherichia coli K-12 Keio collection (Baba et al.,
2006). I identified orthologous genes in the three data sets by best reciprocal FASTA
hits exhibiting over 30% sequence identity over at least 80% of the amino acid sequence.
Required orthologous genes identified in this manner share a significantly higher average
percent sequence identity with their E. coli counterparts than expected for a random
set of orthologs, at ∼94% identity as compared to ∼87% for all orthologous genes. In
100,000 randomly chosen gene sets of the same size as our required set I did not find
a single set where the average shared identity exceeded 90%, indicating that required
genes identified by TraDIS are more highly conserved at the amino acid level than other
orthologous protein coding sequences.
35
Chapter 2. A comparison of dense transposon insertion libraries in the Salmonellaserovars Typhi and Typhimurium
Baba et al. (2006) have defined an essentiality score for each gene in E. coli based on
evidence from four experimental techniques for determining gene essentiality: targeted
knock-outs using λ-red mediated homologous recombination, genetic footprinting (Gerdes
et al., 2003; Tong et al., 2004), large-scale chromosomal deletions (Hashimoto et al.,
2005), and transposon mutagenesis (Kang et al., 2004). Scores range from -4 to 3, with
negative scores indicating evidence for non-essentiality and positive scores indicating
evidence for essentiality. Comparing the overlap between essential gene sets in E. coli,
S. Typhi, and S. Typhimurium, I found a set of 228 E. coli genes which have a Keio
essentiality score of at least 0.5 (i.e. there is evidence for gene essentiality; See Figure 2.4.)
that have TraDIS-predicted required orthologs in both S. Typhi and S. Typhimurium,
constituting ∼85% of E. coli genes with evidence for essentiality indicating that gene
requirements are largely conserved between these genera. Including orthologous genes
that are only predicted to be essential by TraDIS in S. Typhi or S. Typhimurium
raises this figure to nearly 93%. The majority of shared required genes between all
three bacteria are responsible for fundamental cell processes, including cell division,
transcription and translation. A number of key metabolic pathways are also represented,
such as fatty acid and peptidoglycan biosynthesis (Table 2.1). A recent study in the
α-proteobacteria Caulobacter crescentus reported 210 shared essential genes with E. coli,
despite C. crescentus sharing less than a third as many orthologous genes with E. coli
as Salmonella serovars (Christen et al., 2011). This suggests the existence of a shared
core of approximately 200 essential proteobacterial genes, with the comparatively rapid
turnover of 150 to 250 non-core lineage-specific essential genes.
36
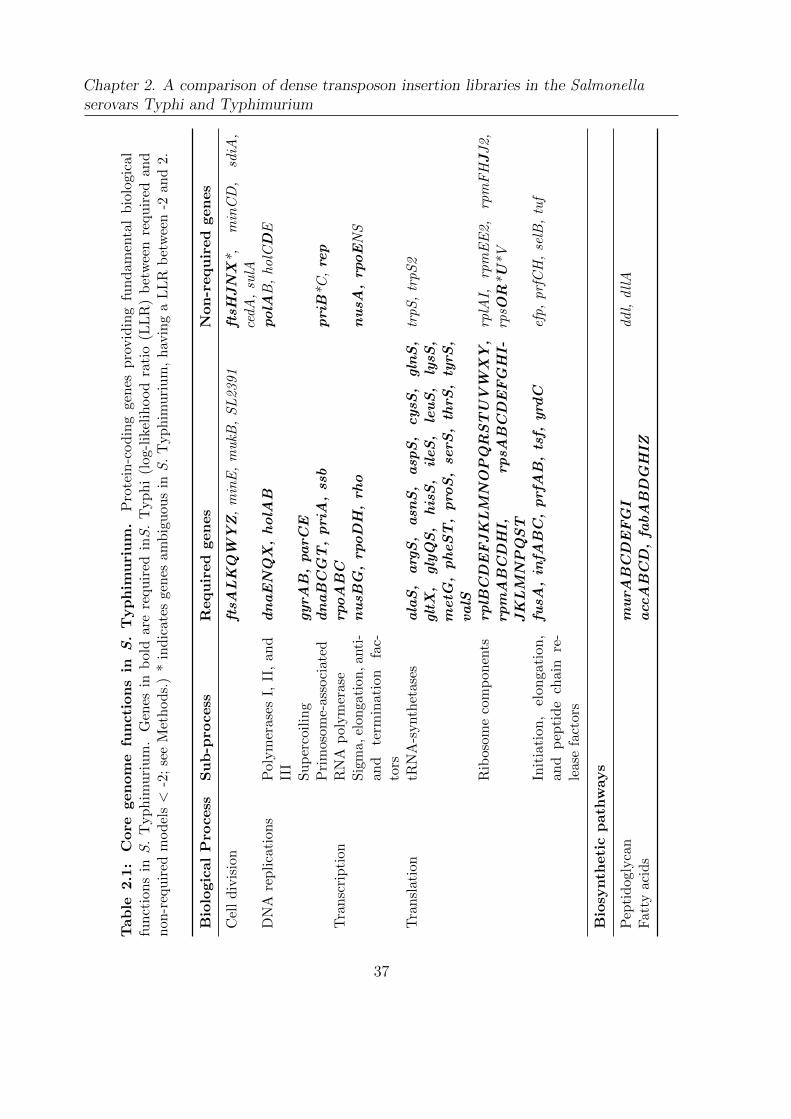
Chapter 2. A comparison of dense transposon insertion libraries in the Salmonellaserovars Typhi and Typhimurium
Tab
le2.1
:C
ore
gen
om
efu
ncti
on
sin
S.
Typ
him
uri
um
.P
rote
in-c
od
ing
gen
esp
rovid
ing
fun
dam
enta
lb
iolo
gic
al
fun
ctio
ns
inS.
Typ
him
uri
um
.G
enes
inb
old
are
requ
ired
inS.
Typ
hi
(log-l
ikel
ihood
rati
o(L
LR
)b
etw
een
requ
ired
an
dnon
-req
uir
edm
odel
s<
-2;
see
Met
hods.
)*
indic
ates
genes
ambig
uou
sin
S.
Typhim
uri
um
,hav
ing
aL
LR
bet
wee
n-2
and
2.
Bio
logic
al
Pro
cess
Su
b-p
rocess
Requ
ired
gen
es
Non
-requ
ired
gen
es
Cel
ld
ivis
ion
ftsA
LK
QW
YZ,minE,mukB
,SL2391
ftsH
JN
X*,
minCD,
sdiA
,cedA,sulA
DN
Are
pli
cati
ons
Poly
mer
ase
sI,
II,
an
dII
Idn
aE
NQ
X,
holA
BpolA
B,holC
DE
Su
per
coil
ing
gyrA
B,
parC
EP
rim
osom
e-as
soci
ated
dn
aB
CG
T,
pri
A,
ssb
pri
B*C,
rep
Tra
nsc
rip
tion
RN
Ap
olym
eras
erp
oA
BC
Sig
ma,
elon
gati
on,an
ti-
an
dte
rmin
ati
on
fac-
tors
nu
sBG
,rp
oD
H,
rho
nu
sA,
rpoENS
Tra
nsl
atio
ntR
NA
-synth
etas
esala
S,
arg
S,
asn
S,
asp
S,
cysS
,gln
S,
glt
X,
gly
QS
,his
S,
ileS
,le
uS
,ly
sS,
metG
,pheS
T,
pro
S,
serS
,th
rS,
tyrS
,valS
trpS,trpS2
Rib
osom
eco
mp
onen
tsrp
lBC
DE
FJ
KL
MN
OP
QR
ST
UV
WX
Y,
rpm
AB
CD
HI,
rpsA
BC
DE
FG
HI-
JK
LM
NP
QS
T
rplAI,
rpmEE2,
rpmFH
JJ2,
rpsO
R*U*V
Init
iati
on
,el
on
gati
on
,an
dp
epti
de
chain
re-
leas
efa
ctor
s
fusA
,in
fAB
C,
prf
AB
,ts
f,yrd
Cefp,prfCH,selB,tuf
Bio
synth
eti
cp
ath
ways
Pep
tid
ogly
can
mu
rAB
CD
EF
GI
ddl,dllA
Fat
tyac
ids
acc
AB
CD
,fa
bA
BD
GH
IZ
37
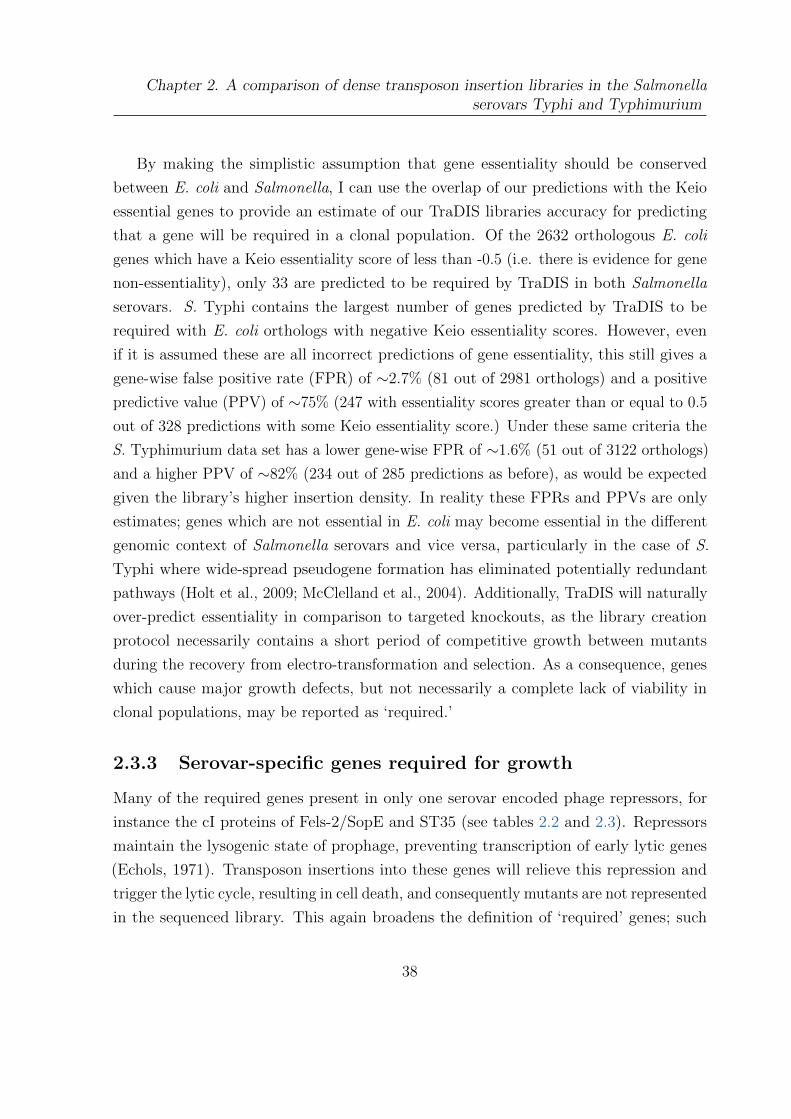
Chapter 2. A comparison of dense transposon insertion libraries in the Salmonellaserovars Typhi and Typhimurium
By making the simplistic assumption that gene essentiality should be conserved
between E. coli and Salmonella, I can use the overlap of our predictions with the Keio
essential genes to provide an estimate of our TraDIS libraries accuracy for predicting
that a gene will be required in a clonal population. Of the 2632 orthologous E. coli
genes which have a Keio essentiality score of less than -0.5 (i.e. there is evidence for gene
non-essentiality), only 33 are predicted to be required by TraDIS in both Salmonella
serovars. S. Typhi contains the largest number of genes predicted by TraDIS to be
required with E. coli orthologs with negative Keio essentiality scores. However, even
if it is assumed these are all incorrect predictions of gene essentiality, this still gives a
gene-wise false positive rate (FPR) of ∼2.7% (81 out of 2981 orthologs) and a positive
predictive value (PPV) of ∼75% (247 with essentiality scores greater than or equal to 0.5
out of 328 predictions with some Keio essentiality score.) Under these same criteria the
S. Typhimurium data set has a lower gene-wise FPR of ∼1.6% (51 out of 3122 orthologs)
and a higher PPV of ∼82% (234 out of 285 predictions as before), as would be expected
given the library’s higher insertion density. In reality these FPRs and PPVs are only
estimates; genes which are not essential in E. coli may become essential in the different
genomic context of Salmonella serovars and vice versa, particularly in the case of S.
Typhi where wide-spread pseudogene formation has eliminated potentially redundant
pathways (Holt et al., 2009; McClelland et al., 2004). Additionally, TraDIS will naturally
over-predict essentiality in comparison to targeted knockouts, as the library creation
protocol necessarily contains a short period of competitive growth between mutants
during the recovery from electro-transformation and selection. As a consequence, genes
which cause major growth defects, but not necessarily a complete lack of viability in
clonal populations, may be reported as ‘required.’
2.3.3 Serovar-specific genes required for growth
Many of the required genes present in only one serovar encoded phage repressors, for
instance the cI proteins of Fels-2/SopE and ST35 (see tables 2.2 and 2.3). Repressors
maintain the lysogenic state of prophage, preventing transcription of early lytic genes
(Echols, 1971). Transposon insertions into these genes will relieve this repression and
trigger the lytic cycle, resulting in cell death, and consequently mutants are not represented
in the sequenced library. This again broadens the definition of ‘required’ genes; such
38
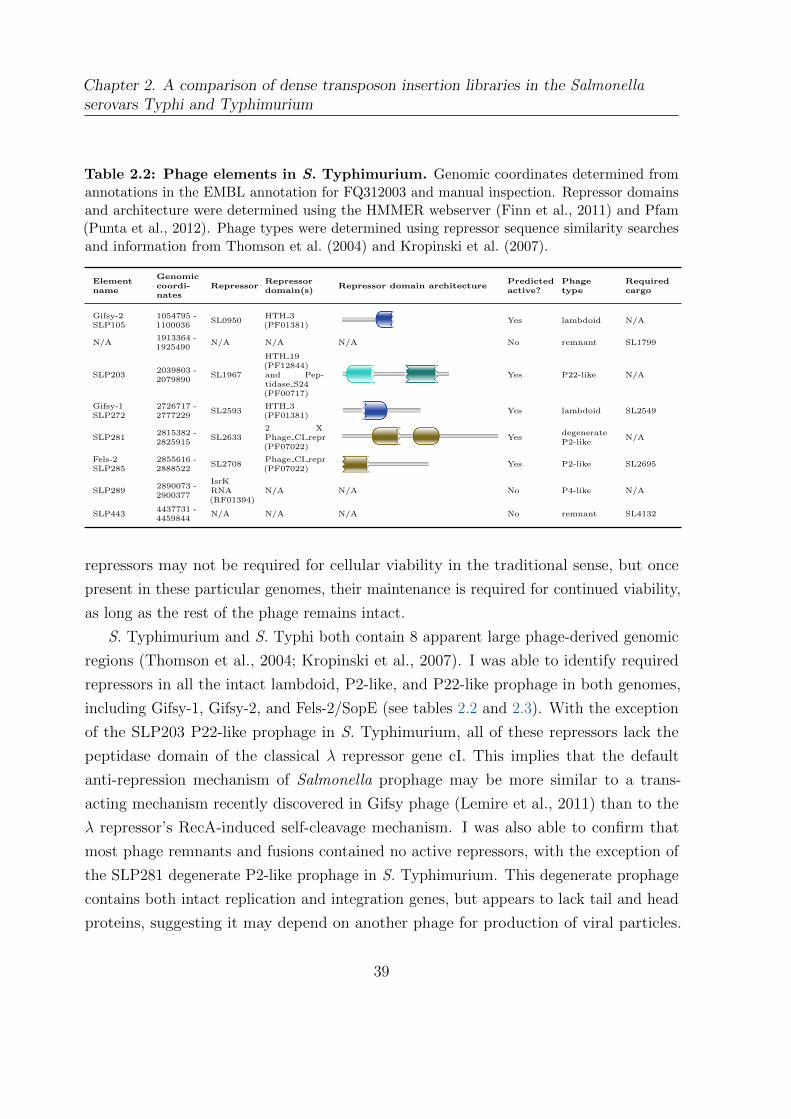
Chapter 2. A comparison of dense transposon insertion libraries in the Salmonellaserovars Typhi and Typhimurium
Table 2.2: Phage elements in S. Typhimurium. Genomic coordinates determined fromannotations in the EMBL annotation for FQ312003 and manual inspection. Repressor domainsand architecture were determined using the HMMER webserver (Finn et al., 2011) and Pfam(Punta et al., 2012). Phage types were determined using repressor sequence similarity searchesand information from Thomson et al. (2004) and Kropinski et al. (2007).
Elementname
Genomiccoordi-nates
RepressorRepressordomain(s)
Repressor domain architecturePredictedactive?
Phagetype
Requiredcargo
Gifsy-2SLP105
1054795 -1100036
SL0950HTH 3(PF01381)
Yes lambdoid N/A
N/A1913364 -1925490
N/A N/A N/A No remnant SL1799
SLP2032039803 -2079890
SL1967
HTH 19(PF12844)and Pep-tidase S24(PF00717)
Yes P22-like N/A
Gifsy-1SLP272
2726717 -2777229
SL2593HTH 3(PF01381)
Yes lambdoid SL2549
SLP2812815382 -2825915
SL26332 XPhage CI repr(PF07022)
Yes
degenerateP2-like
N/A
Fels-2SLP285
2855616 -2888522
SL2708Phage CI repr(PF07022)
Yes P2-like SL2695
SLP2892890073 -2900377
IsrKRNA(RF01394)
N/A N/A No P4-like N/A
SLP4434437731 -4459844
N/A N/A N/A No remnant SL4132
repressors may not be required for cellular viability in the traditional sense, but once
present in these particular genomes, their maintenance is required for continued viability,
as long as the rest of the phage remains intact.
S. Typhimurium and S. Typhi both contain 8 apparent large phage-derived genomic
regions (Thomson et al., 2004; Kropinski et al., 2007). I was able to identify required
repressors in all the intact lambdoid, P2-like, and P22-like prophage in both genomes,
including Gifsy-1, Gifsy-2, and Fels-2/SopE (see tables 2.2 and 2.3). With the exception
of the SLP203 P22-like prophage in S. Typhimurium, all of these repressors lack the
peptidase domain of the classical λ repressor gene cI. This implies that the default
anti-repression mechanism of Salmonella prophage may be more similar to a trans-
acting mechanism recently discovered in Gifsy phage (Lemire et al., 2011) than to the
λ repressor’s RecA-induced self-cleavage mechanism. I was also able to confirm that
most phage remnants and fusions contained no active repressors, with the exception of
the SLP281 degenerate P2-like prophage in S. Typhimurium. This degenerate prophage
contains both intact replication and integration genes, but appears to lack tail and head
proteins, suggesting it may depend on another phage for production of viral particles.
39
Chapter 2. A comparison of dense transposon insertion libraries in the Salmonellaserovars Typhi and Typhimurium
Table 2.3: Phage elements in S. Typhi. Genomic coordinates determined from Thomsonet al. (2004) and manual inspection. Repressor domains and architecture were determinedusing the HMMER webserver (Finn et al., 2011) and Pfam (Punta et al., 2012). Phage typeswere determined using repressor sequence similarity searches and information from Thomsonet al. (2004) and Kropinski et al. (2007).
Elementname
Genomiccoordi-nates
RepressorRepressordomain(s)
Repressor domain architecturePredictedactive?
Phagetype
Requiredcargo
ST151408790 -1441377
N/A N/A N/A NoMu/P2 fu-sion
N/A
Gifsy-21929572 -1972330
t1920HTH 3(PF01381)
Yes lambdoid N/A
ST2-272735054 -2745321
IsrKRNA(RF01394)
N/A N/A Yes P4-like N/A
ST272745477 -2768221
N/A N/A N/A NoP2/iroA fu-sion
N/A
ST353500854 -3536047
t3402Phage CI repr(PF07022)
Yes P2-like t3415
SopE4457346 -4491316
t4337Phage CI repr(PF07022)
Yes P2-like N/A
N/A4519423 -4519501
IsrKRNA(RF01394)
N/A N/A No remnant N/A
ST464666579 -4677433
IsrKRNA(RF01394)
N/A N/A Yes P4-like N/A
Both genomes also encode P4-like satellite prophage, which rely on ‘helper’ phage for lytic
functions and utilize a complex antisense-RNA based regulation mechanism for decision
pathways regarding cell fate (Briani et al., 2001) using structural homologs of the IsrK
(Padalon-Brauch et al., 2008) and C4 ncRNAs (Forti et al., 2002), known as seqA and CI
RNA in the P4 literature, respectively. While the mechanism of P4 lysogenic maintenance
is not known, the IsrK-like ncRNAs of two potentially active P4-like prophage in S.
Typhi are required under TraDIS. This sequence element has previously been shown to be
essential for the establishment of the P4 lysogenic state (Sabbattini et al., 1995), and we
predict based on our observations that it may be necessary for lysogenic maintenance as
well. The fact that some lambdoid prophage in S. Typhimurium encode non-coding genes
structurally similar to the IsrK-C4 immunity system of P4 raises the possibility that
these systems may be acting as a defense mechanism of sorts, protecting the prophage
from predatory satellite phage capable of co-opting its lytic genes.
In addition to repressors, 4 prophage cargo genes in S. Typhimurium and one in S.
Typhi are required (See tables 2.2, 2.3, 2.4, and 2.6). The S. Typhimurium prophage
cargo genes encode a PhoPQ regulated protein, a protein predicted to be involved in
natural transformation, an endodeoxyribonuclease, and a hypothetical protein. The
40
Chapter 2. A comparison of dense transposon insertion libraries in the Salmonellaserovars Typhi and Typhimurium
S. Typhi prophage cargo gene encodes a protein containing the DNA-binding HIRAN
domain (Iyer et al., 2006), believed to be involved in the repair of damaged DNA. These
warrant further investigation, as they are genes that have been recently acquired and
become necessary for survival in rich media.
To compare differences between requirements for orthologous genes in both serovars,
I calculated log-fold read ratios to eliminate genes which were classified differently in S.
Typhi and S. Typhimurium but did not have significantly different read densities (see
Methods.) Even after this correction, 36 S. Typhimurium genes had a significantly lower
frequency of transposon insertion compared to the equivalent genes in S. Typhi (P <
0.05), including four encoding hypothetical proteins (table 2.4). This indicates that these
gene products play a vital role in S. Typhimurium but not in S. Typhi when grown under
laboratory conditions.
41
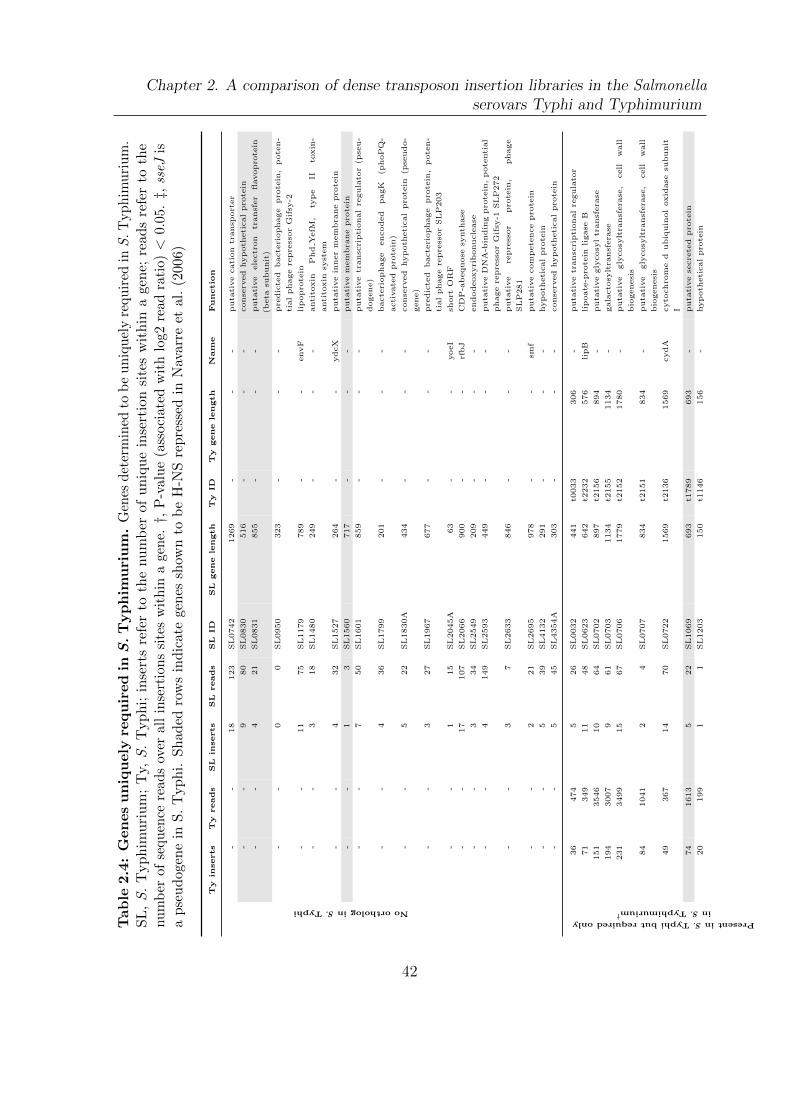
Chapter 2. A comparison of dense transposon insertion libraries in the Salmonellaserovars Typhi and Typhimurium
Tab
le2.4
:G
en
es
un
iqu
ely
requ
ired
inS
.T
yp
him
uri
um
.G
enes
det
erm
ined
tob
euniq
uel
yre
quir
edin
S.
Typhim
uri
um
.S
L,S.
Typ
him
uri
um
;T
y,S.
Typ
hi;
inse
rts
refe
rto
the
nu
mb
erof
un
iqu
ein
sert
ion
site
sw
ith
ina
gen
e;re
ad
sre
fer
toth
enum
ber
ofse
quen
cere
ads
over
all
inse
rtio
ns
site
sw
ithin
age
ne.
†,P
-val
ue
(ass
oci
ated
wit
hlo
g2re
adra
tio)<
0.05
.‡,
sseJ
isa
pse
ud
ogen
ein
S.
Typ
hi.
Sh
aded
row
sin
dic
ate
gen
essh
own
tob
eH
-NS
repre
ssed
inN
avar
reet
al.
(2006)
Ty
inserts
Ty
reads
SL
inserts
SL
reads
SL
ID
SL
gene
length
Ty
ID
Ty
gene
length
Nam
eFunctio
nNoorthologinS.Typhi
--
18
123
SL
0742
1269
--
-puta
tive
cati
on
transp
ort
er
--
980
SL
0830
516
--
-conse
rved
hyp
oth
eti
cal
pro
tein
--
421
SL
0831
855
--
-puta
tive
ele
ctr
on
transf
er
flavopro
tein
(beta
subunit
)
--
00
SL
0950
323
--
-pre
dic
ted
bacte
riophage
pro
tein
,p
ote
n-
tial
phage
repre
ssor
Gif
sy-2
--
11
75
SL
1179
789
--
envF
lip
opro
tein
--
318
SL
1480
249
--
-anti
toxin
Phd
YefM
,ty
pe
IIto
xin
-
anti
toxin
syst
em
--
432
SL
1527
264
--
ydcX
puta
tive
inner
mem
bra
ne
pro
tein
--
13
SL
1560
717
--
-puta
tive
mem
bra
ne
pro
tein
--
750
SL
1601
859
--
-puta
tive
transc
ripti
onal
regula
tor
(pse
u-
dogene)
--
436
SL
1799
201
--
-bacte
riophage
encoded
pagK
(phoP
Q-
acti
vate
dpro
tein
)
--
522
SL
1830A
434
--
-conse
rved
hyp
oth
eti
cal
pro
tein
(pse
udo-
gene)
--
327
SL
1967
677
--
-pre
dic
ted
bacte
riophage
pro
tein
,p
ote
n-
tial
phage
repre
ssor
SL
P203
--
115
SL
2045A
63
--
yoeI
short
OR
F
--
17
107
SL
2066
900
--
rfbJ
CD
P-a
bequose
synth
ase
--
334
SL
2549
209
--
-endodeoxyri
bonucle
ase
--
4149
SL
2593
449
--
-puta
tive
DN
A-b
indin
gpro
tein
,p
ote
nti
al
phage
repre
ssor
Gif
sy-1
SL
P272
--
37
SL
2633
846
--
-puta
tive
repre
ssor
pro
tein
,phage
SL
P281
--
221
SL
2695
978
--
smf
puta
tive
com
pete
nce
pro
tein
--
539
SL
4132
291
--
-hyp
oth
eti
cal
pro
tein
--
545
SL
4354A
303
--
-conse
rved
hyp
oth
eti
cal
pro
tein
PresentinS.Typhibutrequiredonly
inS.Typhimurium†
36
474
526
SL
0032
441
t0033
306
-puta
tive
transc
ripti
onal
regula
tor
71
349
11
48
SL
0623
642
t2232
576
lipB
lip
oate
-pro
tein
ligase
B
151
3546
10
64
SL
0702
897
t2156
894
-puta
tive
gly
cosy
ltr
ansf
era
se
194
3007
961
SL
0703
1134
t2155
1134
-gala
cto
sylt
ransf
era
se
231
3499
15
67
SL
0706
1779
t2152
1780
-puta
tive
gly
cosy
ltra
nsf
era
se,
cell
wall
bio
genesi
s
84
1041
24
SL
0707
834
t2151
834
-puta
tive
gly
cosy
ltra
nsf
era
se,
cell
wall
bio
genesi
s
49
367
14
70
SL
0722
1569
t2136
1569
cydA
cyto
chro
me
dubiq
uin
ol
oxid
ase
subunit
I
74
1613
522
SL
1069
693
t1789
693
-puta
tive
secre
ted
pro
tein
20
199
11
SL
1203
150
t1146
156
-hyp
oth
eti
cal
pro
tein
42
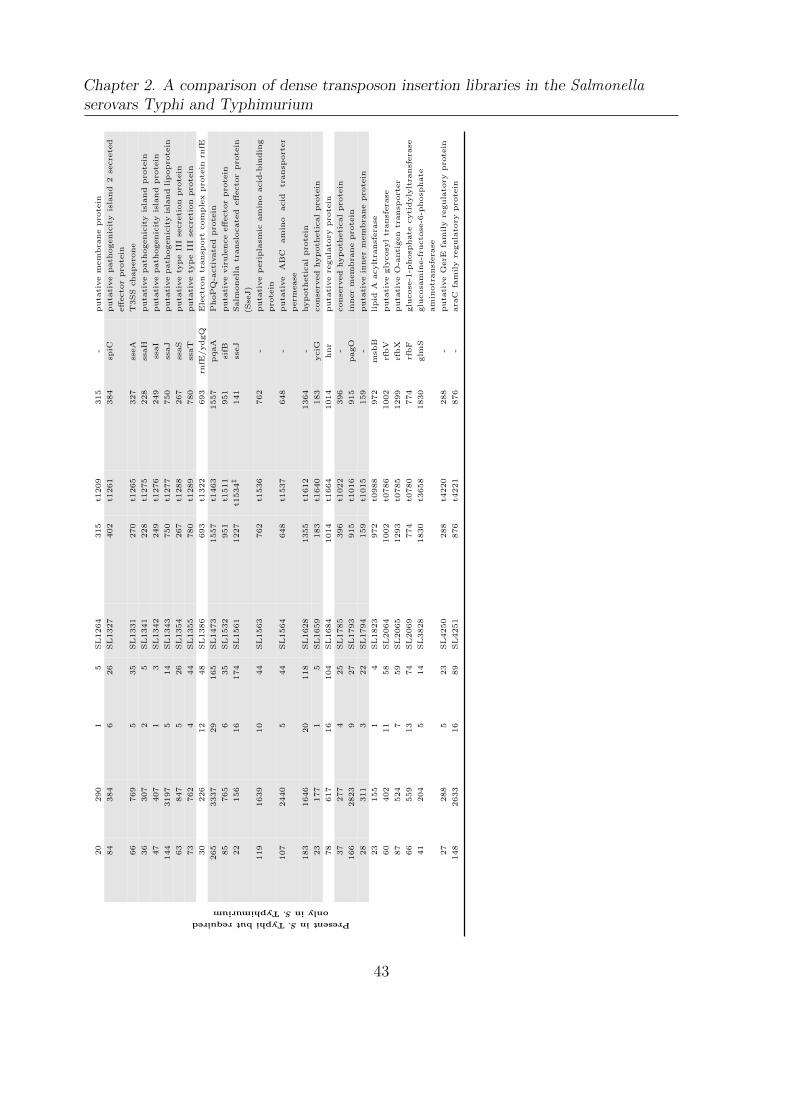
Chapter 2. A comparison of dense transposon insertion libraries in the Salmonellaserovars Typhi and Typhimurium
20
290
15
SL
1264
315
t1209
315
-puta
tive
mem
bra
ne
pro
tein
84
384
626
SL
1327
402
t1261
384
spiC
puta
tive
path
ogenic
ity
isla
nd
2se
cre
ted
eff
ecto
rpro
tein
PresentinS.Typhibutrequired
onlyinS.Typhimurium
66
769
535
SL
1331
270
t1265
327
sseA
T3SS
chap
ero
ne
36
307
25
SL
1341
228
t1275
228
ssaH
puta
tive
path
ogenic
ity
isla
nd
pro
tein
47
407
13
SL
1342
249
t1276
249
ssaI
puta
tive
path
ogenic
ity
isla
nd
pro
tein
144
3197
514
SL
1343
750
t1277
750
ssaJ
puta
tive
path
ogenic
ity
isla
nd
lip
opro
tein
63
847
526
SL
1354
267
t1288
267
ssaS
puta
tive
typ
eII
Ise
cre
tion
pro
tein
73
762
444
SL
1355
780
t1289
780
ssaT
puta
tive
typ
eII
Ise
cre
tion
pro
tein
30
226
12
48
SL
1386
693
t1322
693
rnfE
/ydgQ
Ele
ctr
on
transp
ort
com
ple
xpro
tein
rnfE
265
3337
29
165
SL
1473
1557
t1463
1557
pqaA
PhoP
Q-a
cti
vate
dpro
tein
85
765
635
SL
1532
951
t1511
951
sifB
puta
tive
vir
ule
nce
eff
ecto
rpro
tein
22
156
16
174
SL
1561
1227
t1534‡
141
sseJ
Salm
onella
transl
ocate
deff
ecto
rpro
tein
(Sse
J)
119
1639
10
44
SL
1563
762
t1536
762
-puta
tive
peri
pla
smic
am
ino
acid
-bin
din
g
pro
tein
107
2440
544
SL
1564
648
t1537
648
-puta
tive
AB
Cam
ino
acid
transp
ort
er
perm
ease
183
1646
20
118
SL
1628
1355
t1612
1364
-hyp
oth
eti
cal
pro
tein
23
177
15
SL
1659
183
t1640
183
yciG
conse
rved
hyp
oth
eti
cal
pro
tein
78
617
16
104
SL
1684
1014
t1664
1014
hnr
puta
tive
regula
tory
pro
tein
37
277
425
SL
1785
396
t1022
396
-conse
rved
hyp
oth
eti
cal
pro
tein
166
2823
927
SL
1793
915
t1016
915
pagO
inner
mem
bra
ne
pro
tein
28
311
322
SL
1794
159
t1015
159
-puta
tive
inner
mem
bra
ne
pro
tein
23
155
14
SL
1823
972
t0988
972
msb
Blipid
Aacylt
ransf
era
se
60
402
11
58
SL
2064
1002
t0786
1002
rfbV
puta
tive
gly
cosy
ltr
ansf
era
se
87
524
759
SL
2065
1293
t0785
1299
rfbX
puta
tive
O-a
nti
gen
transp
ort
er
66
559
13
74
SL
2069
774
t0780
774
rfbF
glu
cose
-1-p
hosp
hate
cyti
dyly
ltra
nsf
era
se
41
204
514
SL
3828
1830
t3658
1830
glm
Sglu
cosa
min
e-f
ructo
se-6
-phosp
hate
am
inotr
ansf
era
se
27
288
523
SL
4250
288
t4220
288
-puta
tive
GerE
fam
ily
regula
tory
pro
tein
148
2633
16
89
SL
4251
876
t4221
876
-ara
Cfa
mily
regula
tory
pro
tein
43
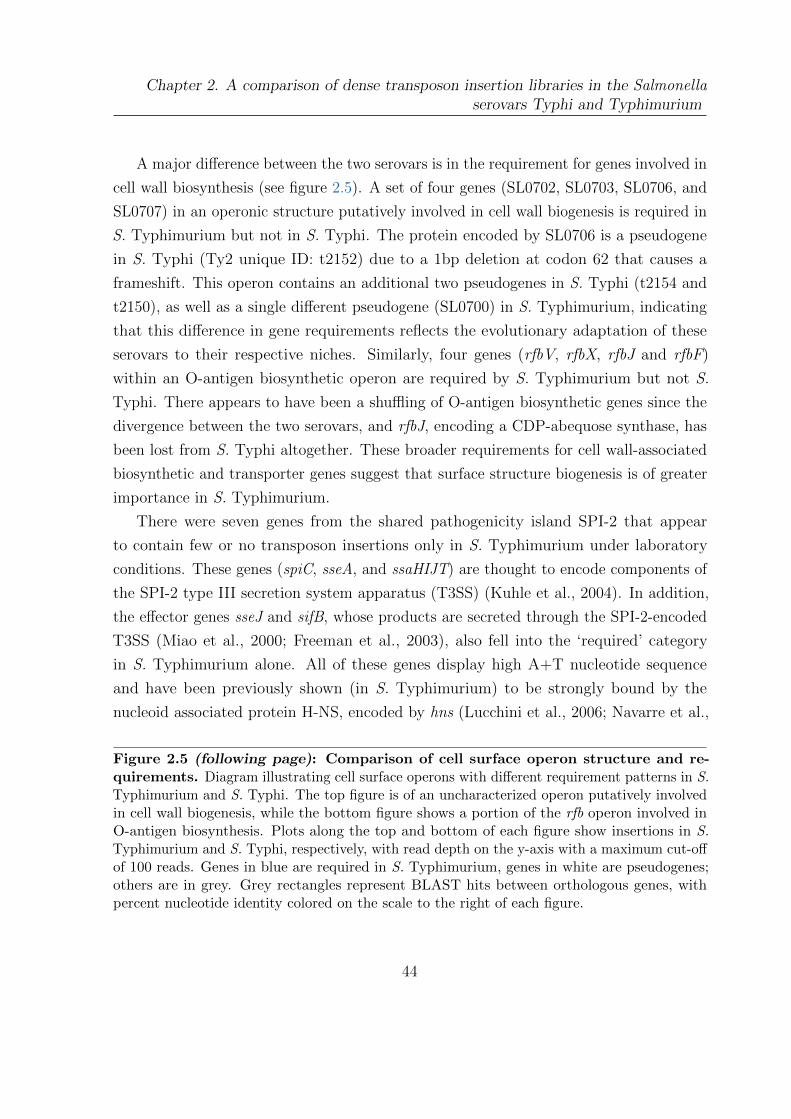
Chapter 2. A comparison of dense transposon insertion libraries in the Salmonellaserovars Typhi and Typhimurium
A major difference between the two serovars is in the requirement for genes involved in
cell wall biosynthesis (see figure 2.5). A set of four genes (SL0702, SL0703, SL0706, and
SL0707) in an operonic structure putatively involved in cell wall biogenesis is required in
S. Typhimurium but not in S. Typhi. The protein encoded by SL0706 is a pseudogene
in S. Typhi (Ty2 unique ID: t2152) due to a 1bp deletion at codon 62 that causes a
frameshift. This operon contains an additional two pseudogenes in S. Typhi (t2154 and
t2150), as well as a single different pseudogene (SL0700) in S. Typhimurium, indicating
that this difference in gene requirements reflects the evolutionary adaptation of these
serovars to their respective niches. Similarly, four genes (rfbV, rfbX, rfbJ and rfbF)
within an O-antigen biosynthetic operon are required by S. Typhimurium but not S.
Typhi. There appears to have been a shuffling of O-antigen biosynthetic genes since the
divergence between the two serovars, and rfbJ, encoding a CDP-abequose synthase, has
been lost from S. Typhi altogether. These broader requirements for cell wall-associated
biosynthetic and transporter genes suggest that surface structure biogenesis is of greater
importance in S. Typhimurium.
There were seven genes from the shared pathogenicity island SPI-2 that appear
to contain few or no transposon insertions only in S. Typhimurium under laboratory
conditions. These genes (spiC, sseA, and ssaHIJT) are thought to encode components of
the SPI-2 type III secretion system apparatus (T3SS) (Kuhle et al., 2004). In addition,
the effector genes sseJ and sifB, whose products are secreted through the SPI-2-encoded
T3SS (Miao et al., 2000; Freeman et al., 2003), also fell into the ‘required’ category
in S. Typhimurium alone. All of these genes display high A+T nucleotide sequence
and have been previously shown (in S. Typhimurium) to be strongly bound by the
nucleoid associated protein H-NS, encoded by hns (Lucchini et al., 2006; Navarre et al.,
Figure 2.5 (following page): Comparison of cell surface operon structure and re-quirements. Diagram illustrating cell surface operons with different requirement patterns in S.Typhimurium and S. Typhi. The top figure is of an uncharacterized operon putatively involvedin cell wall biogenesis, while the bottom figure shows a portion of the rfb operon involved inO-antigen biosynthesis. Plots along the top and bottom of each figure show insertions in S.Typhimurium and S. Typhi, respectively, with read depth on the y-axis with a maximum cut-offof 100 reads. Genes in blue are required in S. Typhimurium, genes in white are pseudogenes;others are in grey. Grey rectangles represent BLAST hits between orthologous genes, withpercent nucleotide identity colored on the scale to the right of each figure.
44
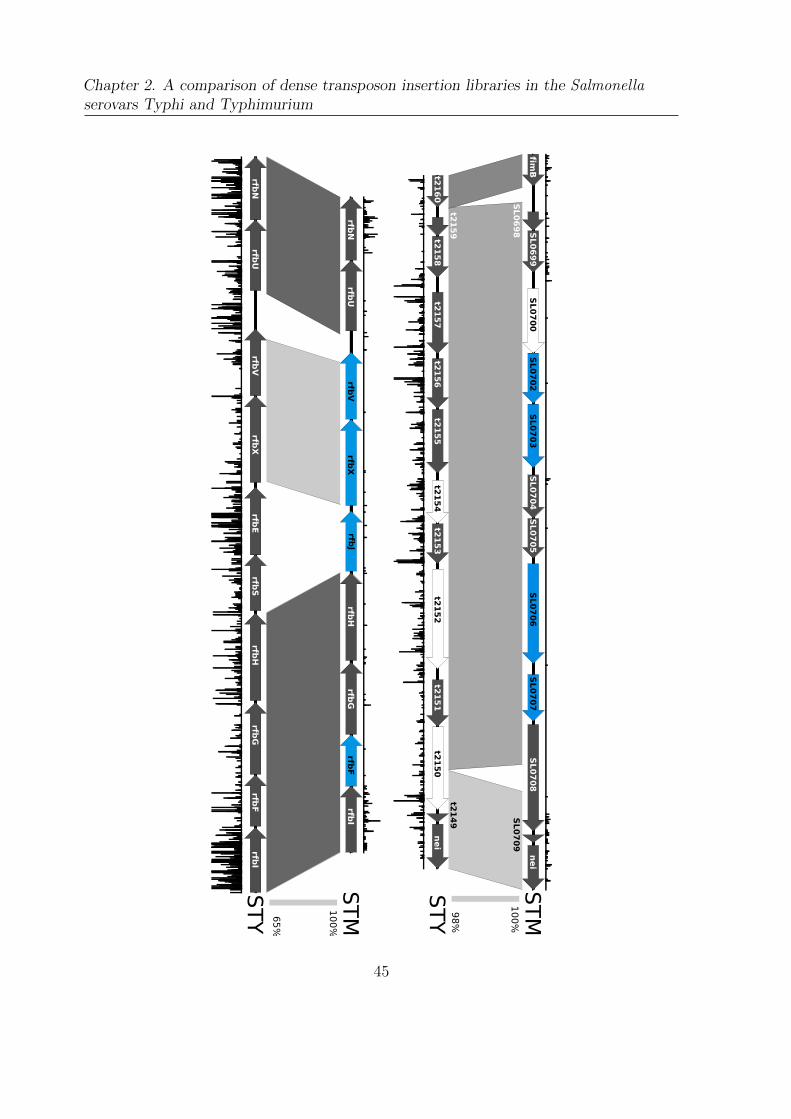
Chapter 2. A comparison of dense transposon insertion libraries in the Salmonellaserovars Typhi and Typhimurium
45
Chapter 2. A comparison of dense transposon insertion libraries in the Salmonellaserovars Typhi and Typhimurium
2006). Therefore, rather than being ‘required’, it is instead possible that access for the
transposon was sufficiently restricted that very few insertions occurred at these sites.
In further support of this hypothesis, a comparison of the binding pattern of H-NS
detected in studies using S. Typhimurium LT2 with the TraDIS results from the SPI-2
locus indicated that high regions of H-NS enrichment correlated well with both the ssa
genes described here and with sseJ (see figure 2.6). An earlier study also suggests that
high-density DNA binding proteins can block Mu, Tn5, and Tn10 insertion (Manna et al.,
2007); however, a genome-wide study of the effects of H-NS binding on transposition
would be necessary to confirm this effect.
Indeed, the generation of null S. Typhimurium mutants in sseJ and sifB, as well
as many others generated at the SPI-2 locus suggest that these genes are not truly a
requirement for growth in this serovar (Freeman et al., 2003; Hensel et al., 1997; Hensel
et al., 1998; Ohlson et al., 2005). While this is a reminder that the interpretation of gene
requirement needs to be made with care, the effect of H-NS upon transposon insertion
is not genome-wide. If this were the case, there would be an under-representation of
transposon mutants in high A+T regions (known for H-NS binding), which is not what
was observed. In total, only 21 required genes fall into the ‘hns-repressed’ category
described in Navarre et al. (2006)(see table 2.5); the remainder (almost 400) contained
sufficient transposon insertions to conclude they were non-required. In addition, all SPI-1
genes that encode another T3SS and are of high A+T content were also found to be
non-required. This phenomenon was not observed in S. Typhi, possibly because the
strain used harbors the pHCM1 plasmid, which encodes the H-NS-like protein sfh and
has been shown to affect H-NS binding (Doyle et al., 2007; Dillon et al., 2010).
Twenty-two S. Typhi genes had a significantly lower frequency of transposon insertion
compared to orthologs in S. Typhimurium (P < 0.05), indicating that they are required
only in S. Typhi for growth under laboratory conditions (table 2.6), including the
fepBDGC operon. This indicates a requirement for ferric (Fe(III)) rather than ferrous
Figure 2.6 (following page): H-NS enrichment across the SPI-2 locus. Based ondata from Lucchini et al. (2006) where a 2 fold enrichment of H-NS-bound DNA over a totalgenomic DNA control in a ChIP-on-chip experiment was taken to indicate regions of H-NSbinding in S. Typhimurium strain LT2. Assuming these binding patterns are similar in the S.Typhimurium strain tested in this study, H-NS binding may have affected transposon access togenes in the SPI-2 locus.
46
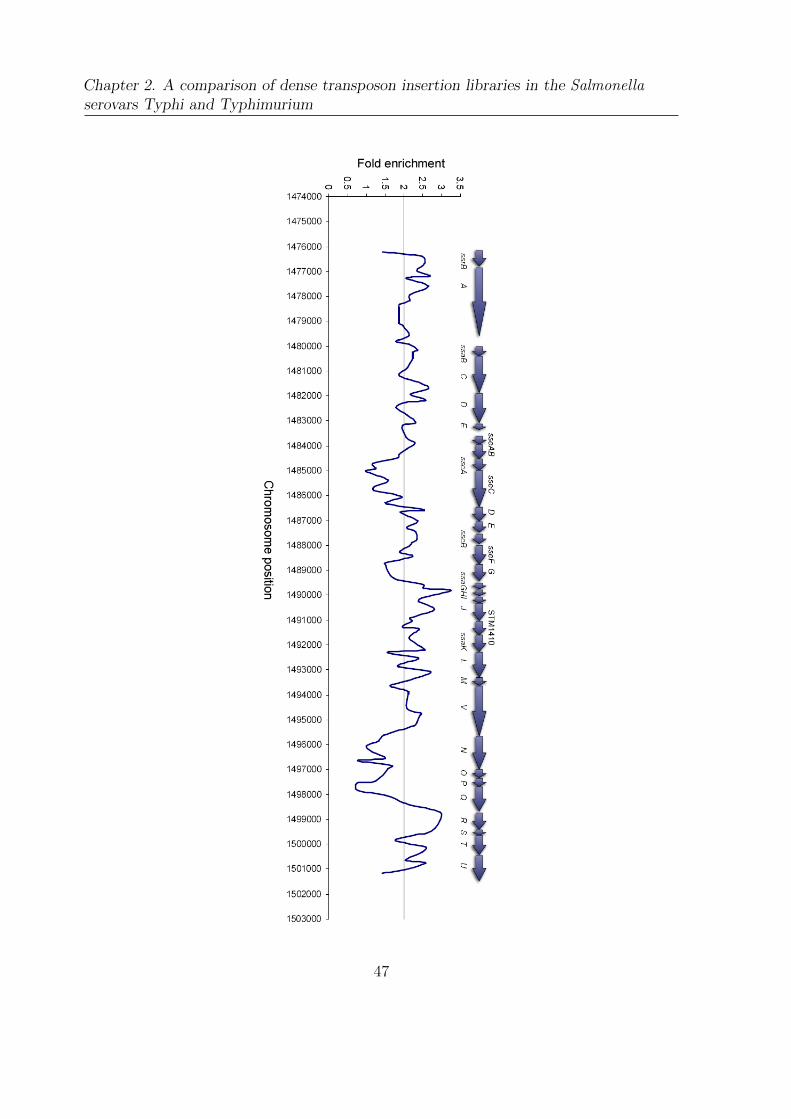
Chapter 2. A comparison of dense transposon insertion libraries in the Salmonellaserovars Typhi and Typhimurium
47
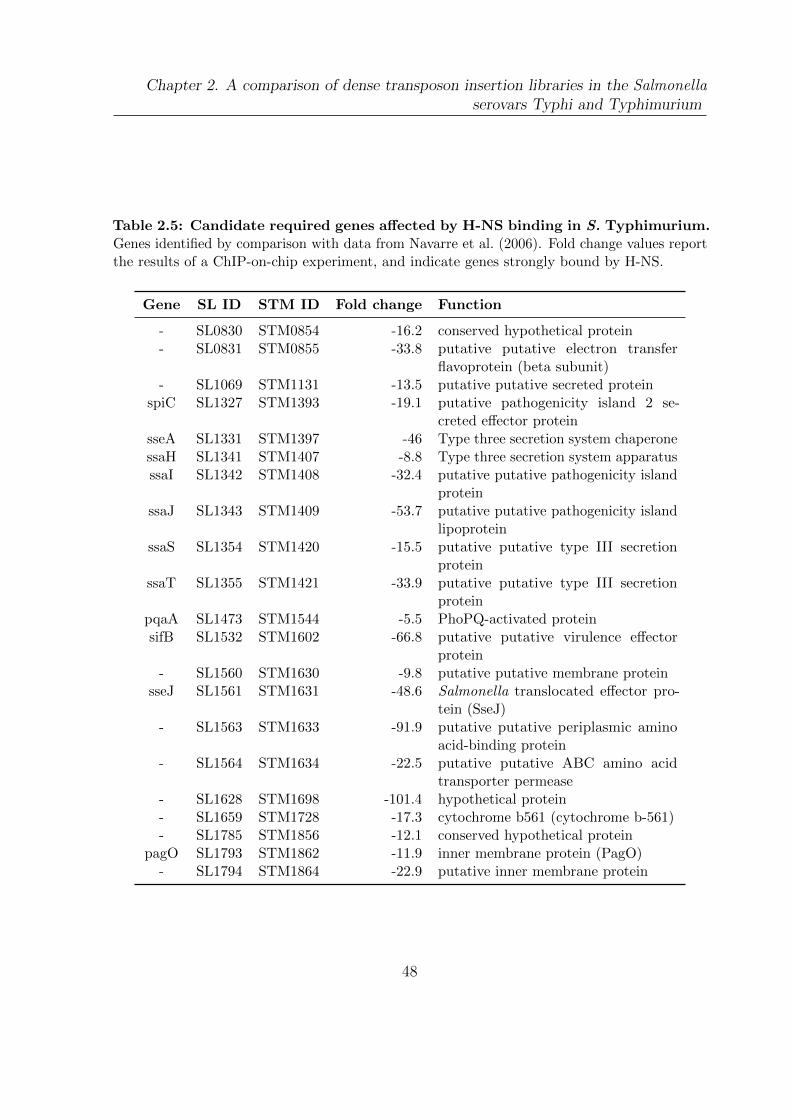
Chapter 2. A comparison of dense transposon insertion libraries in the Salmonellaserovars Typhi and Typhimurium
Table 2.5: Candidate required genes affected by H-NS binding in S. Typhimurium.Genes identified by comparison with data from Navarre et al. (2006). Fold change values reportthe results of a ChIP-on-chip experiment, and indicate genes strongly bound by H-NS.
Gene SL ID STM ID Fold change Function
- SL0830 STM0854 -16.2 conserved hypothetical protein- SL0831 STM0855 -33.8 putative putative electron transfer
flavoprotein (beta subunit)- SL1069 STM1131 -13.5 putative putative secreted protein
spiC SL1327 STM1393 -19.1 putative pathogenicity island 2 se-creted effector protein
sseA SL1331 STM1397 -46 Type three secretion system chaperonessaH SL1341 STM1407 -8.8 Type three secretion system apparatusssaI SL1342 STM1408 -32.4 putative putative pathogenicity island
proteinssaJ SL1343 STM1409 -53.7 putative putative pathogenicity island
lipoproteinssaS SL1354 STM1420 -15.5 putative putative type III secretion
proteinssaT SL1355 STM1421 -33.9 putative putative type III secretion
proteinpqaA SL1473 STM1544 -5.5 PhoPQ-activated proteinsifB SL1532 STM1602 -66.8 putative putative virulence effector
protein- SL1560 STM1630 -9.8 putative putative membrane protein
sseJ SL1561 STM1631 -48.6 Salmonella translocated effector pro-tein (SseJ)
- SL1563 STM1633 -91.9 putative putative periplasmic aminoacid-binding protein
- SL1564 STM1634 -22.5 putative putative ABC amino acidtransporter permease
- SL1628 STM1698 -101.4 hypothetical protein- SL1659 STM1728 -17.3 cytochrome b561 (cytochrome b-561)- SL1785 STM1856 -12.1 conserved hypothetical protein
pagO SL1793 STM1862 -11.9 inner membrane protein (PagO)- SL1794 STM1864 -22.9 putative inner membrane protein
48
Chapter 2. A comparison of dense transposon insertion libraries in the Salmonellaserovars Typhi and Typhimurium
(Fe(II)) iron. This can be explained by the presence of Fe(III) in the bloodstream, where
S. Typhi can be found during typhoid fever (Wain et al., 1998). These genes function
to recover the ferric chelator enterobactin from the periplasm, acting with a number
of proteins known to aid the passage of this siderophore through the outer membrane
(Rabsch et al., 1999). It has long been noted that aroA mutants of S. Typhi, deficient in
their ability to synthesize enterobactin, exhibit severe growth defects on complex media,
while similar mutants of S. Typhimurium grow normally under the same conditions
(Edwards et al., 1988), though the mechanism has not been clear. These results suggest
that this difference in growth of aroA mutants is caused by a requirement for iron uptake
through the fep system in S. Typhi. During host adaptation, S. Typhi has accumulated
pseudogenes in many iron transport and response systems (McClelland et al., 2004),
presumably because they are not necessary for survival in the niche S. Typhi occupies
in the human host, which may have led to this dependence on fep genes. In contrast,
S. Typhimurium generally causes intestinal rather than systemic infection and is able
to utilize a wider range of iron sources, including Fe(II), a soluble form of iron present
under anaerobic conditions such as those found in the intestine (Tsolis et al., 1996).
49
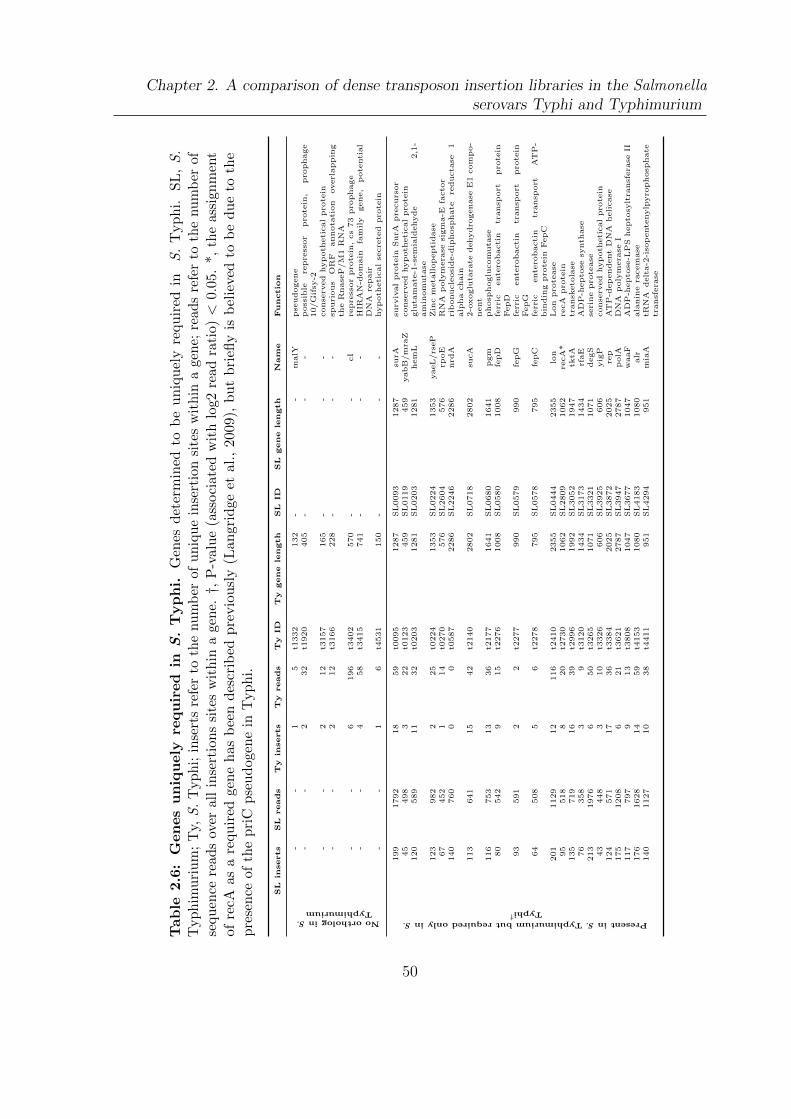
Chapter 2. A comparison of dense transposon insertion libraries in the Salmonellaserovars Typhi and Typhimurium
Tab
le2.6
:G
en
es
un
iqu
ely
requ
ired
inS
.T
yp
hi.
Gen
esd
eter
min
edto
be
un
iqu
ely
requ
ired
inS.
Typ
hi.
SL
,S.
Typhim
uri
um
;T
y,S.
Typhi;
inse
rts
refe
rto
the
num
ber
ofuniq
ue
inse
rtio
nsi
tes
wit
hin
age
ne;
read
sre
fer
toth
enum
ber
ofse
qu
ence
read
sov
eral
lin
sert
ion
ssi
tes
wit
hin
age
ne.
†,P
-val
ue
(ass
oci
ated
wit
hlo
g2re
adra
tio)<
0.05
.*,
the
assi
gnm
ent
of
recA
as
are
qu
ired
gen
ehas
bee
nd
escr
ibed
pre
vio
usl
y(L
an
gri
dge
etal.
,2009),
bu
tb
riefl
yis
bel
ieved
tob
ed
ue
toth
ep
rese
nce
ofth
ep
riC
pse
ud
ogen
ein
Typ
hi.
SL
inserts
SL
reads
Ty
inserts
Ty
reads
Ty
ID
Ty
gene
length
SL
ID
SL
gene
length
Nam
eFunctio
n
NoorthologinS.Typhimurium
--
15
t1332
132
--
malY
pse
udogene
--
232
t1920
405
--
-p
oss
ible
repre
ssor
pro
tein
,pro
phage
10/G
ifsy
-2-
-2
12
t3157
165
--
-conse
rved
hyp
oth
eti
cal
pro
tein
--
212
t3166
228
--
-sp
uri
ous
OR
Fannota
tion
overl
appin
gth
eR
nase
P/M
1R
NA
--
6196
t3402
570
--
cI
repre
ssor
pro
tein
,cs
73
pro
phage
--
458
t3415
741
--
-H
IRA
N-d
om
ain
fam
ily
gene,
pote
nti
al
DN
Are
pair
--
16
t4531
150
--
-hyp
oth
eti
cal
secre
ted
pro
tein
PresentinS.TyphimuriumbutrequiredonlyinS.
Typhi†
199
1792
18
59
t0095
1287
SL
0093
1287
surA
surv
ival
pro
tein
SurA
pre
curs
or
45
498
322
t0123
459
SL
0119
459
yabB
/m
raZ
conse
rved
hyp
oth
eti
cal
pro
tein
120
589
11
32
t0203
1281
SL
0203
1281
hem
Lglu
tam
ate
-1-s
em
iald
ehyde
2,1
-am
inom
uta
se123
982
225
t0224
1353
SL
0224
1353
yaeL
/rs
eP
Zin
cm
eta
llop
epti
dase
67
452
114
t0270
576
SL
2604
576
rpoE
RN
Ap
oly
mera
sesi
gm
a-E
facto
r140
760
00
t0587
2286
SL
2246
2286
nrd
Ari
bonucle
osi
de-d
iphosp
hate
reducta
se1
alp
ha
chain
113
641
15
42
t2140
2802
SL
0718
2802
sucA
2-o
xoglu
tara
tedehydro
genase
E1
com
po-
nent
116
753
13
36
t2177
1641
SL
0680
1641
pgm
phosp
hoglu
com
uta
se80
542
915
t2276
1008
SL
0580
1008
fepD
ferr
icente
robacti
ntr
ansp
ort
pro
tein
FepD
93
591
22
t2277
990
SL
0579
990
fepG
ferr
icente
robacti
ntr
ansp
ort
pro
tein
FepG
64
508
56
t2278
795
SL
0578
795
fepC
ferr
icente
robacti
ntr
ansp
ort
AT
P-
bin
din
gpro
tein
FepC
201
1129
12
116
t2410
2355
SL
0444
2355
lon
Lon
pro
tease
95
518
820
t2730
1062
SL
2809
1062
recA
*re
cA
pro
tein
135
719
16
39
t2996
1992
SL
3052
1947
tktA
transk
eto
lase
76
358
39
t3120
1434
SL
3173
1434
rfaE
AD
P-h
epto
sesy
nth
ase
213
1976
650
t3265
1071
SL
3321
1071
degS
seri
ne
pro
tease
43
448
310
t3326
606
SL
3925
606
yig
Pconse
rved
hyp
oth
eti
cal
pro
tein
124
571
17
36
t3384
2025
SL
3872
2025
rep
AT
P-d
ep
endent
DN
Ahelicase
175
1208
621
t3621
2787
SL
3947
2787
polA
DN
Ap
oly
mera
seI
117
797
913
t3808
1047
SL
3677
1047
waaF
AD
P-h
epto
se-L
PS
hepto
sylt
ransf
era
seII
176
1628
14
59
t4153
1080
SL
4183
1080
alr
ala
nin
era
cem
ase
140
1127
10
38
t4411
951
SL
4294
951
mia
AtR
NA
delt
a-2
-iso
pente
nylp
yro
phosp
hate
transf
era
se
50
Chapter 2. A comparison of dense transposon insertion libraries in the Salmonellaserovars Typhi and Typhimurium
2.3.4 TraDIS provides resolution sufficient to evaluate ncRNA
contributions to fitness
Under a Poisson approximation to the transposon insertion process, a region of 41 (in S.
Typhimurium) or 60 bases (in S. Typhi) has only a 1% probability of not containing an
insertion. NcRNAs tend to be considerably shorter than their protein-coding counterparts,
but this gives us sufficient resolution to assay most of the non-coding complement of
the Salmonella genome. As a proof of principle, I performed an analysis of the best-
understood class of small ncRNAs, the tRNAs. Francis Crick hypothesized that a single
tRNA could recognize more than one codon through wobble recognition (Crick, 1966),
where a non-canonical G-U base pair is formed between the first (wobble) position of
the anticodon and the third nucleotide in the codon. As a result, some codons are
covered by multiple tRNAs, while others are covered non-redundantly by a single tRNA.
I expect that singleton wobble-capable tRNAs, that is wobble tRNAs which recognize a
codon uniquely, will be required. In addition, I inferred the requirement for other tRNAs
through the non-redundant coverage of their codons and used this to benchmark our
ability to use TraDIS to reliably interrogate short genomic intervals.
The S. Typhi and S. Typhimurium genomes encode 78 and 85 (plus one pseudogene)
tRNAs respectively with 40 anticodons, as identified by tRNAscan-SE (Lowe et al.,
1997). In S. Typhi, 10 out of 11 singleton wobble tRNAs are predicted to be required or
ambiguous, compared to 16 tRNAs below the ambiguous LLR cut-off overall (significant
enrichment at the 0.05 level, two-tailed Fishers exact test p-value: 6.4e-08.) Similarly in S.
Typhimurium, 9 of 11 singleton wobble tRNAs are required or ambiguous compared to 15
required or ambiguous tRNAs overall, again showing a significant enrichment of required
tRNAs in this subset (Fishers exact test p-value: 5.2e-07.) The one singleton wobble tRNA
which is consistently not required in both serovars is the tRNA-Pro(GGG), which occurs
within a 4-member codon family. It has previously been shown in S. Typhimurium that
tRNA-Pro(UGG) can read all four proline codons in vivo due to a cmo5U34 modification
to the anticodon, obviating the need for a functional tRNA-Pro(GGG) (Nasvall et al.,
2004) and making this tRNA non-required. The other non-required singleton wobble
tRNA in S. Typhimurium, tRNA-Leu(GAG), is similarly a member of a 4-member codon
family. I predict tRNA-Leu(TAG) may also be capable of recognizing all 4 leucine codons
in this serovar; such a leucine “four-way wobble” has been previously inferred in at least
51
Chapter 2. A comparison of dense transposon insertion libraries in the Salmonellaserovars Typhi and Typhimurium
one other bacterial species (Osawa et al., 1992; Marck et al., 2002).
Of the 6 required non-wobble tRNAs in each serovar, four are shared. These include
two non-wobble singleton tRNAs covering codons uniquely, as well as a tRNA with
the ATG anticodon which is post-transcriptionally modified by the required protein
MesJ/TilS to recognize the isoleucine codon ATA (Marck et al., 2002). An additional two
required tRNAs in both serovars, one shared and one with a differing anticodon, contain
Gln anticodons and are part of a polycistronic tRNA operon containing other required
tRNAs. This operon is conserved in E. coli with the exception of an additional tRNA-Gln
at the 3’ end that has been lost in the Salmonella lineage. It is possible that transposon
insertions early in the operon may interfere with processing of the polycistronic transcript
in to mature tRNAs. Finally, I did not observe insertions in a tRNA-Met and a tRNA-Val
in S. Typhi and S. Typhimurium, respectively.
Using this analysis of the tRNAs we estimate a worst-case PPV for these short
molecules (∼76 bases) at 81%, in line with my previous estimates for conserved protein-
coding genes, and a FPR of <4%, higher than for protein-coding genes but still well
within the typical tolerance of high-throughput experiments. This assumes that the
“required” operonic tRNA-Glns and the serovar-specific tRNA-Met and tRNA-Val are all
false positives; it is not clear that this is in fact the case.
Surveying the shared required ncRNA content of both serovars (see table 2.7), I found
that the RNA components of the signal recognition particle (SRP) and RNase P, two
universally conserved ncRNAs, are required as expected. The SRP is an essential compo-
nent of the cellular secretion machinery, while RNase P is necessary for the maturation of
tRNAs. I also found a number of required known and potential cis-regulatory molecules
associated with genes required for growth under laboratory conditions in both serovars.
The FMN riboswitch controls ribB, a 3,4-dihydroxy-2-butanone 4-phosphate synthase
involved in riboflavin biosynthesis, in response to flavin mononucleotide concentrations
(Winkler et al., 2002). Additionally, I was able to assign putative functions to a number
of previously uncharacterized required non-coding transcripts through their 5′ association
with required genes. SroE, a 90 nucleotide molecule discovered in an early sRNA screen
(Vogel et al., 2003), is consistently located at the 5′ end of the required hisS gene across its
phylogenic distribution in the Enterobacteriaceae. Given this consistent association and
the function of HisS as a histidyl-tRNA synthetase, I hypothesize that this region may
act in a manner similar to a T-box leader, inducing or repressing expression in response
52

Chapter 2. A comparison of dense transposon insertion libraries in the Salmonellaserovars Typhi and Typhimurium
to tRNA-His levels. The thrU leader sequence, recently discovered in a deep-sequencing
screen of E. coli (Raghavan et al., 2011), appears to regulate a polycistronic operon of
required singleton wobble tRNAs. Three additional required cis-regulatory elements,
t44, S15, and StyR-8, are associated with required ribosomal proteins, highlighting the
central role ncRNA elements play in regulating fundamental cellular processes.
53
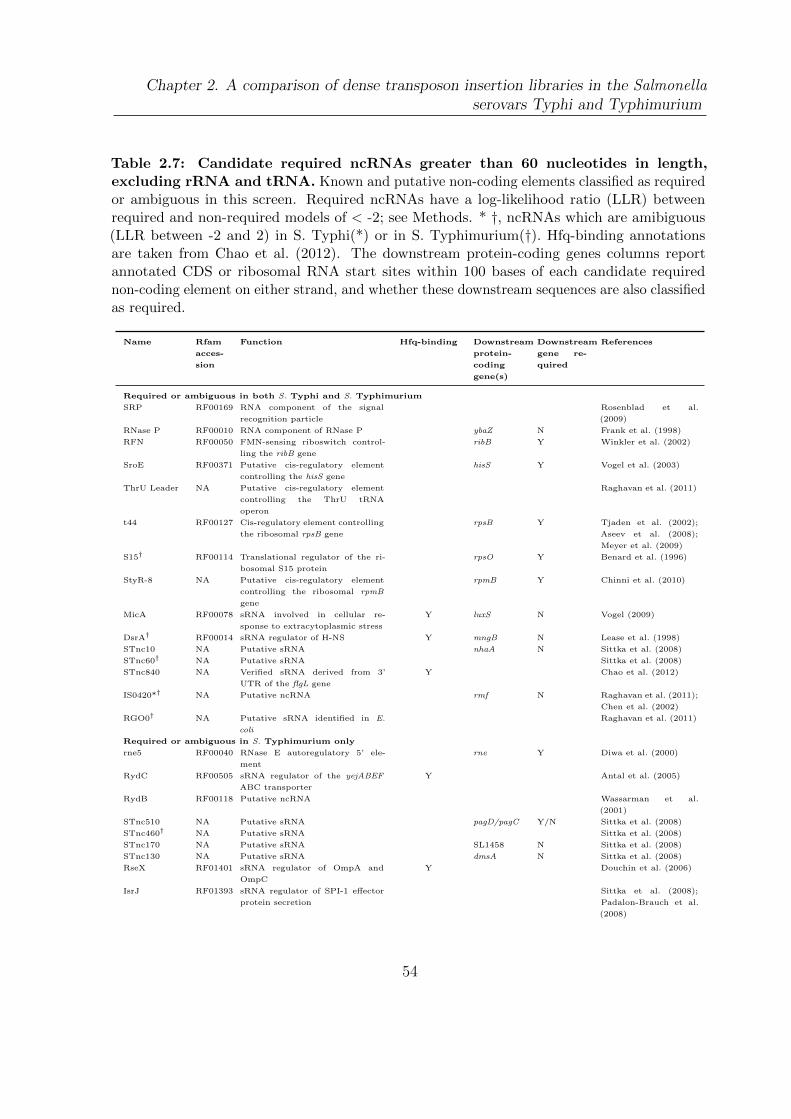
Chapter 2. A comparison of dense transposon insertion libraries in the Salmonellaserovars Typhi and Typhimurium
Table 2.7: Candidate required ncRNAs greater than 60 nucleotides in length,excluding rRNA and tRNA. Known and putative non-coding elements classified as requiredor ambiguous in this screen. Required ncRNAs have a log-likelihood ratio (LLR) betweenrequired and non-required models of < -2; see Methods. * †, ncRNAs which are amibiguous(LLR between -2 and 2) in S. Typhi(*) or in S. Typhimurium(†). Hfq-binding annotationsare taken from Chao et al. (2012). The downstream protein-coding genes columns reportannotated CDS or ribosomal RNA start sites within 100 bases of each candidate requirednon-coding element on either strand, and whether these downstream sequences are also classifiedas required.
Name Rfam
acces-
sion
Function Hfq-binding Downstream
protein-
coding
gene(s)
Downstream
gene re-
quired
References
Required or ambiguous in both S. Typhi and S. Typhimurium
SRP RF00169 RNA component of the signal
recognition particle
Rosenblad et al.
(2009)
RNase P RF00010 RNA component of RNase P ybaZ N Frank et al. (1998)
RFN RF00050 FMN-sensing riboswitch control-
ling the ribB gene
ribB Y Winkler et al. (2002)
SroE RF00371 Putative cis-regulatory element
controlling the hisS gene
hisS Y Vogel et al. (2003)
ThrU Leader NA Putative cis-regulatory element
controlling the ThrU tRNA
operon
Raghavan et al. (2011)
t44 RF00127 Cis-regulatory element controlling
the ribosomal rpsB gene
rpsB Y Tjaden et al. (2002);
Aseev et al. (2008);
Meyer et al. (2009)
S15† RF00114 Translational regulator of the ri-
bosomal S15 protein
rpsO Y Benard et al. (1996)
StyR-8 NA Putative cis-regulatory element
controlling the ribosomal rpmB
gene
rpmB Y Chinni et al. (2010)
MicA RF00078 sRNA involved in cellular re-
sponse to extracytoplasmic stress
Y luxS N Vogel (2009)
DsrA† RF00014 sRNA regulator of H-NS Y mngB N Lease et al. (1998)
STnc10 NA Putative sRNA nhaA N Sittka et al. (2008)
STnc60† NA Putative sRNA Sittka et al. (2008)
STnc840 NA Verified sRNA derived from 3’
UTR of the flgL gene
Y Chao et al. (2012)
IS0420*† NA Putative ncRNA rmf N Raghavan et al. (2011);
Chen et al. (2002)
RGO0† NA Putative sRNA identified in E.
coli
Raghavan et al. (2011)
Required or ambiguous in S. Typhimurium only
rne5 RF00040 RNase E autoregulatory 5’ ele-
ment
rne Y Diwa et al. (2000)
RydC RF00505 sRNA regulator of the yejABEF
ABC transporter
Y Antal et al. (2005)
RydB RF00118 Putative ncRNA Wassarman et al.
(2001)
STnc510 NA Putative sRNA pagD/pagC Y/N Sittka et al. (2008)
STnc460† NA Putative sRNA Sittka et al. (2008)
STnc170 NA Putative sRNA SL1458 N Sittka et al. (2008)
STnc130 NA Putative sRNA dmsA N Sittka et al. (2008)
RseX RF01401 sRNA regulator of OmpA and
OmpC
Y Douchin et al. (2006)
IsrJ RF01393 sRNA regulator of SPI-1 effector
protein secretion
Sittka et al. (2008);
Padalon-Brauch et al.
(2008)
54
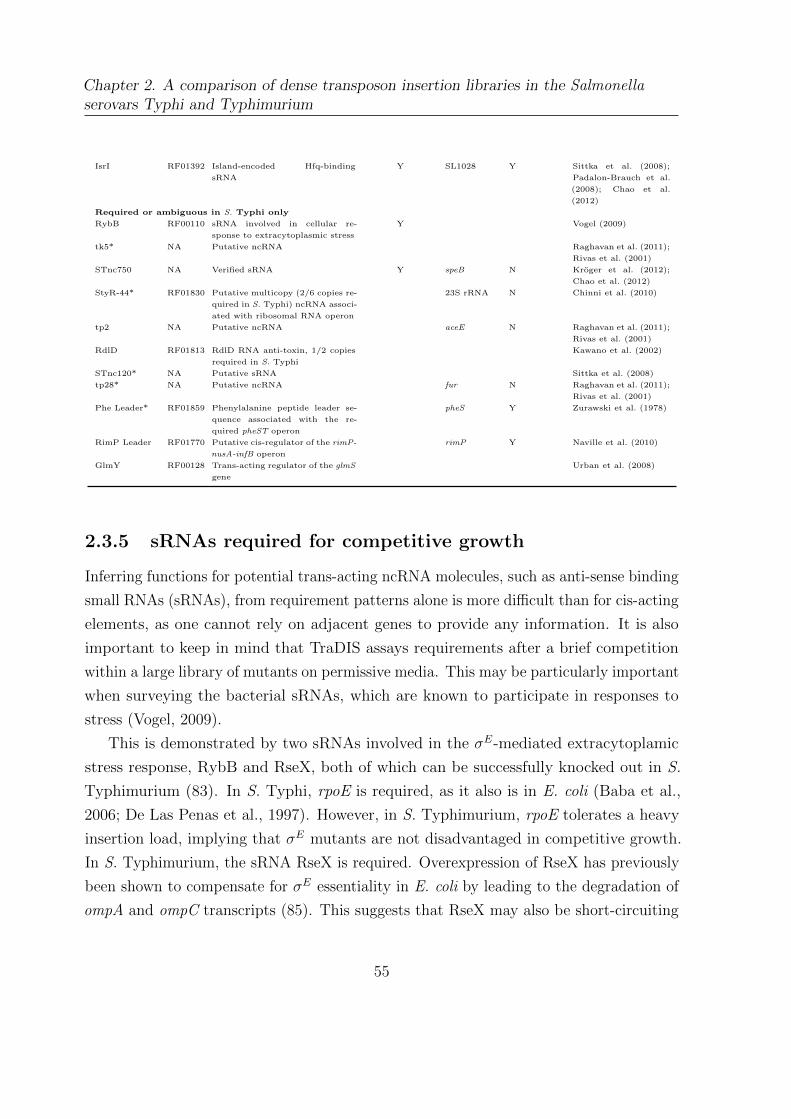
Chapter 2. A comparison of dense transposon insertion libraries in the Salmonellaserovars Typhi and Typhimurium
IsrI RF01392 Island-encoded Hfq-binding
sRNA
Y SL1028 Y Sittka et al. (2008);
Padalon-Brauch et al.
(2008); Chao et al.
(2012)
Required or ambiguous in S. Typhi only
RybB RF00110 sRNA involved in cellular re-
sponse to extracytoplasmic stress
Y Vogel (2009)
tk5* NA Putative ncRNA Raghavan et al. (2011);
Rivas et al. (2001)
STnc750 NA Verified sRNA Y speB N Kroger et al. (2012);
Chao et al. (2012)
StyR-44* RF01830 Putative multicopy (2/6 copies re-
quired in S. Typhi) ncRNA associ-
ated with ribosomal RNA operon
23S rRNA N Chinni et al. (2010)
tp2 NA Putative ncRNA aceE N Raghavan et al. (2011);
Rivas et al. (2001)
RdlD RF01813 RdlD RNA anti-toxin, 1/2 copies
required in S. Typhi
Kawano et al. (2002)
STnc120* NA Putative sRNA Sittka et al. (2008)
tp28* NA Putative ncRNA fur N Raghavan et al. (2011);
Rivas et al. (2001)
Phe Leader* RF01859 Phenylalanine peptide leader se-
quence associated with the re-
quired pheST operon
pheS Y Zurawski et al. (1978)
RimP Leader RF01770 Putative cis-regulator of the rimP-
nusA-infB operon
rimP Y Naville et al. (2010)
GlmY RF00128 Trans-acting regulator of the glmS
gene
Urban et al. (2008)
2.3.5 sRNAs required for competitive growth
Inferring functions for potential trans-acting ncRNA molecules, such as anti-sense binding
small RNAs (sRNAs), from requirement patterns alone is more difficult than for cis-acting
elements, as one cannot rely on adjacent genes to provide any information. It is also
important to keep in mind that TraDIS assays requirements after a brief competition
within a large library of mutants on permissive media. This may be particularly important
when surveying the bacterial sRNAs, which are known to participate in responses to
stress (Vogel, 2009).
This is demonstrated by two sRNAs involved in the σE-mediated extracytoplamic
stress response, RybB and RseX, both of which can be successfully knocked out in S.
Typhimurium (83). In S. Typhi, rpoE is required, as it also is in E. coli (Baba et al.,
2006; De Las Penas et al., 1997). However, in S. Typhimurium, rpoE tolerates a heavy
insertion load, implying that σE mutants are not disadvantaged in competitive growth.
In S. Typhimurium, the sRNA RseX is required. Overexpression of RseX has previously
been shown to compensate for σE essentiality in E. coli by leading to the degradation of
ompA and ompC transcripts (85). This suggests that RseX may also be short-circuiting
55
Chapter 2. A comparison of dense transposon insertion libraries in the Salmonellaserovars Typhi and Typhimurium
Figure 2.7: Proposed differences in sRNA utilization. Diagram illustrating inferredrequired sRNA regulatory networks under TraDIS. Molecules required in S. Typhi are highlightedin yellow and in S. Typhimurium are highlighted in blue. RseA, in yellow/grey check, isambiguous in S. Typhi. Non-required molecules are in grey. Diamonds indicate sRNAs, circlesregulatory proteins, ovals proteases, oblong shapes are membrane-anchored proteins, androunded squares are outer membrane porins.
the σE stress response network in S. Typhimurium (figure 2.7). To our knowledge, this
is the first evidence of a native (i.e. not experimentally induced) activity of RseX.
S. Typhi on the other hand requires σE along with its activating proteases RseP
and DegS and anchoring protein RseA, as well as the σE-dependent sRNA RybB, which
also regulates OmpA and OmpC in S. Typhimurium, along with a host of other OMPs
(Papenfort et al., 2006). It is unclear why the σE response is required in S. Typhi but
not S. Typhimurium, though it may partially be due to the major differences in the cell
wall and outer membrane between the two serovars. In addition, there are significant
differences in the OMP content of the S. Typhi and S. Typhimurium membranes that
56
Chapter 2. A comparison of dense transposon insertion libraries in the Salmonellaserovars Typhi and Typhimurium
may be driving alternative mechanisms for coping with membrane stress. For instance,
S. Typhi completely lacks OmpD, a major component of the S. Typhimurium outer
membrane (Santiviago et al., 2003) and a known target of RybB (Vogel, 2009).
Two additional sRNAs involved in stress response are also required by both S. Typhi
and S. Typhimurium. The first, MicA, is known to regulate ompA and the lamB porin-
coding gene in S. Typhimurium (Bossi et al., 2007), contributing to the extracytoplasmic
stress response. The second, DsrA, has been shown to negatively regulate the nucleoid-
forming protein H-NS and enhance translation of the stationary-phase alternative sigma
factor σS in E. coli (Lease et al., 1998), though its regulation of σS does not appear to be
conserved in S. Typhimurium (Jones et al., 2006). Both have been previously deleted in
S. Typhimurium, and so are not essential. H-NS knockouts have previously been shown
to have severe growth defects in S. Typhimurium that can be rescued by compensatory
mutations in either the phoPQ two-component system or rpoS, implying that the lack of
H-NS is allowing normally silenced detrimental regions to be transcribed (Navarre et al.,
2006). As MicA has recently been shown to negatively regulate PhoPQ expression in E.
coli (Coornaert et al., 2010), it is tempting to speculate that MicA may be moderating
the effects of DsrA-induced H-NS repression; however, it is currently unclear whether
sRNA regulons are sufficiently conserved between E. coli and S. enterica to justify this
hypothesis.
2.4 Conclusions
The extremely high resolution of TraDIS has allowed the assaying of gene requirements in
two very closely related salmonellae with different host ranges. I found, under laboratory
conditions, that 58 genes present in both serovars were required in only one, suggesting
that identical gene products do not necessarily have the same phenotypic effects in the
two different serovar backgrounds. Many of these genes occur in genomic regions or
metabolic systems which contain pseudogenes and/or have undergone reorganization since
the divergence of S. Typhi and S. Typhimurium, demonstrating the complementarity
of TraDIS and phylogenetic analysis. These changes may in part explain differences
observed in the pathogenicity and host specificity of these two serovars. In particular, S.
Typhimurium showed a requirement for cell surface structure biosynthesis genes; this
may be partially explained by the fact that S. Typhi expresses the Vi-antigen which
57
Chapter 2. A comparison of dense transposon insertion libraries in the Salmonellaserovars Typhi and Typhimurium
masks the cell surface, though these genes are not required for survival in our assay. S.
Typhi on the other hand has a requirement for iron uptake through the fep system, which
enables ferric enterobactin transport. This dependence on enterobactin suggests that S.
Typhi is highly adapted to the iron-scarce environments it encounters during systemic
infections. Furthermore, this appears to represent a single point of failure in the S. Typhi
iron utilization pathways, and may present an attractive target for narrow-spectrum
antibiotics.
Of the approximately 4500 protein coding genes present in each serovar, only about 350
were sufficiently depleted in transposon insertions to be classified as required for growth
in rich media. This means that over 92% of the coding genome has sufficient insertion
density to be queried in future assays. Dense transposon mutagenesis libraries have been
used to assay gene requirements under conditions relevant for infection, including S.
Typhi survival in bile (Langridge et al., 2009), Mycobacterium tuberculosis catabolism of
cholesterol (Griffin et al., 2011), drug resistance in Pseudomonas aeruginosa (Gallagher
et al., 2011), and Haemophilus influenzae survival in the lung (Gawronski et al., 2009). I
expect that parallel experiments querying gene requirements under the same conditions
in both serovars examined in this study will yield further insights in to the differences
in the infective process between Typhi and Typhimurium, and ultimately the pathways
that underlie host-adaptation.
Both serovars possess substantial complements of horizontally-acquired DNA. I have
been able to use TraDIS to assay these recently acquired sequences. In particular, I
have been able to identify, on a chromosome wide scale, active prophage through the
requirement for their repressors. The P4 phage utilizes an RNA-based system to make
decisions regarding cell fate, and structurally similar systems are used by P1, P7, and N15
phage (Citron et al., 1990; Ravin et al., 1999). C4-like transcripts have been regarded
as the primary repressor of lytic functions, though the IsrK-like sequence is known to
be essential to the establishment of lysogeny in P4 and is transcribed in at least two
phage types (Sabbattini et al., 1995; Ravin et al., 1999). These observations in S. Typhi
suggest an important role for the IsrK-like sequence in maintenance of the lysogenic state
in P4-like phage, though the mechanism remains unclear.
Recent advances in high-throughput sequencing have greatly enhanced our ability to
detect novel transcripts, such as ncRNAs and short open reading frames (sORFs). In fact,
our ability to identify these transcripts now far out-strips our ability to experimentally
58
Chapter 2. A comparison of dense transposon insertion libraries in the Salmonellaserovars Typhi and Typhimurium
characterize these sequences. There have been previous efforts at high-throughput
characterization of bacterial sRNAs and sORFs in enteric bacteria; however, these have
relied on labor-intensive directed knockout libraries (Santiviago et al., 2009; Hobbs
et al., 2010). Here I have demonstrated that TraDIS has sufficient resolution to reliably
query genomic regions as short as 60 bases, in agreement with a recent high-throughput
transposon mutagenesis study in the α-proteobacteria Caulobacter crescentus (Christen
et al., 2011). This method has the major advantage that library construction does not
rely upon genome annotation, and newly discovered elements can be surveyed with no
further laboratory work.
I have been able to assign putative functions to a number of ncRNAs using TraDIS
though consideration of their genomic and experimental context. In addition, ncRNA
characterization generally is done in model organisms like E. coli or S. Typhimurium,
and it is unclear how stable ncRNA regulatory networks are over evolutionary time. By
assaying two serovars of Salmonella with the same method under the same conditions,
I have seen hints that there may be differences in sRNA regulatory networks between
S. Typhi and S. Typhimurium. In particular, I have found that under the same experi-
mental conditions, S. Typhi appears to rely on the σE stress response pathway while S.
Typhimurium does not; it is tempting to speculate that this difference in stress response
is mediated by the observed difference in requirement for two sRNAs, RybB and RseX. I
believe that this combination of high-throughput transposon mutagenesis with a careful
consideration of the systems context of individual genes provides a powerful tool for
the generation of functional hypotheses. I anticipate that the construction of TraDIS
libraries in additional organisms, as well as the passing of these libraries through rele-
vant experimental conditions, will provide further insights into the function of bacterial
ncRNAs in addition to the protein-coding gene complement.
59

Chapter 2. A comparison of dense transposon insertion libraries in the Salmonellaserovars Typhi and Typhimurium
60
Chapter 3
Methods for the analysis of TraDIS
experiments, with an application to
Salmonella macrophage invasion
Section 3.2 describes a collaborative study with Gemma C. Langridge (Pathogen Genomics,
Wellcome Trust Sanger Institute). Gemma performed all laboratory experiments described
in this chapter unless otherwise noted.
3.1 Introduction
In the previous chapter, I described the results of a study predicting and comparing the
genes required for robust growth of two Salmonella serovars in standard laboratory media.
While this revealed interesting aspects of Salmonella biology, linking these findings
to Salmonella’s infective niche in the human host is difficult. However, transposon-
insertion sequencing can be used to interrogate infective conditions directly (reviewed
previously in section 1.5): by comparing libraries passed through a condition of interest
to control libraries, we can determine the genomic regions involved in survival in that
condition. In this chapter, I describe a pipeline I have devised for the analysis of such
experiments, illustrated with an experiment assaying genes required for S. Typhi and
Typhimurium invasion of (or uptake into) human macrophage. These methods have been
adopted by Pathogen Informatics at the Sanger, form the basis of the current Sanger
61
Chapter 3. Methods for the analysis of TraDIS experiments, with an application toSalmonella macrophage invasion
pipelines for analysis of TraDIS experiments, and are currently being used in a variety of
transposon-insertion sequencing studies.
3.1.1 Salmonella interactions with macrophage
As previously described in section 2.1, the ability to invade and survive in host cells
was a major factor in the early evolution of S. enterica subspecies enterica; survival in
macrophages in particular is known to be necessary for virulence (Fields et al., 1986). This
ability appears to have been largely driven by the acquisition of two horizontally-acquired
pathogenicity islands, SPI-1 and -2. Due to the availability of a mouse model of systemic
infection (Santos et al., 2001), most of what is known about Salmonella interactions with
host cells is derived from studies of S. Typhimurium infection.
S. Typhimurium infections of either epithelial or phagocytic cells appear to follow
broadly similar paths (Figueira et al. (2012), see also figure 3.1). On encountering a
suitable host cell, the bacterium adheres using an array of fimbrial adhesins (Baumler
et al., 1996; Velden et al., 1998). The SPI-1 T3SS, a needle-like complex spanning the
periplasm and presenting its tip to the exterior of the bacterial cell (Mueller et al., 2008),
induces membrane ruffling in the host cell through secretion of effector proteins (Zhou
et al., 2001), facilitating bacterial uptake. While use of this mechanisms is not strictly
necessary for entrance to phagocytic cells such as macrophage, S. Typhimurium strains
unable to induce ruffling are taken up six to ten times less efficiently than the wild-type
(Monack et al., 1996), though the entry mechanism does not ultimately affect cell fate
(Rathman et al., 1997).
Once entry has been gained to the cell, through either active invasion or phagocytic
engulfment, S. Typhimurium begins expressing a second T3SS encoded on SPI-2. The
effectors secreted by this T3SS allow S. Typhimurium to remodel the Salmonella con-
taining vacuole (SCV), and even modulate host immune signalling (see figure 3.1). There
is some controversy as to whether or not the SCV undergoes fusion with lysosomes; a
recent study suggests it does, but that the activity of these lysosomes is first modulated
by the SPI-2 effector SifA (McGourty et al., 2012). Little is known about the growth
conditions S. Typhimurium faces within the SCV, though transcriptomic studies suggest
it is aerobic, mildly acidic, rich in gluconate, and limited in aromatic amino acids, purines,
and pyrimidines (Eriksson et al., 2003; Hautefort et al., 2008).
62
Chapter 3. Methods for the analysis of TraDIS experiments, with an application toSalmonella macrophage invasion
Our understanding of how these findings relate to S. Typhi infections of human
macrophage is limited, largely due to the lack of a non-human model organism for
infection by this serovar. A recent study suggests that SPI-2 may not even be necessary
for S. Typhi invasion of and survival in human macrophages (Forest et al., 2010), though
SPI-2 genes are known to be expressed by S. Typhi in macrophages (Faucher et al.,
2006) and a SPI-2 deletion mutant was previously shown to be attenuated under these
conditions (Khan et al., 2003). Regardless, it is well established that the genotype of both
the Salmonella strain used and the macrophage can have profound effects on the course
of infection. A number of studies comparing a variety of Salmonella serovars infecting
murine-, human-, and even chicken-derived macrophages have repeatedly shown that
serovars exhibit remarkably different behaviors under the same conditions (Buchmeier
et al., 1989; Vladoianu et al., 1990; Schwan et al., 2000; Okamura et al., 2005); these
differences appear to correlate somewhat with the degree of host-adapation exhibited
by the serovar. In this study we compare our Salmonella TraDIS libraries following
uptake by human macrophage in the hopes of uncovering genomic factors underlying
these differences in behavior.
3.1.2 Conditional gene fitness
Determining conditional gene fitness presents a somewhat different problem to that
addressed in the previous chapter, predicting and comparing “essential” genes under
the conditions of library creation. In predicting gene essentiality, we had a single time
point representing the initial growth of the library on rich media, while in identifying
conditional gene fitness (measured as the relative expansion or contraction of mutant
populations) we are always comparing changes in mutant fitness with respect to fitness
in a baseline condition. The ratio of reads between the two conditions is taken as
indicative of differences in relative mutant prevalences between them. In some ways,
this makes the problem of identifying genes with strong fitness effects easier: as we
are primarily interested in the ratio of various insertion mutants present between the
two conditions, effects that may confound the prediction of simple gene essentiality are
effectively “zeroed out”. More explicitly, whether low insertion density in the initial
library occurs due to chance, nucleotide composition bias, or the exclusionary effects of
high-density DNA-binding proteins (described in section 2.3.3) does not matter – these
63
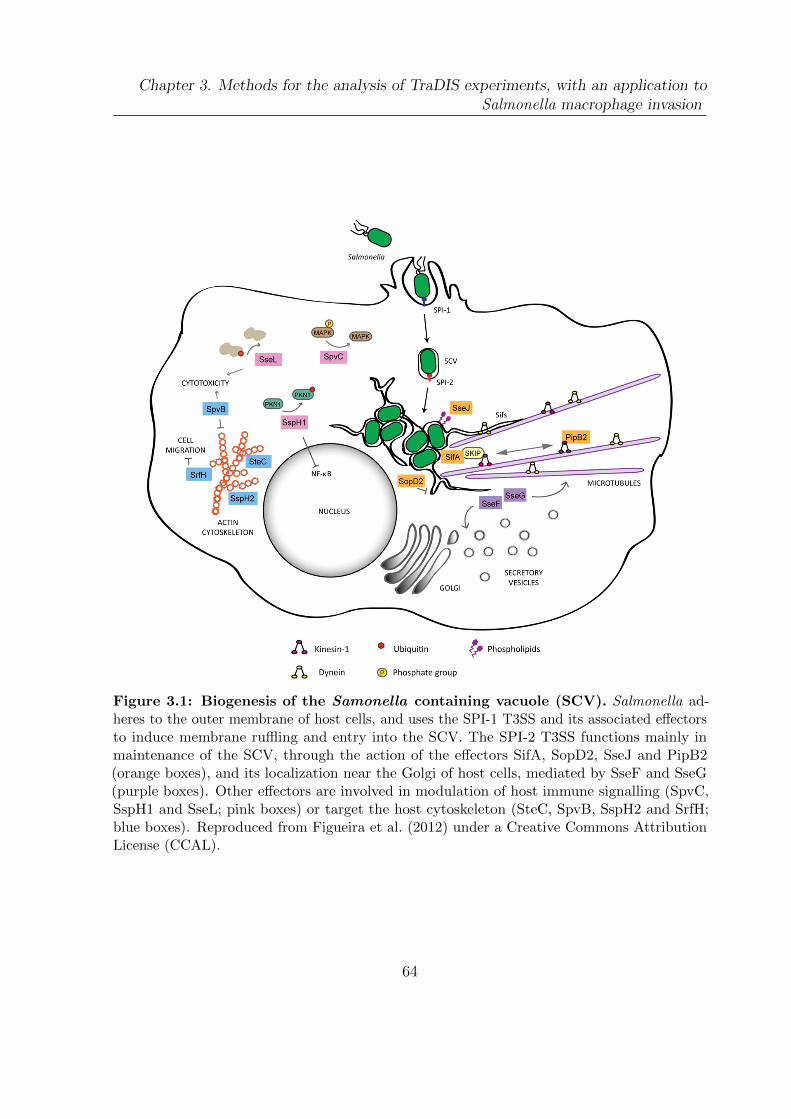
Chapter 3. Methods for the analysis of TraDIS experiments, with an application toSalmonella macrophage invasion
Figure 3.1: Biogenesis of the Samonella containing vacuole (SCV). Salmonella ad-heres to the outer membrane of host cells, and uses the SPI-1 T3SS and its associated effectorsto induce membrane ruffling and entry into the SCV. The SPI-2 T3SS functions mainly inmaintenance of the SCV, through the action of the effectors SifA, SopD2, SseJ and PipB2(orange boxes), and its localization near the Golgi of host cells, mediated by SseF and SseG(purple boxes). Other effectors are involved in modulation of host immune signalling (SpvC,SspH1 and SseL; pink boxes) or target the host cytoskeleton (SteC, SpvB, SspH2 and SrfH;blue boxes). Reproduced from Figueira et al. (2012) under a Creative Commons AttributionLicense (CCAL).
64
Chapter 3. Methods for the analysis of TraDIS experiments, with an application toSalmonella macrophage invasion
regions can simply be identified as not producing sufficient reads over insertion-sites to
be assayed and removed from the analysis.
In many ways, the problem of investigating the statistical and biological significance of
ratios of reads over insertion sites resembles established analyses developed for differential
RNA-seq analysis. In the following sections I describe the application of these methods
to the problem of determining conditional gene fitness using the Salmonella macrophage
infection dataset as an example.
3.2 Experimental methods
Gemma C. Langridge performed all laboratory experiments described in this chapter,
as well as read mapping; condensed descriptions are included here for completeness.
Silvia Pinero prepared the THP-1 cells for infection. Sabine Eckert and Daniel Turner
(Wellcome Trust Sanger Institute) performed the nucleotide sequencing. A more detailed
description of the experimental methods is available in Langridge (2010), including
preliminary assessments of bacterial strain ability to grow in RPMI, invade THP-1
derived macrophage, and experiment optimization.
3.2.1 Strains and cell lines
These experiments were performed with S. Typhi WT174 and S. Typhimurium SL3261
transposon mutant libraries, described in chapter 3. Annotations and orthology pre-
dictions used are as in chapter 3. Human monocytic cell line THP-1 was used for cell
infections.
3.2.2 Preparation of THP-1 cells
THP-1 cells were grown up from frozen stocks in RPMI-1640 supplemented with 10%
heat-inactivated foetal bovine serum and 2 mM L-glutamine, and incubated without
shaking in vented flasks (VWR, Lutterworth, UK) at 37◦C in the presence of 5% CO2.
Culture volumes were split and given fresh media every 3-4 days until the desired volume
and cell density was achieved. Phorbol myristate acetate (PMA) was used to differentiate
the THP-1 monocytes. Briefly, approximately 212 cells in 4 mL supplemented RPMI
65
Chapter 3. Methods for the analysis of TraDIS experiments, with an application toSalmonella macrophage invasion
containing 0.125 ng/mL PMA were seeded into each well of a 6-well plate and incubated
for six days at 37◦C in 5% CO2. On the day of infection, the PMA-containing media
was removed, cells were washed with dPBS and fresh warmed, supplemented RPMI was
added to maintain the cells while the bacterial inoculum was prepared.
3.2.3 Preparation of transposon libraries
Frozen stocks of the Typhi library were found to be at half the concentration of the
Typhimurium library by OD600. To ensure similar concentrations for the infection assay,
a 1 in 5000 dilution of the Typhi library and a 1 in 10,000 dilution of the Typhimurium
library was used to inoculate the growth medium. Cultures of each transposon library
were grown with shaking in 100 mL of RPMI-1640 supplemented with 0.3 g/L L-glutamine
and buffered with 10 mL 1 M MOPS at 37◦C for 16 hours. These cultures were sub-
cultured 1 in 20 into fresh RPMI supplemented and buffered as before, and grown for
between 3 and 4 hours to mid-log phase (OD600 of 2.4).
3.2.4 Infection assay
Five 6-well plates were used for each run of the assay. In total, 29 wells were infected with
the bacterial inoculum and one served as a blank control for eukaryotic cell contamination.
At the start of the assay, media was removed from all wells except for the blank control,
and a 3 mL bacterial inoculum was added to each experimental well. The plates were
centrifuged for 5 minutes at 600 x g and incubated at 37◦C in 5% CO2 for 30 minutes. A
4-6 mL aliquot of the inoculum was processed for genomic DNA as the TraDIS control.
After 30 minutes, media was removed from all wells, and fresh RPMI additionally
supplemented with 100 µg/mL gentamicin was added. After 2 hours the wells were
washed 3 times in plain dPBS. Following washing, 500 µL of 1% Triton-X-100 was added
to each well to lyse the eukaryotic cells, mixed well by pipetting, and incubated at 37◦C
in 5% CO2 for 2 minutes. The cell suspensions from all experimental wells were pooled for
bacterial DNA extraction. Genomic DNA was extracted using the Qiagen DNeasy Blood
and Tissue kit, according to the manufacturers protocol for Gram negative bacteria.
Sequencing was performed as described in section 2.2.4.
66
Chapter 3. Methods for the analysis of TraDIS experiments, with an application toSalmonella macrophage invasion
3.3 Analysis of conditional gene fitness using TraDIS
3.3.1 Experimental design
The goal for this experiment was to determine the differences in gene requirements
for human macrophage infection in two Salmonella serovars: Typhimurium, a host-
generalist, and Typhi, host-restricted to humans as described in the previous chapter.
To this end, infection assays of THP-1 monocytes were performed in triplicate with
transposon libraries for each serovar at high multiplicities of infection in an attempt to
avoid bottleneck effects. These were compared to libraries grown in cell culture medium
(RPMI), to control for any incidental changes in library composition due to growth in
this medium.
3.3.2 Mapping insertion sites
Read mapping is a special case of one of the oldest problems in bioinformatics, aligning
a short sequence of length n to a much longer sequence, or database of sequences, of
length m. An optimal solution (with respect to a particular sequence similarity scoring
scheme) for this problem using dynamic programming was first proposed by Smith et al.
(1981), building on previous work by Needleman et al. (1970). Unfortunately, this method
requires construction of a dynamic programming matrix of size n ×m, which quickly
becomes impractical for large m due to both time and memory constraints. Heuristic
solutions to this problem have been developed, starting with the FASTA and BLAST
algorithms (Lipman et al., 1985; Altschul et al., 1990). The basic idea behind these
heuristics is to rapidly search for identical matches using a hash of the sequence database
before performing a full Smith-Waterman style local alignment around this match. For
the case of mapping reads to larger eukaryotic genomes, more powerful heuristics, such
as the Burrows-Wheeler transform (Burrows et al., 1994; Langmead et al., 2009; Li et al.,
2010), may be required due to time and space constraints. However as we are working
with relatively small bacterial genomes, MAQ (Li et al., 2008) has been used here, which
is similar in spirit to FASTA or BLAST, but with additional refinements to deal with
repetitive genomic regions and to assessing alignment quality.
67
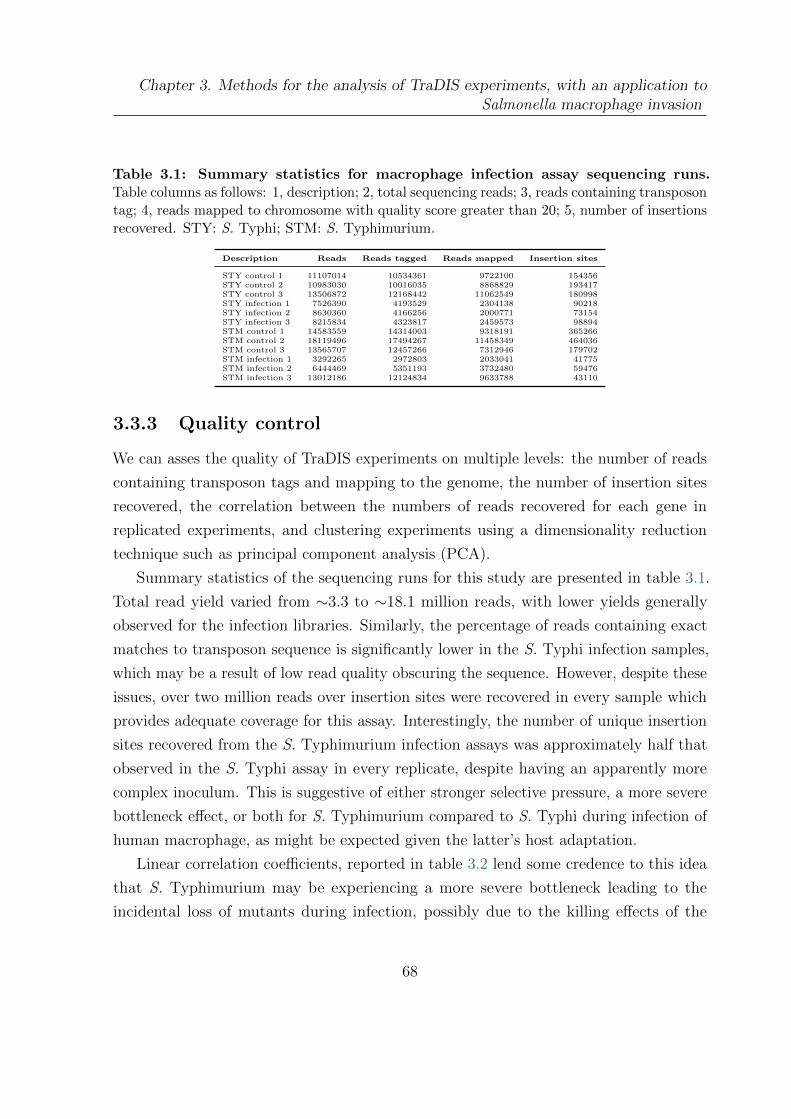
Chapter 3. Methods for the analysis of TraDIS experiments, with an application toSalmonella macrophage invasion
Table 3.1: Summary statistics for macrophage infection assay sequencing runs.Table columns as follows: 1, description; 2, total sequencing reads; 3, reads containing transposontag; 4, reads mapped to chromosome with quality score greater than 20; 5, number of insertionsrecovered. STY: S. Typhi; STM: S. Typhimurium.
Description Reads Reads tagged Reads mapped Insertion sites
STY control 1 11107014 10534361 9722100 154356STY control 2 10983030 10016035 8868829 193417STY control 3 13506872 12168442 11062549 180998STY infection 1 7526390 4193529 2304138 90218STY infection 2 8630360 4166256 2000771 73154STY infection 3 8215834 4323817 2459573 98894STM control 1 14583559 14314003 9318191 365266STM control 2 18119496 17494267 11458349 464036STM control 3 13565707 12457266 7312946 179702STM infection 1 3292265 2972803 2033041 41775STM infection 2 6444469 5351193 3732480 59476STM infection 3 13012186 12124834 9633788 43110
3.3.3 Quality control
We can asses the quality of TraDIS experiments on multiple levels: the number of reads
containing transposon tags and mapping to the genome, the number of insertion sites
recovered, the correlation between the numbers of reads recovered for each gene in
replicated experiments, and clustering experiments using a dimensionality reduction
technique such as principal component analysis (PCA).
Summary statistics of the sequencing runs for this study are presented in table 3.1.
Total read yield varied from ∼3.3 to ∼18.1 million reads, with lower yields generally
observed for the infection libraries. Similarly, the percentage of reads containing exact
matches to transposon sequence is significantly lower in the S. Typhi infection samples,
which may be a result of low read quality obscuring the sequence. However, despite these
issues, over two million reads over insertion sites were recovered in every sample which
provides adequate coverage for this assay. Interestingly, the number of unique insertion
sites recovered from the S. Typhimurium infection assays was approximately half that
observed in the S. Typhi assay in every replicate, despite having an apparently more
complex inoculum. This is suggestive of either stronger selective pressure, a more severe
bottleneck effect, or both for S. Typhimurium compared to S. Typhi during infection of
human macrophage, as might be expected given the latter’s host adaptation.
Linear correlation coefficients, reported in table 3.2 lend some credence to this idea
that S. Typhimurium may be experiencing a more severe bottleneck leading to the
incidental loss of mutants during infection, possibly due to the killing effects of the
68
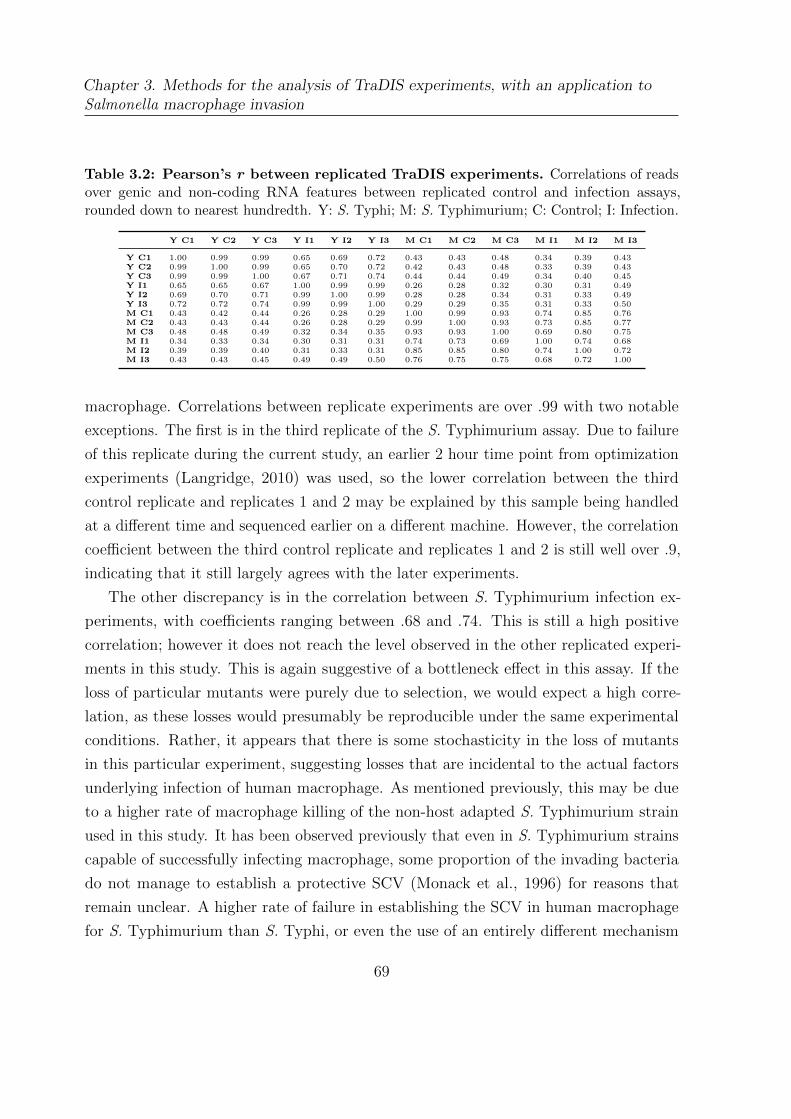
Chapter 3. Methods for the analysis of TraDIS experiments, with an application toSalmonella macrophage invasion
Table 3.2: Pearson’s r between replicated TraDIS experiments. Correlations of readsover genic and non-coding RNA features between replicated control and infection assays,rounded down to nearest hundredth. Y: S. Typhi; M: S. Typhimurium; C: Control; I: Infection.
Y C1 Y C2 Y C3 Y I1 Y I2 Y I3 M C1 M C2 M C3 M I1 M I2 M I3
Y C1 1.00 0.99 0.99 0.65 0.69 0.72 0.43 0.43 0.48 0.34 0.39 0.43Y C2 0.99 1.00 0.99 0.65 0.70 0.72 0.42 0.43 0.48 0.33 0.39 0.43Y C3 0.99 0.99 1.00 0.67 0.71 0.74 0.44 0.44 0.49 0.34 0.40 0.45Y I1 0.65 0.65 0.67 1.00 0.99 0.99 0.26 0.28 0.32 0.30 0.31 0.49Y I2 0.69 0.70 0.71 0.99 1.00 0.99 0.28 0.28 0.34 0.31 0.33 0.49Y I3 0.72 0.72 0.74 0.99 0.99 1.00 0.29 0.29 0.35 0.31 0.33 0.50M C1 0.43 0.42 0.44 0.26 0.28 0.29 1.00 0.99 0.93 0.74 0.85 0.76M C2 0.43 0.43 0.44 0.26 0.28 0.29 0.99 1.00 0.93 0.73 0.85 0.77M C3 0.48 0.48 0.49 0.32 0.34 0.35 0.93 0.93 1.00 0.69 0.80 0.75M I1 0.34 0.33 0.34 0.30 0.31 0.31 0.74 0.73 0.69 1.00 0.74 0.68M I2 0.39 0.39 0.40 0.31 0.33 0.31 0.85 0.85 0.80 0.74 1.00 0.72M I3 0.43 0.43 0.45 0.49 0.49 0.50 0.76 0.75 0.75 0.68 0.72 1.00
macrophage. Correlations between replicate experiments are over .99 with two notable
exceptions. The first is in the third replicate of the S. Typhimurium assay. Due to failure
of this replicate during the current study, an earlier 2 hour time point from optimization
experiments (Langridge, 2010) was used, so the lower correlation between the third
control replicate and replicates 1 and 2 may be explained by this sample being handled
at a different time and sequenced earlier on a different machine. However, the correlation
coefficient between the third control replicate and replicates 1 and 2 is still well over .9,
indicating that it still largely agrees with the later experiments.
The other discrepancy is in the correlation between S. Typhimurium infection ex-
periments, with coefficients ranging between .68 and .74. This is still a high positive
correlation; however it does not reach the level observed in the other replicated experi-
ments in this study. This is again suggestive of a bottleneck effect in this assay. If the
loss of particular mutants were purely due to selection, we would expect a high corre-
lation, as these losses would presumably be reproducible under the same experimental
conditions. Rather, it appears that there is some stochasticity in the loss of mutants
in this particular experiment, suggesting losses that are incidental to the actual factors
underlying infection of human macrophage. As mentioned previously, this may be due
to a higher rate of macrophage killing of the non-host adapted S. Typhimurium strain
used in this study. It has been observed previously that even in S. Typhimurium strains
capable of successfully infecting macrophage, some proportion of the invading bacteria
do not manage to establish a protective SCV (Monack et al., 1996) for reasons that
remain unclear. A higher rate of failure in establishing the SCV in human macrophage
for S. Typhimurium than S. Typhi, or even the use of an entirely different mechanism
69
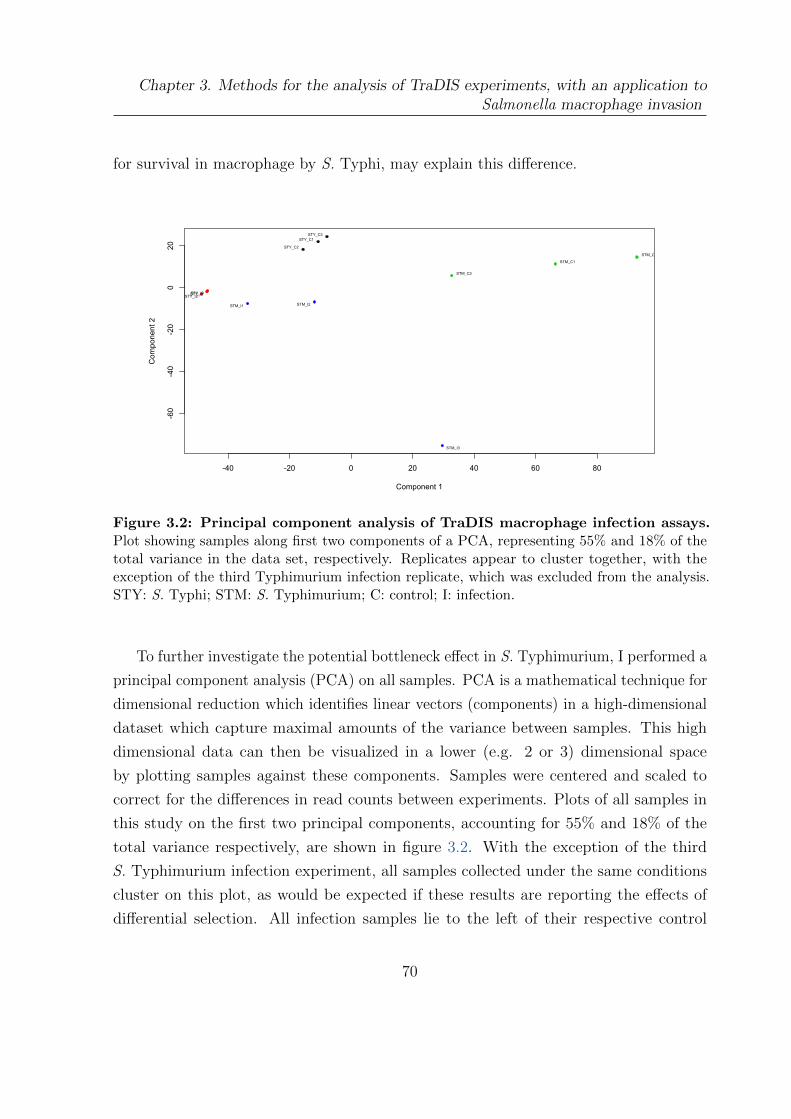
Chapter 3. Methods for the analysis of TraDIS experiments, with an application toSalmonella macrophage invasion
for survival in macrophage by S. Typhi, may explain this difference.
-40 -20 0 20 40 60 80
-60
-40
-20
020
Component 1
Com
pone
nt 2
STM_C1
STM_C2
STM_C3
STM_I3
STY_C1
STY_C2
STY_C3
STY_I1STY_I2STY_I3
STM_I1 STM_I2
Figure 3.2: Principal component analysis of TraDIS macrophage infection assays.Plot showing samples along first two components of a PCA, representing 55% and 18% of thetotal variance in the data set, respectively. Replicates appear to cluster together, with theexception of the third Typhimurium infection replicate, which was excluded from the analysis.STY: S. Typhi; STM: S. Typhimurium; C: control; I: infection.
To further investigate the potential bottleneck effect in S. Typhimurium, I performed a
principal component analysis (PCA) on all samples. PCA is a mathematical technique for
dimensional reduction which identifies linear vectors (components) in a high-dimensional
dataset which capture maximal amounts of the variance between samples. This high
dimensional data can then be visualized in a lower (e.g. 2 or 3) dimensional space
by plotting samples against these components. Samples were centered and scaled to
correct for the differences in read counts between experiments. Plots of all samples in
this study on the first two principal components, accounting for 55% and 18% of the
total variance respectively, are shown in figure 3.2. With the exception of the third
S. Typhimurium infection experiment, all samples collected under the same conditions
cluster on this plot, as would be expected if these results are reporting the effects of
differential selection. All infection samples lie to the left of their respective control
70
Chapter 3. Methods for the analysis of TraDIS experiments, with an application toSalmonella macrophage invasion
samples on the first component, suggesting that the dominant signal in this data is due
to the effects of selection during macrophage infection. The fact that two of the three S.
Typhimurium infection experiments cluster together suggests that this signal is stronger
than any stochastic bottleneck effect despite the lower correlations observed between these
libraries, and that it should be possible to derive useful information about the conditions
faced by S. Typhimurium during infection from these experiments. Unfortunately, the
third S. Typhimurium infection replicate, which was performed separately as described
earlier, does not cluster well with these. I performed a similar analysis using the plotMDS
function of edgeR (Robinson et al., 2010a), which performs multidimensional scaling
using a variance-stabilized distance measure between samples, and came to a similar
result. It is unclear why this replicate is so different, and it may be due to differences in
experimental set up or sequencing. I excluded this replicate from further analysis on this
basis.
3.3.4 Inter-library normalization
Normalization is a critical part of any high-throughput sequencing experiment. As
observed in the previous section, even the same experiment repeated on the same
machine can lead to very different read counts. The naive approach to solving this
problem is simply to scale each sequencing library by some factor so that the total
read counts are equivalent. This may be adequate for analysis of technical replicates
where gene expression levels are identical between all samples. However, Robinson et al.
(2010b) illustrate why this may not be the case for the comparison of sequencing libraries
sampling populations under different conditions with a simple thought experiment:
Imagine we have a sequencing experiment comparing two RNA populations,
A and B. In this hypothetical scenario, suppose every gene that is expressed
in B is expressed in A with the same number of transcripts. However, assume
that sample A also contains a set of genes equal in number and expression
that are not expressed in B. Thus, sample A has twice as many total expressed
genes as sample B, that is, its RNA production is twice the size of sample
B. Suppose that each sample is then sequenced to the same depth. Without
any additional adjustment, a gene expressed in both samples will have, on
average, half the number of reads from sample A, since the reads are spread
71
Chapter 3. Methods for the analysis of TraDIS experiments, with an application toSalmonella macrophage invasion
over twice as many genes. Therefore, the correct normalization would adjust
sample A by a factor of 2. (Robinson et al., 2010b)
More generally, we can think of each gene in a sequencing library as representing
a slice of a pie. If a particular gene increases in expression (or mutant prevalence for
transposon-insertion sequencing such as ours), then the space left in this pie for other genes
necessarily shrinks. A scaling normalization which does not take this fact in to account,
but simply assumes all pies are the same size would necessarily underestimate expression
(or prevalence) for the majority of genes which don’t change, while overestimating it for
the few that do. A recent study has shown that normalization methods which explicitly
account for this problem perform better on both real and simulated data (Dillies et al.,
2012). Here I have used the trimmed mean of M-values (TMM) method, which assumes
the majority of genomic features do not change in actual expression (or mutant prevalence
here) and attempts to align the read counts of these features to produce an appropriate
scaling factor (Robinson et al., 2010b).
3.3.5 Identifying fitness effects
3.3.5.1 Theory
Once sequencing libraries have been normalized, the next step in determining fitness
effects is the choice of a proper test to determine the significance of changes in read
counts. In the previous chapter, I used two test statistics. The first was to test for gene
requirements within a particular library, and this was accomplished by fitting gamma
distributions to the two modes observed in the empirical distributions of insertion indexes,
then setting a threshold based on a log-odds ratio (see figure 2.2). The second was to
additionally test for significant differences in read depth between the S. Typhimurium
and S. Typhi libraries. In this case the log2 read ratios between genomic features in
the two libraries were roughly normally distributed, and I was able to set a significance
threshold based on a fitted normal curve.
Neither of these tests are entirely appropriate for the present situation of identifying
reproducible changes in mutant prevalence in replicated experiments. Most obviously,
neither of these test can easily be modified to accommodate replicates, which is essential
for robust identification of changes in mutant prevalence. Secondly, both tests are
72
Chapter 3. Methods for the analysis of TraDIS experiments, with an application toSalmonella macrophage invasion
dependent on manual fitting of gamma or normal distributions, which can not easily
or robustly be automated. Standard statistical tests, such as the two sample Student’s
T-test or Mann-Whitney U-test are not applicable due to the small numbers of replicates
(3 here, often 2) because of high experimental overhead in replication. Fortunately, these
problems have largely been addressed in modern RNA-seq differential expression analysis
software.
The two leading packages for analysis of RNA-seq based differential expression analysis
are DESeq (Anders et al., 2010) and edgeR (Robinson et al., 2010a). Both assume that
sequence count data is negative binomially distributed. The negative binomial distribution
arises naturally in the case of a Poisson process sampling from gamma-distributed random
variables (Fisher, 1941). Sequencing of mixed populations of oligonucleotides has long
been theorized to behave as a Poisson process, and this has shown to roughly be the case
for technical replicates of Illumina RNA-seq runs (Marioni et al., 2008), i.e. repeated
sequencing of the same input sample. Other studies have shown that biological RNA-seq
and SAGE replicates, i.e. repeated experiments, generate extra-Poisson variability (Lu
et al., 2005; Robinson et al., 2007), possibly due to variability in the concentration of the
transcripts being sampled, which can be captured by the negative binomial.
This leads naturally to the question, is transposon-insertion sequencing data negative
binomially distributed? Obviously, technical replicates of TraDIS experiments will be
roughly Poisson distributed, as this is identical to the case of technical replication of
RNA-seq. The question then becomes whether the underlying distribution of mutant
prevalences being sampled by sequencing can be effectively modelled by a gamma
distribution. Theoretical considerations indicate that this model may be appropriate:
as subcultures of the mutant library expand, the number of insertion mutants per gene
will be the summed result of independent exponentially-expanding clones, which will
be gamma distributed assuming the starting populations are roughly equal. The only
way to answer this question definitively would be to repeat the same experiment a
large number of times, which is impractical. However, this is not necessary. Lu et al.
(2005) showed that the negative binomial assumption is highly robust to the actual
distribution of the data being assessed. In fact, it appears that the underlying transcript
prevalences being sampled by RNA-seq experiments may actually be distributed according
to a sum of log-normal distributions (Bengtsson et al., 2005); this does not prevent
DESeq and edgeR from performing competitively in benchmarks of differential expression
73
Chapter 3. Methods for the analysis of TraDIS experiments, with an application toSalmonella macrophage invasion
analysis (Kvam et al., 2012; Soneson et al., 2013). These approaches have previously
been successfully applied to other Illumina sequencing-based experiments which likely
have different underlying distributions than transcriptomic data, for instance differential
analysis of ChIP-seq data (Robinson et al., 2012).
I have used edgeR (Robinson et al., 2010a) for significance testing here, an R package
which implements the TMM normalization (Robinson et al., 2010b), an approximation
to an empirical Bayes estimation of feature-wise negative binomial dispersion parameters
(Robinson et al., 2007), and a version of Fisher’s exact test modified to deal with
overdispersed data (Robinson et al., 2008) as well as a likelihood-ratio test in the case
of multifactorial designs (McCarthy et al., 2012; Lund et al., 2012). After testing, we
are interested primarily in two values: the P-value given by the statistical testing which
tells us how confident we can be that mutant prevalence differs between two conditions
given the estimated negative binomial distribution distribution of read counts, and the
log2 fold-change (logFC) which gives an estimation of the magnitude of the difference.
LogFC is calculated as
logFCg = log(ng,b)− log(ng,a)
where the index g indicates the genomic feature being tested, ng,b is the normalized
average read count in the test condition, and ng,a is the normalized average read count
in the control condition. This subtraction is equivalent to taking the log of the rationg,b
ng,a, and hence logFCg becomes unstable for small changes in ng,b as ng,a → 0, and
is ultimately undefined when ng,a = 0. In the previous chapter I corrected for this by
adding a pseudocount to each gene’s read count. I take the same approach here, as
implemented in edgeR, only since each library has been normalized by a different factor,
I rather use the transformation
nTg,x = log(ng,xLx
+2
L)
where L is the library size. This has the effect of shrinking unreliable logFCs for features
with small read counts, and removing the problem of undefined logFCs.
74
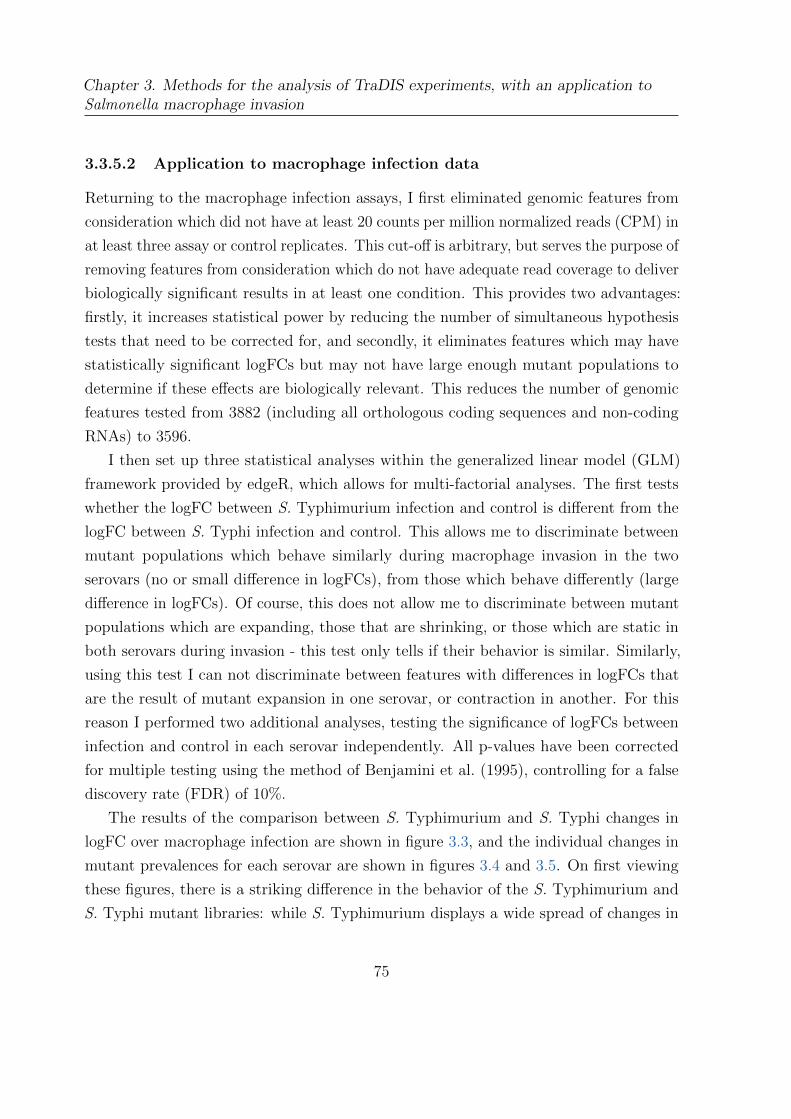
Chapter 3. Methods for the analysis of TraDIS experiments, with an application toSalmonella macrophage invasion
3.3.5.2 Application to macrophage infection data
Returning to the macrophage infection assays, I first eliminated genomic features from
consideration which did not have at least 20 counts per million normalized reads (CPM) in
at least three assay or control replicates. This cut-off is arbitrary, but serves the purpose of
removing features from consideration which do not have adequate read coverage to deliver
biologically significant results in at least one condition. This provides two advantages:
firstly, it increases statistical power by reducing the number of simultaneous hypothesis
tests that need to be corrected for, and secondly, it eliminates features which may have
statistically significant logFCs but may not have large enough mutant populations to
determine if these effects are biologically relevant. This reduces the number of genomic
features tested from 3882 (including all orthologous coding sequences and non-coding
RNAs) to 3596.
I then set up three statistical analyses within the generalized linear model (GLM)
framework provided by edgeR, which allows for multi-factorial analyses. The first tests
whether the logFC between S. Typhimurium infection and control is different from the
logFC between S. Typhi infection and control. This allows me to discriminate between
mutant populations which behave similarly during macrophage invasion in the two
serovars (no or small difference in logFCs), from those which behave differently (large
difference in logFCs). Of course, this does not allow me to discriminate between mutant
populations which are expanding, those that are shrinking, or those which are static in
both serovars during invasion - this test only tells if their behavior is similar. Similarly,
using this test I can not discriminate between features with differences in logFCs that
are the result of mutant expansion in one serovar, or contraction in another. For this
reason I performed two additional analyses, testing the significance of logFCs between
infection and control in each serovar independently. All p-values have been corrected
for multiple testing using the method of Benjamini et al. (1995), controlling for a false
discovery rate (FDR) of 10%.
The results of the comparison between S. Typhimurium and S. Typhi changes in
logFC over macrophage infection are shown in figure 3.3, and the individual changes in
mutant prevalences for each serovar are shown in figures 3.4 and 3.5. On first viewing
these figures, there is a striking difference in the behavior of the S. Typhimurium and
S. Typhi mutant libraries: while S. Typhimurium displays a wide spread of changes in
75
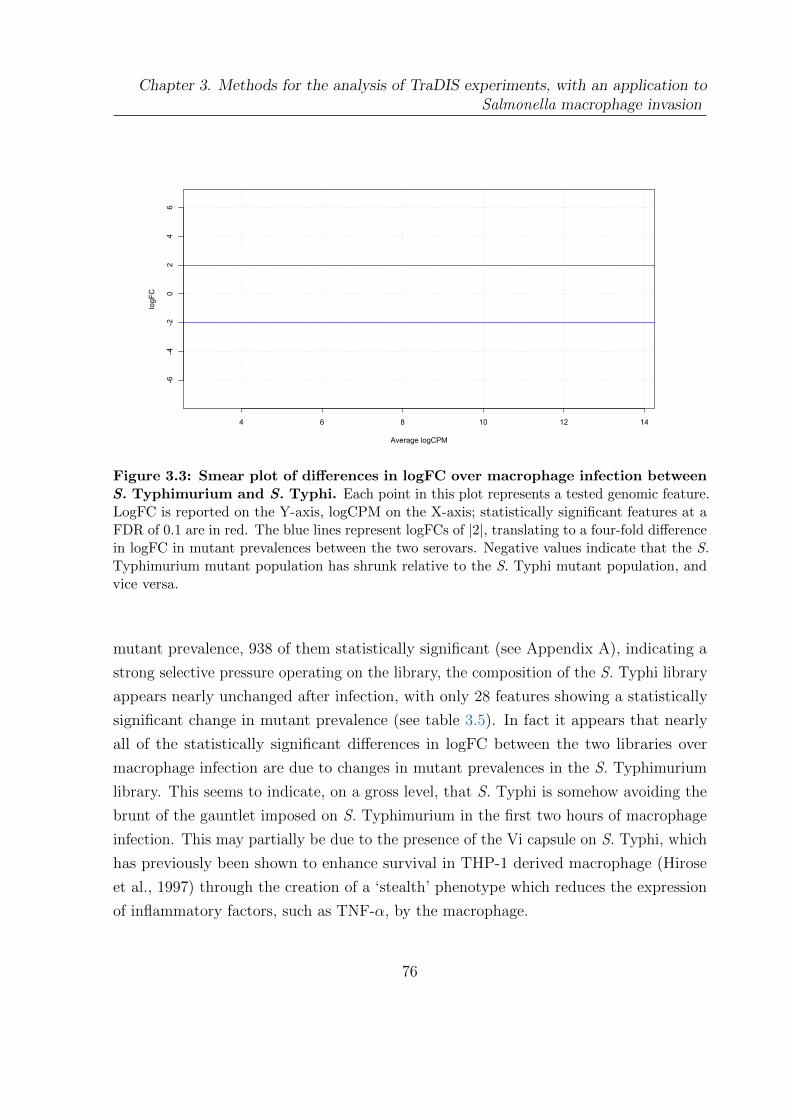
Chapter 3. Methods for the analysis of TraDIS experiments, with an application toSalmonella macrophage invasion
4 6 8 10 12 14
-6-4
-20
24
6
Average logCPM
logFC
Figure 3.3: Smear plot of differences in logFC over macrophage infection betweenS. Typhimurium and S. Typhi. Each point in this plot represents a tested genomic feature.LogFC is reported on the Y-axis, logCPM on the X-axis; statistically significant features at aFDR of 0.1 are in red. The blue lines represent logFCs of |2|, translating to a four-fold differencein logFC in mutant prevalences between the two serovars. Negative values indicate that the S.Typhimurium mutant population has shrunk relative to the S. Typhi mutant population, andvice versa.
mutant prevalence, 938 of them statistically significant (see Appendix A), indicating a
strong selective pressure operating on the library, the composition of the S. Typhi library
appears nearly unchanged after infection, with only 28 features showing a statistically
significant change in mutant prevalence (see table 3.5). In fact it appears that nearly
all of the statistically significant differences in logFC between the two libraries over
macrophage infection are due to changes in mutant prevalences in the S. Typhimurium
library. This seems to indicate, on a gross level, that S. Typhi is somehow avoiding the
brunt of the gauntlet imposed on S. Typhimurium in the first two hours of macrophage
infection. This may partially be due to the presence of the Vi capsule on S. Typhi, which
has previously been shown to enhance survival in THP-1 derived macrophage (Hirose
et al., 1997) through the creation of a ‘stealth’ phenotype which reduces the expression
of inflammatory factors, such as TNF-α, by the macrophage.
76
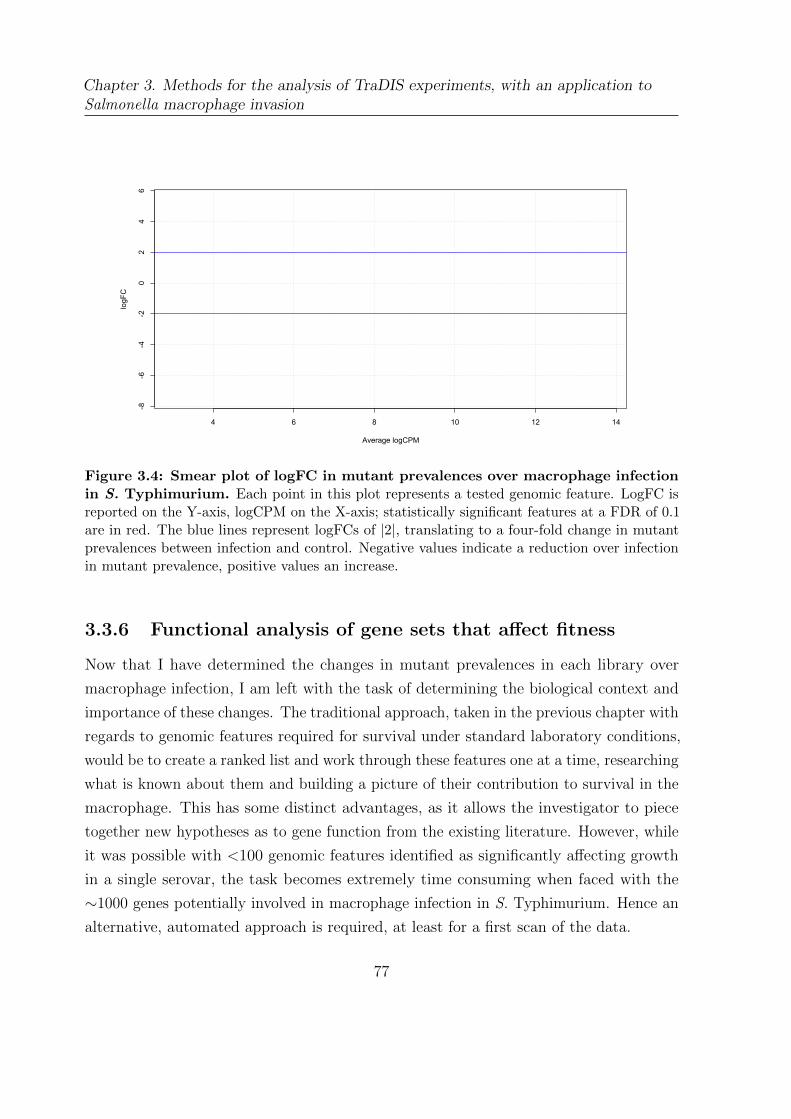
Chapter 3. Methods for the analysis of TraDIS experiments, with an application toSalmonella macrophage invasion
4 6 8 10 12 14
-8-6
-4-2
02
46
Average logCPM
logFC
Figure 3.4: Smear plot of logFC in mutant prevalences over macrophage infectionin S. Typhimurium. Each point in this plot represents a tested genomic feature. LogFC isreported on the Y-axis, logCPM on the X-axis; statistically significant features at a FDR of 0.1are in red. The blue lines represent logFCs of |2|, translating to a four-fold change in mutantprevalences between infection and control. Negative values indicate a reduction over infectionin mutant prevalence, positive values an increase.
3.3.6 Functional analysis of gene sets that affect fitness
Now that I have determined the changes in mutant prevalences in each library over
macrophage infection, I am left with the task of determining the biological context and
importance of these changes. The traditional approach, taken in the previous chapter with
regards to genomic features required for survival under standard laboratory conditions,
would be to create a ranked list and work through these features one at a time, researching
what is known about them and building a picture of their contribution to survival in the
macrophage. This has some distinct advantages, as it allows the investigator to piece
together new hypotheses as to gene function from the existing literature. However, while
it was possible with <100 genomic features identified as significantly affecting growth
in a single serovar, the task becomes extremely time consuming when faced with the
∼1000 genes potentially involved in macrophage infection in S. Typhimurium. Hence an
alternative, automated approach is required, at least for a first scan of the data.
77
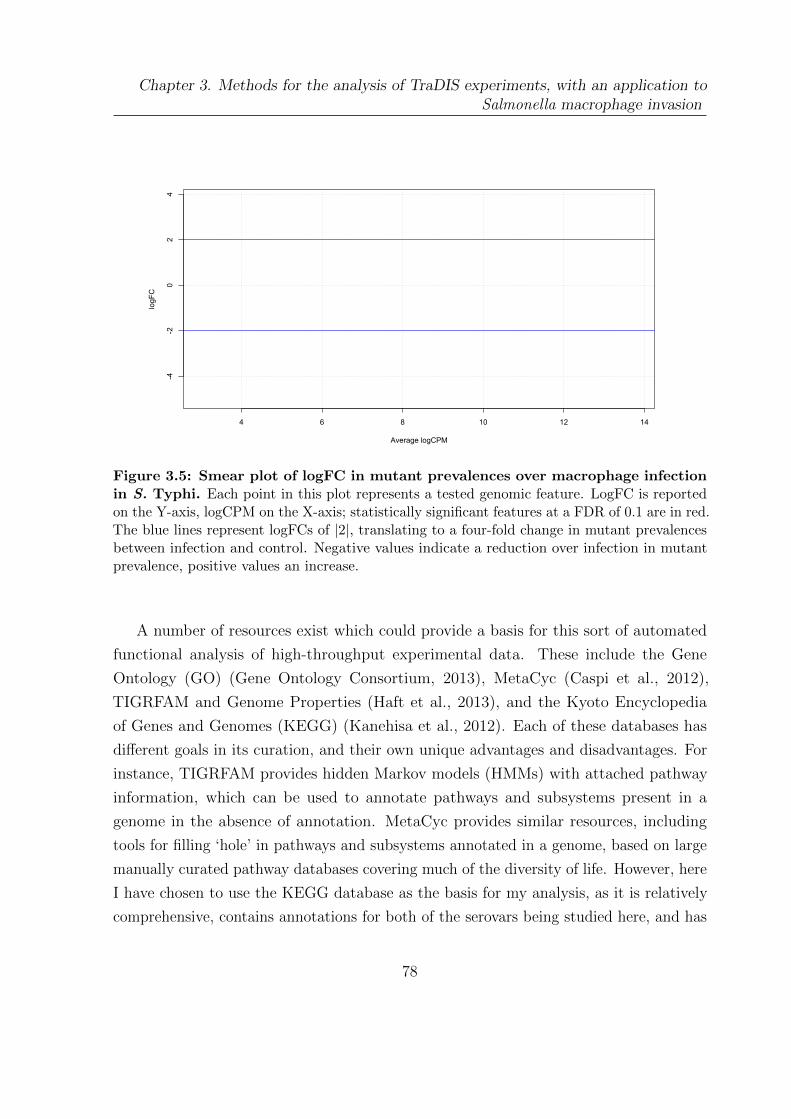
Chapter 3. Methods for the analysis of TraDIS experiments, with an application toSalmonella macrophage invasion
4 6 8 10 12 14
-4-2
02
4
Average logCPM
logFC
Figure 3.5: Smear plot of logFC in mutant prevalences over macrophage infectionin S. Typhi. Each point in this plot represents a tested genomic feature. LogFC is reportedon the Y-axis, logCPM on the X-axis; statistically significant features at a FDR of 0.1 are in red.The blue lines represent logFCs of |2|, translating to a four-fold change in mutant prevalencesbetween infection and control. Negative values indicate a reduction over infection in mutantprevalence, positive values an increase.
A number of resources exist which could provide a basis for this sort of automated
functional analysis of high-throughput experimental data. These include the Gene
Ontology (GO) (Gene Ontology Consortium, 2013), MetaCyc (Caspi et al., 2012),
TIGRFAM and Genome Properties (Haft et al., 2013), and the Kyoto Encyclopedia
of Genes and Genomes (KEGG) (Kanehisa et al., 2012). Each of these databases has
different goals in its curation, and their own unique advantages and disadvantages. For
instance, TIGRFAM provides hidden Markov models (HMMs) with attached pathway
information, which can be used to annotate pathways and subsystems present in a
genome in the absence of annotation. MetaCyc provides similar resources, including
tools for filling ‘hole’ in pathways and subsystems annotated in a genome, based on large
manually curated pathway databases covering much of the diversity of life. However, here
I have chosen to use the KEGG database as the basis for my analysis, as it is relatively
comprehensive, contains annotations for both of the serovars being studied here, and has
78
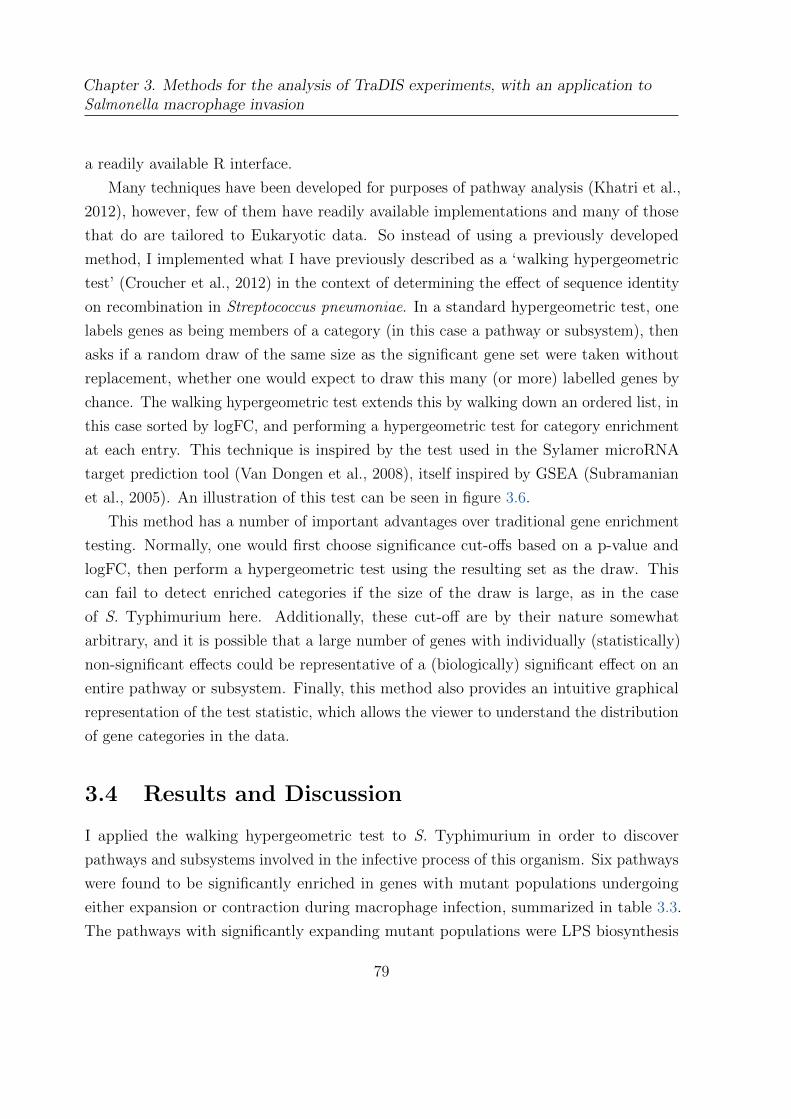
Chapter 3. Methods for the analysis of TraDIS experiments, with an application toSalmonella macrophage invasion
a readily available R interface.
Many techniques have been developed for purposes of pathway analysis (Khatri et al.,
2012), however, few of them have readily available implementations and many of those
that do are tailored to Eukaryotic data. So instead of using a previously developed
method, I implemented what I have previously described as a ‘walking hypergeometric
test’ (Croucher et al., 2012) in the context of determining the effect of sequence identity
on recombination in Streptococcus pneumoniae. In a standard hypergeometric test, one
labels genes as being members of a category (in this case a pathway or subsystem), then
asks if a random draw of the same size as the significant gene set were taken without
replacement, whether one would expect to draw this many (or more) labelled genes by
chance. The walking hypergeometric test extends this by walking down an ordered list, in
this case sorted by logFC, and performing a hypergeometric test for category enrichment
at each entry. This technique is inspired by the test used in the Sylamer microRNA
target prediction tool (Van Dongen et al., 2008), itself inspired by GSEA (Subramanian
et al., 2005). An illustration of this test can be seen in figure 3.6.
This method has a number of important advantages over traditional gene enrichment
testing. Normally, one would first choose significance cut-offs based on a p-value and
logFC, then perform a hypergeometric test using the resulting set as the draw. This
can fail to detect enriched categories if the size of the draw is large, as in the case
of S. Typhimurium here. Additionally, these cut-off are by their nature somewhat
arbitrary, and it is possible that a large number of genes with individually (statistically)
non-significant effects could be representative of a (biologically) significant effect on an
entire pathway or subsystem. Finally, this method also provides an intuitive graphical
representation of the test statistic, which allows the viewer to understand the distribution
of gene categories in the data.
3.4 Results and Discussion
I applied the walking hypergeometric test to S. Typhimurium in order to discover
pathways and subsystems involved in the infective process of this organism. Six pathways
were found to be significantly enriched in genes with mutant populations undergoing
either expansion or contraction during macrophage infection, summarized in table 3.3.
The pathways with significantly expanding mutant populations were LPS biosynthesis
79
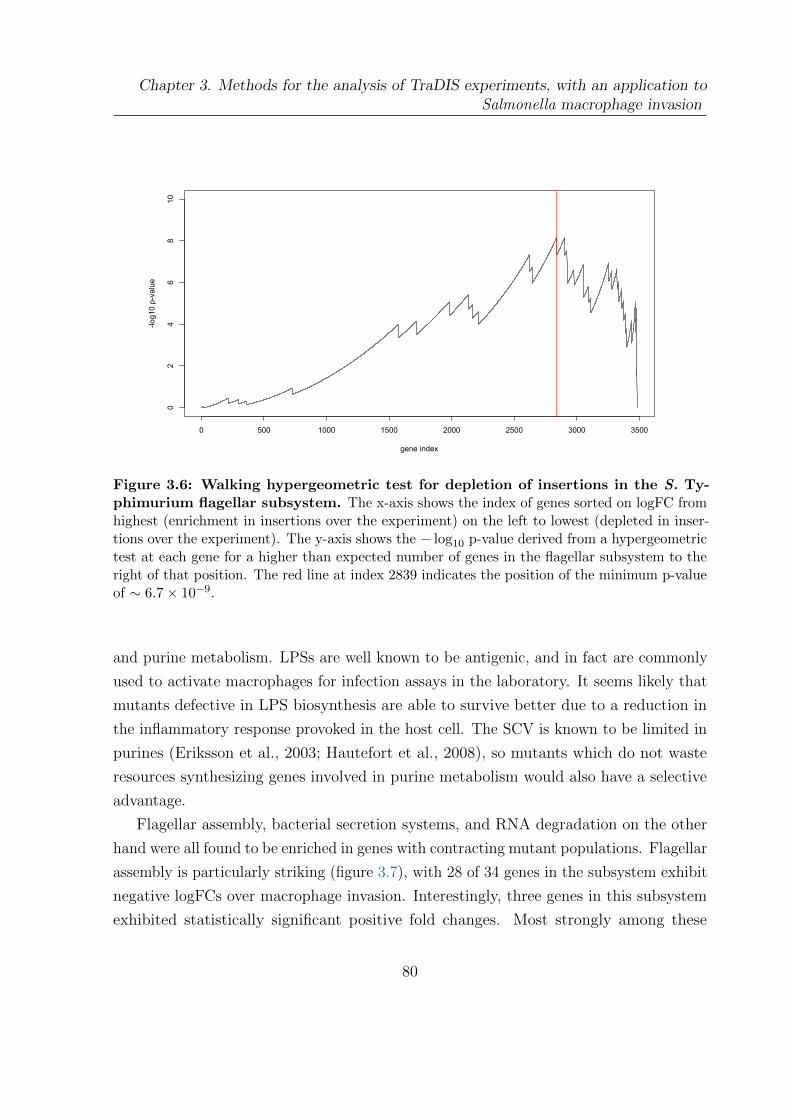
Chapter 3. Methods for the analysis of TraDIS experiments, with an application toSalmonella macrophage invasion
0 500 1000 1500 2000 2500 3000 3500
02
46
810
gene index
-log1
0 p-
valu
e
Figure 3.6: Walking hypergeometric test for depletion of insertions in the S. Ty-phimurium flagellar subsystem. The x-axis shows the index of genes sorted on logFC fromhighest (enrichment in insertions over the experiment) on the left to lowest (depleted in inser-tions over the experiment). The y-axis shows the − log10 p-value derived from a hypergeometrictest at each gene for a higher than expected number of genes in the flagellar subsystem to theright of that position. The red line at index 2839 indicates the position of the minimum p-valueof ∼ 6.7× 10⁻⁹.
and purine metabolism. LPSs are well known to be antigenic, and in fact are commonly
used to activate macrophages for infection assays in the laboratory. It seems likely that
mutants defective in LPS biosynthesis are able to survive better due to a reduction in
the inflammatory response provoked in the host cell. The SCV is known to be limited in
purines (Eriksson et al., 2003; Hautefort et al., 2008), so mutants which do not waste
resources synthesizing genes involved in purine metabolism would also have a selective
advantage.
Flagellar assembly, bacterial secretion systems, and RNA degradation on the other
hand were all found to be enriched in genes with contracting mutant populations. Flagellar
assembly is particularly striking (figure 3.7), with 28 of 34 genes in the subsystem exhibit
negative logFCs over macrophage invasion. Interestingly, three genes in this subsystem
exhibited statistically significant positive fold changes. Most strongly among these
80
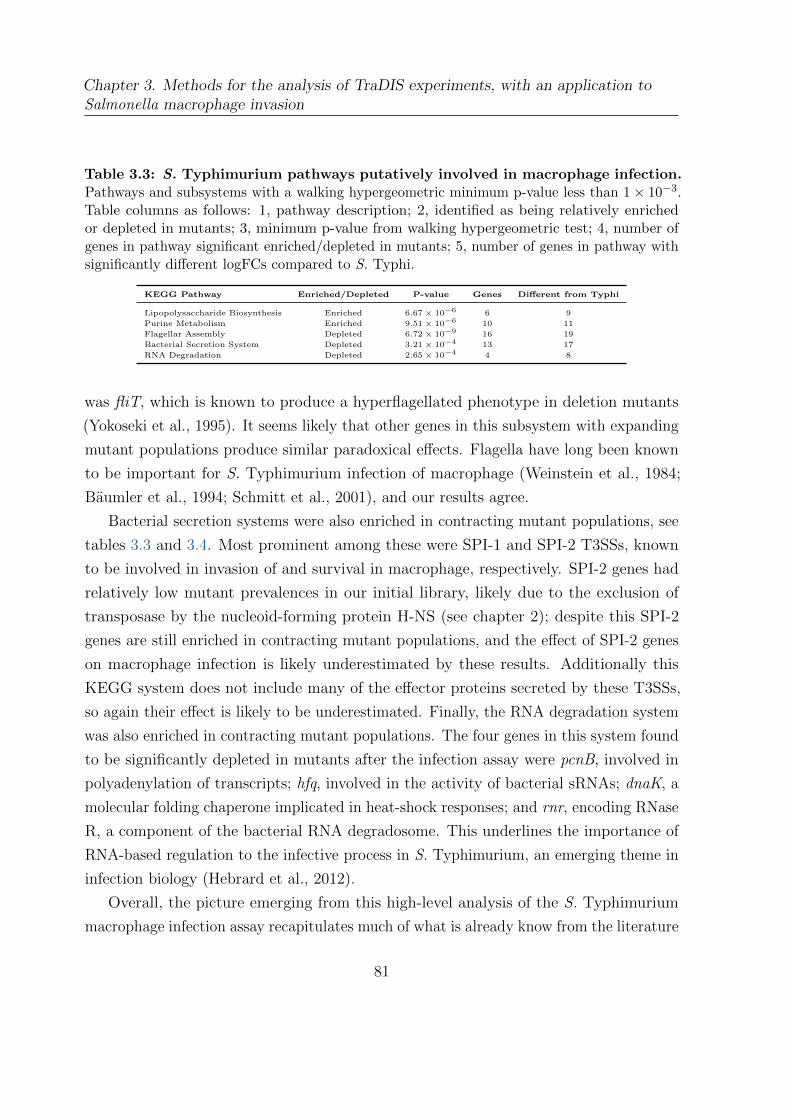
Chapter 3. Methods for the analysis of TraDIS experiments, with an application toSalmonella macrophage invasion
Table 3.3: S. Typhimurium pathways putatively involved in macrophage infection.Pathways and subsystems with a walking hypergeometric minimum p-value less than 1× 10⁻³.Table columns as follows: 1, pathway description; 2, identified as being relatively enrichedor depleted in mutants; 3, minimum p-value from walking hypergeometric test; 4, number ofgenes in pathway significant enriched/depleted in mutants; 5, number of genes in pathway withsignificantly different logFCs compared to S. Typhi.
KEGG Pathway Enriched/Depleted P-value Genes Different from Typhi
Lipopolysaccharide Biosynthesis Enriched 6.67 × 10⁻⁶ 6 9
Purine Metabolism Enriched 9.51 × 10⁻⁶ 10 11
Flagellar Assembly Depleted 6.72 × 10⁻⁹ 16 19
Bacterial Secretion System Depleted 3.21 × 10⁻⁴ 13 17
RNA Degradation Depleted 2.65 × 10⁻⁴ 4 8
was fliT, which is known to produce a hyperflagellated phenotype in deletion mutants
(Yokoseki et al., 1995). It seems likely that other genes in this subsystem with expanding
mutant populations produce similar paradoxical effects. Flagella have long been known
to be important for S. Typhimurium infection of macrophage (Weinstein et al., 1984;
Baumler et al., 1994; Schmitt et al., 2001), and our results agree.
Bacterial secretion systems were also enriched in contracting mutant populations, see
tables 3.3 and 3.4. Most prominent among these were SPI-1 and SPI-2 T3SSs, known
to be involved in invasion of and survival in macrophage, respectively. SPI-2 genes had
relatively low mutant prevalences in our initial library, likely due to the exclusion of
transposase by the nucleoid-forming protein H-NS (see chapter 2); despite this SPI-2
genes are still enriched in contracting mutant populations, and the effect of SPI-2 genes
on macrophage infection is likely underestimated by these results. Additionally this
KEGG system does not include many of the effector proteins secreted by these T3SSs,
so again their effect is likely to be underestimated. Finally, the RNA degradation system
was also enriched in contracting mutant populations. The four genes in this system found
to be significantly depleted in mutants after the infection assay were pcnB, involved in
polyadenylation of transcripts; hfq, involved in the activity of bacterial sRNAs; dnaK, a
molecular folding chaperone implicated in heat-shock responses; and rnr, encoding RNase
R, a component of the bacterial RNA degradosome. This underlines the importance of
RNA-based regulation to the infective process in S. Typhimurium, an emerging theme in
infection biology (Hebrard et al., 2012).
Overall, the picture emerging from this high-level analysis of the S. Typhimurium
macrophage infection assay recapitulates much of what is already know from the literature
81
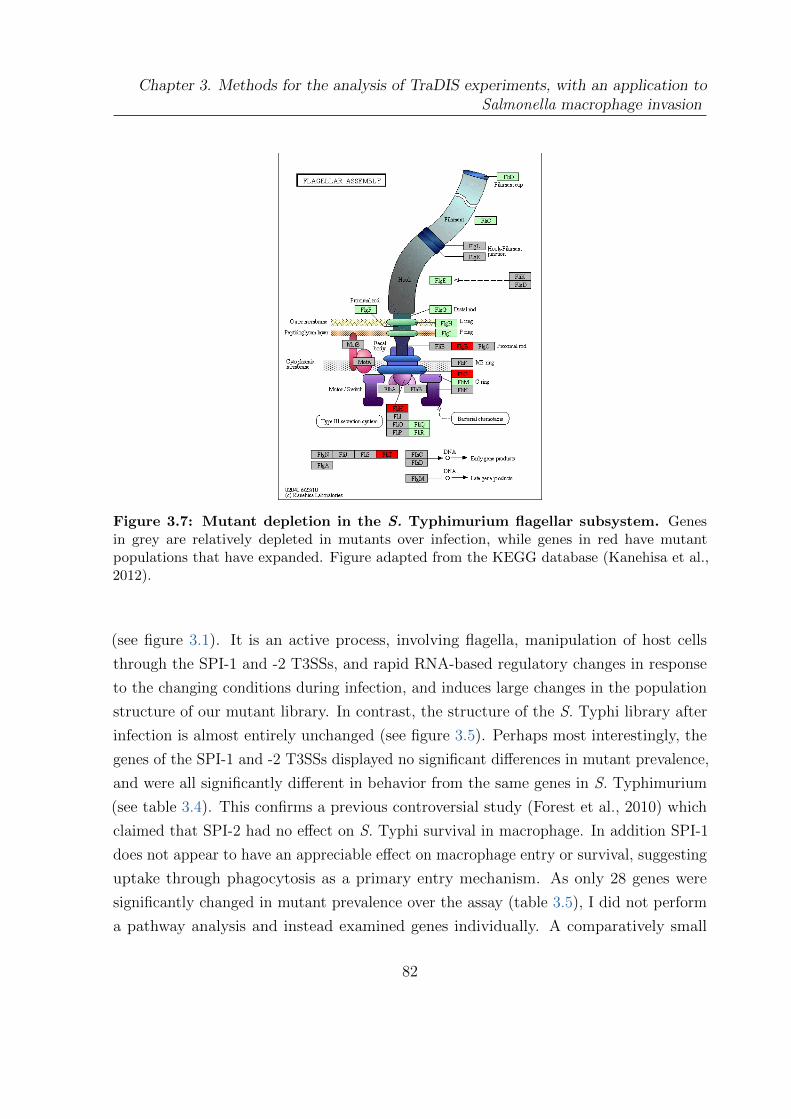
Chapter 3. Methods for the analysis of TraDIS experiments, with an application toSalmonella macrophage invasion
Figure 3.7: Mutant depletion in the S. Typhimurium flagellar subsystem. Genesin grey are relatively depleted in mutants over infection, while genes in red have mutantpopulations that have expanded. Figure adapted from the KEGG database (Kanehisa et al.,2012).
(see figure 3.1). It is an active process, involving flagella, manipulation of host cells
through the SPI-1 and -2 T3SSs, and rapid RNA-based regulatory changes in response
to the changing conditions during infection, and induces large changes in the population
structure of our mutant library. In contrast, the structure of the S. Typhi library after
infection is almost entirely unchanged (see figure 3.5). Perhaps most interestingly, the
genes of the SPI-1 and -2 T3SSs displayed no significant differences in mutant prevalence,
and were all significantly different in behavior from the same genes in S. Typhimurium
(see table 3.4). This confirms a previous controversial study (Forest et al., 2010) which
claimed that SPI-2 had no effect on S. Typhi survival in macrophage. In addition SPI-1
does not appear to have an appreciable effect on macrophage entry or survival, suggesting
uptake through phagocytosis as a primary entry mechanism. As only 28 genes were
significantly changed in mutant prevalence over the assay (table 3.5), I did not perform
a pathway analysis and instead examined genes individually. A comparatively small
82
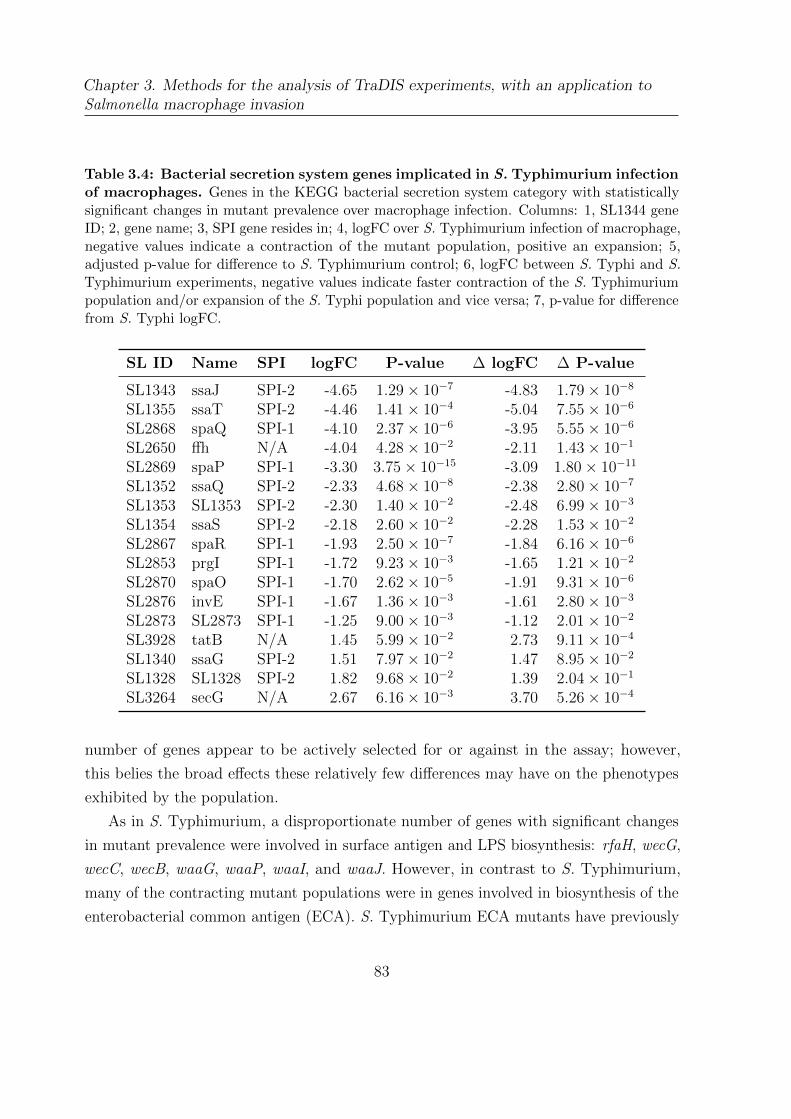
Chapter 3. Methods for the analysis of TraDIS experiments, with an application toSalmonella macrophage invasion
Table 3.4: Bacterial secretion system genes implicated in S. Typhimurium infectionof macrophages. Genes in the KEGG bacterial secretion system category with statisticallysignificant changes in mutant prevalence over macrophage infection. Columns: 1, SL1344 geneID; 2, gene name; 3, SPI gene resides in; 4, logFC over S. Typhimurium infection of macrophage,negative values indicate a contraction of the mutant population, positive an expansion; 5,adjusted p-value for difference to S. Typhimurium control; 6, logFC between S. Typhi and S.Typhimurium experiments, negative values indicate faster contraction of the S. Typhimuriumpopulation and/or expansion of the S. Typhi population and vice versa; 7, p-value for differencefrom S. Typhi logFC.
SL ID Name SPI logFC P-value ∆ logFC ∆ P-value
SL1343 ssaJ SPI-2 -4.65 1.29× 10⁻⁷ -4.83 1.79× 10⁻⁸
SL1355 ssaT SPI-2 -4.46 1.41× 10⁻⁴ -5.04 7.55× 10⁻⁶
SL2868 spaQ SPI-1 -4.10 2.37× 10⁻⁶ -3.95 5.55× 10⁻⁶
SL2650 ffh N/A -4.04 4.28× 10⁻² -2.11 1.43× 10⁻¹
SL2869 spaP SPI-1 -3.30 3.75× 10⁻¹⁵ -3.09 1.80× 10⁻¹¹
SL1352 ssaQ SPI-2 -2.33 4.68× 10⁻⁸ -2.38 2.80× 10⁻⁷
SL1353 SL1353 SPI-2 -2.30 1.40× 10⁻² -2.48 6.99× 10⁻³
SL1354 ssaS SPI-2 -2.18 2.60× 10⁻² -2.28 1.53× 10⁻²
SL2867 spaR SPI-1 -1.93 2.50× 10⁻⁷ -1.84 6.16× 10⁻⁶
SL2853 prgI SPI-1 -1.72 9.23× 10⁻³ -1.65 1.21× 10⁻²
SL2870 spaO SPI-1 -1.70 2.62× 10⁻⁵ -1.91 9.31× 10⁻⁶
SL2876 invE SPI-1 -1.67 1.36× 10⁻³ -1.61 2.80× 10⁻³
SL2873 SL2873 SPI-1 -1.25 9.00× 10⁻³ -1.12 2.01× 10⁻²
SL3928 tatB N/A 1.45 5.99× 10⁻² 2.73 9.11× 10⁻⁴
SL1340 ssaG SPI-2 1.51 7.97× 10⁻² 1.47 8.95× 10⁻²
SL1328 SL1328 SPI-2 1.82 9.68× 10⁻² 1.39 2.04× 10⁻¹
SL3264 secG N/A 2.67 6.16× 10⁻³ 3.70 5.26× 10⁻⁴
number of genes appear to be actively selected for or against in the assay; however,
this belies the broad effects these relatively few differences may have on the phenotypes
exhibited by the population.
As in S. Typhimurium, a disproportionate number of genes with significant changes
in mutant prevalence were involved in surface antigen and LPS biosynthesis: rfaH, wecG,
wecC, wecB, waaG, waaP, waaI, and waaJ. However, in contrast to S. Typhimurium,
many of the contracting mutant populations were in genes involved in biosynthesis of the
enterobacterial common antigen (ECA). S. Typhimurium ECA mutants have previously
83
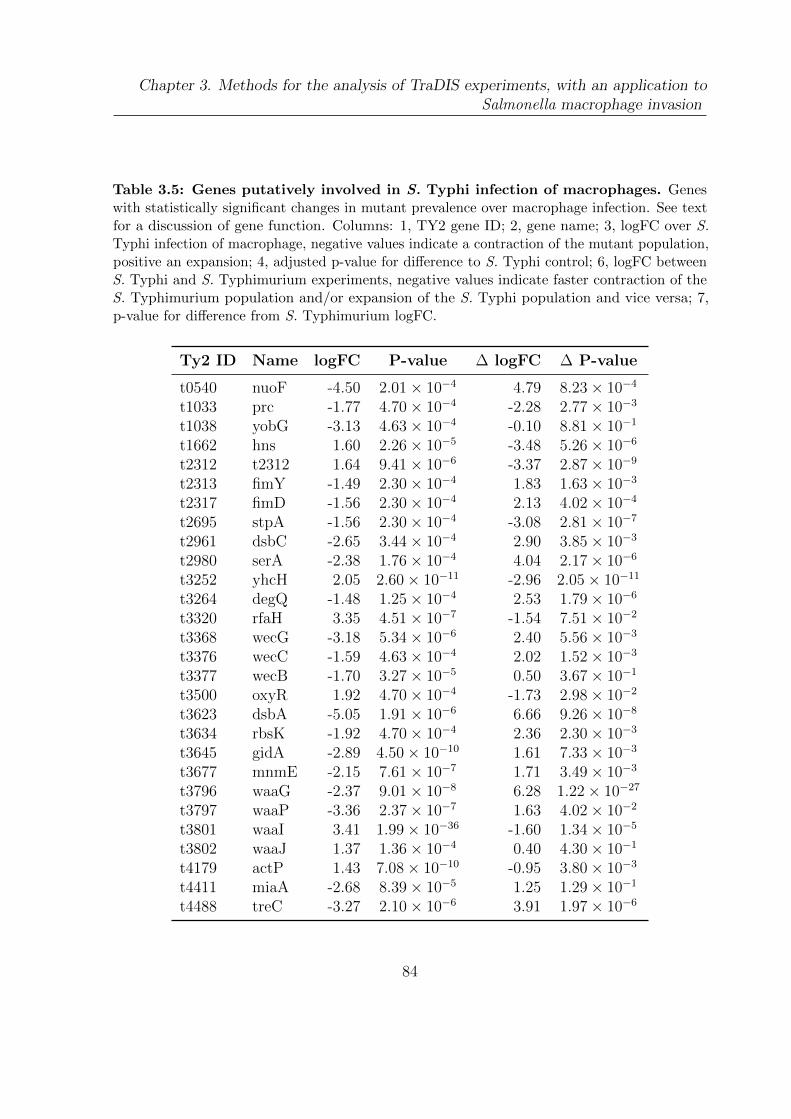
Chapter 3. Methods for the analysis of TraDIS experiments, with an application toSalmonella macrophage invasion
Table 3.5: Genes putatively involved in S. Typhi infection of macrophages. Geneswith statistically significant changes in mutant prevalence over macrophage infection. See textfor a discussion of gene function. Columns: 1, TY2 gene ID; 2, gene name; 3, logFC over S.Typhi infection of macrophage, negative values indicate a contraction of the mutant population,positive an expansion; 4, adjusted p-value for difference to S. Typhi control; 6, logFC betweenS. Typhi and S. Typhimurium experiments, negative values indicate faster contraction of theS. Typhimurium population and/or expansion of the S. Typhi population and vice versa; 7,p-value for difference from S. Typhimurium logFC.
Ty2 ID Name logFC P-value ∆ logFC ∆ P-value
t0540 nuoF -4.50 2.01× 10⁻⁴ 4.79 8.23× 10⁻⁴
t1033 prc -1.77 4.70× 10⁻⁴ -2.28 2.77× 10⁻³
t1038 yobG -3.13 4.63× 10⁻⁴ -0.10 8.81× 10⁻¹
t1662 hns 1.60 2.26× 10⁻⁵ -3.48 5.26× 10⁻⁶
t2312 t2312 1.64 9.41× 10⁻⁶ -3.37 2.87× 10⁻⁹
t2313 fimY -1.49 2.30× 10⁻⁴ 1.83 1.63× 10⁻³
t2317 fimD -1.56 2.30× 10⁻⁴ 2.13 4.02× 10⁻⁴
t2695 stpA -1.56 2.30× 10⁻⁴ -3.08 2.81× 10⁻⁷
t2961 dsbC -2.65 3.44× 10⁻⁴ 2.90 3.85× 10⁻³
t2980 serA -2.38 1.76× 10⁻⁴ 4.04 2.17× 10⁻⁶
t3252 yhcH 2.05 2.60× 10⁻¹¹ -2.96 2.05× 10⁻¹¹
t3264 degQ -1.48 1.25× 10⁻⁴ 2.53 1.79× 10⁻⁶
t3320 rfaH 3.35 4.51× 10⁻⁷ -1.54 7.51× 10⁻²
t3368 wecG -3.18 5.34× 10⁻⁶ 2.40 5.56× 10⁻³
t3376 wecC -1.59 4.63× 10⁻⁴ 2.02 1.52× 10⁻³
t3377 wecB -1.70 3.27× 10⁻⁵ 0.50 3.67× 10⁻¹
t3500 oxyR 1.92 4.70× 10⁻⁴ -1.73 2.98× 10⁻²
t3623 dsbA -5.05 1.91× 10⁻⁶ 6.66 9.26× 10⁻⁸
t3634 rbsK -1.92 4.70× 10⁻⁴ 2.36 2.30× 10⁻³
t3645 gidA -2.89 4.50× 10⁻¹⁰ 1.61 7.33× 10⁻³
t3677 mnmE -2.15 7.61× 10⁻⁷ 1.71 3.49× 10⁻³
t3796 waaG -2.37 9.01× 10⁻⁸ 6.28 1.22× 10⁻²⁷
t3797 waaP -3.36 2.37× 10⁻⁷ 1.63 4.02× 10⁻²
t3801 waaI 3.41 1.99× 10−36 -1.60 1.34× 10⁻⁵
t3802 waaJ 1.37 1.36× 10⁻⁴ 0.40 4.30× 10⁻¹
t4179 actP 1.43 7.08× 10⁻¹⁰ -0.95 3.80× 10⁻³
t4411 miaA -2.68 8.39× 10⁻⁵ 1.25 1.29× 10⁻¹
t4488 treC -3.27 2.10× 10⁻⁶ 3.91 1.97× 10⁻⁶
84
Chapter 3. Methods for the analysis of TraDIS experiments, with an application toSalmonella macrophage invasion
been shown to not cause acute disease in mice, though they are capable of persistently
colonizing the spleen and liver (Gilbreath et al., 2012), reminiscent of S. Typhi infections
of silent carriers, though the relevance of this to S. Typhi infection of macrophages is
unclear. The most interesting of the LPS biosynthesis genes affected, rfaH, is a anti-
termination factor affecting primarily LPS biosynthesis loci (Artsimovitch et al., 2002;
Santangelo et al., 2002) with a >8-fold increase in mutant popluation size over the assay.
This anti-termination factor associates with RNA polymerase and prevents pausing at
both Rho-dependent and Rho-independent transcriptional terminators, promoting the
expression of promoter-distal loci. As a result, a mutation in this single gene is likely to
have broad pleiotropic effects, a feature common to many of the genes implicated in S.
Typhi infection.
Other examples of genes with potentially wide-ranging pleiotropic effects include the
paralogous nucleoid-forming proteins hns and stpA. H-NS has been described previously
in chapter 2, but briefly it acts to condense DNA by binding to AT-rich, bent regions, and
primarily regulates virulence and stress-response loci (Navarre et al., 2006; Lucchini et al.,
2006). The paralogous StpA has similar binding affinity, but regulates a reduced regulon
compared to H-NS, and in fact hns masks the phenotypic effects of an stpA deletion
(Lucchini et al., 2009). The expansion of the population containing hns mutations with
the concomitant contraction of stpA mutant populations suggests a subtle interplay
between the two at work under infective conditions, with potentially wide repercussions
for cellular phenotype. Another example of this theme of S. Typhi relying on genes
with pleiotropic effects is given by gidA and mnmE. The products of these genes act
together to post-transcriptionally modify a number of tRNAs (Yim et al., 2006), affecting
translational fidelity (Bregeon et al., 2001). Mutations in these genes can have global
effects (Kinscherf et al., 2002), and have recently been shown to affect S. Typhimurium
virulence (Shippy et al., 2013).
While hns, stpA, gidA, and mnmE modulate gene expression at the transcriptional
and post-transcriptional level, two other genes with depleted mutant populations, dsbA
and dsbC, likely induce effects post-translationally. The dsb genes are involved in disulfide
bond (DSB) formation, which is required for the proper folding and function of a wide
range of proteins, and is known to be required for virulence in a number of bacterial species
including Shigella flexneri and uropathogenic Escherichia coli (Heras et al., 2009). DsbA
catalyzes the formation of DSBs in newly translated proteins translocated periplasm;
85
Chapter 3. Methods for the analysis of TraDIS experiments, with an application toSalmonella macrophage invasion
however, this process is non-specific and introduces spurious bonds. DsbC provides
a proof-reading mechanism through isomerization of non-native bonds introduced by
DsbA. This process is critical to the expression of a wide range of virulence factors in
many species, including toxins and fimbriae (Yu et al., 1999). DsbA expression is known
to affect S. flexneri survival in macrophage (Yu et al., 2001), and it appears to affect
virulence in S. Typhimurium, though this is thought to be mediated through its effects
on the SPI-2 T3SS (Miki et al., 2004). The exact mechanism through which the DSB
system affects S. Typhi survival in macrophage is unclear, though it appears likely that
DSB formation is important for extracellular or cell-surface structures S. Typhi uses to
interact with the host cell.
In conclusion, the picture that emerges from this analysis is that unlike S. Ty-
phimurium, S. Typhi is robust to assault from a human macrophage host cell. Infection
produces only small changes in the population structure of the S. Typhi mutant library,
and those populations which are affected have mutations in genes causing broad pleiotropic
effects which can not help but have a strong effect on phenotype. This suggests that S.
Typhi is already tuned to maintain homeostasis within human macrophages, indicative
of its extreme adaptation to its host. While I have only performed a systematic analysis
of the orthologous genes present in both S. Typhimurium and S. Typhi here, I have also
examined the effect of macrophage infection on the genes involved in synthesis of the Vi
antigen, which may be responsible for some of the differences exhibited between the two
serovars. This capsular antigen confers a protective effect on S. Typhi in macrophage
(Hirose et al., 1997), and as expected mutations in these genes were not well tolerated. It
appears that S. Typhi, with the help of its capsule, adopts a stealth phenotype whereby
it can enter and replicate within macrophage unmolested. S. Typhimurium, on the other
hand, uses its flagella and SPI-encoded T3SSs to actively invade the macrophage, and the
toll of this combat can be seen in the effects on the mutant population. I am currently
working with Prof. John Wain (University of East Anglia) to procure microscopy of
S. Typhimurium and S. Typhi infection of macrophage to confirm and build on these
results.
While I have developed the methods presented in this chapter specifically to deal
with this study, they are broadly generalizable to any transposon-insertion sequencing
study. I am assisting in applying them to a number of TraDIS studies in a wide range
of organisms, including carbon source utilization in S. Typhimurium and S. Enteriditis;
86

Chapter 3. Methods for the analysis of TraDIS experiments, with an application toSalmonella macrophage invasion
twitching motility in Pseudomonas aeruginosa; whole animal infection in Citrobacter,
Salmonella, and Escherichia strains; and drug resistance in Klebsiella pneumoniae. As I
have shown here, with the proper analytical tools TraDIS can be a powerful technique for
the rapid generation of functional hypotheses about gene function in complex processes.
87

Chapter 3. Methods for the analysis of TraDIS experiments, with an application toSalmonella macrophage invasion
88
Chapter 4
Detecting Rho-independent
terminators in genomic sequence
with covariance models
Portions of this chapter are based on the previously published article “RNIE: genome-wide
prediction of bacterial intrinsic terminators” (Gardner et al., 2011). This work is the
result of collaboration with Paul P. Gardner (Wellcome Trust Sanger Institute/University
of Canterbury).
4.1 Introduction
Bacteria are thought to utilize two major systems for transcriptional termination: Rho-
dependent termination, and Rho-independent or intrinsic termination (Peters et al.,
2011). Rho-dependent termination relies on a protein cofactor, Rho, a homohexameric
ring protein that threads its way along the newly synthesized RNA molecule before
causing RNA polymerase (RNAP) to dissociate at poorly defined pause sites. Intrinsic
termination on the other hand, depends primarily on the biophysical characteristics of
the sequence being transcribed. The detection of these intrinsic terminators in genomic
sequence is the subject of this chapter. This chapter will serve largely as background
and motivation for the next, in which I develop computational methods for identifying
and characterizing transcriptional termination motifs across the bacterial phylogeny.
89
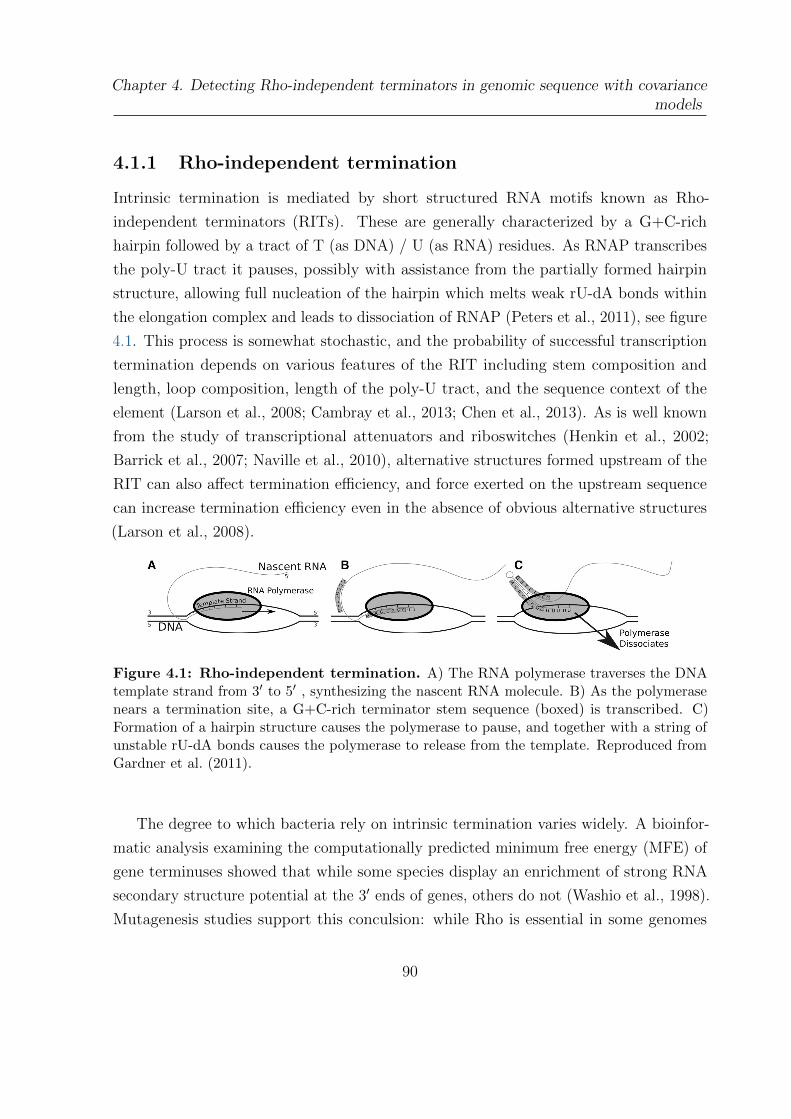
Chapter 4. Detecting Rho-independent terminators in genomic sequence with covariancemodels
4.1.1 Rho-independent termination
Intrinsic termination is mediated by short structured RNA motifs known as Rho-
independent terminators (RITs). These are generally characterized by a G+C-rich
hairpin followed by a tract of T (as DNA) / U (as RNA) residues. As RNAP transcribes
the poly-U tract it pauses, possibly with assistance from the partially formed hairpin
structure, allowing full nucleation of the hairpin which melts weak rU-dA bonds within
the elongation complex and leads to dissociation of RNAP (Peters et al., 2011), see figure
4.1. This process is somewhat stochastic, and the probability of successful transcription
termination depends on various features of the RIT including stem composition and
length, loop composition, length of the poly-U tract, and the sequence context of the
element (Larson et al., 2008; Cambray et al., 2013; Chen et al., 2013). As is well known
from the study of transcriptional attenuators and riboswitches (Henkin et al., 2002;
Barrick et al., 2007; Naville et al., 2010), alternative structures formed upstream of the
RIT can also affect termination efficiency, and force exerted on the upstream sequence
can increase termination efficiency even in the absence of obvious alternative structures
(Larson et al., 2008).
Figure 4.1: Rho-independent termination. A) The RNA polymerase traverses the DNAtemplate strand from 3′ to 5′ , synthesizing the nascent RNA molecule. B) As the polymerasenears a termination site, a G+C-rich terminator stem sequence (boxed) is transcribed. C)Formation of a hairpin structure causes the polymerase to pause, and together with a string ofunstable rU-dA bonds causes the polymerase to release from the template. Reproduced fromGardner et al. (2011).
The degree to which bacteria rely on intrinsic termination varies widely. A bioinfor-
matic analysis examining the computationally predicted minimum free energy (MFE) of
gene terminuses showed that while some species display an enrichment of strong RNA
secondary structure potential at the 3′ ends of genes, others do not (Washio et al., 1998).
Mutagenesis studies support this conculsion: while Rho is essential in some genomes
90
Chapter 4. Detecting Rho-independent terminators in genomic sequence with covariancemodels
with fewer apparent intrinsic terminators (for instance, Salmonella enterica, see table
2.1), it is dispensable in others that are more heavily dependent on intrinsic termination,
such as Bacillus subtilis (Quirk et al., 1993). This suggests competition between the two
termination systems, leading to clade-specific skews in RIT utilization (Carafa et al.,
1990; Kroger et al., 1998; Hoon et al., 2005). The accurate prediction of these elements
is critical to understanding the regulation of transcription, particularly in light of the
≥3000 completed bacterial genomes currently deposited in EMBL-bank. In addition to
their obvious role in helping to define operon structures in genomic sequence (Salgado
et al., 2013), they can also be important indicators of cis-RNA regulation (Henkin et al.,
2002; Barrick et al., 2007; Naville et al., 2010). Finally, the importance of RITs in design-
ing synthetic genetic circuits has recently been recognized, and this has driven studies
attempting to broaden our understanding of the factors affecting intrinsic termination
efficiency (Cambray et al., 2013; Chen et al., 2013).
4.1.2 Previous approaches to identifying intrinsic terminators
Two main approaches to detecting RITs have been taken over the years: RNA motif
descriptors, both expertly constructed (Lesnik et al., 2001) and automatically generated
(Naville et al., 2011); and thermodynamic models of RNA folding to detect hairpins
paired with a heuristic scoring scheme for the poly-T tail region (Ermolaeva et al., 2000;
Wan et al., 2005; Wan et al., 2006; Kingsford et al., 2007). Arguably the most popular
of these methods has been TransTermHP (Kingsford et al., 2007), an example of the
second approach.
The TransTermHP algorithm takes a windowed approach to detecting RITs (figure
4.2). In order to avoid the computational cost of predicting local secondary structure
across the entire genome, TransTermHP first scans overlapping windows of 6 bases for
those containing at least 3 T residues. Upon finding such a window, TransTermHP
performs a dynamic programming procedure to predict potential hairpin structures, using
a simplified version of the Zuker algorithm (Zuker et al., 1981) for in silico RNA folding
parameterized using a set of experimentally validated Escherichia coli RITs (Ermolaeva
et al., 2000). This is then combined with a heuristic score for the quality of the poly-T tail
(Carafa et al., 1990) which rewards T residues occurring closer to the closing base-pairs
of the predicted hairpin structure. Candidate RITs are then filtered on stem length, loop
91
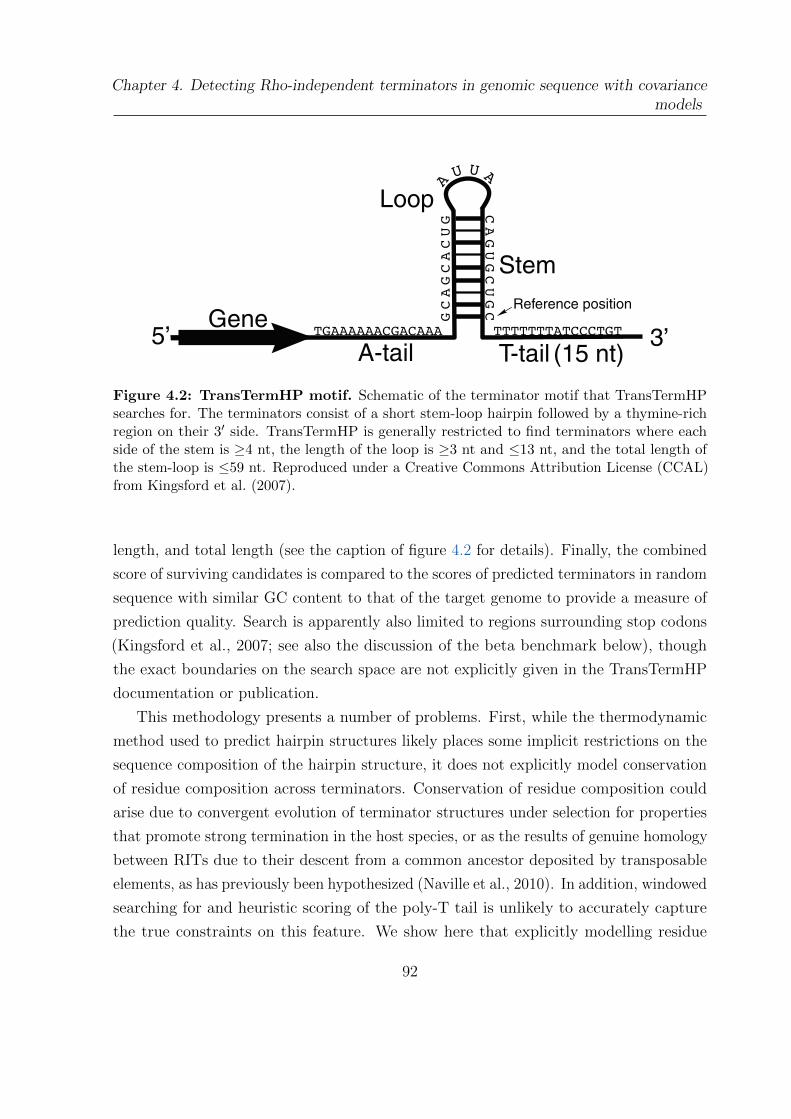
Chapter 4. Detecting Rho-independent terminators in genomic sequence with covariancemodels
A-tail T-tail (15 nt)
Gene
Loop
Stem
Reference position
3’5’
Figure 4.2: TransTermHP motif. Schematic of the terminator motif that TransTermHPsearches for. The terminators consist of a short stem-loop hairpin followed by a thymine-richregion on their 3′ side. TransTermHP is generally restricted to find terminators where eachside of the stem is ≥4 nt, the length of the loop is ≥3 nt and ≤13 nt, and the total length ofthe stem-loop is ≤59 nt. Reproduced under a Creative Commons Attribution License (CCAL)from Kingsford et al. (2007).
length, and total length (see the caption of figure 4.2 for details). Finally, the combined
score of surviving candidates is compared to the scores of predicted terminators in random
sequence with similar GC content to that of the target genome to provide a measure of
prediction quality. Search is apparently also limited to regions surrounding stop codons
(Kingsford et al., 2007; see also the discussion of the beta benchmark below), though
the exact boundaries on the search space are not explicitly given in the TransTermHP
documentation or publication.
This methodology presents a number of problems. First, while the thermodynamic
method used to predict hairpin structures likely places some implicit restrictions on the
sequence composition of the hairpin structure, it does not explicitly model conservation
of residue composition across terminators. Conservation of residue composition could
arise due to convergent evolution of terminator structures under selection for properties
that promote strong termination in the host species, or as the results of genuine homology
between RITs due to their descent from a common ancestor deposited by transposable
elements, as has previously been hypothesized (Naville et al., 2010). In addition, windowed
searching for and heuristic scoring of the poly-T tail is unlikely to accurately capture
the true constraints on this feature. We show here that explicitly modelling residue
92
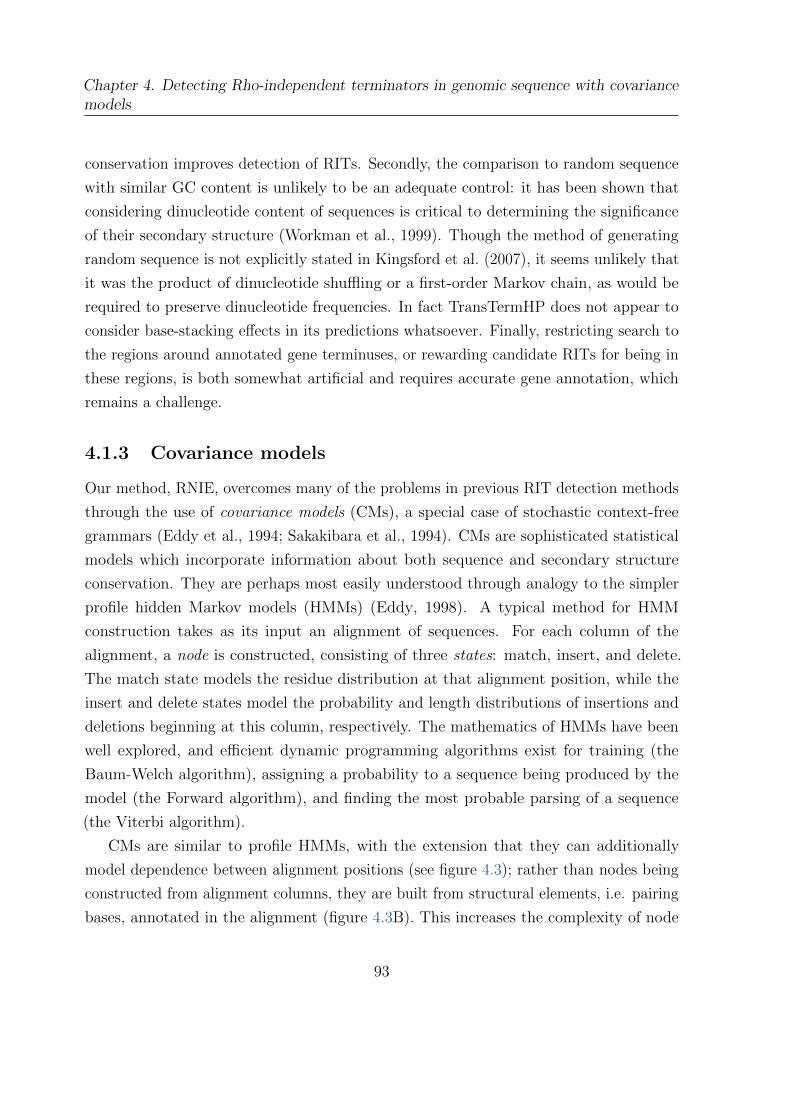
Chapter 4. Detecting Rho-independent terminators in genomic sequence with covariancemodels
conservation improves detection of RITs. Secondly, the comparison to random sequence
with similar GC content is unlikely to be an adequate control: it has been shown that
considering dinucleotide content of sequences is critical to determining the significance
of their secondary structure (Workman et al., 1999). Though the method of generating
random sequence is not explicitly stated in Kingsford et al. (2007), it seems unlikely that
it was the product of dinucleotide shuffling or a first-order Markov chain, as would be
required to preserve dinucleotide frequencies. In fact TransTermHP does not appear to
consider base-stacking effects in its predictions whatsoever. Finally, restricting search to
the regions around annotated gene terminuses, or rewarding candidate RITs for being in
these regions, is both somewhat artificial and requires accurate gene annotation, which
remains a challenge.
4.1.3 Covariance models
Our method, RNIE, overcomes many of the problems in previous RIT detection methods
through the use of covariance models (CMs), a special case of stochastic context-free
grammars (Eddy et al., 1994; Sakakibara et al., 1994). CMs are sophisticated statistical
models which incorporate information about both sequence and secondary structure
conservation. They are perhaps most easily understood through analogy to the simpler
profile hidden Markov models (HMMs) (Eddy, 1998). A typical method for HMM
construction takes as its input an alignment of sequences. For each column of the
alignment, a node is constructed, consisting of three states: match, insert, and delete.
The match state models the residue distribution at that alignment position, while the
insert and delete states model the probability and length distributions of insertions and
deletions beginning at this column, respectively. The mathematics of HMMs have been
well explored, and efficient dynamic programming algorithms exist for training (the
Baum-Welch algorithm), assigning a probability to a sequence being produced by the
model (the Forward algorithm), and finding the most probable parsing of a sequence
(the Viterbi algorithm).
CMs are similar to profile HMMs, with the extension that they can additionally
model dependence between alignment positions (see figure 4.3); rather than nodes being
constructed from alignment columns, they are built from structural elements, i.e. pairing
bases, annotated in the alignment (figure 4.3B). This increases the complexity of node
93
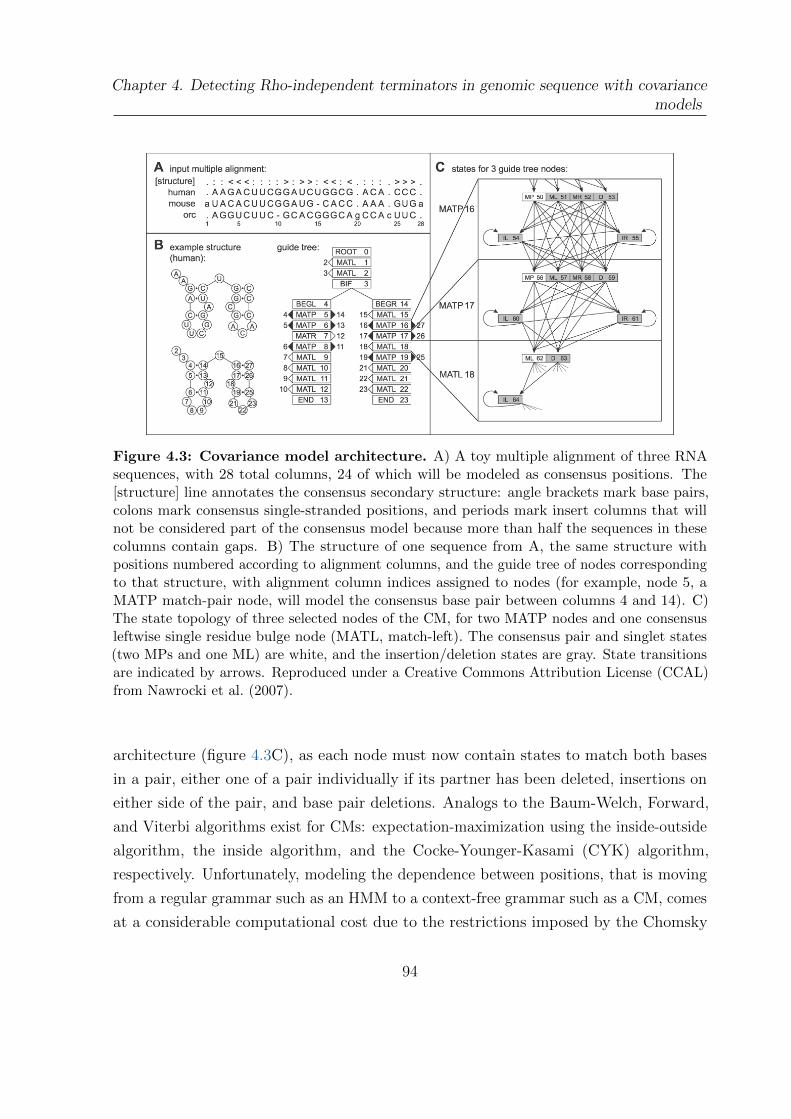
Chapter 4. Detecting Rho-independent terminators in genomic sequence with covariancemodels
Figure 4.3: Covariance model architecture. A) A toy multiple alignment of three RNAsequences, with 28 total columns, 24 of which will be modeled as consensus positions. The[structure] line annotates the consensus secondary structure: angle brackets mark base pairs,colons mark consensus single-stranded positions, and periods mark insert columns that willnot be considered part of the consensus model because more than half the sequences in thesecolumns contain gaps. B) The structure of one sequence from A, the same structure withpositions numbered according to alignment columns, and the guide tree of nodes correspondingto that structure, with alignment column indices assigned to nodes (for example, node 5, aMATP match-pair node, will model the consensus base pair between columns 4 and 14). C)The state topology of three selected nodes of the CM, for two MATP nodes and one consensusleftwise single residue bulge node (MATL, match-left). The consensus pair and singlet states(two MPs and one ML) are white, and the insertion/deletion states are gray. State transitionsare indicated by arrows. Reproduced under a Creative Commons Attribution License (CCAL)from Nawrocki et al. (2007).
architecture (figure 4.3C), as each node must now contain states to match both bases
in a pair, either one of a pair individually if its partner has been deleted, insertions on
either side of the pair, and base pair deletions. Analogs to the Baum-Welch, Forward,
and Viterbi algorithms exist for CMs: expectation-maximization using the inside-outside
algorithm, the inside algorithm, and the Cocke-Younger-Kasami (CYK) algorithm,
respectively. Unfortunately, modeling the dependence between positions, that is moving
from a regular grammar such as an HMM to a context-free grammar such as a CM, comes
at a considerable computational cost due to the restrictions imposed by the Chomsky
94
Chapter 4. Detecting Rho-independent terminators in genomic sequence with covariancemodels
hierarchy (Chomsky, 1959), roughly equivalent to adding an additional dimension to
the dynamic programming matrix. In this study we have used the Infernal package
(Nawrocki et al., 2009), which implements CMs and associated algorithms for RNA
sequence analysis, and includes a number of heuristics for increasing the speed of CM-
based searches including adaptive banding of the dynamic programming matrix (Nawrocki
et al., 2007) and HMM pre-filters based on HMMER (Eddy, 2011). Importantly, Infernal
also incorporates a null model for scoring sequence hits; for sequence that matches the
CM, the probability of this match is compared to the probability of a match to the
null model. This comparison is expressed as a log2 odds ratio, or bitscore, and from
this further statistics, such as an expect value (E-value), can be calculated. Covariance
models are widely used in RNA homology search, most notably by the Rfam database
(Burge et al., 2013) and the tRNAscan-SE tool (Lowe et al., 1997) for predicting tRNAs
in genomic sequence.
4.2 Methods
Paul P. Gardner implemented and benchmarked the RNIE tool. Eric P. Nawrocki (Howard
Hughes Medical Institute Janelia Farm Research Campus) assisted in optimizing Infernal
parameters for RIT search. Zasha Weinberg (Howard Hughes Medical Institute/Yale
University) ran the Rnall and Rnall-Brkr algorithms for benchmarking. I designed
and implemented the analysis which lead to the discovery of the putative mycobacterial
termination motif.
4.2.1 Construction of a covariance model for Rho-independent
terminators
One hundred seventy-one and 891 experimentally validated RIT sequences from Es-
cherichia coli and Bacillus subtilis, respectively, were collected from the E. coli Database
Collection (ECDC; Wahl et al., 1995) and the supplementary information of Hoon et al.
(2005) and manually curated based on evidence quality, leaving a set of 981 RIT sequences.
These sequences were subjected to iterative rounds of alignment, structure prediction,
homology search and refinement. Alignments and secondary structures were predicted
using WAR (Torarinsson et al., 2008a), CMfinder (Yao et al., 2006), and MLocarna (Will
95
Chapter 4. Detecting Rho-independent terminators in genomic sequence with covariancemodels
et al., 2007), iteratively refined using Infernal (Nawrocki et al., 2009), then manually
refined using the RALEE emacs environment (Griffiths-Jones, 2005). Sequence searches
were performed using the resulting CM against EMBL with the Rfam pipeline (Gardner
et al., 2009), and additional sequences were incorporated in to the alignment based on
the following criteria: i) the maximum similarity to an existing seed sequence had to be
95% and the minimum 60%, ii) the minimum fraction of canonical base pairs had to be
75%, iii) the sequence annotation should not contain terms like contaminant, pseudogene,
repeat or transposon and iv) they must score above a bitscore threshold of 20. These
additional sequences were then manually checked for their position near a gene terminus.
This resulted in 1117 aligned sequences, which were further split in to two groups based
on how well they matched the resulting CM. Those scoring with a bitscore over 14 were
placed in alignment A, those scoring less were placed in alignment B. These alignments
were then again automatically refined using Infernal before a final round of manual
refinement.
4.2.2 RNIE run modes
As described in the introduction, algorithms for performing inference with CMs can
be very slow, and as a result Infernal implements a number of filters to reduce the
number of sequences which proceed to a full CM-based homology search. In response to
this, two modes for RNIE were developed: genome mode meant for large-scale searches,
which enables HMM filters and adaptive banding and uses the CYK algorithm with a
higher threshold for reported RIT predictions; and gene mode meant for annotation of
relatively short sequence regions, which disables Infernal’s filtering mechanisms and uses
the slower but more powerful inside algorithm with a lower threshold for reporting RIT
predictions. Genome mode scans sequence at ∼43 kb/s with a low false positive rate
of ∼1.7 FP/Mb. The sensitivity, positive predictive value and Matthews’ correlation
coefficient for this mode (determined in the alpha benchmark below) are 0.70, 0.79 and
0.74. Gene mode scans at ∼1kb/s, and the false positive rate, positive predictive value
and Matthews’ correlation coefficient are ∼9.6 FP/Mb, 0.45 and 0.61, respectively. The
Infernal parameters used for genome and gene mode, respectively, are
cmsearch -T 16 -g --fil-no-qdb --fil-T-hmm 2
--cyk --beta 0.05 CM query_sequence.fasta
96
Chapter 4. Detecting Rho-independent terminators in genomic sequence with covariancemodels
cmsearch -T 14 -g --fil-no-qdb --fil-no-hmm
--no-qdb --inside CM query_sequence.fasta
4.2.3 Definitions
For the purposes of benchmarking, the following measures were used
Sensitivity =TP
TP + FN
PPV =TP
TP + FP
FPR =FP
Total length in kb
MCC =TP × TN − FP × FN√
(TP + FP )(TP + FN)(TN + FP )(TN + FN)
where any prediction that covered a known RIT by at least one nucleotide was considered
a true positive (TP), any prediction that did not overlap a known RIT was considered a
false positive (FP), a missed RIT was considered a false negative (FN), and the number
of unclassified, non-RIT sequence were considered true negatives (TN).
97
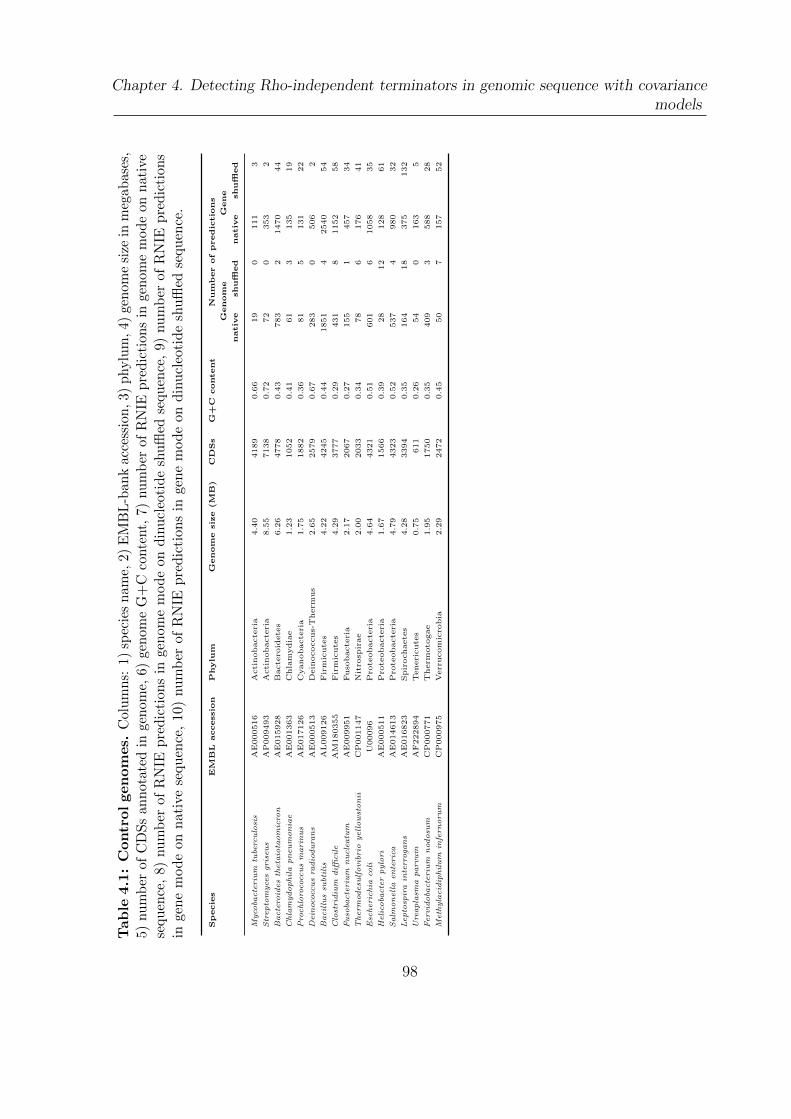
Chapter 4. Detecting Rho-independent terminators in genomic sequence with covariancemodels
Tab
le4.1
:C
ontr
olgen
om
es.
Col
um
ns:
1)sp
ecie
snam
e,2)
EM
BL
-ban
kac
cess
ion,
3)phylu
m,
4)ge
nom
esi
zein
meg
abas
es,
5)num
ber
ofC
DSs
annot
ated
inge
nom
e,6)
genom
eG
+C
conte
nt,
7)num
ber
ofR
NIE
pre
dic
tion
sin
genom
em
ode
onnat
ive
sequ
ence
,8)
nu
mb
erof
RN
IEp
red
icti
ons
inge
nom
em
od
eon
din
ucl
eoti
de
shu
ffled
sequ
ence
,9)
nu
mb
erof
RN
IEp
red
icti
ons
inge
ne
mod
eon
nat
ive
sequ
ence
,10
)nu
mb
erof
RN
IEp
red
icti
ons
inge
ne
mod
eon
din
ucl
eoti
de
shu
ffled
sequ
ence
.
Sp
ecie
sE
MB
Laccessio
nP
hylu
mG
enom
esiz
e(M
B)
CD
Ss
G+
Ccontent
Num
ber
of
predic
tio
ns
Genom
eG
ene
nativ
eshuffl
ed
nativ
eshuffl
ed
Myco
bacte
riu
mtu
berc
ulo
sis
AE
000516
Acti
nobacte
ria
4.4
04189
0.6
619
0111
3
Str
epto
myce
sgris
eu
sA
P009493
Acti
nobacte
ria
8.5
57138
0.7
272
0353
2
Bacte
roid
es
theta
iota
om
icro
nA
E015928
Bacte
roid
ete
s6.2
64778
0.4
3783
21470
44
Chla
mydophil
apn
eu
mon
iae
AE
001363
Chla
mydia
e1.2
31052
0.4
161
3135
19
Pro
chlo
roco
ccu
sm
arin
us
AE
017126
Cyanobacte
ria
1.7
51882
0.3
681
5131
22
Dein
oco
ccu
sra
dio
du
ran
sA
E000513
Dein
ococcus-
Therm
us
2.6
52579
0.6
7283
0506
2
Bacil
lus
subti
lis
AL
009126
Fir
mic
ute
s4.2
24245
0.4
41851
42540
54
Clo
strid
ium
diffi
cil
eA
M180355
Fir
mic
ute
s4.2
93777
0.2
9431
81152
58
Fu
soba
cte
riu
mn
ucle
atu
mA
E009951
Fuso
bacte
ria
2.1
72067
0.2
7155
1457
34
Therm
odesu
lfovib
rio
yell
ow
ston
iiC
P001147
Nit
rosp
irae
2.0
02033
0.3
478
6176
41
Esc
heric
hia
coli
U00096
Pro
teobacte
ria
4.6
44321
0.5
1601
61058
35
Heli
coba
cte
rpylo
ri
AE
000511
Pro
teobacte
ria
1.6
71566
0.3
928
12
128
61
Salm
on
ell
aen
teric
aA
E014613
Pro
teobacte
ria
4.7
94323
0.5
2537
4980
32
Lepto
spir
ain
terro
gan
sA
E016823
Spir
ochaete
s4.2
83394
0.3
5164
18
375
132
Ure
apla
sma
parvu
mA
F222894
Teneri
cute
s0.7
5611
0.2
654
0163
5
Fervid
oba
cte
riu
mn
odosu
mC
P000771
Therm
oto
gae
1.9
51750
0.3
5409
3588
28
Meth
yla
cid
iphil
um
infe
rn
oru
mC
P000975
Verr
ucom
icro
bia
2.2
92472
0.4
550
7157
52
98
Chapter 4. Detecting Rho-independent terminators in genomic sequence with covariancemodels
4.3 Results
Benchmarking a tool for RIT detection is challenging. As described in the methods
section, only a relatively small number of RITs had been verified at the time of this study.
While this situation is beginning to improve with the development of high-throughput
techniques for RIT characterization (Cambray et al., 2013; Chen et al., 2013), verified
RITs are still largely drawn from the model bacteria E. coli and B. subtilis. As a
result, two benchmarks were performed: the first, or alpha, benchmark examines method
performance on known RITs, with the caveat that these RITs formed part of the training
set for RNIE and many of the other methods tested. The second, or beta, benchmark is
a qualitative assessment on whole genomes with unknown RIT contents, evaluating the
quality of predictions by their genomic position and estimating the FPR by the relative
number of predictions on shuffled sequence.
4.3.1 Alpha benchmark
For the first benchmark 485 known RITs, curated on the basis of experimental evidence
for activity, were used, drawn from the ECDC (Wahl et al., 1995) and the supplementary
information of Hoon et al. (2005). Each RIT was embedded in 1000 bases of randomly
selected dinucleotide shuffled sequence drawn from the genomes in table 4.1. For each
known RIT a first-order Markov chain was trained on the nucleotide distribution of
that sequence and 100 decoy sequences were generated and similarly embedded in 1000
bases of dinucleotide shuffled sequence. A first-order Markov chain was used rather than
dinucleotide shuffling of the native RITs, as these short sequences may have a limited
number of permutations with identical dinucleotide content. As TransTermHP will only
run on annotated sequence, artificial gene annotations were added to each sequence, with
either decoys or genuine RITs positioned at the 3′ end of one of the annotations.
Four methods besides RNIE were tested (figure 4.4): TransTermHP (with 2, 4, 9, or
10 gene features; Kingsford et al., 2007), RNAmotif (using either the structural score
alone (struct), or the structural score augmented with a score for hybridization between
the poly-U tail and the DNA sequence (dG); Lesnik et al., 2001), Rnall (using either the
score for hairpin formation (dG), or the score for hairpin formation augmented with a
score for poly-U/DNA hybridization (hbG); Wan et al., 2005; Wan et al., 2006), and a
99
Chapter 4. Detecting Rho-independent terminators in genomic sequence with covariancemodels
version of Rnall modified by the Breaker lab at Yale Univeristy (Rnall-Brkr; using either
the score for hairpin formation (dG), or the score for hairpin formation augmented with
a score for poly-U/DNA hybridization (hbG); Barrick et al., 2007; Weinberg et al., 2007).
The results of this benchmark show that RNIE’s performance is superior to any
previous method for detecting RITs at any level of sensitivity or specificity. Interestingly,
all methods which rely on poly-U/DNA hybridization scores performed extremely poorly,
suggesting that the understanding of the role of RNA-DNA hybridization in intrinsic
termination modelled by these methods is incorrect, or at best incomplete. Of the other
methods, the only ones besides RNIE which cross the line y = 1− x, the performance of
a hypothetical ‘random’ predictor, on the sensitivity versus PPV plot were TransTermHP
and RNAmotif. The scanning speed of RNIE in genome mode, ∼43 kb/s, is comparable
to that of TransTermHP at ∼74-186 kb/s, depending on the number of gene annotations.
Based on these results, thresholds were chosen for reporting RNIE RIT predictions in
genome and gene modes at levels slightly below the maximum MCC, that is allowing for
a slightly higher FPR in return for increased sensitivity with the assumption that false
positives can often be determined by their genomic context.
4.3.2 Beta benchmark
For the second benchmark 17 genomes representative of the diversity of the bacterial
phylogeny (table 4.1) were scanned with both RNIE and TransTermHP, and the results
compared. Additionally, dinucleotide shuffles of these genomes were scanned to provide an
estimate of the FPR of each method. Genuine RITs are expected to occur preferentially in
the 3′ region of annotated genes. As can be seen in figure 4.5, predictions for both RNIE
and TransTermHP are enriched in predictions 3′ to gene annotations (solid lines). RNIE
makes relatively few predictions in shuffled sequence (dashed lines), particularly in the
more stringent genome mode, and these appear to be randomly distributed with respect
to gene terminuses. Worryingly, TransTermHP predictions on dinucleotide shuffled
Figure 4.4 (following page): Alpha benchmark. The accuracy of RNIE compared toexisting methods of terminator prediction. The left figure shows a ROC plot for four independentmethods. The middle figure compares the sensitivity and PPV for the four methods. The figureon the right shows the speeds for each algorithm in kilobases per second. Reproduced fromGardner et al. (2011).
100
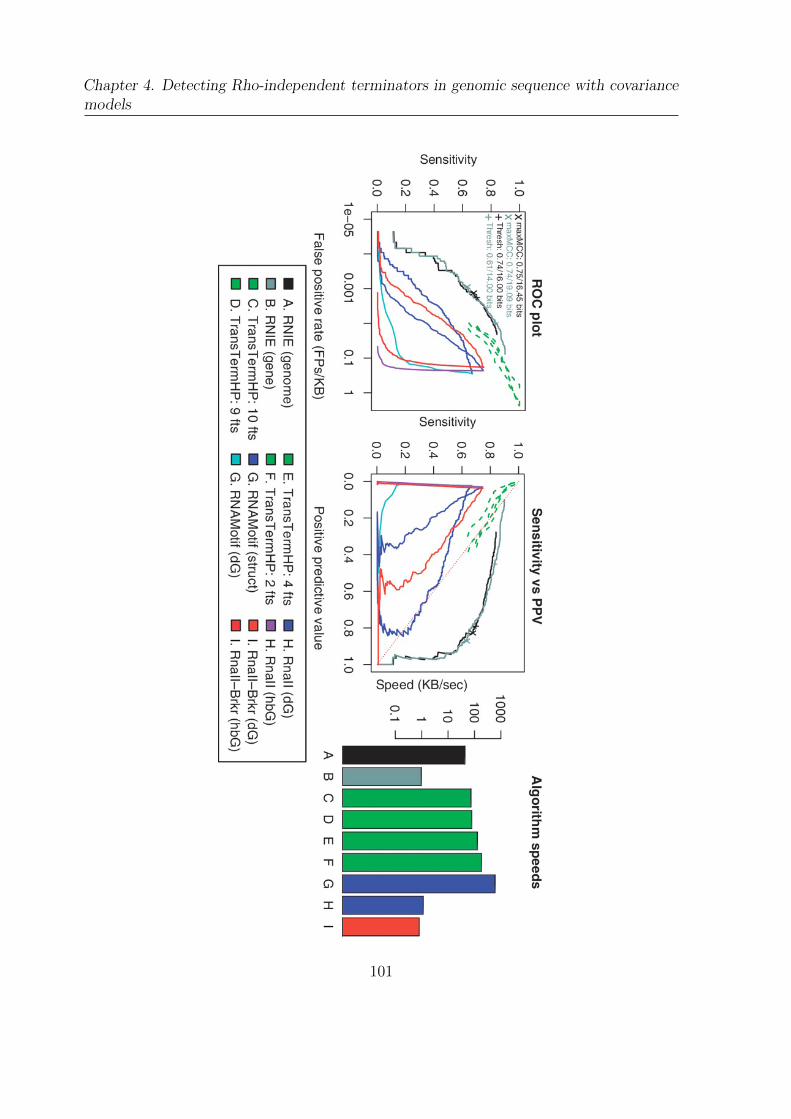
Chapter 4. Detecting Rho-independent terminators in genomic sequence with covariancemodels
101
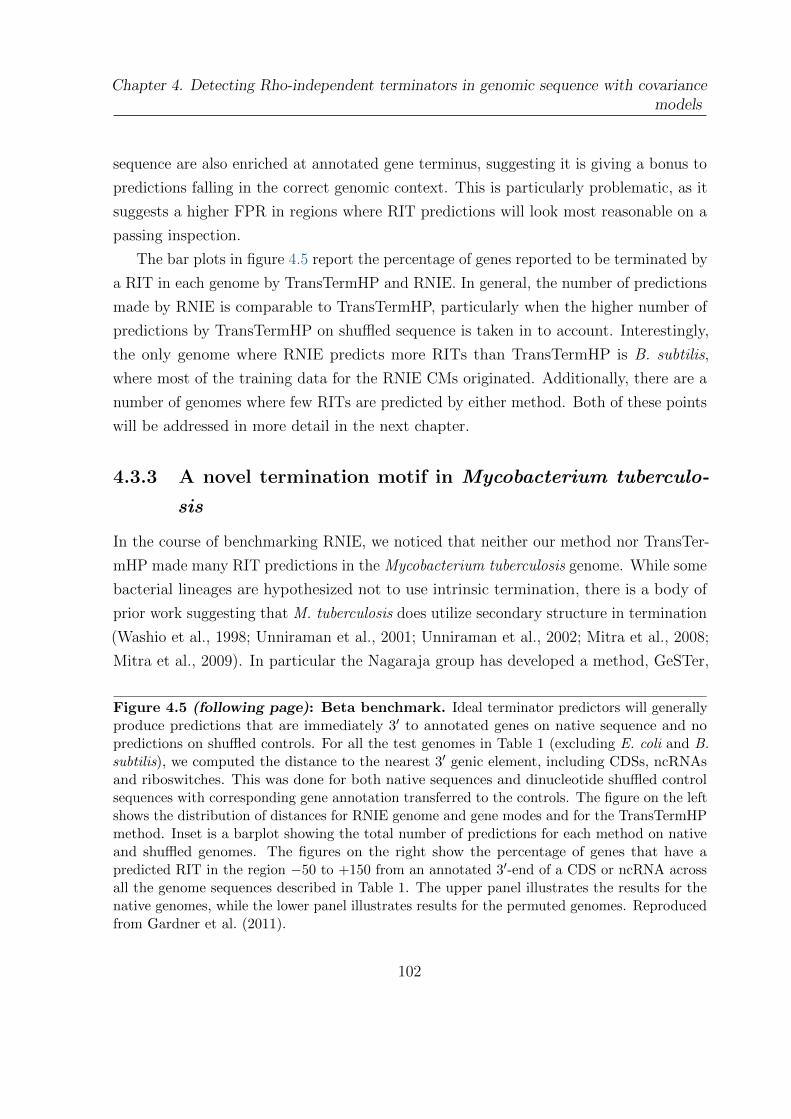
Chapter 4. Detecting Rho-independent terminators in genomic sequence with covariancemodels
sequence are also enriched at annotated gene terminus, suggesting it is giving a bonus to
predictions falling in the correct genomic context. This is particularly problematic, as it
suggests a higher FPR in regions where RIT predictions will look most reasonable on a
passing inspection.
The bar plots in figure 4.5 report the percentage of genes reported to be terminated by
a RIT in each genome by TransTermHP and RNIE. In general, the number of predictions
made by RNIE is comparable to TransTermHP, particularly when the higher number of
predictions by TransTermHP on shuffled sequence is taken in to account. Interestingly,
the only genome where RNIE predicts more RITs than TransTermHP is B. subtilis,
where most of the training data for the RNIE CMs originated. Additionally, there are a
number of genomes where few RITs are predicted by either method. Both of these points
will be addressed in more detail in the next chapter.
4.3.3 A novel termination motif in Mycobacterium tuberculo-
sis
In the course of benchmarking RNIE, we noticed that neither our method nor TransTer-
mHP made many RIT predictions in the Mycobacterium tuberculosis genome. While some
bacterial lineages are hypothesized not to use intrinsic termination, there is a body of
prior work suggesting that M. tuberculosis does utilize secondary structure in termination
(Washio et al., 1998; Unniraman et al., 2001; Unniraman et al., 2002; Mitra et al., 2008;
Mitra et al., 2009). In particular the Nagaraja group has developed a method, GeSTer,
Figure 4.5 (following page): Beta benchmark. Ideal terminator predictors will generallyproduce predictions that are immediately 3′ to annotated genes on native sequence and nopredictions on shuffled controls. For all the test genomes in Table 1 (excluding E. coli and B.subtilis), we computed the distance to the nearest 3′ genic element, including CDSs, ncRNAsand riboswitches. This was done for both native sequences and dinucleotide shuffled controlsequences with corresponding gene annotation transferred to the controls. The figure on the leftshows the distribution of distances for RNIE genome and gene modes and for the TransTermHPmethod. Inset is a barplot showing the total number of predictions for each method on nativeand shuffled genomes. The figures on the right show the percentage of genes that have apredicted RIT in the region −50 to +150 from an annotated 3′-end of a CDS or ncRNA acrossall the genome sequences described in Table 1. The upper panel illustrates the results for thenative genomes, while the lower panel illustrates results for the permuted genomes. Reproducedfrom Gardner et al. (2011).
102
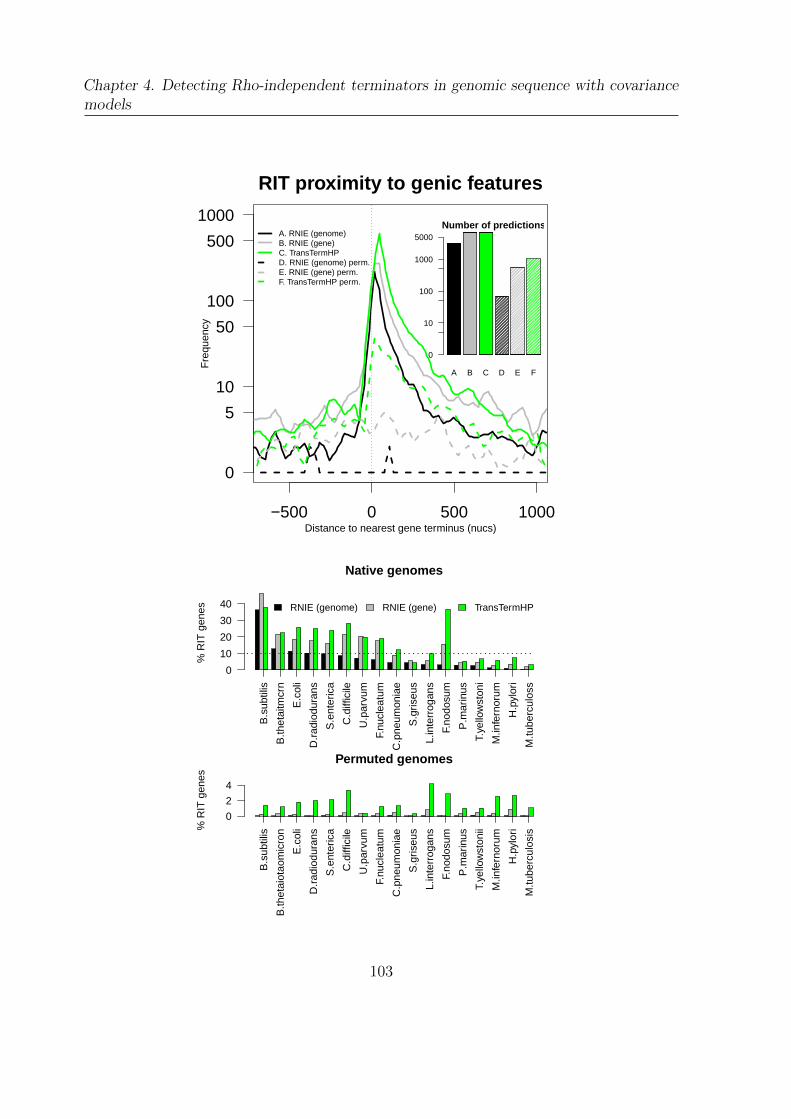
Chapter 4. Detecting Rho-independent terminators in genomic sequence with covariancemodels
−500 0 500 1000
RIT proximity to genic features
0
5
10
50
100
500
1000F
requ
ency
Distance to nearest gene terminus (nucs)
A. RNIE (genome)B. RNIE (gene)C. TransTermHPD. RNIE (genome) perm.E. RNIE (gene) perm.F. TransTermHP perm.
A B C D E F
Number of predictions
0
10
100
1000
5000
Native genomes
% R
IT g
enes
0
10
20
30
40
B.s
ubtil
is
B.th
etai
tmcr
n
E.c
oli
D.r
adio
dura
ns
S.e
nter
ica
C.d
iffic
ile
U.p
arvu
m
F.nu
clea
tum
C.p
neum
onia
e
S.g
riseu
s
L.in
terr
ogan
s
F.no
dosu
m
P.m
arin
us
T.ye
llow
ston
i
M.in
fern
orum
H.p
ylor
i
M.tu
berc
ulos
s
RNIE (genome) RNIE (gene) TransTermHP
Permuted genomes
% R
IT g
enes
B.s
ubtil
is
B.th
etai
otao
mic
ron
E.c
oli
D.r
adio
dura
ns
S.e
nter
ica
C.d
iffic
ile
U.p
arvu
m
F.nu
clea
tum
C.p
neum
onia
e
S.g
riseu
s
L.in
terr
ogan
s
F.no
dosu
m
P.m
arin
us
T.ye
llow
ston
ii
M.in
fern
orum
H.p
ylor
i
M.tu
berc
ulos
is
0
2
4
103
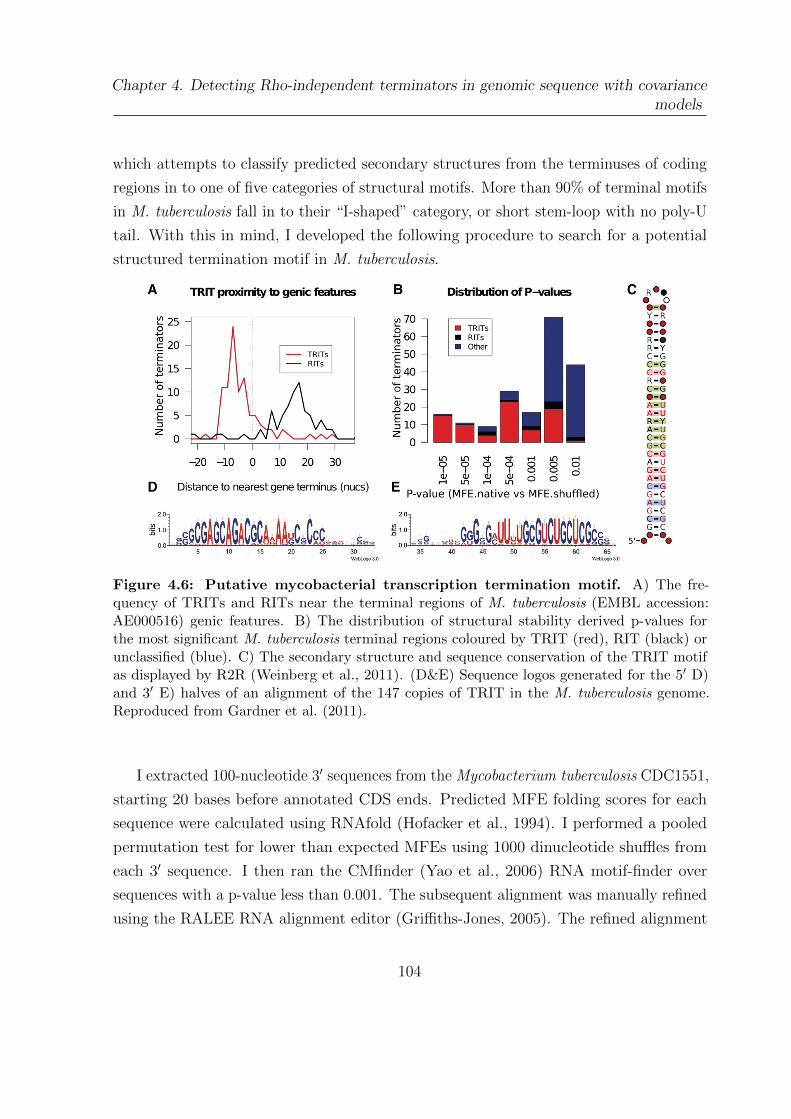
Chapter 4. Detecting Rho-independent terminators in genomic sequence with covariancemodels
which attempts to classify predicted secondary structures from the terminuses of coding
regions in to one of five categories of structural motifs. More than 90% of terminal motifs
in M. tuberculosis fall in to their “I-shaped” category, or short stem-loop with no poly-U
tail. With this in mind, I developed the following procedure to search for a potential
structured termination motif in M. tuberculosis.
Figure 4.6: Putative mycobacterial transcription termination motif. A) The fre-quency of TRITs and RITs near the terminal regions of M. tuberculosis (EMBL accession:AE000516) genic features. B) The distribution of structural stability derived p-values forthe most significant M. tuberculosis terminal regions coloured by TRIT (red), RIT (black) orunclassified (blue). C) The secondary structure and sequence conservation of the TRIT motifas displayed by R2R (Weinberg et al., 2011). (D&E) Sequence logos generated for the 5′ D)and 3′ E) halves of an alignment of the 147 copies of TRIT in the M. tuberculosis genome.Reproduced from Gardner et al. (2011).
I extracted 100-nucleotide 3′ sequences from the Mycobacterium tuberculosis CDC1551,
starting 20 bases before annotated CDS ends. Predicted MFE folding scores for each
sequence were calculated using RNAfold (Hofacker et al., 1994). I performed a pooled
permutation test for lower than expected MFEs using 1000 dinucleotide shuffles from
each 3′ sequence. I then ran the CMfinder (Yao et al., 2006) RNA motif-finder over
sequences with a p-value less than 0.001. The subsequent alignment was manually refined
using the RALEE RNA alignment editor (Griffiths-Jones, 2005). The refined alignment
104
Chapter 4. Detecting Rho-independent terminators in genomic sequence with covariancemodels
was used to construct an Infernal CM (Nawrocki et al., 2009), as had been done for
canonical RITs, which was then searched across all Mycobacteria genomes in the EMBL
nucleotide sequence database.
This revealed a well-conserved structured sequence motif associated with gene terminal
regions in Mycobacteria which we named the tuberculosis Rho-independent terminators,
or TRITs, in light of the source of the discovery (see Figure 4.6). TRITs are found across
the entire genus, ranging in approximate copy-number from 150 to 250 in M. abscessus,
M. avium, M. bovis, M. gilvum, M intracellulare, M. kansasii, M. leprae, M. marinum, M.
smegmatis, M. tuberculosis, M. ulcerans and M. vanbaalenii. The TRITs account for 72%
(59/82) of terminal sequences with highly significant secondary structure (p < 0.001)
in M. tuberculosis. TRIT predictions made by our model fall overwhelmingly at the
terminus of annotated coding regions, tending to start 8 bases before the annotated gene
end (Figure 4.6A), distinct from the distribution of RITs. In addition, TRITs appear to
be associated with sharp drops in transcription in RNA-seq experiments (data presented
in the next chapter). Additionally, since the publication of this study two sRNA screens
in Mycobacteria have discovered TRITs apparently terminating sRNA transcription
(Miotto et al., 2012; Li et al., 2013), providing additional evidence for their activity. The
high sequence conservation (Figure 4.6D&E) across elements suggests that this element
has either arisen relatively recently, or possibly requires a nucleotide-binding co-factor to
perform its function. In the next chapter, I describe a study scaling up this approach to
discover transcriptional termination motifs across the entire bacterial phylogeny.
105

Chapter 4. Detecting Rho-independent terminators in genomic sequence with covariancemodels
106
Chapter 5
Kingdom-wide discovery of bacterial
intrinsic termination motifs
5.1 Introduction
As discussed in the previous chapter, intrinsic termination of transcription is a fun-
damental cellular process in many, if not all, bacterial species. As reviewed in the
previous chapter, the bulk of work on intrinsic termination has focused on canonical
Rho-independent terminators (RITs), consisting of a G/C-rich hairpin structure followed
by a poly-U tail. This is due to both their prevalence in model organisms such as
Escherichia coli and Bacillus subtilis, as well as the distinctiveness of this motif making
it an easy target for automated classification.
Despite this focus on canonical RITs, a number of intrinsic terminators which do
not rely on a poly-U tail for termination activity are known. These include synthetic
constructs derived from canonical RITs (Abe et al., 1996), as well as naturally occurring
terminators in Streptomyces (Deng et al., 1987; Neal et al., 1991; Ingham et al., 1995)
and Mycobacteria (Unniraman et al., 2001). Additionally, a number of ncRNA screens
in Actinobacteria have described potential non-canonical RITs terminating ncRNA
transcription (Swiercz et al., 2008; Miotto et al., 2012; Li et al., 2013). However, a more
wide-spread effort at characterization of these elements has been hampered by two factors:
their occurrence primarily in non-model organisms such as the Actinobacteria, and a
lack of a systematic classification of these elements making it difficult to determine how
107
Chapter 5. Kingdom-wide discovery of bacterial intrinsic termination motifs
wide-spread such elements are. The only study surveying potential alternative intrinsic
terminators in the bacterial kingdom relied primarily on categorizing elements based on
the shape of their predicted secondary structure (Unniraman et al., 2002). However, this
fails to consider the large number of very different sequences that can give rise to any
particular secondary structure (Schuster et al., 1994). It is well understood from studies of
synthetic perturbations of canonical RITs that the sequence of both the hairpin structure
and flanking sequence can have large, and often unexpected, effects on termination
efficiency (Reynolds et al., 1992; Abe et al., 1996; Cambray et al., 2013; Chen et al.,
2013); there is no reason to think that non-canonical RITs would not exhibit a similar
pattern of sequence specificity. As a result, there is a need for a robust classification of
potential non-canonical RITs which considers both the sequence and structural features
of these elements so that they can be systematically investigated.
In the previous chapter I showed that covariance models (CMs) are able to capture
sequence as well as structural features of canonical as well as putative non-canonical RITs.
In this chapter I describe a method for the discovery of potential structured termination
motifs across the bacterial kingdom, present an initial analysis of the elements discovered,
and provide evidence for their activity through the analysis of a large collection of
publicly-available RNA-seq data.
5.2 Methods
James Hadfield (University of Canterbury) ran the MCL clustering under my supervision.
Paul P. Gardner (University of Canterbury) developed and ran the analysis of expression
data, and assisted in manual curation of cluster alignments. Stinus Lindgreen (University
of Canterbury/University of Copenhagen) processed RNA-seq data and performed mapping.
I performed all other work described here.
5.2.1 Genome-wise motif discovery
1853 EMBL format files containing the genomic sequence and annotations for 1639
bacteria were obtained from the EMBL European Nucleotide Archive completed bacterial
genomes pages, see Appendix B for organisms and accession numbers.
Each EMBL file was screened independently for putative multi-copy termination
108
Chapter 5. Kingdom-wide discovery of bacterial intrinsic termination motifs
motifs. For each EMBL file, I extracted sequences from -20 to +80 around annotated ORF
stop site. Each extracted sequence was screened for a lower than expected predicted MFE
using RNAfold in order to screen out locally GC-rich but unstructured sequences. The
sequence under consideration was shuffled 1000 times preserving dinucleotide frequencies,
and a Gumbel distribution was fitted to the resulting empirical null MFE distribution
using the R MASS package (Venables et al., 1994). Sequences with a native MFE below
the 95th percentile of the null distribution were discarded. The resulting set of sequences
was then given as input to CMfinder (Yao et al., 2006), which produces collections of
locally-aligned structurally conserved motifs. I built a CM for each motif using Infernal
1.0.2 (Nawrocki et al., 2009). The resulting CMs were searched against the EMBL file
the motif was discovered in, and were then screened on the following criteria for the
collection of search hits with an E-value of less than 1: a copy number of between 100
and 3000, and a median distance of <10 to the nearest annotated ORF stop site. This
resulted in a collection of 4359 putative termination motif CMs, each derived from a
single EMBL file.
5.2.2 Clustering covariance models
In order to cluster CMs, I developed an extension of MCL-based clustering (Enright et al.,
2002) to generative models of sequence variation. I call the measure of CM similarity I
developed for this purpose the reciprocal similarity score (RSS), defined as:[∑ni=1− ln (Ex,y,i) +
∑nj=1− ln (Ex,y,j)
2n
]+ ln(n)
where Ex,y,i is the E-value of the ith sequence emitted by model x scored by model y and
for the purposes of this study n = 1000. Briefly, for each pair of CMs 1000 sequences
were emitted from each CM and reciprocally scored with the other CM. The average of
the negative log-transformed E-values was calculated, then shifted to be strictly positive
by adding ln(1000) to generate the RSS appropriate for use with MCL. MCL was run
over the resulting RSS matrix, and the 100 largest clusters, ranging in size from 332 to 6
CMs, were taken forward for further analysis.
109
Chapter 5. Kingdom-wide discovery of bacterial intrinsic termination motifs
5.2.3 Building consensus covariance models
To build covariance models which captured the diversity of sequences represented by
each cluster, I searched the ten CMs with the highest sum of RSS scores in each cluster
against the set of genomes which contributed motifs to the cluster. Sequences on which
at least four CMs agreed on with an E-value of < 1 were collected. The redundancy of
the collected sequences was iteratively reduced in an alignment-free fashion using cd-hit
(Li et al., 2006) with the parameters -G 0 -aL 0.1 -aS 0.3 until there were less than
2000 sequences remaining or there were no remaining sequences with > 85% nucleotide
identity. Sequences were extended by 20 bases on each side to capture features which may
not have been in the CMfinder-derived motifs, e.g. poorly conserved poly-U tracts. The
resulting set of sequences was aligned using MAFFT Q-INS-i (Katoh et al., 2008) using
McCaskill base-pairing probabilities (McCaskill, 1990), and secondary structures were
predicted using CentroidAlifold (Hamada et al., 2009), again with McCaskill base-pairing
probabilities. CMs were built from the resulting cluster alignments, and sequences
which did not match the CM with a bitscore of at least 20 were iteratively discarded.
The resulting alignments were then manually curated using RALEE (Griffiths-Jones,
2005), trimming non-conserved flanking sequence and extending the predicted secondary
structure where possible. Conserved stop codons were specifically trimmed, so as not to
bias subsequent searches.
5.2.4 Genome annotation
The resulting cluster CMs were searched over the initial 1853 EMBL files. Bitscore
thresholds were set for hit significance for each cluster CM using shuffled sequence.
Specifically, each cluster model was also used to search a dinucleotide shuffled database
of these same 1853 EMBL file. For each model, a Gumbel distribution was fitted to the
distribution of bitscores over the shuffled database, and this null Gumbel distribution
was used to compute P-values for hit significance in the native sequences. P-values were
corrected for multiple hypothesis testing using the method of Benjamini et al. (1995),
and these were used to set bitscore thresholds at specific FDRs reported in the text,
generally 1% or 5%.
110
Chapter 5. Kingdom-wide discovery of bacterial intrinsic termination motifs
5.2.5 Analysis of expression data
Data sets were downloaded from the SRA (Leinonen et al., 2011), preferring whenever
possible to start our own analyses with the raw fastq input instead of relying on previous
mapping results. This was done to make the data sets comparable. After retrieving the
data sets, we extracted fastq reads for further analysis. Most data sets were downloaded
in SRA format. Fastq files were extracted using the command fastqdump –split-3 from
the SRA toolkit version 2.3.2-4. This creates two fastq files in the case of paired end
data, and one fastq file in case of single end data. When BED files were used as the
primary input, the BAM file was extracted directly using bedToBam from the bedtools
package, version 2.17.0 (Quinlan et al., 2010). Data sets in SOLiD format was translated
to fastq using solid2fastq from bfast version 0.7.0a (Homer et al., 2009). All extracted
fastq files were cleaned using AdapterRemoval version 1.4 (Lindgreen, 2012) with the
flags –trimns –trimqualities to remove residual adapters from the reads and to remove
low quality segments and stretches of Ns in the 5′ and/or 3′ ends.
Most data sets were mapped using bowtie2 version 2.1 (Langmead et al., 2012), and
the output was saved in BAM format using samtools version 0.1.18 (Li et al., 2009). In
the single end case, the following command was used:
bowtie2 -x <INDEX> -U <READS> |samtools view -bS - \
| samtools sort - <OUTPUT>.sorted
In the paired end case, a similar command was used, but the number of input files
was larger because 1) there are two files containing the paired reads, and 2) additional
single end reads might have been produced by AdapterRemoval because some pairs were
collapsed due to overlaps, or one mate pair was discarded due to e.g. low quality. For
454 data, using the above command produced few mappings to the reference genome.
We therefore used bowtie2 but with relaxed parameters to accommodate the longer reads
by adding the flags –local –very-sensitive-local. For SOLiD data, we used bfast version
0.7.0a for mapping with the following commands:
bfast match -f <INDEX> -A 1 -r <READS> > <OUTPUT>.bmf
bfast localalign -f <INDEX> -A 1 -m <OUTPUT>.bmf > <OUTPUT>.baf
bfast postprocess -f <INDEX> -i <OUTPUT>.baf -A 1 | samtools view -bS - \
| samtools sort - <OUTPUT>.sorted
111
Chapter 5. Kingdom-wide discovery of bacterial intrinsic termination motifs
For each BAM-file, we generated a PLOT file containing two tab separated columns
(reverse strand, forward strand) and a line per position in the genome. Each line gives
information on the number of mapped reads on each strand for that particular position
in the reference genome. The PLOT files were generated using the following commands
from samtools version 0.1.18:
samtools view -F 0x10 -b <INPUT> (for reads mapped to the forward strand)
samtools view -f 0x10 -b <INPUT> (for reads mapped to the reverse strand)
Then, the samtools depth command was used to get the actual depths and save them in
a WIG format file, which was then transformed to PLOT file by filling out the 0-depth
positions based on the length of the reference genome.
Terminator activity plots were produced by selecting all predicted putative attenuation
motifs (TAMs) at an FDR of 5% with an upstream mean read count of at least 10. The
median expression at each position between -80 and +80 with respect to the TAM was
calculated and plotted. As a negative control, random positions meeting the criteria of
a mean upsteam read count ≥ 10 were selected at random and their median recounts
plotted. Specific data sets are cited in the text.
5.3 Results
5.3.1 Kingdom-wide motif discovery
The pipeline I developed for discovering putative termination motifs consisted of 3 major
stages: genome-wise motif discovery with CMfinder (Yao et al., 2006), clustering of
motifs using a novel similarity measure and the MCL algorithm (Enright et al., 2002),
and manual curation of the resulting motif clusters.
In the first stage I extracted sequence from -20 to +80 with respect to annotated
stop sites, which were then filtered on predicted structural potential to screen for
sequences with stronger structures than predicted by their dinucleotide content alone
(see Methods). For each genome, I used the resulting set of sequences as input for the
CMfinder alogrithm (Yao et al., 2006). Briefly, CMfinder uses heuristic sequence search,
thermodynamic and mutual information-based predictions of secondary structure, and
CM-based searches within an expectation-maximization (EM) framework to iteratively
112
Chapter 5. Kingdom-wide discovery of bacterial intrinsic termination motifs
discover and refine potential structured RNA motifs, returning a multiple sequence
alignment and corresponding CM. CMfinder has previously been successfully used as
part of pipelines for the discovery of non-coding RNAs in bacteria (Weinberg et al.,
2007; Weinberg et al., 2010) and eukaryotes (Torarinsson et al., 2008b), as well as in our
previous discovery of the TRIT element (Gardner et al., 2011). Applying this algorithm
to the filtered sequences for each genome resulted in a total of 22310 motif predictions. I
searched these CMs back over the genome they were predicted from and removed from
consideration motifs with very low (<100) or very high (> 3000) copy number to remove
motifs with low explanatory power and non-specific motifs, respectively, or were not
enriched with respect to gene terminal regions, leaving a set of 4359 putative termination
motifs, approximately 2.5 per organism.
To reduce the complexity of this data set, I developed a method for clustering CMs.
Two previous approaches to comparing CMs have been described in the literature. The
first, known as CMcompare (Honer zu Siederdissen et al., 2010), computes the score of a
so-called ‘link sequence’, that is a sequence with the highest value of min (S1(s), S2(s)),
where Sx(s) is the score of sequence s with respect to model Sx. While this has been
proposed as a measure of CM specificity in the context of the Rfam database, it is unclear
how accurately this single link sequence captures the overlap between the sequence
spaces described by two CMs, let alone the reality of overlaps in actual biological
sequence databases. A second method, proposed as part of the Evofam pipeline for
automated ncRNA family discovery in eukaryotic genome alignments (Parker et al.,
2011), approximates the Kullback-Leibler divergence between two CMs, that is the
(dis)similarity of the probability distributions over sequences emitted by the two CMs,
using the difference in Infernal CM E-value calculations on a human reference sequence
from each model’s training set. In the context of the Evofam pipeline, the use of the
human reference sequence is justifiable, as the study was primarily concerned with the
discovery of ncRNA families present in the human genome. However, in the present case
of clustering motifs across an entire domain of life, there is no obvious single sequence to
use as a reference for the purposes of a comparison between every pair of CMs.
I have developed a sampling based approach to measuring CM similarity, inspired
by discussions of using summed bitscores as a measure of remote homology between
CMs (personal communication, Paul P. Gardner and Sean R. Eddy) and the reciprocal
BLAST measure used by TRIBE-MCL (Enright et al., 2002). Rather than using a single
113
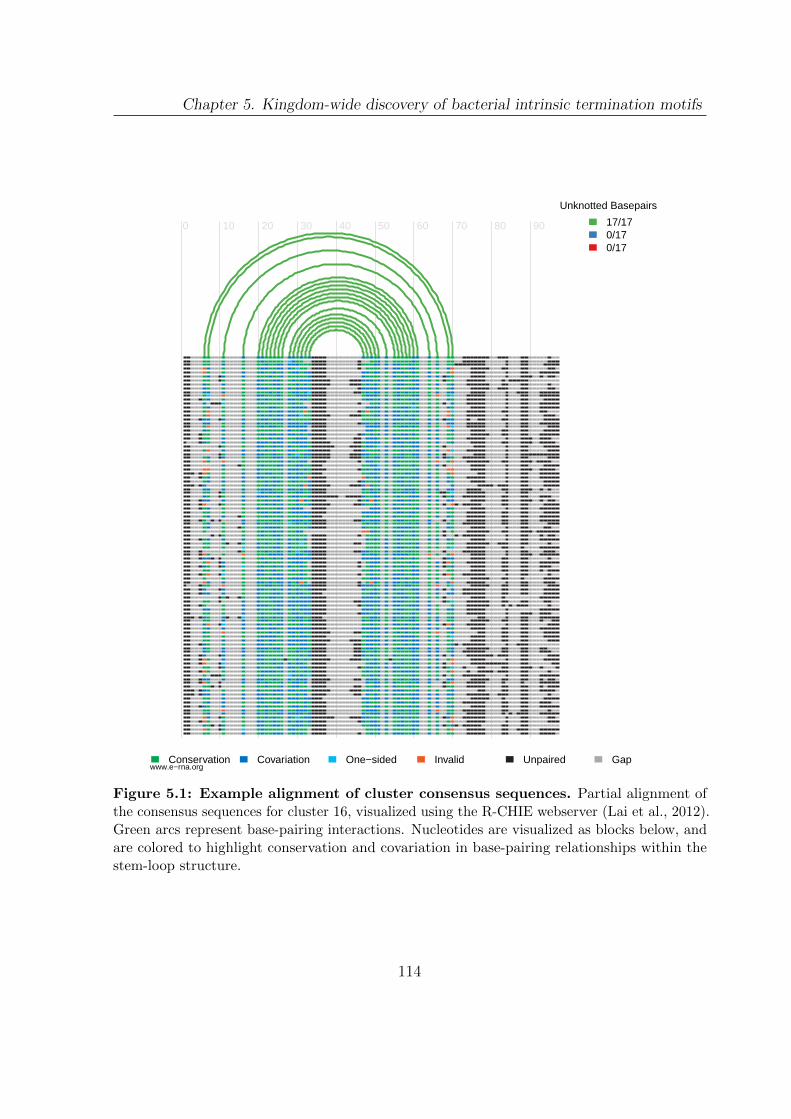
Chapter 5. Kingdom-wide discovery of bacterial intrinsic termination motifs
0 10 20 30 40 50 60 70 80 90
Conservation Covariation One−sided Invalid Unpaired Gap
Unknotted Basepairs
17/170/170/17
www.e−rna.org
Figure 5.1: Example alignment of cluster consensus sequences. Partial alignment ofthe consensus sequences for cluster 16, visualized using the R-CHIE webserver (Lai et al., 2012).Green arcs represent base-pairing interactions. Nucleotides are visualized as blocks below, andare colored to highlight conservation and covariation in base-pairing relationships within thestem-loop structure.
114
Chapter 5. Kingdom-wide discovery of bacterial intrinsic termination motifs
reference sequence for the purpose of comparison, I use the fact that CMs are generative
models to measure the average similarity of of their respective sequence spaces. Infernal
reports bitscores and E-value for each match between a CM and a given sequence region.
The bitscore, ignoring the specifics of algorithm used (either CYK or Inside), is
S = log2
(P (x | H)
P (x | R)
)where P (x | H) is the probability of sequence x under model H, and P (x | R) is the
probability of x under a null model R, generally an iid sites model with a geometric
length distribution. This score is expected to follow a Type 1 Extreme Value (or Gumbel)
distribution (Karlin et al., 1990; Eddy, 2008), and this empirically appears to be the case
for Infernal scores (Nawrocki et al., 2007). Hence the E-value can be calculated as
e−λ(S−µ)
where λ and µ are fitted parameters depending on the size of the database searched and
the model architecture, and normalize for these factors. So the reciprocal similarity score
(RSS) I have defined:
RSSx,y =
[∑ni=1− ln (Ex,y,i) +
∑nj=1− ln (Ey,x,j)
2n
]+ ln(n)
where Ex,y,i is the E-value of the ith sequence emitted by model x scored by model y, can
be understood as the average normalized bitscore of each model over the other’s sequence
space, and is similar in spirit to Monte Carlo approximations to the Kullback-Leibler
divergence (Parker et al., 2011; Juang et al., 1985).
This measure appeared robust to the number of samples used, but this may depend
in part on model complexity. As the maximal E-value in this case is n, − ln(n) is a
theoretical lower bound on the average − ln (E), and the subtraction of this factor ensures
that the RSS is strictly positive. It is worth noting that this measure is symmetric
ignoring sampling error. Asymmetric variants may have some applications. For instance,
by taking the minimum of the average bitscore under either model, one would give
preference to full-length model matches in comparisons between models of various sizes
due to the glocal nature of Infernal search (global with respect to the model, local with
115
Chapter 5. Kingdom-wide discovery of bacterial intrinsic termination motifs
respect to sequence), and this may be preferable for determining similarity between
ncRNA families. Conversely, taking the maximum may have some utility in searching for
shorter motifs. In the current application, I expect all CMs to be of roughly similar sizes
and symmetric measures simplify clustering. This measure should be applicable to any
generative model, and so could be similarly used to cluster e.g. HMMs.
A related measure was previously used by the TRIBE-MCL algorithm to cluster
protein families based on reciprocal log10 BLAST E-values (Enright et al., 2002). The
MCL algorithm is described in detail elsewhere (Van Dongen, 2008), but in brief it
uses simulations of random walks on a weighted graph to define clusters through an
unsupervised, iterative process. Unsurprisingly, many of the clusters that were generated
using MCL with RSSes appeared to be composed of CMs representing canonical RITs
on visual inspection with some notable exceptions, described below. However, despite a
complete lack of phylogenetic assumptions in our pipeline, we found that the majority
of clusters were dominated by one or two orders, generally within the same phyla,
and sometimes even a single genera. This both validates our clustering procedure and
indicates that RITs, despite their small size and stereotypical sequence composition,
carry a phylogenetic signal when considered in aggregate.
To further study lineage-specific biases in terminator composition, I took the top
100 clusters, ranging in size from 332 to 6 CMs, and constructed consensus models
through a semi-automated process. First, for each cluster I selected the 10 CMs with the
highest sum of RSS scores with other cluster CMs (or all CMs in the case of clusters
with < 10 members), and searched these across all of the genomes the cluster CMs were
derived from. Regions that these CMs agreed were likely to be terminator sequences were
collected and aligned using MAFFT Q-INS-i (Katoh et al., 2008), a heuristic Sankoff
alignment algorithm which considers both sequence and secondary structure in alignment,
and secondary structure was predicted using CentroidAlifold (Hamada et al., 2009), and
manually refined using RALEE (Griffiths-Jones, 2005) (see figure 5.1; see also Methods
for detailed alignment protocol). I annotated the 1853 EMBL files we started with, and
iteratively removed from consideration any model with at least 85% of its sequence hits
covered by another model. This left 16 putative terminator models, on which all further
analysis was done.
116
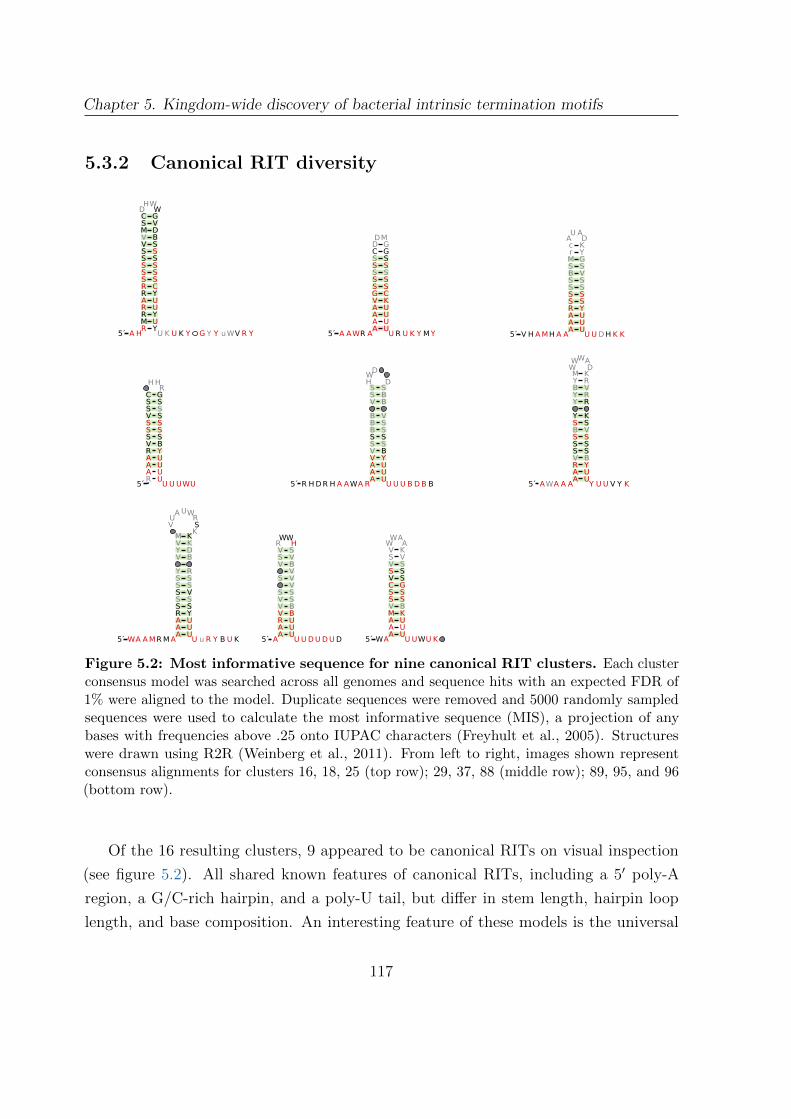
Chapter 5. Kingdom-wide discovery of bacterial intrinsic termination motifs
5.3.2 Canonical RIT diversity
Figure 5.2: Most informative sequence for nine canonical RIT clusters. Each clusterconsensus model was searched across all genomes and sequence hits with an expected FDR of1% were aligned to the model. Duplicate sequences were removed and 5000 randomly sampledsequences were used to calculate the most informative sequence (MIS), a projection of anybases with frequencies above .25 onto IUPAC characters (Freyhult et al., 2005). Structureswere drawn using R2R (Weinberg et al., 2011). From left to right, images shown representconsensus alignments for clusters 16, 18, 25 (top row); 29, 37, 88 (middle row); 89, 95, and 96(bottom row).
Of the 16 resulting clusters, 9 appeared to be canonical RITs on visual inspection
(see figure 5.2). All shared known features of canonical RITs, including a 5′ poly-A
region, a G/C-rich hairpin, and a poly-U tail, but differ in stem length, hairpin loop
length, and base composition. An interesting feature of these models is the universal
117
Chapter 5. Kingdom-wide discovery of bacterial intrinsic termination motifs
presence of base-pairing interactions between the poly-A and poly-U regions. Though it
has been widely assumed that the poly-A region’s function is primarily to contribute to
bidirectional activity of RITs, some studies have shown that complementarity between
the poly-A and poly-U region increase termination efficiency (Abe et al., 1996; Chen
et al., 2013), presumably by contributing to the ratcheting effect of hairpin formation on
the poly-U tail. In fact, a recent study showed that strong terminators with clear poly-A
regions generally do not posses strong bidirectional activity, suggesting that the primary
function of the poly-A region is to contribute to this ratcheting (Chen et al., 2013). I have
observed covariation within many of the A-U pairs in our terminator models, supporting
this observation.
5.3.2.1 Validating RIT activity with RNA-seq
To validate RIT predictions, publicly available RNA-seq datasets were collected and
plots summarizing the behavior of transcription across the predictions were created (see
Methods for details). There are some difficulties in using RNA-seq data to validate
terminator activity. In perfect digital transcriptomic data, we would expect to observe
the majority of transcripts terminating precisely within the poly-U tail of annotated
RITs. Unfortunately, modern high-throughput sequencing technologies do not sequence
complete RNA molecules, rather sequencing short stretches of size-selected fragmented
RNA libraries. These fragments in these libraries are incidentally selected for sequence
composition during both library amplification through PCR and sequencing, often with
poorly understood biases, giving rise to the characteristically hilly appearance of these
data sets when visualized. Additonally, protocols for the sequencing of RNA retaining
strand information generally sequence all fragments of a particular RNA molecule in
the same direction (for example, see Croucher et al. (2009)). As a result, if we assume
that the fragmentation proceeds roughly by a Poisson process, this will naturally lead
to an exponential decay in apparent expression along the 3′ region of each transcript.
Newer data sets with longer read lengths tend to give cleaner indications of termination
activity. Finally, in some data sets we observed patterns of reported transcription that
are suggestive of degradation of the RNA by 3′ exonucleases or high levels of genomic
DNA contamination.
Despite these potential problems, when taken in aggregate, a clear signal from the
118
Chapter 5. Kingdom-wide discovery of bacterial intrinsic termination motifs
termination activity of canonical RITs can be observed (see figure 5.3 for examples).
These plots present median read counts over predicted RITs as a robust estimator of the
mean expression. As a control, the median read counts over randomly selected positions
were similarly selected. A clear difference in the change in the level of transcription
over RITs can be observed as compared to random positions, often much larger than
the difference between the top estimate of a 75% confidence interval before and the
bottom estimate after these randomly positions. This pattern appears to hold for all
of the canonical RIT clusters discovered in the course of this work. I did observe
cases where there did not appear to be the characteristic drop in transcription across
predicted canonical RITs; however, these could generally be attributed to high levels of
‘background transcription’ (possibly resulting from sample contamination with genomic
DNA) confounding the selection criteria on element upstream transcription (see methods
for details). An adaptive selection criteria based on the median absolute deviation from
the median transcription across all positions in the genome, rather than an arbitrary cut-
off on mean transcription, may correct this, and we are currently pursuing this possibility.
As it stands, these plots provide a qualitative indication of termination activity. However,
it should be possible to quantify these results using, e.g., a permutation test on the
change in median transcription over random samples of the same size as the number of
predicted RITs meeting the upstream transcription selection criterion.
5.3.2.2 Lineage-specific enrichment of canonical RIT clusters
As noted previously, many of the clusters recovered by the motif-discovery pipeline
appeared to consist largely of elements discovered in related genomes. The final consensus
alignments constructed from these clusters have broadly similar architectures (see figure
Figure 5.3 (following page): Analysis of diverse RNA-seq datasets confirm canon-ical terminator activity. These plots present representative analysis for terminus associatedmotifs (TAMs) predicted by the cluster 37 canonical terminator consensus model. The medianexpression over TAMs with an upstream mean expression of at least 10 reads per position isplotted in blue. Random positions meeting this same constraint are plotted in grey, and thedashed grey lines provide a 75% confidence interval for this estimate. RNA-seq data (from left toright) drawn from experiments in the γ-proteobacterium Vibrio cholerae (Mandlik et al., 2011),the β-proteobacterium Neisseria gonorrhoeae (Isabella et al., 2011), and the BacteroidetesPorphyromonas gingivalis (Høvik et al. (2012); bottom).
119
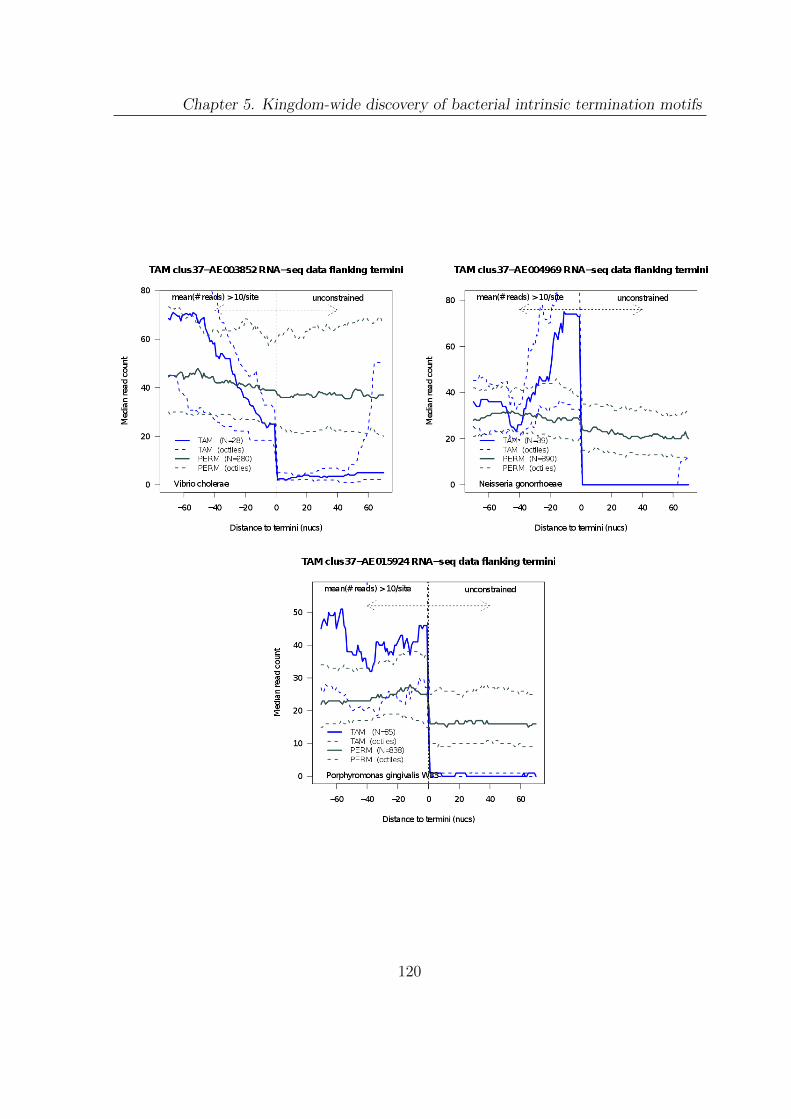
Chapter 5. Kingdom-wide discovery of bacterial intrinsic termination motifs
120
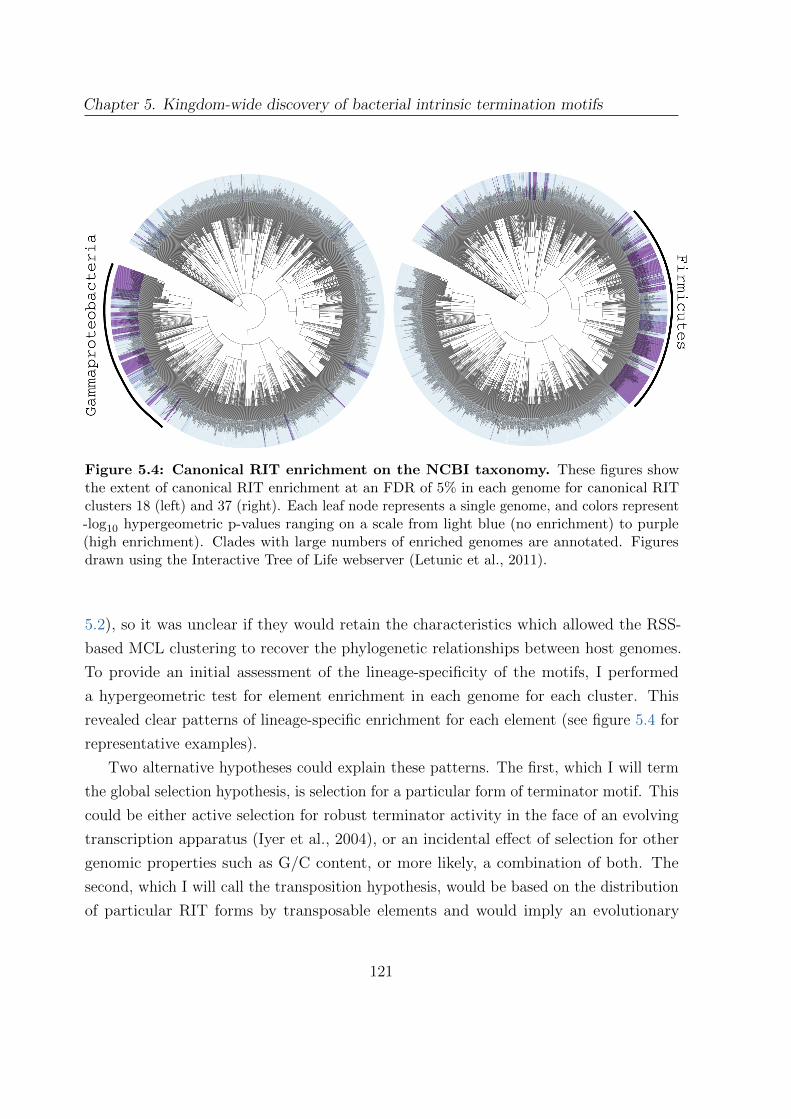
Chapter 5. Kingdom-wide discovery of bacterial intrinsic termination motifs
Figure 5.4: Canonical RIT enrichment on the NCBI taxonomy. These figures showthe extent of canonical RIT enrichment at an FDR of 5% in each genome for canonical RITclusters 18 (left) and 37 (right). Each leaf node represents a single genome, and colors represent-log10 hypergeometric p-values ranging on a scale from light blue (no enrichment) to purple(high enrichment). Clades with large numbers of enriched genomes are annotated. Figuresdrawn using the Interactive Tree of Life webserver (Letunic et al., 2011).
5.2), so it was unclear if they would retain the characteristics which allowed the RSS-
based MCL clustering to recover the phylogenetic relationships between host genomes.
To provide an initial assessment of the lineage-specificity of the motifs, I performed
a hypergeometric test for element enrichment in each genome for each cluster. This
revealed clear patterns of lineage-specific enrichment for each element (see figure 5.4 for
representative examples).
Two alternative hypotheses could explain these patterns. The first, which I will term
the global selection hypothesis, is selection for a particular form of terminator motif. This
could be either active selection for robust terminator activity in the face of an evolving
transcription apparatus (Iyer et al., 2004), or an incidental effect of selection for other
genomic properties such as G/C content, or more likely, a combination of both. The
second, which I will call the transposition hypothesis, would be based on the distribution
of particular RIT forms by transposable elements and would imply an evolutionary
121
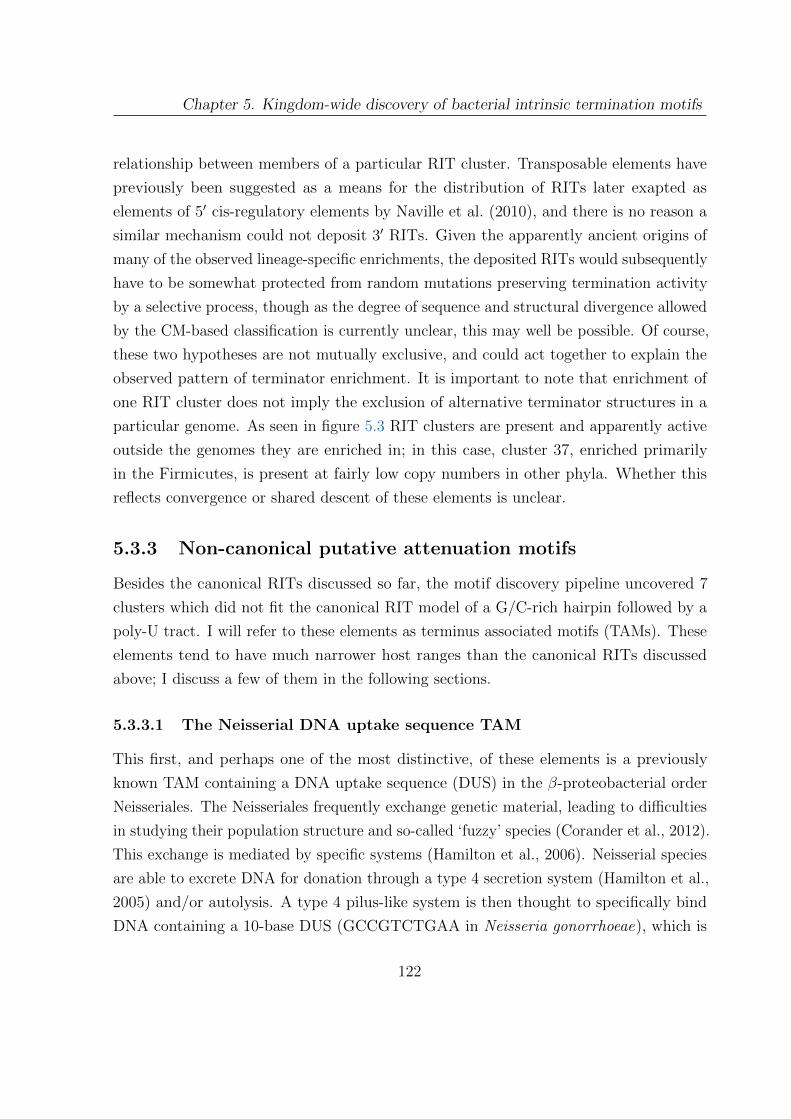
Chapter 5. Kingdom-wide discovery of bacterial intrinsic termination motifs
relationship between members of a particular RIT cluster. Transposable elements have
previously been suggested as a means for the distribution of RITs later exapted as
elements of 5′ cis-regulatory elements by Naville et al. (2010), and there is no reason a
similar mechanism could not deposit 3′ RITs. Given the apparently ancient origins of
many of the observed lineage-specific enrichments, the deposited RITs would subsequently
have to be somewhat protected from random mutations preserving termination activity
by a selective process, though as the degree of sequence and structural divergence allowed
by the CM-based classification is currently unclear, this may well be possible. Of course,
these two hypotheses are not mutually exclusive, and could act together to explain the
observed pattern of terminator enrichment. It is important to note that enrichment of
one RIT cluster does not imply the exclusion of alternative terminator structures in a
particular genome. As seen in figure 5.3 RIT clusters are present and apparently active
outside the genomes they are enriched in; in this case, cluster 37, enriched primarily
in the Firmicutes, is present at fairly low copy numbers in other phyla. Whether this
reflects convergence or shared descent of these elements is unclear.
5.3.3 Non-canonical putative attenuation motifs
Besides the canonical RITs discussed so far, the motif discovery pipeline uncovered 7
clusters which did not fit the canonical RIT model of a G/C-rich hairpin followed by a
poly-U tract. I will refer to these elements as terminus associated motifs (TAMs). These
elements tend to have much narrower host ranges than the canonical RITs discussed
above; I discuss a few of them in the following sections.
5.3.3.1 The Neisserial DNA uptake sequence TAM
This first, and perhaps one of the most distinctive, of these elements is a previously
known TAM containing a DNA uptake sequence (DUS) in the β-proteobacterial order
Neisseriales. The Neisseriales frequently exchange genetic material, leading to difficulties
in studying their population structure and so-called ‘fuzzy’ species (Corander et al., 2012).
This exchange is mediated by specific systems (Hamilton et al., 2006). Neisserial species
are able to excrete DNA for donation through a type 4 secretion system (Hamilton et al.,
2005) and/or autolysis. A type 4 pilus-like system is then thought to specifically bind
DNA containing a 10-base DUS (GCCGTCTGAA in Neisseria gonorrhoeae), which is
122
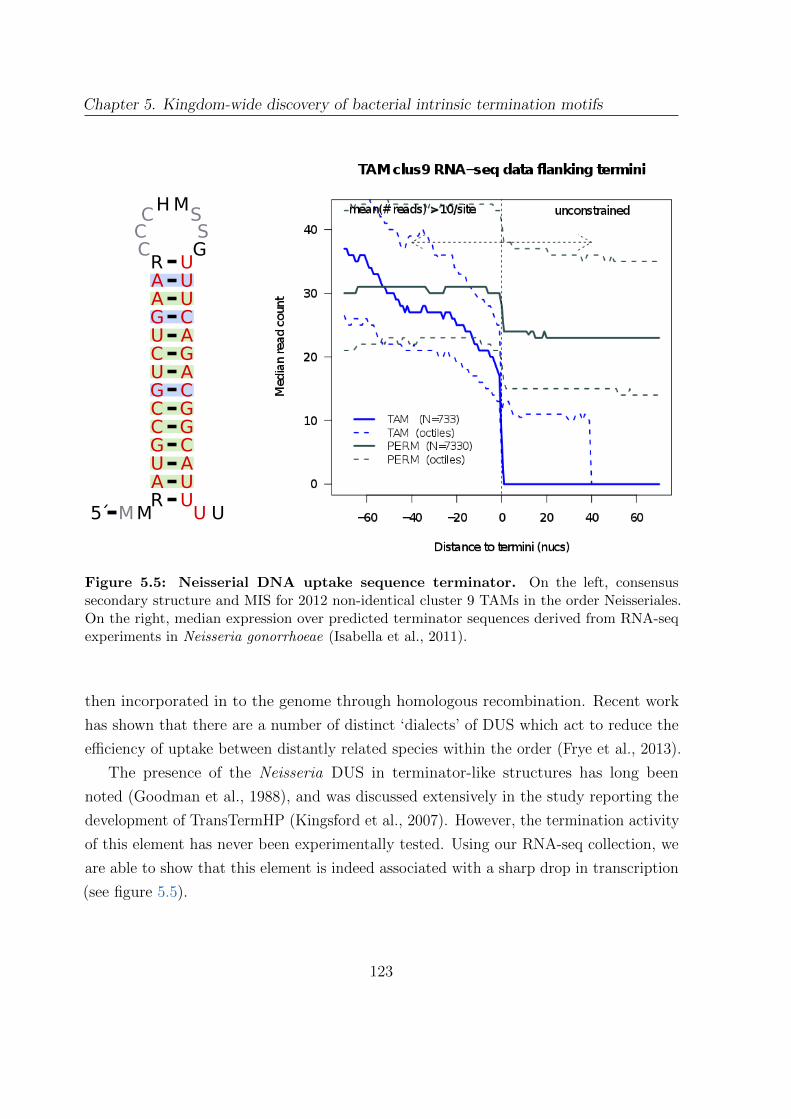
Chapter 5. Kingdom-wide discovery of bacterial intrinsic termination motifs
MMRAUGCCGUCUGAAR
CCCHMS
SG
UUUCAGACGGCAUUU U5´
Figure 5.5: Neisserial DNA uptake sequence terminator. On the left, consensussecondary structure and MIS for 2012 non-identical cluster 9 TAMs in the order Neisseriales.On the right, median expression over predicted terminator sequences derived from RNA-seqexperiments in Neisseria gonorrhoeae (Isabella et al., 2011).
then incorporated in to the genome through homologous recombination. Recent work
has shown that there are a number of distinct ‘dialects’ of DUS which act to reduce the
efficiency of uptake between distantly related species within the order (Frye et al., 2013).
The presence of the Neisseria DUS in terminator-like structures has long been
noted (Goodman et al., 1988), and was discussed extensively in the study reporting the
development of TransTermHP (Kingsford et al., 2007). However, the termination activity
of this element has never been experimentally tested. Using our RNA-seq collection, we
are able to show that this element is indeed associated with a sharp drop in transcription
(see figure 5.5).
123
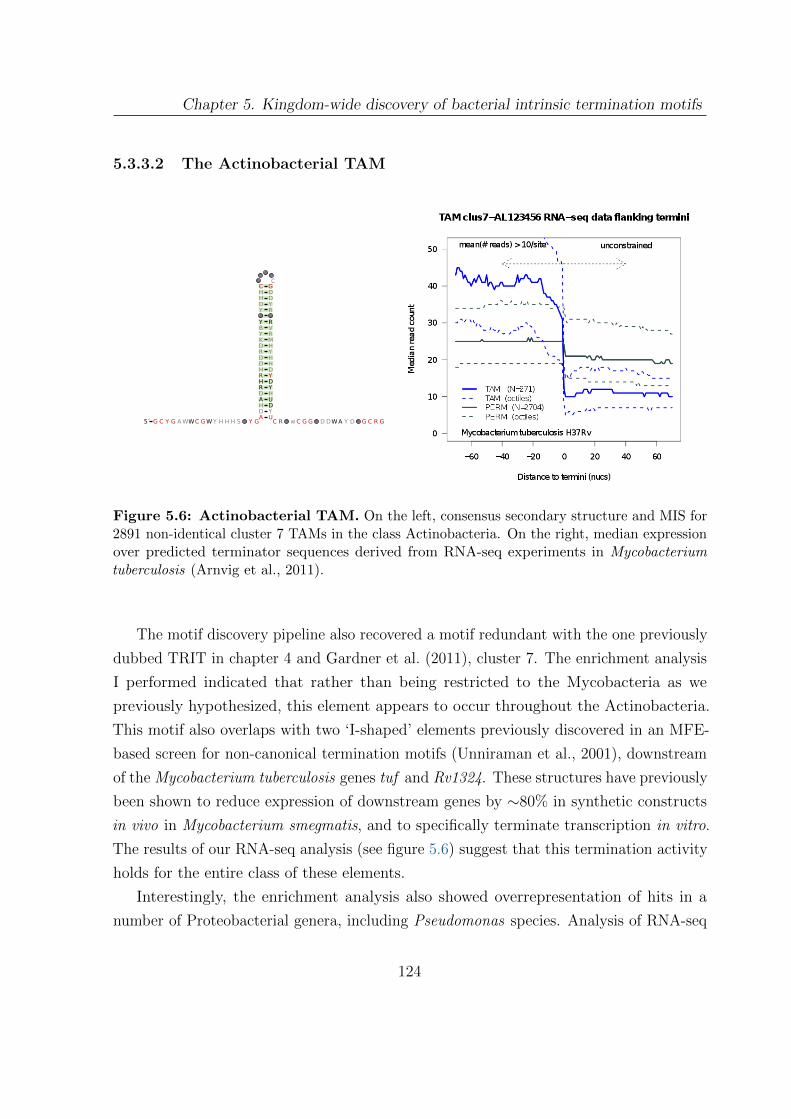
Chapter 5. Kingdom-wide discovery of bacterial intrinsic termination motifs
5.3.3.2 The Actinobacterial TAM
Figure 5.6: Actinobacterial TAM. On the left, consensus secondary structure and MIS for2891 non-identical cluster 7 TAMs in the class Actinobacteria. On the right, median expressionover predicted terminator sequences derived from RNA-seq experiments in Mycobacteriumtuberculosis (Arnvig et al., 2011).
The motif discovery pipeline also recovered a motif redundant with the one previously
dubbed TRIT in chapter 4 and Gardner et al. (2011), cluster 7. The enrichment analysis
I performed indicated that rather than being restricted to the Mycobacteria as we
previously hypothesized, this element appears to occur throughout the Actinobacteria.
This motif also overlaps with two ‘I-shaped’ elements previously discovered in an MFE-
based screen for non-canonical termination motifs (Unniraman et al., 2001), downstream
of the Mycobacterium tuberculosis genes tuf and Rv1324. These structures have previously
been shown to reduce expression of downstream genes by ∼80% in synthetic constructs
in vivo in Mycobacterium smegmatis, and to specifically terminate transcription in vitro.
The results of our RNA-seq analysis (see figure 5.6) suggest that this termination activity
holds for the entire class of these elements.
Interestingly, the enrichment analysis also showed overrepresentation of hits in a
number of Proteobacterial genera, including Pseudomonas species. Analysis of RNA-seq
124
Chapter 5. Kingdom-wide discovery of bacterial intrinsic termination motifs
data in Pseudomonas putida (Frank et al., 2011), which harbors ∼300 putative copies
of this element, showed no evidence of involvement in transcription termination. An
alignment generated from the putative Pseudomonas sequences contained extended
G/C-rich sequence within the loop region of the motif, which could potentially form an
extended secondary structure. Together, this suggests that the Pseudomonas element is
not a member of the same class as the Actinobacterial element, and these hits may be a
result of low specificity in the cluster consensus model, likely due to partial similarity
between the stem structure of the two elements confounding the RSS measure. A second
cluster with exclusively Actinobacterial sequences was also discovered by MCL, and it
is possible this has higher specificity for the TAM. Alternatively, the specificity of the
cluster 7 model could potentially be increased by removing non-Actinobacterial seqeunces
from the alignment.
5.3.3.3 Type 1 integron attC sites
Many Gram-negative bacteria harbor arrays of horizontally-acquired gene cassettes
known as integrons (Hall, 2012). The architecture of these integrons is roughly similar,
consisting of an intI gene encoding an integrase, an attI integration site, and a series
of gene cassettes containing attC sites important for recognition by IntI. While the
sequence of attC sites can vary widely, it has long been known that the attC sites of the
Vibrio cholerae type 1 integron are unusually homogenous. My pipeline discovered this
motif (see figure 5.7), and it is enriched primarily in Vibrio and Shewanella genomes,
though can be found sporadically at low copy number throughout the γ-proteobacteria.
Expression of type 1 integrons is thought to be driven primarily by a single upstream
promoter. An early study of this expression suggested that the attC sites may be acting
as transcriptional terminators based on Northern blots showing that transcripts did
not cover the entire integron and tended to contain full-length gene cassettes, and that
transcript frequency was inversely correlated with transcript length (Collis et al., 1995). A
single study has attempted verify this hypothesis, and found that attC sites do not appear
to promote transcriptional termination, and rather propose a mechanism for enhancing
cassette expression through the presence of short ORFs within the attC sites (Jacquier
et al., 2009). However, this study only tested a single attC site with an atypically large
hairpin-loop region for termination activity; additionally this study does not explain the
125
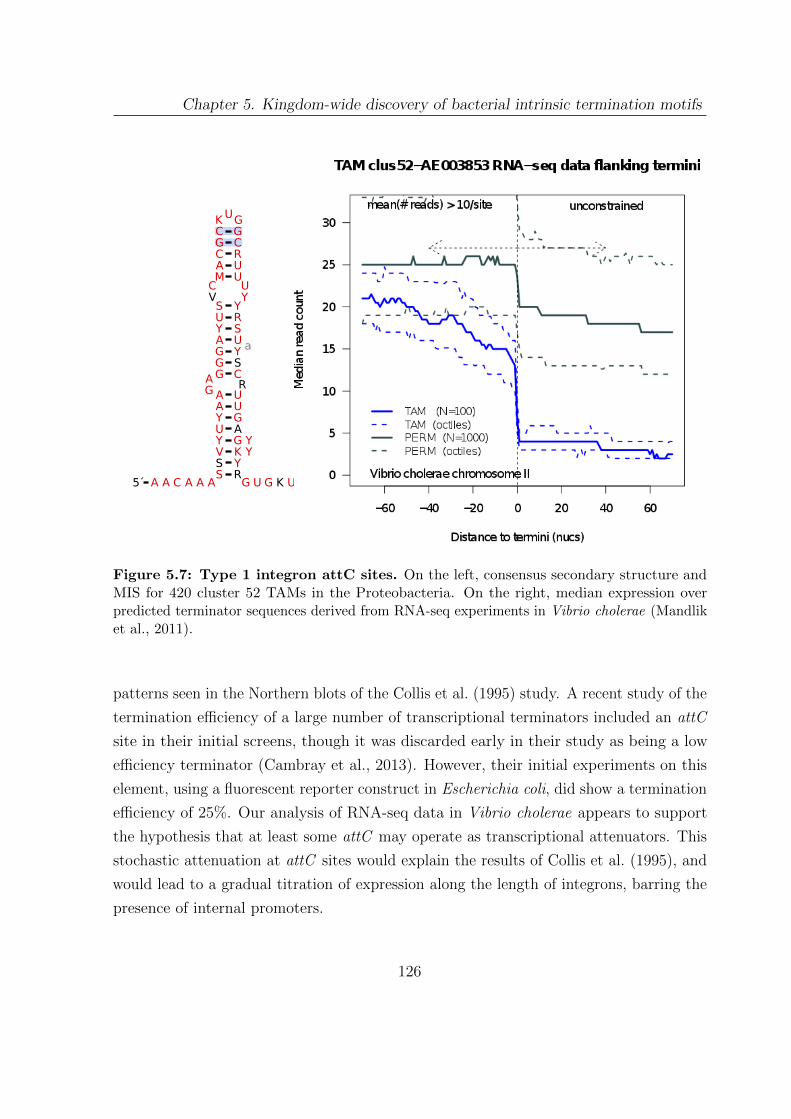
Chapter 5. Kingdom-wide discovery of bacterial intrinsic termination motifs
A A C A A ASSVYUYAAG
AGGGAYUS
VCMACGCKUG
GCRUUUY
YRSU aYSCRUUGAG YYK
YRG U G K U U5´
Figure 5.7: Type 1 integron attC sites. On the left, consensus secondary structure andMIS for 420 cluster 52 TAMs in the Proteobacteria. On the right, median expression overpredicted terminator sequences derived from RNA-seq experiments in Vibrio cholerae (Mandliket al., 2011).
patterns seen in the Northern blots of the Collis et al. (1995) study. A recent study of the
termination efficiency of a large number of transcriptional terminators included an attC
site in their initial screens, though it was discarded early in their study as being a low
efficiency terminator (Cambray et al., 2013). However, their initial experiments on this
element, using a fluorescent reporter construct in Escherichia coli, did show a termination
efficiency of 25%. Our analysis of RNA-seq data in Vibrio cholerae appears to support
the hypothesis that at least some attC may operate as transcriptional attenuators. This
stochastic attenuation at attC sites would explain the results of Collis et al. (1995), and
would lead to a gradual titration of expression along the length of integrons, barring the
presence of internal promoters.
126
Chapter 5. Kingdom-wide discovery of bacterial intrinsic termination motifs
5.3.3.4 Other non-canonical TAMs
Four other non-canonical TAMs were identified by the motif-discovery pipeline. One of
these appears to be a simple repeat family in the β-proteobacteria, and RNA-seq analysis
indicates it is likely not involved in transcriptional termination. I am still investigating
the potential activity of the other three at the time of writing.
5.4 Discussion
In a recent comprehensive review of transcriptional termination, Peters et al. (2011) lay
out four criteria for experimental validation of transcriptional terminators:
1) it causes dissociation of (the elongation complex) during in vitro transcrip-
tion as detected by release of RNA and DNA from RNAP; 2) it generates
terminated RNA 3′-ends before readthrough transcripts appear during syn-
chronized in vitro transcription; 3) it generates the terminated RNA 3′-ends
in vivo; and 4) it significantly reduces synthesis of RNA downstream from
the site in vivo.
A primarily computational study as described here cannot hope to meet this burden
of evidence. Indeed, the authors of this review admit that only a small number of
even canonical RITs have been subjected to this degree of validation, and furthermore
discuss a number of cases where even “obvious” RITs have turned out not to function as
transcriptional terminators. However, while I can not rule out with certainty alternative
explanations for the transcriptional patterns I have observed over predicted TAMs, such
as protection from 3′ exonucleases, I believe that the evidence I have presented here in
combination with previous studies suggesting possible non-canonical termination motifs
is indicative of a wider diversity of intrinsic termination mechanisms than is immediately
evident from studies in model organisms.
While the work presented here provides initial insights into the diversity of elements
associated with transcriptional termination, there remain a number of issues that need
to be addressed in this study. Foremost is the criterion used to define the set of TAMs
which I carried forward for enrichment and transcriptional analysis, that is <85% overlap
with all other TAMs across the phylogeny. It is well known that currently available
127
Chapter 5. Kingdom-wide discovery of bacterial intrinsic termination motifs
genome sequences are highly biased towards a relatively small number of organisms that
are easily cultivated; furthermore, this set is itself biased towards model species and
human pathogens, which may not be representative of the phylogeny as a whole. It
is possible that a more nuanced criterion, based for instance on overlaps at the class
level, may provide a clearer picture of terminator diversity. Providing this view of
terminator diversity will be increasingly important as our understanding of bacterial
diversity expands in light of sequencing projects targeting underrepresented genera (Wu
et al., 2009) and the difficult to cultivate ‘dark matter’ of the phylogeny through single-cell
sequencing (Marcy et al., 2007; Rinke et al., 2013).
A second major challenge to be addressed is identifying the determinants which
allow the CMs I have constructed to distinguish between classes of RITs in various
lineages. These determinants may include the sequence compositions of particular regions
or base-pairs within the terminator structure, or gross aspects of each class such as
stem-length and G/C content. It is well known that the specific sequence composition
of RITs can have large effects on termination efficiency in Escherichia coli, even when
maintaining the canonical G/C-rich hairpin followed by a poly-U tail (Chen et al., 2013;
Cambray et al., 2013). It seems likely that evolution of the transcriptional apparatus
would change these design constraints, and I believe the methods I have developed in this
study may allow us to begin to probe the parameters which may underlie RIT function
in diverse host species.
128
Publications
Publications arising in the course of this thesis:
• Read H., Johnson S., Barquist L., Mills G., Gardner P.P., Patrick W.M., Wiles
S. The effect of constitutive bioluminescence expression on the in vitro
and in vivo fitness of the mouse enteropathogen Citrobacter rodentium.
Manuscript in preparation.
• Okoro C.K., Barquist L., Kingsley R.A., Connor T.R., Harris S.R., Arends M.,
Stevens M., Parry C.M., Al-Mashhadani M.N., Kariuki S., Msefula C.L., Gordon
M.A., de Pinna E., Wain J., Heyderman R.S., Obaro S., Alonso P.L., Mando-
mando I., MacLennan C.A., Tapia M.D., Levine M.M., Tennant S.M., Parkhill J.,
Dougan G. Signatures of adaptation in human invasive S. Typhimurium
populations. Manuscript in preparation.
• Wong V., Pickard D., Barquist L., Sivaraman K., Hart P., Arends M., Holt K., Kane
L., Mottram L., Ellison L., Kay S., Wileman T., Kenney L., MacLennan C., Kingsley
R.A., Dougan G. Characterization of the yehUT two-component regula-
tory system of Salmonella enterica serovars Typhi and Typhimurium.
Manuscript under review.
• Wilf N.M., Reid A.J., Ramsay J.P., Williamson N.R., Croucher N.J., Gatto L., Hes-
ter S.S., Goulding D., Barquist L., Lilley K.S., Kingsley R.A., Dougan G., Salmond
G.P.C.. RNA-seq reveals the RNA binding proteins, Hfq and RsmA,
play various roles in virulence, antibiotic production and genomic flux
in Serratia sp. 39006. Manuscript under review.
129
Published Works
• Pettit L.J., Browne H.P., Yu L., Smits W.K., Fagan R.P., Barquist L., Martin
M.J., Goulding D., Duncan S.H., Flint H.J., Dougan G., Choudhary J.S., Lawley
T.D. Functional genomics reveals that Clostridium difficile Spo0A coor-
dinates sporulation, virulence and metabolism. Manuscript under review.
• Reuter S., Connor T.R., Barquist L., Walker D., Feltwell T., Harris S.R., Fookes
M., Hall M.E., Fuchs T.M., Corander J., Dufour M., Ringwood T., Savin C.,
Bouchier C., Martin L., Miettinen M., Shubin M., Laukkanen-Ninios R., Sihvonen
L.M., Siitonen A., Skurnik M., Falcao J.P., Fukushima H., Scholz H.C., Prentice
M., Wren B.W., Parkhill J., Carniel E., Achtman M., McNally A., Thomson
N.R. Parallel independent evolution of pathogenicity within the genus
Yersinia. Manuscript under review.
• Barquist L., Burge S.W., Gardner P.P. Building non-coding RNA families.
Methods in Molecular Biology, in press.
• Hoeppner M.P., Barquist L., Gardner P.P. An introduction to RNA databases.
Methods in Molecular Biology, in press.
• Croucher N.J., Mitchell A.M., Gould K.A., Inverarity D., Barquist L., Feltwell
T., Fookes M.C., Harris S.R., Dordel J., Salter S.J., Browall S., Zemlickova H.,
Parkhill J., Normark S., Henriques-Normark B., Hinds J., Mitchell T.J., Bentley
S.D. Dominant role of nucleotide substitution in the diversification of
serotype 3 pneumococci over decades and during a single infection. PLoS
Genetics, 2013.
• Kingsley R.A., Whitehead S., Connor T., Barquist L., Sait L., Holt K., Sivaraman
K., Wileman T., Goulding D., Clare S., Hale C., Seshasayee A., Harris S., Thomson
N., Gardner P., Rabsch W., Wigley P., Humphrey T., Parkhill J., Dougan G.
Genome and transcriptome adaptation accompanying emergence of the
DT2 host-restricted Salmonella Typhimurium pathovar. mBio, 2013.
• Martin M.J., Clare S., Goulding D., Faulds-Pain A., Barquist L., Browne H., Pettit
L., Dougan G., Lawley T.D., Wren B.W. The agr locus regulates virulence
and colonization genes in Clostridium difficile 027. Journal of Bacteriology,
2013.
130
Published Works
• Barquist L., Boinett C.J., Cain A.K.. Approaches to querying bacterial
genomes with transposon-insertion sequencing. RNA Biology, 10(7), 2013.
• Barquist L., Langridge G.C., Turner D.J., Phan M.D., Turner A.K., Bateman
A., Parkhill J., Wain J., Gardner P.P. A comparison of dense transposon
insertion libraries in the Salmonella serovars Typhi and Typhimurium.
Nucleic Acids Research, 41(8):4549-4564, 2013.
• Burge S.W., Daub J., Eberhardt R., Tate J., Barquist L., Nawrocki E.P., Eddy S.R.,
Gardner P.P., Bateman A. Rfam 11.0: 10 years of RNA families. Nucleic
Acids Research. 41(D1):D226-D232, 2013
• Croucher N.J., Harris S.R., Barquist L., Parkhill J., Bentley S.D. A high-resolution
view of genome-wide pneumococcal transformation. PLoS Pathogens, 8(6),
2012
• Westesson O., Barquist L., Holmes I. HandAlign: Bayesian multiple se-
quence alignment, phylogeny, and ancestral reconstruction. Bioinfor-
matics, 28(8):1170-1171, 2012
• Gardner P.P., Barquist L., Bateman A., Nawrocki E.P., Weinberg Z. RNIE:
genome-wide prediction of bacterial intrinsic terminators. Nucleic Acids
Research, 39(14):5845-5852, 2011
131

Appendix
132
Appendix A: Supplementary data
for chapters 2 and 3
This thesis should include a CD containing supplementary data for chapters 2 and
3. This CD contains two files in Excel format.
Chapter2.xls contains the complete results of the TraDIS assays described in
chapter 2, and should be identical to the supplementary information of Barquist
et al. (2013b).
Chapter3.xls contains genomic features significantly depleted or enriched in inser-
tions over the macrophage assays described in chapter 3.
If the CD is not enclosed, or if you are viewing this thesis electronically, contact
Lars Barquist ([email protected]) to obtain these files.
133

Appendix
134
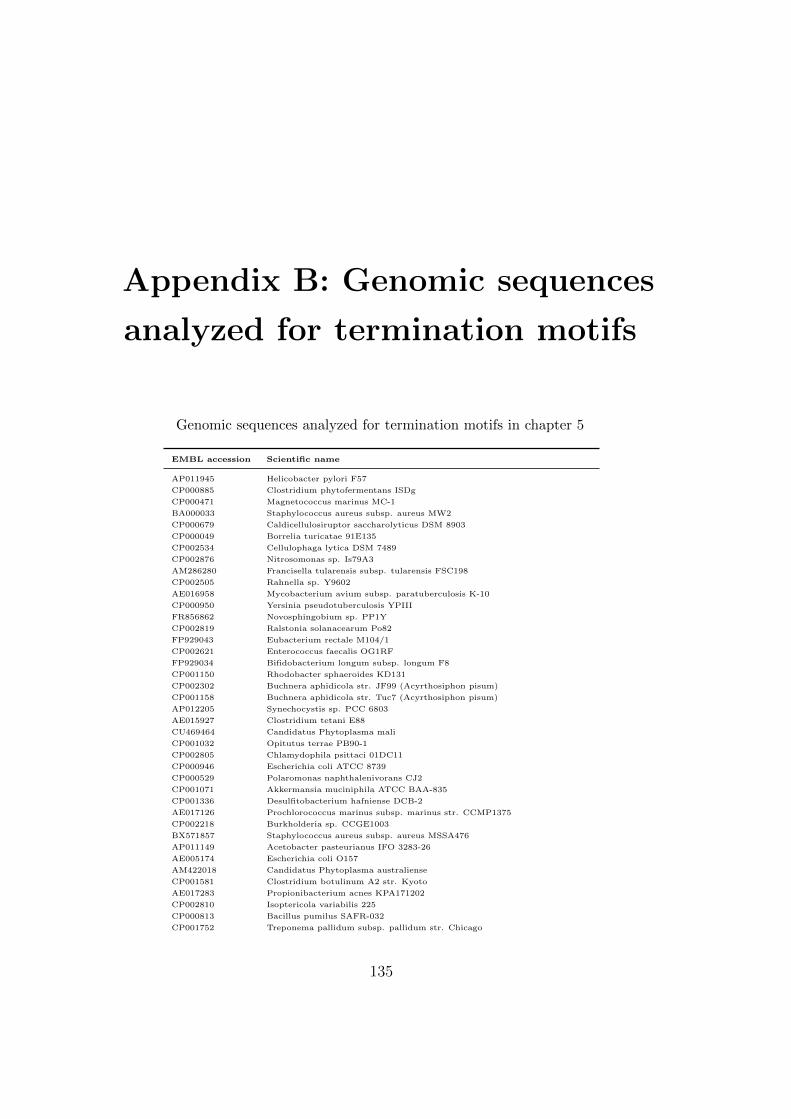
Appendix B: Genomic sequences
analyzed for termination motifs
Genomic sequences analyzed for termination motifs in chapter 5
EMBL accession Scientific name
AP011945 Helicobacter pylori F57
CP000885 Clostridium phytofermentans ISDg
CP000471 Magnetococcus marinus MC-1
BA000033 Staphylococcus aureus subsp. aureus MW2
CP000679 Caldicellulosiruptor saccharolyticus DSM 8903
CP000049 Borrelia turicatae 91E135
CP002534 Cellulophaga lytica DSM 7489
CP002876 Nitrosomonas sp. Is79A3
AM286280 Francisella tularensis subsp. tularensis FSC198
CP002505 Rahnella sp. Y9602
AE016958 Mycobacterium avium subsp. paratuberculosis K-10
CP000950 Yersinia pseudotuberculosis YPIII
FR856862 Novosphingobium sp. PP1Y
CP002819 Ralstonia solanacearum Po82
FP929043 Eubacterium rectale M104/1
CP002621 Enterococcus faecalis OG1RF
FP929034 Bifidobacterium longum subsp. longum F8
CP001150 Rhodobacter sphaeroides KD131
CP002302 Buchnera aphidicola str. JF99 (Acyrthosiphon pisum)
CP001158 Buchnera aphidicola str. Tuc7 (Acyrthosiphon pisum)
AP012205 Synechocystis sp. PCC 6803
AE015927 Clostridium tetani E88
CU469464 Candidatus Phytoplasma mali
CP001032 Opitutus terrae PB90-1
CP002805 Chlamydophila psittaci 01DC11
CP000946 Escherichia coli ATCC 8739
CP000529 Polaromonas naphthalenivorans CJ2
CP001071 Akkermansia muciniphila ATCC BAA-835
CP001336 Desulfitobacterium hafniense DCB-2
AE017126 Prochlorococcus marinus subsp. marinus str. CCMP1375
CP002218 Burkholderia sp. CCGE1003
BX571857 Staphylococcus aureus subsp. aureus MSSA476
AP011149 Acetobacter pasteurianus IFO 3283-26
AE005174 Escherichia coli O157
AM422018 Candidatus Phytoplasma australiense
CP001581 Clostridium botulinum A2 str. Kyoto
AE017283 Propionibacterium acnes KPA171202
CP002810 Isoptericola variabilis 225
CP000813 Bacillus pumilus SAFR-032
CP001752 Treponema pallidum subsp. pallidum str. Chicago
135
Appendix
CP000348 Leptospira borgpetersenii serovar Hardjo-bovis str. L550
BX571963 Rhodopseudomonas palustris CGA009
CP002811 Shewanella baltica OS117
AE013598 Xanthomonas oryzae pv. oryzae KACC 10331
CP002881 Pseudomonas stutzeri ATCC 17588 = LMG 11199
DS180873 Leptospirillum rubarum
CP002829 Thermodesulfobacterium sp. OPB45
CP000606 Shewanella loihica PV-4
AM902716 Bordetella petrii
CP000076 Pseudomonas protegens Pf-5
AP009389 Pelotomaculum thermopropionicum SI
CP001037 Nostoc punctiforme PCC 73102
CU468135 Erwinia tasmaniensis Et1/99
CP002026 Starkeya novella DSM 506
FP929051 Ruminococcus bromii L2-63
CP000924 Thermoanaerobacter pseudethanolicus ATCC 33223
CP000553 Prochlorococcus marinus str. NATL1A
CP002728 Tepidanaerobacter acetatoxydans Re1
CP002312 Borrelia burgdorferi JD1
CP000384 Mycobacterium sp. MCS
CP002521 Acidovorax avenae subsp. avenae ATCC 19860
FN433596 Staphylococcus aureus subsp. aureus TW20
CM000728 Bacillus cereus Rock1-3
CR522870 Desulfotalea psychrophila LSv54
CP001509 Escherichia coli BL21(DE3)
AB097150 Onion yellows phytoplasma
CP001960 Campylobacter jejuni subsp. jejuni S3
CP000943 Methylobacterium sp. 4-46
CP000667 Salinispora tropica CNB-440
CP001958 Segniliparus rotundus DSM 44985
CM000604 Clostridium difficile ATCC 43255
CP002660 Clostridium acetobutylicum DSM 1731
CP001794 Geobacillus sp. Y412MC61
CP002868 Spirochaeta caldaria DSM 7334
CP001959 Brachyspira murdochii DSM 12563
FM242711 Listeria monocytogenes serotype 4b str. CLIP 80459
FM204884 Streptococcus equi subsp. zooepidemicus
CP002442 Geobacillus sp. Y412MC52
CP000680 Pseudomonas mendocina ymp
CP002777 Thermus thermophilus SG0.5JP17-16
FN568063 Streptococcus mitis B6
CP000386 Rubrobacter xylanophilus DSM 9941
FR668087 Mycoplasma leachii 99/014/6
AP010888 Bifidobacterium longum subsp. longum JCM 1217
CP001124 Geobacter bemidjiensis Bem
AM040264 Brucella melitensis biovar Abortus 2308
CP001801 Halothiobacillus neapolitanus c2
CP002416 Clostridium thermocellum DSM 1313
CP000458 Burkholderia cenocepacia HI2424
CP000828 Acaryochloris marina MBIC11017
CP002890 Escherichia coli UMNF18
BA000045 Gloeobacter violaceus PCC 7421
AP006628 Onion yellows phytoplasma OY-M
CP001981 Candidatus Sulcia muelleri DMIN
CP000932 Campylobacter lari RM2100
CP000774 Parvibaculum lavamentivorans DS-1
CP001903 Bacillus thuringiensis BMB171
CP002164 Caldicellulosiruptor obsidiansis OB47
CP002825 Lacinutrix sp. 5H-3-7-4
CP001196 Oligotropha carboxidovorans OM5
CP000869 Burkholderia multivorans ATCC 17616
AP012030 Escherichia coli DH1
CP000837 Streptococcus suis GZ1
CP001488 Brucella melitensis ATCC 23457
CP002542 Fluviicola taffensis DSM 16823
CP000685 Flavobacterium johnsoniae UW101
CP001251 Dictyoglomus turgidum DSM 6724
136
Appendix
CP002767 Shewanella baltica BA175
CP002334 Helicobacter pylori Lithuania75
CP001184 Ureaplasma urealyticum serovar 10 str. ATCC 33699
CP001930 Chlamydia trachomatis G/9301
BA000008 Chlamydophila pneumoniae J138
CP000803 Francisella tularensis subsp. holarctica FTNF002-00
AP009484 Macrococcus caseolyticus JCSC5402
CP002593 Pseudonocardia dioxanivorans CB1190
CP001504 Burkholderia glumae BGR1
CM000738 Bacillus cereus AH676
CP000248 Novosphingobium aromaticivorans DSM 12444
AE017194 Bacillus cereus ATCC 10987
CP000705 Lactobacillus reuteri DSM 20016
CP001281 Thauera sp. MZ1T
FP236530 Mycoplasma hominis ATCC 23114
CP000154 Paenibacillus polymyxa E681
CP000283 Rhodopseudomonas palustris BisB5
CM000776 Helicobacter canadensis MIT 98-5491
AM233362 Francisella tularensis subsp. holarctica LVS
CP001100 Chloroherpeton thalassium ATCC 35110
AE017196 Wolbachia endosymbiont of Drosophila melanogaster
BX897700 Bartonella quintana str. Toulouse
CM000747 Bacillus thuringiensis Bt407
CP002120 Staphylococcus aureus subsp. aureus str. JKD6008
CP002627 Bacillus amyloliquefaciens TA208
CP002739 Thermoanaerobacterium xylanolyticum LX-11
CP002345 Paludibacter propionicigenes WB4
AP012035 Acidiphilium multivorum AIU301
CU234118 Bradyrhizobium sp. ORS 278
CP001744 Planctomyces limnophilus DSM 3776
CP000875 Herpetosiphon aurantiacus DSM 785
CP002300 Buchnera aphidicola str. LL01 (Acyrthosiphon pisum)
AM990992 Staphylococcus aureus subsp. aureus ST398
CP001814 Streptosporangium roseum DSM 43021
CP002526 Glaciecola sp. 4H-3-7+YE-5
CP000910 Renibacterium salmoninarum ATCC 33209
CP002927 Bacillus amyloliquefaciens XH7
CP002361 Oceanithermus profundus DSM 14977
CP002339 Alteromonas sp. SN2
CM000661 Clostridium difficile QCD-76w55
CP000108 Chlorobium chlorochromatii CaD3
CP002468 Bacillus subtilis BSn5
CP002096 Helicobacter pylori 35A
CP002080 Acinetobacter oleivorans DR1
CR628337 Legionella pneumophila str. Lens
CP002124 Erwinia sp. Ejp617
CP000688 Dehalococcoides sp. BAV1
AE016795 Vibrio vulnificus CMCP6
CP000026 Salmonella enterica subsp. enterica serovar Paratyphi A str. ATCC 9150
CP000030 Anaplasma marginale str. St. Maries
CP001661 Geobacter sp. M21
CP001643 Brachybacterium faecium DSM 4810
CP000675 Legionella pneumophila str. Corby
AP008957 Rhodococcus erythropolis PR4
CR354532 Photobacterium profundum SS9
CM000757 Bacillus thuringiensis serovar pulsiensis BGSC 4CC1
CM000748 Bacillus thuringiensis serovar thuringiensis str. T01001
CP002219 Caldicellulosiruptor hydrothermalis 108
CP000517 Lactobacillus helveticus DPC 4571
AP010656 Candidatus Azobacteroides pseudotrichonymphae genomovar. CFP2
CP002901 Sulfobacillus acidophilus TPY
CP000613 Rhodospirillum centenum SW
CP000115 Nitrobacter winogradskyi Nb-255
BA000012 Mesorhizobium loti MAFF303099
CP000048 Borrelia hermsii DAH
CU459003 Magnetospirillum gryphiswaldense MSR-1
CP001734 Desulfohalobium retbaense DSM 5692
137
Appendix
CP000246 Clostridium perfringens ATCC 13124
CP002536 Deinococcus proteolyticus MRP
AE008691 Thermoanaerobacter tengcongensis MB4
AE004439 Pasteurella multocida subsp. multocida str. Pm70
CP002188 Mycoplasma bovis PG45
CP002185 Escherichia coli W
CP000847 Rickettsia akari str. Hartford
CP001598 Bacillus anthracis str. A0248
CP000023 Streptococcus thermophilus LMG 18311
FR773153 Mycoplasma haemofelis str. Langford 1
CP002110 Staphylococcus aureus subsp. aureus TCH60
CP000702 Thermotoga petrophila RKU-1
AJ235269 Rickettsia prowazekii str. Madrid E
CP001872 Mycoplasma gallisepticum str. R(high)
CP001674 Methylovorus glucosetrophus SIP3-4
AM398681 Flavobacterium psychrophilum JIP02/86
CP002273 Eubacterium limosum KIST612
CP001287 Cyanothece sp. PCC 8801
AE008692 Zymomonas mobilis subsp. mobilis ZM4
CP002516 Escherichia coli KO11FL
CP001848 Pirellula staleyi DSM 6068
CP000918 Streptococcus pneumoniae 70585
CP001978 Marinobacter adhaerens HP15
CP002616 Lactobacillus casei LC2W
CP000814 Campylobacter jejuni subsp. jejuni 81116
AP011540 Rothia mucilaginosa DY-18
CP000247 Escherichia coli 536
CP000709 Brucella ovis ATCC 25840
CP001182 Acinetobacter baumannii AB0057
CP002525 Mycoplasma suis str. Illinois
FP929033 Bacteroides xylanisolvens XB1A
CP002024 Chlamydia trachomatis L2c
CP002338 Lactobacillus amylovorus GRL 1112
FR775250 Salmonella enterica subsp. enterica serovar Weltevreden str. 2007-60-3289-1
AP007281 Lactobacillus reuteri JCM 1112
CP001322 Desulfatibacillum alkenivorans AK-01
CP000821 Shewanella sediminis HAW-EB3
AP012032 Pantoea ananatis AJ13355
CP001234 Vibrio cholerae M66-2
CP001230 Persephonella marina EX-H1
CP001886 Chlamydia trachomatis E/150
CP000727 Clostridium botulinum A str. Hall
CM000758 Bacillus thuringiensis IBL 200
FP565814 Salinibacter ruber M8
FN424405 Salmonella enterica subsp. enterica serovar Typhimurium str. D23580
FP929059 Eubacterium siraeum V10Sc8a
CM000723 Bacillus cereus BDRD-ST24
AE017340 Idiomarina loihiensis L2TR
CP001348 Clostridium cellulolyticum H10
CM000755 Bacillus thuringiensis serovar pondicheriensis BGSC 4BA1
CP002725 Gardnerella vaginalis HMP9231
CP000057 Haemophilus influenzae 86-028NP
FP885895 Ralstonia solanacearum CMR15
AM849034 Clavibacter michiganensis subsp. sepedonicus
CP001798 Nitrosococcus halophilus Nc4
BX293980 Mycoplasma mycoides subsp. mycoides SC str. PG1
FM211187 Streptococcus pneumoniae ATCC 700669
CP001844 Staphylococcus aureus 04-02981
CU468230 Acinetobacter baumannii
CM000736 Bacillus cereus F65185
CP000887 Brucella abortus S19
CP000395 Borrelia afzelii PKo
FP929038 Coprococcus catus GD/7
AE005674 Shigella flexneri 2a str. 301
AP010958 Escherichia coli O103
CP002171 Thermoanaerobacterium thermosaccharolyticum DSM 571
CP002780 Desulfotomaculum ruminis DSM 2154
138
Appendix
CP002745 Collimonas fungivorans Ter331
CP000117 Anabaena variabilis ATCC 29413
CP002456 Taylorella equigenitalis MCE9
CP001850 Clostridiales genomosp. BVAB3 str. UPII9-5
CP002865 Zymomonas mobilis subsp. pomaceae ATCC 29192
CP001736 Kribbella flavida DSM 17836
CP000725 Streptococcus gordonii str. Challis substr. CH1
CP002582 Clostridium lentocellum DSM 5427
CP001793 Paenibacillus sp. Y412MC10
CP000416 Lactobacillus brevis ATCC 367
CP000036 Shigella boydii Sb227
CP002857 Corynebacterium resistens DSM 45100
CP000850 Salinispora arenicola CNS-205
CP002910 Klebsiella pneumoniae KCTC 2242
AE010300 Leptospira interrogans serovar Lai str. 56601
CP001635 Variovorax paradoxus S110
CP002281 Ilyobacter polytropus DSM 2926
CP002634 Bacillus amyloliquefaciens LL3
CP001855 Escherichia coli O83
BA000004 Bacillus halodurans C-125
CP000110 Synechococcus sp. CC9605
CP000075 Pseudomonas syringae pv. syringae B728a
CP000422 Pediococcus pentosaceus ATCC 25745
CR555306 Aromatoleum aromaticum EbN1
CP000031 Ruegeria pomeroyi DSS-3
CP002786 Amycolicicoccus subflavus DQS3-9A1
CP001633 Francisella tularensis subsp. tularensis NE061598
CP001634 Kosmotoga olearia TBF 19.5.1
CP000046 Staphylococcus aureus subsp. aureus COL
BX470249 Bordetella parapertussis 12822
CP001809 Corynebacterium pseudotuberculosis 1002
CP002251 Corynebacterium pseudotuberculosis I19
CP002189 Candidatus Blochmannia vafer str. BVAF
BA000040 Bradyrhizobium japonicum USDA 110
CP001680 Helicobacter pylori 52
CP000088 Thermobifida fusca YX
CP002205 Sulfurimonas autotrophica DSM 16294
AP008981 Orientia tsutsugamushi str. Ikeda
CT573326 Pseudomonas entomophila L48
CP000114 Streptococcus agalactiae A909
AL646052 Ralstonia solanacearum GMI1000
FN555004 Helicobacter mustelae 12198
CP001011 Xylella fastidiosa M23
CM000636 Mycobacterium kansasii ATCC 12478
AJ749949 Francisella tularensis subsp. tularensis SCHU S4
CP001389 Sinorhizobium fredii NGR234
CP000970 Escherichia coli SMS-3-5
CP000359 Deinococcus geothermalis DSM 11300
CP001104 Eubacterium eligens ATCC 27750
BX897699 Bartonella henselae str. Houston-1
CP000967 Xanthomonas oryzae pv. oryzae PXO99A
CP002213 Paenibacillus polymyxa SC2
CP001878 Bacillus pseudofirmus OF4
CP002689 Porphyromonas asaccharolytica DSM 20707
FQ312029 Streptococcus pneumoniae INV200
CP001727 Alicyclobacillus acidocaldarius subsp. acidocaldarius DSM 446
BX248353 Corynebacterium diphtheriae NCTC 13129
FP929044 Eubacterium siraeum 70/3
CP001026 Burkholderia ambifaria MC40-6
AE001439 Helicobacter pylori J99
CM000731 Bacillus cereus Rock3-29
CP001138 Salmonella enterica subsp. enterica serovar Agona str. SL483
CP000251 Anaeromyxobacter dehalogenans 2CP-C
CP000853 Alkaliphilus oremlandii OhILAs
CP002571 Helicobacter pylori 2017
CP000316 Polaromonas sp. JS666
CP001737 Nakamurella multipartita DSM 44233
139
Appendix
CP001337 Chloroflexus aggregans DSM 9485
CP002121 Streptococcus pneumoniae AP200
CP000749 Marinomonas sp. MWYL1
CP000436 Haemophilus somnus 129PT
CP002608 Chlamydophila pecorum E58
CP000111 Prochlorococcus marinus str. MIT 9312
CP002160 Clostridium cellulovorans 743B
CP002299 Frankia sp. EuI1c
CP000140 Parabacteroides distasonis ATCC 8503
CP002422 Neisseria meningitidis M01-240355
CP002558 Francisella cf. novicida 3523
CP002162 Micromonospora aurantiaca ATCC 27029
CP001837 Staphylococcus lugdunensis HKU09-01
U00096 Escherichia coli str. K-12 substr. MG1655
CP002336 Helicobacter pylori SouthAfrica7
CP001145 Coprothermobacter proteolyticus DSM 5265
CP000777 Leptospira biflexa serovar Patoc strain ’Patoc 1 (Ames)’
CP000360 Candidatus Koribacter versatilis Ellin345
AE016877 Bacillus cereus ATCC 14579
CP001562 Bartonella grahamii as4aup
AM920689 Xanthomonas campestris pv. campestris
FR872580 Parachlamydia acanthamoebae UV-7
AP010968 Kitasatospora setae KM-6054
CP001797 Pseudoalteromonas sp. SM9913
CP000969 Thermotoga sp. RQ2
CP001843 Treponema primitia ZAS-2
CP001656 Paenibacillus sp. JDR-2
CP000720 Yersinia pseudotuberculosis IP 31758
CP001820 Veillonella parvula DSM 2008
CP001759 Anaplasma centrale str. Israel
AE007317 Streptococcus pneumoniae R6
BX072543 Tropheryma whipplei TW08/27
BX548174 Prochlorococcus marinus subsp. pastoris str. CCMP1986
FN806773 Propionibacterium freudenreichii subsp. shermanii CIRM-BIA1
CP001841 Treponema azotonutricium ZAS-9
CP002419 Neisseria meningitidis G2136
CP001769 Spirosoma linguale DSM 74
CP000681 Shewanella putrefaciens CN-32
CP001191 Rhizobium leguminosarum bv. trifolii WSM2304
AE000511 Helicobacter pylori 26695
AE015924 Porphyromonas gingivalis W83
CP002159 Gallionella capsiferriformans ES-2
CP001217 Helicobacter pylori P12
CP002409 Propionibacterium acnes 266
AP012203 Porphyromonas gingivalis TDC60
CP002167 Escherichia coli UM146
FN667741 Xenorhabdus bovienii SS-2004
CM000744 Bacillus mycoides Rock3-17
CP002669 Mycoplasma hyorhinis MCLD
CM000913 Streptomyces clavuligerus ATCC 27064
CP000109 Thiomicrospira crunogena XCL-2
CM000724 Bacillus cereus BDRD-ST26
CP001291 Cyanothece sp. PCC 7424
CM000714 Bacillus cereus m1293
CP000975 Methylacidiphilum infernorum V4
CP001867 Geodermatophilus obscurus DSM 43160
AE002160 Chlamydia muridarum Nigg
CP002158 Fibrobacter succinogenes subsp. succinogenes S85
CP000096 Chlorobium luteolum DSM 273
CP001931 Thermocrinis albus DSM 14484
AE017334 Bacillus anthracis str. ’Ames Ancestor’
CP001650 Zunongwangia profunda SM-A87
CP000578 Rhodobacter sphaeroides ATCC 17029
CP000634 Agrobacterium vitis S4
AP008232 Sodalis glossinidius str. ’morsitans’
AM889285 Gluconacetobacter diazotrophicus PAl 5
FQ859185 Streptomyces cattleya NRRL 8057 = DSM 46488
140
Appendix
BA000035 Corynebacterium efficiens YS-314
AP011142 Acetobacter pasteurianus IFO 3283-22
AP011941 Helicobacter pylori F30
AP011135 Acetobacter pasteurianus IFO 3283-07
CP001407 Bacillus cereus 03BB102
CP000090 Ralstonia eutropha JMP134
CP000419 Streptococcus thermophilus LMD-9
CP002086 Nitrosococcus watsonii C-113
CP002439 Staphylococcus pseudintermedius HKU10-03
AE016825 Chromobacterium violaceum ATCC 12472
FP929036 Butyrivibrio fibrisolvens 16/4
CP000253 Staphylococcus aureus subsp. aureus NCTC 8325
AE016822 Leifsonia xyli subsp. xyli str. CTCB07
CP000095 Prochlorococcus marinus str. NATL2A
CP001044 Burkholderia phymatum STM815
AE017333 Bacillus licheniformis DSM 13 = ATCC 14580
AP010655 Streptococcus mutans NN2025
CM000718 Bacillus cereus MM3
CP001034 Natranaerobius thermophilus JW/NM-WN-LF
AE000512 Thermotoga maritima MSB8
CP001022 Exiguobacterium sibiricum 255-15
FM864216 Mycoplasma conjunctivae
CP000563 Shewanella baltica OS155
CP002085 Desulfarculus baarsii DSM 2075
CM000720 Bacillus cereus R309803
CP001940 Desulfurivibrio alkaliphilus AHT2
CP001928 Waddlia chondrophila WSU 86-1044
CP002222 Lactobacillus plantarum subsp. plantarum ST-III
CP001792 Fibrobacter succinogenes subsp. succinogenes S85
CP002170 Mycoplasma hyorhinis HUB-1
CP000409 Rickettsia canadensis str. McKiel
FN434113 Erwinia amylovora CFBP1430
AP009380 Porphyromonas gingivalis ATCC 33277
CP000819 Escherichia coli B str. REL606
CP001707 Kangiella koreensis DSM 16069
FP929140 gamma proteobacterium HdN1
CP001277 Candidatus Hamiltonella defensa 5AT (Acyrthosiphon pisum)
AP012027 Erysipelothrix rhusiopathiae str. Fujisawa
AE017332 Mycoplasma hyopneumoniae 232
AP008971 Finegoldia magna ATCC 29328
CP000437 Francisella tularensis subsp. holarctica OSU18
CP002605 Helicobacter pylori 83
CP000388 Pseudoalteromonas atlantica T6c
CP002657 Alicycliphilus denitrificans K601
CU928160 Escherichia coli IAI1
CP002869 Paenibacillus mucilaginosus KNP414
AP012200 Melissococcus plutonius ATCC 35311
FP929040 Enterobacter cloacae subsp. cloacae NCTC 9394
CP001617 Lactobacillus plantarum JDM1
CP001738 Thermomonospora curvata DSM 43183
CP000859 Desulfococcus oleovorans Hxd3
CP000569 Actinobacillus pleuropneumoniae serovar 5b str. L20
CP001996 Staphylococcus aureus subsp. aureus ED133
FM872307 Chlamydia trachomatis B/TZ1A828/OT
BA000034 Streptococcus pyogenes SSI-1
FM252032 Streptococcus suis BM407
CP002047 Streptomyces bingchenggensis BCW-1
CP002130 Candidatus Midichloria mitochondrii IricVA
FN392235 Erwinia pyrifoliae DSM 12163
CP000025 Campylobacter jejuni RM1221
AP011943 Helicobacter pylori F32
CP001279 Nautilia profundicola AmH
CP002794 Bifidobacterium longum subsp. longum KACC 91563
CP000236 Ehrlichia chaffeensis str. Arkansas
CP001995 Mycoplasma fermentans JER
CM000487 Bacillus subtilis subsp. subtilis str. 168
AP011548 Lactobacillus rhamnosus GG
141
Appendix
CP002183 Bacillus subtilis subsp. spizizenii str. W23
AE015451 Pseudomonas putida KT2440
CP002400 Ethanoligenens harbinense YUAN-3
CM000726 Bacillus cereus BDRD-Cer4
AP006840 Symbiobacterium thermophilum IAM 14863
CP000948 Escherichia coli str. K-12 substr. DH10B
AP009493 Streptomyces griseus subsp. griseus NBRC 13350
FQ312030 Streptococcus pneumoniae INV104
CP000393 Trichodesmium erythraeum IMS101
CP000302 Shewanella denitrificans OS217
CP001391 Wolbachia sp. wRi
FP929053 Ruminococcus sp. SR1/5
CP002341 Lactobacillus delbrueckii subsp. bulgaricus ND02
CP002271 Stigmatella aurantiaca DW4/3-1
CP001778 Stackebrandtia nassauensis DSM 44728
CM000789 Mycobacterium tuberculosis KZN R506
CP000264 Jannaschia sp. CCS1
CP001607 Aggregatibacter aphrophilus NJ8700
CP002331 Helicobacter pylori India7
CP002528 Krokinobacter sp. 4H-3-7-5
CM000737 Bacillus cereus AH603
CP001638 Geobacillus sp. WCH70
CP002198 Cyanothece sp. PCC 7822
CP000382 Clostridium novyi NT
CP002006 Prevotella ruminicola 23
CP000301 Rhodopseudomonas palustris BisB18
CP001487 Blattabacterium sp. (Blattella germanica) str. Bge
CP001605 Candidatus Sulcia muelleri SMDSEM
CP000051 Chlamydia trachomatis A/HAR-13
CP002034 Lactobacillus salivarius CECT 5713
CP001364 Chloroflexus sp. Y-400-fl
CP000097 Synechococcus sp. CC9902
BA000018 Staphylococcus aureus subsp. aureus N315
CP000962 Clostridium botulinum A3 str. Loch Maree
AM406671 Lactococcus lactis subsp. cremoris MG1363
CP002458 Mycoplasma fermentans M64
CP002614 Salmonella enterica subsp. enterica serovar Typhimurium str. UK-1
CP000546 Burkholderia mallei NCTC 10229
AE002098 Neisseria meningitidis MC58
CP002552 Nitrosomonas sp. AL212
CP002824 Enterobacter aerogenes KCTC 2190
L42023 Haemophilus influenzae Rd KW20
CP002390 Filifactor alocis ATCC 35896
CP001213 Bifidobacterium animalis subsp. lactis AD011
CP000926 Pseudomonas putida GB-1
CP002028 Thermincola potens JR
CP002330 Caldicellulosiruptor kronotskyensis 2002
CP001853 Bifidobacterium animalis subsp. lactis BB-12
CP001585 Yersinia pestis D106004
FN543502 Citrobacter rodentium ICC168
CP000804 Roseiflexus castenholzii DSM 13941
CP000512 Acidovorax citrulli AAC00-1
CP001791 Bacillus selenitireducens MLS10
CP001672 Methylotenera mobilis JLW8
CP002797 Escherichia coli NA114
CP001252 Shewanella baltica OS223
CP001321 Haemophilus parasuis SH0165
CP001684 Slackia heliotrinireducens DSM 20476
CP000576 Prochlorococcus marinus str. MIT 9301
FP929049 Roseburia intestinalis M50/1
CP001069 Ralstonia pickettii 12J
FP929061 butyrate-producing bacterium SSC/2
FQ312003 Salmonella enterica subsp. enterica serovar Typhimurium str. SL1344
FQ312005 Bacteriovorax marinus SJ
FQ312027 Streptococcus pneumoniae OXC141
AM167904 Bordetella avium 197N
CP000644 Aeromonas salmonicida subsp. salmonicida A449
142
Appendix
CP001962 Thermus scotoductus SA-01
CR931997 Corynebacterium jeikeium K411
CP002816 Listeria monocytogenes M7
CP001097 Chlorobium limicola DSM 245
CP001157 Azotobacter vinelandii DJ
CP001033 Streptococcus pneumoniae CGSP14
BA000043 Geobacillus kaustophilus HTA426
CP001020 Coxiella burnetii CbuK˙Q154
FN668944 Clostridium difficile BI9
CP000750 Kineococcus radiotolerans SRS30216
CP001197 Desulfovibrio vulgaris str. ’Miyazaki F’
CP000412 Lactobacillus delbrueckii subsp. bulgaricus ATCC BAA-365
CP000942 Ureaplasma parvum serovar 3 str. ATCC 27815
FP236842 Erwinia pyrifoliae Ep1/96
CP000252 Syntrophus aciditrophicus SB
BA000036 Corynebacterium glutamicum ATCC 13032
CM000735 Bacillus cereus Rock4-18
CP002293 Geobacillus sp. Y4.1MC1
CP000951 Synechococcus sp. PCC 7002
CP002465 Streptococcus suis JS14
CU179680 Mycoplasma agalactiae PG2
CP001900 Campylobacter jejuni subsp. jejuni M1
BX950851 Pectobacterium atrosepticum SCRI1043
CP000524 Bartonella bacilliformis KC583
CP001873 Mycoplasma gallisepticum str. F
CP000449 Maricaulis maris MCS10
FP929052 Ruminococcus champanellensis 18P13
CM000729 Bacillus cereus Rock1-15
CP002154 Edwardsiella tarda FL6-60
CP000930 Heliobacterium modesticaldum Ice1
CP002917 Corynebacterium variabile DSM 44702
CP002924 Corynebacterium pseudotuberculosis PAT10
CP001298 Methylobacterium chloromethanicum CM4
FM200053 Salmonella enterica subsp. enterica serovar Paratyphi A str. AKU˙12601
AP009510 uncultured Termite group 1 bacterium phylotype Rs-D17
AE017308 Mycoplasma mobile 163K
CP002623 Roseobacter litoralis Och 149
BA000021 Wigglesworthia glossinidia endosymbiont of Glossina brevipalpis
CP001604 Listeria monocytogenes 08-5923
FP929062 butyrate-producing bacterium SS3/4
CP000770 Candidatus Sulcia muelleri GWSS
CP000890 Coxiella burnetii RSA 331
CP002025 Brachyspira pilosicoli 95/1000
CP002543 Desulfurobacterium thermolithotrophum DSM 11699
CP001133 Vibrio fischeri MJ11
CP001628 Micrococcus luteus NCTC 2665
CP001631 Acidimicrobium ferrooxidans DSM 10331
CP000653 Enterobacter sp. 638
FP929056 Synergistetes bacterium SGP1
FN665653 Clostridium difficile M120
CP000413 Lactobacillus gasseri ATCC 33323
CR925677 Ehrlichia ruminantium str. Gardel
FR878060 Mycobacterium africanum GM041182
AE017243 Mycoplasma hyopneumoniae J
CP002277 Haemophilus influenzae R2866
CP000488 Candidatus Ruthia magnifica str. Cm (Calyptogena magnifica)
AP008230 Desulfitobacterium hafniense Y51
CP000769 Anaeromyxobacter sp. Fw109-5
CP001146 Dictyoglomus thermophilum H-6-12
CP000721 Clostridium beijerinckii NCIMB 8052
AP009152 Kocuria rhizophila DC2201
CP002224 Ketogulonicigenium vulgare Y25
AE017354 Legionella pneumophila subsp. pneumophila str. Philadelphia 1
CP000931 Shewanella halifaxensis HAW-EB4
BX571966 Burkholderia pseudomallei K96243
CP000473 Candidatus Solibacter usitatus Ellin6076
FR877557 Salmonella bongori NCTC 12419
143
Appendix
CP001486 Vibrio cholerae MJ-1236
AP009384 Azorhizobium caulinodans ORS 571
FQ312044 Streptococcus pneumoniae SPN994039
CP001220 Comamonas testosteroni CNB-2
CP001905 Thioalkalivibrio sp. K90mix
CP002804 Chlamydophila psittaci C19/98
FQ790233 Mycoplasma suis KI3806
CP002280 Rothia dentocariosa ATCC 17931
CP002097 Corynebacterium pseudotuberculosis FRC41
CP000703 Staphylococcus aureus subsp. aureus JH9
CP002478 Staphylococcus pseudintermedius ED99
CP002743 Bifidobacterium breve ACS-071-V-Sch8b
CP002077 Mycoplasma pneumoniae FH
CP002346 Riemerella anatipestifer ATCC 11845 = DSM 15868
CP000285 Chromohalobacter salexigens DSM 3043
CU466930 Candidatus Cloacamonas acidaminovorans str. Evry
CP000016 Candidatus Blochmannia pennsylvanicus str. BPEN
CU458896 Mycobacterium abscessus
CP000717 Mycobacterium tuberculosis F11
CP002054 Chlamydia trachomatis D-LC
CP002549 Chlamydophila psittaci 6BC
CP001739 Sebaldella termitidis ATCC 33386
CP001612 Rickettsia africae ESF-5
CP000239 Synechococcus sp. JA-3-3Ab
CP002421 Neisseria meningitidis M01-240149
AE009440 Chlamydophila pneumoniae TW-183
CP001666 Clostridium ljungdahlii DSM 13528
CP001013 Leptothrix cholodnii SP-6
CP001275 Thermomicrobium roseum DSM 5159
CP000487 Campylobacter fetus subsp. fetus 82-40
CP000144 Rhodobacter sphaeroides 2.4.1
CP000949 Pseudomonas putida W619
CP001746 Bacillus cereus biovar anthracis str. CI
CP000555 Methylibium petroleiphilum PM1
AL111168 Campylobacter jejuni subsp. jejuni NCTC 11168 = ATCC 700819
CP002011 Clostridium botulinum F str. 230613
CP001175 Listeria monocytogenes HCC23
FN666575 Erwinia amylovora ATCC 49946
CP000158 Hyphomonas neptunium ATCC 15444
CP001619 Dyadobacter fermentans DSM 18053
CP002104 Gardnerella vaginalis ATCC 14019
CP000730 Staphylococcus aureus subsp. aureus USA300˙TCH1516
CP001677 Candidatus Liberibacter asiaticus str. psy62
CP001215 Bacillus anthracis str. CDC 684
CP000245 Ramlibacter tataouinensis TTB310
FP475956 Thiomonas sp. 3As
CP000482 Pelobacter propionicus DSM 2379
CP001185 Thermosipho africanus TCF52B
CP000671 Haemophilus influenzae PittEE
CP000849 Rickettsia bellii OSU 85-389
FR873482 Streptococcus salivarius JIM8777
AP011156 Acetobacter pasteurianus IFO 3283-32
CM000439 Burkholderia thailandensis E264
CP000024 Streptococcus thermophilus CNRZ1066
CP000394 Granulibacter bethesdensis CGDNIH1
CP002216 Caldicellulosiruptor owensensis OL
CP002522 Acinetobacter baumannii TCDC-AB0715
FP103042 Methylobacterium extorquens DM4
CP002630 Marinithermus hydrothermalis DSM 14884
CP002466 Thermoanaerobacter brockii subsp. finnii Ako-1
CM000770 Rickettsia endosymbiont of Ixodes scapularis
AP009387 Burkholderia multivorans ATCC 17616
AP006841 Bacteroides fragilis YCH46
CP001819 Sanguibacter keddieii DSM 10542
CP000438 Pseudomonas aeruginosa UCBPP-PA14
CP002773 Serratia plymuthica AS9
CP001144 Salmonella enterica subsp. enterica serovar Dublin str. CT˙02021853
144
Appendix
DQ489736 Leuconostoc citreum KM20
CP002113 Capnocytophaga canimorsus Cc5
CP002033 Lactobacillus fermentum CECT 5716
AE013218 Buchnera aphidicola str. Sg (Schizaphis graminum)
CP000312 Clostridium perfringens SM101
CM000743 Bacillus mycoides Rock1-4
FP929039 Coprococcus sp. ART55/1
CP001983 Bacillus megaterium QM B1551
AE004969 Neisseria gonorrhoeae FA 1090
CP000233 Lactobacillus salivarius UCC118
CP002455 Weeksella virosa DSM 16922
AE016853 Pseudomonas syringae pv. tomato str. DC3000
AE017042 Yersinia pestis biovar Microtus str. 91001
CP002459 Brucella melitensis M28
CP000448 Syntrophomonas wolfei subsp. wolfei str. Goettingen
CP002764 Lactobacillus kefiranofaciens ZW3
CP002326 Caldicellulosiruptor kristjanssonii 177R1B
CP002279 Mesorhizobium opportunistum WSM2075
CP002371 Candidatus Liberibacter solanacearum CLso-ZC1
AE017143 Haemophilus ducreyi 35000HP
CP000612 Desulfotomaculum reducens MI-1
CP000012 Helicobacter pylori 51
CP001921 Acinetobacter baumannii 1656-2
CP001854 Conexibacter woesei DSM 14684
CP000884 Delftia acidovorans SPH-1
CP002052 Chlamydia trachomatis D-EC
CP000381 Neisseria meningitidis 053442
CP002083 Hyphomicrobium denitrificans ATCC 51888
CP002329 Mycobacterium sp. JDM601
BX470251 Photorhabdus luminescens subsp. laumondii TTO1
AM494475 Orientia tsutsugamushi str. Boryong
AE003852 Vibrio cholerae O1 biovar El Tor str. N16961
CP001589 Yersinia pestis D182038
CP000759 Ochrobactrum anthropi ATCC 49188
CP001968 Denitrovibrio acetiphilus DSM 12809
CM000741 Bacillus cereus AH1273
CP000001 Bacillus cereus E33L
CP000383 Cytophaga hutchinsonii ATCC 33406
CP000441 Burkholderia ambifaria AMMD
BX548020 Synechococcus sp. WH 8102
CR954247 Pseudoalteromonas haloplanktis TAC125
CP000107 Ehrlichia canis str. Jake
CP001132 Acidithiobacillus ferrooxidans ATCC 53993
BA000026 Mycoplasma penetrans HF-2
CP001063 Shigella boydii CDC 3083-94
BX936398 Yersinia pseudotuberculosis IP 32953
AP010904 Desulfovibrio magneticus RS-1
CP002643 Staphylococcus aureus subsp. aureus T0131
CM000750 Bacillus thuringiensis serovar pakistani str. T13001
CP001339 Thioalkalivibrio sulfidophilus HL-EbGr7
CP001091 Actinobacillus pleuropneumoniae serovar 7 str. AP76
CP000786 Leptospira biflexa serovar Patoc strain ’Patoc 1 (Paris)’
CM000732 Bacillus cereus Rock3-42
AE017282 Methylococcus capsulatus str. Bath
CP000661 Rhodobacter sphaeroides ATCC 17025
CP001561 Neisseria meningitidis alpha710
CP001621 Mycoplasma mycoides subsp. capri str. GM12
CP002286 Bifidobacterium longum subsp. longum BBMN68
CP000716 Thermosipho melanesiensis BI429
CP000414 Leuconostoc mesenteroides subsp. mesenteroides ATCC 8293
CM000753 Bacillus thuringiensis serovar berliner ATCC 10792
AM260479 Ralstonia eutropha H16
FP929050 Roseburia intestinalis XB6B4
CP001129 Streptococcus equi subsp. zooepidemicus MGCS10565
CP002039 Herbaspirillum seropedicae SmR1
CP001678 Hirschia baltica ATCC 49814
CP001720 Desulfotomaculum acetoxidans DSM 771
145
Appendix
CU914168 Ralstonia solanacearum IPO1609
CP001080 Sulfurihydrogenibium sp. YO3AOP1
CP002618 Lactobacillus casei BD-II
FR873481 Streptococcus salivarius CCHSS3
CP002399 Micromonospora sp. L5
CP001052 Burkholderia phytofirmans PsJN
CP001811 Butyrivibrio proteoclasticus B316
AP010889 Bifidobacterium longum subsp. infantis ATCC 15697 = JCM 1222
CP000544 Halorhodospira halophila SL1
CP001078 Clostridium botulinum E3 str. Alaska E43
CP002050 Geobacillus sp. C56-T3
AE017223 Brucella abortus bv. 1 str. 9-941
CP001511 Methylobacterium extorquens AM1
CP001632 Capnocytophaga ochracea DSM 7271
CP000611 Mycobacterium tuberculosis H37Ra
FM177140 Lactobacillus casei BL23
AE017197 Rickettsia typhi str. Wilmington
CP000923 Thermoanaerobacter sp. X514
CP002165 Xylella fastidiosa subsp. fastidiosa GB514
AM260522 Helicobacter acinonychis str. Sheeba
CP000230 Rhodospirillum rubrum ATCC 11170
FM999788 Neisseria meningitidis 8013
BX470248 Bordetella pertussis Tohama I
CP000444 Shewanella sp. MR-7
CP000492 Chlorobium phaeobacteroides DSM 266
AE004091 Pseudomonas aeruginosa PAO1
CP001685 Leptotrichia buccalis C-1013-b
CP001472 Acidobacterium capsulatum ATCC 51196
CP000490 Paracoccus denitrificans PD1222
CP000857 Salmonella enterica subsp. enterica serovar Paratyphi C strain RKS4594
CP001965 Sideroxydans lithotrophicus ES-1
CP000672 Haemophilus influenzae PittGG
CP000156 Lactobacillus delbrueckii subsp. bulgaricus 2038
CP001807 Rhodothermus marinus DSM 4252
CU207366 Gramella forsetii KT0803
CP000259 Streptococcus pyogenes MGAS9429
CP000410 Streptococcus pneumoniae D39
CP001084 Lactobacillus casei str. Zhang
FN563149 Rhodococcus equi 103S
CP001649 Desulfovibrio salexigens DSM 2638
CP001671 Escherichia coli ABU 83972
CP001907 Bacillus thuringiensis serovar chinensis CT-43
CP002870 Pseudomonas putida S16
CP000915 Francisella tularensis subsp. mediasiatica FSC147
CP001829 Corynebacterium pseudotuberculosis C231
AE014299 Shewanella oneidensis MR-1
AE016827 Mannheimia succiniciproducens MBEL55E
CP002637 Selenomonas sputigena ATCC 35185
CP000325 Mycobacterium ulcerans Agy99
AP007255 Magnetospirillum magneticum AMB-1
CP001408 Burkholderia pseudomallei MSHR346
CP002620 Pseudomonas mendocina NK-01
AM711867 Clavibacter michiganensis subsp. michiganensis NCPPB 382
CP000385 Mycobacterium sp. MCS
CP002156 Parvularcula bermudensis HTCC2503
CM000441 Clostridium difficile QCD-66c26
CP000683 Rickettsia massiliae MTU5
CP001085 Candidatus Riesia pediculicola USDA
BX470250 Bordetella bronchiseptica RB50
CP002355 Sulfuricurvum kujiense DSM 16994
CP002899 Weissella koreensis KACC 15510
CP000157 Erythrobacter litoralis HTCC2594
CP002691 Haliscomenobacter hydrossis DSM 1100
FP929046 Faecalibacterium prausnitzii SL3/3
CP001999 Arcobacter nitrofigilis DSM 7299
CP000746 Actinobacillus succinogenes 130Z
CP001681 Pedobacter heparinus DSM 2366
146
Appendix
CP000767 Campylobacter curvus 525.92
CM000717 Bacillus cereus 172560W
CP001924 Dehalococcoides sp. GT
CP001698 Spirochaeta thermophila DSM 6192
CP000152 Burkholderia sp. 383
CP002272 Enterobacter cloacae SCF1
CP001751 Candidatus Puniceispirillum marinum IMCC1322
CP001966 Tsukamurella paurometabola DSM 20162
CP000656 Mycobacterium gilvum PYR-GCK
CP001806 Vibrio sp. Ex25
CP000038 Shigella sonnei Ss046
FR824043 Streptococcus gallolyticus subsp. gallolyticus ATCC BAA-2069
AM408590 Mycobacterium bovis BCG str. Pasteur 1173P2
CP002589 Prevotella denticola F0289
CP000941 Xylella fastidiosa M12
CP000912 Brucella suis ATCC 23445
CP002844 Lactobacillus reuteri SD2112
CP002480 Granulicella tundricola MP5ACTX9
CP001834 Lactococcus lactis subsp. lactis KF147
CP000323 Psychrobacter cryohalolentis K5
AE017262 Listeria monocytogenes serotype 4b str. F2365
FP929054 Ruminococcus obeum A2-162
CP002163 Candidatus Sulcia muelleri CARI
FQ670179 Helicobacter felis ATCC 49179
CP000308 Yersinia pestis Antiqua
CM000488 Bacillus subtilis subsp. subtilis str. NCIB 3610
CP000511 Mycobacterium vanbaalenii PYR-1
CP002114 Staphylococcus aureus subsp. aureus JKD6159
CP000830 Dinoroseobacter shibae DFL 12
AP006627 Bacillus clausii KSM-K16
CP002157 Maribacter sp. HTCC2170
FR871757 Helicobacter bizzozeronii CIII-1
CP000554 Prochlorococcus marinus str. MIT 9303
CP002365 Lactococcus lactis subsp. lactis CV56
CM000730 Bacillus cereus Rock3-28
FM209186 Pseudomonas aeruginosa LESB58
CM000751 Bacillus thuringiensis serovar kurstaki str. T03a001
CU459141 Acinetobacter baumannii AYE
BX908798 Candidatus Protochlamydia amoebophila UWE25
FM204883 Streptococcus equi subsp. equi 4047
FM211688 Listeria monocytogenes L99
CP001010 Polynucleobacter necessarius subsp. necessarius STIR1
CP002815 Propionibacterium acnes 6609
FN667742 Xenorhabdus nematophila ATCC 19061
BA000022 Synechocystis sp. PCC 6803
CP000605 Bifidobacterium longum DJO10A
CM000788 Mycobacterium tuberculosis KZN V2475
CP001344 Cyanothece sp. PCC 7425
CP002106 Olsenella uli DSM 7084
CP001682 Cryptobacterium curtum DSM 15641
CP000116 Thiobacillus denitrificans ATCC 25259
FR870271 Staphylococcus lugdunensis N920143
FP476056 Zobellia galactanivorans
CP002161 Candidatus Zinderia insecticola CARI
CP001662 Mycobacterium tuberculosis KZN 4207
CP000724 Alkaliphilus metalliredigens QYMF
CR543861 Acinetobacter sp. ADP1
CP000009 Gluconobacter oxydans 621H
CP000790 Vibrio harveyi ATCC BAA-1116
CP000829 Streptococcus pyogenes NZ131
CM000662 Escherichia coli O157
FR856861 Novosphingobium sp. PP1Y
CP002429 Lactobacillus helveticus H10
CP001804 Haliangium ochraceum DSM 14365
CP000263 Buchnera aphidicola BCc
CP002918 Candidatus Tremblaya princeps PCVAL
FQ312002 Haemophilus parainfluenzae T3T1
147
Appendix
FP929041 Eubacterium cylindroides T2-87
CP001510 Methylobacterium extorquens AM1
CP002073 Helicobacter pylori SJM180
CP002776 Thioalkalimicrobium cyclicum ALM1
CP001095 Bifidobacterium longum subsp. infantis ATCC 15697 = JCM 1222
CP000513 Dichelobacter nodosus VCS1703A
CP002206 Pantoea vagans C9-1
CP002042 Meiothermus silvanus DSM 9946
CP001606 Bifidobacterium animalis subsp. lactis DSM 10140
AP010890 Bifidobacterium longum subsp. infantis 157F
AM999887 Wolbachia endosymbiont of Culex quinquefasciatus Pel
BA000031 Vibrio parahaemolyticus RIMD 2210633
CP002046 Croceibacter atlanticus HTCC2559
AF222894 Ureaplasma parvum serovar 3 str. ATCC 700970
CP000921 Streptococcus pneumoniae Taiwan19F-14
CP001641 Mycobacterium tuberculosis CCDC5079
CP000518 Mycobacterium sp. KMS
FN538970 Clostridium difficile CD196
AM286690 Alcanivorax borkumensis SK2
AP009049 Clostridium kluyveri NBRC 12016
CM000745 Bacillus pseudomycoides DSM 12442
CP001176 Bacillus cereus B4264
CP000468 Escherichia coli APEC O1
CP002791 Corynebacterium ulcerans BR-AD22
CP002736 Desulfotomaculum carboxydivorans CO-1-SRB
CP000446 Shewanella sp. MR-4
CP002045 Arcanobacterium haemolyticum DSM 20595
FQ312039 Streptococcus pneumoniae SPN032672
CP000113 Myxococcus xanthus DK 1622
FQ312043 Streptococcus pneumoniae SPN034183
AM181176 Pseudomonas fluorescens SBW25
CP000851 Shewanella pealeana ATCC 700345
CP001015 Streptococcus pneumoniae G54
CP001615 Exiguobacterium sp. AT1b
CP000822 Citrobacter koseri ATCC BAA-895
CP002292 Rhodomicrobium vannielii ATCC 17100
CP001029 Methylobacterium populi BJ001
CP000112 Desulfovibrio alaskensis G20
BX927147 Corynebacterium glutamicum ATCC 13032
BX248583 Candidatus Blochmannia floridanus
CP000807 Cyanothece sp. ATCC 51142
AP006716 Staphylococcus haemolyticus JCSC1435
AM180355 Clostridium difficile 630
BA000030 Streptomyces avermitilis MA-4680
CP001147 Thermodesulfovibrio yellowstonii DSM 11347
CP002609 Lactobacillus amylovorus GRL1118
CP002423 Neisseria meningitidis M04-240196
AM946981 Escherichia coli BL21(DE3)
AE017225 Bacillus anthracis str. Sterne
CP001280 Methylocella silvestris BL2
CP000423 Lactobacillus casei ATCC 334
CP002546 Planctomyces brasiliensis DSM 5305
AP008229 Xanthomonas oryzae pv. oryzae MAFF 311018
CP001781 Staphylococcus aureus subsp. aureus ED98
CP000271 Burkholderia xenovorans LB400
FR720602 Streptococcus oralis Uo5
CM000657 Clostridium difficile QCD-97b34
CP002074 Helicobacter pylori PeCan4
FN668941 Clostridium difficile BI1
CP001396 Escherichia coli BW2952
CP000269 Janthinobacterium sp. Marseille
CP000089 Dechloromonas aromatica RCB
CP000303 Bifidobacterium breve UCC2003
CP001349 Methylobacterium nodulans ORS 2060
AE015925 Chlamydophila caviae GPIC
CP002209 Ferrimonas balearica DSM 9799
CR628336 Legionella pneumophila str. Paris
148
Appendix
CP002005 Moraxella catarrhalis BBH18
CP002770 Desulfotomaculum kuznetsovii DSM 6115
CP001875 Pantoea ananatis LMG 20103
CP002332 Helicobacter pylori Gambia94/24
CP002049 Truepera radiovictrix DSM 17093
CP000509 Nocardioides sp. JS614
CP002826 Oligotropha carboxidovorans OM5
CP002573 Acidithiobacillus caldus SM-1
CP000353 Cupriavidus metallidurans CH34
FM179322 Lactobacillus rhamnosus GG
CP000812 Thermotoga lettingae TMO
CP000462 Aeromonas hydrophila subsp. hydrophila ATCC 7966
CP001629 Desulfomicrobium baculatum DSM 4028
CM000740 Bacillus cereus AH1272
BA000016 Clostridium perfringens str. 13
AM412317 Clostridium botulinum A str. ATCC 3502
CP002586 Chlamydophila psittaci 6BC
CP002872 Francisella sp. TX077308
CP002276 Haemophilus influenzae R2846
CP001733 Aggregatibacter actinomycetemcomitans D11S-1
CP000939 Clostridium botulinum B1 str. Okra
AP011170 Acetobacter pasteurianus IFO 3283-12
CT573213 Frankia alni ACN14a
CM000659 Clostridium difficile CIP 107932
CP001079 Anaplasma marginale str. Florida
CP000733 Coxiella burnetii Dugway 5J108-111
CP002301 Buchnera aphidicola str. TLW03 (Acyrthosiphon pisum)
AP010960 Escherichia coli O111
CM000721 Bacillus cereus ATCC 4342
CP001642 Mycobacterium tuberculosis CCDC5180
CP002305 Leadbetterella byssophila DSM 17132
CP002394 Bacillus cellulosilyticus DSM 2522
CP001120 Salmonella enterica subsp. enterica serovar Heidelberg str. SL476
AE009951 Fusobacterium nucleatum subsp. nucleatum ATCC 25586
CP001135 Edwardsiella tarda EIB202
AP010946 Azospirillum sp. B510
CP001637 Escherichia coli DH1
CP001936 Thermoanaerobacter italicus Ab9
CP000013 Borrelia garinii PBi
AP009048 Escherichia coli str. K-12 substr. W3110
CP002131 Thermosediminibacter oceani DSM 16646
CP002032 Thermoanaerobacter mathranii subsp. mathranii str. A3
AE017285 Desulfovibrio vulgaris str. Hildenborough
CP001189 Gluconacetobacter diazotrophicus PAl 5
CP000390 Chelativorans sp. BNC1
CP001785 Ammonifex degensii KC4
AP009179 Sulfurovum sp. NBC37-1
CM000855 Campylobacter jejuni subsp. jejuni 414
CP002076 Helicobacter pylori Cuz20
CP001726 Eggerthella lenta DSM 2243
FN554889 Streptomyces scabiei 87.22
AE004092 Streptococcus pyogenes M1 GAS
CP000976 Borrelia duttonii Ly
CP000736 Staphylococcus aureus subsp. aureus JH1
AM946016 Streptococcus suis P1/7
CP002606 Hippea maritima DSM 10411
CM000787 Mycobacterium tuberculosis KZN 4207
CP000738 Sinorhizobium medicae WSM419
CP000439 Francisella novicida U112
AE000657 Aquifex aeolicus VF5
CP001099 Chlorobaculum parvum NCIB 8327
BX842601 Bdellovibrio bacteriovorus HD100
CP002290 Pseudomonas putida BIRD-1
CP000123 Mycoplasma capricolum subsp. capricolum ATCC 27343
BA000003 Buchnera aphidicola str. APS (Acyrthosiphon pisum)
CP001600 Edwardsiella ictaluri 93-146
AP009153 Gemmatimonas aurantiaca T-27
149
Appendix
CP002340 Streptococcus thermophilus ND03
CP001816 Sulfurospirillum deleyianum DSM 6946
CP002123 Prevotella melaninogenica ATCC 25845
AL645882 Streptomyces coelicolor A3(2)
AE001273 Chlamydia trachomatis D/UW-3/CX
CP001998 Coraliomargarita akajimensis DSM 45221
CP001701 Cyanothece sp. PCC 8802
AM263198 Listeria welshimeri serovar 6b str. SLCC5334
CP000380 Burkholderia cenocepacia AU 1054
AL591688 Sinorhizobium meliloti 1021
CP000771 Fervidobacterium nodosum Rt17-B1
FM211192 Mycobacterium leprae Br4923
CP002349 Marivirga tractuosa DSM 4126
CP002252 Methylovorus sp. MP688
CP002471 Streptococcus parauberis KCTC 11537
AJ965256 Dehalococcoides sp. CBDB1
CP000527 Desulfovibrio vulgaris DP4
CP002607 Aeromonas veronii B565
CP001164 Escherichia coli O157
FQ312041 Streptococcus pneumoniae SPN994038
CP001089 Geobacter lovleyi SZ
CP002221 Hydrogenobacter thermophilus TK-6
CR936503 Lactobacillus sakei subsp. sakei 23K
CP002243 Candidatus Moranella endobia PCIT
CP000766 Rickettsia rickettsii str. Iowa
CM000440 Fusobacterium nucleatum subsp. polymorphum ATCC 10953
CP002176 Streptococcus pneumoniae 670-6B
CP000260 Streptococcus pyogenes MGAS10270
CP000086 Burkholderia thailandensis E264
FP565809 [Clostridium] sticklandii
AM295007 Streptococcus pyogenes str. Manfredo
CP001283 Bacillus cereus AH820
CP000878 Prochlorococcus marinus str. MIT 9211
CP000879 Petrotoga mobilis SJ95
CP000284 Methylobacillus flagellatus KT
CP002511 Candidatus Pelagibacter sp. IMCC9063
CP000083 Colwellia psychrerythraea 34H
CP000925 synthetic Mycoplasma genitalium JCVI-1.0
CP002821 Oligotropha carboxidovorans OM4
AE017220 Salmonella enterica subsp. enterica serovar Choleraesuis str. SC-B67
CP001172 Acinetobacter baumannii AB307-0294
CP002353 Isosphaera pallida ATCC 43644
FM178380 Aliivibrio salmonicida LFI1238
CP001340 Caulobacter crescentus NA1000
CP000463 Rhodopseudomonas palustris BisA53
AP011112 Hydrogenobacter thermophilus TK-6
AL732656 Streptococcus agalactiae NEM316
CP000959 Burkholderia cenocepacia MC0-3
AE017125 Helicobacter hepaticus ATCC 51449
CP001072 Helicobacter pylori Shi470
CP000480 Mycobacterium smegmatis str. MC2 155
CP001992 Mobiluncus curtisii ATCC 43063
CP000232 Moorella thermoacetica ATCC 39073
CM000637 Clostridium difficile QCD-63q42
CP002888 Streptococcus salivarius 57.I
CP001991 Mycoplasma crocodyli MP145
CP002385 Mycobacterium gilvum Spyr1
CP002116 Spirochaeta smaragdinae DSM 11293
CP001655 Dickeya zeae Ech1591
CT971583 Synechococcus sp. WH 7803
CP000503 Shewanella sp. W3-18-1
CU928163 Escherichia coli UMN026
AP011940 Helicobacter pylori F16
CM000287 Clostridium difficile QCD-32g58
CP000880 Salmonella enterica subsp. arizonae serovar 62
CP000848 Rickettsia rickettsii str. ’Sheila Smith’
AM180252 Lawsonia intracellularis PHE/MN1-00
150
Appendix
CP000521 Acinetobacter baumannii ATCC 17978
CP002297 Desulfovibrio vulgaris RCH1
CR767821 Ehrlichia ruminantium str. Welgevonden
FN298497 Lactobacillus johnsonii FI9785
FM954973 Vibrio splendidus LGP32
CP002545 Pedobacter saltans DSM 12145
BA000017 Staphylococcus aureus subsp. aureus Mu50
CP001368 Escherichia coli O157
AP009180 Candidatus Carsonella ruddii PV
FP929060 butyrate-producing bacterium SM4/1
FP929058 Enterococcus sp. 7L76
FP565575 Candidatus Methylomirabilis oxyfera
CP001840 Bifidobacterium bifidum PRL2010
AE008923 Xanthomonas axonopodis pv. citri str. 306
AM747721 Burkholderia cenocepacia J2315
CP001110 Pelodictyon phaeoclathratiforme BU-1
BA000028 Oceanobacillus iheyensis HTE831
AP011121 Acetobacter pasteurianus IFO 3283-01
CP000243 Escherichia coli UTI89
CP000781 Xanthobacter autotrophicus Py2
CP001096 Rhodopseudomonas palustris TIE-1
CP002210 Thermoanaerobacter sp. X513
FN557490 Listeria seeligeri serovar 1/2b str. SLCC3954
CP000817 Lysinibacillus sphaericus C3-41
BX571856 Staphylococcus aureus subsp. aureus MRSA252
FM162591 Photorhabdus asymbiotica
CP000726 Clostridium botulinum A str. ATCC 19397
CP000825 Prochlorococcus marinus str. MIT 9215
CP000356 Sphingopyxis alaskensis RB2256
CP002774 Serratia sp. AS12
CP002102 Brevundimonas subvibrioides ATCC 15264
CP002665 [Cellvibrio] gilvus ATCC 13127
CP000082 Psychrobacter arcticus 273-4
CP000747 Phenylobacterium zucineum HLK1
CP001790 Pectobacterium wasabiae WPP163
CP000050 Xanthomonas campestris pv. campestris str. 8004
CP000474 Arthrobacter aurescens TC1
CP002547 Syntrophobotulus glycolicus DSM 8271
CP002010 Bifidobacterium longum subsp. longum JDM301
CP002071 Helicobacter pylori Sat464
CM000746 Bacillus thuringiensis serovar tochigiensis BGSC 4Y1
CP000319 Nitrobacter hamburgensis X14
CP002512 Aerococcus urinae ACS-120-V-Col10a
CP001127 Salmonella enterica subsp. enterica serovar Schwarzengrund str. CVM19633
CP000993 Borrelia recurrentis A1
FP929048 Megamonas hypermegale ART12/1
CP000481 Acidothermus cellulolyticus 11B
FQ482149 Chlamydophila psittaci RD1
AE009948 Streptococcus agalactiae 2603V/R
AE014184 Tropheryma whipplei str. Twist
CP001644 Ralstonia pickettii 12D
FP929045 Faecalibacterium prausnitzii L2-6
CP000571 Burkholderia pseudomallei 668
CP000507 Shewanella amazonensis SB2B
L43967 Mycoplasma genitalium G37
CP001658 Mycobacterium tuberculosis KZN 1435
CP000776 Campylobacter hominis ATCC BAA-381
CM000833 Burkholderia pseudomallei 1710a
AP008934 Staphylococcus saprophyticus subsp. saprophyticus ATCC 15305
CP002084 Dehalogenimonas lykanthroporepellens BL-DC-9
CP002467 Terriglobus saanensis SP1PR4
FN554766 Escherichia coli 042
AL445566 Mycoplasma pulmonis UAB CTIP
CP000250 Rhodopseudomonas palustris HaA2
CP002454 Deinococcus maricopensis DSM 21211
CP001721 Atopobium parvulum DSM 20469
CP002457 Shewanella putrefaciens 200
151
Appendix
CP001665 Escherichia coli ’BL21-Gold(DE3)pLysS AG’
CP000450 Nitrosomonas eutropha C91
CP002000 Amycolatopsis mediterranei U32
CP000712 Pseudomonas putida F1
CP000753 Shewanella baltica OS185
FN597254 Streptococcus gallolyticus UCN34
CP001602 Listeria monocytogenes 08-5578
CP002850 Zymomonas mobilis subsp. mobilis ATCC 10988
CM000752 Bacillus thuringiensis serovar monterrey BGSC 4AJ1
CP000238 Baumannia cicadellinicola str. Hc (Homalodisca coagulata)
CP002446 Pseudoxanthomonas suwonensis 11-1
CP000526 Burkholderia mallei SAVP1
CP002652 Lactobacillus buchneri NRRL B-30929
CP001431 Neorickettsia risticii str. Illinois
CP001359 Anaeromyxobacter dehalogenans 2CP-1
AE015928 Bacteroides thetaiotaomicron VPI-5482
CP002902 Alicyclobacillus acidocaldarius subsp. acidocaldarius Tc-4-1
BX248333 Mycobacterium bovis AF2122/97
FN692037 Lactobacillus crispatus ST1
AP009351 Staphylococcus aureus subsp. aureus str. Newman
CT978603 Synechococcus sp. RCC307
FP885891 Ralstonia solanacearum PSI07
CP001229 Sulfurihydrogenibium azorense Az-Fu1
AE003849 Xylella fastidiosa 9a5c
CP000687 Actinobacillus pleuropneumoniae serovar 3 str. JL03
AL450380 Mycobacterium leprae TN
BA000037 Vibrio vulnificus YJ016
CP000728 Clostridium botulinum F str. Langeland
CP002433 Pantoea sp. At-9b
CP000964 Klebsiella pneumoniae 342
CP001103 Alteromonas macleodii str. ’Deep ecotype’
CP000922 Anoxybacillus flavithermus WK1
AE009949 Streptococcus pyogenes MGAS8232
AM743169 Stenotrophomonas maltophilia K279a
CP000479 Mycobacterium avium 104
CP002508 Bacillus thuringiensis serovar finitimus YBT-020
CP000469 Shewanella sp. ANA-3
AM039952 Xanthomonas campestris pv. vesicatoria str. 85-10
CP002727 Pseudomonas fulva 12-X
CP002038 Dickeya dadantii 3937
AP011163 Acetobacter pasteurianus IFO 3283-01-42C
CP001827 Dehalococcoides sp. VS
CP000435 Synechococcus sp. CC9311
CP000920 Streptococcus pneumoniae P1031
CP001584 Rickettsia prowazekii Rp22
CP000305 Yersinia pestis Nepal516
CP000860 Candidatus Desulforudis audaxviator MP104C
CP001593 Yersinia pestis Z176003
CP002444 Thermovibrio ammonificans HB-1
CP001055 Elusimicrobium minutum Pei191
CP000478 Syntrophobacter fumaroxidans MPOB
AP011128 Acetobacter pasteurianus IFO 3283-03
CP001226 Candidatus Hodgkinia cicadicola Dsem
CP000891 Shewanella baltica OS195
AP012052 Microbacterium testaceum StLB037
CP000240 Synechococcus sp. JA-2-3B’a(2-13)
CU207211 Herminiimonas arsenicoxydans
AE009952 Yersinia pestis KIM10+
AP011177 Shewanella violacea DSS12
CP001227 Rickettsia peacockii str. Rustic
CP000805 Treponema pallidum subsp. pallidum SS14
CP002352 Bacteroides helcogenes P 36-108
CP001700 Catenulispora acidiphila DSM 44928
CP001874 Thermobispora bispora DSM 43833
CM000660 Clostridium difficile QCD-23m63
CP000431 Rhodococcus jostii RHA1
CR925678 Ehrlichia ruminantium str. Welgevonden
152
Appendix
CP001102 Candidatus Amoebophilus asiaticus 5a2
CR954253 Lactobacillus delbrueckii subsp. bulgaricus ATCC 11842
CP001708 Anaerococcus prevotii DSM 20548
CM000489 Bacillus subtilis subsp. subtilis str. JH642
AM946015 Streptococcus uberis 0140J
CP002017 Kyrpidia tusciae DSM 2912
CP000453 Alkalilimnicola ehrlichii MLHE-1
CP000557 Geobacillus thermodenitrificans NG80-2
CP001363 Salmonella enterica subsp. enterica serovar Typhimurium str. 14028S
CP001219 Acidithiobacillus ferrooxidans ATCC 23270
CP002557 Francisella cf. novicida Fx1
CP002629 Desulfobacca acetoxidans DSM 11109
CM000725 Bacillus cereus BDRD-ST196
CP000934 Cellvibrio japonicus Ueda107
CP002303 Buchnera aphidicola str. JF98 (Acyrthosiphon pisum)
FP929003 Candidatus Nitrospira defluvii
FR845719 Streptomyces venezuelae ATCC 10712
CP002904 Streptococcus equi subsp. zooepidemicus ATCC 35246
AE016879 Bacillus anthracis str. Ames
BX571656 Wolinella succinogenes DSM 1740
CP002775 Serratia sp. AS13
AP012212 Clostridium sp. SY8519
AE007870 Agrobacterium fabrum str. C58
CP000084 Candidatus Pelagibacter ubique HTCC1062
CP001887 Chlamydia trachomatis G/9768
AP011115 Rhodococcus opacus B4
CP000607 Chlorobium phaeovibrioides DSM 265
CM000749 Bacillus thuringiensis serovar sotto str. T04001
CP001743 Meiothermus ruber DSM 1279
BA000007 Escherichia coli O157
CP000485 Bacillus thuringiensis str. Al Hakam
CP000235 Anaplasma phagocytophilum HZ
CP001108 Prosthecochloris aestuarii DSM 271
CP000886 Salmonella enterica subsp. enterica serovar Paratyphi B str. SPB7
CP000261 Streptococcus pyogenes MGAS2096
CP000010 Burkholderia mallei ATCC 23344
CM000722 Bacillus cereus m1550
CP002583 Marinomonas mediterranea MMB-1
CP000961 Shewanella woodyi ATCC 51908
CP000034 Shigella dysenteriae Sd197
CP002452 Nitratifractor salsuginis DSM 16511
CP002808 Mycoplasma haemofelis Ohio2
FR774048 Neisseria meningitidis WUE 2594
CP001849 Gardnerella vaginalis 409-05
CP002859 Runella slithyformis DSM 19594
CP002021 Thiomonas intermedia K12
AE017321 Wolbachia endosymbiont strain TRS of Brugia malayi
CP000936 Streptococcus pneumoniae Hungary19A-6
CP001654 Dickeya dadantii Ech703
BA000039 Thermosynechococcus elongatus BP-1
CP000764 Bacillus cytotoxicus NVH 391-98
CP000142 Pelobacter carbinolicus DSM 2380
CP002696 Treponema brennaborense DSM 12168
CM000719 Bacillus cereus AH621
CP001341 Arthrobacter chlorophenolicus A6
AJ938182 Staphylococcus aureus RF122
CP001683 Saccharomonospora viridis DSM 43017
CP000304 Pseudomonas stutzeri A1501
CP001795 Geobacillus sp. Y412MC61
CP001622 Rhizobium leguminosarum bv. trifolii WSM1325
CP000916 Thermotoga neapolitana DSM 4359
CU914166 Ralstonia solanacearum IPO1609
CP000033 Lactobacillus acidophilus NCFM
CP000668 Yersinia pestis Pestoides F
CP000580 Mycobacterium sp. JLS
CP002896 Amycolatopsis mediterranei S699
CP000655 Polynucleobacter necessarius subsp. asymbioticus QLW-P1DMWA-1
153
Appendix
AM260525 Bartonella tribocorum CIP 105476
CP002738 Methylomonas methanica MC09
CP002735 Delftia sp. Cs1-4
CP001087 Desulfobacterium autotrophicum HRM2
AE016830 Enterococcus faecalis V583
CP001186 Bacillus cereus G9842
CP000027 Dehalococcoides ethenogenes 195
CP000713 Psychrobacter sp. PRwf-1
CP002347 Calditerrivibrio nitroreducens DSM 19672
AE014613 Salmonella enterica subsp. enterica serovar Typhi str. Ty2
AE005673 Caulobacter crescentus CB15
AP010935 Streptococcus dysgalactiae subsp. equisimilis GGS˙124
CP002447 Mesorhizobium ciceri biovar biserrulae WSM1271
AP008226 Thermus thermophilus HB8
CP000053 Rickettsia felis URRWXCal2
CP001161 Buchnera aphidicola str. 5A (Acyrthosiphon pisum)
AP012157 Solibacillus silvestris StLB046
CP000568 Clostridium thermocellum ATCC 27405
CP001846 Escherichia coli O55
CP000896 Acholeplasma laidlawii PG-8A
CP002108 Mycoplasma leachii PG50
CP001016 Beijerinckia indica subsp. indica ATCC 9039
CP002544 Odoribacter splanchnicus DSM 20712
AP009240 Escherichia coli SE11
CP002898 Leuconostoc sp. C2
CP001131 Anaeromyxobacter sp. K
CP001896 Allochromatium vinosum DSM 180
FP565176 Xanthomonas albilineans GPE PC73
FQ312042 Streptococcus pneumoniae SPN033038
FQ312045 Streptococcus pneumoniae SPN034156
CP002638 Verrucosispora maris AB-18-032
CP002274 Mycoplasma hyopneumoniae 168
CP001358 Desulfovibrio desulfuricans subsp. desulfuricans str. ATCC 27774
CP000282 Saccharophagus degradans 2-40
FN995097 Neisseria lactamica 020-06
CP001722 Zymomonas mobilis subsp. mobilis NCIMB 11163
CP002858 Flexistipes sinusarabici DSM 4947
AB370334 Lactobacillus brevis
CP002048 Syntrophothermus lipocalidus DSM 12680
CP000863 Acinetobacter baumannii ACICU
CP001019 Coxiella burnetii CbuG˙Q212
CP001889 Chlamydia trachomatis G/11074
CP000673 Clostridium kluyveri DSM 555
CP001859 Acidaminococcus fermentans DSM 20731
CP000820 Frankia sp. EAN1pec
CP002464 Lactobacillus johnsonii DPC 6026
AL935263 Lactobacillus plantarum WCFS1
CP000255 Staphylococcus aureus subsp. aureus USA300˙FPR3757
CP000538 Campylobacter jejuni subsp. jejuni 81-176
CM000754 Bacillus thuringiensis serovar andalousiensis BGSC 4AW1
CP001111 Stenotrophomonas maltophilia R551-3
CP000103 Nitrosospira multiformis ATCC 25196
AE017244 Mycoplasma hyopneumoniae 7448
CP001630 Actinosynnema mirum DSM 43827
CP001392 Acidovorax ebreus TPSY
AM420293 Saccharopolyspora erythraea NRRL 2338
CP000241 Helicobacter pylori HPAG1
CP001706 Jonesia denitrificans DSM 20603
CP002830 Myxococcus fulvus HW-1
CP000159 Salinibacter ruber DSM 13855
CP002487 Salmonella enterica subsp. enterica serovar Typhimurium str. ST4/74
AE014133 Streptococcus mutans UA159
CP001891 Klebsiella variicola At-22
AE006914 Rickettsia conorii str. Malish 7
AE016828 Coxiella burnetii RSA 493
CP000237 Neorickettsia sennetsu str. Miyayama
CP000127 Nitrosococcus oceani ATCC 19707
154
Appendix
CP002628 Coriobacterium glomerans PW2
AP012211 Eggerthella sp. YY7918
CP000614 Burkholderia vietnamiensis G4
FN543093 Cronobacter turicensis z3032
CP000249 Frankia sp. CcI3
CP002771 Marinomonas posidonica IVIA-Po-181
CP002094 Lactococcus lactis subsp. cremoris NZ9000
CP000901 Yersinia pestis Angola
CP000552 Prochlorococcus marinus str. MIT 9515
CP002008 Caulobacter segnis ATCC 21756
CP001969 Escherichia coli IHE3034
CP000411 Oenococcus oeni PSU-1
CP000628 Agrobacterium radiobacter K84
CP000133 Rhizobium etli CFN 42
CP001839 Thermotoga naphthophila RKU-10
CM000490 Bacillus subtilis subsp. subtilis str. SMY
FN665654 Clostridium difficile 2007855
FQ311875 Arthrobacter arilaitensis Re117
CU928161 Escherichia coli S88
CP002491 Enterococcus faecalis 62
CP002666 Cellulomonas fimi ATCC 484
CP000937 Francisella philomiragia subsp. philomiragia ATCC 25017
CP000408 Streptococcus suis 98HAH33
AE009442 Xylella fastidiosa Temecula1
CP001964 Cellulomonas flavigena DSM 20109
FP929055 Ruminococcus torques L2-14
CP001601 Corynebacterium aurimucosum ATCC 700975
CP002562 Riemerella anatipestifer RA-GD
CP000425 Lactococcus lactis subsp. cremoris SK11
CP001890 Chlamydia trachomatis E/11023
CP000472 Shewanella piezotolerans WP3
CP002027 synthetic Mycoplasma mycoides JCVI-syn1.0
CP000407 Streptococcus suis 05ZYH33
CP002107 Mycoplasma mycoides subsp. mycoides SC str. Gladysdale
FN597644 Bacillus amyloliquefaciens DSM 7
CP002513 Mycoplasma bovis Hubei-1
CP000362 Roseobacter denitrificans OCh 114
AP009044 Corynebacterium glutamicum R
CP001712 Robiginitalea biformata HTCC2501
AM884176 Chlamydia trachomatis 434/Bu
FN650140 Legionella longbeachae NSW150
CP001715 Candidatus Accumulibacter phosphatis clade IIA str. UW-1
AE005176 Lactococcus lactis subsp. lactis Il1403
FQ312004 Bacteroides fragilis 638R
CP001686 Kytococcus sedentarius DSM 20547
CP001977 Propionibacterium acnes SK137
CP001836 Dickeya dadantii Ech586
AP006725 Klebsiella pneumoniae subsp. pneumoniae NTUH-K2044
CP001802 Gordonia bronchialis DSM 43247
CP000061 Aster yellows witches’-broom phytoplasma AYWB
CP000262 Streptococcus pyogenes MGAS10750
AP010953 Escherichia coli O26
CP002622 Pseudomonas stutzeri DSM 4166
CP001830 Sinorhizobium meliloti SM11
FR773526 Clostridium botulinum H04402 065
CP000139 Bacteroides vulgatus ATCC 8482
AP012053 Streptococcus gallolyticus subsp. gallolyticus ATCC 43143
CP002040 Nocardiopsis dassonvillei subsp. dassonvillei DSM 43111
CP001113 Salmonella enterica subsp. enterica serovar Newport str. SL254
AE014292 Brucella suis 1330
AE014074 Streptococcus pyogenes MGAS315
AM889136 Neisseria meningitidis alpha14
CP002440 Neisseria gonorrhoeae TCDC-NG08107
CP002118 Clostridium acetobutylicum EA 2018
CP002424 Neisseria meningitidis NZ-05/33
FR729477 Yersinia enterocolitica subsp. palearctica Y11
CP000447 Shewanella frigidimarina NCIMB 400
155
Appendix
CP000017 Streptococcus pyogenes MGAS5005
FN645454 Bartonella clarridgeiae 73
CP000352 Cupriavidus metallidurans CH34
CP001083 Clostridium botulinum Ba4 str. 657
CP001892 Bifidobacterium animalis subsp. lactis V9
CP000454 Arthrobacter sp. FB24
CP002059 ’Nostoc azollae’ 0708
CP000510 Psychromonas ingrahamii 37
CP001048 Yersinia pseudotuberculosis PB1/+
BX119912 Rhodopirellula baltica SH 1
CP000494 Bradyrhizobium sp. BTAi1
CP002287 Achromobacter xylosoxidans A8
CM000756 Bacillus thuringiensis serovar huazhongensis BGSC 4BD1
CP001823 Sphaerobacter thermophilus DSM 20745
AP006861 Chlamydophila felis Fe/C-56
CP002663 Pusillimonas sp. T7-7
CP001173 Helicobacter pylori G27
FQ859181 Hyphomicrobium sp. MC1
AE008922 Xanthomonas campestris pv. campestris str. ATCC 33913
CP002379 Arthrobacter phenanthrenivorans Sphe3
CP002383 Shewanella baltica OS678
CP002344 Thermaerobacter marianensis DSM 12885
CU928145 Escherichia coli 55989
AE000783 Borrelia burgdorferi B31
FM252031 Streptococcus suis SC84
CP001098 Halothermothrix orenii H 168
CP000783 Cronobacter sakazakii ATCC BAA-894
CP001393 Caldicellulosiruptor bescii DSM 6725
CP001616 Tolumonas auensis DSM 9187
FM179323 Lactobacillus rhamnosus Lc 705
CP001357 Brachyspira hyodysenteriae WA1
CP002343 Intrasporangium calvum DSM 43043
AE007869 Agrobacterium fabrum str. C58
CP001779 Streptobacillus moniliformis DSM 12112
CP002568 Polymorphum gilvum SL003B-26A1
CP002572 Helicobacter pylori 2018
CP001818 Thermanaerovibrio acidaminovorans DSM 6589
AE017263 Mesoplasma florum L1
CP001758 Leuconostoc kimchii IMSNU 11154
CP002801 Frankia symbiont of Datisca glomerata
CM000658 Clostridium difficile QCD-37x79
CP001828 Legionella pneumophila 2300/99 Alcoy
CP002248 Agrobacterium sp. H13-3
AE017198 Lactobacillus johnsonii NCC 533
CP000626 Vibrio cholerae O395
CP002215 Streptococcus dysgalactiae subsp. equisimilis ATCC 12394
CP002903 Spirochaeta thermophila DSM 6578
AE017180 Geobacter sulfurreducens PCA
CP002246 Yersinia enterocolitica subsp. palearctica 105.5R(r)
AL123456 Mycobacterium tuberculosis H37Rv
AM286415 Yersinia enterocolitica subsp. enterocolitica 8081
FN822744 Leuconostoc gasicomitatum LMG 18811
CP000699 Sphingomonas wittichii RW1
CP001825 Thermobaculum terrenum ATCC BAA-798
CP002631 Treponema succinifaciens DSM 2489
CP001236 Vibrio cholerae O395
CP000514 Marinobacter aquaeolei VT8
AE017245 Mycoplasma synoviae 53
CP002453 Cellulophaga algicola DSM 14237
CP002806 Chlamydophila psittaci 02DC15
AE000520 Treponema pallidum subsp. pallidum str. Nichols
CP002431 Desulfovibrio aespoeensis Aspo-2
CM000716 Bacillus cereus BGSC 6E1
AE000513 Deinococcus radiodurans R1
CP002014 Burkholderia sp. CCGE1002
CP000608 Francisella tularensis subsp. tularensis WY96-3418
CP002207 Bacillus atrophaeus 1942
156
Appendix
AE017221 Thermus thermophilus HB27
CP000361 Arcobacter butzleri RM4018
AE002161 Chlamydophila pneumoniae AR39
CP001821 Xylanimonas cellulosilytica DSM 15894
AP009324 Staphylococcus aureus subsp. aureus Mu3
CM000742 Bacillus mycoides DSM 2048
FN869568 Halomonas elongata DSM 2581
CP000560 Bacillus amyloliquefaciens FZB42
AE006468 Salmonella enterica subsp. enterica serovar Typhimurium str. LT2
CP000124 Burkholderia pseudomallei 1710b
CP000686 Roseiflexus sp. RS-1
AL592022 Listeria innocua Clip11262
CP001074 Rhizobium etli CIAT 652
AE000516 Mycobacterium tuberculosis CDC1551
AE006470 Chlorobium tepidum TLS
HE572590 Mycobacterium canettii CIPT 140010059
AM406670 Azoarcus sp. BH72
FN545816 Clostridium difficile R20291
AP006618 Nocardia farcinica IFM 10152
FP929047 Gordonibacter pamelaeae 7-10-1-b
CP001668 Mycoplasma mycoides subsp. capri str. GM12
FP929042 Eubacterium rectale DSM 17629
CP002659 Sphaerochaeta coccoides DSM 17374
AM884177 Chlamydia trachomatis L2b/UCH-1/proctitis
CP000377 Ruegeria sp. TM1040
AM421808 Neisseria meningitidis FAM18
CP000087 Rickettsia bellii RML369-C
AM933172 Salmonella enterica subsp. enterica serovar Enteritidis str. P125109
AL954747 Nitrosomonas europaea ATCC 19718
CP001997 Aminobacterium colombiense DSM 12261
CP002449 Alicycliphilus denitrificans BC
CP001056 Clostridium botulinum B str. Eklund 17B
AM942759 Proteus mirabilis HI4320
CP000542 Verminephrobacter eiseniae EF01-2
CM000733 Bacillus cereus Rock3-44
AP012054 Streptococcus pasteurianus ATCC 43144
CP002360 Mahella australiensis 50-1 BON
CP000908 Methylobacterium extorquens PA1
CP002807 Chlamydophila psittaci 08DC60
AP008955 Brevibacillus brevis NBRC 100599
CP001205 Borrelia burgdorferi ZS7
AE017226 Treponema denticola ATCC 35405
CP002228 Borrelia burgdorferi N40
CP002403 Ruminococcus albus 7
AM746676 Sorangium cellulosum So ce56
CP002479 Geobacter sp. M18
CP001130 Hydrogenobaculum sp. Y04AAS1
AL590842 Yersinia pestis CO92
BK006741 Francisella tularensis subsp. holarctica OSU18
CP000387 Streptococcus sanguinis SK36
CP000153 Sulfurimonas denitrificans DSM 1251
AE014075 Escherichia coli CFT073
CM000715 Bacillus cereus ATCC 10876
CP000056 Streptococcus pyogenes MGAS6180
CP000792 Campylobacter concisus 13826
CP000698 Geobacter uraniireducens Rf4
CP001114 Deinococcus deserti VCD115
CP001608 Yersinia pestis biovar Medievalis str. Harbin 35
AB370337 Lactobacillus brevis
CP001047 Mycoplasma arthritidis 158L3-1
CP000227 Bacillus cereus Q1
CP000744 Pseudomonas aeruginosa PA7
AP009247 Candidatus Vesicomyosocius okutanii HA
CP000927 Caulobacter sp. K31
AE005672 Streptococcus pneumoniae TIGR4
CP000826 Serratia proteamaculans 568
AL157959 Neisseria meningitidis Z2491
157
Appendix
CP001177 Bacillus cereus AH187
CP002184 Helicobacter pylori 908
BA000019 Nostoc sp. PCC 7120
DS995265 Leptospirillum sp. Group II ’5-way CG’
CM000775 Burkholderia pseudomallei 1106b
CP000909 Chloroflexus aurantiacus J-10-fl
FR714927 Staphylococcus aureus subsp. aureus ECT-R 2
CM000912 Aggregatibacter actinomycetemcomitans D7S-1
AB370335 Lactobacillus brevis
AE016826 Buchnera aphidicola str. Bp (Baizongia pistaciae)
CP002541 Sphaerochaeta globus str. Buddy
CP001918 Enterobacter cloacae subsp. cloacae ATCC 13047
FR687359 Burkholderia rhizoxinica HKI 454
AM933173 Salmonella enterica subsp. enterica serovar Gallinarum str. 287/91
CP000267 Rhodoferax ferrireducens T118
CP002417 Variovorax paradoxus EPS
CP000539 Acidovorax sp. JS42
CP002244 Candidatus Tremblaya princeps PCIT
CP000573 Burkholderia pseudomallei 1106a
CP002585 Pseudomonas brassicacearum subsp. brassicacearum NFM421
BX548175 Prochlorococcus marinus str. MIT 9313
CP001993 Streptococcus pneumoniae TCH8431/19A
CP002105 Acetohalobium arabaticum DSM 5501
CP002729 Escherichia coli UMNK88
CR626927 Bacteroides fragilis NCTC 9343
AB370336 Lactobacillus brevis
AP010803 Sphingobium japonicum UT26S
CT009589 Corynebacterium glutamicum
AM942444 Corynebacterium urealyticum DSM 7109
AE008917 Brucella melitensis bv. 1 str. 16M
CP002559 Lactobacillus acidophilus 30SC
CP002563 Carnobacterium sp. 17-4
AP009256 Bifidobacterium adolescentis ATCC 15703
FN668375 Clostridium difficile M68
FN652779 Chlamydia trachomatis Sweden2
CP001101 Chlorobium phaeobacteroides BS1
FN665652 Clostridium difficile CF5
CP002364 Desulfobulbus propionicus DSM 2032
AP012204 Microlunatus phosphovorus NM-1
CP000100 Synechococcus elongatus PCC 7942
AE016824 Leptospira interrogans serovar Copenhageni str. Fiocruz L1-130
CP000141 Carboxydothermus hydrogenoformans Z-2901
FP236843 Erwinia billingiae Eb661
FR872582 Simkania negevensis Z
CP001750 Bifidobacterium dentium Bd1
CM000854 Campylobacter jejuni subsp. jejuni 1336
CP000802 Escherichia coli HS
CM000739 Bacillus cereus AH1271
AM295250 Staphylococcus carnosus subsp. carnosus TM300
CP002377 Vibrio furnissii NCTC 11218
AP009552 Microcystis aeruginosa NIES-843
CU633749 Cupriavidus taiwanensis LMG 19424
CP000800 Escherichia coli E24377A
CP002175 Halanaerobium praevalens DSM 2228
FP929032 Alistipes shahii WAL 8301
CP002418 Rhodopseudomonas palustris DX-1
FN649414 Escherichia coli ETEC H10407
CP001515 Bifidobacterium animalis subsp. lactis Bl-04
CP001107 Eubacterium rectale ATCC 33656
CP000806 Cyanothece sp. ATCC 51142
CP001154 Laribacter hongkongensis HLHK9
FN598874 Helicobacter pylori B8
CP000551 Prochlorococcus marinus str. AS9601
AL513382 Salmonella enterica subsp. enterica serovar Typhi str. CT18
CP002410 Clostridium botulinum BKT015925
CP000094 Pseudomonas fluorescens Pf0-1
CP002031 Geobacter sulfurreducens KN400
158
Appendix
CP002912 Rickettsia heilongjiangensis 054
AP009178 Nitratiruptor sp. SB155-2
CP002740 Sinorhizobium meliloti BL225C
CR848038 Chlamydophila abortus S26/3
CU928158 Escherichia fergusonii ATCC 35469
CP000872 Brucella canis ATCC 23365
CP001312 Rhodobacter capsulatus SB 1003
FR687201 Legionella pneumophila 130b
CP000697 Acidiphilium cryptum JF-5
U00089 Mycoplasma pneumoniae M129
CP002475 Streptomyces flavogriseus ATCC 33331
CU928164 Escherichia coli IAI39
CP000003 Streptococcus pyogenes MGAS10394
CP002633 Streptococcus suis ST3
CP002220 Bifidobacterium bifidum S17
AP008937 Lactobacillus fermentum IFO 3956
CP001842 cyanobacterium UCYN-A
CP002695 Bordetella pertussis CS
CP000266 Shigella flexneri 5 str. 8401
CP002915 Bifidobacterium animalis subsp. lactis CNCM I-2494
CM000734 Bacillus cereus Rock4-2
FP929037 Clostridium cf. saccharolyticum K10
CP002530 Bacteroides salanitronis DSM 18170
CP001614 Teredinibacter turnerae T7901
CM000759 Bacillus thuringiensis IBL 4222
CP002897 Paracoccus denitrificans SD1
CP000903 Bacillus weihenstephanensis KBAB4
CP001673 Flavobacteriaceae bacterium 3519-10
CP000058 Pseudomonas syringae pv. phaseolicola 1448A
CP001429 Blattabacterium sp. (Periplaneta americana) str. BPLAN
AE014073 Shigella flexneri 2a str. 2457T
CP000002 Bacillus licheniformis DSM 13 = ATCC 14580
AE001437 Clostridium acetobutylicum ATCC 824
AL591824 Listeria monocytogenes EGD-e
FQ312006 Haemophilus influenzae 10810
FP671138 Mycoplasma agalactiae
FR875178 Streptococcus thermophilus JIM 8232
AP010918 Mycobacterium bovis BCG str. Tokyo 172
CP001582 Helicobacter pylori v225d
CP001876 Campylobacter jejuni subsp. jejuni IA3902
AM236080 Rhizobium leguminosarum bv. viciae 3841
CM000727 Bacillus cereus 95/8201
CP001001 Methylobacterium radiotolerans JCM 2831
AE015450 Mycoplasma gallisepticum str. R(low)
FM180568 Escherichia coli O127
CP002304 Halanaerobium hydrogeniformans
CP001657 Pectobacterium carotovorum subsp. carotovorum PC1
AP012029 Anaerolinea thermophila UNI-1
CP000647 Klebsiella pneumoniae subsp. pneumoniae MGH 78578
CP000854 Mycobacterium marinum M
AE014295 Bifidobacterium longum NCC2705
CP000351 Leptospira borgpetersenii serovar Hardjo-bovis str. JB197
AP009378 Escherichia coli SE15
AL009126 Bacillus subtilis subsp. subtilis str. 168
AP011529 Deferribacter desulfuricans SSM1
AP008231 Synechococcus elongatus PCC 6301
CP002584 Sphingobacterium sp. 21
CP002790 Corynebacterium ulcerans 809
CP000548 Burkholderia mallei NCTC 10247
CP002109 Clostridium saccharolyticum WM1
CP001579 Brucella microti CCM 4915
CP002029 Campylobacter jejuni subsp. jejuni ICDCCJ07001
CP001982 Bacillus megaterium DSM 319
CP001620 Corynebacterium kroppenstedtii DSM 44385
FM991728 Helicobacter pylori B38
CP000768 Campylobacter jejuni subsp. doylei 269.97
CP000148 Geobacter metallireducens GS-15
159
Appendix
AE008918 Brucella melitensis bv. 1 str. 16M
CP000155 Hahella chejuensis KCTC 2396
FM872308 Chlamydia trachomatis B/Jali20/OT
CP002177 Acinetobacter calcoaceticus PHEA-2
AE001363 Chlamydophila pneumoniae CWL029
CP002056 Methylotenera versatilis 301
CP000919 Streptococcus pneumoniae JJA
CP001888 Chlamydia trachomatis G/11222
CU928162 Escherichia coli ED1a
CP001713 Chlamydophila pneumoniae LPCoLN
CP002432 Desulfurispirillum indicum S5
AE015929 Staphylococcus epidermidis ATCC 12228
CP002420 Neisseria meningitidis H44/76
CP000021 Vibrio fischeri ES114
CP000029 Staphylococcus epidermidis RP62A
CP001699 Chitinophaga pinensis DSM 2588
FP885897 Ralstonia solanacearum CFBP2957
CP001618 Beutenbergia cavernae DSM 12333
AE017355 Bacillus thuringiensis serovar konkukian str. 97-27
CP001390 Geobacter daltonii FRC-32
CP001383 Shigella flexneri 2002017
CP001050 Neisseria gonorrhoeae NCCP11945
CP000947 Haemophilus somnus 2336
160
References
Abe, H. and H. Aiba (1996). “Differential contributions of two elements of rho-independent terminator to transcription termination and mRNA stabilization.”Biochimie 78.11-12, pp. 1035–42 (see pp. 107, 108, 118).
Abrahams, G. L. and M. Hensel (2006). “Manipulating cellular transport and im-mune responses: dynamic interactions between intracellular Salmonella entericaand its host cells.” Cellular Microbiology 8.5, pp. 728–37 (see pp. 23, 27).
AbuOun, M., P. F. Suthers, G. I. Jones, B. R. Carter, M. P. Saunders, C. D. Maranas,M. J. Woodward, and M. F. Anjum (2009). “Genome scale reconstruction ofa Salmonella metabolic model: comparison of similarity and differences witha commensal Escherichia coli strain.” Journal of Biological Chemistry 284.43,pp. 29480–8 (see p. 22).
Achtman, M., K. Zurth, G. Morelli, G. Torrea, A. Guiyoule, and E. Carniel (1999).“Yersinia pestis, the cause of plague, is a recently emerged clone of Yersiniapseudotuberculosis.” Proceedings of the National Academy of Sciences of theUnited States of America 96.24, pp. 14043–8 (see p. xxiii).
Achtman, M. and M. Wagner (2008). “Microbial diversity and the genetic nature ofmicrobial species.” Nature Reviews Microbiology 6.6, pp. 431–40 (see p. xxiii).
Adey, A., H. G. Morrison, Asan, X. Xun, J. O. Kitzman, E. H. Turner, B. Stackhouse,A. P. MacKenzie, N. C. Caruccio, X. Zhang, and J. Shendure (2010). “Rapid,low-input, low-bias construction of shotgun fragment libraries by high-densityin vitro transposition.” Genome Biology 11.12, R119 (see p. 8).
Akerley, B. J., E. J. Rubin, V. L. Novick, K. Amaya, N. Judson, and J. J. Mekalanos(2002). “A genome-scale analysis for identification of genes required for growthor survival of Haemophilus influenzae.” Proceedings of the National Academy ofSciences of the United States of America 99.2, pp. 966–71 (see p. 2).
Altschul, S. F., W. Gish, W. Miller, E. W. Myers, and D. J. Lipman (1990). “Basiclocal alignment search tool.” Journal of Molecular Biology 215.3, pp. 403–10(see p. 67).
Anders, S. and W. Huber (2010). “Differential expression analysis for sequencecount data.” Genome Biology 11.10, R106 (see p. 73).
161
References
Andersson, S. G., A. Zomorodipour, J. O. Andersson, T. Sicheritz-Ponten, U. C.Alsmark, R. M. Podowski, A. K. Naslund, A. S. Eriksson, H. H. Winkler, andC. G. Kurland (1998). “The genome sequence of Rickettsia prowazekii and theorigin of mitochondria.” Nature 396.6707, pp. 133–40 (see p. 26).
Antal, M., V. Bordeau, V. Douchin, and B. Felden (2005). “A small bacterial RNAregulates a putative ABC transporter.” The Journal of Biological Chemistry280.9, pp. 7901–8 (see p. 54).
Arnvig, K. and D. Young (2012). “Non-coding RNA and its potential role inMycobacterium tuberculosis pathogenesis.” RNA Biology 9.4, pp. 427–36 (seep. 16).
Arnvig, K. B., I. Comas, N. R. Thomson, J. Houghton, H. I. Boshoff, N. J. Croucher,G. Rose, T. T. Perkins, J. Parkhill, G. Dougan, and D. B. Young (2011).“Sequence-based analysis uncovers an abundance of non-coding RNA in thetotal transcriptome of Mycobacterium tuberculosis.” PLoS Pathogens 7.11,e1002342 (see p. 124).
Artsimovitch, I. and R. Landick (2002). “The transcriptional regulator RfaHstimulates RNA chain synthesis after recruitment to elongation complexes bythe exposed nontemplate DNA strand.” Cell 109.2, pp. 193–203 (see p. 85).
Aseev, L. V., A. A. Levandovskaya, L. S. Tchufistova, N. V. Scaptsova, and I. V. Boni(2008). “A new regulatory circuit in ribosomal protein operons: S2-mediatedcontrol of the rpsB-tsf expression in vivo.” RNA 14.9, pp. 1882–94 (see p. 54).
Baba, T., T. Ara, M. Hasegawa, Y. Takai, Y. Okumura, M. Baba, K. A. Datsenko,M. Tomita, B. L. Wanner, and H. Mori (2006). “Construction of Escherichia coliK-12 in-frame, single-gene knockout mutants: the Keio collection.” MolecularSystems Biology 2, p. 2006 0008 (see pp. 2, 13, 35, 36, 55).
Barquist, L., C. J. Boinett, and A. K. Cain (2013a). “Approaches to queryingbacterial genomes with high-throughput transposon insertion sequencing.” RNABiology 10.7, pp. 1161–1169 (see pp. xxiii, 1, 28).
Barquist, L., G. C. Langridge, D. J. Turner, M. D. Phan, A. K. Turner, A. Bateman,J. Parkhill, J. Wain, and P. P. Gardner (2013b). “A comparison of dense trans-poson insertion libraries in the Salmonella serovars Typhi and Typhimurium.”Nucleic Acids Research 41.8, pp. 4549–4564 (see pp. xxiv, 6, 8, 13, 19, 21, 133).
Barrick, J. E. and R. R. Breaker (2007). “The distributions, mechanisms, andstructures of metabolite-binding riboswitches.” Genome Biology 8.11, R239 (seepp. 90, 91, 100).
Baumler, A. J. (1997). “The record of horizontal gene transfer in Salmonella.”Trends in Microbiology 5.8, pp. 318–22 (see p. 23).
Baumler, A. J., J. G. Kusters, I. Stojiljkovic, and F. Heffron (1994). “SalmonellaTyphimurium loci involved in survival within macrophages.” Infection andImmunity 62.5, pp. 1623–30 (see p. 81).
162
References
Baumler, A. J., R. M. Tsolis, T. A. Ficht, and L. G. Adams (1998). “Evolutionof host adaptation in Salmonella enterica.” Infection and Immunity 66.10,pp. 4579–87 (see p. 25).
Baumler, A. J., R. M. Tsolis, and F. Heffron (1996). “Contribution of fimbrialoperons to attachment to and invasion of epithelial cell lines by SalmonellaTyphimurium.” Infection and Immunity 64.5, pp. 1862–5 (see p. 62).
Bauwens, L., F. Vercammen, S. Bertrand, J.-M. Collard, and S. De Ceuster (2006).“Isolation of Salmonella from environmental samples collected in the reptiledepartment of Antwerp Zoo using different selective methods.” Journal ofApplied Microbiology 101.2, pp. 284–9 (see p. 22).
Benard, L., C. Philippe, B. Ehresmann, C. Ehresmann, and C. Portier (1996).“Pseudoknot and translational control in the expression of the S15 ribosomalprotein.” Biochimie 78.7, pp. 568–76 (see p. 54).
Bengtsson, M., A. Stahlberg, P. Rorsman, and M. Kubista (2005). “Gene expressionprofiling in single cells from the pancreatic islets of Langerhans reveals lognormaldistribution of mRNA levels.” Genome Research 15.10, pp. 1388–92 (see p. 73).
Benjamini, Y. and Y. Hochberg (1995). “Controlling the false discovery rate: apractical and powerful approach to multiple testing.” Journal of the RoyalStatistical Society, Series B (Methodological), pp. 289–300 (see pp. 75, 110).
Bentley, D. R. et al. (2008). “Accurate whole human genome sequencing usingreversible terminator chemistry.” Nature 456.7218, pp. 53–9 (see p. 11).
Berardinis, V. de et al. (2008). “A complete collection of single-gene deletionmutants of Acinetobacter baylyi ADP1.” Molecular Systems Biology 4, p. 174(see p. 2).
Bhutta, Z. A. and J. Threlfall (2009). “Addressing the global disease burden oftyphoid fever.” JAMA : the Journal of the American Medical Association 302.8,pp. 898–9 (see p. 26).
Bochner, B. R. (2009). “Global phenotypic characterization of bacteria.” FEMSMicrobiology Reviews 33.1, pp. 191–205 (see p. 20).
Bossi, L. and N. Figueroa-Bossi (2007). “A small RNA downregulates LamBmaltoporin in Salmonella.” Molecular Microbiology 65.3, pp. 799–810 (seep. 57).
Bregeon, D., V. Colot, M. Radman, and F. Taddei (2001). “Translational misread-ing: a tRNA modification counteracts a +2 ribosomal frameshift.” Genes &Development 15.17, pp. 2295–306 (see p. 85).
Brenner, F. W., R. G. Villar, F. J. Angulo, R. Tauxe, and B. Swaminathan (2000).“Salmonella nomenclature.” Journal of Clinical Microbiology 38.7, pp. 2465–7(see p. 21).
Briani, F., G. Deho, F. Forti, and D. Ghisotti (2001). “The plasmid status ofsatellite bacteriophage P4.” Plasmid 45.1, pp. 1–17 (see p. 40).
163
References
Brutinel, E. D. and J. A. Gralnick (2012). “Preferential utilization of D-lactateby Shewanella oneidensis.” Applied and Environmental Microbiology 78.23,pp. 8474–6 (see p. 6).
Buchmeier, N. A. and F. Heffron (1989). “Intracellular survival of wild-typeSalmonella Typhimurium and macrophage-sensitive mutants in diverse popula-tions of macrophages.” Infection and Immunity 57.1, pp. 1–7 (see p. 63).
Burge, S. W., J. Daub, R. Eberhardt, J. Tate, L. Barquist, E. P. Nawrocki, S. R.Eddy, P. P. Gardner, and A. Bateman (2013). “Rfam 11.0: 10 years of RNAfamilies.” Nucleic Acids Research 41.D1, pp. D226–32 (see pp. 29, 95).
Burrows, M. and D. J. Wheeler (1994). A block-sorting lossless data compressionalgorithm. Tech. rep. 124. Digital Equipment Corporation (see p. 67).
Cain, A. K. and R. M. Hall (2012). “Evolution of a multiple antibiotic resistanceregion in IncHI1 plasmids: reshaping resistance regions in situ.” The Journal ofAntimicrobial Chemotherapy 67.12, pp. 2848–53 (see p. 27).
Cambray, G., J. C. Guimaraes, V. K. Mutalik, C. Lam, Q.-A. Mai, T. Thimmaiah,J. M. Carothers, A. P. Arkin, and D. Endy (2013). “Measurement and modelingof intrinsic transcription terminators.” Nucleic Acids Research 41.9, pp. 5139–48(see pp. 90, 91, 99, 108, 126, 128).
Carafa, Y. d’Aubenton, E. Brody, and C. Thermes (1990). “Prediction of rho-independent Escherichia coli transcription terminators. A statistical analysis oftheir RNA stem-loop structures.” Journal of Molecular Biology 216.4, pp. 835–58 (see p. 91).
Caspi, R., T. Altman, K. Dreher, C. A. Fulcher, P. Subhraveti, I. M. Keseler, A.Kothari, M. Krummenacker, M. Latendresse, L. A. Mueller, Q. Ong, S. Paley,A. Pujar, A. G. Shearer, M. Travers, D. Weerasinghe, P. Zhang, and P. D.Karp (2012). “The MetaCyc database of metabolic pathways and enzymes andthe BioCyc collection of pathway/genome databases.” Nucleic Acids Research40.Database issue, pp. D742–53 (see p. 78).
CDC (2009). “Salmonella surveillance: Annual summary.” (See p. 27).Chao, Y., K. Papenfort, R. Reinhardt, C. M. Sharma, and J. Vogel (2012). “An atlas
of Hfq-bound transcripts reveals 3’ UTRs as a genomic reservoir of regulatorysmall RNAs.” The EMBO Journal 31.20, pp. 4005–19 (see pp. 54, 55).
Chen, S., E. A. Lesnik, T. A. Hall, R. Sampath, R. H. Griffey, D. J. Ecker, andL. B. Blyn (2002). “A bioinformatics based approach to discover small RNAgenes in the Escherichia coli genome.” BioSystems 65.2-3, pp. 157–77 (seep. 54).
Chen, Y.-J., P. Liu, A. A. K. Nielsen, J. A. N. Brophy, K. Clancy, T. Peterson, andC. A. Voigt (2013). “Characterization of 582 natural and synthetic terminatorsand quantification of their design constraints.” Nature Methods 10.7, pp. 659–64(see pp. 90, 91, 99, 108, 118, 128).
164
References
Chinni, S. V., C. A. Raabe, R. Zakaria, G. Randau, C. H. Hoe, A. Zemann, J. Brosius,T. H. Tang, and T. S. Rozhdestvensky (2010). “Experimental identification andcharacterization of 97 novel npcRNA candidates in Salmonella enterica serovarTyphi.” Nucleic Acids Research 38.17, pp. 5893–908 (see pp. 29, 54, 55).
Chomsky, N. (1959). “On certain formal properties of grammars.” Information andControl 2.2, pp. 137–167 (see p. 95).
Christen, B., E. Abeliuk, J. M. Collier, V. S. Kalogeraki, B. Passarelli, J. A. Coller,M. J. Fero, H. H. McAdams, and L. Shapiro (2011). “The essential genome of abacterium.” Molecular Systems Biology 7, p. 528 (see pp. 5, 8, 13, 16, 28, 36,59).
Citron, M. and H. Schuster (1990). “The c4 repressors of bacteriophages P1 andP7 are antisense RNAs.” Cell 62.3, pp. 591–8 (see p. 58).
Cole, S. T. et al. (2001). “Massive gene decay in the leprosy bacillus.” Nature409.6823, pp. 1007–11 (see p. 26).
Collis, C. M. and R. M. Hall (1995). “Expression of antibiotic resistance genes inthe integrated cassettes of integrons.” Antimicrobial Agents and Chemotherapy39.1, pp. 155–62 (see pp. 125, 126).
Coornaert, A., A. Lu, P. Mandin, M. Springer, S. Gottesman, and M. Guillier(2010). “MicA sRNA links the PhoP regulon to cell envelope stress.” MolecularMicrobiology 76.2, pp. 467–79 (see p. 57).
Corander, J., T. R. Connor, C. A. O’Dwyer, J. S. Kroll, and W. P. Hanage (2012).“Population structure in the Neisseria, and the biological significance of fuzzyspecies.” Interface, Journal of the Royal Society 9.71, pp. 1208–15 (see p. 122).
Crick, F. H. (1966). “Codon–anticodon pairing: the wobble hypothesis.” Journal ofMolecular Biology 19.2, pp. 548–55 (see p. 51).
Cromie, M. J., Y. Shi, T. Latifi, and E. A. Groisman (2006). “An RNA sensor forintracellular Mg(2+).” Cell 125.1, pp. 71–84 (see p. 28).
Croucher, N. J., M. C. Fookes, T. T. Perkins, D. J. Turner, S. B. Marguerat, T.Keane, M. A. Quail, M. He, S. Assefa, J. Bahler, R. A. Kingsley, J. Parkhill,S. D. Bentley, G. Dougan, and N. R. Thomson (2009). “A simple method fordirectional transcriptome sequencing using Illumina technology.” Nucleic AcidsResearch 37.22, e148 (see p. 118).
Croucher, N. J., S. R. Harris, L. Barquist, J. Parkhill, and S. D. Bentley (2012).“A high-resolution view of genome-wide pneumococcal transformation.” PLoSPathogens 8.6, e1002745 (see p. 79).
Crump, J. A., S. P. Luby, and E. D. Mintz (2004). “The global burden of typhoidfever.” Bulletin of the World Health Organization 82.5, pp. 346–53 (see p. 26).
Darwin, K. H. and V. L. Miller (1999). “InvF is required for expression of genesencoding proteins secreted by the SPI1 type III secretion apparatus in SalmonellaTyphimurium.” Journal of Bacteriology 181.16, pp. 4949–54 (see p. 27).
165
References
Datsenko, K. A. and B. L. Wanner (2000). “One-step inactivation of chromosomalgenes in Escherichia coli K-12 using PCR products.” Proceedings of the NationalAcademy of Sciences of the United States of America 97.12, pp. 6640–5 (seep. 2).
Datta, N. (1962). “Transmissible drug resistance in an epidemic strain of Salmonellatyphimurium.” The Journal of Hygiene 60, pp. 301–10 (see p. 27).
De Las Penas, A., L. Connolly, and C. A. Gross (1997). “SigmaE is an essentialsigma factor in Escherichia coli.” Journal of Bacteriology 179.21, pp. 6862–4(see p. 55).
DeJesus, M., Y. J. Zhang, C. M. Sassetti, E. J. Rubin, J. C. Sacchettini, and T. R.Ioerger (2013). “Bayesian analysis of gene essentiality based on sequencing oftransposon insertion libraries.” Bioinformatics (see p. 13).
Deng, W., S. R. Liou, 3. Plunkett G., G. F. Mayhew, D. J. Rose, V. Burland,V. Kodoyianni, D. C. Schwartz, and F. R. Blattner (2003). “Comparativegenomics of Salmonella enterica serovar Typhi strains Ty2 and CT18.” Journalof Bacteriology 185.7, pp. 2330–7 (see p. 27).
Deng, Z., T. Kieser, and D. A. Hopwood (1987). “Activity of a Streptomycestranscriptional terminator in Escherichia coli.” Nucleic Acids Research 15.6,pp. 2665–2675 (see p. 107).
Dillies, M.-A., A. Rau, J. Aubert, C. Hennequet-Antier, M. Jeanmougin, N. Servant,C. Keime, G. Marot, D. Castel, J. Estelle, G. Guernec, B. Jagla, L. Jouneau, D.Laloe, C. Le Gall, B. Schaeffer, S. Le Crom, M. Guedj, F. Jaffrezic, and on behalfof The French StatOmique Consortium (2012). “A comprehensive evaluationof normalization methods for Illumina high-throughput RNA sequencing dataanalysis.” Briefings in Bioinformatics (see p. 72).
Dillon, S. C., A. D. Cameron, K. Hokamp, S. Lucchini, J. C. Hinton, and C. J.Dorman (2010). “Genome-wide analysis of the H-NS and Sfh regulatory networksin Salmonella Typhimurium identifies a plasmid-encoded transcription silencingmechanism.” Molecular Microbiology 76.5, pp. 1250–65 (see p. 46).
Diwa, A., A. L. Bricker, C. Jain, and J. G. Belasco (2000). “An evolutionarilyconserved RNA stem-loop functions as a sensor that directs feedback regulationof RNase E gene expression.” Genes & Development 14.10, pp. 1249–60 (seep. 54).
Doolittle, R. F., D. F. Feng, S. Tsang, G. Cho, and E. Little (1996). “Determiningdivergence times of the major kingdoms of living organisms with a proteinclock.” Science 271.5248, pp. 470–7 (see pp. xxiii, 22).
Doolittle, W. F. and O. Zhaxybayeva (2009). “On the origin of prokaryotic species.”Genome Research 19.5, pp. 744–56 (see p. xxiii).
Douchin, V., C. Bohn, and P. Bouloc (2006). “Down-regulation of porins by asmall RNA bypasses the essentiality of the regulated intramembrane proteolysis
166
References
protease RseP in Escherichia coli.” The Journal of Biological Chemistry 281.18,pp. 12253–9 (see p. 54).
Doyle, M., M. Fookes, A. Ivens, M. W. Mangan, J. Wain, and C. J. Dorman (2007).“An H-NS-like stealth protein aids horizontal DNA transmission in bacteria.”Science 315.5809, pp. 251–2 (see p. 46).
Dziva, F., P. M. van Diemen, M. P. Stevens, A. J. Smith, and T. S. Wallis (2004).“Identification of Escherichia coli O157 : H7 genes influencing colonization of thebovine gastrointestinal tract using signature-tagged mutagenesis.” Microbiology150.Pt 11, pp. 3631–45 (see p. 12).
Echols, H. (1971). “Lysogeny: viral repression and site-specific recombination.”Annual Review of Biochemistry 40, pp. 827–54 (see p. 38).
Eckert, S. E., F. Dziva, R. R. Chaudhuri, G. C. Langridge, D. J. Turner, D. J.Pickard, D. J. Maskell, N. R. Thomson, and M. P. Stevens (2011). “Retrospectiveapplication of transposon-directed insertion site sequencing to a library ofsignature-tagged mini-Tn5Km2 mutants of Escherichia coli O157:H7 screenedin cattle.” Journal of Bacteriology 193.7, pp. 1771–6 (see pp. 5, 12).
Eddy, S. R. (1998). “Profile hidden Markov models.” Bioinformatics 14.9, pp. 755–63 (see p. 93).
Eddy, S. R. and R. Durbin (1994). “RNA sequence analysis using covariancemodels.” Nucleic Acids Research 22.11, pp. 2079–88 (see p. 93).
Eddy, S. R. (2008). “A probabilistic model of local sequence alignment that simplifiesstatistical significance estimation.” PLoS Computational Biology 4.5, e1000069(see p. 115).
Eddy, S. R. (2011). “Accelerated profile HMM searches.” PLoS ComputationalBiology 7.10, e1002195 (see p. 95).
Edwards, M. F. and B. A. Stocker (1988). “Construction of delta aroA his deltapur strains of Salmonella Typhi.” Journal of Bacteriology 170.9, pp. 3991–5(see p. 49).
Enright, A. J., S. Van Dongen, and C. A. Ouzounis (2002). “An efficient algorithmfor large-scale detection of protein families.” Nucleic Acids Research 30.7,pp. 1575–84 (see pp. 109, 112, 113, 116).
Eriksson, S., S. Lucchini, A. Thompson, M. Rhen, and J. C. D. Hinton (2003).“Unravelling the biology of macrophage infection by gene expression profiling ofintracellular Salmonella enterica.” Molecular Microbiology 47.1, pp. 103–18 (seepp. 62, 80).
Ermolaeva, M. D., H. G. Khalak, O. White, H. O. Smith, and S. L. Salzberg(2000). “Prediction of transcription terminators in bacterial genomes.” Journalof Molecular Biology 301.1, pp. 27–33 (see p. 91).
Faucher, S. P., S. Porwollik, C. M. Dozois, M. McClelland, and F. Daigle (2006).“Transcriptome of Salmonella enterica serovar Typhi within macrophages re-
167
References
vealed through the selective capture of transcribed sequences.” Proceedingsof the National Academy of Sciences of the United States of America 103.6,pp. 1906–11 (see p. 63).
Feasey, N. A., G. Dougan, R. A. Kingsley, R. S. Heyderman, and M. A. Gordon(2012). “Invasive non-typhoidal Salmonella disease: an emerging and neglectedtropical disease in Africa.” Lancet 379.9835, pp. 2489–99 (see pp. xxiii, 26).
Fedurco, M., A. Romieu, S. Williams, I. Lawrence, and G. Turcatti (2006). “BTA, anovel reagent for DNA attachment on glass and efficient generation of solid-phaseamplified DNA colonies.” Nucleic Acids Research 34.3, e22 (see p. 11).
Fields, P. I., R. V. Swanson, C. G. Haidaris, and F. Heffron (1986). “Mutantsof Salmonella Typhimurium that cannot survive within the macrophage areavirulent.” Proceedings of the National Academy of Sciences of the United Statesof America 83.14, pp. 5189–93 (see p. 62).
Figueira, R. and D. W. Holden (2012). “Functions of the Salmonella pathogenicityisland 2 (SPI-2) type III secretion system effectors.” Microbiology 158.Pt 5,pp. 1147–61 (see pp. 62, 64).
Finlay, B. B. and P. Cossart (1997). “Exploitation of mammalian host cell functionsby bacterial pathogens.” Science 276.5313, pp. 718–25 (see p. xxiii).
Finn, R. D., J. Clements, and S. R. Eddy (2011). “HMMER web server: interactivesequence similarity searching.” Nucleic Acids Research 39.Web Server issue,W29–37 (see pp. 29, 39, 40).
Fisher, R. A. (1941). “The negative binomial distribution.” Annals of Eugenics11.1, pp. 182–187 (see p. 73).
Fookes, M. et al. (2011). “Salmonella bongori provides insights into the evolutionof the Salmonellae.” PLoS Pathogens 7.8, e1002191 (see p. 23).
Forest, C. G., E. Ferraro, S. C. Sabbagh, and F. Daigle (2010). “Intracellular survivalof Salmonella enterica serovar Typhi in human macrophages is independent ofSalmonella pathogenicity island (SPI)-2.” Microbiology 156.Pt 12, pp. 3689–98(see pp. 63, 82).
Forti, F., I. Dragoni, F. Briani, G. Deho, and D. Ghisotti (2002). “Characterizationof the small antisense CI RNA that regulates bacteriophage P4 immunity.”Journal of Molecular Biology 315.4, pp. 541–9 (see p. 40).
Frank, D. N. and N. R. Pace (1998). “Ribonuclease P: unity and diversity in atRNA processing ribozyme.” Annual Review of Biochemistry 67, pp. 153–80(see p. 54).
Frank, S., F. Schmidt, J. Klockgether, C. F. Davenport, M. Gesell Salazar, U.Volker, and B. Tummler (2011). “Functional genomics of the initial phase ofcold adaptation of Pseudomonas putida KT2440.” FEMS Microbiology Letters318.1, pp. 47–54 (see p. 125).
168
References
Fraser, C. M. et al. (1995). “The minimal gene complement of Mycoplasma genital-ium.” Nature 270.5235, pp. 397–404 (see p. 26).
Freeman, J. A., M. E. Ohl, and S. I. Miller (2003). “The Salmonella entericaserovar Typhimurium translocated effectors SseJ and SifB are targeted to theSalmonella-containing vacuole.” Infection and Immunity 71.1, pp. 418–27 (seepp. 44, 46).
Freyhult, E., V. Moulton, and P. Gardner (2005). “Predicting RNA structure usingmutual information.” Applied Bioinformatics 4.1, pp. 53–9 (see p. 117).
Frye, S. A., M. Nilsen, T. Tønjum, and O. H. Ambur (2013). “Dialects of the DNAuptake sequence in Neisseriaceae.” PLoS Genetics 9.4, e1003458 (see p. 123).
Gallagher, L. A., J. Shendure, and C. Manoil (2011). “Genome-scale identificationof resistance functions in Pseudomonas aeruginosa using Tn-seq.” mBio 2.1,e00315–10 (see pp. 5, 7, 9–11, 14, 58).
Gardner, P. P., L. Barquist, A. Bateman, E. P. Nawrocki, and Z. Weinberg (2011).“RNIE: genome-wide prediction of bacterial intrinsic terminators.” Nucleic AcidsResearch 39.14, pp. 5845–5852 (see pp. xxiv, 89, 90, 100, 102, 104, 113, 124).
Gardner, P. P., J. Daub, J. G. Tate, E. P. Nawrocki, D. L. Kolbe, S. Lindgreen,A. C. Wilkinson, R. D. Finn, S. Griffiths-Jones, S. R. Eddy, and A. Bateman(2009). “Rfam: updates to the RNA families database.” Nucleic Acids Research37.Database issue, pp. D136–40 (see p. 96).
Gawronski, J. D., S. M. Wong, G. Giannoukos, D. V. Ward, and B. J. Akerley(2009). “Tracking insertion mutants within libraries by deep sequencing and agenome-wide screen for Haemophilus genes required in the lung.” Proceedingsof the National Academy of Sciences of the United States of America 106.38,pp. 16422–7 (see pp. 4, 7–9, 14, 58).
Gene Ontology Consortium (2013). “Gene Ontology annotations and resources.”Nucleic Acids Research 41.Database issue, pp. D530–5 (see p. 78).
Gerdes, S. Y. et al. (2003). “Experimental determination and system level analysisof essential genes in Escherichia coli MG1655.” Journal of Bacteriology 185.19,pp. 5673–84 (see p. 36).
Gibson, D. G. et al. (2010). “Creation of a bacterial cell controlled by a chemicallysynthesized genome.” Science 329.5987, pp. 52–6 (see p. 2).
Gilbreath, J. J., J. Colvocoresses Dodds, P. D. Rick, M. J. Soloski, D. S. Merrell, andE. S. Metcalf (2012). “Enterobacterial common antigen mutants of Salmonellaenterica serovar Typhimurium establish a persistent infection and provideprotection against subsequent lethal challenge.” Infection and Immunity 80.1,pp. 441–50 (see p. 85).
Glass, J. I., N. Assad-Garcia, N. Alperovich, S. Yooseph, M. R. Lewis, M. Maruf,3. Hutchison C. A., H. O. Smith, and J. C. Venter (2006). “Essential genes of a
169
References
minimal bacterium.” Proceedings of the National Academy of Sciences of theUnited States of America 103.2, pp. 425–30 (see p. 13).
Goodman, A. L., N. P. McNulty, Y. Zhao, D. Leip, R. D. Mitra, C. A. Lozupone,R. Knight, and J. I. Gordon (2009). “Identifying genetic determinants neededto establish a human gut symbiont in its habitat.” Cell Host & Microbe 6.3,pp. 279–89 (see pp. 4, 7, 9, 11, 13, 15, 19).
Goodman, A. L., M. Wu, and J. I. Gordon (2011). “Identifying microbial fitnessdeterminants by insertion sequencing using genome-wide transposon mutantlibraries.” Nature Protocols 6.12, pp. 1969–80 (see pp. 7, 9).
Goodman, S. D. and J. J. Scocca (1988). “Identification and arrangement of theDNA sequence recognized in specific transformation of Neisseria gonorrhoeae.”Proceedings of the National Academy of Sciences of the United States of America85.18, pp. 6982–6 (see p. 123).
Goryshin, I. Y. and W. S. Reznikoff (1998). “Tn5 in vitro transposition.” TheJournal of Biological Chemistry 273.13, pp. 7367–74 (see p. 8).
Green, B., C. Bouchier, C. Fairhead, N. L. Craig, and B. P. Cormack (2012).“Insertion site preference of Mu, Tn5, and Tn7 transposons.” Mobile DNA 3.1,p. 3 (see p. 8).
Griffin, J. E., J. D. Gawronski, M. A. Dejesus, T. R. Ioerger, B. J. Akerley, and C. M.Sassetti (2011). “High-resolution phenotypic profiling defines genes essentialfor mycobacterial growth and cholesterol catabolism.” PLoS Pathogens 7.9,e1002251 (see pp. 5, 12–14, 58).
Griffiths-Jones, S. (2005). “RALEE–RNA ALignment editor in Emacs.” Bioinfor-matics 21.2, pp. 257–9 (see pp. 96, 104, 110, 116).
Grimont, P. A. and F.-X. Weill (2007). “Antigenic formulae of the Salmonellaserovars.” WHO Collaborating Centre for Reference and Research on Salmonella,Institut Pasteur, Paris, France (see p. 23).
Gulig, P. A. and R. Curtiss (1987). “Plasmid-associated virulence of SalmonellaTyphimurium.” Infection and Immunity 55.12, pp. 2891–901 (see p. 27).
Gulig, P. A., H. Danbara, D. G. Guiney, A. J. Lax, F. Norel, and M. Rhen (1993).“Molecular analysis of spv virulence genes of the Salmonella virulence plasmids.”Molecular microbiology 7.6, pp. 825–30 (see p. 27).
Haft, D. H., J. D. Selengut, R. A. Richter, D. Harkins, M. K. Basu, and E. Beck(2013). “TIGRFAMs and Genome Properties in 2013.” Nucleic Acids Research41.Database issue, pp. D387–95 (see p. 78).
Hall, R. M. (2012). “Integrons and gene cassettes: hotspots of diversity in bacterialgenomes.” Annals of the New York Academy of Sciences 1267, pp. 71–8 (seep. 125).
170
References
Hamada, M., K. Sato, H. Kiryu, T. Mituyama, and K. Asai (2009). “CentroidAlign:fast and accurate aligner for structured RNAs by maximizing expected sum-of-pairs score.” Bioinformatics 25.24, pp. 3236–43 (see pp. 110, 116).
Hamilton, H. L. and J. P. Dillard (2006). “Natural transformation of Neisseriagonorrhoeae: from DNA donation to homologous recombination.” Mol Microbiol59.2, pp. 376–85 (see p. 122).
Hamilton, H. L., N. M. Domınguez, K. J. Schwartz, K. T. Hackett, and J. P. Dillard(2005). “Neisseria gonorrhoeae secretes chromosomal DNA via a novel type IVsecretion system.” Molecular Microbiology 55.6, pp. 1704–21 (see p. 122).
Hashimoto, M., T. Ichimura, H. Mizoguchi, K. Tanaka, K. Fujimitsu, K. Keyamura,T. Ote, T. Yamakawa, Y. Yamazaki, H. Mori, T. Katayama, and J. Kato (2005).“Cell size and nucleoid organization of engineered Escherichia coli cells with areduced genome.” Molecular Microbiology 55.1, pp. 137–49 (see p. 36).
Hautefort, I., A. Thompson, S. Eriksson-Ygberg, M. L. Parker, S. Lucchini, V.Danino, R. J. M. Bongaerts, N. Ahmad, M. Rhen, and J. C. D. Hinton (2008).“During infection of epithelial cells Salmonella enterica serovar Typhimuriumundergoes a time-dependent transcriptional adaptation that results in simulta-neous expression of three type 3 secretion systems.” Cellular Microbiology 10.4,pp. 958–84 (see pp. 62, 80).
Hebrard, M., C. Kroger, S. Srikumar, A. Colgan, K. Handler, and J. Hinton (2012).“sRNAs and the virulence of Salmonella enterica serovar Typhimurium.” RNABiology 9.4 (see pp. 28, 81).
Henkin, T. M. and C. Yanofsky (2002). “Regulation by transcription attenua-tion in bacteria: how RNA provides instructions for transcription termina-tion/antitermination decisions.” Bioessays 24.8, pp. 700–7 (see pp. 90, 91).
Hensel, M., J. E. Shea, A. J. Baumler, C. Gleeson, F. Blattner, and D. W. Holden(1997). “Analysis of the boundaries of Salmonella pathogenicity island 2 andthe corresponding chromosomal region of Escherichia coli K-12.” Journal ofBacteriology 179.4, pp. 1105–11 (see p. 46).
Hensel, M., J. E. Shea, C. Gleeson, M. D. Jones, E. Dalton, and D. W. Holden(1995). “Simultaneous identification of bacterial virulence genes by negativeselection.” Science 269.5222, pp. 400–3 (see p. 3).
Hensel, M., J. E. Shea, S. R. Waterman, R. Mundy, T. Nikolaus, G. Banks, A.Vazquez-Torres, C. Gleeson, F. C. Fang, and D. W. Holden (1998). “Genesencoding putative effector proteins of the type III secretion system of Salmonellapathogenicity island 2 are required for bacterial virulence and proliferation inmacrophages.” Molecular Microbiology 30.1, pp. 163–74 (see p. 46).
Hensel, M. (2004). “Evolution of pathogenicity islands of Salmonella enterica.”International Journal of Medical Microbiology 294.2-3, pp. 95–102 (see p. 22).
171
References
Heras, B., S. R. Shouldice, M. Totsika, M. J. Scanlon, M. A. Schembri, and J. L.Martin (2009). “DSB proteins and bacterial pathogenicity.” Nature ReviewsMicrobiology 7.3, pp. 215–25 (see p. 85).
Hilbert, F., F. Smulders, R. Chopra-Dewasthaly, and P. Paulsen (2012). “Salmonellain the wildlife-human interface.” Food Research International 45.2, pp. 603–608(see p. 23).
Hirose, K., T. Ezaki, M. Miyake, T. Li, A. Q. Khan, Y. Kawamura, H. Yokoyama,and T. Takami (1997). “Survival of Vi-capsulated and Vi-deleted Salmonella Ty-phi strains in cultured macrophage expressing different levels of CD14 antigen.”FEMS Microbiology Letters 147.2, pp. 259–65 (see pp. 76, 86).
Hobbs, E. C., J. L. Astarita, and G. Storz (2010). “Small RNAs and small proteinsinvolved in resistance to cell envelope stress and acid shock in Escherichiacoli : analysis of a bar-coded mutant collection.” Journal of Bacteriology 192.1,pp. 59–67 (see pp. 2, 59).
Hofacker, I. L., W. Fontana, P. F. Stadler, L. S. Bonhoeffer, M. Tacker, and P.Schuster (1994). “Fast folding and comparison of RNA secondary structures.”Monatshefte fur Chemie/Chemical Monthly 125.2, pp. 167–188 (see p. 104).
Holt, K. E., J. Parkhill, C. J. Mazzoni, P. Roumagnac, F. X. Weill, I. Goodhead,R. Rance, S. Baker, D. J. Maskell, J. Wain, C. Dolecek, M. Achtman, andG. Dougan (2008). “High-throughput sequencing provides insights into genomevariation and evolution in Salmonella Typhi.” Nature Genetics 40.8, pp. 987–93(see p. 27).
Holt, K. E., Y. Y. Teo, H. Li, S. Nair, G. Dougan, J. Wain, and J. Parkhill (2009).“Detecting SNPs and estimating allele frequencies in clonal bacterial populationsby sequencing pooled DNA.” Bioinformatics 25.16, pp. 2074–5 (see pp. 26, 27,38).
Holt, K. E., N. R. Thomson, J. Wain, M. D. Phan, S. Nair, R. Hasan, Z. A. Bhutta,M. A. Quail, H. Norbertczak, D. Walker, G. Dougan, and J. Parkhill (2007).“Multidrug-resistant Salmonella enterica serovar paratyphi A harbors IncHI1plasmids similar to those found in serovar typhi.” Journal of Bacteriology 189.11,pp. 4257–64 (see p. 27).
Homer, N., B. Merriman, and S. F. Nelson (2009). “BFAST: an alignment tool forlarge scale genome resequencing.” PLoS One 4.11, e7767 (see p. 111).
Honer zu Siederdissen, C. and I. L. Hofacker (2010). “Discriminatory power of RNAfamily models.” Bioinformatics 26.18, pp. i453–9 (see p. 113).
Hoon, M. J. L. de, Y. Makita, K. Nakai, and S. Miyano (2005). “Predictionof transcriptional terminators in Bacillus subtilis and related species.” PLoSComputational Biology 1.3, e25 (see pp. 91, 95, 99).
172
References
Høvik, H., W.-H. Yu, I. Olsen, and T. Chen (2012). “Comprehensive transcriptomeanalysis of the periodontopathogenic bacterium Porphyromonas gingivalis W83.”Journal of Bacteriology 194.1, pp. 100–14 (see p. 119).
Hutchison, C. A., S. N. Peterson, S. R. Gill, R. T. Cline, O. White, C. M. Fraser,H. O. Smith, and J. C. Venter (1999). “Global transposon mutagenesis and aminimal Mycoplasma genome.” Science 286.5447, pp. 2165–9 (see pp. 3, 4, 12).
Ingham, C. J., I. S. Hunter, and M. C. Smith (1995). “Rho-independent terminatorswithout 3 poly-U tails from the early region of actinophage øC31.” NucleicAcids Research 23.3, pp. 370–376 (see p. 107).
Isabella, V. M. and V. L. Clark (2011). “Deep sequencing-based analysis of theanaerobic stimulon in Neisseria gonorrhoeae.” BMC Genomics 12, p. 51 (seepp. 119, 123).
Iyer, L. M., M. M. Babu, and L. Aravind (2006). “The HIRAN domain andrecruitment of chromatin remodeling and repair activities to damaged DNA.”Cell Cycle 5.7, pp. 775–82 (see p. 41).
Iyer, L. M., E. V. Koonin, and L. Aravind (2004). “Evolution of bacterial RNApolymerase: implications for large-scale bacterial phylogeny, domain accretion,and horizontal gene transfer.” Gene 335, pp. 73–88 (see p. 121).
Jacobs, M. A., A. Alwood, I. Thaipisuttikul, D. Spencer, E. Haugen, S. Ernst, O.Will, R. Kaul, C. Raymond, R. Levy, L. Chun-Rong, D. Guenthner, D. Bovee,M. V. Olson, and C. Manoil (2003). “Comprehensive transposon mutant libraryof Pseudomonas aeruginosa.” Proceedings of the National Academy of Sciencesof the United States of America 100.24, pp. 14339–44 (see pp. 2, 13).
Jacquier, H., C. Zaoui, M.-J. Sanson-le Pors, D. Mazel, and B. Bercot (2009).“Translation regulation of integrons gene cassette expression by the attC sites.”Molecular Microbiology 72.6, pp. 1475–1486 (see p. 125).
Johnsborg, O., V. Eldholm, and L. S. Havarstein (2007). “Natural genetic trans-formation: prevalence, mechanisms and function.” Research in Microbiology158.10, pp. 767–78 (see p. 8).
Jones, A. M., A. Goodwill, and T. Elliott (2006). “Limited role for the DsrA andRprA regulatory RNAs in rpoS regulation in Salmonella enterica.” Journal ofBacteriology 188.14, pp. 5077–88 (see p. 57).
Jørgensen, B. B., M. F. Isaksen, and H. W. Jannasch (1992). “Bacterial sulfatereduction above 100◦C in deep-sea hydrothermal vent sediments.” Science258.5089, pp. 1756–7 (see p. xxiii).
Juang, B.-H. and L. Rabiner (1985). “A probabilistic distance measure for hiddenMarkov models.” AT&T Technical Journal 64.2, pp. 391–408 (see p. 115).
Kanehisa, M., S. Goto, Y. Sato, M. Furumichi, and M. Tanabe (2012). “KEGG forintegration and interpretation of large-scale molecular data sets.” Nucleic AcidsResearch 40.Database issue, pp. D109–14 (see pp. 78, 82).
173
References
Kang, Y., T. Durfee, J. D. Glasner, Y. Qiu, D. Frisch, K. M. Winterberg, andF. R. Blattner (2004). “Systematic mutagenesis of the Escherichia coli genome.”Journal of Bacteriology 186.15, pp. 4921–30 (see p. 36).
Kaper, J. B., J. P. Nataro, and H. L. Mobley (2004). “Pathogenic Escherichia coli.”Nature Reviews Microbiology 2.2, pp. 123–40 (see p. 22).
Karlin, S. and S. F. Altschul (1990). “Methods for assessing the statistical sig-nificance of molecular sequence features by using general scoring schemes.”Proceedings of the National Academy of Sciences of the United States of America87.6, pp. 2264–8 (see p. 115).
Katoh, K. and H. Toh (2008). “Improved accuracy of multiple ncRNA alignment byincorporating structural information into a MAFFT-based framework.” BMCBioinformatics 9, p. 212 (see pp. 110, 116).
Kawano, M., S. Kanaya, T. Oshima, Y. Masuda, T. Ara, and H. Mori (2002).“Distribution of repetitive sequences on the leading and lagging strands of theEscherichia coli genome: comparative study of Long Direct Repeat (LDR)sequences.” DNA Research 9.1, pp. 1–10 (see p. 55).
Khan, S. A., R. Stratford, T. Wu, N. McKelvie, T. Bellaby, Z. Hindle, K. A. Sinha, S.Eltze, P. Mastroeni, D. Pickard, G. Dougan, S. N. Chatfield, and F. R. Brennan(2003). “Salmonella typhi and S. typhimurium derivatives harbouring deletionsin aromatic biosynthesis and Salmonella Pathogenicity Island-2 (SPI-2) genesas vaccines and vectors.” Vaccine 21.5-6, pp. 538–48 (see p. 63).
Khatiwara, A., T. Jiang, S. S. Sung, T. Dawoud, J. N. Kim, D. Bhattacharya, H. B.Kim, S. C. Ricke, and Y. M. Kwon (2012). “Genome scanning for conditionallyessential genes in Salmonella enterica serotype Typhimurium.” Applied andEnvironmental Microbiology 78.9, pp. 3098–107 (see pp. 5, 14).
Khatri, P., M. Sirota, and A. J. Butte (2012). “Ten years of pathway analysis:current approaches and outstanding challenges.” PLoS Computational Biology8.2, e1002375 (see p. 79).
Kidgell, C., U. Reichard, J. Wain, B. Linz, M. Torpdahl, G. Dougan, and M.Achtman (2002). “Salmonella Typhi, the causative agent of typhoid fever, isapproximately 50,000 years old.” 2.1, pp. 39–45 (see pp. xxiv, 26).
Kingsford, C. L., K. Ayanbule, and S. L. Salzberg (2007). “Rapid, accurate, com-putational discovery of Rho-independent transcription terminators illuminatestheir relationship to DNA uptake.” Genome Biology 8.2, R22 (see pp. 91–93,99, 123).
Kingsley, R. A., A. D. Humphries, E. H. Weening, M. R. De Zoete, S. Winter,A. Papaconstantinopoulou, G. Dougan, and A. J. Baumler (2003). “Molecularand phenotypic analysis of the CS54 island of Salmonella enterica serotypeTyphimurium: identification of intestinal colonization and persistence determi-nants.” Infection and Immunity 71.2, pp. 629–40 (see p. 28).
174
References
Kinscherf, T. G. and D. K. Willis (2002). “Global regulation by gidA in Pseu-domonas syringae.” Journal of Bacteriology 184.8, pp. 2281–6 (see p. 85).
Klein, B. A., E. L. Tenorio, D. W. Lazinski, A. Camilli, M. J. Duncan, andL. T. Hu (2012). “Identification of essential genes of the periodontal pathogenPorphyromonas gingivalis.” BMC Genomics 13, p. 578 (see p. 6).
Knuth, K., H. Niesalla, C. J. Hueck, and T. M. Fuchs (2004). “Large-scale identifi-cation of essential Salmonella genes by trapping lethal insertions.” MolecularMicrobiology 51.6, pp. 1729–44 (see pp. 2, 33, 35).
Kobayashi, K. et al. (2003). “Essential Bacillus subtilis genes.” Proceedings of theNational Academy of Sciences of the United States of America 100.8, pp. 4678–83 (see p. 2).
Koonin, E. V. (2003). “Comparative genomics, minimal gene-sets and the lastuniversal common ancestor.” Nature Reviews Microbiology 1.2, pp. 127–36 (seepp. 1, 2).
Kothari, A., A. Pruthi, and T. D. Chugh (2008). “The burden of enteric fever.”Journal of Infection in Developing Countries 2.4, pp. 253–9 (see p. 26).
Kroger, C. et al. (2012). “The transcriptional landscape and small RNAs ofSalmonella enterica serovar Typhimurium.” Proceedings of the National Academyof Sciences of the United States of America 109.20, E1277–86 (see pp. 28, 29,55).
Kroger, M. and R. Wahl (1998). “Compilation of DNA sequences of Escherichiacoli K12: description of the interactive databases ECD and ECDC.” NucleicAcids Research 26.1, pp. 46–9 (see p. 91).
Kropinski, A. M., A. Sulakvelidze, P. Konczy, and C. Poppe (2007). “Salmonellaphages and prophages–genomics and practical aspects.” Methods in MolecularBiology 394, pp. 133–75 (see pp. 39, 40).
Kuhle, V. and M. Hensel (2004). “Cellular microbiology of intracellular Salmonellaenterica: functions of the type III secretion system encoded by Salmonellapathogenicity island 2.” Cellular and Molecular Life Sciences 61.22, pp. 2812–26(see pp. 23, 27, 44).
Kvam, V. M., P. Liu, and Y. Si (2012). “A comparison of statistical methods fordetecting differentially expressed genes from RNA-seq data.” American Journalof Botany 99.2, pp. 248–56 (see p. 74).
Lai, D., J. R. Proctor, J. Y. A. Zhu, and I. M. Meyer (2012). “R-CHIE: a webserver and R package for visualizing RNA secondary structures.” Nucleic AcidsResearch 40.12, e95 (see p. 114).
Lampe, D. J., M. E. Churchill, and H. M. Robertson (1996). “A purified marinertransposase is sufficient to mediate transposition in vitro.” The EMBO Journal15.19, pp. 5470–9 (see p. 8).
175
References
Lampe, D. J., T. E. Grant, and H. M. Robertson (1998). “Factors affecting transpo-sition of the Himar1 mariner transposon in vitro.” Genetics 149.1, pp. 179–87(see p. 8).
Landt, S. G., E. Abeliuk, P. T. McGrath, J. A. Lesley, H. H. McAdams, and L.Shapiro (2008). “Small non-coding RNAs in Caulobacter crescentus.” MolecularMicrobiology 68.3, pp. 600–14 (see p. 16).
Langmead, B. and S. L. Salzberg (2012). “Fast gapped-read alignment with Bowtie2.” Nature Methods 9.4, pp. 357–9 (see p. 111).
Langmead, B., C. Trapnell, M. Pop, and S. L. Salzberg (2009). “Ultrafast andmemory-efficient alignment of short DNA sequences to the human genome.”Genome Biology 10.3, R25 (see p. 67).
Langridge, G. C. (2010). “Metabolic capability in host-restricted serovars ofSalmonella enterica.” PhD thesis. University of Cambridge (see pp. 21, 29,65, 69).
Langridge, G. C., M. D. Phan, D. J. Turner, T. T. Perkins, L. Parts, J. Haase,I. Charles, D. J. Maskell, S. E. Peters, G. Dougan, J. Wain, J. Parkhill, andA. K. Turner (2009). “Simultaneous assay of every Salmonella Typhi gene usingone million transposon mutants.” Genome Research 19.12, pp. 2308–16 (seepp. 4, 7–9, 13, 14, 28–31, 33, 50, 58).
Larson, M. H., W. J. Greenleaf, R. Landick, and S. M. Block (2008). “Appliedforce reveals mechanistic and energetic details of transcription termination.”Cell 132.6, pp. 971–82 (see p. 90).
Lease, R. A., M. E. Cusick, and M. Belfort (1998). “Riboregulation in Escherichiacoli : DsrA RNA acts by RNA:RNA interactions at multiple loci.” Proceedingsof the National Academy of Sciences of the United States of America 95.21,pp. 12456–61 (see pp. 54, 57).
Leinonen, R., H. Sugawara, M. Shumway, and International Nucleotide SequenceDatabase Collaboration (2011). “The sequence read archive.” Nucleic AcidsResearch 39.Database issue, pp. D19–21 (see p. 111).
Lemire, S., N. Figueroa-Bossi, and L. Bossi (2011). “Bacteriophage crosstalk: coor-dination of prophage induction by trans-acting antirepressors.” PLoS Genetics7.6, e1002149 (see p. 39).
Lesnik, E. A., R. Sampath, H. B. Levene, T. J. Henderson, J. A. McNeil, andD. J. Ecker (2001). “Prediction of rho-independent transcriptional terminatorsin Escherichia coli.” Nucleic Acids Research 29.17, pp. 3583–94 (see pp. 91, 99).
Letunic, I. and P. Bork (2011). “Interactive Tree Of Life v2: online annotation anddisplay of phylogenetic trees made easy.” Nucleic Acids Research 39.Web Serverissue, W475–8 (see p. 121).
176
References
Li, H., J. Ruan, and R. Durbin (2008). “Mapping short DNA sequencing readsand calling variants using mapping quality scores.” Genome Research 18.11,pp. 1851–8 (see pp. 30, 67).
Li, H. and R. Durbin (2010). “Fast and accurate long-read alignment with Burrows-Wheeler transform.” Bioinformatics 26.5, pp. 589–95 (see p. 67).
Li, H., B. Handsaker, A. Wysoker, T. Fennell, J. Ruan, N. Homer, G. Marth,G. Abecasis, R. Durbin, and 1000 Genome Project Data Processing Subgroup(2009). “The Sequence Alignment/Map format and SAMtools.” Bioinformatics25.16, pp. 2078–9 (see p. 111).
Li, S.-K., P. K.-S. Ng, H. Qin, J. K.-Y. Lau, J. P.-Y. Lau, S. K.-W. Tsui, T.-F.Chan, and T. C.-K. Lau (2013). “Identification of small RNAs in Mycobacteriumsmegmatis using heterologous Hfq.” RNA 19.1, pp. 74–84 (see pp. 105, 107).
Li, W. and A. Godzik (2006). “Cd-hit: a fast program for clustering and comparinglarge sets of protein or nucleotide sequences.” Bioinformatics 22.13, pp. 1658–9(see p. 110).
Lindgreen, S. (2012). “AdapterRemoval: easy cleaning of next-generation sequencingreads.” BMC Research Notes 5, p. 337 (see p. 111).
Lipman, D. J. and W. R. Pearson (1985). “Rapid and sensitive protein similaritysearches.” Science 227.4693, pp. 1435–41 (see p. 67).
Lowe, T. M. and S. R. Eddy (1997). “tRNAscan-SE: a program for improveddetection of transfer RNA genes in genomic sequence.” Nucleic Acids Research25.5, pp. 955–64 (see pp. 51, 95).
Lu, J., J. K. Tomfohr, and T. B. Kepler (2005). “Identifying differential expressionin multiple SAGE libraries: an overdispersed log-linear model approach.” BMCBioinformatics 6, p. 165 (see p. 73).
Lucchini, S., G. Rowley, M. D. Goldberg, D. Hurd, M. Harrison, and J. C. Hinton(2006). “H-NS mediates the silencing of laterally acquired genes in bacteria.”PLoS Pathogens 2.8, e81 (see pp. 14, 44, 46, 85).
Lucchini, S., P. McDermott, A. Thompson, and J. C. D. Hinton (2009). “The H-NS-like protein StpA represses the RpoS (sigma 38) regulon during exponentialgrowth of Salmonella Typhimurium.” Mol Microbiol 74.5, pp. 1169–86 (seep. 85).
Lund, S. P., D. Nettleton, D. J. McCarthy, G. K. Smyth, et al. (2012). “De-tecting Differential Expression in RNA-sequence Data Using Quasi-likelihoodwith Shrunken Dispersion Estimates.” Statistical Applications in Genetics andMolecular Biology 11.5 (see p. 74).
Majowicz, S. E., J. Musto, E. Scallan, F. J. Angulo, M. Kirk, S. J. O’Brien, T. F.Jones, A. Fazil, and R. M. Hoekstra (2010). “The global burden of nontyphoidalSalmonella gastroenteritis.” Clinical Infectious Diseases 50.6, pp. 882–9 (seep. 27).
177
References
Mandlik, A., J. Livny, W. P. Robins, J. M. Ritchie, J. J. Mekalanos, and M. K.Waldor (2011). “RNA-Seq-based monitoring of infection-linked changes in Vibriocholerae gene expression.” Cell Host & Microbe 10.2, pp. 165–74 (see pp. 119,126).
Mann, B., T. van Opijnen, J. Wang, C. Obert, Y. D. Wang, R. Carter, D. J.McGoldrick, G. Ridout, A. Camilli, E. I. Tuomanen, and J. W. Rosch (2012).“Control of virulence by small RNAs in Streptococcus pneumoniae.” PLoSPathogens 8.7, e1002788 (see pp. 5, 16, 17).
Manna, D., S. Porwollik, M. McClelland, R. Tan, and N. P. Higgins (2007). “Microar-ray analysis of Mu transposition in Salmonella enterica, serovar Typhimurium:transposon exclusion by high-density DNA binding proteins.” Molecular Micro-biology 66.2, pp. 315–28 (see pp. 14, 46).
Marck, C. and H. Grosjean (2002). “tRNomics: analysis of tRNA genes from 50genomes of Eukarya, Archaea, and Bacteria reveals anticodon-sparing strategiesand domain-specific features.” RNA 8.10, pp. 1189–232 (see p. 52).
Marcy, Y., C. Ouverney, E. M. Bik, T. Losekann, N. Ivanova, H. G. Martin, E. Szeto,D. Platt, P. Hugenholtz, D. A. Relman, and S. R. Quake (2007). “Dissectingbiological “dark matter” with single-cell genetic analysis of rare and uncultivatedTM7 microbes from the human mouth.” Proceedings of the National Academyof Sciences of the United States of America 104.29, pp. 11889–94 (see p. 128).
Marioni, J. C., C. E. Mason, S. M. Mane, M. Stephens, and Y. Gilad (2008).“RNA-seq: an assessment of technical reproducibility and comparison with geneexpression arrays.” Genome Research 18.9, pp. 1509–17 (see p. 73).
Mazurkiewicz, P., C. M. Tang, C. Boone, and D. W. Holden (2006). “Signature-tagged mutagenesis: barcoding mutants for genome-wide screens.” Nature Re-views Genetics 7.12, pp. 929–39 (see p. 3).
McCarthy, D. J., Y. Chen, and G. K. Smyth (2012). “Differential expression analysisof multifactor RNA-Seq experiments with respect to biological variation.”Nucleic Acids Research 40.10, pp. 4288–97 (see p. 74).
McCaskill, J. S. (1990). “The equilibrium partition function and base pair bindingprobabilities for RNA secondary structure.” Biopolymers 29.6-7, pp. 1105–19(see p. 110).
McClelland, M. et al. (2001). “Complete genome sequence of Salmonella entericaserovar Typhimurium LT2.” Nature 413.6858, pp. 852–6 (see p. 27).
McClelland, M. et al. (2004). “Comparison of genome degradation in ParatyphiA and Typhi, human-restricted serovars of Salmonella enterica that causetyphoid.” Nature Genetics 36.12, pp. 1268–74 (see pp. 26, 27, 38, 49).
McGourty, K., T. L. Thurston, S. A. Matthews, L. Pinaud, L. J. Mota, andD. W. Holden (2012). “Salmonella inhibits retrograde trafficking of mannose-6-
178
References
phosphate receptors and lysosome function.” Science 338.6109, pp. 963–7 (seep. 62).
Mermin, J., L. Hutwagner, D. Vugia, S. Shallow, P. Daily, J. Bender, J. Koehler,R. Marcus, F. J. Angulo, and Emerging Infections Program FoodNet Work-ing Group (2004). “Reptiles, amphibians, and human Salmonella infection: apopulation-based, case-control study.” Clinical Infectious Diseases 38 Suppl 3,S253–61 (see pp. 22, 23).
Meyer, M. M., T. D. Ames, D. P. Smith, Z. Weinberg, M. S. Schwalbach, S. J. Gio-vannoni, and R. R. Breaker (2009). “Identification of candidate structured RNAsin the marine organism ‘Candidatus Pelagibacter ubique’.” BMC Genomics 10,p. 268 (see p. 54).
Miao, E. A. and S. I. Miller (2000). “A conserved amino acid sequence directingintracellular type III secretion by Salmonella Typhimurium.” Proceedings of theNational Academy of Sciences of the United States of America 97.13, pp. 7539–44 (see p. 44).
Miki, T., N. Okada, and H. Danbara (2004). “Two periplasmic disulfide oxidoreduc-tases, DsbA and SrgA, target outer membrane protein SpiA, a component ofthe Salmonella pathogenicity island 2 type III secretion system.” The Journalof Biological Chemistry 279.33, pp. 34631–42 (see p. 86).
Miotto, P., F. Forti, A. Ambrosi, D. Pellin, D. F. Veiga, G. Balazsi, M. L. Gennaro,C. Di Serio, D. Ghisotti, and D. M. Cirillo (2012). “Genome-wide discoveryof small RNAs in Mycobacterium tuberculosis.” PLoS One 7.12, e51950 (seepp. 105, 107).
Mitra, A., K. Angamuthu, and V. Nagaraja (2008). “Genome-wide analysis ofthe intrinsic terminators of transcription across the genus Mycobacterium.”Tuberculosis 88.6, pp. 566–75 (see p. 102).
Mitra, A., K. Angamuthu, H. V. Jayashree, and V. Nagaraja (2009). “Occurrence,divergence and evolution of intrinsic terminators across eubacteria.” Genomics94.2, pp. 110–6 (see p. 102).
Monack, D. M., B. Raupach, A. E. Hromockyj, and S. Falkow (1996). “SalmonellaTyphimurium invasion induces apoptosis in infected macrophages.” Proceedingsof the National Academy of Sciences of the United States of America 93.18,pp. 9833–8 (see pp. 62, 69).
Moran, N. A. (2002). “Microbial minimalism: genome reduction in bacterialpathogens.” Cell 108.5, pp. 583–6 (see p. 25).
Morozova, O. and M. A. Marra (2008). “Applications of next-generation sequencingtechnologies in functional genomics.” Genomics 92.5, pp. 255–64 (see p. 10).
Mueller, C. A., P. Broz, and G. R. Cornelis (2008). “The type III secretion systemtip complex and translocon.” Molecular Microbiology 68.5, pp. 1085–95 (seep. 62).
179
References
Murray, A. E., F. Kenig, C. H. Fritsen, C. P. McKay, K. M. Cawley, R. Edwards,E. Kuhn, D. M. McKnight, N. E. Ostrom, V. Peng, A. Ponce, J. C. Priscu,V. Samarkin, A. T. Townsend, P. Wagh, S. A. Young, P. T. Yung, and P. T.Doran (2012). “Microbial life at -13 ◦C in the brine of an ice-sealed Antarcticlake.” Proceedings of the National Academy of Sciences of the United States ofAmerica 109.50, pp. 20626–31 (see p. xxiii).
Mushegian, A. R. and E. V. Koonin (1996). “A minimal gene set for cellularlife derived by comparison of complete bacterial genomes.” Proceedings of theNational Academy of Sciences of the United States of America 93.19, pp. 10268–73 (see p. 1).
Nasvall, S. J., P. Chen, and G. R. Bjork (2004). “The modified wobble nucleosideuridine-5-oxyacetic acid in tRNAPro(cmo5UGG) promotes reading of all fourproline codons in vivo.” RNA 10.10, pp. 1662–73 (see p. 51).
Navarre, W. W., S. Porwollik, Y. Wang, M. McClelland, H. Rosen, S. J. Libby, andF. C. Fang (2006). “Selective silencing of foreign DNA with low GC content bythe H-NS protein in Salmonella.” Science 313.5784, pp. 236–8 (see pp. 14, 42,44, 46, 48, 57, 85).
Naville, M. and D. Gautheret (2010). “Premature terminator analysis sheds lighton a hidden world of bacterial transcriptional attenuation.” Genome Biology11.9, R97 (see pp. 55, 90–92, 122).
Naville, M., A. Ghuillot-Gaudeffroy, A. Marchais, and D. Gautheret (2011). “ARNold:a web tool for the prediction of Rho-independent transcription terminators.”RNA Biology 8.1, pp. 11–3 (see p. 91).
Nawrocki, E. P., D. L. Kolbe, and S. R. Eddy (2009). “Infernal 1.0: inference ofRNA alignments.” Bioinformatics 25.10, pp. 1335–7 (see pp. 95, 96, 105, 109).
Nawrocki, E. P. and S. R. Eddy (2007). “Query-dependent banding (QDB) forfaster RNA similarity searches.” PLoS Computational Biology 3.3, e56 (seepp. 94, 95, 115).
Neal, R. J. and K. F. Chater (1991). “Bidirectional promoter and terminator regionsbracket mmr, a resistance gene embedded in the Streptomyces coelicolor A3(2)gene cluster encoding methylenomycin production.” Gene 100, pp. 75–83 (seep. 107).
Needleman, S. B. and C. D. Wunsch (1970). “A general method applicable to thesearch for similarities in the amino acid sequence of two proteins.” Journal ofMolecular Biology 48.3, pp. 443–53 (see p. 67).
Nichols, R. J., S. Sen, Y. J. Choo, P. Beltrao, M. Zietek, R. Chaba, S. Lee, K. M.Kazmierczak, K. J. Lee, A. Wong, M. Shales, S. Lovett, M. E. Winkler, N. J.Krogan, A. Typas, and C. A. Gross (2011). “Phenotypic landscape of a bacterialcell.” Cell 144.1, pp. 143–56 (see p. 20).
180
References
Ochman, H. and E. A. Groisman (1996). “Distribution of pathogenicity islands inSalmonella spp.” Infection and Immunity 64.12, pp. 5410–2 (see p. 27).
Ochman, H. and A. C. Wilson (1987). “Evolution in bacteria: evidence for auniversal substitution rate in cellular genomes.” Journal of Molecular Evolution26.1-2, pp. 74–86 (see p. 22).
Ohlson, M. B., K. Fluhr, C. L. Birmingham, J. H. Brumell, and S. I. Miller (2005).“SseJ deacylase activity by Salmonella enterica serovar Typhimurium promotesvirulence in mice.” Infection and Immunity 73.10, pp. 6249–59 (see p. 46).
Okamura, M., H. S. Lillehoj, R. B. Raybourne, U. S. Babu, R. A. Heckert, H.Tani, K. Sasai, E. Baba, and E. P. Lillehoj (2005). “Differential responses ofmacrophages to Salmonella enterica serovars Enteritidis and Typhimurium.”Veterinary Immunology and Immunopathology 107.3-4, pp. 327–35 (see p. 63).
Okoro, C. K. et al. (2012). “Intracontinental spread of human invasive SalmonellaTyphimurium pathovariants in sub-Saharan Africa.” Nature Genetics 44.11,pp. 1215–21 (see pp. xxiii, 26).
Opijnen, T. van, K. L. Bodi, and A. Camilli (2009). “Tn-seq: high-throughputparallel sequencing for fitness and genetic interaction studies in microorganisms.”Nature Methods 6.10, pp. 767–72 (see pp. 4, 7–9, 11, 13, 15).
Opijnen, T. van and A. Camilli (2012). “A fine scale phenotype-genotype virulencemap of a bacterial pathogen.” Genome Research 22.12, pp. 2541–51 (see pp. 6,11, 14, 15, 20).
Osawa, S., T. H. Jukes, K. Watanabe, and A. Muto (1992). “Recent evidence forevolution of the genetic code.” Microbiological Reviews 56.1, pp. 229–64 (seep. 52).
Padalon-Brauch, G., R. Hershberg, M. Elgrably-Weiss, K. Baruch, I. Rosenshine,H. Margalit, and S. Altuvia (2008). “Small RNAs encoded within genetic islandsof Salmonella typhimurium show host-induced expression and role in virulence.”Nucleic Acids Research 36.6, pp. 1913–27 (see pp. 40, 54, 55).
Pallen, M. J. and B. W. Wren (2007). “Bacterial pathogenomics.” Nature 449.7164,pp. 835–42 (see p. 25).
Papenfort, K., V. Pfeiffer, F. Mika, S. Lucchini, J. C. Hinton, and J. Vogel (2006).“SigmaE-dependent small RNAs of Salmonella respond to membrane stress byaccelerating global omp mRNA decay.” Molecular Microbiology 62.6, pp. 1674–88 (see p. 56).
Paradis, S., M. Boissinot, N. Paquette, S. D. Belanger, E. A. Martel, D. K. Boudreau,F. J. Picard, M. Ouellette, P. H. Roy, and M. G. Bergeron (2005). “Phylogenyof the Enterobacteriaceae based on genes encoding elongation factor Tu andF-ATPase beta-subunit.” International Journal of Systematic and EvolutionaryMicrobiology 55.Pt 5, pp. 2013–25 (see p. 22).
181
References
Parker, B. J., I. Moltke, A. Roth, S. Washietl, J. Wen, M. Kellis, R. Breaker,and J. S. Pedersen (2011). “New families of human regulatory RNA structuresidentified by comparative analysis of vertebrate genomes.” Genome Research21.11, pp. 1929–43 (see pp. 113, 115).
Parkhill, J. et al. (2001). “Complete genome sequence of a multiple drug resistantSalmonella enterica serovar Typhi CT18.” Nature 413.6858, pp. 848–52 (seepp. 26–28).
Peters, J. M., A. D. Vangeloff, and R. Landick (2011). “Bacterial transcriptionterminators: the RNA 3’-end chronicles.” Journal of Molecular Biology 412.5,pp. 793–813 (see pp. 89, 90, 127).
Pham, H. N., K. Ohkusu, N. Mishima, M. Noda, M. Monir Shah, X. Sun, M.Hayashi, and T. Ezaki (2007). “Phylogeny and species identification of thefamily Enterobacteriaceae based on dnaJ sequences.” Diagnostic Microbiologyand Infectious Disease 58.2, pp. 153–61 (see p. 22).
Phan, M. D., C. Kidgell, S. Nair, K. E. Holt, A. K. Turner, J. Hinds, P. Butcher,F. J. Cooke, N. R. Thomson, R. Titball, Z. A. Bhutta, R. Hasan, G. Dougan,and J. Wain (2009). “Variation in Salmonella enterica serovar Typhi IncHI1plasmids during the global spread of resistant typhoid fever.” AntimicrobialAgents and Chemotherapy 53.2, pp. 716–27 (see p. 27).
Pickard, D., R. A. Kingsley, C. Hale, K. Turner, K. Sivaraman, M. Wetter, G.Langridge, and G. Dougan (2013). “A genome-wide mutagenesis screen identifiesmultiple genes contributing to Vi capsular expression in Salmonella Typhi.”Journal of Bacteriology 195.6, pp. 1320–1326 (see pp. 6, 14).
Pickard, D., J. Wain, S. Baker, A. Line, S. Chohan, M. Fookes, A. Barron, P. O.Gaora, J. A. Chabalgoity, N. Thanky, C. Scholes, N. Thomson, M. Quail, J.Parkhill, and G. Dougan (2003). “Composition, acquisition, and distributionof the Vi exopolysaccharide-encoding Salmonella enterica pathogenicity islandSPI-7.” Journal of Bacteriology 185.17, pp. 5055–65 (see p. 27).
Prosseda, G., M. L. Di Martino, R. Campilongo, R. Fioravanti, G. Micheli, M.Casalino, and B. Colonna (2012). “Shedding of genes that interfere with thepathogenic lifestyle: the Shigella model.” Research in Microbiology 163.6-7,pp. 399–406 (see pp. 22, 25).
Punta, M., P. C. Coggill, R. Y. Eberhardt, J. Mistry, J. Tate, C. Boursnell, N. Pang,K. Forslund, G. Ceric, J. Clements, A. Heger, L. Holm, E. L. Sonnhammer,S. R. Eddy, A. Bateman, and R. D. Finn (2012). “The Pfam protein familiesdatabase.” Nucleic Acids Research 40.D, pp. D290–301 (see pp. 29, 39, 40).
Quinlan, A. R. and I. M. Hall (2010). “BEDTools: a flexible suite of utilities forcomparing genomic features.” Bioinformatics 26.6, pp. 841–2 (see p. 111).
182
References
Quirk, P. G., E. Dunkley, P. Lee, and T. A. Krulwich (1993). “Identification of aputative Bacillus subtilis rho gene.” Journal of Bacteriology 175.3, pp. 647–654(see p. 91).
Rabsch, W., W. Voigt, R. Reissbrodt, R. M. Tsolis, and A. J. Baumler (1999).“Salmonella typhimurium IroN and FepA proteins mediate uptake of enter-obactin but differ in their specificity for other siderophores.” Journal of Bacte-riology 181.11, pp. 3610–2 (see p. 49).
Raghavan, R., E. A. Groisman, and H. Ochman (2011). “Genome-wide detectionof novel regulatory RNAs in E. coli.” Genome Research 21.9, pp. 1487–97 (seepp. 29, 53–55).
Rathman, M., L. P. Barker, and S. Falkow (1997). “The unique trafficking patternof Salmonella Typhimurium-containing phagosomes in murine macrophages isindependent of the mechanism of bacterial entry.” Infection and Immunity 65.4,pp. 1475–85 (see p. 62).
Ravin, N. V., A. N. Svarchevsky, and G. Deho (1999). “The anti-immunity systemof phage-plasmid N15: identification of the antirepressor gene and its control bya small processed RNA.” Molecular Microbiology 34.5, pp. 980–94 (see p. 58).
Retchless, A. C. and J. G. Lawrence (2007). “Temporal fragmentation of speciationin bacteria.” Science 317.5841, pp. 1093–6 (see p. 22).
Reynolds, R. and M. J. Chamberlin (1992). “Parameters affecting transcriptiontermination by Escherichia coli RNA. II. Construction and analysis of hybridterminators.” Journal of Molecular Biology 224.1, pp. 53–63 (see p. 108).
Richter, A. S. and R. Backofen (2012). “Accessibility and conservation: Generalfeatures of bacterial small RNA-mRNA interactions?”: RNA Biology 9.7 (seep. 28).
Rinke, C. et al. (2013). “Insights into the phylogeny and coding potential ofmicrobial dark matter.” Nature 499.7459, pp. 431–7 (see p. 128).
Rivas, E. and S. R. Eddy (2001). “Noncoding RNA gene detection using comparativesequence analysis.” BMC Bioinformatics 2, p. 8 (see p. 55).
Robinson, M. D., D. J. McCarthy, and G. K. Smyth (2010a). “edgeR: a Bioconductorpackage for differential expression analysis of digital gene expression data.”Bioinformatics 26.1, pp. 139–40 (see pp. 71, 73, 74).
Robinson, M. D. and A. Oshlack (2010b). “A scaling normalization method fordifferential expression analysis of RNA-seq data.” Genome Biology 11.3, R25(see pp. 71, 72, 74).
Robinson, M. D. and G. K. Smyth (2007). “Moderated statistical tests for assessingdifferences in tag abundance.” Bioinformatics 23.21, pp. 2881–7 (see pp. 73,74).
183
References
Robinson, M. D. and G. K. Smyth (2008). “Small-sample estimation of negativebinomial dispersion, with applications to SAGE data.” Biostatistics 9.2, pp. 321–32 (see p. 74).
Robinson, M. D., D. Strbenac, C. Stirzaker, A. L. Statham, J. Song, T. P. Speed,and S. J. Clark (2012). “Copy-number-aware differential analysis of quantitativeDNA sequencing data.” Genome Research 22.12, pp. 2489–96 (see p. 74).
Rosenblad, M. A., N. Larsen, T. Samuelsson, and C. Zwieb (2009). “Kinship in theSRP RNA family.” RNA Biology 6.5, pp. 508–16 (see p. 54).
Ross-Macdonald, P., P. S. Coelho, T. Roemer, S. Agarwal, A. Kumar, R. Jansen,K. H. Cheung, A. Sheehan, D. Symoniatis, L. Umansky, M. Heidtman, F. K.Nelson, H. Iwasaki, K. Hager, M. Gerstein, P. Miller, G. S. Roeder, and M.Snyder (1999). “Large-scale analysis of the yeast genome by transposon taggingand gene disruption.” Nature 402.6760, pp. 413–8 (see p. 19).
Rubin, E. J., B. J. Akerley, V. N. Novik, D. J. Lampe, R. N. Husson, and J. J.Mekalanos (1999). “In vivo transposition of mariner-based elements in entericbacteria and mycobacteria.” Proceedings of the National Academy of Sciencesof the United States of America 96.4, pp. 1645–50 (see p. 8).
Sabbattini, P., F. Forti, D. Ghisotti, and G. Deho (1995). “Control of transcriptiontermination by an RNA factor in bacteriophage P4 immunity: identification ofthe target sites.” Journal of Bacteriology 177.6, pp. 1425–34 (see pp. 40, 58).
Sagan, L. (1967). “On the origin of mitosing cells.” Journal of Theoretical Biology14.3, pp. 255–74 (see pp. xxiii, 26).
Sakakibara, Y., M. Brown, R. C. Underwood, I. S. Mian, and D. Haussler (1994).“Stochastic context-free grammars for modeling RNA.” Proceedings of theTwenty-Seventh Hawaii International Conference on System Sciences. Vol. 5.IEEE, pp. 284–293 (see p. 93).
Salgado, H. et al. (2013). “RegulonDB v8.0: omics data sets, evolutionary conser-vation, regulatory phrases, cross-validated gold standards and more.” NucleicAcids Research 41.Database issue, pp. D203–13 (see p. 91).
Sanger, F., S. Nicklen, and A. R. Coulson (1977). “DNA sequencing with chain-terminating inhibitors.” Proceedings of the National Academy of Sciences of theUnited States of America 74.12, pp. 5463–7 (see p. 10).
Santangelo, T. J. and J. W. Roberts (2002). “RfaH, a bacterial transcriptionantiterminator.” Molecular Cell 9.4, pp. 698–700 (see p. 85).
Santiviago, C. A., M. M. Reynolds, S. Porwollik, S. H. Choi, F. Long, H. L. Andrews-Polymenis, and M. McClelland (2009). “Analysis of pools of targeted Salmonelladeletion mutants identifies novel genes affecting fitness during competitiveinfection in mice.” PLoS Pathogens 5.7, e1000477 (see pp. 33, 59).
184
References
Santiviago, C. A., C. S. Toro, A. A. Hidalgo, P. Youderian, and G. C. Mora (2003).“Global regulation of the Salmonella enterica serovar typhimurium major porin,OmpD.” Journal of Bacteriology 185.19, pp. 5901–5 (see p. 57).
Santos, R. L., S. Zhang, R. M. Tsolis, R. A. Kingsley, L. G. Adams, and A. J.Baumler (2001). “Animal models of Salmonella infections: enteritis versustyphoid fever.” Microbes and Infection 3.14-15, pp. 1335–44 (see pp. 27, 62).
Santos, R. L., M. Raffatellu, C. L. Bevins, L. G. Adams, C. Tukel, R. M. Tsolis,and A. J. Baumler (2009). “Life in the inflamed intestine, Salmonella style.”Trends in Microbiology 17.11, pp. 498–506 (see p. 25).
Sassetti, C. M., D. H. Boyd, and E. J. Rubin (2003). “Genes required for mycobac-terial growth defined by high density mutagenesis.” Molecular Microbiology48.1, pp. 77–84 (see p. 12).
Schmitt, C. K., J. S. Ikeda, S. C. Darnell, P. R. Watson, J. Bispham, T. S. Wallis,D. L. Weinstein, E. S. Metcalf, and A. D. O’Brien (2001). “Absence of allcomponents of the flagellar export and synthesis machinery differentially altersvirulence of Salmonella enterica serovar Typhimurium in models of typhoid fever,survival in macrophages, tissue culture invasiveness, and calf enterocolitis.”Infection and Immunity 69.9, pp. 5619–25 (see p. 81).
Schuster, P., W. Fontana, P. F. Stadler, and I. L. Hofacker (1994). “From sequencesto shapes and back: a case study in RNA secondary structures.” Proceedings ofthe Royal Society B: Biological Sciences 255.1344, pp. 279–84 (see p. 108).
Schwan, W. R., X. Z. Huang, L. Hu, and D. J. Kopecko (2000). “Differentialbacterial survival, replication, and apoptosis-inducing ability of Salmonellaserovars within human and murine macrophages.” Infection and Immunity 68.3,pp. 1005–13 (see p. 63).
Seth-Smith, H. M. (2008). “SPI-7: Salmonella’s Vi-encoding Pathogenicity Island.”Journal of Infection in Developing Countries 2.4, pp. 267–71 (see p. 27).
Shea, J. E., M. Hensel, C. Gleeson, and D. W. Holden (1996). “Identification ofa virulence locus encoding a second type III secretion system in SalmonellaTyphimurium.” Proceedings of the National Academy of Sciences of the UnitedStates of America 93.6, pp. 2593–7 (see p. 27).
Shelobolina, E. S., S. A. Sullivan, K. R. O’Neill, K. P. Nevin, and D. R. Lovley(2004). “Isolation, characterization, and U(VI)-reducing potential of a faculta-tively anaerobic, acid-resistant Bacterium from Low-pH, nitrate- and U(VI)-contaminated subsurface sediment and description of Salmonella subterranea sp.nov.” Applied and Environmental Microbiology 70.5, pp. 2959–65 (see p. 22).
Shevchenko, Y., G. G. Bouffard, Y. S. Butterfield, R. W. Blakesley, J. L. Hartley,A. C. Young, M. A. Marra, S. J. Jones, J. W. Touchman, and E. D. Green(2002). “Systematic sequencing of cDNA clones using the transposon Tn5.”Nucleic Acids Research 30.11, pp. 2469–77 (see p. 8).
185
References
Shippy, D. C., N. M. Eakley, C. T. Lauhon, P. N. Bochsler, and A. A. Fadl (2013).“Virulence characteristics of Salmonella following deletion of genes encodingthe tRNA modification enzymes GidA and MnmE.” Microbial Pathogenesis 57,pp. 1–9 (see p. 85).
Sittka, A., S. Lucchini, K. Papenfort, C. M. Sharma, K. Rolle, T. T. Binnewies,J. C. Hinton, and J. Vogel (2008). “Deep sequencing analysis of small noncodingRNA and mRNA targets of the global post-transcriptional regulator, Hfq.”PLoS Genetics 4.8, e1000163 (see pp. 29, 54, 55).
Smith, T. F. and M. S. Waterman (1981). “Identification of common molecularsubsequences.” Journal of Molecular Biology 147.1, pp. 195–7 (see p. 67).
Soneson, C. and M. Delorenzi (2013). “A comparison of methods for differentialexpression analysis of RNA-seq data.” BMC Bioinformatics 14, p. 91 (see p. 74).
Soper, G. A. (1939). “The Curious Career of Typhoid Mary.” Bulletin of the NewYork Academy of Medicine 15.10, pp. 698–712 (see p. 26).
Subramanian, A., P. Tamayo, V. K. Mootha, S. Mukherjee, B. L. Ebert, M. A.Gillette, A. Paulovich, S. L. Pomeroy, T. R. Golub, E. S. Lander, and J. P.Mesirov (2005). “Gene set enrichment analysis: a knowledge-based approachfor interpreting genome-wide expression profiles.” Proceedings of the NationalAcademy of Sciences of the United States of America 102.43, pp. 15545–50 (seep. 79).
Swiercz, J. P., Hindra, J. Bobek, J. Bobek, H. J. Haiser, C. Di Berardo, B. Tjaden,and M. A. Elliot (2008). “Small non-coding RNAs in Streptomyces coelicolor.”Nucleic Acids Research 36.22, pp. 7240–51 (see p. 107).
Thomson, N. R. et al. (2008). “Comparative genome analysis of Salmonella Enteri-tidis PT4 and Salmonella Gallinarum 287/91 provides insights into evolutionaryand host adaptation pathways.” Genome Research 18.10, pp. 1624–37 (seepp. 26, 27).
Thomson, N., S. Baker, D. Pickard, M. Fookes, M. Anjum, N. Hamlin, J. Wain,D. House, Z. Bhutta, K. Chan, S. Falkow, J. Parkhill, M. Woodward, A. Ivens,and G. Dougan (2004). “The role of prophage-like elements in the diversity ofSalmonella enterica serovars.” Journal of Molecular Biology 339.2, pp. 279–300(see pp. 39, 40).
Tjaden, B., R. M. Saxena, S. Stolyar, D. R. Haynor, E. Kolker, and C. Rosenow(2002). “Transcriptome analysis of Escherichia coli using high-density oligonu-cleotide probe arrays.” Nucleic Acids Research 30.17, pp. 3732–8 (see p. 54).
Toft, C. and S. G. Andersson (2010). “Evolutionary microbial genomics: insightsinto bacterial host adaptation.” Nature Reviews Genetics 11.7, pp. 465–75 (seep. 15).
Tong, X., J. W. Campbell, G. Balazsi, K. A. Kay, B. L. Wanner, S. Y. Gerdes,and Z. N. Oltvai (2004). “Genome-scale identification of conditionally essential
186
References
genes in E. coli by DNA microarrays.” Biochemical and Biophysical ResearchCommunications 322.1, pp. 347–54 (see p. 36).
Torarinsson, E. and S. Lindgreen (2008a). “WAR: Webserver for aligning structuralRNAs.” Nucleic Acids Research 36.Web Server issue, W79–84 (see p. 95).
Torarinsson, E., Z. Yao, E. D. Wiklund, J. B. Bramsen, C. Hansen, J. Kjems,N. Tommerup, W. L. Ruzzo, and J. Gorodkin (2008b). “Comparative genomicsbeyond sequence-based alignments: RNA structures in the ENCODE regions.”Genome Research 18.2, pp. 242–51 (see p. 113).
Townsend, S. M., N. E. Kramer, R. Edwards, S. Baker, N. Hamlin, M. Simmonds,K. Stevens, S. Maloy, J. Parkhill, G. Dougan, and A. J. Baumler (2001).“Salmonella enterica serovar Typhi possesses a unique repertoire of fimbrialgene sequences.” Infection and Immunity 69.5, pp. 2894–901 (see p. 27).
Tsolis, R. M., A. J. Baumler, F. Heffron, and I. Stojiljkovic (1996). “Contributionof TonB- and Feo-mediated iron uptake to growth of Salmonella Typhimuriumin the mouse.” Infection and Immunity 64.11, pp. 4549–56 (see p. 49).
Unniraman, S., R. Prakash, and V. Nagaraja (2001). “Alternate paradigm forintrinsic transcription termination in eubacteria.” The Journal of BiologicalChemistry 276.45, pp. 41850–5 (see pp. 102, 107, 124).
Unniraman, S., R. Prakash, and V. Nagaraja (2002). “Conserved economics oftranscription termination in eubacteria.” Nucleic Acids Eesearch 30.3, pp. 675–84 (see pp. 102, 108).
Urban, J. H. and J. Vogel (2008). “Two seemingly homologous noncoding RNAsact hierarchically to activate glmS mRNA translation.” PLoS Biology 6.3, e64(see p. 55).
Van Dongen, S. (2008). “Graph clustering via a discrete uncoupling process.” SIAMJournal on Matrix Analysis and Applications 30.1, pp. 121–141 (see p. 116).
Van Dongen, S., C. Abreu-Goodger, and A. J. Enright (2008). “Detecting microRNAbinding and siRNA off-target effects from expression data.” Nature Methods5.12, pp. 1023–5 (see p. 79).
Velden, A. W. van der, A. J. Baumler, R. M. Tsolis, and F. Heffron (1998). “Multiplefimbrial adhesins are required for full virulence of Salmonella Typhimurium inmice.” Infection and Immunity 66.6, pp. 2803–8 (see p. 62).
Venables, W. N. and B. D. Ripley (1994). Modern Applied Statistics with S-PLUS.Vol. 250. Springer-verlag New York (see p. 109).
Vladoianu, I. R., H. R. Chang, and J. C. Pechere (1990). “Expression of hostresistance to Salmonella Typhi and Salmonella Typhimurium: bacterial survivalwithin macrophages of murine and human origin.” Microbial Pathogenesis 8.2,pp. 83–90 (see p. 63).
Vogel, J. (2009). “A rough guide to the non-coding RNA world of Salmonella.”Molecular Microbiology 71.1, pp. 1–11 (see pp. 28, 54, 55, 57).
187
References
Vogel, J., V. Bartels, T. H. Tang, G. Churakov, J. G. Slagter-Jager, A. Huttenhofer,and E. G. Wagner (2003). “RNomics in Escherichia coli detects new sRNAspecies and indicates parallel transcriptional output in bacteria.” Nucleic AcidsResearch 31.22, pp. 6435–43 (see pp. 52, 54).
Wahl, R. and M. Kroger (1995). “ECDC–a totally integrated and interactivelyusable genetic map of Escherichia coli K12.” Microbiological Research 150.1,pp. 7–61 (see pp. 95, 99).
Wain, J., T. S. Diep, V. A. Ho, A. M. Walsh, T. T. Nguyen, C. M. Parry, and N. J.White (1998). “Quantitation of bacteria in blood of typhoid fever patients andrelationship between counts and clinical features, transmissibility, and antibioticresistance.” Journal of Clinical Microbiology 36.6, pp. 1683–7 (see pp. 27, 49).
Waldminghaus, T., N. Heidrich, S. Brantl, and F. Narberhaus (2007). “FourU: anovel type of RNA thermometer in Salmonella.” Molecular Microbiology 65.2,pp. 413–24 (see p. 28).
Wan, X.-F., G. Lin, and D. Xu (2006). “Rnall: an efficient algorithm for pre-dicting RNA local secondary structural landscape in genomes.” Journal ofBioinformatics and Computational Biology 4.5, pp. 1015–31 (see pp. 91, 99).
Wan, X.-F. and D. Xu (2005). “Intrinsic terminator prediction and its applicationin Synechococcus sp. WH8102.” Journal of Computer Science and Technology20.4, pp. 465–482 (see pp. 91, 99).
Washio, T., J. Sasayama, and M. Tomita (1998). “Analysis of complete genomessuggests that many prokaryotes do not rely on hairpin formation in transcriptiontermination.” Nucleic Acids Research 26.23, pp. 5456–5463 (see pp. 90, 102).
Wassarman, K. M., F. Repoila, C. Rosenow, G. Storz, and S. Gottesman (2001).“Identification of novel small RNAs using comparative genomics and microar-rays.” Genes & Development 15.13, pp. 1637–51 (see p. 54).
Weinberg, Z., J. E. Barrick, Z. Yao, A. Roth, J. N. Kim, J. Gore, J. X. Wang, E. R.Lee, K. F. Block, N. Sudarsan, S. Neph, M. Tompa, W. L. Ruzzo, and R. R.Breaker (2007). “Identification of 22 candidate structured RNAs in bacteriausing the CMfinder comparative genomics pipeline.” Nucleic Acids Research35.14, pp. 4809–19 (see pp. 100, 113).
Weinberg, Z. and R. R. Breaker (2011). “R2R–software to speed the depiction ofaesthetic consensus RNA secondary structures.” BMC Bioinformatics 12, p. 3(see pp. 104, 117).
Weinberg, Z., J. X. Wang, J. Bogue, J. Yang, K. Corbino, R. H. Moy, and R. R.Breaker (2010). “Comparative genomics reveals 104 candidate structured RNAsfrom bacteria, archaea, and their metagenomes.” Genome Biology 11.3, R31(see p. 113).
188
References
Weinstein, D. L., M. Carsiotis, C. R. Lissner, and A. D. O’Brien (1984). “Flagellahelp Salmonella Typhimurium survive within murine macrophages.” Infectionand Immunity 46.3, pp. 819–25 (see p. 81).
Will, S., K. Reiche, I. L. Hofacker, P. F. Stadler, and R. Backofen (2007). “Inferringnoncoding RNA families and classes by means of genome-scale structure-basedclustering.” PLoS Computational Biology 3.4, e65 (see p. 95).
Winkler, W., A. Nahvi, and R. R. Breaker (2002). “Thiamine derivatives bindmessenger RNAs directly to regulate bacterial gene expression.” Nature 419.6910,pp. 952–6 (see pp. 52, 54).
Workman, C. and A. Krogh (1999). “No evidence that mRNAs have lower foldingfree energies than random sequences with the same dinucleotide distribution.”Nucleic Acids Research 27.24, pp. 4816–22 (see p. 93).
Wu, D. et al. (2009). “A phylogeny-driven genomic encyclopaedia of Bacteria andArchaea.” Nature 462.7276, pp. 1056–60 (see pp. 19, 22, 128).
Yao, Z., Z. Weinberg, and W. L. Ruzzo (2006). “CMfinder–a covariance modelbased RNA motif finding algorithm.” Bioinformatics 22.4, pp. 445–52 (seepp. 95, 104, 109, 112).
Yim, L., I. Moukadiri, G. R. Bjork, and M.-E. Armengod (2006). “Further insightsinto the tRNA modification process controlled by proteins MnmE and GidA ofEscherichia coli.” Nucleic Acids Research 34.20, pp. 5892–905 (see p. 85).
Yokoseki, T., K. Kutsukake, K. Ohnishi, and T. Iino (1995). “Functional analysis ofthe flagellar genes in the fliD operon of Salmonella Typhimurium.” Microbiology141 ( Pt 7), pp. 1715–22 (see p. 81).
Yu, J. and J. S. Kroll (1999). “DsbA: a protein-folding catalyst contributing tobacterial virulence.” Microbes and Infection 1.14, pp. 1221–8 (see p. 86).
Yu, J., E. E. Oragui, A. Stephens, J. S. Kroll, and M. M. Venkatesan (2001).“Inactivation of DsbA alters the behaviour of Shigella flexneri towards murineand human-derived macrophage-like cells.” FEMS Microbiology Letters 204.1,pp. 81–8 (see p. 86).
Zhang, Y. J., T. R. Ioerger, C. Huttenhower, J. E. Long, C. M. Sassetti, J. C. Sac-chettini, and E. J. Rubin (2012). “Global assessment of genomic regions requiredfor growth in Mycobacterium tuberculosis.” PLoS Pathogens 8.9, e1002946 (seepp. 6, 11–13, 16, 17).
Zhou, D. and J. Galan (2001). “Salmonella entry into host cells: the work inconcert of type III secreted effector proteins.” Microbes and Infection 3.14-15,pp. 1293–8 (see p. 62).
Zomer, A., P. Burghout, H. J. Bootsma, P. W. Hermans, and S. A. van Hijum (2012).“ESSENTIALS: software for rapid analysis of high throughput transposoninsertion sequencing data.” PloS One 7.8, e43012 (see p. 13).
189

References
Zuker, M. and P. Stiegler (1981). “Optimal computer folding of large RNA sequencesusing thermodynamics and auxiliary information.” Nucleic Acids Research 9.1,pp. 133–48 (see p. 91).
Zurawski, G., K. Brown, D. Killingly, and C. Yanofsky (1978). “Nucleotide sequenceof the leader region of the phenylalanine operon of Escherichia coli.” Proceedingsof the National Academy of Sciences of the United States of America 75.9,pp. 4271–5 (see p. 55).
190


