Embed Size (px)
Citation preview
Single-Cell Biochemical Multiplexingby Multidimensional Phasor Demixingand Spectral Fluorescence LifetimeImaging MicroscopyKalina T. Haas1,2*, Maximilian W. Fries1, Ashok R. Venkitaraman1 and Alessandro Esposito1
1The Medical Research Council Cancer Unit, University of Cambridge, Cambridge, United Kingdon, 2Institut Jean-Pierre Bourgin,INRAE, AgroParisTech, Université Paris-Saclay, Versailles, France
Revealing mechanisms underpinning cell function requires understanding the relationshipbetween different biochemical reactions in living cells. However, our capabilities to monitormore than two biochemical reactions in living cells are limited. Therefore, the developmentof methods for real-time biochemical multiplexing is of fundamental importance. Here, weshow that data acquired with multicolor (mcFLIM) or spectrally resolved (sFLIM)fluorescence lifetime imaging can be conveniently described with multidimensionalphasor transforms. We demonstrate a computational framework capable of demixingthree Forster resonance energy transfer (FRET) probes and quantifying multiplexedbiochemical activities in single living cells. We provide a comparison between mcFLIMand sFLIM suggesting that sFLIM might be advantageous for the future development ofheavily multiplexed assays. However, mcFLIM—more readily available with commercialsystems—can be applied for the concomitant monitoring of three enzymes in living cellswithout significant losses.
Keywords: sFLIM, FRET biosensors, TCSPC, spectral demixing, biochemical multiplexing
INTRODUCTION
The fluorescence lifetime (τ) is the average time a fluorescent molecule spends in the excited statebefore returning to the ground state with the emission of a photon [5, 44]. Often, τ depends on thephysicochemical characteristics of the environment surrounding the fluorophore but does not dependon the fluorophore concentration; thus, fluorescence lifetime sensing has been applied successfully toprobe cell biochemistry (e.g., pH, analyte concentration, enzymatic activities, protein–proteininteractions, and conformational changes). Fluorescence lifetime imaging microscopy (FLIM) iscommonly used to map cell biochemistry in a quantitative and low-invasive way [18, 28, 45, 46].
Genetically expressed (e.g., using fluorescent proteins) biosensors permit researchers to probediverse biochemical reactions exploiting the use of Forster resonance energy transfer (FRET). FRETis the non-radiative transfer of energy from a donor fluorophore to an acceptor molecule that canoccur when the two molecules are sufficiently close, typically <10 nm [13, 37]. FRET causes a loss influorescence intensity (quenching) and a decrease of the donor’s fluorescence lifetime, both of whichare directly proportional to the fraction of energy transferred from the donor to the acceptor. Thus,FRET can be exploited to quantify interactions at the nanometer scale via using a diffraction-limitedmicroscope [75]. This property makes FRET an excellent tool for minimally invasive assays to probemolecular interactions, signal transduction, and biochemical activity in living cells [2, 48].
Edited by:Klaus Suhling,
King’s College London,United Kingdom
Reviewed by:Jianming Wen,
Kennesaw State University,United StatesMarc Tramier,
UMR6290 Institut de Genetique et deDeveloppement de Rennes (IGDR),
France
*Correspondence:Kalina T. Haas
Specialty section:This article was submitted to
Optics and Photonics,a section of the journal
Frontiers in Physics
Received: 02 December 2020Accepted: 07 May 2021Published: 27 May 2021
Citation:Haas KT, Fries MW, Venkitaraman AR
and Esposito A (2021) Single-CellBiochemical Multiplexing by
Multidimensional Phasor Demixing andSpectral Fluorescence Lifetime
Imaging Microscopy.Front. Phys. 9:637123.
doi: 10.3389/fphy.2021.637123
Frontiers in Physics | www.frontiersin.org May 2021 | Volume 9 | Article 6371231
ORIGINAL RESEARCHpublished: 27 May 2021
doi: 10.3389/fphy.2021.637123
Historically, the estimation of fluorescence lifetime relied onthe iterative fitting of the experimental decays [4, 31] or simpleanalytical relations between signals integrated in a few time-windows (e.g., [65]). Over the last decade, however,nonparametric data analysis using frequency-domaintechniques [20, 33, 41], phasor-based representation [10, 18,25, 35, 68], and extended phasors [8] have become verypopular in the community. This strategy is simple,computationally efficient, and, more importantly, does notrequire model assumptions (e.g., mono or bi-exponential) thatin complex, multiplexing assays might easily break down (e.g.,because of background, cross-talks, and spurious signals). This isespecially important at the low photon budget we must operateinstrumentations to minimize phototoxicity.
With a large palette of fluorescent proteins that can be usedto construct FRET biosensors of different colors (from the UV/blue to near infrared [3, 16, 27, 40, 53, 54, 66]), we can monitormultiple signaling events in living cells. Dual FRET biosensingwas demonstrated with different experimental configurationsand demixing analysis frameworks: multichannel ratiometricdetection [1, 30, 57, 67], simultaneous homo-FRET and hetero-FRET detected with time-resolved anisotropy and globalanalysis [74], and dual-color FRET–FLIM to follow twobiosensors using time-domain analysis [17]. However, thesimultaneous detection of three and more FRET pairsremains challenging. Previously three-protein interaction wasmeasured using “triple fluorophore” three-way FRET sensing [7,29, 64, 69].
Recently, we have shown that the rational design of FRETpairs aimed to optimize the utilization of the visible spectrumenables multi-color FLIM (mcFLIM) to multiplex at least threeFRET probes with a single excitation laser [27] at the speed andresolution necessary for live cell imaging [71]. The utilizationof additional excitation wavelengths and hyperspectraldetection might extend this strategy to the integration of ahigher number of markers, biosensors, or optogenetic tools[39, 67, 71].
However, computational frameworks for the robust andsensitive multiplexing of FRET are at their infancy, andfurther work is necessary to improve our multiplexingcapabilities. Phasor analysis of time decays has often beenapplied to quantify FRET for single probes by separating thetwo states of a typical sensor (low/high FRET) [10, 14, 18, 26,35, 36, 38, 41, 47, 49, 50, 55, 60, 70, 72, 73]. Similarly, theintegration of spectrally resolved FLIM (sFLIM) [34] andmultidimensional phasor analysis has been successfullyapplied to the quantification of single FRET probes [25].In Fries et al. [27], we have illustrated how to utilizemulticolor FLIM and multidimensional phasors fordemixing three FRET probes. However, to our knowledge,the demixing of multiple fluorescent species (donor,acceptors, and FRET for several probes simultaneously)has not been sufficiently explored.
In this work, first we briefly illustrate the development of aphoton-efficient spectrally resolved FLIM based on off-the-shelfcomponents. Second, we demonstrate the generalization of theNyxSense computational framework which we had first
introduced for mcFLIM applications [27]. Most importantly,we provide a detailed comparison of various algorithms aimedto provide efficient dimensionality reduction bymultidimensional phasors that can be used for demixingthree FRET pairs by spectral FLIM (either multicolor orspectrally resolved FLIM).
We show that phasors of higher dimensionality significantlyimprove demixing algorithms for both mcFLIM and sFLIM. Wedemonstrate that while spectrally resolved FLIM could provideadvantages in demixing of more than three FRET probes, state-of-the-art fast time-correlated single-photon counting (TCSPC)still attains very high performances with significant implicationsfor future developments of multiplexing time-resolvedplatforms.
MATERIALS AND METHODS
MicroscopyWe have developed a simple spectrally resolved FLIM (sFLIM)setup built with off-the-shelf components, including a 16-channelmulti-anode GaAsP photomultiplier tube (PML-16-GASP16,Becker&Hick GmbH) placed at the de-scanned port of a SP5Leica Confocal Microscope (Leica MicrosystemsUnited Kingdom, Ltd.). Spectral dispersion was achieved witha direct vision prism (G331120000, LINOS, GmbH) to provide asimple alignment and low optical losses. Notably, GaAsPphotomultiplier tubes provide very high quantum efficiencies(45% at 500 nm) compared to the previous generation ofphotocathodes available (<20% for the bialkali PML-16-1),without compromising the instrument response function ofthe system significantly (220 vs 200 ps, nominal valuesprovided by the manufacturer). The electrical signals from thephotomultiplier assembly were routed to time-correlated single-photon counting electronics (SPC-150 by Becker & Hick GmbH)utilizing a single arm of the hyperdimensional imagingmicroscopy electronics we have described previously [19].Single confocal plane images were acquired with a 40x oilobjective (Leica HCX PL APO CS 40.0 × 1.25 OIL UV), 256 ×256 pixel image size, and 120 s acquisition time. A simultaneoustwo-photon excitation of the FRET pairs was achieved with a Ti:Sapphire Laser Chameleon Vision II (Coherent Inc.) tuned at860 nm.
Cell Culture And Time-Lapse ImagingFor time-lapse imaging, we used HeLa-CCL2 cell lines(European Collection of Cell Cultures #93021013)expressing the three sensors with the plasmid described in[27]. The sensors have been fully characterized in our formerpublication: TagBFP-sREACh, mAmetrine-msCP576, andmKeima-tdNirFP, fused with the flexible linkers containingthe sequences VDTTD, DEVDR, and LEHD that are cleavedpreferentially by caspase 2, caspase 3, and caspase 9,respectively. Cells were periodically mycoplasma-testedand STR profiled using the services of the CRUKCambridge Institute. Cells were treated with the genotoxicdrug cisplatin to induced cell death and imaged for 8 h at 1 h
Frontiers in Physics | www.frontiersin.org May 2021 | Volume 9 | Article 6371232
Haas et al. Biochemical Multiplexing by Spectral FLIM
intervals in LabTek II glass-bottom chambered slides (Nunc,#1.5) containing a 400 µl Leibovitz (L-15) mediumsupplemented with 10% FCS, 100 μM Cisplatin, and 0.9%NaCl. Multidimensional phasor fingerprinting of individual
components was performed just before the time-lapseexperiment, with HeLa-CCL2 cells transiently transfectedwith donor fluorophores not fused with an acceptor, and adonor–acceptor fusion pair (known FRET), as shown in [27].
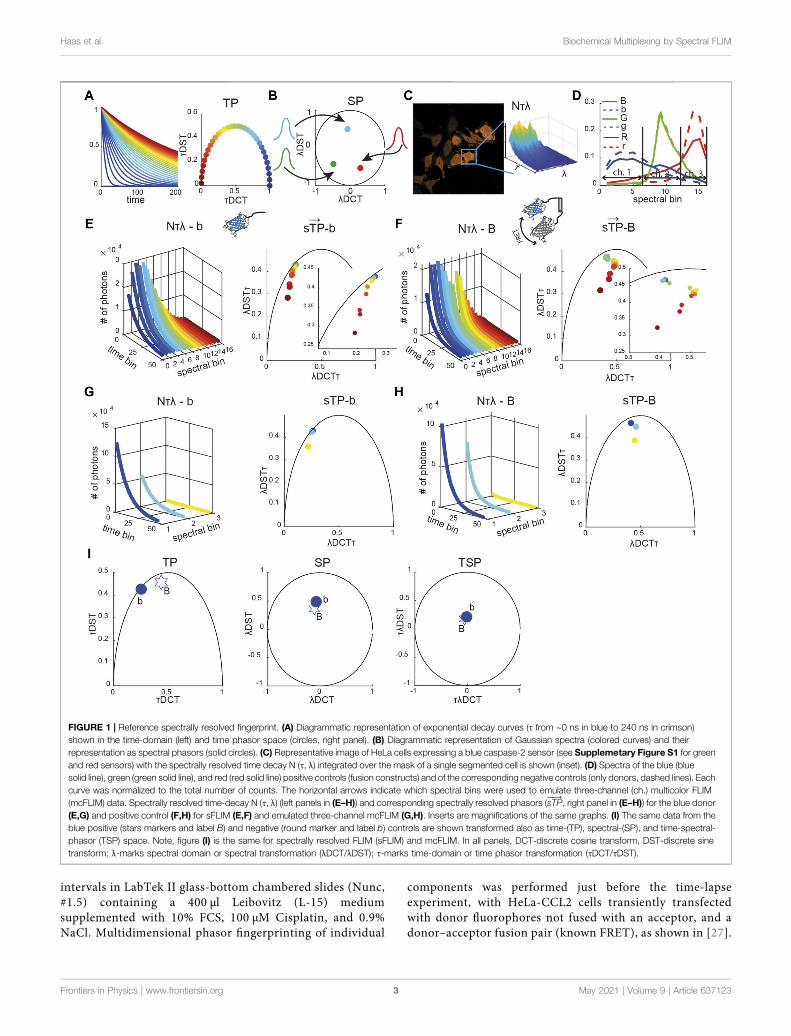
FIGURE 1 | Reference spectrally resolved fingerprint. (A) Diagrammatic representation of exponential decay curves (τ from ∼0 ns in blue to 240 ns in crimson)shown in the time-domain (left) and time phasor space (circles, right panel). (B) Diagrammatic representation of Gaussian spectra (colored curves) and theirrepresentation as spectral phasors (solid circles). (C) Representative image of HeLa cells expressing a blue caspase-2 sensor (see Supplemetary Figure S1 for greenand red sensors) with the spectrally resolved time decay N (τ, λ) integrated over the mask of a single segmented cell is shown (inset). (D) Spectra of the blue (bluesolid line), green (green solid line), and red (red solid line) positive controls (fusion constructs) and of the corresponding negative controls (only donors, dashed lines). Eachcurve was normalized to the total number of counts. The horizontal arrows indicate which spectral bins were used to emulate three-channel (ch.) multicolor FLIM(mcFLIM) data. Spectrally resolved time-decay N (τ, λ) (left panels in (E–H)) and corresponding spectrally resolved phasors (sTP
���→, right panel in (E–H)) for the blue donor
(E,G) and positive control (F,H) for sFLIM (E,F) and emulated three-channel mcFLIM (G,H). Inserts are magnifications of the same graphs. (I) The same data from theblue positive (stars markers and label B) and negative (round marker and label b) controls are shown transformed also as time-(TP), spectral-(SP), and time-spectral-phasor (TSP) space. Note, figure (I) is the same for spectrally resolved FLIM (sFLIM) and mcFLIM. In all panels, DCT-discrete cosine transform, DST-discrete sinetransform; λ-marks spectral domain or spectral transformation (λDCT/λDST); τ-marks time-domain or time phasor transformation (τDCT/τDST).
Frontiers in Physics | www.frontiersin.org May 2021 | Volume 9 | Article 6371233
Haas et al. Biochemical Multiplexing by Spectral FLIM
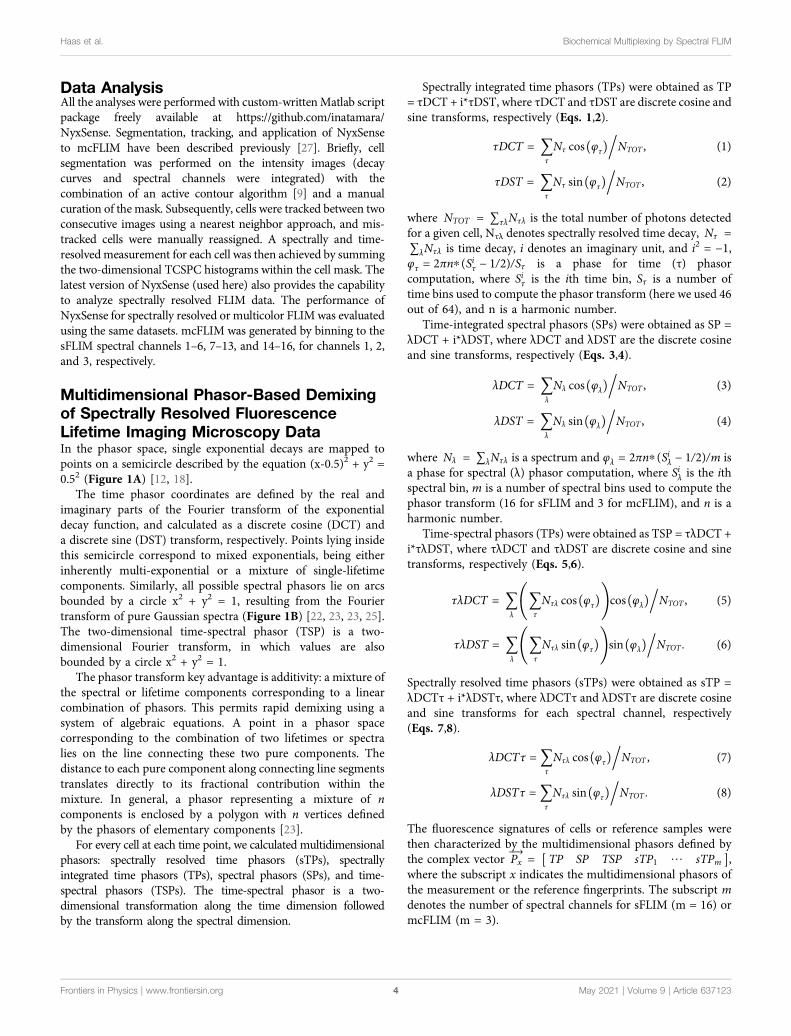
Data AnalysisAll the analyses were performed with custom-writtenMatlab scriptpackage freely available at https://github.com/inatamara/NyxSense. Segmentation, tracking, and application of NyxSenseto mcFLIM have been described previously [27]. Briefly, cellsegmentation was performed on the intensity images (decaycurves and spectral channels were integrated) with thecombination of an active contour algorithm [9] and a manualcuration of the mask. Subsequently, cells were tracked between twoconsecutive images using a nearest neighbor approach, and mis-tracked cells were manually reassigned. A spectrally and time-resolvedmeasurement for each cell was then achieved by summingthe two-dimensional TCSPC histograms within the cell mask. Thelatest version of NyxSense (used here) also provides the capabilityto analyze spectrally resolved FLIM data. The performance ofNyxSense for spectrally resolved or multicolor FLIMwas evaluatedusing the same datasets. mcFLIM was generated by binning to thesFLIM spectral channels 1–6, 7–13, and 14–16, for channels 1, 2,and 3, respectively.
Multidimensional Phasor-Based Demixingof Spectrally Resolved FluorescenceLifetime Imaging Microscopy DataIn the phasor space, single exponential decays are mapped topoints on a semicircle described by the equation (x-0.5)2 + y2 �0.52 (Figure 1A) [12, 18].
The time phasor coordinates are defined by the real andimaginary parts of the Fourier transform of the exponentialdecay function, and calculated as a discrete cosine (DCT) anda discrete sine (DST) transform, respectively. Points lying insidethis semicircle correspond to mixed exponentials, being eitherinherently multi-exponential or a mixture of single-lifetimecomponents. Similarly, all possible spectral phasors lie on arcsbounded by a circle x2 + y2 � 1, resulting from the Fouriertransform of pure Gaussian spectra (Figure 1B) [22, 23, 23, 25].The two-dimensional time-spectral phasor (TSP) is a two-dimensional Fourier transform, in which values are alsobounded by a circle x2 + y2 � 1.
The phasor transform key advantage is additivity: a mixture ofthe spectral or lifetime components corresponding to a linearcombination of phasors. This permits rapid demixing using asystem of algebraic equations. A point in a phasor spacecorresponding to the combination of two lifetimes or spectralies on the line connecting these two pure components. Thedistance to each pure component along connecting line segmentstranslates directly to its fractional contribution within themixture. In general, a phasor representing a mixture of ncomponents is enclosed by a polygon with n vertices definedby the phasors of elementary components [23].
For every cell at each time point, we calculated multidimensionalphasors: spectrally resolved time phasors (sTPs), spectrallyintegrated time phasors (TPs), spectral phasors (SPs), and time-spectral phasors (TSPs). The time-spectral phasor is a two-dimensional transformation along the time dimension followedby the transform along the spectral dimension.
Spectrally integrated time phasors (TPs) were obtained as TP� τDCT + i*τDST, where τDCT and τDST are discrete cosine andsine transforms, respectively (Eqs. 1,2).
τDCT � ∑τ
Nτ cos(φτ)/NTOT , (1)
τDST � ∑τ
Nτ sin(φτ)/NTOT , (2)
where NTOT � ∑τλNτλ is the total number of photons detectedfor a given cell, Nτλ denotes spectrally resolved time decay, Nτ �∑λNτλ is time decay, i denotes an imaginary unit, and i2 � −1,φτ � 2πnp(Siτ − 1/2)/Sτ is a phase for time (τ) phasorcomputation, where Siτ is the ith time bin, Sτ is a number oftime bins used to compute the phasor transform (here we used 46out of 64), and n is a harmonic number.
Time-integrated spectral phasors (SPs) were obtained as SP �λDCT + i*λDST, where λDCT and λDST are the discrete cosineand sine transforms, respectively (Eqs. 3,4).
λDCT � ∑λ
Nλ cos(φλ)/NTOT , (3)
λDST � ∑λ
Nλ sin(φλ)/NTOT , (4)
where Nλ � ∑λNτλ is a spectrum and φλ � 2πnp(Siλ − 1/2)/m isa phase for spectral (λ) phasor computation, where Siλ is the ithspectral bin, m is a number of spectral bins used to compute thephasor transform (16 for sFLIM and 3 for mcFLIM), and n is aharmonic number.
Time-spectral phasors (TPs) were obtained as TSP � τλDCT +i*τλDST, where τλDCT and τλDST are discrete cosine and sinetransforms, respectively (Eqs. 5,6).
τλDCT � ∑λ
⎛⎝∑τ
Nτλ cos(φτ)⎞⎠cos(φλ)/NTOT , (5)
τλDST � ∑λ
⎛⎝∑τ
Nτλ sin(φτ)⎞⎠sin(φλ)/NTOT . (6)
Spectrally resolved time phasors (sTPs) were obtained as sTP �λDCTτ + i*λDSTτ, where λDCTτ and λDSTτ are discrete cosineand sine transforms for each spectral channel, respectively(Eqs. 7,8).
λDCTτ � ∑τ
Nτλ cos(φτ)/NTOT , (7)
λDSTτ � ∑τ
Nτλ sin(φτ)/NTOT . (8)
The fluorescence signatures of cells or reference samples werethen characterized by the multidimensional phasors defined bythe complex vector Px
�→ � [TP SP TSP sTP1 / sTPm ],where the subscript x indicates the multidimensional phasors ofthe measurement or the reference fingerprints. The subscript mdenotes the number of spectral channels for sFLIM (m � 16) ormcFLIM (m � 3).
Frontiers in Physics | www.frontiersin.org May 2021 | Volume 9 | Article 6371234
Haas et al. Biochemical Multiplexing by Spectral FLIM
Demixing of sFLIM can be achieved by minimization of acomplex nonlinear multivariable constrained function (CF) withrespect to fractional contributions of the six control signatures (C).At each minimization step, CF is computed as a squared residualbetween experimental phasors (Pexp
��→) and phasors estimated using
the fractional contributions (Pest��→
):CF � ∑n(Pexp��→− Pest
��→)2, where n isa number of elements in Pest
��→, Pexp��→
, and the Pexp��→ � [ sTP��→
TP SP TSP].Pest��→ � [sTP��→
est TPest SPest TSPest ] is a nonlinear vectorial function ofthe fractional contributions C
→ � (c1/ck). The spectrally resolvedtime phasors are estimated as sTP
��→est � PI
→⊙RHO����→− 1
,RHO����→ � C
→BM
T,
and PI � C→((BM⊙ sTPctr)T)†, where ⊙ denotes Hadamart
operation, BM � (N1λ
�→/Nk
λ
�→), sTPctr � (sTP1����→
/sTPk���→), where N→k
λ �∑τNkτλ is a column vector of spectrum and sTPk
���→is a column vector
of spectrally resolved time phasors for the kth control signature.TPest � ∑kCkTPk, SPest � ∑kCkSPk, and TSPest � ∑kCkTSPk,where TPk, SPk, and TSPk are time, spectral, and time-spectralphasors for the kth control signature. However, the minimization ofthe complex CF renders undetermined system for certain phasorcombinations (e.g., Pest
��→ � [ TPest SPest TSPest ], three equationsfor six unknown variables, and most of mcFLIM Pest
��→combinations). To assure that the system of equations is notunderdetermined, to compare mcFLIM and sFLIM, we used realand imaginary parts of Pexp
��→and Pest
��→separately, that is, Pexp
��→ �[real( sTP��→) imag( sTP��→) real(TP SP TSP) imag(TP SP TSP)] and
Pest��→ � [real(sTP��→
est) imag(sTP��→est) real(TPest SPest TSPest)
imag(TPest SPest TSPest)] and the remainder is as described above.We note that the demixing results using complex CF and real CF(with twice as much equations) are almost the same even for themcFLIM. In addition, for the minimization involving Pest
��→ �[ TPest SPest TSPest ] for mcFLIM/sFLIM or Pest
��→ � [ sTPest�����→ ] formcFLIM, the phasors were calculated at the first and the secondharmonic. This assured that the number of equation is greater thanthe number of parameters to estimate, which was necessary tocalculate the standardized residuals (see Eq. 10).
The minimization procedure was achieved using fminconMatlab solver. The lower (LB) and upper bonds (UB) for thefractional contributions were constrained to 0 and 1, respectively.The initial values for the fractional contributions were typically 0for all the control signatures.
The relative enzymatic activity (REA) for each FRET sensor(caspase) was calculated using the following equations:
REA � fd/[fd + func/(1 − E)], (9)
where fd and func are the fractional contribution of the donor-onlyand uncleavable sensor control signatures, respectively, E is FRETefficiency, and division by (1 − E) compensates for the change inbrightness. To avoid the division by a very small number leadingto large errors, REA was set to 0 for fd and func typically below0.01–0.02. We note that in the specific case of proteolytic sensor,REA represents the cumulative enzymatic activity of the proteasesas cleavage is irreversible (until new sensors are expressed de novo).
The standardized phasor residuals were calculated as adifference between experimental phasors and phasorscalculated using the unmixed fractional contributions.
Resstand �∣∣∣∣∣∣Pexp��→− Pest
��→∣∣∣∣∣∣/(σ �����1 − hii
√ ), (10)
where σ is the estimated residual standard deviation and hii is aleverage of the ith observation (i.e., ith element of the residualvector): σ � ∑n(Pexp
���→− Pest��→)2/(n − p),where n is the number of
equations (number of elements in Pest��→
or Pexp���→
) and p is thenumber of parameters (six control signatures).
The root mean square deviation (RMSD) for the REA wascomputed as follows:
RMSDREA ����������������������������∑t,P
(REA0(t, P) − REA(t, P))2/Nt
√, (11)
where P is a FRET pair (B, G, R), Nt � 8 is the number of theexperimental time points, REA0 is the known enzymaticactivity (the ground truth), and REA is obtained from thedemixing.
Simulating Spectrally ResolvedFluorescence Lifetime Imaging MicroscopyDataThe following equation was used to generate time- and spectrallyresolved emission for each FRET pair (n):
E(t, λ)n � (fDeD(λ)τD
)⊗e− tτD + (r0eA(λ)
τA
− (1 − fD)(1 − r0) (τD − τDA)(τA − τDA)τDeA(λ))⊗e− t
τA+
((1 − fD) eD(λ)τD
− (1 − fD)(1 − r0) (τD − τDA)(τA − τDA)τDeA(λ))⊗e− t
τDA ,
(12)
where eD(λ), eA(λ) are the spectrally resolved normalizedemission profiles, τD, τA are a lifetime of the donor andacceptor, respectively, and τDA � τD(1 − E) is a donor lifetimein the presence of acceptor. fD is a fraction of free donors and r0 isa fraction of the directly excited acceptors. The donor andacceptor absorption cross-sections, quantum efficiencies, thetransition rates, and the donor-to-acceptor ratio were set to 1.Finally, ⊗ is a convolution operation. The final counts per pixelwas calculated as follows:
E(t, λ)tot � N1E(t, λ)1 + N2E(t, λ)2 + N3E(t, λ)3, (13)
where N1, N2,N3 are the total photon count for each FRET pair,respectively, which was set to 2,600 photons. The lifetime decayswere modeled as a single exponential. The donor and acceptoremission spectra (eD(λ), eA(λ)) were modeled as the Lorentziancurves. The synthetic images containing simulated three FRETpairs were generated with the following parameters: the donors’lifetimes (τD) were 2.3, 2.5, and 2.7 ns for FRET pairs 1–3,respectively, the acceptors’ lifetimes (τA) was set to 0.3 ns, andFRET efficiencies 0.35 for each FRET pair. The donors’ spectramaxima were 470, 515, and 570 nm and FWHM 55 nm, and theacceptors’ spectra maxima were 505, 550, and 605 nm withFWHM 55 nm for each fluorophore. The acceptor direct
Frontiers in Physics | www.frontiersin.org May 2021 | Volume 9 | Article 6371235
Haas et al. Biochemical Multiplexing by Spectral FLIM
excitation relative to the donor excitation was set to 5 or 0%. ThePoisson noise was added using the Matlab function imnoise andresulted in ∼12% noise.
RESULTS
Multidimensional Phasor FingerprintProvides an Efficient Method forDimensionality ReductionTo test the capabilities of the computational frameworkpresented in the Methods section, we used the NyxBitssensor platform we have described recently to sensecleavage of different substrates (the peptides VDTTD,DEVDR, and LEHD) that are preferentially cleaved bycaspase 2, caspase 3, and caspase 9, respectively [27]. In ourformer work, we demonstrated the capability of mcFLIM todemix the blue (labeled as B in all figures, caspase 2), green (G,caspase 3), and red (R, caspase 9) FRET pairs excited at thesame wavelength (Figure 1). Upon cleavage, each sensor yieldstwo principal components with different lifetimes and spectra:an unquenched donor (labeled with the small b, g, and r lettersin all figures) and the uncleaved donor–acceptor undergoingFRET (B, G, and R). Thanks to the large Stokes shifts of theprobes and acceptor chromophores of a very low quantumyield, the free acceptors are excited with low efficiency andhave a minor impact on our experiments. Here, wecharacterize the three FRET sensors and compare theperformance of mcFLIM and sFLIM using a simple andoptically efficient spectrally resolved FLIM (see Materialsand Methods).
Each sFLIM image has two spatial dimensions (x, y–here 256 ×256), the time-resolved fluorescence decay histogrammed in64 time bins (τ) and a spectral dimension represented with 16spectral bins (λ). The spectrally and time-resolved fluorescencedecay of each pixel can therefore be represented in an abstractspace of high dimensionality (64 × 16 � 1,024 numbers, orphoton-counts). Multidimensional phasor transformspermitted us to project this space onto a space of lowerdimensionality where the fluorescence characteristics detectedin each pixel are described by a vector Pexp
���→ � [ sTP��→TP SP TSP]
(see Eqs. 1–8) of 19 complex components (6 for mcFLIM).Although different combinations of phasor transforms havebeen used previously, here we maintain a higherdimensionality of Pexp
���→than other works [23, 52, 61] to ensure
sufficient features are preserved during dimensionality reduction.Aiming to limit acquisition time and phototoxicity that affectbiologically relevant measurements, we have acquired typically1,000–1,500 photons per pixel. Rather than on pixel basis, weperform cell-based demixing by segmenting and thresholding(pixels with typically minimum ∼200 photons are retained)individual cells and integrating photons collected within eachcell. In the time-spectral domain (τλ), the biochemical state of acell is thus described by a surface spanned by the number ofphotons (N), spectral information (λ), and time decay (τ)(Figures 1C,D).
The reference phasors were obtained by imaging cellsexpressing only one control signature, that is, only a donoror a sensor rendered non-cleavable by substituting thesubstrates with a proteolytically stable sequence. Figures1E,F show the unquenched blue donor (b) and a blueuncleavable FRET pair (B) fingerprints, respectively,including spectrally resolved lifetime, decays (N[λτ]),spectrally resolved time phasors (sTPs), spectrallyintegrated time phasors (TPs), time-integrated spectralphasor (SP), and time-spectral phasors (TSPs) (see alsoSupplementary Figure S1). We compare the biochemicalsensitivity of spectral FLIM to multicolor FLIM by binningthe 16 spectral bins into three channels that numericallyemulate multicolor detection (Figures 1D,G,I,Supplementary Figure S1, see also Material and Methods).This strategy permitted us to compare the computationalperformance of the two methods, without having to accountfor differences in the detection efficiency of two detectionsystems that would be otherwise difficult to controlexperimentally.
Multidimensional Phasor-Based DemixingMinimizes Cross-Talks Between SensorsSubsets of the components of Pexp
���→(sTP��→
) have been previouslyused to demix single FRET pair (donor and acceptor fluorescence,and interacting donor–acceptor pairs [25]). Different subsets ofPexp���→
(TP, SP, and TSP) were applied to separate three fluorescencecomponents using phasor plots [52], and blindly demix threesignal components for contrast enhancement in tissue imaging[24, 61]. Here, we used the full complement of the featuresdescribed by Pexp
���→(sTP��→
with the combination of TP, SP, andTSP) and experimental reference fingerprints to ensurerobustness and reproducibility of the results. First, we testedour framework by demixing single FRET pair images containingonly two reference components (b-B, g-G, or r-R; Figure 2). Thisapproach permitted to evaluate false-positive detection of the fourother components that were not present in a sample. For this, werecorded time-lapse sFLIM images of cells expressing individualsensors (B, G, or R) after exposure to the genotoxic drug cisplatin.Cisplatin induces irreparable DNA damage, leading to switch-likeactivation of caspases that execute apoptosis. Figure 2A showsthat the biochemical trajectories of cells undergoing apoptosis(Figure 2B) tend to trace a line connecting two controlfingerprints (i.e., FRET and no-FRET). The FRET controlcorresponds to uncleaved sensors; that is, no caspase isactivated. During the apoptosis, caspases are activated, sensorsget cleaved, and the experimental phasors (black line, Figure 2A)approach no-FRET control phasors signatures. In Figure 3 andSupplemetary Figures S2, S3, we compare spectral demixingusing different components of the multidimensional phasors Pexp
���→for both sFLIM and mcFLIM. The single-cell traces of the blue-and green-emitting biosensors displayed linear trajectories in aphasor space (Figure 2A). The demixing correctly detected thefractional contribution of control fingerprints (Figure 3,Supplemetary Figures S2, S3), which resulted in ∼80 and∼50% final sensor cleavage (cumulative relative enzymatic
Frontiers in Physics | www.frontiersin.org May 2021 | Volume 9 | Article 6371236
Haas et al. Biochemical Multiplexing by Spectral FLIM
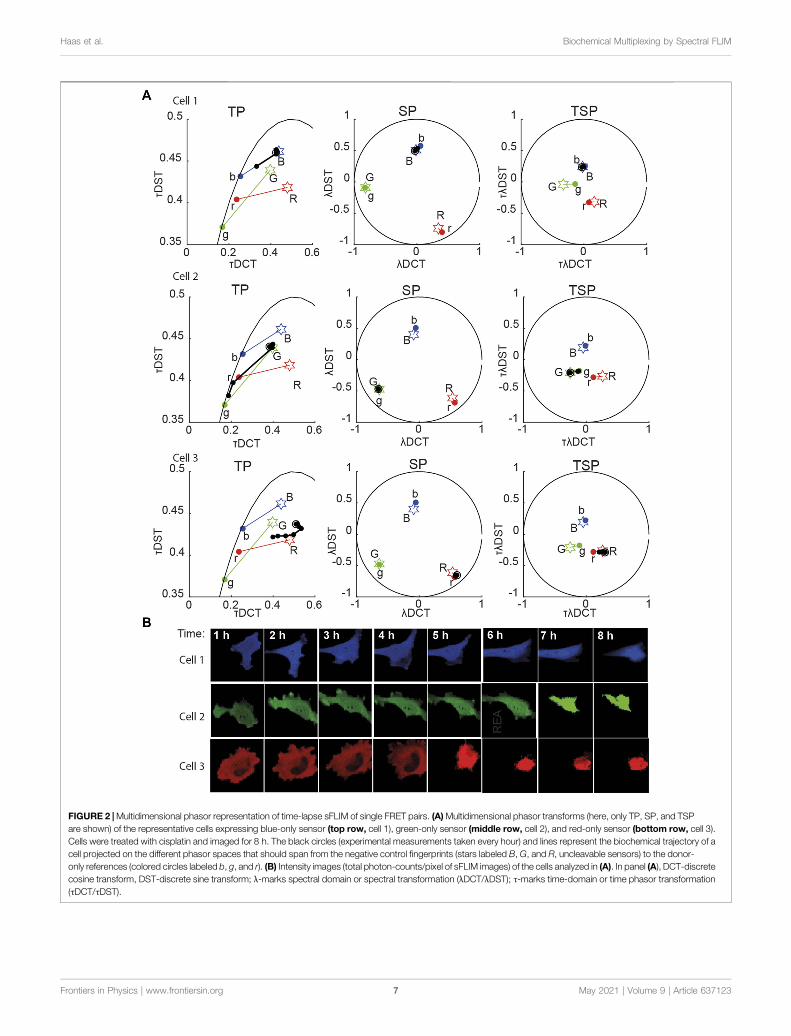
FIGURE 2 |Multidimensional phasor representation of time-lapse sFLIM of single FRET pairs. (A)Multidimensional phasor transforms (here, only TP, SP, and TSPare shown) of the representative cells expressing blue-only sensor (top row, cell 1), green-only sensor (middle row, cell 2), and red-only sensor (bottom row, cell 3).Cells were treated with cisplatin and imaged for 8 h. The black circles (experimental measurements taken every hour) and lines represent the biochemical trajectory of acell projected on the different phasor spaces that should span from the negative control fingerprints (stars labeled B, G, and R, uncleavable sensors) to the donor-only references (colored circles labeled b, g, and r). (B) Intensity images (total photon-counts/pixel of sFLIM images) of the cells analyzed in (A). In panel (A), DCT-discretecosine transform, DST-discrete sine transform; λ-marks spectral domain or spectral transformation (λDCT/λDST); τ-marks time-domain or time phasor transformation(τDCT/τDST).
Frontiers in Physics | www.frontiersin.org May 2021 | Volume 9 | Article 6371237
Haas et al. Biochemical Multiplexing by Spectral FLIM
activity (REA)) for a cell expressing the green (G) or the blue (B)sensor, respectively. However, we note that the red sensor (R) candisplay curved trajectories in the phasor space in severalexperiments, observation we attribute to non-idealities of themKeima/tdNirFP, including residual fluorescence of tdNirFP andoccasional photo-conversion of mKeima that can occur at higherexcitation regimes. However, despite these non-idealities,demixing of the red FRET pair is also sufficiently robust.
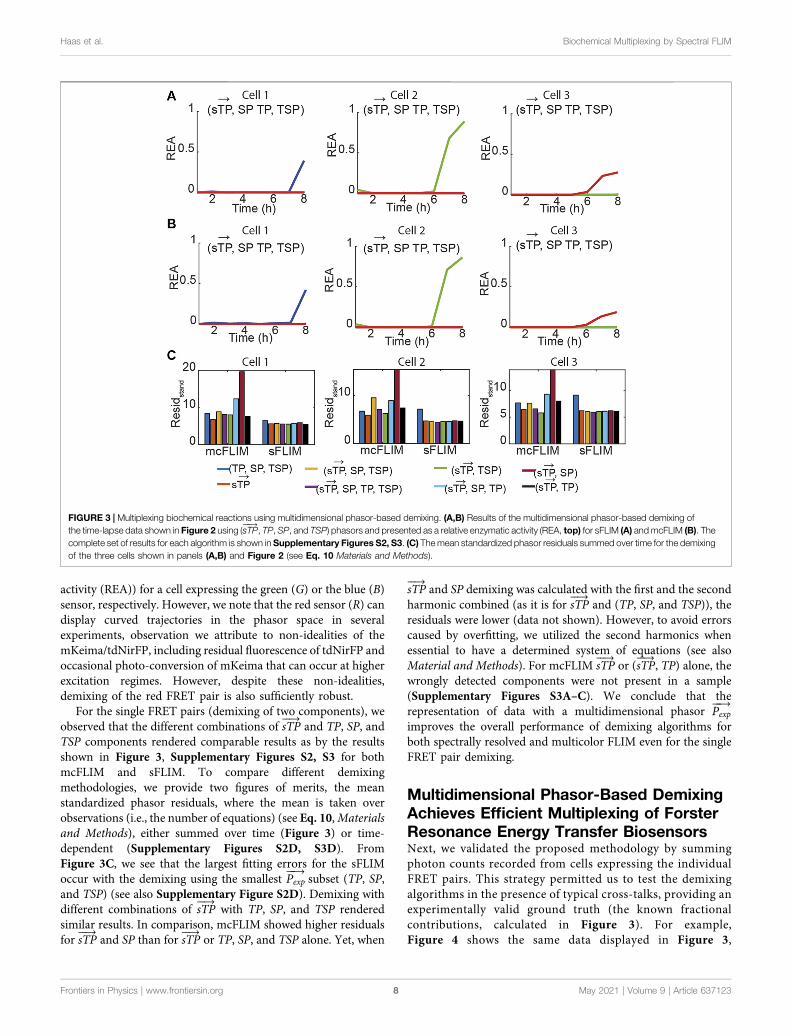
For the single FRET pairs (demixing of two components), weobserved that the different combinations of sTP
��→and TP, SP, and
TSP components rendered comparable results as by the resultsshown in Figure 3, Supplementary Figures S2, S3 for bothmcFLIM and sFLIM. To compare different demixingmethodologies, we provide two figures of merits, the meanstandardized phasor residuals, where the mean is taken overobservations (i.e., the number of equations) (see Eq. 10,Materialsand Methods), either summed over time (Figure 3) or time-dependent (Supplementary Figures S2D, S3D). FromFigure 3C, we see that the largest fitting errors for the sFLIMoccur with the demixing using the smallest Pexp
���→subset (TP, SP,
and TSP) (see also Supplementary Figure S2D). Demixing withdifferent combinations of sTP
��→with TP, SP, and TSP rendered
similar results. In comparison, mcFLIM showed higher residualsfor sTP
��→and SP than for sTP
��→or TP, SP, and TSP alone. Yet, when
sTP��→
and SP demixing was calculated with the first and the secondharmonic combined (as it is for sTP
��→and (TP, SP, and TSP)), the
residuals were lower (data not shown). However, to avoid errorscaused by overfitting, we utilized the second harmonics whenessential to have a determined system of equations (see alsoMaterial and Methods). For mcFLIM sTP
��→or (sTP
��→, TP) alone, the
wrongly detected components were not present in a sample(Supplementary Figures S3A–C). We conclude that therepresentation of data with a multidimensional phasor Pexp
���→improves the overall performance of demixing algorithms forboth spectrally resolved and multicolor FLIM even for the singleFRET pair demixing.
Multidimensional Phasor-Based DemixingAchieves Efficient Multiplexing of ForsterResonance Energy Transfer BiosensorsNext, we validated the proposed methodology by summingphoton counts recorded from cells expressing the individualFRET pairs. This strategy permitted us to test the demixingalgorithms in the presence of typical cross-talks, providing anexperimentally valid ground truth (the known fractionalcontributions, calculated in Figure 3). For example,Figure 4 shows the same data displayed in Figure 3,
FIGURE 3 | Multiplexing biochemical reactions using multidimensional phasor-based demixing. (A,B) Results of the multidimensional phasor-based demixing ofthe time-lapse data shown in Figure 2 using (sTP
���→, TP, SP, and TSP) phasors and presented as a relative enzymatic activity (REA, top) for sFLIM (A) andmcFLIM (B). The
complete set of results for each algorithm is shown in Supplementary Figures S2, S3. (C) Themean standardized phasor residuals summed over time for the demixingof the three cells shown in panels (A,B) and Figure 2 (see Eq. 10 Materials and Methods).
Frontiers in Physics | www.frontiersin.org May 2021 | Volume 9 | Article 6371238
Haas et al. Biochemical Multiplexing by Spectral FLIM
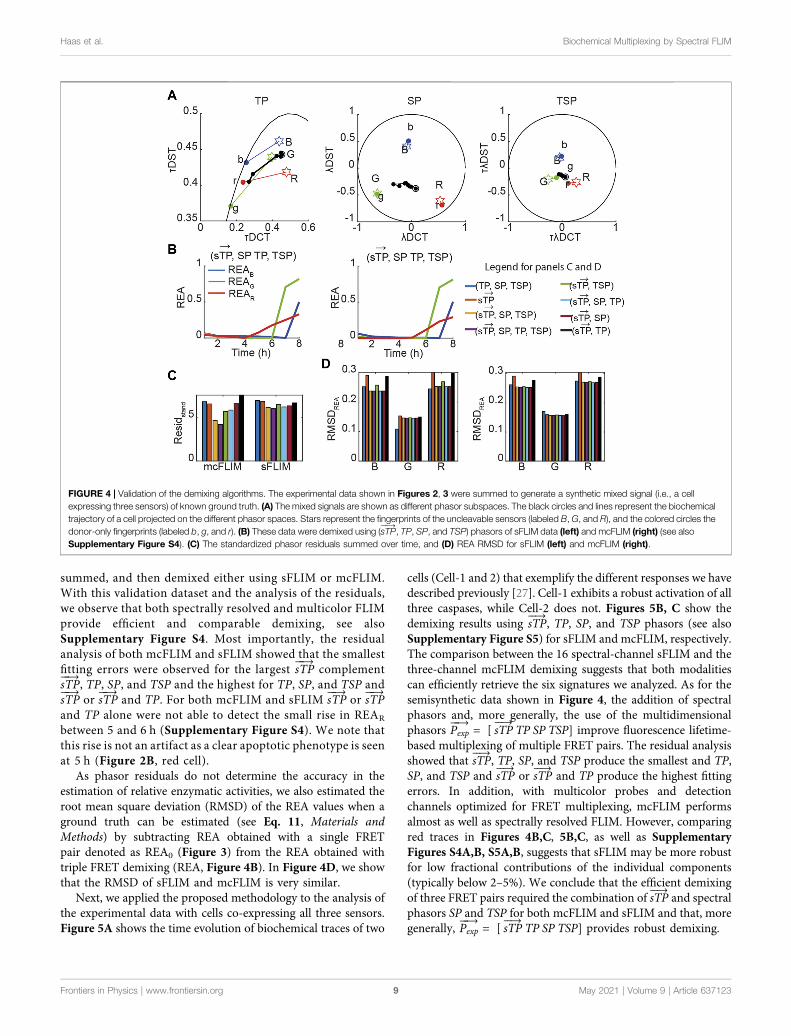
summed, and then demixed either using sFLIM or mcFLIM.With this validation dataset and the analysis of the residuals,we observe that both spectrally resolved and multicolor FLIMprovide efficient and comparable demixing, see alsoSupplementary Figure S4. Most importantly, the residualanalysis of both mcFLIM and sFLIM showed that the smallestfitting errors were observed for the largest sTP
���→complement
sTP���→
, TP, SP, and TSP and the highest for TP, SP, and TSP andsTP���→
or sTP���→
and TP. For both mcFLIM and sFLIM sTP���→
or sTP���→
and TP alone were not able to detect the small rise in REAR
between 5 and 6 h (Supplementary Figure S4). We note thatthis rise is not an artifact as a clear apoptotic phenotype is seenat 5 h (Figure 2B, red cell).
As phasor residuals do not determine the accuracy in theestimation of relative enzymatic activities, we also estimated theroot mean square deviation (RMSD) of the REA values when aground truth can be estimated (see Eq. 11, Materials andMethods) by subtracting REA obtained with a single FRETpair denoted as REA0 (Figure 3) from the REA obtained withtriple FRET demixing (REA, Figure 4B). In Figure 4D, we showthat the RMSD of sFLIM and mcFLIM is very similar.
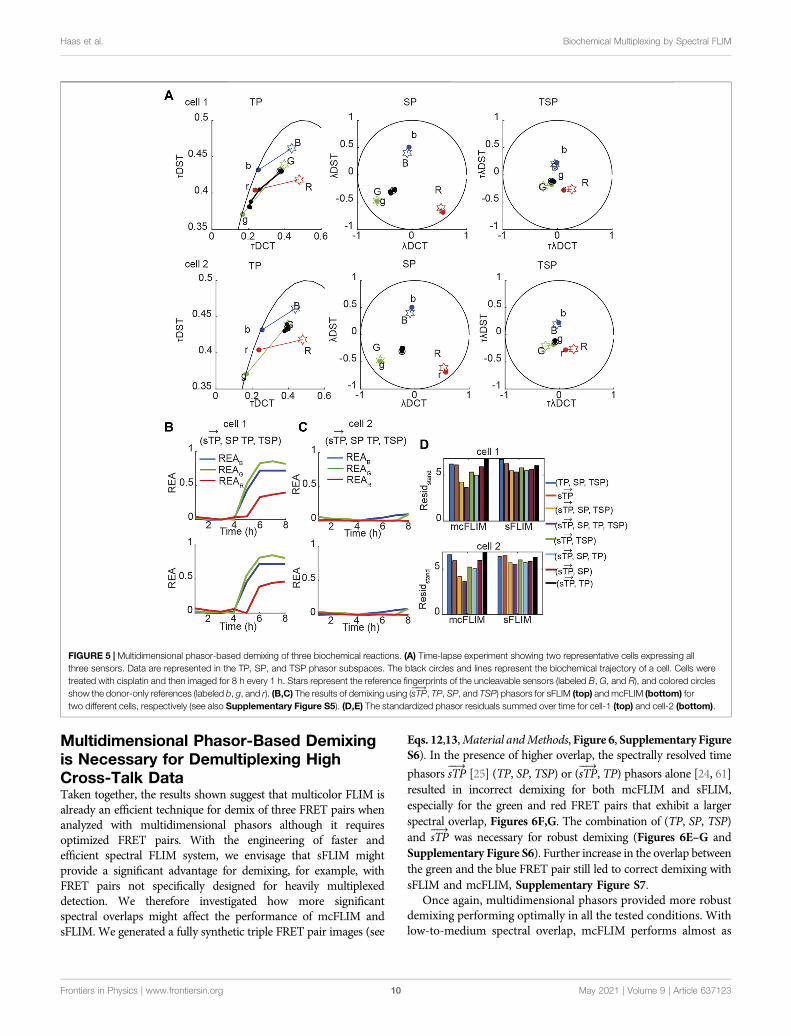
Next, we applied the proposed methodology to the analysis ofthe experimental data with cells co-expressing all three sensors.Figure 5A shows the time evolution of biochemical traces of two
cells (Cell-1 and 2) that exemplify the different responses we havedescribed previously [27]. Cell-1 exhibits a robust activation of allthree caspases, while Cell-2 does not. Figures 5B, C show thedemixing results using sTP
��→, TP, SP, and TSP phasors (see also
Supplementary Figure S5) for sFLIM and mcFLIM, respectively.The comparison between the 16 spectral-channel sFLIM and thethree-channel mcFLIM demixing suggests that both modalitiescan efficiently retrieve the six signatures we analyzed. As for thesemisynthetic data shown in Figure 4, the addition of spectralphasors and, more generally, the use of the multidimensionalphasors Pexp
���→ � [ sTP��→TP SP TSP] improve fluorescence lifetime-
based multiplexing of multiple FRET pairs. The residual analysisshowed that sTP
��→, TP, SP, and TSP produce the smallest and TP,
SP, and TSP and sTP��→
or sTP��→
and TP produce the highest fittingerrors. In addition, with multicolor probes and detectionchannels optimized for FRET multiplexing, mcFLIM performsalmost as well as spectrally resolved FLIM. However, comparingred traces in Figures 4B,C, 5B,C, as well as SupplementaryFigures S4A,B, S5A,B, suggests that sFLIM may be more robustfor low fractional contributions of the individual components(typically below 2–5%). We conclude that the efficient demixingof three FRET pairs required the combination of sTP
��→and spectral
phasors SP and TSP for both mcFLIM and sFLIM and that, moregenerally, Pexp
���→ � [ sTP��→TP SP TSP] provides robust demixing.
FIGURE 4 | Validation of the demixing algorithms. The experimental data shown in Figures 2, 3 were summed to generate a synthetic mixed signal (i.e., a cellexpressing three sensors) of known ground truth. (A) The mixed signals are shown as different phasor subspaces. The black circles and lines represent the biochemicaltrajectory of a cell projected on the different phasor spaces. Stars represent the fingerprints of the uncleavable sensors (labeled B, G, and R), and the colored circles thedonor-only fingerprints (labeled b, g, and r). (B) These data were demixed using (sTP
���→, TP, SP, and TSP) phasors of sFLIM data (left) and mcFLIM (right) (see also
Supplementary Figure S4). (C) The standardized phasor residuals summed over time, and (D) REA RMSD for sFLIM (left) and mcFLIM (right).
Frontiers in Physics | www.frontiersin.org May 2021 | Volume 9 | Article 6371239
Haas et al. Biochemical Multiplexing by Spectral FLIM
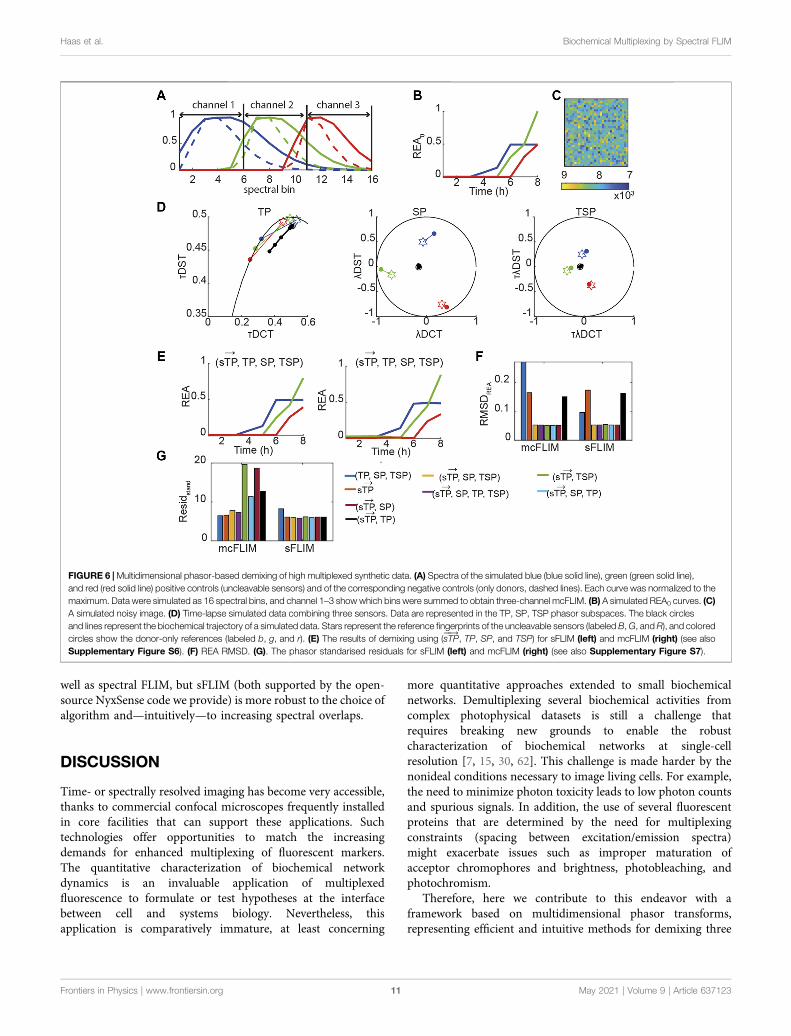
Multidimensional Phasor-Based Demixingis Necessary for Demultiplexing HighCross-Talk DataTaken together, the results shown suggest that multicolor FLIM isalready an efficient technique for demix of three FRET pairs whenanalyzed with multidimensional phasors although it requiresoptimized FRET pairs. With the engineering of faster andefficient spectral FLIM system, we envisage that sFLIM mightprovide a significant advantage for demixing, for example, withFRET pairs not specifically designed for heavily multiplexeddetection. We therefore investigated how more significantspectral overlaps might affect the performance of mcFLIM andsFLIM. We generated a fully synthetic triple FRET pair images (see
Eqs. 12,13,Material andMethods,Figure 6, Supplementary FigureS6). In the presence of higher overlap, the spectrally resolved time
phasors sTP��→
[25] (TP, SP, TSP) or (sTP��→
, TP) phasors alone [24, 61]resulted in incorrect demixing for both mcFLIM and sFLIM,especially for the green and red FRET pairs that exhibit a largerspectral overlap, Figures 6F,G. The combination of (TP, SP, TSP)and sTP
��→was necessary for robust demixing (Figures 6E–G and
Supplementary Figure S6). Further increase in the overlap betweenthe green and the blue FRET pair still led to correct demixing withsFLIM and mcFLIM, Supplementary Figure S7.
Once again, multidimensional phasors provided more robustdemixing performing optimally in all the tested conditions. Withlow-to-medium spectral overlap, mcFLIM performs almost as
FIGURE 5 | Multidimensional phasor-based demixing of three biochemical reactions. (A) Time-lapse experiment showing two representative cells expressing allthree sensors. Data are represented in the TP, SP, and TSP phasor subspaces. The black circles and lines represent the biochemical trajectory of a cell. Cells weretreated with cisplatin and then imaged for 8 h every 1 h. Stars represent the reference fingerprints of the uncleavable sensors (labeled B, G, and R), and colored circlesshow the donor-only references (labeled b, g, and r). (B,C) The results of demixing using (sTP
���→, TP, SP, and TSP) phasors for sFLIM (top) and mcFLIM (bottom) for
two different cells, respectively (see also Supplementary Figure S5). (D,E) The standardized phasor residuals summed over time for cell-1 (top) and cell-2 (bottom).
Frontiers in Physics | www.frontiersin.org May 2021 | Volume 9 | Article 63712310
Haas et al. Biochemical Multiplexing by Spectral FLIM
well as spectral FLIM, but sFLIM (both supported by the open-source NyxSense code we provide) is more robust to the choice ofalgorithm and—intuitively—to increasing spectral overlaps.
DISCUSSION
Time- or spectrally resolved imaging has become very accessible,thanks to commercial confocal microscopes frequently installedin core facilities that can support these applications. Suchtechnologies offer opportunities to match the increasingdemands for enhanced multiplexing of fluorescent markers.The quantitative characterization of biochemical networkdynamics is an invaluable application of multiplexedfluorescence to formulate or test hypotheses at the interfacebetween cell and systems biology. Nevertheless, thisapplication is comparatively immature, at least concerning
more quantitative approaches extended to small biochemicalnetworks. Demultiplexing several biochemical activities fromcomplex photophysical datasets is still a challenge thatrequires breaking new grounds to enable the robustcharacterization of biochemical networks at single-cellresolution [7, 15, 30, 62]. This challenge is made harder by thenonideal conditions necessary to image living cells. For example,the need to minimize photon toxicity leads to low photon countsand spurious signals. In addition, the use of several fluorescentproteins that are determined by the need for multiplexingconstraints (spacing between excitation/emission spectra)might exacerbate issues such as improper maturation ofacceptor chromophores and brightness, photobleaching, andphotochromism.
Therefore, here we contribute to this endeavor with aframework based on multidimensional phasor transforms,representing efficient and intuitive methods for demixing three
FIGURE 6 |Multidimensional phasor-based demixing of high multiplexed synthetic data. (A) Spectra of the simulated blue (blue solid line), green (green solid line),and red (red solid line) positive controls (uncleavable sensors) and of the corresponding negative controls (only donors, dashed lines). Each curve was normalized to themaximum. Data were simulated as 16 spectral bins, and channel 1–3 show which bins were summed to obtain three-channel mcFLIM. (B) A simulated REA0 curves. (C)A simulated noisy image. (D) Time-lapse simulated data combining three sensors. Data are represented in the TP, SP, TSP phasor subspaces. The black circlesand lines represent the biochemical trajectory of a simulated data. Stars represent the reference fingerprints of the uncleavable sensors (labeled B,G, andR), and coloredcircles show the donor-only references (labeled b, g, and r). (E) The results of demixing using (sTP
���→, TP, SP, and TSP) for sFLIM (left) and mcFLIM (right) (see also
Supplementary Figure S6). (F) REA RMSD. (G). The phasor standarised residuals for sFLIM (left) and mcFLIM (right) (see also Supplementary Figure S7).
Frontiers in Physics | www.frontiersin.org May 2021 | Volume 9 | Article 63712311
Haas et al. Biochemical Multiplexing by Spectral FLIM
FRET pairs excited at a single wavelength. Building on workpublished by us and others (e.g., [21–23, 25, 27, 61]) we extendedthis computational framework, including higher phasordimensionality. We demonstrate its efficacy to demix threeFRET pairs imaged at a single excitation wavelength that wepreviously optimized for the multiplexing and by simulatingsynthetic triple FRET pair images with more spectral overlap.We provide a description of our methodology and the extensionto spectrally resolved FLIM of the NyxSense computationalplatform that we had briefly described only for mcFLIM [27].This platform is available in the public domain (https://github.com/inatamara/NyxSense) and could be used by the communityto test, further improve, or simply use the methodology weproposed. Spectrally resolved FLIM is readily availablecommercially, and several bespoke implementations aimed tomake available cost-effective and user-friendly solutions havebeen also published (e.g., [6, 42, 43, 51, 56, 58, 61, 63, 76],promising increased availability of such sophisticated assays inthe near future. We showed that the combination of spectrallyresolved time phasors (sTP
��→) with the spectral phasors (SP or TSP)
permitted efficient demixing of three FRET pairs, presenting alow level of direct acceptor excitation using only six controlsignatures. Interestingly, the results for sFLIM (16 spectral bins)and mcFLIM (three spectral channels) were very similar for thedata discussed here, that is, six main control signatures (donor-only and uncleavable sensors) with a low level of direct acceptorexcitation. However, the sFLIM is more robust to unmix lowerfractional contributions. Spectrally resolved FLIM will thereforebe an essential tool either to demix common FRET pairs withlarge spectral overlaps or to further expand our capability tomultiplex more than three biochemical reactions from singleliving cells.
However, we suggest that readily available equipmentdedicated to multicolor FLIM, particularly instruments capableof fast detection, can already perform such complexexperiments efficiently. Therefore, the innovation of detectiontechnologies of both scanning and wide-field microscopescan make biochemical multiplexing a routine technique in
the future [11, 32, 47, 59, 60]. We show that excellentdemixing results can be achieved with the open-sourcetoolbox NyxSense for both sFLIM and mcFLIM. NyxSenseimplements the multidimensional phasor transforms thatfacilitate the projection of complex multidimensionalphotophysical data onto biochemical spaces of lowerdimensionality to represent the biochemical trajectory ofsingle cells in response to stimuli.
DATA AVAILABILITY STATEMENT
The original contributions presented in the study are included inthe article/Supplementary Material; further inquiries can bedirected to the corresponding author.
AUTHOR CONTRIBUTIONS
AE, KH, and MF designed the experiments; KH andMF executedthe experiments; AE built the microscope; KH and AE wrote themanuscript; KH analyzed the data and wrote the programs.
FUNDING
MF was funded by the Gates Foundation studentship. Weacknowledge funding from the Medical Research Council coregrants (MC_UU_12022/1 and MC_UU_12022/8) and theWellcome Trust (090340/Z/09/Z) to AV, and from the CancerResearch UK (C54674/A27487) to AE.
SUPPLEMENTARY MATERIAL
The SupplementaryMaterial for this article can be found online at:https://www.frontiersin.org/articles/10.3389/fphy.2021.637123/full#supplementary-material
REFERENCES
1. Ai H-w., Hazelwood KL, Davidson MW, and Campbell RE. FluorescentProtein FRET Pairs for Ratiometric Imaging of Dual Biosensors. NatMethods (2008) 5(5):401–3. doi:10.1038/nmeth.1207
2. Algar WR, Hildebrandt N, Vogel SS, and Medintz IL. FRET as a BiomolecularResearch Tool - Understanding its Potential while Avoiding Pitfalls. NatMethods (2019) 16(9):815–29. doi:10.1038/s41592-019-0530-8
3. Bajar B, Wang E, Zhang S, Lin M, and Chu J. A Guide to Fluorescent ProteinFRET Pairs. Sensors (2016) 16(9):1488–24. doi:10.3390/s16091488
4. Barber PR, Ameer-Beg SM, Gilbey J, Carlin LM, Keppler M, Ng TC, et al.Multiphoton Time-Domain Fluorescence Lifetime Imaging Microscopy:Practical Application to Protein-Protein Interactions Using Global Analysis.J R Soc Interf (2009) 6, S93–S105. doi:10.1098/rsif.2008.0451.focus
5. Berezin MY, and Achilefu S. Fluorescence Lifetime Measurements andBiological Imaging. Chem Rev (2010) 110(5):2641–84. doi:10.1021/cr900343z
6. Bruschini C, Homulle H, Antolovic IM, Burri S, and Charbon E. Single-photonSPAD Imagers in Biophotonics: Review and Outlook. ArXiv (2019).
7. Bunt G, and Wouters FS. FRET from Single to Multiplexed Signaling Events.Biophys Rev (2017) 9(2):119–29. doi:10.1007/s12551-017-0252-z
8. Campos-Delgado DU, Navarro OG, Arce-Santana ER, and Jo JA. ExtendedOutput Phasor Representation of Multi-Spectral Fluorescence LifetimeImaging Microscopy. Biomed Opt Express (2015) 6(6):2088. doi:10.1364/boe.6.002088
9. Chan TF, and Vese LA. Active Contours without Edges. IEEE Trans ImageProcess (2001) 10(2):266–77. doi:10.1109/83.902291
10. Chen W, Avezov E, Schlachter SC, Gielen F, Laine RF, Harding HP, et al. AMethod to Quantify FRET Stoichiometry with Phasor Plot Analysis andAcceptor Lifetime Ingrowth. Biophysical J (2015) 108(5):999–1002. doi:10.1016/j.bpj.2015.01.012
11. Chen H, Holst G, and Gratton E. Modulated CMOS Camera for FluorescenceLifetime Microscopy. Microsc Res Tech (2015a) 78(12):1075–81. doi:10.1002/jemt.22587
12. Clayton AHA, Hanley QS, and Verveer PJ. Graphical Representation andMulticomponent Analysis of Single-Frequency Fluorescence Lifetime ImagingMicroscopy Data. J Microsc (2004) 213(1):1–5. doi:10.1111/j.1365-2818.2004.01265.x
Frontiers in Physics | www.frontiersin.org May 2021 | Volume 9 | Article 63712312
Haas et al. Biochemical Multiplexing by Spectral FLIM
13. Clegg RM Chapter 1 Förster Resonance Energy Transfer-FRET what Is it,Why Do it, and How It’s Done, Laboratory Techniques in Biochemistry andMolecular Biology, 33 (2009). p. 1–57. doi:10.1016/S0075-7535(08)00001-6
14. Colyer R, Siegmund O, Tremsin A, Vallerga J, Weiss S, and Michalet X.Phasor-based Single-Molecule Fluorescence Lifetime Imaging Using a Wide-Field Photon-Counting Detector. Single Molecule Spectrosc Imaging (2009)(71850T) 7185. doi:10.1117/12.809496
15. Dagher M, Kleinman M, Ng A, and Juncker D. Ensemble Multicolour FRETModel Enables Barcoding at Extreme FRET Levels. Nat Nanotech (2018)13(10):925–32. doi:10.1038/s41565-018-0205-0
16. Dean KM, and Palmer AE. Advances in Fluorescence Labeling Strategies forDynamic Cellular Imaging. Nat Chem Biol (2014) 10(7):512–23. doi:10.1038/nchembio.1556
17. Demeautis C, Sipieter F, Roul J, Chapuis C, Padilla-Parra S, Riquet FB, et al.Multiplexing PKA and ERK1&2 Kinases FRET Biosensors in Living CellsUsing Single Excitation Wavelength Dual Colour FLIM. Sci Rep (2017)7(December):1–14. doi:10.1038/srep41026
18. Digman MA, Caiolfa VR, Zamai M, and Gratton E. The Phasor Approach toFluorescence Lifetime Imaging Analysis. Biophysical J (2008) 94(2):L14–L16.doi:10.1529/biophysj.107.120154
19. Esposito A, and Venkitaraman AR. Enhancing Biochemical Resolution byHyperdimensional Imaging Microscopy. Biophysical J (2019) 116(10):1815–22. doi:10.1016/j.bpj.2019.04.015
20. Esposito A, Gerritsen HC, and Wouters FS. Fluorescence LifetimeHeterogeneity Resolution in the Frequency Domain by Lifetime MomentsAnalysis. Biophysical J (2005) 89(6):4286–99. doi:10.1529/biophysj.104.053397
21. Esposito A, Popleteeva M, and Venkitaraman AR. Maximizing theBiochemical Resolving Power of Fluorescence Microscopy. PLoS ONE(2013) 8(10):e77392. doi:10.1371/journal.pone.0077392
22. Fereidouni F, Bader AN, and Gerritsen HC. Spectral Phasor Analysis AllowsRapid and Reliable Unmixing of Fluorescence Microscopy Spectral Images.Opt Express (2012) 20(12):12729. doi:10.1364/oe.20.012729
23. Fereidouni F, Blab GA, and Gerritsen HC. Blind Unmixing of SpectrallyResolved Lifetime Images. J Biomed Opt (2013) 18(8):086006. doi:10.1117/1.jbo.18.8.086006
24. Fereidouni F, Reitsma K, and Gerritsen HC. High Speed MultispectralFluorescence Lifetime Imaging. Opt Express (2013) 21(10):11769. doi:10.1364/oe.21.011769
25. Fereidouni F, Blab GA, and Gerritsen HC. Phasor Based Analysis of FRETImages Recorded Using Spectrally Resolved Lifetime Imaging. Methods ApplFluoresc (2014) 2(3):035001. doi:10.1088/2050-6120/2/3/035001
26. Forde TS, and Hanley QS. Spectrally Resolved Frequency Domain Analysis ofMulti-Fluorophore Systems Undergoing Energy Transfer. Appl Spectrosc(2006) 60(12):1442–52. doi:10.1366/000370206779321544
27. Fries MW, Haas KT, Ber S, Saganty J, Richardson EK, Venkitaraman AR, et al.Multiplexed Biochemical Imaging Reveals Caspase Activation PatternsUnderlying Single Cell Fate. BioRxiv (2018). doi:10.1101/427237
28. Gadella TW, and Jovin TM. Oligomerization of Epidermal Growth FactorReceptors on A431 Cells Studied by Time-Resolved Fluorescence ImagingMicroscopy. A Stereochemical Model for Tyrosine Kinase ReceptorActivation. J Cel Biol (1995) 129(6):1543–58. doi:10.1083/jcb.129.6.1543
29. Galperin E, Verkhusha VV, and Sorkin A. Three-chromophore FretMicroscopy to Analyze Multiprotein Interactions in Living Cells. NatMethods (2004) 1(3):209–17. doi:10.1038/nmeth720
30. Grant DM, Zhang W, McGhee EJ, Bunney TD, Talbot CB, Kumar S, et al.Multiplexed FRET to Image Multiple Signaling Events in Live Cells.Biophysical J (2008) 95(10):L69–L71. doi:10.1529/biophysj.108.139204
31. Grecco HE, Roda-Navarro P, and Verveer PJ. Global Analysis of TimeCorrelated Single Photon Counting FRET-FLIM Data. Opt Express (2009)17(8):6493. doi:10.1364/oe.17.006493
32. Guerrieri F, Tisa S, Tosi A, and Zappa F. Two-dimensional SPAD ImagingCamera for Photon Counting. IEEE Photon J. (2010) 2(5):759–74. doi:10.1109/JPHOT.2010.2066554
33. Hanley QS, and Clayton AHA. AB-plot Assisted Determination ofFluorophore Mixtures in a Fluorescence Lifetime Microscope Using Spectraor Quenchers. J Microsc (2005) 218(1):62–7. doi:10.1111/j.1365-2818.2005.01463.x
34. Hanley QS. Spectrally Resolved Fluorescent Lifetime Imaging. J R Soc Interf(2009) 6. doi:10.1098/rsif.2008.0393.focus
35. Hinde E, Digman MA, Welch C, Hahn KM, and Gratton E. Biosensor FörsterResonance Energy Transfer Detection by the Phasor Approach to FluorescenceLifetime Imaging Microscopy. Microsc Res Tech (2012) 75(3):271–81. doi:10.1002/jemt.21054
36. Hinde E, Digman MA, Hahn KM, and Gratton E. Millisecond SpatiotemporalDynamics of FRET Biosensors by the Pair Correlation Function and thePhasor Approach to FLIM. Proc Natl Acad Sci (2013) 110(1):135–40. doi:10.1073/pnas.1211882110
37. Jares-Erijman EA, and Jovin TM. FRET Imaging. Nat Biotechnol (2003)21(11):1387–95. doi:10.1038/nbt896
38. Kaufmann T, Herbert S, Hackl B, Besold JM, Schramek C, Gotzmann J, et al.Direct Measurement of Protein-Protein Interactions by FLIM-FRET at UVLaser-Induced DNA Damage Sites in Living Cells. Nucleic Acids Res (2020)48(21):e122. doi:10.1093/nar/gkaa859
39. Kim J, and Heo WD. Synergistic Ensemble of Optogenetic Actuators andDynamic Indicators in Cell Biology. Mol Cell (2018) 41(9):809–17. doi:10.14348/molcells.2018.0295
40. Kogure T, Karasawa S, Araki T, Saito K, Kinjo M, and Miyawaki A. AFluorescent Variant of a Protein from the Stony Coral MontiporaFacilitates Dual-Color Single-Laser Fluorescence Cross-CorrelationSpectroscopy. Nat Biotechnol (2006) 24(5):577–81. doi:10.1038/nbt1207
41. Kremers G-J, Van Munster EB, Goedhart J, and Gadella TWJ. QuantitativeLifetime Unmixing of Multiexponentially Decaying Fluorophores UsingSingle-Frequency Fluorescence Lifetime Imaging Microscopy. Biophysical J(2008) 95(1):378–89. doi:10.1529/biophysj.107.125229
42. Krstajic N, Levitt J, Poland S, Ameer-Beg S, and Henderson R. 256 × 2 SPADLine Sensor for Time Resolved Fluorescence Spectroscopy. Opt Express (2015)23(5):5653–69. doi:10.1364/oe.23.005653
43. Lagarto JL, Villa F, Tisa S, Zappa F, Shcheslavskiy V, Pavone FS, et al. Real-timeMultispectral Fluorescence Lifetime Imaging Using Single Photon AvalancheDiode Arrays. Sci Rep (2020) 10(1):1–10. doi:10.1038/s41598-020-65218-3
44. Lakowicz JR. Principles of Fluorescence Spectroscopy. Boston, MA: Springer.(2006). doi:10.1007/978-0-387-46312-4
45. Le Marois A, and Shuling K. Multi-Parametric Live Cell Microscopy of 3DTissue Models. Advances in Experimental Medicine and Biology. Russia.Springer International Publishing. (2017). doi:10.1007/978-3-319-67358-5
46. Levitt JA, Matthews DR, Ameer-Beg SM, and Suhling K. Fluorescence Lifetimeand Polarization-Resolved Imaging in Cell Biology. Curr Opin Biotechnol(2009) 20(1):28–36. doi:10.1016/j.copbio.2009.01.004
47. Levitt JA, Poland SP, Krstajic N, Pfisterer K, Erdogan A, Barber PR, et al.Quantitative Real-Time Imaging of Intracellular FRET Biosensor DynamicsUsing Rapid Multi-Beam Confocal FLIM. Sci Rep (2020) 10(1):1–9. doi:10.1038/s41598-020-61478-1
48. Li IT, Pham E, and Truong K. Protein Biosensors Based on the Principle ofFluorescence Resonance Energy Transfer for Monitoring Cellular Dynamics.Biotechnol Lett (2006) 28(24):1971–82. doi:10.1007/s10529-006-9193-5
49. Liang Z, Lou J, Scipioni L, Gratton E, and Hinde E. Quantifying Nuclear WideChromatin Compaction by Phasor Analysis of Histone Förster ResonanceEnergy Transfer (FRET) in Frequency Domain Fluorescence Lifetime ImagingMicroscopy (FLIM) Data. Data in Brief (2020) 30:105401. doi:10.1016/j.dib.2020.105401
50. Lou J, Scipioni L, Wright BK, Bartolec TK, Zhang J, Masamsetti VP, et al.Phasor Histone FLIM-FRET Microscopy Quantifies SpatiotemporalRearrangement of Chromatin Architecture during the DNA DamageResponse. Proc Natl Acad Sci USA (2019) 116(15):7323–32. doi:10.1073/pnas.1814965116
51. Mai H, Poland SP, Mattioli Della Rocca F, Treacy C, Aluko J, Nedbal J, et al.Flow Cytometry Visualization and Real-Time Processing with a CMOS SPADArray and High-Speed Hardware Implementation Algorithm. Proc.SPIE(2020) 11243. doi:10.1117/12.2544759
52. Malacrida L, Jameson DM, and Gratton E. A Multidimensional PhasorApproach Reveals LAURDAN Photophysics in NIH-3T3 Cell Membranes.Sci Rep (2017) 7(1):1–11. doi:10.1038/s41598-017-08564-z
53. Mastop M, Bindels DS, Shaner NC, Postma M, Gadella TWJ, and Goedhart J.Characterization of a SpectrallyDiverse Set of Fluorescent Proteins as FRETAcceptorsfor mTurquoise2. Sci Rep (2017) 7(1):1–18. doi:10.1038/s41598-017-12212-x
Frontiers in Physics | www.frontiersin.org May 2021 | Volume 9 | Article 63712313
Haas et al. Biochemical Multiplexing by Spectral FLIM
54. Miyawaki A, Shcherbakova DM, and Verkhusha VV. Red FluorescentProteins: Chromophore Formation and Cellular Applications. Curr OpinStruct Biol (2012) 22(5):679–88. doi:10.1016/j.sbi.2012.09.002
55. Molina-Guijarro JM, García C, Macías Á, García-Fernández LF, MorenoC, Reyes F, et al. Elisidepsin Interacts Directly with Glycosylceramides inthe Plasma Membrane of Tumor Cells to Induce Necrotic Cell Death.PLoS ONE (2015) 10(10):e0140782–18. doi:10.1371/journal.pone.0140782
56. Niehörster T, Löschberger A, Gregor I, Krämer B, Rahn H-J, Patting M, et al.Multi-target Spectrally Resolved Fluorescence Lifetime Imaging Microscopy.Nat Methods (2016) 13(3):257–62. doi:10.1038/nmeth.3740
57. Niino Y, Hotta K, and Oka K. Simultaneous Live Cell Imaging Using DualFRET Sensors with a Single Excitation Light. PLoS ONE (2009) 4(6):e6036–9.doi:10.1371/journal.pone.0006036
58. Pian Q, Yao R, Sinsuebphon N, and Intes X. Compressive Hyperspectral Time-Resolved Wide-Field Fluorescence Lifetime Imaging. Nat Photon (2017) 11(7):411–4. doi:10.1038/nphoton.2017.82
59. Poland SP, Krstajic N, Monypenny J, Coelho S, Tyndall D, Walker RJ, et al. AHigh Speed Multifocal Multiphoton Fluorescence Lifetime ImagingMicroscope for Live-Cell FRET Imaging. Biomed Opt Express (2015) 6(2):277. doi:10.1364/boe.6.000277
60. Poland SP, Chan GK, Levitt JA, Krstajic N, Erdogan AT, Henderson RK, et al.Multifocal Multiphoton Volumetric Imaging Approach for High-Speed Time-Resolved Förster Resonance Energy Transfer Imaging In Vivo. Opt Lett (2018)43(24):6057. doi:10.1364/ol.43.006057
61. Popleteeva M, Haas KT, Stoppa D, Pancheri L, Gasparini L, Kaminski CF, et al.Fast and Simple Spectral FLIM for Biochemical and Medical Imaging. OptExpress (2015) 23(18):23511. doi:10.1364/oe.23.023511
62. Qiu X, Guo J, Xu J, and Hildebrandt N. Three-Dimensional FRETMultiplexing for DNA Quantification with Attomolar Detection Limits.J Phys Chem Lett (2018) 9(15):4379–84. doi:10.1021/acs.jpclett.8b01944
63. Rück A, Hauser C, Mosch S, and Kalinina S. Spectrally Resolved FluorescenceLifetime Imaging to Investigate Cell Metabolism in Malignant andNonmalignant Oral Mucosa Cells. J Biomed Opt (2014) 19(9):96005–9.doi:10.1117/1.JBO.19.9.096005
64. Scott BL, and Hoppe AD. Three-dimensional Reconstruction of Three-WayFRET Microscopy Improves Imaging of Multiple Protein-ProteinInteractions. PLoS ONE (2016) 11(3):e0152401–17. doi:10.1371/journal.pone.0152401
65. Sharman KK, Periasamy A, Ashworth H, Demas JN, and Snow NH. ErrorAnalysis of the Rapid Lifetime Determination Method for Double-ExponentialDecays and New Windowing Schemes. Anal Chem (1999) 71(5):947–52.doi:10.1021/ac981050d
66. Shcherbakova DM, Hink MA, Joosen L, Gadella TWJ, and Verkhusha VV. Anorange Fluorescent Protein with a Large Stokes Shift for Single-ExcitationMulticolor FCCS and FRET Imaging. J Am Chem Soc (2012) 134(18):7913–23.doi:10.1021/ja3018972
67. Shcherbakova DM, Cox Cammer N, Huisman TM, Verkhusha VV, andHodgson L. Direct Multiplex Imaging and Optogenetics of Rho GTPasesEnabled by Near-Infrared FRET. Nat Chem Biol (2018) 14(6):591–600. doi:10.1038/s41589-018-0044-1
68. Stringari C, Cinquin A, Cinquin O, Digman MA, Donovan PJ, and Gratton E.Phasor Approach to Fluorescence Lifetime Microscopy DistinguishesDifferent Metabolic States of Germ Cells in a Live Tissue. Proc Natl AcadSci (2011) 108(33):13582–7. doi:10.1073/pnas.1108161108
69. Sun Y, Wallrabe H, Booker CF, Day RN, and Periasamy A. Three-colorSpectral FRET Microscopy Localizes Three Interacting Proteins in LivingCells. Biophysical J (2010) 99(4):1274–83. doi:10.1016/j.bpj.2010.06.004
70. Szmacinski H, Toshchakov V, and Lakowicz JR. Application of Phasor Plotand Autofluorescence Correction for Study of Heterogeneous Cell Population.J Biomed Opt (2014) 19(4):046017. doi:10.1117/1.jbo.19.4.046017
71. Trinh AL, Ber S, Howitt A, Valls PO, and Fries MW Europe PMC FundersGroup Fast Single-Cell Biochemistry : Theory, open source Microsc Appl(2020), 7. doi:10.1088/2050-6120/ab3bd2.Fast
72. Ulku A, Ardelean A, Antolovic M, Weiss S, Charbon E, Bruschini C, et al.Wide-field Time-Gated SPAD Imager for Phasor-Based FLIMApplications. Methods Appl Fluoresc (2020) 8(2):024002. doi:10.1088/2050-6120/ab6ed7
73. Wang S, Shen B, Ren S, Zhao Y, Zhang S, Qu J, et al. Implementation andApplication of FRET-FLIM Technology. J Innov Opt Health Sci (2019) 12(5):1930010–2. doi:10.1142/S1793545819300106
74. Warren S, Margineanu A, Katan M, Dunsby C, and French P. Homo-FRETBased Biosensors and Their Application to Multiplexed Imaging ofSignalling Events in Live Cells. Ijms (2015) 16(7):14695–716. doi:10.3390/ijms160714695
75. Zeug A, Woehler A, Neher E, and Ponimaskin EG. Quantitative Intensity-Based FRET Approaches-A Comparative Snapshot. Biophysical J (2012)103(9):1821–7. doi:10.1016/j.bpj.2012.09.031
76. Zickus V, Wu M-L, Morimoto K, Kapitany V, Fatima A, Turpin A, et al.Fluorescence Lifetime Imaging with a Megapixel SPAD Camera and NeuralNetwork Lifetime Estimation. Sci Rep (2020) 10(1):1–10. doi:10.1038/s41598-020-77737-0
Conflict of Interest: The authors declare that the research was conducted in theabsence of any commercial or financial relationships that could be construed as apotential conflict of interest.
Copyright © 2021 Haas, Fries, Venkitaraman and Esposito. This is an open-accessarticle distributed under the terms of the Creative Commons Attribution License (CCBY). The use, distribution or reproduction in other forums is permitted, provided theoriginal author(s) and the copyright owner(s) are credited and that the originalpublication in this journal is cited, in accordance with accepted academic practice.No use, distribution or reproduction is permitted which does not comply withthese terms.
Frontiers in Physics | www.frontiersin.org May 2021 | Volume 9 | Article 63712314
Haas et al. Biochemical Multiplexing by Spectral FLIM


