Embed Size (px)
Citation preview
i
IMPACT OF LAND USE CHANGE ON ECOSYSTEM SERVICES IN BARISAL
SADAR UPAZILA
A Thesis
by
Md. Al-Amin
MASTER OF SCIENCE IN WATER RESOURCES DEVELOPMENT
BUET
INSTITUTE OF WATER AND FLOOD MANAGEMENT
BANGLADESH UNIVERSITY OF ENGINEERING AND TECHNOLOGY
September, 2018
ii
IMPACT OF LAND USE CHANGE ON ECOSYSTEM SERVICES IN BARISAL
SADAR UPAZILA
A Thesis
by
Md. Al-Amin
Submitted in partial fulfillment of the requirements for the degree of
Master of Science in Water Resources Development
BUET
INSTITUTE OF WATER AND FLOOD MANAGEMENT
BANGLADESH UNIVERSITY OF ENGINEERING AND TECHNOLOGY
September, 2018
iii
The thesis titled ‗Impact of Land Use Change on Ecosystem Services in Barisal Sadar
Upazila’ submitted by Md. Al-Amin, Roll No. 1014282003 and Session: October 2014, has
been accepted as satisfactory in partial fulfillment of the requirements for the degree of
Master of Science in Water Resources Development in September, 2018.
BOARD OF EXAMINERS .................................................. Dr. G.M.Tarekul Islam Chairman Professor (Supervisor) Institute of Water and Flood Management Bangladesh University of Engineering and Technology, Dhaka ................................................ Member Director (Ex-officio) Institute of Water and Flood Management Bangladesh University of Engineering and Technology, Dhaka ................................................. Member Dr. Mohammad Anisul Haque Professor Institute of Water and Flood Management Bangladesh University of Engineering and Technology, Dhaka .................................................. Dr. Md. Munsur Rahman Member Professor Institute of Water and Flood Management Bangladesh University of Engineering and Technology, Dhaka ................................................. Member Dr. Syed Hafizur Rahman (External) Professor Department of Environmental Sciences Jahangirnagar University, Savar, Dhaka
iv
CANDIDATE’S DECLARATION
It is hereby declared that this thesis or any part of it has not been submitted elsewhere for the
award of any degree.
………………………..
Md. Al-Amin
Roll No. 1014282003
Session: October, 2014

v
Dedicated to............................................................................
My parents, my sister & my teachers
vi
ACKNOWLEDGMENTS
First of all, I would like to thank almighty Allah for giving me the ability to finish this
research work. My special thanks to my parents and younger sister for their constant
sustenance to complete this research work.
I would like to express my sincere appreciation to my supervisor, Dr. G.M.Tarekul Islam,
Professor, Institute of Water and Flood Management (IWFM), Bangladesh University of
Engineering and Technology (BUET), Dhaka; for his continuous instruction, guidance,
supervision and encouragement to finish this research work. He shared his personal research
experience and helped me whenever I face problems. Without his strong support, it would
have been very difficult to complete this research work successfully. I am very happy to work
with him.
I would like to extend my gratitude to Professor Dr. Md. Munsur Rahman and Professor Dr.
Anisul Haque, Institute of Water and Flood Management (IWFM), Bangladesh University of
Engineering and Technology (BUET), Dhaka; for their encouragement for this research
work.
I am grateful to my course coordinator Dr. Mohammed Abed Hossain, Associate Professor,
Institute of Water and Flood Management (IWFM), Bangladesh University of Engineering
and Technology (BUET), Dhaka; for his encouragement and kindness to complete this
research work.
I am also grateful to Md. Mehedi Hasan and Syed Tariqur Rahman for their help and valuable
suggestions during the questionnaire survey.
Thanks to Bangladesh Bureau of Statistics and Department of Fisheries for sharing their data
for this research work.
Finally, thanks to Institute of Water and Flood Management (IWFM) and its stuff for
permitting and support this research.
vii
ABSTRACT
Bangladesh is one of the most densely populated countries in the world having an area of
1, 47,570 square kilometers. About 1063 people live per sq. km in Bangladesh. According to
Bangladesh Bureau of Statistics, the number of population in Bangladesh was 76.4 million in
1974, which increased to 149.78 million in 2011 and 150.99 million in 2016. The stress
exerted by this huge population to our small land area is tremendous. As a consequence land
use pattern showed a notable conversion through this period. Barisal Sadar Upazila not only
the central part of Barisal District but also a key point for entire southern part of Bangladesh,
is also affected by this land use change. In this research, land use change of Barisal Sadar
Upazila have been analyzed using Landsat satellite image from 1980 to 2010 with 10 years
interval with ILWIS version 3.7.2, a windows base open source software and its impact on
ecosystem services have determined with the help of secondary data and a questionnaire
survey. In Barisal Sadar Upazila, Agricultural area decreased from 125.08 sq. km to 87.86 sq.
km; Wetlands decreased from 24.69 sq. km to 13.02 sq. km; Water body decreased from
34.19 sq. km to 32.05 sq. km during 1980 to 2010 period. On the contrary, Urban area
increased from 14.33 sq. km to 43.15 sq. km, which is more than three times of its original
area and rural area increased from 95.6 sq. km to 117.80 sq. km during 1980 to 2010. These
land use change put a significant impact on various ecosystem services which is a huge
concern in present situation. Due to the reduction of agricultural area and water body, several
provisioning services such as production of rice, captured fisheries and livestock are
decreasing and so is the area used for these production. For maximum productivity within
minimum area, farmers are using hybrid seeds, different types of pesticides and chemical
fertilizers; which destroyed the natural ecosystem. Natural fish production and number of
domestic animal reduced dangerously. Besides, increase in urban and rural area helps to
improve educational, recreational and communication facilities of Barisal Sadar Upazila. It
also affects the livelihood off the community. Many people are living fishing and agricultural
profession for private and public services and entrepreneurships such as auto rickshaw driver,
shopkeepers, saw miller, small businessman. Sometime these changes brought economic
solvency, better educational, medical and transportation facilities and improve the life style of
the local community. But it affects the various ecosystem services adversely and some of the
damages are not recoverable. For a sustainable development, district and upazila land use
management strategy should be taken up in order to enhance the ecosystem services. As well
as local people need to be aware in this regard.
viii
TABLE OF CONTENTS
CANDIDATE’S DECLARATION ........................................................................................ iv
ACKNOWLEDGMENTS ...................................................................................................... vi
ABSTRACT ............................................................................................................................ vii
LIST OF FIGURES ............................................................................................................... xii
LIST OF TABLES ................................................................................................................. xv
CHAPTER ONE
INTRODUCTION.................................................................................................................... 1
1.1 Background of the Study .......................................................................................... 1
1.2 Land Use Changes in Bangladesh ............................................................................ 3
1.3 Research Objectives .................................................................................................. 5
1.4 Scope of the Study ..................................................................................................... 5
1.5 Possible Outcome of the Study ................................................................................. 6
CHAPTER TWO
STUDY AREA .......................................................................................................................... 7
2.1 Geographical Location .............................................................................................. 7
2.2 Characteristics of Barisal Sadar Upazila ................................................................ 8
2.3 Population Characteristics ....................................................................................... 8
2.4 Drinking Water Supply ............................................................................................ 9
2.5 Sanitation Facilities ................................................................................................... 9
2.6 Literacy Rate ........................................................................................................... 10
2.7 Major Types of Crop Production .......................................................................... 10
2.8 Livestock and Poultry ............................................................................................. 11
2.9 Fish Production ....................................................................................................... 11
2.10 Livelihood Characteristics ...................................................................................... 12
2.11 Climate Characteristics ........................................................................................... 13
ix
CHAPTER THREE
REVIEW OF LITERATURE ............................................................................................... 15
3.1 Different Studies to Determine the Land Use Change around the Globe .......... 15
3.2 Different Studies to Determine the Impact of Land Use Change on Ecosystem
Services around the Globe ................................................................................................. 24
3.3 Different Studies to Determine Land Use Change and its Impact on Ecosystem
Services in Bangladesh ....................................................................................................... 30
CHAPTER FOUR
METHODOLOGY ................................................................................................................ 38
4.1 Conceptual Research Framework ......................................................................... 38
4.2 Methodology ............................................................................................................ 39
4.3 Digital Interpretation of the Land Use Change .................................................... 39
4.4 Confusion Matrix and Ground Truthing .............................................................. 43
4.5 Determination of the Impact of Land Use Change on Ecosystem Services ....... 43
4.6 Questionnaire Survey .............................................................................................. 44
CHAPTER FIVE
ASSESSMENT OF THE LAND USE CHANGE ............................................................... 45
5.1 Introduction ............................................................................................................. 45
5.2 Assessment of the Land Use Change ..................................................................... 49
5.3 Assessment of the Accuracy of Land Use Classification ...................................... 52
5.3.1 Confusion Matrix for Assessment the Accuracy of Land Use Classification ......... 52
5.3.2 Ground Truthing for Accuracy Assessment of Land Use Classification ................ 55
CHAPTER SIX
IMPACT OF LAND USE CHANGE ON ECOSYSTEM SERVICES ............................. 58
6.1 Impact of Land Use Change on Ecosystem Services ............................................ 58
6.1.1 Impact of Land Use Change on Agricultural Area .................................................. 61
6.1.2 Impact of Land Use Change on Livestock .............................................................. 65
6.1.3 Impact of Land Use Change on Fish Production ..................................................... 66
x
6.1.4 Impact of Land Use Change on Fresh Water and Fuel ............................................ 69
6.1.5 Impact of Land Use Change on Road Network ....................................................... 69
6.1.6 Impact of Land Use Change on Educational System .............................................. 71
6.2 Impact of Land Use Change on Livelihood .......................................................... 72
6.2.1 Reasons for Leaving Agricultural Work ............................................................... 722
6.2.2 Fusion Fabrication in Agriculture............................................................................ 73
6.2.3 Remarkable Scenario in Various Non-Agricultural Profession ............................ 744
6.3 Impact of Land Use Change on Environment ...................................................... 81
6.4 Gender’s Contribution in the Society .................................................................. 833
6.5 Impact of Land Use Change on Society .............................................................. 844
CHAPTER SEVEN
CONCLUSION .................................................................................................................... 855
7.1 Conclusion .............................................................................................................. 855
7.2 Recommendations ................................................................................................. 877
References ............................................................................................................................. 888
Appendix-A ........................................................................................................................... 933
Appendix-B ........................................................................................................................... 955
xi
LIST OF FIGURES
Figure 2.1 Barisal Sadar Upazila Map (Source-LGED) 7
Figure 2.2 Decadal Growth Rate (%) of Population in Barisal Sadar Upazila from 1951-2011
9
Figure 2.3 Literacy Rate by Sex in Barisal Sadar Upazila from 1991-2011 10
Figure 2.4 Area under Rice Production (Aman, Aus and Boro) in Barisal Sadar Upazila
11
Figure 2.5 Temporal Change of Inland Fish Production in Barisal District from 1983-84 to 2016-17
12
Figure 2.6 Temporal Change of Annual Mean Precipitation in Barisal Sadar Upazila during 1949 to 2010
13
Figure 2.7 Temporal Change of Annual Maximum Temperature in Barisal Sadar Upazila during 1949 to 2010
13
Figure 2.8 Temporal Change of Annual Mean Temperature in Barisal Sadar Upazila during 1949 to 2010
14
Figure 3.1 200 Years Historical Development in Washington/Baltimore Area (Source: Clarke and Gaydos, 1998)
17
Figure 3.2 Land Use Comparison at Nelson region, New Zealand from 1970 to 1990 (Source: Nagashima et al. 2002.)
18
Figure 3.3 Urban Area of Dongguan City in 1988 and 1993 (Source: Yeh and Li, 2002)
19
Figure 3.4 Land Use/land Cover change (Km2) in Taveta District between 1987 and 2011 (Source: Syombua, 2013)
20
Figure 3.5 Land Use and Land Cover Changes for the Years 1987, 2001, and 2011 as a, b, and c respectively. (Source: Syombua, 2013)
21
Figure 3.6 Land Use and Land Cover Map of Kodaikanal- 1969 (Source: Prakasam, 2010)
22
Figure 3.7 Land Use and Land Cover Map of Kodaikanal -2003 (Source: Prakasam, 2010)
23
Figure 3.8 Land Use and Land Cover Map of Kodaikanal -2008 (Source: Prakasam, 2010)
23
Figure 3.9 Kodaikanal Taluk: Area under Land Use and Land Cover (Source: Prakasam, 2010)
24
xii
Figure 3.10 Number of Papers Using the Term ―Ecosystem Services‖ or ―Ecological Services‖ in an ISI Web of Science Search through 2007. (Source: Fisher et al. 2009)
25
Figure 3.11 Land Use Changes Over Time at Boca Del Rio. (Source: Mendoza-Gonzálezet al. 2012)
26
Figure 3.12 Land Use Changes Over Time at Chachalacas. (Source: Mendoza-González et al. 2012)
26
Figure 3.13 Land Use Changes Over Time at Costa Esmeralda (Source: Mendoza-González et al. 2012)
27
Figure 3.14 Land Cover Maps of the Three Urban Agglomerations Liaodong Peninsula (LP), Jing-Jin-Ji (JJJ) and Shandong Peninsula (SP) in 2000 (a) and 2010 (b). (Source: Zhang et al. 2015)
28
Figure 3.15 Change in the Area of the Land Cover Types in the Three Urban Agglomerations between 2000 and 2010 (Source: Zhang et al. 2015)
28
Figure 3.16 Changes in the Total Ecosystem Service Value in LP, JJJ and SP in 2000−2010 (Source: Zhang et al. 2015)
29
Figure 3.17 Degradation of Forest in Madagascar between 1972 (left) and 2001 (right). Each image is 20km by 20 km. (Source- Eva et al. 2006)
29
Figure 3.18 Abandonment of the agricultural zone in Angola, during the late '70s and 2000
30
Figure 3.19 Net Cultivated Land Area (in Mha) of Bangladesh from 1976 to 2010
30
Figure 3.20 Land Use in Bangladesh from 1976 to 2010 (Source: (Hasan et al. 2013)
31
Figure 3.21 Land Use/Cover Change of Manikganj Sadar Upazila, Bangladesh from 1989 to 2009 (Source: Sayed & Haruyama, 2015)
32
Figure 3.22 Ganges Delta in Bangladesh (Source: Islam et al. 2015) 33
Figure 3.23 Spatial Coverage of Agricultural Lands in the Ganges Delta from 1980 to 2008 (Source: Islam et al. 2015)
34
Figure 3.24 Land Use Changes at Ganges Delta in Bangladesh (Islam et al. 2015)
35
Figure 3.25 Temporal Change of Rice Cultivated Area in Ganges Delta, Bangladesh (Source: Islam et al. 2015)
35
xiii
Figure 3.26 Temporal Variation of Shrimp and Fish Production in Ganges Delta, Bangladesh (Source: Islam et al. 2015)
36
Figure 3.27 Temporal Variation of different provisioning and regulating services in Bangladesh Coastal Zone (Source: Hossain et al. 2016)
37
Figure 4.1 Conceptual Research Framework 38
Figure 5.1 Land Use Map of Barisal Sadar Upazila in 1980 45
Figure 5.2 Land Use Map of Barisal Sadar Upazila in 1990 46
Figure 5.3 Land Use Map of Barisal Sadar Upazila in 2000 47
Figure 5.4 Land Use Map of Barisal Sadar Upazila in 2010 48
Figure 5.5 Temporal Change of the Agricultural Area in Barisal Sadar Upazila From 1980 to 2010 (Year Vs Area in sq. km.)
50
Figure 5.6 Temporal Change of the Wetlands in Barisal Sadar Upazila From 1980 to 2010 (Year Vs Area in sq. km.)
50
Figure 5.7 Temporal Change of the Water Body in Barisal Sadar Upazila From 1980 to 2010 (Year Vs Area in sq. km.)
51
Figure 5.8 Temporal Change of the Urban Area in Barisal Sadar Upazila From 1980 To 2010 (Year Vs Area in sq. km.)
51
Figure 5.9 Temporal Change of the Rural Area in Barisal Sadar Upazila From 1980 to 2010 (Year Vs Area in sq. km.)
52
Figure 5.10 Identifying Location Using a GPS Machine 56
Figure 5.11 Location of Ground Truthing in Barisal Sadar Upazila 56
Figure 6.1 The Role of Agriculture Ecosystem with in Ecosystem Services (Source: Clarke et al. 2018)
61
Figure 6.2 Temporal Changes of the Area of Rice Production in Barisal Sadar Upazila
62
Figure 6.3 Temporal Changes of Rice Production in Barisal District 62
Figure 6.4 Temporal Changes of Rice Productivity in Barisal District 63
Figure 6.5 Temporal Change in the Area of Crop Production (excluding rice) in Barisal Sadar Upazila
64
Figure 6.6 Temporal Change of Livestock and Poultry in Barisal Sadar Upazila 65
Figure 6.7 Temporal Change of Inland Water Areas and Fish Production in Bangladesh
66
xiv
Figure 6.8 The yield of Inland open water (capture), Inland closed water (culture), marine fisheries and total fish production in Bangladesh from 2000-2001 to 2014-2015
67
Figure 6.9 Temporal Change of Total Annual Fish Production in Inland Water Areas of Barisal District
68
Figure 6.10 Temporal Change of Total Annual Catch of Hilsa in Barisal District 68
Figure 6.11 Recently Built Dapdapia Bridge at Barisal That Connects the Other Side of Kirtonkhola River with Barisal City. (Source: Collected)
70
Figure 6.12 Recently Built Barisal-Bhola Highway at Barisal 70
Figure 6.13 Construction of New Academic Building at Batna Government Primary School in Barisal Sadar Upazila
71
Figure 6.14 Academic Building of Abdur Rashid Khan High School in Char Kowa in Barisal Sadar Upazila
71
Figure 6.15 Construction of Barisal University in Barisal Sadar Upazila 72
Figure 6.16 Temporal change in HYV Rice Crop Area (acres) in Barisal District During 1979-80 to 2016-17
73
Figure 6.17 An Auto Rickshaw Stand in Barisal Sadar Upazila 75
Figure 6.18 Auto Rickshaw Labour Union Office at Char Kowa, Barisal Sadar Upazila
75
Figure 6.19 Saw Mill in Nobogram Road in Barisal Sadar Upazila 76
Figure 6.20 A Recently Vacated Poultry Farm in Barisal Sadar Upazila 77
Figure 6.21 A Successful Fish Farming Project at Batna in Barisal Sadar Upazila
77
Figure 6.22 Combined Poultry Farm and Fish Farming Project at Babubazar, Barisal Sadar Upazila
78
Figure 6.23 A Small Tea Stall during Night at Batna 79
Figure 6.24 A Shop in Locality Selling Gas Cylinder and Fuel for Vehicle at Nobogram Road
79
Figure 6.25 Log Stored in Locality 81
Figure 6.26 Two Recently Made Fruit Garden 82
xv
LIST OF TABLES
Table 2.1 Test of Trend for Annual Mean Precipitation, Annual Maximum
Temperature and Annual Mean Temperature in Barisal Sadar Upazila during 1949-2010
14
Table 4.1 Details of Landsat Satellite Images 39
Table 4.2 USGS Land Use and Land Cover Classification System (Source: Parthasarathy et al. 2012)
40
Table 4.3 Land Cover Classification Scheme of Twin Cities (Minnesota) Metropolitan Area (Source: Yuan et al. 2005)
42
Table 4.4 Land Use Classification Scheme of Barisal Sadar Upazila 42
Table 4.5 Details about the Main Sources of Secondary Data 44
Table 5.1 Confusion Matrix for Assessment the Accuracy of Land Use Classification for 1980
53
Table 5.2 Confusion Matrix for Assessment the Accuracy of Land Use Classification for 1990
54
Table 5.3 Confusion Matrix for Assessment the Accuracy of Land Use Classification for 2000
54
Table 5.4 Confusion Matrix for Assessment the Accuracy of Land Use Classification for 2010
55
Table 5.5 Comparison of Field Data against Model Data for Land Cover Map of Year 2010
57
Table 6.1 Ecosystem Services Classification Considering Practical Appearances for Operational Purposes (Source: Millennium Ecosystem Assessment, 2005).
58
1
CHAPTER ONE
INTRODUCTION
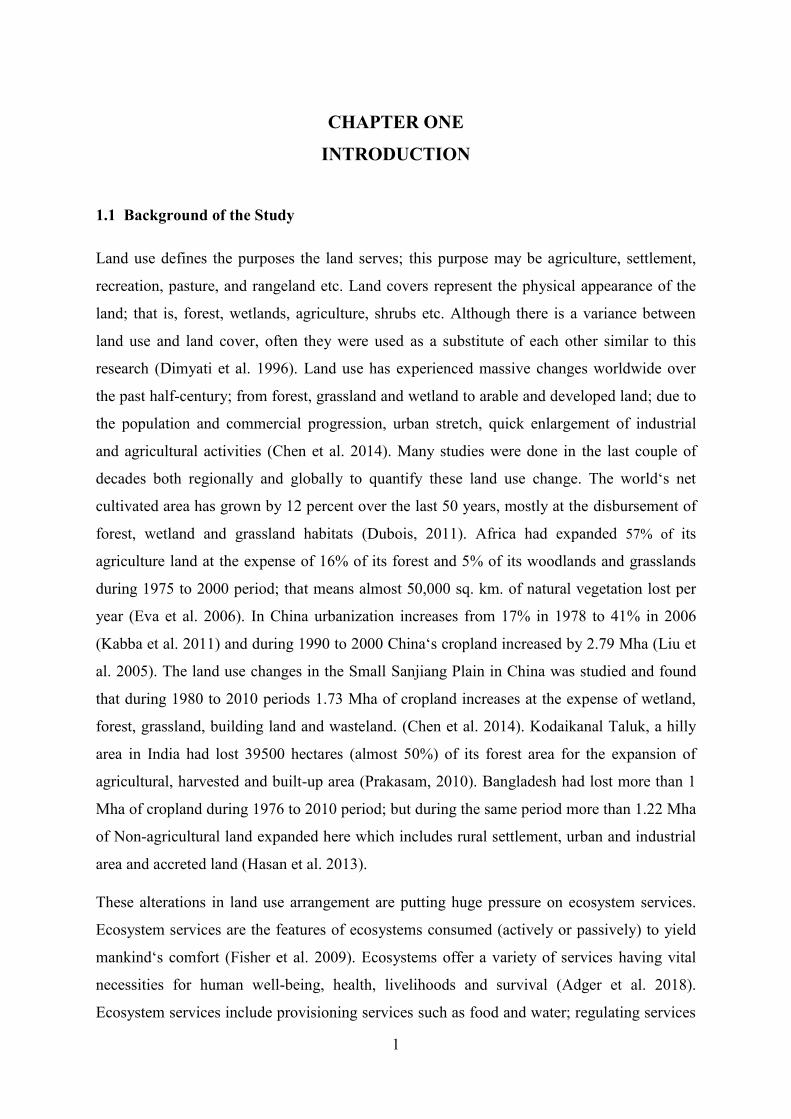
1.1 Background of the Study
Land use defines the purposes the land serves; this purpose may be agriculture, settlement,
recreation, pasture, and rangeland etc. Land covers represent the physical appearance of the
land; that is, forest, wetlands, agriculture, shrubs etc. Although there is a variance between
land use and land cover, often they were used as a substitute of each other similar to this
research (Dimyati et al. 1996). Land use has experienced massive changes worldwide over
the past half-century; from forest, grassland and wetland to arable and developed land; due to
the population and commercial progression, urban stretch, quick enlargement of industrial
and agricultural activities (Chen et al. 2014). Many studies were done in the last couple of
decades both regionally and globally to quantify these land use change. The world‘s net
cultivated area has grown by 12 percent over the last 50 years, mostly at the disbursement of
forest, wetland and grassland habitats (Dubois, 2011). Africa had expanded 57% of its
agriculture land at the expense of 16% of its forest and 5% of its woodlands and grasslands
during 1975 to 2000 period; that means almost 50,000 sq. km. of natural vegetation lost per
year (Eva et al. 2006). In China urbanization increases from 17% in 1978 to 41% in 2006
(Kabba et al. 2011) and during 1990 to 2000 China‘s cropland increased by 2.79 Mha (Liu et
al. 2005). The land use changes in the Small Sanjiang Plain in China was studied and found
that during 1980 to 2010 periods 1.73 Mha of cropland increases at the expense of wetland,
forest, grassland, building land and wasteland. (Chen et al. 2014). Kodaikanal Taluk, a hilly
area in India had lost 39500 hectares (almost 50%) of its forest area for the expansion of
agricultural, harvested and built-up area (Prakasam, 2010). Bangladesh had lost more than 1
Mha of cropland during 1976 to 2010 period; but during the same period more than 1.22 Mha
of Non-agricultural land expanded here which includes rural settlement, urban and industrial
area and accreted land (Hasan et al. 2013).
These alterations in land use arrangement are putting huge pressure on ecosystem services.
Ecosystem services are the features of ecosystems consumed (actively or passively) to yield
mankind‘s comfort (Fisher et al. 2009). Ecosystems offer a variety of services having vital
necessities for human well-being, health, livelihoods and survival (Adger et al. 2018).
Ecosystem services include provisioning services such as food and water; regulating services
2
such as flood and disease control; cultural services such as spiritual, recreational and cultural
benefits, that affect people directly and supporting services, such as nutrient cycling, that
sustain the surroundings for life on Earth (Mooney et al. 1996). The provision of ecosystem
services is directly affected by land use (deGroot et al. 2002). Demolition of Ecosystem
services may cause a societal collapse. Because of cultural belief; inhabitants of Easter Island
had totally deforest their island which lead to loss of soils and no raw materials for building
sea vessels. As a consequence, their society destroyed. Appreciating the necessity of balanced
ecosystem services, a number of studies were done on this topic over the past decades. Some
of the study quantified the damage of ecosystem services in monetary value and some of
them described the damage qualitatively. The various benefits offered by ecosystem services
have more magnitude by normal financial metrics compared to worldwide economy
(Costanza et al. 1997). The loss of ecosystem services value along the coast of the Gulf of
Mexico was found approximately $2006/Ha/year during 1995 to 2006 period (Mendoza-
González et al. 2012). Due to coastal erosion in Europe ecosystem services value decreased
approximately from 22.3 billion Euros in 1975 to 21.6 billion Euro in 2006 and for the year
2050 the predicted loss stuck between 20.1 billion Euros to 19.4 billion Euros per year
(Roebeling et al. 2013). Vihervaara et al. (2012) studied the land use changes in Uruguay
during 1987 to 2007 period and found a significant loss of grassland area to plantations,
which affects the provision of ecosystem services seriously. At the Small Sanjiang Plain,
China excluding the food production all other ecosystem services were reduced from 1980 to
2010. The estimated loss of ecosystem services at the Small Sanjiang Plain in China was
169.88 × 10⁸ Yuan from 1980 to 2000 and 120.00 × 10⁸ Yuan from 2000 to 2010 (Chen et
al. 2014). Islam et al. (2015) identified the agricultural land use changes in the Ganges delta
and its implications with ecosystem services. They found almost 50% reduction of
agricultural land and over 500% expansion of wetlands from 1980 to 2008 because of a
significant increasing trend of saltwater shrimp farming. The reduction of agricultural lands
and rise of wetlands are endorsed to the fact that the agricultural lands have been transformed
into shrimp farms in the study area. During this period settlement & other land use type has
also been increased to nearly 5% but the area of Sundarbans remains steady (Islam et al.
2015). Contrary to these studies, ecosystem services value in Huairou reservoir basin, China
showed an increasing trend. Compared with the ecosystem services value in 1990; it was
increased 0.57%, 1.58%, 2.46% and 2.88% in 1995, 2000, 2005 and 2008 respectively (Wang
et al. 2014). Valuations of interferences to save certain ecosystem services sometime produce
such degree of benefits which is much greater than their costs (Balmford et al. 2002). From
3
the perspective of ecosystem services, wetlands are among the most important and valuable
ecosystems in the world but earlier the wetlands were called as wastelands and filled for other
land use purpose (de Groot et al. 2012). Social-ecological system Bangladesh coastal area is
altering quickly because of sea level rise, more storminess, land use changes, adjusted river
flows, population growth, migration, urbanization and resilient preservation actions (ADB
2005). Hossain et al. (2016) studied the recent changes in ecosystem services and human
well-being of the Bangladesh coastal zone and found many ecosystem services had gone
through noteworthy changes from 1975 to 1980 period.
1.2 Land Use Changes in Bangladesh
After the liberation in 1971 the land use pattern in Bangladesh is changing rapidly.
Bangladesh is a land scarce country where per capita cultivated land is only 12.5 decimals
(Quasem, 2011). About 1063 people live per sq. km. in this country (BBS, 2016). To fulfill
the necessities of such a huge population, high degree of exploitation of natural resources and
degradation of the environment have occurred (Hossain 2001). According to BBS, total land
area of Bangladesh increased from 14.28 Mha to 14.84 million Mha during 1976-77 to 2010-
11 periods due to the reclamation of char lands but during the same period net cultivable land
decreased from 9.39 Mha to 8.52 Mha at a rate of 0.27 percent annually (Yearbook of
Agricultural Statistics Bangladesh, 2011).
Soil Resource Development Institute (SRDI) studied the agricultural and non-agricultural
land use change in Bangladesh from 1976 to 2010. Agricultural land consists of cropland,
forest, mangrove forest, river, lake (Kaptai), beel and haor, tea estate and salt pan. Non-
agricultural land consists of rural settlement, urban and industrial area and accreted area. The
annual loss of agricultural land during 1976 to 2010 was 33140 ha. Agricultural land
decreased from 13303654 ha in 1976 to 12742274 ha in 2000 with an annual loss of 23391 ha
and again with an annual loss of 56537 ha it reached to 12176904 ha in 2010. These findings
indicate that the agricultural land was in much faster decreasing trend during the period from
2000 to 2010 than 1976 to 2000. Considering the agricultural land in 1976 as the base then
annual land lost from agriculture was 0.176, 0.444 and 0.249 percent during 1976-2000,
2000-2010 and 1976-2010 respectively The area under non-agricultural land was increased
from 1183605 ha, which was 8.17 percent in 1976 to 1788307 ha, which was 12.31 percent in
2000 and further increases to 2400867 ha, which was 16.47 percent in 2010. If we consider
the non-agricultural land area of 1976 as base area then during 1976-2000, 2000-2010 and
4
1976-2010 annual increase of the non-agricultural land area is 2.129 percent, 3.425 percent,
and 3.025 percent respectively (Hasan et al. 2013).
Dewan et al. (2008) studied the land use or land cover change in Dhaka Metropolitan area
during 1960 to 2005 period and identified that the built-up areas increased 15,924 ha,
agricultural land decreased 7,614 ha, vegetation decreased 2,336 ha, wetland/lowland
decreased 6,385 ha, water bodies decreased about 864 ha during this period. Overall, urban
areas increased from 11% in 1960 to 344% in 2005 and landfill/bare soils category increased
about 256% (Dewan et al. 2008).
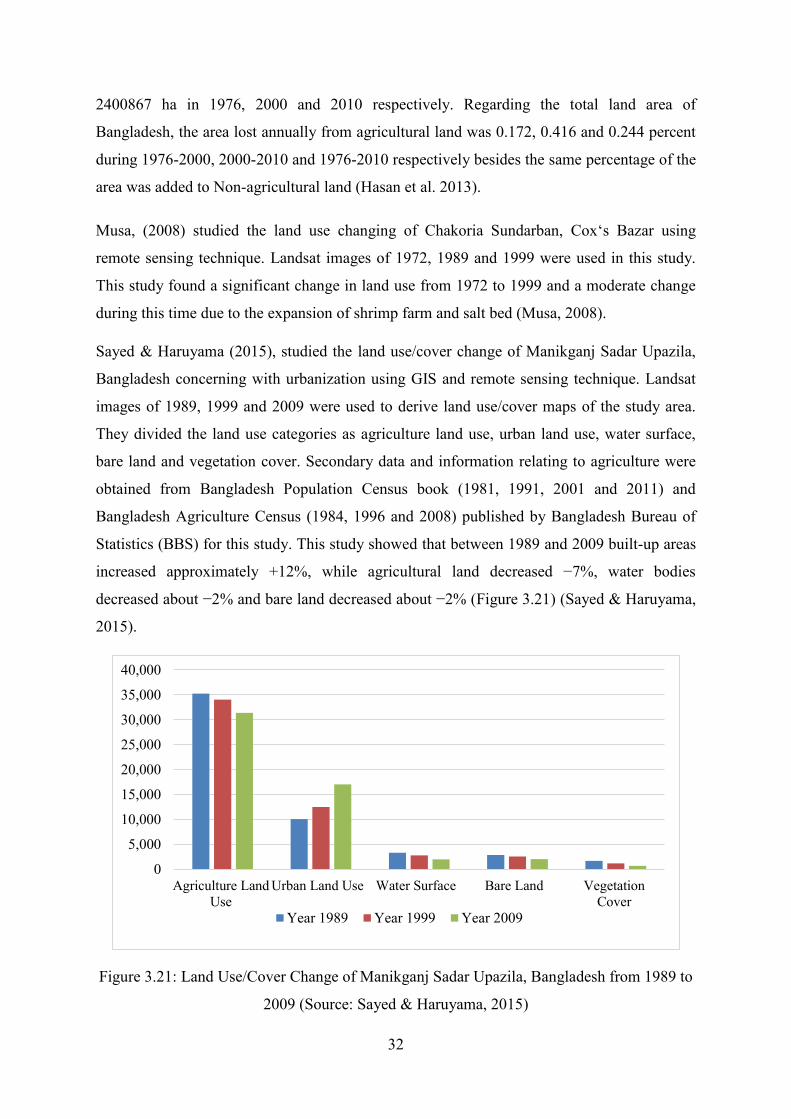
In Manikganj Sadar Upazila built-up areas increased approximately 12%, while agricultural
land decreased 7%, water bodies decreased about 2% and bare land decreased about 2%
between 1989 and 2009 (Sayed and Haruyama, 2015).
In the Ganges delta of Bangladesh, the agricultural lands have been reduced by
approximately 50%, while the wetlands have been increased by over 500% during 1980 to
2008 (Islam et al. 2015).
Chakoria Sundarban, a mangrove forest area in Bangladesh experiences a remarkable land
use changes during 1989 to 1999 and the shrimp farm and Salt Bed are taking place of
mangrove forest area (Musa, 2008).
Rapid urbanization has led to the transformation of rural areas into urban areas, and it has
been estimated that more than 199,908 acre (1% of total agriculture land) of agricultural land
is converted to cities, roads and infrastructure annually (Sayed and Haruyama, 2015). Due to
this rapid change of land use in Bangladesh, its ecosystem services are also changing
alarmingly. Especially the deltaic region, which is most affected by human actions and where
1 in 14 people live globally; the changes in ecosystem services is notable (Adger et al. 2018).
The Ganges–Brahmaputra–Meghna delta in Bangladesh is the world‘s most inhabited delta.
Hossain et al. (2016), Islam et al. (2015) studied the ecosystem services of Bangladesh
coastal zone and several ecosystem services were found deteriorating.
Barisal is one of the most important cities in southern part of Bangladesh and Barisal Sadar
Upazila is the center of this city. It is the entry point of Barisal, Barguna, Bhola, Patuakhali,
Jhalokhati, Bagerhat and Pirojpur; all of them are the part of the south-west coastal zone of
Bangladesh and exposed to sea. Many important infrastructure development project is
ongoing in this area. The government is planning to turn Patuakhali as a power hub. Pyara sea
5
port was formally inaugurated in 2016. Bangladesh-India Friendship Power Company is
making two power plant each have a capacity of 1320 MW in Bagerhat. A special economic
zone is being constructed in Bagerhat also and the Khan Jahan Ali Airport project is being
fast-tracked to become a fully-fledged airport. After construction of the Padma Bridge it is
expected to create employment for 50 million people and an increase in GDP by 1.2 percent.
Future development of these area are closely connected with Barisal Sadar Upazila. It is the
administrative and judicial headquarter of both Barisal Division and Barisal District. The
second largest river port of Bangladesh is located here. Considering the population, it is the
biggest Upazila of Barisal Zila. About 5, 27,017 people live in this Upazila with an annual
growth rate of 1.28 percent. The average population density of Barisal Sadar Upazila per sq.
km is 1625. Sher e Bangla Medical College (SBMC), University of Barisal, Shaheed Abdur
Rab Serniabat Textile Engineering College, Barisal Engineering College, Barisal Polytechnic
Institute and many other governments and private organization located here. Many people
come here for work, education and treatment. As a consequence, the urban area is expanding
rapidly, mainly at the expense of agricultural land. For a sustainable future development it is
very essential to quantify this land use change and determine its impact on society; but very
little work has been done on this regard. So in this study, I choose to quantify the land use
change and determine its impacts on Ecosystem services for Barisal Sadar Upazila.
1.3 Research Objectives
The objectives of the present research have been set as follows:
i. To analyze the land use change pattern of the study area.
ii. To determine the impacts of land use change on ecosystem services.
1.4 Scope of the Study
On 18 January 1923, Barisal Sadar Upazila was established as a Thana and upgraded to
Upazila in 1984. Barisal Sadar Upazila stands beside Kirtonkhola river and covers an area of
324.40 sq. km. including 60.84 sq. km. area of Barisal City Corporation; which is almost 11
percent of Barisal District. It consists of 1 City Corporation, 30 wards, 225 mahallas, 10
unions, 103 populated mauzas and 110 villages. In this study, I quantify the land use change
of the study area using Landsat satellite image from 1980 to 2010 with 10 years interval.
The land use change information would be compared with the ecosystem services data for
impact assessment. Data on ecosystem services such as crop production, fish production,
wetlands including ponds and lakes would be collected from Bangladesh Bureau of Statistics
6
and Department of Fisheries. Because of the 10 year interval the change in the map not only
it is easy to visualize but also gave a decadal changing information. Besides secondary data
used in this study is collected mainly from Bangladesh Bureau of Statistics and they did
national census in 1974, 1981, 1991, 2001 and 2011. So it is easy to connect the secondary
data with land use change for impact assessment. The land use change has social and
environmental impacts as well. A questionnaire survey would be carried out to assess the
social impact of land use change. Non-probability sampling technique would be used to
ensure diversity and avoid sampling errors containing biases (Pereira et al. 2005). The
questionnaires survey would focus on two important social aspects such as the impact on
different livelihoods groups and use of ecosystem services in the community.
1.5 Possible Outcome of the Study
From this study, the land use change from 1980 to 2010 has been quantified for Barisal Sadar
Upazila. The land divided into five categories such as Agriculture Area, Rural Area, Urban
Area, Water Body and Wetlands. So a better understanding of land use changing pattern in
Barisal Sadar Upazila achieved for each type of land during this period. Besides this study
helped to understand the impact of land use change on ecosystem services and the perception
of the community about land use change which will assist in formulating a strategy for
planning and management of land for sustainable development. It also gave a clear
understanding about the livelihood of community and how and why livelihoods are changing
in the study area.
7
CHAPTER TWO
STUDY AREA
2.1 Geographical Location
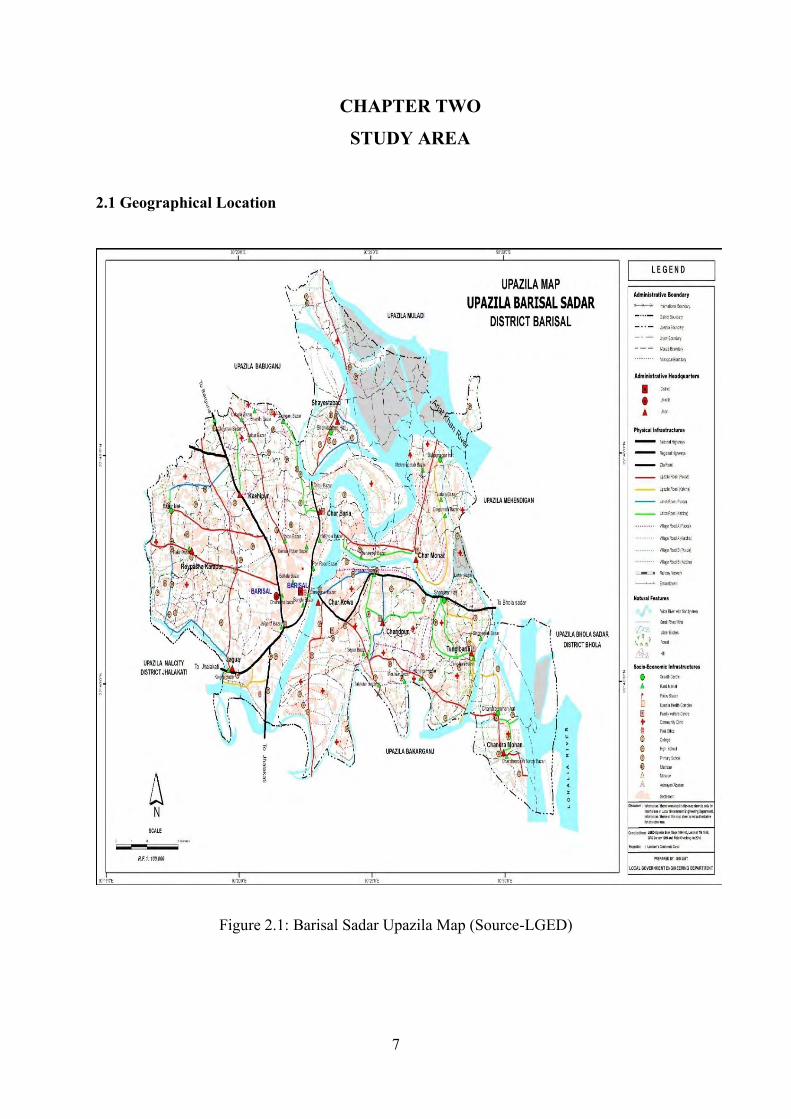
Figure 2.1: Barisal Sadar Upazila Map (Source-LGED)
8
Barisal Sadar Upazila has been selected as the study area for this research. It is the central
part of Barisal Zila. It is located between 22°37' and 22°43' north latitudes and between
90°16' and 90°32' east longitudes. It is bounded by Babuganj, Muladi and Mehendiganj
Upazilas on the north, Bakerganj and Nalchity upazila on the south, Mehendiganj and Bhola
Sadar Upazilas on the east, Jhalokati Sadar and Nalchity Upazilas on the west. It has an area
of 324.40 sq. km. including 60.84 sq. km. area of Barisal City Corporation and 15.54 sq. km.
river area (Figure 2.1).
2.2 Characteristics of Barisal Sadar Upazila
Barisal Sadar Upazila has a very dynamic land use changing pattern. The area of Barisal
Sadar Upazila increased from 307.59 sq. km in 1981 to 317.70 sq. km in 2001 and further
increased to 324.40 sq. km in 2011 including 60.84 sq. km area of Barisal City Corporation
and 15.54 sq. km river area. In this study secondary data about the agricultural area, the
livelihood of the community, the number of domestic animal etc. were collected from
population census report and statistical yearbook of Bangladesh Bureau of Statistics and this
is the only dependable source for this kind of data for any region in Bangladesh. It collects
statistical data of all the sectors, compiles them and publishes them to meet the requirements
of the users. After the independence in 1971, Bangladesh Bureau of Statistics conducted five
population census and four agricultural censuses in Bangladesh. First, second, third, fourth
and fifth population census was conducted in 1974, 1981, 1991, 2001 and 2011 respectively.
First, second, third and fourth agricultural census was conducted in 1977, 1986, 1997 and
2008 respectively. They update these data and published statistical yearbook every year.
Secondary data about fish production were collected from Fisheries Statistical Yearbook of
Department of Fisheries, Bangladesh. To study the characteristics of population, water supply
and sanitation facilities, literacy rate, major types of crop production, fish production,
livestock and poultry, livelihood and climate condition of Barisal Sadar Upazila these data
were used below. Besides to study the climate condition of this area secondary data were
collected from Bangladesh Meteorological Department.
2.3 Population Characteristics
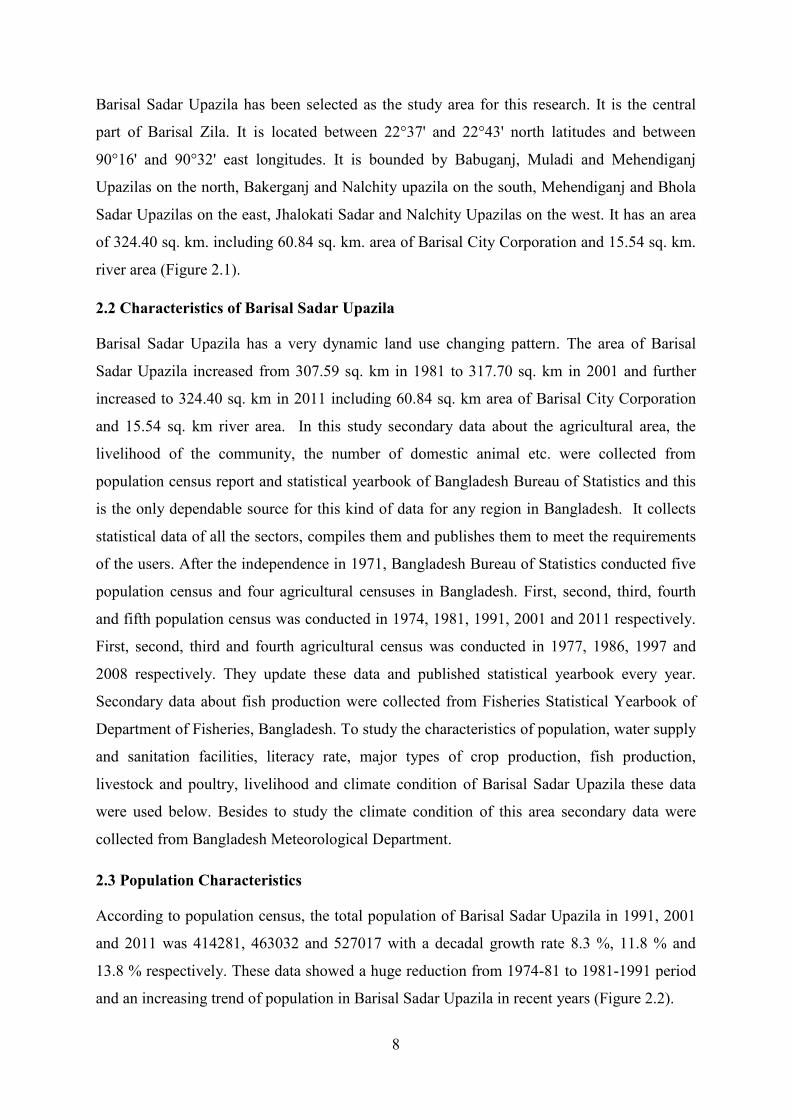
According to population census, the total population of Barisal Sadar Upazila in 1991, 2001
and 2011 was 414281, 463032 and 527017 with a decadal growth rate 8.3 %, 11.8 % and
13.8 % respectively. These data showed a huge reduction from 1974-81 to 1981-1991 period
and an increasing trend of population in Barisal Sadar Upazila in recent years (Figure 2.2).
9
Figure 2.2: Decadal Growth Rate (%) of Population in Barisal Sadar Upazila from 1951-2011
(Source: BBS Population Census, 2011)
Population pressure was declared as the number one problem of the country in 1978. The
government, non-government, private and international organizations started several
programmes to solve the population problem. As a result population growth rate decreased
remarkably in the 1980s and 1990s. In the early 1970s, total fertility (TFR) was about 7, and
it was estimated to be 3.4 in the first Demographic and Health Survey (DHS) in 1993-1994.
(Bairagi, 2001). But recently people migrated here for better work, education and medical
facilities.
2.4 Drinking Water Supply
The drinking water supply system of Barisal Sadar Upazila was vastly improved during last
two decades. In 1991, 45.82 % of household used tube well, 27.45 % used supply water, 0.51
% used dug well, 18.95 % used the pond and 7.28 % used canal or river as the main source
for drinking water. In 2011, the scenario improved significantly; about 91.8 % of general
household used deep tube-well, 6 % used supply water and remaining 2.2 % used other
sources for drinking water (BBS Population Census, 1991 & 2011).
2.5 Sanitation Facilities
Sanitation Facilities of Barisal Sadar Upazila showed a huge improvement during 1981 to
2011 period. The use of sanitary latrine increases from 39.46% of households in 1981 to
80.4% household in 2011, use of non-sanitary latrine decreased from 58.43% of households
23.1
19
23.1
8.3
11.8
13.8
0
5
10
15
20
25
1951-1961 1961-1974 1974-1981 1981-1991 1991-2001 2001-2011
Dea
dal G
row
th R
ate
%
Year
10
in 1981 to 18.6% household in 2011 and household with no toilet facility dropped from
11.10% to 1% during this time (BBS Population Census, 1981 & 2011).
2.6 Literacy Rate
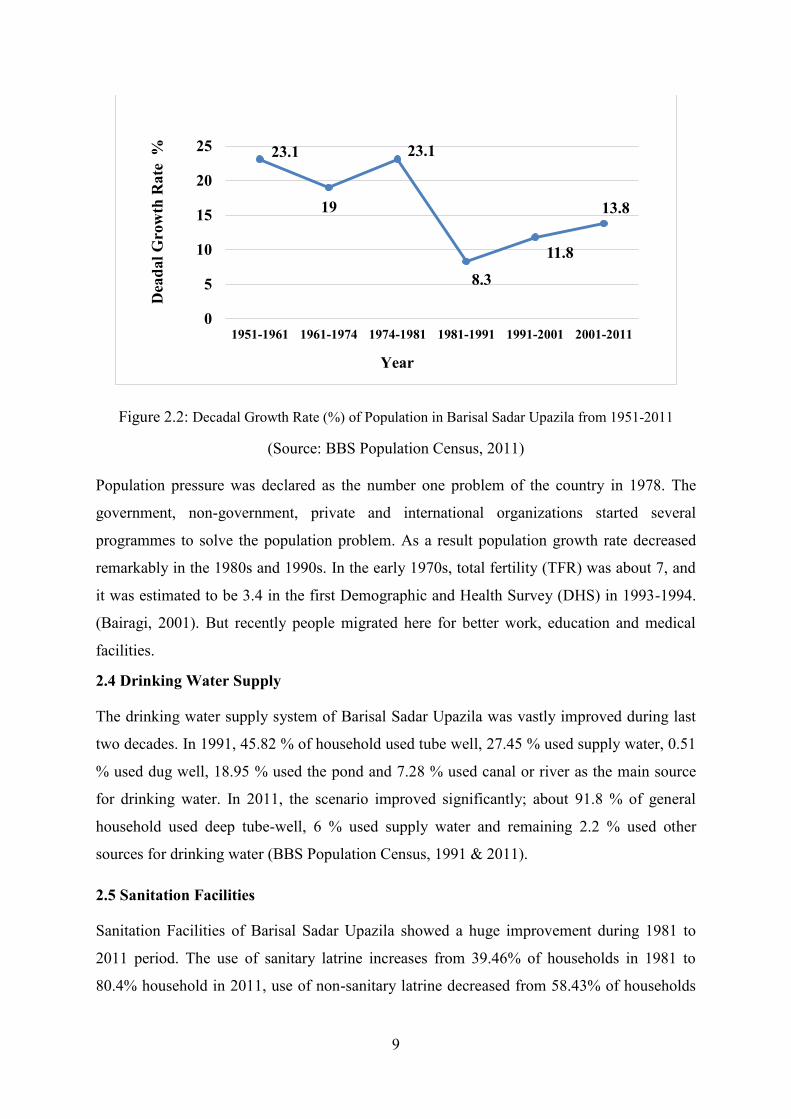
Literacy rate (for 7 years and above) in Barisal Sadar Upazila was found 53.5%, 64.8% and
69.3% in 1991, 2001 and 2011 respectively. The literacy rate of female was found less than
male, though the difference is minimal in recent years (Figure 2.3).
Figure 2.3: Literacy Rate by Sex in Barisal Sadar Upazila from 1991-2011
(Source: BBS Population Census, 2011)
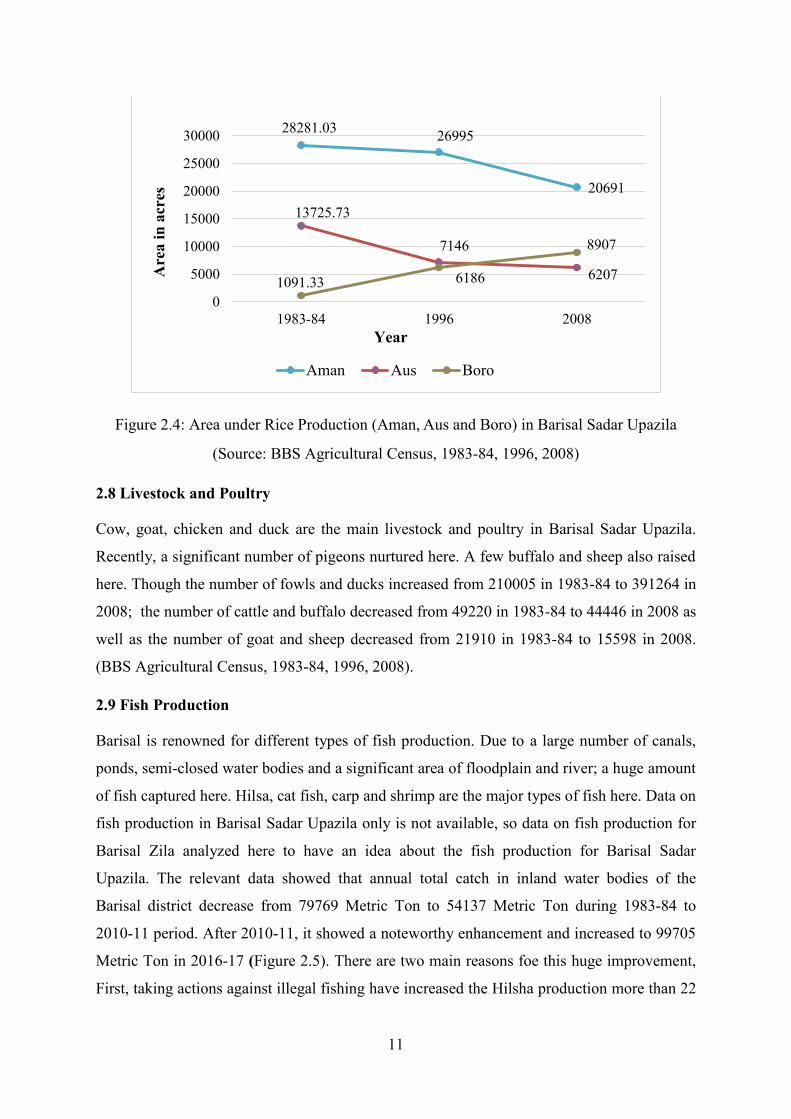
2.7 Major Types of Crop Production
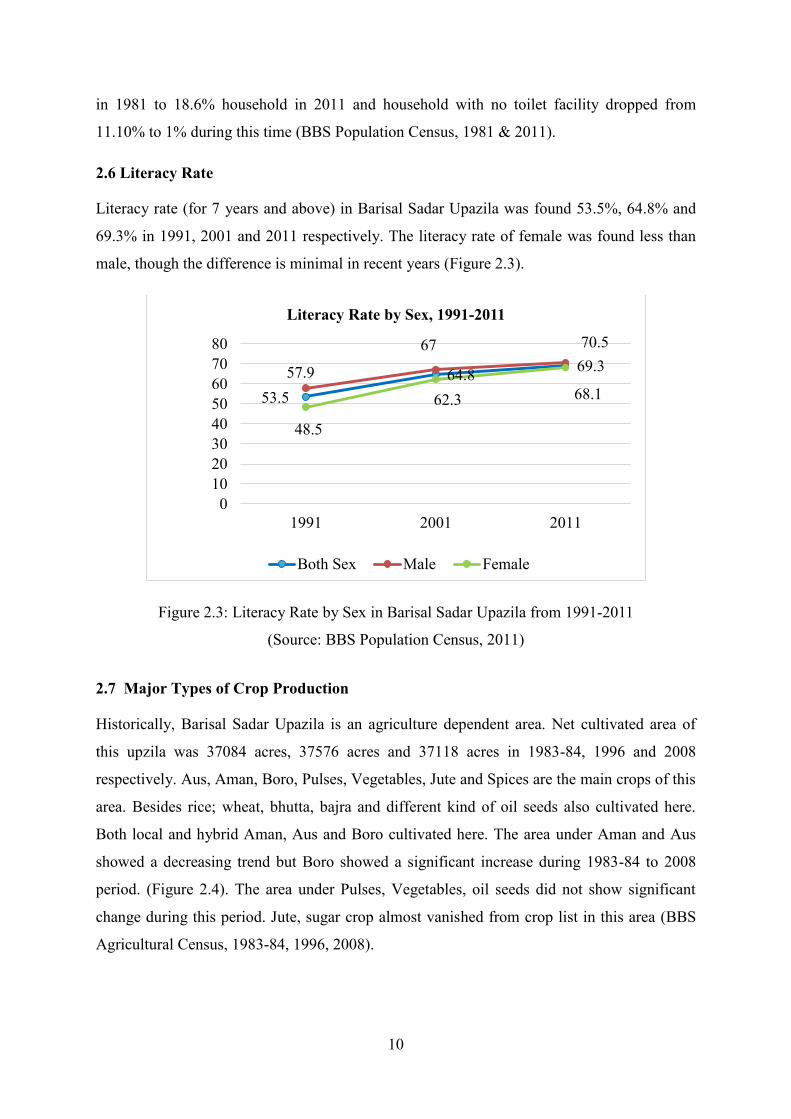
Historically, Barisal Sadar Upazila is an agriculture dependent area. Net cultivated area of
this upzila was 37084 acres, 37576 acres and 37118 acres in 1983-84, 1996 and 2008
respectively. Aus, Aman, Boro, Pulses, Vegetables, Jute and Spices are the main crops of this
area. Besides rice; wheat, bhutta, bajra and different kind of oil seeds also cultivated here.
Both local and hybrid Aman, Aus and Boro cultivated here. The area under Aman and Aus
showed a decreasing trend but Boro showed a significant increase during 1983-84 to 2008
period. (Figure 2.4). The area under Pulses, Vegetables, oil seeds did not show significant
change during this period. Jute, sugar crop almost vanished from crop list in this area (BBS
Agricultural Census, 1983-84, 1996, 2008).
53.5 64.8 69.3 57.9
67 70.5
48.5
62.3 68.1
01020304050607080
1991 2001 2011
Literacy Rate by Sex, 1991-2011
Both Sex Male Female
11
Figure 2.4: Area under Rice Production (Aman, Aus and Boro) in Barisal Sadar Upazila
(Source: BBS Agricultural Census, 1983-84, 1996, 2008)
2.8 Livestock and Poultry
Cow, goat, chicken and duck are the main livestock and poultry in Barisal Sadar Upazila.
Recently, a significant number of pigeons nurtured here. A few buffalo and sheep also raised
here. Though the number of fowls and ducks increased from 210005 in 1983-84 to 391264 in
2008; the number of cattle and buffalo decreased from 49220 in 1983-84 to 44446 in 2008 as
well as the number of goat and sheep decreased from 21910 in 1983-84 to 15598 in 2008.
(BBS Agricultural Census, 1983-84, 1996, 2008).
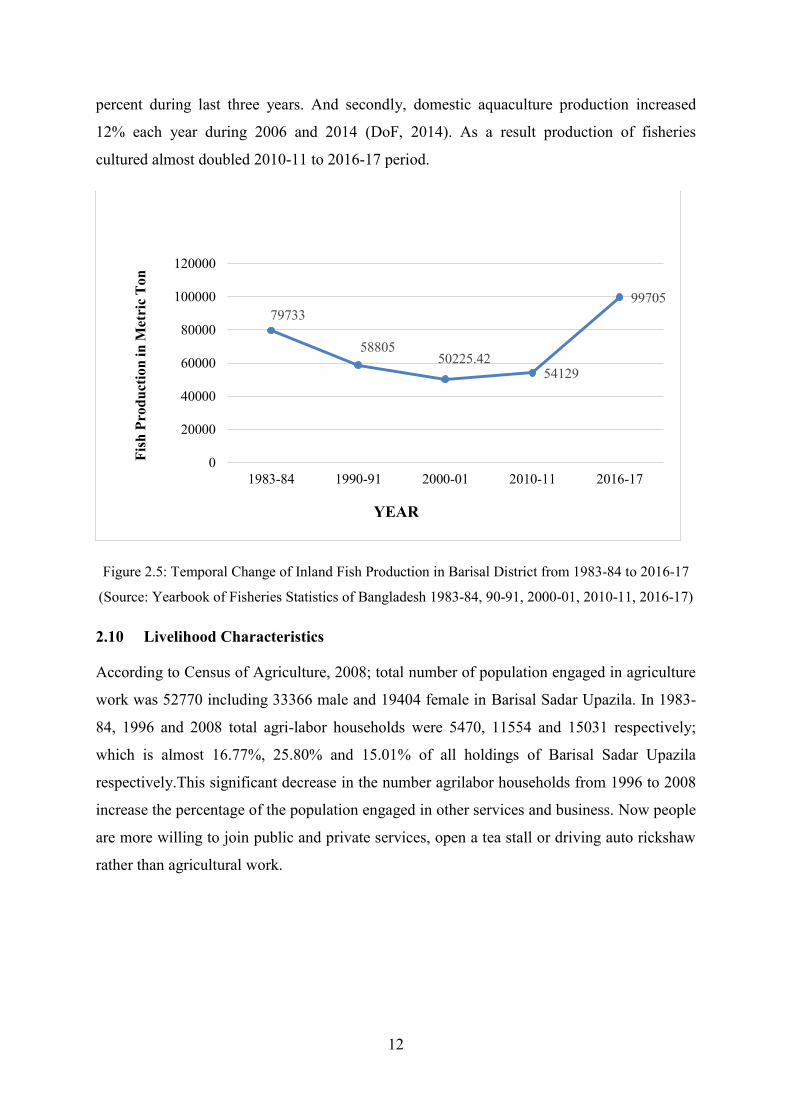
2.9 Fish Production
Barisal is renowned for different types of fish production. Due to a large number of canals,
ponds, semi-closed water bodies and a significant area of floodplain and river; a huge amount
of fish captured here. Hilsa, cat fish, carp and shrimp are the major types of fish here. Data on
fish production in Barisal Sadar Upazila only is not available, so data on fish production for
Barisal Zila analyzed here to have an idea about the fish production for Barisal Sadar
Upazila. The relevant data showed that annual total catch in inland water bodies of the
Barisal district decrease from 79769 Metric Ton to 54137 Metric Ton during 1983-84 to
2010-11 period. After 2010-11, it showed a noteworthy enhancement and increased to 99705
Metric Ton in 2016-17 (Figure 2.5). There are two main reasons foe this huge improvement,
First, taking actions against illegal fishing have increased the Hilsha production more than 22
28281.03 26995
20691
13725.73
7146
6207 1091.33 6186
8907
0
5000
10000
15000
20000
25000
30000
1983-84 1996 2008
Aman Aus Boro
Are
a in
acr
es
Year
12
percent during last three years. And secondly, domestic aquaculture production increased
12% each year during 2006 and 2014 (DoF, 2014). As a result production of fisheries
cultured almost doubled 2010-11 to 2016-17 period.
Figure 2.5: Temporal Change of Inland Fish Production in Barisal District from 1983-84 to 2016-17
(Source: Yearbook of Fisheries Statistics of Bangladesh 1983-84, 90-91, 2000-01, 2010-11, 2016-17)
2.10 Livelihood Characteristics
According to Census of Agriculture, 2008; total number of population engaged in agriculture
work was 52770 including 33366 male and 19404 female in Barisal Sadar Upazila. In 1983-
84, 1996 and 2008 total agri-labor households were 5470, 11554 and 15031 respectively;
which is almost 16.77%, 25.80% and 15.01% of all holdings of Barisal Sadar Upazila
respectively.This significant decrease in the number agrilabor households from 1996 to 2008
increase the percentage of the population engaged in other services and business. Now people
are more willing to join public and private services, open a tea stall or driving auto rickshaw
rather than agricultural work.
79733
58805 50225.42
54129
99705
0
20000
40000
60000
80000
100000
120000
1983-84 1990-91 2000-01 2010-11 2016-17
YEAR
Fish
Pro
duct
ion
in M
etri
c T
on
13
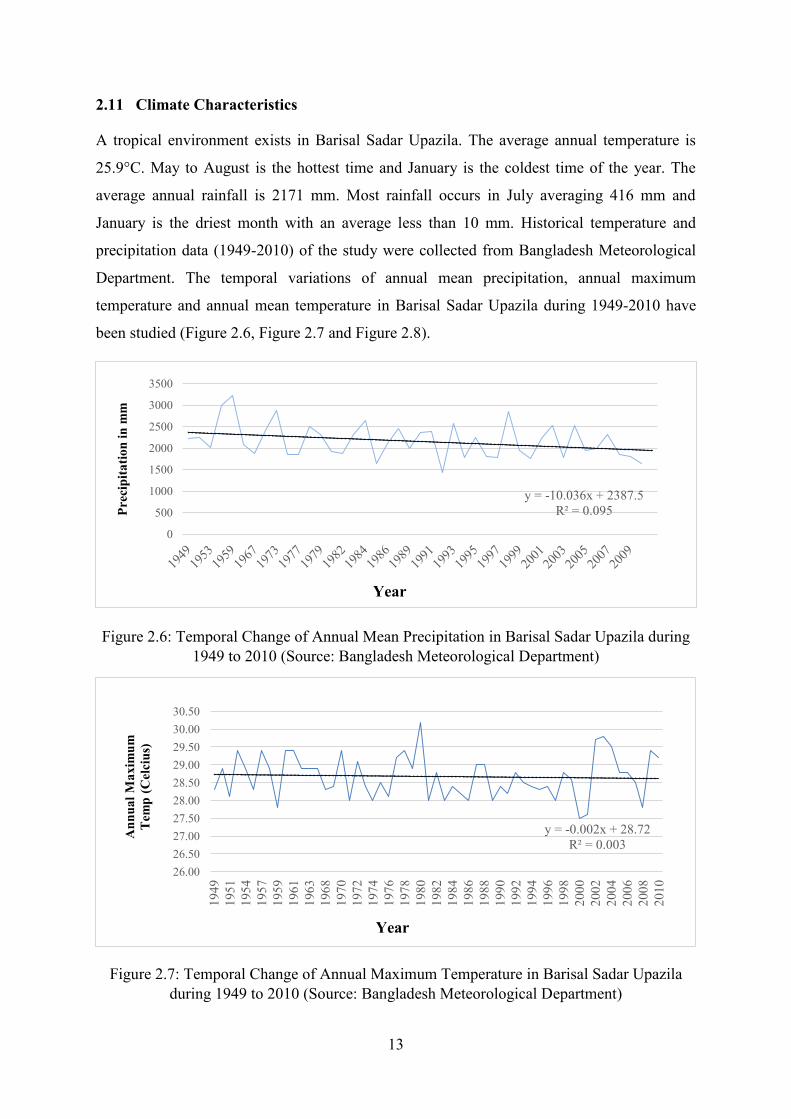
2.11 Climate Characteristics
A tropical environment exists in Barisal Sadar Upazila. The average annual temperature is
25.9°C. May to August is the hottest time and January is the coldest time of the year. The
average annual rainfall is 2171 mm. Most rainfall occurs in July averaging 416 mm and
January is the driest month with an average less than 10 mm. Historical temperature and
precipitation data (1949-2010) of the study were collected from Bangladesh Meteorological
Department. The temporal variations of annual mean precipitation, annual maximum
temperature and annual mean temperature in Barisal Sadar Upazila during 1949-2010 have
been studied (Figure 2.6, Figure 2.7 and Figure 2.8).
Figure 2.6: Temporal Change of Annual Mean Precipitation in Barisal Sadar Upazila during 1949 to 2010 (Source: Bangladesh Meteorological Department)
Figure 2.7: Temporal Change of Annual Maximum Temperature in Barisal Sadar Upazila during 1949 to 2010 (Source: Bangladesh Meteorological Department)
y = -10.036x + 2387.5 R² = 0.095
0
500
1000
1500
2000
2500
3000
3500
Prec
ipita
tion
in m
m
Year
y = -0.002x + 28.72 R² = 0.003
26.0026.5027.0027.5028.0028.5029.0029.5030.0030.50
1949
1951
1954
1957
1959
1961
1963
1968
1970
1972
1974
1976
1978
1980
1982
1984
1986
1988
1990
1992
1994
1996
1998
2000
2002
2004
2006
2008
2010
Ann
ual M
axim
um
Tem
p (C
elci
us)
Year
14
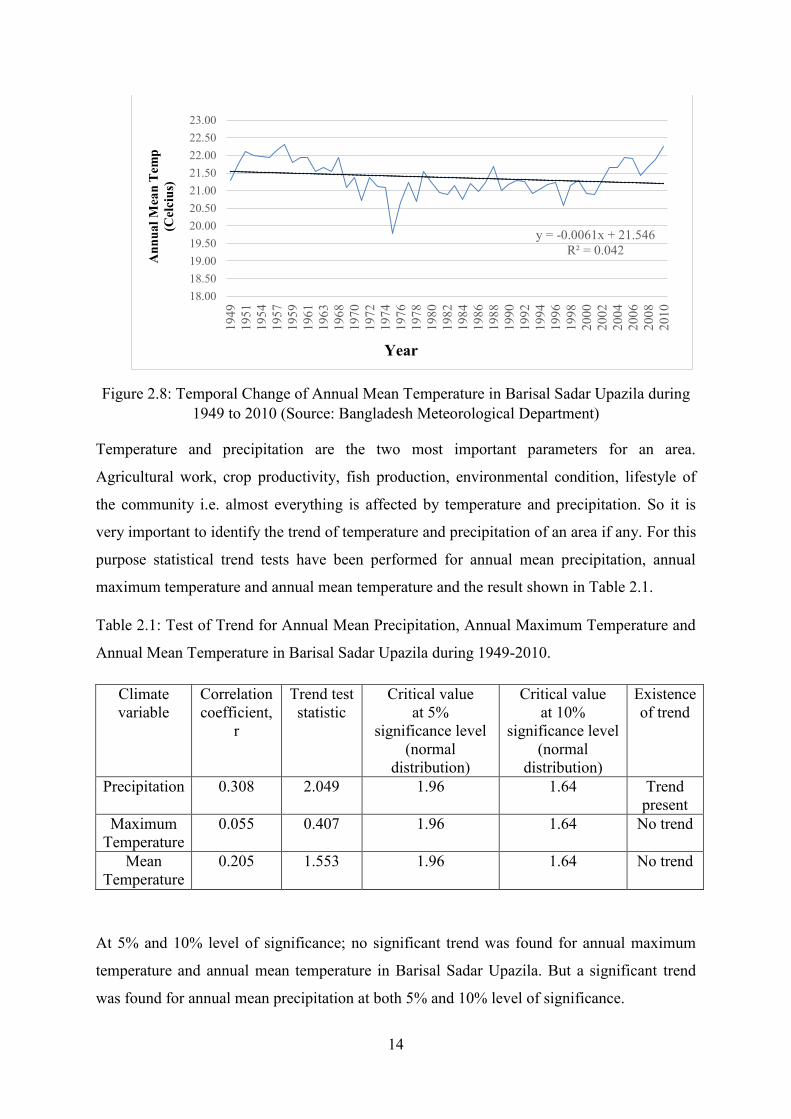
Figure 2.8: Temporal Change of Annual Mean Temperature in Barisal Sadar Upazila during 1949 to 2010 (Source: Bangladesh Meteorological Department)
Temperature and precipitation are the two most important parameters for an area.
Agricultural work, crop productivity, fish production, environmental condition, lifestyle of
the community i.e. almost everything is affected by temperature and precipitation. So it is
very important to identify the trend of temperature and precipitation of an area if any. For this
purpose statistical trend tests have been performed for annual mean precipitation, annual
maximum temperature and annual mean temperature and the result shown in Table 2.1.
Table 2.1: Test of Trend for Annual Mean Precipitation, Annual Maximum Temperature and
Annual Mean Temperature in Barisal Sadar Upazila during 1949-2010.
Climate variable
Correlation coefficient,
r
Trend test statistic
Critical value at 5%
significance level (normal
distribution)
Critical value at 10%
significance level (normal
distribution)
Existence of trend
Precipitation 0.308 2.049 1.96 1.64 Trend present
Maximum Temperature
0.055 0.407 1.96 1.64 No trend
Mean Temperature
0.205 1.553 1.96 1.64 No trend
At 5% and 10% level of significance; no significant trend was found for annual maximum
temperature and annual mean temperature in Barisal Sadar Upazila. But a significant trend
was found for annual mean precipitation at both 5% and 10% level of significance.
y = -0.0061x + 21.546 R² = 0.042
18.0018.5019.0019.5020.0020.5021.0021.5022.0022.5023.00
1949
1951
1954
1957
1959
1961
1963
1968
1970
1972
1974
1976
1978
1980
1982
1984
1986
1988
1990
1992
1994
1996
1998
2000
2002
2004
2006
2008
2010
Ann
ual M
ean
Tem
p (C
elci
us)
Year
15
CHAPTER THREE
REVIEW OF LITERATURE
3.1 Different Studies to Determine the Land Use Change around the Globe
The global land area is 13.2 billion hectare. Of this, 1.6 billion hectare (12%) is currently in
use for cultivation of agricultural crops, 3.7 billion hectares (28%) is under forest and 4.6
billion hectare (35%) comprises grasslands and woodland ecosystems (Dubois, 2011). To
predict future infrastructure development and its impact on ecosystem services; it is very
important to study the present land use changing pattern and availability of land for different
purposes like Forest area, Agricultural area, Waste Land, Built-up area, Harvested Land and
Water bodies. Quantifying the changes in the landscape is very important for the clear
understanding of the spatial and structural variability in the land use and their associated
ecological effects (Turner, 2005). Quantitative assessment of the effects of land use changes
on the value of ecosystem services is one of the research focuses on sustainable development
in science (Hongyi et al. 2008). From this realization, a number of studies performed
worldwide since 1990. Some of the study conducted on large scale and some of them
regionally. The International Geosphere-Biosphere Programme Committee on Global Change
(IGBP) started a program in 1994 called Land Use and Land Cover Change (LUCC) project
with four objectives. Those are-
i. To understand the human and biophysical dynamics of land use changes and their
impacts on land cover.
ii. To develop a standard model to predict future land use and land cover changes
iii. To classify the land according to their use
iv. To acquire information by organized and incorporated case studies around the globe.
Land-Cover and Land-Use Change (LCLUC) Program was launched by NASA to improve
understanding of human interactions with the environment and, thus, provides a scientific
foundation for understanding the sustainability, vulnerability and resilience of human land-
use and terrestrial ecosystems (Mather, 1999.) This program used an interdisciplinary
approach to connect the scholars of various discipline throughout the globe to address the
land use change and its impact on hydrology, biodiversity, carbon cycle and biochemistry.
With time these studies became more focused to identify and quantify land use changes, the
reason for this changes and impact of these changes.
16
Now Global Land Programme initiated a study with three specific objectives-
i. To identify the agents, structures and nature of change in coupled human environment
systems on land, and to quantify their effects on the coupled system;
ii. To assess how the provision of ecosystem services is affected by the changes and
iii. To identify the character and dynamics of vulnerable and sustainable coupled human
environment systems to interacting perturbations, including climate change.
All of these projects focused to build transparent database globally on land use changing
pattern, their impact on human society and ecosystem and predict the future land use and
their consequences
Different methods were introduced by renowned scholars around the globe to determine the
land use change in various studies. The ecological processes, availability of relevant
information on study area are the important parameters to select a specific method for
determining and quantifying land use change. A new era in these studies was established
when Remote Sensing and Geographical Information Systems (GIS) were added to these
research which has gained huge momentum recently to determine the land use change. These
tools have broadened a new insight in front of researchers to have their optimum, desired
level of output. Remote Sensing and Geographical Information Systems (GIS) is very useful
to find the accurate land use change and visualize them in the study area. Now I will discuss
some studies and different methods used by the researcher in these studies to justify my
methodology for this study and how the methods are evolving with time. This literature
review will also give me an idea about the possible findings and a platform to compare them.
Johnson and Kasischke (1998) introduced Change vector analysis (CVA), a method for
identifying the multispectral changes in land cover. It is a vigorous approach for identifying
and classifying radiometric change in multispectral remote sensing data sets. This technique
can be used to systemize the full dimensionality of multispectral/multi-layer data to find out
any changes present in the data and determine the changes in multispectral data (Johnson and
Kasischke, 1998).
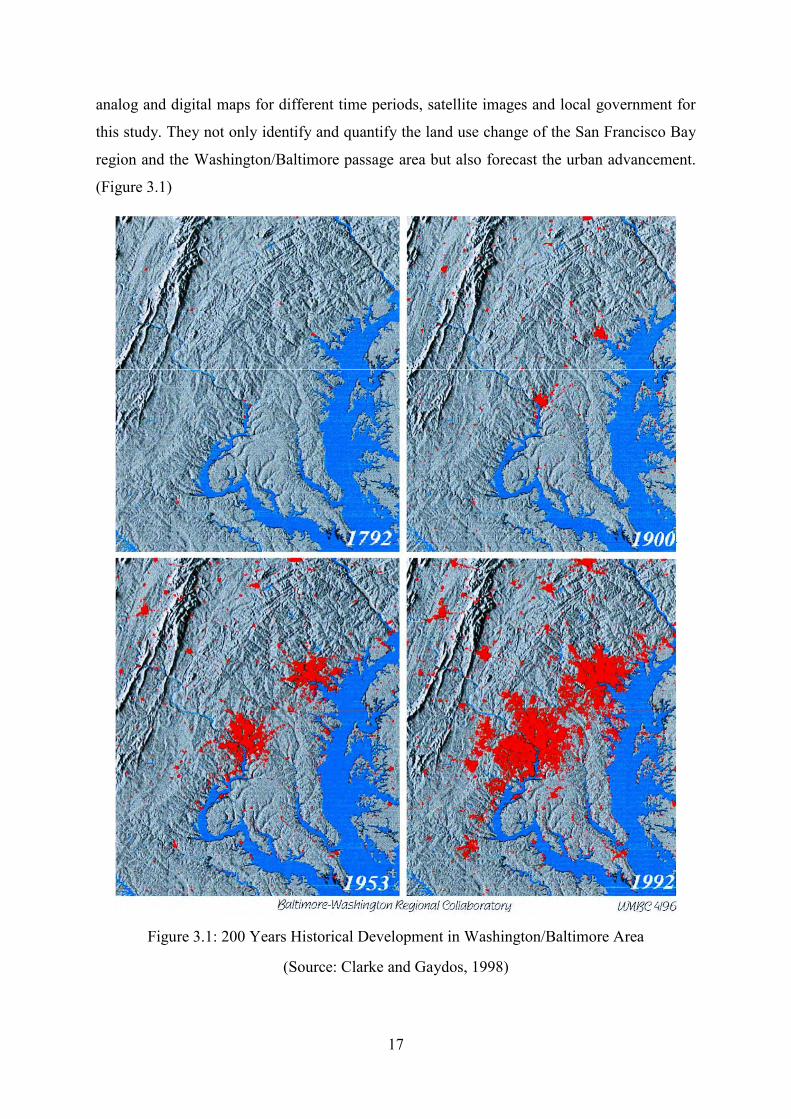
Clarke and Gaydos (1998) applied Cellular Automata (CA) model in the San Francisco Bay
region and the Washington/Baltimore passage in the Eastern USA. Geographical Information
Systems (GIS) was loosely connected with Cellular Automata (CA) model in this study to
visualize and predict the future urban advancement. They collected data from historical maps,
17
analog and digital maps for different time periods, satellite images and local government for
this study. They not only identify and quantify the land use change of the San Francisco Bay
region and the Washington/Baltimore passage area but also forecast the urban advancement.
(Figure 3.1)
Figure 3.1: 200 Years Historical Development in Washington/Baltimore Area
(Source: Clarke and Gaydos, 1998)
18
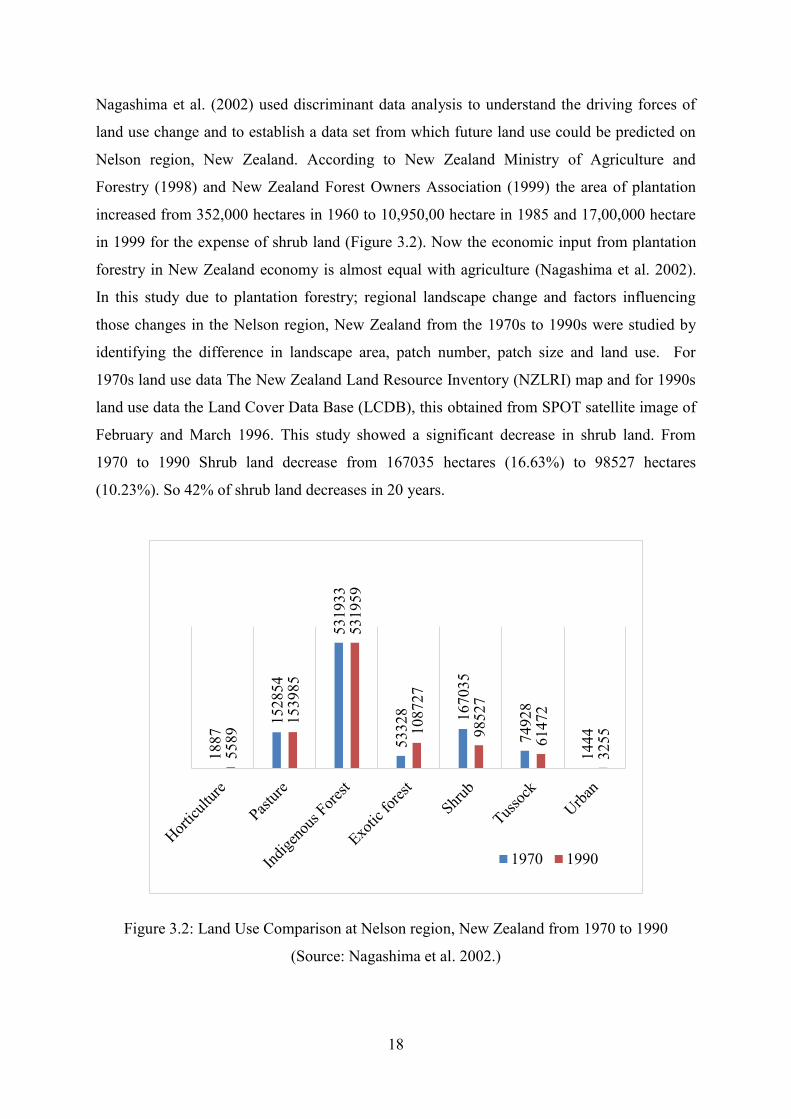
Nagashima et al. (2002) used discriminant data analysis to understand the driving forces of
land use change and to establish a data set from which future land use could be predicted on
Nelson region, New Zealand. According to New Zealand Ministry of Agriculture and
Forestry (1998) and New Zealand Forest Owners Association (1999) the area of plantation
increased from 352,000 hectares in 1960 to 10,950,00 hectare in 1985 and 17,00,000 hectare
in 1999 for the expense of shrub land (Figure 3.2). Now the economic input from plantation
forestry in New Zealand economy is almost equal with agriculture (Nagashima et al. 2002).
In this study due to plantation forestry; regional landscape change and factors influencing
those changes in the Nelson region, New Zealand from the 1970s to 1990s were studied by
identifying the difference in landscape area, patch number, patch size and land use. For
1970s land use data The New Zealand Land Resource Inventory (NZLRI) map and for 1990s
land use data the Land Cover Data Base (LCDB), this obtained from SPOT satellite image of
February and March 1996. This study showed a significant decrease in shrub land. From
1970 to 1990 Shrub land decrease from 167035 hectares (16.63%) to 98527 hectares
(10.23%). So 42% of shrub land decreases in 20 years.
Figure 3.2: Land Use Comparison at Nelson region, New Zealand from 1970 to 1990
(Source: Nagashima et al. 2002.)
1887
1528
54
5319
33
5332
8 1670
35
7492
8
1444
5589
1539
85
5319
59
1087
27
9852
7
6147
2
3255
1970 1990
19
Sonis et al. (2007) used an arrangement of matrix land-use analysis and Geographical
Information System (GIS) for analyzing multi-date satellite images to study landscape
changes in the Israeli Carmel area. The Matrix Land Use Analysis is utilizing the matrices of
the land uses redistributions within a given set of regions in a given time period (Sonis et al.
2007).
Lambin and Ehrlich (1997) used remote sensing process to identify land cover changes in
sub-Saharan Africa from 1982 to 1991. During this period huge changes were found in
Southern Africa, Eastern Africa and the Sahelo-Sudanian belt but the evergreen forest of
Central Africa showed a stable ecosystem. Overall less than 4% of the study area was
changed but its impact on ecosystem and livelihood could be huge (Lambin and Ehrlich,
1997).
Samant and Subramanyan (1998) studied the land use changes of Mumbai during 1925 to
1994 period. They compared the land use map of 1925 and 1967 with the Landsat images of
1994 using GIS to detect and quantify land use change in the study area. They found that
Mumbai, the densely populated urban area in India; had lost 55% of its forest area from 1925
to 1994 due to a massive expansion of urban area. During this same period built up area
increased almost 300% (Samant and Subramanyan, 1998).
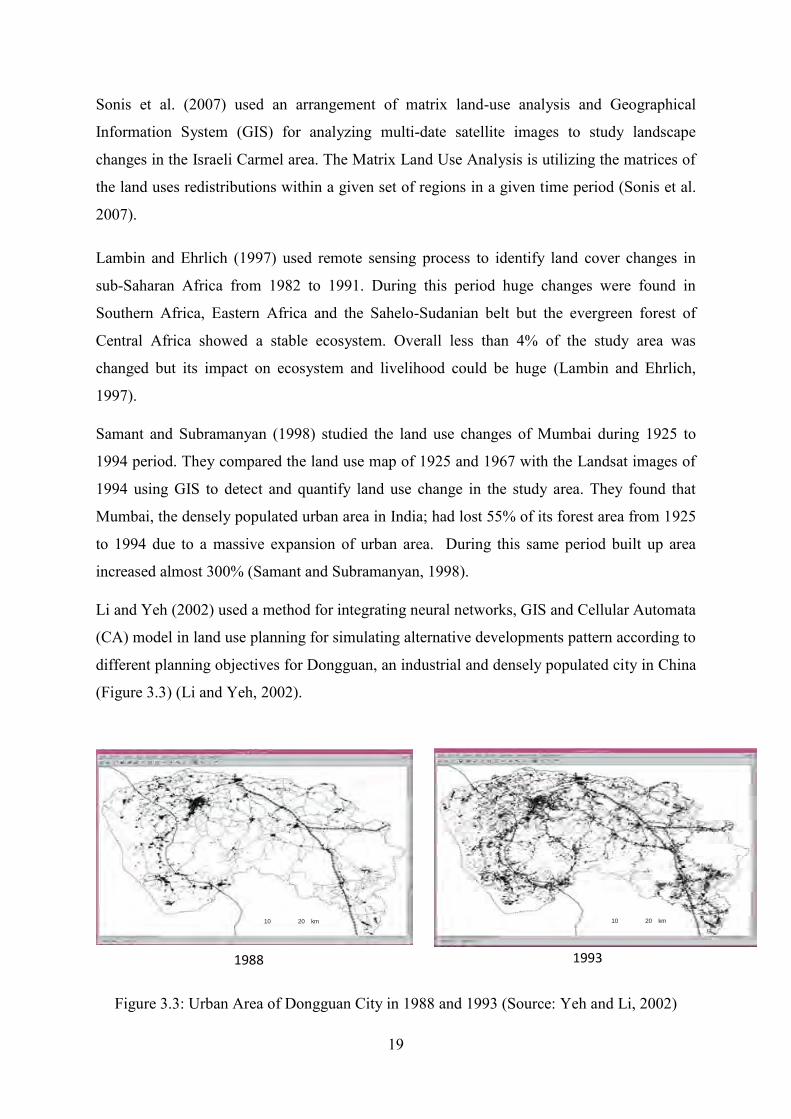
Li and Yeh (2002) used a method for integrating neural networks, GIS and Cellular Automata
(CA) model in land use planning for simulating alternative developments pattern according to
different planning objectives for Dongguan, an industrial and densely populated city in China
(Figure 3.3) (Li and Yeh, 2002).
Figure 3.3: Urban Area of Dongguan City in 1988 and 1993 (Source: Yeh and Li, 2002)
1988 1993
10 km 20 10 20 km
20
Liu et al. (2005) studied the spatial and temporal patterns of China‘s cropland during 1990 to
2000. They used Landsat satellite image of 30-meter resolution for detecting and quantifying
the change. This study showed that a huge amount of cropland lost during 1990 to 2000 in
Huang-Huai-Hai Plain, the Yangtze River Delta, the Huanghe River Band in the vicinity of
Baotou and Datong sections and the Sichuan Basin but a significant increase in Northeast
China, Northern China and the Xinjiang oases during this time. Overall 2.79 Mha cropland
increased in China from 1990 to 2000 (Liu et al. 2005).
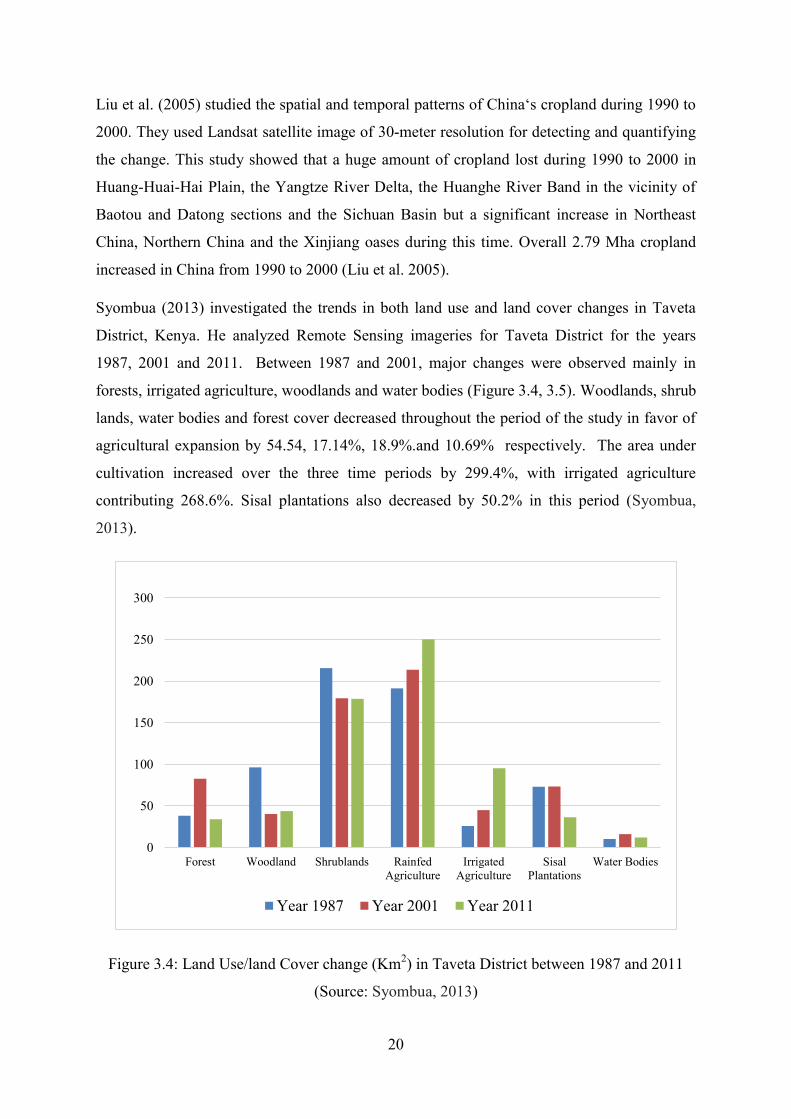
Syombua (2013) investigated the trends in both land use and land cover changes in Taveta
District, Kenya. He analyzed Remote Sensing imageries for Taveta District for the years
1987, 2001 and 2011. Between 1987 and 2001, major changes were observed mainly in
forests, irrigated agriculture, woodlands and water bodies (Figure 3.4, 3.5). Woodlands, shrub
lands, water bodies and forest cover decreased throughout the period of the study in favor of
agricultural expansion by 54.54, 17.14%, 18.9%.and 10.69% respectively. The area under
cultivation increased over the three time periods by 299.4%, with irrigated agriculture
contributing 268.6%. Sisal plantations also decreased by 50.2% in this period (Syombua,
2013).
Figure 3.4: Land Use/land Cover change (Km2) in Taveta District between 1987 and 2011
(Source: Syombua, 2013)
0
50
100
150
200
250
300
Forest Woodland Shrublands RainfedAgriculture
IrrigatedAgriculture
SisalPlantations
Water Bodies
Year 1987 Year 2001 Year 2011
21
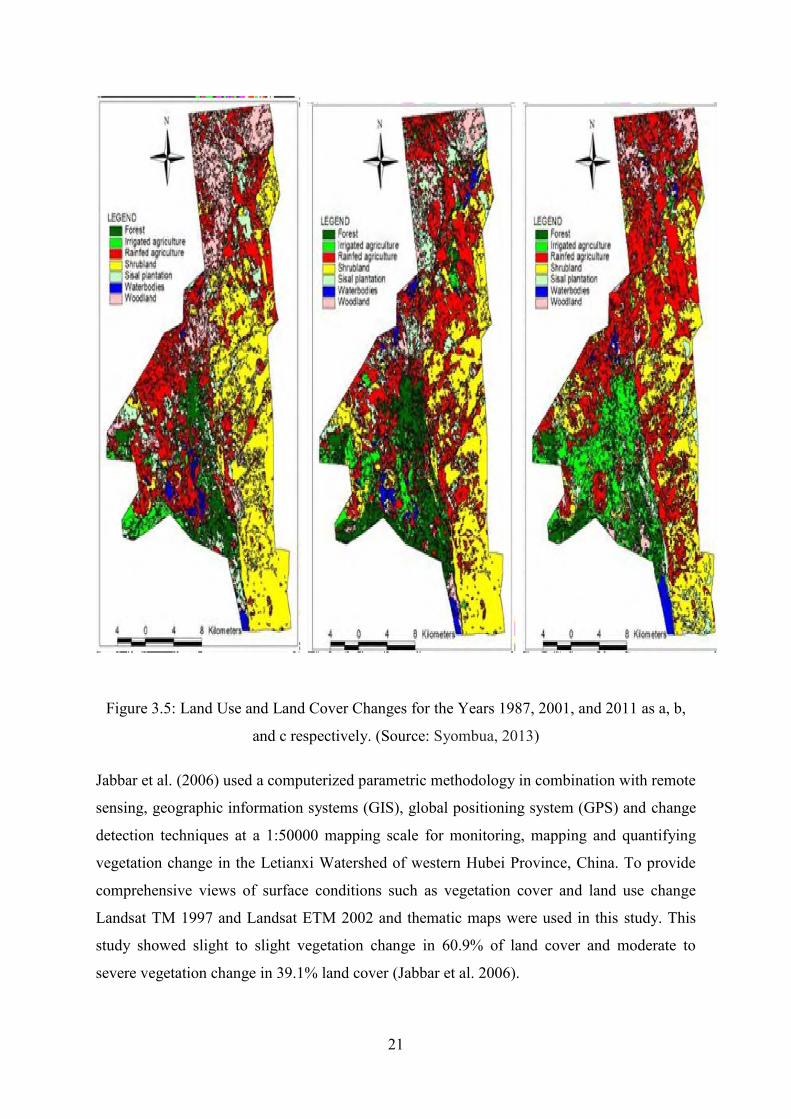
Figure 3.5: Land Use and Land Cover Changes for the Years 1987, 2001, and 2011 as a, b,
and c respectively. (Source: Syombua, 2013) Jabbar et al. (2006) used a computerized parametric methodology in combination with remote
sensing, geographic information systems (GIS), global positioning system (GPS) and change
detection techniques at a 1:50000 mapping scale for monitoring, mapping and quantifying
vegetation change in the Letianxi Watershed of western Hubei Province, China. To provide
comprehensive views of surface conditions such as vegetation cover and land use change
Landsat TM 1997 and Landsat ETM 2002 and thematic maps were used in this study. This
study showed slight to slight vegetation change in 60.9% of land cover and moderate to
severe vegetation change in 39.1% land cover (Jabbar et al. 2006).
22
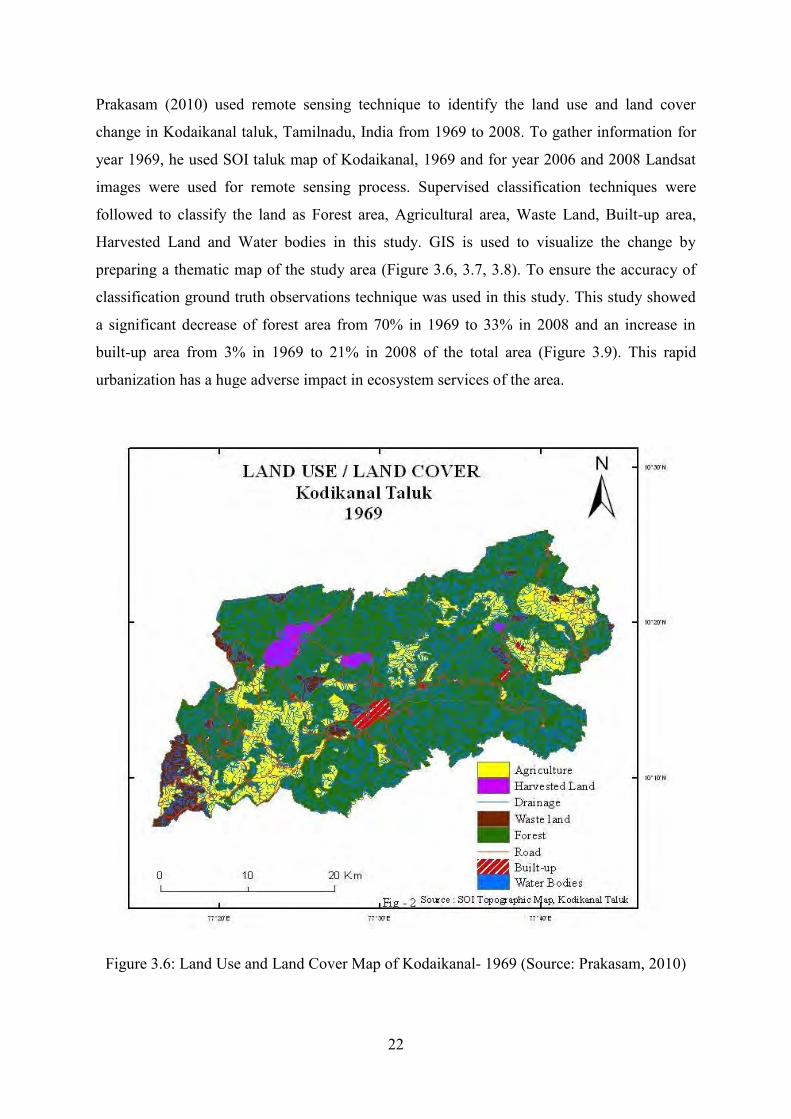
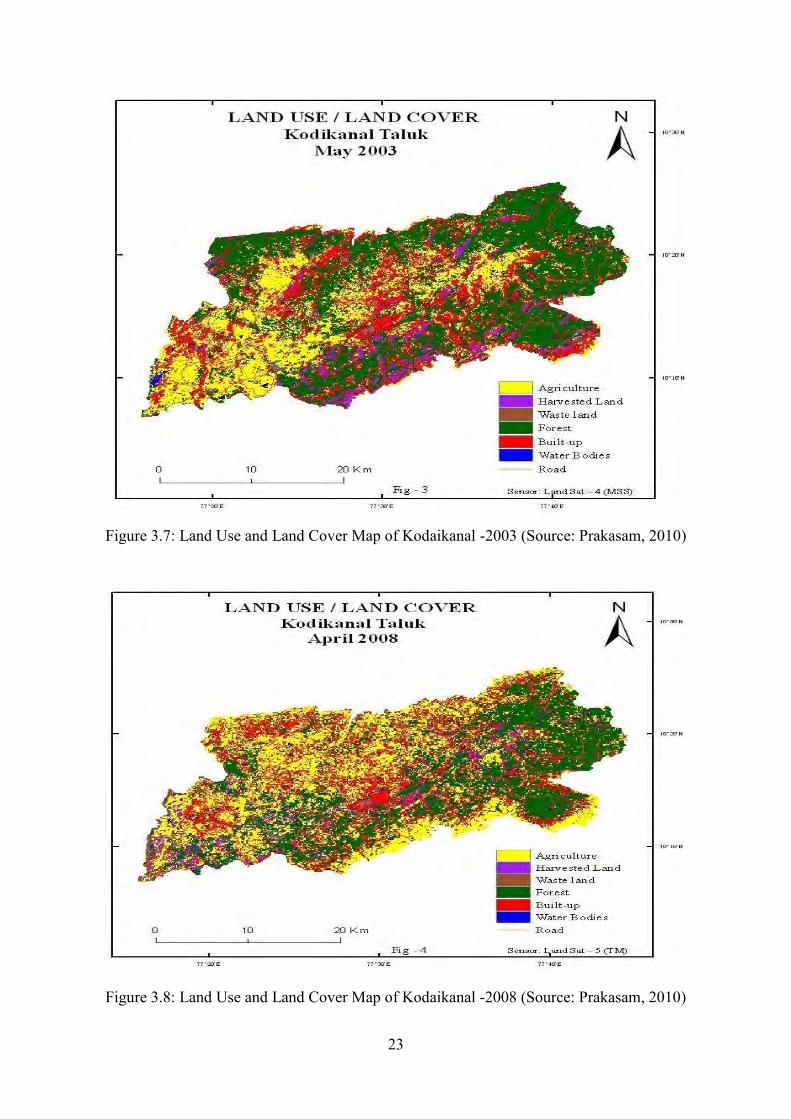
Prakasam (2010) used remote sensing technique to identify the land use and land cover
change in Kodaikanal taluk, Tamilnadu, India from 1969 to 2008. To gather information for
year 1969, he used SOI taluk map of Kodaikanal, 1969 and for year 2006 and 2008 Landsat
images were used for remote sensing process. Supervised classification techniques were
followed to classify the land as Forest area, Agricultural area, Waste Land, Built-up area,
Harvested Land and Water bodies in this study. GIS is used to visualize the change by
preparing a thematic map of the study area (Figure 3.6, 3.7, 3.8). To ensure the accuracy of
classification ground truth observations technique was used in this study. This study showed
a significant decrease of forest area from 70% in 1969 to 33% in 2008 and an increase in
built-up area from 3% in 1969 to 21% in 2008 of the total area (Figure 3.9). This rapid
urbanization has a huge adverse impact in ecosystem services of the area.
Figure 3.6: Land Use and Land Cover Map of Kodaikanal- 1969 (Source: Prakasam, 2010)
23
Figure 3.7: Land Use and Land Cover Map of Kodaikanal -2003 (Source: Prakasam, 2010)
Figure 3.8: Land Use and Land Cover Map of Kodaikanal -2008 (Source: Prakasam, 2010)
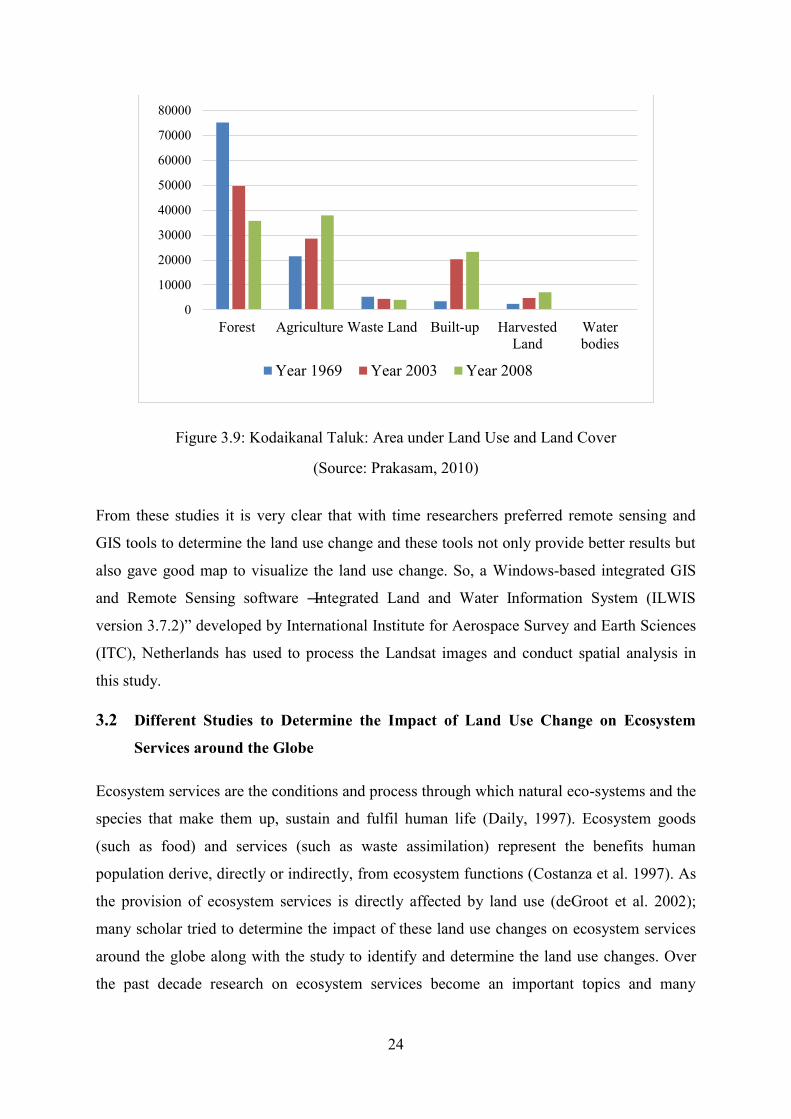
24
Figure 3.9: Kodaikanal Taluk: Area under Land Use and Land Cover
(Source: Prakasam, 2010)
From these studies it is very clear that with time researchers preferred remote sensing and
GIS tools to determine the land use change and these tools not only provide better results but
also gave good map to visualize the land use change. So, a Windows-based integrated GIS
and Remote Sensing software ―Integrated Land and Water Information System (ILWIS
version 3.7.2)‖ developed by International Institute for Aerospace Survey and Earth Sciences
(ITC), Netherlands has used to process the Landsat images and conduct spatial analysis in
this study.
3.2 Different Studies to Determine the Impact of Land Use Change on Ecosystem
Services around the Globe
Ecosystem services are the conditions and process through which natural eco-systems and the
species that make them up, sustain and fulfil human life (Daily, 1997). Ecosystem goods
(such as food) and services (such as waste assimilation) represent the benefits human
population derive, directly or indirectly, from ecosystem functions (Costanza et al. 1997). As
the provision of ecosystem services is directly affected by land use (deGroot et al. 2002);
many scholar tried to determine the impact of these land use changes on ecosystem services
around the globe along with the study to identify and determine the land use changes. Over
the past decade research on ecosystem services become an important topics and many
0
10000
20000
30000
40000
50000
60000
70000
80000
Forest Agriculture Waste Land Built-up HarvestedLand
Waterbodies
Year 1969 Year 2003 Year 2008
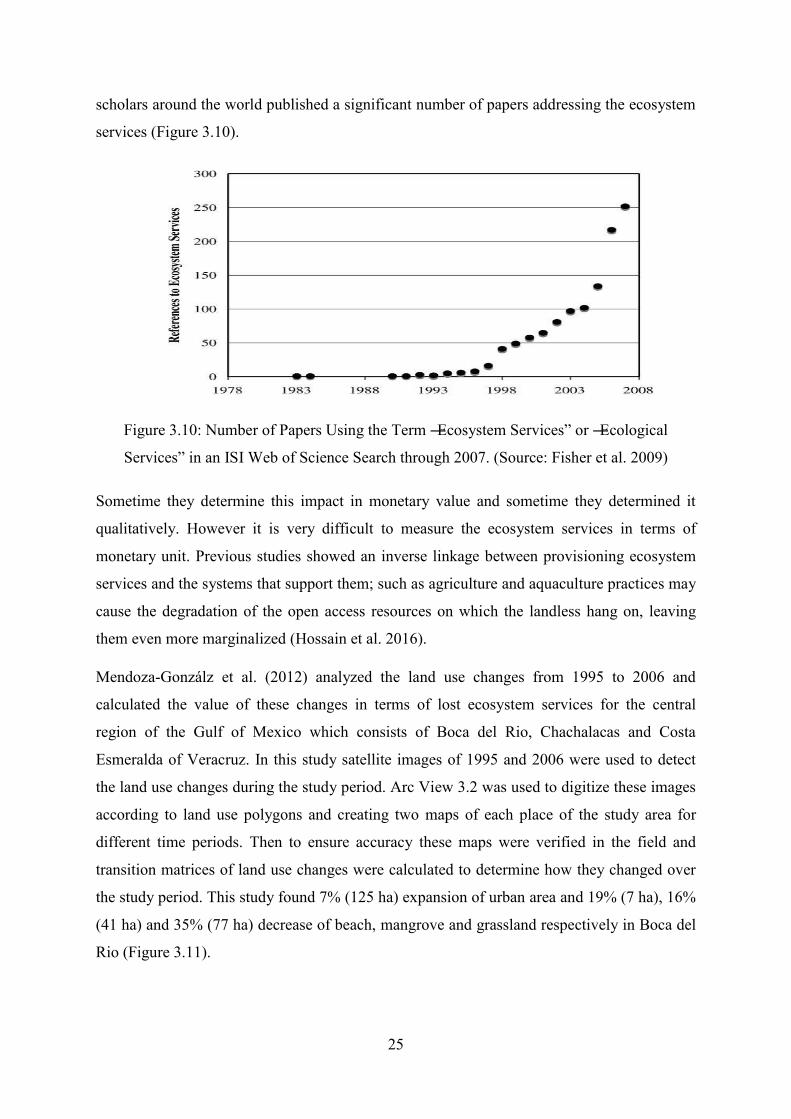
25
scholars around the world published a significant number of papers addressing the ecosystem
services (Figure 3.10).
Figure 3.10: Number of Papers Using the Term ―Ecosystem Services‖ or ―Ecological
Services‖ in an ISI Web of Science Search through 2007. (Source: Fisher et al. 2009)
Sometime they determine this impact in monetary value and sometime they determined it
qualitatively. However it is very difficult to measure the ecosystem services in terms of
monetary unit. Previous studies showed an inverse linkage between provisioning ecosystem
services and the systems that support them; such as agriculture and aquaculture practices may
cause the degradation of the open access resources on which the landless hang on, leaving
them even more marginalized (Hossain et al. 2016).
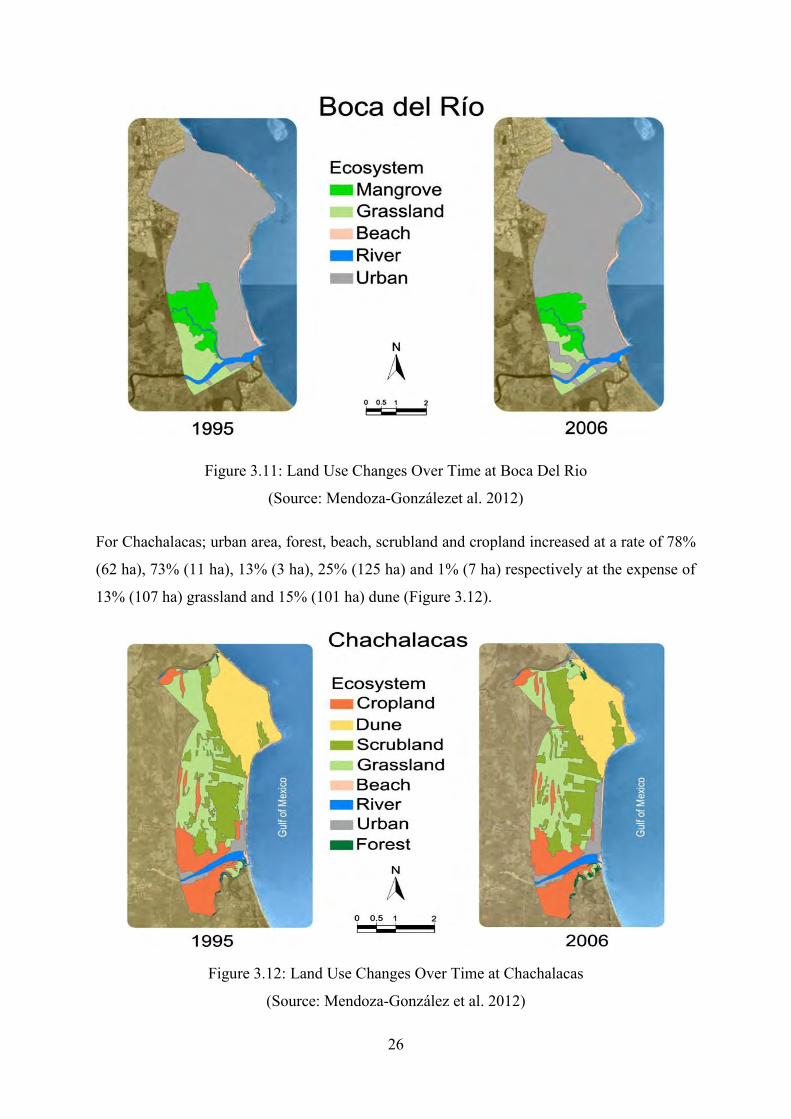
Mendoza-Gonzálz et al. (2012) analyzed the land use changes from 1995 to 2006 and
calculated the value of these changes in terms of lost ecosystem services for the central
region of the Gulf of Mexico which consists of Boca del Rio, Chachalacas and Costa
Esmeralda of Veracruz. In this study satellite images of 1995 and 2006 were used to detect
the land use changes during the study period. Arc View 3.2 was used to digitize these images
according to land use polygons and creating two maps of each place of the study area for
different time periods. Then to ensure accuracy these maps were verified in the field and
transition matrices of land use changes were calculated to determine how they changed over
the study period. This study found 7% (125 ha) expansion of urban area and 19% (7 ha), 16%
(41 ha) and 35% (77 ha) decrease of beach, mangrove and grassland respectively in Boca del
Rio (Figure 3.11).
26
Figure 3.11: Land Use Changes Over Time at Boca Del Rio
(Source: Mendoza-Gonzálezet al. 2012)
For Chachalacas; urban area, forest, beach, scrubland and cropland increased at a rate of 78%
(62 ha), 73% (11 ha), 13% (3 ha), 25% (125 ha) and 1% (7 ha) respectively at the expense of
13% (107 ha) grassland and 15% (101 ha) dune (Figure 3.12).
Figure 3.12: Land Use Changes Over Time at Chachalacas
(Source: Mendoza-González et al. 2012)
27
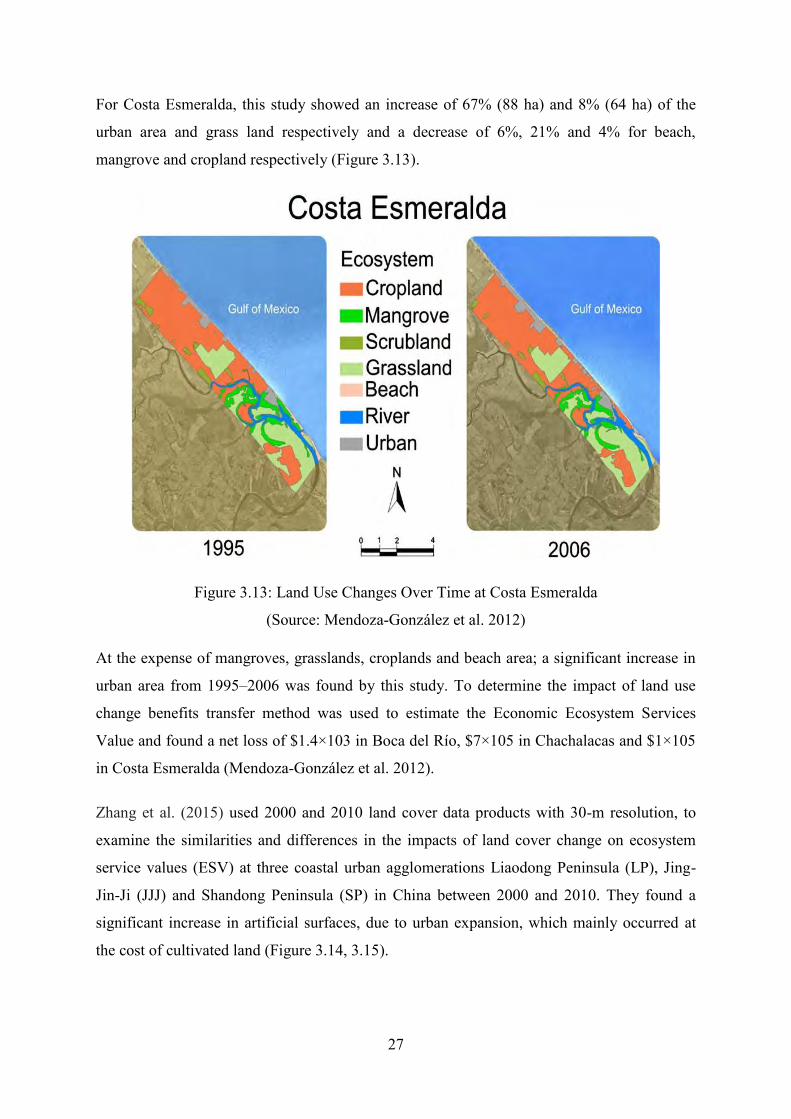
For Costa Esmeralda, this study showed an increase of 67% (88 ha) and 8% (64 ha) of the
urban area and grass land respectively and a decrease of 6%, 21% and 4% for beach,
mangrove and cropland respectively (Figure 3.13).
Figure 3.13: Land Use Changes Over Time at Costa Esmeralda
(Source: Mendoza-González et al. 2012)
At the expense of mangroves, grasslands, croplands and beach area; a significant increase in
urban area from 1995–2006 was found by this study. To determine the impact of land use
change benefits transfer method was used to estimate the Economic Ecosystem Services
Value and found a net loss of $1.4×10³ in Boca del Río, $7×10⁵ in Chachalacas and $1×10⁵
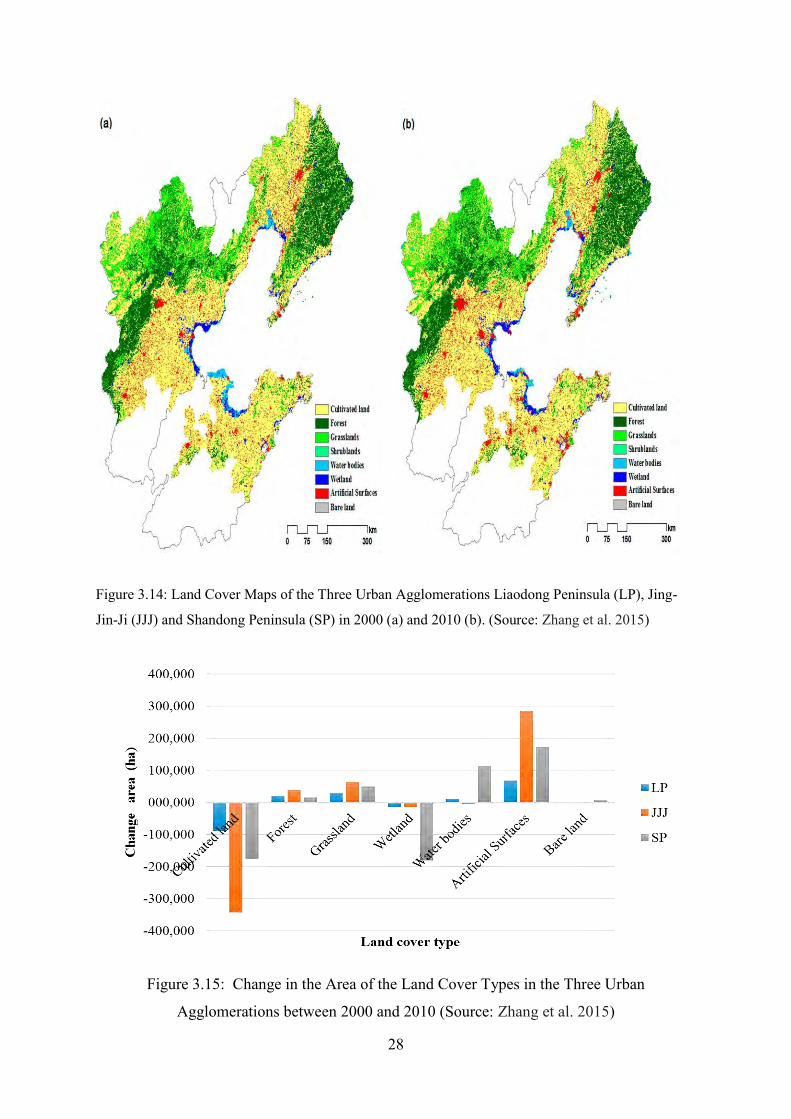
in Costa Esmeralda (Mendoza-González et al. 2012). Zhang et al. (2015) used 2000 and 2010 land cover data products with 30-m resolution, to
examine the similarities and differences in the impacts of land cover change on ecosystem
service values (ESV) at three coastal urban agglomerations Liaodong Peninsula (LP), Jing-
Jin-Ji (JJJ) and Shandong Peninsula (SP) in China between 2000 and 2010. They found a
significant increase in artificial surfaces, due to urban expansion, which mainly occurred at
the cost of cultivated land (Figure 3.14, 3.15).
28
Figure 3.14: Land Cover Maps of the Three Urban Agglomerations Liaodong Peninsula (LP), Jing-
Jin-Ji (JJJ) and Shandong Peninsula (SP) in 2000 (a) and 2010 (b). (Source: Zhang et al. 2015)
Figure 3.15: Change in the Area of the Land Cover Types in the Three Urban
Agglomerations between 2000 and 2010 (Source: Zhang et al. 2015)
29
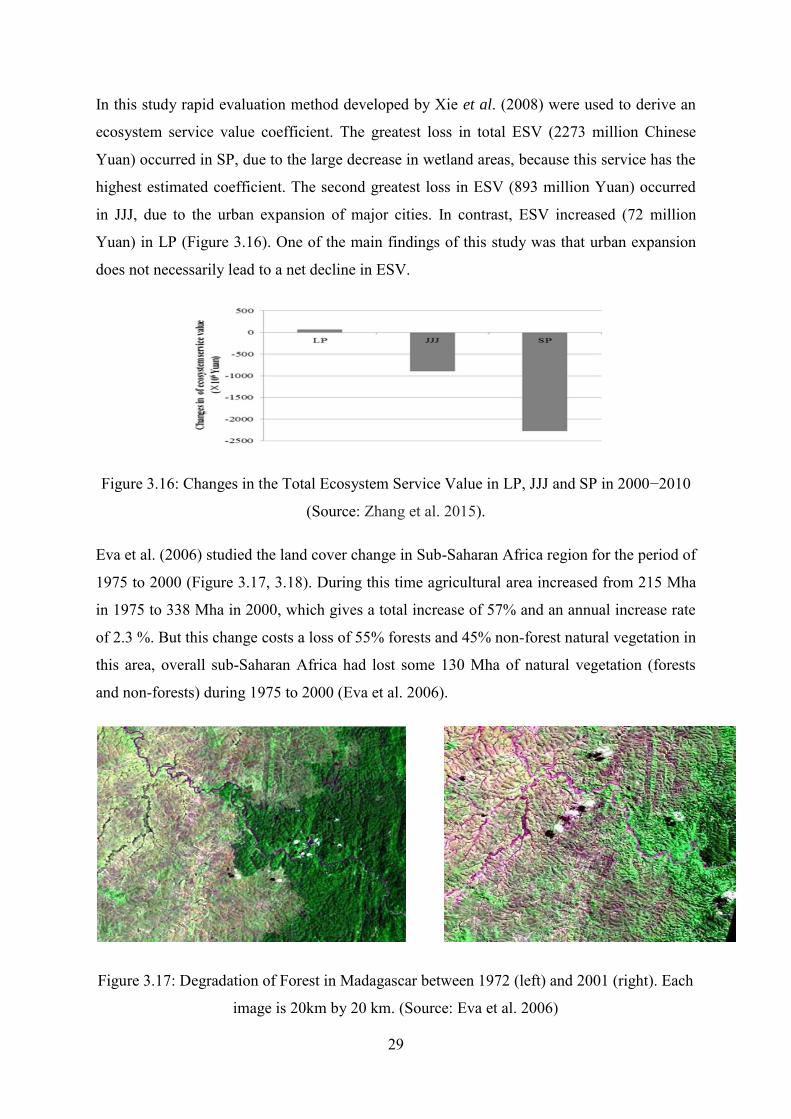
In this study rapid evaluation method developed by Xie et al. (2008) were used to derive an
ecosystem service value coefficient. The greatest loss in total ESV (2273 million Chinese
Yuan) occurred in SP, due to the large decrease in wetland areas, because this service has the
highest estimated coefficient. The second greatest loss in ESV (893 million Yuan) occurred
in JJJ, due to the urban expansion of major cities. In contrast, ESV increased (72 million
Yuan) in LP (Figure 3.16). One of the main findings of this study was that urban expansion
does not necessarily lead to a net decline in ESV.
Figure 3.16: Changes in the Total Ecosystem Service Value in LP, JJJ and SP in 2000−2010
(Source: Zhang et al. 2015).
Eva et al. (2006) studied the land cover change in Sub-Saharan Africa region for the period of
1975 to 2000 (Figure 3.17, 3.18). During this time agricultural area increased from 215 Mha
in 1975 to 338 Mha in 2000, which gives a total increase of 57% and an annual increase rate
of 2.3 %. But this change costs a loss of 55% forests and 45% non-forest natural vegetation in
this area, overall sub-Saharan Africa had lost some 130 Mha of natural vegetation (forests
and non-forests) during 1975 to 2000 (Eva et al. 2006).
Figure 3.17: Degradation of Forest in Madagascar between 1972 (left) and 2001 (right). Each
image is 20km by 20 km. (Source: Eva et al. 2006)
30
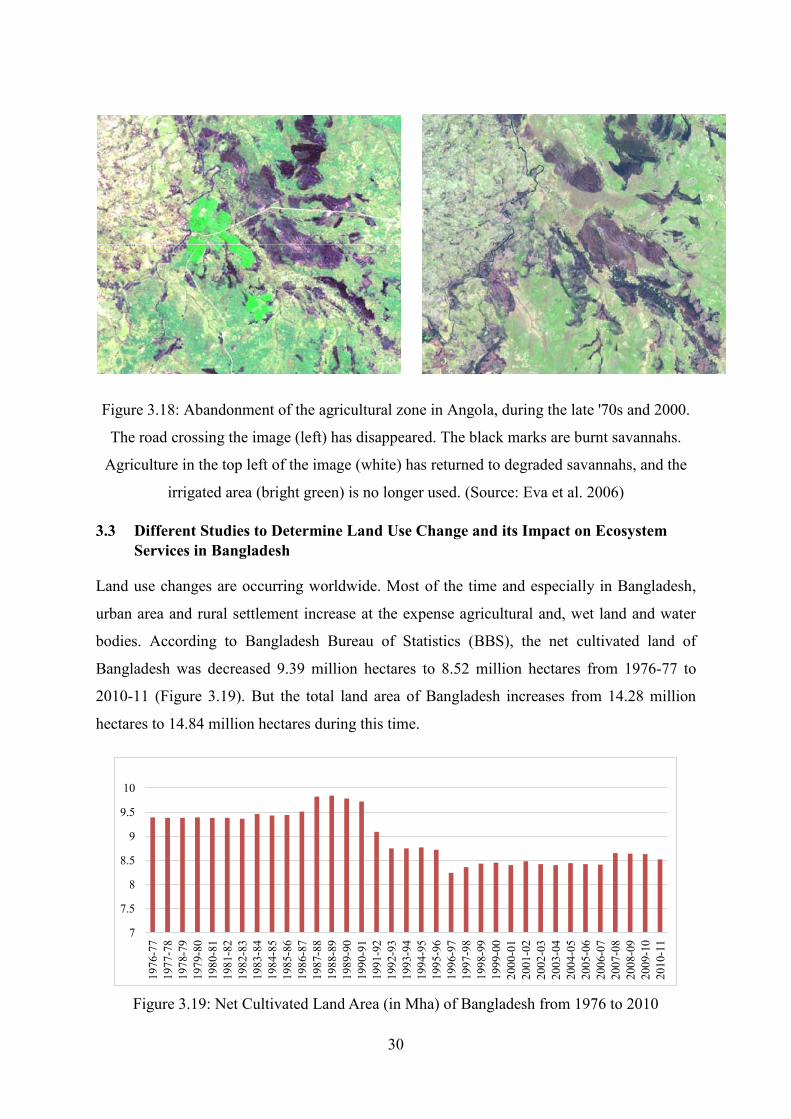
Figure 3.18: Abandonment of the agricultural zone in Angola, during the late '70s and 2000.
The road crossing the image (left) has disappeared. The black marks are burnt savannahs.
Agriculture in the top left of the image (white) has returned to degraded savannahs, and the
irrigated area (bright green) is no longer used. (Source: Eva et al. 2006)
3.3 Different Studies to Determine Land Use Change and its Impact on Ecosystem Services in Bangladesh
Land use changes are occurring worldwide. Most of the time and especially in Bangladesh,
urban area and rural settlement increase at the expense agricultural and, wet land and water
bodies. According to Bangladesh Bureau of Statistics (BBS), the net cultivated land of
Bangladesh was decreased 9.39 million hectares to 8.52 million hectares from 1976-77 to
2010-11 (Figure 3.19). But the total land area of Bangladesh increases from 14.28 million
hectares to 14.84 million hectares during this time.
Figure 3.19: Net Cultivated Land Area (in Mha) of Bangladesh from 1976 to 2010
7
7.5
8
8.5
9
9.5
10
1976
-77
1977
-78
1978
-79
1979
-80
1980
-81
1981
-82
1982
-83
1983
-84
1984
-85
1985
-86
1986
-87
1987
-88
1988
-89
1989
-90
1990
-91
1991
-92
1992
-93
1993
-94
1994
-95
1995
-96
1996
-97
1997
-98
1998
-99
1999
-00
2000
-01
2001
-02
2002
-03
2003
-04
2004
-05
2005
-06
2006
-07
2007
-08
2008
-09
2009
-10
2010
-11
31
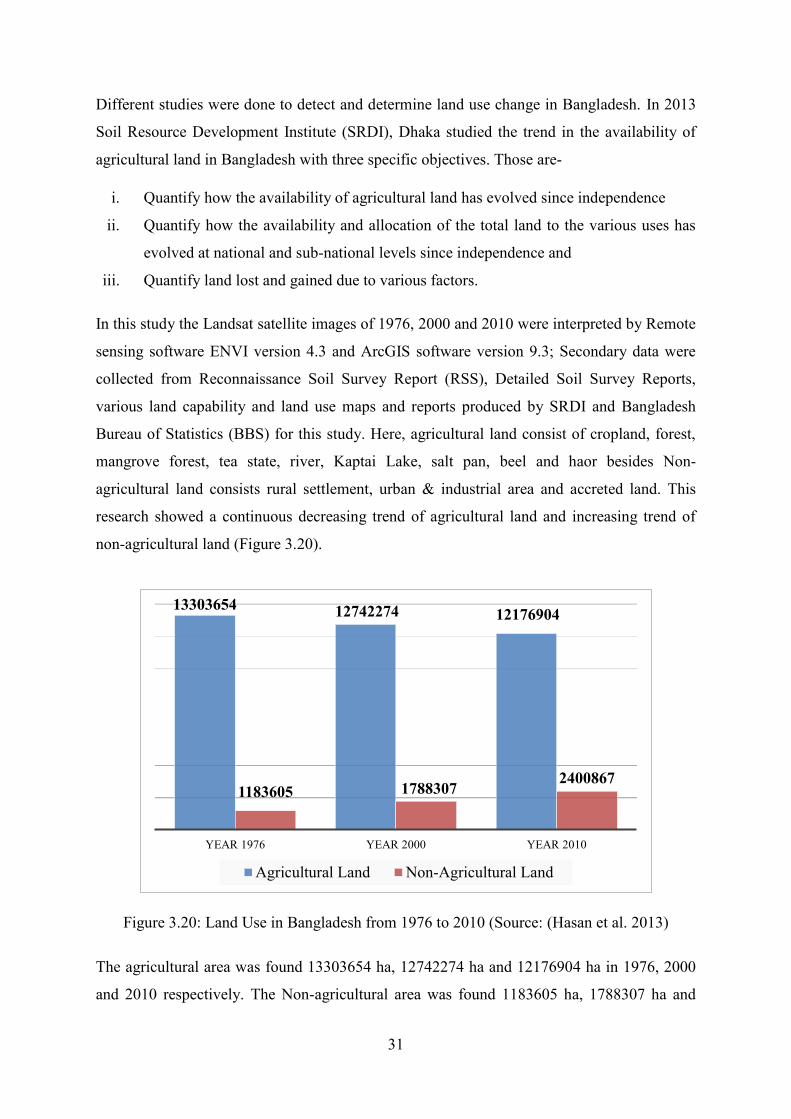
Different studies were done to detect and determine land use change in Bangladesh. In 2013
Soil Resource Development Institute (SRDI), Dhaka studied the trend in the availability of
agricultural land in Bangladesh with three specific objectives. Those are-
i. Quantify how the availability of agricultural land has evolved since independence
ii. Quantify how the availability and allocation of the total land to the various uses has
evolved at national and sub-national levels since independence and
iii. Quantify land lost and gained due to various factors.
In this study the Landsat satellite images of 1976, 2000 and 2010 were interpreted by Remote
sensing software ENVI version 4.3 and ArcGIS software version 9.3; Secondary data were
collected from Reconnaissance Soil Survey Report (RSS), Detailed Soil Survey Reports,
various land capability and land use maps and reports produced by SRDI and Bangladesh
Bureau of Statistics (BBS) for this study. Here, agricultural land consist of cropland, forest,
mangrove forest, tea state, river, Kaptai Lake, salt pan, beel and haor besides Non-
agricultural land consists rural settlement, urban & industrial area and accreted land. This
research showed a continuous decreasing trend of agricultural land and increasing trend of
non-agricultural land (Figure 3.20).
Figure 3.20: Land Use in Bangladesh from 1976 to 2010 (Source: (Hasan et al. 2013) The agricultural area was found 13303654 ha, 12742274 ha and 12176904 ha in 1976, 2000
and 2010 respectively. The Non-agricultural area was found 1183605 ha, 1788307 ha and
13303654 12742274 12176904
1183605 1788307 2400867
YEAR 1976 YEAR 2000 YEAR 2010
Agricultural Land Non-Agricultural Land
32
2400867 ha in 1976, 2000 and 2010 respectively. Regarding the total land area of
Bangladesh, the area lost annually from agricultural land was 0.172, 0.416 and 0.244 percent
during 1976-2000, 2000-2010 and 1976-2010 respectively besides the same percentage of the
area was added to Non-agricultural land (Hasan et al. 2013).
Musa, (2008) studied the land use changing of Chakoria Sundarban, Cox‘s Bazar using
remote sensing technique. Landsat images of 1972, 1989 and 1999 were used in this study.
This study found a significant change in land use from 1972 to 1999 and a moderate change
during this time due to the expansion of shrimp farm and salt bed (Musa, 2008).
Sayed & Haruyama (2015), studied the land use/cover change of Manikganj Sadar Upazila,
Bangladesh concerning with urbanization using GIS and remote sensing technique. Landsat
images of 1989, 1999 and 2009 were used to derive land use/cover maps of the study area.
They divided the land use categories as agriculture land use, urban land use, water surface,
bare land and vegetation cover. Secondary data and information relating to agriculture were
obtained from Bangladesh Population Census book (1981, 1991, 2001 and 2011) and
Bangladesh Agriculture Census (1984, 1996 and 2008) published by Bangladesh Bureau of
Statistics (BBS) for this study. This study showed that between 1989 and 2009 built-up areas
increased approximately +12%, while agricultural land decreased −7%, water bodies
decreased about −2% and bare land decreased about −2% (Figure 3.21) (Sayed & Haruyama,
2015).
Figure 3.21: Land Use/Cover Change of Manikganj Sadar Upazila, Bangladesh from 1989 to
2009 (Source: Sayed & Haruyama, 2015)
0
5,000
10,000
15,000
20,000
25,000
30,000
35,000
40,000
Agriculture LandUse
Urban Land Use Water Surface Bare Land VegetationCover
Year 1989 Year 1999 Year 2009
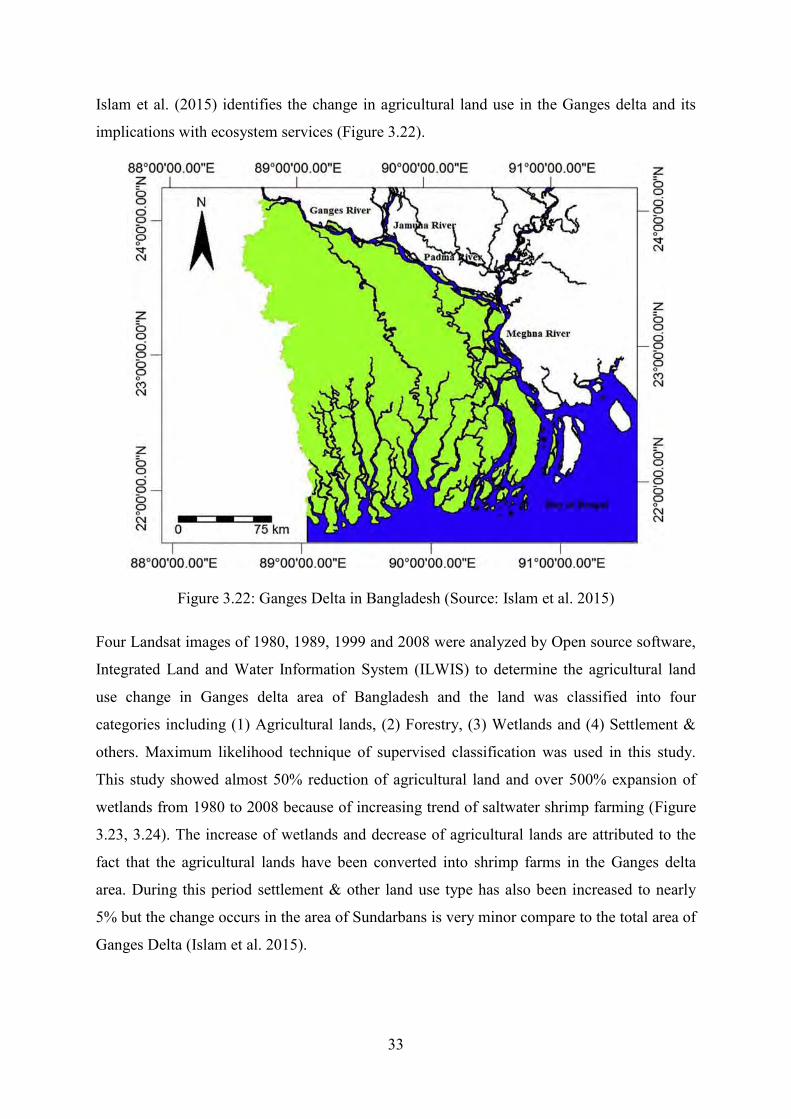
33
Islam et al. (2015) identifies the change in agricultural land use in the Ganges delta and its
implications with ecosystem services (Figure 3.22).
Figure 3.22: Ganges Delta in Bangladesh (Source: Islam et al. 2015)
Four Landsat images of 1980, 1989, 1999 and 2008 were analyzed by Open source software,
Integrated Land and Water Information System (ILWIS) to determine the agricultural land
use change in Ganges delta area of Bangladesh and the land was classified into four
categories including (1) Agricultural lands, (2) Forestry, (3) Wetlands and (4) Settlement &
others. Maximum likelihood technique of supervised classification was used in this study.
This study showed almost 50% reduction of agricultural land and over 500% expansion of
wetlands from 1980 to 2008 because of increasing trend of saltwater shrimp farming (Figure
3.23, 3.24). The increase of wetlands and decrease of agricultural lands are attributed to the
fact that the agricultural lands have been converted into shrimp farms in the Ganges delta
area. During this period settlement & other land use type has also been increased to nearly
5% but the change occurs in the area of Sundarbans is very minor compare to the total area of
Ganges Delta (Islam et al. 2015).
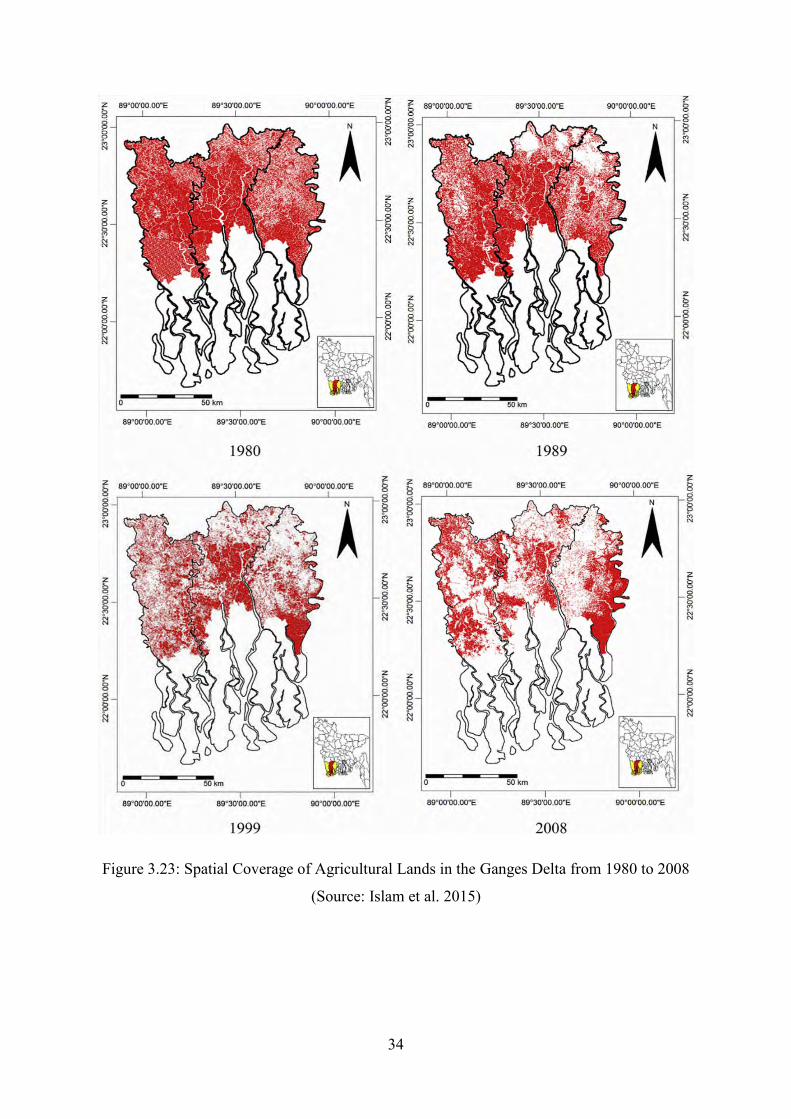
34
Figure 3.23: Spatial Coverage of Agricultural Lands in the Ganges Delta from 1980 to 2008
(Source: Islam et al. 2015)
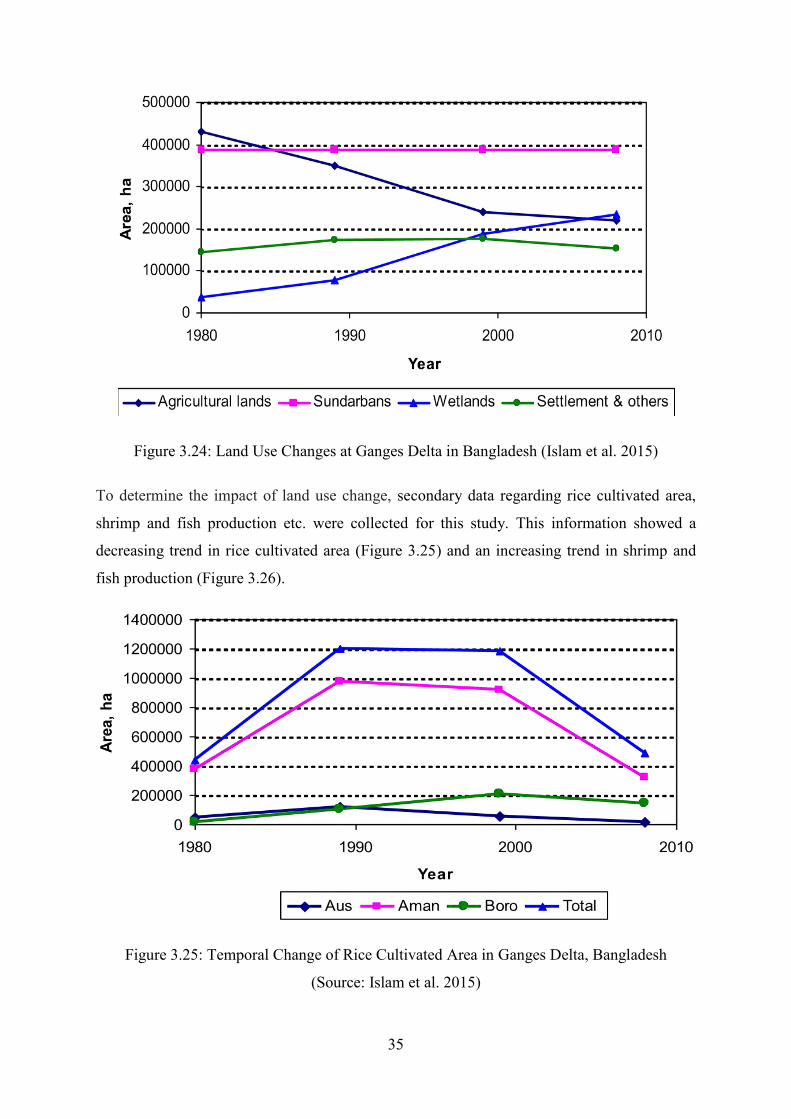
35
Figure 3.24: Land Use Changes at Ganges Delta in Bangladesh (Islam et al. 2015) To determine the impact of land use change, secondary data regarding rice cultivated area,
shrimp and fish production etc. were collected for this study. This information showed a
decreasing trend in rice cultivated area (Figure 3.25) and an increasing trend in shrimp and
fish production (Figure 3.26).
Figure 3.25: Temporal Change of Rice Cultivated Area in Ganges Delta, Bangladesh
(Source: Islam et al. 2015)
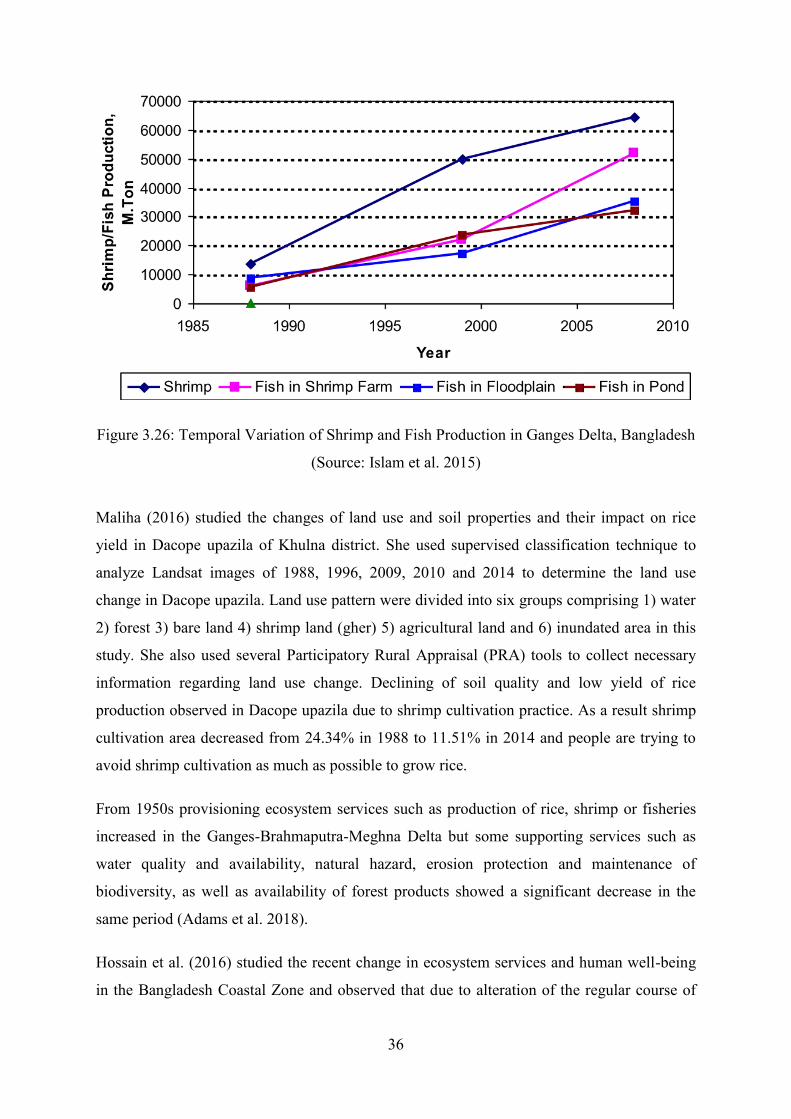
36
Figure 3.26: Temporal Variation of Shrimp and Fish Production in Ganges Delta, Bangladesh
(Source: Islam et al. 2015)
Maliha (2016) studied the changes of land use and soil properties and their impact on rice
yield in Dacope upazila of Khulna district. She used supervised classification technique to
analyze Landsat images of 1988, 1996, 2009, 2010 and 2014 to determine the land use
change in Dacope upazila. Land use pattern were divided into six groups comprising 1) water
2) forest 3) bare land 4) shrimp land (gher) 5) agricultural land and 6) inundated area in this
study. She also used several Participatory Rural Appraisal (PRA) tools to collect necessary
information regarding land use change. Declining of soil quality and low yield of rice
production observed in Dacope upazila due to shrimp cultivation practice. As a result shrimp
cultivation area decreased from 24.34% in 1988 to 11.51% in 2014 and people are trying to
avoid shrimp cultivation as much as possible to grow rice.
From 1950s provisioning ecosystem services such as production of rice, shrimp or fisheries
increased in the Ganges-Brahmaputra-Meghna Delta but some supporting services such as
water quality and availability, natural hazard, erosion protection and maintenance of
biodiversity, as well as availability of forest products showed a significant decrease in the
same period (Adams et al. 2018).
Hossain et al. (2016) studied the recent change in ecosystem services and human well-being
in the Bangladesh Coastal Zone and observed that due to alteration of the regular course of
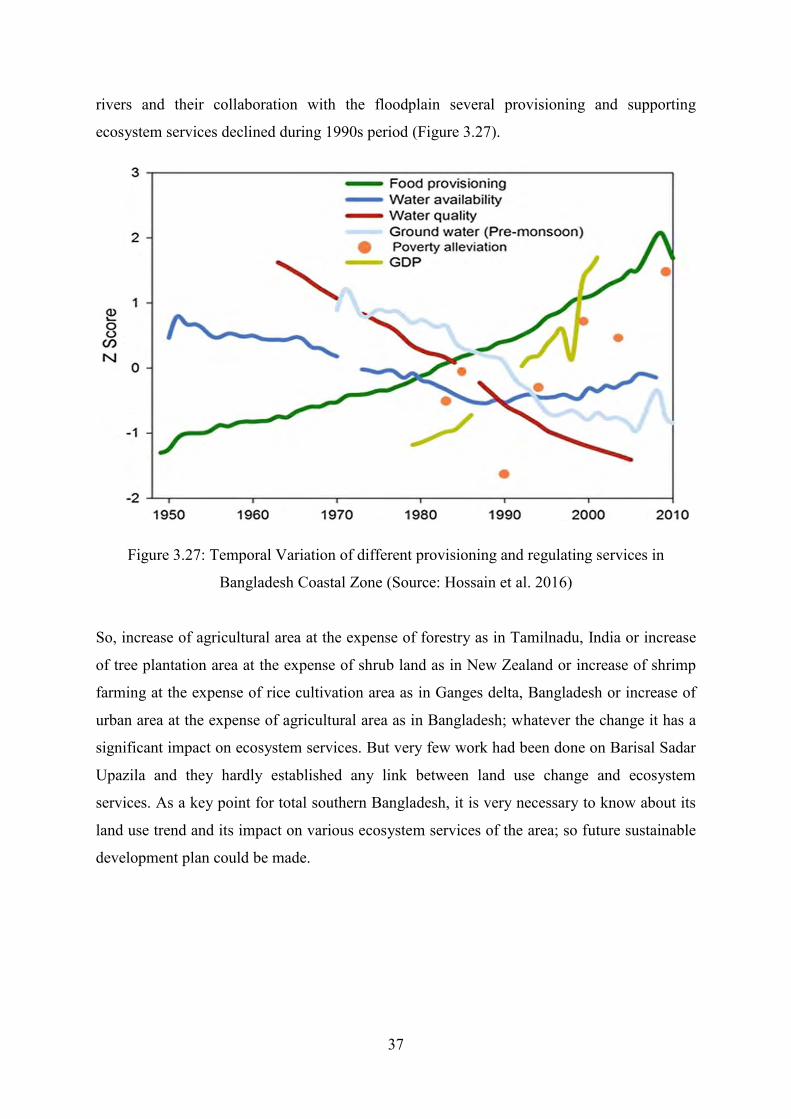
37
rivers and their collaboration with the floodplain several provisioning and supporting
ecosystem services declined during 1990s period (Figure 3.27).
Figure 3.27: Temporal Variation of different provisioning and regulating services in
Bangladesh Coastal Zone (Source: Hossain et al. 2016)
So, increase of agricultural area at the expense of forestry as in Tamilnadu, India or increase
of tree plantation area at the expense of shrub land as in New Zealand or increase of shrimp
farming at the expense of rice cultivation area as in Ganges delta, Bangladesh or increase of
urban area at the expense of agricultural area as in Bangladesh; whatever the change it has a
significant impact on ecosystem services. But very few work had been done on Barisal Sadar
Upazila and they hardly established any link between land use change and ecosystem
services. As a key point for total southern Bangladesh, it is very necessary to know about its
land use trend and its impact on various ecosystem services of the area; so future sustainable
development plan could be made.
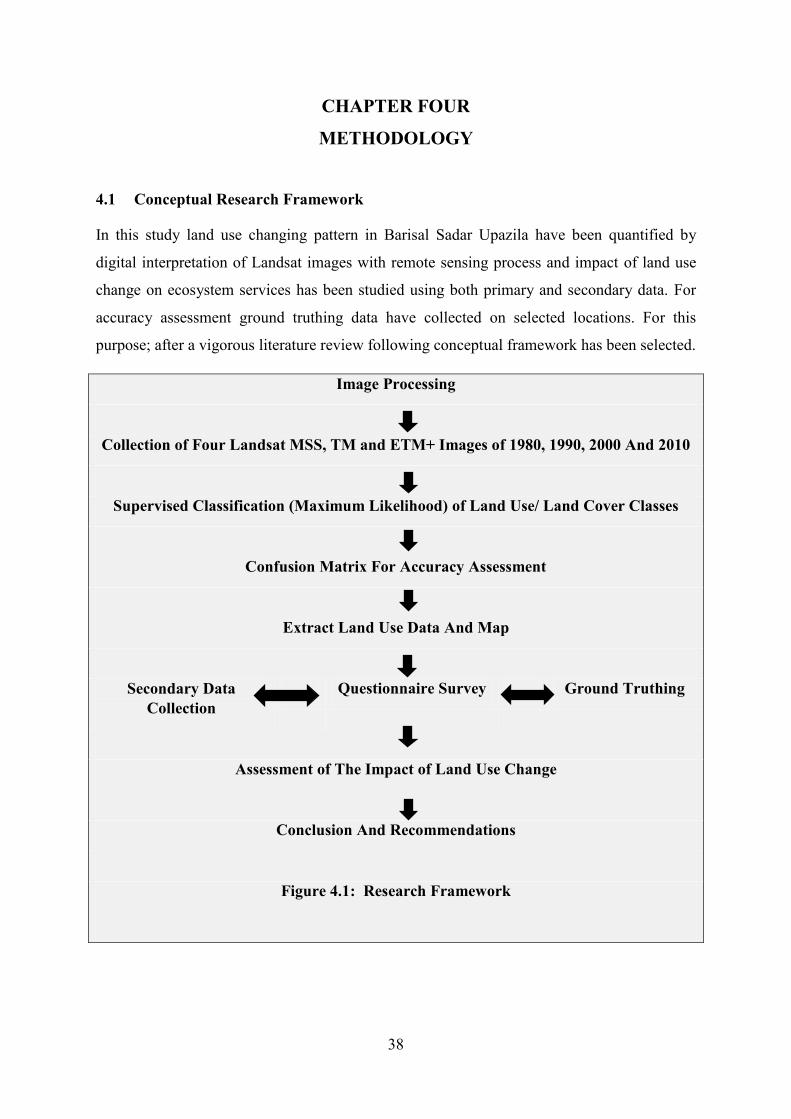
38
CHAPTER FOUR
METHODOLOGY
4.1 Conceptual Research Framework
In this study land use changing pattern in Barisal Sadar Upazila have been quantified by
digital interpretation of Landsat images with remote sensing process and impact of land use
change on ecosystem services has been studied using both primary and secondary data. For
accuracy assessment ground truthing data have collected on selected locations. For this
purpose; after a vigorous literature review following conceptual framework has been selected.
Image Processing
Collection of Four Landsat MSS, TM and ETM+ Images of 1980, 1990, 2000 And 2010
Supervised Classification (Maximum Likelihood) of Land Use/ Land Cover Classes
Confusion Matrix For Accuracy Assessment
Extract Land Use Data And Map
Secondary Data Collection
Questionnaire Survey Ground Truthing
Assessment of The Impact of Land Use Change
Conclusion And Recommendations
Figure 4.1: Research Framework
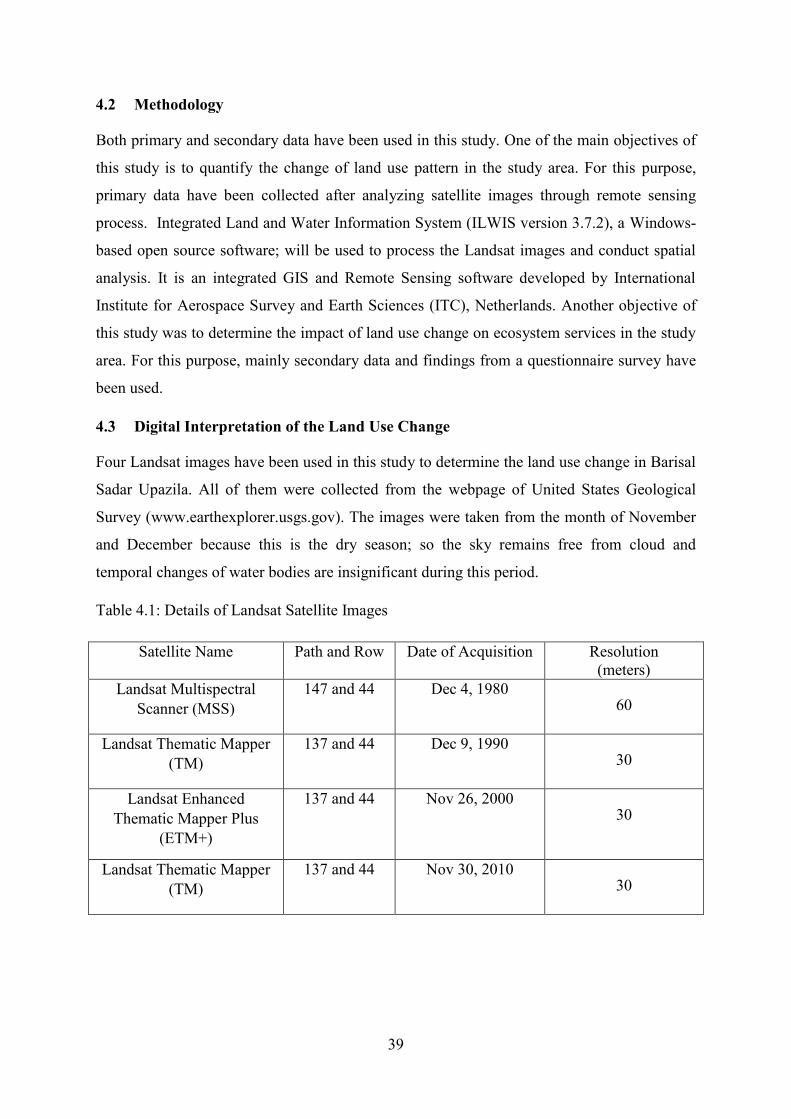
39
4.2 Methodology
Both primary and secondary data have been used in this study. One of the main objectives of
this study is to quantify the change of land use pattern in the study area. For this purpose,
primary data have been collected after analyzing satellite images through remote sensing
process. Integrated Land and Water Information System (ILWIS version 3.7.2), a Windows-
based open source software; will be used to process the Landsat images and conduct spatial
analysis. It is an integrated GIS and Remote Sensing software developed by International
Institute for Aerospace Survey and Earth Sciences (ITC), Netherlands. Another objective of
this study was to determine the impact of land use change on ecosystem services in the study
area. For this purpose, mainly secondary data and findings from a questionnaire survey have
been used.
4.3 Digital Interpretation of the Land Use Change
Four Landsat images have been used in this study to determine the land use change in Barisal
Sadar Upazila. All of them were collected from the webpage of United States Geological
Survey (www.earthexplorer.usgs.gov). The images were taken from the month of November
and December because this is the dry season; so the sky remains free from cloud and
temporal changes of water bodies are insignificant during this period.
Table 4.1: Details of Landsat Satellite Images
Satellite Name Path and Row Date of Acquisition Resolution (meters)
Landsat Multispectral Scanner (MSS)
147 and 44 Dec 4, 1980 60
Landsat Thematic Mapper (TM)
137 and 44 Dec 9, 1990 30
Landsat Enhanced Thematic Mapper Plus
(ETM+)
137 and 44 Nov 26, 2000 30
Landsat Thematic Mapper (TM)
137 and 44 Nov 30, 2010 30
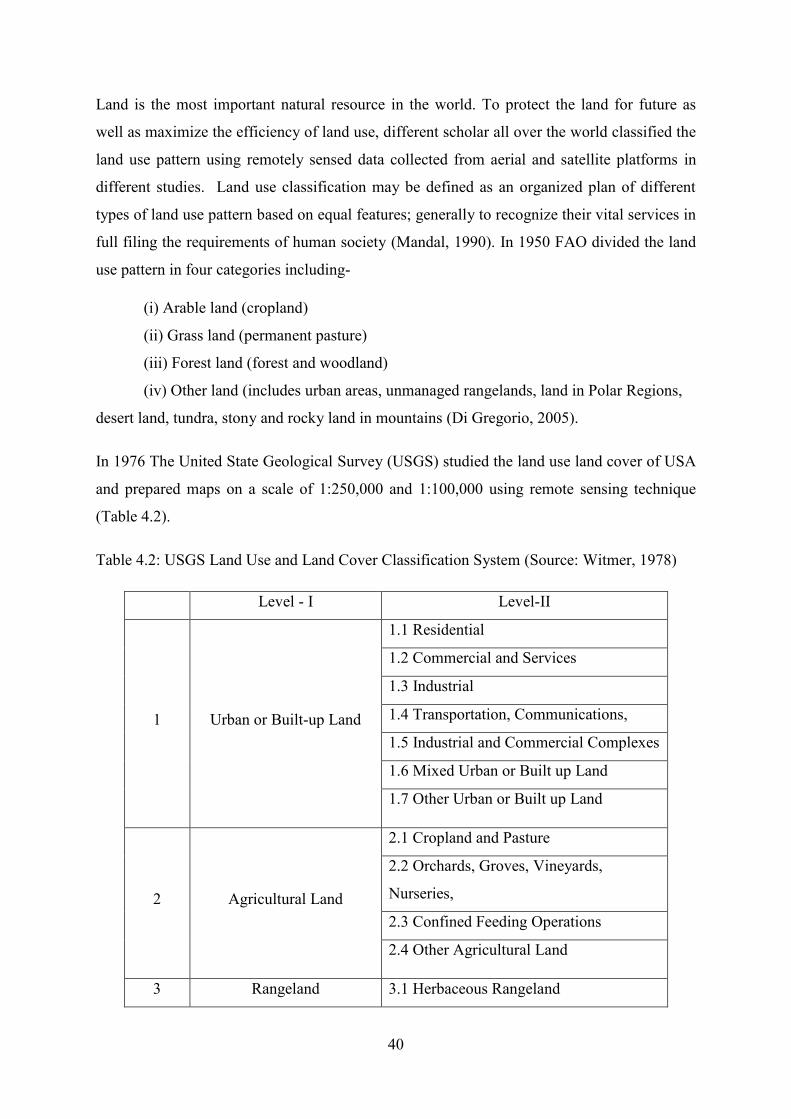
40
Land is the most important natural resource in the world. To protect the land for future as
well as maximize the efficiency of land use, different scholar all over the world classified the
land use pattern using remotely sensed data collected from aerial and satellite platforms in
different studies. Land use classification may be defined as an organized plan of different
types of land use pattern based on equal features; generally to recognize their vital services in
full filing the requirements of human society (Mandal, 1990). In 1950 FAO divided the land
use pattern in four categories including-
(i) Arable land (cropland)
(ii) Grass land (permanent pasture)
(iii) Forest land (forest and woodland)
(iv) Other land (includes urban areas, unmanaged rangelands, land in Polar Regions,
desert land, tundra, stony and rocky land in mountains (Di Gregorio, 2005).
In 1976 The United State Geological Survey (USGS) studied the land use land cover of USA
and prepared maps on a scale of 1:250,000 and 1:100,000 using remote sensing technique
(Table 4.2).
Table 4.2: USGS Land Use and Land Cover Classification System (Source: Witmer, 1978)
Level - I Level-II
1 Urban or Built-up Land
1.1 Residential
1.2 Commercial and Services
1.3 Industrial
1.4 Transportation, Communications,
1.5 Industrial and Commercial Complexes
1.6 Mixed Urban or Built up Land
1.7 Other Urban or Built up Land
2 Agricultural Land
2.1 Cropland and Pasture
2.2 Orchards, Groves, Vineyards,
Nurseries,
2.3 Confined Feeding Operations
2.4 Other Agricultural Land
3 Rangeland 3.1 Herbaceous Rangeland
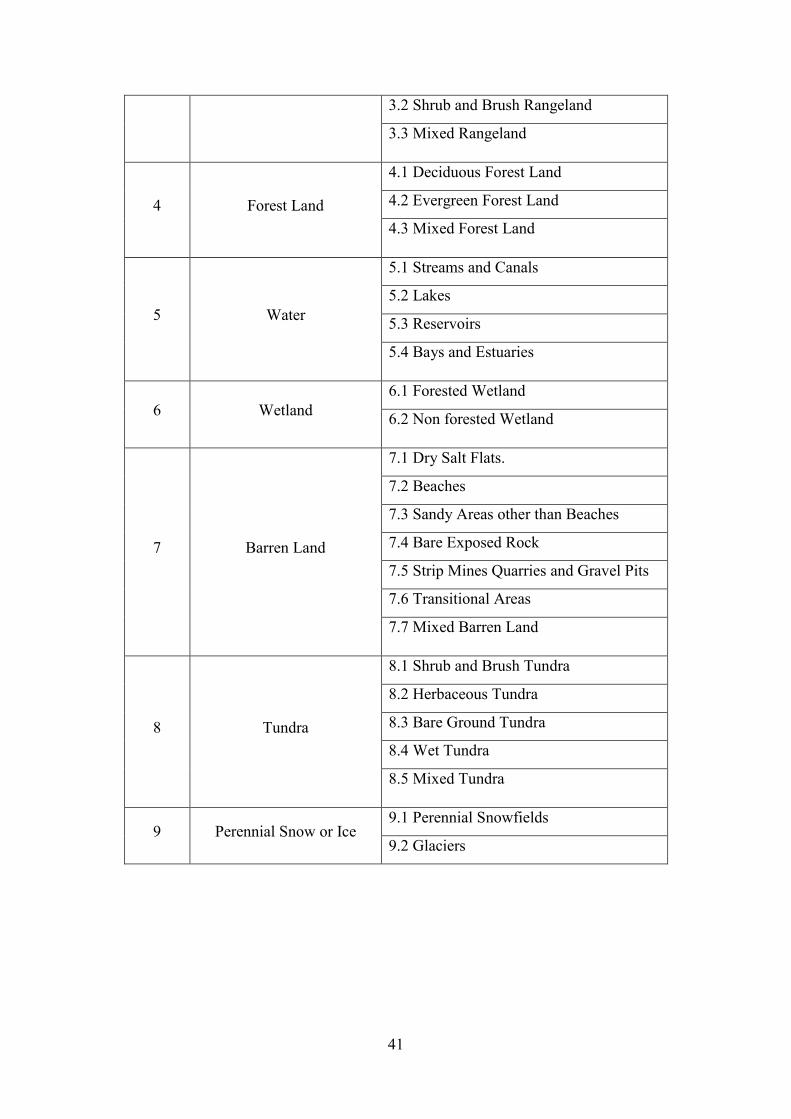
41
3.2 Shrub and Brush Rangeland
3.3 Mixed Rangeland
4 Forest Land
4.1 Deciduous Forest Land
4.2 Evergreen Forest Land
4.3 Mixed Forest Land
5 Water
5.1 Streams and Canals
5.2 Lakes
5.3 Reservoirs
5.4 Bays and Estuaries
6 Wetland 6.1 Forested Wetland
6.2 Non forested Wetland
7 Barren Land
7.1 Dry Salt Flats.
7.2 Beaches
7.3 Sandy Areas other than Beaches
7.4 Bare Exposed Rock
7.5 Strip Mines Quarries and Gravel Pits
7.6 Transitional Areas
7.7 Mixed Barren Land
8 Tundra
8.1 Shrub and Brush Tundra
8.2 Herbaceous Tundra
8.3 Bare Ground Tundra
8.4 Wet Tundra
8.5 Mixed Tundra
9 Perennial Snow or Ice 9.1 Perennial Snowfields
9.2 Glaciers
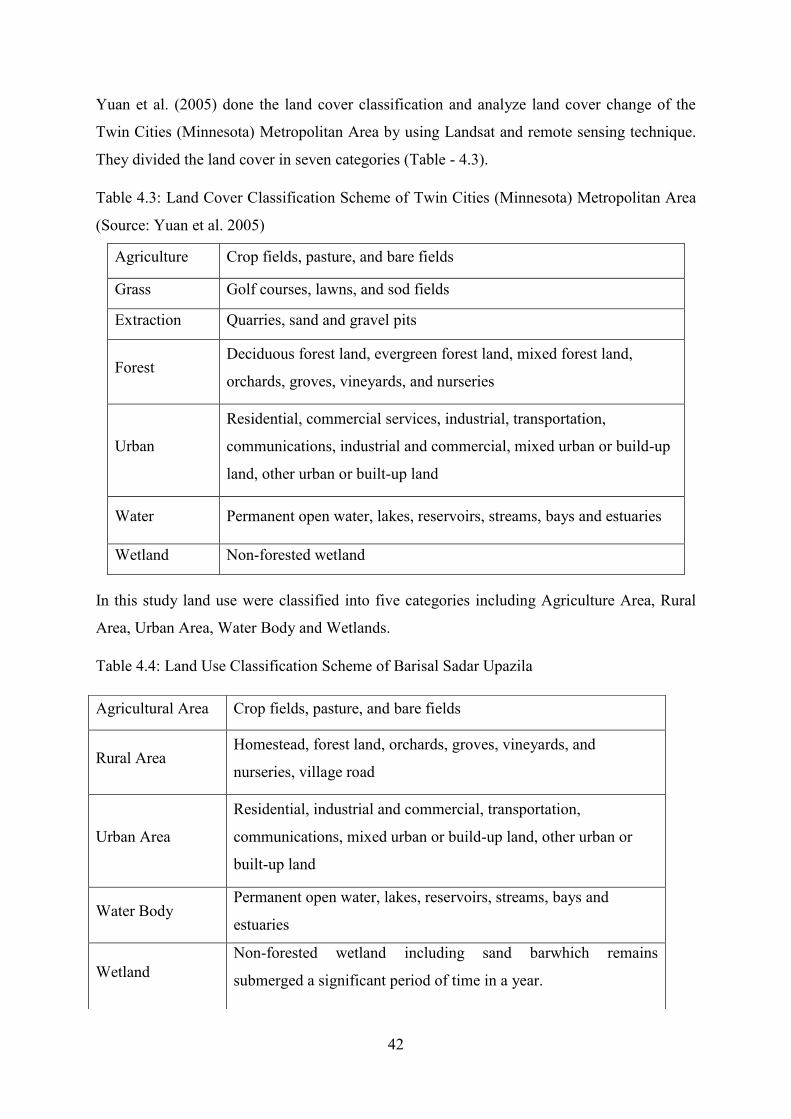
42
Yuan et al. (2005) done the land cover classification and analyze land cover change of the
Twin Cities (Minnesota) Metropolitan Area by using Landsat and remote sensing technique.
They divided the land cover in seven categories (Table - 4.3).
Table 4.3: Land Cover Classification Scheme of Twin Cities (Minnesota) Metropolitan Area
(Source: Yuan et al. 2005)
Agriculture Crop fields, pasture, and bare fields
Grass Golf courses, lawns, and sod fields
Extraction Quarries, sand and gravel pits
Forest Deciduous forest land, evergreen forest land, mixed forest land,
orchards, groves, vineyards, and nurseries
Urban
Residential, commercial services, industrial, transportation,
communications, industrial and commercial, mixed urban or build-up
land, other urban or built-up land
Water Permanent open water, lakes, reservoirs, streams, bays and estuaries
Wetland Non-forested wetland
In this study land use were classified into five categories including Agriculture Area, Rural
Area, Urban Area, Water Body and Wetlands.
Table 4.4: Land Use Classification Scheme of Barisal Sadar Upazila
Agricultural Area Crop fields, pasture, and bare fields
Rural Area Homestead, forest land, orchards, groves, vineyards, and
nurseries, village road
Urban Area
Residential, industrial and commercial, transportation,
communications, mixed urban or build-up land, other urban or
built-up land
Water Body Permanent open water, lakes, reservoirs, streams, bays and
estuaries
Wetland Non-forested wetland including sand barwhich remains
submerged a significant period of time in a year.
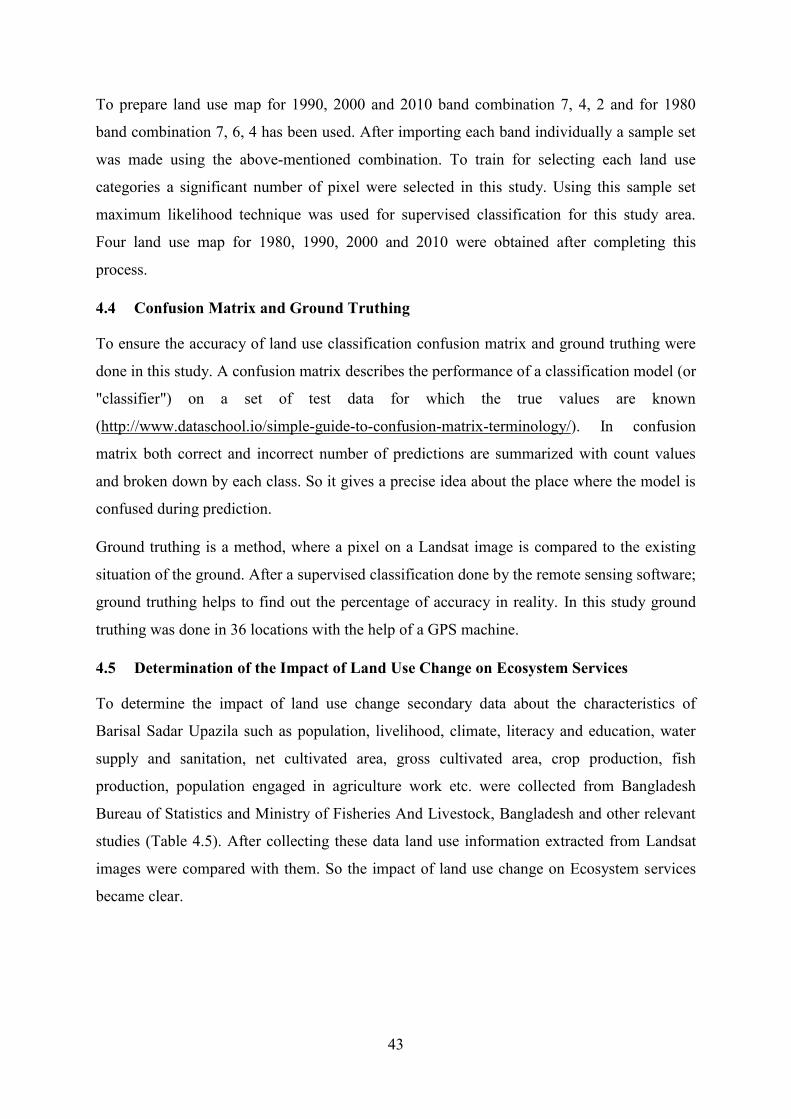
43
To prepare land use map for 1990, 2000 and 2010 band combination 7, 4, 2 and for 1980
band combination 7, 6, 4 has been used. After importing each band individually a sample set
was made using the above-mentioned combination. To train for selecting each land use
categories a significant number of pixel were selected in this study. Using this sample set
maximum likelihood technique was used for supervised classification for this study area.
Four land use map for 1980, 1990, 2000 and 2010 were obtained after completing this
process.
4.4 Confusion Matrix and Ground Truthing
To ensure the accuracy of land use classification confusion matrix and ground truthing were
done in this study. A confusion matrix describes the performance of a classification model (or
"classifier") on a set of test data for which the true values are known
(http://www.dataschool.io/simple-guide-to-confusion-matrix-terminology/). In confusion
matrix both correct and incorrect number of predictions are summarized with count values
and broken down by each class. So it gives a precise idea about the place where the model is
confused during prediction.
Ground truthing is a method, where a pixel on a Landsat image is compared to the existing
situation of the ground. After a supervised classification done by the remote sensing software;
ground truthing helps to find out the percentage of accuracy in reality. In this study ground
truthing was done in 36 locations with the help of a GPS machine.
4.5 Determination of the Impact of Land Use Change on Ecosystem Services
To determine the impact of land use change secondary data about the characteristics of
Barisal Sadar Upazila such as population, livelihood, climate, literacy and education, water
supply and sanitation, net cultivated area, gross cultivated area, crop production, fish
production, population engaged in agriculture work etc. were collected from Bangladesh
Bureau of Statistics and Ministry of Fisheries And Livestock, Bangladesh and other relevant
studies (Table 4.5). After collecting these data land use information extracted from Landsat
images were compared with them. So the impact of land use change on Ecosystem services
became clear.
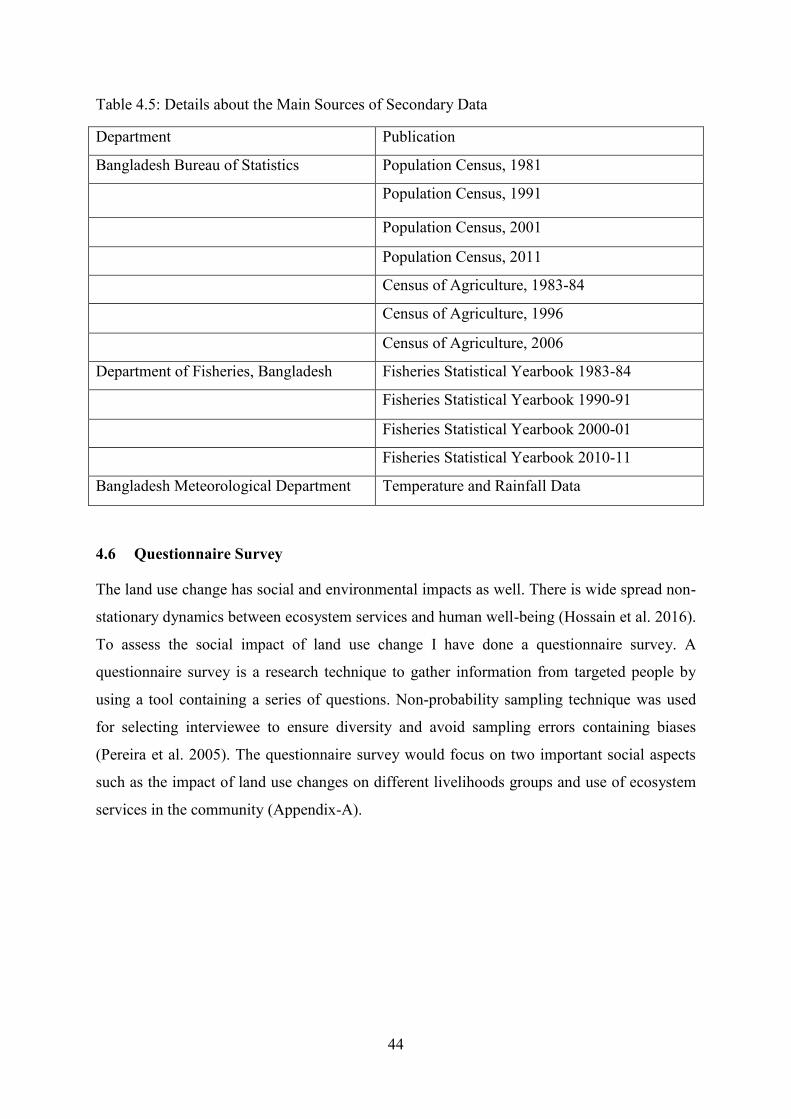
44
Table 4.5: Details about the Main Sources of Secondary Data
Department Publication
Bangladesh Bureau of Statistics Population Census, 1981
Population Census, 1991
Population Census, 2001
Population Census, 2011
Census of Agriculture, 1983-84
Census of Agriculture, 1996
Census of Agriculture, 2006
Department of Fisheries, Bangladesh Fisheries Statistical Yearbook 1983-84
Fisheries Statistical Yearbook 1990-91
Fisheries Statistical Yearbook 2000-01
Fisheries Statistical Yearbook 2010-11
Bangladesh Meteorological Department Temperature and Rainfall Data
4.6 Questionnaire Survey
The land use change has social and environmental impacts as well. There is wide spread non-
stationary dynamics between ecosystem services and human well-being (Hossain et al. 2016).
To assess the social impact of land use change I have done a questionnaire survey. A
questionnaire survey is a research technique to gather information from targeted people by
using a tool containing a series of questions. Non-probability sampling technique was used
for selecting interviewee to ensure diversity and avoid sampling errors containing biases
(Pereira et al. 2005). The questionnaire survey would focus on two important social aspects
such as the impact of land use changes on different livelihoods groups and use of ecosystem
services in the community (Appendix-A).
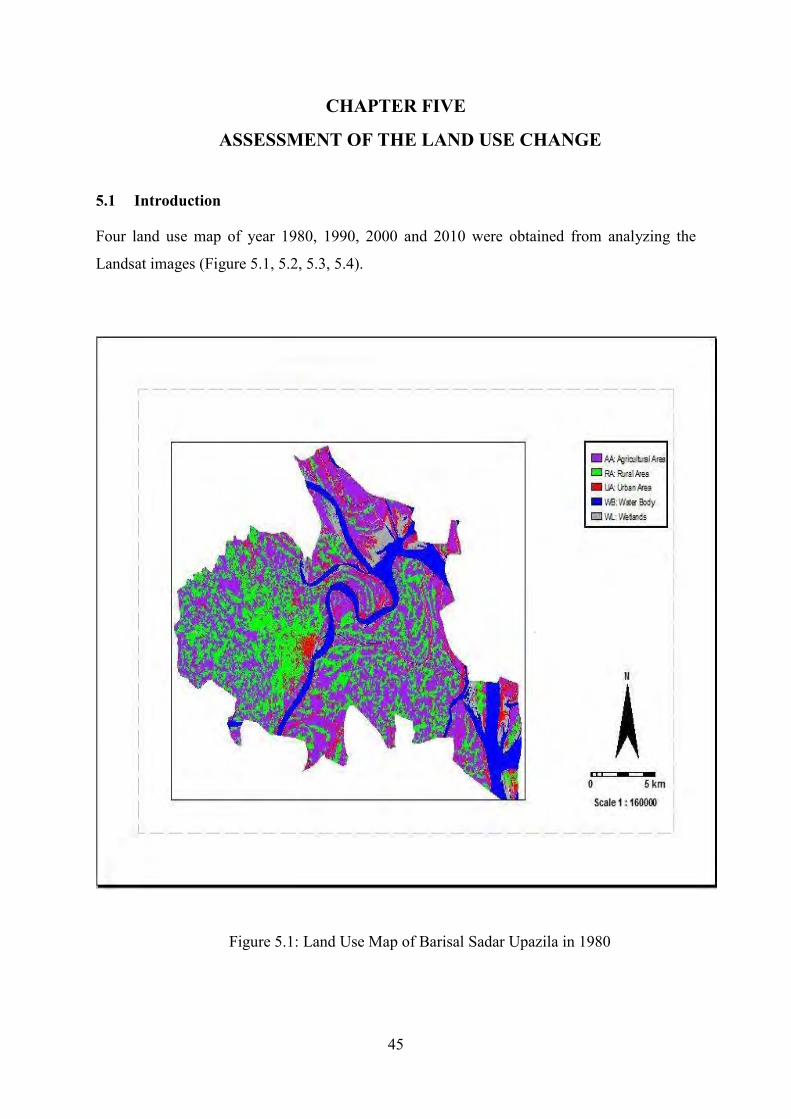
45
CHAPTER FIVE
ASSESSMENT OF THE LAND USE CHANGE
5.1 Introduction
Four land use map of year 1980, 1990, 2000 and 2010 were obtained from analyzing the
Landsat images (Figure 5.1, 5.2, 5.3, 5.4).
Figure 5.1: Land Use Map of Barisal Sadar Upazila in 1980
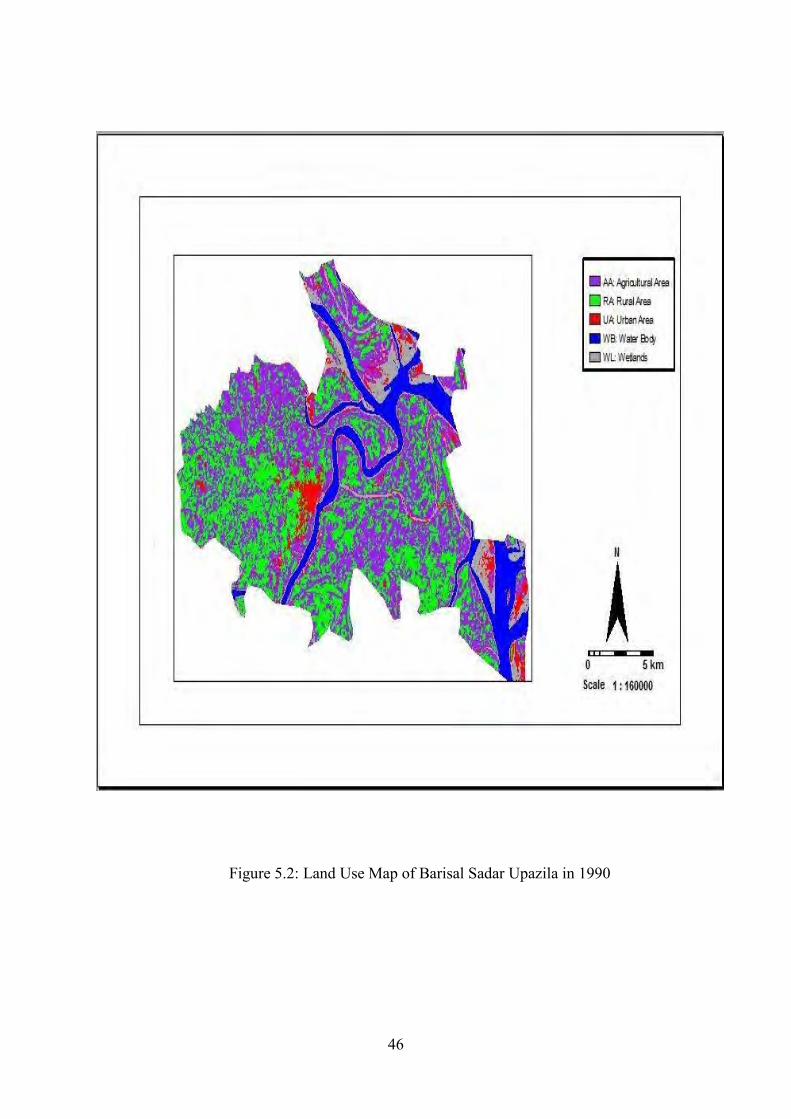
46
Figure 5.2: Land Use Map of Barisal Sadar Upazila in 1990
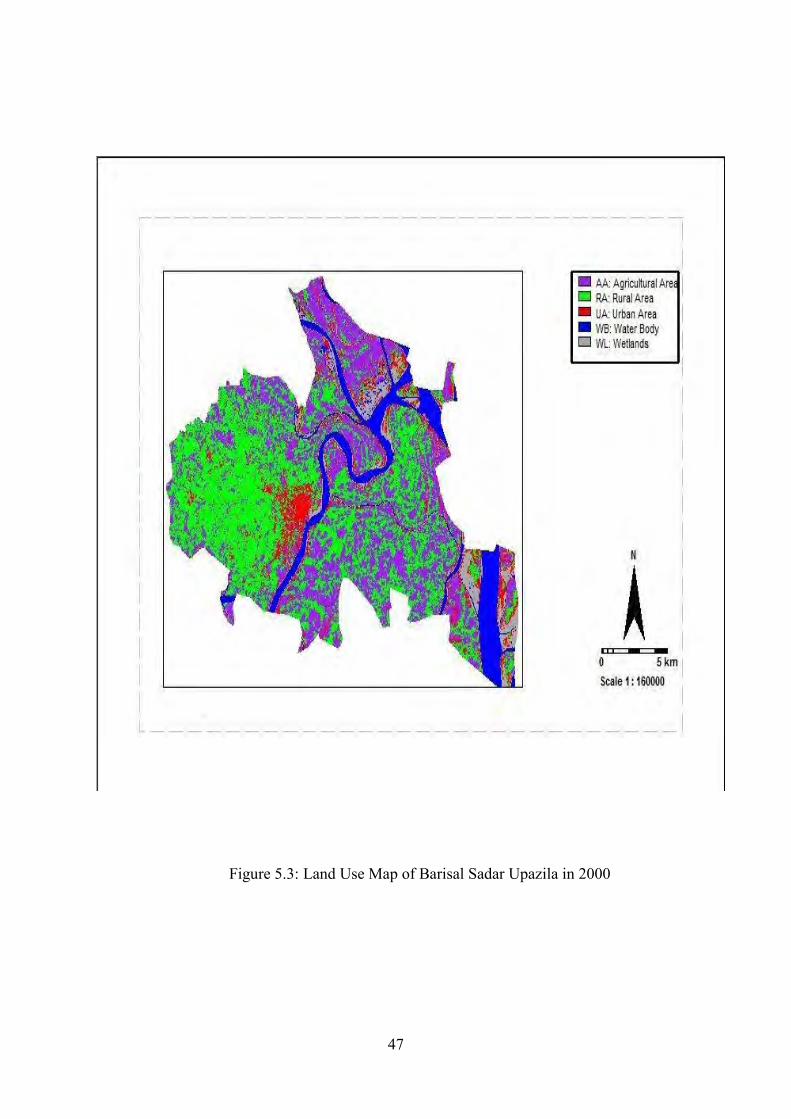
47
Figure 5.3: Land Use Map of Barisal Sadar Upazila in 2000
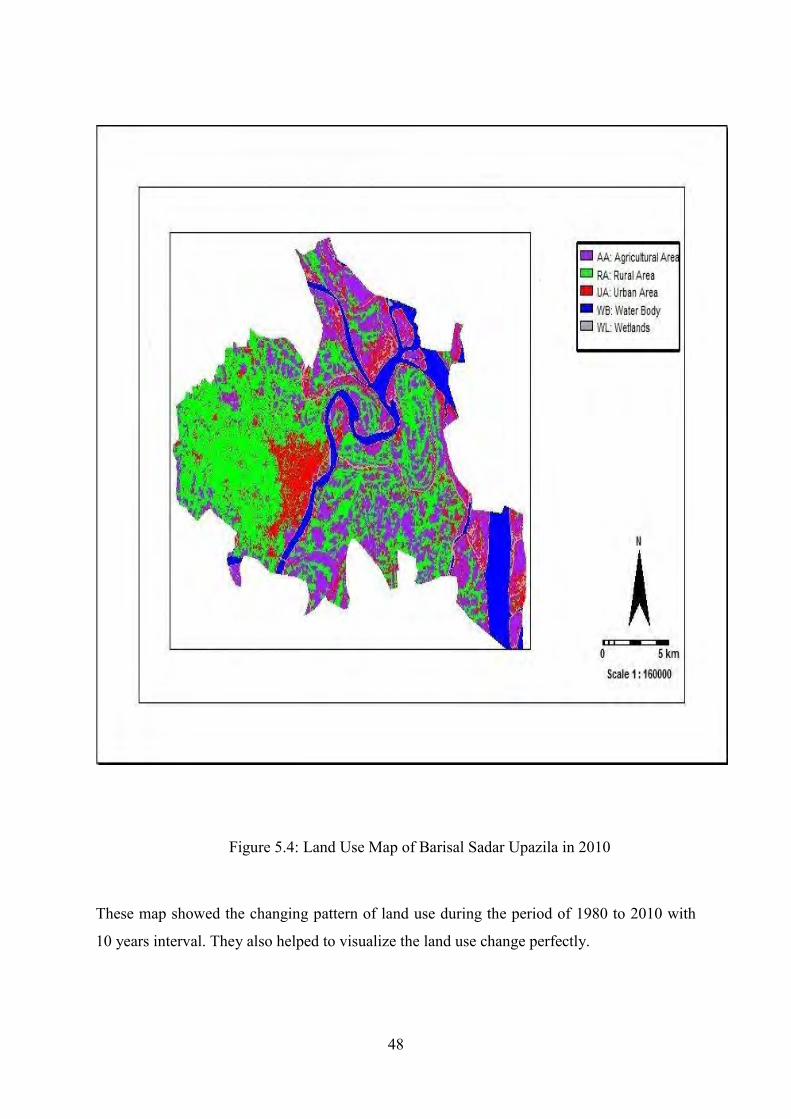
48
Figure 5.4: Land Use Map of Barisal Sadar Upazila in 2010
These map showed the changing pattern of land use during the period of 1980 to 2010 with
10 years interval. They also helped to visualize the land use change perfectly.
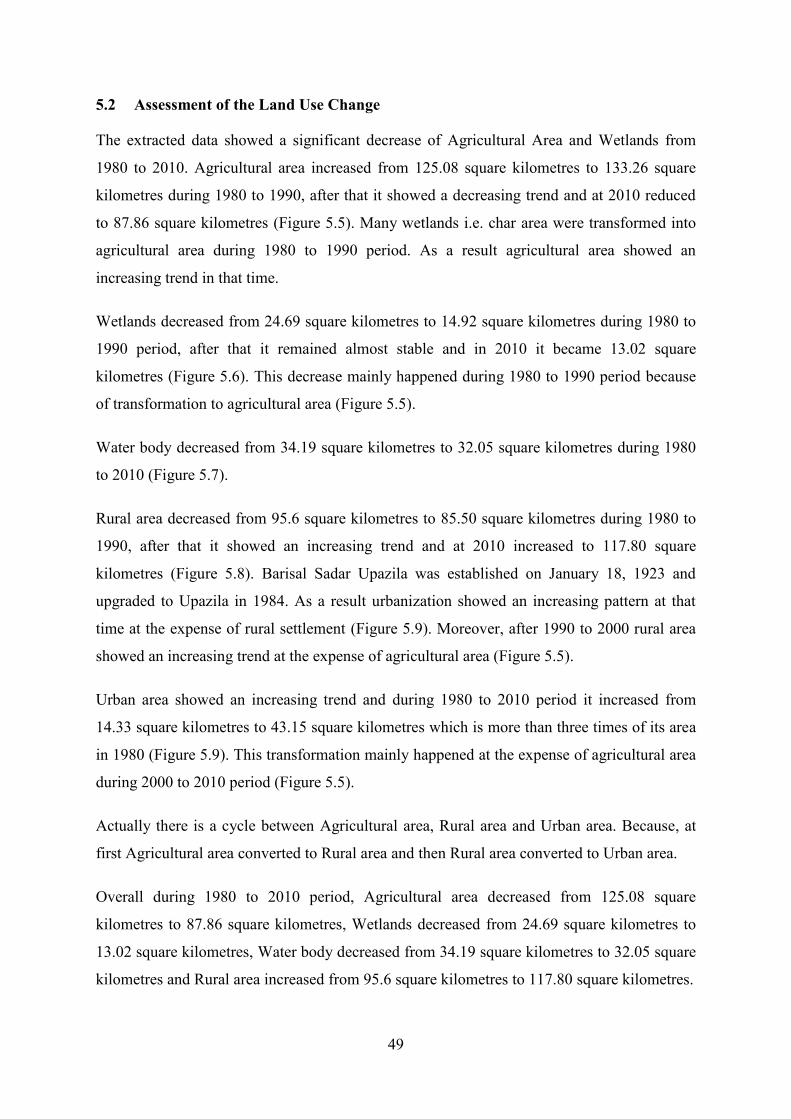
49
5.2 Assessment of the Land Use Change
The extracted data showed a significant decrease of Agricultural Area and Wetlands from
1980 to 2010. Agricultural area increased from 125.08 square kilometres to 133.26 square
kilometres during 1980 to 1990, after that it showed a decreasing trend and at 2010 reduced
to 87.86 square kilometres (Figure 5.5). Many wetlands i.e. char area were transformed into
agricultural area during 1980 to 1990 period. As a result agricultural area showed an
increasing trend in that time.
Wetlands decreased from 24.69 square kilometres to 14.92 square kilometres during 1980 to
1990 period, after that it remained almost stable and in 2010 it became 13.02 square
kilometres (Figure 5.6). This decrease mainly happened during 1980 to 1990 period because
of transformation to agricultural area (Figure 5.5).
Water body decreased from 34.19 square kilometres to 32.05 square kilometres during 1980
to 2010 (Figure 5.7).
Rural area decreased from 95.6 square kilometres to 85.50 square kilometres during 1980 to
1990, after that it showed an increasing trend and at 2010 increased to 117.80 square
kilometres (Figure 5.8). Barisal Sadar Upazila was established on January 18, 1923 and
upgraded to Upazila in 1984. As a result urbanization showed an increasing pattern at that
time at the expense of rural settlement (Figure 5.9). Moreover, after 1990 to 2000 rural area
showed an increasing trend at the expense of agricultural area (Figure 5.5).
Urban area showed an increasing trend and during 1980 to 2010 period it increased from
14.33 square kilometres to 43.15 square kilometres which is more than three times of its area
in 1980 (Figure 5.9). This transformation mainly happened at the expense of agricultural area
during 2000 to 2010 period (Figure 5.5).
Actually there is a cycle between Agricultural area, Rural area and Urban area. Because, at
first Agricultural area converted to Rural area and then Rural area converted to Urban area.
Overall during 1980 to 2010 period, Agricultural area decreased from 125.08 square
kilometres to 87.86 square kilometres, Wetlands decreased from 24.69 square kilometres to
13.02 square kilometres, Water body decreased from 34.19 square kilometres to 32.05 square
kilometres and Rural area increased from 95.6 square kilometres to 117.80 square kilometres.
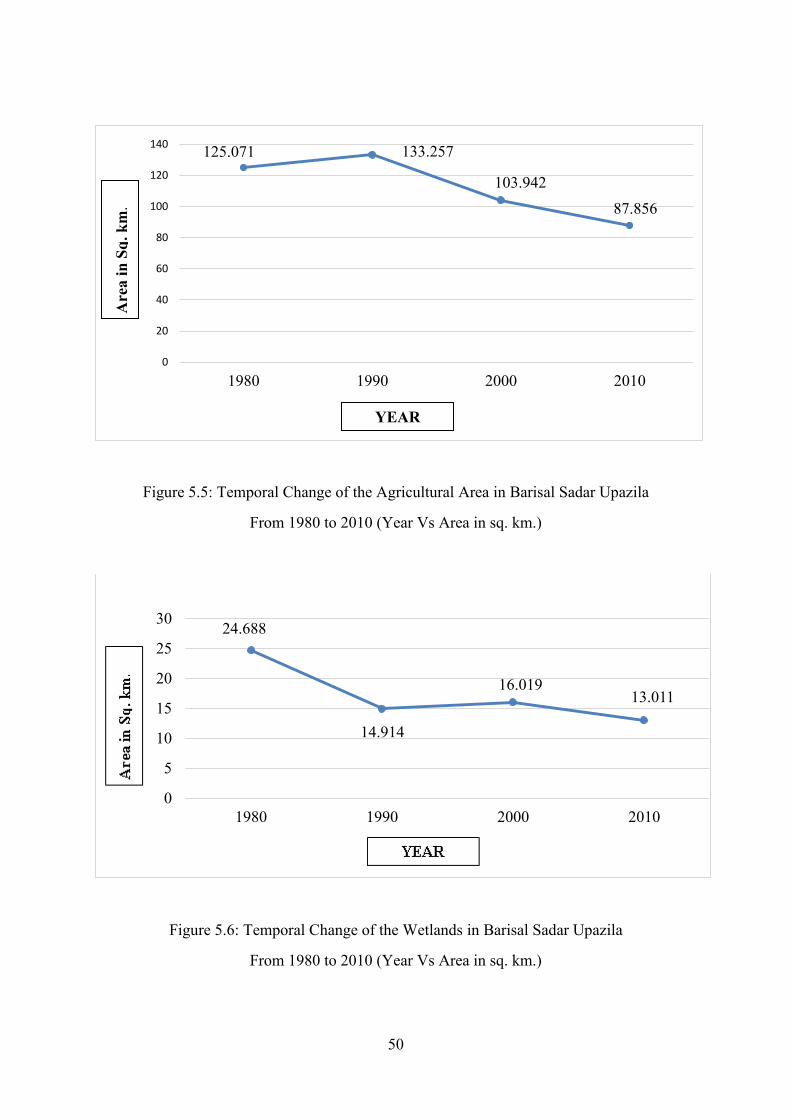
50
Figure 5.5: Temporal Change of the Agricultural Area in Barisal Sadar Upazila
From 1980 to 2010 (Year Vs Area in sq. km.)
Figure 5.6: Temporal Change of the Wetlands in Barisal Sadar Upazila
From 1980 to 2010 (Year Vs Area in sq. km.)
125.071 133.257
103.942 87.856
0
20
40
60
80
100
120
140
1980 1990 2000 2010
24.688
14.914
16.019 13.011
0
5
10
15
20
25
30
1980 1990 2000 2010
YEAR
Are
a in
Sq.
km
.
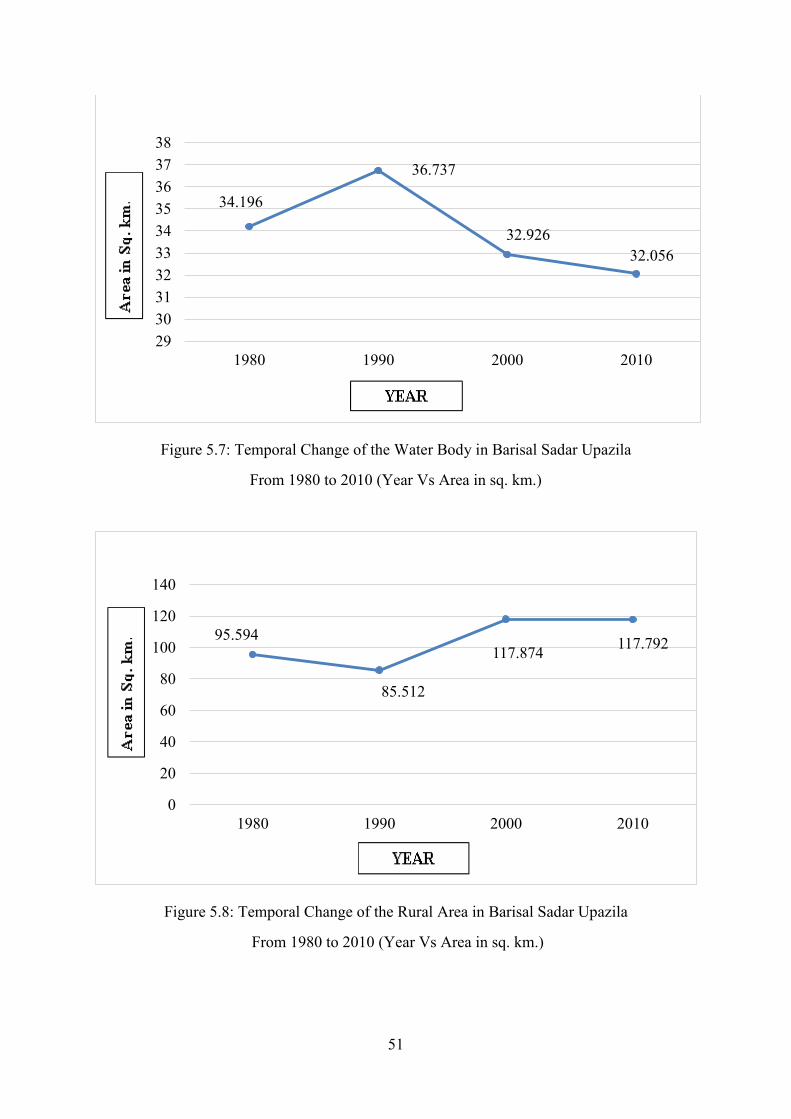
51
Figure 5.7: Temporal Change of the Water Body in Barisal Sadar Upazila
From 1980 to 2010 (Year Vs Area in sq. km.)
Figure 5.8: Temporal Change of the Rural Area in Barisal Sadar Upazila
From 1980 to 2010 (Year Vs Area in sq. km.)
34.196
36.737
32.926 32.056
29303132333435363738
1980 1990 2000 2010
95.594
85.512
117.874 117.792
0
20
40
60
80
100
120
140
1980 1990 2000 2010
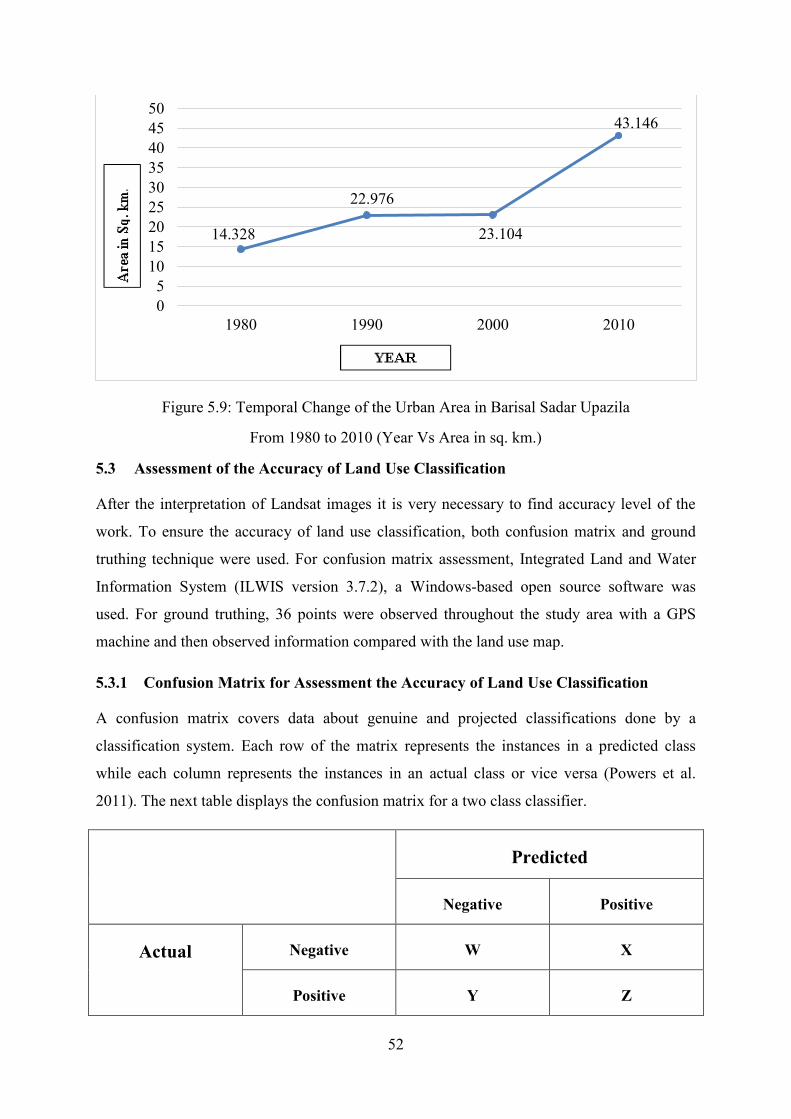
52
Figure 5.9: Temporal Change of the Urban Area in Barisal Sadar Upazila
From 1980 to 2010 (Year Vs Area in sq. km.)
5.3 Assessment of the Accuracy of Land Use Classification
After the interpretation of Landsat images it is very necessary to find accuracy level of the
work. To ensure the accuracy of land use classification, both confusion matrix and ground
truthing technique were used. For confusion matrix assessment, Integrated Land and Water
Information System (ILWIS version 3.7.2), a Windows-based open source software was
used. For ground truthing, 36 points were observed throughout the study area with a GPS
machine and then observed information compared with the land use map.
5.3.1 Confusion Matrix for Assessment the Accuracy of Land Use Classification
A confusion matrix covers data about genuine and projected classifications done by a
classification system. Each row of the matrix represents the instances in a predicted class
while each column represents the instances in an actual class or vice versa (Powers et al.
2011). The next table displays the confusion matrix for a two class classifier.
Predicted
Negative Positive
Actual Negative W X
Positive Y Z
14.328
22.976
23.104
43.146
05
101520253035404550
1980 1990 2000 2010
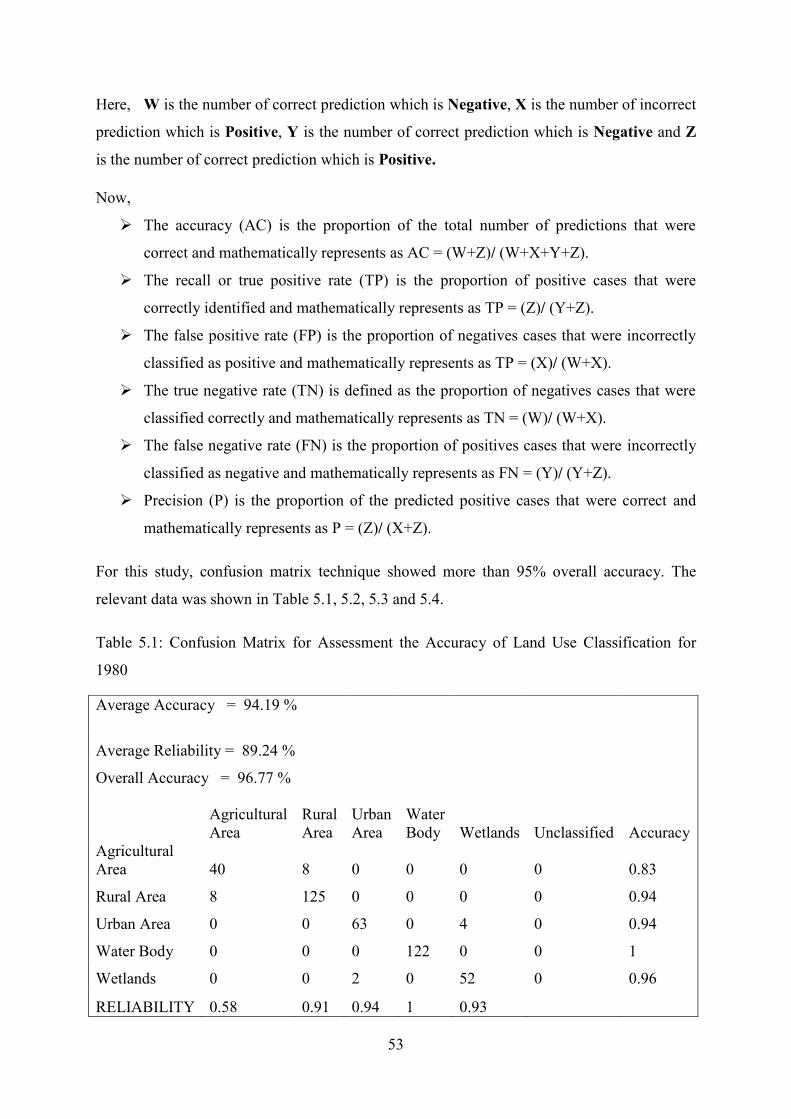
53
Here, W is the number of correct prediction which is Negative, X is the number of incorrect
prediction which is Positive, Y is the number of correct prediction which is Negative and Z
is the number of correct prediction which is Positive.
Now,
The accuracy (AC) is the proportion of the total number of predictions that were
correct and mathematically represents as AC = (W+Z)/ (W+X+Y+Z).
The recall or true positive rate (TP) is the proportion of positive cases that were
correctly identified and mathematically represents as TP = (Z)/ (Y+Z).
The false positive rate (FP) is the proportion of negatives cases that were incorrectly
classified as positive and mathematically represents as TP = (X)/ (W+X).
The true negative rate (TN) is defined as the proportion of negatives cases that were
classified correctly and mathematically represents as TN = (W)/ (W+X).
The false negative rate (FN) is the proportion of positives cases that were incorrectly
classified as negative and mathematically represents as FN = (Y)/ (Y+Z).
Precision (P) is the proportion of the predicted positive cases that were correct and
mathematically represents as P = (Z)/ (X+Z).
For this study, confusion matrix technique showed more than 95% overall accuracy. The
relevant data was shown in Table 5.1, 5.2, 5.3 and 5.4.
Table 5.1: Confusion Matrix for Assessment the Accuracy of Land Use Classification for
1980
Average Accuracy = 94.19 %
Average Reliability = 89.24 %
Overall Accuracy = 96.77 %
Agricultural Area
Rural Area
Urban Area
Water Body Wetlands Unclassified Accuracy
Agricultural Area 40 8 0 0 0 0 0.83
Rural Area 8 125 0 0 0 0 0.94
Urban Area 0 0 63 0 4 0 0.94
Water Body 0 0 0 122 0 0 1
Wetlands 0 0 2 0 52 0 0.96
RELIABILITY 0.58 0.91 0.94 1 0.93
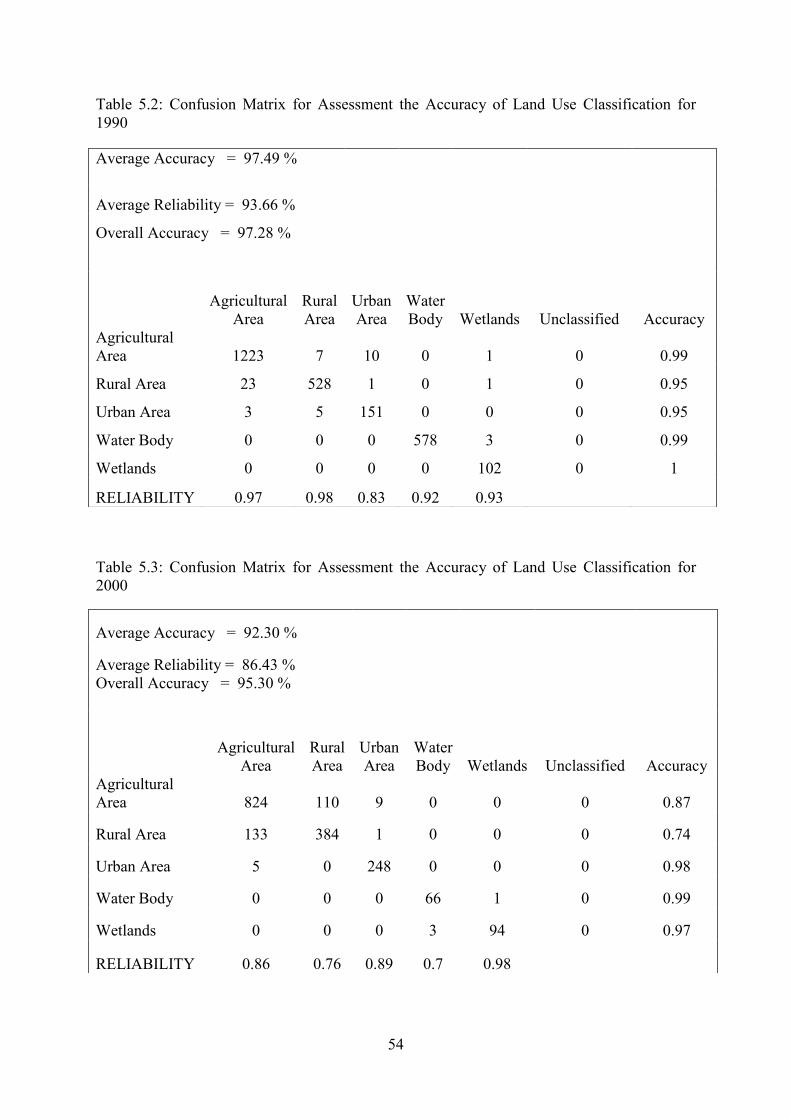
54
Table 5.2: Confusion Matrix for Assessment the Accuracy of Land Use Classification for 1990
Table 5.3: Confusion Matrix for Assessment the Accuracy of Land Use Classification for 2000
Average Accuracy = 97.49 %
Average Reliability = 93.66 %
Overall Accuracy = 97.28 %
Agricultural
Area Rural Area
Urban Area
Water Body Wetlands Unclassified Accuracy
Agricultural Area 1223 7 10 0 1 0 0.99
Rural Area 23 528 1 0 1 0 0.95
Urban Area 3 5 151 0 0 0 0.95
Water Body 0 0 0 578 3 0 0.99
Wetlands 0 0 0 0 102 0 1
RELIABILITY 0.97 0.98 0.83 0.92 0.93
Average Accuracy = 92.30 %
Average Reliability = 86.43 %
Overall Accuracy = 95.30 %
Agricultural
Area Rural Area
Urban Area
Water Body Wetlands Unclassified Accuracy
Agricultural Area 824 110 9 0 0 0 0.87
Rural Area 133 384 1 0 0 0 0.74
Urban Area 5 0 248 0 0 0 0.98
Water Body 0 0 0 66 1 0 0.99
Wetlands 0 0 0 3 94 0 0.97
RELIABILITY 0.86 0.76 0.89 0.7 0.98
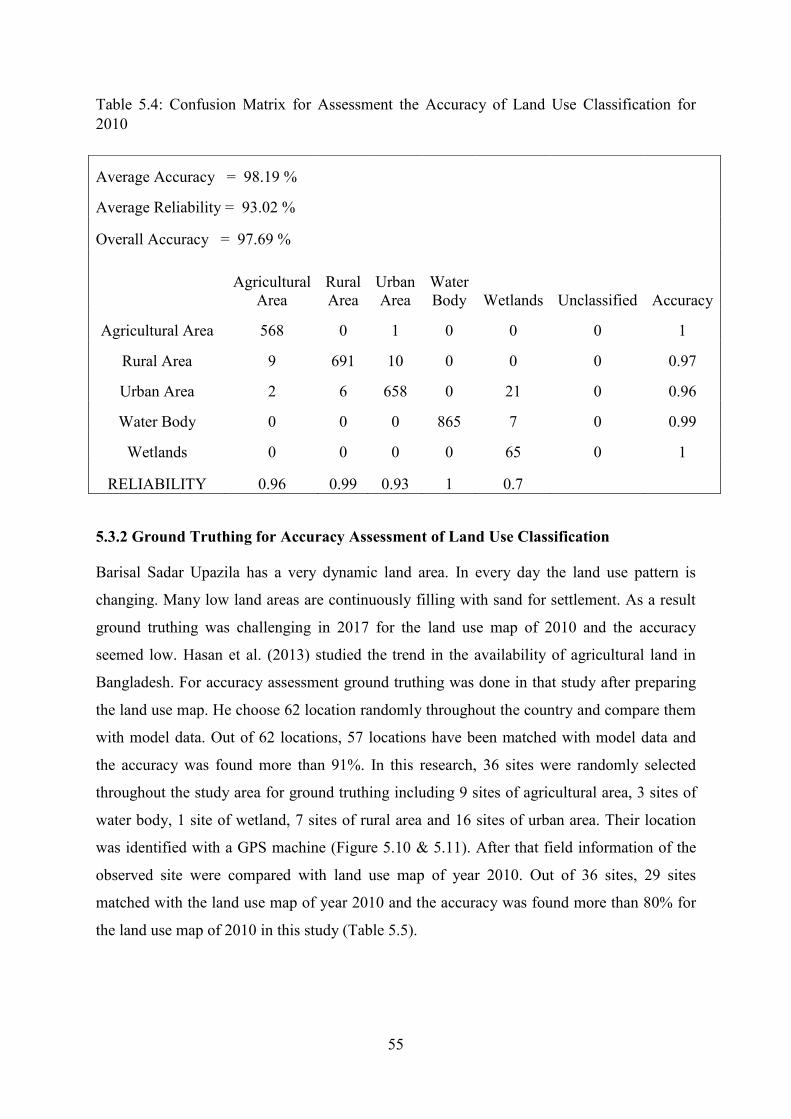
55
Table 5.4: Confusion Matrix for Assessment the Accuracy of Land Use Classification for 2010
5.3.2 Ground Truthing for Accuracy Assessment of Land Use Classification
Barisal Sadar Upazila has a very dynamic land area. In every day the land use pattern is
changing. Many low land areas are continuously filling with sand for settlement. As a result
ground truthing was challenging in 2017 for the land use map of 2010 and the accuracy
seemed low. Hasan et al. (2013) studied the trend in the availability of agricultural land in
Bangladesh. For accuracy assessment ground truthing was done in that study after preparing
the land use map. He choose 62 location randomly throughout the country and compare them
with model data. Out of 62 locations, 57 locations have been matched with model data and
the accuracy was found more than 91%. In this research, 36 sites were randomly selected
throughout the study area for ground truthing including 9 sites of agricultural area, 3 sites of
water body, 1 site of wetland, 7 sites of rural area and 16 sites of urban area. Their location
was identified with a GPS machine (Figure 5.10 & 5.11). After that field information of the
observed site were compared with land use map of year 2010. Out of 36 sites, 29 sites
matched with the land use map of year 2010 and the accuracy was found more than 80% for
the land use map of 2010 in this study (Table 5.5).
Average Accuracy = 98.19 %
Average Reliability = 93.02 %
Overall Accuracy = 97.69 %
Agricultural
Area Rural Area
Urban Area
Water Body Wetlands Unclassified Accuracy
Agricultural Area 568 0 1 0 0 0 1
Rural Area 9 691 10 0 0 0 0.97
Urban Area 2 6 658 0 21 0 0.96
Water Body 0 0 0 865 7 0 0.99
Wetlands 0 0 0 0 65 0 1
RELIABILITY 0.96 0.99 0.93 1 0.7
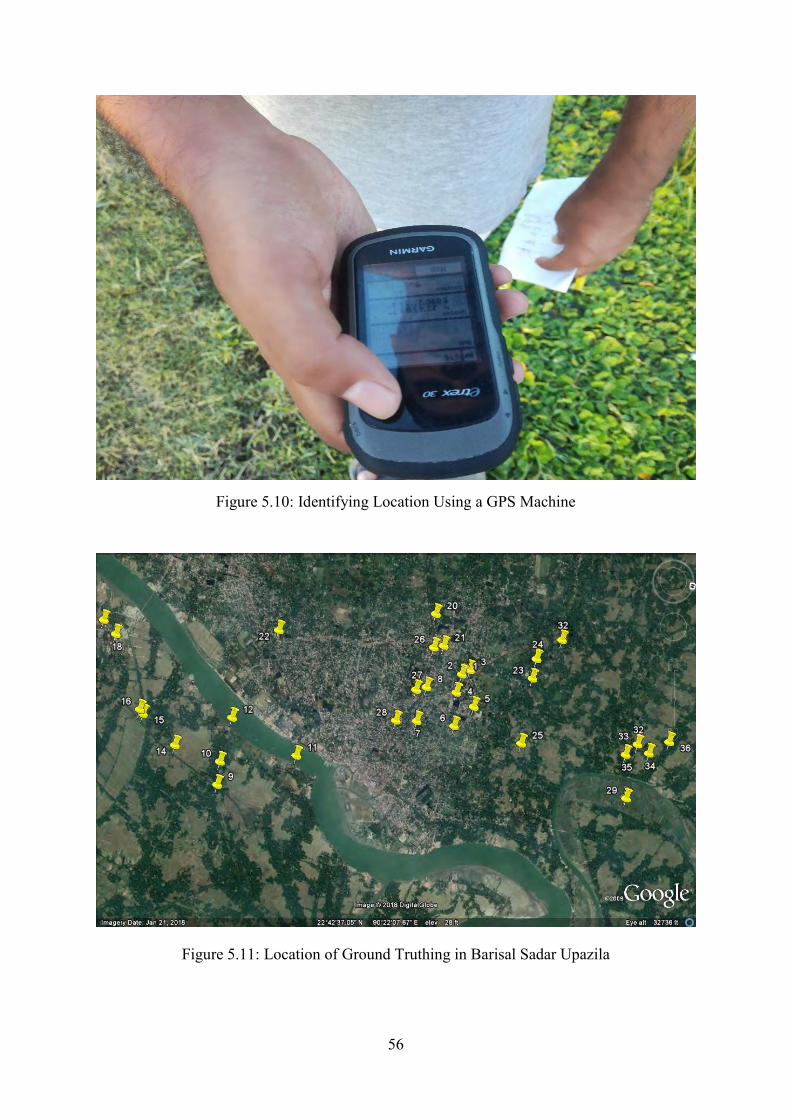
56
Figure 5.10: Identifying Location Using a GPS Machine
Figure 5.11: Location of Ground Truthing in Barisal Sadar Upazila
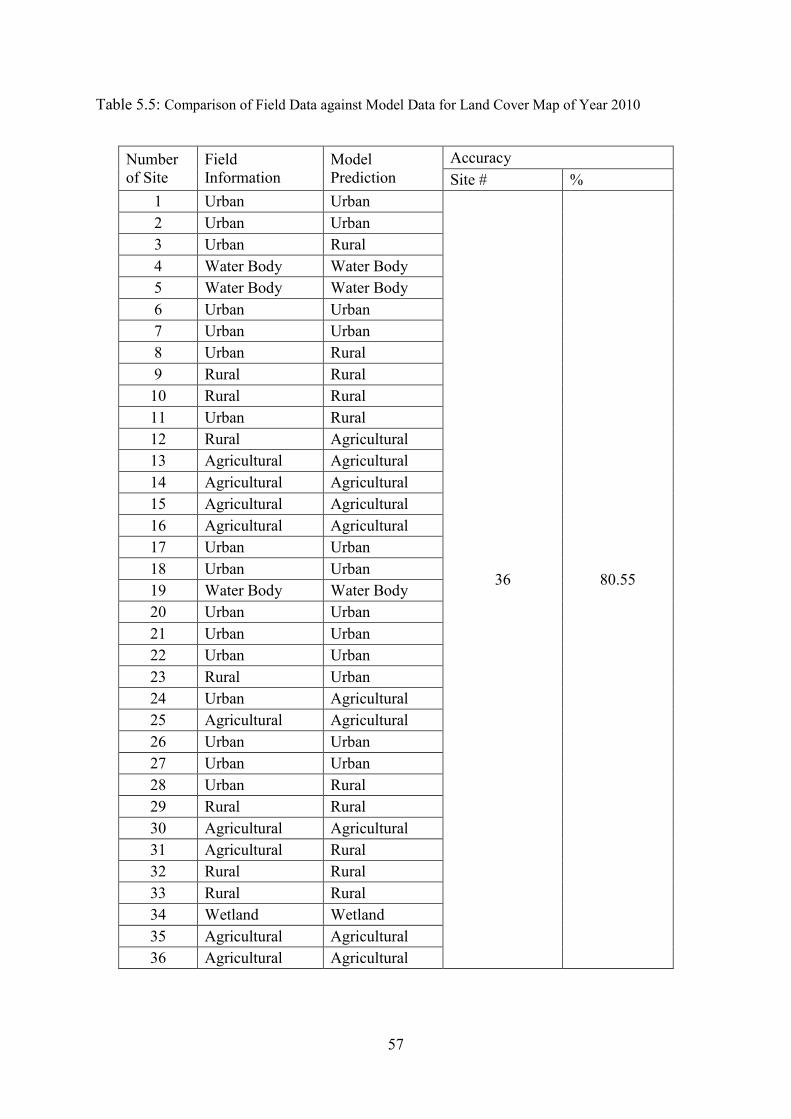
57
Table 5.5: Comparison of Field Data against Model Data for Land Cover Map of Year 2010
Number of Site
Field Information
Model Prediction
Accuracy Site # %
1 Urban Urban
36 80.55
2 Urban Urban 3 Urban Rural 4 Water Body Water Body 5 Water Body Water Body 6 Urban Urban 7 Urban Urban 8 Urban Rural 9 Rural Rural 10 Rural Rural 11 Urban Rural 12 Rural Agricultural 13 Agricultural Agricultural 14 Agricultural Agricultural 15 Agricultural Agricultural 16 Agricultural Agricultural 17 Urban Urban 18 Urban Urban 19 Water Body Water Body 20 Urban Urban 21 Urban Urban 22 Urban Urban 23 Rural Urban 24 Urban Agricultural 25 Agricultural Agricultural 26 Urban Urban 27 Urban Urban 28 Urban Rural 29 Rural Rural 30 Agricultural Agricultural 31 Agricultural Rural 32 Rural Rural 33 Rural Rural 34 Wetland Wetland 35 Agricultural Agricultural 36 Agricultural Agricultural
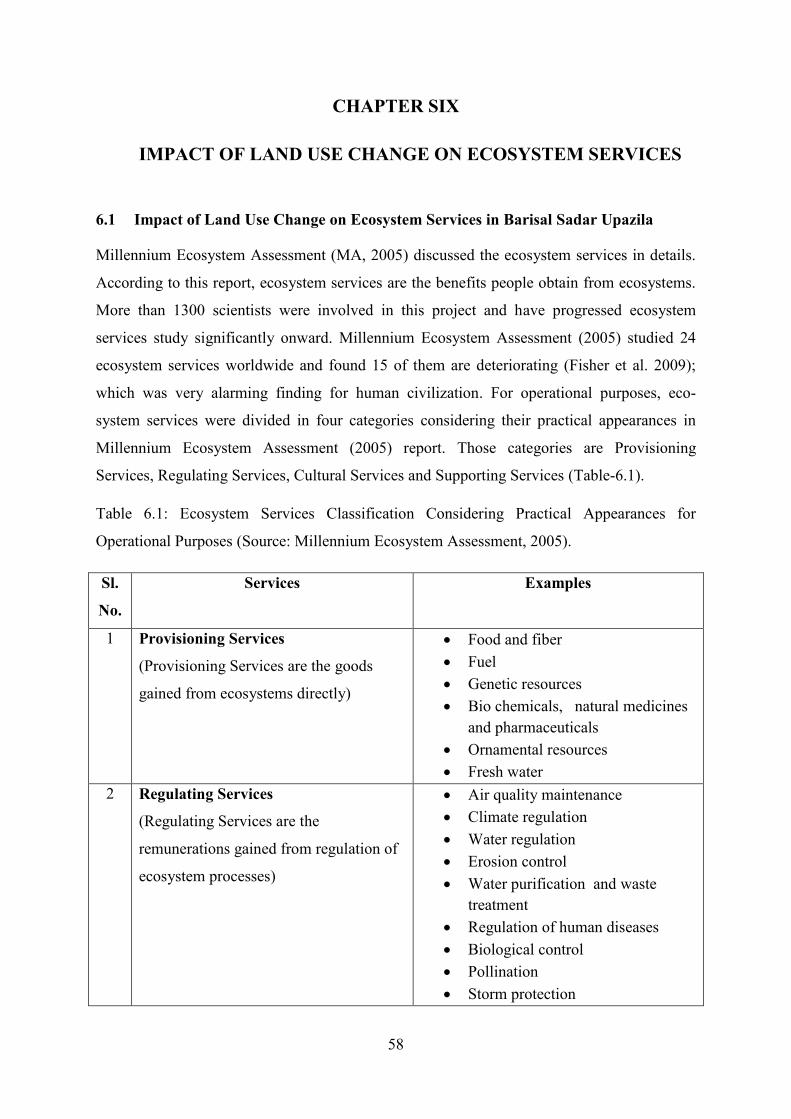
58
CHAPTER SIX
IMPACT OF LAND USE CHANGE ON ECOSYSTEM SERVICES
6.1 Impact of Land Use Change on Ecosystem Services in Barisal Sadar Upazila
Millennium Ecosystem Assessment (MA, 2005) discussed the ecosystem services in details.
According to this report, ecosystem services are the benefits people obtain from ecosystems.
More than 1300 scientists were involved in this project and have progressed ecosystem
services study significantly onward. Millennium Ecosystem Assessment (2005) studied 24
ecosystem services worldwide and found 15 of them are deteriorating (Fisher et al. 2009);
which was very alarming finding for human civilization. For operational purposes, eco-
system services were divided in four categories considering their practical appearances in
Millennium Ecosystem Assessment (2005) report. Those categories are Provisioning
Services, Regulating Services, Cultural Services and Supporting Services (Table-6.1).
Table 6.1: Ecosystem Services Classification Considering Practical Appearances for
Operational Purposes (Source: Millennium Ecosystem Assessment, 2005).
Sl.
No.
Services Examples
1 Provisioning Services
(Provisioning Services are the goods
gained from ecosystems directly)
Food and fiber Fuel Genetic resources Bio chemicals, natural medicines
and pharmaceuticals Ornamental resources Fresh water
2 Regulating Services
(Regulating Services are the
remunerations gained from regulation of
ecosystem processes)
Air quality maintenance Climate regulation Water regulation Erosion control Water purification and waste
treatment Regulation of human diseases Biological control Pollination Storm protection
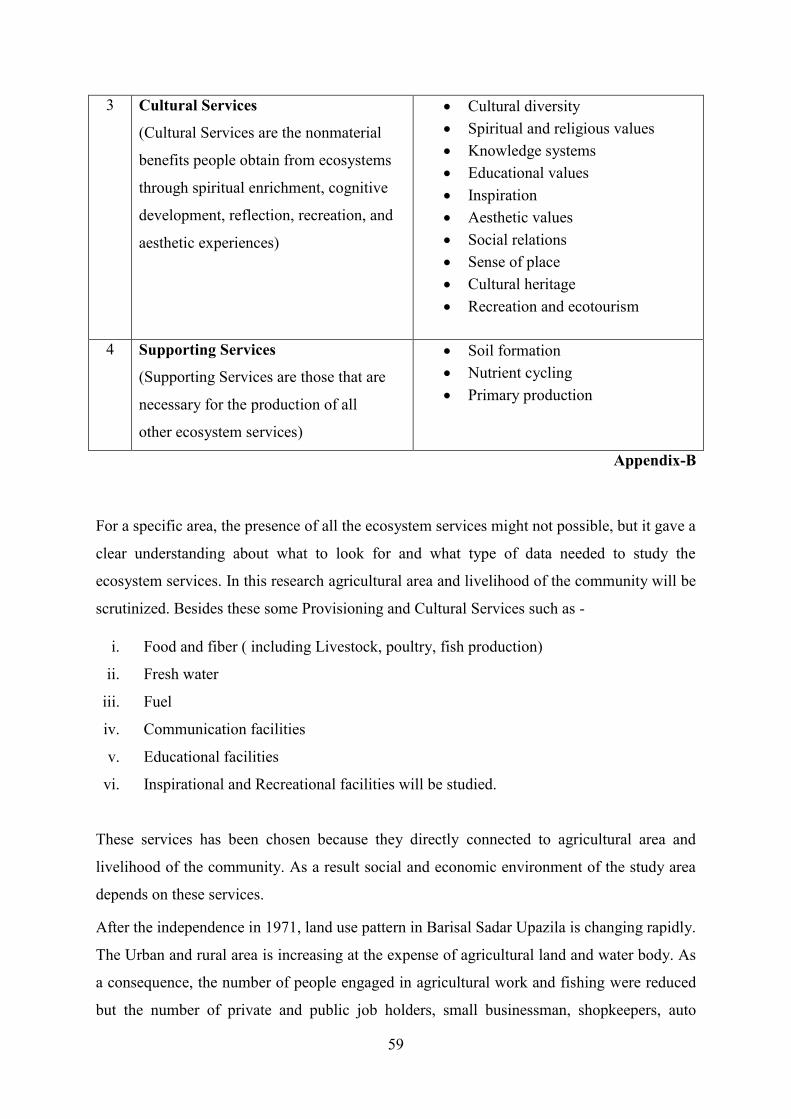
59
3 Cultural Services
(Cultural Services are the nonmaterial
benefits people obtain from ecosystems
through spiritual enrichment, cognitive
development, reflection, recreation, and
aesthetic experiences)
Cultural diversity Spiritual and religious values Knowledge systems Educational values Inspiration Aesthetic values Social relations Sense of place Cultural heritage Recreation and ecotourism
4 Supporting Services
(Supporting Services are those that are
necessary for the production of all
other ecosystem services)
Soil formation Nutrient cycling Primary production
Appendix-B
For a specific area, the presence of all the ecosystem services might not possible, but it gave a
clear understanding about what to look for and what type of data needed to study the
ecosystem services. In this research agricultural area and livelihood of the community will be
scrutinized. Besides these some Provisioning and Cultural Services such as -
i. Food and fiber ( including Livestock, poultry, fish production)
ii. Fresh water
iii. Fuel
iv. Communication facilities
v. Educational facilities
vi. Inspirational and Recreational facilities will be studied.
These services has been chosen because they directly connected to agricultural area and
livelihood of the community. As a result social and economic environment of the study area
depends on these services.
After the independence in 1971, land use pattern in Barisal Sadar Upazila is changing rapidly.
The Urban and rural area is increasing at the expense of agricultural land and water body. As
a consequence, the number of people engaged in agricultural work and fishing were reduced
but the number of private and public job holders, small businessman, shopkeepers, auto
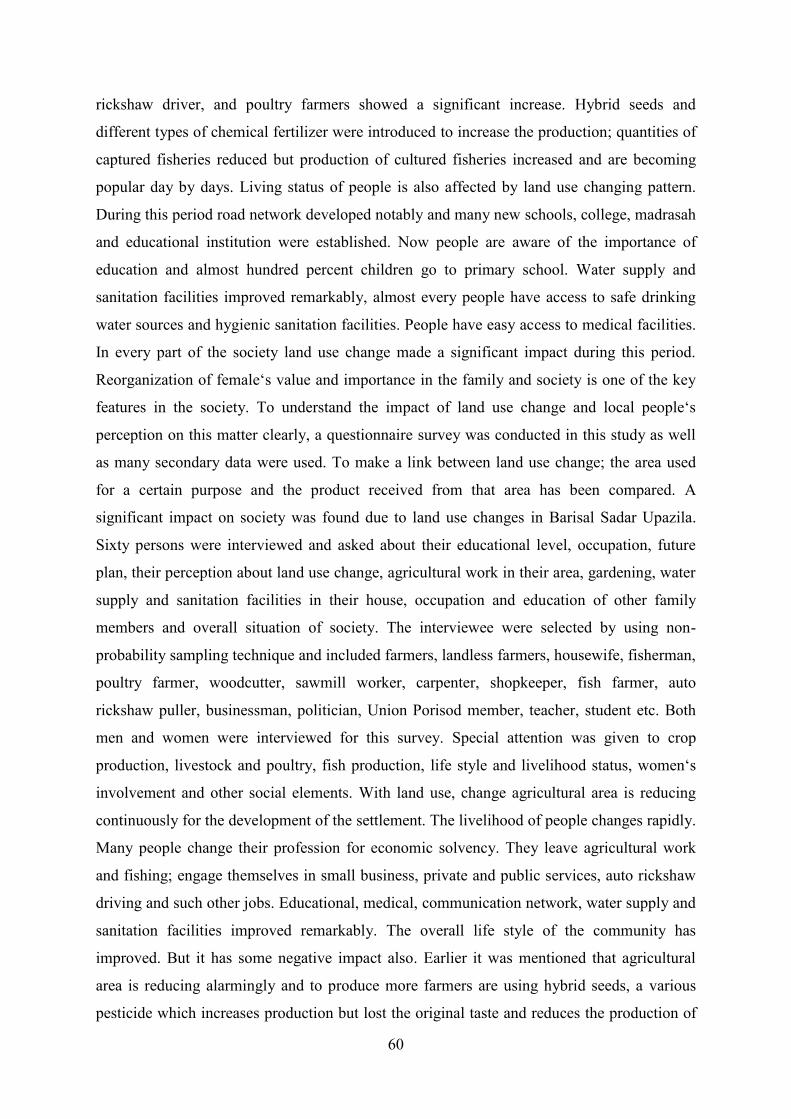
60
rickshaw driver, and poultry farmers showed a significant increase. Hybrid seeds and
different types of chemical fertilizer were introduced to increase the production; quantities of
captured fisheries reduced but production of cultured fisheries increased and are becoming
popular day by days. Living status of people is also affected by land use changing pattern.
During this period road network developed notably and many new schools, college, madrasah
and educational institution were established. Now people are aware of the importance of
education and almost hundred percent children go to primary school. Water supply and
sanitation facilities improved remarkably, almost every people have access to safe drinking
water sources and hygienic sanitation facilities. People have easy access to medical facilities.
In every part of the society land use change made a significant impact during this period.
Reorganization of female‘s value and importance in the family and society is one of the key
features in the society. To understand the impact of land use change and local people‘s
perception on this matter clearly, a questionnaire survey was conducted in this study as well
as many secondary data were used. To make a link between land use change; the area used
for a certain purpose and the product received from that area has been compared. A
significant impact on society was found due to land use changes in Barisal Sadar Upazila.
Sixty persons were interviewed and asked about their educational level, occupation, future
plan, their perception about land use change, agricultural work in their area, gardening, water
supply and sanitation facilities in their house, occupation and education of other family
members and overall situation of society. The interviewee were selected by using non-
probability sampling technique and included farmers, landless farmers, housewife, fisherman,
poultry farmer, woodcutter, sawmill worker, carpenter, shopkeeper, fish farmer, auto
rickshaw puller, businessman, politician, Union Porisod member, teacher, student etc. Both
men and women were interviewed for this survey. Special attention was given to crop
production, livestock and poultry, fish production, life style and livelihood status, women‘s
involvement and other social elements. With land use, change agricultural area is reducing
continuously for the development of the settlement. The livelihood of people changes rapidly.
Many people change their profession for economic solvency. They leave agricultural work
and fishing; engage themselves in small business, private and public services, auto rickshaw
driving and such other jobs. Educational, medical, communication network, water supply and
sanitation facilities improved remarkably. The overall life style of the community has
improved. But it has some negative impact also. Earlier it was mentioned that agricultural
area is reducing alarmingly and to produce more farmers are using hybrid seeds, a various
pesticide which increases production but lost the original taste and reduces the production of
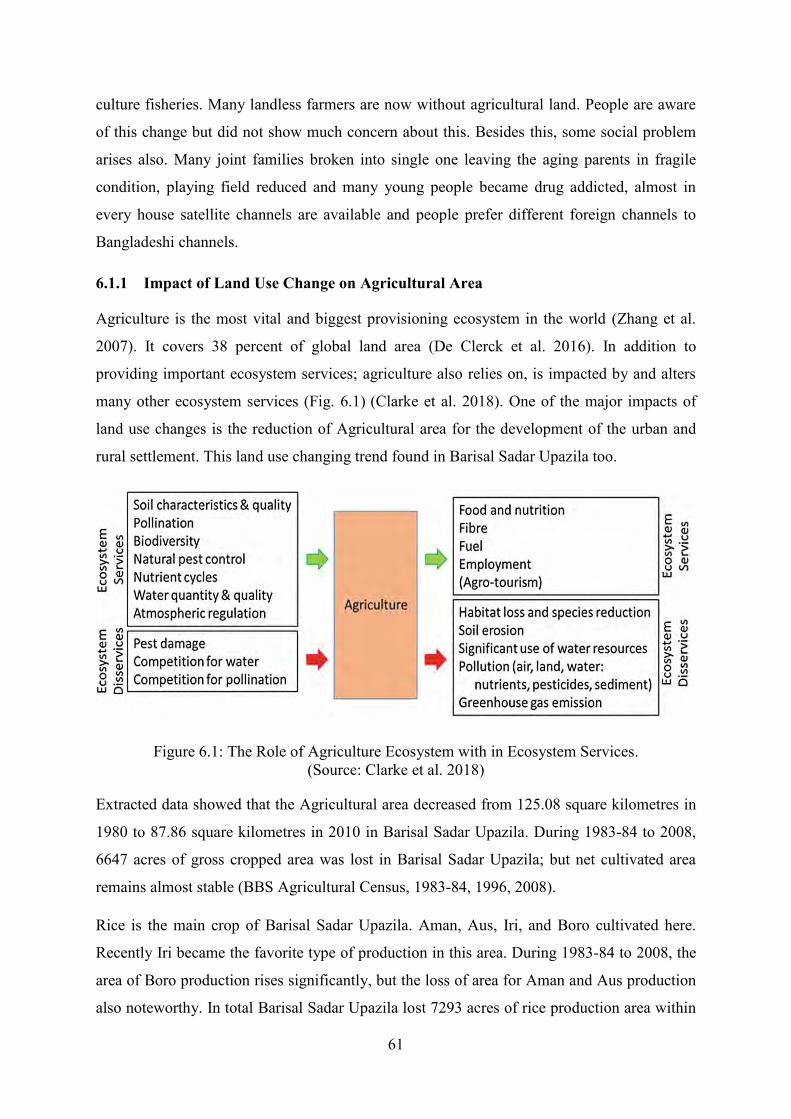
61
culture fisheries. Many landless farmers are now without agricultural land. People are aware
of this change but did not show much concern about this. Besides this, some social problem
arises also. Many joint families broken into single one leaving the aging parents in fragile
condition, playing field reduced and many young people became drug addicted, almost in
every house satellite channels are available and people prefer different foreign channels to
Bangladeshi channels.
6.1.1 Impact of Land Use Change on Agricultural Area
Agriculture is the most vital and biggest provisioning ecosystem in the world (Zhang et al.
2007). It covers 38 percent of global land area (De Clerck et al. 2016). In addition to
providing important ecosystem services; agriculture also relies on, is impacted by and alters
many other ecosystem services (Fig. 6.1) (Clarke et al. 2018). One of the major impacts of
land use changes is the reduction of Agricultural area for the development of the urban and
rural settlement. This land use changing trend found in Barisal Sadar Upazila too.
Figure 6.1: The Role of Agriculture Ecosystem with in Ecosystem Services. (Source: Clarke et al. 2018)
Extracted data showed that the Agricultural area decreased from 125.08 square kilometres in
1980 to 87.86 square kilometres in 2010 in Barisal Sadar Upazila. During 1983-84 to 2008,
6647 acres of gross cropped area was lost in Barisal Sadar Upazila; but net cultivated area
remains almost stable (BBS Agricultural Census, 1983-84, 1996, 2008).
Rice is the main crop of Barisal Sadar Upazila. Aman, Aus, Iri, and Boro cultivated here.
Recently Iri became the favorite type of production in this area. During 1983-84 to 2008, the
area of Boro production rises significantly, but the loss of area for Aman and Aus production
also noteworthy. In total Barisal Sadar Upazila lost 7293 acres of rice production area within
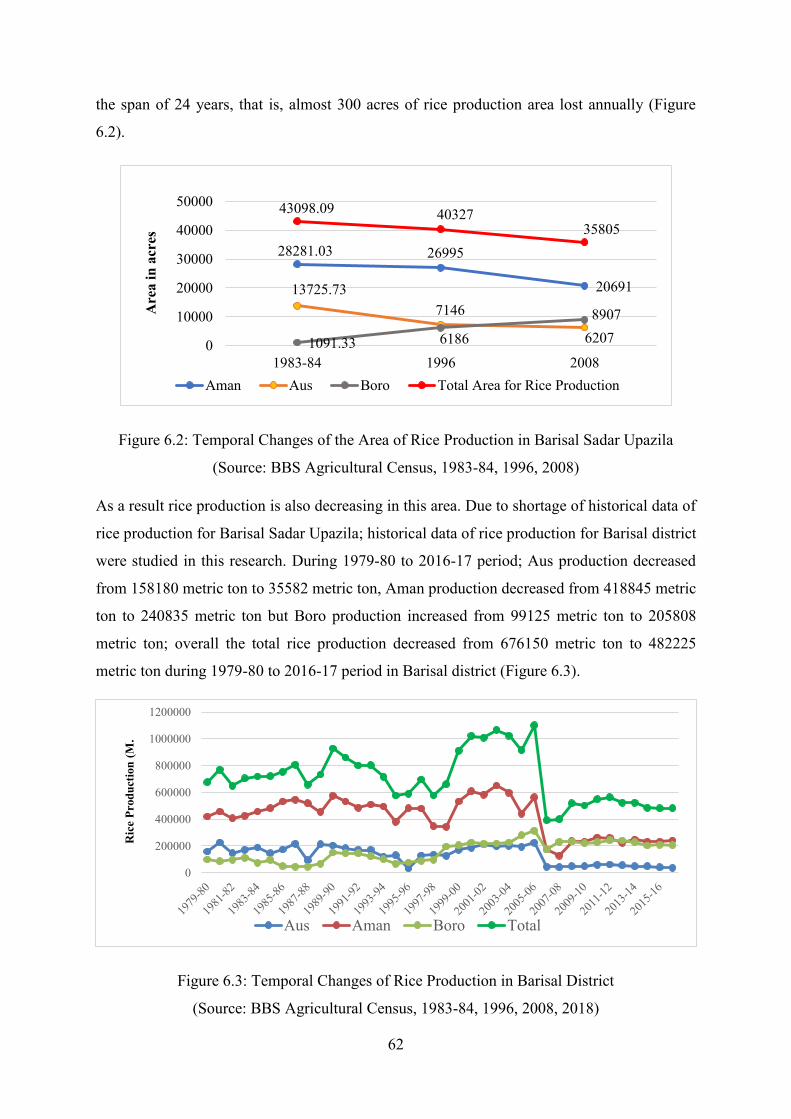
62
the span of 24 years, that is, almost 300 acres of rice production area lost annually (Figure
6.2).
Figure 6.2: Temporal Changes of the Area of Rice Production in Barisal Sadar Upazila
(Source: BBS Agricultural Census, 1983-84, 1996, 2008)
As a result rice production is also decreasing in this area. Due to shortage of historical data of
rice production for Barisal Sadar Upazila; historical data of rice production for Barisal district
were studied in this research. During 1979-80 to 2016-17 period; Aus production decreased
from 158180 metric ton to 35582 metric ton, Aman production decreased from 418845 metric
ton to 240835 metric ton but Boro production increased from 99125 metric ton to 205808
metric ton; overall the total rice production decreased from 676150 metric ton to 482225
metric ton during 1979-80 to 2016-17 period in Barisal district (Figure 6.3).
Figure 6.3: Temporal Changes of Rice Production in Barisal District
(Source: BBS Agricultural Census, 1983-84, 1996, 2008, 2018)
28281.03 26995
20691 13725.73 7146
6207 1091.33 6186 8907
43098.09 40327 35805
0
10000
20000
30000
40000
50000
1983-84 1996 2008Aman Aus Boro Total Area for Rice Production
Are
a in
acr
es
0
200000
400000
600000
800000
1000000
1200000
Aus Aman Boro Total
Ric
e Pr
oduc
tion
(M.
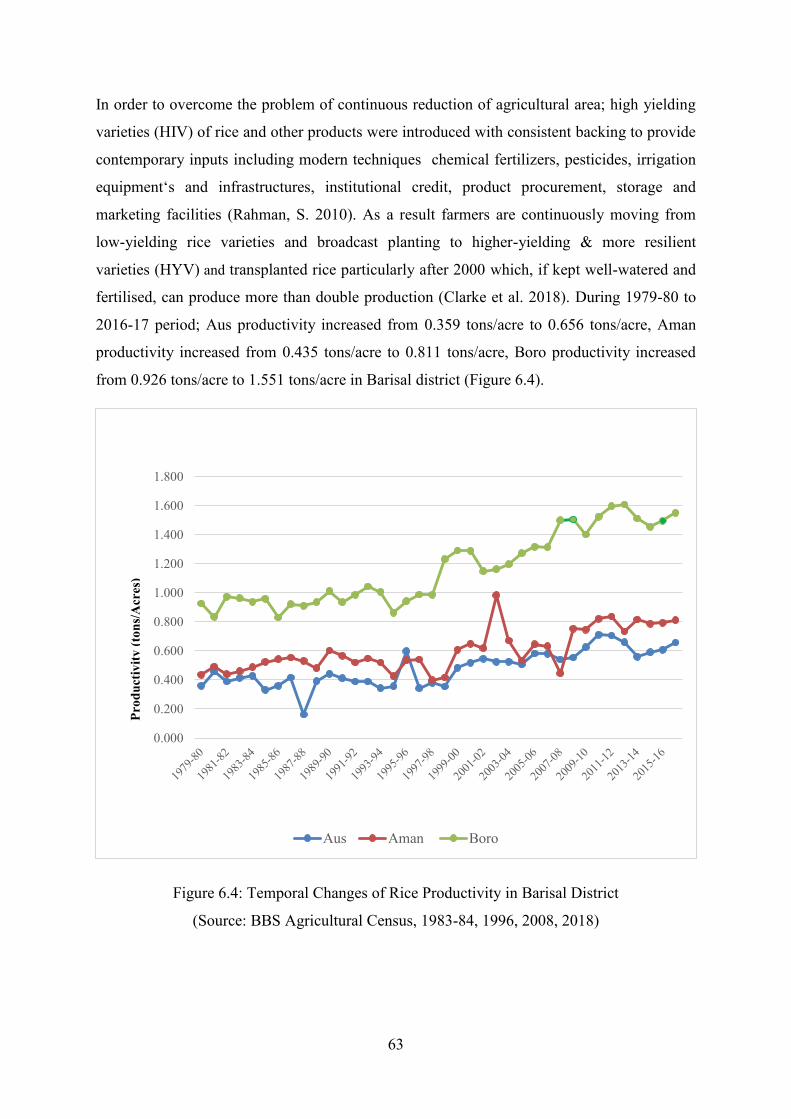
63
In order to overcome the problem of continuous reduction of agricultural area; high yielding
varieties (HIV) of rice and other products were introduced with consistent backing to provide
contemporary inputs including modern techniques chemical fertilizers, pesticides, irrigation
equipment‘s and infrastructures, institutional credit, product procurement, storage and
marketing facilities (Rahman, S. 2010). As a result farmers are continuously moving from
low-yielding rice varieties and broadcast planting to higher-yielding & more resilient
varieties (HYV) and transplanted rice particularly after 2000 which, if kept well-watered and
fertilised, can produce more than double production (Clarke et al. 2018). During 1979-80 to
2016-17 period; Aus productivity increased from 0.359 tons/acre to 0.656 tons/acre, Aman
productivity increased from 0.435 tons/acre to 0.811 tons/acre, Boro productivity increased
from 0.926 tons/acre to 1.551 tons/acre in Barisal district (Figure 6.4).
Figure 6.4: Temporal Changes of Rice Productivity in Barisal District
(Source: BBS Agricultural Census, 1983-84, 1996, 2008, 2018)
0.000
0.200
0.400
0.600
0.800
1.000
1.200
1.400
1.600
1.800
Aus Aman Boro
Prod
uctiv
ity (t
ons/
Acr
es)
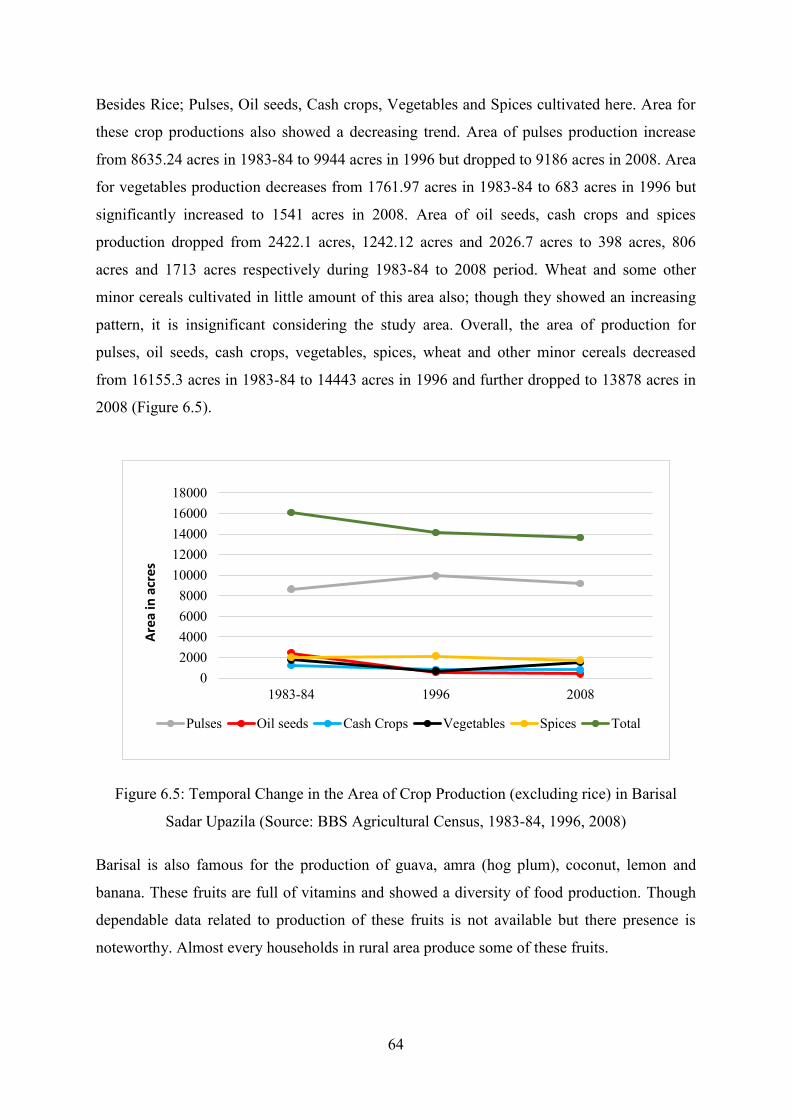
64
Besides Rice; Pulses, Oil seeds, Cash crops, Vegetables and Spices cultivated here. Area for
these crop productions also showed a decreasing trend. Area of pulses production increase
from 8635.24 acres in 1983-84 to 9944 acres in 1996 but dropped to 9186 acres in 2008. Area
for vegetables production decreases from 1761.97 acres in 1983-84 to 683 acres in 1996 but
significantly increased to 1541 acres in 2008. Area of oil seeds, cash crops and spices
production dropped from 2422.1 acres, 1242.12 acres and 2026.7 acres to 398 acres, 806
acres and 1713 acres respectively during 1983-84 to 2008 period. Wheat and some other
minor cereals cultivated in little amount of this area also; though they showed an increasing
pattern, it is insignificant considering the study area. Overall, the area of production for
pulses, oil seeds, cash crops, vegetables, spices, wheat and other minor cereals decreased
from 16155.3 acres in 1983-84 to 14443 acres in 1996 and further dropped to 13878 acres in
2008 (Figure 6.5).
Figure 6.5: Temporal Change in the Area of Crop Production (excluding rice) in Barisal
Sadar Upazila (Source: BBS Agricultural Census, 1983-84, 1996, 2008)
Barisal is also famous for the production of guava, amra (hog plum), coconut, lemon and
banana. These fruits are full of vitamins and showed a diversity of food production. Though
dependable data related to production of these fruits is not available but there presence is
noteworthy. Almost every households in rural area produce some of these fruits.
02000400060008000
1000012000140001600018000
1983-84 1996 2008
Pulses Oil seeds Cash Crops Vegetables Spices Total
Are
a in
acr
es
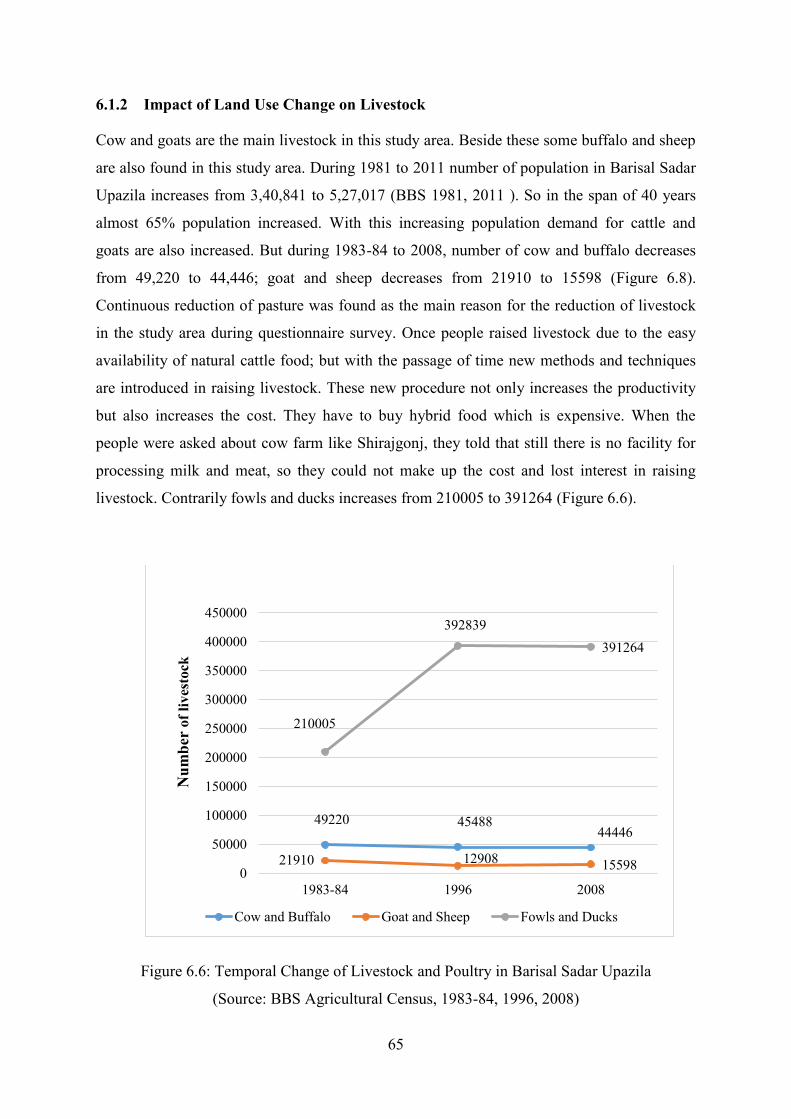
65
6.1.2 Impact of Land Use Change on Livestock
Cow and goats are the main livestock in this study area. Beside these some buffalo and sheep
are also found in this study area. During 1981 to 2011 number of population in Barisal Sadar
Upazila increases from 3,40,841 to 5,27,017 (BBS 1981, 2011 ). So in the span of 40 years
almost 65% population increased. With this increasing population demand for cattle and
goats are also increased. But during 1983-84 to 2008, number of cow and buffalo decreases
from 49,220 to 44,446; goat and sheep decreases from 21910 to 15598 (Figure 6.8).
Continuous reduction of pasture was found as the main reason for the reduction of livestock
in the study area during questionnaire survey. Once people raised livestock due to the easy
availability of natural cattle food; but with the passage of time new methods and techniques
are introduced in raising livestock. These new procedure not only increases the productivity
but also increases the cost. They have to buy hybrid food which is expensive. When the
people were asked about cow farm like Shirajgonj, they told that still there is no facility for
processing milk and meat, so they could not make up the cost and lost interest in raising
livestock. Contrarily fowls and ducks increases from 210005 to 391264 (Figure 6.6).
Figure 6.6: Temporal Change of Livestock and Poultry in Barisal Sadar Upazila
(Source: BBS Agricultural Census, 1983-84, 1996, 2008)
49220 45488 44446
21910 12908 15598
210005
392839 391264
0
50000
100000
150000
200000
250000
300000
350000
400000
450000
1983-84 1996 2008
Cow and Buffalo Goat and Sheep Fowls and Ducks
Num
ber
of li
vest
ock
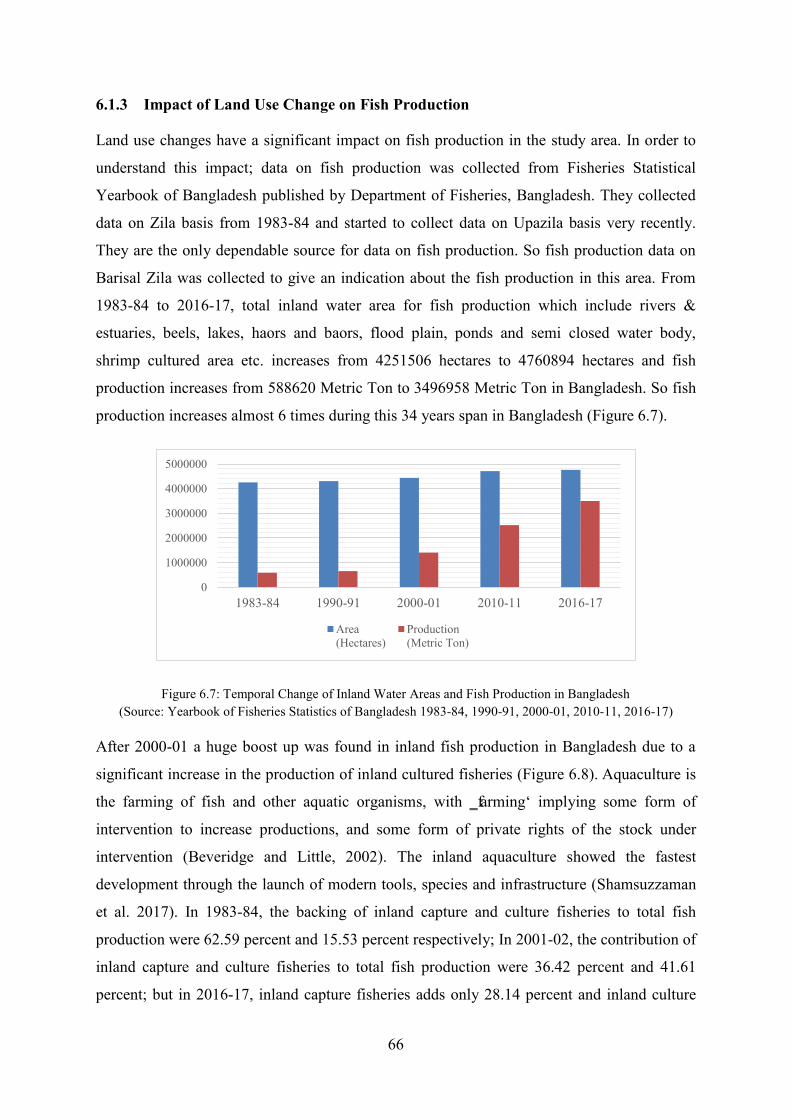
66
6.1.3 Impact of Land Use Change on Fish Production
Land use changes have a significant impact on fish production in the study area. In order to
understand this impact; data on fish production was collected from Fisheries Statistical
Yearbook of Bangladesh published by Department of Fisheries, Bangladesh. They collected
data on Zila basis from 1983-84 and started to collect data on Upazila basis very recently.
They are the only dependable source for data on fish production. So fish production data on
Barisal Zila was collected to give an indication about the fish production in this area. From
1983-84 to 2016-17, total inland water area for fish production which include rivers &
estuaries, beels, lakes, haors and baors, flood plain, ponds and semi closed water body,
shrimp cultured area etc. increases from 4251506 hectares to 4760894 hectares and fish
production increases from 588620 Metric Ton to 3496958 Metric Ton in Bangladesh. So fish
production increases almost 6 times during this 34 years span in Bangladesh (Figure 6.7).
Figure 6.7: Temporal Change of Inland Water Areas and Fish Production in Bangladesh (Source: Yearbook of Fisheries Statistics of Bangladesh 1983-84, 1990-91, 2000-01, 2010-11, 2016-17)
After 2000-01 a huge boost up was found in inland fish production in Bangladesh due to a
significant increase in the production of inland cultured fisheries (Figure 6.8). Aquaculture is
the farming of fish and other aquatic organisms, with ‗farming‘ implying some form of
intervention to increase productions, and some form of private rights of the stock under
intervention (Beveridge and Little, 2002). The inland aquaculture showed the fastest
development through the launch of modern tools, species and infrastructure (Shamsuzzaman
et al. 2017). In 1983-84, the backing of inland capture and culture fisheries to total fish
production were 62.59 percent and 15.53 percent respectively; In 2001-02, the contribution of
inland capture and culture fisheries to total fish production were 36.42 percent and 41.61
percent; but in 2016-17, inland capture fisheries adds only 28.14 percent and inland culture
0
1000000
2000000
3000000
4000000
5000000
1983-84 1990-91 2000-01 2010-11 2016-17
Area(Hectares)
Production(Metric Ton)
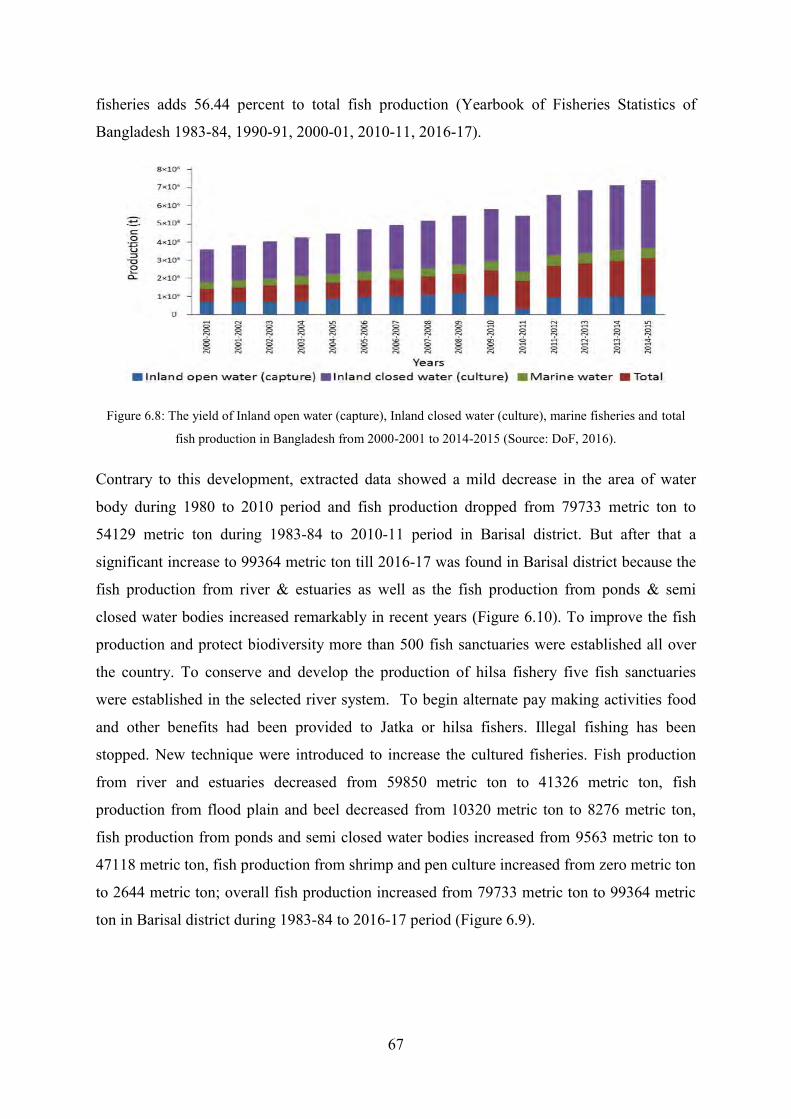
67
fisheries adds 56.44 percent to total fish production (Yearbook of Fisheries Statistics of
Bangladesh 1983-84, 1990-91, 2000-01, 2010-11, 2016-17).
Figure 6.8: The yield of Inland open water (capture), Inland closed water (culture), marine fisheries and total
fish production in Bangladesh from 2000-2001 to 2014-2015 (Source: DoF, 2016).
Contrary to this development, extracted data showed a mild decrease in the area of water
body during 1980 to 2010 period and fish production dropped from 79733 metric ton to
54129 metric ton during 1983-84 to 2010-11 period in Barisal district. But after that a
significant increase to 99364 metric ton till 2016-17 was found in Barisal district because the
fish production from river & estuaries as well as the fish production from ponds & semi
closed water bodies increased remarkably in recent years (Figure 6.10). To improve the fish
production and protect biodiversity more than 500 fish sanctuaries were established all over
the country. To conserve and develop the production of hilsa fishery five fish sanctuaries
were established in the selected river system. To begin alternate pay making activities food
and other benefits had been provided to Jatka or hilsa fishers. Illegal fishing has been
stopped. New technique were introduced to increase the cultured fisheries. Fish production
from river and estuaries decreased from 59850 metric ton to 41326 metric ton, fish
production from flood plain and beel decreased from 10320 metric ton to 8276 metric ton,
fish production from ponds and semi closed water bodies increased from 9563 metric ton to
47118 metric ton, fish production from shrimp and pen culture increased from zero metric ton
to 2644 metric ton; overall fish production increased from 79733 metric ton to 99364 metric
ton in Barisal district during 1983-84 to 2016-17 period (Figure 6.9).
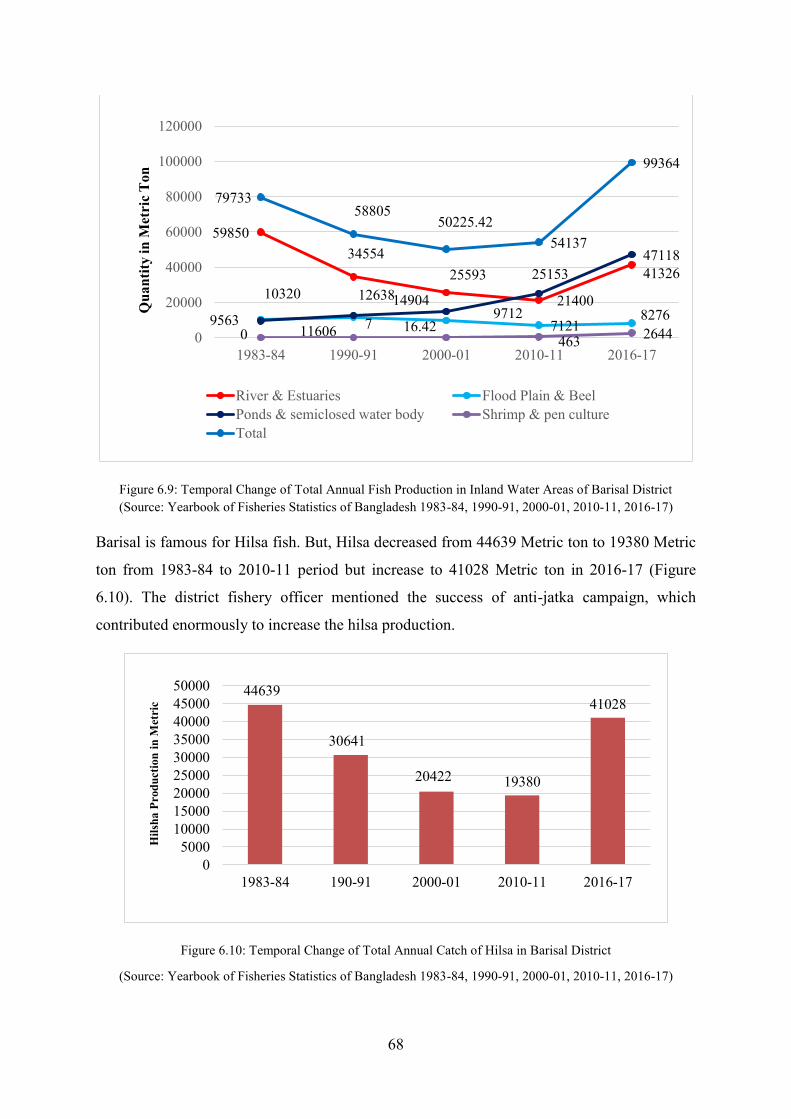
68
Figure 6.9: Temporal Change of Total Annual Fish Production in Inland Water Areas of Barisal District (Source: Yearbook of Fisheries Statistics of Bangladesh 1983-84, 1990-91, 2000-01, 2010-11, 2016-17)
Barisal is famous for Hilsa fish. But, Hilsa decreased from 44639 Metric ton to 19380 Metric
ton from 1983-84 to 2010-11 period but increase to 41028 Metric ton in 2016-17 (Figure
6.10). The district fishery officer mentioned the success of anti-jatka campaign, which
contributed enormously to increase the hilsa production.
Figure 6.10: Temporal Change of Total Annual Catch of Hilsa in Barisal District
(Source: Yearbook of Fisheries Statistics of Bangladesh 1983-84, 1990-91, 2000-01, 2010-11, 2016-17)
59850 34554
25593
21400
41326 10320
11606 9712
7121 8276 9563
12638 14904
25153 47118
0 7 16.42
463 2644
79733 58805
50225.42 54137
99364
0
20000
40000
60000
80000
100000
120000
1983-84 1990-91 2000-01 2010-11 2016-17
River & Estuaries Flood Plain & BeelPonds & semiclosed water body Shrimp & pen cultureTotal
Qua
ntity
in M
etri
c T
on
44639
30641
20422 19380
41028
05000
100001500020000250003000035000400004500050000
1983-84 190-91 2000-01 2010-11 2016-17
Hils
ha P
rodu
ctio
n in
Met
ric
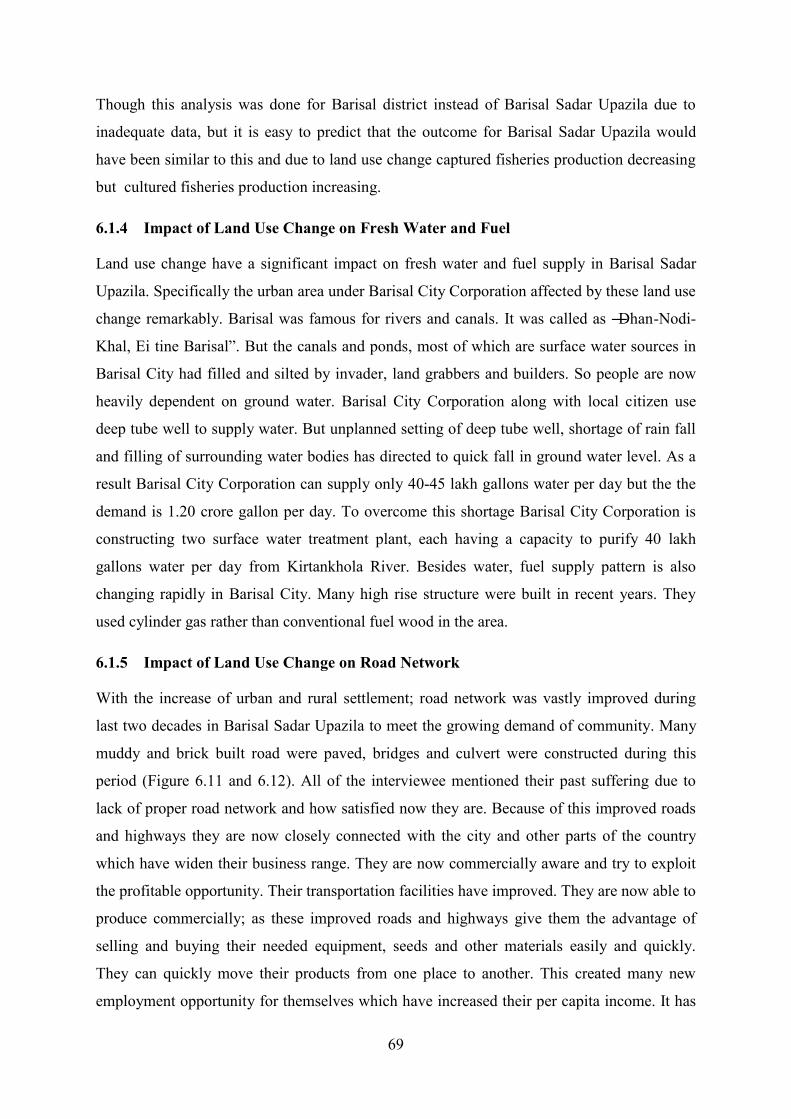
69
Though this analysis was done for Barisal district instead of Barisal Sadar Upazila due to
inadequate data, but it is easy to predict that the outcome for Barisal Sadar Upazila would
have been similar to this and due to land use change captured fisheries production decreasing
but cultured fisheries production increasing.
6.1.4 Impact of Land Use Change on Fresh Water and Fuel
Land use change have a significant impact on fresh water and fuel supply in Barisal Sadar
Upazila. Specifically the urban area under Barisal City Corporation affected by these land use
change remarkably. Barisal was famous for rivers and canals. It was called as ―Dhan-Nodi-
Khal, Ei tine Barisal‖. But the canals and ponds, most of which are surface water sources in
Barisal City had filled and silted by invader, land grabbers and builders. So people are now
heavily dependent on ground water. Barisal City Corporation along with local citizen use
deep tube well to supply water. But unplanned setting of deep tube well, shortage of rain fall
and filling of surrounding water bodies has directed to quick fall in ground water level. As a
result Barisal City Corporation can supply only 40-45 lakh gallons water per day but the the
demand is 1.20 crore gallon per day. To overcome this shortage Barisal City Corporation is
constructing two surface water treatment plant, each having a capacity to purify 40 lakh
gallons water per day from Kirtankhola River. Besides water, fuel supply pattern is also
changing rapidly in Barisal City. Many high rise structure were built in recent years. They
used cylinder gas rather than conventional fuel wood in the area.
6.1.5 Impact of Land Use Change on Road Network
With the increase of urban and rural settlement; road network was vastly improved during
last two decades in Barisal Sadar Upazila to meet the growing demand of community. Many
muddy and brick built road were paved, bridges and culvert were constructed during this
period (Figure 6.11 and 6.12). All of the interviewee mentioned their past suffering due to
lack of proper road network and how satisfied now they are. Because of this improved roads
and highways they are now closely connected with the city and other parts of the country
which have widen their business range. They are now commercially aware and try to exploit
the profitable opportunity. Their transportation facilities have improved. They are now able to
produce commercially; as these improved roads and highways give them the advantage of
selling and buying their needed equipment, seeds and other materials easily and quickly.
They can quickly move their products from one place to another. This created many new
employment opportunity for themselves which have increased their per capita income. It has
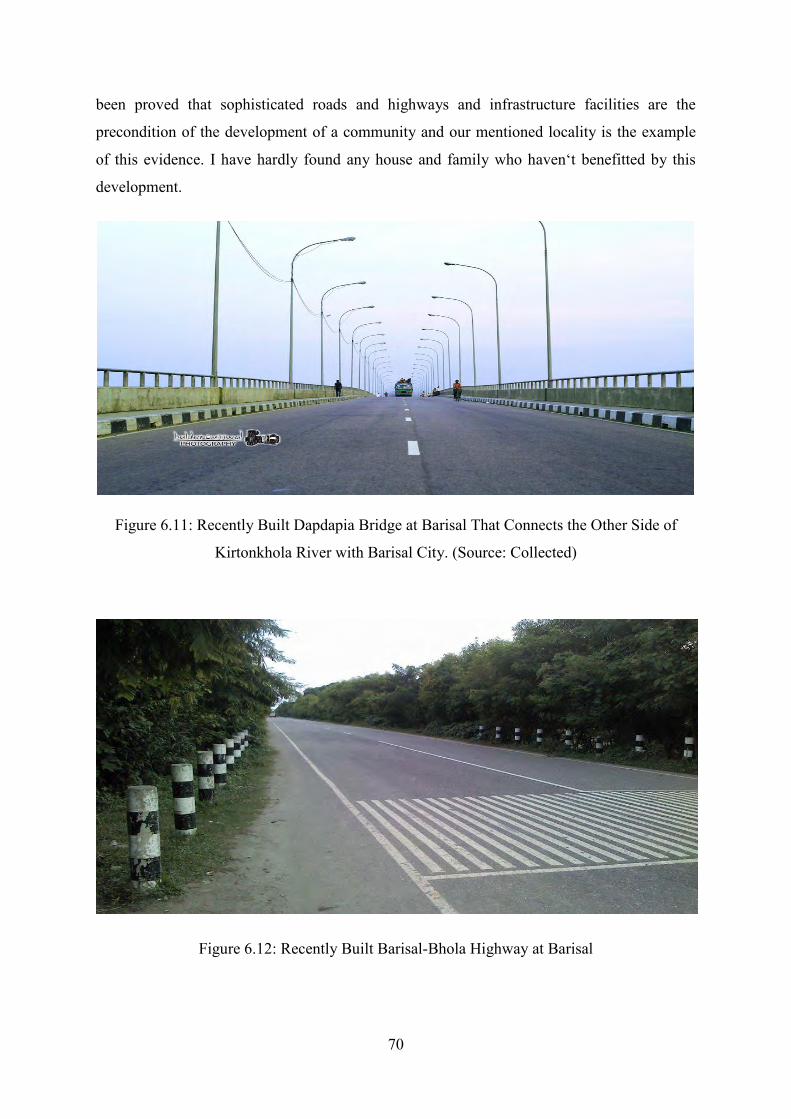
70
been proved that sophisticated roads and highways and infrastructure facilities are the
precondition of the development of a community and our mentioned locality is the example
of this evidence. I have hardly found any house and family who haven‘t benefitted by this
development.
Figure 6.11: Recently Built Dapdapia Bridge at Barisal That Connects the Other Side of
Kirtonkhola River with Barisal City. (Source: Collected)
Figure 6.12: Recently Built Barisal-Bhola Highway at Barisal
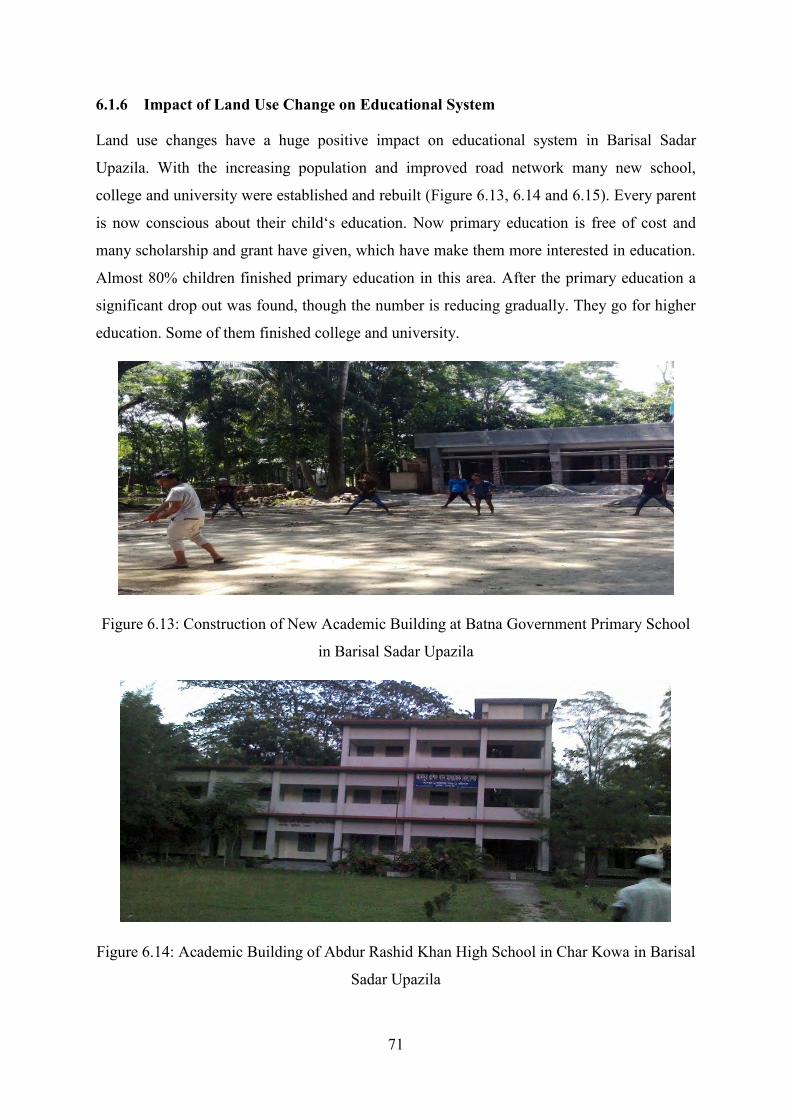
71
6.1.6 Impact of Land Use Change on Educational System
Land use changes have a huge positive impact on educational system in Barisal Sadar
Upazila. With the increasing population and improved road network many new school,
college and university were established and rebuilt (Figure 6.13, 6.14 and 6.15). Every parent
is now conscious about their child‘s education. Now primary education is free of cost and
many scholarship and grant have given, which have make them more interested in education.
Almost 80% children finished primary education in this area. After the primary education a
significant drop out was found, though the number is reducing gradually. They go for higher
education. Some of them finished college and university.
Figure 6.13: Construction of New Academic Building at Batna Government Primary School
in Barisal Sadar Upazila
Figure 6.14: Academic Building of Abdur Rashid Khan High School in Char Kowa in Barisal
Sadar Upazila
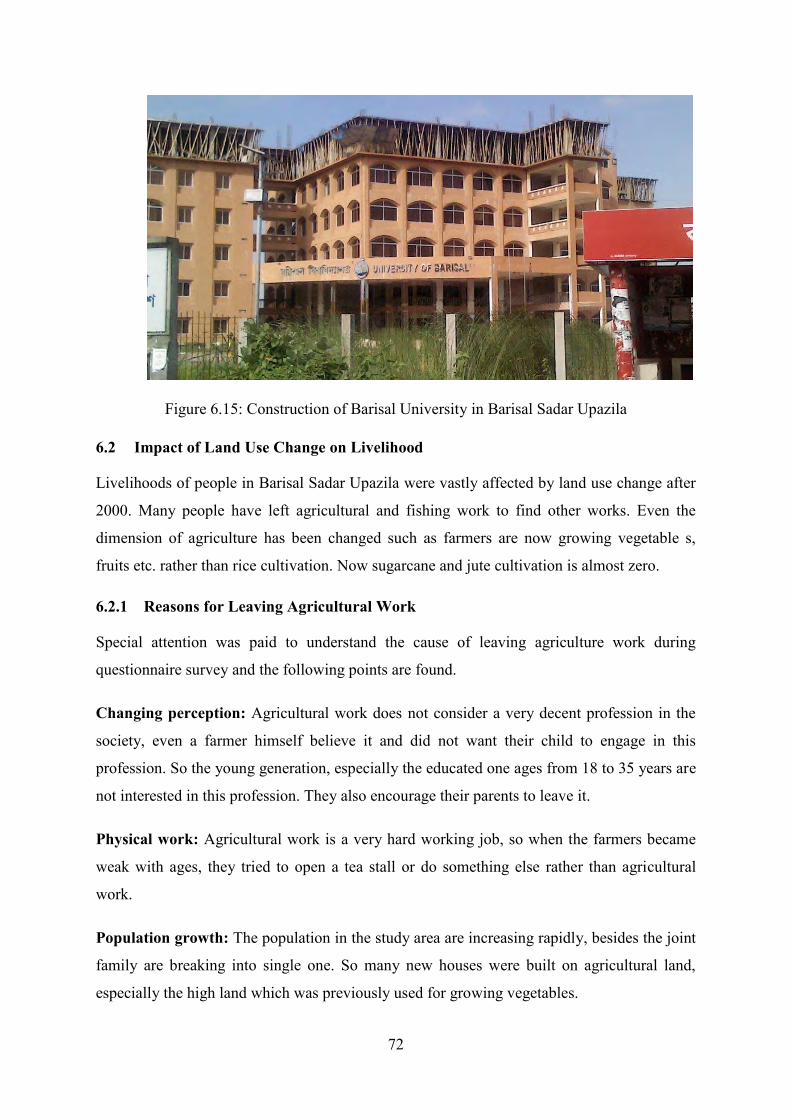
72
Figure 6.15: Construction of Barisal University in Barisal Sadar Upazila
6.2 Impact of Land Use Change on Livelihood
Livelihoods of people in Barisal Sadar Upazila were vastly affected by land use change after
2000. Many people have left agricultural and fishing work to find other works. Even the
dimension of agriculture has been changed such as farmers are now growing vegetable s,
fruits etc. rather than rice cultivation. Now sugarcane and jute cultivation is almost zero.
6.2.1 Reasons for Leaving Agricultural Work
Special attention was paid to understand the cause of leaving agriculture work during
questionnaire survey and the following points are found.
Changing perception: Agricultural work does not consider a very decent profession in the
society, even a farmer himself believe it and did not want their child to engage in this
profession. So the young generation, especially the educated one ages from 18 to 35 years are
not interested in this profession. They also encourage their parents to leave it.
Physical work: Agricultural work is a very hard working job, so when the farmers became
weak with ages, they tried to open a tea stall or do something else rather than agricultural
work.
Population growth: The population in the study area are increasing rapidly, besides the joint
family are breaking into single one. So many new houses were built on agricultural land,
especially the high land which was previously used for growing vegetables.
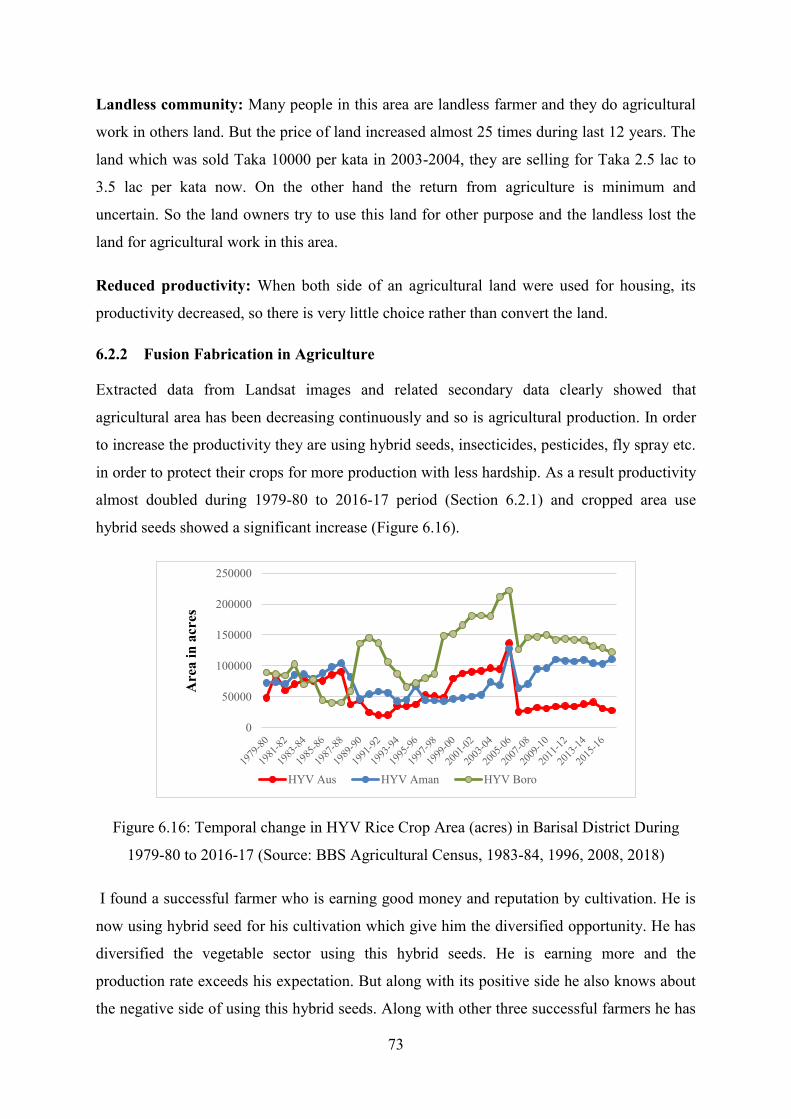
73
Landless community: Many people in this area are landless farmer and they do agricultural
work in others land. But the price of land increased almost 25 times during last 12 years. The
land which was sold Taka 10000 per kata in 2003-2004, they are selling for Taka 2.5 lac to
3.5 lac per kata now. On the other hand the return from agriculture is minimum and
uncertain. So the land owners try to use this land for other purpose and the landless lost the
land for agricultural work in this area.
Reduced productivity: When both side of an agricultural land were used for housing, its
productivity decreased, so there is very little choice rather than convert the land.
6.2.2 Fusion Fabrication in Agriculture
Extracted data from Landsat images and related secondary data clearly showed that
agricultural area has been decreasing continuously and so is agricultural production. In order
to increase the productivity they are using hybrid seeds, insecticides, pesticides, fly spray etc.
in order to protect their crops for more production with less hardship. As a result productivity
almost doubled during 1979-80 to 2016-17 period (Section 6.2.1) and cropped area use
hybrid seeds showed a significant increase (Figure 6.16).
Figure 6.16: Temporal change in HYV Rice Crop Area (acres) in Barisal District During
1979-80 to 2016-17 (Source: BBS Agricultural Census, 1983-84, 1996, 2008, 2018)
I found a successful farmer who is earning good money and reputation by cultivation. He is
now using hybrid seed for his cultivation which give him the diversified opportunity. He has
diversified the vegetable sector using this hybrid seeds. He is earning more and the
production rate exceeds his expectation. But along with its positive side he also knows about
the negative side of using this hybrid seeds. Along with other three successful farmers he has
0
50000
100000
150000
200000
250000
HYV Aus HYV Aman HYV Boro
Are
a in
acr
es
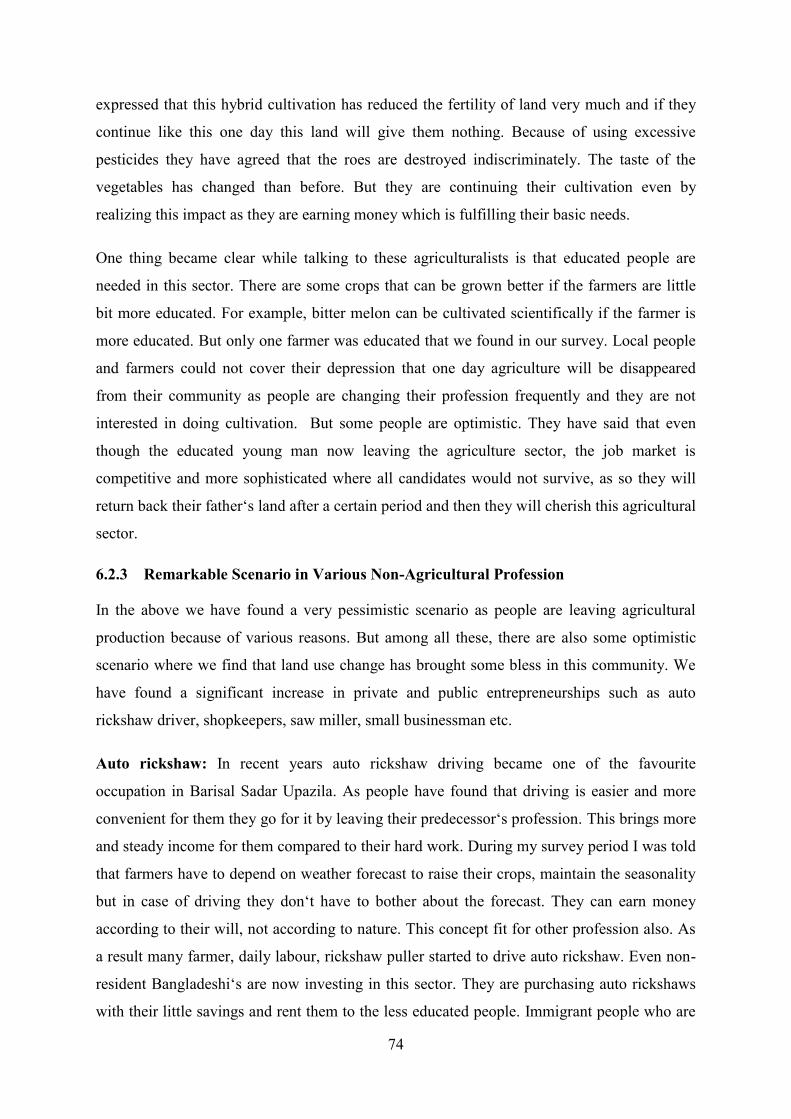
74
expressed that this hybrid cultivation has reduced the fertility of land very much and if they
continue like this one day this land will give them nothing. Because of using excessive
pesticides they have agreed that the roes are destroyed indiscriminately. The taste of the
vegetables has changed than before. But they are continuing their cultivation even by
realizing this impact as they are earning money which is fulfilling their basic needs.
One thing became clear while talking to these agriculturalists is that educated people are
needed in this sector. There are some crops that can be grown better if the farmers are little
bit more educated. For example, bitter melon can be cultivated scientifically if the farmer is
more educated. But only one farmer was educated that we found in our survey. Local people
and farmers could not cover their depression that one day agriculture will be disappeared
from their community as people are changing their profession frequently and they are not
interested in doing cultivation. But some people are optimistic. They have said that even
though the educated young man now leaving the agriculture sector, the job market is
competitive and more sophisticated where all candidates would not survive, as so they will
return back their father‘s land after a certain period and then they will cherish this agricultural
sector.
6.2.3 Remarkable Scenario in Various Non-Agricultural Profession
In the above we have found a very pessimistic scenario as people are leaving agricultural
production because of various reasons. But among all these, there are also some optimistic
scenario where we find that land use change has brought some bless in this community. We
have found a significant increase in private and public entrepreneurships such as auto
rickshaw driver, shopkeepers, saw miller, small businessman etc.
Auto rickshaw: In recent years auto rickshaw driving became one of the favourite
occupation in Barisal Sadar Upazila. As people have found that driving is easier and more
convenient for them they go for it by leaving their predecessor‘s profession. This brings more
and steady income for them compared to their hard work. During my survey period I was told
that farmers have to depend on weather forecast to raise their crops, maintain the seasonality
but in case of driving they don‘t have to bother about the forecast. They can earn money
according to their will, not according to nature. This concept fit for other profession also. As
a result many farmer, daily labour, rickshaw puller started to drive auto rickshaw. Even non-
resident Bangladeshi‘s are now investing in this sector. They are purchasing auto rickshaws
with their little savings and rent them to the less educated people. Immigrant people who are
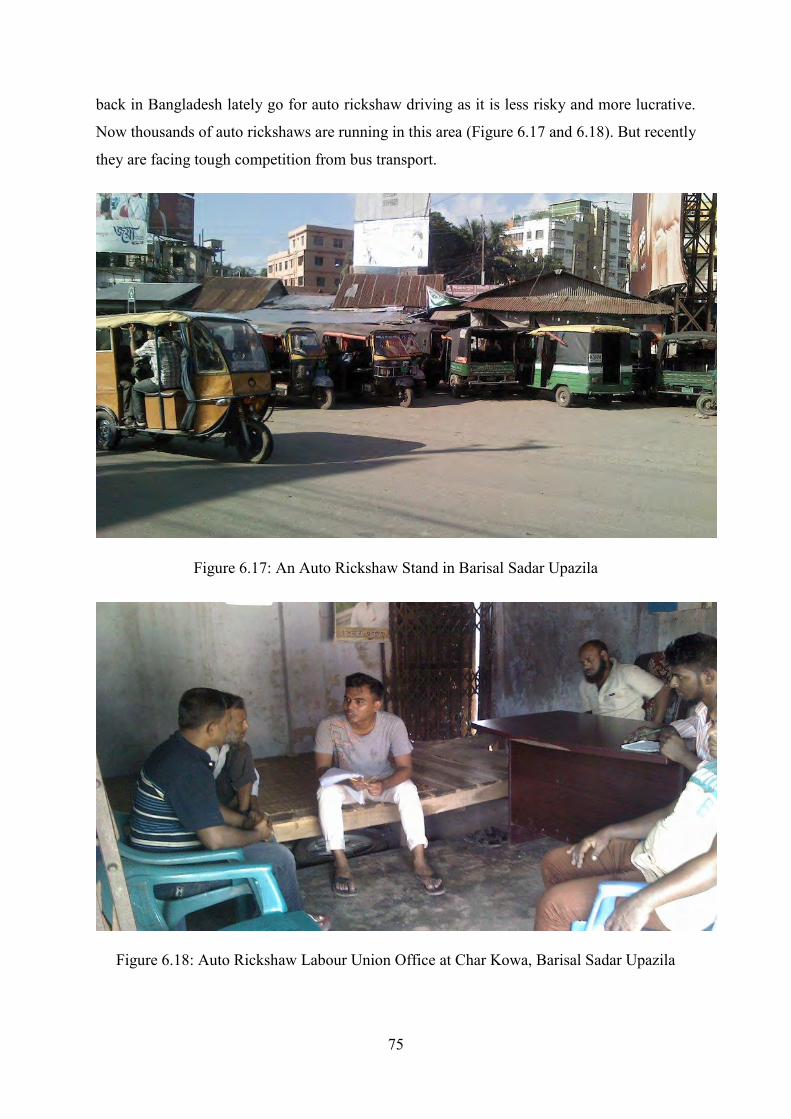
75
back in Bangladesh lately go for auto rickshaw driving as it is less risky and more lucrative.
Now thousands of auto rickshaws are running in this area (Figure 6.17 and 6.18). But recently
they are facing tough competition from bus transport.
Figure 6.17: An Auto Rickshaw Stand in Barisal Sadar Upazila
Figure 6.18: Auto Rickshaw Labour Union Office at Char Kowa, Barisal Sadar Upazila
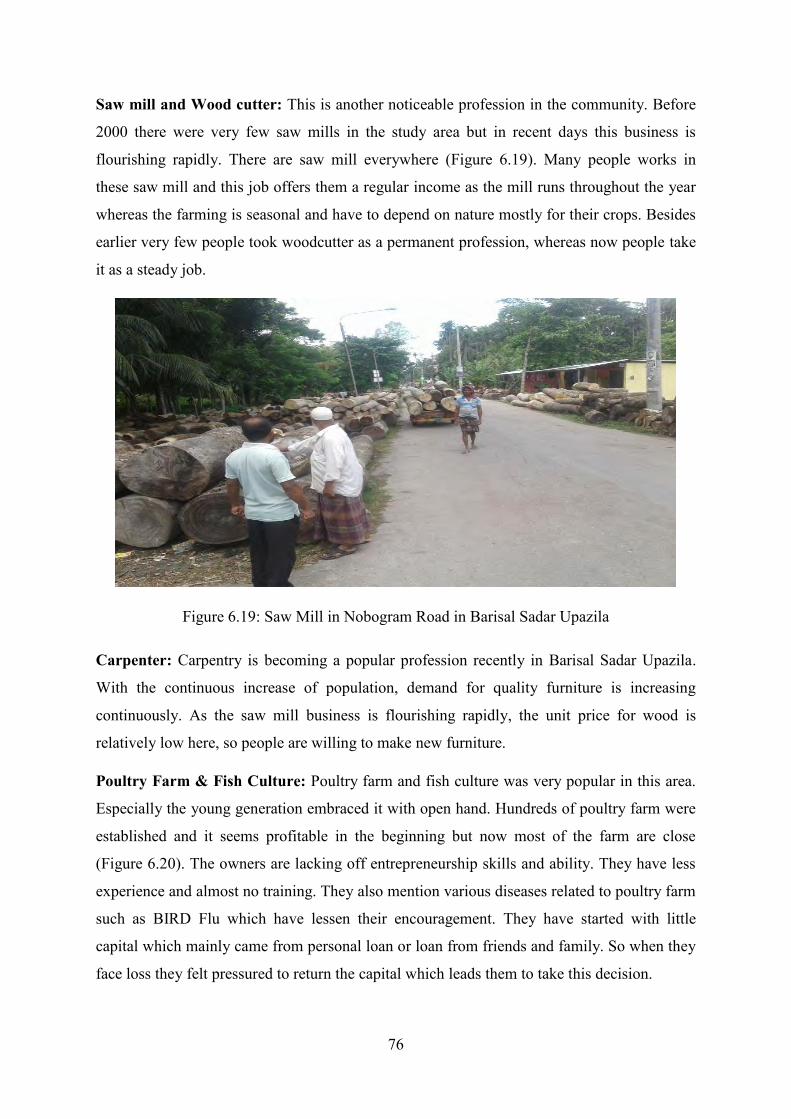
76
Saw mill and Wood cutter: This is another noticeable profession in the community. Before
2000 there were very few saw mills in the study area but in recent days this business is
flourishing rapidly. There are saw mill everywhere (Figure 6.19). Many people works in
these saw mill and this job offers them a regular income as the mill runs throughout the year
whereas the farming is seasonal and have to depend on nature mostly for their crops. Besides
earlier very few people took woodcutter as a permanent profession, whereas now people take
it as a steady job.
Figure 6.19: Saw Mill in Nobogram Road in Barisal Sadar Upazila
Carpenter: Carpentry is becoming a popular profession recently in Barisal Sadar Upazila.
With the continuous increase of population, demand for quality furniture is increasing
continuously. As the saw mill business is flourishing rapidly, the unit price for wood is
relatively low here, so people are willing to make new furniture.
Poultry Farm & Fish Culture: Poultry farm and fish culture was very popular in this area.
Especially the young generation embraced it with open hand. Hundreds of poultry farm were
established and it seems profitable in the beginning but now most of the farm are close
(Figure 6.20). The owners are lacking off entrepreneurship skills and ability. They have less
experience and almost no training. They also mention various diseases related to poultry farm
such as BIRD Flu which have lessen their encouragement. They have started with little
capital which mainly came from personal loan or loan from friends and family. So when they
face loss they felt pressured to return the capital which leads them to take this decision.
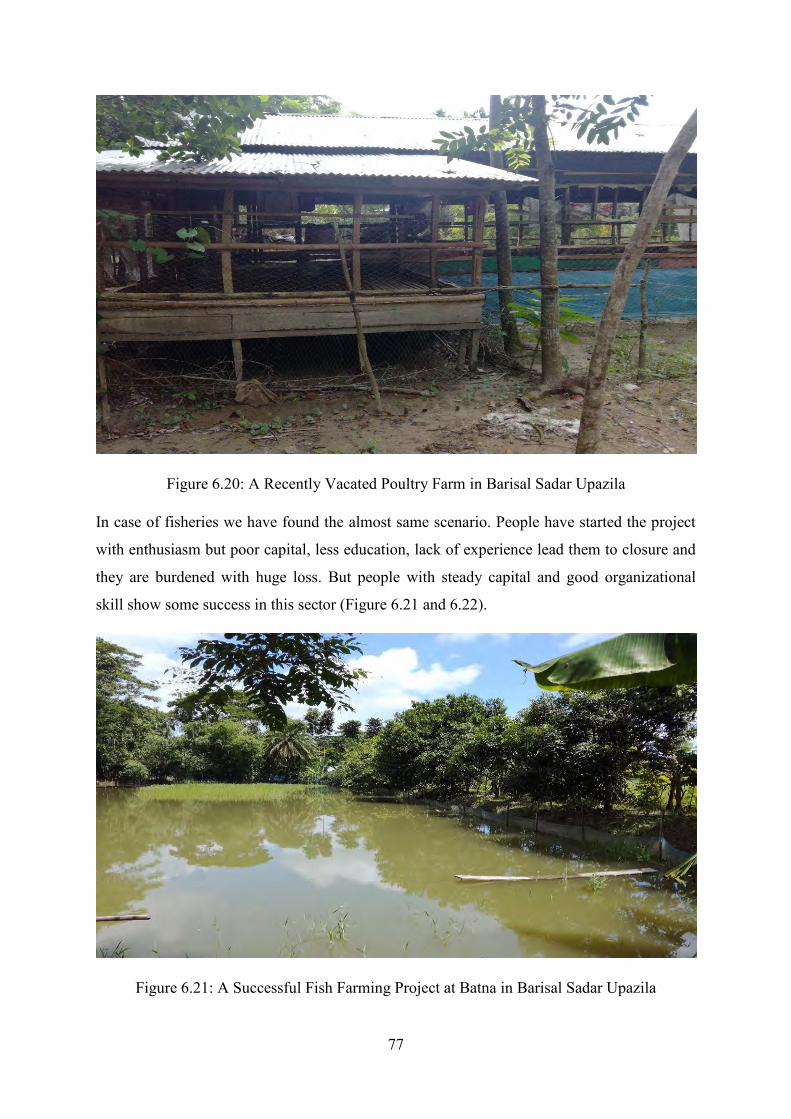
77
Figure 6.20: A Recently Vacated Poultry Farm in Barisal Sadar Upazila
In case of fisheries we have found the almost same scenario. People have started the project
with enthusiasm but poor capital, less education, lack of experience lead them to closure and
they are burdened with huge loss. But people with steady capital and good organizational
skill show some success in this sector (Figure 6.21 and 6.22).
Figure 6.21: A Successful Fish Farming Project at Batna in Barisal Sadar Upazila
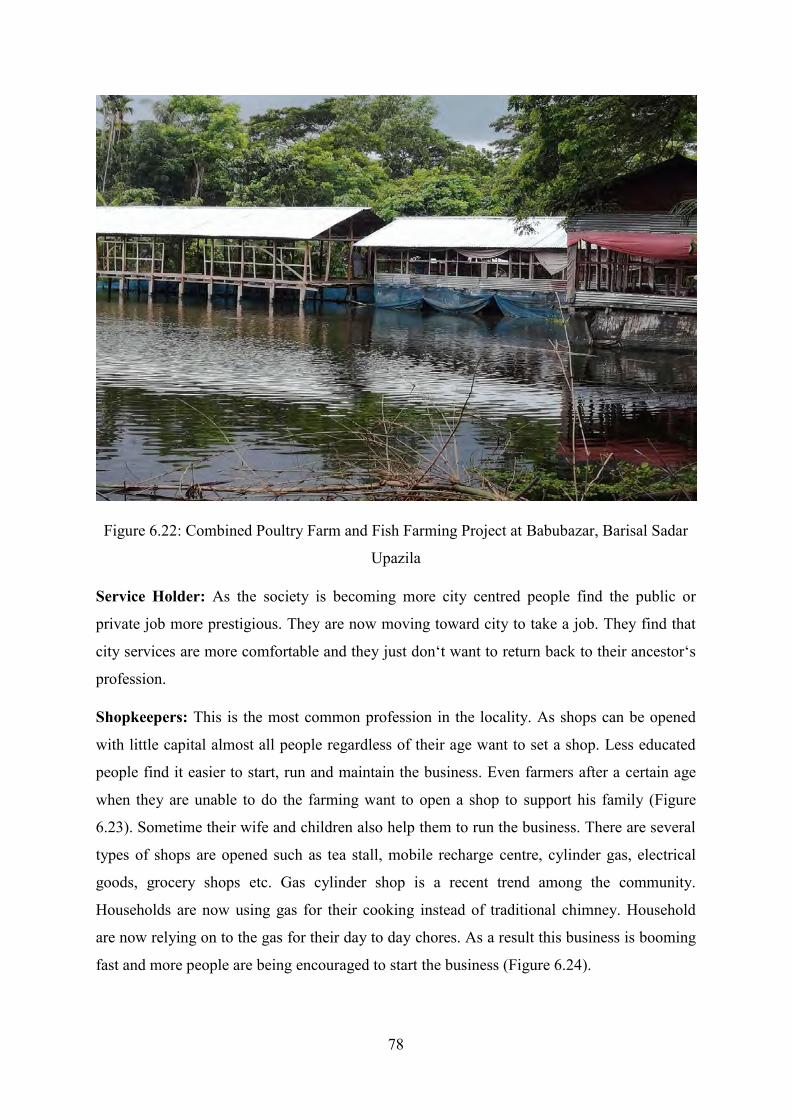
78
Figure 6.22: Combined Poultry Farm and Fish Farming Project at Babubazar, Barisal Sadar
Upazila
Service Holder: As the society is becoming more city centred people find the public or
private job more prestigious. They are now moving toward city to take a job. They find that
city services are more comfortable and they just don‘t want to return back to their ancestor‘s
profession.
Shopkeepers: This is the most common profession in the locality. As shops can be opened
with little capital almost all people regardless of their age want to set a shop. Less educated
people find it easier to start, run and maintain the business. Even farmers after a certain age
when they are unable to do the farming want to open a shop to support his family (Figure
6.23). Sometime their wife and children also help them to run the business. There are several
types of shops are opened such as tea stall, mobile recharge centre, cylinder gas, electrical
goods, grocery shops etc. Gas cylinder shop is a recent trend among the community.
Households are now using gas for their cooking instead of traditional chimney. Household
are now relying on to the gas for their day to day chores. As a result this business is booming
fast and more people are being encouraged to start the business (Figure 6.24).
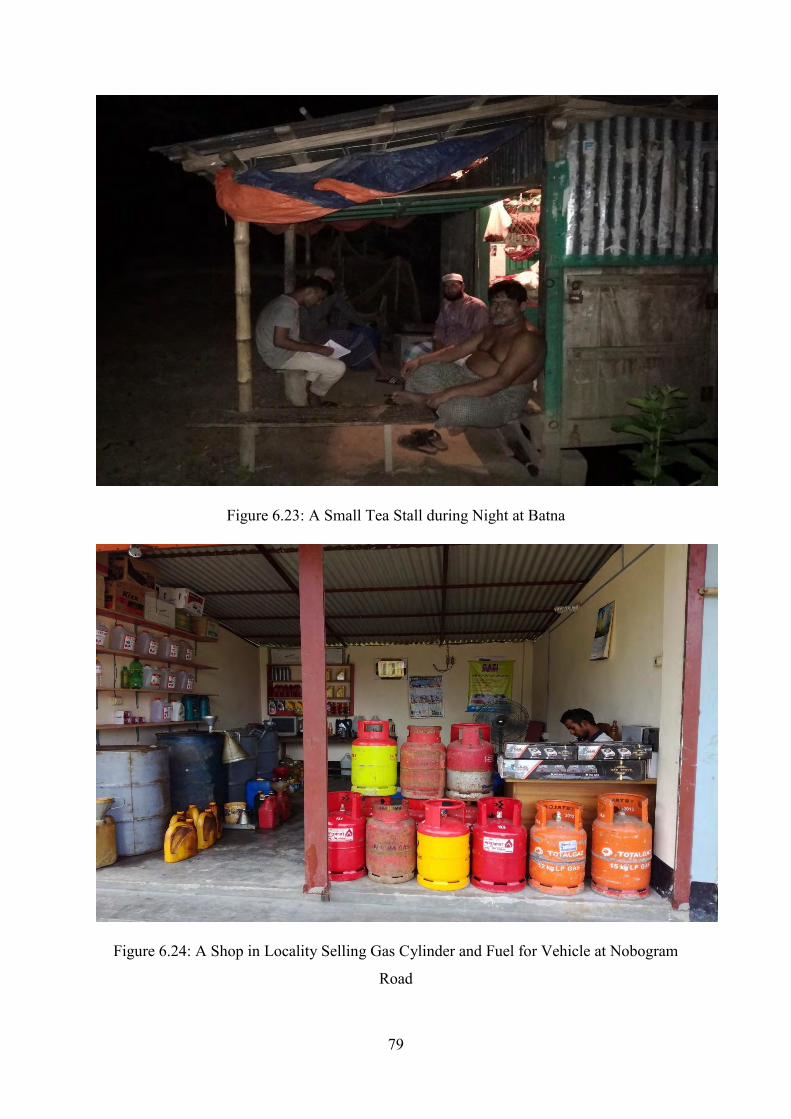
79
Figure 6.23: A Small Tea Stall during Night at Batna
Figure 6.24: A Shop in Locality Selling Gas Cylinder and Fuel for Vehicle at Nobogram
Road
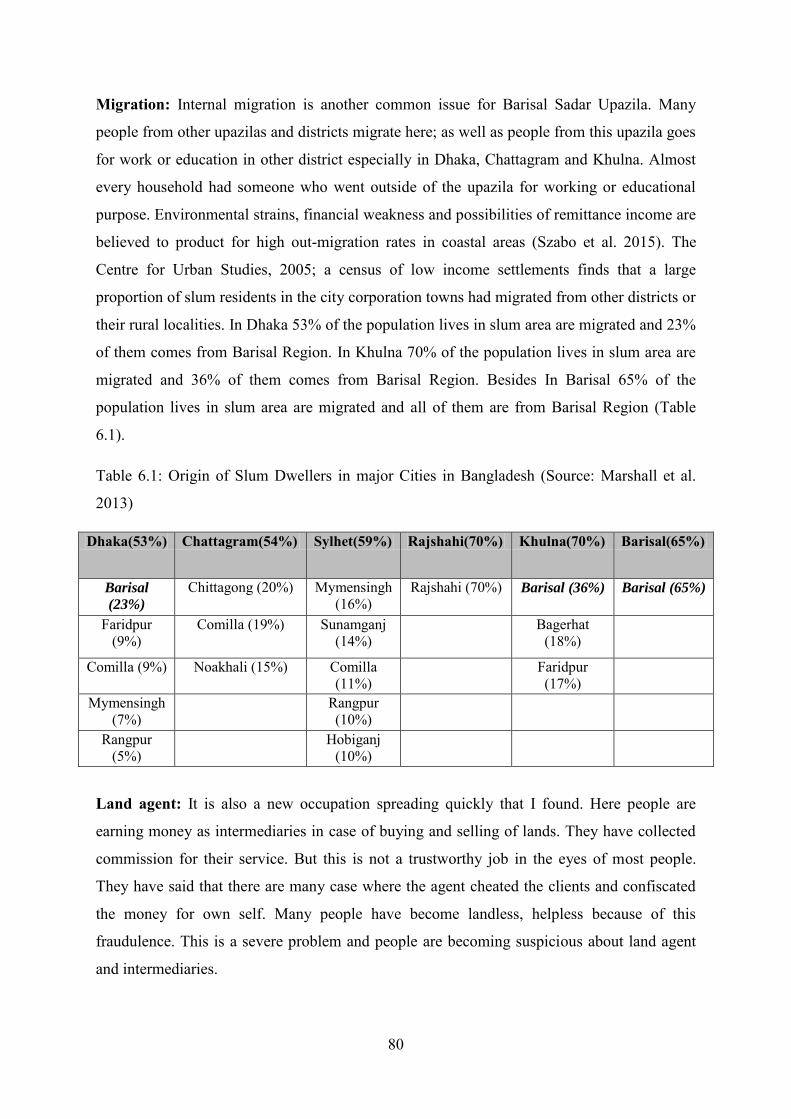
80
Migration: Internal migration is another common issue for Barisal Sadar Upazila. Many
people from other upazilas and districts migrate here; as well as people from this upazila goes
for work or education in other district especially in Dhaka, Chattagram and Khulna. Almost
every household had someone who went outside of the upazila for working or educational
purpose. Environmental strains, financial weakness and possibilities of remittance income are
believed to product for high out-migration rates in coastal areas (Szabo et al. 2015). The
Centre for Urban Studies, 2005; a census of low income settlements finds that a large
proportion of slum residents in the city corporation towns had migrated from other districts or
their rural localities. In Dhaka 53% of the population lives in slum area are migrated and 23%
of them comes from Barisal Region. In Khulna 70% of the population lives in slum area are
migrated and 36% of them comes from Barisal Region. Besides In Barisal 65% of the
population lives in slum area are migrated and all of them are from Barisal Region (Table
6.1).
Table 6.1: Origin of Slum Dwellers in major Cities in Bangladesh (Source: Marshall et al.
2013)
Dhaka(53%) Chattagram(54%) Sylhet(59%) Rajshahi(70%) Khulna(70%) Barisal(65%)
Barisal
(23%)
Chittagong (20%) Mymensingh (16%)
Rajshahi (70%) Barisal (36%) Barisal (65%)
Faridpur (9%)
Comilla (19%) Sunamganj (14%)
Bagerhat (18%)
Comilla (9%) Noakhali (15%) Comilla (11%)
Faridpur (17%)
Mymensingh (7%)
Rangpur (10%)
Rangpur (5%)
Hobiganj (10%)
Land agent: It is also a new occupation spreading quickly that I found. Here people are
earning money as intermediaries in case of buying and selling of lands. They have collected
commission for their service. But this is not a trustworthy job in the eyes of most people.
They have said that there are many case where the agent cheated the clients and confiscated
the money for own self. Many people have become landless, helpless because of this
fraudulence. This is a severe problem and people are becoming suspicious about land agent
and intermediaries.
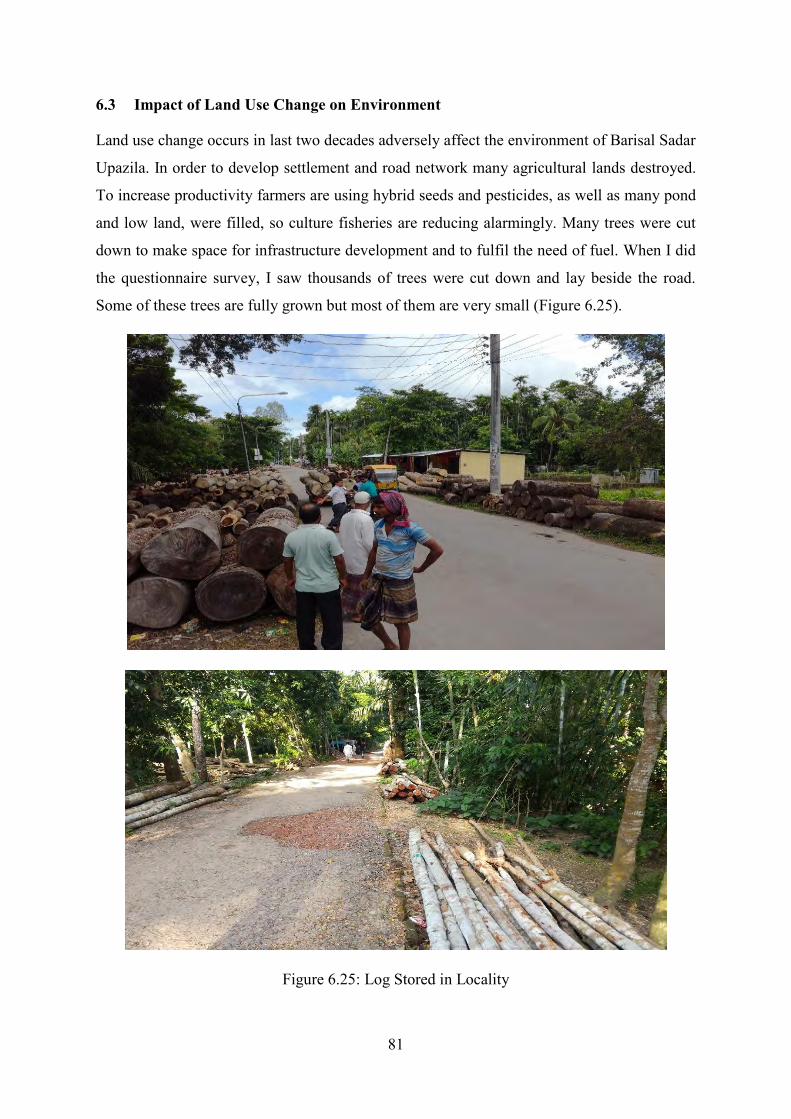
81
6.3 Impact of Land Use Change on Environment
Land use change occurs in last two decades adversely affect the environment of Barisal Sadar
Upazila. In order to develop settlement and road network many agricultural lands destroyed.
To increase productivity farmers are using hybrid seeds and pesticides, as well as many pond
and low land, were filled, so culture fisheries are reducing alarmingly. Many trees were cut
down to make space for infrastructure development and to fulfil the need of fuel. When I did
the questionnaire survey, I saw thousands of trees were cut down and lay beside the road.
Some of these trees are fully grown but most of them are very small (Figure 6.25).
Figure 6.25: Log Stored in Locality
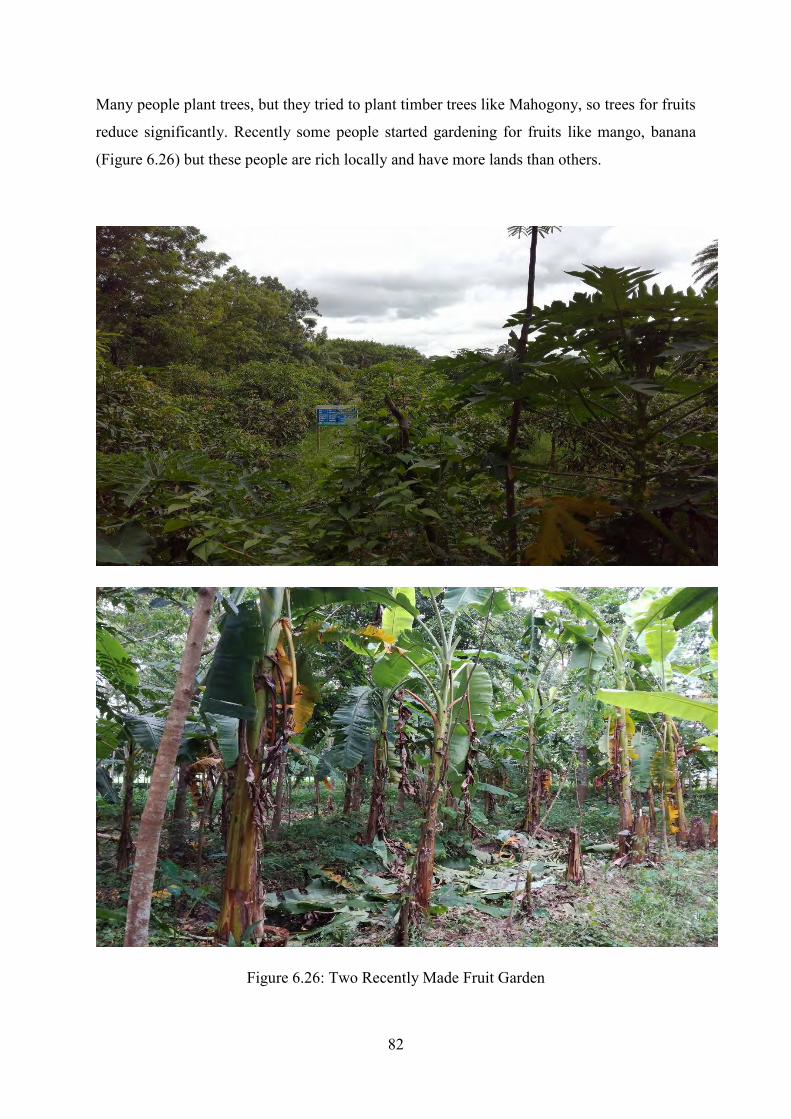
82
Many people plant trees, but they tried to plant timber trees like Mahogony, so trees for fruits
reduce significantly. Recently some people started gardening for fruits like mango, banana
(Figure 6.26) but these people are rich locally and have more lands than others.
Figure 6.26: Two Recently Made Fruit Garden
83
6.4 Gender’s Contribution in the Society
For a long time, women were contributing in our society silently. Our mentioned locality is
not exceptional one in this content. Without the women‘s contribution, this locality couldn‘t
be developed at this rate. They not only do household chores but also contribute to the
economy by various means. They are raising children; maintain household, raising cattle,
growing vegetables, working in the rice mills, poultry farms, fisheries etc. Though it is
typical that in this male dominated society they hardly found proper value of their role, but
they have contributed physically and mentally to shape up the society even unconsciously.
Any sector were hardly found where women contribution is negligible. At first, they were
confined in household chores. After that, they were growing vegetables in order to meet their
food need. They have found that after meeting their demand, the surplus vegetable can be
sold in the local market which will bring them additional money into their home. So they
started to sell them and they found it profitable. As a result, they have widened their range.
Women are producing vegetables, doing gardening for commercial purpose. They are now
contributing economically in their family along with their husbands. During the harvest time,
women dry up the harvest, do rice scoop without expecting any return.
During our survey, we have found some women took training from BRAC, an NGO on
family planning, gardening, sewing, raising livestock, fisheries etc. They go every home in
order to make the rural people aware of family planning. They are the pillar of the success of
birth control in this locality. They are now working as midwives in the locality. This is why
the death rate of pregnant women has reduced significantly. Midwives visit pregnant women
time to time and suggest them what treatment they should take during their pregnancy and
how to live their life in order to give birth a healthy child. They also help patients who are
affected by tuberculosis. There was a time when people were afraid of tuberculosis and the
patient was isolated if their neighborhood found out about the disease. But it is the women
who have raised awareness among people and help them to lead a normal life. They go to the
patient‘s house and take care of the medicine, therapy etc. so that the patient could recover
his/her illness and can back to his/her normal life again. Besides doing this they earned good
money also. Women are also expert at giving first aid in case of emergency in this locality.
Local people are relying heavily on them in any emergency situation. They call them and take
the suggestions. As they know that at some point people‘s lives are depend on them they have
become more conscious about their responsibility and they really love to take responsibility
as they believe that their action will save one‘s life. Many women are now coming forward in
84
this sector. They are interested in midwifes, nursing course which will bring them money and
peace both.
Women are now interested to start their own business like small shops, commercial crops
production, gardening etc. In some family, we have found that women are playing the lead
role in the case of economic solvency. They are earning money, sending children to school,
creating employment for her husband, even for other men and women. They want to see
themselves as self-independent women in the society. Many government and private
organizations, NGO are providing training, loan facilities to these women in order to fulfill
their dreams. It is proved that women are thriftier person than men. They took a loan; spend
them in such a way so that they will be able to return the loan within specified time and will
received more loan in order to broaden the business. They are more hard working, thoughtful,
considerate, selfless and kind. It is them who bring peace and happiness and financial
solvency in their family.
6.5 Impact of Land Use Change on Society
From the secondary data and findings of questionnaire survey it is clearly found that land use
change has a serious impact on society in the study area. With land use, change agricultural
area is reducing continuously for the development of the settlement. The livelihood of people
changes rapidly. Many people change their profession for economic solvency. They leave
agricultural work and fishing; engage themselves in small business, private and public
services, auto rickshaw driving and such other jobs. Educational, medical, communication
network, water supply and sanitation facilities improved remarkably. The overall life style of
the community has improved. But it has some negative impact also. Earlier it was mentioned
that agricultural area is reducing alarmingly and to produce more farmers are using hybrid
seeds, a various pesticide which increases production but lost the original taste and reduces
the production of culture fisheries. Many landless farmers are now without agricultural land.
People are aware of this change but did not show much concern about this. Besides this, some
social problem arises also. Many joint families broken into single one leaving the aging
parents in fragile condition, playing field reduced and many young people became drug
addicted, almost in every house satellite channels are available and people prefer different
foreign channels to Bangladeshi channels.
85
CHAPTER SEVEN
CONCLUSION
7.1 Conclusion
Barisal Sadar Upazila showed a significant land use change during 1980-2010 periods. Urban
and rural settlement expanded at the expense of agricultural area and wetlands during this
time.
i. Agricultural area increases from 125.08 square kilometres to 133.26 square
kilometres during 1980 to 1990, after that it showed a decreasing trend and at
2010 reduced to 87.86 square kilometres. So overall 37.22 square kilometres
agricultural area decreases during 1980-2010 period.
ii. Wetlands decreases from 24.69 square kilometres to 13.02 square kilometres
during 1980 to 2010.
iii. Water bodies decreases from 34.19 square kilometres to 32.05 square kilometres
during 1980 to 2010.
iv. Rural area increases from 95.6 square kilometres to 117.80 square kilometres
during 1980 to 2010.
v. Urban area increases from 14.33 square kilometres to 43.15 square kilometres
during 1980 to 2010 which is more than three times of its previous area.
These land use changes have a huge impact on different ecosystem services. After analysing
the various secondary data and results of questionnaire survey the following things have been
noticed.
i. During 1983-84 to 2008, within the span of 24 years, Barisal Sadar Upazila lost
7293 acres of rice production area. Almost 300 acres of rice production area lost
annually. As a result production of rice showed a decreasing trend, though the
productivity almost doubled during this time.
ii. Increased use of hybrid seeds, insecticides, pesticides, fly spray etc. were found in
Barisal Sadar Upazila in order to increase the productivity. This hybrid cultivation
has reduced the fertility of land very much. Because of using excess pesticides the
roes are destroying alarmingly. The taste of the vegetables also changed than
before.
86
iii. Cultured fish production from ponds and semi closed water bodies increased
significantly, but the loss of captured fisheries from rivers & estuaries and from
flood plain & beel is alarming. After the success against illegal fishing and an
effective campaign to stop fishing and marketing jatka; hilsa production showed a
significant increase recently.
iv. Due to continuous reduction of pasture, number of cow and buffalo decreases
from 49,220 to 44,446; goat and sheep decreases from 21910 to 15598 during
1983-84 to 2008 period in Barisal Sadar Upazila but the population almost
doubled and so is demand.
v. Livelihoods of people in Barisal Sadar Upazila were vastly affected by land use
changes. Many people have left agricultural and fishing work to find other works.
The young generations are not willing to engage in agricultural work.
vi. Various non-Agricultural profession such as auto rickshaw driver, shopkeepers,
saw miller, small businessman private and public entrepreneurships etc. showed a
significant increase in Barisal Sadar Upazila. Though poultry and fish culture are
popular but their success is not very encouraging.
vii. Transportation system especially the road network was vastly improved during
last two decades in Barisal Sadar Upazila. Many muddy and brick built road were
paved, bridges and culvert were constructed during this period. These improved
road networks give them the advantage of selling and buying their needed
equipment, seeds and other materials easily and quickly. All of the interviewee
mentioned their past suffering due to lack of proper road network and how
satisfied now they are. I have hardly found any house and family who haven‘t
benefitted by this development.
viii. Land use changes have a huge positive impact on educational system in Barisal
Sadar Upazila. With the increasing population, improved road network, urban and
rural settlement many new school, college and university were established and
rebuilt.
ix. Land use changes adversely affect the environment of Barisal Sadar Upazila.
Many trees were cut down to make space for infrastructure development and to
fulfil the need of fuel. Besides most people prefer to plant trees for timber like
Mahogony, Raintree etc. so trees for fruits are reducing significantly.
87
x. Women‘s contribution in the society is remarkable. They are now contributing
economically in their family along with their husbands. They are producing
vegetables for commercial purpose. During the harvest time, women dry up the
harvest, do rice scoop without expecting any return. Some women took training
from NGO on family planning, gardening, sewing, raising livestock, fisheries etc.
They go every home in order to make the rural people aware of family planning.
They are the pillar of the success of birth control in this locality.
xi. After the statistical trend test was done; no significant trend was found for annual
maximum temperature and annual mean temperature in Barisal Sadar Upazila. But
a decreasing trend was found for annual mean precipitation at both 5% and 10%
level of significance during 1949 to 2010 period.
Finally, the overall life style of the community has vastly improved during past two decades.
Communication facilities, educational facilities, treatment facilities are within the reach of
the community. People are very satisfied with them. Along with this improvement, some
social problem arises also. Many landless farmers are now without agricultural land. Many
joint families broken into single one leaving the aging parents in fragile condition, playing
field reduced and many young people became drug addicted, almost in every house satellite
channels are available and people prefer different foreign channels to Bangladeshi channels.
So people need to aware in this regard.
7.2 Recommendations
i. In this research different ecosystem services value were not determined in monetary
unit. In future study different ecosystem services value might be determined in
monetary unit. It gains more attention if the loss or gain present in monetary unit.
ii. For a sustainable development, district and upazila land use management strategy
should be taken up in order to enhance the ecosystem services.
88
References
Adams, H., Adger, W. N., & Nicholls, R. J. (2018). Ecosystem Services Linked to Livelihoods and Well-Being in the Ganges-Brahmaputra-Meghna Delta. In Ecosystem Services for Well-Being in Deltas (pp. 29-47). Palgrave Macmillan, Cham. Adger, W. N., Adams, H., Kay, S., Nicholls, R. J., Hutton, C. W., Hanson, S. E., ... & Salehin, M. (2018). Ecosystem Services, Well-Being and Deltas: Current Knowledge and Understanding. In Ecosystem Services for Well-Being in Deltas (pp. 3-27). Palgrave Macmillan, Cham. ADB (2005) Summery environmental impact assessment: south west area integrated water resources planning and management project in Bangladesh. Asian Development Bank (ADB). Agricultural Statistics Yearbook of Bangladesh, 2011 and 2018. Assessment, M.E., 2005. Millennium ecosystem assessment. Ecosystems and human wellbeing: a framework for assessment Washington, DC: Island Press. Bangladesh Bureau of Statistics, Population Census 1981, 1991, 2001 and 2011. Bangladesh Bureau of Statistics, Census of Agriculture 1983-84, 1996 and 2006. Bairagi, R. (2001). Demographic transition in Bangladesh: what happened here in the 20th century and what is next. ICDDR, B. Beveridge, M. C., & Little, D. C. (2002). The history of aquaculture in traditional societies. Ecological aquaculture. The evolution of the Blue Revolution, 3-29. Balmford, A., Bruner, A., Cooper, P., Costanza, R., Farber, S., Green, R. E., ... & Munro, K. (2002). Economic reasons for conserving wild nature. science, 297(5583), 950-953. B. L. Turner, D. Skole, S. Sanderson, G. Fischer, L. Fresco, and R. Leemans, ―Land-use and land-cover change, science/research plan,‖ Global Change Report, 1995. Chen, J., Sun, B.M., Chen, D., Wu, X., Guo, L.Z. and Wang, G., 2014. Land use changes and their effects on the value of ecosystem services in the small Sanjiang plain in China. The Scientific World Journal, 2014. Clarke, K.C. and Gaydos, L.J., 1998. Loose-coupling a cellular automaton model and GIS: long-term urban growth prediction for San Francisco and Washington/Baltimore. International journal of geographical information science, 12(7), pp.699-714. Clarke, D., Lázár, A. N., Saleh, A. F. M., & Jahiruddin, M. (2018). Prospects for Agriculture Under Climate Change and Soil Salinisation. In Ecosystem Services for Well-Being in Deltas (pp. 447-467). Palgrave Macmillan, Cham.
89
C. Nunes and J. Auge, Land-Use and Land-Cover Change (LUCC): Implementation Strategy, 1999. Costanza, R., d'Arge, R., De Groot, R., Farber, S., Grasso, M., Hannon, B., Limburg, K., Naeem, S., O'neill, R.V., Paruelo, J. and Raskin, R.G., 1997. The value of the world's ecosystem services and natural capital. nature, 387(6630), pp.253-260. Daily, G. ed., 1997. Nature's services: societal dependence on natural ecosystems. Island Press. Department of Fisheries, Bangladesh, Fisheries Statistical Yearbook 1983-84, 1990-91, 2000-01, 2010-11, 2013-14 and 2016-17. DeClerck, F.A.J., S.K. Jones, S. Attwood, D. Bossio, E. Girvetz, B. Chaplin-Kramer, E. Enfors, A.K. Fremier, L.J. Gordon, F. Kizito, I. Lopez Noriega, N. Matthews, M. McCartney, M. Meacham, A. Noble, M. Quintero, R. Remans, R. Soppe, L. Willemen, S.L.R. Wood, and W. Zhang. 2016. Agricultural ecosystems and their services: the vanguard of sustainability? Current Opinion in Environmental Sustainability 23: 92–99. De Groot, R. S., Wilson, M. A., & Boumans, R. M. (2002). A typology for the classification, description and valuation of ecosystem functions, goods and services. Ecological economics, 41(3), 393-408. De Groot, R., Brander, L., Van Der Ploeg, S., Costanza, R., Bernard, F., Braat, L., ... & Hussain, S. (2012). Global estimates of the value of ecosystems and their services in monetary units. Ecosystem services, 1(1), 50-61. Dewan, A. M., & Yamaguchi, Y. (2009). Land use and land cover change in Greater Dhaka, Bangladesh: Using remote sensing to promote sustainable urbanization. Applied Geography, 29(3), 390-401. Di Gregorio, A. (2005). Land cover classification system: classification concepts and user manual: LCCS (Vol. 8). Food & Agriculture Org. Dimyati, M. U. H., Mizuno, K., Kobayashi, S., & Kitamura, T. (1996). An analysis of land use/cover change in Indonesia. International Journal of Remote Sensing, 17(5), 931-944. Dubois, O., 2011. The state of the world's land and water resources for food and agriculture: managing systems at risk. Earthscan. Eva, H.D., Brink, A. and Simonetti, D., 2006. Monitoring land cover dynamics in sub-Saharan Africa. Institute for Environmental and Sustainability, Tech. Rep. EUR, 22498. Fisher, B., Turner, R.K. and Morling, P., 2009. Defining and classifying ecosystem services for decision making. Ecological economics, 68(3), pp.643-653. Hasan, M.N., Hossain, M.S., Islam, M.R., Bari, M.A., Karim, D. and Rahman, M.Z., 2013. Trends in the availability of agricultural land in Bangladesh. Soil Resource Development
90
Institute (SRDI), Ministry of Agriculture, Bangladesh, Dhaka. Available from URL: http://www. nfpcsp.org/agridrupal/sites/default/files/Trends-in-the-availability-ofagricultural-land-in-Bangladesh-SRDI-Supported-by-NFPCSP-FAO. pdf (accessed 17.05. 15.). Hossain, M. S. (2001). Biological aspects of the coastal and marine environment of Bangladesh. Ocean & Coastal Management, 44(3-4), 261-282. Hossain, M.S., Dearing, J.A., Rahman, M.M. and Salehin, M., 2016. Recent changes in ecosystem services and human well-being in the Bangladesh coastal zone. Regional Environmental Change, 16(2), pp.429-443. Hongyi, Z., Donghong, X. and Zhong, Y., 2008. Effects of land use change on ecosystem service value in Yuanmou dry-hot valley. Transactions of the Chinese Society of Agricultural Engineering, 2008(3). Islam, G.T., Islam, A.S., Shopan, A.A., Rahman, M.M., Lázár, A.N. and Mukhopadhyay, A., 2015. Implications of agricultural land use change to ecosystem services in the Ganges delta. Journal of environmental management, 161, pp.443-452. Jabbar, M.T., Zhi-Hua, S.H.I., Tian-Wei, W.A.N.G. and Chong-Fa, C.A.T., 2006. Vegetation Change Prediction with Geo-Information Techniques in the Three Gorges Area of China11Project Supported by the National Natural Science Foundation of China (No. 40271073). Pedosphere, 16(4), pp.457-467. Johnson, R.D. and Kasischke, E.S., 1998. Change vector analysis: a technique for the multispectral monitoring of land cover and condition. International Journal of Remote Sensing, 19(3), pp.411-426. Kabba, V.T.S. and Li, J., 2011. Analysis of land use and land cover changes, and their ecological implications in Wuhan, China. Journal of Geography and Geology, 3(1), p.104. Lambin, E.F. and Ehrlich, D., 1997. Land-cover changes in sub-Saharan Africa (1982–1991): Application of a change index based on remotely sensed surface temperature and vegetation indices at a continental scale. Remote sensing of environment, 61(2), pp.181-200 Li, X. and Yeh, A.G.O., 2002. Neural-network-based cellular automata for simulating multiple land use changes using GIS. International Journal of Geographical Information Science, 16(4), pp.323-343. Liu, J., Liu, M., Tian, H., Zhuang, D., Zhang, Z., Zhang, W., Tang, X. and Deng, X., 2005. Spatial and temporal patterns of China's cropland during 1990–2000: an analysis based on Landsat TM data. Remote sensing of Environment, 98(4), pp.442-456.
Maliha, S. (2016). Changes of land use and soil properties and their impact on rice yield in Dacope upazila of Khulna district. Marshall, R., & Rahman, S. (2013). Internal migration in Bangladesh: character, drivers and policy issues. United Nations Development Programme (UNDP), New York.
91
Mandal, R. B. (1990). Land utilization: Theory and practice. Concept Publishing Company. Mather, A. S. (1999). Land use and cover change. Land use policy, 16, 143. Mendoza-González, G., Martínez, M.L., Lithgow, D., Pérez-Maqueo, O. and Simonin, P., 2012. Land use change and its effects on the value of ecosystem services along the coast of the Gulf of Mexico. Ecological Economics, 82, pp.23-32. Mooney, H., Cropper, A., & Reid, W. (1996). Ecosystems and human well-being: a framework for assessment. Musa, K.B., 2008. Identifying Land Use Changes and It's Socio-economic Impacts: A Case Study of ChacoriaSundarban in Bangladesh. Nagashima, K., Sands, R., Whyte, A.G.D., Bilek, E.M. and Nakagoshi, N., 2002. Regional landscape change as a consequence of plantation forestry expansion: an example in the Nelson region, New Zealand. Forest Ecology and Management, 163(1), pp.245-261. Pereira, E., Queiroz, C., Pereira, H.M. and Vicente, L., 2005. Ecosystem services and human well-being: a participatory study in a mountain community in Portugal. Ecology and Society, 10(2). Powers, D. M. (2011). Evaluation: from precision, recall and F-measure to ROC, informedness, markedness and correlation. Prakasam, C., 2010. Land use and land cover change detection through remote sensing approach: A case study of Kodaikanaltaluk, Tamil nadu. International journal of Geomatics and Geosciences, 1(2), p.150. Quasem, M.A., 2011. Conversion of agricultural land to non-agricultural uses in Bangladesh: Extent and determinants. The Bangladesh Development Studies, pp.59-85. Rahman, S. (2010). Six decades of agricultural land use change in Bangladesh: Effects on crop diversity, productivity, food availability and the environment, 1948–2006. Singapore Journal of Tropical Geography, 31(2), 254-269. Roebeling, P.C., Costa, L., Magalhães-Filho, L. and Tekken, V., 2013. Ecosystem service value losses from coastal erosion in Europe: historical trends and future projections. Journal of coastal conservation, 17(3), pp.389-395. R. S. deGroot,M. A.Wilson, andR.M. J. Boumans, ―A typology for the classification, description and valuation of ecosystem functions, goods and services,‖ Ecological
Economics, vol. 41,no.3, pp. 393–408, 2002. Samant, H.P. and Subramanyan, V., 1998. Landuse/land cover change in Mumbai-Navi Mumbai cities and its effects on the drainage Basins and channels—a study using GIS. Journal of the Indian society of Remote sensing, 26(1), pp.1-6.
92
Sayed, M.B. and Haruyama, S., 2015. Dynamics of Land Use/Cover Change in Manikganj District, Bangladesh: A Case Study of ManikganjSadarUpazila. Journal of Geographic Information System, 7(06), p.579. Shamsuzzaman, M. M., Islam, M. M., Tania, N. J., Al-Mamun, M. A., Barman, P. P., & Xu, X. (2017). Fisheries resources of Bangladesh: Present status and future direction. Aquaculture and Fisheries. Sonis, M., Shoshany, M. and Goldschlager, N., 2005. Matrix Land Use Analysis-a Case Study of Landscape Changes in Israeli Carmel Area. Statistical Yearbook of Bangladesh, 2016. Syombua, M.J., 2013. Land use and land cover changes and their implications for human-wildlife conflicts in the semi-arid rangelands of southern Kenya. Journal of Geography and regional planning, 6(5), p.193. Szabo, S., Begum, D., Ahmad, S., Matthews, Z., & Streatfield, P. K. (2015). Scenarios of population change in the coastal Ganges Brahmaputra delta (2011-2051). Asia-Pacific Population Journal, 30(2), 51-72. Turner, M.G., 2005. Landscape ecology in North America: past, present, and future. Ecology, 86(8), pp.1967-1974 Vihervaara, P., Marjokorpi, A., Kumpula, T., Walls, M., & Kamppinen, M. (2012). Ecosystem services of fast-growing tree plantations: a case study on integrating social valuations with land-use changes in Uruguay. Forest Policy and Economics, 14(1), 58-68. Witmer, R. E. (1978). USGS land use and land cover classification system. PB-US National Technical Information Service. Wolman, M. G., & Fournier, F. G. A. (1987). Land transformation in agriculture. Yuan, F., Sawaya, K. E., Loeffelholz, B. C., & Bauer, M. E. (2005). Land cover classification and change analysis of the Twin Cities (Minnesota) Metropolitan Area by multitemporal Landsat remote sensing. Remote sensing of Environment, 98(2-3), 317-328. Y.Wang, X. Yu,K.He, S. Song,G. Jia, andZ. Huang, ―Ecosystem services value based on land use change in Huairou reservoir watershed,‖ Transactions of the Chinese Society of
Agricultural Engineering, vol. 28, no. 5, pp. 246–251, 2012. Zhang, W., Ricketts, T. H., Kremen, C., Carney, K., & Swinton, S. M. (2007). Ecosystem services and dis-services to agriculture. Ecological economics, 64(2), 253-260. Zhang, Y., Zhao, L., Liu, J., Liu, Y. and Li, C., 2015. The Impact of Land Cover Change on Ecosystem Service Values in Urban Agglomerations along the Coast of the Bohai Rim, China. Sustainability, 7(8), pp.10365-10387.
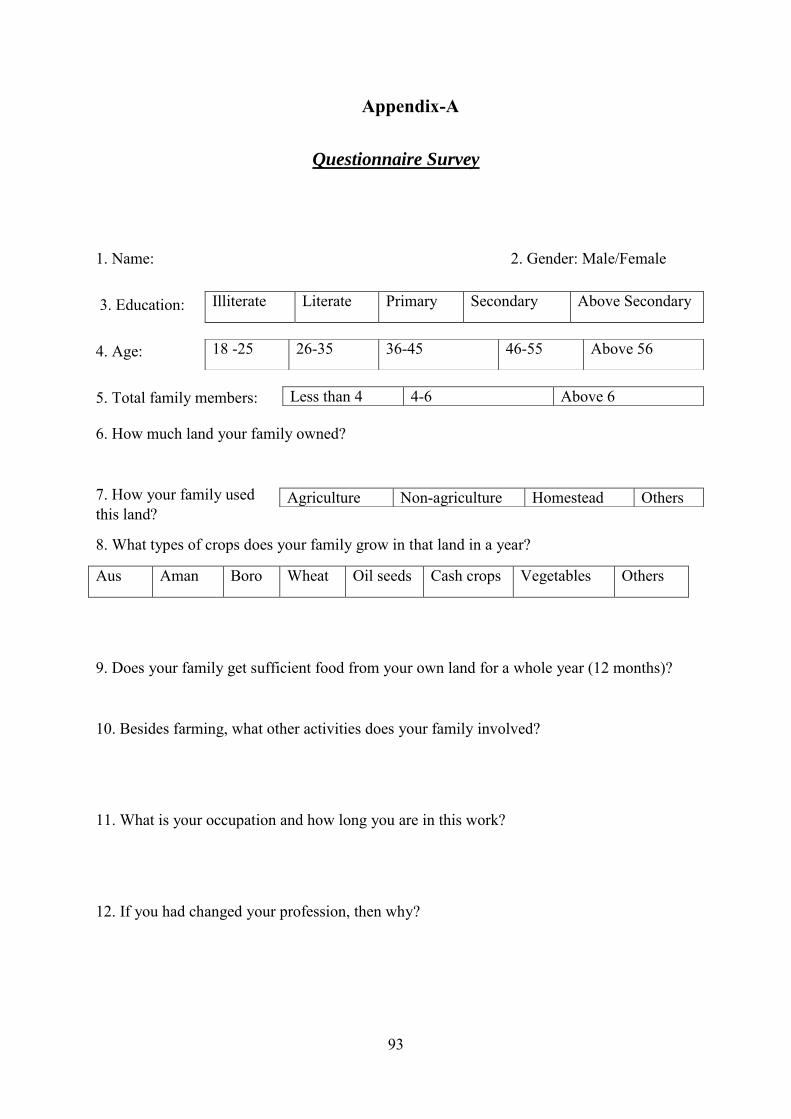
93
Appendix-A
Questionnaire Survey
1. Name: 2. Gender: Male/Female
3. Education:
4. Age:
5. Total family members:
6. How much land your family owned?
7. How your family used this land?
8. What types of crops does your family grow in that land in a year?
Aus Aman Boro Wheat Oil seeds Cash crops Vegetables Others
9. Does your family get sufficient food from your own land for a whole year (12 months)?
10. Besides farming, what other activities does your family involved?
11. What is your occupation and how long you are in this work?
12. If you had changed your profession, then why?
Illiterate Literate Primary Secondary Above Secondary
18 -25 26-35 36-45 46-55 Above 56
Less than 4 4-6 Above 6
Agriculture Non-agriculture Homestead Others
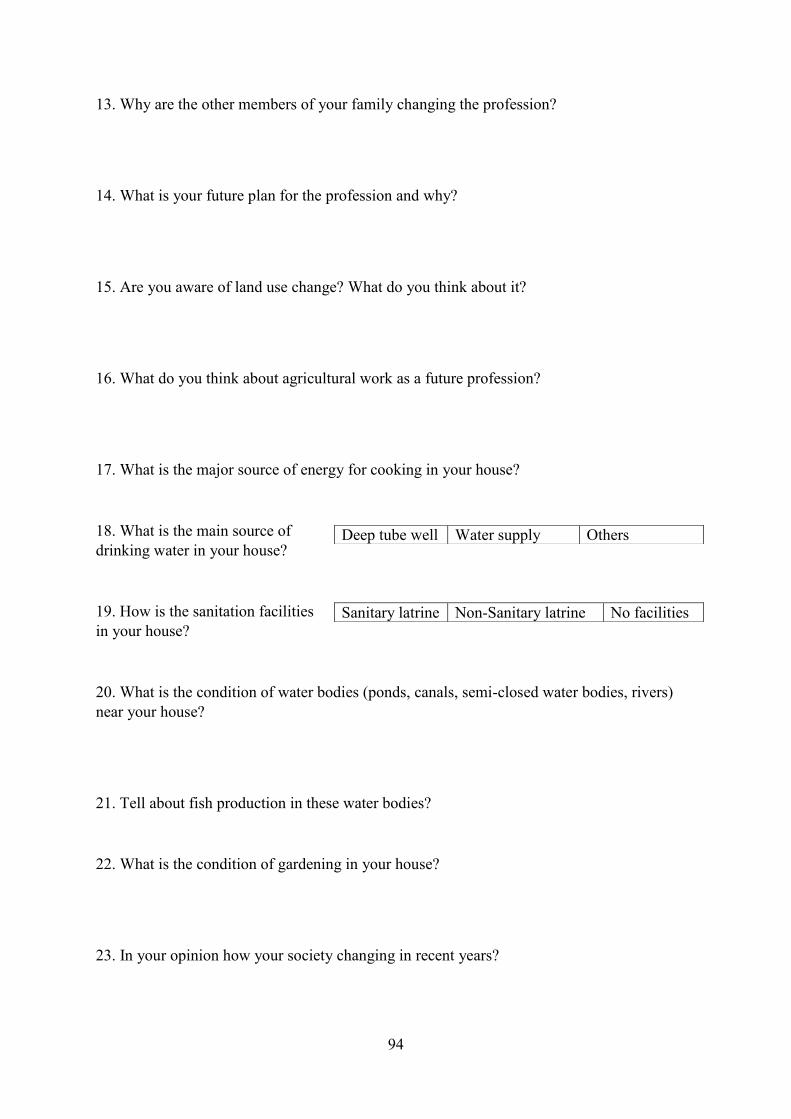
94
13. Why are the other members of your family changing the profession?
14. What is your future plan for the profession and why?
15. Are you aware of land use change? What do you think about it?
16. What do you think about agricultural work as a future profession?
17. What is the major source of energy for cooking in your house?
18. What is the main source of drinking water in your house?
19. How is the sanitation facilities in your house?
20. What is the condition of water bodies (ponds, canals, semi-closed water bodies, rivers) near your house?
21. Tell about fish production in these water bodies?
22. What is the condition of gardening in your house?
23. In your opinion how your society changing in recent years?
Deep tube well Water supply Others
Sanitary latrine Non-Sanitary latrine No facilities
95
Appendix-B (Source: De Groot et al. 2012)
Provisioning Services
These are the goods gained from ecosystems directly comprising-
Food and fiber- This includes the vast range of food products derived from plants, animals,
and microbes, as well as materials such as wood, jute, hemp, silk, and many other products
derived from ecosystems.
Fuel- Wood, dung, and other biological materials serve as sources of energy.
Genetic resources- This includes the genes and genetic information used for animal and plant
breeding and biotechnology.
Bio chemicals, natural medicines and pharmaceuticals- Many medicines, biocides, food
additives such as alginates, and biological materials are derived from ecosystems.
Ornamental resources- Animal products, such as skins and shells, and flowers are used as
ornaments, although the value of these resources is often culturally determined. This is an
example of linkages between the categories of ecosystem services.
Fresh water- Fresh water is another example of linkages between categories—in this case,
between provisioning and regulating services.
Regulating Services
These are the benefits obtained from the regulation of ecosystem processes, including:
Air quality maintenance- Ecosystems both contribute chemicals to and extract chemicals
from the atmosphere, influencing many aspects of air quality.
Climate regulation- Ecosystems influence climate both locally and globally. For example, at a
local scale, changes in land cover can affect both temperature and precipitation. At the global
scale, ecosystems play an important role in climate by either sequestering or emitting
greenhouse gases.
Water regulation- The timing and magnitude of runoff, flooding, and aquifer recharge can be
strongly influenced by changes in land cover, including, in particular, alterations that change
the water storage potential of the system, such as the conversion of wetlands or the
replacement of forests with croplands or croplands with urban areas.
Erosion control- Vegetative cover plays an important role in soil retention and the prevention
of landslides.
96
Water purification and waste treatment- Ecosystems can be a source of impurities in fresh
water but also can help to filter out and decompose organic wastes introduced into inland
waters and coastal and marine ecosystems.
Regulation of human diseases- Changes in ecosystems can directly change the abundance of
human pathogens, such as cholera, and can alter the abundance of disease vectors, such as
mosquitoes.
Biological control- Ecosystem changes affect the prevalence of crop and livestock pests and
diseases.
Pollination- Ecosystem changes affect the distribution, abundance, and effectiveness of
pollinators.
Storm protection- The presence of coastal ecosystems such as mangroves and coral reefs can
dramatically reduce the damage caused by hurricanes or large waves.
Cultural Services
These are the nonmaterial benefits people obtain from ecosystems through spiritual
enrichment, cognitive development, reflection, recreation, and aesthetic experiences,
including:
Cultural diversity- The diversity of ecosystems is one factor influencing the diversity of
cultures.
Spiritual and religious values- Many religions attach spiritual and religious values to
ecosystems or their components.
Knowledge systems (traditional and formal) - Ecosystems influence the types of knowledge
systems developed by different cultures.
Educational values- Ecosystems and their components and processes provide the basis for
both formal and informal education in many societies.
Inspiration- Ecosystems provide a rich source of inspiration for art, folklore, national
symbols, architecture, and advertising.
Aesthetic values- Many people find beauty or aesthetic value in various aspects of
ecosystems, as reflected in the support for parks, ―scenic drives,‖ and the selection of housing
locations.
Social relations- Ecosystems influence the types of social relations that are established in
particular cultures. Fishing societies, for example, differ in many respects in their social
relations from nomadic herding or agricultural societies.
97
Sense of place- Many people value the ―sense of place‖ that is associated with recognized
features of their environment, including aspects of the ecosystem.
Cultural heritage values- Many societies place high value on the maintenance of either
historically important landscapes (―cultural landscapes‖) or culturally significant species.
Recreation and ecotourism- People often choose where to spend their leisure time based in
part on the characteristics of the natural or cultivated landscapes in a particular area.
Cultural services are tightly bound to human values and behaviour, as well as to human
institutions and patterns of social, economic, and political organization. Thus perceptions of
cultural services are more likely to differ among individuals and communities than, say,
perceptions of the importance of food production.
Supporting Services
Supporting services are those that are necessary for the production of all other ecosystem
services. They differ from provisioning, regulating, and cultural services in that their impacts
on people are either indirect or occur over a very long time, whereas changes in the other
categories have relatively direct and short-term impacts on people. (Some services, like
erosion control, can be categorized as both a supporting and a regulating service, depending
on the time scale and immediacy of their impact on people.) For example, humans do not
directly use soil formation services, although changes in this would indirectly affect people
through the impact on the provisioning service of food production. Similarly, climate
regulation is categorized as a regulating service since ecosystem changes can have an impact
on local or global climate over time scales relevant to human decision-making (decades or
centuries), whereas the production of oxygen gas (through photosynthesis) is categorized as a
supporting service since any impacts on the concentration of oxygen in the atmosphere would
only occur over an extremely long time. Some other examples of supporting services are
primary production, production of atmospheric oxygen, soil formation and retention, nutrient
cycling, water cycling, and provisioning of habitat.


