Embed Size (px)
Citation preview

Research Reports | 379 |
Robert Stehrer, Terry Ward et al.
Sectoral Employment Effects of
Economic Downturns
August
2012

Robert Stehrer is Deputy Director of Research at the Vienna Institute for International Economic Studies (wiiw). Terry Ward is Director of Studies at Applica, Brussels.
With contributions by Neil Foster (wiiw), Doris
Hanzl-Weiss (wiiw), Sandra Leitner (wiiw), Sebas-
tian Leitner (wiiw), Fadila Sanoussi (Applica) and
Nirina Rabemiafara (Applica),
This publication is supported by the European Un-ion Programme for Employment and Social Solidar-ity-PROGRESS (2007-2013). This programme is im-plemented by the European Commission. It was established to financially support the implementa-tion of the objectives of the European Union in the employment, social affairs and equal opportunities area, and thereby contribute to the achievement of the Europe 2020 Strategy goals in these fields. The seven-year Programme targets all stakeholders who can help shape the development of appropri-ate and effective employment and social legisla-tion and policies, across the EU-27, EFTA-EEA and EU candidate and pre-candidate countries. For more information see: http://ec.europa.eu/progress. The information contained in this publication does not necessarily reflect the position or opinion of the European Commission.
Robert Stehrer,
Terry Ward et al.
Sectoral Employment
Effects of Economic
Downturns

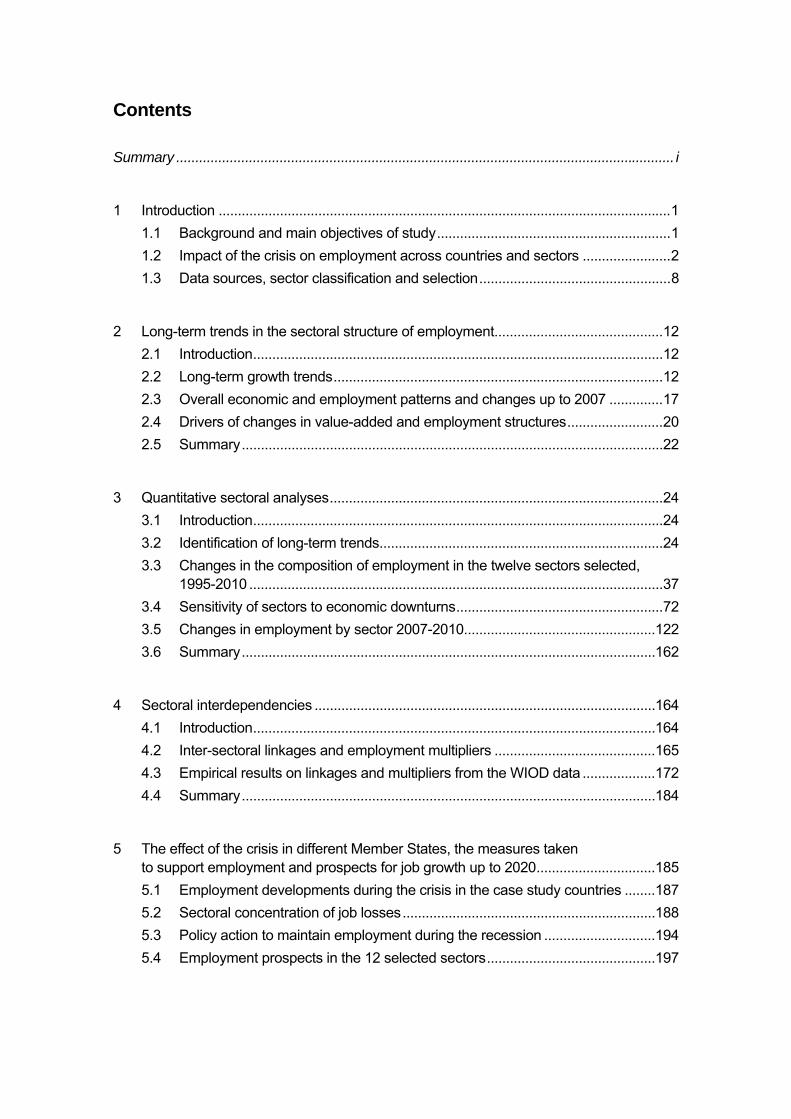
Contents
Summary .................................................................................................................................. i
1 Introduction ...................................................................................................................... 1 1.1 Background and main objectives of study ............................................................. 1 1.2 Impact of the crisis on employment across countries and sectors ....................... 2 1.3 Data sources, sector classification and selection .................................................. 8
2 Long-term trends in the sectoral structure of employment ............................................ 12 2.1 Introduction ........................................................................................................... 12 2.2 Long-term growth trends ...................................................................................... 12 2.3 Overall economic and employment patterns and changes up to 2007 .............. 17 2.4 Drivers of changes in value-added and employment structures ......................... 20 2.5 Summary .............................................................................................................. 22
3 Quantitative sectoral analyses ....................................................................................... 24 3.1 Introduction ........................................................................................................... 24 3.2 Identification of long-term trends .......................................................................... 24 3.3 Changes in the composition of employment in the twelve sectors selected,
1995-2010 ............................................................................................................ 37 3.4 Sensitivity of sectors to economic downturns ...................................................... 72 3.5 Changes in employment by sector 2007-2010.................................................. 122 3.6 Summary ............................................................................................................ 162
4 Sectoral interdependencies ......................................................................................... 164 4.1 Introduction ......................................................................................................... 164 4.2 Inter-sectoral linkages and employment multipliers .......................................... 165 4.3 Empirical results on linkages and multipliers from the WIOD data ................... 172 4.4 Summary ............................................................................................................ 184
5 The effect of the crisis in different Member States, the measures taken to support employment and prospects for job growth up to 2020 ............................... 185 5.1 Employment developments during the crisis in the case study countries ........ 187 5.2 Sectoral concentration of job losses .................................................................. 188 5.3 Policy action to maintain employment during the recession ............................. 194 5.4 Employment prospects in the 12 selected sectors ............................................ 197
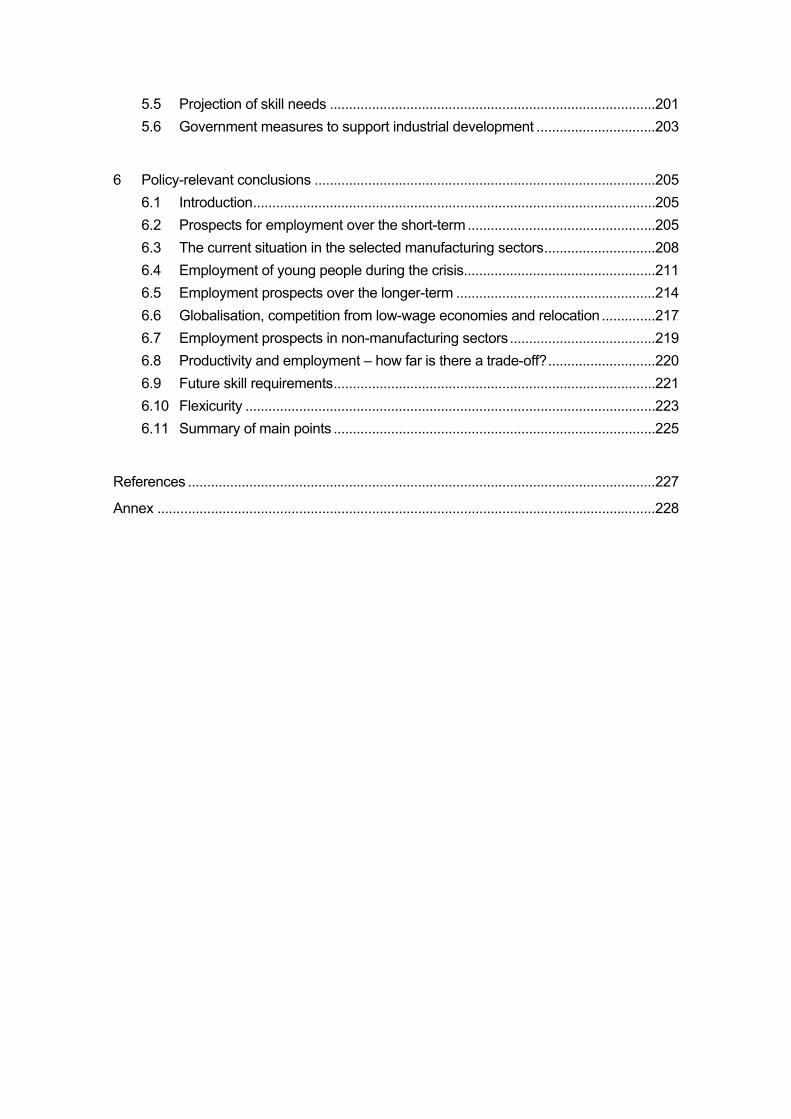
5.5 Projection of skill needs ..................................................................................... 201 5.6 Government measures to support industrial development ............................... 203
6 Policy-relevant conclusions ......................................................................................... 205 6.1 Introduction ......................................................................................................... 205 6.2 Prospects for employment over the short-term ................................................. 205 6.3 The current situation in the selected manufacturing sectors ............................. 208 6.4 Employment of young people during the crisis.................................................. 211 6.5 Employment prospects over the longer-term .................................................... 214 6.6 Globalisation, competition from low-wage economies and relocation .............. 217 6.7 Employment prospects in non-manufacturing sectors ...................................... 219 6.8 Productivity and employment – how far is there a trade-off? ............................ 220 6.9 Future skill requirements .................................................................................... 221 6.10 Flexicurity ........................................................................................................... 223 6.11 Summary of main points .................................................................................... 225
References .......................................................................................................................... 227
Annex .................................................................................................................................. 228
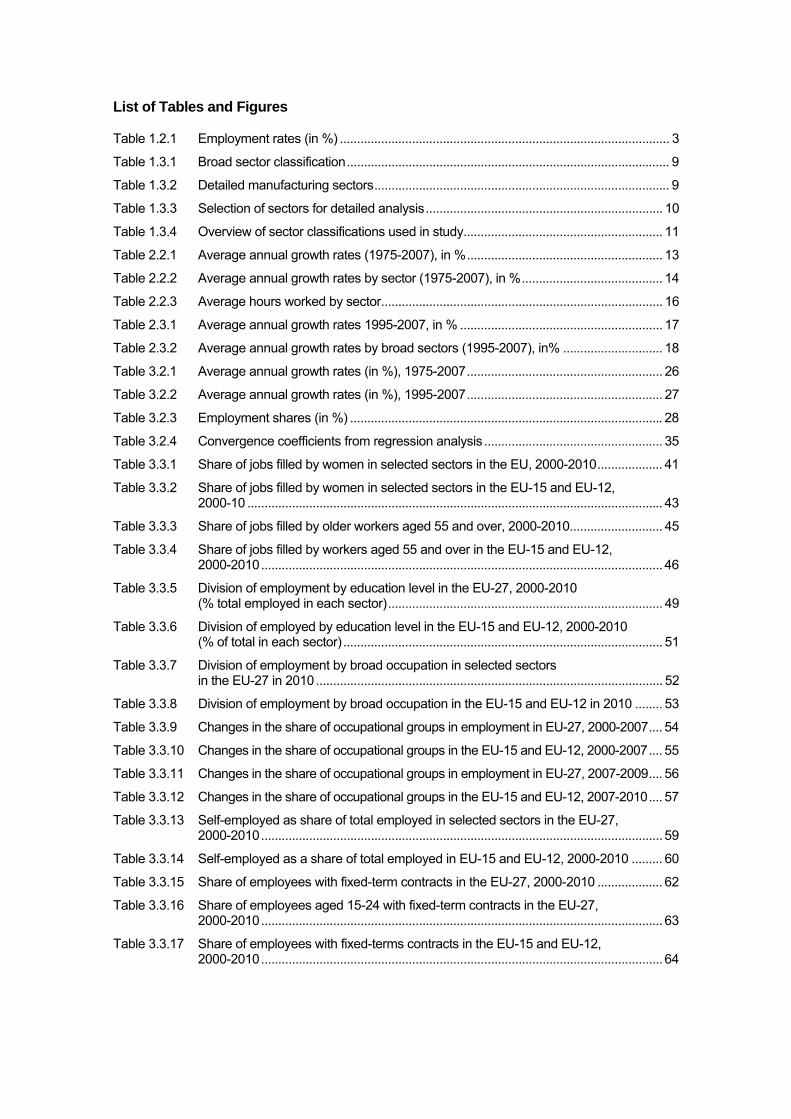
List of Tables and Figures
Table 1.2.1 Employment rates (in %) ................................................................................................ 3
Table 1.3.1 Broad sector classification .............................................................................................. 9
Table 1.3.2 Detailed manufacturing sectors ...................................................................................... 9
Table 1.3.3 Selection of sectors for detailed analysis ..................................................................... 10
Table 1.3.4 Overview of sector classifications used in study .......................................................... 11
Table 2.2.1 Average annual growth rates (1975-2007), in % ......................................................... 13
Table 2.2.2 Average annual growth rates by sector (1975-2007), in % ......................................... 14
Table 2.2.3 Average hours worked by sector .................................................................................. 16
Table 2.3.1 Average annual growth rates 1995-2007, in % ........................................................... 17
Table 2.3.2 Average annual growth rates by broad sectors (1995-2007), in% ............................. 18
Table 3.2.1 Average annual growth rates (in %), 1975-2007 ......................................................... 26
Table 3.2.2 Average annual growth rates (in %), 1995-2007 ......................................................... 27
Table 3.2.3 Employment shares (in %) ........................................................................................... 28
Table 3.2.4 Convergence coefficients from regression analysis .................................................... 35
Table 3.3.1 Share of jobs filled by women in selected sectors in the EU, 2000-2010 ................... 41
Table 3.3.2 Share of jobs filled by women in selected sectors in the EU-15 and EU-12, 2000-10 ......................................................................................................................... 43
Table 3.3.3 Share of jobs filled by older workers aged 55 and over, 2000-2010........................... 45
Table 3.3.4 Share of jobs filled by workers aged 55 and over in the EU-15 and EU-12, 2000-2010 ..................................................................................................................... 46
Table 3.3.5 Division of employment by education level in the EU-27, 2000-2010 (% total employed in each sector) ................................................................................ 49
Table 3.3.6 Division of employed by education level in the EU-15 and EU-12, 2000-2010 (% of total in each sector) ............................................................................................. 51
Table 3.3.7 Division of employment by broad occupation in selected sectors in the EU-27 in 2010 ..................................................................................................... 52
Table 3.3.8 Division of employment by broad occupation in the EU-15 and EU-12 in 2010 ........ 53
Table 3.3.9 Changes in the share of occupational groups in employment in EU-27, 2000-2007 .... 54
Table 3.3.10 Changes in the share of occupational groups in the EU-15 and EU-12, 2000-2007 .... 55
Table 3.3.11 Changes in the share of occupational groups in employment in EU-27, 2007-2009 .... 56
Table 3.3.12 Changes in the share of occupational groups in the EU-15 and EU-12, 2007-2010 .... 57
Table 3.3.13 Self-employed as share of total employed in selected sectors in the EU-27, 2000-2010 ..................................................................................................................... 59
Table 3.3.14 Self-employed as a share of total employed in EU-15 and EU-12, 2000-2010 ......... 60
Table 3.3.15 Share of employees with fixed-term contracts in the EU-27, 2000-2010 ................... 62
Table 3.3.16 Share of employees aged 15-24 with fixed-term contracts in the EU-27, 2000-2010 ..................................................................................................................... 63
Table 3.3.17 Share of employees with fixed-terms contracts in the EU-15 and EU-12, 2000-2010 ..................................................................................................................... 64
Table 3.3.18 Share of employees, 15-24, with fixed-term contracts in EU-15 and EU-12, 2000-2010 ..................................................................................................................... 65
Table 3.3.19 Share of workers employed part-time (usually working <35 hours a week) in the EU-27, 2000-2010 .............................................................................................. 68
Table 3.3.20 Share of workers employed part-time in the EU-15 and EU-12, 2000-2010 .............. 69
Table 3.3.21 Share of jobs filled by migrants from outside the EU, 2000- 2010 .............................. 71
Table 3.4.1 Strongest sectoral labour productivity reactions to the crisis of the 1970s, the 1980s and the 1990s: EU-15 aggregate ................................................................ 86
Table 3.4.2 Strongest sectoral labour productivity reactions to the crisis of the 1980s, the 1990s and the Dotcom crisis: US ......................................................................... 113
Table 3.4.3 Strongest sectoral labour productivity reactions to the crisis of the 1970s: Japan ... 120
Table 3.5.1 Changes in value-added and employment by broad sector in the EU, 2003-2010 .... 123
Table 3.5.2 Changes in average hours worked and value-added per hour worked in the EU, 2003-2010 .................................................................................................. 129
Table 3.5.3 Changes in production and employment in selected manufacturing industries, 2007-2011 ................................................................................................................... 133
Table 3.5.4 Changes in average hours worked and labour productivity in selected manufacturing industries, 2007-2011 ......................................................................... 139
Table 3.5.5 Changes in average hours worked and labour productivity, 2008-2011 .................. 142
Table 3.5.6 Changes in value-added and employment in selected service sectors, 2003-2010 ... 144
Table 3.5.7 Changes in average hours worked and productivity in selected service sectors, 2003-2010 ................................................................................................................... 147
Table 3.5.8 Job losses and gains from large enterprise restructuring in the EU, 2003-2011 ..... 151
Table 3.5.9 Job losses and gains from large enterprise restructuring in the EU15, 2003-2011 .... 153
Table 3.5.10 Job losses and gains from large enterprise restructuring in the EU12, 2003-2011 .... 153
Table 3.5.11 Division of job losses from restructuring by form in the EU, 2003-2011 ................... 155
Table 3.5.12 Division of job losses from restructuring by form in the EU 15, 2003-2011 .............. 157
Table 3.5.13 Division of job losses from restructuring by form in the EU 12, 2003-2011 .............. 158
Table 3.5.14 Changes in labour costs, wages and salaries in %, 2003-2010 ............................... 159
Table 3.5.15 Changes in labour costs by industry in % in selected countries, 2003-2010 ........... 161
Table 4.3.1 Total employment multiplier (domestic and interregional), 2005 .............................. 173
Table 4.3.2 Employment multipliers (domestic and interregional), 2005 ..................................... 183
Table 4.3.3 Total employment multiplier (domestic and interregional), 2005 .............................. 184
Table 5.1 Change in employment in manufacturing sectors in selected EU countries, first quarter 2007 to first quarter 2011 ........................................................................ 189
Table 5.2 Change in labour productivity per hour worked in manufacturing sectors in selected EU countries, first quarter 2007 to first quarter 2011 .............................. 190
Table 5.3 Changes in employment in service sectors in selected Member States, first quarter 2008 to first quarter 2011 ........................................................................ 191
Table 5.4 Changes in average hours worked in manufacturing sectors in selected Member States, first quarter 2007 to first quarter 2011 .......................... 193
Table 5.5 Summary of measures taken in countries to support jobs during the recession ...... 196
Table 6.2.1 GDP and employment in the EU over the recent past and forecasts up to 2013 .... 206
Table 6.2.2 GDP and employment in selected EU Member States over the recent past and forecasts up to 2013 ............................................................................................ 207
Table 6.5.1 Change in value-added in manufacturing sectors in selected countries, 2003-2007 ................................................................................................................... 215
Figure 1.2.1 GDP, employment, productivity (GDP per person employed), and hours worked
in Spain (in percentage changes compared to the corresponding period of the previous year) ................................................................................................................. 4
Figure 1.2.2 GDP, employment, productivity (GDP per person employed), and hours worked in Germany (in percentage changes compared to the corresponding period of the previous year) ................................................................................................................. 4
Figure 2.2.1 Deviations from annual average growth rates – in percentage points ........................ 15
Figure 2.2.2 Sectoral shares in hours worked, in % ......................................................................... 16
Figure 2.3.1 Deviations in annual average growth rates of hours worked from overall employment growth, 1995-2007 .................................................................................. 19
Figure 2.3.2 Sectoral shares in hours worked (in %) ....................................................................... 20
Figure 3.3.1 Share of jobs filled by women in selected sectors in the EU, 2000-2010 ................... 40
Figure 3.3.2 Share of jobs filled by older workers aged 55 and over, 2000-2010........................... 45
Figure 3.3.3 Division of employment by education level in the EU-27, 2000-2010 (% total employed in each sector) ................................................................................ 48
Figure 3.3.4 Self-employed as share of total employed in selected sectors in the EU-27, 2000-2010 ..................................................................................................................... 58
Figure 3.3.5 Share of employees with fixed-term contracts in the EU-27, 2000-2010 ................... 62
Figure 3.3.6 Share of workers employed part-time (usually working <35 hours a week) in the EU-27, 2000-2010 ............................................................................................. 67
Figure 3.3.7 Share of jobs filled by migrants from outside the EU, 2000- 2010 .............................. 71
Figure 3.4.1 Growth rates of value-added and hours worked ......................................................... 74
Figure 3.4.2 Return to pre-crisis levels (Index of maximum before crisis = 0) in terms of employment ................................................................................................ 76
Figure 3.4.3 Return to pre-crisis levels in terms of hours worked (Index of employment maximum before crisis = 0) .......................................................................................... 77
Figure 3.4.4 Sectoral employment growth rates during different economic crises in the EU-15 ....... 79
Figure 3.4.5 Sectoral hours worked growth rates during different economic crises in the EU-15 ..... 81
Figure 3.4.6 Sectoral value-added growth rates during different economic crises in the EU-15 ....... 84
Figure 3.4.7 A comparison of strongest employment responses in all EU-15 member countries .... 90
Figure 3.4.8 A comparison of strongest hours worked responses in all EU-15 member countries ... 91
Figure 3.4.9 A comparison of strongest value-added responses in all EU-15 member countries .... 93
Figure 3.4.10 A comparison of strongest labour productivity responses in all EU-15 member countries (hours worked based) ......................................................... 99
Figure 3.4.11 A comparison of strongest labour productivity responses in all EU-15 member countries (employment based)......................................................... 100
Figure 3.4.12 Sectoral employment growth rates during different economic crises in the USA..... 104
Figure 3.4.13 Sectoral hours worked growth rates during different economic crises in the USA... 108
Figure 3.4.14 Sectoral value-added growth rates during different economic crises in the USA .... 111
Figure 3.4.15 Sectoral employment growth rates during the economic crises of the 1970s in Japan ....................................................................................................................... 116
Figure 3.4.16 Sectoral hours worked growth rates during the economic crises of the 1970s in Japan ....................................................................................................................... 117
Figure 3.4.17 Sectoral value-added growth rates during the economic crises of the 1970s in Japan ....................................................................................................................... 119
Figure 3.5.1 Change in labour costs in % in EU-27, 2003-2010 ................................................... 160
Figure 4.3.1 Total employment multiplier (domestic and interregional), 2005 .............................. 172
Figure 4.3.2 EU-27: Average domestic employment multipliers, ranked by 2005 employment multiplier ................................................................................................. 174
Figure 4.3.3 Domestic employment multipliers, 1995, 2000 and 2005 ......................................... 177
Figure 4.3.4 EU-27: Domestic and interregional employment multipliers ..................................... 181
Figure 6.3.1 Employment in selected manufacturing sectors across the EU in the first quarter of 2011 relative to the first quarter of 2008 (% change) ............................................ 209
Figure 6.3.2 Change in labour productivity per hour worked in selected manufacturing sectors across the EU, first quarter 2008 to first quarter 2011 .................................. 209
Figure 6.3.3 Employment in construction and selected service sectors across the EU, 2010 relative to 2008 (%change) ............................................................................... 210
Figure 6.4.1 Young people as a share of employment in selected sectors in the EU, 2000-2010 (average annual change in % of total) .................................................... 212
Figure 6.4.2 Employment rates of young people aged under 25 in EU Member States (% of population aged 15-24) ..................................................................................... 213
i
Summary
The recent economic downturn
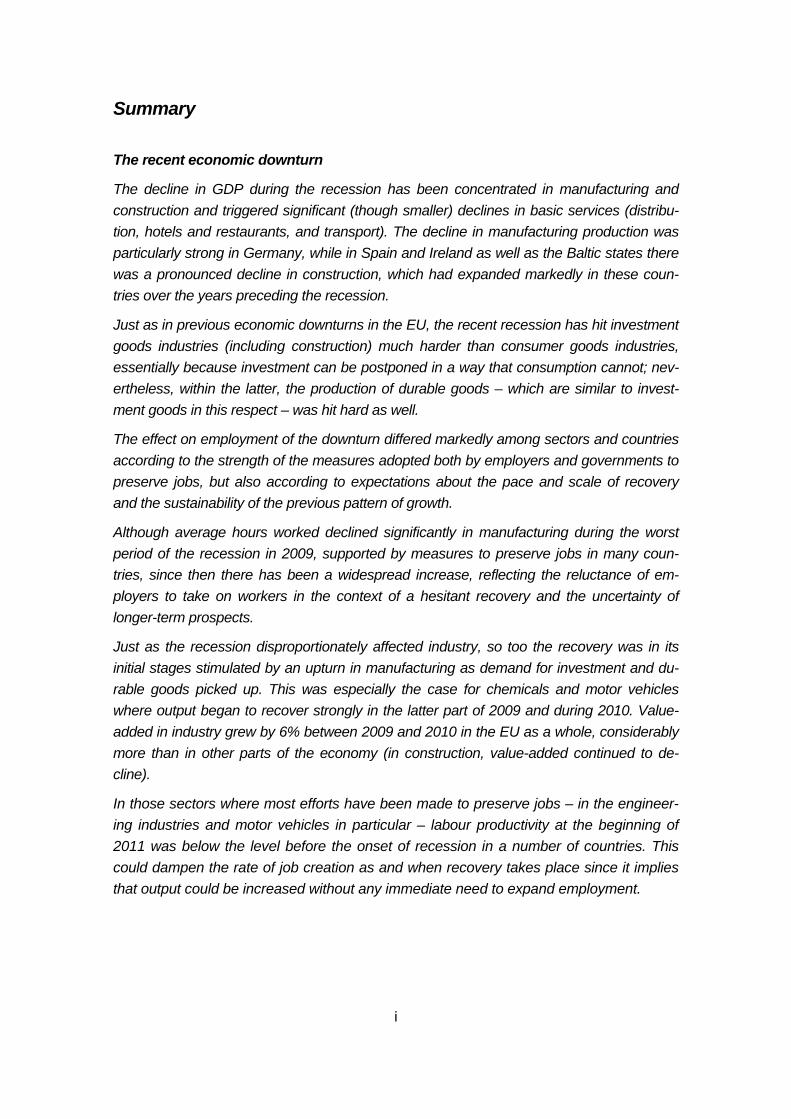
The decline in GDP during the recession has been concentrated in manufacturing and construction and triggered significant (though smaller) declines in basic services (distribu-tion, hotels and restaurants, and transport). The decline in manufacturing production was particularly strong in Germany, while in Spain and Ireland as well as the Baltic states there was a pronounced decline in construction, which had expanded markedly in these coun-tries over the years preceding the recession.
Just as in previous economic downturns in the EU, the recent recession has hit investment goods industries (including construction) much harder than consumer goods industries, essentially because investment can be postponed in a way that consumption cannot; nev-ertheless, within the latter, the production of durable goods – which are similar to invest-ment goods in this respect – was hit hard as well.
The effect on employment of the downturn differed markedly among sectors and countries according to the strength of the measures adopted both by employers and governments to preserve jobs, but also according to expectations about the pace and scale of recovery and the sustainability of the previous pattern of growth.
Although average hours worked declined significantly in manufacturing during the worst period of the recession in 2009, supported by measures to preserve jobs in many coun-tries, since then there has been a widespread increase, reflecting the reluctance of em-ployers to take on workers in the context of a hesitant recovery and the uncertainty of longer-term prospects.
Just as the recession disproportionately affected industry, so too the recovery was in its initial stages stimulated by an upturn in manufacturing as demand for investment and du-rable goods picked up. This was especially the case for chemicals and motor vehicles where output began to recover strongly in the latter part of 2009 and during 2010. Value-added in industry grew by 6% between 2009 and 2010 in the EU as a whole, considerably more than in other parts of the economy (in construction, value-added continued to de-cline).
In those sectors where most efforts have been made to preserve jobs – in the engineer-ing industries and motor vehicles in particular – labour productivity at the beginning of 2011 was below the level before the onset of recession in a number of countries. This could dampen the rate of job creation as and when recovery takes place since it implies that output could be increased without any immediate need to expand employment.
ii
Employment trends in selected sectors: results from analysis of long-term devel-opments
Employment is strongly related to changes in value-added, though an increase in value-added tends to be partly met by productivity growth as well as by employing more people. Similarly, a fall in value-added tends to be associated with a decline in productivity growth as well as a decline in employment, though lags in adjustment may delay the latter.
The relationship between employment and real wages tends to be significant in manufac-turing, where increases in real wages tend to reduce the growth of employment; this is not the case in services.
In the UK, as in the US, real wages tend to adjust more quickly to changes in labour de-mand than in Germany and France, suggesting that labour markets are more flexible in the former countries.
There is an inverse relationship between average hours worked and the number em-ployed, indicating in general that the more hours people work, the smaller the number em-ployed and vice versa, so that adjustments in working time has an important effect on jobs.
Investment in ICT has positive and significant effects on employment in manufacturing, probably working through improvements in productivity. The opposite is the case in ser-vices, suggesting that the increasing use of ICT tends to reduce employment.
After a shock, it takes up to three years for employment to return to trend levels in France, Spain, Belgium and the Netherlands. In the other countries, the pace of adjustment is faster, at only one-and-a-half to two years on average. Changes in the composition of employment
Over the recession period from 2007 to 2010, the share of jobs filled by women continued to increase across the EU. This, however, reflects the large job losses in manufacturing and construction where few women are employed. In most sectors, even in services, the share of jobs filled by women declined.
The share of jobs filled by workers aged 55 and over has increased in most parts of the EU over the past ten years, reflecting a tendency for older people to remain longer in work. This continued to be the case over the recession period, unlike during previous periods of economic downturn when early retirement has been a major means of reducing work forces. The main group hit by the present crisis are the young below the age of 25.
The proportion of the work force with tertiary education increased in all sectors over the years leading up to the recession; the same is true for the share of employment accounted for by managers and professionals. Both trends have continued over the recession period.
There has been a shift from full-time to part-time jobs over the recession period, which may reflect uncertainty among employers over future prospects as well as the pursuit of more flexible organization of work.
iii
Employment experience in previous economic downturns
There are some differences between previous periods of downturn in those sectors in which employment was most affected. In all periods, however, employment continued to expand in business services and hotels and restaurants.
Economic crises were predominantly weathered by adjustments in hours worked to pre-serve jobs and the know-how of the work force, thus limiting the costs of re-employment and training. This tendency was strongest in the 1970s, moderate in the 1980s and mixed in the 1990s.
Value-added was generally more volatile than the number employed and hours worked. During the three periods of economic downturn, value-added grew only in business ser-vices. The largest losses were observed in machinery and equipment, basic metals and construction in all three periods. Sectoral interdependencies
For each job created by an increase in final demand in a particular sector, there are be-tween 1.4 and 2.3 additional jobs created in the economy as a whole. Employment multi-pliers are highest in manufacturing (especially in chemicals, electrical equipment and transport equipment) and are lowest in services, which need fewer inputs from other sec-tors.
Domestic employment multipliers tend to have remained broadly unchanged over the past 15 years or so whereas international employment multipliers (the effect of growth in one country on employment in others) have increased markedly, reflecting the growing impor-tance of production networks and international integration.
Employment creation in services is mainly a domestic process, whereas within manufactur-ing, job creation takes place internationally (particularly in textiles, chemicals and electrical equipment and transport equipment).
Growth of demand in the EU tends to lead to significant employment creation in other countries, reflecting the increase in imports that it results in. This is particularly so with re-spect to electrical equipment, textiles and chemicals, though it is also the case for each of those that growth of demand increases employment not only in the Member State in which it occurs but also in other parts of the EU. Measures taken to support employment during the crisis
Measures to counter the effect of the recession on employment were implemented in all Member States. However, those were mainly general; relatively few responses were sec-tor-specific, such as car scrapping schemes, which were introduced in a number of coun-tries, and cuts in value-added tax on hotels and restaurants (in Ireland and France). But there has been a decentralization of pay bargaining to company level in some sectors in some countries (such as in basic metals or chemicals in Germany).
iv
Many countries introduced expansionary fiscal policies to stimulate demand as well as short-time working arrangements (mainly concentrated in manufacturing).
In a number of countries, there has been an expansion of training and work experience programmes, recruitment incentive schemes for employers hiring new workers, support to business start-ups, measures to increase access to credit, pay freezes and more flexible working arrangements, all designed to increase employment.
Young people, who have been severely affected by the recession and the lack of job crea-tion, have been a particular target for government support, in the form of subsidized em-ployment schemes, work placement programmes, work experience or training guarantees and intensified job search assistance. Keywords: employment effects of crisis, sectoral employment, economic downturns and
sectoral labour demand, policy reactions JEL classification: E24, J08, J21, J23
1
Robert Stehrer, Terry Ward et al.
Sectoral employment effects of economic downturns
1 Introduction
1.1 Background and main objectives of study
The financial crisis that started off in 2008 has had a severe and sustained impact on the economic situation around the world and particularly in the more developed countries such as the US and Europe. As has become evident recently, though there have been signs of recovery in 2009 or 2010, growth prospects with respect to GDP have again deteriorated due to increasing economic and financial uncertainty in particular countries.1 Prospects for employment recovery in general are therefore again less favourable, implying that one expects sustained high unemployment rates and little or no recovery in terms of employ-ment levels. Additionally, the impact of the crisis itself and the period after the crisis with a tendency towards recovery both in terms of GDP growth and employment was quite het-erogeneous across the EU Member States. This heterogeneity of economic developments and prospects is still in place if not increasing further. Similarly, economic sectors suffered differently – both in terms of output and employment – from the crisis and recovered un-evenly if at all. The again unfavourable outlook for the next year and maybe the years to come will also show in a differentiated impact on activity and employment across sectors and countries. In view of these developments and the severe and seemingly long-lasting impacts of the crisis and its prolongation on activity and employment, a European Economic Recovery Plan (EERP) was put in place in November 2008 which also includes the monitoring of employment and the social situation. In this framework, sector-specific developments are analysed in the Employment and Social Situation Quarterly Review, with a special focus on labour market trends in the sectors reviewed.2 The present study further underpins this monitoring of sectoral developments over a longer time horizon and fosters the under-standing of the sectoral implications of the crisis, the recovery phase and the medium-term prospects. To this end, the study aims at a systematic analysis of the longer-term devel-opments, the interdependencies and linkages between sectors, their sensitivity to cyclical variations and measures undertaken, and the strategies implemented by the sectors, aim-ing at reinforcing the employment dimension of the crisis exit and of the EU2020 strategy. In this respect the study provides a comprehensive collection of long-term analyses of key sectoral data across countries and in the EU as a whole, focusing on the sectoral devel-opments and inter-dependencies between sectors. This is done, first, for a set of broad 1 See European Commission (2011), European Economic Forecast – Autumn 2011, DG Economic and Financial Affairs. 2 See http://ec.europa.eu/social/main.jsp?langId=fr&catId=89&newsId=1080&furtherNews=yes.
2
sectors covering a major part of the total economy and, second, for a representative set of detailed sectors. Attention is being paid to longer-term trends, underlying determinants (technological change, labour productivity, outsourcing and restructuring, offshoring), the structures of employment (e.g. by educational attainment categories, gender, etc.), the effects of the crisis and overall employment strategies (e.g. flexicurity measures, work-time schemes) to mitigate the crisis effects. The study therefore provides:
• an overview of historical changes in sectoral employment focusing on long-term trends and an assessment of their sensitivity to cyclical variations and sectoral inter-dependencies;
• an in-depth analysis of recent developments in sectoral employment;
• an assessment of the direct and indirect impacts of the crisis and the measures imple-mented to mitigate its effects on employment in selected sectors;
• an assessment of future employment challenges acknowledging sectoral and country-specific differentiation.
Accompanying the report, a set of stylized facts (‘fiches’) across sectors and countries have been worked out which are presented in the form of fact sheets. A first set of syn-thetic fiches describes the overall trends of broad sectoral aggregates comparing the EU with the US and Japan over a longer time horizon. A second set of sectoral fiches focuses on twelve selected sectors compared across a large set of countries with respect to overall developments and selected sectoral characteristics for the period since 1995 until before the crisis. A third set of country fiches finally compares broad sector developments and characteristics for a set of more than thirty countries, again over a longer time horizon.3 1.2 Impact of the crisis on employment across countries and sectors
The economic crisis has had a differential effect on GDP and the demand for labour across the EU Member States and other countries in the world. The extent of the decline in GDP was particularly large in Ireland and the three Baltic states for example, and these coun-tries have also experienced large-scale job losses. Elsewhere, however, the extent of the reduction in employment varies markedly, even between Member States which have ex-perienced a similar decline in GDP, reflecting differing responses in terms of preserving jobs, either through accepting a decrease in productivity or by reducing hours worked or a combination of both. Accordingly, while the employment rate in the EU as a whole declined by almost 2 percentage points (pps) between the third quarter of 2008 and the third quarter of 2010, it declined by about 9 pps in Latvia, almost 8 pps in Estonia, just under 8 pps in Ireland and around 7 pps in Lithuania as well as Spain. On the other hand, the employ-ment rate increased over this period in Luxembourg, Germany and Malta, even if only 3 These fiches, comprising eight broad sectors, 12 detailed sectors and more than 30 countries, are available from wiiw
upon request.
3
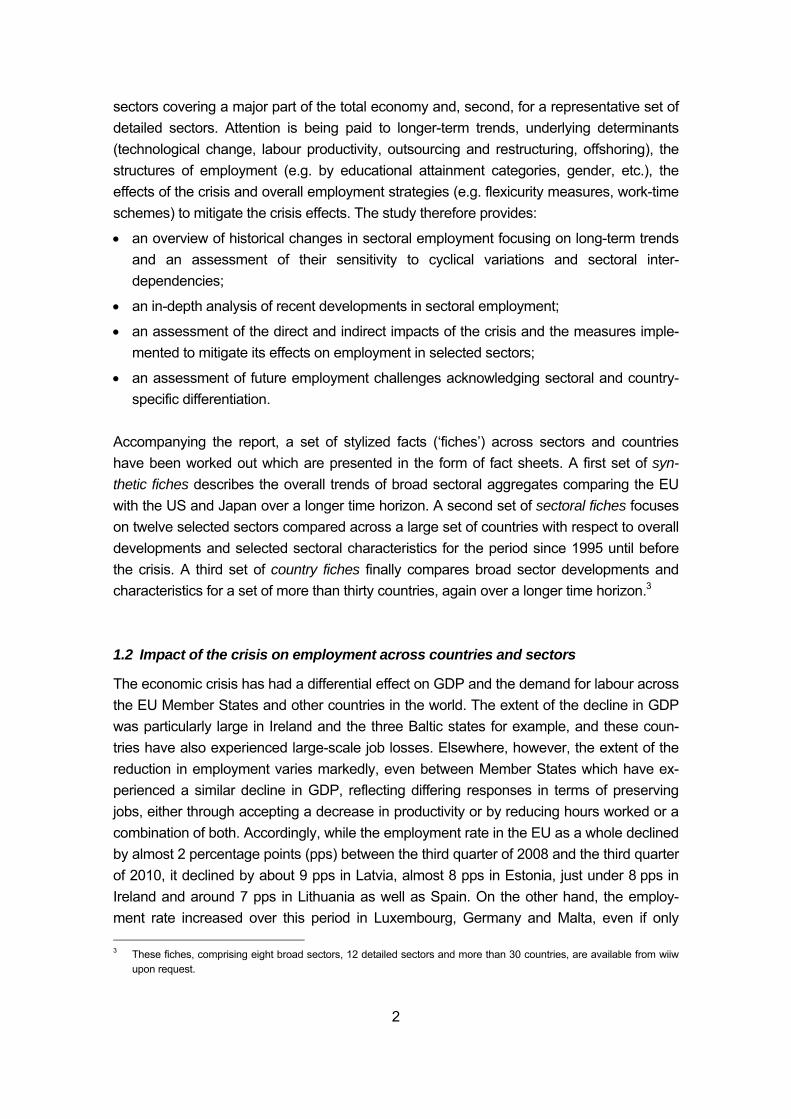
slightly, and remained much the same in Poland (see Table 1.2.1, which shows employ-ment rates for population 15-64). Table 1.2.1
Employment rates (in %)
2007Q3 2008Q3 2009Q3 2010Q3
Austria 72.5 72.8 72.3 72.6Belgium 62.1 62.6 61.4 62.0Bulgaria 62.7 65.0 63.1 60.6Cyprus 71.3 71.0 70.0 70.0Czech Republic 66.3 66.7 65.2 65.4Germany 69.9 71.3 71.0 71.5Denmark 77.1 78.5 76.3 73.8Estonia 70.2 70.4 63.4 62.1Spain 66.0 64.5 59.7 58.9Finland 71.7 72.1 69.3 69.3France 64.9 65.3 64.4 64.4Greene 61.8 62.2 61.7 59.7Hungary 57.7 57.3 55.5 56.0Ireland 70.0 68.0 61.8 60.3Italy 59.1 59.0 57.5 56.7Lithuania 66.1 65.0 60.4 58.5Luxembourg 64.7 63.9 65.8 66.1Latvia 69.0 69.0 59.8 60.6Malta 54.9 56.1 55.1 56.8Netherlands 76.5 77.5 77.0 74.9Poland 57.8 60.0 59.9 60.0Portugal 68.1 68.1 65.8 65.5Romania 60.5 60.5 60.4 60.2Sweden 75.7 75.7 72.9 74.1Slovenia 69.0 70.1 68.3 66.3Slovak Republic 60.7 63.1 60.1 59.2United Kingdom 71.6 71.5 69.8 70.0EU-27 66.0 66.4 64.8 64.6
Source: Eurostat.
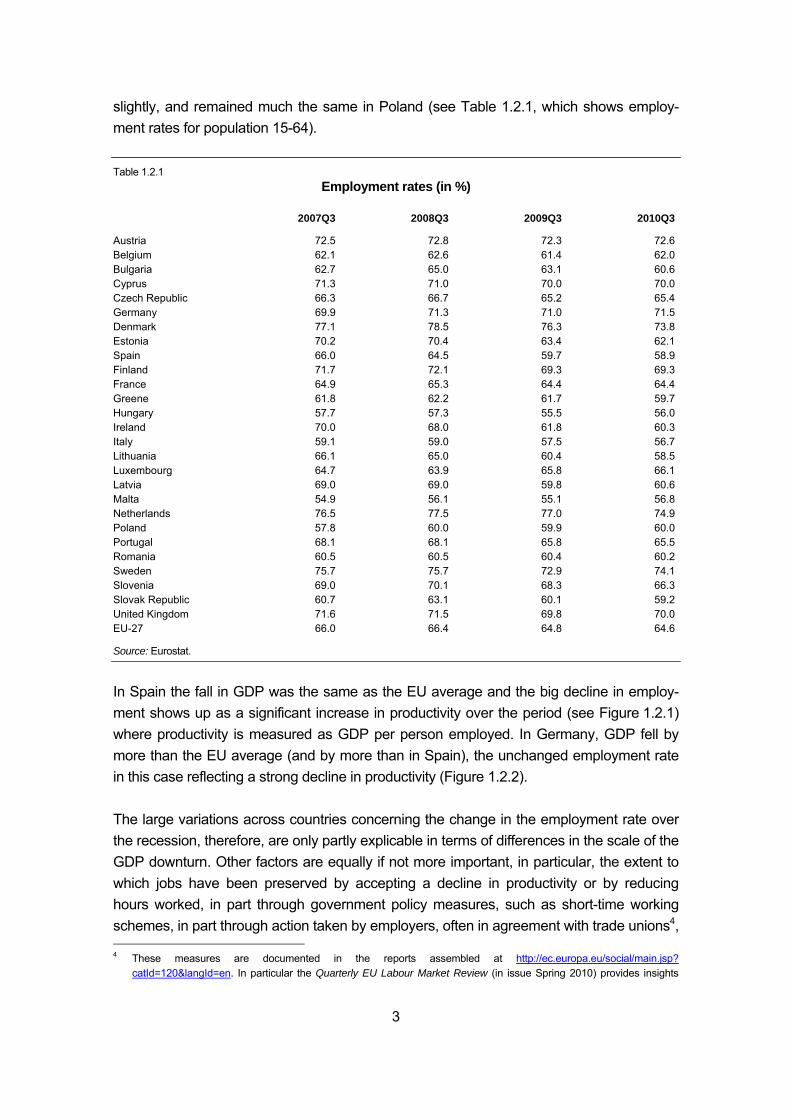
In Spain the fall in GDP was the same as the EU average and the big decline in employ-ment shows up as a significant increase in productivity over the period (see Figure 1.2.1) where productivity is measured as GDP per person employed. In Germany, GDP fell by more than the EU average (and by more than in Spain), the unchanged employment rate in this case reflecting a strong decline in productivity (Figure 1.2.2). The large variations across countries concerning the change in the employment rate over the recession, therefore, are only partly explicable in terms of differences in the scale of the GDP downturn. Other factors are equally if not more important, in particular, the extent to which jobs have been preserved by accepting a decline in productivity or by reducing hours worked, in part through government policy measures, such as short-time working schemes, in part through action taken by employers, often in agreement with trade unions4, 4 These measures are documented in the reports assembled at http://ec.europa.eu/social/main.jsp?
catId=120&langId=en. In particular the Quarterly EU Labour Market Review (in issue Spring 2010) provides insights
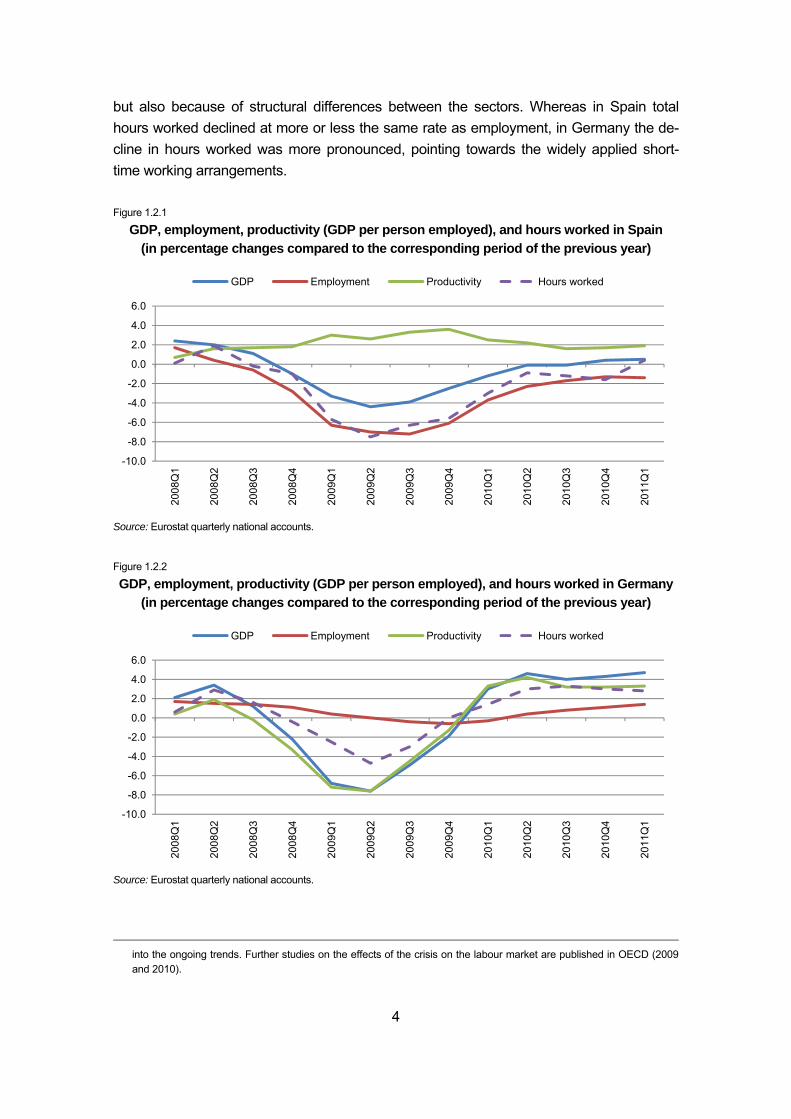
4
but also because of structural differences between the sectors. Whereas in Spain total hours worked declined at more or less the same rate as employment, in Germany the de-cline in hours worked was more pronounced, pointing towards the widely applied short-time working arrangements. Figure 1.2.1
GDP, employment, productivity (GDP per person employed), and hours worked in Spain (in percentage changes compared to the corresponding period of the previous year)
Source: Eurostat quarterly national accounts.
Figure 1.2.2
GDP, employment, productivity (GDP per person employed), and hours worked in Germany (in percentage changes compared to the corresponding period of the previous year)
Source: Eurostat quarterly national accounts.
into the ongoing trends. Further studies on the effects of the crisis on the labour market are published in OECD (2009 and 2010).
-10.0
-8.0
-6.0
-4.0
-2.0
0.0
2.0
4.0
6.0
2008
Q1
2008
Q2
2008
Q3
2008
Q4
2009
Q1
2009
Q2
2009
Q3
2009
Q4
2010
Q1
2010
Q2
2010
Q3
2010
Q4
2011
Q1
GDP Employment Productivity Hours worked
-10.0
-8.0
-6.0
-4.0
-2.0
0.0
2.0
4.0
6.0
2008
Q1
2008
Q2
2008
Q3
2008
Q4
2009
Q1
2009
Q2
2009
Q3
2009
Q4
2010
Q1
2010
Q2
2010
Q3
2010
Q4
2011
Q1
GDP Employment Productivity Hours worked
5
The decline in GDP in 2009 in the EU-27 amounted to just over 4% according to the latest data available, and the latest estimate (European Economic Forecast – Spring 2011) is for growth to have been around 1.8% in 2010 and just under 2% in 2011, much lower than the trend rate of growth before the onset of the crisis. Employment fell by just under 2% in 2009 and is estimated to have declined by 0.5% in 2010, with only a few countries experi-encing any growth in employment, and to grow by just 0.4% in 2011, well below the trend growth of around 1% a year before the recession. Overall, therefore, the employment de-cline in the two years 2008-2010 amounts to 2.4%, equivalent to a net loss of jobs of about 5.6 million. This, however, significantly understates the effect of the recession on employ-ment, since, in the absence of an economic downturn, employment could have been ex-pected to continue increasing at its trend rate, of about 1% a year. This means that the overall job loss relative to what would have happened if the recession had not occurred is at about 4.5% over those two years, or just under 10 million. Nevertheless, the job loss across the EU at present estimated is still less than initially pro-jected at the beginning of 2009 (an overall employment decline of 4%). This is partly be-cause the scale of the decline in GDP seems to have been less (around 2.5% over the two years as against 4%), but also because there were more jobs saved than anticipated, though as indicated above, to very different extents in the individual countries. The effect of the recession across sectors of activity has been equally diverse. According to the broad (6) sector breakdown in the national accounts, gross value-added in industry, excluding construction, in the EU as a whole was just over 12% lower in volume terms in the first quarter of 2010 than two years earlier, and the decline was much the same in construction. On the other hand, in public administration, education, healthcare and personal services, value-added at constant prices was just over 2% higher than two years earlier and in busi-ness and financial services, only just over 1% lower. The effect on employment was simi-larly diverse, the number in work declining by almost 11% in construction over those two years and by 8% in industry, in both cases signalling a decline in labour productivity as measured by value-added per person employed. This was also the case in basic services (distribution, hotels and restaurants and transport), where the fall in employment was some 3 pps less than the decline in value-added (a decline of 2.7% as against one of 5.7%). By contrast, employment increased by 2.5% in public and personal services and declined by under 2% in business and financial services, in both cases in line with the change in value-added. The reasons underlying this diverse experience across sectors, and the possible implications for future developments in the numbers employed, is one of the issues which will be focused on in the study, given that the full effects on employment in the different sectors of the decline in output relative to trend have yet to work themselves out. Much of the difference in the experience between sectors, however, has occurred within the broad sectors distinguished in the national accounts quarterly data. Just as in previous economic downturns in the EU in the early 1980s and the early 1990s, the recession hit
6
investment goods industries, including construction, much harder than consumer goods industries, essentially because investment can be postponed in a way that consumption cannot, though within the latter, durable goods are similar to investment goods in this re-spect.5 This means, in practice, that the effect was more pronounced on the engineering industries, including motor vehicles, and on the sectors supplying inputs into these, as well as on those producing inputs for the construction industry (such as non-metallic mineral products, in particular) than on other parts of the economy. Accordingly, much of the focus of policy aimed at countering the effects of the recession was on these industries. It is, therefore, important to go beyond the broad classification of sectors to examine devel-opments in employment at a level of disaggregation which distinguishes developments within manufacturing. Indeed, such a level of disaggregation is essential for understanding not only the effect of the recession on employment but also the international competitive-ness of economies, which ultimately determines the rate of net job creation which can be sustained, and which despite the growing numbers employed in services, is dependent in most cases on the trade performance of particular manufactures. Moreover, since the recession has had a differential effect on employment in sectors within manufacturing, it is important to examine the sectoral pattern of employment change at the same level of disaggregation as recovery takes place. A key point of interest, therefore, is whether and to what extent the recession may have led to a long-term shift in the sectoral structure of employment, how far the jobs that were lost in the economic downturn are re-gained as growth resumes and how far the sectoral composition of job creation in the re-covery differs from the composition of job loss. A key objective of the study is to explore the mechanisms through which employment in EU economies is affected by global developments, the importance of which has been high-lighted by the crisis, and the interrelationship between the traded goods and services sec-tors which feature prominently in international competition and other parts of the economy which to a large extent are dependent on the success of the former sectors. This requires a systematic analysis of long-term trends in the individual sectors of the economy, disaggre-gated appropriately to bring out the main drivers of growth in the different European economies, the interdependencies and linkages between them, their sensitivity to cyclical fluctuations in activity, and their importance in the process of economic, and employment, recovery. In doing so, a parallel concern is to assess the effectiveness – and the longer-terms consequences – of the various policies that have been implemented with the aim of maintaining employment in the face of the recession and the main elements of the sectoral strategies now required to support economic recovery, as well as to strengthen the resil-ience of the economy against future global downturns. These objectives are described in 5 For an analysis of the sectoral effects of these earlier economic downturns in the EU and a comparison with the initial
effects of the recent recession, see Stehrer and Ward (2010).
7
more detail below when setting out the approach that will be followed in undertaking the different tasks that are part of the study. The study’s main objectives are therefore to present, first, an overview of changes since 1975, as far as data allow, in the sectoral employment structure at EU and Member State level and in the US and Japan to serve as a point of comparison. As far as data allow, in-formation on other European Economic Area countries (Iceland, Liechtenstein, Norway) and candidate countries for EU entry (Croatia, FYROM, Turkey, Serbia) are included. Sec-ond, a detailed analysis of developments in sectoral employment over recent years and the main underlying factors, including in particular trends in globalization and technology, is presented. Third, an assessment is made of the direct and indirect impact of the crisis on employment in the different sectors and of how employment is tending to change as re-covery takes place, especially regarding its sectoral structure. Fourth, a summary of the measures implemented to mitigate the social effects of the crisis on employment and a more detailed review of the measures adopted in selected sectors in the different Member States as well as of their longer-term effects as economic recovery occurs are given. Fi-nally, fifth, an assessment is made of future challenges for employment in the individual sectors, challenges that will need to be overcome as economic recovery takes place in order to both support recovery and ensure that there is a resumption in employment growth. The study, first, undertakes a reasonably comprehensive analysis of sectoral develop-ments in employment across Europe over the long term and of the interrelationships that exist between sectors at different stages of the production chain; those interrelationships increasingly extend beyond national economies with the development of outsourcing and, more generally, the organization of production on a global, or at least European, basis. The impact of the crisis on the individual sectors will be analysed both in overall terms and, in more detail, for a representative selection of sectors. The analysis of the latter will pay par-ticular attention to various related issues, specifically the effect of labour market institutions (such as the extent of employment protection legislation, collective bargaining and, more widely, flexicurity) and employer and job characteristics. These characteristics include e.g. the prevailing size structure of enterprises, the extent of foreign ownership, the skill and education level requirements of jobs, the division of those between men and women, the international environment (in particular, the process of globalization, the degree of out-sourcing, the extent of delocalization of activity and the trends in patterns of trade that re-sult from those developments) and the characteristics of production (such as the degree of capital or labour intensity, expenditure on R&D, the rate of innovation – as reflected in pat-ent applications – and the extent of concentration, or the share of value-added accounted for by a small number of firms) and the way that they are tending to change over time (as reflected in the rate of labour productivity growth and the extent of restructuring).
8
1.3 Data sources, sector classification and selection
The analysis will be mainly based on the EU KLEMS database (www.euklems.net); this database has been specially constructed from national sources to be as comparable as possible between countries and data from the OECD STAN database (based on ISIC rev. 3) and will be supplemented where necessary by data from the sectoral divisions in the Eurostat National Accounts (which distinguishes 60 NACE rev. 1 2-digit sectors), and as consistent as possible over time, and from the Structural Business Statistics (SBS). All four databases (though the SBS tends to be less complete for some countries) have the merit of containing most of the variables that are needed to carry out the analysis, including total hours worked to provide an indication both of changes in average hours worked (in combination with the total number employed) and of labour productivity, as defined in terms of value-added per unit of labour input. Part of the analysis in the next chapters is using the European Labour Force Survey data (EU LFS) which provide detailed informa-tion on the structure of employment in several dimensions, as outlined in detail below (see Section 2.2). Further data from national sources will be used only as a last resort because of the likely problems of comparability with the data for other countries. At the sectoral level, the study will distinguish employment development by NACE 1-digit sector (i.e. in terms of the division by letter – A, B, etc. according to NACE rev. 2) with dis-aggregation to the NACE 2-digit level for selected sectors. In practice, most of the analysis will be conducted in terms of sectors as defined by the NACE rev. 1.1 classification, since these are the only data which go back sufficiently far in time to identify trends, though these will be aligned with the NACE rev. 2 classification.6 The broad sector breakdown (NACE rev. 2) that serves as a basis for the selection of particular sectors and for which a more detailed analysis will be performed in the following sections is, therefore, as indicated in Table 1.3.1. Such a division, however, is not sufficient to bring out the main underlying trends and to distinguish between tradable and non-tradable goods and services, which is a key part of the analysis. Though there is no clear-cut distinction between those two categories of goods and services – and increasingly less so over time along with the development of the internet and the possibility of remote delivery of services – the international competitive-ness of economies, as reflected in their trade performance, remains an essential determi-nant of the rate of economic growth that can be sustained. It also remains the case that manufactures dominate international trade flows. Despite the tertiarization of economies, manufactures still account for about three-quarters of total exports and imports in most cases and, even in the EU economies for which trade in services is most developed, have shown only a slight tendency to decline in importance over time. Moreover, within manu- 6 Since the bases of the two classifications are different, NACE rev. 1 being based on a division according to the goods
and services produced, NACE rev. 2 on a division according to the activity performed, it is inevitable that there will be differences, but, in practice, these are relatively small for most sectors.
9
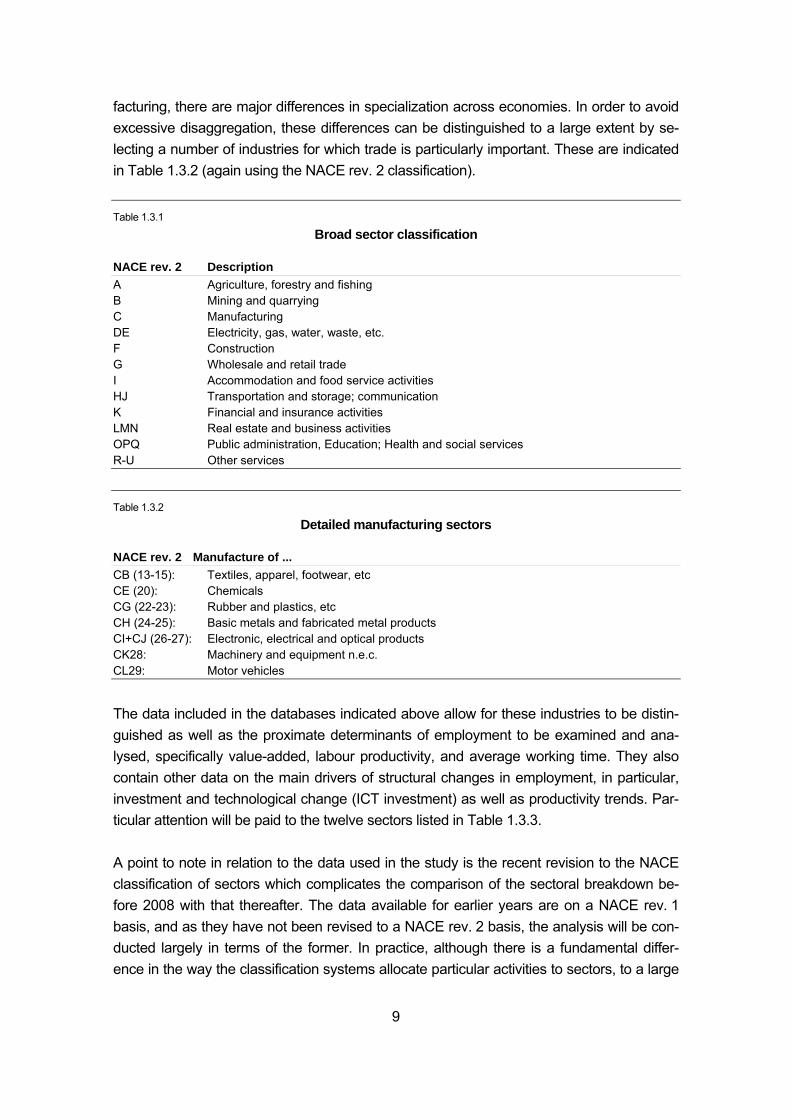
facturing, there are major differences in specialization across economies. In order to avoid excessive disaggregation, these differences can be distinguished to a large extent by se-lecting a number of industries for which trade is particularly important. These are indicated in Table 1.3.2 (again using the NACE rev. 2 classification). Table 1.3.1
Broad sector classification
NACE rev. 2 Description A Agriculture, forestry and fishing B Mining and quarrying C Manufacturing DE Electricity, gas, water, waste, etc. F Construction G Wholesale and retail trade I Accommodation and food service activities HJ Transportation and storage; communication K Financial and insurance activities LMN Real estate and business activities OPQ Public administration, Education; Health and social services R-U Other services
Table 1.3.2
Detailed manufacturing sectors
NACE rev. 2 Manufacture of ... CB (13-15): Textiles, apparel, footwear, etc CE (20): Chemicals CG (22-23): Rubber and plastics, etc CH (24-25): Basic metals and fabricated metal products CI+CJ (26-27): Electronic, electrical and optical products CK28: Machinery and equipment n.e.c. CL29: Motor vehicles
The data included in the databases indicated above allow for these industries to be distin-guished as well as the proximate determinants of employment to be examined and ana-lysed, specifically value-added, labour productivity, and average working time. They also contain other data on the main drivers of structural changes in employment, in particular, investment and technological change (ICT investment) as well as productivity trends. Par-ticular attention will be paid to the twelve sectors listed in Table 1.3.3. A point to note in relation to the data used in the study is the recent revision to the NACE classification of sectors which complicates the comparison of the sectoral breakdown be-fore 2008 with that thereafter. The data available for earlier years are on a NACE rev. 1 basis, and as they have not been revised to a NACE rev. 2 basis, the analysis will be con-ducted largely in terms of the former. In practice, although there is a fundamental differ-ence in the way the classification systems allocate particular activities to sectors, to a large
10
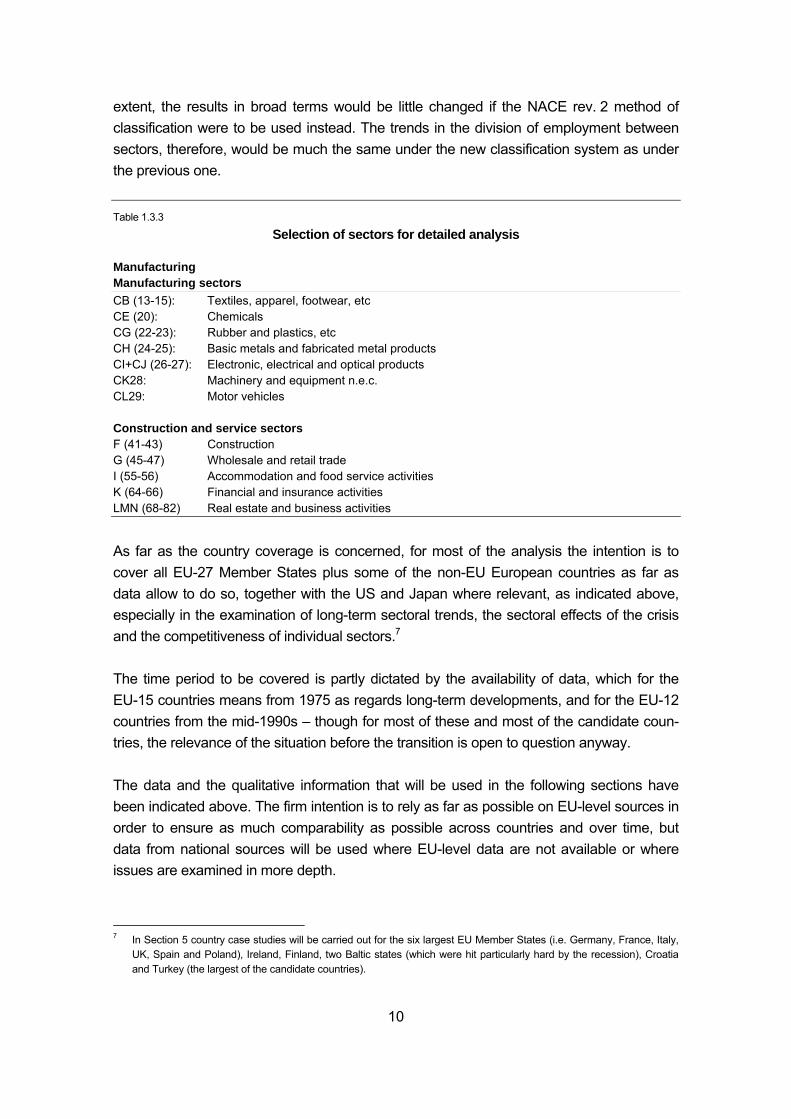
extent, the results in broad terms would be little changed if the NACE rev. 2 method of classification were to be used instead. The trends in the division of employment between sectors, therefore, would be much the same under the new classification system as under the previous one. Table 1.3.3
Selection of sectors for detailed analysis
Manufacturing Manufacturing sectors CB (13-15): Textiles, apparel, footwear, etc CE (20): Chemicals CG (22-23): Rubber and plastics, etc CH (24-25): Basic metals and fabricated metal products CI+CJ (26-27): Electronic, electrical and optical products CK28: Machinery and equipment n.e.c. CL29: Motor vehicles Construction and service sectors F (41-43) Construction G (45-47) Wholesale and retail trade I (55-56) Accommodation and food service activities K (64-66) Financial and insurance activities LMN (68-82) Real estate and business activities
As far as the country coverage is concerned, for most of the analysis the intention is to cover all EU-27 Member States plus some of the non-EU European countries as far as data allow to do so, together with the US and Japan where relevant, as indicated above, especially in the examination of long-term sectoral trends, the sectoral effects of the crisis and the competitiveness of individual sectors.7 The time period to be covered is partly dictated by the availability of data, which for the EU-15 countries means from 1975 as regards long-term developments, and for the EU-12 countries from the mid-1990s – though for most of these and most of the candidate coun-tries, the relevance of the situation before the transition is open to question anyway. The data and the qualitative information that will be used in the following sections have been indicated above. The firm intention is to rely as far as possible on EU-level sources in order to ensure as much comparability as possible across countries and over time, but data from national sources will be used where EU-level data are not available or where issues are examined in more depth.
7 In Section 5 country case studies will be carried out for the six largest EU Member States (i.e. Germany, France, Italy,
UK, Spain and Poland), Ireland, Finland, two Baltic states (which were hit particularly hard by the recession), Croatia and Turkey (the largest of the candidate countries).
11
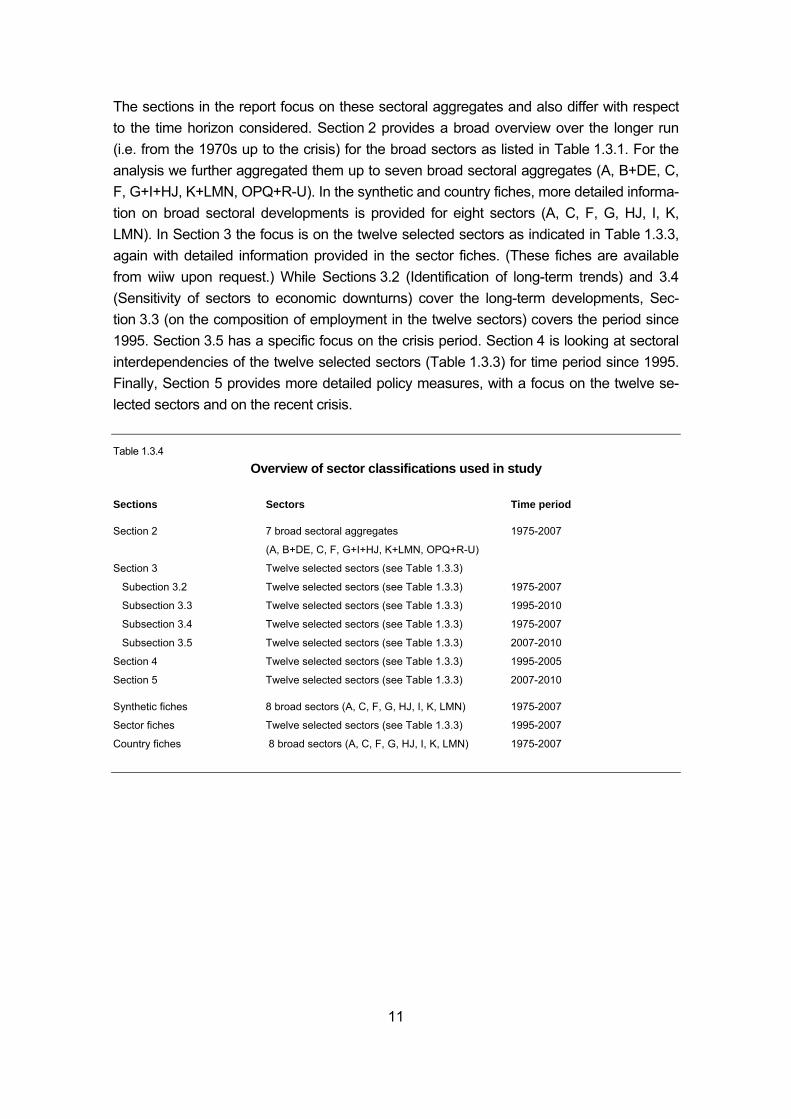
The sections in the report focus on these sectoral aggregates and also differ with respect to the time horizon considered. Section 2 provides a broad overview over the longer run (i.e. from the 1970s up to the crisis) for the broad sectors as listed in Table 1.3.1. For the analysis we further aggregated them up to seven broad sectoral aggregates (A, B+DE, C, F, G+I+HJ, K+LMN, OPQ+R-U). In the synthetic and country fiches, more detailed informa-tion on broad sectoral developments is provided for eight sectors (A, C, F, G, HJ, I, K, LMN). In Section 3 the focus is on the twelve selected sectors as indicated in Table 1.3.3, again with detailed information provided in the sector fiches. (These fiches are available from wiiw upon request.) While Sections 3.2 (Identification of long-term trends) and 3.4 (Sensitivity of sectors to economic downturns) cover the long-term developments, Sec-tion 3.3 (on the composition of employment in the twelve sectors) covers the period since 1995. Section 3.5 has a specific focus on the crisis period. Section 4 is looking at sectoral interdependencies of the twelve selected sectors (Table 1.3.3) for time period since 1995. Finally, Section 5 provides more detailed policy measures, with a focus on the twelve se-lected sectors and on the recent crisis. Table 1.3.4
Overview of sector classifications used in study
Sections Sectors Time period
Section 2 7 broad sectoral aggregates 1975-2007
(A, B+DE, C, F, G+I+HJ, K+LMN, OPQ+R-U)
Section 3 Twelve selected sectors (see Table 1.3.3)
Subection 3.2 Twelve selected sectors (see Table 1.3.3) 1975-2007
Subsection 3.3 Twelve selected sectors (see Table 1.3.3) 1995-2010
Subsection 3.4 Twelve selected sectors (see Table 1.3.3) 1975-2007
Subsection 3.5 Twelve selected sectors (see Table 1.3.3) 2007-2010
Section 4 Twelve selected sectors (see Table 1.3.3) 1995-2005
Section 5 Twelve selected sectors (see Table 1.3.3) 2007-2010
Synthetic fiches 8 broad sectors (A, C, F, G, HJ, I, K, LMN) 1975-2007
Sector fiches Twelve selected sectors (see Table 1.3.3) 1995-2007
Country fiches 8 broad sectors (A, C, F, G, HJ, I, K, LMN) 1975-2007
12
2 Long-term trends in the sectoral structure of employment
2.1 Introduction
In this section we provide an overview of long-term trends in employment and employment patterns by broad industries as well as the changes over time. We will do this, first, for seven broad sectors which will be defined in more detail below and for four country groups: the EU-15, the US, Japan and – though only for a shorter time period – the EU-12. For this we mostly rely on the EU KLEMS database (release November 2009) which provides the information for drawing an overall picture and also allows for relating the trends to impor-tant determinants with respect to employment growth. The time span covered is from 1975 to 2007 (though depending on data availability), i.e. the year before the ‘Great Recession’ set in, though with some variation concerning coverage by country. The variables that we will look at first are employment, value-added, hours worked and, derived from these, the number of average hours worked (per employed person) and labour productivity.8 Specifically, the chapter provides:
• an overview over long-term trends (1975-2007) by broad country groups and broad sectors concerning growth in employment, value-added, hours worked, and labour pro-ductivity;
• the respective changes in the above-mentioned variables for a shorter time period (1995-2007), allowing for an inclusion of the EU-12 countries in the phase of the Euro-pean integration process;
• a discussion of the determinants of changes in employment at the sectoral level, to be analysed in more detail in Section 3.
• Accompanying this study is a set of synthetic fiches covering eight of the broad sectors as indicated in Table 1.3.1 and developments in the EU-15 and EU-109, the US and Ja-pan. Country-level details on sectoral developments are provided in the country fiches which are also accompanying this study (these fiche are available upon request).
2.2 Long-term growth trends
Table 2.2.1 shows the long-term growth rates for the EU-15, Japan and the USA for which longer time series are available. Starting with value-added growth (which is in constant prices 1995) there is a difference of about half a percentage point between the EU-15 and the US and Japan, which reached an almost 3% growth rate in the long run. In terms of employment growth, one can see that
8 Detailed country and sector comparisons are provided in a set of synthetic fiches, sector fiches and country fiches in
the appendix to this report. 9 The EU-10 refers to the new Member States not including Bulgaria and Romania.
13
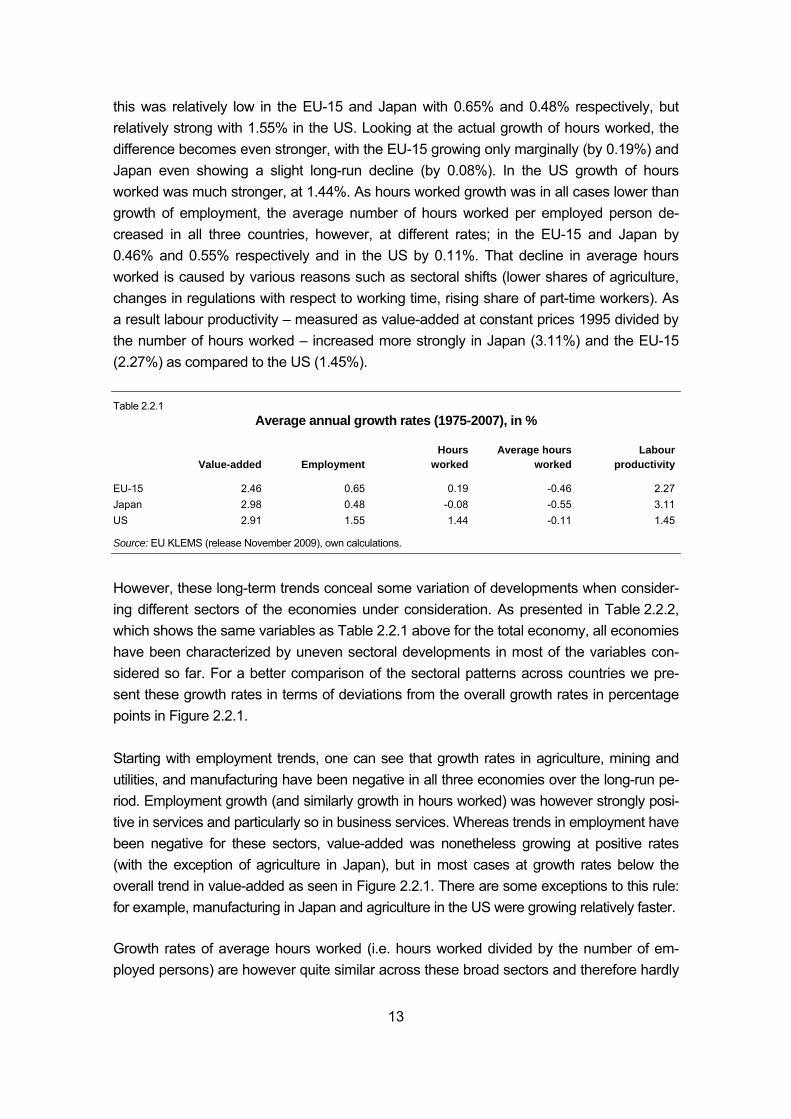
this was relatively low in the EU-15 and Japan with 0.65% and 0.48% respectively, but relatively strong with 1.55% in the US. Looking at the actual growth of hours worked, the difference becomes even stronger, with the EU-15 growing only marginally (by 0.19%) and Japan even showing a slight long-run decline (by 0.08%). In the US growth of hours worked was much stronger, at 1.44%. As hours worked growth was in all cases lower than growth of employment, the average number of hours worked per employed person de-creased in all three countries, however, at different rates; in the EU-15 and Japan by 0.46% and 0.55% respectively and in the US by 0.11%. That decline in average hours worked is caused by various reasons such as sectoral shifts (lower shares of agriculture, changes in regulations with respect to working time, rising share of part-time workers). As a result labour productivity – measured as value-added at constant prices 1995 divided by the number of hours worked – increased more strongly in Japan (3.11%) and the EU-15 (2.27%) as compared to the US (1.45%). Table 2.2.1
Average annual growth rates (1975-2007), in %
Value-added EmploymentHours
workedAverage hours
worked Labour
productivity
EU-15 2.46 0.65 0.19 -0.46 2.27Japan 2.98 0.48 -0.08 -0.55 3.11US 2.91 1.55 1.44 -0.11 1.45
Source: EU KLEMS (release November 2009), own calculations.
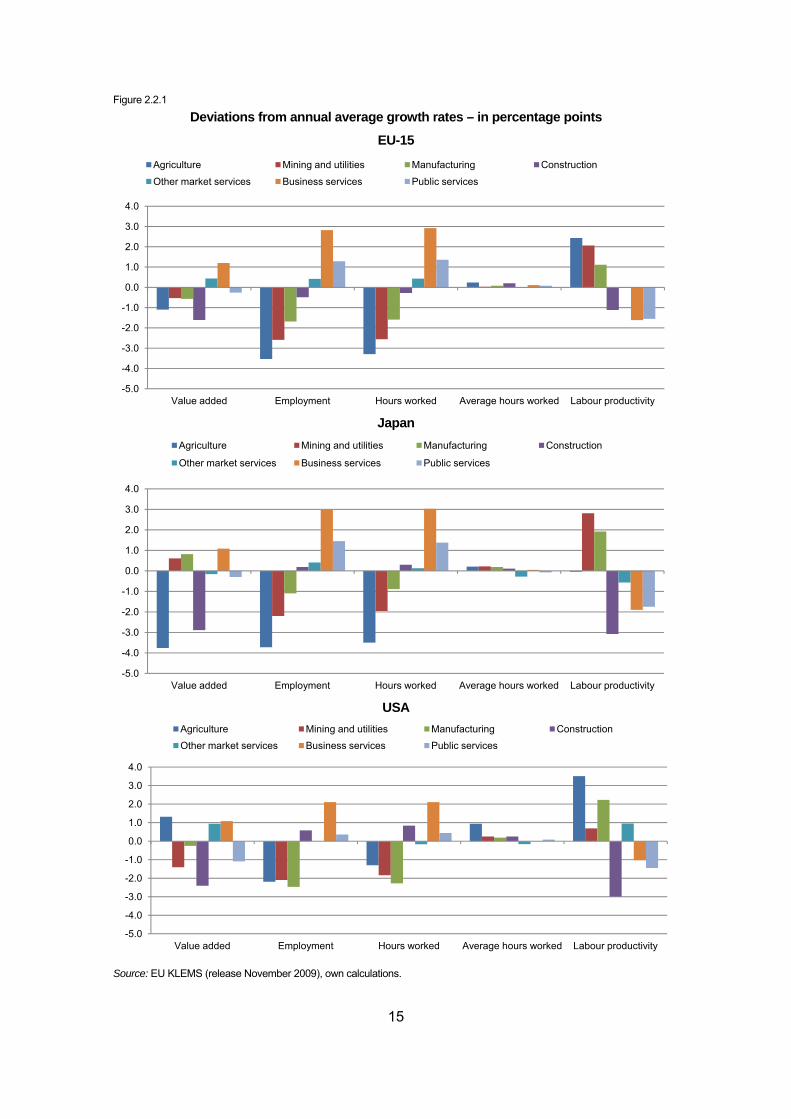
However, these long-term trends conceal some variation of developments when consider-ing different sectors of the economies under consideration. As presented in Table 2.2.2, which shows the same variables as Table 2.2.1 above for the total economy, all economies have been characterized by uneven sectoral developments in most of the variables con-sidered so far. For a better comparison of the sectoral patterns across countries we pre-sent these growth rates in terms of deviations from the overall growth rates in percentage points in Figure 2.2.1. Starting with employment trends, one can see that growth rates in agriculture, mining and utilities, and manufacturing have been negative in all three economies over the long-run pe-riod. Employment growth (and similarly growth in hours worked) was however strongly posi-tive in services and particularly so in business services. Whereas trends in employment have been negative for these sectors, value-added was nonetheless growing at positive rates (with the exception of agriculture in Japan), but in most cases at growth rates below the overall trend in value-added as seen in Figure 2.2.1. There are some exceptions to this rule: for example, manufacturing in Japan and agriculture in the US were growing relatively faster. Growth rates of average hours worked (i.e. hours worked divided by the number of em-ployed persons) are however quite similar across these broad sectors and therefore hardly
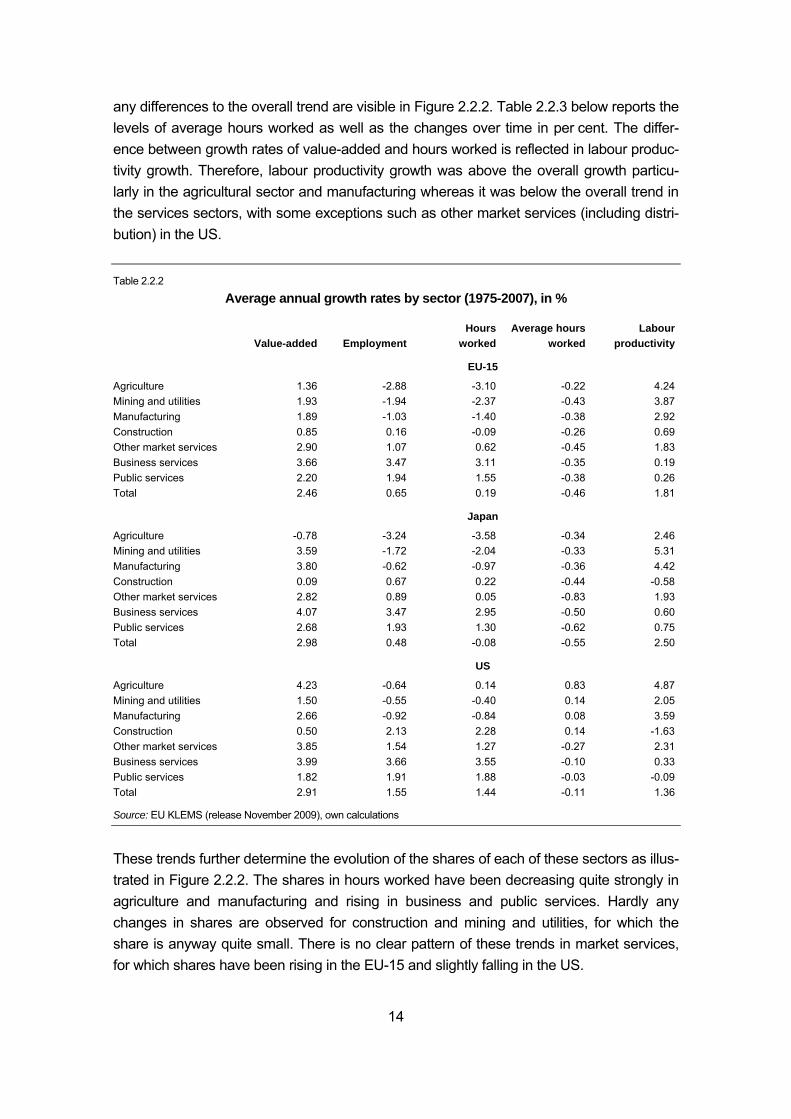
14
any differences to the overall trend are visible in Figure 2.2.2. Table 2.2.3 below reports the levels of average hours worked as well as the changes over time in per cent. The differ-ence between growth rates of value-added and hours worked is reflected in labour produc-tivity growth. Therefore, labour productivity growth was above the overall growth particu-larly in the agricultural sector and manufacturing whereas it was below the overall trend in the services sectors, with some exceptions such as other market services (including distri-bution) in the US. Table 2.2.2
Average annual growth rates by sector (1975-2007), in %
Value-added EmploymentHours
workedAverage hours
worked Labour
productivity
EU-15
Agriculture 1.36 -2.88 -3.10 -0.22 4.24Mining and utilities 1.93 -1.94 -2.37 -0.43 3.87Manufacturing 1.89 -1.03 -1.40 -0.38 2.92Construction 0.85 0.16 -0.09 -0.26 0.69Other market services 2.90 1.07 0.62 -0.45 1.83Business services 3.66 3.47 3.11 -0.35 0.19Public services 2.20 1.94 1.55 -0.38 0.26Total 2.46 0.65 0.19 -0.46 1.81
Japan
Agriculture -0.78 -3.24 -3.58 -0.34 2.46Mining and utilities 3.59 -1.72 -2.04 -0.33 5.31Manufacturing 3.80 -0.62 -0.97 -0.36 4.42Construction 0.09 0.67 0.22 -0.44 -0.58Other market services 2.82 0.89 0.05 -0.83 1.93Business services 4.07 3.47 2.95 -0.50 0.60Public services 2.68 1.93 1.30 -0.62 0.75Total 2.98 0.48 -0.08 -0.55 2.50
US
Agriculture 4.23 -0.64 0.14 0.83 4.87Mining and utilities 1.50 -0.55 -0.40 0.14 2.05Manufacturing 2.66 -0.92 -0.84 0.08 3.59Construction 0.50 2.13 2.28 0.14 -1.63Other market services 3.85 1.54 1.27 -0.27 2.31Business services 3.99 3.66 3.55 -0.10 0.33Public services 1.82 1.91 1.88 -0.03 -0.09Total 2.91 1.55 1.44 -0.11 1.36
Source: EU KLEMS (release November 2009), own calculations
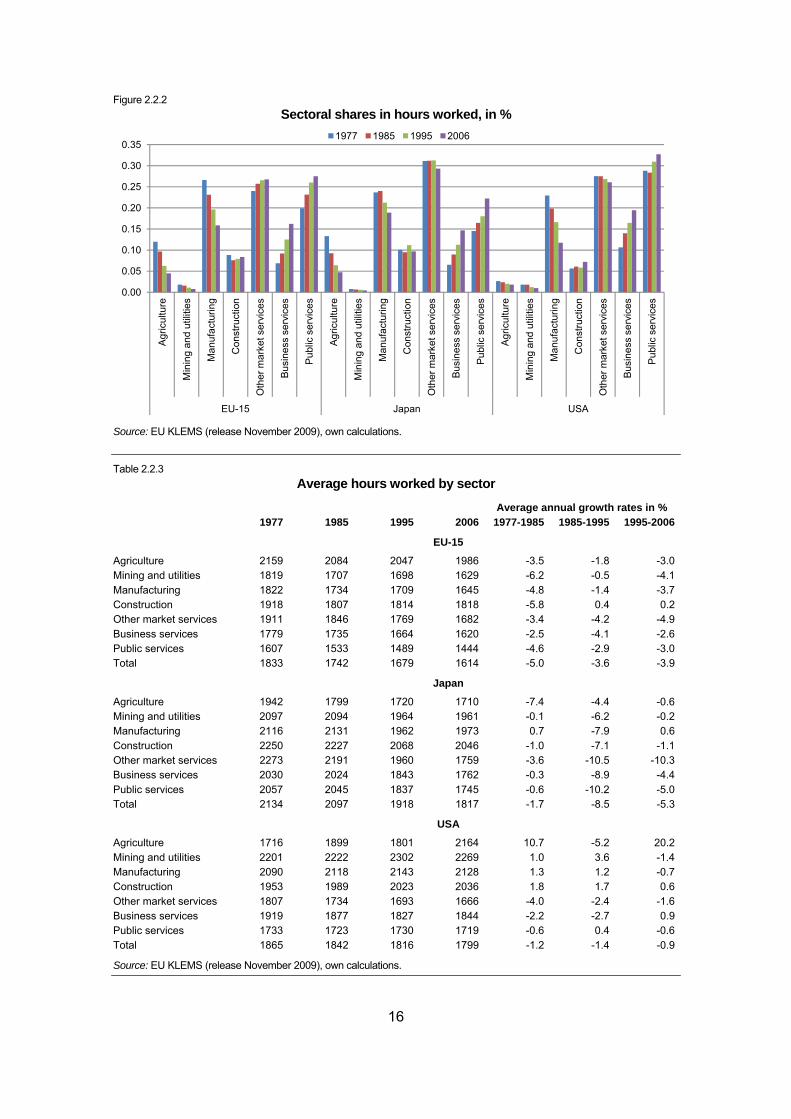
These trends further determine the evolution of the shares of each of these sectors as illus-trated in Figure 2.2.2. The shares in hours worked have been decreasing quite strongly in agriculture and manufacturing and rising in business and public services. Hardly any changes in shares are observed for construction and mining and utilities, for which the share is anyway quite small. There is no clear pattern of these trends in market services, for which shares have been rising in the EU-15 and slightly falling in the US.
15
Figure 2.2.1
Deviations from annual average growth rates – in percentage points
EU-15
Japan
USA
Source: EU KLEMS (release November 2009), own calculations.
-5.0
-4.0
-3.0
-2.0
-1.0
0.0
1.0
2.0
3.0
4.0
Value added Employment Hours worked Average hours worked Labour productivity
Agriculture Mining and utilities Manufacturing Construction
Other market services Business services Public services
-5.0
-4.0
-3.0
-2.0
-1.0
0.0
1.0
2.0
3.0
4.0
Value added Employment Hours worked Average hours worked Labour productivity
Agriculture Mining and utilities Manufacturing Construction
Other market services Business services Public services
-5.0
-4.0
-3.0
-2.0
-1.0
0.0
1.0
2.0
3.0
4.0
Value added Employment Hours worked Average hours worked Labour productivity
Agriculture Mining and utilities Manufacturing Construction
Other market services Business services Public services
16
Figure 2.2.2 Sectoral shares in hours worked, in %
Source: EU KLEMS (release November 2009), own calculations. Table 2.2.3
Average hours worked by sector Average annual growth rates in %
1977 1985 1995 2006 1977-1985 1985-1995 1995-2006
EU-15
Agriculture 2159 2084 2047 1986 -3.5 -1.8 -3.0Mining and utilities 1819 1707 1698 1629 -6.2 -0.5 -4.1Manufacturing 1822 1734 1709 1645 -4.8 -1.4 -3.7Construction 1918 1807 1814 1818 -5.8 0.4 0.2Other market services 1911 1846 1769 1682 -3.4 -4.2 -4.9Business services 1779 1735 1664 1620 -2.5 -4.1 -2.6Public services 1607 1533 1489 1444 -4.6 -2.9 -3.0Total 1833 1742 1679 1614 -5.0 -3.6 -3.9
Japan
Agriculture 1942 1799 1720 1710 -7.4 -4.4 -0.6Mining and utilities 2097 2094 1964 1961 -0.1 -6.2 -0.2Manufacturing 2116 2131 1962 1973 0.7 -7.9 0.6Construction 2250 2227 2068 2046 -1.0 -7.1 -1.1Other market services 2273 2191 1960 1759 -3.6 -10.5 -10.3Business services 2030 2024 1843 1762 -0.3 -8.9 -4.4Public services 2057 2045 1837 1745 -0.6 -10.2 -5.0Total 2134 2097 1918 1817 -1.7 -8.5 -5.3
USA
Agriculture 1716 1899 1801 2164 10.7 -5.2 20.2Mining and utilities 2201 2222 2302 2269 1.0 3.6 -1.4Manufacturing 2090 2118 2143 2128 1.3 1.2 -0.7Construction 1953 1989 2023 2036 1.8 1.7 0.6Other market services 1807 1734 1693 1666 -4.0 -2.4 -1.6Business services 1919 1877 1827 1844 -2.2 -2.7 0.9Public services 1733 1723 1730 1719 -0.6 0.4 -0.6Total 1865 1842 1816 1799 -1.2 -1.4 -0.9
Source: EU KLEMS (release November 2009), own calculations.
0.00
0.05
0.10
0.15
0.20
0.25
0.30
0.35
Agr
icul
ture
Min
ing
and
utili
ties
Man
ufac
turin
g
Con
stru
ctio
n
Oth
er m
arke
t ser
vice
s
Busi
ness
ser
vice
s
Pub
lic s
ervi
ces
Agr
icul
ture
Min
ing
and
utili
ties
Man
ufac
turin
g
Con
stru
ctio
n
Oth
er m
arke
t ser
vice
s
Busi
ness
ser
vice
s
Pub
lic s
ervi
ces
Agr
icul
ture
Min
ing
and
utili
ties
Man
ufac
turin
g
Con
stru
ctio
n
Oth
er m
arke
t ser
vice
s
Busi
ness
ser
vice
s
Pub
lic s
ervi
ces
EU-15 Japan USA
1977 1985 1995 2006
17
2.3 Overall economic and employment patterns and changes up to 2007
So far we have only described the developments in the long run, i.e. starting in the 1970s up to the mid-2000s. However, for a better understanding of the more recent patterns and trends in Europe as compared to the US and Japan, it is necessary to consider a shorter period. The situation in Europe has changed quite dramatically with the breakdown of the Iron Curtain in 1989 and the transition of the former communist countries to market econo-mies which resulted in an enlargement of the European Union in 2004 and 2007 to 27 countries. That event on top of the anyway ongoing trends has led to a strong integration process of European countries amongst themselves but at the same time also in a more global sense due to increased internationalization worldwide. Therefore, in this section we consider this more recent period for a set of four countries/country groups: EU-15, EU-10, Japan and the US, also providing information on internationalization tendencies, changes in export and import markets for these economies and the international competitiveness along with an overview of important changes in regulatory frameworks in this period. In our analysis we start from the year 1995, on the one hand for practical purposes be-cause since then consistent and comparable data are available for all countries under con-sideration with respect to the most important variables examined in this study, on the other hand because 1995 marks a year when the EU was enlarged to 15 countries and most of the transition countries started to grow again after the transformational recession that had hit them at the beginning of the 1990s. The last year considered is 2007, with an analysis of the crisis period 2008-2010 left for a more detailed discussion in the next section. Table 2.3.1
Average annual growth rates 1995-2007, in %
Value-added EmploymentHours
workedAverage
hours worked Labour
productivity
EU-10 3.46 0.06 -0.13 -0.20 3.61
EU-15 2.38 1.20 0.86 -0.33 1.50
Japan 1.37 -0.30 -0.76 -0.47 2.15
USA 3.01 1.25 1.16 -0.08 1.83
Source: EU KLEMS (release November 2009), own calculations.
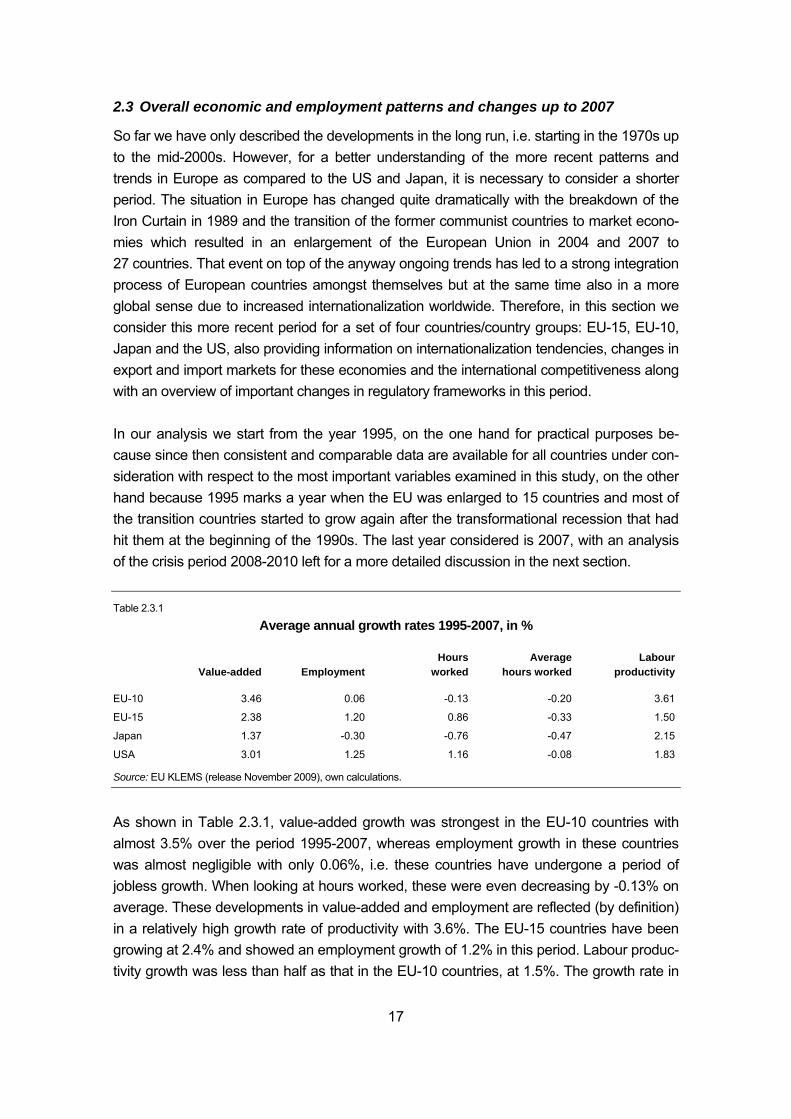
As shown in Table 2.3.1, value-added growth was strongest in the EU-10 countries with almost 3.5% over the period 1995-2007, whereas employment growth in these countries was almost negligible with only 0.06%, i.e. these countries have undergone a period of jobless growth. When looking at hours worked, these were even decreasing by -0.13% on average. These developments in value-added and employment are reflected (by definition) in a relatively high growth rate of productivity with 3.6%. The EU-15 countries have been growing at 2.4% and showed an employment growth of 1.2% in this period. Labour produc-tivity growth was less than half as that in the EU-10 countries, at 1.5%. The growth rate in
18
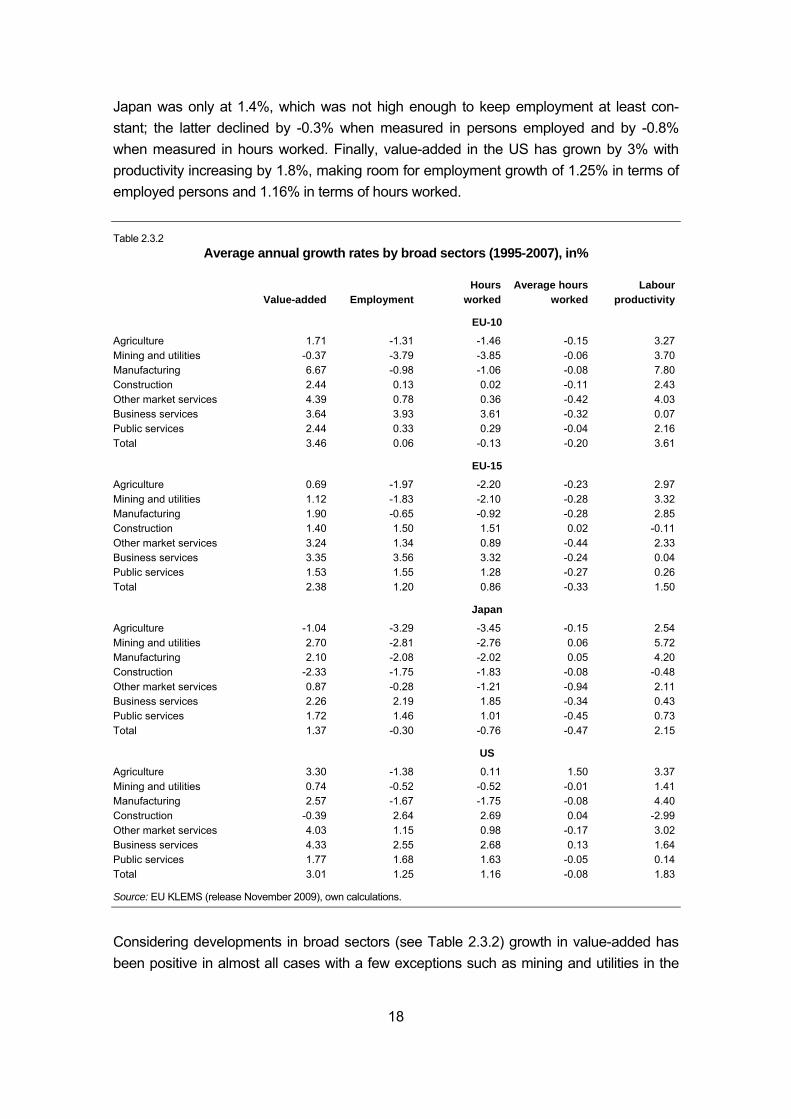
Japan was only at 1.4%, which was not high enough to keep employment at least con-stant; the latter declined by -0.3% when measured in persons employed and by -0.8% when measured in hours worked. Finally, value-added in the US has grown by 3% with productivity increasing by 1.8%, making room for employment growth of 1.25% in terms of employed persons and 1.16% in terms of hours worked. Table 2.3.2
Average annual growth rates by broad sectors (1995-2007), in%
Value-added EmploymentHours
workedAverage hours
worked Labour
productivity
EU-10
Agriculture 1.71 -1.31 -1.46 -0.15 3.27Mining and utilities -0.37 -3.79 -3.85 -0.06 3.70Manufacturing 6.67 -0.98 -1.06 -0.08 7.80Construction 2.44 0.13 0.02 -0.11 2.43Other market services 4.39 0.78 0.36 -0.42 4.03Business services 3.64 3.93 3.61 -0.32 0.07Public services 2.44 0.33 0.29 -0.04 2.16Total 3.46 0.06 -0.13 -0.20 3.61
EU-15
Agriculture 0.69 -1.97 -2.20 -0.23 2.97Mining and utilities 1.12 -1.83 -2.10 -0.28 3.32Manufacturing 1.90 -0.65 -0.92 -0.28 2.85Construction 1.40 1.50 1.51 0.02 -0.11Other market services 3.24 1.34 0.89 -0.44 2.33Business services 3.35 3.56 3.32 -0.24 0.04Public services 1.53 1.55 1.28 -0.27 0.26Total 2.38 1.20 0.86 -0.33 1.50
Japan
Agriculture -1.04 -3.29 -3.45 -0.15 2.54Mining and utilities 2.70 -2.81 -2.76 0.06 5.72Manufacturing 2.10 -2.08 -2.02 0.05 4.20Construction -2.33 -1.75 -1.83 -0.08 -0.48Other market services 0.87 -0.28 -1.21 -0.94 2.11Business services 2.26 2.19 1.85 -0.34 0.43Public services 1.72 1.46 1.01 -0.45 0.73Total 1.37 -0.30 -0.76 -0.47 2.15
US
Agriculture 3.30 -1.38 0.11 1.50 3.37Mining and utilities 0.74 -0.52 -0.52 -0.01 1.41Manufacturing 2.57 -1.67 -1.75 -0.08 4.40Construction -0.39 2.64 2.69 0.04 -2.99Other market services 4.03 1.15 0.98 -0.17 3.02Business services 4.33 2.55 2.68 0.13 1.64Public services 1.77 1.68 1.63 -0.05 0.14Total 3.01 1.25 1.16 -0.08 1.83
Source: EU KLEMS (release November 2009), own calculations.
Considering developments in broad sectors (see Table 2.3.2) growth in value-added has been positive in almost all cases with a few exceptions such as mining and utilities in the
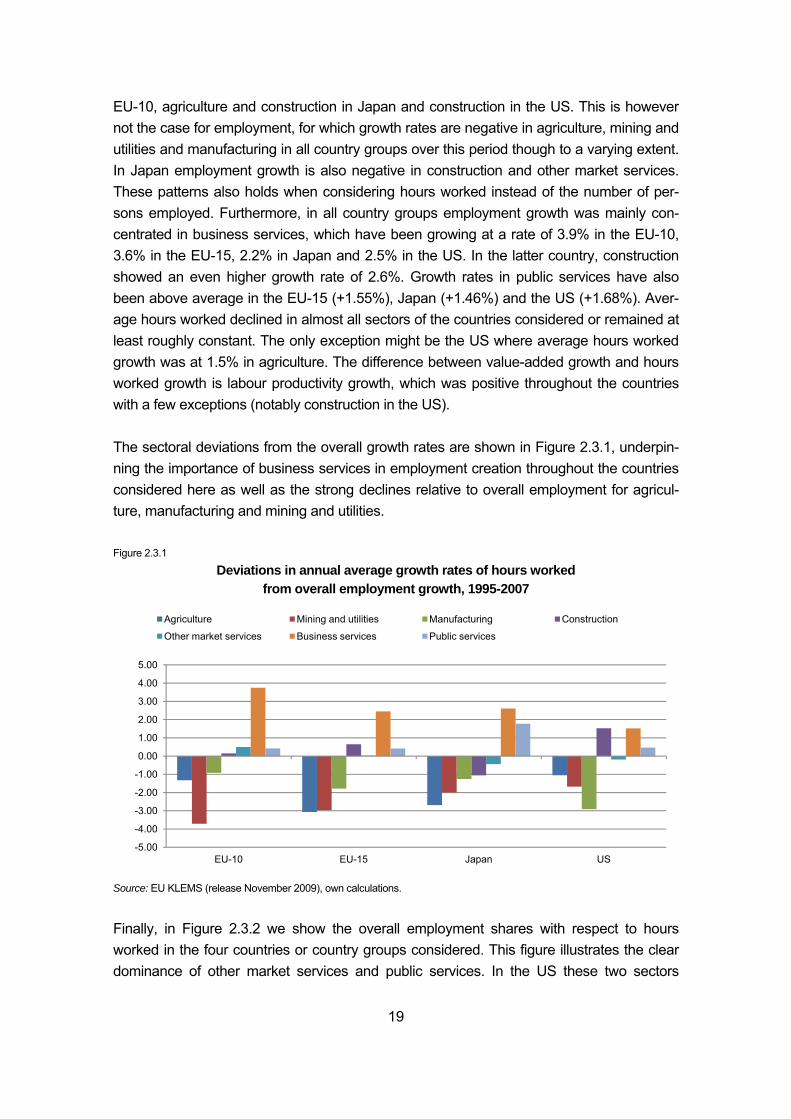
19
EU-10, agriculture and construction in Japan and construction in the US. This is however not the case for employment, for which growth rates are negative in agriculture, mining and utilities and manufacturing in all country groups over this period though to a varying extent. In Japan employment growth is also negative in construction and other market services. These patterns also holds when considering hours worked instead of the number of per-sons employed. Furthermore, in all country groups employment growth was mainly con-centrated in business services, which have been growing at a rate of 3.9% in the EU-10, 3.6% in the EU-15, 2.2% in Japan and 2.5% in the US. In the latter country, construction showed an even higher growth rate of 2.6%. Growth rates in public services have also been above average in the EU-15 (+1.55%), Japan (+1.46%) and the US (+1.68%). Aver-age hours worked declined in almost all sectors of the countries considered or remained at least roughly constant. The only exception might be the US where average hours worked growth was at 1.5% in agriculture. The difference between value-added growth and hours worked growth is labour productivity growth, which was positive throughout the countries with a few exceptions (notably construction in the US). The sectoral deviations from the overall growth rates are shown in Figure 2.3.1, underpin-ning the importance of business services in employment creation throughout the countries considered here as well as the strong declines relative to overall employment for agricul-ture, manufacturing and mining and utilities. Figure 2.3.1
Deviations in annual average growth rates of hours worked from overall employment growth, 1995-2007
Source: EU KLEMS (release November 2009), own calculations.
Finally, in Figure 2.3.2 we show the overall employment shares with respect to hours worked in the four countries or country groups considered. This figure illustrates the clear dominance of other market services and public services. In the US these two sectors
-5.00
-4.00
-3.00
-2.00
-1.00
0.00
1.00
2.00
3.00
4.00
5.00
EU-10 EU-15 Japan US
Agriculture Mining and utilities Manufacturing Construction
Other market services Business services Public services
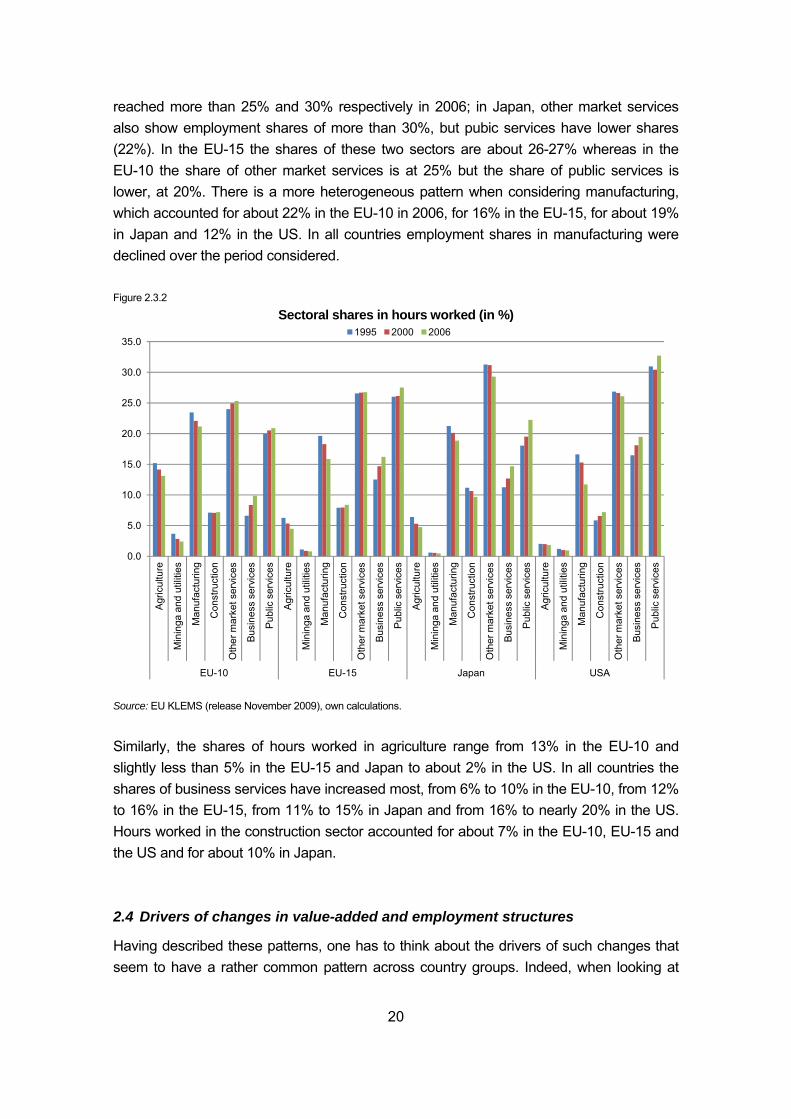
20
reached more than 25% and 30% respectively in 2006; in Japan, other market services also show employment shares of more than 30%, but pubic services have lower shares (22%). In the EU-15 the shares of these two sectors are about 26-27% whereas in the EU-10 the share of other market services is at 25% but the share of public services is lower, at 20%. There is a more heterogeneous pattern when considering manufacturing, which accounted for about 22% in the EU-10 in 2006, for 16% in the EU-15, for about 19% in Japan and 12% in the US. In all countries employment shares in manufacturing were declined over the period considered. Figure 2.3.2
Sectoral shares in hours worked (in %)
Source: EU KLEMS (release November 2009), own calculations.
Similarly, the shares of hours worked in agriculture range from 13% in the EU-10 and slightly less than 5% in the EU-15 and Japan to about 2% in the US. In all countries the shares of business services have increased most, from 6% to 10% in the EU-10, from 12% to 16% in the EU-15, from 11% to 15% in Japan and from 16% to nearly 20% in the US. Hours worked in the construction sector accounted for about 7% in the EU-10, EU-15 and the US and for about 10% in Japan. 2.4 Drivers of changes in value-added and employment structures
Having described these patterns, one has to think about the drivers of such changes that seem to have a rather common pattern across country groups. Indeed, when looking at
0.0
5.0
10.0
15.0
20.0
25.0
30.0
35.0
Agr
icul
ture
Min
inga
and
util
ities
Man
ufac
turin
g
Con
stru
ctio
n
Oth
er m
arke
t ser
vice
s
Busi
ness
ser
vice
s
Pub
lic s
ervi
ces
Agr
icul
ture
Min
inga
and
util
ities
Man
ufac
turin
g
Con
stru
ctio
n
Oth
er m
arke
t ser
vice
s
Busi
ness
ser
vice
s
Pub
lic s
ervi
ces
Agr
icul
ture
Min
inga
and
util
ities
Man
ufac
turin
g
Con
stru
ctio
n
Oth
er m
arke
t ser
vice
s
Busi
ness
ser
vice
s
Pub
lic s
ervi
ces
Agr
icul
ture
Min
inga
and
util
ities
Man
ufac
turin
g
Con
stru
ctio
n
Oth
er m
arke
t ser
vice
s
Busi
ness
ser
vice
s
Pub
lic s
ervi
ces
EU-10 EU-15 Japan USA
1995 2000 2006
21
individual countries, one would also find similar developments though these might be shifted in time and occur more or less rapidly. There are several factors that may explain these broad shifts in the structure of output and employment which we focus on. In simple terms, employment in a particular sector is determined by the level of output (or value-added) and labour productivity. In terms of growth rates this simply implies that employ-ment growth depends on labour productivity growth and value-added growth. Thus, one has to think about these two components first individually but also in which way these might be interrelated. This latter aspect makes it much more complex to analyse employ-ment changes over time: for example, while labour productivity growth implies lower de-mand for labour (for a given level of output), higher labour productivity growth may also imply higher growth rates of the sectoral outputs (due to price effects or international spe-cialization effects) and thus generate employment. In a recent study (European Commission, 2009b) a detailed assessment of various per-formance indicators (growth of value-added, employment, and productivity, profitability and international trade) and the underlying sectoral growth drivers are discussed in detail. Among these growth drivers the study included macroeconomic conditions, demand-side factors, inputs for production processes, innovation indicators, market structure and open-ness indicators. Basically, the study supports the expectations, e.g. that higher long-term interest rates, high exchange rates and implied tax rates and large government deficits are significant barriers to growth also at the sectoral levels (when compared across countries). Further, relative price levels and changes (themselves driven by productivity changes and costs of production along with product market conditions) affect sectoral output patterns, i.e. in sectors facing faster price increases, growth rates tend to be lower. There is further evidence that innovation performance and accumulation of resources (ICT capital and educated labour in particular) is conducive to growth. Competition measures (such as high turnover rates, higher degrees of openness in international trade and lower firm concentra-tion) also show a positive relation to growth. Evidence for individual sectors however re-veals that the impact of such drivers tends to be quite differentiated and thus requires a detailed industry-level assessment. Finally, the study also highlights a great deal of differ-ences across countries and country groups (either in comparison of the EU-15 to the EU-12 or to the US). Particularly, for some less developed countries one would expect a sector-specific catching-up process depending on the initial productivity gap but also on country- and sector-specific conditions such as the availability of resources (e.g. skilled labour) and effects of foreign technology spillovers (driven by foreign direct investments for example). This can particularly be seen for the EU-12 countries, which have been charac-terized by large initial productivity gaps along with a relatively highly qualified workforce that enabled them (or at least some countries) to specialize in high-tech manufacturing industries and attract foreign direct investment inflows in these industries, contributing fur-ther to productivity growth.
22
As argued above, employment changes are somewhat more complex: on the one hand, productivity changes have a positive effect on sectoral performance in terms of value-added growth and thus on employment, but on the other hand this also implies a negative effect due to the factor-saving nature of technical change. At the broad sectoral level ana-lysed above, the shift in employment shares towards manufacturing seems, first, to be driven by a combination of lower growth in value-added combined with strong differences in productivity growth rates. Both agriculture and manufacturing sectors show below total economy value-added growth rates, which might be explained by a relative decline in de-mand (e.g. higher income implies that a larger proportion of it is spent on services) and a shift of the production structure towards more service inputs (together with a trend towards outsourcing of service activities). Furthermore, these sectors are characterized by above-average productivity growth rates due to technical innovations and scale effects. Services industries in general and business services in particular are characterized by below-average productivity growth rates but above-average value-added growth rates, which broadly explains the shift in employment patterns towards these sectors. On top of that, a country’s place in the international division of labour and the changes therein certainly play an important role that has to be studied at a more detailed country level. Furthermore, in the process of reallocation of workers across sectors, worker mobility is an important aspect, particularly in the case of rapid changes or economic crises. Such transi-tions (including job-to-job flows, unemployment-to-job flows, and out of labour force-to-job flows) which themselves are affecting overall and sectoral productivity might be affected by overall employment regulations. These transitions and flows were studied in detail, for ex-ample, in European Commission (2009a) and OECD (2010). Both studies find that more stringent employment protection legislations has a negative impact on worker reallocation though also pointing towards negative welfare aspects of fluctuations. These results are broadly in line with other studies (often at the country level). Finally, the effect of product market regulations has been studied in less detail though there is evidence that product market deregulations tend to raise labour reallocations in the industries concerned (see OECD, 2010). 2.5 Summary
This section provided an overview of sectoral developments with a focus on employment and hours worked. As developments in employment levels and industrial structures are determined by sectoral developments with respect to output and value-added growth, technological change and labour productivity, these indicators have been considered as well. The predominant pattern is that in all cases employment declined in agricultural, min-ing and manufacturing sectors whereas positive employment growth is only observed in services sectors, and mainly so in business services. This pattern is in line with the broad trend towards tertiarization of the advanced economies. With respect to overall employ-

23
ment patterns, the largest shares are in manufacturing, other market services and public services, ranging between 15% and 30% though with differentiation across countries. The fastest growing sector in this categorization is business services, which accounts for 15-25% of employment in the country groups considered. Based on this broad picture both in empirical terms and the discussion of underlying factors and their complex interaction, the next chapters focus on developments in the twelve detailed sectors selected (see Ta-ble 1.3.3) providing a more detailed picture of historical developments, driving factors and sensitivity to economic cycles as well as the effects of the recent crisis on employment levels and patterns.
24
3 Quantitative sectoral analyses
3.1 Introduction
Having discussed longer-term trends at a broad sectoral level and in large countries, we now focus on the twelve selected sectors from various points of view. This focus on a lim-ited number of sectors allows for considering patterns and changes in employment over time in more detail, covering the long-term trends and sectoral sensitivity to economic downturns on the one hand and a detailed account of employment characteristics on the other hand. Further, the respective changes over the crisis that started in 2008 are dis-cussed. This section is accompanied by a set of 12 sector fiches providing more informa-tion on the respective patterns and characteristics across countries. Particularly, this chapter therefore goes as follows:
• First, in Section 3.2, we present the most important trends for the twelve selected sec-tors (see Table 1.3.3) regarding employment, value-added, productivity and hours worked. A much more detailed comparison across countries for each of these sectors is provided in the accompanying sector fiches (available upon request).
• In this section we then proceed to identify long-term trends in the sectoral division of labour, starting with a quantitative analysis of the main factors explaining these trends and the return to trend level in case of economic fluctuations applying error-correction modelling.
• Second, in Section 3.3, we give a detailed overview of the changes in the composition of employment in the twelve selected sectors, drawing on detailed data from the EU La-bour Force Survey (EU LFS) over the period 1995-2009 (and from 1997 or 1998 for most of the EU-12 countries).
• In Section 3.4 we analyse the sensitivity of the different sectors in previous economic downturns comparing business cycles in the 1970s, 1980s and 1990s for EU countries, the US and Japan in a comparative manner.
• Section 3.5 provides an analysis of developments during the recent crisis, with a focus on employment.
3.2 Identification of long-term trends
3.2.1 Trends and patterns in selected sectors
Before discussing the econometric results we provide a brief overview of the trends and patterns of these selected sectors with a focus on employment similar to the analysis pro-vided in Section 2 on the broad sectors. For a more detailed assessment over the longer run and a comparison across countries, the set of sector fiches can be consulted. Ta-ble 3.2.1 shows the average growth rates for employment, value-added (in real terms), hours worked and labour productivity for these selected sectors. Results are presented for
25
the EU-15, Japan and the US. Regarding employment, one can see that the growth rates are negative for the manufacturing sectors, particularly so for textiles (CB), while they are positive for the services sectors. This is in line with the findings in Section 2. In all cases it was employment growth in real estate and business activities (LMN) that was particularly high, with more than 4% in all cases. Generally, in the US growth rates of employment in the services sectors tend to be higher as compared to the EU-15 and Japan. These find-ings are also confirmed when considering hours worked. Employment shifts were mostly driven by differences in growth rates of labour productivity which tend to be higher in manufacturing sectors as compared to services sectors. Especially Japan and the US ex-perienced quite high growth rates of labour productivity in the electronics sector (CI+CJ). Wholesale trade (G) and real estate and business activities (LMN) show the highest growth rates of labour productivity within the services sectors considered. Table 3.2.2 provides the same evidence for the shorter time period from 1995 which allows for including the EU-12 countries as well. In this case somewhat distinct patterns are found when comparing the country groups. As before, growth rates in textiles (CB) are again quite negative in all countries. Further, some other manufacturing industries show more pronounced employment losses in the US and Japan. For example, employment growth rates tend to be more negative in most industries – particularly so in chemicals and elec-tronics – in Japan but also in the US. For the average EU-15 countries this pattern is differ-ent as these small positive growth rates. EU-12 countries are also showing strong negative growth rates in chemicals (CE) and machinery and equipment (CK28). Employment growth is however again strongly positive in the services sectors in almost all cases with the ex-ception of Japan (apart from business activities). Again, similar patterns are found when looking at hours worked instead of employment. It seems however that over this shorter period the relative importance of labour productivity growth and value-added growth is less clear when looking across countries and sectors. This might be driven by various potential drivers of employment growth as discussed above, notably changing trade patterns in manufacturing but also in services with the integration of EU-12 countries and emerging countries like China and India as well as the diffusion of ICT technologies which also in-creased productivity in service sectors. These differences in employment growth rates also imply changes in the sectoral structure of employment. In Table 3.2.3 we therefore show these shares for some years. In size terms the most important sectors are wholesale and retail trade (G) with around 15% in all countries considered, real estate and business activities (LMN) which amounts to more than 10% and up to 14% in 2005 in EU-15, Japan and the US. The share of the latter is however much lower in the EU-12 with about 8%. Particularly the share of real estate and business activities was increasing quite strongly with wholesale and retail trade showing a more stagnant share. Another important sector in terms of employment is construction (F) which amounts to about 7% in the US and EU-12 and up to almost 10% in Japan in 2005.
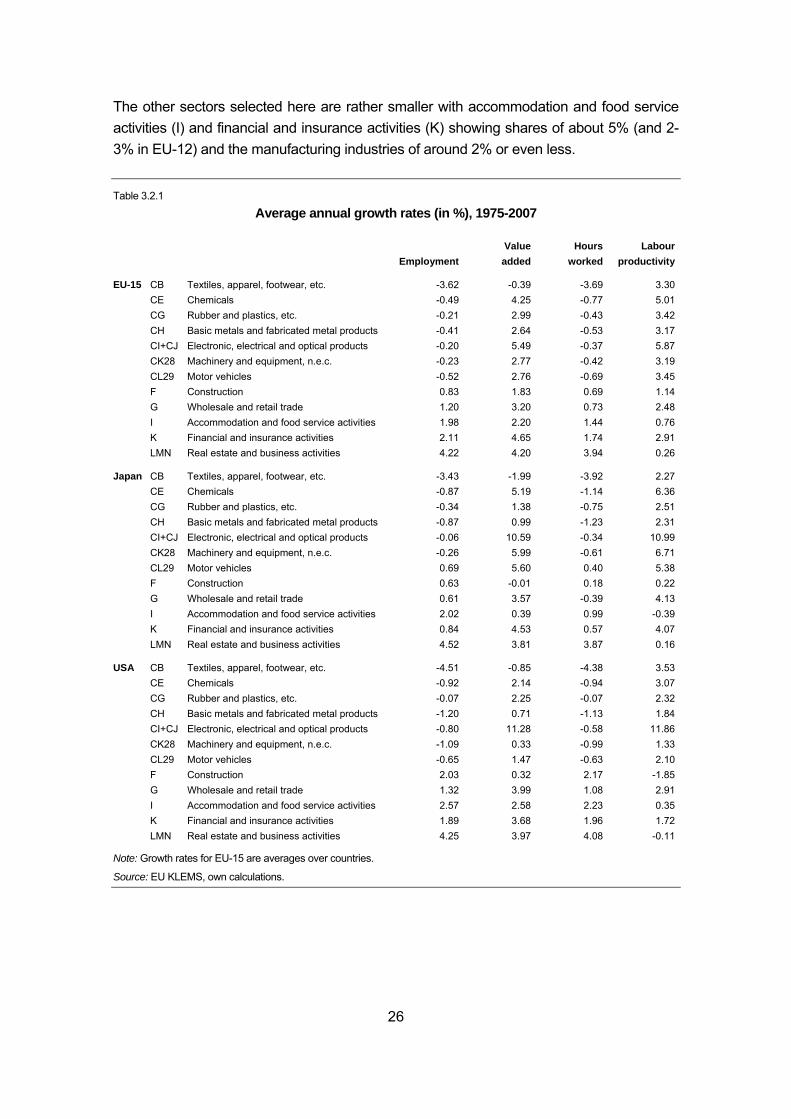
26
The other sectors selected here are rather smaller with accommodation and food service activities (I) and financial and insurance activities (K) showing shares of about 5% (and 2-3% in EU-12) and the manufacturing industries of around 2% or even less. Table 3.2.1
Average annual growth rates (in %), 1975-2007
EmploymentValue added
Hours worked
Labour productivity
EU-15 CB Textiles, apparel, footwear, etc. -3.62 -0.39 -3.69 3.30CE Chemicals -0.49 4.25 -0.77 5.01CG Rubber and plastics, etc. -0.21 2.99 -0.43 3.42CH Basic metals and fabricated metal products -0.41 2.64 -0.53 3.17CI+CJ Electronic, electrical and optical products -0.20 5.49 -0.37 5.87CK28 Machinery and equipment, n.e.c. -0.23 2.77 -0.42 3.19CL29 Motor vehicles -0.52 2.76 -0.69 3.45F Construction 0.83 1.83 0.69 1.14G Wholesale and retail trade 1.20 3.20 0.73 2.48I Accommodation and food service activities 1.98 2.20 1.44 0.76K Financial and insurance activities 2.11 4.65 1.74 2.91LMN Real estate and business activities 4.22 4.20 3.94 0.26
Japan CB Textiles, apparel, footwear, etc. -3.43 -1.99 -3.92 2.27CE Chemicals -0.87 5.19 -1.14 6.36CG Rubber and plastics, etc. -0.34 1.38 -0.75 2.51CH Basic metals and fabricated metal products -0.87 0.99 -1.23 2.31CI+CJ Electronic, electrical and optical products -0.06 10.59 -0.34 10.99CK28 Machinery and equipment, n.e.c. -0.26 5.99 -0.61 6.71CL29 Motor vehicles 0.69 5.60 0.40 5.38F Construction 0.63 -0.01 0.18 0.22G Wholesale and retail trade 0.61 3.57 -0.39 4.13I Accommodation and food service activities 2.02 0.39 0.99 -0.39K Financial and insurance activities 0.84 4.53 0.57 4.07LMN Real estate and business activities 4.52 3.81 3.87 0.16
USA CB Textiles, apparel, footwear, etc. -4.51 -0.85 -4.38 3.53CE Chemicals -0.92 2.14 -0.94 3.07CG Rubber and plastics, etc. -0.07 2.25 -0.07 2.32CH Basic metals and fabricated metal products -1.20 0.71 -1.13 1.84CI+CJ Electronic, electrical and optical products -0.80 11.28 -0.58 11.86CK28 Machinery and equipment, n.e.c. -1.09 0.33 -0.99 1.33CL29 Motor vehicles -0.65 1.47 -0.63 2.10F Construction 2.03 0.32 2.17 -1.85G Wholesale and retail trade 1.32 3.99 1.08 2.91I Accommodation and food service activities 2.57 2.58 2.23 0.35K Financial and insurance activities 1.89 3.68 1.96 1.72LMN Real estate and business activities 4.25 3.97 4.08 -0.11
Note: Growth rates for EU-15 are averages over countries.
Source: EU KLEMS, own calculations.
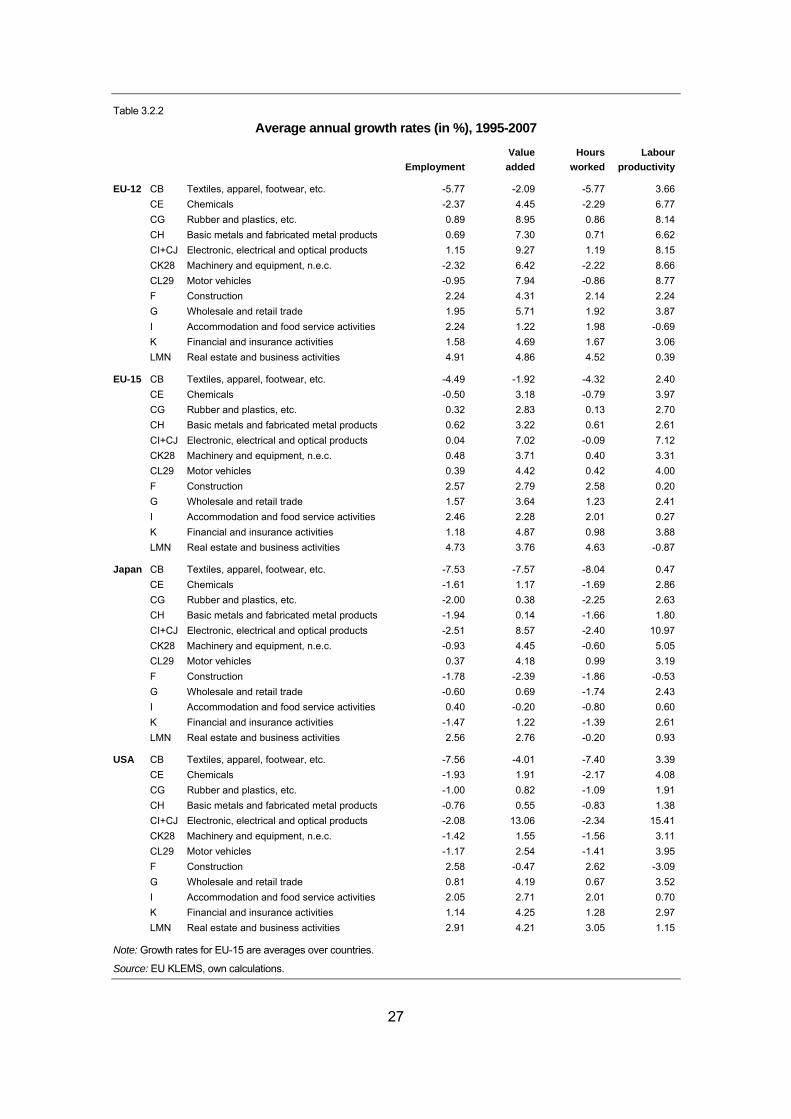
27
Table 3.2.2
Average annual growth rates (in %), 1995-2007
EmploymentValue added
Hours worked
Labour productivity
EU-12 CB Textiles, apparel, footwear, etc. -5.77 -2.09 -5.77 3.66CE Chemicals -2.37 4.45 -2.29 6.77CG Rubber and plastics, etc. 0.89 8.95 0.86 8.14CH Basic metals and fabricated metal products 0.69 7.30 0.71 6.62CI+CJ Electronic, electrical and optical products 1.15 9.27 1.19 8.15CK28 Machinery and equipment, n.e.c. -2.32 6.42 -2.22 8.66CL29 Motor vehicles -0.95 7.94 -0.86 8.77F Construction 2.24 4.31 2.14 2.24G Wholesale and retail trade 1.95 5.71 1.92 3.87I Accommodation and food service activities 2.24 1.22 1.98 -0.69K Financial and insurance activities 1.58 4.69 1.67 3.06LMN Real estate and business activities 4.91 4.86 4.52 0.39
EU-15 CB Textiles, apparel, footwear, etc. -4.49 -1.92 -4.32 2.40CE Chemicals -0.50 3.18 -0.79 3.97CG Rubber and plastics, etc. 0.32 2.83 0.13 2.70CH Basic metals and fabricated metal products 0.62 3.22 0.61 2.61CI+CJ Electronic, electrical and optical products 0.04 7.02 -0.09 7.12CK28 Machinery and equipment, n.e.c. 0.48 3.71 0.40 3.31CL29 Motor vehicles 0.39 4.42 0.42 4.00F Construction 2.57 2.79 2.58 0.20G Wholesale and retail trade 1.57 3.64 1.23 2.41I Accommodation and food service activities 2.46 2.28 2.01 0.27K Financial and insurance activities 1.18 4.87 0.98 3.88LMN Real estate and business activities 4.73 3.76 4.63 -0.87
Japan CB Textiles, apparel, footwear, etc. -7.53 -7.57 -8.04 0.47CE Chemicals -1.61 1.17 -1.69 2.86CG Rubber and plastics, etc. -2.00 0.38 -2.25 2.63CH Basic metals and fabricated metal products -1.94 0.14 -1.66 1.80CI+CJ Electronic, electrical and optical products -2.51 8.57 -2.40 10.97CK28 Machinery and equipment, n.e.c. -0.93 4.45 -0.60 5.05CL29 Motor vehicles 0.37 4.18 0.99 3.19F Construction -1.78 -2.39 -1.86 -0.53G Wholesale and retail trade -0.60 0.69 -1.74 2.43I Accommodation and food service activities 0.40 -0.20 -0.80 0.60K Financial and insurance activities -1.47 1.22 -1.39 2.61LMN Real estate and business activities 2.56 2.76 -0.20 0.93
USA CB Textiles, apparel, footwear, etc. -7.56 -4.01 -7.40 3.39CE Chemicals -1.93 1.91 -2.17 4.08CG Rubber and plastics, etc. -1.00 0.82 -1.09 1.91CH Basic metals and fabricated metal products -0.76 0.55 -0.83 1.38CI+CJ Electronic, electrical and optical products -2.08 13.06 -2.34 15.41CK28 Machinery and equipment, n.e.c. -1.42 1.55 -1.56 3.11CL29 Motor vehicles -1.17 2.54 -1.41 3.95F Construction 2.58 -0.47 2.62 -3.09G Wholesale and retail trade 0.81 4.19 0.67 3.52I Accommodation and food service activities 2.05 2.71 2.01 0.70K Financial and insurance activities 1.14 4.25 1.28 2.97LMN Real estate and business activities 2.91 4.21 3.05 1.15
Note: Growth rates for EU-15 are averages over countries.
Source: EU KLEMS, own calculations.
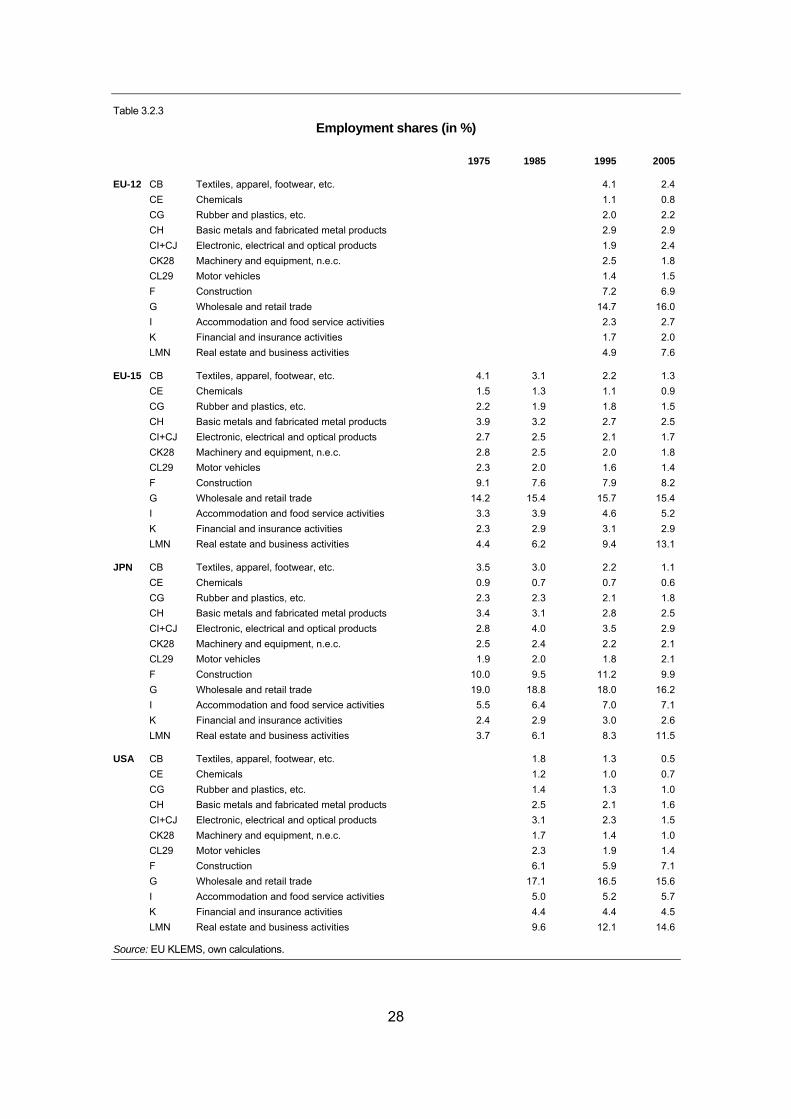
28
Table 3.2.3
Employment shares (in %)
1975 1985 1995 2005
EU-12 CB Textiles, apparel, footwear, etc. 4.1 2.4CE Chemicals 1.1 0.8CG Rubber and plastics, etc. 2.0 2.2CH Basic metals and fabricated metal products 2.9 2.9CI+CJ Electronic, electrical and optical products 1.9 2.4CK28 Machinery and equipment, n.e.c. 2.5 1.8CL29 Motor vehicles 1.4 1.5F Construction 7.2 6.9G Wholesale and retail trade 14.7 16.0I Accommodation and food service activities 2.3 2.7K Financial and insurance activities 1.7 2.0LMN Real estate and business activities 4.9 7.6
EU-15 CB Textiles, apparel, footwear, etc. 4.1 3.1 2.2 1.3CE Chemicals 1.5 1.3 1.1 0.9CG Rubber and plastics, etc. 2.2 1.9 1.8 1.5CH Basic metals and fabricated metal products 3.9 3.2 2.7 2.5CI+CJ Electronic, electrical and optical products 2.7 2.5 2.1 1.7CK28 Machinery and equipment, n.e.c. 2.8 2.5 2.0 1.8CL29 Motor vehicles 2.3 2.0 1.6 1.4F Construction 9.1 7.6 7.9 8.2G Wholesale and retail trade 14.2 15.4 15.7 15.4I Accommodation and food service activities 3.3 3.9 4.6 5.2K Financial and insurance activities 2.3 2.9 3.1 2.9LMN Real estate and business activities 4.4 6.2 9.4 13.1
JPN CB Textiles, apparel, footwear, etc. 3.5 3.0 2.2 1.1CE Chemicals 0.9 0.7 0.7 0.6CG Rubber and plastics, etc. 2.3 2.3 2.1 1.8CH Basic metals and fabricated metal products 3.4 3.1 2.8 2.5CI+CJ Electronic, electrical and optical products 2.8 4.0 3.5 2.9CK28 Machinery and equipment, n.e.c. 2.5 2.4 2.2 2.1CL29 Motor vehicles 1.9 2.0 1.8 2.1F Construction 10.0 9.5 11.2 9.9G Wholesale and retail trade 19.0 18.8 18.0 16.2I Accommodation and food service activities 5.5 6.4 7.0 7.1K Financial and insurance activities 2.4 2.9 3.0 2.6LMN Real estate and business activities 3.7 6.1 8.3 11.5
USA CB Textiles, apparel, footwear, etc. 1.8 1.3 0.5CE Chemicals 1.2 1.0 0.7CG Rubber and plastics, etc. 1.4 1.3 1.0CH Basic metals and fabricated metal products 2.5 2.1 1.6CI+CJ Electronic, electrical and optical products 3.1 2.3 1.5CK28 Machinery and equipment, n.e.c. 1.7 1.4 1.0CL29 Motor vehicles 2.3 1.9 1.4F Construction 6.1 5.9 7.1G Wholesale and retail trade 17.1 16.5 15.6I Accommodation and food service activities 5.0 5.2 5.7K Financial and insurance activities 4.4 4.4 4.5LMN Real estate and business activities 9.6 12.1 14.6
Source: EU KLEMS, own calculations.
29
3.2.2 Theoretical background, data and econometric strategy
In the following we aim to identify underlying long-term trends and underlying determinants in the sectoral division of employment up to the onset of the recession and carry out a quantitative analysis of the main factors underlying these in order to assess their relative importance and gain an understanding of the processes at work. In the previous section we already presented a broad overview of the relevant variables which has to be consid-ered and the more complex relationships when focusing on employment rather than growth of value-added (see Section 2.4). Furthermore we apply a framework not only pro-viding evidence for long-term relationships of determinants on labour demand but also to assess the role of fluctuations around the long-run trend. The analysis here focuses on the twelve selected detailed sectors (see Table 1.3.3).10 The concern in this section will be to identify trends and determinants in employment and related aspects over the longer period. In particular, it will focus on labour and therefore examine developments in working time, labour productivity and average labour costs and wages as well as the number employed at sector level over this period in the twelve sec-tors selected for detailed study. The analyses undertaken will be based on the same data-set as above (see Section 1.3). As dictated by the availability of data, in particular informa-tion on capital in the EU KLEMS database, the analysis has to be restricted to seventeen countries including twelve old EU Member States (Austria, Belgium, Germany, Denmark, Spain, Finland, France, Ireland, Italy, Netherlands, Sweden, and UK) together with US and Japan for which longer time series are available and three new Member States (Czech Republic, Hungary and Slovenia) for which however only shorter time series are available. Results are therefore less reliable for these countries. These changes will be related to the growth of employment including the extent to which fluctuations in value-added are accompanied by counterpart fluctuations in labour produc-tivity, and the implications for employment over both the long-term and during the eco-nomic cycle. For this also productivity changes and wage changes (and therefore implicitly taking unit labour costs into account) as well as changes in average hours worked will be examined in order to identify any long-term trends and the extent to which employment varies in line with fluctuations in output as well as the way that it is affected by changes in other determinants mentioned above. In addition, an attempt will be made to assess the effect on employment of structural labour market reforms and institutional changes in gen-eral, which would be expected to operate through productivity and labour costs and through these on the growth of value-added and the demand for labour. The difficulty here is both in identifying the changes in question and the time which they took effect and in quantifying them in terms of their relative importance, as well as their differential impact, if
10 The sector fiches in the appendix provide a detailed descriptive overview of patterns and trends of the relevant
variables in these sectors.
30
any, across sectors. Institutional variables will also be included in the analysis to try to pick up the effect of labour market reform, though this is not straight-forward given their nature. Particularly we use OECD indicators of Employment Protection Legislation (EPL) and their inclusion as explanatory variables will be explored along with other possible measures which might be constructed from the information available on the reform process in differ-ent countries (see OECD, 2004, and Boeri and Garibaldi, 2010, for a discussion on recent developments). Given the complex relationship between these variables and their interrelated nature and the various determinants of labour demand, and of changes in the number employed once account is taken of changes in average hours worked, can be analysed in more detail us-ing regression methods. In more detail the aim is to estimate labour demand equations where labour demand, in terms of both levels and growth over time, depends on output, import penetration, ICT and non-ICT investment capturing embodied technical change and labour costs, as well as changes in these in the case of the growth of labour demand over time. In addition we include measures of the EPL indicators and various dummies covering country and sector specific effects (like technical change and country specific characteris-tics). The variables included will be lagged appropriately; to capture adjustment costs we will also include a lagged dependent variable. Further, the specifications will be tested at the level of industries as defined above which provides industry specific effects across countries. The data in principle provide a panel with dimensions of country, sector and years and so allow advanced econometric methods to be used. When estimations are performed in lev-els this requires to take into account the lagged dependent variable which requires using dynamic panel methods procedures to avoid biased and inconsistent estimates. After a first screening of data and some econometric test it was decided that there is a great deal of heterogeneity across countries and sectors – in line with the study on sectoral growth drivers (see European Commission, 2009b) - which renders is doubtful whether pooling across countries or sectors is a useful econometric strategy. Furthermore, the identification of long-term trends should be combined with an assessment to which extent sectors return back to these trends in the course of fluctuations and cycles at the sectoral level which is the focus of this study. For these reasons we finally decided to estimate a so-called error correction model (ECM) for each country and sector pair individually which first takes ac-count of the heterogeneity and further allows to assess the speed at which sectors return to ‘normal’, i.e. long-term trend after a shock. To examine these issues we present below estimates of labour demand equations for up to 17 countries and 12 industries for which data allow us to do so. The approach adopted follows the approach outlined by Pierluigi and Roma (2008), which involves the estimation of fairly standard labour demand functions (see for example Morgan, 2001; Mourre, 2006).
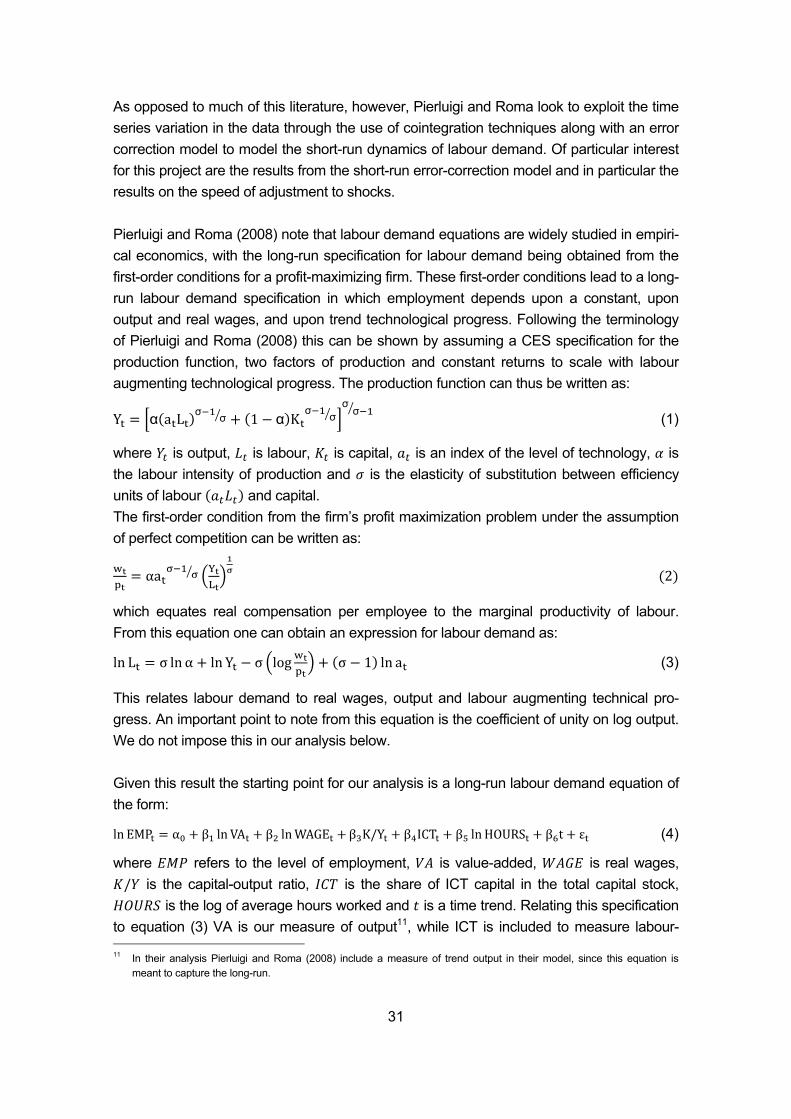
31
As opposed to much of this literature, however, Pierluigi and Roma look to exploit the time series variation in the data through the use of cointegration techniques along with an error correction model to model the short-run dynamics of labour demand. Of particular interest for this project are the results from the short-run error-correction model and in particular the results on the speed of adjustment to shocks. Pierluigi and Roma (2008) note that labour demand equations are widely studied in empiri-cal economics, with the long-run specification for labour demand being obtained from the first-order conditions for a profit-maximizing firm. These first-order conditions lead to a long-run labour demand specification in which employment depends upon a constant, upon output and real wages, and upon trend technological progress. Following the terminology of Pierluigi and Roma (2008) this can be shown by assuming a CES specification for the production function, two factors of production and constant returns to scale with labour augmenting technological progress. The production function can thus be written as:
Y α a L σ σ 1 α Kσ σ
σσ (1)
where is output, is labour, is capital, is an index of the level of technology, is the labour intensity of production and is the elasticity of substitution between efficiency units of labour and capital. The first-order condition from the firm’s profit maximization problem under the assumption of perfect competition can be written as:
αa YL
2
which equates real compensation per employee to the marginal productivity of labour. From this equation one can obtain an expression for labour demand as:
ln L σ ln α ln Y σ log σ 1 ln a (3)
This relates labour demand to real wages, output and labour augmenting technical pro-gress. An important point to note from this equation is the coefficient of unity on log output. We do not impose this in our analysis below. Given this result the starting point for our analysis is a long-run labour demand equation of the form:
ln EMP α β ln VA β lnWAGE β K/Y β ICT β lnHOURS β t ε (4)
where refers to the level of employment, is value-added, is real wages, / is the capital-output ratio, is the share of ICT capital in the total capital stock,
is the log of average hours worked and is a time trend. Relating this specification to equation (3) VA is our measure of output11, while ICT is included to measure labour- 11 In their analysis Pierluigi and Roma (2008) include a measure of trend output in their model, since this equation is
meant to capture the long-run.
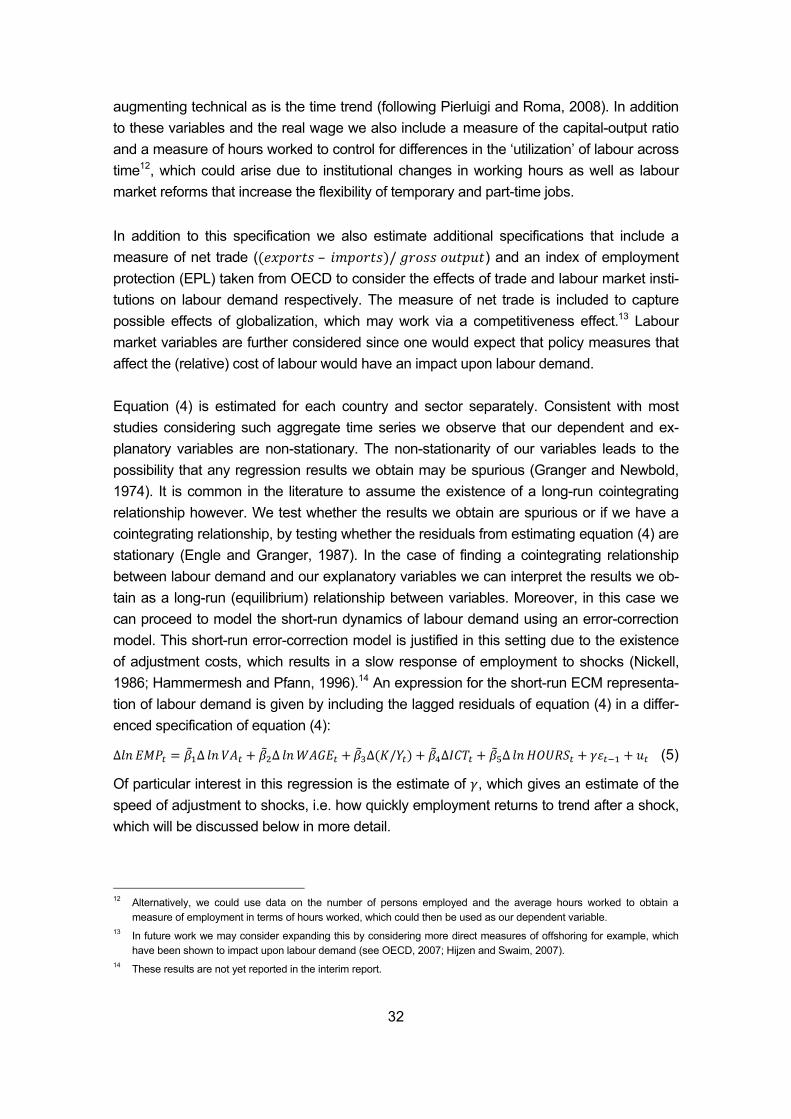
32
augmenting technical as is the time trend (following Pierluigi and Roma, 2008). In addition to these variables and the real wage we also include a measure of the capital-output ratio and a measure of hours worked to control for differences in the ‘utilization’ of labour across time12, which could arise due to institutional changes in working hours as well as labour market reforms that increase the flexibility of temporary and part-time jobs.
In addition to this specification we also estimate additional specifications that include a measure of net trade ( – / ) and an index of employment protection (EPL) taken from OECD to consider the effects of trade and labour market insti-tutions on labour demand respectively. The measure of net trade is included to capture possible effects of globalization, which may work via a competitiveness effect.13 Labour market variables are further considered since one would expect that policy measures that affect the (relative) cost of labour would have an impact upon labour demand. Equation (4) is estimated for each country and sector separately. Consistent with most studies considering such aggregate time series we observe that our dependent and ex-planatory variables are non-stationary. The non-stationarity of our variables leads to the possibility that any regression results we obtain may be spurious (Granger and Newbold, 1974). It is common in the literature to assume the existence of a long-run cointegrating relationship however. We test whether the results we obtain are spurious or if we have a cointegrating relationship, by testing whether the residuals from estimating equation (4) are stationary (Engle and Granger, 1987). In the case of finding a cointegrating relationship between labour demand and our explanatory variables we can interpret the results we ob-tain as a long-run (equilibrium) relationship between variables. Moreover, in this case we can proceed to model the short-run dynamics of labour demand using an error-correction model. This short-run error-correction model is justified in this setting due to the existence of adjustment costs, which results in a slow response of employment to shocks (Nickell, 1986; Hammermesh and Pfann, 1996).14 An expression for the short-run ECM representa-tion of labour demand is given by including the lagged residuals of equation (4) in a differ-enced specification of equation (4):
∆ ∆ ∆ ∆ / ∆ ∆ (5)
Of particular interest in this regression is the estimate of , which gives an estimate of the speed of adjustment to shocks, i.e. how quickly employment returns to trend after a shock, which will be discussed below in more detail.
12 Alternatively, we could use data on the number of persons employed and the average hours worked to obtain a
measure of employment in terms of hours worked, which could then be used as our dependent variable. 13 In future work we may consider expanding this by considering more direct measures of offshoring for example, which
have been shown to impact upon labour demand (see OECD, 2007; Hijzen and Swaim, 2007). 14 These results are not yet reported in the interim report.
33
3.2.3 Results from the econometric analysis
The two regression equations are estimated for each country and industry using the two-step procedure of Engle and Granger (1987). With seven manufacturing and five service industries and up to 17 countries there are a large number of coefficients to present. The results of the regressions both for the long-run and short-run for each sector and country are presented in the appendix. Here we begin discussing results from the long-run specifi-cation given by equation (4) before considering the results from the short-run error-correction model given by equation (5). Long-Run Results
As already mentioned above the coefficients tend to be quite heterogeneous across coun-tries which renders it difficult to draw any firm general conclusions from this. For the same reason it is not justified to estimate the relationships in a panel set-up which would force the coefficients to be the same across countries (by sector). Tables A3.1A-A3.1L report the long-run results for each of the twelve sectors, with each table reporting results for each of the seventeen countries separately. Given the large number of coefficients estimated in these tables it is difficult to draw any general conclusions from the results, especially since there is a great deal of heterogeneity in the results across both sectors and countries. This large degree of heterogeneity indicates that the use of panel data methods, which would provide a single parameter estimate for each variable for all countries and sectors, is in appropriate. Despite this we will identify some trends in the coefficients in these tables. In some cases this heterogeneity is driven by the fact that for some countries (particularly including the Eastern European countries) time series are rather short which together the particularity of the time period considered. Considering initially the coefficient on the log of value-added (our measure of output) we observe across the tables that the coefficients tend to differ significantly from the restriction in equation (3) of a unitary elasticity between output and employment. While the coeffi-cients tend to be positive as expected they also tend to be less than one, though there are notable exceptions where the coefficient is greater than one. The coefficients tend to be smaller when considering Textiles, Apparel, Footwear, etc (NACE CB (13-15)) and the service sectors (sectors F through LMN), as well as in countries such as Japan and the Czech Republic. Coefficients tend to be larger for some of the smaller European econo-mies such as Belgium, Ireland, Finland and Spain, though again there are significant dif-ferences across industries. Considering some of the larger economies in the sample we tend to observe that the coefficients on output tend to be relatively small for Japan and larger (but below one) for some of the larger European countries such as Germany and the UK, as well as the USA.
34
Turning to the long-run relationship between employment and real wages we observe a distinct difference in results for manufacturing versus service sectors. In the case of manu-facturing we tend to observe negative coefficients on the real wage variable that tend to be significant, while for services the coefficients are more mixed and are usually insignificant. In terms of the manufacturing industries the coefficients tend to lie between -0.5 and -1.0, though there are a considerable number of exceptions where the coefficient is less an 0.5 in absolute value and a smaller number of cases where the coefficient exceeds 1.0 in ab-solute value. Once again, the coefficients are often relatively large (in absolute value) for some of the smaller European countries such as Belgium, Denmark and Finland. In terms of the larger countries in our sample the coefficients tend to be small for Japan and rela-tively large for the UK and the USA, with the coefficients for Germany and France often found to be between these two extreme cases. The coefficients on the capital-output ratio are particularly difficult to summarize. While often being significant the coefficients are found to take on both positive and negative val-ues, both across sectors for the same country or across countries for the same sector. This is true for the larger countries in our sample as well as the smaller ones. This pattern also emerges in both manufacturing and service industries, though there are relatively few sig-nificant coefficients for the machinery and equipment sector. This result is might reflect that an increase in capital per output on the one hand has labour-saving effect in that it in-creases productivity and thus tends to have a negative effect on employment whereas on the other hand it also means an expansion of capacities. The results on the ICT share are also difficult to summarize, though a few interesting patterns emerge. We tend to find across sectors (again with some notable exceptions) negative and significant coefficients for large European countries such as Germany and France (as well as other smaller na-tions). This is also the case for the UK and the USA (again with exceptions), but for Japan a different pattern emerges. In particular, the coefficients tend to be positive and significant when considering manufacturing sectors, but turn negative and significant when consider-ing service industries. Finally, the coefficients on hours worked tend to be negative as one would expect, indicat-ing that the more hours people work on average the lower the number of people employed. The coefficients are however often insignificant, though when they are significant the coef-ficients tend to be large (greater than one) in absolute value. Short-Run Results
In tables A3.2A-A3.2L we report the corresponding results from estimating the short-run error-correction model. Each table reports the results from estimating the model on a par-ticular sector for each country separately. The results are again not straightforward to summarize so we attempt to identify some general trends, concentrating in particular on the error-correction (i.e. speed of adjustment) coefficient.
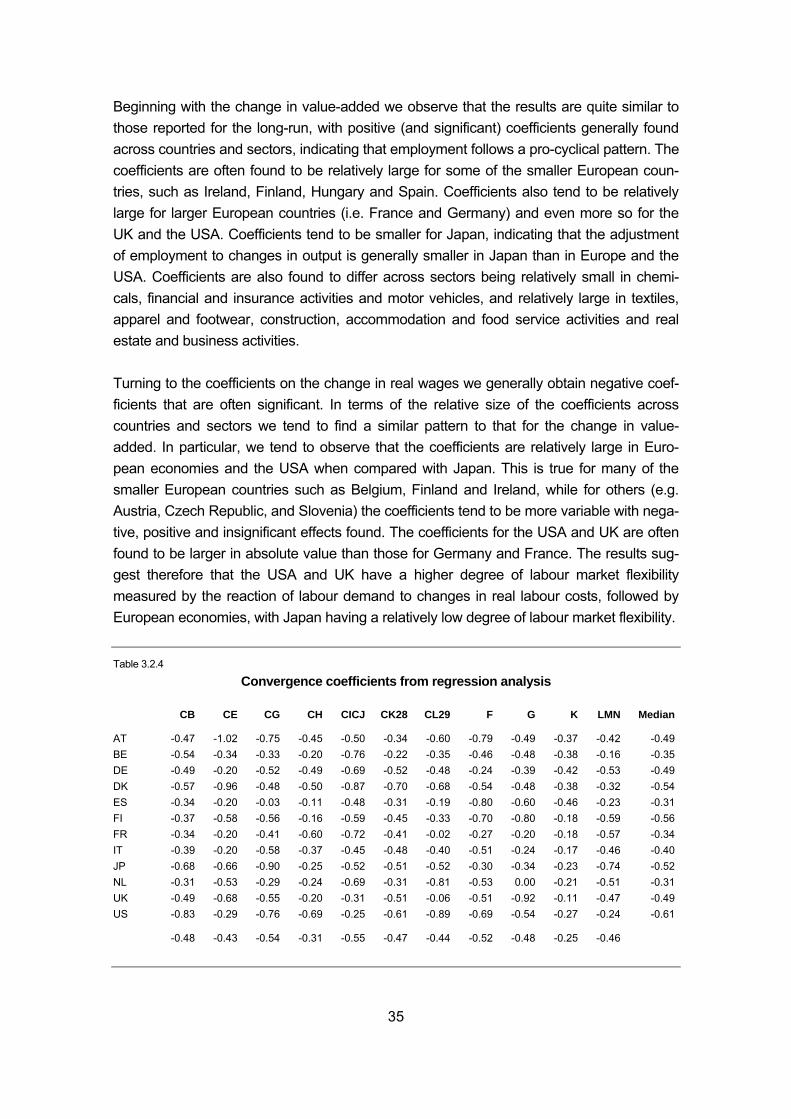
35
Beginning with the change in value-added we observe that the results are quite similar to those reported for the long-run, with positive (and significant) coefficients generally found across countries and sectors, indicating that employment follows a pro-cyclical pattern. The coefficients are often found to be relatively large for some of the smaller European coun-tries, such as Ireland, Finland, Hungary and Spain. Coefficients also tend to be relatively large for larger European countries (i.e. France and Germany) and even more so for the UK and the USA. Coefficients tend to be smaller for Japan, indicating that the adjustment of employment to changes in output is generally smaller in Japan than in Europe and the USA. Coefficients are also found to differ across sectors being relatively small in chemi-cals, financial and insurance activities and motor vehicles, and relatively large in textiles, apparel and footwear, construction, accommodation and food service activities and real estate and business activities. Turning to the coefficients on the change in real wages we generally obtain negative coef-ficients that are often significant. In terms of the relative size of the coefficients across countries and sectors we tend to find a similar pattern to that for the change in value-added. In particular, we tend to observe that the coefficients are relatively large in Euro-pean economies and the USA when compared with Japan. This is true for many of the smaller European countries such as Belgium, Finland and Ireland, while for others (e.g. Austria, Czech Republic, and Slovenia) the coefficients tend to be more variable with nega-tive, positive and insignificant effects found. The coefficients for the USA and UK are often found to be larger in absolute value than those for Germany and France. The results sug-gest therefore that the USA and UK have a higher degree of labour market flexibility measured by the reaction of labour demand to changes in real labour costs, followed by European economies, with Japan having a relatively low degree of labour market flexibility. Table 3.2.4
Convergence coefficients from regression analysis
CB CE CG CH CICJ CK28 CL29 F G K LMN Median
AT -0.47 -1.02 -0.75 -0.45 -0.50 -0.34 -0.60 -0.79 -0.49 -0.37 -0.42 -0.49BE -0.54 -0.34 -0.33 -0.20 -0.76 -0.22 -0.35 -0.46 -0.48 -0.38 -0.16 -0.35DE -0.49 -0.20 -0.52 -0.49 -0.69 -0.52 -0.48 -0.24 -0.39 -0.42 -0.53 -0.49DK -0.57 -0.96 -0.48 -0.50 -0.87 -0.70 -0.68 -0.54 -0.48 -0.38 -0.32 -0.54ES -0.34 -0.20 -0.03 -0.11 -0.48 -0.31 -0.19 -0.80 -0.60 -0.46 -0.23 -0.31FI -0.37 -0.58 -0.56 -0.16 -0.59 -0.45 -0.33 -0.70 -0.80 -0.18 -0.59 -0.56FR -0.34 -0.20 -0.41 -0.60 -0.72 -0.41 -0.02 -0.27 -0.20 -0.18 -0.57 -0.34IT -0.39 -0.20 -0.58 -0.37 -0.45 -0.48 -0.40 -0.51 -0.24 -0.17 -0.46 -0.40JP -0.68 -0.66 -0.90 -0.25 -0.52 -0.51 -0.52 -0.30 -0.34 -0.23 -0.74 -0.52NL -0.31 -0.53 -0.29 -0.24 -0.69 -0.31 -0.81 -0.53 0.00 -0.21 -0.51 -0.31UK -0.49 -0.68 -0.55 -0.20 -0.31 -0.51 -0.06 -0.51 -0.92 -0.11 -0.47 -0.49US -0.83 -0.29 -0.76 -0.69 -0.25 -0.61 -0.89 -0.69 -0.54 -0.27 -0.24 -0.61
-0.48 -0.43 -0.54 -0.31 -0.55 -0.47 -0.44 -0.52 -0.48 -0.25 -0.46
36
The coefficients on the capital-labour ratio are highly variable across countries and sectors with positive and negative coefficients found, often being insignificant. It is difficult therefore to draw any inference from the coefficients on this variable therefore. This is also true for the ICT share, where positive and negative coefficients are again found. In this case how-ever, we tend to find more positive and significant effects when considering the manufac-turing sector than significant negative effects. This indicates that changes in ICT use show a tendency in many manufacturing sectors and countries to increase the level of employ-ment, possibly as a result of productivity improvements following the increased use of ICT. The results for the service sectors are somewhat different with negative coefficients tend-ing to be found when significant, suggesting that the increasing use of ICT in service sec-tors has had a negative ‘technology’ effect on employment in services. The coefficients on hours worked tend to be negative, significant and relatively large in size. This indicates the importance of adjustments in hours worked to changes in the level of employment across countries and sectors. Finally, we turn to the coefficients on the error-correction term which give an estimate of the speed of adjustment to shocks. The coefficients on the error-correction terms tend to be negative and significant across countries and sectors as expected, indicating the impor-tance of out of equilibrium dynamics in labour demand equations. The coefficients are of-ten found to be largest in smaller European countries such as Slovenia, Sweden, Hungary and the Czech Republic with values being larger than one in absolute terms. For some of these countries only a small number of observations are available in the time series, how-ever, and thus these findings are not reliable. Table 3.2.4 presents the numbers for the convergence coefficients with the medians across countries and industries. These coeffi-cients tend to be lowest for France, Spain, Belgium and Netherlands with median values of 0.3 and 0.35 in absolute terms. Thus in these countries it takes longer for employment to return to the trend level if employment is driven away from this. The other countries tend to have larger values around -0.5 and even -0.6 as in the case of US. Thus, in broad terms, whereas in the latter group of countries it takes about 1.5 to 2 years to return to trend it takes up to 3 years in the former group of countries. This might be related to overall labour market institutions, adjustment in hours worked, etc. over the time period considered. But one can also see a somewhat distinct pattern across the twelve industries considered here. The coefficients tend to relative low (in absolute terms) in basic metals and fabricated metal products (CH) and financial and insurance activities (K) in which it therefore tends to return to trend level takes longer. In the other sectors the return to trend is somewhat faster with coefficients of around -0.5 and thus about 2 years. Again there are strong differences across countries. A more detailed analysis and explanation of these results would require investigating the country and sector specific factors, as well as the nature of the shocks (e.g. technology, trade, etc.), especially as we look at a rather short time span here, and a potential asymmetry of these (e.g. shocks which push labour above trend might have dif-ferent implications as those which push labour below trend). Another important point in this
37
respective analysis is to investigate whether sectors on a declining trend behave differently as compared to sectors on a rising employment trend. Other variables
As argued above a number of other variables capturing the countries’ or sector’s position in the international environment and employment specific regulations might be important in determining the demand for labour. Including these variables on trade and employment protection legislation (EPL) as mentioned above did not change these results a lot. Fur-thermore, the inclusion of these trade and labour market measures results in a relatively large reduction in the number of observations (with only between 16 and 20 observations being available as the EPL index is starting only later) making inference less reliable. Fur-thermore the sample of countries is restricted to eleven EU countries and Japan for which the EPL indicator is available in a longer time-series and we only consider the seven manufacturing sectors for which trade plays an important role. Moreover, the lack of varia-tion in the employment protection index EPL index results in few significant effects of la-bour market institutions on labour demand. We report results of this exercise in Appendix Tables A.3.2.3A-A.3.2.3G for the long-term and A.3.2.4A-A.3.2.5G for the short term results. In general, the results from these addi-tional models result in insignificant coefficients on the trade and labour market variables, though in the small number of cases where the coefficients are significant they tend to be negative in the case of trade and positive in the case of the employment protection index. Significant results are often found for larger countries like Germany, France and Japan. The negative effect of trade might point towards a competitiveness effect for these coun-tries – either in terms of productivity or within-sectoral specialization - as larger net exports are negatively related to labour demand. For smaller countries which tended to be more open this plays a less important role. With respect to the employment protection legislation the positive coefficient points towards less flexibility in the labour market (having a positive employment effect but might have negative overall productivity effects). This variable is again mostly significant for larger countries having experienced some labour market re-forms (e.g. German and Japan) or higher levels of employment protections like France. 3.3 Changes in the composition of employment in the twelve sectors selected,
1995-2010
3.3.1 Overall sectoral developments
The focus here is on the way that the work force employed in the sectors selected for study has tended to change over recent years in terms of:
• the gender composition
• the division between different broad age groups
38
• the general skill levels, as indicated by educational attainment
• the broad occupational breakdown
• the relative importance of self-employment
• the extent of fixed-term contracts of employment and of part-time working
• the degree to which it is made up of migrants. The concern is both to examine the apparent trends up to the onset of the recession in 2008 and the changes which have occurred since then, to see which groups of workers were most affected by the downturn in economic activity and how far they are being fa-voured as the recovery takes place. The twelve sectors have different characteristics in terms of the activities they involve, the skills they require and the extent and nature of competition they face in global markets. These all have implications for the work force they employ and the changes which have occurred in the pattern of employment over recent years. Textiles, clothing and footwear (NACE CB, termed Textiles in the rest of this section) is a declining industry in the EU in terms of both value-added and employment, reflecting the labour-intensive and relatively low-skilled nature of many of the activities involved in the manufacturing process. The decline, however, is not universal across Member States. In a few of the EU-12 countries which have entered the EU since 2004, the industry has ex-panded over recent years precisely because of its labour-intensive nature and the com-parative advantage which low wages give to the countries concerned. The Basic metals and fabricated metal products industry (NACE CH – termed Basic met-als) is also a declining industry in the EU, at least in terms of employment, though again not in a number of the EU-12 countries. Much the same applies to Machinery and equip-ment (NACE CK28 – termed Machinery) and Electronic, electrical and optical products (NACE CI+CJ – termed Electronics). Both involve a wide range of products (in the case of Electronics, for example, extending from Transformers to electric lighting, mobile phones and precision instruments), which lend themselves to varying degrees to automation. La-bour-intensive parts of the production process, particularly those involving assembly lines in the Electronics industry, have increasingly been located in low wage economies, with a significant part of production in the EU shifting from EU-15 countries to the EU-12. Both Chemicals (NACE CE) and Rubber, plastics and other non-metallic mineral products (NACE CG – termed Rubber and plastics) have tended to experience more stable employ-ment developments, with their share of overall employment falling only slowly, while the Motor vehicles industry (NACE CL29) is very much divided into mass-produced volume cars, for which labour costs are a major factor in competiveness, and high-end specialist
39
vehicles, for which engineering sophistication and expertise is of key importance, as well as the manufacture of components, where increasingly computerization is becoming important. Construction (NACE F) is also a labour-intensive sector where many activities involve rela-tively low skill levels, at least in terms of education requirements, but one which has tended to be a source of net job creation in many countries, in the more advanced economies as well as the less developed ones, since it is an activity which needs to be performed at the location concerned, at least up to a point. Much the same applies to the Wholesale and retail trade (NACE G - Distribution) and Ac-commodation and food services (NACE I - HORECA), which have equally tended to be sec-tors of employment growth across the EU, though less so in recent years in the case of the former in more developed economies, in particular, with the growth of supermarkets. Financial and insurance (NACE K – Financial services) also tends to be a source of net job creation in the less developed economies but not in the more developed ones, with the spread of computerization and the relocation of labour-intensive back office activities to low wage cost countries. Real estate and business activities (NACE LMN – Business services), which also involve a great many different kinds of activity (ranging from professional ser-vices and consultancy to cleaning), requiring a range of education and skills levels, have been a major source of employment growth right across the EU for many years . It should be noted that the analysis in this section is based entirely on the European La-bour Force Survey maintained by Eurostat and relates to the 12 sectors defined on a NACE rev. 2 basis. This has involved the adjustment of data for the years before 2008 when the change in classification was made from NACE rev. 1 basis to NACE rev. 2 one in order to make the series consistent over the period being examined, which is predomi-nantly 2000 to 2010. The figures for employment in the 12 sectors, and the characteristics of employment examined, therefore, might differ from those published by Eurostat which are based on the NACE rev. 1 sectoral classification (see Box 3.3.1 for a brief description of the adjustment method used). Box 3.3.1 – Adjusting the data from a NACE rev. 1 to a NACE rev. 2 basis
The data for the years before 2008, when the LFS data for all countries have been published on a NACE rev. 2 basis, are adjusted to the latter primarily by using the data for 2008 which Eurostat has also made available on a NACE rev. 1 basis. The detailed figures for the characteristics of employ-ment examined here – gender, age, educational level, occupation and so on of those employed – have therefore been provided by Eurostat on both bases so that a link can be made between the two and an adjustment correspondingly made to the data for earlier years to convert them to a NACE rev. 2 basis on the implicit assumption that the correspondence between the two classifica-tion systems remains constant. This effectively means that the proportion of employment in particu-lar NACE rev. 1 sectors which are included as part of a NACE rev. 2 sector remains unchanged over
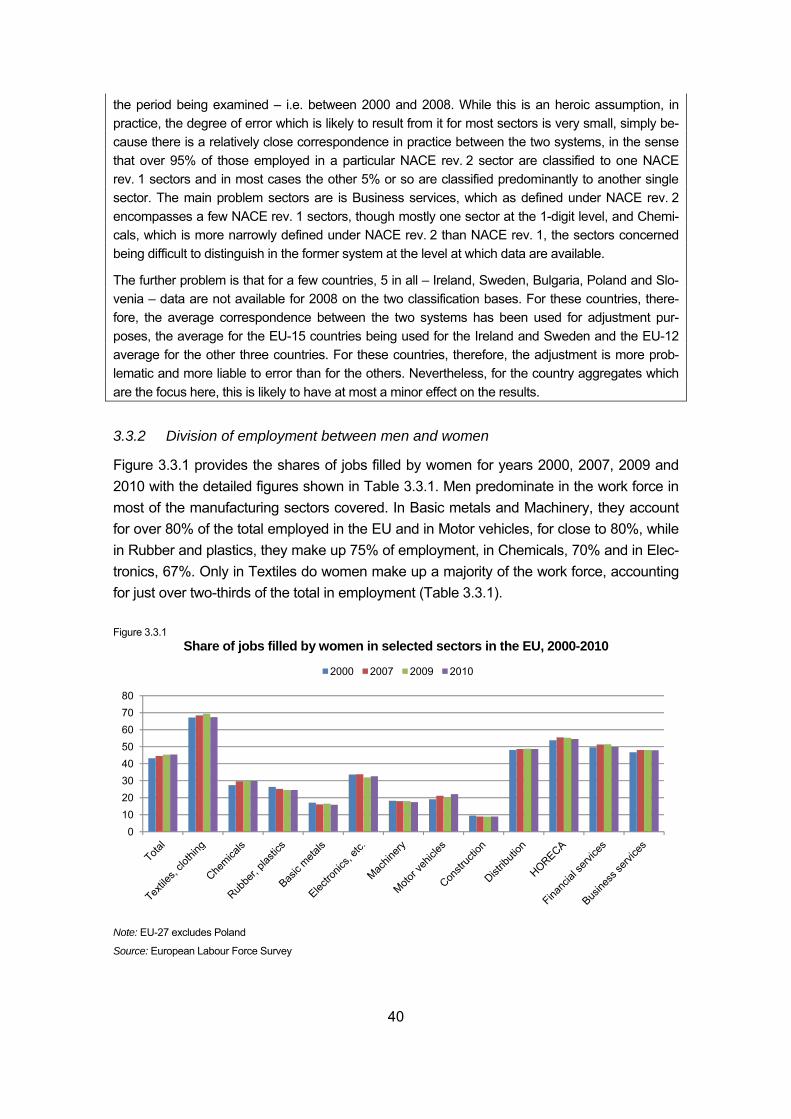
40
the period being examined – i.e. between 2000 and 2008. While this is an heroic assumption, in practice, the degree of error which is likely to result from it for most sectors is very small, simply be-cause there is a relatively close correspondence in practice between the two systems, in the sense that over 95% of those employed in a particular NACE rev. 2 sector are classified to one NACE rev. 1 sectors and in most cases the other 5% or so are classified predominantly to another single sector. The main problem sectors are is Business services, which as defined under NACE rev. 2 encompasses a few NACE rev. 1 sectors, though mostly one sector at the 1-digit level, and Chemi-cals, which is more narrowly defined under NACE rev. 2 than NACE rev. 1, the sectors concerned being difficult to distinguish in the former system at the level at which data are available.
The further problem is that for a few countries, 5 in all – Ireland, Sweden, Bulgaria, Poland and Slo-venia – data are not available for 2008 on the two classification bases. For these countries, there-fore, the average correspondence between the two systems has been used for adjustment pur-poses, the average for the EU-15 countries being used for the Ireland and Sweden and the EU-12 average for the other three countries. For these countries, therefore, the adjustment is more prob-lematic and more liable to error than for the others. Nevertheless, for the country aggregates which are the focus here, this is likely to have at most a minor effect on the results.
3.3.2 Division of employment between men and women
Figure 3.3.1 provides the shares of jobs filled by women for years 2000, 2007, 2009 and 2010 with the detailed figures shown in Table 3.3.1. Men predominate in the work force in most of the manufacturing sectors covered. In Basic metals and Machinery, they account for over 80% of the total employed in the EU and in Motor vehicles, for close to 80%, while in Rubber and plastics, they make up 75% of employment, in Chemicals, 70% and in Elec-tronics, 67%. Only in Textiles do women make up a majority of the work force, accounting for just over two-thirds of the total in employment (Table 3.3.1). Figure 3.3.1
Share of jobs filled by women in selected sectors in the EU, 2000-2010
Note: EU-27 excludes Poland
Source: European Labour Force Survey
01020304050607080
2000 2007 2009 2010
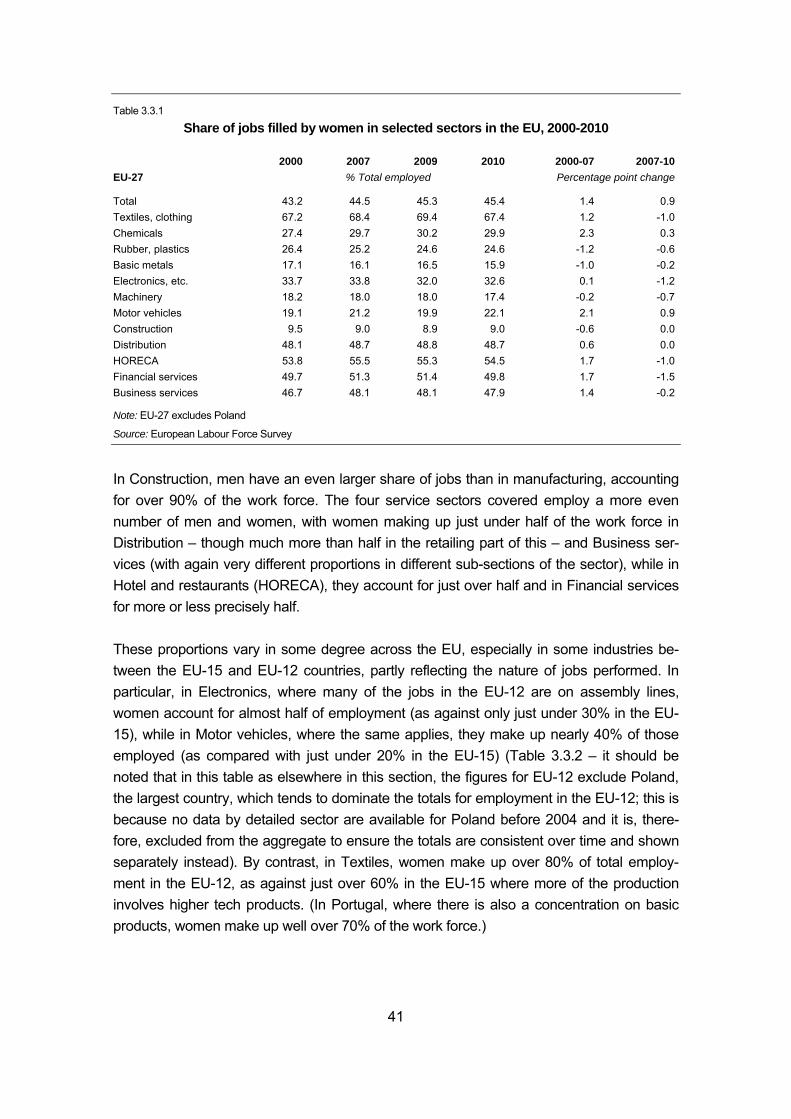
41
Table 3.3.1
Share of jobs filled by women in selected sectors in the EU, 2000-2010
2000 2007 2009 2010 2000-07 2007-10EU-27 % Total employed Percentage point change
Total 43.2 44.5 45.3 45.4 1.4 0.9Textiles, clothing 67.2 68.4 69.4 67.4 1.2 -1.0Chemicals 27.4 29.7 30.2 29.9 2.3 0.3Rubber, plastics 26.4 25.2 24.6 24.6 -1.2 -0.6Basic metals 17.1 16.1 16.5 15.9 -1.0 -0.2Electronics, etc. 33.7 33.8 32.0 32.6 0.1 -1.2Machinery 18.2 18.0 18.0 17.4 -0.2 -0.7Motor vehicles 19.1 21.2 19.9 22.1 2.1 0.9Construction 9.5 9.0 8.9 9.0 -0.6 0.0Distribution 48.1 48.7 48.8 48.7 0.6 0.0HORECA 53.8 55.5 55.3 54.5 1.7 -1.0Financial services 49.7 51.3 51.4 49.8 1.7 -1.5Business services 46.7 48.1 48.1 47.9 1.4 -0.2
Note: EU-27 excludes Poland
Source: European Labour Force Survey
In Construction, men have an even larger share of jobs than in manufacturing, accounting for over 90% of the work force. The four service sectors covered employ a more even number of men and women, with women making up just under half of the work force in Distribution – though much more than half in the retailing part of this – and Business ser-vices (with again very different proportions in different sub-sections of the sector), while in Hotel and restaurants (HORECA), they account for just over half and in Financial services for more or less precisely half. These proportions vary in some degree across the EU, especially in some industries be-tween the EU-15 and EU-12 countries, partly reflecting the nature of jobs performed. In particular, in Electronics, where many of the jobs in the EU-12 are on assembly lines, women account for almost half of employment (as against only just under 30% in the EU-15), while in Motor vehicles, where the same applies, they make up nearly 40% of those employed (as compared with just under 20% in the EU-15) (Table 3.3.2 – it should be noted that in this table as elsewhere in this section, the figures for EU-12 exclude Poland, the largest country, which tends to dominate the totals for employment in the EU-12; this is because no data by detailed sector are available for Poland before 2004 and it is, there-fore, excluded from the aggregate to ensure the totals are consistent over time and shown separately instead). By contrast, in Textiles, women make up over 80% of total employ-ment in the EU-12, as against just over 60% in the EU-15 where more of the production involves higher tech products. (In Portugal, where there is also a concentration on basic products, women make up well over 70% of the work force.)
42
In the four service sectors, there is also some difference in the share of employment ac-counted for by women between the EU-15 and EU-12 countries, with women filling more of the jobs in the latter in Distribution (around 56% as against 48% in the EU-15), HORECA (59% as against 54%) and, most especially, in Financial services (65% as against 48%), where in the EU-15, routine jobs comprise a smaller proportion of the total. There has been only a limited tendency for the share of women to increase in the industrial sectors across the EU-27. Only in Chemicals, Motor vehicles and, to a lesser extent, in Textiles, did the share of women increase significantly over the period 2000-2007 before the onset of the recession. In three of the manufacturing industries (Rubber and plastics, Basic metals and Machinery) as well as in Construction, the share of women was tending to decline before the onset of recession, i.e. over the period 2000-2007. This was true in both the EU-15 and EU-12, while in the EU-15, the share of women in Textiles also de-clined over the period 2000-2007. Indeed, in marked contrast to the trend in the EU-15, the overall share of women in total employment in the EU-12 has fallen since 2000 and this is a true of Poland as of the other countries. This, in some degree, reflects the adjustment to the situation before the transi-tion when in the former Communist regime, everyone, women as well as men, were ex-pected to be in paid employment except for the period following child-birth. In Electronics, however, there was also an increase in the share of jobs filled by women in the EU-12 before the recession, which was especially the case in Poland (from 2004 on at least). This contrasts with the reduction which occurred in the EU-15, which might reflect the changing nature of activities in the two groups of countries, as indicated by the occupa-tional structure of employment noted below. In contrast to industry, there has been a clear tendency for the share of women to increase in services, at least in the EU-15 countries. This is less clear in the EU-12, where in the countries excluding Poland, the share of jobs filled by women declined slightly over the period 2000-2007 in Distribution, while in Poland, the share of women declined in Financial services. Over the recession period from 2007 to 2010, the share of jobs filled by women continued to increase across the EU as a whole (by 1 percentage point), though again this was pre-dominantly in the EU-15 and to a large extent reflects the shift in the structure of employ-ment over the period and, in particular, the large job losses in industry coupled with a much smaller decline in jobs in services, if any decline at all. In the EU-15, therefore, the share of women increased in only two sectors, Chemicals and Motor vehicles. The impression gained, therefore, of jobs for men being lost and jobs for women being preserved seems to
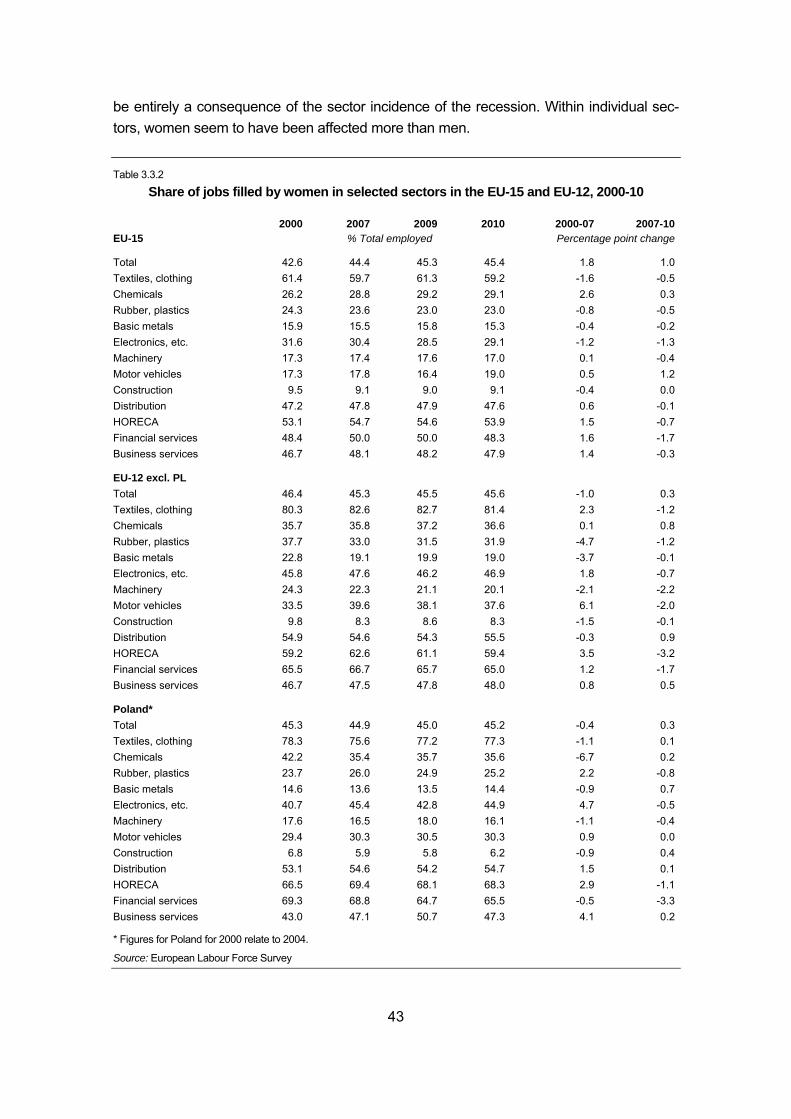
43
be entirely a consequence of the sector incidence of the recession. Within individual sec-tors, women seem to have been affected more than men. Table 3.3.2
Share of jobs filled by women in selected sectors in the EU-15 and EU-12, 2000-10
2000 2007 2009 2010 2000-07 2007-10EU-15 % Total employed Percentage point change
Total 42.6 44.4 45.3 45.4 1.8 1.0Textiles, clothing 61.4 59.7 61.3 59.2 -1.6 -0.5Chemicals 26.2 28.8 29.2 29.1 2.6 0.3Rubber, plastics 24.3 23.6 23.0 23.0 -0.8 -0.5Basic metals 15.9 15.5 15.8 15.3 -0.4 -0.2Electronics, etc. 31.6 30.4 28.5 29.1 -1.2 -1.3Machinery 17.3 17.4 17.6 17.0 0.1 -0.4Motor vehicles 17.3 17.8 16.4 19.0 0.5 1.2Construction 9.5 9.1 9.0 9.1 -0.4 0.0Distribution 47.2 47.8 47.9 47.6 0.6 -0.1HORECA 53.1 54.7 54.6 53.9 1.5 -0.7Financial services 48.4 50.0 50.0 48.3 1.6 -1.7Business services 46.7 48.1 48.2 47.9 1.4 -0.3
EU-12 excl. PL Total 46.4 45.3 45.5 45.6 -1.0 0.3Textiles, clothing 80.3 82.6 82.7 81.4 2.3 -1.2Chemicals 35.7 35.8 37.2 36.6 0.1 0.8Rubber, plastics 37.7 33.0 31.5 31.9 -4.7 -1.2Basic metals 22.8 19.1 19.9 19.0 -3.7 -0.1Electronics, etc. 45.8 47.6 46.2 46.9 1.8 -0.7Machinery 24.3 22.3 21.1 20.1 -2.1 -2.2Motor vehicles 33.5 39.6 38.1 37.6 6.1 -2.0Construction 9.8 8.3 8.6 8.3 -1.5 -0.1Distribution 54.9 54.6 54.3 55.5 -0.3 0.9HORECA 59.2 62.6 61.1 59.4 3.5 -3.2Financial services 65.5 66.7 65.7 65.0 1.2 -1.7Business services 46.7 47.5 47.8 48.0 0.8 0.5
Poland* Total 45.3 44.9 45.0 45.2 -0.4 0.3Textiles, clothing 78.3 75.6 77.2 77.3 -1.1 0.1Chemicals 42.2 35.4 35.7 35.6 -6.7 0.2Rubber, plastics 23.7 26.0 24.9 25.2 2.2 -0.8Basic metals 14.6 13.6 13.5 14.4 -0.9 0.7Electronics, etc. 40.7 45.4 42.8 44.9 4.7 -0.5Machinery 17.6 16.5 18.0 16.1 -1.1 -0.4Motor vehicles 29.4 30.3 30.5 30.3 0.9 0.0Construction 6.8 5.9 5.8 6.2 -0.9 0.4Distribution 53.1 54.6 54.2 54.7 1.5 0.1HORECA 66.5 69.4 68.1 68.3 2.9 -1.1Financial services 69.3 68.8 64.7 65.5 -0.5 -3.3Business services 43.0 47.1 50.7 47.3 4.1 0.2
* Figures for Poland for 2000 relate to 2004.
Source: European Labour Force Survey
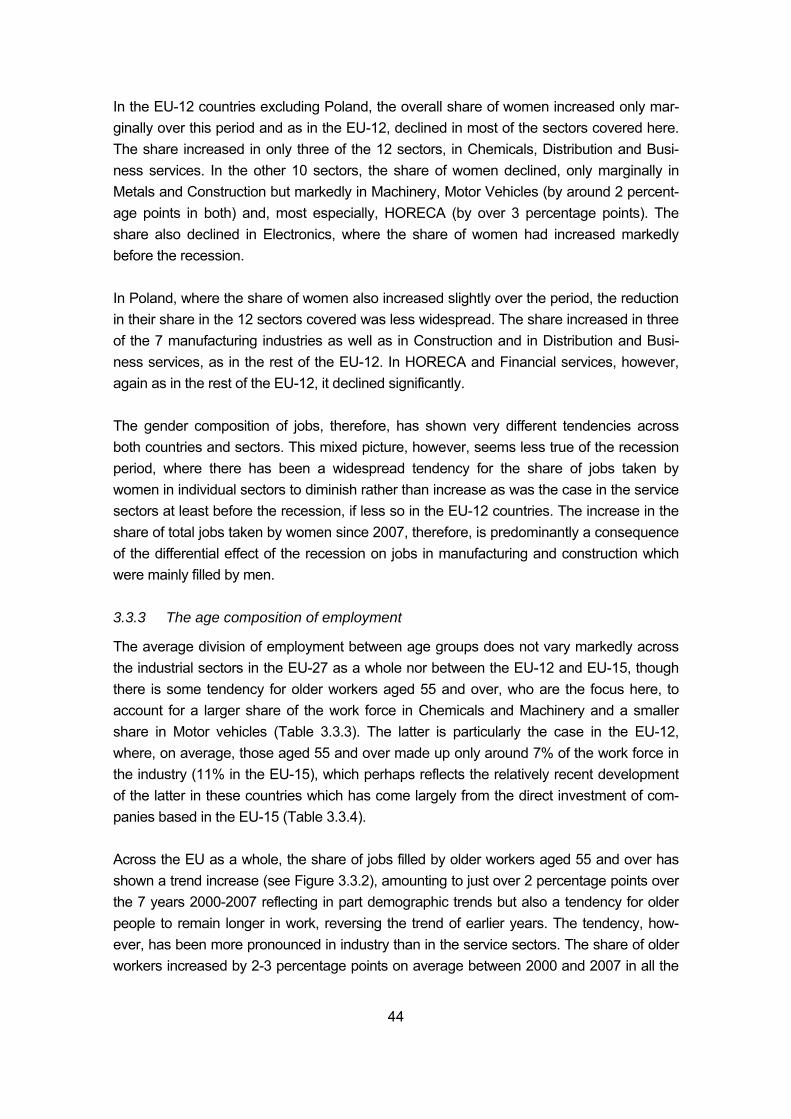
44
In the EU-12 countries excluding Poland, the overall share of women increased only mar-ginally over this period and as in the EU-12, declined in most of the sectors covered here. The share increased in only three of the 12 sectors, in Chemicals, Distribution and Busi-ness services. In the other 10 sectors, the share of women declined, only marginally in Metals and Construction but markedly in Machinery, Motor Vehicles (by around 2 percent-age points in both) and, most especially, HORECA (by over 3 percentage points). The share also declined in Electronics, where the share of women had increased markedly before the recession. In Poland, where the share of women also increased slightly over the period, the reduction in their share in the 12 sectors covered was less widespread. The share increased in three of the 7 manufacturing industries as well as in Construction and in Distribution and Busi-ness services, as in the rest of the EU-12. In HORECA and Financial services, however, again as in the rest of the EU-12, it declined significantly. The gender composition of jobs, therefore, has shown very different tendencies across both countries and sectors. This mixed picture, however, seems less true of the recession period, where there has been a widespread tendency for the share of jobs taken by women in individual sectors to diminish rather than increase as was the case in the service sectors at least before the recession, if less so in the EU-12 countries. The increase in the share of total jobs taken by women since 2007, therefore, is predominantly a consequence of the differential effect of the recession on jobs in manufacturing and construction which were mainly filled by men. 3.3.3 The age composition of employment
The average division of employment between age groups does not vary markedly across the industrial sectors in the EU-27 as a whole nor between the EU-12 and EU-15, though there is some tendency for older workers aged 55 and over, who are the focus here, to account for a larger share of the work force in Chemicals and Machinery and a smaller share in Motor vehicles (Table 3.3.3). The latter is particularly the case in the EU-12, where, on average, those aged 55 and over made up only around 7% of the work force in the industry (11% in the EU-15), which perhaps reflects the relatively recent development of the latter in these countries which has come largely from the direct investment of com-panies based in the EU-15 (Table 3.3.4). Across the EU as a whole, the share of jobs filled by older workers aged 55 and over has shown a trend increase (see Figure 3.3.2), amounting to just over 2 percentage points over the 7 years 2000-2007 reflecting in part demographic trends but also a tendency for older people to remain longer in work, reversing the trend of earlier years. The tendency, how-ever, has been more pronounced in industry than in the service sectors. The share of older workers increased by 2-3 percentage points on average between 2000 and 2007 in all the
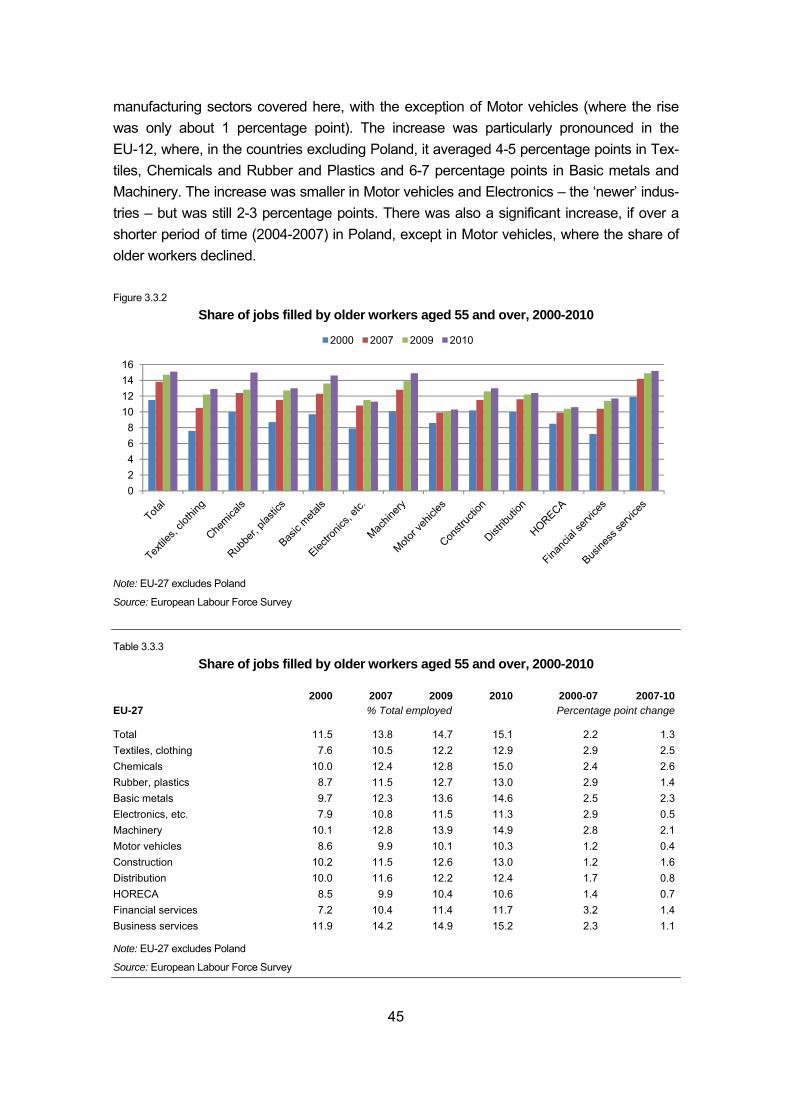
45
manufacturing sectors covered here, with the exception of Motor vehicles (where the rise was only about 1 percentage point). The increase was particularly pronounced in the EU-12, where, in the countries excluding Poland, it averaged 4-5 percentage points in Tex-tiles, Chemicals and Rubber and Plastics and 6-7 percentage points in Basic metals and Machinery. The increase was smaller in Motor vehicles and Electronics – the ‘newer’ indus-tries – but was still 2-3 percentage points. There was also a significant increase, if over a shorter period of time (2004-2007) in Poland, except in Motor vehicles, where the share of older workers declined. Figure 3.3.2
Share of jobs filled by older workers aged 55 and over, 2000-2010
Note: EU-27 excludes Poland
Source: European Labour Force Survey
Table 3.3.3
Share of jobs filled by older workers aged 55 and over, 2000-2010
2000 2007 2009 2010 2000-07 2007-10EU-27 % Total employed Percentage point change
Total 11.5 13.8 14.7 15.1 2.2 1.3Textiles, clothing 7.6 10.5 12.2 12.9 2.9 2.5Chemicals 10.0 12.4 12.8 15.0 2.4 2.6Rubber, plastics 8.7 11.5 12.7 13.0 2.9 1.4Basic metals 9.7 12.3 13.6 14.6 2.5 2.3Electronics, etc. 7.9 10.8 11.5 11.3 2.9 0.5Machinery 10.1 12.8 13.9 14.9 2.8 2.1Motor vehicles 8.6 9.9 10.1 10.3 1.2 0.4Construction 10.2 11.5 12.6 13.0 1.2 1.6Distribution 10.0 11.6 12.2 12.4 1.7 0.8HORECA 8.5 9.9 10.4 10.6 1.4 0.7Financial services 7.2 10.4 11.4 11.7 3.2 1.4Business services 11.9 14.2 14.9 15.2 2.3 1.1
Note: EU-27 excludes Poland
Source: European Labour Force Survey
02468
10121416
2000 2007 2009 2010
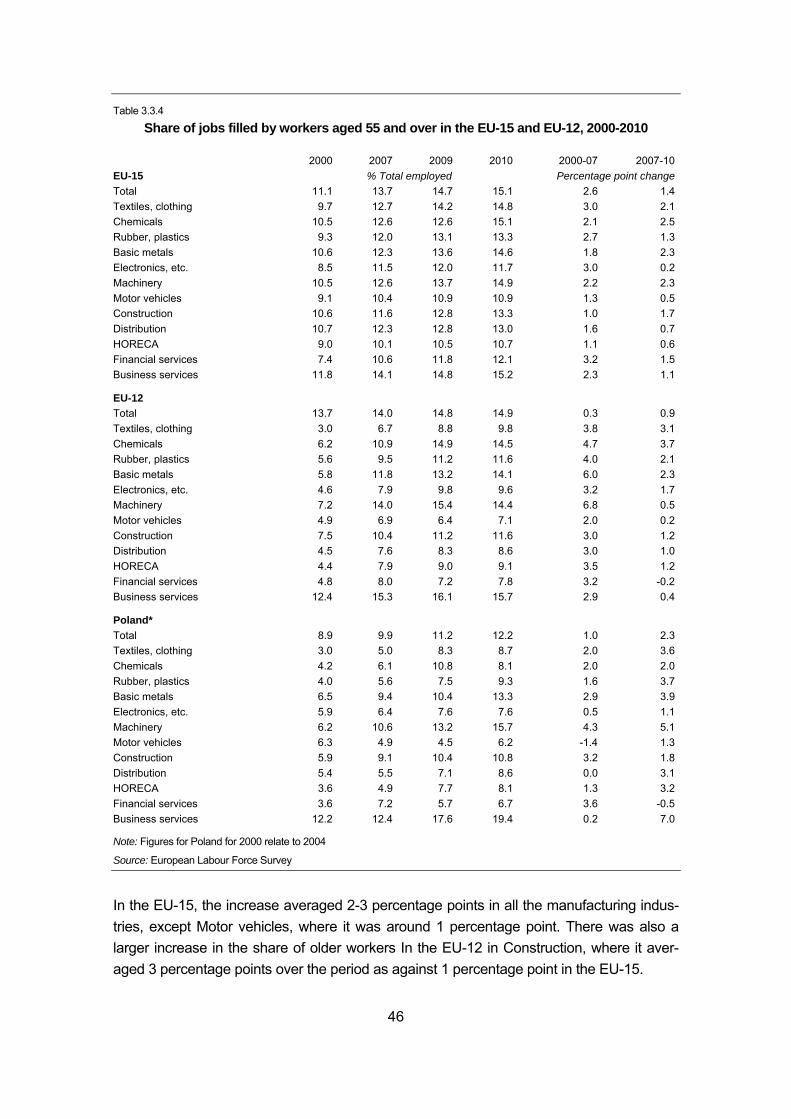
46
Table 3.3.4
Share of jobs filled by workers aged 55 and over in the EU-15 and EU-12, 2000-2010
2000 2007 2009 2010 2000-07 2007-10EU-15 % Total employed Percentage point changeTotal 11.1 13.7 14.7 15.1 2.6 1.4Textiles, clothing 9.7 12.7 14.2 14.8 3.0 2.1Chemicals 10.5 12.6 12.6 15.1 2.1 2.5Rubber, plastics 9.3 12.0 13.1 13.3 2.7 1.3Basic metals 10.6 12.3 13.6 14.6 1.8 2.3Electronics, etc. 8.5 11.5 12.0 11.7 3.0 0.2Machinery 10.5 12.6 13.7 14.9 2.2 2.3Motor vehicles 9.1 10.4 10.9 10.9 1.3 0.5Construction 10.6 11.6 12.8 13.3 1.0 1.7Distribution 10.7 12.3 12.8 13.0 1.6 0.7HORECA 9.0 10.1 10.5 10.7 1.1 0.6Financial services 7.4 10.6 11.8 12.1 3.2 1.5Business services 11.8 14.1 14.8 15.2 2.3 1.1
EU-12 Total 13.7 14.0 14.8 14.9 0.3 0.9Textiles, clothing 3.0 6.7 8.8 9.8 3.8 3.1Chemicals 6.2 10.9 14.9 14.5 4.7 3.7Rubber, plastics 5.6 9.5 11.2 11.6 4.0 2.1Basic metals 5.8 11.8 13.2 14.1 6.0 2.3Electronics, etc. 4.6 7.9 9.8 9.6 3.2 1.7Machinery 7.2 14.0 15.4 14.4 6.8 0.5Motor vehicles 4.9 6.9 6.4 7.1 2.0 0.2Construction 7.5 10.4 11.2 11.6 3.0 1.2Distribution 4.5 7.6 8.3 8.6 3.0 1.0HORECA 4.4 7.9 9.0 9.1 3.5 1.2Financial services 4.8 8.0 7.2 7.8 3.2 -0.2Business services 12.4 15.3 16.1 15.7 2.9 0.4
Poland* Total 8.9 9.9 11.2 12.2 1.0 2.3Textiles, clothing 3.0 5.0 8.3 8.7 2.0 3.6Chemicals 4.2 6.1 10.8 8.1 2.0 2.0Rubber, plastics 4.0 5.6 7.5 9.3 1.6 3.7Basic metals 6.5 9.4 10.4 13.3 2.9 3.9Electronics, etc. 5.9 6.4 7.6 7.6 0.5 1.1Machinery 6.2 10.6 13.2 15.7 4.3 5.1Motor vehicles 6.3 4.9 4.5 6.2 -1.4 1.3Construction 5.9 9.1 10.4 10.8 3.2 1.8Distribution 5.4 5.5 7.1 8.6 0.0 3.1HORECA 3.6 4.9 7.7 8.1 1.3 3.2Financial services 3.6 7.2 5.7 6.7 3.6 -0.5Business services 12.2 12.4 17.6 19.4 0.2 7.0
Note: Figures for Poland for 2000 relate to 2004
Source: European Labour Force Survey
In the EU-15, the increase averaged 2-3 percentage points in all the manufacturing indus-tries, except Motor vehicles, where it was around 1 percentage point. There was also a larger increase in the share of older workers In the EU-12 in Construction, where it aver-aged 3 percentage points over the period as against 1 percentage point in the EU-15.
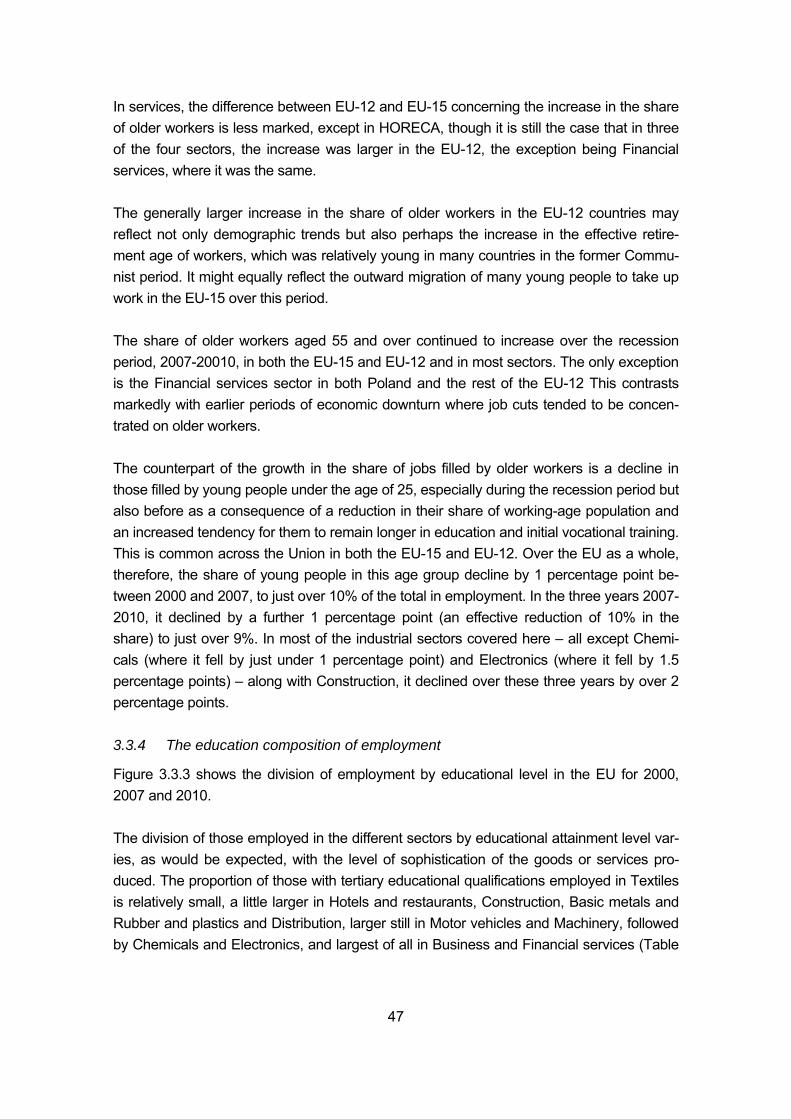
47
In services, the difference between EU-12 and EU-15 concerning the increase in the share of older workers is less marked, except in HORECA, though it is still the case that in three of the four sectors, the increase was larger in the EU-12, the exception being Financial services, where it was the same. The generally larger increase in the share of older workers in the EU-12 countries may reflect not only demographic trends but also perhaps the increase in the effective retire-ment age of workers, which was relatively young in many countries in the former Commu-nist period. It might equally reflect the outward migration of many young people to take up work in the EU-15 over this period. The share of older workers aged 55 and over continued to increase over the recession period, 2007-20010, in both the EU-15 and EU-12 and in most sectors. The only exception is the Financial services sector in both Poland and the rest of the EU-12 This contrasts markedly with earlier periods of economic downturn where job cuts tended to be concen-trated on older workers. The counterpart of the growth in the share of jobs filled by older workers is a decline in those filled by young people under the age of 25, especially during the recession period but also before as a consequence of a reduction in their share of working-age population and an increased tendency for them to remain longer in education and initial vocational training. This is common across the Union in both the EU-15 and EU-12. Over the EU as a whole, therefore, the share of young people in this age group decline by 1 percentage point be-tween 2000 and 2007, to just over 10% of the total in employment. In the three years 2007-2010, it declined by a further 1 percentage point (an effective reduction of 10% in the share) to just over 9%. In most of the industrial sectors covered here – all except Chemi-cals (where it fell by just under 1 percentage point) and Electronics (where it fell by 1.5 percentage points) – along with Construction, it declined over these three years by over 2 percentage points. 3.3.4 The education composition of employment
Figure 3.3.3 shows the division of employment by educational level in the EU for 2000, 2007 and 2010. The division of those employed in the different sectors by educational attainment level var-ies, as would be expected, with the level of sophistication of the goods or services pro-duced. The proportion of those with tertiary educational qualifications employed in Textiles is relatively small, a little larger in Hotels and restaurants, Construction, Basic metals and Rubber and plastics and Distribution, larger still in Motor vehicles and Machinery, followed by Chemicals and Electronics, and largest of all in Business and Financial services (Table
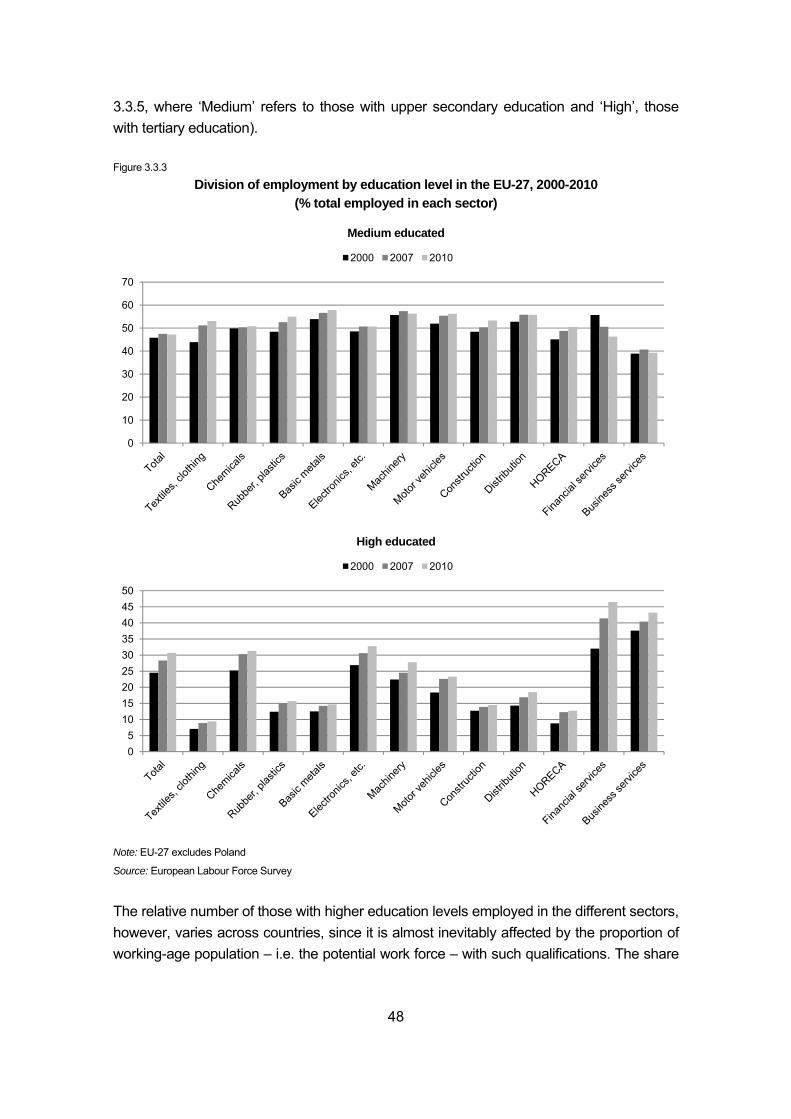
48
3.3.5, where ‘Medium’ refers to those with upper secondary education and ‘High’, those with tertiary education). Figure 3.3.3
Division of employment by education level in the EU-27, 2000-2010 (% total employed in each sector)
Medium educated
High educated
Note: EU-27 excludes Poland
Source: European Labour Force Survey
The relative number of those with higher education levels employed in the different sectors, however, varies across countries, since it is almost inevitably affected by the proportion of working-age population – i.e. the potential work force – with such qualifications. The share
0
10
20
30
40
50
60
70
2000 2007 2010
05
101520253035404550
2000 2007 2010
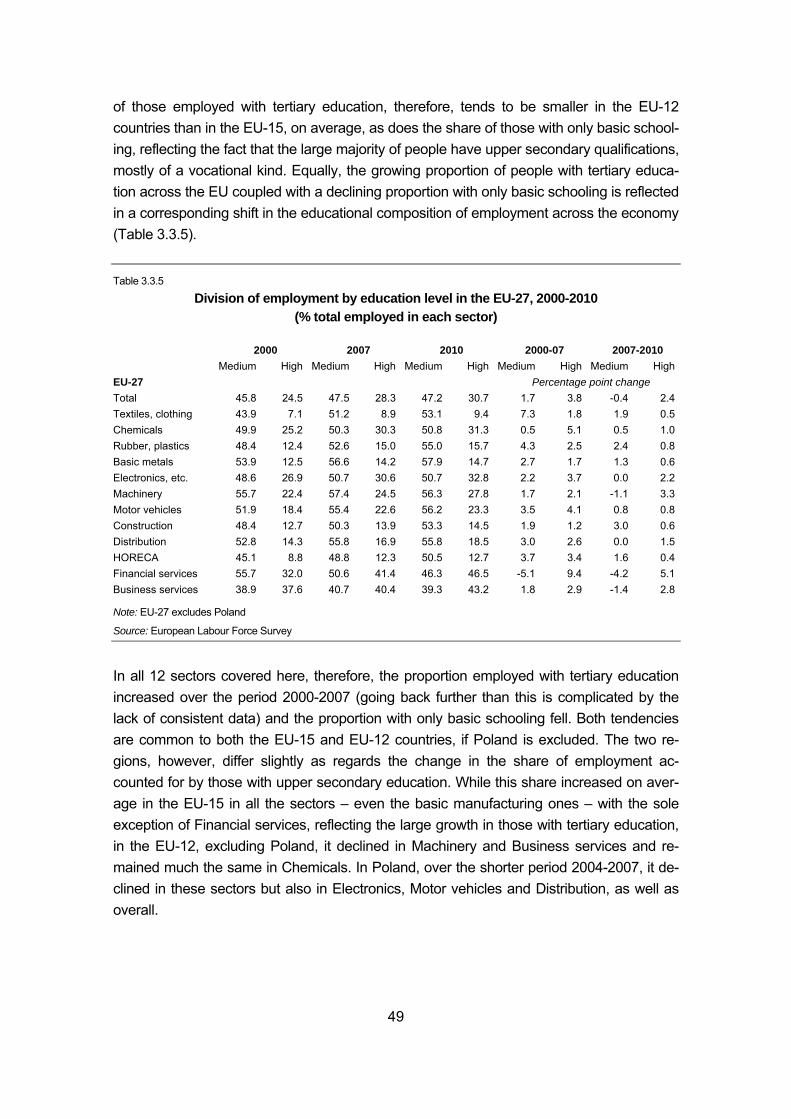
49
of those employed with tertiary education, therefore, tends to be smaller in the EU-12 countries than in the EU-15, on average, as does the share of those with only basic school-ing, reflecting the fact that the large majority of people have upper secondary qualifications, mostly of a vocational kind. Equally, the growing proportion of people with tertiary educa-tion across the EU coupled with a declining proportion with only basic schooling is reflected in a corresponding shift in the educational composition of employment across the economy (Table 3.3.5). Table 3.3.5
Division of employment by education level in the EU-27, 2000-2010 (% total employed in each sector)
2000 2007 2010 2000-07 2007-2010 Medium High Medium High Medium High Medium High Medium High EU-27 Percentage point change Total 45.8 24.5 47.5 28.3 47.2 30.7 1.7 3.8 -0.4 2.4Textiles, clothing 43.9 7.1 51.2 8.9 53.1 9.4 7.3 1.8 1.9 0.5Chemicals 49.9 25.2 50.3 30.3 50.8 31.3 0.5 5.1 0.5 1.0Rubber, plastics 48.4 12.4 52.6 15.0 55.0 15.7 4.3 2.5 2.4 0.8Basic metals 53.9 12.5 56.6 14.2 57.9 14.7 2.7 1.7 1.3 0.6Electronics, etc. 48.6 26.9 50.7 30.6 50.7 32.8 2.2 3.7 0.0 2.2Machinery 55.7 22.4 57.4 24.5 56.3 27.8 1.7 2.1 -1.1 3.3Motor vehicles 51.9 18.4 55.4 22.6 56.2 23.3 3.5 4.1 0.8 0.8Construction 48.4 12.7 50.3 13.9 53.3 14.5 1.9 1.2 3.0 0.6Distribution 52.8 14.3 55.8 16.9 55.8 18.5 3.0 2.6 0.0 1.5HORECA 45.1 8.8 48.8 12.3 50.5 12.7 3.7 3.4 1.6 0.4Financial services 55.7 32.0 50.6 41.4 46.3 46.5 -5.1 9.4 -4.2 5.1Business services 38.9 37.6 40.7 40.4 39.3 43.2 1.8 2.9 -1.4 2.8
Note: EU-27 excludes Poland
Source: European Labour Force Survey
In all 12 sectors covered here, therefore, the proportion employed with tertiary education increased over the period 2000-2007 (going back further than this is complicated by the lack of consistent data) and the proportion with only basic schooling fell. Both tendencies are common to both the EU-15 and EU-12 countries, if Poland is excluded. The two re-gions, however, differ slightly as regards the change in the share of employment ac-counted for by those with upper secondary education. While this share increased on aver-age in the EU-15 in all the sectors – even the basic manufacturing ones – with the sole exception of Financial services, reflecting the large growth in those with tertiary education, in the EU-12, excluding Poland, it declined in Machinery and Business services and re-mained much the same in Chemicals. In Poland, over the shorter period 2004-2007, it de-clined in these sectors but also in Electronics, Motor vehicles and Distribution, as well as overall.
50
Moreover, unlike in the rest of the EU-12, the share of those in employment with tertiary education in Poland declined in Rubber and plastics, Basic metals, Construction and HORECA. In the rest of the EU-12 as well as in the EU-15, the share of those employed with tertiary qualifications increased in all sectors and in most of them significantly. The big increase in the EU-12, including in Poland, occurred in both Financial and Business ser-vices, reflecting perhaps the professionalization of these sectors and the shift to higher level activities. The share of the work force with tertiary qualifications also increased in the EU-15 in these two sectors, though to a smaller extent. The increase in share was equally marked, how-ever, in Electronics and Motor vehicles, as well as in Chemicals, whereas the former two sectors showed below average increases in the share in the EU-12. As indicated below, this reflects a shift in the activities performed in both of these sectors. Over the recession period 2007-2010, the share of those with tertiary education increased across the EU as a whole in all the sectors covered without exception. The share of those with upper secondary education also increased in 9 of the 12 sectors all except Machinery, Financial services and Business services, in all of which there was a significant increase in the share of the work force with tertiary education. This widespread increase across sec-tors, however, was accompanied by a reduction in the overall share of those with upper secondary education in the total employment, which as in the case of women noted above is a consequence of the large-scale job losses in manufacturing and construction in which many of those with this level of qualification are employed. What is true, however, is that both across the economy as a whole and in all the sectors covered here, the share of jobs filled by workers with only basic education levels has declined markedly over the reces-sion, intensifying the long-term downward trend evident before the recession. At the same time, there was some difference in the pattern of change in the EU-15 and EU-12. Whereas there was a virtually common increase in the share of jobs filled by those with tertiary education over the period 2007-2010 in all sectors – the only exception being in Machinery in the EU-12, excluding Poland – the change in the share of those filled by workers with upper secondary qualifications was more mixed. In the EU-15, the share de-clined only in Machinery and Business and Financial services, remaining broadly un-changed in Electronics. In Poland, on the other hand, it declined in all the sectors apart from Rubber and plastics, Motor vehicles and Construction, and in the rest of the EU-12, it declined in 8 of the 12 sectors, increasing only in Machinery and remaining unchanged, or virtually so, in Textiles, Rubber and plastics and HORECA. The implication is that whereas in the EU-15, there was a general and significant decline in the share of jobs filled by those with only basic schooling over the three years 2007-2010, who were accordingly among the main victims of the crisis, in the EU-12, this is less the
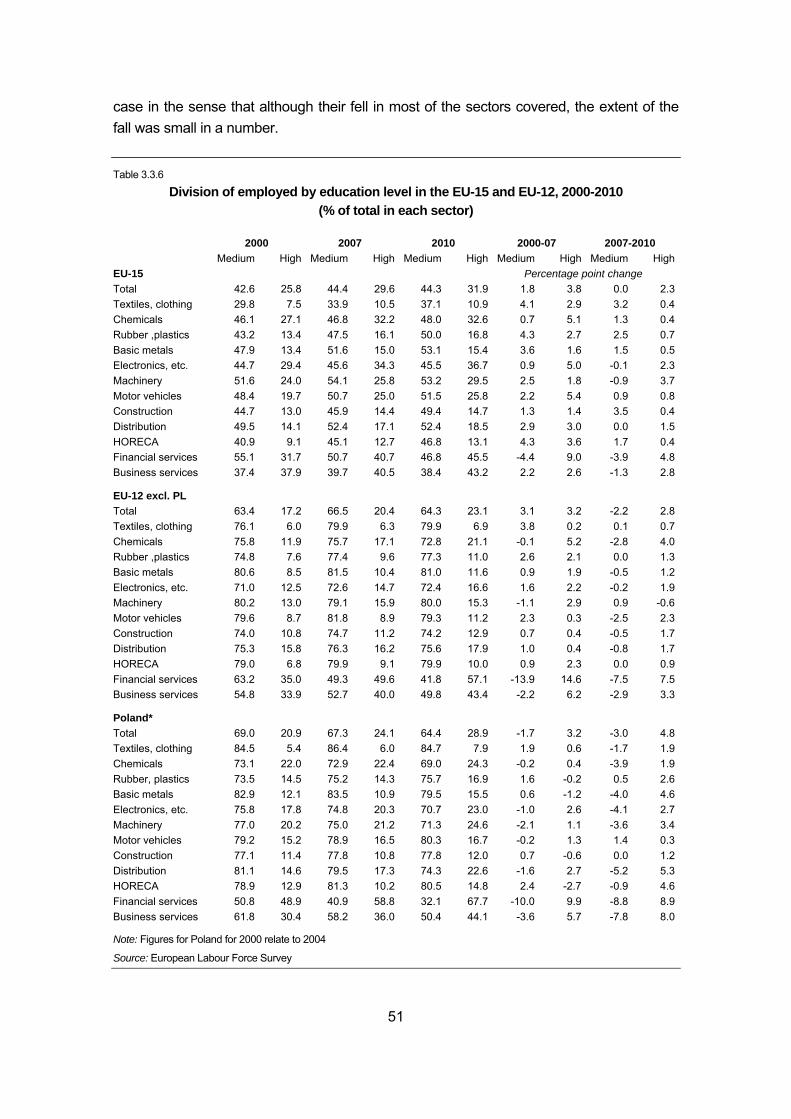
51
case in the sense that although their fell in most of the sectors covered, the extent of the fall was small in a number. Table 3.3.6
Division of employed by education level in the EU-15 and EU-12, 2000-2010 (% of total in each sector)
2000 2007 2010 2000-07 2007-2010 Medium High Medium High Medium High Medium High Medium High EU-15 Percentage point change Total 42.6 25.8 44.4 29.6 44.3 31.9 1.8 3.8 0.0 2.3Textiles, clothing 29.8 7.5 33.9 10.5 37.1 10.9 4.1 2.9 3.2 0.4Chemicals 46.1 27.1 46.8 32.2 48.0 32.6 0.7 5.1 1.3 0.4Rubber ,plastics 43.2 13.4 47.5 16.1 50.0 16.8 4.3 2.7 2.5 0.7Basic metals 47.9 13.4 51.6 15.0 53.1 15.4 3.6 1.6 1.5 0.5Electronics, etc. 44.7 29.4 45.6 34.3 45.5 36.7 0.9 5.0 -0.1 2.3Machinery 51.6 24.0 54.1 25.8 53.2 29.5 2.5 1.8 -0.9 3.7Motor vehicles 48.4 19.7 50.7 25.0 51.5 25.8 2.2 5.4 0.9 0.8Construction 44.7 13.0 45.9 14.4 49.4 14.7 1.3 1.4 3.5 0.4Distribution 49.5 14.1 52.4 17.1 52.4 18.5 2.9 3.0 0.0 1.5HORECA 40.9 9.1 45.1 12.7 46.8 13.1 4.3 3.6 1.7 0.4Financial services 55.1 31.7 50.7 40.7 46.8 45.5 -4.4 9.0 -3.9 4.8Business services 37.4 37.9 39.7 40.5 38.4 43.2 2.2 2.6 -1.3 2.8
EU-12 excl. PL Total 63.4 17.2 66.5 20.4 64.3 23.1 3.1 3.2 -2.2 2.8Textiles, clothing 76.1 6.0 79.9 6.3 79.9 6.9 3.8 0.2 0.1 0.7Chemicals 75.8 11.9 75.7 17.1 72.8 21.1 -0.1 5.2 -2.8 4.0Rubber ,plastics 74.8 7.6 77.4 9.6 77.3 11.0 2.6 2.1 0.0 1.3Basic metals 80.6 8.5 81.5 10.4 81.0 11.6 0.9 1.9 -0.5 1.2Electronics, etc. 71.0 12.5 72.6 14.7 72.4 16.6 1.6 2.2 -0.2 1.9Machinery 80.2 13.0 79.1 15.9 80.0 15.3 -1.1 2.9 0.9 -0.6Motor vehicles 79.6 8.7 81.8 8.9 79.3 11.2 2.3 0.3 -2.5 2.3Construction 74.0 10.8 74.7 11.2 74.2 12.9 0.7 0.4 -0.5 1.7Distribution 75.3 15.8 76.3 16.2 75.6 17.9 1.0 0.4 -0.8 1.7HORECA 79.0 6.8 79.9 9.1 79.9 10.0 0.9 2.3 0.0 0.9Financial services 63.2 35.0 49.3 49.6 41.8 57.1 -13.9 14.6 -7.5 7.5Business services 54.8 33.9 52.7 40.0 49.8 43.4 -2.2 6.2 -2.9 3.3
Poland* Total 69.0 20.9 67.3 24.1 64.4 28.9 -1.7 3.2 -3.0 4.8Textiles, clothing 84.5 5.4 86.4 6.0 84.7 7.9 1.9 0.6 -1.7 1.9Chemicals 73.1 22.0 72.9 22.4 69.0 24.3 -0.2 0.4 -3.9 1.9Rubber, plastics 73.5 14.5 75.2 14.3 75.7 16.9 1.6 -0.2 0.5 2.6Basic metals 82.9 12.1 83.5 10.9 79.5 15.5 0.6 -1.2 -4.0 4.6Electronics, etc. 75.8 17.8 74.8 20.3 70.7 23.0 -1.0 2.6 -4.1 2.7Machinery 77.0 20.2 75.0 21.2 71.3 24.6 -2.1 1.1 -3.6 3.4Motor vehicles 79.2 15.2 78.9 16.5 80.3 16.7 -0.2 1.3 1.4 0.3Construction 77.1 11.4 77.8 10.8 77.8 12.0 0.7 -0.6 0.0 1.2Distribution 81.1 14.6 79.5 17.3 74.3 22.6 -1.6 2.7 -5.2 5.3HORECA 78.9 12.9 81.3 10.2 80.5 14.8 2.4 -2.7 -0.9 4.6Financial services 50.8 48.9 40.9 58.8 32.1 67.7 -10.0 9.9 -8.8 8.9Business services 61.8 30.4 58.2 36.0 50.4 44.1 -3.6 5.7 -7.8 8.0
Note: Figures for Poland for 2000 relate to 2004
Source: European Labour Force Survey
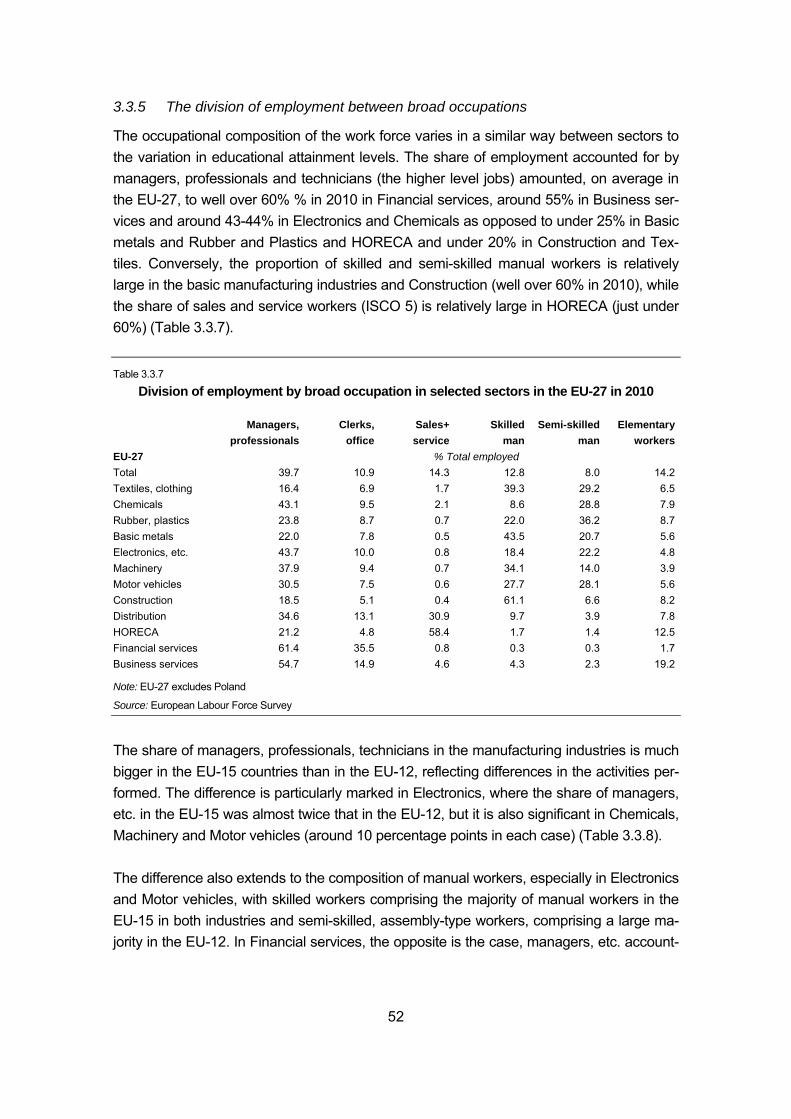
52
3.3.5 The division of employment between broad occupations
The occupational composition of the work force varies in a similar way between sectors to the variation in educational attainment levels. The share of employment accounted for by managers, professionals and technicians (the higher level jobs) amounted, on average in the EU-27, to well over 60% % in 2010 in Financial services, around 55% in Business ser-vices and around 43-44% in Electronics and Chemicals as opposed to under 25% in Basic metals and Rubber and Plastics and HORECA and under 20% in Construction and Tex-tiles. Conversely, the proportion of skilled and semi-skilled manual workers is relatively large in the basic manufacturing industries and Construction (well over 60% in 2010), while the share of sales and service workers (ISCO 5) is relatively large in HORECA (just under 60%) (Table 3.3.7). Table 3.3.7
Division of employment by broad occupation in selected sectors in the EU-27 in 2010
Managers,
professionals Clerks,
officeSales+
serviceSkilled
manSemi-skilled
man Elementary
workersEU-27 % Total employed Total 39.7 10.9 14.3 12.8 8.0 14.2Textiles, clothing 16.4 6.9 1.7 39.3 29.2 6.5Chemicals 43.1 9.5 2.1 8.6 28.8 7.9Rubber, plastics 23.8 8.7 0.7 22.0 36.2 8.7Basic metals 22.0 7.8 0.5 43.5 20.7 5.6Electronics, etc. 43.7 10.0 0.8 18.4 22.2 4.8Machinery 37.9 9.4 0.7 34.1 14.0 3.9Motor vehicles 30.5 7.5 0.6 27.7 28.1 5.6Construction 18.5 5.1 0.4 61.1 6.6 8.2Distribution 34.6 13.1 30.9 9.7 3.9 7.8HORECA 21.2 4.8 58.4 1.7 1.4 12.5Financial services 61.4 35.5 0.8 0.3 0.3 1.7Business services 54.7 14.9 4.6 4.3 2.3 19.2
Note: EU-27 excludes Poland
Source: European Labour Force Survey
The share of managers, professionals, technicians in the manufacturing industries is much bigger in the EU-15 countries than in the EU-12, reflecting differences in the activities per-formed. The difference is particularly marked in Electronics, where the share of managers, etc. in the EU-15 was almost twice that in the EU-12, but it is also significant in Chemicals, Machinery and Motor vehicles (around 10 percentage points in each case) (Table 3.3.8). The difference also extends to the composition of manual workers, especially in Electronics and Motor vehicles, with skilled workers comprising the majority of manual workers in the EU-15 in both industries and semi-skilled, assembly-type workers, comprising a large ma-jority in the EU-12. In Financial services, the opposite is the case, managers, etc. account-
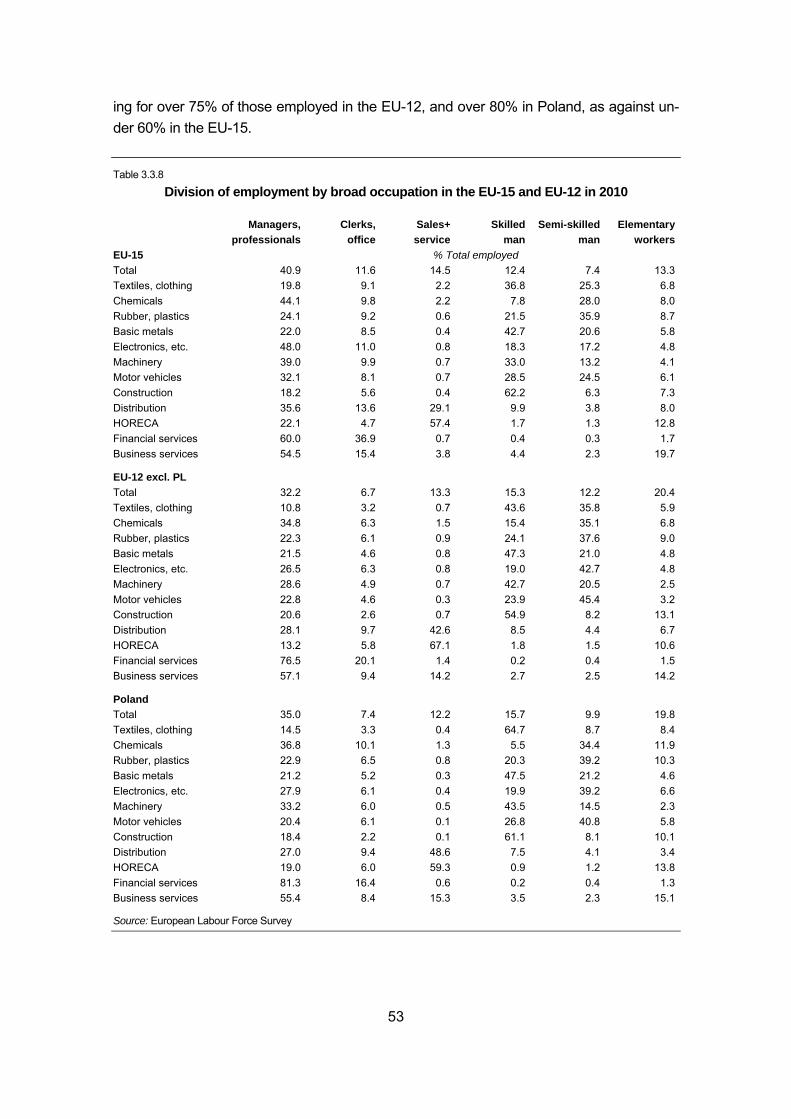
53
ing for over 75% of those employed in the EU-12, and over 80% in Poland, as against un-der 60% in the EU-15. Table 3.3.8
Division of employment by broad occupation in the EU-15 and EU-12 in 2010
Managers,
professionals Clerks,
officeSales+ service
Skilled man
Semi-skilled man
Elementary workers
EU-15 % Total employed Total 40.9 11.6 14.5 12.4 7.4 13.3Textiles, clothing 19.8 9.1 2.2 36.8 25.3 6.8Chemicals 44.1 9.8 2.2 7.8 28.0 8.0Rubber, plastics 24.1 9.2 0.6 21.5 35.9 8.7Basic metals 22.0 8.5 0.4 42.7 20.6 5.8Electronics, etc. 48.0 11.0 0.8 18.3 17.2 4.8Machinery 39.0 9.9 0.7 33.0 13.2 4.1Motor vehicles 32.1 8.1 0.7 28.5 24.5 6.1Construction 18.2 5.6 0.4 62.2 6.3 7.3Distribution 35.6 13.6 29.1 9.9 3.8 8.0HORECA 22.1 4.7 57.4 1.7 1.3 12.8Financial services 60.0 36.9 0.7 0.4 0.3 1.7Business services 54.5 15.4 3.8 4.4 2.3 19.7
EU-12 excl. PL Total 32.2 6.7 13.3 15.3 12.2 20.4Textiles, clothing 10.8 3.2 0.7 43.6 35.8 5.9Chemicals 34.8 6.3 1.5 15.4 35.1 6.8Rubber, plastics 22.3 6.1 0.9 24.1 37.6 9.0Basic metals 21.5 4.6 0.8 47.3 21.0 4.8Electronics, etc. 26.5 6.3 0.8 19.0 42.7 4.8Machinery 28.6 4.9 0.7 42.7 20.5 2.5Motor vehicles 22.8 4.6 0.3 23.9 45.4 3.2Construction 20.6 2.6 0.7 54.9 8.2 13.1Distribution 28.1 9.7 42.6 8.5 4.4 6.7HORECA 13.2 5.8 67.1 1.8 1.5 10.6Financial services 76.5 20.1 1.4 0.2 0.4 1.5Business services 57.1 9.4 14.2 2.7 2.5 14.2
Poland Total 35.0 7.4 12.2 15.7 9.9 19.8Textiles, clothing 14.5 3.3 0.4 64.7 8.7 8.4Chemicals 36.8 10.1 1.3 5.5 34.4 11.9Rubber, plastics 22.9 6.5 0.8 20.3 39.2 10.3Basic metals 21.2 5.2 0.3 47.5 21.2 4.6Electronics, etc. 27.9 6.1 0.4 19.9 39.2 6.6Machinery 33.2 6.0 0.5 43.5 14.5 2.3Motor vehicles 20.4 6.1 0.1 26.8 40.8 5.8Construction 18.4 2.2 0.1 61.1 8.1 10.1Distribution 27.0 9.4 48.6 7.5 4.1 3.4HORECA 19.0 6.0 59.3 0.9 1.2 13.8Financial services 81.3 16.4 0.6 0.2 0.4 1.3Business services 55.4 8.4 15.3 3.5 2.3 15.1
Source: European Labour Force Survey
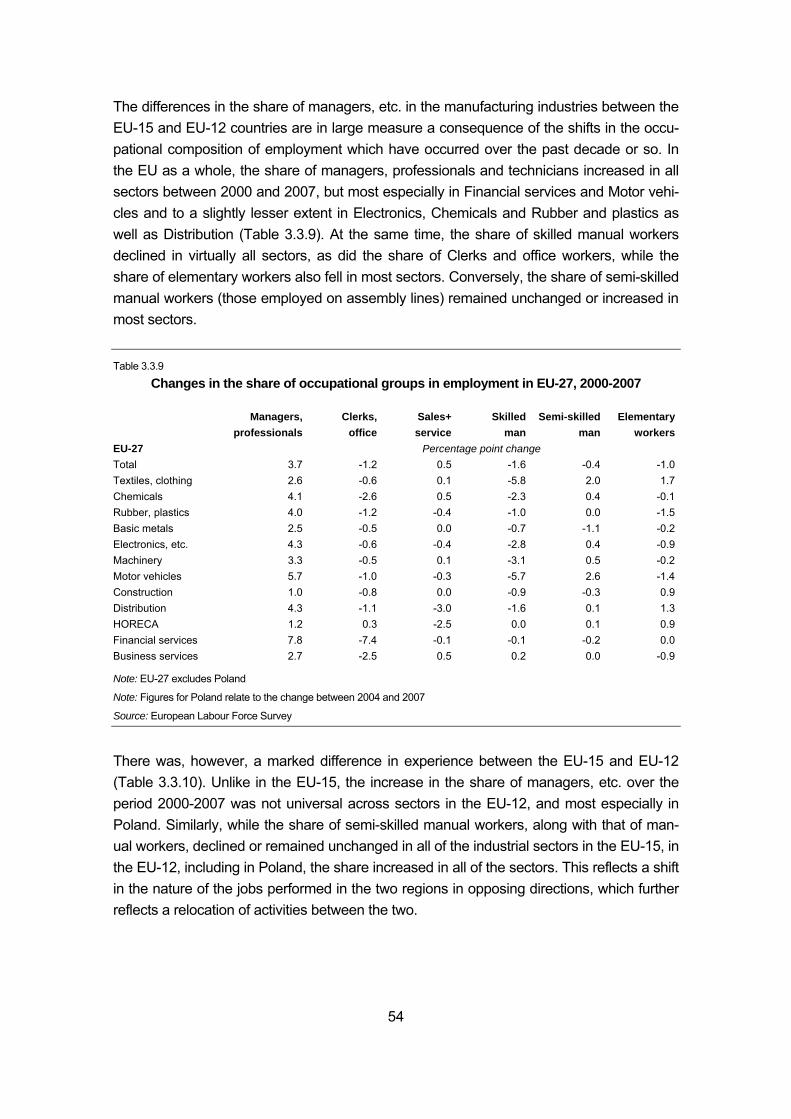
54
The differences in the share of managers, etc. in the manufacturing industries between the EU-15 and EU-12 countries are in large measure a consequence of the shifts in the occu-pational composition of employment which have occurred over the past decade or so. In the EU as a whole, the share of managers, professionals and technicians increased in all sectors between 2000 and 2007, but most especially in Financial services and Motor vehi-cles and to a slightly lesser extent in Electronics, Chemicals and Rubber and plastics as well as Distribution (Table 3.3.9). At the same time, the share of skilled manual workers declined in virtually all sectors, as did the share of Clerks and office workers, while the share of elementary workers also fell in most sectors. Conversely, the share of semi-skilled manual workers (those employed on assembly lines) remained unchanged or increased in most sectors. Table 3.3.9
Changes in the share of occupational groups in employment in EU-27, 2000-2007
Managers,
professionals Clerks,
officeSales+ service
Skilled man
Semi-skilled man
Elementary workers
EU-27 Percentage point change Total 3.7 -1.2 0.5 -1.6 -0.4 -1.0Textiles, clothing 2.6 -0.6 0.1 -5.8 2.0 1.7Chemicals 4.1 -2.6 0.5 -2.3 0.4 -0.1Rubber, plastics 4.0 -1.2 -0.4 -1.0 0.0 -1.5Basic metals 2.5 -0.5 0.0 -0.7 -1.1 -0.2Electronics, etc. 4.3 -0.6 -0.4 -2.8 0.4 -0.9Machinery 3.3 -0.5 0.1 -3.1 0.5 -0.2Motor vehicles 5.7 -1.0 -0.3 -5.7 2.6 -1.4Construction 1.0 -0.8 0.0 -0.9 -0.3 0.9Distribution 4.3 -1.1 -3.0 -1.6 0.1 1.3HORECA 1.2 0.3 -2.5 0.0 0.1 0.9Financial services 7.8 -7.4 -0.1 -0.1 -0.2 0.0Business services 2.7 -2.5 0.5 0.2 0.0 -0.9
Note: EU-27 excludes Poland
Note: Figures for Poland relate to the change between 2004 and 2007
Source: European Labour Force Survey
There was, however, a marked difference in experience between the EU-15 and EU-12 (Table 3.3.10). Unlike in the EU-15, the increase in the share of managers, etc. over the period 2000-2007 was not universal across sectors in the EU-12, and most especially in Poland. Similarly, while the share of semi-skilled manual workers, along with that of man-ual workers, declined or remained unchanged in all of the industrial sectors in the EU-15, in the EU-12, including in Poland, the share increased in all of the sectors. This reflects a shift in the nature of the jobs performed in the two regions in opposing directions, which further reflects a relocation of activities between the two.
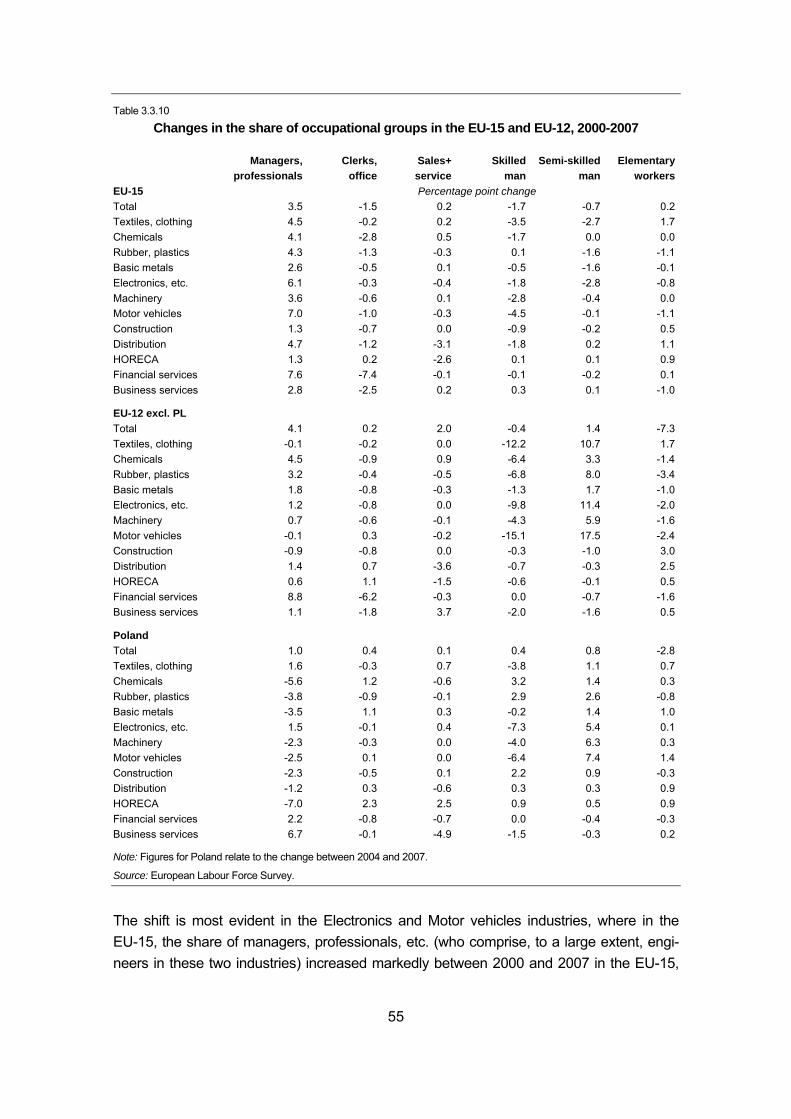
55
Table 3.3.10
Changes in the share of occupational groups in the EU-15 and EU-12, 2000-2007
Managers,
professionals Clerks,
officeSales+ service
Skilled man
Semi-skilled man
Elementary workers
EU-15 Percentage point change Total 3.5 -1.5 0.2 -1.7 -0.7 0.2Textiles, clothing 4.5 -0.2 0.2 -3.5 -2.7 1.7Chemicals 4.1 -2.8 0.5 -1.7 0.0 0.0Rubber, plastics 4.3 -1.3 -0.3 0.1 -1.6 -1.1Basic metals 2.6 -0.5 0.1 -0.5 -1.6 -0.1Electronics, etc. 6.1 -0.3 -0.4 -1.8 -2.8 -0.8Machinery 3.6 -0.6 0.1 -2.8 -0.4 0.0Motor vehicles 7.0 -1.0 -0.3 -4.5 -0.1 -1.1Construction 1.3 -0.7 0.0 -0.9 -0.2 0.5Distribution 4.7 -1.2 -3.1 -1.8 0.2 1.1HORECA 1.3 0.2 -2.6 0.1 0.1 0.9Financial services 7.6 -7.4 -0.1 -0.1 -0.2 0.1Business services 2.8 -2.5 0.2 0.3 0.1 -1.0
EU-12 excl. PL Total 4.1 0.2 2.0 -0.4 1.4 -7.3Textiles, clothing -0.1 -0.2 0.0 -12.2 10.7 1.7Chemicals 4.5 -0.9 0.9 -6.4 3.3 -1.4Rubber, plastics 3.2 -0.4 -0.5 -6.8 8.0 -3.4Basic metals 1.8 -0.8 -0.3 -1.3 1.7 -1.0Electronics, etc. 1.2 -0.8 0.0 -9.8 11.4 -2.0Machinery 0.7 -0.6 -0.1 -4.3 5.9 -1.6Motor vehicles -0.1 0.3 -0.2 -15.1 17.5 -2.4Construction -0.9 -0.8 0.0 -0.3 -1.0 3.0Distribution 1.4 0.7 -3.6 -0.7 -0.3 2.5HORECA 0.6 1.1 -1.5 -0.6 -0.1 0.5Financial services 8.8 -6.2 -0.3 0.0 -0.7 -1.6Business services 1.1 -1.8 3.7 -2.0 -1.6 0.5
Poland Total 1.0 0.4 0.1 0.4 0.8 -2.8Textiles, clothing 1.6 -0.3 0.7 -3.8 1.1 0.7Chemicals -5.6 1.2 -0.6 3.2 1.4 0.3Rubber, plastics -3.8 -0.9 -0.1 2.9 2.6 -0.8Basic metals -3.5 1.1 0.3 -0.2 1.4 1.0Electronics, etc. 1.5 -0.1 0.4 -7.3 5.4 0.1Machinery -2.3 -0.3 0.0 -4.0 6.3 0.3Motor vehicles -2.5 0.1 0.0 -6.4 7.4 1.4Construction -2.3 -0.5 0.1 2.2 0.9 -0.3Distribution -1.2 0.3 -0.6 0.3 0.3 0.9HORECA -7.0 2.3 2.5 0.9 0.5 0.9Financial services 2.2 -0.8 -0.7 0.0 -0.4 -0.3Business services 6.7 -0.1 -4.9 -1.5 -0.3 0.2
Note: Figures for Poland relate to the change between 2004 and 2007.
Source: European Labour Force Survey.
The shift is most evident in the Electronics and Motor vehicles industries, where in the EU-15, the share of managers, professionals, etc. (who comprise, to a large extent, engi-neers in these two industries) increased markedly between 2000 and 2007 in the EU-15,
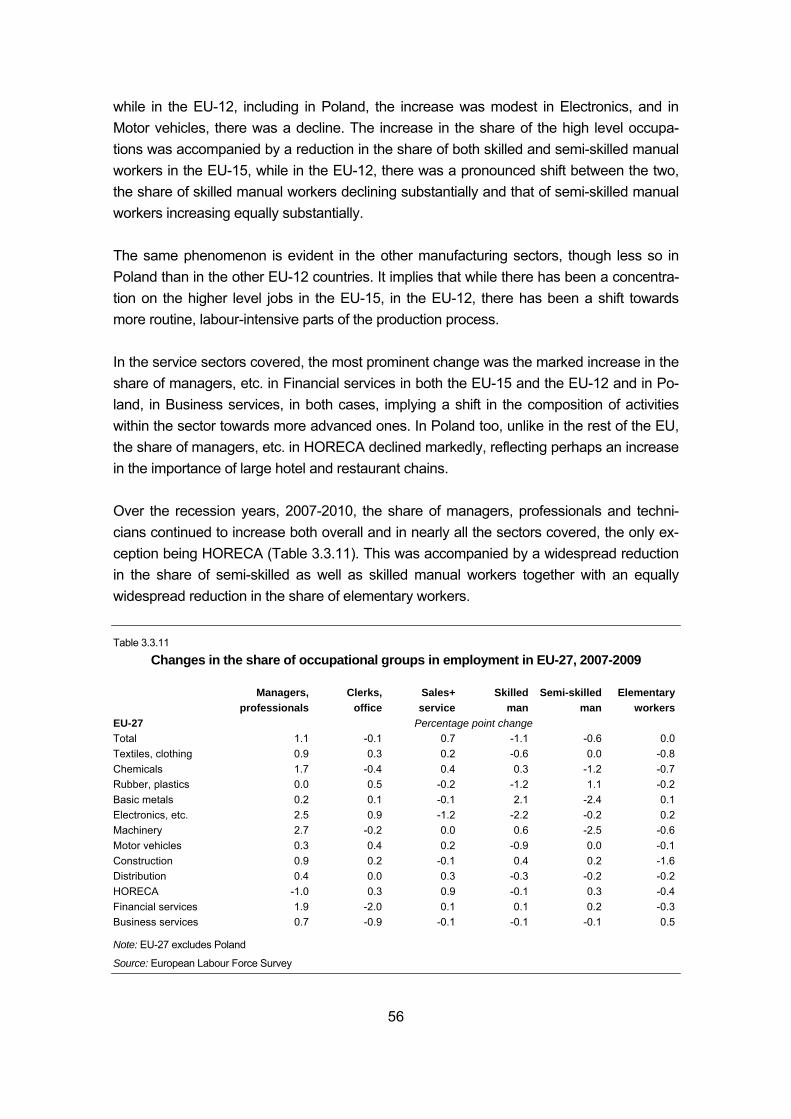
56
while in the EU-12, including in Poland, the increase was modest in Electronics, and in Motor vehicles, there was a decline. The increase in the share of the high level occupa-tions was accompanied by a reduction in the share of both skilled and semi-skilled manual workers in the EU-15, while in the EU-12, there was a pronounced shift between the two, the share of skilled manual workers declining substantially and that of semi-skilled manual workers increasing equally substantially. The same phenomenon is evident in the other manufacturing sectors, though less so in Poland than in the other EU-12 countries. It implies that while there has been a concentra-tion on the higher level jobs in the EU-15, in the EU-12, there has been a shift towards more routine, labour-intensive parts of the production process. In the service sectors covered, the most prominent change was the marked increase in the share of managers, etc. in Financial services in both the EU-15 and the EU-12 and in Po-land, in Business services, in both cases, implying a shift in the composition of activities within the sector towards more advanced ones. In Poland too, unlike in the rest of the EU, the share of managers, etc. in HORECA declined markedly, reflecting perhaps an increase in the importance of large hotel and restaurant chains. Over the recession years, 2007-2010, the share of managers, professionals and techni-cians continued to increase both overall and in nearly all the sectors covered, the only ex-ception being HORECA (Table 3.3.11). This was accompanied by a widespread reduction in the share of semi-skilled as well as skilled manual workers together with an equally widespread reduction in the share of elementary workers. Table 3.3.11
Changes in the share of occupational groups in employment in EU-27, 2007-2009
Managers,
professionals Clerks,
officeSales+ service
Skilled man
Semi-skilled man
Elementary workers
EU-27 Percentage point change Total 1.1 -0.1 0.7 -1.1 -0.6 0.0Textiles, clothing 0.9 0.3 0.2 -0.6 0.0 -0.8Chemicals 1.7 -0.4 0.4 0.3 -1.2 -0.7Rubber, plastics 0.0 0.5 -0.2 -1.2 1.1 -0.2Basic metals 0.2 0.1 -0.1 2.1 -2.4 0.1Electronics, etc. 2.5 0.9 -1.2 -2.2 -0.2 0.2Machinery 2.7 -0.2 0.0 0.6 -2.5 -0.6Motor vehicles 0.3 0.4 0.2 -0.9 0.0 -0.1Construction 0.9 0.2 -0.1 0.4 0.2 -1.6Distribution 0.4 0.0 0.3 -0.3 -0.2 -0.2HORECA -1.0 0.3 0.9 -0.1 0.3 -0.4Financial services 1.9 -2.0 0.1 0.1 0.2 -0.3Business services 0.7 -0.9 -0.1 -0.1 -0.1 0.5
Note: EU-27 excludes Poland
Source: European Labour Force Survey
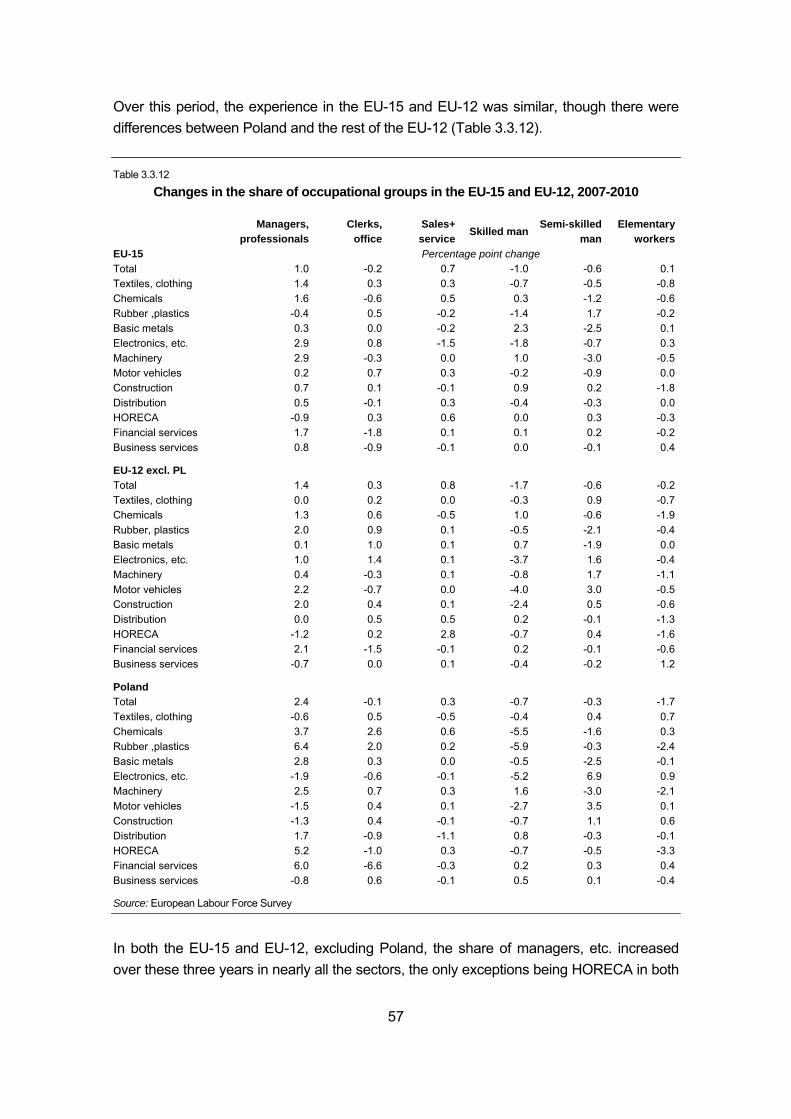
57
Over this period, the experience in the EU-15 and EU-12 was similar, though there were differences between Poland and the rest of the EU-12 (Table 3.3.12). Table 3.3.12
Changes in the share of occupational groups in the EU-15 and EU-12, 2007-2010
Managers,
professionals Clerks,
officeSales+ service
Skilled manSemi-skilled
man Elementary
workersEU-15 Percentage point change Total 1.0 -0.2 0.7 -1.0 -0.6 0.1Textiles, clothing 1.4 0.3 0.3 -0.7 -0.5 -0.8Chemicals 1.6 -0.6 0.5 0.3 -1.2 -0.6Rubber ,plastics -0.4 0.5 -0.2 -1.4 1.7 -0.2Basic metals 0.3 0.0 -0.2 2.3 -2.5 0.1Electronics, etc. 2.9 0.8 -1.5 -1.8 -0.7 0.3Machinery 2.9 -0.3 0.0 1.0 -3.0 -0.5Motor vehicles 0.2 0.7 0.3 -0.2 -0.9 0.0Construction 0.7 0.1 -0.1 0.9 0.2 -1.8Distribution 0.5 -0.1 0.3 -0.4 -0.3 0.0HORECA -0.9 0.3 0.6 0.0 0.3 -0.3Financial services 1.7 -1.8 0.1 0.1 0.2 -0.2Business services 0.8 -0.9 -0.1 0.0 -0.1 0.4
EU-12 excl. PL Total 1.4 0.3 0.8 -1.7 -0.6 -0.2Textiles, clothing 0.0 0.2 0.0 -0.3 0.9 -0.7Chemicals 1.3 0.6 -0.5 1.0 -0.6 -1.9Rubber, plastics 2.0 0.9 0.1 -0.5 -2.1 -0.4Basic metals 0.1 1.0 0.1 0.7 -1.9 0.0Electronics, etc. 1.0 1.4 0.1 -3.7 1.6 -0.4Machinery 0.4 -0.3 0.1 -0.8 1.7 -1.1Motor vehicles 2.2 -0.7 0.0 -4.0 3.0 -0.5Construction 2.0 0.4 0.1 -2.4 0.5 -0.6Distribution 0.0 0.5 0.5 0.2 -0.1 -1.3HORECA -1.2 0.2 2.8 -0.7 0.4 -1.6Financial services 2.1 -1.5 -0.1 0.2 -0.1 -0.6Business services -0.7 0.0 0.1 -0.4 -0.2 1.2
Poland Total 2.4 -0.1 0.3 -0.7 -0.3 -1.7Textiles, clothing -0.6 0.5 -0.5 -0.4 0.4 0.7Chemicals 3.7 2.6 0.6 -5.5 -1.6 0.3Rubber ,plastics 6.4 2.0 0.2 -5.9 -0.3 -2.4Basic metals 2.8 0.3 0.0 -0.5 -2.5 -0.1Electronics, etc. -1.9 -0.6 -0.1 -5.2 6.9 0.9Machinery 2.5 0.7 0.3 1.6 -3.0 -2.1Motor vehicles -1.5 0.4 0.1 -2.7 3.5 0.1Construction -1.3 0.4 -0.1 -0.7 1.1 0.6Distribution 1.7 -0.9 -1.1 0.8 -0.3 -0.1HORECA 5.2 -1.0 0.3 -0.7 -0.5 -3.3Financial services 6.0 -6.6 -0.3 0.2 0.3 0.4Business services -0.8 0.6 -0.1 0.5 0.1 -0.4
Source: European Labour Force Survey
In both the EU-15 and EU-12, excluding Poland, the share of managers, etc. increased over these three years in nearly all the sectors, the only exceptions being HORECA in both
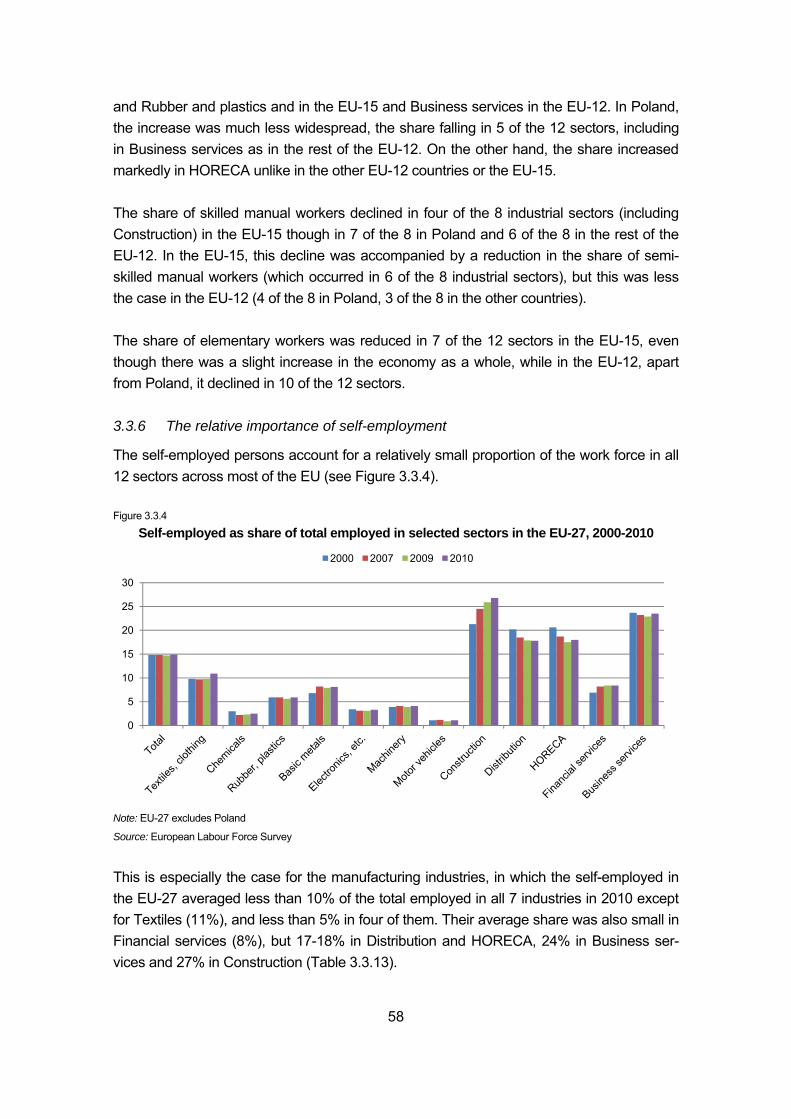
58
and Rubber and plastics and in the EU-15 and Business services in the EU-12. In Poland, the increase was much less widespread, the share falling in 5 of the 12 sectors, including in Business services as in the rest of the EU-12. On the other hand, the share increased markedly in HORECA unlike in the other EU-12 countries or the EU-15. The share of skilled manual workers declined in four of the 8 industrial sectors (including Construction) in the EU-15 though in 7 of the 8 in Poland and 6 of the 8 in the rest of the EU-12. In the EU-15, this decline was accompanied by a reduction in the share of semi-skilled manual workers (which occurred in 6 of the 8 industrial sectors), but this was less the case in the EU-12 (4 of the 8 in Poland, 3 of the 8 in the other countries). The share of elementary workers was reduced in 7 of the 12 sectors in the EU-15, even though there was a slight increase in the economy as a whole, while in the EU-12, apart from Poland, it declined in 10 of the 12 sectors. 3.3.6 The relative importance of self-employment
The self-employed persons account for a relatively small proportion of the work force in all 12 sectors across most of the EU (see Figure 3.3.4). Figure 3.3.4
Self-employed as share of total employed in selected sectors in the EU-27, 2000-2010
Note: EU-27 excludes Poland
Source: European Labour Force Survey
This is especially the case for the manufacturing industries, in which the self-employed in the EU-27 averaged less than 10% of the total employed in all 7 industries in 2010 except for Textiles (11%), and less than 5% in four of them. Their average share was also small in Financial services (8%), but 17-18% in Distribution and HORECA, 24% in Business ser-vices and 27% in Construction (Table 3.3.13).
0
5
10
15
20
25
30
2000 2007 2009 2010
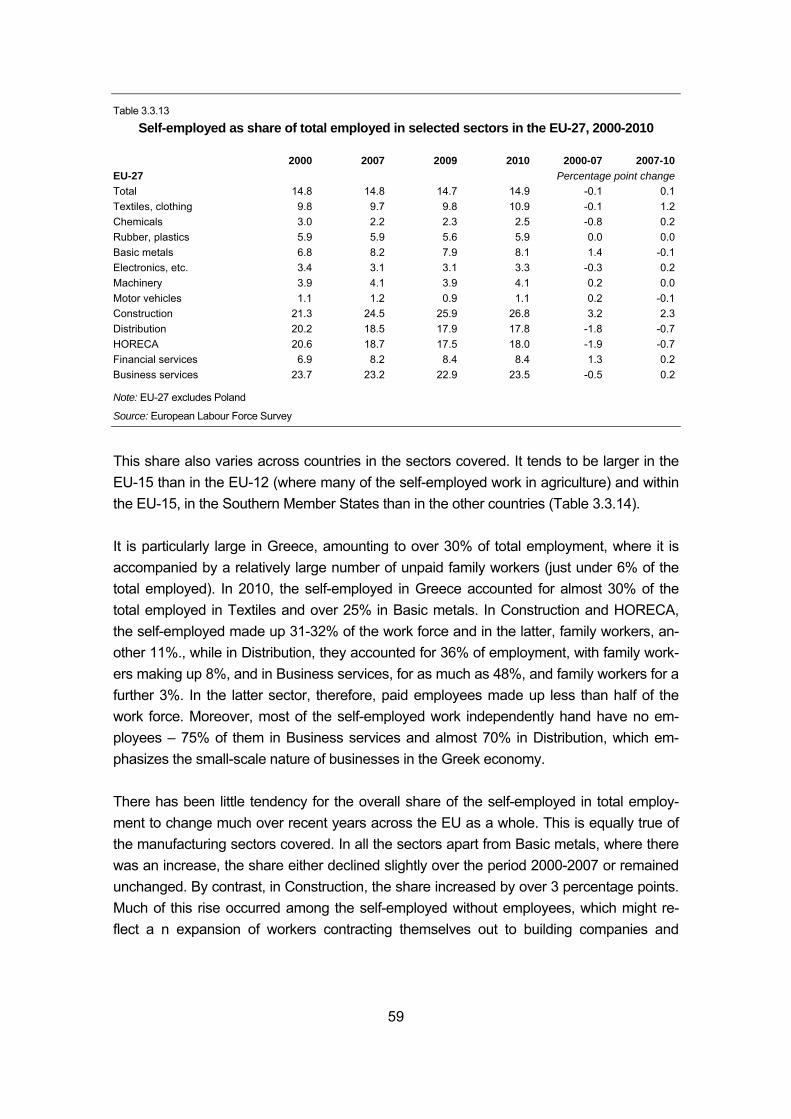
59
Table 3.3.13
Self-employed as share of total employed in selected sectors in the EU-27, 2000-2010
2000 2007 2009 2010 2000-07 2007-10EU-27 Percentage point changeTotal 14.8 14.8 14.7 14.9 -0.1 0.1Textiles, clothing 9.8 9.7 9.8 10.9 -0.1 1.2Chemicals 3.0 2.2 2.3 2.5 -0.8 0.2Rubber, plastics 5.9 5.9 5.6 5.9 0.0 0.0Basic metals 6.8 8.2 7.9 8.1 1.4 -0.1Electronics, etc. 3.4 3.1 3.1 3.3 -0.3 0.2Machinery 3.9 4.1 3.9 4.1 0.2 0.0Motor vehicles 1.1 1.2 0.9 1.1 0.2 -0.1Construction 21.3 24.5 25.9 26.8 3.2 2.3Distribution 20.2 18.5 17.9 17.8 -1.8 -0.7HORECA 20.6 18.7 17.5 18.0 -1.9 -0.7Financial services 6.9 8.2 8.4 8.4 1.3 0.2Business services 23.7 23.2 22.9 23.5 -0.5 0.2
Note: EU-27 excludes Poland
Source: European Labour Force Survey
This share also varies across countries in the sectors covered. It tends to be larger in the EU-15 than in the EU-12 (where many of the self-employed work in agriculture) and within the EU-15, in the Southern Member States than in the other countries (Table 3.3.14). It is particularly large in Greece, amounting to over 30% of total employment, where it is accompanied by a relatively large number of unpaid family workers (just under 6% of the total employed). In 2010, the self-employed in Greece accounted for almost 30% of the total employed in Textiles and over 25% in Basic metals. In Construction and HORECA, the self-employed made up 31-32% of the work force and in the latter, family workers, an-other 11%., while in Distribution, they accounted for 36% of employment, with family work-ers making up 8%, and in Business services, for as much as 48%, and family workers for a further 3%. In the latter sector, therefore, paid employees made up less than half of the work force. Moreover, most of the self-employed work independently hand have no em-ployees – 75% of them in Business services and almost 70% in Distribution, which em-phasizes the small-scale nature of businesses in the Greek economy. There has been little tendency for the overall share of the self-employed in total employ-ment to change much over recent years across the EU as a whole. This is equally true of the manufacturing sectors covered. In all the sectors apart from Basic metals, where there was an increase, the share either declined slightly over the period 2000-2007 or remained unchanged. By contrast, in Construction, the share increased by over 3 percentage points. Much of this rise occurred among the self-employed without employees, which might re-flect a n expansion of workers contracting themselves out to building companies and
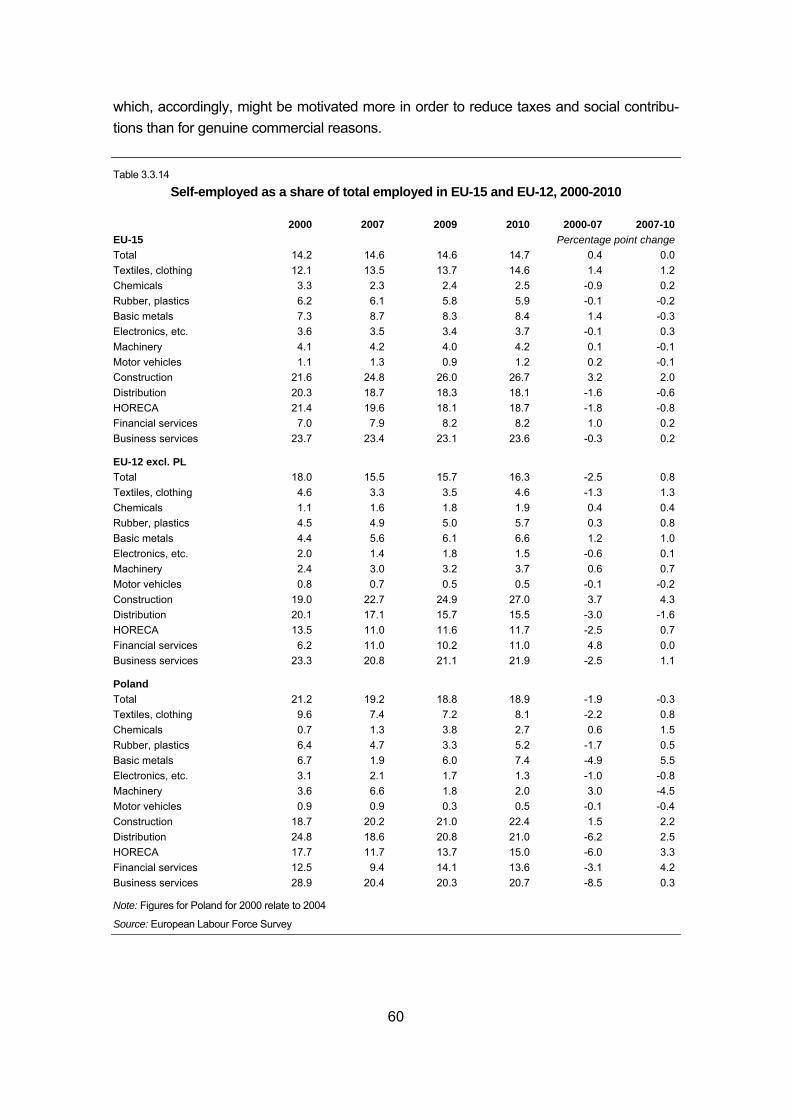
60
which, accordingly, might be motivated more in order to reduce taxes and social contribu-tions than for genuine commercial reasons. Table 3.3.14
Self-employed as a share of total employed in EU-15 and EU-12, 2000-2010
2000 2007 2009 2010 2000-07 2007-10EU-15 Percentage point changeTotal 14.2 14.6 14.6 14.7 0.4 0.0Textiles, clothing 12.1 13.5 13.7 14.6 1.4 1.2Chemicals 3.3 2.3 2.4 2.5 -0.9 0.2Rubber, plastics 6.2 6.1 5.8 5.9 -0.1 -0.2Basic metals 7.3 8.7 8.3 8.4 1.4 -0.3Electronics, etc. 3.6 3.5 3.4 3.7 -0.1 0.3Machinery 4.1 4.2 4.0 4.2 0.1 -0.1Motor vehicles 1.1 1.3 0.9 1.2 0.2 -0.1Construction 21.6 24.8 26.0 26.7 3.2 2.0Distribution 20.3 18.7 18.3 18.1 -1.6 -0.6HORECA 21.4 19.6 18.1 18.7 -1.8 -0.8Financial services 7.0 7.9 8.2 8.2 1.0 0.2Business services 23.7 23.4 23.1 23.6 -0.3 0.2
EU-12 excl. PL Total 18.0 15.5 15.7 16.3 -2.5 0.8Textiles, clothing 4.6 3.3 3.5 4.6 -1.3 1.3Chemicals 1.1 1.6 1.8 1.9 0.4 0.4Rubber, plastics 4.5 4.9 5.0 5.7 0.3 0.8Basic metals 4.4 5.6 6.1 6.6 1.2 1.0Electronics, etc. 2.0 1.4 1.8 1.5 -0.6 0.1Machinery 2.4 3.0 3.2 3.7 0.6 0.7Motor vehicles 0.8 0.7 0.5 0.5 -0.1 -0.2Construction 19.0 22.7 24.9 27.0 3.7 4.3Distribution 20.1 17.1 15.7 15.5 -3.0 -1.6HORECA 13.5 11.0 11.6 11.7 -2.5 0.7Financial services 6.2 11.0 10.2 11.0 4.8 0.0Business services 23.3 20.8 21.1 21.9 -2.5 1.1
Poland Total 21.2 19.2 18.8 18.9 -1.9 -0.3Textiles, clothing 9.6 7.4 7.2 8.1 -2.2 0.8Chemicals 0.7 1.3 3.8 2.7 0.6 1.5Rubber, plastics 6.4 4.7 3.3 5.2 -1.7 0.5Basic metals 6.7 1.9 6.0 7.4 -4.9 5.5Electronics, etc. 3.1 2.1 1.7 1.3 -1.0 -0.8Machinery 3.6 6.6 1.8 2.0 3.0 -4.5Motor vehicles 0.9 0.9 0.3 0.5 -0.1 -0.4Construction 18.7 20.2 21.0 22.4 1.5 2.2Distribution 24.8 18.6 20.8 21.0 -6.2 2.5HORECA 17.7 11.7 13.7 15.0 -6.0 3.3Financial services 12.5 9.4 14.1 13.6 -3.1 4.2Business services 28.9 20.4 20.3 20.7 -8.5 0.3
Note: Figures for Poland for 2000 relate to 2004
Source: European Labour Force Survey
61
In the service sectors, the share of the self-employed declined over the period in both Dis-tribution and HORECA, reflecting the changing structure of the sectors and the growing importance of large companies. It also declined in Business services, though to a lesser extent for similar reasons. The share of the self-employed n Financial services, however, increased despite the rising importance of large banks, which might be a result of a grow-ing number of financial professionals in the insurance sector especially. Trends in the EU-15 and EU-12 countries were similar, though the decline in self-employment in the service sectors was much larger in the EU-12, reflecting the more sub-stantial changes in the structure of the sectors over the period and in Business services, a change in the relative importance of the different activities covered. In Textiles, the share of the self-employed declined in the EU-12 whereas it increased in the EU-15, again reflect-ing differing structural tendencies, while in the other manufacturing industries, the changes were for the most part much the same, as they were in Construction, where self-employment increased in both regions. In Poland, the changes over the shorter period were broadly similar to those in the rest of the EU-12, the main exception being Financial services, where the share of the self-employed declined instead of increasing. Over the recession period, 2007-2010, there was little change in the share of self-employment except in the EU-12, excluding Poland, where it increased by just under 1 percentage point. And where there was an increase in 9 of the 12 sectors covered, the exceptions being Motor vehicles, Distribution and Financial services, in the last of which it remained unchanged. There was also a widespread increase in the share in Poland, even though the total share declined slightly. In only three of the sectors – all in manufacturing – did the share fall over these three years. The increase was particularly large in the service sectors apart from Business services. 3.3.7 Temporary workers
Those employed on fixed-term contracts account in most countries across the EU for a relatively small proportion of the total in work – some 13% of employees on average in 2010 (Figure 3.3.5). Among younger workers, however, such contracts are much more important, the number of employees aged under 25 in jobs with fixed-term contracts amounting to 40% of all employees in this age group (Table 3.3.16). The proportion of employees with fixed-term contracts varies markedly between sectors (Table 3.3.15), being much more important in Construction and HORECA than the other sectors covered and much less important in the manufacturing sectors as well as in Finan-cial services. This is not the case, however, for those under 25, the proportion with such contracts in Construction and HORECA being slightly below average. Moreover, for this

62
age group, unlike for employees in general, fixed-term contracts tend to be more important in manufacturing than in services, Textiles being the main exception, reflecting the larger number of young people in manufacturing with apprenticeships, or traineeships more gen-erally. Figure 3.3.5
Share of employees with fixed-term contracts in the EU-27, 2000-2010
Note: EU-27 excludes Poland
Source: European Labour Force Survey
Table 3.3.15
Share of employees with fixed-term contracts in the EU-27, 2000-2010
2000 2007 2009 2010 2000-07 2007-10EU-27 Percentage point change Total 12.5 13.5 12.4 12.7 1.0 -0.7Textiles, clothing 8.3 7.6 5.8 7.7 -0.7 0.1Chemicals 7.8 8.3 7.5 8.6 0.5 0.2Rubber, plastics 9.5 10.2 7.0 8.3 0.6 -1.9Basic metals 9.6 10.7 8.2 9.0 1.1 -1.7Electronics, etc. 9.4 9.5 7.6 8.6 0.1 -0.9Machinery 7.3 8.3 7.3 7.3 1.0 -1.0Motor vehicles 10.3 10.4 7.3 8.9 0.1 -1.5Construction 18.4 18.4 15.2 15.5 0.0 -2.9Distribution 11.4 12.0 11.0 11.4 0.6 -0.5HORECA 20.8 22.0 21.3 20.7 1.2 -1.3Financial services 6.4 6.2 5.6 5.9 -0.3 -0.3Business services 13.5 14.4 13.7 14.1 0.9 -0.3
Note: EU-27 excludes Poland
Source: European Labour Force Survey
0
5
10
15
20
25
2000 2007 2009 2010

63
Table 3.3.16
Share of employees aged 15-24 with fixed-term contracts in the EU-27, 2000-2010
2000 2007 2009 2010 2000-07 2007-10EU-27 Percentage point changeTotal 36.1 39.7 38.5 40.1 3.6 0.4Textiles, clothing 20.3 26.3 25.0 24.5 6.0 -1.8Chemicals 41.5 53.3 47.8 41.0 11.8 -12.3Rubber, plastics 30.3 36.4 36.4 37.3 6.2 0.9Basic metals 34.5 41.1 41.1 43.0 6.6 1.9Electronics, etc. 34.1 40.2 40.2 42.1 6.0 1.9Machinery 36.3 41.3 43.2 44.3 5.0 3.0Motor vehicles 43.4 43.4 38.3 45.6 0.0 2.2Construction 42.3 38.5 36.4 42.1 -3.8 3.6Distribution 30.3 33.5 33.0 34.1 3.2 0.6HORECA 34.5 38.1 35.7 35.8 3.6 -2.3Financial services 29.3 33.0 29.8 36.9 3.6 4.0Business services 33.1 38.6 38.2 40.1 5.5 1.5
Source: European Labour Force Survey
The importance of fixed-term contracts also varies markedly between countries, account-ing for 27% of all employees, on average, in Poland and 25% in Spain (though in the latter the figure has fallen greatly over the recent past as the Government has made a major effort to reduce the use of such contracts) and 23% in Portugal, but for under 5% in many of the EU-12 countries (the three Baltic states, Bulgaria, Romania and Slovakia (Table 3.3.17). The proportion of employees with fixed-term contracts tended to increase over the ten years or so leading up to the recession in the EU as a whole, though this tends to disguise disparate tendencies in different countries and between those aged under 25 and those older. Across the EU-27, the share of employees in fixed-term jobs increased by 1 per-centage point on average between 2000 and 2007, with relatively little variation between sectors, apart from Textiles and . Financial services, where the share fell over this period. Among employees aged under 25, however, the increase in share was much larger, averag-ing almost 4 percentage points across the EU as a whole and over 3 percentage points in the EU-15, with only Construction among the sectors covered recording a fall (Table 3.3.18). The increase was less widespread in the EU-12, if Poland is left to one side, than in the EU-15, at least for total employees. In the EU-12 excluding Poland, therefore, there was a reduction in the share of employees with fixed-term contracts, if relatively small, in Rubber and plastics, HORECA and Business services, and most especially in Textiles, Construc-tion and Distribution. In Poland, by contrast, there were significant increases in all sectors, most especially in Electronics and Motor vehicles. In the EU-15, it should be noted that the increase recorded was larger than the average over this period in most countries because
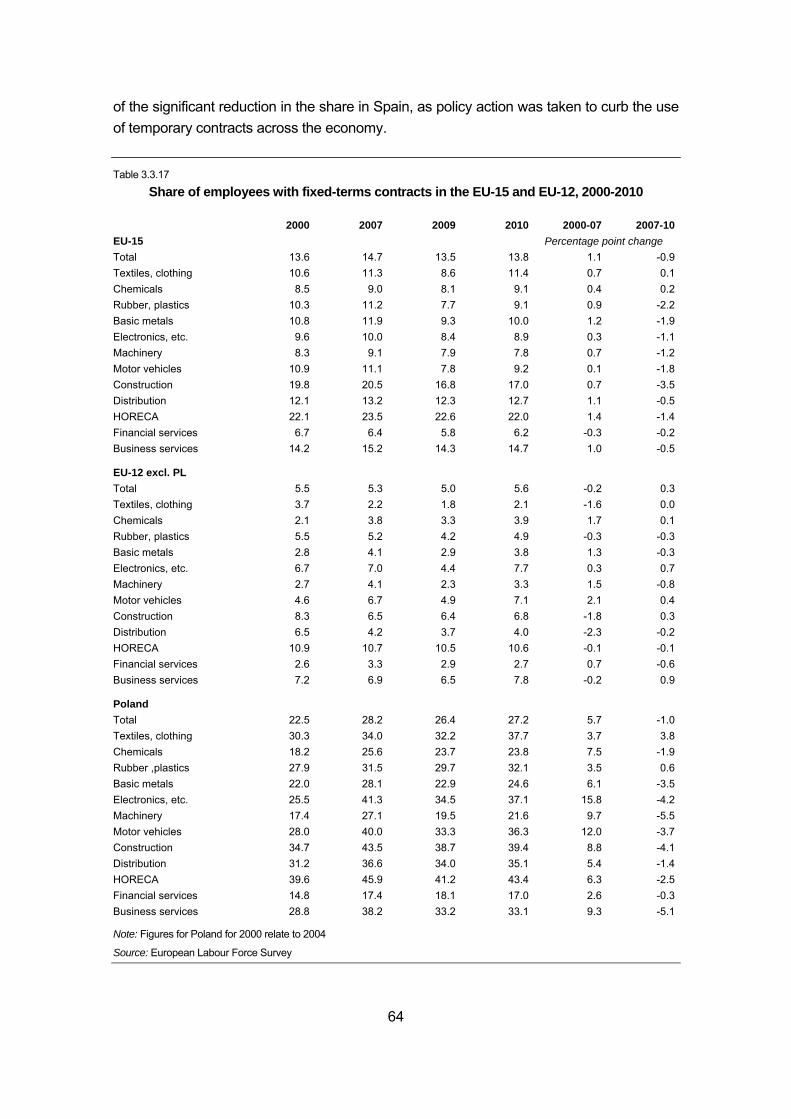
64
of the significant reduction in the share in Spain, as policy action was taken to curb the use of temporary contracts across the economy. Table 3.3.17
Share of employees with fixed-terms contracts in the EU-15 and EU-12, 2000-2010
2000 2007 2009 2010 2000-07 2007-10EU-15 Percentage point change Total 13.6 14.7 13.5 13.8 1.1 -0.9Textiles, clothing 10.6 11.3 8.6 11.4 0.7 0.1Chemicals 8.5 9.0 8.1 9.1 0.4 0.2Rubber, plastics 10.3 11.2 7.7 9.1 0.9 -2.2Basic metals 10.8 11.9 9.3 10.0 1.2 -1.9Electronics, etc. 9.6 10.0 8.4 8.9 0.3 -1.1Machinery 8.3 9.1 7.9 7.8 0.7 -1.2Motor vehicles 10.9 11.1 7.8 9.2 0.1 -1.8Construction 19.8 20.5 16.8 17.0 0.7 -3.5Distribution 12.1 13.2 12.3 12.7 1.1 -0.5HORECA 22.1 23.5 22.6 22.0 1.4 -1.4Financial services 6.7 6.4 5.8 6.2 -0.3 -0.2Business services 14.2 15.2 14.3 14.7 1.0 -0.5
EU-12 excl. PL Total 5.5 5.3 5.0 5.6 -0.2 0.3Textiles, clothing 3.7 2.2 1.8 2.1 -1.6 0.0Chemicals 2.1 3.8 3.3 3.9 1.7 0.1Rubber, plastics 5.5 5.2 4.2 4.9 -0.3 -0.3Basic metals 2.8 4.1 2.9 3.8 1.3 -0.3Electronics, etc. 6.7 7.0 4.4 7.7 0.3 0.7Machinery 2.7 4.1 2.3 3.3 1.5 -0.8Motor vehicles 4.6 6.7 4.9 7.1 2.1 0.4Construction 8.3 6.5 6.4 6.8 -1.8 0.3Distribution 6.5 4.2 3.7 4.0 -2.3 -0.2HORECA 10.9 10.7 10.5 10.6 -0.1 -0.1Financial services 2.6 3.3 2.9 2.7 0.7 -0.6Business services 7.2 6.9 6.5 7.8 -0.2 0.9
Poland Total 22.5 28.2 26.4 27.2 5.7 -1.0Textiles, clothing 30.3 34.0 32.2 37.7 3.7 3.8Chemicals 18.2 25.6 23.7 23.8 7.5 -1.9Rubber ,plastics 27.9 31.5 29.7 32.1 3.5 0.6Basic metals 22.0 28.1 22.9 24.6 6.1 -3.5Electronics, etc. 25.5 41.3 34.5 37.1 15.8 -4.2Machinery 17.4 27.1 19.5 21.6 9.7 -5.5Motor vehicles 28.0 40.0 33.3 36.3 12.0 -3.7Construction 34.7 43.5 38.7 39.4 8.8 -4.1Distribution 31.2 36.6 34.0 35.1 5.4 -1.4HORECA 39.6 45.9 41.2 43.4 6.3 -2.5Financial services 14.8 17.4 18.1 17.0 2.6 -0.3Business services 28.8 38.2 33.2 33.1 9.3 -5.1
Note: Figures for Poland for 2000 relate to 2004
Source: European Labour Force Survey
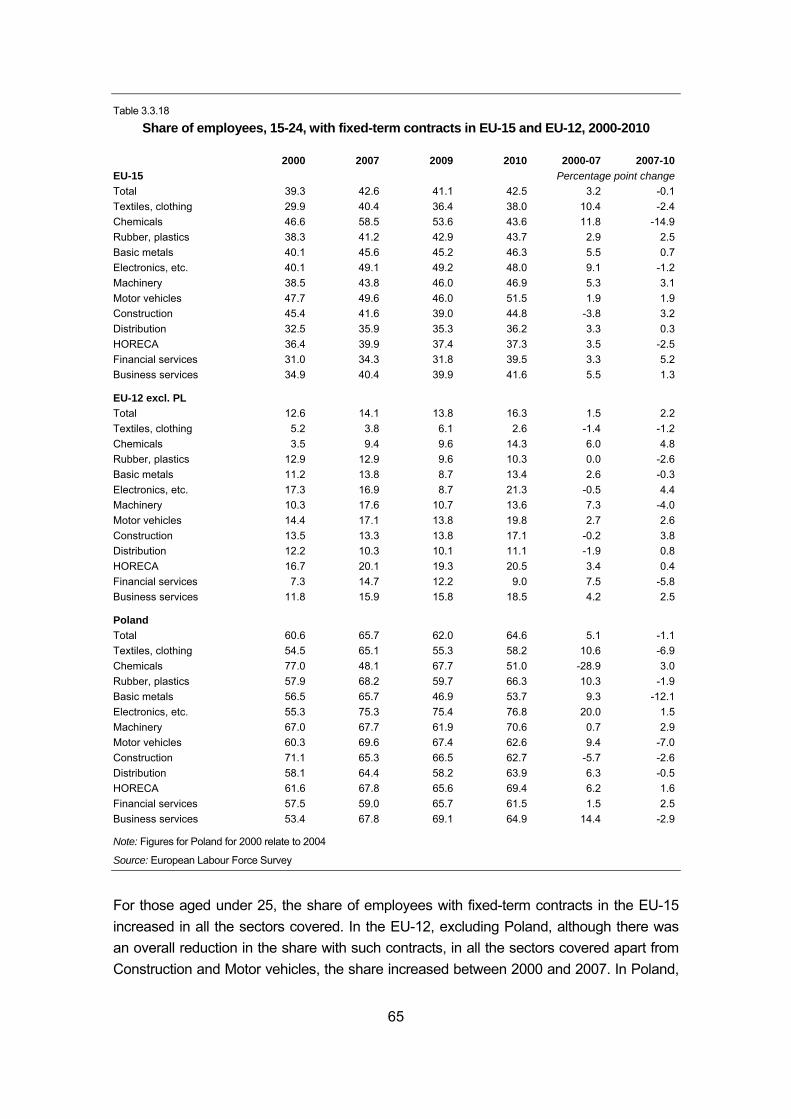
65
Table 3.3.18
Share of employees, 15-24, with fixed-term contracts in EU-15 and EU-12, 2000-2010
2000 2007 2009 2010 2000-07 2007-10EU-15 Percentage point changeTotal 39.3 42.6 41.1 42.5 3.2 -0.1Textiles, clothing 29.9 40.4 36.4 38.0 10.4 -2.4Chemicals 46.6 58.5 53.6 43.6 11.8 -14.9Rubber, plastics 38.3 41.2 42.9 43.7 2.9 2.5Basic metals 40.1 45.6 45.2 46.3 5.5 0.7Electronics, etc. 40.1 49.1 49.2 48.0 9.1 -1.2Machinery 38.5 43.8 46.0 46.9 5.3 3.1Motor vehicles 47.7 49.6 46.0 51.5 1.9 1.9Construction 45.4 41.6 39.0 44.8 -3.8 3.2Distribution 32.5 35.9 35.3 36.2 3.3 0.3HORECA 36.4 39.9 37.4 37.3 3.5 -2.5Financial services 31.0 34.3 31.8 39.5 3.3 5.2Business services 34.9 40.4 39.9 41.6 5.5 1.3
EU-12 excl. PL Total 12.6 14.1 13.8 16.3 1.5 2.2Textiles, clothing 5.2 3.8 6.1 2.6 -1.4 -1.2Chemicals 3.5 9.4 9.6 14.3 6.0 4.8Rubber, plastics 12.9 12.9 9.6 10.3 0.0 -2.6Basic metals 11.2 13.8 8.7 13.4 2.6 -0.3Electronics, etc. 17.3 16.9 8.7 21.3 -0.5 4.4Machinery 10.3 17.6 10.7 13.6 7.3 -4.0Motor vehicles 14.4 17.1 13.8 19.8 2.7 2.6Construction 13.5 13.3 13.8 17.1 -0.2 3.8Distribution 12.2 10.3 10.1 11.1 -1.9 0.8HORECA 16.7 20.1 19.3 20.5 3.4 0.4Financial services 7.3 14.7 12.2 9.0 7.5 -5.8Business services 11.8 15.9 15.8 18.5 4.2 2.5
Poland Total 60.6 65.7 62.0 64.6 5.1 -1.1Textiles, clothing 54.5 65.1 55.3 58.2 10.6 -6.9Chemicals 77.0 48.1 67.7 51.0 -28.9 3.0Rubber, plastics 57.9 68.2 59.7 66.3 10.3 -1.9Basic metals 56.5 65.7 46.9 53.7 9.3 -12.1Electronics, etc. 55.3 75.3 75.4 76.8 20.0 1.5Machinery 67.0 67.7 61.9 70.6 0.7 2.9Motor vehicles 60.3 69.6 67.4 62.6 9.4 -7.0Construction 71.1 65.3 66.5 62.7 -5.7 -2.6Distribution 58.1 64.4 58.2 63.9 6.3 -0.5HORECA 61.6 67.8 65.6 69.4 6.2 1.6Financial services 57.5 59.0 65.7 61.5 1.5 2.5Business services 53.4 67.8 69.1 64.9 14.4 -2.9
Note: Figures for Poland for 2000 relate to 2004
Source: European Labour Force Survey
For those aged under 25, the share of employees with fixed-term contracts in the EU-15 increased in all the sectors covered. In the EU-12, excluding Poland, although there was an overall reduction in the share with such contracts, in all the sectors covered apart from Construction and Motor vehicles, the share increased between 2000 and 2007. In Poland,
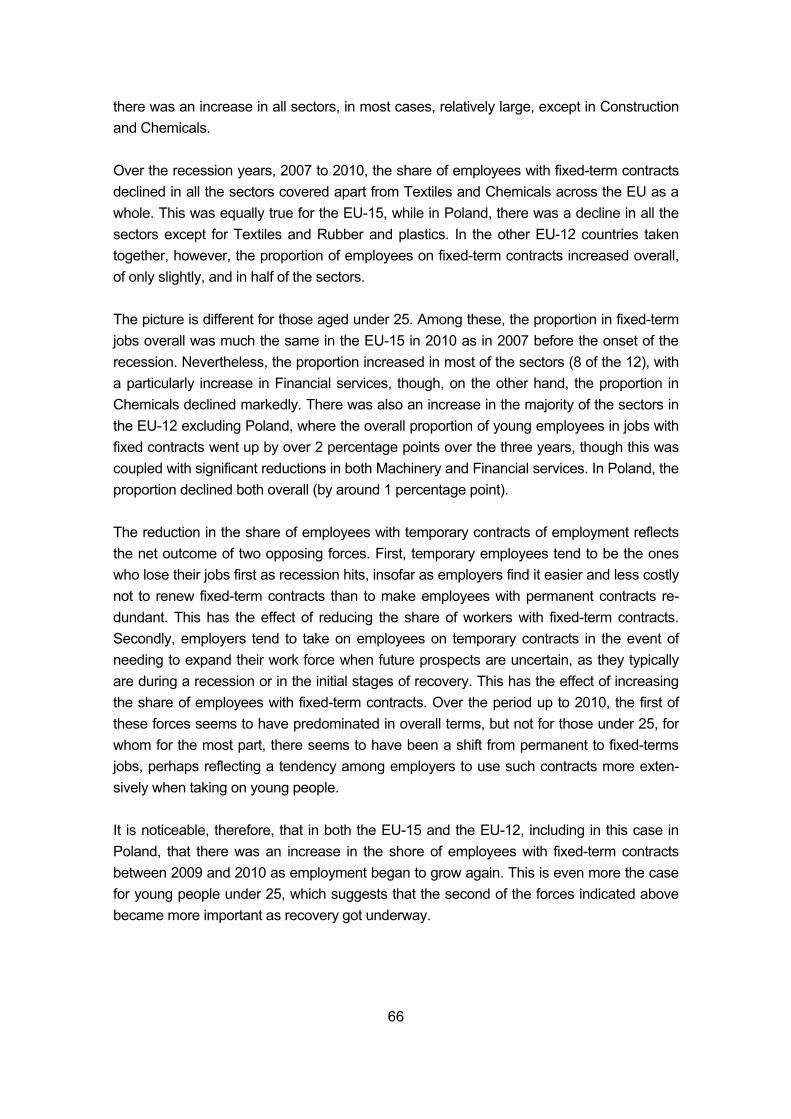
66
there was an increase in all sectors, in most cases, relatively large, except in Construction and Chemicals. Over the recession years, 2007 to 2010, the share of employees with fixed-term contracts declined in all the sectors covered apart from Textiles and Chemicals across the EU as a whole. This was equally true for the EU-15, while in Poland, there was a decline in all the sectors except for Textiles and Rubber and plastics. In the other EU-12 countries taken together, however, the proportion of employees on fixed-term contracts increased overall, of only slightly, and in half of the sectors. The picture is different for those aged under 25. Among these, the proportion in fixed-term jobs overall was much the same in the EU-15 in 2010 as in 2007 before the onset of the recession. Nevertheless, the proportion increased in most of the sectors (8 of the 12), with a particularly increase in Financial services, though, on the other hand, the proportion in Chemicals declined markedly. There was also an increase in the majority of the sectors in the EU-12 excluding Poland, where the overall proportion of young employees in jobs with fixed contracts went up by over 2 percentage points over the three years, though this was coupled with significant reductions in both Machinery and Financial services. In Poland, the proportion declined both overall (by around 1 percentage point). The reduction in the share of employees with temporary contracts of employment reflects the net outcome of two opposing forces. First, temporary employees tend to be the ones who lose their jobs first as recession hits, insofar as employers find it easier and less costly not to renew fixed-term contracts than to make employees with permanent contracts re-dundant. This has the effect of reducing the share of workers with fixed-term contracts. Secondly, employers tend to take on employees on temporary contracts in the event of needing to expand their work force when future prospects are uncertain, as they typically are during a recession or in the initial stages of recovery. This has the effect of increasing the share of employees with fixed-term contracts. Over the period up to 2010, the first of these forces seems to have predominated in overall terms, but not for those under 25, for whom for the most part, there seems to have been a shift from permanent to fixed-terms jobs, perhaps reflecting a tendency among employers to use such contracts more exten-sively when taking on young people. It is noticeable, therefore, that in both the EU-15 and the EU-12, including in this case in Poland, that there was an increase in the shore of employees with fixed-term contracts between 2009 and 2010 as employment began to grow again. This is even more the case for young people under 25, which suggests that the second of the forces indicated above became more important as recovery got underway.
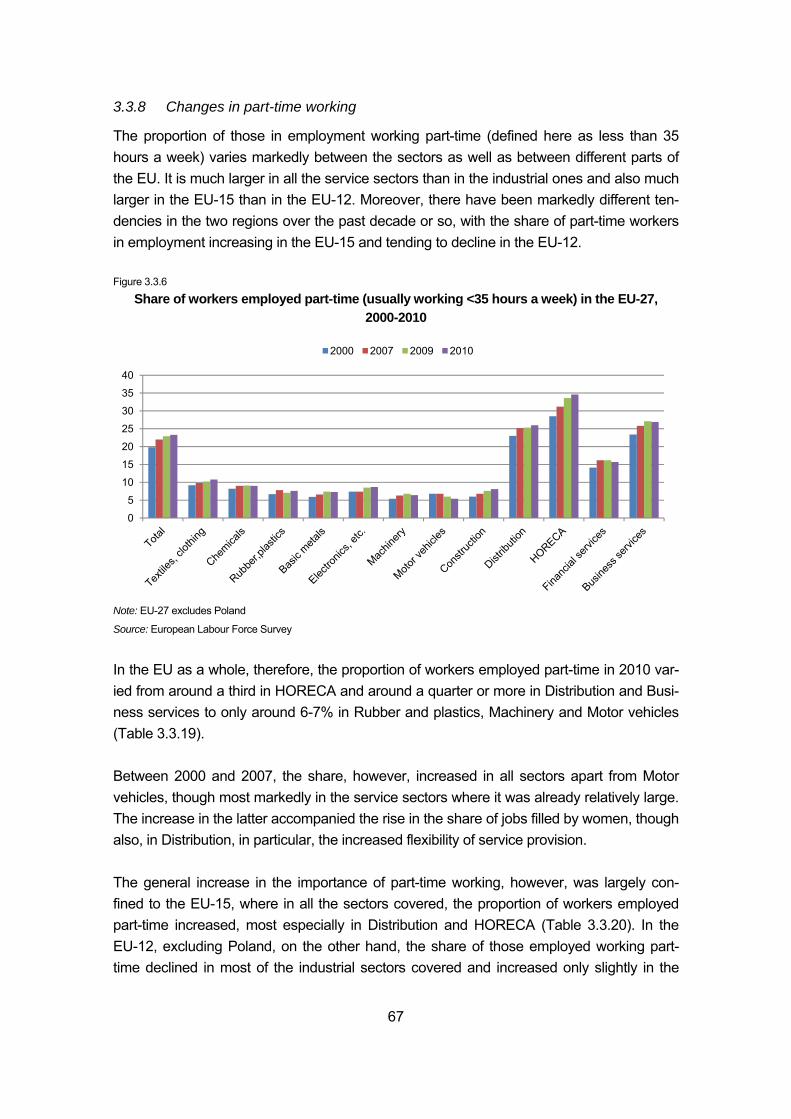
67
3.3.8 Changes in part-time working
The proportion of those in employment working part-time (defined here as less than 35 hours a week) varies markedly between the sectors as well as between different parts of the EU. It is much larger in all the service sectors than in the industrial ones and also much larger in the EU-15 than in the EU-12. Moreover, there have been markedly different ten-dencies in the two regions over the past decade or so, with the share of part-time workers in employment increasing in the EU-15 and tending to decline in the EU-12. Figure 3.3.6
Share of workers employed part-time (usually working <35 hours a week) in the EU-27, 2000-2010
Note: EU-27 excludes Poland
Source: European Labour Force Survey
In the EU as a whole, therefore, the proportion of workers employed part-time in 2010 var-ied from around a third in HORECA and around a quarter or more in Distribution and Busi-ness services to only around 6-7% in Rubber and plastics, Machinery and Motor vehicles (Table 3.3.19). Between 2000 and 2007, the share, however, increased in all sectors apart from Motor vehicles, though most markedly in the service sectors where it was already relatively large. The increase in the latter accompanied the rise in the share of jobs filled by women, though also, in Distribution, in particular, the increased flexibility of service provision. The general increase in the importance of part-time working, however, was largely con-fined to the EU-15, where in all the sectors covered, the proportion of workers employed part-time increased, most especially in Distribution and HORECA (Table 3.3.20). In the EU-12, excluding Poland, on the other hand, the share of those employed working part-time declined in most of the industrial sectors covered and increased only slightly in the
0
5
10
15
20
25
30
35
40
2000 2007 2009 2010
68
service sectors. In Poland, the proportion working part-time also declined in most of the industrial sectors but, unlike in the other EU-12 countries taken together, it declined as well in all four of the service sectors. Table 3.3.19
Share of workers employed part-time (usually working <35 hours a week) in the EU-27, 2000-2010
2000 2007 2009 2010 2000-07 2007-10EU-27 Percentage point changeTotal 19.8 22.0 22.9 23.3 2.2 1.3Textiles, clothing 9.2 9.8 10.2 10.8 0.6 1.0Chemicals 8.2 9.0 9.1 9.0 0.8 0.1Rubber, plastics 6.7 7.8 7.1 7.6 1.0 -0.2Basic metals 5.9 6.6 7.4 7.3 0.7 0.7Electronics, etc. 7.4 7.4 8.5 8.7 0.0 1.4Machinery 5.4 6.3 6.8 6.4 0.9 0.1Motor vehicles 6.8 6.8 6.0 5.4 -0.1 -1.4Construction 6.0 6.8 7.6 8.1 0.8 1.4Distribution 23.0 25.2 25.3 26.0 2.2 0.7HORECA 28.5 31.2 33.6 34.6 2.8 3.4Financial services 14.1 16.2 16.2 15.7 2.2 -0.5Business services 23.4 25.8 27.1 26.9 2.4 1.1
Note: EU-27 excludes Poland
Source: European Labour Force Survey
No tendency was evident before the recession, therefore, for the relative number of people employed part-time to converge in the EU-12 towards that in the EU-15. This might be explained at least in part by the relatively low wages in these countries making it difficult for people to earn sufficient income to be employed in part-time jobs. It is also the case that the employment rate of women, who tend to take most part-time jobs, did not rise in the EU-12 in the same way as in the EU-15. Over the recession years, there has been a notable change in trends. In the EU as a whole, the proportion of those employed working part-time increased in most sectors be-tween 2007 and 2010, as it did before the economic downturn, the only exceptions being Rubber and plastics and Motor vehicles, where the proportion is relatively small anyway, as well as Financial services. The increase was less widespread in the EU-15, with the share of the work force employed part-time declining slightly over these three years in Chemicals and Machinery – which are also sectors where part-time working is of minor importance – as well as in the other three sectors. In the EU-12, excluding Poland, on the other hand, in contrast to the tendency before the recession, there was an increase in part-working both overall (by around 1 percentage point) and in all 12 of the sectors covered, except for Financial services. This was less the
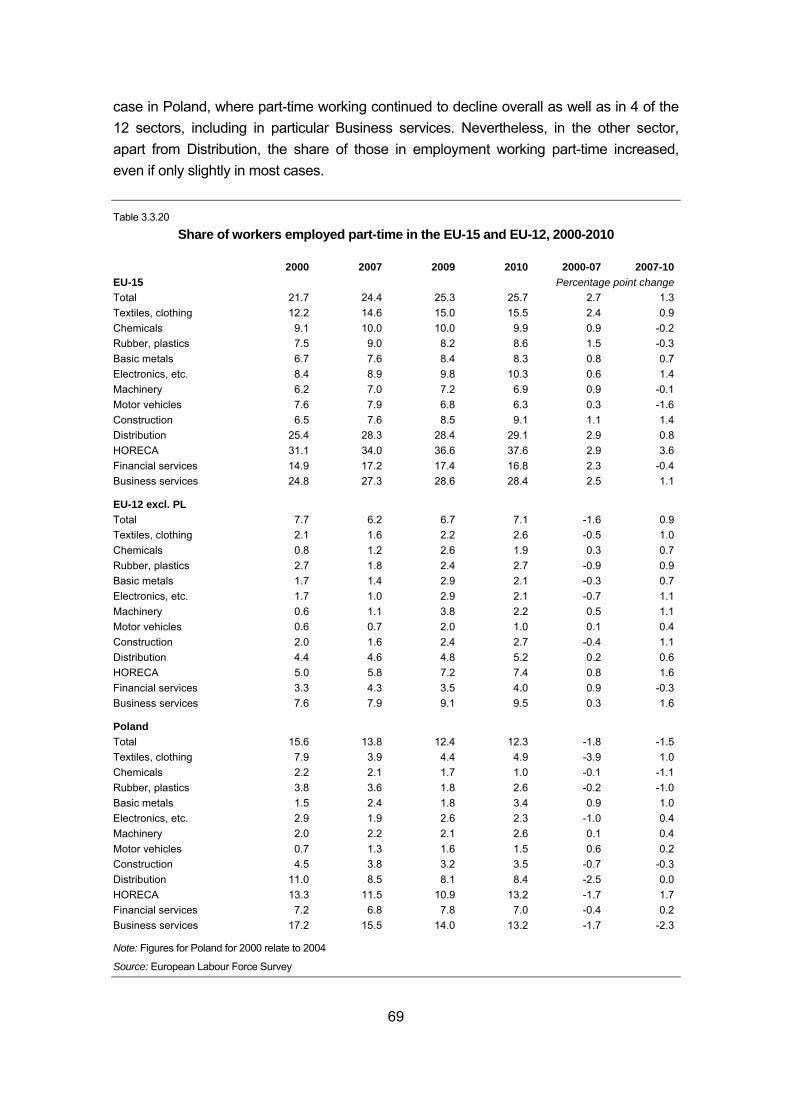
69
case in Poland, where part-time working continued to decline overall as well as in 4 of the 12 sectors, including in particular Business services. Nevertheless, in the other sector, apart from Distribution, the share of those in employment working part-time increased, even if only slightly in most cases. Table 3.3.20
Share of workers employed part-time in the EU-15 and EU-12, 2000-2010
2000 2007 2009 2010 2000-07 2007-10EU-15 Percentage point changeTotal 21.7 24.4 25.3 25.7 2.7 1.3Textiles, clothing 12.2 14.6 15.0 15.5 2.4 0.9Chemicals 9.1 10.0 10.0 9.9 0.9 -0.2Rubber, plastics 7.5 9.0 8.2 8.6 1.5 -0.3Basic metals 6.7 7.6 8.4 8.3 0.8 0.7Electronics, etc. 8.4 8.9 9.8 10.3 0.6 1.4Machinery 6.2 7.0 7.2 6.9 0.9 -0.1Motor vehicles 7.6 7.9 6.8 6.3 0.3 -1.6Construction 6.5 7.6 8.5 9.1 1.1 1.4Distribution 25.4 28.3 28.4 29.1 2.9 0.8HORECA 31.1 34.0 36.6 37.6 2.9 3.6Financial services 14.9 17.2 17.4 16.8 2.3 -0.4Business services 24.8 27.3 28.6 28.4 2.5 1.1
EU-12 excl. PL Total 7.7 6.2 6.7 7.1 -1.6 0.9Textiles, clothing 2.1 1.6 2.2 2.6 -0.5 1.0Chemicals 0.8 1.2 2.6 1.9 0.3 0.7Rubber, plastics 2.7 1.8 2.4 2.7 -0.9 0.9Basic metals 1.7 1.4 2.9 2.1 -0.3 0.7Electronics, etc. 1.7 1.0 2.9 2.1 -0.7 1.1Machinery 0.6 1.1 3.8 2.2 0.5 1.1Motor vehicles 0.6 0.7 2.0 1.0 0.1 0.4Construction 2.0 1.6 2.4 2.7 -0.4 1.1Distribution 4.4 4.6 4.8 5.2 0.2 0.6HORECA 5.0 5.8 7.2 7.4 0.8 1.6Financial services 3.3 4.3 3.5 4.0 0.9 -0.3Business services 7.6 7.9 9.1 9.5 0.3 1.6
Poland Total 15.6 13.8 12.4 12.3 -1.8 -1.5Textiles, clothing 7.9 3.9 4.4 4.9 -3.9 1.0Chemicals 2.2 2.1 1.7 1.0 -0.1 -1.1Rubber, plastics 3.8 3.6 1.8 2.6 -0.2 -1.0Basic metals 1.5 2.4 1.8 3.4 0.9 1.0Electronics, etc. 2.9 1.9 2.6 2.3 -1.0 0.4Machinery 2.0 2.2 2.1 2.6 0.1 0.4Motor vehicles 0.7 1.3 1.6 1.5 0.6 0.2Construction 4.5 3.8 3.2 3.5 -0.7 -0.3Distribution 11.0 8.5 8.1 8.4 -2.5 0.0HORECA 13.3 11.5 10.9 13.2 -1.7 1.7Financial services 7.2 6.8 7.8 7.0 -0.4 0.2Business services 17.2 15.5 14.0 13.2 -1.7 -2.3
Note: Figures for Poland for 2000 relate to 2004
Source: European Labour Force Survey
70
The evidence suggests, therefore, that there was a shift towards part-time jobs over the recession period, which might again reflect uncertainty among employers over future pros-pects. This is consistent with the reduction in average hours worked which occurred over the recession period (see Section 3.5 of this study, though this reduction seems to have been reversed as recovery has begun. Given the apparent coincidence of an increase in average hours worked and a rise in part-time working, which in itself should tend to reduce the average working time of those in employment as measured, the implication is that the hours worked by those in full-time jobs and, possibly part-time as well, has risen as the economy has started to grow again. This is confirmed in some degree by the data on actual hours worked (rather than on usual hours which have been used here to identify part-time workers), which shows a small in-crease for those employed full-time between the first quarter of 2010 and the first quarter of 2011, which is slightly larger in the EU-15 than in the EU-12 and is larger in manufacturing than in services. Average hours actually worked by those employed full-time were there-fore around 1% higher in the latter quarter than three years earlier in the first quarter of 2008. 3.3.9 The share of jobs taken by migrants from outside the EU
Migrants from outside the EU – defined here as those living in the EU who were born in a country outside15 – make up a small but significant proportion of the work force in a number of Member States (Figure 3.3.7). Moreover, the numbers have increased markedly in some countries over the past decade or so. This is less the case in the EU-12 countries, where migrants represent in most cases only a small proportion of the population of work-ing-age and which in many cases (Poland, the Baltic states, Romania and Bulgaria, espe-cially) have experienced significant outward migration, particularly to the EU-15 countries, in recent years. The analysis here, therefore, is confined to the EU-15 countries. The proportion of the work force made up of migrants from outside the EU averaged around 7% in the EU-15 in 2009 (Table 3.3.21), though the figure was as high as 12% in Spain. The proportion varies significantly between sectors, in broad terms, inversely with the level of technology or knowledge intensity of the sector. The proportion is, therefore, relatively large on average across the EU-15 in HORECA in particular (15% in 2009), but also in Construction and Textiles and relatively small in Electronics, Motor vehicles and 15 The definition often used to identify migrants statistically is in terms of nationality or citizenship – i.e. those who do not
possess citizenship of an EU Member State. The problem with this definition, however, is that it leaves out of account those who have acquired citizenship after living in a Member State for a time. Moreover, since the regulations governing the acquisition of citizenship vary across countries, adopting this definition excludes a variable proportion of migrants in different Member States. Although the definition used here also gives rise to problems, not least that nationals of a country may also have been born abroad because their parents were living outside the EU at the time, these problems seem less serious. In addition, the present definition has the advantage of identifying significantly more migrants than the alternative, so increasing the sample size. A major drawback of the definition, however, is that there are no data for Germany on country of birth, so this has to be omitted from the analysis.
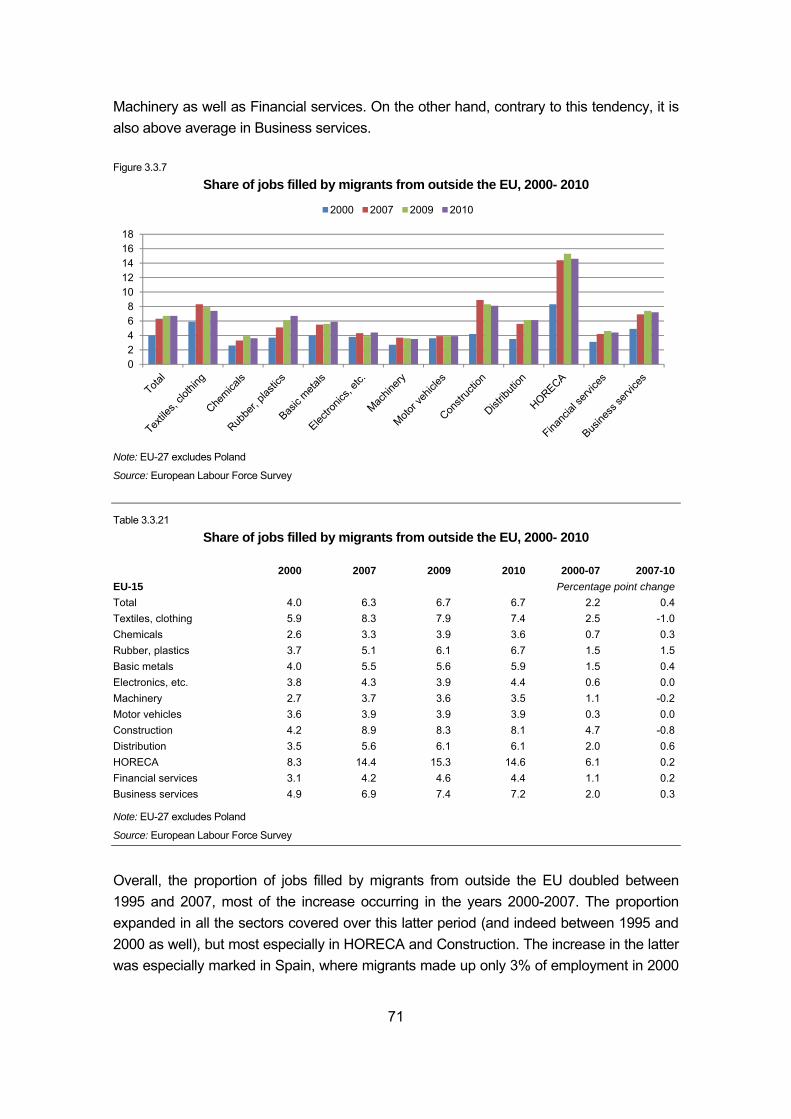
71
Machinery as well as Financial services. On the other hand, contrary to this tendency, it is also above average in Business services. Figure 3.3.7
Share of jobs filled by migrants from outside the EU, 2000- 2010
Note: EU-27 excludes Poland
Source: European Labour Force Survey
Table 3.3.21
Share of jobs filled by migrants from outside the EU, 2000- 2010
2000 2007 2009 2010 2000-07 2007-10EU-15 Percentage point changeTotal 4.0 6.3 6.7 6.7 2.2 0.4Textiles, clothing 5.9 8.3 7.9 7.4 2.5 -1.0Chemicals 2.6 3.3 3.9 3.6 0.7 0.3Rubber, plastics 3.7 5.1 6.1 6.7 1.5 1.5Basic metals 4.0 5.5 5.6 5.9 1.5 0.4Electronics, etc. 3.8 4.3 3.9 4.4 0.6 0.0Machinery 2.7 3.7 3.6 3.5 1.1 -0.2Motor vehicles 3.6 3.9 3.9 3.9 0.3 0.0Construction 4.2 8.9 8.3 8.1 4.7 -0.8Distribution 3.5 5.6 6.1 6.1 2.0 0.6HORECA 8.3 14.4 15.3 14.6 6.1 0.2Financial services 3.1 4.2 4.6 4.4 1.1 0.2Business services 4.9 6.9 7.4 7.2 2.0 0.3
Note: EU-27 excludes Poland
Source: European Labour Force Survey
Overall, the proportion of jobs filled by migrants from outside the EU doubled between 1995 and 2007, most of the increase occurring in the years 2000-2007. The proportion expanded in all the sectors covered over this latter period (and indeed between 1995 and 2000 as well), but most especially in HORECA and Construction. The increase in the latter was especially marked in Spain, where migrants made up only 3% of employment in 2000
02468
1012141618
2000 2007 2009 2010
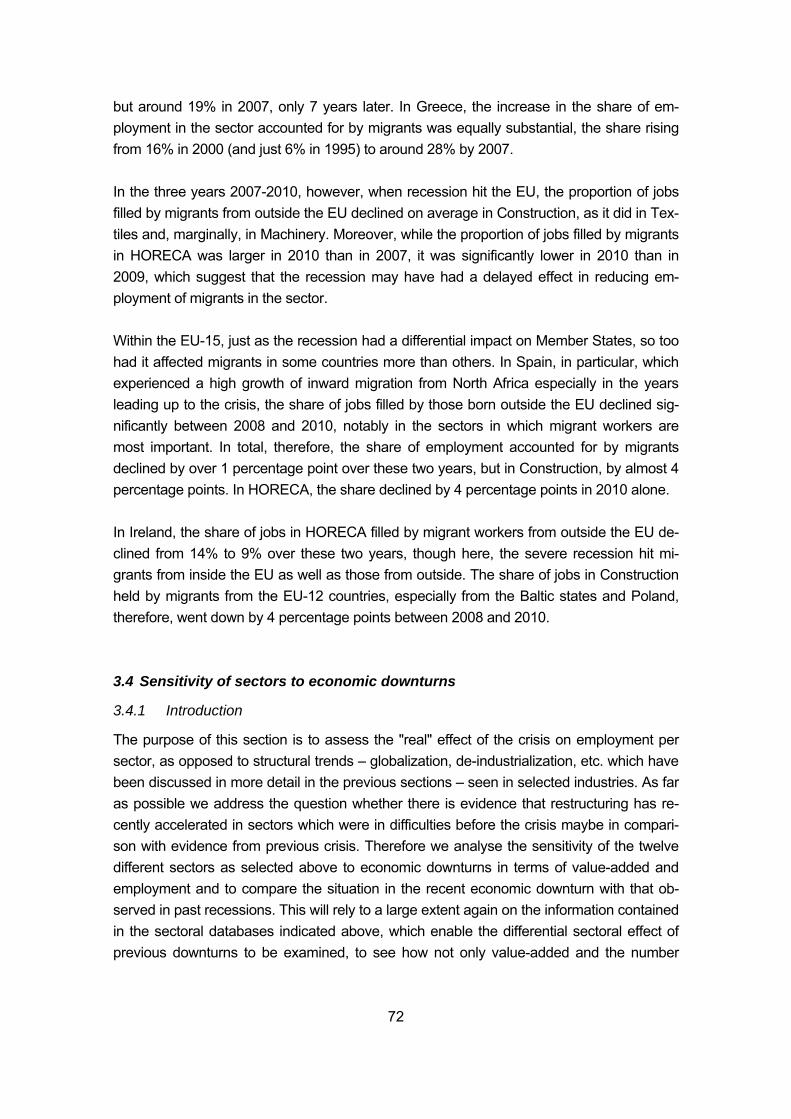
72
but around 19% in 2007, only 7 years later. In Greece, the increase in the share of em-ployment in the sector accounted for by migrants was equally substantial, the share rising from 16% in 2000 (and just 6% in 1995) to around 28% by 2007. In the three years 2007-2010, however, when recession hit the EU, the proportion of jobs filled by migrants from outside the EU declined on average in Construction, as it did in Tex-tiles and, marginally, in Machinery. Moreover, while the proportion of jobs filled by migrants in HORECA was larger in 2010 than in 2007, it was significantly lower in 2010 than in 2009, which suggest that the recession may have had a delayed effect in reducing em-ployment of migrants in the sector. Within the EU-15, just as the recession had a differential impact on Member States, so too had it affected migrants in some countries more than others. In Spain, in particular, which experienced a high growth of inward migration from North Africa especially in the years leading up to the crisis, the share of jobs filled by those born outside the EU declined sig-nificantly between 2008 and 2010, notably in the sectors in which migrant workers are most important. In total, therefore, the share of employment accounted for by migrants declined by over 1 percentage point over these two years, but in Construction, by almost 4 percentage points. In HORECA, the share declined by 4 percentage points in 2010 alone. In Ireland, the share of jobs in HORECA filled by migrant workers from outside the EU de-clined from 14% to 9% over these two years, though here, the severe recession hit mi-grants from inside the EU as well as those from outside. The share of jobs in Construction held by migrants from the EU-12 countries, especially from the Baltic states and Poland, therefore, went down by 4 percentage points between 2008 and 2010. 3.4 Sensitivity of sectors to economic downturns
3.4.1 Introduction
The purpose of this section is to assess the "real" effect of the crisis on employment per sector, as opposed to structural trends – globalization, de-industrialization, etc. which have been discussed in more detail in the previous sections – seen in selected industries. As far as possible we address the question whether there is evidence that restructuring has re-cently accelerated in sectors which were in difficulties before the crisis maybe in compari-son with evidence from previous crisis. Therefore we analyse the sensitivity of the twelve different sectors as selected above to economic downturns in terms of value-added and employment and to compare the situation in the recent economic downturn with that ob-served in past recessions. This will rely to a large extent again on the information contained in the sectoral databases indicated above, which enable the differential sectoral effect of previous downturns to be examined, to see how not only value-added and the number
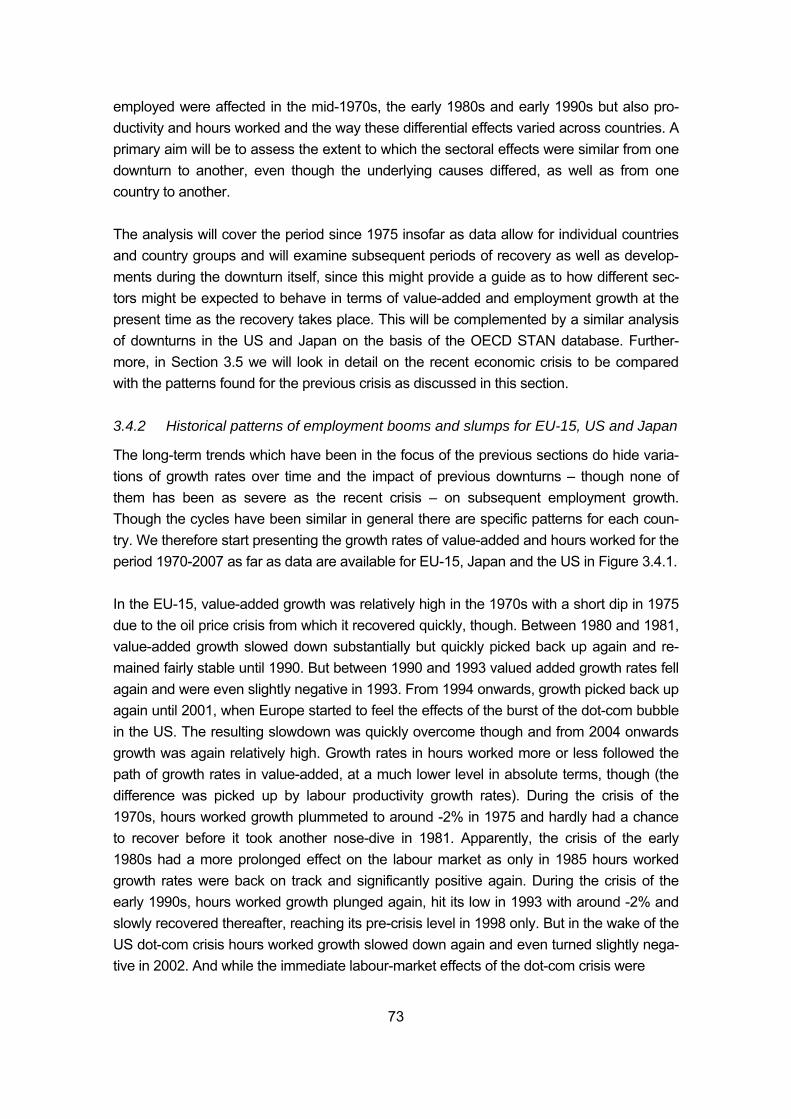
73
employed were affected in the mid-1970s, the early 1980s and early 1990s but also pro-ductivity and hours worked and the way these differential effects varied across countries. A primary aim will be to assess the extent to which the sectoral effects were similar from one downturn to another, even though the underlying causes differed, as well as from one country to another. The analysis will cover the period since 1975 insofar as data allow for individual countries and country groups and will examine subsequent periods of recovery as well as develop-ments during the downturn itself, since this might provide a guide as to how different sec-tors might be expected to behave in terms of value-added and employment growth at the present time as the recovery takes place. This will be complemented by a similar analysis of downturns in the US and Japan on the basis of the OECD STAN database. Further-more, in Section 3.5 we will look in detail on the recent economic crisis to be compared with the patterns found for the previous crisis as discussed in this section. 3.4.2 Historical patterns of employment booms and slumps for EU-15, US and Japan
The long-term trends which have been in the focus of the previous sections do hide varia-tions of growth rates over time and the impact of previous downturns – though none of them has been as severe as the recent crisis – on subsequent employment growth. Though the cycles have been similar in general there are specific patterns for each coun-try. We therefore start presenting the growth rates of value-added and hours worked for the period 1970-2007 as far as data are available for EU-15, Japan and the US in Figure 3.4.1. In the EU-15, value-added growth was relatively high in the 1970s with a short dip in 1975 due to the oil price crisis from which it recovered quickly, though. Between 1980 and 1981, value-added growth slowed down substantially but quickly picked back up again and re-mained fairly stable until 1990. But between 1990 and 1993 valued added growth rates fell again and were even slightly negative in 1993. From 1994 onwards, growth picked back up again until 2001, when Europe started to feel the effects of the burst of the dot-com bubble in the US. The resulting slowdown was quickly overcome though and from 2004 onwards growth was again relatively high. Growth rates in hours worked more or less followed the path of growth rates in value-added, at a much lower level in absolute terms, though (the difference was picked up by labour productivity growth rates). During the crisis of the 1970s, hours worked growth plummeted to around -2% in 1975 and hardly had a chance to recover before it took another nose-dive in 1981. Apparently, the crisis of the early 1980s had a more prolonged effect on the labour market as only in 1985 hours worked growth rates were back on track and significantly positive again. During the crisis of the early 1990s, hours worked growth plunged again, hit its low in 1993 with around -2% and slowly recovered thereafter, reaching its pre-crisis level in 1998 only. But in the wake of the US dot-com crisis hours worked growth slowed down again and even turned slightly nega-tive in 2002. And while the immediate labour-market effects of the dot-com crisis were
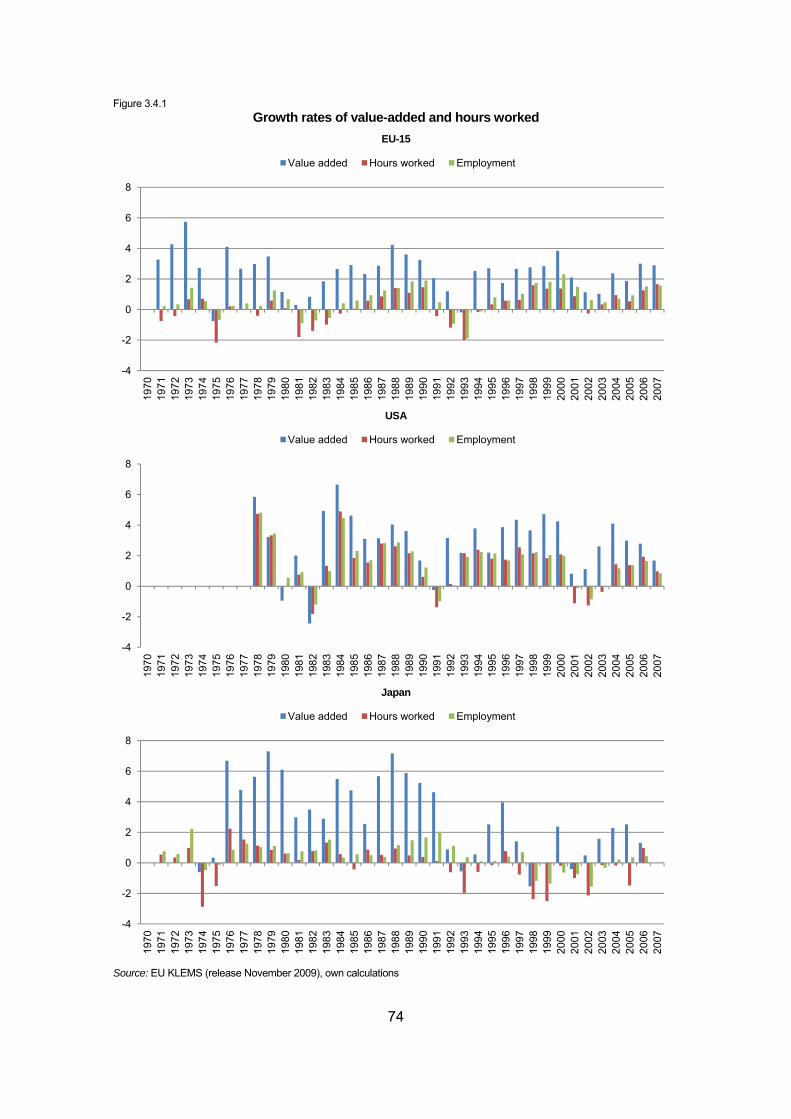
74
Figure 3.4.1 Growth rates of value-added and hours worked
EU-15
USA
Japan
Source: EU KLEMS (release November 2009), own calculations
-4
-2
0
2
4
6
8
1970
1971
1972
1973
1974
1975
1976
1977
1978
1979
1980
1981
1982
1983
1984
1985
1986
1987
1988
1989
1990
1991
1992
1993
1994
1995
1996
1997
1998
1999
2000
2001
2002
2003
2004
2005
2006
2007
Value added Hours worked Employment
-4
-2
0
2
4
6
8
1970
1971
1972
1973
1974
1975
1976
1977
1978
1979
1980
1981
1982
1983
1984
1985
1986
1987
1988
1989
1990
1991
1992
1993
1994
1995
1996
1997
1998
1999
2000
2001
2002
2003
2004
2005
2006
2007
Value added Hours worked Employment
-4
-2
0
2
4
6
8
1970
1971
1972
1973
1974
1975
1976
1977
1978
1979
1980
1981
1982
1983
1984
1985
1986
1987
1988
1989
1990
1991
1992
1993
1994
1995
1996
1997
1998
1999
2000
2001
2002
2003
2004
2005
2006
2007
Value added Hours worked Employment
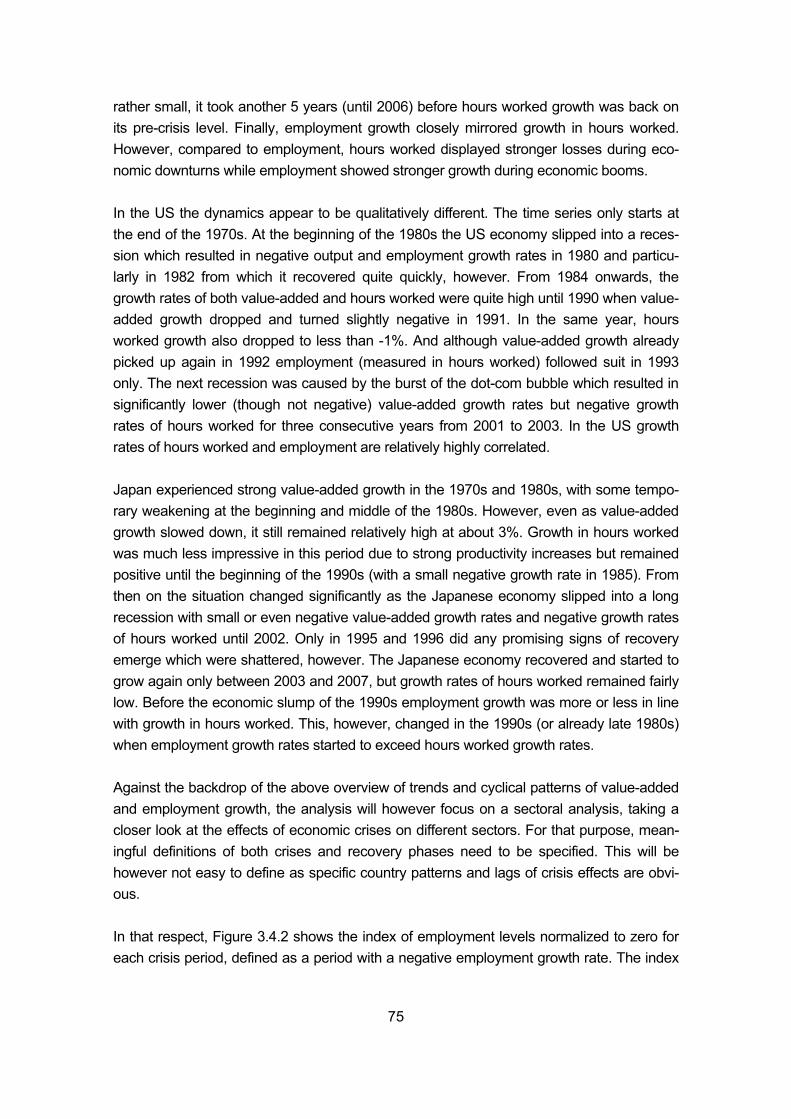
75
rather small, it took another 5 years (until 2006) before hours worked growth was back on its pre-crisis level. Finally, employment growth closely mirrored growth in hours worked. However, compared to employment, hours worked displayed stronger losses during eco-nomic downturns while employment showed stronger growth during economic booms. In the US the dynamics appear to be qualitatively different. The time series only starts at the end of the 1970s. At the beginning of the 1980s the US economy slipped into a reces-sion which resulted in negative output and employment growth rates in 1980 and particu-larly in 1982 from which it recovered quite quickly, however. From 1984 onwards, the growth rates of both value-added and hours worked were quite high until 1990 when value-added growth dropped and turned slightly negative in 1991. In the same year, hours worked growth also dropped to less than -1%. And although value-added growth already picked up again in 1992 employment (measured in hours worked) followed suit in 1993 only. The next recession was caused by the burst of the dot-com bubble which resulted in significantly lower (though not negative) value-added growth rates but negative growth rates of hours worked for three consecutive years from 2001 to 2003. In the US growth rates of hours worked and employment are relatively highly correlated. Japan experienced strong value-added growth in the 1970s and 1980s, with some tempo-rary weakening at the beginning and middle of the 1980s. However, even as value-added growth slowed down, it still remained relatively high at about 3%. Growth in hours worked was much less impressive in this period due to strong productivity increases but remained positive until the beginning of the 1990s (with a small negative growth rate in 1985). From then on the situation changed significantly as the Japanese economy slipped into a long recession with small or even negative value-added growth rates and negative growth rates of hours worked until 2002. Only in 1995 and 1996 did any promising signs of recovery emerge which were shattered, however. The Japanese economy recovered and started to grow again only between 2003 and 2007, but growth rates of hours worked remained fairly low. Before the economic slump of the 1990s employment growth was more or less in line with growth in hours worked. This, however, changed in the 1990s (or already late 1980s) when employment growth rates started to exceed hours worked growth rates. Against the backdrop of the above overview of trends and cyclical patterns of value-added and employment growth, the analysis will however focus on a sectoral analysis, taking a closer look at the effects of economic crises on different sectors. For that purpose, mean-ingful definitions of both crises and recovery phases need to be specified. This will be however not easy to define as specific country patterns and lags of crisis effects are obvi-ous. In that respect, Figure 3.4.2 shows the index of employment levels normalized to zero for each crisis period, defined as a period with a negative employment growth rate. The index
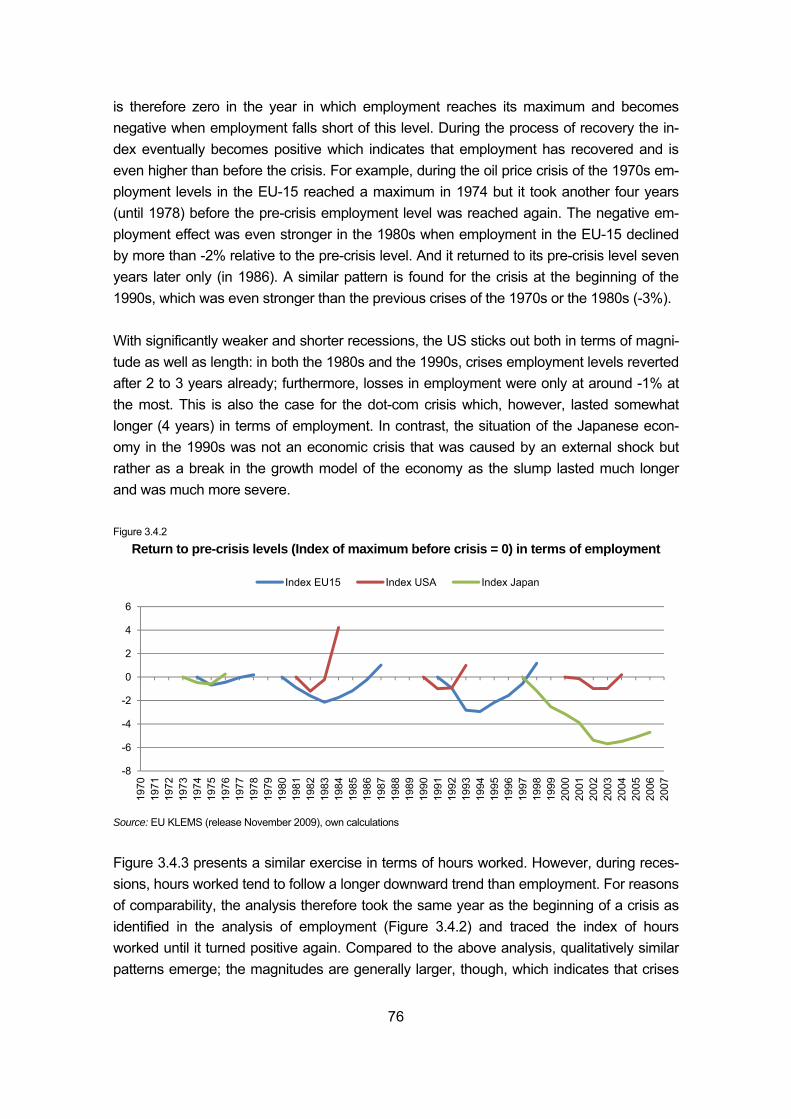
76
is therefore zero in the year in which employment reaches its maximum and becomes negative when employment falls short of this level. During the process of recovery the in-dex eventually becomes positive which indicates that employment has recovered and is even higher than before the crisis. For example, during the oil price crisis of the 1970s em-ployment levels in the EU-15 reached a maximum in 1974 but it took another four years (until 1978) before the pre-crisis employment level was reached again. The negative em-ployment effect was even stronger in the 1980s when employment in the EU-15 declined by more than -2% relative to the pre-crisis level. And it returned to its pre-crisis level seven years later only (in 1986). A similar pattern is found for the crisis at the beginning of the 1990s, which was even stronger than the previous crises of the 1970s or the 1980s (-3%). With significantly weaker and shorter recessions, the US sticks out both in terms of magni-tude as well as length: in both the 1980s and the 1990s, crises employment levels reverted after 2 to 3 years already; furthermore, losses in employment were only at around -1% at the most. This is also the case for the dot-com crisis which, however, lasted somewhat longer (4 years) in terms of employment. In contrast, the situation of the Japanese econ-omy in the 1990s was not an economic crisis that was caused by an external shock but rather as a break in the growth model of the economy as the slump lasted much longer and was much more severe. Figure 3.4.2
Return to pre-crisis levels (Index of maximum before crisis = 0) in terms of employment
Source: EU KLEMS (release November 2009), own calculations
Figure 3.4.3 presents a similar exercise in terms of hours worked. However, during reces-sions, hours worked tend to follow a longer downward trend than employment. For reasons of comparability, the analysis therefore took the same year as the beginning of a crisis as identified in the analysis of employment (Figure 3.4.2) and traced the index of hours worked until it turned positive again. Compared to the above analysis, qualitatively similar patterns emerge; the magnitudes are generally larger, though, which indicates that crises
-8
-6
-4
-2
0
2
4
6
1970
1971
1972
1973
1974
1975
1976
1977
1978
1979
1980
1981
1982
1983
1984
1985
1986
1987
1988
1989
1990
1991
1992
1993
1994
1995
1996
1997
1998
1999
2000
2001
2002
2003
2004
2005
2006
2007
Index EU15 Index USA Index Japan
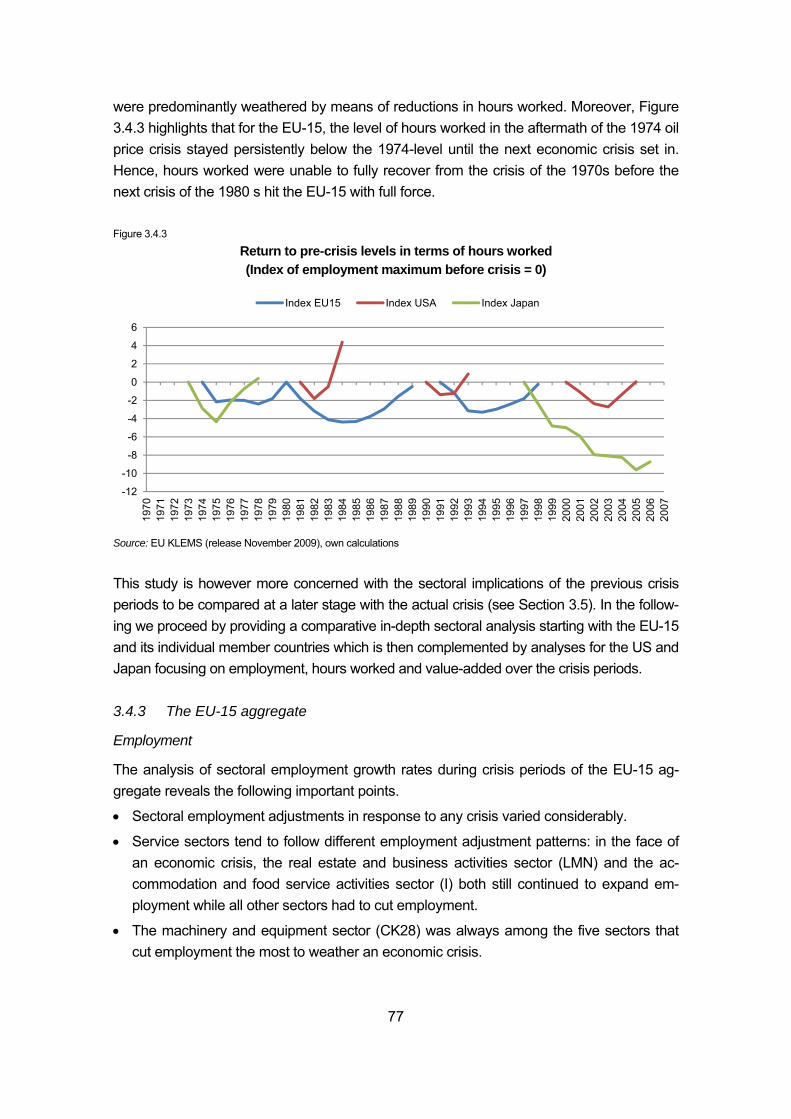
77
were predominantly weathered by means of reductions in hours worked. Moreover, Figure 3.4.3 highlights that for the EU-15, the level of hours worked in the aftermath of the 1974 oil price crisis stayed persistently below the 1974-level until the next economic crisis set in. Hence, hours worked were unable to fully recover from the crisis of the 1970s before the next crisis of the 1980 s hit the EU-15 with full force. Figure 3.4.3
Return to pre-crisis levels in terms of hours worked (Index of employment maximum before crisis = 0)
Source: EU KLEMS (release November 2009), own calculations
This study is however more concerned with the sectoral implications of the previous crisis periods to be compared at a later stage with the actual crisis (see Section 3.5). In the follow-ing we proceed by providing a comparative in-depth sectoral analysis starting with the EU-15 and its individual member countries which is then complemented by analyses for the US and Japan focusing on employment, hours worked and value-added over the crisis periods. 3.4.3 The EU-15 aggregate
Employment
The analysis of sectoral employment growth rates during crisis periods of the EU-15 ag-gregate reveals the following important points.
• Sectoral employment adjustments in response to any crisis varied considerably.
• Service sectors tend to follow different employment adjustment patterns: in the face of an economic crisis, the real estate and business activities sector (LMN) and the ac-commodation and food service activities sector (I) both still continued to expand em-ployment while all other sectors had to cut employment.
• The machinery and equipment sector (CK28) was always among the five sectors that cut employment the most to weather an economic crisis.
-12
-10
-8
-6
-4
-2
0
2
4
6
1970
1971
1972
1973
1974
1975
1976
1977
1978
1979
1980
1981
1982
1983
1984
1985
1986
1987
1988
1989
1990
1991
1992
1993
1994
1995
1996
1997
1998
1999
2000
2001
2002
2003
2004
2005
2006
2007
Index EU15 Index USA Index Japan
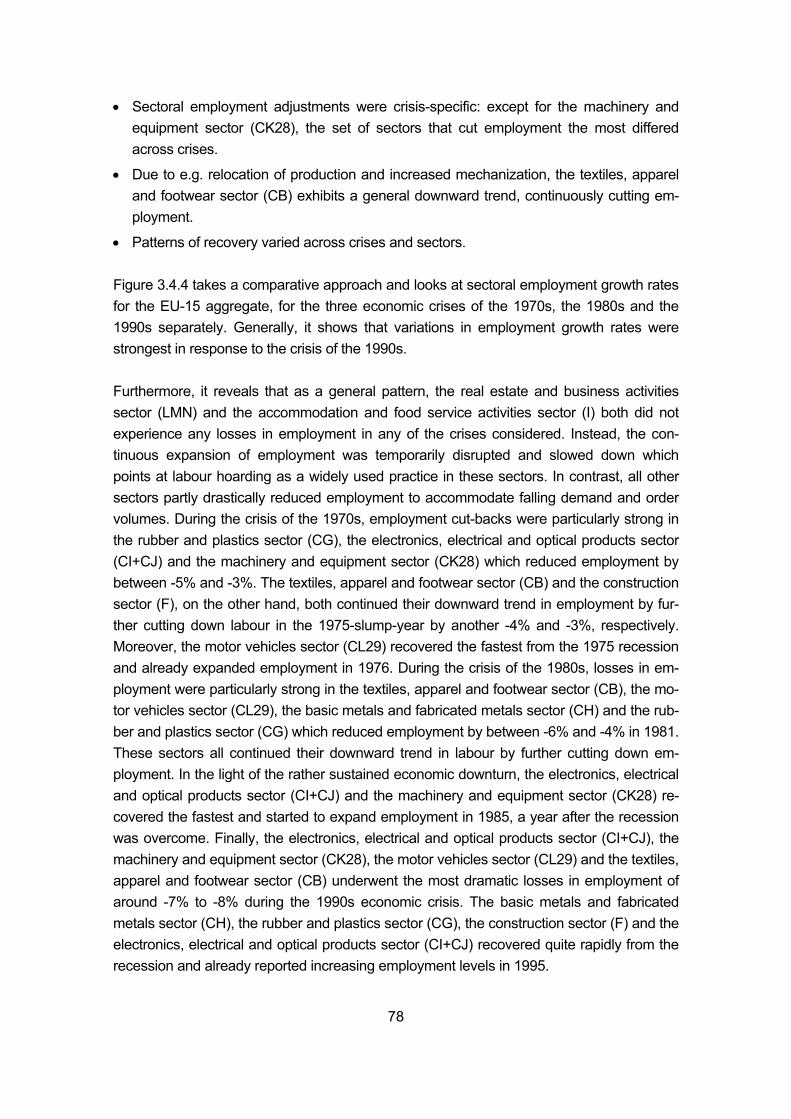
78
• Sectoral employment adjustments were crisis-specific: except for the machinery and equipment sector (CK28), the set of sectors that cut employment the most differed across crises.
• Due to e.g. relocation of production and increased mechanization, the textiles, apparel and footwear sector (CB) exhibits a general downward trend, continuously cutting em-ployment.
• Patterns of recovery varied across crises and sectors. Figure 3.4.4 takes a comparative approach and looks at sectoral employment growth rates for the EU-15 aggregate, for the three economic crises of the 1970s, the 1980s and the 1990s separately. Generally, it shows that variations in employment growth rates were strongest in response to the crisis of the 1990s. Furthermore, it reveals that as a general pattern, the real estate and business activities sector (LMN) and the accommodation and food service activities sector (I) both did not experience any losses in employment in any of the crises considered. Instead, the con-tinuous expansion of employment was temporarily disrupted and slowed down which points at labour hoarding as a widely used practice in these sectors. In contrast, all other sectors partly drastically reduced employment to accommodate falling demand and order volumes. During the crisis of the 1970s, employment cut-backs were particularly strong in the rubber and plastics sector (CG), the electronics, electrical and optical products sector (CI+CJ) and the machinery and equipment sector (CK28) which reduced employment by between -5% and -3%. The textiles, apparel and footwear sector (CB) and the construction sector (F), on the other hand, both continued their downward trend in employment by fur-ther cutting down labour in the 1975-slump-year by another -4% and -3%, respectively. Moreover, the motor vehicles sector (CL29) recovered the fastest from the 1975 recession and already expanded employment in 1976. During the crisis of the 1980s, losses in em-ployment were particularly strong in the textiles, apparel and footwear sector (CB), the mo-tor vehicles sector (CL29), the basic metals and fabricated metals sector (CH) and the rub-ber and plastics sector (CG) which reduced employment by between -6% and -4% in 1981. These sectors all continued their downward trend in labour by further cutting down em-ployment. In the light of the rather sustained economic downturn, the electronics, electrical and optical products sector (CI+CJ) and the machinery and equipment sector (CK28) re-covered the fastest and started to expand employment in 1985, a year after the recession was overcome. Finally, the electronics, electrical and optical products sector (CI+CJ), the machinery and equipment sector (CK28), the motor vehicles sector (CL29) and the textiles, apparel and footwear sector (CB) underwent the most dramatic losses in employment of around -7% to -8% during the 1990s economic crisis. The basic metals and fabricated metals sector (CH), the rubber and plastics sector (CG), the construction sector (F) and the electronics, electrical and optical products sector (CI+CJ) recovered quite rapidly from the recession and already reported increasing employment levels in 1995.
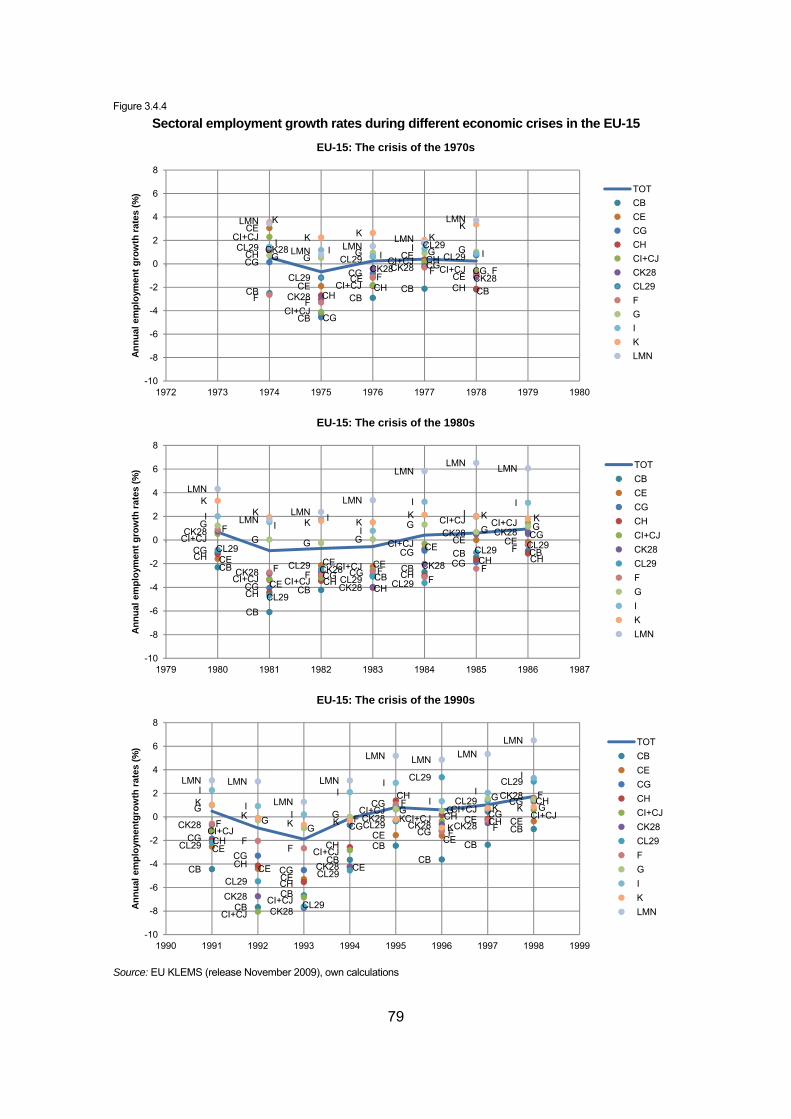
79
Figure 3.4.4
Sectoral employment growth rates during different economic crises in the EU-15
Source: EU KLEMS (release November 2009), own calculations
CB
CB
CBCB CB
CE
CECE
CE
CECG
CG
CGCG
CH
CHCH
CH
CH
CI+CJ
CI+CJ
CI+CJ
CI+CJCI+CJ
CK28
CK28
CK28CK28CK28
CL29
CL29
CL29CL29
CL29
F F
F F CG, FG G G G GI
I II I
K
K K KKLMN
LMN LMNLMN
LMN
-10
-8
-6
-4
-2
0
2
4
6
8
1972 1973 1974 1975 1976 1977 1978 1979 1980
Annu
al e
mpl
oym
ent g
row
th ra
tes
(%)
EU-15: The crisis of the 1970s
TOTCBCECGCHCI+CJCK28CL29FGIKLMN
CB
CB
CBCB
CBCB CB
CE
CE
CE CE
CECE CE
CG
CGCG CG
CGCG
CG
CH
CHCH
CHCH
CH CH
CI+CJ
CI+CJ CI+CJCI+CJ
CI+CJ
CI+CJ CI+CJCK28
CK28 CK28
CK28
CK28
CK28 CK28
CL29
CL29
CL29CL29 CL29
CL29 CL29
F
FF F
FF
F
G
G G GG G G
II
II
II
IKK
K KK K K
LMN
LMNLMN
LMN
LMNLMN LMN
-10
-8
-6
-4
-2
0
2
4
6
8
1979 1980 1981 1982 1983 1984 1985 1986 1987
Annu
al e
mpl
oym
ent g
row
th ra
tes
(%)
EU-15: The crisis of the 1980s
TOTCBCECGCHCI+CJCK28CL29FGIKLMN
CB
CBCB
CBCB
CBCB
CB
CE
CECE
CE
CE CE
CE CE
CG
CGCG
CG
CG
CG
CGCG
CH
CH
CH
CH
CH
CH CH
CH
CI+CJ
CI+CJCI+CJ
CI+CJ
CI+CJCI+CJ
CI+CJ CI+CJCK28
CK28CK28
CK28
CK28CK28 CK28
CK28
CL29
CL29
CL29
CL29
CL29
CL29
CL29
CL29
F
FF
F
F
F F
FG
GG
G G GG
G
I
II
II
II
I
KK
K K KK
K K
LMN LMN
LMN
LMN
LMN LMN LMNLMN
-10
-8
-6
-4
-2
0
2
4
6
8
1990 1991 1992 1993 1994 1995 1996 1997 1998 1999
Annu
al e
mpl
oym
entg
row
th ra
tes
(%)
EU-15: The crisis of the 1990s
TOTCBCECGCHCI+CJCK28CL29FGIKLMN
80
Hours worked
Generally, the analysis of sectoral hours worked growth rates of the EU-15 aggregate re-veals the following:
• Adjustment patterns in hours worked growth strongly mirror those in employment;
• Labour hoarding was a general phenomenon: economic crises were predominantly weathered by means of adjustments in hours worked;
• However, the degree of labour hoarding differed across crises and sectors considered: labour hoarding was strongest during the crises of the 1970s, moderate during the crisis of the 1980s but mixed during the crises of the 1990s as some sectors (e.g. the elec-tronics, electrical and optical products sector (CI+CJ)) mainly resorted to reductions in employment to overcome the crisis;
• First signs of recovery were mainly accommodated by means of adjustments in hours worked, however, some sectors relied on adjustments in labour instead;
Figure 3.4.5 depicts and compares sectoral responses of hours worked growth rates across economic crises for the EU-15 aggregate. It highlights that compared to employ-ment growth (see Figure 3.4.4) hours worked growth was generally more volatile, reacting more intensely to economic crises. More specifically, hours worked adjustments were strongest during the crises of the 1980s and the 1990s. Generally, hours worked growth strongly mirrors the growth patterns of employment identi-fied in Figure 3.4.4. However, the consistently stronger cuts in hours worked suggest that each economic crisis was predominantly accommodated by reductions in hours worked. This was particularly true for the crisis of the 1970s: the lion’s share of any demand short-falls in the electronics, electrical and optical products sector (CI+CJ) and the machinery and equipment sector (CK28) was absorbed by adjustments in hours worked. Moreover, Figures 3.4.4 and 3.4.5 suggest that during the 1970s recession labour hoarding was par-ticularly prevalent in the real estate and business activities sector (LMN) and the wholesale and retail trade sector (G) which both averted losses in employment by primarily cutting back on hours worked. This was less so during the crisis of the 1980s in which reductions in hours worked were only slightly higher than those in employment. Specifically, the tex-tiles, apparel and footwear sector (CB), the motor vehicles sector (CL29), the basic metals and fabricated metals sector (CH) and the rubber and plastics sector (CG) which reduced employment by between -4% and -6% in 1981 cut back on hours worked by between -5% and around -7%. The picture was more diverse during the crisis of the 1990s. Particularly, the machinery and equipment sector (CK28) and the motor vehicles sector (CL29) also relied on adjustments of hours worked to deal with the recession of the 1990s: both sectors cut employment by around -8% while hours worked fell by -8% and almost -10%, respec-tively. In contrast, the textiles, apparel and footwear sector (CB) and the electronics, elec-trical and optical products sector (CI+CJ) both mainly resorted to reductions in labour to
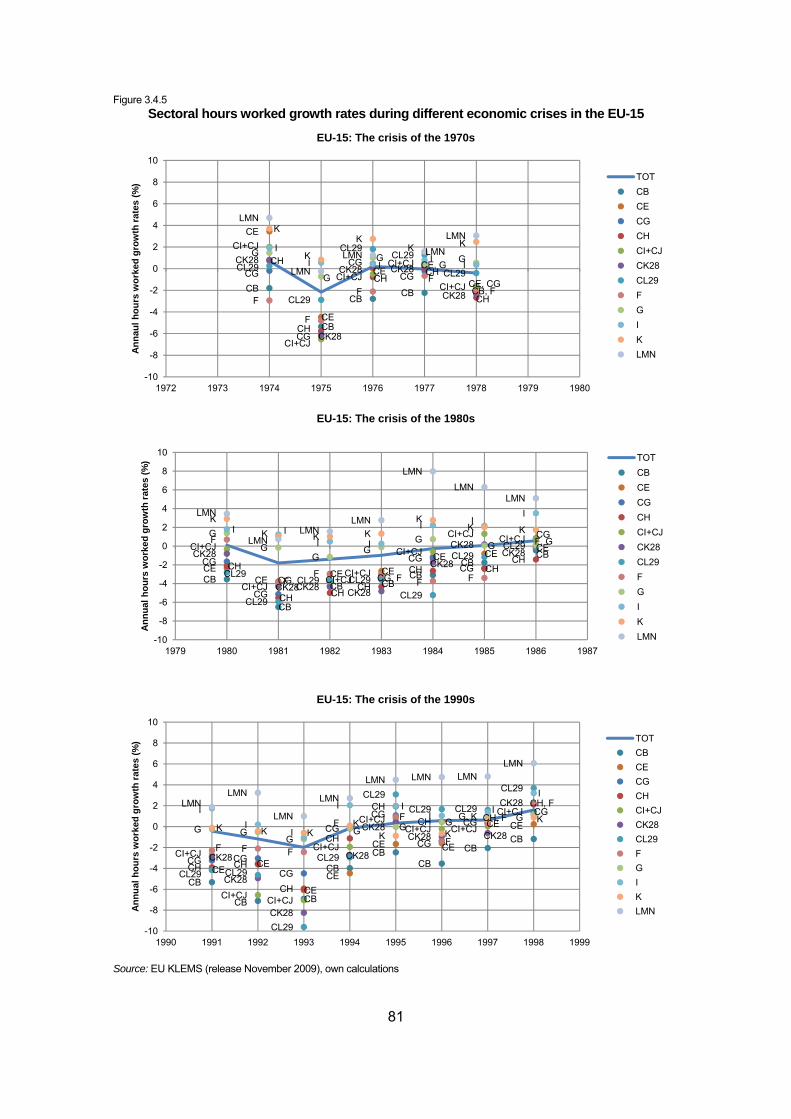
81
Figure 3.4.5 Sectoral hours worked growth rates during different economic crises in the EU-15
Source: EU KLEMS (release November 2009), own calculations
CB
CB
CB CB CB, F
CE
CE
CECE, CG
CG
CG
CGCG
CH
CH
CHCH
CH
CI+CJ
CI+CJ
CI+CJCI+CJ
CI+CJ
CK28
CK28
CK28 CK28
CK28
CL29
CL29
CL29CL29
CL29
F
F
FF
G
G
GCE, G G
II I
II
K
K
KK K
LMN
LMN
LMN LMN
LMN
-10
-8
-6
-4
-2
0
2
4
6
8
10
1972 1973 1974 1975 1976 1977 1978 1979 1980
Anna
ul h
ours
wor
ked
grow
th ra
tes
(%)
EU-15: The crisis of the 1970s
TOTCBCECGCHCI+CJCK28CL29FGIKLMN
CB
CB
CB CBCB
CBCB
CECE
CE CECE CE CE
CG
CG
CG, F
CGCG
CG
CH
CH CHCH
CH CHCH
CI+CJ
CI+CJCI+CJ
CI+CJ
CI+CJ
CI+CJ CI+CJCK28
CK28CK28 CK28
CK28
CK28CK28
CL29
CL29
CG, CL29 CL29CL29
CL29CL29F
FF
F F
GG
GG
GG F, G
I II I
I IIK
K K KK
K K
LMN
LMNLMN
LMN
LMN
LMNLMN
-10
-8
-6
-4
-2
0
2
4
6
8
10
1979 1980 1981 1982 1983 1984 1985 1986 1987
Annu
al h
ours
wor
ked
grow
th ra
tes
(%)
EU-15: The crisis of the 1980s
TOTCBCECGCHCI+CJCK28CL29FGIKLMN
CB
CB CB
CB
CBCB
CBCB
CECE
CECE
CE CE
CE CE
CG CGCG
CGCG
CG
CGCG
CH CH
CH
CH
CHCH CH, F
CI+CJ
CI+CJ CI+CJ
CI+CJ
CI+CJCI+CJ CI+CJ
CI+CJ
CK28
CK28
CK28
CK28
CK28CK28 CK28
CK28
CL29 CL29
CL29
CL29
CL29CL29 CL29
CL29
F F F
FF
F
CH, F
G GG
G G G G, K GI
II
I II
I
I
K K KK
K KK
LMNLMN
LMN
LMN
LMN LMN LMNLMN
-10
-8
-6
-4
-2
0
2
4
6
8
10
1990 1991 1992 1993 1994 1995 1996 1997 1998 1999
Annu
al h
ours
wor
ked
grow
th ra
tes
(%)
EU-15: The crisis of the 1990s
TOTCBCECGCHCI+CJCK28CL29FGIKLMN
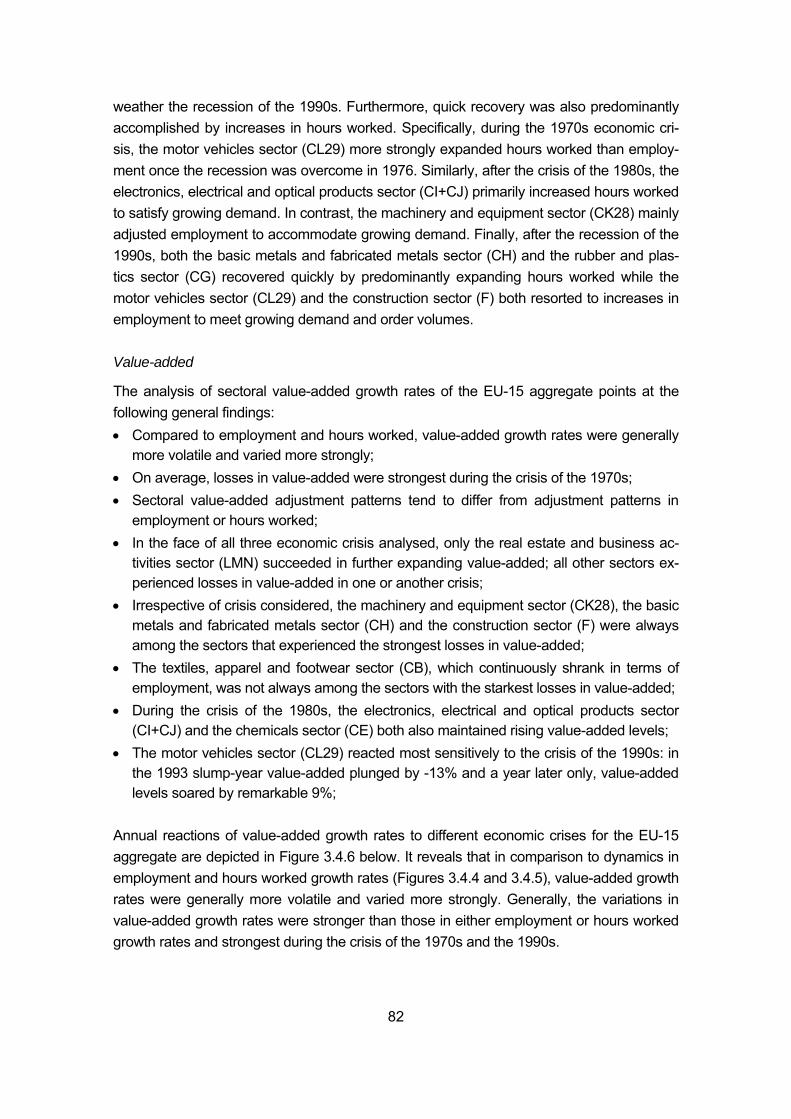
82
weather the recession of the 1990s. Furthermore, quick recovery was also predominantly accomplished by increases in hours worked. Specifically, during the 1970s economic cri-sis, the motor vehicles sector (CL29) more strongly expanded hours worked than employ-ment once the recession was overcome in 1976. Similarly, after the crisis of the 1980s, the electronics, electrical and optical products sector (CI+CJ) primarily increased hours worked to satisfy growing demand. In contrast, the machinery and equipment sector (CK28) mainly adjusted employment to accommodate growing demand. Finally, after the recession of the 1990s, both the basic metals and fabricated metals sector (CH) and the rubber and plas-tics sector (CG) recovered quickly by predominantly expanding hours worked while the motor vehicles sector (CL29) and the construction sector (F) both resorted to increases in employment to meet growing demand and order volumes. Value-added
The analysis of sectoral value-added growth rates of the EU-15 aggregate points at the following general findings: • Compared to employment and hours worked, value-added growth rates were generally
more volatile and varied more strongly; • On average, losses in value-added were strongest during the crisis of the 1970s; • Sectoral value-added adjustment patterns tend to differ from adjustment patterns in
employment or hours worked; • In the face of all three economic crisis analysed, only the real estate and business ac-
tivities sector (LMN) succeeded in further expanding value-added; all other sectors ex-perienced losses in value-added in one or another crisis;
• Irrespective of crisis considered, the machinery and equipment sector (CK28), the basic metals and fabricated metals sector (CH) and the construction sector (F) were always among the sectors that experienced the strongest losses in value-added;
• The textiles, apparel and footwear sector (CB), which continuously shrank in terms of employment, was not always among the sectors with the starkest losses in value-added;
• During the crisis of the 1980s, the electronics, electrical and optical products sector (CI+CJ) and the chemicals sector (CE) both also maintained rising value-added levels;
• The motor vehicles sector (CL29) reacted most sensitively to the crisis of the 1990s: in the 1993 slump-year value-added plunged by -13% and a year later only, value-added levels soared by remarkable 9%;
Annual reactions of value-added growth rates to different economic crises for the EU-15 aggregate are depicted in Figure 3.4.6 below. It reveals that in comparison to dynamics in employment and hours worked growth rates (Figures 3.4.4 and 3.4.5), value-added growth rates were generally more volatile and varied more strongly. Generally, the variations in value-added growth rates were stronger than those in either employment or hours worked growth rates and strongest during the crisis of the 1970s and the 1990s.
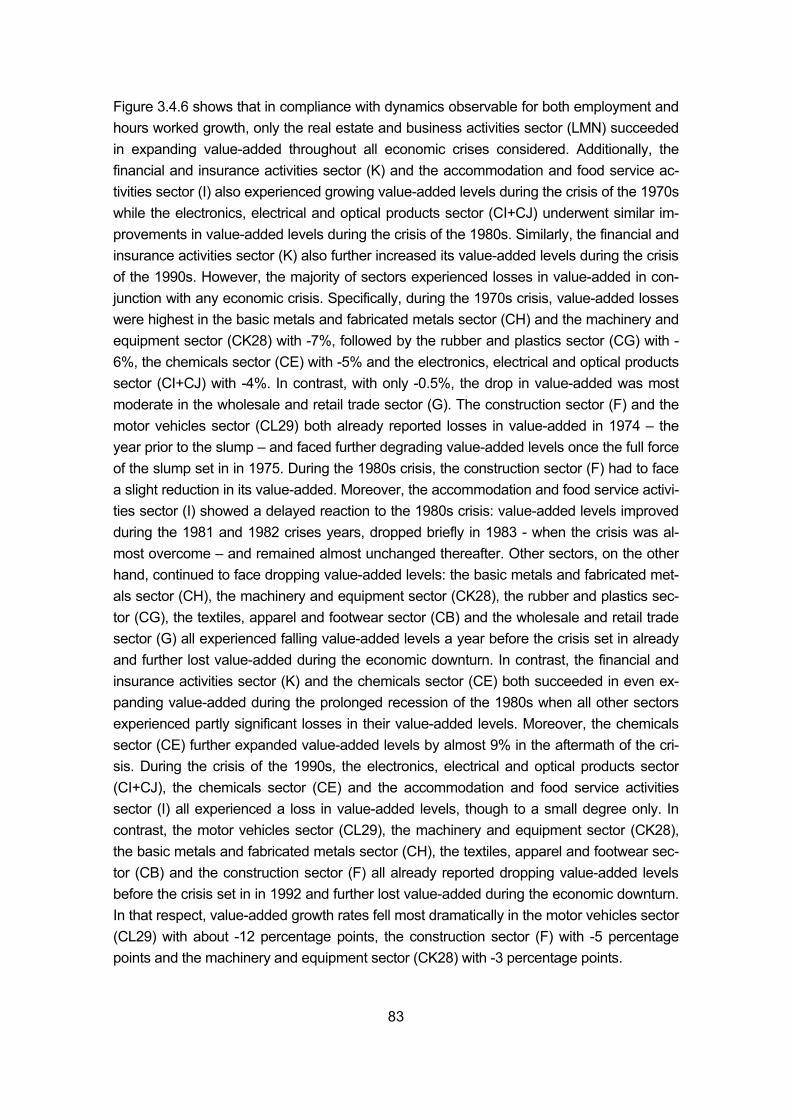
83
Figure 3.4.6 shows that in compliance with dynamics observable for both employment and hours worked growth, only the real estate and business activities sector (LMN) succeeded in expanding value-added throughout all economic crises considered. Additionally, the financial and insurance activities sector (K) and the accommodation and food service ac-tivities sector (I) also experienced growing value-added levels during the crisis of the 1970s while the electronics, electrical and optical products sector (CI+CJ) underwent similar im-provements in value-added levels during the crisis of the 1980s. Similarly, the financial and insurance activities sector (K) also further increased its value-added levels during the crisis of the 1990s. However, the majority of sectors experienced losses in value-added in con-junction with any economic crisis. Specifically, during the 1970s crisis, value-added losses were highest in the basic metals and fabricated metals sector (CH) and the machinery and equipment sector (CK28) with -7%, followed by the rubber and plastics sector (CG) with -6%, the chemicals sector (CE) with -5% and the electronics, electrical and optical products sector (CI+CJ) with -4%. In contrast, with only -0.5%, the drop in value-added was most moderate in the wholesale and retail trade sector (G). The construction sector (F) and the motor vehicles sector (CL29) both already reported losses in value-added in 1974 – the year prior to the slump – and faced further degrading value-added levels once the full force of the slump set in in 1975. During the 1980s crisis, the construction sector (F) had to face a slight reduction in its value-added. Moreover, the accommodation and food service activi-ties sector (I) showed a delayed reaction to the 1980s crisis: value-added levels improved during the 1981 and 1982 crises years, dropped briefly in 1983 - when the crisis was al-most overcome – and remained almost unchanged thereafter. Other sectors, on the other hand, continued to face dropping value-added levels: the basic metals and fabricated met-als sector (CH), the machinery and equipment sector (CK28), the rubber and plastics sec-tor (CG), the textiles, apparel and footwear sector (CB) and the wholesale and retail trade sector (G) all experienced falling value-added levels a year before the crisis set in already and further lost value-added during the economic downturn. In contrast, the financial and insurance activities sector (K) and the chemicals sector (CE) both succeeded in even ex-panding value-added during the prolonged recession of the 1980s when all other sectors experienced partly significant losses in their value-added levels. Moreover, the chemicals sector (CE) further expanded value-added levels by almost 9% in the aftermath of the cri-sis. During the crisis of the 1990s, the electronics, electrical and optical products sector (CI+CJ), the chemicals sector (CE) and the accommodation and food service activities sector (I) all experienced a loss in value-added levels, though to a small degree only. In contrast, the motor vehicles sector (CL29), the machinery and equipment sector (CK28), the basic metals and fabricated metals sector (CH), the textiles, apparel and footwear sec-tor (CB) and the construction sector (F) all already reported dropping value-added levels before the crisis set in in 1992 and further lost value-added during the economic downturn. In that respect, value-added growth rates fell most dramatically in the motor vehicles sector (CL29) with about -12 percentage points, the construction sector (F) with -5 percentage points and the machinery and equipment sector (CK28) with -3 percentage points.
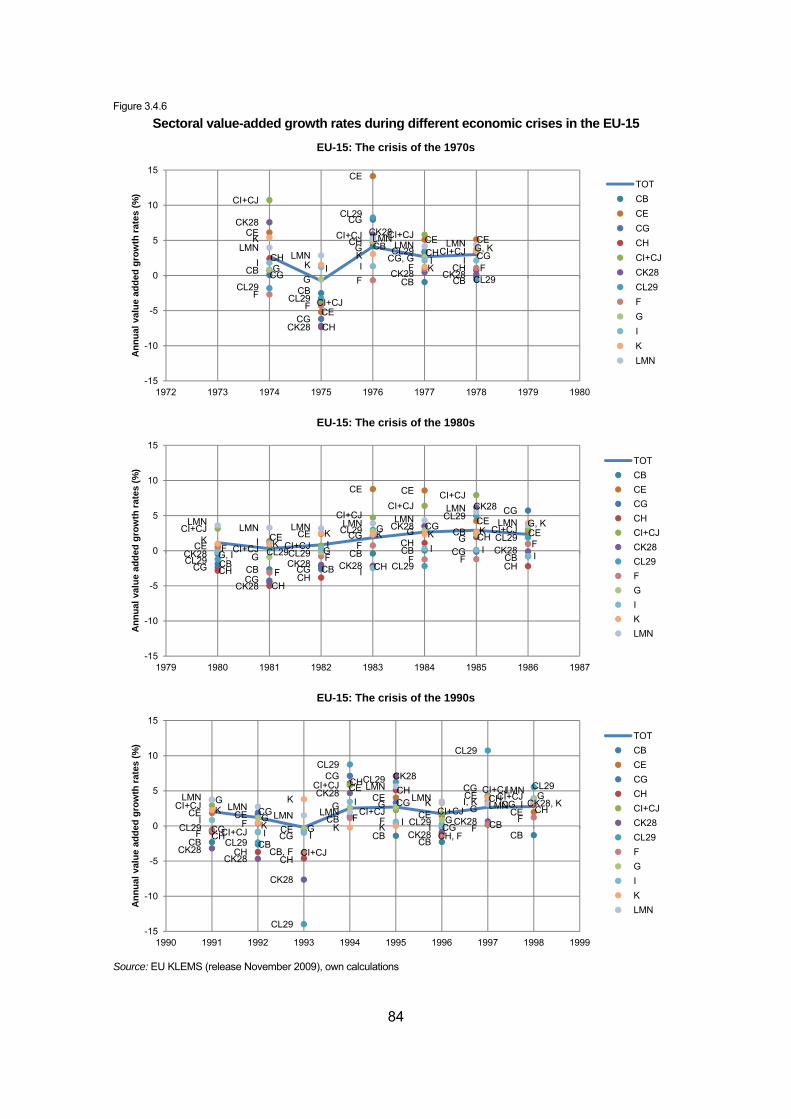
84
Figure 3.4.6
Sectoral value-added growth rates during different economic crises in the EU-15
Source: EU KLEMS (release November 2009), own calculations
CB
CB
CB
CB CB
CE
CE
CE
CE CE
CG
CG
CG
CGCH
CH
CHCH
CH
CI+CJ
CI+CJ
CI+CJ CI+CJ
CI+CJ
CK28
CK28
CK28
CK28 CK28CL29
CL29
CL29
CL29
CL29F
F
FF FG
G
GCG, G
G, KI I I I I
K
KK
K
LMNLMN
LMNLMN LMN
-15
-10
-5
0
5
10
15
1972 1973 1974 1975 1976 1977 1978 1979 1980
Annu
al v
alue
add
ed g
row
th ra
tes
(%)
EU-15: The crisis of the 1970s
TOTCBCECGCHCI+CJCK28CL29FGIKLMN
CB CB CB
CB CB
CB
CBCE
CE CE
CE CE
CECE
CGCG
CG
CGCG
CG
CG
CHCH
CHCH
CH CH
CH
CI+CJ
CI+CJ CI+CJ
CI+CJCI+CJ
CI+CJ
CI+CJ
CK28
CK28
CK28 CK28
CK28
CK28
CK28CL29
CL29CL29
CL29
CL29
CL29
CL29F
FF
FF F
FG, I G
G
G GGI I
I
I II
K KK K K K
G, KLMNLMN LMN LMN LMN
LMNLMN
-15
-10
-5
0
5
10
15
1979 1980 1981 1982 1983 1984 1985 1986 1987
Annu
al v
alue
add
ed g
row
th ra
tes
(%)
EU-15: The crisis of the 1980s
TOTCBCECGCHCI+CJCK28CL29FGIKLMN
CB CB
CB
CB CB
CBCB
CE CECE
CECE
CE
CE
CE
CG
CG
CG
CG
CG
CG
CG
CG, I
CH
CHCH
CHCH
CH, F
CHCHCI+CJ
CI+CJ
CI+CJ
CI+CJ
CI+CJ CI+CJ
CI+CJCI+CJ
CK28CK28
CK28
CK28
CK28
CK28CK28
CK28, K
CL29CL29
CL29
CL29CL29
CL29
CL29
CL29
FF
CB, F
F FF
F
G
GG
G GG
GG
II I
I
I I
I, KK
K
K
K K
KLMNLMN
LMN LMN
LMNLMN
LMNLMN
-15
-10
-5
0
5
10
15
1990 1991 1992 1993 1994 1995 1996 1997 1998 1999
Annu
al v
alue
add
ed g
row
th ra
tes
(%)
EU-15: The crisis of the 1990s
TOTCBCECGCHCI+CJCK28CL29FGIKLMN
85
Furthermore, irrespective of economic crisis considered, recovery in terms of value-added was swift in the machinery and equipment sector (CK28). However, in the aftermath of the 1980s economic crisis, recovery was fastest in the chemicals sector (CE), the motor vehi-cles sector (CL29) and the rubber and plastics sector (CG). Furthermore, the basic metals and fabricated metals sector (CH) and the rubber and plastics sector (CG) both recovered the fastest after the 1980s crisis while the motor vehicles sector (CL29) and the basic met-als and fabricated metals sector (CH) underwent the fastest recovery once the crisis of the 1990s was overcome. Generally, the motor vehicles sector (CL29) reacted most sensitively to the crisis of the 1990s and underwent the most dramatic and impressive recovery: in the 1993 slump-year value-added plunged by 13% and a year later only, value-added levels already soared by remarkable 9%. Labour productivity
The analysis of sectoral labour productivity growth rates of the EU-15 aggregate demon-strates the following: • With the exception of the crisis of the 1970s, total labour productivity remained positive,
despite any ongoing crisis; • Sectoral labour productivity responses were diverse and crisis specific; • During the crisis of the 1980s, sectors with the strongest labour productivity losses were
concentrated in the service sector; • Across all three crisis considered, only the electronics, electrical and optical products
sector (CI+CJ) was consistently among the three sectors with the strongest labour pro-ductivity improvements;
Annual reactions of labour productivity growth rates to economic crises of the 1970s, the 1980s and the 1990s are presented in Table 3.4.1 below for the EU-15 aggregate. It high-lights that both overall as well as sectoral labour productivity responses to different eco-nomic crises partly strongly depend on the exact definition of labour productivity. Specifi-cally, expressed in terms of hours worked, total labour productivity growth remained posi-tive throughout the entire crisis of the 1970s which indicates that the drop in hours worked growth was more pronounced than the drop in value-added growth. In contrast, expressed in terms of employment, labour productivity growth was slightly negative during the 1970s crisis which implies that the decline in hours worked growth was less pronounced than the decline in value-added growth. Hence, as pointed out above, labour hoarding was a com-mon phenomenon. Moreover, labour productivity responses varied strongly across sectors. As such, expressed in terms of hours worked, labour productivity losses were strongest in the motor vehicles sector (CL29) (with -2.06%), the basic metals and fabricated metals sector (CH) (with -1.56%) and the machinery and equipment sector (CK28) (with -1.03%). In contrast, despite the economic crisis, several sectors recorded labour productivity gains: with 2.69%, the highest gains emerged in the electronics, electrical and optical products sector (CI+CJ), followed by the textiles, apparel and footwear sector (CB) with 1.31% and
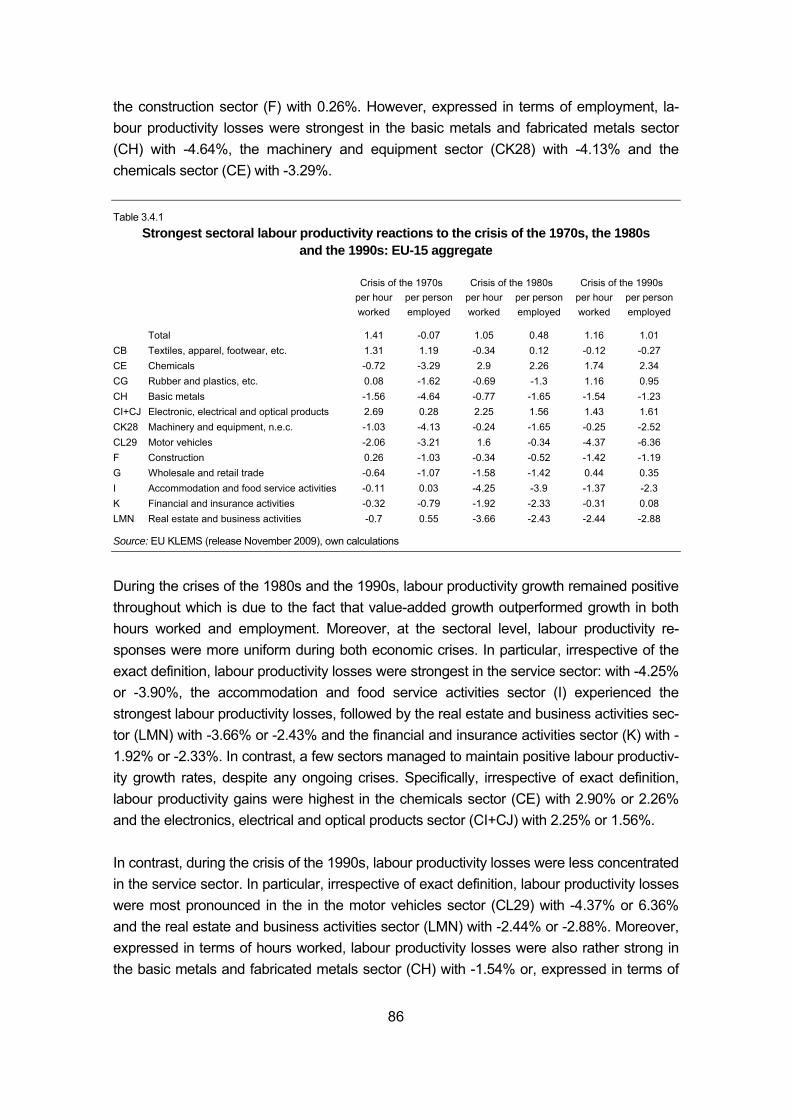
86
the construction sector (F) with 0.26%. However, expressed in terms of employment, la-bour productivity losses were strongest in the basic metals and fabricated metals sector (CH) with -4.64%, the machinery and equipment sector (CK28) with -4.13% and the chemicals sector (CE) with -3.29%. Table 3.4.1
Strongest sectoral labour productivity reactions to the crisis of the 1970s, the 1980s and the 1990s: EU-15 aggregate
Crisis of the 1970s Crisis of the 1980s Crisis of the 1990s per hour worked
per person employed
per hour worked
per person employed
per hour worked
per person employed
Total 1.41 -0.07 1.05 0.48 1.16 1.01 CB Textiles, apparel, footwear, etc. 1.31 1.19 -0.34 0.12 -0.12 -0.27 CE Chemicals -0.72 -3.29 2.9 2.26 1.74 2.34 CG Rubber and plastics, etc. 0.08 -1.62 -0.69 -1.3 1.16 0.95 CH Basic metals -1.56 -4.64 -0.77 -1.65 -1.54 -1.23 CI+CJ Electronic, electrical and optical products 2.69 0.28 2.25 1.56 1.43 1.61 CK28 Machinery and equipment, n.e.c. -1.03 -4.13 -0.24 -1.65 -0.25 -2.52 CL29 Motor vehicles -2.06 -3.21 1.6 -0.34 -4.37 -6.36 F Construction 0.26 -1.03 -0.34 -0.52 -1.42 -1.19 G Wholesale and retail trade -0.64 -1.07 -1.58 -1.42 0.44 0.35 I Accommodation and food service activities -0.11 0.03 -4.25 -3.9 -1.37 -2.3 K Financial and insurance activities -0.32 -0.79 -1.92 -2.33 -0.31 0.08 LMN Real estate and business activities -0.7 0.55 -3.66 -2.43 -2.44 -2.88
Source: EU KLEMS (release November 2009), own calculations
During the crises of the 1980s and the 1990s, labour productivity growth remained positive throughout which is due to the fact that value-added growth outperformed growth in both hours worked and employment. Moreover, at the sectoral level, labour productivity re-sponses were more uniform during both economic crises. In particular, irrespective of the exact definition, labour productivity losses were strongest in the service sector: with -4.25% or -3.90%, the accommodation and food service activities sector (I) experienced the strongest labour productivity losses, followed by the real estate and business activities sec-tor (LMN) with -3.66% or -2.43% and the financial and insurance activities sector (K) with -1.92% or -2.33%. In contrast, a few sectors managed to maintain positive labour productiv-ity growth rates, despite any ongoing crises. Specifically, irrespective of exact definition, labour productivity gains were highest in the chemicals sector (CE) with 2.90% or 2.26% and the electronics, electrical and optical products sector (CI+CJ) with 2.25% or 1.56%. In contrast, during the crisis of the 1990s, labour productivity losses were less concentrated in the service sector. In particular, irrespective of exact definition, labour productivity losses were most pronounced in the in the motor vehicles sector (CL29) with -4.37% or 6.36% and the real estate and business activities sector (LMN) with -2.44% or -2.88%. Moreover, expressed in terms of hours worked, labour productivity losses were also rather strong in the basic metals and fabricated metals sector (CH) with -1.54% or, expressed in terms of
87
employment, in the machinery and equipment sector (CK28) with -2.52%. Furthermore, despite the crisis, some sectors kept positive labour productivity growth rates. Irrespective of exact definition, the chemicals sector (CE) with 1.74% or 2.34%, the electronics, electri-cal and optical products sector (CI+CJ) with 1.43% or 1.61% and the rubber and plastics sector (CG) with 1.16% or 0.95% all reported the highest labour productivity gains. Summary
Generally, the analysis demonstrates that sectoral employment adjustment patterns in the EU-15 aggregate in response to the economic crises of the 1970s, the 1980s or the 1990s were rather diverse. Specifically, with the exception of the textiles, apparel and footwear sector (CB) which continuously shrank throughout the entire observation period, only the machinery and equipment sector (CK28) was consistently among the 5 sectors that cut employment the most in response to any crisis considered. Moreover, only the accommo-dation and food service activities sector (I) and the real estate and business activities sec-tor (LMN) both continued to expand employment throughout all crises. In contrast, all other sectors responded rather individually to economic crises. This suggests that the specific source of economic crises played a pivotal role in shaping sectoral response patterns. In addition to the textiles, apparel and footwear sector (CB) and the machinery and equip-ment sector (CK28), employment reductions were strongest in the rubber and plastics sec-tor (CG), the electronics, electrical and optical products sector (CI+CJ) and the construc-tion sector (F), which all reduced employment by between -5% and -3% in response to the economic crisis of the 1970s. During the crisis of the 1980s, cut-backs in employment were strongest in the motor vehicles sector (CL29), the basic metals and fabricated metals sec-tor (CH) and the rubber and plastics sector (CG) which reduced employment by between -6% and -4% in the 1981-slump year. Finally, the electronics, electrical and optical products sector (CI+CJ), the motor vehicles sector (CL29) underwent the most dramatic losses in employment of around -7% to -8% during the 1990s economic crisis. Moreover, adjustment patterns in hours worked growth strongly resemble adjustment pat-terns in employment. However, the generally stronger adjustments in hours worked em-phasises that crises were predominantly weathered by means of significant reductions in hours worked. This in turn suggests that labour hoarding, aimed at conserving firm-specific knowledge and know-how and at limiting the costs of re-employment and training, was a generally practiced strategy. However, the degree of labour hoarding differed across crises and sectors, depending on the source, strength or length of any recession considered. In contrast to employment or hours worked, value-added responded more strongly to eco-nomic crises. Moreover, sectoral adjustment patterns in value-added tend to differ from adjustment patterns in either employment or hours worked. Specifically, in addition to the machinery and equipment sector (CK28), the basic metals and fabricated metals sector (CH) and the construction sector (F) were the only three sectors which consistently lost
88
value-added throughout all three crises considered. In contrast, only the real estate and business activities sector (LMN) succeeded in further expanding value-added despite any ongoing recession. Finally, light is also shed on labour productivity dynamics, either expressed in terms of hours worked or in terms of employment. The analysis demonstrates that sectoral labour productivity dynamics were crisis-specific. During the crisis of the 1980s, sectors with the strongest labour productivity losses were concentrated in the service sector while during the economic crises of the 1970s and the 1990s both the manufacturing and the service sector hosted sectors with non-negligible labour productivity losses. In contrast, across all crises considered, almost without exception, the manufacturing sector hosted all sectors with the highest labour productivity gains. And only the electronics, electrical and optical products sector (CI+CJ) was always among the three sectors that experienced the strong-est expansion in labour productivity, irrespective of crisis considered. 3.4.4 EU-15 member countries
The analysis now proceeds by discussing sectoral responses to either economic crisis of EU-15 member countries. However, instead of a dynamic approach which would analyse the yearly responses of different variables for each year during each crises and each sec-tor, the ensuing analysis takes a direct and focused approach and concentrates on one particular year only: the year with the strongest adjustments of either employment, hours worked or value-added in each sector per crisis. This provides a more meaningful and rep-resentative picture of direct sectoral responses to crises which remains unblurred by any recovery dynamics.16 Employment
Basically, the analysis of sectoral employment growth rates of all EU-15 member countries finds the following:
• Service sectors (excluding construction (F)) tend to display smaller and more uniform labour adjustments to economic crises;
• Manufacturing sectors (including construction (F)) show much stronger variation in ad-justment rates across sectors which varied the most in the textiles, apparel and footwear sector (CB) and the rubber and plastics sector (CG), irrespective of crisis considered;
• During the crisis of the 1970s, employment growth rates varied the most in the machin-ery and equipment sector (CK28), the rubber and plastics sector (CG), the electronics, electrical and optical products sector (CI+CJ) and the motor vehicles sector (CL29);
16 A similar analysis for the EU-12 member states is not provided as these countries faced a very different development in
the 1990s which was characterized by phase of job-less growth due to strong productivity increases. In the more recent years before the crisis positive employment growth could be observed however. As this section focuses on the cyclical sensitivity of particular sectors we could not include these countries.
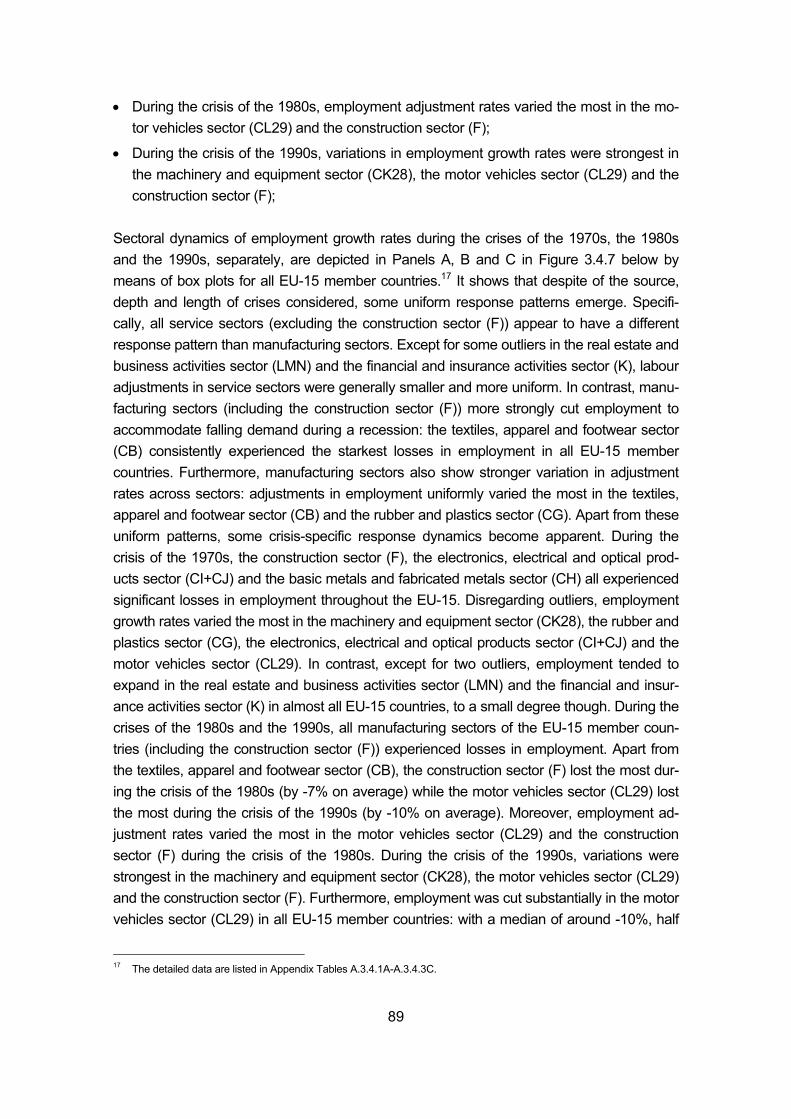
89
• During the crisis of the 1980s, employment adjustment rates varied the most in the mo-tor vehicles sector (CL29) and the construction sector (F);
• During the crisis of the 1990s, variations in employment growth rates were strongest in the machinery and equipment sector (CK28), the motor vehicles sector (CL29) and the construction sector (F);
Sectoral dynamics of employment growth rates during the crises of the 1970s, the 1980s and the 1990s, separately, are depicted in Panels A, B and C in Figure 3.4.7 below by means of box plots for all EU-15 member countries.17 It shows that despite of the source, depth and length of crises considered, some uniform response patterns emerge. Specifi-cally, all service sectors (excluding the construction sector (F)) appear to have a different response pattern than manufacturing sectors. Except for some outliers in the real estate and business activities sector (LMN) and the financial and insurance activities sector (K), labour adjustments in service sectors were generally smaller and more uniform. In contrast, manu-facturing sectors (including the construction sector (F)) more strongly cut employment to accommodate falling demand during a recession: the textiles, apparel and footwear sector (CB) consistently experienced the starkest losses in employment in all EU-15 member countries. Furthermore, manufacturing sectors also show stronger variation in adjustment rates across sectors: adjustments in employment uniformly varied the most in the textiles, apparel and footwear sector (CB) and the rubber and plastics sector (CG). Apart from these uniform patterns, some crisis-specific response dynamics become apparent. During the crisis of the 1970s, the construction sector (F), the electronics, electrical and optical prod-ucts sector (CI+CJ) and the basic metals and fabricated metals sector (CH) all experienced significant losses in employment throughout the EU-15. Disregarding outliers, employment growth rates varied the most in the machinery and equipment sector (CK28), the rubber and plastics sector (CG), the electronics, electrical and optical products sector (CI+CJ) and the motor vehicles sector (CL29). In contrast, except for two outliers, employment tended to expand in the real estate and business activities sector (LMN) and the financial and insur-ance activities sector (K) in almost all EU-15 countries, to a small degree though. During the crises of the 1980s and the 1990s, all manufacturing sectors of the EU-15 member coun-tries (including the construction sector (F)) experienced losses in employment. Apart from the textiles, apparel and footwear sector (CB), the construction sector (F) lost the most dur-ing the crisis of the 1980s (by -7% on average) while the motor vehicles sector (CL29) lost the most during the crisis of the 1990s (by -10% on average). Moreover, employment ad-justment rates varied the most in the motor vehicles sector (CL29) and the construction sector (F) during the crisis of the 1980s. During the crisis of the 1990s, variations were strongest in the machinery and equipment sector (CK28), the motor vehicles sector (CL29) and the construction sector (F). Furthermore, employment was cut substantially in the motor vehicles sector (CL29) in all EU-15 member countries: with a median of around -10%, half
17 The detailed data are listed in Appendix Tables A.3.4.1A-A.3.4.3C.
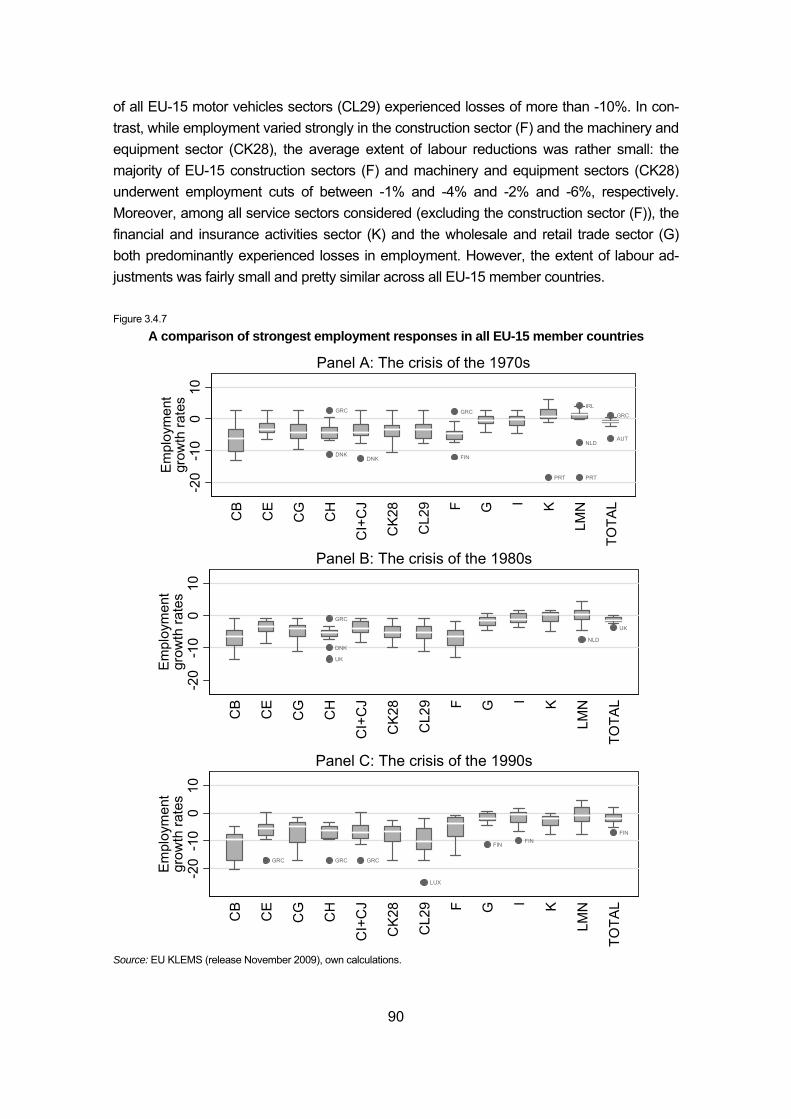
90
of all EU-15 motor vehicles sectors (CL29) experienced losses of more than -10%. In con-trast, while employment varied strongly in the construction sector (F) and the machinery and equipment sector (CK28), the average extent of labour reductions was rather small: the majority of EU-15 construction sectors (F) and machinery and equipment sectors (CK28) underwent employment cuts of between -1% and -4% and -2% and -6%, respectively. Moreover, among all service sectors considered (excluding the construction sector (F)), the financial and insurance activities sector (K) and the wholesale and retail trade sector (G) both predominantly experienced losses in employment. However, the extent of labour ad-justments was fairly small and pretty similar across all EU-15 member countries. Figure 3.4.7
A comparison of strongest employment responses in all EU-15 member countries
Source: EU KLEMS (release November 2009), own calculations.
DNK
GRC
DNK FIN
GRC
PRT PRT
NLD
IRL
AUT
GRC
-20
-10
010
Em
ploy
men
tgr
owth
rate
s
CB
CE
CG
CH
CI+
CJ
CK
28
CL2
9 F G I K
LMN
TOTA
L
Panel A: The crisis of the 1970s
UK
DNK
GRC
NLD
UK
-20
-10
010
Em
ploy
men
tgr
owth
rate
s
CB
CE
CG
CH
CI+
CJ
CK2
8
CL2
9 F G I K
LMN
TOTA
L
Panel B: The crisis of the 1980s
GRC GRC GRC
LUX
FINFIN
FIN
-20
-10
010
Em
ploy
men
tgr
owth
rate
s
CB
CE
CG
CH
CI+
CJ
CK
28
CL2
9 F G I K
LMN
TOTA
L
Panel C: The crisis of the 1990s
91
Hours worked
Basically, the analysis of sectoral hours worked growth rates of all EU-15 member coun-tries points at the following:
• Adjustment patterns in hours worked strongly resemble adjustment patterns in employ-ment in terms of direction, were, however, generally more diverse and varied more strongly;
• Adjustment patterns in service sectors (excluding construction (F)) tend to be more uni-form;
Figure 3.4.8
A comparison of strongest hours worked responses in all EU-15 member countries
Source: EU KLEMS (release November 2009), own calculations.
DNK
GRC
PRT PRT
NLD
-20
-10
010
Hou
rs w
orke
dgr
owth
rate
s
CB
CE
CG
CH
CI+
CJ
CK
28
CL2
9 F G I K
LMN
TOTA
L
Panel A: The crisis of the 1970s
UK
ITA
-20
-10
010
Hou
rs w
orke
dgr
owth
rate
s
CB
CE
CG
CH
CI+
CJ
CK
28
CL2
9 F G I K
LMN
TOTA
L
Panel B: The crisis of the 1980s
GRC GRCFIN
FINFIN FIN
FIN
LUX
-20
-10
010
Hou
rs w
orke
dgr
owth
rate
s
CB
CE
CG
CH
CI+
CJ
CK
28
CL2
9 F G I K
LMN
TOTA
L
Panel C: The crisis of the 1990s
92
Panels A, B and C of Figure 3.4.8 show sectoral dynamics of hours worked growth rates during the crises of the 1970s, the 1980s and the 1990s, separately, for all EU-15 member countries together. Apparently, changes in hours worked strongly correspond to adjust-ments of employment in terms of direction but display stronger overall variation. During the crisis of the 1970s, almost all manufacturing sectors (including construction (F)) in the EU-15 member states cut hours worked, partly substantially, while service sectors of the EU-15 – particularly the real estate and business activities sector (LMN) and the financial and insurance activities sector (K) – managed to expand hours worked. Moreover, without exception, all EU-15 manufacturing sectors (including construction (F)) cut hours worked during both the recession of the 1980s and the 1990s. Hours worked were also consistently cut in the financial and insurance activities sector (K) in response to the recession of the 1990s. The construction sector (F) was an interesting case during the economic crisis of the 1990s: while all EU-15 member countries consistently cut employment in the construction sector (F), some still managed to increase hours worked. This is indicative of a substitution effect such that some EU-15 member countries compensated a loss in total employment with an increase in hours worked by shifting the additional workload to fewer employees. However, throughout the EU-15, hours worked growth rates were generally more diverse and varied more strongly than growth rates of employment. This is particularly true for the chemicals sector (CE), the rubber and plastics sector (CG), the electronics, electrical and optical products sector (CI+CJ), the motor vehicles sector (CL29) and the machinery and equipment sector (CK28) during the crisis of the 1970s. However, it was less so during the crises of the 1980s and the 1990s. Only the construction sector (F) shows significantly stronger variation in hours worked than in employment during the crisis of the 1980s while hours worked growth rates were more diverse in the textiles, apparel and footwear sector (CB), the electronics, electrical and optical products sector (CI+CJ) and the motor vehicles sector (CL29) during the crisis of the 1990s. Value-added
Basically, the analysis of sectoral value-added growth rates of all EU-15 member countries reveals the following:
• Variations in value-added growth rates were stronger than variations in either employ-ment or hours worked growth rates;
• Throughout all crises considered, value-added growth rates varied the most in the mo-tor vehicles sector (CL29);
• Disregarding Luxembourg, value-added responses to the crisis of the 1970s were most uniform in the basic metals and fabricated metals sector (CH) and most diverse in the chemicals sector (CE);
• During the recession of the 1980s, among all manufacturing sectors considered (includ-ing construction (F)), value-added varied the most in the motor vehicles sector (CL29)
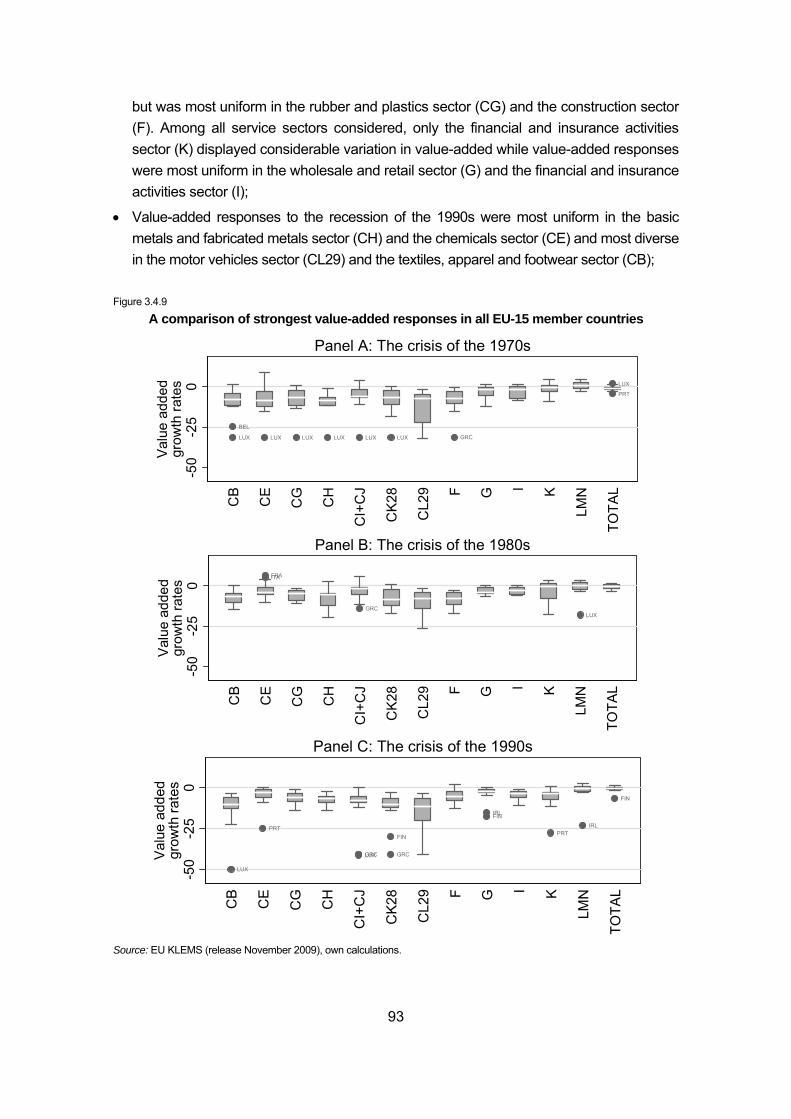
93
but was most uniform in the rubber and plastics sector (CG) and the construction sector (F). Among all service sectors considered, only the financial and insurance activities sector (K) displayed considerable variation in value-added while value-added responses were most uniform in the wholesale and retail sector (G) and the financial and insurance activities sector (I);
• Value-added responses to the recession of the 1990s were most uniform in the basic metals and fabricated metals sector (CH) and the chemicals sector (CE) and most diverse in the motor vehicles sector (CL29) and the textiles, apparel and footwear sector (CB);
Figure 3.4.9
A comparison of strongest value-added responses in all EU-15 member countries
Source: EU KLEMS (release November 2009), own calculations.
LUX
BEL
LUX LUX LUX LUX LUX GRC
PRT
LUX
-50
-25
0
Val
ue a
dded
grow
th ra
tes
CB
CE
CG
CH
CI+
CJ
CK
28
CL2
9 F G I K
LMN
TOTA
L
Panel A: The crisis of the 1970s
ITAFRA
GRCLUX
-50
-25
0
Val
ue a
dded
grow
th ra
tes
CB
CE
CG
CH
CI+
CJ
CK
28
CL2
9 F G I K
LMN
TOTA
L
Panel B: The crisis of the 1980s
LUX
PRT
LUXGRC GRC
FIN
FINIRL
PRTIRL
FIN
-50
-25
0
Val
ue a
dded
grow
th ra
tes
CB
CE
CG
CH
CI+
CJ
CK
28
CL2
9 F G I K
LMN
TOTA
L
Panel C: The crisis of the 1990s
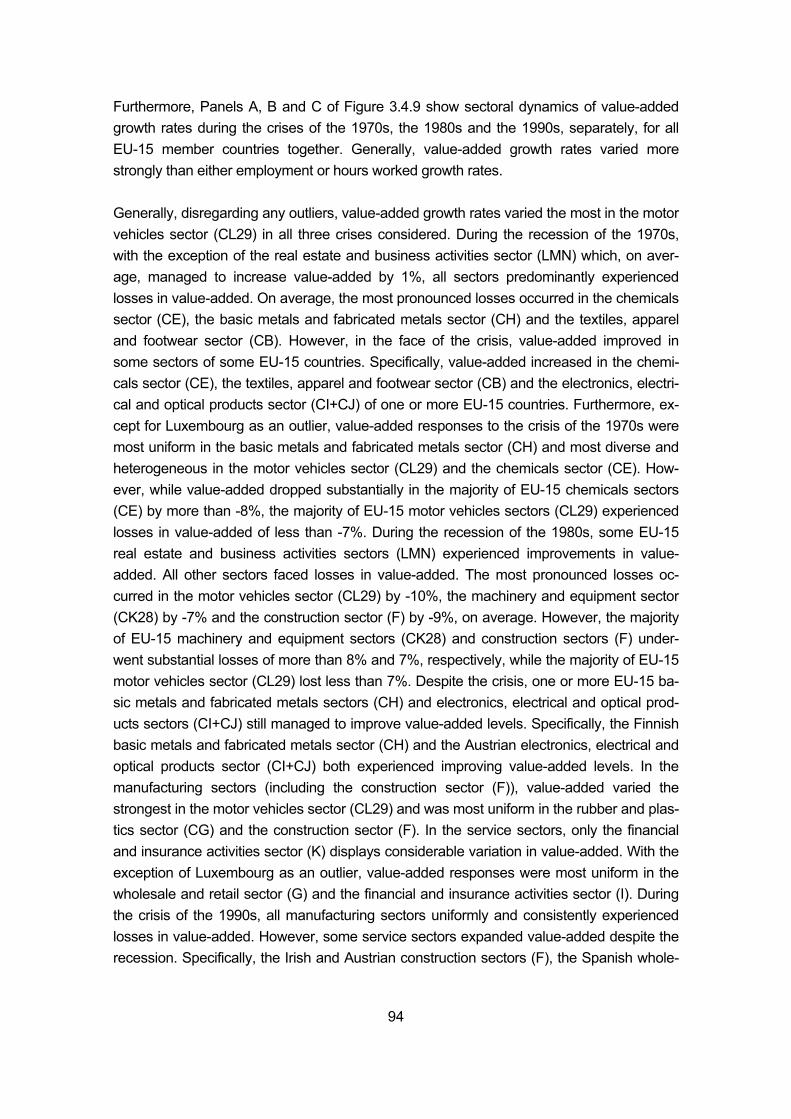
94
Furthermore, Panels A, B and C of Figure 3.4.9 show sectoral dynamics of value-added growth rates during the crises of the 1970s, the 1980s and the 1990s, separately, for all EU-15 member countries together. Generally, value-added growth rates varied more strongly than either employment or hours worked growth rates. Generally, disregarding any outliers, value-added growth rates varied the most in the motor vehicles sector (CL29) in all three crises considered. During the recession of the 1970s, with the exception of the real estate and business activities sector (LMN) which, on aver-age, managed to increase value-added by 1%, all sectors predominantly experienced losses in value-added. On average, the most pronounced losses occurred in the chemicals sector (CE), the basic metals and fabricated metals sector (CH) and the textiles, apparel and footwear sector (CB). However, in the face of the crisis, value-added improved in some sectors of some EU-15 countries. Specifically, value-added increased in the chemi-cals sector (CE), the textiles, apparel and footwear sector (CB) and the electronics, electri-cal and optical products sector (CI+CJ) of one or more EU-15 countries. Furthermore, ex-cept for Luxembourg as an outlier, value-added responses to the crisis of the 1970s were most uniform in the basic metals and fabricated metals sector (CH) and most diverse and heterogeneous in the motor vehicles sector (CL29) and the chemicals sector (CE). How-ever, while value-added dropped substantially in the majority of EU-15 chemicals sectors (CE) by more than -8%, the majority of EU-15 motor vehicles sectors (CL29) experienced losses in value-added of less than -7%. During the recession of the 1980s, some EU-15 real estate and business activities sectors (LMN) experienced improvements in value-added. All other sectors faced losses in value-added. The most pronounced losses oc-curred in the motor vehicles sector (CL29) by -10%, the machinery and equipment sector (CK28) by -7% and the construction sector (F) by -9%, on average. However, the majority of EU-15 machinery and equipment sectors (CK28) and construction sectors (F) under-went substantial losses of more than 8% and 7%, respectively, while the majority of EU-15 motor vehicles sector (CL29) lost less than 7%. Despite the crisis, one or more EU-15 ba-sic metals and fabricated metals sectors (CH) and electronics, electrical and optical prod-ucts sectors (CI+CJ) still managed to improve value-added levels. Specifically, the Finnish basic metals and fabricated metals sector (CH) and the Austrian electronics, electrical and optical products sector (CI+CJ) both experienced improving value-added levels. In the manufacturing sectors (including the construction sector (F)), value-added varied the strongest in the motor vehicles sector (CL29) and was most uniform in the rubber and plas-tics sector (CG) and the construction sector (F). In the service sectors, only the financial and insurance activities sector (K) displays considerable variation in value-added. With the exception of Luxembourg as an outlier, value-added responses were most uniform in the wholesale and retail sector (G) and the financial and insurance activities sector (I). During the crisis of the 1990s, all manufacturing sectors uniformly and consistently experienced losses in value-added. However, some service sectors expanded value-added despite the recession. Specifically, the Irish and Austrian construction sectors (F), the Spanish whole-
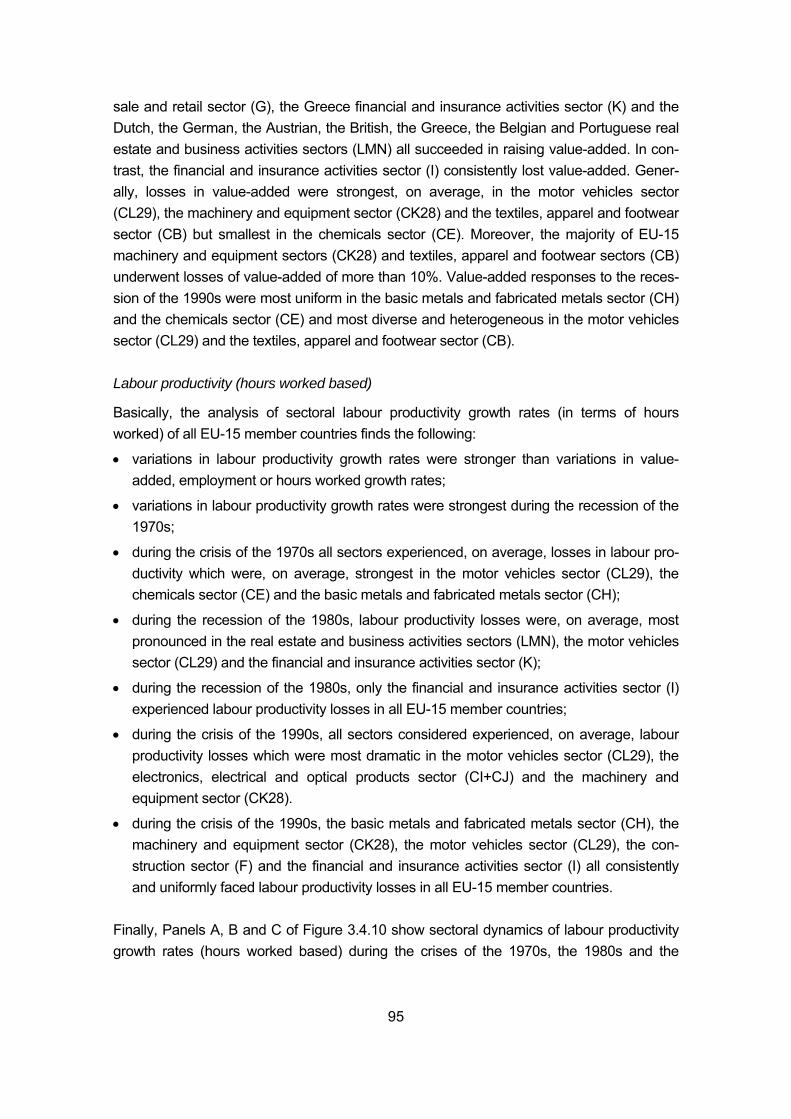
95
sale and retail sector (G), the Greece financial and insurance activities sector (K) and the Dutch, the German, the Austrian, the British, the Greece, the Belgian and Portuguese real estate and business activities sectors (LMN) all succeeded in raising value-added. In con-trast, the financial and insurance activities sector (I) consistently lost value-added. Gener-ally, losses in value-added were strongest, on average, in the motor vehicles sector (CL29), the machinery and equipment sector (CK28) and the textiles, apparel and footwear sector (CB) but smallest in the chemicals sector (CE). Moreover, the majority of EU-15 machinery and equipment sectors (CK28) and textiles, apparel and footwear sectors (CB) underwent losses of value-added of more than 10%. Value-added responses to the reces-sion of the 1990s were most uniform in the basic metals and fabricated metals sector (CH) and the chemicals sector (CE) and most diverse and heterogeneous in the motor vehicles sector (CL29) and the textiles, apparel and footwear sector (CB). Labour productivity (hours worked based)
Basically, the analysis of sectoral labour productivity growth rates (in terms of hours worked) of all EU-15 member countries finds the following:
• variations in labour productivity growth rates were stronger than variations in value-added, employment or hours worked growth rates;
• variations in labour productivity growth rates were strongest during the recession of the 1970s;
• during the crisis of the 1970s all sectors experienced, on average, losses in labour pro-ductivity which were, on average, strongest in the motor vehicles sector (CL29), the chemicals sector (CE) and the basic metals and fabricated metals sector (CH);
• during the recession of the 1980s, labour productivity losses were, on average, most pronounced in the real estate and business activities sectors (LMN), the motor vehicles sector (CL29) and the financial and insurance activities sector (K);
• during the recession of the 1980s, only the financial and insurance activities sector (I) experienced labour productivity losses in all EU-15 member countries;
• during the crisis of the 1990s, all sectors considered experienced, on average, labour productivity losses which were most dramatic in the motor vehicles sector (CL29), the electronics, electrical and optical products sector (CI+CJ) and the machinery and equipment sector (CK28).
• during the crisis of the 1990s, the basic metals and fabricated metals sector (CH), the machinery and equipment sector (CK28), the motor vehicles sector (CL29), the con-struction sector (F) and the financial and insurance activities sector (I) all consistently and uniformly faced labour productivity losses in all EU-15 member countries.
Finally, Panels A, B and C of Figure 3.4.10 show sectoral dynamics of labour productivity growth rates (hours worked based) during the crises of the 1970s, the 1980s and the
96
1990s, separately, for all EU-15 member countries together. Generally, labour productivity growth rates varied more strongly than either value-added, employment or hours worked growth rates. Ignoring any outliers, labour productivity growth rates varied the most in response to the crisis of the 1970s. Furthermore, at the sectoral level, variations in labour productivity growth rates were crisis specific. During the crisis of the 1970s, while, on average, all sec-tors experienced losses in labour productivity, none of the sectors under consideration faced losses in labour productivity in all EU-15 countries alike. Quite the contrary, at least one sector in one EU-15 member country always maintained positive sectoral labour pro-ductivity growth rates. Generally, labour productivity losses were, on average, strongest in the motor vehicles sector (CL29) with -9%, the chemicals sector (CE) with -7% and the basic metals and fabricated metals sector (CH) with -6%. Furthermore, except for Greece, Luxembourg, Portugal and Sweden as outliers, labour productivity responses to the crisis of the 1970s were most uniform in the electronics, electrical and optical products sector (CI+CJ), the wholesale and retail sector (G) and the real estate and business activities sectors (LMN) and most heterogeneous in the chemicals sector (CE), the textiles, apparel and footwear sector (CB) and the motor vehicles sector (CL29). During the recession of the 1980s, labour productivity losses were, on average, most pronounced in the real estate and business activities sectors (LMN) with -9%, the motor vehicles sector (CL29) with -8% and the financial and insurance activities sector (K) with -7%. Furthermore, only the finan-cial and insurance activities sector (I) underwent labour productivity losses in all EU-15 member countries while the remaining sectors still experienced labour productivity im-provements in one or the other EU-15 member country. In that respect, individual labour productivity gains were highest in the chemicals sector (CE): with around 8%, the French chemicals sector experienced the highest labour productivity gains, followed by the Italian chemicals sector with around 7% and the Belgium chemicals sector with around 6%. Dis-regarding any outliers, labour productivity responses to the recession were most uniform in the rubber and plastics sector (CG), the textiles, apparel and footwear sector (CB) and the electronics, electrical and optical products sector (CI+CJ) and most heterogeneous in the motor vehicles sector (CL29), ranging between 1.7% in the British motor vehicles sector and -30% in the Danish motor vehicles sector. Finally, during the crisis of the 1990s, with-out exception, all sectors considered experienced, on average, labour productivity losses. With on average -12%, these losses were most dramatic in the motor vehicles sector (CL29), followed by the electronics, electrical and optical products sector (CI+CJ) with -9% on average and the machinery and equipment sector (CK28) with -8% on average. More-over, several sectors did not undergo any productivity gains at all, in none of the EU-15 member countries: the basic metals and fabricated metals sector (CH), the machinery and equipment sector (CK28), the motor vehicles sector (CL29), the construction sector (F) and the financial and insurance activities sector (I) all consistently and uniformly faced labour productivity losses in the wake of the crisis. In contrast, despite the crisis, some sectors still
97
managed to maintain positive labour productivity growth rates. With around 2%, labour productivity gains were highest in the French rubber and plastics sector (CG) and the Aus-trian electronics, electrical and optical products sector (CI+CJ). Labour productivity (employment based)
Basically, the analysis of sectoral labour productivity growth rates (in terms of employment) of all EU-15 member countries reveals the following:
• on average, variations in labour productivity growth rates (based on employment) were stronger than variations in value-added, employment or hours worked growth rates as well as variations in labour productivity growth rates (based on hours worked);
• labour productivity varied the most during the recession of the 1970s and the least dur-ing the recession of the 1990s;
• on average, during all three crisis considered, all sectors underwent losses in labour productivity;
• during the recession of the 1970s, the motor vehicles sector (CL29), the basic metals and fabricated metals sector (CH) and the chemicals sector (CE) underwent the most pronounced labour productivity losses;
• labour productivity responses were most uniform in the construction sector (F) and the electronics, electrical and optical products sector (CI+CJ) and most heterogeneous in the chemicals sector (CE), the motor vehicles sector (CL29) and the textiles, apparel and footwear sector (CB);
• on average, during the recession of the 1980s, the motor vehicles sector (CL29), the real estate and business activities sectors (LMN) and the financial and insurance activi-ties sector (K) all faced the most dramatic losses in labour productivity;
• the financial and insurance activities sector (I) and the real estate and business activi-ties sectors (LMN) were the only two sectors which consistently and uniformly experi-enced labour productivity losses in all EU-15 member countries;
• during the recession of the 1980s, crisis-driven labour productivity responses were most uniform in the rubber and plastics sector (CG) and the electronics, electrical and optical products sector (CI+CJ) and most diverse in the motor vehicles sector (CL29);
• during the recession of the 1990s, average productivity losses were strongest in the motor vehicles sector (CL29), the electronics, electrical and optical products sector (CI+CJ) and the machinery and equipment sector (CK28);
• disregarding any outliers, labour productivity responses were most uniform in the wholesale and retail sector (G), the construction sector (F), the financial and insurance activities sector (I) and the textiles, apparel and footwear sector (CB) and most hetero-geneous in the machinery and equipment sector (CK28).
98
Finally, for the sake of completeness, Panels A, B and C of Figure 3.4.11 show sectoral responses of labour productivity growth (employment based) during the crises of the 1970s, the 1980s and the 1990s, separately, for all EU-15 member countries together. Generally, labour productivity growth rates varied more strongly than either value-added, employment or hours worked growth rates but less intensely than labour productivity based on hours worked. All in all, pretty similar patterns emerge. Again, labour productivity varied the most during the recession of the 1970s and the least during the recession of the 1990s. During the cri-sis of the 1970s, all sectors underwent losses in labour productivity, on average, with the motor vehicles sector (CL29) with -10%, the basic metals and fabricated metals sector (CH) with -8% and the chemicals sector (CE) with -7% experiencing the most pronounced losses, on average. Disregarding any outliers (France, Greece, Luxembourg and Portugal), labour productivity responses were most uniform in the construction sector (F) and the electronics, electrical and optical products sector (CI+CJ) and most heterogeneous in the chemicals sector (CE), the motor vehicles sector (CL29) and the textiles, apparel and foot-wear sector (CB). During the recession of the 1980s, with -8% each, the motor vehicles sector (CL29) and the real estate and business activities sectors (LMN) both faced the most dramatic losses in labour productivity, followed by the financial and insurance activi-ties sector (K) with -7%. Furthermore, the financial and insurance activities sector (I) and the real estate and business activities sectors (LMN) were the only two sectors that consis-tently and uniformly experienced losses in labour productivity in all EU-15 member coun-tries. Disregarding any outliers, crisis-driven labour productivity responses were most uni-form in the rubber and plastics sector (CG) and the electronics, electrical and optical prod-ucts sector (CI+CJ) and most diverse in the motor vehicles sector (CL29), which ranged between -33% in the Danish case and around 1% in the Italian case. Moreover, the highest labour productivity gains across all sectors occurred in the French chemicals sector (CE) whose labour productivity growth remained as high as 9%, despite the crisis. Finally, dur-ing the recession of the 1990s, all sectors again underwent losses in labour productivity, on average. With -12% and -9% each, the motor vehicles sector (CL29), the electronics, elec-trical and optical products sector (CI+CJ) and the machinery and equipment sector (CK28), respectively, underwent the strongest losses in labour productivity, across all sectors con-sidered. Moreover, a few sectors did not experience any productivity gains at all, in none of the EU-15 countries: the motor vehicles sector (CL29), the construction sector (F), the fi-nancial and insurance activities sector (I) and the real estate and business activities sec-tors (LMN) all consistently faced labour productivity losses. However, some sectors still managed to maintain labour productivity gains which were most pronounced in the Aus-trian electronics, electrical and optical products sector (CI+CJ) and the Swedish wholesale and retail sector (G). Disregarding any outliers, labour productivity responses were most uniform in the wholesale and retail sector (G), the construction sector (F), the financial and insurance activities sector (I) and the textiles, apparel and footwear sector (CB) and most
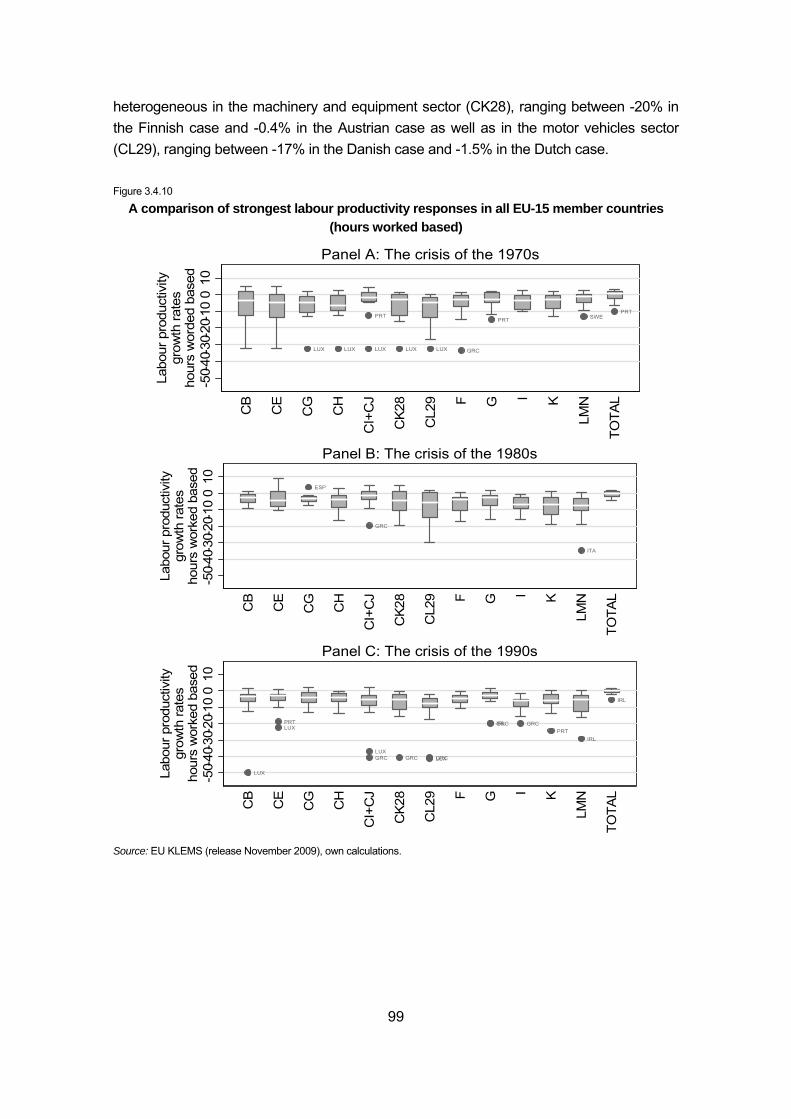
99
heterogeneous in the machinery and equipment sector (CK28), ranging between -20% in the Finnish case and -0.4% in the Austrian case as well as in the motor vehicles sector (CL29), ranging between -17% in the Danish case and -1.5% in the Dutch case. Figure 3.4.10
A comparison of strongest labour productivity responses in all EU-15 member countries (hours worked based)
Source: EU KLEMS (release November 2009), own calculations.
LUX LUX LUX
PRT
LUX LUX GRC
PRT SWEPRT
-50-
40-3
0-20
-10
010
Labo
ur p
rodu
ctiv
itygr
owth
rate
sho
urs
wor
ded
base
d
CB
CE
CG
CH
CI+
CJ
CK2
8
CL2
9 F G I K
LMN
TOTA
L
Panel A: The crisis of the 1970s
ESP
GRC
ITA
-50-
40-3
0-20
-10
010
Labo
ur p
rodu
ctiv
itygr
owth
rate
sho
urs
wor
ked
base
d
CB
CE
CG CH
CI+
CJ
CK2
8
CL2
9 F G I K
LMN
TOTA
L
Panel B: The crisis of the 1980s
LUX
LUXPRT
GRCLUX
GRC LUXGRC
GRCIRL GRCPRT
IRL
IRL
-50-
40-3
0-20
-10
010
Labo
ur p
rodu
ctiv
itygr
owth
rate
sho
urs
wor
ked
base
d
CB
CE
CG CH
CI+
CJ
CK2
8
CL2
9 F G I K
LMN
TOTA
L
Panel C: The crisis of the 1990s

100
Figure 3.4.11
A comparison of strongest labour productivity responses in all EU-15 member countries (employment based)
Source: EU KLEMS (release November 2009), own calculations.
Summary
A closer look at the group of individual EU-15 member countries highlights that sectoral employment adjustment patterns in response to economic crises tend to vary partly greatly across EU-15 member countries. Specifically, irrespective of crisis considered, adjust-ments in employment varied the most in the textiles, apparel and footwear sector (CB) and
LUX LUX LUX
PRT
FRA
LUXGRC
PRT PRT SWEPRT
-50-
40-3
0-20
-10
010
Labo
ur p
rodu
ctiv
itygr
owth
rate
sem
ploy
men
t bas
ed
CB
CE
CG CH
CI+
CJ
CK2
8
CL2
9 F G I K
LMN
TOTA
L
Panel A: The crisis of the 1970s
IRL
ESP
GRC
PRT
LUX
LUXGRCUK
-50-
40-3
0-20
-10
010
Labo
ur p
rodu
ctiv
itygr
owth
rate
sem
ploy
men
t bas
ed
CB
CE
CG CH
CI+
CJ
CK2
8
CL2
9 F G I K
LMN
TOTA
L
Panel B: The crisis of the 1980s
LUX
FIN
LUXPRT
GRCLUX
GRC LUXGRC
GRCIRL
GRCPRT
IRL
GRC
-50-
40-3
0-20
-10
010
Labo
ur p
rodu
ctiv
itygr
owth
rate
sem
ploy
men
t bas
ed
CB
CE
CG CH
CI+
CJ
CK2
8
CL2
9 F G I K
LMN
TOTA
LPanel C: The crisis of the 1990s
101
the rubber and plastics sector (CG) but were most uniform in all service sectors (excluding construction (F)), particularly the wholesale and retail trade sector (G). In addition, crisis-specific patterns emerged and during the crisis of the 1970s, the strongest variations in employment growth rates occurred in the machinery and equipment sector (CK28), the rubber and plastics sector (CG), the electronics, electrical and optical products sector (CI+CJ) and the motor vehicles sector (CL29). During the crisis of the 1980s, employment adjustment rates varied the most in the motor vehicles sector (CL29) and the construction sector (F) while during the crisis of the 1990s, variations in employment growth rates were strongest in the machinery and equipment sector (CK28), the motor vehicles sector (CL29) and the construction sector (F). Additionally, while adjustments in hours worked strongly resemble adjustments in employ-ment in terms of direction, these were generally more diverse and varied more strongly. Again, service sectors (excluding construction (F)) exhibited more uniform adjustment pat-terns in terms of hours worked than manufacturing sectors. Moreover, variations in hours worked were strongly crisis-specific. Specifically, during the crisis of the 1970s, the textiles, apparel and footwear sector (CB), which shrinks throughout Europe, and the machinery and equipment sector (CK28) both exhibited the strongest variations in hours worked ad-justments. In contrast, during the crisis of the 1980s, the rubber and plastics sector (CG) and the construction sector (F) both showed the starkest variations in hours worked while during the crisis of the 1990s, hours worked varied the most in the textiles, apparel and footwear sector (CB) and the motor vehicles sector (CL29). Moreover, among all EU-15 member countries, variations in sectoral value-added growth rates were generally stronger than variations in either employment or hours worked growth rates. Again, with the exception of the motor vehicles sector (CL29) whose value-added growth rates varied the most during all crises considered, value-added responses were crisis-specific. Specifically, in addition to the motor vehicles sector (CL29), value-added responses were most diverse in the chemicals sector (CE) during the crisis of the 1970s. During the recession of the 1980s, value-added varied the most in the machinery and equipment sector (CK28) and the financial and insurance activities sector (K). Finally, value-added responses to the recession of the 1990s were most diverse in the textiles, apparel and footwear sector (CB). Finally, variations in labour productivity (both in terms of hours worked and employment) were diverse and rather crisis specific. In particular, with the exception of the motor vehi-cles sector (CL29) whose average labour productivity losses were always among the most pronounced ones and whose crisis-related labour productivity responses varied the most, response patterns differed across crises. During the recession of the 1970s, labour produc-tivity losses were strongest in the motor vehicles sector (CL29), the basic metals and fabri-cated metals sector (CH) and the chemicals sector (CE), during the recession of the
102
1980s, these losses were most pronounced in the motor vehicles sector (CL29), the finan-cial and insurance activities sector (K) and the real estate and business activities sectors (LMN). Finally, the electronics, electrical and optical products sector (CI+CJ), the motor vehicles sector (CL29) and the machinery and equipment sector (CK28) underwent the strongest losses during the recession of the 1990s. 3.4.5 The USA
Employment
Basically, the analysis of US sectoral employment growth rates highlights the following:
• the machinery and equipment sector (CK28) was always among the sectors which cut employment the most during any crisis considered;
• the textiles, apparel and footwear sector (CB) exhibits a general downward trend, con-tinuously cutting employment;
• none of the service sectors managed to weather all crises without cutting employment;
• during the crises of the 1980s and the dot-com crisis, some (service) sectors kept on expanding employment, however, during the crisis of the 1990s, all sectors had to cut employment;
• during the crisis of the 1980s, employment fell the most in the basic metals and fabri-cated metals sector (CH), the machinery and equipment sector (CK28), the motor vehi-cles (CL29) and the textiles, apparel and footwear sectors (CB);
• during the crisis of the 1990s, employment contracted the most in the construction sec-tor (F);
• during the dot-com crisis, the strongest employment reductions occurred in the electron-ics, electrical and optical products sector (CI+CJ), the machinery and equipment sector (CK28) and the basic metals and fabricated metals sector (CH);
• recovery from any crisis took the longest in sectors whose employment levels plum-meted most significantly.
Figure 3.4.12 takes a closer look at sectoral employment growth rates for the US economy for the crisis of the 1980s (between 1981 and 1984), the 1990s (between 1990s and 1993) and the dot-com crisis (between 2000 and 2005). It highlights that, in general, sectoral em-ployment varied the most during the crisis of the 1980s and the dot-com crisis. Further-more, from a comparative perspective (Figure 3.4.4 above and Figure 3.4.12 below), dur-ing the 1980s crisis sectoral employment in the US was on average more volatile and re-acted more strongly than sectoral employment in the EU-15. The opposite holds true for the crisis of the 1990s which resulted in, on average, stronger employment responses and adjustments in the EU-15. Generally, except for the construction sector (F) in the US and the electronics, electrical and optical products sector (CI+CJ) in the EU-15, similar sectors
103
were affected by the crises of the 1980s and the 1990s: the textiles, apparel and footwear sector (CB), the basic metals and fabricated metals sector (CH) and the rubber and plas-tics sector (CG), the machinery and equipment sector (CK28) and the motor vehicles sec-tor (CL29). Moreover, Figure 3.4.12 also highlights that none of the sectors considered overcame all crises unharmed. Instead, all sectors experienced a loss in employment during one crisis or another. During the crisis of the 1980s, only the real estate and business activities sector (LMN), the financial and insurance activities sector (K) and the accommodation and food service activities sector (I) were able to still expand employment, despite generally shrink-ing demand. This pattern is consistent with developments during the crisis of the 1980s in the EU-15 (Figure 3.4.4 above). In contrast, employment contracted the most in the basic metals and fabricated metals sector (CH) by close to -13%, the machinery and equipment sector (CK28) by -10% and the motor vehicles sector (CL29) and the textiles, apparel and footwear sector (CB) by about -8% each. Furthermore, employment losses in the 1982 slump-year were most moderate in the wholesale and retail trade sector (G) with only -0.2% and the electronics, electrical and optical products sector (CI+CJ) with -2%. During the crisis of the 1990s, all sectors experienced losses in employment, to different degrees though. With -7%, employment shrank the most in the construction sector (F). The ma-chinery and equipment sector (CK28), the motor vehicles sector (CL29), the basic metals and fabricated metals sector (CH), the rubber and plastics sector (CG) and the electronics, electrical and optical products sector (CI+CJ) all already reduced employment prior to the 1991 slump-year and further cut employment by another -4% to -5%. In contrast, with be-tween -0.5 and -1.5%, losses in employment were fairly moderate in the real estate and business activities sector (LMN), the financial and insurance activities sector (K), the ac-commodation and food service activities sector (I) and the chemicals sector (CE). During the dot-com crisis, with -13%, the strongest employment reductions occurred in the elec-tronics, electrical and optical products sector (CI+CJ) in the 2002 slump-year. Additionally, the machinery and equipment sector (CK28) and the basic metals and fabricated metals sector (CH) both cut employment by -9% and -8%, respectively. In contrast, employment losses were rather modest in the wholesale and retail trade sector (G), the construction sector (F) and the real estate and business activities sector (LMN) which all reduced labour by between -1% and -3% only. Both, the motor vehicles sector (CL29) and the textiles, apparel and footwear sector (CB) already cut employment in the eve of the crisis by -1 and -5%, respectively, and further reduced employment by another -6% and -12%, respec-tively. In contrast, only the accommodation and food service activities sector (I) did not see the need to trim down employment. Recovery from any crisis took the longest in sectors whose employment levels plummeted most dramatically. During the crisis of the 1980s, the wholesale and retail trade sector (G) only took a year to get back to its pre-crisis employment growth levels. Furthermore, the
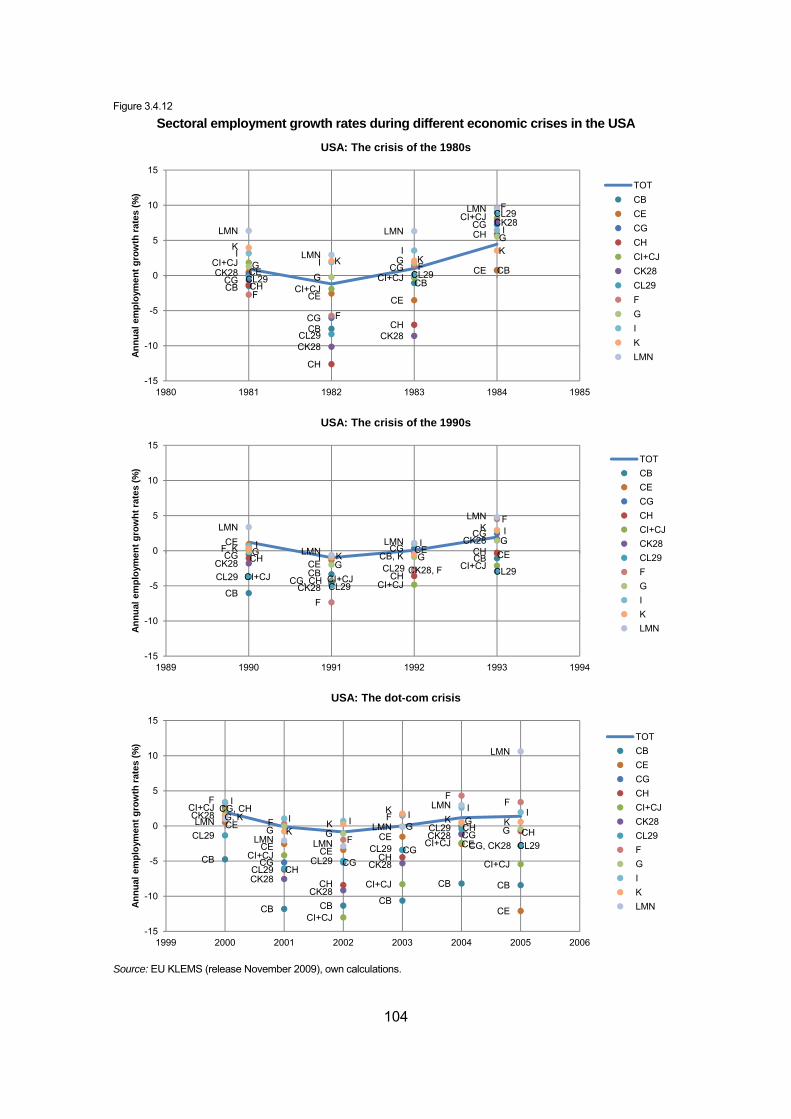
104
Figure 3.4.12
Sectoral employment growth rates during different economic crises in the USA
Source: EU KLEMS (release November 2009), own calculations.
CB
CB
CBCBCE
CE CE
CECG
CG
CG
CG
CH
CH
CH
CH
CI+CJ
CI+CJCI+CJ
CI+CJ
CK28
CK28CK28
CK28
CL29
CL29
CL29
CL29
F
F
F
F
GG
G
GI
II
I
KK K
K
LMN
LMN
LMN
LMN
-15
-10
-5
0
5
10
15
1980 1981 1982 1983 1984 1985
Annu
al e
mpl
oym
ent g
row
th ra
tes
(%)
USA: The crisis of the 1980s
TOTCBCECGCHCI+CJCK28CL29FGIKLMN
CB
CB
CB, K CB
CE
CECE CECG
CGCG
CH
CG, CH CH
CH
CI+CJ CI+CJ CI+CJ
CI+CJCK28
CK28
CK28, F
CK28
CL29CL29
CL29 CL29
F
F
GG
G
GII
II
F, KK
KLMN
LMNLMN
LMN
-15
-10
-5
0
5
10
15
1989 1990 1991 1992 1993 1994
Annu
al e
mpl
oym
ent g
row
ht ra
tes
(%)
USA: The crisis of the 1990s
TOTCBCECGCHCI+CJCK28CL29FGIKLMN
CB
CB CB CB
CB CB
CE
CE CECE
CE
CE
CG CGCG
CG
CG, CH
CHCH
CH
CH CH
CI+CJ
CI+CJ
CI+CJ
CI+CJ
CI+CJ
CI+CJ
CK28
CK28CK28
CK28
CK28CG, CK28
CL29
CL29CL29
CL29
CL29
CL29
F
F
F
F
FF
G GG G
G
I
I II
I IG, KK
KK
K KLMN
LMN LMN
LMN
LMN
LMN
-15
-10
-5
0
5
10
15
1999 2000 2001 2002 2003 2004 2005 2006
Annu
al e
mpl
oym
ent g
row
th ra
tes
(%)
USA: The dot-com crisis
TOTCBCECGCHCI+CJCK28CL29FGIKLMN
105
construction sector (F) and the rubber and plastics sector (CG) recovered swiftly and ex-panded employment by around 1.5% the year after the economic slump already. On the contrary, the machinery and equipment sector (CK28), the basic metals and fabricated metals sector (CH) and the motor vehicles sector (CL29) took another year before em-ployment was expanded again. Similarly, during the crisis of the 1990s, the real estate and business activities sector (LMN), the accommodation and food service activities sector (I), the chemicals sector (CE) and the rubber and plastics sector (CG) all already expanded employment in the year after the recession. However, the construction sector (F) and the machinery and equipment sector (CK28) took two years to recover and to start expanding employment. Some sectors, however, appear to have embarked on a long-term downward spiral: the textiles, apparel and footwear sector (CB) and the chemicals sector (CE) both continued their slimming policy throughout the 1990s, constantly cutting employment. The basic metals and fabricated metals sector (CH) and the motor vehicles sector (CL29) took until 1994 before employment started to expand again while the electronics, electrical and optical products sector (CI+CJ) took until 1995 before employment rose again. Finally, during the dot-com crisis, recovery was quickest in the real estate and business activities sector (LMN), the construction sector (F) and the financial and insurance activities sector (K) which experienced moderate employment losses only. The textiles, apparel and foot-wear sector (CB) and the chemicals sector (CE) both maintained their trimming policy, further cutting employment. Hours worked
The ensuing analysis of US sectoral hours worked growth rates finds the following:
• adjustment patterns in hours worked and employment strongly coincide;
• however, during any of the three crises considered, variations in sectoral hours worked growth rates were more pronounced than variations in sectoral employment growth rates;
• none of the sectors managed to weather all crises without cutting hours worked;
• the basic metals and fabricated metals sector (CH) and the machinery and equipment sector (CK28) were always among the sectors which cut hours worked the most to ac-commodate economic crises;
• during the crises of the 1980s and the dot-com crisis, some (service) sectors managed to expand hours worked, however, during the crisis of the 1990s, all sectors had to cut hours worked;
• during the crisis of the 1980s, the basic metals and fabricated metals sector (CH), the machinery and equipment sector (CK28), the textiles, apparel and footwear sector (CB) and the motor vehicles sector (CL29) experienced the strongest cuts in hours worked;
• during the crisis of the 1990s, the starkest cutbacks in hours worked occurred in the construction sector (F);
106
• during the dot-com crisis, the strongest reductions occurred in the electronics, electrical and optical products sector (CI+CJ), the textiles, apparel and footwear sector (CB), the machinery and equipment sector (CK28) and the basic metals and fabricated metals sector (CH);
• recovery patterns were diverse. Sectoral hours worked growth rates for the three economic crises the US economy experi-enced in the 1980s, the 1990s and around the Millennium are depicted in Figure 3.4.13 below. It highlights that, in general, during any of the three crises considered, variations in sectoral hours worked growth rates were more pronounced than variations in sectoral em-ployment growth rates. Moreover, during the crisis of the 1980s, US sectoral hours worked growth rates underwent significantly stronger fluctuations than sectoral hours worked growth rates in the EU-15 aggregate. During the crisis of the 1990s, however, variations in US and EU-15 hours worked growth rates coincided. Figure 3.4.13 also reveals that – just like in the EU-15 – all sectors were forced to cut hours worked during any one of the three crises analysed. During the 1980s crisis, only the real estate and business activities sector (LMN), the financial and insurance activities sector (K) and the accommodation and food service activities sector (I) managed without any reduc-tions in hours worked. Furthermore, the basic metals and fabricated metals sector (CH) with -15%, the machinery and equipment sector (CK28) with -12%, the textiles, apparel and footwear sector (CB) with -10% and the motor vehicles sector (CL29) with -9% experi-enced the strongest cuts in hours worked during the 1982 slump-year. In contrast, with -1% only, reductions in hours worked were rather moderate in the wholesale and retail trade sector (G). Additionally, a comparison of Figures 3.4.12 and 3.4.13 reveals that all sectors weathered the crisis predominantly by means of reductions in hours worked. Dur-ing the crisis of the 1990s, all sectors, without exception, had to resort to reductions in hours worked to deal with the fall in demand. With -7%, the starkest cutbacks occurred in the construction sector (F), which still increased hours worked the year before the crisis hit the US economy with full force. Moreover, similar to the crisis of the 1980s, the motor vehi-cles sector (CL29), the rubber and plastics sector (CG), the basic metals and fabricated metals sector (CH), the electronics, electrical and optical products sector (CI+CJ) and the machinery and equipment sector (CK28) all substantially decreased hours worked by around -5%. In contrast, with approximately -1%, reductions in hours worked were fairly moderate in the real estate and business activities sector (LMN) and the chemicals sector (CE). A comparison of Figures 3.4.12 and 3.4.13 emphasizes that only the textiles, apparel and footwear sector (CB) predominantly resorted to cuts in employment to weather the crisis. All remaining sectors reduced both employment and hours worked alike to over-come the crisis. Finally, the more pronounced dot-com crisis at the beginning of the new millennium also forced all sectors to partly dramatically cut hours worked. Similar to the crisis of the 1980s and the 1990s, the strongest reductions occurred in the electronics,
107
electrical and optical products sector (CI+CJ) with -13%, the textiles, apparel and footwear sector (CB) with -11%, the machinery and equipment sector (CK28) with -10% and the basic metals and fabricated metals sector (CH) with -9%. However, the textiles, apparel and footwear sector (CB) seems to be a special case: since the mid-1990s, it has em-barked on a general downward spiral, incessantly slashing both hours worked and em-ployment. In contrast, hours worked only slightly contracted in service sectors like the ac-commodation and food service activities sector (I), the wholesale and retail trade sector (G) and the financial and insurance activities sector (K). With respect to the relative reactions of employment and hours worked, a comparison of Figures 3.4.12 and 3.4.13 reveals that the accommodation and food service activities sector (I) pursued an interesting strategy to overcome the crisis: it slightly reduced hours worked but more strongly increased employ-ment which might indicate that more part-time jobs were created on average. All other sec-tors again weathered the crisis by reducing both employment and hours worked alike. Patterns of recovery were quite diverse. Generally, however, sectors which experienced the strongest drop in hours worked also took the longest to recover. During the crisis of the 1980s, the basic metals and fabricated metals sector (CH) and the machinery and equip-ment sector (CK28) experienced the most dramatic cutbacks in hours worked and needed two years (until 1984) before hours worked increased again: hours worked expanded by 8% and 10%, respectively, in 1984. Recovery was particularly quick in the motor vehicles sector (CL29) and the construction sector (F): hours worked already expanded by 2% the year after the recession and by impressive 10% two years after the recession. Similarly, the rubber and plastics sector (CG) also recovered swiftly. In 1983, hours worked already increased by 4%, in 1984 by 8%. For all sectors considered, relative to employment, hours worked recovered faster. After the crisis of the 1990s, the construction sector (F), which underwent the strongest cuts in hours worked in the 1991 slump-year (-7%), needed two years before hours worked were increased again: in 1992, hours worked were still cut by around 3%, while in 1993, hours worked grew by 5% already. Similarly, the rubber and plastics sector (CG) experienced a rapid recovery and jumped from slashing hours worked by almost 5% in 1991 to increasing hours worked by around 2% in 1992. In contrast, re-covery was more sluggish in the machinery and equipment sector (CK28) and the basic metals and fabricated metals sector (CH). Both cut hours worked by around 5% in 1991 but only managed to raise hours worked two years later, in 1993, by 3 and 1%, respec-tively. Recovery took the longest in the electronics, electrical and optical products sector (CI+CJ) – until 1995 – and the motor vehicles sector (CL29) – until 1994. The textiles, ap-parel and footwear sector (CB) and the chemicals sector (CE) both never really recovered from the crisis of the 1990s, continuously reducing hours worked until the end of the obser-vation period (2007). In general, recovery from the more pronounced dot-com crisis took longer. Only the accommodation and food service activities sector (I), which cut hours worked by only -0.5% in 2001, already expanded hours worked in 2002, while the crisis was still under way. A year later, the construction sector (F) and the financial and insurance
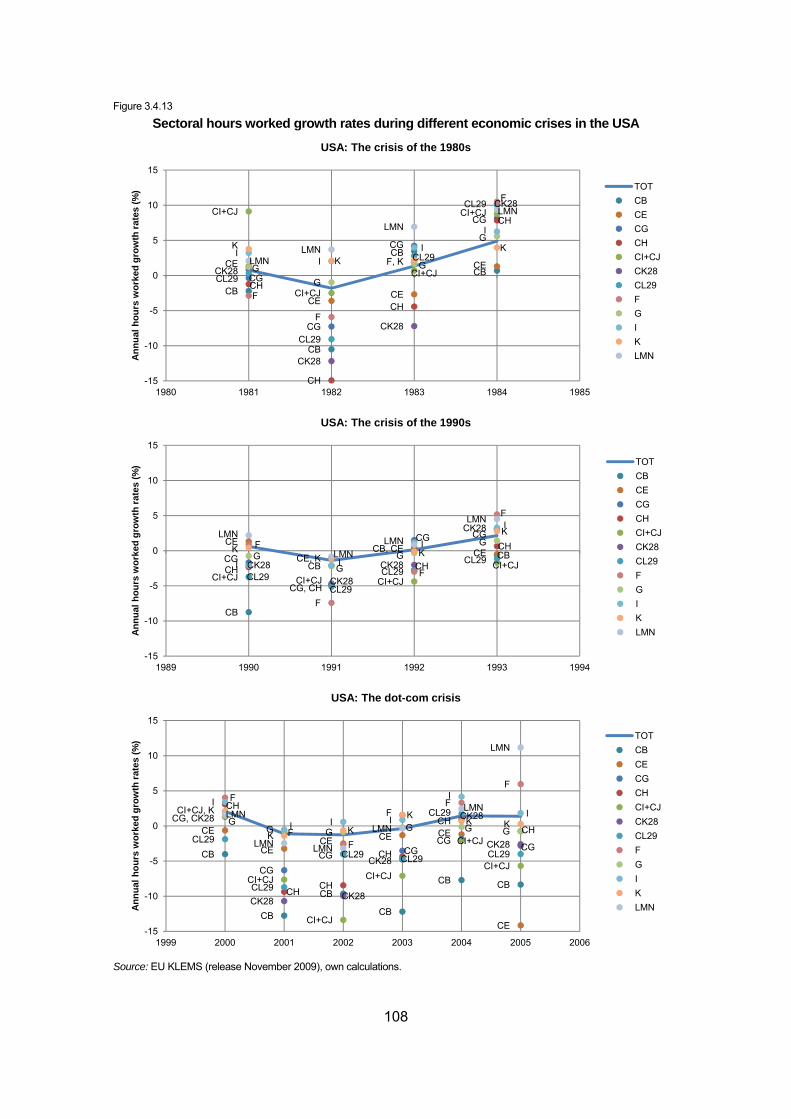
108
Figure 3.4.13
Sectoral hours worked growth rates during different economic crises in the USA
Source: EU KLEMS (release November 2009), own calculations.
CB
CB
CB
CBCE
CECE
CECG
CG
CG
CG
CH
CH
CH
CHCI+CJ
CI+CJ
CI+CJ
CI+CJ
CK28
CK28
CK28
CK28
CL29
CL29
CL29
CL29
F
F
F, K
F
GG
G
GI
II
IK
KK
LMNLMN
LMN
LMN
-15
-10
-5
0
5
10
15
1980 1981 1982 1983 1984 1985
Annu
al h
ours
wor
ked
grow
th ra
tes
(%)
USA: The crisis of the 1980s
TOTCBCECGCHCI+CJCK28CL29FGIKLMN
CB
CBCB
CE
CE, KCB, CE CECG
CG CG
CH
CG, CH
CH
CH
CI+CJ CI+CJ CI+CJ
CI+CJCK28
CK28
CK28
CK28
CL29CL29
CL29CL29
F
F
F
F
GG
GG
I I
I
I
K K
KLMN
LMNLMN
LMN
-15
-10
-5
0
5
10
15
1989 1990 1991 1992 1993 1994
Annu
al h
ours
wor
ked
grow
th ra
tes
(%)
USA: The crisis of the 1990s
TOTCBCECGCHCI+CJCK28CL29FGIKLMN
CB
CB
CB
CB
CB CB
CE
CECE CE CE
CE
CGCG CG
CGCG
CH
CHCH
CH
CHCH
CI+CJ, K
CI+CJ
CI+CJ
CI+CJ
CI+CJ
CI+CJ
CG, CK28
CK28 CK28
CK28
CK28
CK28CL29
CL29
CL29 CL29
CL29
CL29
F
FF
FF
F
GG G G G G
I
I I I
I
I
K KK
K KLMN
LMN LMN
LMN
LMN
LMN
-15
-10
-5
0
5
10
15
1999 2000 2001 2002 2003 2004 2005 2006
Annu
al h
ours
wor
ked
grow
th ra
tes
(%)
USA: The dot-com crisis
TOTCBCECGCHCI+CJCK28CL29FGIKLMN
109
activities sector (K) followed suit and started expanding hours worked. In contrast, it took until 2004 before the motor vehicles sector (CL29) and the machinery and equipment sec-tor (CK28) increased hours worked again, an upward trend that was temporarily inter-rupted in 2005, when hours worked were cut again. Finally, the electronics, electrical and optical products sector (CI+CJ) did not really recover from the dot-com crisis as hours worked continued to fall until the end of the observation period (2007). Value-added
The analysis of value-added growth rates of different US sectors emphasizes the following:
• variations in value-added growth were generally stronger than those of either employ-ment or hours worked;
• both the basic metals and fabricated metals sector (CH) and the machinery and equip-ment sector (CK28) were always among the sectors which experienced the most pro-nounced losses in value-added during all three economic crises considered;
• only the financial and insurance activities sector (K) weathered all three crises without any losses in value-added;
• during the crisis of the 1980s, the most significant losses in value-added occurred in the basic metals and fabricated metals sector (CH), the machinery and equipment sector (CK28), the construction sector (F), the rubber and plastics sector (CG) and the textiles, apparel and footwear sector (CB);
• during the crisis of the 1990s, value-added plummeted in the machinery and equipment sector (CK28) and in the construction sector (F);
• during the dot-com crisis, value-added dropped the strongest in the textiles, apparel and footwear sector (CB), the basic metals and fabricated metals sector (CH), the machin-ery and equipment sector (CK28) and the motor vehicles sector (CL29);
• recovery patterns were diverse, across sectors and crises considered.
Sectoral value-added growth rates for the three economic crises are depicted in Figure 3.4.14 below, which shows that variations in value-added growth were generally stronger than those of either employment or hours worked. Moreover, value-added growth rates varied the strongest in the crisis of the 1980s and the dot-com crisis. Furthermore, varia-tions in US value-added growth rates were more pronounced than variations in value-added growth rates in the EU-15. Generally, in the US and the EU-15, similar sectors ex-perienced losses in value-added by the crises of the 1980s and the 1990s: the textiles, apparel and footwear sector (CB), the basic metals and fabricated metals sector (CH) and the rubber and plastics sector (CG), the machinery and equipment sector (CK28) and the motor vehicles sector (CL29).
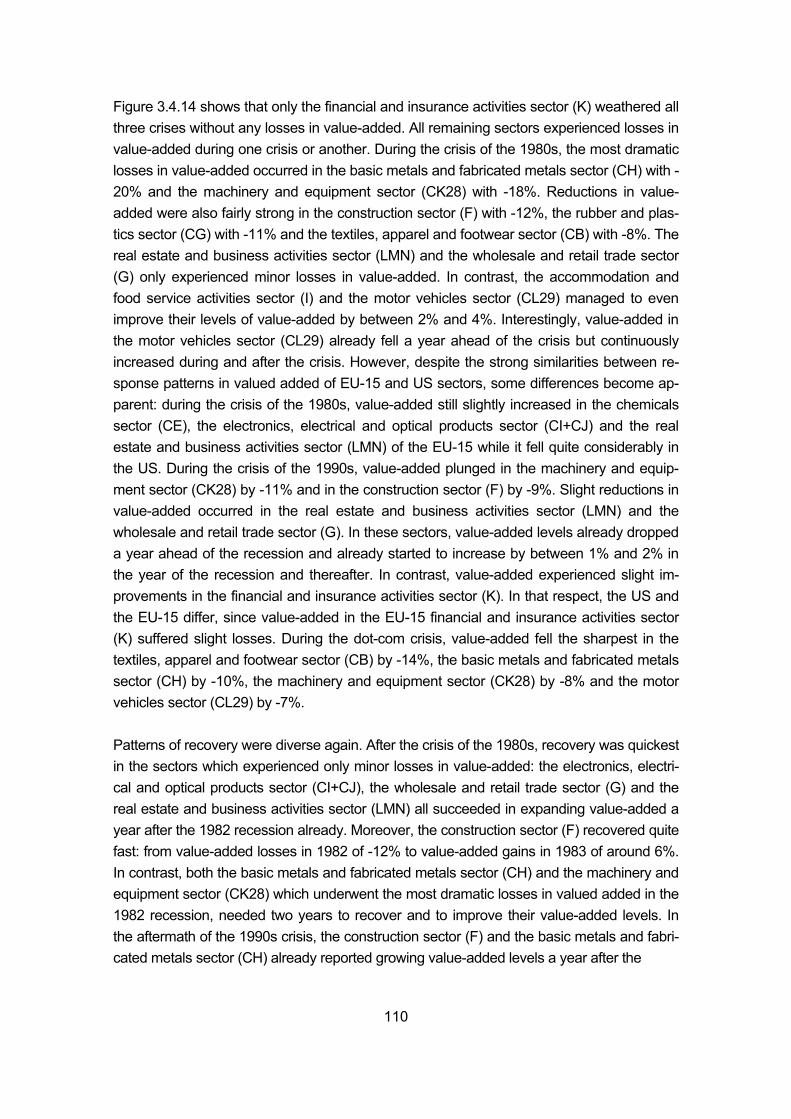
110
Figure 3.4.14 shows that only the financial and insurance activities sector (K) weathered all three crises without any losses in value-added. All remaining sectors experienced losses in value-added during one crisis or another. During the crisis of the 1980s, the most dramatic losses in value-added occurred in the basic metals and fabricated metals sector (CH) with -20% and the machinery and equipment sector (CK28) with -18%. Reductions in value-added were also fairly strong in the construction sector (F) with -12%, the rubber and plas-tics sector (CG) with -11% and the textiles, apparel and footwear sector (CB) with -8%. The real estate and business activities sector (LMN) and the wholesale and retail trade sector (G) only experienced minor losses in value-added. In contrast, the accommodation and food service activities sector (I) and the motor vehicles sector (CL29) managed to even improve their levels of value-added by between 2% and 4%. Interestingly, value-added in the motor vehicles sector (CL29) already fell a year ahead of the crisis but continuously increased during and after the crisis. However, despite the strong similarities between re-sponse patterns in valued added of EU-15 and US sectors, some differences become ap-parent: during the crisis of the 1980s, value-added still slightly increased in the chemicals sector (CE), the electronics, electrical and optical products sector (CI+CJ) and the real estate and business activities sector (LMN) of the EU-15 while it fell quite considerably in the US. During the crisis of the 1990s, value-added plunged in the machinery and equip-ment sector (CK28) by -11% and in the construction sector (F) by -9%. Slight reductions in value-added occurred in the real estate and business activities sector (LMN) and the wholesale and retail trade sector (G). In these sectors, value-added levels already dropped a year ahead of the recession and already started to increase by between 1% and 2% in the year of the recession and thereafter. In contrast, value-added experienced slight im-provements in the financial and insurance activities sector (K). In that respect, the US and the EU-15 differ, since value-added in the EU-15 financial and insurance activities sector (K) suffered slight losses. During the dot-com crisis, value-added fell the sharpest in the textiles, apparel and footwear sector (CB) by -14%, the basic metals and fabricated metals sector (CH) by -10%, the machinery and equipment sector (CK28) by -8% and the motor vehicles sector (CL29) by -7%. Patterns of recovery were diverse again. After the crisis of the 1980s, recovery was quickest in the sectors which experienced only minor losses in value-added: the electronics, electri-cal and optical products sector (CI+CJ), the wholesale and retail trade sector (G) and the real estate and business activities sector (LMN) all succeeded in expanding value-added a year after the 1982 recession already. Moreover, the construction sector (F) recovered quite fast: from value-added losses in 1982 of -12% to value-added gains in 1983 of around 6%. In contrast, both the basic metals and fabricated metals sector (CH) and the machinery and equipment sector (CK28) which underwent the most dramatic losses in valued added in the 1982 recession, needed two years to recover and to improve their value-added levels. In the aftermath of the 1990s crisis, the construction sector (F) and the basic metals and fabri-cated metals sector (CH) already reported growing value-added levels a year after the
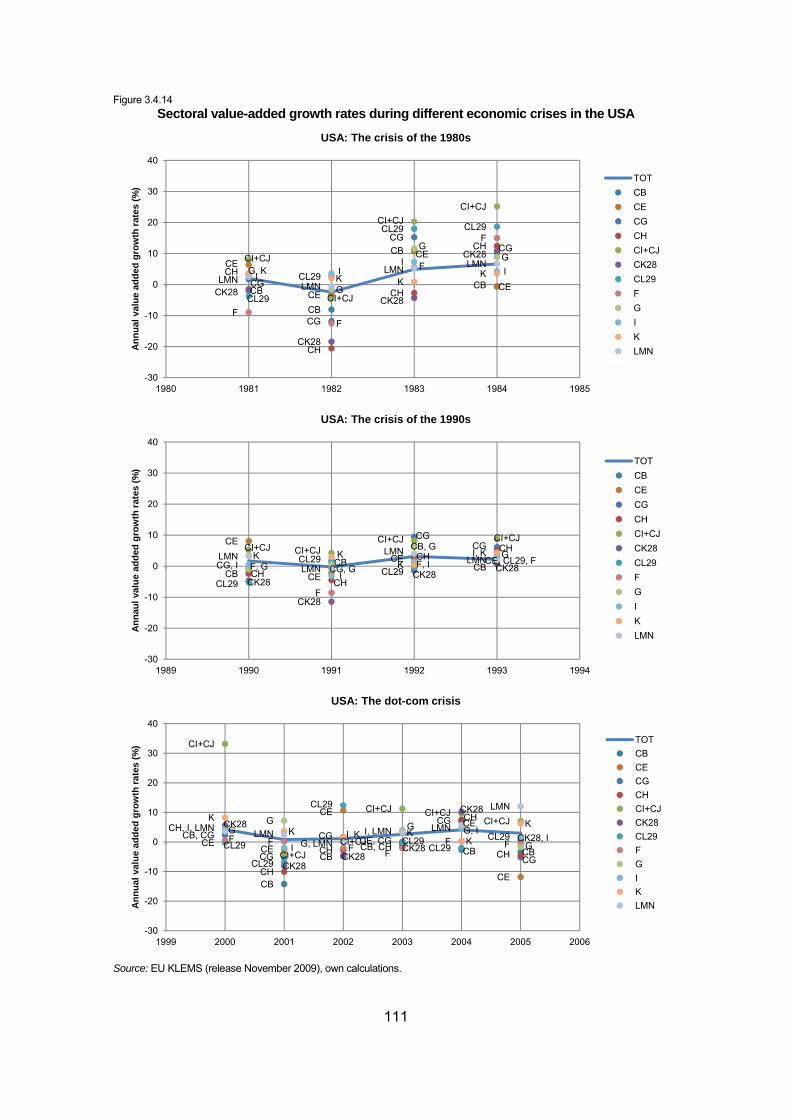
111
Figure 3.4.14 Sectoral value-added growth rates during different economic crises in the USA
Source: EU KLEMS (release November 2009), own calculations.
CB
CB
CB
CB
CE
CE
CE
CECG
CG
CGCG
CH
CH
CH
CHCI+CJ
CI+CJ
CI+CJCI+CJ
CK28
CK28
CK28
CK28
CL29
CL29
CL29 CL29
FF
F
F
G
GG
I II
IG, KK K
KLMNLMN
LMN LMN
-30
-20
-10
0
10
20
30
40
1980 1981 1982 1983 1984 1985
Annu
al v
alue
add
ed g
row
th ra
tes
(%)
USA: The crisis of the 1980s
TOTCBCECGCHCI+CJCK28CL29FGIKLMN
CBCB CB
CE
CE
CECG, I CG, G
CGCG
CHCH
CHCHCI+CJ CI+CJ
CI+CJ CI+CJ
CK28
CK28
CK28CK28
CL29
CL29CL29
CE, CL29, F
F
F, IF, G
CB, GG
I
K KK
I, KLMNLMN
LMNLMN
-30
-20
-10
0
10
20
30
40
1989 1990 1991 1992 1993 1994
Anna
ul v
alue
add
ed g
row
th ra
tes
(%)
USA: The crisis of the 1990s
TOTCBCECGCHCI+CJCK28CL29FGIKLMN
CB
CBCB, CH CB CB
CECE
CECE
CE
CB, CG
CG
CG CE, CG
CG
CGCH
CH
CH
CH
CI+CJ
CI+CJCI+CJ
CI+CJ CI+CJCI+CJCK28
CK28CK28
CK28
CK28
CK28, ICL29
CL29
CL29
CL29CL29
CL29F FF F
F FG
G G
GI
G, IK
K I, K KK
KCH, I, LMN LMNG, LMN
I, LMN LMN
LMN
-30
-20
-10
0
10
20
30
40
1999 2000 2001 2002 2003 2004 2005 2006
Annu
al v
alue
add
ed g
row
th ra
tes
(%)
USA: The dot-com crisis
TOTCBCECGCHCI+CJCK28CL29FGIKLMN
112
recession. In contrast, the machinery and equipment sector (CK28) took two years before it managed to expand its value-added levels again. Finally, recovery after the sustained dot-com crisis was rather erratic and slow. Particularly, value-added of the chemicals sector (CE) dropped by -2% in 2001, improved by 10% in 2002, fell again slightly by -0.3% in 2003, recovered again and grew by 7% in 2004, before it dropped temporarily by 11% in 2005 and improved by 11% and 3% in 2006 and 2007, respectively. Likewise, the basic metals and fabricated metals sector (CH) started expanding its value-added levels in 2004 only, experienced a temporary setback in 2004 when value-added levels dropped by around -5%, but was back on its recovery track in 2006 already with a 3% growth rate. In contrast, value-added levels of the machinery and equipment sector (CK28) continuously improved from -8% in 2001, to -5% in 2002, to -0.3% in 2003, to 10% in 2004. Finally, the textiles, apparel and footwear sector (CB) experienced growing losses in value-added: by -14% in 2001, by -5% in 2002, by -2% in 2003 and by -3% in 2004 and 2005. Labour productivity
The analysis of labour productivity growth rates of different US sectors found the following:
• labour productivity responses were crisis specific;
• in contrast to the EU-15 experience, during the crisis of the 1980s, none of the sectors considered managed to maintain positive labour productivity growth;
• during the crisis of the 1990s, all top-three labour productivity winners belonged to the manufacturing sector;
• with the exception of the crisis of the 1980s, only the electronics, electrical and optical products sector (CI+CJ) was consistently among the top-three sectors that experienced the strongest labour productivity gains.
Sectoral labour productivity growth rates for the three economic crises are presented in Table 3.4.2 below. It stresses that at the level of the overall economy, with the exception of the crisis of the 1980s, labour productivity growth remained positive and was highest dur-ing the dot-com crisis. Specifically, during the crisis of the 1980s, labour productivity losses were the result of losses in value-added that exceeded losses in both hours worked and employment. In contrast, labour productivity gains of the 1990s crisis and the dot-com cri-sis were due to value-added gains that exceeded increases in both hours worked and em-ployment. At the sectoral level, labour productivity dynamics were diverse and crisis spe-cific. In particular - in contrast to the EU-15 experience - during the crisis of the 1980s, none of the sectors managed to maintain positive labour productivity growth (irrespective of the exact definition used). And with -6.59% or -6.77%, the construction sector (F) reported the highest losses in labour productivity, followed by the machinery and equipment sector (CK28) with -6.22% or 8.27% and the basic metals and fabricated metals sector (CH) with -5.65% or -7.96%.
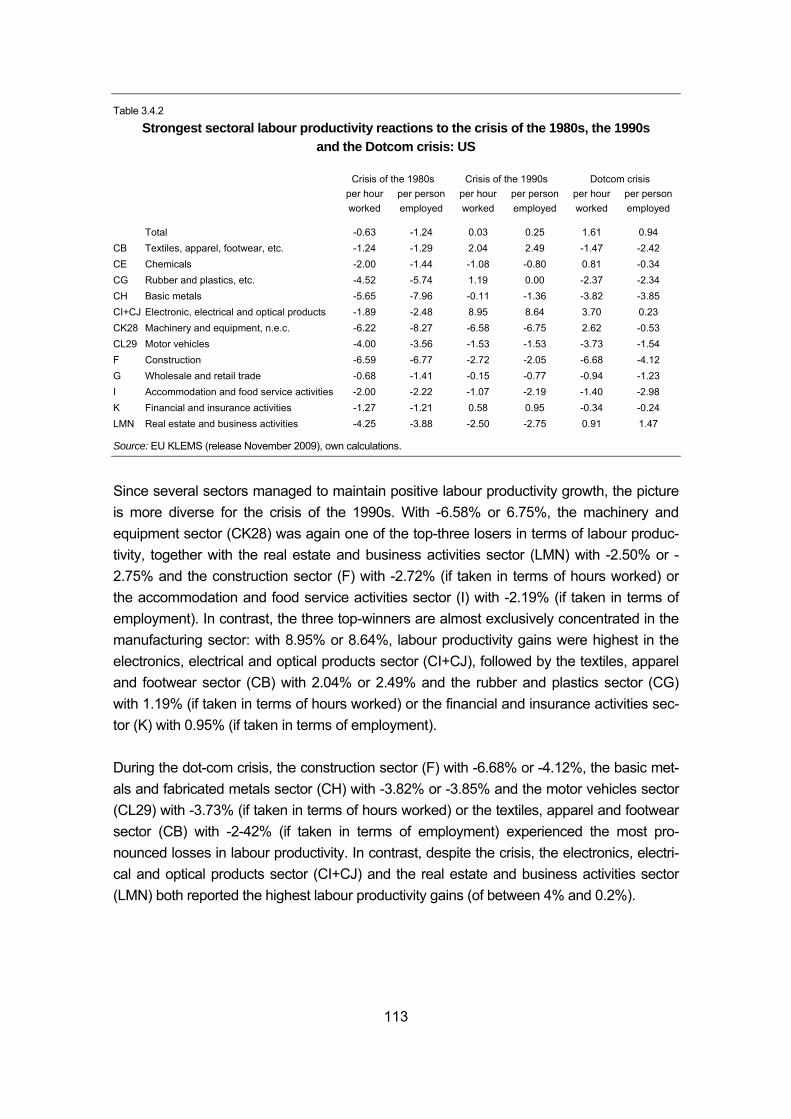
113
Table 3.4.2
Strongest sectoral labour productivity reactions to the crisis of the 1980s, the 1990s and the Dotcom crisis: US
Crisis of the 1980s Crisis of the 1990s Dotcom crisis per hour worked
per person employed
per hour worked
per person employed
per hour worked
per person employed
Total -0.63 -1.24 0.03 0.25 1.61 0.94 CB Textiles, apparel, footwear, etc. -1.24 -1.29 2.04 2.49 -1.47 -2.42 CE Chemicals -2.00 -1.44 -1.08 -0.80 0.81 -0.34 CG Rubber and plastics, etc. -4.52 -5.74 1.19 0.00 -2.37 -2.34 CH Basic metals -5.65 -7.96 -0.11 -1.36 -3.82 -3.85 CI+CJ Electronic, electrical and optical products -1.89 -2.48 8.95 8.64 3.70 0.23 CK28 Machinery and equipment, n.e.c. -6.22 -8.27 -6.58 -6.75 2.62 -0.53 CL29 Motor vehicles -4.00 -3.56 -1.53 -1.53 -3.73 -1.54 F Construction -6.59 -6.77 -2.72 -2.05 -6.68 -4.12 G Wholesale and retail trade -0.68 -1.41 -0.15 -0.77 -0.94 -1.23 I Accommodation and food service activities -2.00 -2.22 -1.07 -2.19 -1.40 -2.98 K Financial and insurance activities -1.27 -1.21 0.58 0.95 -0.34 -0.24 LMN Real estate and business activities -4.25 -3.88 -2.50 -2.75 0.91 1.47
Source: EU KLEMS (release November 2009), own calculations.
Since several sectors managed to maintain positive labour productivity growth, the picture is more diverse for the crisis of the 1990s. With -6.58% or 6.75%, the machinery and equipment sector (CK28) was again one of the top-three losers in terms of labour produc-tivity, together with the real estate and business activities sector (LMN) with -2.50% or -2.75% and the construction sector (F) with -2.72% (if taken in terms of hours worked) or the accommodation and food service activities sector (I) with -2.19% (if taken in terms of employment). In contrast, the three top-winners are almost exclusively concentrated in the manufacturing sector: with 8.95% or 8.64%, labour productivity gains were highest in the electronics, electrical and optical products sector (CI+CJ), followed by the textiles, apparel and footwear sector (CB) with 2.04% or 2.49% and the rubber and plastics sector (CG) with 1.19% (if taken in terms of hours worked) or the financial and insurance activities sec-tor (K) with 0.95% (if taken in terms of employment). During the dot-com crisis, the construction sector (F) with -6.68% or -4.12%, the basic met-als and fabricated metals sector (CH) with -3.82% or -3.85% and the motor vehicles sector (CL29) with -3.73% (if taken in terms of hours worked) or the textiles, apparel and footwear sector (CB) with -2-42% (if taken in terms of employment) experienced the most pro-nounced losses in labour productivity. In contrast, despite the crisis, the electronics, electri-cal and optical products sector (CI+CJ) and the real estate and business activities sector (LMN) both reported the highest labour productivity gains (of between 4% and 0.2%).
114
Summary
Generally, the analysis stresses that sectoral employment growth rates in the US varied strongly in response to the economic crises of the 1980s, the 1990s or the dot-com crisis of the New Millennium. Sectoral employment responses were strongest during the crisis of the 1980s and the dot-com crisis. From a comparative perspective, during the crisis of the 1980s, US sectoral employment growth rates were on average more volatile and higher than sectoral employment growth rates in the EU-15. In contrast, in response to the crisis of the 1990s which was considerably stronger and lasted longer in the Europe, employ-ment adjustments were on average stronger in the EU-15. Basically, all US sectors con-sidered faced losses in employment during one crisis or another. However, the machinery and equipment sector (CK28) was always among the sectors which cut employment the most during any of the three economic crises considered: with around -10%, employment reductions were most significant in response to the crisis of the 1980s and the dot-com crisis. Furthermore, similar to observable trends in the EU-15, the US textiles, apparel and footwear sector (CB) is downsizing, continuously cutting employment. Apart from these uniform patterns, employment adjustments were crisis-specific. Generally, during the crises of the 1980s and the dot-com crisis, some sectors – particularly services sectors – kept on expanding employment. However, during the crisis of the 1990s, all sectors had to cut em-ployment to accommodate falling demand. Moreover, during the crisis of the 1980s, in ad-dition to the machinery and equipment sector (CK28) and the textiles, apparel and foot-wear sector (CB) employment contracted the most in the basic metals and fabricated met-als sector (CH) and the motor vehicles (CL29). During the crisis of the 1990s, employment contracted the most in the construction sector (F) while during the dot-com crisis, the strongest employment reductions occurred in the electronics, electrical and optical prod-ucts sector (CI+CJ) and the basic metals and fabricated metals sector (CH). With respect to hours worked, adjustment patterns in hours worked and employment are found to strongly coincide. Moreover, since variations in sectoral hours worked growth rates were more pronounced than variations in sectoral employment growth rates during any of the three crises considered, clear evidence of labour hoarding is provided. Similar to em-ployment responses, none of the sectors managed to weather all crises without cutting hours worked. However, only during the crises of the 1980s did some sectors – particularly service sectors – expand hours worked. Additionally, both and the machinery and equipment sector (CK28) as well as the basic metals and fabricated metals sector (CH) were always among the sectors which cut hours worked the most to accommodate economic crises. Generally, reactions of value-added growth rates were stronger than those of either em-ployment or hours worked. Additionally, only the financial and insurance activities sector (K) weathered all three crises without any losses in value-added while both the basic metals and fabricated metals sector (CH) and the machinery and equipment sector (CK28) were always among the sectors which experienced the starkest losses in value-added during all
115
three economic crises considered. However, adjustment patterns in value-added differ from adjustment patterns in either employment or hours worked. Specifically, during the crisis of the 1980s, in addition to the basic metals and fabricated metals sector (CH), the machinery and equipment sector (CK28), the most significant losses in value-added occurred in the construction sector (F), the rubber and plastics sector (CG) and the textiles, apparel and footwear sector (CB). During the crisis of the 1990s, value-added also plummeted in the machinery and equipment sector (CK28) and in the construction sector (F) while during the dot-com crisis, value-added plunged in the textiles, apparel and footwear sector (CB), the basic metals and fabricated metals sector (CH) and the motor vehicles sector (CL29). Finally, labour productivity dynamics in response to different economic crisis were diverse and crisis specific. As such, none of the US sectors considered experience any labour pro-ductivity gains during the crisis of the 1980s. And, with between 8% and 6%, labour pro-ductivity losses were most pronounced in the construction sector (F), the machinery and equipment sector (CK28) and the basic metals and fabricated metals sector (CH). Re-sponse patterns were more divers during the crisis of the 1990s and the dot-com crisis. Labour productivity losses were strongest in the machinery and equipment sector (CK28), the real estate and business activities sector (LMN), the construction sector (F) and the accommodation and food service activities sector (I), ranging between -7% and -2%. In contrast, labour productivity gains were highest in the electronics, electrical and optical products sector (CI+CJ), the textiles, apparel and footwear sector (CB), the rubber and plastics sector (CG) and the financial and insurance activities sector (K), with between 9% and 1%. Finally, during the dot-com crisis, both the basic metals and fabricated metals sec-tor (CH), the motor vehicles sector (CL29) and the textiles, apparel and footwear sector (CB) experienced the starkest labour productivity losses while the electronics, electrical and optical products sector (CI+CJ) and the real estate and business activities sector (LMN) both experienced the highest labour productivity gains (of between 4% and 0.2%). 3.4.6 Japan
Employment
The analysis of employment growth rates of different sectors in Japan reveals the following:
• the majority of sectors reacted with a one-year lag to the crisis of the 1970s;
• the electronics, electrical and optical products sector (CI+CJ), the machinery and equipment sector (CK28), the basic metals and fabricated metals sector (CH) and the rubber and plastics sector (CG) cut employment the most;
• in contrast, all service sectors (except for construction (F)) were still expanding em-ployment, despite the crisis;
• recovery was rather quick in the construction sector (F), the electronics, electrical and optical products sector (CI+CJ), the textiles, apparel and footwear sector (CB) and the rubber and plastics sector (CG).
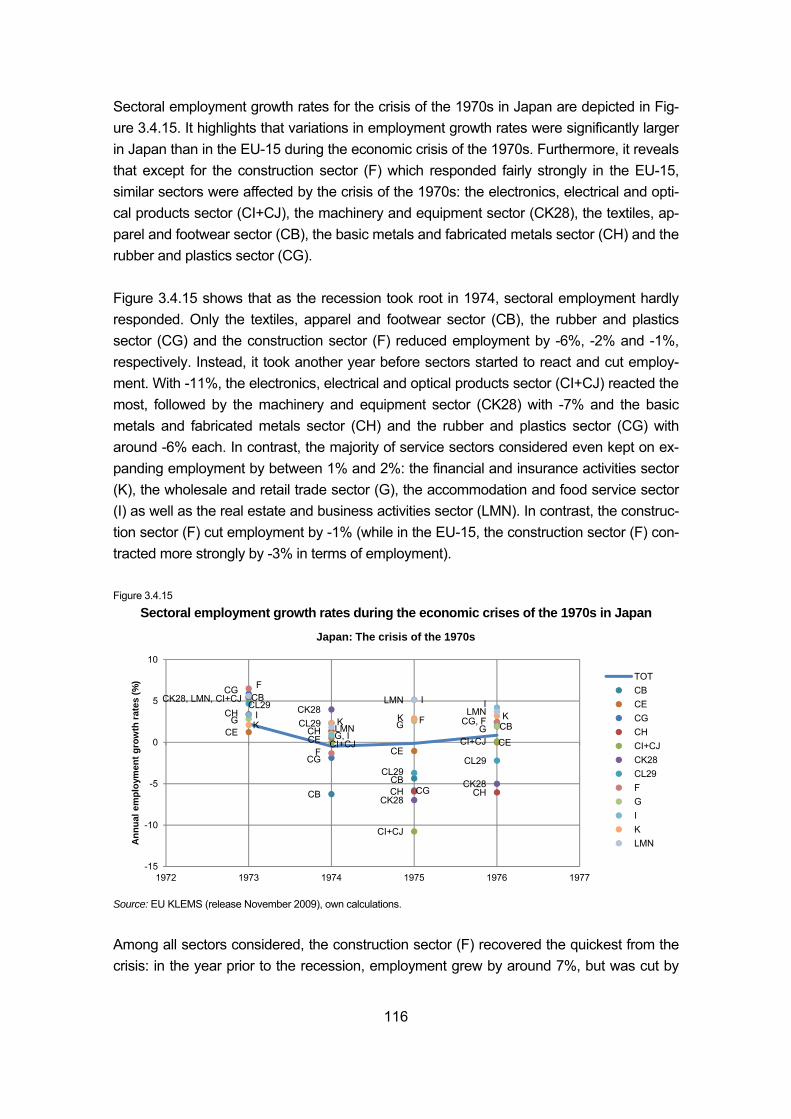
116
Sectoral employment growth rates for the crisis of the 1970s in Japan are depicted in Fig-ure 3.4.15. It highlights that variations in employment growth rates were significantly larger in Japan than in the EU-15 during the economic crisis of the 1970s. Furthermore, it reveals that except for the construction sector (F) which responded fairly strongly in the EU-15, similar sectors were affected by the crisis of the 1970s: the electronics, electrical and opti-cal products sector (CI+CJ), the machinery and equipment sector (CK28), the textiles, ap-parel and footwear sector (CB), the basic metals and fabricated metals sector (CH) and the rubber and plastics sector (CG). Figure 3.4.15 shows that as the recession took root in 1974, sectoral employment hardly responded. Only the textiles, apparel and footwear sector (CB), the rubber and plastics sector (CG) and the construction sector (F) reduced employment by -6%, -2% and -1%, respectively. Instead, it took another year before sectors started to react and cut employ-ment. With -11%, the electronics, electrical and optical products sector (CI+CJ) reacted the most, followed by the machinery and equipment sector (CK28) with -7% and the basic metals and fabricated metals sector (CH) and the rubber and plastics sector (CG) with around -6% each. In contrast, the majority of service sectors considered even kept on ex-panding employment by between 1% and 2%: the financial and insurance activities sector (K), the wholesale and retail trade sector (G), the accommodation and food service sector (I) as well as the real estate and business activities sector (LMN). In contrast, the construc-tion sector (F) cut employment by -1% (while in the EU-15, the construction sector (F) con-tracted more strongly by -3% in terms of employment). Figure 3.4.15
Sectoral employment growth rates during the economic crises of the 1970s in Japan
Source: EU KLEMS (release November 2009), own calculations.
Among all sectors considered, the construction sector (F) recovered the quickest from the crisis: in the year prior to the recession, employment grew by around 7%, but was cut by
CB
CBCB
CBCECE
CECE
CG
CG
CG
CG, FCH
CH
CH CH
CI+CJ
CI+CJ
CI+CJ
CK28, LMN, CI+CJCK28
CK28
CK28
CL29
CL29
CL29CL29
F
F
FG G GI
G, I
I I
K K K KLMN
LMNLMN
-15
-10
-5
0
5
10
1972 1973 1974 1975 1976 1977
Annu
al e
mpl
oym
ent g
row
th ra
tes
(%)
Japan: The crisis of the 1970s
TOTCBCECGCHCI+CJCK28CL29FGIKLMN
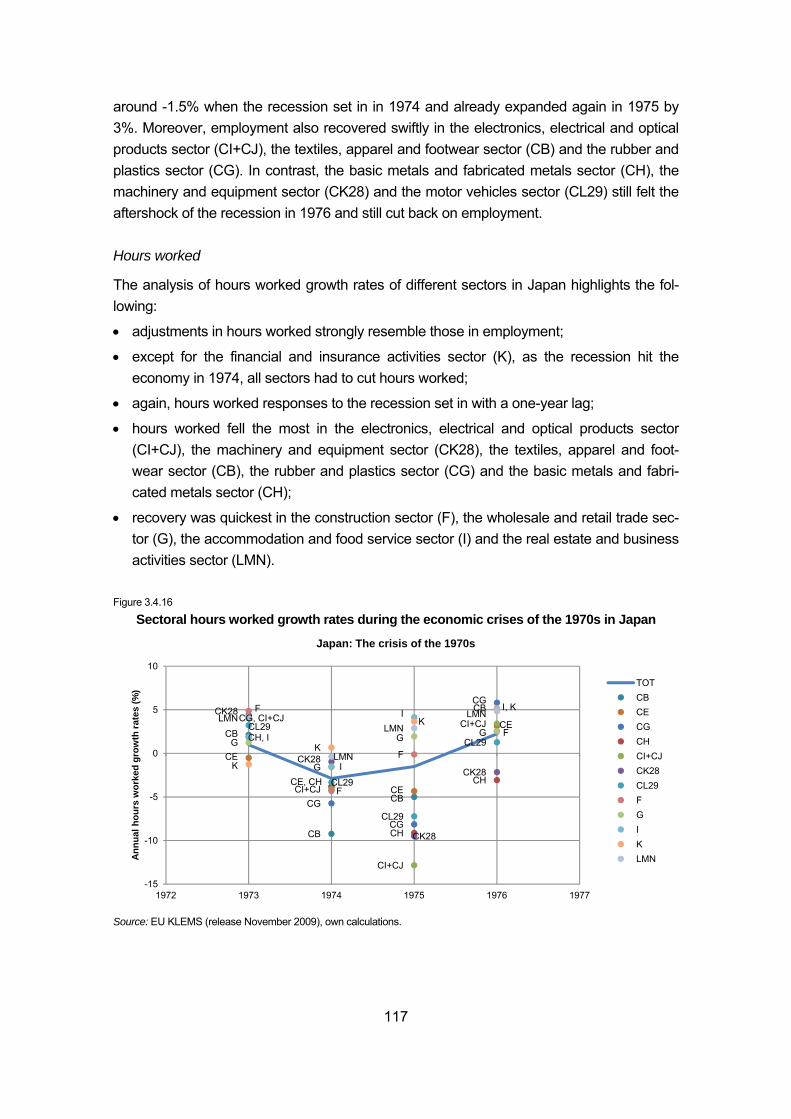
117
around -1.5% when the recession set in in 1974 and already expanded again in 1975 by 3%. Moreover, employment also recovered swiftly in the electronics, electrical and optical products sector (CI+CJ), the textiles, apparel and footwear sector (CB) and the rubber and plastics sector (CG). In contrast, the basic metals and fabricated metals sector (CH), the machinery and equipment sector (CK28) and the motor vehicles sector (CL29) still felt the aftershock of the recession in 1976 and still cut back on employment. Hours worked
The analysis of hours worked growth rates of different sectors in Japan highlights the fol-lowing:
• adjustments in hours worked strongly resemble those in employment;
• except for the financial and insurance activities sector (K), as the recession hit the economy in 1974, all sectors had to cut hours worked;
• again, hours worked responses to the recession set in with a one-year lag;
• hours worked fell the most in the electronics, electrical and optical products sector (CI+CJ), the machinery and equipment sector (CK28), the textiles, apparel and foot-wear sector (CB), the rubber and plastics sector (CG) and the basic metals and fabri-cated metals sector (CH);
• recovery was quickest in the construction sector (F), the wholesale and retail trade sec-tor (G), the accommodation and food service sector (I) and the real estate and business activities sector (LMN).
Figure 3.4.16
Sectoral hours worked growth rates during the economic crises of the 1970s in Japan
Source: EU KLEMS (release November 2009), own calculations.
CB
CB
CB
CB
CE
CE
CE
CG
CG
CG
CH, I
CE, CH
CH
CH
CG, CI+CJ
CI+CJ
CI+CJ
CI+CJCK28
CK28
CK28
CK28
CL29
CL29
CL29
CL29
F
F
F
FG
G
G G
I
I
K
K
KI, K
LMN
LMN
LMNLMN
-15
-10
-5
0
5
10
1972 1973 1974 1975 1976 1977
Annu
al h
ours
wor
ked
grow
th ra
tes
(%)
Japan: The crisis of the 1970s
TOTCBCECGCHCI+CJCK28CL29FGIKLMN
118
The response in hours worked to the crisis of the 1970s is depicted in Figure 3.4.16. It high-lights that variations in sectoral hours worked were stronger in Japan than in the EU-15. Furthermore, it emphasizes that similar sectors were affected by the 1970s crisis, to differ-ent degrees though: the electronics, electrical and optical products sector (CI+CJ), the ma-chinery and equipment sector (CK28), the textiles, apparel and footwear sector (CB), the basic metals and fabricated metals sector (CH) and the rubber and plastics sector (CG). Adjustments in hours worked strongly mirror those in employment. But, as the recession hit the economy in 1974, almost all sectors responded by cutting down hours worked. The strongest reductions occurred in the textiles, apparel and footwear sector (CB) with -6%, the rubber and plastics sector (CG) with -2% and the construction sector (F) with -1%. However, again, hours worked responses were strongest in the year after the recession and hours worked plummeted by -13% in the electronics, electrical and optical products sector (CI+CJ), by -9% in the machinery and equipment sector (CK28) and by -8% each in the rubber and plastics sector (CG) and the basic metals and fabricated metals sector (CH). Throughout the crisis, only the financial and insurance activities sector (K) managed to further expand hours worked: by 0.7% in 1974 and by 4% and 5% in 1975 and 1976, respectively. This stands in contrast to responses of service sectors in the EU-15 where all service sectors except for the accommodation and food service sector (I) and the financial insurance activities sector (K) cut hours worked. A comparison of Figures 3.4.15 and 3.4.16 further reveals that the economic crisis of the 1970s was predominantly weathered by flexibly adjusting hours worked. In 1975, the construction sector (F), the wholesale and retail trade sector (G), the accom-modation and food service sector (I) as well as the real estate and business activities sec-tor (LMN) quickly resumed increasing hours worked. The motor vehicles sector (CL29), the electronics, electrical and optical products sector (CI+CJ) and the rubber and plastics sec-tor (CG) quickly followed suit and expanded hours worked in 1976. In contrast, recovery was more sluggish in the basic metals and fabricated metals sector (CH) and the machin-ery and equipment sector (CK28) which both started increasing hours worked in 1979 only. Value-added
The analysis of sectoral value-added growth rates in Japan highlights the following:
• similar to employment and hours worked, value-added responded with a one-year lag;
• value-added fell most considerably in the chemicals sector (CE) by -46% and the elec-tronics, electrical and optical products sector (CI+CJ) by -24%;
• the financial and insurance activities sector (K) and the construction sector (F) were the first sectors to recover from the crisis.
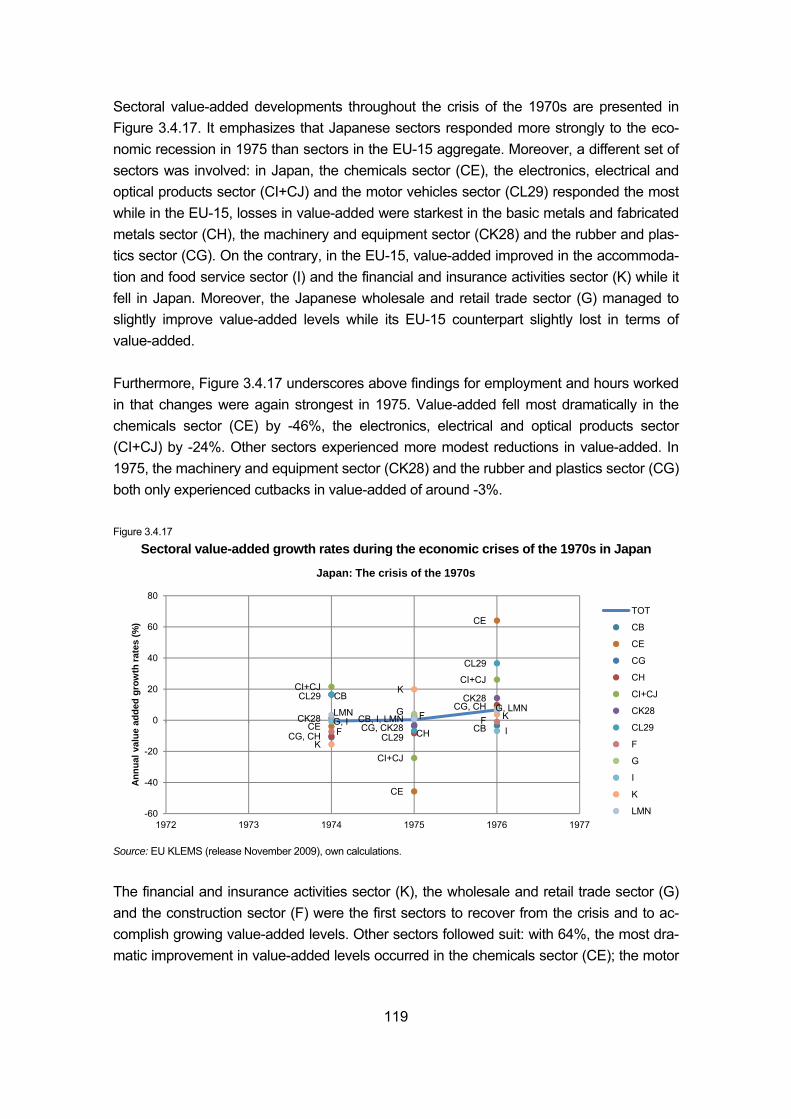
119
Sectoral value-added developments throughout the crisis of the 1970s are presented in Figure 3.4.17. It emphasizes that Japanese sectors responded more strongly to the eco-nomic recession in 1975 than sectors in the EU-15 aggregate. Moreover, a different set of sectors was involved: in Japan, the chemicals sector (CE), the electronics, electrical and optical products sector (CI+CJ) and the motor vehicles sector (CL29) responded the most while in the EU-15, losses in value-added were starkest in the basic metals and fabricated metals sector (CH), the machinery and equipment sector (CK28) and the rubber and plas-tics sector (CG). On the contrary, in the EU-15, value-added improved in the accommoda-tion and food service sector (I) and the financial and insurance activities sector (K) while it fell in Japan. Moreover, the Japanese wholesale and retail trade sector (G) managed to slightly improve value-added levels while its EU-15 counterpart slightly lost in terms of value-added. Furthermore, Figure 3.4.17 underscores above findings for employment and hours worked in that changes were again strongest in 1975. Value-added fell most dramatically in the chemicals sector (CE) by -46%, the electronics, electrical and optical products sector (CI+CJ) by -24%. Other sectors experienced more modest reductions in value-added. In 1975, the machinery and equipment sector (CK28) and the rubber and plastics sector (CG) both only experienced cutbacks in value-added of around -3%. Figure 3.4.17
Sectoral value-added growth rates during the economic crises of the 1970s in Japan
Source: EU KLEMS (release November 2009), own calculations.
The financial and insurance activities sector (K), the wholesale and retail trade sector (G) and the construction sector (F) were the first sectors to recover from the crisis and to ac-complish growing value-added levels. Other sectors followed suit: with 64%, the most dra-matic improvement in value-added levels occurred in the chemicals sector (CE); the motor
CB
CBCE
CE
CE
CG, CH CH
CG, CH
CI+CJ
CI+CJ
CI+CJ
CK28CG, CK28
CK28CL29
CL29
CL29
F
F FG
G, II
K
K
KLMNCB, I, LMN
G, LMN
-60
-40
-20
0
20
40
60
80
1972 1973 1974 1975 1976 1977
Annu
al v
alue
add
ed g
row
th ra
tes
(%)
Japan: The crisis of the 1970s
TOT
CB
CE
CG
CH
CI+CJ
CK28
CL29
F
G
I
K
LMN
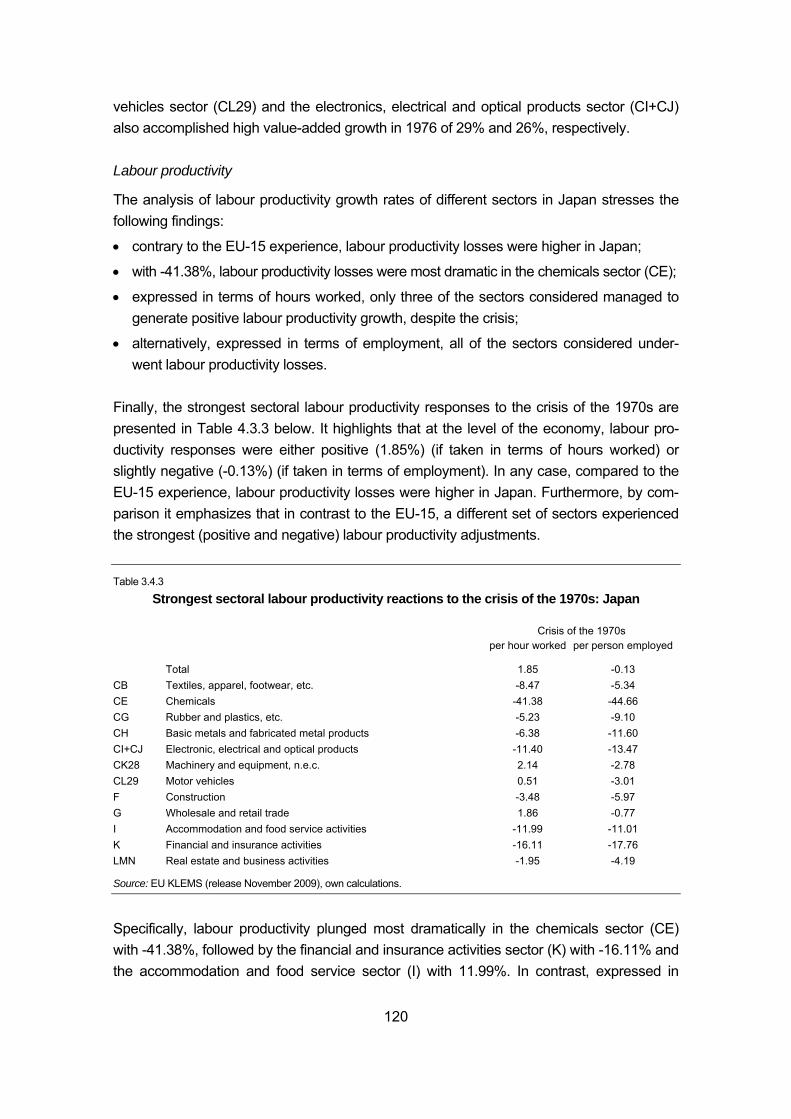
120
vehicles sector (CL29) and the electronics, electrical and optical products sector (CI+CJ) also accomplished high value-added growth in 1976 of 29% and 26%, respectively. Labour productivity
The analysis of labour productivity growth rates of different sectors in Japan stresses the following findings:
• contrary to the EU-15 experience, labour productivity losses were higher in Japan;
• with -41.38%, labour productivity losses were most dramatic in the chemicals sector (CE);
• expressed in terms of hours worked, only three of the sectors considered managed to generate positive labour productivity growth, despite the crisis;
• alternatively, expressed in terms of employment, all of the sectors considered under-went labour productivity losses.
Finally, the strongest sectoral labour productivity responses to the crisis of the 1970s are presented in Table 4.3.3 below. It highlights that at the level of the economy, labour pro-ductivity responses were either positive (1.85%) (if taken in terms of hours worked) or slightly negative (-0.13%) (if taken in terms of employment). In any case, compared to the EU-15 experience, labour productivity losses were higher in Japan. Furthermore, by com-parison it emphasizes that in contrast to the EU-15, a different set of sectors experienced the strongest (positive and negative) labour productivity adjustments. Table 3.4.3
Strongest sectoral labour productivity reactions to the crisis of the 1970s: Japan
Crisis of the 1970s per hour worked per person employed
Total 1.85 -0.13 CB Textiles, apparel, footwear, etc. -8.47 -5.34 CE Chemicals -41.38 -44.66 CG Rubber and plastics, etc. -5.23 -9.10 CH Basic metals and fabricated metal products -6.38 -11.60 CI+CJ Electronic, electrical and optical products -11.40 -13.47 CK28 Machinery and equipment, n.e.c. 2.14 -2.78 CL29 Motor vehicles 0.51 -3.01 F Construction -3.48 -5.97 G Wholesale and retail trade 1.86 -0.77 I Accommodation and food service activities -11.99 -11.01 K Financial and insurance activities -16.11 -17.76 LMN Real estate and business activities -1.95 -4.19
Source: EU KLEMS (release November 2009), own calculations.
Specifically, labour productivity plunged most dramatically in the chemicals sector (CE) with -41.38%, followed by the financial and insurance activities sector (K) with -16.11% and the accommodation and food service sector (I) with 11.99%. In contrast, expressed in
121
terms of hours worked, only three sectors experienced any labour productivity gains during the economic crisis of the 1970s: the machinery and equipment sector (CK28) (with 2.14%), the wholesale and retail trade sector (G) (with 1.86%) and the motor vehicles sec-tor (CL29) (with 0.51%). However, expressed in terms of employment, none of the sectors considered experienced any labour productivity gains during the crisis of the 1970s. Summary
The analysis of sectoral employment responses to the economic crisis of the 1970s dem-onstrates that the majority of sectors reacted with a one-year lag only. Moreover, employ-ment reductions were strongest in the electronics, electrical and optical products sector (CI+CJ), the machinery and equipment sector (CK28), the basic metals and fabricated metals sector (CH) and the rubber and plastics sector (CG). However, despite the crisis, with the exception of construction (F), all service sectors still expanded employment. And from a comparative perspective, despite the weaker and shorter 1970s recession in Japan, variations in employment growth rates were significantly larger in Japan than in the EU-15. Furthermore, a similar set of sectors were affected by the crisis of the 1970s. Again, patterns of adjustment of hours worked reveal that labour hoarding was a uniformly practiced strategy in all sectors considered. Additionally, adjustments in hours worked in manufacturing sectors strongly resemble those in employment. In contrast, employment expansions in all service sectors (except construction (F)) had to be counterbalanced by cut-backs in hours worked to accommodate the recession. And except for the financial and insurance activities sector (K) which already adjusted hours worked prior to the recession, as the recession hit the economy in 1974, all sectors had to cut hours worked. However, similar to employment adjustments, hours worked were predominantly adjusted with a one-year lag. And from a comparative perspective, variations in sectoral hours worked were stronger in Japan than in the EU-15. Similar to employment and hours worked, value-added responded with a one-year lag only. From a comparative perspective, sectors in Japan responded more strongly to the economic recession of the 1970s than sectors in the EU-15 aggregate. Moreover, a different set of sectors was affected. Value-added dropped the most in the chemicals sector (CE) by -46% and the electronics, electrical and optical products sector (CI+CJ) by -24%. In contrast, the wholesale and retail sector (G) and the real estate and business activities sector (LMN) both succeeded in further expanding value-added levels despite the ongoing recession. Finally, some sectors experienced rather dramatic changes in labour productivity. Specifi-cally, with -41.38%, the chemicals sector (CE) underwent the most dramatic labour produc-tivity losses, followed by the financial and insurance activities sector (K) with -16.11% and the accommodation and food service sector (I) with 11.99%. In contrast, only very few sec-tors maintained positive labour productivity growth, despite the crisis: together with the
122
machinery and equipment sector (CK28), only the wholesale and retail trade sector (G) and the motor vehicles sector (CL29) managed to further expand labour productivity, de-spite the economically difficult times. 3.5 Changes in employment by sector 2007-2010
3.5.1 Introduction
After having analysed these previous patterns of employment change in crisis periods we now turn to the developments during the recent recession in the same terms, i.e. distin-guishing changes in value-added, hours worked, productivity and the number employed. The aim is to examine the changes which occurred not only over the period of economic downturn which followed the global financial crisis, but equally importantly over the subse-quent initial stages of recovery, which in most EU countries took place in the latter part of 2009. This is based in the first instance on annual Eurostat national accounts data which, in principle, distinguish sectors of economic activity at the NACE 2-digit level. Unfortu-nately, however, at the time of writing (at the beginning of October, 2011), there are as yet no data available for sectors within manufacturing for 2010 for nearly all countries, which means that there are no data either for EU aggregates. Nevertheless, there are data at the NACE 1-digit level which means that at least it is possible to examine developments in the service sectors selected for study as well as in the construction industry. To overcome this lack of national accounts data, data are used instead from the short-term business statistics (STS) compiled by Eurostat which are both reasonably up to date (they contain data for employment up to the first quarter of 2011) and disaggregated by NACE 2-digit sector within manufacturing. Moreover, unlike the national accounts, they are com-piled on a NACE rev. 2 basis and accordingly conform to the way the 12 sectors selected for the study are defined. In addition, they contain data on production which enables em-ployment to be related to output and the implied movement of labour productivity during both the recession and the subsequent recovery to be examined. The analysis begins, however, by considering developments at the broad sector level in order to give a general overview of changes during these two periods across the economy as a whole. 3.5.2 Developments in GDP and total employment
The economic downturn in response to the financial crisis and consequent global recession was initiated during the course of 2008, earlier in some countries, like Ireland and the Baltic states, later in others, such as many of the EU-12 countries (the countries which have en-tered the EU since 2004), the timing largely reflecting exposure to the turmoil in world finan-cial markets. Because of adjustment lags – the delay in the realization among employers of
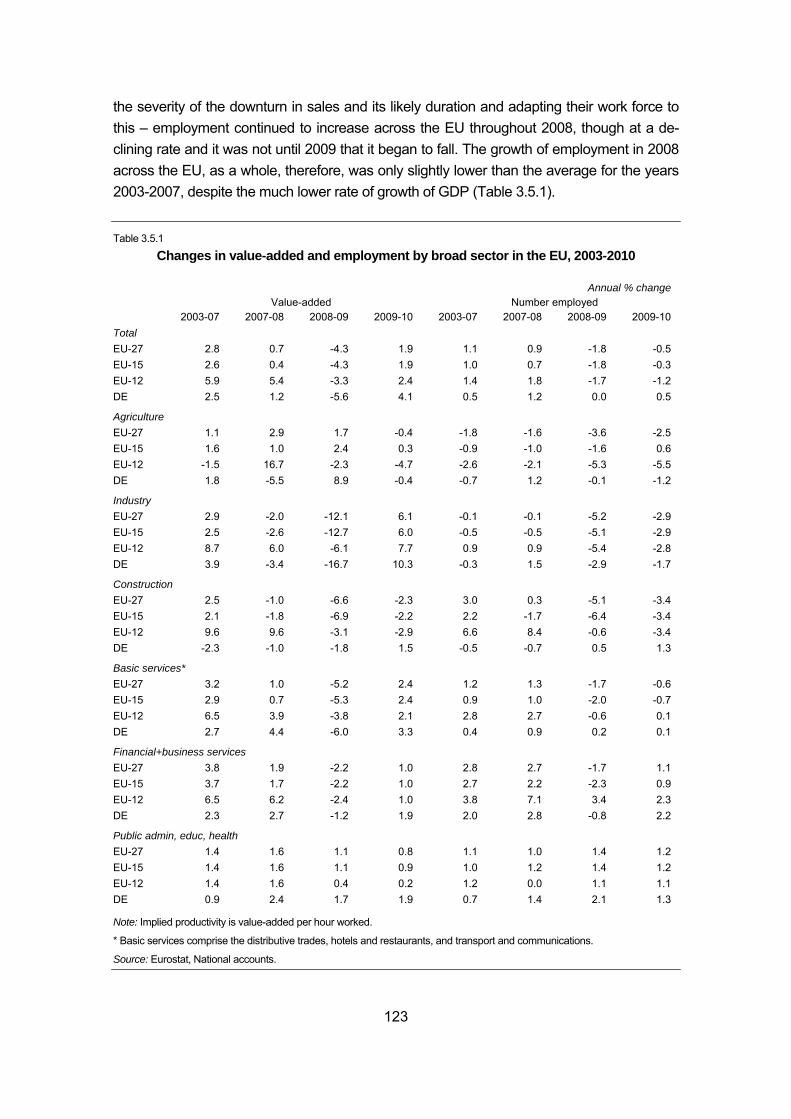
123
the severity of the downturn in sales and its likely duration and adapting their work force to this – employment continued to increase across the EU throughout 2008, though at a de-clining rate and it was not until 2009 that it began to fall. The growth of employment in 2008 across the EU, as a whole, therefore, was only slightly lower than the average for the years 2003-2007, despite the much lower rate of growth of GDP (Table 3.5.1). Table 3.5.1
Changes in value-added and employment by broad sector in the EU, 2003-2010
Annual % change Value-added Number employed 2003-07 2007-08 2008-09 2009-10 2003-07 2007-08 2008-09 2009-10Total EU-27 2.8 0.7 -4.3 1.9 1.1 0.9 -1.8 -0.5EU-15 2.6 0.4 -4.3 1.9 1.0 0.7 -1.8 -0.3EU-12 5.9 5.4 -3.3 2.4 1.4 1.8 -1.7 -1.2DE 2.5 1.2 -5.6 4.1 0.5 1.2 0.0 0.5
Agriculture EU-27 1.1 2.9 1.7 -0.4 -1.8 -1.6 -3.6 -2.5EU-15 1.6 1.0 2.4 0.3 -0.9 -1.0 -1.6 0.6EU-12 -1.5 16.7 -2.3 -4.7 -2.6 -2.1 -5.3 -5.5DE 1.8 -5.5 8.9 -0.4 -0.7 1.2 -0.1 -1.2
Industry EU-27 2.9 -2.0 -12.1 6.1 -0.1 -0.1 -5.2 -2.9EU-15 2.5 -2.6 -12.7 6.0 -0.5 -0.5 -5.1 -2.9EU-12 8.7 6.0 -6.1 7.7 0.9 0.9 -5.4 -2.8DE 3.9 -3.4 -16.7 10.3 -0.3 1.5 -2.9 -1.7
Construction EU-27 2.5 -1.0 -6.6 -2.3 3.0 0.3 -5.1 -3.4EU-15 2.1 -1.8 -6.9 -2.2 2.2 -1.7 -6.4 -3.4EU-12 9.6 9.6 -3.1 -2.9 6.6 8.4 -0.6 -3.4DE -2.3 -1.0 -1.8 1.5 -0.5 -0.7 0.5 1.3
Basic services* EU-27 3.2 1.0 -5.2 2.4 1.2 1.3 -1.7 -0.6EU-15 2.9 0.7 -5.3 2.4 0.9 1.0 -2.0 -0.7EU-12 6.5 3.9 -3.8 2.1 2.8 2.7 -0.6 0.1DE 2.7 4.4 -6.0 3.3 0.4 0.9 0.2 0.1
Financial+business services EU-27 3.8 1.9 -2.2 1.0 2.8 2.7 -1.7 1.1EU-15 3.7 1.7 -2.2 1.0 2.7 2.2 -2.3 0.9EU-12 6.5 6.2 -2.4 1.0 3.8 7.1 3.4 2.3DE 2.3 2.7 -1.2 1.9 2.0 2.8 -0.8 2.2
Public admin, educ, health EU-27 1.4 1.6 1.1 0.8 1.1 1.0 1.4 1.2EU-15 1.4 1.6 1.1 0.9 1.0 1.2 1.4 1.2EU-12 1.4 1.6 0.4 0.2 1.2 0.0 1.1 1.1DE 0.9 2.4 1.7 1.9 0.7 1.4 2.1 1.3
Note: Implied productivity is value-added per hour worked.
* Basic services comprise the distributive trades, hotels and restaurants, and transport and communications.
Source: Eurostat, National accounts.
124
Growth of employment in the EU-15 was much less than in the EU-12, reflecting the fact that GDP growth was also much lower – indeed, in the EU-12, growth of GDP between 2007 and 2008 was still over 5% and only marginally lower than the average over the pre-ceding four years. In Germany, growth of employment in 2008 was also above the rate in the rest of the EU-15 as was growth of GDP even if less than over the previous 4 years. cat that , em-ployment in the fourth quarter of 2008 was already below the level of year earlier, whereas in the EU-12 countries, taken together, it was 1% higher, reflecting the fact that GDP, unlike, in the EU-15, was also well above the level in the fourth quarter of 2007 (by over 2%). Employment was also 1% above the level of a year earlier in Germany, though here GDP, as in the rest of the, EU-15 had already fallen by over 2% as compared with 2007. GDP continued to fall in the first half of 2009, so that the average for the year in the EU was over 4% lower than in 2008. In consequence, the number employed also fell but not at the same rate, the average over the year being just under 2% less than a year earlier. The reduction in GDP in the EU-12 was some 1 percentage point less than in the EU-15, at just over 3%. Nevertheless, the decline in numbers employed was much the same. In Ger-many, however, GDP fell by more in 2009 than the EU - by around 5.5% - but there was no decline in employment, the number in work remaining the same in 2009 as in 2008 sig-nalling very different behaviour on the part of employers than in the rest of the EU. Implic-itly, therefore, there was a much bigger reduction in value-added per person employed in Germany than in other Member States (the extent to which this was due to a reduction in average hours worked is considered below). The fall in GDP came to end in most countries during the course of 2009 and, by the sec-ond half of the year, there was a resumption of growth, though at a slow rate. Modest growth continued during 2010 and GDP over the year in the EU was some 2% higher than a year earlier. There was also some pick-up in employment from the second quarter of 2010 on, but not by enough to compensate for the reduction during 2009, so the average number employed over the year was still around 0.5% lower than in the previous year. Growth of GDP was slightly higher in the EU-12 than in the EU-15 (by some 0.5 of a per-centage point), but the fall in employment between the two years, at over 1%, was larger than in the latter. Indeed, in the EU-12, there was little sign of any significant recovery in employment during the year and the number employed in n the first quarter of 2011 was only marginally higher than a year earlier. In Germany, growth of GDP was also higher than the EU-15 average, but in this case sig-nificantly so, the average level of GDP in 2010 being some 4% higher than in 2009. Whereas, therefore, Germany suffered a bigger reduction in GDP during the recession
125
than the EU average, it has also enjoyed a faster recovery, reflecting its specialization in investment goods and motor vehicles for which global demand picked up strongly as re-covery occurred. Instead of falling, therefore, the number employed in 2010 was higher than a year earlier (by 0.5%). This is less than would be expected on past relationships given the rate of growth of GDP, but it came after a large fall in GDP per person employed as noted above and, as indicated below, it still left the level of labour productivity signifi-cantly lower than it was in 2007 before the recession began. 3.5.3 Developments in employment by broad sector
Developments over the recession period
The decline in GDP during the recession was very much concentrated in industry (which consists largely of manufacturing but also mining and public utilities). While there also sig-nificant reductions in construction and basic services (distribution, hotels and restaurants and transport and communications), these were much smaller. In the EU as a whole, value-added in industry was some 12% lower in 2009 than in 2008 when it was already 2% lower than in 2007 because of the sharp fall in the second half of the year. The decline was much smaller in the EU-12 than in the EU-15, at just 6% and since the recession hit most of the countries concerned later than in the EU-15 (though not the Baltic states), industry still registered value-added growth of 6% in 2008. Accordingly, there was little or no fall in value-added in this sector between 2007 and 2009, in stark contrast to the steep decline in the EU-15. The decline, moreover, was even larger in Germany than the EU-15 average, value-added in industry being almost 17% lower in 2009 than in 2008 and around 20% lower than in 2007 before the recession began. The fall in value-added led to significant job losses in industry across the EU, the number employed being on average 5% lower in 2009 than in 2008. The reduction in employment was slightly larger in the EU-12 than in the EU-15 despite the much smaller fall in value-added, signifying very different behaviour on the part of employers, though also reflecting a difference in the underlying rate of productivity growth which averaged around 7% in indus-try over the four years 2003-2007, twice the average rate over this period in the EU-15 (this is considered further below). In Germany, despite the larger reduction in value-added than in the rest of the EU-15 taken together, the number employed decline by much less and was only around 3% lower in the 2009 than in 2008. Moreover, since in contrast to the rest of the EU-15, there was an in-crease in employment in 2008, the number employed in industry in Germany was only 1.5% lower in 2009 than before the recession began even though value-added was 20% less.
126
In other sectors, the reduction in value-added was less but it still averaged around 6.5% in construction between 2008 and 2009 across the EU and 5% in basic services. In both cases, the fall was much larger in the EU-15 than in the EU-12, especially in construction (around twice as large). The behaviour of employment in relation to value-added, however, was markedly different in the two sectors, particularly in the EU-15. Whereas in basic ser-vices, the number employed declined by much less than the fall in value-added – by around as opposed to over 5% - in construction, it declined by only slightly less. In the EU-15, therefore, the number employed in construction was around 6.5% lower in 2009 than in 2008 having fallen by just over 1.5% in the latter year, implying an overall reduction in the two years of around 8%, not much less than the fall in value-added. The reduction in value-added in construction, therefore, was much more directly translated into a cutback in the work force than in basic services or, indeed, in industry. This reflects in part the different division of the decline in output in construction between Member States than in industry or basic services. While the decline in industry dispropor-tionately occurred in Germany, as indicated above – and the decline in basic services was relatively evenly spread across countries – the decline in construction occurred dispropor-tionately in Spain (as well as Ireland). In the latter, there is evidence of a much greater ten-dency on the part of employers, not only in construction, to reduce employment as output fell than in Germany or in other countries. Indeed, in Germany, employment in construction increased slightly in 2009 despite a reduction in value-added, even if smaller than in other EU-15 countries. In the financial and business sector (i.e. advanced rather than basic services), the decline in value-added, despite the crisis being initiated by problems in the financial market, was much less, averaging only just over 2% in 2009 across the EU as a whole and by the same in the EU-12 as in the EU-15. In the EU-15, the number employed declined at a similar rate to that of value-added. In the EU-12, however, employment increased at much the same rate as over the four year 2003-2007 despite the fall in value-added – though it should be noted that the measurement of value-added in financial services in particular is relatively complicated and bears little relationship to the actual activities performed by those em-ployed in the sector. It should equally be noted that though there were well-publicized job cuts in many large banks during the recession, these were predominantly concentrated among those involved in financial market activities who account for a relatively small pro-portion of the total work force, rather than in financial services as such. In the public sector parts of service activities – in education and healthcare as well as pub-lic administration – together with personal services (though these account for only a small share of the total) employment, along with value-added, continued to grow by much the same rate in 2009 as in earlier years, at just over 1%, in both the EU-15 and EU-12, though in this case at a slightly higher rate in the former than the latter. In Germany, there
127
was an increase of 2%, over twice the average over the 2003-2007 period and more than in the rest of the EU-15. Job growth in the public sector over the recession period, there-fore, helped to some (small) extent to compensate for job losses on other sectors and, accordingly, to prevent the overall number employed from falling further. Developments in the early stages of recovery
Just as the recession was concentrated in industry, so has been the recovery, at least in its early stages. Value-added grew by 6% between 2009 and 2010 in the EU as a whole, considerably more than in other parts of the economy. In the EU-12, growth was even higher at almost 8%. In Germany, however, it was higher still at around 10.5%, compensat-ing for half of the decline experienced over the preceding two years. Although employment in industry began to increase in the EU during the year – if in most countries not until towards the end – the rise was not sufficient to prevent the number in work being some 3% lower in 2010 than in 2009. This was the case in both the EU-15 and the EU-12. In Germany, on the other hand, the number employed was only just over 1.5% lower in 2010 than a year earlier, reflecting the much larger increase in value-added. While in the EU-15 on average, therefore, employment in industry was over 8% less in 2010 than in 2007 before the recession began, in Germany, it was around 3% less despite the overall reduction in value-added over this period being similar. In the EU-12, employment in indus-try was just over 7% less in 2010 than in 2007, a slightly smaller decline than in the EU-15. Here, however, value-added was significantly higher in 2010 than three years earlier – by around 7.5% - implying an increase in labour productivity over this period unlike in the rest of the EU, even if at a much slower rate than over the preceding growth period. In other sectors, value-added either increased by much less than in industry or, in the case of construction, continued to decline, though in Germany, there was an increase in this sector as well. In the latter country apart, where the number employment also went up, employment was around 3.5 percentage points lower in 2010 than in 2009 in both the EU-15 and EU-12. In basic services, where value-added was some 2% or slightly higher in 2010 than a year earlier across the EU, employment was down by just under 1% in the EU-15, while in both the EU-12 Germany and Germany, it was up marginally. In financial and business services, where value-added went up by just 1% between 2009 and 2010 across the EU as a whole, well below the average growth rate recorded over the growth years before the recession, the number employed increased at much the same rate, though by more in both the EU-12 and Germany, in the latter reflecting a higher rate of value-added growth than elsewhere (2%).
128
In the public sector, employment across the EU was just over 1% higher in 2010 than in 2009, a marginally smaller increase than in the latter year but similar to the growth rate over the 2003-2007 period. 3.5.4 Developments in average hours worked and labour productivity
Developments over the recession period
The above summary of changes in value-added and employment over the recession and subsequent beginnings of recovery indicate that the relationship between the two altered over this period, particularly in industry. The concern here is to explore how far the decline in value-added per person employed during the recession was due to a reduction in aver-age hours worked and how far to a decline in productivity, measures in terms of value-added per hour worked, as well as to examine what has happened as the economy has begun to recover. It is evident in practice that both contributed significantly to maintaining the number in work during the recession. It also evident that the reduction in both which occurred is being reversed as growth is resumed. Across the EU as a whole, therefore, average hours worked declined by around 1.5% be-tween 2008 and 2009 which compares with a marginal reduction of only 0.1% a year over the period 2003-2007 (Table 3.5.2). The decline in 2009 was slightly larger in the EU-12 than in the EU-15, but it was larger still in Germany, where it was over 2.5%. This was ac-companied by a slightly smaller decline in labour productivity in the EU-15 – of around 1% - though not in the EU-12, where productivity remained almost the same, which, neverthe-less, represents a significant decline in relation to the long-term trend (growth of over 4% in 2003-2007). Even in the EU-15, value-added per hour worked was around 4.5% lower in 2009 than it would have been had productivity grown by the same rate between 2007 and 2009 as over the preceding four years. In Germany, the reduction in productivity in 2009 was much larger than in other countries, amounting to some 3%, so that value-added per hour worked in this year was even further below the long-term trend. Although the reduction in hours worked was widespread across the economy, if smaller in the public sector than elsewhere, it was much larger in industry than in other sectors. It is evident, however, that the decline was concentrated in industry. Across the EU as a whole, average hours worked in industry declined by almost 4% between 2008 and 2009, though slightly less in the EU-12 (around 3.5%). In Germany, however, the reduction amount to almost 7% after a decline of 1% in 2008. The reduction in productivity in industry was very similar in the EU-15 to that in average hours worked, amounting to just over 4% in 2009 following a fall of just over 1.5% in 2008.
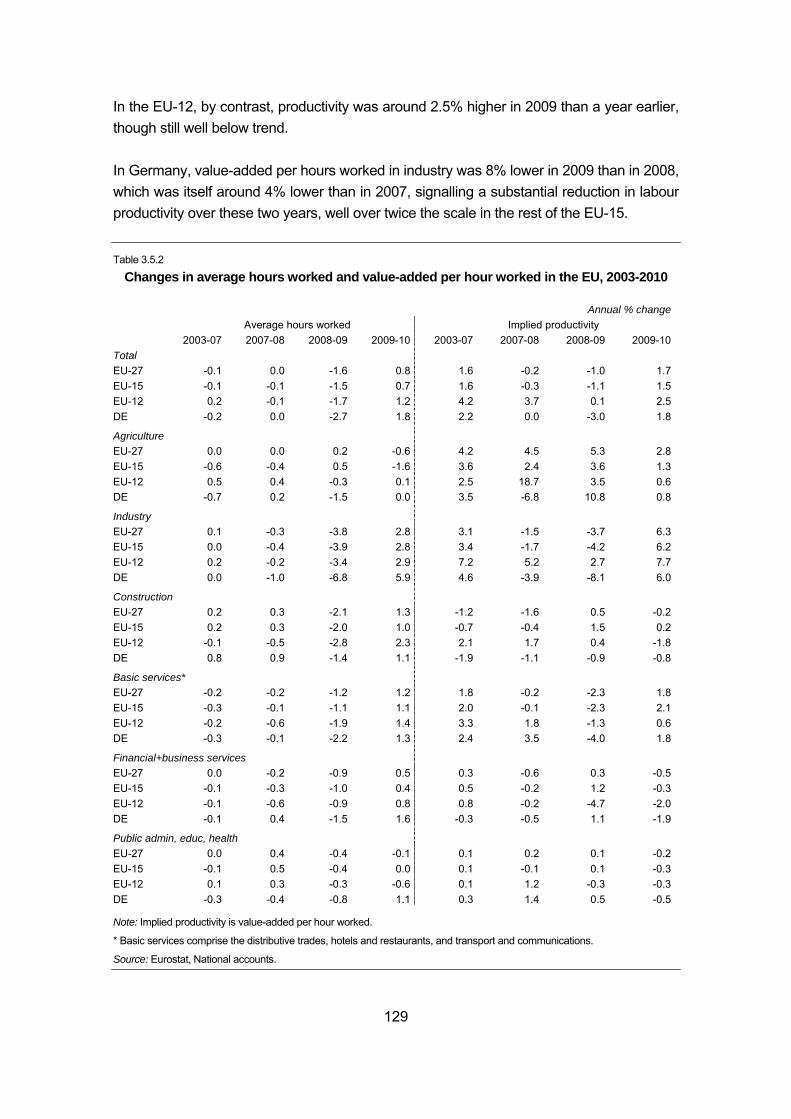
129
In the EU-12, by contrast, productivity was around 2.5% higher in 2009 than a year earlier, though still well below trend. In Germany, value-added per hours worked in industry was 8% lower in 2009 than in 2008, which was itself around 4% lower than in 2007, signalling a substantial reduction in labour productivity over these two years, well over twice the scale in the rest of the EU-15. Table 3.5.2
Changes in average hours worked and value-added per hour worked in the EU, 2003-2010
Annual % change Average hours worked Implied productivity
2003-07 2007-08 2008-09 2009-10 2003-07 2007-08 2008-09 2009-10Total EU-27 -0.1 0.0 -1.6 0.8 1.6 -0.2 -1.0 1.7EU-15 -0.1 -0.1 -1.5 0.7 1.6 -0.3 -1.1 1.5EU-12 0.2 -0.1 -1.7 1.2 4.2 3.7 0.1 2.5DE -0.2 0.0 -2.7 1.8 2.2 0.0 -3.0 1.8
Agriculture EU-27 0.0 0.0 0.2 -0.6 4.2 4.5 5.3 2.8EU-15 -0.6 -0.4 0.5 -1.6 3.6 2.4 3.6 1.3EU-12 0.5 0.4 -0.3 0.1 2.5 18.7 3.5 0.6DE -0.7 0.2 -1.5 0.0 3.5 -6.8 10.8 0.8
Industry EU-27 0.1 -0.3 -3.8 2.8 3.1 -1.5 -3.7 6.3EU-15 0.0 -0.4 -3.9 2.8 3.4 -1.7 -4.2 6.2EU-12 0.2 -0.2 -3.4 2.9 7.2 5.2 2.7 7.7DE 0.0 -1.0 -6.8 5.9 4.6 -3.9 -8.1 6.0
Construction EU-27 0.2 0.3 -2.1 1.3 -1.2 -1.6 0.5 -0.2EU-15 0.2 0.3 -2.0 1.0 -0.7 -0.4 1.5 0.2EU-12 -0.1 -0.5 -2.8 2.3 2.1 1.7 0.4 -1.8DE 0.8 0.9 -1.4 1.1 -1.9 -1.1 -0.9 -0.8
Basic services* EU-27 -0.2 -0.2 -1.2 1.2 1.8 -0.2 -2.3 1.8EU-15 -0.3 -0.1 -1.1 1.1 2.0 -0.1 -2.3 2.1EU-12 -0.2 -0.6 -1.9 1.4 3.3 1.8 -1.3 0.6DE -0.3 -0.1 -2.2 1.3 2.4 3.5 -4.0 1.8
Financial+business services EU-27 0.0 -0.2 -0.9 0.5 0.3 -0.6 0.3 -0.5EU-15 -0.1 -0.3 -1.0 0.4 0.5 -0.2 1.2 -0.3EU-12 -0.1 -0.6 -0.9 0.8 0.8 -0.2 -4.7 -2.0DE -0.1 0.4 -1.5 1.6 -0.3 -0.5 1.1 -1.9
Public admin, educ, health EU-27 0.0 0.4 -0.4 -0.1 0.1 0.2 0.1 -0.2EU-15 -0.1 0.5 -0.4 0.0 0.1 -0.1 0.1 -0.3EU-12 0.1 0.3 -0.3 -0.6 0.1 1.2 -0.3 -0.3DE -0.3 -0.4 -0.8 1.1 0.3 1.4 0.5 -0.5
Note: Implied productivity is value-added per hour worked.
* Basic services comprise the distributive trades, hotels and restaurants, and transport and communications.
Source: Eurostat, National accounts.
130
In construction, the reduction in average hours worked was much less than in industry, averaging around 2% across the EU in 2009, though close to 3% in the EU-12 and produc-tivity increased slightly, though by more in the EU-15 than in the EU-12. In Germany, how-ever, it declined by 1% in both 2008 and 2009. In basic services, the reduction in average hours worked was smaller still, except in Ger-many. In the EU-15, therefore, jobs were maintained largely through a reduction in produc-tivity and even more so in Germany, where it fell by 4% in 2009. In the EU-12, the reduc-tion in hours worked was more important, amounting to some 2% in 2009 following a de-cline of 0.5% in 2008. In financial and business services, average hours worked across the EU – in both the EU-12 and the EU-15 – were around 1% lower in 2009 than in 2008. In the EU-15, productivity was 1% higher, while in the EU-12, it was around 4.5% lower (those as indicated above, this may largely reflect the way that value-added is measured in financial services rather than a significant reduction in the activities performed). In public services, where productivity as measured does not mean much, average hours worked declined by only around 0.5% in the EU as a whole, though this followed an in-crease of a similar amount in 2008. Developments during the early stages of recovery
As recovery has begun, so both average hours worked and productivity have increased to make good some of the reduction which occurred during the recession period. This is common across broad sectors in the EU as a whole but it is especially evident in industry. Across the EU, therefore, average hours worked increased by just under 1% between 2009 and 2010 and by slightly over 1% in the EU-12. In Germany, they increased by al-most 2%, so reversing much of the reduction which occurred in 2009. At the same time, labour productivity rose by 1.5% in the EU-15 and 2.5% in the EU-12, in the former, taking the level of value-added per hour worked back to what it was in 2007 and in the latter to well above this. In Germany, productivity rose by just under 2%, but this still left it over 1% below the level in 2007 before the recession hit and much further below what it would have been if it had grown at its trend rate over this period. In industry, average hours worked increased by around 3% in both the EU-15 and EU-12, again making good some but not all of the reduction which occurred in 2009. In Germany, they increased by 6%, but again this was less than the reduction in the previous year.
131
Productivity in industry increased substantially across the EU, by over 6% in the EU-15 and by over 7.5% in the EU-12, in the former taking value-added per hour worked v back to the level in 2007. In the EU-12, it meant a return to the growth rate experienced in the years before the recession hit. In Germany, the increase in productivity between 2009 and 2010 was much the same as in the EU-15 average, but in this case, it left value-added per hour worked at only half the level it was in 2007, i.e. some 6% less than before the recession. In the other sectors, average hours worked also increased, reversing much of the decline in 2009. Productivity rose as well in basic services, though not in construction, where value-added continued to decline, or in the other sectors. In basic services, therefore, the growth in productivity took the level in the EU-15 back to what it was in 2007 and in the EU-12 – as well as in Germany – to above this level, despite the increase being relatively small. 3.5.5 Developments in employment in manufacturing industries
As noted above, the national accounts data available do not enable employment develop-ments within industry to be examined in 2010 let alone in the first part of 2011. To overcome this difficulty, the Short-term Business Statistics compiled by Eurostat are used instead. These provide data on employment in manufacturing at the 2-digit level classified according to NACE rev. 2 instead of NACE rev. 1 which had to be used for the historical analysis in the earlier parts of this report. They, therefore, enable the developments in the 7 sectors selected for study within manufacturing to be examined over the most recent period – up to the first quarter of 2011 at the time of writing. The one drawback with the data is that al-though statistics for output as well as employment are included so as allow labour productiv-ity to be calculated, these relate to production rather value-added, which accordingly include the value of inputs and corresponds to gross rather than net output. Over a relative short period, however, the relationship between production and value-added ought not to change significantly and, therefore, the former should give a reasonable indication of the change in activity within the selected industries since 2007 and so of labour productivity. The quarterly data also enable some account to be taken of the likely lag between changes in output and changes in employment, reflecting the probable delayed response of em-ployers in adjusting their work force to such a change. Taking account of such a lag, there-fore, should give a better indication of the underlying change in labour productivity than simply relating current employment to current output. The lag applied here is two quarters, which is somewhat arbitrary – it might be more or less than the actual lag – but is intended simply to give an indication of the underlying productivity change. Of course, employers are much more able to adjust the working time of their employees quickly than the numbers and, in practice, this is indicated by the data.
132
Developments over the recession period
The short-term statistics show much the same change in manufacturing over the period 2007-2009 as the national accounts data for industry, which is not too surprising since manufacturing accounts for a major share of industrial output and employment. At the same time, it should be noted that because of the difference in classification methodology between NACE rev. 1 and NACE rev. 2, the activities included as part of manufacturing are not precisely the same in the two classifications18, which is a possible cause of difference between the developments examined above and those examined in this section. Between the first quarter of 2008 and the first quarter of 2009, therefore, manufacturing production fell by almost 19% in the EU as a whole, by more in the EU-12 than in the EU-15 and equally by more in Germany (21.5%) (see Table 3.5.3). This was accompanied by a fall in employment of around 5% over the period, though by 8% in the EU-12, almost twice as much as in the EU-15. In Germany in sharp contrast, the number employed fell only slightly despite the larger reduction in production. The decline in manufacturing production was mirrored in the 7 industries selected for study. The extent of the fall was much the same in Textiles and clothing, slightly larger in Chemicals, Robber (including plastics, glass and non-metallic mineral products), Electronic and electrical equipment and Machinery and equipment, significantly larger in basic metals (28% across the EU as a whole as well as in the EU-15 and EU-12) and largest of all in Motor vehicles, which production declined by 40% in the EU, slightly more in the EU-15, slightly less in the EU-12 and in Germany. This differential effect on industries is even more marked if account is taken of the underlying trend in production in the various sectors, which is reflected in the change between the first quarters of 2007 and 2008 before the crisis hit. Whereas, therefore, there was a long-term downward trend in the textiles industry across the EU – if not in all Member States – and low growth in the rubber, plastics etc. industry, there was significant growth in electronics, machinery and equipment and motor vehicles and, indeed, to a lesser extent in the basic metals industry. The impact of the crisis, therefore, in terms of the industries most affected, especially if the decline in production that occurred is related to underlying trends, was similar to that in previous periods of economic downturn, though much larger in scale than at any time in the post-war period. The response of employment to the fall in production, however, differed markedly across sectors. The largest decline was in textiles and clothing, where the number employed fell by 12.5% across the EU as a whole between the first quarters of 2008 and 2009 and by 18 The fact that NACE rev. 2 is on an activity basis and NACE rev. 1 on a production basis means that activities such as
central office administration or after-sales services included as part of manufacturing under the latter if they were undertaken for a manufacturing enterprise are no longer included under NACE rev. 2 if they can be distinguished.
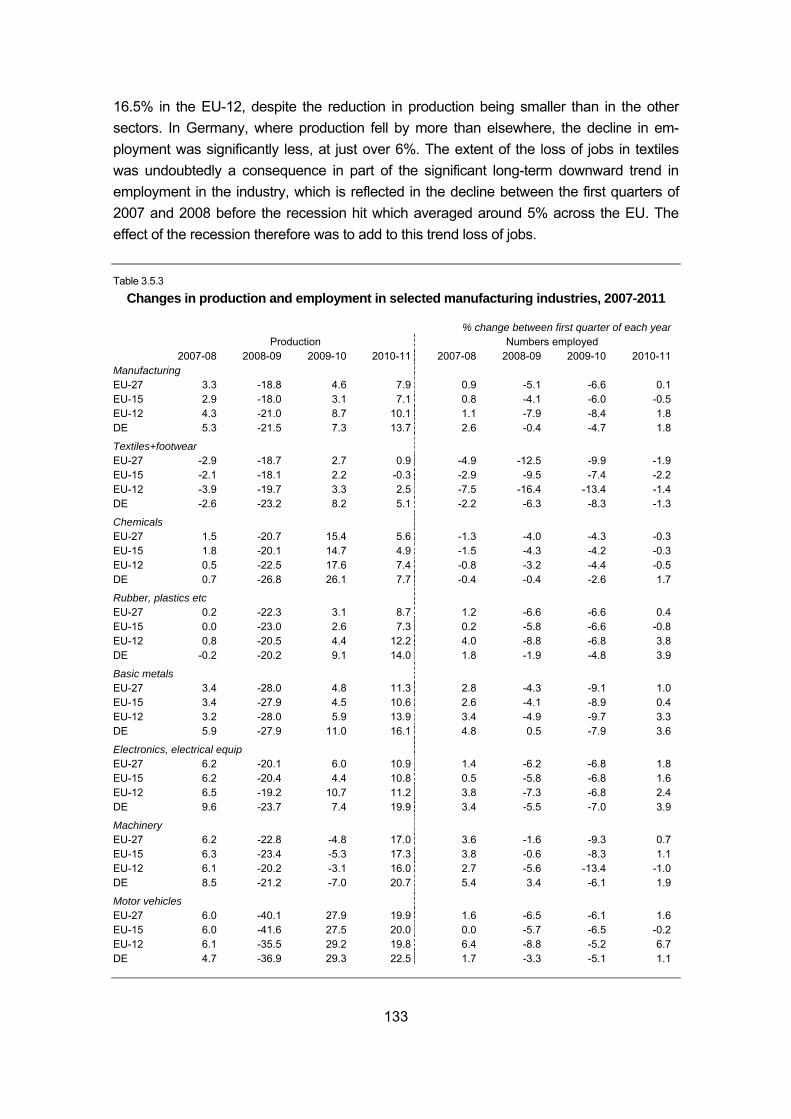
133
16.5% in the EU-12, despite the reduction in production being smaller than in the other sectors. In Germany, where production fell by more than elsewhere, the decline in em-ployment was significantly less, at just over 6%. The extent of the loss of jobs in textiles was undoubtedly a consequence in part of the significant long-term downward trend in employment in the industry, which is reflected in the decline between the first quarters of 2007 and 2008 before the recession hit which averaged around 5% across the EU. The effect of the recession therefore was to add to this trend loss of jobs. Table 3.5.3
Changes in production and employment in selected manufacturing industries, 2007-2011
% change between first quarter of each year Production Numbers employed 2007-08 2008-09 2009-10 2010-11 2007-08 2008-09 2009-10 2010-11Manufacturing EU-27 3.3 -18.8 4.6 7.9 0.9 -5.1 -6.6 0.1EU-15 2.9 -18.0 3.1 7.1 0.8 -4.1 -6.0 -0.5EU-12 4.3 -21.0 8.7 10.1 1.1 -7.9 -8.4 1.8DE 5.3 -21.5 7.3 13.7 2.6 -0.4 -4.7 1.8
Textiles+footwear EU-27 -2.9 -18.7 2.7 0.9 -4.9 -12.5 -9.9 -1.9EU-15 -2.1 -18.1 2.2 -0.3 -2.9 -9.5 -7.4 -2.2EU-12 -3.9 -19.7 3.3 2.5 -7.5 -16.4 -13.4 -1.4DE -2.6 -23.2 8.2 5.1 -2.2 -6.3 -8.3 -1.3
Chemicals EU-27 1.5 -20.7 15.4 5.6 -1.3 -4.0 -4.3 -0.3EU-15 1.8 -20.1 14.7 4.9 -1.5 -4.3 -4.2 -0.3EU-12 0.5 -22.5 17.6 7.4 -0.8 -3.2 -4.4 -0.5DE 0.7 -26.8 26.1 7.7 -0.4 -0.4 -2.6 1.7
Rubber, plastics etc EU-27 0.2 -22.3 3.1 8.7 1.2 -6.6 -6.6 0.4EU-15 0.0 -23.0 2.6 7.3 0.2 -5.8 -6.6 -0.8EU-12 0.8 -20.5 4.4 12.2 4.0 -8.8 -6.8 3.8DE -0.2 -20.2 9.1 14.0 1.8 -1.9 -4.8 3.9
Basic metals EU-27 3.4 -28.0 4.8 11.3 2.8 -4.3 -9.1 1.0EU-15 3.4 -27.9 4.5 10.6 2.6 -4.1 -8.9 0.4EU-12 3.2 -28.0 5.9 13.9 3.4 -4.9 -9.7 3.3DE 5.9 -27.9 11.0 16.1 4.8 0.5 -7.9 3.6
Electronics, electrical equip EU-27 6.2 -20.1 6.0 10.9 1.4 -6.2 -6.8 1.8EU-15 6.2 -20.4 4.4 10.8 0.5 -5.8 -6.8 1.6EU-12 6.5 -19.2 10.7 11.2 3.8 -7.3 -6.8 2.4DE 9.6 -23.7 7.4 19.9 3.4 -5.5 -7.0 3.9
Machinery EU-27 6.2 -22.8 -4.8 17.0 3.6 -1.6 -9.3 0.7EU-15 6.3 -23.4 -5.3 17.3 3.8 -0.6 -8.3 1.1EU-12 6.1 -20.2 -3.1 16.0 2.7 -5.6 -13.4 -1.0DE 8.5 -21.2 -7.0 20.7 5.4 3.4 -6.1 1.9
Motor vehicles EU-27 6.0 -40.1 27.9 19.9 1.6 -6.5 -6.1 1.6EU-15 6.0 -41.6 27.5 20.0 0.0 -5.7 -6.5 -0.2EU-12 6.1 -35.5 29.2 19.8 6.4 -8.8 -5.2 6.7DE 4.7 -36.9 29.3 22.5 1.7 -3.3 -5.1 1.1
134
At the other end of the scale, the reduction in employment in motor vehicles, where pro-duction declined by much more than in other industries, was only slightly larger than the average decline in manufacturing at around 5-6%, though more in the EU-12 (9%) than in the EU-15. In Germany, in line with the experience in other industries, it was smaller at only just over 3%. The reduction in employment between the first quarters of 2008 and 2009 was smallest on average across the EU in machinery and equipment, at only around 1.5%, despite the de-cline in production being slightly larger than average. This reflects to a large extent, how-ever, the continued growth of employment in Germany (or at least the longer delay in the response to the downturn in production). In the metal industry too, where the decline in production was much larger than the aver-age for manufacturing as a whole, the size of the fall in employment was much the same or slightly below average. On the other hand, in both the rubber, plastics, etc. industry and electronics, employment fell by more than average over this period. This was also the case in Germany for the latter, though not the former, perhaps reflecting the relatively large fall in production. Developments over the early stages of the recovery
From the around the middle of 2009, production in manufacturing began to recover across the EU, though at different times and at different rates across industries, as well as across countries. Manufacturing production, therefore, increased by around 4.5% across the EU between the first quarter of 2009 and the same quarter of 2010, though by much more in the EU-12 (just over 8.5%) than in the EU-15 (3%) and by much more in Germany (just over 7%) than in the rest of the EU-15. This growth in production, however, was concen-trated in particular industries, most especially in chemicals (up by 15.5%) and even more so in motor vehicles (up by 28%). In machinery and equipment, production continued to decline over this period, so that the effect of the recession on the industry was much greater than indicated by the size of the decline in the year up the first quarter of 2009. This was as much the case In the EU-12 as in the EU-15 and in Germany as much as in the rest of the EU-15. The other selected sectors showed increases in production of around the manufacturing average, slightly higher in electronics and lower in textiles, though in contrast to the long-term trend, there was at least growth in the latter. In all the industries selected for study, the increase in production over this period was lar-ger in the EU-12 than in the EU-15 – or the fall in the case of machinery was smaller – most especially in electronics. Equally in Germany, the increase was larger than in the rest of the EU-15 in most industries; particularly in chemicals, basic metals and textiles the growth in production in Germany was much larger than in the rest of the EU-15, while on the other hand, in machinery the decline in production was larger.
135
The response of employment to the general upturn again varied across sectors, though slightly less so than over the preceding year. In manufacturing as a whole, the number employed declined by around 6.5% over the period across the EU as a whole, slightly more than over the year before and bringing the overall fall over the recession period to around 11.5%. As before, the fall in the EU-12 was larger than in the EU-15, increasing the jobs losses in manufacturing between the beginning of 2008 and the beginning of 2010 in the former to 15.5% as against around 10% in the latter, despite the overall decline in pro-duction over the period being larger in the EU-15 than the EU-12. Once again, the fall in employment in Germany was smaller than in other countries at around 4.5%, in this case reflecting in part the higher rate of growth of production. Accordingly, total net job losses in manufacturing over the recession period in manufacturing in Germany amounted to 5%, only a third of the scale of losses in the EU-12 where the decline in production over the period was only slightly smaller. As before the reduction in employment in textiles was larger across the EU as a whole than in other industries over the year up to the first quarter of 2010 (10%), and particularly large in the EU-12 (13.5%), though in this period it was almost matched by the size of the decline in machinery and equipment (just under 9.5%), where production continued to fall as noted above, and basic metals (9%), where the fall in production over the preceding year had been relatively large. The decline in employment was smaller in chemicals than elsewhere (just under 4.5%), reflecting the relatively high growth in production and around the manufacturing average in the other sectors. Taking the two-years between the first quarters of 2008 and 2010 as whole, the size of the reduction in the number employed does not reflect the scale of decline in production at all closely. The reduction in employment was largest in textiles, at over 21% across the EU as whole, almost double the total job losses in manufacturing, and as much as 27.5% in the EU-12, yet the overall fall in production over the two years was only slightly larger than the manufacturing average. The scale of jobs losses, in proportionate terms, was much the same in basic metals, mo-tor vehicles, rubber, plastics, etc., and electronics – around 12-13% across the EU as whole, slightly higher than the total for manufacturing – yet the decline in production was significantly larger in the first two than the third and much larger still than in the fourth, where the decline was only marginally above the average in manufacturing. Job losses were smaller than in machinery, employment declining by around 10.5% across the EU over the two years, less than the average in manufacturing, but the decline in pro-duction (26.5%) was larger even than in Basic metals or Motor vehicles.
136
On the other hand, employment declined by least in chemicals (by 8%) which also experi-enced the smallest fall in production over the period (8.5%). The above comparison indicates, therefore, that the behaviour of employment in relation to movements in production varied markedly across sectors and suggests that there were greater attempts to maintain jobs in some industries than in others. The evidence also suggests that such attempts were more limited in the EU-12 than the EU-15, though the downward pressure on employment from the much larger upward trend in productivity needs to be taken into account. There is, however, only limited evidence that the behaviour of employment relative to pro-duction was markedly different in Germany than in the rest of the EU-15 once the two years up to the first quarter of 2010 are taken together and once individual sectors are ex-amined rather than manufacturing as a whole (which is necessary because the structure of manufacturing in Germany is different from that in the rest of the EU, with the motor vehi-cles and other engineering industries accounting for a much larger share of output and employment). This does not signify that efforts to maintain jobs in the face of the recession were no greater in Germany than elsewhere. In practice, as indicated above, the reduction in employment over the period when the recession was at its deepest was smaller than elsewhere but this was followed by a quicker and larger upturn in production which re-duced the need for cutbacks in employment. Nevertheless, there are two industries, ma-chinery and equipment and chemicals, where the number employed in Germany has been maintained at a higher level relative to production than in the rest of the EU. In both indus-tries, therefore, employment was reduced by only around 3% over the two years up to the first quarter of 2010 as opposed to an average reduction of 8-9% across the EU-15 as a whole, while the decline in production was only marginally smaller in Germany than the average. The relationship between output and employment in these sectors is explored further in the next section. Growth of manufacturing production across the EU accelerated during 2010 and in the year from the first quarter of 2010 to that of 2011, production rose by an average of 8%, though again by more in the EU-12 (10%) than in the EU-15 (10%). Growth was much higher in Germany than in the rest of the EU-15, production increasing by around twice the rate over this period. This meant that in Germany, production in the first quarter of 2011 was almost back to the level that it was in the first quarter of 2008 before the crisis hit, while in the rest of the EU, and in the rest of the EU-15 especially, it was still well below the level. Growth in the year up to the beginning of 2011, as in the year before, varied markedly across sectors. It was especially high in machinery, where production had fallen in the pre-vious year, at 17%, and close to 21% in Germany, as the delayed recovery got underway,
137
though this still left production well below the level of three years earlier (some 14% below on average). Growth was even higher in motor vehicles, averaging some 20% across the EU and over 22% in Germany, which in the latter took the level back to what it was in the first quarter of 2008. The same was the case in the EU-12, though In the EU-15, it left it almost 11% below this level. In the other sectors covered, growth was less, but in basic metals and electronics espe-cially, at around 11% in each, above the manufacturing average. Again the rate of growth was particularly high in Germany, at almost twice the EU-15 average in electronics and 50% above the average in basic metals. The level of production in the first quarter of 2011, however, remained below the level three years earlier in both industries, if by much less in Germany than in the rest of the EU-15, especially in electronics (around 2% below in Ger-many), where production in the EU-12 was virtually back to what it was at the beginning of 2008. Much the same was the case in rubber, plastics, etc. – where production in Germany was only marginally below the level of three years earlier but in the EU-15 as a whole 15% below – and, to a lesser extent, in chemicals and textiles, where production, as in the years before the recession, increased by much less than in other manufacturing sectors or, in the case of the EU-15, declined. The significant growth of production in manufacturing between the first quarters of 2010 and 2011 was accompanied by the fall in employment coming to an end in the EU as a whole, despite the level of production remaining below what it was before the recession. While in the EU-15, the number employed fell slightly over the year, in Germany and the EU-12, reflecting the higher growth in production – or the smaller reduction relative to the level three years earlier – it increased by just under 2%. The increase in employment was largest on average in electronics (just under 2%), where there was a rise in both the EU-15 and the EU-12, and motor vehicles, where it was largely concentrated in the EU-12, though there also a small rise in Germany. There was similarly a common rise across the EU in basic metals, though smaller overall (1%). In machinery, employment also increased overall, but declined in the EU-12, while in rubber, plastics, etc., the increase was relatively large in the EU-12 and Germany (around 3.5% in both) but employment fell in the EU-15. In both textiles and chemicals, especially the former, there was a reduction in the number employed in both the EU-15 and EU-12, though in the latter, a rise in Germany. The increases in employment in the year up to the first quarter of 2011 were not sufficient in any of the sectors to recover the job losses experienced during the recession period. Overall in manufacturing, the number employed in the EU was just over 11% lower at the beginning of 2011 than three years earlier. In the EU-12, it was 14% lower, though in Ger-many, it was down by only 3.5%. In textiles, there were 22.5% fewer people employed than
138
at the beginning of 2008 and in the EU-12, 28.5% fewer. In rubber, plastics, etc. and basic metals, the reduction was 11-12% in both the EU-15 and EU-12, though again much less in Germany (3-4%). In electronics and motor vehicles, the reduction was much the same as the average in manufacturing and in these two cases, less different in Germany than in other countries (7-9%). In machinery, the decline in employment over the three years was slightly smaller than in the rest of manufacturing (around 10%) in the EU as a whole, but much larger in the EU-12 (19%) and very small in Germany (1%). The scale of the decline was further below the manufacturing average in chemicals, where, as noted, fall in produc-tion over the period was relatively small, though it still amounted to around 8.5% in the EU overall. Developments in average hours worked and labour productivity
The relationship between employment and production can be explored further, as above, by examining what happened to average hours worked and labour productivity, or production per hour worked, over both the period of recession and the early stages of recovery. In order to do so, as explained earlier, explicit account is taken of the lagged response of employment to the fall in output and the subsequent resumption of growth which is evident from the fig-ures discussed in the previous section. Specifically, a lagged response of two quarters is assumed in order to give an indication of the underlying movement in labour productivity. In most parts of the economy but particularly in manufacturing, there is long-term down-ward trend in average hours worked, which in many services is primarily associated with the development of part-time working, but which in manufacturing is more related to a re-duction in full-time hours. This downward trend, it should be noted, is a result not only of a shortening in the normal working week but also of an increase in the number of days’ holi-day per year. Both should be captured, in principle at least, by the Short-term Business Statistics19. The long-term decline in working time is reflected in the reduction of around 0.5% in the average hours worked in manufacturing across the EU between the first quarter of 2007 and that of 2008. A reduction, though of varying sizes, was common to all the sectors se-lected for study, except Basic metals, where there was an increase of around 0.5%, and to both the EU-15 and EU-12 (except in Textiles in the former) (Table 3.5.4).
19 This it should be noted is not the case as regards the Labour Force Survey data which are often used to examine
changes in hours worked and which relate either to hours worked during the reference week (which is carefully chosen to minimise the chances that it contains a national holiday) or to usual weekly hours worked. In either case, the data do not pick up changes in the number of weeks worked per year or, as often occurred during the recent recession, enforced leave from work, except insofar as the time off concerned coincided with the reference week. How far in practice the Short-term Business Statistics capture the latter is open to question, though the data do show, as indicated, a reduction in average hours worked
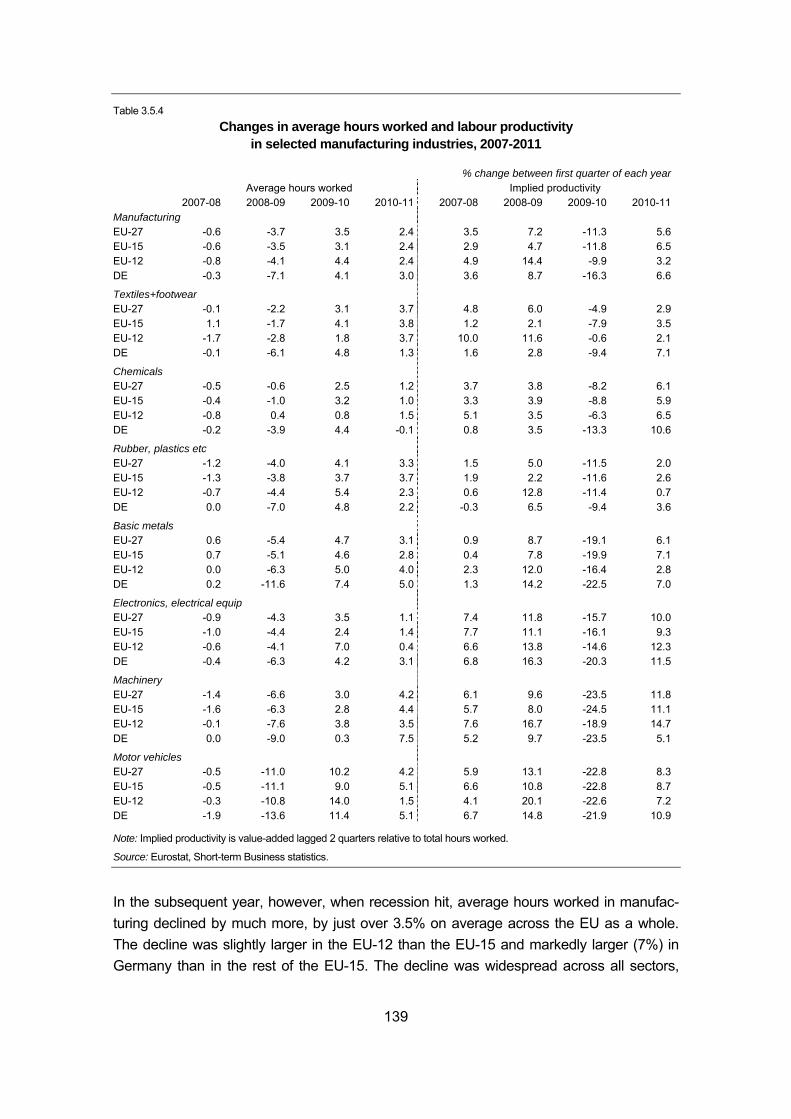
139
Table 3.5.4 Changes in average hours worked and labour productivity
in selected manufacturing industries, 2007-2011
% change between first quarter of each year Average hours worked Implied productivity 2007-08 2008-09 2009-10 2010-11 2007-08 2008-09 2009-10 2010-11Manufacturing EU-27 -0.6 -3.7 3.5 2.4 3.5 7.2 -11.3 5.6EU-15 -0.6 -3.5 3.1 2.4 2.9 4.7 -11.8 6.5EU-12 -0.8 -4.1 4.4 2.4 4.9 14.4 -9.9 3.2DE -0.3 -7.1 4.1 3.0 3.6 8.7 -16.3 6.6
Textiles+footwear EU-27 -0.1 -2.2 3.1 3.7 4.8 6.0 -4.9 2.9EU-15 1.1 -1.7 4.1 3.8 1.2 2.1 -7.9 3.5EU-12 -1.7 -2.8 1.8 3.7 10.0 11.6 -0.6 2.1DE -0.1 -6.1 4.8 1.3 1.6 2.8 -9.4 7.1
Chemicals EU-27 -0.5 -0.6 2.5 1.2 3.7 3.8 -8.2 6.1EU-15 -0.4 -1.0 3.2 1.0 3.3 3.9 -8.8 5.9EU-12 -0.8 0.4 0.8 1.5 5.1 3.5 -6.3 6.5DE -0.2 -3.9 4.4 -0.1 0.8 3.5 -13.3 10.6
Rubber, plastics etc EU-27 -1.2 -4.0 4.1 3.3 1.5 5.0 -11.5 2.0EU-15 -1.3 -3.8 3.7 3.7 1.9 2.2 -11.6 2.6EU-12 -0.7 -4.4 5.4 2.3 0.6 12.8 -11.4 0.7DE 0.0 -7.0 4.8 2.2 -0.3 6.5 -9.4 3.6
Basic metals EU-27 0.6 -5.4 4.7 3.1 0.9 8.7 -19.1 6.1EU-15 0.7 -5.1 4.6 2.8 0.4 7.8 -19.9 7.1EU-12 0.0 -6.3 5.0 4.0 2.3 12.0 -16.4 2.8DE 0.2 -11.6 7.4 5.0 1.3 14.2 -22.5 7.0
Electronics, electrical equip EU-27 -0.9 -4.3 3.5 1.1 7.4 11.8 -15.7 10.0EU-15 -1.0 -4.4 2.4 1.4 7.7 11.1 -16.1 9.3EU-12 -0.6 -4.1 7.0 0.4 6.6 13.8 -14.6 12.3DE -0.4 -6.3 4.2 3.1 6.8 16.3 -20.3 11.5
Machinery EU-27 -1.4 -6.6 3.0 4.2 6.1 9.6 -23.5 11.8EU-15 -1.6 -6.3 2.8 4.4 5.7 8.0 -24.5 11.1EU-12 -0.1 -7.6 3.8 3.5 7.6 16.7 -18.9 14.7DE 0.0 -9.0 0.3 7.5 5.2 9.7 -23.5 5.1
Motor vehicles EU-27 -0.5 -11.0 10.2 4.2 5.9 13.1 -22.8 8.3EU-15 -0.5 -11.1 9.0 5.1 6.6 10.8 -22.8 8.7EU-12 -0.3 -10.8 14.0 1.5 4.1 20.1 -22.6 7.2DE -1.9 -13.6 11.4 5.1 6.7 14.8 -21.9 10.9
Note: Implied productivity is value-added lagged 2 quarters relative to total hours worked.
Source: Eurostat, Short-term Business statistics.
In the subsequent year, however, when recession hit, average hours worked in manufac-turing declined by much more, by just over 3.5% on average across the EU as a whole. The decline was slightly larger in the EU-12 than the EU-15 and markedly larger (7%) in Germany than in the rest of the EU-15. The decline was widespread across all sectors,
140
though it was much smaller in Chemicals than in other sectors. It was especially large in Motor vehicles – averaging around 11% in both the EU-15 and EU-12 – particularly in Germany, where it was as much as 13.5%, reflecting the big fall in production. It was also relatively large in Machinery and Basic metals, where the decline in production was also relatively big, in each case, the decline being larger in the EU-12 than the EU-15 and larger in Germany than in the rest of the latter. In the following year, from the first quarter 2009 to the first quarter 2010, this reduction in average hours was reversed, or almost reversed, in both manufacturing as a whole and in most sectors. The increase in average hours, therefore, was particularly large in the sec-tors where the fall had been biggest in the preceding year, in Motor vehicles, especially. It also tended to be larger in the EU-12 than in the EU-15 and larger in Germany than in the rest of the EU-15. The reduction in hours worked as a means of maintaining jobs was, therefore, relatively short-lived. Moreover, there was a further widespread increase in average hours worked in the follow-ing year, between the beginning of 2010 and the beginning of 2011. This averaged 2.5% in manufacturing over the EU as a whole and was much the same in the EU-12 as in the EU-15, though it was slightly larger in Germany (3%) than in other countries. It was particularly large in Machinery and Motor vehicles (over 4%), where the increase in the preceding year had been smaller than the reduction during the recession period. The rise was also rela-tively large, however, in Textiles (almost 3%) – though not in Germany – where the in-crease over the year before had already virtually compensated for the reduction in the re-cession year. The result, as indicated below, is that by the first quarter of 2011, average hours worked in manufacturing and in most industries were not only back to the level they were three years earlier but above this. The general reduction in average hours worked as the recession hit had the effect of push-ing up labour productivity, measured by production per hour worked. Partly because of this effect, between the first quarter of 2008 and the first quarter of 2009, underlying labour pro-ductivity,, relating total hours worked to production two quarters previously to take account of the lagged response of employment to changes in output, increased in both manufactur-ing as a whole across the EU and all the sectors selected for study. This increase was then followed by a steep decline as output fell and the number employed, though cut back, was not reduced in line. Moreover, as indicated above, average worked started to increase over this period, pushing down labour productivity as measured here, even further. This reduc-tion was then followed by a renewed increase in productivity as production began to recover and employment either remained much the same or was reduced further. The year-to-year pattern of productivity developments over this period, however, is not really important so far as future developments are concerned. The real interest is in how
141
productivity changed over the period as a whole and how the level now – or in the first quarter of 2011 which is the latest for which data are available – compares with that before the recession occurred. The issue, therefore, is whether and to what extent labour produc-tivity declined over the recession period which is likely to be relevant for the prospects for job growth in the coming years. If, therefore, productivity is now lower than it was at the beginning of 2008, it is plausible to assume that this loss will be made good as recovery continues, since there is little reason to suppose that the loss represents a permanent rather than temporary state of affairs. Comparing productivity in manufacturing in the first quarter of 2011 with the level three years earlier indicates that across the EU as a whole, there was hardly any change over this period. Production per hour worked, therefore, was only around 0.5% higher than in the first quarter of 2008. This small increase over the period, however, is entirely due to the rise in the EU-12, which amounted on average to around 6.5% over the period, whereas In the EU-15, it was just over 1.5% lower and in Germany, 3% lower (Table 3.5.5). This general pattern is repeated in most sectors. Only in Electronics and Chemicals was the level of productivity in the first quarter of 2011 higher than three years earlier in both the EU-15 and the EU-12. In Rubber, plastics, etc., Metals, Machinery and Motor vehicles in the EU-15, it was well below the level, as was also the case in Basic metals in the EU-12. The apparent reduction in productivity over these three years in Machinery is especially large in Germany (almost 12%), though it is only slightly smaller in the rest of the EU-15. In Rubber, plastics, etc., Metals and Motor vehicles, however, it is in the rest of the EU-15 where the reduction in productivity is most marked (7-8%). The change in average hours worked over the thee-year period is equally relevant for the future prospects as regards employment. If average hours had declined over this period by more than the trend decline, then this would be expected to moderate job creation over the coming years as normal working hours were re-established. As indicated above, however, the reverse has occurred and instead of falling, average hours worked have increased over the period, at least in manufacturing. In consequence, this might have a positive effect on job creation as normal working time is resumed, assuming it is, of course. In the first quarter of 2011, therefore, average hours worked were around 2% higher in manufacturing in the EU as a whole than three year earlier before the crisis hit and around 2.5% higher in the EU-12. On the other hand, in Germany, they were slightly lower. The pattern, however, varies markedly across sectors within manufacturing. The increase in hours worked over the period across the EU was largest in Textiles, at over 4.5% (over 6% in the EU-15), followed by Rubber, plastics, etc. and Chemicals, at just over 3%. In all three of the sectors, average hours in Germany either declined slightly or remained much the same. In Motor vehicles, there was also an increase, though slightly smaller (just over 2%)
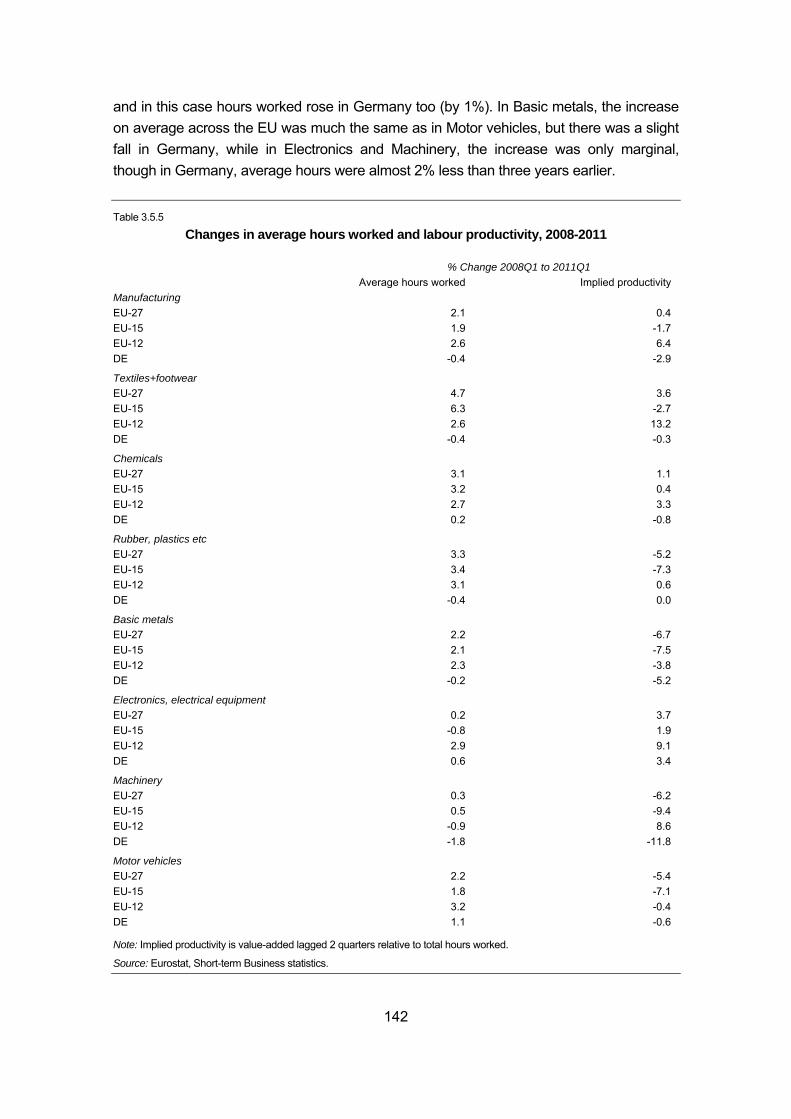
142
and in this case hours worked rose in Germany too (by 1%). In Basic metals, the increase on average across the EU was much the same as in Motor vehicles, but there was a slight fall in Germany, while in Electronics and Machinery, the increase was only marginal, though in Germany, average hours were almost 2% less than three years earlier. Table 3.5.5
Changes in average hours worked and labour productivity, 2008-2011
% Change 2008Q1 to 2011Q1 Average hours worked Implied productivityManufacturing EU-27 2.1 0.4EU-15 1.9 -1.7EU-12 2.6 6.4DE -0.4 -2.9
Textiles+footwear EU-27 4.7 3.6EU-15 6.3 -2.7EU-12 2.6 13.2DE -0.4 -0.3
Chemicals EU-27 3.1 1.1EU-15 3.2 0.4EU-12 2.7 3.3DE 0.2 -0.8
Rubber, plastics etc EU-27 3.3 -5.2EU-15 3.4 -7.3EU-12 3.1 0.6DE -0.4 0.0
Basic metals EU-27 2.2 -6.7EU-15 2.1 -7.5EU-12 2.3 -3.8DE -0.2 -5.2
Electronics, electrical equipment EU-27 0.2 3.7EU-15 -0.8 1.9EU-12 2.9 9.1DE 0.6 3.4
Machinery EU-27 0.3 -6.2EU-15 0.5 -9.4EU-12 -0.9 8.6DE -1.8 -11.8
Motor vehicles EU-27 2.2 -5.4EU-15 1.8 -7.1EU-12 3.2 -0.4DE 1.1 -0.6
Note: Implied productivity is value-added lagged 2 quarters relative to total hours worked.
Source: Eurostat, Short-term Business statistics.
143
This widespread increase in average hours worked over the period is perhaps explicable in terms of the uncertainty generated by the recession and the hesitant recovery which has been underway since mid-2009. Employers, therefore, might understandably be reluctant to take people on if the prospects for growth continuing for the next year or two are unclear. This is especially the case for manufacturing industries, particularly those that stand to be most affected by a renewed downturn in activity. Accordingly, although the increase in hours worked would seem to be favourable for future job creation, it is probable that the present uncertainty would need to be dispelled before this happens in practice. 3.5.6 Developments in employment in the service sectors
Although data on employment in services are produced as part of the Short-term business statistics, in most cases they are not accompanied by data on output in real terms nor do they cover Financial services20. Moreover, they also do not include data on hours worked, which since part-time working is of major importance in the Distributive trades and Hotels and restaurants is a serious deficiency in being able to interpret the movements shown by the data. Accordingly, the following analysis is based on national accounts data, which in principle ways is preferable because they include data on value-added at constant prices. Unfortunately, however, as noted earlier there are no quarterly data available at EU-level for the services sectors selected for coverage, which means that there is no alternative but to rely on annual data. At the time of writing (mid-October), however, for nearly all coun-tries, these are available only up to 2009. Nevertheless, Eurostat has made estimates for EU aggregates for 2010 and these form the basis of the analysis here. This means that developments in Germany are not analysed separately as in the previous section, but this is of less importance since, unlike in the case of manufacturing, Germany does not ac-count for a disproportionate share of the total EU output or employment in services and employment behaviour does not seem to be so different from that of other EU-15 countries taken together, further drawback of the data, as again noted earlier, is that the data are compiled on a NACE rev. 1 basis and so the sectors distinguished do not precisely con-form to those selected for study, though this is of very minor significance except possibly for Business services, which here include communication activities (other than telecommu-nications) included under a different category in NACE rev. 2. This ought not, however, to have a significant effect on the employment developments analysed below. Each of the services sectors selected for study have shown a long-term tendency to grow in terms of both value-added and employment across the EU. Growth in value-added (measured in real terms as elsewhere in the analysis) has been especially high in Financial services, averaging just over 5% in the 4 years 2003-2007 leading up to the crisis and over 9% in the EU-12 countries (Table 3.5.6). Such growth, however, needs to be interpreted
20 Data on turnover at constant prices in the retailing, though not in wholesaling, are included but the data for the other
service sectors include only data on sales at current prices.
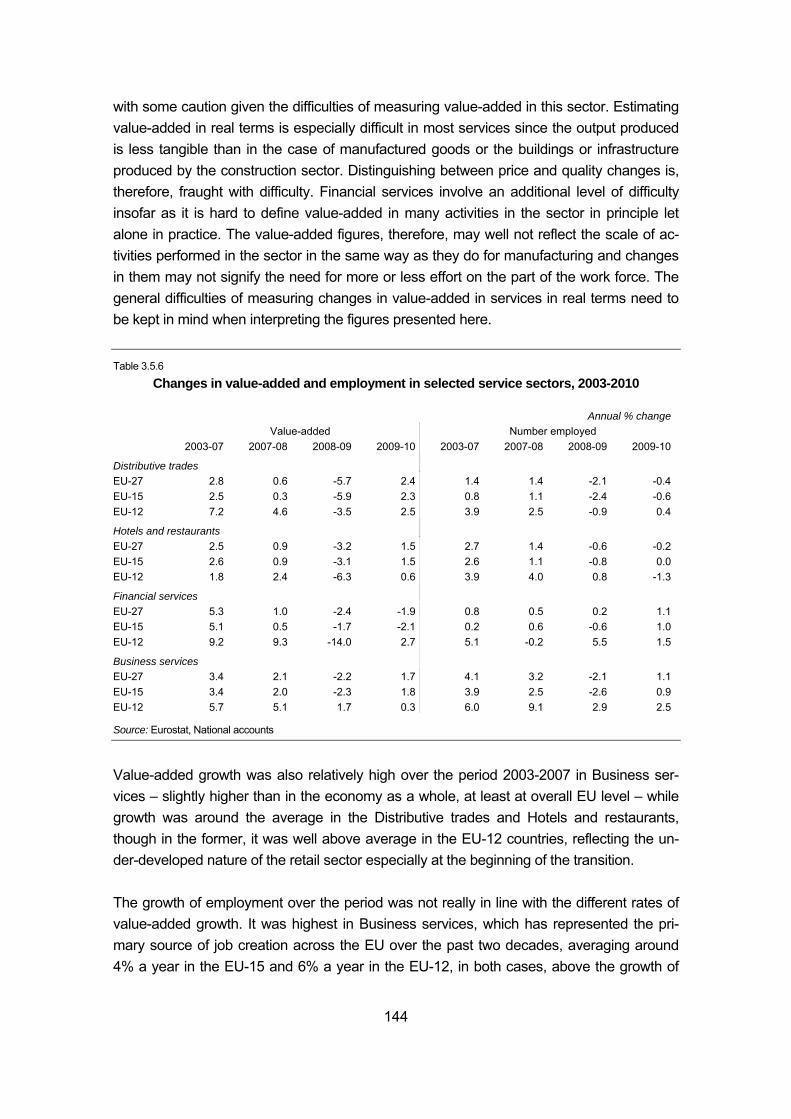
144
with some caution given the difficulties of measuring value-added in this sector. Estimating value-added in real terms is especially difficult in most services since the output produced is less tangible than in the case of manufactured goods or the buildings or infrastructure produced by the construction sector. Distinguishing between price and quality changes is, therefore, fraught with difficulty. Financial services involve an additional level of difficulty insofar as it is hard to define value-added in many activities in the sector in principle let alone in practice. The value-added figures, therefore, may well not reflect the scale of ac-tivities performed in the sector in the same way as they do for manufacturing and changes in them may not signify the need for more or less effort on the part of the work force. The general difficulties of measuring changes in value-added in services in real terms need to be kept in mind when interpreting the figures presented here. Table 3.5.6
Changes in value-added and employment in selected service sectors, 2003-2010
Annual % change Value-added Number employed 2003-07 2007-08 2008-09 2009-10 2003-07 2007-08 2008-09 2009-10
Distributive trades EU-27 2.8 0.6 -5.7 2.4 1.4 1.4 -2.1 -0.4EU-15 2.5 0.3 -5.9 2.3 0.8 1.1 -2.4 -0.6EU-12 7.2 4.6 -3.5 2.5 3.9 2.5 -0.9 0.4
Hotels and restaurants EU-27 2.5 0.9 -3.2 1.5 2.7 1.4 -0.6 -0.2EU-15 2.6 0.9 -3.1 1.5 2.6 1.1 -0.8 0.0EU-12 1.8 2.4 -6.3 0.6 3.9 4.0 0.8 -1.3
Financial services EU-27 5.3 1.0 -2.4 -1.9 0.8 0.5 0.2 1.1EU-15 5.1 0.5 -1.7 -2.1 0.2 0.6 -0.6 1.0EU-12 9.2 9.3 -14.0 2.7 5.1 -0.2 5.5 1.5
Business services EU-27 3.4 2.1 -2.2 1.7 4.1 3.2 -2.1 1.1EU-15 3.4 2.0 -2.3 1.8 3.9 2.5 -2.6 0.9EU-12 5.7 5.1 1.7 0.3 6.0 9.1 2.9 2.5
Source: Eurostat, National accounts
Value-added growth was also relatively high over the period 2003-2007 in Business ser-vices – slightly higher than in the economy as a whole, at least at overall EU level – while growth was around the average in the Distributive trades and Hotels and restaurants, though in the former, it was well above average in the EU-12 countries, reflecting the un-der-developed nature of the retail sector especially at the beginning of the transition. The growth of employment over the period was not really in line with the different rates of value-added growth. It was highest in Business services, which has represented the pri-mary source of job creation across the EU over the past two decades, averaging around 4% a year in the EU-15 and 6% a year in the EU-12, in both cases, above the growth of
145
value-added. It was also relatively high in Hotels and restaurants, in this case broadly the same as the rate of increase in value-added, though not in the EU-12, where it was well above the latter. Employment growth in the Distributive trades and Financial services was lower across the EU as a whole and in the EU-15, below the growth in employment in the economy as a whole. In the EU-12, on the other hand, growth was well above that in the rest of the econ-omy, averaging around 4% a year in the former, reflecting the high growth rate of value-added, and 5% in the latter. Growth of value-added slowed down in all four sectors in the EU-15 in 2008, partly due to the onset of recession, but, apart from in the Distributive trades, continued at much the same rate as before in the EU-12 where the recession in most countries hit later. Employ-ment continued to grow in the EU-15 though at lower rates in Hotels and restaurants and Business services but at slightly higher rates in the Distributive trades and Financial ser-vices. In the EU-12, employment increased at much the same rate as before in Hotels and restaurants and at a much higher rate in Business services (by 9%) but at a lower rate in the Distributive trades, though still around 2.5%, well above the rate in the rest of the econ-omy, while it declined slightly in Financial services. The onset of the recession led to value-added declining in all four of the service sectors across the EU, apart from Business services in the EU-12, though by not nearly as much as in manufacturing. The decline overall in 2009 was steepest in the Distributive trades and Hotels and restaurants, while in the EU-15 at least, the decline in Financials services was relatively modest, despite the origins of the crisis being in this sector. In the EU-12, value-added in the sector is recorded as falling by 14%, though how much this represented a decline in activities is unclear. The fall in value-added resulted in a decline in employment in the EU-15 in all four sectors, though to varying extents and again not fully in line with the reduction in value-added. In the EU-12, however, the Distributive trades were the only one of the sectors in which the number employed fell.. In the EU-15, the decline was largest in Business services and the Distributive trades, averaging around 2.5%, in the former case, much the same as the fall in value-added but in the latter well below. In both Hotels and restaurants and Financial services, the decline was less than 1%, in the former case, well below the size of the re-duction in value-added. In the EU-12, the number employed continued to grow significantly in Business services (by 3%), even if at a lower rate than before, reflecting the lower growth of value-added. The increase in employment in Financial services was even larger (5.5%), irrespective of the large reduction in value-added. In Hotels and restaurants, where there was also a signifi-
146
cant fall in value-added, employment continued to increase too if at a much lower rate. Employment declined in the Distributive trades (by around 1%) but as in the EU-15 by less than the fall in value-added. Between 2009 and 2010, value-added across increased on average in all of the sectors apart from Financial services. The increase was largest in the Distributive trades, at around 2.5% in both the EU-15 and EU-12, as consumer expenditure began to recover, and very similar (at around 1.5% across the EU as a whole) in Hotels and restaurants and Business services, in this case higher in the EU-15 than in the EU-12. In both sectors in the latter, the increase was only around 0.5% reflecting the continuing depressed state of company spending and tourism. In Financial services, value-added declined in the EU-15 but in-creased in the EU-12. The growth of value-added in the Distributive trades did not lead to any increase in employ-ment in the EU-15, the work force declining by around 0.5%, but in the EU-12, the number employed rose slightly (by around 0.5%). There was, however, an expansion of employment in Business services, where the growth of value-added was less, though equally the preced-ing fall had been smaller. The increase in employment was particularly large in the EU-12 – 2.5% - almost reversing the reduction which had occurred in 2009. There also growth of em-ployment in Financial services – by 1% in the EU-15 and slightly higher in the EU-12 – in the EU-15 more than compensating for the job losses the previous year. In Hotels and restaurants, the number employed remained unchanged in the EU-15 but fell by over 1% in the EU-12, perhaps reflecting the delayed effects of the large fall in value-added in 2009. Overall, the only sector in which the number employed in 2010 was less than in 2007 be-fore the recession began is the Distributive trades and then only in the EU-15 (by around 2%). In the latter, however, the number employed in Hotels and restaurants was only mar-ginally above the level three years earlier and in both Financial services and Business ser-vices, only around 1% higher. In the EU-12, employment in Business services was much higher (around 15% higher – twice the increase in value-added) than three years before and in Financial services, around 7% higher, while even in Hotels and restaurants, where value-added declined par-ticularly sharply in the recession and has been slow to recover, the number employed was around 3.5% higher. The next section explores the both the implied changes in productivity over this period and, perhaps more relevantly given the measurement problems surrounding changes in value-added, changes in average hours worked.
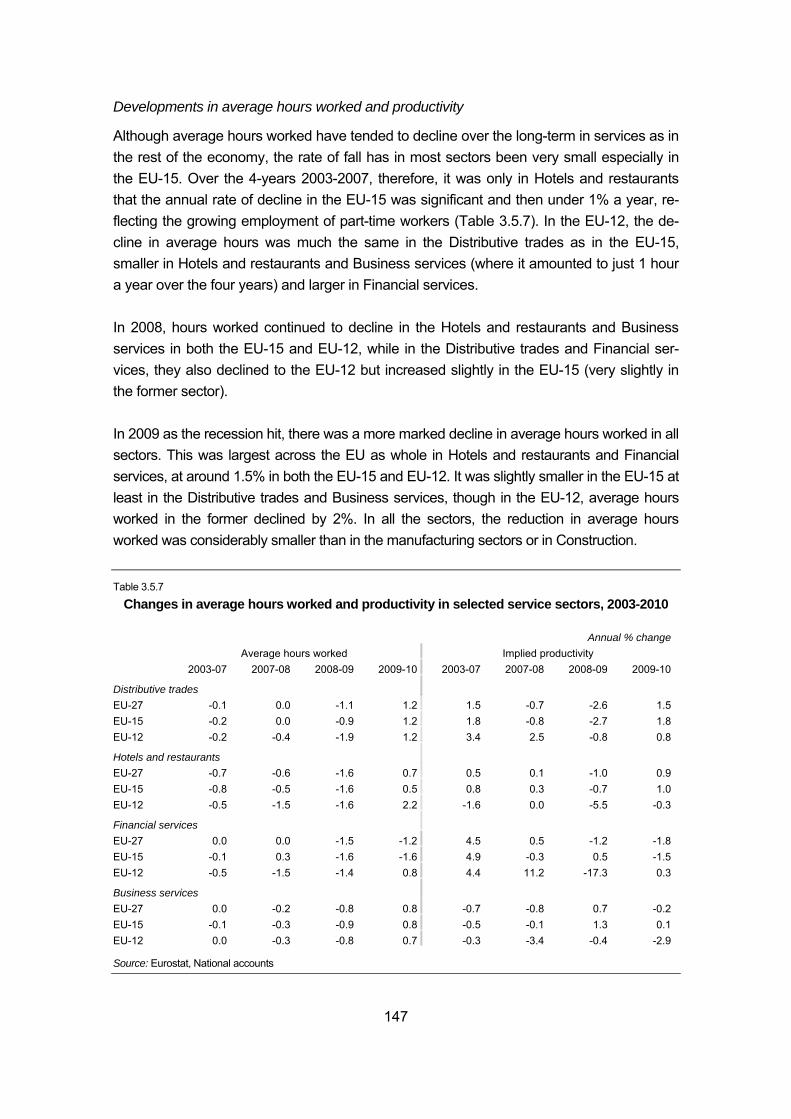
147
Developments in average hours worked and productivity
Although average hours worked have tended to decline over the long-term in services as in the rest of the economy, the rate of fall has in most sectors been very small especially in the EU-15. Over the 4-years 2003-2007, therefore, it was only in Hotels and restaurants that the annual rate of decline in the EU-15 was significant and then under 1% a year, re-flecting the growing employment of part-time workers (Table 3.5.7). In the EU-12, the de-cline in average hours was much the same in the Distributive trades as in the EU-15, smaller in Hotels and restaurants and Business services (where it amounted to just 1 hour a year over the four years) and larger in Financial services. In 2008, hours worked continued to decline in the Hotels and restaurants and Business services in both the EU-15 and EU-12, while in the Distributive trades and Financial ser-vices, they also declined to the EU-12 but increased slightly in the EU-15 (very slightly in the former sector). In 2009 as the recession hit, there was a more marked decline in average hours worked in all sectors. This was largest across the EU as whole in Hotels and restaurants and Financial services, at around 1.5% in both the EU-15 and EU-12. It was slightly smaller in the EU-15 at least in the Distributive trades and Business services, though in the EU-12, average hours worked in the former declined by 2%. In all the sectors, the reduction in average hours worked was considerably smaller than in the manufacturing sectors or in Construction. Table 3.5.7
Changes in average hours worked and productivity in selected service sectors, 2003-2010
Annual % change Average hours worked Implied productivity 2003-07 2007-08 2008-09 2009-10 2003-07 2007-08 2008-09 2009-10
Distributive trades EU-27 -0.1 0.0 -1.1 1.2 1.5 -0.7 -2.6 1.5EU-15 -0.2 0.0 -0.9 1.2 1.8 -0.8 -2.7 1.8EU-12 -0.2 -0.4 -1.9 1.2 3.4 2.5 -0.8 0.8
Hotels and restaurants EU-27 -0.7 -0.6 -1.6 0.7 0.5 0.1 -1.0 0.9EU-15 -0.8 -0.5 -1.6 0.5 0.8 0.3 -0.7 1.0EU-12 -0.5 -1.5 -1.6 2.2 -1.6 0.0 -5.5 -0.3
Financial services EU-27 0.0 0.0 -1.5 -1.2 4.5 0.5 -1.2 -1.8EU-15 -0.1 0.3 -1.6 -1.6 4.9 -0.3 0.5 -1.5EU-12 -0.5 -1.5 -1.4 0.8 4.4 11.2 -17.3 0.3
Business services EU-27 0.0 -0.2 -0.8 0.8 -0.7 -0.8 0.7 -0.2EU-15 -0.1 -0.3 -0.9 0.8 -0.5 -0.1 1.3 0.1EU-12 0.0 -0.3 -0.8 0.7 -0.3 -3.4 -0.4 -2.9
Source: Eurostat, National accounts
148
In 2010, average hours worked increased in all sectors in both the EU-15 and EU-12, ex-cept in Financial services, where the increase was confined to the EU-12. In Business ser-vices, the increase was virtually of the same size as the reduction in the preceding year, bringing average hours worked back to their 2008 level. Similarly, in the Distributive trades, the increase, which was the same in the EU-12 and EU-15, had a similar effect across the EU as a whole, though it left hours worked in the EU-12 at a slightly lower than in 2008 but in the EU-15 at a higher level. In Hotels and restaurants, the increase in hours worked in 2010 was larger in the EU-12 than the reduction in 2009, though it still left the average below what it was in 2007, while in the EU-15, it only partly compensated for the reduction in the preceding year. However, given the relatively large trend decline in hours worked in the latter, it is questionable whether a further reduction is likely. In Financial services, average hours worked declined by much the same amount in the EU-15 as in 2009, leaving the level some 3% below what it was in 2007, while in the EU-12, they increase (by just under 1%), though this still left them around 2% below the level three years earlier. The changes in productivity in the four sectors, implied by changes in value-added relative to changes in numbers employed and average hours worked, are more tricky to interpret than in the case of manufacturing because of the problems of measuring changes in real value-added referred to above. Leaving aside Financial services where the problem is par-ticularly acute, the long-trend of productivity as reflected in the annual average changes over the 2003-2007 period, shows an increase in the Distributive trades of just under 2% a year in the EU-15 and one of around 3.5% a year in the EU-12. In Hotels and restaurants, there was an increase of just under 1% in the EU-15 and a decline of around 1.5% in the EU-12. In Business services, productivity as measured fell by around 0.5% a year in both the EU-15 and the EU-12. In 2008, productivity in the EU-15 either declined slightly or remained unchanged in all three sectors, while in the EU-12, it increased in the Distributive trades, though at a lower rate than over the previous four years, remained unchanged in Hotels and restaurants and declined markedly in Business services. In 2009, productivity fell in all three sectors in the EU-12, only slightly in the Distributive trades and Business services but substantially in Hotels and restaurants (by 5.5%). In the EU-15, productivity also declined in the latter sector, but by under 1%, and by more in the Distributive trades (by just over 2.5%). Productivity, however, increased in Business ser-vices.
149
In 2010, there was a rise in productivity in the EU-15 in all three sectors, marginally in Business services but in the Distributive trades and Hotels and restaurants at much the same rates as over the 4 years leading up to the recession. In the EU-12, productivity fell markedly in Business services and slightly in Hotels and restaurants and increased in the Distributive trades, in the latter at the same rate as the fall in the previous year. In the EU-15, overall, therefore, again leaving aside Financial services, the only service sector in which productivity was lower in 2010 than in 2007 before the onset of the reces-sion was the Distributive trades, where it was around 1.5% lower. Given the apparent trend growth of just under 2% a year, it is plausible to expect this loss to be made up in the com-ing years. In Hotels and restaurants and Business services, it was higher but only slightly so (by around 0.5% and 1%, respectively), which in both cases may have little implication for the rate of net job creation in the short or medium-term. In the EU-12, productivity was substantially lower in both Hotels and restaurants and Busi-ness services in 2010 than in 2007 (by around 6% in both cases), which in the former at least might dampen the rate of net job creation in the coming years. In the Distributive trades, it was 2.5% higher than three years before, which in itself implies that there was no loss of productivity during the recession to be made good as recovery takes place, though there was still a significant loss relative to the apparent upward trend in productivity which could potentially moderate future employment growth. 3.5.7 Changes in employment due to enterprise restructuring
The European Restructuring Monitor (ERM) database, maintained by the European Foun-dation for the Improvement of Living and Working Conditions in Dublin, compiles informa-tion on cases of restructuring by large enterprises in the EU, which includes details of the companies involved, the sector in which they operate and the job losses, or gains, implied by the restructuring (see Box 3.5.1 for further details). This information compiled covers the period from the end of 2002 right up to the present. Accordingly, it provides an indication of the extent of restructuring in the sectors selected for detail study before and after the crisis hit in 2008 and the job losses that resulted from it. Box 3.5.1 - The data on large enterprise restructuring
The data on which this section is based come from the European Restructuring Monitor which compiles informa-tion on cases of restructuring in all EU Member States which involve job losses or gains of 100 or more or where the job losses amount to at least 10% of the work force at a particular site where 250 people or more are em-ployed. The information began to be collected towards the end of 2002 in the EU15 countries but only from 2004 and, in some cases, from 2005, in the EU12 countries.
The information comes from national correspondents, who collect it from media reports. In principle, all cases which conform with these criteria should be covered, at least so far as job losses are concerned, since in all Member States companies are statutorily required to announce publicly job losses on this scale in advance of making the people concerned redundant. In practice, the cases reported depend on the diligence and conscien-tiousness of the correspondents in the different countries. The information should nevertheless be indicative of
150
the relative scale of restructuring by large firms across the EU in the different sectors and how this has tended to change over time.
This is much less true for restructuring involving job gains. In contrast to job losses, there is no compulsion for firms to announce such gains, though most of them would regard it as good – and essentially free – publicity to do so. Moreover, the criterion applied to the cases reported in the ERM is biased against jobs created relative to those that are lost since it relates only to cases where at least 100 jobs are involved, whereas cases of job losses can potentially be as small as 25 (10% of employment in a site where 250 people work). The number of job gains reported, therefore, is much more likely to be an under-estimate of the true figure than for job losses.
The information collected focuses on the number of job losses or gains which are announced by the firms con-cerned. Although this may differ from the actual number which ultimately results, comparisons of the number announced with the latter in cases where it is available (which is a minority of cases) indicate that, on average, it gives a close approximation of the actual number (if anything, it tends to be an under-estimate rather than an over-estimate).
To put these job losses into perspective, they are related here to the total employed in large enterprises (those employing 250 people or more) in the 12 sectors concerned, the data coming from the Structural Business Sta-tistics (Eurostat) for 2008, which are taken as an estimate of the numbers concerned in each of the years cov-ered.
Job restructuring by detailed sectors
The ERM indicates that over the period leading up to the crisis, job losses resulting from the restructuring of large enterprises across the EU were on average largest in Chemicals and Electronics, amounting to around 4% of the number employed in the enterprises con-cerned over the 5 years 203 to 2007 (Table 3.5.8). They were next largest In Motor vehi-cles (just under 2% of the total employed), followed by Textiles and clothing and Metal manufacture (both around 1.5%) while, in the other sectors, apart from Rubber and plastics (1%), they amounted to less than 1% of employment in large companies. Job gains were much smaller in scale, partly because of the more restrictive coverage of these (see Box 3.5.1). They were largest in Electronics and Motor vehicles, two of the sec-tors experiencing the largest losses, reflecting to a large extent the shift of the more labour-intensive manufacturing activities from the EU15 to the EU12 in these two industries. In both cases, however, they amounted to only around 0.5% of employment in large enter-prises. In the other 10 sectors, they were of negligible importance, though this does not mean that job expansion did not occur in some countries, only that they did not occur in discrete one-off instances on the scale required to qualify for inclusion in the ERM. In 2008, the scale of job losses from restructuring increased as the recession hit mid-way through the year. The biggest losses were in the sectors which had experienced the largest losses in the preceding years, in Chemicals (7% of those employed in large enterprises, or around 1 in every 14 people employed), Electronics (just under 6%) and Motor vehicles (4.5%). Large-scale job losses also occurred in Financial services (just over 4%), reflecting the problems encountered by banks as a result of the value of their assets being reduced markedly in many cases following the turmoil that hit the housing market. Job losses were also larger than in the preceding years in all the other sectors, except in Hotels and restau-
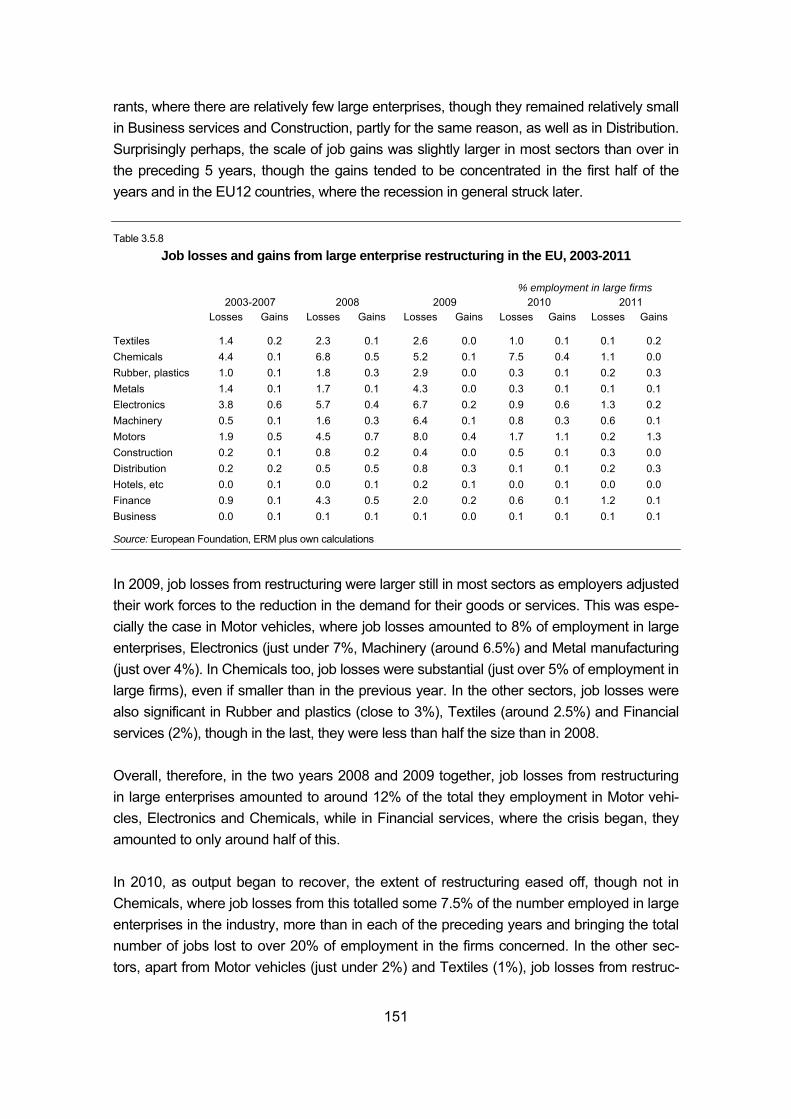
151
rants, where there are relatively few large enterprises, though they remained relatively small in Business services and Construction, partly for the same reason, as well as in Distribution. Surprisingly perhaps, the scale of job gains was slightly larger in most sectors than over in the preceding 5 years, though the gains tended to be concentrated in the first half of the years and in the EU12 countries, where the recession in general struck later. Table 3.5.8
Job losses and gains from large enterprise restructuring in the EU, 2003-2011
% employment in large firms 2003-2007 2008 2009 2010 2011 Losses Gains Losses Gains Losses Gains Losses Gains Losses Gains
Textiles 1.4 0.2 2.3 0.1 2.6 0.0 1.0 0.1 0.1 0.2 Chemicals 4.4 0.1 6.8 0.5 5.2 0.1 7.5 0.4 1.1 0.0 Rubber, plastics 1.0 0.1 1.8 0.3 2.9 0.0 0.3 0.1 0.2 0.3 Metals 1.4 0.1 1.7 0.1 4.3 0.0 0.3 0.1 0.1 0.1 Electronics 3.8 0.6 5.7 0.4 6.7 0.2 0.9 0.6 1.3 0.2 Machinery 0.5 0.1 1.6 0.3 6.4 0.1 0.8 0.3 0.6 0.1 Motors 1.9 0.5 4.5 0.7 8.0 0.4 1.7 1.1 0.2 1.3 Construction 0.2 0.1 0.8 0.2 0.4 0.0 0.5 0.1 0.3 0.0 Distribution 0.2 0.2 0.5 0.5 0.8 0.3 0.1 0.1 0.2 0.3 Hotels, etc 0.0 0.1 0.0 0.1 0.2 0.1 0.0 0.1 0.0 0.0 Finance 0.9 0.1 4.3 0.5 2.0 0.2 0.6 0.1 1.2 0.1 Business 0.0 0.1 0.1 0.1 0.1 0.0 0.1 0.1 0.1 0.1
Source: European Foundation, ERM plus own calculations
In 2009, job losses from restructuring were larger still in most sectors as employers adjusted their work forces to the reduction in the demand for their goods or services. This was espe-cially the case in Motor vehicles, where job losses amounted to 8% of employment in large enterprises, Electronics (just under 7%, Machinery (around 6.5%) and Metal manufacturing (just over 4%). In Chemicals too, job losses were substantial (just over 5% of employment in large firms), even if smaller than in the previous year. In the other sectors, job losses were also significant in Rubber and plastics (close to 3%), Textiles (around 2.5%) and Financial services (2%), though in the last, they were less than half the size than in 2008. Overall, therefore, in the two years 2008 and 2009 together, job losses from restructuring in large enterprises amounted to around 12% of the total they employment in Motor vehi-cles, Electronics and Chemicals, while in Financial services, where the crisis began, they amounted to only around half of this. In 2010, as output began to recover, the extent of restructuring eased off, though not in Chemicals, where job losses from this totalled some 7.5% of the number employed in large enterprises in the industry, more than in each of the preceding years and bringing the total number of jobs lost to over 20% of employment in the firms concerned. In the other sec-tors, apart from Motor vehicles (just under 2%) and Textiles (1%), job losses from restruc-
152
turing amounted to less than 1% of the number employed. Moreover, in Motor vehicles, the job losses were accompanied by jobs gains of just over 1% as some companies expanded their work force. In 2011, job losses from restructuring21 were again on a much smaller scale than in 2009 in all the sectors and exceeded 1% of employment in large enterprises only in Electronics, Chemicals – the two sectors where restructuring has been most prevalent over the years – and Financial services. At the same time, there were significant jobs gains in Motor vehi-cles (around 1.5% of employment in large firms). Restructuring in the EU15 and EU12
Distinguishing between the restructuring in the EU15 and the EU12 indicates some marked differences between what happened in the two broad regions both in the years preceding the crisis and during the crisis itself, as well as what has happened subsequently. First, in the years before the crisis hit, job losses from restructuring tended to be larger in the EU15 than in the EU12, while the reverse was the case for job gains (Tables 3.5.9 and 3.5.10). Indeed, more detailed examination of the data indicates that the job losses which did occur in the EU12 were predominantly in domestic firms while the job gains were largely created by foreign-owned companies, especially from the EU15, moving in. These were attracted by the low wage costs in the countries concerned and, accordingly, relo-cated the more labour-intensive parts of the production process there to supply the wider European and global market as well as supplying markets in the EU12 countries them-selves. This was particularly the case in Electronics and Motor vehicles, where in both cases the number of jobs created through business expansion in the EU12 greatly ex-ceeded the number of jobs lost through restructuring. At the same time, significant job losses in both sectors resulted from the restructuring of large firms in the EU15. On the other hand, in both Textiles and, more especially, Metal manufacturing, both declin-ing sectors overall in the Union, experienced bigger jobs losses from the restructuring of large companies in the EU12 than in the EU15. The same broad pattern is also evident in 2008. Job losses from restructuring in the EU15 greatly exceeded those in the EU12, especially in Electronics and Motor vehicles once again, but also in Chemicals and Financial services. Indeed, in the last, there were virtually no job losses from restructuring in the EU12. Equally, jobs continued to be created in the EU12 through the expansion of large enterprises in Electronics and Motor vehicles (though on a smaller scale than in earlier years in the first), as well as in Rubber and plastics. By the latter part of the year, however, as the crisis spread to the EU12, restructuring was also taking place in the countries concerned. 21 The figures, which go up to July-August time, have been adjusted approximately to a full year basis.
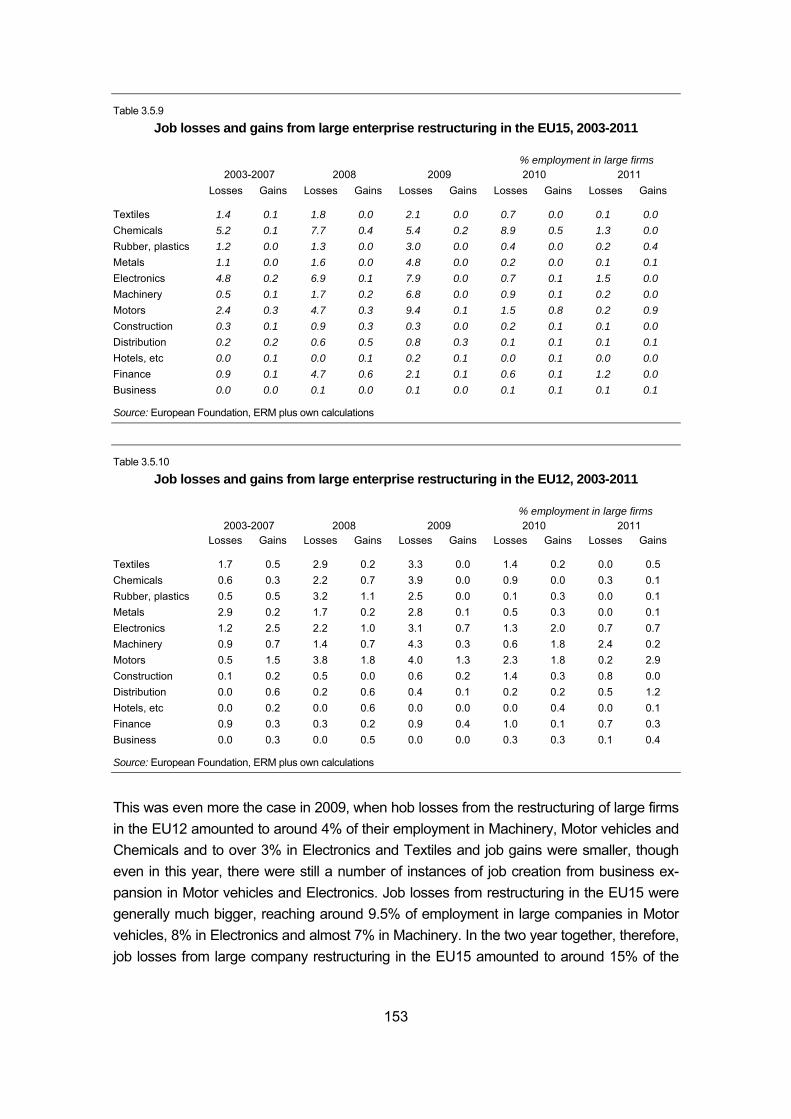
153
Table 3.5.9
Job losses and gains from large enterprise restructuring in the EU15, 2003-2011
% employment in large firms 2003-2007 2008 2009 2010 2011 Losses Gains Losses Gains Losses Gains Losses Gains Losses Gains
Textiles 1.4 0.1 1.8 0.0 2.1 0.0 0.7 0.0 0.1 0.0 Chemicals 5.2 0.1 7.7 0.4 5.4 0.2 8.9 0.5 1.3 0.0 Rubber, plastics 1.2 0.0 1.3 0.0 3.0 0.0 0.4 0.0 0.2 0.4 Metals 1.1 0.0 1.6 0.0 4.8 0.0 0.2 0.0 0.1 0.1 Electronics 4.8 0.2 6.9 0.1 7.9 0.0 0.7 0.1 1.5 0.0 Machinery 0.5 0.1 1.7 0.2 6.8 0.0 0.9 0.1 0.2 0.0 Motors 2.4 0.3 4.7 0.3 9.4 0.1 1.5 0.8 0.2 0.9 Construction 0.3 0.1 0.9 0.3 0.3 0.0 0.2 0.1 0.1 0.0 Distribution 0.2 0.2 0.6 0.5 0.8 0.3 0.1 0.1 0.1 0.1 Hotels, etc 0.0 0.1 0.0 0.1 0.2 0.1 0.0 0.1 0.0 0.0 Finance 0.9 0.1 4.7 0.6 2.1 0.1 0.6 0.1 1.2 0.0 Business 0.0 0.0 0.1 0.0 0.1 0.0 0.1 0.1 0.1 0.1
Source: European Foundation, ERM plus own calculations
Table 3.5.10
Job losses and gains from large enterprise restructuring in the EU12, 2003-2011
% employment in large firms 2003-2007 2008 2009 2010 2011 Losses Gains Losses Gains Losses Gains Losses Gains Losses Gains
Textiles 1.7 0.5 2.9 0.2 3.3 0.0 1.4 0.2 0.0 0.5 Chemicals 0.6 0.3 2.2 0.7 3.9 0.0 0.9 0.0 0.3 0.1 Rubber, plastics 0.5 0.5 3.2 1.1 2.5 0.0 0.1 0.3 0.0 0.1 Metals 2.9 0.2 1.7 0.2 2.8 0.1 0.5 0.3 0.0 0.1 Electronics 1.2 2.5 2.2 1.0 3.1 0.7 1.3 2.0 0.7 0.7 Machinery 0.9 0.7 1.4 0.7 4.3 0.3 0.6 1.8 2.4 0.2 Motors 0.5 1.5 3.8 1.8 4.0 1.3 2.3 1.8 0.2 2.9 Construction 0.1 0.2 0.5 0.0 0.6 0.2 1.4 0.3 0.8 0.0 Distribution 0.0 0.6 0.2 0.6 0.4 0.1 0.2 0.2 0.5 1.2 Hotels, etc 0.0 0.2 0.0 0.6 0.0 0.0 0.0 0.4 0.0 0.1 Finance 0.9 0.3 0.3 0.2 0.9 0.4 1.0 0.1 0.7 0.3 Business 0.0 0.3 0.0 0.5 0.0 0.0 0.3 0.3 0.1 0.4
Source: European Foundation, ERM plus own calculations
This was even more the case in 2009, when hob losses from the restructuring of large firms in the EU12 amounted to around 4% of their employment in Machinery, Motor vehicles and Chemicals and to over 3% in Electronics and Textiles and job gains were smaller, though even in this year, there were still a number of instances of job creation from business ex-pansion in Motor vehicles and Electronics. Job losses from restructuring in the EU15 were generally much bigger, reaching around 9.5% of employment in large companies in Motor vehicles, 8% in Electronics and almost 7% in Machinery. In the two year together, therefore, job losses from large company restructuring in the EU15 amounted to around 15% of the
154
number employed in these two industries, in some degree accelerating the shift of produc-tion – and employment – evident before the crisis hit, from the EU15 to the EU12. In 2010, job losses from restructuring were on a much smaller scale in nearly all the sec-tors in both broad regions, the main exception being the Chemical industry in the EU15 (where they amounted to 9% of employment). Moreover, job gains exceeded job losses in the EU12 in Electronics and Machinery and were also relatively large in Motor vehicles, if slightly smaller than job losses. There was some expansion of jobs in Motor vehicles in the EU15 as well, though in other sectors, there were relatively few cases of job gains. Much the same picture is evident in 2011, with the scale of job losses from restructuring declining further in most sectors in both the EU15 and EU12, the main exceptions being Electronics in the former and Machinery in the latter. Again job gains tended to be larger in the EU12 than the EU15, with a particularly large expansion of jobs in Motor vehicles (3% of employment in large companies) and signs of a continuing shift of production and em-ployment in Electronics from the EU15 to the EU12. The form of restructuring
The ERM also contains information on the form which restructuring has taken, though as in the case of job losses, this is only indicative since only the main form is reported. Any case of restructuring, therefore, can possibly involve a number of different forms, such as, for example, when a merger leads to the closure of certain sites coupled with the relocation of particular activities and the reorganization of others, or when reorganization is combined with relocation – or ‘off-shoring’ – as well as, perhaps, outsourcing. How these particular forms are reported in the database with regard to any particular case depends on the inter-pretation by the individual national correspondents of the details announced and the rela-tive importance attached to the different aspects involved. In practice, internal reorganization, which typically involves downsizing, at least of the work force, tends to be the most common form of restructuring in all the sectors, accounting for between just under half of all job losses from restructuring of large firms in Textiles and cloth-ing to just over 80% in Chemicals in the years 2003-2007 in the EU as a whole (Ta-ble 3.5.11), where the sectors in which restructuring is of relatively low importance – at least as regards the cases included in the ERM – are excluded). The next most common form is the closure of an entire site or enterprise, which includes bankruptcy, which was responsible for just over a third of all job losses from restructuring over this period in Textiles and just under a quarter in Machinery, though less than 2% in Financial services. Off-shoring – the relocation of activities abroad – accounted for almost 20% of job losses from restructuring in Machinery, 15% in Textiles and 9-10% of jobs losses in Financial services, Rubber and plas-tics, Electronics and Motor vehicles. The other forms of restructuring are far less important in most of the sectors. Mergers, however, were responsible for a quarter of job losses from
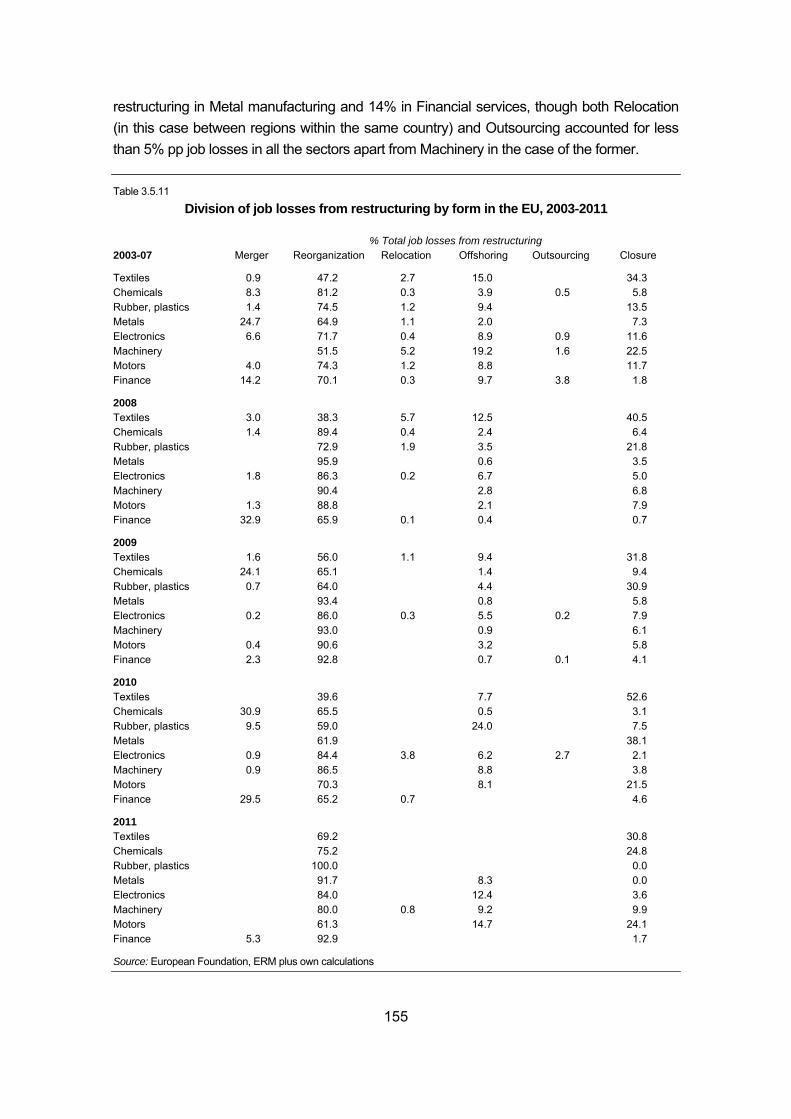
155
restructuring in Metal manufacturing and 14% in Financial services, though both Relocation (in this case between regions within the same country) and Outsourcing accounted for less than 5% pp job losses in all the sectors apart from Machinery in the case of the former. Table 3.5.11
Division of job losses from restructuring by form in the EU, 2003-2011
% Total job losses from restructuring 2003-07 Merger Reorganization Relocation Offshoring Outsourcing Closure
Textiles 0.9 47.2 2.7 15.0 34.3 Chemicals 8.3 81.2 0.3 3.9 0.5 5.8 Rubber, plastics 1.4 74.5 1.2 9.4 13.5 Metals 24.7 64.9 1.1 2.0 7.3 Electronics 6.6 71.7 0.4 8.9 0.9 11.6 Machinery 51.5 5.2 19.2 1.6 22.5 Motors 4.0 74.3 1.2 8.8 11.7 Finance 14.2 70.1 0.3 9.7 3.8 1.8
2008 Textiles 3.0 38.3 5.7 12.5 40.5 Chemicals 1.4 89.4 0.4 2.4 6.4 Rubber, plastics 72.9 1.9 3.5 21.8 Metals 95.9 0.6 3.5 Electronics 1.8 86.3 0.2 6.7 5.0 Machinery 90.4 2.8 6.8 Motors 1.3 88.8 2.1 7.9 Finance 32.9 65.9 0.1 0.4 0.7
2009 Textiles 1.6 56.0 1.1 9.4 31.8 Chemicals 24.1 65.1 1.4 9.4 Rubber, plastics 0.7 64.0 4.4 30.9 Metals 93.4 0.8 5.8 Electronics 0.2 86.0 0.3 5.5 0.2 7.9 Machinery 93.0 0.9 6.1 Motors 0.4 90.6 3.2 5.8 Finance 2.3 92.8 0.7 0.1 4.1
2010 Textiles 39.6 7.7 52.6 Chemicals 30.9 65.5 0.5 3.1 Rubber, plastics 9.5 59.0 24.0 7.5 Metals 61.9 38.1 Electronics 0.9 84.4 3.8 6.2 2.7 2.1 Machinery 0.9 86.5 8.8 3.8 Motors 70.3 8.1 21.5 Finance 29.5 65.2 0.7 4.6
2011 Textiles 69.2 30.8 Chemicals 75.2 24.8 Rubber, plastics 100.0 0.0 Metals 91.7 8.3 0.0 Electronics 84.0 12.4 3.6 Machinery 80.0 0.8 9.2 9.9 Motors 61.3 14.7 24.1 Finance 5.3 92.9 1.7
Source: European Foundation, ERM plus own calculations
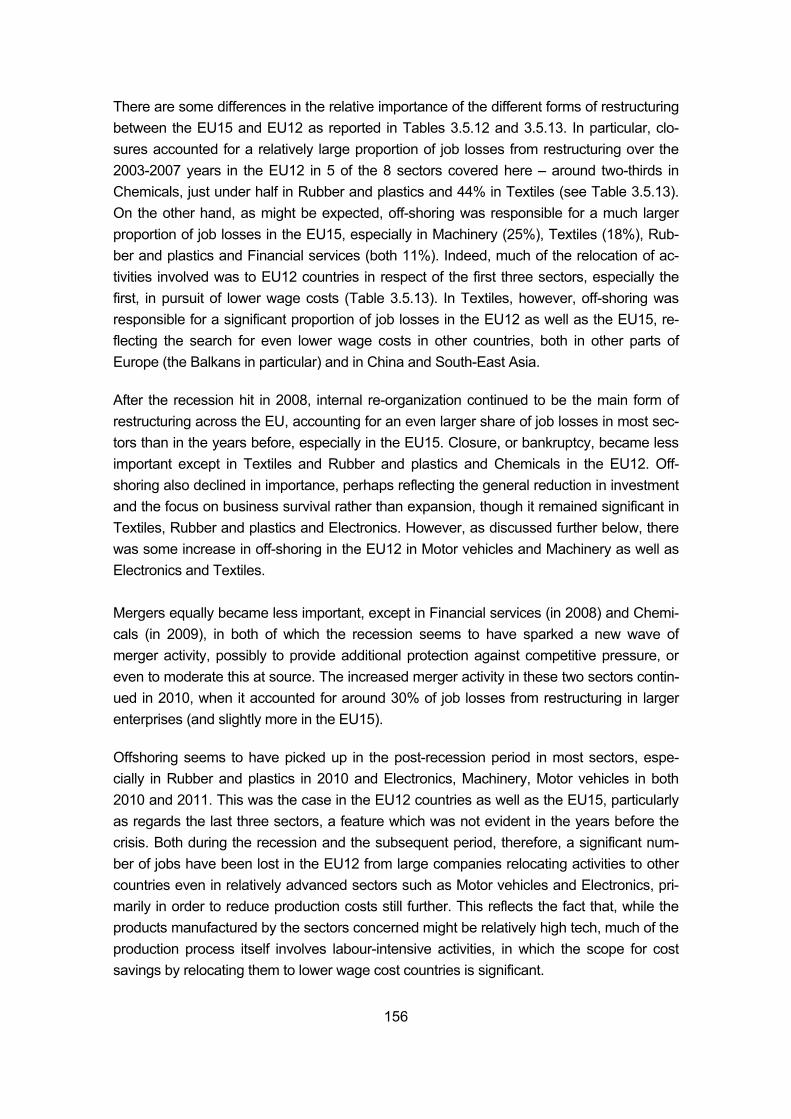
156
There are some differences in the relative importance of the different forms of restructuring between the EU15 and EU12 as reported in Tables 3.5.12 and 3.5.13. In particular, clo-sures accounted for a relatively large proportion of job losses from restructuring over the 2003-2007 years in the EU12 in 5 of the 8 sectors covered here – around two-thirds in Chemicals, just under half in Rubber and plastics and 44% in Textiles (see Table 3.5.13). On the other hand, as might be expected, off-shoring was responsible for a much larger proportion of job losses in the EU15, especially in Machinery (25%), Textiles (18%), Rub-ber and plastics and Financial services (both 11%). Indeed, much of the relocation of ac-tivities involved was to EU12 countries in respect of the first three sectors, especially the first, in pursuit of lower wage costs (Table 3.5.13). In Textiles, however, off-shoring was responsible for a significant proportion of job losses in the EU12 as well as the EU15, re-flecting the search for even lower wage costs in other countries, both in other parts of Europe (the Balkans in particular) and in China and South-East Asia. After the recession hit in 2008, internal re-organization continued to be the main form of restructuring across the EU, accounting for an even larger share of job losses in most sec-tors than in the years before, especially in the EU15. Closure, or bankruptcy, became less important except in Textiles and Rubber and plastics and Chemicals in the EU12. Off-shoring also declined in importance, perhaps reflecting the general reduction in investment and the focus on business survival rather than expansion, though it remained significant in Textiles, Rubber and plastics and Electronics. However, as discussed further below, there was some increase in off-shoring in the EU12 in Motor vehicles and Machinery as well as Electronics and Textiles. Mergers equally became less important, except in Financial services (in 2008) and Chemi-cals (in 2009), in both of which the recession seems to have sparked a new wave of merger activity, possibly to provide additional protection against competitive pressure, or even to moderate this at source. The increased merger activity in these two sectors contin-ued in 2010, when it accounted for around 30% of job losses from restructuring in larger enterprises (and slightly more in the EU15). Offshoring seems to have picked up in the post-recession period in most sectors, espe-cially in Rubber and plastics in 2010 and Electronics, Machinery, Motor vehicles in both 2010 and 2011. This was the case in the EU12 countries as well as the EU15, particularly as regards the last three sectors, a feature which was not evident in the years before the crisis. Both during the recession and the subsequent period, therefore, a significant num-ber of jobs have been lost in the EU12 from large companies relocating activities to other countries even in relatively advanced sectors such as Motor vehicles and Electronics, pri-marily in order to reduce production costs still further. This reflects the fact that, while the products manufactured by the sectors concerned might be relatively high tech, much of the production process itself involves labour-intensive activities, in which the scope for cost savings by relocating them to lower wage cost countries is significant.
157
Table 3.5.12
Division of job losses from restructuring by form in the EU 15, 2003-2011
% Total job losses from restructuring 2003-07 Merger Reorganization Relocation Offshoring Outsourcing Closure
Textiles 1.5 49.7 4.1 17.9 26.7 Chemicals 8.5 82.2 0.3 4.0 0.5 4.6 Rubber, plastics 1.6 77.6 1.4 10.7 8.8 Metals 43.1 42.4 1.9 3.5 9.0 Electronics 7.0 72.7 0.4 9.0 0.9 10.0 Machinery 45.9 6.7 25.0 2.1 20.3 Motors 1.1 76.2 1.3 9.0 12.5 Finance 12.2 70.4 0.3 10.7 4.2 2.0
2008 Textiles 2.0 38.4 7.0 52.6 Chemicals 1.5 91.1 0.4 2.5 4.5 Rubber, plastics 83.5 3.7 6.8 6.0 Metals 96.3 0.8 2.8 Electronics 2.0 87.4 0.2 5.8 4.6 Machinery 91.7 0.8 7.5 Motors 1.6 87.8 2.6 8.0 Finance 33.2 65.6 0.1 0.4 0.7
2009 Textiles 3.7 76.7 2.5 13.4 3.7 Chemicals 27.3 66.9 1.6 4.2 Rubber, plastics 75.7 5.0 19.3 Metals 94.5 0.2 5.3 Electronics 86.6 0.4 6.2 0.2 6.6 Machinery 92.2 1.0 6.9 Motors 0.4 93.7 1.0 4.9 Finance 2.5 93.0 0.2 0.1 4.3
2010 Textiles 15.1 21.6 63.3 Chemicals 31.5 64.8 0.5 3.2 Rubber, plastics 10.5 54.5 26.6 8.4 Metals 29.1 70.9 Electronics 1.4 84.8 2.3 4.0 4.3 3.3 Machinery 1.1 87.1 7.5 4.3 Motors 77.3 4.4 18.3 Finance 36.6 56.8 0.9 5.7
2011 Textiles 55.6 44.4 Chemicals 74.3 25.7 Rubber, plastics 100.0 Metals 91.7 8.3 Electronics 87.2 10.9 1.9 Machinery 71.3 28.7 Motors 51.8 14.1 34.1 Finance 5.8 92.4 1.9
Source: European Foundation, ERM plus own calculations
The experience during this period, therefore, suggests that companies which moved pro-duction to the EU12 countries before and after their accession to the Union may now be in
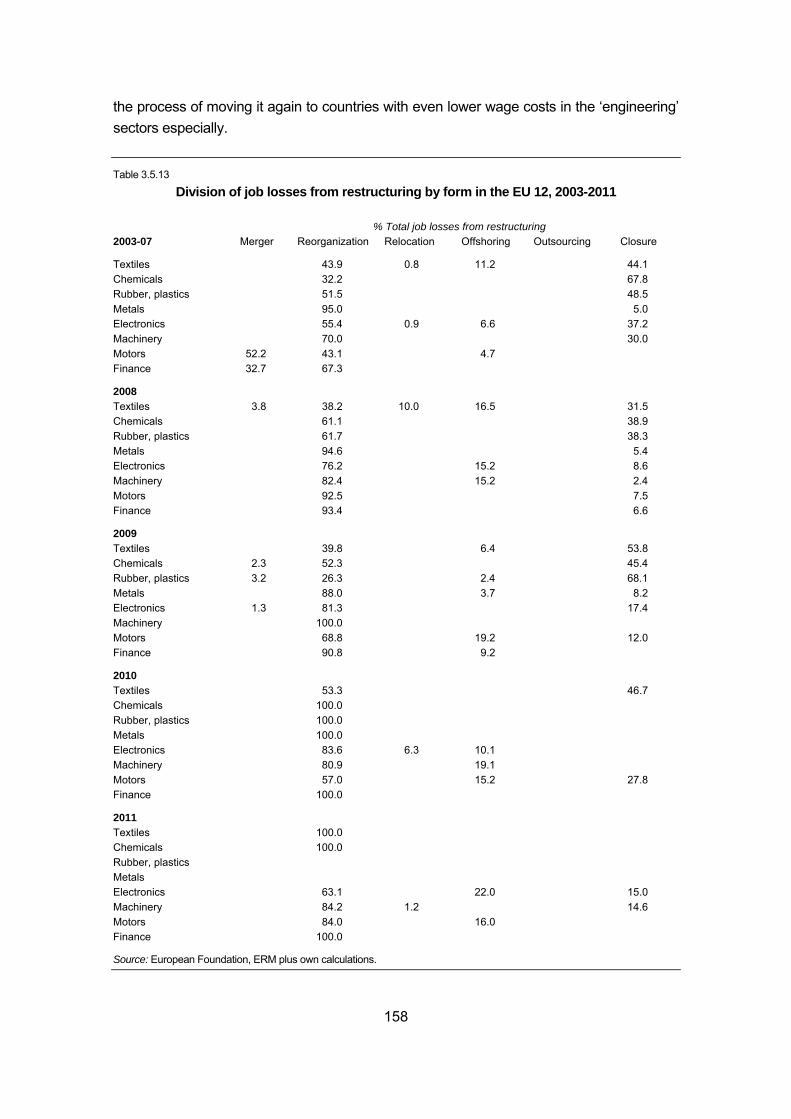
158
the process of moving it again to countries with even lower wage costs in the ‘engineering’ sectors especially. Table 3.5.13
Division of job losses from restructuring by form in the EU 12, 2003-2011
% Total job losses from restructuring 2003-07 Merger Reorganization Relocation Offshoring Outsourcing Closure
Textiles 43.9 0.8 11.2 44.1 Chemicals 32.2 67.8 Rubber, plastics 51.5 48.5 Metals 95.0 5.0 Electronics 55.4 0.9 6.6 37.2 Machinery 70.0 30.0 Motors 52.2 43.1 4.7 Finance 32.7 67.3
2008 Textiles 3.8 38.2 10.0 16.5 31.5 Chemicals 61.1 38.9 Rubber, plastics 61.7 38.3 Metals 94.6 5.4 Electronics 76.2 15.2 8.6 Machinery 82.4 15.2 2.4 Motors 92.5 7.5 Finance 93.4 6.6
2009 Textiles 39.8 6.4 53.8 Chemicals 2.3 52.3 45.4 Rubber, plastics 3.2 26.3 2.4 68.1 Metals 88.0 3.7 8.2 Electronics 1.3 81.3 17.4 Machinery 100.0 Motors 68.8 19.2 12.0 Finance 90.8 9.2
2010 Textiles 53.3 46.7 Chemicals 100.0 Rubber, plastics 100.0 Metals 100.0 Electronics 83.6 6.3 10.1 Machinery 80.9 19.1 Motors 57.0 15.2 27.8 Finance 100.0
2011 Textiles 100.0 Chemicals 100.0 Rubber, plastics Metals Electronics 63.1 22.0 15.0 Machinery 84.2 1.2 14.6 Motors 84.0 16.0 Finance 100.0
Source: European Foundation, ERM plus own calculations.
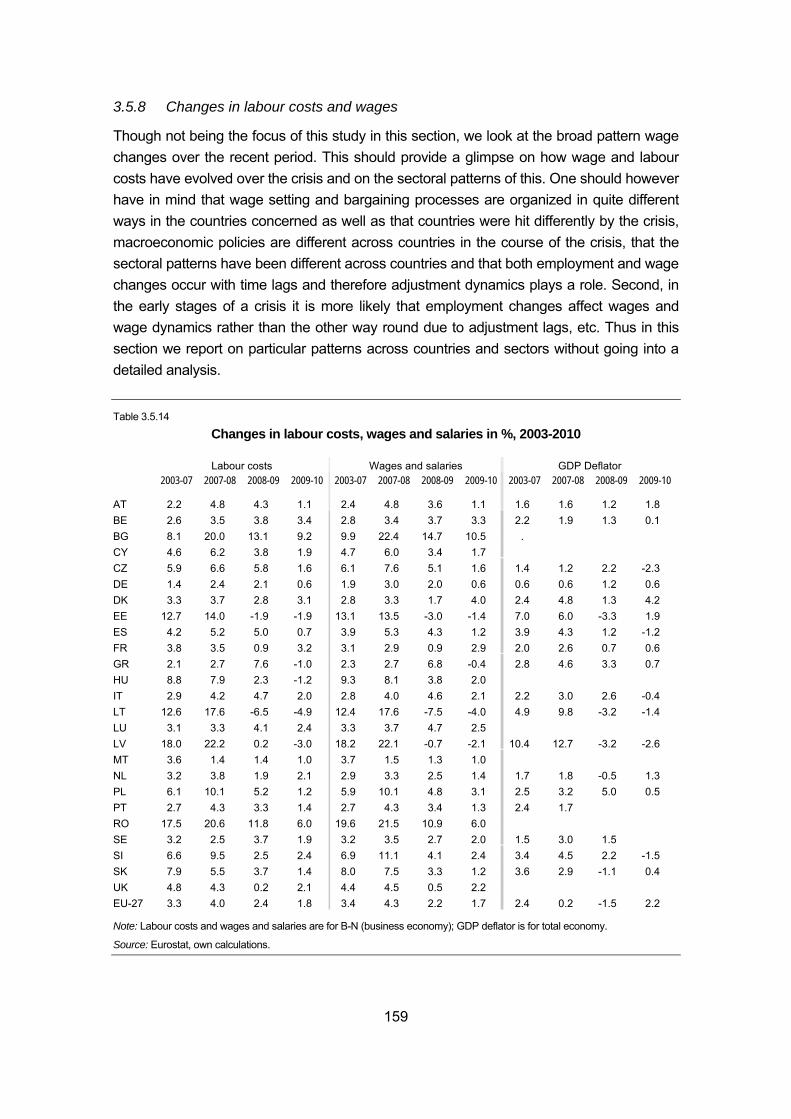
159
3.5.8 Changes in labour costs and wages
Though not being the focus of this study in this section, we look at the broad pattern wage changes over the recent period. This should provide a glimpse on how wage and labour costs have evolved over the crisis and on the sectoral patterns of this. One should however have in mind that wage setting and bargaining processes are organized in quite different ways in the countries concerned as well as that countries were hit differently by the crisis, macroeconomic policies are different across countries in the course of the crisis, that the sectoral patterns have been different across countries and that both employment and wage changes occur with time lags and therefore adjustment dynamics plays a role. Second, in the early stages of a crisis it is more likely that employment changes affect wages and wage dynamics rather than the other way round due to adjustment lags, etc. Thus in this section we report on particular patterns across countries and sectors without going into a detailed analysis. Table 3.5.14
Changes in labour costs, wages and salaries in %, 2003-2010
Labour costs Wages and salaries GDP Deflator 2003-07 2007-08 2008-09 2009-10 2003-07 2007-08 2008-09 2009-10 2003-07 2007-08 2008-09 2009-10
AT 2.2 4.8 4.3 1.1 2.4 4.8 3.6 1.1 1.6 1.6 1.2 1.8 BE 2.6 3.5 3.8 3.4 2.8 3.4 3.7 3.3 2.2 1.9 1.3 0.1 BG 8.1 20.0 13.1 9.2 9.9 22.4 14.7 10.5 . CY 4.6 6.2 3.8 1.9 4.7 6.0 3.4 1.7 CZ 5.9 6.6 5.8 1.6 6.1 7.6 5.1 1.6 1.4 1.2 2.2 -2.3 DE 1.4 2.4 2.1 0.6 1.9 3.0 2.0 0.6 0.6 0.6 1.2 0.6 DK 3.3 3.7 2.8 3.1 2.8 3.3 1.7 4.0 2.4 4.8 1.3 4.2 EE 12.7 14.0 -1.9 -1.9 13.1 13.5 -3.0 -1.4 7.0 6.0 -3.3 1.9 ES 4.2 5.2 5.0 0.7 3.9 5.3 4.3 1.2 3.9 4.3 1.2 -1.2 FR 3.8 3.5 0.9 3.2 3.1 2.9 0.9 2.9 2.0 2.6 0.7 0.6 GR 2.1 2.7 7.6 -1.0 2.3 2.7 6.8 -0.4 2.8 4.6 3.3 0.7 HU 8.8 7.9 2.3 -1.2 9.3 8.1 3.8 2.0 IT 2.9 4.2 4.7 2.0 2.8 4.0 4.6 2.1 2.2 3.0 2.6 -0.4 LT 12.6 17.6 -6.5 -4.9 12.4 17.6 -7.5 -4.0 4.9 9.8 -3.2 -1.4 LU 3.1 3.3 4.1 2.4 3.3 3.7 4.7 2.5 LV 18.0 22.2 0.2 -3.0 18.2 22.1 -0.7 -2.1 10.4 12.7 -3.2 -2.6 MT 3.6 1.4 1.4 1.0 3.7 1.5 1.3 1.0 NL 3.2 3.8 1.9 2.1 2.9 3.3 2.5 1.4 1.7 1.8 -0.5 1.3 PL 6.1 10.1 5.2 1.2 5.9 10.1 4.8 3.1 2.5 3.2 5.0 0.5 PT 2.7 4.3 3.3 1.4 2.7 4.3 3.4 1.3 2.4 1.7 RO 17.5 20.6 11.8 6.0 19.6 21.5 10.9 6.0 SE 3.2 2.5 3.7 1.9 3.2 3.5 2.7 2.0 1.5 3.0 1.5 SI 6.6 9.5 2.5 2.4 6.9 11.1 4.1 2.4 3.4 4.5 2.2 -1.5 SK 7.9 5.5 3.7 1.4 8.0 7.5 3.3 1.2 3.6 2.9 -1.1 0.4 UK 4.8 4.3 0.2 2.1 4.4 4.5 0.5 2.2 EU-27 3.3 4.0 2.4 1.8 3.4 4.3 2.2 1.7 2.4 0.2 -1.5 2.2
Note: Labour costs and wages and salaries are for B-N (business economy); GDP deflator is for total economy.
Source: Eurostat, own calculations.
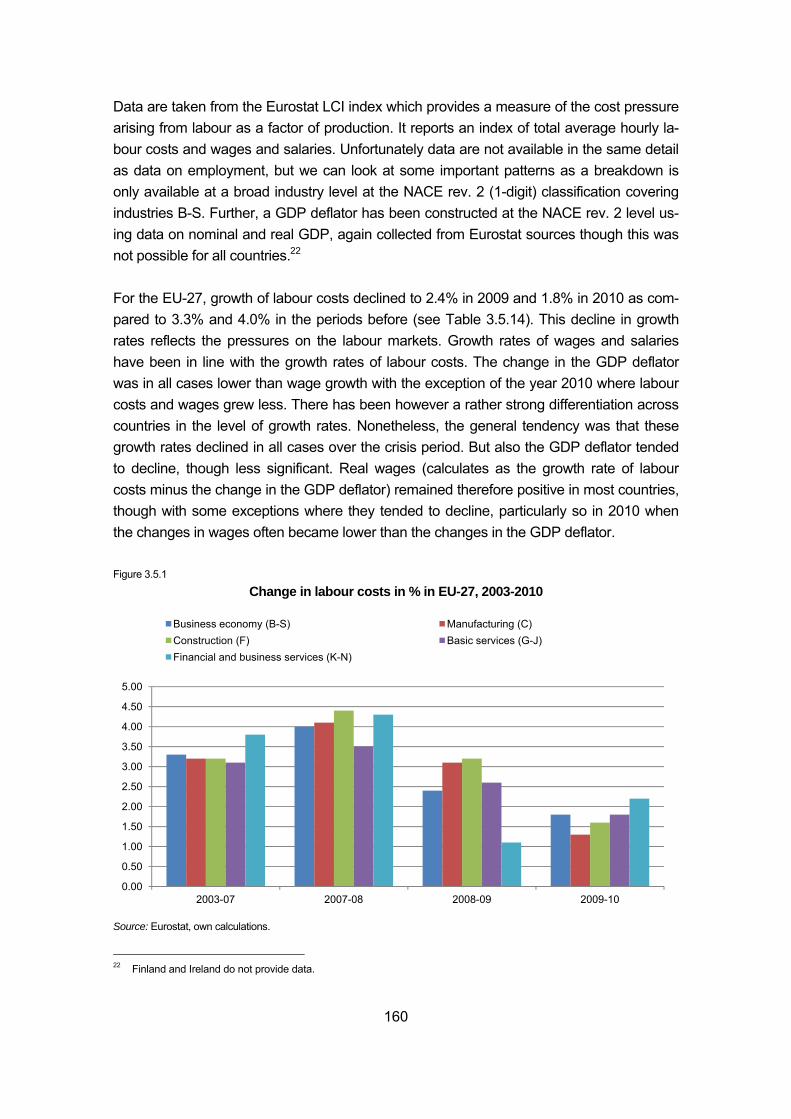
160
Data are taken from the Eurostat LCI index which provides a measure of the cost pressure arising from labour as a factor of production. It reports an index of total average hourly la-bour costs and wages and salaries. Unfortunately data are not available in the same detail as data on employment, but we can look at some important patterns as a breakdown is only available at a broad industry level at the NACE rev. 2 (1-digit) classification covering industries B-S. Further, a GDP deflator has been constructed at the NACE rev. 2 level us-ing data on nominal and real GDP, again collected from Eurostat sources though this was not possible for all countries.22 For the EU-27, growth of labour costs declined to 2.4% in 2009 and 1.8% in 2010 as com-pared to 3.3% and 4.0% in the periods before (see Table 3.5.14). This decline in growth rates reflects the pressures on the labour markets. Growth rates of wages and salaries have been in line with the growth rates of labour costs. The change in the GDP deflator was in all cases lower than wage growth with the exception of the year 2010 where labour costs and wages grew less. There has been however a rather strong differentiation across countries in the level of growth rates. Nonetheless, the general tendency was that these growth rates declined in all cases over the crisis period. But also the GDP deflator tended to decline, though less significant. Real wages (calculates as the growth rate of labour costs minus the change in the GDP deflator) remained therefore positive in most countries, though with some exceptions where they tended to decline, particularly so in 2010 when the changes in wages often became lower than the changes in the GDP deflator. Figure 3.5.1
Change in labour costs in % in EU-27, 2003-2010
Source: Eurostat, own calculations.
22 Finland and Ireland do not provide data.
0.00
0.50
1.00
1.50
2.00
2.50
3.00
3.50
4.00
4.50
5.00
2003-07 2007-08 2008-09 2009-10
Business economy (B-S) Manufacturing (C)Construction (F) Basic services (G-J)Financial and business services (K-N)
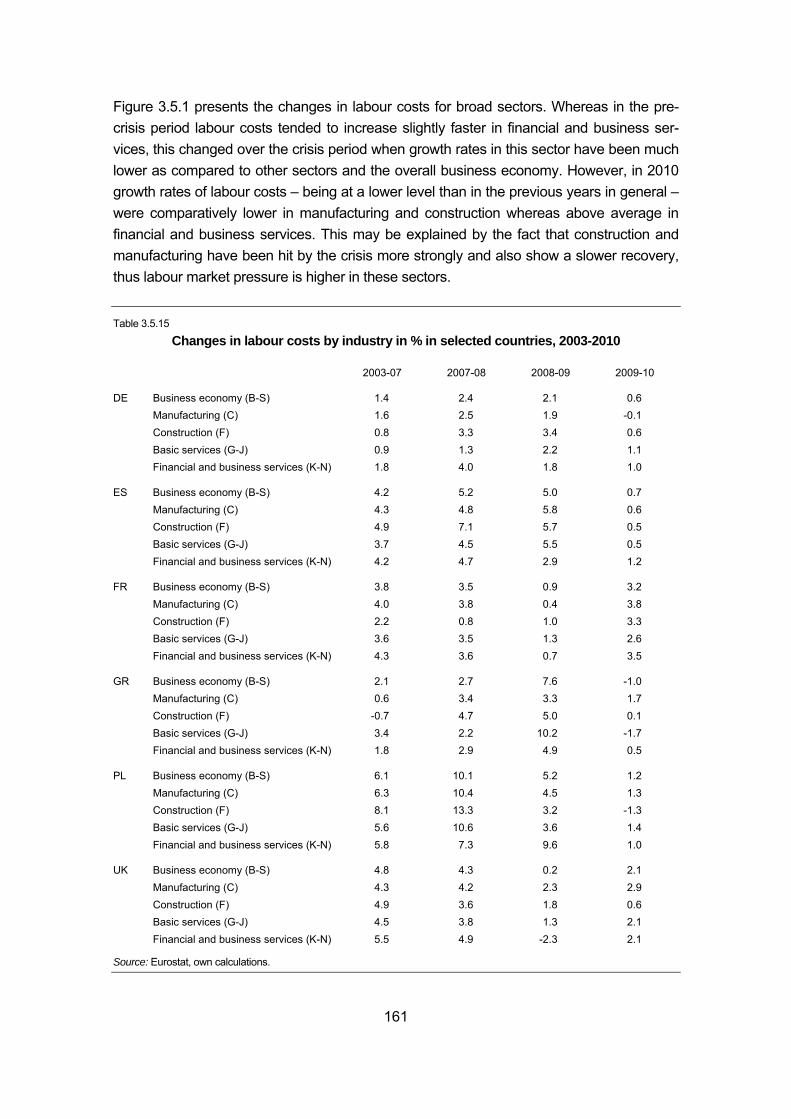
161
Figure 3.5.1 presents the changes in labour costs for broad sectors. Whereas in the pre-crisis period labour costs tended to increase slightly faster in financial and business ser-vices, this changed over the crisis period when growth rates in this sector have been much lower as compared to other sectors and the overall business economy. However, in 2010 growth rates of labour costs – being at a lower level than in the previous years in general – were comparatively lower in manufacturing and construction whereas above average in financial and business services. This may be explained by the fact that construction and manufacturing have been hit by the crisis more strongly and also show a slower recovery, thus labour market pressure is higher in these sectors. Table 3.5.15
Changes in labour costs by industry in % in selected countries, 2003-2010
2003-07 2007-08 2008-09 2009-10
DE Business economy (B-S) 1.4 2.4 2.1 0.6 Manufacturing (C) 1.6 2.5 1.9 -0.1 Construction (F) 0.8 3.3 3.4 0.6 Basic services (G-J) 0.9 1.3 2.2 1.1 Financial and business services (K-N) 1.8 4.0 1.8 1.0
ES Business economy (B-S) 4.2 5.2 5.0 0.7 Manufacturing (C) 4.3 4.8 5.8 0.6 Construction (F) 4.9 7.1 5.7 0.5 Basic services (G-J) 3.7 4.5 5.5 0.5 Financial and business services (K-N) 4.2 4.7 2.9 1.2
FR Business economy (B-S) 3.8 3.5 0.9 3.2 Manufacturing (C) 4.0 3.8 0.4 3.8 Construction (F) 2.2 0.8 1.0 3.3 Basic services (G-J) 3.6 3.5 1.3 2.6 Financial and business services (K-N) 4.3 3.6 0.7 3.5
GR Business economy (B-S) 2.1 2.7 7.6 -1.0 Manufacturing (C) 0.6 3.4 3.3 1.7 Construction (F) -0.7 4.7 5.0 0.1 Basic services (G-J) 3.4 2.2 10.2 -1.7 Financial and business services (K-N) 1.8 2.9 4.9 0.5
PL Business economy (B-S) 6.1 10.1 5.2 1.2 Manufacturing (C) 6.3 10.4 4.5 1.3 Construction (F) 8.1 13.3 3.2 -1.3 Basic services (G-J) 5.6 10.6 3.6 1.4 Financial and business services (K-N) 5.8 7.3 9.6 1.0
UK Business economy (B-S) 4.8 4.3 0.2 2.1 Manufacturing (C) 4.3 4.2 2.3 2.9 Construction (F) 4.9 3.6 1.8 0.6 Basic services (G-J) 4.5 3.8 1.3 2.1 Financial and business services (K-N) 5.5 4.9 -2.3 2.1
Source: Eurostat, own calculations.
162
However, these patterns have not been uniform across countries as can be seen in Table 3.5.15 which shows the changes in labour costs for selected countries. For example, in Germany labour costs were growing relatively faster in the pre-crisis period and were grow-ing relatively strongly in construction in 2009. But in 2010 labour costs even declined in manufacturing whereas still being above average in the services sectors. In Spain wage growth was relatively uniform across sectors before the crisis, with the exception of con-struction which showed higher growth rates. In the crisis year wage growth was becoming significantly below average in business services whereas it was slightly above average in this industry in 2010. However, one should note that the growth rates are at much lower levels in all sectors as compared to the pre-crisis period. In France, labour cost growth in construction was much below average before the crisis. In 2009 wage growth rates be-came more uniform across sectors with basic services being above average. In 2010 la-bour cost growth was again at a much higher level on average, with growth in manufactur-ing and financial services being above average. In Greece wage growth was even stronger in the first years of the crisis and particularly so in basic services in 2009. In 2010 labour cost growth declined to negative rates in the total business economy with negative growth rates in basic services but still positive ones in manufacturing. Also in Poland, which was not hit by the crisis, the pattern of wage growth changed. In the period 2003-2007 it was rather uniform across sectors, but showed more differentiation in 2008 when growth rates in construction were much above average whereas growth rates in financial services much below. This turned into the opposite in 2009. In 2010 labour costs also grew at a much lower level and turned even negative in construction while being rather uniform in the other sectors. Finally, the UK showed a quite even pattern of growth before the crisis. In 2009 however labour cost growth turned strongly negative in financial services whereas remain-ing positive in the other sectors though at much lower levels. In 2010 the pattern became again more uniform, with the exception of construction which shows lower growth as com-pared to the other sectors. 3.6 Summary
In this section we spanned a wide range of topics concerning the specific developments of employment in the twelve sectors selected for a detailed analysis. First, focusing on the long-term developments concerning employment in these sectors, we provided some styl-ized facts which show that across countries employment growth was primarily taking place in the services sectors. In manufacturing sectors stronger productivity growth rates offset employment growth despite positive value-added growth. The particular patterns and changes of employment in the respective sectors as well as characteristics of these are documented in detail in the sector fiches accompanying this study (available upon re-quest).
163
Second, the relationship between value-added growth and productivity growth and other determinants like real wages, capital accumulation, etc. have been addressed applying an error-correction model which allows considering both long-term and short-run effects. Though results might differ across countries and sectors considered the most important findings can be summarized as follows:
• Employment is strongly related to changes in value-added, though an increase in value-added tends to be partly met by productivity growth as well as by employing more peo-ple. Similarly a fall in value-added tends to be associated with a reduction in productivity growth as well as a decline in employment, though lags in adjustment may delay the lat-ter.
• The relationship between employment and real wages tends to be significant in manu-facturing, where increases in real wages tend to reduce the growth of employment, but this is not the case in services. In the UK, as in the US, real wages tend to adjust more quickly to changes in labour demand than in Germany and France, suggesting labour market are more flexible.
• There is inverse relationship between average hours worked and the number em-ployed, indicating in general that the more hours people work, the smaller the number employed and vice versa, so that adjustments in working time has an important effect on jobs.
• Investment in ICT has positive and significant effects on employment in manufacturing, probably working through improvements in productivity. The opposite is the case in ser-vices, suggesting that the increasing use of ICT tends to reduce employment.
• After a shock, it takes up to 3 years for employment to return to trend levels in France, Spain, Belgium and Netherlands. In the other countries, the pace of adjustment is quicker at only 1½ to 2 years on average.
Following that a detailed analysis of changes in the composition of employment in the twelve selected sectors in the more recent periods before the crisis and over the crisis was provided.
• Over the recession period from 2007 to 2010, the share of jobs filled by women contin-ued to increase across the EU. This, however, reflects the large job losses in manufac-turing and construction where few women are employed. In most sectors, even in ser-vices, the share of jobs filled by women declined.
• The share of jobs filled by workers aged 55 and over has increased in most parts of the EU over the past 10 years, reflecting a tendency for older people to remain longer in work. This continued to be the case over the recession period, unlike during previous periods of economic downturn when early retirement has been a major means of reduc-ing work forces. The main people hit by the present crisis are the young under the age of 25.
164
• The proportion of the work force with tertiary education increased in all sectors over the years leading up to the recession and the same is true of the share of employment ac-counted by managers and professionals. Both trends have continued over the reces-sion period.
• There has been a shift from full-time to part-time jobs over the recession period, which might reflect uncertainty among employers over future prospects as well as the pursuit of more flexible organization of work.
Finally the section focused on employment experiences in previous economic downturns together with a more detailed assessment of ongoing developments in the recent crisis:
• There are some differences between previous periods of downturn in the sectors in which employment was most affected. In all periods, however, employment continued to expand in Business services and Hotels and restaurants.
• Economic crises were predominantly weathered by adjustments in hours worked to preserve jobs and the know-how of the work force, so limiting the costs of re-employment and training. This tendency was strongest in the 1970s, moderate in the 1980s and mixed in the 1990s.
• Value-added was generally more volatile than the number employed and hours worked. During the three period of economic downturn, value-added grew only in Business ser-vices. The largest losses were in Machinery and equipment, Basic metals and Con-struction in all three periods.
4 Sectoral interdependencies
4.1 Introduction
The analysis as provided in the previous sections examined the development of employ-ment patterns over time during periods of economic downturn as well as periods of recov-ery and the ‘in-between’ period when growth was broadly following its trend rate, using both econometric exercises and detailed descriptive work. However, it is important to keep in mind that the sectoral developments concerned are not independent of each other but are a reflection of interrelationships across the economy, which in turn reflect the way that production is organized. The output of one sector, therefore, is often the input of another sector, so that fluctuations in the output of the latter because of the economic cycle will inevitably affect the former. Or, if output in one sector drops because of cyclical fluctua-tions, this will also have inevitable consequences for other sectors providing inputs into the sector suffering from a drop in demand. A fall in car sales, for example, does not only hit the output of the automotive industry but almost inevitably leads to a reduction in the output of industries supplying the various goods and services which go into car manufacturing, from sheet steel, the leather produced for seats and the rubber for tyres to computer soft-ware programmes and all the component manufacture in between. Equally, fewer car
165
sales also hit the dealers selling cars as well as the hauliers transporting them to the show-rooms and almost certainly the advertisers helping to market them. As output is affected, so are jobs in these various sectors. For every job in the automotive industry, therefore, there are an estimated three jobs in other parts of the economy which are dependent on the industry.23 The present task will attempt to quantify these inter-sectoral linkages and their role both during the recession and during recovery with respect to employment. The analysis is based on tables from an ongoing project (WIOD) which collects input-output data for 40 countries (including all EU Member States) which are consistent with National Accounts and are linked across countries so that one can also take account of domestic versus for-eign effects. This section is structured as follows:
• We first provide a short description of the method applied, i.e. the calculation of em-ployment multipliers following the recent literature (see Miller and Blair, 2009, for a de-tailed technical treatment). The indicators will be applied using data from the world in-put-output database – WIOD – project which will be described as well.
• Second, these employment multipliers calculated are then used to assess how much employment is created due to changes in final demand for a particular industry. The calculations will be performed at the level of details provided in the input-output tables. Results will, however, be presented and summarized for the 12 sectors selected which cover some of the most interesting ones in terms of their effect on other parts of the economy and the impact of the recession and subsequent recovery on them.
• The aim is to assess the overall effect on employment of developments in the sectors under consideration with respect to the overall multiplier effects but also differentiating between domestic and international employment effects.
4.2 Inter-sectoral linkages and employment multipliers
4.2.1 Methodology of multipliers and linkages
In this chapter we briefly review the methods used below to analyse inter-sectoral linkages and employment multipliers which show the effects of a final demand stimulus in one sec-tor on other sectors’ employment and therefore general employment levels. Here one has to keep in mind that these employment effects do not only appear in one country but spread over to other countries due to international production linkages. We therefore start by providing the analytical tools for discussing these linkages which are themselves based on the notion of output multipliers. 23 See ‘A comprehensive analysis of the evolution of the European automotive industry’, a study produced for
DG Employment in 2008 as part of the sector studies on future skill requirements.
166
An increase in final demand in one sector, e.g. the car industry, first has an ‘initial’ impact on the output of that industry, but also induces ‘direct’ effects in terms of demand in other sectors which serve as inputs into the car manufacturing industry. These inputs may either stem from other industries in the same economy or may be sourced abroad. As also these other sectors source their production from different sectors (perhaps in different countries) this creates further effects which are summarized as ‘indirect’ effects. The initial output effect is the value needed to satisfy the additional demand. The output multiplier then shows the ratio of the direct and indirect effects to this initial change. Formally, this can be represented in the way that gross output x (this is a vector of dimension Nx1 where n is the number of sectors) must equal demand for intermediates and final goods. Demand for intermediates is given from technical coefficients, i.e. inputs from other industries per unit of output, which is summarized in a coefficient matrix denoted by A. This matrix is of dimen-sion NxN where each column denotes demand of this industry in other industries. In the simplest case one assumes that final demand f is exogenously given. Thus, total output can be written as
x = Ax + f = (I-A)-1 f
This has an intuitive interpretation which we exemplify with a change in final demand. A change in final demand first has a direct effect, I Δf, where I denotes an identity matrix, the direct effect, i.e. demand created in other industries to produce this car, A Δf, and the next round effects (demand of these industries on other industries) which is formally (A2 + A3 + ...) Δf. Summarizing, one can therefore write the effects as
Δx = (I + A + A2 + A3 + ...) Δf = (I-A)-1 Δf
Thus, matrix L = (I-A)-1, which is well known as the Leontief inverse, gives valuable insights into the effects of a final demand increase in one sector on the other sectors’ output. Summing up, these columns provide insight into the total output effect in the economy which is referred to as the ‘simple output multiplier’. Looking at a particular column of the Leontief inverse therefore provides an estimate of the output effects in this (initial) and the other sectors (direct and indirect). Formally, this can be written as
where lij denotes the coefficients of the Leontief inverse, j is the industry with the final de-mand stimulus and i denotes the other industries delivering inputs. The simple output mul-tiplier for industry j is denoted by m(o)j. To take account of the international structure of production is formally easy as one has to think of the coefficients matrix A in terms of a global sourcing matrix. For example, the German car manufacturing industry sources inputs per unit of output from other German industries but also from industries in other countries (such as the Slovak Republic, Austria, etc.) and in analogy to above can be differentiated into direct and indirect (i.e. second,
167
third, ... round) effects. The A matrix therefore is of a much larger dimension depending on the number of countries included. The output multiplier would then be written as
where C denotes the number of countries and denotes the coefficient of the Leontief inverse associated with the sourcing of sector j in country c in sectors i in countries r. Though it is conceptually relatively straightforward taking account of these international linkages, it is challenging from a data point of view as data are provided on a national ba-sis. Here we use data from the WIOD project which aims at creating such a database (for a more detailed description see below) that allows capturing also these international link-ages. Fist, however, we briefly summarize how this concept of multipliers is related to measures of international linkages and multipliers with respect to employment. Generally, two kinds of linkages occur in the framework of the input-output analysis: On the one hand, a sector needs inputs from other sectors. The interconnection of a particular sector with those ‘upstream’ sectors from which it purchases inputs is termed ‘backward linkages’. The economic effect on other sectors is to be found on the demand side: ‘If sec-tor j increased its output, this means there will be increased demands from sector j (as a purchaser) on the sectors whose goods are used as inputs to production in j’ (see Miller and Blair, 2009, p. 555). On the other hand, a sector sells its output to other sectors. This kind of interconnection of a particular sector with those ‘downstream’ sectors to which it sells its output is called ‘forward linkages’. The economic effect is to be found on the supply side: ‘If sector j increased its output, this means there will be increased supplies from sec-tor j (as a seller) for the sectors that use good j in their production’ (see Miller and Blair, 2009, p. 555). Various measures have been proposed to calculate backward and forward linkages: An early and today still commonly used linkage index was suggested by Rasmussen in 1957 (see Box 4.2.1). A number of contributions have later refined this traditional concept and suggested different measures of industries linkages. Rasmussen himself, for example, proposed an amended measure taking account of extreme values and calculated the coef-ficient of variation indices (see Soofi, 1992, p. 352). Jones (1976, as cited in Drejer, 2002) questions the use of Rasmussen’s index of sensitivity of dispersion measure of forward linkages and instead proposes to utilize the output inverse matrix in the calculation of the index. Cuello et al. (1992) again use information from outside the Leontief inverse in order to refine the Rasmussen linkage indices.
168
Box 4.2.1 - Measurements of backward and forward linkages
The Rasmussen linkage index ‘power of dispersion’ describes the relative extent to which an in-crease in final demand for the products of a given industry is dispersed throughout the total system of industries and is defined as:
∑
∑=
ijij
iij
j
ln
lnU
2
1
1
where n is the number of industries and Σi lij is the sum of the column elements in the Leontief in-verse matrix L = (I-A)-1. It can be interpreted as the total increase in output from the entire system of industries needed to cope with an increase in final demand for the products of industry j by one unit. This index describes the ‘backward linkage effects’.
Rasmussen also presented a supplementary index describing the extent to which the system of industries draws upon a given industry – an index of the ‘sensitivity of dispersion’. The sensitivity of dispersion index measures the increase in the production of industry i, driven by a unit increase in the final demand for all industries in the system. The index is defined as:
∑
∑=
ijij
jij
i
ln
ln
U
2
1
1
where Σj lij is the sum of the row elements in the Leontief inverse matrix, which is interpreted as the increase in output in industry i needed in order to cope with a unit increase in the final demand for the product of each industry. This index may be labelled as ‘forward linkage effects’.
See Drejer (2002), p. 5.
Finally, we turn to employment multipliers, which will be the focus of the empirical exercise with respect to the overall aim of this report. Employment multipliers are used in order to calculate employment effects of a final demand stimulus in an industry. This means that based on an initial stimulus on final demand in a selected sector, this sector generates additional employment in its own sector (initial effect) and – through its interconnection with other sectors – also the rest of the domestic economy creates employment (domestic di-rect effect). In addition, since inputs are needed from industries in other countries as well, employment is also created in foreign countries (international direct effect). Employment multipliers in most cases are reported at the total economy level which therefore does not tell in which particular sectors (or countries in the case of international linkages) employ-ment creation takes place – it might be in agriculture, manufacturing as well as services sectors – depending on the demand structure of the respective industry (or the upstream sectors). Employment multipliers are calculated by connecting a simple input-output model as de-scribed above with an external variable, which in this case is the employment variable. The
169
input-output model from which the employment multiplier is derived follows from the analy-sis of the output multipliers above. The direct effect of a final demand change is associated with a change in labour demand in that sector which is given by the number of workers needed to produce one unit of output (i.e. the inverse of labour productivity). Similarly, the direct effect in the other sectors also shows up as the increase in employment to produce the additional output which stems from the demand from the industry in which final demand has increased. An analogous interpretation also holds for the indirect effects. Formally, this is achieved by pre-multiplying the output effects with the coefficients which show how much labour is used to produce this additional output. We denote these by hj. The em-ployment multiplier would therefore be ∑ which however is often normal-ized by the initial effect and referred to as Type I multiplier (Miller and Blair, 2009; Valadkhani, 2005) for a particular sector j and therefore becomes
1
Variable j is the direct labour coefficient per unit of gross output i and lij is the ij th element of the Leontief inverse matrix. The summation term on the right-hand side can be interpreted as the impact of a one unit increase (e.g. one million of US dollars) of final demand in sector j on employment. Dividing the employment multiplier by the direct labour coefficient of sector j provides the final Type I employment multiplier which shows the additional number of per-sons employed in the economy for each additional person directly employed in sector j. Thus, this measure shows how many additional jobs are created in the total economy for each job created in sector j. This measure therefore depends on the structure of inter-industry linkages , the respective employment intensities , and the sectoral labour pro-ductivity. The more interlinked a sector is, particularly with employment-intensive sectors, and the higher the labour productivity of this sector, the higher this measure of the employ-ment multiplier tends to be. As the aim of this report is to provide a comparison across sec-tors and countries and over time, this ‘relative’ measure is appropriate in indicating the link-ages across sectors and countries in a comparative manner.24 If inputs are needed from other countries’ industries as well, employment is created not only in the domestic economy but also in other economies. Technically, this would imply that the summation is over all countries and sectors:
, ∑ ∑ (4.2.1)
Here, C denotes the number of countries under consideration and the direct labour input coefficient has to be superscripted by country. Furthermore, as we can also distinguish from which other countries’ industries intermediates are sourced, we have to characterize 24 Specifically, this measure is less problematic with respect to different sizes of the sectors considered and using current
price data (constant price series will be constructed in the WIOD project but have not been available when writing this report). It should however be noted that for evaluating policy measures (such as the car scrapping schemes) the absolute numbers should be used.
170
the elements of the Leontief inverse by sourcing country as well. This sum can be calcu-lated for each particular country. Here we show the employment effects for the country under consideration and the international effect on employment demand.
Box 4.2.2 – Example
As a specific example explaining these concepts let us look at the transport equipment sector in Germany in 2005. An increase in final demand of one million USD would imply an initial employment creation effect of about 2.71 persons (corresponding to the labour input coefficient in this sector). Through the domestic and international inter-industry linkages, another 19.6 jobs would be created (direct and indirect effects). Splitting them up into the domestic and the international effect shows that 8.2 jobs are created in Germany and 11.4 in other countries. The measure reported according to equation (4.2.1) thus indicates that for each job created due to the initial demand stimulus another 7.2 (= 19.6/2.71) jobs are created world-wide, of which 3 (= 8.2/2.71) in Germany and 4.2 (= 11.4/2.71) in the other countries.
4.2.2 The WIOD database
The data used for the analysis are taken from the ‘World Input-Output Database’ (WIOD) as available in July 2011.25 In this section we provide a brief description of the data to be used and how these have been constructed. The WIOD data are the outcome of a recent effort undertaken in an ongoing project within the Framework 7 programme which aims to bring together information from national accounts statistics, supply and use tables, trade in goods and services data and corresponding data on factors of production (capital and la-bour) for 40 countries over the period 1995-2006. The database covers all 27 EU countries plus Turkey and includes other major economies such as the NAFTA countries (USA, Canada and Mexico), the BRIIC countries (Brazil, Russia, India, Indonesia and China), Japan, Korea, Taiwan, and Australia. Let us provide a brief description of this database. National accounts data have been col-lected for all countries over the period 1995-2006 which served as benchmark values. Ex-isting supply and use tables have then been adjusted to these national accounts data with some of the tables being estimated for years in which data were not available. Some coun-tries only provide input-output tables which have been transformed back into supply and use tables. Through this process all tables have been standardized over years and across countries with respect to product and industry classifications. These tables contain informa-tion on supply and use of 59 products in 35 industries together with the information on final use and value-added. Accompanying this information, corresponding trade data were collected at the same level of disaggregation at the product level. Data on goods trade are taken from UN COM-
25 For detailed information see www.wiod.org.
171
TRADE at the HS 6-digit product level which can be aggregated to the CPA products at 2-digit level as reported in the supply and use tables. However, services trade is only avail-able from balance-of-payments statistics providing information on a detailed basis only in Balance-of-Payments categories. Using a rough correspondence these were merged to the product level data provided in the supply and use tables. Additionally, the trade data are split up into use categories fitting the needs of supply and use tables, i.e. intermedi-ates, consumption and gross fixed capital formation. Goods trade has been split up by applying a categorization of products into intermediates, final consumer goods and gross fixed capital goods. The correspondence used for this was created by beginning with the usually used Broad Economic Categories (BEC) classification (provided by UN) but adapt-ing the classification to the specific needs. In particular, the correspondence between HS 6-digit and BEC categories has been revised and in a number of cases we use weights for particular products in order to distinguish between intermediates and the other catego-ries. For services trade, however, no such information is available. Therefore, we used data from existing input-output and supply and use data and applied average shares across countries. Relying on these underlying data we started from the import vector pro-vided in the supply tables. Import values for each country and product are split up, first, into the three use categories. Second, within each use category a proportionality assumption is applied to split up the imports for each use category across the relevant dimensions. For example, imports of intermediates are allocated across using industries proportional to the structure in the total use table. Similarly, imports for final consumption are split up into final demand categories. Investments are allocated only to gross fixed capital formation (i.e. not considering changes in inventories and valuables). This resulted in an import use table for each country. Finally, each cell of the import use table was again split up by country of ori-gin, resulting in 39+1 (including the rest of world) import use tables for each country. Merg-ing these tables provides a full set of inter-country supply and use tables. Finally, an inter-national input-output table was constructed by applying the transformations of model D as described in the Eurostat manual (Eurostat, 2008). This results in a world input-output da-tabase for 40 countries and 35 industries, i.e. the intermediates demand block is of dimen-sion 1400x1400 plus the additional rows on value-added and columns on final demand categories. The rest of the world is not explicitly modelled in this case but appears only in the import columns (imports from rest of the world by product) and export column (exports to rest of the world). In the application below an assumption on the structure of input coeffi-cients is necessary which will be outlined below. Corresponding data at the industry level allow splitting up value-added into capital and labour income as well as physical inputs such as employment and capital.26
26 Furthermore, in an ongoing effort capital income will be split up into ICT and Non-ICT income, and labour income into
income of low-, medium- and high-educated workers. These additional data for the factor incomes correspond in construction to the method applied in the EU KLEMS database (see www.euklems.org) and efforts undertaken in the World KLEMS project.
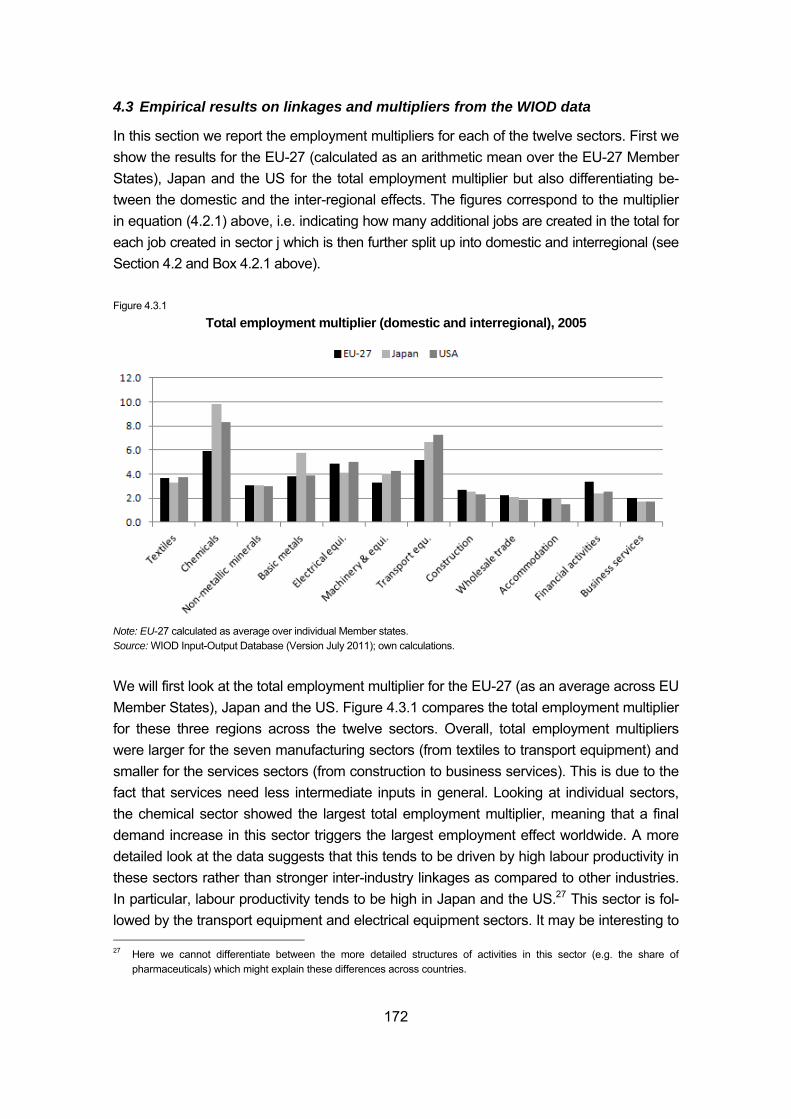
172
4.3 Empirical results on linkages and multipliers from the WIOD data
In this section we report the employment multipliers for each of the twelve sectors. First we show the results for the EU-27 (calculated as an arithmetic mean over the EU-27 Member States), Japan and the US for the total employment multiplier but also differentiating be-tween the domestic and the inter-regional effects. The figures correspond to the multiplier in equation (4.2.1) above, i.e. indicating how many additional jobs are created in the total for each job created in sector j which is then further split up into domestic and interregional (see Section 4.2 and Box 4.2.1 above). Figure 4.3.1
Total employment multiplier (domestic and interregional), 2005
Note: EU-27 calculated as average over individual Member states. Source: WIOD Input-Output Database (Version July 2011); own calculations.
We will first look at the total employment multiplier for the EU-27 (as an average across EU Member States), Japan and the US. Figure 4.3.1 compares the total employment multiplier for these three regions across the twelve sectors. Overall, total employment multipliers were larger for the seven manufacturing sectors (from textiles to transport equipment) and smaller for the services sectors (from construction to business services). This is due to the fact that services need less intermediate inputs in general. Looking at individual sectors, the chemical sector showed the largest total employment multiplier, meaning that a final demand increase in this sector triggers the largest employment effect worldwide. A more detailed look at the data suggests that this tends to be driven by high labour productivity in these sectors rather than stronger inter-industry linkages as compared to other industries. In particular, labour productivity tends to be high in Japan and the US.27 This sector is fol-lowed by the transport equipment and electrical equipment sectors. It may be interesting to 27 Here we cannot differentiate between the more detailed structures of activities in this sector (e.g. the share of
pharmaceuticals) which might explain these differences across countries.
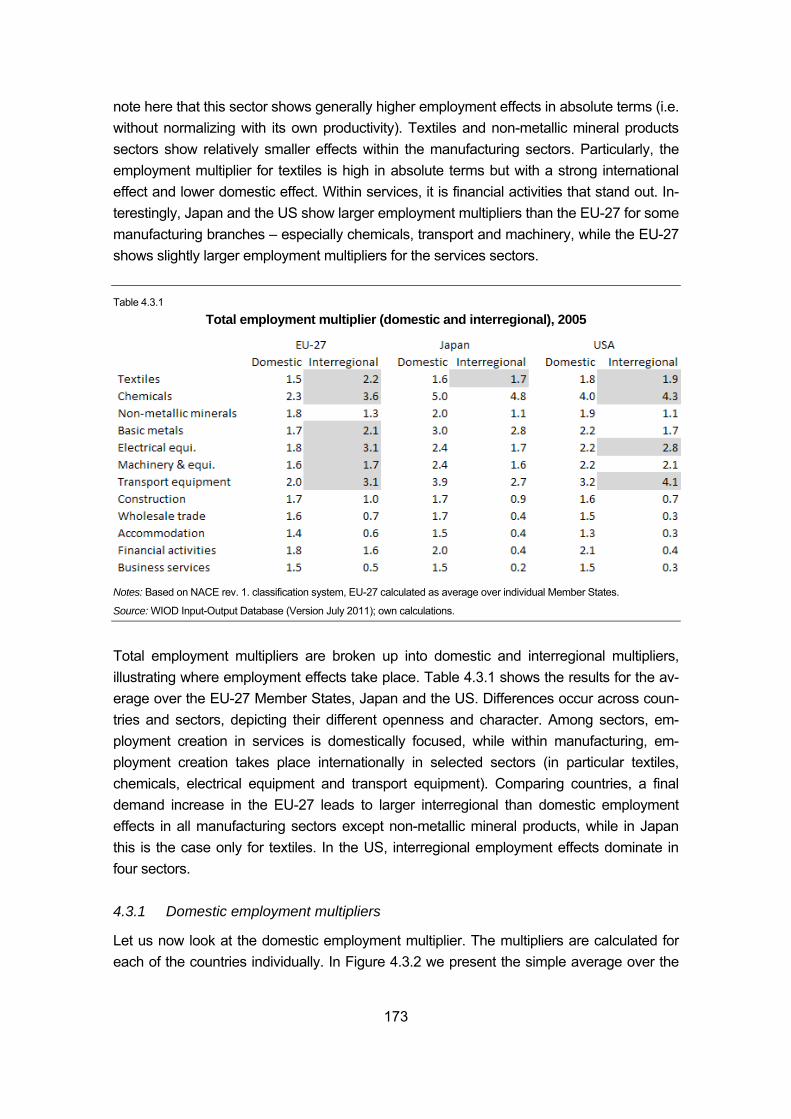
173
note here that this sector shows generally higher employment effects in absolute terms (i.e. without normalizing with its own productivity). Textiles and non-metallic mineral products sectors show relatively smaller effects within the manufacturing sectors. Particularly, the employment multiplier for textiles is high in absolute terms but with a strong international effect and lower domestic effect. Within services, it is financial activities that stand out. In-terestingly, Japan and the US show larger employment multipliers than the EU-27 for some manufacturing branches – especially chemicals, transport and machinery, while the EU-27 shows slightly larger employment multipliers for the services sectors. Table 4.3.1
Total employment multiplier (domestic and interregional), 2005
Notes: Based on NACE rev. 1. classification system, EU-27 calculated as average over individual Member States.
Source: WIOD Input-Output Database (Version July 2011); own calculations.
Total employment multipliers are broken up into domestic and interregional multipliers, illustrating where employment effects take place. Table 4.3.1 shows the results for the av-erage over the EU-27 Member States, Japan and the US. Differences occur across coun-tries and sectors, depicting their different openness and character. Among sectors, em-ployment creation in services is domestically focused, while within manufacturing, em-ployment creation takes place internationally in selected sectors (in particular textiles, chemicals, electrical equipment and transport equipment). Comparing countries, a final demand increase in the EU-27 leads to larger interregional than domestic employment effects in all manufacturing sectors except non-metallic mineral products, while in Japan this is the case only for textiles. In the US, interregional employment effects dominate in four sectors. 4.3.1 Domestic employment multipliers
Let us now look at the domestic employment multiplier. The multipliers are calculated for each of the countries individually. In Figure 4.3.2 we present the simple average over the
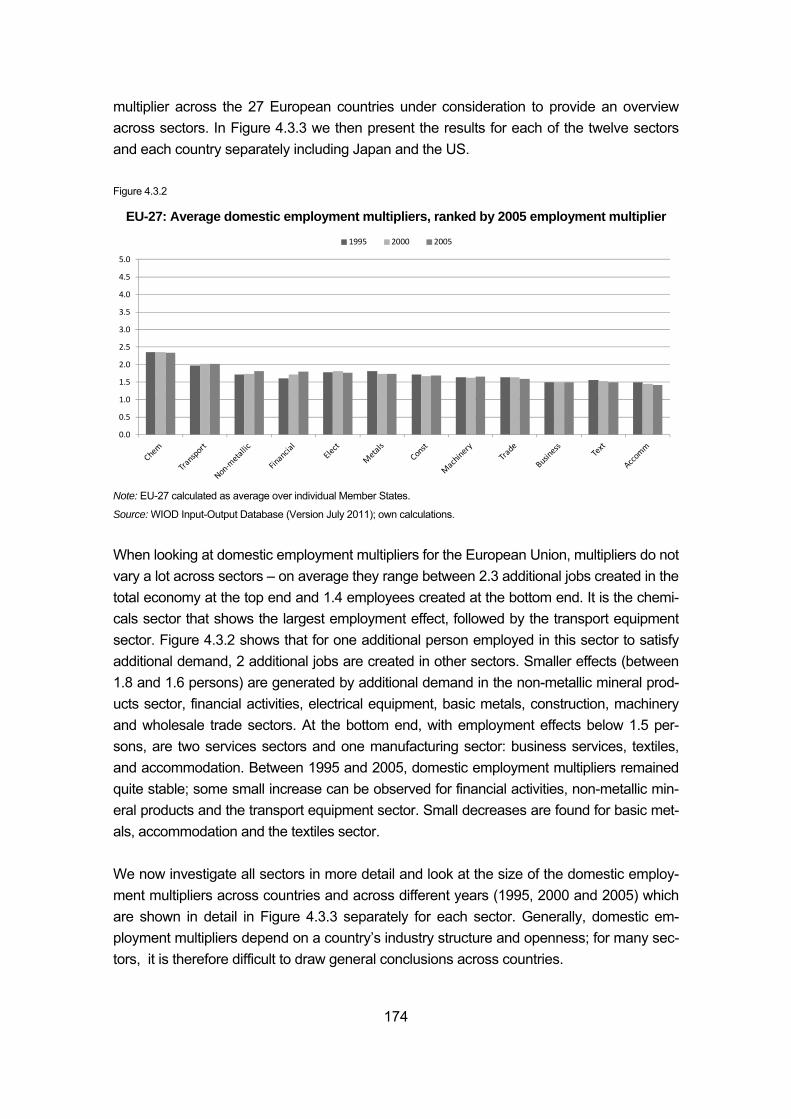
174
multiplier across the 27 European countries under consideration to provide an overview across sectors. In Figure 4.3.3 we then present the results for each of the twelve sectors and each country separately including Japan and the US. Figure 4.3.2
EU-27: Average domestic employment multipliers, ranked by 2005 employment multiplier
Note: EU-27 calculated as average over individual Member States.
Source: WIOD Input-Output Database (Version July 2011); own calculations.
When looking at domestic employment multipliers for the European Union, multipliers do not vary a lot across sectors – on average they range between 2.3 additional jobs created in the total economy at the top end and 1.4 employees created at the bottom end. It is the chemi-cals sector that shows the largest employment effect, followed by the transport equipment sector. Figure 4.3.2 shows that for one additional person employed in this sector to satisfy additional demand, 2 additional jobs are created in other sectors. Smaller effects (between 1.8 and 1.6 persons) are generated by additional demand in the non-metallic mineral prod-ucts sector, financial activities, electrical equipment, basic metals, construction, machinery and wholesale trade sectors. At the bottom end, with employment effects below 1.5 per-sons, are two services sectors and one manufacturing sector: business services, textiles, and accommodation. Between 1995 and 2005, domestic employment multipliers remained quite stable; some small increase can be observed for financial activities, non-metallic min-eral products and the transport equipment sector. Small decreases are found for basic met-als, accommodation and the textiles sector. We now investigate all sectors in more detail and look at the size of the domestic employ-ment multipliers across countries and across different years (1995, 2000 and 2005) which are shown in detail in Figure 4.3.3 separately for each sector. Generally, domestic em-ployment multipliers depend on a country’s industry structure and openness; for many sec-tors, it is therefore difficult to draw general conclusions across countries.
0.0
0.5
1.0
1.5
2.0
2.5
3.0
3.5
4.0
4.5
5.0
1995 2000 2005
175
Textiles. Not surprisingly, domestic employment multipliers are rather small in this sector. It was highest in France and Italy in 2005 (each additional job in this industry raised domestic employment by 2 extra persons in the total economy) and reached the lowest level in Roma-nia, Slovakia, Lithuania and Cyprus (triggering an employment effect of around 1.2 persons) in 2005. The domestic employment multiplier was quite high for the US (1.8 persons) in the textiles sector, as it sources a lot in agriculture (cotton industry). The domestic employment multiplier was above the EU-27 average in Japan (1.6 persons). Over time, the multiplier for the textiles, apparel & footwear sectors tended to decline, especially in the EU-12 countries. Chemicals. Across countries, the employment multiplier for the chemical sector was excep-tionally large for three countries: In Japan, France and the US, one job created in the chemical sector generated 5 and 4 additional persons respectively in the whole economy. These differences are mostly driven by differences in labour productivity in this sector across countries and to a lesser extent by differences in the inter-industry linkages. On the EU average the employment effect was 2.3 persons. While in Portugal, Italy, Great Britain and the Netherlands it was even above 3 additional persons, it ranged at the bottom end in Malta, Luxembourg and Cyprus. On average, there was a quite stable trend over time; in half the countries the employment multiplier increased while in the other half it decreased over time. Non-metallic mineral products. Employment multipliers of the non-metallic mineral products sector are quite uniform across countries. Effects ranged between 2.3 persons (Spain, France, Italy, Bulgaria, Hungary) and 1.4 persons (Ireland, Lithuania, Luxembourg) in 2005. Employment multipliers for Japan or the US were above the EU average (about 2 persons). Over time, employment effects increased. Basic metals. For this sector, domestic employment multipliers lie in the medium range, stimulating on average 1.7 persons of additional employment in the total economy in the EU-27. It was most pronounced in Japan (effect of 3 persons). In the EU Bulgaria showed the largest effect (2.5), Cyprus the lowest (1.1). Over time, there is a slightly declining trend for the basic metals employment multipliers. Electrical and optical products. Also for the electrical equipment sector, domestic employ-ment multipliers are in the medium range, with additional 1.8 persons created in the total economy in the EU-27. Finland showed the largest employment multiplier for this sector in 2005 (2.5 persons), followed by Japan, Spain, the US and the Netherlands. The lowest multiplier was again found for Cyprus. On average, employment multipliers remained rather stable for this sector between 1995 and 2005. Machinery and equipment. This sector has an employment multiplier ranging again in the midfield; it creates 1.6 persons additional employment in the total economy on the
176
EU average. The multiplier was largest in Japan (2.4) and slightly larger than the EU average in Italy, the US, France, Finland and Germany (above 2 persons), while in Cyprus it was again at the lowest level in 2005. Between 1995 and 2005 employment multipliers remained quite stable. Transport equipment. For this sector employment multipliers differed a lot across countries; they peaked in Japan, generating 4 persons additional employment in the total domestic economy in 2005. Within the EU, France showed the highest employment multipliers, fol-lowed by Germany, Italy and Spain. The employment multiplier was also quite large for the US (3 persons). Luxembourg and Cyprus exhibited the lowest multipliers. Over the period investigated, the multipliers mostly increased. Construction. For the construction sector, employment multipliers again range in the mid-field and are quite uniform across countries. They range between 2 persons in the Czech Republic, Poland, Bulgaria, Slovenia and Great Britain and 1.2 persons in Luxembourg. Over time, employment multipliers remained rather stable. Wholesale trade. This sector created medium employment effects in the total economy. On the EU average, the employment multiplier reached 1.6 persons. It was slightly larger in Hungary, Bulgaria and Italy (with effects above 2 persons); at the lower end, the employ-ment multiplier was smallest in Cyprus, Ireland and Malta, where it created about 1.2 per-sons additionally employed in the total economy. The EU average multiplier did not change over time between 1995 and 2005. Accommodation. This sector showed the lowest employment multipliers of all sectors, cre-ating 1.4 additionally employed in the total economy on EU average. The multiplier was somewhat higher in Romania (2.3 persons), Portugal, Greece and Italy. It was lowest in Lithuania and Luxembourg. Between 1995 and 2005 the employment multiplier declined. Financial activities. Employment multipliers for this sector are well positioned among other sectors of the economy and even rank first among the services sectors. The Czech Re-public showed the highest multiplier in 2005, followed by Great Britain and Germany. The smallest employment multipliers were found in Latvia and Cyprus. Over the period investi-gated, the employment multiplier grew in all but three countries. Business services. Employment multipliers were the lowest for this sector, averaging 1.5 persons additionally employed in the total economy in the EU. Estonia, Latvia and Cy-prus showed the largest employment multipliers in 2005, Malta and Greece the lowest. Over time the multiplier showed a rather stable trend.
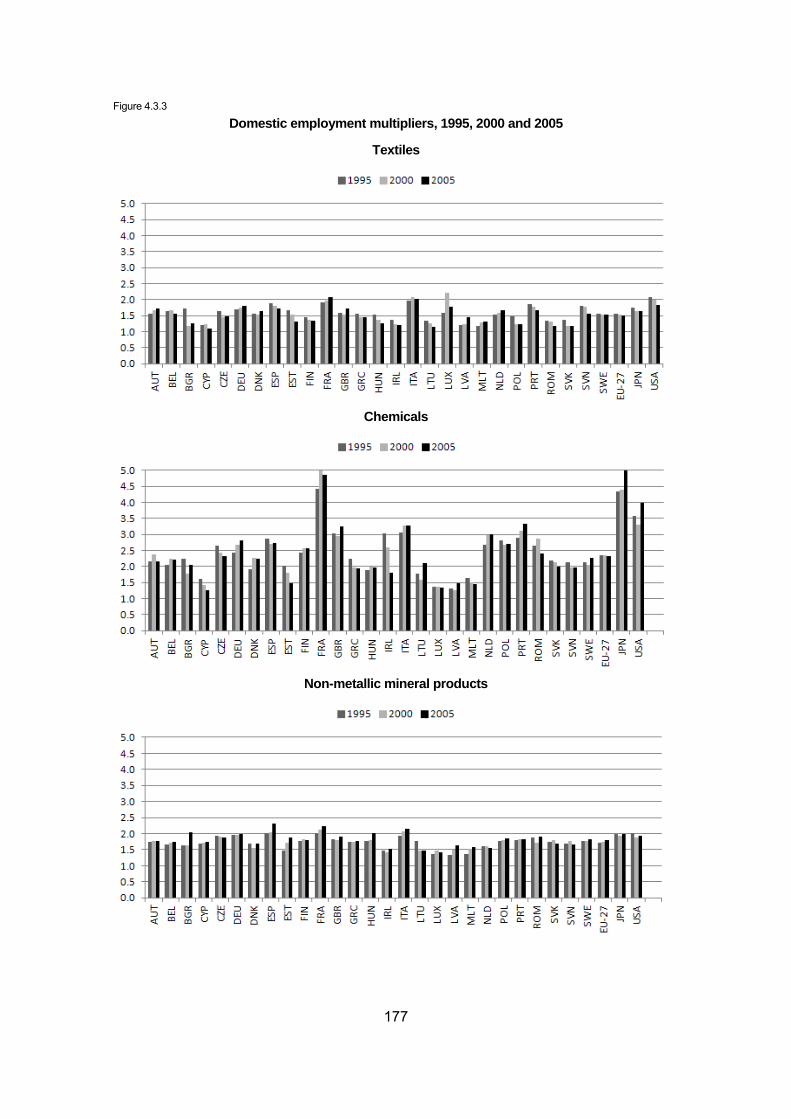
177
Figure 4.3.3
Domestic employment multipliers, 1995, 2000 and 2005
Textiles
Chemicals
Non-metallic mineral products
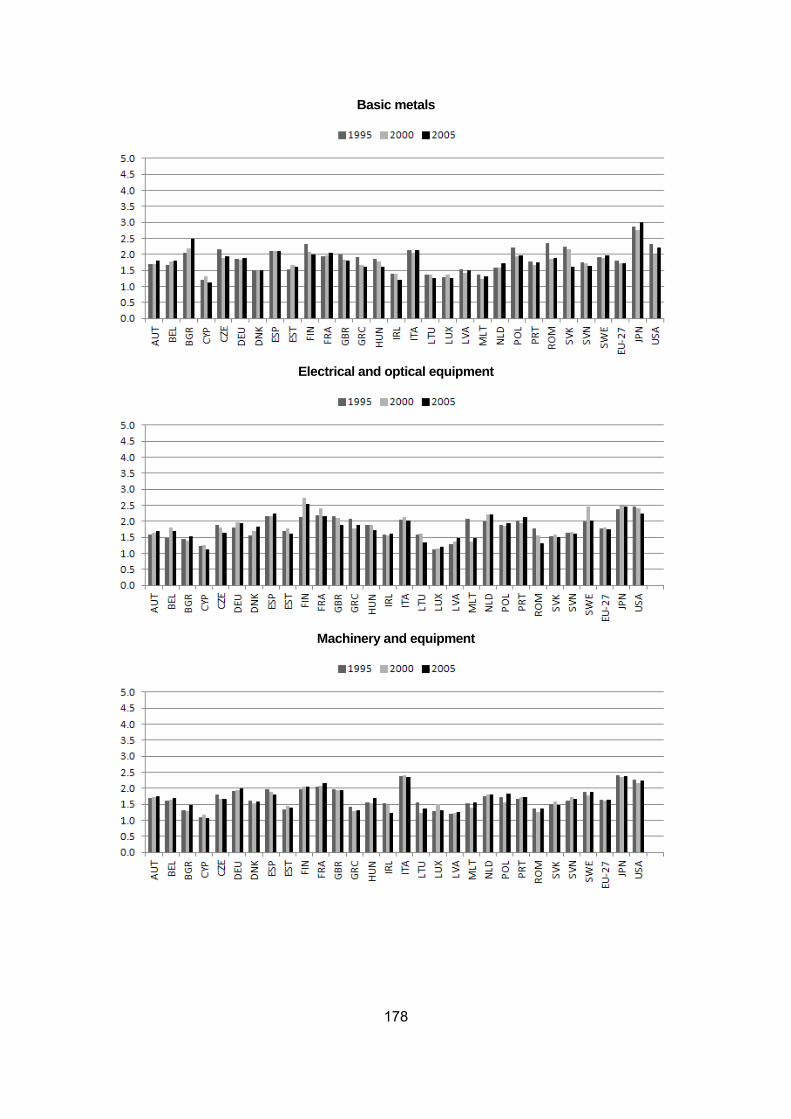
178
Basic metals
Electrical and optical equipment
Machinery and equipment
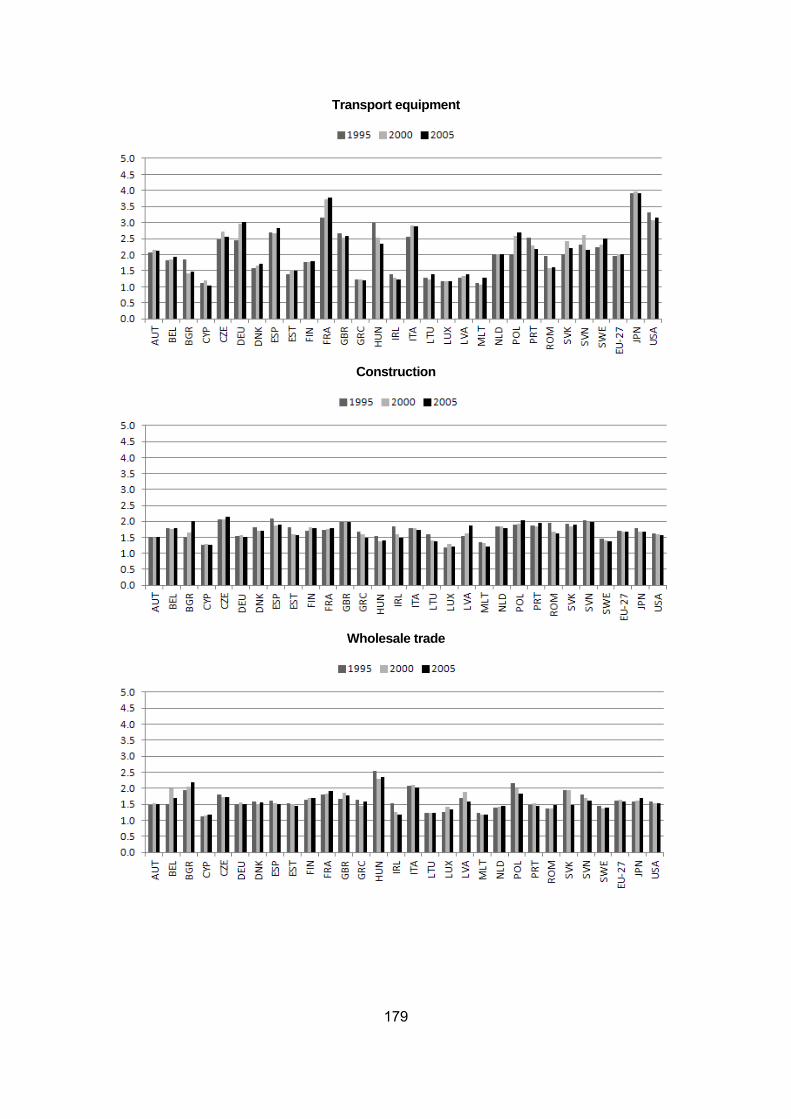
179
Transport equipment
Construction
Wholesale trade
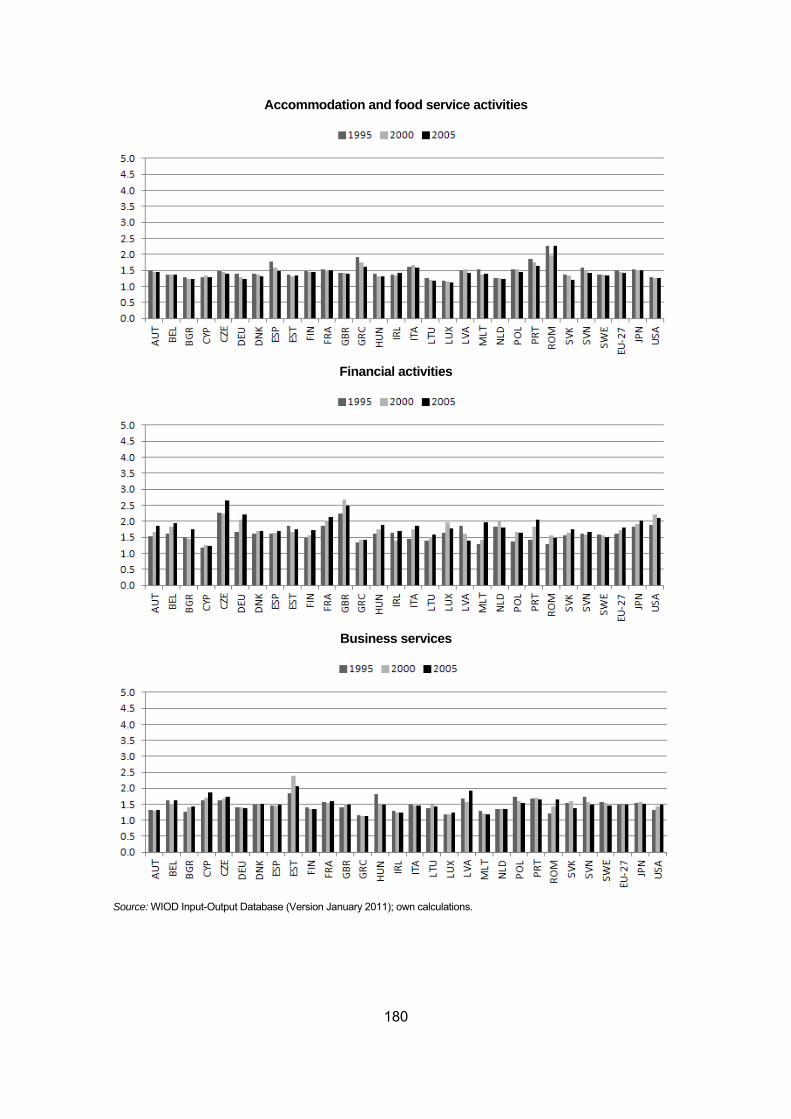
180
Accommodation and food service activities
Financial activities
Business services
Source: WIOD Input-Output Database (Version January 2011); own calculations.
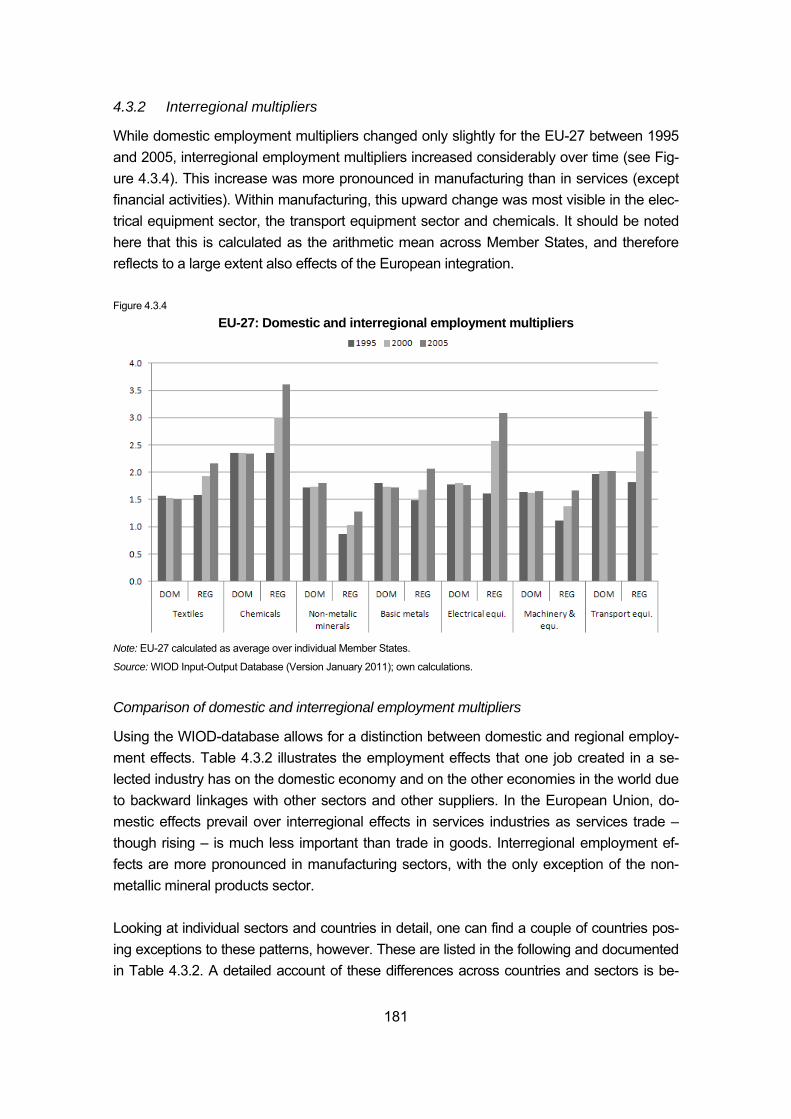
181
4.3.2 Interregional multipliers
While domestic employment multipliers changed only slightly for the EU-27 between 1995 and 2005, interregional employment multipliers increased considerably over time (see Fig-ure 4.3.4). This increase was more pronounced in manufacturing than in services (except financial activities). Within manufacturing, this upward change was most visible in the elec-trical equipment sector, the transport equipment sector and chemicals. It should be noted here that this is calculated as the arithmetic mean across Member States, and therefore reflects to a large extent also effects of the European integration. Figure 4.3.4
EU-27: Domestic and interregional employment multipliers
Note: EU-27 calculated as average over individual Member States.
Source: WIOD Input-Output Database (Version January 2011); own calculations.
Comparison of domestic and interregional employment multipliers
Using the WIOD-database allows for a distinction between domestic and regional employ-ment effects. Table 4.3.2 illustrates the employment effects that one job created in a se-lected industry has on the domestic economy and on the other economies in the world due to backward linkages with other sectors and other suppliers. In the European Union, do-mestic effects prevail over interregional effects in services industries as services trade – though rising – is much less important than trade in goods. Interregional employment ef-fects are more pronounced in manufacturing sectors, with the only exception of the non-metallic mineral products sector. Looking at individual sectors and countries in detail, one can find a couple of countries pos-ing exceptions to these patterns, however. These are listed in the following and documented in Table 4.3.2. A detailed account of these differences across countries and sectors is be-
182
yond the scope of this overview. However, in most cases differences across countries for a particular sector emerge from differences in sectoral productivity rather than large differences with respect to the inter-industry international linkages. Higher labour productivity tends to increase the relative employment multiplier as argued above. These differences in productiv-ity levels may be driven by intra-industry specialization (e.g. pharmaceuticals. which are in-cluded in chemicals) which explains some of the differences as indicated below especially for small countries (e.g. chemicals in Belgium, transport equipment). Further, the interregional multipliers generally tend to be larger for smaller countries as expected. Textiles. In terms of average EU multiplier, this sector creates some medium-sized interre-gional employment effects (2 persons on average). In four countries interregional effects are very large (8.6 to 6 persons), i.e. in Belgium, Luxembourg, the Netherlands and Den-mark. Interregional effects are lowest in Romania and Bulgaria (0.1). Chemicals. In terms of the EU average, this sector creates the largest regional employ-ment effects (3 persons on average). Compared to domestic multipliers, interregional mul-tipliers are very high in the Netherlands and Ireland (13.7 and 10.5 persons respectively). Regional employment effects are lowest for Bulgaria and Romania (0.7 persons). Non-metallic mineral products. This is the only sector where domestic employment effects prevail over international effects in the EU. Only in six countries are interregional effects larger than domestic multipliers (Belgium, Luxembourg, Denmark, Sweden, Ireland and the Netherlands). Basic metals. In terms of average EU multiplier, this sector creates a medium-sized inter-regional employment effect (2 persons on average). Compared to domestic multipliers, interregional effects are larger in Belgium and Luxembourg (6 and 5 persons respectively). Lithuania and Malta show the smallest interregional effects. Electrical and optical products. Inter-regional employment multipliers are pronounced in this sector, pointing to strong inter-linkages in international trade. The EU average multi-plier reaches 3 persons. It is very high in Ireland (14.4 persons), and still large in Finland, the Netherlands and Estonia. Machinery and equipment. On the EU average, the interregional multiplier is slightly larger than the domestic one. Interregional effects are especially pronounced in Belgium and the Netherlands. Transport equipment. Also this sector shows significant interregional employment multipli-ers that point to strong inter-linkages in international trade. The EU average multiplier reaches 3 persons. It is most pronounced in Belgium (10 persons) and Austria (6.8 per-
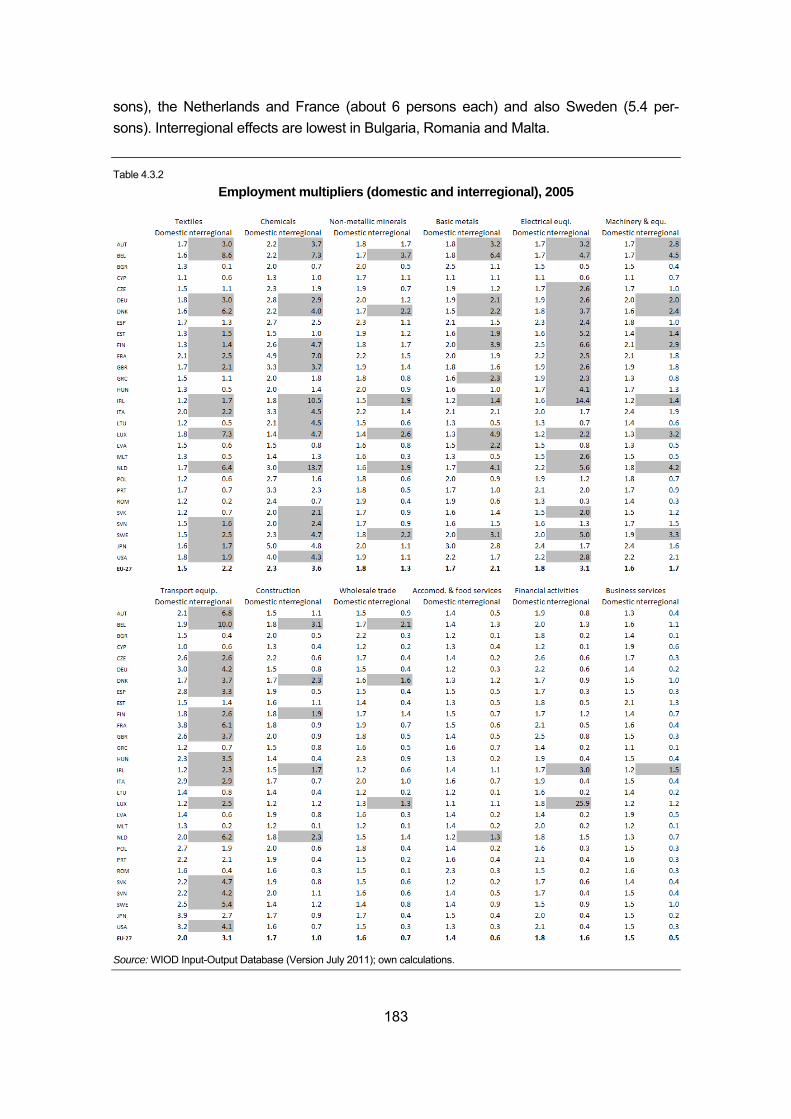
183
sons), the Netherlands and France (about 6 persons each) and also Sweden (5.4 per-sons). Interregional effects are lowest in Bulgaria, Romania and Malta. Table 4.3.2
Employment multipliers (domestic and interregional), 2005
Source: WIOD Input-Output Database (Version July 2011); own calculations.
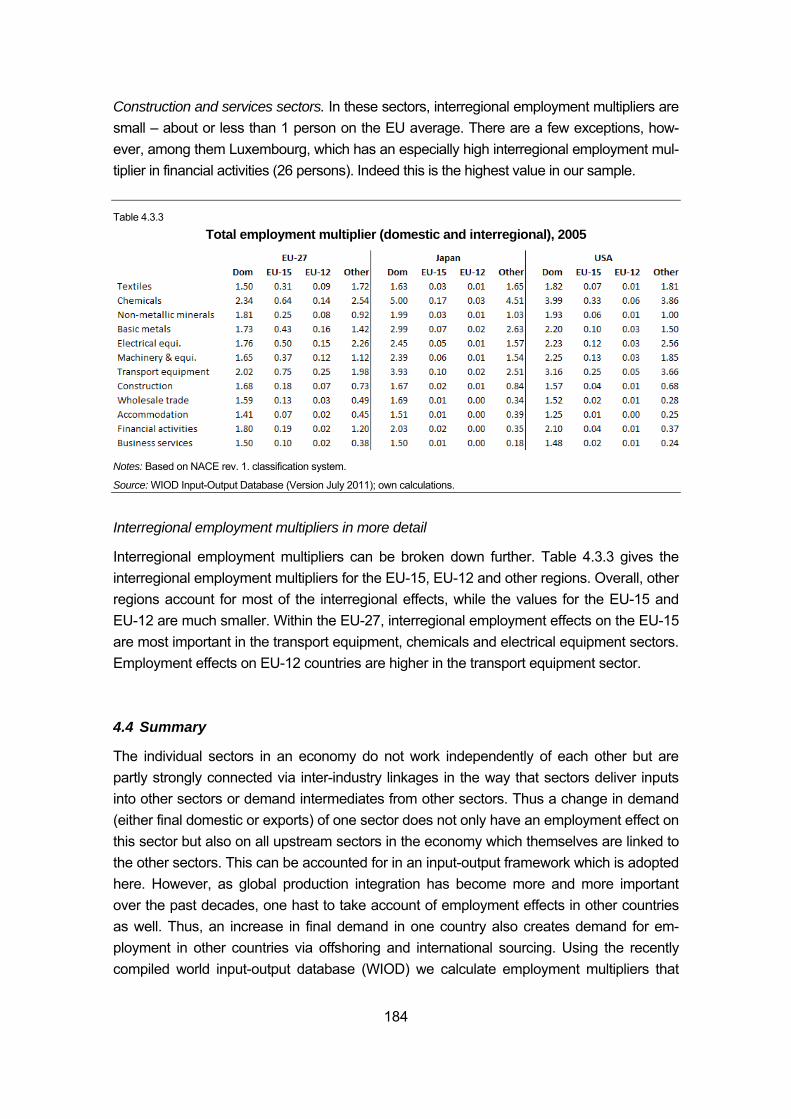
184
Construction and services sectors. In these sectors, interregional employment multipliers are small – about or less than 1 person on the EU average. There are a few exceptions, how-ever, among them Luxembourg, which has an especially high interregional employment mul-tiplier in financial activities (26 persons). Indeed this is the highest value in our sample. Table 4.3.3
Total employment multiplier (domestic and interregional), 2005
Notes: Based on NACE rev. 1. classification system.
Source: WIOD Input-Output Database (Version July 2011); own calculations.
Interregional employment multipliers in more detail
Interregional employment multipliers can be broken down further. Table 4.3.3 gives the interregional employment multipliers for the EU-15, EU-12 and other regions. Overall, other regions account for most of the interregional effects, while the values for the EU-15 and EU-12 are much smaller. Within the EU-27, interregional employment effects on the EU-15 are most important in the transport equipment, chemicals and electrical equipment sectors. Employment effects on EU-12 countries are higher in the transport equipment sector. 4.4 Summary
The individual sectors in an economy do not work independently of each other but are partly strongly connected via inter-industry linkages in the way that sectors deliver inputs into other sectors or demand intermediates from other sectors. Thus a change in demand (either final domestic or exports) of one sector does not only have an employment effect on this sector but also on all upstream sectors in the economy which themselves are linked to the other sectors. This can be accounted for in an input-output framework which is adopted here. However, as global production integration has become more and more important over the past decades, one hast to take account of employment effects in other countries as well. Thus, an increase in final demand in one country also creates demand for em-ployment in other countries via offshoring and international sourcing. Using the recently compiled world input-output database (WIOD) we calculate employment multipliers that
185
take into account the direct and indirect effects of a change in demand on employment, and also allow for distinguishing domestic and international employment effects. Generally, employment multipliers are in the range of 1.5 to 2, i.e. for each additional em-ployed person due to a final demand increase, labour demand of 1.5 to 2 is created. Em-ployment multipliers are highest in chemicals and transport equipment and tend to be lower in service activities. Regarding the international dimension, we first distinguish be-tween domestic and interregional multipliers. Whereas the former tend to be roughly con-stant over time, the international multipliers increased in all cases pointing towards the in-creasing importance of production networks and international integration. In some cases the interregional multipliers are even higher than the domestic ones, which is particularly the case for manufacturing industries but less so for service industries. Breaking them fur-ther down to individual regions, one finds that for the EU-27 the larger part of employment is created in other regions than the EU-12 or EU-15, which is particularly the case for chemicals, textiles and electrical equipment. 5 The effect of the crisis in different Member States, the measures taken to
support employment and prospects for job growth up to 2020
This part of the study is based largely on two main sources. The first consists of case stud-ies of 12 countries, 10 of them EU Member States, carried out by experts from each of the countries concerned.28 The second comprises information received from industry repre-sentatives at EU level of developments, both actual and prospective, in selected sectors. The 12 countries for which cases studies have been carried out comprise:
• the 6 largest EU Member States – Germany, France, Italy, the UK, Spain and Poland
• four of the countries which were hit particularly hard by the economic recession which followed the financial crisis and began to affect employment, in most cases, during the course of 2009 – Ireland and Finland and two of the Baltic states, Estonia and Lithuania
• two of the candidate countries for EU membership – Croatia and Turkey There is also a further case study of the United States which provides an interesting com-parison with the European countries, insofar as it is seen as a more liberal economy with, in general, less intervention from government to protect particular sectors in difficulty and to
28 These case studies, which are available from wiiw upon request, were undertaken by Timo Baas (Institut für
Arbeitsmarkt- und Berufsforschung, Nürnberg) for Germany, Francesco Crespi (Università di Roma) for Italy, Sebastian Leitner (The Vienna Institute for International Economic Studies – wiiw, Vienna) for Estonia and Lithuania, Fernando Muñoz Bullón (Universidad Carlos III de Madrid) for Spain, Jouko Nätti (University of Tampere) for Finland, Pascal Petit (Centre national de la recherche scientifique Paris) for France, Leon Podkaminer (The Vienna Institute for International Economic Studies – wiiw, Vienna) for Poland, John Schmitt (Center for Economic and Policy Research, Washington D.C.) for the US, Gokce Uysal (Bahçeşehir Üniversitesi Istanbul) for Turkey, Terry Ward (Applica, Brussels) for Ireland and UK, and Hermine Vidovic (The Vienna Institute for International Economic Studies – wiiw, Vienna) for Croatia.
186
safeguard employment. The support given to the banking sector and to the automobile industry during the crisis, however, somewhat contradicts this stereotypical view. In each case, the focus was on the 12 sectors selected for detailed study:
• Textiles, apparel, footwear, etc.
• Chemicals
• Rubber and plastics, etc.
• Basic metals and fabricated metal products
• Electronic, electrical and optical products
• Machinery and equipment n.e.c.
• Motor vehicles
• Construction
• Wholesale and retail trade
• Accommodation and food service activities
• Financial and insurance activities
• Real estate and business activities. The case studies were supplemented by information provided by industry representatives at European level who either responded to a questionnaire specially prepared for the pur-pose or who pointed to relevant reports or documents which covered at least some of the questions. .A summary of the information provided by a number of European Associations, or extracted from the documents concerned, is set out in an Annex to this report. The issues considered as regards each of the sectors relate to employment developments over the period of the recession and the subsequent early stages of economic recovery; the changes in labour productivity and average hours worked which accompanied these developments and their implications for job growth in the future; the measures taken to counter the effects of the economic recession and the extent to which they have been re-moved – and the effects of their removal on employment – as the recovery got underway; and the prospects for employment growth in future years, both in the short and longer term. The employment developments during the recession and the period since then were con-sidered in Section 3.5 above, together with the movements in labour productivity and aver-age hours worked which occurred at the same time. As indicated, these movements during the economic downturn, in general, prevented the scale of job losses being even greater than it was, though they have since tended to be reversed which has had the opposite effect on job growth. In many cases, however, this reversal has not yet (at least up to the first quarter of 2011) made good the reduction which occurred as economic activity fell.
187
These developments are considered in more detail in the case studies in each of the coun-tries concerned. 5.1 Employment developments during the crisis in the case study countries
Economic activity in all the 13 countries covered in the cases-studies was affected by the recent crisis. But the consequences for the number in employment varied markedly across countries. The economic downturn triggered a sharp decline in employment in Ireland, Estonia and Lithuania, where in each case the reduction in GDP was substantial and much larger than elsewhere, but there was also a large decline in employment in Spain, where the reduction in GDP was smaller than average. On the other hand, the loss of jobs was smaller in Poland than in most other countries, largely because it escaped the worst of the recession and GDP continued to grow – the only country in the EU where this was the case – even if by much less than before. But job losses were also relatively small in the UK and, above all, in Germany, where in both cases, the decline in GDP was around or even slightly larger than the EU average. In the UK, this can be explained by the fact that manu-facturing industry – which was much more strongly affected by the crisis than other sec-tors, construction apart – accounts for a smaller part of the total economy than elsewhere because of the large-scale de-industrialisation that occurred in the 1970s and 1980s. In Germany, where employment declined only slightly, the absence of large-scale job losses owes a great deal not only to the extensive use of the short-term working arrange-ments, which helped to maintain people in work by effectively subsidising their continued employment, but also to the widespread expectation among the business community that the recession, though deep, was likely to be only short-lived and that sales would recover relatively quickly. Consequently, they were prepared to keep people in work rather than to make them redundant only to have to take them on again once the upturn came. This con-trasts markedly with the situation in Spain, where there was an equally widespread realisa-tion that the sector which had provided most of the job growth in the years leading up to the recession, construction, was likely to remain depressed for some time to come be-cause of the collapse of the housing market, on the one hand, and the long-term reduction in public sector investment on infrastructure because of the state of public finances, on the other. In Germany, therefore, the structure of the economy as it was before the recession hit, with its concentration on medium-to-high tech manufacturing and on high value-added products which are highly competitive in global markets, especially those in developing countries, was sustainable in the long-run. In Spain, with its over-expanded construction sector, which was the main driver of growth and employment creation in the years preced-ing the crisis, it was not. The almost immediate impact of the economic downturn on employment in Spain can, therefore, be understood in these terms. In brief, it was not possible for employers in con-
188
struction, in particular, where many of the job losses occurred, to maintain employment levels simply because demand was unlikely to return on anywhere near the same scale as before the recession. The loss of the main driver of growth then inevitably gave rise to un-certainty about future prospects for any significant upturn in other parts of the economy, so causing employers elsewhere to lay off workers and making them reluctant to take on peo-ple as the downturn slowed. 5.2 Sectoral concentration of job losses
Construction seems to be the sector which suffered most from the recession in many coun-tries – though not all – not least because it was hit by the financial crisis which was initiated in the housing market and, which accordingly affected this market more than others. Large job losses occurred in this sector in most of the countries covered by the case studies, the exceptions being France, Finland and, above all, Germany where employment in construc-tion has increased since before the recession. This reflects the fact that Germany did not experience the same house price bubble as most other countries in the EU (house prices changed by very little over the 10 years preceding the recession, whereas in many other countries, they increased by 2 or 3 times), a reflection, in turn, of the relatively low extent of home ownership in the country (the lowest in the EU). The largest reductions in jobs in construction occurred in Ireland, Spain, Estonia and Lithuania, in all of which employment in the sector expanded substantially in the years pre-ceding the recession as the housing boomed and public investment in infrastructure in-creased markedly. In all of these countries, the number employed in construction fell by around 30% or more between the first quarter of 2007 and the first quarter of 2010 and by close to 40% in both Ireland and Spain (in Latvia, the decline was even greater at close to 50%). In the subsequent year, when some economic recovery was evident in most parts of the EU, employment in construction increased in both Estonia and Lithuania, especially in the latter (by 13%), whereas it continued to decline in both Ireland and Spain, by as much as a further 20% in the former and 10% in the latter. In Ireland, therefore, the number em-ployed in the sector at the beginning of 2011 was under half of the number employed four years earlier – the job losses in construction representing over half the total reduction in employment over the recession period – in Spain, only just over half. In the US too, where the financial crisis began, construction was hit especially hard by the turmoil in the housing market and subsequently by the economic recession, which reduced the demand for new houses and for building generally, employment falling by over 25% between 2007 and 2011, with no sign in the latter year of any upturn. There was a more general reduction in employment in manufacturing in all 12 of the case study countries, though again by less in Germany than elsewhere despite the substantial
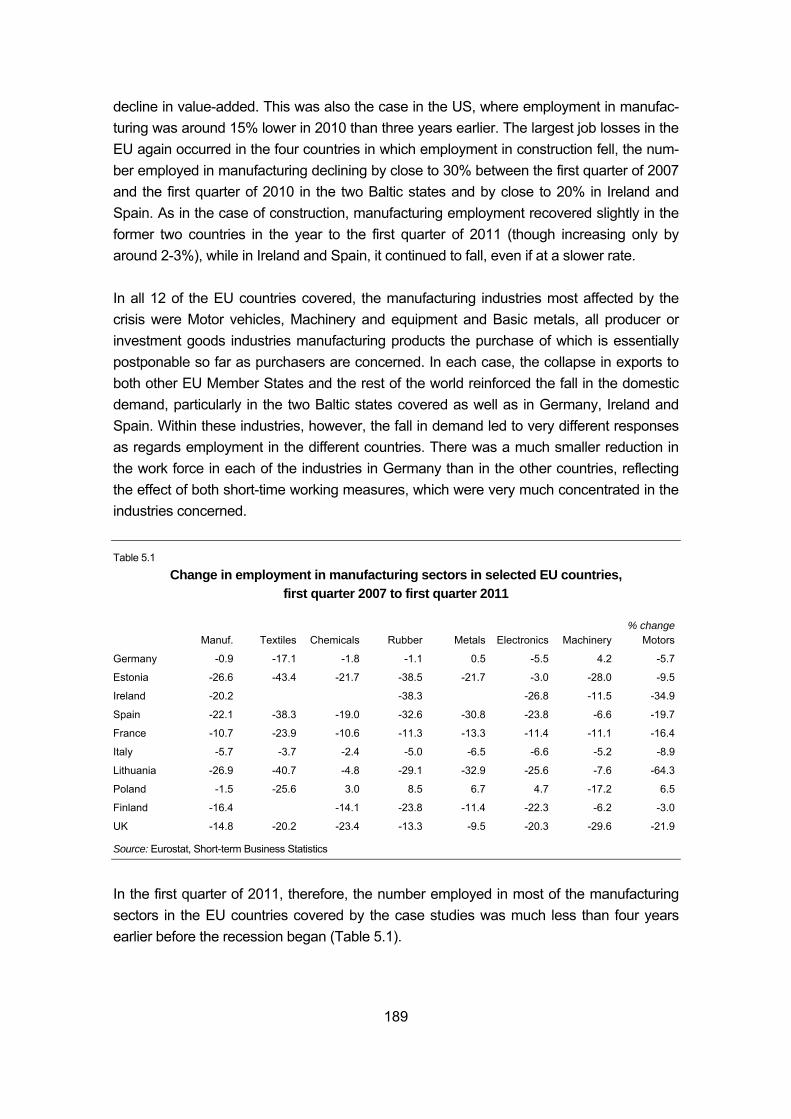
189
decline in value-added. This was also the case in the US, where employment in manufac-turing was around 15% lower in 2010 than three years earlier. The largest job losses in the EU again occurred in the four countries in which employment in construction fell, the num-ber employed in manufacturing declining by close to 30% between the first quarter of 2007 and the first quarter of 2010 in the two Baltic states and by close to 20% in Ireland and Spain. As in the case of construction, manufacturing employment recovered slightly in the former two countries in the year to the first quarter of 2011 (though increasing only by around 2-3%), while in Ireland and Spain, it continued to fall, even if at a slower rate. In all 12 of the EU countries covered, the manufacturing industries most affected by the crisis were Motor vehicles, Machinery and equipment and Basic metals, all producer or investment goods industries manufacturing products the purchase of which is essentially postponable so far as purchasers are concerned. In each case, the collapse in exports to both other EU Member States and the rest of the world reinforced the fall in the domestic demand, particularly in the two Baltic states covered as well as in Germany, Ireland and Spain. Within these industries, however, the fall in demand led to very different responses as regards employment in the different countries. There was a much smaller reduction in the work force in each of the industries in Germany than in the other countries, reflecting the effect of both short-time working measures, which were very much concentrated in the industries concerned. Table 5.1
Change in employment in manufacturing sectors in selected EU countries, first quarter 2007 to first quarter 2011
% change Manuf. Textiles Chemicals Rubber Metals Electronics Machinery Motors
Germany -0.9 -17.1 -1.8 -1.1 0.5 -5.5 4.2 -5.7
Estonia -26.6 -43.4 -21.7 -38.5 -21.7 -3.0 -28.0 -9.5
Ireland -20.2 -38.3 -26.8 -11.5 -34.9
Spain -22.1 -38.3 -19.0 -32.6 -30.8 -23.8 -6.6 -19.7
France -10.7 -23.9 -10.6 -11.3 -13.3 -11.4 -11.1 -16.4
Italy -5.7 -3.7 -2.4 -5.0 -6.5 -6.6 -5.2 -8.9
Lithuania -26.9 -40.7 -4.8 -29.1 -32.9 -25.6 -7.6 -64.3
Poland -1.5 -25.6 3.0 8.5 6.7 4.7 -17.2 6.5
Finland -16.4 -14.1 -23.8 -11.4 -22.3 -6.2 -3.0
UK -14.8 -20.2 -23.4 -13.3 -9.5 -20.3 -29.6 -21.9
Source: Eurostat, Short-term Business Statistics
In the first quarter of 2011, therefore, the number employed in most of the manufacturing sectors in the EU countries covered by the case studies was much less than four years earlier before the recession began (Table 5.1).
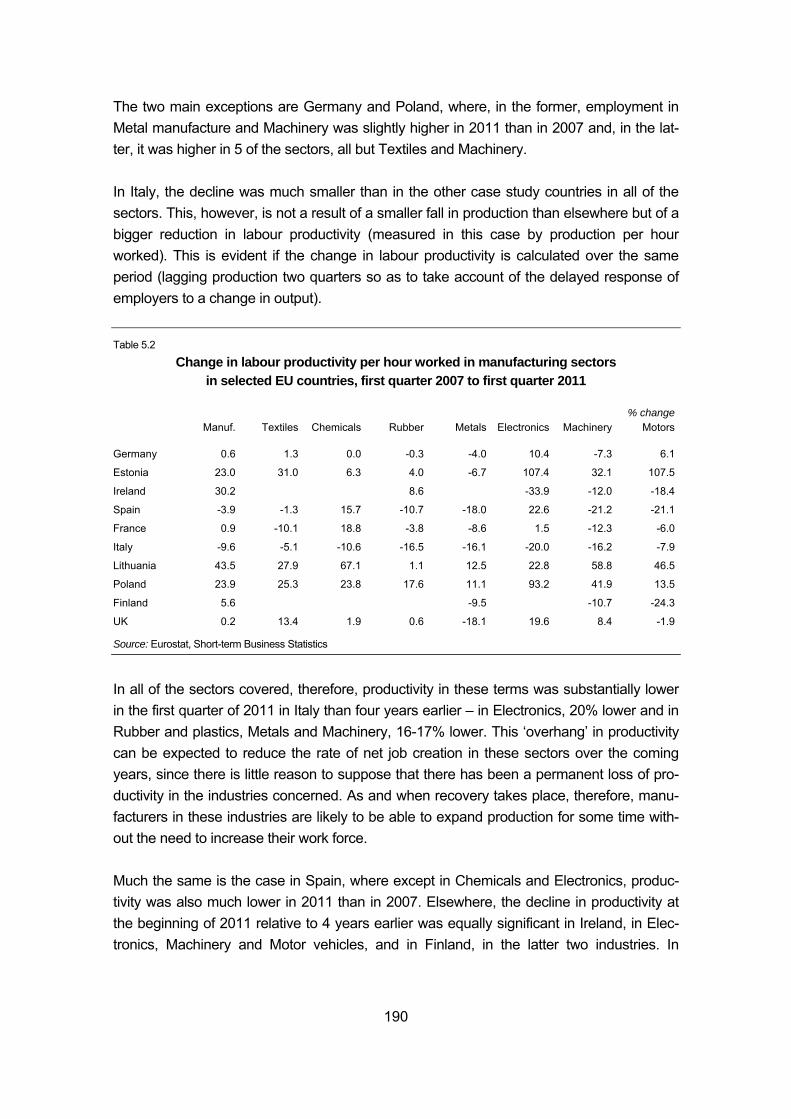
190
The two main exceptions are Germany and Poland, where, in the former, employment in Metal manufacture and Machinery was slightly higher in 2011 than in 2007 and, in the lat-ter, it was higher in 5 of the sectors, all but Textiles and Machinery. In Italy, the decline was much smaller than in the other case study countries in all of the sectors. This, however, is not a result of a smaller fall in production than elsewhere but of a bigger reduction in labour productivity (measured in this case by production per hour worked). This is evident if the change in labour productivity is calculated over the same period (lagging production two quarters so as to take account of the delayed response of employers to a change in output). Table 5.2
Change in labour productivity per hour worked in manufacturing sectors in selected EU countries, first quarter 2007 to first quarter 2011
% change Manuf. Textiles Chemicals Rubber Metals Electronics Machinery Motors
Germany 0.6 1.3 0.0 -0.3 -4.0 10.4 -7.3 6.1
Estonia 23.0 31.0 6.3 4.0 -6.7 107.4 32.1 107.5
Ireland 30.2 8.6 -33.9 -12.0 -18.4
Spain -3.9 -1.3 15.7 -10.7 -18.0 22.6 -21.2 -21.1
France 0.9 -10.1 18.8 -3.8 -8.6 1.5 -12.3 -6.0
Italy -9.6 -5.1 -10.6 -16.5 -16.1 -20.0 -16.2 -7.9
Lithuania 43.5 27.9 67.1 1.1 12.5 22.8 58.8 46.5
Poland 23.9 25.3 23.8 17.6 11.1 93.2 41.9 13.5
Finland 5.6 -9.5 -10.7 -24.3
UK 0.2 13.4 1.9 0.6 -18.1 19.6 8.4 -1.9
Source: Eurostat, Short-term Business Statistics
In all of the sectors covered, therefore, productivity in these terms was substantially lower in the first quarter of 2011 in Italy than four years earlier – in Electronics, 20% lower and in Rubber and plastics, Metals and Machinery, 16-17% lower. This ‘overhang’ in productivity can be expected to reduce the rate of net job creation in these sectors over the coming years, since there is little reason to suppose that there has been a permanent loss of pro-ductivity in the industries concerned. As and when recovery takes place, therefore, manu-facturers in these industries are likely to be able to expand production for some time with-out the need to increase their work force. Much the same is the case in Spain, where except in Chemicals and Electronics, produc-tivity was also much lower in 2011 than in 2007. Elsewhere, the decline in productivity at the beginning of 2011 relative to 4 years earlier was equally significant in Ireland, in Elec-tronics, Machinery and Motor vehicles, and in Finland, in the latter two industries. In
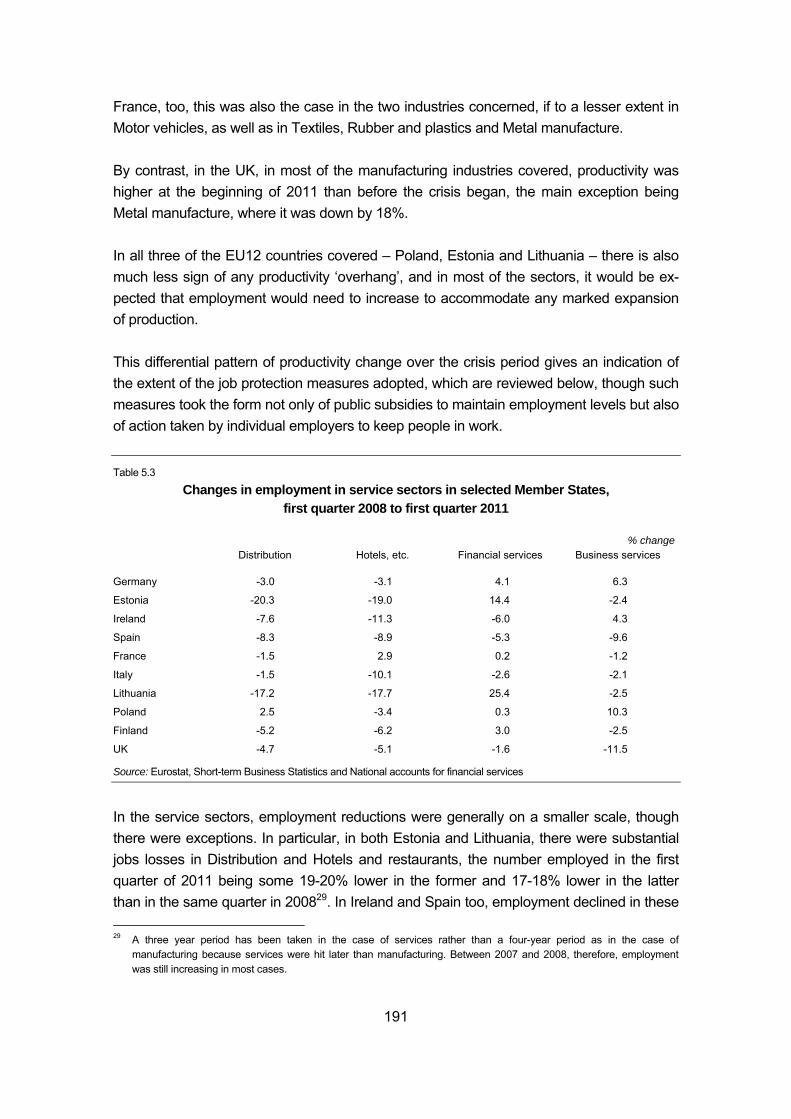
191
France, too, this was also the case in the two industries concerned, if to a lesser extent in Motor vehicles, as well as in Textiles, Rubber and plastics and Metal manufacture. By contrast, in the UK, in most of the manufacturing industries covered, productivity was higher at the beginning of 2011 than before the crisis began, the main exception being Metal manufacture, where it was down by 18%. In all three of the EU12 countries covered – Poland, Estonia and Lithuania – there is also much less sign of any productivity ‘overhang’, and in most of the sectors, it would be ex-pected that employment would need to increase to accommodate any marked expansion of production. This differential pattern of productivity change over the crisis period gives an indication of the extent of the job protection measures adopted, which are reviewed below, though such measures took the form not only of public subsidies to maintain employment levels but also of action taken by individual employers to keep people in work. Table 5.3
Changes in employment in service sectors in selected Member States, first quarter 2008 to first quarter 2011
% change Distribution Hotels, etc. Financial services Business services
Germany -3.0 -3.1 4.1 6.3
Estonia -20.3 -19.0 14.4 -2.4
Ireland -7.6 -11.3 -6.0 4.3
Spain -8.3 -8.9 -5.3 -9.6
France -1.5 2.9 0.2 -1.2
Italy -1.5 -10.1 -2.6 -2.1
Lithuania -17.2 -17.7 25.4 -2.5
Poland 2.5 -3.4 0.3 10.3
Finland -5.2 -6.2 3.0 -2.5
UK -4.7 -5.1 -1.6 -11.5
Source: Eurostat, Short-term Business Statistics and National accounts for financial services
In the service sectors, employment reductions were generally on a smaller scale, though there were exceptions. In particular, in both Estonia and Lithuania, there were substantial jobs losses in Distribution and Hotels and restaurants, the number employed in the first quarter of 2011 being some 19-20% lower in the former and 17-18% lower in the latter than in the same quarter in 200829. In Ireland and Spain too, employment declined in these 29 A three year period has been taken in the case of services rather than a four-year period as in the case of
manufacturing because services were hit later than manufacturing. Between 2007 and 2008, therefore, employment was still increasing in most cases.
192
two sectors though to a smaller extent, as it did in Italy, Finland and the UK, though in Italy, the fall in Distribution was relatively small. In Germany, there was also a decline but smaller than in the latter group of countries. In France, however, employment in Hotels and restaurants increased over the period, as it did in Distribution in Poland. In Business services30, which had been one of the most important sectors of job growth in the years before the recession, employment also declined in most of the countries, though not in Germany, Poland and, perhaps surprisingly given the scale of the overall loss of jobs, Ireland. The decline was particularly marked in Spain and the UK. In Financial services, however, where the crisis began, employment increased in the ma-jority of the countries and declined – and then by generally less than in other service sec-tors – only in Ireland, Spain, Italy and the UK. In both Estonia and Lithuania, employment increased markedly over the recession period, whereas it fell equally markedly in most other sectors of the two economies. In the US, the number employed in 2011 was lower than four years earlier in all three of the four service sectors, the exception being Hotels and restaurants, where it was slightly higher (around 2%). The decline in employment was especially marked in Financial ser-vices, where the number in work fell by some 8% over this four-year period. Changes in average working time
In all of the countries, though to widely varying extents, a reduction in average hours worked cushioned the loss of jobs and helped to maintain the number in employment. As noted earlier, this was especially the case in the manufacturing industries, though it was mainly confined to the most severe period of the recession in 2008-2009. As the recession moderated and production began to recover, average hours worked increase in most countries. In the first quarter of 2011, therefore, average hours worked in manufacturing was in many cases above what it was before the recession began. This was true in manu-facturing as a whole in all the countries except France, where the level was slightly lower (though there are no data for Italy) (Table 5.4). Despite the significant reduction in average hours worked in 2009 in most of the manufac-turing sectors in Germany, in all the sectors covered here, apart from Chemicals, where they were much the same, average hours worked were higher in the first quarter of 2011 than four years earlier. In the UK, they were significantly higher in all the sectors, most es-pecially in Textiles and Rubber and plastics and this was even more the case in Lithuania and Estonia (apart from Motor vehicles). In Poland too, they were also higher in all sectors, 30 It should be said that the figures for Business services, as for the other sectors, are taken from the Eurostat Short-term
Business Statistics and relate to NACE Rev.2 M and N insofar as the activities included in these two groups are covered by the SBS.
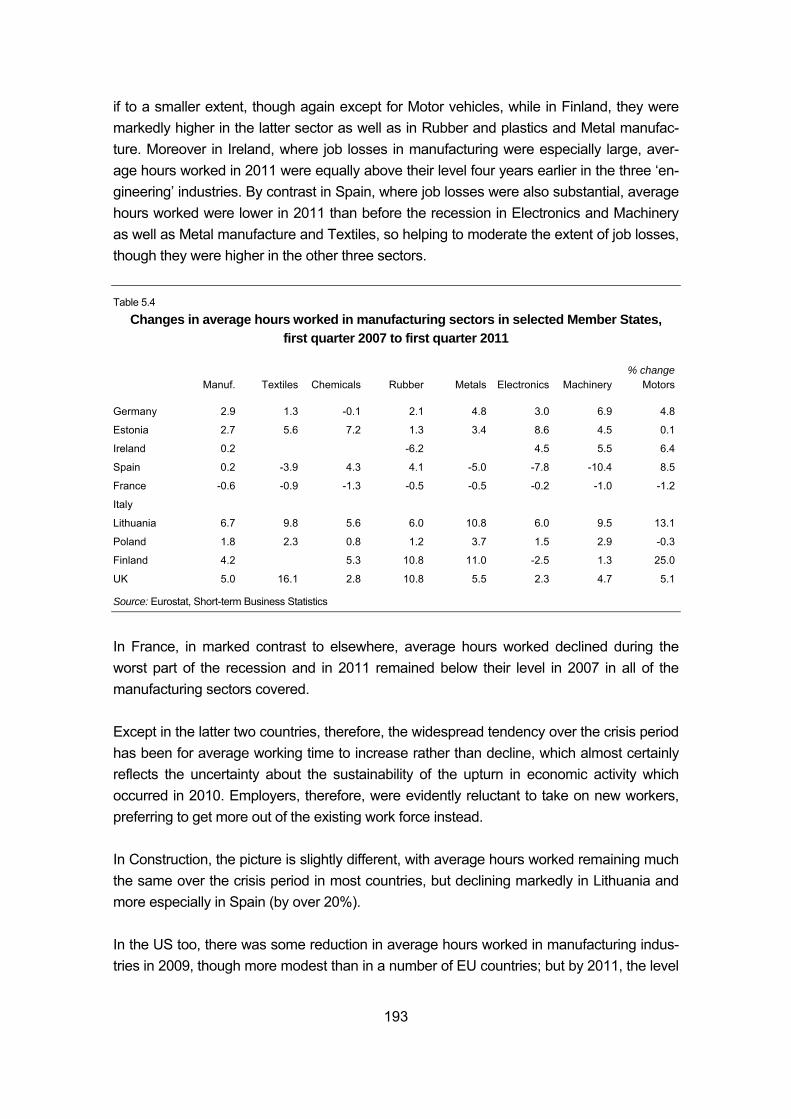
193
if to a smaller extent, though again except for Motor vehicles, while in Finland, they were markedly higher in the latter sector as well as in Rubber and plastics and Metal manufac-ture. Moreover in Ireland, where job losses in manufacturing were especially large, aver-age hours worked in 2011 were equally above their level four years earlier in the three ‘en-gineering’ industries. By contrast in Spain, where job losses were also substantial, average hours worked were lower in 2011 than before the recession in Electronics and Machinery as well as Metal manufacture and Textiles, so helping to moderate the extent of job losses, though they were higher in the other three sectors. Table 5.4
Changes in average hours worked in manufacturing sectors in selected Member States, first quarter 2007 to first quarter 2011
% change Manuf. Textiles Chemicals Rubber Metals Electronics Machinery Motors
Germany 2.9 1.3 -0.1 2.1 4.8 3.0 6.9 4.8
Estonia 2.7 5.6 7.2 1.3 3.4 8.6 4.5 0.1
Ireland 0.2 -6.2 4.5 5.5 6.4
Spain 0.2 -3.9 4.3 4.1 -5.0 -7.8 -10.4 8.5
France -0.6 -0.9 -1.3 -0.5 -0.5 -0.2 -1.0 -1.2
Italy
Lithuania 6.7 9.8 5.6 6.0 10.8 6.0 9.5 13.1
Poland 1.8 2.3 0.8 1.2 3.7 1.5 2.9 -0.3
Finland 4.2 5.3 10.8 11.0 -2.5 1.3 25.0
UK 5.0 16.1 2.8 10.8 5.5 2.3 4.7 5.1
Source: Eurostat, Short-term Business Statistics
In France, in marked contrast to elsewhere, average hours worked declined during the worst part of the recession and in 2011 remained below their level in 2007 in all of the manufacturing sectors covered. Except in the latter two countries, therefore, the widespread tendency over the crisis period has been for average working time to increase rather than decline, which almost certainly reflects the uncertainty about the sustainability of the upturn in economic activity which occurred in 2010. Employers, therefore, were evidently reluctant to take on new workers, preferring to get more out of the existing work force instead. In Construction, the picture is slightly different, with average hours worked remaining much the same over the crisis period in most countries, but declining markedly in Lithuania and more especially in Spain (by over 20%). In the US too, there was some reduction in average hours worked in manufacturing indus-tries in 2009, though more modest than in a number of EU countries; but by 2011, the level

194
was, as in the EU, higher in most industries than before the onset of recession. The only industries in which this was not the case are Textiles and, marginally, Electronics. In Con-struction as well, average working time was slightly longer in 2011 than in 2007. 5.3 Policy action to maintain employment during the recession
All countries introduced specific measures to counter the effect of the recession on em-ployment, though to varying extents and in slightly different forms. These consisted to a large extent of fiscal measures – increases in public expenditure, especially in public in-vestment, or an acceleration of planned investment programmes and reductions in taxa-tion, in value-added tax in particular – designed to expand aggregate demand in the econ-omy. These measures tended in the main to be non-sector specific, though the expansion of public investment programmes had the effect, as intended, of increasing activity in the construction industry which in a number of countries had been particularly hard hit by the crisis because of its impact on the housing market31. They also tended to benefit industries supplying the construction industry, such as non-metallic mineral products (included with Rubber and plastics in one of the 12 sectors), though in some cases the machinery indus-try as well, since in a number of countries, the renovation and refurbishment of buildings, partly with the aim of improving their energy efficiency, were included in the construction programmes initiated or expanded. In addition, EU rules governing State aid were relaxed and many SMEs in particular re-ceived public support during the crisis, in the form of direct grants, soft loans or loan guar-antees. The rules of the European Globalisation Adjustment Fund (EGF) were also revised to provide support for workers made redundant as a direct result of the global financial and economic crisis as well as of globalisation. The expansionary fiscal policies adopted were, moreover, accompanied in most countries by measures aimed directly at safe-guarding jobs and at propping up demand in particular sectors of the economy, especially the car industry as indicated below. Sector-specific measures
Apart from the Construction industry, specific measures were taken in many countries to assist the motor vehicle industry which was hit particularly hard by the recession. These took the form in the main of car scrapping schemes under which people were given a spe-cial bonus or discount if they traded in their old car for a new one, so long as it was over a certain age (typically 10 years old and over). According to industry estimates, such 31 In Spain, for example, two temporary funds for public investment in infrastructure in local areas were created (Fondo
Estatal de Inversión Local, agreed at the end of 2008 and Fondo Estatal para el Empleo y la Sostenibilidad Local launched in 2010. Both had come to an end by 2011 and though they had some effect, they could not prevent a large-scale decline in employment in the industry.
195
schemes forestalled or prevented the loss of up to 120,000 jobs across the EU. At the same time, however, the boost to car sales it gave was followed by a sharp reduction once the scheme came to an end (in Germany, for example, where the scheme was in operation in 2009 and where it was especially generous, sales of new cars fell by 23% in 2010). Such schemes were supplemented by action at EU level in the form of the Green Cars Initiative, which was part of the European Economic Recovery Plan and which, in addition to providing access to European Investment Bank loans, made available a total of EUR 1 billion for R&D through joint funding programmes of the EU, national governments and the industry. In some countries, reductions in value-added tax were also introduced to assist particular sectors, as in France and Ireland, where the tax on Hotels and restaurants was cut in order to help the sector, hit by both a fall-off in domestic demand and a decline in foreign tourists. (A list of the sector-specific schemes which were introduced is set out in the Annex to this chapter.) Measures to assist those made redundant
The measures taken also included programmes to assist those losing their jobs, in the form, especially of training schemes designed to increase their employability and so their chances of finding a new job when the upturn came. They equally included measures to encourage employers to take on new workers as well as the provision of support to help those losing their jobs to start up new businesses and to assist existing firms, especially SMEs, to expand, particularly through trying to ensure access to credit. A summary of the measures of these kinds adopted, and the countries adopting them, is given in Table 5.5. As indicated, short-time working schemes, including temporary lay-offs, under which Gov-ernments provided financial assistance to companies or directly to the workers concerned in order to support wage when the hours or days worked were substantially less than nor-mal, were the most widespread measure adopted to maintain jobs. They were concen-trated predominantly in manufacturing and construction, and within the former in the in-vestment goods industries which were most affected by the economic downturn – and, therefore, in the Motor vehicle, Machinery and Basic metals industry among the 12 se-lected sectors. The schemes were most important in terms of the proportion of workers covered – i.e. those involved in the schemes concerned – in Germany, Italy (in the form of Cassa Integrazione Guadagni, CIG), Belgium, the Netherlands and Slovenia. The evi-dence indicates that they were effective in maintaining jobs in these countries, which tended to experience a smaller reduction in employment over the recession than others, given the extent of decline in GDP. In the Chemicals industry, it is worth noting the Joint
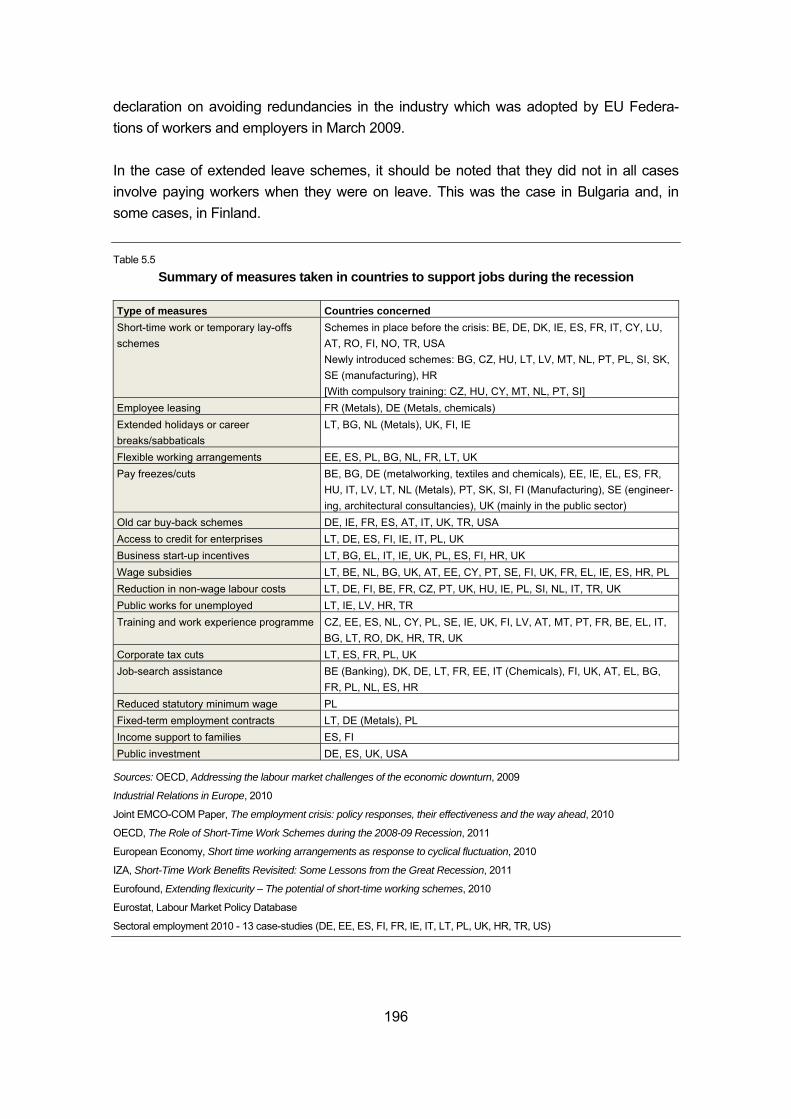
196
declaration on avoiding redundancies in the industry which was adopted by EU Federa-tions of workers and employers in March 2009. In the case of extended leave schemes, it should be noted that they did not in all cases involve paying workers when they were on leave. This was the case in Bulgaria and, in some cases, in Finland. Table 5.5
Summary of measures taken in countries to support jobs during the recession
Type of measures Countries concerned Short-time work or temporary lay-offs schemes
Schemes in place before the crisis: BE, DE, DK, IE, ES, FR, IT, CY, LU, AT, RO, FI, NO, TR, USA Newly introduced schemes: BG, CZ, HU, LT, LV, MT, NL, PT, PL, SI, SK, SE (manufacturing), HR [With compulsory training: CZ, HU, CY, MT, NL, PT, SI]
Employee leasing FR (Metals), DE (Metals, chemicals) Extended holidays or career breaks/sabbaticals
LT, BG, NL (Metals), UK, FI, IE
Flexible working arrangements EE, ES, PL, BG, NL, FR, LT, UK Pay freezes/cuts BE, BG, DE (metalworking, textiles and chemicals), EE, IE, EL, ES, FR,
HU, IT, LV, LT, NL (Metals), PT, SK, SI, FI (Manufacturing), SE (engineer-ing, architectural consultancies), UK (mainly in the public sector)
Old car buy-back schemes DE, IE, FR, ES, AT, IT, UK, TR, USA Access to credit for enterprises LT, DE, ES, FI, IE, IT, PL, UK Business start-up incentives LT, BG, EL, IT, IE, UK, PL, ES, FI, HR, UK Wage subsidies LT, BE, NL, BG, UK, AT, EE, CY, PT, SE, FI, UK, FR, EL, IE, ES, HR, PL Reduction in non-wage labour costs LT, DE, FI, BE, FR, CZ, PT, UK, HU, IE, PL, SI, NL, IT, TR, UK Public works for unemployed LT, IE, LV, HR, TR Training and work experience programme CZ, EE, ES, NL, CY, PL, SE, IE, UK, FI, LV, AT, MT, PT, FR, BE, EL, IT,
BG, LT, RO, DK, HR, TR, UK Corporate tax cuts LT, ES, FR, PL, UK Job-search assistance BE (Banking), DK, DE, LT, FR, EE, IT (Chemicals), FI, UK, AT, EL, BG,
FR, PL, NL, ES, HR Reduced statutory minimum wage PL Fixed-term employment contracts LT, DE (Metals), PL Income support to families ES, FI Public investment DE, ES, UK, USA
Sources: OECD, Addressing the labour market challenges of the economic downturn, 2009
Industrial Relations in Europe, 2010
Joint EMCO-COM Paper, The employment crisis: policy responses, their effectiveness and the way ahead, 2010
OECD, The Role of Short-Time Work Schemes during the 2008-09 Recession, 2011
European Economy, Short time working arrangements as response to cyclical fluctuation, 2010
IZA, Short-Time Work Benefits Revisited: Some Lessons from the Great Recession, 2011
Eurofound, Extending flexicurity – The potential of short-time working schemes, 2010
Eurostat, Labour Market Policy Database
Sectoral employment 2010 - 13 case-studies (DE, EE, ES, FI, FR, IE, IT, LT, PL, UK, HR, TR, US)

197
Flexible working arrangements to a large extent involved a shift from full-time to part-time jobs, which shows up in the statistics as indicated earlier, as well as an expansion of fixed-term or temporary contracts, as, for example, in the case of France. Pay freezes or even reductions in wages were also a widespread means adopted of reduc-ing the labour costs of companies to help them remain in operation during the economic downturn. In many cases, however, they have been extended to the recovery period on the grounds that they were necessary to help companies find the finance for expansion and so to enable more jobs to be created. In a number of countries, they have represented a source of conflict between employers and trade unions, though equally there are many cases too where they have been negotiated by trade unions as a means of saving jobs. In Germany, provisions have been included in some collective agreements to allow compa-nies to depart from agreed pay schedules if they are facing economic difficulties. Similarly in Finland, the recession has led to moves to decentralise pay bargaining to com-pany level and to link it specifically to the economic situation in order to give companies a better chance of remaining in business and of maintaining jobs. Wage subsidies have in many countries been introduced or extended specifically to help particular groups of workers into employment, such as young people or the unemployed, while in Poland, they have been adopted as a means of expanding employment in low-paid jobs. Young people, who have been severely affected by the recession and the lack of job crea-tion which it has involved, have been a particular target for Government support, in the form of work placement programmes (as in Ireland), work experience or training guaran-tees (as in the UK), or intensified job search assistance (as in France) if they have been unemployed for any length of time. 5.4 Employment prospects in the 12 selected sectors
The public sector financial problems across the EU, which have led to financial market pressure on a number of Eurozone countries with large borrowing needs, as well as to governments taking action to cut budget deficits, raise the distinct possibility of renewed recession in the short-term and at best low growth. The modest recovery which has oc-curred so far has largely been export-driven, with the Motor vehicles and engineering in-dustries, in particular, experiencing significant growth primarily because of the expansion of markets in the emerging economies, especially in Asia and Latin America, and only to a limited extent because of growth of demand in the EU. This has benefited some countries more than others, most especially, Germany, because of the nature of the industry there
198
and its specialisation in advanced, high valued-added products, the demand for which has expanded particularly rapidly in developing economies as income has risen. If the European economy remains depressed or fails to grow more than modestly, this pat-tern is likely to continue in future years, with major implications for the structure of the in-dustries covered here and their distribution across the EU. As the European representative of the Chemical industry made clear, in these circumstances, investment in future years is likely to be increasingly concentrated outside of Europe in countries where the market is growing rapidly. Accordingly, employment in the industry in Europe would decline by even more than it is already likely to. Much the same applies in the other industrial sectors, where in a number of cases, such as Motor vehicles and Electronics as well as Textiles, the motivation for investment to locate where markets are growing most rapidly is com-bined with a concern to locate where labour costs are lowest. In the Motor vehicle industry, according to representatives at EU-level, there is a problem of over-capacity in Europe which the down-sizing, redundancies and plant closures during the recession did not fully resolve – in part because of the actions taken to preserve jobs. Restructuring of the industry, therefore, still has to occur in future years (see Annex). This will inevitably involve job losses, or at best limited employment growth over a number of years if growth of the EU economy at a reasonable rate can be achieved in the longer-term, which will affect some countries more than others, especially those in the EU15 where volume car production is concentrated. At the same time, the development and growth of electrically-driven cars, which involve fewer components, could equally lead to a decline in employment in the industry, as well as further restructuring with the possible en-try of new companies. In Construction, where international trade is of limited importance, future employment prospects depend very much on government policy and, in particular, on whether public investment continues to be restrained by financial problems and a concern to reduce budget deficits. According to industry representatives, this is as true of Germany as of Spain where employment in construction has fallen precipitously since the onset of the financial crisis and public investment has been cut back markedly. A similar point was made by representatives of the Basic metals industry, who equally called for increased public expenditure, or lower taxes, to stimulate growth. Although independent forecasts of employment developments in the sectors covered here are available in a number of the countries, these in nearly all cases were made a year or two ago before the debt crisis, resulting from the recession and the measures taken to counter it, began to depress economic activity and to dampen prospects for recovery over the next year or two. Accordingly, they tend to be more optimistic about medium and longer-term prospects than at present seems justified. This not only has implications for
199
the overall projections of employment growth produced but also potentially the structure, or composition, of job growth since sectors are affected differentially – as is clear from the above analysis of periods of economic downturn – by the rate of economic growth being higher and lower. Equally, they are also affected in different ways by the rate at which the EU economy grows relative to economies in the rest of the world and by the extent to which they are involved in exporting as opposed to producing for the domestic market. The performance of German manufacturers over the last year or two since the trough of the recession was reached – and, in particular, their success in exporting to developing economies – and the effects of this on the domestic economy is an ample illustration of the importance of such differential effects. The rate of growth of the EU economy relative to the rest of the world, therefore, not only affects the relative prospects for different sectors but also the prospects for individual sectors in different EU countries depending on both their overall competitive-ness in global markets and the markets in which they are most represented. The other main deficiency of existing forecasts is that those undertaken for particular sec-tors in individual countries tend to limit their scope to that sector alone without taking suffi-cient account of developments in the wider economy, let alone in the rest of the world, and the way that these affect the sector concerned. More often than not, they are based essen-tially on extrapolations of past trends, which in the present context, means trends which were evident before the onset of the crisis, and, accordingly, fail to take account of underly-ing changes in the structure of the economy since then. This criticism carries over to some of the more general forecasts which cover all the sectors, at various levels of disaggrega-tion, but which do so by examining the prospects for each sector separately and so leave the interdependencies between sectors out of account32. The one set of medium and longer-term projections which cover all sectors – as well as all EU Member States – and explicitly take account of the interdependencies between them is that produced by Cedefop as a basis for identifying future skill needs across the EU. These projections too, however, were produced before the full extent of the implications of the present debt crisis became evident and, accordingly, may turn out to be over-optimistic. There are also some question-marks over some of the details of the projections. According to the base, or central, projection, employment is likely to decline over the long-term in most of the manufacturing industries covered here in Germany, Estonia, the UK and Po-land, which in the last would represent a major change in the tendency for employment to increase which is evident over the crisis period.
32 See, for example, Centre d’analyse stratégique, Les secteurs créateurs d’emplois à court-moyen terme après la crise
(La Note d’analyse, Nov 2010
200
In Lithuania however, manufacturing (and in particular Machinery and equipment) is fore-cast to be one of the main sources of growth, together with services (Real estate and busi-ness activities and Public services). The largest reductions in employment in this country are forecast in Accommodation and food services as well as Textiles. In Spain too, much of the future employment growth is forecast to be in the manufacturing sector (especially in Motor vehicles, Basic metals and Machinery and equipment), which would represent a marked turnaround from recent experience, which has seen large-scale job losses over the crisis period, with very few signs of any reversal. The only one of the manufacturing sectors covered which showed any increase in employment in the first part of 2011 relative to a year earlier is Electronics. In all the other manufacturing sectors, em-ployment continued to decline over this period, even if at a slower rate. The employment growth forecast in Motor vehicles and Basic metals is especially open to question given recent experience and given also the tendency also for growth in these industries to take place increasingly outside the EU15, particularly in the volume end of the car industry which is where Spain tends to specialise and where over-capacity in Europe at the present time is most acute. In Finland as well, the forecast is for employment to increase in two manufacturing sectors, Electronics and Motor vehicles, which in the first case would be in line with the growth ex-perienced over the years leading up to the recession and in the second would be contrary to the pre-recession experience but would continue the growth shown in 2011. A significant increase is also forecast in Distribution whereas employment in Financial services is pro-jected to decline significantly over the longer-term, which would be in line with the long-term downward trend evident before the recession struck but not with the experience over the crisis period when employment in this sector has risen slightly. In Italy, significant employment contraction is expected in Textiles, Motor vehicles and Fi-nancial services whereas employment is expected to grow over the long-term in Machinery and equipment, though, as indicated above, the significant productivity overhang built up over the recession period is likely to delay any net job creation. In France, Estonia, Poland and the UK, employment increases are forecast in Construc-tion, though, as indicated above, this is likely to depend critically on the government policy and the extent to which public finances provide room for investment in infrastructure. In Estonia, significant job growth is also projected in Hotels and restaurants as well as Rub-ber and plastics and Chemicals (the only manufacturing industries where employment is forecast to expand). In Ireland, high rates of employment growth are forecast, once recovery gets underway, in Chemicals and Metal manufacture as well as in Business activities, which as indicated
201
above, seems to have largely escaped the crisis. By contrast, employment is projected to continue to decline in Textiles – as in virtually all EU countries – Construction and Distribu-tion, though in Construction, given the scale of job losses which have already occurred, the scope for further reductions seems limited. Future prospects for recovery in employment, especially in manufacturing, though also in some degree in Business services, depend very much on the behaviour and performance of multinationals which were the main source of economic growth in the country before the crisis. In the UK, much of the net additional jobs in future years, as in the past before the reces-sion, are projected to be generated in Business services (+25%). Similarly, in Poland, em-ployment in Business services is expected to grow, though here along with employment in Distribution. The projections of employment growing in services, which is a common feature of the long-term forecasts, are, however, likely to be accompanied by an expansion of part-time work-ing, continuing both the long-term trend evident before the recession and the shorter-term tendency for more people to be employed in such jobs over the crisis period. In Germany, in particular, part-time working is increasing especially fast in Distribution and Hotels and restaurants. Whether this shift towards part-time working is also likely to continue over the long-term in the EU12 countries is more questionable given that it is accompanied by lower wages as well as shorter working hours and given also the low earnings levels which pre-vails in the countries concerned. Temporary-agency work is also expected to gain in importance in many countries, espe-cially in the more basic services and Construction. 5.5 Projection of skill needs
Projections of skill needs for the countries in which they are available indicate that in most cases, unsurprisingly, the main growth in demand is likely to continue to be for higher edu-cated workers (managers, professionals as well as technicians and associate profession-als), which in virtually all countries have been the main source of net job creation for many years. The demand for sales and service workers is also projected to increase in most countries, but especially in Germany, Poland, Ireland and the UK. More surprisingly per-haps, the number of low-skilled manual workers is forecast to grow as well in Germany, Italy, Finland, Estonia and Lithuania (and marginally in Ireland). A feature of long-term de-velopments, however, before the onset of the recession in the EU15 at least was for the share of such workers in total employment to remain broadly unchanged and to increase relative to skilled and semi-skilled manual workers who were more vulnerable to the spread of automation.
202
On the other hand, a reduction in demand is projected for clerks and office workers in Germany, Italy, the UK, Finland, Estonia and Lithuania. Meeting the increased demand for high-skilled workers may prove to be problematic in a number of countries. In Germany, in particular, where a large proportion of young people go through the dual education system (where classroom teaching is combined with on-the-job training), there is a concern that the demand for professionals may be difficult to meet because the relative number of young people graduating with university degrees is com-paratively small. Moreover, unlike in many other countries, it has not tended to increase much over many years. A recent projection in Germany of the demand for particular skills and of their future supply, however, concluded that the supply of tertiary-educated people was likely to grow over the long-term (up to 2025) in excess of demand, which was expected to result in the people concerned taking up employment in lower level jobs which do not necessarily require their levels of education33. On the other hand, an alternative projection as part of the same study indicated that supply shortages of university graduates or those with equivalent qualifica-tions were likely to remain a problem, illustrating the difficulty of making long-term projec-tions of skill requirements and prospective shortages and the variation which can occur by changing the underlying assumptions or the properties of the model used. There are likely to be similar shortages of tertiary-educated people in Estonia and Lithuania if the economic recovery continues, though here it is because of the large-scale emigration of young people, many of whom are well-educated, especially to EU15 countries. At the same time, information from industry representatives at EU-level suggests that in some industries, Chemicals being a case in point (see Annex), there could well be skill shortages as regards skilled manual workers, those involved in processing in particular, This is not necessarily because of an overall shortage of people with the skills in question but because of a difficulty of the industries concerned in attracting them. Young people, therefore, tend to be deterred by the unfavourable image of many manufacturing industries from pursuing a career path, and undertaking the associated education and training, in the industries concerned. This applies not only to Chemicals but also to Textiles and Basic metals which are seen as either being in decline or having poor working conditions and, accordingly, offering limited opportunities for advancement and obtaining high levels of salary in future years. The aim in these industries needs, therefore, to be both to encour-age education and training providers to offer appropriate programmes in line with their needs and to encourage young people to pursue such programmes while at the same time trying to change the image of the industries. 33 See Zika, Gerd, and Helmrich, Robert (2011), ‘Qualifikations- und Berufsfeldprojektionen bis 2025’, Sozialer Fortschritt,
08/2011,

203
In Motor vehicles, there is some uncertainty about the specific nature of future skill needs given the likely growth of electrically-driven cars, for which the labour skills required are not at present fully known. This is just one example of a general problem of forecasting skill needs into the long-term when technology is likely to change markedly so that in a number of cases the products manufactured, the production methods and materials used and, therefore, the specific tasks involved in the manufacturing process could well be substan-tially different even in 5 years’ time from those at present. In such a context, it is only pos-sible to give a broad indication of future skill requirements, in generic terms rather than in terms of particular narrowly defined occupations. This means that while it is possible to predict that there will be a growing need for computer skills among both process workers and skilled manual workers (such as mechanics, toolmakers, machine tool setters and so on) as well as among professionals and those in managerial and administrative positions, it is difficult to know which specific jobs will expand and which new jobs will emerge. 5.6 Government measures to support industrial development
There is wide agreement across the industries covered that governments need to support the increased flexibility which employers have gained over the recession period over the organisation of their work force and working time. This has been important in enabling companies to adjust hours and days of work in line with the demand for their output and so avoid making people redundant. In a number of countries, this has been achieved through bargaining with trade unions and enshrined in collective agreements, though it has been supported by government measures subsidising short-time working arrangements and by changes in labour law where necessary. The need for flexibility and, accordingly for gov-ernment support, is thought to be important in future years not only to safeguard jobs but also to help maintain competitiveness in an increasingly globalised market. This in effect means the pursuit and strengthening of a flexicurity approach on the part of national governments across the EU, which all of them have signed up to but which up to now has only partly been implemented in many cases, in the sense that ensuring security for workers has lagged behind action to increase labour market flexibility. Putting a fully-fledged policy in place, however, is under threat from the priority given at present in most parts of the EU to fiscal consolidation to reduce budget deficits. This severely constrains the resources available to fund the income support and active labour market measures required to provide an effective safety net and other forms of assistance for those out of work, vulnerable to losing their jobs or failing in their business ventures. In the two industries covered which are particularly vulnerable to competition from develop-ing countries, Textiles and Basic metals, there are strong calls for government support at EU level to ensure that competition takes place on a level playing field and that producers in other countries do not have an unfair advantage from subsidies or lax regulations on
204
their production methods and emissions. Such a focus, however, carries the risk of divert-ing attention away from the action which is more directly under the control of companies in the industries concerned, which is to improve their competitiveness not only by increasing efficiency and reducing the costs of production, but also, and perhaps more importantly, by improving the quality of products, their design, the new lines developed, their marketing and so on. In the industries covered, especially in the Motor, Chemicals and Rubber, plastics, etc. industries, similar calls for government support at EU-level have focused on trying to en-sure that the legislation and regulations in place – restricting emissions, safeguarding the health of workers and the general public, and so on – are reasonable in terms of the ability of EU producers to compete with those from other counties and are introduced with suffi-cient advance warning to give them a chance of making the necessary modifications in a cost-efficient way. There is more general agreement about the importance of government support for R&D since innovation – which is dependent on R&D – is considered to be key to EU-based companies competing effectively on world markets, even in traditional industries such as Textiles and clothing, and being able to generate the income required to sustain growth and job creation across the economy as a whole. Above all, however, it is considered important for governments to invest in education and training which is essential to ensure the future availability of a suitably skilled work force for industries to draw on. The skills in question are not only high level ones possessed by en-gineers, computer scientists, financial experts, managers and so on, but also vocational ones which those directly involved in the production process itself require. Although the demand for such skills has tended to decline over the past, it is still the case that there could be a future shortage of the skills concerned as present workers retire. As indicated above, however, the provision of the requisite education and training programmes needs to be accompanied by action within the industries themselves to improve their image and to encourage young people to join them, though government’s also have a role in persuading young people to pursue the fields of study in question.
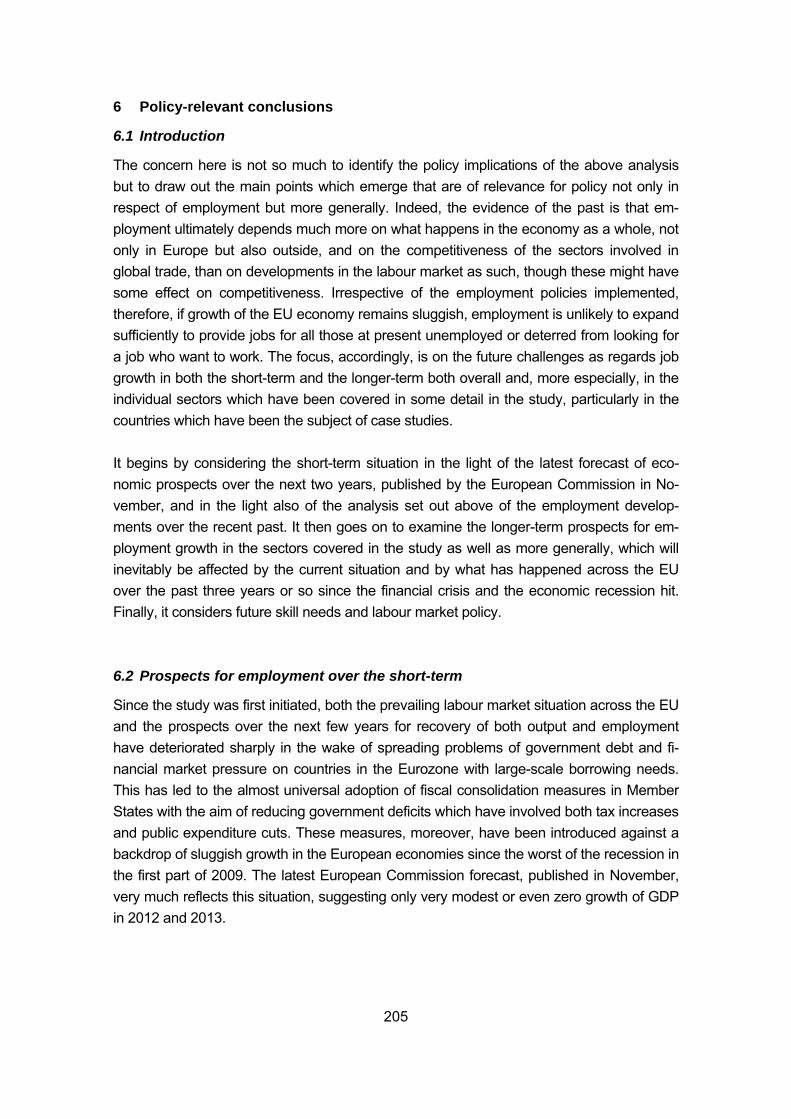
205
6 Policy-relevant conclusions
6.1 Introduction
The concern here is not so much to identify the policy implications of the above analysis but to draw out the main points which emerge that are of relevance for policy not only in respect of employment but more generally. Indeed, the evidence of the past is that em-ployment ultimately depends much more on what happens in the economy as a whole, not only in Europe but also outside, and on the competitiveness of the sectors involved in global trade, than on developments in the labour market as such, though these might have some effect on competitiveness. Irrespective of the employment policies implemented, therefore, if growth of the EU economy remains sluggish, employment is unlikely to expand sufficiently to provide jobs for all those at present unemployed or deterred from looking for a job who want to work. The focus, accordingly, is on the future challenges as regards job growth in both the short-term and the longer-term both overall and, more especially, in the individual sectors which have been covered in some detail in the study, particularly in the countries which have been the subject of case studies. It begins by considering the short-term situation in the light of the latest forecast of eco-nomic prospects over the next two years, published by the European Commission in No-vember, and in the light also of the analysis set out above of the employment develop-ments over the recent past. It then goes on to examine the longer-term prospects for em-ployment growth in the sectors covered in the study as well as more generally, which will inevitably be affected by the current situation and by what has happened across the EU over the past three years or so since the financial crisis and the economic recession hit. Finally, it considers future skill needs and labour market policy. 6.2 Prospects for employment over the short-term
Since the study was first initiated, both the prevailing labour market situation across the EU and the prospects over the next few years for recovery of both output and employment have deteriorated sharply in the wake of spreading problems of government debt and fi-nancial market pressure on countries in the Eurozone with large-scale borrowing needs. This has led to the almost universal adoption of fiscal consolidation measures in Member States with the aim of reducing government deficits which have involved both tax increases and public expenditure cuts. These measures, moreover, have been introduced against a backdrop of sluggish growth in the European economies since the worst of the recession in the first part of 2009. The latest European Commission forecast, published in November, very much reflects this situation, suggesting only very modest or even zero growth of GDP in 2012 and 2013.
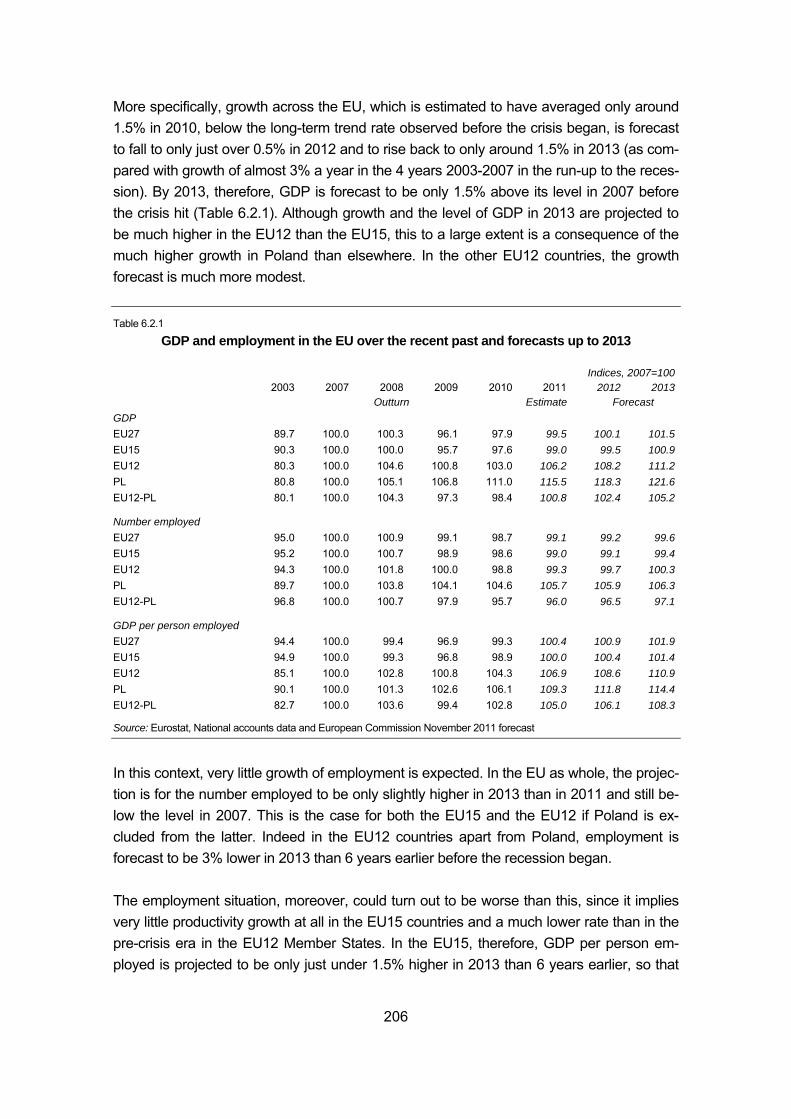
206
More specifically, growth across the EU, which is estimated to have averaged only around 1.5% in 2010, below the long-term trend rate observed before the crisis began, is forecast to fall to only just over 0.5% in 2012 and to rise back to only around 1.5% in 2013 (as com-pared with growth of almost 3% a year in the 4 years 2003-2007 in the run-up to the reces-sion). By 2013, therefore, GDP is forecast to be only 1.5% above its level in 2007 before the crisis hit (Table 6.2.1). Although growth and the level of GDP in 2013 are projected to be much higher in the EU12 than the EU15, this to a large extent is a consequence of the much higher growth in Poland than elsewhere. In the other EU12 countries, the growth forecast is much more modest. Table 6.2.1
GDP and employment in the EU over the recent past and forecasts up to 2013
Indices, 2007=100 2003 2007 2008 2009 2010 2011 2012 2013
Outturn Estimate Forecast GDP EU27 89.7 100.0 100.3 96.1 97.9 99.5 100.1 101.5EU15 90.3 100.0 100.0 95.7 97.6 99.0 99.5 100.9EU12 80.3 100.0 104.6 100.8 103.0 106.2 108.2 111.2PL 80.8 100.0 105.1 106.8 111.0 115.5 118.3 121.6EU12-PL 80.1 100.0 104.3 97.3 98.4 100.8 102.4 105.2
Number employed EU27 95.0 100.0 100.9 99.1 98.7 99.1 99.2 99.6EU15 95.2 100.0 100.7 98.9 98.6 99.0 99.1 99.4EU12 94.3 100.0 101.8 100.0 98.8 99.3 99.7 100.3PL 89.7 100.0 103.8 104.1 104.6 105.7 105.9 106.3EU12-PL 96.8 100.0 100.7 97.9 95.7 96.0 96.5 97.1
GDP per person employed EU27 94.4 100.0 99.4 96.9 99.3 100.4 100.9 101.9EU15 94.9 100.0 99.3 96.8 98.9 100.0 100.4 101.4EU12 85.1 100.0 102.8 100.8 104.3 106.9 108.6 110.9PL 90.1 100.0 101.3 102.6 106.1 109.3 111.8 114.4EU12-PL 82.7 100.0 103.6 99.4 102.8 105.0 106.1 108.3
Source: Eurostat, National accounts data and European Commission November 2011 forecast
In this context, very little growth of employment is expected. In the EU as whole, the projec-tion is for the number employed to be only slightly higher in 2013 than in 2011 and still be-low the level in 2007. This is the case for both the EU15 and the EU12 if Poland is ex-cluded from the latter. Indeed in the EU12 countries apart from Poland, employment is forecast to be 3% lower in 2013 than 6 years earlier before the recession began. The employment situation, moreover, could turn out to be worse than this, since it implies very little productivity growth at all in the EU15 countries and a much lower rate than in the pre-crisis era in the EU12 Member States. In the EU15, therefore, GDP per person em-ployed is projected to be only just under 1.5% higher in 2013 than 6 years earlier, so that
207
the beginnings of a recovery in productivity to make good the loss experienced in 2008 and 2009, evident in 2010 and in the latest figures for 2011, is assumed to slow down. In the EU12 countries excluding Poland, the implicit assumption is the same, growth in GDP per person employed being forecast to slow down markedly in 2012 and 2013, when the level is projected to be only just over 8% higher than 6 years earlier, an implied growth rate of less than 1.5% a year over the period as against a rate of 5% a year in the 4 years 2003-2007. Table 6.2.2
GDP and employment in selected EU Member States over the recent past and forecasts up to 2013
Indices, 2007=100 2003 2007 2008 2009 2010 2011 2012 2013GDP Outturn Estimate Forecast Germany 91.7 100.0 101.1 95.9 99.4 102.3 103.1 104.6Estonia 73.0 100.0 96.3 82.6 84.5 91.2 94.1 97.9Ireland 82.0 100.0 97.0 90.2 89.9 90.8 91.8 93.9Spain 86.8 100.0 100.9 97.1 97.0 97.8 98.4 99.8France 91.4 100.0 99.9 97.2 98.6 100.2 100.8 102.2Italy 93.7 100.0 98.8 93.9 95.3 95.8 95.9 96.5Lithuania 73.0 100.0 102.9 87.6 88.9 94.3 97.5 101.2Finland 84.8 100.0 101.0 92.7 96.1 99.0 100.4 102.1UK 89.6 100.0 98.9 94.6 96.2 96.9 97.4 98.9Number employed Germany 97.6 100.0 101.2 101.3 101.7 103.1 103.5 103.7Estonia 92.3 100.0 100.2 90.1 85.8 90.9 92.0 93.1Ireland 85.2 100.0 98.9 90.9 87.1 85.4 84.9 85.4Spain 86.5 100.0 99.8 93.1 90.7 89.9 89.5 90.0France 96.8 100.0 100.5 99.3 99.5 100.1 100.5 100.9Italy 95.9 100.0 100.3 98.6 97.9 98.2 98.1 98.2Lithuania 93.3 100.0 99.3 92.6 87.8 90.9 92.7 94.5Finland 94.4 100.0 102.6 99.0 97.6 98.6 98.9 99.1UK 96.4 100.0 100.7 99.1 99.4 100.2 100.7 101.2GDP per person employed Germany 93.9 100.0 99.9 94.7 97.7 99.3 99.6 100.9Estonia 79.1 100.0 96.2 91.6 98.4 100.3 102.3 105.2Ireland 96.2 100.0 98.1 99.3 103.2 106.4 108.2 110.0Spain 100.4 100.0 101.1 104.3 107.0 108.8 109.9 110.9France 94.4 100.0 99.4 97.8 99.1 100.1 100.3 101.3Italy 97.7 100.0 98.6 95.2 97.3 97.6 97.7 98.2Lithuania 78.3 100.0 103.6 94.7 101.2 103.7 105.1 107.1Finland 89.9 100.0 98.4 93.6 98.4 100.4 101.5 103.0UK 92.9 100.0 98.2 95.4 96.9 96.6 96.7 97.7
Source: Eurostat, National accounts data and European Commission November 2011 forecast
The employment prospects are even worse in many Member States. In those that were hit particularly hard by the recession, the number employed in 2013 is forecast still to be well
208
below the level before the recession began – in Ireland, around 15% lower (back to the level 10 years earlier in 2003), in Spain, 9-10% lower and in Estonia, 7% lower (Table 6.2.2, which shows the forecasts for the EU case study countries.). This is largely a conse-quence of the slow rate of GDP growth which is forecast, which in all of the countries apart from Germany, is projected in 2013 to be either less than in 2007 or only slightly higher. Even in Germany, it is forecast to be less than 5% higher than 6 years earlier, an implied rate of growth of well under 1% a year. Significantly for longer-term employment prospects, GDP per person employed is forecast to be only marginally higher in 2013 in Germany than in 2007 before the onset of the re-cession, which is also the case in France, while in Italy and the UK, it is forecast to be be-low this level. Moreover, in Estonia, Lithuania and Finland, although GDP per person em-ployed in 2013 is projected to be above the level in 2007, the implied rate of labour produc-tivity growth over this period (leaving aside any marked reduction in average hours worked, which has not occurred up to 2011, as indicated earlier in the study) is well below the rate experienced in the years before the recession began (only around 1% a year in the two Baltic states as opposed to around 6% a year between 2003 and 2007, and 0.5% a year in Finland as against almost 3% a year).. This inevitably raises the question of whether this implicit loss of productivity is likely to be a permanent feature or whether it is likely to be recovered as, and when, growth occurs. Though this recovery is implicitly assumed in the forecast not to happen over the next two years, it still remains a possibility over the years beyond 2013, especially if growth picks up. The longer-term prospects for employment growth in these countries – and indeed in many others across the EU34 - need to be con-sidered with this in mind. 6.3 The current situation in the selected manufacturing sectors
In this context, a number of the sectors which have been the focus of attention above are likely to be particularly affected. As indicated, employment in many of these sectors over much of the EU remains well below what it was before the recession began (Figure 6.3.1 summarises the situation at the beginning of 201135). Indeed, there is a distinct possibility of a new round of lay-offs if growth does not pick up. This then raises the question of whether there is any scope for re-introducing, or extending, the measures, such as short-time working schemes, implemented to maintain employment 34 In Greece, where employment in 2013 is projected to be 9% less than in 2007, GDP per person employed in 2013 is
forecast to be 5% below the level 6 years earlier. Clearly, if this implied reduction in productivity does not occur then the reduction in employment could be significantly greater than is being forecast.
35 Note that the period taken here is the three years from the first quarter of 2008 to the first quarter of 2011 rather than the four years from the first quarter of 2007 which was the focus in the earlier section which examined developments in the case study countries. This is because in the EU as a whole the peak of employment was reached in 2008, whereas in some countries, it was reached in 2007.
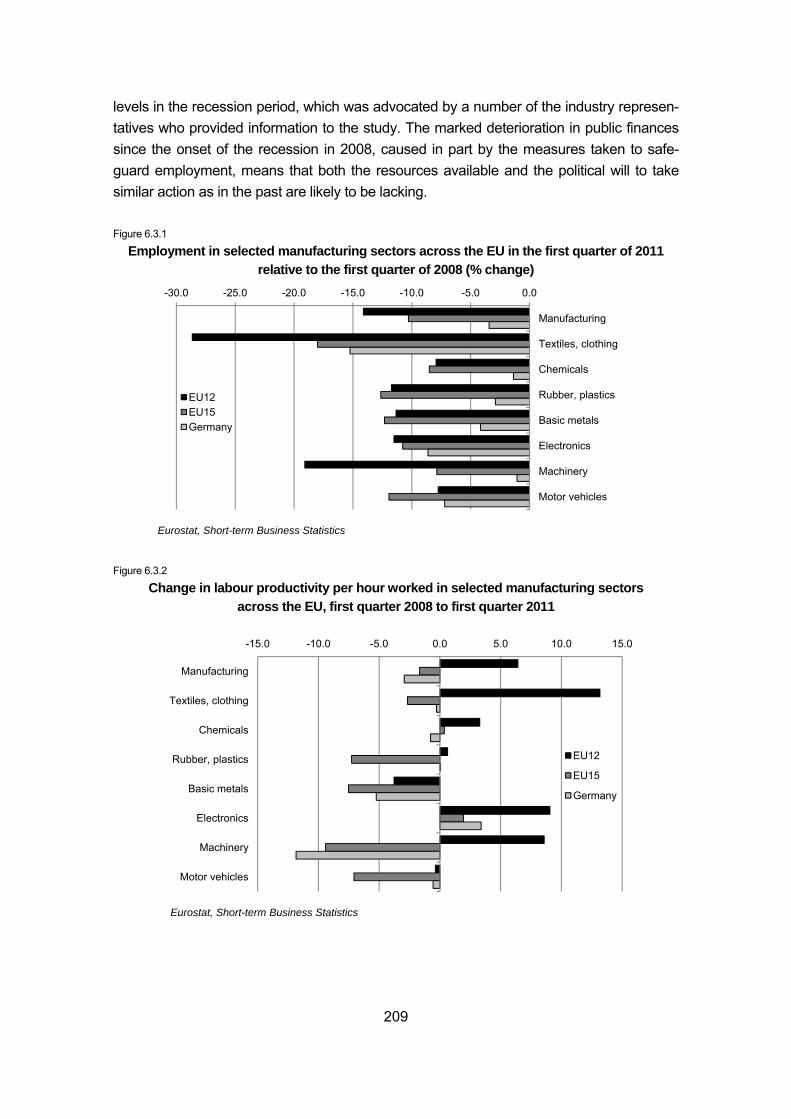
209
levels in the recession period, which was advocated by a number of the industry represen-tatives who provided information to the study. The marked deterioration in public finances since the onset of the recession in 2008, caused in part by the measures taken to safe-guard employment, means that both the resources available and the political will to take similar action as in the past are likely to be lacking. Figure 6.3.1
Employment in selected manufacturing sectors across the EU in the first quarter of 2011 relative to the first quarter of 2008 (% change)
Figure 6.3.2
Change in labour productivity per hour worked in selected manufacturing sectors across the EU, first quarter 2008 to first quarter 2011
-30.0 -25.0 -20.0 -15.0 -10.0 -5.0 0.0
Manufacturing
Textiles, clothing
Chemicals
Rubber, plastics
Basic metals
Electronics
Machinery
Motor vehicles
EU12EU15Germany
Eurostat, Short-term Business Statistics
-15.0 -10.0 -5.0 0.0 5.0 10.0 15.0
Manufacturing
Textiles, clothing
Chemicals
Rubber, plastics
Basic metals
Electronics
Machinery
Motor vehicles
EU12
EU15
Germany
Eurostat, Short-term Business Statistics
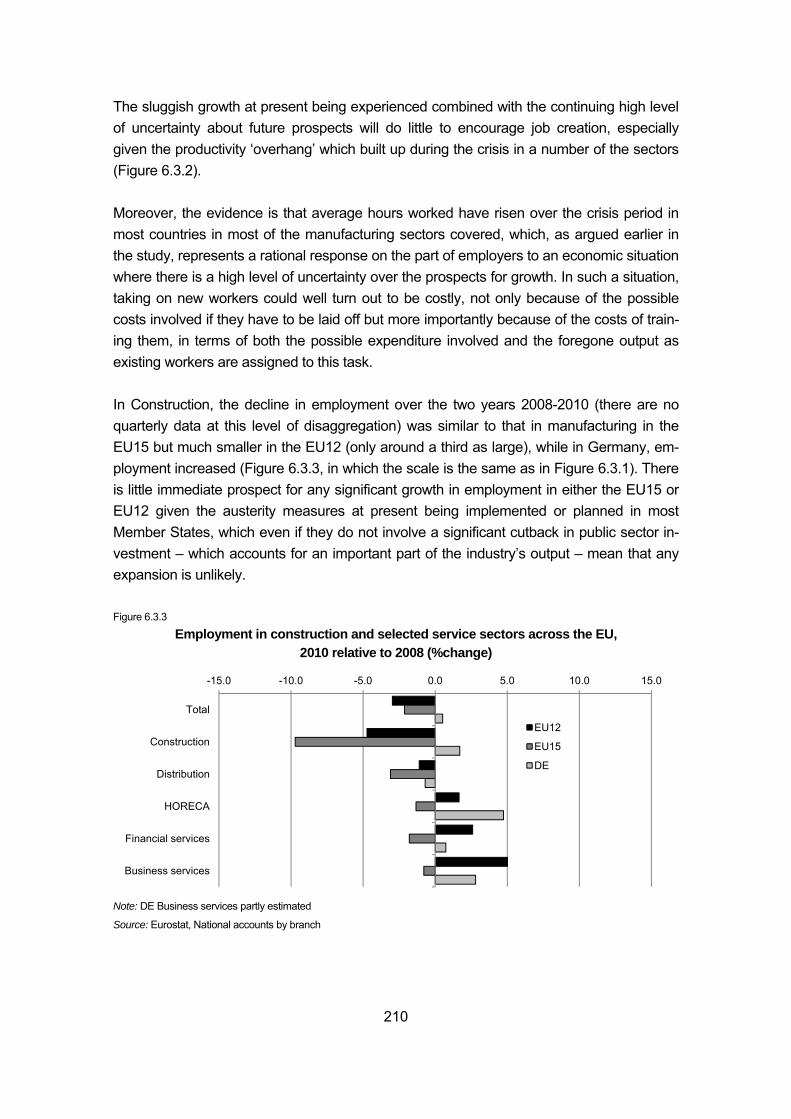
210
The sluggish growth at present being experienced combined with the continuing high level of uncertainty about future prospects will do little to encourage job creation, especially given the productivity ‘overhang’ which built up during the crisis in a number of the sectors (Figure 6.3.2). Moreover, the evidence is that average hours worked have risen over the crisis period in most countries in most of the manufacturing sectors covered, which, as argued earlier in the study, represents a rational response on the part of employers to an economic situation where there is a high level of uncertainty over the prospects for growth. In such a situation, taking on new workers could well turn out to be costly, not only because of the possible costs involved if they have to be laid off but more importantly because of the costs of train-ing them, in terms of both the possible expenditure involved and the foregone output as existing workers are assigned to this task. In Construction, the decline in employment over the two years 2008-2010 (there are no quarterly data at this level of disaggregation) was similar to that in manufacturing in the EU15 but much smaller in the EU12 (only around a third as large), while in Germany, em-ployment increased (Figure 6.3.3, in which the scale is the same as in Figure 6.3.1). There is little immediate prospect for any significant growth in employment in either the EU15 or EU12 given the austerity measures at present being implemented or planned in most Member States, which even if they do not involve a significant cutback in public sector in-vestment – which accounts for an important part of the industry’s output – mean that any expansion is unlikely. Figure 6.3.3
Employment in construction and selected service sectors across the EU, 2010 relative to 2008 (%change)
Note: DE Business services partly estimated
Source: Eurostat, National accounts by branch
-15.0 -10.0 -5.0 0.0 5.0 10.0 15.0
Total
Construction
Distribution
HORECA
Financial services
Business services
EU12
EU15
DE
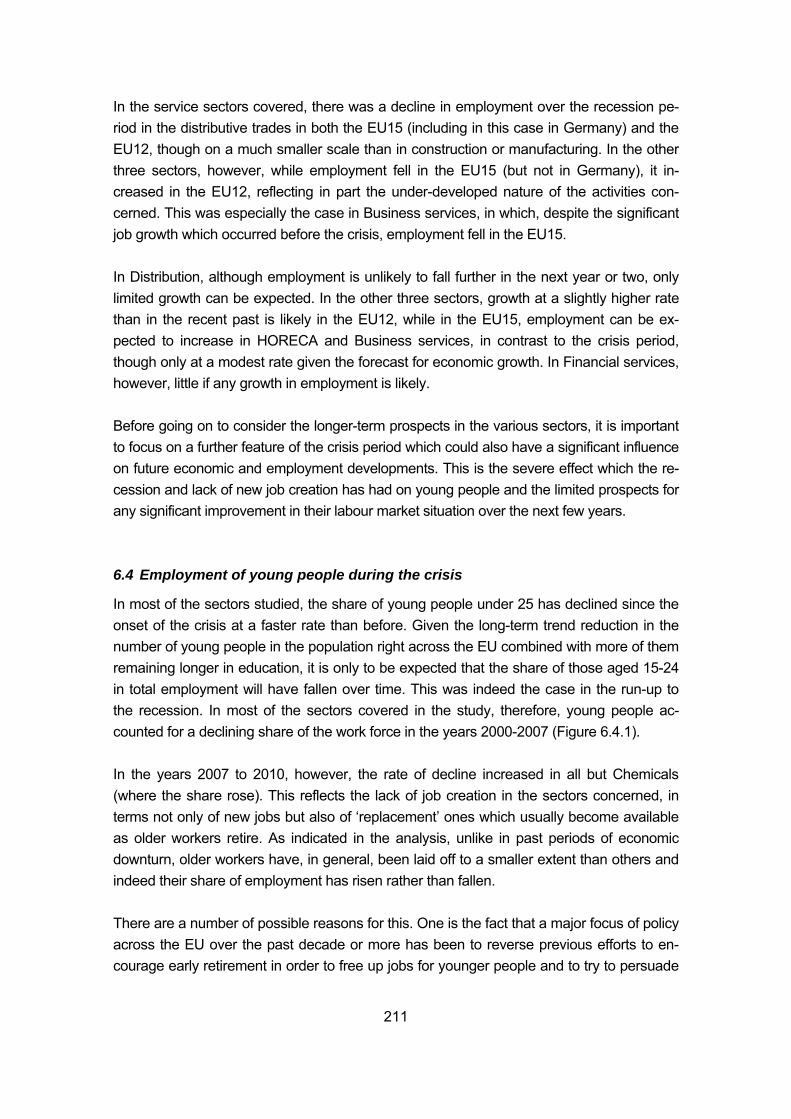
211
In the service sectors covered, there was a decline in employment over the recession pe-riod in the distributive trades in both the EU15 (including in this case in Germany) and the EU12, though on a much smaller scale than in construction or manufacturing. In the other three sectors, however, while employment fell in the EU15 (but not in Germany), it in-creased in the EU12, reflecting in part the under-developed nature of the activities con-cerned. This was especially the case in Business services, in which, despite the significant job growth which occurred before the crisis, employment fell in the EU15. In Distribution, although employment is unlikely to fall further in the next year or two, only limited growth can be expected. In the other three sectors, growth at a slightly higher rate than in the recent past is likely in the EU12, while in the EU15, employment can be ex-pected to increase in HORECA and Business services, in contrast to the crisis period, though only at a modest rate given the forecast for economic growth. In Financial services, however, little if any growth in employment is likely. Before going on to consider the longer-term prospects in the various sectors, it is important to focus on a further feature of the crisis period which could also have a significant influence on future economic and employment developments. This is the severe effect which the re-cession and lack of new job creation has had on young people and the limited prospects for any significant improvement in their labour market situation over the next few years. 6.4 Employment of young people during the crisis
In most of the sectors studied, the share of young people under 25 has declined since the onset of the crisis at a faster rate than before. Given the long-term trend reduction in the number of young people in the population right across the EU combined with more of them remaining longer in education, it is only to be expected that the share of those aged 15-24 in total employment will have fallen over time. This was indeed the case in the run-up to the recession. In most of the sectors covered in the study, therefore, young people ac-counted for a declining share of the work force in the years 2000-2007 (Figure 6.4.1). In the years 2007 to 2010, however, the rate of decline increased in all but Chemicals (where the share rose). This reflects the lack of job creation in the sectors concerned, in terms not only of new jobs but also of ‘replacement’ ones which usually become available as older workers retire. As indicated in the analysis, unlike in past periods of economic downturn, older workers have, in general, been laid off to a smaller extent than others and indeed their share of employment has risen rather than fallen. There are a number of possible reasons for this. One is the fact that a major focus of policy across the EU over the past decade or more has been to reverse previous efforts to en-courage early retirement in order to free up jobs for younger people and to try to persuade
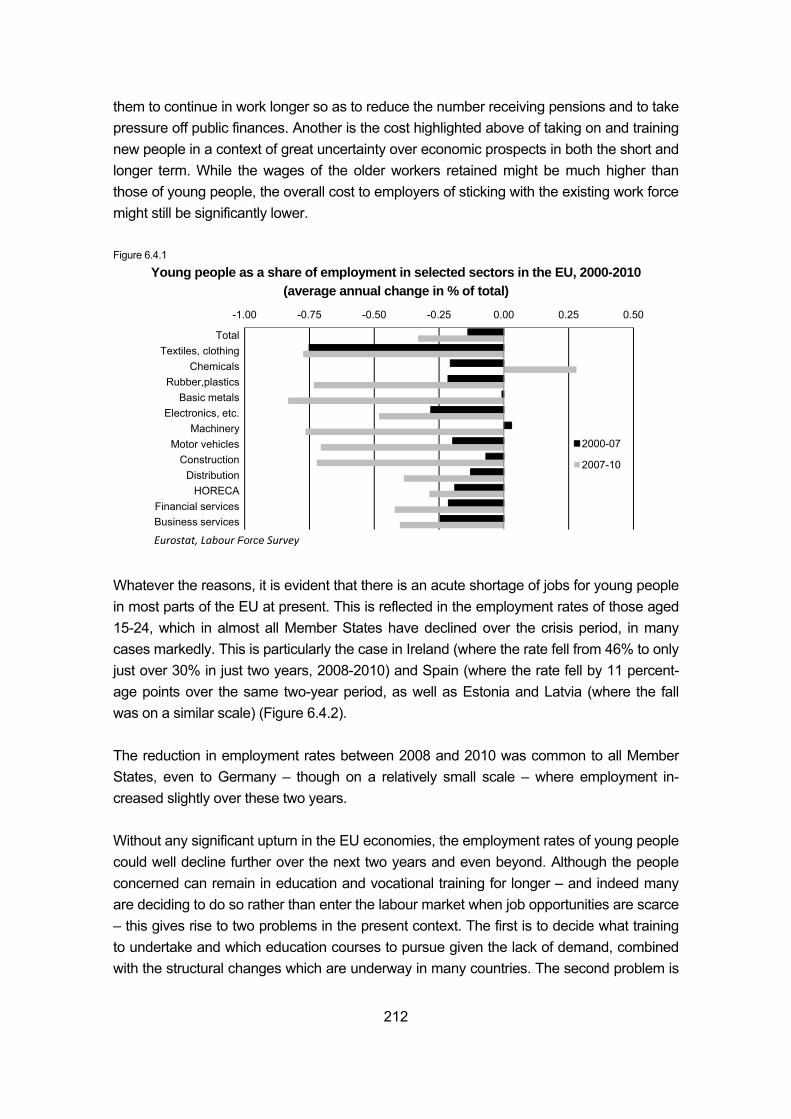
212
them to continue in work longer so as to reduce the number receiving pensions and to take pressure off public finances. Another is the cost highlighted above of taking on and training new people in a context of great uncertainty over economic prospects in both the short and longer term. While the wages of the older workers retained might be much higher than those of young people, the overall cost to employers of sticking with the existing work force might still be significantly lower. Figure 6.4.1
Young people as a share of employment in selected sectors in the EU, 2000-2010 (average annual change in % of total)
Whatever the reasons, it is evident that there is an acute shortage of jobs for young people in most parts of the EU at present. This is reflected in the employment rates of those aged 15-24, which in almost all Member States have declined over the crisis period, in many cases markedly. This is particularly the case in Ireland (where the rate fell from 46% to only just over 30% in just two years, 2008-2010) and Spain (where the rate fell by 11 percent-age points over the same two-year period, as well as Estonia and Latvia (where the fall was on a similar scale) (Figure 6.4.2). The reduction in employment rates between 2008 and 2010 was common to all Member States, even to Germany – though on a relatively small scale – where employment in-creased slightly over these two years. Without any significant upturn in the EU economies, the employment rates of young people could well decline further over the next two years and even beyond. Although the people concerned can remain in education and vocational training for longer – and indeed many are deciding to do so rather than enter the labour market when job opportunities are scarce – this gives rise to two problems in the present context. The first is to decide what training to undertake and which education courses to pursue given the lack of demand, combined with the structural changes which are underway in many countries. The second problem is
-1.00 -0.75 -0.50 -0.25 0.00 0.25 0.50
TotalTextiles, clothing
ChemicalsRubber,plastics
Basic metalsElectronics, etc.
MachineryMotor vehicles
ConstructionDistribution
HORECAFinancial servicesBusiness services
2000-07
2007-10
Eurostat, Labour Force Survey
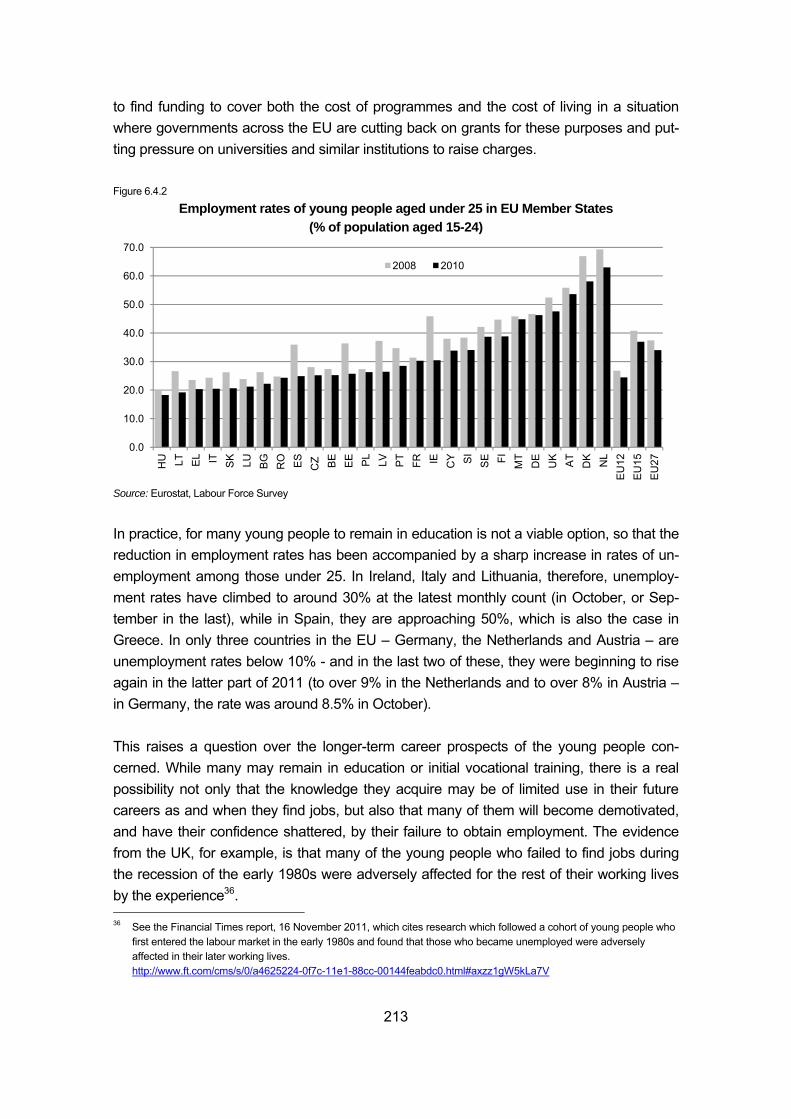
213
to find funding to cover both the cost of programmes and the cost of living in a situation where governments across the EU are cutting back on grants for these purposes and put-ting pressure on universities and similar institutions to raise charges. Figure 6.4.2
Employment rates of young people aged under 25 in EU Member States (% of population aged 15-24)
Source: Eurostat, Labour Force Survey In practice, for many young people to remain in education is not a viable option, so that the reduction in employment rates has been accompanied by a sharp increase in rates of un-employment among those under 25. In Ireland, Italy and Lithuania, therefore, unemploy-ment rates have climbed to around 30% at the latest monthly count (in October, or Sep-tember in the last), while in Spain, they are approaching 50%, which is also the case in Greece. In only three countries in the EU – Germany, the Netherlands and Austria – are unemployment rates below 10% - and in the last two of these, they were beginning to rise again in the latter part of 2011 (to over 9% in the Netherlands and to over 8% in Austria – in Germany, the rate was around 8.5% in October). This raises a question over the longer-term career prospects of the young people con-cerned. While many may remain in education or initial vocational training, there is a real possibility not only that the knowledge they acquire may be of limited use in their future careers as and when they find jobs, but also that many of them will become demotivated, and have their confidence shattered, by their failure to obtain employment. The evidence from the UK, for example, is that many of the young people who failed to find jobs during the recession of the early 1980s were adversely affected for the rest of their working lives by the experience36. 36 See the Financial Times report, 16 November 2011, which cites research which followed a cohort of young people who
first entered the labour market in the early 1980s and found that those who became unemployed were adversely affected in their later working lives. http://www.ft.com/cms/s/0/a4625224-0f7c-11e1-88cc-00144feabdc0.html#axzz1gW5kLa7V
0.0
10.0
20.0
30.0
40.0
50.0
60.0
70.0
HU LT EL IT SK LU BG
RO ES
CZ BE
EE PL
LV PT
FR IE CY SI
SE FI MT
DE
UK AT
DK NL
EU
12E
U15
EU
27
2008 2010
214
This is not only an issue for young people – and for governments across the EU faced with a growing number of young people without a job and without much prospect of finding one for some time to come and the social unrest which is likely to result – it is also an issue for the economy. The fact that many young people are not working is already a waste of re-sources and of the investment which has gone into educating and training them. A signifi-cant proportion of the young people unemployed across the EU are university graduates with tertiary qualifications. In Greece, the unemployment rate of those under 25 with tertiary education was close to 50% in the second quarter of 2011, in Spain, it was around 33% and in Italy, 26%. In Portugal too, where the proportion of young people with university qualifications is among the smallest in the EU, it was over 20%, as it was in Poland, where much policy effort has gone into increasing the number of tertiary educated people. However, it is not only a current source of waste but potentially a future source as well if those that are unable to find jobs begin to lose their skills, as well as their motivation, as a result. This is a particular problem given the likely need for highly educated people virtually throughout the economy in the years to come. 6.5 Employment prospects over the longer-term
The sectors selected for analysis have extremely diverse prospects for employment growth in future years, just as they have behaved differently during the recession period. The key issue over the long-term, however, is not so much the jobs that both manufacturing as a whole and the individual sectors provide directly, but those that they support in the rest of the economy. The analysis of inter-linkages between sectors set out earlier in this report demonstrates the significant number of jobs that tend to be created across the economy from an increase in the demand for manufactured goods, especially the ones covered in the study. In the EU, moreover, given the increasingly close links between national economies, an increase in demand in one country tends to boost employment right across the Union, the more so of course in countries where the industries concerned are concentrated. In addition, the sectors covered and, indeed, other parts of manufacturing remain by far the main source of net exports in nearly all the EU Member States, even though there has been a long-term growth in the importance of net exports of services. The income gener-ated by manufacturing, therefore, is vital for sustaining growth – and job creation – in the rest of the economy. The performance of manufacturing – and of sectors within manufac-turing – in the EU in future years, given the continuing process of globalisation, depends critically on its international competitiveness, on its ability to compete effectively in world markets. For individual Member States within the EU, however, it is also important that they are able to participate in this process, to generate sufficient income from the manufac-turing – and traded services – sectors located there to sustain an acceptable rate of growth in GDP and employment. This is not only for the economic health of the countries them-
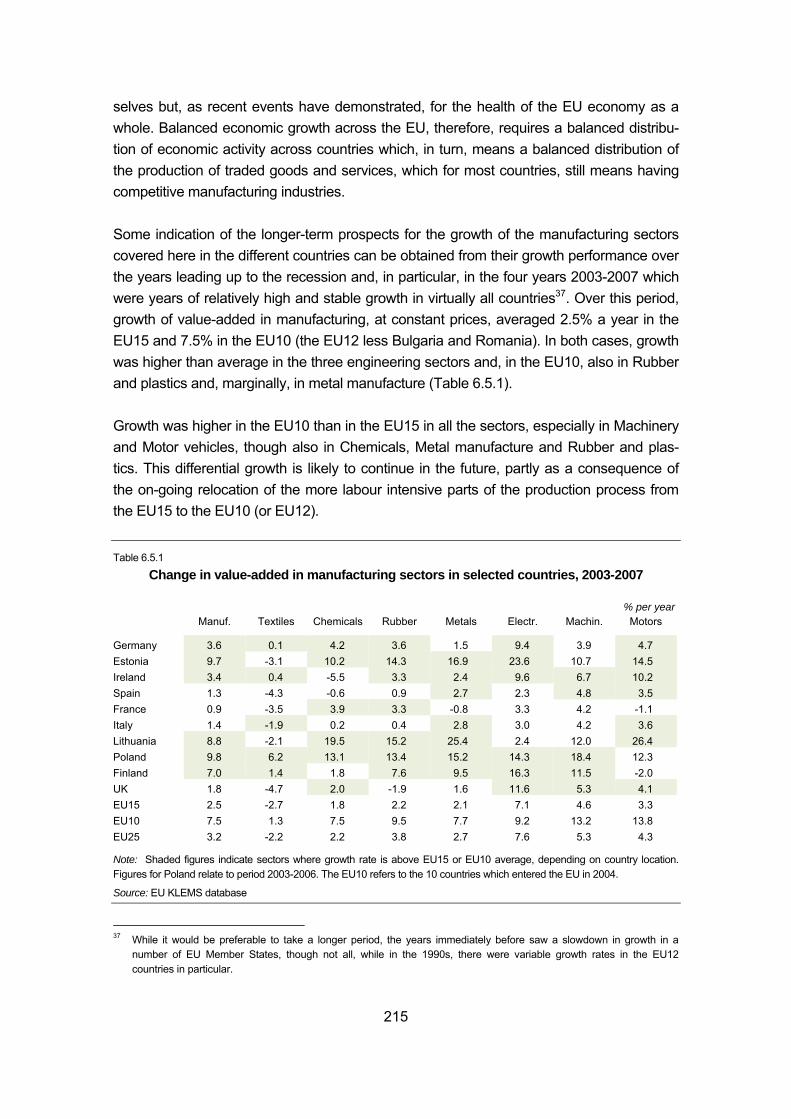
215
selves but, as recent events have demonstrated, for the health of the EU economy as a whole. Balanced economic growth across the EU, therefore, requires a balanced distribu-tion of economic activity across countries which, in turn, means a balanced distribution of the production of traded goods and services, which for most countries, still means having competitive manufacturing industries. Some indication of the longer-term prospects for the growth of the manufacturing sectors covered here in the different countries can be obtained from their growth performance over the years leading up to the recession and, in particular, in the four years 2003-2007 which were years of relatively high and stable growth in virtually all countries37. Over this period, growth of value-added in manufacturing, at constant prices, averaged 2.5% a year in the EU15 and 7.5% in the EU10 (the EU12 less Bulgaria and Romania). In both cases, growth was higher than average in the three engineering sectors and, in the EU10, also in Rubber and plastics and, marginally, in metal manufacture (Table 6.5.1). Growth was higher in the EU10 than in the EU15 in all the sectors, especially in Machinery and Motor vehicles, though also in Chemicals, Metal manufacture and Rubber and plas-tics. This differential growth is likely to continue in the future, partly as a consequence of the on-going relocation of the more labour intensive parts of the production process from the EU15 to the EU10 (or EU12). Table 6.5.1
Change in value-added in manufacturing sectors in selected countries, 2003-2007
% per year Manuf. Textiles Chemicals Rubber Metals Electr. Machin. Motors
Germany 3.6 0.1 4.2 3.6 1.5 9.4 3.9 4.7 Estonia 9.7 -3.1 10.2 14.3 16.9 23.6 10.7 14.5 Ireland 3.4 0.4 -5.5 3.3 2.4 9.6 6.7 10.2 Spain 1.3 -4.3 -0.6 0.9 2.7 2.3 4.8 3.5 France 0.9 -3.5 3.9 3.3 -0.8 3.3 4.2 -1.1 Italy 1.4 -1.9 0.2 0.4 2.8 3.0 4.2 3.6 Lithuania 8.8 -2.1 19.5 15.2 25.4 2.4 12.0 26.4 Poland 9.8 6.2 13.1 13.4 15.2 14.3 18.4 12.3 Finland 7.0 1.4 1.8 7.6 9.5 16.3 11.5 -2.0 UK 1.8 -4.7 2.0 -1.9 1.6 11.6 5.3 4.1 EU15 2.5 -2.7 1.8 2.2 2.1 7.1 4.6 3.3 EU10 7.5 1.3 7.5 9.5 7.7 9.2 13.2 13.8 EU25 3.2 -2.2 2.2 3.8 2.7 7.6 5.3 4.3
Note: Shaded figures indicate sectors where growth rate is above EU15 or EU10 average, depending on country location. Figures for Poland relate to period 2003-2006. The EU10 refers to the 10 countries which entered the EU in 2004.
Source: EU KLEMS database
37 While it would be preferable to take a longer period, the years immediately before saw a slowdown in growth in a
number of EU Member States, though not all, while in the 1990s, there were variable growth rates in the EU12 countries in particular.
216
As indicated above, however, there are already signs of such activities moving away from the latter countries, especially the more developed ones with higher income levels, to those where labour costs are even lower, both in Europe and outside, especially in South-East Asia. As also indicated above, such relocation which is motivated by the aim of reducing labour costs, is combined with a tendency to locate investment to countries where markets are expanding. A diversion of investment away from Europe is all the more likely if growth continues to be sluggish or if there is a continuing high level of uncertainty about future growth prospects. While significant loss of jobs might result from the relocation of production in pursuit of lower labour costs, in practice, it might be the only viable way in the long-term of keeping any jobs in the companies concerned in the EU. If relocation to lower cost economies is essential for companies to remain competitive, then the alternative might be the eventual complete clo-sure of the companies in question. Indeed, if companies can strengthen their competitive-ness through this means, then in the long-run it might result in an expansion of jobs in higher level activities (in R&D, planning, design, marketing and so on) in the parts of the companies which remain. Within the EU15, there were significant differences over this period in the growth rates of the industries concerned between Member States, in large part reflecting the growth of the export markets in which companies in the different countries were specialised. In particular, the growth experienced in Germany in most of the sectors was above the EU15 average – and only slightly below in Metal manufacture and Machinery38 where this was not the case – as it was in Finland (where growth was below the EU15 average only in Motor vehicles). In Spain, Italy and France, however, this was not the case. In Spain, therefore, growth was above the EU15 average over this period only in Metal manufacture, Machinery and Motor vehicles and then only slightly in the last two. Similarly, in Italy, growth was above average only in Metal manufacture and Motor vehicles, while the decline which occurred in Textiles and clothing was less than the EU average. In the France, growth was above average in only two of the sectors, Chemicals and Rubber and plastics, and value-added declined over this period in three of them, including Motor vehicles. In the UK, growth of manufacturing as a whole was below the EU15 average though it was above average in four of the 7 sectors, including all three of the engineering industries. Among the EU10 countries, Poland stands out with growth rates of value-added well above average in all the sectors except Motor vehicles, where the rate still exceeded 12% a year over this period. In both Estonia and Lithuania, high rates of growth were achieved
38 Germany remains dominant in the Machinery and equipment sector, accounting for close to 40% of the value-added
produced in the EU in 2007, as indicated in the Sector fiche.
217
in a number of the sectors, especially in Metal manufacture and Motor vehicles in the latter and Electronics in Estonia. The experience over this period suggests that in the coming years:
• the three engineering sectors are likely to grow faster than other parts of manufacturing in both the EU12 and EU15
• production in activities which are labour-intensive is likely to continue to shift from the EU15 to the EU12 and from the higher income EU12 countries to lower cost locations both in Europe and outside
• growth of value-added in most manufacturing sectors, especially the medium-to-high tech ones is likely to continue to be higher in Germany than elsewhere
• growth in many parts of manufacturing is likely to be less than average in Spain, Italy and France.
The experience in the period since 2007 which is analysed above reinforces these conclu-sions, in the sense that the trends evident before the onset of the recession have remained in operation at least up to the first part of 2011. Whether similar growth rates as in the pre-recession period can be achieved in these sec-tors in the future beyond 2013, however, remains an open question. As noted above, much depends on their competitiveness not only in the EU but also in global markets, but this will almost inevitably be adversely affected if growth continues to be sluggish across the Union. In this kind of context, where company earnings are depressed, investment in new prod-ucts and process, which is ultimately the key to remaining competitive, is almost certain to be limited by both the lack of finance and the uncertainty over future prospects. In this kind of context too, European companies are likely to look outside the EU when looking to in-vest in order to be closer to growing markets. After all, if they have international interests, large companies do not necessarily need to be based in the EU39. The possibility of this kind of development makes forecasting future rates of growth in particular sectors even more problematic. 6.6 Globalisation, competition from low-wage economies and relocation
Globalisation, in the sense of the opening up of markets through the dismantling of barriers to trade and the organisation of production on a trans-national basis, which has been ac-celerated by technological developments which have made transportation and communica-
39 In practice, there is a distinct trend for the larger companies towards becoming truly global so that they are not based in
any particular country but instead have a network of bases to serve different parts of the world which can be expanded or contracted as the market dictates. In this kind of situation, there is no longer any such thing as a European company but only multinationals without any national allegiance.
218
tion both faster and cheaper, is set to continue and even gather pace in future years. It is equally likely that the growth of manufacturers in low-cost locations in developing econo-mies will also continue, posing an increasing competitive threat to producers in the EU, especially in sectors where it is both possible and advantageous to locate labour-intensive parts of the production process in places where wage costs are lowest. As indicated above, this is not only the case for basic industries, such as Textile and clothing and Basic metals, b ut also for large segments of the Motor vehicle industry and Electrical and elec-tronic engineering. Such relocation has already occurred to a significant in these industries over recent years and growth of employment in them in the EU in future years will depend very much on how companies in the industries concerned respond both to the competition from producers in low-wage economies and to the increasing possibilities of they them-selves locating there. The strategies pursued by EU producers in the past in the face of the competitive threat from low-cost producers have taken a number of forms, often in combination:
• to seek protection through lobbying governments for the imposition, or re-imposition, of trade barriers against ‘unfair’ competition, which has been the case in the Textile indus-try in particular, especially in Portugal;
• to keep labour costs down in order to try to compete with producers in developing coun-tries;
• to introduce more efficient, and more capital-intensive methods of production, i.e. to look to technology as a means of reducing production costs, which, for example, has been the case in the Textile industry in Italy;
• to focus on specialist or niche markets and on high-value products, so as to compete in terms of product quality rather than price, which is the case of German car manufactur-ers, though also those in other engineering industries.
Ultimately, the first two strategies are almost certain to be doomed to failure since they fail to recognise the realities of the situation, while denying workers the possibility of increasing their real incomes and enjoying higher standards of living which comes from generating higher value-added. A combination of the second two strategies, therefore, represents the only viable way of responding to the competitive threat concerned. They might be com-bined in turn with the relocation of the most labour-intensive activities and those that in-volve mass-market products (such as volume cars in the Motor industry) to low-wage economies while maintaining intact the other, more strategic activities in which there is more likely to be a competitive advantage in undertaking them in more developed coun-tries. This is a strategy adopted, for example, by companies in the Electronics industry (Nokia is a prime example). Indeed, as suggested above, this might be the only viable way of keeping at least some activities, and some jobs, in the EU in the sectors concerned, and
219
of perhaps even expanding those activities over the long-term if the strategy is successful and competitiveness is maintained or strengthened. Ultimately, therefore, producers in the EU cannot hope to compete with those in low-wage economies in the manufacture of certain products or in carrying out certain parts of the production process. But nor should they try to do so instead of concentrating on the prod-ucts and activities where they have a competitive advantage, an advantage which stems from know-how, a capacity to innovate and other attributes rather than a willingness to work for low wages. In the EU12, however, which has been the destination for many companies in the EU which have relocated production over the past few years and where labour costs in many parts remain low, it makes sense to exploit this comparative advantage while it remains. At the same time, it should be recognised explicitly that this is a temporary state of affairs which will elapse as the economies develop and as income levels increase. The strategy should, therefore, be to seek to use the time available, and the income generated, to de-velop new activities and new areas of specialisation which can replace the labour-intensive activities concerned as a source of net export earnings and jobs when labour costs are no longer sufficiently low. The Portuguese experience over the past 25 years, when it passed from being a favoured location for the production of clothing to one which can no longer compete with producers in China and other low cost countries but which has not ade-quately developed other areas of specialisation to replace the Textile industry, provides a salutary reminder of the costs of inaction.
6.7 Employment prospects in non-manufacturing sectors
Although, in sharp contrast to subsequent developments, employment in Construction in-creased significantly in most EI countries – by over 1% a year on average in both the EU15 and EU12 – in the years leading up to the crisis, there is considerable doubt about the prospects for job growth in future years. This is, in large part, because of the major role which public sector investment plays in the industry and the high level of uncertainty which attaches to the future course of this investment across the EU in the context of the debt crisis. With the focus of budgetary policy in many, if not most, countries on fiscal consolida-tion, on reducing government borrowing and curbing public expenditure as a central part of this, the constraints on public investment are likely to remain tight for some time to come, so limiting the chances of any widespread growth in public investment. In the short-term (over the next 2-3 years), therefore, employment in construction is likely to remain depressed in the EU. Moreover, even in the medium- to longer-term, it is hard to envisage any substantial growth in employment in the EU15 at least, though the extensive
220
infrastructure needs in the EU12 may give rise to a significant expansion of jobs in these countries, so long as budget constraints can be relaxed. In the service sectors covered, there is a much better prospect of employment expanding over the longer-term, as it did before the crisis hit. This is particularly the case In Business services, where growth of employment averaged 4-5% a year across the EU over the four years 2003-2007 (slightly more in the EU12 than in the EU15). Whether a rate this high is achievable, however, depends to a large extent on the overall rate of growth of the econ-omy and whether or not the rate experienced over these four years can be attained in the future. In Financial services, little if any growth in employment can be expected in the EU15 longer-term because of the continuing effects of automation and internet banking which depressed job growth before 2008 and are likely to continue to do so.. In the EU12, how-ever, the sector remains very much underdeveloped, employment in the sector, despite the high rate of net job creation in recent years, accounting on average for only 0.5% of the total in 2010, as compared with around 2.5% in the EU15. There, therefore, seems ample scope for continued high job growth. In Distribution, employment is likely to continue to grow only modestly in the EU15, as it did before the crisis. In the EU12, growth of employment could well be lower than in the year before the crisis (when it grew by over 3% a year on average between 2003 and 2007) since the size of the sector is now much more similar to that in the EU15 than it was in the past. (In 2003, Distribution accounted for around 12.5% of total employment in the EU12 as opposed to 15% in the EU15. In 2010, it accounted for just over 14% in the EU12 as against just over 14.5% in the EU15.) The scope for job growth at the pre-crisis rate, there-fore, may well be limited. In HORECA, the growth in employment before the crisis was relatively high in both the EU15 and EU12 (averaging around 3% a year in the former and 6% a year in the latter in the years 2003-2007) and growth is likely to pick up over the medium and longer-term as economic recovery takes place. The rate at which this occurs, however, as in Business services, is likely to depend very much on the rate of growth of the economy, which in turn depends to an important extent on the growth of manufacturing, especially the sectors considered in the present study, in terms of the value-added generated. 6.8 Productivity and employment – how far is there a trade-off?
The analysis presented in this report indicates that in the manufacturing sectors in particu-lar, a reduction in productivity across the EU, though most especially in the EU15 coun-tries, played an important role in preserving jobs during the worst period of the crisis. This
221
reduction has, as also indicated, not yet been fully made good in many cases, so dampen-ing the prospects of any significant expansion in employment as productivity returns to its pre-crisis level and above. The positive effects of lower productivity on jobs in the reces-sion, combined with the possibility of perhaps a prolonged period of jobless growth, emu-lating the experience of the previous period of economic downturn in the early 1990s, when it took until 1998 in the EU15 for the number employed to return to its pre-crisis level, raises the inevitable question of whether policy should be directed at discouraging produc-tivity increases rather than the reverse. It seems somewhat ironic, therefore, that the measures taken by employers with government support to preserve jobs during the crisis should be applauded while at the same time policy efforts are now being focused, as in the Europe 2020 strategy, at increasing productivity as a means of boosting economic growth. This apparent contradiction, however, is more apparent than real. While in the short-term, a reduction in productivity is a necessary part of job maintenance as economic activity de-clines – and, indeed, might be essential for companies to retain the workforce and skills they need to meet the increased demand as recovery takes place, in the longer-term, job growth may well be dependent on increasing productivity in order to maintain and strengthen competitiveness. As the analysis in the present report implies, over the long-term, productivity growth and employment growth tend to be positively rather than nega-tively associated, though this is much more the case in manufacturing than in services. Indeed, as emphasised above, it is the growth of value-added in manufacturing, and to a lesser extent in traded services, which is a key determinant of the overall growth of the economy and of the rate of job creation. Such growth, to a large extent, depends, in turn, on the competitiveness of the traded goods and services sectors, which tends to be related to productivity, though the relationship is not necessarily one-to-one, since there are other elements which are important for competitiveness apart from costs – product quality, de-sign, technical sophistication, reliability and so on. Overall job creation, therefore, is likely to be positively affected by productivity growth over the long-term, but growth of productivity in manufacturing rather than in services or over the economy as a whole. The finding in the present study, for example, that the use of ICT and employment are positively related in manufacturing but negatively in services reflects this. 6.9 Future skill requirements
A prominent feature of employment developments over the past decade or more, especially in the EU15, is the tendency for higher level jobs (for managers and professionals of one kind or another) to expand at the expense, in particular, of skilled and semi-skilled manual jobs and to a lesser extent of clerks and office workers. This has been accompanied by growth of sales and service jobs, though at a lower rate, and by low skilled manual jobs remaining broadly unchanged in terms of relative numbers. The spread of automation and
222
ICT underlies these shifts in the composition of employment, insofar as jobs at both the top end and bottom end of the skill range are the most difficult to replace by machinery. These shifts are common to all sectors, though they have occurred at different rates. They have been accompanied by a parallel increase in the education level of the work force in nearly all sectors, which is a consequence of the demand for higher skill levels – or rather for skills requiring more intellectual ability than manual dexterity or strength. It is also a consequence, however, of the significant increase in participation in higher education and the growth in the number of people with tertiary qualifications, who, in many cases, especially outside of manufacturing and construction, are more likely to find work than those with lower qualifications, irrespective of whether the tasks involved in particular jobs require such qualifications or not. These two tendencies are difficult to disentangle and the relative strength of the two hard to assess. Both are likely to continue in future years. All projections of the future composition of em-ployment, therefore, predict a shift towards higher level jobs and a decline in manual ones, together with the need for more ICT know-how in most occupations. In manufacturing sec-tors, especially in the engineering industries though also in others, this shift takes the form of the employment of more qualified engineers and computer analysts, together with more sales and financial professionals, and fewer skilled and semi-skilled manual worker on the shop floor. This, however, is more in the EU15 countries than in the EU12, where, as noted above, the more labour-intensive activities have tended to be concentrated, particularly in Electronics and Motor vehicles (though also in Textiles and clothing so far as Bulgaria is concerned). Nevertheless, even in the EU15, there is a concern in a number of industries about a potential shortage of skilled manual workers in future years as the present genera-tion retires – despite the overall decline in the number of jobs for such workers, the fear is that the supply of those with suitable skills could decline by even more. This fear is rein-forced by the increasingly unattractive image that many manufacturing sectors have ac-quired among young people in the EU15 especially, partly because of a long-term decline in employment, which tends to deter them from pursuing the education and training re-quired to take up jobs in the industries concerned. As also noted above, however, there are signs of labour-intensive activities being relocated to countries with even lower wage costs as the EU12 countries develop and real wages rise. The competitive advantage which comes from low wages, therefore, tends to be only a temporary state of affairs and countries need to use the time it lasts to develop longer-term areas of specialisation which can turn into major sources of net exports in the future. A key issue for manufacturing sectors in the EU15 is not only whether there will be the engineers and other professionals, as well as the skilled operatives, they need on the la-bour market in the coming years but also whether they will be able to attract them. The
223
present depressed state of both the engineering and other industries in many EU countries and the limited prospects for any significant growth of jobs over the next few years will al-most inevitably deter many young people from pursuing engineering or other technologi-cally-based occupations as a career path. Moreover, those who do successfully complete a related programme of study, such as in computer science or mathematics, will not nec-essarily be attracted to enter industries which are growing only slowly or even contracting as opposed to, say, going into business services or even financial services, where despite the financial crisis salaries remain high. Without the influx of highly educated people, however, the manufacturing sectors con-cerned are likely to experience difficulty in maintaining and strengthening their ability to compete on global markets, potentially reinforcing the effect of macroeconomic problems in slowing down growth and job creation across the EU. Nevertheless, there remains a need for governments across the EU to try to ensure that sufficient young people both participate in further and higher education and graduate with the qualifications and in the areas of study which are in line with the needs of the economy. This means, in turn ensuring that the investment necessary to achieve this does not fall victim to public expenditure cuts as part of fiscal consolidation measures. Given the high degree of uncertainty attached to the future structure of jobs, except in very broad terms, and the entirely new jobs which are likely to emerge over the next 10 years or so, the education and training provided should be, so far as possible, generic in nature rather than specific to any particular narrowly-defined job. It should, accordingly, include the teaching of skills which are needed to perform a range of jobs, such as those related to ICT and computing, so widening the opportunities open to the young people concerned. It is then largely for the industries concerned to attract the young people they need and to provide the specialist training required for them to be able to contribute effectively to the industries’ development and their future competitiveness. 6.10 Flexicurity
A central recommendation at EU-level in recent years has been for Member States to adopt a ‘flexicurity’ approach to labour market policy. Essentially this means making labour markets more flexible and removing restrictions which inhibit employers from adjusting their work force in line with their production needs or wages in line with the productivity of workers, while at the same time ensuring that an effective social security system is in place to protect those who lose their jobs and to give them the time, and support, they need to find a new one. It is undoubtedly the case that labour markets in most countries have be-come more flexible over the crisis period and employers have more scope for organising their work force as they wish. Indeed, such a tendency lies behind the fact that employ-
224
ment levels did not fall by much more than they did over the recession period, in the sense that employers were able to reduce working-time and, in some cases, to negotiate reduc-tions in wages, or at least pay restraint, which meant that they could avoid redundancies. While the share of workers on fixed-term contracts has declined in most sectors in the EU15 over the recession period, after increasing in most cases in preceding years, this does not necessarily signify a reduction in the use of such contracts or any move towards jobs becoming more secure. Instead it reflects a widespread non-renewal of fixed-term contracts when they came to an end together with the limited creation of new fixed-term jobs – or indeed any jobs. Much the same is the case in the EU12, especially in Poland where before the onset of the crisis there was a marked increase in temporary jobs in all sectors. For young people under 25 in the EU15, however, there has been an increase over the recession period in the proportion employed on fixed-term contracts in all sectors apart from construction. What jobs have become available for young people, therefore, have been predominantly temporary ones. While there is less evidence of this in the EU12 over the period as whole, in 2010, most jobs taken by those under 25 were fixed-term in these countries as well. This apparent tendency towards the greater use of fixed–term contracts for those jobs which are created is accompanied by an increase in part-time jobs in both the EU12 as well as the EU15. Both tendencies, together with increasing the average hours worked of existing staff to produce more when output when needed, are an understandable reaction of employers to the high level of uncertainty over future developments which prevails. However, they are occurring at a time when social security is being trimmed rather than extended as part of the measures taken to reduce government borrowing. Indeed, given the constraints on public finances, there seems only a limited prospect at present of the safety net which is an integral part of the flexicurity approach being maintained and ex-panded further in the countries where it is under-developed. This is especially so since some of the main countries concerned are in the south of Europe and are likely to face the most severe constraints on public spending for some time to come. While employers, therefore, might increasingly pursue the ‘flexi’ part of the policy and while workers might increasingly have little option but to accept the implications for the organisa-tion of work and rates of pay, it is questionable whether governments across the EU will be able to deliver the ‘curity’ part of the policy on which the strategy depends if it is to be equi-table and sustainable from an economic as well as social perspective. Given the emphasis put by industry stakeholders on flexibility in the work place being maintained and even in-creased further as a major means of preserving and strengthening competitiveness, the need for effective social support could well become even more important in future years.
225
6.11 Summary of main points
There is little sign of the crisis which first beset the EU economies in 2008 coming to an end and growth is forecast to be sluggish across the EU over the next two years. In this context, the rate of net job creation is likely to remain low and unemployment to re-main high in most parts of the EU at least in the short-to-medium-term, particularly in the construction industry and manufacturing sectors most affected by the recession. Even in the longer-term, the prospects for any significant increase in employment in the manufacturing sectors are limited by the ‘overhang’ of productivity built up over the crisis as well as by apparent overcapacity in some industries (motor vehicles in particular) which was evident even before the crisis hit. While growth of employment is likely in services in both the short and longer-term, it is likely to be lower than before the crisis unless there is a significant pick-up of growth in manufacturing to generate the increase in income required to support the creation of jobs elsewhere in the economy. While there might be a short-term trade-off between productivity and employment, in the longer-term, employment growth depends on growth of productivity, though specifically in manufacturing sectors in order to maintain their global competitiveness so that they can generate the growth in income on which employment growth depends. On the evidence of the years preceding the onset of the recession and of what has hap-pened since, Italy and Spain are likely to experience slower growth of manufacturing in the future, together with France. This has implications for the balanced growth of the EU econ-omy. Young people have been hit particularly hard by the crisis and the lack of job creation which has accompanied it and employment rates of those aged 15-24 have fallen in all EU countries, in many considerably. This could have damaging long-term consequences for both the young people concerned and the economy. There is likely to be a continuing shift of manufacturing from the EU15 to the EU12, espe-cially of engineering industries, though there are signs of production beginning to shift out of the EU12 to lower wage economies. Policy-makers across the EU need to recognise that the logic of globalisation is that labour-intensive activities, especially those involved in the manufacture of mass market products, will gradually be concentrated in low-wage countries; and so focus on measures to en-courage a shift to higher value-added activities rather than on maintaining the status quo.

226
There is also likely to be a continuing shift in the composition of employment towards higher level jobs – to managers and professional – and away from skilled and semi-skilled manual workers, in particular. As in the past, this is likely to be common to all sectors. This shift will be accompanied by a growing share of jobs being taken by those with tertiary qualifications, though how far this will reflect job requirements as opposed to more young people coming on to the labour market with such qualifications is an open question. Whether manufacturing sectors in which growth is likely to be slow or negative will be able to attract the increasing numbers of tertiary-educated people entering the labour market on which their long-term competitiveness is likely to depend is questionable. Nevertheless, it is important for governments to ensure that education and training places are available for sufficient young people to be able undertake the programmes of study leading to the qualifications that industry is likely to need and that investment in education does not fall victim to austerity measures. The flexicurity approach to labour market policy, which has been advocated for some time at EU level, is being pursued by employers and is reflected in a shift to fixed-term and part-time jobs across the Union as well as by more flexible ways of working and wage agree-ments. But it is not being accompanied by a parallel strengthening of government support for workers who are, or who are liable to be, affected. Instead, social support systems and active labour market policies are being cut back, or are under threat of so being, as part of fiscal consolidation measures.
227
References
Boeri, T. and P. Garibaldi (2009), ‘Beyond Eurosclerosis’, Economic Policy, Vol. 24, pp. 409-461.
Centre d’analyse stratégique (2010), Les secteurs créateurs d’emplois à court-moyen terme après la crise, La note d’analyse, November.
Engle, R. and C. Granger (1987), ‘Co-integration and Error Correction: Representation, Estimation and Testing’, Econometrica, Vol. 55, pp. 251-276.
European Commission (2009a), Employment in Europe Report 2009, Brussels.
European Commission (2009b), Sectoral Growth Drivers and Competitiveness in the European Union, Brussels.
European Commission (2010), EU Quarterly Labour Market Review – Spring 2010, Brussels.
European Commission (2011), European Economic Forecast – Spring 2011, Brussels.
Eurostat (2008), Eurostat Manual of Supply, Use and Input-Output Tables, Luxembourg.
Granger, C. and P. Newbold (1974), ‘Spurious regressions in econometrics’, Journal of Econometrics, Vol. 2, pp. 111-120.
Hammermesh, D. and G.A. Pfann (1996), ‘Adjustment costs in factor demand’, Journal of Economic Literature, Vol. XXXIV, pp. 1264-1294.
Miller, R. E. and P. D. Blair (2009), Input-Output-Analysis: Foundations and Extensions, Englewood Cliffs, 2nd ed.
Morgan, J (2001), ‘Employment security and the demand for labour in Europe’, Applied Economics, Vol. 33, pp. 1763-1774.
Mourre, G. (2006), ‘Did the pattern of aggregate employment growth change in the Euro area in the late 1990s?’, Applied Econometrics, Vol. 38, pp. 1783-1807.
Nickell, S. (1986), ‘Dynamic models of labour demand’, in: O. Ashenfelter and R. Layard (eds), Handbook of Labour Economics, Vol. 1.
OECD (2004), Employment Outlook, Paris.
OECD (2009), OECD Employment Outlook. Tackling the job crisis, OECD, Paris.
OECD (2010), OECD Employment Outlook. Moving beyond the job crisis, OECD, Paris.
Pierluigi, B. and M. Roma (2008), ‘Labour costs and employment across euro area countries and sectors’, manuscript.
Stehrer, R. and T. Ward (2010), ‘Short-run Projections of Patterns of Job Contraction in the EU’, wiiw Research Reports, No. 361, Vienna, February.
Valadkhani, A. (2005), ‘A Cross-Country Analysis of High Employment Generating Industries’, Faculty of Com-merce – Papers 388, University of Wollongong, Australia.
Van den Cruyce, B. and J. Wera (2007), ‘Qualitative Employment Multipliers for Belgium, Results for 2000 and 2002’, Working Paper 15-07, Federal Planning Bureau, November.
Zika, G. and R. Helmrich (2011), ‘Qualifikations- und Berufsfeldprojektionen bis 2025’, Sozialer Fortschritt, 08/2011.
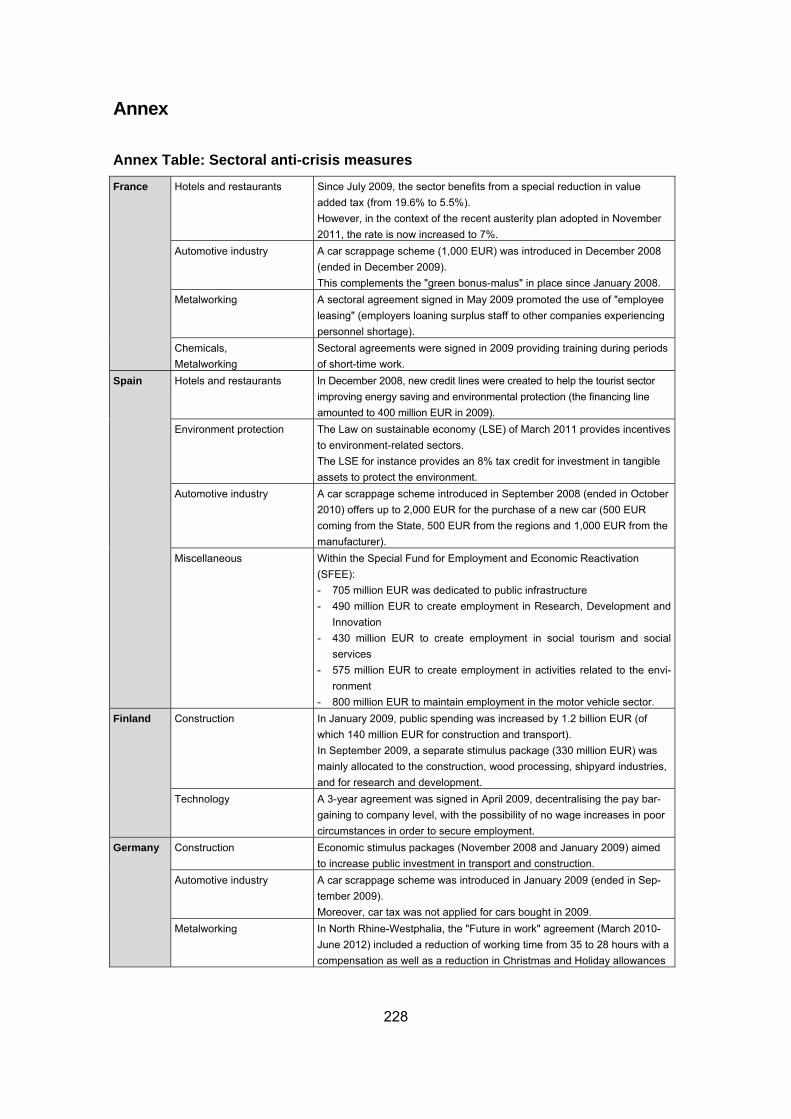
228
Annex
Annex Table: Sectoral anti-crisis measures
France Hotels and restaurants Since July 2009, the sector benefits from a special reduction in value added tax (from 19.6% to 5.5%). However, in the context of the recent austerity plan adopted in November 2011, the rate is now increased to 7%.
Automotive industry A car scrappage scheme (1,000 EUR) was introduced in December 2008 (ended in December 2009). This complements the "green bonus-malus" in place since January 2008.
Metalworking A sectoral agreement signed in May 2009 promoted the use of "employee leasing" (employers loaning surplus staff to other companies experiencing personnel shortage).
Chemicals, Metalworking
Sectoral agreements were signed in 2009 providing training during periods of short-time work.
Spain Hotels and restaurants In December 2008, new credit lines were created to help the tourist sector improving energy saving and environmental protection (the financing line amounted to 400 million EUR in 2009).
Environment protection The Law on sustainable economy (LSE) of March 2011 provides incentives to environment-related sectors. The LSE for instance provides an 8% tax credit for investment in tangible assets to protect the environment.
Automotive industry A car scrappage scheme introduced in September 2008 (ended in October 2010) offers up to 2,000 EUR for the purchase of a new car (500 EUR coming from the State, 500 EUR from the regions and 1,000 EUR from the manufacturer).
Miscellaneous Within the Special Fund for Employment and Economic Reactivation (SFEE): - 705 million EUR was dedicated to public infrastructure - 490 million EUR to create employment in Research, Development and
Innovation - 430 million EUR to create employment in social tourism and social
services - 575 million EUR to create employment in activities related to the envi-
ronment - 800 million EUR to maintain employment in the motor vehicle sector.
Finland Construction In January 2009, public spending was increased by 1.2 billion EUR (of which 140 million EUR for construction and transport). In September 2009, a separate stimulus package (330 million EUR) was mainly allocated to the construction, wood processing, shipyard industries, and for research and development.
Technology A 3-year agreement was signed in April 2009, decentralising the pay bar-gaining to company level, with the possibility of no wage increases in poor circumstances in order to secure employment.
Germany Construction Economic stimulus packages (November 2008 and January 2009) aimed to increase public investment in transport and construction.
Automotive industry A car scrappage scheme was introduced in January 2009 (ended in Sep-tember 2009). Moreover, car tax was not applied for cars bought in 2009.
Metalworking In North Rhine-Westphalia, the "Future in work" agreement (March 2010-June 2012) included a reduction of working time from 35 to 28 hours with a compensation as well as a reduction in Christmas and Holiday allowances
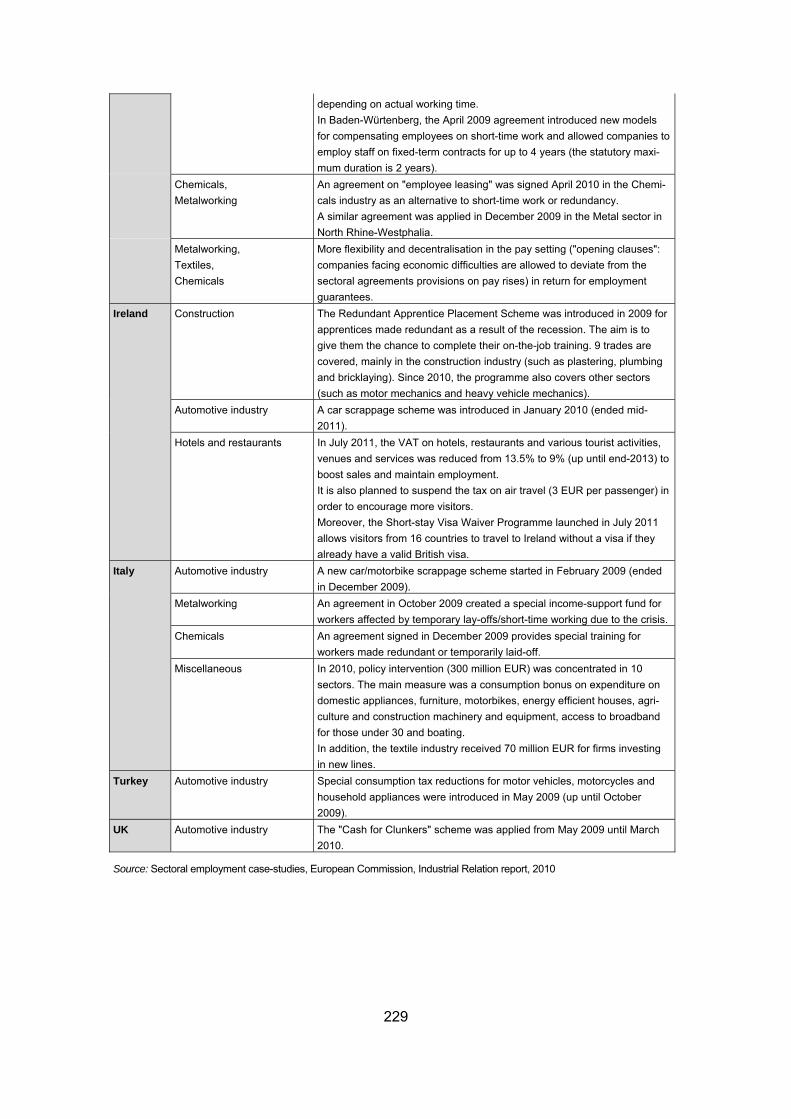
229
depending on actual working time. In Baden-Würtenberg, the April 2009 agreement introduced new models for compensating employees on short-time work and allowed companies to employ staff on fixed-term contracts for up to 4 years (the statutory maxi-mum duration is 2 years).
Chemicals, Metalworking
An agreement on "employee leasing" was signed April 2010 in the Chemi-cals industry as an alternative to short-time work or redundancy. A similar agreement was applied in December 2009 in the Metal sector in North Rhine-Westphalia.
Metalworking, Textiles, Chemicals
More flexibility and decentralisation in the pay setting ("opening clauses": companies facing economic difficulties are allowed to deviate from the sectoral agreements provisions on pay rises) in return for employment guarantees.
Ireland Construction The Redundant Apprentice Placement Scheme was introduced in 2009 for apprentices made redundant as a result of the recession. The aim is to give them the chance to complete their on-the-job training. 9 trades are covered, mainly in the construction industry (such as plastering, plumbing and bricklaying). Since 2010, the programme also covers other sectors (such as motor mechanics and heavy vehicle mechanics).
Automotive industry A car scrappage scheme was introduced in January 2010 (ended mid-2011).
Hotels and restaurants In July 2011, the VAT on hotels, restaurants and various tourist activities, venues and services was reduced from 13.5% to 9% (up until end-2013) to boost sales and maintain employment. It is also planned to suspend the tax on air travel (3 EUR per passenger) in order to encourage more visitors. Moreover, the Short-stay Visa Waiver Programme launched in July 2011 allows visitors from 16 countries to travel to Ireland without a visa if they already have a valid British visa.
Italy Automotive industry A new car/motorbike scrappage scheme started in February 2009 (ended in December 2009).
Metalworking An agreement in October 2009 created a special income-support fund for workers affected by temporary lay-offs/short-time working due to the crisis.
Chemicals An agreement signed in December 2009 provides special training for workers made redundant or temporarily laid-off.
Miscellaneous In 2010, policy intervention (300 million EUR) was concentrated in 10 sectors. The main measure was a consumption bonus on expenditure on domestic appliances, furniture, motorbikes, energy efficient houses, agri-culture and construction machinery and equipment, access to broadband for those under 30 and boating. In addition, the textile industry received 70 million EUR for firms investing in new lines.
Turkey Automotive industry Special consumption tax reductions for motor vehicles, motorcycles and household appliances were introduced in May 2009 (up until October 2009).
UK Automotive industry The "Cash for Clunkers" scheme was applied from May 2009 until March 2010.
Source: Sectoral employment case-studies, European Commission, Industrial Relation report, 2010
230
Annex: Information received from sector representatives
A questionnaire (reproduced at the end of the annex) was prepared and sent out to Euro-pean-level representatives in the 8 industrial sectors covered by the study. Replies to some of the questions were received from representatives of the Chemicals, Engineering, Metals and Construction industries, in the first case through interview, while representatives of the Motor vehicles industry sent relevant documents which contained answers to many of the questions. In the case of Textiles and the Engineering industries, relevant information was extracted from published documents. A summary of the information used in the present report is set out below. Textiles
(Information from EURATEX – European Apparel and Textile Confederation – Annual Report, 2010)
Two special measures introduced at EU level to counter the recession at the end of 2008 were of particular importance for the Textile industry – an increase in the State aid allowed to support companies (to up to EUR 500,000 per company) and the activation of an export credit measure. Both measures helped SMEs in particular to withstand the effects of the crisis, both by supporting investment and assisting them to preserve export market shares. In the face of a deterioration in the economic situation in the EU These measures were prolonged by an additional year up until the end of 2011. According to industry representatives at EU-level, government support is needed to create the conditions for the sustainable development of the industry across the Union, which involves adopting appropriate measures to ensure protection of the environment, energy and water efficiency, safety at work and high social standards. Such an approach, it is con-sidered would help improve the image of the industry as well as generating new market opportunities. Support is equally needed to stimulate investment in R&D and innovation, which is the basis for the growth of the industry. Chemicals
(Information received via interview with Andreas Ogrinz, European Chemical Employ-ers Group, (ECEG)
Measures implemented to weather the crisis
The effect of the crisis on the Chemical industry varied between countries. Output fell par-ticularly sharply in Finland, leading to a substantial decline in employment (of over 26% between the first quarters of 2008 and 2009). Flexibility measures (involving a reduction in working-time, such as through short-time working schemes, as well as more flexible pay rates) have been widely used in order to maintain jobs, most especially in Germany, In this regard, opening clauses were introduced in collective agreements to allow companies fac-
231
ing difficulties to deviate from the terms of the sectoral agreement by reducing working hours and/or limiting pay rises. Industry representatives expect that such measures will remain important in future years and that they may even become more so. Main factors affecting long-term trends
The Chemicals industry in the EU is still very competitive in world markets. Nevertheless, employment in the sector is expected to decline in future years as markets outside Europe grow much faster and companies direct investment to the countries concerned. In recent years, although there are a few examples of companies relocating some produc-tion to the EU12 countries (Henkel, a German chemical company, being a prominent case in point), there has been no widespread tendency in this respect. This is primarily because low labour costs are not a prime factor in international competition and being located close to the market is more important than producing in places where wage costs are low. Ac-cordingly, there has been a notable shift in the industry towards emergent countries (such as China, India and Brazil) in the recent past as companies seek to develop new markets. Measures to support employment in the sector
The regulation imposed on the industry need to be carefully formulated so that they take account of environmental and safety concerns but at the same time avoid imposing exces-sive costs on the industry which are likely to have an adverse effect on its development and therefore on employment. There is an equal need for governments collectively to support research and innovation which is key to the industry in the EU remaining competitive. Above all, however, it is im-portant for governments to invest in education and training which is essential to ensure the future availability of a suitably skilled work force for the industry to draw on. Despite the depressed nature of the EU economy, therefore, the industry is still affected by shortages of particular skills. The need in the future is not only for people with high education levels to fill the top positions as scientists, engineers and managers but also for those with voca-tional education and training to work in lower level positions, such as process operators. It is not sufficient, however, that more young people with appropriate qualifications are educated and trained. There is still a need for the industry to be able to recruit the people concerned and at present it suffers from a poor image among young people who prefer to pursue career opportunities in other sectors. It is important, therefore, that efforts are made by the industry to develop a more attractive image, through promotional campaigns tar-geted at schools, colleges and universities, so that companies can recruit the people they need.
232
Basic metals
(Information from EUROFER - European Steel Association)
Measures implemented to weather the crisis
Three broad types of measure were implemented in a number of countries in response to the economic crisis:
• short-time working schemes under which workers attended the workplace for a shorter time than usual, such as for 3 days per week instead of 5 in order to avoid redundan-cies;
• temporary lay-offs, or ‘economic’ unemployment, under which workers were asked to stay away from the workplace for a period of time but kept their contracts of employ-ment and were not made redundant;
• voluntary early retirement. The first type of measure was important in maintaining jobs and avoiding redundancies in the EU steel industry. The second type of measure was less important, though in some cases, it was combined with offering employees the possibility of participating in training sessions during the period of lay-off. The third type of measure seems not to have been used extensively. Measures of these kinds generally came to an end at the beginning of 2011. In some countries, however, no short-time working schemes were introduced to support employment during the crisis period. Main factors affecting long-term trends
The financial crisis, which struck in 2008, is considered, with its social and economic con-sequences, to be the biggest economic challenge since the founding of the European Coal and Steel Community in 1951. Confidence in the financial system completely collapsed. Banks were extremely reluctant to lend and the risk-aversion of credit insurers became a major impediment to trade. Consequently, the European steel industry experienced a col-lapse in demand from the end of 2008 onwards. Order levels fell by almost 60% and ap-parent consumption by 30%. Capacity utilisation fell to 30% on average and steel prices declined by 50%. More than 120,000 people (27% of the workforce in the steel industry in the EU) had either lost their jobs or were on short-time working or temporary lay-off schemes at the end of March 2009. Measures to support employment in the sector
The restoration of normal financial market conditions and the preservation of jobs are the cornerstones for the recovery of the European economy. According to the industry, the

233
measures called for to support employment in the steel industry in both the short and longer-term are: 1. Short term measures to increase liquidity and secure employment
• there is a need to secure liquidity through banks and the ECB to avoid a further deterio-ration of the EU economy;
• banks need to increase credit facilities for steel industry customers so that they can place orders;
• stimulus measures, in the form of increased public expenditure and low taxes need to be implemented in a timely and effective way;
• EU-wide support measures need to be put in place to assist workers subject to tempo-rary short-term working, enabling employers to hold on to valuable skills and avoid hard redundancies.
2. Measures to ensure a level playing field on trade:
• there is a need to initiate all means of dialogue with EU main trading partners in order to communicate the difficult situation on the EU steel market;
• at a time when EU companies are reducing supply to bring it into line with plummeting demand, it is essential that there is strict enforcement of the EU trade laws. Appropriate trade action needs to be taken if the EU market were to be destabilised by a surge of imports from third countries;
• all protectionist measures need to contested vigorously, including the use of tax and trade tariff policies aimed at stimulating exports or restricting imports from our major trading partners;
3. Other measures for the medium to long term:
• fiscal stimulus should be used to improve infrastructure and logistics (in transport, en-ergy and telecommunications) across the EU;
• support for R&D and innovation in the steel industry should be boosted;
• there is a need to ensure that the implementation of the ETS (Emissions Trading Scheme) Directive for phase 3 does not result in an additional cost burden on industry.
Engineering industries
(ORGALIME – covering Machinery and equipment, Electrical and electronic equipment and appliances and Metal products, Press statement, October 2011)
Relatively high growth of output in the mechanical, electrical and electronic engineering industries in the EU in the two years 2010 and 2011 was mainly due to the expansion of emerging markets in Asia and Latin America and the consequent increase in demand for investment goods. Although demand for such goods also picked up in the EU, it did so only
234
to a modest extent. Moreover, demand eased off during 2011 as a consequence of overall low growth in Europe, fixed investment in industry remaining well below its 2008 peak. Much the same pattern of development applies to Metal products. The unfavourable short-term prospects for economic recovery in the EU are likely to reduce the growth of both engineering output and that of metal products over the next year. Motor vehicles
(Information extracted from Working documents sent by ACEA, European Automobile Manufacturers Association)
Measures implemented to weather the crisis
The introduction of car-scrapping schemes visibly helped to stabilise the market for motor vehicles and the industry (in the shape of ACEA, the EU Automobile Manufacturers Asso-ciation) has estimated that such schemes forestalled, if not ultimately prevented, the loss of up to 120,000 jobs in the industry. In addition, flexible collective bargaining allowed companies to deal with a substantial re-duction in production by adjusting working conditions and working-time arrangements in-stead of through large-scale redundancies. The measures introduced include temporary wage freezes and short-time working and partial unemployment schemes combined with training during periods of when work was slack and were implemented in such a way that that they could be quickly reversed when necessary. Several Member States also introduced packages of support measures, including soft loans and state guarantees, to enable investment, and employment, to be maintained in R&D programmes especially. National measures were supplemented by action at EU level targeted at the automotive sector – in particular, the Green Cars Initiative, which was included as part of the European Economic Recovery Plan and which, as well as providing loans through the European In-vestment Bank, made available a total of EUR 1 billion for R&D through joint funding pro-grammes of the European Commission, Member States and the industry. The rules of the European Globalisation Adjustment Fund (EGF) were also revised to provide support for workers made redundant as a direct result of the global financial and economic crisis as well as of globalisation. By February 2011, 13 applications had been submitted by 8 differ-ent Member States for support measures amounting to EUR 192.8 million (EUR 120 from the EGF) in relation to the automotive industry which had by then assisted over 18,000 workers by financing their training or re-training.
235
Assessment of the actions taken to support employment
While the overall effect of car scrapping schemes was positive in helping manufacturers maintain production and employment during the recession, the ‘pay-back’ effect is visible in a number of countries, most visibly in Germany where the scheme was the most generous and where a 23% decline in sales was recorded in 2010 as compared with 2009. Component suppliers, however, received much less public support and through they indi-rectly benefited from the measures taken to assist vehicle manufacturers, they were more affected by the crisis, though this was less the case for major suppliers which were able to access EIB loans. According to a number of commentators, the opportunity was missed of taking full advan-tage of the crisis to undertake the long overdue restructuring of the industry in the EU to reduce overcapacity. Though there was some consolidation of the industry, it was not suffi-cient and the lack scale and profitability of many manufacturers and dealers could hamper the competitiveness of the industry in several Member States in the coming years. Development of the industry over recent years
There have been significant shifts in the pattern of global sales over recent years towards smaller cars with lower emissions as well as between different parts of the world. This is likely to continue in the future. By 2009, 25% of all new car sales in the EU were accounted for by those emitting less than 120g of CO2 per km. Nevertheless, the growth in demand in emerging markets has led to the increased sales of luxury car models, which is also likely to continue, benefiting some companies – and countries (Germany especially) – much more than others. Future developments in the structure of the industry in the EU depend very much on the relative growth of European and external markets as well as on how far the necessary consolidation of capacity takes place. Long-term challenges
The main challenge in the longer-term is to maintain and strengthen the competitiveness of manufacturers in the EU by ensuring that the Union remains an attractive place to produce and invest in as compared with third countries where labour costs are lower and growth of the market is higher. New technologies, in particular, electrically-driven power units and in-car entertainment as well as new means of increasing safety, provide significant opportuni-ties for the future growth of the industry in Europe, though taking advantage of these is dependent on the availability of raw materials and energy at suitable prices, a sufficient number of suitably skilled workers, access to finance and financial market stability and favourable overall macroeconomic conditions. ‘Smart’ regulation, especially as regards emissions, is also important as is the access of exporters to third countries if manufacturers
236
are to remain in the EU rather than relocating production to the countries concerned. Gov-ernment policy has an important role to play in all of these areas. One important uncertainty, in addition to market growth, concerns the implications of the development of electrically-driven vehicles for both employment (how far the industry is likely to become less labour-intensive because fewer parts are needed) and skill require-ments. The skills required are at present not available on the labour market and education and training programmes across the EU need to be adapted to ensure that there is a suffi-cient supply of people with the requisite skills when they become evident. At the same time, electrification is likely to lead to structural changes in the industry with the emergence of new companies and the demise of some existing ones which could have important im-plications for employment in particular places. These in turn are likely to have social con-sequences which call for a need for public support, which implies a need to monitor the situation and to prepare plans in advance for dealing the consequences concerned. Basic metals and fabricated metal products, Machinery and equipment and Mo-tor vehicles
(Information from CEEMET, Council of EU Employers of the Metal, Engineering and Technology-based Industries, received from representatives in Belgium, France, Neth-erlands and Finland)
Measures implemented to weather the crisis
In Belgium, various measures such as the time credit scheme (entitling employees to take a career break) and short-time work were used during the crisis. Most importantly, a collec-tive agreement was put into force which allows employers to suspend temporarily the em-ployment contract of all groups of workers for economic reasons. The measures had a major effect on employment in the sector, reducing the number of redundancies as com-pared with previous crisis periods, though at a relatively high cost into terms of social secu-rity expenditure. In France, a derogation to the regular short-time working scheme was applied in the indus-try (providing a higher level of remuneration and a higher financial support for companies). As a counterpart, enterprises have to maintain their level of employment for twice as long as in the regular short-time scheme. Companies and employees are encouraged to use this period for training (including outside usual working hours). In addition, an agreement in the metal sector was signed in May 2009. This promotes training measures during short-time work; aims at maintaining the same level of apprenticeship and “Professionalisation contracts”; promotes measures to facilitate geographical mobility; and provides a strong incentive to use the “employee leasing” system (allowing employers with surplus staff to loan them temporarily to another company). The withdrawal of these measures (which are all still in place) would have a significant and immediate impact on employment. Between
237
end-2008 and end-2010, the output of the metal industry decreased by 28% whereas em-ployment declined by only 10%. In the Netherlands, a series of measures were adopted to maintain jobs during the crisis (none of which are any longer in place). Part-time unemployment benefits (coupled with training during periods of unemployment) were extensively used and contributed to saving jobs in the industry. On the other hand, students were encouraged to extend their educa-tion or training, which helped to limit the number of jobseekers in the sector significantly. In addition, the maximum number of fixed-term contracts was temporarily extended to four in 4 years for those under 27. In addition, some30 mobility centres were set up to assist the unemployed to find jobs. However, none of the three measures had a significant effect on employment. In Finland, temporary lay-offs were used extensively to limit the number of redundancies. At the end of 2009, one worker in five (i.e. 57,000) in the metal industry was covered by the scheme. Specific agreements at the company-level limiting or delaying wage increases were also made possible. Main factors affecting competitiveness and related policies
Innovation is seen as the major factor affecting the development of the industry over the past 10 years in Belgium. Flexible working arrangements, automated production methods and relocation of low value-added products to other countries were implemented to remain competitive. But it is considered that major efforts are still needed to stimulate innovation and reduce wage costs. Lifelong learning is a key issue: people have to work longer but become smarter. This can be achieved through “age management” programmes (promot-ing longer and better quality working life). In France, the industry representatives call for more coherence between EU and national industrial policy in order to improve competitiveness. They also urge a shift from a con-sumer-oriented policy to a producer-oriented one. The demand for highly educated work-ers is expected to increase in future years. The industry is currently attempting to improve its attractiveness by promoting jobs in industry and science and technology studies as ca-reer choices for young people. In the Netherlands, the industry has had to face many challenges over the past 10 years: globalization, EU enlargement, technological advances, innovation and ageing of the popu-lation as well as the limited availability of technical staff. Strategies to remain competitive include an increasing flexibility of working arrangements and organisation of the workforce, ‘lean’ manufacturing and innovation as well as relocation to lower cost countries. Employ-ment in the industry is expected to decline in the country over the next 10 years. But a shortage of high skilled technical workers is likely to occur due to technological innovations.
238
In order to make sure that these skills will be available, the industry is investing in lifelong learning and is upgrading education and vocational training schemes. In Finland, globalisation and the changing age structure of the work force were the major factors affecting the development of the industry. In order to remain competitive, it is con-sidered that more flexibility in terms of working time is required as well in terms of wages. There is an increasing need for highly skilled graduates in mechanical engineering and the metal industry due to the retirement of older workers. It is expected that the share of uni-versity/polytechnic graduates in the workforce will continue to increase in all technology-based industries (mechanical engineering, metals, electronics, IT and consulting engineer-ing). The industry representatives anticipate that skills, knowledge and competences (SKC) relating to the new technologies and their application form the basis for competitive-ness in the future. However in all technology-based industry jobs the importance of SKCs relating to consumer demand and sales, networking and communications and energy effi-ciency is increasing. The industry is actively promoting the attractiveness of the sector among school-children and students. It is also involved in the major reforms currently un-derway in the education and innovation systems, it is promoting co-operation between companies and education/training/research institutions and it is supporting good leadership and strategic management, long term investment in new capabilities and human resources and the internationalisation of SMEs through programmes such as TRIOplus. Measures to support employment in the sector
In Belgium, it is considered that more flexibility in terms of working arrangements with spe-cific possibilities for the different activities would better support employment in the sector (the legislation could be improved). According to the industry representatives in France, a revision of the short-time working arrangements is needed in order to increase their flexibility and their duration. Moreover, they also call for the possibility of concluding “competitiveness/employment agreements” which allow for a reduction in working time and wages in exchange for a guarantee of em-ployment. Construction
(Information from received from the European Construction Industry Federation from questionnaire replies from the German, Spanish, Dutch and Portuguese Federations)
Measures implemented to weather the crisis
In the Netherlands, a temporary part-time unemployment scheme was implemented during the recession period which was withdrawn in July 2011. This was applicable to all sectors but had a very limited effect on employment. In the second half of 2011, the tax rate on
239
house purchases was lowered in order to stimulate the housing market, which has had some effect on employment. It is considered that the part-time unemployment measure was withdrawn prematurely since the recession has never really come to an end so far as construction is concerned and given the deterioration in the economic situation should now be reintroduced. In Germany, the Government introduced two economic stimulus packages totalling EUR 81 billion to counter the economic downturn in 2008-2009. Almost a quarter of this overall amount was directed at the construction industry, the measures including, in particular, increased investment in transport infrastructure and improvements in energy efficiency in buildings with the aim of reducing CO2 emissions. These measures were relatively important in helping to maintain employment in the con-struction industry. Although they came to an end at the end of 2011, the effect on output and employment in construction is considered to be relatively small. In Spain, two temporary funds for public investment in infrastructure in local areas were created (Fondo Estatal de Inversión Local, agreed at the end of 2008 and Fondo Estatal para el Empleo y la Sostenibilidad Local launched in 2010. Both had come to an end by 2011 and though they had some effect, they could not prevent a large-scale decline in em-ployment in the industry. In Portugal, legislation was introduced to enable employers to increase the flexibility of working time (Banco de horas) and to allow them to lay off workers for periods of time when there was insufficient work (Trabalho intermitente). At the same time, specific meas-ures were taken by the government (such as Programa de Qualificação e Emprego), to support earnings during such periods, though this was limited to 2009, or to reduce social contributions. Main factors affecting long-term trends
The main factors which have affected the development of the industry in the EU over the past 10 years have been EU enlargement, which has led to an increased movement of labour from the Member States entering the Union to the EU15 countries, together with improvements in employees’ social rights and stricter health and safety regulations. At the same time, the industry was boosted before the onset of the recession by major infrastruc-ture projects in a number of countries.

240
Measures to support employment in the sector
It is considered that governments can help to increase flexibility in working arrangements in the industry, which is important for its competitiveness, by pursuing a flexicurity approach. Such flexibility in Spain, according to industry representatives, needs to include the possi-bility of maintaining temporary contracts of employment as well as of varying working time given the nature of the industry. At the same time, there is a need for a well-educated work force to draw on which has the requisite skills, which increasingly include knowledge and expertise in new energy effi-ciency and environmental requirements as well as new technologies. The industry has an important part to play in providing the continuing training to the people concerned, while agreements between employers and trade unions are important in ensuring that working arrangements are sufficiently flexible. There is equally a need for continued innovation in building methods and materials In Germany, it is considered that a large-scale public investment programme, directed es-pecially at local infrastructure, is needed if employment in the industry is to be maintained or even expanded. This is equally the case in Spain, where cuts in public expenditure to reduce the budget deficit and public sector debt have reduced public investment in infra-structure and where an expansion of such investment is considered vital for recovery of employment both in the industry and in the economy more generally. There is, in addition, a need for government measures to ensure access to credit, which has become difficult for many companies since the onset of the financial crisis.

241
Annex: Questionnaire The following questions are intended to help in the assessment, first, of employment de-velopments in your industry over the past 2-3 years and the extent to which jobs have been supported by government measures and, secondly, of the employment prospects in the industry over the short and longer-ter. It should be emphasised that we are not looking for quantitative estimates of the developments referred to (though if any exist it would be useful if you could indicate where they can be found) but only broad qualitative indications (e.g. whether a particular development is important or whether a specific measure has had a significant effect or only a minor one). Our interest is in the EU as a whole though we do not expect you to report on developments in each individual country but only in those where the industry is important and developments or the measures adopted have also been important. Short-term 1) What are the main measures which have been taken across the EU in your indus-
try in response to the economic crisis, or which have affected your industry in par-ticular? (e.g. short-time working arrangements or other measures to support jobs, such as those for increasing demand for the sector’s output, like the car scrapping scheme for the automotive industry)? Measure 1: Measure 2: Measure 3, etc. (if relevant)
2) What has been the effect of these measures on employment in the industry (i.e. to what extent have they helped to maintain jobs)? [on a scale of 1=negligible effect to 5=very significant effect] Measure 1: Measure 2: Measure 3, etc. (if relevant)
3) Are measures of this kind still in place in any EU Member State? 4) To the extent that these measures are still in place, what is the effect likely to be on
employment of them being withdrawn? [on a scale of 1=negligible effect to 5=very significant effect] Measure 1: Measure 2: Measure 3, etc. (if relevant)
5) How would you assess the national and EU actions taken to support employment? In your view, a) what measures were missing (i.e. not introduced but should have

242
been) and b) what measures would be needed to better support employment in your sector in the current economic situation? a. Missing measures b. Measures that need to be introduced
Long-term 6) What have been the major factors which have affected the development of your
industry in Europe over the past 10 years or so (e.g. increasing globalisation (in-cluding growing competition from developing countries), EU enlargements in 2004-2007, technological advances (which, for example, have made it easier to out-source activities or relocate production)?
7) How have these factors affected the different countries in Europe where the indus-
try is located? In particular, to what extent has there been a shift in the industry be-tween countries – e.g. from the EU15 (the Western part) to the EU12 (the Central and Eastern part) or from the North to the South of Europe or vice versa?
8) What strategy has your industry adopted over the past ten years to remain com-
petitive, or to strengthen competitiveness, in global markets? Does this strategy in-clude: • increasing the flexibility of working arrangements or the organisation of the
work force? • adopting more automated methods of production? • relocating parts of the industry to lower cost countries?
9) Do you see the need for further restructuring of your sector for it to remain competi-
tive? If so, what kinds of change are needed and how are they likely to affect employ-ment in your sector?
10) Looking to the longer-term, what are the main labour skills likely to be required by your industry in future years in order for it to maintain and strengthen its competi-tiveness?
11) What is the strategy in your sector for ensuring that these skills are available? 12) What are the prospects for the growth of your sector in Europe over the next 10
years and how will this translate into job creation?
Short list of the most recent wiiw publications (as of August 2012) For current updates and summaries see also wiiw's website at www.wiiw.ac.at Sectoral Employment Effects of Economic Downturns by Robert Stehrer, Terry Ward et al.
wiiw Research Reports, No. 379, August 2012 246 pages including 64 Tables and 39 Figures hardcopy: EUR 24.00 (PDF: free download from wiiw's website)
Surveying Romanian Migrants in Italy Before and After the EU Accession: Migration Plans, Labour Market Features and Social Inclusion by Isilda Mara
wiiw Research Reports, No. 378, July 2012 136 pages including 39 Tables and 112 Figures hardcopy: EUR 24.00 (PDF: free download from wiiw's website)
Fasting or Feasting? Europe – Old and New – at the Crossroads by Leon Podkaminer, Kazimierz Laski, Peter Havlik, Hermine Vidovic, Doris Hanzl-Weiss, Michael Landesmann et al.
wiiw Current Analyses and Forecasts. Economic Prospects for Central, East and Southeast Europe, No. 10, July 2012 150 pages including 31 Tables and 17 Figures hardcopy: EUR 80.00 (PDF: EUR 65.00)
wiiw Monthly Report 7/12 edited by Leon Podkaminer
• Financial balances of the private, foreign and public sectors: long-term tendencies for the European Union
• Labour hoarding during the crisis: Evidence for selected new member states from the Financial Crisis Survey
• The European banking crisis and spillover effects in the countries of CESEE revisited • Statistical Annex: Selected monthly data on the economic situation in Central, East and
Southeast Europe wiiw, July 2012 30 pages including 11 Tables and 14 Figures (exclusively for subscribers to the wiiw Service Package)
Wirtschaftsentwicklung divergiert in den kommenden Jahren auch in Mitteleuropa, Ost- und Südosteuropa zwischen Norden und Süden by Vasily Astrov, Doris Hanzl-Weiss, Mario Holzner and Sebastian Leitner
wiiw Research Papers in German language, June 2012 (reprinted from: WIFO-Monatsberichte, Vol. 85, No. 5, May 2012) 10 pages including 5 Tables and 4 Figures hardcopy: EUR 8.00 (PDF: free download from wiiw's website)
Labour Hoarding during the Crisis: Evidence for selected New Member States from the Financial Crisis Survey by Sandra M. Leitner and Robert Stehrer
wiiw Working Papers, No. 84, June 2012 17 pages including 10 Tables and 1 Figure hardcopy: EUR 8.00 (PDF: free download from wiiw's website)
Bilateral Exchange Rates and Jobs by Eddy Bekkers and Joseph Francois
wiiw Working Papers, No. 83, June 2012 31 pages including 2 Tables and 3 Figures hardcopy: EUR 8.00 (PDF: free download from wiiw's website)
Import Prices, Income, and Inequality by Eddy Bekkers, Joseph Francois and Miriam Manchin
wiiw Working Papers, No. 82, June 2012 44 pages including and 4 Tables hardcopy: EUR 8.00 (PDF: free download from wiiw's website)
Trade in Value Added and the Valued Added in Trade by Robert Stehrer
wiiw Working Papers, No. 81, June 2012 20 pages including 7 Tables and 1 Figure hardcopy: EUR 8.00 (PDF: free download from wiiw's website)
Value Added and Factors in Trade: A Comprehensive Approach by Robert Stehrer, Neil Foster and Gaaitzen de Vries
wiiw Working Papers, No. 80, June 2012 23 pages including 9 Tables hardcopy: EUR 8.00 (PDF: free download from wiiw's website)
wiiw Monthly Report 6/12 edited by Leon Podkaminer
• The transformation of international financial markets and the future of the eurozone • The harmonization of banking supervision: a chokehold • The impact of offshoring on the skill structure of labour demand • Statistical Annex: Selected monthly data on the economic situation in Central, East and
Southeast Europe wiiw, June 2012 30 pages including 15 Tables and 4 Figures (exclusively for subscribers to the wiiw Service Package)

wiiw Database on Foreign Direct Investment in Central, East and Southeast Europe, 2012: Short-lived Recovery by Gábor Hunya. Database and layout by Monika Schwarzhappel
wiiw Database on Foreign Direct Investment in Central, East and Southeast Europe, May 2012 142 pages including 109 Tables and 8 Figures hardcopy: EUR 70.00 (PDF: EUR 65.00), CD-ROM (including hardcopy): EUR 145.00
International Spillovers in a World of Technology Clubs by Roman Stöllinger
wiiw Working Papers, No. 79, May 2012 25 pages including 8 Tables and 3 Figures hardcopy: EUR 8.00 (PDF: free download from wiiw's website)
wiiw Monthly Report 5/12 edited by Leon Podkaminer
• Interim Romanian government sworn in: any room for manoeuvring? • Croatia’s EU membership: lessons from earlier accessions • The cold civil war in Poland • Statistical Annex: Selected monthly data on the economic situation in Central, East and
Southeast Europe wiiw, May 2012 22 pages including 8 Tables (exclusively for subscribers to the wiiw Service Package)
Convergence of Knowledge-intensive Sectors and the EU’s External Competitiveness by Robert Stehrer et al.
wiiw Research Reports, No. 377, April 2012 123 pages including 30 Tables and 60 Figures hardcopy: EUR 8.00 (PDF: free download from wiiw's website)
wiiw Monthly Report 4/12 edited by Leon Podkaminer
• Slovakia after the elections • Labour market issues in Europe’s Eastern and Western Balkan neighbours • Net private savings in relation to the government’s financial balance • Statistical Annex: Selected monthly data on the economic situation in Central, East and
Southeast Europe wiiw, April 2012 28 pages including 10 Tables and 4 Figures (exclusively for subscribers to the wiiw Service Package)

wiiw Service Package
The Vienna Institute offers to firms and institutions interested in unbiased and up-to-date information on Central, East and Southeast European markets a package of exclusive services and preferential access to its publications and research findings, on the basis of a subscription at an annual fee of EUR 2,000.
This subscription fee entitles to the following package of Special Services:
– A free invitation to the Vienna Institute's Spring Seminar, a whole-day event at the end of March, devoted to compelling topics in the economic transformation of the Central and East European region (for subscribers to the wiiw Service Package only).
– Copies of, or online access to, The Vienna Institute Monthly Report, a periodical consisting of timely articles summarizing and interpreting the latest economic developments in Central and Eastern Europe and the former Soviet Union. The statistical annex to each Monthly Report contains, alternately, country-specific tables or graphs with monthly key economic indicators, economic forecasts, the latest data from the wiiw Industrial Database and excerpts from the wiiw FDI Database. This periodical is not for sale, it can only be obtained in the framework of the wiiw Service Package.
– Free copies of the Institute's Research Reports (including Reprints), Current Analyses and Forecasts, Country Profiles and Statistical Reports.
– A free copy of the wiiw Handbook of Statistics (published in October/November each year and containing more than 400 tables and graphs on the economies of Albania, Bosnia and Herzegovina, Bulgaria, Croatia, the Czech Republic, Estonia, Hungary, Latvia, Lithuania, Macedonia, Montenegro, Poland, Romania, Russia, Serbia, the Slovak Republic, Slovenia and Ukraine)
– Free online access to the wiiw Monthly Database, containing more than 1200 leading indicators monitoring the latest key economic developments in ten Central and East European countries.
– Consulting. The Vienna Institute is pleased to advise subscribers on questions concerning the East European economies or East-West economic relations if the required background research has already been undertaken by the Institute. We regret we have to charge extra for ad hoc research.
– Free access to the Institute's specialized economics library and documentation facilities.
Subscribers who wish to purchase wiiw data sets on CD-ROM or special publications not in-cluded in the wiiw Service Package are granted considerable price reductions.
For detailed information about the wiiw Service Package please visit wiiw's website at www.wiiw.ac.at

To The Vienna Institute for International Economic Studies Rahlgasse 3 A-1060 Vienna
Please forward more detailed information about the Vienna Institute's Service Package Please forward a complete list of the Vienna Institute's publications to the following address
Please enter me for
1 yearly subscription of Research Reports (including Reprints) at a price of EUR 120.00 (hardcopy, Austria), EUR 135.00 (hardcopy, Europe), EUR 155.00 (hardcopy, overseas) and EUR 48.00 (PDF download with password) respectively
1 yearly subscription of Current Analyses and Forecasts a price of EUR 150.00 (hardcopy, Austria), EUR 155.00 (hardcopy, Europe), EUR 170.00 (hardcopy, overseas) and EUR 120.00 (PDF download with password) respectively
Please forward
the following issue of Research Reports ..............................................................................................
the following issue of Current Analyses and Forecasts .......................................................................
the following issue of Working Papers .................................................................................................
the following issue of Research Papers in German language ............................................................
the following issue of wiiw Database on Foreign Direct Investment ...................................................
the following issue of wiiw Handbook of Statistics ...............................................................................
(other) ....................................................................................................................................................
.........................................................................................................................................................................................................
Name
.........................................................................................................................................................................................................
Address
.........................................................................................................................................................................................................
Telephone Fax E-mail
............................................................ ..........................................................
Date Signature
Herausgeber, Verleger, Eigentümer und Hersteller:
Verein „Wiener Institut für Internationale Wirtschaftsvergleiche“ (wiiw), Wien 6, Rahlgasse 3
ZVR-Zahl: 329995655
Postanschrift: A-1060 Wien, Rahlgasse 3, Tel: [+431] 533 66 10, Telefax: [+431] 533 66 10 50
Internet Homepage: www.wiiw.ac.at
Nachdruck nur auszugsweise und mit genauer Quellenangabe gestattet.
P.b.b. Verlagspostamt 1060 Wien


