Embed Size (px)
Citation preview
29ECONOMIE ET STATISTIQUE / ECONOMICS AND STATISTICS N° 499, 2018
Received on 22 December 2016; accepted after revisions on 17 April 2018 Translated from: « Productivité sectorielle du travail et compétitivité de l'économie de la Nouvelle-Calédonie ».
Sectoral labour productivity and economic competitiveness in New CaledoniaSerge Rey* and Catherine Ris**
Abstract – A small island economy, New Caledonia stands out amidst other French overseas territories, and even more so the islands of Oceania, for its high standard of living and human development. However, it also suffers from the disadvantages com‑mon to small island economies (remoteness, small market size, etc.). The slowdown in growth observed over the last few years reveals how the New Caledonian model of “extensive” growth is losing pace overall: producing more from more of inputs to satisfy the domestic demand, protecting itself from international competition in the process, and drawing largely on nickel mining. This article aims to assess the competitiveness of New Caledonia's economy. It puts forward labour productivity indicators for the main market sectors of the New Caledonian economy from 1992 to 2014 to derive changes in unit costs and finally in real exchange rates. It shows that labour productivity has tended to stagnate since the early 2000s, while at the same time increases in minimum wage contribute to an increase in unit costs and a decline in competitiveness.
JEL Classification: O13, O40, O56Keywords: New Caledonia, labour productivity, price/cost competitiveness, nickel industry
To cite this article: Rey, S. & Ris, C. (2018). Sectoral labour productivity and economic competitiveness in New Caledonia. Economie et Statistique / Economics and Statistics, 499, 29–53. https://doi.org/10.24187/ecostat.2018.499s.1938
* CATT, Université de Pau et des Pays de l’Adour (serge.rey@univ‑pau.fr)** LARJE, University of New Caledonia (catherine.ris@univ‑nc.nc)
The authors wish to thank the journal’s anonymous reviewers for their comments and suggestions.
Reminder:
The opinions and analyses in this article are those of the author(s) and do not necessarily reflect their institution’s or Insee’s views.
ECONOMIE ET STATISTIQUE / ECONOMICS AND STATISTICS N° 499, 201830
New Caledonia experienced a period of very sharp economic growth between
the early 1960s and 2010. This prosperity was and remains an exception amongst over‑seas French territories. The average level of income per capita is high and comparable to that of mainland France (not adjusted for pur‑chasing power parity, PPP)1. New Caledonia can also be compared to surrounding areas of the South Pacific, with a level of economic and human development on par with that of New Zealand and significantly higher than that of its other neighbouring island states. However, this prosperity rests in part on fragile founda‑tions. New Caledonia is a small, wealthy but unequal economy2, where wealth is derived mainly from nickel mining and industry, i.e. a non‑renewable natural resource, and from the transfers provided by mainland France. Its economy is therefore dependent on cycli‑cal and non‑lasting sources of income, even though it is protected from external shocks by its relatively low degree of openness. Moreover, it struggles with a significant hand‑icap that hampers its long‑term growth: the poor competitiveness of the local production system, as this article will bring to light.
According to the study from CEROM (CEROM, 2017, p. 9), different stages of growth can be distinguished over the last five decades. In the 1960s up to the first oil shock, New Caledonia’s economy, highly special‑ised in nickel industry, experienced a surge in growth (average annual rate of 8%); in the following decade, its growth fell to null, in particular due to the end of the nickel boom; then, in the second half of the 1980s, the New Caledonian economy returned to sustained growth, at an average annual rate close to 8%, higher than that of mainland France and other economies in overseas France, while the June 1988 Matignon Agreements brought peace back to the territories. Lastly, since the early 1990s, the New Caledonian economy has experienced steady average growth of around 3%, supported first by investments in the metallurgy sector, and secondly, since the early 2010s, by household consumption and nickel exports.
Historically, growth has been fuelled by mas‑sive external transfers – endowment funds from mainland France and foreign direct investment in the nickel sector, particularly for the con‑struction of two new nickel processing plants in the 2000s – as well as by rapidly growing government spending (both in operation and
investment). In particular, investment, and more specifically private investment, played a decisive part between 2003 and 2011, cul‑minating in 44% of GDP. Public investment efforts have also been significant: +10.5% on average per year over this period, with a contribution of 4% to 5% of GDP. While the knock‑on effects were particularly significant in the construction and business services sec‑tors, private investment by households and companies also benefited from the various tax exemption schemes adopted nationally (insti‑tuted in 1986 by the “Pons Act” during the violent events that took place at that time) and locally (instituted since 2002, see Chauchat & Perret, 2006, p. 104) and the low interest rates at the end of the 2000s. Over the same period, salaried employment rose sharply, i.e. +3.9% on annual average. The accumulation of the labour factor combined with the capital fac‑tor is characteristic of a period of particularly extensive growth, but one without any real competitiveness imperative, due to the strong protection set up around the domestic market (Wasmer, 2012).
In the same time, New Caledonia lags behind countries with the same level of wealth where education is concerned. While the proportion of higher education graduates has increased in the younger generations, it remains 16 per‑centage points lower than the OECD average in 2014‑2015, 13 percentage points lower than in New Zealand, a gap that is increasing, and 22 percentage points lower than in Australia (Ris et al., 2017). In addition, there are signif‑icant disparities between the three provinces (Southern Province, Northern Province and Loyauté Islands), due in particular to the une‑ven distribution of educational infrastructures. These figures suggest that New Caledonia was not completely spared from the potential “curse of natural resources”123; economic history tells us that natural resources are often poorly managed and that countries highly endowed in natural resources prove the poorest in terms of economic and human development (Macartan et al., 2007). Natural resources exploitation often goes hand in hand, first, with under‑in‑vestment in education and, secondly, with socio‑economic inequalities between those who have been able to take hold of the
1. Taking into consideration the particularly high price levels, once GDP is adjusted for PPP, the relative level of GDP per capita is less favourable to New Caledonia.2. See in particular Ris (2014), on ethnic inequalities in the labour market.3. New Caledonia ranks 2nd in the world in terms of estimated nickel reserves (11%), after Australia (23%).
ECONOMIE ET STATISTIQUE / ECONOMICS AND STATISTICS N° 499, 2018 31
Sectoral labour productivity and economic competitiveness in New Caledonia
Box 1 – New Caledonia's institutional status
New Caledonia is unique amongst French overseas territories, with a status defined under Title XIII of the Constitution and implemented by Organic Law No. 99-209 of 19 March 1999. As sui generis status, New Caledonia has its own institutions, an unpar-alleled transfer regime from mainland France, and political autonomy. Registered with the UN on the list of countries to be decolonised, the country's eligible population will vote on 4 November 2018 on the full emancipation of the country by answering the follow-ing question: “Do you want New Caledonia to gain full sovereignty and become independent?”
New Caledonia’s status is original in that it gives rec-ognition to the Kanak people alongside other French populations looking ahead to the prospective construc-tion of a common destiny, by establishing country citi-zenship that is destined to become a nationality, and by enabling the operation of quasi-State and parliamentary institutions. The Matignon Agreements in 1988 created three provinces (South Province, Northern Province, and Province of the Loyauté Islands) that share power geographically, while the Nouméa Agreement in 1998 initiated the political sharing of power by establishing
a collegial government, elected proportionally to Congress and accountable to it. The Congress votes on “country laws”, which are legislative acts equal to national law, directly overseen by the Constitutional Council. The Customary Senate is a second chamber for matters relating to customary civil status, land and identity symbols.
The President of the Government runs the administra-tion, appoints individuals to public jobs, and represents New Caledonia. Since the 1980s, New Caledonia has benefited from progressive and unusual transfers of power, including on labour law, taxation, foreign trade, the regulation of natural resources, the repression of fraud, price regulation, the rules on health and social protection, a move sped up even more by successive political agreements with civil law, commercial law, pri-mary and secondary education, etc. Under the terms of the Nouméa Agreement, following final transfers (status of municipalities, legality control, universities and audio-visual sector), mainland France shall hold powers solely on sovereign matters, defence, justice, police, currency and foreign relations, in which New Caledonia is nonetheless already involved.
natural resources and the others. Since nat‑ural resources do not need to be produced, but merely extracted, resources can be mined independently of other economic activities, without externalities for the productive sec‑tor. The high incomes generated by the natu‑ral resources sector encourage the payment of high wages, which are attractive to unskilled or low‑skilled labour. The return on invest‑ment in education is therefore low. Another possible explanation for low investment in education across the New Caledonian popu‑lation lies in the high level of protectionism around its economy4. This may well contrib‑ute to delaying the increase in the education level by making work in the sheltered sector (demanding unskilled labour) more attractive than in other sectors, thereby reducing the rel‑ative return on education.
As emphasised in CEROM (2017) and Ris et al. (2017), following the positive shocks from which the New Caledonian economy benefited in the 2000s ‒ a confidence shock following the Nouméa Agreement (1998), an investment shock and a “terms of trade” shock thanks to historically high nickel prices ‒ these same factors had a negative impact from 2012, both because of the slowdown in the growth model and for situational reasons: a phase of
large‑scale private investments that had likely reached their term; plummeting nickel prices that would not stabilise until 2016‑2017, gen‑erating significant deficits in three metallurgy plants; significant variations in mining rates due to major technological issues encoun‑tered for a few years since, and lastly, insti‑tutional uncertainties due to the referendum on self‑determination planned in November 2018 (see Box 1). Since the end of 2017, a slight improvement in the economic environ‑ment, thanks primarily to the situation in the nickel sector (increase in production, better price trend and effort to control costs) and an increase in household investment in housing form what continues to be a sluggish environ‑ment (IEOM, 2016; 2018).4
An analysis of the conditions for a return to sus‑tained economic growth in New Caledonia first requires a study of total or global factor pro‑ductivity, or the productivity of a given factor (AFD, 2016). This second approach has been
4. Bignon and García‑Peñalosa (2017) show that the sharp increase in duties in France in 1892 lowered education levels and increased birth rates in departments where the share of employment dedicated to agri‑cultural production was highest. This hypothesis has not been tested for New Caledonia.
ECONOMIE ET STATISTIQUE / ECONOMICS AND STATISTICS N° 499, 201832
favoured here5. This is because, first of all, a lasting improvement in labour productivity is a decisive factor for growth. Without review‑ing the literature exhaustively, we can see a slowdown in labour productivity growth since the early 1970s, especially in the countries of the European core (Austria, Belgium, France, Germany and the Netherlands), along with a slowdown in GDP growth (Dabla‑Norris et al., 2015, p. 7). Secondly, labour productivity combined with wages determine the unit costs and therefore the price/cost competitiveness of an economy, which will also ultimately have an impact on the country’s growth, via trade flows (export‑driven growth) and/or via services and in particular tourism in small island States.
There is abundant literature on the links between productivity, competitiveness (and some times openness) and growth, as well as on the determinants of productivity. For example, Krüger (2008) proposes a literature review focused on the relationship between productivity and technological change, while Bourlès and Cette (2007) conclude that hourly labour productivity increases with the pro‑duction capacity utilisation rate and the per‑centage of communication and information technology production in GDP, and declines when the employment rate or the number of hours worked increases. These conclu‑sions can be related with the research carried out by Malinvaud (1973) who showed that hourly labour productivity increased with the reduction in working time, the capital/labour substitution (increase in capital stock and replacement of obsolete capital) and the acceleration of production. Based on microe‑conomic data covering 7 sectors, Cette et al. (2017) analyse the slowdown in productivity (labour productivity and total factor productiv‑ity (TFP)) for mainland France and the French overseas departments, and reveal breaks in trends, mainly in the late 1990s and in 2008, but reject the theory of a reduction in the spread of innovation. From a long‑term perspective, Lunsford (2017) shows a negative relationship between TFP growth and real interest rates in the United States over the period 1914‑2016, but notes that the use of labour productivity led to “quasi‑”similar results. Finally, looking at the period 1890‑2012, Storesletten et al. (2016)6 measure hourly labour productivity and TFP for 13 advanced countries and show, first, that many breaks have occurred follow‑ing shocks (wars, financial crises, oil shocks, etc.) and structural policies (Canada and
Sweden), and that, secondly, the processes by which new technologies spread are often pro‑tracted, which leads them to have some reser‑vations about the impact of the revolution in information and communication technologies (ICT) in the years to come.56
The New Caledonian economy: a highly tertiarised productive structure
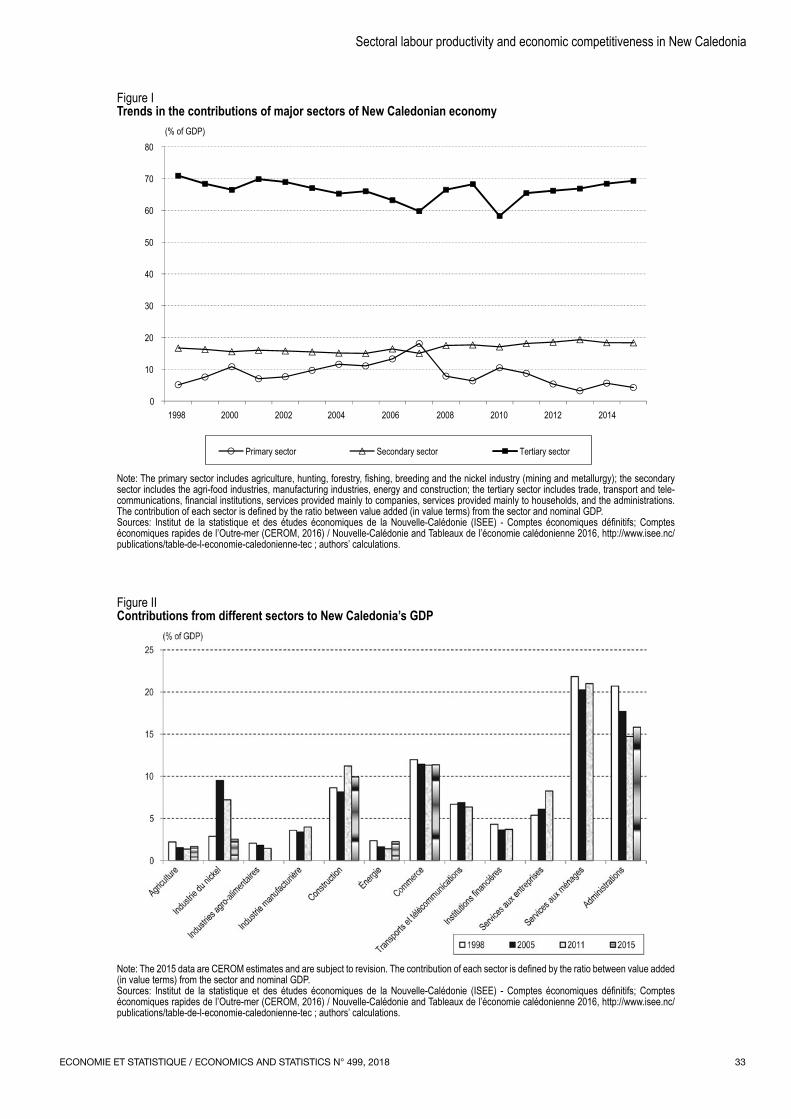
The economy in New Caledonia is dominated by its tertiary sector. This situation is not new: in the mid‑1960s, it already represented a little more than half of nominal GDP (54% versus 52% in metropolitan France) (CEROM, 2005). Since then, this tertiarisation has consistently increased, reaching around 70% of GDP in the late 1990s, which remains comparable to mainland France. The phenomenon appears to have stabilised overall over the last decade (Figure I).
Figure II shows more detailed analysis over twelve sectors of activity over the years 1998‑2015. Significant growth can be seen in the construction and business services sectors, which have seen their contributions to GDP increase from 8.6% in 1998 to 11.2% in 2015 and from 5.4% to 8.3%, respectively, due to the major works undertaken in the construc‑tion of the two new nickel processing plants as well as to major public construction projects (hospital, airport, social housing).
The other sectors’ contributions have been relatively stable, with the exception of the administrations, whose contribution fell in the mid‑2000s, before stabilising at around 15% of GDP7. At the same time, the proportion of GDP derived from agriculture, the agri‑food industry and energy has fallen steadily, from 2.2% in 1998 to 1.4% in 2015, from 2.1% to 1.5% and from 2.4% to 1.4%, respectively.
5. Note that total factor productivity has been analysed from three angles: measurement, determinants and effects on growth. Syverson (2011) offers an extensive review of these subjects, while Buccirossi et al. (2013) show that total productivity increases with competition, in 12 OECD countries over the period 1995‑2005. De Loecker and Van Biesebroeck (2016) discuss in detail the trade‑market power‑productivity relationship. As to Bhaskara Rao et al. (2007), they conclude that in the case of small island states (Fiji, Solomon Islands and Papua New Guinea), an accumulation of factors is essential to explain growth while total factor productivity has a negligible effect. 6. Detailed productivity data are provided in the database www.longter‑mproductivity.com.7. The weight of the government sector in GDP is comparable to that seen in mainland France, but lower than that of French Polynesia (which reached more than 32% of GDP in 2013).
ECONOMIE ET STATISTIQUE / ECONOMICS AND STATISTICS N° 499, 2018 33
Sectoral labour productivity and economic competitiveness in New Caledonia
Figure ITrends in the contributions of major sectors of New Caledonian economy
(% of GDP)
0
10
20
30
40
50
60
70
80
1998
Primary sector Secondary sector Tertiary sector
2000 2002 2004 2006 2008 2010 2012 2014
Note: The primary sector includes agriculture, hunting, forestry, fishing, breeding and the nickel industry (mining and metallurgy); the secondary sector includes the agri-food industries, manufacturing industries, energy and construction; the tertiary sector includes trade, transport and tele-communications, financial institutions, services provided mainly to companies, services provided mainly to households, and the administrations. The contribution of each sector is defined by the ratio between value added (in value terms) from the sector and nominal GDP. Sources: Institut de la statistique et des études économiques de la Nouvelle‑Calédonie (ISEE) ‑ Comptes économiques définitifs; Comptes économiques rapides de l’Outre-mer (CEROM, 2016) / Nouvelle-Calédonie and Tableaux de l’économie calédonienne 2016, http://www.isee.nc/publications/table-de-l-economie-caledonienne-tec ; authors’ calculations.
Figure IIContributions from different sectors to New Caledonia’s GDP
Note: The 2015 data are CEROM estimates and are subject to revision. The contribution of each sector is defined by the ratio between value added (in value terms) from the sector and nominal GDP. Sources: Institut de la statistique et des études économiques de la Nouvelle‑Calédonie (ISEE) ‑ Comptes économiques définitifs; Comptes économiques rapides de l’Outre-mer (CEROM, 2016) / Nouvelle-Calédonie and Tableaux de l’économie calédonienne 2016, http://www.isee.nc/publications/table-de-l-economie-caledonienne-tec ; authors’ calculations.
ECONOMIE ET STATISTIQUE / ECONOMICS AND STATISTICS N° 499, 201834
The share derived from manufacturing indus‑tries (excluding AFIs) remained stable, while that of the nickel sector fluctuated signifi‑cantly with the global price of minerals. The proportion of GDP derived from the nickel sector shows a long‑term downward trend, while fluctuating with the global minerals price (which fell by 30% between 2005 and 2015): from 30% in 1970 to 10% in 1978, then to 3% in 1998, to 9.5% in 2005 and then to 16.8% in 2007, ultimately falling below 3% in 2015.
We are thus seeing a twofold change: on the one hand, a downward trend in the relative weight of the exposed‑/free‑ market sector, defined as the combination of the agricultural sector, the nickel sector and all industries and energy (CEROM, 2005), due primarily to the drop in the contribution of nickel since the end of the 1960s, the time of the “nickel boom”; on the other hand, a surge in the activities pro‑tected from international competition (primar‑ily construction and services to companies) (CEROM, 2008 and 2011).
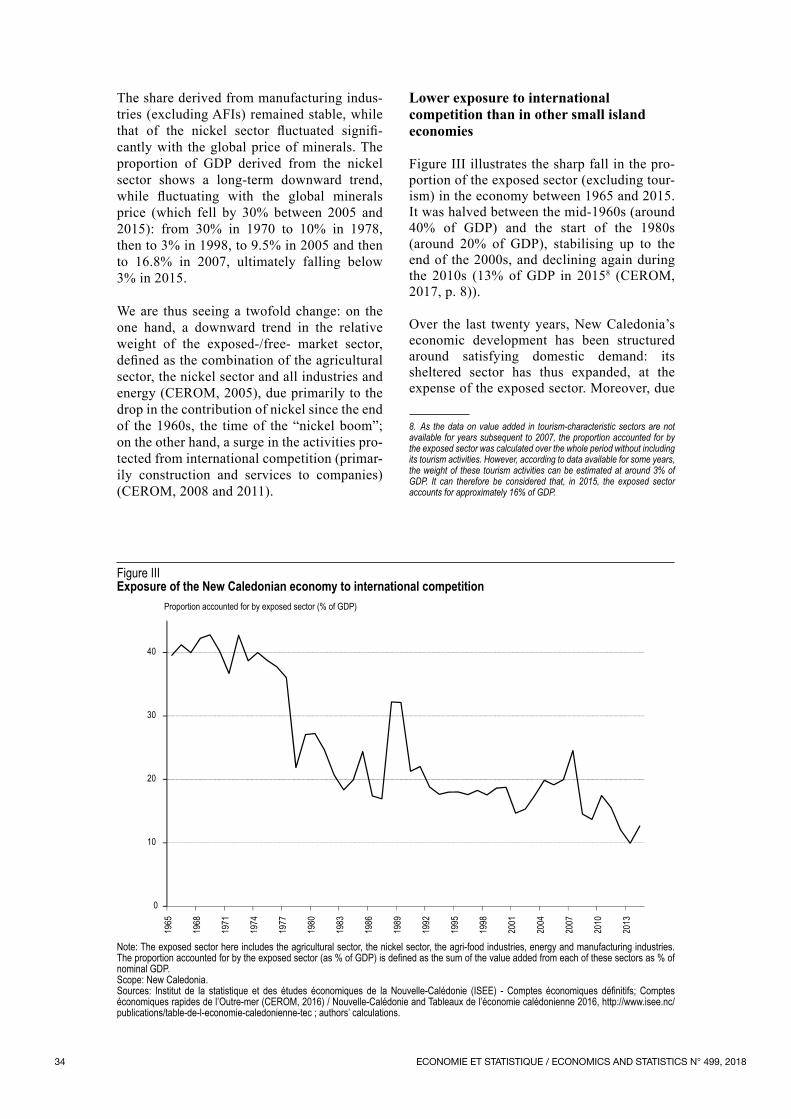
Lower exposure to international competition than in other small island economies
Figure III illustrates the sharp fall in the pro‑portion of the exposed sector (excluding tour‑ism) in the economy between 1965 and 2015. It was halved between the mid‑1960s (around 40% of GDP) and the start of the 1980s (around 20% of GDP), stabilising up to the end of the 2000s, and declining again during the 2010s (13% of GDP in 20158 (CEROM, 2017, p. 8)).
Over the last twenty years, New Caledonia’s economic development has been structured around satisfying domestic demand: its sheltered sector has thus expanded, at the expense of the exposed sector. Moreover, due
8. As the data on value added in tourism‑characteristic sectors are not available for years subsequent to 2007, the proportion accounted for by the exposed sector was calculated over the whole period without including its tourism activities. However, according to data available for some years, the weight of these tourism activities can be estimated at around 3% of GDP. It can therefore be considered that, in 2015, the exposed sector accounts for approximately 16% of GDP.
Figure IIIExposure of the New Caledonian economy to international competition
Proportion accounted for by exposed sector (% of GDP)
0
10
20
30
40
1965
1968
1971
1974
1977
1980
1983
1986
1989
1992
1995
1998
2001
2004
2007
2010
2013
Note: The exposed sector here includes the agricultural sector, the nickel sector, the agri-food industries, energy and manufacturing industries. The proportion accounted for by the exposed sector (as % of GDP) is defined as the sum of the value added from each of these sectors as % of nominal GDP.Scope: New Caledonia.Sources: Institut de la statistique et des études économiques de la Nouvelle‑Calédonie (ISEE) ‑ Comptes économiques définitifs; Comptes économiques rapides de l’Outre-mer (CEROM, 2016) / Nouvelle-Calédonie and Tableaux de l’économie calédonienne 2016, http://www.isee.nc/publications/table-de-l-economie-caledonienne-tec ; authors’ calculations.
ECONOMIE ET STATISTIQUE / ECONOMICS AND STATISTICS N° 499, 2018 35
Sectoral labour productivity and economic competitiveness in New Caledonia
to the structural impediments faced by New Caledonian companies in a context of small island economies (mainly isolation, remote‑ness and small size of the domestic market), New Caledonia, which has held powers in the areas of taxation and external trade reg‑ulation since the “Statut Stirn” of 1976, has introduced market protection measures9 and thus extended the scope of economic activities “naturally” protected from international com‑petition. The initial goal was to foster flour‑ishing growth for local companies and job creation. In the agricultural sector, it was also aimed at addressing issues of land use plan‑ning and food self‑sufficiency.
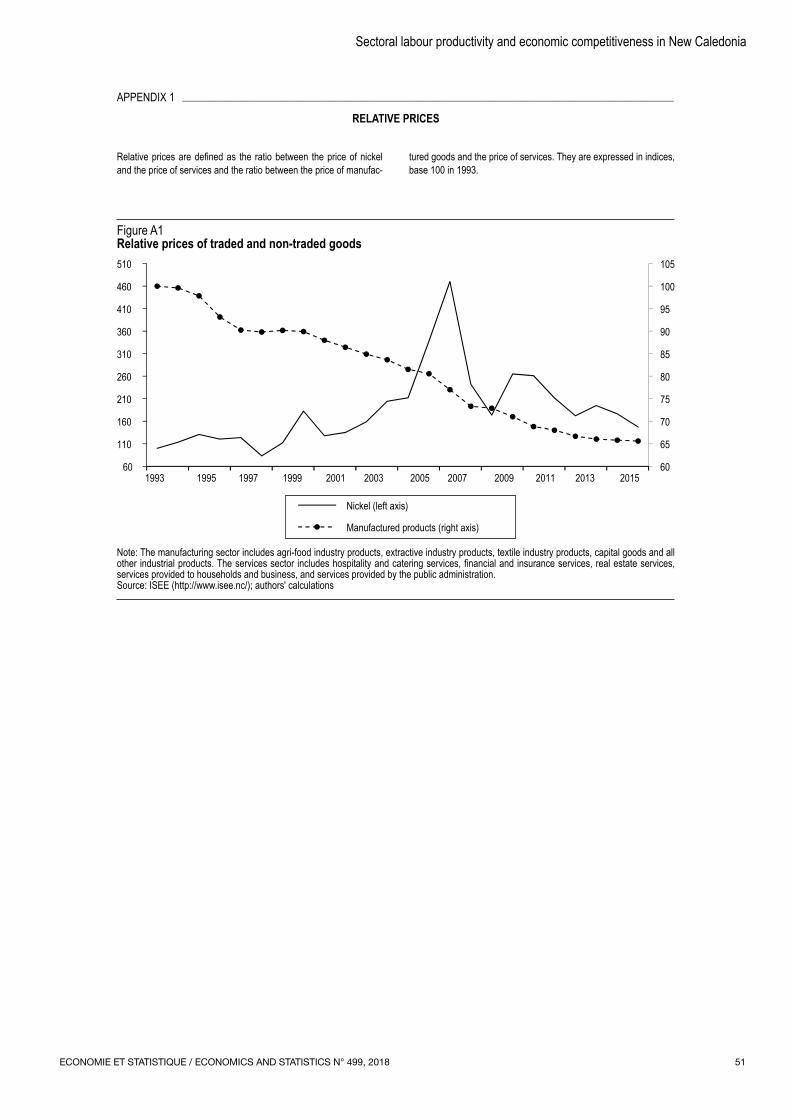
While this system meets the development constraints of local production in the context of a narrow and fragile market, these meas‑ures have had major negative effects: higher price levels and less choice for consumers, a less competitive environment and a lower incentive to achieve productivity gains for local companies (Autorité de la concurrence, 2012). The trend in relative prices (figure A1 of Appendix 1) illustrates this. While the price of nickel relative to services reflects sharp fluctuations in the global minerals price, the long‑run decline in the price of manufactured goods relative to services is indicative of the external constraint weighing on the prices of traded goods.
Also, benefiting from significant transfers from mainland France (11% of GDP in 2015), New Caledonia has developed an introverted economy, focusing on satisfying domestic demand while protecting its market, which is little affected by the unpredictability of the international environment, if not through fluc‑tuations in nickel prices. The openness rate of New Caledonia’s economy10 is relatively low, below 30%, compared to the average of 40% observed in small island economies. The pro‑portion of activities exposed to international competition is thus markedly lower than that
9. The market protection policy in New Caledonia plays out along two main lines: i) tariff protection through a system of overlapping taxes with around ten specific taxes on competing imports from the New Caledonian industry and a general tax on imports, which the country laws of 2000 reformed and simplified but which remain complex; the average rate of customs tariffs of New Caledonia is 18.6%, compared to 4% in Australia and New Zealand and 6% in the European Union; a reform of indirect tax‑ation, during the pre‑commercial launch stage since April 2017 and which was expected to come into effect on 1st July 2018, aimed at replacing some of these import taxes with the General Consumption Tax (equivalent to VAT), ii) certain manufactured or agricultural products are subject to quantitative restrictions (suspension or extension).10. Defined as [(Exports of goods +Imports of goods) / 2 x GDP]; the variables being expressed in value terms (CEROM, 2017, p.9).
measured in other small island economies in the South Pacific. For purposes of compar‑ison, according to the World Bank’s World Development Indicators, activities exposed to international competition (including only agriculture and the manufacturing sector, i.e. excluding tourism) provided 28% of GDP in Kiribati, 43% in Papua New Guinea and around 33% in Fiji and Tonga. This also reflects the original development models that distinguish these states from New Caledonia. For example, while some have given priority to official transfers and transfers from workers abroad (remittances can account for up to 30% of the GDP of some small Pacific islands such as Tonga, Samoa, Micronesia, Kiribati), which relied on the exploitation of raw materials (Tuvalu, Fiji until the mid‑2000s), or tourism (up to 70% of GDP, as is the case of Fiji, the Cook Islands, and Guam), when they have not turned into tax havens (Vanuatu) (Baldacchino & Bertram, 2009).
This observation naturally leads us to look at the performance of the different sectors of the New Caledonian economy in terms of productivity.
Labour productivity stagnating since the early 2000s
In this section, we propose a detailed study of labour productivity, both by sector and for the New Caledonian economy as a whole. Based on the methodology proposed by the OECD (Schreyer & Pilat, 2001), we have constructed an original database containing annual activity indicators (in value and volume) and employ‑ment indicators for 8 market sectors over the period 1992‑2014. This original database is used first to compute labour productivity indi‑cators by sector of activity, then indicators on unit labour costs and competitiveness.
Labour productivity indicators by sector
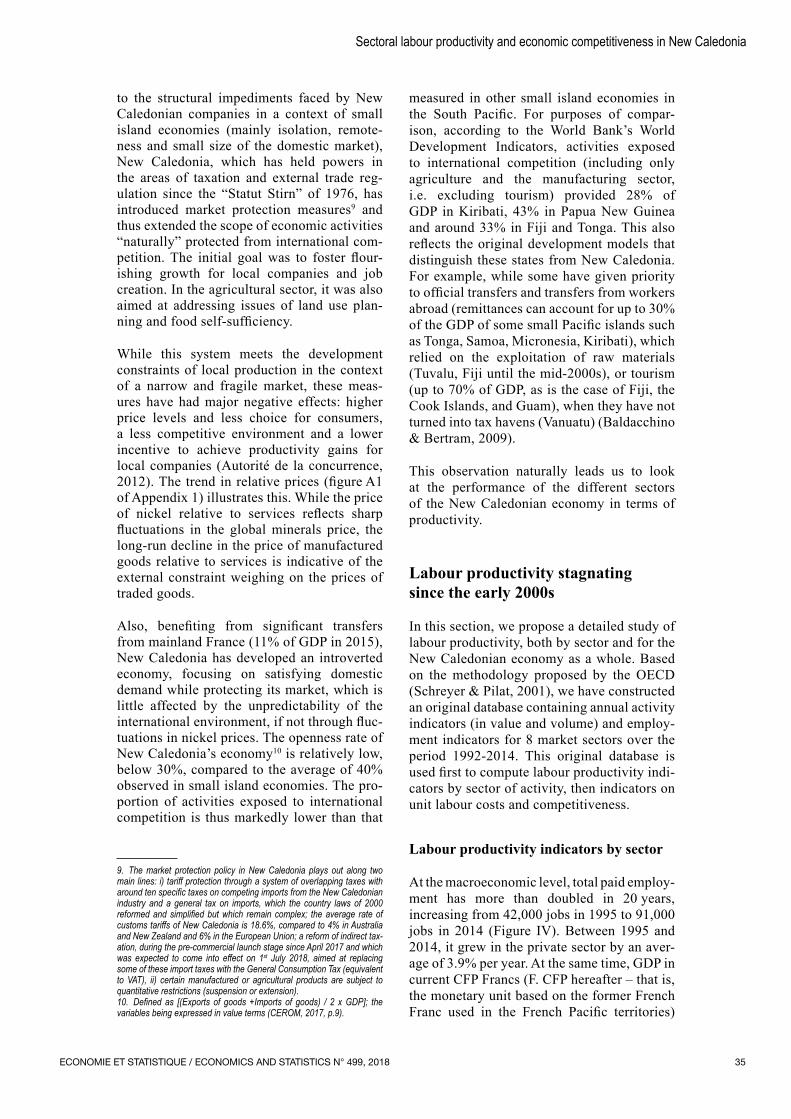
At the macroeconomic level, total paid employ‑ment has more than doubled in 20 years, increasing from 42,000 jobs in 1995 to 91,000 jobs in 2014 (Figure IV). Between 1995 and 2014, it grew in the private sector by an aver‑age of 3.9% per year. At the same time, GDP in current CFP Francs (F. CFP hereafter – that is, the monetary unit based on the former French Franc used in the French Pacific territories)
ECONOMIE ET STATISTIQUE / ECONOMICS AND STATISTICS N° 499, 201836
nearly tripled, increasing from F. CFP 329 bil‑lion in 1995 to 955 billion in 2014, while in constant F. CFP 1995, the increase was slightly more than 70% over the period.
However, this overall performance level does not adequately reflect disparities between sec‑tors. The labour productivity (productivity per capita) indicator shown by sector over the period 1992‑2014 establishes a ratio between an activity indicator and the number of sala‑ried jobs. Only salaried workers were included because of the lack of other data. It can be substantiated insofar as this study focuses on trends in productivity (and not in actual pro‑ductivity levels) when salaried employment follows a trend similar to total employment11. Moreover, due to the lack of information on the number of hours worked in all the sectors considered and the period analysed, the hourly productivity could not be calculated12.
As to the activity indicator, whenever possi‑ble, two calculation methods were used. The first is based on value added data (VA), stated in real terms after being deflated by a price index; Table A2‑2 of Appendix 2 specifies the choice of price indices. The second calcula‑tion method is more direct since it is based on
the quantities produced (in units). Since some series of value added have not been complete since the early 1990s, Year 2000 is chosen as a reference year in comparisons between sec‑tors over the period 1998‑2014, for which all data are available for all the variables. Data on VA are available for seven sectors of activ‑ity: agriculture, the nickel industry (which includes mining and metallurgical produc‑tion), manufacturing industry (including the agri‑food industry111213), construction, transport and telecommunications, energy and trade. However, no information is available over the period studied on VA for tourism specific activities (Table A2‑1 in Appendix 2).
11. According to population census data for 2014 (ISEE, 2014), the working population is 112,103 individuals, 85% of whom are employees. Non‑salaried employment (self‑employed professionals and craftsmen, merchants, industrials, self‑employed workers) accounts for 4% (agricul‑ture) to 30% (construction) of employment depending on sector (the cen‑sus data making it possible to distinguish between 5 sectors of activity). According to the available data, the share of non‑salaried employment has remained relatively stable over the period, especially since the 2000s (14% in the early 2000s).12. The statistics on full‑time equivalent jobs are not extensive enough for us to take into consideration the development of part‑time work in certain sectors.13. While it is possible to identify the value added of agri‑food industries (AFIs), when it comes to the manufacturing industry as a whole, including AFIs, only the salaried job data are available, hence the decision to calcu‑late a single productivity indicator aggregating all these sectors.
Figure IVTrends in employment and GDP in New Caledonia
0
200
400
600
800
1 000
1 200
0
20 000
40 000
60 000
80 000
100 000
Salaried public-sector employment Salaried private-sector employment
Total employment GDP (billions of F. CFP, right axis)
1990 1993 1996 1999 2002 2005 2008 2011 2014
Unit: Number of salaried jobs (left axis), GDP in billions F. CFP (right axis).Scope: New Caledonia.Sources: Institut de la statistique et des études économiques de la Nouvelle‑Calédonie (ISEE) ‑ Comptes économiques définitifs; Comptes économiques rapides de l’Outre-mer (CEROM, 2016) / Nouvelle-Calédonie and Tableaux de l’économie calédonienne 2016, http://www.isee.nc/publications/table-de-l-economie-caledonienne-tec; CAFAT (Social Security Fund of New Caledonia); RIDET (Company and Establishment Identification Directory); authors’ calculations.
ECONOMIE ET STATISTIQUE / ECONOMICS AND STATISTICS N° 499, 2018 37
Sectoral labour productivity and economic competitiveness in New Caledonia
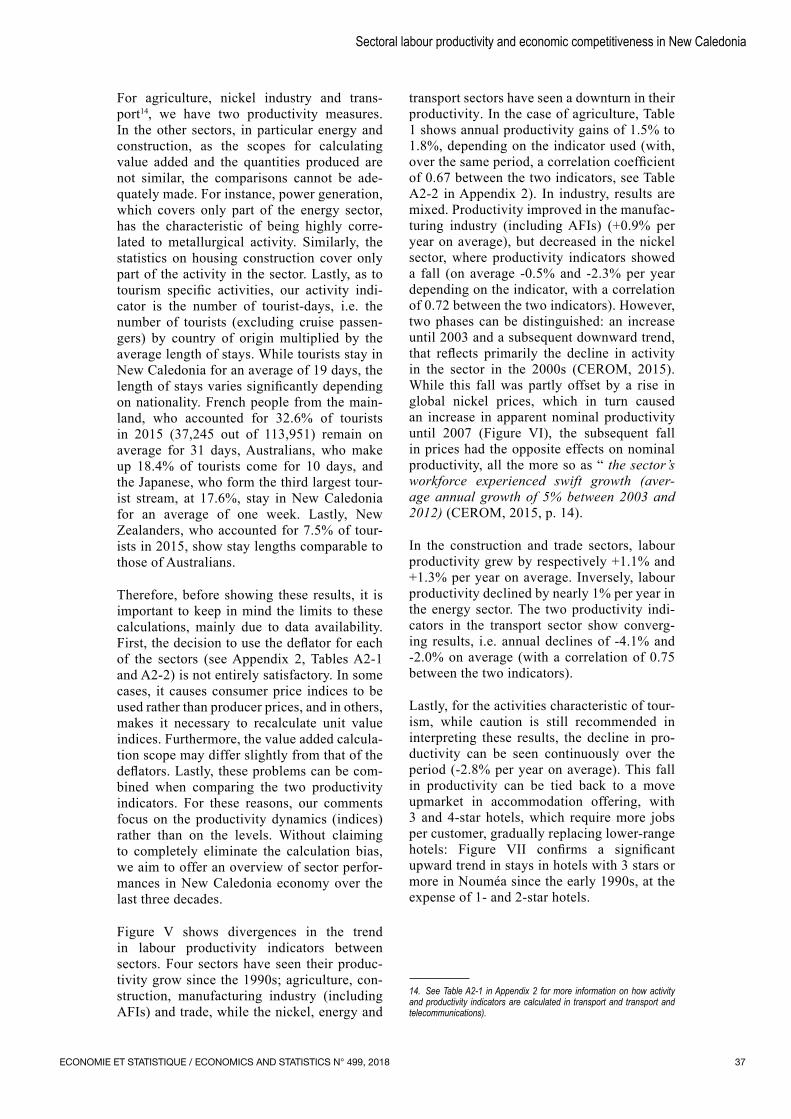
For agriculture, nickel industry and trans‑port14, we have two productivity measures. In the other sectors, in particular energy and construction, as the scopes for calculating value added and the quantities produced are not similar, the comparisons cannot be ade‑quately made. For instance, power generation, which covers only part of the energy sector, has the characteristic of being highly corre‑lated to metallurgical activity. Similarly, the statistics on housing construction cover only part of the activity in the sector. Lastly, as to tourism specific activities, our activity indi‑cator is the number of tourist‑days, i.e. the number of tourists (excluding cruise passen‑gers) by country of origin multiplied by the average length of stays. While tourists stay in New Caledonia for an average of 19 days, the length of stays varies significantly depending on nationality. French people from the main‑land, who accounted for 32.6% of tourists in 2015 (37,245 out of 113,951) remain on average for 31 days, Australians, who make up 18.4% of tourists come for 10 days, and the Japanese, who form the third largest tour‑ist stream, at 17.6%, stay in New Caledonia for an average of one week. Lastly, New Zealanders, who accounted for 7.5% of tour‑ists in 2015, show stay lengths comparable to those of Australians.
Therefore, before showing these results, it is important to keep in mind the limits to these calculations, mainly due to data availability. First, the decision to use the deflator for each of the sectors (see Appendix 2, Tables A2‑1 and A2‑2) is not entirely satisfactory. In some cases, it causes consumer price indices to be used rather than producer prices, and in others, makes it necessary to recalculate unit value indices. Furthermore, the value added calcula‑tion scope may differ slightly from that of the deflators. Lastly, these problems can be com‑bined when comparing the two productivity indicators. For these reasons, our comments focus on the productivity dynamics (indices) rather than on the levels. Without claiming to completely eliminate the calculation bias, we aim to offer an overview of sector perfor‑mances in New Caledonia economy over the last three decades.
Figure V shows divergences in the trend in labour productivity indicators between sectors. Four sectors have seen their produc‑tivity grow since the 1990s; agriculture, con‑struction, manufacturing industry (including AFIs) and trade, while the nickel, energy and
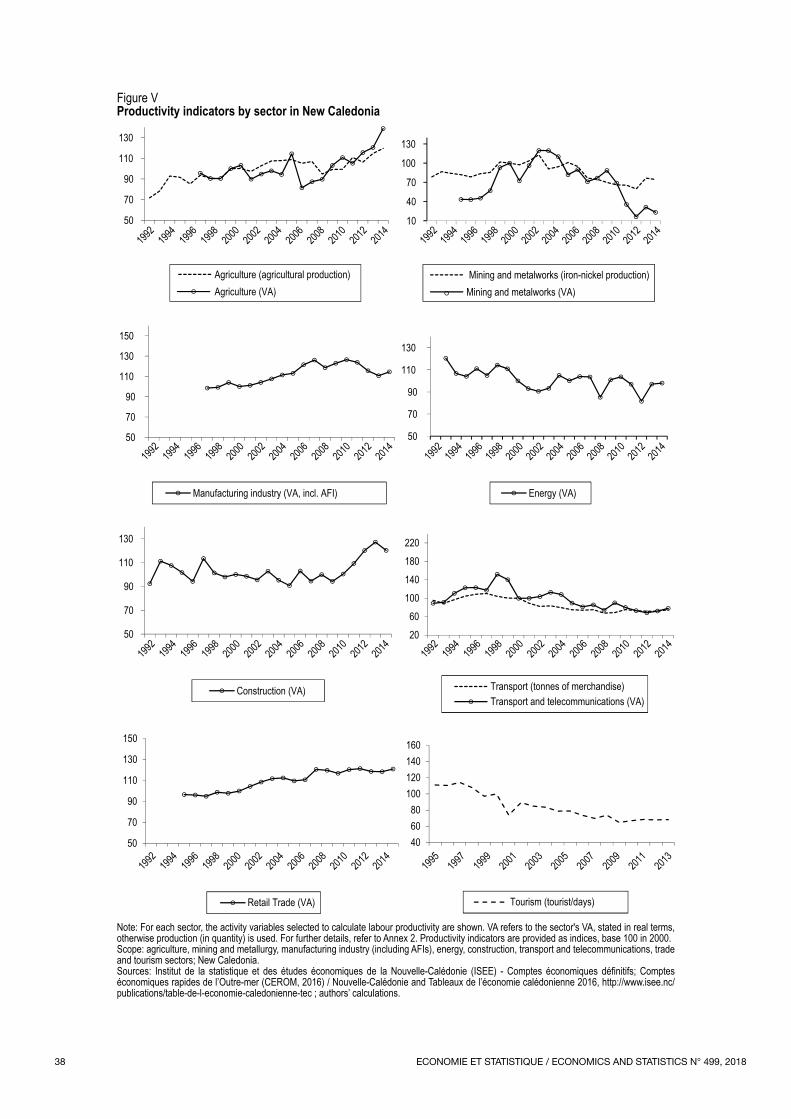
transport sectors have seen a downturn in their productivity14. In the case of agriculture, Table 1 shows annual productivity gains of 1.5% to 1.8%, depending on the indicator used (with, over the same period, a correlation coefficient of 0.67 between the two indicators, see Table A2‑2 in Appendix 2). In industry, results are mixed. Productivity improved in the manufac‑turing industry (including AFIs) (+0.9% per year on average), but decreased in the nickel sector, where productivity indicators showed a fall (on average ‑0.5% and ‑2.3% per year depending on the indicator, with a correlation of 0.72 between the two indicators). However, two phases can be distinguished: an increase until 2003 and a subsequent downward trend, that reflects primarily the decline in activity in the sector in the 2000s (CEROM, 2015). While this fall was partly offset by a rise in global nickel prices, which in turn caused an increase in apparent nominal productivity until 2007 (Figure VI), the subsequent fall in prices had the opposite effects on nominal productivity, all the more so as “ the sector’s workforce experienced swift growth (aver‑age annual growth of 5% between 2003 and 2012) (CEROM, 2015, p. 14).
In the construction and trade sectors, labour productivity grew by respectively +1.1% and +1.3% per year on average. Inversely, labour productivity declined by nearly 1% per year in the energy sector. The two productivity indi‑cators in the transport sector show converg‑ing results, i.e. annual declines of ‑4.1% and ‑2.0% on average (with a correlation of 0.75 between the two indicators).
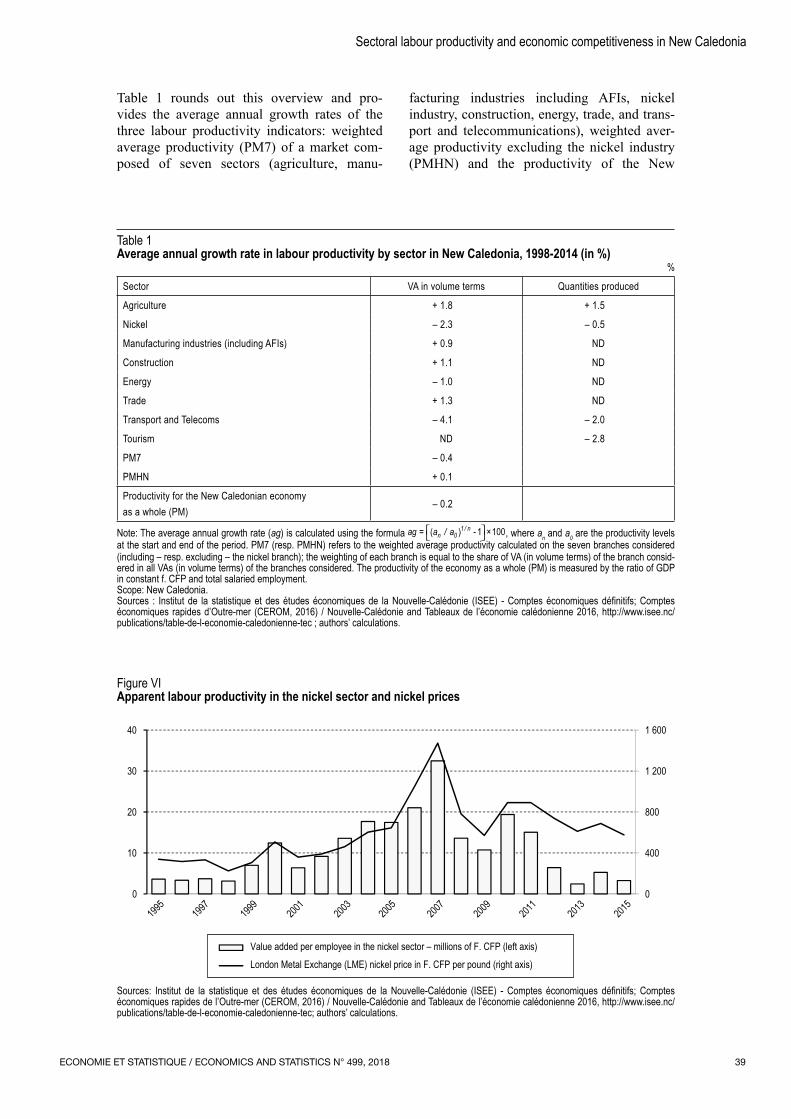
Lastly, for the activities characteristic of tour‑ism, while caution is still recommended in interpreting these results, the decline in pro‑ductivity can be seen continuously over the period (‑2.8% per year on average). This fall in productivity can be tied back to a move upmarket in accommodation offering, with 3 and 4‑star hotels, which require more jobs per customer, gradually replacing lower‑range hotels: Figure VII confirms a significant upward trend in stays in hotels with 3 stars or more in Nouméa since the early 1990s, at the expense of 1‑ and 2‑star hotels.
14. See Table A2‑1 in Appendix 2 for more information on how activity and productivity indicators are calculated in transport and transport and telecommunications).
ECONOMIE ET STATISTIQUE / ECONOMICS AND STATISTICS N° 499, 201838
Figure V Productivity indicators by sector in New Caledonia
50
70
90
110
130
Agriculture (agricultural production)Agriculture (VA)
10
40
70
100
130
Mining and metalworks (iron-nickel production)Mining and metalworks (VA)
50
70
90
110
130
150
Manufacturing industry (VA, incl. AFI)
50
70
90
110
130
Energy (VA)
50
70
90
110
130
Construction (VA)
2060
100140180220
Transport (tonnes of merchandise)Transport and telecommunications (VA)
50
70
90
110
130
150
Retail Trade (VA)
406080
100120140160
Tourism (tourist/days)
1992
1994
1996
1998
2000
2002
2004
2006
2008
2010
2012
2014
1992
1994
1996
1998
2000
2002
2004
2006
2008
2010
2012
2014
1992
1994
1996
1998
2000
2002
2004
2006
2008
2010
2012
2014
1992
1994
1996
1998
2000
2002
2004
2006
2008
2010
2012
2014
1992
1994
1996
1998
2000
2002
2004
2006
2008
2010
2012
2014
1992
1994
1996
1998
2000
2002
2004
2006
2008
2010
2012
2014
1992
1994
1996
1998
2000
2002
2004
2006
2008
2010
2012
2014
1995
1997
1999
2001
2003
2005
2007
2009
2011
2013
Note: For each sector, the activity variables selected to calculate labour productivity are shown. VA refers to the sector's VA, stated in real terms, otherwise production (in quantity) is used. For further details, refer to Annex 2. Productivity indicators are provided as indices, base 100 in 2000.Scope: agriculture, mining and metallurgy, manufacturing industry (including AFIs), energy, construction, transport and telecommunications, trade and tourism sectors; New Caledonia.Sources: Institut de la statistique et des études économiques de la Nouvelle‑Calédonie (ISEE) ‑ Comptes économiques définitifs; Comptes économiques rapides de l’Outre-mer (CEROM, 2016) / Nouvelle-Calédonie and Tableaux de l’économie calédonienne 2016, http://www.isee.nc/publications/table-de-l-economie-caledonienne-tec ; authors’ calculations.
ECONOMIE ET STATISTIQUE / ECONOMICS AND STATISTICS N° 499, 2018 39
Sectoral labour productivity and economic competitiveness in New Caledonia
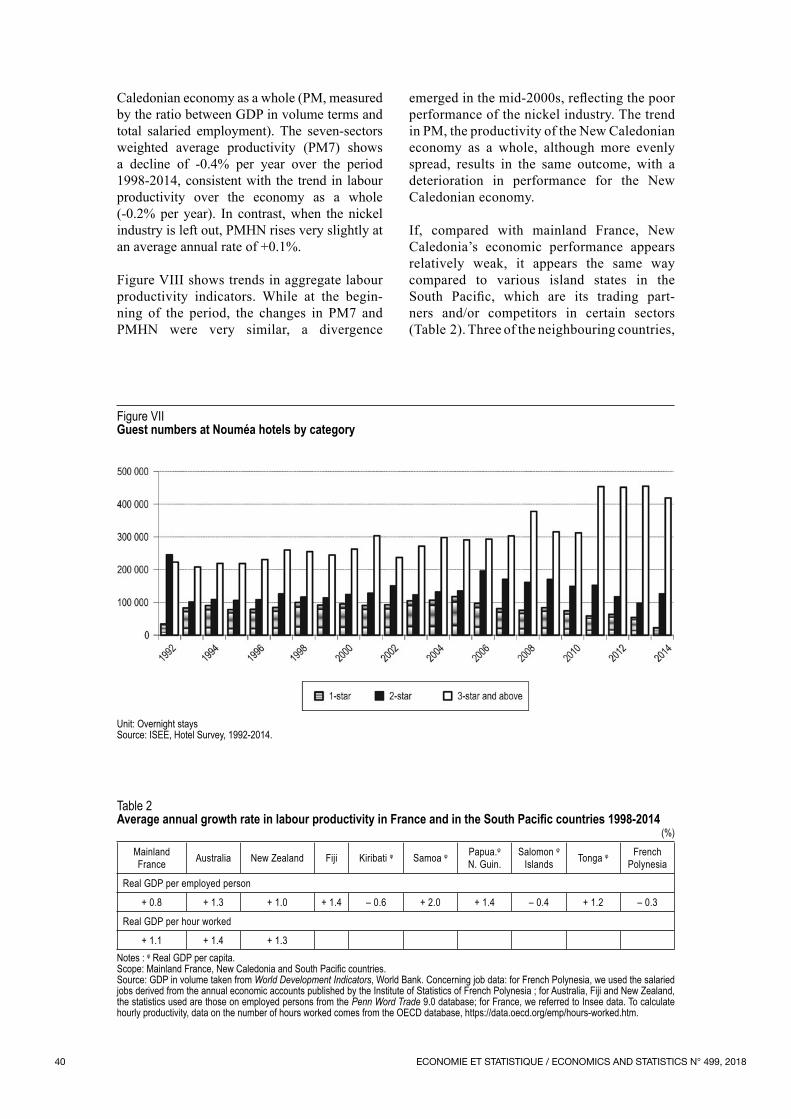
Table 1 rounds out this overview and pro‑vides the average annual growth rates of the three labour productivity indicators: weighted average productivity (PM7) of a market com‑posed of seven sectors (agriculture, manu‑
facturing industries including AFIs, nickel industry, construction, energy, trade, and trans‑port and telecommunications), weighted aver‑age productivity excluding the nickel industry (PMHN) and the productivity of the New
Figure VIApparent labour productivity in the nickel sector and nickel prices
0
400
800
1 200
1 600
0
10
20
30
40
Value added per employee in the nickel sector – millions of F. CFP (left axis)London Metal Exchange (LME) nickel price in F. CFP per pound (right axis)
1995
1997
1999
2001
2003
2005
2007
2009
2011
2013
2015
Sources: Institut de la statistique et des études économiques de la Nouvelle‑Calédonie (ISEE) ‑ Comptes économiques définitifs; Comptes économiques rapides de l’Outre-mer (CEROM, 2016) / Nouvelle-Calédonie and Tableaux de l’économie calédonienne 2016, http://www.isee.nc/publications/table-de-l-economie-caledonienne-tec; authors’ calculations.
Table 1Average annual growth rate in labour productivity by sector in New Caledonia, 1998‑2014 (in %)
%
Sector VA in volume terms Quantities produced
Agriculture + 1.8 + 1.5
Nickel – 2.3 – 0.5
Manufacturing industries (including AFIs) + 0.9 ND
Construction + 1.1 ND
Energy – 1.0 ND
Trade + 1.3 ND
Transport and Telecoms – 4.1 – 2.0
Tourism ND – 2.8
PM7 – 0.4
PMHN + 0.1
Productivity for the New Caledonian economy as a whole (PM)
– 0.2
Note: The average annual growth rate (ag) is calculated using the formula ag a / an 01 / n= ( ) - 1 ×100 , where an and a0 are the productivity levels
at the start and end of the period. PM7 (resp. PMHN) refers to the weighted average productivity calculated on the seven branches considered (including – resp. excluding – the nickel branch); the weighting of each branch is equal to the share of VA (in volume terms) of the branch consid-ered in all VAs (in volume terms) of the branches considered. The productivity of the economy as a whole (PM) is measured by the ratio of GDP in constant f. CFP and total salaried employment.Scope: New Caledonia.Sources : Institut de la statistique et des études économiques de la Nouvelle‑Calédonie (ISEE) ‑ Comptes économiques définitifs; Comptes économiques rapides d’Outre-mer (CEROM, 2016) / Nouvelle-Calédonie and Tableaux de l’économie calédonienne 2016, http://www.isee.nc/publications/table-de-l-economie-caledonienne-tec ; authors’ calculations.
ECONOMIE ET STATISTIQUE / ECONOMICS AND STATISTICS N° 499, 201840
Figure VIIGuest numbers at Nouméa hotels by category
Unit: Overnight staysSource: ISEE, Hotel Survey, 1992-2014.
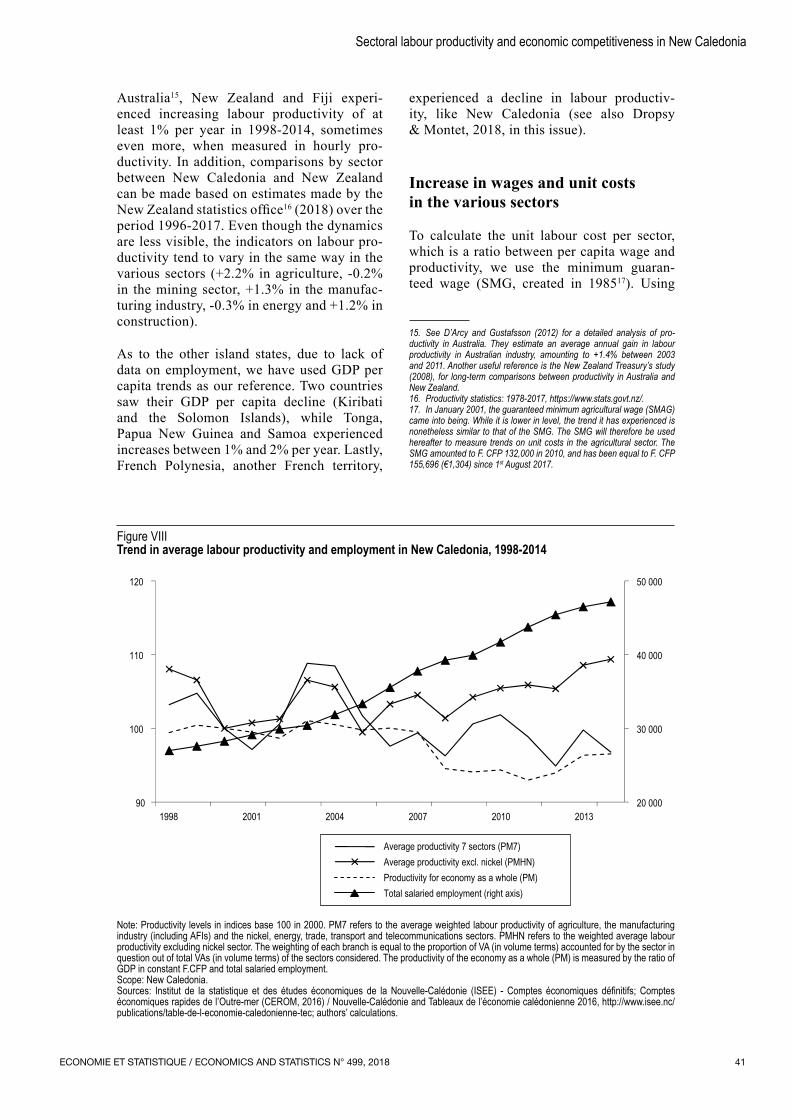
Caledonian economy as a whole (PM, measured by the ratio between GDP in volume terms and total salaried employment). The seven‑sectors weighted average productivity (PM7) shows a decline of ‑0.4% per year over the period 1998‑2014, consistent with the trend in labour productivity over the economy as a whole (‑0.2% per year). In contrast, when the nickel industry is left out, PMHN rises very slightly at an average annual rate of +0.1%.
Figure VIII shows trends in aggregate labour productivity indicators. While at the begin‑ning of the period, the changes in PM7 and PMHN were very similar, a divergence
emerged in the mid‑2000s, reflecting the poor performance of the nickel industry. The trend in PM, the productivity of the New Caledonian economy as a whole, although more evenly spread, results in the same outcome, with a deterioration in performance for the New Caledonian economy.
If, compared with mainland France, New Caledonia’s economic performance appears relatively weak, it appears the same way compared to various island states in the South Pacific, which are its trading part‑ners and/or competitors in certain sectors (Table 2). Three of the neighbouring countries,
Table 2Average annual growth rate in labour productivity in France and in the South Pacific countries 1998‑2014
(%)
Mainland France Australia New Zealand Fiji Kiribati φ Samoa φ Papua.φ
N. Guin.Salomon φ
Islands Tonga φ French Polynesia
Real GDP per employed person
+ 0.8 + 1.3 + 1.0 + 1.4 – 0.6 + 2.0 + 1.4 – 0.4 + 1.2 – 0.3
Real GDP per hour worked
+ 1.1 + 1.4 + 1.3Notes : φ Real GDP per capita.Scope: Mainland France, New Caledonia and South Pacific countries.Source: GDP in volume taken from World Development Indicators, World Bank. Concerning job data: for French Polynesia, we used the salaried jobs derived from the annual economic accounts published by the Institute of Statistics of French Polynesia ; for Australia, Fiji and New Zealand, the statistics used are those on employed persons from the Penn Word Trade 9.0 database; for France, we referred to Insee data. To calculate hourly productivity, data on the number of hours worked comes from the OECD database, https://data.oecd.org/emp/hours-worked.htm.
ECONOMIE ET STATISTIQUE / ECONOMICS AND STATISTICS N° 499, 2018 41
Sectoral labour productivity and economic competitiveness in New Caledonia
Figure VIIITrend in average labour productivity and employment in New Caledonia, 1998‑2014
20 000
30 000
40 000
50 000
90
100
110
120
Average productivity 7 sectors (PM7)Average productivity excl. nickel (PMHN)
1998 2001 2004 2007 2010 2013
Productivity for economy as a whole (PM)Total salaried employment (right axis)
Note: Productivity levels in indices base 100 in 2000. PM7 refers to the average weighted labour productivity of agriculture, the manufacturing industry (including AFIs) and the nickel, energy, trade, transport and telecommunications sectors. PMHN refers to the weighted average labour productivity excluding nickel sector. The weighting of each branch is equal to the proportion of VA (in volume terms) accounted for by the sector in question out of total VAs (in volume terms) of the sectors considered. The productivity of the economy as a whole (PM) is measured by the ratio of GDP in constant F.CFP and total salaried employment.Scope: New Caledonia.Sources: Institut de la statistique et des études économiques de la Nouvelle‑Calédonie (ISEE) ‑ Comptes économiques définitifs; Comptes économiques rapides de l’Outre-mer (CEROM, 2016) / Nouvelle-Calédonie and Tableaux de l’économie calédonienne 2016, http://www.isee.nc/publications/table-de-l-economie-caledonienne-tec; authors’ calculations.
Australia15, New Zealand and Fiji experi‑enced in creasing labour productivity of at least 1% per year in 1998‑2014, sometimes even more, when measured in hourly pro‑ductivity. In addition, comparisons by sector between New Caledonia and New Zealand can be made based on estimates made by the New Zealand statistics office16 (2018) over the period 1996‑2017. Even though the dynamics are less visible, the indicators on labour pro‑ductivity tend to vary in the same way in the various sectors (+2.2% in agriculture, ‑0.2% in the mining sector, +1.3% in the manufac‑turing industry, ‑0.3% in energy and +1.2% in construction).
As to the other island states, due to lack of data on employment, we have used GDP per capita trends as our reference. Two countries saw their GDP per capita decline (Kiribati and the Solomon Islands), while Tonga, Papua New Guinea and Samoa experienced increases between 1% and 2% per year. Lastly, French Polynesia, another French territory,
experienced a decline in labour productiv‑ity, like New Caledonia (see also Dropsy & Montet, 2018, in this issue).1516
Increase in wages and unit costs in the various sectors
To calculate the unit labour cost per sector, which is a ratio between per capita wage and productivity, we use the minimum guaran‑teed wage (SMG, created in 198517). Using
15. See D’Arcy and Gustafsson (2012) for a detailed analysis of pro‑ductivity in Australia. They estimate an average annual gain in labour productivity in Australian industry, amounting to +1.4% between 2003 and 2011. Another useful reference is the New Zealand Treasury’s study (2008), for long‑term comparisons between productivity in Australia and New Zealand. 16. Productivity statistics: 1978‑2017, https://www.stats.govt.nz/.17. In January 2001, the guaranteed minimum agricultural wage (SMAG) came into being. While it is lower in level, the trend it has experienced is nonetheless similar to that of the SMG. The SMG will therefore be used hereafter to measure trends on unit costs in the agricultural sector. The SMG amounted to F. CFP 132,000 in 2010, and has been equal to F. CFP 155,696 (€1,304) since 1st August 2017.
ECONOMIE ET STATISTIQUE / ECONOMICS AND STATISTICS N° 499, 201842
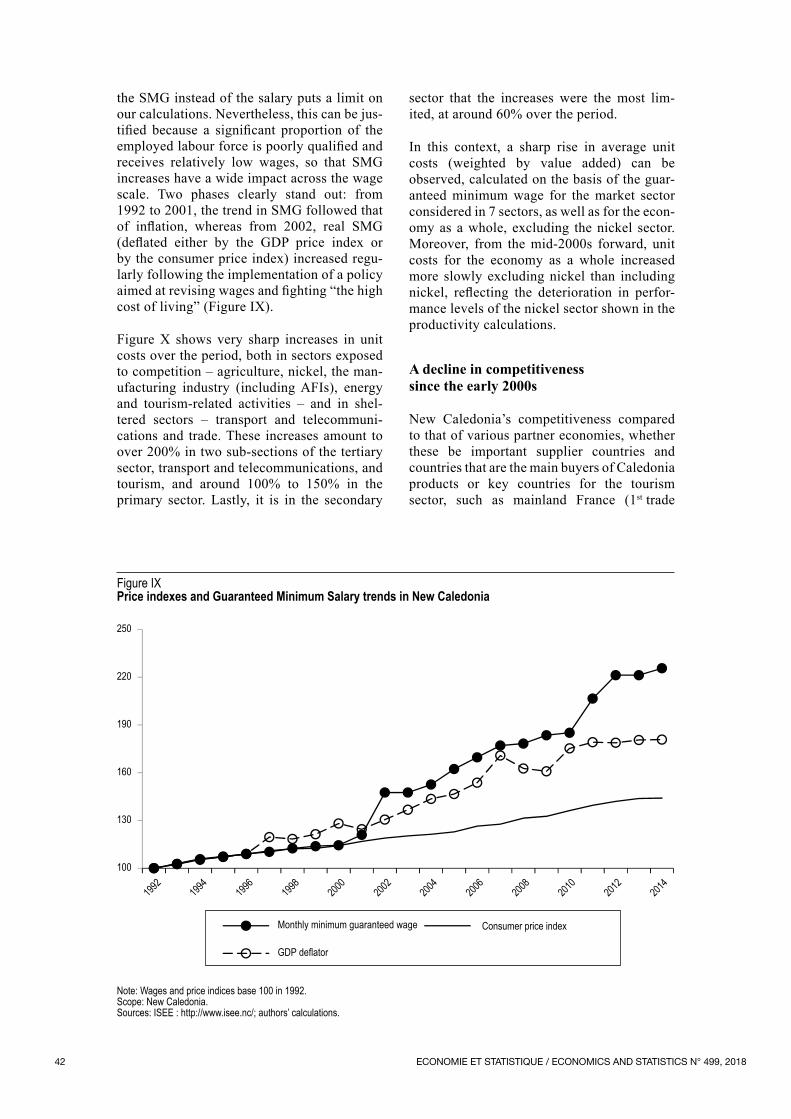
the SMG instead of the salary puts a limit on our calculations. Nevertheless, this can be jus‑tified because a significant proportion of the employed labour force is poorly qualified and receives relatively low wages, so that SMG increases have a wide impact across the wage scale. Two phases clearly stand out: from 1992 to 2001, the trend in SMG followed that of inflation, whereas from 2002, real SMG (deflated either by the GDP price index or by the consumer price index) increased regu‑larly following the implementation of a policy aimed at revising wages and fighting “the high cost of living” (Figure IX).
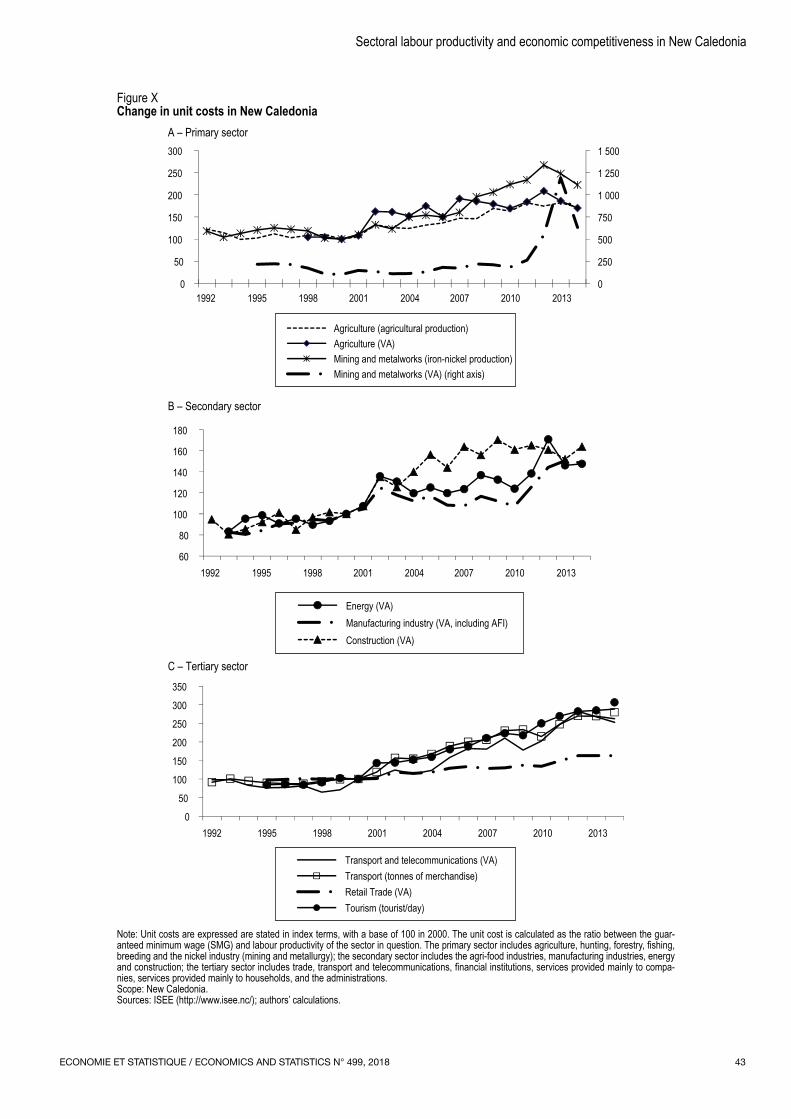
Figure X shows very sharp increases in unit costs over the period, both in sectors exposed to competition – agriculture, nickel, the man‑ufacturing industry (including AFIs), energy and tourism‑related activities – and in shel‑tered sectors – transport and telecommuni‑cations and trade. These increases amount to over 200% in two sub‑sections of the tertiary sector, transport and telecommunications, and tourism, and around 100% to 150% in the primary sector. Lastly, it is in the secondary
sector that the increases were the most lim‑ited, at around 60% over the period.
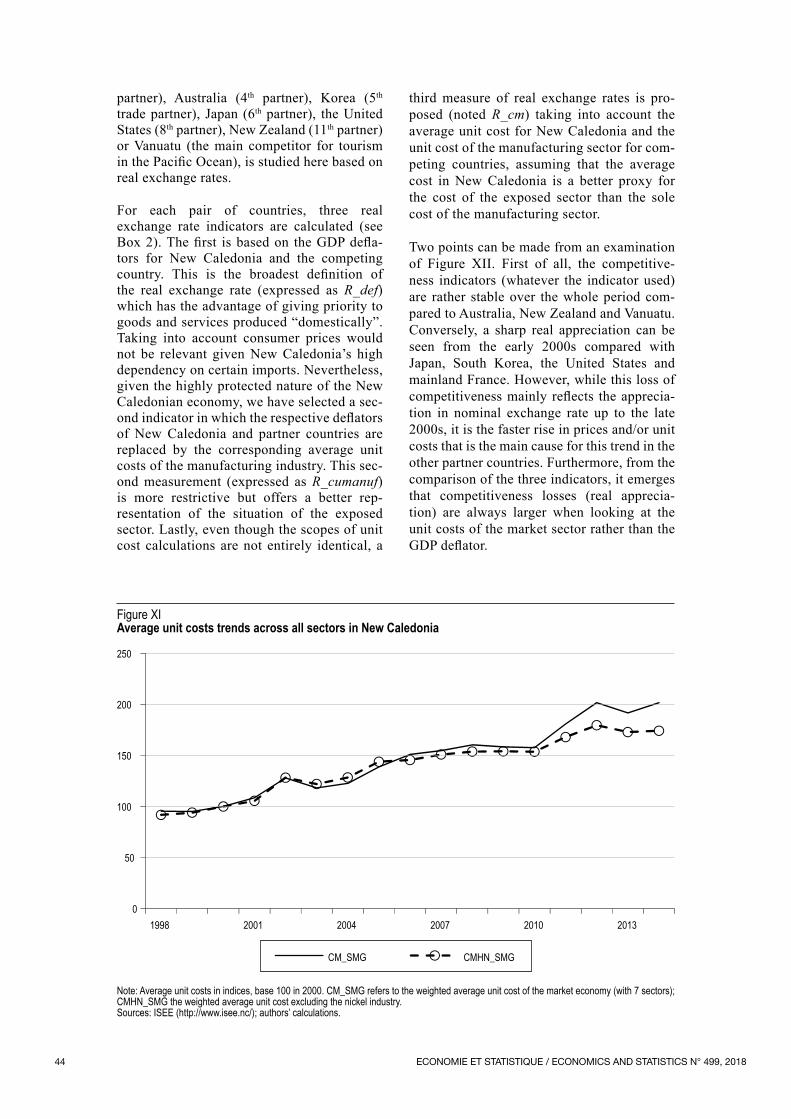
In this context, a sharp rise in average unit costs (weighted by value added) can be observed, calculated on the basis of the guar‑anteed minimum wage for the market sector considered in 7 sectors, as well as for the econ‑omy as a whole, excluding the nickel sector. Moreover, from the mid‑2000s forward, unit costs for the economy as a whole increased more slowly excluding nickel than including nickel, reflecting the deterioration in perfor‑mance levels of the nickel sector shown in the productivity calculations.
A decline in competitiveness since the early 2000s
New Caledonia’s competitiveness compared to that of various partner economies, whether these be important supplier countries and countries that are the main buyers of Caledonia products or key countries for the tourism sector, such as mainland France (1st trade
Figure IX Price indexes and Guaranteed Minimum Salary trends in New Caledonia
100
130
160
190
220
250
Monthly minimum guaranteed wage Consumer price index
GDP deflator
1992
1994
1996
1998
2000
2002
2004
2006
2008
2010
2012
2014
Note: Wages and price indices base 100 in 1992.Scope: New Caledonia.Sources: ISEE : http://www.isee.nc/; authors’ calculations.
ECONOMIE ET STATISTIQUE / ECONOMICS AND STATISTICS N° 499, 2018 43
Sectoral labour productivity and economic competitiveness in New Caledonia
Figure X Change in unit costs in New Caledonia
A – Primary sector
B – Secondary sector
C – Tertiary sector
0
250
500
750
1 000
1 250
1 500
0
50
100
150
200
250
300
Agriculture (agricultural production)Agriculture (VA)Mining and metalworks (iron-nickel production)Mining and metalworks (VA) (right axis)
60
80
100
120
140
160
180
Energy (VA)Manufacturing industry (VA, including AFI)Construction (VA)
0
50
100
150
200
250
300
350
Transport and telecommunications (VA)Transport (tonnes of merchandise)Retail Trade (VA)Tourism (tourist/day)
1992 1995 1998 2001 2004 2007 2010 2013
1992 1995 1998 2001 2004 2007 2010 2013
1992 1995 1998 2001 2004 2007 2010 2013
Note: Unit costs are expressed are stated in index terms, with a base of 100 in 2000. The unit cost is calculated as the ratio between the guar-anteed minimum wage (SMG) and labour productivity of the sector in question. The primary sector includes agriculture, hunting, forestry, fishing, breeding and the nickel industry (mining and metallurgy); the secondary sector includes the agri-food industries, manufacturing industries, energy and construction; the tertiary sector includes trade, transport and telecommunications, financial institutions, services provided mainly to compa-nies, services provided mainly to households, and the administrations.Scope: New Caledonia.Sources: ISEE (http://www.isee.nc/); authors’ calculations.
ECONOMIE ET STATISTIQUE / ECONOMICS AND STATISTICS N° 499, 201844
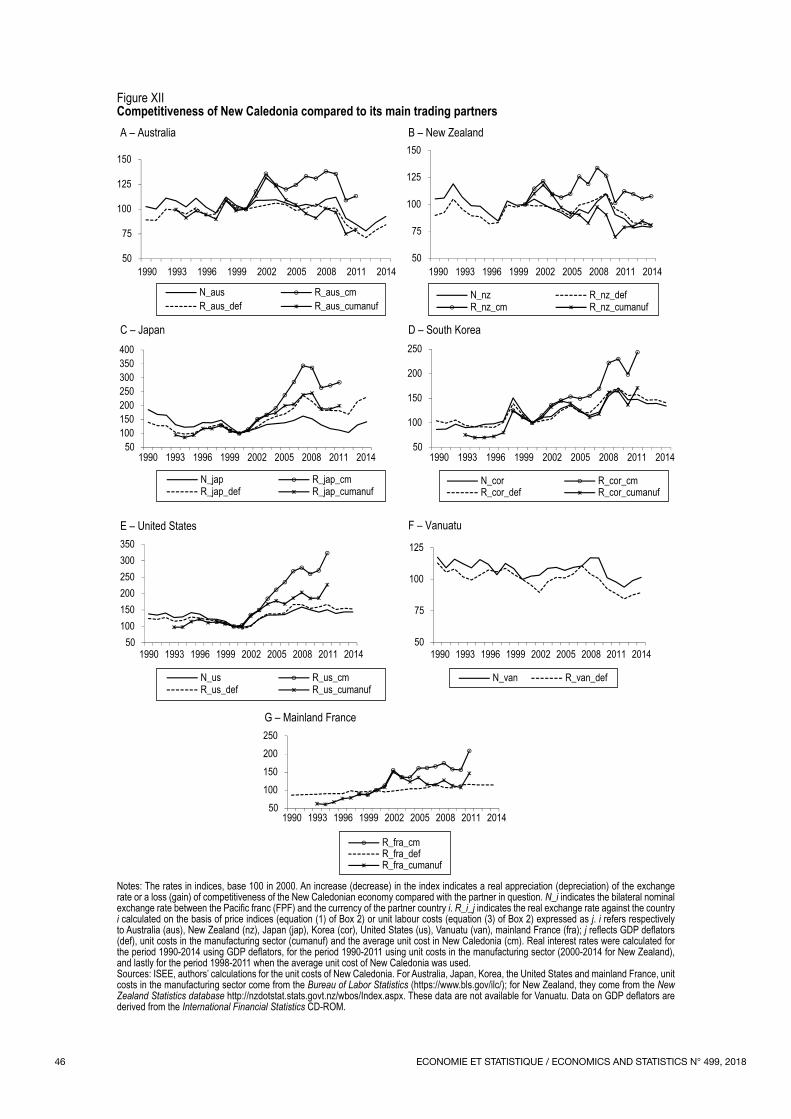
partner), Australia (4th partner), Korea (5th trade partner), Japan (6th partner), the United States (8th partner), New Zealand (11th partner) or Vanuatu (the main competitor for tourism in the Pacific Ocean), is studied here based on real exchange rates.
For each pair of countries, three real exchange rate indicators are calculated (see Box 2). The first is based on the GDP defla‑tors for New Caledonia and the competing country. This is the broadest definition of the real exchange rate (expressed as R_def) which has the advantage of giving priority to goods and services produced “domestically”. Taking into account consumer prices would not be relevant given New Caledonia’s high dependency on certain imports. Nevertheless, given the highly protected nature of the New Caledonian economy, we have selected a sec‑ond indicator in which the respective deflators of New Caledonia and partner countries are replaced by the corresponding average unit costs of the manufacturing industry. This sec‑ond measurement (expressed as R_cumanuf) is more restrictive but offers a better rep‑resentation of the situation of the exposed sector. Lastly, even though the scopes of unit cost calculations are not entirely identical, a
third measure of real exchange rates is pro‑posed (noted R_cm) taking into account the average unit cost for New Caledonia and the unit cost of the manufacturing sector for com‑peting countries, assuming that the average cost in New Caledonia is a better proxy for the cost of the exposed sector than the sole cost of the manufacturing sector.
Two points can be made from an examination of Figure XII. First of all, the competitive‑ness indicators (whatever the indicator used) are rather stable over the whole period com‑pared to Australia, New Zealand and Vanuatu. Conversely, a sharp real appreciation can be seen from the early 2000s compared with Japan, South Korea, the United States and mainland France. However, while this loss of competitiveness mainly reflects the apprecia‑tion in nominal exchange rate up to the late 2000s, it is the faster rise in prices and/or unit costs that is the main cause for this trend in the other partner countries. Furthermore, from the comparison of the three indicators, it emerges that competitiveness losses (real apprecia‑tion) are always larger when looking at the unit costs of the market sector rather than the GDP deflator.
Figure XIAverage unit costs trends across all sectors in New Caledonia
0
50
100
150
200
250
CM_SMG CMHN_SMG
1998 2001 2004 2007 2010 2013
Note: Average unit costs in indices, base 100 in 2000. CM_SMG refers to the weighted average unit cost of the market economy (with 7 sectors); CMHN_SMG the weighted average unit cost excluding the nickel industry.Sources: ISEE (http://www.isee.nc/); authors’ calculations.
ECONOMIE ET STATISTIQUE / ECONOMICS AND STATISTICS N° 499, 2018 45
Sectoral labour productivity and economic competitiveness in New Caledonia
Lastly, the F. CFP anchored to the Euro18, and thus to the trend in bilateral nominal exchange rates, obviously has an impact on the dynam‑ics of real exchange rates, especially in the short term. Nevertheless, the analysis high‑lights a loss of structural competitiveness in New Caledonia, especially compared with mainland France and Japan.
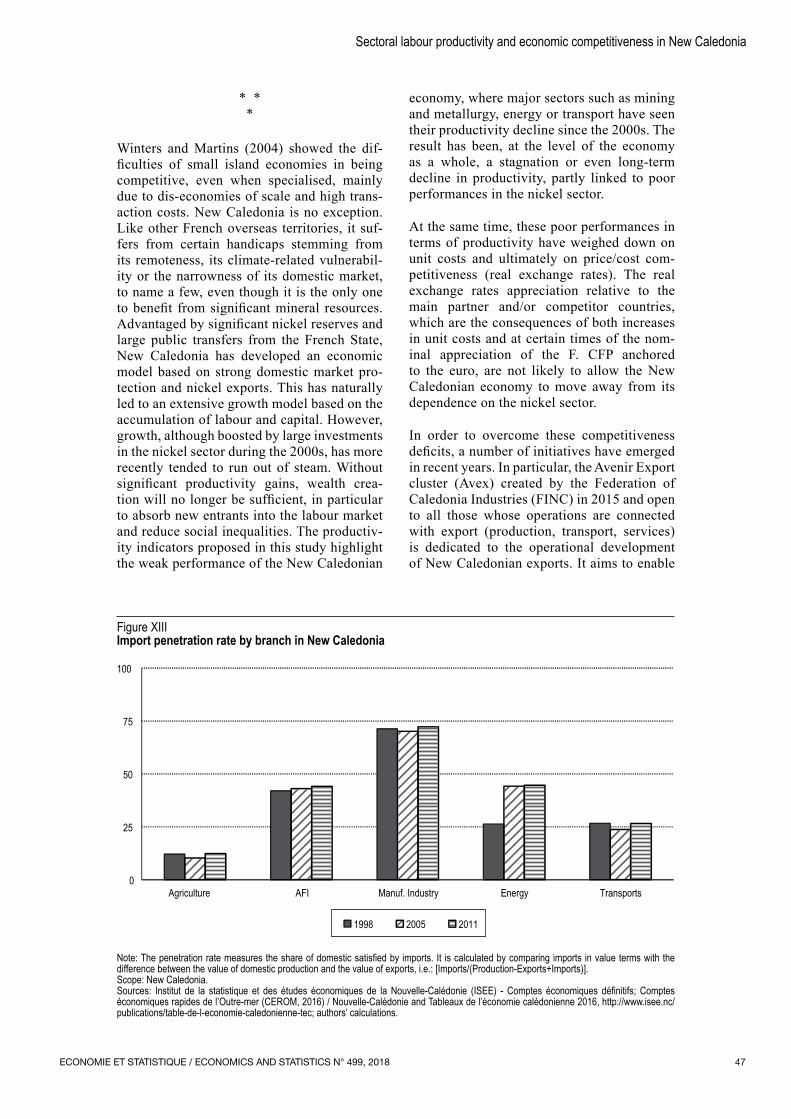
Lastly, the loss of competitiveness did not come alongside an increase in the Caledonian market penetration. Import penetration rates by branch remained relatively constant over the period 1998‑2011, with the exception of energy, which increased sharply. Moreover, these rates differ sharply; they are very low for agriculture and transport, and higher for energy and industry (Figure XIII). These
conclusions are not surprising in view of the economic strategy followed in the territory. When New Caledonian companies are una‑ble to substitute goods for imports, penetra‑tion rates are very high. This is the case, for example, with capital goods with a penetra‑tion rate of 93.2% in 20111819. Conversely, when the possibility of competing with imported goods exists, as in agriculture and the AFIs, the New Caledonian government implements various protectionist measures to limit domes‑tic market penetration (CEROM, 2011 p. 16, and footnote n° 9).
18. Fixed rate, with parity of 1 euro = 119.33 F. CFP.19. The rate exceeded 96% in 1998.
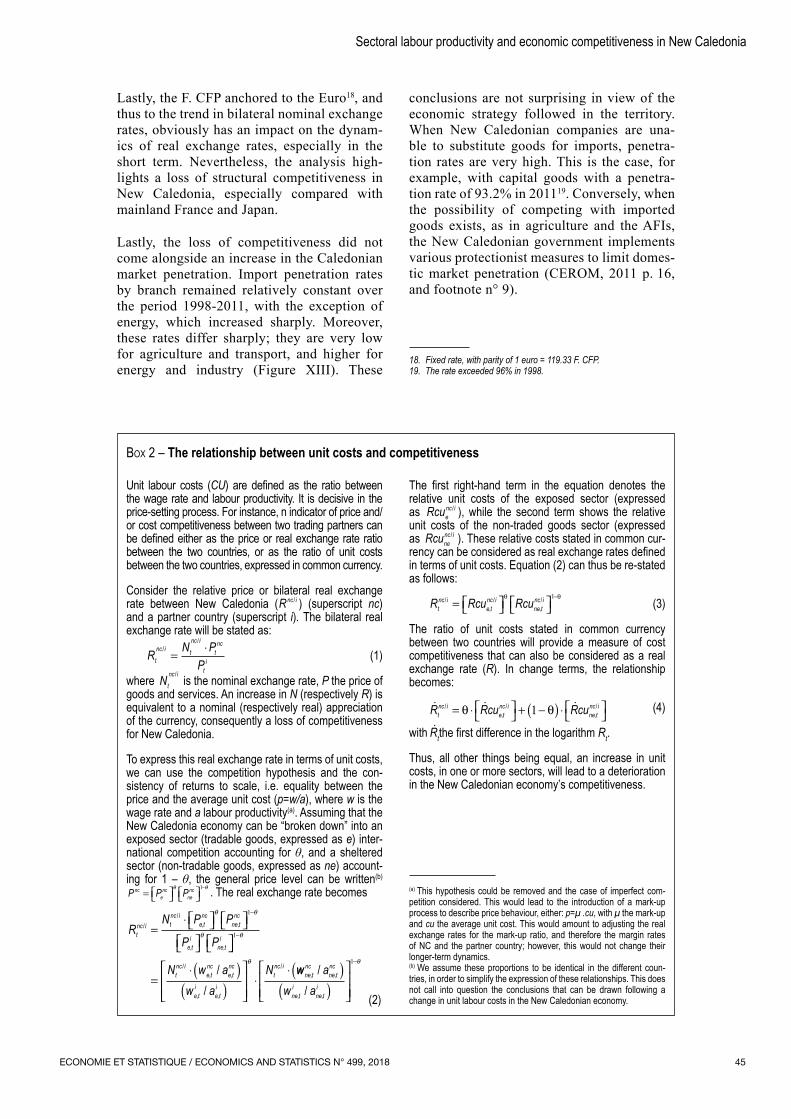
Box 2 – The relationship between unit costs and competitiveness
Unit labour costs (CU) are defined as the ratio between the wage rate and labour productivity. It is decisive in the price-setting process. For instance, n indicator of price and/or cost competitiveness between two trading partners can be defined either as the price or real exchange rate ratio between the two countries, or as the ratio of unit costs between the two countries, expressed in common currency.
Consider the relative price or bilateral real exchange rate between New Caledonia (Rnc i/ ) (superscript nc) and a partner country (superscript i). The bilateral real exchange rate will be stated as:
R N PPt
nc i t
nc i
tnc
ti
//
= ⋅ (1)
where Nt
nc i/ is the nominal exchange rate, P the price of goods and services. An increase in N (respectively R) is equivalent to a nominal (respectively real) appreciation of the currency, consequently a loss of competitiveness for New Caledonia.
To express this real exchange rate in terms of unit costs, we can use the competition hypothesis and the con-sistency of returns to scale, i.e. equality between the price and the average unit cost (p=w/a), where w is the wage rate and a labour productivity(a). Assuming that the New Caledonia economy can be “broken down” into an exposed sector (tradable goods, expressed as e) inter-national competition accounting for θ, and a sheltered sector (non-tradable goods, expressed as ne) account-ing for 1 – θ, the general price level can be written(b) P P Pnc
enc
nenc=
−θ θ1 . The real exchange rate becomes
RN P P
P Ptnc i t
nc i ncnnc
ini
//
=⋅
−
e,t e,t
e,t e,t
θ θ
θ
1
=⋅ ( )
( )
⋅⋅
−1 θ
θN w a
w aNt
nc i nc nc
i i
tnc i/ //
/e,t e,t
e,t e,t
ww aw a
nnc
nnc
ni
ni
e,t e,t
e,t e,t
//
( )( )
−1 θ
(2)
The first right‑hand term in the equation denotes the relative unit costs of the exposed sector (expressed as Rcue
nc i/ ), while the second term shows the relative unit costs of the non-traded goods sector (expressed as Rcune
nc i/ ). These relative costs stated in common cur-rency can be considered as real exchange rates defined in terms of unit costs. Equation (2) can thus be re-stated as follows:
R Rcu Rcutnc i nc i
nnc i/ / /=
−
e,t e,t
θ θ1 (3)
The ratio of unit costs stated in common currency between two countries will provide a measure of cost competitiveness that can also be considered as a real exchange rate (R). In change terms, the relationship becomes:
R Rcu Rcutnc i nc i
nnc i/ / /= ⋅
+ −( ) ⋅
θ θe,t e,t1 (4)
with .
Rt the first difference in the logarithm Rt.
Thus, all other things being equal, an increase in unit costs, in one or more sectors, will lead to a deterioration in the New Caledonian economy’s competitiveness.
(a) This hypothesis could be removed and the case of imperfect com-petition considered. This would lead to the introduction of a mark-up process to describe price behaviour, either: p=μ .cu, with μ the mark-up and cu the average unit cost. This would amount to adjusting the real exchange rates for the mark-up ratio, and therefore the margin rates of NC and the partner country; however, this would not change their longer-term dynamics.(b) We assume these proportions to be identical in the different coun-tries, in order to simplify the expression of these relationships. This does not call into question the conclusions that can be drawn following a change in unit labour costs in the New Caledonian economy.
ECONOMIE ET STATISTIQUE / ECONOMICS AND STATISTICS N° 499, 201846
Figure XIICompetitiveness of New Caledonia compared to its main trading partners
C – Japan D – South Korea
E – United States F – Vanuatu
G – Mainland France
50
75
100
125
150
N_aus R_aus_cmR_aus_def R_aus_cumanuf
50
75
100
125
150
N_nz R_nz_defR_nz_cm R_nz_cumanuf
50100150200250300350400
50
100
150
200
250
N_cor R_cor_cmR_cor_def R_cor_cumanuf
50100150200250300350
50
75
100
125
N_van R_van_def
50100150200250
R_fra_cmR_fra_defR_fra_cumanuf
A – Australia B – New Zealand
1990 1993 1996 2002 2005 2008 2011 20141999 1990 1993 1996 2002 2005 2008 2011 20141999
1990 1993 1996 2002 2005 2008 2011 20141999 1990 1993 1996 2002 2005 2008 2011 20141999
1990 1993 1996 2002 2005 2008 2011 20141999 1990 1993 1996 2002 2005 2008 2011 20141999
1990 1993 1996 2002 2005 2008 2011 20141999
N_jap R_jap_cmR_jap_def R_jap_cumanuf
N_us R_us_cmR_us_def R_us_cumanuf
Notes: The rates in indices, base 100 in 2000. An increase (decrease) in the index indicates a real appreciation (depreciation) of the exchange rate or a loss (gain) of competitiveness of the New Caledonian economy compared with the partner in question. N_i indicates the bilateral nominal exchange rate between the Pacific franc (FPF) and the currency of the partner country i. R_i_j indicates the real exchange rate against the country i calculated on the basis of price indices (equation (1) of Box 2) or unit labour costs (equation (3) of Box 2) expressed as j. i refers respectively to Australia (aus), New Zealand (nz), Japan (jap), Korea (cor), United States (us), Vanuatu (van), mainland France (fra); j reflects GDP deflators (def), unit costs in the manufacturing sector (cumanuf) and the average unit cost in New Caledonia (cm). Real interest rates were calculated for the period 1990‑2014 using GDP deflators, for the period 1990‑2011 using unit costs in the manufacturing sector (2000‑2014 for New Zealand), and lastly for the period 1998-2011 when the average unit cost of New Caledonia was used.Sources: ISEE, authors’ calculations for the unit costs of New Caledonia. For Australia, Japan, Korea, the United States and mainland France, unit costs in the manufacturing sector come from the Bureau of Labor Statistics (https://www.bls.gov/ilc/); for New Zealand, they come from the New Zealand Statistics database http://nzdotstat.stats.govt.nz/wbos/Index.aspx. These data are not available for Vanuatu. Data on GDP deflators are derived from the International Financial Statistics CD-ROM.
ECONOMIE ET STATISTIQUE / ECONOMICS AND STATISTICS N° 499, 2018 47
Sectoral labour productivity and economic competitiveness in New Caledonia
* * *
Winters and Martins (2004) showed the dif‑ficulties of small island economies in being competitive, even when specialised, mainly due to dis‑economies of scale and high trans‑action costs. New Caledonia is no exception. Like other French overseas territories, it suf‑fers from certain handicaps stemming from its remoteness, its climate‑related vulnerabil‑ity or the narrowness of its domestic market, to name a few, even though it is the only one to benefit from significant mineral resources. Advantaged by significant nickel reserves and large public transfers from the French State, New Caledonia has developed an economic model based on strong domestic market pro‑tection and nickel exports. This has naturally led to an extensive growth model based on the accumulation of labour and capital. However, growth, although boosted by large investments in the nickel sector during the 2000s, has more recently tended to run out of steam. Without significant productivity gains, wealth crea‑tion will no longer be sufficient, in particular to absorb new entrants into the labour market and reduce social inequalities. The productiv‑ity indicators proposed in this study highlight the weak performance of the New Caledonian
economy, where major sectors such as mining and metallurgy, energy or transport have seen their productivity decline since the 2000s. The result has been, at the level of the economy as a whole, a stagnation or even long‑term decline in productivity, partly linked to poor performances in the nickel sector.
At the same time, these poor performances in terms of productivity have weighed down on unit costs and ultimately on price/cost com‑petitiveness (real exchange rates). The real exchange rates appreciation relative to the main partner and/or competitor countries, which are the consequences of both increases in unit costs and at certain times of the nom‑inal appreciation of the F. CFP anchored to the euro, are not likely to allow the New Caledonian economy to move away from its dependence on the nickel sector.
In order to overcome these competitiveness deficits, a number of initiatives have emerged in recent years. In particular, the Avenir Export cluster (Avex) created by the Federation of Caledonia Industries (FINC) in 2015 and open to all those whose operations are connected with export (production, transport, services) is dedicated to the operational development of New Caledonian exports. It aims to enable
Figure XIIIImport penetration rate by branch in New Caledonia
0
25
50
75
100
Agriculture
1998 2005 2011
AFI TransportsEnergyManuf. Industry
Note: The penetration rate measures the share of domestic satisfied by imports. It is calculated by comparing imports in value terms with the difference between the value of domestic production and the value of exports, i.e.: [Imports/(Production-Exports+Imports)]. Scope: New Caledonia.Sources: Institut de la statistique et des études économiques de la Nouvelle‑Calédonie (ISEE) ‑ Comptes économiques définitifs; Comptes économiques rapides de l’Outre-mer (CEROM, 2016) / Nouvelle-Calédonie and Tableaux de l’économie calédonienne 2016, http://www.isee.nc/publications/table-de-l-economie-caledonienne-tec; authors’ calculations.
ECONOMIE ET STATISTIQUE / ECONOMICS AND STATISTICS N° 499, 201848
companies to pool their resources in order to achieve the critical mass needed for export.
More broadly, a return to sustained medi‑um‑term growth in New Caledonia now requires a change in the growth model, finding endogenous drivers – education and training should be one of the pathways given priority to improve productivity and generate greater competitiveness (see in particular the recom‑mendations by Ris et al., 2017) – and relying on the continuation of a set of social, eco‑nomic and fiscal reforms.
The 2014 economic, social and fiscal confer‑ence, which brought together most political parties and employers and trade union organ‑isations resulted in the adoption of a shared economic, fiscal and social agenda, setting New Caledonia on the path to economic model reform. Several taxes, duties and contributions have since been introduced successively, and various tax measures have also been decided. They pertain to indirect taxation (the cen‑tral measure of which is the creation of the General Tax on Consumption ‒ the TGC, local VAT – which would replace 7 import taxes), direct taxation (reform of the tax on income, creation of additional centiles on income tax on transferable securities, a complete overhaul
of the additional contribution to corporate tax, etc.), and financing for the social protection system (creation of the local Caledonian soli‑darity contribution, the equivalent of France’s CSG, an increase in tobacco tax, etc.). In terms of market protection, the government is com‑mitted to ensuring that the general interest is respected by stepping up its requirements with regard to companies benefiting from protec‑tion measures. “Performance contracts” have been concluded between the government and the companies involved, which set counter‑parties for protection in terms of investment, employment, quality, prices and wealth shar‑ing, however, these contracts are not binding for the time being (CEROM, 2017). Lastly, a competition authority was recently set up in February 2018, with responsibility for see‑ing to the proper functioning of the markets, as well as monitoring business concentration projects and requests to open, enlarge, take over or change businesses, and, if necessary, to sanction practices found to be in violation of New Caledonian competition law.
There is a strong expectation from all players regarding this set of measures, which has the potential to set off a new growth process that is no longer linked to diptych domestic market protection/nickel exports.
ECONOMIE ET STATISTIQUE / ECONOMICS AND STATISTICS N° 499, 2018 49
Sectoral labour productivity and economic competitiveness in New Caledonia
AFD (2016). La productivité comme relais de la croissance calédonienne ? Synthèse de la confé‑rence du 5 août 2016, Nouméa. h t t p s : / / w w w. a f d . f r / s i t e s / a f d / f i l e s / . . . / 75‑ans‑afd‑conferences‑outre‑mer‑transitions.pdf
Autorité de la concurrence (2012). Rapport de l’Autorité de la concurrence relatif aux struc‑tures de contrôle en matière de concurrence en Nouvelle‑Calédonie, et Rapport de l’Autorité de la concurrence relatif aux mécanismes d’impor‑tation et de distribution des produits de grande consommation en Nouvelle‑Calédonie.http://www.autoritedelaconcurrence.fr/doc/rap‑port_nvelle_caledonie_controle.pdf
Baldacchino, G. & Bertram, G. (2009). The Beak of the Finch: Insights into the Economic Development of Small Economies. The Round Table, 98 (401), 141‒160. https://doi.org/10.1080/00358530902757867
Bergeaud, A., Cette, G. & Lecat, R. (2016). Pro‑ductivity Trends in Advanced Countries between 1890 and 2012. Review of Income and Wealth, 62(3), 420–444. https://doi.org/10.1111/roiw.12185
Bhaskara Rao, B., Lal Sharma, K., Singh, R. & Lata, N. (2007). A Survey of Growth and Deve‑lopment Issues of the Pacific Islands. Research Paper N° 2007/34, United Nations University, World Institute for Development Research. h t t p s : / / w w w. e c o n s t o r . e u / b i t s t r e a m / 10419/63538/1/537384227.pdf
Bignon, V. & García‑Peñalosa, C. (2017). Le coût à long terme du protectionnisme sur l’éduca‑tion. Rue de la Banque, N° 47. https://publications.banque‑france.fr/le‑cout‑ long‑terme‑du‑protectionnisme‑sur‑leducation
Bourlès, R. & Cette, G. (2007). Trends in “struc‑tural” productivity levels in the major industria‑lized countries. Economics Letters, 95, 151–156.
Buccirossi, P., Ciari, L., Duso, T., Spagnolo, G. & Vitale, C. (2013). Competition Policy and Productivity Growth: An Empirical Assess‑ment. Review of Economics and Statistics, 95(4), 1324–1336. https://doi.org/10.1162/REST_a_00304
CEROM (2017). L’économie calédonienne, entre résilience et recherche de nouveaux équilibres.
h t tp : / /www.cerom‑outremer. f r /nouvel le‑ caledonie/publications/etudes‑cerom/l‑economie‑ caledonienne‑entre‑resilience‑et‑recherche‑ de‑nouveaux‑equilibres.html.
CEROM (2016). Les comptes économiques rapides de la Nouvelle‑Calédonie en 2015. Les synthèses du CEROM, septembre 2016. http://www.cerom‑outremer.fr/IMG/pdf/cerom_comptes_rapides_nc_2015.pdf
CEROM (2015). L’impact du nickel en Nouvelle‑ Calédonie.h t tp : / /www.cerom‑outremer. f r / IMG/pdf /etude_cerom_‑_impact_du_nickel_en_nouvelle‑ caledonie_‑_juin_2015.pdf
CEROM (2011). Les entreprises de Nouvelle‑ Calédonie.http://www.cerom‑outremer.fr/IMG/pdf/cerom_entreprises_de_nouvelle‑caledonie.pdf
CEROM (2008). Les défis de la croissance calédonienne.http://www.cerom‑outremer.fr/nouvelle‑caledonie/ publications/etudes‑cerom/les‑defis‑de‑la‑croissance‑ decembre‑2008.html
CEROM (2005). L’économie calédonienne en mouvement.ht tp : / /www.cerom‑outremer. f r / IMG/pdf / l_economie_caledonienne_en_mouvement.pdf
Cette, G., Corde, S. & Lecat, R. (2017). Stagnation of productivity in France: A legacy of the crisis or a structural slowdown? Economie et Statis‑tique / Economics and Statistics, 494‑495‑496, 11–36. https://insee.fr/en/statistiques/3135047
Chauchat, M. & Perret, C. (2006). Vers un déve‑loppement citoyen ; perspectives d’émancipation pour la Nouvelle‑Calédonie. Grenoble : PUG.
D’Arcy, P. & Gustafsson, L. (2012). Australia’s Productivity Performance and Real Incomes. Bulletin ‑ June Quarter, Reserve Bank of Australia. https://www.rba.gov.au/publications/bulletin/2012/ jun/pdf/bu‑0612‑3.pdf
Dabla‑Norris, E., Guo, S., Haksar, V., Kim, M., Kochhar, K., Wiseman, K. & Zdzienicka, A. (2015). The New Normal: A Sector‑Level Perspec‑tive on Productivity Trends in Advanced Economies. IMF Staff Discussion Note N°3.https://www.imf.org/external/pubs/ft/sdn/2015/sdn1503.pdf
BIBLIOGRAPHY
ECONOMIE ET STATISTIQUE / ECONOMICS AND STATISTICS N° 499, 201850
De Loecker, J. & Van Biesebroeck, J. (2016). Effect of International Competition on Firm Productivity and Market Power. NBER Working Paper N° 21994.
Dropsy, V. & Montet, C. (2018). Economic growth and productivity in French Polynesia: a long term analysis. Economie et Statistique / Economics and Statistics, ce numéro.
IEOM (2017). Nouvelle‑Calédonie 2016. Rap‑port annuel, édition 2017.http://www.ieom.fr/IMG/pdf/ra2016_nouvelle‑ caledonie.pdf
IEOM (2018). Tendances conjoncturelles 4e tri‑mestre 2017. Note expresse N° 241. http://www.ieom.fr/IMG/pdf/ne_tendances_ tendances_conjoncturelles_4t2017_nc.pdf
Krüger, J. J. (2008). Productivity and Structural Change: A Review of the Literature. Journal of Economic Surveys, 22, 330–363.
Lunsford, K. G. (2017). Productivity Growth and Real Interest Rates in the Long Run. Economic Commentary, Federal Reserve Bank of Cleveland, N° 2017–20, November. https://www.clevelandfed.org/newsroom‑and‑ events/ publications/economic‑commentary/2017‑ economic‑ commentaries/ec‑201720‑productivity‑ real‑interest‑rates‑long‑run.aspx
Macartan, H., Sachs, J. & Stiglitz J. (2007). Esca‑ping the Resource Curse. Columbia University Press.
Malinvaud, E. (1973). Une explication de la pro‑ductivité horaire du travail. Économie et Statis‑tique, 48, 46–50.https://doi.org/10.3406/estat.1973.1367
New Zealand Treasury (2008). New Zealand’s Productivity Performance. New Zealand Treasury Productivity Paper 08/02. https://treasury.govt.nz/sites/default/files/2008‑ 04/tprp08‑02.pdf
Ris, C. (2014). Les inégalités ethniques dans l’ac‑cès à l’emploi en Nouvelle‑Calédonie. Économie et Statistique, 464‑465‑466, 59–72. https://doi.org/10.3406/estat.2013.10229
Ris, C., Trannoy, A. & Wasmer, E. (2017). L’économie néo‑calédonienne au‑delà du nickel. Notes du CAE N° 39. h t tp : / /www.cae‑eco . f r /L‑economie‑neo‑ caledonienne‑au‑dela‑du‑nickel.html
Schreyer, P. & Pilat, D. (2001). Mesurer la pro‑ductivité. Revue économique de l’OCDE, 33 (2), 137‒184. https://www.cairn.info/revue‑economique‑ de‑l‑ocde‑2001‑2‑page‑137.htm
Syverson, C. (2011). What Determines Produc‑tivity?. Journal of Economic Literature, 49(2), 326‒365. http:www.aeaweb.org/articles.php?doi=10.1257/jel.49.2.326
Wasmer, E. & David, Q. (2012). Rapport sur la situation économique de la Nouvelle‑Calédonie. Congrès de Nouvelle‑Calédonie. http://www.ufcnouvellecaledonie.nc/wp‑content/uploads/2013/12/situation‑economique‑de‑la‑nc.pdf
Winters, A. & Martins, P. (2004). When com‑parative advantage is not enough: business costs in small remote economies. World Trade Review, 3(3), 347–383. https://doi.org/10.1017/S1474745604001922
ECONOMIE ET STATISTIQUE / ECONOMICS AND STATISTICS N° 499, 2018 51
Sectoral labour productivity and economic competitiveness in New Caledonia
Relative prices are defined as the ratio between the price of nickel and the price of services and the ratio between the price of manufac-
tured goods and the price of services. They are expressed in indices, base 100 in 1993.
APPENDIX 1 __________________________________________________________________________________________
RELATIVE PRICES
Figure A1Relative prices of traded and non‑traded goods
60
65
70
75
80
85
90
95
100
105
60
110
160
210
260
310
360
410
460
510
1993
Nickel (left axis)
Manufactured products (right axis)
1995 1997 1999 2001 2003 2005 2007 2009 2011 2013 2015
Note: The manufacturing sector includes agri-food industry products, extractive industry products, textile industry products, capital goods and all other industrial products. The services sector includes hospitality and catering services, financial and insurance services, real estate services, services provided to households and business, and services provided by the public administration.Source: ISEE (http://www.isee.nc/); authors' calculations
ECONOMIE ET STATISTIQUE / ECONOMICS AND STATISTICS N° 499, 201852
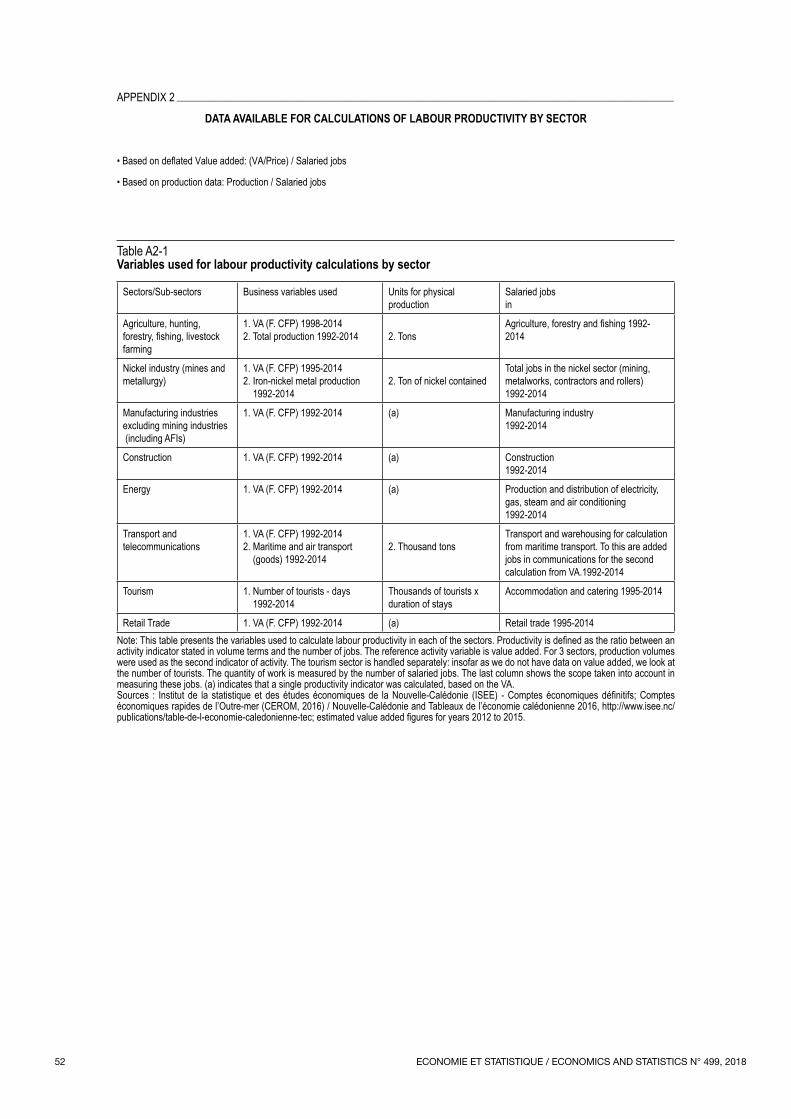
• Based on deflated Value added: (VA/Price) / Salaried jobs
• Based on production data: Production / Salaried jobs
Table A2-1Variables used for labour productivity calculations by sector
Sectors/Sub-sectors Business variables used Units for physical production
Salaried jobs in
Agriculture, hunting, forestry, fishing, livestock farming
1. VA (F. CFP) 1998-20142. Total production 1992-2014 2. Tons
Agriculture, forestry and fishing 1992‑2014
Nickel industry (mines and metallurgy)
1. VA (F. CFP) 1995-20142. Iron-nickel metal production
1992-20142. Ton of nickel contained
Total jobs in the nickel sector (mining, metalworks, contractors and rollers) 1992-2014
Manufacturing industries excluding mining industries (including AFIs)
1. VA (F. CFP) 1992-2014 (a) Manufacturing industry 1992-2014
Construction 1. VA (F. CFP) 1992-2014 (a) Construction 1992-2014
Energy 1. VA (F. CFP) 1992-2014 (a) Production and distribution of electricity, gas, steam and air conditioning 1992-2014
Transport and telecommunications
1. VA (F. CFP) 1992-20142. Maritime and air transport
(goods) 1992-20142. Thousand tons
Transport and warehousing for calculation from maritime transport. To this are added jobs in communications for the second calculation from VA.1992-2014
Tourism 1. Number of tourists - days 1992-2014
Thousands of tourists x duration of stays
Accommodation and catering 1995-2014
Retail Trade 1. VA (F. CFP) 1992-2014 (a) Retail trade 1995-2014Note: This table presents the variables used to calculate labour productivity in each of the sectors. Productivity is defined as the ratio between an activity indicator stated in volume terms and the number of jobs. The reference activity variable is value added. For 3 sectors, production volumes were used as the second indicator of activity. The tourism sector is handled separately: insofar as we do not have data on value added, we look at the number of tourists. The quantity of work is measured by the number of salaried jobs. The last column shows the scope taken into account in measuring these jobs. (a) indicates that a single productivity indicator was calculated, based on the VA.Sources : Institut de la statistique et des études économiques de la Nouvelle‑Calédonie (ISEE) ‑ Comptes économiques définitifs; Comptes économiques rapides de l’Outre-mer (CEROM, 2016) / Nouvelle-Calédonie and Tableaux de l’économie calédonienne 2016, http://www.isee.nc/publications/table‑de‑l‑economie‑caledonienne‑tec; estimated value added figures for years 2012 to 2015.
APPENDIX 2 ___________________________________________________________________________________________
DATA AVAILABLE FOR CALCULATIONS OF LABOUR PRODUCTIVITY BY SECTOR
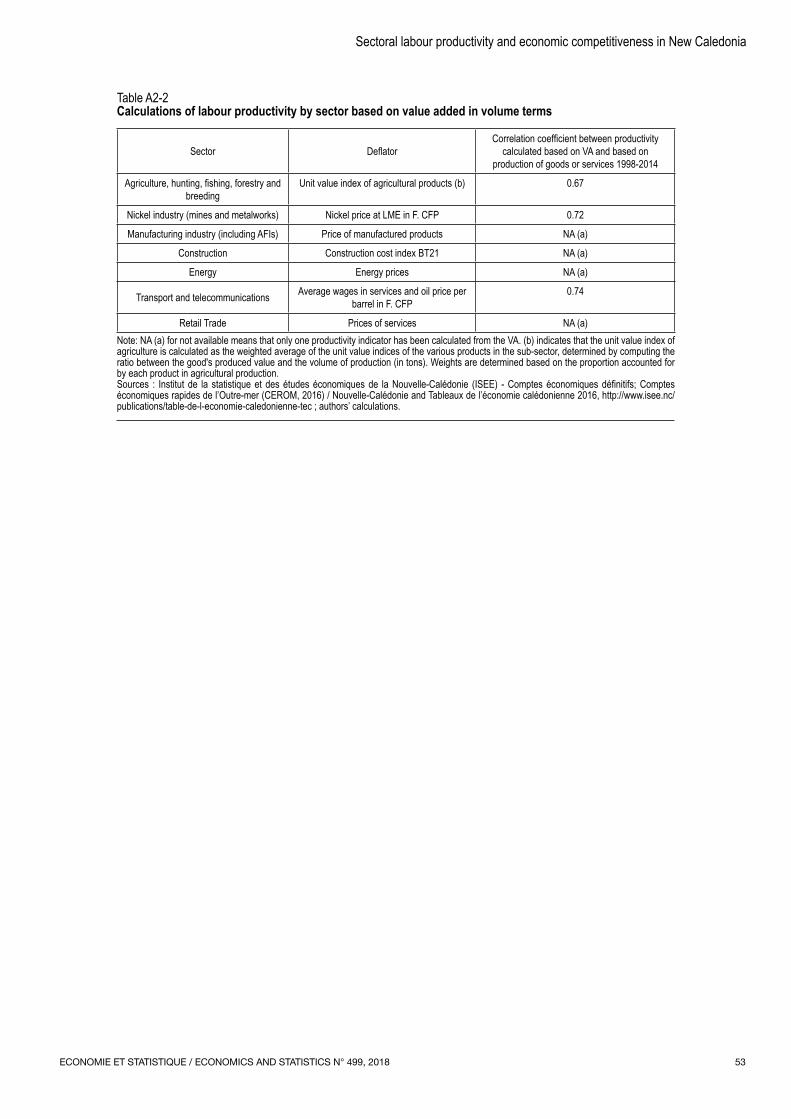
ECONOMIE ET STATISTIQUE / ECONOMICS AND STATISTICS N° 499, 2018 53
Sectoral labour productivity and economic competitiveness in New Caledonia
Table A2-2 Calculations of labour productivity by sector based on value added in volume terms
Sector DeflatorCorrelation coefficient between productivity
calculated based on VA and based on production of goods or services 1998-2014
Agriculture, hunting, fishing, forestry and breeding
Unit value index of agricultural products (b) 0.67
Nickel industry (mines and metalworks) Nickel price at LME in F. CFP 0.72
Manufacturing industry (including AFIs) Price of manufactured products NA (a)
Construction Construction cost index BT21 NA (a)
Energy Energy prices NA (a)
Transport and telecommunications Average wages in services and oil price per barrel in F. CFP
0.74
Retail Trade Prices of services NA (a)Note: NA (a) for not available means that only one productivity indicator has been calculated from the VA. (b) indicates that the unit value index of agriculture is calculated as the weighted average of the unit value indices of the various products in the sub-sector, determined by computing the ratio between the good's produced value and the volume of production (in tons). Weights are determined based on the proportion accounted for by each product in agricultural production.Sources : Institut de la statistique et des études économiques de la Nouvelle‑Calédonie (ISEE) ‑ Comptes économiques définitifs; Comptes économiques rapides de l’Outre-mer (CEROM, 2016) / Nouvelle-Calédonie and Tableaux de l’économie calédonienne 2016, http://www.isee.nc/publications/table-de-l-economie-caledonienne-tec ; authors’ calculations.