Embed Size (px)
Citation preview
B R A Z I L | 2 0 1 8
SECTORAL REPORTFOOTWEAR INDUSTRY
Presented by:
Sponsored by:
B R A Z I L | 2 0 1 8
SECTORAL REPORTFOOTWEAR INDUSTRY
01. LOGO + DECODIFICADOR
ADVISORYClarissa Black
Marcos Tadeu Lélis
TECHNICAL COORDINATIONPriscila Linck
TECHNICAL TEAMAlessandra Roehrig
PROOFREADINGAlice RodriguesDiego Rosinha
Maristela Kirst de Lima Girola
GRAPHIC DESIGNGabriel Dias
Sectoral report: Brazilian footwear industry 2018Brazilian Footwear Industries Association. Novo Hamburgo: Abicalçados, 2018.
ISBN: 978-85-93812-04-0
PRESIDENTRosnei Alfredo da Silva
BOARD MEMBERSAdão Oscar Wolff, Caetano Bianco Neto, Caio Borges Ferreira, Danilo Cristófoli, Ernani Reuter, Haroldo Ferreira, José Carlos Brigagão do Couto, Júnior César Silva, Lioveral Bacher, Marco Antônio Coutinho,
Marco Lourenço Müller, Nilson Erineu Spohr, Paulo Roberto Konrath, Paulo Roberto Schefer, Paulo Vicente Bender, Renato Klein, Ricardo Wirth, Sérgio Gracia e Werner Arthur Muller Júnior
EXECUTIVE PRESIDENT
Heitor Klein
CONTACT USRua Júlio de Castilhos, 561 - Novo Hamburgo/RS –Zip code: 93510-130
Phone number: +55 51 [email protected]
www.abicalcados.com.br
B R A Z I L | 2 0 1 8
SECTORAL REPORTFOOTWEAR INDUSTRY
01. LOGO + DECODIFICADOR
SUMÁRIO
5
6
7
7
8
9
11
13
16
17
18
18
23
23
25
31
34
36
36
37
37
38
39
40
41
44
48
49
52
53
54
54
55
55
1. EDITORIAL
2. WORLD2.1 Global Economic Panorama
2.2 Global Footwear Panorama
2.2.1 Main Producing Countries
2.2.2 Main Consuming Countries
2.2.3 Main Exporting Countries
2.2.4 Main Importing Countries
3. BRAZIL3.1 Footwear Production
3.1.1 Installed Capacity Utilization Rate (ICUR)
3.1.2 Production Segmentation
3.2 Footwear Consumption
3.3 Foreign Trade
3.3.1 Exports
3.3.2 Imports
3.4 Employment and Establishments
3.5 Economic Indicators
3.5.1 Exchange Rate
3.5.2 Trade Behavior
3.5.3 Manufacturing Industry
3.5.4 Domestic Inflation
3.5.5 National Competitiveness
4. OPPORTUNITIES FOR THE INTERNATIONAL MARKET 4.1 Competitiveness Index of Footwear Exports
4.2 Attractiveness Index of Brazilian Footwear Exports
5. EXPERT ANALYSIS5.1 The growth dynamics of footwear production in 2017
6. METHODOLOGY6.1 Production Data
6.2 Statistical Projections
6.3 Sources
6.4 Classification of the Harmonized Commodity Description and Coding System
6.5 Definition of the Footwear Clusters
SECTORAL REPORT - FOOTWEAR INDUSTRY - BRAZIL | 2018 5
EDITORIAL
For the third year in a row, Abicalçados publishes the Sectoral Report of the Footwear Industry independently, through its Intelligence Unit. The compilation features figures relating to the footwear industry gathered in surveys by offi-cial sources such as Instituto Brasileiro de Geografia e Estatística (IBGE) [Bra-zilian Institute of Geography and Statistics], Ministério do Trabalho e Emprego (MTE] [Ministry of Labor and Employment], and Banco Central do Brasil [Brazi-lian Central Bank], among others. These figures were combined with a thorough production survey conducted with members of the organization – who account for over 70% of the domestic production. The quality of the research makes the material assertive and also provides a basis for projections for the current year, made by economists who specialize in analyzing data relating to the footwear industry.
The data was gathered not only to inform and to assist companies in the deci-sion-making process and to set commercial strategies, but also to alert them about the current moment of the footwear industry. A loss of competitiveness has been noticed in recent years, both in the domestic and foreign markets. However, global footwear production has increased by 10% since 2014, rea-ching 22 billion pairs, while ours has plunged by 7.3% during the same period,
reaching 909 million pairs in 2017. One position was also lost in the ranking of manufacturers, falling to the fourth place, behind China, India, and Vietnam, and followed closely by Indonesia. In the ranking of industry exporters, we are already in the 11th place, behind countries with no tradition in footwear manufacture, such as the Netherlands, for example, which acts as a re-exporter.
The reasons are well known and consist mainly of the high cost of production in Brazil, since the tax burden is among the highest in the world, logistics is expensive and inefficient, there are excessive regulations, bure-aucracy, indirect labor costs, and exchange rate dis-crepancy, among many other problems that hinder the development of the industry. For 2018, stability is expected, with a modest yet gradual recovery of the domestic demand. But what can be done to improve the situation of competitiveness loss? The answer is a concerted effort to adapt companies to the new reality of the market, increasingly demanding in terms of products and processes. Competition based on price alone should be discarded. We already know the Asians are unbeatable when it comes to this. Naturally, Abicalçados, as the representative of the Brazilian footwear industry, will continue to fight for better competitiveness conditions, taking our appeals to governments and to the legislature. But we know that in order to grow again, we cannot depend on the good will of the Public Power. Our mission is to create an environment of improvement of productive processes, with the lowest possible cost, an industry that develops distinguished fashion products with embedded technology, seeking to stimulate new business models, adjus-ted to the new customer.
Abicalçados, presenting the third issue of this publication, seeks, as mentioned before, to inform and to alert, with the intention of engaging more companies in this fight for a segment as economically and socially impor-tant as the footwear industry, due to its strategic position in the domestic economy, a result of the potential of the complete, integrated production chain, of the installed capacity, and of its exporting character and high employability.
“FOR 2018, STABILITY IS
EXPECTED,
WITH A MODEST YET GRADUAL
RECOVERY OF THE DOMESTIC
DEMAND.”
FIGURES TO INFORM AND TO ALERT
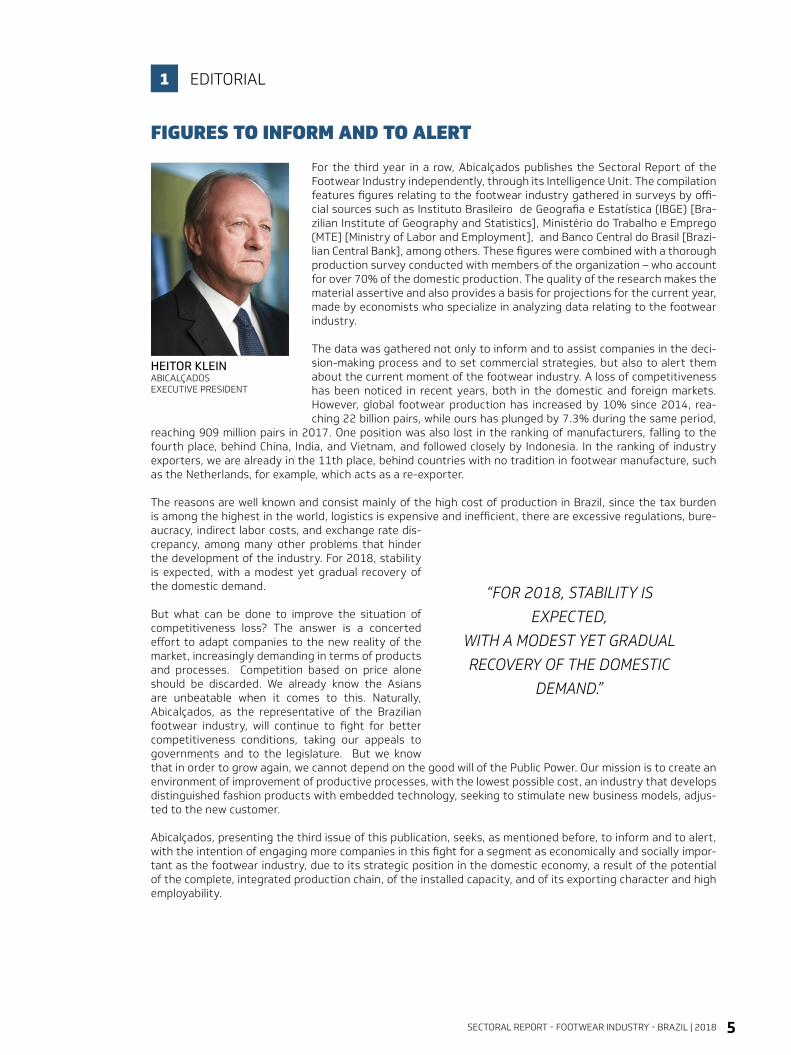
HEITOR KLEINABICALÇADOS EXECUTIVE PRESIDENT
1
SECTORAL REPORT - FOOTWEAR INDUSTRY - BRAZIL | 20186
WORLD2
SECTORAL REPORT - FOOTWEAR INDUSTRY - BRAZIL | 2018 7
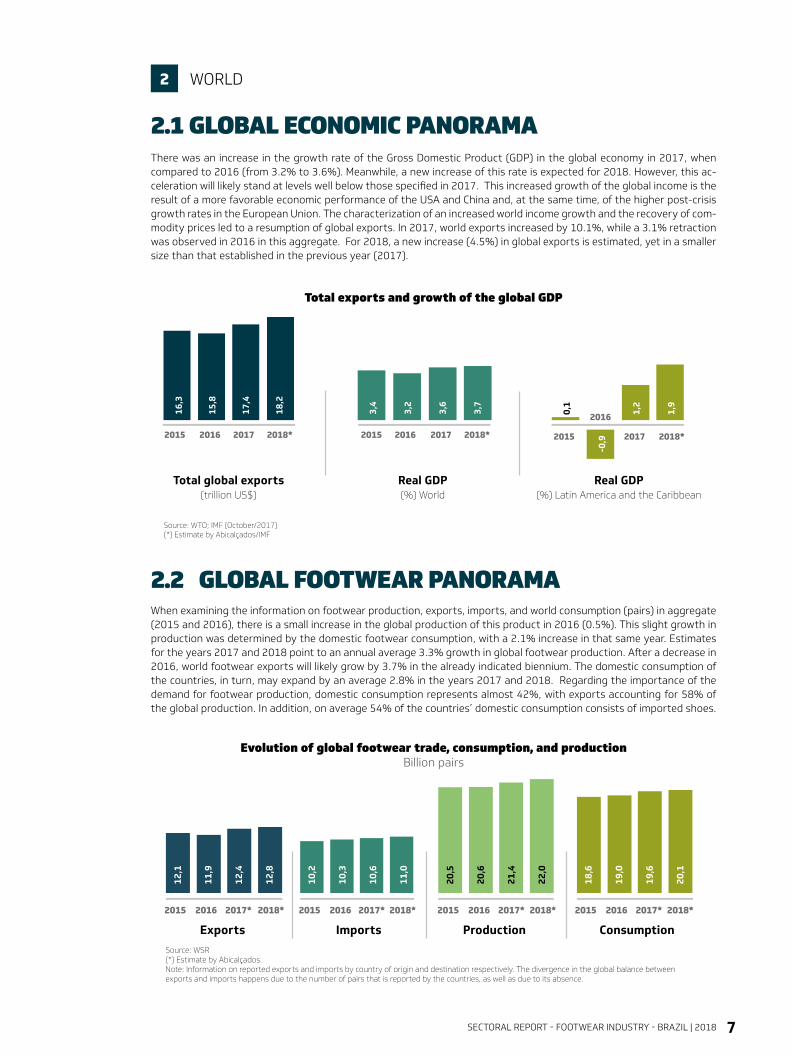
There was an increase in the growth rate of the Gross Domestic Product (GDP) in the global economy in 2017, when compared to 2016 (from 3.2% to 3.6%). Meanwhile, a new increase of this rate is expected for 2018. However, this ac-celeration will likely stand at levels well below those specified in 2017. This increased growth of the global income is the result of a more favorable economic performance of the USA and China and, at the same time, of the higher post-crisis growth rates in the European Union. The characterization of an increased world income growth and the recovery of com-modity prices led to a resumption of global exports. In 2017, world exports increased by 10.1%, while a 3.1% retraction was observed in 2016 in this aggregate. For 2018, a new increase (4.5%) in global exports is estimated, yet in a smaller size than that established in the previous year (2017).
Total exports and growth of the global GDP
Evolution of global footwear trade, consumption, and production Billion pairs
When examining the information on footwear production, exports, imports, and world consumption (pairs) in aggregate (2015 and 2016), there is a small increase in the global production of this product in 2016 (0.5%). This slight growth in production was determined by the domestic footwear consumption, with a 2.1% increase in that same year. Estimates for the years 2017 and 2018 point to an annual average 3.3% growth in global footwear production. After a decrease in 2016, world footwear exports will likely grow by 3.7% in the already indicated biennium. The domestic consumption of the countries, in turn, may expand by an average 2.8% in the years 2017 and 2018. Regarding the importance of the demand for footwear production, domestic consumption represents almost 42%, with exports accounting for 58% of the global production. In addition, on average 54% of the countries’ domestic consumption consists of imported shoes.
2.1 GLOBAL ECONOMIC PANORAMA
2.2 GLOBAL FOOTWEAR PANORAMA
WORLD2
Total global exports(trillion US$)
16,3
15,8
17,4
18,2
3,4
3,2
3,6
3,7
Real GDP(%) World
0,1
1,2
1,9
Real GDP(%) Latin America and the Caribbean
2015 2016 2017 2018* 2015 2016 2017 2018* 2015
2016
2017 2018*
Source: WTO; IMF (October/2017) (*) Estimate by Abicalçados/IMF
-0,9
Exports
12,1
11,9
12,4
12,8
10,2
10,3
10,6
11,0
20,5
20,6
21,4
22,0
18,6
19,0
19,6
20,1
Imports Production ConsumptionSource: WSR(*) Estimate by Abicalçados. Note: Information on reported exports and imports by country of origin and destination respectively. The divergence in the global balance between exports and imports happens due to the number of pairs that is reported by the countries, as well as due to its absence.
2015 2016 2017* 2018* 2015 2016 2017* 2018* 2015 2016 2017* 2018* 2015 2016 2017* 2018*
SECTORAL REPORT - FOOTWEAR INDUSTRY - BRAZIL | 20188
2.2.1 MAIN PRODUCING COUNTRIES
WORLD2
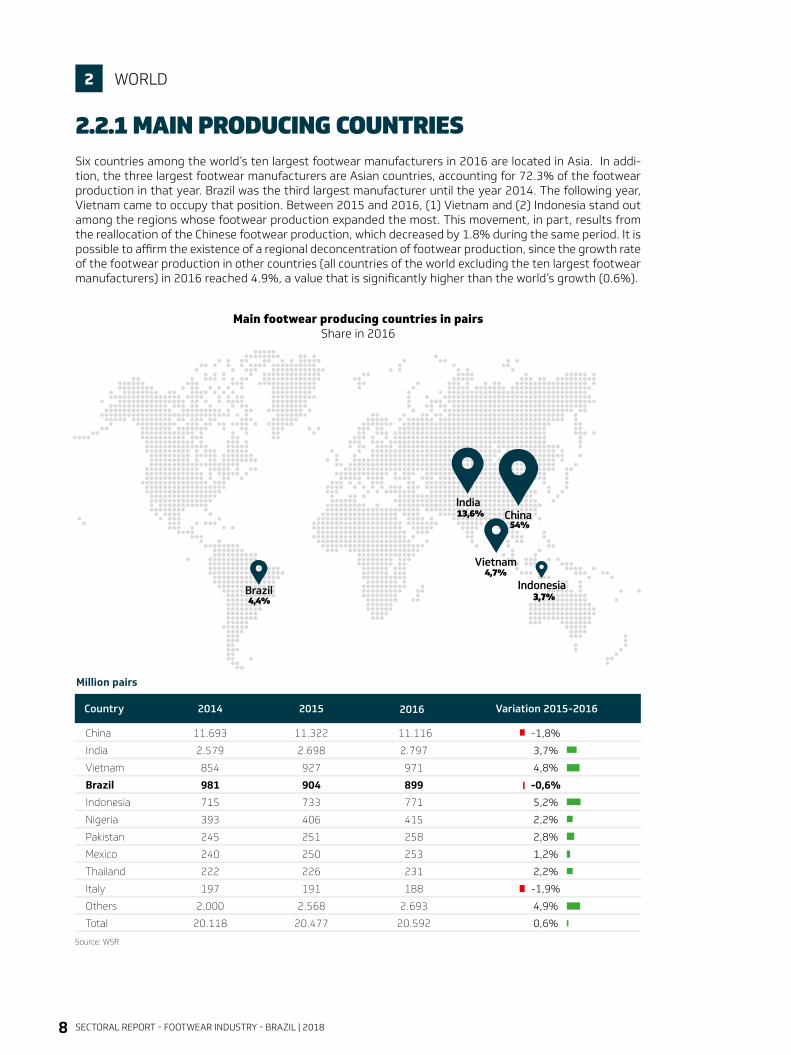
Six countries among the world’s ten largest footwear manufacturers in 2016 are located in Asia. In addi-tion, the three largest footwear manufacturers are Asian countries, accounting for 72.3% of the footwear production in that year. Brazil was the third largest manufacturer until the year 2014. The following year, Vietnam came to occupy that position. Between 2015 and 2016, (1) Vietnam and (2) Indonesia stand out among the regions whose footwear production expanded the most. This movement, in part, results from the reallocation of the Chinese footwear production, which decreased by 1.8% during the same period. It is possible to affirm the existence of a regional deconcentration of footwear production, since the growth rate of the footwear production in other countries (all countries of the world excluding the ten largest footwear manufacturers) in 2016 reached 4.9%, a value that is significantly higher than the world’s growth (0.6%).
Main footwear producing countries in pairsShare in 2016
Country
China
India
Vietnam
Brazil
Indonesia
Nigeria
Pakistan
Mexico
Thailand
Italy
Others
Total
2014
11.693
2.579
854
981
715
393
245
240
222
197
2.000
20.118
2015
11.322
2.698
927
904
733
406
251
250
226
191
2.568
20.477
Million pairs
Source: WSR
11.116
2.797
971
899
771
415
258
253
231
188
2.693
20.592
2016
Brazil
India
Vietnam
China54%
13,6%
4,4%
4,7%Indonesia
3,7%
Variation 2015-2016
-1,8%
3,7%
4,8%
-0,6%
5,2%
2,2%
2,8%
1,2%
2,2%
-1,9%
4,9%
0,6%
SECTORAL REPORT - FOOTWEAR INDUSTRY - BRAZIL | 2018 9
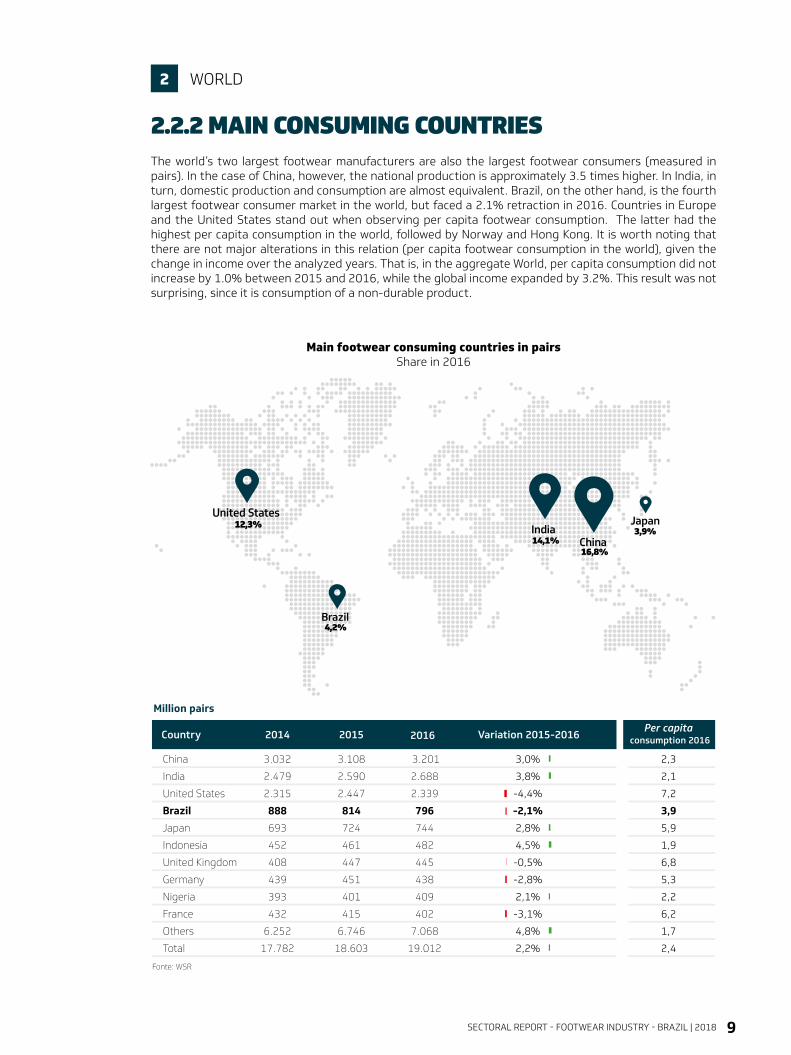
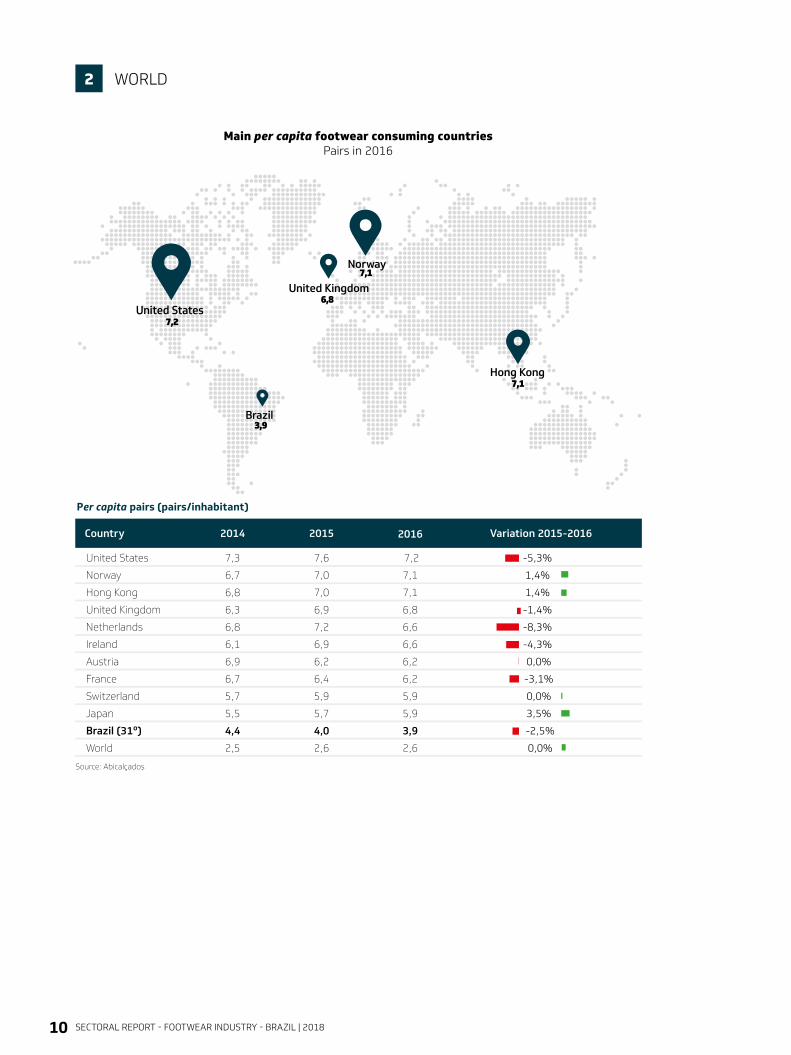
The world’s two largest footwear manufacturers are also the largest footwear consumers (measured in pairs). In the case of China, however, the national production is approximately 3.5 times higher. In India, in turn, domestic production and consumption are almost equivalent. Brazil, on the other hand, is the fourth largest footwear consumer market in the world, but faced a 2.1% retraction in 2016. Countries in Europe and the United States stand out when observing per capita footwear consumption. The latter had the highest per capita consumption in the world, followed by Norway and Hong Kong. It is worth noting that there are not major alterations in this relation (per capita footwear consumption in the world), given the change in income over the analyzed years. That is, in the aggregate World, per capita consumption did not increase by 1.0% between 2015 and 2016, while the global income expanded by 3.2%. This result was not surprising, since it is consumption of a non-durable product.
Main footwear consuming countries in pairsShare in 2016
2.2.2 MAIN CONSUMING COUNTRIES
WORLD2
Country 2014 Variation 2015-2016
China
India
United States
Brazil
Japan
Indonesia
United Kingdom
Germany
Nigeria
France
Others
Total
3.032
2.479
2.315
888
693
452
408
439
393
432
6.252
17.782
2015
3.108
2.590
2.447
814
724
461
447
451
401
415
6.746
18.603
3.201
2.688
2.339
796
744
482
445
438
409
402
7.068
19.012
3,0%
3,8%
-4,4%
-2,1%
2,8%
4,5%
-0,5%
-2,8%
2,1%
-3,1%
4,8%
2,2%
Million pairs
Fonte: WSR
2016
Brazil
IndiaJapan
China16,8%
14,1%
4,2%
3,9%
2,3
2,1
7,2
3,9
5,9
1,9
6,8
5,3
2,2
6,2
1,7
2,4
Per capita consumption 2016
United States12,3%
SECTORAL REPORT - FOOTWEAR INDUSTRY - BRAZIL | 201810
WORLD2
Main per capita footwear consuming countries Pairs in 2016
Country 2014 Variation 2015-2016
United States
Norway
Hong Kong
United Kingdom
Netherlands
Ireland
Austria
France
Switzerland
Japan
Brazil (31º)
World
7,3
6,7
6,8
6,3
6,8
6,1
6,9
6,7
5,7
5,5
4,4
2,5
2015
7,6
7,0
7,0
6,9
7,2
6,9
6,2
6,4
5,9
5,7
4,0
2,6
7,2
7,1
7,1
6,8
6,6
6,6
6,2
6,2
5,9
5,9
3,9
2,6
-5,3%
1,4%
1,4%
-1,4%
-8,3%
-4,3%
0,0%
-3,1%
0,0%
3,5%
-2,5%
0,0%
Per capita pairs (pairs/inhabitant)
Source: Abicalçados
2016
Brazil
Hong Kong
United Kingdom
Norway
United States7,2
7,1
7,1
6,8
3,9
SECTORAL REPORT - FOOTWEAR INDUSTRY - BRAZIL | 2018 11
Country 2014
8.780
569
354
228
228
155
215
165
158
163
130
1.179
12.322
China
Vietnam
Indonesia
Germany
Belgium
United Kingdom
Italy
India
Spain
Netherlands
Brazil (11°)
Others
Total
2015
8.341
617
366
237
239
191
208
177
158
142
124
1.252
12.053
Million pairs
8.049
654
387
252
236
213
206
181
160
146
126
1.276
11.886
2016
Brazil
Germany
Vietnam
China67,7%
2,1%
1,1%
5,5%
Indonesia3,3%
Variation 2015-2016
-3,5%
6,0%
5,5%
6,5%
-1,0%
11,3%
-0,8%
2,2%
1,1%
3,0%
1,2%
1,9%
-1,4%
Source: WSR
Main footwear exporting countries in pairsShare in 2016
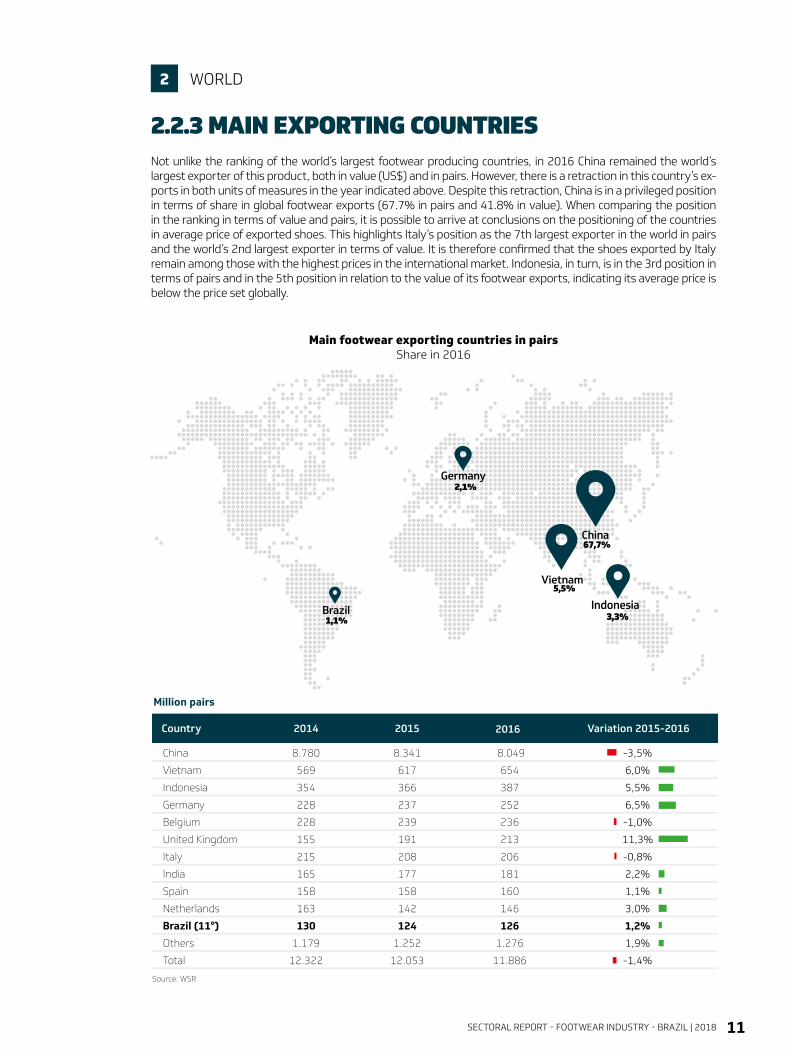
2.2.3 MAIN EXPORTING COUNTRIESNot unlike the ranking of the world’s largest footwear producing countries, in 2016 China remained the world’s largest exporter of this product, both in value (US$) and in pairs. However, there is a retraction in this country’s ex-ports in both units of measures in the year indicated above. Despite this retraction, China is in a privileged position in terms of share in global footwear exports (67.7% in pairs and 41.8% in value). When comparing the position in the ranking in terms of value and pairs, it is possible to arrive at conclusions on the positioning of the countries in average price of exported shoes. This highlights Italy’s position as the 7th largest exporter in the world in pairs and the world’s 2nd largest exporter in terms of value. It is therefore confirmed that the shoes exported by Italy remain among those with the highest prices in the international market. Indonesia, in turn, is in the 3rd position in terms of pairs and in the 5th position in relation to the value of its footwear exports, indicating its average price is below the price set globally.
WORLD2
SECTORAL REPORT - FOOTWEAR INDUSTRY - BRAZIL | 201812
Main footwear exporting countries in US$Share in 2016
WORLD2
País 2014
53.836
10.318
11.154
5.565
5.400
3.972
3.095
3.554
3.507
4.014
1.067
26.059
131.542
China
Vietnam
Italy
Belgium
Germany
Indonesia
France
Netherlands
Spain
Hong Kong
Brazil (17°)
Others
Total
2015
51.096
12.013
9.597
5.403
4.868
4.386
3.083
2.992
3.253
3.578
960
23.880
125.106
Million US$
44.886
12.996
9.831
5.948
5.586
4.526
3.308
3.208
2.916
2.765
998
23.448
120.418
2016
Brazil
Vietnam
Italy
China37,3%
10,8%
0,8%
8,2%
Belgium4,9%
Variation 2015-2016
-12,2%
8,2%
2,4%
10,1%
14,8%
3,2%
7,3%
7,2%
-10,3%
-22,7%
3,9%
-1,8%
-3,7%
Source: UNComtrade
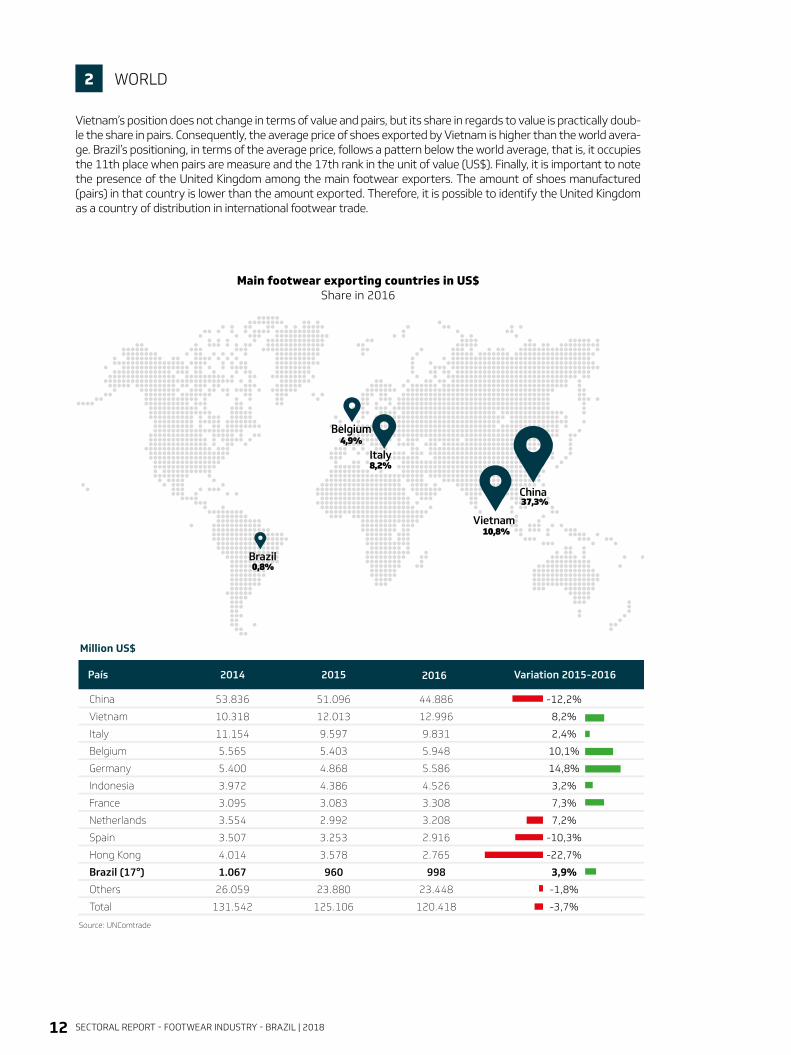
Vietnam’s position does not change in terms of value and pairs, but its share in regards to value is practically doub-le the share in pairs. Consequently, the average price of shoes exported by Vietnam is higher than the world avera-ge. Brazil’s positioning, in terms of the average price, follows a pattern below the world average, that is, it occupies the 11th place when pairs are measure and the 17th rank in the unit of value (US$). Finally, it is important to note the presence of the United Kingdom among the main footwear exporters. The amount of shoes manufactured (pairs) in that country is lower than the amount exported. Therefore, it is possible to identify the United Kingdom as a country of distribution in international footwear trade.
SECTORAL REPORT - FOOTWEAR INDUSTRY - BRAZIL | 2018 13
Country 2014
2.333
610
641
559
509
330
316
283
277
164
37
3.928
9.986
United States
Japan
Germany
United Kingdom
France
Italy
Spain
Belgium
Netherlands
South Africa
Brazil (55°)
Others
Total
2015
2.466
642
654
633
500
328
283
302
264
168
33
3.906
10.179
Million pairs
2.338
665
654
652
486
336
294
290
259
170
23
4.140
10.306
2016
Brazil
Germany
Japan
United Kingdom 6,3%
6,3%
0,2%
6,4%United States22,7%
Variation 2015-2016
-5,2%
3,5%
-0,1%
3,0%
-2,6%
2,4%
3,9%
-3,8%
-2,1%
0,9%
-31,6%
6,0%
1,2%
Source: WSR
Main footwear importing countries in pairsShare in 2016
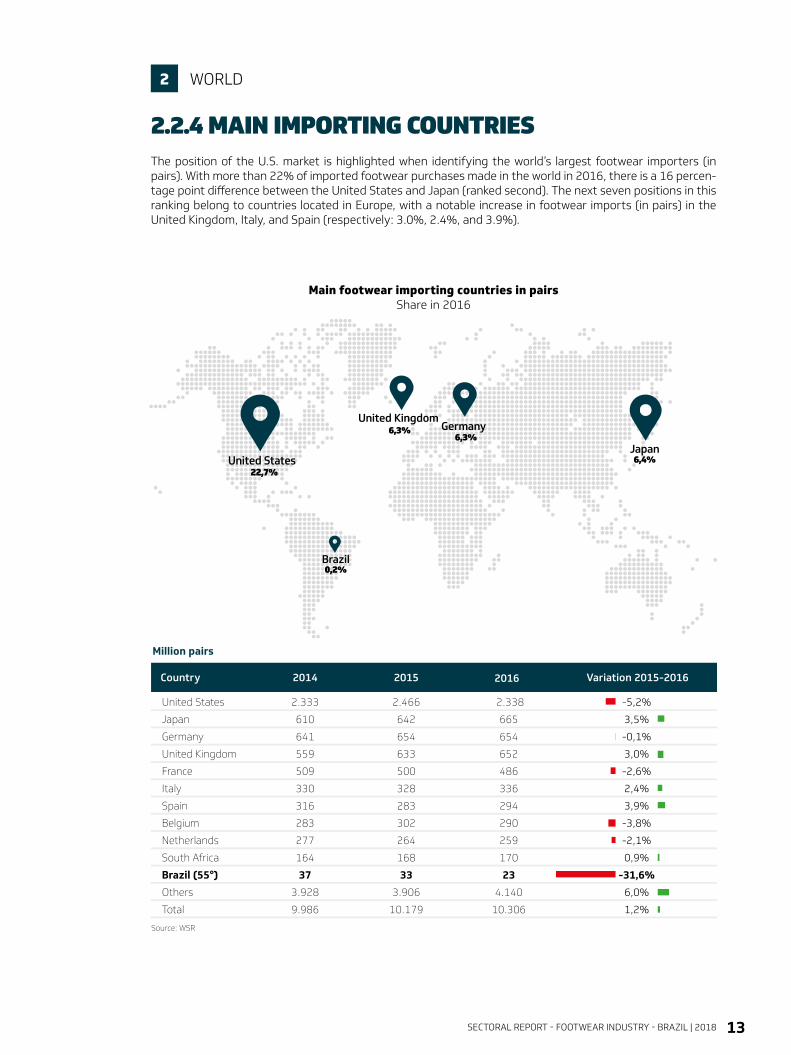
The position of the U.S. market is highlighted when identifying the world’s largest footwear importers (in pairs). With more than 22% of imported footwear purchases made in the world in 2016, there is a 16 percen-tage point difference between the United States and Japan (ranked second). The next seven positions in this ranking belong to countries located in Europe, with a notable increase in footwear imports (in pairs) in the United Kingdom, Italy, and Spain (respectively: 3.0%, 2.4%, and 3.9%).
2.2.4 MAIN IMPORTING COUNTRIES
WORLD2
SECTORAL REPORT - FOOTWEAR INDUSTRY - BRAZIL | 201814
Main footwear importing countries in US$Share in 2016
WORLD2
Country 2014
26.594
10.345
7.437
7.110
5.524
5.453
3.853
3.824
4.288
3.198
561
42.887
121.075
United States
Germany
France
United Kingdom
Italy
Japan
Netherlands
Belgium
Hong Kong
Spain
Brazil (43º)
Others
Total
2015
28.299
9.959
6.973
7.221
5.052
5.160
3.781
3.596
3.945
2.985
481
39.939
117.390
Million US$
26.152
10.231
7.218
6.587
5.202
5.161
3.992
3.980
3.237
3.191
344
40.803
116.096
2016
Brazil
Germany
France
United Kingdom5,7%
8,8%
0,3%
6,2%United States
22,5%
Variation 2015-2016
-7,6%
2,7%
3,5%
-8,8%
3,0%
0,0%
5,6%
10,7%
-17,9%
6,9%
-28,5%
2,2%
-1,1%
Source: UNComtrade
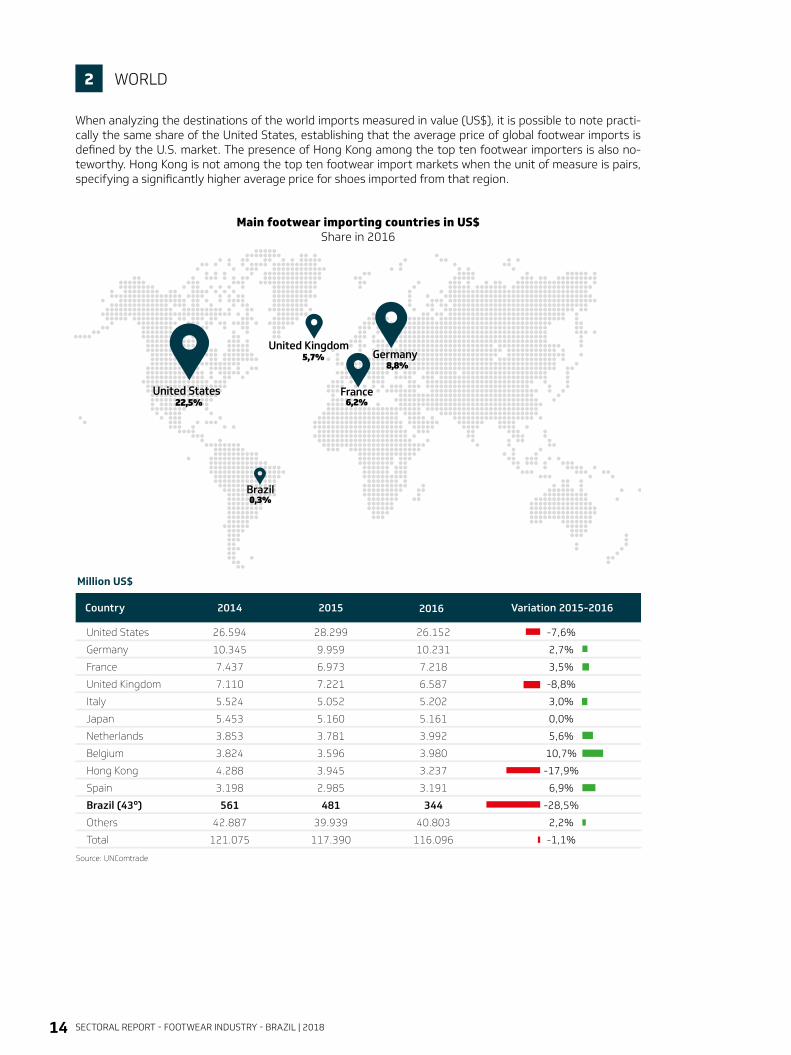
When analyzing the destinations of the world imports measured in value (US$), it is possible to note practi-cally the same share of the United States, establishing that the average price of global footwear imports is defined by the U.S. market. The presence of Hong Kong among the top ten footwear importers is also no-teworthy. Hong Kong is not among the top ten footwear import markets when the unit of measure is pairs, specifying a significantly higher average price for shoes imported from that region.
SECTORAL REPORT - FOOTWEAR INDUSTRY - BRAZIL | 2018 15
AF_Anúncio Orisol iCOS_21x28cm + sangra 5mm
quinta-feira, 29 de março de 2018 13:59:27
SECTORAL REPORT - FOOTWEAR INDUSTRY - BRAZIL | 201816
BRASIL3 BRAZIL3
SECTORAL REPORT - FOOTWEAR INDUSTRY - BRAZIL | 2018 17
Million pairs Million R$
2015 2016 2017 2018* 2018*
3,5%
6,6%
0,4%
4,5%
904,
4
899,
0
908,
9
940,
7
912,
5
2015 2016 2017
23.0
76
22.6
21
20.4
29
20.6
95
21.6
47
Source: IBGE/Abicalçados(*) Estimate by Abicalçados
Pairs R$
-0,6
-7,8
1,1%
4,5%
6,6%
1,3%
0,0%
4,6%
0,4%
3,5%
2015 2016 2017 2018* 2015 2016 2017 2018*
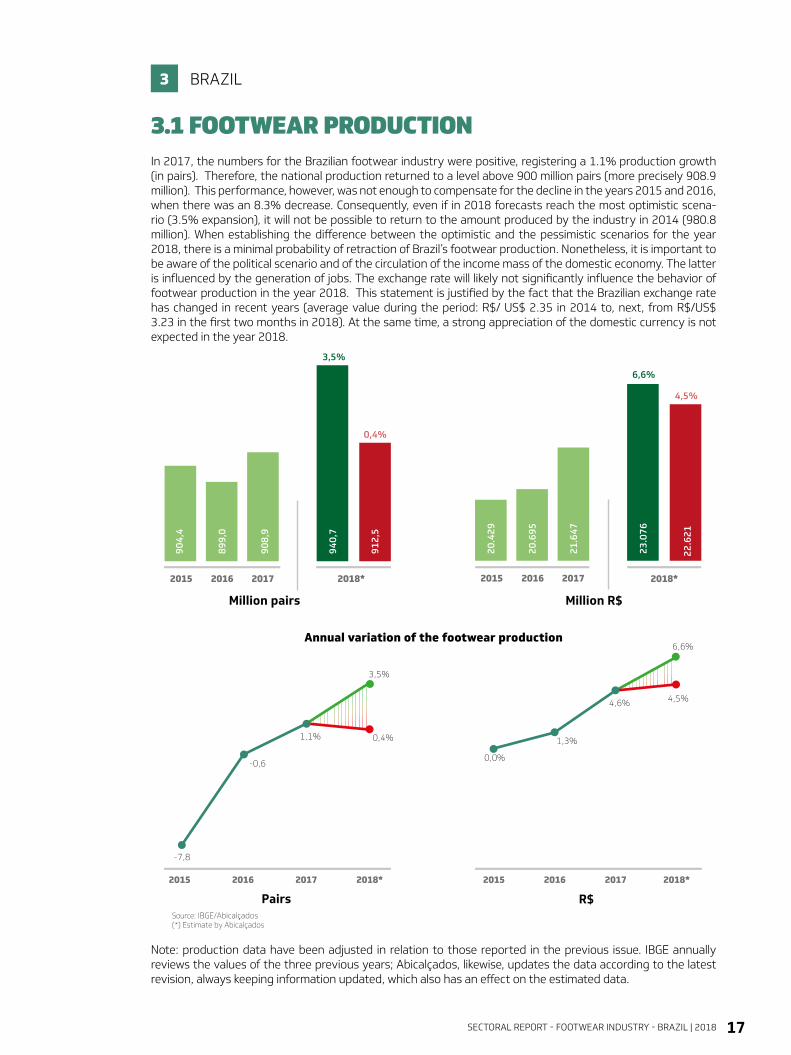
In 2017, the numbers for the Brazilian footwear industry were positive, registering a 1.1% production growth (in pairs). Therefore, the national production returned to a level above 900 million pairs (more precisely 908.9 million). This performance, however, was not enough to compensate for the decline in the years 2015 and 2016, when there was an 8.3% decrease. Consequently, even if in 2018 forecasts reach the most optimistic scena-rio (3.5% expansion), it will not be possible to return to the amount produced by the industry in 2014 (980.8 million). When establishing the difference between the optimistic and the pessimistic scenarios for the year 2018, there is a minimal probability of retraction of Brazil’s footwear production. Nonetheless, it is important to be aware of the political scenario and of the circulation of the income mass of the domestic economy. The latter is influenced by the generation of jobs. The exchange rate will likely not significantly influence the behavior of footwear production in the year 2018. This statement is justified by the fact that the Brazilian exchange rate has changed in recent years (average value during the period: R$/ US$ 2.35 in 2014 to, next, from R$/US$ 3.23 in the first two months in 2018). At the same time, a strong appreciation of the domestic currency is not expected in the year 2018.
Note: production data have been adjusted in relation to those reported in the previous issue. IBGE annually reviews the values of the three previous years; Abicalçados, likewise, updates the data according to the latest revision, always keeping information updated, which also has an effect on the estimated data.
3.1 FOOTWEAR PRODUCTION
BRAZIL3
Annual variation of the footwear production
SECTORAL REPORT - FOOTWEAR INDUSTRY - BRAZIL | 201818
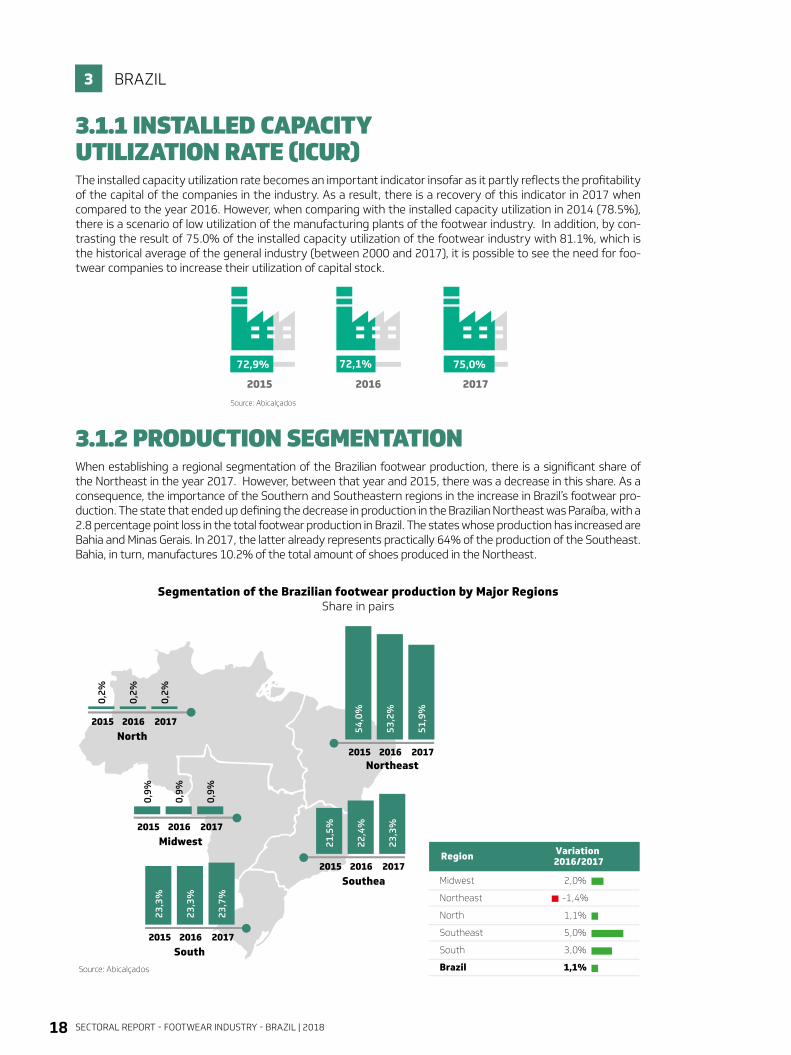
When establishing a regional segmentation of the Brazilian footwear production, there is a significant share of the Northeast in the year 2017. However, between that year and 2015, there was a decrease in this share. As a consequence, the importance of the Southern and Southeastern regions in the increase in Brazil’s footwear pro-duction. The state that ended up defining the decrease in production in the Brazilian Northeast was Paraíba, with a 2.8 percentage point loss in the total footwear production in Brazil. The states whose production has increased are Bahia and Minas Gerais. In 2017, the latter already represents practically 64% of the production of the Southeast. Bahia, in turn, manufactures 10.2% of the total amount of shoes produced in the Northeast.
Segmentation of the Brazilian footwear production by Major RegionsShare in pairs
3.1.2 PRODUCTION SEGMENTATION
BRAZIL3
The installed capacity utilization rate becomes an important indicator insofar as it partly reflects the profitability of the capital of the companies in the industry. As a result, there is a recovery of this indicator in 2017 when compared to the year 2016. However, when comparing with the installed capacity utilization in 2014 (78.5%), there is a scenario of low utilization of the manufacturing plants of the footwear industry. In addition, by con-trasting the result of 75.0% of the installed capacity utilization of the footwear industry with 81.1%, which is the historical average of the general industry (between 2000 and 2017), it is possible to see the need for foo-twear companies to increase their utilization of capital stock.
3.1.1 INSTALLED CAPACITY UTILIZATION RATE (ICUR)
Source: Abicalçados
2015 2016 2017
72,9% 72,1% 75,0%
Source: Abicalçados
Midwest
Northeast
North
Southeast
South
Brazil
2,0%
-1,4%
1,1%
5,0%
3,0%
1,1%
Region Variation 2016/2017
54,0
%
2016
53,2
%
2017
51,9
%
Source: Abicalçados
2015State
Share
Ceará
Rio Grande do Sul
Paraíba
Minas Gerais
São Paulo
Bahia
Santa Catarina
Paraná
Sergipe
Mato Grosso do Sul
Others
Brazil
28,0%
20,4%
20,5%
12,9%
7,9%
4,7%
1,9%
1,1%
1,0%
0,9%
0,7%
100%
26,8%
20,3%
20,6%
14,2%
7,6%
5,1%
1,8%
1,1%
0,9%
0,9%
0,6%
100%
28,1%
20,6%
17,7%
14,9%
7,9%
5,3%
1,9%
1,2%
0,9%
0,9%
0,6%
100%
2016 2017
255,7
186,9
Others
Brazil
5,1908,9
CE
160,7
PB
8,6
SE
8,0
MS135,1
MG48,4
BA
71,7
SP
11,0
PR
17,7
SC
RS
2015Northeast
23,3
%
2016
23,3
%
2017
23,7
%
2015South
21,5
%
2016
22,4
%
2017
23,3
%
2015Southea
0,9%
2016
0,9%
2017
0,9%
2015Midwest
0,2%
2016
0,2%
2017
0,2%
2015North
SECTORAL REPORT - FOOTWEAR INDUSTRY - BRAZIL | 2018 19
Segmentation of the Brazilian footwear production by state in 2017Million pairs
BRAZIL3
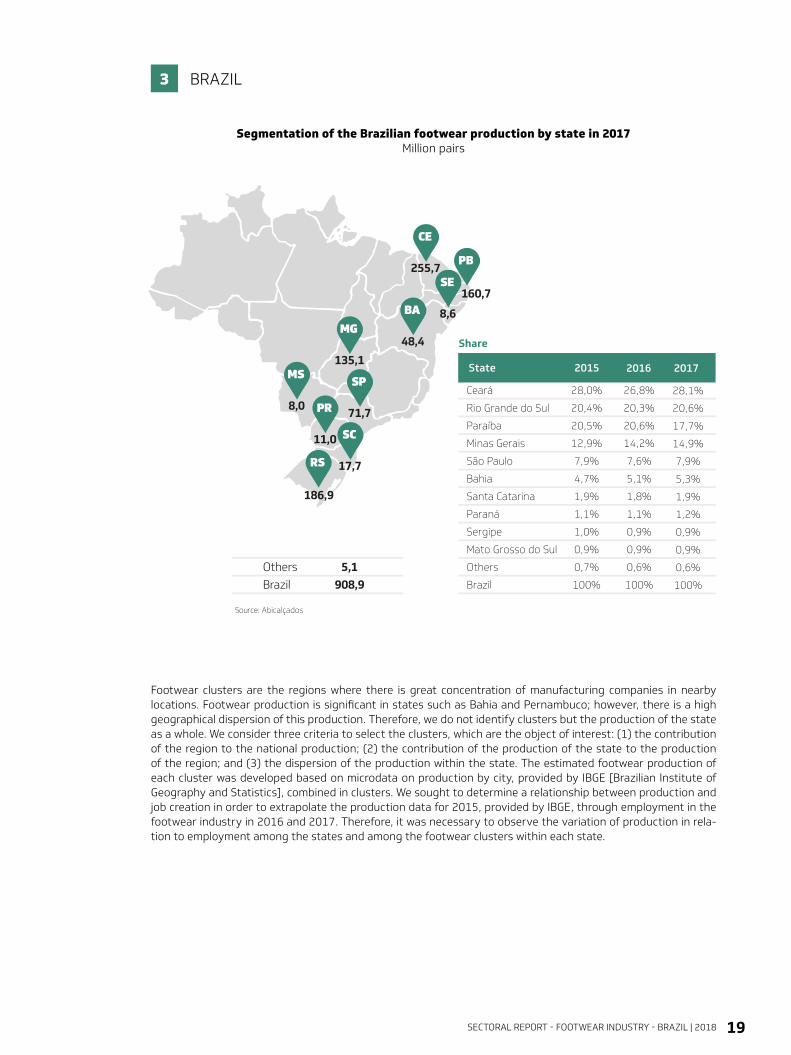
Footwear clusters are the regions where there is great concentration of manufacturing companies in nearby locations. Footwear production is significant in states such as Bahia and Pernambuco; however, there is a high geographical dispersion of this production. Therefore, we do not identify clusters but the production of the state as a whole. We consider three criteria to select the clusters, which are the object of interest: (1) the contribution of the region to the national production; (2) the contribution of the production of the state to the production of the region; and (3) the dispersion of the production within the state. The estimated footwear production of each cluster was developed based on microdata on production by city, provided by IBGE [Brazilian Institute of Geography and Statistics], combined in clusters. We sought to determine a relationship between production and job creation in order to extrapolate the production data for 2015, provided by IBGE, through employment in the footwear industry in 2016 and 2017. Therefore, it was necessary to observe the variation of production in rela-tion to employment among the states and among the footwear clusters within each state.
Source: Abicalçados
Midwest
Northeast
North
Southeast
South
Brazil
2,0%
-1,4%
1,1%
5,0%
3,0%
1,1%
Region Variation 2016/2017
54,0
%
2016
53,2
%
2017
51,9
%
Source: Abicalçados
2015State
Share
Ceará
Rio Grande do Sul
Paraíba
Minas Gerais
São Paulo
Bahia
Santa Catarina
Paraná
Sergipe
Mato Grosso do Sul
Others
Brazil
28,0%
20,4%
20,5%
12,9%
7,9%
4,7%
1,9%
1,1%
1,0%
0,9%
0,7%
100%
26,8%
20,3%
20,6%
14,2%
7,6%
5,1%
1,8%
1,1%
0,9%
0,9%
0,6%
100%
28,1%
20,6%
17,7%
14,9%
7,9%
5,3%
1,9%
1,2%
0,9%
0,9%
0,6%
100%
2016 2017
255,7
186,9
Others
Brazil
5,1908,9
CE
160,7
PB
8,6
SE
8,0
MS135,1
MG48,4
BA
71,7
SP
11,0
PR
17,7
SC
RS
2015Northeast
23,3
%
2016
23,3
%
2017
23,7
%
2015South
21,5
%
2016
22,4
%
2017
23,3
%
2015Southea
0,9%
2016
0,9%
2017
0,9%
2015Midwest
0,2%
2016
0,2%
2017
0,2%
2015North
SECTORAL REPORT - FOOTWEAR INDUSTRY - BRAZIL | 201820
Fonte: IBGE/Abicalçados(*) Estados com a produção descentralizada geograficamente, onde não há elos regionais na indústria, proximidade.
Source: IBGE/AbicalçadosNote: Bahia and Pernambuco are states with a geographically decentralized production, not consisting of the formation of footwear clusters.
Cluster of Campina GrandeCluster of João PessoaOthers
91,9%4,7%3,4%
Paraíba 2015
Cluster of SobralCluster of Juazeiro do NorteCluster of HorizonteCluster of FortalezaOthers
65,0%12,8%5,9%3,3%
13,0%
Ceará 2015
2015
2015
2015
Cluster of Nova SerranaOthers
52,9%47,1%
Minas Gerais
Cluster of BiriguiCluster of FrancaCluster of JaúOthers
45,3%32,7%10,6%11,4%
São Paulo
Cluster of São João BatistaOthers
69,8%30,2%
Santa Catarina
2015
Cluster of Vale do Rio dos SinosCluster of Vale do Paranhana/Encosta da SerraOthers
40,2%
23,8%36,0%
92,9%4,6%2,5%
2016
62,0%11,9%5,8%3,1%
17,2%
2016
2016
2016
2016
56,2%43,8%
45,7%33,5%10,5%10,3%
71,9%28,1%
2016
40,7%
23,2%36,1%
94,5%3,3%2,2%
2017
61,3%8,9%5,9%3,1%
20,8%
2017
2017
2017
2017
56,1%43,9%
44,8%33,6%11,7%9,9%
73,6%26,4%
2017
40,1%
22,5%37,4%
Rio Grande do Sul
Concentration of the main footwear clusters in the footwear pro-duction of the Brazilian states in 2017
Share in pairs
BRAZIL3
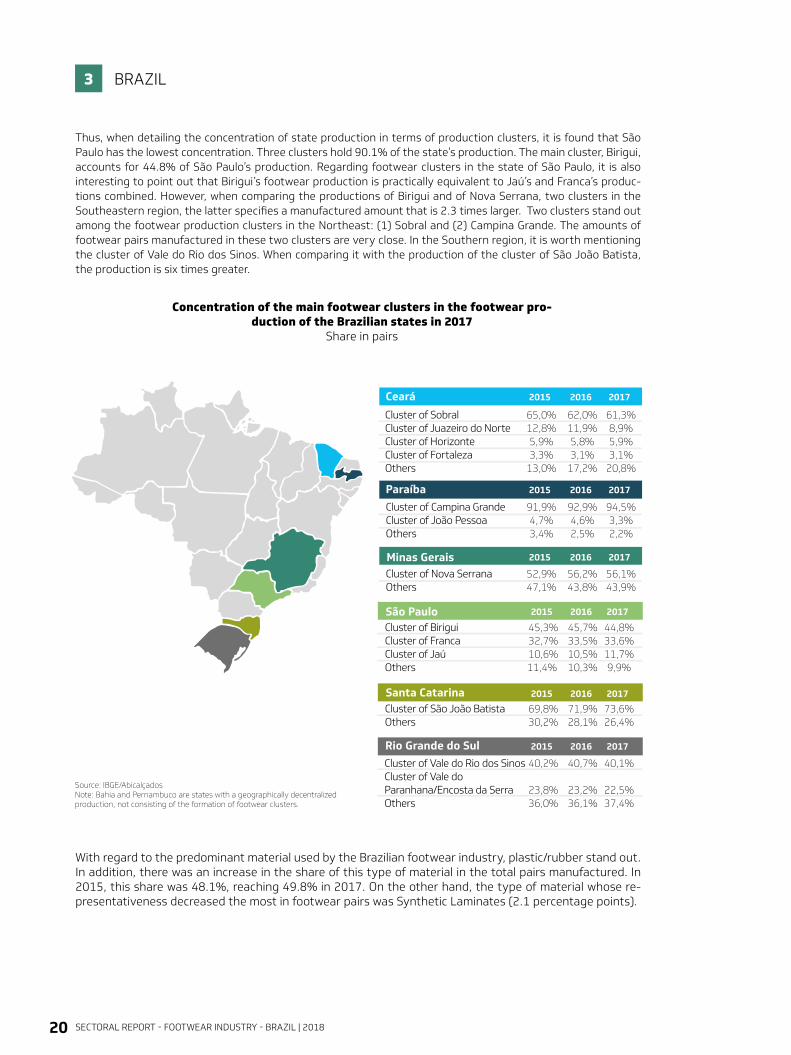
Thus, when detailing the concentration of state production in terms of production clusters, it is found that São Paulo has the lowest concentration. Three clusters hold 90.1% of the state’s production. The main cluster, Birigui, accounts for 44.8% of São Paulo’s production. Regarding footwear clusters in the state of São Paulo, it is also interesting to point out that Birigui’s footwear production is practically equivalent to Jaú’s and Franca’s produc-tions combined. However, when comparing the productions of Birigui and of Nova Serrana, two clusters in the Southeastern region, the latter specifies a manufactured amount that is 2.3 times larger. Two clusters stand out among the footwear production clusters in the Northeast: (1) Sobral and (2) Campina Grande. The amounts of footwear pairs manufactured in these two clusters are very close. In the Southern region, it is worth mentioning the cluster of Vale do Rio dos Sinos. When comparing it with the production of the cluster of São João Batista, the production is six times greater.
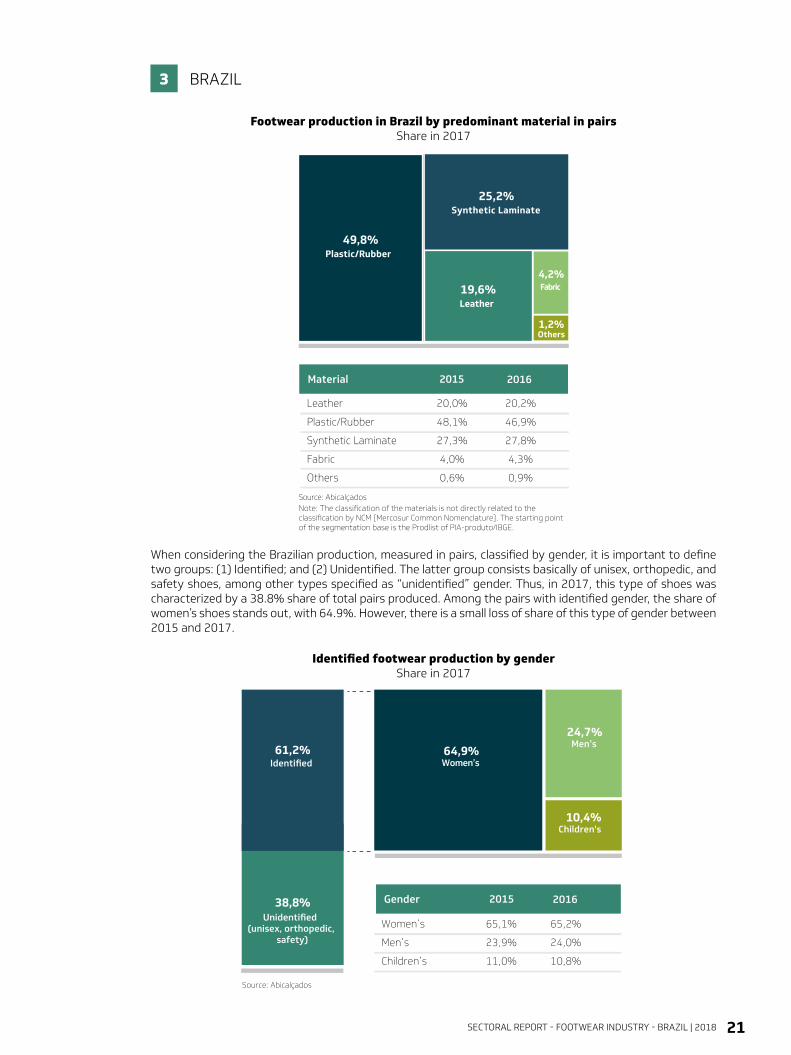
With regard to the predominant material used by the Brazilian footwear industry, plastic/rubber stand out. In addition, there was an increase in the share of this type of material in the total pairs manufactured. In 2015, this share was 48.1%, reaching 49.8% in 2017. On the other hand, the type of material whose re-presentativeness decreased the most in footwear pairs was Synthetic Laminates (2.1 percentage points).
SECTORAL REPORT - FOOTWEAR INDUSTRY - BRAZIL | 2018 21
Identified footwear production by genderShare in 2017
Footwear production in Brazil by predominant material in pairsShare in 2017
BRAZIL3
When considering the Brazilian production, measured in pairs, classified by gender, it is important to define two groups: (1) Identified; and (2) Unidentified. The latter group consists basically of unisex, orthopedic, and safety shoes, among other types specified as “unidentified” gender. Thus, in 2017, this type of shoes was characterized by a 38.8% share of total pairs produced. Among the pairs with identified gender, the share of women’s shoes stands out, with 64.9%. However, there is a small loss of share of this type of gender between 2015 and 2017.
(Participação em 2017)
Produção de calçados no Brasil por material predominante em pares(Participação em 2017)
Fonte: Abicalçados*Nota: Bahia e Pernambuco são estados com a produção descentralizada geograficamente, não consistindo na formação de polos calçadistas.
Source: AbicalçadosNote: The classification of the materials is not directly related to the classification by NCM [Mercosur Common Nomenclature]. The starting point of the segmentation base is the Prodlist of PIA-produto/IBGE.
Outros 32,6%
Participação
Polo do Vale do Rio dos SinosPolo do Vale do Paranhana/Encosta da SerraOutros
41,3%
26,6%32,1%
Rio Grande do Sul
19,6%Leather
25,2%Synthetic Laminate
49,8%Plastic/Rubber
1,2%Others
4,2%Fabric
Source: Abicalçados
Women’s
Men’s
Children’s
2015
65,1%
23,9%
11,0%
2016
65,2%
24,0%
10,8%
10,4%Children's
24,7%Men’s
64,9%Women’s
61,2%
38,8%Unidentified
(unisex, orthopedic, safety)
Identified
Escala de Cores
Leather
Plastic/Rubber
Synthetic Laminate
Fabric
Others
20,0%
48,1%
27,3%
4,0%
0,6%
20,2%
46,9%
27,8%
4,3%
0,9%
Material 2015 2016
Gender 2015 2016
SECTORAL REPORT - FOOTWEAR INDUSTRY - BRAZIL | 201822
Segmentation of the Brazilian footwear production by type of use in pairsShare in 2017
SEASONALITY OF FOOTWEAR PRODUCTION, EXPORTS, AND RETAIL SALES IN BRAZIL
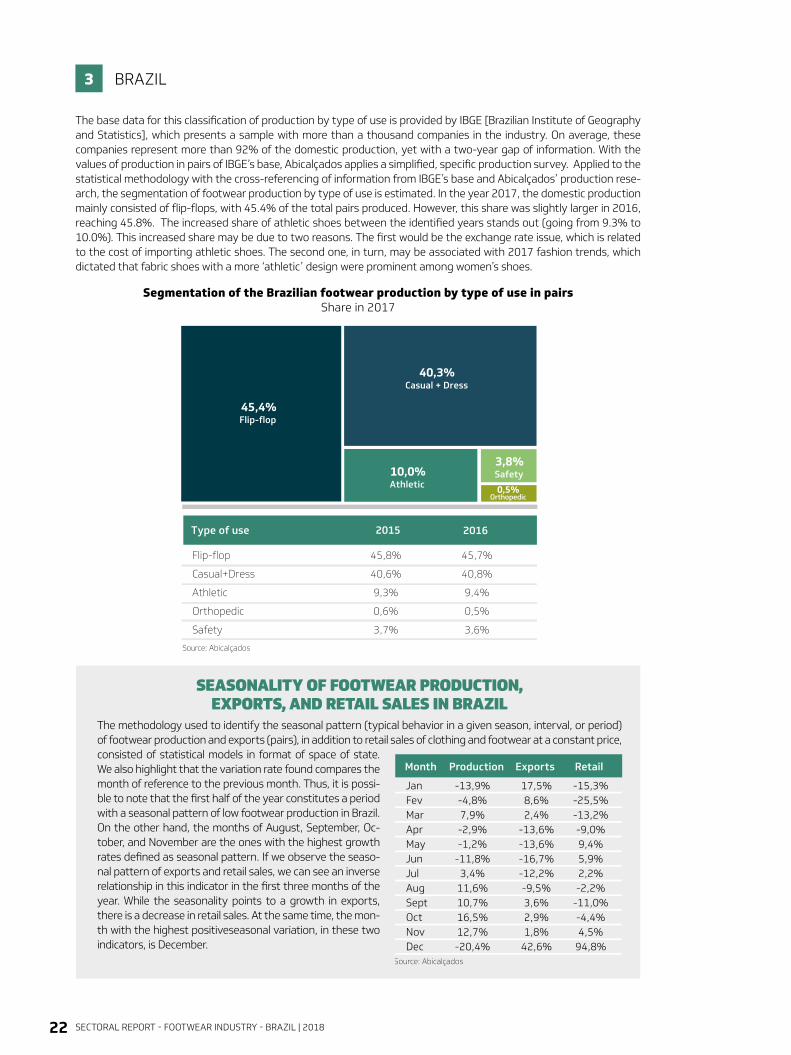
The base data for this classification of production by type of use is provided by IBGE [Brazilian Institute of Geography and Statistics], which presents a sample with more than a thousand companies in the industry. On average, these companies represent more than 92% of the domestic production, yet with a two-year gap of information. With the values of production in pairs of IBGE’s base, Abicalçados applies a simplified, specific production survey. Applied to the statistical methodology with the cross-referencing of information from IBGE’s base and Abicalçados’ production rese-arch, the segmentation of footwear production by type of use is estimated. In the year 2017, the domestic production mainly consisted of flip-flops, with 45.4% of the total pairs produced. However, this share was slightly larger in 2016, reaching 45.8%. The increased share of athletic shoes between the identified years stands out (going from 9.3% to 10.0%). This increased share may be due to two reasons. The first would be the exchange rate issue, which is related to the cost of importing athletic shoes. The second one, in turn, may be associated with 2017 fashion trends, which dictated that fabric shoes with a more ‘athletic’ design were prominent among women’s shoes.
The methodology used to identify the seasonal pattern (typical behavior in a given season, interval, or period) of footwear production and exports (pairs), in addition to retail sales of clothing and footwear at a constant price, consisted of statistical models in format of space of state. We also highlight that the variation rate found compares the month of reference to the previous month. Thus, it is possi-ble to note that the first half of the year constitutes a period with a seasonal pattern of low footwear production in Brazil. On the other hand, the months of August, September, Oc-tober, and November are the ones with the highest growth rates defined as seasonal pattern. If we observe the seaso-nal pattern of exports and retail sales, we can see an inverse relationship in this indicator in the first three months of the year. While the seasonality points to a growth in exports, there is a decrease in retail sales. At the same time, the mon-th with the highest positiveseasonal variation, in these two indicators, is December.
BRAZIL3
Source: Abicalçados
45,4%Flip-flop
40,3%Casual + Dress
10,0%Athletic
3,8%Safety
0,5%Orthopedic
Flip-flop
Casual+Dress
Athletic
Orthopedic
Safety
2015
45,8%
40,6%
9,3%
0,6%
3,7%
2016
45,7%
40,8%
9,4%
0,5%
3,6%
Type of use 2015 2016
Material
Jan
Fev
Mar
Abr
Mai
Jun
Jul
Ago
Set
Out
Nov
Dez
Produção
-13,9%
-4,8%
7,9%
-2,9%
-1,2%
-11,8%
3,4%
11,6%
10,7%
16,5%
12,7%
-20,4%
Exportação
17,5%
8,6%
2,4%
-13,6%
-13,6%
-16,7%
-12,2%
-9,5%
3,6%
2,9%
1,8%
42,6%
Varejo
-15,3%
-25,5%
-13,2%
-9,0%
9,4%
5,9%
2,2%
-2,2%
-11,0%
-4,4%
4,5%
94,8%
Fonte: Abicalçados
Month
JanFevMarAprMayJunJulAugSeptOctNovDec
Production
-13,9%-4,8%7,9%-2,9%-1,2%
-11,8%3,4%
11,6%10,7%16,5%12,7%-20,4%
Exports
17,5%8,6%2,4%
-13,6%-13,6%-16,7%-12,2%-9,5%3,6%2,9%1,8%
42,6%
Retail
-15,3%-25,5%-13,2%-9,0%9,4%5,9%2,2%-2,2%
-11,0%-4,4%4,5%
94,8%Source: Abicalçados
SECTORAL REPORT - FOOTWEAR INDUSTRY - BRAZIL | 2018 23
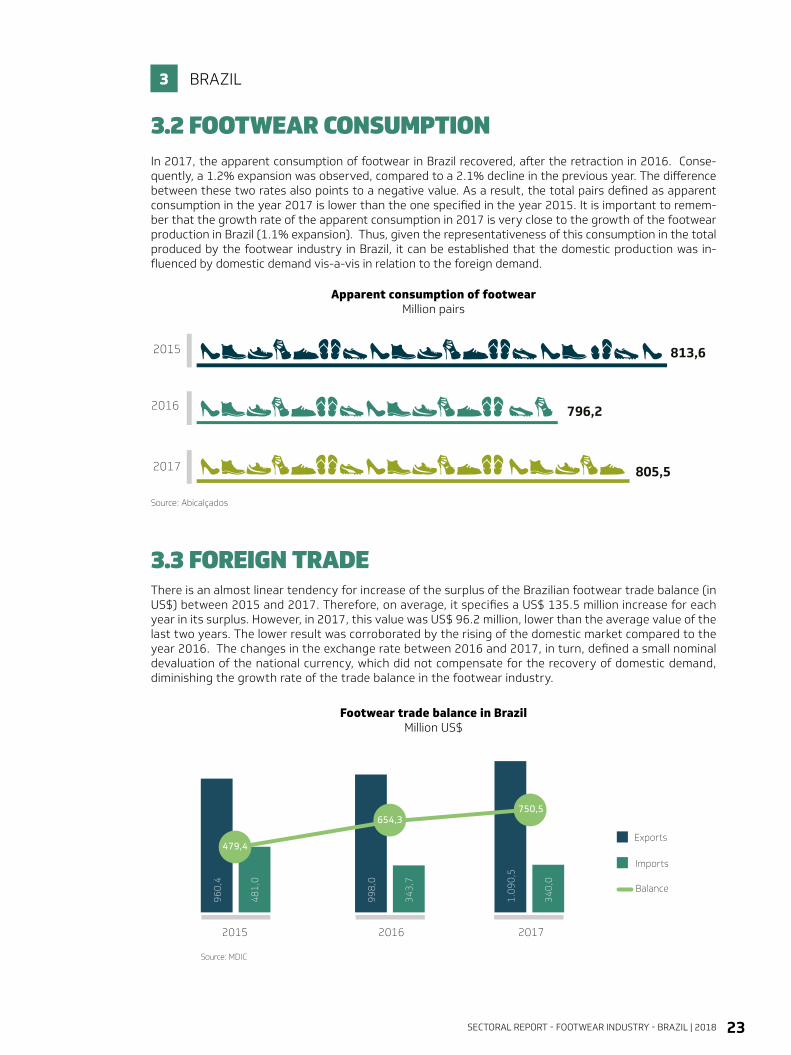
In 2017, the apparent consumption of footwear in Brazil recovered, after the retraction in 2016. Conse-quently, a 1.2% expansion was observed, compared to a 2.1% decline in the previous year. The difference between these two rates also points to a negative value. As a result, the total pairs defined as apparent consumption in the year 2017 is lower than the one specified in the year 2015. It is important to remem-ber that the growth rate of the apparent consumption in 2017 is very close to the growth of the footwear production in Brazil (1.1% expansion). Thus, given the representativeness of this consumption in the total produced by the footwear industry in Brazil, it can be established that the domestic production was in-fluenced by domestic demand vis-a-vis in relation to the foreign demand.
There is an almost linear tendency for increase of the surplus of the Brazilian footwear trade balance (in US$) between 2015 and 2017. Therefore, on average, it specifies a US$ 135.5 million increase for each year in its surplus. However, in 2017, this value was US$ 96.2 million, lower than the average value of the last two years. The lower result was corroborated by the rising of the domestic market compared to the year 2016. The changes in the exchange rate between 2016 and 2017, in turn, defined a small nominal devaluation of the national currency, which did not compensate for the recovery of domestic demand, diminishing the growth rate of the trade balance in the footwear industry.
Apparent consumption of footwearMillion pairs
3.2 FOOTWEAR CONSUMPTION
3.3 FOREIGN TRADE
Footwear trade balance in BrazilMillion US$
BRAZIL3
Consumo aparente de calçados(Milhões de pares)
813,6
796,2
805,5
2015
2016
2017
Escala de Cores
Source: Abicalçados
Balança comercial de calçados no Brasil (Milhões US$)
96
0,4
48
1,0
99
8,0
34
3,7
1.0
90
,5
34
0,0
2015 2016 2017
Exports
Imports
Balance
Source: MDIC
479,4
654,3750,5
SECTORAL REPORT - FOOTWEAR INDUSTRY - BRAZIL | 201824
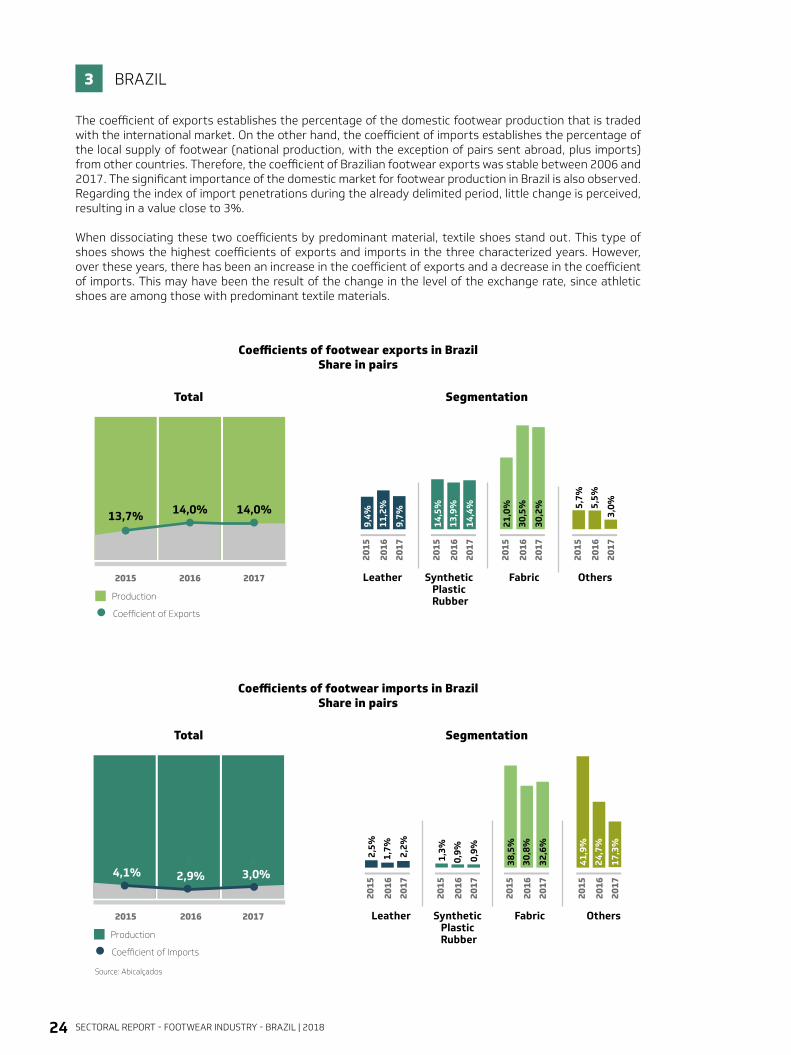
The coefficient of exports establishes the percentage of the domestic footwear production that is traded with the international market. On the other hand, the coefficient of imports establishes the percentage of the local supply of footwear (national production, with the exception of pairs sent abroad, plus imports) from other countries. Therefore, the coefficient of Brazilian footwear exports was stable between 2006 and 2017. The significant importance of the domestic market for footwear production in Brazil is also observed. Regarding the index of import penetrations during the already delimited period, little change is perceived, resulting in a value close to 3%.
When dissociating these two coefficients by predominant material, textile shoes stand out. This type of shoes shows the highest coefficients of exports and imports in the three characterized years. However, over these years, there has been an increase in the coefficient of exports and a decrease in the coefficient of imports. This may have been the result of the change in the level of the exchange rate, since athletic shoes are among those with predominant textile materials.
Coefficients of footwear exports in BrazilShare in pairs
Coefficients of footwear imports in BrazilShare in pairs
Total
Total
Segmentation
Segmentation
BRAZIL3
Coeficiente de Exportações
2015 2016 2017
Source: Abicalçados
Fonte: Abicalçados
14,0%
Production
Coefficient of Exports
Coeficiente de Importações
Coeficiente de Exportações Coeficiente de Importações
2015 2016 2017
4,1% 2,9% 3,0%
Production
Coefficient of Imports
13,7% 14,0%
Leather Fabric OthersSynthetic Plastic Rubber
Leather Fabric OthersSynthetic Plastic Rubber
11,2
%
9,4%
9,7%
2015
2016
2017
13,9
%
14,5
%
14,4
%
2015
2016
2017
30,5
%
21,0
%
30,2
%
2015
2016
2017
5,5%
5,7%
3,0%
2015
2016
2017
1,7%2,5%
2,2%
2015
2016
2017
0,9%
1,3%
0,9%
2015
2016
2017
30,8
%
38,5
%
32,6
%
2015
2016
2017
24,7
%
41,9
%
17,3
%
2015
2016
2017
SECTORAL REPORT - FOOTWEAR INDUSTRY - BRAZIL | 2018 25
BRAZIL3
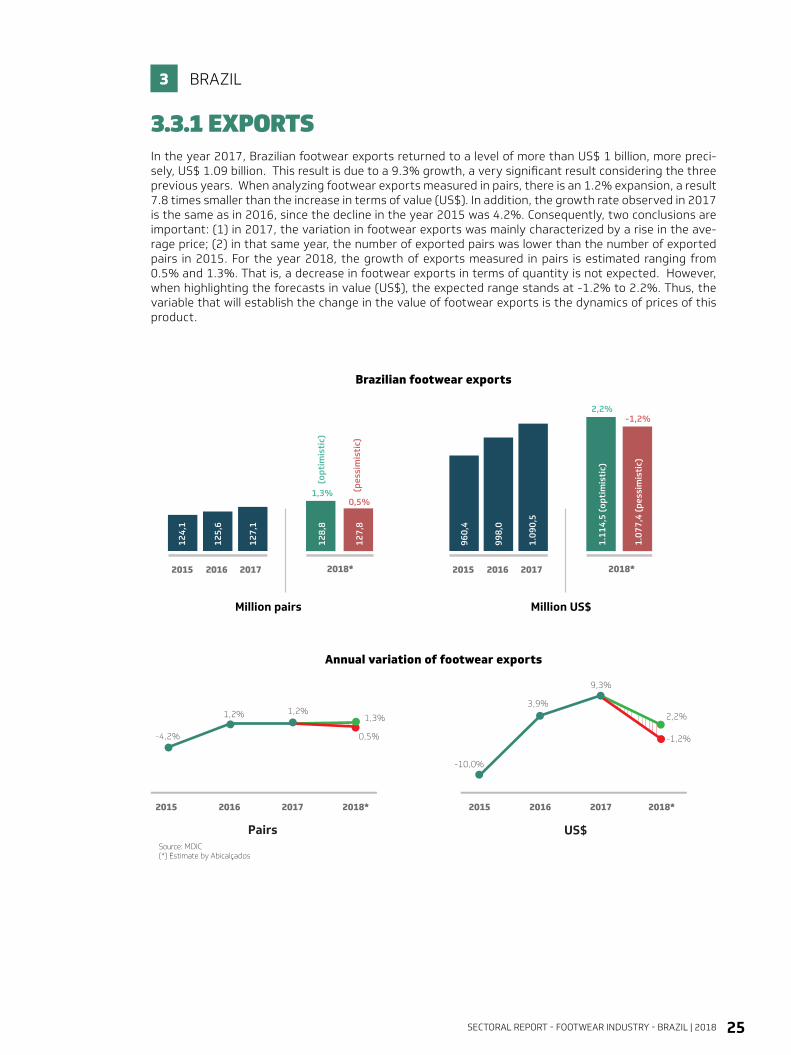
In the year 2017, Brazilian footwear exports returned to a level of more than US$ 1 billion, more preci-sely, US$ 1.09 billion. This result is due to a 9.3% growth, a very significant result considering the three previous years. When analyzing footwear exports measured in pairs, there is an 1.2% expansion, a result 7.8 times smaller than the increase in terms of value (US$). In addition, the growth rate observed in 2017 is the same as in 2016, since the decline in the year 2015 was 4.2%. Consequently, two conclusions are important: (1) in 2017, the variation in footwear exports was mainly characterized by a rise in the ave-rage price; (2) in that same year, the number of exported pairs was lower than the number of exported pairs in 2015. For the year 2018, the growth of exports measured in pairs is estimated ranging from 0.5% and 1.3%. That is, a decrease in footwear exports in terms of quantity is not expected. However, when highlighting the forecasts in value (US$), the expected range stands at -1.2% to 2.2%. Thus, the variable that will establish the change in the value of footwear exports is the dynamics of prices of this product.
Brazilian footwear exports
3.3.1 EXPORTS
Exportações brasileiras de calçados
960,
4
1.09
0,5
998,
0
2015 2016 2017
Million US$
-1,2%2,2%
2018*
1.07
7,4
(pes
sim
isti
c)
1.11
4,5
(opt
imis
tic)
125,
6
124,
1
127,
1
2015 2016 2017
Million pairs
0,5%1,3%
2018*
127,
8(p
essi
mis
tic)
(opt
imis
tic)
128,
8
Escala de Cores
Source: MDIC(*) Estimate by Abicalçados
Pairs US$
1,2%
-4,2%
1,2%2,2%
-1,2%
3,9%
-10,0%
9,3%
0,5%
1,3%
2015 2016 2017 2018* 2015 2016 2017 2018*
Annual variation of footwear exports
SECTORAL REPORT - FOOTWEAR INDUSTRY - BRAZIL | 201826
Main destinations of footwear exports in US$Share in 2017
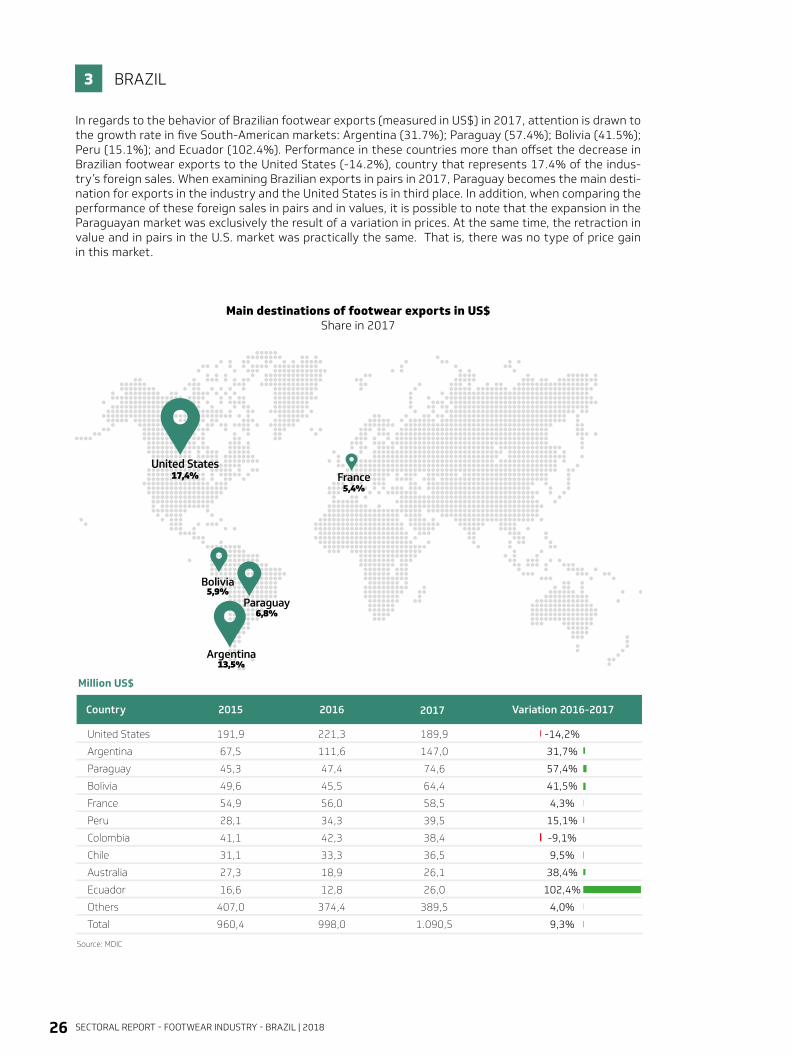
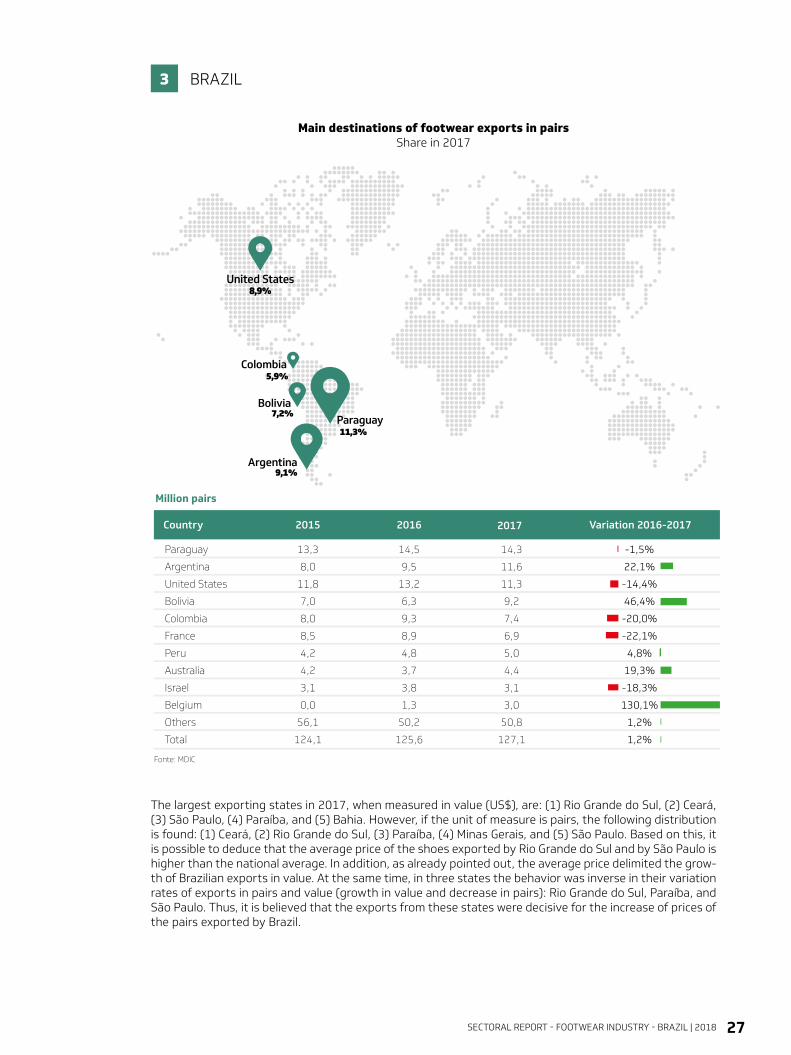
In regards to the behavior of Brazilian footwear exports (measured in US$) in 2017, attention is drawn to the growth rate in five South-American markets: Argentina (31.7%); Paraguay (57.4%); Bolivia (41.5%); Peru (15.1%); and Ecuador (102.4%). Performance in these countries more than offset the decrease in Brazilian footwear exports to the United States (-14.2%), country that represents 17.4% of the indus-try’s foreign sales. When examining Brazilian exports in pairs in 2017, Paraguay becomes the main desti-nation for exports in the industry and the United States is in third place. In addition, when comparing the performance of these foreign sales in pairs and in values, it is possible to note that the expansion in the Paraguayan market was exclusively the result of a variation in prices. At the same time, the retraction in value and in pairs in the U.S. market was practically the same. That is, there was no type of price gain in this market.
BRAZIL3
Country 2015 2016
Million US$
2017
France
Bolivia5,9%
5,4%
Argentina13,5%
Paraguay6,8%
United States17,4%
Variation 2016-2017
Source: MDIC
United States
Argentina
Paraguay
Bolivia
France
Peru
Colombia
Chile
Australia
Ecuador
Others
Total
191,9
67,5
45,3
49,6
54,9
28,1
41,1
31,1
27,3
16,6
407,0
960,4
221,3
111,6
47,4
45,5
56,0
34,3
42,3
33,3
18,9
12,8
374,4
998,0
189,9
147,0
74,6
64,4
58,5
39,5
38,4
36,5
26,1
26,0
389,5
1.090,5
-14,2%
31,7%
57,4%
41,5%
4,3%
15,1%
-9,1%
9,5%
38,4%
102,4%
4,0%
9,3%
SECTORAL REPORT - FOOTWEAR INDUSTRY - BRAZIL | 2018 27
Main destinations of footwear exports in pairsShare in 2017
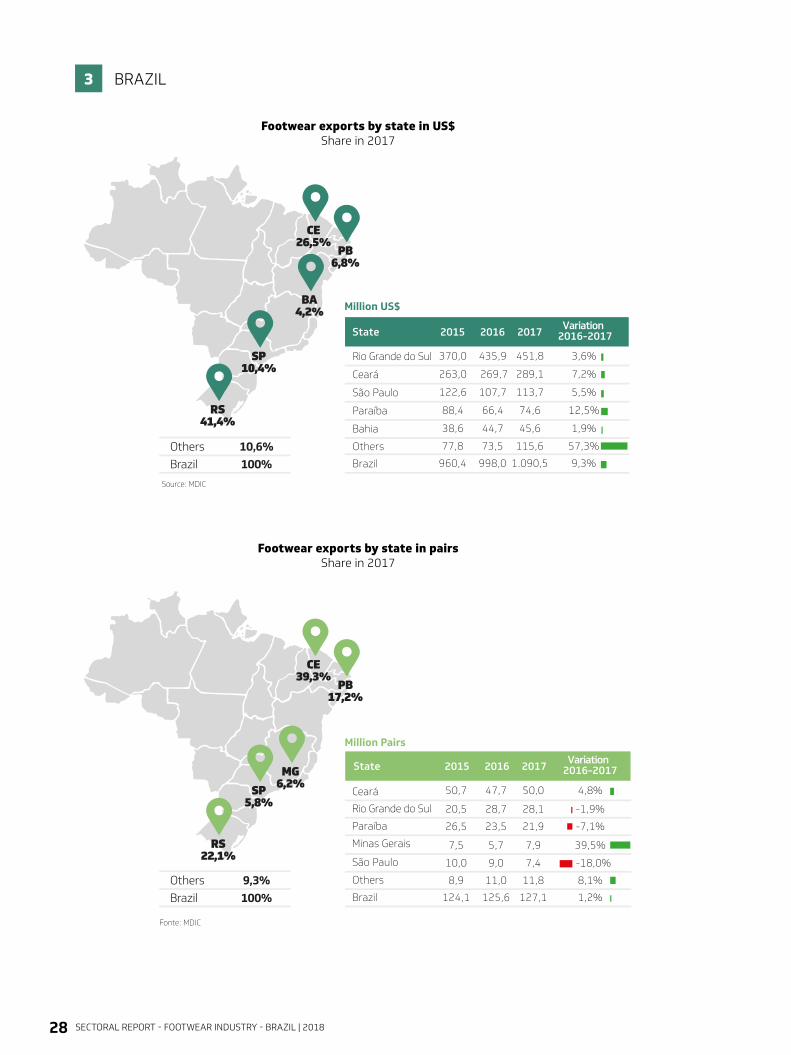
The largest exporting states in 2017, when measured in value (US$), are: (1) Rio Grande do Sul, (2) Ceará, (3) São Paulo, (4) Paraíba, and (5) Bahia. However, if the unit of measure is pairs, the following distribution is found: (1) Ceará, (2) Rio Grande do Sul, (3) Paraíba, (4) Minas Gerais, and (5) São Paulo. Based on this, it is possible to deduce that the average price of the shoes exported by Rio Grande do Sul and by São Paulo is higher than the national average. In addition, as already pointed out, the average price delimited the grow-th of Brazilian exports in value. At the same time, in three states the behavior was inverse in their variation rates of exports in pairs and value (growth in value and decrease in pairs): Rio Grande do Sul, Paraíba, and São Paulo. Thus, it is believed that the exports from these states were decisive for the increase of prices of the pairs exported by Brazil.
BRAZIL3
Country 2015 2016
Million pairs
2017
Bolivia7,2%
Colombia5,9%
Argentina9,1%
Paraguay11,3%
United States8,9%
Variation 2016-2017
Fonte: MDIC
Paraguay
Argentina
United States
Bolivia
Colombia
France
Peru
Australia
Israel
Belgium
Others
Total
13,3
8,0
11,8
7,0
8,0
8,5
4,2
4,2
3,1
0,0
56,1
124,1
14,5
9,5
13,2
6,3
9,3
8,9
4,8
3,7
3,8
1,3
50,2
125,6
14,3
11,6
11,3
9,2
7,4
6,9
5,0
4,4
3,1
3,0
50,8
127,1
-1,5%
22,1%
-14,4%
46,4%
-20,0%
-22,1%
4,8%
19,3%
-18,3%
130,1%
1,2%
1,2%
SECTORAL REPORT - FOOTWEAR INDUSTRY - BRAZIL | 201828
Footwear exports by state in US$ Share in 2017
Footwear exports by state in pairs Share in 2017
BRAZIL3
Source: MDIC
2015State
77,8 115,673,5 57,3%
960,4 1.090,5998,0 9,3%
2016 2017 Variation 2016-2017
2015State
Others
Brazil
2016 2017 Variation 2016-2017
Participação das exportações de calçados por Unidade da Federação (Milhões de US$)
CE26,5%
PB6,8%
BA4,2%
SP10,4%
RS41,4%
Fonte: MDIC
CE39,3%
PB17,2%
MG6,2%SP
5,8%
RS22,1%
Million US$
Million Pairs
Paraíba 21,926,5 23,5 -7,1%
Rio Grande do Sul 28,120,5 28,7 -1,9%
Brazil 127,1124,1 125,6 1,2%
Minas Gerais 7,97,5 5,7 39,5%
Others 11,88,9 11,0 8,1%
São Paulo 7,410,0 9,0 -18,0%
88,4 74,666,4 12,5%Paraíba
263,0 289,1 269,7 7,2%Ceará
122,6 113,7107,7 5,5%São Paulo
370,0 451,8435,9 3,6%Rio Grande do Sul
38,6 45,644,7 1,9%Bahia
Ceará 50,050,7 47,7 4,8%
Others
Brazil
9,3%100%
Others
Brazil
10,6%100%
SECTORAL REPORT - FOOTWEAR INDUSTRY - BRAZIL | 2018 29
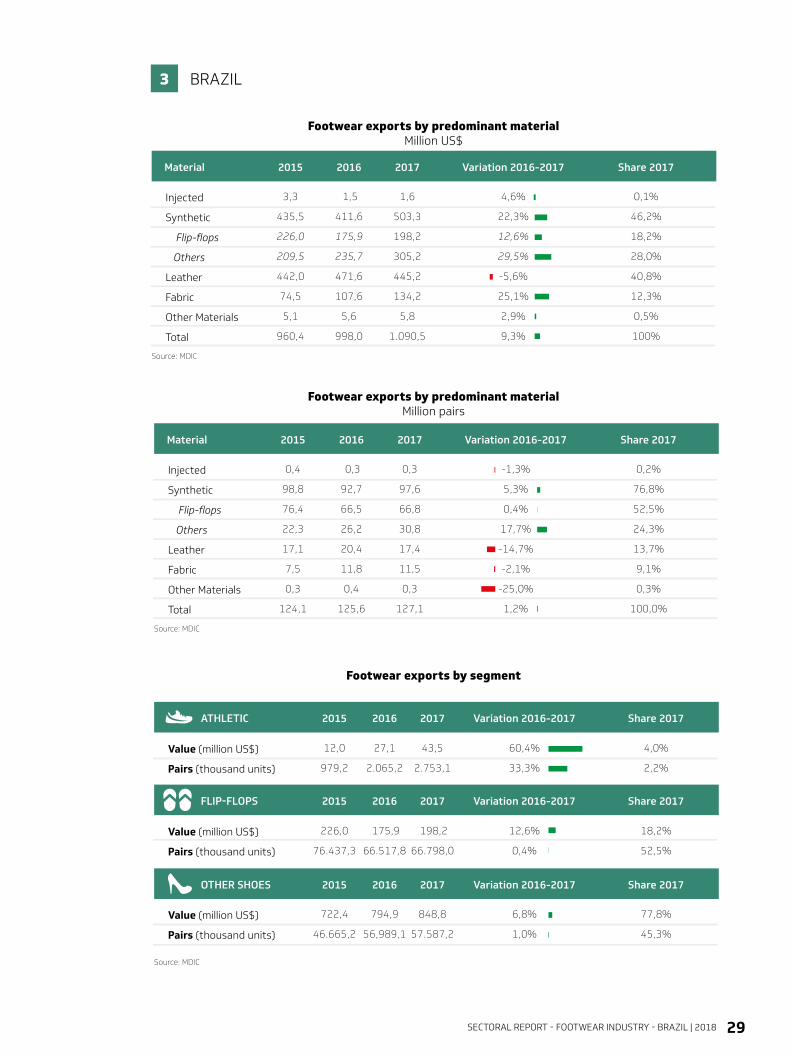
Footwear exports by segment
BRAZIL3
Footwear exports by predominant materialMillion US$
Material 2015
3,3
435,5
226,0
209,5
442,0
74,5
5,1
960,4
Injected
Synthetic
Flip-flops
Others
Leather
Fabric
Other Materials
Total
2016
1,5
411,6
175,9
235,7
471,6
107,6
5,6
998,0
2017
1,6
503,3
198,2
305,2
445,2
134,2
5,8
1.090,5
Share 2017
0,1%
46,2%
18,2%
28,0%
40,8%
12,3%
0,5%
100%
Variation 2016-2017
4,6%
22,3%
12,6%
29,5%
-5,6%
25,1%
2,9%
9,3%
Source: MDIC
Footwear exports by predominant materialMillion pairs
Material 2015
0,4
98,8
76,4
22,3
17,1
7,5
0,3
124,1
Injected
Synthetic
Flip-flops
Others
Leather
Fabric
Other Materials
Total
2016
0,3
92,7
66,5
26,2
20,4
11,8
0,4
125,6
2017
0,3
97,6
66,8
30,8
17,4
11,5
0,3
127,1
Share 2017
0,2%
76,8%
52,5%
24,3%
13,7%
9,1%
0,3%
100,0%
Variation 2016-2017
-1,3%
5,3%
0,4%
17,7%
-14,7%
-2,1%
-25,0%
1,2%
Source: MDIC
ATHLETIC 2015
12,0
979,2
Value (million US$)
Pairs (thousand units)
2016
27,1
2.065,2
2017
43,5
2.753,1
Share 2017
4,0%
2,2%
Variation 2016-2017
60,4%
33,3%
FLIP-FLOPS 2015
226,0
76.437,3
Value (million US$)
Pairs (thousand units)
2016
175,9
66.517,8
2017
198,2
66.798,0
Share 2017
18,2%
52,5%
Variation 2016-2017
12,6%
0,4%
OTHER SHOES 2015
722,4
46.665,2
Value (million US$)
Pairs (thousand units)
2016
794,9
56,989,1
2017
848,8
57.587,2
Share 2017
77,8%
45,3%
Variation 2016-2017
6,8%
1,0%
Source: MDIC

SECTORAL REPORT - FOOTWEAR INDUSTRY - BRAZIL | 201830
Year
20012002200320042005200620072008200920102011201220132014201520162017
50%
40%
30%
20%
10%
0%
-10%
-20%
-30%
-40%
-50%
Value
4,5%-10,3%7,0%
16,9%4,3%-1,5%2,6%-1,6%
-27,7%9,3%
-12,8%-15,7%0,2%-2,6%
-10,0%3,9%9,3%
Quantum
3,4%-3,5%5,7%7,6%
-11,8%-10,3%-13,2%-21,4%-24,0%-1,5%
-24,5%-13,7%2,5%-0,7%-1,4%15,3%-1,4%
Price
1,1%-7,1%1,2%8,6%
18,2%9,8%
18,2%25,2%-4,8%11,0%15,5%-2,3%-2,2%-1,9%-8,7%-9,9%10,8%
Source: AbicalçadosNote: The price and quantum indexes consist of a geometric mean, so that their sum does not constitute the total variation in the value of footwear exports.
Source: BCB, Abicalçados
Effect price (%)
2002 2003 2004 2005 2006 2007 2008 2009 2010 2011 2012 2013 2014 2015 2016 2017
Exchange rate fluctuation (%) Polynomial (Exchange rate fluctuation (%))Polynomial (Effect price (%))
BRAZIL3
QUANTUM INDEX OF BRAZILIAN FOOTWEAR EXPORTS
The Fisher index was the methodology used to establish the quantum indexes and the prices of footwear exports in Brazil. Thus, it is possible to identify that in the delimited years the positive variations in the value of footwear exports were defined by the behavior of prices. That is, it is possible to note a decrease of Brazilian exports mea-sured in quantum, while the price variable is determinant for the expansion of foreign sales.
In addition, the performance of the prices of Brazilian footwear exports followed a pattern inversely related to the exchange rate (R$/US$) in recent years (2002-2017). In other words, when the exchange rate rises, that is, when the Brazilian currency is devalued, the price of foreign sales of shoes decreases and vice versa. It is worth noting that the behavior of these prices, in part, compensated for the decrease in exported volume, which predomina-ted in most of the observed years.
Variation (%) of the prices of Brazilian footwear exports and variation (%) of the nominal exchange rate (R$/US$)
Decomposition of the growth of Brazilian footwear exports
SECTORAL REPORT - FOOTWEAR INDUSTRY - BRAZIL | 2018 31
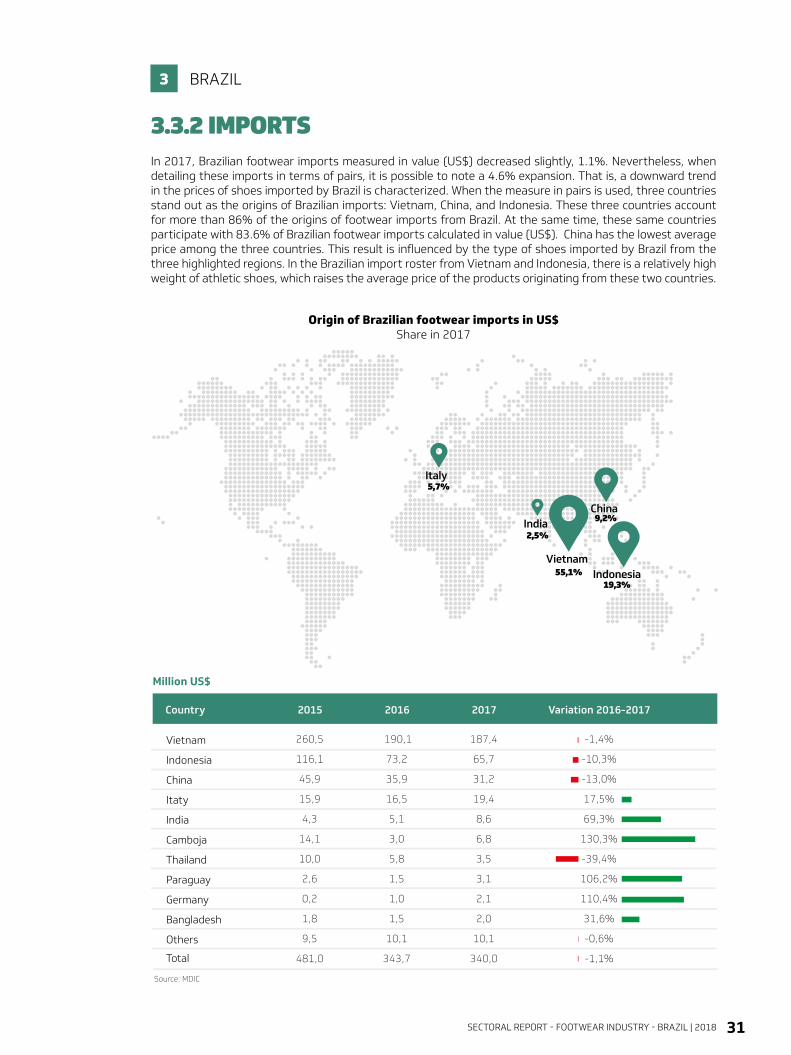
Origin of Brazilian footwear imports in US$Share in 2017
In 2017, Brazilian footwear imports measured in value (US$) decreased slightly, 1.1%. Nevertheless, when detailing these imports in terms of pairs, it is possible to note a 4.6% expansion. That is, a downward trend in the prices of shoes imported by Brazil is characterized. When the measure in pairs is used, three countries stand out as the origins of Brazilian imports: Vietnam, China, and Indonesia. These three countries account for more than 86% of the origins of footwear imports from Brazil. At the same time, these same countries participate with 83.6% of Brazilian footwear imports calculated in value (US$). China has the lowest average price among the three countries. This result is influenced by the type of shoes imported by Brazil from the three highlighted regions. In the Brazilian import roster from Vietnam and Indonesia, there is a relatively high weight of athletic shoes, which raises the average price of the products originating from these two countries.
3.3.2 IMPORTS
BRAZIL3
Vietnam
Indonesia
China
Itaty
India
Camboja
Thailand
Paraguay
Germany
Bangladesh
Others
Total
Source: MDIC
Country
260,5
116,1
45,9
15,9
4,3
14,1
10,0
2,6
0,2
1,8
9,5
481,0
2015
190,1
73,2
35,9
16,5
5,1
3,0
5,8
1,5
1,0
1,5
10,1
343,7
2016
187,4
65,7
31,2
19,4
8,6
6,8
3,5
3,1
2,1
2,0
10,1
340,0
2017
-1,4%
-10,3%
-13,0%
17,5%
69,3%
130,3%
-39,4%
106,2%
110,4%
31,6%
-0,6%
-1,1%
Variation 2016-2017
Million US$
IndonesiaVietnam
China
55,1%
India2,5%
9,2%
Italy5,7%
19,3%
SECTORAL REPORT - FOOTWEAR INDUSTRY - BRAZIL | 201832
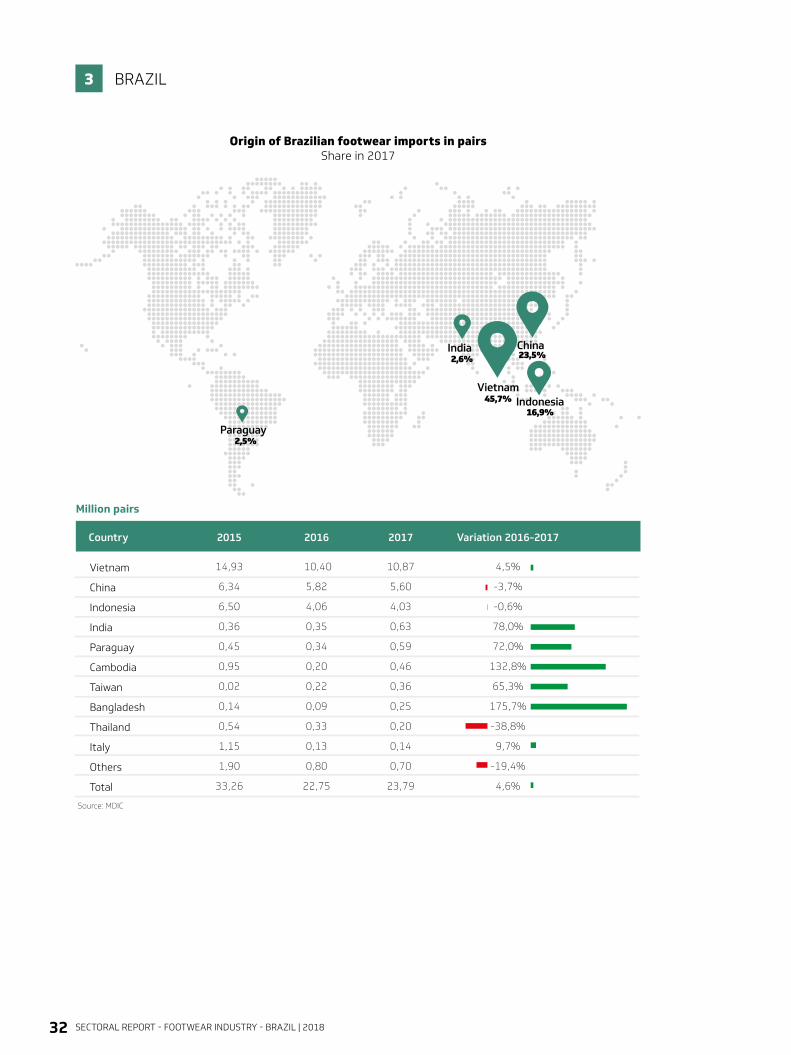
Origin of Brazilian footwear imports in pairsShare in 2017
BRAZIL3
Country 2015
14,93
6,34
6,50
0,36
0,45
0,95
0,02
0,14
0,54
1,15
1,90
33,26
Vietnam
China
Indonesia
India
Paraguay
Cambodia
Taiwan
Bangladesh
Thailand
Italy
Others
Total
2016
10,40
5,82
4,06
0,35
0,34
0,20
0,22
0,09
0,33
0,13
0,80
22,75
2017
10,87
5,60
4,03
0,63
0,59
0,46
0,36
0,25
0,20
0,14
0,70
23,79
Variation 2016-2017
4,5%
-3,7%
-0,6%
78,0%
72,0%
132,8%
65,3%
175,7%
-38,8%
9,7%
-19,4%
4,6%
Source: MDIC
Million pairs
India
IndonesiaVietnam
China
45,7%
23,5%2,6%
Paraguay2,5%
16,9%
SECTORAL REPORT - FOOTWEAR INDUSTRY - BRAZIL | 2018 33
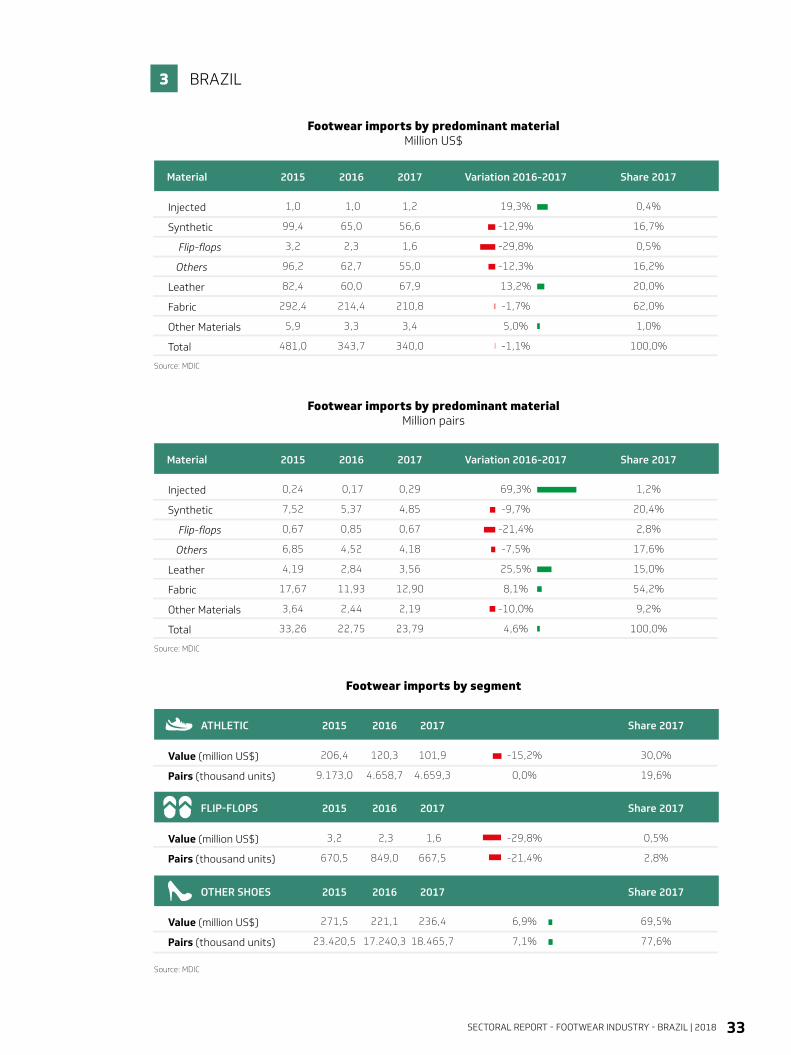
Footwear imports by predominant materialMillion US$
Footwear imports by predominant materialMillion pairs
Footwear imports by segment
BRAZIL3
Material 2015
0,24
7,52
0,67
6,85
4,19
17,67
3,64
33,26
Injected
Synthetic
Flip-flops
Others
Leather
Fabric
Other Materials
Total
2016
0,17
5,37
0,85
4,52
2,84
11,93
2,44
22,75
2017
0,29
4,85
0,67
4,18
3,56
12,90
2,19
23,79
Share 2017
1,2%
20,4%
2,8%
17,6%
15,0%
54,2%
9,2%
100,0%
Variation 2016-2017
69,3%
-9,7%
-21,4%
-7,5%
25,5%
8,1%
-10,0%
4,6%
Source: MDIC
Material 2015
1,0
99,4
3,2
96,2
82,4
292,4
5,9
481,0
Injected
Synthetic
Flip-flops
Others
Leather
Fabric
Other Materials
Total
2016
1,0
65,0
2,3
62,7
60,0
214,4
3,3
343,7
2017
1,2
56,6
1,6
55,0
67,9
210,8
3,4
340,0
Share 2017
0,4%
16,7%
0,5%
16,2%
20,0%
62,0%
1,0%
100,0%
Variation 2016-2017
19,3%
-12,9%
-29,8%
-12,3%
13,2%
-1,7%
5,0%
-1,1%
Source: MDIC
2015
206,4
9.173,0
2016
120,3
4.658,7
2017
101,9
4.659,3
30,0%
19,6%
-15,2%
0,0%
2015
3,2
670,5
2016
2,3
849,0
2017
1,6
667,5
0,5%
2,8%
-29,8%
-21,4%
2015
271,5
23.420,5
2016
221,1
17.240,3
2017
236,4
18.465,7
69,5%
77,6%
6,9%
7,1%
Source: MDIC
ATHLETIC
Value (million US$)
Pairs (thousand units)
Share 2017
FLIP-FLOPS
Value (million US$)
Pairs (thousand units)
Share 2017
OTHER SHOES
Value (million US$)
Pairs (thousand units)
Share 2017
SECTORAL REPORT - FOOTWEAR INDUSTRY - BRAZIL | 201834
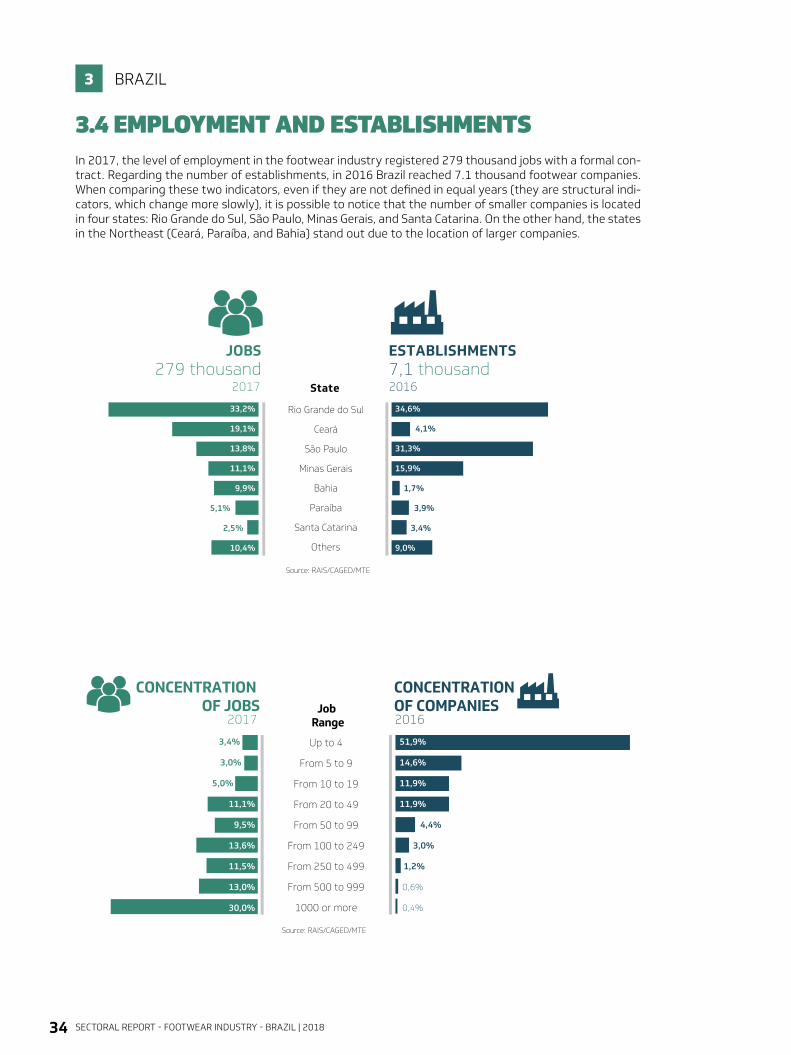
In 2017, the level of employment in the footwear industry registered 279 thousand jobs with a formal con-tract. Regarding the number of establishments, in 2016 Brazil reached 7.1 thousand footwear companies. When comparing these two indicators, even if they are not defined in equal years (they are structural indi-cators, which change more slowly), it is possible to notice that the number of smaller companies is located in four states: Rio Grande do Sul, São Paulo, Minas Gerais, and Santa Catarina. On the other hand, the states in the Northeast (Ceará, Paraíba, and Bahia) stand out due to the location of larger companies.
3.4 EMPLOYMENT AND ESTABLISHMENTS
BRAZIL3
JOBS ESTABLISHMENTS
State
Rio Grande do Sul
Ceará
São Paulo
Minas Gerais
Bahia
Paraíba
279 thousand2017
7,1 thousand2016
33,2%
19,1%
13,8%
11,1%
9,9%
34,6%
4,1%
31,3%
15,9%
1,7%
5,1%
2,5%
3,9%
3,4%
Escala de Cores
Santa Catarina
Others10,4% 9,0%
Source: RAIS/CAGED/MTE
Source: RAIS/CAGED/MTE
CONCENTRATION OF JOBS
CONCENTRATION OF COMPANIES Job
Range
Up to 4
From 5 to 9
From 10 to 19
From 20 to 49
From 50 to 99
From 100 to 249
From 250 to 499
From 500 to 999
1000 or more
2017 2016
51,9%
14,6%
11,9%
11,9%
4,4%
3,0%
1,2%
0,6%
0,4%
3,4%
3,0%
5,0%
11,1%
9,5%
13,6%
11,5%
13,0%
30,0%
SECTORAL REPORT - FOOTWEAR INDUSTRY - BRAZIL | 2018 35
Employment in the footwear industry by state
Footwear manufacturing establishments by state
BRAZIL3
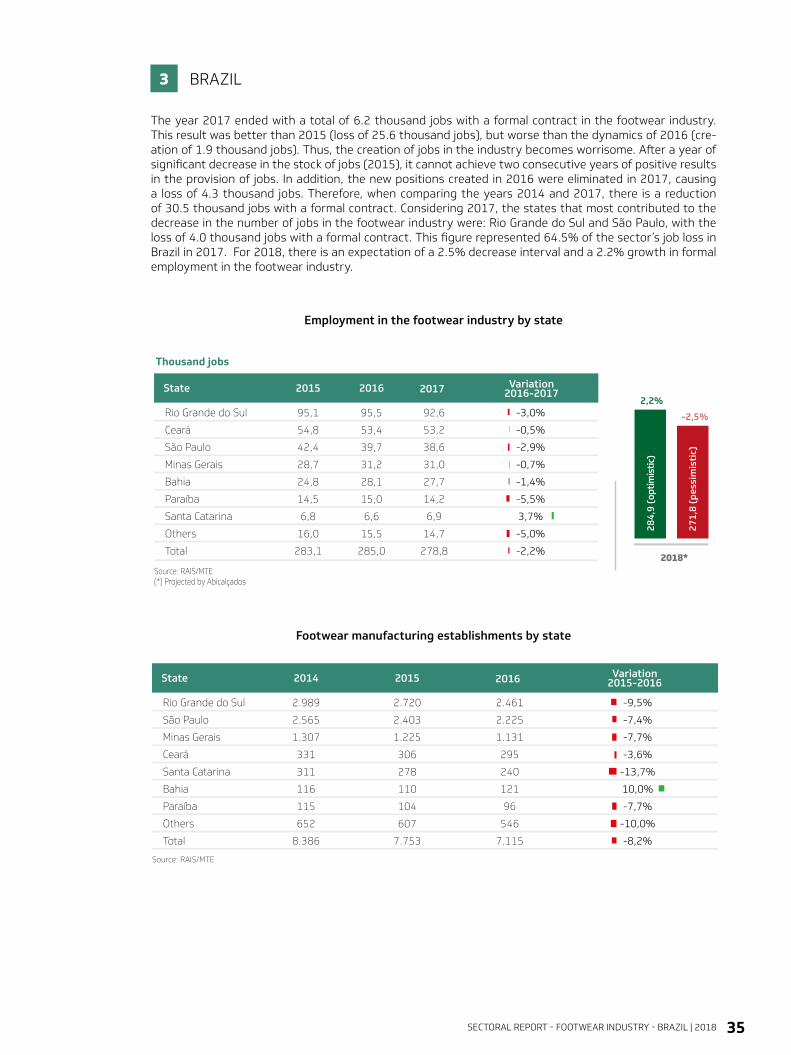
The year 2017 ended with a total of 6.2 thousand jobs with a formal contract in the footwear industry. This result was better than 2015 (loss of 25.6 thousand jobs), but worse than the dynamics of 2016 (cre-ation of 1.9 thousand jobs). Thus, the creation of jobs in the industry becomes worrisome. After a year of significant decrease in the stock of jobs (2015), it cannot achieve two consecutive years of positive results in the provision of jobs. In addition, the new positions created in 2016 were eliminated in 2017, causing a loss of 4.3 thousand jobs. Therefore, when comparing the years 2014 and 2017, there is a reduction of 30.5 thousand jobs with a formal contract. Considering 2017, the states that most contributed to the decrease in the number of jobs in the footwear industry were: Rio Grande do Sul and São Paulo, with the loss of 4.0 thousand jobs with a formal contract. This figure represented 64.5% of the sector’s job loss in Brazil in 2017. For 2018, there is an expectation of a 2.5% decrease interval and a 2.2% growth in formal employment in the footwear industry.
State 2014 2015
Footwear manufacturing establishments by state
2016
Source: RAIS/MTE
Rio Grande do Sul
São Paulo
Minas Gerais
Ceará
Santa Catarina
Bahia
Paraíba
Others
Total
2.989
2.565
1.307
331
311
116
115
652
8.386
2.720
2.403
1.225
306
278
110
104
607
7.753
2.461
2.225
1.131
295
240
121
96
546
7.115
-9,5%
-7,4%
-7,7%
-3,6%
-13,7%
10,0%
-7,7%
-10,0%
-8,2%
Variation2015-2016
State 2015
Thousand jobs
Source: RAIS/MTE(*) Projected by Abicalçados
Rio Grande do Sul
Ceará
São Paulo
Minas Gerais
Bahia
Paraíba
Santa Catarina
Others
Total
95,1
54,8
42,4
28,7
24,8
14,5
6,8
16,0
283,1
2016
95,5
53,4
39,7
31,2
28,1
15,0
6,6
15,5
285,0
2017
92,6
53,2
38,6
31,0
27,7
14,2
6,9
14,7
278,8
Variation2016-2017
-3,0%
-0,5%
-2,9%
-0,7%
-1,4%
-5,5%
3,7%
-5,0%
-2,2%2018*
2,2%
-2,5%
284,
9 (o
ptim
istic
)
271,
8 (p
essi
mis
tic)
Aguardando dados
SECTORAL REPORT - FOOTWEAR INDUSTRY - BRAZIL | 201836
3.5 ECONOMIC INDICATORS
3.5.1 EXCHANGE RATE
Exchange Rate R$/US$
BRAZIL3
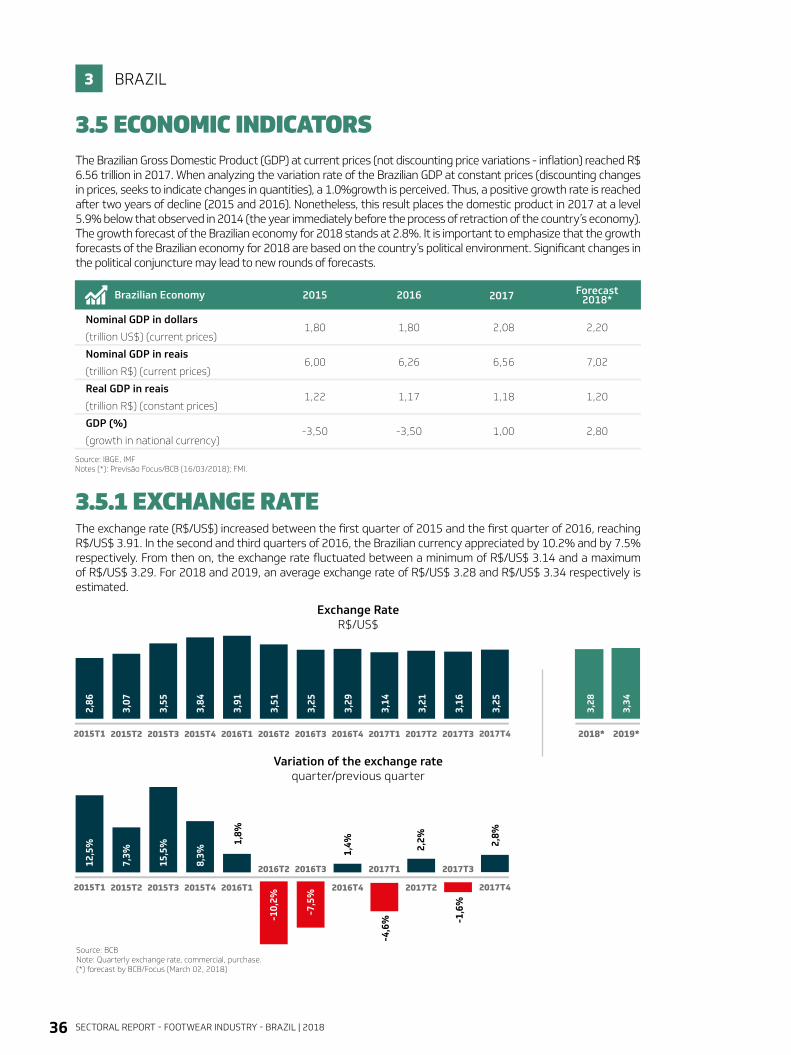
The Brazilian Gross Domestic Product (GDP) at current prices (not discounting price variations - inflation) reached R$ 6.56 trillion in 2017. When analyzing the variation rate of the Brazilian GDP at constant prices (discounting changes in prices, seeks to indicate changes in quantities), a 1.0%growth is perceived. Thus, a positive growth rate is reached after two years of decline (2015 and 2016). Nonetheless, this result places the domestic product in 2017 at a level 5.9% below that observed in 2014 (the year immediately before the process of retraction of the country’s economy). The growth forecast of the Brazilian economy for 2018 stands at 2.8%. It is important to emphasize that the growth forecasts of the Brazilian economy for 2018 are based on the country’s political environment. Significant changes in the political conjuncture may lead to new rounds of forecasts.
The exchange rate (R$/US$) increased between the first quarter of 2015 and the first quarter of 2016, reaching R$/US$ 3.91. In the second and third quarters of 2016, the Brazilian currency appreciated by 10.2% and by 7.5% respectively. From then on, the exchange rate fluctuated between a minimum of R$/US$ 3.14 and a maximum of R$/US$ 3.29. For 2018 and 2019, an average exchange rate of R$/US$ 3.28 and R$/US$ 3.34 respectively is estimated.
Brazilian Economy
Source: IBGE, IMFNotes (*): Previsão Focus/BCB (16/03/2018); FMI.
Nominal GDP in dollars
(trillion US$) (current prices)
Nominal GDP in reais
(trillion R$) (current prices)
Real GDP in reais
(trillion R$) (constant prices)
GDP (%)
(growth in national currency)
2015
1,80
6,00
1,22
-3,50
2016
1,80
6,26
1,17
-3,50
2017
2,08
6,56
1,18
1,00
Forecast2018*
2,20
7,02
1,20
2,80
Variation of the exchange rate quarter/previous quarter
Taxa de câmbio(R$/US$)
3,28
3,34
2015T1 2015T2 2015T3 2015T4 2018* 2019*
Source: BCBNote: Quarterly exchange rate, commercial, purchase. (*) forecast by BCB/Focus (March 02, 2018)
2016T1 2016T2 2016T3 2016T4 2017T1 2017T2 2017T3 2017T4
2,86
3,07
3,55
3,84
3,91
3,51
3,25
3,29
3,14
3,21
3,16
3,25
2015T1 2015T2 2015T3 2015T4 2016T1
2016T2 2016T3
2016T4
2017T1
2017T2
2017T3
2017T4
12,5
%
7,3%
15,5
%
8,3%
-10,
2%
-7,5
%
-4,6
%
-1,6
%
-10,
2%
-7,5
%
-1,6
%
1,4% 2,
2%1,8%
-4,6
%
2,8%
SECTORAL REPORT - FOOTWEAR INDUSTRY - BRAZIL | 2018 37
The installed capacity utilization rate of the manufacturing industry in Brazil decreased in 2016 in relation to the previous year. In 2017, it stood at 74.4%, which is even lower than the result in 2015. In terms of physical production, the manufacturing industry registered a negative change in 2015 (-9.8%) and 2016 (-6.0%), while in 2017 there was a 2.2% expansion. The estimate for 2018 is of a 3.9% growth. In turn, industry confidence increased in the period between 2015 and 2017, until it reached 92.4 points in the last year.
3.5.2 TRADE BEHAVIOR
3.5.3 MANUFACTURING INDUSTRY
BRAZIL3
Retail sales in the apparel, clothing and footwear industry followed the negative performance of overall sa-les volume in Brazil in 2015 and 2016. In terms of nominal revenues, there was a retraction in the apparel, clothing and footwear industry, while Brazil, in general terms, registered a positive performance over the period. In 2017, the volume and nominal revenues from sales recovered. There was a 2.0% and 2.2% posi-tive variation for the apparel, clothing and footwear industry respectively, which is lower than the growth of other industries in general. It is worth mentioning that this positive performance is accompanied by an improvement in trade and consumer confidence.
Sales volume in retail
Source: IBRE/FGV
Source: IBGE
Source: IBGE
Sales volume - by sectorApparel, clothing, and footwear (seasonally adjusted) (cumulative % of the year)
Sales volume - general(seasonally adjusted) (cumulative % of the year)
2015
-8,6
-4,3
2016
-10,9
-6,2
2017
7,6
2,0
Sales revenues in retail
Nominal revenues - by sectorApparel, clothing, and footwear (seasonally adjusted) (cumulative % of the year)
Nominal revenues - general(seasonally adjusted) (cumulative % of the year)
2015
-5,1
3,2
2016
-6,2
4,5
2017
10,3
2,2
Confidence indexes
Confidence of tradeIndex Number - extended retail trade (seasonally adjusted) (points)
Consumer confidenceIndex Number (seasonally adjusted) (points)
2015
71,3
71,5
2016
74,5
73,1
2017
87,2
83,4
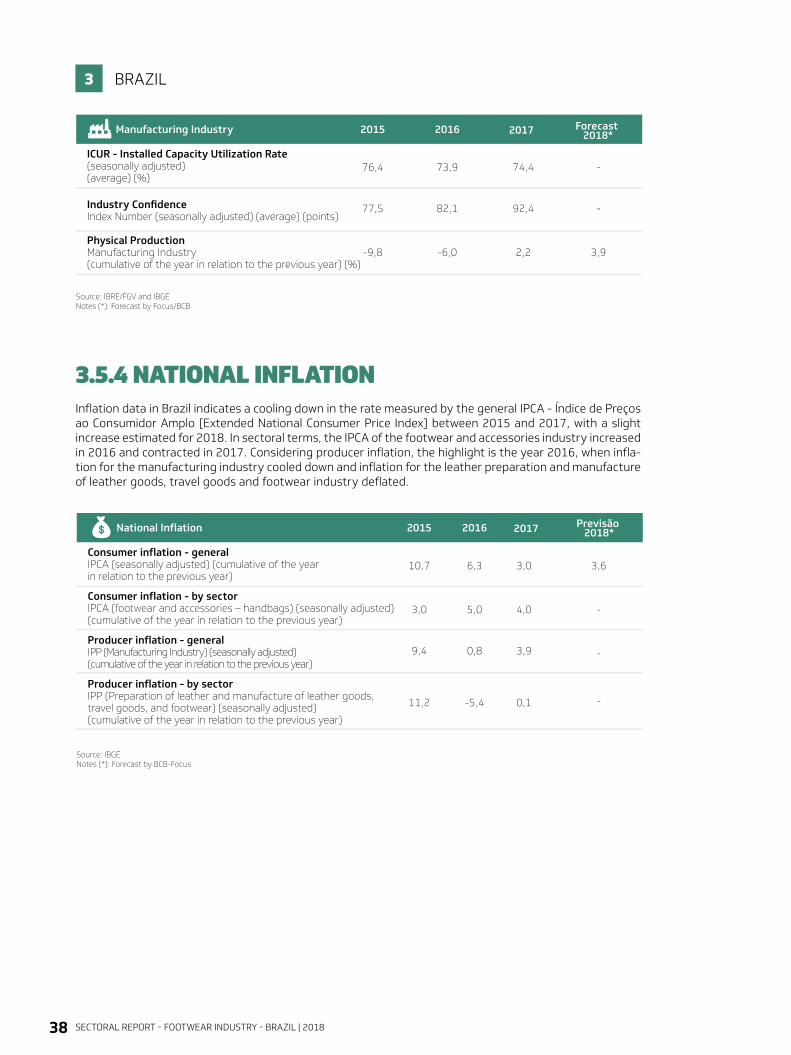
SECTORAL REPORT - FOOTWEAR INDUSTRY - BRAZIL | 201838
Inflation data in Brazil indicates a cooling down in the rate measured by the general IPCA - Índice de Preços ao Consumidor Amplo [Extended National Consumer Price Index] between 2015 and 2017, with a slight increase estimated for 2018. In sectoral terms, the IPCA of the footwear and accessories industry increased in 2016 and contracted in 2017. Considering producer inflation, the highlight is the year 2016, when infla-tion for the manufacturing industry cooled down and inflation for the leather preparation and manufacture of leather goods, travel goods and footwear industry deflated.
3.5.4 NATIONAL INFLATION
BRAZIL3
Manufacturing Industry
Source: IBRE/FGV and IBGENotes (*): Forecast by Focus/BCB
ICUR - Installed Capacity Utilization Rate(seasonally adjusted) (average) (%)
Industry Confidence Index Number (seasonally adjusted) (average) (points)
Physical Production Manufacturing Industry (cumulative of the year in relation to the previous year) (%)
2015
76,4
77,5
-9,8
2016
73,9
82,1
-6,0
2017
74,4
92,4
2,2
-
-
3,9
Forecast 2018*
National Inflation
Source: IBGENotes (*): Forecast by BCB-Focus
Consumer inflation - generalIPCA (seasonally adjusted) (cumulative of the yearin relation to the previous year)
Consumer inflation - by sectorIPCA (footwear and accessories – handbags) (seasonally adjusted) (cumulative of the year in relation to the previous year)
Producer inflation - generalIPP (Manufacturing Industry) (seasonally adjusted) (cumulative of the year in relation to the previous year)
Producer inflation - by sectorIPP (Preparation of leather and manufacture of leather goods, travel goods, and footwear) (seasonally adjusted) (cumulative of the year in relation to the previous year)
2015
10,7
3,0
9,4
11,2
2016
6,3
5,0
0,8
-5,4
2017
3,0
4,0
3,9
0,1
3,6
-
-
-
Previsão 2018*
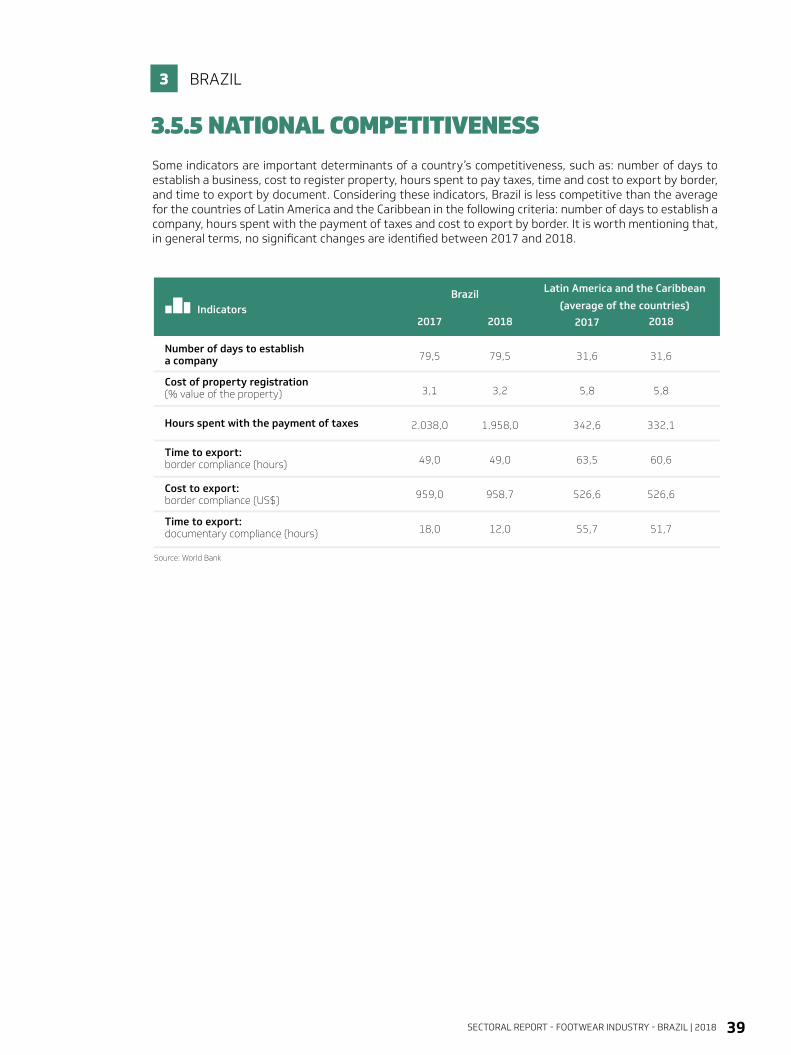
SECTORAL REPORT - FOOTWEAR INDUSTRY - BRAZIL | 2018 39
3.5.5 NATIONAL COMPETITIVENESS
BRAZIL3
Some indicators are important determinants of a country’s competitiveness, such as: number of days to establish a business, cost to register property, hours spent to pay taxes, time and cost to export by border, and time to export by document. Considering these indicators, Brazil is less competitive than the average for the countries of Latin America and the Caribbean in the following criteria: number of days to establish a company, hours spent with the payment of taxes and cost to export by border. It is worth mentioning that, in general terms, no significant changes are identified between 2017 and 2018.
Indicators
Number of days to establisha company
Cost of property registration(% value of the property)
Hours spent with the payment of taxes
Time to export:border compliance (hours)
Cost to export: border compliance (US$)
Time to export: documentary compliance (hours)
2017
79,5
3,1
2.038,0
49,0
959,0
18,0
2018
79,5
3,2
1.958,0
49,0
958,7
12,0
2017
31,6
5,8
342,6
63,5
526,6
55,7
2018
31,6
5,8
332,1
60,6
526,6
51,7
Brazil Latin America and the Caribbean
(average of the countries)
Source: World Bank
SECTORAL REPORT - FOOTWEAR INDUSTRY - BRAZIL | 201840
OPPORTUNITIES FOR THE INTERNATIONAL MARKET4
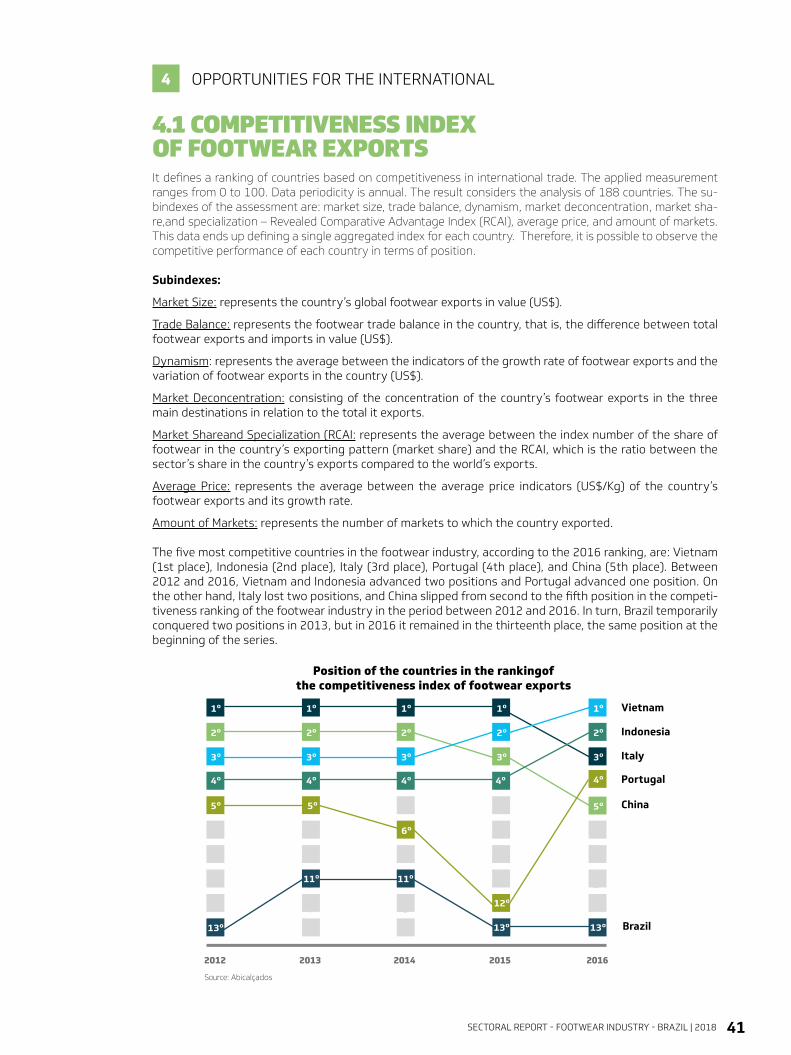
SECTORAL REPORT - FOOTWEAR INDUSTRY - BRAZIL | 2018 41
OPPORTUNITIES FOR THE INTERNATIONAL 4
It defines a ranking of countries based on competitiveness in international trade. The applied measurement ranges from 0 to 100. Data periodicity is annual. The result considers the analysis of 188 countries. The su-bindexes of the assessment are: market size, trade balance, dynamism, market deconcentration, market sha-re,and specialization – Revealed Comparative Advantage Index (RCAI), average price, and amount of markets. This data ends up defining a single aggregated index for each country. Therefore, it is possible to observe the competitive performance of each country in terms of position.
Subindexes:
Market Size: represents the country’s global footwear exports in value (US$).
Trade Balance: represents the footwear trade balance in the country, that is, the difference between total footwear exports and imports in value (US$).
Dynamism: represents the average between the indicators of the growth rate of footwear exports and the variation of footwear exports in the country (US$).
Market Deconcentration: consisting of the concentration of the country’s footwear exports in the three main destinations in relation to the total it exports.
Market Shareand Specialization (RCAI: represents the average between the index number of the share of footwear in the country’s exporting pattern (market share) and the RCAI, which is the ratio between the sector’s share in the country’s exports compared to the world’s exports.
Average Price: represents the average between the average price indicators (US$/Kg) of the country’s footwear exports and its growth rate.
Amount of Markets: represents the number of markets to which the country exported.
The five most competitive countries in the footwear industry, according to the 2016 ranking, are: Vietnam (1st place), Indonesia (2nd place), Italy (3rd place), Portugal (4th place), and China (5th place). Between 2012 and 2016, Vietnam and Indonesia advanced two positions and Portugal advanced one position. On the other hand, Italy lost two positions, and China slipped from second to the fifth position in the competi-tiveness ranking of the footwear industry in the period between 2012 and 2016. In turn, Brazil temporarily conquered two positions in 2013, but in 2016 it remained in the thirteenth place, the same position at the beginning of the series.
4.1 COMPETITIVENESS INDEX OF FOOTWEAR EXPORTS
Position of the countries in the rankingof the competitiveness index of footwear exports
Índice de Competitividade Internacional de Calçados
Fonte: BCBNota: Câmbio médio trimestral, comercial, compra(*) previsão BCB/Focus (26/05/2017)
3,8
%
2
,0%
11
,9%
12
,5%
7,3
%
15
,5%
8,3
%
1,8
%
1,4
%
3
,8%
-5,7
%
-10
,2%
-7,5
%2014T1
2014T2
2014T3 2015T4 2015T1 2015T2 2015T3 2016T4 2016T1
2016T2 2016T3
2016T4
2,3
6
2,3
3
2,2
7
2,5
4
2,8
6
3,0
7
3,5
5
3,8
4
3,9
1
3,5
1
3,2
5
3,2
9
2014T1 2014T2 2014T3 2015T4 2015T1 2015T2 2015T3 2016T4 2016T1 2016T2 2016T3 2016T4 2017* 2018*
3,1
9
3,3
3
2016
Vietnam
Italy
Portugal
China
Indonesia
Brazil
2012 2013 2014 2015
Source: Abicalçados
1º
2º
13º 13º 13º
1º
2º
3º
1º
2º
3º
11º
1º
2º
3º
11º
1º
2º
3º
4º
3º
4º 4º 4º4º
5º5º 5º
12º
6º
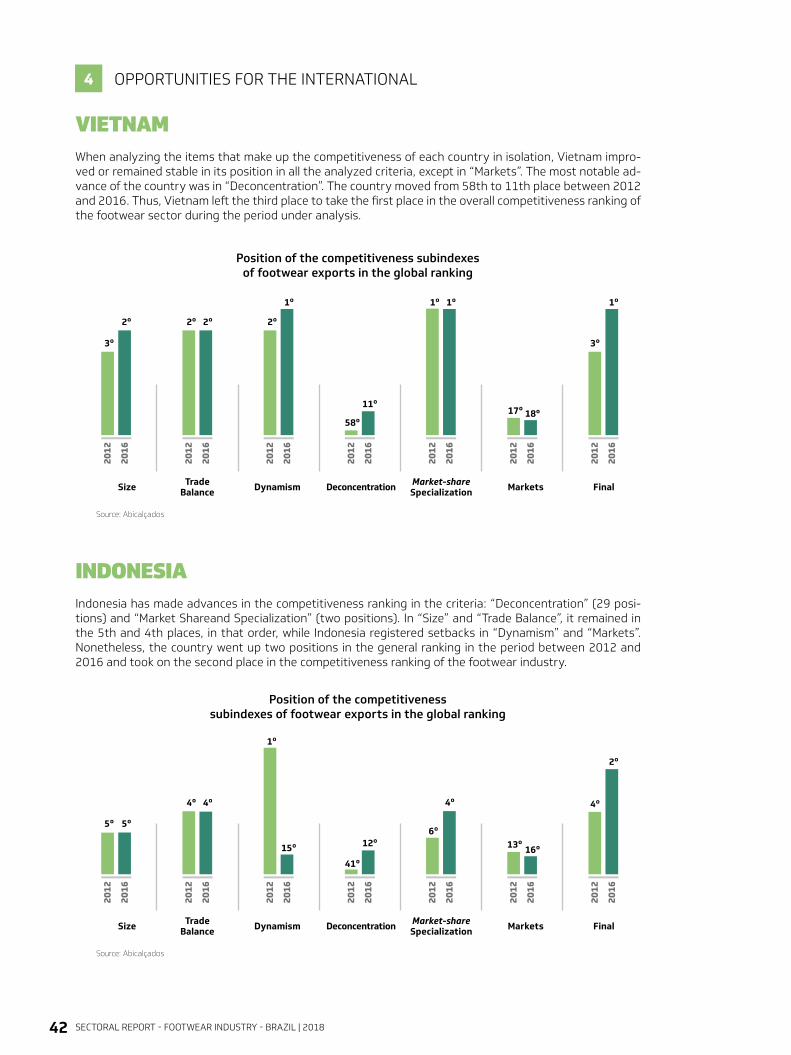
SECTORAL REPORT - FOOTWEAR INDUSTRY - BRAZIL | 201842
VIETNAMWhen analyzing the items that make up the competitiveness of each country in isolation, Vietnam impro-ved or remained stable in its position in all the analyzed criteria, except in “Markets”. The most notable ad-vance of the country was in “Deconcentration”. The country moved from 58th to 11th place between 2012 and 2016. Thus, Vietnam left the third place to take the first place in the overall competitiveness ranking of the footwear sector during the period under analysis.
INDONESIAIndonesia has made advances in the competitiveness ranking in the criteria: “Deconcentration” (29 posi-tions) and “Market Shareand Specialization” (two positions). In “Size” and “Trade Balance”, it remained in the 5th and 4th places, in that order, while Indonesia registered setbacks in “Dynamism” and “Markets”. Nonetheless, the country went up two positions in the general ranking in the period between 2012 and 2016 and took on the second place in the competitiveness ranking of the footwear industry.
OPPORTUNITIES FOR THE INTERNATIONAL 4
Position of the competitiveness subindexes of footwear exports in the global ranking
Position of the competitiveness subindexes of footwear exports in the global ranking
Source: Abicalçados
Size
2012
2016
2012
2016
2012
2016
2012
2016
2012
2016
2012
2016
2012
2016
TradeBalance Dynamism
3º 3º
2º
1º 1º 1º 1º
2º 2º
58º
11º17º 18º
2º
Deconcentration Market-shareSpecialization Markets Final
2012
2016
2012
2016
2012
2016
2012
2016
2012
2016
2012
2016
2012
2016
5º 5º
4º
15º
1º
6º
4º
2º
4º
41º
12º 13º 16º
4º
Source: Abicalçados
Size TradeBalance Dynamism Deconcentration Market-share
Specialization Markets Final

SECTORAL REPORT - FOOTWEAR INDUSTRY - BRAZIL | 2018 43
ITALYItaly, which ranked first in the general competitiveness ranking in 2012, moved to the third place in the 2016 ranking due to the fact that the country has not registered advances in any of the criteria analyzed. The negative highlight is the setback in “Dynamism”, since the country lost 106 positions in the ranking over the observed period.
BRAZILBrazil, in turn, remained in the 13th place in the competitiveness ranking despite the substantial advance in “Dynamism”, in which the country gained 63 positions between 2012 and 2016. Brazil’s positions did not change in “Trade Balance” and “Markets”, while the country lost places in “Size”, “Deconcentration” and “Market Share and Specialization”.
OPPORTUNITIES FOR THE INTERNATIONAL 4
Position of the competitiveness subindexes of footwear exports in the global ranking
Position of the competitiveness subindexes of footwear exports in the global ranking
2012
2016
2012
2016
2012
2016
2012
2016
2012
2016
2012
2016
2012
2016
2º 2º
3º 3º 3º 3º 3º 3º3º
1º
110º
4º 4º
5º
Source: Abicalçados
Size TradeBalance Dynamism Deconcentration Market-share
Specialization Markets Final
2012
2016
2012
2016
2012
2016
2012
2016
2012
2016
2012
2016
2012
2016
13º 13º 13º5º
14º8º 8º 8º
22º 26º68º131º
11º 11º
Source: Abicalçados
Size TradeBalance Dynamism Deconcentration Market-share
Specialization Markets Final
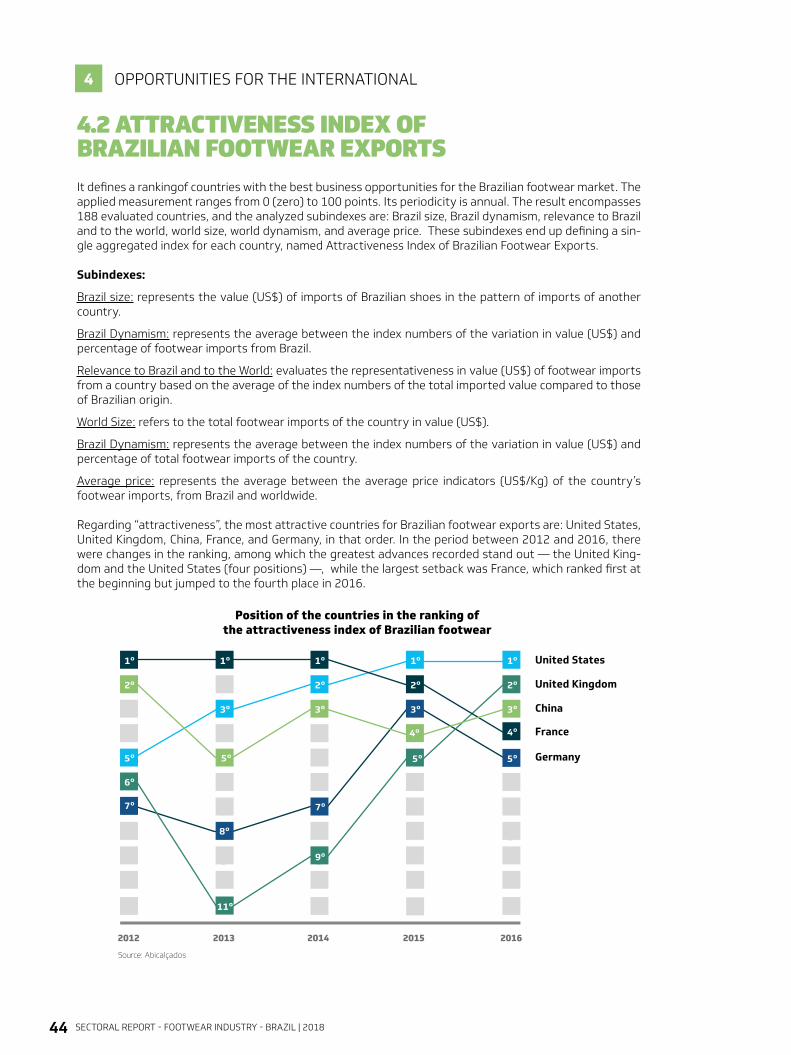
SECTORAL REPORT - FOOTWEAR INDUSTRY - BRAZIL | 201844
It defines a rankingof countries with the best business opportunities for the Brazilian footwear market. The applied measurement ranges from 0 (zero) to 100 points. Its periodicity is annual. The result encompasses 188 evaluated countries, and the analyzed subindexes are: Brazil size, Brazil dynamism, relevance to Brazil and to the world, world size, world dynamism, and average price. These subindexes end up defining a sin-gle aggregated index for each country, named Attractiveness Index of Brazilian Footwear Exports.
Subindexes:
Brazil size: represents the value (US$) of imports of Brazilian shoes in the pattern of imports of another country.
Brazil Dynamism: represents the average between the index numbers of the variation in value (US$) and percentage of footwear imports from Brazil.
Relevance to Brazil and to the World: evaluates the representativeness in value (US$) of footwear imports from a country based on the average of the index numbers of the total imported value compared to those of Brazilian origin.
World Size: refers to the total footwear imports of the country in value (US$).
Brazil Dynamism: represents the average between the index numbers of the variation in value (US$) and percentage of total footwear imports of the country.
Average price: represents the average between the average price indicators (US$/Kg) of the country’s footwear imports, from Brazil and worldwide.
Regarding “attractiveness”, the most attractive countries for Brazilian footwear exports are: United States, United Kingdom, China, France, and Germany, in that order. In the period between 2012 and 2016, there were changes in the ranking, among which the greatest advances recorded stand out — the United King-dom and the United States (four positions) —, while the largest setback was France, which ranked first at the beginning but jumped to the fourth place in 2016.
4.2 ATTRACTIVENESS INDEX OF BRAZILIAN FOOTWEAR EXPORTS
Position of the countries in the ranking of the attractiveness index of Brazilian footwear
OPPORTUNITIES FOR THE INTERNATIONAL 4
Índice de Competitividade Internacional de Calçados
Fonte: BCBNota: Câmbio médio trimestral, comercial, compra(*) previsão BCB/Focus (26/05/2017)
3,8
%
2
,0%
11
,9%
12
,5%
7,3
%
15
,5%
8,3
%
1,8
%
1,4
%
3
,8%
-5,7
%
-10
,2%
-7,5
%2014T1
2014T2
2014T3 2015T4 2015T1 2015T2 2015T3 2016T4 2016T1
2016T2 2016T3
2016T4
2,3
6
2,3
3
2,2
7
2,5
4
2,8
6
3,0
7
3,5
5
3,8
4
3,9
1
3,5
1
3,2
5
3,2
9
2014T1 2014T2 2014T3 2015T4 2015T1 2015T2 2015T3 2016T4 2016T1 2016T2 2016T3 2016T4 2017* 2018*
3,1
9
3,3
3
2016
United States
China
France
Germany
United Kingdom
2012 2013 2014 2015
Source: Abicalçados
1º
2º
13º 13º
1º
3º
1º
2º
3º
11º
9º
1º
2º
3º
11º8º
1º
2º
3º
4º4º 4º 4º
6º
7º
5º5º5º 5º
12º
6º
7º
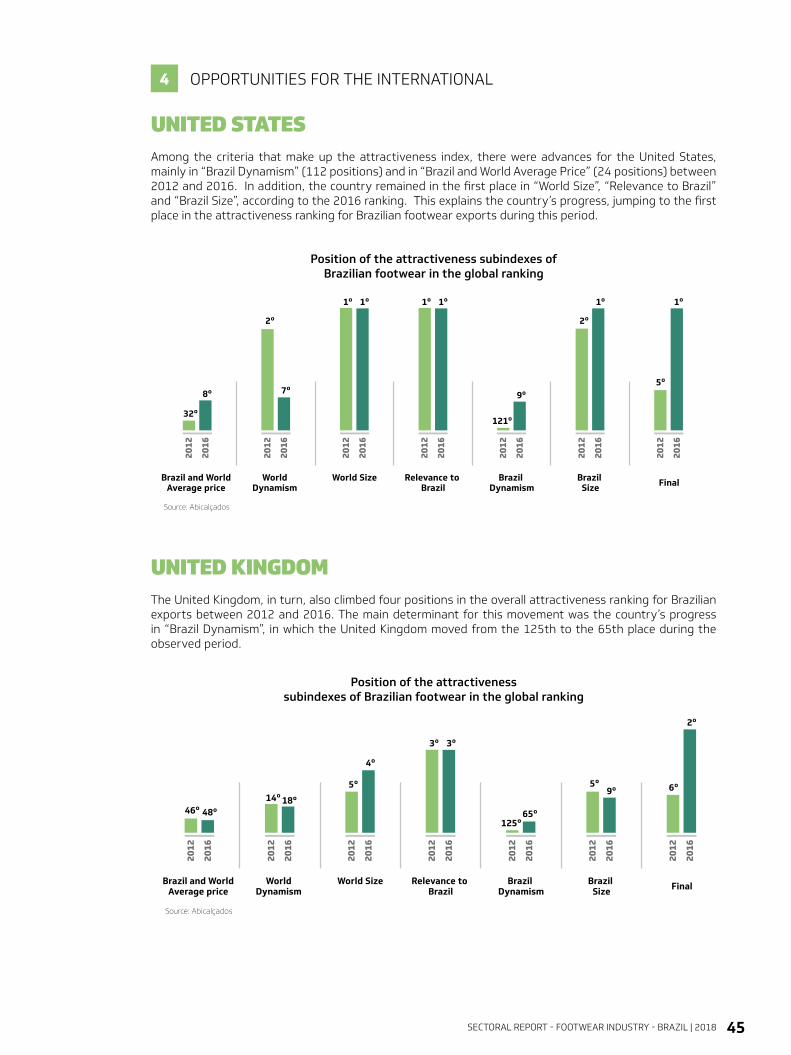
SECTORAL REPORT - FOOTWEAR INDUSTRY - BRAZIL | 2018 45
UNITED STATESAmong the criteria that make up the attractiveness index, there were advances for the United States, mainly in “Brazil Dynamism” (112 positions) and in “Brazil and World Average Price” (24 positions) between 2012 and 2016. In addition, the country remained in the first place in “World Size”, “Relevance to Brazil” and “Brazil Size”, according to the 2016 ranking. This explains the country’s progress, jumping to the first place in the attractiveness ranking for Brazilian footwear exports during this period.
UNITED KINGDOMThe United Kingdom, in turn, also climbed four positions in the overall attractiveness ranking for Brazilian exports between 2012 and 2016. The main determinant for this movement was the country’s progress in “Brazil Dynamism”, in which the United Kingdom moved from the 125th to the 65th place during the observed period.
OPPORTUNITIES FOR THE INTERNATIONAL 4
Position of the attractiveness subindexes of Brazilian footwear in the global ranking
Position of the attractiveness subindexes of Brazilian footwear in the global ranking
Source: Abicalçados
Brazil and World Average price
2012
2016
2012
2016
2012
2016
2012
2016
2012
2016
2012
2016
2012
2016
World Dynamism
World Size
32º
5º8º
1º1º 1º1º
121º
9º
1º1º
2º 2º
7º
Relevance to Brazil
Brazil Dynamism
Brazil Size Final
2012
2016
2012
2016
2012
2016
2012
2016
2012
2016
2012
2016
2012
2016
46º
6º5º
48º
4º
5º
3º3º
125º65º
2º
9º14º 18º
Source: Abicalçados
Brazil and World Average price
World Dynamism
World Size Relevance to Brazil
Brazil Dynamism
Brazil Size Final
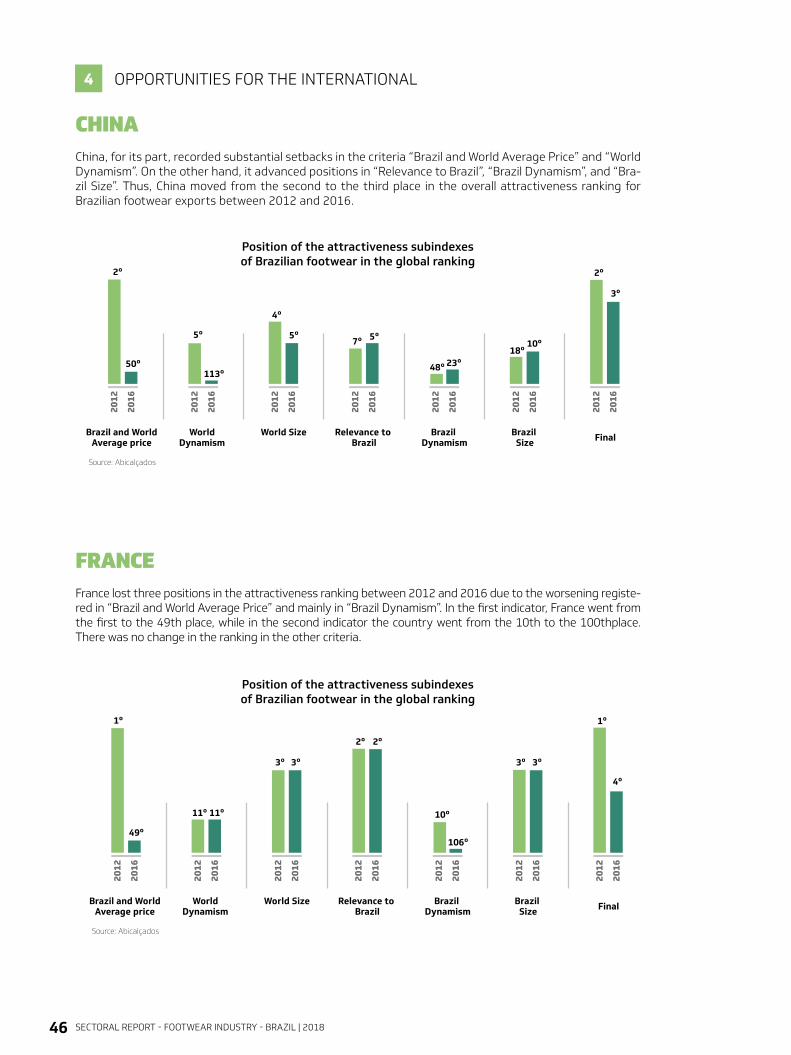
SECTORAL REPORT - FOOTWEAR INDUSTRY - BRAZIL | 201846
CHINAChina, for its part, recorded substantial setbacks in the criteria “Brazil and World Average Price” and “World Dynamism”. On the other hand, it advanced positions in “Relevance to Brazil”, “Brazil Dynamism”, and “Bra-zil Size”. Thus, China moved from the second to the third place in the overall attractiveness ranking for Brazilian footwear exports between 2012 and 2016.
FRANCEFrance lost three positions in the attractiveness ranking between 2012 and 2016 due to the worsening registe-red in “Brazil and World Average Price” and mainly in “Brazil Dynamism”. In the first indicator, France went from the first to the 49th place, while in the second indicator the country went from the 10th to the 100thplace. There was no change in the ranking in the other criteria.
OPPORTUNITIES FOR THE INTERNATIONAL 4
Position of the attractiveness subindexes of Brazilian footwear in the global ranking
Position of the attractiveness subindexes of Brazilian footwear in the global ranking
2012
2016
2012
2016
2012
2016
2012
2016
2012
2016
2012
2016
2012
2016
2º
5º
50º
5º
4º
5º7º
48º 23º
3º
10º
2º
18º
113º
Source: Abicalçados
Brazil and World Average price
World Dynamism
World Size Relevance to Brazil
Brazil Dynamism
Brazil Size Final
2012
2016
2012
2016
2012
2016
2012
2016
2012
2016
2012
2016
2012
2016
1º
2º 2º
11º 11º
49º
3º 3º
4º
3º 3º
10º
106º
1º
Source: Abicalçados
Brazil and World Average price
World Dynamism
World Size Relevance to Brazil
Brazil Dynamism
Brazil Size Final
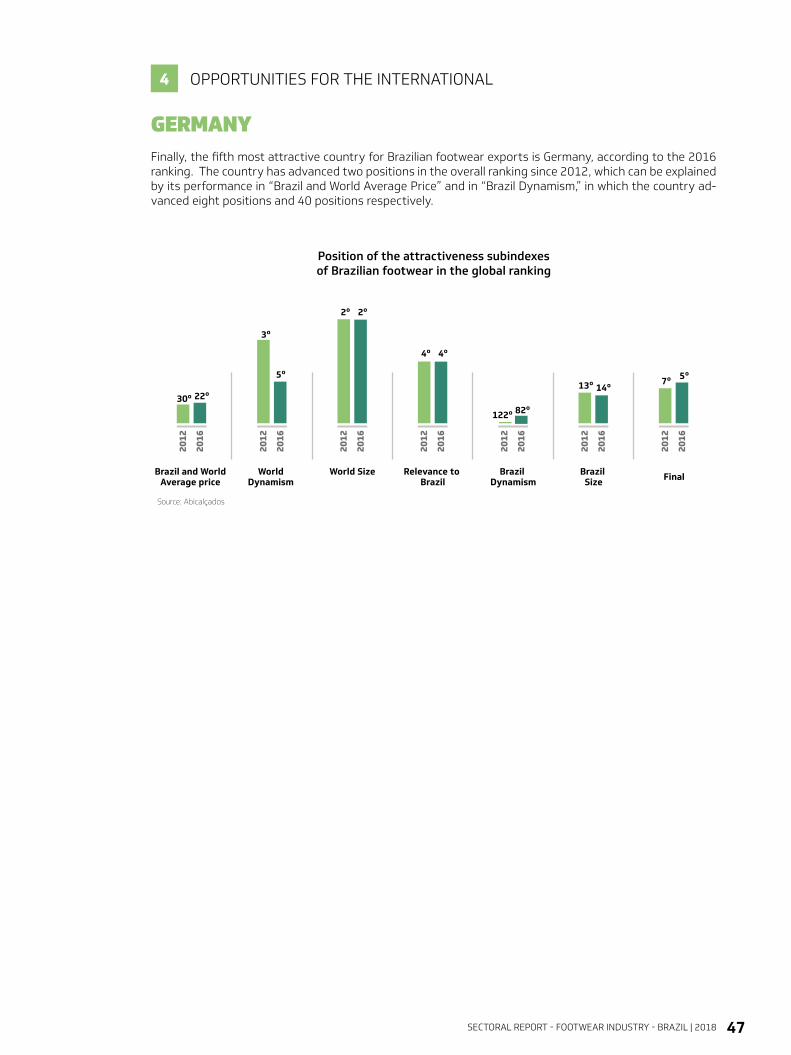
SECTORAL REPORT - FOOTWEAR INDUSTRY - BRAZIL | 2018 47
GERMANYFinally, the fifth most attractive country for Brazilian footwear exports is Germany, according to the 2016 ranking. The country has advanced two positions in the overall ranking since 2012, which can be explained by its performance in “Brazil and World Average Price” and in “Brazil Dynamism,” in which the country ad-vanced eight positions and 40 positions respectively.
OPPORTUNITIES FOR THE INTERNATIONAL 4
Position of the attractiveness subindexes of Brazilian footwear in the global ranking
2012
2016
2012
2016
2012
2016
2012
2016
2012
2016
2012
2016
2012
2016
7º
4º 4º
22º
3º
5º
2º 2º
5º13º 14º
122º 82º30º
Source: Abicalçados
Brazil and World Average price
World Dynamism
World Size Relevance to Brazil
Brazil Dynamism
Brazil Size Final
SECTORAL REPORT - FOOTWEAR INDUSTRY - BRAZIL | 201848
EXPERT ANALYSIS5
SECTORAL REPORT - FOOTWEAR INDUSTRY - BRAZIL | 2018 49
5.1 THE GROWTH DYNAMICSOF FOOTWEAR PRODUCTION IN 2017
EXPERT ANALYSIS5
After two consecutive years of decline in the Gross Domestic Product (GDP), the Brazilian economy begins a process of recovery of its domestic income. Thus, the 1.0% growth in 2017, although limited, leaves behind two years of decline in the GDP. When decomposing the factors that influenced this performance, it is important to highlight domestic consumption and exports of goods and services. The first aggregate grew by 1.0% in 2017, while exports of goods and services expanded by 5.2% in the same year. In a way, the performance of the domestic consumption was basically influenced by the release of the inactive accounts of FGTS (Fundo de Garantia do Tempo de Serviço) [Employee Government Severan-ce Fund], which occurred between March and July 2017. On the other hand, the behavior of exports of goods and services was defined by the agricultural sector, whose GDP grew by 13.0% in 2017.
Despite the incipient recovery process, it is important to observe how this reco-very dynamics occurs, stressing the quality and capacity of income expansion of this movement. One of the main indicators of future production capacity of the economy, the Gross Formation of Fixed Capital (investments made by companies and by the government, excluding the component of inventory variation), is at a very low level. Fourteen consecutive quarters of decrease were observed (when considering the variation rate compared to the same quarter of the previous
year), configuring a combined 22.5% retraction between the third quarter of 2014 and the fourth quarter of 2017. This result may have established not only a difficulty in expanding production in the future, but also a decrease in the current production capacity of the economy, since there were not enough investments to depreciate the companies’ capital stock.
Domestic consumption is another important indica-tor for the growth of the Brazilian economy. Toge-ther with the Gross Fixed Capital Formation, it makes up the domestic demand. Domestic consumption is mainly influenced by two indicators: (1) the growth of the real income mass; and (2) the credit availability of the economy. Two elements are important with re-gards to the growth of the real income mass: the evo-lution of the average real income and the number of employed people. The relationship between these two elements results in the real income mass of the eco-nomy. Thus, when comparing the quarterly moving average of this income mass between November/De-cember/January 2018 and the months of December/January/February 2018, there is a 0.2% retraction. There was a certain stability in the growth in this comparison of the moving averages in the previous month. Therefore, there possibly is a cooling down in the growth of the real average income mass of the Brazilian economy. However, it is important to be aware of this indicator in the coming months of 2018.
With respect to the availability of credit in the Brazilian economy, the continued contraction of supply is pointed out. In January 2018, the credit flow, which considers the available amount of new loans minus the amounts paid, reached a R$ 15.5 billion reduction. In order to get an idea of the size of the contraction of credit in the Brazilian economy, this value was positive R$ 314.5 billion in January 2012 and negative R$ 132.6 billion in January 2017. That is, there is a recovery of credit in Brazil, yet at a very slow pace. Bank spread is another important indicator of the credit market. In effect, in January 2018, the average spread was 19.8%, with the target Selic [short-term interest] rate being fixed at 7.0% per year. At the beginning of the economic crisis that hit the Brazilian economy in January 2015, the average bank spread was 15.9%, with the target Selic rate at 12.25% per year.
“DESPITE THE INCIPIENT RECOVERY PROCESS
IT IS IMPORTANT TO OBSERVE HOW THIS RECOVERY DYNAMICS
OCCURS, STRESSING THE QUALITY AND CAPACITY OF INCOME EXPANSION OF THIS
MOVEMENT.”
MARCOS TADEU LÉLISPH.D. IN ECONOMICS
SECTORAL REPORT - FOOTWEAR INDUSTRY - BRAZIL | 201850
EXPERT ANALYSIS5
Thus, taking into account this set of indicators, which point to a still slow recovery, and the process of resumption of the Brazilian GDP itself, a 2.8% economic growth is expected. It is important to remember that the historical average of the national income growth between 1990 and 2014 (eliminating the crisis effect of 2015, 2016, and 2017) was 2.3%. As a result, economic growth expectations for this year are 0.5% above the historical average. By indicating a GDP growth slightly above the historical average for 2018, with this rate on a combined 5.9% decline of the GDP between 2015 and 2017, it is believed that the Brazilian economy may reach higher rates. However, although the base comparison and growth rate are not ideal, it is fundamental that the recovery pro-cess of the Brazilian economy continues and that this is reflected, as soon as possible, in the unemployment rate.
The footwear industry, in turn, had already reached a recovery momentum of the Brazilian economic crisis in the first half of 2017. When comparing the variation rates of the footwear production with a semiannual periodicity, observing the same period of the previous year, this production grew by 4.9% in the first half of 2017 (measured by IBGE’s Monthly Industrial Survey). This result occurred after a combined 17.2% retraction in the footwear production between the first half of 2015 and the second half of 2016. Notwithstanding the beginning of the recovery process, in the second half of 2017, there is a deceleration in the growth of footwear production, rea-ching a 0.9% growth rate. In other words, in the first half of 2017, production growth stood above the standard for this industry. Therefore, it is not possible to expect a vigorous performance of the industrial footwear pro-duction in the first months of 2018 due to the increase in the comparison base (first semester in 2017) and to
the deceleration of the production growth in the final months in 2017.
Therefore, based on the production figures estimated by this annual report, it is believed that, to a certain extent, the recovery movement in the footwear indus-try was defined by the performance of the domestic demand, contributing with 86% of the production growth in 2017. On the other hand, exports achieved a 14% contribution to the expansion of the indus-try this year. Regarding the contribution of exports to the growth of the amount of shoes manufactured in Brazil, as already mentioned in the box comparing the growth rates of prices and the amount exported, external sales systematically decrease in amount, so that the growth of the exported value would be com-pletely dependent on the variations in the prices of footwear. Thus, exports cannot be expected to signi-
ficantly influence domestic production (in pairs), as their amount and their share in the total produced, which is relatively low, tend to contract.
Still considering the relation between exported value and the prices of shoes geared towards the foreign market, an inverse movement was observed between the growth of prices and the exchange rate fluctuation. Indeed, a devaluation of the national currency pulls prices down, while the opposite movement, that is, an appreciation of the national currency, raises the prices of footwear exports. Thus, the need for companies to recompose the value (in R$) of exports based on the movements of the exchange rate is evident. So, if there is a contraction bias in the changes in the exported amount of footwear in recent years and export prices seem to be dependent on the movements of the exchange rate, the exported value (in US$) of shoes of the Brazilian economy is defined by the appreciation and devaluation of the domestic currency.
Finally, in terms of expectations for the footwear production in pairs, for the year 2018, the lower range of growth stands at 0.4% and the superior range consists of a 3.5% growth. The difference between the ranges lie in the behavior of footwear production in the first half of 2018, considering what has already been mentioned previou-sly and the electoral environment throughout the year.
“IT IS NOT POSSIBLE TO EXPECT A VIGOROUS PERFORMANCE OF
THE INDUSTRIAL FOOTWEAR PRODUCTION IN THE FIRST
MONTHS OF 2018 DUE TO THE INCREASE IN THE COMPARISON
BASE (FIRST SEMESTER IN 2017)”
SECTORAL REPORT - FOOTWEAR INDUSTRY - BRAZIL | 2018 51
ANÁLISE DE ESPECIALISTA5
MonitoringOur team follows the structure and movements of the economic and sectoral scenario, tracking any and all important information for its members.
Further [email protected]
www.abicalcados.com.br/inteligenciademercado
Market InformationAll information collected isanalyzed by professionals, who select the relevant aspects and organize the information according to the different demands of the industry, meeting the particular needs of the companies
Market Intelligence PortalIt is a channel that is exclusive to Abicalçados' members and enables them to access market information. It makes possible to check updated macroeconomic and sectoral perspectives, in addition to market analyses.
Learn more at:www.abicalcados.com.br/inteligenciademercado/portal
Scenario AnalysisSemiannual event in which an economist discusses the short-term prospects of the macroeconomic, political, and sectoral scenario. The content is made available at the Market Intelligence Portal.
Custom studies for companiesThe unit assists in the selection of potential markets for the company's export profile. For the domestic market and marketing, in turn, the big social data tool helps companies understand the brand's consumer profile and to analyze the competition, among other aspects.

SECTORAL REPORT - FOOTWEAR INDUSTRY - BRAZIL | 201852
METHODOLOGY6
SECTORAL REPORT - FOOTWEAR INDUSTRY - BRAZIL | 2018 53
DEFINITIONS - FOOTWEAR PRODUCTION Pesquisa Industrial Anual – Produto (PIA – Produto) [Annual Industrial Survey – Product (AIS – Product)]: a publi-cation that measures production and sales, in terms of amount and value, of the industrial products and services generated in the country. The survey covers the population of local productive units with thirty or more employed people, which earned gross revenues higher than the cut-off in relation to the previous year. Given its scope, PIA--Produto is published with a two-year lag. The last publication refers to 2015.
Produção Industrial Mensal – Produção Física (PIM-PF) [Monthly Industrial Production – Physical Production (MIP--FP)]: publicizes the short-term behavior of the volume of the domestic production through an index number. The monitored product and informant panel for the index is based on PIA-Empresa and PIA-Produto (2010) and repre-sents 85% of the value of the industrial transformation, based on a fixed weighting of the indicators. Otherwise, the indexes are weighted averages of relative amounts, with weights defined by the value of each product, estimated based on the current amounts in the previous month and the prices of the base period (base 2012 = 100).
Production Survey - Abicalçados: collected through the distribution of a structured questionnaire, covering infor-mation related to the years 2015, 2016, 2017, and the expectation of movement for the year 2018. In terms of production volume, it was possible to verify that the sample of the questionnaire, in relation to the data concerning 2017, represents about 70% of the production estimated by Abicalçados based on the production identified by IBGE in 2015.
APPLICATION - FOOTWEAR PRODUCTION The production data released by Abicalçados for the years 2016 and 2017 is based on the official IBGE base for the year 2015 (PIA-produto) and represents a total of 1,540 informant companies in the industry. Thus, footwear pro-duction, in the years 2016 and 2017, was constructed considering the average weighted annual growth, observed in (1) the sample collected by Abicalçados’ Production Survey and by IBGE’s PIA-produto in 2015; and (2) the annual average growth of PIM-PF, published by IBGE monthly.
The production estimate for the year 2018 is based on the same methodological conception. It uses an average ex-pected growth through Abicalçados’ (weighted) sample, defined by the sample companies themselves, and through the statistical projection of the PIM-PF index for the final eleven months of 2018. This establishes the estimate of the average annual growth of IBGE’s physical production index for 2018, based on a confidence interval (maximum and minimum point). This confidence interval is intended to minimize the error caused by the change in the estima-ted trend for the last months of 2018, arriving at interval, non-point estimates.
DEFINITIONS - PRODUCTION REGIONALIZATIONRelação Anual de Informações Sociais (RAIS) [Annual Report of Social Information (ARSI)]: this is an annual report with socioeconomic information requested by the Brazilian Ministry of Labor and Employment to legal entities and other employers. This annual report is the source of statistics on the number of companies and formal employment, by state and industry.
Pesquisa Industrial Anual – Empresa (PIA – Empresa) [Annual Industrial Survey - Company (AIS - Company)]: it is defined based on an annual report that aims to identify the basic structural characteristics of the manufacturing industry. Its results subsidize the Sistema de Contas Nacionais [System of National Accounts] with estimates of production value, intermediate consumption, added value, capital formation, and employed personnel. The survey addresses data on the number of companies, employed personnel (as declared by the companies – formal and in-formal), costs and expenses, personnel expenses, revenues, production value, and industrial transformation value,
6.1 PRODUCTION DATA
The “Sectoral Report: Brazilian Footwear Industry” is published annually. The presented data were collected from official sources or estimated based on them, together with the information collected through the “Production Sur-vey - Abicalçados.” Thus, data may change between the reported years, according to updates and revisions of the sources.
The “Production Survey - Abicalçados” is a structured questionnaire with voluntary responses, applied to a sample. The estimate is that sample of the companies that answer it represents 70% of the domestic production in pairs. The information is confidential and will not be disclosed individually. Only consolidated data will be reported.
METHODOLOGY6
SECTORAL REPORT - FOOTWEAR INDUSTRY - BRAZIL | 201854
BCB | Banco Central do Brasil [Brazilian Central Bank] | bcb.gov.br
EuromonitorInternational | euromonitor.com
IBGE | Instituto Brasileiro de Geografia e Estatística [Brazilian institute of Geography and Statistics] | ibge.gov.br
IBRE/FGV | Instituto Brasileiro de Economia - Fundação Getúlio Vargas [Brazilian Institute of Economy - Getúlio Var-gas Foundation] | portalibre.fgv.br MDIC | Ministério do Desenvolvimento, Indústria e Comércio Exterior [Ministry of Development,Industry and Foreign Trade] | mdic.gov.br
MTE - RAIS/CAGED | Ministério do Trabalho e Emprego - Relação Anual de Informações Sociais e Cadastro Geral de Empregados e Desempregados [Ministry of Labor and Employment - Annual Relation of Social Information and Ge-neral Registry of Employed and Unemployed People] | trabalho.gov.br
UNComtrade | United Nations Comtrade | comtrade.un.org
World Shoe Review | worldshoereview.co.uk
WTO | World Trade Organization | wto.org
6.2 STATISTICAL PROJECTIONS
6.3 SOURCES
DEFINITIONS - STATISTICAL PROJECTIONSStructural Models in State Space and Kalman Filter: the structural models are defined with the objective of extracting the so-called unobserved components of a series analyzed over time: Trend, Seasonality, Cycles, and Irregularities. The statistical treatment of a structural model can be based on the form of state space. Thus, two different sto-chastic equations are characterized: (1) equation of measurement or of the observations; and (2) transition or state equation. The definition of the statistical model in State Space allows updating the estimated parameters all the time, defining non-linear models. The Kalman Filter is an algorithm that provides the final update of each estimated parameter. The main advantage of structural statistical models in state space and Kalman filter lies in the ability to change the behavior of the unobserved components over time, absorbing any structural alteration that occurred in the estimated parameters. This statistical structure enables estimates of trends of the time series more accurately.
APPLICATION - STATISTICAL PROJECTIONSThe available data for 2017 are collected based on the series observed monthly, up to the finalization of Abicalça-dos’ report. The rest of the remaining months in the year 2017 was estimated through the structural model in state space and Kalman filter, based on the trend for the observed series. At the same time, a weighting of this statistical trend was established according to the future expectations for the Brazilian economy. It is important to point out that we chose interval estimates vis-a-vis the estimates per point, since, when defining the confidence interval for the projection, we have a procedure to minimize errors and to establish optimistic and pessimistic scenarios.
based on the Classificação Nacional de Atividades Econômicas [National Classification of Economic Activities] (CNAE 2.0). PIA-Empresa covers the local productive units with thirty or more employed people, which earned gross reve-nues higher than the cut-off in the year before the survey.
APPLICATION - PRODUCTION REGIONALIZATIONThe major challenge to estimate footwear production, considering a regional cut, more specifically a definition by States of the Federation, lies in the segmentation of the production among productive units and in the footwear industry’s capacity to move geographically agilely and constantly (light industry). Thus, the regionalized production of footwear in the years 2016 and 2017 is estimated based on the production by state of the PIA-Produto in 2015 and on a set of indicators from RAIS and PIA-Empresa.
The production estimates by state for the years 2016 and 2017, published by Abicalçados, take into account a set of regionalized information, such as: number of companies, employed personnel (PIA- Empresa and RAIS), and produc-tion value (PIA-Empresa). Thus, the regionalized footwear production was estimated based on 2015’s PIA-Produto and on a weighted average of the movements of employment, company and production value by state.
METHODOLOGY6
SECTORAL REPORT - FOOTWEAR INDUSTRY - BRAZIL | 2018 55
The codes referring to the Harmonized Commodity Description and Coding System (HS6) relating to the footwear industry are covered by chapter 64 “Footwear, gaiters and the like; parts of such articles”, segmented by heading 6401, for injected footwear; 6402 for footwear made of synthetic material; 6403, for leather shoes; 6404, for foo-twear of textile materials; and 6405, for other materials.
The data reported by segments meet the following classification: (1) Flip-flops are included in SH6 6402.20; (2) Athletic shoes are represented by SH6 6402.12, 6402.19, 6403.12, 6403.19, and 6404.11;(3) The other headings of SH6 codes are represented in the group “other footwear.”
The cities that make up each listed footwear cluster were identified based on previously published materials and verified with the local unions. The list of cities in each cluster is below:
RIO GRANDE DO SULCluster of Vale do Rio dos Sinos - Araricá, Campo Bom, Canoas, Dois Irmãos, Estância Velha, Esteio, Ivoti, Nova Hartz, Nova, Santa Rita, Novo Hamburgo, Portão, São Leopoldo, Sapiranga, and Sapucaia do Sul.Cluster of Vale do Paranhana/Encosta da Serra - Igrejinha, Lindolfo Collor, Morro Reuter, Parobé, Picada Café, Presidente Lucena, Riozinho, Rolante, Santa Maria do Herval, Taquara, and Três Coroas.
SÃO PAULOCluster of Franca - Franca.Cluster of Jaú - Jaú.Cluster of Birigui - Birigui, Alto Alegre, Andradina, Araçatuba, Auriflama, Avanhandava, Barbosa, Bento de Abreu, Bilac, Braúna, Brejo Alegre, Buritama, Castilho, Clementina, Coroados, Gabriel Monteiro, Gastão Vidigal, General Salgado, Gli-cério, Guaracai, Guararapes, Guzolândia, Lavínia, Lourdes, Luiziânia, Mirandópolis, Murutinga do Sul, Penápolis, Piacatu, Rubiacea, Santopolis do Aguapei, Turiuba, Valparaiso, Lins, Macaubal, Moncoes, Nova Castilho, Nova Luzitânia, Planalto, Santo Antonio do Aracangua, Zacarias, and União Paulista.
MINAS GERAISCluster of Nova Serrana - Araújos, Bom Despacho, Conceição do Pará, Divinópolis, Igaratinga, Leandro Ferreira, Nova Serrana, Onça de Pitangui, Pará de Minas, Perdigão, Pitangui, and São Gonçalo do Pará.
PARAÍBACluster of Campina Grande - Campina Grande, Mogeiro, Araruna, Guarabira, Serra Redonda, Ingá, Alagoa Nova.Cluster of João Pessoa - João Pessoa, Santa Rita, and Bayeux
SANTA CATARINACluster of São João Batista - Tijucas, Canelinha, Nova Trento, Major Gercino, and São João Batista.
CEARÁCluster of Fortaleza - FortalezaCluster of Sobral - SobralCluster of Horizonte - HorizonteJuazeiro do Norte - Crato, Juazeiro do Norte, Barbalha, Jardim, MissãoVelha, Nova Olinda, Porteiras, and Santana do Cariri
6.4 CLASSIFICATION OF THE HARMONIZED COMMODITY DESCRIPTION AND CODING SYSTEM
6.5 DEFINITION OF THE FOOTWEAR CLUSTERS
METHODOLOGY6
14677 - Anuncio-210x280mm_Nova ID_AF.indd 1 13/04/18 13:49

Rua Júlio de Castilhos, 561 - Novo Hamburgo/RS - Zip code: 93510-130 Phone number: +55 51 3594-7011
B R A Z I L | 2 0 1 8
SECTORAL REPORTFOOTWEAR INDUSTRY


