Embed Size (px)
Citation preview
Cyclical Unemployment: Sectoral Shifts or AggregateDisturbances?
(Article begins on next page)
The Harvard community has made this article openly available.Please share how this access benefits you. Your story matters.
Citation Abraham, Katharine G., and Lawrence F. Katz. 1986. Cyclicalunemployment: Sectoral shifts or aggregate disturbances?Journal of Political Economy 94(3) Part 1: 507-522.
Published Version http://www.jstor.org/stable/1833046
Accessed April 18, 2014 9:13:56 AM EDT
Citable Link http://nrs.harvard.edu/urn-3:HUL.InstRepos:3442781
Terms of Use This article was downloaded from Harvard University's DASHrepository, and is made available under the terms and conditionsapplicable to Other Posted Material, as set forth athttp://nrs.harvard.edu/urn-3:HUL.InstRepos:dash.current.terms-of-use#LAA

Cyclical Unemployment: Sectoral Shifts or Aggregate Disturbances?Author(s): Katharine G. Abraham and Lawrence F. KatzSource: The Journal of Political Economy, Vol. 94, No. 3, Part 1 (Jun., 1986), pp. 507-522Published by: The University of Chicago PressStable URL: http://www.jstor.org/stable/1833046Accessed: 07/12/2009 13:33
Your use of the JSTOR archive indicates your acceptance of JSTOR's Terms and Conditions of Use, available athttp://www.jstor.org/page/info/about/policies/terms.jsp. JSTOR's Terms and Conditions of Use provides, in part, that unlessyou have obtained prior permission, you may not download an entire issue of a journal or multiple copies of articles, and youmay use content in the JSTOR archive only for your personal, non-commercial use.
Please contact the publisher regarding any further use of this work. Publisher contact information may be obtained athttp://www.jstor.org/action/showPublisher?publisherCode=ucpress.
Each copy of any part of a JSTOR transmission must contain the same copyright notice that appears on the screen or printedpage of such transmission.
JSTOR is a not-for-profit service that helps scholars, researchers, and students discover, use, and build upon a wide range ofcontent in a trusted digital archive. We use information technology and tools to increase productivity and facilitate new formsof scholarship. For more information about JSTOR, please contact [email protected].
The University of Chicago Press is collaborating with JSTOR to digitize, preserve and extend access to TheJournal of Political Economy.
http://www.jstor.org
Cyclical Unemployment: Sectoral Shifts or Aggregate Disturbances?
Katharine G. Abraham Brookings Institution and Massachusetts Institute of Technology
Lawrence F. Katz University of California, Berkeley, and National Bureau of Economic Research
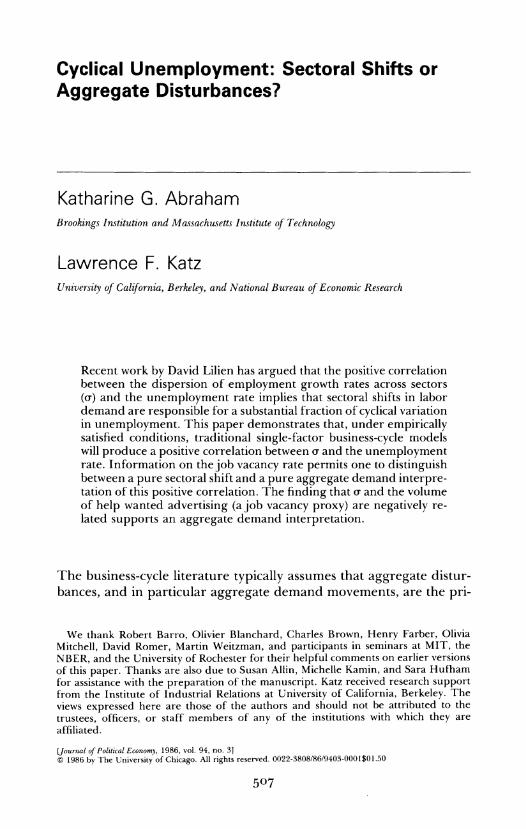
Recent work by David Lilien has argued that the positive correlation between the dispersion of employment growth rates across sectors (a) and the unemployment rate implies that sectoral shifts in labor demand are responsible for a substantial fraction of cyclical variation in unemployment. This paper demonstrates that, under empirically satisfied conditions, traditional single-factor business-cycle models will produce a positive correlation between or and the unemployment rate. Information on the job vacancy rate permits one to distinguish between a pure sectoral shift and a pure aggregate demand interpre- tation of this positive correlation. The finding that a and the volume of help wanted advertising (a job vacancy proxy) are negatively re- lated supports an aggregate demand interpretation.
The business-cycle literature typically assumes that aggregate distur- bances, and in particular aggregate demand movements, are the pri-
We thank Robert Barro, Olivier Blanchard, Charles Brown, Henry Farber, Olivia Mitchell, David Romer, Martin Weitzman, and participants in seminars at MIT, the NBER, and the University of Rochester for their helpful comments on earlier versions of this paper. Thanks are also due to Susan Allin, Michelle Kamin, and Sara Hufham for assistance with the preparation of the manuscript. Katz received research support from the Institute of Industrial Relations at University of California, Berkeley. The views expressed here are those of the authors and should not be attributed to the trustees, officers, or staff members of any of the institutions with which they are affiliated.
Journal of Political Economy, 1986, vol. 94, no. 3] ? 1986 by The University of Chicago. All rights reserved. 0022-3808/86/9403-0001$01.50
507
508 JOURNAL OF POLITICAL ECONOMY
mary cause of cyclical swings in unemployment (see, e.g., Barro 1977; Tobin 1980; Baily and Okun 1982). The aggregate models utilized by macroeconomists usually fail to take into account the possibility that shifts in the sectoral composition of demand can have adverse macro consequences in an economy in which resources are not instanta- neously mobile across sectors. In a provocative recent paper, Lilien (1982b) argues that shifts in demand from some sectors to others, rather than movements in the level of aggregate demand, are in fact responsible for half or more of all cyclical variation in unemployment in the postwar period. Lilien's evidence on this point appears to have been rather widely accepted (see, e.g., Grossman, Hart, and Maskin 1983; Rosen 1983; Barro 1984; Bluestone, Harrison, and Gorham 1984).
The aggregate demand and sectoral shift explanations for cyclical unemployment have potentially quite different policy implications. A pure sectoral shift explanation seems to rule out a useful role for aggregate demand policies in moderating unemployment fluctua- tions. Thus the degree to which each of these two possible sources contributes to cyclical unemployment is a matter of considerable im- portance.
Section I of this paper lays out both a pure sectoral shift explana- tion and a pure aggregate demand explanation for cyclical fluctua- tions in the unemployment rate. We show that either could produce the strong positive relationship between the cross-industry dispersion of employment growth rates and the unemployment rate that Lilien (1982b) appeals to as evidence for the sectoral shift hypothesis. Thus conventional single-factor business-cycle models and pure sectoral shift models of the cycle generate observationally equivalent predic- tions concerning the relationship between the dispersion of employ- ment growth rates across sectors and the unemployment rate. Section II argues that information on job vacancies can be used to distinguish between the pure sectoral shift hypothesis and the pure aggregate demand hypothesis. Estimates using the Conference Board help wanted index as a vacancy proxy offer strong support for the primacy of aggregate demand disturbances in producing cyclical fluctuations in unemployment. Section III considers and rejects the possibility that problems with the help wanted index as a vacancy proxy account for this result.
I. Sectoral Shifts, Aggregate Demand-Induced Business Cycles, and Dispersion in Employment Growth Rates
In this section we demonstrate that either pure shifts in the structure of demand or pure shocks to the level of demand could produce a posi-
CYCLICAL UNEMPLOYMENT 509
tive correlation between the dispersion of employment growth rates and the unemployment rate. This means that evidence of such a correlation cannot be taken as compelling support for the view that pure sectoral shifts have been an important cause of cyclical unem- ployment.
A. Sectoral Shifts
If workers were perfectly mobile and perfectly substitutable, shifts in the sectoral composition of demand for labor that did not alter the aggregate level of demand for labor would have no effect on the unemployment rate. Employment losses in contracting firms would be exactly matched by employment gains in expanding firms. How- ever, if frictions are present, then shifts in employment demand can lead to at least temporary increases in unemployment. This is the basis for the relationship posited in Lilien's work between St, the dispersion in observed employment growth rates across sectors (an empirical proxy for the dispersion in the desired rates of employment growth across sectors), and Ut, the unemployment rate.
A shock to the economy that necessitates that proportionately more labor be allocated to some sectors and proportionately less to others, but does not move aggregate demand off its trend path, increases ua, the dispersion in desired employment growth rates, but does not affect the mean desired sectoral employment growth rate. We will refer to a shock of this sort that increases u* as a mean-preserving spread in the rates of growth of labor demand across sectors.' In a frictionless world, the change in the desired rate of employment growth in a sector will always equal the change in the actual rate of employment growth in the sector. A mean-preserving spread leaves total employ- ment no different than it would have been in the absence of the shock. In the presence of frictions, people losing their jobs in the sectors experiencing negative shocks may be out of work for some period of time while searching for employment in the gaining sectors. Increases in a*, the dispersion in desired rates of employment change across industries, raise the number of workers shifting to new sectors and thereby increase the unemployment rate. One would expect or, the dispersion in desired rates of employment change, to be tracked reasonably closely by at, the dispersion in actual rates of employment change. Thus, in the absence of aggregate demand disturbances, pure sectoral shifts in the composition of demand produce a positive
1 A formal, generalized notion of "variance" was introduced into the economics literature under the name of "mean-preserving spread" by Rothschild and Stiglitz (1970). In this paper, we utilize mean-preserving spread more informally as defined in the text.
510 JOURNAL OF POLITICAL ECONOMY
correlation between the dispersion of employment growth rates and the unemployment rate.2
B. Aggregate Demand Fluctuations
The preceding discussion completely ignores the potential effect of aggregate demand fluctuations on employment growth dispersion. This causes no problems for empirical analysis-in the sense that the dispersion of employment growth rates can still safely be interpreted as a measure of intersectoral shifts 'a la Lilien (1982b)-provided that two conditions are satisfied. First, all sectors must have the same trend rate of growth. Second, sectors must not differ in their sensitivity to aggregate demand fluctuations.3
If these conditions are violated, traditional single-factor business- cycle models may produce a positive correlation between the disper- sion of employment growth rates (ct) and the change in the unem- ployment rate (AUt), even in the absence of sectoral shifts of the sort motivating the previous discussion. If the single aggregate factor can be interpreted as aggregate demand, then aggregate demand fluctua- tions alone can generate this positive correlation. Specifically, this will happen under either of the following scenarios: (1) industries' trend growth rates and cyclical sensitivities are negatively correlated or (2) industries differ in their cyclical sensitivities and labor force adjust- ment costs are asymmetric such that an increase in employment costs more than a decline of equal magnitude.4 Moreover, because A Ut and the unemployment rate (Ut) itself are positively correlated, aggregate demand fluctuations should be capable of producing a positive corre- lation between crt and Ut under either of these same scenarios.
We first consider the implications of a negative correlation between industries' trend rates of growth and their cyclical sensitivities. This
2 Lucas and Prescott (1974) develop a model in which labor market frictions lead to unemployment when workers must be reallocated across sectors. This model seems to have motivated the empirical analysis in Lilien (1982b). Weiss (1984) develops an alter- native model in which pure sectoral shifts generate unemployment through asym- metric quadratic labor force adjustment costs such that firms experiencing a decline in their relative position fire workers more rapidly than expanding firms hire additional workers.
3 Lilien (1982a) notes that employment growth rates may be affected by aggregate demand and attempts to develop a sectoral shifts measure based on the dispersion in employment growth rates net of aggregate demand influences. In contrast to the dis- cussion here, Lilien (1982a) does not systematically consider how aggregate demand fluctuations alone could have produced the results of Lilien (1982b). There is also reason to believe that even the "purged" sectoral shifts measure of Lilien (1982a) captures aggregate demand influences; evidence on this point is presented in Abraham and Katz (1984, 1985).
4 This second case is analyzed in detail by Weiss (1984).
CYCLICAL UNEMPLOYMENT 511
alone is sufficient for aggregate demand fluctuations to produce a correlation between a, and A U,. This basic result can be demonstrated for ease of exposition with a hypothetical two-sector economy driven solely by transitory fluctuations in aggregate demand around its trend rate of growth. Employment in the first sector trends upward rapidly but is relatively unresponsive to cyclical movements in gross national product (GNP); employment in the second sector trends upward less rapidly but is more responsive to fluctuations in GNP. (Sector 1 can be thought of as services and sector 2 as manufacturing.) We can write
lnEt = E + + Fit ? y(ln Yt -InY*) (1)
and
In E2, = + ?2t + _y2(In Yt- In Y*), (2)
where El, and E2t are employment in the two sectors, t is a time trend, Y, is actual GNP, Y* is trend GNP, F1 > F2 (service employment is growing at a more rapid trend rate than manufacturing employ- ment), and -yl < Y2 (service employment is less cyclically responsive than manufacturing employment). A measure of the dispersion in the rate of growth of employment across sectors at any point in time is defined as
at = [ Et (A In Elt - A In Et)2 + (A In E2t - A In Et)21 (3)
This is approximately equal to
|1/2 (l - F2) + 1/2(Yl - Y2)(A In Y, - A In Y*)l
if we assume that the two sectors start out equal in size. How will at move over the business cycle? In this example, yi - 'Y2 is
negative, so that the second term in our approximate expression for (Ft is positive when the actual rate of GNP growth falls short of the trend rate of GNP growth (during a downturn) and negative when the actual rate of GNP growth exceeds the trend rate of GNP growth (during an upturn). The value of oat is thus high during downturns and low during upturns, at least under reasonable assumptions about the shape of the business cycle.5
5 If 1(-Yi - _Y2)(A In Y, - A In Yt)l exceeded IrF - F21 at any point during the upturn, cF
would decrease to zero, increase a bit, fall back to zero, then finally increase again as the economy moved from trough to peak. There would have to be larger differences between the cyclical responsiveness of the two sectors and/or larger fluctuations of GNP around trend over shorter time periods than seems reasonable for this to happen. Even if this flip-flopping does occur, a will still be lower during upturns than during down- turns as long as upturns are not markedly steeper than downturns.
512 JOURNAL OF POLITICAL ECONOMY
If U, bears an Okun's law relationship to the percentage deviation of GNP from trend, we can write
U, = X + O(In Y, - In Y*), (4)
where 0 is negative. Unemployment rises when the actual growth rate falls short of the trend growth rate (during a downturn) and falls when the actual growth rate exceeds the trend growth rate (during an upturn). This means that St and A U, will be positively correlated. The existence of a negative correlation between industries' trend rates of growth and their cyclical sensitivities is thus sufficient to produce a positive correlation between crt and A U,.
A single-factor business-cycle model in which industries have dif- ferent sensitivities to a common shock may also generate a positive correlation between at and AU, even if differences in industry trend growth rates are unimportant. This will occur if firms have asym- metric convex labor force adjustment costs in which the cost of hiring is greater than the cost of firing. Weiss (1984) has shown in this type of model that, if firms respond in the same direction to a common shock but differ in their sensitivities and if upturns last as long as downturns, hiring costs that exceed firing costs will cause the mean cross-section variance of employment growth rates across industries to be higher in downturns than in upturns. Thus u, and AU, will be positively correlated if industries have different cyclical sensitivities and if firms find it easier to reduce employment rapidly than to in- crease employment rapidly.
Conditions sufficient for aggregate demand fluctuations to gener- ate a positive correlation between u, and AU, appear to have been empirically satisfied in the postwar United States. In the first place, there is a strong negative correlation across industries between the trend rate of growth and the responsiveness of employment to cyclical fluctuations. To demonstrate this, we fit models of the following form for each of 11 major sectors:
An Eit = F, + r2t + -(A Iln Y - A In Y*) (5)
+ y2z(Aln Yt~1 - A In Y*_1) + it)
where Et is employment in sector i, t is a time trend, in Yt is log(GNP), in Yt is the trend value of log(GNP), and the F's and -y's are pa- rameters. The simple correlation between the estimated value of d(ln Eit)ldt, evaluated at the mean value of t, and the sum of the -y's based on coefficients from ordinary least squares (OLS) equations estimated using annual data for 1949-80 equals -.517; the rank correlation is -.545. There is also evidence of asymmetry in the cyclical movements of employment consistent with hiring costs ex- ceeding firing costs. Weiss (1984) shows that the distribution of em-
CYCLICAL UNEMPLOYMENT 513
ployment growth rates is skewed such that sharp drops in employ- ment are more common than sharp increases in employment.
Thus far we have shown only that aggregate demand fluctuations can be expected to produce a positive correlation between the disper- sion of employment growth rates and the change in the unemploy- ment rate. It is also true that A U, and U1 are positively correlated so that a, and U, can reasonably be expected to bear a positive relation- ship to one another. In annual data for 1949-80, the change in de- trended Ut (A UDT1) and detrended Ut (UDTt) itself have a correlation of .506.6 This positive correlation of Ut and A U, does not imply that the unemployment rate series is necessarily explosive. In fact, a positive correlation between the level of a variable, X,, and its first difference, Xt - X -1, is a basic property of a wide variety of stationary discrete time stochastic processes. Thus it seems quite plausible that an aggre- gate demand-driven positive correlation between ot and A U, could, through a positive correlation between A U, and U,, produce a positive correlation between art and Ut.
Thus, under empirically satisfied conditions, pure aggregate de- mand fluctuations and pure sectoral shifts lead to observationally equivalent predictions concerning the relationship between (Ft and Ut. This implies that the positive relationship between ax, and the unem- ployment rate does not necessarily imply an important role for sec- toral shifts in cyclical fluctuations.
II. Differentiating between the Sectoral Shift and Aggregate Demand Hypotheses
While either pure sectoral shifts or pure aggregate demand fluctua- tions can produce a positive correlation between the dispersion in employment growth rates and the unemployment rate, the two pro- cesses can be distinguished empirically in other respects. In particu- lar, the behavior of job vacancies can reveal which has been the more important cause of the correlation between crt and U1.
A. Predictions Concerning Cyclical Movements in the Job Vacancy Rate
One important difference between the mean-preserving spread sec- toral shift story and the aggregate demand story lies with what each
6 Since we are concerned with explaining short-term fluctuations in unemployment, independent of trend movements in the level of unemployment, we present results based on values of U, with a linear trend removed here and include a time trend in the regressions presented later. Detrending never has an important effect on the re- sults.
514 JOURNAL OF POLITICAL ECONOMY
predicts for the behavior of the job vacancy rate. If the pure sectoral shift hypothesis correctly captured why a, and U, are positively re- lated, then ur and Vt, the job vacancy rate, should also be positively related. In contrast, the aggregate demand scenario concerning the positive relationship between a, and U, generates a negative relation- ship between ul and V,.
These predictions rest on the existence of an inverse relationship between U1 and Vt over the course of an aggregate demand-driven cycle. Strong aggregate demand can be expected to reduce the num- ber of people unemployed and raise the number of vacant jobs, whereas weak aggregate demand can be expected to raise the number of people unemployed and reduce the number of vacant jobs. Thus, holding the structural characteristics of the economy fixed, one would expect a plot of the job vacancy rate against the unemployment rate to yield a downward-sloping UV curve. An increase in the unemploy- ment rate that is caused purely by a negative shock to aggregate demand should be accompanied by a decrease in the job vacancy rate.
Changes in the structural characteristics of the economy can shift the entire UV curve either inward (improvements in worker/job matching) or outward (worsening of worker/job matching). Increased dispersion in the desired rates of employment growth across sectors is one possible cause of an outward shift in the UV curve. An increase in the unemployment rate caused purely by an increase in the dispersion of desired employment growth rates should be accompanied by an increase in the job vacancy rate.7
The contrast of the predicted relationship between u, and Vt emerg- ing from the sectoral shift story and that emerging from the aggre- gate demand story provides a means of empirically determining which is more important.
7 Holt and David (1966), Hansen (1970), andJackman, Layard, and Pissarides (1983) present theoretical models that produce an inverse relationship between U, and V, over an aggregate demand-driven business cycle; this downward-sloping curve is commonly referred to as the Beveridge curve. In all of these models, a worsening of the match between unemployed people and vacant jobs leads to an outward shift in the Beveridge curve. The increased unemployment caused by a mean-preserving spread in desired employment growth rates could generate feedback that reduces aggregate demand. In the absence of such feedback, a mean-preserving spread would cause vacancies to rise one-for-one with unemployment; with feedback, the short-run increase in the number of vacancies might be less than the short-run increase in unemployment. Increases in unemployment attributable to the feedback following a mean-preserving spread should not be considered increases in the natural rate in the sense of Lilien (1982b) since they are susceptible to alteration by aggregate demand policy in the same way as unemploy- ment caused directly by a negative shock to aggregate demand.
CYCLICAL UNEMPLOYMENT 515
B. Patterns of Movement in Annual Data
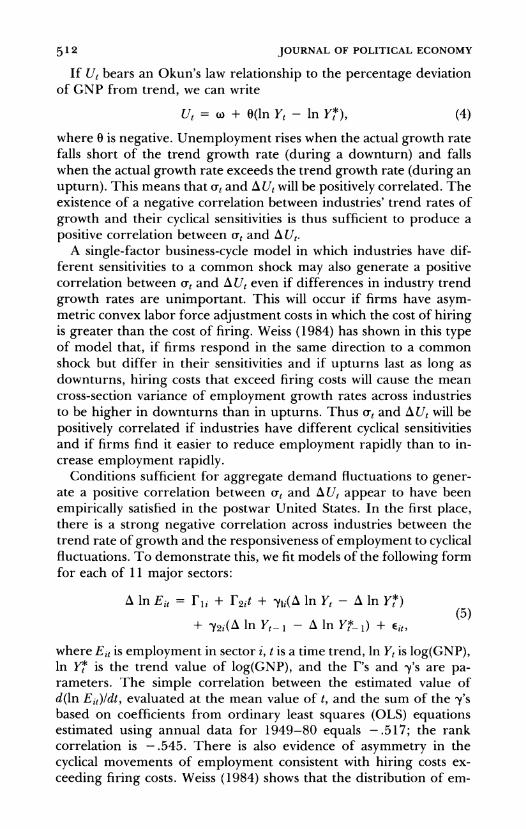
Unfortunately, comprehensive job vacancy data have not been col- lected on an ongoing basis in the United States. The best available proxy for the number of vacant jobs is the Conference Board's help wanted index. This index is essentially an employment-weighted av- erage of the number of help wanted advertisements in 51 major met- ropolitan newspapers, deflated so that 1967 equals 100.8 Dividing the national help wanted index by total nonagricultural payroll employ- ment yields a reasonable proxy for the job vacancy rate. We use this normalized help wanted index (help wanted index divided by total nonag- ricultural payroll employment) as a vacancy rate surrogate in the analysis that follows. Consideration of whether the help wanted index is a suitable vacancy proxy for our purpose is deferred to Section III.
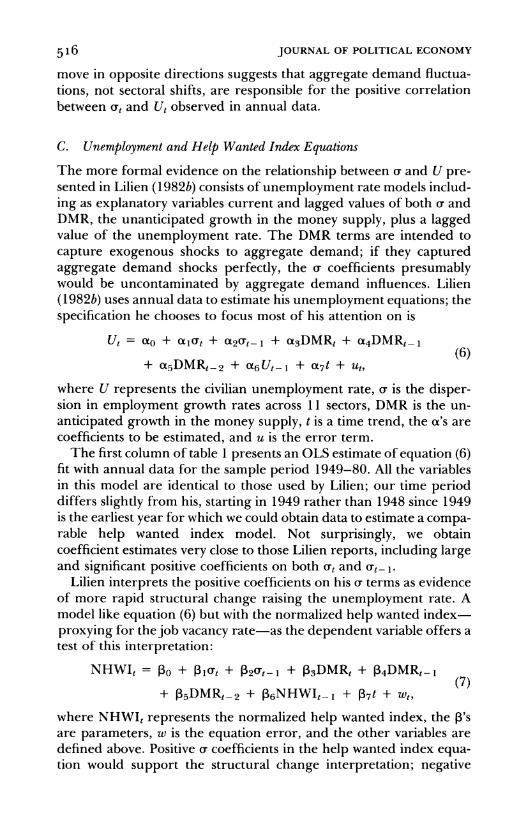
The left-hand panel of figure 1 plots the dispersion of employment growth rates ((a) calculated using annual average employment figures against the civilian unemployment rate, as in Lilien (1982b); it is clear that at and U, are positively correlated. The right-hand panel of figure 1 presents a similar plot, but with the normalized help wanted in- dex-our proxy for the job vacancy rate-replacing the unemploy- ment rate. The pure sectoral shift hypothesis implies that ot and the normalized help wanted index should move together; the pure aggre- gate demand hypothesis implies that they should move in opposite directions. The fact that crt and the normalized help wanted index
UN
50 55 60 65 70 75 80 50 55 60 65 70 75 80
FIG. 1.-Unemployment rate, normalized help wanted index, and sigma in annual data. a, Unemployment rate (U) vs. sigma (S). b, Normalized help wanted index (N) vs. sigma (S).
" Preston (1977) discusses in considerable detail the data and methodology used in creating the help wanted index.
516 JOURNAL OF POLITICAL ECONOMY
move in opposite directions suggests that aggregate demand fluctua- tions, not sectoral shifts, are responsible for the positive correlation between ot, and U, observed in annual data.
C. Unemployment and Help Wanted Index Equations
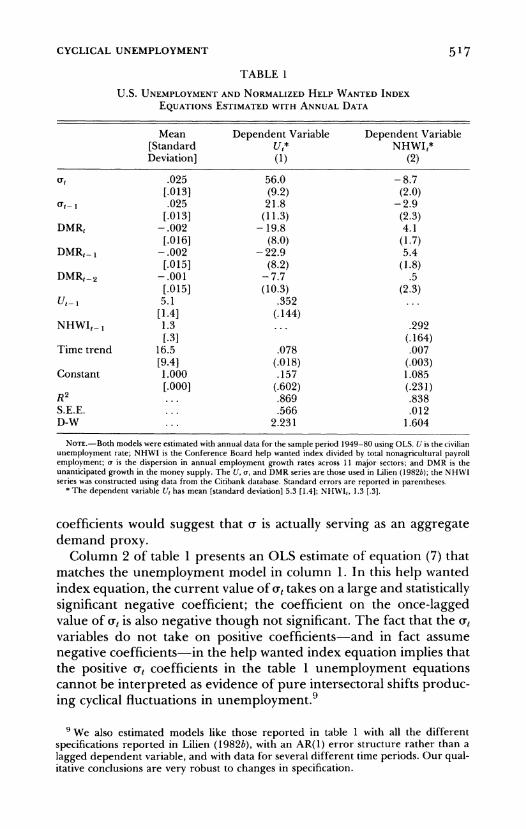
The more formal evidence on the relationship between u and U pre- sented in Lilien (1982b) consists of unemployment rate models includ- ing as explanatory variables current and lagged values of both a and DMR, the unanticipated growth in the money supply, plus a lagged value of the unemployment rate. The DMR terms are intended to capture exogenous shocks to aggregate demand; if they captured aggregate demand shocks perfectly, the cr coefficients presumably would be uncontaminated by aggregate demand influences. Lilien (1982b) uses annual data to estimate his unemployment equations; the specification he chooses to focus most of his attention on is
Ut= to + Otlart + %2Ct-I + Ot3DMRt + a4DMRt-i (6)
+ a5DMRt-2 + aO6Utl + cv7t + Ut,
where U represents the civilian unemployment rate, or is the disper- sion in employment growth rates across 11 sectors, DMR is the un- anticipated growth in the money supply, t is a time trend, the cs's are coefficients to be estimated, and u is the error term.
The first column of table 1 presents an OLS estimate of equation (6) fit with annual data for the sample period 1949-80. All the variables in this model are identical to those used by Lilien; our time period differs slightly from his, starting in 1949 rather than 1948 since 1949 is the earliest year for which we could obtain data to estimate a compa- rable help wanted index model. Not surprisingly, we obtain coefficient estimates very close to those Lilien reports, including large and significant positive coefficients on both at and uS- 1.
Lilien interprets the positive coefficients on his C terms as evidence of more rapid structural change raising the unemployment rate. A model like equation (6) but with the normalized help wanted index- proxying for the job vacancy rate-as the dependent variable offers a test of this interpretation:
NHWIJ = 130 + l(Jt + I2ut-1 + 03DMRt + 34DMRt- (7) + P5DMRt-2 + P6NHWI, I + 137t + wt,
where NHWIt represents the normalized help wanted index, the O3's are parameters, w is the equation error, and the other variables are defined above. Positive ( coefficients in the help wanted index equa- tion would support the structural change interpretation; negative
CYCLICAL UNEMPLOYMENT 517
TABLE 1
U.S. UNEMPLOYMENT AND NORMALIZED HELP WANTED INDEX
EQUATIONS ESTIMATED WITH ANNUAL DATA
Mean Dependent Variable Dependent Variable [Standard Ut* NHWIt* Deviation] (1) (2)
ant .025 56.0 -8.7 [.013] (9.2) (2.0)
art- I .025 21.8 -2.9 [.013] (11.3) (2.3)
DMRt -.002 - 19.8 4.1 [.016] (8.0) (1.7)
DMR,1 -.002 - 22.9 5.4 [.015] (8.2) (1.8)
DMR5-2 -.001 -7.7 .5 [.015] (10.3) (2.3)
Ut- 1 5.1 .352 ... [1.4] (.144)
NHWI,- 1.3 ... .292 [.3] (.164)
Time trend 16.5 .078 .007 [9.4] (.018) (.003)
Constant 1.000 .157 1.085 [.000] (.602) (.231)
R2 ... .869 .838 S.E.E. ... .566 .012 D-W ... 2.231 1.604
NOTE.-Both models were estimated with annual data for the sample period 1949-80 using OLS. U is the civilian unemployment rate; NHWI is the Conference Board help wanted index divided by total nonagricultural payroll employment; a is the dispersion in annual employment growth rates across 11 major sectors; and DMR is the unanticipated growth in the money supply. The U, or, and DMR series are those used in Lilien (1982b); the NHWI series was constructed using data from the Citibank database. Standard errors are reported in parentheses.
* The dependent variable U1 has mean [standard deviation] 5.3 [1.4]; NHWIt, 1.3 [.3].
coefficients would suggest that C is actually serving as an aggregate demand proxy.
Column 2 of table 1 presents an OLS estimate of equation (7) that matches the unemployment model in column 1. In this help wanted index equation, the current value of at takes on a large and statistically significant negative coefficient; the coefficient on the once-lagged value of ut is also negative though not significant. The fact that the St
variables do not take on positive coefficients-and in fact assume negative coefficients-in the help wanted index equation implies that the positive a, coefficients in the table 1 unemployment equations cannot be interpreted as evidence of pure intersectoral shifts produc- ing cyclical fluctuations in unemployment.9
9 We also estimated models like those reported in table 1 with all the different specifications reported in Lilien (1982b), with an AR(1) error structure rather than a lagged dependent variable, and with data for several different time periods. Our qual- itative conclusions are very robust to changes in specification.
518 JOURNAL OF POLITICAL ECONOMY
III. Using the Help Wanted Index as a Job Vacancy Proxy
An important question is whether the normalized help wanted index does a satisfactory job of capturing cyclical fluctuations in the job vacancy rate. Available evidence suggests that it does. Moreover, Brit- ish vacancy data perform similarly to the U.S. help wanted index in models like those discussed in Section II, which suggests that our findings there are not an artifact of having used a bad vacancy proxy.
A. Evidence on the Help Wanted Index
A potential problem in using the normalized help wanted index as a vacancy rate proxy arises if different sectors have different propen- sities to use help wanted advertising. Specifically, if manufacturing industries were more likely to advertise vacancies than service indus- tries, a sectoral shift from manufacturing to services (the most com- mon in the period we study) that increased the overall vacancy rate might not increase the help wanted index. In fact, however, the avail- able evidence suggests that manufacturing vacancies are, if anything, less likely to be advertised than vacancies in other sectors,10 so that a negative correlation between at and the normalized help wanted in- dex should arise only if there is an even stronger negative relationship between crt and the job vacancy rate.
Some direct insight into how well cyclical swings in help wanted advertising track cyclical swings in job vacancies can be obtained using help wanted index and job openings data available monthly from January 1972 to December 1981 for the Minneapolis/St. Paul met- ropolitan area. With these data, we can compare month-to-month movements in help wanted advertising and job vacancies.1 1 An equa- tion with the log of the normalized Minneapolis/St. Paul help wanted
10 U.S. vacancy data from the sources described in Abraham (1983) suggest that the manufacturing vacancy rate is generally close to the all industry vacancy rate, whereas data on the distribution of want ads for 12 cities in 1975 (Walsh, Johnson, and Sugar- man 1975, p. 85) show that manufacturing jobs account for a smaller share of want ads than of national employment in that year (14 percent of the want ads for which the employer's industry could be identified vs. 24 percent of national employment). This suggests that manufacturing vacancies are less likely to be advertised than other vacan- cies. In addition, a direct comparison of the occupational distribution of want ads with the occupational distribution of vacancies for Rochester, N.Y., in February and May 1965 showed that blue-collar vacancies were less likely to be advertised than white- collar vacancies (Myers and Creamer 1967, p. 98). Since manufacturing jobs are dispro- portionately blue-collar, this also suggests that manufacturing vacancies are less likely to be advertised than vacancies in other industries.
l See Abraham (1983) for a more detailed discussion of the Minnesota job vacancy data.
CYCLICAL UNEMPLOYMENT 519
index on the left-hand side and the log of the Minneapolis/St. Paul vacancy rate, month dummies, and a time trend on the right-hand side was fit for this purpose.'2 The estimated coefficient on the log of the vacancy rate was .884 with a standard error of .051. This coefficient estimate is significantly less than 1.0, which suggests that help wanted advertising may be somewhat less cyclically responsive than job vacancies, though this result could also reflect noise in the vacancy rate series. The equation R2 is a respectable .800. The limited evidence we have available thus suggests that short-term movements in help wanted advertising track short-term movements in job vacan- cies reasonably well.
B. Results with British Vacancy Data
The availability of vacancy data for other countries provides an addi- tional opportunity to assess whether problems with the normalized help wanted index account for the results reported in Section II. We have compiled British data suitable for estimating unemployment rate and vacancy rate models like those in table 1 for the years 1961 - 81; these estimates are reported in table 2.13 In Britain as in the United States, there is a positive relationship between ar and the un- employment rate. This shows up both in the column 1 model using the untransformed unemployment rate and in the column 3 model using the log of the unemployment rate, though the coefficient in the column 3 model is significant only at the .10 level; we prefer the column 3 model because the time trend in the British unemployment rate seems to have been essentially exponential over the period of analysis. If sectoral shifts account for the positive relationship be- tween St and Ut in Britain, at and Vt should also move together; if aggregate demand movements account for the positive relationship
12 Neither the help wanted series nor the vacancy series was seasonally adjusted. We include month dummies in the model to correct for possible differences in the pat- tern of seasonality in the two series and a time trend because we are interested in how short-term movements in the two series compare rather than in possible differences in their longer-term tendencies.
13 One concern with the British data is that the employment series are not fully consistent over time. However, in each year in which the employment series methodol- ogy was changed, data were presented on both the old and new bases so that we were always able to calculate values of a using consistent data across the two relevant years. A second concern is that the British vacancy numbers are derived from Employment Service records and thus could be affected by changes in the scope of Employment Service operations. We use a corrected vacancy series described in Layard and Nickell (1984) and created by dividing the reported vacancy numbers by a correction factor X. This X equals [(outflow of registered vacancies/engagements) + (inflow of registered vacancies/separations)]/2, where the engagement and separation counts come from a national survey.
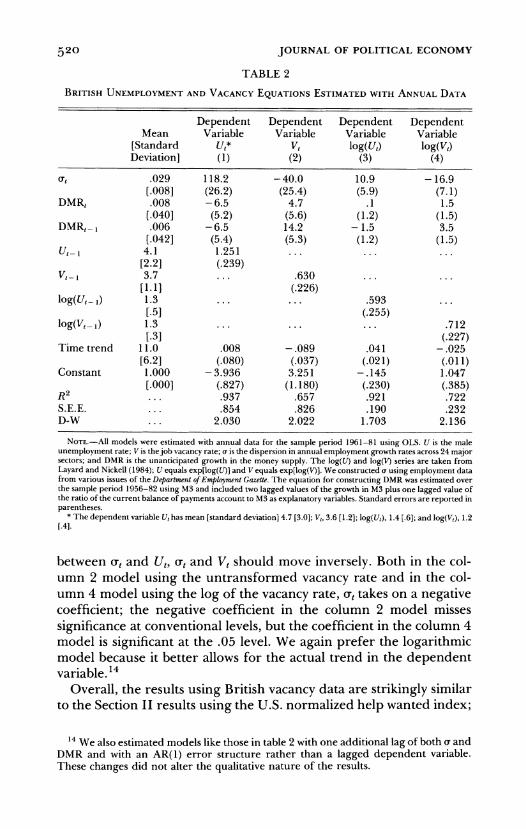
520 JOURNAL OF POLITICAL ECONOMY
TABLE 2
BRITISH UNEMPLOYMENT AND VACANCY EQUATIONS ESTIMATED WITH ANNUAL DATA
Dependent Dependent Dependent Dependent Mean Variable Variable Variable Variable
[Standard Ut* Vt log(U,) log(Vt) Deviation] (1) (2) (3) (4)
at .029 118.2 -40.0 10.9 -16.9 [.008] (26.2) (25.4) (5.9) (7.1)
DMRt .008 - 6.5 4.7 .1 1.5 [.040] (5.2) (5.6) (1.2) (1.5)
DMR, 1 .006 -6.5 14.2 - 1.5 3.5 [.042] (5.4) (5.3) (1.2) (1.5)
Ut- 1 4.1 1.251 ... ... ... [2.2] (.239)
Vt_ I 3.7 ... .630 ... ... [1.1] (.226)
log(U,- 1) 1.3 ... ... .593 ...
[.5] (.255) log(Vt- 1) 1.3 ... ... ... .712
[.3] (.227) Time trend 11.0 .008 -.089 .041 -.025
[6.2] (.080) (.037) (.021) (.011) Constant 1.000 -3.936 3.251 - .145 1.047
[.000] (.827) (1.180) (.230) (.385) R2 ... .937 .657 .921 .722 S.E.E. ... .854 .826 .190 .232 D-W ... 2.030 2.022 1.703 2.136
NOTE.-All models were estimated with annual data for the sample period 1961-81 using OLS. U is the male unemployment rate; V is thejob vacancy rate; a is the dispersion in annual employment growth rates across 24 major sectors; and DMR is the unanticipated growth in the money supply. The log(U) and log(V) series are taken from Layard and Nickell (1984); U equals exp[log(U)] and V equals exp[log(V)]. We constructed a using employment data from various issues of the Department of Employment Gazette. The equation for constructing DMR was estimated over the sample period 1956-82 using M3 and included two lagged values of the growth in M3 plus one lagged value of the ratio of the current balance of payments account to M3 as explanatory variables. Standard errors are reported in parentheses.
* The dependent variable Ut has mean [standard deviation] 4.7 [3.0]; Vt, 3.6 [1.21; log(Ul), 1.4 [.6]; and log(Vt), 1.2 [.4].
between a, and U,, o- and V, should move inversely. Both in the col- umn 2 model using the untransformed vacancy rate and in the col- umn 4 model using the log of the vacancy rate, ot takes on a negative coefficient; the negative coefficient in the column 2 model misses significance at conventional levels, but the coefficient in the column 4 model is significant at the .05 level. We again prefer the logarithmic model because it better allows for the actual trend in the dependent variable. 14
Overall, the results using British vacancy data are strikingly similar to the Section II results using the U.S. normalized help wanted index;
14 We also estimated models like those in table 2 with one additional lag of both r and DMR and with an AR(1) error structure rather than a lagged dependent variable. These changes did not alter the qualitative nature of the results.
CYCLICAL UNEMPLOYMENT 521
we take this as providing additional, albeit indirect, support for our interpretation of the normalized help wanted index results.
IV. Conclusion
Some previous research has taken the fact that the dispersion of em- ployment growth rates and the unemployment rate are positively cor- related to indicate that the former bears a causal relationship to the latter. We have shown that, under certain empirically satisfied condi- tions, traditional single-factor business-cycle models produce a posi- tive correlation between sectoral employment growth rate dispersion and the unemployment rate. This correlation alone cannot be taken as evidence for a causal role of sectoral shifts in the business cycle.
Additionally, it has been demonstrated that information on job vacancies can be used to distinguish the pure sectoral shift hypothesis from a pure aggregate demand characterization. The negative rela- tionship between the dispersion of employment growth rates and the normalized Conference Board help wanted index, the best available U.S. vacancy rate proxy, provides support for the aggregate distur- bance hypothesis.
The evidence seems consistent with the view that cyclical unemploy- ment movements are primarily related to aggregate shocks. In an economy in which sectors have different cyclical sensitivities, aggre- gate demand movements affect both the dispersion in employment growth rates and the unemployment rate, producing a positive corre- lation between the two. The evidence does not seem congruent with the view that changes in the required rate of labor reallocation across sectors associated with relative shocks are primary causes of cyclical unemployment fluctuations.
References
Abraham, Katharine G. "Structural/Frictional vs. Deficient Demand Unem- ployment: Some New Evidence." A.E.R. 73 (September 1983): 708-24.
Abraham, Katharine G., and Katz, Lawrence F. "Cyclical Unemployment: Sectoral Shifts or Aggregate Disturbances?" Working Paper no. 1410. Cambridge, Mass.: N.B.E.R., July 1984.
. "Aggregate Downturns and Secular Adjustments." Mimeographed. Washington: Brookings Inst., 1985.
Baily, Martin N., and Okun, Arthur M., eds. The Battle against Unemployment and Inflation. New York: Norton, 1982.
Barro, Robert J. "Unanticipated Money Growth and Unemployment in the United States." A.E.R. 67 (March 1977): 101-15.
. "Rational Expectations and Macroeconomics in 1984." A.E.R. Papers and Proc. 74 (May 1984): 179-82.
Bluestone, Barry; Harrison, Bennet; and Gorham, Lucy. "Storm Clouds on
522 JOURNAL OF POLITICAL ECONOMY
the Horizon: Labor Market Crisis and Industrial Policy." Mimeographed. Brookline, Mass.: Econ. Educ. Project, 1984.
Grossman, Sanford J.; Hart, Oliver D.; and Maskin, Eric S. "Unemployment with Observable Aggregate Shocks."J.P.E. 91 (December 1983): 907-28.
Hansen, Bent. "Excess Demand, Unemployment, Vacancies, and Wages." QJ.E. 84 (February 1970): 1-23.
Holt, Charles C., and David, Martin H. "The Concept of Job Vacancies in a Dynamic Theory of the Labor Market." In The Measurement and Interpreta- tion ofJob Vacancies. New York: Columbia Univ. Press (for N.B.E.R.), 1966.
Jackman, Richard; Layard, Richard; and Pissarides, Christopher. "On Vacan- cies." Discussion Paper no. 165. London: London School Econ., Center Labor Econ., August 1983.
Layard, Richard, and Nickell, Stephen J. "The Causes of British Unemploy- ment." Mimeographed. London: London School Econ., Center Labor Econ., 1984.
Lilien, David M. "Sectoral Model of the Business Cycle." Working Paper no. 8231. Los Angeles: Univ. Southern California, Dept. Econ., Modelling Re- search Group, December 1982. (a)
"Sectoral Shifts and Cyclical Unemployment." J.P.E. 90 (August 1982): 777-93. (b)
Lucas, Robert E., Jr., and Prescott, Edward C. "Equilibrium Search and Un- employment."J. Econ. Theory 7 (February 1974): 188-209.
Myers, John G., and Creamer, Daniel. Measuring Job Vacancies. New York: Nat. Indus. Conf. Bd., 1967.
Preston, Noreen L. The Help Wanted Index: Technical Description and Behavioral Trends. Report no. 716. New York: Conf. Bd., 1977.
Rosen, Sherwin. "Unemployment and Insurance." Working Paper no. 1095. Cambridge, Mass.: N.B.E.R., March 1983.
Rothschild, Michael, and Stiglitz, Joseph E. "Increasing Risk: I. A Definition." J. Econ. Theory 2 (September 1970): 225-43.
Tobin, James. "Stabilization Policy Ten Years After." Brookings Papers Econ. Activity, no. 1 (1980), pp. 19-71.
Walsh, John; Johnson, Miriam; and Sugarman, Marged. Help Wanted: Case Studies of Classified Ads. Salt Lake City: Olympus, 1975.
Weiss, Laurence. "Asymmetric Adjustment Costs and Sectoral Shifts." Mim- eographed. Chicago: Univ. Chicago, Dept. Econ., 1984.