Embed Size (px)
Citation preview

‘European Journal of Political Economy 8 (1992) 579-597. North-Holland
Conflict inflation, distribution, cyclical accumulation and crises
Amitava Krishna Dutt*
University of Notre Dame, Notre Dame, IN 46556, USA
Accepted for publication December 1991
This paper develops a model of inflation, distribution and accumulation. The theory of inflation is a conflict theory in which inflation results from the conflicting claims on income made by workers and firms, claims which are affected by the relative bargaining power of the two groups. This bargaining power affects the distribution of income, and therefore the pattern of accumulation in the economy, which in turn affects how the bargaining power of different groups changes over time. The model shows how the economy can experience cyclical growth, alternating between periods of excess capacity and full capacity utilization, and comments on the possibility, and implications, of deep slumps from which recovery is difficult.
1. Introduction
An expanding body of literature which explains long-run inflationary processes in terms of the conflicting claims on income by different groups in the economy has recently emerged.’
The contributions to this literature have cast much light on how conflict between workers, firms, and governments (as well as foreigners) generates inflation, and how inflation interacts with the distribution of income. The models developed typically assume that workers and firms attempt to achieve a targeted share of income, and inflation emerges to determine the actual shares when these targeted shares are in conflict. The targeted shares (and often the speed at which the targets tend to be attained) depend on variables such as the rate of unemployment and the rate of capacity utilization, which capture the relative bargaining positions of these groups [see Rowthorn
Correspondence to: Amitava Krishna Dutt, Department of Economics, University of Notre Dame, Notre Dame, IN 46556, USA.
*I would like to thank Jaime Ros, an anonymous referee for this journal, and Peter Skott, for their valuable comments on earlier drafts. I am especially grateful to the latter for spotting some important errors and loose ends.
‘See, for example, Rowthorn (1977), Turnovsky and Pitchford (1978), Ros (1989) and the references cited therein. Inflation caused by conflici between different groips is aiso a’feature of many mainstream contributions related to the Phillips curve. Lavard and Nickel1 (1987). for instance, model conflict between firms and workers, alt-hough they do not explicitly formalize the dynamics of wage and price change.
01762680/92/$05.00 0 1992-Elsevier Science Publishers B.V. All rights reserved

580 A.K. Dutt, Conflict inflation, distribution, cyclical accumulation and crises
(1977)]. However, the models usually assume that the rate of economic growth is exogenously determined by the demand-management policies of the government.2 Consequently, they do not examine the interaction between inflation, distribution and accumulation patterns, it being implicitly assumed that the effects of distributional changes on demand, caused by inflation, are exactly compensated by changes in demand-management policies.
The recent years have also experienced a growth in the literature on the interaction between economic growth and income distribution, some of the contributions to which have incorporated inflation into the analysis.3 Marglin (1984a, b), for example, has developed a model in which the economy grows with its capital fully utilized, income is distributed between workers and capitalists who have different propensities to consume, and output growth is determined by savings behaviour, firms desired accumu- lation plans, and inflation. The rate of price change is determined by the excess demand in the goods market while the rate of wage change is determined by the excess of the wage targeted by workers over their actual real wage. Dutt (1987) also assuming differential saving propensities and that growth is affected by desired accumulation and savings, considers an economy with excess capacity, in which wage and price changes are the result of attempts by workers and firms to try to achieve their (inconsistent) targeted shares of income. While these models focus on the interaction of accumulation patterns and distribution, and also explain the determination of inflation in terms of conflicting claims, they generally take the targeted shares of income desired by the different groups (as well as the speeds of adjustment towards targets) as given. Thus Marglin (1984a, b) takes the wage target of workers to be fixed, and Dutt (1987) takes the wage target of workers and the markup target of firms as given.
The purpose of this paper is to attempt to synthesize these two literatures by developing a model of conflict inflation, distribution and accumulation, which makes inflation the result of conflict between different groups where the determinants of the share targets of the groups is explicitly modeled, and which takes into account the interaction between inflation, distribution and accumulation. By so doing, this paper will also contribute to the literature on cyclical dynamics, in which growth involving the interaction between capital
2Rowthorn (1977), in the earlier sections of his paper, also takes the unemployment rate to be given, which implies - for a given rate of growth of labour supply - that he takes the rate of growth of the economy to be given. Later he considers the determination of the growth rate in terms of the rate of growth of money demand, but does not - by his own admission - provide a full dynamic analysis of the growth process. The rate of growth in his model, moreover, is not affected by income distributional changes, unlike what is assumed in the model developed in this paper. Layard and Nickel1 (1987) do not consider growth but confine themselves to a static level of output, which is determined exogenously by demand.
‘See, for example, Marglin (1984a, b), Taylor (1983, 1985) and Dutt (1987, 1990).

AX. Dutt, ConJict inflation, distribution, cyclical accumulation and crises 581
accumulation and changes in income distribution is seen to follow a cyclical pattern4 and to the analysis of crises.
2. Structure of the model
To describe the structure of the model we may discuss in turn the theories of inflation, distribution, and accumulation embodied in it.
2.1. Inflation
The theory of inflation is a conflict theory, and comprises of a theory of wage change and a theory of price change.
Regarding wage change we assume that the money wage changes accord- ing to the gap between the real wage targeted by workers and the actual real wage. This is formalized with the linear equation
&=p[V,- V],
where W is the money wage, V the real wage, W/P, where P is the price level, V, the level of the real wage targeted by workers, p is the speed of adjustment, and the overhat denotes time rates of growth.’ It is assumed that the real wage targeted by workers depends on their relative bargaining power, and that this bargaining power increases with the employment rate and the tightening of the labour market. This idea, consistent with the Phillips curve, is formalized with the linear equation
where e is the employment rate, L/N, where L is the level of employment, N the supply of labour, and /$ > 0 are fixed parameters.
Eq. (1) follows Marglin (1984a, b) and Dutt (1987) where, as noted above, p and V, are exogenously given. Conflict inflation models usually endogenize these parameters, and we do the same by making V, depend on e as in (2). More generally, p, which measures the rate at which workers attain their real wage target, should also be made to depend on labour market conditions,6
4The locus classicus is Goodwin (1967). 5Expectational issues could be introduced by modifying the model by replacing eq. (1) by
@=~,[VW-V]+~28e. where Be is the expected rate of inflation and p2>0 is a constant. According to this equation, a higher expected rate of inflation implies, other things constant, a higher rate of wage change. Assuming that p2 < 1 and that there is perfect foresight regarding the rate of inflation, the qualitative behaviour of our model will not be changed by this modification. See Dutt (1991) for an analysis of this case.
6Turnovsky and Pitchford (1978) in effect make V, exogenous and assume that p depends on the employment rate.

582 A.K. Dutt, Conflict inflation, distribution, cyclical accumulation and crises
but we assume it to be a constant to simplify our algebra. This simplification is not unpalatable because the central fact we wish to capture in our model is that the rate of wage change depends on the employment rate, and by substituting (2) into (1) we see that our specification does so without making it necessary to make p depend on e as well.
Regarding price change we assume that the rate of price change depends on the extent to which the firms’ targeted markup is higher than their actual markup, and on the strength of excess demand in the economy. Abstracting from technological change, the markup on prime costs is inversely related to the real wage, so that the gap between the targeted and actual markups can be measured by the gap between the actual and targeted real wage. When excess demand exists at a given price we assume that firms are rationed in their ability to invest according to their desires;’ thus a measure of excess demand is the excess of desired investment over their actual accumulation, determined by savings. Thus the price change equation can be written in the linear form
where V, is the real wage targeted by firms (determined by their targeted markup), gd and g the desired and actual rates of accumulation as a ratio of capital stock, and zi speeds of adjustment coefflcients.8 The targeted markup of firms depends on the state of the market (independently of the state of excess demand), and we assume that the markup targeted by tirms rises with the level of capacity utilization; this is captured with the linear equation
1/,=8,-O,U, (4)
where u is the rate of capacity utilization measured by X/K, where X is output and K is capital stock, and Qi>O are parameters. We will examine the determinants of the desired and actual rates of accumulation below.
Eq. (3) combines the approaches used in Marglin (1984a, b) and Dutt (1987). Marglin (1984a, b) deals with a situation of full capacity utilization in which inflation is caused by excess demand; in his approach only the second term in our equation provides the inflation dynamics. In Dutt (1987), where
‘An alternative, which would complicate the algebra somewhat, is to assume that consumers also are rationed and therefore forced to save. The usual notion of forced saving of consumers (especially workers) assumes distributional changes due to price increases. Since the rationing considered here is at a given price, we do not preclude such forced saving due to price increases later on in our analysis (see the discussion on the dynamics for the full capacity utilization case).
‘But as in the case of the earlier equation, and without fundamentally altering our model [see Dutt (1991)], we could introduce expectations by replacing eq. (3) by 8=r,[V- V,] + T~[&~]+T$~, and by assuming perfect foresight (that is, P=P’) and r3< 1.

AK. Dutt, Conflict inflation, distribution, cyclical accumulation and crises 583
it is assumed that firms try to attain a targeted markup, only the first term of our equation provides the theory of inflation. While there it is assumed that V, is given, eq. (4) follows conflict inflation models and makes it a function of the state of the goods market as measured by the rate of capacity utilization. The rationale behind o1 >O is that firms attempt to raise markups to take advantage of buoyant markets and reduce markups when sales are 10w.~ However, there are a number of arguments which suggest that 0, ~0 may also in some cases be an appropriate assumption.” Because of this ambiguity we will modify our analysis later to examine the implications of assuming 8, < 0.
There are several differences between some earlier formulations and the one adopted. First, as pointed out above, ours introduces an excess demand effect which is ignored in earlier conflict inflation models. Second, the state of the market is directly measured by the rate of capacity utilization (rather than proxying it by the employment rate), which seems to be an improve- ment. Finally, as in the wage change equation, and for similar reasons, we do not introduce the complication of making z1 depend on the rate of capacity utilization.’ ’
2.2. Distribution
Income in the economy is distributed between two classes: Workers who earn wage income and capitalists who receive profit income (since firms distribute their entire earnings to the capitalists). Workers are assumed to be in excess supply in the sense that the level of the demand for labour never exceeds the available level of labour supply. Following neo-Marxian and post-Keynesian tradition [for instance, Kaldor (19551956); Pasinetti (1962); Kalecki (1971)], we assume that workers consume their entire income, while capitalists save a constant fraction s of theirs, which is channelled back to firms through the ownership of equity or through the banking sector, which is not explicitly introduced. At a point in time the money wage and the price level are given and this (given the technological parameters) determines the
% may also be argued, following Eichner (1976), Harcourt and Kenyon (1976) and Wood (1975), that during expansions firms may want to invest more by generating higher internal savings, and desire a higher markup.
“‘See, for example, Kalecki (1954) Harrod (1936), Stiglitz (1984) and Rotemberg and Saloner (1986) for example, and Dutt (1990, pp. 6667) for a summary.
“Layard and Nickell’s (1987) model, as noted earlier, also considers conflict between firms and workers, and in their approach the markup of firms and the wage target of workers depend on the level of economic activity. However, they assume that if expectations are fulfilled (as they are in long-run equilibrium), the ‘feasible’ real wage implied by the pricing behaviour of firms and the ‘target’ real wage implied by the wage-setting behaviour of wage bargainers must be - _ equal to each other. This differs from the approach adopted here because we allow for differences between expectations and anticipations [see Rowthorn (1977)]: Even if the future is correctly expected, one may not be able to fully react to that knowledge.

584 A.K. Dutt, Conjlict inflation, distribution, cyclical accumulation and crises
distribution of income. Over time the price and wage change according to the dynamics just described, and this changes the distribution of income. Changes in distribution in turn affect the pattern of accumulation, to an examination of which we now turn.
2.3. Accumulation
Firms make investment plans and accumulate capital. We assume that firms desire to invest at a higher rate when their rate of
profit is higher (reflecting greater expected profits or easier financial con- ditions) and when they have a higher utilization of capacity (greater excess capacity deterring investment).‘* Using a linear equation we write
where Y is the rate of profit, defined by
r=(l-l/a,)4 (6)
where a,, is the fixed labour-output ratio (reflecting a fixed-coefficient production technology) and where ai> are fixed parametersi Whether or not the investment plan is realized depends on whether or not there is excess capacity in the economy.
If there is excess capacity, so that u< uk, where uk is the maximum technologically possible degree of capacity utilization (which is fixed, reflect- ing fixed technique and technology),14 firms produce according to demand,
so that there is no excess demand in the economy. In this case the accumulation plans of firms are realized, so that
However, if capacity is fully utilized, so that u=uk, the firm cannot expand
12The assumption of the dependence of investment on the rate of profit follows Robinson (1962) and Marglin (1984a, b), and that of the dependence on capacity utilization follows Kaldor (1940) Steindl (1952) Rowthorn (1982) Dutt (1984, 1990) and Taylor (1983).
‘jWe ignore the rate of interest and the rate of inflation as arguments in the investment function. The interest rate is assumed to be ftxed, with money supply assumed to be endogenous, following the post-Keynesian tradition of Weintraub (1978) and Kaldor (1982). [See also Moore (1988)]. It is assumed that the monetary authorities supply money endogenously to fix the real interest rate for the economy. If the monetary authorities fixed the nominal interest rate, which is more consistent with post-Keynesian views, the expected inflation rate would have to appear as an additional variable. See Dutt (1991) for an analysis of this case.
141n reality, there may be no such thing as a technologically-fixed level; it is more likely to be a maximum based partly on technology and partly on social conventions (relating to the number of shifts).
A.K. Dutt, Conflict inflation, distribution, cyclical accumulation and crises 585
output any further, and excess demand will not be satisfied. We assume in this case that consumers buy what they want, and that firms are rationed: thus gd>g. Accumulation will, in this case, be determined by saving, which (as a ratio of capital stock) is given by
g=sr, (8)
Finally, we have
R=g, (9)
since we assume away the depreciation of capital.
3. Inflation, cyclical accumulation and crises
In this section we analyze the implications of the assumptions made in the previous section. We first discuss the behaviour of the economy in the short run, and then in the long run.
3.1. The short run
The short run is defined to be a period in which the stock of capital, the supply of labour, the price level and the money wage are taken to be given. Given all this, as we have already discussed, if there is excess capacity firms will produce according to demand, or if there is full capacity firms will invest according to saving, and not realize their desired accumulation plans.
In the case of excess capacity, supply-demand equality requires that
u=a,Vu+(l -s)(l-a,V)u+gd, (10)
which implies that planned investment is equal to saving, or
s(1 -a,V)u=gd. (11)
Substituting from (5) we can solve for the short-run equilibrium value of u, given V and the other parameters, which is
u=clrJ/[(s-C(J(l-ua,V)-Ea,]. (12)
If we assume a short-run adjustment mechanism which states that output changes in proportion to the excess demand in the economy, this short-run equilibrium can be shown to be stable if
(s--GI*)(l- Vao)-cc, >o,
J.Pol E C
586 A.K. Dutt, ConJlict inflation, distribution, cyclical accumulation and crises
which also ensures that u>O in equilibrium. We assume that this condition is satisfied, and that 1 <Vu,. which ensures positive profits. The condition implies that the responsiveness of investment to variations in the rate of profit (or rate of capacity utilization) is smaller than the responsiveness of saving. Note that this implies that s>c~r +a,. To be consistent with our assumption that there is excess capacity the parameters should also be such that the equilibrium usuk. The short-run equilibrium value of the rate of accumulation is obtained by substituting the equilibrium value of u (from (12) into (5) or (8) after substituting from (6).
It may be noted that the short-run equilibrium value of u rises with the real wage, K since a rise in the real wage implies a redistribution of income towards workers which increases consumption spending, increases investment spending via the capacity utilization effect on investment and thus raises the level of activity [see Dutt (1984)]. The level of V at which full capacity is reached is given by
v,= [u~(s-xal -2*)-cc(J/(s-ac(z)uKuo. (13)
When the economy reaches full capacity utilization, firms cannot react to excess demand by increasing u in the short run. In this case u =I+, and gd>g=s( 1 --a,V)u,, so that the firms accumulation plans are not realized.
3.2. The long run
In the long run we assume that short-run equilibrium conditions are always satisfied, that the money wage changes according to (l), the price level according to (3) and the stock of capital according to (9). We also assume that the supply of labour grows at an exogenously fixed rate n, so that
R=n. (14)
To examine the long-run dynamics for this economy we examine the movement of V, the real wage, and k= K/N, the capital-labour supply ratio. The equations of motion for these state variables are
p=p-p, (15)
and
k^=R-fi. (16)
Substituting from eqs. (l)-(6) and (8) and (9) into (15) we get
A.K. Dutt, Conflict inflation, distribution, cyclical accumulation and crises 587
k
‘V=O
0 “1 vK “2 V
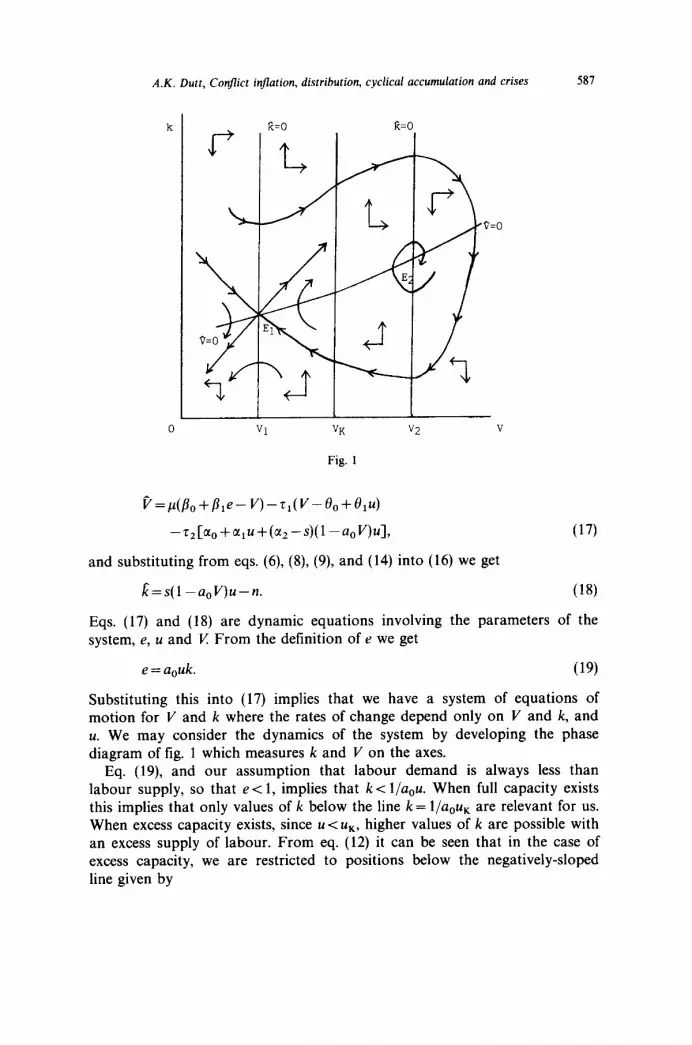
Fig. 1
~=p(~0+~le-V)-z,(V-8,+~lu)
-z,[cro+cc,u+(a,-s)(l-a,r/)u],
and substituting from eqs. (6), (8), (9), and (14) into (16) we get
(17)
#C=s(l -a,+-n. (18)
Eqs. (17) and (18) are dynamic equations involving the parameters of the system, e, u and 1/: From the definition of e we get
e = a,uk. (19)
Substituting this into (17) implies that we have a system of equations of motion for V and k where the rates of change depend only on V and k, and U. We may consider the dynamics of the system by developing the phase diagram of fig. 1 which measures k and V on the axes.
Eq. (19), and our assumption that labour demand is always less than labour supply, so that e< 1, implies that kc l/a,u. When full capacity exists this implies that only values of k below the line k= l/aOuK are relevant for us. When excess capacity exists, since u<uK, higher values of k are possible with
an excess supply of labour. From eq. (12) it can be seen that in the case of excess capacity, we are restricted to positions below the negatively-sloped line given by
588 A.K. Duct, Conflict inflation, distribution, cyclical accumulation and crises
We confine our attention to the feasible zone bounded by these constraints (which are not shown in the diagram to avoid c1utter).15
We may divide the feasible part of the diagram into two parts, one which shows positions of excess capacity, and the other, positions of full capacity utilization. The boundary between these two zones is given by I/= V, where V, is defined in eq. (13). For I/ < V, we have excess capacity, and for V> V’, the economy fully utilizes its capital. We now deal separately with the two zones.
To the left of the V, line we are in the zone with excess capacity. Here, gd=g, and substituting from (12) and (19) into (17) and (18) we get
-zl{v-e,+e,cr,lC(s-cc,)(l -~,~)-~,I}, (20)
and
L=s(l -aeV)a,/[(s-cc,)(l -a,V)-a,]-n. (21)
The partial derivatives for this dynamic system are given by
~^vPf’= --/$I -Bla~cco(s-a,)k/02]-t,[l +B,a,a,(s-cc,)/D*], (22)
dii/dk = pPluocr,JD > 0, (23)
c%k/W=cr,(s-cr,)scr,u,/D*>O, (24)
&/ak = 0, (25)
where
D=(s-cx,)(l -u,V)--a, >o.
All except the first partial can be definitely signed. The signs can be explained in the following way. A rise in V implies a redistribution of income to workers, and hence higher rates of capacity utilization and employment. The desired real wage for workers increases with the employment rate, but
ISWe also assume that the parameters of the model are such that any stable equilibrium in the model. if it exists, lies in this feasible region. If the economy is pushed to these boundaries, it will exhibit labour scarcity, and some of the assumption of the-model will have to be altered. See Dutt (1990). Note also, that the feasible zone is also bounded to the left by the line V= l/a,, if we confine attention to situations with positive profits.
AX. Dutt, Conj7ict inflation, distribution, cyclical accumulation and crises 589
since the actual real wage also increases, it is not clear whether the rate of money wage change increases or falls: The effect of this on the rate of change of V is therefore ambiguous. If a higher rate of capacity utilization raises the desired markup of firms, and since the rise in V reduces the actual markup, firms will raise the price level at a faster rate, so that this implies a tendency for a lower rate of growth of V All this is reflected in the ambiguity of the expression in (22). Given the rate of capacity utilization (which is given for a given I/ and the parameters of the model), a rise in k implies a higher employment rate, which implies a tighter labour market and a higher rate of money wage increase, and therefore a higher rate of real wage change, explaining the sign in (23). A rise in r! by raising the rate of capacity utilization, as discussed above, raises the rate of profits; this raises the rate of accumulation, and given the rate of growth of labour supply, this raises the rate of growth of k, explaining the sign in (24). Since a rise in k does not affect V or u, there is no effect on the rate of accumulation, and hence no effect on the rate of growth of k, as shown in (25).
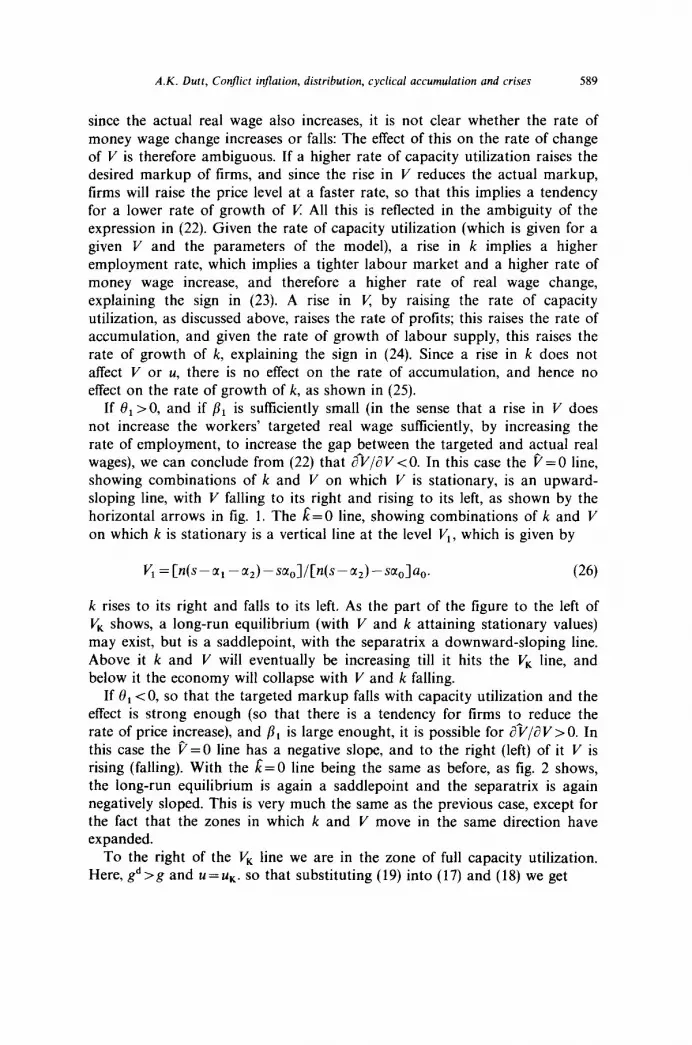
If 8, ~0, and if fil is sufficiently small (in the sense that a rise in I/ does not increase the workers’ targeted real wage sufficiently, by increasing the rate of employment, to increase the gap between the targeted and actual real wages), we can conclude from (22) that &/aV ~0. In this case the P=O line, showing combinations of k and I/ on which V is stationary, is an upward- sloping line, with V falling to its right and rising to its left, as shown by the horizontal arrows in fig. 1. The fi=O line, showing combinations of k and V on which k is stationary is a vertical line at the level Vi, which is given by
1/1=[n(s-a,-a,)-sa,]/[n(s-a2)-sa0]a0. (26)
k rises to its right and falls to its left. As the part of the figure to the left of V, shows, a long-run equilibrium (with V and k attaining stationary values) may exist, but is a saddlepoint, with the separatrix a downward-sloping line. Above it k and V will eventually be increasing till it hits the V, line, and below it the economy will collapse with V and k falling.
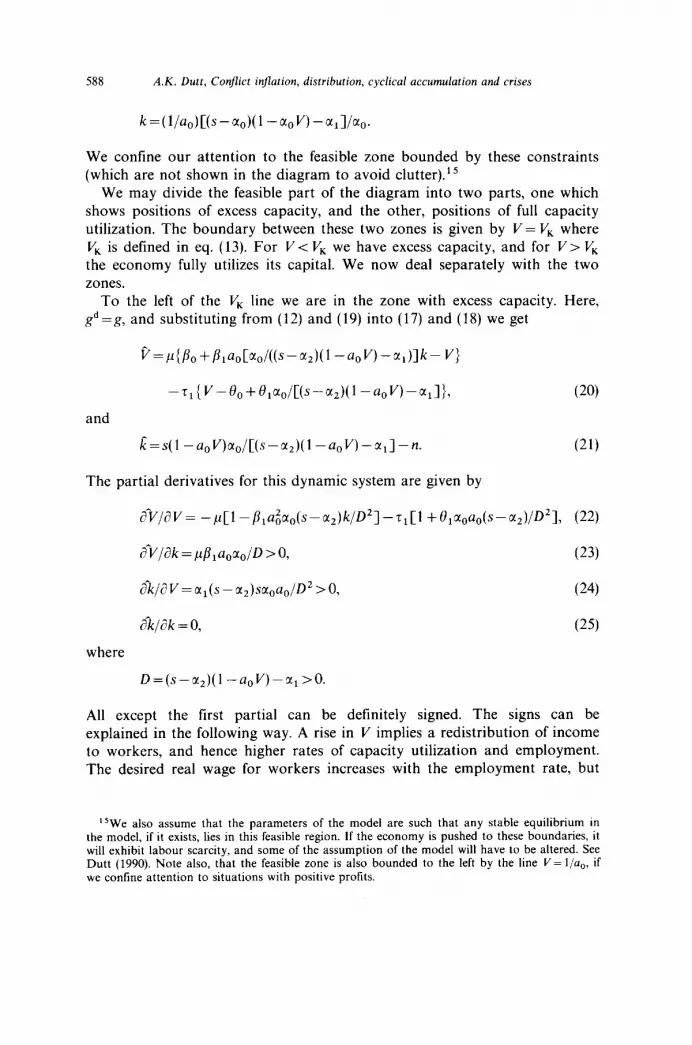
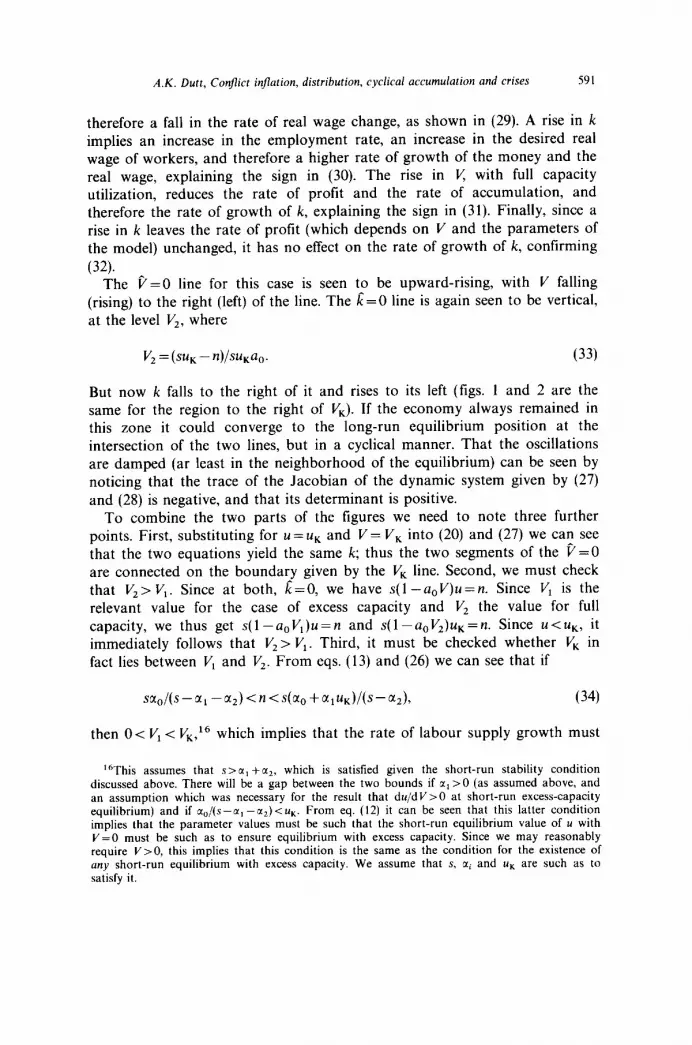
If 8, ~0, so that the targeted markup falls with capacity utilization and the effect is strong enough (so that there is a tendency for firms to reduce the rate of price increase), and fli is large enought, it is possible for @/aI’> 0. In this case the a=0 line has a negative slope, and to the right (left) of it V is rising (falling). With the I;=0 line being the same as before, as fig. 2 shows, the long-run equilibrium is again a saddlepoint and the separatrix is again negatively sloped. This is very much the same as the previous case, except for the fact that the zones in which k and V move in the same direction have expanded.
To the right of the V, line we are in the zone of full capacity utilization. Here, gd >g and u=uk. so that substituting (19) into (17) and (18) we get

590 A.K. Dutt, Conflict injlation, distribution, cyclical accumulation and crises
k
0 v 1 “K “2 V
Fig. 2
E=s(l-a,V)u,-n. (28)
The partial derivatives for this case are given bY
a^v/aV= -C1--rl-ZZ(S-aGL1)aOUK<O, (29)
d*V/ak = pj?,aouK > 0, (30)
&k/w= - SU$4K < 0, (31)
&/iJk = 0. (32)
(27)
The signs can be explained as follows. A rise in V implies a lower rate of wage increases (since the desired real wage of workers is given for a given k) and a higher rate of price increase both because firms experience a fall in their actual markup compared to their desired one, and because there is an increase in excess demand caused by the redistribution to workers; there is
A.K. Dutt, Conjlict inJation, distribution, cyclical accumulation and crises 591
therefore a fall in the rate of real wage change, as shown in (29). A rise in k implies an increase in the employment rate, an increase in the desired real wage of workers, and therefore a higher rate of growth of the money and the real wage, explaining the sign in (30). The rise in x with full capacity utilization, reduces the rate of profit and the rate of accumulation, and therefore the rate of growth of k, explaining the sign in (31). Finally, since a rise in k leaves the rate of profit (which depends on V and the parameters of the model) unchanged, it has no effect on the rate of growth of k, confirming
(32). The P=O line for this case is seen to be upward-rising, with V falling
(rising) to the right (left) of the line. The k^=O line is again seen to be vertical, at the level V,, where
v, = (SUK - n)/su&. (33)
But now k falls to the right of it and rises to its left (figs. 1 and 2 are the same for the region to the right of V,). If the economy always remained in this zone it could converge to the long-run equilibrium position at the intersection of the two lines, but in a cyclical manner. That the oscillations are damped (ar least in the neighborhood of the equilibrium) can be seen by noticing that the trace of the Jacobian of the dynamic system given by (27) and (28) is negative, and that its determinant is positive.
To combine the two parts of the figures we need to note three further points. First, substituting for u = uK and V= V, into (20) and (27) we can see that the two equations yield the same k; thus the two segments of the P=O are connected on the boundary given by the V, line. Second, we must check that V,>V,. Since at both, &=O, we have s(l-a,V)u=n. Since VI is the relevant value for the case of excess capacity and V, the value for full capacity, we thus get ~(1 -a,r/,)u=n and ~(1 -aoV2)uK=n. Since u<uk, it immediately follows that V, > VI. Third, it must be checked whether V, in fact lies between VI and V,. From eqs. (13) and (26) we can see that if
sad(s-al -ad <n<s(a, +aluK)/(s-ad, (34)
then 0 < VI < VK,16 which implies that the rate of labour supply growth must
r6This assumes that s>a, +a,, which is satisfied given the short-run stability condition discussed above. There will be a gap between the two bounds if a, >0 (as assumed above, and an assumption which was necessary for the result that du/dV>O at short-run excess-capacity equilibrium) and if a,/(~-cc, -~(~)<a~. From eq. (12) it can be seen that this latter condition implies that the parameter values must be such that the short-run equilibrium value of a with V=O must be such as to ensure equilibrium with excess capacity. Since we may reasonably require VrO, this implies that this condition is the same as the condition for the existence of any short-run equilibrium with excess capacity. We assume that s, ai and uK are such as to satisfy it.
592 A.K. Dutt, Conflict inflation, distribution, cyclical accumulation and crises
lie between two bounds given by the saving and investment parameters, and the maximum rate of capacity utilization. From eqs. (13) and (33) we can see that if the second inequality is satisfied, we will also obtain Vk< V,. For now we will assume that (34) is satisfied, so that V, in fact lies between V, and V,, and postpone discussion of other cases until later.
The dynamics for the cases combined can now be examined in figs. 1 and 2. They show the following features.
First, there are two long-run equilibria, of which E, is a saddlepoint and E, is locally stable.
Second, there is a subset of the phase plane which the economy will never leave if it happens to start inside it; we call it the zone of stability and its complement, the zone of crisis. If the separatrix through E, happens to intersect the horizontal axis to the left of the V, line, this subset will be the entire region above the separatrix. If the separatrix happens to intersect the V, line at a positive k, as shown in fig. 1, the subset is found by tracing back the path of the economy which leads into the lower part of the separatrix all the way through the region of full capacity utilization and back to the region of excess capacity utilization, as shown in fig. 1.
Third, if the economy is in the zone of stability, it will move cyclically. Starting from a position of excess capacity, a rise in I/ will increase the rates of capacity utilization and accumulation, increasing k over time. As this occurs the economy will reach full capacity utilization, when further increases in I/ will (due to tighter labour markets and the price-change dynamics of firms) reduce the rate of profit and the rate of accumulation, eventually reducing k. As k falls and the employment rate falls, the real wage will begin to fall due to a slackening of the labour marklet which may again raise the rate of profit and the rate of accumulation. The fall in the real wage may even make the economy return to excess capacity, but the rise in the rate of accumulation will tighten labour markets (among other things) and raise the real wage, making the economy return to full capacity utilization. At this point the cycle begins again.
Fourth, since E, is locally stable, if the parameters of the system do not change and if the economy starts from ‘near’ E, it will experience damped oscillations, eventually converging to E2.17 At E,, since k reaches a stable value, the rate of accumulation will be equal to the rate of growth of labour supply, which is exogenously fixed. It should be noted, however, that this property of this model does not make it a supply-constrained model in the usual sense. First, at the long-run equilibrium, even though the rates of growth of labour supply and demand grow at the same rate, we still have
“This property of damped oscillations in the neighbourhood of E, distinguishes this model from Goodwin’s (1967). The difference is due to the fact that we take into account the effects of the rate of price change. Goodwin’s model also does not introduce effective demand consider- ations, and thus does not allow for the possibility of crisis due to effective demand failures.

AX. Dutt, Conflict inflation, distribution, cyclical accumulation and crises 593
e< 1, so that there is still unemployed labour in the economy. The rate of employment has stabilized to stabilize the real wage, which is required for long-run equilibrium. Second, and more importantly, our model has ex- amined the dynamics of the economy out of long-run equilibrium in which it is driven by demand and as well supply forces. Since the economy will arrive, if at all (since in the zone of crisis it will have no tendency to move towards it), at long-run equilibrium only in the limit, and since exogenous parametric shifts may be shifting this equilibrium frequently, the economy modelled here is not usually supply-constrained even in the sense that it always grows at the rate of labour supply growth.
It should be stressed that the zone of stability is stable not in the sense that the economy in it will always converge to E,, since we have only proved its local stability, but only in the sense that the economy in it will not leave it and experience cumulative decline (see below). The equilibrium E, is only locally stable even within the zone of stability because although it is the only equilibrium point in it, we cannot rule out closed orbits within the zone.
Fifth, a parametric change involving a fall in ~1~ can shift the curves of the figures and push the economy left of the separatrix for E, (thereby making it enter the zone of crisis), in which case it will experience (eventually) a fall in V and k.18 Since we are now in the zone of excess capacity a fall in V
implies a fall in U, .I9 from (19) it follows that the employment rate must be falling, so that this decline is characterized by declines in the real wage, capacity utilization and the rate of employment. It is also easily shown that the rate of accumulation and inflation fall. The fall in the real wage continues to redistribute income to capitalists, reducing aggregate demand, and the rates of employment and capacity utilization, which reduces the rate of real wage change due to the reasons discussed above, and the rate of accumu- lation; the downward spiral is thus cumulative. The decline in cl0 can be taken to be an exogeneous decline in confidence, which may well have its roots in financial markets where expectations play a very important role.
Sixth, this cumulative decline cannot be endogenously reversed by the system itself, but will require an exogenously-enforced rise in ~1~. The collapse can thus be thought of as a crisis, in which the system’s self-adjusting ability is destroyed. and external change is necessary to stabilize it. The real-world counterpart of such external changes is government aggregate demand policy
‘*This is, of course, not the only parametric change that will affect the behaviour of the economy. For instance, a rise in n &I shift the Vz leftwards and the V, line rightwards if condition (26) is satisfied (as can be checked from eas. (22) and (25). Bv eqs. (20) and (23). however, there will be no shift in the P=O lines, This implies that the’crisis zdne‘(to the left of the V, line) will expand due to the rise in n, and the stable long-run equilibrium will be at a lower V and a lower k. It is also obvious that at this equilibrium, the economy will accumulate capital at a higher rate.
“From (12) it can be seen that fi={(s-a,)a,V/[(s-a,)(1 -a,V,)-a,]}f?
594 A.K. Dutt, Confict inflation, distribution, cyclical accumulation and crises
change, which increases the level of capacity utilization and the rate of accumulation sufficiently to push the economy out of the zone of crisis.
Finally, the longer the system is in a phase of uninterrupted cyclical growth without crises, the further away from the separatrix it will get (unless it is on a stable closed orbit), and the exogenous fall in w0 required to push it to a crisis will have to be greater. In this sense the system ~ when uninterrupted by shocks large enough to create a crisis - gains stability through time. However, a crisis will destroy this accumulated stability and require it to start accumulating stability all over again.
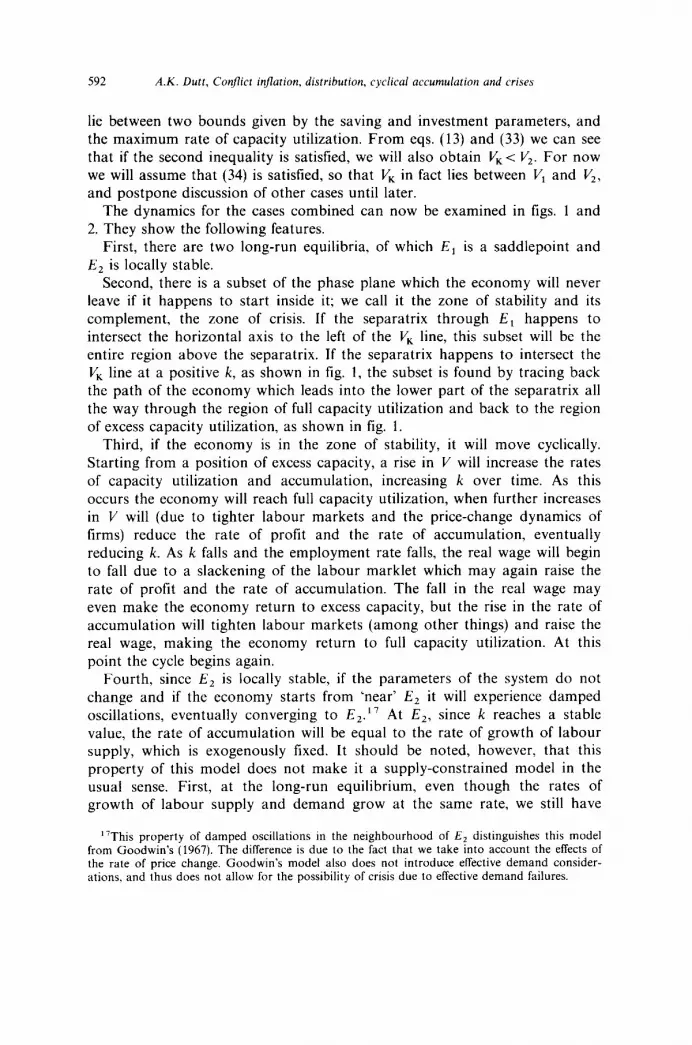
This analysis requires modification if the conditions in (34) are not satisfied. Three comments can be made in this regard. First, if the inequality is violated, but n >saJ(s-a,) is satisfied, it will still be the case that VI < Vk, but VI ~0. This implies that the zone of stability will become very large, but the qualitative properties of our analysis will not otherwise be changed. Second, if n is so large that the second inequality is violated, V, < Vk. But in this case, since the V, line will lie in the zone of excess capacity, it will play no role in determining the dynamic path of the economy, since it is calculated assuming that there is full capacity utilization. What this implies is that in the zone to the right V, the economy will behave as it did in the above discussion above the VZ line, and the zone between Vk and V, will disappear. But, given our assumptions, if the second inequality is violated, it will also be true that VI > Vk, so that the zone between VI and V, will also disappear. The case in which 0, >O is shown in fig. 3, where it is seen that k is falling throughout the phase plane, there is no stable equilibrium in the positive orthant, and the zone of stability has completely disappeared. (The cases in which 8, ~0 is not shown, but also exhibits these properties.) In this case, labour supply grows too rapidly to allow accumulation to keep pace with it, and eventually V and k fall cumulatively. Third, if n is so small that n < .saJ( s - a,), the condition for VI < V, becomes
which can no longer be satisfied. Since the condition for Vz> V, remains the second inequality in (34) it follows that VI > V, and V, > Vk. This implies that the while region to the left of the VK line will be like the region to the left of the VI line in the above discussion, and the zone between the V, and V, lines will disappear. The qualitative behaviour of the model will remain the same as shown in figs. 1 and 2. The possibility of crisis, in this case, will be greater than implied in the figures. We see, therefore, that some of the qualitative properties of our model are not altered in the cases considered here: there may still be a zone of stability in which the economy will move cyclically, perhaps converging to an equilibrium point, and there will be an unstable zone in which the economy experiences crisis. What alters are the

A.K. Dutt, Conflict inflntion, distribution, cyclical accumulation and crises 595
k
0 “2 “K “1 V
Fig. 3
sizes of the stable and crisis zones, and hence the likelihood of crises, and the stability properties of the equilibrium point inside the zone of stability. Most significantly, our analysis shows that it is possible that the stable zone need not exist for high levels of n, so the crisis is inevitable, in this case government intervention (to increase aO) may be necessary to create a zone of stability, and not merely to push the economy into it.
4. Conclusion
This paper has developed a model of inflation, distribution and accumu- lation and shown that the economy may generally grow in a stable - although cyclical - manner, but may collapse if subjected to a violent downward shock.
The inflation theory developed here is a conflict theory, and draws on the existing literature on conflict inflation and income distribution. These contributions have typically taken output to grow at an exogenously fixed rate, so that they have not been able to examine the interaction between inflation and distribution on the one hand, and accumulation patterns on the other. The main contribution this paper makes to that literature is to endogenize the rate of accumulation and examine the implications of this

596 AX. Dutt, Conflict inflation, distribution, cyclical accumulation and crises
interaction. In the model inflation in a situation of conflicting claims determines income distribution, income distribution affects accumulation patterns, and the pattern of accumulation in turn affects the claims made by different groups.
The theory of accumulation developed here follows the Keynes-Kalecki approach which emphasizes the role of accumulation plans of firms, as well as the distribution of income between workers and capitalists. Existing models of this type often do not incorporate inflationary dynamics, and when they do so, typically assume a conflict model where the targeted shares of income of different groups is exogenously given. The main contributions this paper makes to the literature on Keynes-Kalecki models of accumulation is to endogenize the share targets of different groups in the conflicting claims approach to inflation, and to synthesize different approaches to the growth- distribution interaction, those which stress the market-creating effects of real- wage increases, and those which stress the profit-squeeze effects.
The result of the synthesis of these two literatures is a model where cyclical growth may occur, and consequently this paper contributes to the literature on growth cycles as well. 2o Cyclical growth occurs in the model with oscillations in the real wage due to changing conditions in the labour and the goods markets (which affect, respectively, the rates of money wage and price change), and with oscillations in the capital-labour supply ratio due to income-distributional changes caused by variations in the real wage. Along with Skott (1989a, b), it develops the Goodwin approach to cycles by introducing Keynes-Kalecki effective demand issues, but it additionally incorporates inflationary dynamics into the story. Most importantly, it provides a theoretical underpinning to the idea that capitalist economies may be generally stable, even if subject to cyclical fluctuations, but severe shocks can dislodge the economy and push it on a downward spiral (when distributional and effective demand problems feed on each other) from which return requires purposeful action on the part of governments: That even if the economy is stable in the small, it is not globally stable.
“Of course it ignores a variety of features which are important for the actual explanation of cycles, including technological change and financial issues.
References
Dutt, A.K., 1984, Stagnation, income distribution and monopoly power, Cambridge Journal of Economics 8, 2540.
Dutt, A.K., 1987, Alternative closures again: Comment on ‘Growth, distribution and inflation’, Cambridge Journal of Economics 11, 75-82.
Dutt, A.K., 1990, Growth, distribution and uneven development (Cambridge University Press, Cambridge, MA).
Dutt, A.K., 1991, On the long-run stability of capitalist economies: Implications of a model of growth and distribution, paper presented at a conference on new directions in analytical political economy, University of Notre Dame, March.
A.K. Dutt, Conflict inflation, distribution, cyclical accumulation and crises 597
Eichner, AS., 1976, The megacorp and oligopoly (Cambridge University Press, Cambridge, MA). Goodwin, R.M., 1967, A growth cycle, in: C.H. Feinstein, ed., Socialism, capitalism and
economic growth (Cambridge University Press, Cambridge, MA). Harcourt, C.C. and P. Kenyon, 1976, Pricing and the investment decision, Kyklos 29, 449-477. Harrod, R.F., 1936, The trade cycle (Oxford University Press, Oxford). Kaldor, N., 1940, A model of the trade cycle, Economic Journal, March. Kaldor, N., 19551956, Alternative theories of distribution, Review of Economic Studies 23. Kaldor, N., 1982, The scourage of monetarism (Oxford University Press, London). Kalecki, M., 1954, Theory of economic dynamics (Allen and Unwin, London). Kalecki, M., 1971, Selected essays on the dynamics of capitalist economies (Cambridge
University Press, Cambridge, MA). Layard, R. and S. Nickell, 1987, The labour market, in: R. Dornbusch and R. Layard, eds., The
performance of the British economy (Clarendon Press, Oxford). Marglin, S.A., 1984a, Growth, distribution and inflation: A centennial synthesis, Cambridge
Journal of Economics 8. Marghn, S.A., 1984b, Growth, distribution and prices (Harvard University Press, Cambridge,
MA). Moore, B.J., 1988, Horizontalists and verticalists (Cambridge University Press, Cambridge, MA). Pasinetti, L., 1962, The rate of profit and income distribution in relation to the rate of economic
growth, Review of Economic Studies 29, 267-279. Robinson, J.V., 1962, Essays in the theory of economic growth (Macmillan, London). Ros, J., 1989, A review of literature on inflation and stabilization, unpublished, World Institute
of Development Economics Research, Helsinki. Rotemberg, J.J. and G. Saloner, 1986, A supergame-theoretic model of price wars during booms,
American Economic Review 76, 39&407. Rowthorn, R.E., 1977, Conflict, inflation and money, Cambridge Journal of Economics 1,
215-239. Rowthorn, R.E., 1982, Demand, real wages and economic growth, Studi Economici 18, 2-53. Skott, P., 1989a, Effective demand class struggle and cyclical growth, International Economic
Review 30, 231-247. Skott, P., 1989b, Conflict and effective demand in economic growth (Cambridge University
Press, Cambridge, MA). Steindl, J., 1952, Maturity and stagnation in American capitalism (Basil Blackwell, Oxford). Stightz, J.E., 1984, Price rigidities and market structure, American Economic Review 74,
35G355. Taylor, L., 1983, Structuralist macroeconomics (Basic Books, New York). Taylor, L., 1985, A stagnationist model of economic growth, Cambridge Journal of Economics. Turnovsky, S.J. and J.D. Pitchford, 1978, Expectations and income claims in wage-price
determination: An aspect of the inflationary process, in: A.R. Bergstrom, A.J.L. Catt, M.H. Peston and B. Silverstone, eds., Stability and inflation: Essays in honor of A.W. Phillips (Wiley, New York).
Weintraub, S., 1978, Keynes, Keynesians and monetarists (University of Pennsylvania Press, Philadelphia, PA).
Wood, A., 1975, A theory of profits (Cambridge University Press, Cambridge, MA).