Embed Size (px)
Citation preview

CHAPTER 1.4
Gender, Entrepreneurship, andCompetitiveness in AfricaELENA BARDASI
C. MARK BLACKDEN
JUAN CARLOS GUZMAN
at the World Bank
An appreciation of gender issues is important whenconsidering strategies to improve Africa’s competitive-ness in the world and ways to promote private-sectordevelopment.There are three main reasons why gendermatters. First, women are major players in the privatesector, particularly in agriculture and in informal busi-nesses. It is estimated that women-owned businessesaccount for over one-third of all firms, and they are themajority of businesses in the informal sector in Africancountries. Second, the ability of women to formalizeand grow their businesses, to create jobs, and to enhanceproductivity is hampered where legal and institutionalbarriers exist that affect men’s and women’s enterprisesdifferently.Third, there is evidence—especially at themicro level—to indicate that gender disparities not onlydisadvantage women but also reduce the growth poten-tial of the region as a whole.The existence of gender-related barriers can thwart the economic potential ofwomen as entrepreneurs and workers, and such barriershave an adverse impact on enterprise development, pro-ductivity, and competitiveness in Africa. Consequently,addressing gender-specific barriers to entrepreneurshipand leveraging the full participation of both men andwomen in the development of Africa’s private sectortogether represent a significant opportunity to unleashAfrica’s productive potential and to strengthen econom-ic growth.
This chapter aims to shed light on the nature ofmen’s and women’s enterprises in Africa, to assess theextent to which the constraints and obstacles faced bywomen and men entrepreneurs may differ, and to addresswhether the constraints and obstacles entrepreneurs faceaffect the productivity and performance of men’s andwomen’s businesses differently.We begin with a briefoverview of gender in the economy, followed by a moredetailed analysis of available Enterprise Survey datawhere key characteristics of businesses can be disaggre-gated by the sex of the business owner.1 This allows usto look at various characteristics of men’s and women’sbusinesses, including perceptions of obstacles and con-straints, and to assess productivity differences.Afterbriefly placing this analysis in a wider context, the chapter concludes with some recommended actions toaddress the gender dimensions of entrepreneurship moresystematically in policy and programs aimed at supportingprivate-sector development, along with suggestions forfurther data collection and analysis.
69
1.4:
Gen
der,
Entr
epre
neur
ship
, and
Com
petit
iven
ess
in A
fric
a
Gbemisola Oseni and Federica Saliola provided valuable assistance tothe authors in the preparation of this chapter. We thank TheodoreAhlers, Theresa Bradley, Mayra Buvinic, Constantine Chikosi, SimeonDjankov, Amanda Ellis, Lucia Fort, Alan Gelb, Ola Granström, MaryHallward-Driemeier, Giuseppe Iarossi, Andrew Morrison, Sudhir Shetty,Andrew Stone, and Julie Weeks, who provided useful comments onearlier drafts.
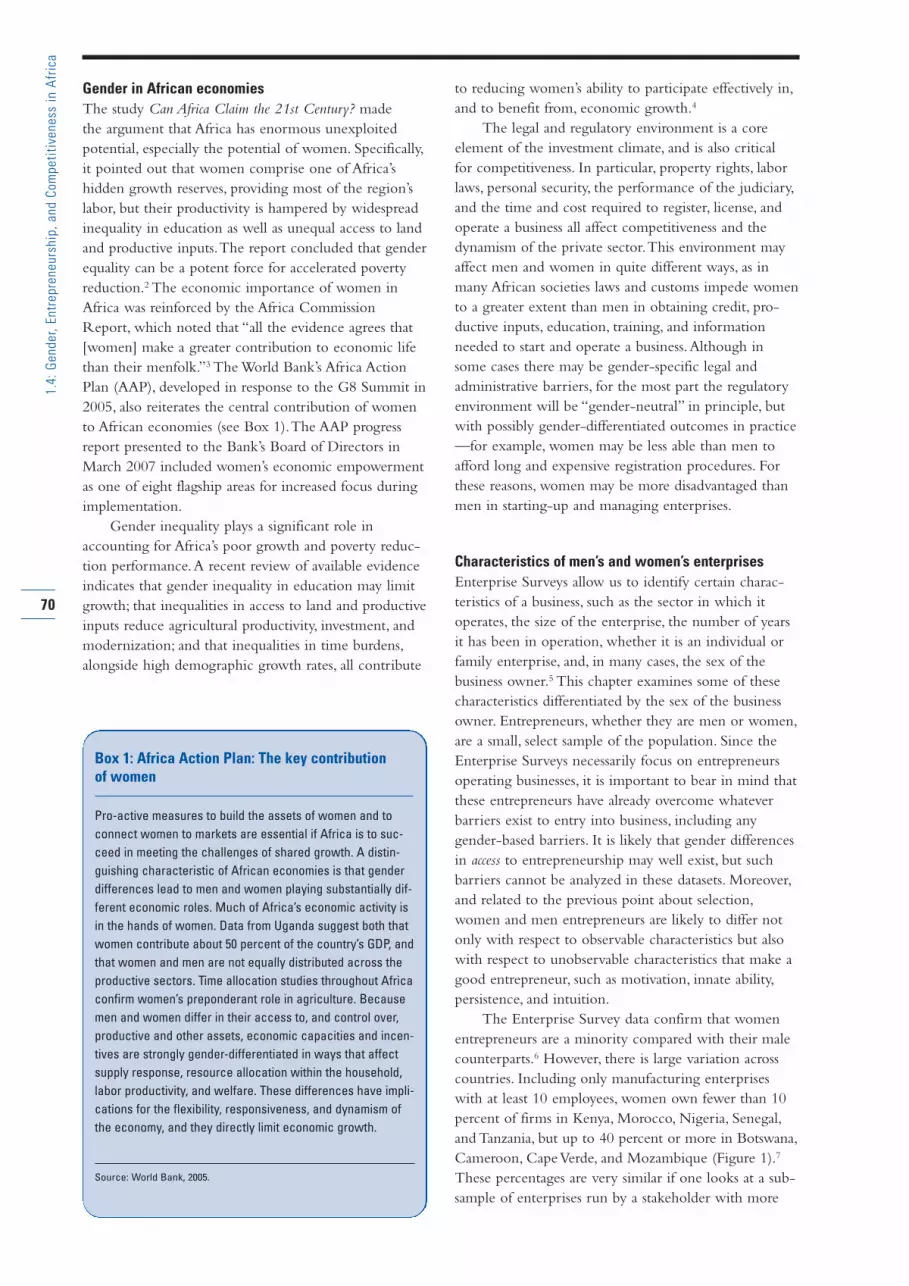
Gender in African economiesThe study Can Africa Claim the 21st Century? made the argument that Africa has enormous unexploitedpotential, especially the potential of women. Specifically,it pointed out that women comprise one of Africa’s hidden growth reserves, providing most of the region’slabor, but their productivity is hampered by widespreadinequality in education as well as unequal access to landand productive inputs.The report concluded that genderequality can be a potent force for accelerated povertyreduction.2 The economic importance of women inAfrica was reinforced by the Africa CommissionReport, which noted that “all the evidence agrees that[women] make a greater contribution to economic lifethan their menfolk.”3 The World Bank’s Africa ActionPlan (AAP), developed in response to the G8 Summit in2005, also reiterates the central contribution of womento African economies (see Box 1).The AAP progressreport presented to the Bank’s Board of Directors inMarch 2007 included women’s economic empowermentas one of eight flagship areas for increased focus duringimplementation.
Gender inequality plays a significant role inaccounting for Africa’s poor growth and poverty reduc-tion performance.A recent review of available evidenceindicates that gender inequality in education may limitgrowth; that inequalities in access to land and productiveinputs reduce agricultural productivity, investment, andmodernization; and that inequalities in time burdens,alongside high demographic growth rates, all contribute
to reducing women’s ability to participate effectively in,and to benefit from, economic growth.4
The legal and regulatory environment is a core element of the investment climate, and is also critical for competitiveness. In particular, property rights, laborlaws, personal security, the performance of the judiciary,and the time and cost required to register, license, andoperate a business all affect competitiveness and thedynamism of the private sector.This environment mayaffect men and women in quite different ways, as inmany African societies laws and customs impede womento a greater extent than men in obtaining credit, pro-ductive inputs, education, training, and informationneeded to start and operate a business.Although insome cases there may be gender-specific legal andadministrative barriers, for the most part the regulatoryenvironment will be “gender-neutral” in principle, butwith possibly gender-differentiated outcomes in practice—for example, women may be less able than men toafford long and expensive registration procedures. Forthese reasons, women may be more disadvantaged thanmen in starting-up and managing enterprises.
Characteristics of men’s and women’s enterprisesEnterprise Surveys allow us to identify certain charac-teristics of a business, such as the sector in which itoperates, the size of the enterprise, the number of yearsit has been in operation, whether it is an individual orfamily enterprise, and, in many cases, the sex of thebusiness owner.5 This chapter examines some of thesecharacteristics differentiated by the sex of the businessowner. Entrepreneurs, whether they are men or women,are a small, select sample of the population. Since theEnterprise Surveys necessarily focus on entrepreneursoperating businesses, it is important to bear in mind thatthese entrepreneurs have already overcome whateverbarriers exist to entry into business, including any gender-based barriers. It is likely that gender differencesin access to entrepreneurship may well exist, but suchbarriers cannot be analyzed in these datasets. Moreover,and related to the previous point about selection,women and men entrepreneurs are likely to differ notonly with respect to observable characteristics but alsowith respect to unobservable characteristics that make agood entrepreneur, such as motivation, innate ability,persistence, and intuition.
The Enterprise Survey data confirm that womenentrepreneurs are a minority compared with their malecounterparts.6 However, there is large variation acrosscountries. Including only manufacturing enterpriseswith at least 10 employees, women own fewer than 10percent of firms in Kenya, Morocco, Nigeria, Senegal,and Tanzania, but up to 40 percent or more in Botswana,Cameroon, Cape Verde, and Mozambique (Figure 1).7
These percentages are very similar if one looks at a sub-sample of enterprises run by a stakeholder with more
70
1.4:
Gen
der,
Entr
epre
neur
ship
, and
Com
petit
iven
ess
in A
fric
a
Pro-active measures to build the assets of women and toconnect women to markets are essential if Africa is to suc-ceed in meeting the challenges of shared growth. A distin-guishing characteristic of African economies is that genderdifferences lead to men and women playing substantially dif-ferent economic roles. Much of Africa’s economic activity isin the hands of women. Data from Uganda suggest both thatwomen contribute about 50 percent of the country’s GDP, andthat women and men are not equally distributed across theproductive sectors. Time allocation studies throughout Africaconfirm women’s preponderant role in agriculture. Becausemen and women differ in their access to, and control over,productive and other assets, economic capacities and incen-tives are strongly gender-differentiated in ways that affectsupply response, resource allocation within the household,labor productivity, and welfare. These differences have impli-cations for the flexibility, responsiveness, and dynamism ofthe economy, and they directly limit economic growth.
Source: World Bank, 2005.
Box 1: Africa Action Plan: The key contribution of women

than 50 percent of the firm’s shares—the percentage offemale-owned enterprises decreases in Cameroon andEgypt, and particularly in Mozambique and Cape Verde,but remains very similar in all the other countries. If it isreasonable to assume that a majority stakeholder alsoruns the business, these percentages can be interpreted asapproximately reflecting the share of female ownerswho manage their own enterprise.
Research conducted in other regions indicates thatwomen are less likely than their male counterparts toown businesses.8 In the 40 countries included in thisstudy, the percentage of women entrepreneurs rangesfrom a low of 1.9 percent of adult women in Belgiumto 49.9 percent in the Philippines.While overall entre-preneurship rates for both men and women are higherin low/middle-income countries than in high-incomecountries, in all of the countries studied entrepreneurshiprates for men are higher than those for women.
The data for African countries also distinguishbetween individual and family enterprises.The percentageof entrepreneurs in family enterprises (as distinct fromindividual enterprises) is higher—sometimes muchhigher—for female-owned enterprises than for male-owned enterprises in almost all countries.As shown inFigure 2, only in Kenya and Lesotho are men entrepre-neurs more likely than women entrepreneurs to be in afamily enterprise. Overall, women are more likely thanmen to own (and possibly manage) their enterprisetogether with other family members, rather than ontheir own.The predominance of women in family
enterprises is also significant in two other respects. First,it may be that family enterprises are a way for womento combine their business activities with their domesticor household tasks, which are disproportionatelywomen’s responsibility. Second, other factors affectingfamily members—such as their legal status and theirmarital and property rights—are likely to affect the typeof constraints that the firm may face and the performanceof the business as well.
Unfortunately, the Enterprise Survey data do notinclude much information on the personal characteristicsof the entrepreneur.To build a profile of men andwomen entrepreneurs, we have therefore analyzedhousehold survey data9 that allow us to distinguishbetween several categories of workers, including“employers” (defined as self-employed people who hireemployees), whom we believe to be a reasonable proxyfor the category of “entrepreneurs” in the EnterpriseSurveys.The analysis of household survey data indicatesthat women entrepreneurs tend to be younger than men(by two to six years), an encouraging sign that accessinto entrepreneurship may be easier for younger cohortsof women. In almost all countries, a much lower shareof female than male entrepreneurs is married.This is aparticularly significant finding in that it suggests thatwomen may not find it easy to combine both familyand enterprise responsibilities. Case studies confirm thisfinding, as it is rare to find women entrepreneurs whosehusbands support their enterprises.10 Finally, these dataconfirm that women entrepreneurs are much more
71
1.4:
Gen
der,
Entr
epre
neur
ship
, and
Com
petit
iven
ess
in A
fric
a
0
10
20
30
40
50
60
70
Figure 1: Percentage of enterprises owned by women in selected African countries
Source: World Bank Enterprise Surveys, 2002–2006.
Note: The sample is restricted to individual and family firms. Enterprises with fewer than 10 employees and enterprises operating in the service sector are excluded.
Mor
occo
Nig
eria
Keny
a
Sout
h Af
rica
Sene
gal
Beni
n
Mal
i
Nig
er
Tanz
ania
Mau
ritiu
s
Cong
o, D
em. R
ep.
Guin
ea-B
issa
u
Zam
bia
Mau
ritan
ia
The
Gam
bia
Mal
awi
Egyp
t
Swaz
iland
Ango
la
Mad
agas
car
Nam
ibia
Ugan
da
Burk
ina
Faso
Buru
ndi
Cam
eroo
n
Moz
ambi
que
Bots
wan
a
Cape
Ver
de
Perc
ent

likely than men to live in a household with other entrepreneurs—suggesting that women are more likelyto own and manage the enterprise together with familymembers rather than independently (for example, theymay be likely to work in the enterprise of their familyof origin).This reinforces the findings of the EnterpriseSurvey data presented above.
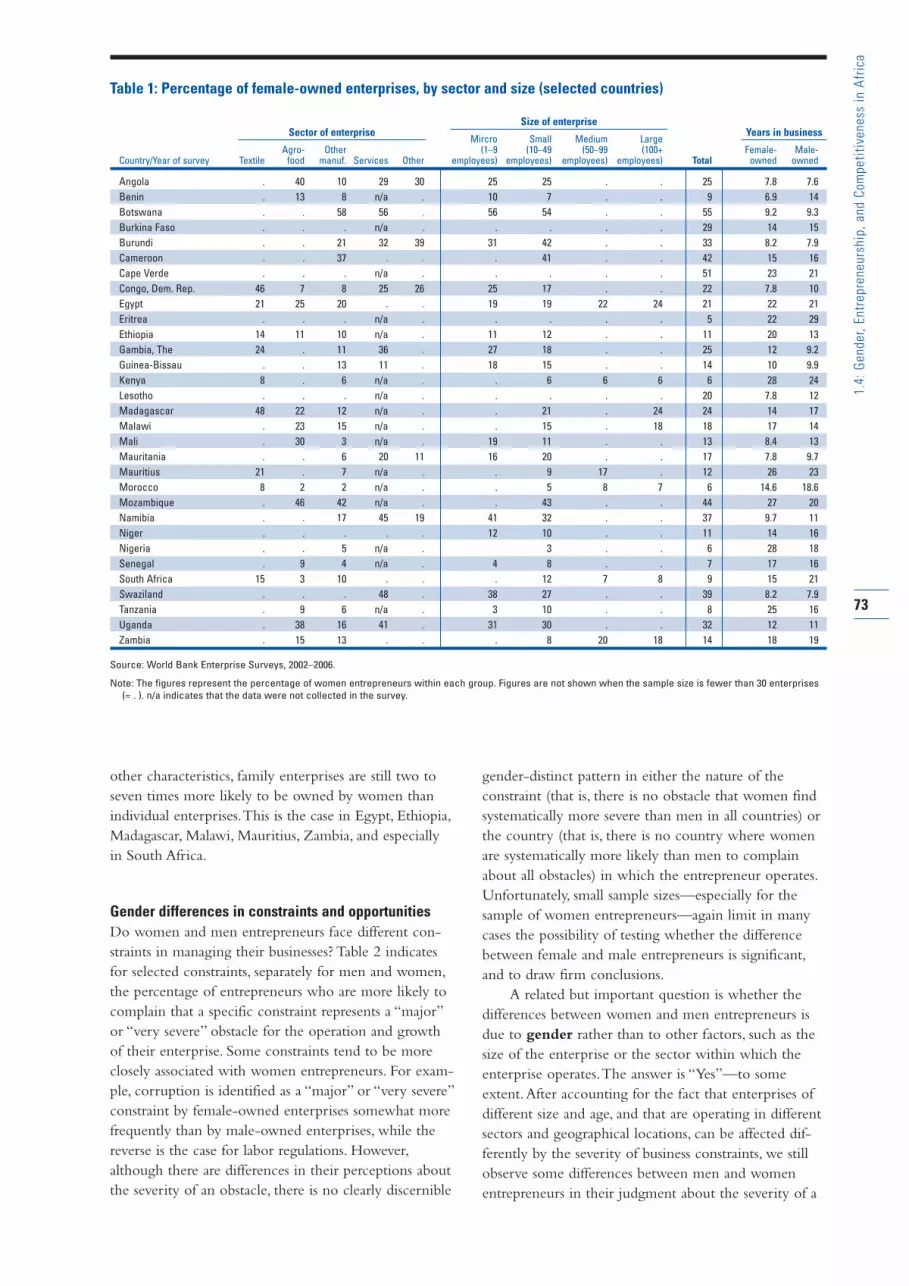
Table 1 summarizes key characteristics of male- andfemale-owned enterprises in Africa.These include thesector, the size, and the number of years in business.Female-owned enterprises are more likely found insome sectors than in others, although the sector withmore women entrepreneurs varies depending on thecountry. For example, women are more likely found inthe textile sector in the Democratic Republic of Congo(DRC), Madagascar, Mauritius, and South Africa; inagro-food in Angola, Malawi, and Mali; and in servicesin The Gambia, Mauritania, Namibia, and Uganda.Asthe table shows, there is no unambiguous pattern, eitherin terms of sector or business size, that differentiatesmale-owned from female-owned enterprises.
Contrary to a priori expectations, female-ownedenterprises in the formal manufacturing sector are notdisproportionately small and medium-sized enterprises(SMEs).Women are as likely to own large firms as theyare to own small ones. In fact, in five of seven countriesfor which data are available, the percentage of female-owned enterprises is higher among large firms thanamong small firms.11 Although the Enterprise Surveydata do not tell us how long the woman herself has
owned the enterprise, there is information about the age of the enterprise.Table 1 shows that women are notsystematically more likely than men to own new firms.While in some countries (Benin, DRC, Eritrea, Lesotho,Mali, and South Africa) the average age of the enterprisesowned by women is lower than those owned by men, inother countries (Kenya, Mauritius, Mozambique, Nigeria,and Tanzania) the opposite is the case.With few excep-tions, countries where businesses are on average younger(older) for both men and women tend to have a higher(lower) share of female-owned enterprises.This mayindicate that a higher level of female entrepreneurshipexists where it is easier altogether to start a business(that is, where obstacles at entry are lower) and there is ahigher level of entrepreneurial activity.
The multivariate analysis confirms the patternshighlighted in Table 1. In several countries (DRC,Madagascar, Mauritius, Morocco, Namibia, Niger, SouthAfrica, and Uganda), enterprises in the textiles sector aredisproportionately more likely to be owned by womenthan enterprises in other sectors. In other countries(Angola, Cape Verde,The Gambia, Madagascar, Mali,Mauritania, Senegal,Tanzania, and Uganda), manufactur-ing enterprises are less likely to be owned by womenthan enterprises in other sectors.After controlling forsector, size is not correlated in any significant way withfemale ownership except in South Africa (where bigfirms are less likely to be owned by women) and inAngola (where medium-sized enterprises are more likely to be female-owned). Even after controlling for
72
1.4:
Gen
der,
Entr
epre
neur
ship
, and
Com
petit
iven
ess
in A
fric
a
0
20
40
60
80
Figure 2: Percentage of entrepreneurs in family enterprises (as opposed to individual enterprises), by the sex of the owner
Source: World Bank Enterprise Surveys, 2002–2006.
Beni
n
Leso
tho
Ugan
da
Mal
i
Keny
a
Sene
gal
Mad
agas
car
Tanz
ania
Mau
ritiu
s
Zam
bia
Egyp
t
Sout
h Af
rica
Mal
awi
Mor
occo
Perc
ent
■ Female entrepreneurs ■ Male entrepreneurs
other characteristics, family enterprises are still two toseven times more likely to be owned by women thanindividual enterprises.This is the case in Egypt, Ethiopia,Madagascar, Malawi, Mauritius, Zambia, and especiallyin South Africa.
Gender differences in constraints and opportunitiesDo women and men entrepreneurs face different con-straints in managing their businesses? Table 2 indicatesfor selected constraints, separately for men and women,the percentage of entrepreneurs who are more likely tocomplain that a specific constraint represents a “major”or “very severe” obstacle for the operation and growthof their enterprise. Some constraints tend to be moreclosely associated with women entrepreneurs. For exam-ple, corruption is identified as a “major” or “very severe”constraint by female-owned enterprises somewhat morefrequently than by male-owned enterprises, while thereverse is the case for labor regulations. However,although there are differences in their perceptions aboutthe severity of an obstacle, there is no clearly discernible
gender-distinct pattern in either the nature of the constraint (that is, there is no obstacle that women findsystematically more severe than men in all countries) orthe country (that is, there is no country where womenare systematically more likely than men to complainabout all obstacles) in which the entrepreneur operates.Unfortunately, small sample sizes—especially for thesample of women entrepreneurs—again limit in manycases the possibility of testing whether the differencebetween female and male entrepreneurs is significant,and to draw firm conclusions.
A related but important question is whether thedifferences between women and men entrepreneurs isdue to gender rather than to other factors, such as thesize of the enterprise or the sector within which theenterprise operates.The answer is “Yes”—to someextent.After accounting for the fact that enterprises ofdifferent size and age, and that are operating in differentsectors and geographical locations, can be affected dif-ferently by the severity of business constraints, we stillobserve some differences between men and womenentrepreneurs in their judgment about the severity of a
73
1.4:
Gen
der,
Entr
epre
neur
ship
, and
Com
petit
iven
ess
in A
fric
a
Table 1: Percentage of female-owned enterprises, by sector and size (selected countries)
Mircro Small Medium LargeAgro- Other (1–9 (10–49 (50–99 (100+ Female- Male-
Country/Year of survey Textile food manuf. Services Other employees) employees) employees) employees) Total owned owned
Angola . 40 10 29 30 25 25 . . 25 7.8 7.6Benin . 13 8 n/a . 10 7 . . 9 6.9 14Botswana . . 58 56 . 56 54 . . 55 9.2 9.3Burkina Faso . . . n/a . . . . . 29 14 15Burundi . . 21 32 39 31 42 . . 33 8.2 7.9Cameroon . . 37 . . . 41 . . 42 15 16Cape Verde . . . n/a . . . . . 51 23 21Congo, Dem. Rep. 46 7 8 25 26 25 17 . . 22 7.8 10Egypt 21 25 20 . . 19 19 22 24 21 22 21Eritrea . . . n/a . . . . . 5 22 29Ethiopia 14 11 10 n/a . 11 12 . . 11 20 13Gambia, The 24 . 11 36 . 27 18 . . 25 12 9.2Guinea-Bissau . . 13 11 . 18 15 . . 14 10 9.9Kenya 8 . 6 n/a . . 6 6 6 6 28 24Lesotho . . . n/a . . . . . 20 7.8 12Madagascar 48 22 12 n/a . . 21 . 24 24 14 17Malawi . 23 15 n/a . . 15 . 18 18 17 14Mali . 30 3 n/a . 19 11 . . 13 8.4 13Mauritania . . 6 20 11 16 20 . . 17 7.8 9.7Mauritius 21 . 7 n/a . . 9 17 . 12 26 23Morocco 8 2 2 n/a . . 5 8 7 6 14.6 18.6Mozambique . 46 42 n/a . . 43 . . 44 27 20Namibia . . 17 45 19 41 32 . . 37 9.7 11Niger . . . . . 12 10 . . 11 14 16Nigeria . . 5 n/a . 3 . . 6 28 18Senegal . 9 4 n/a . 4 8 . . 7 17 16South Africa 15 3 10 . . . 12 7 8 9 15 21Swaziland . . . 48 . 38 27 . . 39 8.2 7.9Tanzania . 9 6 n/a . 3 10 . . 8 25 16Uganda . 38 16 41 . 31 30 . . 32 12 11Zambia . 15 13 . . . 8 20 18 14 18 19
Source: World Bank Enterprise Surveys, 2002–2006.
Note: The figures represent the percentage of women entrepreneurs within each group. Figures are not shown when the sample size is fewer than 30 enterprises(= . ). n/a indicates that the data were not collected in the survey.
Sector of enterpriseSize of enterprise
Years in business

given constraint. Figure 3 shows predicted probabilitiesof complaining about an obstacle being “major” or“very severe” for a man and a woman entrepreneur withfixed characteristics—that is, similar in all respectsexcept for their sex.12 The results are shown for 6 of the 18 constraints identified in the Enterprise Surveyquestionnaire—these are the constraints that are usuallyindicated as more binding and critical for women thanfor men, such as corruption and access to finance.Women and men entrepreneurs do differ in their per-ceptions of business constraints, after controlling for themost important observable characteristics.Again, howev-er, there is no consistent pattern across countries andconstraints. In some countries, men are more likely thanwomen to report a constraint as “major” or “verysevere”; in other countries the opposite holds—evenwhen looking at the same type of constraint. In severalcases, men and women entrepreneurs agree on theseverity of a constraint. No constraint appears to be a“female-type” of constraint, that is, one overwhelminglysuffered by women. Corruption, for example, is, along
with access to finance, a constraint that one wouldexpect women to be more likely to complain aboutthan others.As shown in Figure 3b, in Mozambique,Senegal, and Zambia, women are more likely than mento judge corruption a “major” or “very severe” obstacle,but in Angola, Benin, Egypt, Malawi, and Mali, men aremuch more likely to complain about corruption.
Access to finance appears to be as much a maleproblem as it is a female one. If women are more likelyto indicate this constraint as “major” or “very severe” inBurundi, Eritrea, Kenya, Lesotho, and Madagascar, menidentify this more as a constraint in Angola, Mauritania,and Tanzania. Figure 3 reveals a very clear positive correlation—in countries where the probability of awoman considering an obstacle “major” or “very severe”is higher, the probability of men complaining about thesame obstacle to the same degree is also higher. So, forexample, corruption is clearly a problem for both menand women in Egypt and Kenya, access to finance inGuinea-Bissau and Cameroon, and tax administration inCameroon and Kenya. Some issues appear to be more
74
1.4:
Gen
der,
Entr
epre
neur
ship
, and
Com
petit
iven
ess
in A
fric
a
Table 2: Percentage of entrepreneurs who identify selected obstacles as “major” or “very severe,” by sex of thebusiness owner
OBSTACLE
Skills and education Crime, Labor LicensesAccess to land of available workers Corruption theft, disorder regulations and permits
Country/Year of survey Female Male Female Male Female Male Female Male Female Male Female Male
Angola 15 26 10 22 22 37 27 35 3 12 31 31Benin . 32 . 21 . 85 . 50 . 34 . 52Botswana 31 23 18 14 23 22 14 22 5 9 16 16Burkina Faso . 8 . 19 . 50 . 8 . 19 . 22Burundi 29 30 12 10 24 14 21 17 0 2 16 10Cameroon 26 6 17 6 42 29 26 6 75 61 42 29Cape Verde . . . . . . . . . . . .Congo, Dem. Rep. 24 15 14 15 18 18 30 20 14 12 31 25Egypt 29 20 35 36 59 63 n/a n/a 24 31 14 11Eritrea . . . 36 . 3 . 0 . 3 . 6Ethiopia 61 63 14 15 46 43 8 11 0 4 3 10Gambia, The 30 27 18 8 15 9 15 11 7 2 13 14Guinea-Bissau 26 24 15 11 40 45 29 33 12 3 9 20Kenya . 24 . 29 . 77 . 72 . 25 . 16Lesotho . 29 . 33 . 38 . 51 . 19 . 27Madagascar 18 22 32 27 41 48 42 35 19 10 14 14Malawi . 19 . 45 . 48 . 49 . 15 . 5Mali . 40 . 21 . 52 . 25 . 4 . 10Mauritania 14 29 26 15 21 15 0 4 0 3 2 4Mauritius . 23 . 39 . 35 . 24 . 26 . 46Morocco 38 45 36 20 16 16 9 8 18 15 18 19Mozambique 35 24 32 32 63 56 49 51 18 43 31 25Namibia 19 14 13 24 26 18 26 26 9 10 9 7Niger . 14 . 2 . 58 . 6 . 17 . 17Nigeria n/a n/a . 5 n/a n/a . 26 . 17 . 12Senegal . 28 . 18 . 36 . 13 . 16 . 7South Africa 6 3 19 30 19 16 35 32 16 33 0 3Swaziland 10 13 12 11 19 24 31 32 4 6 21 26Tanzania . 29 . 29 . 54 . 29 . 13 . 30Uganda 13 22 9 9 25 20 15 14 1 2 8 16Zambia . 19 . 39 . 50 . 56 . 19 . 15
Source: World Bank Enterprise Surveys, 2002–2006.
Note: The figures represent the percentage of entrepreneurs reporting the identified obstacle as “major” or “very severe.” Figures are not shown when the samplesize is fewer than 30 enterprises (= . ). n/a indicates that the data were not collected in the survey.

75
1.4:
Gen
der,
Entr
epre
neur
ship
, and
Com
petit
iven
ess
in A
fric
a
0 10 20 30 40 50 60 70 80 90 1000
20
40
60
80
100Kenya
Mozambique
The Gambia
Congo, Dem. Rep.Egypt
Angola
Mauritania
Figure 3: Probability of an entrepreneur declaring that a specific constraint constitutes a “major” or “very severe”obstacle for the operation and growth of the business, by sex of the business owner
3a: Anticompetitive and informal practices
Source: World Bank Enterprise Surveys, 2002–2006.
Note: Predicted probabilities are evaluated for a stylized enterprise with the following characteristics: small firm, in manufacturing (outside textile and agro-food),located in the capital city, in operation for about seven years, and where top management has an education level below university.
The points above the diagonal line represent countries in which the estimated probability of the “stylized enterprise” complaining about the constraint as a “major”or “very severe” obstacle is greater for women enterprises. The points below the diagonal line show where the probability is greater for male enterprises.
Only in countries indicated in bold is the difference significant in a statistical sense (at the 5 percent level). However, because the sample sizes are often quitesmall, it is not possible to determine in countries with a substantial but not statistically significant difference whether this result is due to the small sample sizeor whether it reflects the fact that there is no economic difference between men and women. For this reason, where this is the case, these countries are alsoincluded in the figure.
Male-owned enterprises
Fem
ale-
owne
d en
terp
rise
s
0 10 20 30 40 50 60 70 80 90 1000
20
40
60
80
100
EgyptKenya
Benin
Mozambique
Malawi
Mali
Angola
Zambia
Senegal
3b: Corruption
0 10 20 30 40 50 60 70 80 90 1000
20
40
60
80
100
Mauritania
Tanzania
Angola
Eritrea
Lesotho BurundiCongo, Dem. Rep.
KenyaCameroon
Guinea-Bissau
South Africa
Madagascar
Egypt
Zambia
3c: Access to finance
Male-owned enterprises
Fem
ale-
owne
d en
terp
rise
s
Male-owned enterprises
Fem
ale-
owne
d en
terp
rise
s

76
1.4:
Gen
der,
Entr
epre
neur
ship
, and
Com
petit
iven
ess
in A
fric
a
0 10 20 30 40 50 60 70 80 90 1000
20
40
60
80
100
Mozambique
The Gambia
South AfricaAngola
Figure 3: Probability of an entrepreneur declaring that a specific constraint constitutes a “major” or “very severe”obstacle for the operation and growth of the business, by sex of the business owner (cont’d.)
3d: Labor regulations
Source: World Bank Enterprise Surveys, 2002–2006.
Note: Predicted probabilities are evaluated for a stylized enterprise with the following characteristics: small firm, in manufacturing (outside textile and agro-food),located in the capital city, in operation for about seven years, and where top management has an education level below university.
The points above the diagonal line represent countries in which the estimated probability of the “stylized enterprise” complaining about the constraint as a “major”or “very severe” obstacle is greater for women enterprises. The points below the diagonal line show where the probability is greater for male enterprises.
Only in countries indicated in bold is the difference significant in a statistical sense (at the 5 percent level). However, because the sample sizes are often quitesmall, it is not possible to determine in countries with a substantial but not statistically significant difference whether this result is due to the small sample sizeor whether it reflects the fact that there is no economic difference between men and women. For this reason, where this is the case, these countries are alsoincluded in the figure.
Male-owned enterprises
Fem
ale-
owne
d en
terp
rise
s
0 10 20 30 40 50 60 70 80 90 1000
20
40
60
80
100
Lesotho
Mali
Kenya
Zambia
Egypt
Madagascar
Mozambique
Tanzania
3e: Macroeconomic instability
0 10 20 30 40 50 60 70 80 90 1000
20
40
60
80
100
Uganda
SenegalMozambique
Cameroon
AngolaTanzania Lesotho
Madagascar
Kenya
3f. Tax administration
Male-owned enterprises
Fem
ale-
owne
d en
terp
rise
s
Male-owned enterprises
Fem
ale-
owne
d en
terp
rise
s

severe than others—access to finance is in general clearly felt as a more problematic constraint than laborregulations.
International research in other regions indicates thata lower level of confidence, a greater fear of failure, andthe lack of role models may be preventing some womenfrom entering into business ownership in the first place.In interviews conducted as part of the 2006 GlobalEntrepreneurship Monitor surveys in 40 countries,fewer adult women than men interviewed feel that they “have the required skills and knowledge to start abusiness”: 41 percent of women in low- or middle-income countries compared with 50 percent of men,and 33 percent of women in high-income countriescompared with 46 percent of men.These gender differ-ences disappear among the women and men interviewedwho actually own enterprises, with over three-quartersof male and female respondents saying they have therequired knowledge and skills. Likewise, women whoare not business owners are more likely than men toagree that “fear of failure would prevent me from startinga business” (40 percent compared with 33 percent inlow- or middle-income countries and 44 percent com-pared with 39 percent in high-income countries) and,again, gender differences disappear among the activebusiness owners interviewed.13
The lack of role models is another constraint towomen’s entrepreneurship, but one that appears to bediminishing with time.Among the adult women inter-viewed for the 2006 Global Entrepreneurship Monitorstudy, just 35 percent in low- or middle-income countriesand 27 percent in high-income countries personallyknow someone who has started a business.That shareincreases to 53 percent and 47 percent, respectively,among established business owners (those who havebeen in business for more than 42 months), and it iseven higher for newly established businesses—61 percentof women in low- or middle-income countries and 56 percent of women in high-income countries.14
Consequently, familiarity with someone involved inentrepreneurship is positively correlated with becomingan entrepreneur, and it appears that there are now moresuch role models for women getting into business todaythan even in the recent past.These factors all affectselection into entrepreneurship at the outset, and help toexplain why, once already engaged in entrepreneurialactivity, differences based on gender seem to becomeless immediately relevant.
The results derived from the Enterprise Survey datapresented here need to be interpreted with caution.First, sample sizes are small. Second, there are missingobservations that are likely not to be random and there-fore are likely to affect the results. For example, entre-preneurs who have a strong feeling about a constraintbeing severe may be more likely to answer the question(or vice versa).This selection effect on the missing valuesmay be different for men and women.Third, these
results reflect perceptions, not objective measures of theconstraints identified. Finally, the severity of the con-straints is assessed by entrepreneurs already in business—therefore these constraints are perceived in relation tohow they affect the firm’s operations, not its startup. Itmay be that women are affected more than men by spe-cific constraints at the startup stage, so that they are notable to enter into business, but this is not amenable toanalysis through the Enterprise Survey data.
How is the performance of businesses affected?The analysis of constraints developed in the previoussection indicates that, although there are cases in whichwomen are more likely to identify certain obstacles as“major” or “very severe,” men’s and women’s perceptionstend to be in agreement more often than we might haveexpected. Even if perceptions of constraints are frequentlysimilar for men and women, it is important to askwhether some constraints affect the performance offemale-owned enterprises more than they affect the performance of male-owned enterprises.
In what follows, two indicators of performancehave been analyzed: value-added per worker and totalfactor productivity (TFP).15 A priori, differences betweenfemale- and male-owned enterprises may be expected,due, for example, to women facing greater difficultiesthan male entrepreneurs in managing their enterprises.Or, conversely, differences may be due to women entre-preneurs being a very selected sample, because they hadto face greater obstacles than men to start their businessesin the first place.
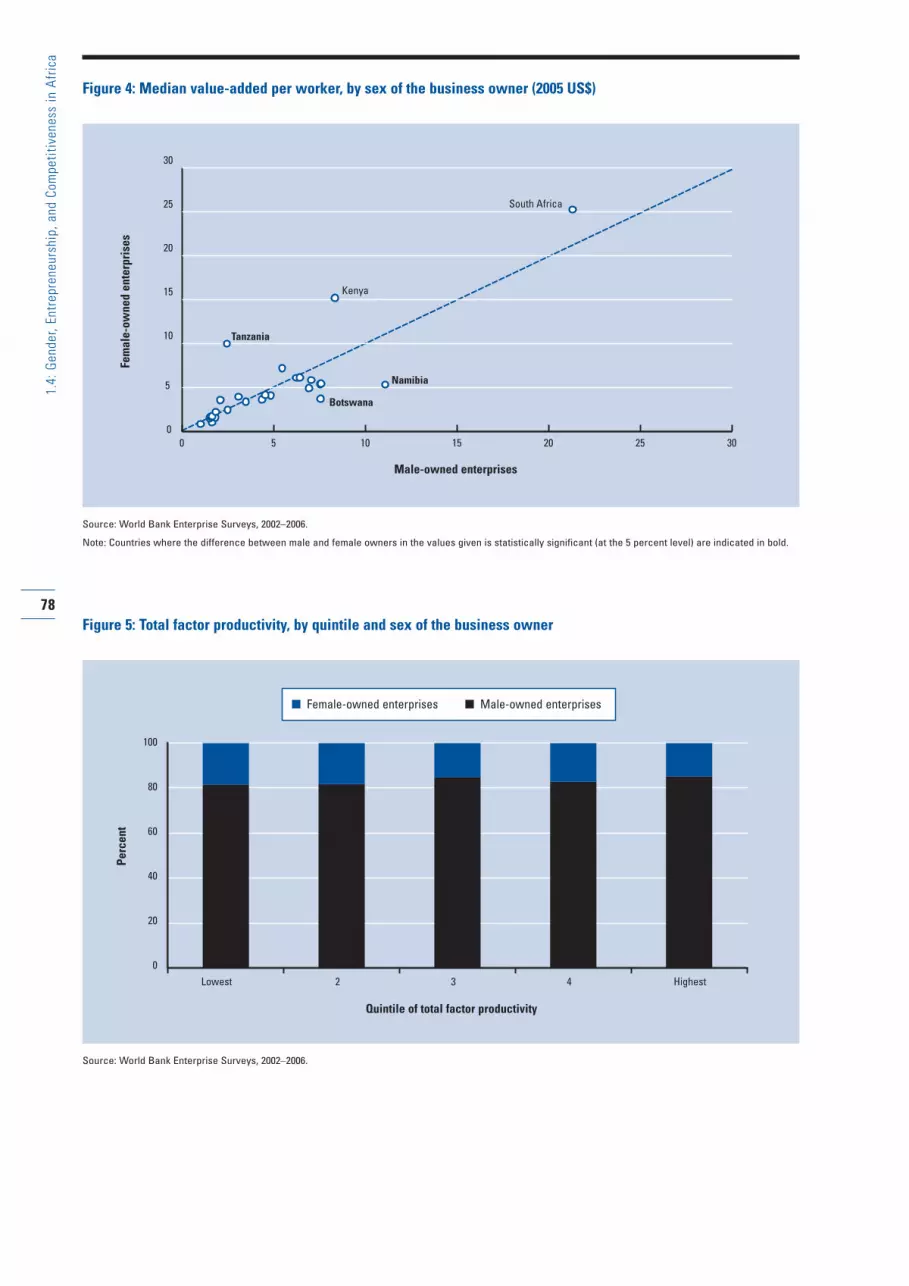
The value-added per worker is very similar for menand women, as Figure 4 illustrates.This analysis disag-gregates the results presented in Chapter 1.2 by sex ofthe owner of the enterprise. Only in three countries(Tanzania, in favor of women; Namibia and Botswana, infavor of men) is there a statistically significant differencebetween the median of the value-added per worker ofthe two groups of entrepreneurs.
Women entrepreneurs are also fairly equally distrib-uted across quintiles of TFP—see Figure 5.16 Women arenot overrepresented at the top of the distribution ofTFP, nor are they overrepresented at the bottom.
These results suggest that, once men and womenentrepreneurs are in business (and survive in business),they face on average the same conditions, and theirenterprises display very similar levels of value-added perworker and TFP. It may be that, if selection of womeninto entrepreneurship is tougher than for men, higherunobservable characteristics of women compensate forhigher obstacles that they may be facing as women, butthe net result is essentially one of no difference in pro-ductivity.The positive message, therefore, is that in Africawomen’s enterprises can be just as productive as men’s.
What about the impact of business constraints onfirm productivity? Even in this case there is no evidence
77
1.4:
Gen
der,
Entr
epre
neur
ship
, and
Com
petit
iven
ess
in A
fric
a
78
1.4:
Gen
der,
Entr
epre
neur
ship
, and
Com
petit
iven
ess
in A
fric
a
0 5 10 15 20 25 300
5
10
15
20
25
30
South Africa
Kenya
Namibia
Botswana
Tanzania
Figure 4: Median value-added per worker, by sex of the business owner (2005 US$)
Source: World Bank Enterprise Surveys, 2002–2006.
Note: Countries where the difference between male and female owners in the values given is statistically significant (at the 5 percent level) are indicated in bold.
Male-owned enterprises
Fem
ale-
owne
d en
terp
rise
s
Lowest 2 3 4 Highest
100
80
60
40
0
20
Figure 5: Total factor productivity, by quintile and sex of the business owner
Source: World Bank Enterprise Surveys, 2002–2006.
Quintile of total factor productivity
Perc
ent
■ Female-owned enterprises ■ Male-owned enterprises

of the performance of female-owned enterprises beingdisproportionately negatively affected. Figure 6 showsthe relationship between median value-added per worker(by sex of the business owner) and the severity of twoconstraints that are generally identified as gender-adverse:corruption (measured by the percentage of entrepreneursforced to pay bribes to obtain a service or a license,Figure 6a) and access to finance (measured by the averagepercentage of working capital financed by “formal”sources—from local or foreign commercial banks, leasingarrangements, investment funds, trade credit, creditcards, Figure 6b—and by all types of external sources,including informal networks, Figure 6c). In this case, thechosen constraints are more “objective” than the percep-tions of entrepreneurs about the severity of an obstacle,analyzed in the previous section.
The negative relationship between corruption andproductivity highlighted in Chapter 1.2 exists for bothmen and women entrepreneurs. However, according tothe Enterprise Survey data, the productivity of female-owned businesses does not appear to be affected morethan the productivity of male-owned businesses.17 Thesame holds for access to finance, measured as the averagepercentage of working capital from formal sources.Similarly, across countries, a larger share of working cap-ital derived from external sources (that is, from formalsources as well as informal channels such as family,friends, money lenders, but excluding internal funds and
sale of stock) is associated with higher productivity, butthe same relationship exists for men and women alike.
These findings are confirmed even after controllingfor the firm’s characteristics (size, sector, location, andwhether the firm exports or not). Except in a few cases,the performance of female-owned enterprises is not disproportionately affected by the severity of the con-straints.18 In other words, once they are over the entrythreshold and are operating businesses, both men andwomen entrepreneurs in this sample are by and largeaffected by these constraints in the same way.
The broader contextAlthough the focus on formal sector entrepreneurssheds light on a particular, if small, facet of entrepre-neurial activity, it is important to bear in mind both thewider context in which such activity occurs in Africaand the limitations of available data in interpreting theseresults. First, much economic activity in Africa takesplace in the informal sector, which is poorly captured inavailable data and statistics. Second, data on the legal status of men and women, on gender differences inproperty rights—for example, with respect to land own-ership—or rights relating to marriage and inheritance,which are highly relevant for understanding how thebusiness climate affects men and women differently,are largely unavailable and require in-depth and
79
1.4:
Gen
der,
Entr
epre
neur
ship
, and
Com
petit
iven
ess
in A
fric
a
6a: Corruption (percentage of entrepreneurs paying bribes)
0 10 20 30 40 50 60 70 80 90 100
0
5
10
15
20
25
30
South Africa
South Africa
TanzaniaNamibia
NamibiaMali
Cameroon Cameroon
Congo, Dem. Rep.Congo, Dem. Rep.
Kenya
Kenya
Figure 6: Median value-added per worker and intensity of selected constraints, by sex of the business owner
Source: World Bank Enterprise Surveys, 2002–2006.
Percentage of entrepreneurs paying bribes
Med
ian
valu
e-ad
ded
per w
orke
r
● Value-added per worker (women) ● Value-added per worker (men)

80
1.4:
Gen
der,
Entr
epre
neur
ship
, and
Com
petit
iven
ess
in A
fric
a
6b: Access to finance (percentage of working capital from formal sources)
0 10 20 30 40 50 60
0
5
10
15
20
25
30
South Africa
South Africa
Tanzania Namibia
Mali
The GambiaThe Gambia
Mauritius
Ethiopia
Kenya
Kenya
Figure 6: Median value-added per worker and intensity of selected constraints, by sex of business owner (cont’d.)
Percentage of working capital from formal sources
Med
ian
valu
e-ad
ded
per w
orke
r
● Value-added per worker (women) ● Value-added per worker (men)
6c: Access to finance (percentage of working capital from external sources)
0 10 20 30 40 50 60
0
5
10
15
20
25
30
South Africa
South Africa
Tanzania Namibia
Mali
Mali
The Gambia
SenegalCameroon
Kenya
Kenya
Source: World Bank Enterprise Surveys, 2002–2006.
Percentage of working capital from external sources
Med
ian
valu
e-ad
ded
per w
orke
r
● Value-added per worker (women) ● Value-added per worker (men)

country-specific analysis that is beyond the scope of thischapter.Third, Enterprise Surveys have important limi-tations for the analysis of female entrepreneurship interms of coverage, sample size, and information collect-ed.These issues will be addressed in turn.
The informal sectorEntrepreneurs—male or female—constitute a very smallpercentage of the population, according to householdsurvey data.Almost everywhere, less than 1 percent of allwomen of working age (15 to 65 years old) are“employers”—that is, women who own a business inwhich they employ hired labor. In Africa, most workingwomen are not “formal” entrepreneurs but are ratherself-employed and own-account workers in the informalsector.The informal sector is particularly important inAfrica, and is often an entry point for broadening participation in the private sector. International LabourOrganization (ILO) data indicate that the informal sector represents 48 percent of nonagricultural employ-ment in North Africa, and 72 percent of nonagriculturalemployment in sub-Saharan Africa.19 Informal employ-ment is generally a larger source of employment forwomen, though not in North Africa.
For example, the recently completed Gender andGrowth Assessment (GGA) for Tanzania confirmed theimportance of the informal sector in the economy, not-ing that the vast majority of businesses in the countryare outside the formal legal system. It is estimated thatthe number of women entrepreneurs ranges from730,000 to 1.2 million, and are particularly found in the micro, small, and medium-sized enterprise (MSME)sector where they make up 43 percent of the total.Barriers to the formalization of a business—particularlylengthy and complex business registration, incorpora-tion, and licensing practices—have a disproportionatelynegative effect on women, in some cases making itimpossible for them to formalize their businesses.20
Women’s participation in the informal economy mayhelp in understanding their participation in the formalsector. It has been argued, for example, that women running informal enterprises value the higher flexibilityoffered by the informal sector.This is confirmed bywomen entrepreneurs in both Kenya and Tanzania.21
One of the important reasons that women may prefer the flexibility of informal arrangements is thatthis flexibility makes it easier for women to managetheir “double workday.” Because women usually have toassume by far the greater burden of domestic tasks, asrevealed in time allocation data in Africa, their capacityto engage in economic, including entrepreneurial, activ-ity is much more constrained.22 Moreover, the boundarybetween economic and household activity is less welldrawn in Africa than in other regions,23 and conventionallabor force data capture a much more limited share ofwomen’s total workload than men’s.This additionalworkload means that women can essentially carry out
economic activities only in conjunction with or afterfulfilling their domestic responsibilities.This may help toexplain why, as indicated earlier, women are more likelyto be involved in family enterprises that are more com-patible with combining both domestic and economicactivity.
Legal and regulatory constraintsMany African countries are characterized by the coexis-tence of dual or multiple legal systems, which lead togreater insecurity of women’s legal status, comparedwith men.A 10-country study of women’s legal rightsin sub-Saharan Africa finds that under both statutoryand customary law, the overwhelming majority ofwomen in sub-Saharan Africa—often regardless of theirmarital status—cannot own or inherit land, housing, orother property in their own right.24 Eligibility to accessfinance is identified as a hurdle in the World Bank’srecent study of finance in Africa. In Swaziland, forexample, legislation mandates that a woman can beparty to a contract (such as opening an account or takingout a loan) only with the consent of her father, husband,or other male family member.This might explain thelarge gender gap in bank accounts—52 percent of menbut only 30 percent of women have accounts in thatcountry.25 Many country studies document the ways inwhich property rights differ for men and women, andhow protections and remedies afforded to women aredifferent from those afforded to men.These constraintsmay not have as much impact on women who arealready entrepreneurs, but may have a severe impact onwomen who want to become entrepreneurs and are notable to do so. Unfortunately, data are “sorely lacking”according to one study of women’s property rights insub-Saharan Africa.26 This makes it difficult to know thetrue extent of women’s ownership or control of keyassets and resources.
Some African countries have embarked on reformsaimed at reducing the discriminatory treatment ofwomen by their legal systems. Reforms have generallyfocused on gaining equal legal protection for womenunder constitutions, suffrage rights, fair labor laws, familylaw (for example, incorporating the various customsgoverning women’s role in the family into a uniformlegal code), and improving women’s right to propertyunder intestate laws. Not all constitutions guaranteewomen equal rights with men, and in countries wherethey do, lower-level laws or application of laws may violate the gender equality provision of the constitution,and common practice may ignore it altogether.Toaddress some of these issues,African heads of stateadopted a protocol to the African Charter on Human andPeoples’ Rights on the Rights of Women in Africa in Maputoin 2003, which entered into force in November 2005.In all, 43 countries have signed the protocol, and 20have ratified it.27
81
1.4:
Gen
der,
Entr
epre
neur
ship
, and
Com
petit
iven
ess
in A
fric
a
A promising area of intervention in support ofwomen’s entrepreneurship has been opened up throughthe work pioneered by the Gender EntrepreneurshipMarkets (GEM) unit of the International FinanceCorporation (IFC), in collaboration with the ForeignInvestment Advisory Service (FIAS) and the WorldBank.A program of Gender and Growth Assessments(GGAs) is now being developed to address legal andregulatory obstacles that affect men and women differ-ently, to build the capacity of entrepreneurs, bankers,and other stakeholders, and to put in place financingmechanisms for women entrepreneurs in partnershipwith commercial banks (Box 2).
The Uganda GGA, for example, found that womencomprise 39 percent of businesses with registered prem-ises, yet most female workers in Uganda either areunpaid family farm workers or are self-employed in theinformal sector.28 Barriers to the formalization of a busi-ness appear to have a disproportionate effect on femaleentrepreneurs in Uganda due to increased time con-straints, fewer official contacts, and less access to funds.
In some cases, these constraints create an absolute barrier to women’s ability to formalize their businesses.The costs of registration and licensing regulations aremarkedly different for women compared with men (seeBox 3).
Limitations of Enterprise Survey data for gender analysisAlthough the Enterprise Survey data are without doubta rich source of information about enterprises, theiractivity, and their constraints, they have important limi-tations for investigating entrepreneurship disaggregatedby sex.The first problem is one of coverage. Becauseonly enterprises are sampled, it is impossible to analyzethe process of selection into entrepreneurship and theeffect of the constraints on the startup of enterprises,including those owned and managed by women.Second, sample sizes are often too small to allow an in-depth analysis of women entrepreneurs, who representin some cases only 10 percent or less of the sample.Third, the relationship between ownership and manage-ment is not thoroughly examined in these data.Yet this
82
1.4:
Gen
der,
Entr
epre
neur
ship
, and
Com
petit
iven
ess
in A
fric
a
To strengthen the business-enabling environment for womenentrepreneurs, the Gender Entrepreneurship Markets (GEM)unit of the International Finance Corporation (IFC) in collabora-tion with the Foreign Investment Advisory Service (FIAS) andthe Africa Region of the World Bank has developed new adviso-ry and analytical products. At government request (usuallyfinance or trade ministries), Gender and Growth Assessments(GGAs) have been carried out in Kenya, Tanzania, and Ugandaand are underway or planned in Ethiopia, Ghana, and Rwanda.Building on the “Doing Business” indicators, Investment ClimateAssessments, and FIAS Assessments, these GGAs address—through a gender lens—the legal and regulatory obstacles thataffect businesses and propose concrete measures to tackle theobstacles identified. In Ghana, Kenya, and Tanzania, accompa-nying Voices of Women Entrepreneurs reports showcase suc-cessful women entrepreneurs as role models. Key results todate include:
• In Uganda and Kenya, GGA recommendations have beenfully integrated into these countries’ private-sector devel-opment strategies.
• In Uganda, a Gender Coalition has been created to supportthe implementation of GGA recommendations. Followinglobbying from the coalition, GGA recommendations havebeen incorporated into four labor reform bills coveringemployment, occupational safety and health, labor dis-putes, and labor unions, which were passed in 2006. TheMinistry of Finance, acting on GGA recommendations,commissioned new legal drafts of the Companies Act, theChattels Transfer Act, and other bills.
• As access to formal finance is now identified as amongthe most significant obstacles, IFC-GEM has worked withIFC Financial Markets to put in place lines of credit foronlending to women entrepreneurs through commercialbanks. In Nigeria, a US$15 million line of credit was provid-ed to Access Bank plc, to onlend to women entrepreneurs,and by January 2007 US$4.5 million had been disbursed to33 women-owned businesses. In Uganda, US$6 million hasbeen provided to Development Finance Company ofUganda (DFCU), with US$2 million set aside for womenentrepreneurs. In Tanzania, a US$5 million line of credit foronlending to women entrepreneurs has been provided toExIm Bank, of which US$1 million has been onlent to awoman-owned microleasing company.
• Lending to women is only part of the story. Under a finan-cial products and advisory services package, the IFC ishelping to train bank staff in areas such as market posi-tioning and gender sensitivity, and is advising banks onnew product development, such as insurance services forwomen. Women clients receive tailored training in how toprepare a bankable business, in product development, andin access to markets. To date, around 280 stakeholders inGhana, Kenya, Tanzania, and Uganda—including govern-ment staff, lawyers, entrepreneurs, and members of civilsociety—have been trained in public-private dialogue,advocacy and media issues, and business managementskills.
Source: Based on materials provided by the IFC GEM Unit.
Box 2: World Bank–IFC partnership focuses on women entrepreneurs

issue appears to be particularly relevant for women,given that one of the more pertinent findings presentedin this chapter concerns the very high percentage ofwomen entrepreneurs who are part of a family enter-prise. Finally, in addition to clarifying the relationshipbetween ownership and management, EnterpriseSurveys would be better suited to the analysis of femaleentrepreneurship if they included more questions aboutthe background of the entrepreneur, for example, moreinformation about personal characteristics and familybackground, and the reasons that motivated the individ-ual to become an entrepreneur in the first place.
ConclusionsThis chapter shows that both men and women areactive as entrepreneurs in Africa, and their enterprisesshare many common characteristics. For the select sam-ple of manufacturing and service sector entrepreneurscaptured in the Enterprise Surveys, the analysis revealssurprisingly little difference between men and womenentrepreneurs.There are some differences in the type ofbusinesses in which men and women are engaged, andsome differences in perceived constraints. However,these differences are often quite small and are not con-sistently associated with specific countries, sectors, ortypes of business.
Because this chapter finds such small differencesbetween men and women entrepreneurs along thedimensions analyzed here, it may be tempting to conclude that there is little to be gained from addressing
entrepreneurship in Africa through a gender lens.Thiswould be a mistake, as even the absence of differences—for example, with respect to firm performance—is animportant and positive finding.This analysis brings tolight several important findings that are relevant forstrengthening Africa’s competitiveness and entrepre-neurship:
• Women entrepreneurs are more likely than theirmale counterparts to be engaged in family enter-prises.They are also generally younger and less likely to be married. In recent years, it seems tohave become easier for women to enter into entre-preneurship.This suggests that family dynamics playan important role in entrepreneurship in Africa, andthat these dynamics are particularly relevant forwomen entrepreneurs.The confluence of familyand business activity, or, as mentioned earlier, theblurring of the boundary between household andeconomic activity, suggests that the legal status andrights of women within the family—especially inrelation to marriage, inheritance, and propertyrights—have a bearing on their capacity to engagein entrepreneurial activity.
• Contrary to what one might expect, in the sampleanalyzed here women are as likely to own largebusinesses as small ones, and there is no gender-distinct segmentation of women entrepreneurs interms of the sector of operation or the size and ageof the business.
83
1.4:
Gen
der,
Entr
epre
neur
ship
, and
Com
petit
iven
ess
in A
fric
a
The Uganda Regulatory Cost Survey Report 2004, which cov-ered 241 enterprises in four regions, measured the compliancecost of registration and licensing requirements. Key findingswere:
• Over a quarter of all enterprises reported that govern-ment officials had “interfered” with their business, by,for example, threatening to close it or asking for bribes.For female-headed enterprises, the figure rose to 43percent.
• Forty percent of micro enterprises headed by a womanfelt that the total burden of regulation was “heavy” or“severe” (as compared with 35 percent for enterprisesheaded by a man).
• Trade licenses were identified as the most burdensomeregulation. Over 40 percent of women, compared withjust over 30 percent of men, reported trade license pro-cedures as an obstacle to the growth of their business.
The Regulatory Best Practice Program has started pilot proj-ects to reduce the time and monetary cost of obtaining tradelicenses, by streamlining licensing procedures and reducing thenumber of approvals. A pilot project in Entebbe Municipalityreduced the time spent by Ugandan businesses in obtaininglicenses by 90 percent, reduced compliance costs by 75 per-cent, and increased revenue collection by 40 percent. Theimpact assessment of the first pilot at Entebbe (which hasrecently won an International Investors award) suggests thatthe reforms were encouraging female-owned enterprises toobtain licenses for the first time—most of the license applica-tions from women were first-time registrations.
Source: Ellis et al., 2006.
Box 3: Regulatory reform and female-headed enterprises in Uganda

• Women’s businesses are at least as productive asthose of their male counterparts, as measured byvalue-added per worker and TFP. Once men andwomen entrepreneurs are operating their businesses,the constraints and obstacles they face affect themin largely the same way. Differences based on gendertend to disappear, as shown both in this chapter andin the Global Entrepreneurship Monitor surveys in40 countries.This is further confirmed in the find-ing that in countries where it is easier overall tostart, register, license, and operate a business, thereare more women entrepreneurs.
• The absence of significant gender-based barriers inoperating a business does not mean that there areno gender-based obstacles to entrepreneurship. It isvery likely that barriers to entry into entrepreneur-ship present greater obstacles for women than formen.
• Consequently, measures aimed at facilitating entryinto entrepreneurship through legal, regulatory, andother reforms are likely to have a more positiveimpact on women entrepreneurs.As shown in theGGA program, priority needs to be given to tack-ling gender-based legal and regulatory obstacles tostarting a business as a specific component of thewider effort to improve the business-enabling environment.
This analysis suggests that complex family dynamicsare at work in relation to business activity in ways thatare particularly important for women.This raises ques-tions that merit further analysis, such as what decision-making power women have, and whether the presenceof a male relative in the enterprise either dilutes orfacilitates (for example, by mediating access to credit)the discharge of their managerial responsibility.A furtherquestion concerns the ways in which women managetheir “double workday,” including through preferringinformal arrangements that are more compatible withtheir domestic responsibilities.The wider realms of fam-ily relations, and of property, marital, and inheritancerights, all have a bearing on the potential and prospectsfacing women entrepreneurs that are not the same as formen.Though data are very limited, available evidencesuggests that there is persistent discrimination againstwomen and greater precariousness of their legal statusand rights.
An important arena for further work is to addresswomen’s disadvantage by analyzing other types ofdata—for example, household surveys, or surveys ofinformal sector activities.Also, more could be doneusing Enterprise Surveys if they included more informa-tion about observable characteristics of the entrepreneurthat are not currently collected—for example, familybackground (what do parents and spouses do?), the way
the firm was acquired, and the role played by men andwomen in managing the firm. Since sex-disaggregateddata on property ownership, assets, and legal rights arelacking, one critical task is to develop statistical anddata-gathering capacity in this area.
The finding that there are no or few significant dif-ferences between female and male entrepreneurs oncethey are already operating businesses—in terms of thesectors of operation, the size or age of the business, andthe performance and productivity of the business—isencouraging. It suggests, for example, that Africa doesindeed have considerable hidden growth potential in itswomen, and that tapping that potential, includingthrough removal of barriers that exist at entry, andreducing disparities in access to and control of resourcesby empowering women economically, can make a sub-stantial difference for Africa’s growth and poverty reduc-tion. If Africa is to remain competitive, and is to tap thefull productive potential of all economic actors—maleand female—it is important to understand and tacklegender-based barriers to entrepreneurship. OnceEnterprise Surveys obtain more information on thebackground of male and female entrepreneurs, includingthrough larger samples of female entrepreneurs, it willbe possible to undertake more robust analysis of thegender dynamics of entrepreneurship in Africa.
Notes1 The World Bank’s Enterprise Surveys, some results of which are pre-
sented in the Investment Climate Profiles at the end of thisReport, were earlier termed the “Investment Climate Surveys.”
2 World Bank 2000.
3 Commission for Africa 2005.
4 Blackden et al., in Mavrotas and Shorrocks 2007. For recentoverviews of analysis relating to gender, economic growth, andmacroeconomic policy, see Stotsky 2006 and World Bank 2007a.For a wider discussion of the relevance of gender for growth anddevelopment, see World Bank 2001.
5 For more information on Enterprise Surveys, see http://www.enter-prisesurveys.org/.
6 Throughout this chapter, the data included in the analysis refer onlyto individual and family enterprises where it is both possible anduseful to determine the sex of the business owner. Governmententerprises and foreign enterprises are excluded. As a generalrule, no results are presented when there are fewer than 30enterprises in the sample or subsample being analyzed.
7 More recent surveys include a much larger percentage of very smallfirms than older surveys, and some include only manufacturingenterprises, while in others services are also covered. Because itmay be expected that women are more concentrated in smallfirms and in services, and to facilitate comparability across sur-veys and time periods, we have excluded these enterprises incomputing the percentages shown in Figure 1. In fact, womenare not overrepresented in small and service sector enterprises inthese datasets, and very similar figures are obtained using the fullsample.
8 Allen et al. 2007.
9 We used Living Standards Measurement Survey (LSMS) data for thecountries analyzed in this chapter.
10 Case studies of women entrepreneurs are presented in Voices ofWomen Entrepreneurs reports for Kenya and Tanzania (Cutura2006, 2007).
84
1.4:
Gen
der,
Entr
epre
neur
ship
, and
Com
petit
iven
ess
in A
fric
a
11 Because of small sample sizes for large firms, we are able to reportresults only for a minority of countries.
12 These characteristics are chosen to represent a “common type” ofenterprise—a small firm, in manufacturing other than textile andagro-food, located in the capital city, which has been in operationfor about seven years, and with top management at an educationlevel below university. The predicted probabilities are based onthe estimates of a logit model—very similar results are obtainedwith an ordered logit model.
13 Allen et al. 2007.
14 Allen et al. 2007.
15 The value-added per worker has a more straightforward interpreta-tion and has been used for the univariate analysis (Figures 4 and6). Total factor productivity has been derived from estimating pro-duction functions including a dummy variable for female entrepre-neurship, and interactions between this variable and the invest-ment climate constraints. Several specifications have been used,in one- and two-step procedures, to assess the robustness of theresults.
16 The quintiles of TFP are created by dividing all the entrepreneurs infive groups of 20 percent each, after sorting all the entrepreneursin order from the least productive (the ones with the lowest TFP)to the most productive (with the highest TFP).
17 The slope of the line that captures the relationship between aver-age value-added per worker and percentage of entrepreneurs pay-ing bribes is the same for men and women (the same results holdwhen fitting functional forms other than the linear one).
18 We run one-step production function regressions for each country,including a dummy for female ownership and an interactionbetween female ownership and each constraint. We addressedthe potential endogeneity of the constraint by computing its aver-age over enterprises’ sector, size, and geographical location. Wetested whether the coefficient of the interaction term (femaleownership*average constraints) was significantly different fromzero.
19 ILO 2002; see also UNIFEM 2005.
20 World Bank 2007b.
21 Cutura 2006, 2007.
22 For more on the time poverty issue, see Blackden and Wodon2006.
23 Gelb 2001.
24 COHRE 2004.
25 Honohan and Beck 2007.
26 Strickland 2004.
27 Data on the protocol are maintained by the African Union:http://www.africa-union.org/root/au/Documents/Treaties/List/Protocol%20on%20the%20Rights%20of%20Women.pdf
28 Ellis et al. 2006.
ReferencesAllen, I. E., N. Langowitz, and M. Minitti. 2007. Global Entrepreneurship
Monitor, 2006 Report on Women and Entrepreneurship. Centerfor Women’s Leadership, Babson College, and London School ofEconomics.
Blackden, C. M. and Q. Wodon, Eds. 2006. “Gender, Time Use, andPoverty in Sub-Saharan Africa.” World Bank Working Paper No.73. Washington, DC: World Bank.
Blackden, C. M., S. Canagarajah, S. Klasen, and D. Lawson. 2007.“Gender and Growth in Sub-Saharan Africa: Issues andEvidence.” In G. Mavrotas and A. Shorrocks, eds. AdvancingDevelopment: Core Themes in Global Economics. Basingstoke,UK: Palgrave Macmillan in association with United NationsUniversity-World Institute for Development Economics Research(UNU-WIDER).
COHRE (Center on Housing Rights and Evictions). 2004. BringingEquality Home, Promoting and Protecting the Inheritance Rightsof Women: A Survey of Law and Practice in Sub-Saharan Africa.Geneva, Switzerland: COHRE.
Commission for Africa. 2005. Our Common Interest: Report of theCommission for Africa, March. Available at www.commission-forafrica.org.
Cutura, J. 2006. Voices of Women Entrepreneurs in Kenya, Report.Washington, DC: International Finance Corporation.
———. 2007. Voices of Women Entrepreneurs in Tanzania, Report.Washington, DC: International Finance Corporation.
Ellis, A., C. Manuel, and C. M. Blackden. 2006. Gender and EconomicGrowth in Uganda: Unleashing the Power of Women.Washington, DC: World Bank, Directions in Development.
Gelb, A. 2001. “Gender and Growth: Africa’s Missed Potential.” AfricaRegion Findings No. 197, December. Washington, DC: WorldBank.
Honohan, P. and T. Beck. 2007. Making Finance Work for Africa.Washington, DC: World Bank.
ILO (International Labour Organization). 2002. Women and Men in theInformal Economy: A Statistical Picture. Geneva: ILO,Employment Sector.
Mavrotas, G., and A. Shorrocks, eds. 2007. Advancing Development:Core Themes in Global Economics. Basingstoke, UK: PalgraveMacmillan in association with United Nations University-WorldInstitute for Development Economics Research (UNU-WIDER).
Stotsky, J. G. 2006. “Gender and Its Relevance to MacroeconomicPolicy: A Survey.” IMF Working Paper No. WP/06/233.Washington, DC: International Monetary Fund.
Strickland, R. 2004. “To Have and To Hold: Women’s Property andInheritance Rights in the Context of HIV/AIDS in Sub-SaharanAfrica.” International Center for Research on Women (ICRW)Working Paper. Washington, DC: ICRW in collaboration with theGlobal Coalition on Women and AIDS.
UNIFEM (United Nations Development Fund for Women). 2005.Progress of the World’s Women 2005: Women, Work, andPoverty. New York: United Nations.
World Bank. 2000. Can Africa Claim the 21st Century? Report preparedjointly by the African Development Bank, the African EconomicResearch Consortium, the Global Coalition for Africa, theEconomic Commission for Africa, and the World Bank.Washington, DC: World Bank.
———. 2001. Engendering Development: Through Gender Equality inRights, Resources, and Voice. A World Bank Policy ResearchReport. Washington, DC: World Bank.
———. 2005. Meeting the Challenges of Africa’s Development: AWorld Bank Group Action Plan. World Bank Board Document,SecM 2005-0445. Washington, DC: World Bank.
———. 2007a. Global Monitoring Report 2007: MillenniumDevelopment Goals: Confronting the Challenges of GenderEquality and Fragile States. Washington, DC: World Bank.
———. 2007b.(forthcoming). Gender and Economic Growth in Tanzania.Washington, DC: Directions in Development.
85
1.4:
Gen
der,
Entr
epre
neur
ship
, and
Com
petit
iven
ess
in A
fric
a