Embed Size (px)
Citation preview

Energy and Economic Competitiveness
Energy Working Group
October 2016
Energy and Economic Competitiveness
October 2016
Energy Working Group
EWG 02 2015S
PRODUCED BY:
Asia Pacific Energy Research Centre (APERC) Institute of Energy Economics, Japan Inui Building, Kachidoki 11F, 1-13-1 Kachidoki Chuo-ku, Tokyo 104-0054 Japan
Tel: (813) 5144-8551 Fax: (813) 5144-8555 E-mail: [email protected] (administration) Website: http://aperc.ieej.or.jp/
FOR:
Asia-Pacific Economic Cooperation Secretariat 35 Heng Mui Keng Terrace, Singapore 119616 Tel: (65) 68 919 600 Fax: (65) 68 919 690 E-mail: [email protected] Website: http://www.apec.org
© 2016 APEC Secretariat APEC#216-RE-03.1 ISBN 978-981-11-2325-2
Foreword
During the 11th APEC Energy Ministers’ Meeting (EMM11) held in Beijing, China on 2 September 2014, the Ministers issued instructions to the Energy Working Group (EWG). This includes an instruction to Asia Pacific Energy Research Centre (APERC) to strengthen cooperation with existing mechanisms and organisations to carry out specific research on the energy and economic competitiveness of the APEC region, including making in-depth analyses and holding seminars.
Following this instruction, APERC carried out Energy and Economic Competitiveness research project. This study analyses how the fluctuations of energy prices would affect macroeconomic situations, industrial sectors, trade and competitiveness of APEC economies.
I would like to thank the contributors to the Energy and Economic Competitiveness research project for the time they have spent doing research works.
This study does not necessarily reflect the views or policies of the APEC Energy Working Group or individual member economies. I do hope that this report will serve its purpose especially to the policy makers in APEC in addressing the energy and economic competitiveness issues in the APEC region.
Takato OJIMI President
Asia Pacific Energy Research Centre
Acknowledgments
We would like to thank all those who contributed to the completion of this report in various forms. It would not have been completed without their valuable contributions.
We wish to express our deepest appreciation to the following APEC member economy officials and experts who attended the 1st Workshop on Energy and Economic Competitiveness in Tokyo, Japan on 11 June 2015 for providing us with their constructive advices and comments, namely, in alphabetical order, Dr Cary Bloyd (Senior Staff Scientist, Pacific Northwest National Laboratory, US), Dr Jyuun-Shiauu Chern (Chief, Bureau of Energy, Ministry of Economic Affairs, Chinese Taipei), Dr Nuwong Chollacoop (Head, Renewable Energy Laboratoty National Metal and materials Technology Center, Thailand), Ms Sarea Coates (Manager, Energy Efficiency Policy and Engagement, Department of Industry and Science, Australia), Mr Terrence Collins (Director, Collins Consulting, New Zealand), Mr Masaomi Koyama (Senior Programme Officer – Innovation and Technology, International Renewable Energy Agency), Mr Benoit Lebot (Executive Director, International Partnership on Energy Efficiency Cooporation), Dr Ali Izadi-Najafabadi (Head of Japan, Bloomberg New Energy Finance), Mr Samuel Napolitano (Director of the Office of Integrated and International Energy Analysis, Energy Information Administration, US), Dr Bai Quan (Deputy Director of Energy Efficiency Center of Energy Research Institute, National Development and Reform Commission, China), and Dr Twarath Subtabutr (Deputy Director General, Department of Alternative Energy Development and Efficiency, Ministry of Energy, Thailand)
We also wish to express our deepest appreciation to Mr Jon Hansen (Energy Analyst, Global Energy Policy, the International Energy Agency) and Dr Ross Lambie (General Manager, Resources and Energy Economics, Australia), who attended the 2nd Workshop on Energy and Economic Competitiveness in Canberra, Australia on 9 May 2016 for providing us with their constructive advices and comments.
We wish to thank Dr Ryo Eto (Economist of Energy Data and Modelling Center of the Institute of Energy economics, Japan) for his contributions in processing some data requirements and helping out for securing other important information for this report.
LU Zheng Senior Economist, Energy and Economic Analysis Group (EEA),
Energy Data and Modelling Center (EDMC), the Institute of Energy Economics, Japan (IEEJ)
Asia Pacific Energy Research Centre (APERC)
Ichiro Kutani Senior Economist, Manager, Global Energy Group 1, Assistant to Managing Director, Strategy Research Unit, IEEJ
APERC

Contents EXECUTIVE SUMMARY ........................................................................... 1 Chapter 1 Background and Purpose .......................................................... 3
1-1 Background ................................................................................................................................. 3 1-2 Rationale ...................................................................................................................................... 3 1-3 Outline of the study ..................................................................................................................... 4
Chapter 2 Energy price in APEC ............................................................... 5 2-1 International energy prices .......................................................................................................... 6 2-2 Prices of oil for industrial use and transportation use ................................................................ 11 2-3 Prices of natural gas for industrial use....................................................................................... 13 2-4 Prices of coal for industrial use ................................................................................................. 14 2-5 Prices of electricity for industrial use ........................................................................................ 15 Box 1 Electricity prices and power generation mix ......................................................................... 21
Chapter 3 Energy consumption in industry sector .................................. 22 3-1 Composition of final energy consumption in the industrial sectors of APEC economies ......... 22 3-2 Energy efficiency in the manufacturing industries of APEC ..................................................... 24 3-3 Energy efficiency in the steel industries of APEC ..................................................................... 26 3-4 Energy efficiency in paper and pulp industries of APEC .......................................................... 29 3-5 Power generation efficiency in APEC ....................................................................................... 31 Box 2 Economy of energy-saving investments ................................................................................ 33
Chapter 4 Energy cost of manufacturing in APEC .................................. 35 4-1 Cost structure of manufacturing in APEC ................................................................................. 35
4-1-1 Cost structure of manufacturing in APEC ............................................................................ 35 4-1-2 Energy cost of manufacturing in APEC ............................................................................... 35
4-2 Energy cost of major industries in APEC .................................................................................. 37 4-2-1 Cost structure of major industries in APEC ......................................................................... 37 4-2-2 Energy cost of major industries in APEC ............................................................................ 38
Box 3 Indirect impact of energy price on major industries .............................................................. 42 Chapter 5 The relations of industrial competitiveness and energy ......... 44
5-1 Industrial competitiveness of APEC .......................................................................................... 44 5-1-1 How to measure industrial competitiveness ......................................................................... 44 5-1-2 International competitiveness of key industries in major economies................................... 45 5-1-3 Conclusion ........................................................................................................................... 63
5-2 Industrial competitiveness with energy ..................................................................................... 64 5-2-1 Industrial competitiveness and energy price ........................................................................ 64 5-2-2 Industrial competitiveness and energy intensity .................................................................. 67
5-2-3 Industrial competitiveness and energy cost share ................................................................ 67 5-2-4 Conclusion ........................................................................................................................... 69
Chapter 6 Impact of Energy in Macro economy ..................................... 70 6-1 Methodology ............................................................................................................................. 70
6-1-1 GTAP model ........................................................................................................................ 70 6-1-2 GTAP data ............................................................................................................................ 71
6-2 Economic impact of the changes of energy price ...................................................................... 72 6-2-1 Assumption of the analysis .................................................................................................. 72 6-2-2 Impact on the electricity price .............................................................................................. 73 6-2-3 Impact on the energy trade ................................................................................................... 73 6-2-4 Impact on the price in energy-intensive industries ............................................................... 74 6-2-5 Impact on industrial competitiveness ................................................................................... 74 6-2-6 Impact on macro economy ................................................................................................... 78
6-3 Economic impact of the changes of energy structure ................................................................ 79 6-3-1 Assumption of the analysis .................................................................................................. 79 6-3-2 Impact on electricity price ................................................................................................... 79 6-3-3 Impact on energy trade ......................................................................................................... 80 6-3-4 Impact on the price in energy-intensive industries ............................................................... 81 6-3-5 Impact on industrial competitiveness ................................................................................... 81 6-3-6 Impact on macro economy ................................................................................................... 83 6-3-7 Environmental impact .......................................................................................................... 84
6-4 Economic impact on energy-saving investment ........................................................................ 85 6-4-1 Assumption of the analysis .................................................................................................. 85 6-4-2 Impact on energy prices ....................................................................................................... 85 6-4-3 Impact on energy trade ......................................................................................................... 86 6-4-4 Impact on the price in energy-intensive industries ............................................................... 87 6-4-5 Impact on industrial competitiveness ................................................................................... 88 6-4-6 Impact on macro economy ................................................................................................... 90 6-4-7 Environment impact ............................................................................................................. 91
Chapter 7 Conclusion .............................................................................. 92 7-1 Summary of the results .............................................................................................................. 92 7-2 Policy implications .................................................................................................................... 93
References ................................................................................................. 95
List of Tables Table B-1-1 Result of multiple regression analysis of prices of electricity for industry and the
share of various electricity sources ..................................................................................... 21 Table 5-1-1 Indictors of industrial competitiveness .................................................................... 45 Table 5-2-1 Electricity price for industry and RTB ..................................................................... 65 Table 5-2-2 Electricity price for industry and RCA .................................................................... 65 Table 5-2-3 Relative level of electricity price for industry and RTB .......................................... 66 Table 5-2-4 Relative level of electricity price for industry and RCA ......................................... 66 Table 5-2-5 Energy intensity and RTB ........................................................................................ 67 Table 5-2-6 Energy intensity and RCA ....................................................................................... 67 Table 5-2-7 Energy cost share and RTB...................................................................................... 68 Table 5-2-8 Energy cost share and RCA ..................................................................................... 68 Table 5-2-9 Energy cost share and RTB (ignoring the cross-section effect) ............................... 68 Table 5-2-10 Energy cost share and RCA (ignoring the cross-section effect) ............................ 69 Table 6-1-1 Regional classification and sectoral breakdown in this study ................................. 71 Table 6-4-1 Energy-saving potential of the energy-intensive industries in APEC economies .... 85
List of Figures Figure 2-1-1 Spot price of crude oil in major markets .................................................................. 7 Figure 2-1-2 Price of natural gas in major markets ....................................................................... 8 Figure 2-1-3 Price of steam coal in major markets ....................................................................... 9 Figure 2-1-4 Price of fossil fuels in the same calorific value ...................................................... 10 Figure 2-2-1 Light fuel oil prices for industry ............................................................................ 11 Figure 2-2-2 Gasoline prices ....................................................................................................... 12 Figure 2-3-1 Natural gas prices for industry ............................................................................... 13 Figure 2-4-1 Coal prices for industry .......................................................................................... 14 Figure 2-5-1 Energy mix in power generation (based on electricity generated, 2013) ............... 15 Figure 2-5-2 Electricity price for industry in APEC and others in 2014 ..................................... 19 Figure 2-5-3 Trends in prices for electricity for industry in major economies ........................... 19 Figure 2-5-4 Prices of electricity for industrial/household use and taxes in major economies
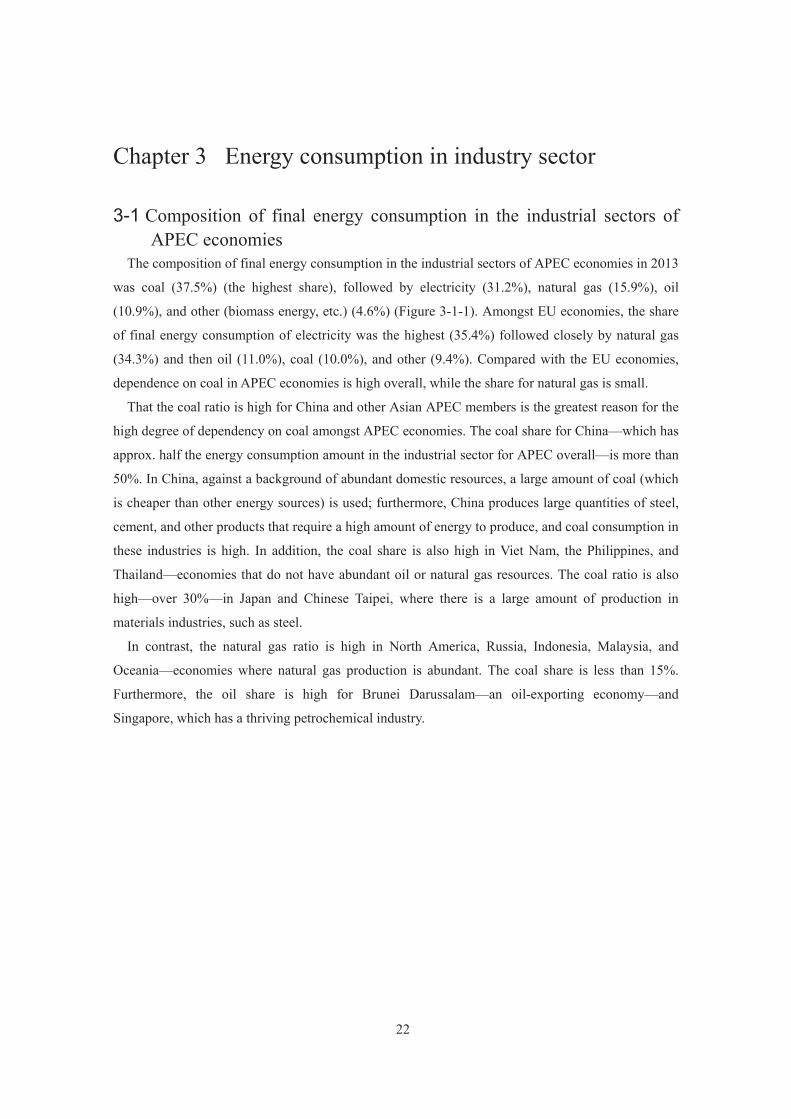
(2014) .................................................................................................................................. 20 Figure 3-1-1 Composition of energy consumption in industrial sectors (2013) ......................... 23 Figure 3-2-1 Final energy consumption per gross value added in manufacturing (2013) .......... 24 Figure 3-2-2 Trends in final energy consumption per real gross value added in manufacturing 25 Figure 3-3-1 Final energy consumption per crude steel production (2013) ................................ 26 Figure 3-3-2 Ratio of electric furnace usage in overall crude steel production (2013) ............... 27
Figure 3-3-3 Trends in final energy consumption per crude steel production ............................ 27 Figure 3-3-4 Trends in electric furnace ratios ............................................................................. 28 Figure 3-3-5 Worldwide energy-saving potential in steel industry ............................................. 28 Figure 3-4-1 Energy consumption per production of paper and paperboard (2013) ................... 29 Figure 3-4-2 Trends in energy consumption per production of paper and paperboard ............... 30 Figure 3-4-3 Energy-saving potential for the paper and pulp industry ....................................... 30 Figure 3-5-1 Efficiency of fossil fuel-fired power generation (2013) ......................................... 31 Figure 3-5-2 Trends in coal-fired power generation efficiency .................................................. 32 Figure 3-5-3 Trends in natural gas-fired power generation efficiency ........................................ 32 Figure 4-1-1 Cost structure of manufacturing in APEC and EU ................................................. 35 Figure 4-1-2 Energy cost of manufacturing in APEC and EU .................................................... 36 Figure 4-2-1 Cost structure of major industries in APEC in 2011 .............................................. 37 Figure 4-2-2 Energy consumption of chemical in major economies in 2011.............................. 39 Figure 4-2-3 Sales per ton crude steel in 2011 ............................................................................ 39 Figure 4-2-4 Energy consumption of iron and steel in major economies in 2011 ...................... 41 Figure 4-2-5 Energy consumption of non-metallic mineral in major economies in 2011 ........... 42 Figure 5-1-1 Changes in the export value in manufacturing ....................................................... 46 Figure 5-1-2 Transition of the export value of the manufacturing in major APEC economies and
global market share ............................................................................................................. 47 Figure 5-1-3 Transition of RTB of the manufacturing in major APEC economies ..................... 49 Figure 5-1-4 Transition of RCA in major APEC economies in manufacturing .......................... 50 Figure 5-1-5 Transition of export value of iron and steel ........................................................... 51 Figure 5-1-6 Transition of the export value in the iron and steel industry in major APEC
economies ........................................................................................................................... 52 Figure 5-1-7 Transition or RTB in the iron and steel industry in APEC ..................................... 53 Figure 5-1-8 Transition of RCA in the iron and steel industry in APEC ..................................... 54 Figure 5-1-9 Transition of export value of non-metallic mineral ................................................ 55 Figure 5-1-10 Transition of the export value of Non-metallic mineral in major APEC economies
............................................................................................................................................ 56 Figure 5-1-11 Transition of RTB of non-metallic mineral in APEC ........................................... 57 Figure 5-1-12 Transition of RCA of non-metallic mineral in APEC .......................................... 58 Figure 5-1-13 Transition of the export value of basic chemical products ................................... 59 Figure 5-1-14 Transition of the export value in major APEC economies ................................... 60 Figure 5-1-15 Transition of RTB in basic chemical products in APEC ...................................... 61 Figure 5-1-16 Transition of RCA of basic chemical products in APEC ..................................... 62 Figure 5-2-1 Electricity price and Relative level of electricity price .......................................... 66
Figure 6-1-1 Simplified GTAP model framework ...................................................................... 70 Figure 6-2-1 The rate of decline in prices of fossil fuels in the Lower Energy Prices case ........ 72 Figure 6-2-2 The change rate of electricity price in APEC and EU in the Lower Energy Prices
case ...................................................................................................................................... 73 Figure 6-2-3 Import value of fossil fuel per nominal GDP ......................................................... 73 Figure 6-2-4 Change rate of the price in energy-intensive industries in APEC and EU in the
Lower Energy Prices case ................................................................................................... 74 Figure 6-2-5 Change rate in imports and exports of manufacturing in the Lower Energy Prices
case ...................................................................................................................................... 75 Figure 6-2-6 Relative Trade Balance (RTB) in manufacturing in the case of Lower Energy
Prices ................................................................................................................................... 75 Figure 6-2-7 Change rate in export in manufacturing industries in the Lower Energy Prices case
............................................................................................................................................ 76 Figure 6-2-8 Change rate of production prices in major manufacturing industries in the Lower
Energy Prices case .............................................................................................................. 76 Figure 6-2-9 Revealed Comparative Advantage (RCA) in major manufacturing industries in
APEC and EU ..................................................................................................................... 77 Figure 6-2-10 Change rate in real GDP in APEC in the Lower Energy Prices case ................... 78 Figure 6-3-1 Assumption of power generation mix in major economies .................................... 79 Figure 6-3-2 Change rate of electricity price in the Low Carbon case ....................................... 80 Figure 6-3-3 Import value of fossil fuel per nominal GDP ......................................................... 80 Figure 6-3-4 Change rate of price in energy-intensive industries in the Low Carbon case ........ 81 Figure 6-3-5 Change rate in imports and exports of manufacturing in the Low Carbon case .... 82 Figure 6-3-6 RTB of manufacturing in APEC economies and EU ............................................. 82 Figure 6-3-7 Change rate in export in major manufacturing industries in APEC and EU in the
Low Carbon case ................................................................................................................. 83 Figure 6-3-8 RCA in major manufacturing industries in APEC and EU .................................... 83 Figure 6-3-9 Change rate of real GDP in the Low Carbon case ................................................. 84 Figure 6-3-10 Coefficient of CO2 emission for electricity in APEC and EU .............................. 84 Figure 6-4-1 Change rate of international energy prices in the High Efficiency case ................ 86 Figure 6-4-2 Change rate of electricity price in the High Efficiency case .................................. 86 Figure 6-4-3 Import value of fossil fuel per nominal GDP ......................................................... 87 Figure 6-4-4 Change rate of price in energy-intensive industries in High Efficiency case ......... 87 Figure 6-4-5 Change rate of exports and imports in the manufacturing industry in the High
Efficiency case .................................................................................................................... 88 Figure 6-4-6 Changes of RTB in the manufacturing industry in the High Efficiency case......... 89

Figure 6-4-7 Changes in the exports of the manufacturing industry in the High Efficiency case
............................................................................................................................................ 89 Figure 6-4-8 Changes in RCA in the manufacturing industry in the High Efficiency case ........ 90 Figure 6-4-9 Change rate of real GDP in the High Efficiency case ............................................ 90 Figure 6-4-10 CO2 emission per real GDP in APEC and EU ..................................................... 91
1
EXECUTIVE SUMMARY Energy price
Large differences of electricity prices exist depending on the difference in the energy mix and
power generation efficiency, as well as the price structure and tax system among APEC
economies. On the other hand, compared to the European Union, where the introduction of
high-cost renewable energy expanded, electricity prices in the APEC economies are relatively
low in the context of the high rate of inexpensive coal-fired power generation. Even the price of
petroleum products in APEC is lower than the EU due to the difference in tax rate.
Energy efficiency While APEC has economies with high energy efficiency in manufacturing, such as Japan, there
are also economies with large potential for improved efficiency, such as Russia and China. In
addition, improved energy efficiency has the effect of alleviating any increase in the cost of
energy as energy prices rise. Overall, the energy efficiency for manufacturing and
energy-intensive industries in APEC is lower than the EU.
Energy cost Low energy cost and a large consumption ratio of particularly inexpensive coal mean it is
effective to lower the energy cost of manufacturing in APEC. For that reason, despite the poor
energy efficiency in APEC compared to the EU, the energy cost share is lower in some
energy-intensive industries.
Energy and economic competitiveness The results of verification analysis regarding the data from 1995 to 2014 in major APEC
economies suggest that the energy cost, especially the relative level of energy cost from a
global perspective, exerts a significant impact on competitiveness in energy-intensive industries.
On the other hand, during the period of this analysis, it was not significant in the relation of
energy efficiency and industrial competitiveness in major APEC economies. As for the energy
cost share, the results suggest a link with a relative relationship to industrial competitiveness
among the economies.
The impact of the introduction of low-carbon technology exerted on electricity prices differs by
economic performance of the technologies and power generation mix. On the other hand, the
introduction of a power supply with low-carbon technology and the penetration of
energy-saving technology will help reduce the demand for fossil fuels and have the effect of
2
lowering the price of fossil fuels. In addition, the decline in the energy price and the reduction
in the cost of energy through energy savings has the effect of increasing competitiveness in
manufacturing by lowering the price of products.
While the decline in energy import prices and the drop in energy import volume help increase
GDP in economies that import energy, the GDP of economies that produce and export energy
suffer a negative effect. The shrink in demand in exporting economies also causes a reduction
in exports and production in other economies. Conversely, the decline in energy cost due to
energy savings can possibly bring advantages to all economies. In addition, by shifting labor
and capital from energy industries to other industries, it is possible that competitiveness in
manufacturing will increase in economies that produce and export energy.
Implications Amid an increasing need to respond to climate change issues and in order to promote the
reduction of CO2 emissions, expanding the introduction of energy-saving and low-carbon
technology is necessary in all APEC economies. The analysis suggests that these approaches
will bring economic advantages to the import economies of fossil energy. For economies
exporting fossil energy, while low-carbonization in importing economies brings the pain of
reducing export income from fossil energy, the results suggest the possibility of alleviation of
the pain by advancing the low-carbon energy demand structure in the exporting economies. It
therefore means that although the degree of benefit differs, the actions toward low-carbon
energy bring in a positive effect as a whole. It is recommended that all APEC economies take
action steadily toward the realization.
The following four points are specific actions needed to realize a low-carbon society:
1. Lowering the cost of renewable energy and the construction of energy supply systems
suitable for introduction of renewable in large quantities.
2. The utilization of nuclear power generation in the economies with such usage possibilities.
3. The reinforcement of the initiative to facilitate high efficient use of fossil energy as much
as possible.
4. The reformation of the international natural gas/LNG market so that the natural gas can be
easily accessible.
3
Chapter 1 Background and Purpose
1-1 Background Energy is essential goods for every economic activity. Accordingly, it is considered that the degree
of energy cost has an effect on industrial competitiveness, together with geographical requirements,
foreign exchange rate, infrastructure, the taxation system, labor cost, and so on. The effects of energy
cost on the industry include not only the degree of direct energy input cost, but indirect action of
energy input cost and competitiveness in other intermediate goods and services.
Recently, attention has been particularly drawn to the effects of energy cost on the industry
because of transition of the crude oil price at an unprecedented high level. Although the crude oil
price is presently declining, it may rise again in the long run against the backdrop of a steady
increase in global energy demand. Even if the crude oil price does not return to around $100/bbl, the
effects of energy cost on the industry still persist and cannot be ignored.
From such a viewpoint, the International Energy Agency and the European Commission had
raised the issue of energy cost and competitiveness in the past. Presently, however, there is no
accepted notion on decisive factors and improvement measures for industrial competitiveness, and
no analysis has been made in view of the features of the Asia-Pacific Economic Cooperation (APEC)
regions and member economies.
In the APEC regions, economies boasting a global leading economic scale and energy
consumption already exist, and the economic scale is expected to further expand, centering on the
developing economies. In order for the APEC member economies to make future healthy
development, it is required to address the issue of energy and industrial competitiveness while taking
account of the diversity of the member economies.
Accordingly, it is believed to be highly contributive to drafting of future energy policies and
intra-regional cooperation to make a new analysis on energy cost and industrial competitiveness,
targeting the APEC regions.
1-2 Rationale Against problem consciousness mentioned in 1-1, it was commonly recognized at the 11th APEC
Energy Ministerial Meeting held in Beijing in Sep. 2014 that energy cost had a great effect on the
energy-intensive industries in the APEC economies. Based on this recognition, the Ministers of
Energy ordered the Asia Pacific Energy Research Centre to study energy and economic
competitiveness1. This study is conducted under this order.
1 2014 APEC Energy Ministerial Meeting, Beijing Declaration & Instruction of the APEC Energy Ministers
4
1-3 Outline of the study This study targets the energy-intensive industries for analysis. This is because an economic
structure differs depending on the economy, but in many cases, the industry is a significant field
consisting of an economy, and the energy-intensive industries are most considerably affected by
energy cost above all.
First, this study collects the information about energy price, energy efficiency and energy cost in
the industry in APEC. Based on these, regression analysis is made on the effects of energy on
industrial competitiveness. And to estimate the impact of the changes of energy price and efficiency
on macro economy, quantitative analysis is made with a global computable general equilibrium
(CGE) model.
5
Chapter 2 Energy price in APEC
In recent years, there has been great interest in the impact exerted by energy prices on industrial
competitiveness. From the latter half of the 2000s, natural gas prices in the US market have fallen
considerably due to the rapid increase in US production of unconventional natural gas, and the
difference in prices between the United States and other major markets of Europe and Asia has
widened. A debate arose as to whether the decrease in energy prices within the United States has led
to a decrease in US industrial energy costs and an increase in competitiveness as represented by the
revival of the US manufacturing industry.
In contrast, in Japan, following the Fukushima Daiichi Nuclear Power Station accident, nuclear
power plants have been shut down one after the other due to safety concerns, threatening to cause
insufficient electricity supply capability. At the same time, because of the increase in the fossil
fuel-fired power generation ratio coupled with the rise in import prices for fossil fuels, electricity
prices have increased significantly. Such increases in energy prices and supply risks are viewed as
problematic because of their pushing up production costs for Japanese businesses, lowering business
competitiveness, and placing pressure on operations.
In Europe, because of the introduction of environmental taxes, carbon taxes, and the EU ETS
since the 1990s, the energy costs of energy-intensive industries have increased, while the
introduction and expansion of renewable energy generation are further pushing up electricity prices.
Because of the difference in energy prices with the United States and other economies, concerns are
held that the EU’s industrial export competitiveness will be impaired.
In comparisons of energy prices in various economies, analyses center on oil, natural gas, and
electricity. Since oil prices are determined on world markets by crude oil prices, the differences
between major economies in base prices for oil products are small. However, because of tax amounts,
there are significant differences in the wholesale prices and retail prices of diesel oil and gasoline for
transportation. In contrast, because natural gas prices are determined by markets in each economy,
compared with crude oil the difference in natural gas prices between economics is large. Electricity
prices are influenced by many factors, including power generation mix, the price of each type of fuel
used in electricity generation, electricity generation efficiency, costs and shares of renewable energy,
and electricity transmission/distribution costs. Furthermore, depending on electricity cost structures
and tax systems, electricity wholesale and retail prices can vary largely.
Bearing in mind the impact of energy prices on industrial competitiveness, here we provide an
overview of energy prices for industrial use in APEC economies, comparing these with the EU,
based on fossil fuel price trends in major markets in recent years.
6
2-1 International energy prices 1) Oil
As the largest supply source for primary energy, oil is used in an extremely wide range of fields,
including transportation, industry, consumer use, and power generation. Consequently, crude oil
prices are important benchmarks for the overall macro economy, and in Asia and other economies,
crude oil prices are also used as a reference in deciding natural gas prices. In the three major markets
of North America, Europe, and Asia, the primary price benchmarks—reflecting the properties of the
marker crude oil and changes in supply and demand in each region—are West Texas Intermediate
(WTI), North Sea Brent, and Dubai Crude. Although there are price differences (spread) amongst
different types of oil, these price benchmarks move in unison.
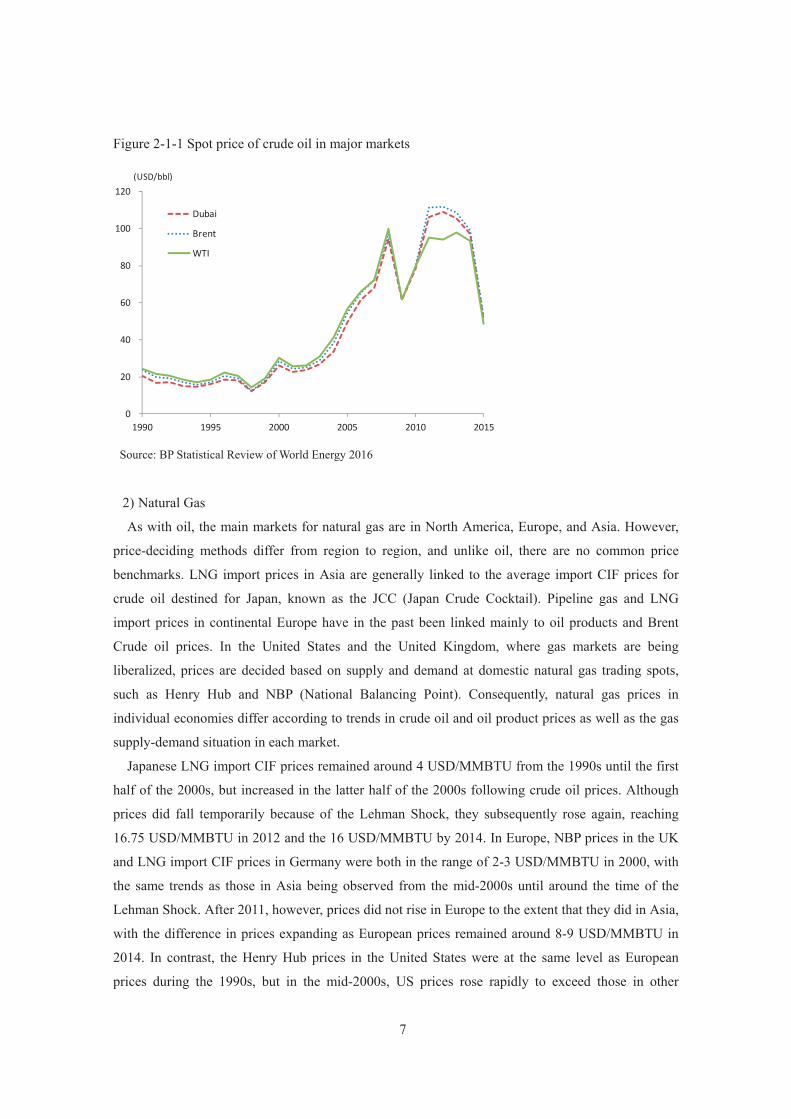
Although crude oil prices were comparatively stable during the 1990s within the $20/bbl range,
they have continued to rise rapidly since the latter half of the 2000s due to a steady increase in oil
demand in China and other emerging economies, at one point exceeding 130 USD/bbl in mid-2008.
Following the Lehman Shock, crude oil prices fell rapidly after September 2008, at one point
dropping to within the 40 USD/bbl range in the first half of 2009. Subsequently, however, crude oil
prices again began to rise with the revival of the world economy, beginning with emerging
economies, as well as cooperative production cutbacks by OPEC oil-producing economies, and for
most of the period between 2011 and mid-2014 Brent and Dubai remained at a level above 100
USD/bbl. With the easing of supply and demand due to increased production of shale oil in the
United States, the gap between WTI prices and Brent /Dubai prices widened, but even so, WTI
remained steady in the 90 USD/bbl range. However, from the latter half of 2014 onwards, crude oil
prices once again fell rapidly due to the increase in crude oil supply by North America and other
non-OPEC oil-producing economies, slowing of economic and oil demand growth in emerging
economies, and share-securing strategies by OPEC oil-producing economies, such as Saudi Arabia.
As of 2016, the slump in crude oil prices is continuing.
7
Figure 2-1-1 Spot price of crude oil in major markets
Source: BP Statistical Review of World Energy 2016
2) Natural Gas
As with oil, the main markets for natural gas are in North America, Europe, and Asia. However,
price-deciding methods differ from region to region, and unlike oil, there are no common price
benchmarks. LNG import prices in Asia are generally linked to the average import CIF prices for
crude oil destined for Japan, known as the JCC (Japan Crude Cocktail). Pipeline gas and LNG
import prices in continental Europe have in the past been linked mainly to oil products and Brent
Crude oil prices. In the United States and the United Kingdom, where gas markets are being
liberalized, prices are decided based on supply and demand at domestic natural gas trading spots,
such as Henry Hub and NBP (National Balancing Point). Consequently, natural gas prices in
individual economies differ according to trends in crude oil and oil product prices as well as the gas
supply-demand situation in each market.
Japanese LNG import CIF prices remained around 4 USD/MMBTU from the 1990s until the first
half of the 2000s, but increased in the latter half of the 2000s following crude oil prices. Although
prices did fall temporarily because of the Lehman Shock, they subsequently rose again, reaching
16.75 USD/MMBTU in 2012 and the 16 USD/MMBTU by 2014. In Europe, NBP prices in the UK
and LNG import CIF prices in Germany were both in the range of 2-3 USD/MMBTU in 2000, with
the same trends as those in Asia being observed from the mid-2000s until around the time of the
Lehman Shock. After 2011, however, prices did not rise in Europe to the extent that they did in Asia,
with the difference in prices expanding as European prices remained around 8-9 USD/MMBTU in
2014. In contrast, the Henry Hub prices in the United States were at the same level as European
prices during the 1990s, but in the mid-2000s, US prices rose rapidly to exceed those in other
0
20
40
60
80
100
120
1990 1995 2000 2005 2010 2015
Dubai
Brent
WTI
(USD/bbl)

8
regions, reaching 8.79 USD/MMBTU in 2005. Prices plummeted in response to the rapid expansion
of unconventional natural gas production beginning in the latter 2000s, and in recent years have
maintained a low level of 2-4 USD/MMBTU.
Reasons that LNG prices in the Asian market were higher than prices in other regions up until
2014 are that the supply-and-demand situation in Asian markets was tight, liquidity was low, and
LNG prices were greatly influenced by increases in crude oil prices due to pricing mechanisms that
referenced crude oil prices. However, from the latter half of 2014 onwards, LNG prices have been
falling because of the decline in crude oil prices and the easing of LNG supply and demand, and so
the price difference between Asia and Europe/North America contracted.
Figure 2-1-2 Price of natural gas in major markets
Source: BP Statistical Review of World Energy 2016
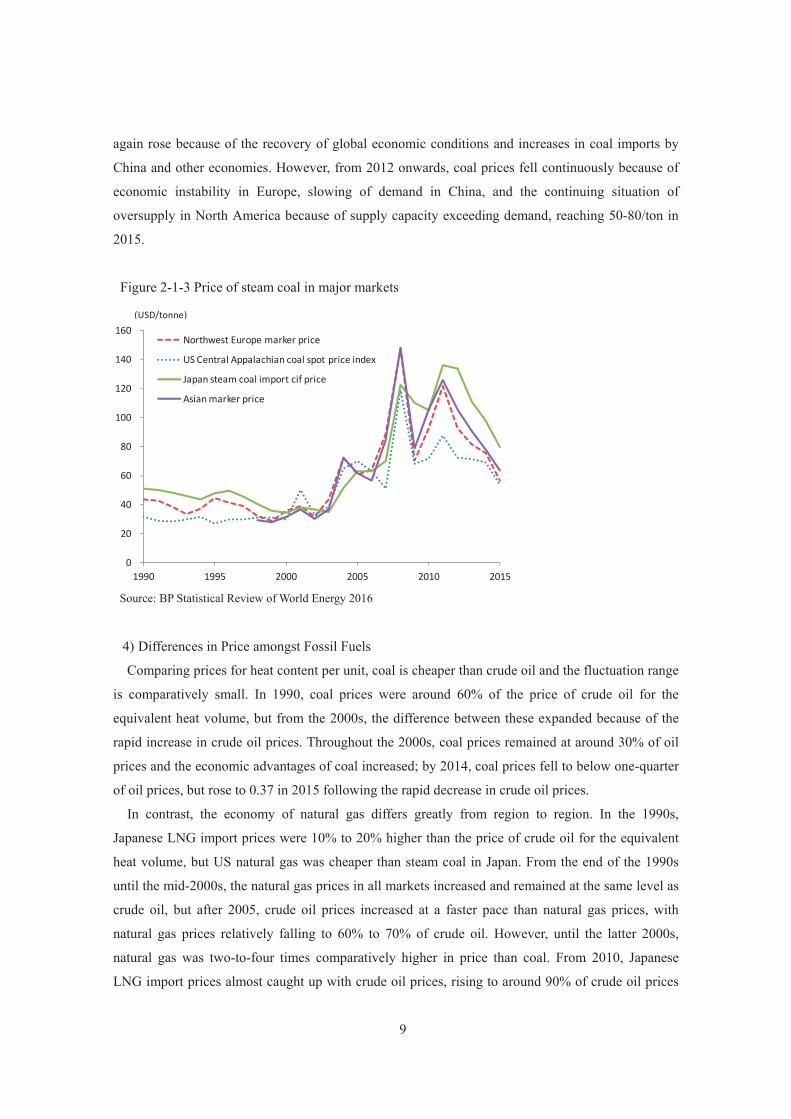
3) Coal
Compared to oil and natural gas, the major production economies and consumption economies for
coal are the same in many cases, with each economy/region forming its own domestic and regional
markets. In contrast to the percentage of international trade volume ratio for worldwide
production/consumption amounts held by oil (approx. 60%) and natural gas (approx. one-third), coal
comprises only approx. one-sixth of international trade volume.
Looking at the main price benchmarks for international coal trading by North America, Europe,
and Asia, as with natural gas, there are no large differences between regions. In the 1990s, stream
coal prices in each region tended to remain either around the same level or decrease, and around
2000 coal prices were around 30 USD/ton. From 2003 onwards, prices rose rapidly in response to
tight supply and demand worldwide, reaching around 120-150 USD/ton in 2008; however, reduced
demand due to the Lehman Shock caused a rapid drop in coal prices in 2009. From 2010, coal prices
0
2
4
6
8
10
12
14
16
18
1990 1995 2000 2005 2010 2015
Japan LNG CIF
German LNG cif
UK(NBP)
US Henry Hub
(USD/MMBTU)
9
again rose because of the recovery of global economic conditions and increases in coal imports by
China and other economies. However, from 2012 onwards, coal prices fell continuously because of
economic instability in Europe, slowing of demand in China, and the continuing situation of
oversupply in North America because of supply capacity exceeding demand, reaching 50-80/ton in
2015.
Figure 2-1-3 Price of steam coal in major markets
Source: BP Statistical Review of World Energy 2016
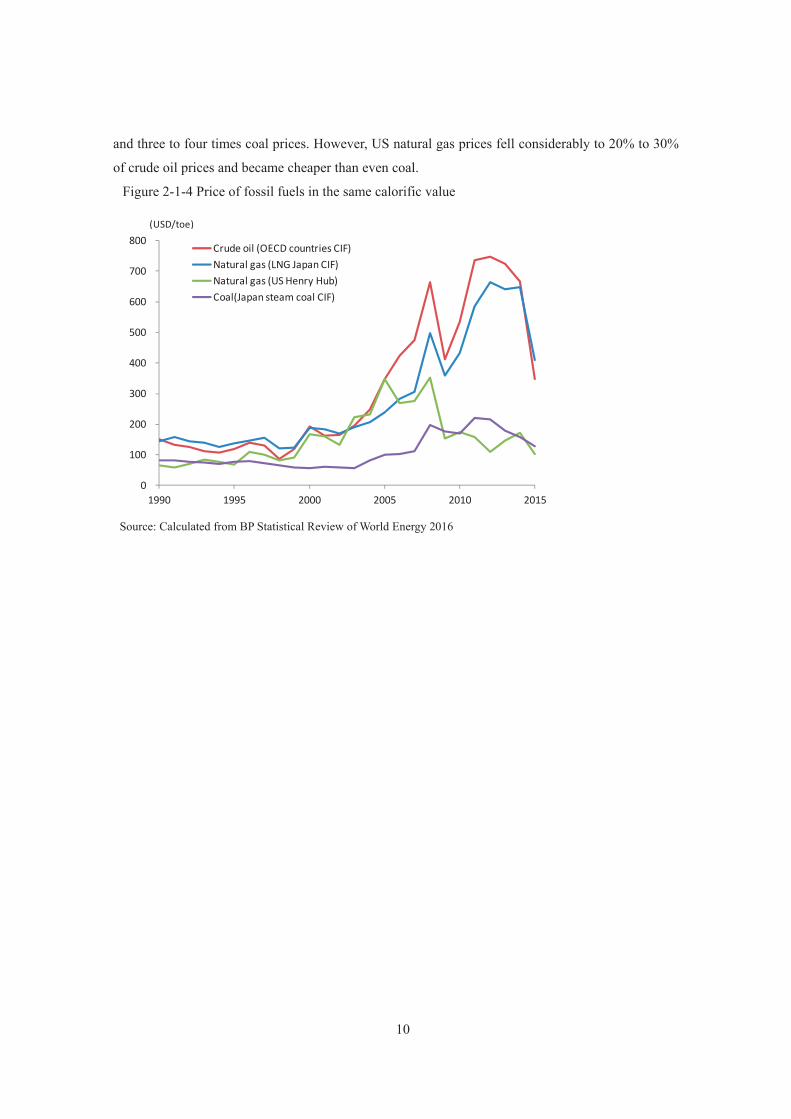
4) Differences in Price amongst Fossil Fuels
Comparing prices for heat content per unit, coal is cheaper than crude oil and the fluctuation range
is comparatively small. In 1990, coal prices were around 60% of the price of crude oil for the
equivalent heat volume, but from the 2000s, the difference between these expanded because of the
rapid increase in crude oil prices. Throughout the 2000s, coal prices remained at around 30% of oil
prices and the economic advantages of coal increased; by 2014, coal prices fell to below one-quarter
of oil prices, but rose to 0.37 in 2015 following the rapid decrease in crude oil prices.
In contrast, the economy of natural gas differs greatly from region to region. In the 1990s,
Japanese LNG import prices were 10% to 20% higher than the price of crude oil for the equivalent
heat volume, but US natural gas was cheaper than steam coal in Japan. From the end of the 1990s
until the mid-2000s, the natural gas prices in all markets increased and remained at the same level as
crude oil, but after 2005, crude oil prices increased at a faster pace than natural gas prices, with
natural gas prices relatively falling to 60% to 70% of crude oil. However, until the latter 2000s,
natural gas was two-to-four times comparatively higher in price than coal. From 2010, Japanese
LNG import prices almost caught up with crude oil prices, rising to around 90% of crude oil prices
0
20
40
60
80
100
120
140
160
1990 1995 2000 2005 2010 2015
Northwest Europe marker price
US Central Appalachian coal spot price index
Japan steam coal import cif price
Asian marker price
(USD/tonne)
10
and three to four times coal prices. However, US natural gas prices fell considerably to 20% to 30%
of crude oil prices and became cheaper than even coal.
Figure 2-1-4 Price of fossil fuels in the same calorific value
Source: Calculated from BP Statistical Review of World Energy 2016
0
100
200
300
400
500
600
700
800
1990 1995 2000 2005 2010 2015
Crude oil (OECD countries CIF)Natural gas (LNG Japan CIF)Natural gas (US Henry Hub)Coal(Japan steam coal CIF)
(USD/toe)

11
2-2 Prices of oil for industrial use and transportation use In the industrial sector, a wide diversity of oil products is used for a variety of purposes, such as
fuels or raw materials, and so there is no single representative product or price. Here, using the
example of light fuel oil for industrial use—which is used in many economies and for which price
information statistics have been complied—we will compare the prices of oil products for industrial
use in major economies.
As of 2005, the price of light fuel oil for industrial use in major economies was 450-650 USD/toe.
In APEC economies, tax rates are relatively lower than in the EU, with many economies levying
taxes of around 500 USD/toe. The economy with a higher tax rate than this standard is Canada (tax
rate approx. 10% = nearly 600 USD/toe) and the economy with a lower tax rate is Mexico (under
300 USD/toe). In the EU, tax in Italy is high, the tax rate of close to 50% resulting in the highest
prices for light fuel oil of close to 1300 USD/toe. In the UK, France, Germany, and other economies,
tax is around 10%, resulting in light fuel oil prices of around 600 USD/toe (tax included).
Reflecting the increase in international crude oil prices, the prices for light fuel oil for industrial
use in all economies increased in 2014. In virtually all the economics, the increase range was
300-500 USD/toe. Whereas in the EU (excluding Italy) prices reached around 1,000 USD/toe,
amongst APEC economies, prices in virtually all economies—excluding Japan and Canada, where
prices were on the same level as EU prices—were around 800 USD/toe. Mexico continued to have
the lowest prices, but the increases were large and the price difference between Mexico and other
APEC economies contracted.
Figure 2-2-1 Light fuel oil prices for industry
Note: For Indonesia and Russia, figures are for the total price.
Source: Compiled based on IEA “Energy Prices and Taxes” and official statistics for each economy
771 913
700
1003 832 786 895 955
834
1138
455 536 279
483 447 469 490 471 578 545 688
479
811
597
997
279
723
531
1106
447
832
469 490
786
582
1106
660
1043
631
925
1280
1770
0
200
400
600
800
1,000
1,200
1,400
1,600
1,800
2,000
2005
2014
2005
2014
2005
2014
2005
2014
2005
2014
2005
2014
2005
2014
2005
2014
2005
2014
2005
2014
2005
2014
USA CDA MEX JPN NZ INA RUS GBR FRA DEU ITA
TaxEx-tax price 2005Ex-tax price 2014
(US¢/kWh)(USD/toe)
12
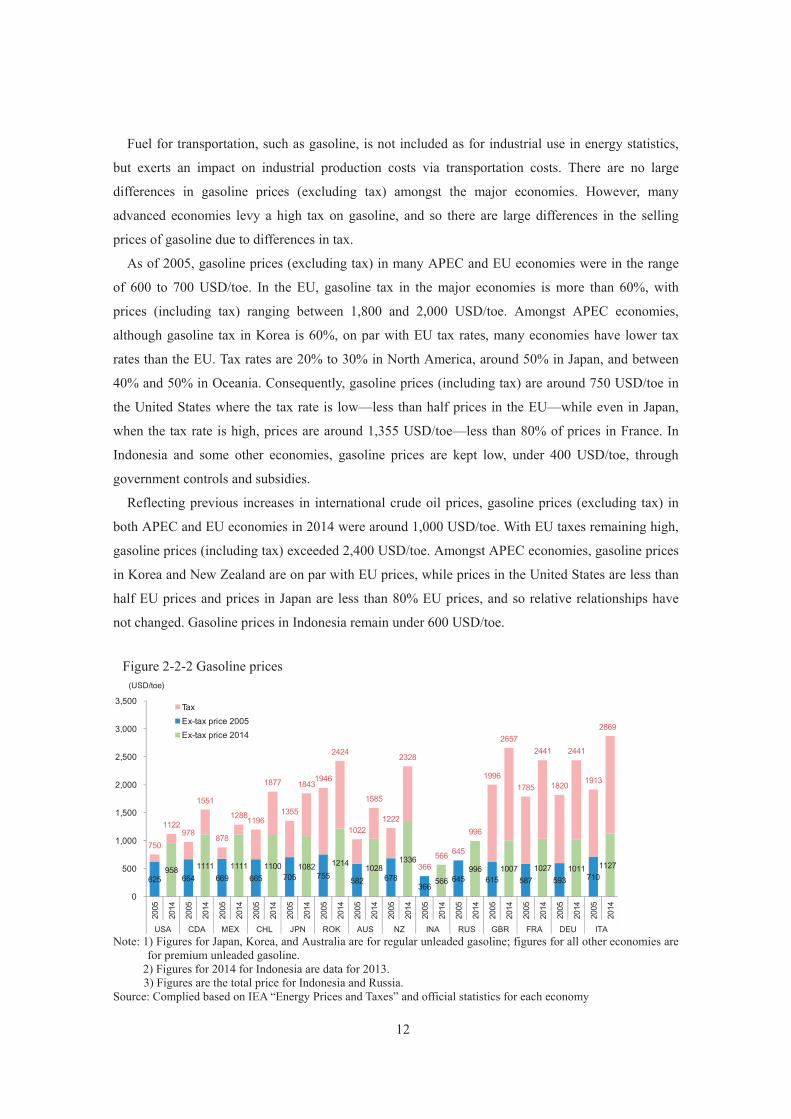
Fuel for transportation, such as gasoline, is not included as for industrial use in energy statistics,
but exerts an impact on industrial production costs via transportation costs. There are no large
differences in gasoline prices (excluding tax) amongst the major economies. However, many
advanced economies levy a high tax on gasoline, and so there are large differences in the selling
prices of gasoline due to differences in tax.
As of 2005, gasoline prices (excluding tax) in many APEC and EU economies were in the range
of 600 to 700 USD/toe. In the EU, gasoline tax in the major economies is more than 60%, with
prices (including tax) ranging between 1,800 and 2,000 USD/toe. Amongst APEC economies,
although gasoline tax in Korea is 60%, on par with EU tax rates, many economies have lower tax
rates than the EU. Tax rates are 20% to 30% in North America, around 50% in Japan, and between
40% and 50% in Oceania. Consequently, gasoline prices (including tax) are around 750 USD/toe in
the United States where the tax rate is low—less than half prices in the EU—while even in Japan,
when the tax rate is high, prices are around 1,355 USD/toe—less than 80% of prices in France. In
Indonesia and some other economies, gasoline prices are kept low, under 400 USD/toe, through
government controls and subsidies.
Reflecting previous increases in international crude oil prices, gasoline prices (excluding tax) in
both APEC and EU economies in 2014 were around 1,000 USD/toe. With EU taxes remaining high,
gasoline prices (including tax) exceeded 2,400 USD/toe. Amongst APEC economies, gasoline prices
in Korea and New Zealand are on par with EU prices, while prices in the United States are less than
half EU prices and prices in Japan are less than 80% EU prices, and so relative relationships have
not changed. Gasoline prices in Indonesia remain under 600 USD/toe.
Figure 2-2-2 Gasoline prices
Note: 1) Figures for Japan, Korea, and Australia are for regular unleaded gasoline; figures for all other economies are
for premium unleaded gasoline. 2) Figures for 2014 for Indonesia are data for 2013.
3) Figures are the total price for Indonesia and Russia. Source: Complied based on IEA “Energy Prices and Taxes” and official statistics for each economy
958 1111 1111 1100 1082 1214 10281336
566 996 1007 1027 1011 1127
625 664 669 665 705 755 582 678 366
645 615 587 593 710
750
1122 978
1551
878
1288 1196
1877
1355
1843 1946
2424
1022
1585
1222
2328
366 566 645
996
1996
2657
1785
2441
1820
2441
1913
2869
0
500
1,000
1,500
2,000
2,500
3,000
3,500
2005
2014
2005
2014
2005
2014
2005
2014
2005
2014
2005
2014
2005
2014
2005
2014
2005
2014
2005
2014
2005
2014
2005
2014
2005
2014
2005
2014
USA CDA MEX CHL JPN ROK AUS NZ INA RUS GBR FRA DEU ITA
TaxEx-tax price 2005Ex-tax price 2014
(US¢/kWh)(USD/toe)
13
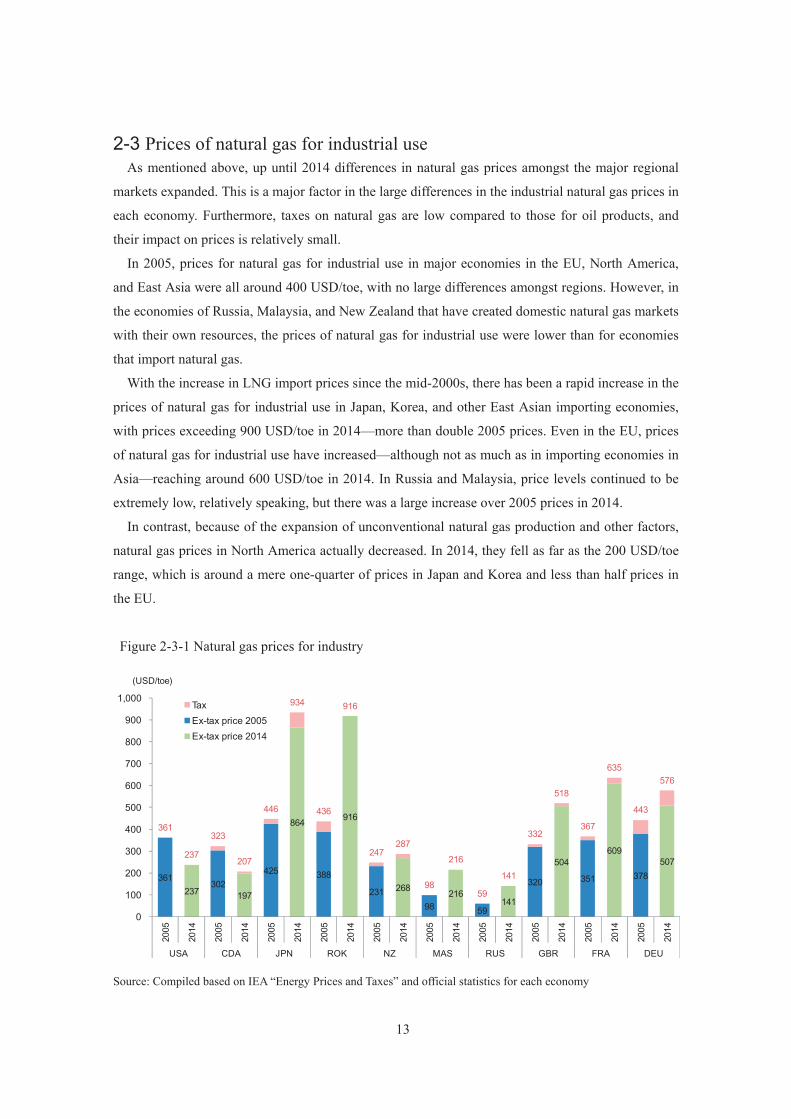
2-3 Prices of natural gas for industrial use As mentioned above, up until 2014 differences in natural gas prices amongst the major regional
markets expanded. This is a major factor in the large differences in the industrial natural gas prices in
each economy. Furthermore, taxes on natural gas are low compared to those for oil products, and
their impact on prices is relatively small.
In 2005, prices for natural gas for industrial use in major economies in the EU, North America,
and East Asia were all around 400 USD/toe, with no large differences amongst regions. However, in
the economies of Russia, Malaysia, and New Zealand that have created domestic natural gas markets
with their own resources, the prices of natural gas for industrial use were lower than for economies
that import natural gas.
With the increase in LNG import prices since the mid-2000s, there has been a rapid increase in the
prices of natural gas for industrial use in Japan, Korea, and other East Asian importing economies,
with prices exceeding 900 USD/toe in 2014—more than double 2005 prices. Even in the EU, prices
of natural gas for industrial use have increased—although not as much as in importing economies in
Asia—reaching around 600 USD/toe in 2014. In Russia and Malaysia, price levels continued to be
extremely low, relatively speaking, but there was a large increase over 2005 prices in 2014.
In contrast, because of the expansion of unconventional natural gas production and other factors,
natural gas prices in North America actually decreased. In 2014, they fell as far as the 200 USD/toe
range, which is around a mere one-quarter of prices in Japan and Korea and less than half prices in
the EU.
Figure 2-3-1 Natural gas prices for industry
Source: Compiled based on IEA “Energy Prices and Taxes” and official statistics for each economy
237 197
864 916
268 216141
504609
507
361302
425 388
23198 59
320 351 378
361
237
323
207
446
934
436
916
247287
98
216
59
141
332
518
367
635
443
576
0
100
200
300
400
500
600
700
800
900
1,000
2005
2014
2005
2014
2005
2014
2005
2014
2005
2014
2005
2014
2005
2014
2005
2014
2005
2014
2005
2014
USA CDA JPN ROK NZ MAS RUS GBR FRA DEU
TaxEx-tax price 2005Ex-tax price 2014
(US¢/kWh)(USD/toe)
14
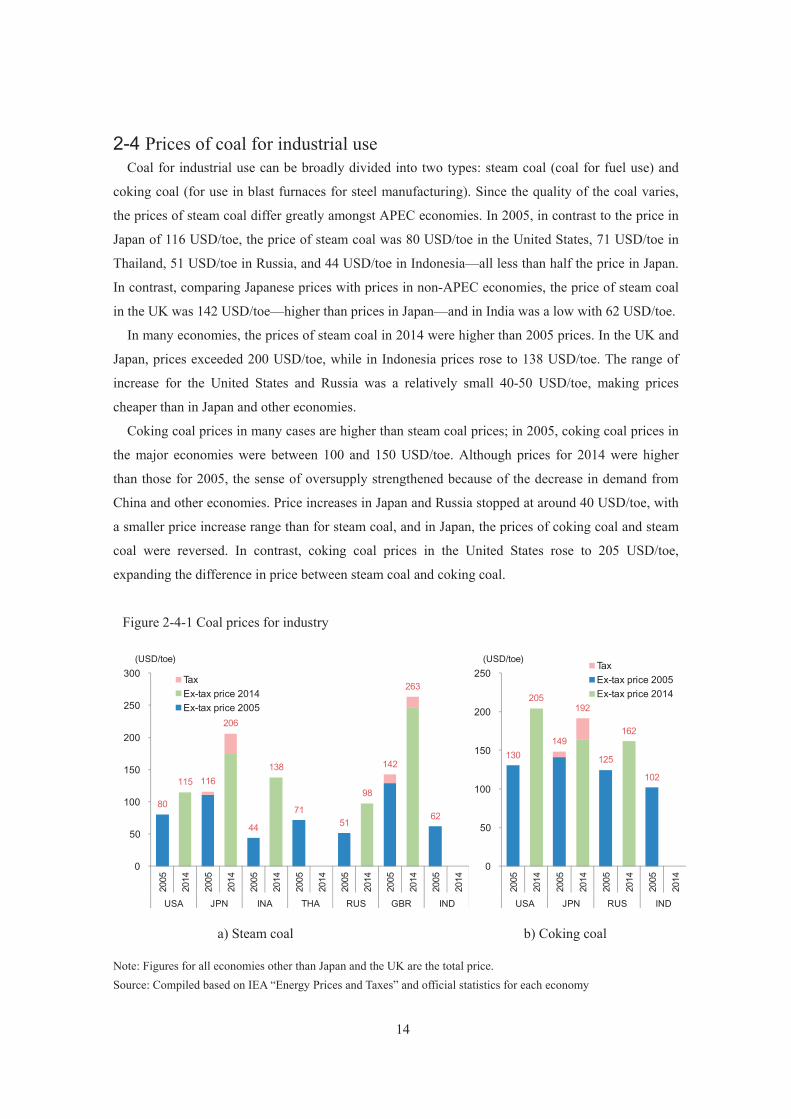
2-4 Prices of coal for industrial use Coal for industrial use can be broadly divided into two types: steam coal (coal for fuel use) and
coking coal (for use in blast furnaces for steel manufacturing). Since the quality of the coal varies,
the prices of steam coal differ greatly amongst APEC economies. In 2005, in contrast to the price in
Japan of 116 USD/toe, the price of steam coal was 80 USD/toe in the United States, 71 USD/toe in
Thailand, 51 USD/toe in Russia, and 44 USD/toe in Indonesia—all less than half the price in Japan.
In contrast, comparing Japanese prices with prices in non-APEC economies, the price of steam coal
in the UK was 142 USD/toe—higher than prices in Japan—and in India was a low with 62 USD/toe.
In many economies, the prices of steam coal in 2014 were higher than 2005 prices. In the UK and
Japan, prices exceeded 200 USD/toe, while in Indonesia prices rose to 138 USD/toe. The range of
increase for the United States and Russia was a relatively small 40-50 USD/toe, making prices
cheaper than in Japan and other economies.
Coking coal prices in many cases are higher than steam coal prices; in 2005, coking coal prices in
the major economies were between 100 and 150 USD/toe. Although prices for 2014 were higher
than those for 2005, the sense of oversupply strengthened because of the decrease in demand from
China and other economies. Price increases in Japan and Russia stopped at around 40 USD/toe, with
a smaller price increase range than for steam coal, and in Japan, the prices of coking coal and steam
coal were reversed. In contrast, coking coal prices in the United States rose to 205 USD/toe,
expanding the difference in price between steam coal and coking coal.
Figure 2-4-1 Coal prices for industry
a) Steam coal b) Coking coal Note: Figures for all economies other than Japan and the UK are the total price. Source: Compiled based on IEA “Energy Prices and Taxes” and official statistics for each economy
80
115 116
206
44
138
7151
98
142
263
62
0
50
100
150
200
250
300
2005
2014
2005
2014
2005
2014
2005
2014
2005
2014
2005
2014
2005
2014
USA JPN INA THA RUS GBR IND
TaxEx-tax price 2014Ex-tax price 2005
(US¢/kWh)(USD/toe)
130
205
149
192
125
162
102
0
50
100
150
200
250
2005
2014
2005
2014
2005
2014
2005
2014
USA JPN RUS IND
TaxEx-tax price 2005Ex-tax price 2014
(US¢/kW(USD/toe)
15
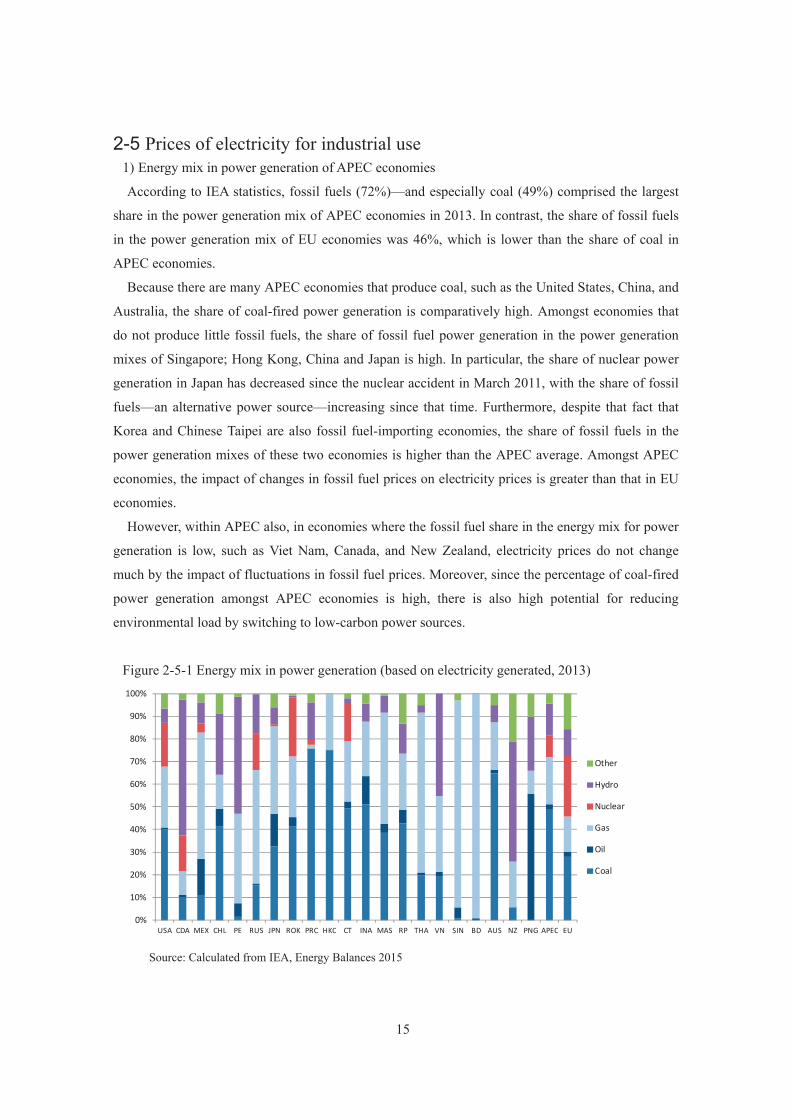
2-5 Prices of electricity for industrial use 1) Energy mix in power generation of APEC economies
According to IEA statistics, fossil fuels (72%)—and especially coal (49%) comprised the largest
share in the power generation mix of APEC economies in 2013. In contrast, the share of fossil fuels
in the power generation mix of EU economies was 46%, which is lower than the share of coal in
APEC economies.
Because there are many APEC economies that produce coal, such as the United States, China, and
Australia, the share of coal-fired power generation is comparatively high. Amongst economies that
do not produce little fossil fuels, the share of fossil fuel power generation in the power generation
mixes of Singapore; Hong Kong, China and Japan is high. In particular, the share of nuclear power
generation in Japan has decreased since the nuclear accident in March 2011, with the share of fossil
fuels—an alternative power source—increasing since that time. Furthermore, despite that fact that
Korea and Chinese Taipei are also fossil fuel-importing economies, the share of fossil fuels in the
power generation mixes of these two economies is higher than the APEC average. Amongst APEC
economies, the impact of changes in fossil fuel prices on electricity prices is greater than that in EU
economies.
However, within APEC also, in economies where the fossil fuel share in the energy mix for power
generation is low, such as Viet Nam, Canada, and New Zealand, electricity prices do not change
much by the impact of fluctuations in fossil fuel prices. Moreover, since the percentage of coal-fired
power generation amongst APEC economies is high, there is also high potential for reducing
environmental load by switching to low-carbon power sources.
Figure 2-5-1 Energy mix in power generation (based on electricity generated, 2013)
Source: Calculated from IEA, Energy Balances 2015
0%
10%
20%
30%
40%
50%
60%
70%
80%
90%
100%
USA CDA MEX CHL PE RUS JPN ROK PRC HKC CT INA MAS RP THA VN SIN BD AUS NZ PNG APEC EU
Other
Hydro
Nuclear
Gas
Oil
Coal
16
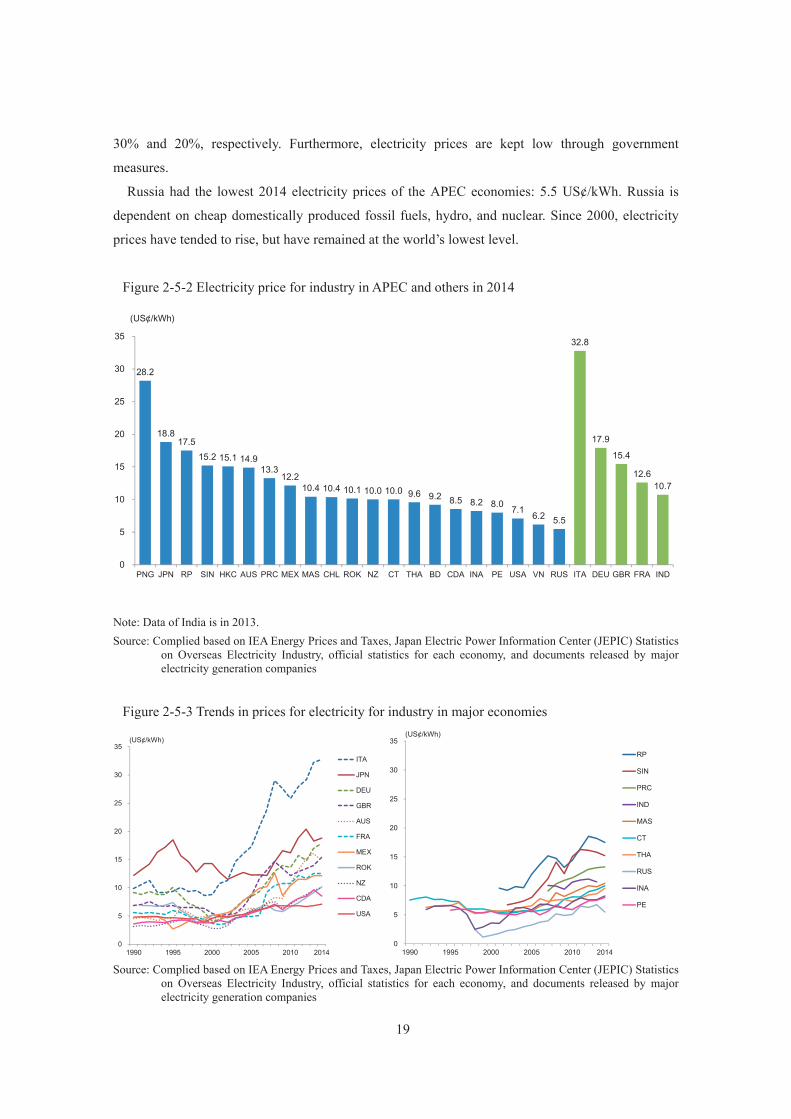
2) Changes in and current status of prices of electricity for industrial use
Looking at changes in prices of electricity for industrial use in major APEC economies, major EU
economies, and India, electricity prices remained at the around the same level or decreased in
virtually all economies throughout the 1990s. Entering the 2000s, economies with a high dependence
on fossil fuels experienced large increases in electricity prices because of large increases in energy
prices, such as oil and natural gas prices.
Within the EU, electricity prices rose rapidly because of increases in levies related to
environmental taxes and renewable energy, in addition to increases in fossil fuel prices. In Italy in
particular, electricity prices increased dramatically from the mid-2000s onwards due to the
economy’s increasing dependence on natural gas and have remained the highest level of electricity
prices amongst the major EU economies, with 2014 prices rising to 3.7 times 2000 prices. Although
in 2000 Germany had the lowest level of electricity prices of all the major industrial economies, the
cost of buying renewable electricity and environmental taxes were shifted to electricity prices, with
the result that electricity prices in 2014 were 4.4 higher than those in 2000, reaching a high level
even by international standards. In France, prices of electricity for industrial use have tended to
increase because of increases in Contribution au Service Public de l'Electricité (CSPE) surcharges,
but because of high nuclear power generation ratio, rising fossil fuel prices since the first half of the
2000s have had little impact on electricity prices compared to other major European economies.
In India, increases in fuel costs have been relatively small due to the large domestic dependency
on coal, with the weak rupee also having an effect, with dollar-based electricity prices stabilizing at
relatively low levels.
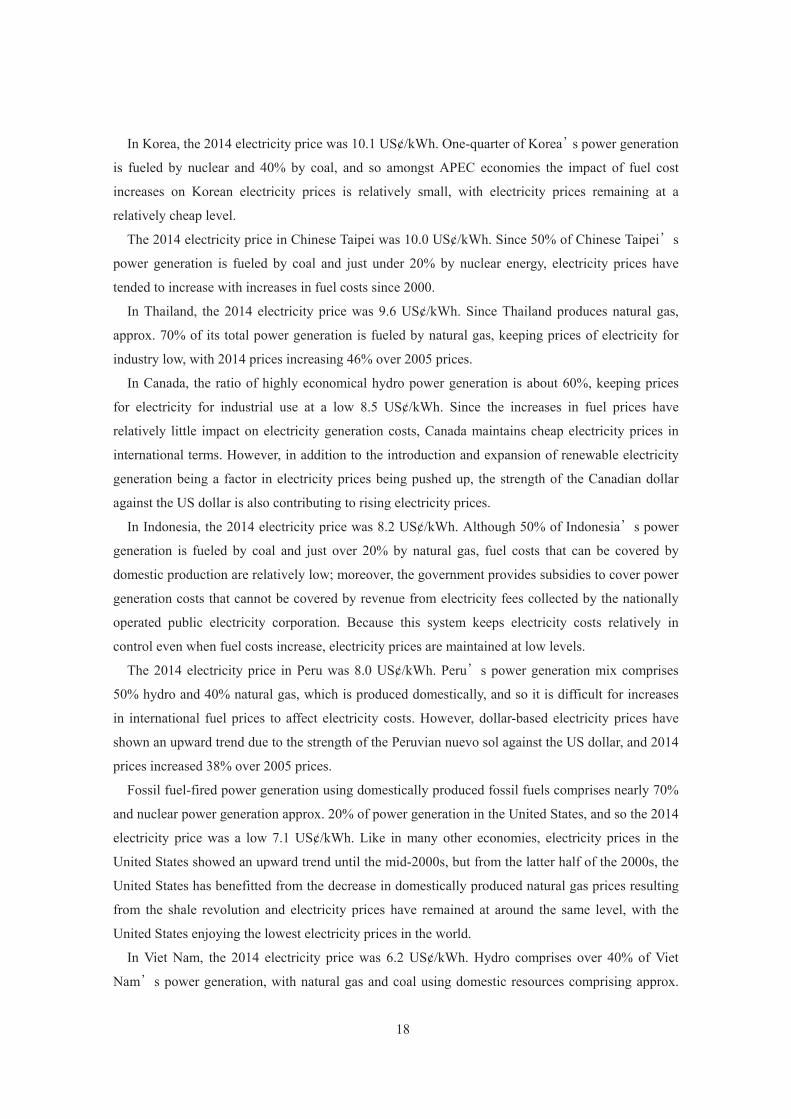
Amongst APEC economies, there were large differences in electricity prices for 2014. Prices of
electricity for industrial use in 2014 were highest in Papua New Guinea (28.2 US¢/kWh), about five
times the prices in Russia, where prices were the lowest (5.5 US¢/kWh). The median price was 10.1
US¢/kWh, which was cheaper than prices in major EU economies (Italy 32.8 US¢/kWh; Germany
17.9 US¢/kWh; UK 15.4 US¢/kWh; and France 12.6 US¢/kWh). However, amongst APEC’s main
exporting economies, price levels for Japan (18.8¢/kWh) and China (13.3¢/kWh) were on par with
price levels for major EU economies and higher than the price in India (10.7¢/kWh).
Looking in detail at APEC prices by economy, as mentioned above, within APEC, prices in 2014
were highest in Papua New Guinea, reaching 28.2 US¢/kWh. One of the main factors in this is
Papua New Guinea’s high dependency on oil, which have high power generation costs. Following
Papua New Guinea is Japan, where the 2014 electricity price was 18.8 US¢/kWh. This is the result
of increases in fuel costs pushing up electricity prices because of the decrease in nuclear power
generation following the 2011 Fukushima Daichi Nuclear Power Station accident and subsequent
large increase in fossil fuel-fired power generation.
Next after Japan is the Philippines, where the 2014 electricity price was 17.5 US¢/kWh. Of the
17
more than 7,000 islands comprising this economy, electricity prices are relatively high for those
areas not connected to the electricity grid, causing electricity prices in all areas to rise. Since fossil
fuel comprises over 70% of the Philippines’ power generation mix, prices have remained at a high
level in comparison with other APEC economies. However, the coal ratio is high and substitution of
domestic natural gas for oil is progressing, and so the price increase range has been relatively small,
stopping at an increase of 46% over 2005 prices.
The 2014 electricity price in Singapore was 15.2 US¢/kWh. Because virtually all electricity
generation in Singapore relies on imported natural gas and oil, the impact of increases in
international energy prices on electricity prices is the most notable, with 2014 electricity prices
rising to approx. twice 2005 prices.
The 2014 electricity price in Hong Kong, China was 15.1 US¢/kWh. This is due to the fact that
Hong Kong, China is 100% dependent on fossil fuel power generation (coal and natural gas), and
that approx. 20% of electric power consumption is imported from Mainland China.
The 2014 electricity price in Australia was 14.9 US¢/kWh. In addition to electricity prices being
pushed up considerably by such factors as increases in fossil fuel-fired power plant costs due to the
introduction of a carbon tax in the latter half of the 2000s, cost increases related to the
implementation and promotion of renewable energy sources, such as wind power, and the expansion
of investment related to power transmission and distribution, US dollar-based electricity prices rose
rapidly due to the strong Australian dollar against the US dollar.
The 2014 electricity price in China was 13.3 US¢/kWh. Since coal-fired power generation
comprises about 60% of China’s power generation mix, increases in coal prices in recent years have
pushed up electricity prices. Furthermore, spurred by the introduction and expansion of renewable
energy, investment in large-scale electricity supply networks, and increase in dollar-based electricity
prices due to the high yuan against the US dollar, 2014 prices for electricity for industrial use rose
46% over 2007 prices.
The 2014 electricity price in Mexico was 12.2 US¢/kWh. More than 50% of electric power
generation in Mexico uses natural gas, while less than 20% uses oil, and so increases in fuel prices
impact electricity prices.
In Malaysia, natural gas-fired power generation comprised half of the total power generation mix,
but the oil ratio was low, with a 2014 electricity price of 10.4 US¢/kWh. As fuel costs increased,
electricity prices tended to rise after 2000, and 2014 prices increased 87% over 2005 prices.
In Chile, electricity price were pushed up by the interruption of natural gas supplies from
Argentina and diminished hydro-electric power generation capacity due to drought in the late 2000s.
Increase of coal-fired power generation played an important role to meet the expanding electricity
demand in recent years. The electricity price turned to decrease in the early 2010s, was 10.4
US¢/kWh in 2014.
18
In Korea, the 2014 electricity price was 10.1 US¢/kWh. One-quarter of Korea’s power generation
is fueled by nuclear and 40% by coal, and so amongst APEC economies the impact of fuel cost
increases on Korean electricity prices is relatively small, with electricity prices remaining at a
relatively cheap level.
The 2014 electricity price in Chinese Taipei was 10.0 US¢/kWh. Since 50% of Chinese Taipei’s
power generation is fueled by coal and just under 20% by nuclear energy, electricity prices have
tended to increase with increases in fuel costs since 2000.
In Thailand, the 2014 electricity price was 9.6 US¢/kWh. Since Thailand produces natural gas,
approx. 70% of its total power generation is fueled by natural gas, keeping prices of electricity for
industry low, with 2014 prices increasing 46% over 2005 prices.
In Canada, the ratio of highly economical hydro power generation is about 60%, keeping prices
for electricity for industrial use at a low 8.5 US¢/kWh. Since the increases in fuel prices have
relatively little impact on electricity generation costs, Canada maintains cheap electricity prices in
international terms. However, in addition to the introduction and expansion of renewable electricity
generation being a factor in electricity prices being pushed up, the strength of the Canadian dollar
against the US dollar is also contributing to rising electricity prices.
In Indonesia, the 2014 electricity price was 8.2 US¢/kWh. Although 50% of Indonesia’s power
generation is fueled by coal and just over 20% by natural gas, fuel costs that can be covered by
domestic production are relatively low; moreover, the government provides subsidies to cover power
generation costs that cannot be covered by revenue from electricity fees collected by the nationally
operated public electricity corporation. Because this system keeps electricity costs relatively in
control even when fuel costs increase, electricity prices are maintained at low levels.
The 2014 electricity price in Peru was 8.0 US¢/kWh. Peru’s power generation mix comprises
50% hydro and 40% natural gas, which is produced domestically, and so it is difficult for increases
in international fuel prices to affect electricity costs. However, dollar-based electricity prices have
shown an upward trend due to the strength of the Peruvian nuevo sol against the US dollar, and 2014
prices increased 38% over 2005 prices.
Fossil fuel-fired power generation using domestically produced fossil fuels comprises nearly 70%
and nuclear power generation approx. 20% of power generation in the United States, and so the 2014
electricity price was a low 7.1 US¢/kWh. Like in many other economies, electricity prices in the
United States showed an upward trend until the mid-2000s, but from the latter half of the 2000s, the
United States has benefitted from the decrease in domestically produced natural gas prices resulting
from the shale revolution and electricity prices have remained at around the same level, with the
United States enjoying the lowest electricity prices in the world.
In Viet Nam, the 2014 electricity price was 6.2 US¢/kWh. Hydro comprises over 40% of Viet
Nam’s power generation, with natural gas and coal using domestic resources comprising approx.
19
30% and 20%, respectively. Furthermore, electricity prices are kept low through government
measures.
Russia had the lowest 2014 electricity prices of the APEC economies: 5.5 US¢/kWh. Russia is
dependent on cheap domestically produced fossil fuels, hydro, and nuclear. Since 2000, electricity
prices have tended to rise, but have remained at the world’s lowest level.
Figure 2-5-2 Electricity price for industry in APEC and others in 2014
Note: Data of India is in 2013. Source: Complied based on IEA Energy Prices and Taxes, Japan Electric Power Information Center (JEPIC) Statistics
on Overseas Electricity Industry, official statistics for each economy, and documents released by major electricity generation companies
Figure 2-5-3 Trends in prices for electricity for industry in major economies
Source: Complied based on IEA Energy Prices and Taxes, Japan Electric Power Information Center (JEPIC) Statistics
on Overseas Electricity Industry, official statistics for each economy, and documents released by major electricity generation companies
28.2
18.8 17.5
15.2 15.1 14.9 13.3
12.2 10.4 10.4 10.1 10.0 10.0 9.6 9.2 8.5 8.2 8.0 7.1 6.2 5.5
32.8
17.9
15.4
12.6 10.7
0
5
10
15
20
25
30
35
PNG JPN RP SIN HKC AUS PRC MEX MAS CHL ROK NZ CT THA BD CDA INA PE USA VN RUS ITA DEU GBR FRA IND
(US¢/kWh)
0
5
10
15
20
25
30
35
1990 1995 2000 2005 2010 2014
(US¢/kWh)
ITA
JPN
DEU
GBR
AUS
FRA
MEX
ROK
NZ
CDA
USA
0
5
10
15
20
25
30
35
1990 1995 2000 2005 2010 2014
(US¢/kWh)
RP
SIN
PRC
IND
MAS
CT
THA
RUS
INA
PE
20
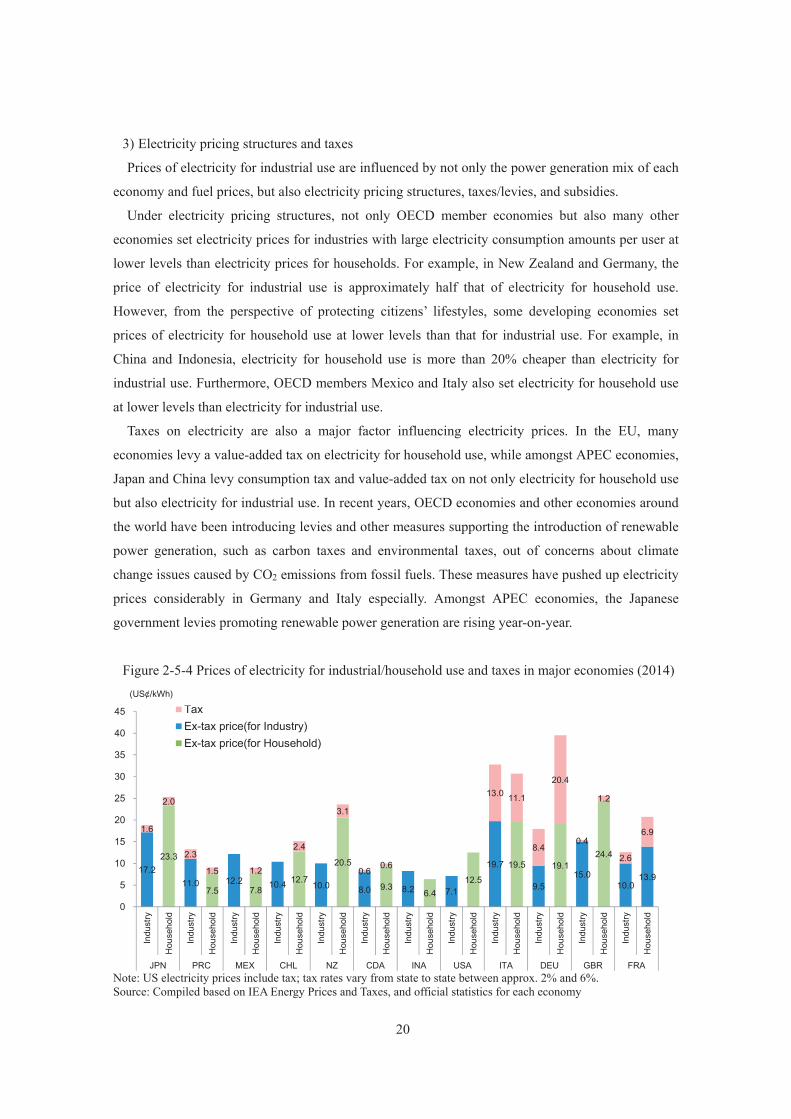
3) Electricity pricing structures and taxes
Prices of electricity for industrial use are influenced by not only the power generation mix of each
economy and fuel prices, but also electricity pricing structures, taxes/levies, and subsidies.
Under electricity pricing structures, not only OECD member economies but also many other
economies set electricity prices for industries with large electricity consumption amounts per user at
lower levels than electricity prices for households. For example, in New Zealand and Germany, the
price of electricity for industrial use is approximately half that of electricity for household use.
However, from the perspective of protecting citizens’ lifestyles, some developing economies set
prices of electricity for household use at lower levels than that for industrial use. For example, in
China and Indonesia, electricity for household use is more than 20% cheaper than electricity for
industrial use. Furthermore, OECD members Mexico and Italy also set electricity for household use
at lower levels than electricity for industrial use.
Taxes on electricity are also a major factor influencing electricity prices. In the EU, many
economies levy a value-added tax on electricity for household use, while amongst APEC economies,
Japan and China levy consumption tax and value-added tax on not only electricity for household use
but also electricity for industrial use. In recent years, OECD economies and other economies around
the world have been introducing levies and other measures supporting the introduction of renewable
power generation, such as carbon taxes and environmental taxes, out of concerns about climate
change issues caused by CO2 emissions from fossil fuels. These measures have pushed up electricity
prices considerably in Germany and Italy especially. Amongst APEC economies, the Japanese
government levies promoting renewable power generation are rising year-on-year.
Figure 2-5-4 Prices of electricity for industrial/household use and taxes in major economies (2014)
Note: US electricity prices include tax; tax rates vary from state to state between approx. 2% and 6%. Source: Compiled based on IEA Energy Prices and Taxes, and official statistics for each economy
17.2 23.3
11.0 7.5
12.2 7.8 10.4 12.7 10.0
20.5
8.0 9.3 8.2 6.4 7.1 12.5
19.7 19.5
9.5
19.1 15.0
24.4
10.0 13.9
1.6
2.0
2.3
1.5 1.2
2.4
3.1
0.6 0.6
13.0 11.1
8.4
20.4
0.4
1.2
2.6
6.9
0
5
10
15
20
25
30
35
40
45
Indu
stry
Hou
seho
ld
Indu
stry
Hou
seho
ld
Indu
stry
Hou
seho
ld
Indu
stry
Hou
seho
ld
Indu
stry
Hou
seho
ld
Indu
stry
Hou
seho
ld
Indu
stry
Hou
seho
ld
Indu
stry
Hou
seho
ld
Indu
stry
Hou
seho
ld
Indu
stry
Hou
seho
ld
Indu
stry
Hou
seho
ld
Indu
stry
Hou
seho
ld
JPN PRC MEX CHL NZ CDA INA USA ITA DEU GBR FRA
TaxEx-tax price(for Industry)Ex-tax price(for Household)
(US¢/kWh)(US¢/kWh)
21
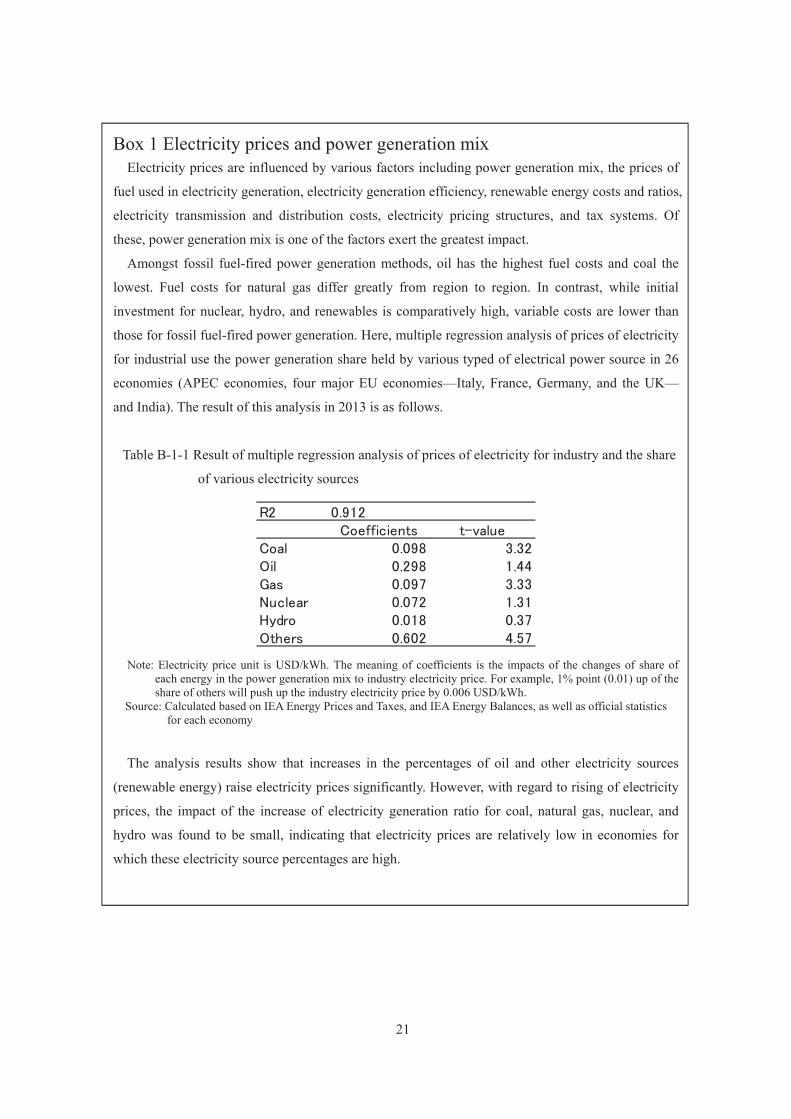
Box 1 Electricity prices and power generation mix Electricity prices are influenced by various factors including power generation mix, the prices of
fuel used in electricity generation, electricity generation efficiency, renewable energy costs and ratios,
electricity transmission and distribution costs, electricity pricing structures, and tax systems. Of
these, power generation mix is one of the factors exert the greatest impact.
Amongst fossil fuel-fired power generation methods, oil has the highest fuel costs and coal the
lowest. Fuel costs for natural gas differ greatly from region to region. In contrast, while initial
investment for nuclear, hydro, and renewables is comparatively high, variable costs are lower than
those for fossil fuel-fired power generation. Here, multiple regression analysis of prices of electricity
for industrial use the power generation share held by various typed of electrical power source in 26
economies (APEC economies, four major EU economies—Italy, France, Germany, and the UK—
and India). The result of this analysis in 2013 is as follows.
Table B-1-1 Result of multiple regression analysis of prices of electricity for industry and the share
of various electricity sources
Note: Electricity price unit is USD/kWh. The meaning of coefficients is the impacts of the changes of share of
each energy in the power generation mix to industry electricity price. For example, 1% point (0.01) up of the share of others will push up the industry electricity price by 0.006 USD/kWh.
Source: Calculated based on IEA Energy Prices and Taxes, and IEA Energy Balances, as well as official statistics for each economy
The analysis results show that increases in the percentages of oil and other electricity sources
(renewable energy) raise electricity prices significantly. However, with regard to rising of electricity
prices, the impact of the increase of electricity generation ratio for coal, natural gas, nuclear, and
hydro was found to be small, indicating that electricity prices are relatively low in economies for
which these electricity source percentages are high.
R2 0.912Coefficients t-value
Coal 0.098 3.32Oil 0.298 1.44Gas 0.097 3.33Nuclear 0.072 1.31Hydro 0.018 0.37Others 0.602 4.57
22
Chapter 3 Energy consumption in industry sector
3-1 Composition of final energy consumption in the industrial sectors of APEC economies
The composition of final energy consumption in the industrial sectors of APEC economies in 2013
was coal (37.5%) (the highest share), followed by electricity (31.2%), natural gas (15.9%), oil
(10.9%), and other (biomass energy, etc.) (4.6%) (Figure 3-1-1). Amongst EU economies, the share
of final energy consumption of electricity was the highest (35.4%) followed closely by natural gas
(34.3%) and then oil (11.0%), coal (10.0%), and other (9.4%). Compared with the EU economies,
dependence on coal in APEC economies is high overall, while the share for natural gas is small.
That the coal ratio is high for China and other Asian APEC members is the greatest reason for the
high degree of dependency on coal amongst APEC economies. The coal share for China—which has
approx. half the energy consumption amount in the industrial sector for APEC overall—is more than
50%. In China, against a background of abundant domestic resources, a large amount of coal (which
is cheaper than other energy sources) is used; furthermore, China produces large quantities of steel,
cement, and other products that require a high amount of energy to produce, and coal consumption in
these industries is high. In addition, the coal share is also high in Viet Nam, the Philippines, and
Thailand—economies that do not have abundant oil or natural gas resources. The coal ratio is also
high—over 30%—in Japan and Chinese Taipei, where there is a large amount of production in
materials industries, such as steel.
In contrast, the natural gas ratio is high in North America, Russia, Indonesia, Malaysia, and
Oceania—economies where natural gas production is abundant. The coal share is less than 15%.
Furthermore, the oil share is high for Brunei Darussalam—an oil-exporting economy—and
Singapore, which has a thriving petrochemical industry.
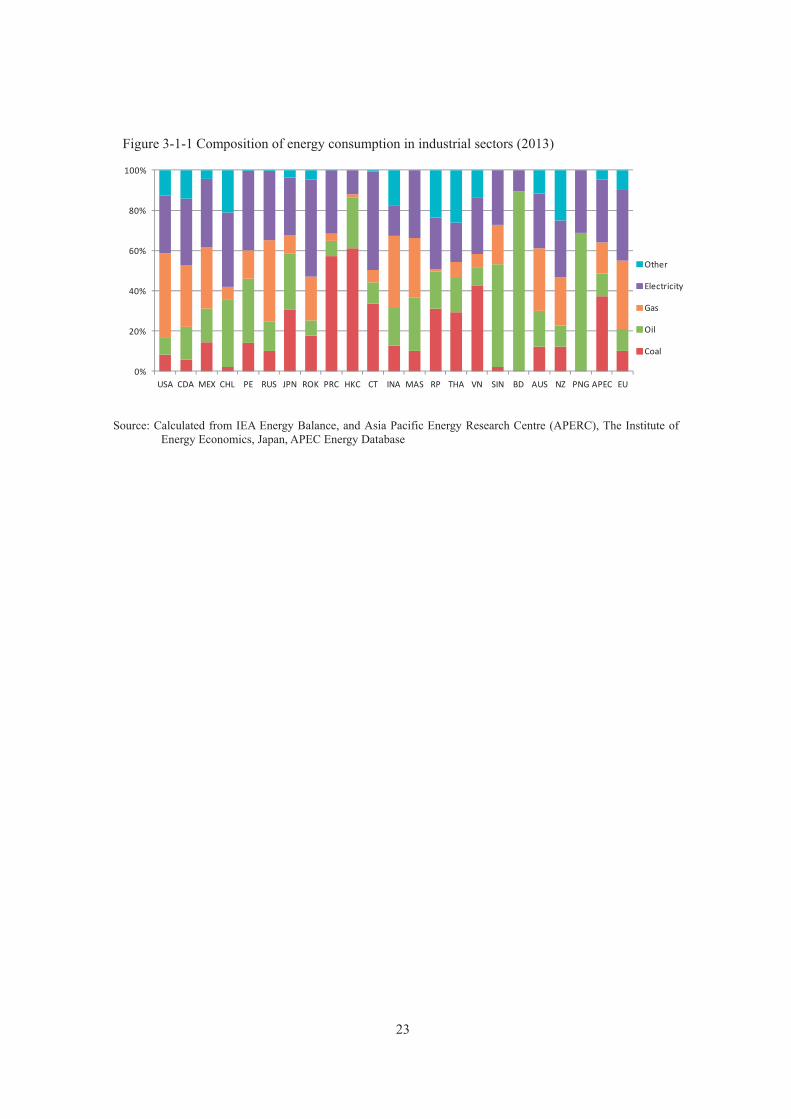
23
Figure 3-1-1 Composition of energy consumption in industrial sectors (2013)
Source: Calculated from IEA Energy Balance, and Asia Pacific Energy Research Centre (APERC), The Institute of Energy Economics, Japan, APEC Energy Database
0%
20%
40%
60%
80%
100%
USA CDA MEX CHL PE RUS JPN ROK PRC HKC CT INA MAS RP THA VN SIN BD AUS NZ PNG APEC EU
Other
Electricity
Gas
Oil
Coal

24
3-2 Energy efficiency in the manufacturing industries of APEC Looking in terms of final energy consumption per gross value added, energy efficiency for
manufacturing industries in APEC in 2013 was 208 toe/million USD, approx. twice the figure for the
EU, which was 103 toe/million USD. The reason for this is that the ratio of non-OECD economies is
higher for APEC than for the EU. In Russia, final energy consumption per gross value added was the
highest at 458 toe/million USD. This was followed by Thailand and China with 257 toe/million USD
and 250 toe/million USD, respectively, which is above the APEC average. Consumption per gross
value added for Malaysia, Indonesia, and Chinese Taipei was around 200 toe/million USD, close to
the APEC average.
Amongst APEC’s OECD members, because Japan is pursuing energy saving measures, final
energy consumption per gross value added in manufacturing industries is 91 toe/million USD, which
is lower than for the EU. Final energy consumption per gross value added for Korea and the United
States is 129 toe/million USD and 134 toe/million USD, respectively, which is not as efficient as
Japan and the EU but still far under the APEC average. In contrast, efficiency for Australia is
relatively bad, with final energy consumption per gross value added largest after Russia, Thailand,
and China.
Figure 3-2-1 Final energy consumption per gross value added in manufacturing (2013)
Source: IEA Energy Balance, World Bank World Development Indicators, National Development Council (Chinese
Taipei) Statistical Data Book 2015
134 163
458
91 129
250
193 192 207
257 242 208
103
0
100
200
300
400
500
USA MEX RUS JPN ROK PRC CT INA MAS THA AUS APEC EU
OtherGasOilCoalElectricity
toe/million USD
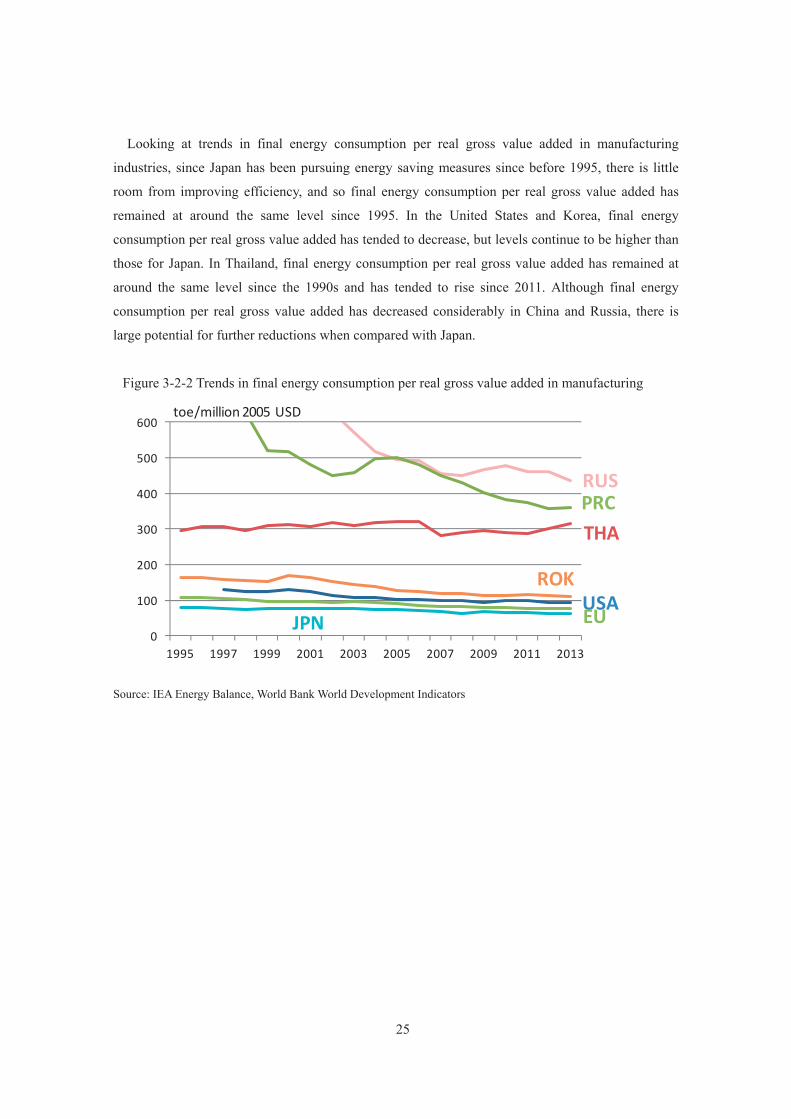
25
Looking at trends in final energy consumption per real gross value added in manufacturing
industries, since Japan has been pursuing energy saving measures since before 1995, there is little
room from improving efficiency, and so final energy consumption per real gross value added has
remained at around the same level since 1995. In the United States and Korea, final energy
consumption per real gross value added has tended to decrease, but levels continue to be higher than
those for Japan. In Thailand, final energy consumption per real gross value added has remained at
around the same level since the 1990s and has tended to rise since 2011. Although final energy
consumption per real gross value added has decreased considerably in China and Russia, there is
large potential for further reductions when compared with Japan.
Figure 3-2-2 Trends in final energy consumption per real gross value added in manufacturing
Source: IEA Energy Balance, World Bank World Development Indicators
0
100
200
300
400
500
600
1995 1997 1999 2001 2003 2005 2007 2009 2011 2013
toe/million 2005 USD
USA
RUS
THAPRC
ROK
EUJPN
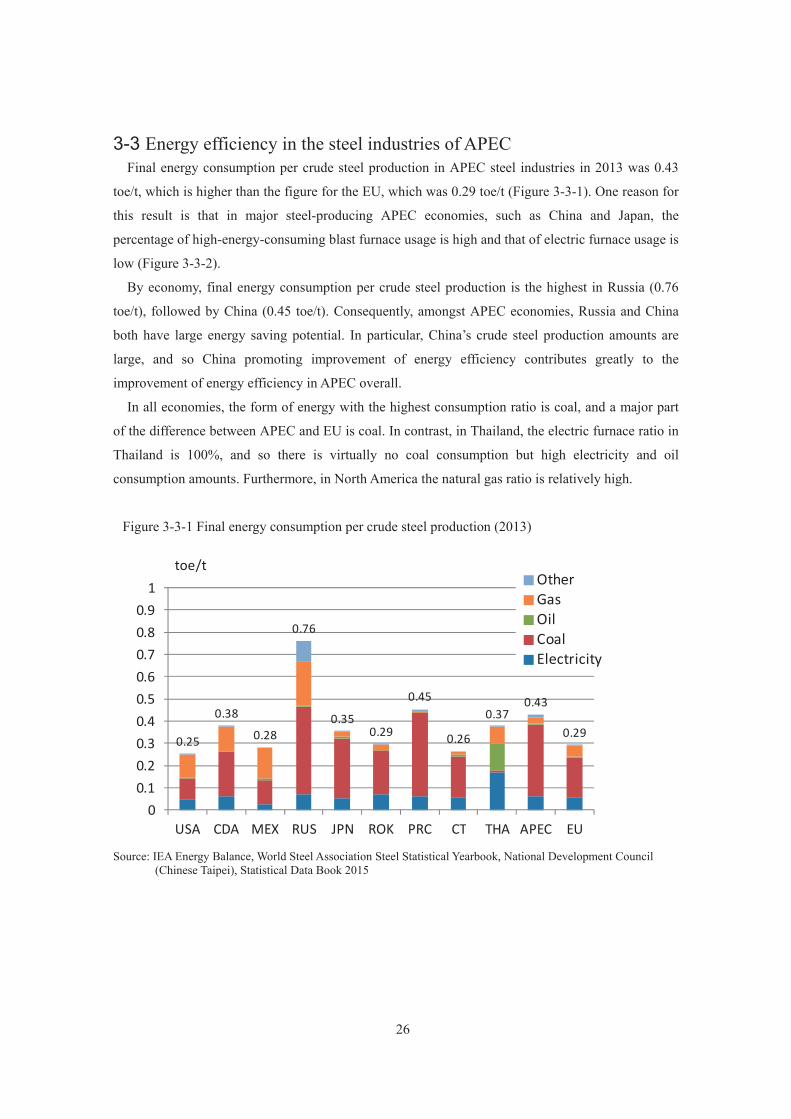
26
3-3 Energy efficiency in the steel industries of APEC Final energy consumption per crude steel production in APEC steel industries in 2013 was 0.43
toe/t, which is higher than the figure for the EU, which was 0.29 toe/t (Figure 3-3-1). One reason for
this result is that in major steel-producing APEC economies, such as China and Japan, the
percentage of high-energy-consuming blast furnace usage is high and that of electric furnace usage is
low (Figure 3-3-2).
By economy, final energy consumption per crude steel production is the highest in Russia (0.76
toe/t), followed by China (0.45 toe/t). Consequently, amongst APEC economies, Russia and China
both have large energy saving potential. In particular, China’s crude steel production amounts are
large, and so China promoting improvement of energy efficiency contributes greatly to the
improvement of energy efficiency in APEC overall.
In all economies, the form of energy with the highest consumption ratio is coal, and a major part
of the difference between APEC and EU is coal. In contrast, in Thailand, the electric furnace ratio in
Thailand is 100%, and so there is virtually no coal consumption but high electricity and oil
consumption amounts. Furthermore, in North America the natural gas ratio is relatively high.
Figure 3-3-1 Final energy consumption per crude steel production (2013)
Source: IEA Energy Balance, World Steel Association Steel Statistical Yearbook, National Development Council
(Chinese Taipei), Statistical Data Book 2015
0.25
0.38
0.28
0.76
0.35 0.29
0.45
0.26
0.37 0.43
0.29
00.10.20.30.40.50.60.70.80.9
1
USA CDA MEX RUS JPN ROK PRC CT THA APEC EU
OtherGasOilCoalElectricity
toe/t
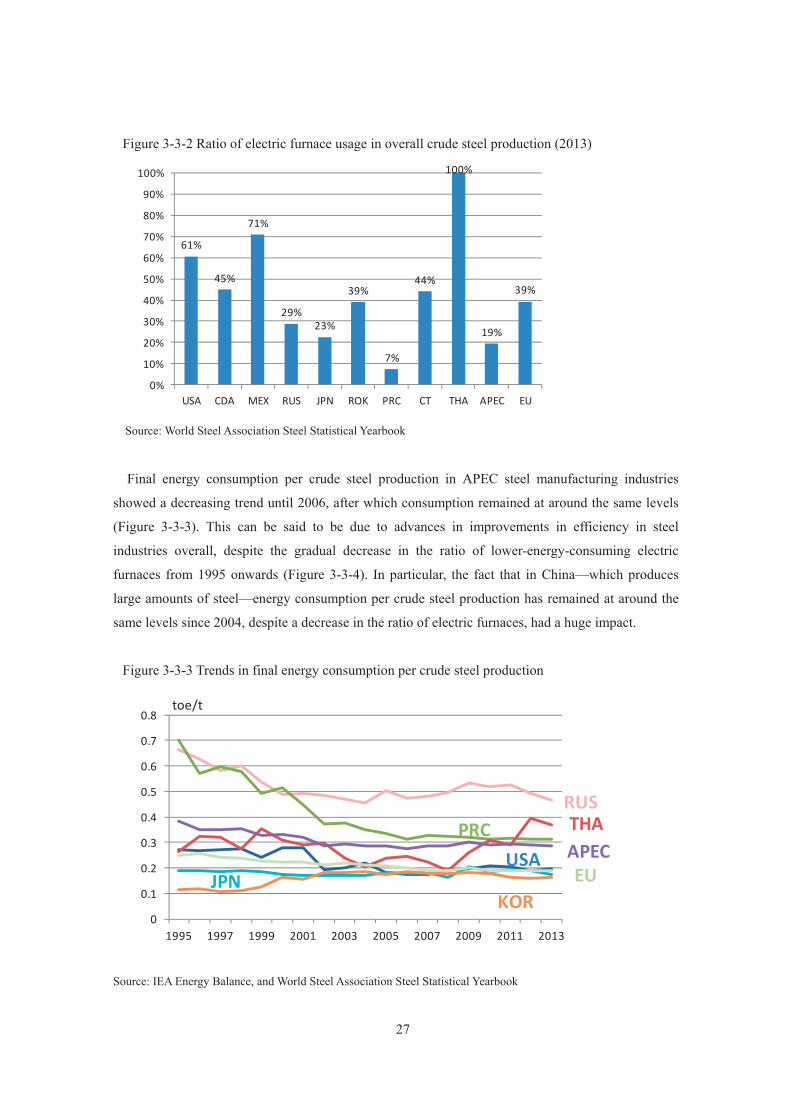
27
Figure 3-3-2 Ratio of electric furnace usage in overall crude steel production (2013)
Source: World Steel Association Steel Statistical Yearbook
Final energy consumption per crude steel production in APEC steel manufacturing industries
showed a decreasing trend until 2006, after which consumption remained at around the same levels
(Figure 3-3-3). This can be said to be due to advances in improvements in efficiency in steel
industries overall, despite the gradual decrease in the ratio of lower-energy-consuming electric
furnaces from 1995 onwards (Figure 3-3-4). In particular, the fact that in China—which produces
large amounts of steel—energy consumption per crude steel production has remained at around the
same levels since 2004, despite a decrease in the ratio of electric furnaces, had a huge impact.
Figure 3-3-3 Trends in final energy consumption per crude steel production
Source: IEA Energy Balance, and World Steel Association Steel Statistical Yearbook
61%
45%
71%
29%23%
39%
7%
44%
100%
19%
39%
0%
10%
20%
30%
40%
50%
60%
70%
80%
90%
100%
USA CDA MEX RUS JPN ROK PRC CT THA APEC EU
0
0.1
0.2
0.3
0.4
0.5
0.6
0.7
0.8
1995 1997 1999 2001 2003 2005 2007 2009 2011 2013
toe/t
USA
RUSTHAPRC
KOREUJPNAPEC
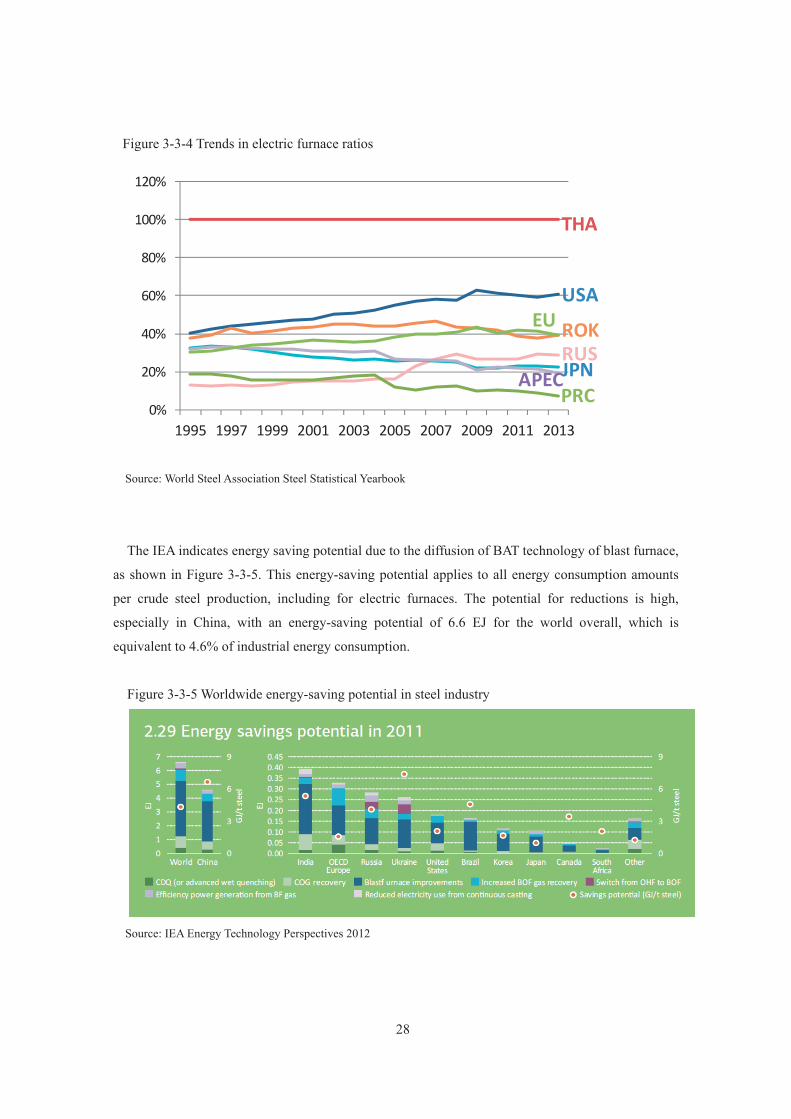
28
Figure 3-3-4 Trends in electric furnace ratios
Source: World Steel Association Steel Statistical Yearbook
The IEA indicates energy saving potential due to the diffusion of BAT technology of blast furnace,
as shown in Figure 3-3-5. This energy-saving potential applies to all energy consumption amounts
per crude steel production, including for electric furnaces. The potential for reductions is high,
especially in China, with an energy-saving potential of 6.6 EJ for the world overall, which is
equivalent to 4.6% of industrial energy consumption.
Figure 3-3-5 Worldwide energy-saving potential in steel industry
Source: IEA Energy Technology Perspectives 2012
0%
20%
40%
60%
80%
100%
120%
1995 1997 1999 2001 2003 2005 2007 2009 2011 2013
RUS
THA
USAEU ROK
JPNAPECPRC
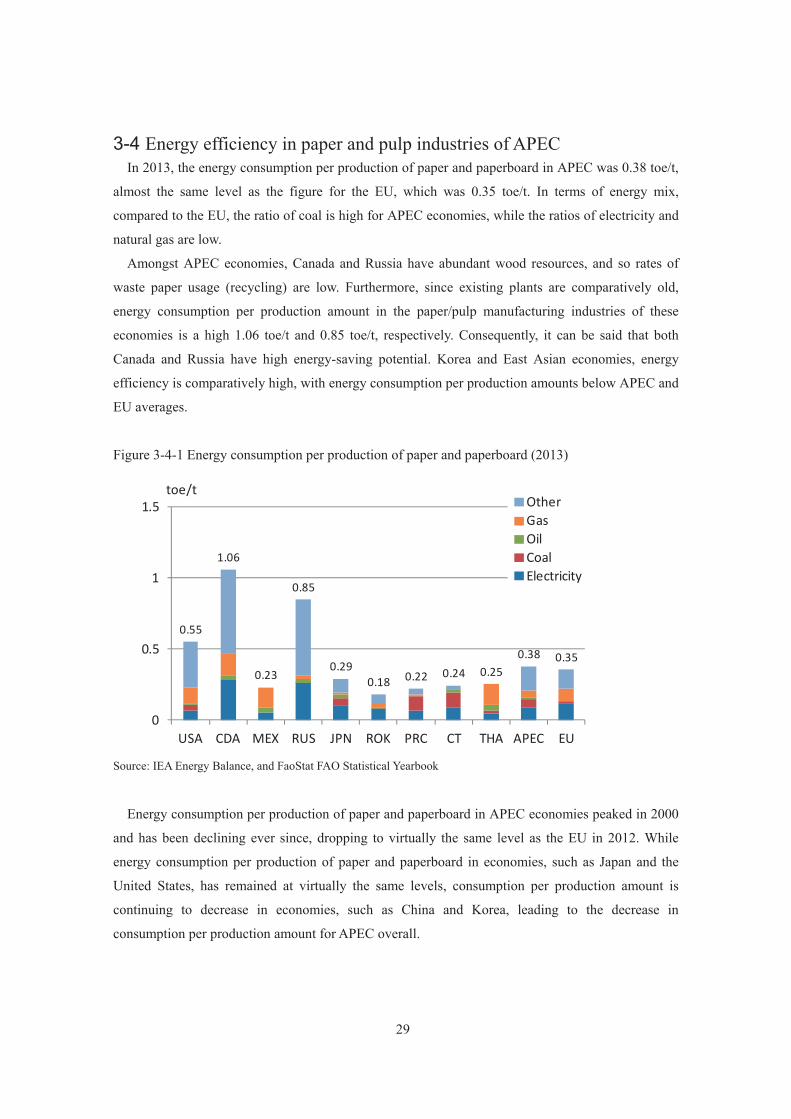
29
3-4 Energy efficiency in paper and pulp industries of APEC In 2013, the energy consumption per production of paper and paperboard in APEC was 0.38 toe/t,
almost the same level as the figure for the EU, which was 0.35 toe/t. In terms of energy mix,
compared to the EU, the ratio of coal is high for APEC economies, while the ratios of electricity and
natural gas are low.
Amongst APEC economies, Canada and Russia have abundant wood resources, and so rates of
waste paper usage (recycling) are low. Furthermore, since existing plants are comparatively old,
energy consumption per production amount in the paper/pulp manufacturing industries of these
economies is a high 1.06 toe/t and 0.85 toe/t, respectively. Consequently, it can be said that both
Canada and Russia have high energy-saving potential. Korea and East Asian economies, energy
efficiency is comparatively high, with energy consumption per production amounts below APEC and
EU averages.
Figure 3-4-1 Energy consumption per production of paper and paperboard (2013)
Source: IEA Energy Balance, and FaoStat FAO Statistical Yearbook
Energy consumption per production of paper and paperboard in APEC economies peaked in 2000
and has been declining ever since, dropping to virtually the same level as the EU in 2012. While
energy consumption per production of paper and paperboard in economies, such as Japan and the
United States, has remained at virtually the same levels, consumption per production amount is
continuing to decrease in economies, such as China and Korea, leading to the decrease in
consumption per production amount for APEC overall.
0.55
1.06
0.23
0.85
0.29 0.18 0.22 0.24 0.25
0.38 0.35
0
0.5
1
1.5
USA CDA MEX RUS JPN ROK PRC CT THA APEC EU
OtherGasOilCoalElectricity
toe/t

30
Figure 3-4-2 Trends in energy consumption per production of paper and paperboard
Source: IEA Energy Balance, and FaoStat FAO Statistical Yearbook
According to the IEA, the energy-saving potential for the paper/pulp manufacturing sector
worldwide is 3GJ/t. Potential is especially high for Russia, Canada, the United States, and other
economies where existing plants are old.
Figure 3-4-3 Energy-saving potential for the paper and pulp industry
Source: IEA Energy Technology Perspectives 2012
0
0.1
0.2
0.3
0.4
0.5
0.6
0.7
1995 1997 1999 2001 2003 2005 2007 2009 2011 2013
toe/t
USA
THAPRCROK
EU JPN
APEC
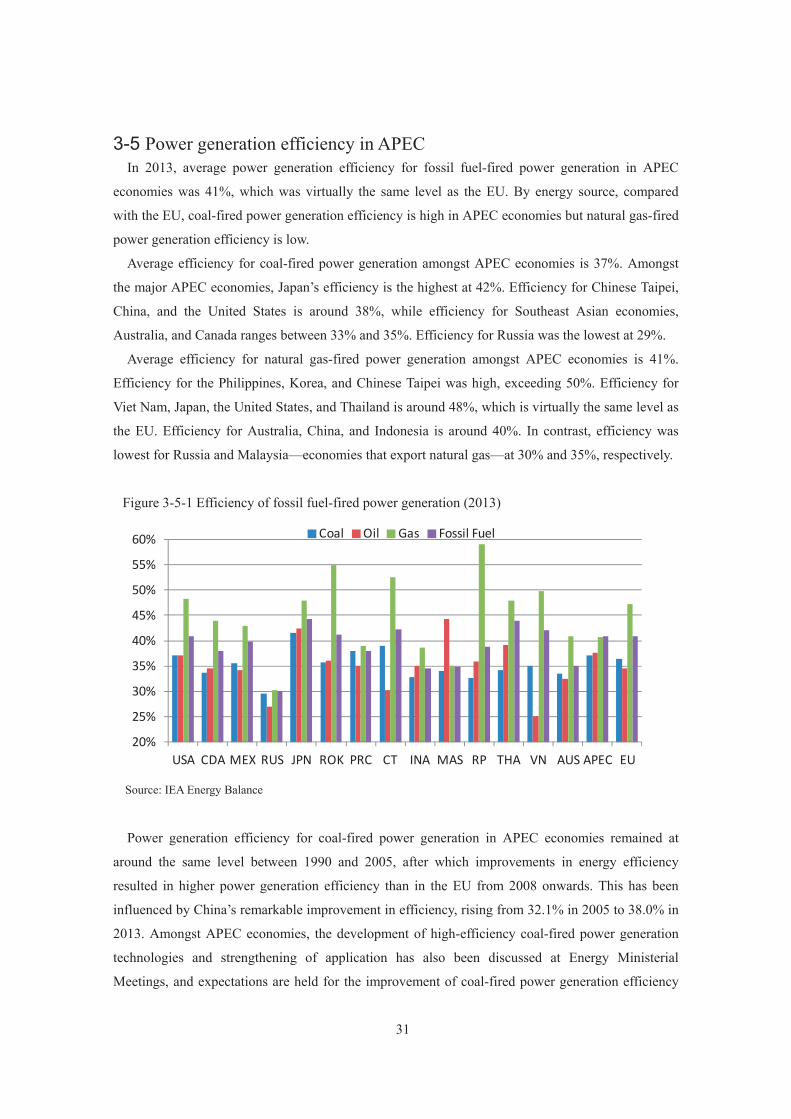
31
3-5 Power generation efficiency in APEC In 2013, average power generation efficiency for fossil fuel-fired power generation in APEC
economies was 41%, which was virtually the same level as the EU. By energy source, compared
with the EU, coal-fired power generation efficiency is high in APEC economies but natural gas-fired
power generation efficiency is low.
Average efficiency for coal-fired power generation amongst APEC economies is 37%. Amongst
the major APEC economies, Japan’s efficiency is the highest at 42%. Efficiency for Chinese Taipei,
China, and the United States is around 38%, while efficiency for Southeast Asian economies,
Australia, and Canada ranges between 33% and 35%. Efficiency for Russia was the lowest at 29%.
Average efficiency for natural gas-fired power generation amongst APEC economies is 41%.
Efficiency for the Philippines, Korea, and Chinese Taipei was high, exceeding 50%. Efficiency for
Viet Nam, Japan, the United States, and Thailand is around 48%, which is virtually the same level as
the EU. Efficiency for Australia, China, and Indonesia is around 40%. In contrast, efficiency was
lowest for Russia and Malaysia—economies that export natural gas—at 30% and 35%, respectively.
Figure 3-5-1 Efficiency of fossil fuel-fired power generation (2013)
Source: IEA Energy Balance
Power generation efficiency for coal-fired power generation in APEC economies remained at
around the same level between 1990 and 2005, after which improvements in energy efficiency
resulted in higher power generation efficiency than in the EU from 2008 onwards. This has been
influenced by China’s remarkable improvement in efficiency, rising from 32.1% in 2005 to 38.0% in
2013. Amongst APEC economies, the development of high-efficiency coal-fired power generation
technologies and strengthening of application has also been discussed at Energy Ministerial
Meetings, and expectations are held for the improvement of coal-fired power generation efficiency
20%
25%
30%
35%
40%
45%
50%
55%
60%
USA CDA MEX RUS JPN ROK PRC CT INA MAS RP THA VN AUS APEC EU
Coal Oil Gas Fossil Fuel
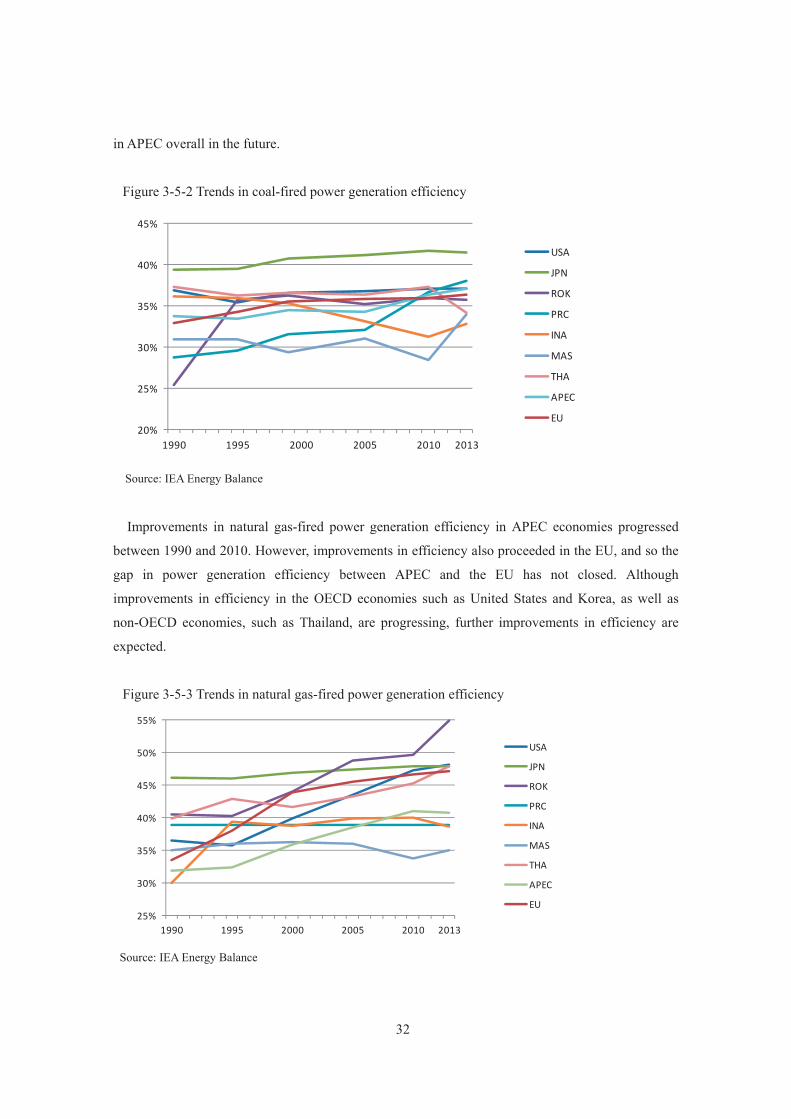
32
in APEC overall in the future.
Figure 3-5-2 Trends in coal-fired power generation efficiency
Source: IEA Energy Balance
Improvements in natural gas-fired power generation efficiency in APEC economies progressed
between 1990 and 2010. However, improvements in efficiency also proceeded in the EU, and so the
gap in power generation efficiency between APEC and the EU has not closed. Although
improvements in efficiency in the OECD economies such as United States and Korea, as well as
non-OECD economies, such as Thailand, are progressing, further improvements in efficiency are
expected.
Figure 3-5-3 Trends in natural gas-fired power generation efficiency
Source: IEA Energy Balance
20%
25%
30%
35%
40%
45%
1990 1995 2000 2005 2010 2013
USA
JPN
ROK
PRC
INA
MAS
THA
APEC
EU
25%
30%
35%
40%
45%
50%
55%
1990 1995 2000 2005 2010 2013
USA
JPN
ROK
PRC
INA
MAS
THA
APEC
EU
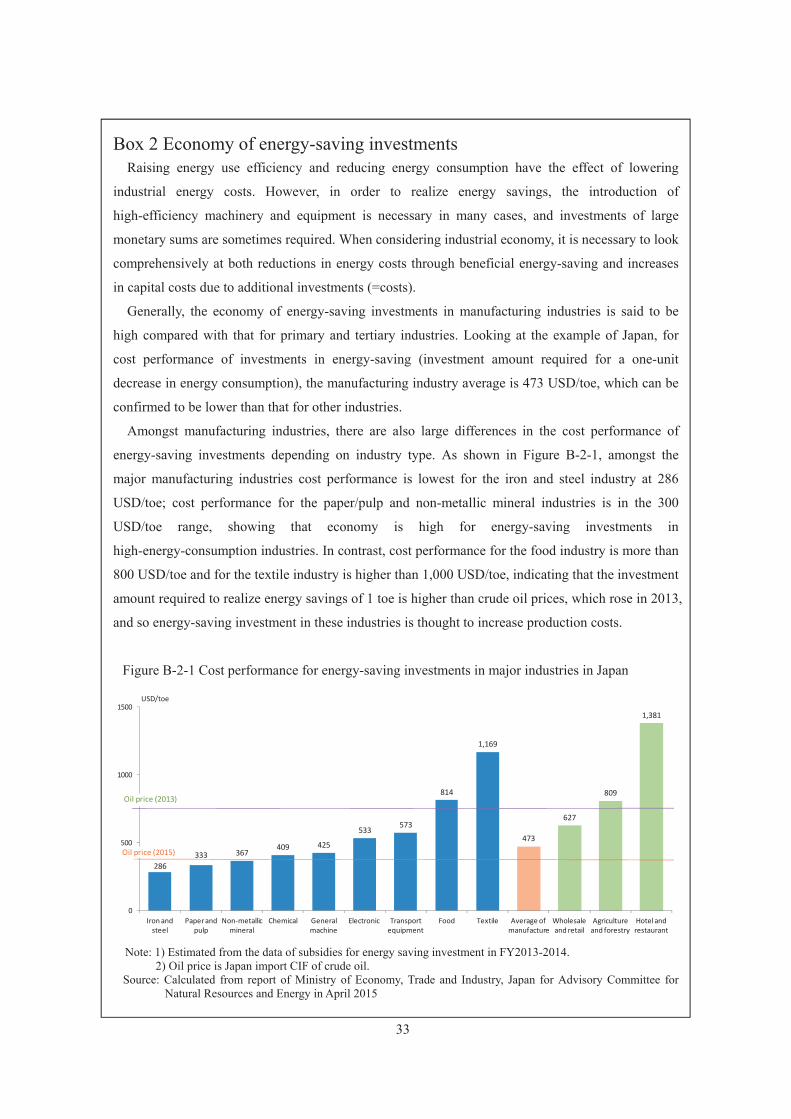
33
Box 2 Economy of energy-saving investments Raising energy use efficiency and reducing energy consumption have the effect of lowering
industrial energy costs. However, in order to realize energy savings, the introduction of
high-efficiency machinery and equipment is necessary in many cases, and investments of large
monetary sums are sometimes required. When considering industrial economy, it is necessary to look
comprehensively at both reductions in energy costs through beneficial energy-saving and increases
in capital costs due to additional investments (=costs).
Generally, the economy of energy-saving investments in manufacturing industries is said to be
high compared with that for primary and tertiary industries. Looking at the example of Japan, for
cost performance of investments in energy-saving (investment amount required for a one-unit
decrease in energy consumption), the manufacturing industry average is 473 USD/toe, which can be
confirmed to be lower than that for other industries.
Amongst manufacturing industries, there are also large differences in the cost performance of
energy-saving investments depending on industry type. As shown in Figure B-2-1, amongst the
major manufacturing industries cost performance is lowest for the iron and steel industry at 286
USD/toe; cost performance for the paper/pulp and non-metallic mineral industries is in the 300
USD/toe range, showing that economy is high for energy-saving investments in
high-energy-consumption industries. In contrast, cost performance for the food industry is more than
800 USD/toe and for the textile industry is higher than 1,000 USD/toe, indicating that the investment
amount required to realize energy savings of 1 toe is higher than crude oil prices, which rose in 2013,
and so energy-saving investment in these industries is thought to increase production costs.
Figure B-2-1 Cost performance for energy-saving investments in major industries in Japan
Note: 1) Estimated from the data of subsidies for energy saving investment in FY2013-2014.
2) Oil price is Japan import CIF of crude oil. Source: Calculated from report of Ministry of Economy, Trade and Industry, Japan for Advisory Committee for
Natural Resources and Energy in April 2015
286 333 367
409 425
533 573
814
1,169
473
627
809
1,381
0
500
1000
1500
Iron and steel
Paper and pulp
Non-metallic mineral
Chemical General machine
Electronic Transport equipment
Food Textile Average of manufacture
Wholesale and retail
Agriculture and forestry
Hotel and restaurant
USD/toe
Oil price (2013)
Oil price (2015)

34
In evaluating the economy of energy-saving investments, energy price is an important indicator.
Because of the rapid decrease in energy prices from the latter half of 2014, achieving energy-saving
investment profitability has become increasingly difficult.
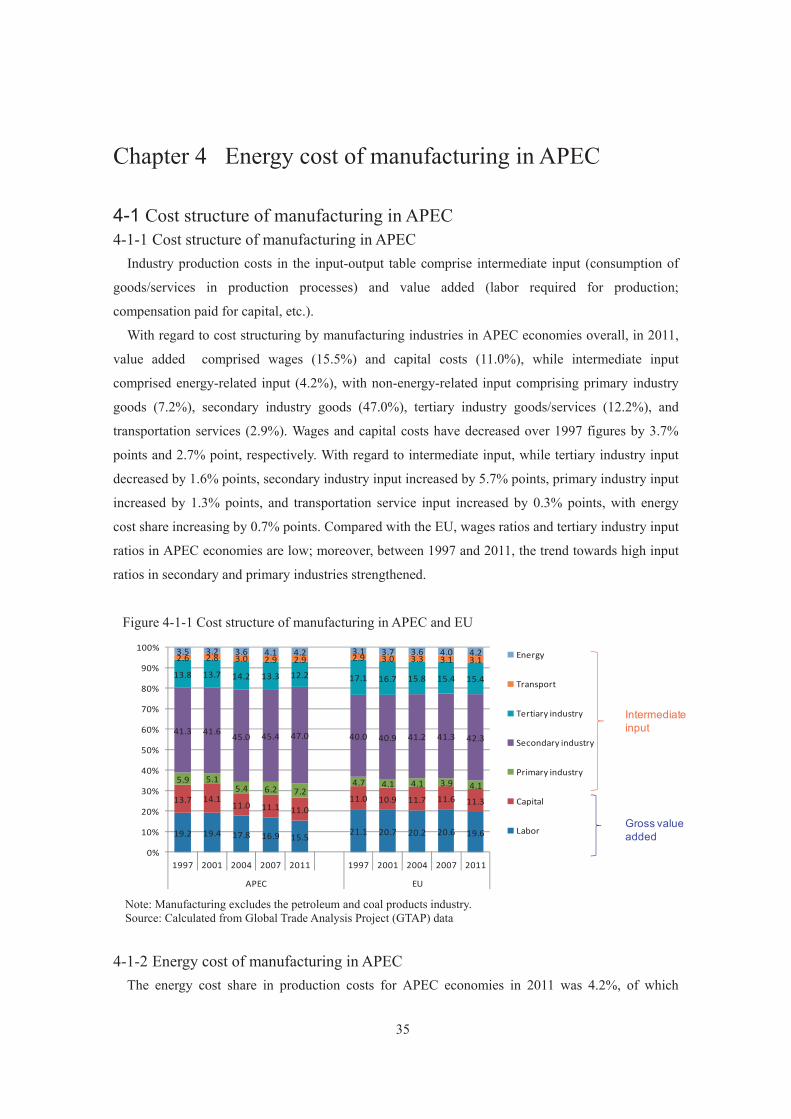
35
Chapter 4 Energy cost of manufacturing in APEC
4-1 Cost structure of manufacturing in APEC 4-1-1 Cost structure of manufacturing in APEC
Industry production costs in the input-output table comprise intermediate input (consumption of
goods/services in production processes) and value added (labor required for production;
compensation paid for capital, etc.).
With regard to cost structuring by manufacturing industries in APEC economies overall, in 2011,
value added comprised wages (15.5%) and capital costs (11.0%), while intermediate input
comprised energy-related input (4.2%), with non-energy-related input comprising primary industry
goods (7.2%), secondary industry goods (47.0%), tertiary industry goods/services (12.2%), and
transportation services (2.9%). Wages and capital costs have decreased over 1997 figures by 3.7%
points and 2.7% point, respectively. With regard to intermediate input, while tertiary industry input
decreased by 1.6% points, secondary industry input increased by 5.7% points, primary industry input
increased by 1.3% points, and transportation service input increased by 0.3% points, with energy
cost share increasing by 0.7% points. Compared with the EU, wages ratios and tertiary industry input
ratios in APEC economies are low; moreover, between 1997 and 2011, the trend towards high input
ratios in secondary and primary industries strengthened.
Figure 4-1-1 Cost structure of manufacturing in APEC and EU
Note: Manufacturing excludes the petroleum and coal products industry. Source: Calculated from Global Trade Analysis Project (GTAP) data
4-1-2 Energy cost of manufacturing in APEC The energy cost share in production costs for APEC economies in 2011 was 4.2%, of which
19.2 19.4 17.8 16.9 15.5 21.1 20.7 20.2 20.6 19.6
13.7 14.1 11.0 11.1 11.0
11.0 10.9 11.7 11.6 11.3
5.9 5.1 5.4 6.2 7.2
4.7 4.1 4.1 3.9 4.1
41.3 41.6 45.0 45.4 47.0 40.0 40.9 41.2 41.3 42.3
13.8 13.7 14.2 13.3 12.2 17.1 16.7 15.8 15.4 15.4
2.6 2.8 3.0 2.9 2.9 2.9 3.0 3.3 3.1 3.1 3.5 3.2 3.6 4.1 4.2 3.1 3.7 3.6 4.0 4.2
0%
10%
20%
30%
40%
50%
60%
70%
80%
90%
100%
1997 2001 2004 2007 2011 1997 2001 2004 2007 2011
APEC EU
Energy
Transport
Tertiary industry
Secondary industry
Primary industry
Capital
Labor
Intermediate input
Gross value added
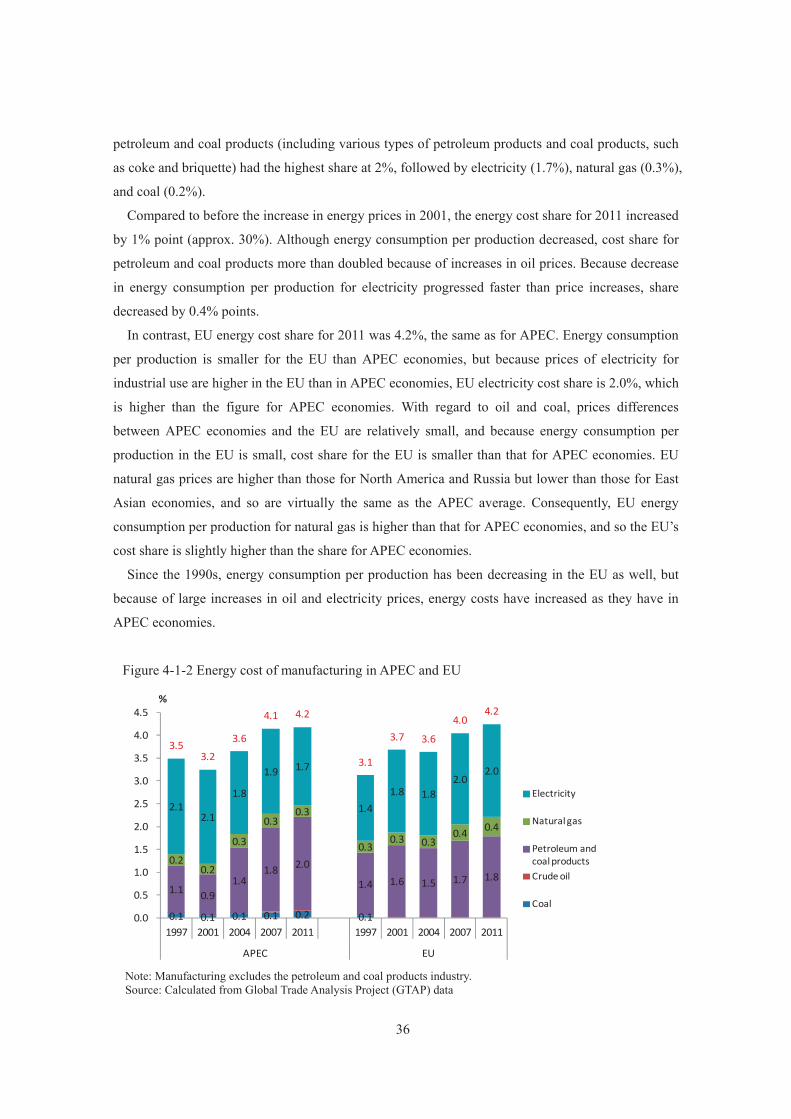
36
petroleum and coal products (including various types of petroleum products and coal products, such
as coke and briquette) had the highest share at 2%, followed by electricity (1.7%), natural gas (0.3%),
and coal (0.2%).
Compared to before the increase in energy prices in 2001, the energy cost share for 2011 increased
by 1% point (approx. 30%). Although energy consumption per production decreased, cost share for
petroleum and coal products more than doubled because of increases in oil prices. Because decrease
in energy consumption per production for electricity progressed faster than price increases, share
decreased by 0.4% points.
In contrast, EU energy cost share for 2011 was 4.2%, the same as for APEC. Energy consumption
per production is smaller for the EU than APEC economies, but because prices of electricity for
industrial use are higher in the EU than in APEC economies, EU electricity cost share is 2.0%, which
is higher than the figure for APEC economies. With regard to oil and coal, prices differences
between APEC economies and the EU are relatively small, and because energy consumption per
production in the EU is small, cost share for the EU is smaller than that for APEC economies. EU
natural gas prices are higher than those for North America and Russia but lower than those for East
Asian economies, and so are virtually the same as the APEC average. Consequently, EU energy
consumption per production for natural gas is higher than that for APEC economies, and so the EU’s
cost share is slightly higher than the share for APEC economies.
Since the 1990s, energy consumption per production has been decreasing in the EU as well, but
because of large increases in oil and electricity prices, energy costs have increased as they have in
APEC economies.
Figure 4-1-2 Energy cost of manufacturing in APEC and EU
Note: Manufacturing excludes the petroleum and coal products industry. Source: Calculated from Global Trade Analysis Project (GTAP) data
0.1 0.1 0.1 0.1 0.2 0.1
1.1 0.9 1.4
1.8 2.0
1.4 1.6 1.5 1.7 1.8 0.2
0.2
0.3
0.3 0.3
0.3 0.3 0.3
0.4 0.4
2.1 2.1
1.8
1.9 1.7
1.4 1.8 1.8
2.0 2.0
3.5 3.2
3.6
4.1 4.2
3.1
3.7 3.6
4.0 4.2
0.0
0.5
1.0
1.5
2.0
2.5
3.0
3.5
4.0
4.5
1997 2001 2004 2007 2011 1997 2001 2004 2007 2011
APEC EU
%
Electricity
Natural gas
Petroleum and coal productsCrude oil
Coal
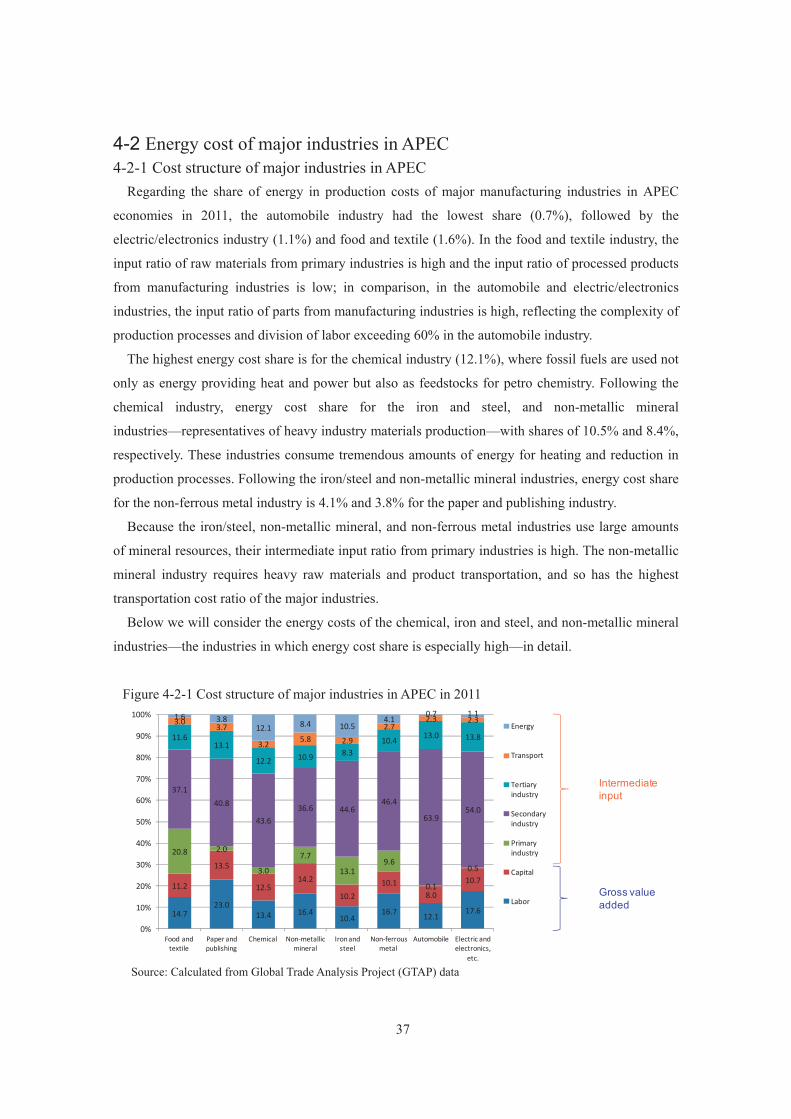
37
4-2 Energy cost of major industries in APEC 4-2-1 Cost structure of major industries in APEC
Regarding the share of energy in production costs of major manufacturing industries in APEC
economies in 2011, the automobile industry had the lowest share (0.7%), followed by the
electric/electronics industry (1.1%) and food and textile (1.6%). In the food and textile industry, the
input ratio of raw materials from primary industries is high and the input ratio of processed products
from manufacturing industries is low; in comparison, in the automobile and electric/electronics
industries, the input ratio of parts from manufacturing industries is high, reflecting the complexity of
production processes and division of labor exceeding 60% in the automobile industry.
The highest energy cost share is for the chemical industry (12.1%), where fossil fuels are used not
only as energy providing heat and power but also as feedstocks for petro chemistry. Following the
chemical industry, energy cost share for the iron and steel, and non-metallic mineral
industries—representatives of heavy industry materials production—with shares of 10.5% and 8.4%,
respectively. These industries consume tremendous amounts of energy for heating and reduction in
production processes. Following the iron/steel and non-metallic mineral industries, energy cost share
for the non-ferrous metal industry is 4.1% and 3.8% for the paper and publishing industry.
Because the iron/steel, non-metallic mineral, and non-ferrous metal industries use large amounts
of mineral resources, their intermediate input ratio from primary industries is high. The non-metallic
mineral industry requires heavy raw materials and product transportation, and so has the highest
transportation cost ratio of the major industries.
Below we will consider the energy costs of the chemical, iron and steel, and non-metallic mineral
industries—the industries in which energy cost share is especially high—in detail.
Figure 4-2-1 Cost structure of major industries in APEC in 2011
Source: Calculated from Global Trade Analysis Project (GTAP) data
14.7 23.0
13.4 16.4 10.4
16.7 12.1 17.6
11.2
13.5
12.5 14.2
10.2 10.1
8.0
10.7
20.8 2.0
3.0
7.7
13.1 9.6
0.1
0.5
37.1 40.8
43.6 36.6 44.6
46.4
63.9 54.0
11.6 13.1
12.2 10.9 8.3 10.4 13.0 13.8
3.0 3.7
3.2 5.8 2.9 2.7
2.3 2.3 1.6 3.8 12.1 8.4 10.5
4.1 0.7 1.1
0%
10%
20%
30%
40%
50%
60%
70%
80%
90%
100%
Food and textile
Paper and publishing
Chemical Non-metallic mineral
Iron and steel
Non-ferrous metal
Automobile Electric and electronics,
etc.
Energy
Transport
Tertiary industry
Secondary industry
Primary industry
Capital
Labor
Intermediate input
Gross value added
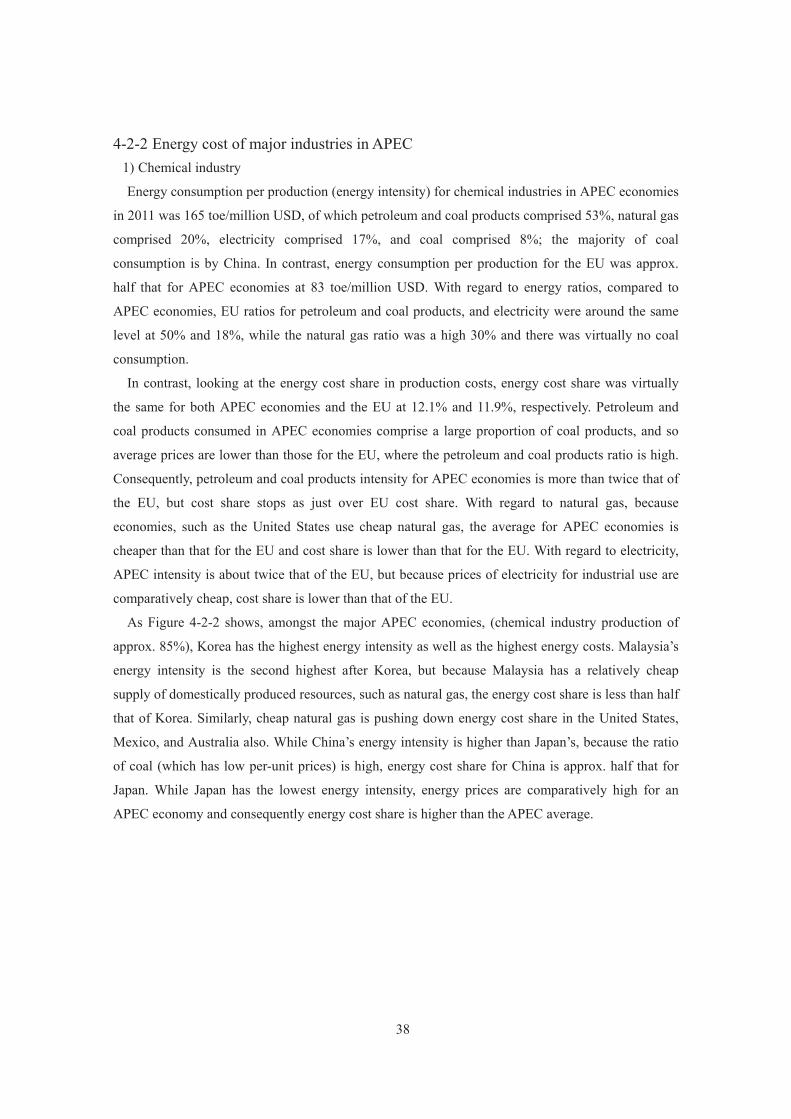
38
4-2-2 Energy cost of major industries in APEC 1) Chemical industry
Energy consumption per production (energy intensity) for chemical industries in APEC economies
in 2011 was 165 toe/million USD, of which petroleum and coal products comprised 53%, natural gas
comprised 20%, electricity comprised 17%, and coal comprised 8%; the majority of coal
consumption is by China. In contrast, energy consumption per production for the EU was approx.
half that for APEC economies at 83 toe/million USD. With regard to energy ratios, compared to
APEC economies, EU ratios for petroleum and coal products, and electricity were around the same
level at 50% and 18%, while the natural gas ratio was a high 30% and there was virtually no coal
consumption.
In contrast, looking at the energy cost share in production costs, energy cost share was virtually
the same for both APEC economies and the EU at 12.1% and 11.9%, respectively. Petroleum and
coal products consumed in APEC economies comprise a large proportion of coal products, and so
average prices are lower than those for the EU, where the petroleum and coal products ratio is high.
Consequently, petroleum and coal products intensity for APEC economies is more than twice that of
the EU, but cost share stops as just over EU cost share. With regard to natural gas, because
economies, such as the United States use cheap natural gas, the average for APEC economies is
cheaper than that for the EU and cost share is lower than that for the EU. With regard to electricity,
APEC intensity is about twice that of the EU, but because prices of electricity for industrial use are
comparatively cheap, cost share is lower than that of the EU.
As Figure 4-2-2 shows, amongst the major APEC economies, (chemical industry production of
approx. 85%), Korea has the highest energy intensity as well as the highest energy costs. Malaysia’s
energy intensity is the second highest after Korea, but because Malaysia has a relatively cheap
supply of domestically produced resources, such as natural gas, the energy cost share is less than half
that of Korea. Similarly, cheap natural gas is pushing down energy cost share in the United States,
Mexico, and Australia also. While China’s energy intensity is higher than Japan’s, because the ratio
of coal (which has low per-unit prices) is high, energy cost share for China is approx. half that for
Japan. While Japan has the lowest energy intensity, energy prices are comparatively high for an
APEC economy and consequently energy cost share is higher than the APEC average.
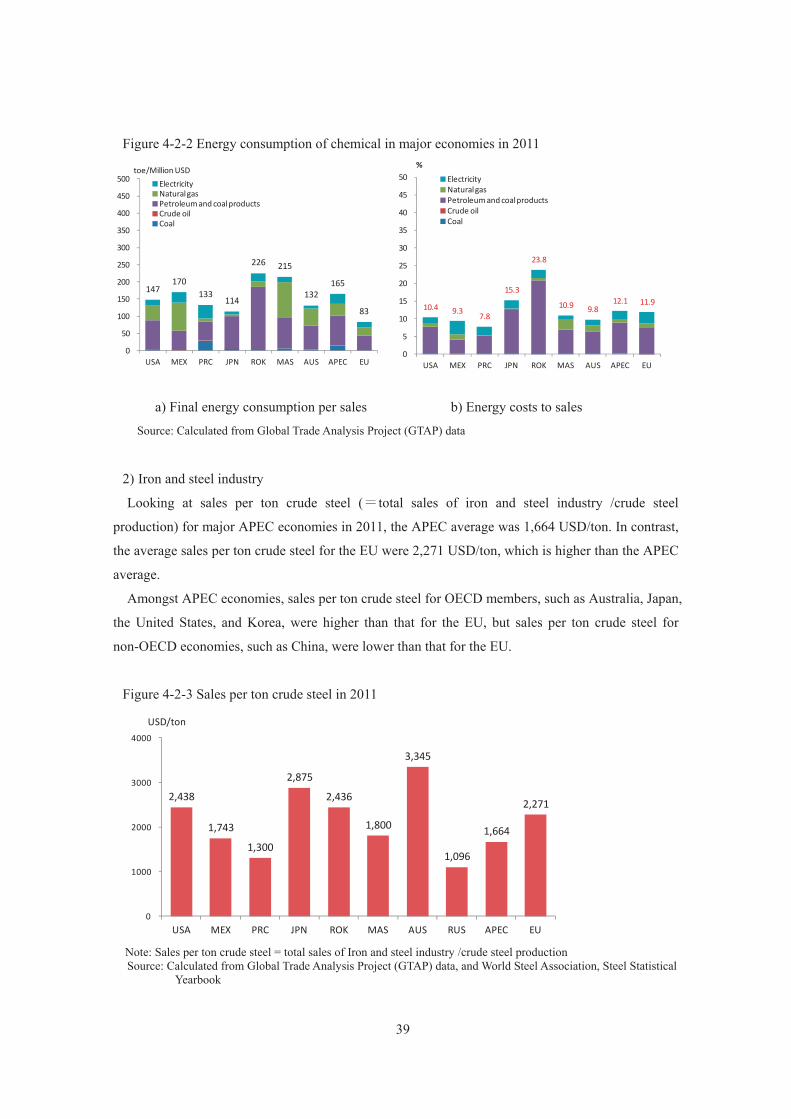
39
Figure 4-2-2 Energy consumption of chemical in major economies in 2011
a) Final energy consumption per sales b) Energy costs to sales
Source: Calculated from Global Trade Analysis Project (GTAP) data
2) Iron and steel industry
Looking at sales per ton crude steel (=total sales of iron and steel industry /crude steel
production) for major APEC economies in 2011, the APEC average was 1,664 USD/ton. In contrast,
the average sales per ton crude steel for the EU were 2,271 USD/ton, which is higher than the APEC
average.
Amongst APEC economies, sales per ton crude steel for OECD members, such as Australia, Japan,
the United States, and Korea, were higher than that for the EU, but sales per ton crude steel for
non-OECD economies, such as China, were lower than that for the EU.
Figure 4-2-3 Sales per ton crude steel in 2011
Note: Sales per ton crude steel = total sales of Iron and steel industry /crude steel production Source: Calculated from Global Trade Analysis Project (GTAP) data, and World Steel Association, Steel Statistical
Yearbook
147 170
133 114
226 215
132 165
83
0
50
100
150
200
250
300
350
400
450
500
USA MEX PRC JPN ROK MAS AUS APEC EU
ElectricityNatural gasPetroleum and coal productsCrude oilCoal
toe/Million USD
10.4 9.3 7.8
15.3
23.8
10.9 9.8 12.1 11.9
0
5
10
15
20
25
30
35
40
45
50
USA MEX PRC JPN ROK MAS AUS APEC EU
%ElectricityNatural gasPetroleum and coal productsCrude oilCoal
2,438
1,743
1,300
2,875
2,436
1,800
3,345
1,096
1,664
2,271
0
1000
2000
3000
4000
USA MEX PRC JPN ROK MAS AUS RUS APEC EU
USD/ton
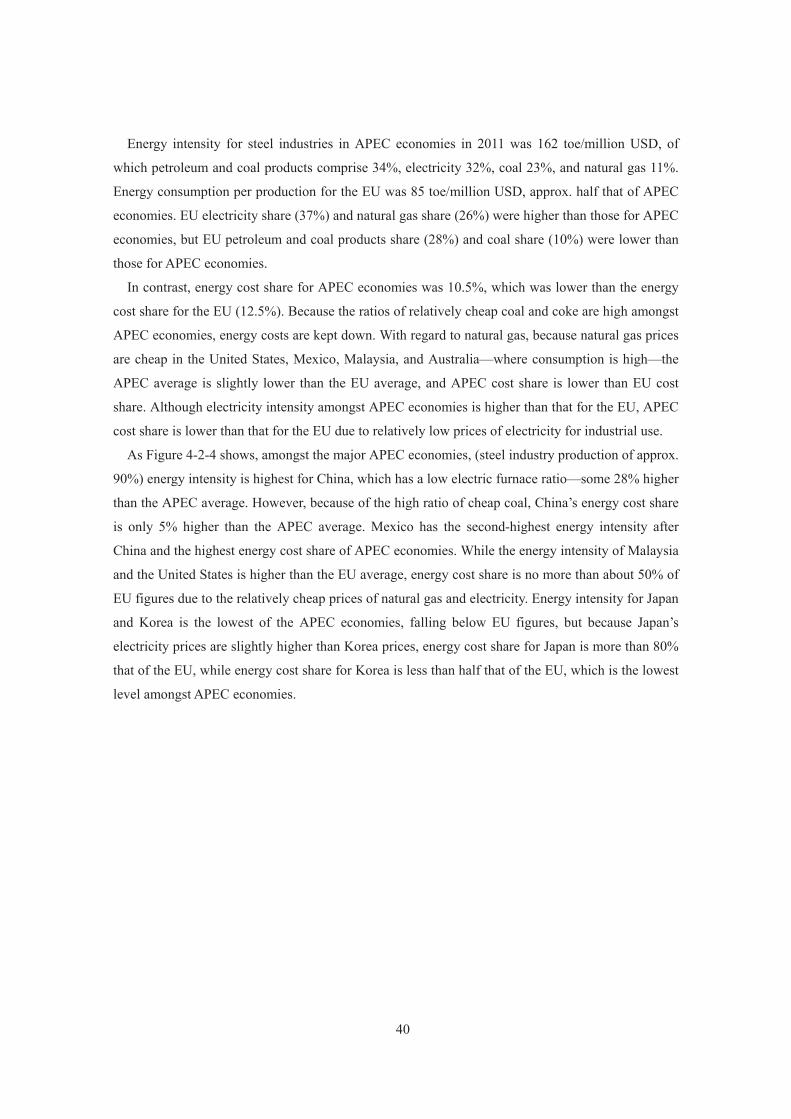
40
Energy intensity for steel industries in APEC economies in 2011 was 162 toe/million USD, of
which petroleum and coal products comprise 34%, electricity 32%, coal 23%, and natural gas 11%.
Energy consumption per production for the EU was 85 toe/million USD, approx. half that of APEC
economies. EU electricity share (37%) and natural gas share (26%) were higher than those for APEC
economies, but EU petroleum and coal products share (28%) and coal share (10%) were lower than
those for APEC economies.
In contrast, energy cost share for APEC economies was 10.5%, which was lower than the energy
cost share for the EU (12.5%). Because the ratios of relatively cheap coal and coke are high amongst
APEC economies, energy costs are kept down. With regard to natural gas, because natural gas prices
are cheap in the United States, Mexico, Malaysia, and Australia—where consumption is high—the
APEC average is slightly lower than the EU average, and APEC cost share is lower than EU cost
share. Although electricity intensity amongst APEC economies is higher than that for the EU, APEC
cost share is lower than that for the EU due to relatively low prices of electricity for industrial use.
As Figure 4-2-4 shows, amongst the major APEC economies, (steel industry production of approx.
90%) energy intensity is highest for China, which has a low electric furnace ratio—some 28% higher
than the APEC average. However, because of the high ratio of cheap coal, China’s energy cost share
is only 5% higher than the APEC average. Mexico has the second-highest energy intensity after
China and the highest energy cost share of APEC economies. While the energy intensity of Malaysia
and the United States is higher than the EU average, energy cost share is no more than about 50% of
EU figures due to the relatively cheap prices of natural gas and electricity. Energy intensity for Japan
and Korea is the lowest of the APEC economies, falling below EU figures, but because Japan’s
electricity prices are slightly higher than Korea prices, energy cost share for Japan is more than 80%
that of the EU, while energy cost share for Korea is less than half that of the EU, which is the lowest
level amongst APEC economies.
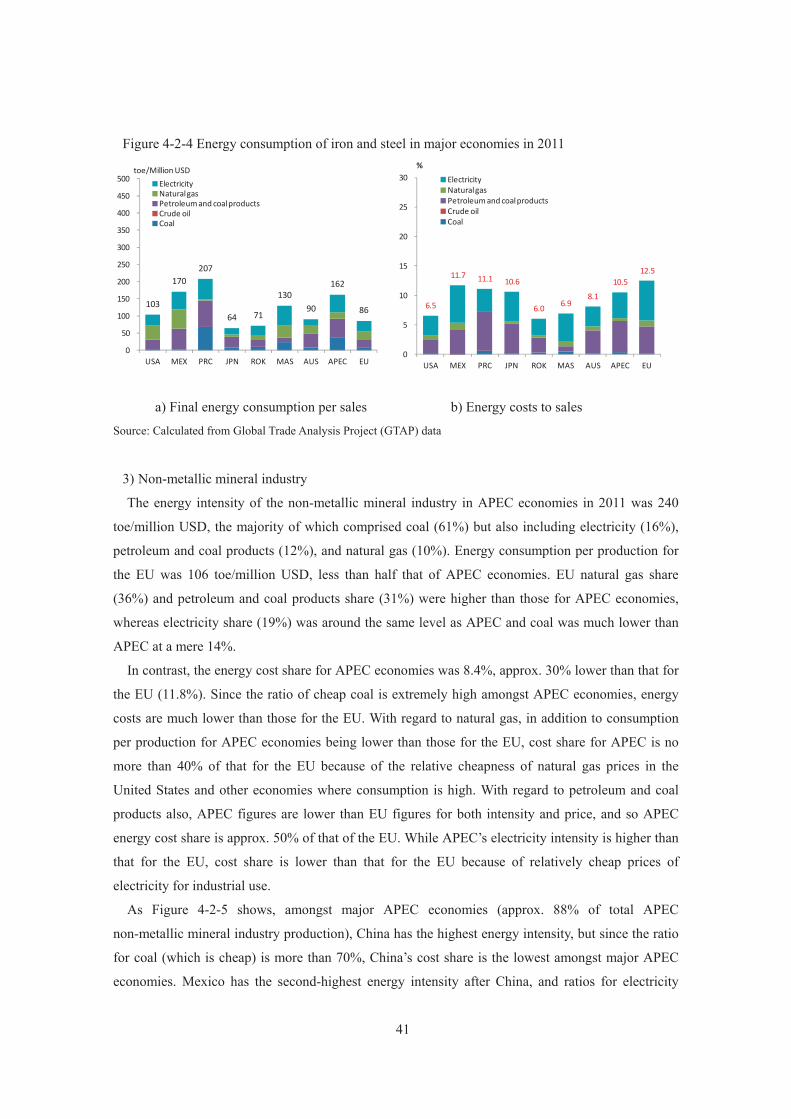
41
Figure 4-2-4 Energy consumption of iron and steel in major economies in 2011
a) Final energy consumption per sales b) Energy costs to sales
Source: Calculated from Global Trade Analysis Project (GTAP) data
3) Non-metallic mineral industry
The energy intensity of the non-metallic mineral industry in APEC economies in 2011 was 240
toe/million USD, the majority of which comprised coal (61%) but also including electricity (16%),
petroleum and coal products (12%), and natural gas (10%). Energy consumption per production for
the EU was 106 toe/million USD, less than half that of APEC economies. EU natural gas share
(36%) and petroleum and coal products share (31%) were higher than those for APEC economies,
whereas electricity share (19%) was around the same level as APEC and coal was much lower than
APEC at a mere 14%.
In contrast, the energy cost share for APEC economies was 8.4%, approx. 30% lower than that for
the EU (11.8%). Since the ratio of cheap coal is extremely high amongst APEC economies, energy
costs are much lower than those for the EU. With regard to natural gas, in addition to consumption
per production for APEC economies being lower than those for the EU, cost share for APEC is no
more than 40% of that for the EU because of the relative cheapness of natural gas prices in the
United States and other economies where consumption is high. With regard to petroleum and coal
products also, APEC figures are lower than EU figures for both intensity and price, and so APEC
energy cost share is approx. 50% of that of the EU. While APEC’s electricity intensity is higher than
that for the EU, cost share is lower than that for the EU because of relatively cheap prices of
electricity for industrial use.
As Figure 4-2-5 shows, amongst major APEC economies (approx. 88% of total APEC
non-metallic mineral industry production), China has the highest energy intensity, but since the ratio
for coal (which is cheap) is more than 70%, China’s cost share is the lowest amongst major APEC
economies. Mexico has the second-highest energy intensity after China, and ratios for electricity
103
170 207
64 71
130 90
162
86
0
50
100
150
200
250
300
350
400
450
500
USA MEX PRC JPN ROK MAS AUS APEC EU
ElectricityNatural gasPetroleum and coal productsCrude oilCoal
toe/Million USD
6.5
11.7 11.1 10.6
6.0 6.9 8.1
10.5 12.5
0
5
10
15
20
25
30
USA MEX PRC JPN ROK MAS AUS APEC EU
%ElectricityNatural gasPetroleum and coal productsCrude oilCoal
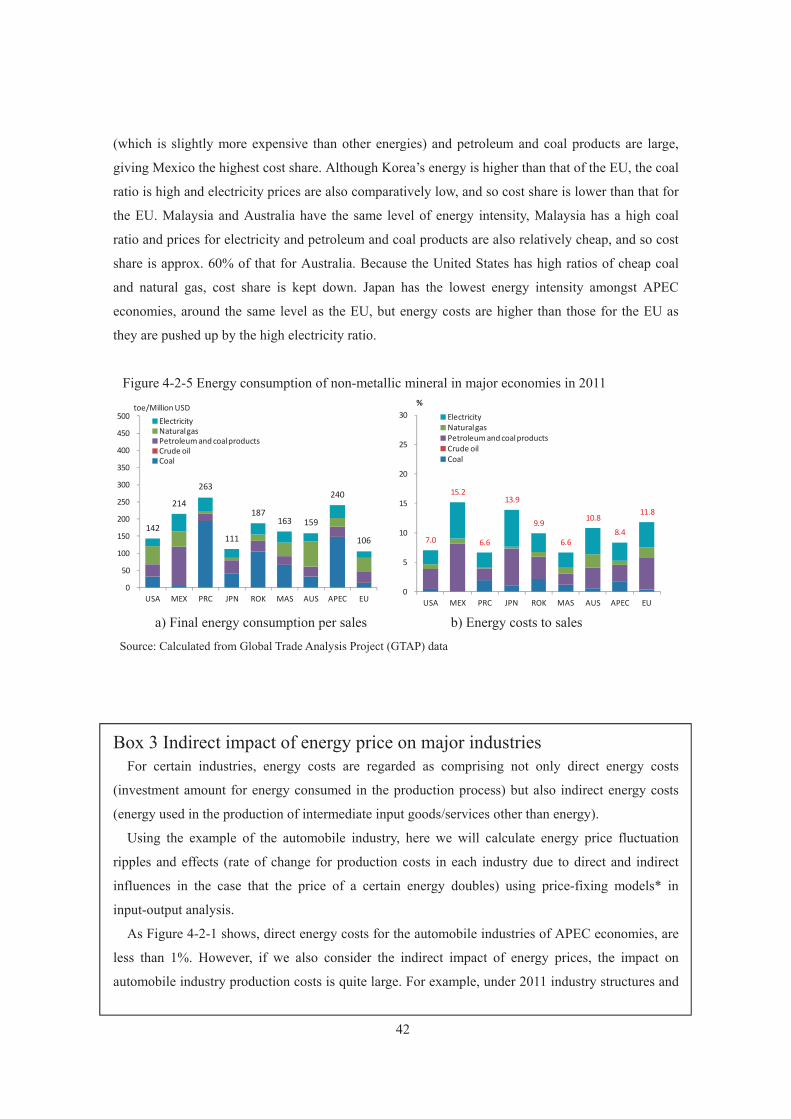
42
(which is slightly more expensive than other energies) and petroleum and coal products are large,
giving Mexico the highest cost share. Although Korea’s energy is higher than that of the EU, the coal
ratio is high and electricity prices are also comparatively low, and so cost share is lower than that for
the EU. Malaysia and Australia have the same level of energy intensity, Malaysia has a high coal
ratio and prices for electricity and petroleum and coal products are also relatively cheap, and so cost
share is approx. 60% of that for Australia. Because the United States has high ratios of cheap coal
and natural gas, cost share is kept down. Japan has the lowest energy intensity amongst APEC
economies, around the same level as the EU, but energy costs are higher than those for the EU as
they are pushed up by the high electricity ratio.
Figure 4-2-5 Energy consumption of non-metallic mineral in major economies in 2011
a) Final energy consumption per sales b) Energy costs to sales
Source: Calculated from Global Trade Analysis Project (GTAP) data
Box 3 Indirect impact of energy price on major industries For certain industries, energy costs are regarded as comprising not only direct energy costs
(investment amount for energy consumed in the production process) but also indirect energy costs
(energy used in the production of intermediate input goods/services other than energy).
Using the example of the automobile industry, here we will calculate energy price fluctuation
ripples and effects (rate of change for production costs in each industry due to direct and indirect
influences in the case that the price of a certain energy doubles) using price-fixing models* in
input-output analysis.
As Figure 4-2-1 shows, direct energy costs for the automobile industries of APEC economies, are
less than 1%. However, if we also consider the indirect impact of energy prices, the impact on
automobile industry production costs is quite large. For example, under 2011 industry structures and
142
214
263
111
187 163 159
240
106
0
50
100
150
200
250
300
350
400
450
500
USA MEX PRC JPN ROK MAS AUS APEC EU
ElectricityNatural gasPetroleum and coal productsCrude oilCoal
toe/Million USD
7.0
15.2
6.6
13.9
9.9
6.6
10.8 8.4
11.8
0
5
10
15
20
25
30
USA MEX PRC JPN ROK MAS AUS APEC EU
%ElectricityNatural gasPetroleum and coal productsCrude oilCoal
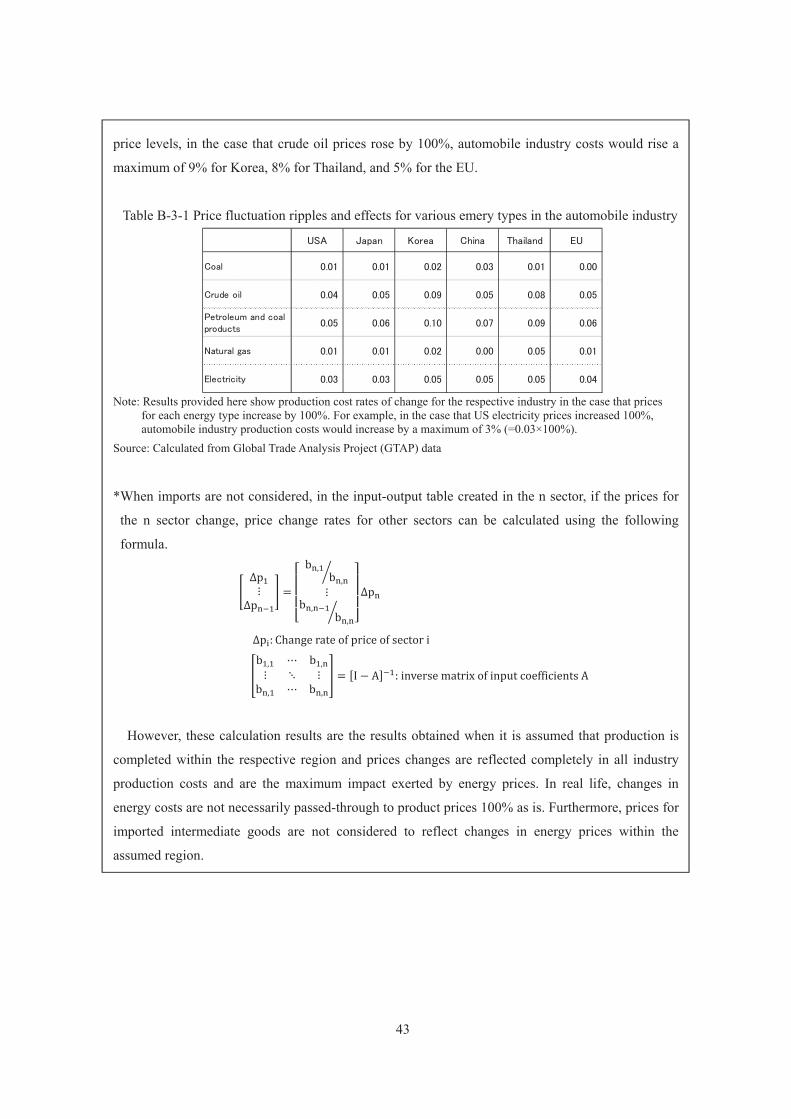
43
price levels, in the case that crude oil prices rose by 100%, automobile industry costs would rise a
maximum of 9% for Korea, 8% for Thailand, and 5% for the EU.
Table B-3-1 Price fluctuation ripples and effects for various emery types in the automobile industry
Note: Results provided here show production cost rates of change for the respective industry in the case that prices
for each energy type increase by 100%. For example, in the case that US electricity prices increased 100%, automobile industry production costs would increase by a maximum of 3% (=0.03×100%).
Source: Calculated from Global Trade Analysis Project (GTAP) data
*When imports are not considered, in the input-output table created in the n sector, if the prices for
the n sector change, price change rates for other sectors can be calculated using the following
formula.
∆p⋮∆p = b , b ,⋮b , b ,
∆p
∆p : Change rate of price of sector i
b , ⋯ b ,⋮ ⋱ ⋮b , ⋯ b , = I − A : inverse matrix of input coefficients A
However, these calculation results are the results obtained when it is assumed that production is
completed within the respective region and prices changes are reflected completely in all industry
production costs and are the maximum impact exerted by energy prices. In real life, changes in
energy costs are not necessarily passed-through to product prices 100% as is. Furthermore, prices for
imported intermediate goods are not considered to reflect changes in energy prices within the
assumed region.
USA Japan Korea China Thailand EU
Coal 0.01 0.01 0.02 0.03 0.01 0.00
Crude oil 0.04 0.05 0.09 0.05 0.08 0.05
Petroleum and coalproducts
0.05 0.06 0.10 0.07 0.09 0.06
Natural gas 0.01 0.01 0.02 0.00 0.05 0.01
Electricity 0.03 0.03 0.05 0.05 0.05 0.04
44
Chapter 5 The relations of industrial competitiveness and
energy
5-1 Industrial competitiveness of APEC 5-1-1 How to measure industrial competitiveness
In related existing studies, the definition of competitiveness is as follows: "Competitiveness is a
situation where an economy produces goods and services cheaply enough to compete in world
markets and is thus able to export successfully and/or to sell domestically without being
out-competed by imports from other countries or requiring protection through costly trade barriers."2
At the sector level, industrial competitiveness is how attractive different economies are for a
particular industry and is often measured in terms of performance in international trade (net exports,
investment flows). The main drivers of sector competitiveness include availability of production
factors (including raw materials, labor, and skills), industrial policy, supply chain linkages and
economies of agglomeration" (Document 14).
The degree and change of competitiveness of the specified industry in a certain economy or region
can be evaluated from various viewpoints, such as comparisons with the industry itself in different
times, comparisons with the same industry in another economy or region, and comparisons with
another industry in their own economy or region.
The export volume, export share in the global market, revealed comparative advantage (RCA),3
and relative trade balance (RTB)4 are generally used as indexes for measuring the competitiveness
of the specified industries in the related existing studies.
Among these indexes, as international competitiveness of a certain industry in a certain economy
is enhanced, its export volume increases. On the other hand, an absolute export volume may change
depending on expansion of the international market. Accordingly, an export share in the international
market is also a significant index to measure competitiveness in order to compare the degree of
relative competitiveness with the same industry in another economy or region. Furthermore, because
degrees of export volume and international share are also related to the economic scale and
population of the economy or region, the RCA is used as an index to measure export competitiveness
of the specified industry in a certain economy in terms of the relative position of all exports from
2 Andrew Scott, “Energy and low-carbon competitiveness: the case of low-income countries” (2013). 3 The RCA shows how the share of exports of a certain sector in total exports in a certain economy develops relative
to the share of this sector in overall world exports. However, in some researches, the same index is defined as relative World Trade Share (RWS), and RCA is used to present the index that compares the national export/import-ratio of one sector to the total national export/import-ratio.
4 The RTB compares the trade balance (exports minus imports) for a product to the total trade (exports plus imports) of that product.

45
that economy or region. Also, international competitiveness is not only a comparison between export
products in the international market, but that between domestic or regional products and import
products in the domestic or regional market. At that time, the RTB serves as one of evaluation
indexes.
Table 5-1-1 Indictors of industrial competitiveness
Indicator Definition and feature
Export volume The basic indicator to measure export. It will increase
as the competitiveness becomes stronger.
Global market share Index to measure competitiveness in order to
compare the degree of relative competitiveness with the
same industry in another economy or region.
Relative Trade Balance (RTB) (Export - Import)/(Export + Import). One of the
indicators of exports competitiveness and the value is
between -1 and +1. As the value is the higher, the
exports competitiveness is stronger.
Revealed Comparative Advantage (RCA) The share of exports of a certain sector in total
exports in an economy, relative to the share of this
sector in overall world exports. One of the indicators to
show the relative advantage of a sector on export in an
economy.
The next section focuses on the changes in international competitiveness in manufacturing
especially the energy-intensive industries in APEC in recent years with the use of these
competitiveness indexes.
5-1-2 International competitiveness of key industries in major economies. 1) Overall manufacturing
(1) Export value and export share
With the exception of the temporary drop after the Lehman shock, the world’s trade continued to
expand with global population growth and economic growth mainly in emerging economies. For
nearly 20 years from 1995 to 2014, the export value of manufacturing in the world (except for
petroleum and coal products; the same applies hereafter) grew from 4.0 trillion USD to 13.1 trillion
USD with the average annual rate of increase at 6.4%.
The export value of manufacturing in APEC increased from 1.9 trillion USD in 1995 to 6.8 trillion
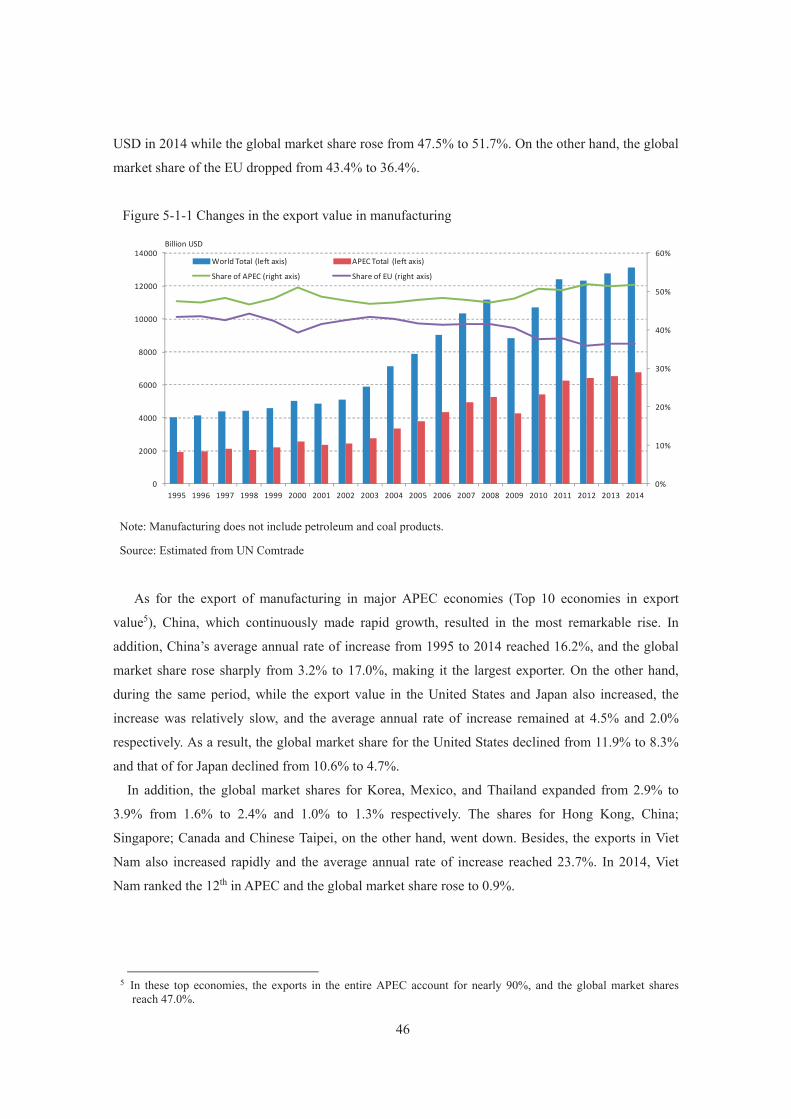
46
USD in 2014 while the global market share rose from 47.5% to 51.7%. On the other hand, the global
market share of the EU dropped from 43.4% to 36.4%.
Figure 5-1-1 Changes in the export value in manufacturing
Note: Manufacturing does not include petroleum and coal products.
Source: Estimated from UN Comtrade
As for the export of manufacturing in major APEC economies (Top 10 economies in export
value5), China, which continuously made rapid growth, resulted in the most remarkable rise. In
addition, China’s average annual rate of increase from 1995 to 2014 reached 16.2%, and the global
market share rose sharply from 3.2% to 17.0%, making it the largest exporter. On the other hand,
during the same period, while the export value in the United States and Japan also increased, the
increase was relatively slow, and the average annual rate of increase remained at 4.5% and 2.0%
respectively. As a result, the global market share for the United States declined from 11.9% to 8.3%
and that of for Japan declined from 10.6% to 4.7%.
In addition, the global market shares for Korea, Mexico, and Thailand expanded from 2.9% to
3.9% from 1.6% to 2.4% and 1.0% to 1.3% respectively. The shares for Hong Kong, China;
Singapore; Canada and Chinese Taipei, on the other hand, went down. Besides, the exports in Viet
Nam also increased rapidly and the average annual rate of increase reached 23.7%. In 2014, Viet
Nam ranked the 12th in APEC and the global market share rose to 0.9%.
5 In these top economies, the exports in the entire APEC account for nearly 90%, and the global market shares
reach 47.0%.
0%
10%
20%
30%
40%
50%
60%
0
2000
4000
6000
8000
10000
12000
14000
1995 1996 1997 1998 1999 2000 2001 2002 2003 2004 2005 2006 2007 2008 2009 2010 2011 2012 2013 2014
Billion USD
World Total (left axis) APEC Total (left axis)
Share of APEC (right axis) Share of EU (right axis)

47
Figure 5-1-2 Transition of the export value of the manufacturing in major APEC economies and
global market share
Note: Petroleum and coal products are not included in manufacturing.
Source: Estimated from UN Comtrade
(2) RTB
As for the RTB in manufacturing, since the exports and imports in the entire APEC are at roughly
the same level, the figures hover at about zero. While the RTB fell below slightly zero in the early
2000s, it turned positive after 2005 and maintains the level that exports are slightly more than
imports.
In China and Korea, with the expansion of trade surpluses, there is a significant increase in the
RTB and rose from 0.09 in 1995 to 0.28 and 0.27 in 2014. Japan, on the other hand, has been seeing
a declining trend and dropped by nearly half from 0.36 in 1995 to 0.18 in 2014, although it
maintained the highest level in APEC until 2010. As for Chinese Taipei, while the economy
maintained the level that exceeds 0.2 in the mid-2000s, the growth has been sluggish in recent years,
recording 0.16 in 2014.
Singapore maintained a positive level after the Asian economic crisis and demonstrated an upward
trend in recent years, resulting in a rise to 0.12 in 2014. While Thailand maintained a positive level
in recent years, in 2012, because of the recovery and restoration from a major flood that occurred in
the previous year, causing an increase in imports, and it went negative temporarily, the RTB
recovered to 0.05 in 2014. For the Philippines, although it underwent a change at nearly zero and
went negative around 2010 due to a decline in exports, it picked up to 0.05 in 2014. For Malaysia,
although RTB was more than 0.05 in the early 2000s, it has been on a downward trend in recent
years, and the exports and imports became equal, dropping to 0.01 in 2014. In Viet Nam, the
expansion of exports caused the increase in imports to surpass exports, resulting in a rapid rise in the
0
500
1000
1500
2000
2500
1995
1996
1997
1998
1999
2000
2001
2002
2003
2004
2005
2006
2007
2008
2009
2010
2011
2012
2013
2014
Billion USD
PRC
USA
JPN
ROK
HKC
MEX
SIN
CDA
CT
THA
Other APEC
0%
10%
20%
30%
40%
50%
60%
70%
80%
90%
100%
1995
1996
1997
1998
1999
2000
2001
2002
2003
2004
2005
2006
2007
2008
2009
2010
2011
2012
2013
2014
Non APECOther APECTHA
CT
CDA
SIN
MEX
HKC
ROK
JPN
USA
PRC
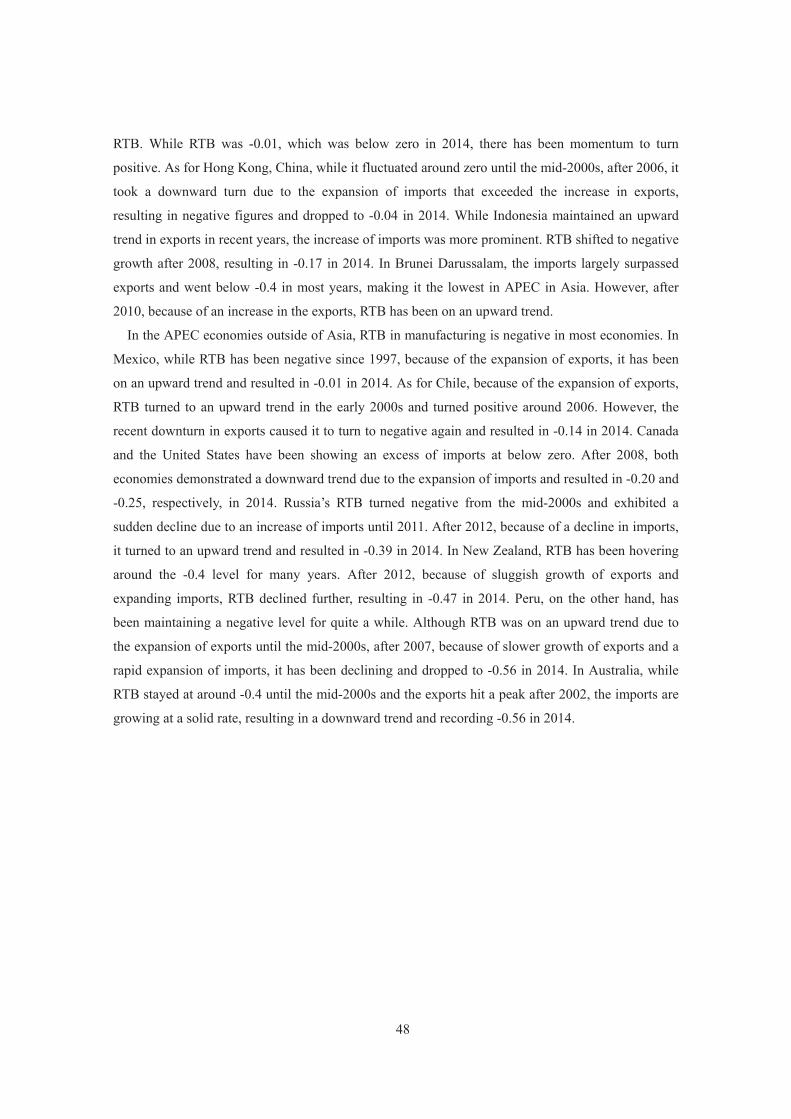
48
RTB. While RTB was -0.01, which was below zero in 2014, there has been momentum to turn
positive. As for Hong Kong, China, while it fluctuated around zero until the mid-2000s, after 2006, it
took a downward turn due to the expansion of imports that exceeded the increase in exports,
resulting in negative figures and dropped to -0.04 in 2014. While Indonesia maintained an upward
trend in exports in recent years, the increase of imports was more prominent. RTB shifted to negative
growth after 2008, resulting in -0.17 in 2014. In Brunei Darussalam, the imports largely surpassed
exports and went below -0.4 in most years, making it the lowest in APEC in Asia. However, after
2010, because of an increase in the exports, RTB has been on an upward trend.
In the APEC economies outside of Asia, RTB in manufacturing is negative in most economies. In
Mexico, while RTB has been negative since 1997, because of the expansion of exports, it has been
on an upward trend and resulted in -0.01 in 2014. As for Chile, because of the expansion of exports,
RTB turned to an upward trend in the early 2000s and turned positive around 2006. However, the
recent downturn in exports caused it to turn to negative again and resulted in -0.14 in 2014. Canada
and the United States have been showing an excess of imports at below zero. After 2008, both
economies demonstrated a downward trend due to the expansion of imports and resulted in -0.20 and
-0.25, respectively, in 2014. Russia’s RTB turned negative from the mid-2000s and exhibited a
sudden decline due to an increase of imports until 2011. After 2012, because of a decline in imports,
it turned to an upward trend and resulted in -0.39 in 2014. In New Zealand, RTB has been hovering
around the -0.4 level for many years. After 2012, because of sluggish growth of exports and
expanding imports, RTB declined further, resulting in -0.47 in 2014. Peru, on the other hand, has
been maintaining a negative level for quite a while. Although RTB was on an upward trend due to
the expansion of exports until the mid-2000s, after 2007, because of slower growth of exports and a
rapid expansion of imports, it has been declining and dropped to -0.56 in 2014. In Australia, while
RTB stayed at around -0.4 until the mid-2000s and the exports hit a peak after 2002, the imports are
growing at a solid rate, resulting in a downward trend and recording -0.56 in 2014.
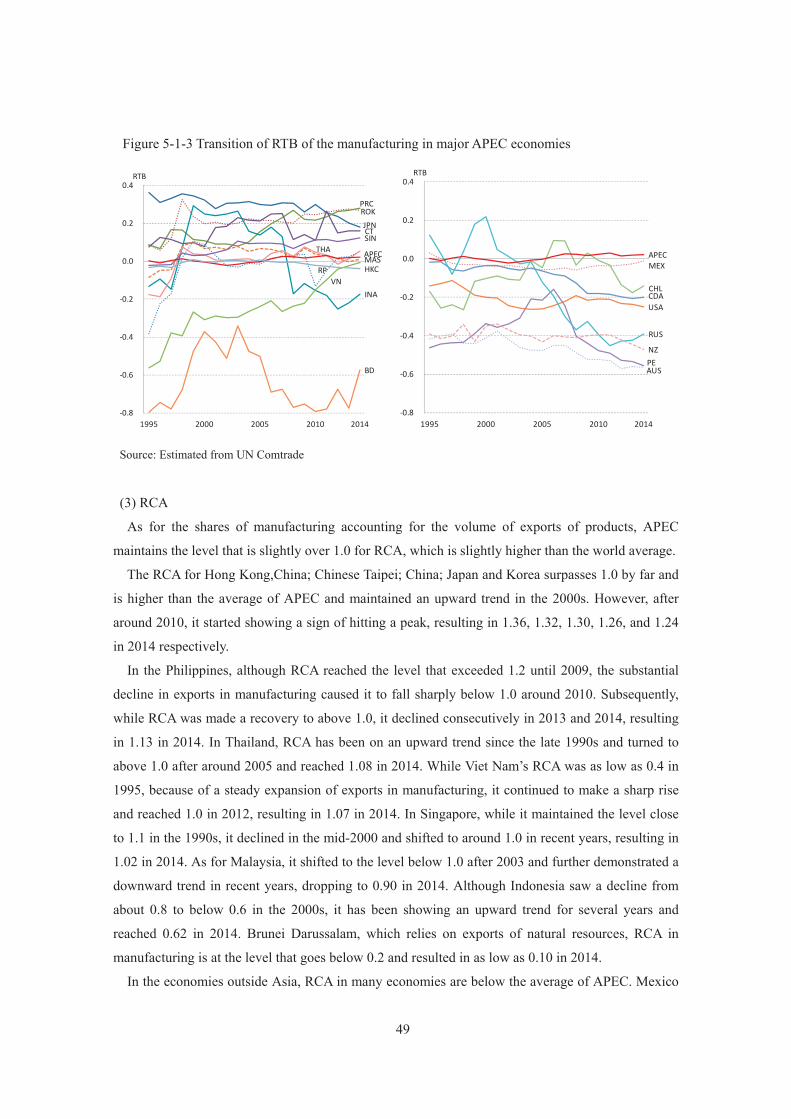
49
Figure 5-1-3 Transition of RTB of the manufacturing in major APEC economies
Source: Estimated from UN Comtrade
(3) RCA
As for the shares of manufacturing accounting for the volume of exports of products, APEC
maintains the level that is slightly over 1.0 for RCA, which is slightly higher than the world average.
The RCA for Hong Kong,China; Chinese Taipei; China; Japan and Korea surpasses 1.0 by far and
is higher than the average of APEC and maintained an upward trend in the 2000s. However, after
around 2010, it started showing a sign of hitting a peak, resulting in 1.36, 1.32, 1.30, 1.26, and 1.24
in 2014 respectively.
In the Philippines, although RCA reached the level that exceeded 1.2 until 2009, the substantial
decline in exports in manufacturing caused it to fall sharply below 1.0 around 2010. Subsequently,
while RCA was made a recovery to above 1.0, it declined consecutively in 2013 and 2014, resulting
in 1.13 in 2014. In Thailand, RCA has been on an upward trend since the late 1990s and turned to
above 1.0 after around 2005 and reached 1.08 in 2014. While Viet Nam’s RCA was as low as 0.4 in
1995, because of a steady expansion of exports in manufacturing, it continued to make a sharp rise
and reached 1.0 in 2012, resulting in 1.07 in 2014. In Singapore, while it maintained the level close
to 1.1 in the 1990s, it declined in the mid-2000 and shifted to around 1.0 in recent years, resulting in
1.02 in 2014. As for Malaysia, it shifted to the level below 1.0 after 2003 and further demonstrated a
downward trend in recent years, dropping to 0.90 in 2014. Although Indonesia saw a decline from
about 0.8 to below 0.6 in the 2000s, it has been showing an upward trend for several years and
reached 0.62 in 2014. Brunei Darussalam, which relies on exports of natural resources, RCA in
manufacturing is at the level that goes below 0.2 and resulted in as low as 0.10 in 2014.
In the economies outside Asia, RCA in many economies are below the average of APEC. Mexico
JPNROKPRC
CT
INA
MASRP
THA
VN
SIN
APEC
BD
HKC
-0.8
-0.6
-0.4
-0.2
0.0
0.2
0.4
1995 2000 2005 2010 2014
RTB
USACDA
MEX
CHL
PE
RUS
AUS
NZ
APEC
-0.8
-0.6
-0.4
-0.2
0.0
0.2
0.4
1995 2000 2005 2010 2014
RTB
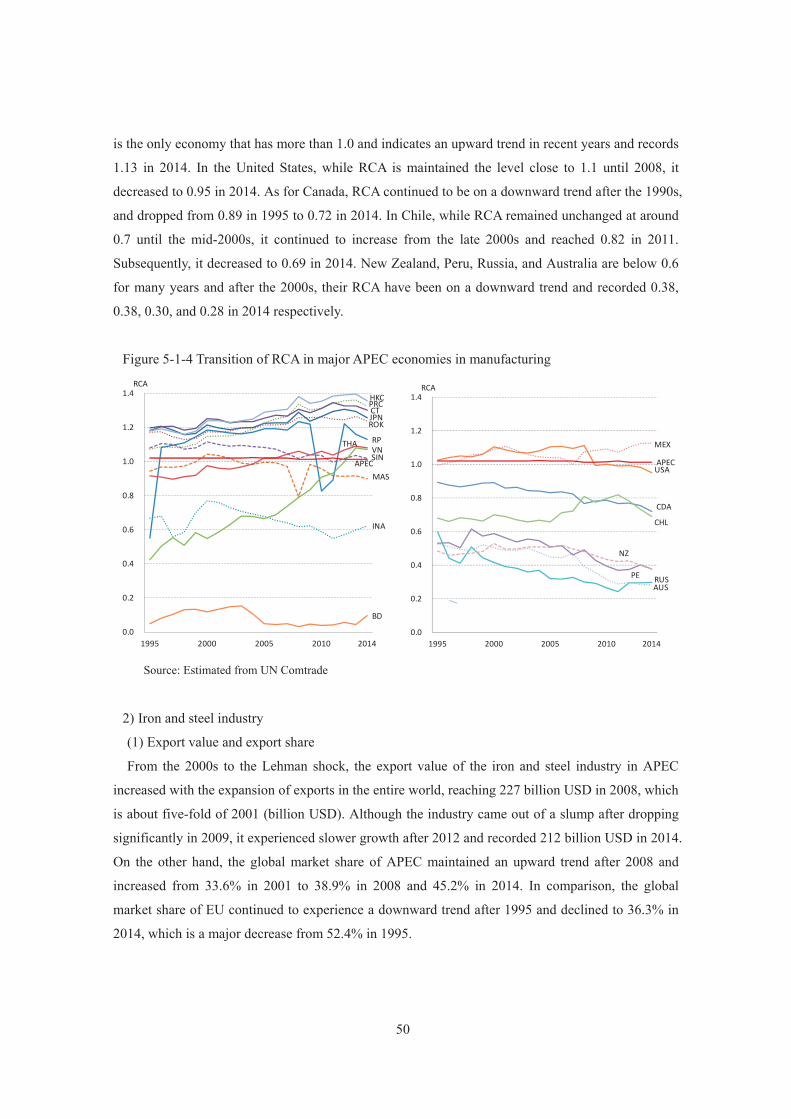
50
is the only economy that has more than 1.0 and indicates an upward trend in recent years and records
1.13 in 2014. In the United States, while RCA is maintained the level close to 1.1 until 2008, it
decreased to 0.95 in 2014. As for Canada, RCA continued to be on a downward trend after the 1990s,
and dropped from 0.89 in 1995 to 0.72 in 2014. In Chile, while RCA remained unchanged at around
0.7 until the mid-2000s, it continued to increase from the late 2000s and reached 0.82 in 2011.
Subsequently, it decreased to 0.69 in 2014. New Zealand, Peru, Russia, and Australia are below 0.6
for many years and after the 2000s, their RCA have been on a downward trend and recorded 0.38,
0.38, 0.30, and 0.28 in 2014 respectively.
Figure 5-1-4 Transition of RCA in major APEC economies in manufacturing
Source: Estimated from UN Comtrade
2) Iron and steel industry
(1) Export value and export share
From the 2000s to the Lehman shock, the export value of the iron and steel industry in APEC
increased with the expansion of exports in the entire world, reaching 227 billion USD in 2008, which
is about five-fold of 2001 (billion USD). Although the industry came out of a slump after dropping
significantly in 2009, it experienced slower growth after 2012 and recorded 212 billion USD in 2014.
On the other hand, the global market share of APEC maintained an upward trend after 2008 and
increased from 33.6% in 2001 to 38.9% in 2008 and 45.2% in 2014. In comparison, the global
market share of EU continued to experience a downward trend after 1995 and declined to 36.3% in
2014, which is a major decrease from 52.4% in 1995.
JPNROK
PRCCT
INA
MAS
RPTHAVNSIN
APEC
BD
HKC
0.0
0.2
0.4
0.6
0.8
1.0
1.2
1.4
1995 2000 2005 2010 2014
RCA
USA
CDA
MEX
CHL
PE RUSAUS
NZ
APEC
0.0
0.2
0.4
0.6
0.8
1.0
1.2
1.4
1995 2000 2005 2010 2014
RCA
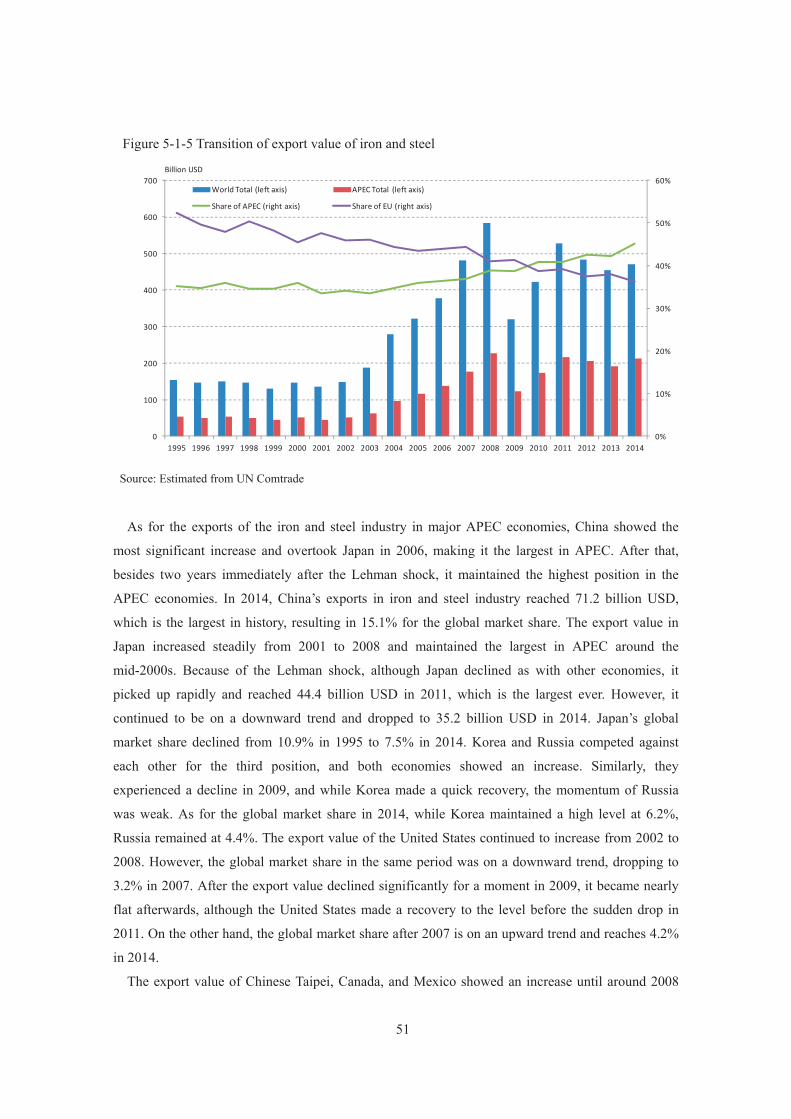
51
Figure 5-1-5 Transition of export value of iron and steel
Source: Estimated from UN Comtrade
As for the exports of the iron and steel industry in major APEC economies, China showed the
most significant increase and overtook Japan in 2006, making it the largest in APEC. After that,
besides two years immediately after the Lehman shock, it maintained the highest position in the
APEC economies. In 2014, China’s exports in iron and steel industry reached 71.2 billion USD,
which is the largest in history, resulting in 15.1% for the global market share. The export value in
Japan increased steadily from 2001 to 2008 and maintained the largest in APEC around the
mid-2000s. Because of the Lehman shock, although Japan declined as with other economies, it
picked up rapidly and reached 44.4 billion USD in 2011, which is the largest ever. However, it
continued to be on a downward trend and dropped to 35.2 billion USD in 2014. Japan’s global
market share declined from 10.9% in 1995 to 7.5% in 2014. Korea and Russia competed against
each other for the third position, and both economies showed an increase. Similarly, they
experienced a decline in 2009, and while Korea made a quick recovery, the momentum of Russia
was weak. As for the global market share in 2014, while Korea maintained a high level at 6.2%,
Russia remained at 4.4%. The export value of the United States continued to increase from 2002 to
2008. However, the global market share in the same period was on a downward trend, dropping to
3.2% in 2007. After the export value declined significantly for a moment in 2009, it became nearly
flat afterwards, although the United States made a recovery to the level before the sudden drop in
2011. On the other hand, the global market share after 2007 is on an upward trend and reaches 4.2%
in 2014.
The export value of Chinese Taipei, Canada, and Mexico showed an increase until around 2008
0%
10%
20%
30%
40%
50%
60%
0
100
200
300
400
500
600
700
1995 1996 1997 1998 1999 2000 2001 2002 2003 2004 2005 2006 2007 2008 2009 2010 2011 2012 2013 2014
Billion USD
World Total (left axis) APEC Total (left axis)
Share of APEC (right axis) Share of EU (right axis)
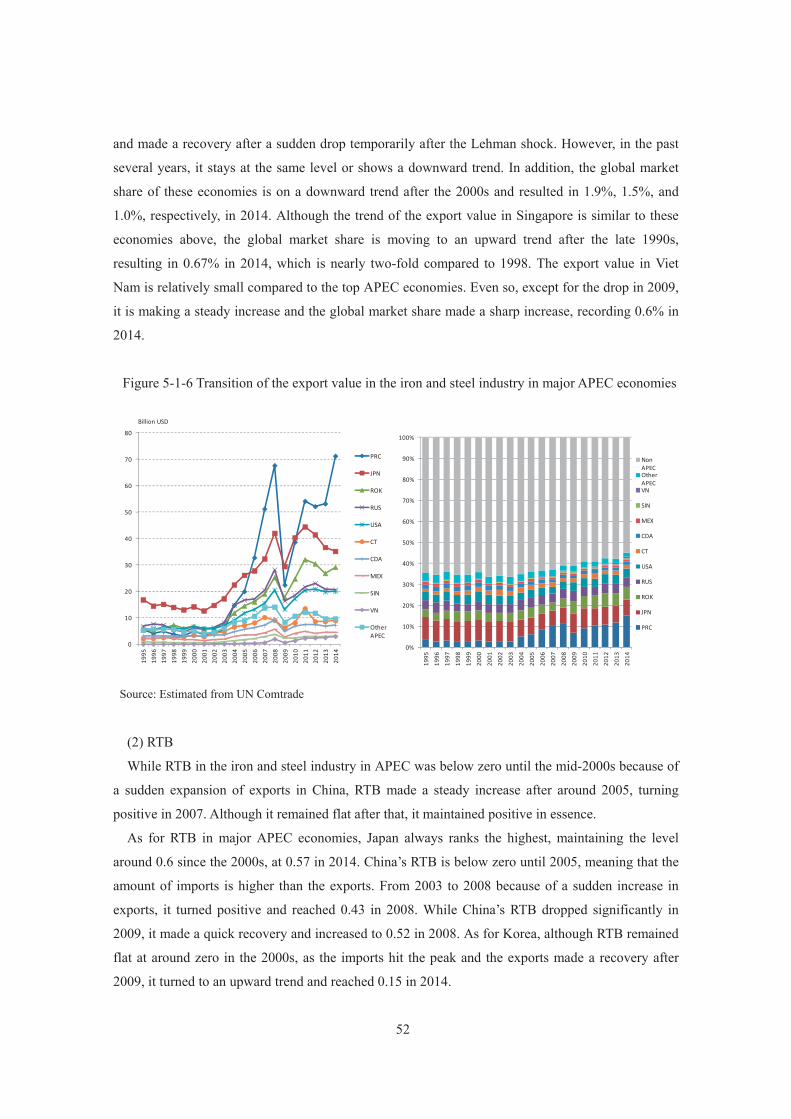
52
and made a recovery after a sudden drop temporarily after the Lehman shock. However, in the past
several years, it stays at the same level or shows a downward trend. In addition, the global market
share of these economies is on a downward trend after the 2000s and resulted in 1.9%, 1.5%, and
1.0%, respectively, in 2014. Although the trend of the export value in Singapore is similar to these
economies above, the global market share is moving to an upward trend after the late 1990s,
resulting in 0.67% in 2014, which is nearly two-fold compared to 1998. The export value in Viet
Nam is relatively small compared to the top APEC economies. Even so, except for the drop in 2009,
it is making a steady increase and the global market share made a sharp increase, recording 0.6% in
2014.
Figure 5-1-6 Transition of the export value in the iron and steel industry in major APEC economies
Source: Estimated from UN Comtrade
(2) RTB
While RTB in the iron and steel industry in APEC was below zero until the mid-2000s because of
a sudden expansion of exports in China, RTB made a steady increase after around 2005, turning
positive in 2007. Although it remained flat after that, it maintained positive in essence.
As for RTB in major APEC economies, Japan always ranks the highest, maintaining the level
around 0.6 since the 2000s, at 0.57 in 2014. China’s RTB is below zero until 2005, meaning that the
amount of imports is higher than the exports. From 2003 to 2008 because of a sudden increase in
exports, it turned positive and reached 0.43 in 2008. While China’s RTB dropped significantly in
2009, it made a quick recovery and increased to 0.52 in 2008. As for Korea, although RTB remained
flat at around zero in the 2000s, as the imports hit the peak and the exports made a recovery after
2009, it turned to an upward trend and reached 0.15 in 2014.
0
10
20
30
40
50
60
70
80
1995
1996
1997
1998
1999
2000
2001
2002
2003
2004
2005
2006
2007
2008
2009
2010
2011
2012
2013
2014
Billion USD
PRC
JPN
ROK
RUS
USA
CT
CDA
MEX
SIN
VN
Other APEC
0%
10%
20%
30%
40%
50%
60%
70%
80%
90%
100%
1995
1996
1997
1998
1999
2000
2001
2002
2003
2004
2005
2006
2007
2008
2009
2010
2011
2012
2013
2014
Non APECOther APECVN
SIN
MEX
CDA
CT
USA
RUS
ROK
JPN
PRC
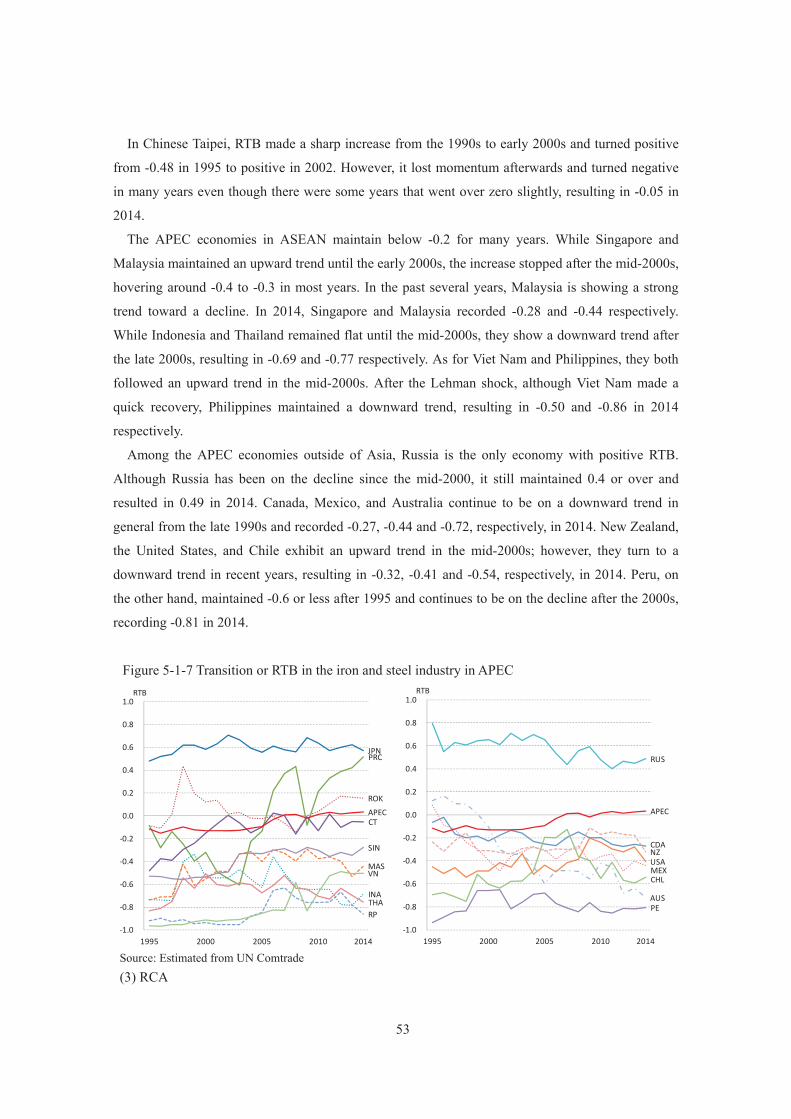
53
In Chinese Taipei, RTB made a sharp increase from the 1990s to early 2000s and turned positive
from -0.48 in 1995 to positive in 2002. However, it lost momentum afterwards and turned negative
in many years even though there were some years that went over zero slightly, resulting in -0.05 in
2014.
The APEC economies in ASEAN maintain below -0.2 for many years. While Singapore and
Malaysia maintained an upward trend until the early 2000s, the increase stopped after the mid-2000s,
hovering around -0.4 to -0.3 in most years. In the past several years, Malaysia is showing a strong
trend toward a decline. In 2014, Singapore and Malaysia recorded -0.28 and -0.44 respectively.
While Indonesia and Thailand remained flat until the mid-2000s, they show a downward trend after
the late 2000s, resulting in -0.69 and -0.77 respectively. As for Viet Nam and Philippines, they both
followed an upward trend in the mid-2000s. After the Lehman shock, although Viet Nam made a
quick recovery, Philippines maintained a downward trend, resulting in -0.50 and -0.86 in 2014
respectively.
Among the APEC economies outside of Asia, Russia is the only economy with positive RTB.
Although Russia has been on the decline since the mid-2000, it still maintained 0.4 or over and
resulted in 0.49 in 2014. Canada, Mexico, and Australia continue to be on a downward trend in
general from the late 1990s and recorded -0.27, -0.44 and -0.72, respectively, in 2014. New Zealand,
the United States, and Chile exhibit an upward trend in the mid-2000s; however, they turn to a
downward trend in recent years, resulting in -0.32, -0.41 and -0.54, respectively, in 2014. Peru, on
the other hand, maintained -0.6 or less after 1995 and continues to be on the decline after the 2000s,
recording -0.81 in 2014.
Figure 5-1-7 Transition or RTB in the iron and steel industry in APEC
Source: Estimated from UN Comtrade (3) RCA
JPN
ROK
PRC
CT
INA
MAS
RPTHA
VN
SIN
APEC
-1.0
-0.8
-0.6
-0.4
-0.2
0.0
0.2
0.4
0.6
0.8
1.0
1995 2000 2005 2010 2014
RTB
USA
CDA
MEXCHL
PE
RUS
AUS
NZ
APEC
-1.0
-0.8
-0.6
-0.4
-0.2
0.0
0.2
0.4
0.6
0.8
1.0
1995 2000 2005 2010 2014
RTB
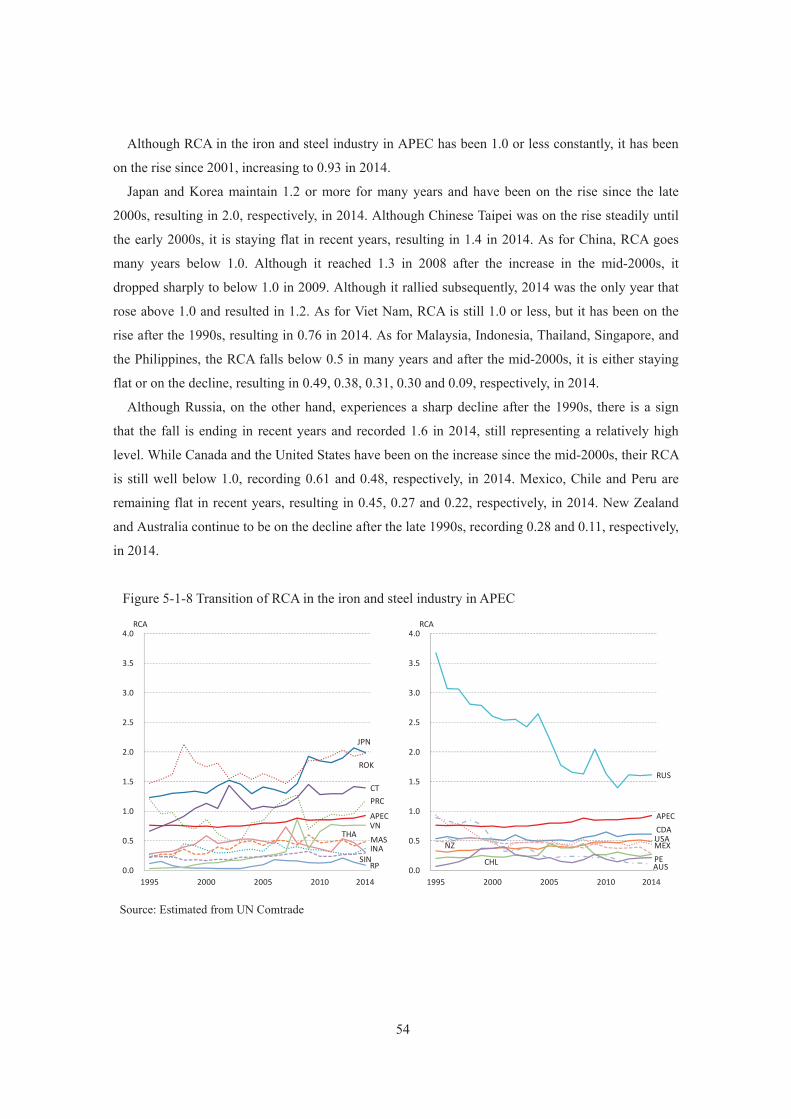
54
Although RCA in the iron and steel industry in APEC has been 1.0 or less constantly, it has been
on the rise since 2001, increasing to 0.93 in 2014.
Japan and Korea maintain 1.2 or more for many years and have been on the rise since the late
2000s, resulting in 2.0, respectively, in 2014. Although Chinese Taipei was on the rise steadily until
the early 2000s, it is staying flat in recent years, resulting in 1.4 in 2014. As for China, RCA goes
many years below 1.0. Although it reached 1.3 in 2008 after the increase in the mid-2000s, it
dropped sharply to below 1.0 in 2009. Although it rallied subsequently, 2014 was the only year that
rose above 1.0 and resulted in 1.2. As for Viet Nam, RCA is still 1.0 or less, but it has been on the
rise after the 1990s, resulting in 0.76 in 2014. As for Malaysia, Indonesia, Thailand, Singapore, and
the Philippines, the RCA falls below 0.5 in many years and after the mid-2000s, it is either staying
flat or on the decline, resulting in 0.49, 0.38, 0.31, 0.30 and 0.09, respectively, in 2014.
Although Russia, on the other hand, experiences a sharp decline after the 1990s, there is a sign
that the fall is ending in recent years and recorded 1.6 in 2014, still representing a relatively high
level. While Canada and the United States have been on the increase since the mid-2000s, their RCA
is still well below 1.0, recording 0.61 and 0.48, respectively, in 2014. Mexico, Chile and Peru are
remaining flat in recent years, resulting in 0.45, 0.27 and 0.22, respectively, in 2014. New Zealand
and Australia continue to be on the decline after the late 1990s, recording 0.28 and 0.11, respectively,
in 2014.
Figure 5-1-8 Transition of RCA in the iron and steel industry in APEC
Source: Estimated from UN Comtrade
JPN
ROK
PRCCT
INAMAS
RP
THAVN
SIN
APEC
0.0
0.5
1.0
1.5
2.0
2.5
3.0
3.5
4.0
1995 2000 2005 2010 2014
RCA
USACDA
MEX
CHL PE
RUS
AUS
NZ
APEC
0.0
0.5
1.0
1.5
2.0
2.5
3.0
3.5
4.0
1995 2000 2005 2010 2014
RCA
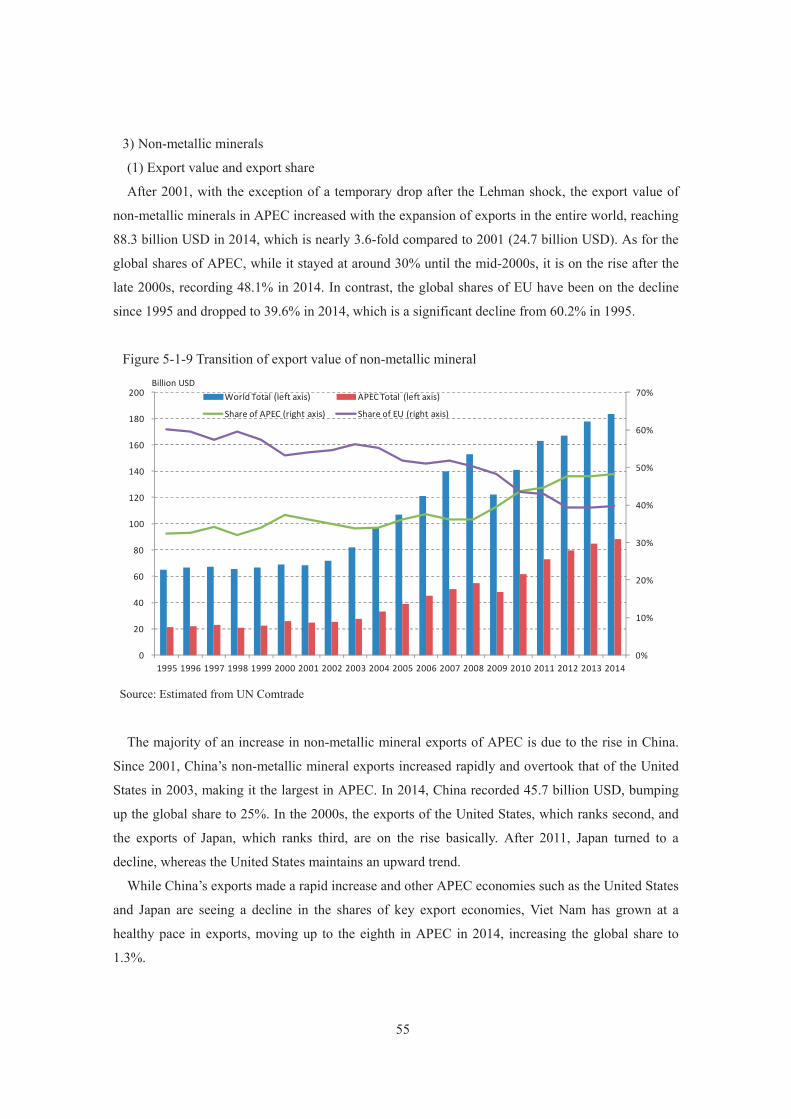
55
3) Non-metallic minerals
(1) Export value and export share
After 2001, with the exception of a temporary drop after the Lehman shock, the export value of
non-metallic minerals in APEC increased with the expansion of exports in the entire world, reaching
88.3 billion USD in 2014, which is nearly 3.6-fold compared to 2001 (24.7 billion USD). As for the
global shares of APEC, while it stayed at around 30% until the mid-2000s, it is on the rise after the
late 2000s, recording 48.1% in 2014. In contrast, the global shares of EU have been on the decline
since 1995 and dropped to 39.6% in 2014, which is a significant decline from 60.2% in 1995.
Figure 5-1-9 Transition of export value of non-metallic mineral
Source: Estimated from UN Comtrade
The majority of an increase in non-metallic mineral exports of APEC is due to the rise in China.
Since 2001, China’s non-metallic mineral exports increased rapidly and overtook that of the United
States in 2003, making it the largest in APEC. In 2014, China recorded 45.7 billion USD, bumping
up the global share to 25%. In the 2000s, the exports of the United States, which ranks second, and
the exports of Japan, which ranks third, are on the rise basically. After 2011, Japan turned to a
decline, whereas the United States maintains an upward trend.
While China’s exports made a rapid increase and other APEC economies such as the United States
and Japan are seeing a decline in the shares of key export economies, Viet Nam has grown at a
healthy pace in exports, moving up to the eighth in APEC in 2014, increasing the global share to
1.3%.
0%
10%
20%
30%
40%
50%
60%
70%
0
20
40
60
80
100
120
140
160
180
200
1995 1996 1997 1998 1999 2000 2001 2002 2003 2004 2005 2006 2007 2008 2009 2010 2011 2012 2013 2014
Billion USDWorld Total (left axis) APEC Total (left axis)
Share of APEC (right axis) Share of EU (right axis)
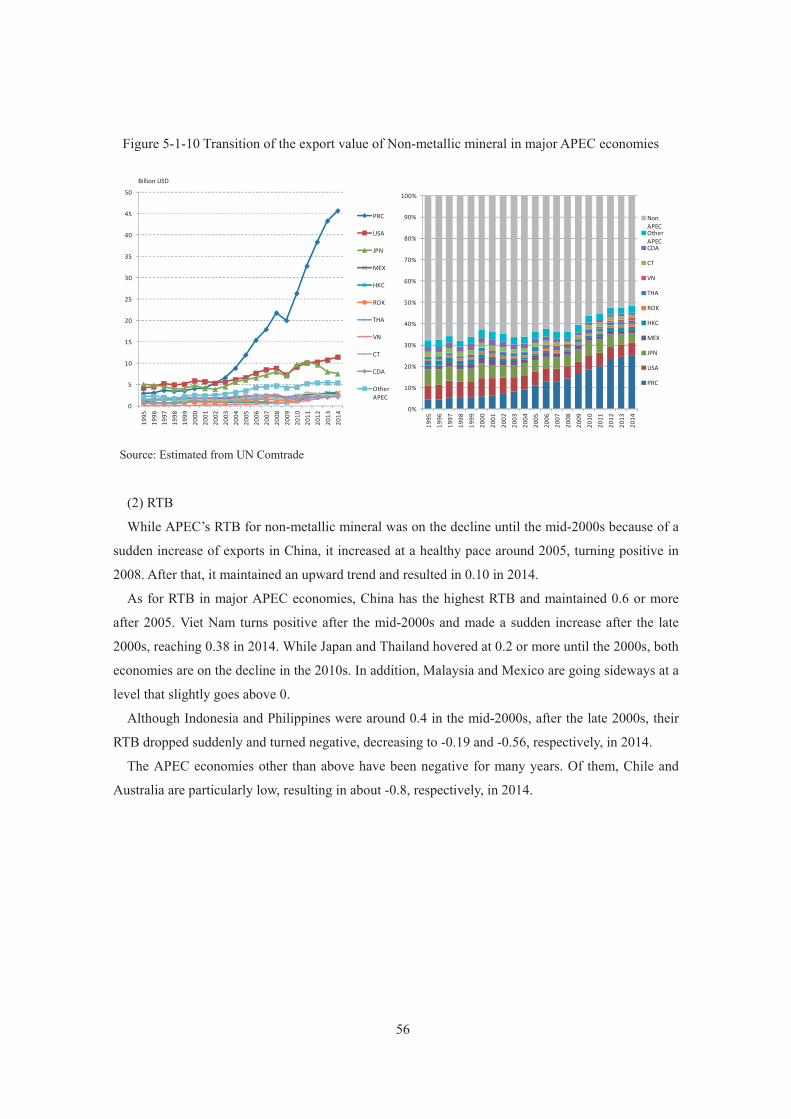
56
Figure 5-1-10 Transition of the export value of Non-metallic mineral in major APEC economies
Source: Estimated from UN Comtrade
(2) RTB
While APEC’s RTB for non-metallic mineral was on the decline until the mid-2000s because of a
sudden increase of exports in China, it increased at a healthy pace around 2005, turning positive in
2008. After that, it maintained an upward trend and resulted in 0.10 in 2014.
As for RTB in major APEC economies, China has the highest RTB and maintained 0.6 or more
after 2005. Viet Nam turns positive after the mid-2000s and made a sudden increase after the late
2000s, reaching 0.38 in 2014. While Japan and Thailand hovered at 0.2 or more until the 2000s, both
economies are on the decline in the 2010s. In addition, Malaysia and Mexico are going sideways at a
level that slightly goes above 0.
Although Indonesia and Philippines were around 0.4 in the mid-2000s, after the late 2000s, their
RTB dropped suddenly and turned negative, decreasing to -0.19 and -0.56, respectively, in 2014.
The APEC economies other than above have been negative for many years. Of them, Chile and
Australia are particularly low, resulting in about -0.8, respectively, in 2014.
0
5
10
15
20
25
30
35
40
45
50
1995
1996
1997
1998
1999
2000
2001
2002
2003
2004
2005
2006
2007
2008
2009
2010
2011
2012
2013
2014
Billion USD
PRC
USA
JPN
MEX
HKC
ROK
THA
VN
CT
CDA
Other APEC
0%
10%
20%
30%
40%
50%
60%
70%
80%
90%
100%
1995
1996
1997
1998
1999
2000
2001
2002
2003
2004
2005
2006
2007
2008
2009
2010
2011
2012
2013
2014
Non APECOther APECCDA
CT
VN
THA
ROK
HKC
MEX
JPN
USA
PRC

57
Figure 5-1-11 Transition of RTB of non-metallic mineral in APEC
Source: Estimated from UN Comtrade
(3) RTB and RCA
The RCA of non-metallic minerals in APEC remained flat at the level of 0.7 to 0.8 until the early
2000s. After the mid-2000s, it turned to an upward trend and stayed at around 1.0 in the 2010s.
While China maintained 1.5 or more for many years, it has been on the rise after the late 2000s,
moving close to 2.0 in the 2010s. As for Viet Nam and Japan, their figures were above 1.0 from
around 2005 and increased quickly until around 2010. Subsequently, while Viet Nam maintains an
upward trend, Japan is seeing a declining trend.
As for Thailand, while it maintained 1.2 or more until 2010, it has been on the decline since 2010,
dropping to nearly 1.0 in 2013. Although Chinese Taipei exhibited a sudden drop in the early 2000s,
dropping to 1.0 or less, it turned to an increase in the mid-2000 and recovered to 1.0 or more in the
2010s. As for Indonesia and Mexico, their RCA turned to a downward trend from the mid-2000s,
decreasing to 1.0 or less around 2005. In the 2010s, Indonesia declined to 0.5 and Mexico declined
to 0.8.
The RCA of non-metallic minerals in other APEC economies was below 1.0 for many years. In
particular, Australia, Chile, and Singapore have low RCA and result in nearly 1.0 in the 2010s.
JPN
ROK
PRC
CTINA
MAS
RP
THA
VN
SIN
APEC
-1.0
-0.8
-0.6
-0.4
-0.2
0.0
0.2
0.4
0.6
0.8
1.0
1995 2000 2005 2010 2014
RTB
USA
CDA
MEX
CHL
PERUS
AUS
NZ
APEC
-1.0
-0.8
-0.6
-0.4
-0.2
0.0
0.2
0.4
0.6
0.8
1.0
1995 2000 2005 2010 2014
RTB
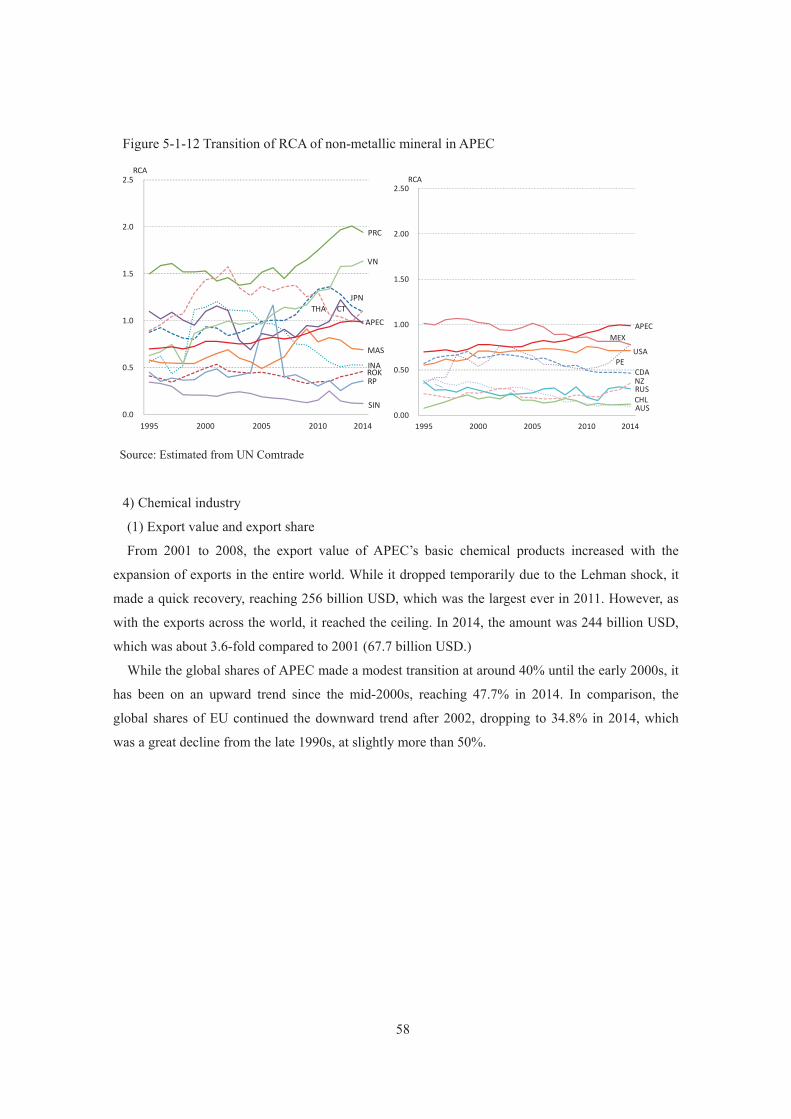
58
Figure 5-1-12 Transition of RCA of non-metallic mineral in APEC
Source: Estimated from UN Comtrade
4) Chemical industry
(1) Export value and export share
From 2001 to 2008, the export value of APEC’s basic chemical products increased with the
expansion of exports in the entire world. While it dropped temporarily due to the Lehman shock, it
made a quick recovery, reaching 256 billion USD, which was the largest ever in 2011. However, as
with the exports across the world, it reached the ceiling. In 2014, the amount was 244 billion USD,
which was about 3.6-fold compared to 2001 (67.7 billion USD.)
While the global shares of APEC made a modest transition at around 40% until the early 2000s, it
has been on an upward trend since the mid-2000s, reaching 47.7% in 2014. In comparison, the
global shares of EU continued the downward trend after 2002, dropping to 34.8% in 2014, which
was a great decline from the late 1990s, at slightly more than 50%.
JPN
ROK
PRC
CT
INA
MAS
RP
THA
VN
SIN
APEC
0.0
0.5
1.0
1.5
2.0
2.5
1995 2000 2005 2010 2014
RCA
USA
CDA
MEX
CHL
PE
RUS
AUS
NZ
APEC
0.00
0.50
1.00
1.50
2.00
2.50
1995 2000 2005 2010 2014
RCA
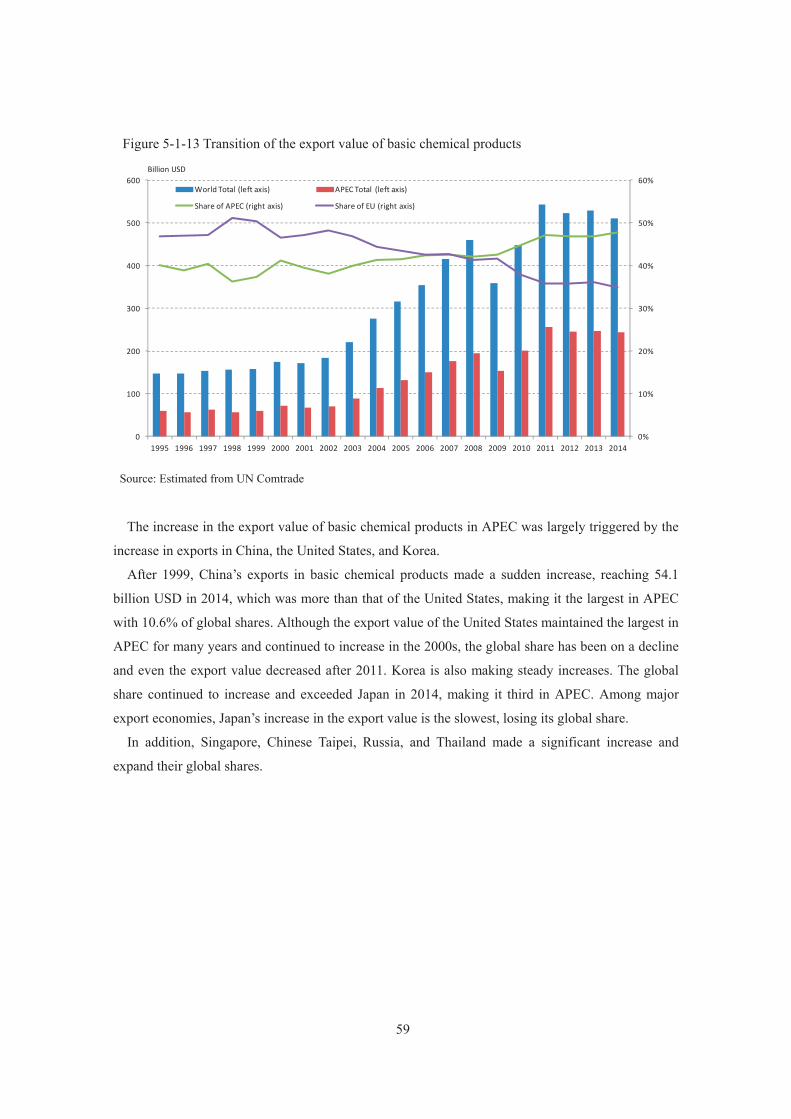
59
Figure 5-1-13 Transition of the export value of basic chemical products
Source: Estimated from UN Comtrade
The increase in the export value of basic chemical products in APEC was largely triggered by the
increase in exports in China, the United States, and Korea.
After 1999, China’s exports in basic chemical products made a sudden increase, reaching 54.1
billion USD in 2014, which was more than that of the United States, making it the largest in APEC
with 10.6% of global shares. Although the export value of the United States maintained the largest in
APEC for many years and continued to increase in the 2000s, the global share has been on a decline
and even the export value decreased after 2011. Korea is also making steady increases. The global
share continued to increase and exceeded Japan in 2014, making it third in APEC. Among major
export economies, Japan’s increase in the export value is the slowest, losing its global share.
In addition, Singapore, Chinese Taipei, Russia, and Thailand made a significant increase and
expand their global shares.
0%
10%
20%
30%
40%
50%
60%
0
100
200
300
400
500
600
1995 1996 1997 1998 1999 2000 2001 2002 2003 2004 2005 2006 2007 2008 2009 2010 2011 2012 2013 2014
Billion USD
World Total (left axis) APEC Total (left axis)
Share of APEC (right axis) Share of EU (right axis)
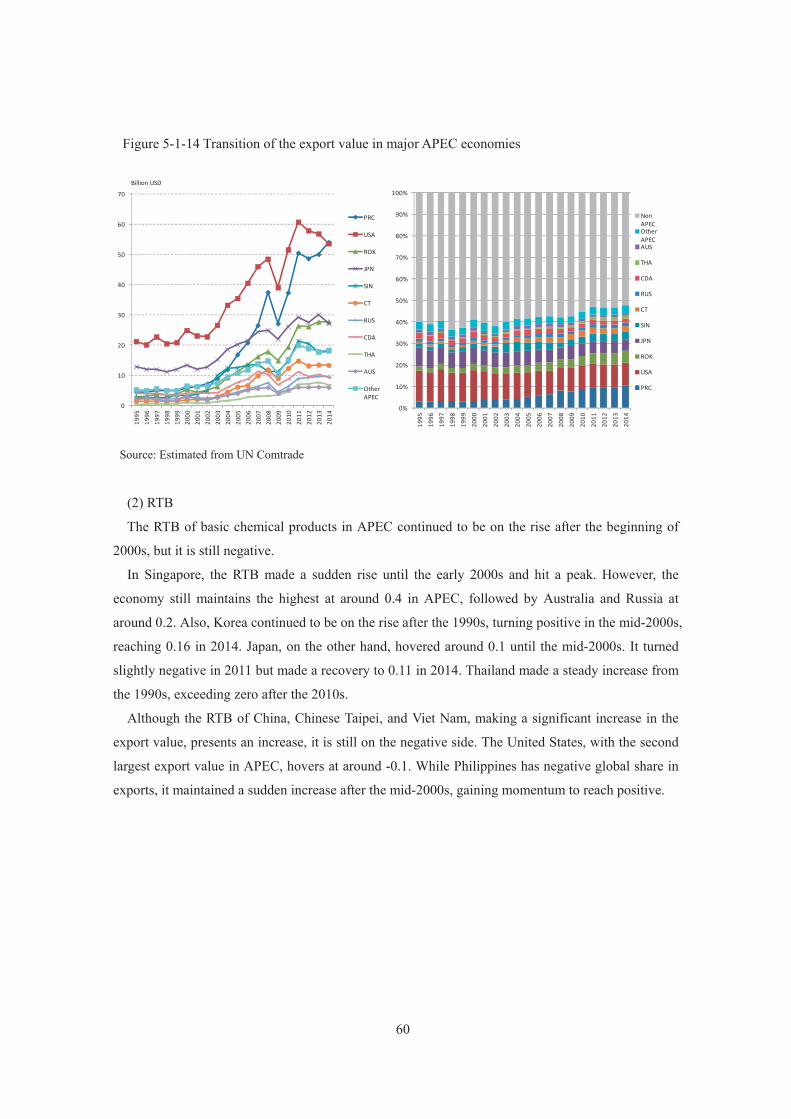
60
Figure 5-1-14 Transition of the export value in major APEC economies
Source: Estimated from UN Comtrade
(2) RTB
The RTB of basic chemical products in APEC continued to be on the rise after the beginning of
2000s, but it is still negative.
In Singapore, the RTB made a sudden rise until the early 2000s and hit a peak. However, the
economy still maintains the highest at around 0.4 in APEC, followed by Australia and Russia at
around 0.2. Also, Korea continued to be on the rise after the 1990s, turning positive in the mid-2000s,
reaching 0.16 in 2014. Japan, on the other hand, hovered around 0.1 until the mid-2000s. It turned
slightly negative in 2011 but made a recovery to 0.11 in 2014. Thailand made a steady increase from
the 1990s, exceeding zero after the 2010s.
Although the RTB of China, Chinese Taipei, and Viet Nam, making a significant increase in the
export value, presents an increase, it is still on the negative side. The United States, with the second
largest export value in APEC, hovers at around -0.1. While Philippines has negative global share in
exports, it maintained a sudden increase after the mid-2000s, gaining momentum to reach positive.
0
10
20
30
40
50
60
70
1995
1996
1997
1998
1999
2000
2001
2002
2003
2004
2005
2006
2007
2008
2009
2010
2011
2012
2013
2014
Billion USD
PRC
USA
ROK
JPN
SIN
CT
RUS
CDA
THA
AUS
Other APEC
0%
10%
20%
30%
40%
50%
60%
70%
80%
90%
100%
1995
1996
1997
1998
1999
2000
2001
2002
2003
2004
2005
2006
2007
2008
2009
2010
2011
2012
2013
2014
Non APECOther APECAUS
THA
CDA
RUS
CT
SIN
JPN
ROK
USA
PRC

61
Figure 5-1-15 Transition of RTB in basic chemical products in APEC
Source: Estimated from UN Comtrade
(3) RCA
The RCA of basic chemical products in APEC stayed flat at the level of 0.8 until the early 2000s.
It turned to an upward trend after the mid-2000s and maintained the level close to 1.0 in the 2010s.
Of the APEC economies, Chinese Taipei, Korea, Singapore, Japan, the United States, and
Thailand were the economies that had 1.0 or more of RCA in 2014. Chinese Taipei and Singapore
experienced a sudden increase in the mid-2000s and at the beginning of 2000 respectively, though
staying flat in recent years. Korea and Thailand have been making steady increases since the 1990s,
and continued on an upward trend after the 2010s. Japan, on the other hand, made a slow increase
from the late 1990s. While the United States continued to be 1.0 or more for many years, it presented
a downward trend in the 2010s. Australia and Chile had 1.0 or more until the mid-2000s, but
dropped below 1.0 in the late 2000s.
China, the largest export economy in APEC, continued to decline from the late 1990s to the
mid-2000s. However, it is subsequently made a slow increase and remained at or below 1.0 in 2014.
While Viet Nam has been on the rise since the late 2000s, it is still 0.3 or below. Philippines made a
sudden increase after the mid-2000s, exceeding 0.7 in 2014.
JPNROK
PRCCT
INA
MAS
RP
THA
VN
SIN
APEC
-1.0
-0.8
-0.6
-0.4
-0.2
0.0
0.2
0.4
0.6
0.8
1.0
1995 2000 2005 2010 2014
RTB
USA
CDA
MEX
CHL
PE
RUSAUS
NZ
APEC
-1.0
-0.8
-0.6
-0.4
-0.2
0.0
0.2
0.4
0.6
0.8
1.0
1995 2000 2005 2010 2014
RTB
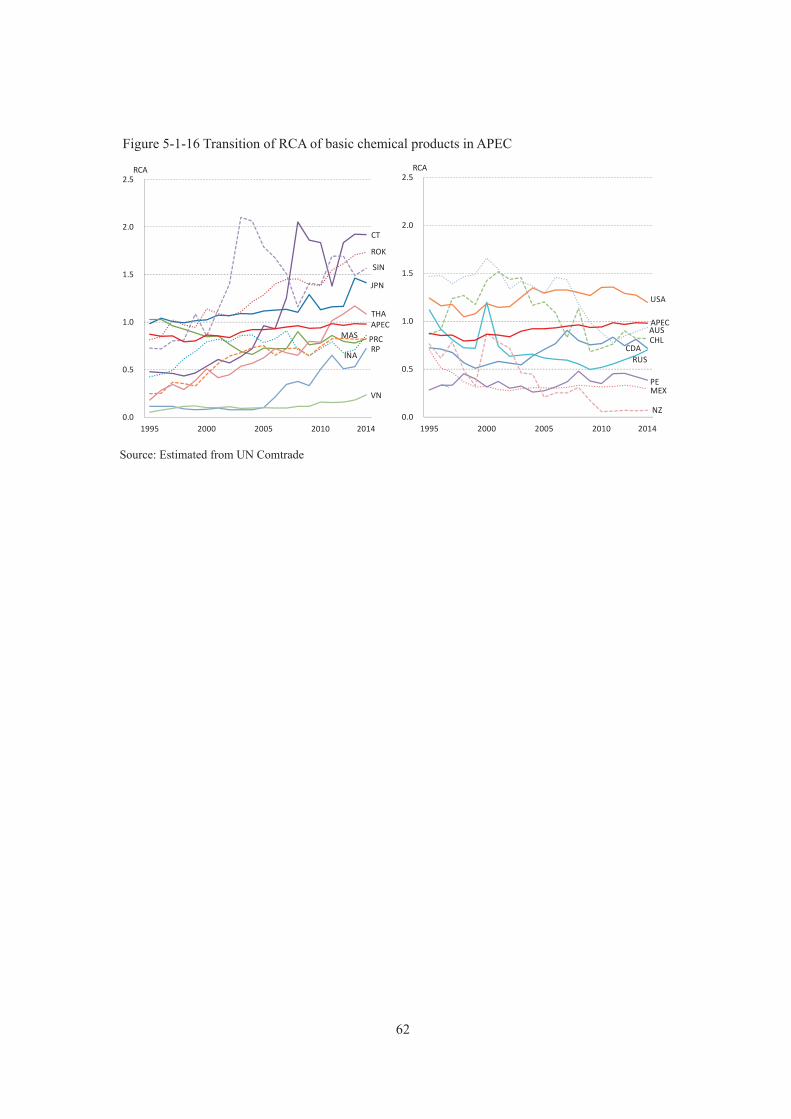
62
Figure 5-1-16 Transition of RCA of basic chemical products in APEC
Source: Estimated from UN Comtrade
JPN
ROK
PRC
CT
INA
MASRP
THA
VN
SIN
APEC
0.0
0.5
1.0
1.5
2.0
2.5
1995 2000 2005 2010 2014
RCA
USA
CDA
MEX
CHL
PE
RUS
AUS
NZ
APEC
0.0
0.5
1.0
1.5
2.0
2.5
1995 2000 2005 2010 2014
RCA
63
5-1-3 Conclusion Considering the international competitiveness of manufacturing from 1995 to 2014, by looking at
APEC as a whole, although the export value made a significant expansion, the global share of
exports made a slow increase. While the RTB made a slight rise and was above zero in recent years,
the RCA remains nearly unchanged, staying slightly more than 1.0.
It indicates that the exports of manufacturing in APEC increase at a pace that is slightly above the
expansion of trades in the entire world. Concurrently, while the imports also made an expansion, the
growth rate of exports is stronger, and the trades in APEC’s manufacturing are moving into the black
to a limited extent. On the other hand, as for the shares of manufacturing to the total exports of
products, APEC maintains a level that is slightly above the world average, indicating that the
structure of exports is not specific only to manufacturing.
On the other hand, the growth of export value in the energy-intensive industries in APEC is
running above average of manufacturing. The global market share of exports of non-metallic
minerals and iron and steel are expanding rapidly after the 2000s. The RTB of non-metallic minerals
and iron and steel exceeds 1.0 from the late 2000s, exhibiting the expansion in the excess of exports.
While the RTB of basic chemical products is on the rise, it is still negative. In addition, while the
RCA of energy-intensive industries is on the increase, it remains 1.0 or less.
Although these changes in the indexes indicate a steady increase of the competitiveness in the
APEC’s energy-intensive industries, the exports in APEC are not necessarily dedicated to
energy-intensive industries.
The relation of various indexes of industrial competitiveness in each economy suggests that the
changes in export shares relate to the growth of export value in other economies, indicating that the
changes in export value extend to a different direction in many cases. Because the changes in RTB
are often similar to the changes and trends in export shares and the export shares relate to the
economic magnitude of the economies, RTB is more helpful for the comparison of export
competitiveness on a global scale. On the other hand, the change direction of RCA, which measures
the relative advantage among industries within economies, is not necessarily the same as RTB. In the
comparison among economies, RTB and RCA trade places in some cases.
Because the changes in global competitiveness in industries cannot be measured with a single
index, it is necessary to consider the indexes such as RTB and RCA in a comprehensive manner.
64
5-2 Industrial competitiveness with energy This research targets the energy-intensive industries in major APEC economies to perform
quantitative analysis of the instantaneous relationship with the changes in energy prices in the
industries and the changes in energy efficiency in the industries with the changes in various indexes
that measure industrial competitiveness.
In the analysis, the RTB and RCA of energy-intensive industries such as iron and steel, and paper
and pulp in major APEC economies are considered explained variables, and the price of electricity
for industries in each economy, or energy intensity are considered independent variables to analyze
the panel data using the following formula (5.1) for the period of 1995 to 2014.
tjitjiiitji xbacompIndex ,,,,,,_ (5.1)
tjijitji ,,,,, (5.2)
i : industry j: economy t : time
compIndex _ : RTB or RCA ba , : coefficients
x: electricity price, or energy intensity, or energy cost share
: cross-section effect : residuals
5-2-1 Industrial competitiveness and energy price Table 5-2-1 indicates the analysis results for the relationship between electricity price for industry
and RTB of energy-intensive industries from 1995 to 2014 in major APEC economies6. Iron and
steel industry and non-metallic mineral industry are the industries that have the significance in the
relationship between electricity price for industry and RTB (It is where the coefficient b in the
formula (5.1) is negative and the absolute value of t-value is 2.0 or more). For example, as the
electricity price for industry increases by 0.01 USD/kWh, the RTB of the iron and steel industry
decreases by 0.0144. On the other hand, basic chemical industry, non-ferrous metals industry, and
paper and pulp industry do not show any significance in the relationship between RTB and
electricity price for industry.
6 This analysis uses the data of the U.S., Canada, Mexico, Japan, Korea, Chinese Taipei, Indonesia and Thailand.
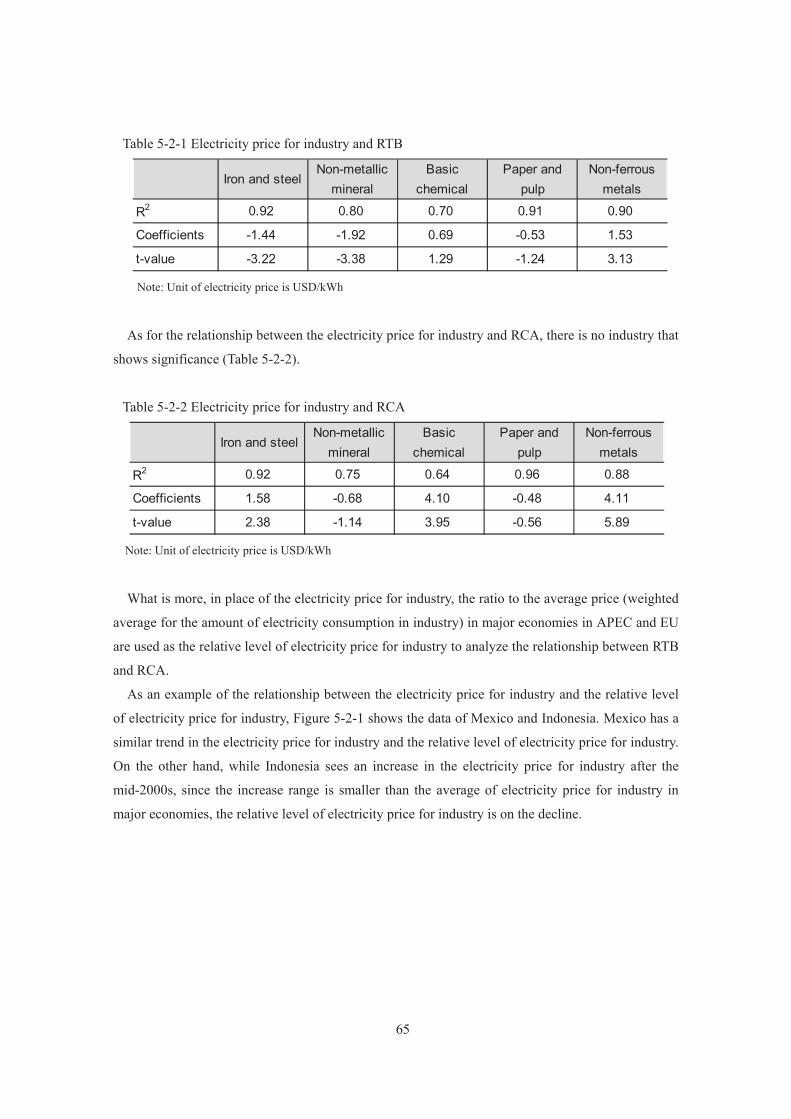
65
Table 5-2-1 Electricity price for industry and RTB
Note: Unit of electricity price is USD/kWh
As for the relationship between the electricity price for industry and RCA, there is no industry that
shows significance (Table 5-2-2).
Table 5-2-2 Electricity price for industry and RCA
Note: Unit of electricity price is USD/kWh
What is more, in place of the electricity price for industry, the ratio to the average price (weighted
average for the amount of electricity consumption in industry) in major economies in APEC and EU
are used as the relative level of electricity price for industry to analyze the relationship between RTB
and RCA.
As an example of the relationship between the electricity price for industry and the relative level
of electricity price for industry, Figure 5-2-1 shows the data of Mexico and Indonesia. Mexico has a
similar trend in the electricity price for industry and the relative level of electricity price for industry.
On the other hand, while Indonesia sees an increase in the electricity price for industry after the
mid-2000s, since the increase range is smaller than the average of electricity price for industry in
major economies, the relative level of electricity price for industry is on the decline.
Iron and steelNon-metallic
mineralBasic
chemicalPaper and
pulpNon-ferrous
metals
R2 0.92 0.80 0.70 0.91 0.90
Coefficients -1.44 -1.92 0.69 -0.53 1.53
t-value -3.22 -3.38 1.29 -1.24 3.13
Iron and steelNon-metallic
mineralBasic
chemicalPaper and
pulpNon-ferrous
metals
R2 0.92 0.75 0.64 0.96 0.88
Coefficients 1.58 -0.68 4.10 -0.48 4.11
t-value 2.38 -1.14 3.95 -0.56 5.89

66
Figure 5-2-1 Electricity price and Relative level of electricity price
Mexico Indonesia
Source: Calculated from IEA Energy Prices and Taxes, Japan Electric Power Information Center (JEPIC) Statistics on Overseas Electricity Industry, official statistics by each economy and official materials released by major electric companies.
The basic chemical industry, non-ferrous metals industry and the paper and pulp with no
significance in the relationship between the electricity price for industry and RTB, which is the
absolute value, start exhibiting significance (Table 5-2-3). What is more, the relative level of
electricity price for industry and RCA indicate significance in the relationship with all industries
(Table 5-2-4).
Table 5-2-3 Relative level of electricity price for industry and RTB
Table 5-2-4 Relative level of electricity price for industry and RCA
0
0.2
0.4
0.6
0.8
1
1.2
1.4
0
0.02
0.04
0.06
0.08
0.1
0.12
0.14
1995 2000 2005 2010 2013
Rel
ativ
e le
vel o
f ele
ctric
ity p
rice
for i
ndus
try
Ele
trici
ty p
rice
for i
ndus
try (U
SD
/kW
h)
Eletricity price for industry(lef t axis)
Relative level of electricity price for industry(right axis)
0
0.2
0.4
0.6
0.8
1
1.2
1.4
0
0.02
0.04
0.06
0.08
0.1
0.12
0.14
1995 2000 2005 2010 2013
Rel
ativ
e le
vel o
f ele
ctric
ity p
rice
for i
ndus
try
Ele
trici
ty p
rice
for i
ndus
try (U
SD
/kW
h)
Eletricity price for industry(lef t axis)
Relative level of electricity price for industry (right axis)
e Iron and steelNon-metallic
mineralBasic
chemicalPaper and
pulpNon-ferrous
metals
R2 0.93 0.80 0.73 0.93 0.91
Coefficients -0.21 -0.09 -0.25 -0.24 -0.26
t-value -4.34 -1.39 -4.43 -5.35 -4.95
e Iron and steelNon-metallic
mineralBasic
chemicalPaper and
pulpNon-ferrous
metals
R2 0.94 0.76 0.66 0.96 0.87
Coefficients -0.44 -0.14 -0.48 -0.26 -0.31
t-value -7.04 -2.07 -4.38 -2.78 -3.78
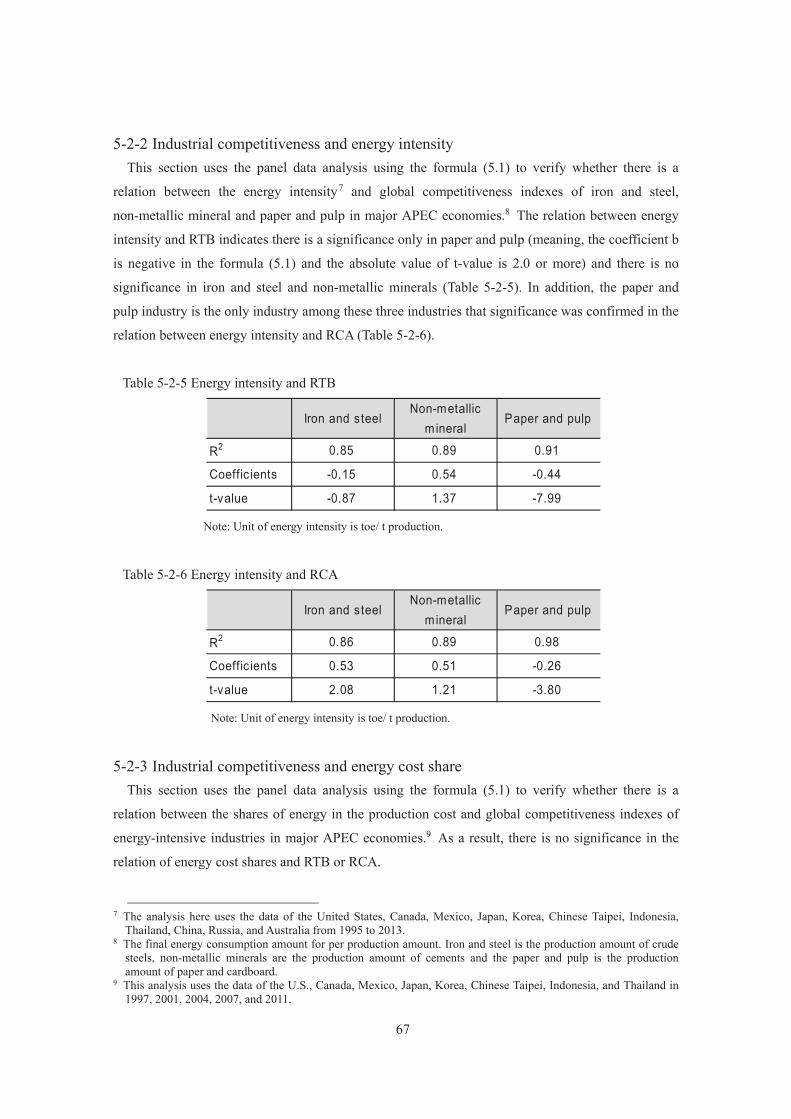
67
5-2-2 Industrial competitiveness and energy intensity This section uses the panel data analysis using the formula (5.1) to verify whether there is a
relation between the energy intensity7 and global competitiveness indexes of iron and steel,
non-metallic mineral and paper and pulp in major APEC economies.8 The relation between energy
intensity and RTB indicates there is a significance only in paper and pulp (meaning, the coefficient b
is negative in the formula (5.1) and the absolute value of t-value is 2.0 or more) and there is no
significance in iron and steel and non-metallic minerals (Table 5-2-5). In addition, the paper and
pulp industry is the only industry among these three industries that significance was confirmed in the
relation between energy intensity and RCA (Table 5-2-6).
Table 5-2-5 Energy intensity and RTB
Note: Unit of energy intensity is toe/ t production.
Table 5-2-6 Energy intensity and RCA
Note: Unit of energy intensity is toe/ t production.
5-2-3 Industrial competitiveness and energy cost share This section uses the panel data analysis using the formula (5.1) to verify whether there is a
relation between the shares of energy in the production cost and global competitiveness indexes of
energy-intensive industries in major APEC economies.9 As a result, there is no significance in the
relation of energy cost shares and RTB or RCA.
7 The analysis here uses the data of the United States, Canada, Mexico, Japan, Korea, Chinese Taipei, Indonesia,
Thailand, China, Russia, and Australia from 1995 to 2013. 8 The final energy consumption amount for per production amount. Iron and steel is the production amount of crude
steels, non-metallic minerals are the production amount of cements and the paper and pulp is the production amount of paper and cardboard.
9 This analysis uses the data of the U.S., Canada, Mexico, Japan, Korea, Chinese Taipei, Indonesia, and Thailand in 1997, 2001, 2004, 2007, and 2011.
Iron and steelNon-metallic
mineralPaper and pulp
R2 0.85 0.89 0.91
Coeffic ients -0.15 0.54 -0.44
t-value -0.87 1.37 -7.99
Iron and steelNon-metallic
mineralPaper and pulp
R2 0.86 0.89 0.98
Coeffic ients 0.53 0.51 -0.26
t-value 2.08 1.21 -3.80
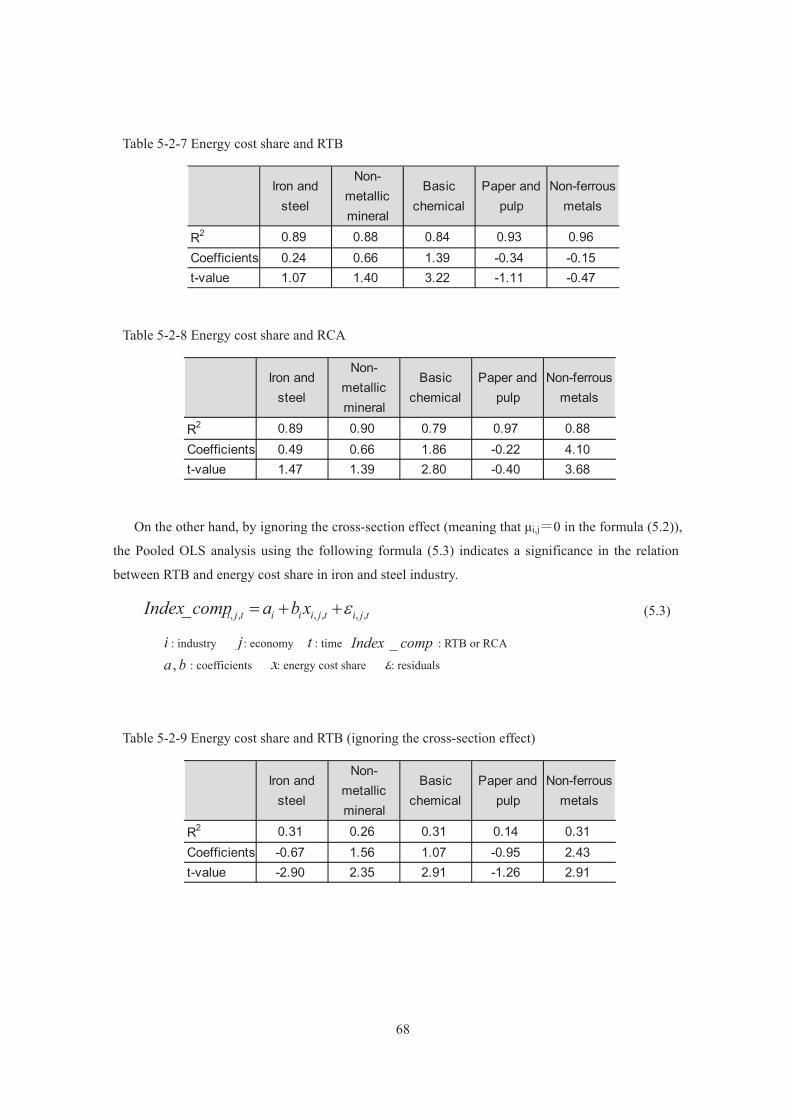
68
Table 5-2-7 Energy cost share and RTB
Table 5-2-8 Energy cost share and RCA
On the other hand, by ignoring the cross-section effect (meaning that μi,j=0 in the formula (5.2)),
the Pooled OLS analysis using the following formula (5.3) indicates a significance in the relation
between RTB and energy cost share in iron and steel industry.
tjitjiiitji xbacompIndex ,,,,,,_ (5.3)
i : industry j: economy t : time compIndex _ : RTB or RCA
ba , : coefficients x: energy cost share : residuals
Table 5-2-9 Energy cost share and RTB (ignoring the cross-section effect)
Iron andsteel
Non-metallicmineral
Basicchemical
Paper andpulp
Non-ferrousmetals
R2 0.89 0.88 0.84 0.93 0.96Coefficients 0.24 0.66 1.39 -0.34 -0.15t-value 1.07 1.40 3.22 -1.11 -0.47
Iron andsteel
Non-metallicmineral
Basicchemical
Paper andpulp
Non-ferrousmetals
R2 0.89 0.90 0.79 0.97 0.88Coefficients 0.49 0.66 1.86 -0.22 4.10t-value 1.47 1.39 2.80 -0.40 3.68
Iron andsteel
Non-metallicmineral
Basicchemical
Paper andpulp
Non-ferrousmetals
R2 0.31 0.26 0.31 0.14 0.31Coefficients -0.67 1.56 1.07 -0.95 2.43t-value -2.90 2.35 2.91 -1.26 2.91
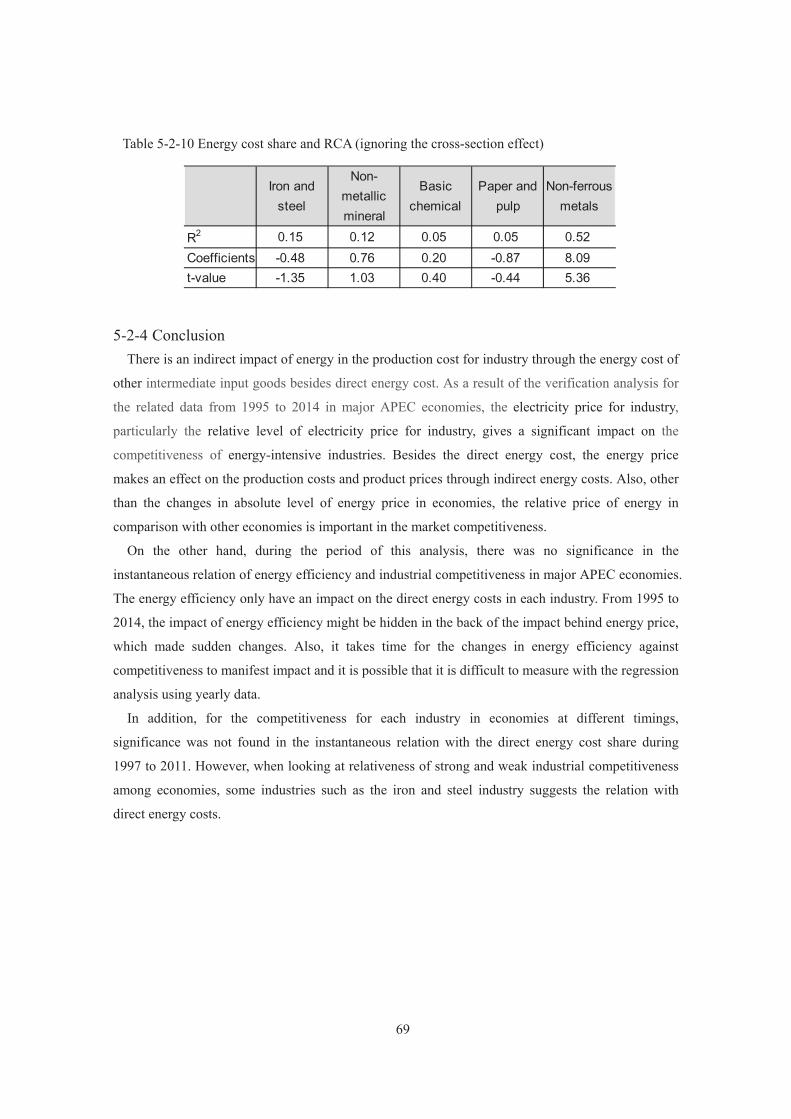
69
Table 5-2-10 Energy cost share and RCA (ignoring the cross-section effect)
5-2-4 Conclusion There is an indirect impact of energy in the production cost for industry through the energy cost of
other intermediate input goods besides direct energy cost. As a result of the verification analysis for
the related data from 1995 to 2014 in major APEC economies, the electricity price for industry,
particularly the relative level of electricity price for industry, gives a significant impact on the
competitiveness of energy-intensive industries. Besides the direct energy cost, the energy price
makes an effect on the production costs and product prices through indirect energy costs. Also, other
than the changes in absolute level of energy price in economies, the relative price of energy in
comparison with other economies is important in the market competitiveness.
On the other hand, during the period of this analysis, there was no significance in the
instantaneous relation of energy efficiency and industrial competitiveness in major APEC economies.
The energy efficiency only have an impact on the direct energy costs in each industry. From 1995 to
2014, the impact of energy efficiency might be hidden in the back of the impact behind energy price,
which made sudden changes. Also, it takes time for the changes in energy efficiency against
competitiveness to manifest impact and it is possible that it is difficult to measure with the regression
analysis using yearly data.
In addition, for the competitiveness for each industry in economies at different timings,
significance was not found in the instantaneous relation with the direct energy cost share during
1997 to 2011. However, when looking at relativeness of strong and weak industrial competitiveness
among economies, some industries such as the iron and steel industry suggests the relation with
direct energy costs.
Iron andsteel
Non-metallicmineral
Basicchemical
Paper andpulp
Non-ferrousmetals
R2 0.15 0.12 0.05 0.05 0.52Coefficients -0.48 0.76 0.20 -0.87 8.09t-value -1.35 1.03 0.40 -0.44 5.36
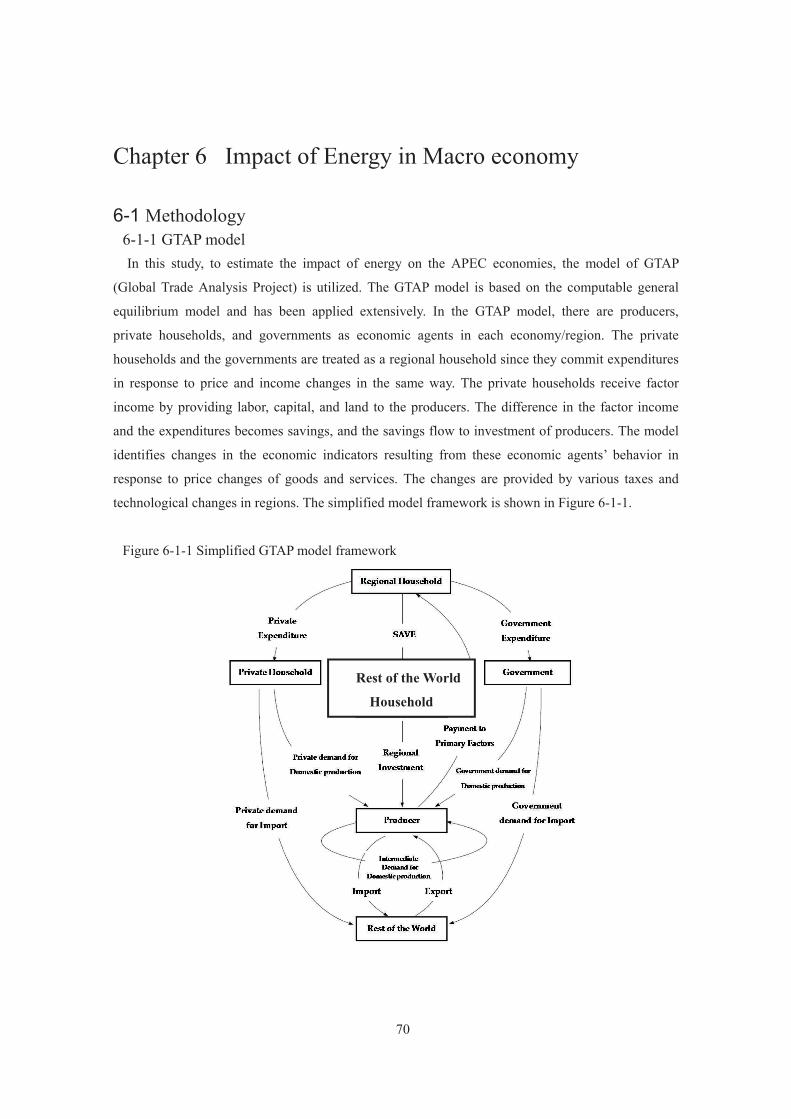
70
Chapter 6 Impact of Energy in Macro economy
6-1 Methodology 6-1-1 GTAP model In this study, to estimate the impact of energy on the APEC economies, the model of GTAP
(Global Trade Analysis Project) is utilized. The GTAP model is based on the computable general
equilibrium model and has been applied extensively. In the GTAP model, there are producers,
private households, and governments as economic agents in each economy/region. The private
households and the governments are treated as a regional household since they commit expenditures
in response to price and income changes in the same way. The private households receive factor
income by providing labor, capital, and land to the producers. The difference in the factor income
and the expenditures becomes savings, and the savings flow to investment of producers. The model
identifies changes in the economic indicators resulting from these economic agents’ behavior in
response to price changes of goods and services. The changes are provided by various taxes and
technological changes in regions. The simplified model framework is shown in Figure 6-1-1.
Figure 6-1-1 Simplified GTAP model framework
Rest of the World Household

71
6-1-2 GTAP data The centerpiece of the Global Trade Analysis Project is the GTAP database, a fully documented,
publicly available global database that contains complete bilateral trade information, transport, and
protection linkages that link a number of economy/regional economic database. The GTAP database
is most commonly used with the GTAP Model. The GTAP 9 database consists of 140 regions and 57
sectors. The regional databases are derived from individual economy Input-Output tables. The
database can be aggregated to the desired level of the study. This study disaggregates to 27
economies and regions that mainly consist of APEC economies in detail. For the sectoral breakdown,
25 sectors are disaggregated with a detail disaggregation of energy goods. The regional breakdown
and the sectoral breakdown in this study are shown in the following.
Table 6-1-1 Regional classification and sectoral breakdown in this study
a) Regional classification b) Sectoral breakdown
Economy or Region Code1 Australia AUS2 Canada CDA Country or Region Code3 Chile CHL 1 Agriculture and husbandary AGR4 China PRC 2 Coal COA5 Hong Kong, China HKC 3 Oil OIL6 Indonesia INA 4 Gas GAS7 Japan JPN 5 Minerals nec OMN8 Korea ROK 6 Food FOD9 Malaysia MAS 7 Textile TEX
10 Mexico MEX 8 Paper products, publishing PPP11 New Zealand NZ 9 Petroleum, coal products P_C12 Papua New Guinea PNG 10 Chemical,rubber,plastic prods CRP13 Peru PE 11 Mineral products nec NMM14 Philippines PH 12 Ferrous metals I_S15 Russia RUS 13 Metals nec and metal products FMP16 Singapore SIN 14 Motor vehicles and parts MVH17 Chinese Taipei CT 15 Other Transport OTN18 Thailand THA 16 Electric Machine ELE19 United States of America USA 17 Other Machine OME20 Viet Nam VN 18 Manufactures nec OMF21 Central and South America CSA 19 Electricity ELY22 European Union EU 20 Water WTR23 Other Europe OEU 21 Construction CNS24 Africa AFR 22 Trade and services SER25 Middle East MEA 23 Transport nec OTP26 India IND 24 Sea transport WTP27 Rest of the World XEA 25 Air transport ATP
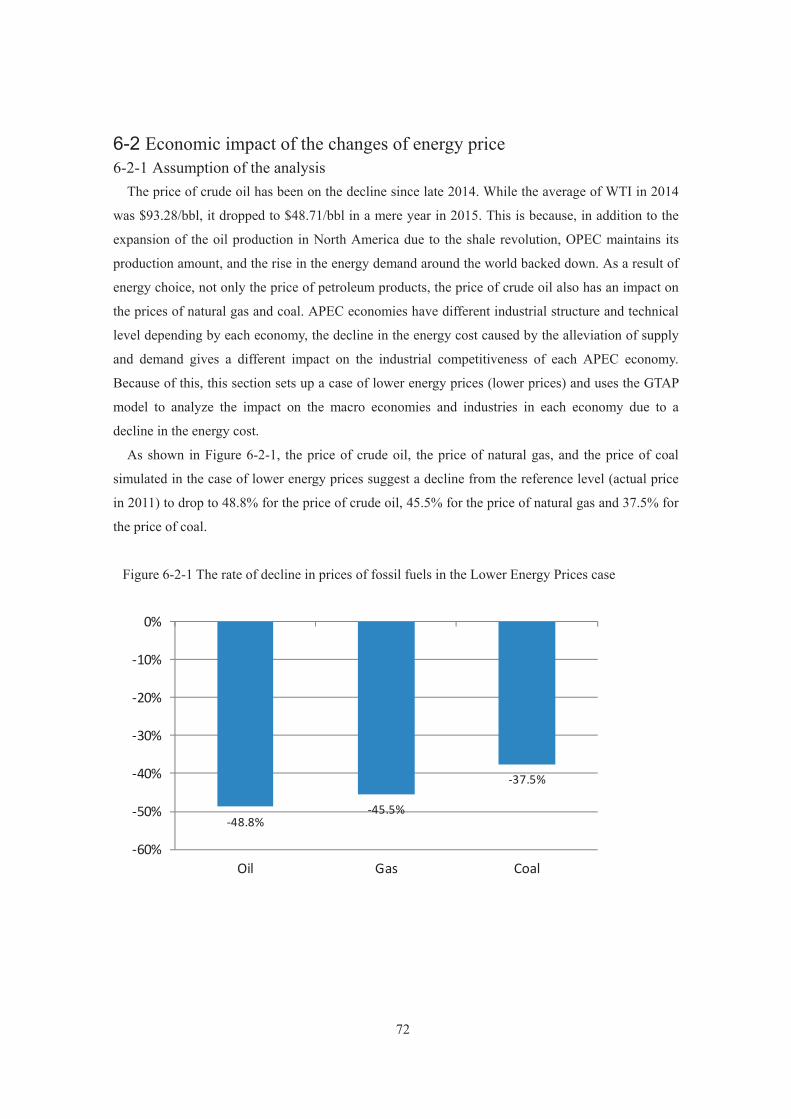
72
6-2 Economic impact of the changes of energy price 6-2-1 Assumption of the analysis
The price of crude oil has been on the decline since late 2014. While the average of WTI in 2014
was $93.28/bbl, it dropped to $48.71/bbl in a mere year in 2015. This is because, in addition to the
expansion of the oil production in North America due to the shale revolution, OPEC maintains its
production amount, and the rise in the energy demand around the world backed down. As a result of
energy choice, not only the price of petroleum products, the price of crude oil also has an impact on
the prices of natural gas and coal. APEC economies have different industrial structure and technical
level depending by each economy, the decline in the energy cost caused by the alleviation of supply
and demand gives a different impact on the industrial competitiveness of each APEC economy.
Because of this, this section sets up a case of lower energy prices (lower prices) and uses the GTAP
model to analyze the impact on the macro economies and industries in each economy due to a
decline in the energy cost.
As shown in Figure 6-2-1, the price of crude oil, the price of natural gas, and the price of coal
simulated in the case of lower energy prices suggest a decline from the reference level (actual price
in 2011) to drop to 48.8% for the price of crude oil, 45.5% for the price of natural gas and 37.5% for
the price of coal.
Figure 6-2-1 The rate of decline in prices of fossil fuels in the Lower Energy Prices case
-48.8%-45.5%
-37.5%
-60%
-50%
-40%
-30%
-20%
-10%
0%
Oil Gas Coal
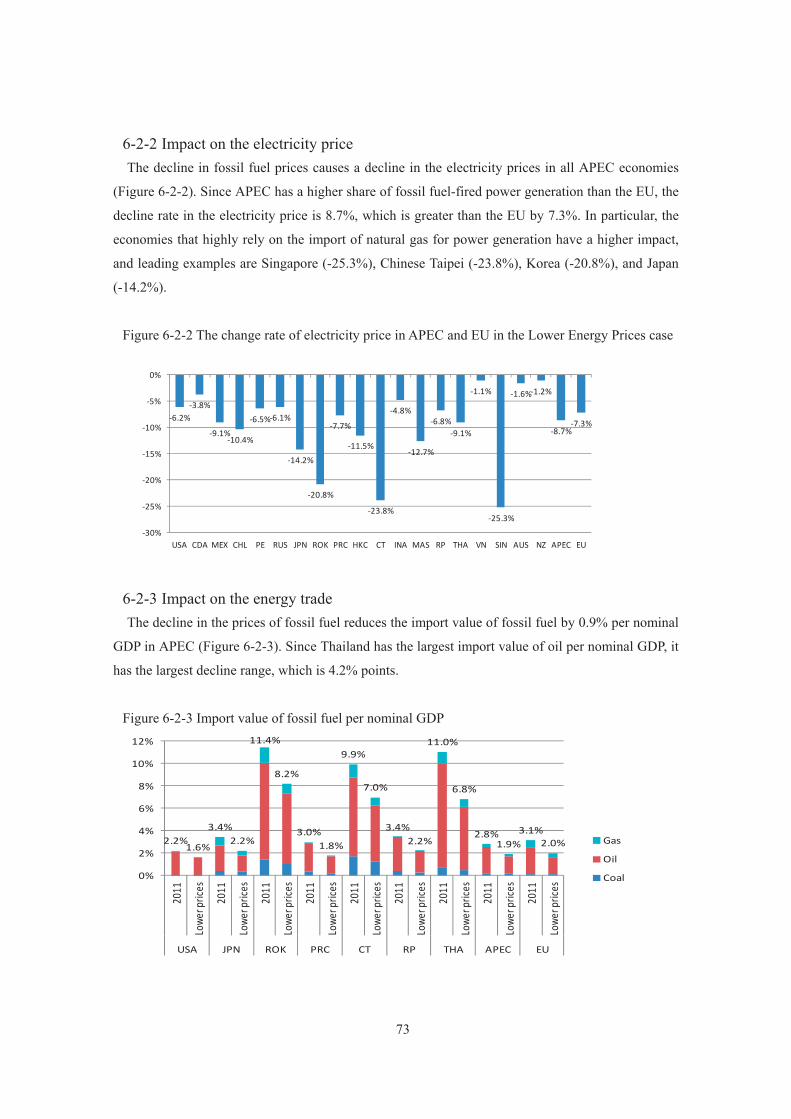
73
6-2-2 Impact on the electricity price The decline in fossil fuel prices causes a decline in the electricity prices in all APEC economies
(Figure 6-2-2). Since APEC has a higher share of fossil fuel-fired power generation than the EU, the
decline rate in the electricity price is 8.7%, which is greater than the EU by 7.3%. In particular, the
economies that highly rely on the import of natural gas for power generation have a higher impact,
and leading examples are Singapore (-25.3%), Chinese Taipei (-23.8%), Korea (-20.8%), and Japan
(-14.2%).
Figure 6-2-2 The change rate of electricity price in APEC and EU in the Lower Energy Prices case
6-2-3 Impact on the energy trade The decline in the prices of fossil fuel reduces the import value of fossil fuel by 0.9% per nominal
GDP in APEC (Figure 6-2-3). Since Thailand has the largest import value of oil per nominal GDP, it
has the largest decline range, which is 4.2% points.
Figure 6-2-3 Import value of fossil fuel per nominal GDP
-6.2%-3.8%
-9.1%-10.4%
-6.5%-6.1%
-14.2%
-20.8%
-7.7%
-11.5%
-23.8%
-4.8%
-12.7%
-6.8%-9.1%
-1.1%
-25.3%
-1.6%-1.2%
-8.7%-7.3%
-30%
-25%
-20%
-15%
-10%
-5%
0%
USA CDA MEX CHL PE RUS JPN ROK PRC HKC CT INA MAS RP THA VN SIN AUS NZ APEC EU
2.2%1.6%
3.4%2.2%
11.4%
8.2%
3.0%1.8%
9.9%
7.0%
3.4%2.2%
11.0%
6.8%
2.8%1.9%
3.1%2.0%
0%
2%
4%
6%
8%
10%
12%
2011
Lowe
r pric
es
2011
Lowe
r pric
es
2011
Lowe
r pric
es
2011
Lowe
r pric
es
2011
Lowe
r pric
es
2011
Lowe
r pric
es
2011
Lowe
r pric
es
2011
Lowe
r pric
es
2011
Lowe
r pric
es
USA JPN ROK PRC CT RP THA APEC EU
Gas
Oil
Coal
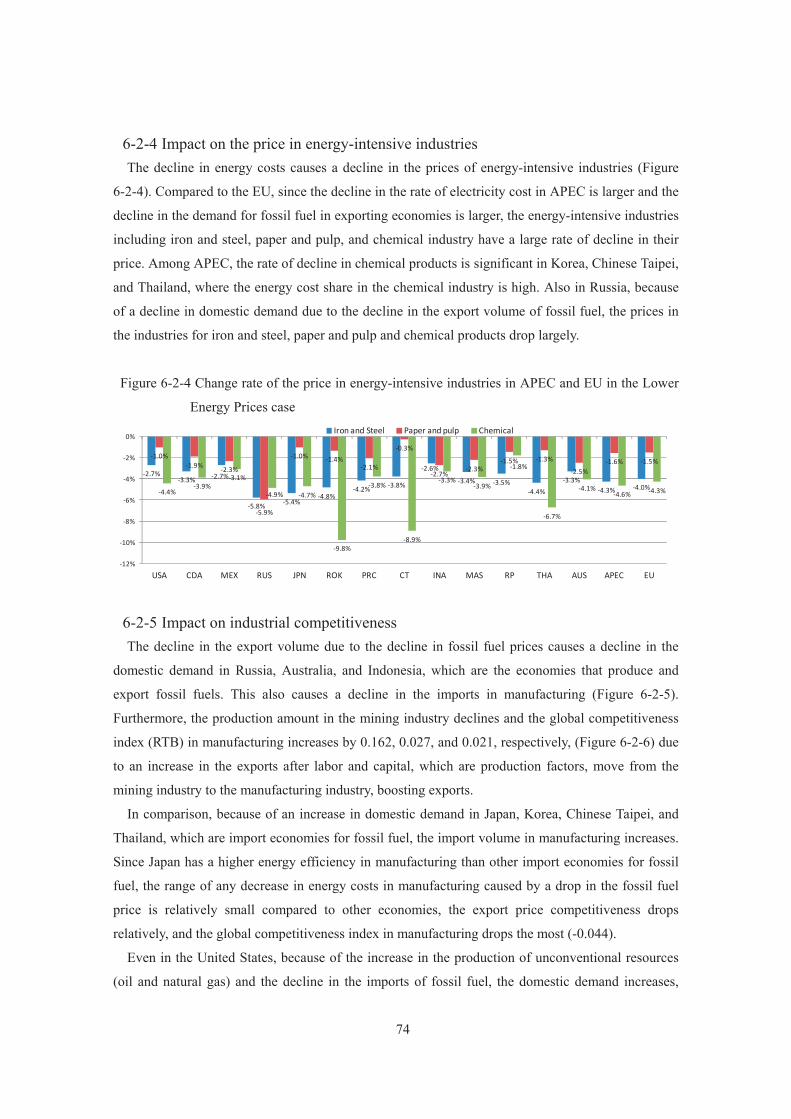
74
6-2-4 Impact on the price in energy-intensive industries The decline in energy costs causes a decline in the prices of energy-intensive industries (Figure
6-2-4). Compared to the EU, since the decline in the rate of electricity cost in APEC is larger and the
decline in the demand for fossil fuel in exporting economies is larger, the energy-intensive industries
including iron and steel, paper and pulp, and chemical industry have a large rate of decline in their
price. Among APEC, the rate of decline in chemical products is significant in Korea, Chinese Taipei,
and Thailand, where the energy cost share in the chemical industry is high. Also in Russia, because
of a decline in domestic demand due to the decline in the export volume of fossil fuel, the prices in
the industries for iron and steel, paper and pulp and chemical products drop largely.
Figure 6-2-4 Change rate of the price in energy-intensive industries in APEC and EU in the Lower
Energy Prices case
6-2-5 Impact on industrial competitiveness The decline in the export volume due to the decline in fossil fuel prices causes a decline in the
domestic demand in Russia, Australia, and Indonesia, which are the economies that produce and
export fossil fuels. This also causes a decline in the imports in manufacturing (Figure 6-2-5).
Furthermore, the production amount in the mining industry declines and the global competitiveness
index (RTB) in manufacturing increases by 0.162, 0.027, and 0.021, respectively, (Figure 6-2-6) due
to an increase in the exports after labor and capital, which are production factors, move from the
mining industry to the manufacturing industry, boosting exports.
In comparison, because of an increase in domestic demand in Japan, Korea, Chinese Taipei, and
Thailand, which are import economies for fossil fuel, the import volume in manufacturing increases.
Since Japan has a higher energy efficiency in manufacturing than other import economies for fossil
fuel, the range of any decrease in energy costs in manufacturing caused by a drop in the fossil fuel
price is relatively small compared to other economies, the export price competitiveness drops
relatively, and the global competitiveness index in manufacturing drops the most (-0.044).
Even in the United States, because of the increase in the production of unconventional resources
(oil and natural gas) and the decline in the imports of fossil fuel, the domestic demand increases,
-2.7%-3.3% -2.7%
-5.8% -5.4%-4.8%
-4.2% -3.8%
-2.6%
-3.4% -3.5%-4.4%
-3.3%-4.3% -4.0%
-1.0%-1.9% -2.3%
-5.9%
-1.0% -1.4%-2.1%
-0.3%
-2.7%-2.3%
-1.5% -1.3%
-2.5%-1.6% -1.5%
-4.4%-3.9%
-3.1%
-4.9% -4.7%
-9.8%
-3.8%
-8.9%
-3.3%-3.9%
-1.8%
-6.7%
-4.1%-4.6% -4.3%
-12%
-10%
-8%
-6%
-4%
-2%
0%
USA CDA MEX RUS JPN ROK PRC CT INA MAS RP THA AUS APEC EU
Iron and Steel Paper and pulp Chemical
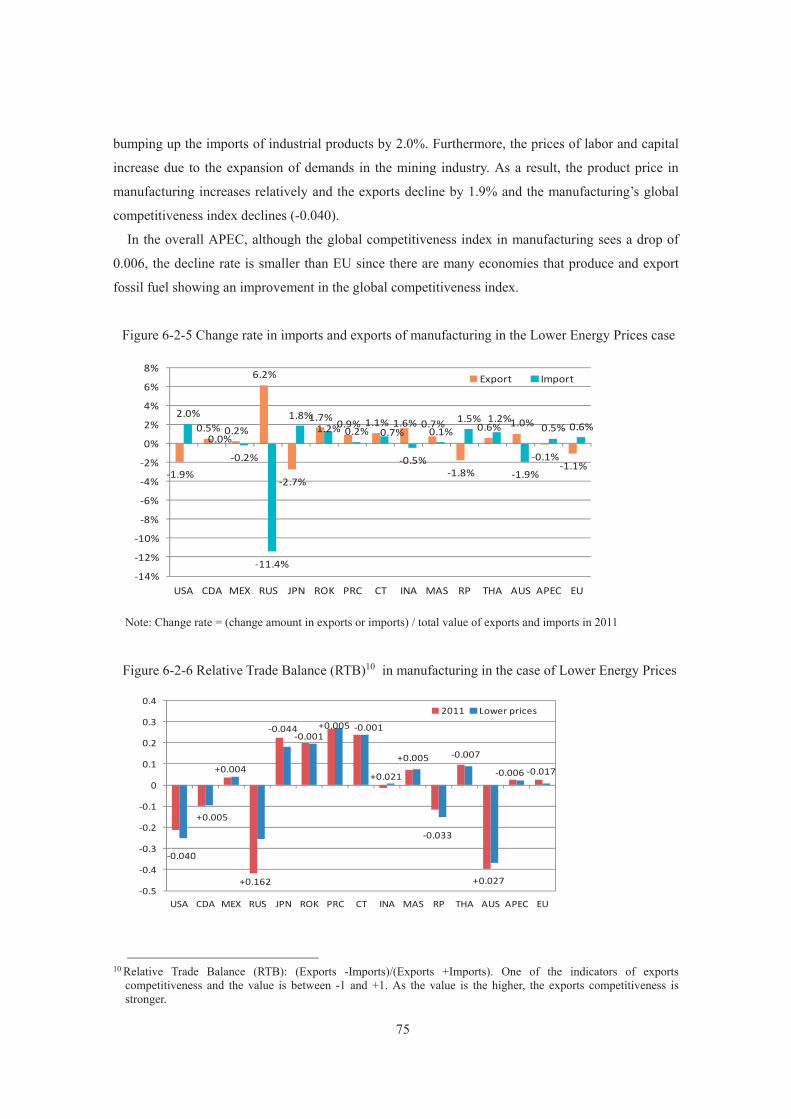
75
bumping up the imports of industrial products by 2.0%. Furthermore, the prices of labor and capital
increase due to the expansion of demands in the mining industry. As a result, the product price in
manufacturing increases relatively and the exports decline by 1.9% and the manufacturing’s global
competitiveness index declines (-0.040).
In the overall APEC, although the global competitiveness index in manufacturing sees a drop of
0.006, the decline rate is smaller than EU since there are many economies that produce and export
fossil fuel showing an improvement in the global competitiveness index.
Figure 6-2-5 Change rate in imports and exports of manufacturing in the Lower Energy Prices case
Note: Change rate = (change amount in exports or imports) / total value of exports and imports in 2011
Figure 6-2-6 Relative Trade Balance (RTB)10 in manufacturing in the case of Lower Energy Prices
10 Relative Trade Balance (RTB): (Exports -Imports)/(Exports +Imports). One of the indicators of exports competitiveness and the value is between -1 and +1. As the value is the higher, the exports competitiveness is stronger.
-1.9%
0.5% 0.2%
6.2%
-2.7%
1.7% 0.9% 1.1% 1.6% 0.7%
-1.8%
0.6% 1.0%
-0.1%-1.1%
2.0%
0.0%
-0.2%
-11.4%
1.8%1.2% 0.2% 0.7%
-0.5%
0.1%1.5% 1.2%
-1.9%
0.5% 0.6%
-14%
-12%
-10%
-8%
-6%
-4%
-2%
0%
2%
4%
6%
8%
USA CDA MEX RUS JPN ROK PRC CT INA MAS RP THA AUS APEC EU
Export Import
-0.040
+0.005
+0.004
+0.162
-0.044 -0.001
+0.005 -0.001
+0.021
+0.005
-0.033
-0.007
+0.027
-0.006 -0.017
-0.5
-0.4
-0.3
-0.2
-0.1
0
0.1
0.2
0.3
0.4
USA CDA MEX RUS JPN ROK PRC CT INA MAS RP THA AUS APEC EU
2011 Lower prices
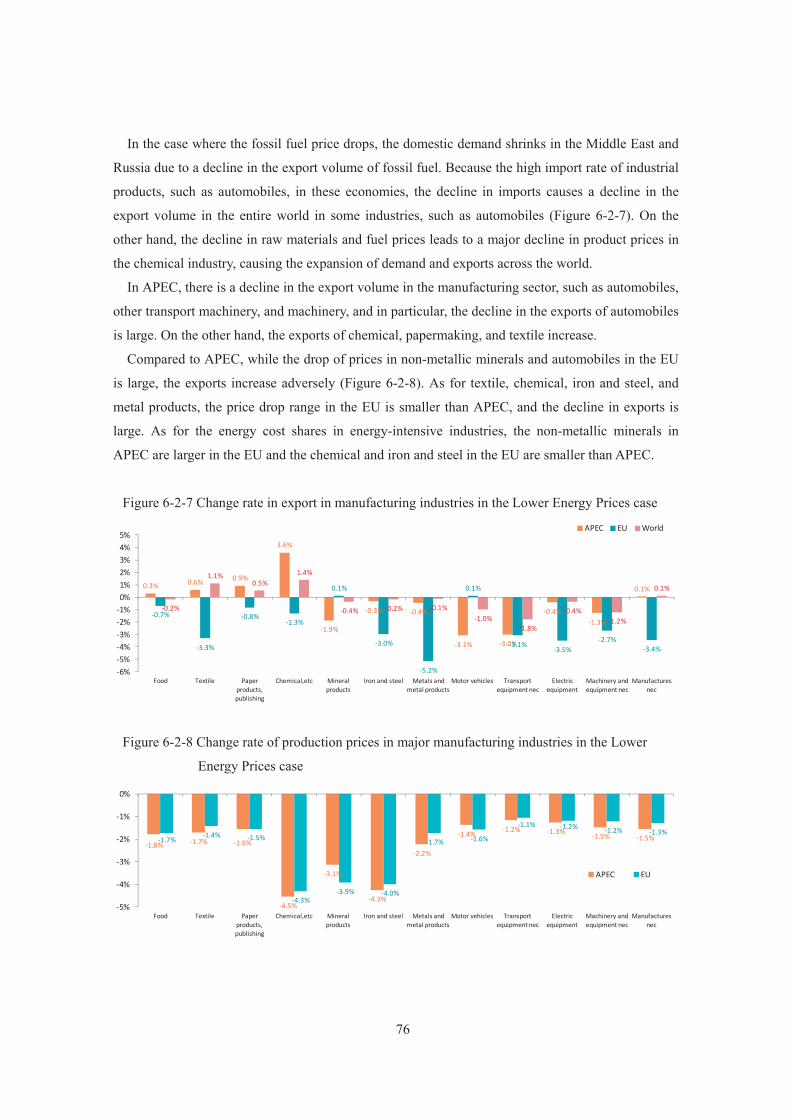
76
In the case where the fossil fuel price drops, the domestic demand shrinks in the Middle East and
Russia due to a decline in the export volume of fossil fuel. Because the high import rate of industrial
products, such as automobiles, in these economies, the decline in imports causes a decline in the
export volume in the entire world in some industries, such as automobiles (Figure 6-2-7). On the
other hand, the decline in raw materials and fuel prices leads to a major decline in product prices in
the chemical industry, causing the expansion of demand and exports across the world.
In APEC, there is a decline in the export volume in the manufacturing sector, such as automobiles,
other transport machinery, and machinery, and in particular, the decline in the exports of automobiles
is large. On the other hand, the exports of chemical, papermaking, and textile increase.
Compared to APEC, while the drop of prices in non-metallic minerals and automobiles in the EU
is large, the exports increase adversely (Figure 6-2-8). As for textile, chemical, iron and steel, and
metal products, the price drop range in the EU is smaller than APEC, and the decline in exports is
large. As for the energy cost shares in energy-intensive industries, the non-metallic minerals in
APEC are larger in the EU and the chemical and iron and steel in the EU are smaller than APEC.
Figure 6-2-7 Change rate in export in manufacturing industries in the Lower Energy Prices case
Figure 6-2-8 Change rate of production prices in major manufacturing industries in the Lower
Energy Prices case
0.3% 0.6% 0.9%
3.6%
-1.9%
-0.3% -0.4%
-3.1% -3.0%
-0.4%-1.3%
0.1%
-0.7%
-3.3%
-0.8%-1.3%
0.1%
-3.0%
-5.2%
0.1%
-3.1%-3.5%
-2.7%-3.4%
-0.2%
1.1%0.5%
1.4%
-0.4% -0.2% -0.1%-1.0%
-1.8%
-0.4%-1.2%
0.1%
-6%-5%-4%-3%-2%-1%0%1%2%3%4%5%
Food Textile Paper products,publishing
Chemical,etc Mineral products
Iron and steel Metals and metal products
Motor vehicles Transport equipment nec
Electric equipment
Machinery and equipment nec
Manufactures nec
APEC EU World
-1.8% -1.7% -1.6%
-4.5%
-3.1%
-4.3%
-2.2%
-1.4% -1.2% -1.3% -1.5% -1.5%-1.7% -1.4% -1.5%
-4.3%-3.9% -4.0%
-1.7% -1.6%
-1.1% -1.2% -1.2% -1.3%
-5%
-4%
-3%
-2%
-1%
0%
Food Textile Paper products,publishing
Chemical,etc Mineral products
Iron and steel Metals and metal products
Motor vehicles Transport equipment nec
Electric equipment
Machinery and equipment nec
Manufactures nec
APEC EU
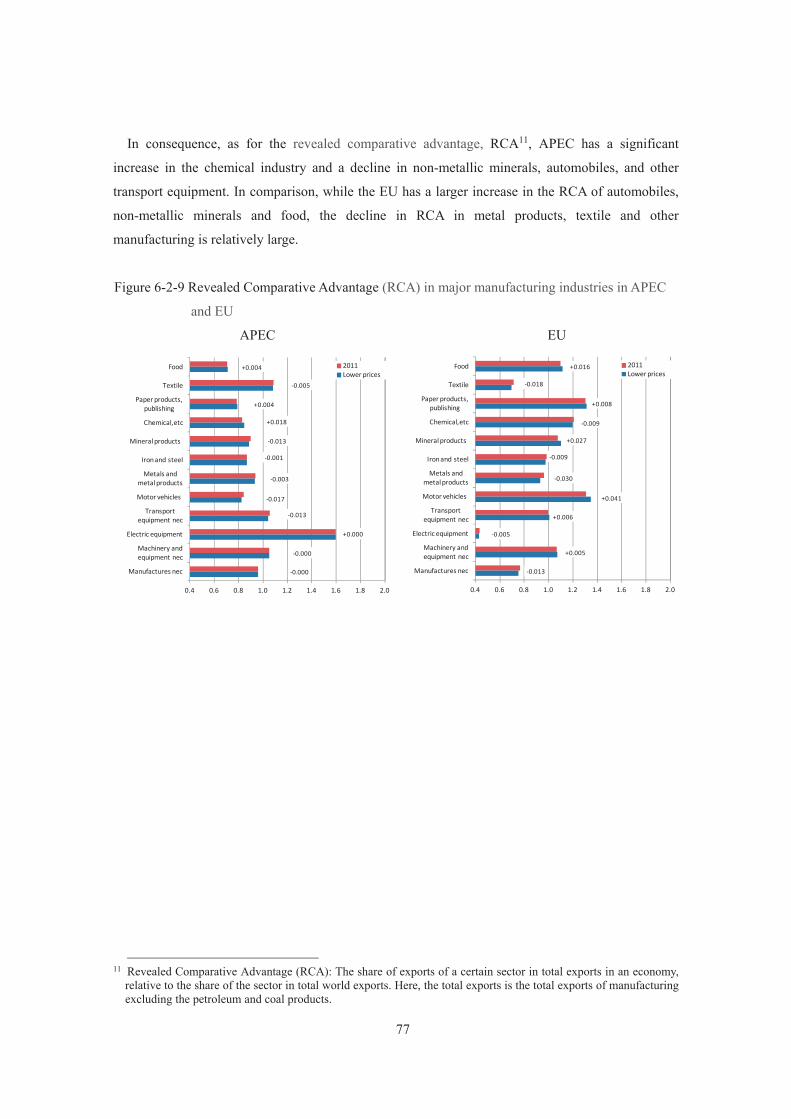
77
In consequence, as for the revealed comparative advantage, RCA11, APEC has a significant
increase in the chemical industry and a decline in non-metallic minerals, automobiles, and other
transport equipment. In comparison, while the EU has a larger increase in the RCA of automobiles,
non-metallic minerals and food, the decline in RCA in metal products, textile and other
manufacturing is relatively large.
Figure 6-2-9 Revealed Comparative Advantage (RCA) in major manufacturing industries in APEC
and EU
APEC EU
11 Revealed Comparative Advantage (RCA): The share of exports of a certain sector in total exports in an economy,
relative to the share of the sector in total world exports. Here, the total exports is the total exports of manufacturing excluding the petroleum and coal products.
+0.004
-0.005
+0.004
+0.018
-0.013
-0.001
-0.003
-0.017
-0.013
+0.000
-0.000
-0.000
0.4 0.6 0.8 1.0 1.2 1.4 1.6 1.8 2.0
Food
Textile
Paper products, publishing
Chemical,etc
Mineral products
Iron and steel
Metals and metal products
Motor vehicles
Transport equipment nec
Electric equipment
Machinery and equipment nec
Manufactures nec
2011Lower prices
+0.016
-0.018
+0.008
-0.009
+0.027
-0.009
-0.030
+0.041
+0.006
-0.005
+0.005
-0.013
0.4 0.6 0.8 1.0 1.2 1.4 1.6 1.8 2.0
Food
Textile
Paper products, publishing
Chemical,etc
Mineral products
Iron and steel
Metals and metal products
Motor vehicles
Transport equipment nec
Electric equipment
Machinery and equipment nec
Manufactures nec
2011Lower prices
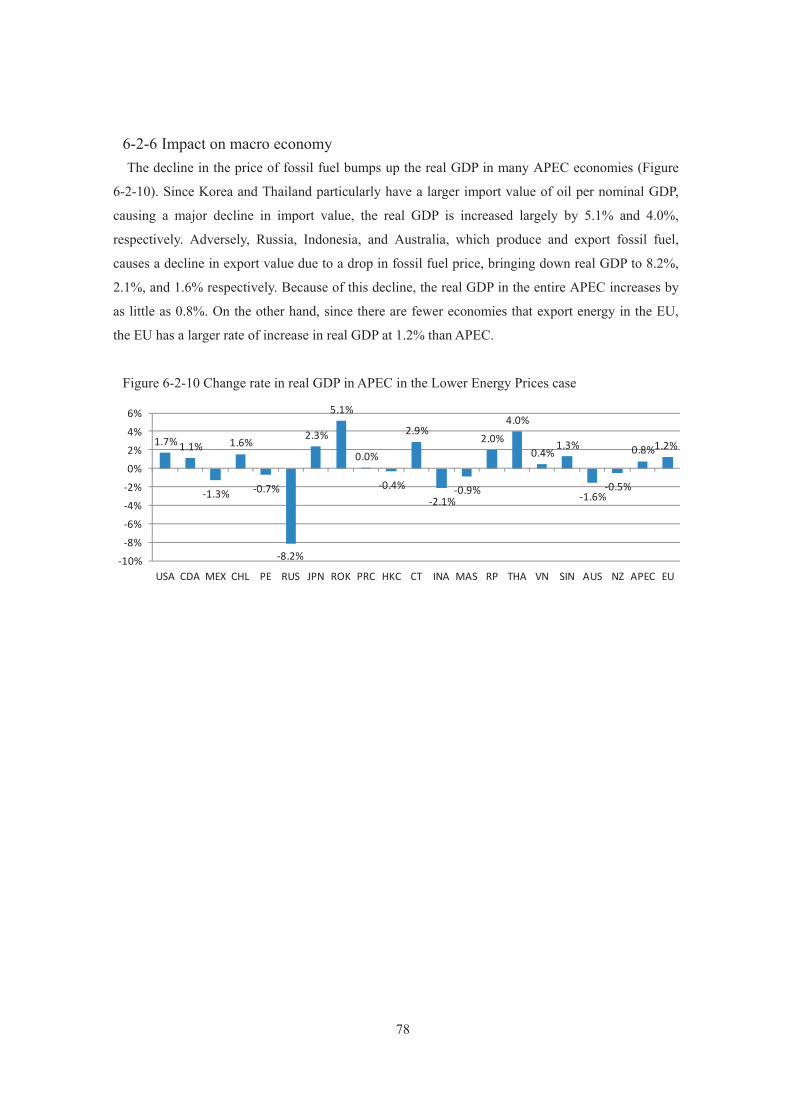
78
6-2-6 Impact on macro economy The decline in the price of fossil fuel bumps up the real GDP in many APEC economies (Figure
6-2-10). Since Korea and Thailand particularly have a larger import value of oil per nominal GDP,
causing a major decline in import value, the real GDP is increased largely by 5.1% and 4.0%,
respectively. Adversely, Russia, Indonesia, and Australia, which produce and export fossil fuel,
causes a decline in export value due to a drop in fossil fuel price, bringing down real GDP to 8.2%,
2.1%, and 1.6% respectively. Because of this decline, the real GDP in the entire APEC increases by
as little as 0.8%. On the other hand, since there are fewer economies that export energy in the EU,
the EU has a larger rate of increase in real GDP at 1.2% than APEC.
Figure 6-2-10 Change rate in real GDP in APEC in the Lower Energy Prices case
1.7% 1.1%
-1.3%
1.6%
-0.7%
-8.2%
2.3%
5.1%
0.0%
-0.4%
2.9%
-2.1%-0.9%
2.0%4.0%
0.4%1.3%
-1.6%-0.5%
0.8%1.2%
-10%-8%-6%-4%-2%0%2%4%6%
USA CDA MEX CHL PE RUS JPN ROK PRC HKC CT INA MAS RP THA VN SIN AUS NZ APEC EU
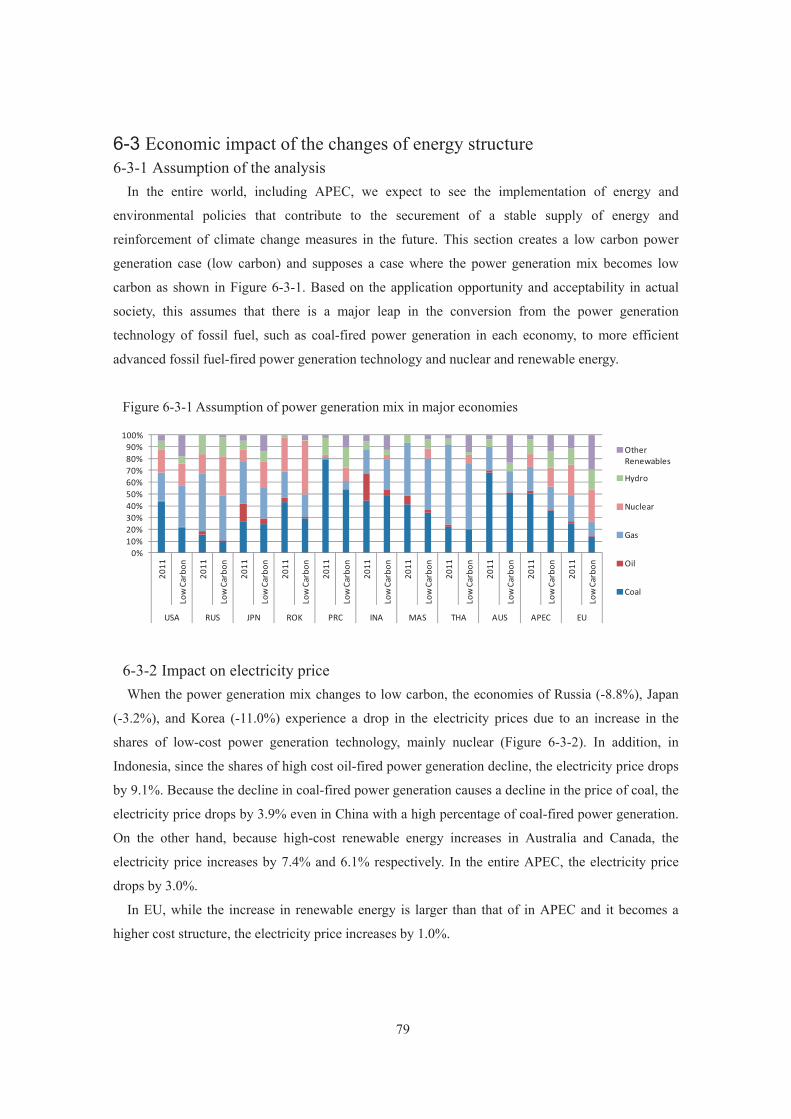
79
6-3 Economic impact of the changes of energy structure 6-3-1 Assumption of the analysis
In the entire world, including APEC, we expect to see the implementation of energy and
environmental policies that contribute to the securement of a stable supply of energy and
reinforcement of climate change measures in the future. This section creates a low carbon power
generation case (low carbon) and supposes a case where the power generation mix becomes low
carbon as shown in Figure 6-3-1. Based on the application opportunity and acceptability in actual
society, this assumes that there is a major leap in the conversion from the power generation
technology of fossil fuel, such as coal-fired power generation in each economy, to more efficient
advanced fossil fuel-fired power generation technology and nuclear and renewable energy.
Figure 6-3-1 Assumption of power generation mix in major economies
6-3-2 Impact on electricity price When the power generation mix changes to low carbon, the economies of Russia (-8.8%), Japan
(-3.2%), and Korea (-11.0%) experience a drop in the electricity prices due to an increase in the
shares of low-cost power generation technology, mainly nuclear (Figure 6-3-2). In addition, in
Indonesia, since the shares of high cost oil-fired power generation decline, the electricity price drops
by 9.1%. Because the decline in coal-fired power generation causes a decline in the price of coal, the
electricity price drops by 3.9% even in China with a high percentage of coal-fired power generation.
On the other hand, because high-cost renewable energy increases in Australia and Canada, the
electricity price increases by 7.4% and 6.1% respectively. In the entire APEC, the electricity price
drops by 3.0%.
In EU, while the increase in renewable energy is larger than that of in APEC and it becomes a
higher cost structure, the electricity price increases by 1.0%.
0%10%20%30%40%50%60%70%80%90%
100%
2011
Low
Car
bon
2011
Low
Car
bon
2011
Low
Car
bon
2011
Low
Car
bon
2011
Low
Car
bon
2011
Low
Car
bon
2011
Low
Car
bon
2011
Low
Car
bon
2011
Low
Car
bon
2011
Low
Car
bon
2011
Low
Car
bon
USA RUS JPN ROK PRC INA MAS THA AUS APEC EU
OtherRenewables
Hydro
Nuclear
Gas
Oil
Coal

80
Figure 6-3-2 Change rate of electricity price in the Low Carbon case
6-3-3 Impact on energy trade Because APEC sees a decline in the imports of fossil fuel, mainly coal, with the penetration of low
carbon power generation technology, the import value of fossil fuel per nominal GDP in APEC
declines by 0.05% point (Figure 6-3-3). Korea (-0.7% point) and Chinese Taipei (-0.4% point) with a
large import value of coal within the APEC economies also see the largest decline.
Figure 6-3-3 Import value of fossil fuel per nominal GDP
-1.8%
6.1%
-0.9%-2.4%
-0.6%
-8.8%
-3.2%
-11.0%
-3.9%-5.2%
-4.0%
-9.1%
-4.1%-1.9%
0.0%
-1.0%
5.0%
7.4%
2.2%
-3.0%
1.0%
-15%
-10%
-5%
0%
5%
10%
USA CDA MEX CHL PER RUS JPN ROK PRC HKC CT INA MAS RP THA VN SIN AUS NZ APEC EU
%
2.2% 2.2%3.4% 3.2%
11.4%10.7%
3.0% 3.1%
9.9% 9.5%
3.4% 3.4%
11.0%10.7%
2.8% 2.7% 3.1% 2.9%
0%
2%
4%
6%
8%
10%
12%
2011
Low
Car
bon
2011
Low
Car
bon
2011
Low
Car
bon
2011
Low
Car
bon
2011
Low
Car
bon
2011
Low
Car
bon
2011
Low
Car
bon
2011
Low
Car
bon
2011
Low
Car
bon
USA JPN ROK PRC CT RP THA APEC EU
Gas
Oil
Coal
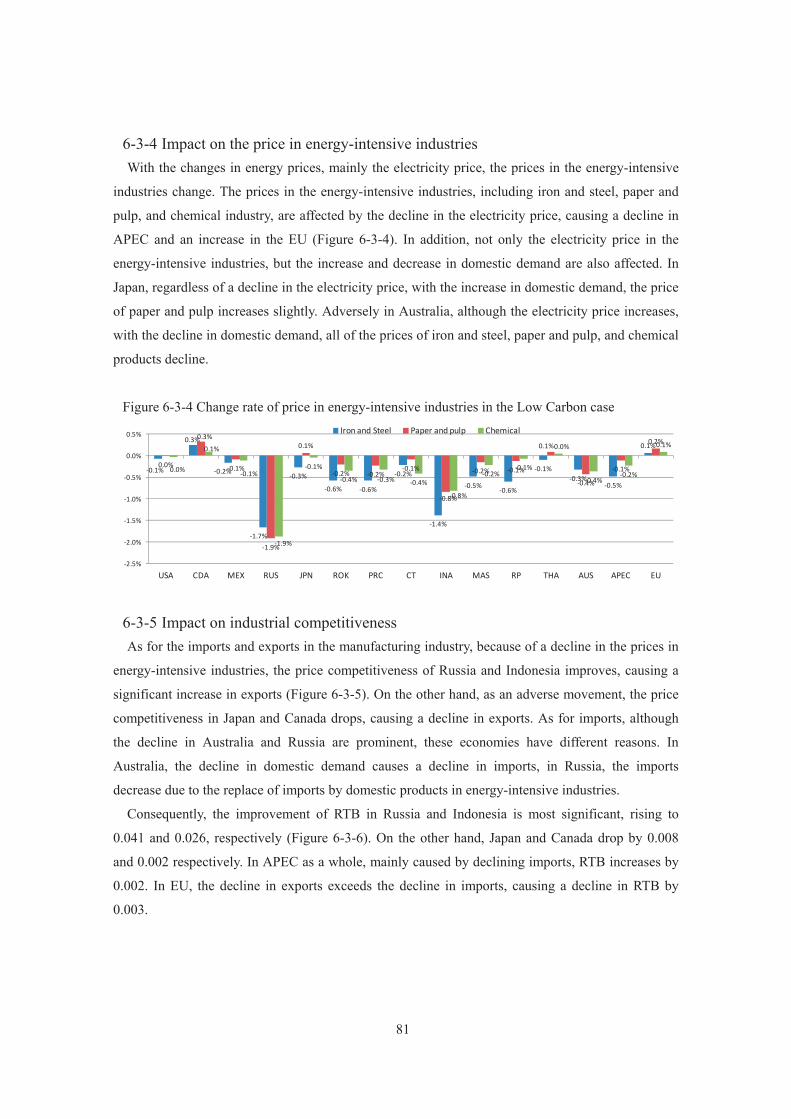
81
6-3-4 Impact on the price in energy-intensive industries With the changes in energy prices, mainly the electricity price, the prices in the energy-intensive
industries change. The prices in the energy-intensive industries, including iron and steel, paper and
pulp, and chemical industry, are affected by the decline in the electricity price, causing a decline in
APEC and an increase in the EU (Figure 6-3-4). In addition, not only the electricity price in the
energy-intensive industries, but the increase and decrease in domestic demand are also affected. In
Japan, regardless of a decline in the electricity price, with the increase in domestic demand, the price
of paper and pulp increases slightly. Adversely in Australia, although the electricity price increases,
with the decline in domestic demand, all of the prices of iron and steel, paper and pulp, and chemical
products decline.
Figure 6-3-4 Change rate of price in energy-intensive industries in the Low Carbon case
6-3-5 Impact on industrial competitiveness As for the imports and exports in the manufacturing industry, because of a decline in the prices in
energy-intensive industries, the price competitiveness of Russia and Indonesia improves, causing a
significant increase in exports (Figure 6-3-5). On the other hand, as an adverse movement, the price
competitiveness in Japan and Canada drops, causing a decline in exports. As for imports, although
the decline in Australia and Russia are prominent, these economies have different reasons. In
Australia, the decline in domestic demand causes a decline in imports, in Russia, the imports
decrease due to the replace of imports by domestic products in energy-intensive industries.
Consequently, the improvement of RTB in Russia and Indonesia is most significant, rising to
0.041 and 0.026, respectively (Figure 6-3-6). On the other hand, Japan and Canada drop by 0.008
and 0.002 respectively. In APEC as a whole, mainly caused by declining imports, RTB increases by
0.002. In EU, the decline in exports exceeds the decline in imports, causing a decline in RTB by
0.003.
-0.1%
0.3%
-0.2%
-1.7%
-0.3%
-0.6% -0.6%
-0.2%
-1.4%
-0.5% -0.6%
-0.1%-0.3%
-0.5%
0.1%
0.0%
0.3%
-0.1%
-1.9%
0.1%
-0.2% -0.2%-0.1%
-0.8%
-0.2% -0.1%
0.1%
-0.4%
-0.1%
0.2%
0.0%
0.1%
-0.1%
-1.9%
-0.1%
-0.4% -0.3% -0.4%
-0.8%
-0.2%-0.1%
0.0%
-0.4%-0.2%
0.1%
-2.5%
-2.0%
-1.5%
-1.0%
-0.5%
0.0%
0.5%
USA CDA MEX RUS JPN ROK PRC CT INA MAS RP THA AUS APEC EU
Iron and Steel Paper and pulp Chemical
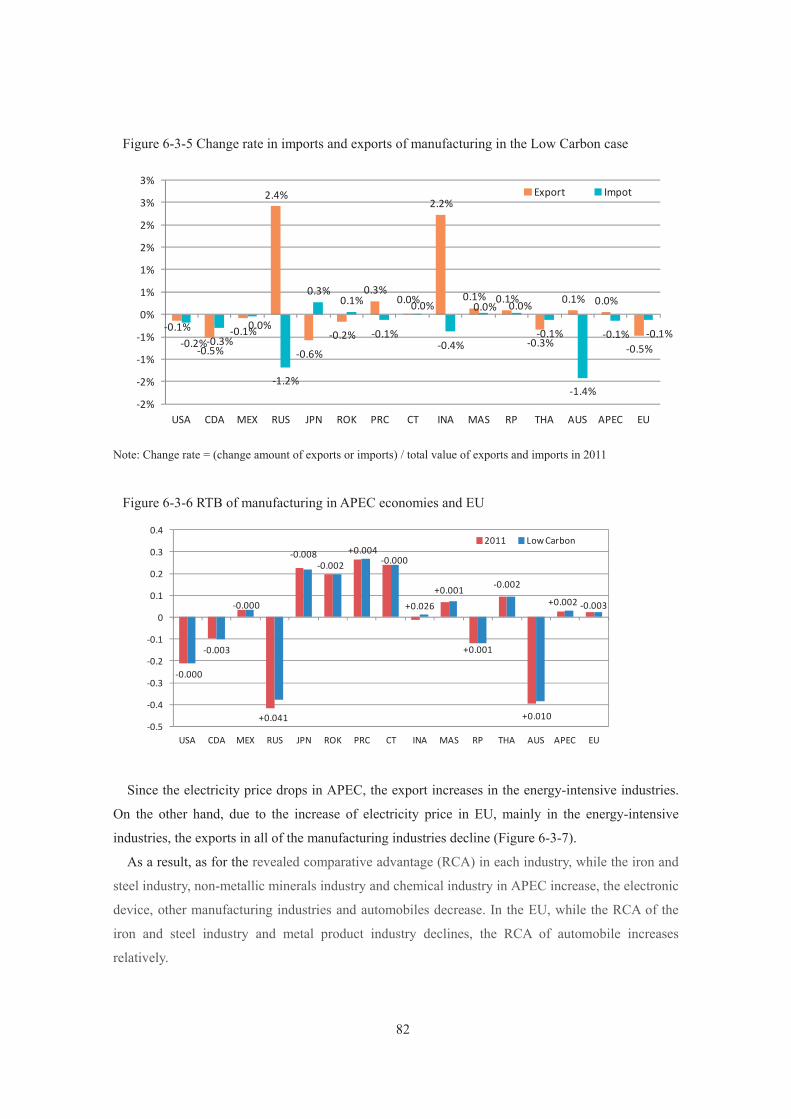
82
Figure 6-3-5 Change rate in imports and exports of manufacturing in the Low Carbon case
Note: Change rate = (change amount of exports or imports) / total value of exports and imports in 2011
Figure 6-3-6 RTB of manufacturing in APEC economies and EU
Since the electricity price drops in APEC, the export increases in the energy-intensive industries.
On the other hand, due to the increase of electricity price in EU, mainly in the energy-intensive
industries, the exports in all of the manufacturing industries decline (Figure 6-3-7).
As a result, as for the revealed comparative advantage (RCA) in each industry, while the iron and
steel industry, non-metallic minerals industry and chemical industry in APEC increase, the electronic
device, other manufacturing industries and automobiles decrease. In the EU, while the RCA of the
iron and steel industry and metal product industry declines, the RCA of automobile increases
relatively.
-0.1%
-0.5%
-0.1%
2.4%
-0.6%-0.2%
0.3%0.0%
2.2%
0.1% 0.1%
-0.3%
0.1% 0.0%
-0.5%-0.2%-0.3%0.0%
-1.2%
0.3%0.1%
-0.1%
0.0%
-0.4%
0.0% 0.0%
-0.1%
-1.4%
-0.1% -0.1%
-2%
-2%
-1%
-1%
0%
1%
1%
2%
2%
3%
3%
USA CDA MEX RUS JPN ROK PRC CT INA MAS RP THA AUS APEC EU
Export Impot
-0.000
-0.003
-0.000
+0.041
-0.008 -0.002
+0.004 -0.000
+0.026 +0.001
+0.001
-0.002
+0.010
+0.002 -0.003
-0.5
-0.4
-0.3
-0.2
-0.1
0
0.1
0.2
0.3
0.4
USA CDA MEX RUS JPN ROK PRC CT INA MAS RP THA AUS APEC EU
2011 Low Carbon

83
Figure 6-3-7 Change rate in export in major manufacturing industries in APEC and EU in the Low
Carbon case
Figure 6-3-8 RCA in major manufacturing industries in APEC and EU
APEC EU
6-3-6 Impact on macro economy With the penetration of low carbon power generation technology, the demand in coal for power
generation declines on a global basis. The decline in the production and export of coal and an
increase in the electricity price due to the introduction of high-cost renewable energy in large amount
cause the real GDP of Australia and Canada declines by -2.0% and -0.8%, respectively, which is the
largest drop in APEC (Figure 6-3-9). In comparison, in the economies that import fossil fuels,
because of the decline in import volume of fossil fuel and electricity price, the real GDP in Korea
(+1.0%), Japan (+0.7%), and Chinese Taipei (+0.5%) see the highest increase in the APEC
economies. In China, Russia, and Malaysia, the positive effect from a decline in the electricity price
and the negative effect from a decline in the production of fossil fuel are offset, leaving the real GDP
0.3% 0.3% 0.2%0.4%
0.5% 0.5%
0.2%
-0.3%
0.1%
-0.1% -0.1% -0.2%
-0.5%
-0.9% -0.8%
-1.2% -1.2%
-1.8%
-1.5%
-0.3%
-0.8% -0.9% -0.9%
-0.6%
-2.0%
-1.5%
-1.0%
-0.5%
0.0%
0.5%
1.0%
Food Textile Paper products,
publishing
Chemical,etc Mineral products
Iron and steel Metals and metal
products
Motor vehicles
Transport equipment
nec
Electric equipment
Machinery and
equipment nec
Manufactures nec
APEC EU
+0.000
+0.001
+0.001
+0.004
+0.006
+0.006
+0.002
-0.004
-0.001
-0.005
-0.001
-0.004
0.4 0.6 0.8 1.0 1.2 1.4 1.6 1.8 2.0
Food
Textile
Paper products, publishing
Chemical,etc
Mineral products
Iron and steel
Metals and metal products
Motor vehicles
Transport equipment nec
Electric equipment
Machinery and equipment nec
Manufactures nec
2011Low Carbon
+0.002
-0.001
+0.001
-0.001
-0.000
-0.006
-0.004
+0.006
+0.001
-0.001
+0.001
+0.002
0.4 0.6 0.8 1.0 1.2 1.4 1.6 1.8 2.0
Food
Textile
Paper products, publishing
Chemical,etc
Mineral products
Iron and steel
Metals and metal products
Motor vehicles
Transport equipment nec
Electric equipment
Machinery and equipment nec
Manufactures nec
2011Low Carbon
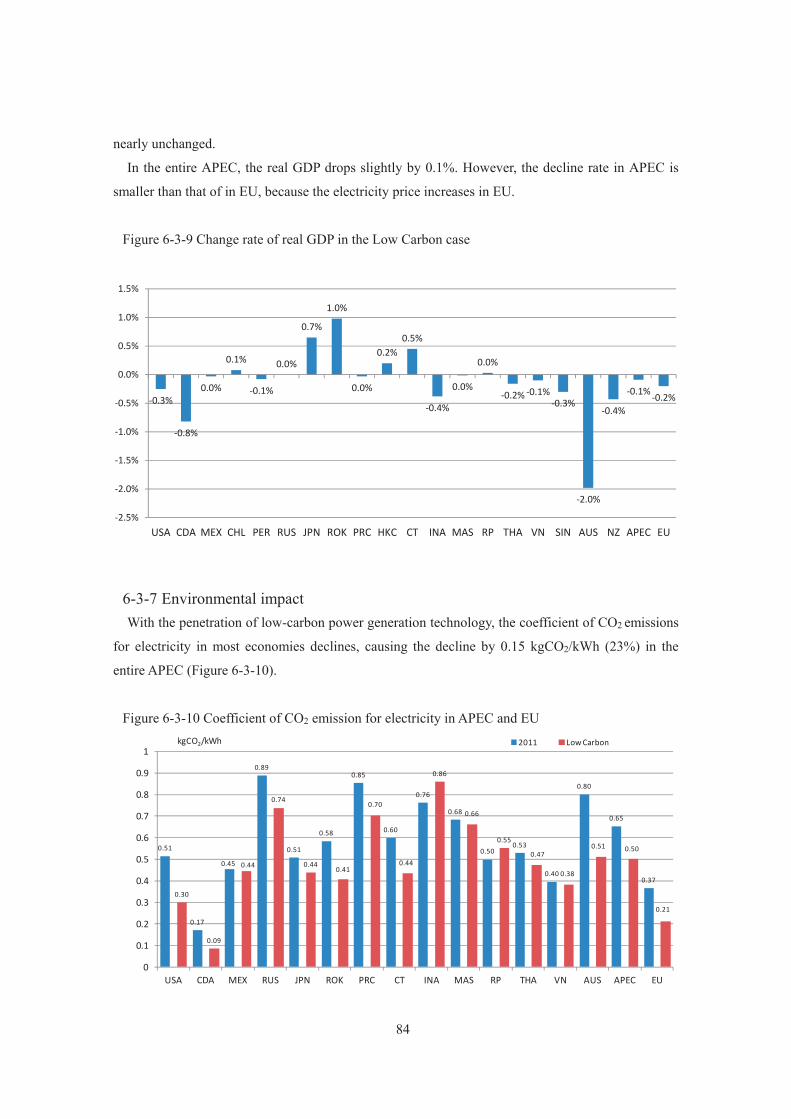
84
nearly unchanged.
In the entire APEC, the real GDP drops slightly by 0.1%. However, the decline rate in APEC is
smaller than that of in EU, because the electricity price increases in EU.
Figure 6-3-9 Change rate of real GDP in the Low Carbon case
6-3-7 Environmental impact With the penetration of low-carbon power generation technology, the coefficient of CO2 emissions
for electricity in most economies declines, causing the decline by 0.15 kgCO2/kWh (23%) in the
entire APEC (Figure 6-3-10).
Figure 6-3-10 Coefficient of CO2 emission for electricity in APEC and EU
-0.3%
-0.8%
0.0%
0.1%
-0.1%
0.0%
0.7%
1.0%
0.0%
0.2%0.5%
-0.4%
0.0%
0.0%
-0.2% -0.1%-0.3%
-2.0%
-0.4%
-0.1% -0.2%
-2.5%
-2.0%
-1.5%
-1.0%
-0.5%
0.0%
0.5%
1.0%
1.5%
USA CDA MEX CHL PER RUS JPN ROK PRC HKC CT INA MAS RP THA VN SIN AUS NZ APEC EU
0.51
0.17
0.45
0.89
0.51
0.58
0.85
0.60
0.76
0.68
0.50 0.53
0.40
0.80
0.65
0.37
0.30
0.09
0.44
0.74
0.44 0.41
0.70
0.44
0.86
0.66
0.55
0.47
0.38
0.51 0.50
0.21
0
0.1
0.2
0.3
0.4
0.5
0.6
0.7
0.8
0.9
1
USA CDA MEX RUS JPN ROK PRC CT INA MAS RP THA VN AUS APEC EU
2011 Low CarbonkgCO2/kWh

85
6-4 Economic impact on energy-saving investment 6-4-1 Assumption of the analysis
The energy-saving investment helps decrease the energy cost in the industry, increasing the
competitiveness of the industry. On the other hand, since it bumps up the capital cost, it also has an
effect to decrease competitiveness. This section creates the case of improved energy efficiency (high
efficiency) to evaluate the impact of macro economies and the industrial competitiveness of APEC
economies when energy-saving investment is implemented to the potential of the introduction for
five sectors of the energy-intensive industries including iron and steel, chemicals and petrochemicals,
non-metallic minerals, paper, pulp and printing, and non-ferrous metals. The energy-saving potential
in the energy-intensive industries uses the analysis results of energy-saving potentials in APEC
(Table 6-4-1).
Table 6-4-1 Energy-saving potential of the energy-intensive industries in APEC economies
Assumed improvement potential (%)
Developed economies Developing economies
Iron and steel 10–15 25–35
Chemicals and petrochemicals 10–25 15–30
Non-metallic mineral 20–25 20–30
Paper, pulp and printing 20–30 15–30
Non-ferrous metals 5–40 5–55
Source: APERC, APEC Energy Demand and Supply Outlook 6th Edition
6-4-2 Impact on energy prices By implementing the energy-saving investment in the APEC’s energy-intensive industries to the
introduction potential, international energy prices drop (Figure 6-4-1). Since the consumption rate of
coal in the industrial sector in APEC is high, the coal price drops the most by -5.6%. Because of a
decline in this fossil fuel price and the electricity consumption in the energy-intensive industry, the
electricity price makes a decline by 1.6% in the entire APEC (Figure 6-4-2). Also in the EU, in
addition to the decline in fossil fuel prices, the decline in industrial competitiveness causes a decline
in electricity demand, the electricity price decreases by 0.9%. By economies, in addition to China
with the high improvement potential of energy efficiency, along with the high rate of fossil fuel-fired
power generation, it has the highest decline in the rate of the electricity price by 3.9%. On the other
hand, because Canada, New Zealand, and Viet Nam have a lower rate of fossil fuel-fired power
generation, the impact of a decline in fossil fuel price is small on the electricity price, thus causing a
slight decline in the electricity price.
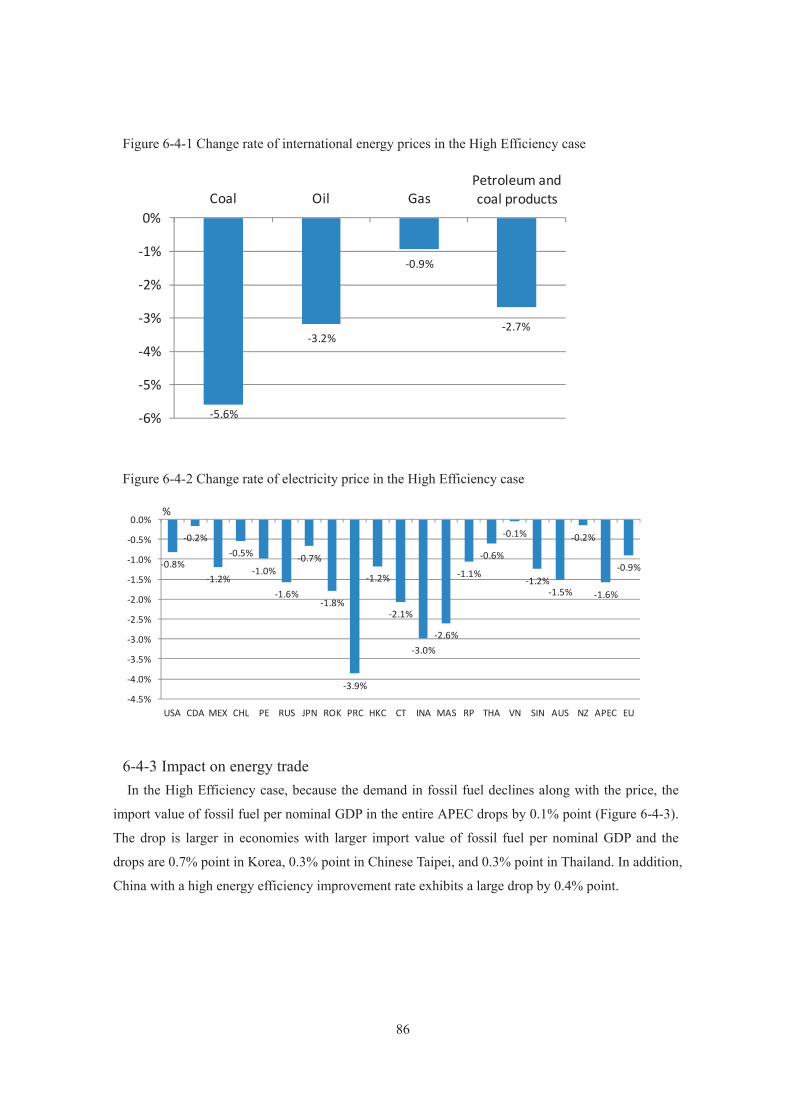
86
Figure 6-4-1 Change rate of international energy prices in the High Efficiency case
Figure 6-4-2 Change rate of electricity price in the High Efficiency case
6-4-3 Impact on energy trade In the High Efficiency case, because the demand in fossil fuel declines along with the price, the
import value of fossil fuel per nominal GDP in the entire APEC drops by 0.1% point (Figure 6-4-3).
The drop is larger in economies with larger import value of fossil fuel per nominal GDP and the
drops are 0.7% point in Korea, 0.3% point in Chinese Taipei, and 0.3% point in Thailand. In addition,
China with a high energy efficiency improvement rate exhibits a large drop by 0.4% point.
-5.6%
-3.2%
-0.9%
-2.7%
-6%
-5%
-4%
-3%
-2%
-1%
0%Coal Oil Gas
Petroleum and coal products
-0.8%
-0.2%
-1.2%
-0.5%
-1.0%
-1.6%
-0.7%
-1.8%
-3.9%
-1.2%
-2.1%
-3.0%-2.6%
-1.1%
-0.6%
-0.1%
-1.2%-1.5%
-0.2%
-1.6%
-0.9%
-4.5%
-4.0%
-3.5%
-3.0%
-2.5%
-2.0%
-1.5%
-1.0%
-0.5%
0.0%
USA CDA MEX CHL PE RUS JPN ROK PRC HKC CT INA MAS RP THA VN SIN AUS NZ APEC EU
%
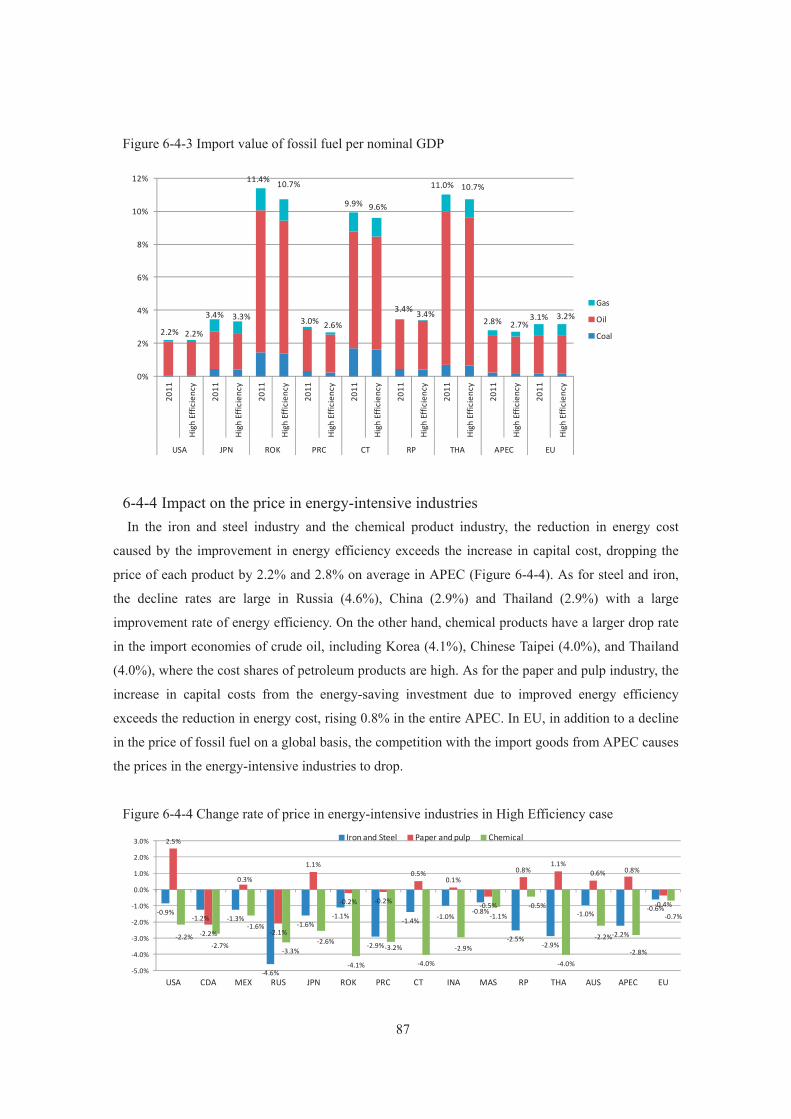
87
Figure 6-4-3 Import value of fossil fuel per nominal GDP
6-4-4 Impact on the price in energy-intensive industries In the iron and steel industry and the chemical product industry, the reduction in energy cost
caused by the improvement in energy efficiency exceeds the increase in capital cost, dropping the
price of each product by 2.2% and 2.8% on average in APEC (Figure 6-4-4). As for steel and iron,
the decline rates are large in Russia (4.6%), China (2.9%) and Thailand (2.9%) with a large
improvement rate of energy efficiency. On the other hand, chemical products have a larger drop rate
in the import economies of crude oil, including Korea (4.1%), Chinese Taipei (4.0%), and Thailand
(4.0%), where the cost shares of petroleum products are high. As for the paper and pulp industry, the
increase in capital costs from the energy-saving investment due to improved energy efficiency
exceeds the reduction in energy cost, rising 0.8% in the entire APEC. In EU, in addition to a decline
in the price of fossil fuel on a global basis, the competition with the import goods from APEC causes
the prices in the energy-intensive industries to drop.
Figure 6-4-4 Change rate of price in energy-intensive industries in High Efficiency case
2.2% 2.2%
3.4% 3.3%
11.4% 10.7%
3.0% 2.6%
9.9% 9.6%
3.4% 3.4%
11.0% 10.7%
2.8% 2.7%3.1% 3.2%
0%
2%
4%
6%
8%
10%
12%20
11
High
Effi
cien
cy
2011
High
Effi
cien
cy
2011
High
Effi
cien
cy
2011
High
Effi
cien
cy
2011
High
Effi
cien
cy
2011
High
Effi
cien
cy
2011
High
Effi
cien
cy
2011
High
Effi
cien
cy
2011
High
Effi
cien
cy
USA JPN ROK PRC CT RP THA APEC EU
Gas
Oil
Coal
-0.9%-1.2% -1.3%
-4.6%
-1.6%-1.1%
-2.9%
-1.4% -1.0%-0.8%
-2.5%-2.9%
-1.0%
-2.2%
-0.6%
2.5%
-2.2%
0.3%
-2.1%
1.1%
-0.2% -0.2%
0.5%0.1%
-0.5%
0.8%1.1%
0.6% 0.8%
-0.4%
-2.2%-2.7%
-1.6%
-3.3%-2.6%
-4.1%
-3.2%
-4.0%
-2.9%
-1.1%-0.5%
-4.0%
-2.2%
-2.8%
-0.7%
-5.0%
-4.0%
-3.0%
-2.0%
-1.0%
0.0%
1.0%
2.0%
3.0%
USA CDA MEX RUS JPN ROK PRC CT INA MAS RP THA AUS APEC EU
Iron and Steel Paper and pulp Chemical
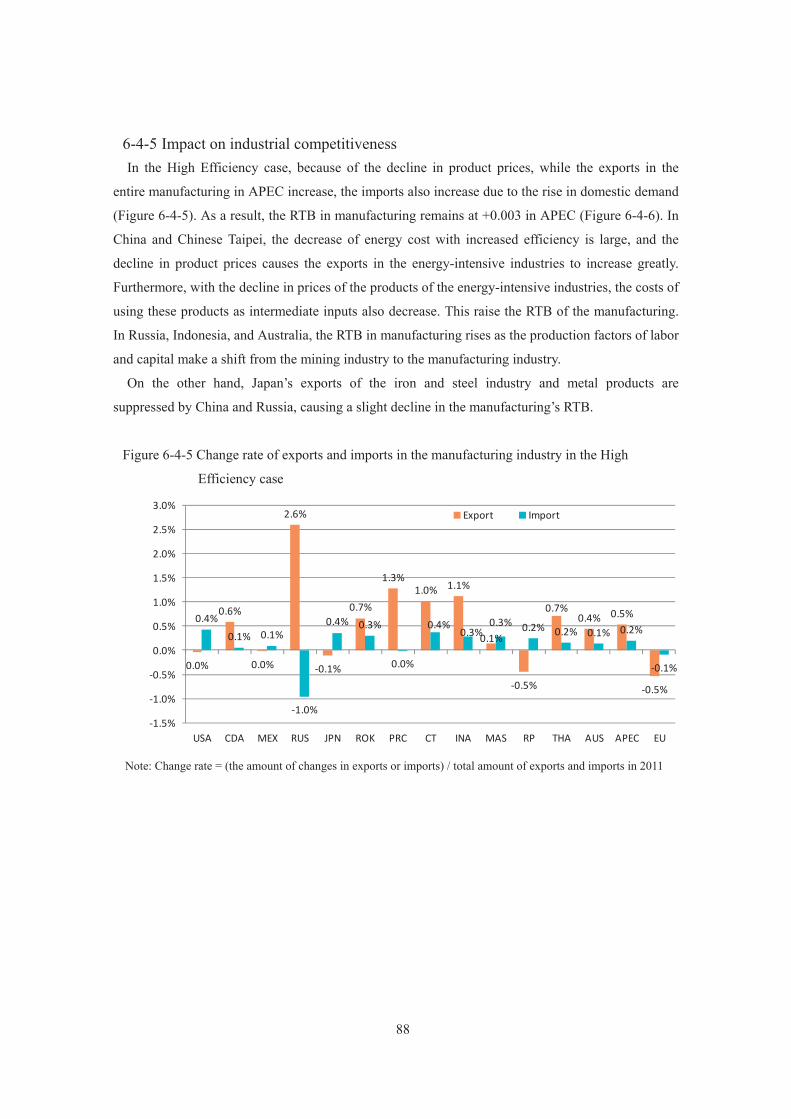
88
6-4-5 Impact on industrial competitiveness In the High Efficiency case, because of the decline in product prices, while the exports in the
entire manufacturing in APEC increase, the imports also increase due to the rise in domestic demand
(Figure 6-4-5). As a result, the RTB in manufacturing remains at +0.003 in APEC (Figure 6-4-6). In
China and Chinese Taipei, the decrease of energy cost with increased efficiency is large, and the
decline in product prices causes the exports in the energy-intensive industries to increase greatly.
Furthermore, with the decline in prices of the products of the energy-intensive industries, the costs of
using these products as intermediate inputs also decrease. This raise the RTB of the manufacturing.
In Russia, Indonesia, and Australia, the RTB in manufacturing rises as the production factors of labor
and capital make a shift from the mining industry to the manufacturing industry.
On the other hand, Japan’s exports of the iron and steel industry and metal products are
suppressed by China and Russia, causing a slight decline in the manufacturing’s RTB.
Figure 6-4-5 Change rate of exports and imports in the manufacturing industry in the High
Efficiency case
Note: Change rate = (the amount of changes in exports or imports) / total amount of exports and imports in 2011
0.0%
0.6%
0.0%
2.6%
-0.1%
0.7%
1.3%1.0% 1.1%
0.1%
-0.5%
0.7%0.4% 0.5%
-0.5%
0.4%0.1% 0.1%
-1.0%
0.4% 0.3%
0.0%
0.4%0.3%
0.3% 0.2% 0.2% 0.1% 0.2%
-0.1%
-1.5%
-1.0%
-0.5%
0.0%
0.5%
1.0%
1.5%
2.0%
2.5%
3.0%
USA CDA MEX RUS JPN ROK PRC CT INA MAS RP THA AUS APEC EU
Export Import
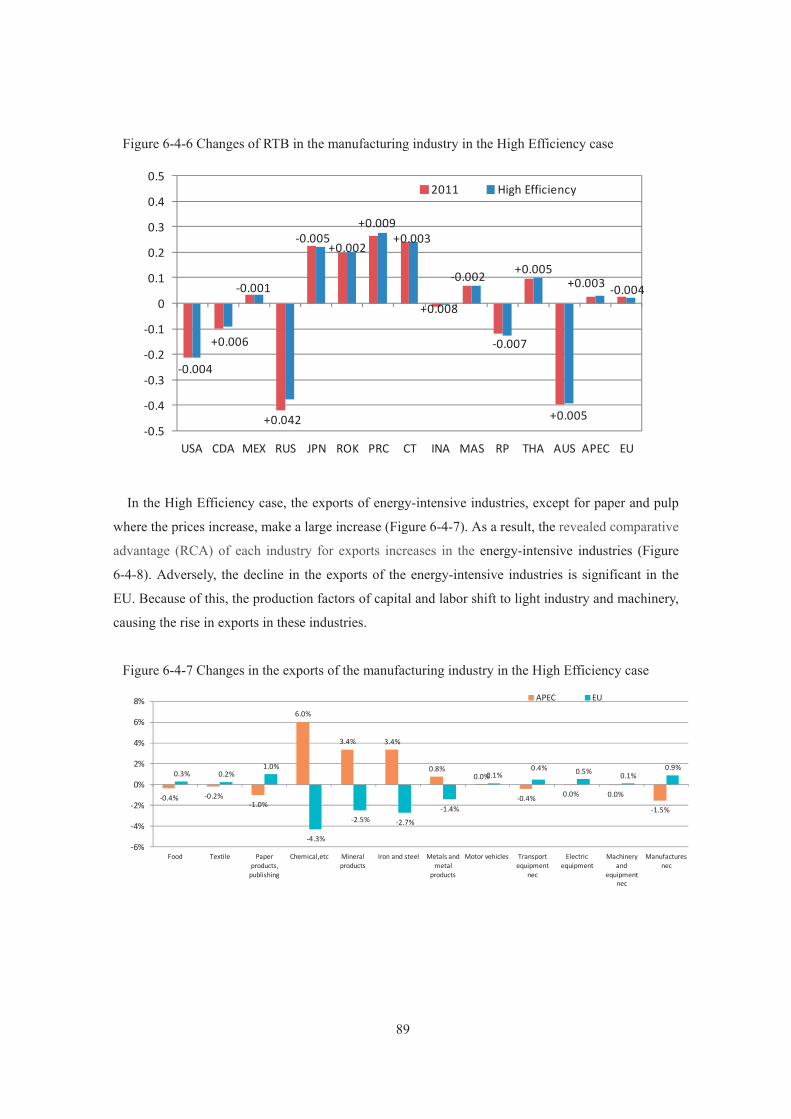
89
Figure 6-4-6 Changes of RTB in the manufacturing industry in the High Efficiency case
In the High Efficiency case, the exports of energy-intensive industries, except for paper and pulp
where the prices increase, make a large increase (Figure 6-4-7). As a result, the revealed comparative
advantage (RCA) of each industry for exports increases in the energy-intensive industries (Figure
6-4-8). Adversely, the decline in the exports of the energy-intensive industries is significant in the
EU. Because of this, the production factors of capital and labor shift to light industry and machinery,
causing the rise in exports in these industries.
Figure 6-4-7 Changes in the exports of the manufacturing industry in the High Efficiency case
-0.004
+0.006
-0.001
+0.042
-0.005 +0.002
+0.009 +0.003
+0.008
-0.002
-0.007
+0.005
+0.005
+0.003 -0.004
-0.5
-0.4
-0.3
-0.2
-0.1
0
0.1
0.2
0.3
0.4
0.5
USA CDA MEX RUS JPN ROK PRC CT INA MAS RP THA AUS APEC EU
2011 High Efficiency
-0.4% -0.2%-1.0%
6.0%
3.4% 3.4%
0.8%0.0%
-0.4% 0.0% 0.0%
-1.5%
0.3% 0.2%1.0%
-4.3%
-2.5% -2.7%
-1.4%
0.1%0.4% 0.5% 0.1%
0.9%
-6%
-4%
-2%
0%
2%
4%
6%
8%
Food Textile Paper products,
publishing
Chemical,etc Mineral products
Iron and steel Metals and metal
products
Motor vehicles Transport equipment
nec
Electric equipment
Machinery and
equipment nec
Manufactures nec
APEC EU
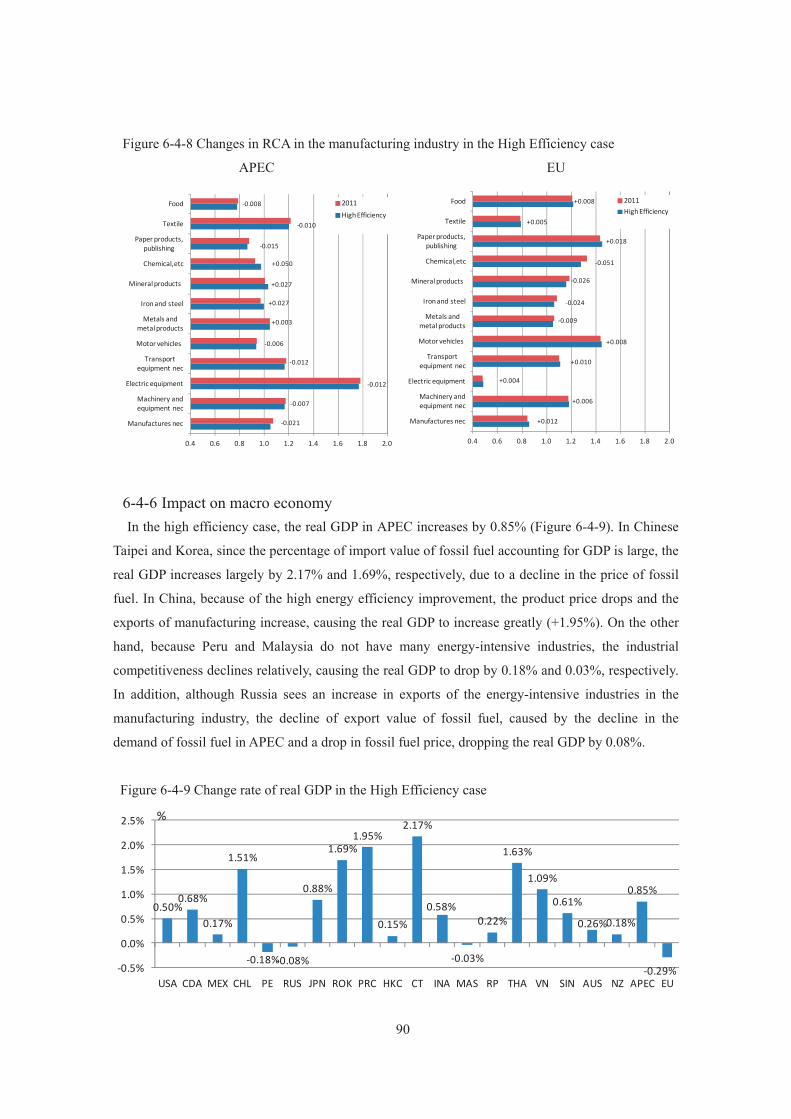
90
Figure 6-4-8 Changes in RCA in the manufacturing industry in the High Efficiency case
APEC EU
6-4-6 Impact on macro economy In the high efficiency case, the real GDP in APEC increases by 0.85% (Figure 6-4-9). In Chinese
Taipei and Korea, since the percentage of import value of fossil fuel accounting for GDP is large, the
real GDP increases largely by 2.17% and 1.69%, respectively, due to a decline in the price of fossil
fuel. In China, because of the high energy efficiency improvement, the product price drops and the
exports of manufacturing increase, causing the real GDP to increase greatly (+1.95%). On the other
hand, because Peru and Malaysia do not have many energy-intensive industries, the industrial
competitiveness declines relatively, causing the real GDP to drop by 0.18% and 0.03%, respectively.
In addition, although Russia sees an increase in exports of the energy-intensive industries in the
manufacturing industry, the decline of export value of fossil fuel, caused by the decline in the
demand of fossil fuel in APEC and a drop in fossil fuel price, dropping the real GDP by 0.08%.
Figure 6-4-9 Change rate of real GDP in the High Efficiency case
-0.008
-0.010
-0.015
+0.050
+0.027
+0.027
+0.003
-0.006
-0.012
-0.012
-0.007
-0.021
0.4 0.6 0.8 1.0 1.2 1.4 1.6 1.8 2.0
Food
Textile
Paper products, publishing
Chemical,etc
Mineral products
Iron and steel
Metals and metal products
Motor vehicles
Transport equipment nec
Electric equipment
Machinery and equipment nec
Manufactures nec
2011High Efficiency
+0.008
+0.005
+0.018
-0.051
-0.026
-0.024
-0.009
+0.008
+0.010
+0.004
+0.006
+0.012
0.4 0.6 0.8 1.0 1.2 1.4 1.6 1.8 2.0
Food
Textile
Paper products, publishing
Chemical,etc
Mineral products
Iron and steel
Metals and metal products
Motor vehicles
Transport equipment nec
Electric equipment
Machinery and equipment nec
Manufactures nec
2011High Efficiency
0.50%0.68%
0.17%
1.51%
-0.18%-0.08%
0.88%
1.69%1.95%
0.15%
2.17%
0.58%
-0.03%
0.22%
1.63%
1.09%
0.61%
0.26%0.18%
0.85%
-0.29%-0.5%
0.0%
0.5%
1.0%
1.5%
2.0%
2.5%
USA CDA MEX CHL PE RUS JPN ROK PRC HKC CT INA MAS RP THA VN SIN AUS NZ APEC EU
%
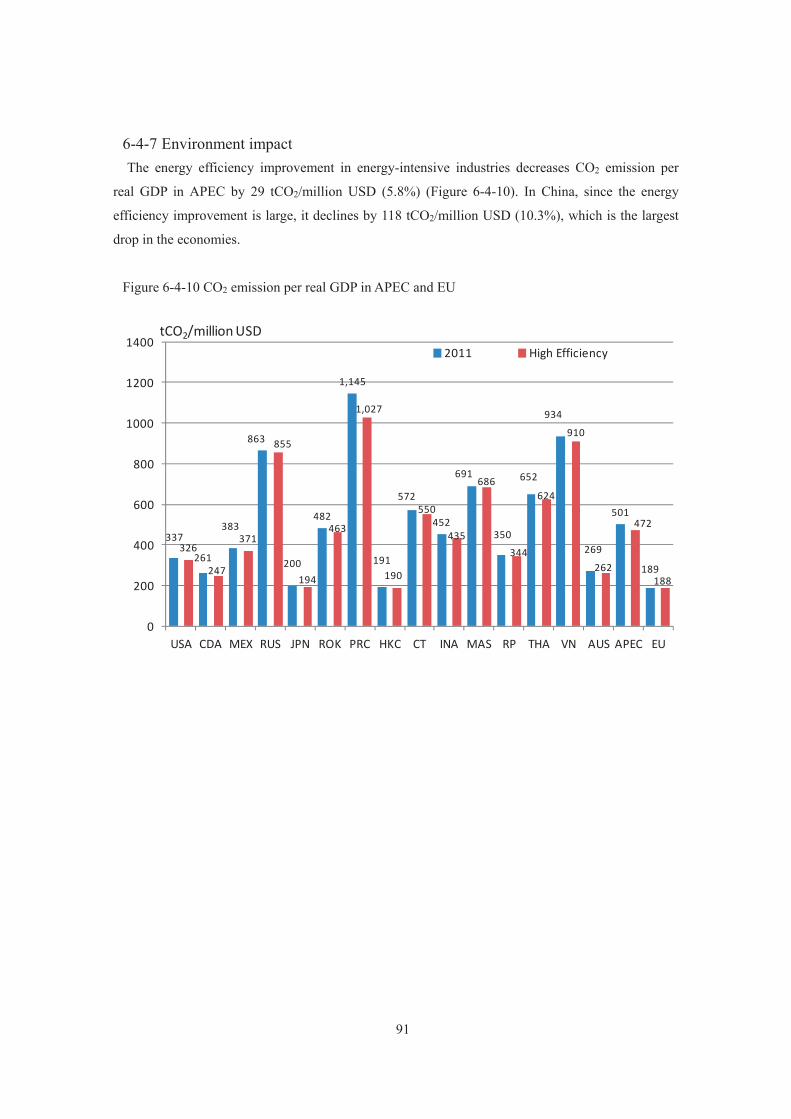
91
6-4-7 Environment impact The energy efficiency improvement in energy-intensive industries decreases CO2 emission per
real GDP in APEC by 29 tCO2/million USD (5.8%) (Figure 6-4-10). In China, since the energy
efficiency improvement is large, it declines by 118 tCO2/million USD (10.3%), which is the largest
drop in the economies.
Figure 6-4-10 CO2 emission per real GDP in APEC and EU
337
261
383
863
200
482
1,145
191
572
452
691
350
652
934
269
501
189
326
247
371
855
194
463
1,027
190
550
435
686
344
624
910
262
472
188
0
200
400
600
800
1000
1200
1400
USA CDA MEX RUS JPN ROK PRC HKC CT INA MAS RP THA VN AUS APEC EU
2011 High EfficiencytCO2/million USD
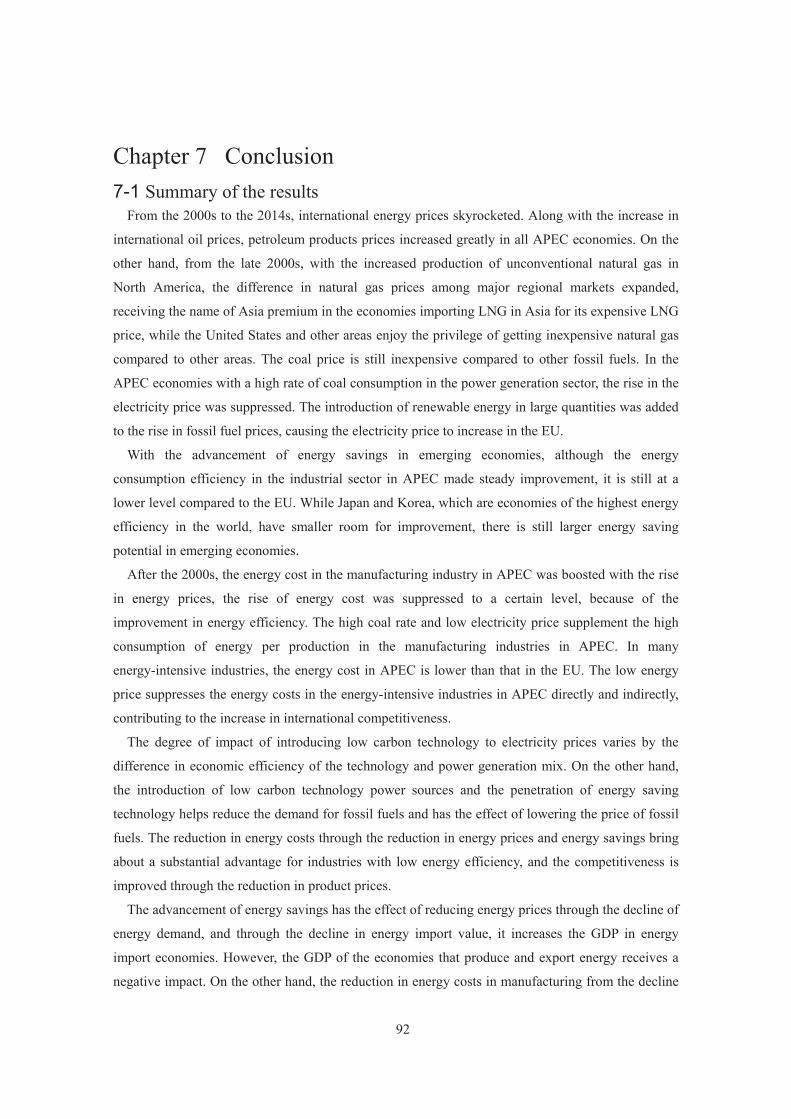
92
Chapter 7 Conclusion 7-1 Summary of the results
From the 2000s to the 2014s, international energy prices skyrocketed. Along with the increase in
international oil prices, petroleum products prices increased greatly in all APEC economies. On the
other hand, from the late 2000s, with the increased production of unconventional natural gas in
North America, the difference in natural gas prices among major regional markets expanded,
receiving the name of Asia premium in the economies importing LNG in Asia for its expensive LNG
price, while the United States and other areas enjoy the privilege of getting inexpensive natural gas
compared to other areas. The coal price is still inexpensive compared to other fossil fuels. In the
APEC economies with a high rate of coal consumption in the power generation sector, the rise in the
electricity price was suppressed. The introduction of renewable energy in large quantities was added
to the rise in fossil fuel prices, causing the electricity price to increase in the EU.
With the advancement of energy savings in emerging economies, although the energy
consumption efficiency in the industrial sector in APEC made steady improvement, it is still at a
lower level compared to the EU. While Japan and Korea, which are economies of the highest energy
efficiency in the world, have smaller room for improvement, there is still larger energy saving
potential in emerging economies.
After the 2000s, the energy cost in the manufacturing industry in APEC was boosted with the rise
in energy prices, the rise of energy cost was suppressed to a certain level, because of the
improvement in energy efficiency. The high coal rate and low electricity price supplement the high
consumption of energy per production in the manufacturing industries in APEC. In many
energy-intensive industries, the energy cost in APEC is lower than that in the EU. The low energy
price suppresses the energy costs in the energy-intensive industries in APEC directly and indirectly,
contributing to the increase in international competitiveness.
The degree of impact of introducing low carbon technology to electricity prices varies by the
difference in economic efficiency of the technology and power generation mix. On the other hand,
the introduction of low carbon technology power sources and the penetration of energy saving
technology helps reduce the demand for fossil fuels and has the effect of lowering the price of fossil
fuels. The reduction in energy costs through the reduction in energy prices and energy savings bring
about a substantial advantage for industries with low energy efficiency, and the competitiveness is
improved through the reduction in product prices.
The advancement of energy savings has the effect of reducing energy prices through the decline of
energy demand, and through the decline in energy import value, it increases the GDP in energy
import economies. However, the GDP of the economies that produce and export energy receives a
negative impact. On the other hand, the reduction in energy costs in manufacturing from the decline
93
in demand and prices improves the competitiveness through the decline in product prices. Not only
the energy import economies, but all of the economies have the possibility of accepting the
advantage. In addition, by the shift of the labor and capital from energy industries to other industries,
the competitiveness of the manufacturing industries in energy production and export economies will
be increased.
7-2 Policy implications Amid an increasing need to respond to climate change issues, in order to promote the reduction of
CO2, the expansion of introducing energy-saving and low-carbon technology are necessary measures
in all APEC economies. The analysis suggests that these approaches will bring economic advantages
to the import economies of fossil energy. For economies exporting fossil energy, while changing into
low-carbon in import economies brings the pain of reducing export income from fossil energy, by
advancing the low carbon in the energy demand structure in the own economy, the results also
suggest the possibility of alleviation. It therefore means that although the degree of benefit differs,
the actions toward a low-carbon society bring in positive effects as a whole. It is recommended that
all APEC economies take action steadily toward realization.
So, what are specific actions needed to realize a low-carbon society? Let us point out four points
here.
First, there are approaches toward the low cost of renewable energy and toward the construction
of an energy supply system suitable for introduction in large quantities. In many cases, the renewable
energy is still expensive compared to conventional energy. In order to realize broad utilization,
technological development and penetration of new technologies toward cost reductions are necessary.
In the initial phase of technological development and penetration, because there is high risk for
private companies, it is necessary to provide support using political measures in these sectors.
Second, it is necessary to utilize nuclear power generation in the economies with the possibility of
such use. There is an advantage that the nuclear power generation can provide a stable supply of
low-carbon energy. However, after the incident in the Fukushima Daiichi Nuclear Power Station, it
is a fact that there is growing concern over safety. For that reason, it is important to secure safety and
facilitate consensus-building efforts with the citizens, and we expect the government to play that
role.
The third point is to reinforce the initiative to facilitate high efficient use of fossil energy as much
as possible. At present, the most secure and available energy is fossil energy, and it is impossible to
create a structure for an energy supply by ignoring it. However, for the use of fossil energy, the
emission of carbon dioxide cannot be avoided, and it requires reducing emissions as much as
possible. Even so, it is unattainable if they rely on economic rationality, which is the principle of
behavior for enterprises, raising the need to implement political measures to lead properly, such as

94
placing restrictions on energy efficiency and the volume of carbon dioxide emissions.
The fourth point is the reformation of the international natural gas/LNG market so that natural gas
can be easy to use. While it is necessary to select more low-carbon energy sources, at this point,
natural gas is the best among other fossil energy sources. However, the natural gas varies greatly by
price level depending on areas, unlike oil and coal. For that reason, it makes it difficult to select
natural gas in the Asian region. It is necessary to make the natural gas an easy-to-use energy by
increasing the flexibility and transparency of the international natural gas/LNG market.
95
References Asia Pacific Energy Research Centre (APERC), Institute of Energy Economics, Japan, APEC
Energy Demand and Supply Outlook 6th Edition, 2016
BP, Statistical Review of World Energy
Census and Statistics Department, Hong Kong, China, Hong Kong Energy Statistics Annual
Report
Department of Electrical Services, Brunei Darussalam, Electricity Tariff
Energy Commission, Malaysia, Malaysia Energy Statistics Handbook
Federal State Statistics Service, Russian, Statistics of Tariffs
International Energy Agency, Energy Prices and Taxes
International Energy Agency, Energy Technology Perspectives 2012
International Energy Agency, World Energy Balances
Japan Electric Power Information Center, Statistics on Overseas Electricity Industry
Korea Energy Statistics Information System, Korea, Average Price and Total Revenues by Tariff
Ministry of Energy and Mineral Resources, Indonesia, Handbook of Energy & Economic
Statistics of Indonesia
Ministry of Energy and Mineral, Peru, Evolution of Electricity Sector Indicators
Ministry of Industry and Trade, Viet Nam, Circular for Electricity Price
National Development Council, Chinese Taipei, Statistical Data Book
State Electricity Regulatory Commission, China, Regulation Report on Power Price
Implementation
Taiwan Power Company, Chinese Taipei, Financial Information
United Nations, Comtrade
United Nations, FAO Statistical Yearbook
World Bank, World Development Indicators
World Steel Association, Steel Statistical Yearbook


