Embed Size (px)
Citation preview
[Type text]
In Brief: Clean Energy Markets: Jobs and Opportunities
July 2011 Update
[Type text]
In Brief: Clean Energy Markets: Jobs and Opportunities
Page 1 of 20 July 2011
Executive Summary
This brief discusses how investment in clean energy technologies will generate economic growth and create new jobs in the United States and around the globe. The United States stands to benefit from the expansion of global clean energy markets, but only if it moves quickly to support domestic demand for and production of clean energy technologies through well-designed policy that enhances the competitiveness of U.S. firms.
Clean energy markets are already substantial in scope and growing fast. Between 2004 and 2010, global clean energy investment exhibited a compound annual growth rate of 32 percent, reaching $243 billion in 2010. Forecasts of investment totals over the next few decades vary according to assumptions made regarding the nature of future global climate policies. Over the next decade, assuming strong global action on climate change, cumulative global investment totals for clean power generation technologies could reach nearly $2.3 trillion.
Recognizing the potential of these markets, the European Union, China, and other nations are moving to cultivate their own clean energy industries and to position them to gain large market shares in the decades ahead.
The European Union continues to lead the world in clean energy investments, spending nearly $81 billion in 2010. Since 2009, China has invested more money per year in clean energy technologies than the United States, investing $54.4 billion in 2010 compared to the United States’ $34 billion. Over 85 percent of today’s market for clean energy technologies is outside of the United States, primarily in Asia and Europe.
Germany’s clean energy investments of $41.2 billion were the second most for any country in 2010, surpassing the now third-place United States.
China now boasts the world’s largest solar panel and wind turbine manufacturing industries, accounting for nearly 50 percent of manufacturing for both technologies.
Danish wind manufacturers produce close to 22 percent of annual global installed wind capacity.
These countries have taken deliberate steps to position themselves as leaders in the 21st century clean energy economy. History shows that it matters where industries are first established, and countries can use policy to foster domestic “lead markets” for particular industries, giving them the foothold that can lead to significant growth in global market share. In the United States, well-crafted climate and clean energy policy can give nascent clean energy industries such a foothold by creating domestic demand and spurring investment and innovation. Strong domestic demand creates not only export opportunities but also jobs – many of which must be located where the demand is, thus fostering domestic job growth even when industry supply chains are globally dispersed.
National climate and clean energy policy in the United States can help create jobs and domestic early-mover industries with the potential to become major international exporters. Such policy should provide incentives for investment in clean energy, for example through a clean energy standard, that requires a certain amount of electricity be obtained from clean energy sources, or a market-based mechanism that puts a price on carbon. The time to act is now: through policy leadership at home and abroad, the United States can position itself to become a market leader in the industries of the 21st century.
[Type text]
In Brief: Clean Energy Markets: Jobs and Opportunities
Page 2 of 20 July 2011
Introduction In the absence of comprehensive climate and energy legislation, questions linger as to how well the United States will compete in the emerging international clean energy economy. While some stakeholders express concerns that climate and clean energy policy could increase the cost of energy for U.S. industries and put them at a competitive disadvantage in international markets if other major economies do not adopt similar policies, recent research indicates that these potential impacts are modest and can be addressed through well designed policies.1 Less attention has been paid to the opportunity presented by climate and clean energy policy to enhance the competitiveness of U.S. firms by driving innovation in the high-growth industries of the future.2 Failure to adopt such policy will ultimately hurt the ability of U.S. companies to compete in emerging, and potentially lucrative, clean energy technology markets—both here and abroad. These markets include products related to renewable energy sources such as wind, solar, biomass, geothermal, and hydropower; carbon capture and storage (CCS) technologies; nuclear power; advanced fuels and vehicles; and industrial, transportation, and building efficiency technologies. Anticipating growing demand for these technologies both at home and abroad, other nations are already moving to cultivate strong clean energy industries. The United States stands to benefit from economic and employment growth in this clean energy future – but these benefits can be realized only if the United States adopts climate and energy policy that stimulates domestic investment in these technologies.3 This brief examines the state of the emerging clean energy technology market, how other countries are taking action, and the policies that would better position U.S. firms as market leaders.
A Global Opportunity Countries do not compete with one another in the same zero-sum manner that companies do. Rather, since countries provide markets for one another’s products, economic growth abroad means bigger markets into which U.S. companies can sell.4 The growth of the global economy over time creates new economic opportunities for all nations.
The implication for climate and clean energy policy is that it is not just the size of the U.S. clean energy market that matters – though this is important – but the size of the overall global market as well. Global clean energy markets are expanding as a result of several factors, such as efforts to reduce greenhouse gas (GHG) emissions in light of growing worldwide concern over climate change; an increased desire on the part of many countries to achieve greater energy security and become less reliant on fossil fuels; higher fossil fuel prices as energy demand grows around the world; and the need to address other environmental problems, such as regional air pollution and water quality.5 Action to address these concerns effectively expands the size of new clean energy markets, providing opportunities for all businesses – and the more action taken around the globe, the greater the scope of these potential opportunities.
Thus, everyone – including the United States – benefits from China, Europe, and other regions moving on climate and clean energy technology policy, if they are positioned to take advantage of 21st century clean energy markets. However, U.S. firms are currently lagging behind their foreign competitors and missing opportunities to compete in these markets. Spurred by action around the globe, including the potential for an eventual binding international climate agreement, clean energy technology markets are poised to play an increasingly important role in the decades ahead as their growth opens up new
[Type text]
In Brief: Clean Energy Markets: Jobs and Opportunities
Page 3 of 20 July 2011
business opportunities. Domestic policy can help bolster the ability of U.S. industries to sell into these substantial new markets, and U.S. leadership in the international climate negotiations can affect the scope of the global market.
Current Status of Clean Energy Markets and Future Outlook Clean energy technology markets are already substantial in scope and likely to grow significantly in the coming decades. This is especially true should the United States adopt stronger domestic climate and energy policies, but even without such action, driven by the concerns noted above, worldwide demand for lower-carbon technologies is increasing.
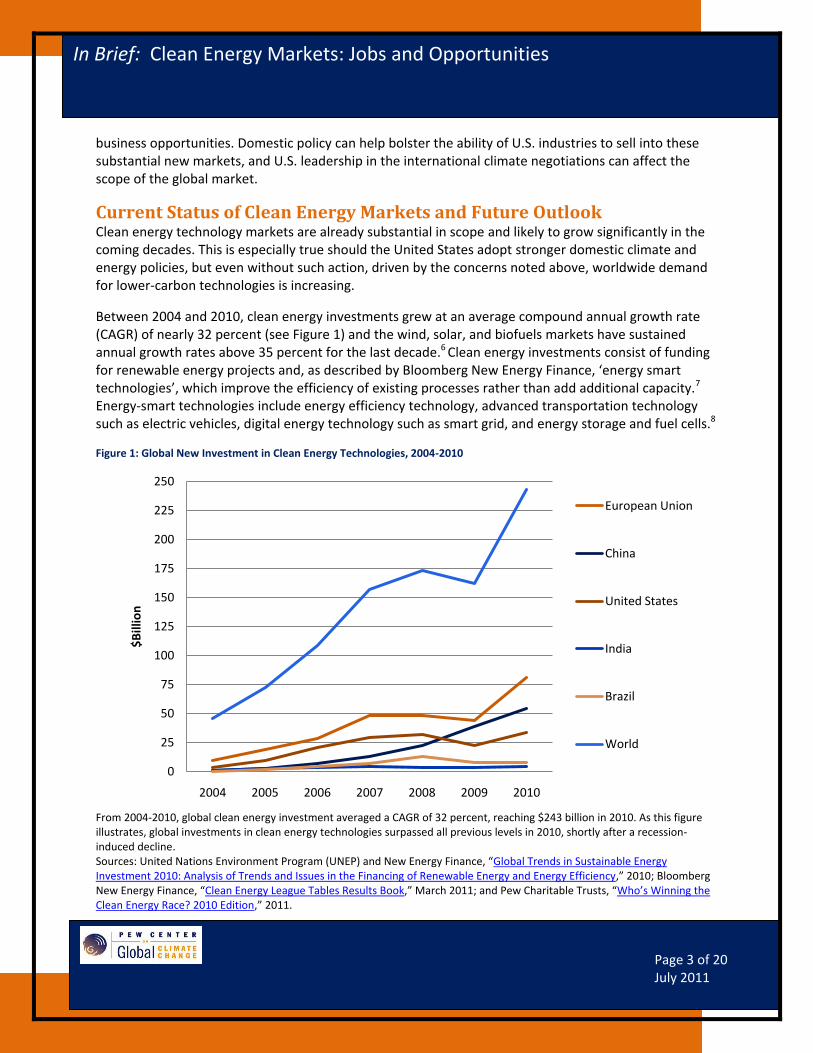
Between 2004 and 2010, clean energy investments grew at an average compound annual growth rate (CAGR) of nearly 32 percent (see Figure 1) and the wind, solar, and biofuels markets have sustained annual growth rates above 35 percent for the last decade.6 Clean energy investments consist of funding for renewable energy projects and, as described by Bloomberg New Energy Finance, ‘energy smart technologies’, which improve the efficiency of existing processes rather than add additional capacity.7 Energy-smart technologies include energy efficiency technology, advanced transportation technology such as electric vehicles, digital energy technology such as smart grid, and energy storage and fuel cells.8
Figure 1: Global New Investment in Clean Energy Technologies, 2004-2010
From 2004-2010, global clean energy investment averaged a CAGR of 32 percent, reaching $243 billion in 2010. As this figure illustrates, global investments in clean energy technologies surpassed all previous levels in 2010, shortly after a recession-induced decline. Sources: United Nations Environment Program (UNEP) and New Energy Finance, “Global Trends in Sustainable Energy Investment 2010: Analysis of Trends and Issues in the Financing of Renewable Energy and Energy Efficiency,” 2010; Bloomberg New Energy Finance, “Clean Energy League Tables Results Book,” March 2011; and Pew Charitable Trusts, “Who’s Winning the Clean Energy Race? 2010 Edition,” 2011.
0
25
50
75
100
125
150
175
200
225
250
2004 2005 2006 2007 2008 2009 2010
$B
illio
n
European Union
China
United States
India
Brazil
World
[Type text]
In Brief: Clean Energy Markets: Jobs and Opportunities
Page 4 of 20 July 2011
Global investment in clean energy technologies totaled $243 billion in 2010, with wind, solar, and biofuels accounting for the vast majority of new investment.9 As in many markets, investment fell in 2009 due to the global recession with investments decreasing 6 percent from $173 billion in 2008 to $162 billion in 2009. However, reflecting the rebound in overall investment, the first quarter of 2010 demonstrated a 70 percent year-on-year rise relative to the same period in 2009.10
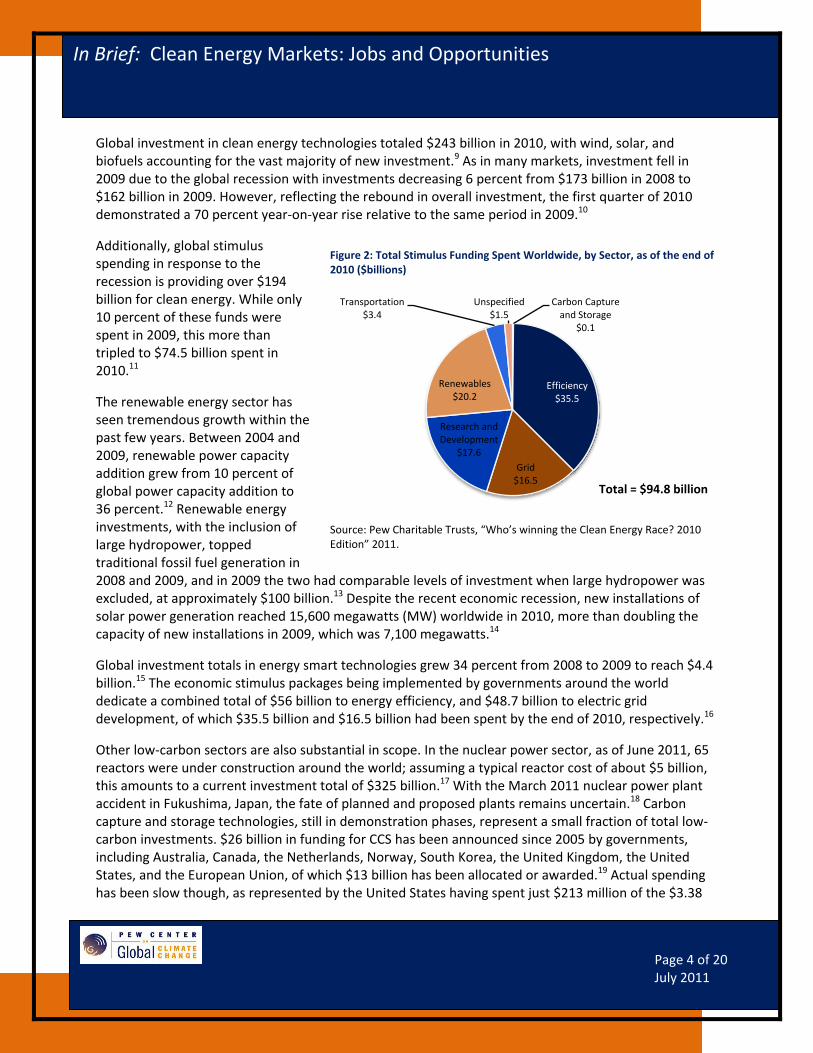
Additionally, global stimulus spending in response to the recession is providing over $194 billion for clean energy. While only 10 percent of these funds were spent in 2009, this more than tripled to $74.5 billion spent in 2010.11
The renewable energy sector has seen tremendous growth within the past few years. Between 2004 and 2009, renewable power capacity addition grew from 10 percent of global power capacity addition to 36 percent.12 Renewable energy investments, with the inclusion of large hydropower, topped traditional fossil fuel generation in 2008 and 2009, and in 2009 the two had comparable levels of investment when large hydropower was excluded, at approximately $100 billion.13 Despite the recent economic recession, new installations of solar power generation reached 15,600 megawatts (MW) worldwide in 2010, more than doubling the capacity of new installations in 2009, which was 7,100 megawatts.14
Global investment totals in energy smart technologies grew 34 percent from 2008 to 2009 to reach $4.4 billion.15 The economic stimulus packages being implemented by governments around the world dedicate a combined total of $56 billion to energy efficiency, and $48.7 billion to electric grid development, of which $35.5 billion and $16.5 billion had been spent by the end of 2010, respectively.16
Other low-carbon sectors are also substantial in scope. In the nuclear power sector, as of June 2011, 65 reactors were under construction around the world; assuming a typical reactor cost of about $5 billion, this amounts to a current investment total of $325 billion.17 With the March 2011 nuclear power plant accident in Fukushima, Japan, the fate of planned and proposed plants remains uncertain.18 Carbon capture and storage technologies, still in demonstration phases, represent a small fraction of total low-carbon investments. $26 billion in funding for CCS has been announced since 2005 by governments, including Australia, Canada, the Netherlands, Norway, South Korea, the United Kingdom, the United States, and the European Union, of which $13 billion has been allocated or awarded.19 Actual spending has been slow though, as represented by the United States having spent just $213 million of the $3.38
Figure 2: Total Stimulus Funding Spent Worldwide, by Sector, as of the end of 2010 ($billions)
Source: Pew Charitable Trusts, “Who’s winning the Clean Energy Race? 2010 Edition” 2011.
Carbon Capture and Storage
$0.1
Efficiency$35.5
Grid$16.5
Research and Development
$17.6
Renewables$20.2
Transportation$3.4
Unspecified$1.5
Total = $94.8 billion
[Type text]
In Brief: Clean Energy Markets: Jobs and Opportunities
Page 5 of 20 July 2011
billion allocated for CCS through the American Recovery and Reinvestment Act of 2009, as of April 2011.20
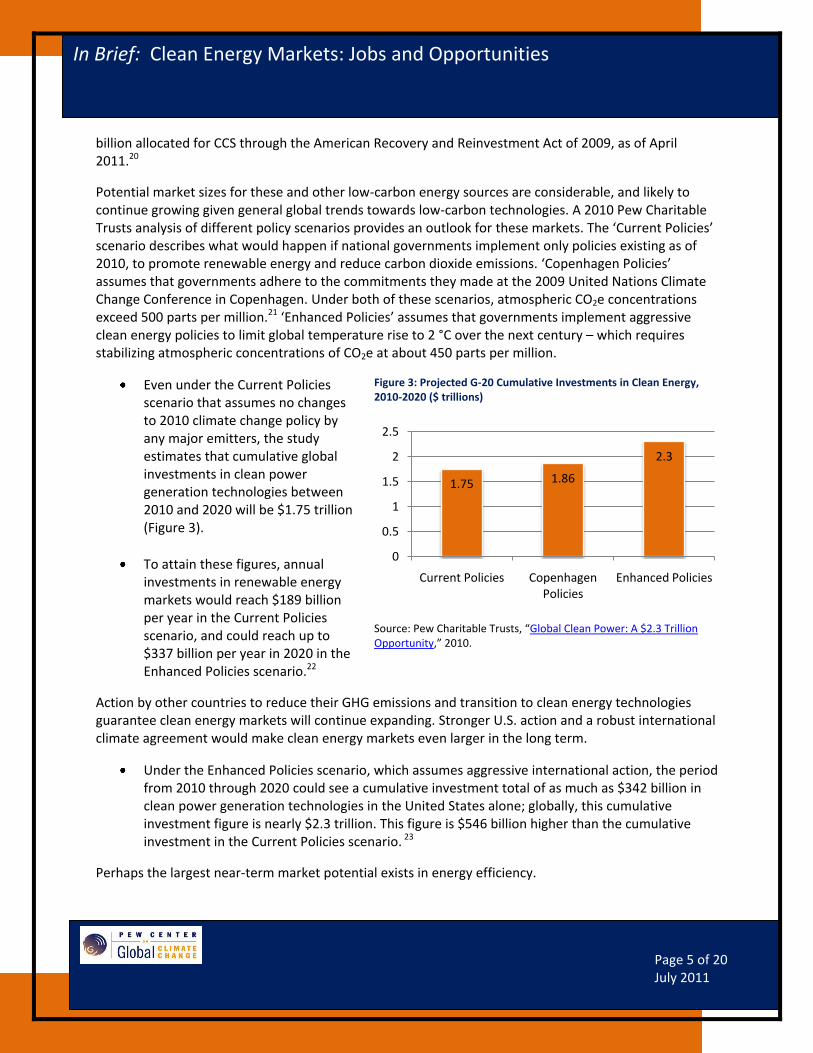
Potential market sizes for these and other low-carbon energy sources are considerable, and likely to continue growing given general global trends towards low-carbon technologies. A 2010 Pew Charitable Trusts analysis of different policy scenarios provides an outlook for these markets. The ‘Current Policies’ scenario describes what would happen if national governments implement only policies existing as of 2010, to promote renewable energy and reduce carbon dioxide emissions. ‘Copenhagen Policies’ assumes that governments adhere to the commitments they made at the 2009 United Nations Climate Change Conference in Copenhagen. Under both of these scenarios, atmospheric CO2e concentrations exceed 500 parts per million.21 ‘Enhanced Policies’ assumes that governments implement aggressive clean energy policies to limit global temperature rise to 2 °C over the next century – which requires stabilizing atmospheric concentrations of CO2e at about 450 parts per million.
Even under the Current Policies scenario that assumes no changes to 2010 climate change policy by any major emitters, the study estimates that cumulative global investments in clean power generation technologies between 2010 and 2020 will be $1.75 trillion (Figure 3).
To attain these figures, annual investments in renewable energy markets would reach $189 billion per year in the Current Policies scenario, and could reach up to $337 billion per year in 2020 in the Enhanced Policies scenario.22
Action by other countries to reduce their GHG emissions and transition to clean energy technologies guarantee clean energy markets will continue expanding. Stronger U.S. action and a robust international climate agreement would make clean energy markets even larger in the long term.
Under the Enhanced Policies scenario, which assumes aggressive international action, the period from 2010 through 2020 could see a cumulative investment total of as much as $342 billion in clean power generation technologies in the United States alone; globally, this cumulative investment figure is nearly $2.3 trillion. This figure is $546 billion higher than the cumulative investment in the Current Policies scenario. 23
Perhaps the largest near-term market potential exists in energy efficiency.
Figure 3: Projected G-20 Cumulative Investments in Clean Energy, 2010-2020 ($ trillions)
Source: Pew Charitable Trusts, “Global Clean Power: A $2.3 Trillion Opportunity,” 2010.
1.75 1.86
2.3
0
0.5
1
1.5
2
2.5
Current Policies Copenhagen Policies
Enhanced Policies
[Type text]
In Brief: Clean Energy Markets: Jobs and Opportunities
Page 6 of 20 July 2011
McKinsey and Co. estimates that pursuing the full range of energy efficiency potential available in the United States between now and 2020 could lead to investments of $50 billion a year (compared to 2009 levels of investment of about $21 billion). Corresponding annual energy savings would reach $130 billion, increasing the amount of money available to spend elsewhere in the economy, thus stimulating job creation as well.24 In addition, McKinsey and Co. estimate that out of the GHG abatement opportunities available between now and 2030, energy efficiency has the highest potential to reduce emissions, reducing up to 14 Gt of CO2e emissions per year by 2030.25
In the International Energy Agency’s (IEA) World Energy Outlook 2010, the strong global action scenario, cumulative global investment in residential and commercial building efficiency between 2010 and 2035 is $5.6 trillion more than it would be under a business-as-usual case.26
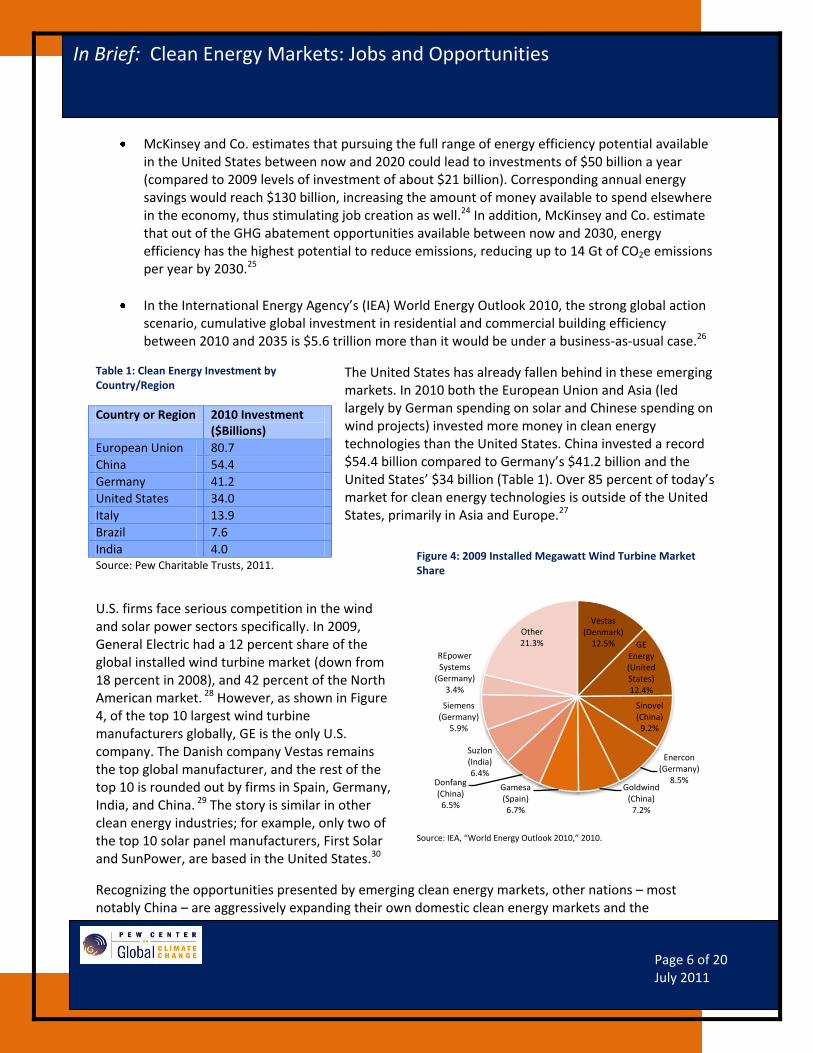
The United States has already fallen behind in these emerging markets. In 2010 both the European Union and Asia (led largely by German spending on solar and Chinese spending on wind projects) invested more money in clean energy technologies than the United States. China invested a record $54.4 billion compared to Germany’s $41.2 billion and the United States’ $34 billion (Table 1). Over 85 percent of today’s market for clean energy technologies is outside of the United States, primarily in Asia and Europe.27
U.S. firms face serious competition in the wind and solar power sectors specifically. In 2009, General Electric had a 12 percent share of the global installed wind turbine market (down from 18 percent in 2008), and 42 percent of the North American market. 28 However, as shown in Figure 4, of the top 10 largest wind turbine manufacturers globally, GE is the only U.S. company. The Danish company Vestas remains the top global manufacturer, and the rest of the top 10 is rounded out by firms in Spain, Germany, India, and China. 29 The story is similar in other clean energy industries; for example, only two of the top 10 solar panel manufacturers, First Solar and SunPower, are based in the United States.30
Recognizing the opportunities presented by emerging clean energy markets, other nations – most notably China – are aggressively expanding their own domestic clean energy markets and the
Table 1: Clean Energy Investment by Country/Region
Country or Region 2010 Investment ($Billions)
European Union 80.7
China 54.4
Germany 41.2
United States 34.0
Italy 13.9
Brazil 7.6
India 4.0 Source: Pew Charitable Trusts, 2011.
Figure 4: 2009 Installed Megawatt Wind Turbine Market Share
Source: IEA, “World Energy Outlook 2010,” 2010.
Vestas (Denmark)
12.5% GE Energy (United States)12.4%
Sinovel (China)
9.2%
Enercon (Germany)
8.5%Goldwind
(China)7.2%
Gamesa (Spain)6.7%
Donfang (China)
6.5%
Suzlon (India)6.4%
Siemens (Germany)
5.9%
REpower Systems
(Germany)3.4%
Other21.3%

[Type text]
In Brief: Clean Energy Markets: Jobs and Opportunities
Page 7 of 20 July 2011
manufacturing capacity to meet anticipated international demand in industries including wind and solar power, advanced batteries, carbon capture and storage, and nuclear energy. Some of the deliberate steps these countries and regions are taking are discussed further below.
Taking the Lead: The Benefits of Being an Early Mover A major reason other countries are moving so decisively on clean energy policy is that they realize that there are benefits of being an early mover in these new industries. Many factors provide different countries a comparative advantage in the production of some goods relative to others, and an industry may take hold and flourish in a particular region for a number of reasons.31 For example, economies of scale and geographic spillovers may lead to cheaper production in certain industries within a given country, as similar firms cluster together, leading to cross-pollination of ideas and innovative practices, and further clustering.32 Aircraft manufacturing in Seattle, information technology in Silicon Valley, and automobile manufacturing in Detroit provide examples of industries that have substantial economies of scale and cluster benefits. In these cases initial growth in certain regions was self-reinforcing and those regions became major centers of activity as the industries expanded dramatically.33
This means that it really matters where industries are first established. Countries can adopt policies to foster domestic demand and create “lead markets” for particular industries, giving them an initial foothold that can lead to significant growth and the ability to better compete in global markets.34 In the case of clean energy markets, well-crafted climate and energy policies can give nascent clean energy industries such a foothold. If these industries can develop significantly in the United States before the clean energy technology markets mature, U.S. firms can achieve economies of scale to form geographic clusters with spillover benefits, thus developing the comparative advantage that can ultimately make them the dominant suppliers of clean energy technologies.
A number of countries are taking steps to reduce GHG emissions, improve their energy security, support lead markets for clean energy technologies, and build up their manufacturing capacity to meet expanded domestic and international demand. Governments can encourage clean energy investments through a variety of policy tools, and as of 2010, at least 85 countries had established some type of clean energy target35:
China’s national strategy for addressing climate change includes plans to reduce its CO2 emissions intensity per unit of GDP by 40 to 45 percent below 2005 levels by 2020 and calls for 15 percent of its primary energy consumption to come from non-fossil fuel sources by 2020.36 To help meet these goals, China is rapidly accelerating its development of clean energy technologies through heavy investment and by creating incentives that allow these technologies to better compete with incumbent energy sources.37 The Chinese government aims to deploy 20 gigawatts (GW) of solar power and 250GW of wind power by 2020, and is providing support for this through its feed-in tariff and Golden Sun solar subsidy program.38 To make renewables cost-competitive, China also adds a small surcharge to all consumer electricity bills, estimated to raise residential electricity bills by only 0.25-0.4 percent and industrial bills by 0.8 percent. Revenue raised from this fee is used to offset the difference in cost between renewables and cheaper incumbent power generation (primarily coal).39 China is also establishing a lead market for solar photovoltaics, initiating the cycle of market creation, investment, and innovation that
[Type text]
In Brief: Clean Energy Markets: Jobs and Opportunities
Page 8 of 20 July 2011
can lead to strong growth.40 In an effort to ensure that its domestic production supplies its own market, China has historically restricted imports of solar panels and wind turbines, though these regulations are being relaxed.41 Thanks to these and other incentives, such as low-cost manufacturing, China is now home to the world’s largest wind turbine and solar panel manufacturing industries, accounting for almost 50 percent of manufacturing for both technologies.42 Although China made only 1 percent of the world’s solar panels in 1999, today it has 45 percent of global solar photovoltaic production and three Chinese companies are top 10 global producers.43 China now also manufactures more wind turbines than any country and four Chinese companies are now top 10 global producers of wind turbines.44 Chinese wind power capacity doubled every year from 2005 to 2009, up to 25.8GW, and then increased a record 17GW in 2010 to reach 43GW of installed capacity, giving China about 22 percent of global installed capacity.45
The European Union (EU) has pledged to reduce its GHG emissions 20 percent below 1990 levels by 2020, and 30 percent below 1990 levels if non-EU developed countries agree to comparable reductions and advanced developing countries contribute according to their capabilities and responsibilities.46 The EU’s core policy instrument for meeting this target is its emissions trading system (ETS), which sets a mandatory cap on aggregate CO2 emissions limits for 12,000 installations in six major industrial sectors.47 The result is a price on carbon that helps drive investment in clean energy industries. The EU also has a mandatory target of deriving 20 percent its energy mix from renewable sources by 2020.48 Together, these policies provide strong incentives for investment in clean energy industries in the EU; the EU led the world in clean energy investments in 2010 with $80.7 billion.49
Denmark deliberately set out to make itself more energy independent and less reliant on fossil fuels by creating a lead market for wind power. Starting in 1979, the Danish government covered nearly a third of wind investment costs for a decade, provided loan guarantees for turbine export projects, established utility purchase mandates (i.e., feed-in tariffs) for wind power, and funded research aimed at making turbine production more cost-effective.50 These policies have given Denmark a share of the global wind turbine market disproportionate to its domestic market and the size of its economy. Twenty percent of Denmark’s domestic electricity generation comes from wind, and the largest wind manufacturer in the world – Vestas, which in 2009 had a global installed turbine market share of 12.5 percent – is Danish.51 Overall, Danish wind manufacturers have produced close to 22 percent of global installed wind capacity, or 44GW.52 Denmark’s energy efficiency and renewable energy policies have helped keep its energy consumption stable even as its GDP has grown 56 percent since 1980.53
Germany has some of the most ambitious renewable energy and climate policies in the world, including a target of generating 18 percent of its total energy consumption from renewable energy sources by 2030, generating 80 percent of its electricity from renewable sources by 2050, feed-in tariffs for renewable energy, and a GHG emissions reduction target of 40 percent below 1990 levels by 2020.54 These policies are already producing significant economic and environmental benefits. Over 17 percent of Germany’s gross electricity consumption already
[Type text]
In Brief: Clean Energy Markets: Jobs and Opportunities
Page 9 of 20 July 2011
comes from renewable energy sources, CO2 emissions have been reduced by 28 percent below 1990 levels, and Germany produces more electricity from solar photovoltaics than any other nation, with 18GW of installed capacity.55 Germany is also producing a new generation of highly-skilled architects and engineers; it has won the U.S. Department of Energy’s (DOE) biennial Solar Decathlon competition – in which teams of college and university students from around the world compete to build the most attractive and efficient solar-powered house – twice in a row.56 The German government estimates that, as of 2010, its renewable energy sector accounts for about 370,000 jobs (primarily in the wind, biomass, and solar power sectors), over twice the 2004 amount of 160,000; about 71 percent of these jobs are attributed to the effects of Germany’s renewable energy policies, namely the Renewable Energy Sources Act of 2004.57 Germany’s renewable energy sector is projected to employ about 450,000 to 580,000 workers by 2020, and between 500,000 and 600,000 in 2030.58 Germany continues to lead as an exporter of renewable energy systems, exporting over 80 percent of the wind turbines it manufactures, but clean energy manufacturing export shares have been declining recently due to Asian competition.59
South Korea invested just $356 million in total financial investment for clean energy in 2010, excluding stimulus funds, but in October of 2010, President Lee Myung-bak announced a 5-year $36 billion renewable energy investment, of which the government will provide $6.25 billion, with the rest coming from the private sector.60 South Korea has spent 37 percent of its $32.1 billion in clean energy stimulus funds, the third largest clean energy recovery package in the world. The country aims to have 3GW of installed renewable energy capacity by the end of 2011, a 1.8GW increase from the 2010 installed capacity.61 South Korea aims to reduce its GHG emissions 30 percent below business-as-usual levels by 2020.62
These are just a few examples of the policies different countries and regions are using to foster domestic clean energy technology industries and the jobs they create.
Clean Energy Jobs Climate and clean energy policy can create strong domestic clean energy technology industries and the jobs that come with them. There is evidence that stronger environmental standards can drive firms to innovate and become more efficient, and that by spawning markets for new technologies, new standards are at least as likely to create jobs in some sectors as to reduce them in others – though the circumstances under which this is true remain a subject of ongoing debate.63
[Type text]
In Brief: Clean Energy Markets: Jobs and Opportunities
Page 10 of 20 July 2011
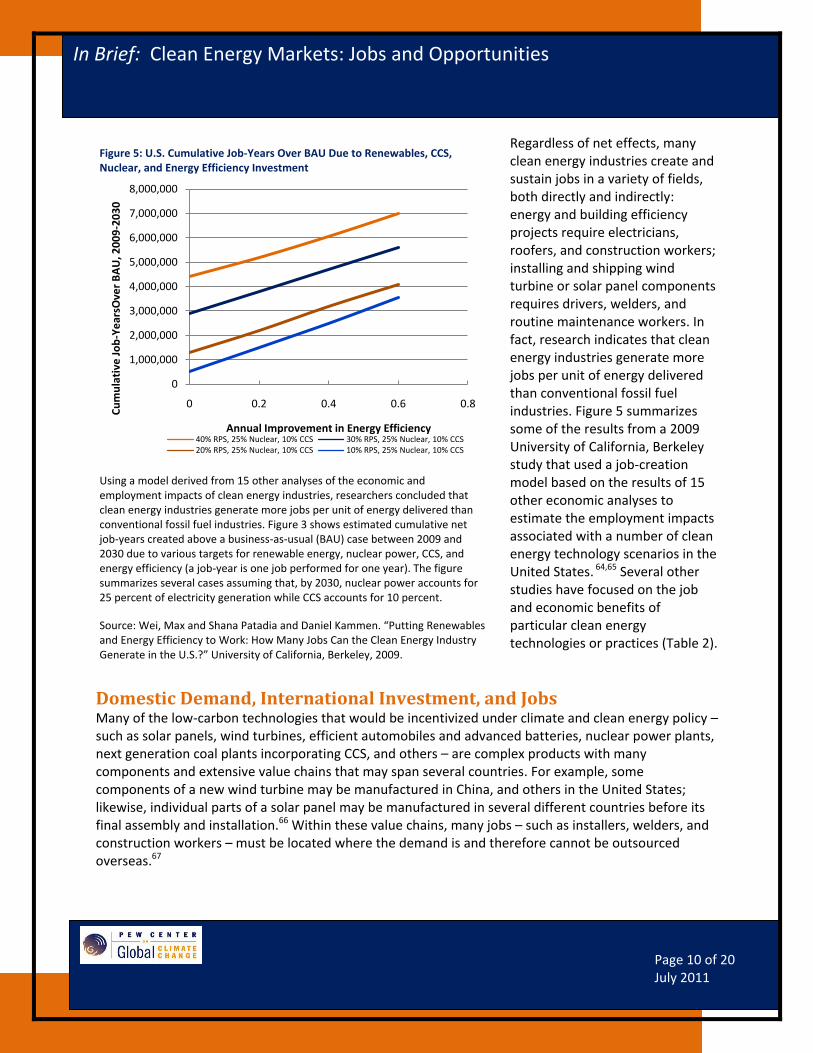
Regardless of net effects, many clean energy industries create and sustain jobs in a variety of fields, both directly and indirectly: energy and building efficiency projects require electricians, roofers, and construction workers; installing and shipping wind turbine or solar panel components requires drivers, welders, and routine maintenance workers. In fact, research indicates that clean energy industries generate more jobs per unit of energy delivered than conventional fossil fuel industries. Figure 5 summarizes some of the results from a 2009 University of California, Berkeley study that used a job-creation model based on the results of 15 other economic analyses to estimate the employment impacts associated with a number of clean energy technology scenarios in the United States. 64,65 Several other studies have focused on the job and economic benefits of particular clean energy technologies or practices (Table 2).
Domestic Demand, International Investment, and Jobs Many of the low-carbon technologies that would be incentivized under climate and clean energy policy – such as solar panels, wind turbines, efficient automobiles and advanced batteries, nuclear power plants, next generation coal plants incorporating CCS, and others – are complex products with many components and extensive value chains that may span several countries. For example, some components of a new wind turbine may be manufactured in China, and others in the United States; likewise, individual parts of a solar panel may be manufactured in several different countries before its final assembly and installation.66 Within these value chains, many jobs – such as installers, welders, and construction workers – must be located where the demand is and therefore cannot be outsourced overseas.67
Figure 5: U.S. Cumulative Job-Years Over BAU Due to Renewables, CCS, Nuclear, and Energy Efficiency Investment
Using a model derived from 15 other analyses of the economic and employment impacts of clean energy industries, researchers concluded that clean energy industries generate more jobs per unit of energy delivered than conventional fossil fuel industries. Figure 3 shows estimated cumulative net job-years created above a business-as-usual (BAU) case between 2009 and 2030 due to various targets for renewable energy, nuclear power, CCS, and energy efficiency (a job-year is one job performed for one year). The figure summarizes several cases assuming that, by 2030, nuclear power accounts for 25 percent of electricity generation while CCS accounts for 10 percent.
Source: Wei, Max and Shana Patadia and Daniel Kammen. “Putting Renewables and Energy Efficiency to Work: How Many Jobs Can the Clean Energy Industry Generate in the U.S.?” University of California, Berkeley, 2009.
0
1,000,000
2,000,000
3,000,000
4,000,000
5,000,000
6,000,000
7,000,000
8,000,000
0 0.2 0.4 0.6 0.8
Cu
mu
lati
ve J
ob
-Ye
arsO
ver
BA
U, 2
00
9-2
03
0
Annual Improvement in Energy Efficiency40% RPS, 25% Nuclear, 10% CCS 30% RPS, 25% Nuclear, 10% CCS20% RPS, 25% Nuclear, 10% CCS 10% RPS, 25% Nuclear, 10% CCS
[Type text]
In Brief: Clean Energy Markets: Jobs and Opportunities
Page 11 of 20 July 2011
This means that even if a clean energy technology company is based in a foreign country or manufactures some technology components elsewhere, if it sells products in the United States it is very likely to create local jobs and hire U.S. workers – if domestic clean energy technology markets exist. Domestic markets can also entice firms in other countries to shift some of their production to the United States, creating jobs.
This is already occurring to some extent, both to meet demand in today’s relatively small domestic markets and in anticipation of future U.S. climate and clean energy policy:
Researchers at the Peterson Institute for International Economics have found that the complex, globalized nature of the wind energy industry means that local demand certainly generates local production and jobs, regardless of where companies are headquartered.75 For example, Goldwind, a Chinese company, has expanded into the U.S. wind power market, forming Goldwind USA in 2010 and hiring U.S. workers.76 Meanwhile, the world’s largest wind turbine manufacturer, Denmark-based Vestas, started adding operations in Colorado in 2008, by investing $700 million in factories, which will support 2,500 jobs.77
Nissan, a Japanese car company, will open a manufacturing facility in 2012 in Tennessee to build 150,000 of its new all-electric cars and 200,000 of the lithium-ion batteries used to power them. The U.S. DOE has said it will loan Nissan $1.4 billion to help pay for plant retrofits, and the plant is expected to support 1,300 American jobs.78
Suntech, a Chinese solar power firm and the largest photovoltaics manufacturer in the world, opened a manufacturing facility in 2010 in the United States – and hired U.S. workers – in an effort to expand
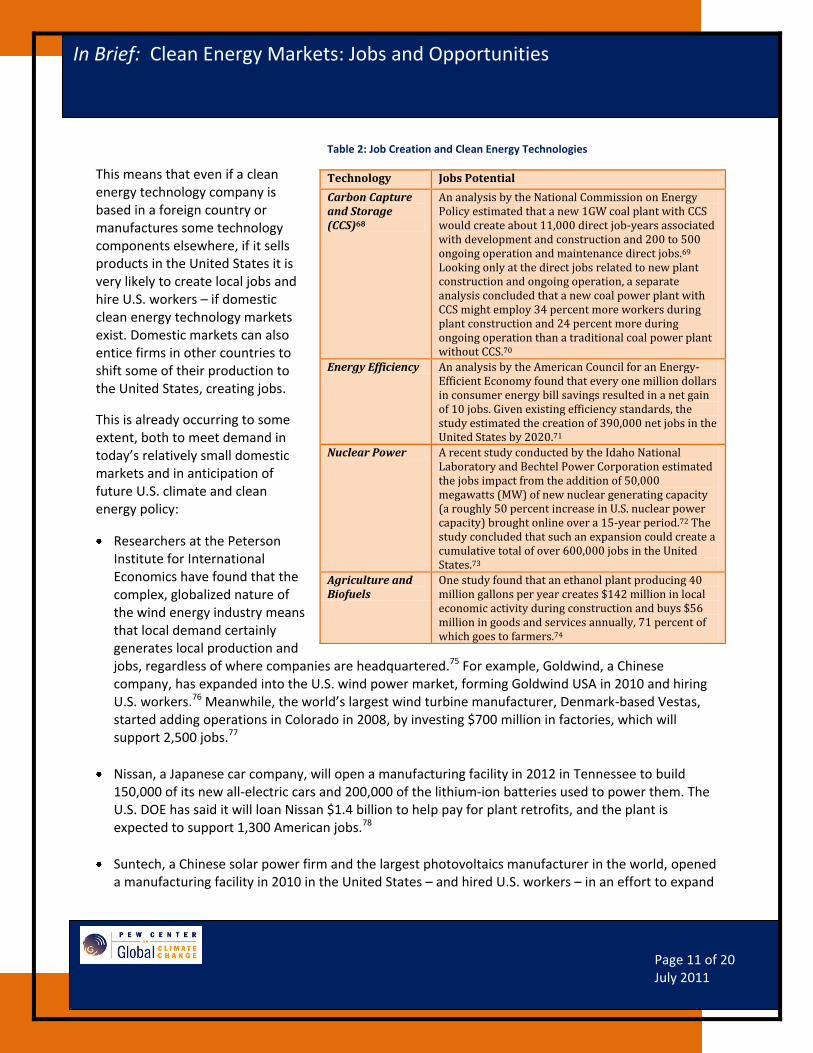
Table 2: Job Creation and Clean Energy Technologies
Technology Jobs Potential
Carbon Capture and Storage (CCS)68
An analysis by the National Commission on Energy Policy estimated that a new 1GW coal plant with CCS would create about 11,000 direct job-years associated with development and construction and 200 to 500 ongoing operation and maintenance direct jobs.69 Looking only at the direct jobs related to new plant construction and ongoing operation, a separate analysis concluded that a new coal power plant with CCS might employ 34 percent more workers during plant construction and 24 percent more during ongoing operation than a traditional coal power plant without CCS.70
Energy Efficiency An analysis by the American Council for an Energy-Efficient Economy found that every one million dollars in consumer energy bill savings resulted in a net gain of 10 jobs. Given existing efficiency standards, the study estimated the creation of 390,000 net jobs in the United States by 2020.71
Nuclear Power A recent study conducted by the Idaho National Laboratory and Bechtel Power Corporation estimated the jobs impact from the addition of 50,000 megawatts (MW) of new nuclear generating capacity (a roughly 50 percent increase in U.S. nuclear power capacity) brought online over a 15-year period.72 The study concluded that such an expansion could create a cumulative total of over 600,000 jobs in the United States.73
Agriculture and Biofuels
One study found that an ethanol plant producing 40 million gallons per year creates $142 million in local economic activity during construction and buys $56 million in goods and services annually, 71 percent of which goes to farmers.74
[Type text]
In Brief: Clean Energy Markets: Jobs and Opportunities
Page 12 of 20 July 2011
further into the North American market and take advantage of what it perceives to be good prospects for U.S. solar panel demand.79
These examples illustrate how foreign investment can lead to job creation in the United States. However, today’s domestic markets remain relatively small, and these levels of investment – and the number of jobs created – could be much larger if domestic demand were greater; while these firms are hiring U.S. workers, the bulk of their operations remains abroad. Furthermore, these examples underscore the fact that foreign firms are taking the lead in these new industries and meeting demand. Again, climate and energy policy would not only create a substantially larger domestic market, but also stimulate domestic firms to expand their operations at home and hire U.S. workers, better positioning them to sell into both local and international markets.
At the same time, some U.S. companies are going where demand exists and investing in projects abroad:
First Solar, Inc., an American company and the world’s second largest solar manufacturer, plans to build a 2,000 MW solar photovoltaic power plant in China – the largest planned project of its kind in the world.80 While First Solar will also add new manufacturing jobs at its U.S. facilities, at least 71 percent of its planned growth is outside of the United States.81
eSolar, based in Silicon Valley, announced in early 2010 that it is licensing its solar thermal technology to a Chinese firm which plans to use it to build the largest concentrated solar power plant in China.82
GE has announced plans to work with a Chinese utility to construct next-generation coal plants in China, including at least one plant that captures its carbon dioxide emissions.83 The new plants will use GE’s integrated gasification combined cycle technology, which allows for lower-emitting coal combustion and makes it easier to capture and sequester GHG emissions from power plants.
A substantially larger domestic market, as would be created under national climate and clean energy policy, would increase clean energy investments and production in the United States.
Seizing the Economic Opportunities: Policies for a Clean Energy Future Other nations are already demonstrating how climate and clean energy policies can provide an edge in preparing for the clean energy technology markets of the future. It is not too late for the United States to position itself as a leader. A number of policies can attract domestic investment in clean energy markets, creating jobs and domestic first-mover industries that will ultimately be better able to compete in global clean energy markets:
Comprehensive National Climate and Energy Policy: Perhaps the single most important component of domestic climate and energy policy is a market-based mechanism that puts a price on GHG emissions. Such a mechanism can help achieve a given level of GHG reductions as cost-effectively as possible while driving innovation and steering investment towards clean energy technologies. Another important policy would be a clean energy standard. In the 2011 State of the Union, President Obama called on the United States to adopt such a standard,
[Type text]
In Brief: Clean Energy Markets: Jobs and Opportunities
Page 13 of 20 July 2011
through which the country would obtain 80 percent of its electricity from clean sources by 2035.84
International Action: On the international front, it is in the interest of the United States to provide global leadership in the effort to develop an international climate agreement with as broad a scope as possible. Such an agreement is the best means of tackling the global climate change problem, and can also foster a vibrant global market in clean energy technology, with more ambitious and comprehensive agreements creating larger global markets. U.S. leadership is critical to achieving the best possible outcome in the international climate negotiations, and can thus affect the scope of the global market. By enacting domestic policy, the United States can demonstrate the kind of leadership needed to reach an international agreement.
State Action: U.S. state policy can continue to provide a strong foundation for federal policy going forward. The 31 U.S. states with renewable or alternative energy portfolio standards are stimulating demand for these technologies and promoting local economic development.85 For example, when Pennsylvania enacted its Alternative Energy Portfolio Standard in 2004, the Spanish wind manufacturer Gamesa located its U.S. headquarters in the state, creating jobs.86 The Regional Greenhouse Gas Initiative, including ten Northeastern and Mid-Atlantic states, raised $789.2 million in CO2 allowance proceeds through 2010 from its regional cap-and-trade program, which began holding auctions in 2008.87 Of this revenue, 52 percent has been invested in energy efficiency programs and 11 percent in renewable energy.88 National policy would more efficiently and effectively drive U.S. leadership in clean energy technologies, though states can continue to retain a key role in the implementation of many effective complementary policies, such as energy efficiency standards, GHG emission reductions targets, and even zoning laws. States also can retain their role as policy laboratories, as they have, for example, through the leadership of California and its vehicle emission standards, which prompted the creation of national standards for passenger vehicles.89
Research and Development: Research and development (R&D) funding can support innovation and foster lead industries. For example, the information technology and biopharmaceutical industries typically spend between 10 and 20 percent of their revenues on R&D, and the biopharmaceutical industry spent nearly $60 billion on R&D in 2007.90 Similar levels of investment in the energy sector may give clean energy industries the foothold needed to flourish in the United States. The U.S. DOE is already in the process of establishing at least three clean energy research clusters that will focus on basic research into next-generation nuclear reactors, energy-efficient buildings, and fuels produced from sunlight, with the goal of bringing new technologies to commercial readiness.91 Initially funded by the American Reinvestment and Recovery Act of 2009 (Recovery Act), the DOE has announced 126 projects totaling $493 million in funding through its Advanced Research Projects Agency-Energy, known as ARPA-E. ARPA-E is a new agency within DOE that aims to fund high-risk, high-payoff energy technology research and commercialization.92 A similar program in the Department of Defense, known as DARPA, funded projects that ultimately led to the commercialization of microchips, the Internet, and
[Type text]
In Brief: Clean Energy Markets: Jobs and Opportunities
Page 14 of 20 July 2011
other technologies. National climate and energy policy can provide further support to cutting-edge research efforts.
Targeted Spending: Direct, targeted government spending that funds and creates demand for clean energy can also help foster domestic industries and jobs in these sectors. The Recovery Act set aside about $90 billion in government investment and tax incentives to support alternative energy projects.93 In January 2010, $2.3 billion of the Recovery Act’s funds were directed to advanced energy manufacturing tax credits to help support manufacturing projects and jobs in the clean energy sector.94 Additional funds are being directed to transportation infrastructure development, including 48 electric vehicle projects. $1.5 billion in Recovery Act funding was authorized for lithium-ion battery manufacturing and recycling, $500 million for electric vehicle component manufacturing, and $400 million for demonstration and deployment of plug-in hybrid and all-electric vehicles, including charging station installations and workforce training.95 The Recovery Act also dedicated a significant amount of funding to energy efficiency, with $3.2 billion for the Energy Efficiency Conservation Block Grant program and $5 billion for home weatherization.96 The White House Council of Economic Advisors estimated that as of the end of the third quarter of 2010, the clean energy provisions in the Recovery Act had saved or created nearly 250,000 clean energy jobs.97
Other policies: While the fate of comprehensive climate and clean energy legislation is uncertain in the near future, more piecemeal steps can contribute to advancing energy policy.98 For example, federal Production Tax Credits have proven effective at driving investment in renewable energy, but have historically required frequent re-authorization, creating uncertainty for businesses who do not know when the credits might expire. Stabilizing federal Production Tax Credit cycles can help sustain investment and growth in renewables (for example, by putting into place incentive programs with longer periods before required Congressional renewal). Transportation policies, such as the 2009 increase in U.S. fuel-economy standards to 35.5 miles per gallon by 2016, can support alternative transportation modes, including electric vehicles.99 Loan guarantees, first authorized under the Energy Policy Act of 2005, with increased funding from the Recovery Act, are helping jumpstart the deployment of clean energy projects that might not otherwise receive full funding.100
Conclusion Action around the world means that global clean energy markets are poised for significant growth in the coming decades. The United States stands to benefit from the development of these markets, but only if it moves quickly to support domestic demand for and production of clean energy technologies. Fostering domestic markets will create jobs and give lead industries the initial foothold they need to better compete in rapidly expanding international clean energy markets – and the sooner these industries can be established, the larger the share of these global markets they stand to gain in the decades ahead. Through policy leadership at home and abroad, America can position itself as a market leader in creating a clean energy future.
[Type text]
In Brief: Clean Energy Markets: Jobs and Opportunities
Page 15 of 20 July 2011
1 Specific concerns exist over potential adverse impacts of climate policy on energy-intensive, trade-exposed (EITE) industries’ competitiveness in international markets. However, recent research has found these effects to be modest, and well-designed policies – including free allowance allocation and an eventual international climate agreement – can moderate their impacts and help these industries transition to a low-carbon future. For a more in-depth discussion of the extent of these impacts, see Aldy, Joseph and William Pizer. “The Competitiveness Impacts of Climate Change Mitigation Policies,” Pew Center on Global Climate Change, 2009. For more information on the policy options available to help address them, see “Addressing Competitiveness in U.S. Climate Change Policy,” Pew Center on Global Climate Change, 2008. The Pew Center has also developed a table summarizing the ways in which various climate and energy policy proposals around the world have considered addressing impacts to vulnerable industries, available here. 2 The theory that environmental regulation can improve industrial competitiveness by forcing firms to continually innovate was originally formulated by the economists Michael Porter and Claas van der Linde, and is often referred to as the Porter Hypothesis. See Porter, Michael and Claas van der Linde. “Toward a New Conception of the Environment-Competitiveness Relationship,” Journal of Economic Perspectives, Vol. 9, No. 4, 1995, pp. 97-118. There is an ongoing debate over the circumstances under which this claim may be true; for some critiques of the Porter hypothesis see Ziesemer, Thomas. “The Porter Hypothesis Revisited: An Overview on Empirical and Theoretical Evidence,” Papers in Global Business Management, Universität Augsburg, December 2007, and Palmer, Oates, and Portney, “Tightening Environmental Standards: The Benefit-Cost or the No-Cost Paradigm?” J. of Economic Perspectives, 9(4), 1995. For a meta-analysis, see Ambec, Stefan et al. “The Porter Hypothesis at 20:Can Environmental Regulation Enhance Innovation and Competitiveness?” Resources for the Future, 2011. 3 The net impact of climate and clean energy policy on employment is difficult to quantify, as some carbon-intensive jobs will require a transition and others will be lost – even as others in new low-carbon sectors are created. The job creation potential associated with various technologies is discussed further below in this brief. 4 For a more extended discussion of contemporary international trade theory, see Krugman, Paul. “Making sense of the competitiveness debate (different approaches to the concept of competitiveness),” Oxford Review of Economic Policy, 12.n3, Autumn, 1996: pp17(9) and Krugman, Paul. “Competitiveness: A Dangerous Obsession,” Foreign Affairs, Volume 73, No. 2, March/April 1994: pp.30-44. 5 The International Energy Agency (IEA) predicts that under the New Policies Scenario, which takes into account policy commitments that have been announced around the globe, worldwide primary energy demand will increase 36 percent by 2035 (as compared to 2008), electricity demand will grow 2.2 percent a year from 2008 to 2035, and demand for oil will increase nearly 18 percent to 99 million barrels a day in 2035. The IEA also projects increasing fossil fuel prices. See International Energy Agency (IEA), “World Energy Outlook 2010,” 2010. 6 Overall clean energy investment growth estimates are derived using data from United Nations Environment Program (UNEP) and New Energy Finance, “Global Trends in Sustainable Energy Investment 2010: Analysis of Trends and Issues in the Financing of Renewable Energy and Energy Efficiency,” 2010; Bloomberg New Energy Finance, “Clean Energy League Tables Results Book,” March 2011; and Pew Charitable Trusts, “Who’s Winning the Clean Energy Race? 2010 Edition,” 2011. This figure includes total financial investment (including venture capital, private equity expansion capital, public markets, and asset finance) as well as government research and development (R&D), corporate R&D, and small projects. Wind, solar and biofuels market growth estimates are from Pernick, Ron and Clint Wilder and Trevor Winnie and Sean Sosnovec. “Clean Energy Trends 2011,” Clean Edge Inc., March 2011. 7 Projects included in Bloomberg New Energy Finance’s “Global Trends in Sustainable Energy Investment 2010” include biomass, geothermal and wind projects of more than 1 MW, all hydropower projects between 0.5 and 50 MW, and solar projects of more than 0.5 MW, all marine energy projects, and all biofuel projects with a capacity of 1m liters or more per year. UNEP and New Energy Finance 2010. 8 UNEP and New Energy Finance 2010.; The smart grid refers to the application of digital technology to the electric power sector to improve reliability, reduce cost, increase efficiency, and enable new components and applications. Smart grid technologies–including communication networks, advanced sensors, and monitoring devices–allow utilities to generate and deliver power more efficiently and reliably and to more easily incorporate new clean technologies and enable consumers to better understand and control their electricity consumption.
[Type text]
In Brief: Clean Energy Markets: Jobs and Opportunities
Page 16 of 20 July 2011
9 This total includes investments in renewables, energy efficiency, biofuels, and other low-carbon technologies. See UNEP and New Energy Finance 2010, and Pernick, Ron et al. 2011. 10 UNEP and New Energy Finance 2010. 11 Pew Charitable Trusts 2011. 12 UNEP and New Energy Finance 2010. 13 UNEP and New Energy Finance 2010, and United Nations Environment Program (UNEP) and New Energy Finance, “Global Trends in Sustainable Energy Investment 2009: Analysis of Trends and Issues in the Financing of Renewable Energy and Energy Efficiency,” 2009. 14 Pernick, Ron et al. 2011 15 UNEP and New Energy Finance 2010. 16 UNEP and New Energy Finance 2010; “Accelerating Technological Innovation in Energy,” Presentation by William Bonvillian, Director, Massachusetts Institute of Technology Washington D.C. office, to the Canadian Embassy, October 15th, 2009; and Pew Charitable Trusts 2011 17 IEA, “World Energy Outlook 2009,” 2009, and International Atomic Energy Agency, “Latest News Related to PRIS and the Status of Nuclear Power Plants,” Accessed June 2011. Notably, none of these plants are being built in the United States, but are principally in China, India, Korea, and Russia. However, since 2007 a number of applications for new nuclear plant licenses have been submitted to the U.S. Nuclear Regulatory Commission and are under review, though most of these plants have yet to obtain financing and are not yet committed to construction. See Nuclear Energy Institute (NEI), Status and Outlook for Nuclear Energy in the United States, May 2009, and MIT, Update of the MIT 2003 Future of Nuclear Power, May 2009. 18 Dempsey, Judy and Jack Ewing. “Germany, in Reversal, Will Close Nuclear Power Plants by 2022,” The New York Times, May 30, 2011.; Davis, Andrew and Alessandra Migliaccio. “Italy Extends Nuclear Moratorium to Focus on Fossil Fuel, Renewable Energy,” Bloomberg, April 20, 2011. 19 Global CCS Institute, “The Global Status of CCS: 2010.” 2011. 20 Wurzelmann, Sam. “U.S. Department of Energy’s Recovery Act Spending.” Pew Center on Global Climate Change, 2011. 21 CO2e is ‘carbon dioxide equivalent’, the internationally recognized measure of greenhouse gas emissions, in terms of carbon dioxide’s global warming potential. 22 Pew Charitable Trusts, “Global Clean Power: A $2.3 Trillion Opportunity,” 2010. This report looks at asset financing for wind, solar, biomass and energy from waste, small-hydro, geothermal and marine technologies as these investments can be reliably modeled into the future, unlike technology innovation or initial public offerings. This report does not review investments in biofuels or energy efficiency on account of uncertainty surrounding the reliability of production targets for biofuels and the challenge of quantifying energy efficiency advances. 23 Pew Charitable Trusts 2010. This case represents a very strong outcome for global action on climate change, and thus the Pew Charitable Trusts totals referenced here should not be read as market forecasts; rather, they are used to illustrate the potential scope of these markets if all major emitters take strong action to reduce their carbon emissions. 24 UNEP and New Energy Finance 2010, and Granade, H.C. et al. “Unlocking Energy Efficiency in the U.S. Economy,” McKinsey and Company, July 2009. The study estimates that the pursuing all efficiency measures would be enough to abate 1.1 gigatonnes (GT) of CO2e a year below business-as-usual by 2020.; Gold, Rachel et al. “Appliance and Equipment Efficiency Standards: A Money Maker and Job Creator,” American Council for an Energy-Efficient Economy (ACEEE), 2011. The American Council for an Energy-Efficient Economy (ACEEE) estimates that for every one million dollars in consumer energy bill savings, the resultant spending of this money creates a net gain of approximately 10 jobs. 25 McKinsey and Company, “Pathways to a Low-Carbon Economy: Version 2 of the Global Greenhouse Gas Abatement Cost Curve,” 2009 26 IEA 2010. The World Energy Outlook 2010’s strong global action scenario (called the ‘450 Scenario’) assumes clean energy policies are introduced that put governments on track to stabilize atmospheric concentrations of greenhouse gas emissions at about 450 parts per million of CO2e, which could limit the increase in global average temperature to 2° Celsius. Business-as-usual describes the ‘Current Policies Scenario’, in which no change in policies of mid-2010 is assumed, and thus, recent commitments are not acted on.
[Type text]
In Brief: Clean Energy Markets: Jobs and Opportunities
Page 17 of 20 July 2011
27 Pew Charitable Trusts 2011. 28 IEA 2010, and “US Wind Turbine Supply Chain Market Forecast and Update,” Presentation by Matthew Kaplan, North America Wind Energy Advisory, IHS Emerging Energy Research, April 5, 2011. 29 IEA 2010. 30 IEA 2010 31 A comparative advantage exists when a country (or a firm) can produce something at a lower relative cost compared to any other. This includes the cost of what is given up in order to produce a particular good – the opportunity cost. Note that even if a country is the best at making something, it doesn’t necessarily have a comparative advantage in its production. If country A is much better at producing cars than country B, but is only slightly better than country B at producing bicycles, it makes more sense for country A to devote its resources to making cars and for country B to make bicycles and for the two countries to trade. 32 Economies of scale exist in industries where the average cost per unit of a good falls as a result of increased production. This may occur for a number of reasons, such as the development of more efficient production techniques that can only be fully realized at certain levels of output, the ability to buy inputs in bulk, regional investment in related industries or infrastructure (e.g. transportation) that helps lower costs, and many other factors. Industry clusters can have positive benefits by increasing the productivity of the firms in a cluster and spurring innovation; for example, as more firms agglomerate in a certain region, they may attract increasingly skilled and specialized workers, or exchange information that makes production more efficient. For more on the potential benefits of business clustering, see Porter, Michael. “Clusters and the New Economics of Competition,” Harvard Business Review, Vol. 76, Issue 6, November-December 1998. 33 Additional examples are noted in Burtis, P.R., B. Epstein, and N. Parker. “Creating Cleantech Clusters: 2006 Update. How Innovation and Investment Can Promote Job Growth and a Healthy Environment,” National Resources Defense Council and Cleantech Venture Network LLC, 2006. 34 For some detailed examples and discussion of environmental lead markets, see Beise, Marian and Klaus Rennings. “Lead Markets of Environmental Innovations: A Framework for Innovation and Environmental Economics,” Discussion Paper prepared for the Centre for European Economic Research, 2003. See also Jänicke, Martin and Klaus Jacob. “Lead Markets for Environmental Innovations: A New Role for the Nation State,” Global Environmental Politics, 4:1, Massachusetts Institute of Technology 2004. 35 Pew Charitable Trusts 2011. 36 Pew Charitable Trusts 2010. 37 Bonvillian, William B. and Charles Weiss. “Structuring an Energy Technology Revolution,” MIT Press, Massachusetts 2009. 38 Pew Charitable Trusts 2010, and Pew Charitable Trusts 2011. Feed-in tariffs are a policy tool used for renewable energy deployment. Under a feed-in tariff policy, utilities are required to buy grid-connected renewable electricity at a pre-determined above-market rate. 39 Bradsher, Keith. “China Leading Global Race to Make Clean Energy,” The New York Times, January 30, 2010. 40 Bradsher, Keith. “China Drawing High-Tech Research From U.S,” The New York Times, March 17, 2010. 41 In 2010 China eliminated import duties applied to components of wind turbines. See “China Removes Import Duties on Wind and Hydro Equipment,” NRDC, May 5, 2010. 42 Pew Charitable Trusts 2011. 43 UNEP and New Energy Finance 2010. 44 UNEP and New Energy Finance 2010; IEA 2010. 45 UNEP and New Energy Finance 2010. 46 Pew Charitable Trusts 2010, and European Commission, 2008. “Climate Action and Renewable Energy Package.” 47 Since 2005, the EU ETS has covered, “power stations and other combustion plants, oil refineries, coke ovens, iron and steel plants and installations producing cement, glass, lime, bricks, ceramics, pulp, paper and board.” In 2012, all domestic and international aviation will be covered by the cap. The scope of the ETS will expand at the commencement of its third phase in 2013, to include “installations producing bulk organic chemicals, hydrogen, ammonia and
[Type text]
In Brief: Clean Energy Markets: Jobs and Opportunities
Page 18 of 20 July 2011
aluminium...,” as well as, “N2O emissions from the production of nitric, adipic and glyocalic acid production and perfluorocarbons from the aluminium sector.” 48 European Commission, 2008. “Climate Action and Renewable Energy Package.” 49 UNEP and New Energy Finance 2011. 50 Engel, Ditlev et al. “Green Jobs and the Clean Energy Economy,” Thought Leadership Series, Copenhagen Climate Council, May 2009. 51 IEA 2010. 52 Pew Charitable Trusts 2011, and Vestas, “Annual Report 2010,” 2011. 53 Engel et al. 2009. 54 Pew Charitable Trusts 2011; German Federal Ministry for the Environment, Nature Conservation, and Nuclear Safety, “100% renewable electricity supply by 2050,”January 26, 2011; German Federal Ministry for the Environment, Nature Conservation, and Nuclear Safety, “The Climate Initiative,” accessed April 2011. For additional information, see the website of the German Federal Ministry for the Environment, Nature Conservation, and Nuclear Safety. 55 German Federal Ministry for the Environment, Nature Conservation, and Nuclear Safety, “Renewables’ contribution to energy supply in Germany continued to rise in 2010,” March 16, 2011; Peterka, Amanda. “Germany offers lessons on GHG reduction, green jobs,” Greenwire, October 22, 2010; and Pew Charitable Trusts 2011. 56 U.S. Department of Energy, 2009. Solar Decathlon Final Results. 57 German Federal Ministry for the Environment, Nature Conservation, and Nuclear Safety, March 16, 2011.; German Federal Ministry for the Environment, Nature Conservation, and Nuclear Safety, “Gross employment from renewable energy in 2010,” March 18, 2011. 58 German Federal Ministry for the Environment, Nature Conservation, and Nuclear Safety, “Renewably employed! Short and long-term impacts of the expansion of renewable energy on the German labour market,” September 2010. This report provides estimates of net jobs in clean energy compared to the fossil fuel-based reference scenario using complex macroeconomic modeling in a variety of political and economic scenarios. Almost all scenarios result in net positive employment in 2020 and 2030. Only under particularly unfavorable circumstances is net employment negative. 59 German Federal Ministry for the Environment, Nature Conservation, and Nuclear Safety, “Innovation Through Research: 2009 Annual Report on Research Funding in the Renewable Energies Sector,” February 2010, and Pew Charitable Trusts 2010. 60 Pew Charitable Trusts 2011, and “S. Korea announces $36B renewable energy investment,” ClimateWire, October 14, 2010. 61 Pew Charitable Trusts 2011. 62 “S. Korea announces $36B renewable energy investment”, ClimateWire, October 14, 2010. 63 See, for example, Greaker, Mads. “Spillovers in the development of new pollution abatement technology: A new look at the Porter-hypothesis,” Journal of Environmental Economics and Management, Vol. 52, 2006; Porter, Michael. “America’s Green Strategy,” Scientific American, 264, 4: 96, 1991; Porter, M. and C. van der Linde, “Toward a New Conception of the Environment-Competitiveness Relationship,” Journal of Economic Perspectives 9, 4:97–118, 1995; Ambec, Stefan et al. “The Porter Hypothesis at 20:Can Environmental Regulation Enhance Innovation and Competitiveness?” Resources for the Future, 2011. As discussed in endnote three, this concept remains controversial and has its critics; see Ziesemer, Thomas. “The Porter Hypothesis Revisited: An Overview on Empirical and Theoretical Evidence,” Papers in Global Business Management, Universität Augsburg, December 2007, and Palmer, Oates, and Portney, “Tightening Environmental Standards: The Benefit-Cost or the No-Cost Paradigm?” J. of Economic Perspectives, 9(4), 1995. The Pew Center has compiled a review summarizing several studies on the links between environmental policy and job creation, available here. 64 Holding these shares for nuclear and CCS generation constant, the researchers looked at how various targets for renewables and energy efficiency gains affected overall job-year creation. For example, assuming BAU improvements in energy efficiency and a 10 percent generation target for renewables in addition to the nuclear and CCS targets, the researchers estimate the creation of about 500,000 net job-years between 2009 and 2030. Under another case,
[Type text]
In Brief: Clean Energy Markets: Jobs and Opportunities
Page 19 of 20 July 2011
increasing renewables’ share to 40 percent of generation and improving overall energy efficiency by 0.6 percent per year while maintaining the nuclear and CCS targets would create about 7,000,000 net job-years. 65 Wei, Max and Shana Patadia and Daniel Kammen. “Putting Renewables and Energy Efficiency to Work: How Many Jobs Can the Clean Energy Industry Generate in the US?” University of California, Berkeley, 2009. Other studies have reached similar conclusions; see, e.g. Burtis, P.R., B. Epstein, and N. Parker, 2006. 66 The wind turbine industry provides a good example of a low-carbon technology with a complex and increasingly globally integrated value chain. See Kirkegaard, Jacob and Thilo Hanemann and Lutz Weischer. “It Should Be a Breeze: Harnessing the Potential of Open Trade and Investment Flows in the Wind Energy Industry,” Peterson Institute of International Economics, December 2009. 67 Concerns are sometimes raised over the impact of climate policy on manufacturing jobs in particular. However, not only do many clean energy technologies rely on manufacturing jobs, but employment in manufacturing faces significant structural challenges unrelated to climate and energy policy, such as increased reliance on automated production. In fact, some “business-as-usual” projections anticipate declining overall employment in manufacturing even as aggregate manufacturing output increases. See United States Energy Information Administration (EIA). “Energy Market and Economic Impacts of H.R. 2454, the American Clean Energy and Security Act of 2009,” U.S. Department of Energy, August 2009. 68 For an overview of how carbon capture and storage technology works, and its potential, see the Pew Center’s carbon capture and storage factsheet, available here. 69 “National Commission on Energy Policy’s Task Force On America’s Future Energy Jobs.” National Commission on Energy Policy, October 2009, pp 32 and 79. 70 These estimates are based on the 2007 National Energy Technology Laboratory (NETL) cost estimates for a new integrated gasification combined cycle power plant with and without CCS and where the number of jobs is assumed to be proportional to the estimated direct labor costs (adjusted to equate the net power output of the plant with and without CCS). See National Energy Technology Laboratory. “Energy Analyses: Fossil Energy Cost and Performance Baseline Studies, Volume 1: Bituminous Coal and Natural Gas to Electricity,” NETL, August 2007. 71 Gold et al. 2011 72 Kenley, C.R. et al., “Job Creation Due to Nuclear Power Resurgence in the United States,” Energy Policy 37 (11): 4894-4900, 2009. 73 This includes 38,000 manufacturing jobs by U.S. nuclear suppliers (assuming the new plants were sourced entirely from U.S. firms); 79,000 construction and operation jobs; 250,000 in indirect nuclear jobs; and the inducement of 242,000 non-nuclear jobs. Examples of direct jobs include those involved with the manufacturing or construction of the nuclear plant and equipment. Indirect jobs include those created by purchases made by directly affected industries from other industries, such as nuclear fuel supply, maintenance and repair, and engineering service. An induced job is created as a result of purchases made by those employed in direct and indirect jobs, such as restaurant and retail workers and home builders. 74 Urbanchuck, J.M. and J. Kapell. “Ethanol and the Local Community,” 2002. 75 Kirkegaard et al 2009. 76 Trabish, Herman. “Goldwind: Will Wind Be China’s Next Big Export to the US?,” Greentech Media, April 19, 2011. 77 “Vestas expanding production despite recession,” Greenwire, May 5, 2009.; U.S. Department of Energy. “Economic Development Impacts in Colorado from Four Vestas Manufacturing Facilities.” April 2009. 78 “Nissan adds battery plant to North American production,” ClimateWire, May 28, 2010. 79 IEA 2010, and Suntech, “Arizona Plant Opening.” 80 IEA 2010, and Woody, Todd. “U.S. Solar Firm Cracks Chinese Market,” The New York Times, September 8, 2009. 81 Martin, Christopher and Jim Efstathiou Jr. “China’s Labor Edge Overpowers Obama’s ‘Green’ Jobs Initiatives,” Bloomberg News Service, February 2, 2010. 82 Kirkland, Joel. “ESolar licenses solar technology to Chinese utilities.” ClimateWire, January 12, 2010. 83 “GE and Shenhua Announce Formation of Cleaner Coal Technology Joint Venture in China,” GE News Center, January 18, 2011.
[Type text]
In Brief: Clean Energy Markets: Jobs and Opportunities
Page 20 of 20 July 2011
84 Office of the Press Secretary, “FACT SHEET: The State of the Union: President Obama’s Plan to Win the Future,” The White House, January 25, 2011. 85 Pew Center on Global Climate Change, “Renewable & Alternative Energy Portfolio Standards,” Accessed May 2011. 86 Gamesa, “History: Global consolidation (2000-2009),” Accessed April 2011. 87 Regional Greenhouse Gas Initiative (RGGI), “RGGI Benefits,” Accessed April 2011. 88 Regional Greenhouse Gas Initiative (RGGI), “Investment of Proceeds from RGGI CO2 Allowances,” February 2011. 89 Pew Center on Global Climate Change, “Vehicle Greenhouse Gas Emissions Standards.” May 2011. 90 Bonvillian and Weiss 2009. 91 Mandel, Jenny. “Chu’s ‘innovation hub’ plan gets rolling,” Environment and Energy Daily, December 23, 2009. 92 For more information, visit the ARPA-E website at United States Department of Energy, Advanced Research Projects Agency – Energy. 93 Council of Economic Advisors, “Supplement to the Third Quarterly Report on the Economic Impact of the American Recovery and Reinvestment Act of 2009,” April 2010. 94 U.S. Department of Energy. “Recovery Act Announcement: President Obama Awards $2.3 Billion for New Clean-Tech Manufacturing Jobs,” January 8, 2010. 95 U.S. Department of Energy, “President Obama Announces $2.4 Billion in Grants to Accelerate the Manufacturing and Deployment of the Next Generation of U.S. Batteries and Electric Vehicles,” August 5, 2009. Wurzelmann 2011. 96 Wurzelmann 2011. 97 Council of Economic Advisers, “The Economic Impact of the American Recovery and Reinvestment Act of 2009: Fifth Quarterly Report,” November 18, 2010. 98 Interview with the Honorable Lisa Murkowski, Senator, State of Alaska. “Lisa Murkowski: Smaller steps mean bigger strides on energy.” Politico Pro. April 11, 2011. 99 Hughes, John and Kim Chipman, “Obama Accelerates Fuel-Economy Standards, Sets Carbon Limit.” Bloomberg, May 18, 2009. 100 U.S. Department of Energy, “Programs.” Loan Programs Office, 2011.


