Embed Size (px)
Citation preview
IN PARTNERSHIP WITH
Dr. Leeanne Alonso
Dr. Deep Narayan Shah

Kate Lazarus
Senior Asia ESG Advisory Lead
IFC
Introduction and Housekeeping
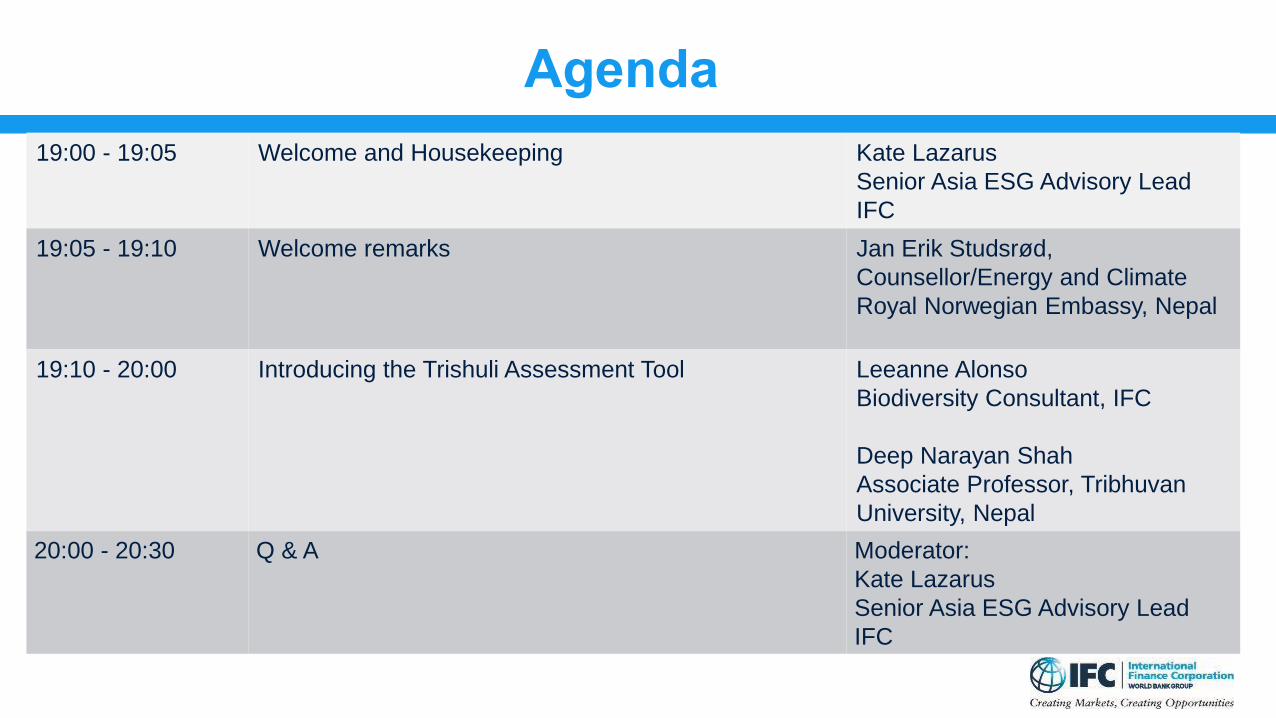
Agenda
19:00 - 19:05 Welcome and Housekeeping Kate Lazarus
Senior Asia ESG Advisory Lead
IFC
19:05 - 19:10 Welcome remarks Jan Erik Studsrød,
Counsellor/Energy and Climate
Royal Norwegian Embassy, Nepal
19:10 - 20:00 Introducing the Trishuli Assessment Tool Leeanne Alonso
Biodiversity Consultant, IFC
Deep Narayan Shah
Associate Professor, Tribhuvan
University, Nepal
20:00 - 20:30 Q & A Moderator:
Kate Lazarus
Senior Asia ESG Advisory Lead
IFC
Welcome Remarks
Jan Erik Studsrød,
Counsellor/Energy and Climate
Royal Norwegian Embassy, Nepal

Introducing the
Trishuli Assessment Tool
Presenters:
Leeanne Alonso
Biodiversity Consultant, IFC
Deep Narayan Shah
Assistant Professor
Tribhuvan University, Nepal
Outline of the Presentation
• What is the Trishuli Assessment Tool
• Need for the Trishuli Assessment Tool
• Development of the Trishuli Assessment Tool
• Field Methods of the Trishuli Assessment Tool
• Sampling Design and Data Analysis
• Next Steps for the Trishuli Assessment Tool

What is the Trishuli Assessment Tool
6

Trishuli Assessment Tool
Methodology for Standardized Sampling of Aquatic Biodiversity to Monitor
Population Trends over Time
To be used to:
• Establish an Aquatic Biodiversity Baseline for ESIA
• Collect data for Environmental Flows (EFlows) Assessment
• Monitor the the impacts of Hydropower (or other impacts) on Aquatic
Biodiversity
Need for the Trishuli Assessment Tool
8

Why is the Trishuli Assessment Tool needed?
• Paucity of data on aquatic biodiversity in Nepal
• Lack of efficient, practical and cost effective list of
methods
• Availability of required equipment
• Use of different methods in different ESIA
surveys- results incomparable and inconsistent
• Sampling sites and effort for ESIAs are variable
and usually minimum
✓To meet international standards, for science and lenders (No Net Loss)
✓ Importance of Aquatic Biodiversity Data for ESIA and monitoring
Why is the Trishuli Assessment Tool needed?
10
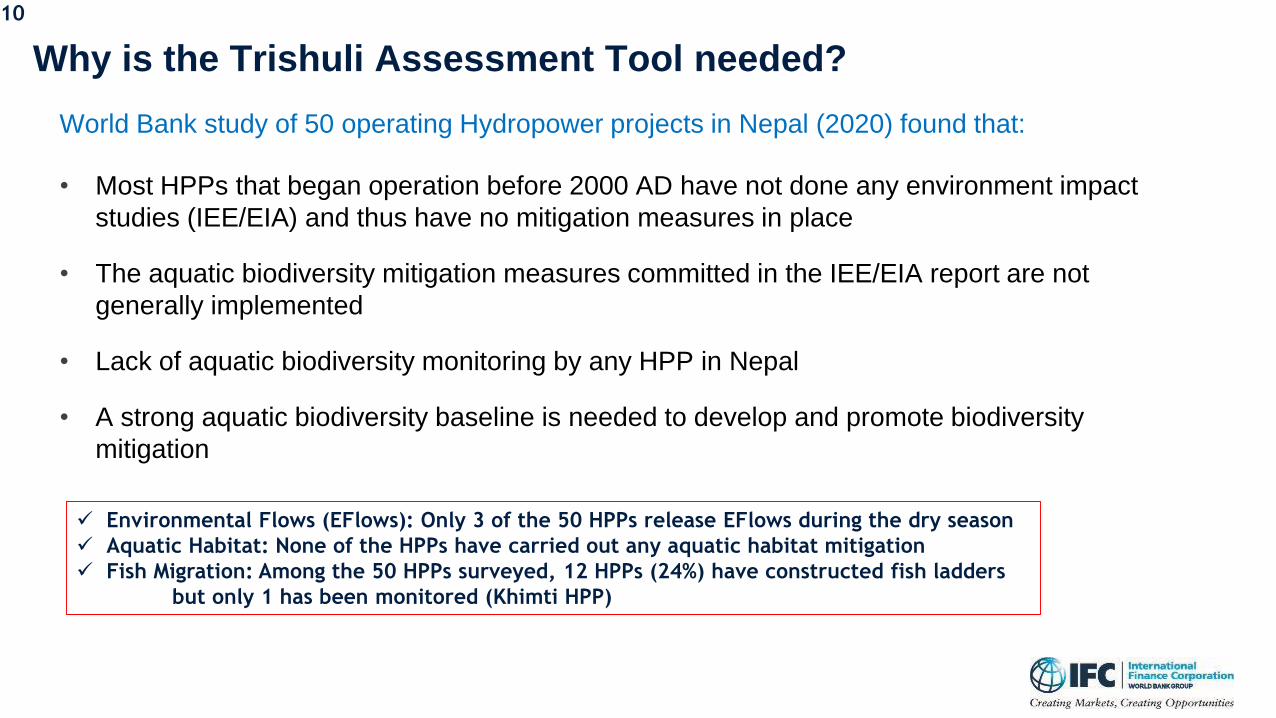
World Bank study of 50 operating Hydropower projects in Nepal (2020) found that:
• Most HPPs that began operation before 2000 AD have not done any environment impact
studies (IEE/EIA) and thus have no mitigation measures in place
• The aquatic biodiversity mitigation measures committed in the IEE/EIA report are not
generally implemented
• Lack of aquatic biodiversity monitoring by any HPP in Nepal
• A strong aquatic biodiversity baseline is needed to develop and promote biodiversity
mitigation
✓ Environmental Flows (EFlows): Only 3 of the 50 HPPs release EFlows during the dry season
✓ Aquatic Habitat: None of the HPPs have carried out any aquatic habitat mitigation
✓ Fish Migration: Among the 50 HPPs surveyed, 12 HPPs (24%) have constructed fish ladders
but only 1 has been monitored (Khimti HPP)

Development of the Trishuli Assessment Tool
11

Why the Tool is needed- slides from Deep
Trishuli River Basin
IFC has interest in the
Trishuli River Basin in Nepal
due to funding of the
Upper Trishuli – 1 HPP
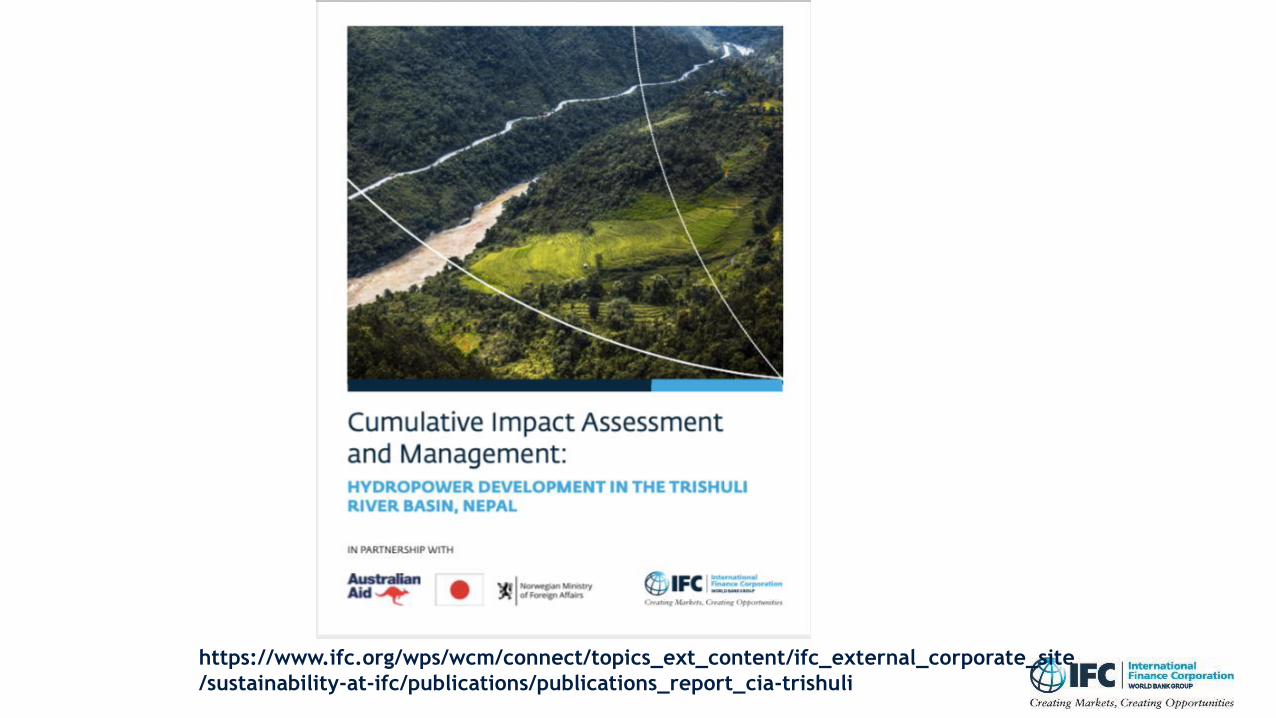
https://www.ifc.org/wps/wcm/connect/topics_ext_content/ifc_external_corporate_site
/sustainability-at-ifc/publications/publications_report_cia-trishuli

Fish Studies in the Trishuli Basin
• 60 species of fish reported for the basin (Rajbanshi 2002)
• Additional field research by NESS (2012, 2013, and 2014-2016) and SWECO (2016) for
Upper Trishuli-1 HPP ESIA: 7-8 species recorded per survey
• Sampling for Cumulative Impact Assessment at 7 sites in the basin (2018), including eDNA
25 species recorded by eDNA
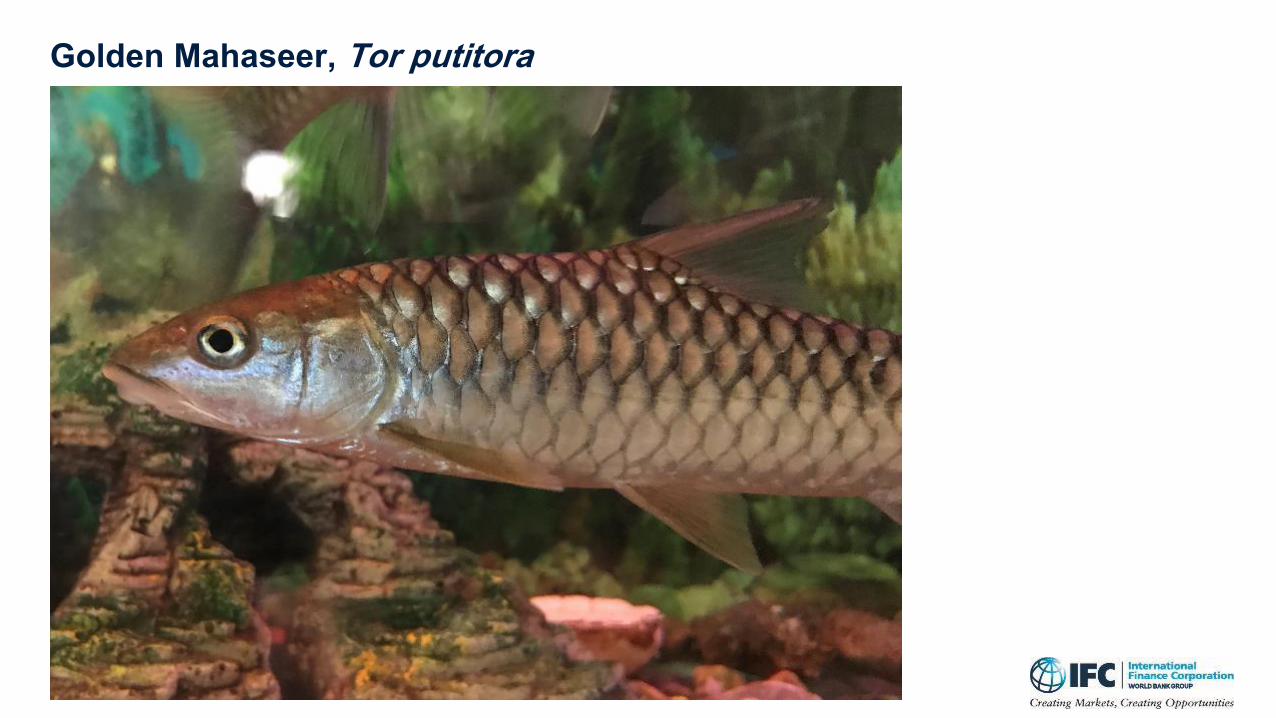
Golden Mahaseer, Tor putitora

Common Snow Trout, Schizothorax richardsonii

Other fish species from the Trishuli River Basin17
Our Shared Goal for Trishuli River and other Nepal rivers:
Sustainable Hydropower Development that maintains
a Healthy Aquatic Ecosystem and Biodiversity
To meet this Goal, we need to:
1) Obtain a Better Understanding of the Aquatic Ecosystem and Biodiversity, and
2) Follow up with Long-term monitoring of the status of the Aquatic Ecosystem
18

Considerations
Balancing between the Best Methods and Practicalities – It is Possible!
• Requirements: Nepal ESIA, International Lenders’ Standards
• Time: Developer’s timelines, pre-construction baseline
• Cost: Personnel, travel, equipment, data analysis
• Expertise/knowledge: Training, experience
• Equipment: Availability, maintenance
• Permits: Research, specimen collections, protected areas, electrofishing
• Safety: Access to sampling sites, equipment
19
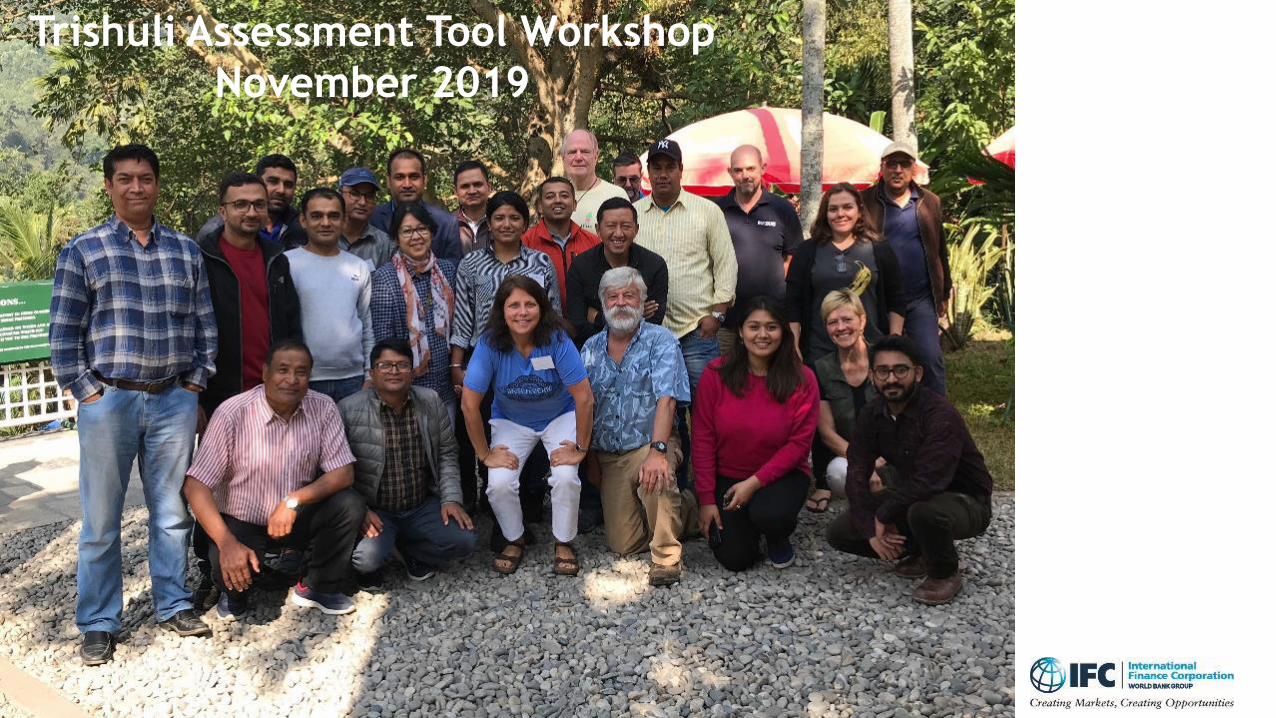
Trishuli Assessment Tool Workshop
November 2019

Workshop Participants
International fish researchers with expertise in fish sampling and monitoring
Nepalese fish researchers with expertise in sampling Nepali rivers and habitats
Hydropower project staff with expertise in Trishuli River environment and HPP design
Government departments staff with expertise in regulations, monitoring, EIAs

Workshop Participants1. Dr. David Philipp, Trishuli consulting team
2. Julie Claussen, Trishuli consulting team
3. Bill Beaumont, Trishuli consulting team
4. Adrian Pinder, Trishuli consulting team
5. Gina Walsh, Trishuli consulting team
6. Adarsh Man Sherchan, Center for Molecular Dynamics Nepal (CMDN)
7. Dibesh Karmacharya, Center for Molecular Dynamics Nepal (CMDN)
8. Nikita Pradhan, Center for Molecular Dynamics Nepal (CMDN)
9. Raj Kapur Napit, Nepal Environmental and Social Services (NESS)
10. Rakesh Yadav, Nepal Environmental and Social Services (NESS)
11. Dr. Deep Narayan Shah, Central Department of Environmental Science, Tribhuvan University
12. Dr. Ram Devi Tachamo Shah, Aquatic Ecology Centre, Kathmandu University
13. Dr. Subohd Sharma, Kathmandu University
14. Dr. Bibhuti Ranjan Jha, Kathmandu University
15. Suresh Wagle, United States Agency for International Development (USAID) Paani Program
16. Asha Raymajhi, National Fisheries Research Centre (NFRC), MA&LD
17. Anjana Shrestha, National Fisheries Research Centre (NFRC), MA&LD
18. Dr. Tek Gurung, National Agricultural Research Center Council (NARC)
19. Janak Kumar Jha, Water and Energy Commission Secretariat (WECS)
20. Milan Dhungana, Ministry of Forest and Environment (MoFE)
21. Nurendra Aryal, Nepal Department of National Parks and Wildlife Conservation, MoFE
22. Tara Datt Bhatt, Nepal Energy Authority (NEA) Training Center, Kharipati
23. Prakash Gaudel, Environmental and Social Studies Department, NEA
24. Baburaja Maharjan, Trishuli HPP (NEA)
25. Ashok Baniya, NWEDC Upper Trishuli – 1 (UT-1) HPP
26. Auras Bhandari, NWEDC Upper Trishuli – 1 (UT-1) HPP
27. Shankar Pyakurel, Upper Trishuli – 3B (UT-3B) HPP (Trishuli hydropower Company)
28. Umesh Pathak, Upper Sanjen HPP
29. Rabindra Timilsina, Swet Ganga Hydropower & Construction Ltd.
30. Dr. Leeanne Alonso, International Finance Corporation (IFC)
31. Mark Pedersen, International Finance Corporation (IFC)
22
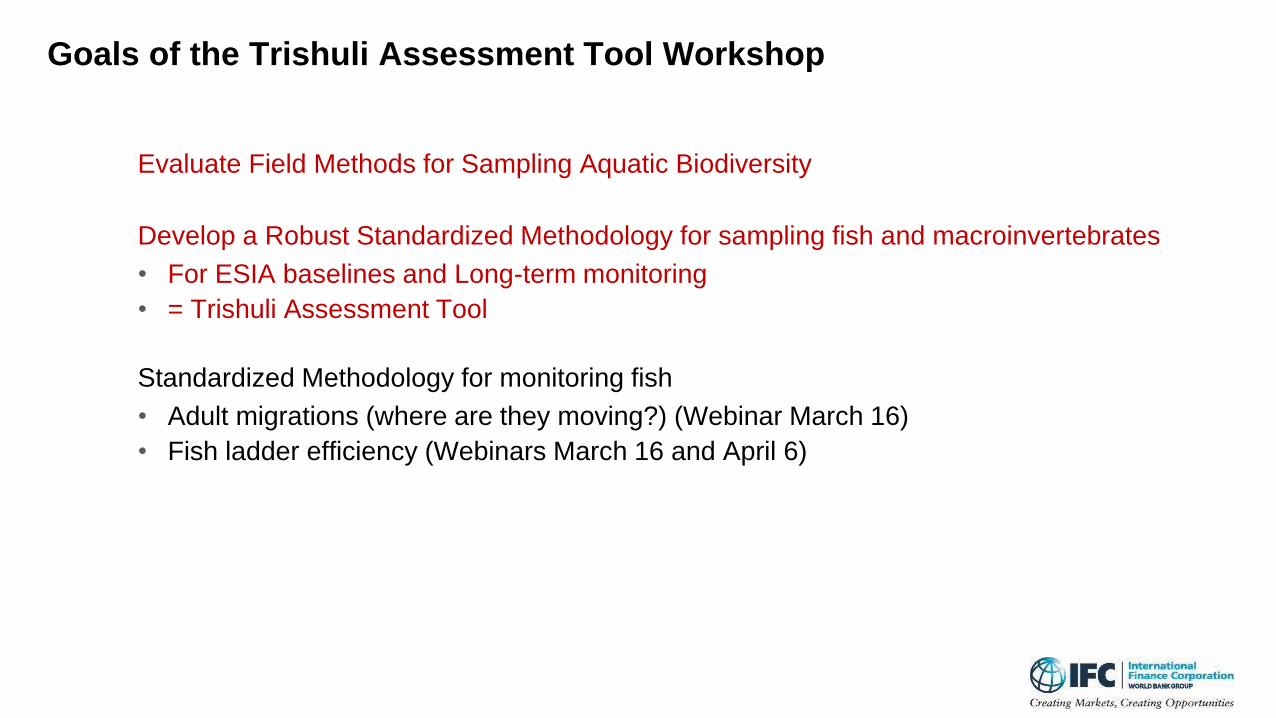
Goals of the Trishuli Assessment Tool Workshop
Evaluate Field Methods for Sampling Aquatic Biodiversity
Develop a Robust Standardized Methodology for sampling fish and macroinvertebrates
• For ESIA baselines and Long-term monitoring
• = Trishuli Assessment Tool
Standardized Methodology for monitoring fish
• Adult migrations (where are they moving?) (Webinar March 16)
• Fish ladder efficiency (Webinars March 16 and April 6)

Targets for Data Collection with the Trishuli Assessment Tool
1. Overall Aquatic Biodiversity
Composition (species list)
# species
# individuals of selected species
2. Snow Trout adults and juveniles (Schizothorax richardsonii)
# individuals
Distribution/locations
Size/weight/gender/reproductive status
3. Golden Mahaseer adults and juveniles (Tor putitora)
# individuals
Distribution/locations
Size/weight/gender/reproductive status
4. Macroinvertebrates and Periphyton
# Key Taxa
Functional Groups/ Key Indices
24
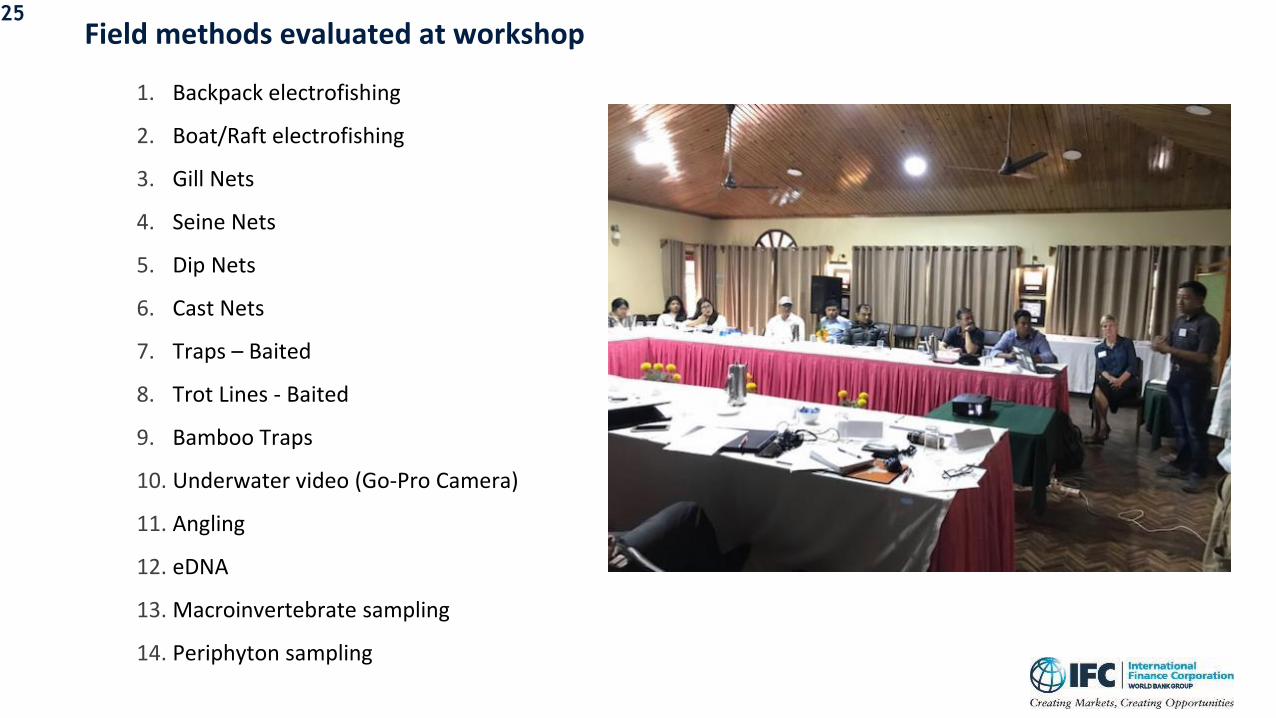
Field methods evaluated at workshop25
1. Backpack electrofishing
2. Boat/Raft electrofishing
3. Gill Nets
4. Seine Nets
5. Dip Nets
6. Cast Nets
7. Traps – Baited
8. Trot Lines - Baited
9. Bamboo Traps
10. Underwater video (Go-Pro Camera)
11. Angling
12. eDNA
13. Macroinvertebrate sampling
14. Periphyton sampling

Evaluated field methods according to:
Targets
• Biodiversity (overall biodiversity)
• Snow Trout (adults, juveniles, movement)
• Golden Mahseer (adults, juveniles, movement)
• Macroinvertebrates and Periphyton
River Habitat/Location
• Tributaries (Large and small)
• Main River Channel
• Upstream and Downstream of Hydropower project
• Altered Environments (e.g. HPP reservoir, diversion reach)
Sampling design and data metrics
26

Working Groups
27
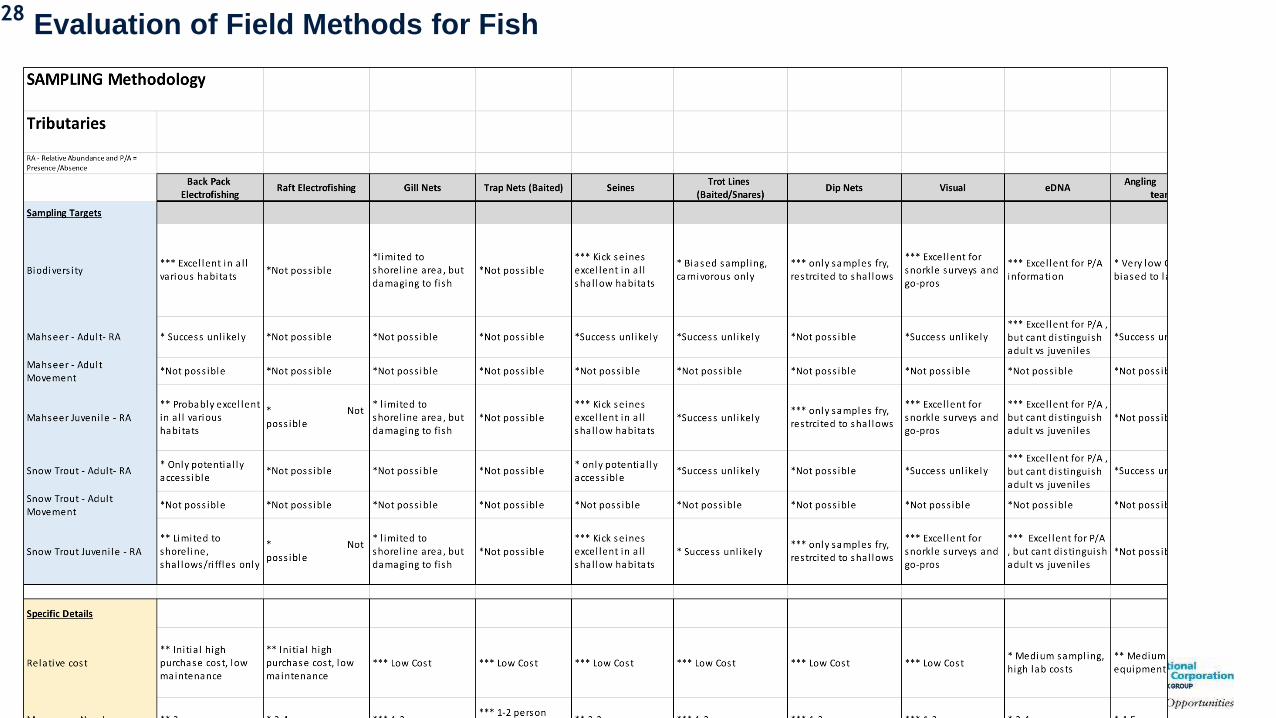
Evaluation of Field Methods for Fish28
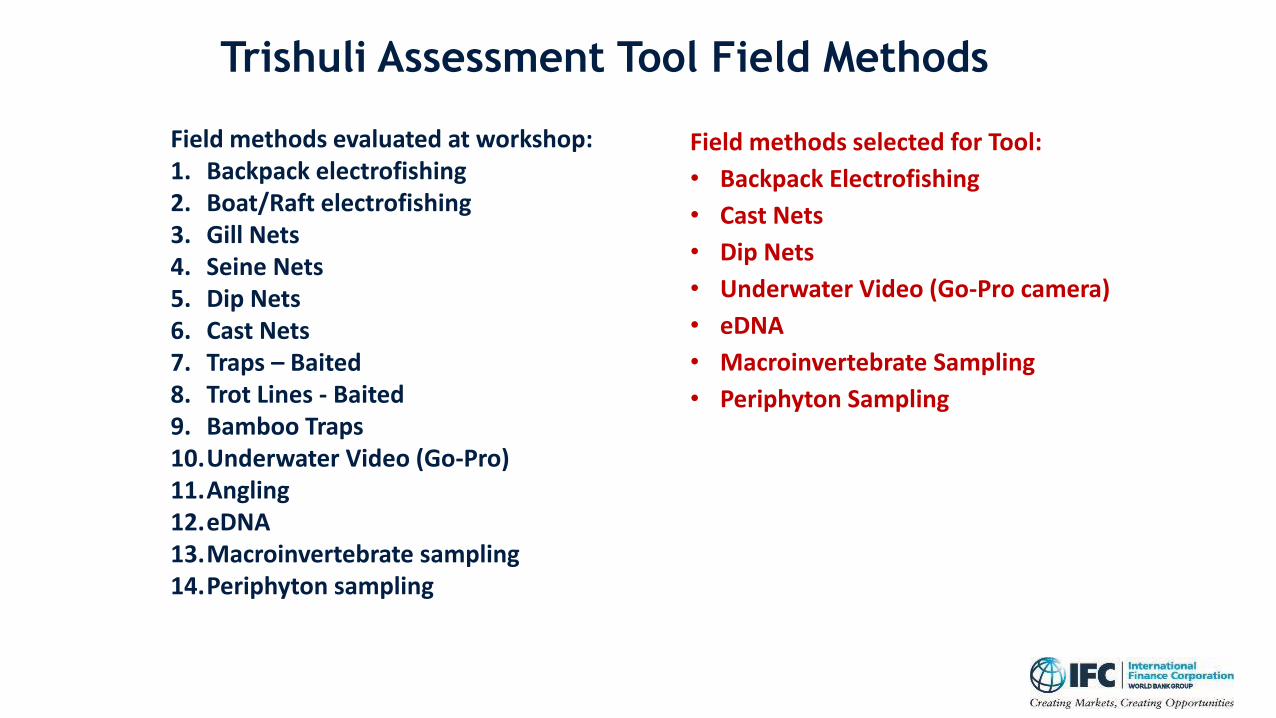
Field methods evaluated at workshop:1. Backpack electrofishing2. Boat/Raft electrofishing3. Gill Nets4. Seine Nets 5. Dip Nets 6. Cast Nets7. Traps – Baited8. Trot Lines - Baited9. Bamboo Traps 10.Underwater Video (Go-Pro)11.Angling12.eDNA13.Macroinvertebrate sampling14.Periphyton sampling
Field methods selected for Tool:
• Backpack Electrofishing
• Cast Nets
• Dip Nets
• Underwater Video (Go-Pro camera)
• eDNA
• Macroinvertebrate Sampling
• Periphyton Sampling
Trishuli Assessment Tool Field Methods
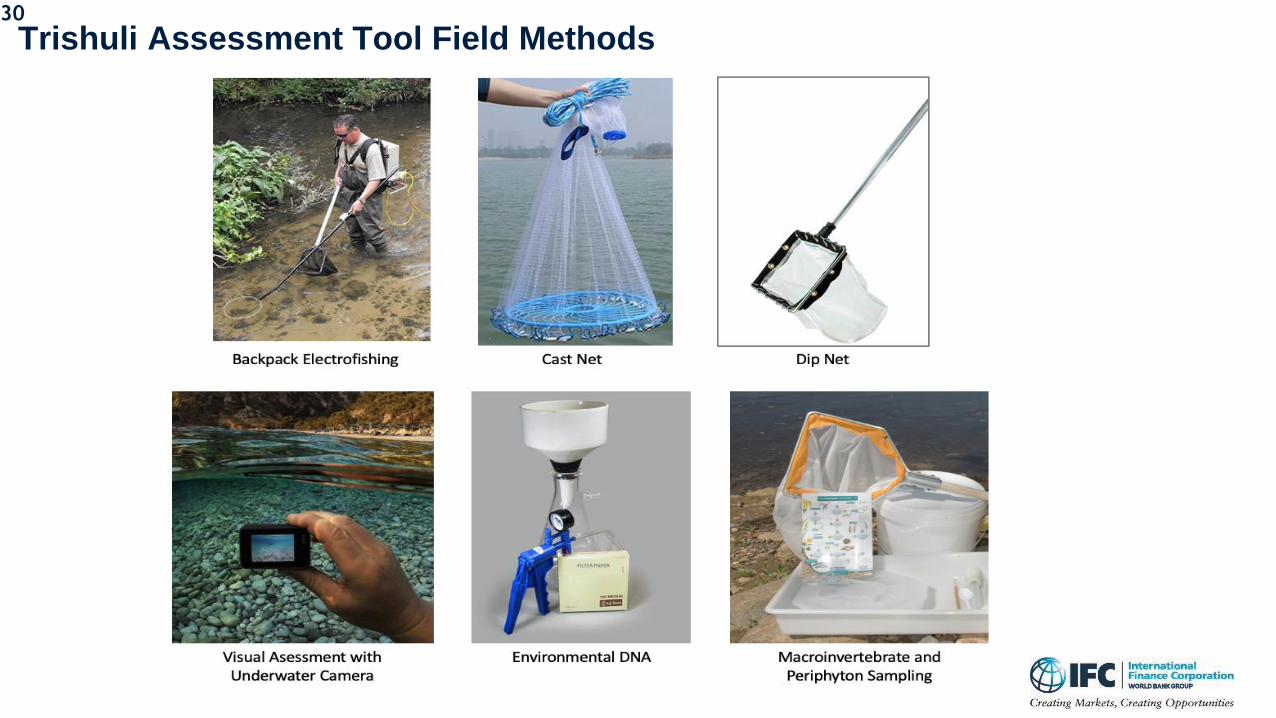
Trishuli Assessment Tool Field Methods30

Trishuli Assessment Tool field methods
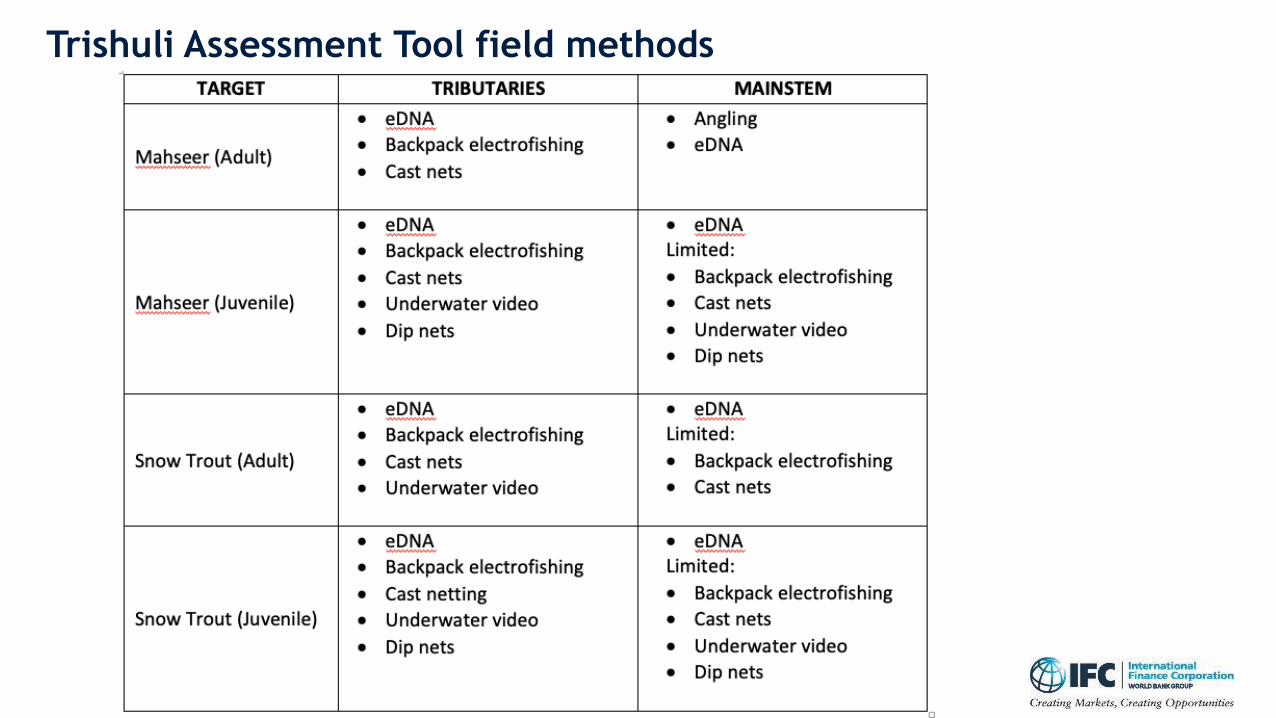
Trishuli Assessment Tool field methods

Sampling Effort for each Field Method - Standardized 33
Method Effort Units Number of units Approx. Sampling/
Total Time*RECORD THE TIME SPENT SAMPLING
Personnel
Electrofishing Time sampling with
current on (minutes)
20 min US/20 min DS
(40 minutes total/site)
40 min/120 min 3 people
Cast Net Cast Net Throws
Time for 25 throws
(mins)
12 US/1 MP/12 DS
(25 total/site)
60 min/120 min 2 people
Dip Net Dip Net Emersions 10 samples/site 30 min/60 min 1 person
Underwater Video Camera sets 5 minute recording/set
6 sets US / 6 sets DS
(12 sets/site)
60 min/90 min 1 person
eDNA 2 L water samples 5 samples+1 control/site
(6 samples/site)
60 min/180 min 2-4 people
Macroinvertebrate
sampling
Net subsamples 20 total over different
substrate types
60 min/150 min 2-3 people
Periphyton sampling Rock Scraped 5 per site 15 min/30 min 2-3 people

Trishuli Field Team February 2020

Sampling Sites for Trishuli Assessment Tool Test survey, February 2020

Field Testing of the Trishuli Assessment Tool – February 2020
36
Fish identification and measurements
eDNAElectrofishing
Electrofishing Training Macroinvertebrate Training Baited Traps
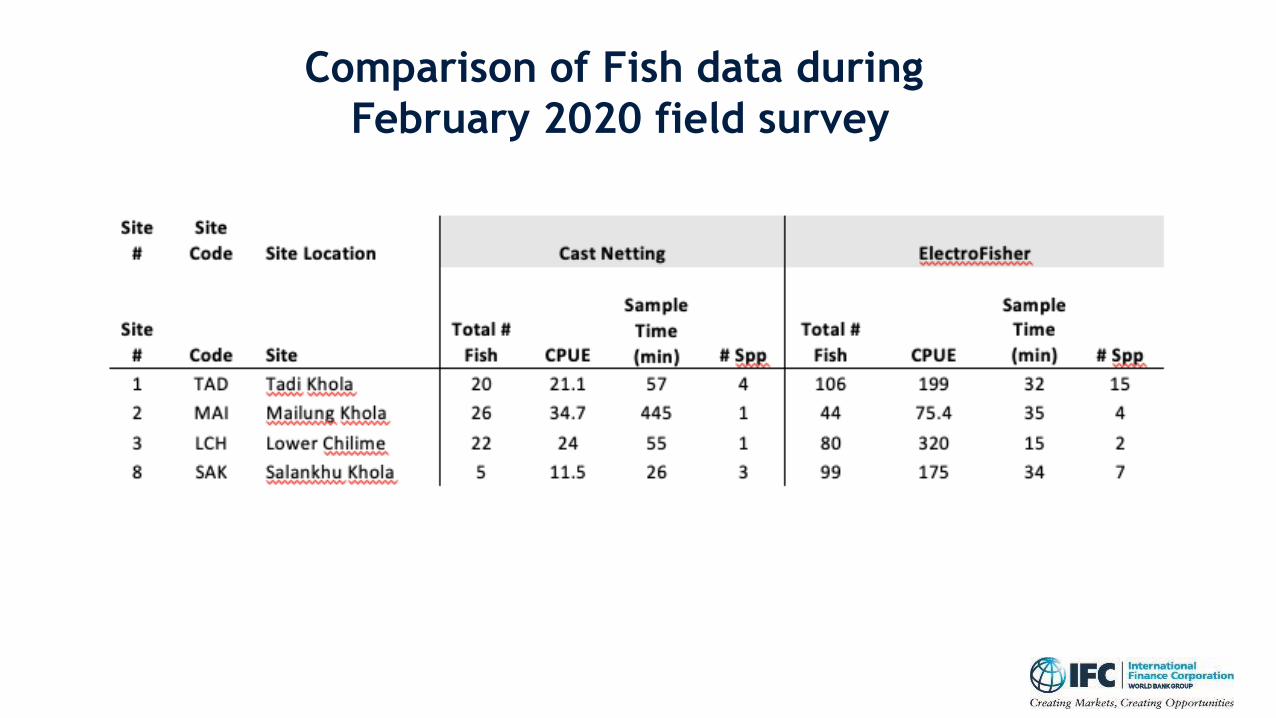
Comparison of Fish data during
February 2020 field survey

Field Methods of the Trishuli Assessment Tool
38

Backpack Electrofishing Webinar February 4
Bill Beaumont
39
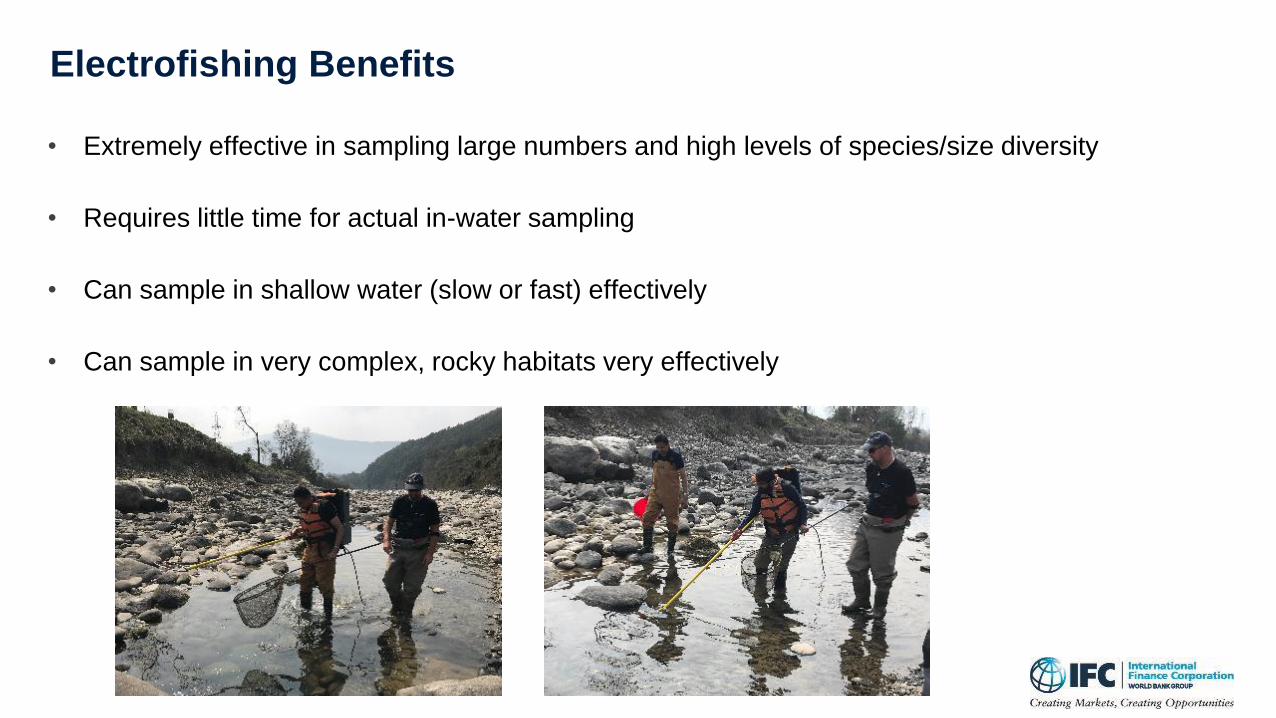
Electrofishing Benefits
• Extremely effective in sampling large numbers and high levels of species/size diversity
• Requires little time for actual in-water sampling
• Can sample in shallow water (slow or fast) effectively
• Can sample in very complex, rocky habitats very effectively
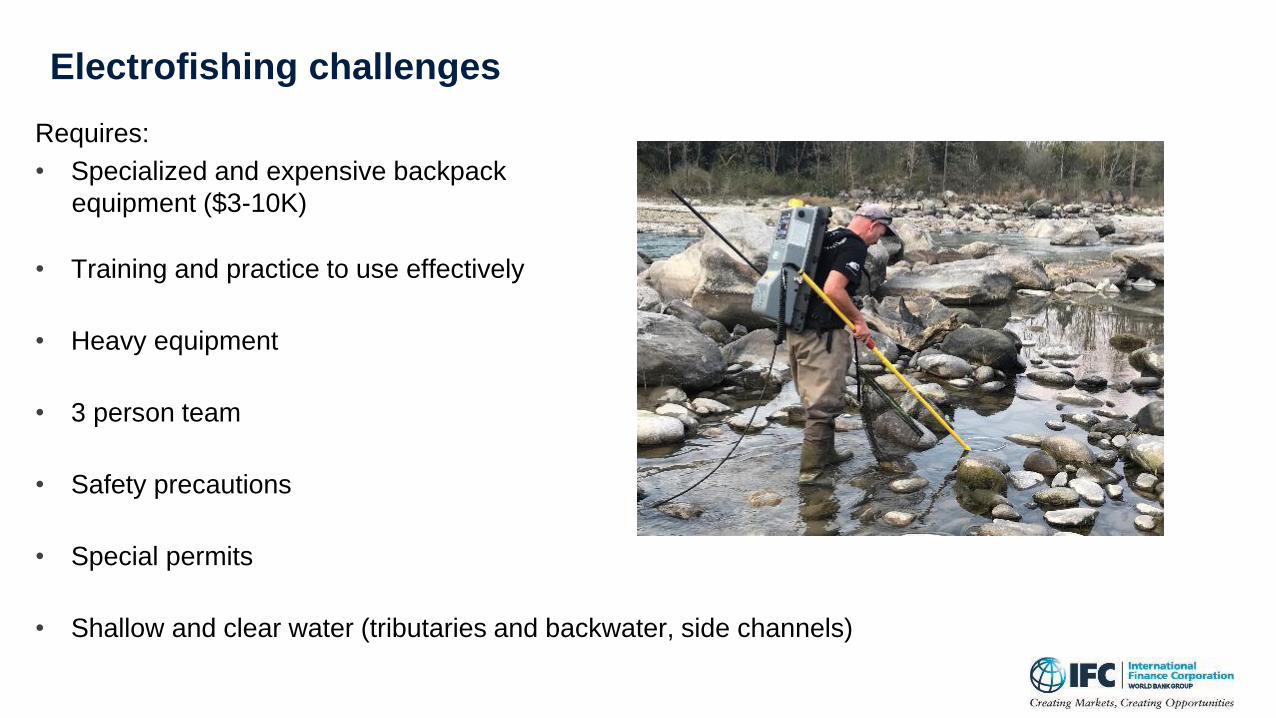
Electrofishing challenges
Requires:
• Specialized and expensive backpack
equipment ($3-10K)
• Training and practice to use effectively
• Heavy equipment
• 3 person team
• Safety precautions
• Special permits
• Shallow and clear water (tributaries and backwater, side channels)
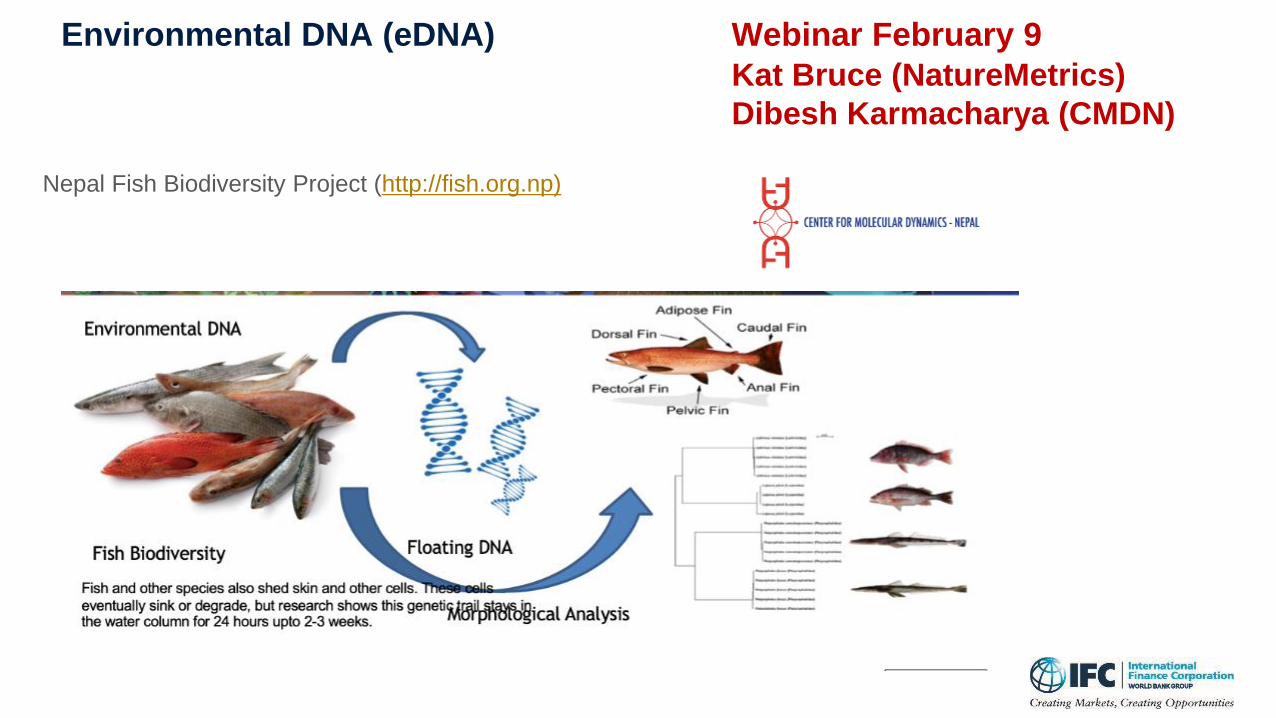
Environmental DNA (eDNA) Webinar February 9
Kat Bruce (NatureMetrics)
Dibesh Karmacharya (CMDN)
Nepal Fish Biodiversity Project (http://fish.org.np)
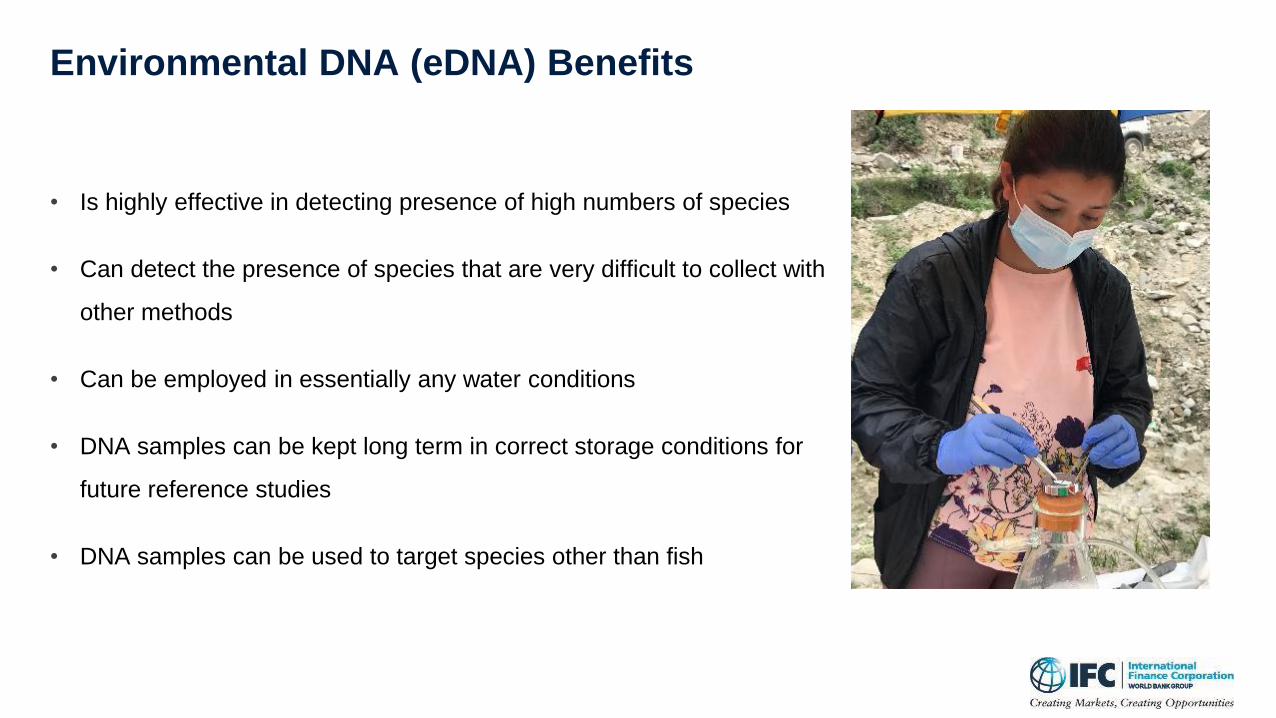
Environmental DNA (eDNA) Benefits
• Is highly effective in detecting presence of high numbers of species
• Can detect the presence of species that are very difficult to collect with
other methods
• Can be employed in essentially any water conditions
• DNA samples can be kept long term in correct storage conditions for
future reference studies
• DNA samples can be used to target species other than fish

Environmental DNA (eDNA) Challenges
Requires:
• The method is still in a developing phase; some
anomalies still need scientific validation
• Specific and bulky field equipment/supplies
• Specialized Training
• Expensive laboratory analysis
• Team of 3-4 people at a minimum
Limitations:
• Abundance data questionable (but improving)
• False positives are possible
• Requires substantial time to get final results

Cast Nets
Pros:
• Moderately effective for catching fish of all sizes
• Can be used in many different habitats including deep and fast moving water
• Requires only two people (caster and bucket carrier)
• Cast nets are relatively inexpensive and available in Nepal
• Is the technique most used in the past, so most compatible with previous data
Challenges:
• Requires skill and experience to cast the net well (but local fishermen are good)
• Limited efficacy for sampling small benthic species (e.g., loach spp)
• Inconsistent mesh size between studies

Underwater Video (with Go-Pro Camera)46
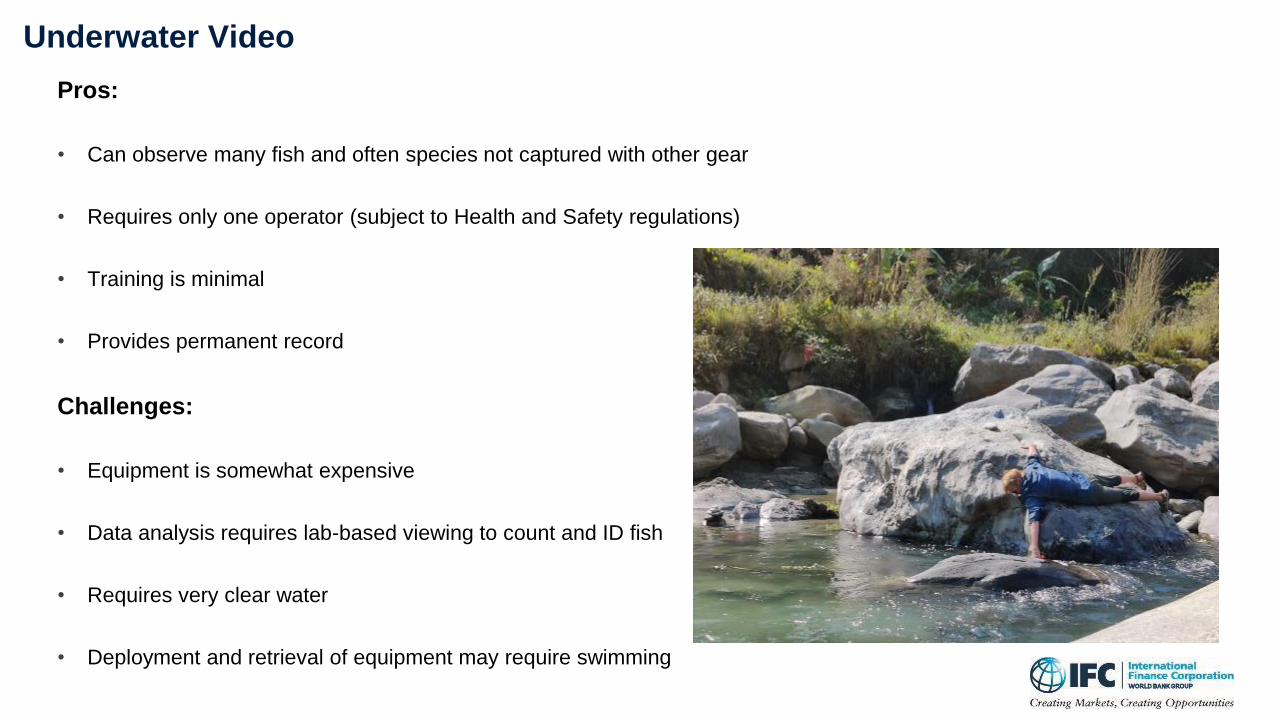
Underwater Video
Pros:
• Can observe many fish and often species not captured with other gear
• Requires only one operator (subject to Health and Safety regulations)
• Training is minimal
• Provides permanent record
Challenges:
• Equipment is somewhat expensive
• Data analysis requires lab-based viewing to count and ID fish
• Requires very clear water
• Deployment and retrieval of equipment may require swimming
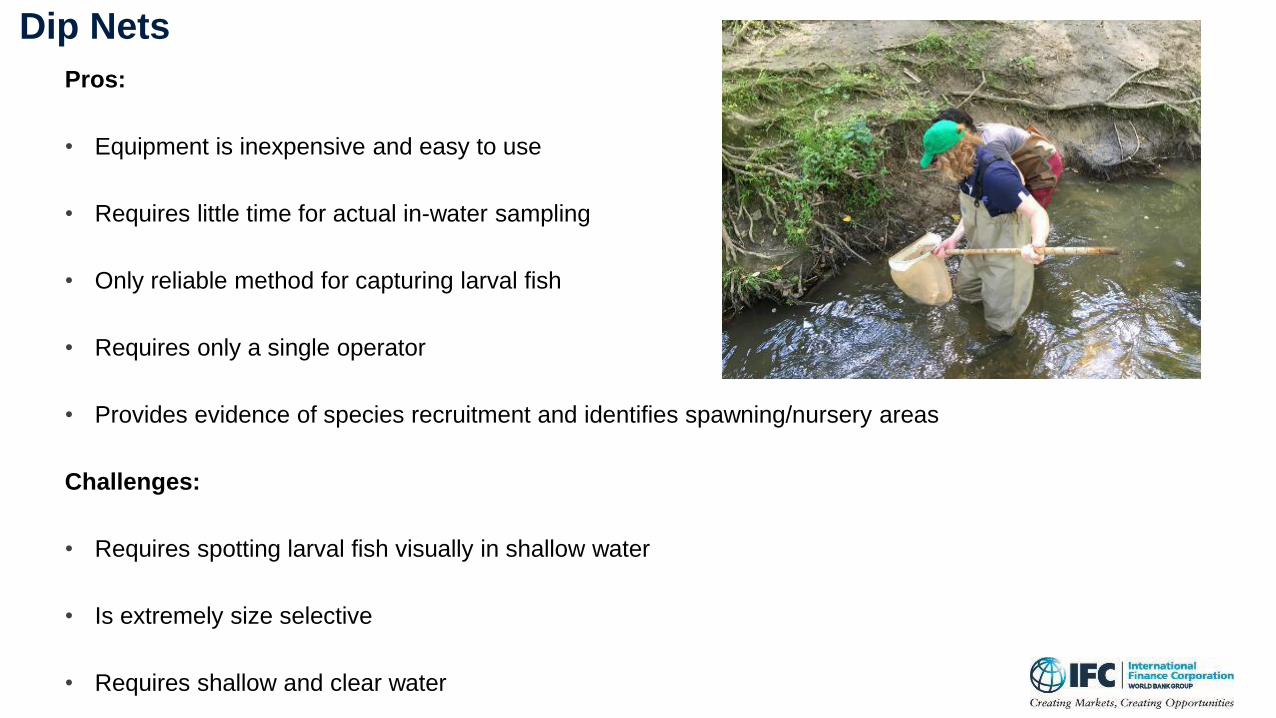
Dip Nets
Pros:
• Equipment is inexpensive and easy to use
• Requires little time for actual in-water sampling
• Only reliable method for capturing larval fish
• Requires only a single operator
• Provides evidence of species recruitment and identifies spawning/nursery areas
Challenges:
• Requires spotting larval fish visually in shallow water
• Is extremely size selective
• Requires shallow and clear water

Macroinvertebrates and Periphyton Webinar February 11
Ram Devi Tachamo Shah
Deep Narayan Shah• Macroinvertebrates are aquatic invertebrates larger than 500 um
• Periphyton are small aquatic animals and plants (eg. algae) that cling to rocks
• Both are important in the aquatic ecosystem
• Food for many other organisms, especially fish
• Break down organic matter
• Filter and clean the water
• Respond quickly to environmental changes, so are good indicators
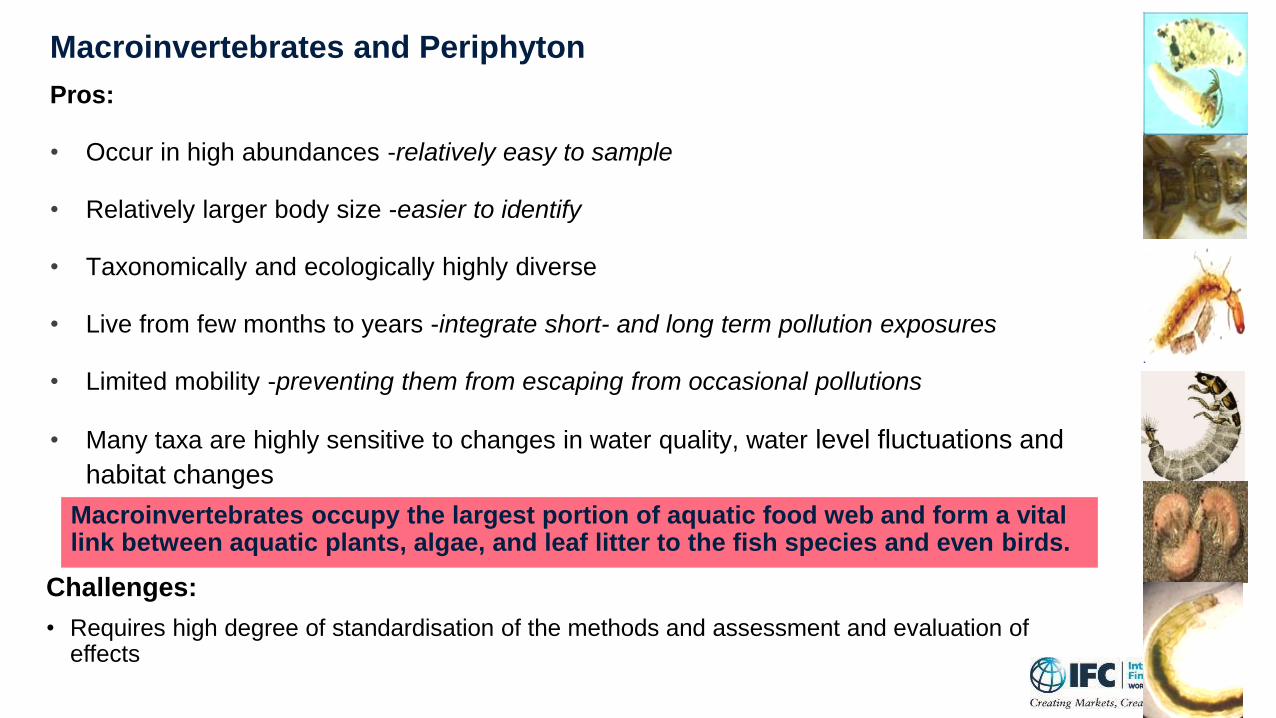
Macroinvertebrates and Periphyton
Pros:
• Occur in high abundances -relatively easy to sample
• Relatively larger body size -easier to identify
• Taxonomically and ecologically highly diverse
• Live from few months to years -integrate short- and long term pollution exposures
• Limited mobility -preventing them from escaping from occasional pollutions
• Many taxa are highly sensitive to changes in water quality, water level fluctuations and
habitat changes
Challenges:
• Requires high degree of standardisation of the methods and assessment and evaluation of effects
Macroinvertebrates occupy the largest portion of aquatic food web and form a vital link between aquatic plants, algae, and leaf litter to the fish species and even birds.

Sampling Design and Data Analysis
51
February 18 Webinar
Leeanne Alonso (IFC)
Jonathan Levin (RSA)

Multi-habitat Sampling (MHS)I
High
II
Good
III
Moderate
IV
Poor
V
Bad
✓ representative sampling of all major habitats (mineral and organic)
Requirements: Field protocol, habitat estimation sheets,
kick-nets, gloves, waders, buckets, white trays, sample
containers, jars, vials, sieve (500 µm), ethyl alcohol (99 %),
pencil & labels, paper, life jacket, rope, second person(!),
cellular phone…
100 meter

Autecology on species level
Ecological indicators
Basis for assessment
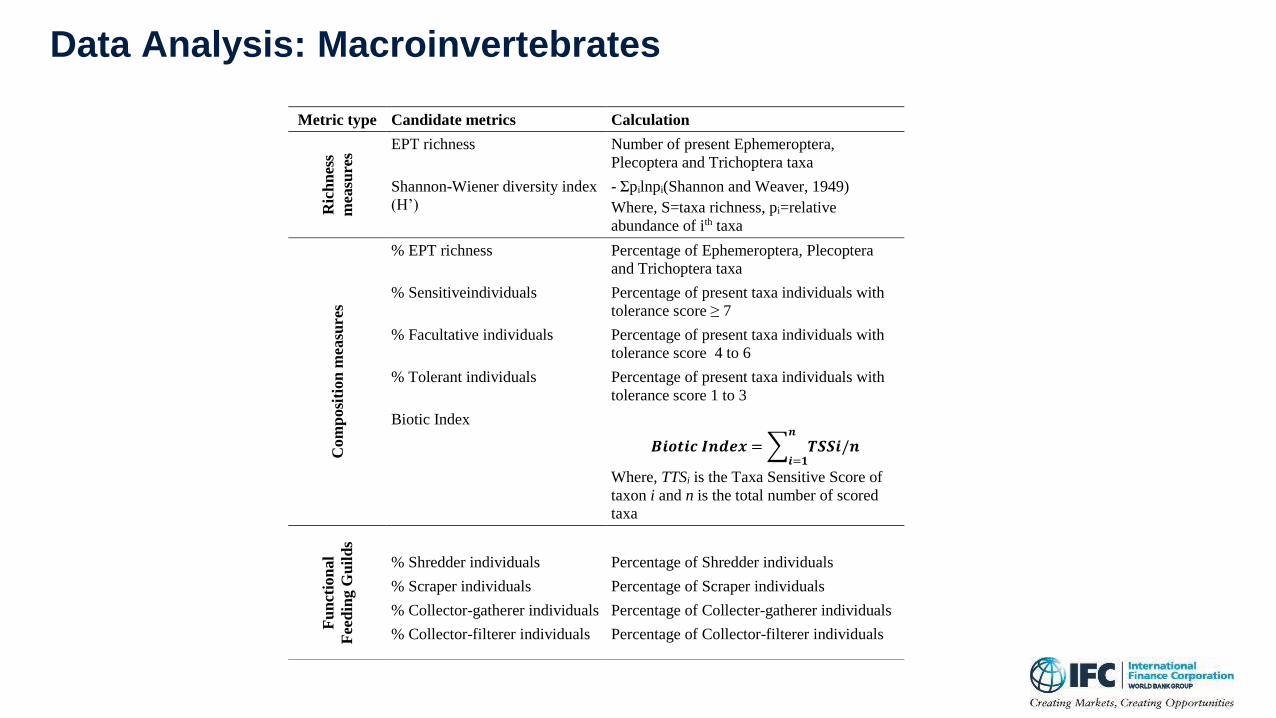
Metric type Candidate metrics Calculation
Ric
hn
ess
mea
sure
s
EPT richness Number of present Ephemeroptera,
Plecoptera and Trichoptera taxa
Shannon-Wiener diversity index
(H’)
- Σpilnpi(Shannon and Weaver, 1949)
Where, S=taxa richness, pi=relative
abundance of ith taxa
Co
mp
osi
tio
n m
easu
res
% EPT richness Percentage of Ephemeroptera, Plecoptera
and Trichoptera taxa
% Sensitiveindividuals Percentage of present taxa individuals with
tolerance score ≥ 7
% Facultative individuals Percentage of present taxa individuals with
tolerance score 4 to 6
% Tolerant individuals Percentage of present taxa individuals with
tolerance score 1 to 3
Biotic Index
𝑩𝒊𝒐𝒕𝒊𝒄 𝑰𝒏𝒅𝒆𝒙 = 𝑻𝑺𝑺𝒊/𝒏𝒏
𝒊=𝟏
Where, TTSi is the Taxa Sensitive Score of
taxon i and n is the total number of scored
taxa
Fu
nct
ion
al
Fee
din
g G
uil
ds
% Shredder individuals Percentage of Shredder individuals
% Scraper individuals Percentage of Scraper individuals
% Collector-gatherer individuals Percentage of Collecter-gatherer individuals
% Collector-filterer individuals Percentage of Collector-filterer individuals
Data Analysis: Macroinvertebrates

Data Targets55
1. Overall Aquatic Biodiversity
Composition – List of Species with taxonomically correct names
# species
# individuals of selected species
2. Snow Trout adults and juveniles (Schizothorax richardsonii)
# individuals
Distribution/locations
Size/weight/gender/reproductive status
3. Golden Mahaseer adults and juveniles (Tor putitora)
# individuals
Distribution/locations
Size/weight/gender/reproductive status
4. Macroinvertebrates/Periphyton
# Key Taxa
Functional Groups/ Key Indices
Study Design and Data Analysis
Plan the Sampling Design and Data Analysis from the start to contribute to all
objectives:
• Establish an Aquatic Biodiversity Baseline for ESIA
• Collect data for Environmental Flows (EFlows) Assessment
• Long-term Monitoring
Monitoring requires repeated sampling with same method, replicates, and
specific data metrics

ESIA Baseline
Questions and Data
1. What is there- which species? (Composition)
• Species List
2. How many are there? (Abundance or Population Size)
• # individuals per species
3. Where are they? (Location and Distribution
• Map of species distribution, compare abundance between sites
Sampling Frequency
• At least 2 seasons: Dry season and Wet season
• Preferably more in relation to fish biology and HPP operation (e.g. onset
of monsoon upstream migration, spawning, low flows)
Sampling Sites
• As many as possible to capture variation in the ecosystem
57

Sampling Regions
An ESIA aquatic survey should include sampling in these Sampling Regions:
1. Upstream of Hydropower Project, including reservoir area
2. Diversion reach
3. Downstream of Power House (especially if a peaking Project)
Within each region, sampling sites should include:
• Main Stem
• Large Tributaries
• Small Tributaries
• River Tributaries
58

Fish Data to collect in field
59Fish Identification Webinar February 17
Rajeev Rahavan, KOFUS, India
Asha Rayamajhi, NFRC

Long-term Monitoring
Questions and Data
1. How has the the number of species changed over time?
2. How has the number of individuals of target species changed over time?
3. How has the distribution of species changed over time?
4. How has the composition of species changed over time?
Monitoring analysis requires specific metrics to quantitatively compare over time
1. CPUE = Catch (# individuals) Per Unit Effort (hours)
2. SPUE = Species (# species) Per Unit Effort (hours)
Monitoring analysis requires replicates to capture natural variation
• Trishuli Assessment Tool recommends at least 6 replicates (spatial sites or temporal
surveys) per sampling region
60

Quantitative Metrics for Long-term Monitoring
Target Indicator Metric
Overall Aquatic Biodiversity Composition Species names
Species Richness (# species) # species / hour (SPUE)
Abundance of target species # individuals / hour (CPUE)
Snow Trout adults and juveniles (Schizothorax richardsonii)
Abundance # individuals / hour (CPUE)
Golden Mahaseer adults and juveniles (Tor putitora)
Abundance # individuals / hour (CPUE)
Macroinvertebrates/Periphyton Richness and abundance of key taxa EPT Index
Functional Feeding Groups Ratio of groups
61

Sample Data from the Tadi Khola, February 2020
Metric Electrofishing Cast Nets Dip Nets
Total # fish individuals (N) 106 20 30
Total Effort (hours) 0.53 0.95 0.33
CPUE (# individuals/hour) 199 21.1 90
Species Richness - Total # fish species (S) 15 4 1
SPUE (# species/hour) 28 4.2 3
62
• For long term monitoring, CPUE and SPUE can be compared statistically between
sampling surveys using T-test, ANOVA or non-parametric statistics
• February 18 Webinar will showcase an Excel-based statistical tool designed for the
Trishuli Assessment Tool

Next Steps for the Trishuli Assessment Tool
63

Next Steps
Trishuli Assessment Tool Kit
• Manual
• Recordings of February Webinars
• Powerpoints from February Webinars
• In-person Training Courses
Develop local capacity for the Trishuli Assessment Tool
Promote use of the Trishuli Assessment Tool for ESIAs
• NEA
• Private Hydropower Developers
Link with the Freshwater Ecosystem Assessment Handbook
• Companion handbook to the Hydropower Environmental Impact
Assessment Manual (MoFE)
• Forthcoming from ICIMOD and Forest Research Training Centre (FRTC)
• Prepared by Deep Shah and Ram Devi Tachamo Shah
• Webinar on May 11http://mofe.gov.np/downloadfile/Hydropower%20Env
ironmental%20Impact%20Assessment%20Manual_153
7854204.pdf

Continue to join the February IFC Workshop Webinar Series
Learn more about the field methods and other components of the Trishuli Assessment Tool:
❖ February 4: Electrofishing
❖ February 9: Environmental DNA (eDNA)
❖ February 11: Macroinvertebrate Sampling
❖ February 17: Himalayan Fish Identification
❖ February 18: Data Analysis for Long-term Monitoring
Sign up for webinars individually. Participants who attend all 6 webinars will receive a
Certificate from IFC and be considered for in-person training on these topics.
65

Moderator:
Ms. Kate Lazarus
Senior Asia ESG Lead
IFC
Q & A Session
Thank you