Embed Size (px)
Citation preview
SYSCO Corporation
U.K. & EuropeInvestor Meetings
June 2004
Certain statements made herein and in conjunction with these slides are Forward-Look ing Statements. They include statements regarding continued strength and recognition of SYSCO Brand products, industry growth, continued competitive advantages, industry leadership, projected sales increases, anticipated capital expenditures, customer mix, product cost inflation/deflation, implementation and anticipated results of supply chain strategies, computer software and hardware technology, anticipated results of initiatives to improve gross margins and expenses, SYSCO's ability to realize efficiencies and cost savings and to solidify customer relationships and service levels from new technologies, “fold-outs,” potential acquisitions and pending acquisitions and any potential benefits resulting therefrom, payment of dividends, consistency and predictability of earnings, cash flow growth and continuation of the share repurchase program, SYSCO's ability to build stronger relationships with existing customers and develop new relationships with additional foodservice operators, SYSCO's ability to outpace overall foodservice industry growth, SYSCO's ability to achieve its long-term objectives with respect to real sales growth and earnings per share growth, and the continued strength of the meals-prepared-away-from-home market.
These statements involve risks and uncertainties and are based on management's current expectations and estimates; actual results may differ materially. Those risks and uncertainties that could impact these statements include: industry growth, sales increases, customer mix, product cost inflation/deflation; Payment of dividends; continuation of the share repurchase program; the consistency and predictability of earnings and cash flow growth that could be affected by conditions in the economy, the industry and internal factors that may alter planned results, the risks relating to the foodservice distribution industry's relatively low profit margins and sensitivity to general economic conditions; SYSCO's leverage and debt risks; the successful completion of acquisitions and integration of acquired companies; the risk of interruption of supplies due to lack of long-term contracts, severe weather, work stoppages or otherwise; and internal factors such as the ability to control expenses. In addition, the decision to pursue acquisitions, “fold-outs” and other capital projects could vary due to construction schedules and the timing of other expenditures, while the implementation and timing of “fold-out” operations, acquisitions and other capital projects could be impacted by competitive conditions, labor issues, weather, satisfactory completion of due diligence, software systems integration and testing and other matters. For a discussion of additional factors that could cause actual results to differ from those described in the forward-look ing statements, see the Company’s Annual Report on Form 10-K for the fiscal year ended June 28, 2003 as filed with the Securities and Exchange Commission.
Forward-Looking Statements

SYSCO ProfileWho:
North America’s #1 foodservice marketer & distributorCY 2003 sales of $27.5 Billion
What:Serve $200 Billion Foodservice & Hospitality marketApproximately 420,000 customers
Where:149 locations in the U.S. and Canada
When:Industry Leader since 1977Founded 1969; IPO in 1970
How:More than 300,000 productsAbout 8,000 marketing associates
Why:Our Mission: To Help Our Customers Succeed
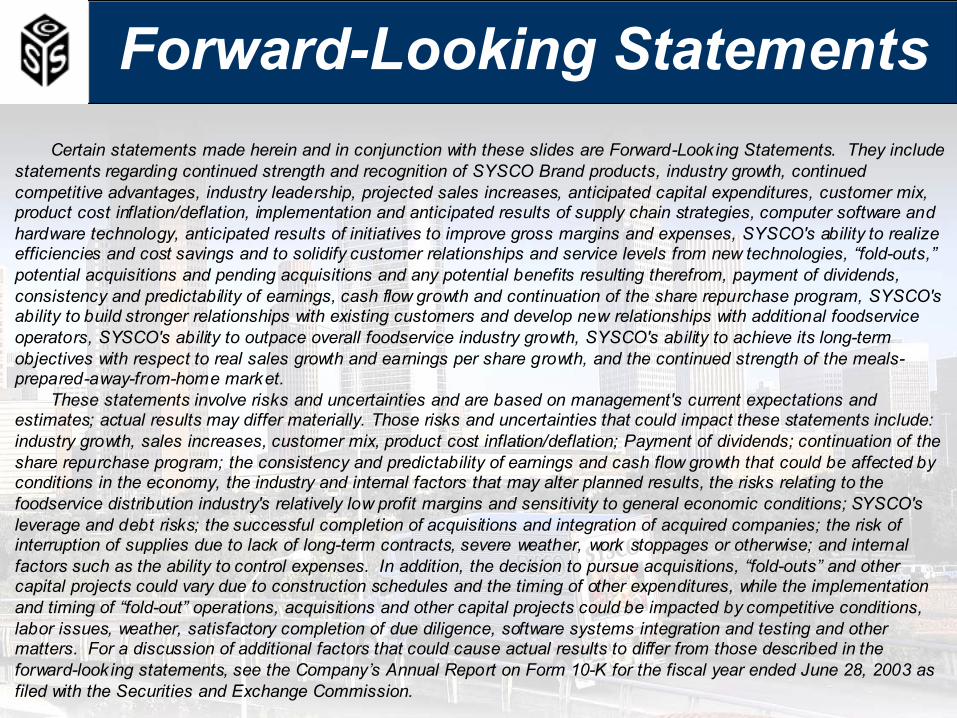
27+ Yrs. of Sales & Earnings Increases!
0
5
10
15
20
25
30
FY89
FY70
FY72
FY74
FY76
FY78
FY80
FY82
FY84
FY86
FY88
FY90
FY93
FY96
FY98
FY99
FY01
FY71
FY73
FY75
FY77
FY79
FY81
FY83
FY85
FY87
FY91
FY92
FY94
FY95
FY97
FY00
FY02
FY03
0
100
200
300
400
500
600
700
800
900SalesNet Earnings
5 Yr. CAGR: Sales = 11.3% Net Earnings 19.1%
10 Yr. CAGR: Sales = 10.1% Net Earnings 14.5%
20 Yr. CAGR: Sales = 14.6% Net Earnings 16.0%
30 Yr. CAGR: Sales = 16.6% Net Earnings 18.1%
Sales (Billions) Net Earn. (Millions)
* All net earnings data is before accounting changes.
FY03 Sales +11.9%; Net Earnings +14.5%
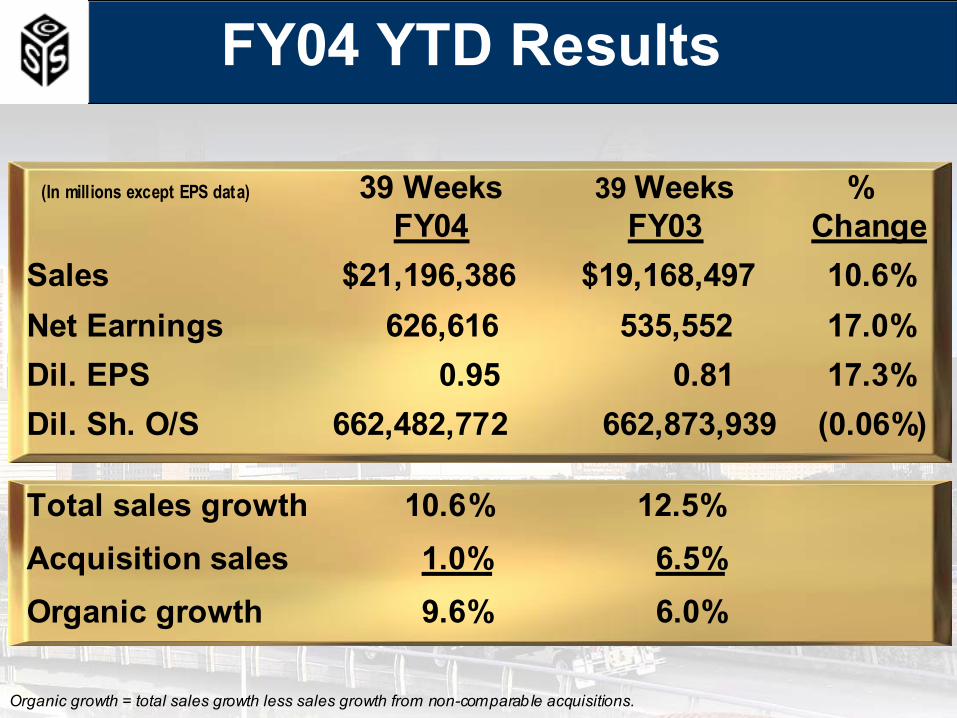
39 Weeks 39 Weeks %FY04 FY03 Change
Sales $21,196,386 $19,168,497 10.6%Net Earnings 626,616 535,552 17.0%Dil. EPS 0.95 0.81 17.3% Dil. Sh. O/S 662,482,772 662,873,939 (0.06%)
Total sales growth 10.6% 12.5%Acquisition sales 1.0% 6.5%Organic growth 9.6% 6.0%
(In millions except EPS data)
FY04 YTD Results
Organic growth = total sales growth less sales growth from non-comparable acquisitions.
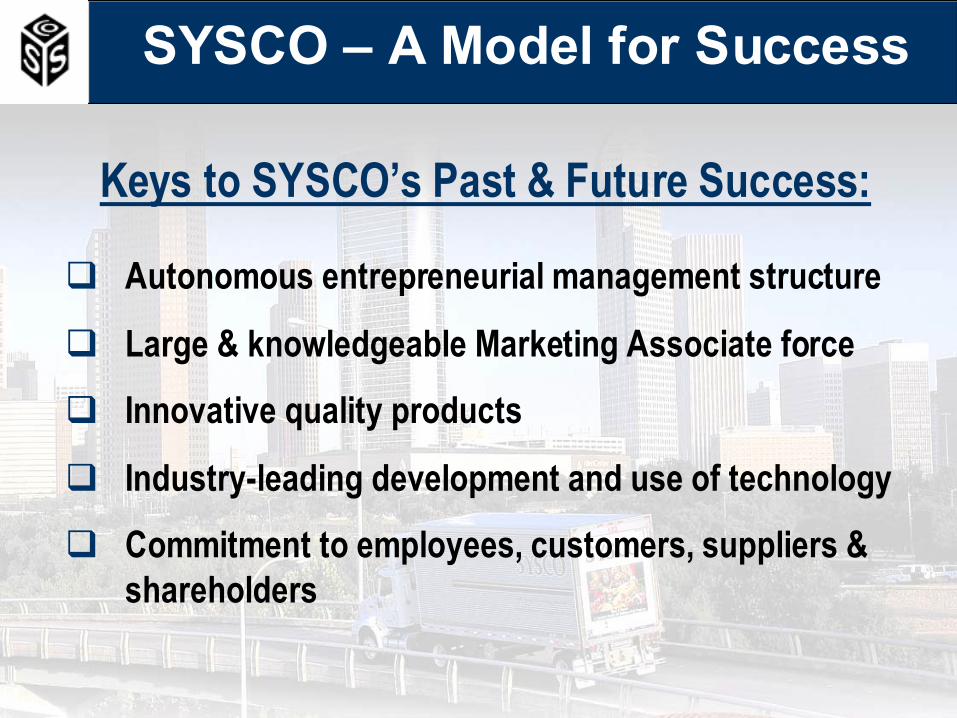
Keys to SYSCO’s Past & Future Success:
Autonomous entrepreneurial management structure
Large & knowledgeable Marketing Associate force
Innovative quality products
Industry-leading development and use of technology
Commitment to employees, customers, suppliers & shareholders
SYSCO – A Model for Success
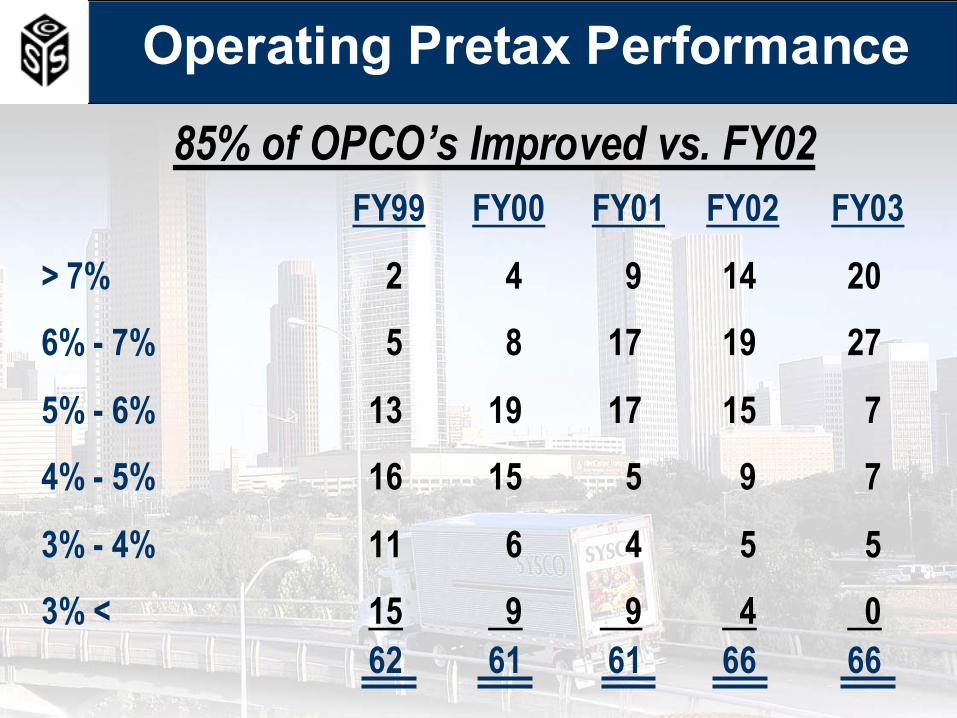
FY99 FY00 FY01 FY02 FY03
> 7% 2 4 9 14 20
6% - 7% 5 8 17 19 27
5% - 6% 13 19 17 15 7
4% - 5% 16 15 5 9 7
3% - 4% 11 6 4 5 5
3% < 15 9 9 4 062 61 61 66 66
85% of OPCO’s Improved vs. FY02
Operating Pretax Performance
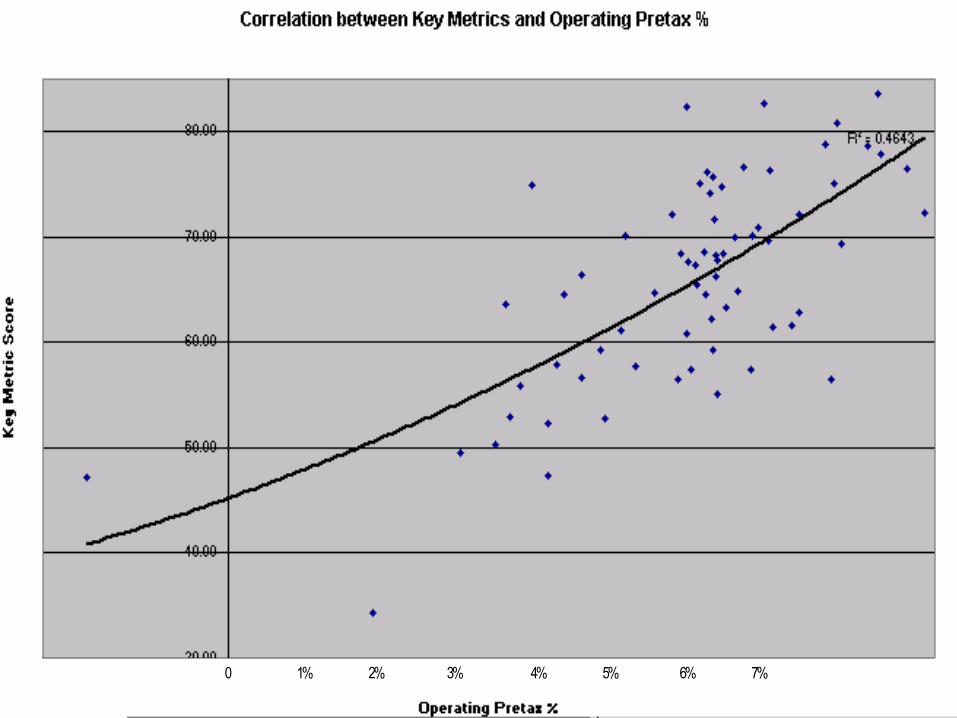
0 1% 2% 3% 4% 5% 6% 7%
Sour
ce: T
echn
omic
35
40
45
50
55
60
65
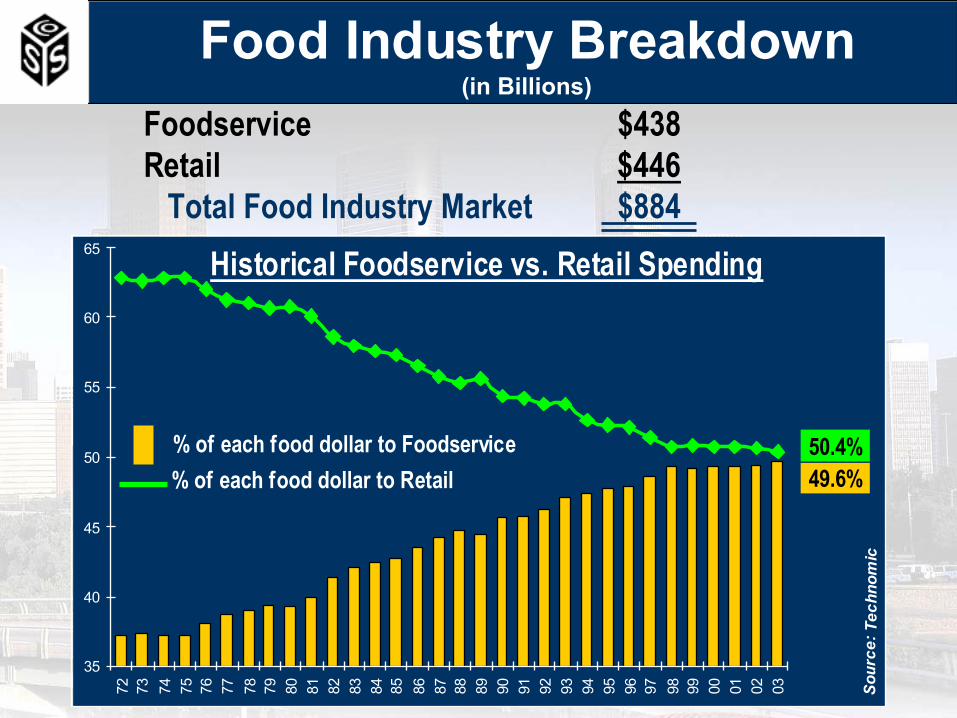
72 73 74 75 76 77 78 79 80 81 82 83 84 85 86 87 88 89 90 91 92 93 94 95 96 97 98 99 00 01 02 03
49.6%50.4%
Historical Foodservice vs. Retail Spending
% of each food dollar to Retail% of each food dollar to Foodservice
Foodservice $438 Retail $446
Total Food Industry Market $884
Food Industry Breakdown(in Billions)

US vs. European Foodservice MarketUnited States EuropeLow cost More expensive
Aging population & more women working areencouraging growth
App. 50% App. 30%
Large fragmented mkt.; Few large distributors;Many regional/niche co’s Many regional/niche co’s
Common Developing
Variety is common, with Diversity by countryregional diversity in areas
1,276 Euros 613 EurosSource: Foodservice Intelligence.
Cost
Demographics
Foodservice’s share of total food dollar
Market
Franchising of retail formats
Tastes / habits / culture
Foodservice sales per capita
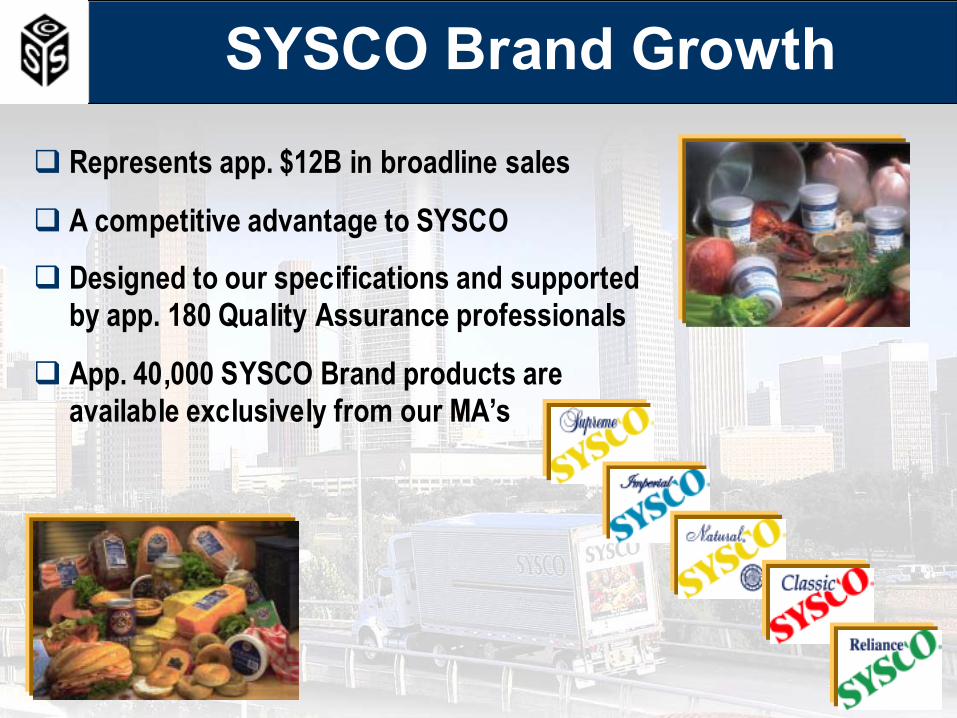
SYSCO Brand Growth
Represents app. $12B in broadline sales
A competitive advantage to SYSCO
Designed to our specifications and supported by app. 180 Quality Assurance professionals
App. 40,000 SYSCO Brand products are available exclusively from our MA’s
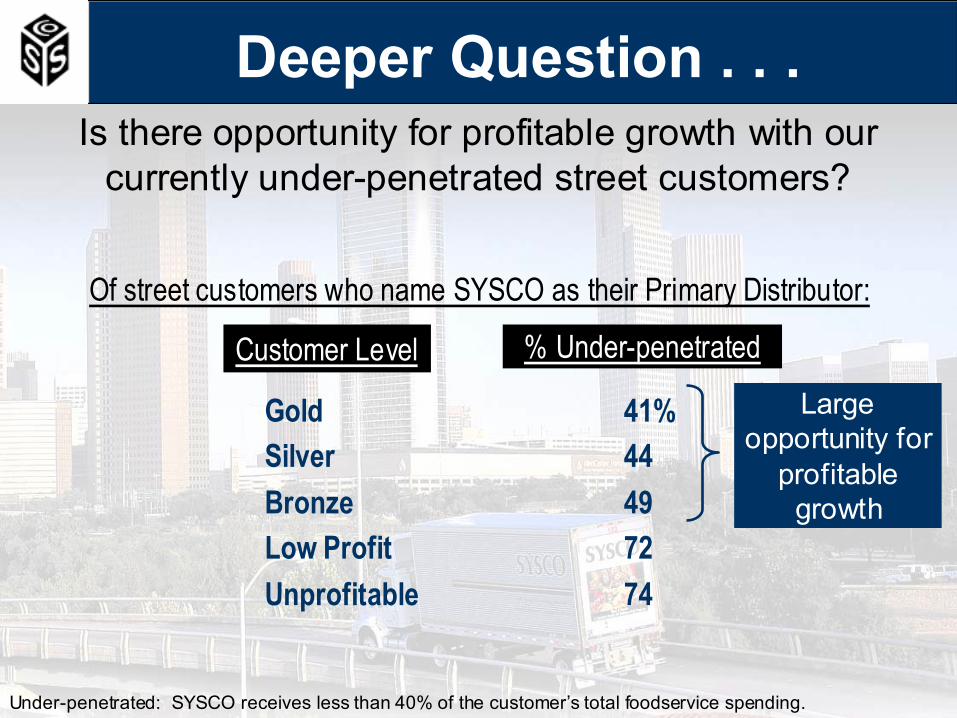
Deeper Question . . .
% Under-penetrated
Of street customers who name SYSCO as their Primary Distributor:
Gold 41%Silver 44Bronze 49Low Profit 72Unprofitable 74
Customer Level
Is there opportunity for profitable growth with our currently under-penetrated street customers?
Large opportunity for
profitable growth
Under-penetrated: SYSCO receives less than 40% of the customer’s total foodservice spending.
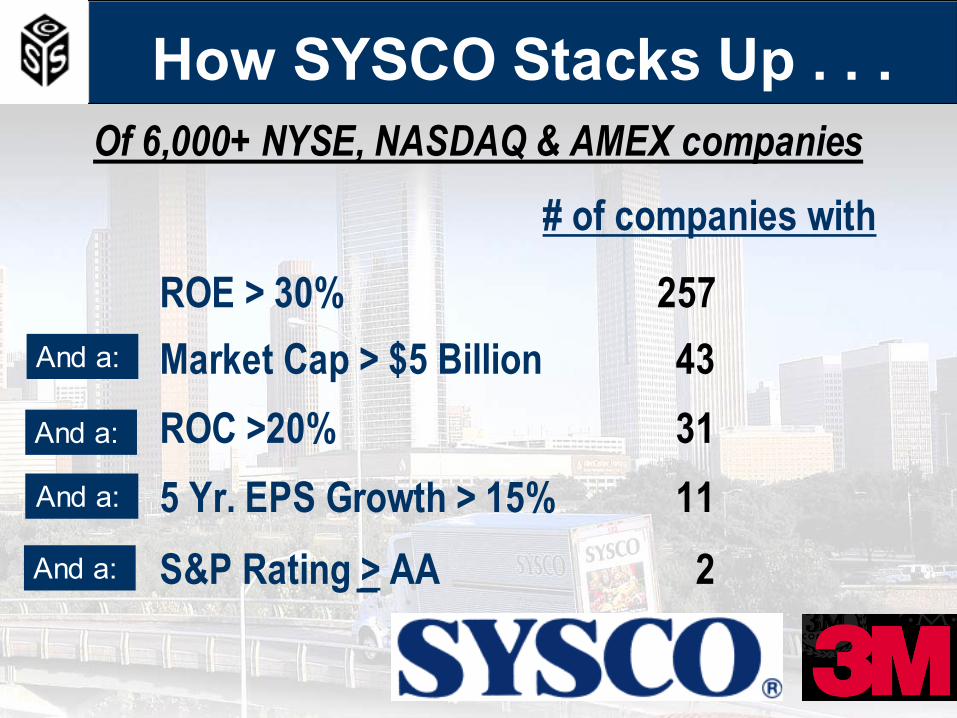
# of companies with
ROE > 30% 257
Of 6,000+ NYSE, NASDAQ & AMEX companies
Market Cap > $5 Billion 43ROC >20% 315 Yr. EPS Growth > 15% 11
And a:
And a:
And a:
And a: S&P Rating > AA 2
How SYSCO Stacks Up . . .
How Do We Optimize Our Supply Chain?
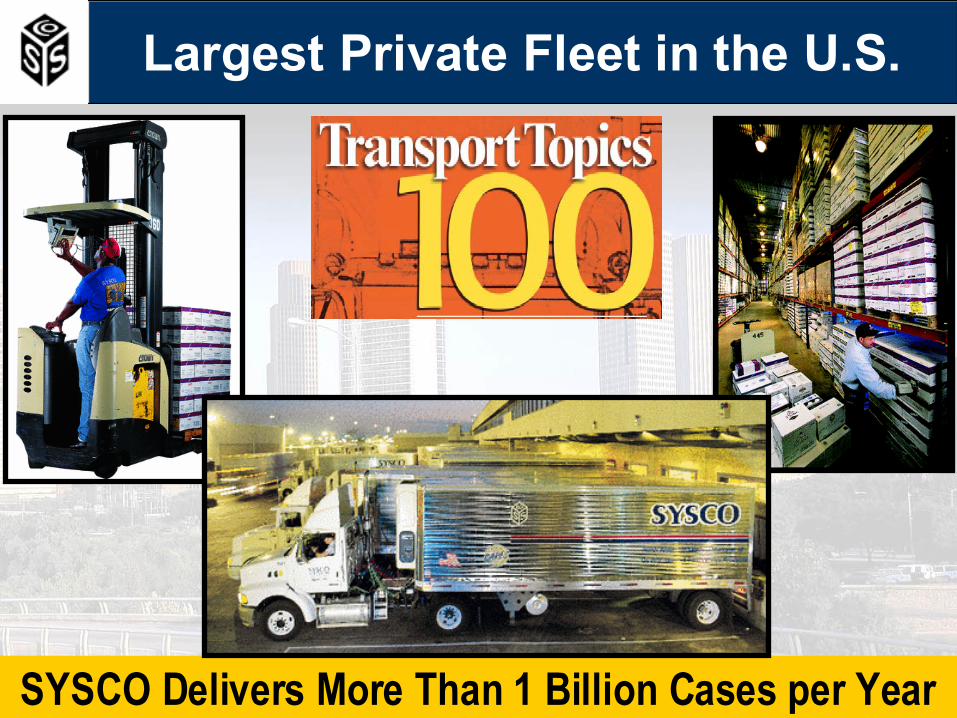
SYSCO Delivers More Than 1 Billion Cases per Year
Largest Private Fleet in the U.S.

3.4
3.7Pieces per Mile
+5.7
%
FY00 FY03
575
625
+4.9%
Pieces per Trip
FY00 FY03 FY00 FY0327
31
+8.2%
Lines per Stop
48
54
+6.7%
Pieces per Stop
FY00 FY03
Distribution Efficiencies
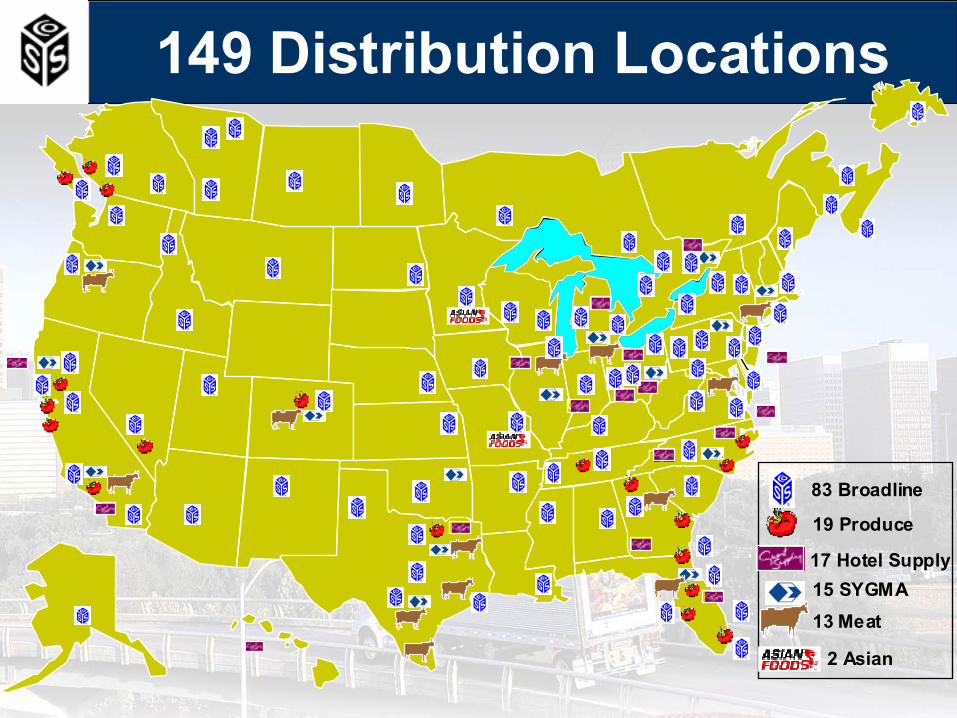
17 Hotel Supply
13 Meat
19 Produce
15 SYGMA
83 Broadline
2 Asian
149 Distribution Locations
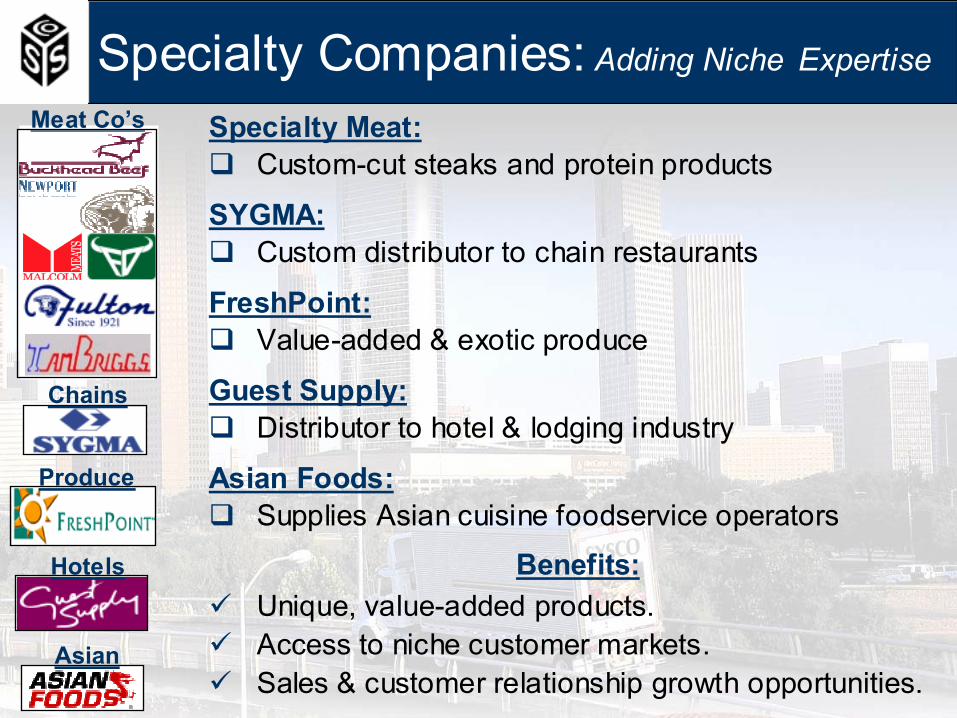
Benefits:Unique, value-added products.Access to niche customer markets.Sales & customer relationship growth opportunities.
Specialty Companies: Adding Niche Expertise
Specialty Meat:Custom-cut steaks and protein products
Asian
Asian Foods:Supplies Asian cuisine foodservice operators
Hotels
Guest Supply:Distributor to hotel & lodging industry
Produce
FreshPoint:Value-added & exotic produce
Chains
SYGMA:Custom distributor to chain restaurants
Meat Co’s
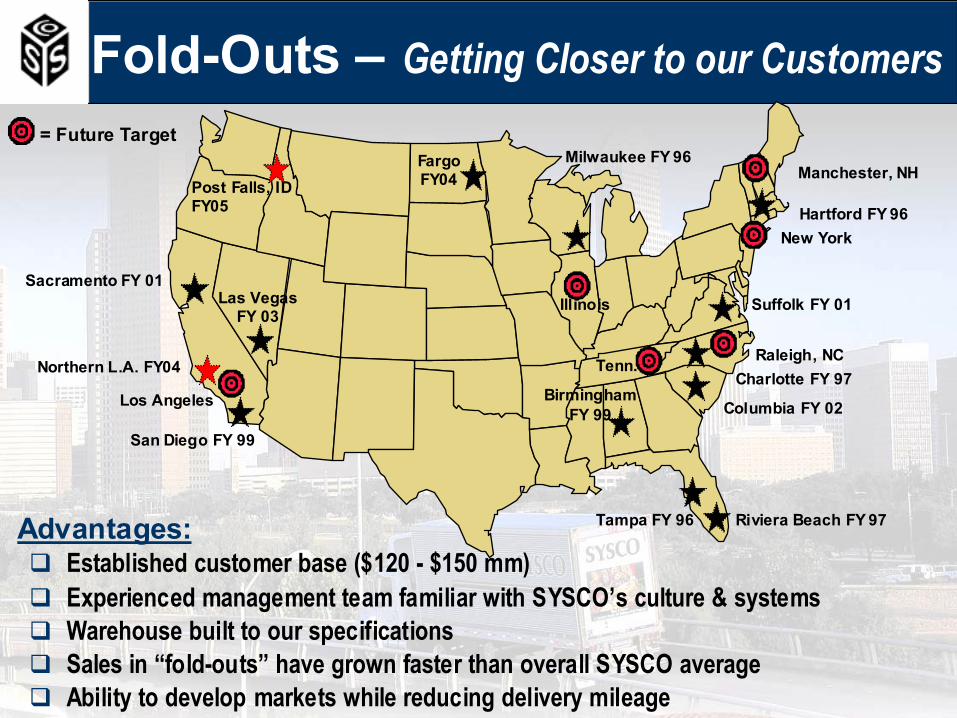
Advantages:Established customer base ($120 - $150 mm)Experienced management team familiar with SYSCO’s culture & systemsWarehouse built to our specificationsSales in “fold-outs” have grown faster than overall SYSCO averageAbility to develop markets while reducing delivery mileage
Sacramento FY 01
San Diego FY 99
Las Vegas FY 03
Tampa FY 96 Riviera Beach FY 97
Charlotte FY 97
Hartford FY 96
Milwaukee FY 96
Suffolk FY 01
Columbia FY 02Birmingham
FY 99
Northern L.A. FY04
New York
Post Falls, IDFY05
FargoFY04 Manchester, NH
Los Angeles
Illinois
Raleigh, NCTenn.
Fold-Outs – Getting Closer to our Customers= Future Target
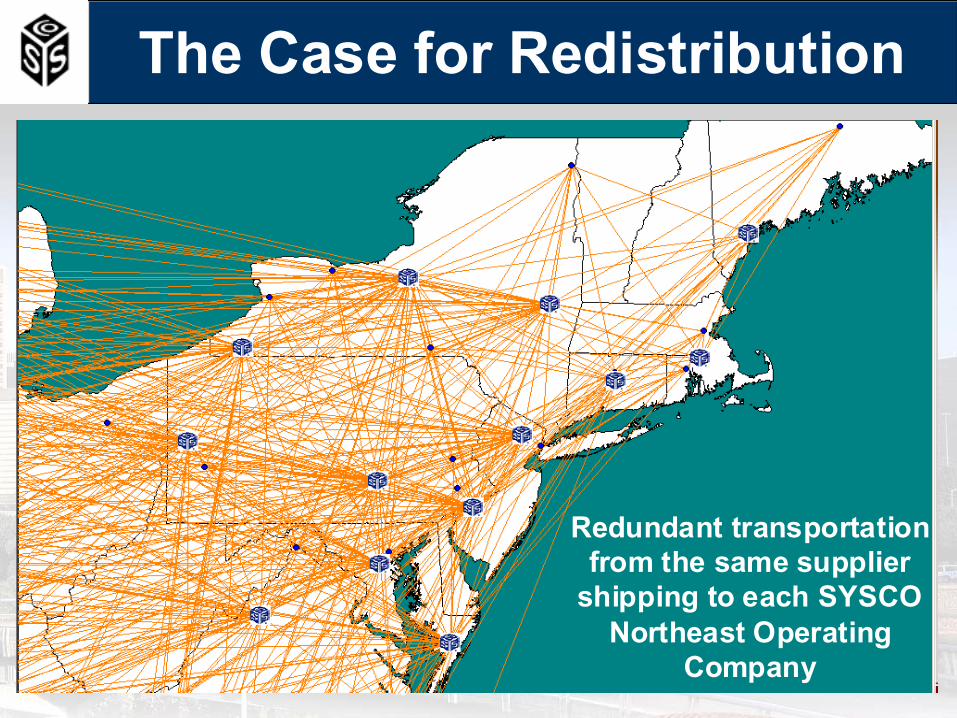
The Case for Redistribution
Redundant transportation from the same supplier
shipping to each SYSCO Northeast Operating
Company
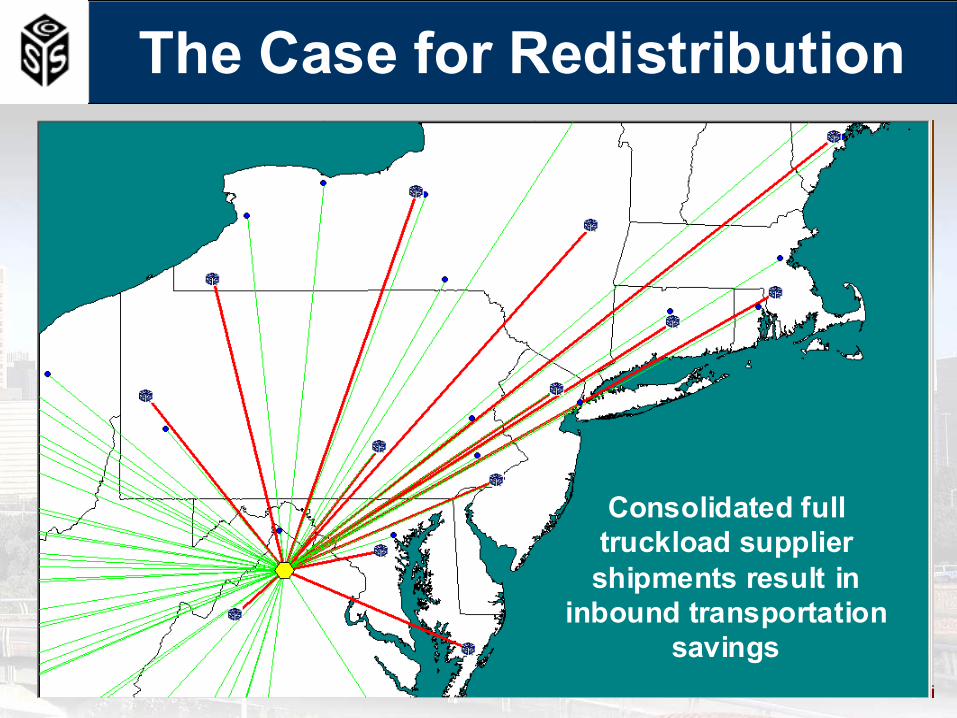
The Case for Redistribution
Consolidated full truckload supplier shipments result in
inbound transportation savings
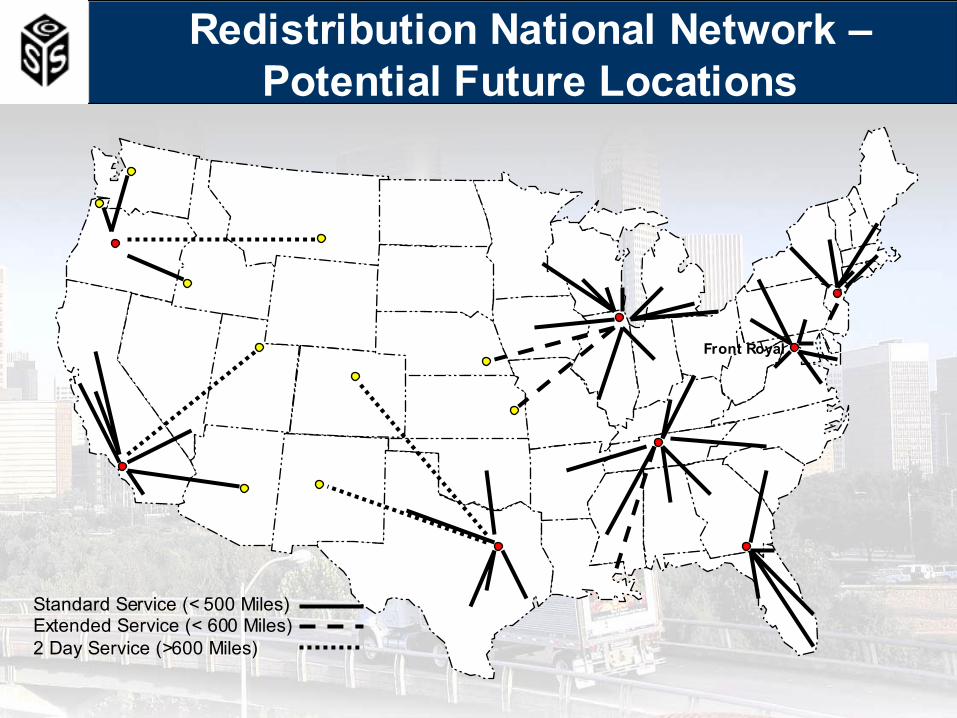
Front Royal
Standard Service (< 500 Miles)Extended Service (< 600 Miles)2 Day Service (>600 Miles)
Redistribution National Network –Potential Future Locations
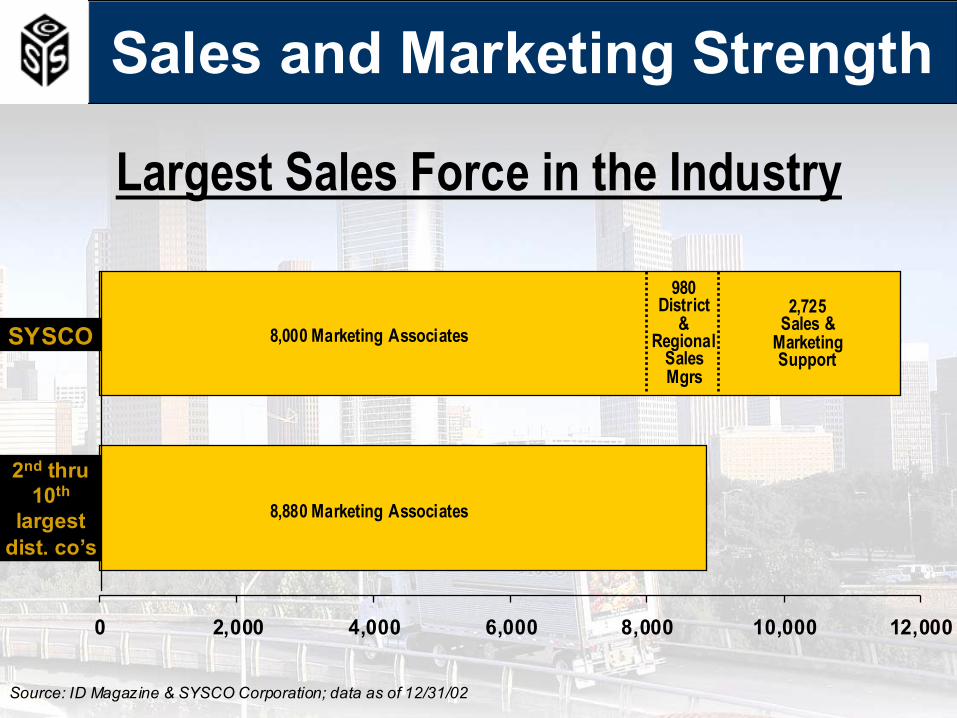
Largest Sales Force in the Industry
Source: ID Magazine & SYSCO Corporation; data as of 12/31/02
Sales and Marketing Strength
0 2,000 4,000 6,000 8,000 10,000 12,000
8,000 Marketing Associates
980District
&Regional
SalesMgrs
2,725Sales &
MarketingSupport
8,880 Marketing Associates
SYSCO
2nd thru 10th
largestdist. co’s
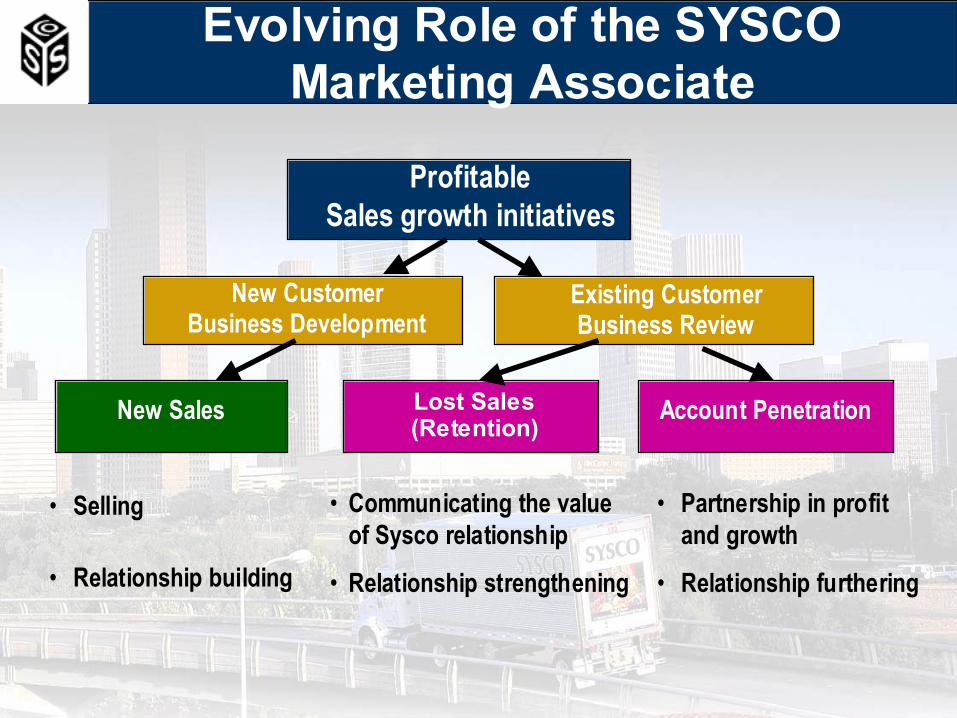
New CustomerBusiness Development
Existing CustomerBusiness Review
Lost Sales(Retention)
Account PenetrationNew Sales
• Selling
• Relationship building
• Communicating the value of Sysco relationship
• Relationship strengthening
• Partnership in profit and growth
• Relationship furthering
ProfitableSales growth initiatives
Evolving Role of the SYSCOMarketing Associate
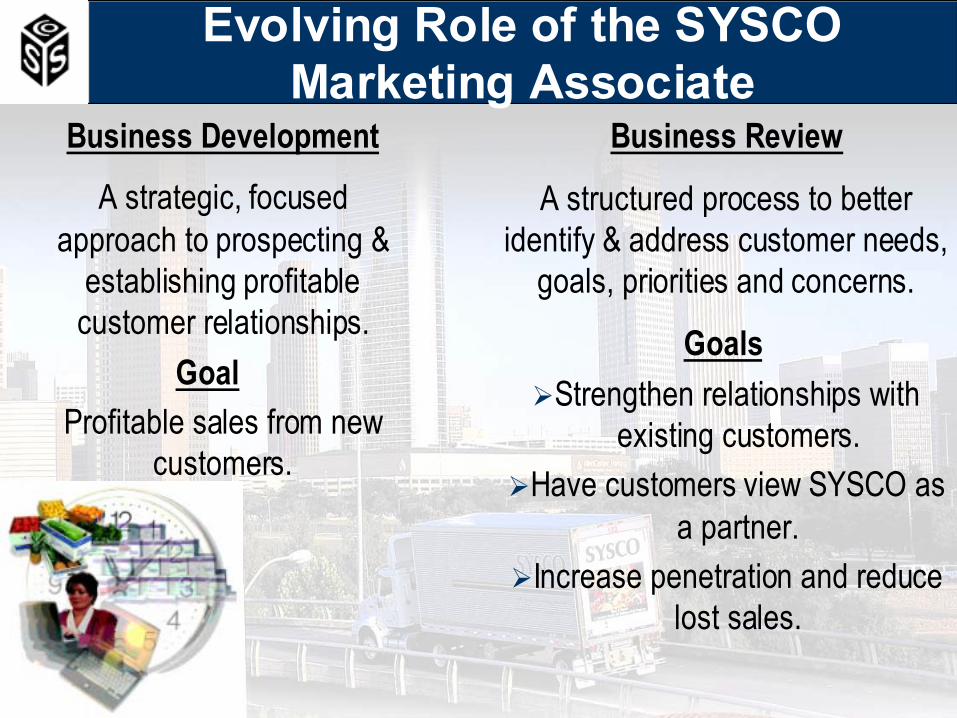
Business DevelopmentA strategic, focused
approach to prospecting & establishing profitable
customer relationships.Goal
Profitable sales from new customers.
Business Review
A structured process to better identify & address customer needs,
goals, priorities and concerns.
GoalsStrengthen relationships with
existing customers.Have customers view SYSCO as
a partner.Increase penetration and reduce
lost sales.
Evolving Role of the SYSCOMarketing Associate
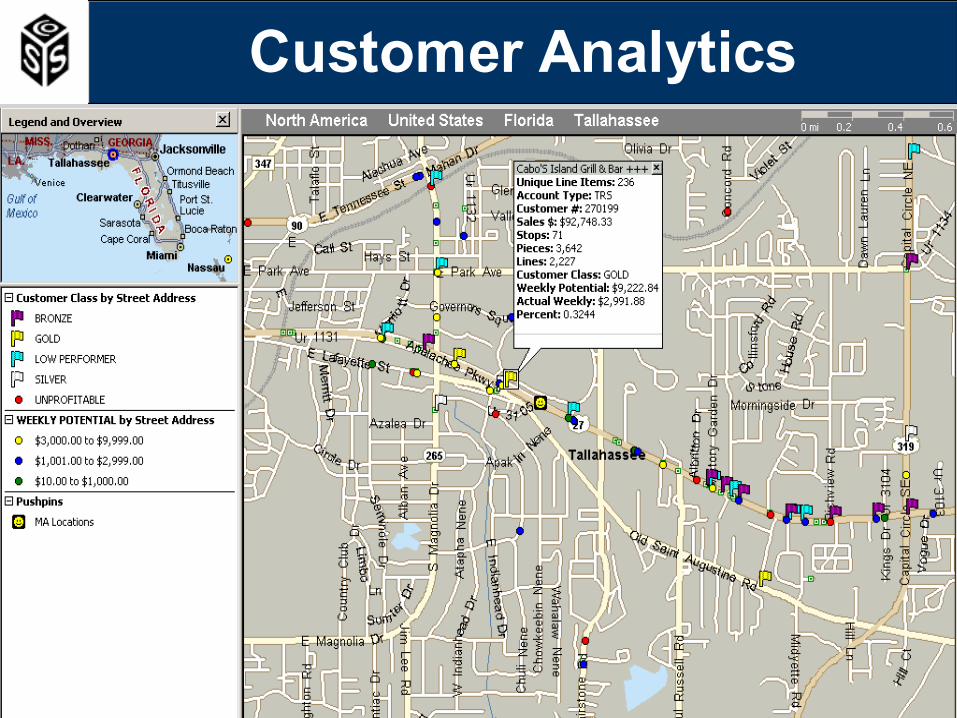
Customer Analytics
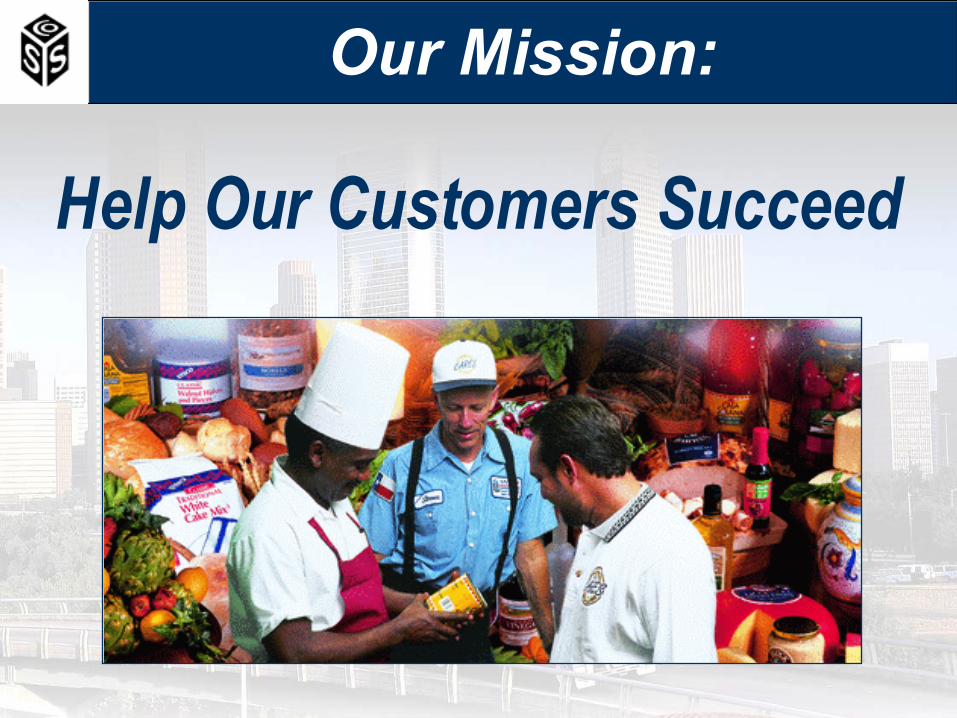
Help Our Customers Succeed
Our Mission:
Long-Term Growth Objectives
Grow total sales in the low- to mid-teens range
Acquisitions, on average, add 3% per year to total sales growth
Leverage earnings growth to outpace sales growth
Maintain a 35% Return on Equity
Maintain a Debt to Total Capital Ratio of 35% - 40%
Thank You!