Embed Size (px)
Citation preview
UNITED STATES SECURITIES AND EXCHANGE COMMISSIONWashington, D.C. 20549
Form 10-K¥ ANNUAL REPORT PURSUANT TO SECTION 13 OR 15(d)
OF THE SECURITIES EXCHANGE ACT OF 1934For the Fiscal Year Ended September 30, 2009
OR
n TRANSITION REPORT PURSUANT TO SECTION 13 OR 15(d)OF THE SECURITIES EXCHANGE ACT OF 1934For the transition period from to
AMERISOURCEBERGEN CORPORATION(Exact name of registrant as specified in its charter)
CommissionFile Number
Registrant, State of IncorporationAddress and Telephone Number
I.R.S. EmployerIdentification No.
1-16671 AmerisourceBergen Corporation(a Delaware Corporation)
1300 Morris DriveChesterbrook, PA 19087-5594
23-3079390
(610) 727-7000
Securities Registered Pursuant to Section 12(b) of the Act:Common Stock, $0.01 par value per share
Securities Registered Pursuant to Section 12(g) of the Act:None
Indicate by check mark if the registrant is a well-known seasoned issuer (as defined in Rule 405 of the SecuritiesAct). Yes ¥ No n
Indicate by check mark if the registrant is not required to file reports pursuant to Section 13 or 15(d) of the Securities ExchangeAct of 1934. Yes n No ¥
Indicate by check mark whether the registrant (1) has filed all reports required to be filed by Section 13 or 15(d) of the SecuritiesExchange Act of 1934 during the preceding 12 months (or for such shorter period that the registrant was required to file such reports),and (2) has been subject to such filing requirements for the past 90 days. Yes ¥ No n
Indicate by check mark whether the registrant has submitted electronically and posted on its corporate website, if any, everyInteractive Data File required to be submitted and posted pursuant to Rule 405 of Regulation S-T (Section 232.405 of this chapter)during the preceding 12 months (or for such shorter period that the registrant was required to submit and post suchfiles). Yes ¥ No n
Indicate by check mark if disclosure of delinquent filers pursuant to Item 405 of Regulation S-K (Section 229.405 of this chapter)is not contained herein, and will not be contained, to the best of the registrant’s knowledge, in definitive proxy or informationstatements incorporated by reference in Part III of this Form 10-K or any amendment to this Form 10-K. n
Indicate by check mark whether the registrant is a large accelerated filer, an accelerated filer, a non-accelerated filer, or a smallerreporting company. See the definitions of “large accelerated filer,” “accelerated filer” and “smaller reporting company” in Rule 12b-2of the Exchange Act. (Check one):
Large accelerated filer ¥ Accelerated filer n Non-accelerated filer n Smaller reporting company n
(Do not check if a smaller reporting company)
Indicate by check mark whether the registrant is a shell company (as defined in Rule 12b-2 of the Securities Exchange Act of1934). Yes n No ¥
The aggregate market value of voting stock held by non-affiliates of the registrant on March 31, 2009 based upon the closing priceof such stock on the New York Stock Exchange on March 31, 2009 was $4,638,411,086.
The number of shares of common stock of AmerisourceBergen Corporation outstanding as of October 31, 2009 was 288,084,821.
Documents Incorporated by ReferencePortions of the following document are incorporated by reference in the Part of this report indicated below:
Part III — Registrant’s Proxy Statement for the 2010 Annual Meeting of Stockholders.
TABLE OF CONTENTS
Item Page
PART I1. Business . . . . . . . . . . . . . . . . . . . . . . . . . . . . . . . . . . . . . . . . . . . . . . . . . . . . . . . . . . . . . . . . . . . . 1
1A. Risk Factors . . . . . . . . . . . . . . . . . . . . . . . . . . . . . . . . . . . . . . . . . . . . . . . . . . . . . . . . . . . . . . . . . 9
1B. Unresolved Staff Comments . . . . . . . . . . . . . . . . . . . . . . . . . . . . . . . . . . . . . . . . . . . . . . . . . . . . . 17
2. Properties . . . . . . . . . . . . . . . . . . . . . . . . . . . . . . . . . . . . . . . . . . . . . . . . . . . . . . . . . . . . . . . . . . . 17
3. Legal Proceedings . . . . . . . . . . . . . . . . . . . . . . . . . . . . . . . . . . . . . . . . . . . . . . . . . . . . . . . . . . . . . 18
4. Submission of Matters to a Vote of Security Holders . . . . . . . . . . . . . . . . . . . . . . . . . . . . . . . . . . . 18
Executive Officers of the Registrant. . . . . . . . . . . . . . . . . . . . . . . . . . . . . . . . . . . . . . . . . . . . . . . . 18
PART II5. Market for Registrant’s Common Equity, Related Stockholder Matters and Issuer Purchases of
Equity Securities . . . . . . . . . . . . . . . . . . . . . . . . . . . . . . . . . . . . . . . . . . . . . . . . . . . . . . . . . . . . . . 19
6. Selected Financial Data . . . . . . . . . . . . . . . . . . . . . . . . . . . . . . . . . . . . . . . . . . . . . . . . . . . . . . . . . 22
7. Management’s Discussion and Analysis of Financial Condition and Results of Operations . . . . . . . . 23
7A. Quantitative and Qualitative Disclosures About Market Risk . . . . . . . . . . . . . . . . . . . . . . . . . . . . . 43
8. Financial Statements and Supplementary Data . . . . . . . . . . . . . . . . . . . . . . . . . . . . . . . . . . . . . . . . 44
9. Changes in and Disagreements with Accountants on Accounting and Financial Disclosure . . . . . . . 929A. Controls and Procedures . . . . . . . . . . . . . . . . . . . . . . . . . . . . . . . . . . . . . . . . . . . . . . . . . . . . . . . . 92
9B. Other Information . . . . . . . . . . . . . . . . . . . . . . . . . . . . . . . . . . . . . . . . . . . . . . . . . . . . . . . . . . . . . 94
PART III10. Directors, Executive Officers and Corporate Governance . . . . . . . . . . . . . . . . . . . . . . . . . . . . . . . . 94
11. Executive Compensation . . . . . . . . . . . . . . . . . . . . . . . . . . . . . . . . . . . . . . . . . . . . . . . . . . . . . . . . 94
12. Security Ownership of Certain Beneficial Owners and Management and Related StockholderMatters . . . . . . . . . . . . . . . . . . . . . . . . . . . . . . . . . . . . . . . . . . . . . . . . . . . . . . . . . . . . . . . . . . . . . 94
13. Certain Relationships and Related Transactions, and Director Independence . . . . . . . . . . . . . . . . . . 94
14. Principal Accountant Fees and Services . . . . . . . . . . . . . . . . . . . . . . . . . . . . . . . . . . . . . . . . . . . . . 94
PART IV15. Exhibits, Financial Statement Schedules . . . . . . . . . . . . . . . . . . . . . . . . . . . . . . . . . . . . . . . . . . . . 95
Signatures. . . . . . . . . . . . . . . . . . . . . . . . . . . . . . . . . . . . . . . . . . . . . . . . . . . . . . . . . . . . . . . . . . . 101
i
PART I
ITEM 1. BUSINESS
As used herein, the terms “Company,” “AmerisourceBergen,” “we,” “us,” or “our” refer to AmerisourceBergenCorporation, a Delaware corporation.
AmerisourceBergen Corporation is one of the world’s largest pharmaceutical services companies, withoperations primarily in the United States and Canada. Servicing both healthcare providers and pharmaceuticalmanufacturers in the pharmaceutical supply channel, we provide drug distribution and related services designed toreduce costs and improve patient outcomes. More specifically, we distribute a comprehensive offering of brand-name and generic pharmaceuticals, over-the-counter healthcare products, home healthcare supplies and equipment,and related services to a wide variety of healthcare providers primarily located in the United States and Canada,including acute care hospitals and health systems, independent and chain retail pharmacies, mail order pharmacies,medical and dialysis clinics, physicians, long-term care and other alternate site pharmacies, and other customers.We also provide pharmacy services to certain specialty drug patients. Additionally, we furnish healthcare providersand pharmaceutical manufacturers with an assortment of related services, including pharmaceutical packaging,pharmacy automation, inventory management, reimbursement and pharmaceutical consulting services, logisticsservices, and pharmacy management.
Industry Overview
Pharmaceutical sales in the United States, as recently estimated by IMS Healthcare, Inc. (“IMS”), anindependent third party provider of information to the pharmaceutical and healthcare industry, are expected togrow between 3% and 5% in calendar 2010. IMS expects that certain sectors of the market, such as biotechnologyand other specialty and generic pharmaceuticals, will grow faster than the overall market. Additionally, IMS expectsthe U.S. pharmaceutical industry to grow annually in the low to mid-single digit percentages through 2013.
In addition to general economic conditions, factors that impact the growth of the pharmaceutical industry in theUnited States, and other industry trends, include:
Aging Population. The number of individuals age 55 and over in the United States currently exceeds70 million and is one of the most rapidly growing segments of the population. This age group suffers from morechronic illnesses and disabilities than the rest of the population and is estimated to account for approximately75% of total healthcare expenditures in the United States.
Introduction of New Pharmaceuticals. Traditional research and development, as well as the advent ofnew research, production and delivery methods such as biotechnology and gene therapy, continue to generatenew pharmaceuticals and delivery methods that are more effective in treating diseases. We believe ongoingresearch and development expenditures by the leading pharmaceutical manufacturers will contribute tocontinued growth of the industry. In particular, we believe ongoing research and development of biotechnologyand other specialty pharmaceutical drugs will provide opportunities for the continued growth of our specialtypharmaceuticals business.
Increased Use of Generic Pharmaceuticals. A significant number of patents for widely used brand-name pharmaceutical products will expire during the next several years. In addition, increased emphasis bymanaged care and other third-party payors on utilization of generics has accelerated their growth. We considerthe increase in generic usage a favorable trend because generic pharmaceuticals have historically provided uswith a greater gross profit margin opportunity than brand-name products, although their lower prices reducerevenue growth.
Increased Use of Drug Therapies. In response to rising healthcare costs, governmental and privatepayors have adopted cost containment measures that encourage the use of efficient drug therapies to prevent ortreat diseases. While national attention has been focused on the overall increase in aggregate healthcare costs,we believe drug therapy has had a beneficial impact on overall healthcare costs by reducing expensivesurgeries and prolonged hospital stays. Pharmaceuticals currently account for approximately 10% of overallhealthcare costs. Pharmaceutical manufacturers’ continued emphasis on research and development is expected
1
to result in the continuing introduction of cost-effective drug therapies and new uses for existing drugtherapies.
Legislative Developments. In recent years, regulation of the healthcare industry has changed signif-icantly in an effort to increase drug utilization and reduce costs. These changes included expansion ofMedicare coverage for outpatient prescription drugs, the enrollment (beginning in 2006) of Medicarebeneficiaries in prescription drug plans offered by private entities, and cuts in Medicare and Medicaidreimbursement rates. In addition, the U.S. Congress may take action in the future to reduce the number ofpeople in the United States who do not have health insurance coverage and thereby increase the number ofpeople in the United States who are eligible to be reimbursed for all or a portion of prescription drug costs.These policies and other legislative developments may affect our businesses directly and/or indirectly (seeGovernment Regulation on page 6 for further details).
The Company
We currently serve our customers (healthcare providers, pharmaceutical manufacturers, and certain specialtydrug patients) through a geographically diverse network of distribution service centers and other operations in theUnited States and Canada, and through packaging facilities in the United States and the United Kingdom. In ourpharmaceutical distribution business, we are typically the primary source of supply of pharmaceutical and relatedproducts to our healthcare provider customers. We offer a broad range of services to our customers designed toenhance the efficiency and effectiveness of their operations, which allows them to improve the delivery ofhealthcare to patients and to lower overall costs in the pharmaceutical supply channel.
Strategy
Our business strategy is focused solely on the pharmaceutical supply channel where we provide value-addeddistribution and service solutions to healthcare providers (primarily pharmacies, health systems, medical anddialysis clinics, and physicians) and pharmaceutical manufacturers that increase channel efficiencies and improvepatient outcomes. Implementing this disciplined, focused strategy has allowed us to significantly expand ourbusiness, and we believe we are well-positioned to continue to grow revenue and increase operating income throughthe execution of the following key elements of our business strategy:
• Optimize and Grow Our Pharmaceutical Distribution and Service Businesses. We believe we are well-positioned in size and market breadth to continue to grow our distribution business as we invest to improveour operating and capital efficiencies. Distribution anchors our growth and position in the pharmaceuticalsupply channel, as we provide superior distribution services and deliver value-added solutions, whichimprove the efficiency and competitiveness of both healthcare providers and pharmaceutical manufacturers,thus allowing the pharmaceutical supply channel to better deliver healthcare to patients.
With the rapid growth of generic pharmaceuticals in the U.S. market, we have introduced strategies toenhance our position in the generic marketplace. We source generics globally, offer a value-added genericformulary program to our healthcare provider customers, and monitor our customers’ compliance with ourgenerics program. We also sell data and other valuable services to our generic manufacturing customers.
We believe we have one of the lowest cost operating structures among all pharmaceutical distributors. OurOptimiz» program for AmerisourceBergen Drug Corporation reduced our distribution facility network inthe U.S. to 26 facilities. The program, which was completed in fiscal 2007, included building six newfacilities and closing 31 facilities. These measures have reduced our operating costs and working capital. Inaddition, we believe we will continue to achieve productivity and operating income gains as we invest in andcontinue to implement warehouse automation technology, adopt “best practices” in warehousing activities,and increase operating leverage by increasing volume per full-service distribution facility. Furthermore, webelieve that the investments that we will make related to our Business Transformation project over the nextfew years will reduce our operating expenses in the future (see Information Systems on page 5 for furtherdetails).
2
We offer value-added services and solutions to assist healthcare providers and pharmaceutical manufac-turers to improve their efficiency and their patient outcomes. Services for manufacturers include: assistancewith rapid new product launches, promotional and marketing services to accelerate product sales, productdata reporting and logistical support. In addition, we provide packaging services to manufacturers, includingcontract packaging.
Our provider solutions include: our Good Neighbor Pharmacy» program, which enables independentcommunity pharmacies to compete more effectively through pharmaceutical benefit and merchandisingprograms; Good Neighbor Pharmacy Provider Network», our managed care network, which connects ourretail pharmacy customers to payor plans throughout the country and is the third-largest in the U.S.; genericproduct purchasing services; hospital pharmacy consulting designed to improve operational efficiencies;scalable automated pharmacy dispensing equipment; and packaging services that deliver unit dose, punchcard and other compliance packaging for institutional and retail pharmacy customers.
In an effort to supplement our organic growth, we continue to utilize a disciplined approach to seekacquisitions that will assist us with our strategic growth plans.
In October 2007, we acquired Bellco Health (“Bellco”), a privately held New York distributor of brandedand generic pharmaceuticals, for a purchase price of $162.2 million, net of cash acquired. Bellco primarilyservices independent retail community pharmacies in the Metro New York City area. The acquisition ofBellco expanded the Company’s presence in this large community pharmacy market. Nationally, Bellcomarkets and sells generic pharmaceuticals to individual retail pharmacies, and provides pharmaceuticalproducts and services to dialysis clinics. Bellco is now fully integrated into the operations of Amerisour-ceBergen Drug Corporation and AmerisourceBergen Specialty Group.
• Optimize and Grow Our Specialty Distribution and Service Businesses. Representing $15.6 billion in totalrevenue in fiscal 2009, our specialty pharmaceuticals business has a significant presence in this rapidlygrowing part of the pharmaceutical supply channel. With distribution and value-added services to physiciansand a broad array of pharmaceutical and specialty services for manufacturers, our specialty pharmaceuticalsbusiness is a well-developed platform for growth. We are the leader in distribution and services tocommunity oncologists and have leading positions in other physician-administered products. We alsodistribute vaccines, other injectables, and plasma and other blood products, and are well-positioned toservice and support many of the new biotech therapies that will be coming to market in the near future.
Our specialty service businesses help pharmaceutical manufacturers, especially in the biotechnology sector,commercialize their products in the channel. We believe we are the largest provider of reimbursementservices that assist pharmaceutical companies to launch drugs with targeted populations and support theproducts in the supply channel. We also provide physician education services, third party logistics, nursingservices, and specialty pharmacy services to help speed products to market.
We continue to seek to expand our offerings in specialty distribution and services.
In fiscal 2009, we acquired Innomar Strategies Inc. (“Innomar”), a Canadian specialty pharmaceuticalservices company, for a purchase price of $13.4 million. Innomar provides services within Canada topharmaceutical and biotechnology companies, including strategic consulting and access solutions, specialtylogistics management, patient assistance and nursing services, and clinical research services. Innomar hasincreased our specialty distribution and services presence in Canada.
Our acquisition of Bellco in fiscal 2008 allowed us to significantly increase our sales of pharmaceuticalproducts and services to dialysis clinics.
In fiscal 2007, we acquired three specialty service businesses, beginning with I.G.G. of America, Inc.(“IgG”), a specialty pharmacy and infusion services business specializing in the blood derivative intra-venous immunoglobulin (“IVIG”). We also acquired Access M.D., Inc. (“Access M.D.”), a Canadiancompany that provides reimbursement support and nursing support services for manufacturers of specialtypharmaceuticals, such as injectable and biological therapies. Access M.D. expanded our specialty servicebusinesses into Canada and complemented the distribution services offered by AmerisourceBergen Canada,
3
our wholesale distribution business in Canada. Lastly, we acquired Xcenda LLC (“Xcenda”), a consultingbusiness that provides additional capabilities within pharmaceutical brand services, applied health out-comes, and biopharma strategies.
• Divestitures. In order to allow us to concentrate on our strategic focus areas of pharmaceutical distributionand related services and specialty pharmaceutical distribution and related services, we have divested certainnon-core businesses and may, from time to time, consider additional divestitures.
In October 2008, we sold PMSI, our workers’ compensation business.
On July 31, 2007, the Company and Kindred Healthcare, Inc. (“Kindred”) completed the spin-offs andsubsequent combination of their institutional pharmacy businesses, PharMerica Long-Term Care (“Long-Term Care”) and Kindred Pharmacy Services (“KPS”), to form a new, independent, publicly tradedcompany named PharMerica Corporation (“PMC”). The Company’s and Kindred’s stockholders eachowned approximately 50 percent of PMC immediately after the closing of the transaction.
Operations
Operating Structure. We are organized based upon the products and services we provide to our customers.Our operations as of September 30, 2009 are comprised of one reportable segment, Pharmaceutical Distribution.
The Pharmaceutical Distribution reportable segment is comprised of three operating segments, which includethe operations of AmerisourceBergen Drug Corporation (“ABDC”), AmerisourceBergen Specialty Group(“ABSG” or “Specialty Group”), and AmerisourceBergen Packaging Group (“ABPG” or “Packaging Group”).Servicing both healthcare providers and pharmaceutical manufacturers in the pharmaceutical supply channel, thePharmaceutical Distribution segment’s operations provide drug distribution and related services designed to reducehealthcare costs and improve patient outcomes.
ABDC distributes a comprehensive offering of brand-name and generic pharmaceuticals, over-the-counterhealthcare products, home healthcare supplies and equipment, and related services to a wide variety of healthcareproviders, including acute care hospitals and health systems, independent and chain retail pharmacies, mail orderpharmacies, medical clinics, long-term care and other alternate site pharmacies, and other customers. ABDC alsoprovides pharmacy management, staffing and other consulting services; scalable automated pharmacy dispensingequipment; medication and supply dispensing cabinets; and supply management software to a variety of retail andinstitutional healthcare providers.
ABSG, through a number of individual operating businesses, provides pharmaceutical distribution and otherservices primarily to physicians who specialize in a variety of disease states, especially oncology, and to otherhealthcare providers, including dialysis clinics. ABSG also distributes vaccines, other injectables, and plasma andother blood products. In addition, through its specialty service businesses, ABSG provides drug commercializationservices, third party logistics, nursing services, and other services for biotech and other pharmaceutical manu-facturers, as well as reimbursement consulting, data analytics, outcomes research, practice management, grouppurchasing services for physician practices, and physician education.
ABPG consists of American Health Packaging, Anderson Packaging (“Anderson”) and Brecon Pharmaceu-ticals Limited (“Brecon”). American Health Packaging delivers unit dose, punch card, unit-of-use, and otherpackaging solutions to institutional and retail healthcare providers. American Health Packaging’s largest customeris ABDC, and, as a result, its operations are closely aligned with the operations of ABDC. Anderson is a leadingprovider of contract packaging services for pharmaceutical manufacturers. Brecon is a United Kingdom-basedprovider of contract packaging and clinical trial materials services for pharmaceutical manufacturers.
Sales and Marketing. The majority of ABDC’s sales force is organized regionally and specialized byhealthcare provider type. Customer service representatives are located in distribution facilities in order to respond tocustomer needs in a timely and effective manner. ABDC also has support professionals focused on its varioustechnologies and service offerings. ABDC’s national marketing organization designs and develops businessmanagement solutions for AmerisourceBergen healthcare provider customers. Tailored to specific groups, theseprograms can be further customized at the business unit or distribution facility level to adapt to local market
4
conditions. ABDC’s sales and marketing organization also serves national account customers through closecoordination with local distribution centers and ensures that our customers are receiving service offerings that meettheir needs. Our Specialty and Packaging groups each have independent sales forces and marketing organizationsthat specialize in their respective product and service offerings.
Customers. We have a diverse customer base that includes institutional and retail healthcare providers aswell as pharmaceutical manufacturers. Institutional healthcare providers include acute care hospitals, healthsystems, mail order pharmacies, long-term care and other alternate care pharmacies and providers of pharmacyservices to such facilities, and physician offices. Retail healthcare providers include national and regional retaildrugstore chains, independent community pharmacies and pharmacy departments of supermarkets and massmerchandisers. We are typically the primary source of supply for our healthcare provider customers. Ourmanufacturing customers include branded, generic and biotech manufacturers of prescribed pharmaceuticals,as well as over-the-counter product and health and beauty aid manufacturers. In addition, we offer a broad range ofvalue-added solutions designed to enhance the operating efficiencies and competitive positions of our customers,thereby allowing them to improve the delivery of healthcare to patients and consumers. In fiscal 2009, total revenuewas comprised of 68% institutional customers and 32% retail customers.
In fiscal 2009, Medco Health Solutions, Inc., our largest customer, accounted for 17% of our total revenue. Noother individual customer accounted for more than 5% of our fiscal 2009 total revenue. Our top ten customersrepresented approximately 41% of fiscal 2009 total revenue. In addition, we have contracts with group purchasingorganizations (“GPOs”), each of which functions as a purchasing agent on behalf of its members, who arehealthcare providers. Approximately 10% of our total revenue in fiscal 2009 was derived from our three largestGPO relationships. The loss of any major customer or GPO relationship could adversely affect future revenue andresults of operations.
Suppliers. We obtain pharmaceutical and other products from manufacturers, none of which accounted for10% or more of our purchases in fiscal 2009. The loss of a supplier could adversely affect our business if alternatesources of supply are unavailable since we are committed to be the primary source of pharmaceutical products for amajority of our customers. We believe that our relationships with our suppliers are good. The ten largest suppliers infiscal 2009 accounted for approximately 48% of our purchases.
Information Systems. ABDC operates its full-service wholesale pharmaceutical distribution facilities in theU.S. on a centralized system. ABDC’s operating system provides for, among other things, electronic order entry bycustomers, invoice preparation and purchasing, and inventory tracking. As a result of electronic order entry, the costof receiving and processing orders has not increased as rapidly as sales volume. ABDC’s systems are intended tostrengthen customer relationships by allowing the customer to lower its operating costs and by providing a platformfor a number of the basic and value-added services offered to our customers, including marketing, product demanddata, inventory replenishment, single-source billing, third-party claims processing, computer price updates andprice labels.
ABDC continues to expand its electronic interface with its suppliers and currently processes a substantialportion of its purchase orders, invoices and payments electronically. Over the last several years, ABDC hassuccessfully implemented a new warehouse operating system, which is used to account for primarily all of ABDC’stransactional volume. The new warehouse operating system has improved ABDC’s productivity and operatingleverage. ABDC will continue to invest in advanced information systems and automated warehouse technology.
In an effort to maintain and improve our existing information technology infrastructure efficiently and cost-effectively, in 2005 we outsourced a significant portion of our information technology activities relating to ABDCand corporate functions to IBM Global Services.
In an effort to continue to make system investments to further improve our information capabilities and meetour future customer and operational needs, we began to make significant investments in fiscal 2008 relating to ourBusiness Transformation project that will include a new enterprise resource planning (“ERP”) platform. The ERPplatform will be implemented throughout ABDC and our corporate functions and will include the development andimplementation of integrated processes to enhance our business practices and lower costs. We expect to continue tomake significant investments in our Business Transformation project through fiscal 2011.
5
ABSG operates the majority of its business on its own common, centralized platform resulting in operatingefficiencies as well as the ability to rapidly deploy new capabilities. The convenience of ordering via the Internet isvery important to ABSG’s customers. Over the past few years, ABSG has enhanced its web capabilities such that asignificant amount of orders are initiated via the Internet.
Competition
We face a highly competitive environment in the distribution of pharmaceuticals and related healthcareservices. Our largest national competitors are Cardinal Health, Inc. (“Cardinal”) and McKesson Corporation(“McKesson”). ABDC competes with both Cardinal and McKesson, as well as national generic distributors andregional distributors within pharmaceutical distribution. In addition, we compete with manufacturers who selldirectly to customers, chain drugstores who manage their own warehousing, specialty distributors, and packagingand healthcare technology companies. The distribution and related service businesses in which ABSG engages arealso highly competitive. ABSG’s operating businesses face competition from a variety of competitors, includingMcKesson, FFF Enterprises, Henry Schein, Inc., Express Scripts, Inc., US Oncology, Inc., Covance Inc., and UPSLogistics, among others. In all areas, competitive factors include price, product offerings, value-added serviceprograms, service and delivery, credit terms, and customer support.
Intellectual Property
We use a number of trademarks and service marks. All of the principal trademarks and service marks used inthe course of our business have been registered in the United States and, in some cases, in foreign jurisdictions or arethe subject of pending applications for registration.
We have developed or acquired various proprietary products, processes, software and other intellectualproperty that are used either to facilitate the conduct of our business or that are made available as products orservices to customers. We generally seek to protect such intellectual property through a combination of trade secret,patent and copyright laws and through confidentiality and other contractually imposed protections.
We hold patents and have patent applications pending that relate to certain of our products, particularly ourautomated pharmacy dispensing equipment, our medication and supply dispensing equipment, certain warehousingequipment and some of our proprietary packaging solutions. We seek patent protection for our proprietaryintellectual property from time to time as appropriate.
Although we believe that our patents or other proprietary products and processes do not infringe upon theintellectual property rights of any third parties, third parties may assert infringement claims against us from time totime.
Employees
As of September 30, 2009, we had approximately 10,300 employees, of which approximately 9,100 were full-time employees. Approximately 4% of our employees are covered by collective bargaining agreements. We believethat our relationship with our employees is good. If any of our employees in locations that are unionized shouldengage in strikes or other such bargaining tactics in connection with the negotiation of new collective bargainingagreements upon the expiration of any existing collective bargaining agreements, such tactics could be disruptive toour operations and adversely affect our results of operations, but we believe we have adequate contingency plans inplace to assure delivery of pharmaceuticals to our customers in the event of any such disruptions.
Government Regulation
We are subject to oversight by various federal and state governmental entities and we are subject to, andaffected by, a variety of federal and state laws, regulations and policies.
Federal and State Statutes and Regulation
The U.S. Drug Enforcement Administration (“DEA”), the U.S. Food and Drug Administration (“FDA”) andvarious state regulatory authorities regulate the purchase, storage, and/or distribution of pharmaceutical products,
6
including controlled substances. Wholesale distributors of controlled substances are required to hold valid DEAlicenses, meet various security and operating standards, and comply with regulations governing their sale,marketing, packaging, holding and distribution. The DEA, FDA and state regulatory authorities have broadenforcement powers, including the ability to suspend our distribution centers from distributing controlled sub-stances, seize or recall products and impose significant criminal, civil and administrative sanctions for violations ofapplicable laws and regulations. As a wholesale distributor of pharmaceuticals and certain related products, we aresubject to these laws and regulations. We have all necessary licenses or other regulatory approvals and believe thatwe are in compliance with all applicable pharmaceutical wholesale distribution requirements needed to conduct ouroperations.
We and our customers are subject to fraud and abuse laws, including the federal anti-kickback statute and theStark law. The anti-kickback statute, and the related regulations, prohibit persons from soliciting, offering,receiving or paying any remuneration in order to induce the purchasing, leasing or ordering, induce a referralto purchase, lease or order, or arrange for or recommend purchasing, leasing or ordering items or services that are inany way paid for by Medicare, Medicaid, or other federal healthcare programs. The Stark law prohibits physiciansfrom making referrals for designated health services reimbursable under Medicare or Medicaid to certain entitieswith which they have a financial relationship. The fraud and abuse laws and regulations are broad in scope and aresubject to frequent modification and varied interpretation. ABSG’s operations are particularly subject to these lawsand regulations, as are certain aspects of ABDC’s operations.
In recent years, some states have passed or have proposed laws and regulations that are intended to protect thesafety of the pharmaceutical supply channel. These laws and regulations are designed to prevent the introduction ofcounterfeit, diverted, adulterated or mislabeled pharmaceuticals into the distribution system. For example, Floridahas implemented and other states are implementing pedigree requirements that require drugs to be accompanied byinformation tracking drugs back to the manufacturers. California has enacted a law requiring chain of custodytechnology using electronic pedigrees, although the effective date has been postponed until January 1, 2015 forpharmaceutical manufacturers and July 1, 2016 for pharmaceutical wholesalers and repackagers. These and otherrequirements are expected to increase our cost of operations. At the federal level, the FDA issued final regulationspursuant to the Prescription Drug Marketing Act that became effective in December 2006. The FDA regulationsimpose pedigree and other chain of custody requirements that increase our costs and/or burden of selling to otherpharmaceutical distributors and handling product returns. In early December 2006, the federal District Court for theEastern District of New York issued a preliminary injunction temporarily enjoining the implementation of theregulations in response to a case initiated by secondary distributors. The federal Court of Appeals for the SecondCircuit affirmed this injunction on July 10, 2008. On December 18, 2008, the parties filed a joint motion to staydiscovery based upon a bill pending in Congress that, if passed, would render the issues in the case moot. The partiesalso agreed to an administrative closing of the file until at least December 31, 2009. Either party may re-open the fileprior to that date. We cannot predict the ultimate outcome of this legal proceeding or related legislation pending inCongress. These laws and regulations could increase the overall regulatory burden and costs associated with ourdistribution business and could adversely affect our results of operations and financial condition.
In addition, the FDA Amendments Act of 2007 requires the FDA to establish standards and identify andvalidate effective technologies for the purpose of securing the pharmaceutical supply chain against counterfeitdrugs. These standards may include track-and-trace or authentication technologies, such as radio frequencyidentification devices and other technologies. The 2007 Act requires the FDA to develop a standardized numericalidentifier by April 1, 2010.
As a result of political, economic and regulatory influences, the healthcare delivery industry in the UnitedStates is under intense scrutiny and subject to fundamental changes. We expect that the current administration,Congress and certain state legislatures will continue to review and assess alternative healthcare delivery systemsand payment methods in order to reform the healthcare system. This process may result in legislation and/oradditional regulation governing the delivery or pricing of pharmaceutical products, as well as potential changes tothe structure of the present healthcare delivery system. We cannot predict what reform proposals, if any, will beadopted, when they may be adopted, or what impact they may have on us.
7
The costs associated with complying with federal and state regulations could be significant and the failure tocomply with any such legal requirements could have a significant impact on our results of operations and financialcondition.
Medicare and Medicaid
The Medicare Prescription Drug Improvement and Modernization Act of 2003 (“MMA”) significantlyexpanded Medicare coverage for outpatient prescription drugs through the new Medicare Part D program.Beginning in 2006, Medicare beneficiaries became eligible to enroll in outpatient prescription drug plans thatare offered by private entities and became eligible for varying levels of coverage for outpatient prescription drugs.Beneficiaries who participate select from a range of stand-alone prescription drug plans or Medicare Advantagemanaged care plans that include prescription drug coverage along with other Medicare services (“Part D Plans”).The Part D Plans are required to make available certain drugs on their formularies. Each Part D Plan negotiatesreimbursement for Part D drugs with pharmaceutical manufacturers. The Part D Plan program has increased the useof pharmaceuticals in the supply channel, which has a positive impact on our revenues and profitability.
The Medicare Improvements for Patients and Providers Act of 2008 (“MIPPA”) established timeframes forPart D Plan payments to pharmacies and long-term care pharmacy submission of claims; required more frequentupdating by Part D Plan sponsors of the drug pricing data they use to pay pharmacies; modified statutory provisionsregarding coverage of certain “protected classes” of drugs; limited certain Part D sales and marketing activities; andmade other Part D reforms.
Effective January 1, 2007, the Deficit Reduction Act of 2005 (“DRA”) changed the federal upper paymentlimit for Medicaid reimbursement from 150% of the lowest published price for generic pharmaceuticals to 250% ofthe lowest average manufacturer price or AMP. On July 17, 2007, Centers for Medicare and Medicaid Services(“CMS”) published a final rule implementing these provisions and clarifying, among other things, the AMPcalculation methodology and the DRA provision requiring manufacturers to publicly report AMP for branded andgeneric pharmaceuticals. In December 2007, the United States District Court for the District of Columbia issued apreliminary injunction that enjoins CMS from implementing certain provisions of the AMP rule to the extent that itaffects Medicaid reimbursement rates for retail pharmacies under the Medicaid program. The order also enjoinedCMS from disclosing AMP data to states and other entities. In October 2008, CMS issued a separate final rule inwhich it stated that the federal upper limits will govern in all states unless a state finds that a particular generic drugis not available within that state. These payment limits remain unenforced as a result of the 2007 preliminaryinjunction. In addition, MIPPA delayed the adoption of CMS’s July 17, 2007 rule and prevented CMS frompublishing AMP data before October 1, 2009. Although CMS has yet to take action, the use of an AMP benchmarkmay result in a reduction in the Medicaid reimbursement rates to our customers for certain generic pharmaceuticals,which may indirectly impact the prices that we can charge our customers for generic pharmaceuticals and causecorresponding declines in our profitability. There can be no assurance that the changes under the DRAwill not havean adverse impact on our business. Unless we are able to develop plans to mitigate the potential impact of theselegislative and regulatory changes, these changes in reimbursement formula and related reporting requirements andother provisions of the DRA could adversely affect our results of operations. The federal government may also takeother actions in the future to increase the Medicaid drug rebate amount for branded pharmaceuticals, amend theMedicare average selling price (“ASP”) calculation methodology, or otherwise modify Medicare/Medicaid drugpayment policy.
Several Medicare and Medicaid policy reforms were included in President Obama’s proposed fiscal year 2010budget. Among other things, the budget includes a 10-year, $634 billion “reserve fund” to finance comprehensivehealth reform, financed by health system savings and tax increases, provides for payment cuts to MedicareAdvantage plans and plans to reduce Medicare reimbursement for many types of providers, including hospitals andcertain post-acute care providers. The budget also calls for increasing the Medicaid drug rebate level paid bypharmaceutical manufacturers to Medicaid for brand-name drugs, applying the rebate levels paid by pharmaceu-tical manufacturers to Medicaid on existing drugs to new formulations of those drugs, and allowing states to collectrebates from pharmaceutical manufacturers on drugs provided through Medicaid managed care organizations. Itfurther seeks to increase Medicare Part D drug premiums for certain higher-income beneficiaries, expand Part Doversight activities, promote the development of follow-on biologicals and generic drugs, and allow drug
8
reimportation. Many of the proposed policy changes would require Congressional approval to implement. Therecan be no assurances that future revisions to Medicare or Medicaid payments, if enacted, will not have an adverseimpact on our business.
Congressional leaders also have expressed their intent to enact a comprehensive health reform plan, includingprovisions to control health care costs, improve health care quality, and expand access to affordable healthinsurance, potentially including the establishment of a government health insurance plan that would compete withprivate health plans. Health reform legislation could include changes in Medicare and Medicaid prescription drugpayment policies and other health care delivery reforms that would potentially impact our business. The UnitedStates House of Representatives has passed its version of a health reform bill, but the United States Senate has notyet taken action on pending health reform proposals. As a result, the exact provisions to be included in a final bill areunknown at this time, nor can we be certain when or if any such legislation will be enacted. Given the potentiallysweeping nature of the changes under consideration, there can be no assurances that health reform legislation, ifadopted, would not adversely impact our business.
See “Risk Factors” below for a discussion of additional regulatory developments that may affect our results ofoperations and financial condition.
Health Information Practices
The Health Information Portability and Accountability Act of 1996 (“HIPAA”) and its accompanying federalregulations set forth health information standards in order to protect security and privacy in the exchange ofindividually identifiable health information. In addition, our operations, depending on their location, may be subjectto additional state or foreign regulations affecting personal data protection and the manner in which informationservices or products are provided. Significant criminal and civil penalties may be imposed for violation of HIPAAstandards and other such laws. We have a HIPAA compliance program to facilitate our ongoing effort to complywith the HIPAA regulations.
On February 17, 2009, President Obama signed into law the American Recovery and Reinvestment Act(“ARRA”). Among other things, the law further strengthens federal privacy and security provisions to protectpersonally-identifiable health information, including new notification requirements related to health data securitybreaches. We currently are assessing the new law, but there can be no assurances that compliance with the newprivacy requirements will not impose new costs on our business.
Available Information
For more information about us, visit our website at www.amerisourcebergen.com. The contents of the websiteare not part of this Form 10-K. Our electronic filings with the Securities and Exchange Commission (including allForms 10-K, 10-Q and 8-K, and any amendments to these reports) are available free of charge through the“Investors” section of our website immediately after we electronically file with or furnish them to the Securities andExchange Commission and may also be viewed using their website at www.sec.gov.
ITEM 1A. RISK FACTORS
The following discussion describes certain risk factors that we believe could affect our business and prospects.These risks factors are in addition to those set forth elsewhere in this report.
Intense competition as well as industry consolidations may erode our profit margins.
The distribution of pharmaceuticals and related healthcare solutions is highly competitive. We compete withtwo national wholesale distributors of pharmaceuticals, Cardinal and McKesson; national generic distributors;regional and local distributors of pharmaceuticals; chain drugstores that warehouse their own pharmaceuticals;manufacturers that distribute their products directly to customers; specialty distributors; and packaging andhealthcare technology companies (see “Competition”). If we were forced by competition to reduce our pricesor offer more favorable payment or other terms, our results of operations or liquidity could be adversely affected. Inaddition, in recent years, the healthcare industry has been subject to increasing consolidation. If this trend continues
9
among our customers and suppliers, it could give the resulting enterprises greater bargaining power, which may leadto greater pressure to reduce prices for our products and services.
Our results of operations continue to be subject to the risks and uncertainties of inflation in brandedpharmaceutical prices and deflation in generic pharmaceutical prices.
Certain distribution service agreements that we have entered into with branded pharmaceutical manufacturerscontinue to have an inflation-based compensation component to them. Arrangements with a small number ofbranded manufacturers continue to be solely inflation-based. As a result, approximately 10% to 15% of our grossprofit from brand-name manufacturers continues to be subject to fluctuation based upon the timing and extent ofprice appreciation. If the frequency or rate of branded pharmaceutical price inflation slows, our results of operationscould be adversely affected. In addition, we distribute generic pharmaceuticals, which are subject to price deflation.If the frequency or rate of generic pharmaceutical price deflation accelerates, our results of operations could beadversely affected.
Declining economic conditions could adversely affect our results of operations and financial condition.
Our operations and performance depend on economic conditions in the United States and other countrieswhere we do business. Deterioration in general economic conditions could adversely affect the amount ofprescriptions that are filled and the amount of pharmaceutical products purchased by consumers and, therefore,reduce purchases by our customers, which would negatively affect our revenue growth and cause a decrease in ourprofitability. Interest rate fluctuations, financial market volatility or credit market disruptions may also negativelyaffect our customers’ ability to obtain credit to finance their businesses on acceptable terms. Reduced purchases byour customers or changes in payment terms could adversely affect our revenue growth and cause a decrease in ourcash flow from operations. Bankruptcies or similar events affecting our customers may cause us to incur bad debtexpense at levels higher than historically experienced. Declining economic conditions may also increase our costs.If the economic conditions in the United States or in the regions outside the United States where we do business donot improve or deteriorate, our results of operations or financial condition could be adversely affected.
Our stock price and our ability to access credit markets may be adversely affected by financial marketvolatility and disruption.
The capital and credit markets have experienced significant volatility and disruption, particularly in the latterhalf of 2008 and in the first quarter of 2009. In some cases, the markets have produced downward pressure on stockprices and credit availability for certain issuers without regard to those issuers’ underlying financial strength. If themarkets return to the levels of disruption and volatility experienced in the latter half of 2008 and the first quarter of2009, there can be no assurance that we will not experience downward movement in our stock price without regardto our financial condition or results of operations or an adverse effect, which may be material, on our ability toaccess credit generally, and on our business, liquidity, financial condition and results of operations.
Our receivables securitization facility expires in 2010. While we did not have any borrowings outstandingunder this facility as of September 30, 2009, we have historically utilized amounts available to us under this facility,from time to time, to meet our business needs. In fiscal 2010, we will seek to renew this facility at available marketrates, which may be higher than the interest rates currently available to us. While we believe we will be able to renewthis facility, there can be no assurance that we will be able to do so.
Our total revenue and results of operations may suffer upon the loss of a significant customer.
Our largest customer, Medco Health Solutions, Inc., accounted for 17% of our total revenue in fiscal 2009. Ourtop ten customers represented approximately 41% of fiscal 2009 total revenue. We also have contracts with grouppurchasing organizations (“GPOs”), each of which functions as a purchasing agent on behalf of its members, whoare hospitals, pharmacies or other healthcare providers. Approximately 10% of our total revenue in fiscal 2009 wasderived from our three largest GPO relationships. We may lose a significant customer or GPO relationship if anyexisting contract with such customer or GPO expires without being extended, renewed, renegotiated or replaced oris terminated by the customer or GPO prior to expiration, to the extent such early termination is permitted by the
10
contract. A number of our contracts with significant customers or GPOs are typically subject to expiration each yearand we may lose any of these customers or GPO relationships if we are unable to extend, renew, renegotiate orreplace the contracts. The loss of any significant customer or GPO relationship could adversely affect our totalrevenue and results of operations.
Our total revenue and results of operations may suffer upon the bankruptcy, insolvency or other creditfailure of a significant customer.
Most of our customers buy pharmaceuticals and other products and services from us on credit. Credit is madeavailable to customers based on our assessment and analysis of creditworthiness. Although we often try to obtain asecurity interest in assets and other arrangements intended to protect our credit exposure, we generally are eithersubordinated to the position of the primary lenders to our customers or substantially unsecured. Volatility of thecapital and credit markets and general economic conditions may adversely affect the solvency or creditworthinessof our customers. The bankruptcy, insolvency or other credit failure of any customer that has a substantial amountowed to us could have a material adverse affect on our operating revenue and results of operations. At September 30,2009, the largest trade receivable balance due from a single customer, which was our largest customer, representedapproximately 9% of accounts receivable, net.
Our results of operations may suffer upon the bankruptcy, insolvency or other credit failure of asignificant supplier.
Our relationships with pharmaceutical suppliers give rise to substantial amounts that are due to us from thesuppliers, including amounts owed to us for returned goods or defective goods, chargebacks, and amounts due to usfor services provided to the suppliers. Volatility of the capital and credit markets and general economic conditionsmay adversely affect the solvency or creditworthiness of our suppliers. The bankruptcy, insolvency or other creditfailure of any supplier at a time when the supplier has a substantial account payable balance due to us could have amaterial adverse affect on our results of operations.
Increasing governmental efforts to regulate the pharmaceutical supply channel may increase our costsand reduce our profitability.
The healthcare industry is highly regulated at the federal and state level. Consequently, we are subject to therisk of changes in various federal and state laws, which include operating and security standards of the DEA, theFDA, various state boards of pharmacy and comparable agencies. In recent years, some states have passed or haveproposed laws and regulations, including laws and regulations obligating pharmaceutical distributors to provideprescription drug pedigrees, that are intended to protect the safety of the supply channel but that also maysubstantially increase the costs and burden of pharmaceutical distribution. For example, the Florida PrescriptionDrug Pedigree laws and regulations that became effective in July 2006 imposed obligations upon us to deliverprescription drug pedigrees to various categories of customers. In order to comply with the Florida requirements, weimplemented an e-pedigree system at our distribution center in Florida that required significant capital outlays.Other states have adopted laws and regulations that would require us to implement pedigree capabilities in thoseother states similar to the pedigree capabilities implemented for Florida. For example, California has enacted a lawrequiring the implementation of costly track and trace chain of custody technologies, such as radio frequencyidentification device (“RFID”) technologies, although the effective date of the law has been postponed untilJanuary 1, 2015 for pharmaceutical manufacturers and until July 1, 2016 for pharmaceutical wholesalers andrepackagers. At the federal level, the FDA issued final regulations pursuant to the Prescription Drug Marketing Actthat became effective in December 2006. The regulations impose pedigree and other chain of custody requirementsthat increase the costs and/or burden to us of selling to other pharmaceutical distributors and handling productreturns. In December 2006, the federal District Court for the Eastern District of New York issued a preliminaryinjunction temporarily enjoining the implementation of certain provisions of the regulations in response to a caseinitiated by secondary distributors. The federal Court of Appeals for the Second Circuit affirmed this injunction onJuly 10, 2008. On December 18, 2008, the parties filed a joint motion to stay discovery based upon a bill pending inCongress that, if passed, would render the issues in the case moot. The parties also agreed to an administrative
11
closing of the file until at least December 31, 2009. Either party may re-open the file prior to that date. We cannotpredict the ultimate outcome of this legal proceeding or related legislation pending in Congress.
In addition, the FDA Amendments Act of 2007 requires the FDA to establish standards and identify andvalidate effective technologies for the purpose of securing the pharmaceutical supply chain against counterfeitdrugs. These standards may include track-and-trace or authentication technologies, such as RFID devices and othertechnologies. The 2007 Act requires the FDA to develop a standardized numerical identifier by April 1, 2010. Theincreased costs of complying with these pedigree and other supply chain custody requirements could increase ourcosts or otherwise significantly affect our results of operations.
The suspension or revocation by the DEA of any of the registrations that must be in effect for ourdistribution facilities to purchase, store and distribute controlled substances or the refusal by DEA toissue a registration to any such facility that requires such registration may adversely affect ourreputation, our business and our results of operations.
The DEA, FDA and various state regulatory authorities regulate the distribution of pharmaceuticals andcontrolled substances. We are required to hold valid DEA and state-level licenses, meet various security andoperating standards and comply with the Controlled Substance Act and its accompanying regulations governing thesale, marketing, packaging, holding and distribution of controlled substances. The DEA, FDA and state regulatoryauthorities have broad enforcement powers, including the ability to suspend our distribution centers’ licenses todistribute pharmaceutical products (including controlled substances), seize or recall products and impose signif-icant criminal, civil and administrative sanctions for violations of these laws and regulations.
In 2007, our Orlando, Florida distribution center’s license to distribute controlled substances and listedchemicals was suspended for an alleged lack of maintaining effective controls against diversion of controlledsubstances. Under an agreement with the DEA, our distribution center had its license reinstated when weimplemented an enhanced and more sophisticated order-monitoring program in all of our ABDC distributioncenters. In addition, in June 2007, one of our subsidiaries, Bellco Drug Corp., entered into a consent judgment withthe DEA following the suspension of Bellco Drug’s DEA license in May 2007 prior to our acquisition of thebusiness. The DEA had alleged that Bellco Drug had failed to maintain effective controls against the diversion ofcontrolled substances as required by federal law. In the consent judgment, Bellco Drug voluntarily surrendered itsDEA registration with leave to apply for a new registration. Bellco Drug received its new DEA registration onFebruary 12, 2008 and resumed distribution of controlled substances. While we expect to continue to comply withall of the DEA’s requirements, there can be no assurance that the DEA will not require further controls against thediversion of controlled substances in the future or will not take similar action against any other of our distributioncenters in the future.
Legal, regulatory and legislative changes reducing reimbursement rates for pharmaceuticals and/ormedical treatments or services may adversely affect our business and results of operations.
Both our business and the businesses of our customers may be adversely affected by laws and regulationsreducing reimbursement rates for pharmaceuticals and/or medical treatments or services or changing the meth-odology by which reimbursement levels are determined.
Effective January 1, 2007, the Deficit Reduction Act of 2005 (“DRA”) changed the federal upper paymentlimit for Medicaid reimbursement from 150% of the lowest published price for generic pharmaceuticals to 250% ofthe lowest average manufacturer price (“AMP”). On July 17, 2007, CMS published a final rule implementing theseprovisions and clarifying, among other things, the AMP calculation methodology and the DRA provision requiringmanufacturers to publicly report AMP for branded and generic pharmaceuticals. In December 2007, the UnitedStates District Court for the District of Columbia issued a preliminary injunction that enjoins CMS fromimplementing certain provisions of the AMP rule to the extent that it affects Medicaid reimbursement rates forretail pharmacies under the Medicaid program. The order also enjoins CMS from disclosing AMP data to states andother entities. In October 2008, CMS issued a separate final rule stating that the federal upper limits will govern inall states unless a state finds that a particular generic drug is not available within that state. These payment limitsremain unenforced as a result of the 2007 preliminary injunction. The outcome of the ongoing litigation in the
12
District of Columbia is unknown. The Medicaid Improvements for Patients and Providers Act of 2008 (“MIPPA”)delayed the adoption of CMS’s July 17, 2007 rule and prevented CMS from publishing AMP data before October 1,2009. Although CMS has yet to take action, the use of an AMP benchmark may result in a reduction in the Medicaidreimbursement rates to our customers for certain generic pharmaceuticals, which may indirectly impact the pricesthat we can charge our customers for generic pharmaceuticals and cause corresponding declines in our profitability.There can be no assurance that the changes under the DRA will not have an adverse impact on our business. Unlesswe are able to develop plans to mitigate the potential impact of these legislative and regulatory changes, thesechanges in reimbursement formula and related reporting requirements and other provisions of the DRA couldsignificantly reduce our profitability.
The Medicare, Medicaid, and SCHIP Extension Act of 2007, among other things, requires CMS to adjustMedicare Part B drug average sales price (“ASP”) calculations to use volume-weighed ASPs based on actual salesvolume. This law, which became effective April 1, 2008, could reduce Medicare reimbursement rates for somePart B drugs, which may indirectly impact the prices we can charge our customers for pharmaceuticals and result inreductions in our profitability.
First DataBank, Inc. and Medi-Span publish drug databases that contain drug information and pricing data.The pricing data includes average wholesale price, or AWP, which is a pricing benchmark widely used to calculate aportion of the Medicaid and Medicare Part D reimbursements payable to pharmacy providers. AWP is also used toestablish the pricing of pharmaceuticals to certain of our pharmaceutical distribution customers in Puerto Rico. OnSeptember 3, 2009, the Court of Appeals for the First Circuit upheld settlements in class action litigation concerningthe calculations of AWP pricing data. Under the settlements, First DataBank, Inc. and Medi-Span reduced to 20%the markup on about 1,400 drugs included in the litigation. The companies also reduced to 20% the markup on alldrugs with a mark-up higher than 20% and will stop publishing AWP in two years. We continue to evaluate theimpact that these actions could have on the business of our customers and our business. There can be no assurancesthat these settlements and related actions will not have an adverse impact on the business of our customers and/orour business.
ABSG’s business may be adversely affected in the future by changes in Medicare reimbursement rates forcertain pharmaceuticals, including oncology drugs administered by physicians. Since ABSG provides a number ofservices to or through physicians, this could result in slower growth or lower revenues for ABSG.
Our revenue growth rate has been negatively impacted by a reduction in sales of certain anemia drugs,primarily those used in oncology, and may, in the future, be adversely affected by any further reductions in sales orrestrictions on the use of anemia drugs or a decrease in Medicare reimbursement for these drugs. Severaldevelopments contributed to the decline in sales of anemia drugs, including expanded warning and other productsafety labeling requirements, more restrictive federal policies governing Medicare reimbursement for the use ofthese drugs to treat oncology patients with kidney failure and dialysis, and changes in regulatory and clinicalmedical guidelines for recommended dosage and use. In addition, the FDA has announced that it is reviewing newclinical study data concerning the possible risks associated with erythropoiesis stimulating agents (anemia drugs)and may take additional action with regard to these drugs. CMS has indicated that it may impose additionalrestrictions on Medicare coverage in the future. Also, on July 30, 2008, CMS announced it is considering a review ofnational Medicare coverage policy for these drugs for patients who have cancer or pre-dialysis chronic kidneydisease. Any further changes in the recommended dosage or use of anemia drugs or reductions in reimbursement forsuch drugs could result in slower growth or lower revenues.
The federal government may adopt measures in the future that would further reduce Medicare and/or Medicaidspending or impose additional requirements on health care entities. At this time, we can provide no assurances thatsuch changes, if adopted, would not have an adverse effect on our business.
Changes to the United States healthcare environment may negatively impact our business and ourprofitability.
Our products and services are intended to function within the structure of the healthcare financing andreimbursement system currently existing in the United States. In recent years, the healthcare industry has undergonesignificant changes in an effort to reduce costs and government spending. These changes include an increased
13
reliance on managed care; cuts in certain Medicare funding affecting our healthcare provider customer base;consolidation of competitors, suppliers and customers; and the development of large, sophisticated purchasinggroups. We expect the healthcare industry to continue to change significantly in the future. Some of these potentialchanges, such as a reduction in governmental funding for certain healthcare services or adverse changes inlegislation or regulations governing prescription drug pricing, healthcare services or mandated benefits, may causehealthcare industry participants to reduce the amount of our products and services they purchase or the price theyare willing to pay for our products and services. We expect continued government and private payor pressure toreduce pharmaceutical pricing. Changes in pharmaceutical manufacturers’ pricing or distribution policies couldalso significantly reduce our profitability.
Congressional leaders also have expressed their intention to enact a comprehensive health reform plan,including provisions to control health care costs, improve health care quality, and expand access to affordable healthinsurance, potentially including the establishment of a government health insurance plan that would compete withprivate health plans. Health reform legislation could include changes in Medicare and Medicaid prescription drugpayment policies and other health care delivery reforms that would potentially impact our business. TheUnited States House of Representatives has passed its version of a health reform bill, but the United States Senatehas not yet taken action on pending health reform proposals. As a result, the exact provisions to be included in a finalbill are unknown at this time, nor can we be certain when or if any such legislation will be enacted. Given thepotentially sweeping nature of the changes under consideration, there can be no assurances that health reformlegislation, if adopted, will not adversely impact our business.
If we fail to comply with laws and regulations in respect of healthcare fraud and abuse, we could sufferpenalties or be required to make significant changes to our operations.
We are subject to extensive and frequently changing federal and state laws and regulations relating tohealthcare fraud and abuse. The federal government continues to strengthen its position and scrutiny over practicesinvolving healthcare fraud affecting Medicare, Medicaid and other government healthcare programs. Our rela-tionships with healthcare providers and pharmaceutical manufacturers subject our business to laws and regulationson fraud and abuse which, among other things, (i) prohibit persons from soliciting, offering, receiving or paying anyremuneration in order to induce the referral of a patient for treatment or the ordering or purchasing of items orservices that are in any way paid for by Medicare, Medicaid or other government-sponsored healthcare programsand (ii) impose a number of restrictions upon referring physicians and providers of designated health services underMedicare and Medicaid programs. Legislative provisions relating to healthcare fraud and abuse give federalenforcement personnel substantially increased funding, powers and remedies to pursue suspected fraud and abuse.While we believe that we are in compliance with all applicable laws and regulations, many of the regulationsapplicable to us, including those relating to marketing incentives offered in connection with pharmaceutical sales,are vague or indefinite and have not been interpreted by the courts. They may be interpreted or applied by aprosecutorial, regulatory or judicial authority in a manner that could require us to make changes in our operations. Ifwe fail to comply with applicable laws and regulations, we could suffer civil and criminal penalties, including theloss of licenses or our ability to participate in Medicare, Medicaid and other federal and state healthcare programs.
Our business and results of operations could be adversely affected by qui tam litigation.
Violations of various federal and state laws governing the marketing, sale and purchase of pharmaceuticalproducts can result in criminal, civil, and administrative liability for which there can be significant financialdamages, criminal and civil penalties, and possible exclusion from participation in federal and state healthprograms. Among other things, such violations can form the basis for qui tam complaints to be filed. The qui tamprovisions of both the federal civil False Claims Act and various state civil False Claims Acts authorize a privateperson, known as a “relator” (i.e. whistleblower), to file civil actions under these federal and state statutes on behalfof the federal and state governments. Under the federal civil False Claims Act and the applicable state civil FalseClaims Acts, the filing of a qui tam complaint by a relator imposes obligations on federal and state governmentauthorities to investigate the allegations and to determine whether or not to intervene in the action. Such casestypically revolve around the marketing, sale and/or purchase of branded pharmaceutical products and allegewrongdoing in the marketing, sale and/or purchase of such products. Such complaints are filed under seal and
14
remain sealed until the applicable court orders otherwise. Our business and results of operations could be adverselyaffected if qui tam complaints are filed against us for alleged violations of any health laws and regulations and fordamages arising from resultant false claims and if government authorities decide to intervene in any such mattersand/or we are found liable for all or any portion of violations alleged in any such matters.
A qui tam matter is pending in the United States District Court for the District of Massachusetts (the “FederalDistrict Court”) naming Amgen Inc. as well as two business units of AmerisourceBergen Specialty Group,AmerisourceBergen Specialty Group, and AmerisourceBergen Corporation as defendants. On October 30, 2009,the relator, a former Amgen employee, filed a second amended complaint and fourteen states and the District ofColumbia filed a complaint (the “Intervention Complaint”) to intervene in the pending civil case. The complaintsallege that from 2002 through 2009, Amgen offered remuneration to medical providers in violation of federal andstate health laws to increase purchases and prescriptions of Amgen’s anemia drug, Aranesp. Specifically withregard to the Company’s business units, the complaints allege that ASD Specialty Healthcare, Inc., which is adistributor of pharmaceuticals to physician practices (“ASD”), and International Nephrology Network, which was abusiness name for one of the Company’s subsidiaries and a group purchasing organization for nephrologists andnephrology practices (“INN”), conspired with Amgen to promote Aranesp in violation of federal and state healthlaws. The complaints further allege that the defendants caused medical providers to submit to state Medicaidprograms false certifications and false claims for payment for Aranesp. According to the complaints, the latterconduct allegedly violated state civil False Claims Acts and constituted fraud and unjust enrichment. The qui tamcomplaint, as amended on October 30, 2009, also alleges that the defendants caused medical providers to submit toother federal health programs, including Medicare, false certifications and false claims for payment for Aranesp.
Under the federal civil False Claims Act and the applicable state civil False Claims Acts, the filing of theoriginal qui tam complaint by the former Amgen employee triggered obligations of federal and certain stategovernment authorities to investigate the allegations and to determine whether or not to intervene in the action. Inconnection with this investigative process, the Company has received subpoenas for records issued by theUnited States Attorney’s Office for the Eastern District of New York (the “Department of Justice”). The allegationsin the Intervention Complaint and the qui tam complaint, as amended, are within the scope of the Department ofJustice’s subpoenas. The Company has been cooperating with the Department of Justice in the inquiry and isproducing records in response to the subpoenas. Such subpoenas may be issued in conjunction with investigationsarising from the filing of one or more qui tam complaints. Because such lawsuits are filed under seal, and remainunder seal until the applicable court orders otherwise, their existence cannot be disclosed absent court order.Therefore, given the pendency of the Department of Justice investigation, the possibility exists that one or more quitam suits have been filed.
Our business and results of operations could be adversely affected if we are found liable for the violationsalleged in the pending qui tam case and/or if the Department of Justice or other state authorities should elect tointervene in the pending case and/or if there should be any companion qui tam cases that arise against us and theother defendants or are pending but yet unsealed.
Our results of operations and financial condition may be adversely affected if we undertake acquisitionsof businesses that do not perform as we expect or that are difficult for us to integrate.
We expect to continue to implement our growth strategy, in part, by acquiring companies. At any particulartime, we may be in various stages of assessment, discussion and negotiation with regard to one or more potentialacquisitions, not all of which will be consummated. We make public disclosure of pending and completedacquisitions when appropriate and required by applicable securities laws and regulations.
Acquisitions involve numerous risks and uncertainties. If we complete one or more acquisitions, our results ofoperations and financial condition may be adversely affected by a number of factors, including: the failure of theacquired businesses to achieve the results we have projected in either the near or long term; the assumption ofunknown liabilities; the fair value of assets acquired and liabilities assumed; the difficulties of imposing adequatefinancial and operating controls on the acquired companies and their management and the potential liabilities thatmight arise pending the imposition of adequate controls; the difficulties in the integration of the operations,
15
technologies, services and products of the acquired companies; and the failure to achieve the strategic objectives ofthese acquisitions.
Our results of operations and our financial condition may be adversely affected by foreign operations.
We have pharmaceutical distribution operations based in Canada and provide contract packaging and clinicaltrials materials services in the United Kingdom. We may consider additional foreign acquisitions in the future. Ourexisting foreign operations and any operations we may acquire in the future carry risks in addition to the risks ofacquisition, as described above. At any particular time, foreign operations may encounter risks and uncertaintiesregarding the governmental, political, economic, business and competitive environment within the countries inwhich those operations are based. Additionally, foreign operations expose us to foreign currency fluctuations thatcould impact our results of operations and financial condition based on the movements of the applicable foreigncurrency exchange rates in relation to the U.S. dollar.
Risks generally associated with our sophisticated information systems may adversely affect our businessand results of operations.
Our businesses rely on sophisticated information systems to obtain, rapidly process, analyze, and manage datato facilitate the purchase and distribution of thousands of inventory items from numerous distribution centers; toreceive, process, and ship orders on a timely basis; to account for other product and service transactions withcustomers; to manage the accurate billing and collections for thousands of customers; and to process payments tosuppliers. Our business and results of operations may be adversely affected if these systems are interrupted ordamaged by unforeseen events or if they fail for any extended period of time, including due to the actions of thirdparties. A third party service provider (IBM) is responsible for managing a significant portion of ABDC’sinformation systems. Our business and results of operations may be adversely affected if the third party serviceprovider does not perform satisfactorily.
Certain of our businesses continue to make substantial investments in information systems. To the extent theimplementation of these systems fail, our business and results of operations may be adversely affected.
Risks generally associated with implementation of an enterprise resource planning (ERP) system mayadversely affect our business and results of operations or the effectiveness of internal control overfinancial reporting.
We are preparing to implement an ERP system to handle the business and financial processes within ABDC’soperations and our corporate functions. ERP implementations are complex and time-consuming projects thatinvolve substantial expenditures on system software and implementation activities that can continue for severalyears. ERP implementations also require transformation of business and financial processes in order to reap thebenefits of the ERP system. Our business and results of operations may be adversely affected if we experienceoperating problems and/or cost overruns during the ERP implementation process or if the ERP system, and theassociated process changes, do not give rise to the benefits that we expect.
Additionally, if we do not effectively implement the ERP system as planned or if the system does not operate asintended, it could adversely affect the effectiveness of our internal controls over financial reporting.
Tax legislation initiatives or challenges to our tax positions could adversely affect our results ofoperations and financial condition.
We are a large corporation with operations in the United States, Puerto Rico, Canada and the United Kingdom.As such, we are subject to tax laws and regulations of the United States federal, state and local governments and ofcertain foreign jurisdictions. From time to time, various legislative initiatives may be proposed that could adverselyaffect our tax positions and/or our tax liabilities. There can be no assurance that our effective tax rate or taxpayments will not be adversely affected by these initiatives. In addition, United States federal, state and local, aswell as foreign, tax laws and regulations, are extremely complex and subject to varying interpretations. There can beno assurance that our tax positions will not be challenged by relevant tax authorities or that we would be successfulin any such challenge.
16
The enactment of provincial legislation or regulations in Canada to lower pharmaceutical product pricingand service fees may adversely affect our pharmaceutical distribution business in Canada, including theprofitability of that business.
As in the United States, our products and services function within the existing regulatory structure of thehealthcare system in Canada. The purchase of pharmaceutical products in Canada is funded in part by the provincialgovernments, which each regulate the financing and reimbursement of drugs independently. In recent years, like theUnited States, the Canadian healthcare industry has undergone significant changes in an effort to reduce costs andgovernment spending. For example, in 2006, the Ontario government enacted the Transparent Drug System forPatients Act, which significantly revised the drug distribution system in Ontario. Then in July 2009, the Ontariogovernment announced that it was undertaking a review of that legislation with a view to, among other things, lowercosts for taxpayers. Some of these potential changes, such as adverse changes in legislation or regulations governingthe drug distribution supply chain, prescription drug pricing, healthcare services or mandated benefits or a reductionin government funding for certain healthcare services may result in lower service fees, cause healthcare industryparticipants to reduce the amount of our products and services they purchase or the price they are willing to pay forour products and services. Legislation and/or regulations that may lower pharmaceutical product pricing and servicefees are reportedly under consideration by some other provinces as well. We expect continued government andprivate payor pressure to reduce pharmaceutical pricing. Changes in pharmaceutical manufacturers’ pricing ordistribution policies could also significantly reduce our profitability in Canada.
ITEM 1B. UNRESOLVED STAFF COMMENTS
None.
ITEM 2. PROPERTIES
As of September 30, 2009, we conducted our business from office and operating facilities at owned and leasedlocations throughout the United States (including Puerto Rico), Canada, and the United Kingdom. In the aggregate,our facilities occupy approximately 8.5 million square feet of office and warehouse space, which is either owned orleased under agreements that expire from time to time through 2020.
We lease approximately 154,000 square feet in Chesterbrook, Pennsylvania for our corporate and ABDCheadquarters.
We have 26 full-service ABDC wholesale pharmaceutical distribution facilities in the United States, ranging insize from approximately 53,000 square feet to 310,000 square feet, with an aggregate of approximately 4.7 millionsquare feet. Leased facilities are located in Puerto Rico plus the following states: Arizona, California, Colorado,Florida, Hawaii, Minnesota, New Jersey, New York, North Carolina, Utah, and Washington. Owned facilities arelocated in the following states: Alabama, California, Georgia, Illinois, Kentucky, Massachusetts, Michigan,Missouri, Ohio, Pennsylvania, Texas and Virginia. As of September 30, 2009, ABDC had 8 wholesale pharma-ceutical distribution facilities in Canada. Two of these facilities are owned and are located in the provinces ofNewfoundland and Ontario. Six of these locations are leased and located in the provinces of Alberta, BritishColumbia, Nova Scotia, Ontario, and Quebec.
As of September 30, 2009, the Specialty Group’s operations were conducted in 23 locations, two of which areowned, comprising of approximately 1.4 million square feet. The Specialty Group’s largest leased facility consistedof approximately 276,000 square feet. Its headquarters are located in Texas and it has significant operations in thestates of Alabama, Kentucky, Nevada, North Carolina, and Ohio.
As of September 30, 2009, the Packaging Group’s operations in the U.S. consisted of 3 owned facilities and 5leased facilities totaling approximately 1.3 million square feet. The Packaging Group’s operations in the U.S. areprimarily located in the states of Illinois and Ohio. The Packaging Group’s operations in the United Kingdom arelocated in 8 owned building units comprising a total of 103,000 square feet.
We consider all of our operating and office properties to be in satisfactory condition.
17
ITEM 3. LEGAL PROCEEDINGS
Legal proceedings in which we are involved are discussed in Note 13 (Legal Matters and Contingencies) of theNotes to the Consolidated Financial Statements appearing in this Annual Report on Form 10-K.
ITEM 4. SUBMISSION OF MATTERS TO A VOTE OF SECURITY HOLDERS
There were no matters submitted to a vote of security holders for the quarter ended September 30, 2009.
EXECUTIVE OFFICERS OF THE REGISTRANT
The following is a list of our principal executive officers and their ages and positions as of November 1, 2009.Each executive officer serves at the pleasure of our board of directors.
Name Age Current Position with the Company
R. David Yost . . . . . . . . . . . . . . . . . . . 62 President, Chief Executive Officer and Director
Michael D. DiCandilo . . . . . . . . . . . . . 48 Executive Vice President and Chief Financial Officer
Steven H. Collis . . . . . . . . . . . . . . . . . . 48 Executive Vice President and President,AmerisourceBergen Drug Corporation
John G. Chou . . . . . . . . . . . . . . . . . . . 53 Senior Vice President, General Counsel andSecretary
Jeanne B. Fisher . . . . . . . . . . . . . . . . . 68 Senior Vice President, Human Resources
Unless indicated to the contrary, the business experience summaries provided below for our executive officersdescribe positions held by the named individuals during the last five years.
Mr. Yost has been Chief Executive Officer and a Director of the Company since August 2001 and wasPresident of the Company until October 2002. He again assumed the position of President of the Company inSeptember 2007. He was Chief Executive Officer of AmeriSource Health Corporation from May 1997 until August2001 and Chairman of the Board of AmeriSource from December 2000 until August 2001. Mr. Yost has beenemployed by the Company or one of its predecessors for 35 years.
Mr. DiCandilo has been Chief Financial Officer of the Company since March 2002 and an Executive VicePresident of the Company since May 2005. From May 2008 to September 2009, he was also Chief Operating Officerof AmerisourceBergen Drug Corporation. From March 2002 to May 2005, Mr. DiCandilo was a Senior VicePresident. Mr. DiCandilo has been employed by the Company or one of its predecessors for 19 years.
Mr. Collis was named Executive Vice President and President of AmerisourceBergen Drug Corporation inSeptember 2009. He was Executive Vice President and President of AmerisourceBergen Specialty Group fromSeptember 2007 to September 2009 and was Senior Vice President of the Company and President of Amer-isourceBergen Specialty Group from August 2001 to September 2007. Mr. Collis has been employed by theCompany or one of its predecessors for 15 years.
Mr. Chou was named Senior Vice President and General Counsel of the Company in January 2007. He hasserved as Secretary of the Company since February 2006. He was Vice President and Deputy General Counsel fromNovember 2004 to January 2007 and Associate General Counsel from July 2002 to November 2004. Mr. Chou hasbeen employed by the Company for 7 years.
Ms. Fisher has been Senior Vice President, Human Resources since January 2003. Ms. Fisher has beenemployed by the Company for 6 years.
18
PART II
ITEM 5. MARKET FOR REGISTRANT’S COMMON EQUITY, RELATED STOCKHOLDER MATTERSAND ISSUER PURCHASES OF EQUITY SECURITIES
The Company’s common stock is traded on the New York Stock Exchange (“NYSE”) under the trading symbol“ABC.” As of October 31, 2009, there were 3,872 record holders of the Company’s common stock. The followingtable sets forth the high and low closing sale prices of the Company’s common stock for the periods indicated.
PRICE RANGE OF COMMON STOCKHigh Low
Fiscal Year Ended September 30, 2009First Quarter . . . . . . . . . . . . . . . . . . . . . . . . . . . . . . . . . . . . . . . . . . . . . . . . . . $18.50 $13.74
Second Quarter . . . . . . . . . . . . . . . . . . . . . . . . . . . . . . . . . . . . . . . . . . . . . . . . $19.38 $14.10
Third Quarter . . . . . . . . . . . . . . . . . . . . . . . . . . . . . . . . . . . . . . . . . . . . . . . . . $18.93 $16.26
Fourth Quarter . . . . . . . . . . . . . . . . . . . . . . . . . . . . . . . . . . . . . . . . . . . . . . . . $22.38 $17.72
Fiscal Year Ended September 30, 2008First Quarter . . . . . . . . . . . . . . . . . . . . . . . . . . . . . . . . . . . . . . . . . . . . . . . . . . $23.56 $21.42
Second Quarter . . . . . . . . . . . . . . . . . . . . . . . . . . . . . . . . . . . . . . . . . . . . . . . . $23.86 $19.55
Third Quarter . . . . . . . . . . . . . . . . . . . . . . . . . . . . . . . . . . . . . . . . . . . . . . . . . $21.20 $19.50
Fourth Quarter . . . . . . . . . . . . . . . . . . . . . . . . . . . . . . . . . . . . . . . . . . . . . . . . $21.58 $18.83
On June 15, 2009, the Company effected a two-for-one stock split of the Company’s outstanding shares ofcommon stock. The stock split occurred in the form of a stock dividend, where each stockholder received oneadditional share for each share owned. The stock dividend was payable to stockholders of record at the close ofbusiness on May 29, 2009.
During the fiscal year ended September 30, 2008, the Company paid quarterly cash dividends of $0.0375. OnNovember 13, 2008, the Company’s board of directors increased the quarterly dividend by 33% and declared a cashdividend of $0.05 per share. During the first three quarters of the fiscal year ended September 30, 2009, theCompany paid quarterly cash dividends of $0.05 per share. During the fourth quarter of the fiscal year endedSeptember 30, 2009, the Company increased the quarterly cash dividend by 20% and paid a quarterly cash dividendof $0.06 per share. On November 12, 2009, our board of directors increased the quarterly dividend again by 33%from $0.06 per share to $0.08 per share. The Company anticipates that it will continue to pay quarterly cashdividends in the future. However, the payment and amount of future dividends remain within the discretion of theCompany’s board of directors and will depend upon the Company’s future earnings, financial condition, capitalrequirements and other factors.
On November 12, 2009, the Company amended its rights agreement to accelerate the expiration date of alloutstanding rights issued under the rights agreement. As a result, any and all rights issued under the rightsagreement expired and were no longer outstanding as of the close of business on November 20, 2009.
BNY Mellon is the Company’s transfer agent. BNY Mellon can be reached at (mail) AmerisourceBergenCorporation c/o BNY Mellon Shareowner Services, P.O. Box 358015, Pittsburgh, PA 15252-8015; (telephone):Domestic 1-877-296-3711, Domestic TDD 1-800-231-5469, International 1-201-680-6578 or InternationalTDD 1-201-680-6610; (internet) www.bnymellon.com/shareowner/isd; and (e-mail) [email protected].
19
ISSUER PURCHASES OF EQUITY SECURITIES
The following table sets forth the total number of shares purchased, the average price paid per share, the totalnumber of shares purchased as part of publicly announced programs, and the approximate dollar value of shares thatmay yet be purchased under the programs during each month in the fiscal year ended September 30, 2009.
Period
TotalNumber of
Shares Purchased
Average PricePaid per
Share
Total Number ofShares Purchasedas Part of Publicly
AnnouncedPrograms
ApproximateDollar Value of
Shares that MayYet Be Purchased
Under thePrograms
October 1 to October 31 . . . . . . . . . . . . — $ — — $ 18,079,594
November 1 to November 30 . . . . . . . . 3,454,952 $14.56 3,454,952 $467,760,715
December 1 to December 31. . . . . . . . . 2,457,400 $15.44 2,457,400 $429,807,858
January 1 to January 31 . . . . . . . . . . . . 2,149,600 $18.60 2,149,600 $389,834,257
February 1 to February 28 . . . . . . . . . . 2,407,848 $18.37 2,282,600 $348,037,057March 1 to March 31 . . . . . . . . . . . . . . 646,760 $15.06 644,600 $338,331,537
April 1 to April 30 . . . . . . . . . . . . . . . . 1,216 $16.33 — $338,331,537
May 1 to May 31 . . . . . . . . . . . . . . . . . 3,688,974 $18.27 3,688,602 $270,930,912
June 1 to June 30 . . . . . . . . . . . . . . . . . 1,453,100 $18.23 1,453,100 $244,440,955
July 1 to July 31. . . . . . . . . . . . . . . . . . 1,225 $17.72 — $244,440,955
August 1 to August 31 . . . . . . . . . . . . . 3,952,919 $20.27 3,952,919 $164,311,879
September 1 to September 30 . . . . . . . . 4,474,591 $21.51 4,474,591 $ 68,083,237
Total . . . . . . . . . . . . . . . . . . . . . . . . . . 24,688,585 $18.33 24,558,364
(a) In May 2007, the Company announced a program to purchase up to $850 million of its outstanding shares ofcommon stock, subject to market conditions. In November 2007, the Company’s board of directors authorizedan increase to the $850 million repurchase program by $500 million, subject to market conditions. During thefiscal year ended September 30, 2009, the Company purchased 1.2 million shares to complete this program.
(b) In November 2008, the Company announced a new program to purchase up to $500 million of its outstandingshares of common stock, subject to market conditions. During the fiscal year ended September 30, 2009, theCompany purchased 23.3 million shares under this program for $431.9 million. There is no expiration daterelated to this new program.
(c) Employees surrendered 130,221 shares during the fiscal year ended September 30, 2009 to meet tax-with-holding obligations upon vesting of restricted stock.
20
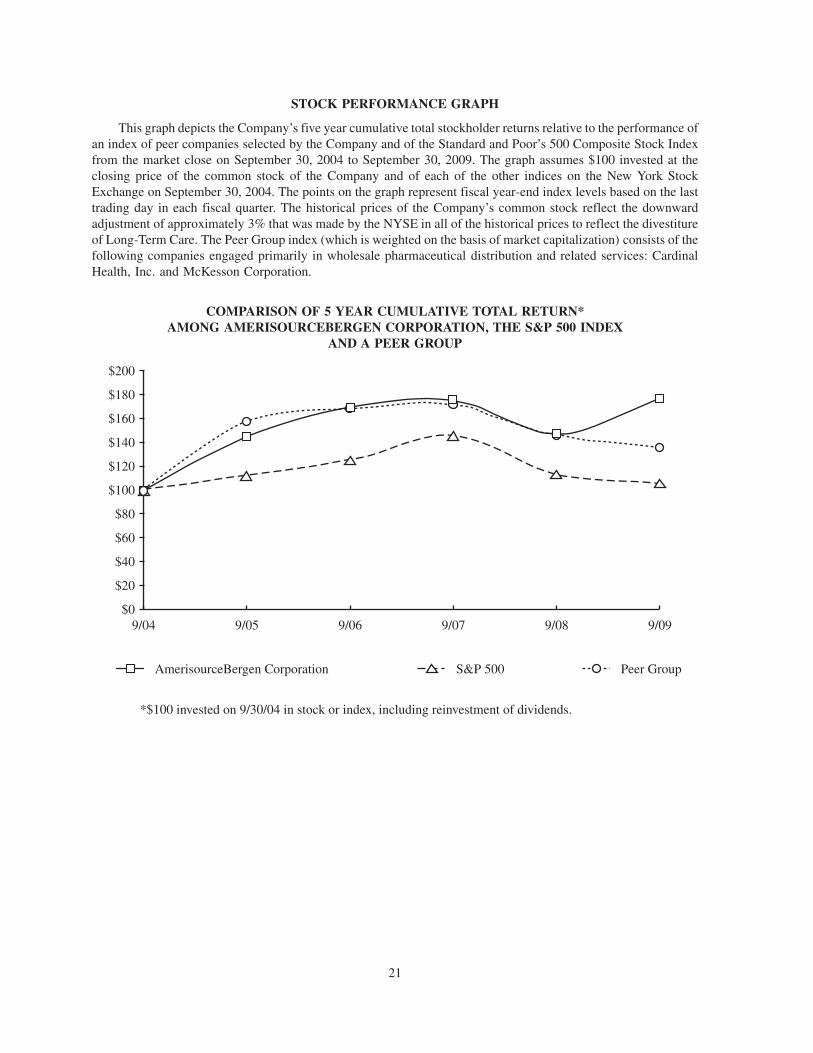
STOCK PERFORMANCE GRAPH
This graph depicts the Company’s five year cumulative total stockholder returns relative to the performance ofan index of peer companies selected by the Company and of the Standard and Poor’s 500 Composite Stock Indexfrom the market close on September 30, 2004 to September 30, 2009. The graph assumes $100 invested at theclosing price of the common stock of the Company and of each of the other indices on the New York StockExchange on September 30, 2004. The points on the graph represent fiscal year-end index levels based on the lasttrading day in each fiscal quarter. The historical prices of the Company’s common stock reflect the downwardadjustment of approximately 3% that was made by the NYSE in all of the historical prices to reflect the divestitureof Long-Term Care. The Peer Group index (which is weighted on the basis of market capitalization) consists of thefollowing companies engaged primarily in wholesale pharmaceutical distribution and related services: CardinalHealth, Inc. and McKesson Corporation.
COMPARISON OF 5 YEAR CUMULATIVE TOTAL RETURN*AMONG AMERISOURCEBERGEN CORPORATION, THE S&P 500 INDEX
AND A PEER GROUP
$0
$20
$40
$60
$80
$100
$120
$140
$160
$180
$200
9/04 9/05 9/06 9/07 9/08 9/09
AmerisourceBergen Corporation S&P 500 Peer Group
*$100 invested on 9/30/04 in stock or index, including reinvestment of dividends.
21
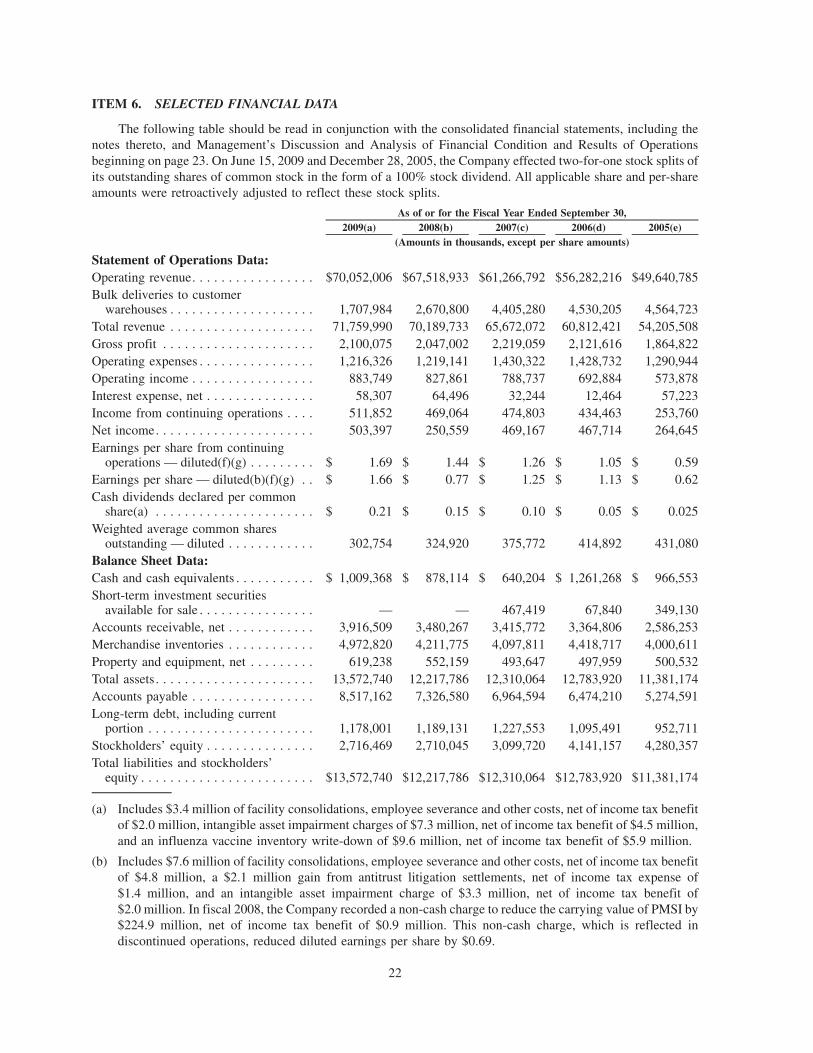
ITEM 6. SELECTED FINANCIAL DATA
The following table should be read in conjunction with the consolidated financial statements, including thenotes thereto, and Management’s Discussion and Analysis of Financial Condition and Results of Operationsbeginning on page 23. On June 15, 2009 and December 28, 2005, the Company effected two-for-one stock splits ofits outstanding shares of common stock in the form of a 100% stock dividend. All applicable share and per-shareamounts were retroactively adjusted to reflect these stock splits.
2009(a) 2008(b) 2007(c) 2006(d) 2005(e)As of or for the Fiscal Year Ended September 30,
(Amounts in thousands, except per share amounts)
Statement of Operations Data:Operating revenue. . . . . . . . . . . . . . . . . $70,052,006 $67,518,933 $61,266,792 $56,282,216 $49,640,785Bulk deliveries to customer
warehouses . . . . . . . . . . . . . . . . . . . . 1,707,984 2,670,800 4,405,280 4,530,205 4,564,723Total revenue . . . . . . . . . . . . . . . . . . . . 71,759,990 70,189,733 65,672,072 60,812,421 54,205,508Gross profit . . . . . . . . . . . . . . . . . . . . . 2,100,075 2,047,002 2,219,059 2,121,616 1,864,822Operating expenses . . . . . . . . . . . . . . . . 1,216,326 1,219,141 1,430,322 1,428,732 1,290,944Operating income . . . . . . . . . . . . . . . . . 883,749 827,861 788,737 692,884 573,878Interest expense, net . . . . . . . . . . . . . . . 58,307 64,496 32,244 12,464 57,223Income from continuing operations . . . . 511,852 469,064 474,803 434,463 253,760Net income. . . . . . . . . . . . . . . . . . . . . . 503,397 250,559 469,167 467,714 264,645Earnings per share from continuing
operations — diluted(f)(g) . . . . . . . . . $ 1.69 $ 1.44 $ 1.26 $ 1.05 $ 0.59Earnings per share — diluted(b)(f)(g) . . $ 1.66 $ 0.77 $ 1.25 $ 1.13 $ 0.62Cash dividends declared per common
share(a) . . . . . . . . . . . . . . . . . . . . . . $ 0.21 $ 0.15 $ 0.10 $ 0.05 $ 0.025Weighted average common shares
outstanding — diluted . . . . . . . . . . . . 302,754 324,920 375,772 414,892 431,080Balance Sheet Data:Cash and cash equivalents . . . . . . . . . . . $ 1,009,368 $ 878,114 $ 640,204 $ 1,261,268 $ 966,553Short-term investment securities
available for sale . . . . . . . . . . . . . . . . — — 467,419 67,840 349,130Accounts receivable, net . . . . . . . . . . . . 3,916,509 3,480,267 3,415,772 3,364,806 2,586,253Merchandise inventories . . . . . . . . . . . . 4,972,820 4,211,775 4,097,811 4,418,717 4,000,611Property and equipment, net . . . . . . . . . 619,238 552,159 493,647 497,959 500,532Total assets . . . . . . . . . . . . . . . . . . . . . . 13,572,740 12,217,786 12,310,064 12,783,920 11,381,174Accounts payable . . . . . . . . . . . . . . . . . 8,517,162 7,326,580 6,964,594 6,474,210 5,274,591Long-term debt, including current
portion . . . . . . . . . . . . . . . . . . . . . . . 1,178,001 1,189,131 1,227,553 1,095,491 952,711Stockholders’ equity . . . . . . . . . . . . . . . 2,716,469 2,710,045 3,099,720 4,141,157 4,280,357Total liabilities and stockholders’
equity . . . . . . . . . . . . . . . . . . . . . . . . $13,572,740 $12,217,786 $12,310,064 $12,783,920 $11,381,174
(a) Includes $3.4 million of facility consolidations, employee severance and other costs, net of income tax benefitof $2.0 million, intangible asset impairment charges of $7.3 million, net of income tax benefit of $4.5 million,and an influenza vaccine inventory write-down of $9.6 million, net of income tax benefit of $5.9 million.
(b) Includes $7.6 million of facility consolidations, employee severance and other costs, net of income tax benefitof $4.8 million, a $2.1 million gain from antitrust litigation settlements, net of income tax expense of$1.4 million, and an intangible asset impairment charge of $3.3 million, net of income tax benefit of$2.0 million. In fiscal 2008, the Company recorded a non-cash charge to reduce the carrying value of PMSI by$224.9 million, net of income tax benefit of $0.9 million. This non-cash charge, which is reflected indiscontinued operations, reduced diluted earnings per share by $0.69.
22
(c) Includes $5.0 million of facility consolidations, employee severance and other costs, net of income tax expenseof $2.9 million and a $22.1 million gain from antitrust litigation settlements, net of income tax expense of$13.7 million and also includes a $17.5 million charge relating to the write-down of tetanus-diphtheria vaccineinventory to its estimated net realizable value, net of income tax benefit of $10.3 million.
As a result of the July 31, 2007 divestiture of Long-Term Care, the statement of operations data includes theoperations of Long-Term Care for the ten months ended July 31, 2007 and the September 30, 2007 balancesheet data excludes Long-Term Care.
(d) Includes $14.2 million of facility consolidations, employee severance and other costs, net of income tax benefitof $5.9 million, a $25.8 million gain from antitrust litigation settlements, net of income tax expense of$15.1 million, and a $4.1 million gain on the sale of an equity investment and an eminent domain settlement,net of income tax expense of $2.4 million.
(e) Includes $14.0 million of facility consolidations, employee severance and other costs, net of income tax benefitof $8.7 million, a $71.4 million loss on early retirement of debt, net of income tax benefit of $40.5 million, a$24.7 million gain from antitrust litigation settlements, net of income tax expense of $15.4 million and animpairment charge of $3.2 million, net of income tax benefit of $2.1 million.
(f) Effective October 1, 2005, the Company adopted Statement of Financial Accounting Standard 123R, using themodified-prospective transition method, and therefore, began to expense the fair value of all outstanding stockoptions over their remaining vesting periods to the extent the options were not fully vested as of the adoption dateand began to expense the fair value of all share-based compensation awards granted subsequent to September 30,2005 over their requisite service periods. Had the Company expensed share-based compensation for the fiscalyear ended September 30, 2005, diluted earnings per share would have been lower by $0.01.
(g) Effective October 1, 2004, the Company changed its accounting method of recognizing cash discounts andother related manufacturer incentives. The Company recorded a $10.2 million charge for the cumulative effectof change in accounting (net of income tax benefit of $6.3 million) in the consolidated statement of operationsfor the fiscal year ended September 30, 2005. The $10.2 million charge reduced diluted earnings per share by$0.02 for the fiscal year ended September 30, 2005.
ITEM 7. MANAGEMENT’S DISCUSSION AND ANALYSIS OF FINANCIAL CONDITION ANDRESULTS OF OPERATIONS
Overview
The following discussion should be read in conjunction with the consolidated financial statements and notesthereto contained herein.
We are a pharmaceutical services company providing drug distribution and related healthcare services and solutionsto our pharmacy, physician, and manufacturer customers, which are based primarily in the United States and Canada. Weare organized based upon the products and services we provide to our customers. Substantially all of our operations arelocated in the United States and Canada. We also have a pharmaceutical packaging operation in the United Kingdom.
In May 2009, we declared a two-for-one stock split of our outstanding shares of common stock. The stock splitoccurred in the form of a 100% stock dividend, whereby each stockholder received one additional share for eachshare owned. The shares were distributed on June 15, 2009 to stockholders of record at the close of business onMay 29, 2009. All applicable share and per share data in this Management’s Discussion and Analysis of FinancialCondition and Results of Operations have been retroactively adjusted to give effect to this stock split.
Acquisition
In May 2009, we acquired Innomar Strategies Inc. (“Innomar”), a Canadian specialty pharmaceutical servicescompany, for a purchase price of $13.4 million, net of a working capital adjustment. Innomar provides serviceswithin Canada to pharmaceutical biotechnology companies, including strategic consulting and access solutions,specialty logistics management, patient assistance and nursing services, and clinical research services. Theacquisition of Innomar expanded our specialty business in Canada.
23
Divestitures
In October 2008, we completed the divestiture of our former workers’ compensation business, PMSI. Weclassified PMSI’s assets and liabilities as held for sale in the consolidated balance sheet as of September 30, 2008and classified PMSI’s operating results and cash flows as discontinued in the consolidated financial statements forall periods presented.
We sold PMSI for approximately $31 million, net of a final working capital adjustment, which includes a$19 million subordinated note due from PMSI on the fifth anniversary of the closing date (the “maturity date”), ofwhich $4 million may be payable in October 2010 if PMSI achieves certain revenue targets with respect to its largestcustomer. Interest, which accrues at an annual rate of LIBOR plus 4% (not to exceed 8%), will be payable in cash ona quarterly basis if PMSI achieves a defined minimum fixed charge coverage ratio, or will be compounded quarterlyand paid at maturity. Additionally, if PMSI’s annual net revenue exceeds certain thresholds through December2011, we may be entitled to additional payments of up to $10 million under the subordinated note due from PMSI onthe maturity date of the note.
On July 31, 2007, we completed the spin-off of our former institutional pharmacy business, PharMerica Long-Term Care (“Long-Term Care”). In connection with the spin-off, we continue to distribute pharmaceuticals to andgenerate cash flows from the disposed institutional pharmacy business. The historical operating results of Long-Term Care are not reported as a discontinued operation because of the significance of the continuing cash flowsresulting from the pharmaceutical distribution agreement entered into between the disposed component and us. Forperiods prior to August 1, 2007, our operating results include Long-Term Care.
Reportable Segments
Our operations are currently comprised of one reportable segment, Pharmaceutical Distribution. The Otherreportable segment included the operating results of Long-Term Care, through the July 31, 2007 spin-off date. Theoperating results of PMSI, which was sold in October 2008, were reclassified to discontinued operations.
Pharmaceutical Distribution
The Pharmaceutical Distribution reportable segment is comprised of three operating segments, which include theoperations of AmerisourceBergen Drug Corporation (“ABDC”), AmerisourceBergen Specialty Group (“ABSG”), andAmerisourceBergen Packaging Group (“ABPG”). Servicing both healthcare providers and pharmaceutical manu-facturers in the pharmaceutical supply channel, the Pharmaceutical Distribution segment’s operations provide drugdistribution and related services designed to reduce healthcare costs and improve patient outcomes.
ABDC distributes a comprehensive offering of brand-name and generic pharmaceuticals, over-the-counterhealthcare products, home healthcare supplies and equipment, and related services to a wide variety of healthcareproviders, including acute care hospitals and health systems, independent and chain retail pharmacies, mail orderpharmacies, medical clinics, long-term care and other alternate site pharmacies, and other customers. ABDC alsoprovides pharmacy management, staffing and other consulting services; scalable automated pharmacy dispensingequipment; medication and supply dispensing cabinets; and supply management software to a variety of retail andinstitutional healthcare providers.
ABSG, through a number of individual operating businesses, provides pharmaceutical distribution and otherservices primarily to physicians who specialize in a variety of disease states, especially oncology, and to otherhealthcare providers, including dialysis clinics. ABSG also distributes vaccines, other injectables, and plasma andother blood products. In addition, through its specialty service businesses, ABSG provides drug commercializationservices, third party logistics, and other services for biotech and other pharmaceutical manufacturers, as well asreimbursement consulting, data analytics, outcomes research, practice management, group purchasing services forphysician practices, and physician education.
ABPG consists of American Health Packaging, Anderson Packaging (“Anderson”), and Brecon Pharmaceu-ticals Limited (“Brecon”). American Health Packaging delivers unit dose, punch card, unit-of-use, and otherpackaging solutions to institutional and retail healthcare providers. American Health Packaging’s largest customeris ABDC, and, as a result, its operations are closely aligned with the operations of ABDC. Anderson is a leading
24
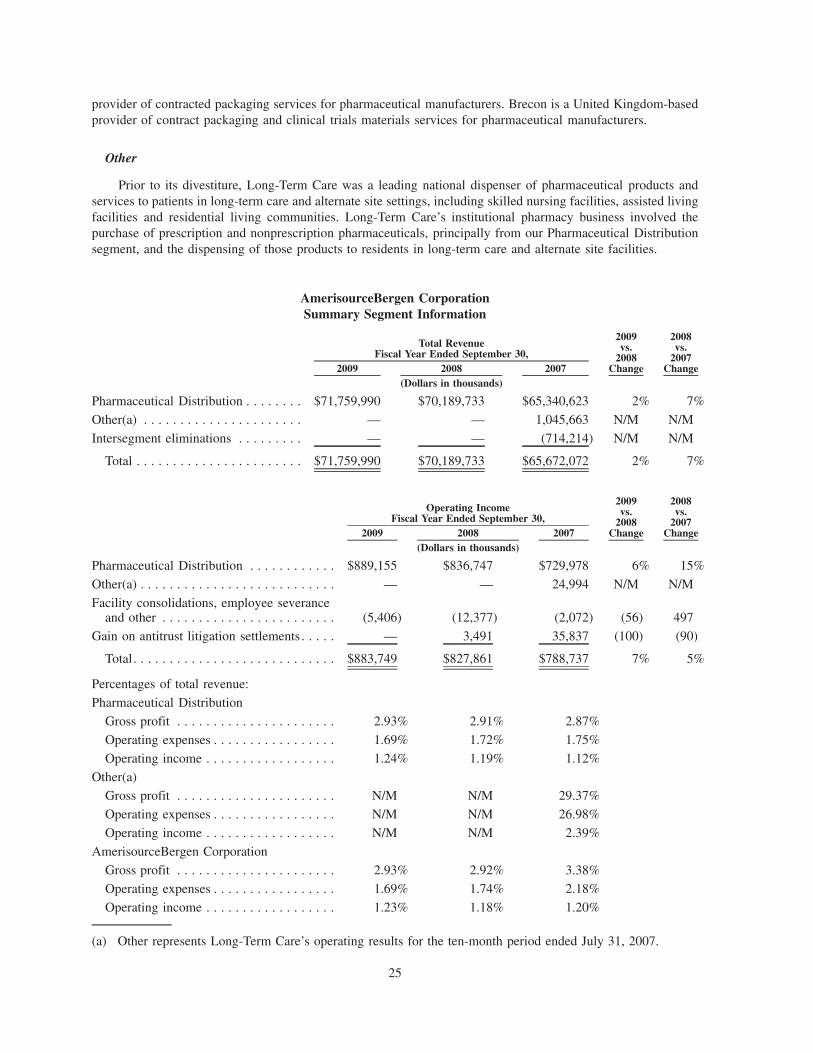
provider of contracted packaging services for pharmaceutical manufacturers. Brecon is a United Kingdom-basedprovider of contract packaging and clinical trials materials services for pharmaceutical manufacturers.
Other
Prior to its divestiture, Long-Term Care was a leading national dispenser of pharmaceutical products andservices to patients in long-term care and alternate site settings, including skilled nursing facilities, assisted livingfacilities and residential living communities. Long-Term Care’s institutional pharmacy business involved thepurchase of prescription and nonprescription pharmaceuticals, principally from our Pharmaceutical Distributionsegment, and the dispensing of those products to residents in long-term care and alternate site facilities.
AmerisourceBergen CorporationSummary Segment Information
2009 2008 2007
2009vs.
2008Change
2008vs.
2007Change
Total RevenueFiscal Year Ended September 30,
(Dollars in thousands)
Pharmaceutical Distribution . . . . . . . . $71,759,990 $70,189,733 $65,340,623 2% 7%
Other(a) . . . . . . . . . . . . . . . . . . . . . . — — 1,045,663 N/M N/M
Intersegment eliminations . . . . . . . . . — — (714,214) N/M N/M
Total . . . . . . . . . . . . . . . . . . . . . . . $71,759,990 $70,189,733 $65,672,072 2% 7%
2009 2008 2007
2009vs.
2008Change
2008vs.
2007Change
Operating IncomeFiscal Year Ended September 30,
(Dollars in thousands)
Pharmaceutical Distribution . . . . . . . . . . . . $889,155 $836,747 $729,978 6% 15%
Other(a) . . . . . . . . . . . . . . . . . . . . . . . . . . . — — 24,994 N/M N/M
Facility consolidations, employee severanceand other . . . . . . . . . . . . . . . . . . . . . . . . (5,406) (12,377) (2,072) (56) 497
Gain on antitrust litigation settlements . . . . . — 3,491 35,837 (100) (90)
Total. . . . . . . . . . . . . . . . . . . . . . . . . . . . $883,749 $827,861 $788,737 7% 5%
Percentages of total revenue:
Pharmaceutical Distribution
Gross profit . . . . . . . . . . . . . . . . . . . . . . 2.93% 2.91% 2.87%
Operating expenses . . . . . . . . . . . . . . . . . 1.69% 1.72% 1.75%
Operating income . . . . . . . . . . . . . . . . . . 1.24% 1.19% 1.12%Other(a)
Gross profit . . . . . . . . . . . . . . . . . . . . . . N/M N/M 29.37%
Operating expenses . . . . . . . . . . . . . . . . . N/M N/M 26.98%
Operating income . . . . . . . . . . . . . . . . . . N/M N/M 2.39%
AmerisourceBergen Corporation
Gross profit . . . . . . . . . . . . . . . . . . . . . . 2.93% 2.92% 3.38%
Operating expenses . . . . . . . . . . . . . . . . . 1.69% 1.74% 2.18%
Operating income . . . . . . . . . . . . . . . . . . 1.23% 1.18% 1.20%
(a) Other represents Long-Term Care’s operating results for the ten-month period ended July 31, 2007.
25
Year ended September 30, 2009 compared with Year ended September 30, 2008
Operating Results
Total revenue of $71.8 billion in fiscal 2009, which includes bulk deliveries to customer warehouses, increased2% from the prior fiscal year. This increase was due to the 7% growth of ABSG and the 1.8% growth of ABDC,which was impacted by the July 1, 2008 loss of certain business (approximately $3 billion on an annualized basis)with a national retail drug chain customer. Excluding the loss of the above-mentioned business, total revenue infiscal 2009 would have increased by 5% from the prior fiscal year. During fiscal 2009 and 2008, 68% of totalrevenue was from sales to institutional customers and 32% was from sales to retail customers. Sales to institutionalcustomers increased 5% in the current fiscal year primarily due to the growth of ABSG and the addition of a newlarge hospital buying group customer. Sales to retail customers decreased 4% in the current fiscal year as the loss ofthe above mentioned national chain business was offset, in part, by market growth and the addition of a new largeindependent retail buying group customer.
We report as revenue bulk deliveries to customer warehouses, whereby we act as an intermediary in theordering and delivery of pharmaceutical products. Bulk delivery transactions are arranged by us at the expressdirection of the customer, and involve either shipments from the supplier directly to customers’ warehouse sites(i.e., drop shipment) or shipments from the supplier to us for immediate shipment to the customers’ warehouse sites(i.e., cross-dock shipment). Bulk deliveries of $1.7 billion in fiscal 2009 decreased 36% from the prior fiscal year.This decline was due to the prior year transition of a significant amount of business previously conducted on a bulkdelivery basis with our largest customer to an operating revenue basis. We are a principal to bulk deliverytransactions because we are the primary obligor and have the ultimate responsibility for fulfillment and accept-ability of the products purchased, and bear full risk of delivery and loss for products, whether the products are drop-shipped or shipped cross-dock. We also bear full credit risk associated with the creditworthiness of any bulkdelivery customer. As a result, we record bulk deliveries to customer warehouses as gross revenues. Due to theinsignificant service fees generated from bulk deliveries, fluctuations in volume have no significant impact on ouroperating margins. However, revenue from bulk deliveries has a positive impact on our cash flows due to favorabletiming between customer payments to us and payments by us to our suppliers.
ABDC’s total revenue in fiscal 2009 increased by 1.8% from the prior fiscal year, primarily due to revenuefrom two new large customers, and was partially offset by the loss of certain business with a large retail drug chaincustomer, as mentioned above.
ABSG’s total revenue in fiscal 2009 of $15.6 billion increased 7% from the prior fiscal year due to good growthbroadly across its distribution and service businesses, offset in part, by declining anemia drug sales (see paragraphbelow). The majority of ABSG’s revenue is generated from the distribution of pharmaceuticals to physicians whospecialize in a variety of disease states, especially oncology. ABSG also distributes vaccines, plasma and otherblood products. ABSG’s business may be adversely impacted in the future by changes in medical guidelines and theMedicare reimbursement rates for certain pharmaceuticals, including oncology drugs administered by physiciansand anemia drugs. Since ABSG provides a number of services to or through physicians, any changes affecting thisservice channel could result in slower or reduced growth in revenues.
Revenue related to the distribution of anemia-related products, which represented 5% of total revenue in fiscal2009, decreased approximately 7% from the prior fiscal year. The decline in sales of anemia-related products hasbeen most pronounced in the use of these products for cancer treatment. Sales of oncology-related anemia productsrepresented approximately 1.8% of total revenue in fiscal 2009, and decreased approximately 25% from the priorfiscal year. Several developments have contributed to the decline in sales of anemia drugs, including expandedwarning and other product safety labeling requirements, more restrictive federal policies governing Medicarereimbursement for the use of these drugs to treat oncology patients undergoing dialysis or experiencing kidneyfailure, and changes in regulatory and clinical medical guidelines for recommended dosage and use. As a result,oncology-related anemia drug sales have declined further in fiscal 2009 from our fiscal 2008 total. In addition, theU.S. Food and Drug Administration (“FDA”) is continuing to review clinical study data concerning the possiblerisks associated with certain anemia products and the Centers for Medicare and Medicaid Services (“CMS”)announced last year that it is considering a review of national Medicare policy for these drugs for patients who havecancer or pre-dialysis kidney disease. The FDA or CMS may take additional action regarding the use, safety
26
labeling and/or Medicare coverage of these drugs in the future. Further changes in medical guidelines for anemiadrugs may impact the availability and extent of reimbursement for these drugs from third party payors, includingfederal and state governments and private insurance plans. Our future revenue growth rate and/or profitability maycontinue to be impacted by any future reductions in reimbursement for anemia drugs or changes that limit thedosage and/or use of anemia drugs.
We expect that our total revenue growth in fiscal 2010 for ABDC and ABSG will be between 5% and 7%. Dueto the addition of two significant new customers in March and April 2009, we expect revenue growth will be higherin the first half of fiscal 2010 than in the second half. Our expected growth reflects U.S. pharmaceutical industryconditions, including increases in prescription drug utilization, the introduction of new products, and higherbranded pharmaceutical prices, offset, in part, by the increased use of lower-priced generics. Our growth has alsobeen impacted by industry competition and changes in customer mix. Industry sales in the United States, as recentlyestimated by industry data firm IMS Healthcare, Inc. (“IMS”), are expected to grow between 3% and 5% in calendar2010. IMS expects that certain sectors of the market, such as biotechnology and other specialty and genericpharmaceuticals, will grow faster than the overall market. Additionally, IMS expects the U.S. pharmaceuticalindustry to grow annually in the low to mid-single digit percentages through 2013. Our future revenue growth willcontinue to be affected by various factors such as industry growth trends, including the likely increase in the numberof generic drugs that will be available over the next few years as a result of the expiration of certain drug patents heldby brand manufacturers, general economic conditions in the United States, competition within the industry,customer consolidation, changes in pharmaceutical manufacturer pricing and distribution policies and practices,increased downward pressure on reimbursement rates, and changes in federal government rules and regulations.
Gross profit of $2.1 billion in fiscal 2009 increased by $53.1 million or 3% from the prior fiscal year. Thisincrease was primarily due to the strong growth and increased profitability of our generic programs, includingspecialty generics (with generic revenue increasing by 15% in comparison to the prior fiscal year), increasedcontributions from our fee-for-service agreements (including $10.2 million of fees relating to prior period salesresulting from the execution of new agreements in the quarter ended December 31, 2008), and good growth fromABSG’s businesses, all of which was offset, in part, by ABSG’s $15.5 million write-down of influenza vaccineinventory in the December 2008 quarter, and normal competitive pressures on customer margins in the current fiscalyear. Gross profit in fiscal 2009 benefited from a settlement of $1.8 million with a former customer. Gross profit in theprior fiscal year benefited from a gain of $13.2 million relating to favorable litigation settlements with a formercustomer and a major competitor, and an $8.6 million settlement of disputed fees with a supplier, and was partiallyoffset by an $8.4 million inventory write-down of certain pharmacy equipment. Additionally, in the prior fiscal year,we recognized a gain of $3.5 million from antitrust litigation settlements with pharmaceutical manufacturers. Thisgain, which was excluded from the determination of Pharmaceutical Distribution segment’s gross profit, was recordedas a reduction to cost of goods sold. The Company is unable to estimate future gains, if any, it will recognize as a resultof antitrust settlements (see Note 14 of the Notes to the Consolidated Financial Statements). As a percentage of totalrevenue, gross profit in fiscal 2009 was 2.93%, an increase of 1 basis point from the prior fiscal year.
Our cost of goods sold includes a last-in, first-out (“LIFO”) provision that is affected by changes in inventoryquantities, product mix, and manufacturer pricing practices, which may be impacted by market and other externalinfluences. We recorded a LIFO charge of $15.1 million and $21.1 million in fiscal 2009 and 2008, respectively. Thefiscal 2009 and 2008 LIFO charges reflect brand-name supplier price inflation, which more than offset pricedeflation of generic drugs.
Operating expenses of $1.2 billion in fiscal 2009 declined by nearly $3.0 million when compared to the priorfiscal year as a decrease in facility consolidations, employee severance and other charges of $7.0 million, a decreasein depreciation and amortization expenses of $3.2 million, and a decrease in asset impairment charges of$1.5 million were offset, in part, by an increase in bad debt expense of $4.2 million. Asset impairment chargesin the current fiscal year included trade name impairment charges of $11.8 million and the write-off of certaincapitalized software totaling $2.8 million. Asset impairment charges in the prior fiscal year included trade nameimpairment charges of $5.3 million related to certain of our smaller business units and impairment charges relatedto capitalized equipment and software development costs totaling $10.8 million, primarily due to ABDC’s decisionto abandon the use of certain software, which will be replaced in connection with our Business Transformationproject. Additionally, expenses incurred in fiscal 2009 in connection with our Business Transformation project,
27
which includes a new enterprise resource planning (“ERP”) platform, increased by $13.8 million from the priorfiscal year. As a result of our cE2 initiative described below, we have been able to substantially offset theseincremental costs by reducing our warehouse operating costs through continuing productivity improvements and bystreamlining our organizational structures within ABDC and ABSG. As a percentage of total revenue, operatingexpenses were 1.69% and 1.74% in fiscal 2009 and 2008, respectively.
The following table illustrates the charges incurred relating to facility consolidations, employee severance andother (which are excluded from the operating expenses of the Pharmaceutical Distribution segment) for the fiscalyears ended September 30, 2009 and 2008 (in thousands):
2009 2008
Facility consolidations and employee severance . . . . . . . . . . . . . . . . . . . . . . . . . $5,406 $ 9,741
Costs relating to business divestitures . . . . . . . . . . . . . . . . . . . . . . . . . . . . . . . . — 2,636
Total facility consolidations, employee severance and other . . . . . . . . . . . . . . $5,406 $12,377
In fiscal 2008, we announced a more streamlined organizational structure and introduced an initiative (“cE2”)designed to drive increased customer efficiency and cost effectiveness. In connection with these efforts, we reducedvarious operating costs and terminated certain positions. During fiscal 2009 and 2008, we terminated 197 and130 employees and incurred $3.1 million and $10.0 million of employee severance costs, respectively, relating toour cE2 initiative. Additionally, in fiscal 2009, we recorded $2.2 million of additional expense relating to the BergenBrunswig Matter as described in Note 13 (Legal Matters and Contingencies) of the Notes to the ConsolidatedFinancial Statements. In fiscal 2008, we reversed $1.0 million of employee severance charges previously estimatedand recorded relating to a prior integration plan. Costs related to business divestitures in fiscal 2008 related to thesale of our former workers’ compensation business, PMSI.
We paid a total of $15.4 million and $6.8 million for employee severance, lease cancellation and other costs infiscal 2009 and 2008, respectively. Remaining unpaid amounts of $11.4 million for employee severance, leasecancellation and other costs are included in accrued expenses and other in the accompanying balance sheet atSeptember 30, 2009. Employees receive their severance benefits over a period of time, generally not in excess of12 months, or in the form of a lump-sum payment.
Operating income of $883.7 million in fiscal 2009 increased 7% from the prior fiscal year primarily due to theincrease in gross profit. As a percentage of total revenue, operating income of 1.23% in fiscal 2009 increased 5 basispoints from the prior fiscal year due to the 2% increase in revenue while operating expense dollars remainedrelatively flat.
The costs of facility consolidations, employee severance and other, and the charges relating to intangible assetimpairments, less the gain on antitrust litigation settlements had the effect of decreasing operating income as apercentage of total revenue by 2 basis points in each of fiscal 2009 and 2008.
Interest expense, interest income, and their respective weighted average interest rates in fiscal 2009 and 2008were as follows (in thousands):
AmountWeighted-Average
Interest Rate AmountWeighted-Average
Interest Rate
2009 2008
Interest expense . . . . . . . . . . . . . . . . . . $63,502 4.88% $ 75,099 5.48%
Interest income . . . . . . . . . . . . . . . . . . . (5,195) 0.85% (10,603) 3.33%
Interest expense, net . . . . . . . . . . . . . . . $58,307 $ 64,496
Interest expense decreased from the prior fiscal year due to a decrease of $90.4 million in average borrowingsand a decrease in the weighted-average interest rate on borrowings under our revolving credit facilities to 2.08%from 4.77% in the prior fiscal year. Interest income decreased from the prior fiscal year primarily due to a decline inthe weighted-average interest rate, offset in part, by an increase in average invested cash of $218.5 million.
28
Our net interest expense in future periods may vary significantly depending upon changes in net borrowings,interest rates, and strategic decisions to deploy our invested cash.
Income taxes in fiscal 2009 reflect an effective income tax rate of 37.9%, compared to 38.4% in the prior fiscalyear. Due to the impact of discrete tax events, we were able to recognize certain federal and state tax benefits infiscal 2009, thereby reducing our effective tax rate from the prior fiscal year.
Income from continuing operations of $511.9 million in fiscal 2009 increased 9% from $469.1 million in theprior fiscal year due to the increase in operating income, the decrease in interest expense and the reduction in theeffective income tax rate. Diluted earnings per share from continuing operations of $1.69 in fiscal 2009 increased17% from $1.44 per share in the prior fiscal year. The difference between diluted earnings per share growth and theincrease in income from continuing operations was due to the 7% reduction in weighted average common sharesoutstanding resulting from purchases of our common stock in connection with our stock repurchase program (seeLiquidity and Capital Resources), net of the impact of stock option exercises.
Loss from discontinued operations, net of income taxes, in fiscal 2009 included a final PMSI working capitaladjustment of $2.8 million and costs in connection with a prior period business disposition. Loss from discontinuedoperations, net of income taxes, in fiscal 2008 primarily related to the PMSI business, and included a $224.8 millioncharge, net of income taxes, to reduce its carrying value.
Year ended September 30, 2008 compared with Year ended September 30, 2007
Operating Results
Total revenue of $70.2 billion in fiscal 2008, which includes bulk deliveries to customer warehouses, increased7% from the prior fiscal year. This increase was driven by the Pharmaceutical Distribution segment, which receiveda 3% contribution from the Bellco acquisition. During fiscal 2008, 68% of total revenue was from sales toinstitutional customers and 32% was from sales to retail customers; this compared to a customer mix in the priorfiscal year of 64% institutional and 36% retail. In comparison to the prior fiscal year results, sales to institutionalcustomers increased 15% primarily due to the acquisition of Bellco (the revenue of which is heavily weightedtowards institutional customers) and the strong growth of certain large customers. Sales to retail customersdecreased 5% primarily due to our decision not to renew a contract, effective January 2007, with a large retailcustomer and the July 1, 2008 loss of certain business totaling approximately $3.0 billion of annual revenue from alarge retail drug chain customer.
Bulk deliveries of $2.7 billion in fiscal 2008 decreased 39% from the prior fiscal year. This decline was due tothe fiscal 2008 transition of a significant amount of business previously conducted on a bulk delivery basis with ourlargest customer to an operating revenue basis. Revenue relating to bulk deliveries fluctuates primarily due tochanges in demand from our largest bulk customer. Due to the insignificant service fees generated from bulkdeliveries, fluctuations in volume have no significant impact on operating margins. However, revenue from bulkdeliveries has a positive impact on our cash flows due to favorable timing between the customer payments to us andpayments by us to our suppliers.
ABDC’s total revenue (excluding Bellco) increased by 5% in fiscal 2008 in comparison to the prior fiscal year.This revenue growth was primarily due to the increase in sales to certain of our large institutional customers, offset,in part, by the decline in retail customer revenue, as discussed above.
ABSG’s total revenue (excluding Bellco) of $13.0 billion in fiscal 2008 increased 3% compared to the priorfiscal year primarily due to strong double-digit growth of its non-oncology distribution businesses. Oncologydistribution’s revenue, which represented approximately 60% of ABSG’s total revenue, was flat compared to theprior fiscal year. ABSG’s revenue growth was affected primarily by declining anemia drug sales and by one of itslarge customers for oncology drugs being acquired by a competitor in October 2007. The former customercontributed approximately $800 million to ABSG’s revenue in fiscal 2007. The majority of ABSG’s revenue is
29
generated from the distribution of pharmaceuticals, primarily injectibles, to physicians who specialize in a varietyof disease states, especially oncology. ABSG also distributes vaccines, plasma, and other blood products.
Revenue related to the distribution of anemia-related products, which represented approximately 5.8% ofPharmaceutical Distribution’s total revenue in fiscal 2008, decreased approximately 23% from the prior fiscal year.The decline in sales of anemia-related products since the second half of fiscal 2007 was most pronounced in the useof these products for cancer treatment. Sales of oncology anemia-related products represented approximately 2.2%of total revenue in fiscal 2008 and decreased approximately 32% from the prior fiscal year. Several developmentscontributed to the decline in sales of anemia drugs, including expanded warning and other product safety labelingrequirements, more restrictive federal policies governing Medicare reimbursement for the use of these drugs to treatoncology patients with kidney failure and dialysis, and changes in regulatory and clinical medical guidelines forrecommended dosage and use.
Gross profit of $2.0 billion in fiscal 2008 decreased 8% from the prior fiscal year. As a percentage of totalrevenue, gross profit in fiscal 2008 was 2.92%, a decrease of 46 basis points from the prior fiscal year. Thesedeclines were related to the Other segment, as the prior year’s consolidated results included $307.1 million of grossprofit from the operating results of Long-Term Care through the July 31, 2007 spin-off date. The Other segmentgross profit decrease was offset, in part, by the 9% increase in the Pharmaceutical Distribution segment’s grossprofit in fiscal 2008, primarily due to revenue growth, growth of our generic programs, the acquisition of Bellco, andstrong brand-name manufacturer price appreciation. Fiscal 2008 gross profit benefited from gains of $13.2 millionrelating to favorable litigation settlements with a former customer (an independent retail group purchasingorganization) and a major competitor and an $8.6 million settlement of disputed fees with a supplier, and wasoffset, in part, by an $8.4 million inventory write-down of certain pharmacy dispensing equipment. Fiscal2007 gross profit was impacted by ABSG’s $27.8 million charge relating to the write-down of tetanus-diptheriavaccine inventory to its estimated net realizable value. In fiscal 2008 and 2007, we recognized gains of $3.5 millionand $35.8 million, respectively, from antitrust litigation settlements with pharmaceutical manufacturers. Thesegains, which are net of attorney fees and estimated payments due to other parties, were recorded as reductions tocost of goods sold and contributed 0.2% and 1.6% of gross profit in fiscal 2008 and 2007, respectively.
Our cost of goods sold includes a last-in, first out (“LIFO”) provision that is affected by changes in inventoryquantities, product mix, and manufacturer pricing practices, which may be impacted by market and other externalinfluences. We recorded a LIFO charge of $21.1 million and $2.2 million in fiscal 2008 and 2007, respectively. Thefiscal 2008 LIFO charge reflects greater brand-name supplier price inflation, which more than offset the impact ofprice deflation of generic drugs. During fiscal 2007, inventory declines resulted in liquidation of LIFO layerscarried at lower costs prevailing in the prior fiscal year. The effect of the liquidation in fiscal 2007 was to decreasecost of goods sold by $7.2 million.
Consolidated operating expenses of $1.2 billion in fiscal 2008 decreased by 15% from the prior fiscal year.This decline was related to the Other segment, as the prior year’s consolidated results included $282.1 million ofoperating expenses from the operating results of Long-Term Care and was partially offset by operating expenses ofour recent acquisitions, primarily those of Bellco. Pharmaceutical Distribution operating expenses in fiscal 2008increased by 5% from the prior fiscal year. This increase was primarily related to the operating expenses of ourrecent acquisitions, primarily those of Bellco. Additionally, Pharmaceutical Distribution operating expenses infiscal 2008 were impacted by ABDC impairment charges related to capitalized equipment and software devel-opment costs totaling $10.8 million, primarily due to ABDC’s decision to abandon the use of certain software whichwill be replaced in connection with our Business Transformation project. Pharmaceutical Distribution operatingexpenses in fiscal 2008 were also impacted by a $5.3 million write-down of intangible assets related to certainsmaller business units. As a percentage of total revenue, Pharmaceutical Distribution operating expenses in fiscal2008 decreased 3 basis points from the prior fiscal year due to improvements in operating leverage, primarily inABDC, where operating expenses declined despite an increase in total revenue, due to a more streamlinedorganizational structure within ABDC and ABSG and the cost savings achieved resulting from our cE2 initiative.
30
The following table illustrates the charges incurred relating to facility consolidations, employee severance andother (which are excluded from the operating expenses of the Pharmaceutical Distribution segment) for the fiscalyears ended September 30, 2008 and 2007 (in thousands):
2008 2007
Facility consolidations and employee severance . . . . . . . . . . . . . . . . . . . . . . . . $ 9,741 $(5,863)
Information technology transition costs . . . . . . . . . . . . . . . . . . . . . . . . . . . . . . — 1,679
Costs relating to business divestitures . . . . . . . . . . . . . . . . . . . . . . . . . . . . . . . . 2,636 9,335
Gain on sale of assets . . . . . . . . . . . . . . . . . . . . . . . . . . . . . . . . . . . . . . . . . . . — (3,079)
Total facility consolidations, employee severance and other . . . . . . . . . . . . . . $12,377 $ 2,072
In fiscal 2008, we announced a more streamlined organizational structure and introduced an initiative (“cE2”)designed to drive increased customer efficiency and cost effectiveness. In connection with these efforts, we reducedvarious operating costs and terminated certain positions. In fiscal 2008, we terminated approximately 130 employ-ees and incurred $10.0 million of employee severance costs, relating to the aforementioned efforts.
In fiscal 2007, we completed our integration plan to consolidate our distribution network and eliminateduplicative administrative functions. The plan included building six new facilities, closing 31 facilities andoutsourcing a significant amount of our information technology activities. In fiscal 2008, we reversed $1.0 millionof employee severance charges previously estimated and recorded related to this integration plan.
In fiscal 2006, we incurred a charge of $13.9 million for an increase in a compensation accrual due to anadverse decision in an employment-related dispute with a former Bergen Brunswig chief executive officer whoseemployment was terminated in 1999. In October 2007, we received a favorable ruling from a California appellatecourt reversing certain portions of the prior adverse decision. As a result, we reduced our liability in fiscal 2007 tothe Bergen Brunswig chief executive officer by $10.4 million (see Bergen Brunswig Matter under Note 13 of Notesto the Consolidated Financial Statements). The fiscal 2007 compensation expense reduction was recorded as acomponent of facility consolidations and employee severance.
Costs related to business divestitures in fiscal 2008 and 2007 related to PMSI and the Long-Term Care spin-off,respectively.
In fiscal 2007, we recognized a $3.1 million gain relating to the sale of certain retail pharmacy assets of ourformer Long-Term Care business.
We paid a total of $6.8 million and $20.7 million for employee severance, lease cancellation and other costs infiscal year 2008 and 2007, respectively. Employees receive their severance benefits over a period of time, generallynot in excess of 12 months, or in the form of a lump-sum payment.
Operating income of $827.9 million in fiscal 2008 increased 5% from the prior fiscal year due to the 15% or$106.8 million increase in the Pharmaceutical Distribution segment’s operating income, which was offset, in part,by a decrease of $32.3 million in gains from antitrust litigation settlements, and an increase of $10.3 million infacility consolidation, employee severance and other costs. Additionally, the prior fiscal year benefited from a$25.0 million contribution from Long-Term Care, prior to its July 2007 spin-off. As a percentage of total revenue,operating income in fiscal 2008 decreased 2 basis points from the prior fiscal year despite PharmaceuticalDistribution’s operating income as a percentage of total revenue increasing by 7 basis points. This increase was dueto the improvements in the gross profit and operating expense margins of the Pharmaceutical Distribution segment.The costs of facility consolidations, employee severance and other, less the gain on antitrust litigation settlements,decreased operating income by $8.9 million in fiscal 2008 and reduced operating income as a percentage of totalrevenue by 1 basis point. The gain on antitrust litigation settlements, less the costs of facility consolidations,employee severance and other, contributed $33.8 million to operating income in fiscal 2007 and increased operatingincome as a percentage of total revenue by 5 basis points. Long-Term Care’s operating income in fiscal 2007increased operating income as a percentage of total revenue by 4 basis points.
Other loss of $2.0 million and $3.0 million in fiscal 2008 and 2007, respectively, primarily related toother-than-temporary impairment losses incurred with respect to equity investments.
31
Interest expense, interest income and their respective weighted average interest rates in fiscal 2008 and 2007were as follows (in thousands):
AmountWeighted Average
Interest Rate AmountWeighted Average
Interest Rate
2008 2007
Interest expense . . . . . . . . . . . . . . . . . . $ 75,099 5.48% $ 75,661 5.65%
Interest income . . . . . . . . . . . . . . . . . . (10,603) 3.33% (43,417) 4.26%
Interest expense, net . . . . . . . . . . . . . . . $ 64,496 $ 32,244
Interest expense was relatively consistent when compared to the prior fiscal year as an increase of $85.2 millionin average borrowings was offset by the decline in the weighted average interest rate. Interest income decreasedsubstantially from the prior fiscal year primarily due to a decline in average invested cash and short-terminvestments from $976.2 million during the prior fiscal year to $309.5 million during fiscal 2008.
The decrease in invested cash and short-term investments from the prior fiscal year was primarily due to ouruse of cash for share repurchases, acquisitions, and capital expenditures, all of which, in the aggregate, exceeded ournet cash provided by operating activities since the prior fiscal year.
Income tax expense reflects an effective income tax rate of 38.4%, versus 37.0% in the prior fiscal year. Theincrease in the effective tax rate from the prior fiscal year was primarily due to the company having benefited less inthe current year from tax-free investment income.
Income from continuing operations of $469.1 million in fiscal 2008 decreased 1% from $474.8 million in theprior fiscal year. The 5% increase in 2008 operating income was offset by the increase in net interest expense and theincrease in the effective income tax rate. Diluted earnings per share from continuing operations of $1.44 increased14% from $1.26 per share in the prior fiscal year. The difference between diluted earnings per share growth and thedecline in income from continuing operations was due to the 14% reduction in weighted average common sharesoutstanding from purchases of our common stock in connection with our stock repurchase program (see Liquidity andCapital Resources), net of the impact of stock option exercises. The costs of facility consolidations, employeeseverance and other, less the gain on antitrust litigation settlements decreased income from continuing operations by$5.5 million and decreased diluted earnings per share by $0.02 in fiscal 2008. The gain on antitrust litigationsettlements less the costs of facility consolidations, employee severance and other contributed $17.0 million to incomefrom continuing operations and $0.05 to diluted earnings per share in fiscal 2007. Additionally, the inclusion of Long-Term Care’s operating results in fiscal 2007 increased diluted earnings per share from continuing operations by $0.04.
The loss from discontinued operations of $218.5 million, net of income taxes, relates to the PMSI business,which was sold in October 2008. The loss from discontinued operations in fiscal 2008 includes a $224.9 millioncharge, net of income taxes, recorded to reduce the carrying value of PMSI. Loss from discontinued operations of$5.6 million, net of income taxes, in fiscal 2007 included a $24.6 million charge, net of income taxes, incurred by usrelated to an adverse court ruling with respect to a contingent purchase price adjustment in connection with the 2003acquisition of Bridge Medical, Inc. (“Bridge”). Substantially all of the assets of the Bridge business were sold inJuly 2005. The aforementioned charge in fiscal 2007 was substantially offset by income from discontinuedoperations relating to the PMSI business.
Other
The Other reportable segment includes the operating results of Long-Term Care, through the July 31, 2007spin-off date. The operating results of PMSI, which was sold in October 2008, have been reclassified todiscontinued operations.
Intersegment Eliminations
These amounts represent the elimination of the Pharmaceutical Distribution segment’s sales to the Othersegment. ABDC was the principal supplier of pharmaceuticals to the Other segment.
32
Critical Accounting Policies and Estimates
Critical accounting policies are those policies which involve accounting estimates and assumptions that can havea material impact on our financial position and results of operations and require the use of complex and subjectiveestimates based upon past experience and management’s judgment. Because of the uncertainty inherent in suchestimates, actual results may differ from these estimates. Below are those policies applied in preparing our financialstatements that management believes are the most dependent on the application of estimates and assumptions. For acomplete list of significant accounting policies, see Note 1 of Notes to the Consolidated Financial Statements.
Allowance for Doubtful Accounts
Trade receivables are primarily comprised of amounts owed to us for our pharmaceutical distribution andservices activities and are presented net of an allowance for doubtful accounts and a reserve for customer sales returns.In determining the appropriate allowance for doubtful accounts, we consider a combination of factors, such as theaging of trade receivables, industry trends, and our customers’ financial strength, credit standing, and payment anddefault history. Changes in the aforementioned factors, among others, may lead to adjustments in our allowance fordoubtful accounts. The calculation of the required allowance requires judgment by our management as to the impact ofthese and other factors on the ultimate realization of our trade receivables. Each of our business units performsongoing credit evaluations of its customers’ financial condition and maintains reserves for probable bad debt lossesbased on historical experience and for specific credit problems when they arise. We write off balances against thereserves when collectability is deemed remote. Each business unit performs formal documented reviews of theallowance at least quarterly and our largest business units perform such reviews monthly. There were no significantchanges to this process during the fiscal years ended September 30, 2009, 2008 and 2007 and bad debt expense wascomputed in a consistent manner during these periods. The bad debt expense for any period presented is equal to thechanges in the period end allowance for doubtful accounts, net of write-offs, recoveries and other adjustments.Schedule II of this Form 10-K sets forth a rollforward of the allowance for doubtful accounts.
Bad debt expense for the fiscal years ended September 30, 2009 and 2008 was $31.8 million and $27.6 million,respectively. Bad debt expense for the fiscal year ended September 30, 2007 was $48.5 million, which includedLong-Term Care’s bad debt expense of $17.6 million. An increase or decrease of 0.1% in the 2009 allowance as apercentage of trade receivables would result in an increase or decrease in the provision on accounts receivable ofapproximately $4.0 million.
Supplier Reserves
We establish reserves against amounts due from our suppliers relating to various price and rebate incentives,including deductions or billings taken against payments otherwise due to them. These reserve estimates areestablished based on the judgment of management after carefully considering the status of current outstandingclaims, historical experience with the suppliers, the specific incentive programs and any other pertinent informationavailable to us. We evaluate the amounts due from our suppliers on a continual basis and adjust the reserve estimateswhen appropriate based on changes in factual circumstances. An increase or decrease of 0.1% in the 2009 supplierreserve balances as a percentage of trade payables would result in an increase or decrease in cost of goods sold byapproximately $8.5 million. The ultimate outcome of any outstanding claim may be different from our estimate.
Loss Contingencies
An estimated loss contingency is accrued in our consolidated financial statements if it is probable that a liabilityhas been incurred and the amount of the loss can be reasonably estimated. Assessing contingencies is highly subjectiveand requires judgments about future events. We regularly review loss contingencies to determine the adequacy of theaccruals and related disclosures. The amount of the actual loss may differ significantly from these estimates.
Merchandise Inventories
Inventories are stated at the lower of cost or market. Cost for approximately 75% and 78% of our inventories atSeptember 30, 2009 and 2008, respectively, has been determined using the last-in, first-out (“LIFO”) method. If we hadused the first-in, first-out (“FIFO”) method of inventory valuation, which approximates current replacement cost,
33
inventories would have been approximately $191.1 million and $176.0 higher than the amounts reported at Septem-ber 30, 2009 and 2008, respectively. We recorded a LIFO charge of $15.1 million, $21.1 million, and $2.2 million infiscal 2009, 2008, and 2007 respectively. During the fiscal year ended September 30, 2007, inventory declines resultedin liquidation of LIFO layers carried at lower costs prevailing in prior years. The effect of the liquidation in fiscal 2007was to decrease cost of goods sold by $7.2 million and increase diluted earnings per share by $0.01.
Business Combinations
The purchase price of an acquired company is allocated between tangible and intangible assets acquired andliabilities assumed from the acquired business based on their estimated fair values, with the residual of the purchaseprice recorded as goodwill. We engage third-party appraisal firms to assist management in determining the fairvalues of certain assets acquired and liabilities assumed. Such valuations require management to make significantjudgments, estimates and assumptions, especially with respect to intangible assets. Management makes estimates offair value based upon assumptions it believes to be reasonable. These estimates are based on historical experienceand information obtained from the management of the acquired companies, and are inherently uncertain. Criticalestimates in valuing certain of the intangible assets include but are not limited to: future expected cash flows fromand economic lives of customer relationships, trade names, existing technology, and other intangible assets; anddiscount rates. Unanticipated events and circumstances may occur which may affect the accuracy or validity of suchassumptions, estimates or actual events.
Goodwill and Intangible Assets
Goodwill and intangible assets with indefinite lives are not amortized; rather, they are tested for impairment onat least an annual basis. Intangible assets with finite lives, primarily customer relationships, non-competeagreements, patents and software technology, are amortized over their useful lives.
In order to test goodwill and intangible assets with indefinite lives, a determination of the fair value of ourreporting units and intangible assets with indefinite lives is required and is based, among other things, on estimates offuture operating performance of the reporting unit and/or the component of the entity being valued. We are required tocomplete an impairment test for goodwill and intangible assets with indefinite lives and record any resulting impairmentlosses at least on an annual basis or more often if warranted by events or changes in circumstances indicating that thecarrying value may exceed fair value (“impairment indicators”). This impairment test includes the projection anddiscounting of cash flows, analysis of our market capitalization and estimating the fair values of tangible and intangibleassets and liabilities. Estimating future cash flows and determining their present values are based upon, among otherthings, certain assumptions about expected future operating performance and appropriate discount rates determined bymanagement. In fiscal 2009, due to the existence of impairment indicators at U.S. Bioservices, a specialty pharmacycompany within the Company’s Specialty Group, we performed an impairment test on the pharmacy’s trade name as ofJune 30, 2009, which resulted in an impairment charge of $8.9 million. In fiscal 2008, PMSI experienced certaincustomer losses and learned that it would lose its largest customer at the end of calendar 2008. As a result, and afterconsidering other factors, we committed to a plan to divest PMSI. We performed an interim impairment test of ourPMSI reporting unit and determined that its goodwill was impaired. Therefore, PMSI wrote-off the carrying value of itsgoodwill of $199.1 million. In addition, we also recognized charges of $26.7 million to record the estimated loss on thesale of PMSI (see Note 4 of the Notes to the Consolidated Financial Statements). We completed our required annualimpairment tests relating to goodwill and other intangible assets with indefinite lives in the fourth quarter of fiscal 2009and 2008 and, as a result, recorded $1.6 million and $5.3 million of impairment charges, respectively. Our estimates ofcash flows may differ from actual cash flows due to, among other things, economic conditions, changes to the businessmodel, or changes in operating performance. Significant differences between these estimates and actual cash flowscould materially affect our future financial results.
Share-Based Compensation
We utilize a binomial option pricing model to determine the fair value of share-based compensation expense,which involves the use of several assumptions, including expected term of the option, future volatility, dividendyield and forfeiture rate. The expected term of options represents the period of time that the options granted are
34
expected to be outstanding and is based on historical experience. Expected volatility is based on historical volatilityof our common stock as well as other factors, such as implied volatility.
Income Taxes
Our income tax expense, deferred tax assets and liabilities, and uncertain tax positions reflect management’sassessment of estimated future taxes to be paid on items in the financial statements. Deferred income taxes arisefrom temporary differences between financial reporting and tax reporting bases of assets and liabilities, as well asnet operating loss and tax credit carryforwards for tax purposes.
We have established a net valuation allowance against certain deferred tax assets for which the ultimaterealization of future benefits is uncertain. Expiring carryforwards and the required valuation allowances areadjusted annually. After application of the valuation allowances described above, we anticipate that no limitationswill apply with respect to utilization of any of the other net deferred income tax assets described above.
During fiscal 2008, we adopted Accounting Standards Codification (“ASC”) 740, “Income Taxes” (formerlyreferenced as FASB Financial Interpretation No. 48, “Accounting for Uncertainty in Income Taxes — an inter-pretation of FASB Statement No. 109”), which changed the framework for accounting for uncertainty in incometaxes. We recognize the tax benefit from an uncertain tax position only if it is more likely than not that the taxposition will be sustained on examination by the taxing authorities, including resolutions of any related appeals orlitigation processes, based on the technical merits of the position.
We have established an estimated liability for federal, state and non-U.S. income tax exposures that arise andmeet the criteria for accrual. We prepare and file tax returns based on our interpretation of tax laws and regulationsand record estimates based on these judgments and interpretations. In the normal course of business, our tax returnsare subject to examination by various taxing authorities. Such examinations may result in future tax and interestassessments by these taxing authorities. Inherent uncertainties exist in estimates of tax contingencies due to changesin tax law resulting from legislation, regulation and/or as concluded through the various jurisdictions’ tax courtsystems.
We believe that our estimates for the valuation allowances against deferred tax assets and tax contingencyreserves are appropriate based on current facts and circumstances. However, others applying reasonable judgmentto the same facts and circumstances could develop a different estimate and the amount ultimately paid uponresolution of issues raised may differ from the amounts accrued.
The significant assumptions and estimates described in the preceding paragraphs are important contributors tothe ultimate effective tax rate in each year. If any of our assumptions or estimates were to change, an increase ordecrease in our effective tax rate by 1% on income from continuing operations before income taxes would havecaused income tax expense to change by $8.2 million in fiscal 2009.
35
Liquidity and Capital Resources
The following table illustrates our debt structure at September 30, 2009, including availability under revolvingcredit facilities and the receivables securitization facility (in thousands):
OutstandingBalance
AdditionalAvailability
Fixed-Rate Debt:$400,000, 55⁄8% senior notes due 2012 . . . . . . . . . . . . . . . . . . . . . . . . . . $ 399,058 $ —
$500,000, 57⁄8% senior notes due 2015 . . . . . . . . . . . . . . . . . . . . . . . . . . 498,339 —
Other. . . . . . . . . . . . . . . . . . . . . . . . . . . . . . . . . . . . . . . . . . . . . . . . . . . 1,113 —
Total fixed-rate debt . . . . . . . . . . . . . . . . . . . . . . . . . . . . . . . . . . . . . . 898,510 —
Variable-Rate Debt:Blanco revolving credit facility due 2010 . . . . . . . . . . . . . . . . . . . . . . . . 55,000 —
Multi-currency revolving credit facility due 2011 . . . . . . . . . . . . . . . . . . 224,026 456,990Receivables securitization facility due 2010 . . . . . . . . . . . . . . . . . . . . . . — 700,000
Other. . . . . . . . . . . . . . . . . . . . . . . . . . . . . . . . . . . . . . . . . . . . . . . . . . . 465 1,161
Total variable-rate debt . . . . . . . . . . . . . . . . . . . . . . . . . . . . . . . . . . . . 279,491 1,158,151
Total debt, including current portion . . . . . . . . . . . . . . . . . . . . . . . . $1,178,001 $1,158,151
Along with our cash balances, our aggregate availability under our revolving credit facilities and ourreceivables securitization facility provides us sufficient sources of capital to fund our working capital requirements.
In November 2009, we issued $400 million of 47⁄8% senior notes due November 15, 2019 (the “2019 Notes”).The 2019 Notes were sold at 99.174% of the principal amount and have an effective yield of 4.98%. Interest on the2019 Notes is payable semiannually, in arrears, commencing May 15, 2010. The 2019 Notes rank pari passu to theMulti-Currency Revolving Credit Facility and the 2012 Notes and the 2015 Notes (all defined below). We used thenet proceeds of the 2019 Notes to repay substantially all amounts outstanding under our Multi-Currency RevolvingCredit Facility and the remaining net proceeds will be used for general corporate purposes. Costs incurred inconnection with the issuance of the 2019 Notes will be deferred and amortized over the 10-year term of the notes.
We have a $695 million multi-currency senior unsecured revolving credit facility, which expires in November2011, (the “Multi-Currency Revolving Credit Facility”) with a syndicate of lenders. (This amount reflects thereduction of $55 million in availability under the facility as a result of the September 2008 bankruptcy of LehmanCommercial Paper, Inc.). Interest on borrowings under the Multi-Currency Revolving Credit Facility accrues atspecified rates based on our debt rating and ranges from 19 basis points to 60 basis points over LIBOR/EURIBOR/Bankers Acceptance Stamping Fee, as applicable (40 basis points over LIBOR/EURIBOR/Bankers AcceptanceStamping Fee at September 30, 2009). Additionally, interest on borrowings denominated in Canadian dollars mayaccrue at the greater of the Canadian prime rate or the CDOR rate. We pay quarterly facility fees to maintain theavailability under the Multi-Currency Revolving Credit Facility at specified rates based on our debt rating, rangingfrom 6 basis points to 15 basis points of the total commitment (10 basis points at September 30, 2009). We maychoose to repay or reduce our commitments under the Multi-Currency Revolving Credit Facility at any time. TheMulti-Currency Revolving Credit Facility contains covenants, including compliance with a financial leverage ratiotest, as well as others that impose limitations on, among other things, indebtedness of excluded subsidiaries andasset sales.
In April 2009, we amended our receivables securitization facility (“Receivables Securitization Facility”),electing to reduce the amount available under the facility from $975 million to $700 million and extend theexpiration date to April 2010. We continue to have an accordion feature available to us whereby the commitment onthe Receivables Securitization Facility may be increased by up to $250 million, subject to lender approval, forseasonal needs during the December and March quarters. Interest rates are based on prevailing market rates forshort-term commercial paper plus a program fee. We pay a commitment fee to maintain the availability under theReceivables Securitization Facility. The program fee and the commitment fee were 150 basis points and 75 basis
36
points, respectively, at September 30, 2009. At September 30, 2009, there were no borrowings outstanding under theReceivables Securitization Facility. In connection with the Receivables Securitization Facility, ABDC sells on arevolving basis certain accounts receivable to Amerisource Receivables Financial Corporation, a wholly ownedspecial purpose entity, which in turn sells a percentage ownership interest in the receivables to commercial paperconduits sponsored by financial institutions. ABDC is the servicer of the accounts receivable under the ReceivablesSecuritization Facility. After the maximum limit of receivables sold has been reached and as sold receivables arecollected, additional receivables may be sold up to the maximum amount available under the facility. We use thefacility as a financing vehicle because it generally offers an attractive interest rate relative to other financingsources. We securitize our trade accounts, which are generally non-interest bearing. The agreement governing theReceivables Securitization Facility contains restrictions and covenants which include limitations on the incurrenceof additional indebtedness, making of certain restricted payments, issuance of preferred stock, creation of certainliens, and certain corporate acts such as mergers, consolidations and sale of substantially all assets.
In April 2009, we amended the $55 million Blanco revolving credit facility, (the “Blanco Credit Facility”) to,among other things, extend the maturity date of the Blanco Credit Facility to April 2010. Borrowings under theBlanco Credit Facility are guaranteed by us. In connection with the April 2009 amendment, interest on borrowingsunder this facility increased from 55 basis points over LIBOR to 200 basis points over LIBOR. Additionally, we arerequired to pay quarterly facility fees of 50 basis points on any unused portion of the facility. The Blanco CreditFacility is not classified in the current portion of long-term debt on the consolidated balance sheet at September 30,2009 because we have the ability and intent to refinance it on a long-term basis.
We have outstanding $400 million of 55⁄8% senior notes due September 15, 2012 (the “2012 Notes”) and$500 million of 57⁄8% senior notes due September 15, 2015 (the “2015 Notes”). The 2012 Notes and 2015 Noteseach were sold at 99.5% of principal amount and have an effective yield of 5.71% and 5.94%, respectively. Intereston the 2012 Notes and the 2015 Notes is payable semiannually in arrears.
Our operating results have generated cash flow, which, together with availability under our debt agreementsand credit terms from suppliers, has provided sufficient capital resources to finance working capital and cashoperating requirements, and to fund capital expenditures, acquisitions, repayment of debt, the payment of intereston outstanding debt, dividends, and repurchases of shares of our common stock.
Deterioration in general economic conditions could adversely affect the amount of prescriptions that are filledand the amount of pharmaceutical products purchased by consumers and, therefore, reduce purchases by ourcustomers. In addition, volatility in financial markets may also negatively impact our customers’ ability to obtaincredit to finance their businesses on acceptable terms. Reduced purchases by our customers or changes in the abilityof our customers to remit payments to us could adversely affect our revenue growth, our profitability, and our cashflow from operations.
In September 2008, one of our lenders under the Multi-Currency Revolving Credit Facility filed forbankruptcy, and as a result, our availability under this facility was reduced by $55 million to $695 million. Wecontinue to monitor the creditworthiness of our lenders and while we do not currently anticipate the failure of anyadditional lenders under our revolving credit facilities and/or under the liquidity facilities of our receivablessecuritization facility, the failure of any further lenders could have an adverse effect on our ability to finance ourbusiness operations.
Our primary ongoing cash requirements will be to finance working capital, fund the payment of interest ondebt, fund repurchases of our common stock, finance acquisitions and fund capital expenditures (including ourBusiness Transformation Project) and routine growth and expansion through new business opportunities. InNovember 2008, our board of directors approved a program allowing us to purchase up to $500 million of ouroutstanding shares of common stock, subject to market conditions. We purchased $450.0 million of our commonstock in fiscal 2009, of which $431.9 million was purchased under the above-mentioned program and $18.1 millionwas purchased to close out the May 2007 share repurchase program. As of September 30, 2009, we had$68.1 million of availability remaining on our $500 million share repurchase program. In November 2009, ourboard of directors approved a new program authorizing us to purchase up to $500 million of our outstanding sharesof common stock, subject to market conditions. We expect to purchase approximately $350 million of our common
37
stock in fiscal 2010, subject to market conditions. Future cash flows from operations and borrowings are expected tobe sufficient to fund our ongoing cash requirements.
Following is a summary of our contractual obligations for future principal and interest payments on our debt,minimum rental payments on our noncancelable operating leases and minimum payments on our other commit-ments at September 30, 2009 (in thousands):
TotalWithin 1
Year 1-3 Years 4-5 YearsAfter 5Years
Payments Due by Period
Debt, including interest payments . . . . . . . . $1,425,724 $108,958 $ 728,641 $ 58,750 $529,375
Operating leases . . . . . . . . . . . . . . . . . . . . . 238,912 52,344 75,125 36,405 75,038
Other commitments . . . . . . . . . . . . . . . . . . . 859,489 275,432 389,052 165,654 29,351
Total . . . . . . . . . . . . . . . . . . . . . . . . . . . . $2,524,125 $436,734 $1,192,818 $260,809 $633,764
The $55 million Blanco Credit Facility, which expires in April 2010, is included in the “Within 1 year” columnin the above table. However, this borrowing is not classified in the current portion of long-term debt on theconsolidated balance sheet at September 30, 2009 because we have the ability and intent to refinance it on a long-term basis.
We have commitments to purchase product from influenza vaccine manufacturers through June 30, 2015. Weare required to purchase annual doses at prices that we believe will represent market prices. We currently estimateour remaining purchase commitment under these agreements, as amended, will be approximately $270.2 million asof September 30, 2009. These influenza vaccine commitments are included in “Other commitments” in the abovetable.
We have commitments to purchase blood products from suppliers through December 31, 2012. We arerequired to purchase quantities at prices that we believe will represent market prices. We currently estimate ourremaining purchase commitment under these agreements will be approximately $421.6 million as of September 30,2009. These blood product commitments are included in “Other commitments” in the above table.
We have outsourced to IBM Global Services (“IBM”) a significant portion of our corporate and ABDCinformation technology activities and, in fiscal 2009, expanded and amended our relationship by engaging IBM toprovide assistance with the implementation of our new enterprise resource planning (“ERP”) platform. Theremaining commitment under our ten-year arrangement, as amended, which expires in June 2015, is approximately$134.8 million and is included in “Other commitments” in the above table.
Our liability for uncertain tax positions was $54.4 million as of September 30, 2009. This liability represents anestimate of tax positions that we have taken in our tax returns which may ultimately not be sustained uponexamination by taxing authorities. Since the amount and timing of any future cash settlements cannot be predictedwith reasonable certainty, the estimated liability has been excluded from the above contractual obligations table.
During fiscal 2009, our operating activities provided $783.8 million of cash as compared to cash provided of$737.1 million in the prior fiscal year. Net cash provided by operating activities during fiscal 2009 was principallythe result of income from continuing operations of $511.9 million, non-cash items of $254.0 million, and anincrease in accounts payable, accrued expenses and income taxes of $1,259.6 million, offset, in part, by an increasein merchandise inventories of $765.0 million and an increase in accounts receivable of $457.8 million. Non-cashitems included the provision for deferred income taxes of $84.3 million, which primarily related to income taxdeductions associated with merchandise inventories. The increase in accounts receivable, merchandise inventoriesand accounts payable, accrued expenses and income taxes all principally related to our 12% revenue growth in themonth of September 2009 in comparison to the prior year month. Additionally, our merchandise inventory andrelated accounts payable balances were also impacted by inventory purchases of approximately $400 million in themonth of September 2009, primarily relating to the purchase of generic products due to a recent product launch andpurchases made in advance of a manufacturer’s temporary plant shut-down in connection with its facilityconsolidation efforts. The average number of days sales outstanding in fiscal 2009 decreased to 18.1 days from
38
18.7 days in fiscal 2008 primarily due to favorable customer mix within ABDC. The number of average inventorydays on hand in fiscal 2009 and 2008 was consistent at 25 days. Additionally, the number of average days payableoutstanding in fiscal 2009 and 2008 was relatively consistent at 32.8 days and 32.6 days, respectively. Operatingcash uses during fiscal 2009 included $56.9 million in interest payments and $192.9 million of income taxpayments, net of refunds.
During fiscal 2008, our operating activities provided $737.1 million of cash as compared to cash provided of$1,207.9 million in the prior fiscal year. Net cash provided by operating activities during fiscal 2008 was principallythe result of income from continuing operations of $469.1 million, non-cash items of $218.1 million, and anincrease in accounts payable, accrued expenses and income taxes of $53.7 million. Non-cash items included theprovision for deferred income taxes of $62.1 million, which was significantly higher than the prior fiscal year due tothe increase in income tax deductions associated with merchandise inventories. Merchandise inventories increasedslightly despite the 7% increase in total revenue, as the number of average inventory days on hand decreased by2 days compared to the prior fiscal year primarily due to the continued benefits achieved from the consolidation ofour distribution network and strong inventory management. Accounts receivable declined by $8.7 million from theprior fiscal year compared to the increase in sales as average days sales outstanding declined from 19.4 days in fiscal2007 to 18.7 days in fiscal 2008 due to changes in customer mix including the July 1, 2008 sales reduction with alarge chain customer. Additionally ABDC, which has lower average days sales outstanding than ABSG, grew fasterthan ABSG in fiscal 2008. Accounts payable, accrued expenses and income taxes grew less than revenues due to thereversal of favorable timing at the end of fiscal 2007. Average days payable outstanding in fiscal 2008 declined by1/2 of one day from the prior fiscal year. Operating cash uses during fiscal 2008 included $68.5 million in interestpayments and $262.9 million of income tax payments, net of refunds.
During fiscal 2007, our operating activities provided $1,207.9 million of cash as compared to cash provided of$807.3 million in the prior fiscal year. Net cash provided by operating activities during fiscal 2007 was principallythe result of income from continuing operations of $474.8 million, non-cash items of $186.9 million, an increase inaccounts payable, accrued expenses and income taxes of $507.6 million, and a decrease in merchandise inventoriesof $286.1 million, partially offset by an increase in accounts receivable of $236.0 million. The increase in accountspayable, accrued expenses and income taxes was primarily driven by the increase in sales and days payableoutstanding. Days payable outstanding in fiscal 2007 increased by 2 days from the prior fiscal year due to favorabletiming of payments to our suppliers and the strong growth of ABSG, which has a higher days payable outstandingratio than ABDC because certain of ABSG’s businesses have more favorable payment terms with their suppliers.The inventory turnover rate for the Pharmaceutical Distribution segment improved to 13.6 times in fiscal 2007 from12.2 times in the prior fiscal year. The number of inventory days on hand decreased compared to the prior fiscal yearprimarily due to the benefits resulting from having completed our integration plan to consolidate the ABDCdistribution network and the strong growth of ABSG’s business, which has lower inventory days on handrequirements. After several years of consolidation activity, the 26 U.S. ABDC distribution facilities in fiscal2007 provided a stable distribution network environment, which combined with strong inventory management,resulted in a significant reduction in safety stock inventory. The increase in accounts receivable was due to theincrease in operating revenue and an increase in average days sales outstanding for the Pharmaceutical Distributionsegment. Average days sales outstanding for the Pharmaceutical Distribution segment increased to 18.8 days infiscal 2007 from 16.7 days in the prior fiscal year. This increase was largely driven by the above-market rate growthof the Specialty Group, which generally has a higher receivable investment than the ABDC distribution business.Operating cash uses during fiscal 2007 included $65.9 million in interest payments and $253.2 million of incometax payments, net of refunds.
Capital expenditures in fiscal 2009, 2008 and 2007 were $145.8 million, $137.3 million, and $111.3 million,respectively. We currently estimate that we will spend approximately $140 million for capital expenditures duringfiscal 2010. Capital expenditures in fiscal 2009 related principally to our Business Transformation project, whichincludes a new ERP platform that will be implemented in ABDC and our corporate office, and improvements madeto our operating facilities. Capital expenditures in fiscal 2008 related principally to improving our informationtechnology infrastructure, which included a significant purchase of software relating to our Business Transfor-mation project, the expansion of our ABPG production facility in Rockford, Illinois, and investments in warehouseexpansions and improvements. Capital expenditures in fiscal 2007 related principally to improving our information
39
technology infrastructure, investments in ABDC warehouse expansions, equipment investments at ABSG andABPG, equipment and furniture related to ABSG’s new corporate facility, and ABPG’s Illinois facility expansion.
In May 2009, we acquired Innomar, a Canadian specialty pharmaceutical services company, for a purchaseprice of $13.4 million, net of a working capital adjustment.
In October 2008, we sold PMSI for approximately $31 million, net of a final working capital adjustment. Wereceived cash totaling $11.9 million and a $19 million subordinated note due from PMSI on the fifth anniversary ofthe closing date.
In October 2007, we purchased Bellco, a privately held New York distributor of branded and genericpharmaceuticals, for a purchase price of $162.2 million, net of cash acquired.
In October 2006, we acquired IgG, a specialty pharmacy and infusion services business specializing in IVIG,for $37.2 million. In November 2006, we acquired AMD, a Canadian company that provides services includingreimbursement support and nursing support services, for $13.4 million. In April 2007, we acquired Xcenda, aconsulting business which applies customized solutions and innovative approaches that discover and communicatethe value of pharmaceuticals and other healthcare technologies, for $25.2 million. Additionally, in fiscal 2007, inconnection with our fiscal 2006 acquisition of Brecon, we made a contingent payment in the amount of $7.6 millionto the former owners of Brecon. We also made payments of $2.9 million in fiscal 2007 related to certain prior periodacquisitions.
Net cash provided by investing activities in fiscal 2008 and 2007 included purchases and sales of short-terminvestment securities. Net proceeds (purchases) relating to these investment activities in fiscal 2008 and 2007 were$467.4 million and $(399.6) million, respectively. These short-term investment securities primarily consisted ofcommercial paper and tax-exempt variable rate demand notes used to maximize our after tax interest income. We donot have any short-term investment securities as of September 30, 2009, nor have we purchased or sold short-terminvestment securities since the quarter ended March 31, 2008.
Net cash used in investing activities in fiscal 2007 also included proceeds from the sales of property andequipment, primarily related to the sale of certain distribution facilities and proceeds from the sales of other assets,which principally related to the sale of certain retail pharmacy assets of our former Long-Term Care business.
Net cash used in financing activities in fiscal 2009, 2008, and 2007 included net (repayments) borrowings of$(8.8) million, $(16.4) million, and $101.8 million, respectively, under our revolving and securitization creditfacilities. The net borrowings in fiscal 2007 were primarily related to our Canadian operations.
In connection with the spin-off transaction, Long-Term Care borrowed $125.0 million from a financialinstitution, and provided a one-time distribution to us. This distribution was reflected as a financing activity in fiscal2007 on our Consolidated Statement of Cash Flows.
During fiscal 2009, 2008, and 2007, we purchased a total of $450.4 million, $679.7 million, and$1,434.4 million, respectively, of our common stock in connection with our share repurchase programs, whichare summarized below.
In August 2006, our board of directors authorized a program allowing the purchase of up to $750 million of ouroutstanding shares of common stock. During fiscal 2007, we purchased 31.1 million shares of our common stock tocomplete this program.
In May 2007, our board of directors authorized a program allowing the purchase of up to $850 million of ouroutstanding shares of common stock, subject to market conditions. During fiscal 2007, we purchased $652.6 millionunder this program. In November 2007, our board of directors authorized an increase to the $850 million sharerepurchase program by $500 million, subject to market conditions. During fiscal 2008, we purchased $679.7 millionunder this program. During fiscal 2009, we purchased 1.2 million shares of our common stock to complete thisprogram.
In November 2008, our board of directors authorized a program allowing the purchase of up to $500 million ofour outstanding shares of common stock, subject to market conditions. During fiscal 2009, we purchased
40
$431.9 million under this program. We have $68.1 million of availability remaining under this share repurchaseprogram as of September 30, 2009.
In November 2009, our board of directors authorized a new program allowing us to purchase up to $500 millionof our outstanding shares of common stock, subject to market conditions.
During fiscal 2008 and 2007, we paid quarterly cash dividends of $0.0375 and $0.025 per share, respectively.In November 2008, our board of directors increased the quarterly dividend by 33% to $0.05 per share. During thefirst three quarters of fiscal 2009, we paid quarterly cash dividends of $0.05 per share. In May 2009, our board ofdirectors increased the quarterly cash dividend by 20% to $0.06 per share and in the fourth quarter of fiscal 2009, wepaid a quarterly cash dividend of $0.06 per share. On November 12, 2009, our board of directors increased thequarterly dividend again by 33% from $0.06 per share to $0.08 per share. We anticipate that we will continue to payquarterly cash dividends in the future. However, the payment and amount of future dividends remain within thediscretion of our board of directors and will depend upon our future earnings, financial condition, capitalrequirements and other factors.
Market Risk
Our most significant market risk is the effect of fluctuations in interest rates relating to our debt. We manageinterest rate risk by using a combination of fixed-rate and variable-rate debt. At September 30, 2009, we had$279.5 million of variable rate debt outstanding. The amount of variable rate debt fluctuates during the year basedon our working capital requirements. We periodically evaluate financial instruments to manage our exposure tofixed and variable interest rates. However, there are no assurances that such instruments will be available on termsacceptable to us. There were no such financial instruments in effect at September 30, 2009.
We also have market risk exposure to interest rate fluctuations relating to our cash and cash equivalents. Wehad $1.0 billion in cash and cash equivalents at September 30, 2009. The unfavorable impact of a hypotheticaldecrease in interest rates on cash and cash equivalents would be partially offset by the favorable impact of such adecrease on variable-rate debt. For every $100 million of cash invested that is in excess of variable-rate debt, a10 basis point decrease in interest rates would increase our annual net interest expense by $0.1 million.
We are exposed to foreign currency and exchange rate risk from our non-U.S. operations. Our largest exposureto foreign exchange rates exists primarily with the Canadian Dollar. We may utilize foreign currency denominatedforward contracts to hedge against changes in foreign exchange rates. Such contracts generally have durations ofless than one year. We had no foreign currency denominated forward contracts at September 30, 2009. We may usederivative instruments to hedge our foreign currency exposure but not for speculative or trading purposes.
Recent Accounting Pronouncements
On July 1, 2009, we adopted Accounting Standards Update (“ASU”) No. 2009-1, “Topic 105 — GenerallyAccepted Accounting Principles,” which amended Accounting Standards Codification (“ASC”) 105, “GenerallyAccepted Accounting Principles,” to establish the Codification as the source of authoritative GAAP recognized bythe FASB to be applied by nongovernmental entities. Rules and interpretive releases of the SEC under authority offederal securities laws are also sources of authoritative GAAP for SEC registrants. On the effective date, theCodification superseded all then-existing non-SEC accounting and reporting standards. All previous references tothe superseded standards in our consolidated financial statements have been replaced by references to the applicablesections of the Codification. The adoption of these sections did not have an impact on our consolidated financialstatements.
In the first quarter of fiscal 2009, we adopted ASC 820-10, “Fair Value Measurements and Disclosures,”(formerly referenced as SFAS No. 157, “Fair Value Measurements”), which defines fair value, establishes aframework for measuring fair value, and expands disclosures about fair value measurements. This new accountingstandard did not require any new fair value measurements.
ASC 820-10 defines fair value as the price that would be received from selling an asset or paid to transfer aliability in an orderly transaction between market participants at the measurement date (exit price). ASC 820-10establishes a fair value hierarchy, which prioritizes the inputs to valuation techniques used to measure fair value into
41
three levels. Level 1 inputs are quoted prices in active markets for identical assets or liabilities. Level 2 inputs areobservable other than quoted prices in active markets for identical assets and liabilities, quoted prices for identicalor similar assets or liabilities in inactive markets, or other inputs that are observable or can be corroborated byobservable market data for substantially the full term of the assets or liabilities. Level 3 inputs are generallyunobservable and typically reflect management’s estimates of assumptions that market participants would use inpricing the asset or liability. At September 30, 2009, we had $928.3 million of investments in a money marketaccount, which was valued as a level 1 investment.
Effective October 1, 2009, we will apply the provisions of ASC 820-10 to fair value measurements relating toall nonfinancial assets and liabilities, such as goodwill and other intangible assets, that are recognized or disclosedat fair value in the financial statements on a nonrecurring basis. This adoption is not expected to have a materialimpact on our financial condition, results of operations, or liquidity.
During the first quarter of fiscal 2009, we adopted ASC 825-10, “Financial Instruments” (formerly referencedas SFAS No. 159, “The Fair Value Option for Financial Assets and Financial Liabilities, including an amendment ofFASB Statement No. 115”), which allows companies to choose to measure eligible financial instruments and certainother items at fair value that are not otherwise required to be measured at fair value. We have not elected the fairvalue option for any eligible financial instruments not already required to be measured at fair value.
On June 30, 2009, we adopted ASC 855-10, “Subsequent Events,” which establishes general standards ofaccounting for and disclosure of events that occur after the balance sheet date but before the financial statements areissued. We evaluated subsequent events through the date and time our financial statements were issued onNovember 25, 2009.
Effective October 1, 2009, we will adopt the applicable sections of ASC 805, “Business Combinations,” whichprovides revised guidance for recognizing and measuring identifiable assets and goodwill acquired, liabilitiesassumed, and any non-controlling interest in the acquiree of a business combination. Additionally, this ASCprovides disclosure requirements to enable users of financial statements to evaluate the nature and financial effectsof the business combination. We will also adopt certain other applicable sections that address application issuesraised on the initial recognition and measurement, subsequent measurement and accounting and disclosure of assetsand liabilities from contingencies from a business combination. The application of ASC 805 relating to anacquisition or divestiture subsequent to September 30, 2009 may have an impact to our financial condition and/orresults of operations.
Forward-Looking Statements
Certain of the statements contained in this Management’s Discussion and Analysis of Financial Condition andResults of Operations (“MD&A”) and elsewhere in this report are “forward-looking statements” within themeaning of Section 27A of the Securities Act of 1933 and Section 21E of the Securities Exchange Act of 1934.These statements are based on management’s current expectations and are subject to uncertainty and change incircumstances. Among the factors that could cause actual results to differ materially from those projected,anticipated or implied are the following: changes in pharmaceutical market growth rates; the loss of one or morekey customer or supplier relationships; changes in customer mix; customer delinquencies, defaults or insolvencies;supplier defaults or insolvencies; changes in pharmaceutical manufacturers’ pricing and distribution policies orpractices; adverse resolution of any contract or other dispute with customers or suppliers; federal and stategovernment enforcement initiatives to detect and prevent suspicious orders of controlled substances and thediversion of controlled substances; qui tam litigation for alleged violations of laws and regulations governing themarketing, sale and purchase of pharmaceutical products; changes in U.S. legislation or regulatory action affectingpharmaceutical product pricing or reimbursement policies, including under Medicaid and Medicare; changes inregulatory or clinical medical guidelines and/or labeling for the pharmaceutical products we distribute, includingcertain anemia products; price inflation in branded pharmaceuticals and price deflation in generics; significantbreakdown or interruption of our information technology systems; our inability to implement an enterprise resourceplanning (ERP) system to handle business and financial processes within AmerisourceBergen Drug Corporation’soperations and our corporate functions without operating problems and/or cost overruns; success of integration,restructuring or systems initiatives; interest rate and foreign currency exchange rate fluctuations; economic,
42
business, competitive and/or regulatory developments in Canada, the United Kingdom and elsewhere outside of theUnited States, including potential changes in Canadian provincial legislation affecting pharmaceutical productpricing or service fees or regulatory action by provincial authorities in Canada to lower pharmaceutical productpricing or service fees; the impact of divestitures or the acquisition of businesses that do not perform as we expect orthat are difficult for us to integrate or control; our inability to successfully complete any other transaction that wemay wish to pursue from time to time; changes in tax legislation or adverse resolution of challenges to our taxpositions; increased costs of maintaining, or reductions in our ability to maintain, adequate liquidity and financingsources; volatility and deterioration of the capital and credit markets; and other economic, business, competitive,legal, tax, regulatory and/or operational factors affecting our business generally. Certain additional factors thatmanagement believes could cause actual outcomes and results to differ materially from those described in forward-looking statements are set forth elsewhere in this MD&A, in Item 1A (Risk Factors), Item 1 (Business) andelsewhere in this report.
ITEM 7A. QUANTITATIVE AND QUALITATIVE DISCLOSURES ABOUT MARKET RISK
The Company’s most significant market risks are the effects of changing interest rates and foreign currencyrisk. See discussion on page 41 under the heading “Market Risk,” which is incorporated by reference herein.
43
ITEM 8. FINANCIAL STATEMENTS AND SUPPLEMENTARY DATA
Report of Independent Registered Public Accounting Firm . . . . . . . . . . . . . . . . . . . . . . . . . . . . . . . . . . . . 45
Consolidated Financial Statements:
Consolidated Balance Sheets as of September 30, 2009 and 2008 . . . . . . . . . . . . . . . . . . . . . . . . . . . . . 46
Consolidated Statements of Operations for the fiscal years ended September 30, 2009, 2008, and2007 . . . . . . . . . . . . . . . . . . . . . . . . . . . . . . . . . . . . . . . . . . . . . . . . . . . . . . . . . . . . . . . . . . . . . . . . 47
Consolidated Statements of Changes in Stockholders’ Equity for the fiscal years ended September 30,2009, 2008, and 2007 . . . . . . . . . . . . . . . . . . . . . . . . . . . . . . . . . . . . . . . . . . . . . . . . . . . . . . . . . . . 48
Consolidated Statements of Cash Flows for the fiscal years ended September 30, 2009, 2008, and2007 . . . . . . . . . . . . . . . . . . . . . . . . . . . . . . . . . . . . . . . . . . . . . . . . . . . . . . . . . . . . . . . . . . . . . . . . 49
Notes to Consolidated Financial Statements . . . . . . . . . . . . . . . . . . . . . . . . . . . . . . . . . . . . . . . . . . . . . 50
44
REPORT OF INDEPENDENT REGISTERED PUBLIC ACCOUNTING FIRM
The Board of Directors and Stockholders of AmerisourceBergen Corporation
We have audited the accompanying consolidated balance sheets of AmerisourceBergen Corporation andsubsidiaries as of September 30, 2009 and 2008, and the related consolidated statements of operations, changes instockholders’ equity, and cash flows for each of the three years in the period ended September 30, 2009. Our auditsalso included the financial statement schedule listed in the Index at Item 15(a). These financial statements andschedule are the responsibility of the Company’s management. Our responsibility is to express an opinion on thesefinancial statements and schedule based on our audits.
We conducted our audits in accordance with the standards of the Public Company Accounting Oversight Board(United States). Those standards require that we plan and perform the audit to obtain reasonable assurance aboutwhether the financial statements are free of material misstatement. An audit includes examining, on a test basis,evidence supporting the amounts and disclosures in the financial statements. An audit also includes assessing theaccounting principles used and significant estimates made by management, as well as evaluating the overallfinancial statement presentation. We believe that our audits provide a reasonable basis for our opinion.
In our opinion, the financial statements referred to above present fairly, in all material respects, theconsolidated financial position of AmerisourceBergen Corporation and subsidiaries at September 30, 2009 and2008, and the consolidated results of their operations and their cash flows for each of the three years in the periodended September 30, 2009, in conformity with U.S. generally accepted accounting principles. Also, in our opinion,the related financial statement schedule, when considered in relation to the basic financial statements taken as awhole, presents fairly in all material respects the information set forth therein.
As discussed in Note 1 to the consolidated financial statements, AmerisourceBergen Corporation changed itsmethod of accounting for uncertainty in income taxes in fiscal 2008.
We also have audited, in accordance with the standards of the Public Company Accounting Oversight Board(United States), internal control over financial reporting of AmerisourceBergen Corporation and subsidiaries as ofSeptember 30, 2009, based on criteria established in Internal Control-Integrated Framework issued by theCommittee of Sponsoring Organizations of the Treadway Commission and our report dated November 25,2009 expressed an unqualified opinion thereon.
/s/ Ernst & Young LLP
Philadelphia, PennsylvaniaNovember 25, 2009
45

AMERISOURCEBERGEN CORPORATION AND SUBSIDIARIES
CONSOLIDATED BALANCE SHEETS
September 30,2009
September 30,2008
(In thousands, except share andper share data)
ASSETSCurrent assets:
Cash and cash equivalents . . . . . . . . . . . . . . . . . . . . . . . . . . . . . . . . . . . . . . . . $ 1,009,368 $ 878,114Accounts receivable, less allowances for returns and doubtful accounts:
2009 — $370,303; 2008 — $393,714 . . . . . . . . . . . . . . . . . . . . . . . . . . . . . . 3,916,509 3,480,267Merchandise inventories . . . . . . . . . . . . . . . . . . . . . . . . . . . . . . . . . . . . . . . . . 4,972,820 4,211,775Prepaid expenses and other . . . . . . . . . . . . . . . . . . . . . . . . . . . . . . . . . . . . . . . 55,056 55,914Assets held for sale . . . . . . . . . . . . . . . . . . . . . . . . . . . . . . . . . . . . . . . . . . . . . — 43,691
Total current assets . . . . . . . . . . . . . . . . . . . . . . . . . . . . . . . . . . . . . . . . . . . 9,953,753 8,669,761
Property and equipment, at cost:Land . . . . . . . . . . . . . . . . . . . . . . . . . . . . . . . . . . . . . . . . . . . . . . . . . . . . . . . 35,665 35,258Buildings and improvements . . . . . . . . . . . . . . . . . . . . . . . . . . . . . . . . . . . . . . 292,903 281,001Machinery, equipment and other . . . . . . . . . . . . . . . . . . . . . . . . . . . . . . . . . . . 694,555 616,942
Total property and equipment . . . . . . . . . . . . . . . . . . . . . . . . . . . . . . . . . . . 1,023,123 933,201Less accumulated depreciation . . . . . . . . . . . . . . . . . . . . . . . . . . . . . . . . . . . . (403,885) (381,042)
Property and equipment, net . . . . . . . . . . . . . . . . . . . . . . . . . . . . . . . . . . . . 619,238 552,159
Other assets:Goodwill and other intangible assets . . . . . . . . . . . . . . . . . . . . . . . . . . . . . . . . 2,859,064 2,875,366Other assets . . . . . . . . . . . . . . . . . . . . . . . . . . . . . . . . . . . . . . . . . . . . . . . . . . 140,685 120,500
Total other assets. . . . . . . . . . . . . . . . . . . . . . . . . . . . . . . . . . . . . . . . . . . . . 2,999,749 2,995,866
TOTAL ASSETS . . . . . . . . . . . . . . . . . . . . . . . . . . . . . . . . . . . . . . . . . . . . . . . . $13,572,740 $12,217,786
LIABILITIES AND STOCKHOLDERS’ EQUITYCurrent liabilities:
Accounts payable . . . . . . . . . . . . . . . . . . . . . . . . . . . . . . . . . . . . . . . . . . . . . . $ 8,517,162 $ 7,326,580Accrued expenses and other . . . . . . . . . . . . . . . . . . . . . . . . . . . . . . . . . . . . . . 315,657 270,823Current portion of long-term debt . . . . . . . . . . . . . . . . . . . . . . . . . . . . . . . . . . 1,068 1,719Deferred income taxes . . . . . . . . . . . . . . . . . . . . . . . . . . . . . . . . . . . . . . . . . . 645,723 550,708Liabilities held for sale . . . . . . . . . . . . . . . . . . . . . . . . . . . . . . . . . . . . . . . . . . — 17,759
Total current liabilities. . . . . . . . . . . . . . . . . . . . . . . . . . . . . . . . . . . . . . . . . 9,479,610 8,167,589
Long-term debt, net of current portion. . . . . . . . . . . . . . . . . . . . . . . . . . . . . . . . . 1,176,933 1,187,412Other liabilities . . . . . . . . . . . . . . . . . . . . . . . . . . . . . . . . . . . . . . . . . . . . . . . . . 199,728 152,740Stockholders’ equity:
Common stock, $0.01 par value — authorized, issued and outstanding:600,000,000 shares, 482,941,212 shares and 287,922,263 shares atSeptember 30, 2009, respectively, and 600,000,000 shares, 481,154,164 sharesand 312,430,920 shares at September 30, 2008, respectively . . . . . . . . . . . . . . . 4,829 4,812
Additional paid-in capital . . . . . . . . . . . . . . . . . . . . . . . . . . . . . . . . . . . . . . . . 3,737,835 3,689,617Retained earnings . . . . . . . . . . . . . . . . . . . . . . . . . . . . . . . . . . . . . . . . . . . . . . 2,919,760 2,479,078Accumulated other comprehensive loss . . . . . . . . . . . . . . . . . . . . . . . . . . . . . . (46,096) (16,490)
6,616,328 6,157,017Treasury stock, at cost: 2009 — 195,018,949 shares; 2008 — 168,723,244 shares . . (3,899,859) (3,446,972)
Total stockholders’ equity . . . . . . . . . . . . . . . . . . . . . . . . . . . . . . . . . . . . . . 2,716,469 2,710,045
TOTAL LIABILITIES AND STOCKHOLDERS’ EQUITY . . . . . . . . . . . . . . $13,572,740 $12,217,786
See notes to consolidated financial statements.
46
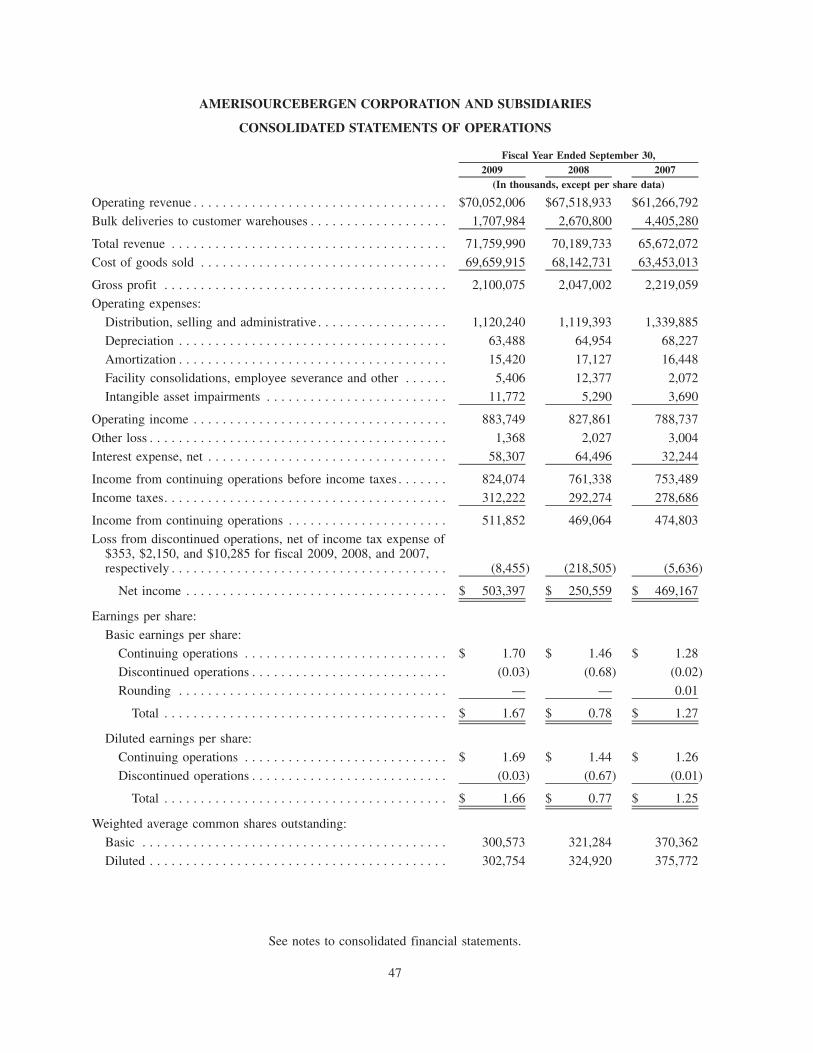
AMERISOURCEBERGEN CORPORATION AND SUBSIDIARIES
CONSOLIDATED STATEMENTS OF OPERATIONS
2009 2008 2007Fiscal Year Ended September 30,
(In thousands, except per share data)
Operating revenue . . . . . . . . . . . . . . . . . . . . . . . . . . . . . . . . . . . $70,052,006 $67,518,933 $61,266,792
Bulk deliveries to customer warehouses . . . . . . . . . . . . . . . . . . . 1,707,984 2,670,800 4,405,280
Total revenue . . . . . . . . . . . . . . . . . . . . . . . . . . . . . . . . . . . . . . 71,759,990 70,189,733 65,672,072
Cost of goods sold . . . . . . . . . . . . . . . . . . . . . . . . . . . . . . . . . . 69,659,915 68,142,731 63,453,013
Gross profit . . . . . . . . . . . . . . . . . . . . . . . . . . . . . . . . . . . . . . . 2,100,075 2,047,002 2,219,059
Operating expenses:
Distribution, selling and administrative . . . . . . . . . . . . . . . . . . 1,120,240 1,119,393 1,339,885
Depreciation . . . . . . . . . . . . . . . . . . . . . . . . . . . . . . . . . . . . . 63,488 64,954 68,227
Amortization . . . . . . . . . . . . . . . . . . . . . . . . . . . . . . . . . . . . . 15,420 17,127 16,448
Facility consolidations, employee severance and other . . . . . . 5,406 12,377 2,072
Intangible asset impairments . . . . . . . . . . . . . . . . . . . . . . . . . 11,772 5,290 3,690
Operating income . . . . . . . . . . . . . . . . . . . . . . . . . . . . . . . . . . . 883,749 827,861 788,737
Other loss . . . . . . . . . . . . . . . . . . . . . . . . . . . . . . . . . . . . . . . . . 1,368 2,027 3,004
Interest expense, net . . . . . . . . . . . . . . . . . . . . . . . . . . . . . . . . . 58,307 64,496 32,244
Income from continuing operations before income taxes . . . . . . . 824,074 761,338 753,489
Income taxes. . . . . . . . . . . . . . . . . . . . . . . . . . . . . . . . . . . . . . . 312,222 292,274 278,686
Income from continuing operations . . . . . . . . . . . . . . . . . . . . . . 511,852 469,064 474,803
Loss from discontinued operations, net of income tax expense of$353, $2,150, and $10,285 for fiscal 2009, 2008, and 2007,respectively . . . . . . . . . . . . . . . . . . . . . . . . . . . . . . . . . . . . . . (8,455) (218,505) (5,636)
Net income . . . . . . . . . . . . . . . . . . . . . . . . . . . . . . . . . . . . $ 503,397 $ 250,559 $ 469,167
Earnings per share:
Basic earnings per share:
Continuing operations . . . . . . . . . . . . . . . . . . . . . . . . . . . . $ 1.70 $ 1.46 $ 1.28
Discontinued operations . . . . . . . . . . . . . . . . . . . . . . . . . . . (0.03) (0.68) (0.02)
Rounding . . . . . . . . . . . . . . . . . . . . . . . . . . . . . . . . . . . . . — — 0.01
Total . . . . . . . . . . . . . . . . . . . . . . . . . . . . . . . . . . . . . . . $ 1.67 $ 0.78 $ 1.27
Diluted earnings per share:
Continuing operations . . . . . . . . . . . . . . . . . . . . . . . . . . . . $ 1.69 $ 1.44 $ 1.26
Discontinued operations . . . . . . . . . . . . . . . . . . . . . . . . . . . (0.03) (0.67) (0.01)
Total . . . . . . . . . . . . . . . . . . . . . . . . . . . . . . . . . . . . . . . $ 1.66 $ 0.77 $ 1.25
Weighted average common shares outstanding:
Basic . . . . . . . . . . . . . . . . . . . . . . . . . . . . . . . . . . . . . . . . . . 300,573 321,284 370,362
Diluted . . . . . . . . . . . . . . . . . . . . . . . . . . . . . . . . . . . . . . . . . 302,754 324,920 375,772
See notes to consolidated financial statements.
47
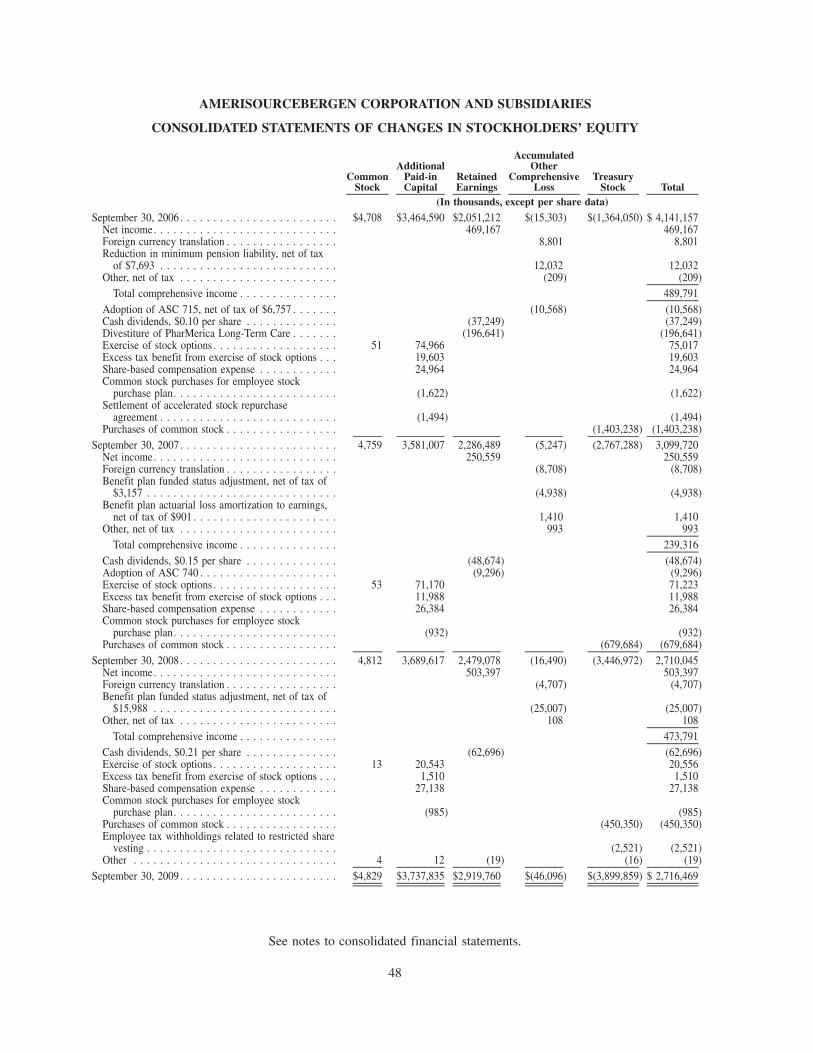
AMERISOURCEBERGEN CORPORATION AND SUBSIDIARIES
CONSOLIDATED STATEMENTS OF CHANGES IN STOCKHOLDERS’ EQUITY
CommonStock
AdditionalPaid-inCapital
RetainedEarnings
AccumulatedOther
ComprehensiveLoss
TreasuryStock Total
(In thousands, except per share data)
September 30, 2006 . . . . . . . . . . . . . . . . . . . . . . . . $4,708 $3,464,590 $2,051,212 $(15,303) $(1,364,050) $ 4,141,157Net income. . . . . . . . . . . . . . . . . . . . . . . . . . . . 469,167 469,167Foreign currency translation . . . . . . . . . . . . . . . . . 8,801 8,801Reduction in minimum pension liability, net of tax
of $7,693 . . . . . . . . . . . . . . . . . . . . . . . . . . . 12,032 12,032Other, net of tax . . . . . . . . . . . . . . . . . . . . . . . . (209) (209)
Total comprehensive income . . . . . . . . . . . . . . . 489,791Adoption of ASC 715, net of tax of $6,757 . . . . . . . (10,568) (10,568)Cash dividends, $0.10 per share . . . . . . . . . . . . . . (37,249) (37,249)Divestiture of PharMerica Long-Term Care . . . . . . . (196,641) (196,641)Exercise of stock options . . . . . . . . . . . . . . . . . . . 51 74,966 75,017Excess tax benefit from exercise of stock options . . . 19,603 19,603Share-based compensation expense . . . . . . . . . . . . 24,964 24,964Common stock purchases for employee stock
purchase plan. . . . . . . . . . . . . . . . . . . . . . . . . (1,622) (1,622)Settlement of accelerated stock repurchase
agreement . . . . . . . . . . . . . . . . . . . . . . . . . . . (1,494) (1,494)Purchases of common stock . . . . . . . . . . . . . . . . . (1,403,238) (1,403,238)
September 30, 2007 . . . . . . . . . . . . . . . . . . . . . . . . 4,759 3,581,007 2,286,489 (5,247) (2,767,288) 3,099,720Net income. . . . . . . . . . . . . . . . . . . . . . . . . . . . 250,559 250,559Foreign currency translation . . . . . . . . . . . . . . . . . (8,708) (8,708)Benefit plan funded status adjustment, net of tax of
$3,157 . . . . . . . . . . . . . . . . . . . . . . . . . . . . . (4,938) (4,938)Benefit plan actuarial loss amortization to earnings,
net of tax of $901 . . . . . . . . . . . . . . . . . . . . . . 1,410 1,410Other, net of tax . . . . . . . . . . . . . . . . . . . . . . . . 993 993
Total comprehensive income . . . . . . . . . . . . . . . 239,316Cash dividends, $0.15 per share . . . . . . . . . . . . . . (48,674) (48,674)Adoption of ASC 740 . . . . . . . . . . . . . . . . . . . . . (9,296) (9,296)Exercise of stock options . . . . . . . . . . . . . . . . . . . 53 71,170 71,223Excess tax benefit from exercise of stock options . . . 11,988 11,988Share-based compensation expense . . . . . . . . . . . . 26,384 26,384Common stock purchases for employee stock
purchase plan. . . . . . . . . . . . . . . . . . . . . . . . . (932) (932)Purchases of common stock . . . . . . . . . . . . . . . . . (679,684) (679,684)
September 30, 2008 . . . . . . . . . . . . . . . . . . . . . . . . 4,812 3,689,617 2,479,078 (16,490) (3,446,972) 2,710,045Net income. . . . . . . . . . . . . . . . . . . . . . . . . . . . 503,397 503,397Foreign currency translation . . . . . . . . . . . . . . . . . (4,707) (4,707)Benefit plan funded status adjustment, net of tax of
$15,988 . . . . . . . . . . . . . . . . . . . . . . . . . . . . (25,007) (25,007)Other, net of tax . . . . . . . . . . . . . . . . . . . . . . . . 108 108
Total comprehensive income . . . . . . . . . . . . . . . 473,791Cash dividends, $0.21 per share . . . . . . . . . . . . . . (62,696) (62,696)Exercise of stock options . . . . . . . . . . . . . . . . . . . 13 20,543 20,556Excess tax benefit from exercise of stock options . . . 1,510 1,510Share-based compensation expense . . . . . . . . . . . . 27,138 27,138Common stock purchases for employee stock
purchase plan. . . . . . . . . . . . . . . . . . . . . . . . . (985) (985)Purchases of common stock . . . . . . . . . . . . . . . . . (450,350) (450,350)Employee tax withholdings related to restricted share
vesting . . . . . . . . . . . . . . . . . . . . . . . . . . . . . (2,521) (2,521)Other . . . . . . . . . . . . . . . . . . . . . . . . . . . . . . . 4 12 (19) (16) (19)
September 30, 2009 . . . . . . . . . . . . . . . . . . . . . . . . $4,829 $3,737,835 $2,919,760 $(46,096) $(3,899,859) $ 2,716,469
See notes to consolidated financial statements.
48
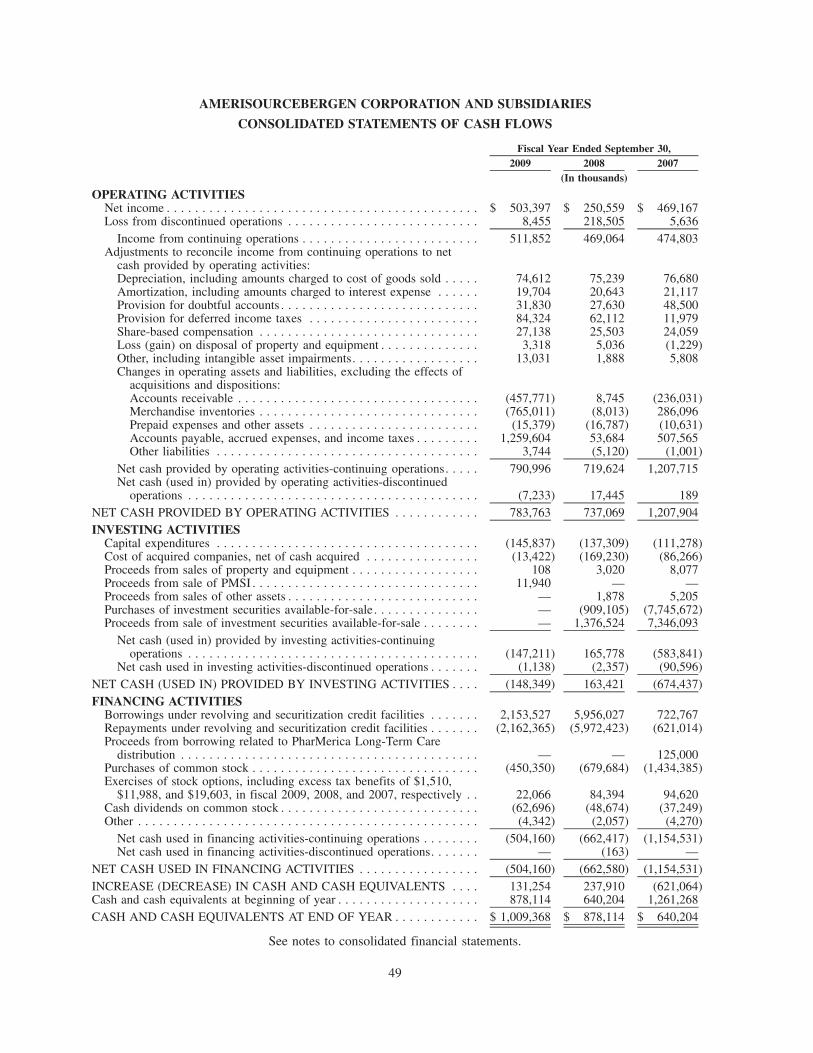
AMERISOURCEBERGEN CORPORATION AND SUBSIDIARIES
CONSOLIDATED STATEMENTS OF CASH FLOWS
2009 2008 2007Fiscal Year Ended September 30,
(In thousands)
OPERATING ACTIVITIESNet income . . . . . . . . . . . . . . . . . . . . . . . . . . . . . . . . . . . . . . . . . . . . $ 503,397 $ 250,559 $ 469,167Loss from discontinued operations . . . . . . . . . . . . . . . . . . . . . . . . . . . 8,455 218,505 5,636
Income from continuing operations . . . . . . . . . . . . . . . . . . . . . . . . . 511,852 469,064 474,803Adjustments to reconcile income from continuing operations to net
cash provided by operating activities:Depreciation, including amounts charged to cost of goods sold . . . . . 74,612 75,239 76,680Amortization, including amounts charged to interest expense . . . . . . 19,704 20,643 21,117Provision for doubtful accounts . . . . . . . . . . . . . . . . . . . . . . . . . . . . 31,830 27,630 48,500Provision for deferred income taxes . . . . . . . . . . . . . . . . . . . . . . . . 84,324 62,112 11,979Share-based compensation . . . . . . . . . . . . . . . . . . . . . . . . . . . . . . . 27,138 25,503 24,059Loss (gain) on disposal of property and equipment . . . . . . . . . . . . . . 3,318 5,036 (1,229)Other, including intangible asset impairments. . . . . . . . . . . . . . . . . . 13,031 1,888 5,808Changes in operating assets and liabilities, excluding the effects of
acquisitions and dispositions:Accounts receivable . . . . . . . . . . . . . . . . . . . . . . . . . . . . . . . . . . (457,771) 8,745 (236,031)Merchandise inventories . . . . . . . . . . . . . . . . . . . . . . . . . . . . . . . (765,011) (8,013) 286,096Prepaid expenses and other assets . . . . . . . . . . . . . . . . . . . . . . . . (15,379) (16,787) (10,631)Accounts payable, accrued expenses, and income taxes . . . . . . . . . 1,259,604 53,684 507,565Other liabilities . . . . . . . . . . . . . . . . . . . . . . . . . . . . . . . . . . . . . 3,744 (5,120) (1,001)
Net cash provided by operating activities-continuing operations. . . . . 790,996 719,624 1,207,715Net cash (used in) provided by operating activities-discontinued
operations . . . . . . . . . . . . . . . . . . . . . . . . . . . . . . . . . . . . . . . . . (7,233) 17,445 189NET CASH PROVIDED BY OPERATING ACTIVITIES . . . . . . . . . . . . 783,763 737,069 1,207,904INVESTING ACTIVITIES
Capital expenditures . . . . . . . . . . . . . . . . . . . . . . . . . . . . . . . . . . . . . (145,837) (137,309) (111,278)Cost of acquired companies, net of cash acquired . . . . . . . . . . . . . . . . (13,422) (169,230) (86,266)Proceeds from sales of property and equipment . . . . . . . . . . . . . . . . . . 108 3,020 8,077Proceeds from sale of PMSI . . . . . . . . . . . . . . . . . . . . . . . . . . . . . . . . 11,940 — —Proceeds from sales of other assets . . . . . . . . . . . . . . . . . . . . . . . . . . . — 1,878 5,205Purchases of investment securities available-for-sale . . . . . . . . . . . . . . . — (909,105) (7,745,672)Proceeds from sale of investment securities available-for-sale . . . . . . . . — 1,376,524 7,346,093
Net cash (used in) provided by investing activities-continuingoperations . . . . . . . . . . . . . . . . . . . . . . . . . . . . . . . . . . . . . . . . . (147,211) 165,778 (583,841)
Net cash used in investing activities-discontinued operations . . . . . . . (1,138) (2,357) (90,596)NET CASH (USED IN) PROVIDED BY INVESTING ACTIVITIES . . . . (148,349) 163,421 (674,437)FINANCING ACTIVITIES
Borrowings under revolving and securitization credit facilities . . . . . . . 2,153,527 5,956,027 722,767Repayments under revolving and securitization credit facilities . . . . . . . (2,162,365) (5,972,423) (621,014)Proceeds from borrowing related to PharMerica Long-Term Care
distribution . . . . . . . . . . . . . . . . . . . . . . . . . . . . . . . . . . . . . . . . . . — — 125,000Purchases of common stock . . . . . . . . . . . . . . . . . . . . . . . . . . . . . . . . (450,350) (679,684) (1,434,385)Exercises of stock options, including excess tax benefits of $1,510,
$11,988, and $19,603, in fiscal 2009, 2008, and 2007, respectively . . 22,066 84,394 94,620Cash dividends on common stock . . . . . . . . . . . . . . . . . . . . . . . . . . . . (62,696) (48,674) (37,249)Other . . . . . . . . . . . . . . . . . . . . . . . . . . . . . . . . . . . . . . . . . . . . . . . . (4,342) (2,057) (4,270)
Net cash used in financing activities-continuing operations . . . . . . . . (504,160) (662,417) (1,154,531)Net cash used in financing activities-discontinued operations. . . . . . . — (163) —
NET CASH USED IN FINANCING ACTIVITIES . . . . . . . . . . . . . . . . . (504,160) (662,580) (1,154,531)INCREASE (DECREASE) IN CASH AND CASH EQUIVALENTS . . . . 131,254 237,910 (621,064)Cash and cash equivalents at beginning of year . . . . . . . . . . . . . . . . . . . . 878,114 640,204 1,261,268CASH AND CASH EQUIVALENTS AT END OF YEAR . . . . . . . . . . . . $ 1,009,368 $ 878,114 $ 640,204
See notes to consolidated financial statements.
49
AMERISOURCEBERGEN CORPORATION AND SUBSIDIARIES
NOTES TO CONSOLIDATED FINANCIAL STATEMENTSSeptember 30, 2009
Note 1. Summary of Significant Accounting Policies
AmerisourceBergen Corporation (the “Company”) is a pharmaceutical services company providing drugdistribution and related healthcare services and solutions to its pharmacy, physician and manufacturer customers,which currently are based primarily in the United States and Canada. Prior to the July 31, 2007 divestiture ofPharMerica Long-Term Care (see below and Note 3), the Company dispensed pharmaceuticals to long-term carepatients. For further information on the Company’s operating segments, see Note 15.
Basis of Presentation
The accompanying consolidated financial statements include the accounts of the Company and its wholly-owned subsidiaries as of the dates and for the fiscal years indicated. All intercompany accounts and transactionshave been eliminated in consolidation.
The preparation of financial statements in conformity with accounting principles generally accepted in theUnited States requires management to make estimates and assumptions that affect amounts reported in the financialstatements and accompanying notes. Actual amounts could differ from these estimated amounts.
On June 15, 2009, the Company effected a two-for-one stock split of its outstanding shares of common stock inthe form of a 100% stock dividend to stockholders of record at the close of business on May 29, 2009. All applicableshare and per-share amounts in the consolidated financial statements and related disclosures have been retroactivelyadjusted to reflect this stock split.
On July 31, 2007, the Company completed the spin-off of its former institutional pharmacy business,PharMerica Long-Term Care (“Long-Term Care”). Beginning August 1, 2007, the operating results of Long-Term Care ceased to be included in the operating results of the Company. The historical operating results of Long-Term Care were not reported as a discontinued operation of the Company because of the significance of thecontinuing cash flows resulting from the pharmaceutical distribution agreement entered into between the disposedcomponent and the Company. Accordingly, for periods prior to August 1, 2007, the Company’s operating resultsinclude Long-Term Care. The Pharmaceutical Distribution segment’s sales to Long-Term Care before the spin-offin the fiscal year ended September 30, 2007 were $714.2 million, which were eliminated in consolidation in theCompany’s historical operating results.
During the fiscal year ended September 30, 2008, the Company committed to a plan to divest its workers’compensation business, PMSI. The Company had both the ability and intent to sell PMSI in its then presentcondition, and as a result, classified PMSI’s assets and liabilities as held for sale in the consolidated balance sheet asof September 30, 2008. The Company also classified PMSI’s operating results and cash flows as discontinued in theconsolidated financial statements for the current and prior fiscal years presented, as PMSI was eliminated from theongoing operations of the Company upon its divestiture and the Company will not have any significant continuinginvolvement in the operations of the disposed component. Previously, PMSI was included in the Company’s Otherreportable segment. In October 2008, the Company completed the sale of PMSI (see Note 4).
Certain reclassifications have been made to prior-year amounts in order to conform to the current-yearpresentation.
Business Combinations
The purchase price of an acquired company is allocated between tangible and intangible assets acquired andliabilities assumed from the acquired business based on their estimated fair values, with the residual of the purchaseprice recorded as goodwill. The results of operations of the acquired businesses are included in the Company’sresults from the dates of acquisition (see Note 2).
50
Cash Equivalents
The Company classifies highly liquid investments with maturities of three months or less at the date ofpurchase as cash equivalents. The carrying value of cash equivalents approximates fair value.
Concentrations of Credit Risk and Allowance for Doubtful Accounts
The Company sells its merchandise inventories to a large number of customers in the healthcare industry thatinclude institutional and retail healthcare providers. Institutional healthcare providers include acute care hospitals,health systems, mail order pharmacies, long-term care and other alternate care pharmacies and providers ofpharmacy services to such facilities, and physician offices. Retail healthcare providers include national and regionalretail drugstore chains, independent community pharmacies and pharmacy departments of supermarkets and massmerchandisers. The financial condition of the Company’s customers can be affected by changes in governmentreimbursement policies as well as by other economic pressures in the healthcare industry.
The Company’s trade accounts receivable are exposed to credit risk, but the risk is moderated because theCompany’s customer base is diverse and geographically widespread primarily within the U.S. and Canada. TheCompany generally does not require collateral for trade receivables. The Company performs ongoing creditevaluations of its customers’ financial condition and maintains an allowance for doubtful accounts. In determiningthe appropriate allowance for doubtful accounts, the Company considers a combination of factors, such as the agingof trade receivables, industry trends, its customers’ financial strength, credit standing, and payment and defaulthistory. Changes in these factors, among others, may lead to adjustments in the Company’s allowance for doubtfulaccounts. The calculation of the required allowance requires judgment by Company management as to the impact ofthose and other factors on the ultimate realization of its trade receivables. Each of the Company’s business unitsperforms ongoing credit evaluations of its customers’ financial condition and maintains reserves for probable baddebt losses based on historical experience and for specific credit problems when they arise. There were nosignificant changes to this process during the fiscal years ended September 30, 2009, 2008, and 2007 and bad debtexpense was computed in a consistent manner during these periods. The bad debt expense for any period presentedis equal to the changes in the period end allowance for doubtful accounts, net of write-offs, recoveries and otheradjustments. Schedule II of this Form 10-K sets forth a rollforward of the allowance for doubtful accounts. AtSeptember 30, 2009, the largest trade receivable due from a single customer represented approximately 9% ofaccounts receivable, net. In fiscal 2009, Medco Health Solutions, Inc. (“Medco”), our largest customer, accountedfor 17% of our total revenue. No other single customer accounted for more than 5% of the Company’s total revenue.
The Company maintains cash and cash equivalents with several financial institutions. Deposits held with banksmay exceed the amount of insurance provided on such deposits. These deposits may be redeemed upon demand, andare maintained with financial institutions with reputable credit, and, therefore, bear minimal credit risk. TheCompany seeks to mitigate such risks by monitoring the risk profiles of these counterparties. The Company alsoseeks to mitigate risk by monitoring the investment strategy of money market funds that it is invested in, which areclassified as cash equivalents.
Derivative Financial Instruments
The Company records all derivative financial instruments on the balance sheet at fair value and complies withestablished criteria for designation and effectiveness of hedging relationships.
As of September 30, 2009 and 2008, there were no outstanding derivative financial instruments. TheCompany’s policy prohibits it from entering into derivative financial instruments for speculative or tradingpurposes.
51
AMERISOURCEBERGEN CORPORATION AND SUBSIDIARIES
NOTES TO CONSOLIDATED FINANCIAL STATEMENTS — (Continued)
Equity Investments
The Company uses the equity method of accounting for its investments in entities in which it has significantinfluence; generally, this represents an ownership interest of between 20% and 50%. The Company’s investments inmarketable equity securities in which the Company does not have significant influence are classified as “availablefor sale” and are carried at fair value, with unrealized gains and losses excluded from earnings and reported in theaccumulated other comprehensive loss component of stockholders’ equity. Unrealized losses that are determined tobe other-than-temporary impairment losses are recorded as a component of earnings in the period in which thatdetermination is made.
Foreign Currency
The functional currency of the Company’s foreign operations is the applicable local currency. Assets andliabilities are translated into U.S. dollars using the current exchange rates in effect at the balance sheet date, whilerevenues and expenses are translated at the weighted-average exchange rates for the period. The resultingtranslation adjustments are recorded as a component of accumulated other comprehensive loss within stockholders’equity.
Goodwill and Other Intangible Assets
The Company does not amortize purchased goodwill or intangible assets with indefinite lives; rather, they aretested for impairment on at least an annual basis. Intangible assets with finite lives, primarily customer relation-ships, non-compete agreements, patents and software technology, are amortized over their useful lives, which rangefrom 2 to 15 years.
The Company’s operating segments are comprised of AmerisourceBergen Drug Corporation, AmerisourceBergenSpecialty Group, and AmerisourceBergen Packaging Group. Each operating segment has an executive who isresponsible for managing the segment and reporting directly to the President and Chief Executive Officer of theCompany, the Company’s Chief Operating Decision Maker (“CODM”). Each of the operating segments is comprised ofa number of operating units (components), for which discrete financial information is available. These components areaggregated into reporting units for purposes of goodwill impairment testing.
In order to test goodwill and intangible assets with indefinite lives, a determination of the fair value of theCompany’s reporting units and intangible assets with indefinite lives is required and is based, among other things,on estimates of future operating performance of the reporting unit and/or the component of the entity being valued.The Company is required to complete an impairment test for goodwill and intangible assets with indefinite lives andrecord any resulting impairment losses at least on an annual basis or more often if warranted by events or changes incircumstances indicating that the carrying value may exceed fair value (“impairment indicators”). This impairmenttest includes the projection and discounting of cash flows, analysis of the Company’s market capitalization andestimating the fair values of tangible and intangible assets and liabilities. Estimates of future cash flows anddetermination of their present values are based upon, among other things, certain assumptions about expected futureoperating performance and appropriate discount rates determined by management. In fiscal 2009, due to theexistence of impairment indicators at U.S. Bioservices, a specialty pharmacy company within the Company’sspecialty group, the Company performed an impairment test on the pharmacy’s trade name as of June 30, 2009,which resulted in an impairment charge of $8.9 million. In fiscal 2008, PMSI experienced certain customer lossesand learned that it would lose its largest customer at the end of calendar 2008. As a result, and after consideringother factors, the Company committed to a plan to divest PMSI. The Company performed an interim impairmenttest of its PMSI reporting unit and determined that its goodwill was impaired. Therefore, PMSI wrote-off thecarrying value of its goodwill of $199.1 million. In addition, it also recognized charges of $26.7 million to record theestimated loss on the sale of PMSI (see Note 4). The Company completed its required annual impairment testsrelating to goodwill and other intangible assets with indefinite lives in the fourth quarter of fiscal 2009 and 2008and, as a result, recorded $1.6 million and $5.3 million of trade name impairment charges, respectively. The
52
AMERISOURCEBERGEN CORPORATION AND SUBSIDIARIES
NOTES TO CONSOLIDATED FINANCIAL STATEMENTS — (Continued)
Company’s estimates of cash flows may differ from actual cash flows due to, among other things, economicconditions, changes to the business model, or changes in operating performance. Significant differences betweenthese estimates and actual cash flows could materially affect the Company’s future financial results.
Income Taxes
The Company accounts for income taxes using a method that requires recognition of deferred tax assets andliabilities for expected future tax consequences of temporary differences that currently exist between tax bases andfinancial reporting bases of the Company’s assets and liabilities (commonly known as the asset and liabilitymethod). In assessing the ability to realize deferred tax assets, the Company considers whether it is more likely thannot that some portion or all of the deferred tax assets will not be realized.
During fiscal 2008, the Company adopted Financial Accounting Standards Board (“FASB”) Accounting StandardsCodification (“ASC”) 740, “Income Taxes” (formerly referenced as FASB Financial Interpretation No. 48, “Accountingfor Uncertainty in Income Taxes — an interpretation of FASB Statement No. 109”), which changed the framework foraccounting for uncertainty in income taxes. The Company recognizes the tax benefit from an uncertain tax position onlyif it is more likely than not that the tax position will be sustained on examination by the taxing authorities, includingresolutions of any related appeals or litigation processes, based on the technical merits of the position. The cumulativeeffect of this adoption resulted in a $9.3 million reduction to retained earnings.
Loss Contingencies
The Company accrues for estimated loss contingencies related to litigation if it is probable that a liability hasbeen incurred and the amount of the loss can be reasonably estimated. Assessing contingencies is highly subjectiveand requires judgments about future events. The Company regularly reviews loss contingencies to determine theadequacy of the accruals and related disclosures. The amount of the actual loss may differ significantly from theseestimates.
Manufacturer Incentives
The Company accounts for fees and other incentives received from its suppliers, relating to the purchase ordistribution of inventory, as a reduction to cost of goods sold. The Company considers these fees and otherincentives to represent product discounts, and as a result, they are capitalized as product costs and relieved throughcost of goods sold upon the sale of the related inventory.
Merchandise Inventories
Inventories are stated at the lower of cost or market. Cost for approximately 75% and 78% of the Company’sinventories at September 30, 2009 and 2008, respectively, has been determined using the last-in, first-out (LIFO)method. If the Company had used the first-in, first-out (FIFO) method of inventory valuation, which approximatescurrent replacement cost, inventories would have been approximately $191.1 million and $176.0 million higherthan the amounts reported at September 30, 2009 and 2008, respectively. The Company recorded a LIFO charge of$15.1 million, $21.1 million, and $2.2 million in fiscal 2009, 2008, and 2007, respectively. During the fiscal yearended September 30, 2007, inventory declines resulted in a liquidation of LIFO layers carried at lower costsprevailing in prior years. The effect of the liquidation in fiscal 2007 was to decrease cost of goods sold by$7.2 million and increase diluted earnings per share by $0.01.
Property and Equipment
Property and equipment are stated at cost and depreciated using the straight-line method over the estimateduseful lives of the assets, which range from 3 to 40 years for buildings and improvements and from 3 to 10 years formachinery, equipment and other. The costs of repairs and maintenance are charged to expense as incurred.
53
AMERISOURCEBERGEN CORPORATION AND SUBSIDIARIES
NOTES TO CONSOLIDATED FINANCIAL STATEMENTS — (Continued)
The Company capitalizes project costs relating to computer software developed or obtained for internal usewhen the activities related to the project reach the application development stage. Software development costs aredepreciated using the straight-line method over the estimated useful lives of the assets which range from 5 to10 years.
Revenue Recognition
The Company recognizes revenue when persuasive evidence of an arrangement exists, product has beendelivered or services have been rendered, the price is fixed or determinable and collectibility is reasonably assured.Revenue as reflected in the accompanying consolidated statements of operations is net of estimated sales returnsand allowances.
The Company’s customer sales return policy generally allows customers to return products only if the productscan be resold at full value or returned to suppliers for full credit. The Company records an accrual for estimatedcustomer sales returns at the time of sale to the customer. At September 30, 2009 and 2008, the Company’s accrualfor estimated customer sales returns was $279.3 million and $282.6 million, respectively.
The Company reports the gross dollar amount of bulk deliveries to customer warehouses in revenue and therelated costs in cost of goods sold. Bulk delivery transactions are arranged by the Company at the express directionof the customer, and involve either drop shipments from the supplier directly to customers’ warehouse sites or cross-dock shipments from the supplier to the Company for immediate shipment to the customers’ warehouse sites. TheCompany is a principal to these transactions because it is the primary obligor and has the ultimate and contractualresponsibility for fulfillment and acceptability of the products purchased, and bears full risk of delivery and loss forproducts, whether the products are drop-shipped or shipped via cross-dock. The Company also bears full credit riskassociated with the creditworthiness of any bulk delivery customer. As a result, the Company records bulk deliveriesto customer warehouses as gross revenues. Gross profit earned by the Company on bulk deliveries was not materialin any year presented.
Share-Based Compensation
The Company accounts for the compensation cost of all share-based payments at fair value and reports therelated expense within distribution, selling and administrative expenses to correspond with the same line item as thecash compensation paid to employees. The benefits of tax deductions in excess of recognized compensationexpense are reported as a financing cash flow ($1.5 million, $12.0 million, and $19.6 million for the fiscal yearsended September 30, 2009, 2008, and 2007 respectively).
Shipping and Handling Costs
Shipping and handling costs include all costs to warehouse, pick, pack and deliver inventory to customers.These costs, which were $297.3 million, $301.6 million and $335.0 million for the fiscal years ended September 30,2009, 2008 and 2007, respectively, are included in distribution, selling and administrative expenses.
Supplier Reserves
The Company establishes reserves against amounts due from its suppliers relating to various price and rebateincentives, including deductions or billings taken against payments otherwise due them from the Company. Thesereserve estimates are established based on the judgment of Company management after carefully considering thestatus of current outstanding claims, historical experience with the suppliers, the specific incentive programs andany other pertinent information available to the Company. The Company evaluates the amounts due from itssuppliers on a continual basis and adjusts the reserve estimates when appropriate based on changes in factualcircumstances. The ultimate outcome of any outstanding claim may be different than the Company’s estimate.
54
AMERISOURCEBERGEN CORPORATION AND SUBSIDIARIES
NOTES TO CONSOLIDATED FINANCIAL STATEMENTS — (Continued)
Recent Accounting Pronouncements
On July 1, 2009, the Company adopted Accounting Standards Update (“ASU”) No. 2009-1, “Topic 105 —Generally Accepted Accounting Principles,” which amended ASC 105, “Generally Accepted Accounting Prin-ciples,” to establish the Codification as the source of authoritative GAAP recognized by the FASB to be applied bynongovernmental entities. Rules and interpretive releases of the SEC under authority of federal securities laws arealso sources of authoritative GAAP for SEC registrants. On the effective date, the Codification superseded all then-existing non-SEC accounting and reporting standards. All previous references to the superseded standards in theCompany’s consolidated financial statements have been replaced by references to the applicable sections of theCodification. The adoption of these sections did not have a material impact on the Company’s consolidatedfinancial statements.
In the first quarter of fiscal 2009, the Company adopted ASC 820-10, “Fair Value Measurements andDisclosures,” (formerly referenced as SFAS No. 157, “Fair Value Measurements”), which defines fair value,establishes a framework for measuring fair value, and expands disclosures about fair value measurements. This newaccounting standard did not require any new fair value measurements. The Company applies fair value accountingfor all financial assets and liabilities and non-financial assets and liabilities that are recognized or disclosed at fairvalue in the financial statements on a recurring basis.
ASC 820-10 defines fair value as the price that would be received from selling an asset or paid to transfer aliability in an orderly transaction between market participants at the measurement date (exit price). ASC 820-10establishes a fair value hierarchy, which prioritizes the inputs to valuation techniques used to measure fair value intothree levels. Level 1 inputs are quoted prices in active markets for identical assets or liabilities. Level 2 inputs areobservable other than quoted prices in active markets for identical assets and liabilities, quoted prices for identicalor similar assets or liabilities in inactive markets, or other inputs that are observable or can be corroborated byobservable market data for substantially the full term of the assets or liabilities. Level 3 inputs are generallyunobservable and typically reflect management’s estimates of assumptions that market participants would use inpricing the asset or liability. At September 30, 2009, the Company had $928.3 million of investments in a moneymarket account, which was valued as a level 1 investment.
Effective October 1, 2009, the Company will apply the provisions of ASC 820-10 to fair value measurementsrelating to all nonfinancial assets and liabilities, such as goodwill and other intangible assets, that are recognized ordisclosed at fair value in the financial statements on a nonrecurring basis. This adoption is not expected to have amaterial impact on the Company’s financial position, results of operations, or liquidity.
During the first quarter of fiscal 2009, the Company adopted ASC 825-10, “Financial Instruments” (formerlyreferenced as SFAS No. 159, “The Fair Value Option for Financial Assets and Financial Liabilities, including anamendment of FASB Statement No. 115”), which allows companies to choose to measure eligible financialinstruments and certain other items at fair value that are not otherwise required to be measured at fair value. TheCompany has not elected the fair value option for any eligible financial instruments not already required to bemeasured at fair value.
On June 30, 2009, the Company adopted ASC 855, “Subsequent Events,” which establishes general standardsof accounting for and disclosure of events that occur after the balance sheet date but before the financial statementsare issued. The Company evaluated subsequent events through the date and time the financial statements wereissued on November 25, 2009.
Effective October 1, 2009, the Company will adopt the applicable sections of ASC 805, “Business Com-binations,” which provides revised guidance for recognizing and measuring identifiable assets and goodwillacquired, liabilities assumed, and any non-controlling interest in the acquiree. Additionally, this ASC providesdisclosure requirements to enable users of financial statements to evaluate the nature and financial effects of thebusiness combination. The Company will also adopt certain other applicable sections that address application issuesraised on the initial recognition and measurement, subsequent measurement and accounting and disclosure of assets
55
AMERISOURCEBERGEN CORPORATION AND SUBSIDIARIES
NOTES TO CONSOLIDATED FINANCIAL STATEMENTS — (Continued)
and liabilities from contingencies from a business combination. The application of ASC 805 relating to anacquisition or divestiture subsequent to September 30, 2009 may have an impact to the Company’s financialposition and/or results of operations.
Note 2. Acquisitions
Fiscal 2009 Acquisition
On May 29, 2009, the Company acquired Innomar Strategies Inc. (“Innomar”) for a purchase price of$13.4 million, net of a working capital adjustment. Innomar is a Canadian specialty pharmaceutical servicescompany that provides services within Canada to pharmaceutical and biotechnology companies, including:strategic consulting and access solutions, specialty logistics management, patient assistance and nursing services,and clinical research services. The acquisition of Innomar expanded the Company’s specialty business in Canada.The purchase price was allocated to the underlying assets acquired and liabilities assumed based upon their fairvalues at the date of acquisition. The purchase price exceeded the fair value of the net tangible and intangible assetsacquired by $8.3 million, which was allocated to goodwill. The fair value of the intangible assets acquired of$4.6 million primarily consist of a trade name of $1.6 million and customer relationships of $2.6 million. TheCompany has begun to amortize the acquired customer relationships over their weighted average life of 10 years.
Fiscal 2008 Acquisition
On October 1, 2007, the Company acquired Bellco Health (“Bellco”) for a purchase price of $162.2 million,net of $20.7 million of cash acquired. Bellco is a pharmaceutical distributor in the Metro New York City area, whereit primarily services independent retail community pharmacies. The acquisition of Bellco expanded the Company’spresence in this large community pharmacy market. Nationally, Bellco markets and sells generic pharmaceuticals toindividual retail pharmacies, and provides pharmaceutical products and services to dialysis clinics. The purchaseprice was allocated to the underlying assets acquired and liabilities assumed based upon their fair values at the dateof the acquisition. The purchase price exceeded the fair value of the net tangible and intangible assets acquired by$139.8 million, which was allocated to goodwill. The fair values of the significant tangible assets acquired andliabilities assumed were as follows: accounts receivable of $112.2 million, merchandise inventories of$106.5 million, and accounts payable and accrued expenses of $237.0 million. The fair values of the intangibleassets acquired of $31.7 million primarily consist of customer relationships of $28.7 million, which are beingamortized over their weighted average life of 8.9 years.
Fiscal 2007 Acquisitions
In October 2006, the Company acquired I.G.G. of America, Inc. (“IgG”), a specialty pharmacy and infusionservices business specializing in the blood derivative intravenous immunoglobulin (“IVIG”), for $37.2 million. Theaddition of IgG supports the Company’s strategy of building its specialty pharmaceutical services to manufacturers.The purchase price was allocated to the underlying assets acquired and liabilities assumed based upon their fairvalues at the date of the acquisition. The purchase price exceeded the fair value of the net tangible and intangibleassets acquired by $20.4 million, which was allocated to goodwill. Intangible assets acquired of $11.6 millionconsist of tradename of $3.3 million, non-compete agreements of $2.6 million and customer relationships of$5.7 million. Non-compete agreements and customer relationships are being amortized over their weighted averagelives of 5 years and 7 years, respectively.
In November 2006, the Company acquired Access M.D., Inc. (“AMD”), a Canadian company, for$13.4 million. AMD provides services, including reimbursement support, third-party logistics and nursing supportservices, to manufacturers of specialty pharmaceuticals such as injectable and biological therapies. The acquisitionof AMD expanded the Company’s specialty services businesses into Canada. The purchase price was allocated tothe underlying assets acquired and liabilities assumed based on their fair values at the date of the acquisition. Thepurchase price exceeded the fair value of the net tangible and intangible assets acquired by $11.9 million, which was
56
AMERISOURCEBERGEN CORPORATION AND SUBSIDIARIES
NOTES TO CONSOLIDATED FINANCIAL STATEMENTS — (Continued)
allocated to goodwill. Intangible assets acquired of $2.9 million primarily consist of tradename of $1.5 million andnon-compete agreements of $0.9 million. Non-compete agreements are being amortized over their weightedaverage lives of 5 years.
In April 2007, the Company acquired Xcenda LLC (“Xcenda”) for a purchase price of $25.2 million. Xcendaenhanced the Company’s consulting business within its existing pharmaceutical and specialty services businessesand provided additional capabilities within pharmaceutical brand services, applied health outcomes and biopharmastrategies. The purchase price was allocated to the underlying assets acquired and liabilities assumed based upontheir fair values at the date of the acquisition. The purchase price exceeded the fair values of the net tangible andintangible assets acquired by $18.7 million, which was allocated to goodwill. Intangible assets acquired of$5.9 million primarily consist of customer relationships of $2.7 million and tradename of $3.1 million. Customerrelationships are being amortized over their weighted average life of 5 years.
Pro forma results of operations for the aforementioned fiscal 2009, 2008 and 2007 acquisitions have not beenpresented because the effects were not material to the consolidated financial statements on either an individual oraggregate basis.
Note 3. Divestiture of PharMerica Long-Term Care
On July 31, 2007, the Company and Kindred Healthcare, Inc. (“Kindred”) completed the spin-offs andsubsequent combination of their institutional pharmacy businesses, Long-Term Care and Kindred PharmacyServices (“KPS”), to form a new, independent, publicly traded company named PharMerica Corporation (“PMC”).At closing, in accordance with the terms of the master transaction agreement, the Company entered into apharmaceutical distribution agreement with PMC. In connection with this transaction, Long-Term Care borrowed$125 million from a financial institution and provided a one-time distribution back to the Company. The cashdistribution by Long-Term Care to the Company was tax-free. The institutional pharmacy businesses were thenspun off to the stockholders of their respective parent companies, followed immediately by the merger of the twoinstitutional pharmacy businesses into subsidiaries of PMC, which resulted in the Company’s and Kindred’sstockholders each owning approximately 50 percent of PMC immediately after the closing of the transaction. TheCompany’s stockholders received 0.0416876 shares of PMC common stock for each share of AmerisourceBergencommon stock owned.
In connection with this transaction, the Company spun off $196.6 million of net assets from its institutionalpharmacy business and recorded a corresponding reduction to its retained earnings. The net assets divestedconsisted of $169.3 million of accounts receivable, $51.3 million of inventory, $35.9 million of property andequipment, $149.2 million of goodwill, $9.4 million of other assets, $125.0 million of long-term debt, $34.8 millionof accounts payable and accrued expenses, and $58.7 million of deferred tax liabilities.
Note 4. Discontinued Operations
In October 2008, the Company completed the divestiture of its workers’ compensation business, PMSI. TheCompany classified PMSI’s assets and liabilities as held for sale in the consolidated balance sheet as ofSeptember 30, 2008 and classified PMSI’s operating results and cash flows as discontinued in the consolidatedfinancial statements for all periods presented. Previously, PMSI was included in the Company’s Other reportablesegment. PMSI’s revenue and (loss) income before income taxes were as follows:
2009 2008 2007Fiscal Year Ended September 30,
Revenue . . . . . . . . . . . . . . . . . . . . . . . . . . . . . . . . . . . . . . . . . . $28,993 $ 403,759 $461,370(Loss) income before income taxes . . . . . . . . . . . . . . . . . . . . . . $ (3,825) $(216,355) $ 31,561
The Company sold PMSI for approximately $31 million, net of a final working capital adjustment, including a$19 million subordinated note payable due from PMSI on the fifth anniversary of the closing date (the “maturity
57
AMERISOURCEBERGEN CORPORATION AND SUBSIDIARIES
NOTES TO CONSOLIDATED FINANCIAL STATEMENTS — (Continued)
date”), of which $4 million may be payable in October 2010 if PMSI achieves certain revenue targets with respect toits largest customer. Interest, which accrues at an annual rate of LIBOR plus 4% (not to exceed 8%), will be payablein cash on a quarterly basis if PMSI achieves a defined minimum fixed charge coverage ratio or will be compoundedquarterly and paid at maturity. Additionally, if PMSI’s annual net revenue exceeds certain thresholds throughDecember 2011, the Company may be entitled to additional payments of up to $10 million under the subordinatednote payable due from PMSI on the maturity date of the note.
The Company recorded a non-cash charge of $225.8 million during fiscal 2008 to reduce the carrying value ofPMSI. This charge, which is included in the loss from discontinued operations for the fiscal year endedSeptember 30, 2008, was comprised of a $199.1 million write-off of PMSI’s goodwill and a $26.7 million chargeto record the Company’s loss on the sale of PMSI. The tax benefit recorded in connection with the above charge wasminimal, as the loss on the sale of PMSI will be treated as a capital loss for income tax purposes, and the Companydoes not have significant capital gains to offset the capital loss.
The following table summarizes the assets and liabilities of PMSI, which were held for sale as of September 30,2008 (in thousands):
Assets:
Accounts receivable . . . . . . . . . . . . . . . . . . . . . . . . . . . . . . . . . . . . . . . . . . . . . . . . . . . $44,033
Other assets . . . . . . . . . . . . . . . . . . . . . . . . . . . . . . . . . . . . . . . . . . . . . . . . . . . . . . . . . (342)
Liabilities:
Accounts payable . . . . . . . . . . . . . . . . . . . . . . . . . . . . . . . . . . . . . . . . . . . . . . . . . . . . . 14,959
Other liabilities . . . . . . . . . . . . . . . . . . . . . . . . . . . . . . . . . . . . . . . . . . . . . . . . . . . . . . 2,800
Net assets . . . . . . . . . . . . . . . . . . . . . . . . . . . . . . . . . . . . . . . . . . . . . . . . . . . . . . . . . . . . $25,932
In 2007, the Company received an adverse court decision with respect to a contingent purchase priceadjustment in connection with Bridge Medical, Inc., which the Company disposed in 2005. As a result, theCompany recorded a charge of $24.6 million, net of income taxes of $2.3 million, in discontinued operations in thefiscal year ended September 30, 2007. In fiscal 2009, the Company incurred additional costs related to thisdisposition.
Note 5. Income Taxes
The income tax provision is as follows (in thousands):
2009 2008 2007Fiscal Year Ended September 30,
Current provision:
Federal . . . . . . . . . . . . . . . . . . . . . . . . . . . . . . . . . . . . . . . . . $200,902 $198,187 $238,969
State and local . . . . . . . . . . . . . . . . . . . . . . . . . . . . . . . . . . . 24,942 26,862 26,180
Foreign . . . . . . . . . . . . . . . . . . . . . . . . . . . . . . . . . . . . . . . . 2,054 5,113 1,558
227,898 230,162 266,707
Deferred provision:
Federal . . . . . . . . . . . . . . . . . . . . . . . . . . . . . . . . . . . . . . . . . 81,711 55,137 10,564
State and local . . . . . . . . . . . . . . . . . . . . . . . . . . . . . . . . . . . 6,178 9,824 3,249
Foreign . . . . . . . . . . . . . . . . . . . . . . . . . . . . . . . . . . . . . . . . (3,565) (2,849) (1,834)
84,324 62,112 11,979
Provision for income taxes . . . . . . . . . . . . . . . . . . . . . . . . . . . . $312,222 $292,274 $278,686
58
AMERISOURCEBERGEN CORPORATION AND SUBSIDIARIES
NOTES TO CONSOLIDATED FINANCIAL STATEMENTS — (Continued)
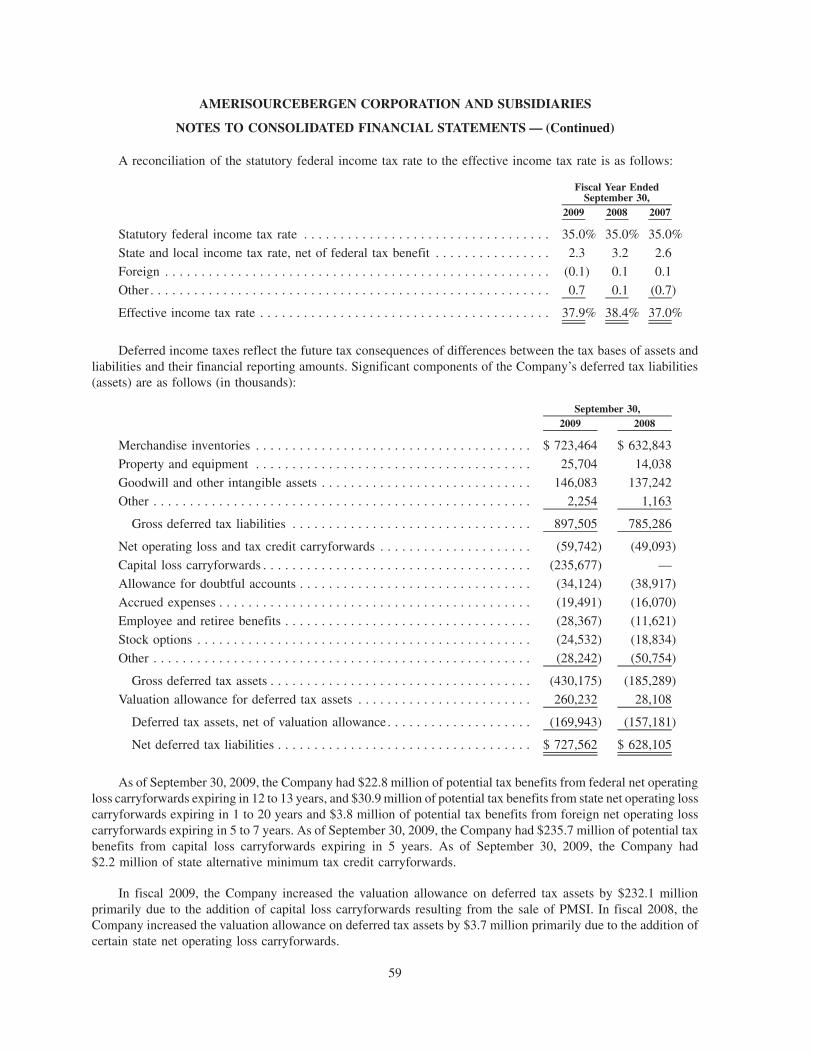
A reconciliation of the statutory federal income tax rate to the effective income tax rate is as follows:
2009 2008 2007
Fiscal Year EndedSeptember 30,
Statutory federal income tax rate . . . . . . . . . . . . . . . . . . . . . . . . . . . . . . . . . . 35.0% 35.0% 35.0%
State and local income tax rate, net of federal tax benefit . . . . . . . . . . . . . . . . 2.3 3.2 2.6
Foreign . . . . . . . . . . . . . . . . . . . . . . . . . . . . . . . . . . . . . . . . . . . . . . . . . . . . . (0.1) 0.1 0.1
Other . . . . . . . . . . . . . . . . . . . . . . . . . . . . . . . . . . . . . . . . . . . . . . . . . . . . . . . 0.7 0.1 (0.7)
Effective income tax rate . . . . . . . . . . . . . . . . . . . . . . . . . . . . . . . . . . . . . . . . 37.9% 38.4% 37.0%
Deferred income taxes reflect the future tax consequences of differences between the tax bases of assets andliabilities and their financial reporting amounts. Significant components of the Company’s deferred tax liabilities(assets) are as follows (in thousands):
2009 2008September 30,
Merchandise inventories . . . . . . . . . . . . . . . . . . . . . . . . . . . . . . . . . . . . . . $ 723,464 $ 632,843
Property and equipment . . . . . . . . . . . . . . . . . . . . . . . . . . . . . . . . . . . . . . 25,704 14,038
Goodwill and other intangible assets . . . . . . . . . . . . . . . . . . . . . . . . . . . . . 146,083 137,242Other . . . . . . . . . . . . . . . . . . . . . . . . . . . . . . . . . . . . . . . . . . . . . . . . . . . . 2,254 1,163
Gross deferred tax liabilities . . . . . . . . . . . . . . . . . . . . . . . . . . . . . . . . . 897,505 785,286
Net operating loss and tax credit carryforwards . . . . . . . . . . . . . . . . . . . . . (59,742) (49,093)
Capital loss carryforwards . . . . . . . . . . . . . . . . . . . . . . . . . . . . . . . . . . . . . (235,677) —
Allowance for doubtful accounts . . . . . . . . . . . . . . . . . . . . . . . . . . . . . . . . (34,124) (38,917)
Accrued expenses . . . . . . . . . . . . . . . . . . . . . . . . . . . . . . . . . . . . . . . . . . . (19,491) (16,070)
Employee and retiree benefits . . . . . . . . . . . . . . . . . . . . . . . . . . . . . . . . . . (28,367) (11,621)
Stock options . . . . . . . . . . . . . . . . . . . . . . . . . . . . . . . . . . . . . . . . . . . . . . (24,532) (18,834)
Other . . . . . . . . . . . . . . . . . . . . . . . . . . . . . . . . . . . . . . . . . . . . . . . . . . . . (28,242) (50,754)
Gross deferred tax assets . . . . . . . . . . . . . . . . . . . . . . . . . . . . . . . . . . . . (430,175) (185,289)
Valuation allowance for deferred tax assets . . . . . . . . . . . . . . . . . . . . . . . . 260,232 28,108
Deferred tax assets, net of valuation allowance . . . . . . . . . . . . . . . . . . . . (169,943) (157,181)
Net deferred tax liabilities . . . . . . . . . . . . . . . . . . . . . . . . . . . . . . . . . . . $ 727,562 $ 628,105
As of September 30, 2009, the Company had $22.8 million of potential tax benefits from federal net operatingloss carryforwards expiring in 12 to 13 years, and $30.9 million of potential tax benefits from state net operating losscarryforwards expiring in 1 to 20 years and $3.8 million of potential tax benefits from foreign net operating losscarryforwards expiring in 5 to 7 years. As of September 30, 2009, the Company had $235.7 million of potential taxbenefits from capital loss carryforwards expiring in 5 years. As of September 30, 2009, the Company had$2.2 million of state alternative minimum tax credit carryforwards.
In fiscal 2009, the Company increased the valuation allowance on deferred tax assets by $232.1 millionprimarily due to the addition of capital loss carryforwards resulting from the sale of PMSI. In fiscal 2008, theCompany increased the valuation allowance on deferred tax assets by $3.7 million primarily due to the addition ofcertain state net operating loss carryforwards.
59
AMERISOURCEBERGEN CORPORATION AND SUBSIDIARIES
NOTES TO CONSOLIDATED FINANCIAL STATEMENTS — (Continued)
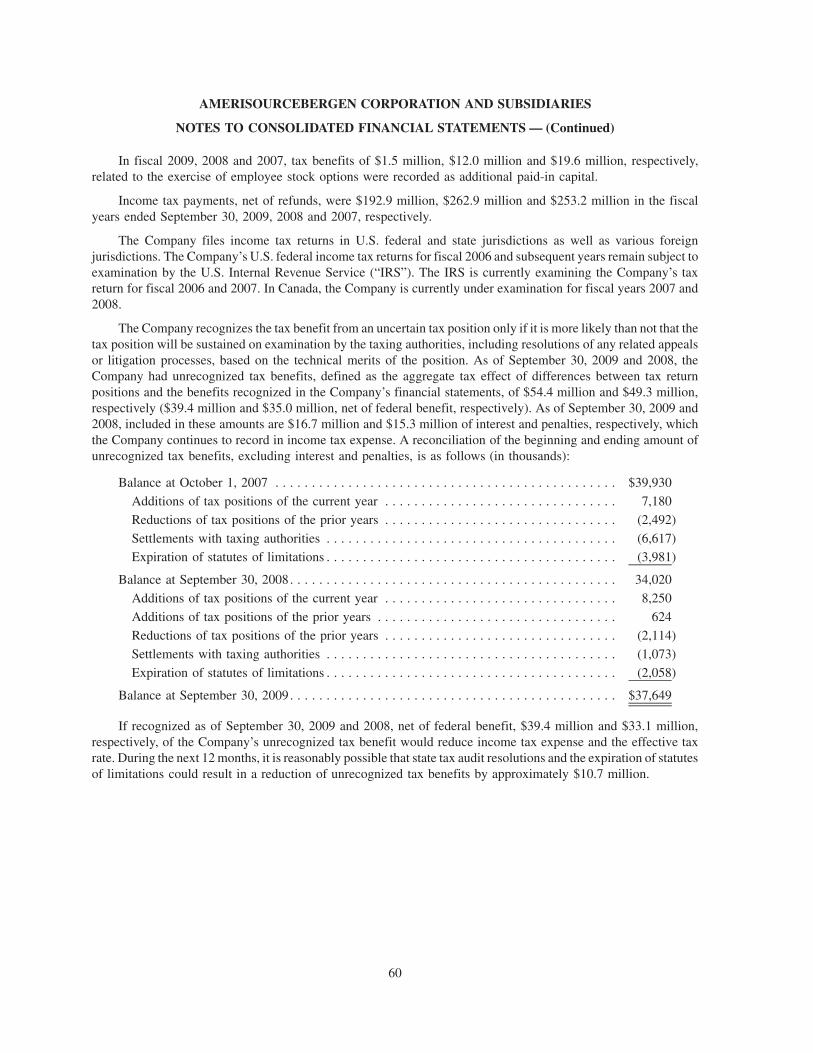
In fiscal 2009, 2008 and 2007, tax benefits of $1.5 million, $12.0 million and $19.6 million, respectively,related to the exercise of employee stock options were recorded as additional paid-in capital.
Income tax payments, net of refunds, were $192.9 million, $262.9 million and $253.2 million in the fiscalyears ended September 30, 2009, 2008 and 2007, respectively.
The Company files income tax returns in U.S. federal and state jurisdictions as well as various foreignjurisdictions. The Company’s U.S. federal income tax returns for fiscal 2006 and subsequent years remain subject toexamination by the U.S. Internal Revenue Service (“IRS”). The IRS is currently examining the Company’s taxreturn for fiscal 2006 and 2007. In Canada, the Company is currently under examination for fiscal years 2007 and2008.
The Company recognizes the tax benefit from an uncertain tax position only if it is more likely than not that thetax position will be sustained on examination by the taxing authorities, including resolutions of any related appealsor litigation processes, based on the technical merits of the position. As of September 30, 2009 and 2008, theCompany had unrecognized tax benefits, defined as the aggregate tax effect of differences between tax returnpositions and the benefits recognized in the Company’s financial statements, of $54.4 million and $49.3 million,respectively ($39.4 million and $35.0 million, net of federal benefit, respectively). As of September 30, 2009 and2008, included in these amounts are $16.7 million and $15.3 million of interest and penalties, respectively, whichthe Company continues to record in income tax expense. A reconciliation of the beginning and ending amount ofunrecognized tax benefits, excluding interest and penalties, is as follows (in thousands):
Balance at October 1, 2007 . . . . . . . . . . . . . . . . . . . . . . . . . . . . . . . . . . . . . . . . . . . . . . . $39,930
Additions of tax positions of the current year . . . . . . . . . . . . . . . . . . . . . . . . . . . . . . . . 7,180
Reductions of tax positions of the prior years . . . . . . . . . . . . . . . . . . . . . . . . . . . . . . . . (2,492)
Settlements with taxing authorities . . . . . . . . . . . . . . . . . . . . . . . . . . . . . . . . . . . . . . . . (6,617)Expiration of statutes of limitations . . . . . . . . . . . . . . . . . . . . . . . . . . . . . . . . . . . . . . . . (3,981)
Balance at September 30, 2008. . . . . . . . . . . . . . . . . . . . . . . . . . . . . . . . . . . . . . . . . . . . . 34,020
Additions of tax positions of the current year . . . . . . . . . . . . . . . . . . . . . . . . . . . . . . . . 8,250
Additions of tax positions of the prior years . . . . . . . . . . . . . . . . . . . . . . . . . . . . . . . . . 624
Reductions of tax positions of the prior years . . . . . . . . . . . . . . . . . . . . . . . . . . . . . . . . (2,114)
Settlements with taxing authorities . . . . . . . . . . . . . . . . . . . . . . . . . . . . . . . . . . . . . . . . (1,073)
Expiration of statutes of limitations . . . . . . . . . . . . . . . . . . . . . . . . . . . . . . . . . . . . . . . . (2,058)
Balance at September 30, 2009. . . . . . . . . . . . . . . . . . . . . . . . . . . . . . . . . . . . . . . . . . . . . $37,649
If recognized as of September 30, 2009 and 2008, net of federal benefit, $39.4 million and $33.1 million,respectively, of the Company’s unrecognized tax benefit would reduce income tax expense and the effective taxrate. During the next 12 months, it is reasonably possible that state tax audit resolutions and the expiration of statutesof limitations could result in a reduction of unrecognized tax benefits by approximately $10.7 million.
60
AMERISOURCEBERGEN CORPORATION AND SUBSIDIARIES
NOTES TO CONSOLIDATED FINANCIAL STATEMENTS — (Continued)
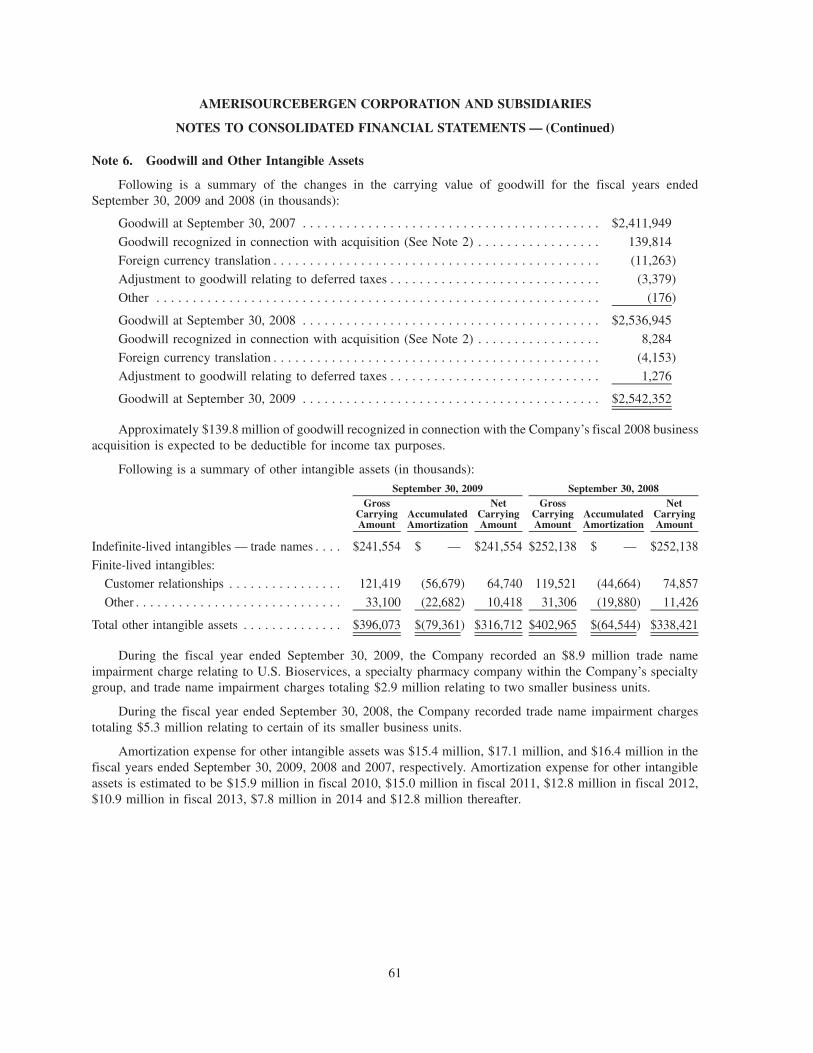
Note 6. Goodwill and Other Intangible Assets
Following is a summary of the changes in the carrying value of goodwill for the fiscal years endedSeptember 30, 2009 and 2008 (in thousands):
Goodwill at September 30, 2007 . . . . . . . . . . . . . . . . . . . . . . . . . . . . . . . . . . . . . . . . . $2,411,949
Goodwill recognized in connection with acquisition (See Note 2) . . . . . . . . . . . . . . . . . 139,814
Foreign currency translation . . . . . . . . . . . . . . . . . . . . . . . . . . . . . . . . . . . . . . . . . . . . . (11,263)
Adjustment to goodwill relating to deferred taxes . . . . . . . . . . . . . . . . . . . . . . . . . . . . . (3,379)
Other . . . . . . . . . . . . . . . . . . . . . . . . . . . . . . . . . . . . . . . . . . . . . . . . . . . . . . . . . . . . . (176)
Goodwill at September 30, 2008 . . . . . . . . . . . . . . . . . . . . . . . . . . . . . . . . . . . . . . . . . $2,536,945
Goodwill recognized in connection with acquisition (See Note 2) . . . . . . . . . . . . . . . . . 8,284
Foreign currency translation . . . . . . . . . . . . . . . . . . . . . . . . . . . . . . . . . . . . . . . . . . . . . (4,153)Adjustment to goodwill relating to deferred taxes . . . . . . . . . . . . . . . . . . . . . . . . . . . . . 1,276
Goodwill at September 30, 2009 . . . . . . . . . . . . . . . . . . . . . . . . . . . . . . . . . . . . . . . . . $2,542,352
Approximately $139.8 million of goodwill recognized in connection with the Company’s fiscal 2008 businessacquisition is expected to be deductible for income tax purposes.
Following is a summary of other intangible assets (in thousands):
GrossCarryingAmount
AccumulatedAmortization
NetCarryingAmount
GrossCarryingAmount
AccumulatedAmortization
NetCarryingAmount
September 30, 2009 September 30, 2008
Indefinite-lived intangibles — trade names . . . . $241,554 $ — $241,554 $252,138 $ — $252,138
Finite-lived intangibles:Customer relationships . . . . . . . . . . . . . . . . 121,419 (56,679) 64,740 119,521 (44,664) 74,857
Other . . . . . . . . . . . . . . . . . . . . . . . . . . . . . 33,100 (22,682) 10,418 31,306 (19,880) 11,426
Total other intangible assets . . . . . . . . . . . . . . $396,073 $(79,361) $316,712 $402,965 $(64,544) $338,421
During the fiscal year ended September 30, 2009, the Company recorded an $8.9 million trade nameimpairment charge relating to U.S. Bioservices, a specialty pharmacy company within the Company’s specialtygroup, and trade name impairment charges totaling $2.9 million relating to two smaller business units.
During the fiscal year ended September 30, 2008, the Company recorded trade name impairment chargestotaling $5.3 million relating to certain of its smaller business units.
Amortization expense for other intangible assets was $15.4 million, $17.1 million, and $16.4 million in thefiscal years ended September 30, 2009, 2008 and 2007, respectively. Amortization expense for other intangibleassets is estimated to be $15.9 million in fiscal 2010, $15.0 million in fiscal 2011, $12.8 million in fiscal 2012,$10.9 million in fiscal 2013, $7.8 million in 2014 and $12.8 million thereafter.
61
AMERISOURCEBERGEN CORPORATION AND SUBSIDIARIES
NOTES TO CONSOLIDATED FINANCIAL STATEMENTS — (Continued)
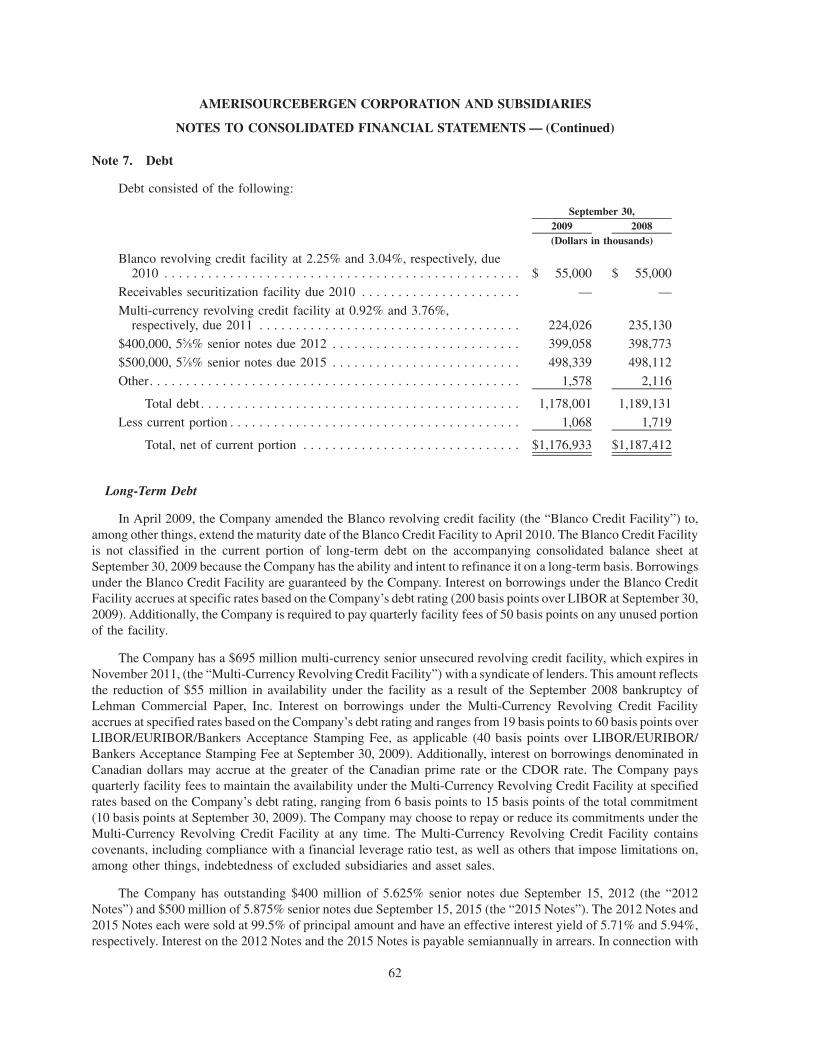
Note 7. Debt
Debt consisted of the following:
2009 2008September 30,
(Dollars in thousands)
Blanco revolving credit facility at 2.25% and 3.04%, respectively, due2010 . . . . . . . . . . . . . . . . . . . . . . . . . . . . . . . . . . . . . . . . . . . . . . . . . $ 55,000 $ 55,000
Receivables securitization facility due 2010 . . . . . . . . . . . . . . . . . . . . . . — —
Multi-currency revolving credit facility at 0.92% and 3.76%,respectively, due 2011 . . . . . . . . . . . . . . . . . . . . . . . . . . . . . . . . . . . . 224,026 235,130
$400,000, 55⁄8% senior notes due 2012 . . . . . . . . . . . . . . . . . . . . . . . . . . 399,058 398,773
$500,000, 57⁄8% senior notes due 2015 . . . . . . . . . . . . . . . . . . . . . . . . . . 498,339 498,112
Other. . . . . . . . . . . . . . . . . . . . . . . . . . . . . . . . . . . . . . . . . . . . . . . . . . . 1,578 2,116
Total debt . . . . . . . . . . . . . . . . . . . . . . . . . . . . . . . . . . . . . . . . . . . . 1,178,001 1,189,131
Less current portion . . . . . . . . . . . . . . . . . . . . . . . . . . . . . . . . . . . . . . . . 1,068 1,719
Total, net of current portion . . . . . . . . . . . . . . . . . . . . . . . . . . . . . . $1,176,933 $1,187,412
Long-Term Debt
In April 2009, the Company amended the Blanco revolving credit facility (the “Blanco Credit Facility”) to,among other things, extend the maturity date of the Blanco Credit Facility to April 2010. The Blanco Credit Facilityis not classified in the current portion of long-term debt on the accompanying consolidated balance sheet atSeptember 30, 2009 because the Company has the ability and intent to refinance it on a long-term basis. Borrowingsunder the Blanco Credit Facility are guaranteed by the Company. Interest on borrowings under the Blanco CreditFacility accrues at specific rates based on the Company’s debt rating (200 basis points over LIBOR at September 30,2009). Additionally, the Company is required to pay quarterly facility fees of 50 basis points on any unused portionof the facility.
The Company has a $695 million multi-currency senior unsecured revolving credit facility, which expires inNovember 2011, (the “Multi-Currency Revolving Credit Facility”) with a syndicate of lenders. This amount reflectsthe reduction of $55 million in availability under the facility as a result of the September 2008 bankruptcy ofLehman Commercial Paper, Inc. Interest on borrowings under the Multi-Currency Revolving Credit Facilityaccrues at specified rates based on the Company’s debt rating and ranges from 19 basis points to 60 basis points overLIBOR/EURIBOR/Bankers Acceptance Stamping Fee, as applicable (40 basis points over LIBOR/EURIBOR/Bankers Acceptance Stamping Fee at September 30, 2009). Additionally, interest on borrowings denominated inCanadian dollars may accrue at the greater of the Canadian prime rate or the CDOR rate. The Company paysquarterly facility fees to maintain the availability under the Multi-Currency Revolving Credit Facility at specifiedrates based on the Company’s debt rating, ranging from 6 basis points to 15 basis points of the total commitment(10 basis points at September 30, 2009). The Company may choose to repay or reduce its commitments under theMulti-Currency Revolving Credit Facility at any time. The Multi-Currency Revolving Credit Facility containscovenants, including compliance with a financial leverage ratio test, as well as others that impose limitations on,among other things, indebtedness of excluded subsidiaries and asset sales.
The Company has outstanding $400 million of 5.625% senior notes due September 15, 2012 (the “2012Notes”) and $500 million of 5.875% senior notes due September 15, 2015 (the “2015 Notes”). The 2012 Notes and2015 Notes each were sold at 99.5% of principal amount and have an effective interest yield of 5.71% and 5.94%,respectively. Interest on the 2012 Notes and the 2015 Notes is payable semiannually in arrears. In connection with
62
AMERISOURCEBERGEN CORPORATION AND SUBSIDIARIES
NOTES TO CONSOLIDATED FINANCIAL STATEMENTS — (Continued)
the issuance of the 2012 Notes and the 2015 Notes, the Company incurred approximately $6.7 million and$8.3 million of costs, respectively, which were deferred and are being amortized over the terms of the notes.
The indentures governing the Multi-Currency Revolving Credit Facility, the 2012 Notes, and the 2015 Notes,contain restrictions and covenants which include limitations on additional indebtedness; distributions and dividendsto stockholders; the repurchase of stock and the making of other restricted payments; issuance of preferred stock;creation of certain liens; transactions with subsidiaries and other affiliates; and certain corporate acts such asmergers, consolidations, and the sale of substantially all assets. An additional covenant requires compliance with afinancial leverage ratio test.
Receivables Securitization Facility
In April 2009, the Company amended its receivables securitization facility (“Receivables SecuritizationFacility”), electing to reduce the amount available under the facility from $975 million to $700 million and extendthe expiration date to April 2010. The Company continues to have available to it an accordion feature whereby thecommitment on the Receivables Securitization Facility may be increased by up to $250 million, subject to lenderapproval, for seasonal needs during the December and March quarters. Interest rates are based on prevailing marketrates for short-term commercial paper plus a program fee. The Company pays a commitment fee to maintain theavailability under the Receivables Securitization Facility. The program fee and the commitment fee were 150 basispoints and 75 basis points, respectively, at September 30, 2009. At September 30, 2009, there were no borrowingsoutstanding under the Receivables Securitization Facility. In connection with the Receivables SecuritizationFacility, ABDC sells on a revolving basis certain accounts receivable to Amerisource Receivables FinancialCorporation, a wholly owned special purpose entity, which in turn sells a percentage ownership interest in thereceivables to commercial paper conduits sponsored by financial institutions. ABDC is the servicer of the accountsreceivable under the Receivables Securitization Facility. After the maximum limit of receivables sold has beenreached and as sold receivables are collected, additional receivables may be sold up to the maximum amountavailable under the facility. The facility is a financing vehicle utilized by the Company because it generally offers anattractive interest rate relative to other financing sources. The Company securitizes its trade accounts, which aregenerally non-interest bearing, in transactions that are accounted for as borrowings. The agreement governing theReceivables Securitization Facility contains restrictions and covenants which include limitations on the incurrenceof additional indebtedness, making of certain restricted payments, issuance of preferred stock, creation of certainliens, and certain corporate acts such as mergers, consolidations and sale of substantially all assets.
Other Information
Scheduled future principal payments of long-term debt are $56.1 million in fiscal 2010, $0.3 million in fiscal2011, $624.3 million in fiscal 2012, and $500.0 million in fiscal 2015.
Interest paid on the above indebtedness during the fiscal years ended September 30, 2009, 2008 and 2007 was$56.9 million, $68.5 million, and $65.9 million, respectively.
Total amortization of financing fees and the accretion of original issue discounts, which are recorded ascomponents of interest expense, were $4.3 million, $3.5 million, and $4.7 million, for the fiscal years endedSeptember 30, 2009, 2008 and 2007, respectively.
Note 8. Stockholders’ Equity and Earnings per Share
The authorized capital stock of the Company consists of 600,000,000 shares of common stock, par value $0.01per share (the “Common Stock”), and 10,000,000 shares of preferred stock, par value $0.01 per share (the“Preferred Stock”).
The board of directors is authorized to provide for the issuance of shares of Preferred Stock in one or moreseries with various designations, preferences and relative, participating, optional or other special rights and
63
AMERISOURCEBERGEN CORPORATION AND SUBSIDIARIES
NOTES TO CONSOLIDATED FINANCIAL STATEMENTS — (Continued)
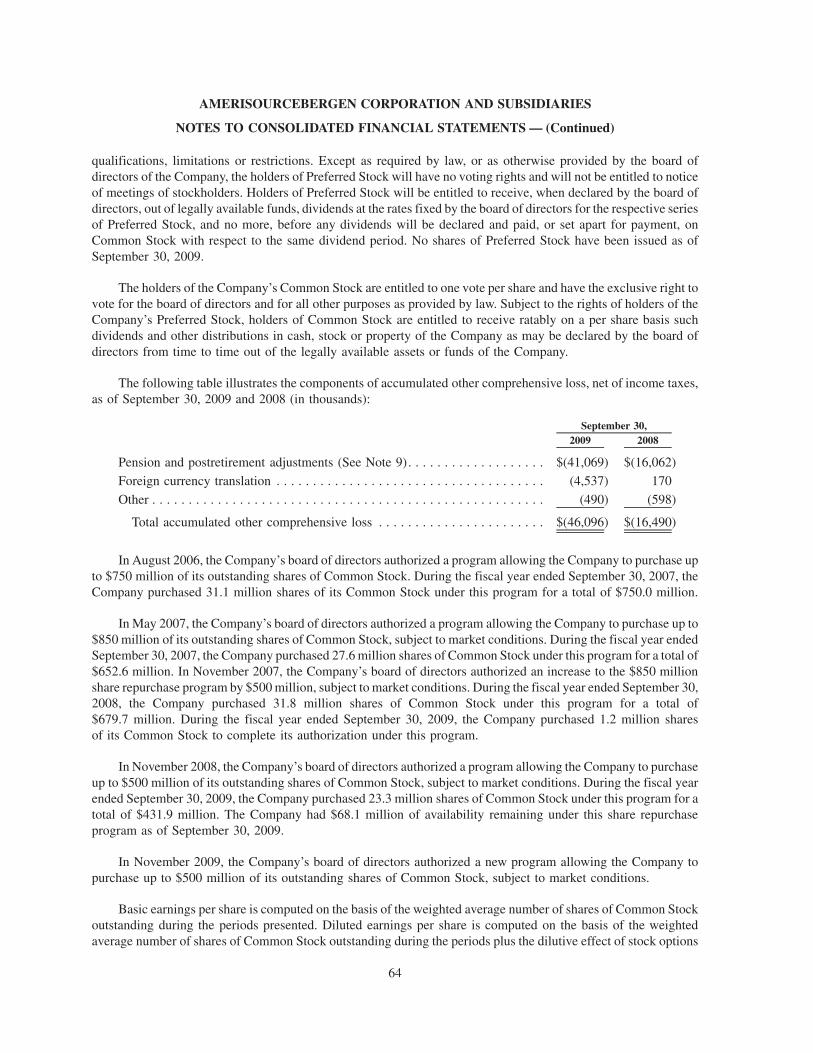
qualifications, limitations or restrictions. Except as required by law, or as otherwise provided by the board ofdirectors of the Company, the holders of Preferred Stock will have no voting rights and will not be entitled to noticeof meetings of stockholders. Holders of Preferred Stock will be entitled to receive, when declared by the board ofdirectors, out of legally available funds, dividends at the rates fixed by the board of directors for the respective seriesof Preferred Stock, and no more, before any dividends will be declared and paid, or set apart for payment, onCommon Stock with respect to the same dividend period. No shares of Preferred Stock have been issued as ofSeptember 30, 2009.
The holders of the Company’s Common Stock are entitled to one vote per share and have the exclusive right tovote for the board of directors and for all other purposes as provided by law. Subject to the rights of holders of theCompany’s Preferred Stock, holders of Common Stock are entitled to receive ratably on a per share basis suchdividends and other distributions in cash, stock or property of the Company as may be declared by the board ofdirectors from time to time out of the legally available assets or funds of the Company.
The following table illustrates the components of accumulated other comprehensive loss, net of income taxes,as of September 30, 2009 and 2008 (in thousands):
2009 2008September 30,
Pension and postretirement adjustments (See Note 9). . . . . . . . . . . . . . . . . . . $(41,069) $(16,062)
Foreign currency translation . . . . . . . . . . . . . . . . . . . . . . . . . . . . . . . . . . . . . (4,537) 170
Other . . . . . . . . . . . . . . . . . . . . . . . . . . . . . . . . . . . . . . . . . . . . . . . . . . . . . . (490) (598)
Total accumulated other comprehensive loss . . . . . . . . . . . . . . . . . . . . . . . $(46,096) $(16,490)
In August 2006, the Company’s board of directors authorized a program allowing the Company to purchase upto $750 million of its outstanding shares of Common Stock. During the fiscal year ended September 30, 2007, theCompany purchased 31.1 million shares of its Common Stock under this program for a total of $750.0 million.
In May 2007, the Company’s board of directors authorized a program allowing the Company to purchase up to$850 million of its outstanding shares of Common Stock, subject to market conditions. During the fiscal year endedSeptember 30, 2007, the Company purchased 27.6 million shares of Common Stock under this program for a total of$652.6 million. In November 2007, the Company’s board of directors authorized an increase to the $850 millionshare repurchase program by $500 million, subject to market conditions. During the fiscal year ended September 30,2008, the Company purchased 31.8 million shares of Common Stock under this program for a total of$679.7 million. During the fiscal year ended September 30, 2009, the Company purchased 1.2 million sharesof its Common Stock to complete its authorization under this program.
In November 2008, the Company’s board of directors authorized a program allowing the Company to purchaseup to $500 million of its outstanding shares of Common Stock, subject to market conditions. During the fiscal yearended September 30, 2009, the Company purchased 23.3 million shares of Common Stock under this program for atotal of $431.9 million. The Company had $68.1 million of availability remaining under this share repurchaseprogram as of September 30, 2009.
In November 2009, the Company’s board of directors authorized a new program allowing the Company topurchase up to $500 million of its outstanding shares of Common Stock, subject to market conditions.
Basic earnings per share is computed on the basis of the weighted average number of shares of Common Stockoutstanding during the periods presented. Diluted earnings per share is computed on the basis of the weightedaverage number of shares of Common Stock outstanding during the periods plus the dilutive effect of stock options
64
AMERISOURCEBERGEN CORPORATION AND SUBSIDIARIES
NOTES TO CONSOLIDATED FINANCIAL STATEMENTS — (Continued)
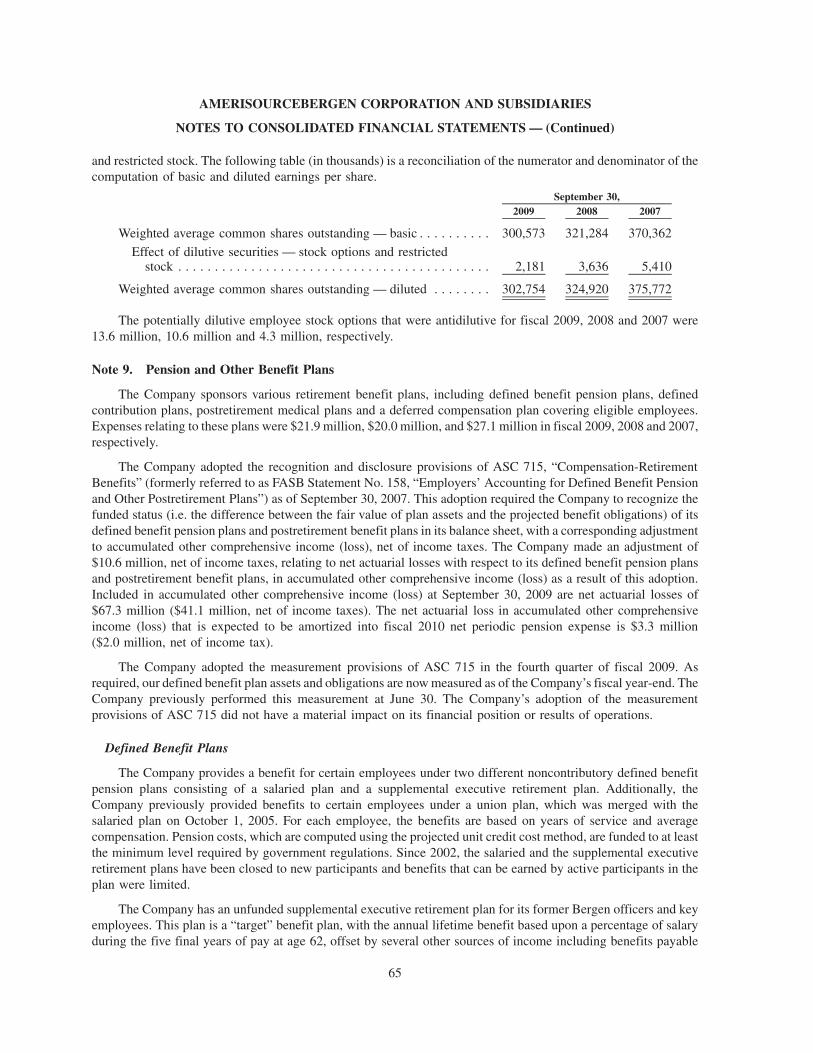
and restricted stock. The following table (in thousands) is a reconciliation of the numerator and denominator of thecomputation of basic and diluted earnings per share.
2009 2008 2007September 30,
Weighted average common shares outstanding — basic . . . . . . . . . . 300,573 321,284 370,362
Effect of dilutive securities — stock options and restrictedstock . . . . . . . . . . . . . . . . . . . . . . . . . . . . . . . . . . . . . . . . . . . 2,181 3,636 5,410
Weighted average common shares outstanding — diluted . . . . . . . . 302,754 324,920 375,772
The potentially dilutive employee stock options that were antidilutive for fiscal 2009, 2008 and 2007 were13.6 million, 10.6 million and 4.3 million, respectively.
Note 9. Pension and Other Benefit Plans
The Company sponsors various retirement benefit plans, including defined benefit pension plans, definedcontribution plans, postretirement medical plans and a deferred compensation plan covering eligible employees.Expenses relating to these plans were $21.9 million, $20.0 million, and $27.1 million in fiscal 2009, 2008 and 2007,respectively.
The Company adopted the recognition and disclosure provisions of ASC 715, “Compensation-RetirementBenefits” (formerly referred to as FASB Statement No. 158, “Employers’ Accounting for Defined Benefit Pensionand Other Postretirement Plans”) as of September 30, 2007. This adoption required the Company to recognize thefunded status (i.e. the difference between the fair value of plan assets and the projected benefit obligations) of itsdefined benefit pension plans and postretirement benefit plans in its balance sheet, with a corresponding adjustmentto accumulated other comprehensive income (loss), net of income taxes. The Company made an adjustment of$10.6 million, net of income taxes, relating to net actuarial losses with respect to its defined benefit pension plansand postretirement benefit plans, in accumulated other comprehensive income (loss) as a result of this adoption.Included in accumulated other comprehensive income (loss) at September 30, 2009 are net actuarial losses of$67.3 million ($41.1 million, net of income taxes). The net actuarial loss in accumulated other comprehensiveincome (loss) that is expected to be amortized into fiscal 2010 net periodic pension expense is $3.3 million($2.0 million, net of income tax).
The Company adopted the measurement provisions of ASC 715 in the fourth quarter of fiscal 2009. Asrequired, our defined benefit plan assets and obligations are now measured as of the Company’s fiscal year-end. TheCompany previously performed this measurement at June 30. The Company’s adoption of the measurementprovisions of ASC 715 did not have a material impact on its financial position or results of operations.
Defined Benefit Plans
The Company provides a benefit for certain employees under two different noncontributory defined benefitpension plans consisting of a salaried plan and a supplemental executive retirement plan. Additionally, theCompany previously provided benefits to certain employees under a union plan, which was merged with thesalaried plan on October 1, 2005. For each employee, the benefits are based on years of service and averagecompensation. Pension costs, which are computed using the projected unit credit cost method, are funded to at leastthe minimum level required by government regulations. Since 2002, the salaried and the supplemental executiveretirement plans have been closed to new participants and benefits that can be earned by active participants in theplan were limited.
The Company has an unfunded supplemental executive retirement plan for its former Bergen officers and keyemployees. This plan is a “target” benefit plan, with the annual lifetime benefit based upon a percentage of salaryduring the five final years of pay at age 62, offset by several other sources of income including benefits payable
65
AMERISOURCEBERGEN CORPORATION AND SUBSIDIARIES
NOTES TO CONSOLIDATED FINANCIAL STATEMENTS — (Continued)
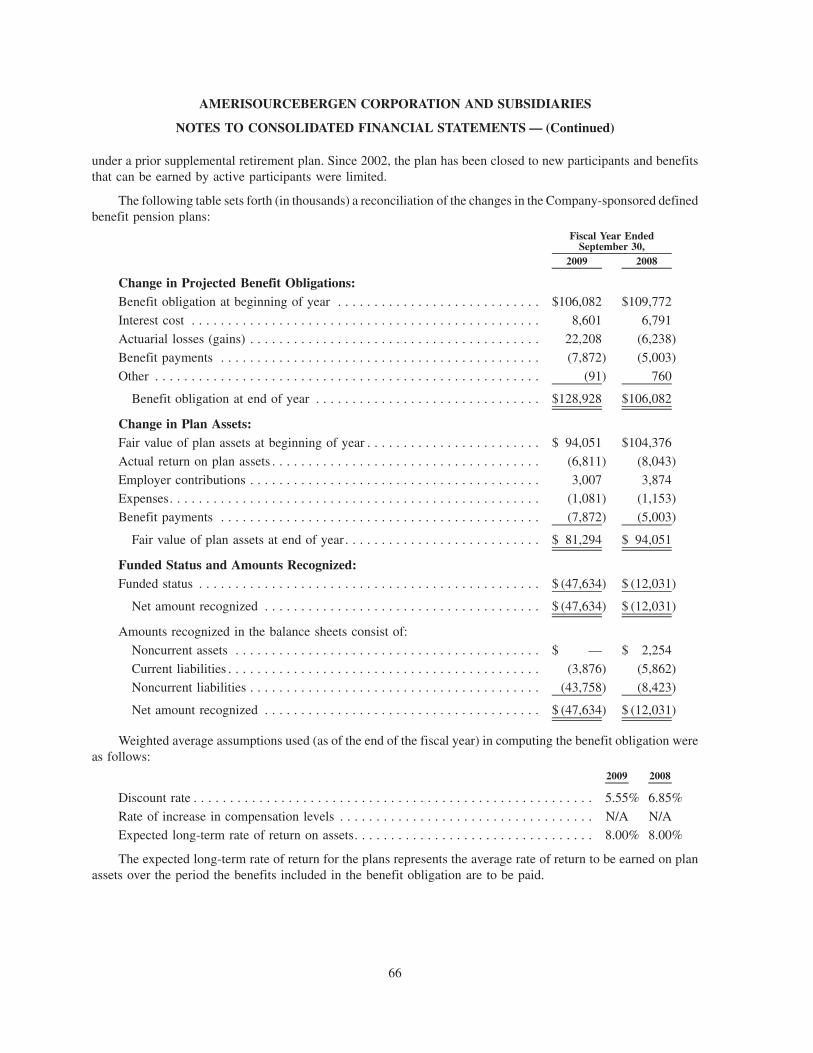
under a prior supplemental retirement plan. Since 2002, the plan has been closed to new participants and benefitsthat can be earned by active participants were limited.
The following table sets forth (in thousands) a reconciliation of the changes in the Company-sponsored definedbenefit pension plans:
2009 2008
Fiscal Year EndedSeptember 30,
Change in Projected Benefit Obligations:Benefit obligation at beginning of year . . . . . . . . . . . . . . . . . . . . . . . . . . . . $106,082 $109,772
Interest cost . . . . . . . . . . . . . . . . . . . . . . . . . . . . . . . . . . . . . . . . . . . . . . . . 8,601 6,791
Actuarial losses (gains) . . . . . . . . . . . . . . . . . . . . . . . . . . . . . . . . . . . . . . . . 22,208 (6,238)
Benefit payments . . . . . . . . . . . . . . . . . . . . . . . . . . . . . . . . . . . . . . . . . . . . (7,872) (5,003)
Other . . . . . . . . . . . . . . . . . . . . . . . . . . . . . . . . . . . . . . . . . . . . . . . . . . . . . (91) 760
Benefit obligation at end of year . . . . . . . . . . . . . . . . . . . . . . . . . . . . . . . $128,928 $106,082
Change in Plan Assets:Fair value of plan assets at beginning of year . . . . . . . . . . . . . . . . . . . . . . . . $ 94,051 $104,376
Actual return on plan assets . . . . . . . . . . . . . . . . . . . . . . . . . . . . . . . . . . . . . (6,811) (8,043)
Employer contributions . . . . . . . . . . . . . . . . . . . . . . . . . . . . . . . . . . . . . . . . 3,007 3,874Expenses. . . . . . . . . . . . . . . . . . . . . . . . . . . . . . . . . . . . . . . . . . . . . . . . . . . (1,081) (1,153)
Benefit payments . . . . . . . . . . . . . . . . . . . . . . . . . . . . . . . . . . . . . . . . . . . . (7,872) (5,003)
Fair value of plan assets at end of year . . . . . . . . . . . . . . . . . . . . . . . . . . . $ 81,294 $ 94,051
Funded Status and Amounts Recognized:Funded status . . . . . . . . . . . . . . . . . . . . . . . . . . . . . . . . . . . . . . . . . . . . . . . $ (47,634) $ (12,031)
Net amount recognized . . . . . . . . . . . . . . . . . . . . . . . . . . . . . . . . . . . . . . $ (47,634) $ (12,031)
Amounts recognized in the balance sheets consist of:
Noncurrent assets . . . . . . . . . . . . . . . . . . . . . . . . . . . . . . . . . . . . . . . . . . $ — $ 2,254
Current liabilities . . . . . . . . . . . . . . . . . . . . . . . . . . . . . . . . . . . . . . . . . . . (3,876) (5,862)
Noncurrent liabilities . . . . . . . . . . . . . . . . . . . . . . . . . . . . . . . . . . . . . . . . (43,758) (8,423)
Net amount recognized . . . . . . . . . . . . . . . . . . . . . . . . . . . . . . . . . . . . . . $ (47,634) $ (12,031)
Weighted average assumptions used (as of the end of the fiscal year) in computing the benefit obligation wereas follows:
2009 2008
Discount rate . . . . . . . . . . . . . . . . . . . . . . . . . . . . . . . . . . . . . . . . . . . . . . . . . . . . . . . 5.55% 6.85%
Rate of increase in compensation levels . . . . . . . . . . . . . . . . . . . . . . . . . . . . . . . . . . . N/A N/A
Expected long-term rate of return on assets. . . . . . . . . . . . . . . . . . . . . . . . . . . . . . . . . 8.00% 8.00%
The expected long-term rate of return for the plans represents the average rate of return to be earned on planassets over the period the benefits included in the benefit obligation are to be paid.
66
AMERISOURCEBERGEN CORPORATION AND SUBSIDIARIES
NOTES TO CONSOLIDATED FINANCIAL STATEMENTS — (Continued)
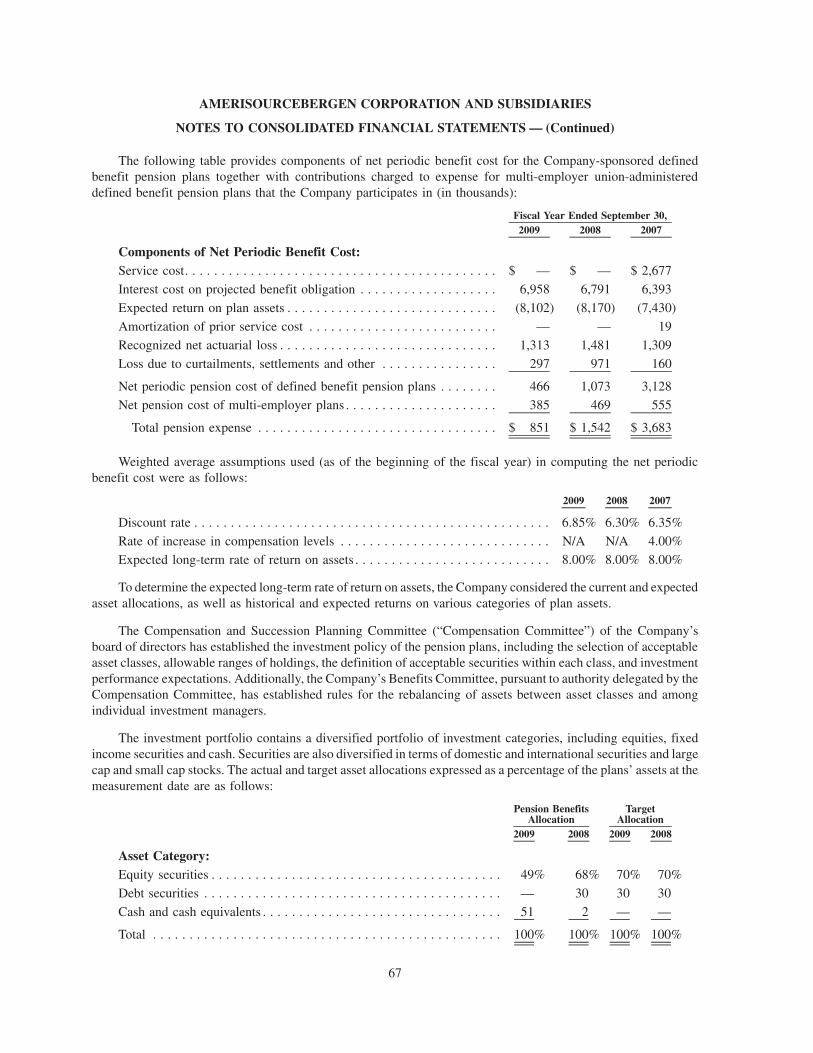
The following table provides components of net periodic benefit cost for the Company-sponsored definedbenefit pension plans together with contributions charged to expense for multi-employer union-administereddefined benefit pension plans that the Company participates in (in thousands):
2009 2008 2007Fiscal Year Ended September 30,
Components of Net Periodic Benefit Cost:Service cost. . . . . . . . . . . . . . . . . . . . . . . . . . . . . . . . . . . . . . . . . . . $ — $ — $ 2,677
Interest cost on projected benefit obligation . . . . . . . . . . . . . . . . . . . 6,958 6,791 6,393
Expected return on plan assets . . . . . . . . . . . . . . . . . . . . . . . . . . . . . (8,102) (8,170) (7,430)
Amortization of prior service cost . . . . . . . . . . . . . . . . . . . . . . . . . . — — 19
Recognized net actuarial loss . . . . . . . . . . . . . . . . . . . . . . . . . . . . . . 1,313 1,481 1,309
Loss due to curtailments, settlements and other . . . . . . . . . . . . . . . . 297 971 160
Net periodic pension cost of defined benefit pension plans . . . . . . . . 466 1,073 3,128
Net pension cost of multi-employer plans . . . . . . . . . . . . . . . . . . . . . 385 469 555
Total pension expense . . . . . . . . . . . . . . . . . . . . . . . . . . . . . . . . . $ 851 $ 1,542 $ 3,683
Weighted average assumptions used (as of the beginning of the fiscal year) in computing the net periodicbenefit cost were as follows:
2009 2008 2007
Discount rate . . . . . . . . . . . . . . . . . . . . . . . . . . . . . . . . . . . . . . . . . . . . . . . . . 6.85% 6.30% 6.35%
Rate of increase in compensation levels . . . . . . . . . . . . . . . . . . . . . . . . . . . . . N/A N/A 4.00%Expected long-term rate of return on assets . . . . . . . . . . . . . . . . . . . . . . . . . . . 8.00% 8.00% 8.00%
To determine the expected long-term rate of return on assets, the Company considered the current and expectedasset allocations, as well as historical and expected returns on various categories of plan assets.
The Compensation and Succession Planning Committee (“Compensation Committee”) of the Company’sboard of directors has established the investment policy of the pension plans, including the selection of acceptableasset classes, allowable ranges of holdings, the definition of acceptable securities within each class, and investmentperformance expectations. Additionally, the Company’s Benefits Committee, pursuant to authority delegated by theCompensation Committee, has established rules for the rebalancing of assets between asset classes and amongindividual investment managers.
The investment portfolio contains a diversified portfolio of investment categories, including equities, fixedincome securities and cash. Securities are also diversified in terms of domestic and international securities and largecap and small cap stocks. The actual and target asset allocations expressed as a percentage of the plans’ assets at themeasurement date are as follows:
2009 2008 2009 2008
Pension BenefitsAllocation
TargetAllocation
Asset Category:Equity securities . . . . . . . . . . . . . . . . . . . . . . . . . . . . . . . . . . . . . . . . 49% 68% 70% 70%
Debt securities . . . . . . . . . . . . . . . . . . . . . . . . . . . . . . . . . . . . . . . . . — 30 30 30
Cash and cash equivalents . . . . . . . . . . . . . . . . . . . . . . . . . . . . . . . . . 51 2 — —
Total . . . . . . . . . . . . . . . . . . . . . . . . . . . . . . . . . . . . . . . . . . . . . . . . 100% 100% 100% 100%
67
AMERISOURCEBERGEN CORPORATION AND SUBSIDIARIES
NOTES TO CONSOLIDATED FINANCIAL STATEMENTS — (Continued)
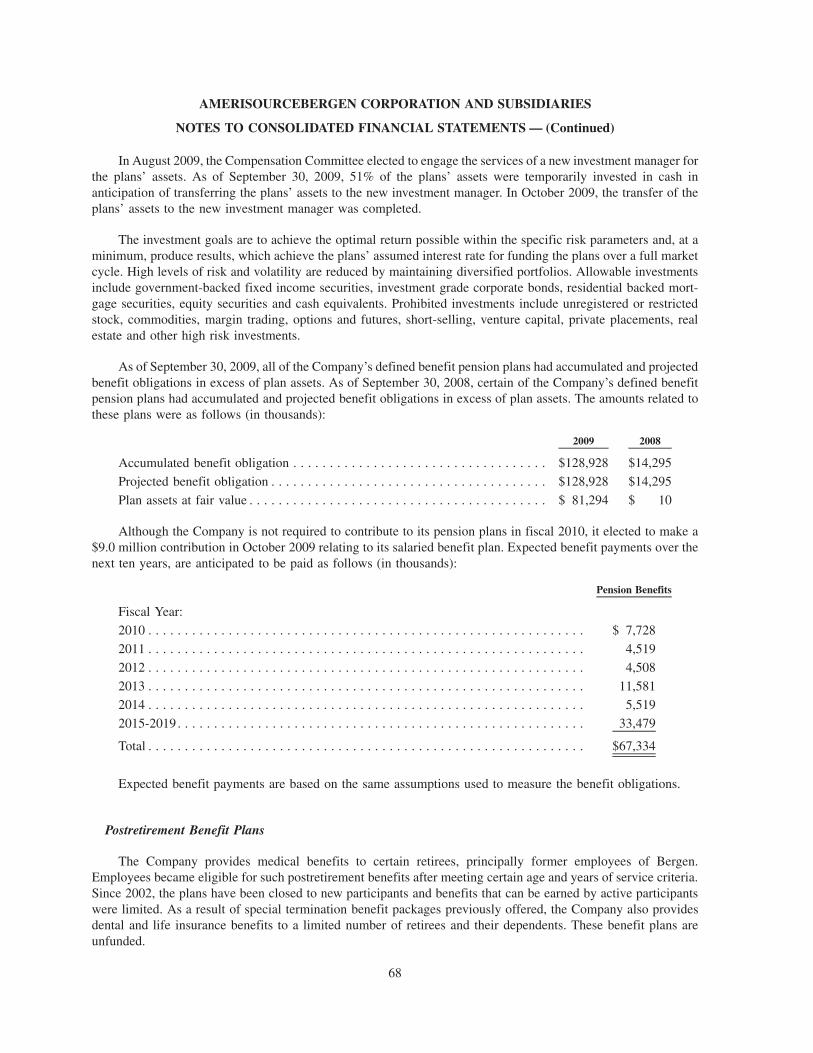
In August 2009, the Compensation Committee elected to engage the services of a new investment manager forthe plans’ assets. As of September 30, 2009, 51% of the plans’ assets were temporarily invested in cash inanticipation of transferring the plans’ assets to the new investment manager. In October 2009, the transfer of theplans’ assets to the new investment manager was completed.
The investment goals are to achieve the optimal return possible within the specific risk parameters and, at aminimum, produce results, which achieve the plans’ assumed interest rate for funding the plans over a full marketcycle. High levels of risk and volatility are reduced by maintaining diversified portfolios. Allowable investmentsinclude government-backed fixed income securities, investment grade corporate bonds, residential backed mort-gage securities, equity securities and cash equivalents. Prohibited investments include unregistered or restrictedstock, commodities, margin trading, options and futures, short-selling, venture capital, private placements, realestate and other high risk investments.
As of September 30, 2009, all of the Company’s defined benefit pension plans had accumulated and projectedbenefit obligations in excess of plan assets. As of September 30, 2008, certain of the Company’s defined benefitpension plans had accumulated and projected benefit obligations in excess of plan assets. The amounts related tothese plans were as follows (in thousands):
2009 2008
Accumulated benefit obligation . . . . . . . . . . . . . . . . . . . . . . . . . . . . . . . . . . . $128,928 $14,295
Projected benefit obligation . . . . . . . . . . . . . . . . . . . . . . . . . . . . . . . . . . . . . . $128,928 $14,295
Plan assets at fair value . . . . . . . . . . . . . . . . . . . . . . . . . . . . . . . . . . . . . . . . . $ 81,294 $ 10
Although the Company is not required to contribute to its pension plans in fiscal 2010, it elected to make a$9.0 million contribution in October 2009 relating to its salaried benefit plan. Expected benefit payments over thenext ten years, are anticipated to be paid as follows (in thousands):
Pension Benefits
Fiscal Year:
2010 . . . . . . . . . . . . . . . . . . . . . . . . . . . . . . . . . . . . . . . . . . . . . . . . . . . . . . . . . . . . $ 7,728
2011 . . . . . . . . . . . . . . . . . . . . . . . . . . . . . . . . . . . . . . . . . . . . . . . . . . . . . . . . . . . . 4,519
2012 . . . . . . . . . . . . . . . . . . . . . . . . . . . . . . . . . . . . . . . . . . . . . . . . . . . . . . . . . . . . 4,508
2013 . . . . . . . . . . . . . . . . . . . . . . . . . . . . . . . . . . . . . . . . . . . . . . . . . . . . . . . . . . . . 11,581
2014 . . . . . . . . . . . . . . . . . . . . . . . . . . . . . . . . . . . . . . . . . . . . . . . . . . . . . . . . . . . . 5,519
2015-2019. . . . . . . . . . . . . . . . . . . . . . . . . . . . . . . . . . . . . . . . . . . . . . . . . . . . . . . . 33,479
Total . . . . . . . . . . . . . . . . . . . . . . . . . . . . . . . . . . . . . . . . . . . . . . . . . . . . . . . . . . . . $67,334
Expected benefit payments are based on the same assumptions used to measure the benefit obligations.
Postretirement Benefit Plans
The Company provides medical benefits to certain retirees, principally former employees of Bergen.Employees became eligible for such postretirement benefits after meeting certain age and years of service criteria.Since 2002, the plans have been closed to new participants and benefits that can be earned by active participantswere limited. As a result of special termination benefit packages previously offered, the Company also providesdental and life insurance benefits to a limited number of retirees and their dependents. These benefit plans areunfunded.
68
AMERISOURCEBERGEN CORPORATION AND SUBSIDIARIES
NOTES TO CONSOLIDATED FINANCIAL STATEMENTS — (Continued)
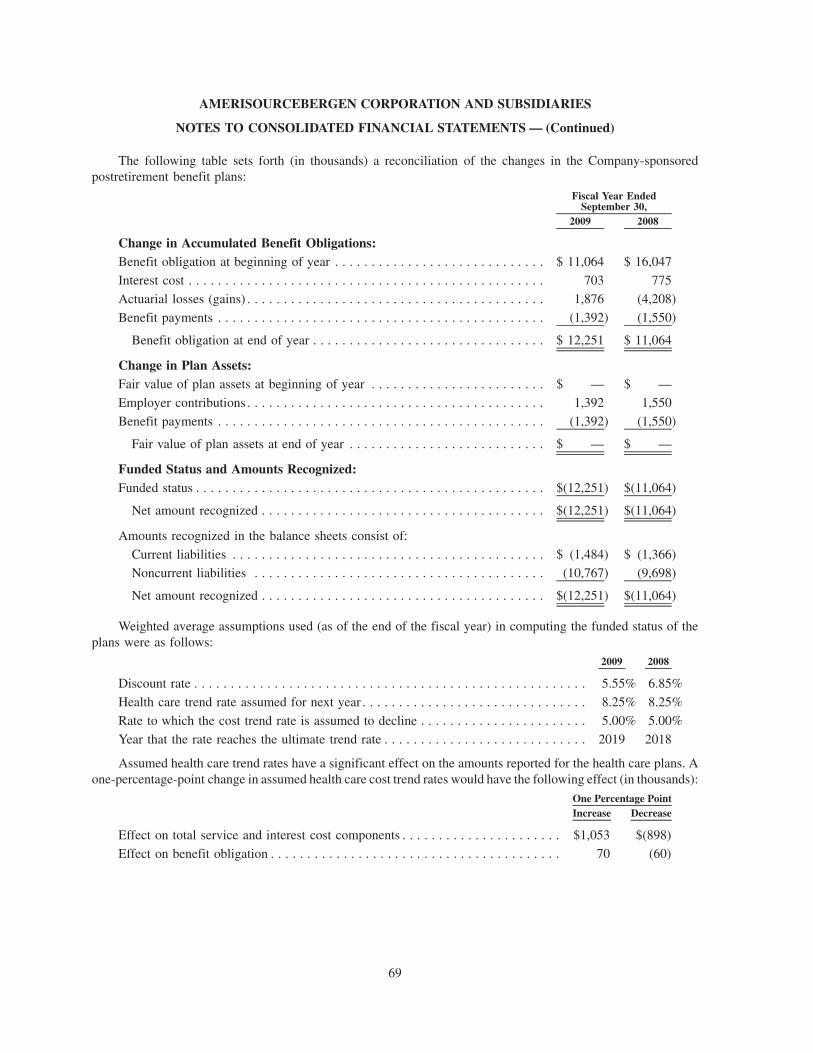
The following table sets forth (in thousands) a reconciliation of the changes in the Company-sponsoredpostretirement benefit plans:
2009 2008
Fiscal Year EndedSeptember 30,
Change in Accumulated Benefit Obligations:Benefit obligation at beginning of year . . . . . . . . . . . . . . . . . . . . . . . . . . . . . $ 11,064 $ 16,047
Interest cost . . . . . . . . . . . . . . . . . . . . . . . . . . . . . . . . . . . . . . . . . . . . . . . . . 703 775
Actuarial losses (gains) . . . . . . . . . . . . . . . . . . . . . . . . . . . . . . . . . . . . . . . . . 1,876 (4,208)
Benefit payments . . . . . . . . . . . . . . . . . . . . . . . . . . . . . . . . . . . . . . . . . . . . . (1,392) (1,550)
Benefit obligation at end of year . . . . . . . . . . . . . . . . . . . . . . . . . . . . . . . . $ 12,251 $ 11,064
Change in Plan Assets:Fair value of plan assets at beginning of year . . . . . . . . . . . . . . . . . . . . . . . . $ — $ —
Employer contributions . . . . . . . . . . . . . . . . . . . . . . . . . . . . . . . . . . . . . . . . . 1,392 1,550
Benefit payments . . . . . . . . . . . . . . . . . . . . . . . . . . . . . . . . . . . . . . . . . . . . . (1,392) (1,550)
Fair value of plan assets at end of year . . . . . . . . . . . . . . . . . . . . . . . . . . . $ — $ —
Funded Status and Amounts Recognized:Funded status . . . . . . . . . . . . . . . . . . . . . . . . . . . . . . . . . . . . . . . . . . . . . . . . $(12,251) $(11,064)
Net amount recognized . . . . . . . . . . . . . . . . . . . . . . . . . . . . . . . . . . . . . . . $(12,251) $(11,064)
Amounts recognized in the balance sheets consist of:
Current liabilities . . . . . . . . . . . . . . . . . . . . . . . . . . . . . . . . . . . . . . . . . . . $ (1,484) $ (1,366)Noncurrent liabilities . . . . . . . . . . . . . . . . . . . . . . . . . . . . . . . . . . . . . . . . (10,767) (9,698)
Net amount recognized . . . . . . . . . . . . . . . . . . . . . . . . . . . . . . . . . . . . . . . $(12,251) $(11,064)
Weighted average assumptions used (as of the end of the fiscal year) in computing the funded status of theplans were as follows:
2009 2008
Discount rate . . . . . . . . . . . . . . . . . . . . . . . . . . . . . . . . . . . . . . . . . . . . . . . . . . . . . . 5.55% 6.85%
Health care trend rate assumed for next year . . . . . . . . . . . . . . . . . . . . . . . . . . . . . . . 8.25% 8.25%
Rate to which the cost trend rate is assumed to decline . . . . . . . . . . . . . . . . . . . . . . . 5.00% 5.00%
Year that the rate reaches the ultimate trend rate . . . . . . . . . . . . . . . . . . . . . . . . . . . . 2019 2018
Assumed health care trend rates have a significant effect on the amounts reported for the health care plans. Aone-percentage-point change in assumed health care cost trend rates would have the following effect (in thousands):
Increase DecreaseOne Percentage Point
Effect on total service and interest cost components . . . . . . . . . . . . . . . . . . . . . . $1,053 $(898)
Effect on benefit obligation . . . . . . . . . . . . . . . . . . . . . . . . . . . . . . . . . . . . . . . . 70 (60)
69
AMERISOURCEBERGEN CORPORATION AND SUBSIDIARIES
NOTES TO CONSOLIDATED FINANCIAL STATEMENTS — (Continued)
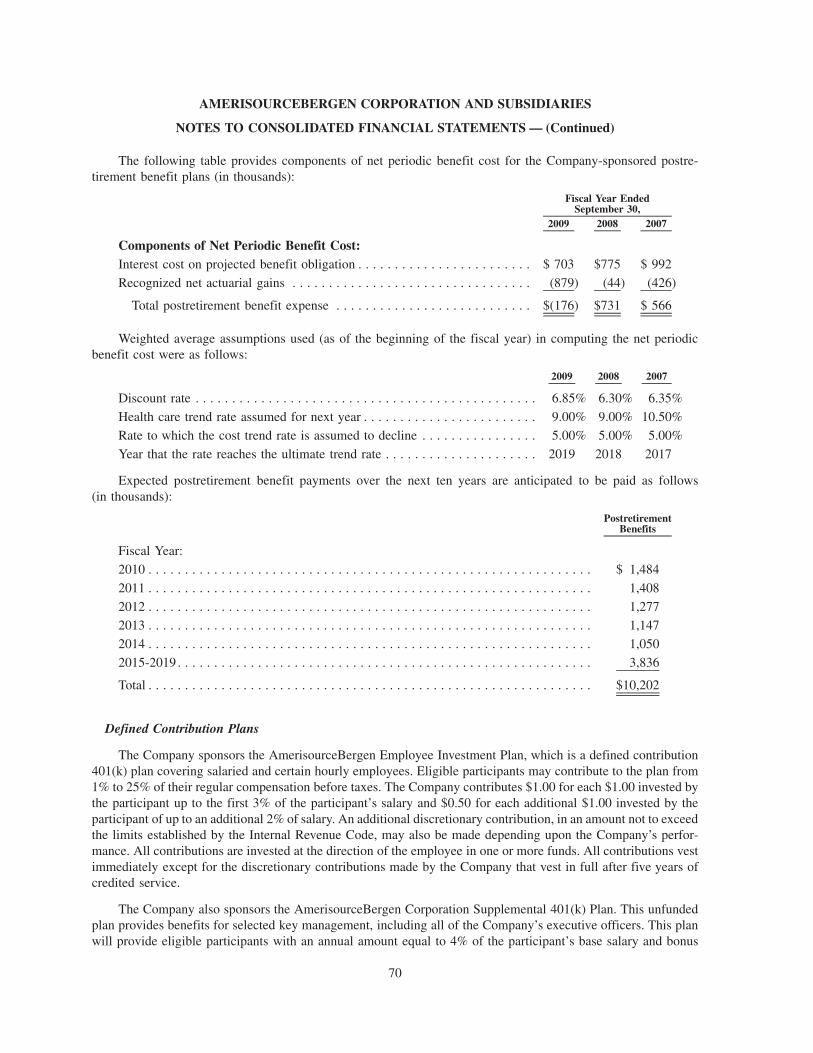
The following table provides components of net periodic benefit cost for the Company-sponsored postre-tirement benefit plans (in thousands):
2009 2008 2007
Fiscal Year EndedSeptember 30,
Components of Net Periodic Benefit Cost:Interest cost on projected benefit obligation . . . . . . . . . . . . . . . . . . . . . . . . $ 703 $775 $ 992
Recognized net actuarial gains . . . . . . . . . . . . . . . . . . . . . . . . . . . . . . . . . (879) (44) (426)
Total postretirement benefit expense . . . . . . . . . . . . . . . . . . . . . . . . . . . $(176) $731 $ 566
Weighted average assumptions used (as of the beginning of the fiscal year) in computing the net periodicbenefit cost were as follows:
2009 2008 2007
Discount rate . . . . . . . . . . . . . . . . . . . . . . . . . . . . . . . . . . . . . . . . . . . . . . . 6.85% 6.30% 6.35%
Health care trend rate assumed for next year . . . . . . . . . . . . . . . . . . . . . . . . 9.00% 9.00% 10.50%
Rate to which the cost trend rate is assumed to decline . . . . . . . . . . . . . . . . 5.00% 5.00% 5.00%
Year that the rate reaches the ultimate trend rate . . . . . . . . . . . . . . . . . . . . . 2019 2018 2017
Expected postretirement benefit payments over the next ten years are anticipated to be paid as follows(in thousands):
PostretirementBenefits
Fiscal Year:
2010 . . . . . . . . . . . . . . . . . . . . . . . . . . . . . . . . . . . . . . . . . . . . . . . . . . . . . . . . . . . . . $ 1,484
2011 . . . . . . . . . . . . . . . . . . . . . . . . . . . . . . . . . . . . . . . . . . . . . . . . . . . . . . . . . . . . . 1,408
2012 . . . . . . . . . . . . . . . . . . . . . . . . . . . . . . . . . . . . . . . . . . . . . . . . . . . . . . . . . . . . . 1,277
2013 . . . . . . . . . . . . . . . . . . . . . . . . . . . . . . . . . . . . . . . . . . . . . . . . . . . . . . . . . . . . . 1,147
2014 . . . . . . . . . . . . . . . . . . . . . . . . . . . . . . . . . . . . . . . . . . . . . . . . . . . . . . . . . . . . . 1,050
2015-2019 . . . . . . . . . . . . . . . . . . . . . . . . . . . . . . . . . . . . . . . . . . . . . . . . . . . . . . . . . 3,836
Total . . . . . . . . . . . . . . . . . . . . . . . . . . . . . . . . . . . . . . . . . . . . . . . . . . . . . . . . . . . . . $10,202
Defined Contribution Plans
The Company sponsors the AmerisourceBergen Employee Investment Plan, which is a defined contribution401(k) plan covering salaried and certain hourly employees. Eligible participants may contribute to the plan from1% to 25% of their regular compensation before taxes. The Company contributes $1.00 for each $1.00 invested bythe participant up to the first 3% of the participant’s salary and $0.50 for each additional $1.00 invested by theparticipant of up to an additional 2% of salary. An additional discretionary contribution, in an amount not to exceedthe limits established by the Internal Revenue Code, may also be made depending upon the Company’s perfor-mance. All contributions are invested at the direction of the employee in one or more funds. All contributions vestimmediately except for the discretionary contributions made by the Company that vest in full after five years ofcredited service.
The Company also sponsors the AmerisourceBergen Corporation Supplemental 401(k) Plan. This unfundedplan provides benefits for selected key management, including all of the Company’s executive officers. This planwill provide eligible participants with an annual amount equal to 4% of the participant’s base salary and bonus
70
AMERISOURCEBERGEN CORPORATION AND SUBSIDIARIES
NOTES TO CONSOLIDATED FINANCIAL STATEMENTS — (Continued)
incentive to the extent that his or her compensation exceeds the annual compensation limit established bySection 401(a) (17) of the Internal Revenue Code.
Costs of the defined contribution plans charged to expense for the fiscal years ended September 30, 2009, 2008and 2007 were $21.1 million, $18.8 million, and $20.9 million, respectively.
Deferred Compensation Plan
The Company sponsors the AmerisourceBergen Corporation 2001 Deferred Compensation Plan. This unfundedplan, under which 2.96 million shares of Common Stock are authorized for issuance, allows eligible officers, directorsand key management employees to defer a portion of their annual compensation. The amount deferred may beallocated by the employee to cash, mutual funds or stock credits. Stock credits, including dividend equivalents, areequal to the full and fractional number of shares of Common Stock that could be purchased with the participant’scompensation allocated to stock credits based on the average of closing prices of Common Stock during each month,plus, at the discretion of the board of directors, up to one-half of a share of Common Stock for each full share credited.Stock credit distributions are made in shares of Common Stock. No shares of Common Stock have been issued underthe deferred compensation plan through September 30, 2009. The Company’s liability relating to its deferredcompensation plan as of September 30, 2009 and 2008 was $6.5 million and $6.3 million, respectively.
Note 10. Share-Based Compensation
Stock Option Plans
The Company’s employee stock option plans provide for the granting of incentive and nonqualified stockoptions to acquire shares of Common Stock to employees at a price not less than the fair market value of theCommon Stock on the date the option is granted. Option terms and vesting periods are determined at the date ofgrant by the Compensation Committee of the board of directors. Employee options generally vest ratably, in equalamounts, over a four-year service period and expire in ten years (seven years for all grants issued in February 2008and thereafter). The Company’s non-employee director stock option plans provide for the granting of nonqualifiedstock options to acquire shares of Common Stock to non-employee directors at the fair market value of the CommonStock on the date of the grant. Non-employee director options vest ratably, in equal amounts, over a three-yearservice period, and options expire in ten years.
In connection with the divestiture of Long-Term Care, the Company’s stockholders received PMC common stock,as previously discussed in Note 3 and the Company’s Common Stock commenced trading without Long-Term Care onAugust 1, 2007. As a result, the price of the Company’s Common Stock decreased from $23.56 per share at the closingof regular trading on July 31, 2007 to an opening price on August 1, 2007 of $23.05 per share. In accordance with theantidilution provisions of the Company’s stock option plans, the number of stock options previously granted to eachemployee or non-employee director, as well as the corresponding grant price, was adjusted accordingly to reflect thedecline in the market price of the Company’s Common Stock between the July 31, 2007 closing price and the August 1,2007 opening price, as quoted on the New York Stock Exchange (the “Modification”). The net effect of the adjustmentswas to reduce the exercise prices of all outstanding options by the same percentage that the price of the Company’sCommon Stock decreased from July 31, 2007 to August 1, 2007, increase the number of options exercisable under eachgrant, and preserve the aggregate spread (whether positive or negative) associated with each grant of options.
At September 30, 2009, options for an additional 29.6 million shares may be granted under the Company’s2002 employee incentive plan and options for an additional 169 thousand shares may be granted under theCompany’s non-employee director stock option plan.
The estimated fair values of options granted are expensed as compensation on a straight-line basis over therequisite service periods of the awards and are net of estimated forfeitures. The Company estimates the fair values ofoption grants using a binomial option pricing model. Expected volatilities are based on the historical volatility of theCompany’s Common Stock and other factors, such as implied market volatility. The Company uses historical
71
AMERISOURCEBERGEN CORPORATION AND SUBSIDIARIES
NOTES TO CONSOLIDATED FINANCIAL STATEMENTS — (Continued)
exercise data, taking into consideration the optionees’ ages at grant date, to estimate the terms for which the optionsare expected to be outstanding. The Company anticipates that the terms of options granted in the future will besimilar to those granted in the past. The risk-free rates during the terms of such options are based on theU.S. Treasury yield curve in effect at the time of grant.
The weighted average fair values of the options granted during the fiscal years ended September 30, 2009,2008 and 2007 were $4.18, $4.92, and $7.43, respectively. The following assumptions were used to estimate the fairvalues of options granted:
2009 2008 2007Fiscal Year Ended September 30,
Weighted average risk-free interest rate . . . . . . . . . . . . . . . . 1.59% 2.79% 4.73%
Expected dividend yield. . . . . . . . . . . . . . . . . . . . . . . . . . . . 1.13% 0.70% 0.37%
Weighted average volatility of common stock . . . . . . . . . . . . 31.82% 28.14% 24.49%
Weighted average expected life of the options . . . . . . . . . . . 3.83 years 3.71 years 4.38 years
Changes to the above valuation assumptions could have a significant impact on share-based compensationexpense. During the fiscal years ended September 30, 2009, 2008 and 2007, the Company recorded stock optionexpense of $17.4 million, $17.4 million, and $17.5 million, respectively.
A summary of the Company’s stock option activity and related information for its option plans for the fiscalyear ended September 30, 2009 is presented below:
Options
WeightedAverageExercise
Price
WeightedAverage
RemainingContractual
Term
AggregateIntrinsic
Value(000’s) (000’s)
Outstanding at September 30, 2008 . . . . . . . . . . . . . . 23,606 $19 6 yearsGranted . . . . . . . . . . . . . . . . . . . . . . . . . . . . . . . . . 3,770 18Exercised . . . . . . . . . . . . . . . . . . . . . . . . . . . . . . . (1,427) 14Forfeited . . . . . . . . . . . . . . . . . . . . . . . . . . . . . . . . (937) 23
Outstanding at September 30, 2009 . . . . . . . . . . . . . . 25,012 $19 5 years $108,042
Exercisable at September 30, 2009 . . . . . . . . . . . . . . 16,560 $18 5 years $ 88,035Expected to vest after September 30, 2009 . . . . . . . . . 7,207 $21 6 years $ 17,046
The intrinsic value of stock option exercises during fiscal 2009, 2008 and 2007 was $7.4 million, $38.5 million,and $54.8 million, respectively.
A summary of the status of the Company’s nonvested options as of September 30, 2009 and changes during thefiscal year ended September 30, 2009 is presented below:
Options
WeightedAverage
Grant DateFair Value
(000’s)
Nonvested at September 30, 2008 . . . . . . . . . . . . . . . . . . . . . . . . . . . . . . . . . . 9,138 $6
Granted . . . . . . . . . . . . . . . . . . . . . . . . . . . . . . . . . . . . . . . . . . . . . . . . . . . 3,770 4
Vested . . . . . . . . . . . . . . . . . . . . . . . . . . . . . . . . . . . . . . . . . . . . . . . . . . . . (3,876) 5
Forfeited . . . . . . . . . . . . . . . . . . . . . . . . . . . . . . . . . . . . . . . . . . . . . . . . . . (580) 6
Nonvested at September 30, 2009 . . . . . . . . . . . . . . . . . . . . . . . . . . . . . . . . . . 8,452 $5
72
AMERISOURCEBERGEN CORPORATION AND SUBSIDIARIES
NOTES TO CONSOLIDATED FINANCIAL STATEMENTS — (Continued)
Expected future compensation expense relating to the 8.5 million nonvested options outstanding as ofSeptember 30, 2009 is $31.7 million over a weighted-average period of 2 years.
Restricted Stock Plan
Restricted shares vest in full after three years. The estimated fair value of restricted shares under theCompany’s restricted stock plans is determined by the product of the number of shares granted and the grant datemarket price of the Company’s Common Stock. The estimated fair value of restricted shares is expensed on astraight-line basis over the requisite service period of three years. During the fiscal years ended September 30, 2009,2008 and 2007, the Company recorded restricted stock expense of $7.5 million, $6.6 million, and $5.4 million,respectively.
A summary of the status of the Company’s restricted shares as of September 30, 2009 and changes during thefiscal year ended September 30, 2009 is presented below:
RestrictedShares
WeightedAverage
Grant DateFair Value
(000’s)
Nonvested at September 30, 2008 . . . . . . . . . . . . . . . . . . . . . . . . . . . . . . . . 1,210 $23
Granted . . . . . . . . . . . . . . . . . . . . . . . . . . . . . . . . . . . . . . . . . . . . . . . . . . 378 18
Vested . . . . . . . . . . . . . . . . . . . . . . . . . . . . . . . . . . . . . . . . . . . . . . . . . . . (382) 22
Forfeited . . . . . . . . . . . . . . . . . . . . . . . . . . . . . . . . . . . . . . . . . . . . . . . . . (109) 24
Nonvested at September 30, 2009 . . . . . . . . . . . . . . . . . . . . . . . . . . . . . . . . 1,097 $22
Expected future compensation expense relating to the 1.1 million restricted shares outstanding as ofSeptember 30, 2009 is $9.5 million over a weighted-average period of 1.3 years.
Employee Stock Purchase Plan
The stockholders approved the adoption of the AmerisourceBergen 2002 Employee Stock Purchase Plan,under which up to an aggregate of 16,000,000 shares of Common Stock may be sold to eligible employees(generally defined as employees with at least 30 days of service with the Company). Under this plan, theparticipants may elect to have the Company withhold up to 25% of base salary to purchase shares of the Company’sCommon Stock at a price equal to 85% of the fair market value of the stock on the first or last business day of eachsix-month purchase period, whichever is lower (95% of the fair market value of the stock on the last business day ofeach six-month purchase period, beginning January 2010). Each participant is limited to $25,000 of purchasesduring each calendar year. During the fiscal years ended September 30, 2009, 2008 and 2007, the Companyacquired 331,639 shares, 299,956 shares, and 308,480 shares, respectively, from the open market for issuance toparticipants in this plan. As of September 30, 2009, the Company has withheld $1.5 million from eligible employeesfor the purchase of additional shares of Common Stock.
Note 11. Leases and Other Commitments
At September 30, 2009, future minimum payments totaling $238.9 million under noncancelable operatingleases with remaining terms of more than one fiscal year were due as follows; 2010 — $52.4 million; 2011 —$45.6 million; 2012 — $29.5 million; 2013 — $20.5 million; 2014 — $15.9 million; and thereafter —$75.0 million. In the normal course of business, operating leases are generally renewed or replaced by otherleases. Certain operating leases include escalation clauses. Total rental expense was $62.8 million in fiscal 2009,$63.0 million in fiscal 2008, and $71.3 million in fiscal 2007.
73
AMERISOURCEBERGEN CORPORATION AND SUBSIDIARIES
NOTES TO CONSOLIDATED FINANCIAL STATEMENTS — (Continued)
The Company has commitments to purchase product from influenza vaccine manufacturers through June 30,2015. The Company is required to purchase annual doses at prices that the Company believes will represent marketprices. The Company currently estimates its remaining purchase commitment under these agreements, as amended,will be approximately $270.2 million as of September 30, 2009, of which $36.5 million represents the Company’scommitment in fiscal 2010.
The Company has commitments to purchase blood products from suppliers through December 31, 2012. TheCompany is required to purchase quantities at prices that the Company believes will represent market prices. TheCompany currently estimates its remaining purchase commitment under these agreements will be approximately$421.6 million as of September 30, 2009, of which $165.0 million represents the Company’s commitment infiscal 2010.
The Company outsources to IBM Global Services (“IBM”) a significant portion of its corporate and ABDCinformation technology activities and, in fiscal 2009, expanded and amended its relationship by engaging IBM toprovide assistance with the implementation of the Company’s new enterprise resource planning (“ERP”) platform.The remaining commitment under the Company’s ten-year arrangement, as amended, which expires in June 2015,is approximately $134.8 million.
Note 12. Facility Consolidations, Employee Severance and Other
The following table illustrates the charges incurred by the Company relating to facility consolidations,employee severance and other for the three fiscal years ended September 30, 2009 (in thousands):
2009 2008 2007
Facility consolidations and employee severance . . . . . . . . . . . . . . . . $5,406 $ 9,741 $(5,863)
Information technology transition costs . . . . . . . . . . . . . . . . . . . . . . . — — 1,679Costs relating to business divestitures . . . . . . . . . . . . . . . . . . . . . . . . — 2,636 9,335
Gain on sale of retail pharmacy assets . . . . . . . . . . . . . . . . . . . . . . . — — (3,079)
Total facility consolidations, employee severance and other . . . . . . $5,406 $12,377 $ 2,072
During fiscal 2008, the Company announced a more streamlined organizational structure and introduced aninitiative (“cE2”) designed to drive increased customer efficiency and cost effectiveness. In connection with theseefforts, the Company has reduced various operating costs and terminated certain positions. During fiscal 2009 and2008, the Company terminated 197 and 130 employees and incurred $3.1 million and $10.0 million of employeeseverance costs, respectively, relating to the cE2 initiative. Employees receive their severance benefits over a periodof time, generally not in excess of 12 months, or in the form of a lump-sum payment.
During fiscal 2007, the Company completed its integration plan to consolidate its distribution network andeliminate duplicative administrative functions. The plan included building six new facilities, closing 31 facilities,and outsourcing a significant amount of its information technology activities. During fiscal 2008, the Companyreversed $1.0 million of employee severance charges previously estimated and recorded related to this integrationplan.
During fiscal 2006, the Company incurred a charge of $13.9 million for an increase in a compensation accrualdue to an adverse decision in an employment-related dispute with a former Bergen Brunswig chief executive officerwhose employment was terminated in 1999. In October 2007, the Company received a favorable ruling from aCalifornia appellate court reversing certain portions of the prior adverse decision. As a result, the Company reducedits liability in fiscal 2007 to the Bergen Brunswig chief executive officer by $10.4 million (see Bergen BrunswigMatter under Note 13). The fiscal 2006 compensation expense and the fiscal 2007 reduction thereof were recordedas a component of the facility consolidations and employee severance line. During fiscal 2009, the Companyrecorded $2.2 million of expense relating to this matter.
74
AMERISOURCEBERGEN CORPORATION AND SUBSIDIARIES
NOTES TO CONSOLIDATED FINANCIAL STATEMENTS — (Continued)
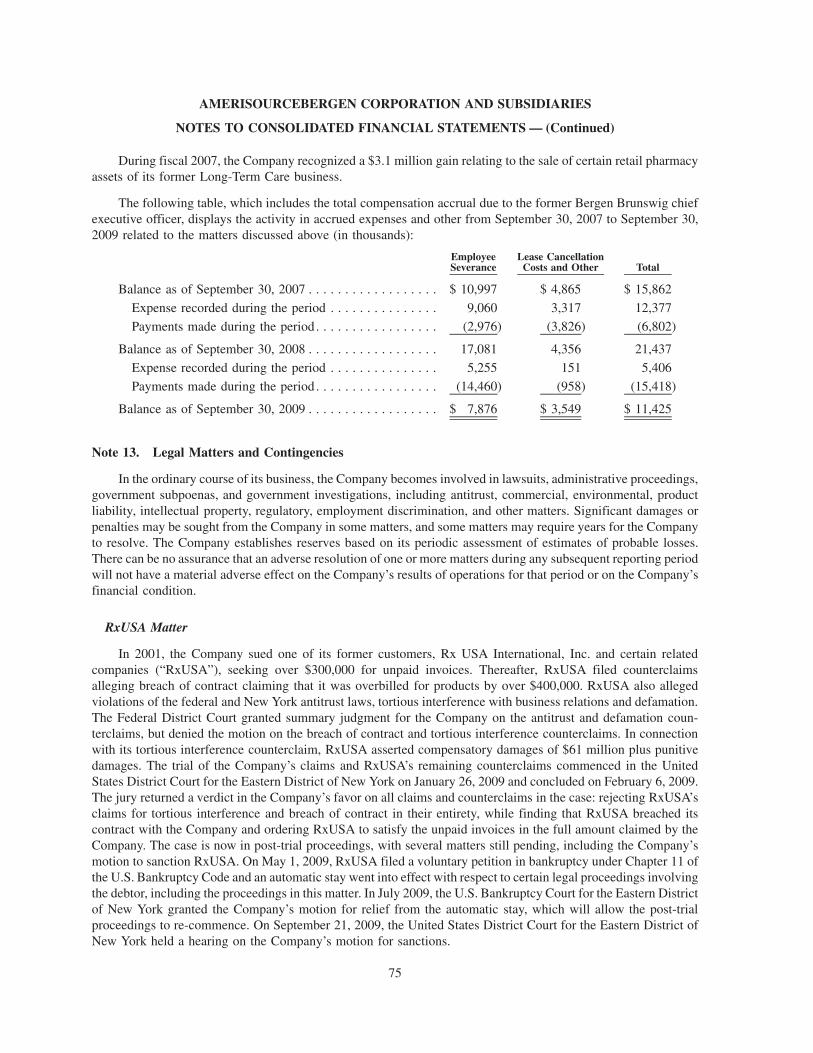
During fiscal 2007, the Company recognized a $3.1 million gain relating to the sale of certain retail pharmacyassets of its former Long-Term Care business.
The following table, which includes the total compensation accrual due to the former Bergen Brunswig chiefexecutive officer, displays the activity in accrued expenses and other from September 30, 2007 to September 30,2009 related to the matters discussed above (in thousands):
EmployeeSeverance
Lease CancellationCosts and Other Total
Balance as of September 30, 2007 . . . . . . . . . . . . . . . . . . $ 10,997 $ 4,865 $ 15,862
Expense recorded during the period . . . . . . . . . . . . . . . 9,060 3,317 12,377
Payments made during the period . . . . . . . . . . . . . . . . . (2,976) (3,826) (6,802)
Balance as of September 30, 2008 . . . . . . . . . . . . . . . . . . 17,081 4,356 21,437
Expense recorded during the period . . . . . . . . . . . . . . . 5,255 151 5,406
Payments made during the period . . . . . . . . . . . . . . . . . (14,460) (958) (15,418)
Balance as of September 30, 2009 . . . . . . . . . . . . . . . . . . $ 7,876 $ 3,549 $ 11,425
Note 13. Legal Matters and Contingencies
In the ordinary course of its business, the Company becomes involved in lawsuits, administrative proceedings,government subpoenas, and government investigations, including antitrust, commercial, environmental, productliability, intellectual property, regulatory, employment discrimination, and other matters. Significant damages orpenalties may be sought from the Company in some matters, and some matters may require years for the Companyto resolve. The Company establishes reserves based on its periodic assessment of estimates of probable losses.There can be no assurance that an adverse resolution of one or more matters during any subsequent reporting periodwill not have a material adverse effect on the Company’s results of operations for that period or on the Company’sfinancial condition.
RxUSA Matter
In 2001, the Company sued one of its former customers, Rx USA International, Inc. and certain relatedcompanies (“RxUSA”), seeking over $300,000 for unpaid invoices. Thereafter, RxUSA filed counterclaimsalleging breach of contract claiming that it was overbilled for products by over $400,000. RxUSA also allegedviolations of the federal and New York antitrust laws, tortious interference with business relations and defamation.The Federal District Court granted summary judgment for the Company on the antitrust and defamation coun-terclaims, but denied the motion on the breach of contract and tortious interference counterclaims. In connectionwith its tortious interference counterclaim, RxUSA asserted compensatory damages of $61 million plus punitivedamages. The trial of the Company’s claims and RxUSA’s remaining counterclaims commenced in the UnitedStates District Court for the Eastern District of New York on January 26, 2009 and concluded on February 6, 2009.The jury returned a verdict in the Company’s favor on all claims and counterclaims in the case: rejecting RxUSA’sclaims for tortious interference and breach of contract in their entirety, while finding that RxUSA breached itscontract with the Company and ordering RxUSA to satisfy the unpaid invoices in the full amount claimed by theCompany. The case is now in post-trial proceedings, with several matters still pending, including the Company’smotion to sanction RxUSA. On May 1, 2009, RxUSA filed a voluntary petition in bankruptcy under Chapter 11 ofthe U.S. Bankruptcy Code and an automatic stay went into effect with respect to certain legal proceedings involvingthe debtor, including the proceedings in this matter. In July 2009, the U.S. Bankruptcy Court for the Eastern Districtof New York granted the Company’s motion for relief from the automatic stay, which will allow the post-trialproceedings to re-commence. On September 21, 2009, the United States District Court for the Eastern District ofNew York held a hearing on the Company’s motion for sanctions.
75
AMERISOURCEBERGEN CORPORATION AND SUBSIDIARIES
NOTES TO CONSOLIDATED FINANCIAL STATEMENTS — (Continued)
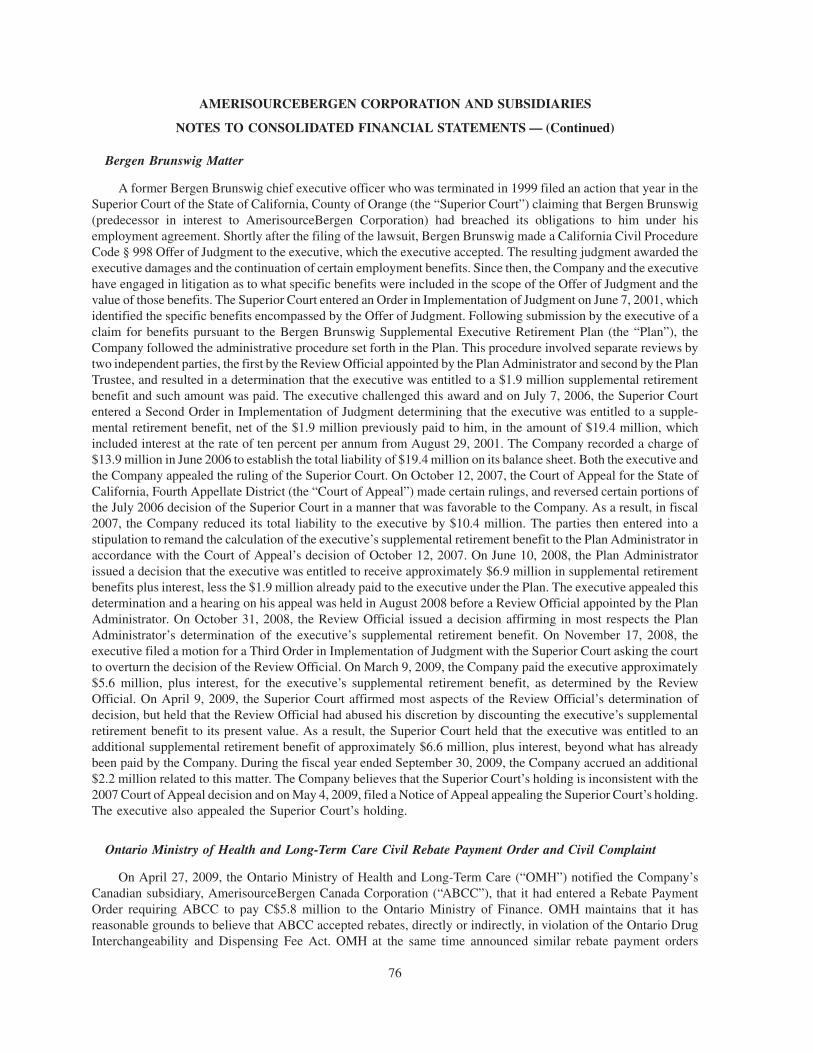
Bergen Brunswig Matter
A former Bergen Brunswig chief executive officer who was terminated in 1999 filed an action that year in theSuperior Court of the State of California, County of Orange (the “Superior Court”) claiming that Bergen Brunswig(predecessor in interest to AmerisourceBergen Corporation) had breached its obligations to him under hisemployment agreement. Shortly after the filing of the lawsuit, Bergen Brunswig made a California Civil ProcedureCode § 998 Offer of Judgment to the executive, which the executive accepted. The resulting judgment awarded theexecutive damages and the continuation of certain employment benefits. Since then, the Company and the executivehave engaged in litigation as to what specific benefits were included in the scope of the Offer of Judgment and thevalue of those benefits. The Superior Court entered an Order in Implementation of Judgment on June 7, 2001, whichidentified the specific benefits encompassed by the Offer of Judgment. Following submission by the executive of aclaim for benefits pursuant to the Bergen Brunswig Supplemental Executive Retirement Plan (the “Plan”), theCompany followed the administrative procedure set forth in the Plan. This procedure involved separate reviews bytwo independent parties, the first by the Review Official appointed by the Plan Administrator and second by the PlanTrustee, and resulted in a determination that the executive was entitled to a $1.9 million supplemental retirementbenefit and such amount was paid. The executive challenged this award and on July 7, 2006, the Superior Courtentered a Second Order in Implementation of Judgment determining that the executive was entitled to a supple-mental retirement benefit, net of the $1.9 million previously paid to him, in the amount of $19.4 million, whichincluded interest at the rate of ten percent per annum from August 29, 2001. The Company recorded a charge of$13.9 million in June 2006 to establish the total liability of $19.4 million on its balance sheet. Both the executive andthe Company appealed the ruling of the Superior Court. On October 12, 2007, the Court of Appeal for the State ofCalifornia, Fourth Appellate District (the “Court of Appeal”) made certain rulings, and reversed certain portions ofthe July 2006 decision of the Superior Court in a manner that was favorable to the Company. As a result, in fiscal2007, the Company reduced its total liability to the executive by $10.4 million. The parties then entered into astipulation to remand the calculation of the executive’s supplemental retirement benefit to the Plan Administrator inaccordance with the Court of Appeal’s decision of October 12, 2007. On June 10, 2008, the Plan Administratorissued a decision that the executive was entitled to receive approximately $6.9 million in supplemental retirementbenefits plus interest, less the $1.9 million already paid to the executive under the Plan. The executive appealed thisdetermination and a hearing on his appeal was held in August 2008 before a Review Official appointed by the PlanAdministrator. On October 31, 2008, the Review Official issued a decision affirming in most respects the PlanAdministrator’s determination of the executive’s supplemental retirement benefit. On November 17, 2008, theexecutive filed a motion for a Third Order in Implementation of Judgment with the Superior Court asking the courtto overturn the decision of the Review Official. On March 9, 2009, the Company paid the executive approximately$5.6 million, plus interest, for the executive’s supplemental retirement benefit, as determined by the ReviewOfficial. On April 9, 2009, the Superior Court affirmed most aspects of the Review Official’s determination ofdecision, but held that the Review Official had abused his discretion by discounting the executive’s supplementalretirement benefit to its present value. As a result, the Superior Court held that the executive was entitled to anadditional supplemental retirement benefit of approximately $6.6 million, plus interest, beyond what has alreadybeen paid by the Company. During the fiscal year ended September 30, 2009, the Company accrued an additional$2.2 million related to this matter. The Company believes that the Superior Court’s holding is inconsistent with the2007 Court of Appeal decision and on May 4, 2009, filed a Notice of Appeal appealing the Superior Court’s holding.The executive also appealed the Superior Court’s holding.
Ontario Ministry of Health and Long-Term Care Civil Rebate Payment Order and Civil Complaint
On April 27, 2009, the Ontario Ministry of Health and Long-Term Care (“OMH”) notified the Company’sCanadian subsidiary, AmerisourceBergen Canada Corporation (“ABCC”), that it had entered a Rebate PaymentOrder requiring ABCC to pay C$5.8 million to the Ontario Ministry of Finance. OMH maintains that it hasreasonable grounds to believe that ABCC accepted rebates, directly or indirectly, in violation of the Ontario DrugInterchangeability and Dispensing Fee Act. OMH at the same time announced similar rebate payment orders
76
AMERISOURCEBERGEN CORPORATION AND SUBSIDIARIES
NOTES TO CONSOLIDATED FINANCIAL STATEMENTS — (Continued)
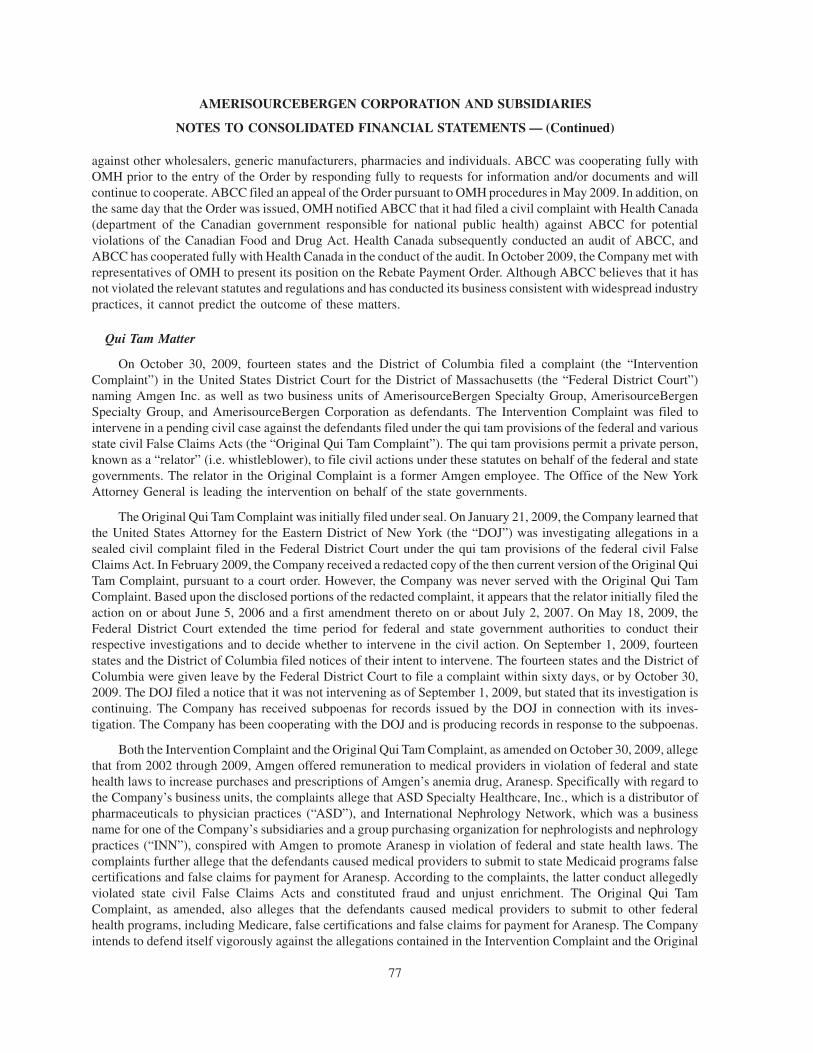
against other wholesalers, generic manufacturers, pharmacies and individuals. ABCC was cooperating fully withOMH prior to the entry of the Order by responding fully to requests for information and/or documents and willcontinue to cooperate. ABCC filed an appeal of the Order pursuant to OMH procedures in May 2009. In addition, onthe same day that the Order was issued, OMH notified ABCC that it had filed a civil complaint with Health Canada(department of the Canadian government responsible for national public health) against ABCC for potentialviolations of the Canadian Food and Drug Act. Health Canada subsequently conducted an audit of ABCC, andABCC has cooperated fully with Health Canada in the conduct of the audit. In October 2009, the Company met withrepresentatives of OMH to present its position on the Rebate Payment Order. Although ABCC believes that it hasnot violated the relevant statutes and regulations and has conducted its business consistent with widespread industrypractices, it cannot predict the outcome of these matters.
Qui Tam Matter
On October 30, 2009, fourteen states and the District of Columbia filed a complaint (the “InterventionComplaint”) in the United States District Court for the District of Massachusetts (the “Federal District Court”)naming Amgen Inc. as well as two business units of AmerisourceBergen Specialty Group, AmerisourceBergenSpecialty Group, and AmerisourceBergen Corporation as defendants. The Intervention Complaint was filed tointervene in a pending civil case against the defendants filed under the qui tam provisions of the federal and variousstate civil False Claims Acts (the “Original Qui Tam Complaint”). The qui tam provisions permit a private person,known as a “relator” (i.e. whistleblower), to file civil actions under these statutes on behalf of the federal and stategovernments. The relator in the Original Complaint is a former Amgen employee. The Office of the New YorkAttorney General is leading the intervention on behalf of the state governments.
The Original Qui Tam Complaint was initially filed under seal. On January 21, 2009, the Company learned thatthe United States Attorney for the Eastern District of New York (the “DOJ”) was investigating allegations in asealed civil complaint filed in the Federal District Court under the qui tam provisions of the federal civil FalseClaims Act. In February 2009, the Company received a redacted copy of the then current version of the Original QuiTam Complaint, pursuant to a court order. However, the Company was never served with the Original Qui TamComplaint. Based upon the disclosed portions of the redacted complaint, it appears that the relator initially filed theaction on or about June 5, 2006 and a first amendment thereto on or about July 2, 2007. On May 18, 2009, theFederal District Court extended the time period for federal and state government authorities to conduct theirrespective investigations and to decide whether to intervene in the civil action. On September 1, 2009, fourteenstates and the District of Columbia filed notices of their intent to intervene. The fourteen states and the District ofColumbia were given leave by the Federal District Court to file a complaint within sixty days, or by October 30,2009. The DOJ filed a notice that it was not intervening as of September 1, 2009, but stated that its investigation iscontinuing. The Company has received subpoenas for records issued by the DOJ in connection with its inves-tigation. The Company has been cooperating with the DOJ and is producing records in response to the subpoenas.
Both the Intervention Complaint and the Original Qui Tam Complaint, as amended on October 30, 2009, allegethat from 2002 through 2009, Amgen offered remuneration to medical providers in violation of federal and statehealth laws to increase purchases and prescriptions of Amgen’s anemia drug, Aranesp. Specifically with regard tothe Company’s business units, the complaints allege that ASD Specialty Healthcare, Inc., which is a distributor ofpharmaceuticals to physician practices (“ASD”), and International Nephrology Network, which was a businessname for one of the Company’s subsidiaries and a group purchasing organization for nephrologists and nephrologypractices (“INN”), conspired with Amgen to promote Aranesp in violation of federal and state health laws. Thecomplaints further allege that the defendants caused medical providers to submit to state Medicaid programs falsecertifications and false claims for payment for Aranesp. According to the complaints, the latter conduct allegedlyviolated state civil False Claims Acts and constituted fraud and unjust enrichment. The Original Qui TamComplaint, as amended, also alleges that the defendants caused medical providers to submit to other federalhealth programs, including Medicare, false certifications and false claims for payment for Aranesp. The Companyintends to defend itself vigorously against the allegations contained in the Intervention Complaint and the Original
77
AMERISOURCEBERGEN CORPORATION AND SUBSIDIARIES
NOTES TO CONSOLIDATED FINANCIAL STATEMENTS — (Continued)
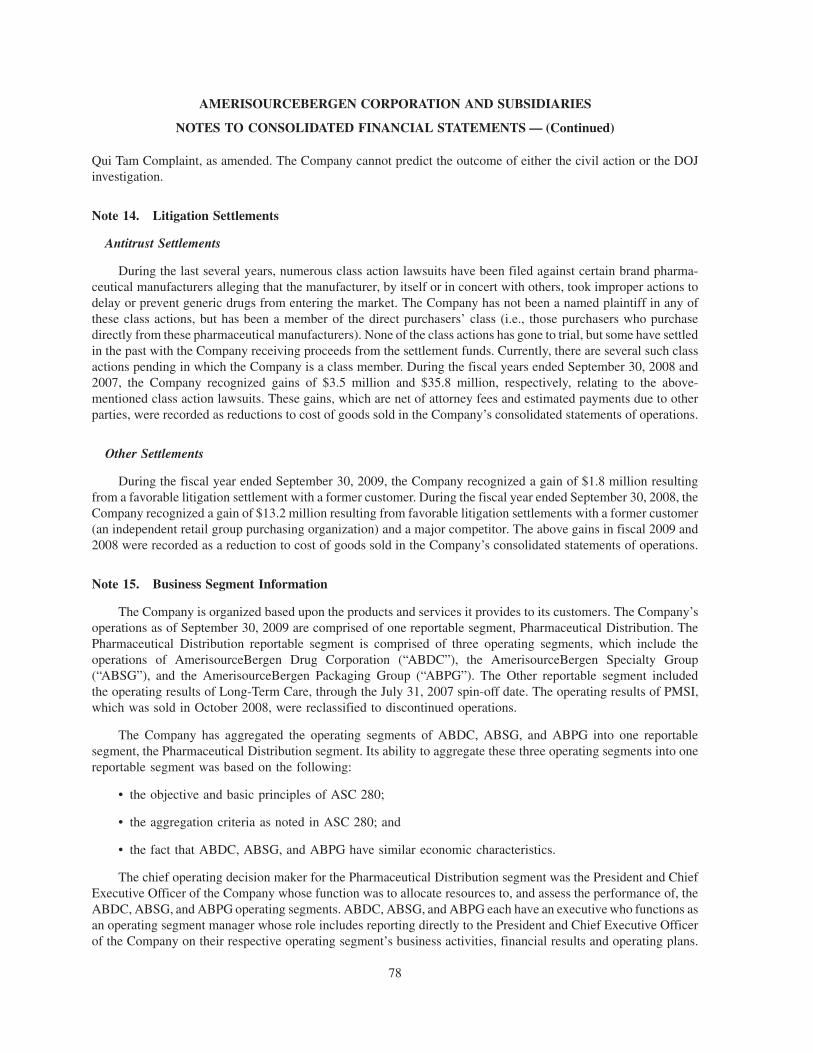
Qui Tam Complaint, as amended. The Company cannot predict the outcome of either the civil action or the DOJinvestigation.
Note 14. Litigation Settlements
Antitrust Settlements
During the last several years, numerous class action lawsuits have been filed against certain brand pharma-ceutical manufacturers alleging that the manufacturer, by itself or in concert with others, took improper actions todelay or prevent generic drugs from entering the market. The Company has not been a named plaintiff in any ofthese class actions, but has been a member of the direct purchasers’ class (i.e., those purchasers who purchasedirectly from these pharmaceutical manufacturers). None of the class actions has gone to trial, but some have settledin the past with the Company receiving proceeds from the settlement funds. Currently, there are several such classactions pending in which the Company is a class member. During the fiscal years ended September 30, 2008 and2007, the Company recognized gains of $3.5 million and $35.8 million, respectively, relating to the above-mentioned class action lawsuits. These gains, which are net of attorney fees and estimated payments due to otherparties, were recorded as reductions to cost of goods sold in the Company’s consolidated statements of operations.
Other Settlements
During the fiscal year ended September 30, 2009, the Company recognized a gain of $1.8 million resultingfrom a favorable litigation settlement with a former customer. During the fiscal year ended September 30, 2008, theCompany recognized a gain of $13.2 million resulting from favorable litigation settlements with a former customer(an independent retail group purchasing organization) and a major competitor. The above gains in fiscal 2009 and2008 were recorded as a reduction to cost of goods sold in the Company’s consolidated statements of operations.
Note 15. Business Segment Information
The Company is organized based upon the products and services it provides to its customers. The Company’soperations as of September 30, 2009 are comprised of one reportable segment, Pharmaceutical Distribution. ThePharmaceutical Distribution reportable segment is comprised of three operating segments, which include theoperations of AmerisourceBergen Drug Corporation (“ABDC”), the AmerisourceBergen Specialty Group(“ABSG”), and the AmerisourceBergen Packaging Group (“ABPG”). The Other reportable segment includedthe operating results of Long-Term Care, through the July 31, 2007 spin-off date. The operating results of PMSI,which was sold in October 2008, were reclassified to discontinued operations.
The Company has aggregated the operating segments of ABDC, ABSG, and ABPG into one reportablesegment, the Pharmaceutical Distribution segment. Its ability to aggregate these three operating segments into onereportable segment was based on the following:
• the objective and basic principles of ASC 280;
• the aggregation criteria as noted in ASC 280; and
• the fact that ABDC, ABSG, and ABPG have similar economic characteristics.
The chief operating decision maker for the Pharmaceutical Distribution segment was the President and ChiefExecutive Officer of the Company whose function was to allocate resources to, and assess the performance of, theABDC, ABSG, and ABPG operating segments. ABDC, ABSG, and ABPG each have an executive who functions asan operating segment manager whose role includes reporting directly to the President and Chief Executive Officerof the Company on their respective operating segment’s business activities, financial results and operating plans.
78
AMERISOURCEBERGEN CORPORATION AND SUBSIDIARIES
NOTES TO CONSOLIDATED FINANCIAL STATEMENTS — (Continued)
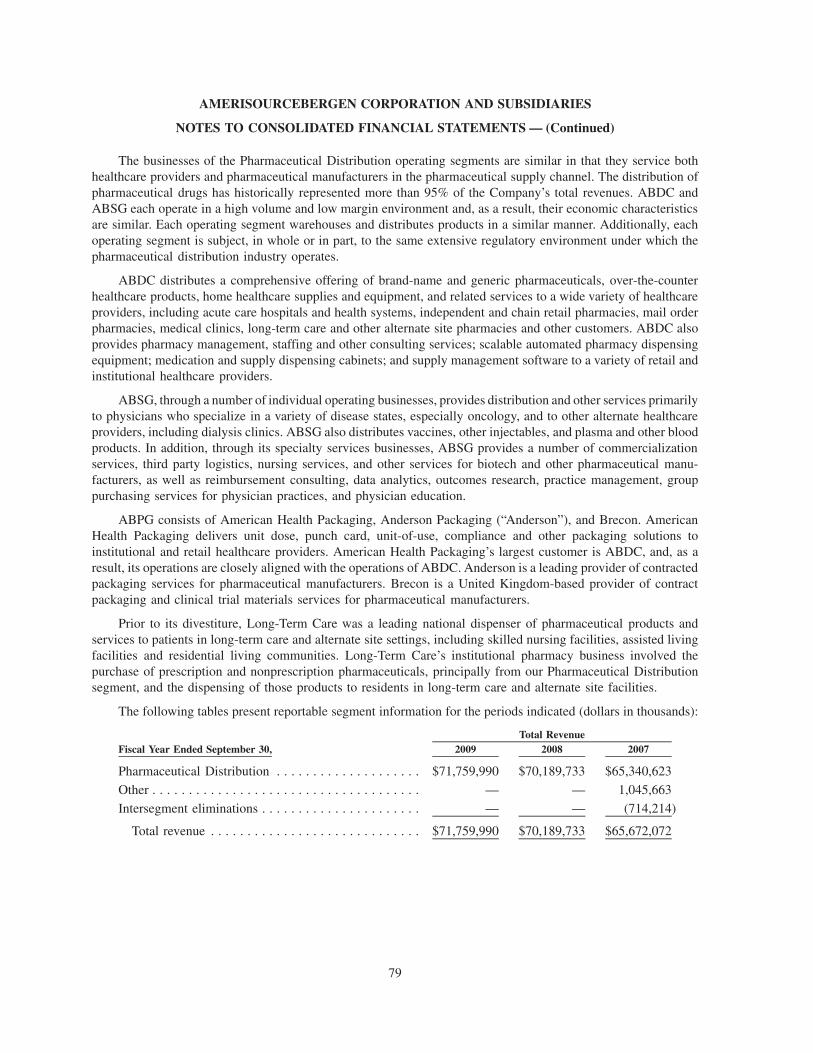
The businesses of the Pharmaceutical Distribution operating segments are similar in that they service bothhealthcare providers and pharmaceutical manufacturers in the pharmaceutical supply channel. The distribution ofpharmaceutical drugs has historically represented more than 95% of the Company’s total revenues. ABDC andABSG each operate in a high volume and low margin environment and, as a result, their economic characteristicsare similar. Each operating segment warehouses and distributes products in a similar manner. Additionally, eachoperating segment is subject, in whole or in part, to the same extensive regulatory environment under which thepharmaceutical distribution industry operates.
ABDC distributes a comprehensive offering of brand-name and generic pharmaceuticals, over-the-counterhealthcare products, home healthcare supplies and equipment, and related services to a wide variety of healthcareproviders, including acute care hospitals and health systems, independent and chain retail pharmacies, mail orderpharmacies, medical clinics, long-term care and other alternate site pharmacies and other customers. ABDC alsoprovides pharmacy management, staffing and other consulting services; scalable automated pharmacy dispensingequipment; medication and supply dispensing cabinets; and supply management software to a variety of retail andinstitutional healthcare providers.
ABSG, through a number of individual operating businesses, provides distribution and other services primarilyto physicians who specialize in a variety of disease states, especially oncology, and to other alternate healthcareproviders, including dialysis clinics. ABSG also distributes vaccines, other injectables, and plasma and other bloodproducts. In addition, through its specialty services businesses, ABSG provides a number of commercializationservices, third party logistics, nursing services, and other services for biotech and other pharmaceutical manu-facturers, as well as reimbursement consulting, data analytics, outcomes research, practice management, grouppurchasing services for physician practices, and physician education.
ABPG consists of American Health Packaging, Anderson Packaging (“Anderson”), and Brecon. AmericanHealth Packaging delivers unit dose, punch card, unit-of-use, compliance and other packaging solutions toinstitutional and retail healthcare providers. American Health Packaging’s largest customer is ABDC, and, as aresult, its operations are closely aligned with the operations of ABDC. Anderson is a leading provider of contractedpackaging services for pharmaceutical manufacturers. Brecon is a United Kingdom-based provider of contractpackaging and clinical trial materials services for pharmaceutical manufacturers.
Prior to its divestiture, Long-Term Care was a leading national dispenser of pharmaceutical products andservices to patients in long-term care and alternate site settings, including skilled nursing facilities, assisted livingfacilities and residential living communities. Long-Term Care’s institutional pharmacy business involved thepurchase of prescription and nonprescription pharmaceuticals, principally from our Pharmaceutical Distributionsegment, and the dispensing of those products to residents in long-term care and alternate site facilities.
The following tables present reportable segment information for the periods indicated (dollars in thousands):
Fiscal Year Ended September 30, 2009 2008 2007Total Revenue
Pharmaceutical Distribution . . . . . . . . . . . . . . . . . . . . $71,759,990 $70,189,733 $65,340,623
Other . . . . . . . . . . . . . . . . . . . . . . . . . . . . . . . . . . . . . — — 1,045,663
Intersegment eliminations . . . . . . . . . . . . . . . . . . . . . . — — (714,214)
Total revenue . . . . . . . . . . . . . . . . . . . . . . . . . . . . . $71,759,990 $70,189,733 $65,672,072
79
AMERISOURCEBERGEN CORPORATION AND SUBSIDIARIES
NOTES TO CONSOLIDATED FINANCIAL STATEMENTS — (Continued)
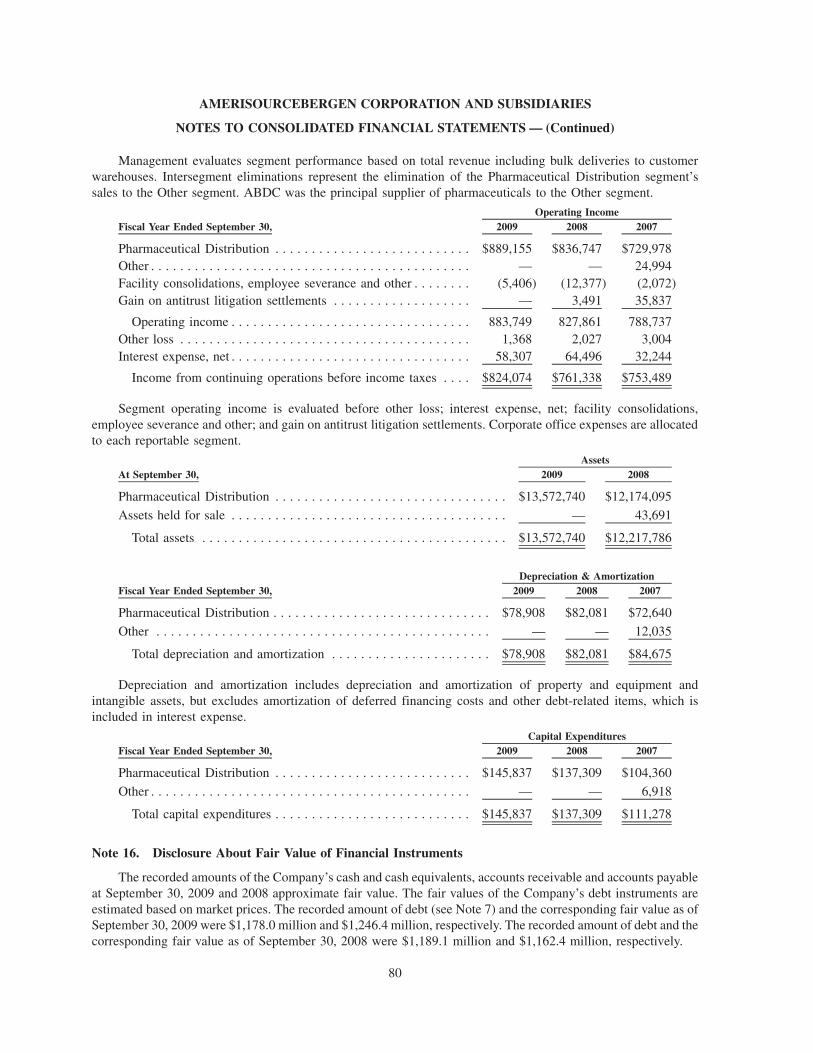
Management evaluates segment performance based on total revenue including bulk deliveries to customerwarehouses. Intersegment eliminations represent the elimination of the Pharmaceutical Distribution segment’ssales to the Other segment. ABDC was the principal supplier of pharmaceuticals to the Other segment.
Fiscal Year Ended September 30, 2009 2008 2007Operating Income
Pharmaceutical Distribution . . . . . . . . . . . . . . . . . . . . . . . . . . . $889,155 $836,747 $729,978Other . . . . . . . . . . . . . . . . . . . . . . . . . . . . . . . . . . . . . . . . . . . . — — 24,994Facility consolidations, employee severance and other . . . . . . . . (5,406) (12,377) (2,072)Gain on antitrust litigation settlements . . . . . . . . . . . . . . . . . . . — 3,491 35,837
Operating income . . . . . . . . . . . . . . . . . . . . . . . . . . . . . . . . . 883,749 827,861 788,737Other loss . . . . . . . . . . . . . . . . . . . . . . . . . . . . . . . . . . . . . . . . 1,368 2,027 3,004Interest expense, net . . . . . . . . . . . . . . . . . . . . . . . . . . . . . . . . . 58,307 64,496 32,244
Income from continuing operations before income taxes . . . . $824,074 $761,338 $753,489
Segment operating income is evaluated before other loss; interest expense, net; facility consolidations,employee severance and other; and gain on antitrust litigation settlements. Corporate office expenses are allocatedto each reportable segment.
At September 30, 2009 2008Assets
Pharmaceutical Distribution . . . . . . . . . . . . . . . . . . . . . . . . . . . . . . . . $13,572,740 $12,174,095
Assets held for sale . . . . . . . . . . . . . . . . . . . . . . . . . . . . . . . . . . . . . . — 43,691
Total assets . . . . . . . . . . . . . . . . . . . . . . . . . . . . . . . . . . . . . . . . . . $13,572,740 $12,217,786
Fiscal Year Ended September 30, 2009 2008 2007Depreciation & Amortization
Pharmaceutical Distribution . . . . . . . . . . . . . . . . . . . . . . . . . . . . . . $78,908 $82,081 $72,640
Other . . . . . . . . . . . . . . . . . . . . . . . . . . . . . . . . . . . . . . . . . . . . . . — — 12,035
Total depreciation and amortization . . . . . . . . . . . . . . . . . . . . . . $78,908 $82,081 $84,675
Depreciation and amortization includes depreciation and amortization of property and equipment andintangible assets, but excludes amortization of deferred financing costs and other debt-related items, which isincluded in interest expense.
Fiscal Year Ended September 30, 2009 2008 2007Capital Expenditures
Pharmaceutical Distribution . . . . . . . . . . . . . . . . . . . . . . . . . . . $145,837 $137,309 $104,360
Other . . . . . . . . . . . . . . . . . . . . . . . . . . . . . . . . . . . . . . . . . . . . — — 6,918
Total capital expenditures . . . . . . . . . . . . . . . . . . . . . . . . . . . $145,837 $137,309 $111,278
Note 16. Disclosure About Fair Value of Financial Instruments
The recorded amounts of the Company’s cash and cash equivalents, accounts receivable and accounts payableat September 30, 2009 and 2008 approximate fair value. The fair values of the Company’s debt instruments areestimated based on market prices. The recorded amount of debt (see Note 7) and the corresponding fair value as ofSeptember 30, 2009 were $1,178.0 million and $1,246.4 million, respectively. The recorded amount of debt and thecorresponding fair value as of September 30, 2008 were $1,189.1 million and $1,162.4 million, respectively.
80
AMERISOURCEBERGEN CORPORATION AND SUBSIDIARIES
NOTES TO CONSOLIDATED FINANCIAL STATEMENTS — (Continued)
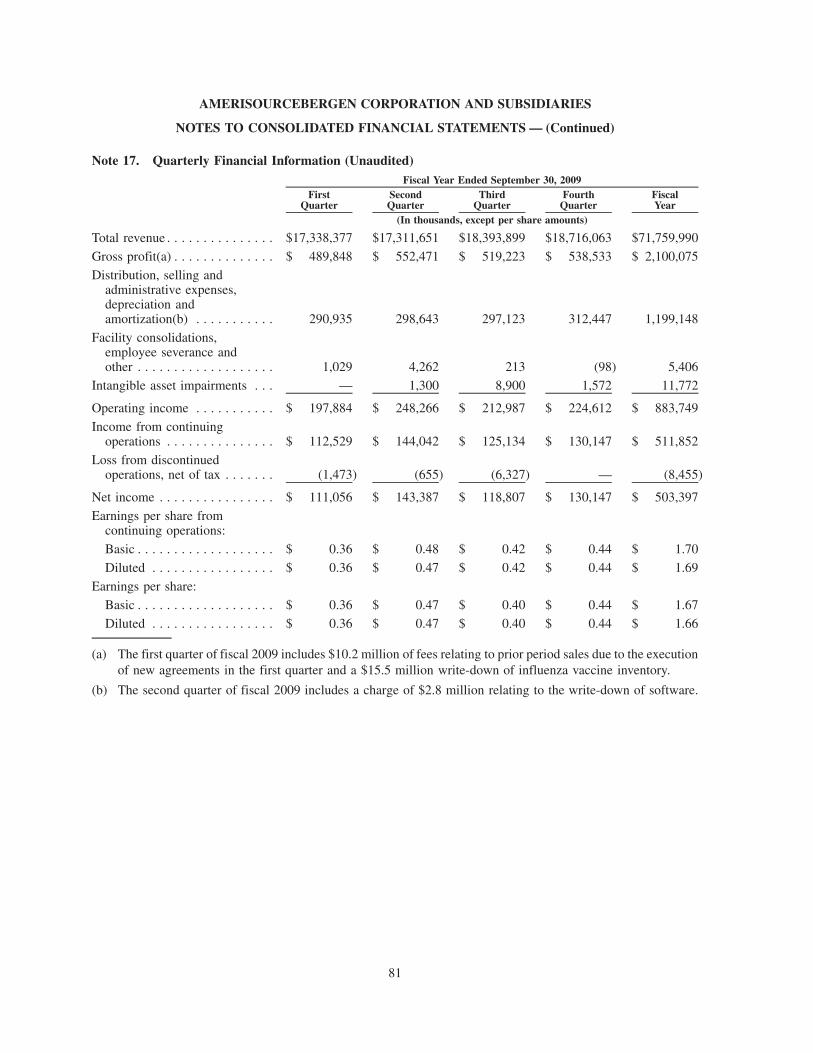
Note 17. Quarterly Financial Information (Unaudited)
FirstQuarter
SecondQuarter
ThirdQuarter
FourthQuarter
FiscalYear
Fiscal Year Ended September 30, 2009
(In thousands, except per share amounts)
Total revenue . . . . . . . . . . . . . . . $17,338,377 $17,311,651 $18,393,899 $18,716,063 $71,759,990
Gross profit(a) . . . . . . . . . . . . . . $ 489,848 $ 552,471 $ 519,223 $ 538,533 $ 2,100,075
Distribution, selling andadministrative expenses,depreciation andamortization(b) . . . . . . . . . . . 290,935 298,643 297,123 312,447 1,199,148
Facility consolidations,employee severance andother . . . . . . . . . . . . . . . . . . . 1,029 4,262 213 (98) 5,406
Intangible asset impairments . . . — 1,300 8,900 1,572 11,772
Operating income . . . . . . . . . . . $ 197,884 $ 248,266 $ 212,987 $ 224,612 $ 883,749
Income from continuingoperations . . . . . . . . . . . . . . . $ 112,529 $ 144,042 $ 125,134 $ 130,147 $ 511,852
Loss from discontinuedoperations, net of tax . . . . . . . (1,473) (655) (6,327) — (8,455)
Net income . . . . . . . . . . . . . . . . $ 111,056 $ 143,387 $ 118,807 $ 130,147 $ 503,397
Earnings per share fromcontinuing operations:
Basic . . . . . . . . . . . . . . . . . . . $ 0.36 $ 0.48 $ 0.42 $ 0.44 $ 1.70
Diluted . . . . . . . . . . . . . . . . . $ 0.36 $ 0.47 $ 0.42 $ 0.44 $ 1.69
Earnings per share:
Basic . . . . . . . . . . . . . . . . . . . $ 0.36 $ 0.47 $ 0.40 $ 0.44 $ 1.67
Diluted . . . . . . . . . . . . . . . . . $ 0.36 $ 0.47 $ 0.40 $ 0.44 $ 1.66
(a) The first quarter of fiscal 2009 includes $10.2 million of fees relating to prior period sales due to the executionof new agreements in the first quarter and a $15.5 million write-down of influenza vaccine inventory.
(b) The second quarter of fiscal 2009 includes a charge of $2.8 million relating to the write-down of software.
81
AMERISOURCEBERGEN CORPORATION AND SUBSIDIARIES
NOTES TO CONSOLIDATED FINANCIAL STATEMENTS — (Continued)
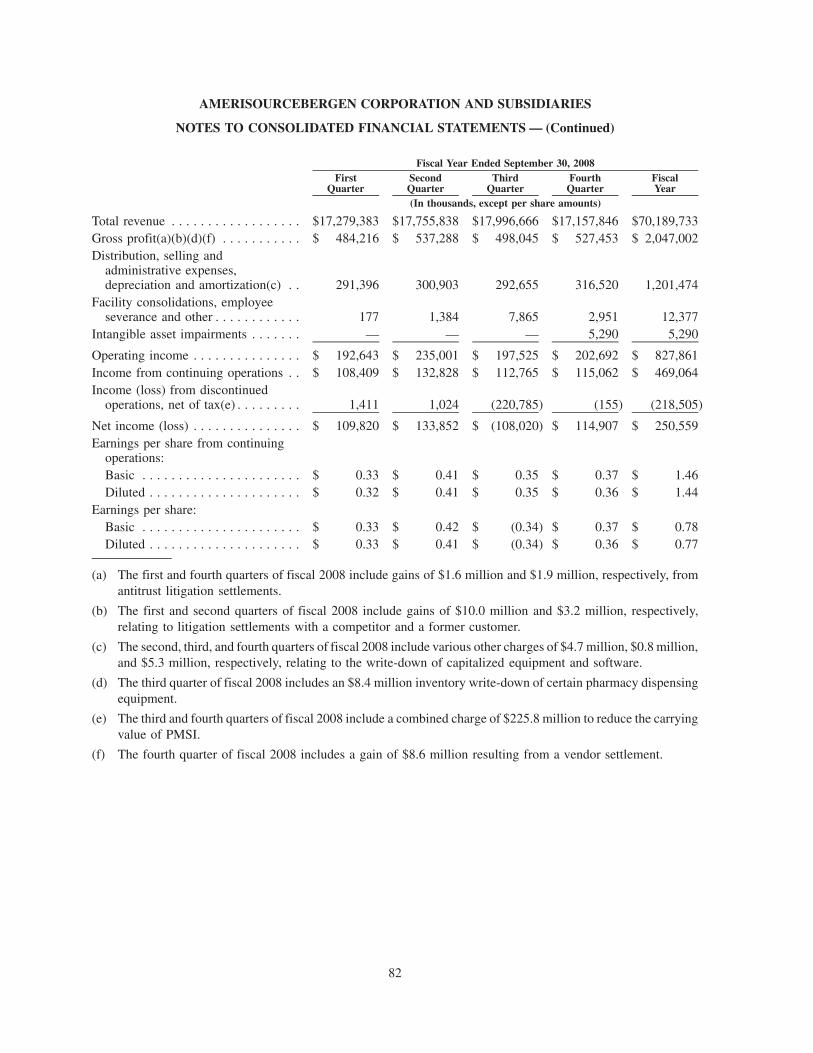
FirstQuarter
SecondQuarter
ThirdQuarter
FourthQuarter
FiscalYear
Fiscal Year Ended September 30, 2008
(In thousands, except per share amounts)
Total revenue . . . . . . . . . . . . . . . . . . $17,279,383 $17,755,838 $17,996,666 $17,157,846 $70,189,733Gross profit(a)(b)(d)(f) . . . . . . . . . . . $ 484,216 $ 537,288 $ 498,045 $ 527,453 $ 2,047,002Distribution, selling and
administrative expenses,depreciation and amortization(c) . . 291,396 300,903 292,655 316,520 1,201,474
Facility consolidations, employeeseverance and other . . . . . . . . . . . . 177 1,384 7,865 2,951 12,377
Intangible asset impairments . . . . . . . — — — 5,290 5,290
Operating income . . . . . . . . . . . . . . . $ 192,643 $ 235,001 $ 197,525 $ 202,692 $ 827,861Income from continuing operations . . $ 108,409 $ 132,828 $ 112,765 $ 115,062 $ 469,064Income (loss) from discontinued
operations, net of tax(e) . . . . . . . . . 1,411 1,024 (220,785) (155) (218,505)
Net income (loss) . . . . . . . . . . . . . . . $ 109,820 $ 133,852 $ (108,020) $ 114,907 $ 250,559Earnings per share from continuing
operations:Basic . . . . . . . . . . . . . . . . . . . . . . $ 0.33 $ 0.41 $ 0.35 $ 0.37 $ 1.46Diluted . . . . . . . . . . . . . . . . . . . . . $ 0.32 $ 0.41 $ 0.35 $ 0.36 $ 1.44
Earnings per share:Basic . . . . . . . . . . . . . . . . . . . . . . $ 0.33 $ 0.42 $ (0.34) $ 0.37 $ 0.78Diluted . . . . . . . . . . . . . . . . . . . . . $ 0.33 $ 0.41 $ (0.34) $ 0.36 $ 0.77
(a) The first and fourth quarters of fiscal 2008 include gains of $1.6 million and $1.9 million, respectively, fromantitrust litigation settlements.
(b) The first and second quarters of fiscal 2008 include gains of $10.0 million and $3.2 million, respectively,relating to litigation settlements with a competitor and a former customer.
(c) The second, third, and fourth quarters of fiscal 2008 include various other charges of $4.7 million, $0.8 million,and $5.3 million, respectively, relating to the write-down of capitalized equipment and software.
(d) The third quarter of fiscal 2008 includes an $8.4 million inventory write-down of certain pharmacy dispensingequipment.
(e) The third and fourth quarters of fiscal 2008 include a combined charge of $225.8 million to reduce the carryingvalue of PMSI.
(f) The fourth quarter of fiscal 2008 includes a gain of $8.6 million resulting from a vendor settlement.
82
AMERISOURCEBERGEN CORPORATION AND SUBSIDIARIES
NOTES TO CONSOLIDATED FINANCIAL STATEMENTS — (Continued)
Note 18. Subsequent Event
Issuance of $400 Million of 47⁄8% Senior Notes Due 2019
In November 2009, the Company issued $400 million of 47/8% senior notes due November 15, 2019 (the “2019Notes”). The 2019 Notes were sold at 99.174% of the principal amount and have an effective yield of 4.98%. TheInterest on the 2019 Notes is payable semiannually, in arrears, commencing May 15, 2010. The 2019 Notes rank paripassu to the Multi-Currency Revolving Credit Facility and the 2012 Notes and the 2015 Notes. The Company used thenet proceeds of the 2019 Notes to repay substantially all amounts outstanding under its Multi-Currency RevolvingCredit Facility and the remaining net proceeds will be used for general corporate purposes. Costs incurred inconnection with the issuance of the 2019 Notes will be deferred and amortized over the 10-year term of the notes.
Note 19. Selected Consolidating Financial Statements of Parent, Guarantors and Non-Guarantors
The Company’s 2012 Notes, the 2015 Notes and beginning in November 2009, the 2019 Notes (together, the“Notes”) each are fully and unconditionally guaranteed on a joint and several basis by certain of the Company’ssubsidiaries (the subsidiaries of the Company that are guarantors of the Notes being referred to collectively as the“Guarantor Subsidiaries”). The total assets, stockholders’ equity, revenues, earnings and cash flows from operatingactivities of the Guarantor Subsidiaries reflects the majority of the consolidated total of such items as of or for theperiods reported. The only consolidated subsidiaries of the Company that are not guarantors of the Notes (the “Non-Guarantor Subsidiaries”) are: (a) the receivables securitization special purpose entity described in Note 7, (b) theforeign operating subsidiaries and (c) certain smaller operating subsidiaries. The following tables present con-densed consolidating financial statements including AmerisourceBergen Corporation (the “Parent”), the GuarantorSubsidiaries, and the Non-Guarantor Subsidiaries. Such financial statements include balance sheets as of Sep-tember 30, 2009 and 2008 and the related statements of operations and cash flows for each of the three years in theperiod ended September 30, 2009.
In fiscal 2009, the Company reclassified the initial contribution of accounts receivable made by ABDC (aguarantor subsidiary), to the receivables special purpose entity (a non-guarantor subsidiary), from a note payable tocapital on the books of the receivable special purpose entity. Additionally, the Company revised its fiscal 2008intercompany interest charge from the Parent to one of the Guarantor Subsidiaries. As a result of the above, theCompany has revised intercompany interest amounts and balances for all prior periods reported herein. Theseintercompany reclassifications had no impact on the Company’s consolidated financial statements.
83
AMERISOURCEBERGEN CORPORATION AND SUBSIDIARIES
NOTES TO CONSOLIDATED FINANCIAL STATEMENTS — (Continued)
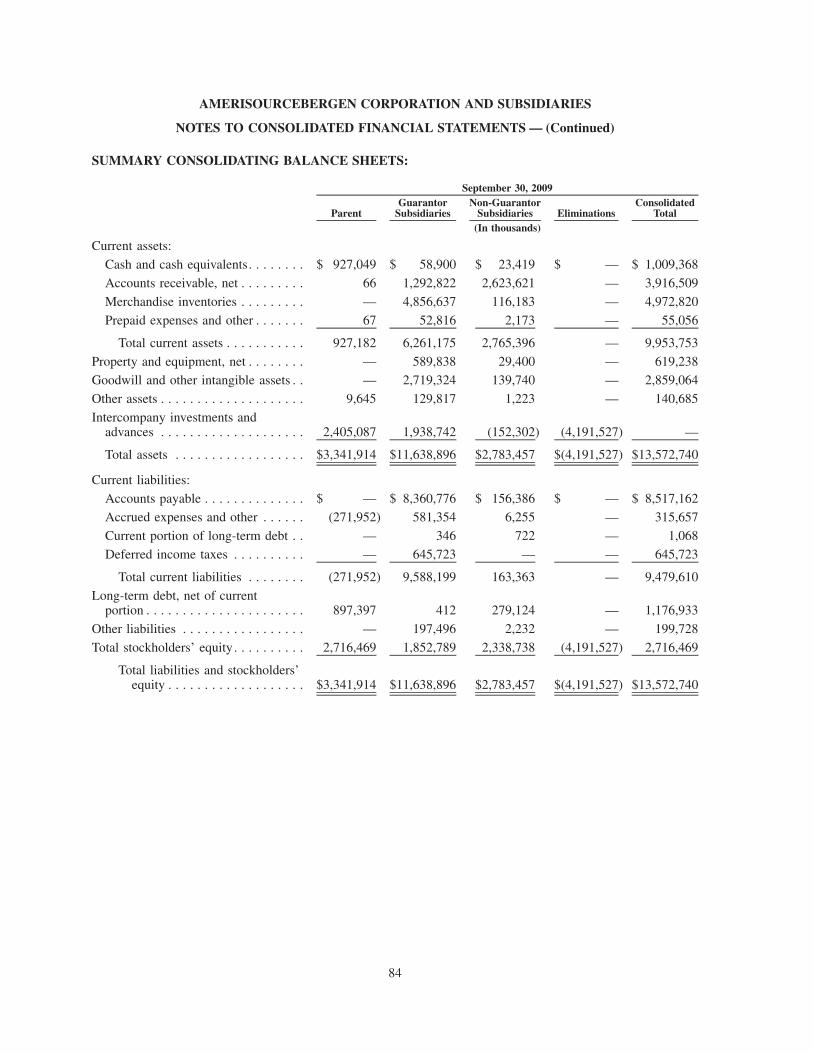
SUMMARY CONSOLIDATING BALANCE SHEETS:
ParentGuarantor
SubsidiariesNon-Guarantor
Subsidiaries EliminationsConsolidated
Total
September 30, 2009
(In thousands)
Current assets:
Cash and cash equivalents. . . . . . . . $ 927,049 $ 58,900 $ 23,419 $ — $ 1,009,368
Accounts receivable, net . . . . . . . . . 66 1,292,822 2,623,621 — 3,916,509
Merchandise inventories . . . . . . . . . — 4,856,637 116,183 — 4,972,820
Prepaid expenses and other . . . . . . . 67 52,816 2,173 — 55,056
Total current assets . . . . . . . . . . . 927,182 6,261,175 2,765,396 — 9,953,753
Property and equipment, net . . . . . . . . — 589,838 29,400 — 619,238Goodwill and other intangible assets . . — 2,719,324 139,740 — 2,859,064
Other assets . . . . . . . . . . . . . . . . . . . . 9,645 129,817 1,223 — 140,685
Intercompany investments andadvances . . . . . . . . . . . . . . . . . . . . 2,405,087 1,938,742 (152,302) (4,191,527) —
Total assets . . . . . . . . . . . . . . . . . . $3,341,914 $11,638,896 $2,783,457 $(4,191,527) $13,572,740
Current liabilities:
Accounts payable . . . . . . . . . . . . . . $ — $ 8,360,776 $ 156,386 $ — $ 8,517,162Accrued expenses and other . . . . . . (271,952) 581,354 6,255 — 315,657
Current portion of long-term debt . . — 346 722 — 1,068
Deferred income taxes . . . . . . . . . . — 645,723 — — 645,723
Total current liabilities . . . . . . . . (271,952) 9,588,199 163,363 — 9,479,610
Long-term debt, net of currentportion . . . . . . . . . . . . . . . . . . . . . . 897,397 412 279,124 — 1,176,933
Other liabilities . . . . . . . . . . . . . . . . . — 197,496 2,232 — 199,728
Total stockholders’ equity . . . . . . . . . . 2,716,469 1,852,789 2,338,738 (4,191,527) 2,716,469
Total liabilities and stockholders’equity . . . . . . . . . . . . . . . . . . . $3,341,914 $11,638,896 $2,783,457 $(4,191,527) $13,572,740
84
AMERISOURCEBERGEN CORPORATION AND SUBSIDIARIES
NOTES TO CONSOLIDATED FINANCIAL STATEMENTS — (Continued)
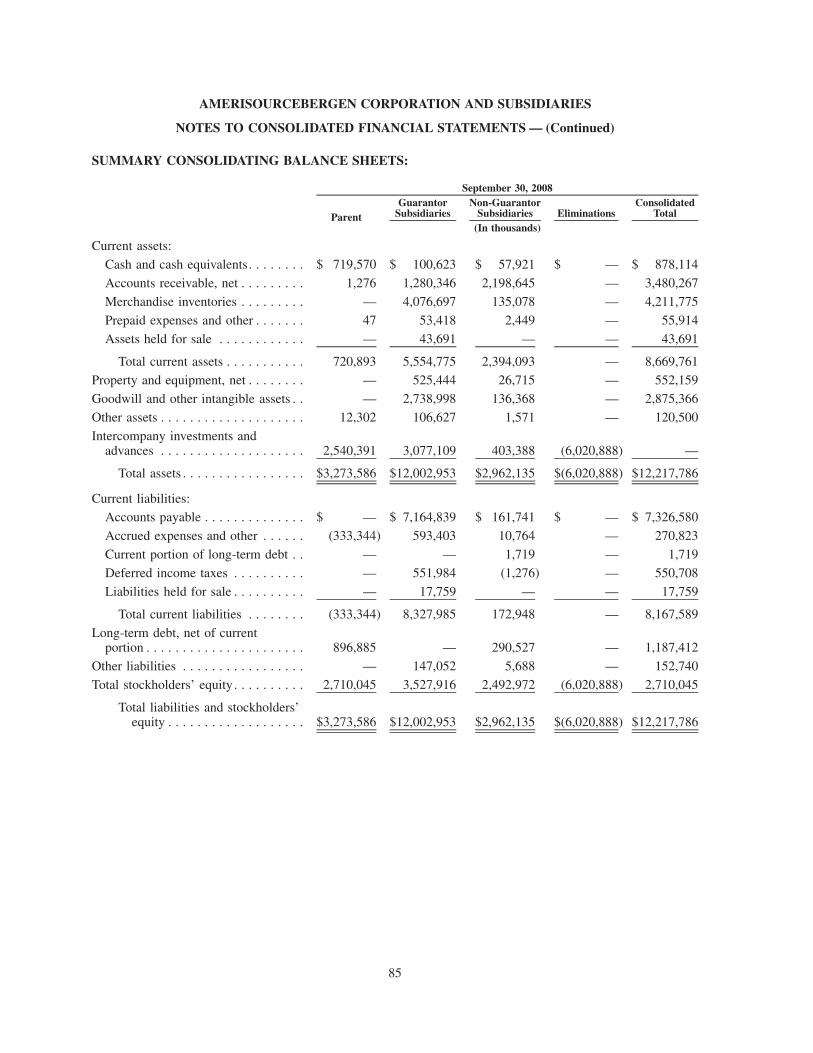
SUMMARY CONSOLIDATING BALANCE SHEETS:
ParentGuarantor
SubsidiariesNon-Guarantor
Subsidiaries EliminationsConsolidated
Total
September 30, 2008
(In thousands)
Current assets:
Cash and cash equivalents. . . . . . . . $ 719,570 $ 100,623 $ 57,921 $ — $ 878,114
Accounts receivable, net . . . . . . . . . 1,276 1,280,346 2,198,645 — 3,480,267
Merchandise inventories . . . . . . . . . — 4,076,697 135,078 — 4,211,775
Prepaid expenses and other . . . . . . . 47 53,418 2,449 — 55,914
Assets held for sale . . . . . . . . . . . . — 43,691 — — 43,691
Total current assets . . . . . . . . . . . 720,893 5,554,775 2,394,093 — 8,669,761Property and equipment, net . . . . . . . . — 525,444 26,715 — 552,159
Goodwill and other intangible assets . . — 2,738,998 136,368 — 2,875,366
Other assets . . . . . . . . . . . . . . . . . . . . 12,302 106,627 1,571 — 120,500
Intercompany investments andadvances . . . . . . . . . . . . . . . . . . . . 2,540,391 3,077,109 403,388 (6,020,888) —
Total assets . . . . . . . . . . . . . . . . . $3,273,586 $12,002,953 $2,962,135 $(6,020,888) $12,217,786
Current liabilities:Accounts payable . . . . . . . . . . . . . . $ — $ 7,164,839 $ 161,741 $ — $ 7,326,580
Accrued expenses and other . . . . . . (333,344) 593,403 10,764 — 270,823
Current portion of long-term debt . . — — 1,719 — 1,719
Deferred income taxes . . . . . . . . . . — 551,984 (1,276) — 550,708
Liabilities held for sale . . . . . . . . . . — 17,759 — — 17,759
Total current liabilities . . . . . . . . (333,344) 8,327,985 172,948 — 8,167,589
Long-term debt, net of currentportion . . . . . . . . . . . . . . . . . . . . . . 896,885 — 290,527 — 1,187,412
Other liabilities . . . . . . . . . . . . . . . . . — 147,052 5,688 — 152,740
Total stockholders’ equity . . . . . . . . . . 2,710,045 3,527,916 2,492,972 (6,020,888) 2,710,045
Total liabilities and stockholders’equity . . . . . . . . . . . . . . . . . . . $3,273,586 $12,002,953 $2,962,135 $(6,020,888) $12,217,786
85
AMERISOURCEBERGEN CORPORATION AND SUBSIDIARIES
NOTES TO CONSOLIDATED FINANCIAL STATEMENTS — (Continued)
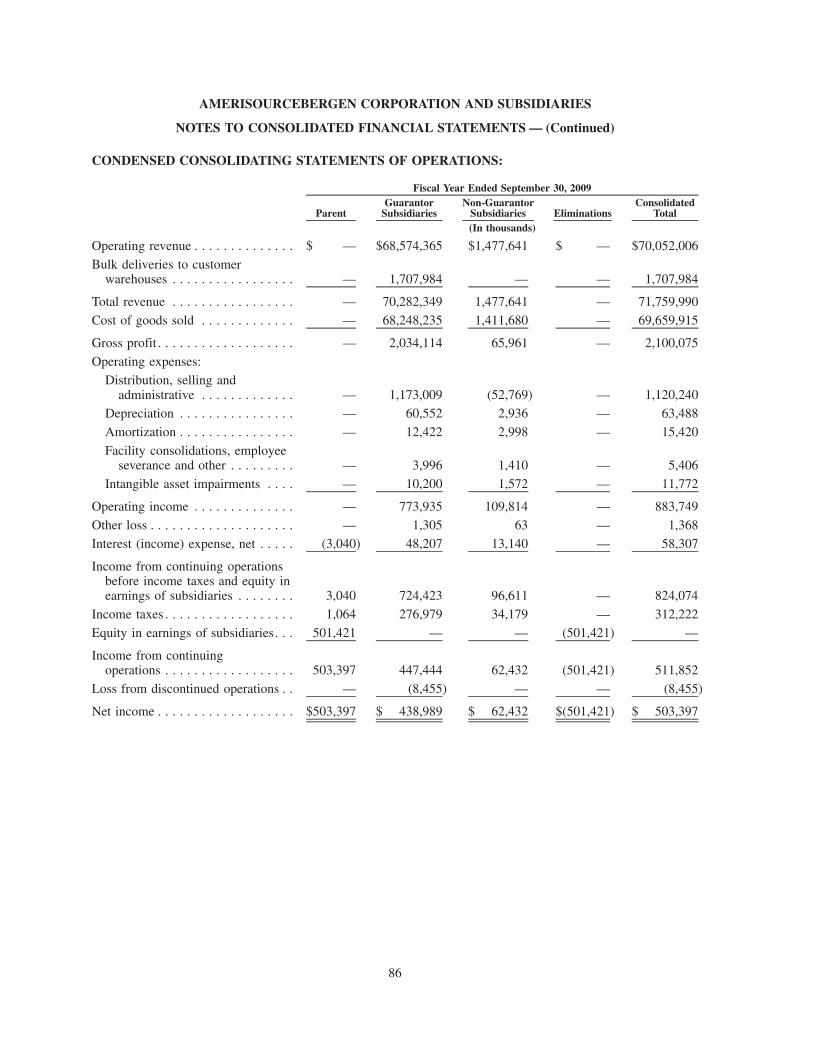
CONDENSED CONSOLIDATING STATEMENTS OF OPERATIONS:
ParentGuarantor
SubsidiariesNon-Guarantor
Subsidiaries EliminationsConsolidated
Total
Fiscal Year Ended September 30, 2009
(In thousands)
Operating revenue . . . . . . . . . . . . . . $ — $68,574,365 $1,477,641 $ — $70,052,006
Bulk deliveries to customerwarehouses . . . . . . . . . . . . . . . . . — 1,707,984 — — 1,707,984
Total revenue . . . . . . . . . . . . . . . . . — 70,282,349 1,477,641 — 71,759,990
Cost of goods sold . . . . . . . . . . . . . — 68,248,235 1,411,680 — 69,659,915
Gross profit . . . . . . . . . . . . . . . . . . . — 2,034,114 65,961 — 2,100,075
Operating expenses:Distribution, selling and
administrative . . . . . . . . . . . . . — 1,173,009 (52,769) — 1,120,240Depreciation . . . . . . . . . . . . . . . . — 60,552 2,936 — 63,488
Amortization . . . . . . . . . . . . . . . . — 12,422 2,998 — 15,420
Facility consolidations, employeeseverance and other . . . . . . . . . — 3,996 1,410 — 5,406
Intangible asset impairments . . . . — 10,200 1,572 — 11,772
Operating income . . . . . . . . . . . . . . — 773,935 109,814 — 883,749
Other loss . . . . . . . . . . . . . . . . . . . . — 1,305 63 — 1,368
Interest (income) expense, net . . . . . (3,040) 48,207 13,140 — 58,307
Income from continuing operationsbefore income taxes and equity inearnings of subsidiaries . . . . . . . . 3,040 724,423 96,611 — 824,074
Income taxes . . . . . . . . . . . . . . . . . . 1,064 276,979 34,179 — 312,222
Equity in earnings of subsidiaries. . . 501,421 — — (501,421) —
Income from continuingoperations . . . . . . . . . . . . . . . . . . 503,397 447,444 62,432 (501,421) 511,852
Loss from discontinued operations . . — (8,455) — — (8,455)
Net income . . . . . . . . . . . . . . . . . . . $503,397 $ 438,989 $ 62,432 $(501,421) $ 503,397
86
AMERISOURCEBERGEN CORPORATION AND SUBSIDIARIES
NOTES TO CONSOLIDATED FINANCIAL STATEMENTS — (Continued)
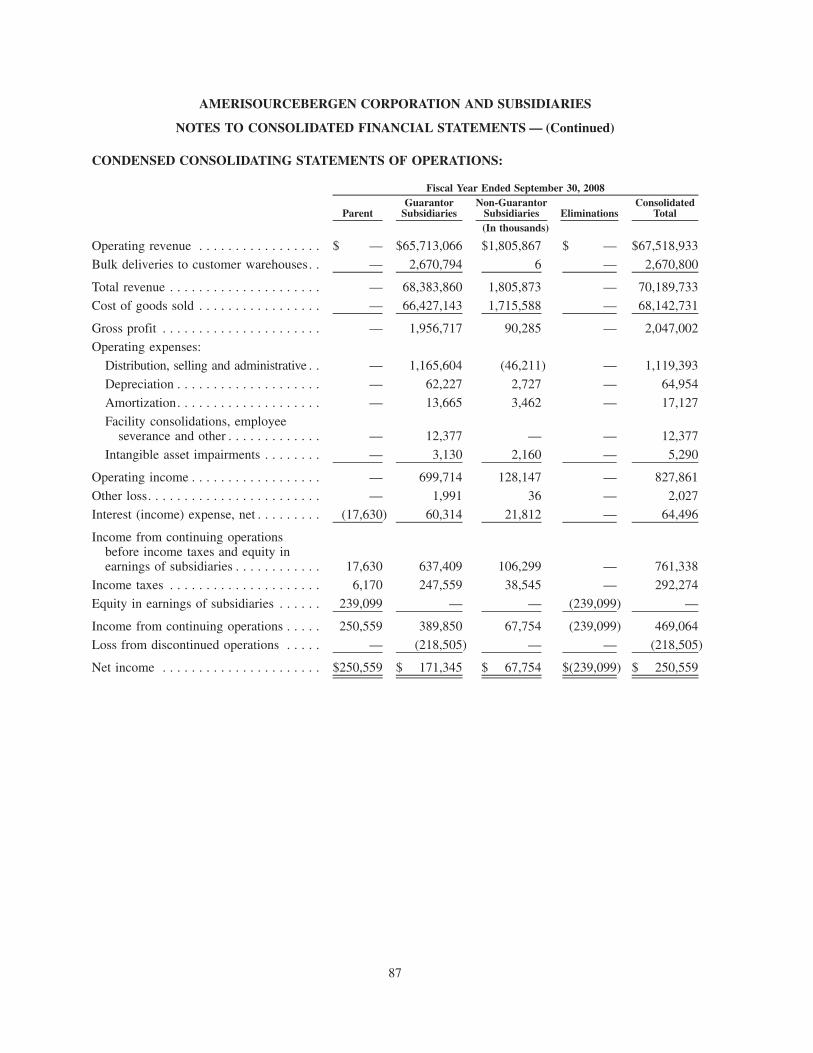
CONDENSED CONSOLIDATING STATEMENTS OF OPERATIONS:
ParentGuarantor
SubsidiariesNon-Guarantor
Subsidiaries EliminationsConsolidated
Total
Fiscal Year Ended September 30, 2008
(In thousands)
Operating revenue . . . . . . . . . . . . . . . . . $ — $65,713,066 $1,805,867 $ — $67,518,933
Bulk deliveries to customer warehouses. . — 2,670,794 6 — 2,670,800
Total revenue . . . . . . . . . . . . . . . . . . . . . — 68,383,860 1,805,873 — 70,189,733
Cost of goods sold . . . . . . . . . . . . . . . . . — 66,427,143 1,715,588 — 68,142,731
Gross profit . . . . . . . . . . . . . . . . . . . . . . — 1,956,717 90,285 — 2,047,002Operating expenses:
Distribution, selling and administrative . . — 1,165,604 (46,211) — 1,119,393
Depreciation . . . . . . . . . . . . . . . . . . . . — 62,227 2,727 — 64,954
Amortization. . . . . . . . . . . . . . . . . . . . — 13,665 3,462 — 17,127
Facility consolidations, employeeseverance and other . . . . . . . . . . . . . — 12,377 — — 12,377
Intangible asset impairments . . . . . . . . — 3,130 2,160 — 5,290
Operating income . . . . . . . . . . . . . . . . . . — 699,714 128,147 — 827,861
Other loss. . . . . . . . . . . . . . . . . . . . . . . . — 1,991 36 — 2,027
Interest (income) expense, net . . . . . . . . . (17,630) 60,314 21,812 — 64,496
Income from continuing operationsbefore income taxes and equity inearnings of subsidiaries . . . . . . . . . . . . 17,630 637,409 106,299 — 761,338
Income taxes . . . . . . . . . . . . . . . . . . . . . 6,170 247,559 38,545 — 292,274
Equity in earnings of subsidiaries . . . . . . 239,099 — — (239,099) —
Income from continuing operations . . . . . 250,559 389,850 67,754 (239,099) 469,064
Loss from discontinued operations . . . . . — (218,505) — — (218,505)
Net income . . . . . . . . . . . . . . . . . . . . . . $250,559 $ 171,345 $ 67,754 $(239,099) $ 250,559
87
AMERISOURCEBERGEN CORPORATION AND SUBSIDIARIES
NOTES TO CONSOLIDATED FINANCIAL STATEMENTS — (Continued)

CONDENSED CONSOLIDATING STATEMENTS OF OPERATIONS:
ParentGuarantor
SubsidiariesNon-Guarantor
Subsidiaries EliminationsConsolidated
Total
Fiscal Year Ended September 30, 2007
(In thousands)
Operating revenue . . . . . . . . . . . . . . . . . $ — $59,497,985 $1,768,807 $ — $61,266,792
Bulk deliveries to customer warehouses. . — 4,405,264 16 — 4,405,280
Total revenue . . . . . . . . . . . . . . . . . . . . . — 63,903,249 1,768,823 — 65,672,072
Cost of goods sold . . . . . . . . . . . . . . . . . — 61,767,751 1,685,262 — 63,453,013
Gross profit . . . . . . . . . . . . . . . . . . . . . . — 2,135,498 83,561 — 2,219,059Operating expenses:
Distribution, selling and administrative . . — 1,368,510 (28,625) — 1,339,885
Depreciation . . . . . . . . . . . . . . . . . . . . — 66,104 2,123 — 68,227
Amortization. . . . . . . . . . . . . . . . . . . . — 13,186 3,262 — 16,448
Facility consolidations, employeeseverance and other . . . . . . . . . . . . . — 2,072 — — 2,072
Intangible asset impairments . . . . . . . . — 3,690 — — 3,690
Operating income . . . . . . . . . . . . . . . . . . — 681,936 106,801 — 788,737
Other loss. . . . . . . . . . . . . . . . . . . . . . . . — 3,003 1 — 3,004
Interest expense (income), net . . . . . . . . . 73,001 (60,744) 19,987 — 32,244
Income from continuing operationsbefore income taxes and equity inearnings of subsidiaries . . . . . . . . . . . . (73,001) 739,677 86,813 — 753,489
Income taxes . . . . . . . . . . . . . . . . . . . . . (25,550) 273,482 30,754 — 278,686
Equity in earnings of subsidiaries . . . . . . 516,618 — — (516,618) —
Income from continuing operations . . . . . 469,167 466,195 56,059 (516,618) 474,803
Loss from discontinued operations . . . . . — (5,636) — — (5,636)
Net income . . . . . . . . . . . . . . . . . . . . . . $469,167 $ 460,559 $ 56,059 $(516,618) $ 469,167
88
AMERISOURCEBERGEN CORPORATION AND SUBSIDIARIES
NOTES TO CONSOLIDATED FINANCIAL STATEMENTS — (Continued)
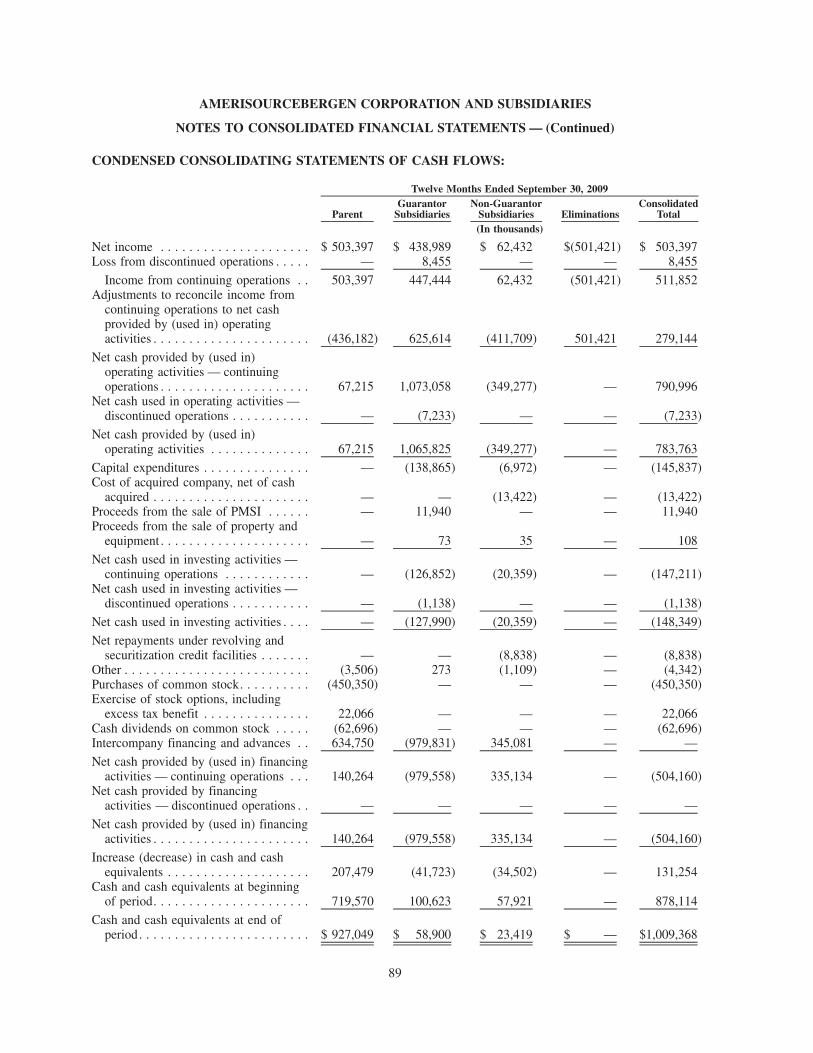
CONDENSED CONSOLIDATING STATEMENTS OF CASH FLOWS:
ParentGuarantor
SubsidiariesNon-Guarantor
Subsidiaries EliminationsConsolidated
Total
Twelve Months Ended September 30, 2009
(In thousands)
Net income . . . . . . . . . . . . . . . . . . . . . $ 503,397 $ 438,989 $ 62,432 $(501,421) $ 503,397Loss from discontinued operations . . . . . — 8,455 — — 8,455
Income from continuing operations . . 503,397 447,444 62,432 (501,421) 511,852Adjustments to reconcile income from
continuing operations to net cashprovided by (used in) operatingactivities . . . . . . . . . . . . . . . . . . . . . . (436,182) 625,614 (411,709) 501,421 279,144
Net cash provided by (used in)operating activities — continuingoperations . . . . . . . . . . . . . . . . . . . . . 67,215 1,073,058 (349,277) — 790,996
Net cash used in operating activities —discontinued operations . . . . . . . . . . . — (7,233) — — (7,233)
Net cash provided by (used in)operating activities . . . . . . . . . . . . . . 67,215 1,065,825 (349,277) — 783,763
Capital expenditures . . . . . . . . . . . . . . . — (138,865) (6,972) — (145,837)Cost of acquired company, net of cash
acquired . . . . . . . . . . . . . . . . . . . . . . — — (13,422) — (13,422)Proceeds from the sale of PMSI . . . . . . — 11,940 — — 11,940Proceeds from the sale of property and
equipment . . . . . . . . . . . . . . . . . . . . . — 73 35 — 108
Net cash used in investing activities —continuing operations . . . . . . . . . . . . — (126,852) (20,359) — (147,211)
Net cash used in investing activities —discontinued operations . . . . . . . . . . . — (1,138) — — (1,138)
Net cash used in investing activities . . . . — (127,990) (20,359) — (148,349)
Net repayments under revolving andsecuritization credit facilities . . . . . . . — — (8,838) — (8,838)
Other . . . . . . . . . . . . . . . . . . . . . . . . . . (3,506) 273 (1,109) — (4,342)Purchases of common stock. . . . . . . . . . (450,350) — — — (450,350)Exercise of stock options, including
excess tax benefit . . . . . . . . . . . . . . . 22,066 — — — 22,066Cash dividends on common stock . . . . . (62,696) — — — (62,696)Intercompany financing and advances . . 634,750 (979,831) 345,081 — —
Net cash provided by (used in) financingactivities — continuing operations . . . 140,264 (979,558) 335,134 — (504,160)
Net cash provided by financingactivities — discontinued operations . . — — — — —
Net cash provided by (used in) financingactivities . . . . . . . . . . . . . . . . . . . . . . 140,264 (979,558) 335,134 — (504,160)
Increase (decrease) in cash and cashequivalents . . . . . . . . . . . . . . . . . . . . 207,479 (41,723) (34,502) — 131,254
Cash and cash equivalents at beginningof period. . . . . . . . . . . . . . . . . . . . . . 719,570 100,623 57,921 — 878,114
Cash and cash equivalents at end ofperiod. . . . . . . . . . . . . . . . . . . . . . . . $ 927,049 $ 58,900 $ 23,419 $ — $1,009,368
89
AMERISOURCEBERGEN CORPORATION AND SUBSIDIARIES
NOTES TO CONSOLIDATED FINANCIAL STATEMENTS — (Continued)
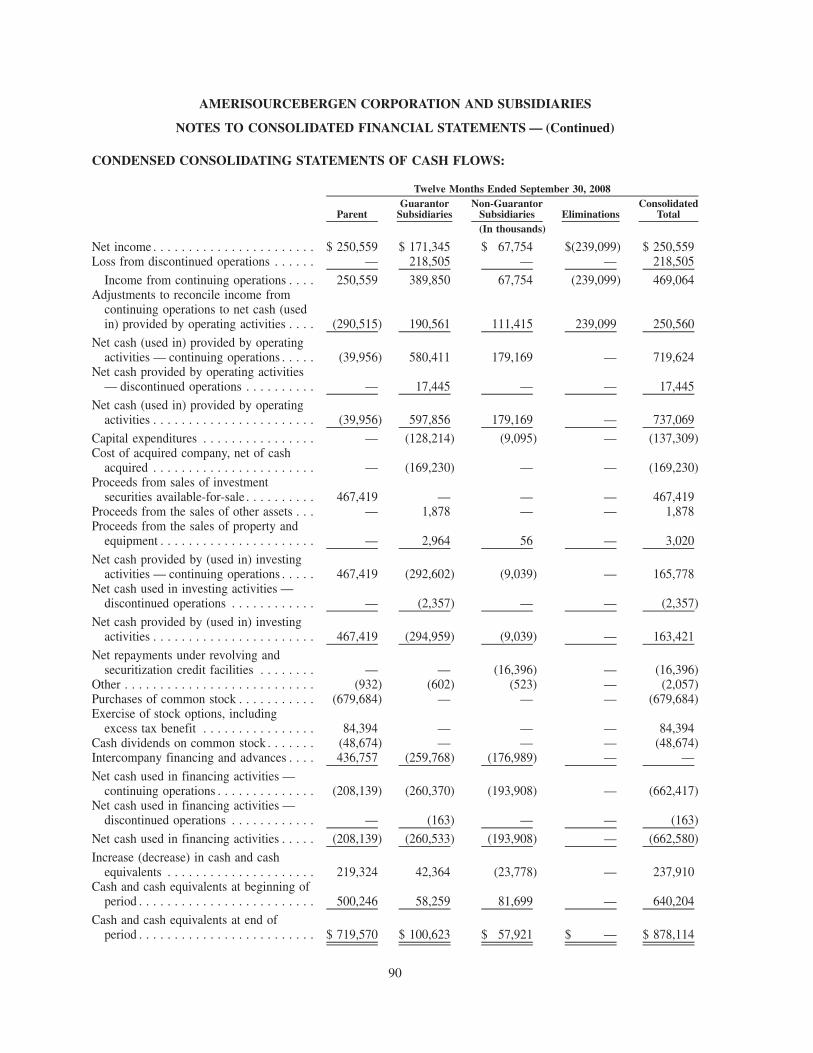
CONDENSED CONSOLIDATING STATEMENTS OF CASH FLOWS:
ParentGuarantor
SubsidiariesNon-Guarantor
Subsidiaries EliminationsConsolidated
Total
Twelve Months Ended September 30, 2008
(In thousands)
Net income . . . . . . . . . . . . . . . . . . . . . . . $ 250,559 $ 171,345 $ 67,754 $(239,099) $ 250,559Loss from discontinued operations . . . . . . — 218,505 — — 218,505
Income from continuing operations . . . . 250,559 389,850 67,754 (239,099) 469,064Adjustments to reconcile income from
continuing operations to net cash (usedin) provided by operating activities . . . . (290,515) 190,561 111,415 239,099 250,560
Net cash (used in) provided by operatingactivities — continuing operations . . . . . (39,956) 580,411 179,169 — 719,624
Net cash provided by operating activities— discontinued operations . . . . . . . . . . — 17,445 — — 17,445
Net cash (used in) provided by operatingactivities . . . . . . . . . . . . . . . . . . . . . . . (39,956) 597,856 179,169 — 737,069
Capital expenditures . . . . . . . . . . . . . . . . — (128,214) (9,095) — (137,309)Cost of acquired company, net of cash
acquired . . . . . . . . . . . . . . . . . . . . . . . — (169,230) — — (169,230)Proceeds from sales of investment
securities available-for-sale . . . . . . . . . . 467,419 — — — 467,419Proceeds from the sales of other assets . . . — 1,878 — — 1,878Proceeds from the sales of property and
equipment . . . . . . . . . . . . . . . . . . . . . . — 2,964 56 — 3,020
Net cash provided by (used in) investingactivities — continuing operations . . . . . 467,419 (292,602) (9,039) — 165,778
Net cash used in investing activities —discontinued operations . . . . . . . . . . . . — (2,357) — — (2,357)
Net cash provided by (used in) investingactivities . . . . . . . . . . . . . . . . . . . . . . . 467,419 (294,959) (9,039) — 163,421
Net repayments under revolving andsecuritization credit facilities . . . . . . . . — — (16,396) — (16,396)
Other . . . . . . . . . . . . . . . . . . . . . . . . . . . (932) (602) (523) — (2,057)Purchases of common stock . . . . . . . . . . . (679,684) — — — (679,684)Exercise of stock options, including
excess tax benefit . . . . . . . . . . . . . . . . 84,394 — — — 84,394Cash dividends on common stock . . . . . . . (48,674) — — — (48,674)Intercompany financing and advances . . . . 436,757 (259,768) (176,989) — —
Net cash used in financing activities —continuing operations . . . . . . . . . . . . . . (208,139) (260,370) (193,908) — (662,417)
Net cash used in financing activities —discontinued operations . . . . . . . . . . . . — (163) — — (163)
Net cash used in financing activities . . . . . (208,139) (260,533) (193,908) — (662,580)
Increase (decrease) in cash and cashequivalents . . . . . . . . . . . . . . . . . . . . . 219,324 42,364 (23,778) — 237,910
Cash and cash equivalents at beginning ofperiod . . . . . . . . . . . . . . . . . . . . . . . . . 500,246 58,259 81,699 — 640,204
Cash and cash equivalents at end ofperiod . . . . . . . . . . . . . . . . . . . . . . . . . $ 719,570 $ 100,623 $ 57,921 $ — $ 878,114
90
AMERISOURCEBERGEN CORPORATION AND SUBSIDIARIES
NOTES TO CONSOLIDATED FINANCIAL STATEMENTS — (Continued)
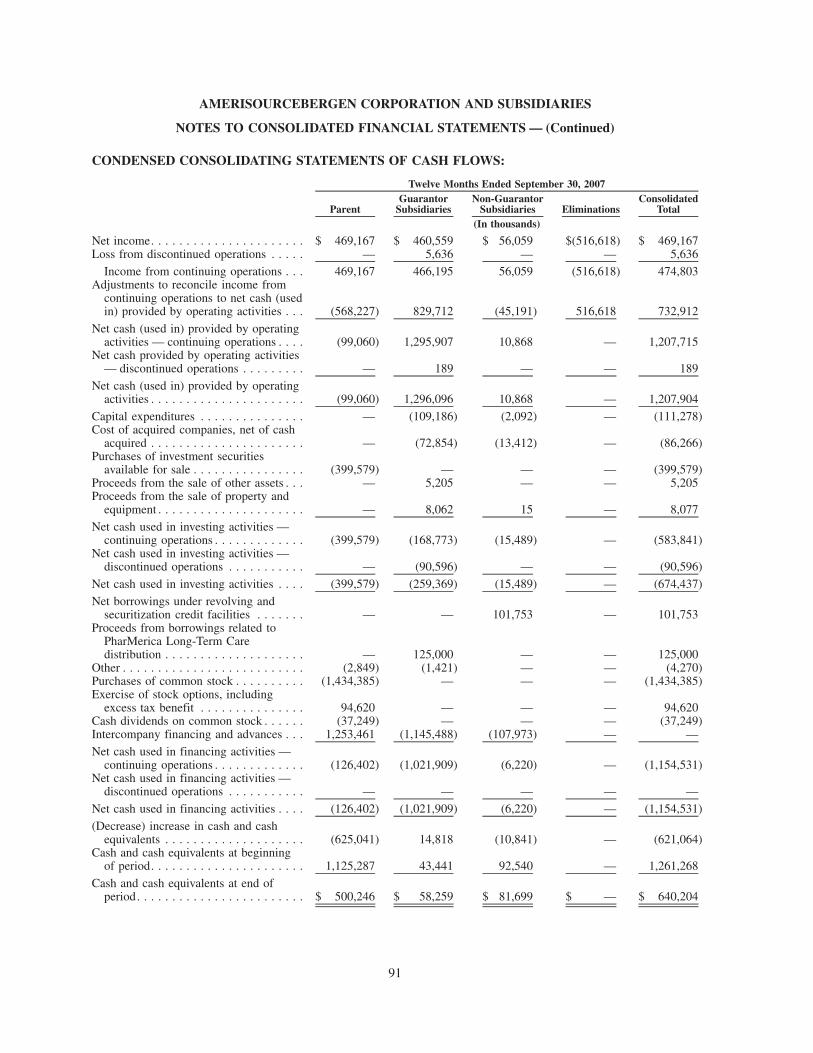
CONDENSED CONSOLIDATING STATEMENTS OF CASH FLOWS:
ParentGuarantor
SubsidiariesNon-Guarantor
Subsidiaries EliminationsConsolidated
Total
Twelve Months Ended September 30, 2007
(In thousands)
Net income. . . . . . . . . . . . . . . . . . . . . . $ 469,167 $ 460,559 $ 56,059 $(516,618) $ 469,167Loss from discontinued operations . . . . . — 5,636 — — 5,636
Income from continuing operations . . . 469,167 466,195 56,059 (516,618) 474,803Adjustments to reconcile income from
continuing operations to net cash (usedin) provided by operating activities . . . (568,227) 829,712 (45,191) 516,618 732,912
Net cash (used in) provided by operatingactivities — continuing operations . . . . (99,060) 1,295,907 10,868 — 1,207,715
Net cash provided by operating activities— discontinued operations . . . . . . . . . — 189 — — 189
Net cash (used in) provided by operatingactivities . . . . . . . . . . . . . . . . . . . . . . (99,060) 1,296,096 10,868 — 1,207,904
Capital expenditures . . . . . . . . . . . . . . . — (109,186) (2,092) — (111,278)Cost of acquired companies, net of cash
acquired . . . . . . . . . . . . . . . . . . . . . . — (72,854) (13,412) — (86,266)Purchases of investment securities
available for sale . . . . . . . . . . . . . . . . (399,579) — — — (399,579)Proceeds from the sale of other assets . . . — 5,205 — — 5,205Proceeds from the sale of property and
equipment . . . . . . . . . . . . . . . . . . . . . — 8,062 15 — 8,077
Net cash used in investing activities —continuing operations . . . . . . . . . . . . . (399,579) (168,773) (15,489) — (583,841)
Net cash used in investing activities —discontinued operations . . . . . . . . . . . — (90,596) — — (90,596)
Net cash used in investing activities . . . . (399,579) (259,369) (15,489) — (674,437)
Net borrowings under revolving andsecuritization credit facilities . . . . . . . — — 101,753 — 101,753
Proceeds from borrowings related toPharMerica Long-Term Caredistribution . . . . . . . . . . . . . . . . . . . . — 125,000 — — 125,000
Other . . . . . . . . . . . . . . . . . . . . . . . . . . (2,849) (1,421) — — (4,270)Purchases of common stock . . . . . . . . . . (1,434,385) — — — (1,434,385)Exercise of stock options, including
excess tax benefit . . . . . . . . . . . . . . . 94,620 — — — 94,620Cash dividends on common stock . . . . . . (37,249) — — — (37,249)Intercompany financing and advances . . . 1,253,461 (1,145,488) (107,973) — —
Net cash used in financing activities —continuing operations . . . . . . . . . . . . . (126,402) (1,021,909) (6,220) — (1,154,531)
Net cash used in financing activities —discontinued operations . . . . . . . . . . . — — — — —
Net cash used in financing activities . . . . (126,402) (1,021,909) (6,220) — (1,154,531)
(Decrease) increase in cash and cashequivalents . . . . . . . . . . . . . . . . . . . . (625,041) 14,818 (10,841) — (621,064)
Cash and cash equivalents at beginningof period. . . . . . . . . . . . . . . . . . . . . . 1,125,287 43,441 92,540 — 1,261,268
Cash and cash equivalents at end ofperiod. . . . . . . . . . . . . . . . . . . . . . . . $ 500,246 $ 58,259 $ 81,699 $ — $ 640,204
91
AMERISOURCEBERGEN CORPORATION AND SUBSIDIARIES
NOTES TO CONSOLIDATED FINANCIAL STATEMENTS — (Continued)
ITEM 9. CHANGES IN AND DISAGREEMENTS WITH ACCOUNTANTS ON ACCOUNTING ANDFINANCIAL DISCLOSURE
None.
ITEM 9A. CONTROLS AND PROCEDURES
Evaluation of Disclosure Controls and Procedures
The Company maintains disclosure controls and procedures that are intended to ensure that information required tobe disclosed in the Company’s reports submitted under the Securities Exchange Act of 1934, as amended (the “ExchangeAct”), is recorded, processed, summarized and reported within the time periods specified in the rules and forms of theSEC. These controls and procedures also are intended to ensure that information required to be disclosed in such reportsis accumulated and communicated to management to allow timely decisions regarding required disclosures.
The Company’s Chief Executive Officer and Chief Financial Officer, with the participation of other membersof the Company’s management, have evaluated the effectiveness of the Company’s disclosure controls andprocedures (as such term is defined in Rules 13a — 15(e) and 15d — 15(e) under the Exchange Act) and haveconcluded that the Company’s disclosure controls and procedures were effective for their intended purposes as ofthe end of the period covered by this report.
Changes in Internal Control over Financial Reporting
There were no changes during the fiscal quarter ended September 30, 2009 in the Company’s internal controlover financial reporting that materially affected, or are reasonably likely to materially affect, those controls.
MANAGEMENT’S REPORT ON INTERNAL CONTROL OVER FINANCIAL REPORTING
The management of AmerisourceBergen Corporation (“AmerisourceBergen” or the “Company”) is responsiblefor establishing and maintaining adequate internal control over financial reporting as defined in Rules 13a-15(f) and15d-15(f) under the Securities Exchange Act of 1934, as amended. AmerisourceBergen’s internal control overfinancial reporting is designed to provide reasonable assurance regarding the reliability of financial reporting and thepreparation of financial statements for external purposes in accordance with generally accepted accounting principles.The Company’s internal control over financial reporting includes those policies and procedures that:
(i) pertain to the maintenance of records that, in reasonable detail, accurately and fairly reflect thetransactions and dispositions of the assets of the Company;
(ii) provide reasonable assurance that transactions are recorded as necessary to permit preparation offinancial statements in accordance with U.S. generally accepted accounting principles, and that receipts andexpenditures of the Company are being made only in accordance with authorizations of management anddirectors of the Company; and
(iii) provide reasonable assurance regarding prevention or timely detection of unauthorized acquisition,use or disposition of the Company’s assets that could have a material effect on the financial statements.
Because of inherent limitations, internal control over financial reporting may not prevent or detect misstate-ments. Also, projections of any evaluation of effectiveness to future periods are subject to risk that controls maybecome inadequate because of changes in conditions, or that the degree of compliance with the policies orprocedures may deteriorate.
AmerisourceBergen’s management assessed the effectiveness of AmerisourceBergen’s internal control overfinancial reporting as of September 30, 2009. In making this assessment, management used the criteria set forth bythe Committee of Sponsoring Organizations of the Treadway Commission (COSO) in Internal Control-IntegratedFramework. Based on management’s assessment and those criteria, management has concluded that Amerisource-Bergen’s internal control over financial reporting was effective as of September 30, 2009. AmerisourceBergen’sindependent registered public accounting firm, Ernst & Young LLP, has issued an attestation report on the effectivenessof AmerisourceBergen’s internal control over financial reporting. This report is set forth on the next page.
92
REPORT OF INDEPENDENT REGISTERED PUBLIC ACCOUNTING FIRM ON INTERNALCONTROL OVER FINANCIAL REPORTING
The Board of Directors and Stockholders of AmerisourceBergen Corporation
We have audited internal control over financial reporting of AmerisourceBergen Corporation and subsidiariesas of September 30, 2009, based on criteria established in Internal Control — Integrated Framework issued by theCommittee of Sponsoring Organizations of the Treadway Commission (the COSO criteria). AmerisourceBergenCorporation’s management is responsible for maintaining effective internal control over financial reporting, and forits assessment of the effectiveness of internal control over financial reporting included in the accompanyingManagement’s Report on Internal Control Over Financial Reporting. Our responsibility is to express an opinion onthe company’s internal control over financial reporting based on our audit.
We conducted our audit in accordance with the standards of the Public Company Accounting Oversight Board(United States). Those standards require that we plan and perform the audit to obtain reasonable assurance aboutwhether effective internal control over financial reporting was maintained in all material respects. Our auditincluded obtaining an understanding of internal control over financial reporting, assessing the risk that a materialweakness exists, testing and evaluating the design and operating effectiveness of internal control based on theassessed risk, and performing such other procedures as we considered necessary in the circumstances. We believethat our audit provides a reasonable basis for our opinion.
A company’s internal control over financial reporting is a process designed to provide reasonable assuranceregarding the reliability of financial reporting and the preparation of financial statements for external purposes inaccordance with generally accepted accounting principles. A company’s internal control over financial reportingincludes those policies and procedures that (1) pertain to the maintenance of records that, in reasonable detail,accurately and fairly reflect the transactions and dispositions of the assets of the company; (2) provide reasonableassurance that transactions are recorded as necessary to permit preparation of financial statements in accordancewith generally accepted accounting principles, and that receipts and expenditures of the company are being madeonly in accordance with authorizations of management and directors of the company; and (3) provide reasonableassurance regarding prevention or timely detection of unauthorized acquisition, use, or disposition of the company’sassets that could have a material effect on the financial statements.
Because of its inherent limitations, internal control over financial reporting may not prevent or detectmisstatements. Also, projections of any evaluation of effectiveness to future periods are subject to the risk thatcontrols may become inadequate because of changes in conditions, or that the degree of compliance with thepolicies or procedures may deteriorate.
In our opinion, AmerisourceBergen Corporation and subsidiaries maintained, in all material respects, effectiveinternal control over financial reporting as of September 30, 2009, based on the COSO criteria.
We also have audited, in accordance with the standards of the Public Company Accounting Oversight Board(United States), the consolidated balance sheets of AmerisourceBergen Corporation and subsidiaries as ofSeptember 30, 2009 and 2008, and the related consolidated statements of operations, changes in stockholders’equity, and cash flows for each of the three years in the period ended September 30, 2009 and our report datedNovember 25, 2009 expressed an unqualified opinion thereon.
/s/ Ernst & Young LLP
Philadelphia, PennsylvaniaNovember 25, 2009
93
ITEM 9B. OTHER INFORMATION
None.
PART III
ITEM 10. DIRECTORS, EXECUTIVE OFFICERS AND CORPORATE GOVERNANCE
Information appearing in our Notice of Annual Meeting of Stockholders and Proxy Statement for the 2010annual meeting of stockholders (the “2010 Proxy Statement”) including information under “Election of Directors,”“Additional Information about the Directors, the Board and the Board Committees,” “Codes of Ethics,” “AuditMatters,” and “Section 16 (a) Beneficial Reporting Compliance,” is incorporated herein by reference. We will filethe 2010 Proxy Statement with the Securities and Exchange Commission pursuant to Regulation 14A within120 days after the close of the fiscal year.
Information with respect to Executive Officers of the Company appears in Part I of this report.
We adopted a Code of Ethics for Designated Senior Officers that applies to our Chief Executive Officer, ChiefFinancial Officer and Corporate Controller. A copy of this Code of Ethics is filed as an exhibit to this report and isposted on our Internet website, which is www.amerisourcebergen.com. Any amendment to, or waiver from, anyprovision of this Code of Ethics will be posted as well on our Internet website.
As required by Section 303A.12(a) of the New York Stock Exchange (“NYSE”) Listed Company Manual, ourPresident and Chief Executive Officer, R. David Yost, certified to the NYSE within 30 days after our 2009 AnnualMeeting of Stockholders that he was not aware of any violation by us of the NYSE Corporate Governance ListingStandards.
ITEM 11. EXECUTIVE COMPENSATION
Information contained in the 2010 Proxy Statement, including information appearing under “CompensationMatters” and “Executive Compensation” in the 2010 Proxy Statement, is incorporated herein by reference.
ITEM 12. SECURITY OWNERSHIP OF CERTAIN BENEFICIAL OWNERS AND MANAGEMENTAND RELATED STOCKHOLDER MATTERS
Information contained in the 2010 Proxy Statement, including information appearing under “BeneficialOwnership of Common Stock” and “Equity Compensation Plan Information” in the 2010 Proxy Statement, isincorporated herein by reference.
ITEM 13. CERTAIN RELATIONSHIPS AND RELATED TRANSACTIONS, AND DIRECTORINDEPENDENCE
Information contained in the 2010 Proxy Statement, including information appearing under “AdditionalInformation about the Directors, the Board, and the Board Committees,” “Corporate Governance,” “Agreementswith Employees” and “Certain Transactions” in the 2010 Proxy Statement, is incorporated herein by reference.
ITEM 14. PRINCIPAL ACCOUNTANT FEES AND SERVICES
Information contained in the 2010 Proxy Statement, including information appearing under “Audit Matters” inthe 2010 Proxy Statement, is incorporated herein by reference.
94
PART IV
ITEM 15. EXHIBITS AND FINANCIAL STATEMENT SCHEDULES
(a) (1) and (2) List of Financial Statements and Schedules.
Financial Statements: The following consolidated financial statements are submitted in response toItem 15(a)(1):
Page
Report of Ernst & Young LLP, Independent Registered Public Accounting Firm . . . . . . . . . . . . . . . . . . . 45
Consolidated Balance Sheets as of September 30, 2009 and 2008. . . . . . . . . . . . . . . . . . . . . . . . . . . . . . 46
Consolidated Statements of Operations for the fiscal years ended September 30, 2009, 2008 and 2007 . . 47
Consolidated Statements of Changes in Stockholders’ Equity for the fiscal years ended September 30,2009, 2008 and 2007 . . . . . . . . . . . . . . . . . . . . . . . . . . . . . . . . . . . . . . . . . . . . . . . . . . . . . . . . . . . . 48
Consolidated Statements of Cash Flows for the fiscal years ended September 30, 2009, 2008 and 2007. . 49
Notes to Consolidated Financial Statements . . . . . . . . . . . . . . . . . . . . . . . . . . . . . . . . . . . . . . . . . . . . . . 50
Financial Statement Schedule: The following financial statement schedule is submitted in response toItem 15(a)(2):
Schedule II — Valuation and Qualifying Accounts . . . . . . . . . . . . . . . . . . . . . . . . . . . . . . . . . . . . . . . . . 102
All other schedules for which provision is made in the applicable accounting regulations of the Securities andExchange Commission are not required under the related instructions or are inapplicable and, therefore, have beenomitted.
95
(a) (3) List of Exhibits.*ExhibitNumber Description
2 Agreement and Plan of Merger dated as of March 16, 2001 by and among AABB Corporation,AmeriSource Health Corporation, Bergen Brunswig Corporation, A-Sub Acquisition Corp. and B-SubAcquisition Corp. (incorporated by reference to Exhibit 2.1 to the Registrant’s Registration StatementNo. 333-71942 on Form S-4, dated October 19, 2001).
3.1 Amended and Restated Certificate of Incorporation, as amended, of the Registrant (incorporated byreference to Annex J to the joint proxy statement-prospectus forming a part of the Registrant’sRegistration Statement on Form S-4/A, Registration No. 333-61440, filed July 5, 2001).
3.2 Amendment to Amended and Restated Certificate of Incorporation, as amended, of the Registrant(incorporated by reference to Exhibit 3.2 to the Registrant’s Registration Statement on Form S-4,Registration No. 333-132017, filed February 23, 2006).
3.2 Amended and Restated Bylaws of the Registrant (incorporated by reference to Exhibit 3(ii) to theRegistrant’s Current Report on Form 8-K filed on November 13, 2007).
4.2 Grant of Registration Rights by the Registrant to US Bioservices Corporation stockholders, datedDecember 13, 2002 (incorporated by reference to Exhibit 4.4 to the Registrant’s RegistrationStatement on Form S-3, Registration No. 333-102090, filed December 20, 2002).
4.3 Registration Rights Agreement, dated as of May 21, 2003, by and among the Registrant, the stockholdersof Anderson Packaging, Inc. and John R. Anderson (incorporated by reference to Exhibit 4.4 to theRegistrant’s Registration Statement on Form S-3, Registration No. 333-105743, filed May 30, 2003).
4.4 Purchase Agreement, dated September 8, 2005, by and among the Registrant, the Subsidiary Guarantorsnamed therein, Lehman Brothers Inc., Banc of America Securities LLC, J.P. Morgan Securities Inc.,Scotia Capital (USA) Inc., Wachovia Securities, Inc. and Wells Fargo Securities, LLC (incorporated byreference to Exhibit 4.4 to the Registrant’s Annual Report on Form 10-K for the fiscal year endedSeptember 30, 2005).
4.5 Indenture, dated as of September 14, 2005, among the Registrant, certain of the Registrant’s subsidiariesas guarantors thereto and J.P. Morgan Trust Company, National Association, as trustee, related to theRegistrant’s 55⁄8% Senior Notes due 2012 and 57⁄8% Senior Notes due 2015 (incorporated by reference toExhibit 4.5 to the Registrant’s Annual Report on Form 10-K for the fiscal year ended September 30,2005).
4.6 Form of 55⁄8% Senior Notes due 2012 (incorporated by reference to Exhibit 4.6 to the Registrant’s AnnualReport on Form 10-K for the fiscal year ended September 30, 2005).
4.7 Form of 57⁄8% Senior Notes due 2015 (incorporated by reference to Exhibit 4.7 to the Registrant’s AnnualReport on Form 10-K for the fiscal year ended September 30, 2005).
4.8 Exchange and Registration Rights Agreement, dated September 14, 2005, by and among the Registrant,the Subsidiary Guarantors named therein, and Lehman Brothers Inc. on behalf of the Initial Purchasersunder the Purchase Agreement dated September 8, 2005 (incorporated by reference to Exhibit 4.8 to theRegistrant’s Annual Report on Form 10-K for the fiscal year ended September 30, 2005).
4.9 Underwriting Agreement, dated November 16, 2009, between the Registrant and J.P. Morgan SecuritiesInc. and Banc of America Securities LLC (incorporated by reference to Exhibit 1.1 to the Registrant’sCurrent Report on Form 8-K filed on November 16, 2009).
4.10 Indenture, dated as of November 19, 2009, among the Registrant and U.S. Bank National Association, astrustee (incorporated by reference to Exhibit 4.1 to the Registrant’s Current Report on Form 8-K filed onNovember 23, 2009).
4.11 First Supplemental Indenture, dated as of November 19, 2009, among the Registrant, the Guarantorsnamed therein and U.S. Bank National Association, as trustee (incorporated by reference to Exhibit 4.2 tothe Registrant’s Current Report on Form 8-K filed on November 23, 2009).
96
ExhibitNumber Description
4.12 Form of 4.875% Senior Notes due 2019 (incorporated by reference to Exhibit 4.2 to the Registrant’sCurrent Report on Form 8-K filed on November 23, 2009).
‡10.1 AmeriSource Master Pension Plan (incorporated by reference to Exhibit 10.9 to Registration Statement onForm S-1 of AmeriSource Health Corporation, Registration No. 33-27835, filed March 29, 1989).
‡10.2 AmerisourceBergen Drug Corporation Supplemental Retirement Plan, as amended and restated as ofNovember 24, 2008 (incorporated by reference to Exhibit 10.2 to the Registrant’s Annual Report onForm 10-K for the fiscal year ended September 30, 2008).
‡10.3 AmeriSource Health Corporation 1996 Stock Option Plan (incorporated by reference to Appendix C toProxy Statement of AmeriSource Health Corporation dated January 15, 1997 for the Annual Meeting ofStockholders held on February 11, 1997).
‡10.4 AmeriSource Health Corporation 1996 Non-Employee Directors Stock Option Plan (incorporated byreference to Appendix D to Proxy Statement of AmeriSource Health Corporation dated January 15, 1997for the Annual Meeting of Stockholders held on February 11, 1997).
‡10.5 AmeriSource Health Corporation 1999 Non-Employee Directors Stock Option Plan (incorporated byreference to Appendix C to Proxy Statement of AmeriSource Health Corporation dated February 5, 1999for the Annual Meeting of Stockholders held on March 3, 1999).
‡10.6 AmeriSource Health Corporation 1999 Stock Option Plan (incorporated by reference to Appendix B toProxy Statement of AmeriSource Health Corporation dated February 5, 1999 for the Annual Meeting ofStockholders held on March 3, 1999).
‡10.7 AmeriSource Health Corporation 2001 Stock Option Plan (incorporated by reference to Exhibit 99.1 tothe Registration Statement on Form S-8 of AmeriSource Health Corporation, filed May 4, 2001).
‡10.8 AmeriSource Health Corporation 2001 Non-Employee Directors Stock Option Plan (incorporated byreference to Exhibit 99.2 to the Registration Statement on Form S-8 of AmeriSource Health Corporation,filed May 4, 2001).
‡10.9 Bergen Brunswig Corporation Fifth Amended and Restated Supplemental Executive Retirement Plan,amended and restated as of November 24, 2008 (incorporated by reference to Exhibit 10.9 to theRegistrant’s Annual Report on Form 10-K for the fiscal year ended September 30, 2008).
‡10.10 Bergen Brunswig Corporation 1999 Management Stock Incentive Plan (incorporated by reference toAnnex F to Registration Statement No. 333-7445 of Form S-4 of Bergen Brunswig Corporation datedMarch 16, 1999).
‡10.11 Bergen Brunswig Corporation 1999 Deferred Compensation Plan (incorporated by reference to Annex Gto Registration Statement No. 333-7445 of Form S-4 of Bergen Brunswig Corporation dated March 16,1999).
‡10.12 Form of the Bergen Brunswig Amended and Restated Capital Accumulation Plan (incorporated byreference to Exhibit 10.2 to Registration Statement No. 333-631 on Form S-3 of Bergen BrunswigCorporation and Amendment No. 1 thereto relating to a shelf offering of $400 million in securities filedFebruary 1, 1996 and March 19, 1996, respectively).
‡10.13 Amendment No. 1 to the Bergen Brunswig Amended and Restated Capital Accumulation Plan(incorporated by reference to Exhibit 10(m) to Annual Report on Form 10-K of Bergen BrunswigCorporation for the fiscal year ended September 30, 1996).
‡10.14 Form of Bergen Brunswig Corporation Officers’ Employment Agreement and Schedule (incorporated byreference to Exhibit 10(q) to Annual Report on Form 10-K for Bergen Brunswig Corporation for the fiscalyear ended September 30, 1994).
‡10.15 Form of Bergen Brunswig Corporation Officers’ Severance Agreement and Schedule (incorporated byreference to Exhibit 10(r) to Annual Report on Form 10-K for Bergen Brunswig Corporation for the fiscalyear ended September 30, 1994).
‡10.16 Bergen Brunswig Corporation 1999 Non-Employee Directors’ Stock Plan (incorporated by reference toAnnex E to Joint Proxy Statement/Prospectus dated March 16, 1999 of Bergen Brunswig Corporation).
97
ExhibitNumber Description
‡10.17 AmerisourceBergen Corporation 2001 Non-Employee Directors’ Stock Option Plan, as amended andrestated November 9, 2005 (incorporated by reference to Exhibit 10.17 to the Registrant’s Annual Reporton Form 10-K for the fiscal year ended September 30, 2005).
‡10.18 AmerisourceBergen Corporation 2001 Restricted Stock Plan, as amended and restated as ofNovember 12, 2008 (incorporated by reference to Exhibit 10.18 to the Registrant’s Annual Report onForm 10-K for the fiscal year ended September 30, 2008).
‡10.19 AmerisourceBergen Corporation 2001 Deferred Compensation Plan, as amended and restated as ofNovember 24, 2008 (incorporated by reference to Exhibit 10.19 to the Registrant’s Annual Report onForm 10-K for the fiscal year ended September 30, 2008).
‡10.20 AmerisourceBergen Corporation Supplemental 401(k) Plan, as amended and restated as of November 24,2008 (incorporated by reference to Exhibit 10.20 to the Registrant’s Annual Report on Form 10-K for thefiscal year ended September 30, 2008).
‡10.21 Registrant’s 2002 Employee Stock Purchase Plan, dated as of January 18, 2002 (incorporated by referenceto Appendix B to the Registrant’s Proxy Statement dated January 22, 2002 for the Annual Meeting ofStockholders held on February 27, 2002).
‡10.22 AmerisourceBergen Corporation Management Incentive Plan, effective as of February 19, 2009(incorporated by reference to Exhibit 99.2 to the Registrant’s Current Report on Form 8-K filed onFebruary 19, 2009).
‡10.23 Amended and Restated Employment Agreement, dated as of November 24, 2008, between the Registrantand R. David Yost (incorporated by reference to Exhibit 10.6 to the Registrant’s Quarterly Report onForm 10-Q for the fiscal quarter ended December 31, 2008).
‡10.24 Letter Agreement, dated January 7, 2009, between the Registrant and R. David Yost (incorporated byreference to Exhibit 10.7 to the Registrant’s Quarterly Report on Form 10-Q for the fiscal quarter endedDecember 31, 2008).
‡10.25 AmerisourceBergen Corporation Amended and Restated Long-Term Incentive Award Agreement, datedDecember 22, 2008, for R. David Yost (incorporated by reference to Exhibit 10.8 to the Registrant’sQuarterly Report on Form 10-Q for the fiscal quarter ended December 31, 2008).
‡10.26 Amended and Restated Employment Agreement, dated as of November 24, 2008, between the Registrantand Michael D. DiCandilo (incorporated by reference to Exhibit 10.9 to the Registrant’s Quarterly Reporton Form 10-Q for the fiscal quarter ended December 31, 2008).
‡10.27 Letter Agreement, dated January 7, 2009, between the Registrant and Michael D. DiCandilo (incorporatedby reference to Exhibit 10.10 to the Registrant’s Quarterly Report on Form 10-Q for the fiscal quarterended December 31, 2008).
‡10.28 Amended and Restated Employment Agreement, dated as of December 15, 2008, between the Registrantand Steven H. Collis (incorporated by reference to Exhibit 10.11 to the Registrant’s Quarterly Report onForm 10-Q for the fiscal quarter ended December 31, 2008).
‡10.29 Letter Agreement, dated January 7, 2009, between the Registrant and Steven H. Collis (incorporated byreference to Exhibit 10.12 to the Registrant’s Quarterly Report on Form 10-Q for the fiscal quarter endedDecember 31, 2008).
‡10.30 Amended and Restated Employment Agreement, dated as of November 24, 2008, between the Registrantand Jeanne B. Fisher (incorporated by reference to Exhibit 10.13 to the Registrant’s Quarterly Report onForm 10-Q for the fiscal quarter ended December 31, 2008).
‡10.31 Letter Agreement, dated January 7, 2009, between the Registrant and Jeanne B. Fisher (incorporated byreference to Exhibit 10.14 to the Registrant’s Quarterly Report on Form 10-Q for the fiscal quarter endedDecember 31, 2008).
‡10.32 Amended and Restated Employment Agreement, dated as of November 24, 2008, between the Registrantand John G. Chou (incorporated by reference to Exhibit 10.15 to the Registrant’s Quarterly Report onForm 10-Q for the fiscal quarter ended December 31, 2008).
‡10.33 Letter Agreement, dated January 7, 2009, between the Registrant and John G. Chou (incorporated byreference to Exhibit 10.16 to the Registrant’s Quarterly Report on Form 10-Q for the fiscal quarter endedDecember 31, 2008).
98
ExhibitNumber Description
‡10.34 AmerisourceBergen Corporation 2002 Management Stock Incentive Plan Award Agreement between theRegistrant and R. David Yost, dated December 6, 2007 (incorporated by reference to Exhibit 10.1 to theRegistrant’s Quarterly Report on Form 10-Q for the fiscal quarter ended December 31, 2007).
10.35 Receivables Sale Agreement between AmerisourceBergen Drug Corporation, as Originator, andAmeriSource Receivables Financial Corporation, as Buyer, dated as of July 10, 2003 (incorporatedby reference to Exhibit 4.22 to the Registrant’s Annual Report on Form 10-K for the fiscal year endedSeptember 30, 2003).
10.36 Receivables Purchase Agreement among AmeriSource Receivables Financial Corporation, as Seller,AmerisourceBergen Drug Corporation, as Initial Servicer, Wachovia Bank, National Association, asAdministrator and various purchase groups, dated as of July 10, 2003 (incorporated by reference toExhibit 4.23 to the Registrant’s Annual Report on Form 10-K for the fiscal year ended September 30,2003).
10.37 Performance Undertaking, dated July 10, 2003, executed by the Registrant, as Performance Guarantor, infavor of Amerisource Receivables Financial Corporation, as Recipient (incorporated by reference toExhibit 4.24 to the Registrant’s Annual Report on Form 10-K for the fiscal year ended September 30,2003).
10.38 Intercreditor Agreement, dated July 10, 2003, executed by Wachovia Bank, National Association, asadministrator under the Receivables Purchase Agreement and JPMorgan Chase Bank (f/k/a The ChaseManhattan Bank), as administrative agent under the Credit Agreement (incorporated by reference toExhibit 4.25 to the Registrant’s Annual Report on Form 10-K for the fiscal year ended September 30,2003).
10.39 First Amendment, dated as of December 12, 2003, to the Receivables Purchase Agreement amongAmeriSource Receivables Financial Corporation, as Seller, AmerisourceBergen Drug Corporation, asInitial Servicer, Wachovia Bank, National Association, as Administrator and various purchase groups,dated as of July 10, 2003 (incorporated by reference to Exhibit 4.29 to the Registrant’s Annual Report onForm 10-K for the fiscal year ended September 30, 2004).
10.40 Second Amendment, dated as of July 8, 2004, to the Receivables Purchase Agreement amongAmeriSource Receivables Financial Corporation, as Seller, AmerisourceBergen Drug Corporation, asInitial Servicer, Wachovia Bank, National Association, as Administrator and various purchase groups,dated as of July 10, 2003 (incorporated by reference to Exhibit 4.30 to the Registrant’s Annual Report onForm 10-K for the fiscal year ended September 30, 2004).
10.41 Third Amendment dated as of December 2, 2004 to the Receivables Purchase Agreement amongAmeriSource Receivables Financial Corporation, as Seller, AmerisourceBergen Drug Corporation, asInitial Servicer, Wachovia Bank, National Association, as Administrator and various purchase groups,dated as of July 10, 2003 (incorporated by reference to Exhibit 10.37 to the Registrant’s Annual Report onForm 10-K for the fiscal year ended September 30, 2005).
10.42 Fourth Amendment dated as of October 31, 2005 to the Receivables Purchase Agreement amongAmeriSource Receivables Financial Corporation, as Seller, AmerisourceBergen Drug Corporation, asInitial Servicer, Wachovia Bank, National Association, as Administrator and various purchase groups,dated as of July 10, 2003 (incorporated by reference to Exhibit 10.39 to the Registrant’s Annual Report onForm 10-K for the fiscal year ended September 30, 2005).
10.43 Fifth Amendment, dated as of November 14, 2006, to the Receivables Purchase Agreement amongAmeriSource Receivables Financial Corporation, as Seller, AmerisourceBergen Drug Corporation, asInitial Servicer, Wachovia Bank, National Association, as Administrator, and various purchase groups,dated as of July 10, 2003 (incorporated by reference to Exhibit 10.43 to the Registrant’s Annual Report onForm 10-K for the fiscal year ended September 30, 2006).
10.44 Sixth Amendment, dated as of June 14, 2007, to the Receivables Purchase Agreement amongAmerisource Receivables Financial Corporation, as Seller, AmerisourceBergen Drug Corporation, asInitial Servicer, Wachovia Bank, National Association, as Administrator, and various purchase groups,dated as of July 10, 2003 (incorporated by reference to Exhibit 10.1 to the Registrant’s Quarterly Reportfor the fiscal quarter ended June 30, 2007).
99
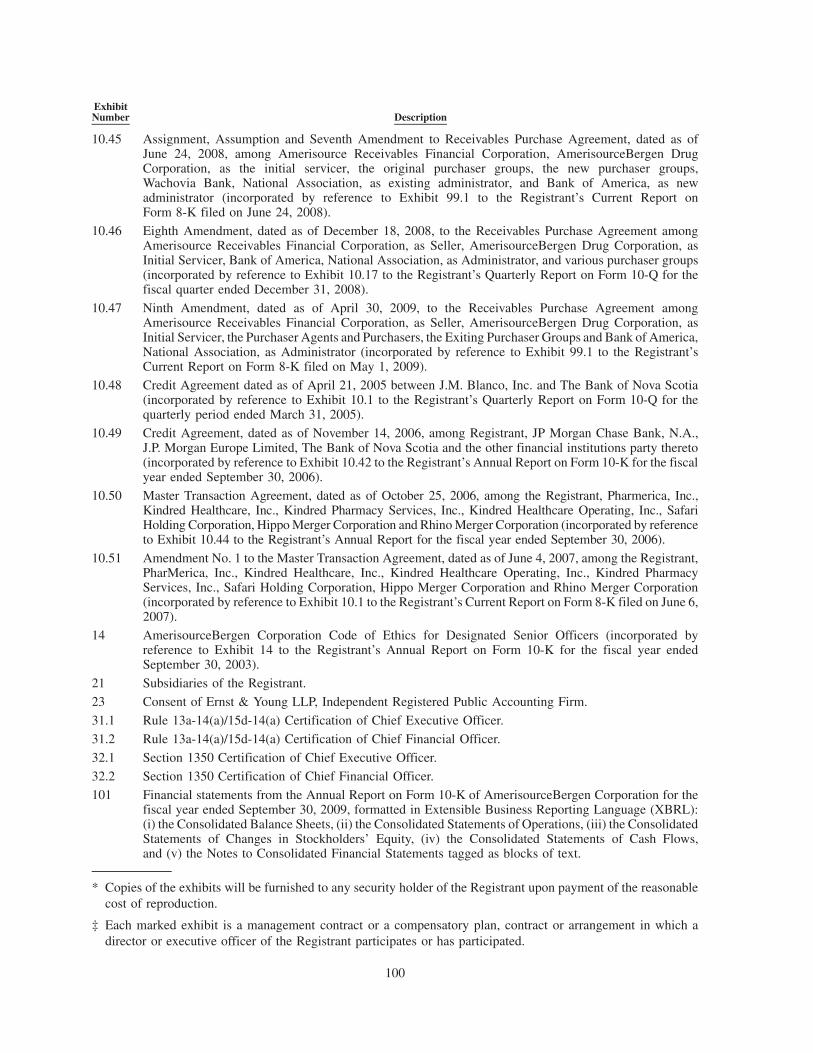
ExhibitNumber Description
10.45 Assignment, Assumption and Seventh Amendment to Receivables Purchase Agreement, dated as ofJune 24, 2008, among Amerisource Receivables Financial Corporation, AmerisourceBergen DrugCorporation, as the initial servicer, the original purchaser groups, the new purchaser groups,Wachovia Bank, National Association, as existing administrator, and Bank of America, as newadministrator (incorporated by reference to Exhibit 99.1 to the Registrant’s Current Report onForm 8-K filed on June 24, 2008).
10.46 Eighth Amendment, dated as of December 18, 2008, to the Receivables Purchase Agreement amongAmerisource Receivables Financial Corporation, as Seller, AmerisourceBergen Drug Corporation, asInitial Servicer, Bank of America, National Association, as Administrator, and various purchaser groups(incorporated by reference to Exhibit 10.17 to the Registrant’s Quarterly Report on Form 10-Q for thefiscal quarter ended December 31, 2008).
10.47 Ninth Amendment, dated as of April 30, 2009, to the Receivables Purchase Agreement amongAmerisource Receivables Financial Corporation, as Seller, AmerisourceBergen Drug Corporation, asInitial Servicer, the Purchaser Agents and Purchasers, the Exiting Purchaser Groups and Bank of America,National Association, as Administrator (incorporated by reference to Exhibit 99.1 to the Registrant’sCurrent Report on Form 8-K filed on May 1, 2009).
10.48 Credit Agreement dated as of April 21, 2005 between J.M. Blanco, Inc. and The Bank of Nova Scotia(incorporated by reference to Exhibit 10.1 to the Registrant’s Quarterly Report on Form 10-Q for thequarterly period ended March 31, 2005).
10.49 Credit Agreement, dated as of November 14, 2006, among Registrant, JP Morgan Chase Bank, N.A.,J.P. Morgan Europe Limited, The Bank of Nova Scotia and the other financial institutions party thereto(incorporated by reference to Exhibit 10.42 to the Registrant’s Annual Report on Form 10-K for the fiscalyear ended September 30, 2006).
10.50 Master Transaction Agreement, dated as of October 25, 2006, among the Registrant, Pharmerica, Inc.,Kindred Healthcare, Inc., Kindred Pharmacy Services, Inc., Kindred Healthcare Operating, Inc., SafariHolding Corporation, Hippo Merger Corporation and Rhino Merger Corporation (incorporated by referenceto Exhibit 10.44 to the Registrant’s Annual Report for the fiscal year ended September 30, 2006).
10.51 Amendment No. 1 to the Master Transaction Agreement, dated as of June 4, 2007, among the Registrant,PharMerica, Inc., Kindred Healthcare, Inc., Kindred Healthcare Operating, Inc., Kindred PharmacyServices, Inc., Safari Holding Corporation, Hippo Merger Corporation and Rhino Merger Corporation(incorporated by reference to Exhibit 10.1 to the Registrant’s Current Report on Form 8-K filed on June 6,2007).
14 AmerisourceBergen Corporation Code of Ethics for Designated Senior Officers (incorporated byreference to Exhibit 14 to the Registrant’s Annual Report on Form 10-K for the fiscal year endedSeptember 30, 2003).
21 Subsidiaries of the Registrant.
23 Consent of Ernst & Young LLP, Independent Registered Public Accounting Firm.
31.1 Rule 13a-14(a)/15d-14(a) Certification of Chief Executive Officer.
31.2 Rule 13a-14(a)/15d-14(a) Certification of Chief Financial Officer.
32.1 Section 1350 Certification of Chief Executive Officer.
32.2 Section 1350 Certification of Chief Financial Officer.
101 Financial statements from the Annual Report on Form 10-K of AmerisourceBergen Corporation for thefiscal year ended September 30, 2009, formatted in Extensible Business Reporting Language (XBRL):(i) the Consolidated Balance Sheets, (ii) the Consolidated Statements of Operations, (iii) the ConsolidatedStatements of Changes in Stockholders’ Equity, (iv) the Consolidated Statements of Cash Flows,and (v) the Notes to Consolidated Financial Statements tagged as blocks of text.
* Copies of the exhibits will be furnished to any security holder of the Registrant upon payment of the reasonablecost of reproduction.
‡ Each marked exhibit is a management contract or a compensatory plan, contract or arrangement in which adirector or executive officer of the Registrant participates or has participated.
100
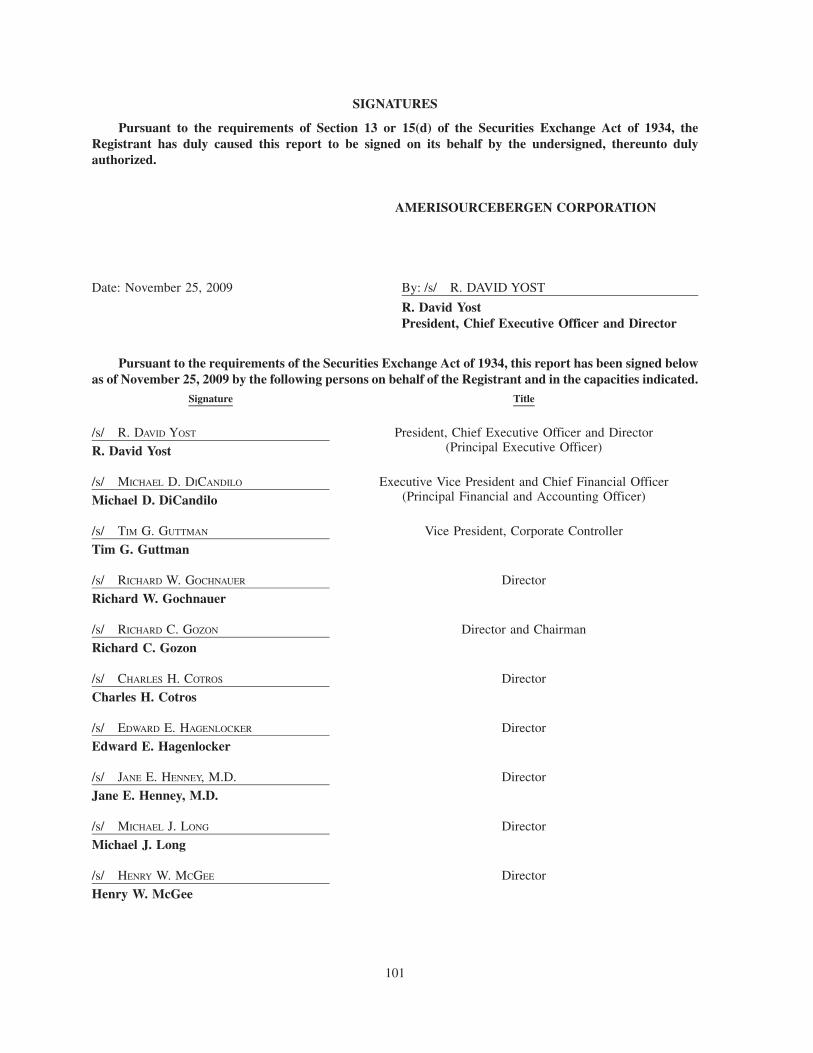
SIGNATURES
Pursuant to the requirements of Section 13 or 15(d) of the Securities Exchange Act of 1934, theRegistrant has duly caused this report to be signed on its behalf by the undersigned, thereunto dulyauthorized.
AMERISOURCEBERGEN CORPORATION
Date: November 25, 2009 By: /s/ R. DAVID YOST
R. David YostPresident, Chief Executive Officer and Director
Pursuant to the requirements of the Securities Exchange Act of 1934, this report has been signed belowas of November 25, 2009 by the following persons on behalf of the Registrant and in the capacities indicated.
Signature Title
/s/ R. DAVID YOST
R. David YostPresident, Chief Executive Officer and Director
(Principal Executive Officer)
/s/ MICHAEL D. DICANDILO
Michael D. DiCandiloExecutive Vice President and Chief Financial Officer
(Principal Financial and Accounting Officer)
/s/ TIM G. GUTTMAN
Tim G. GuttmanVice President, Corporate Controller
/s/ RICHARD W. GOCHNAUER
Richard W. GochnauerDirector
/s/ RICHARD C. GOZON
Richard C. GozonDirector and Chairman
/s/ CHARLES H. COTROS
Charles H. CotrosDirector
/s/ EDWARD E. HAGENLOCKER
Edward E. HagenlockerDirector
/s/ JANE E. HENNEY, M.D.
Jane E. Henney, M.D.Director
/s/ MICHAEL J. LONG
Michael J. LongDirector
/s/ HENRY W. MCGEE
Henry W. McGeeDirector
101
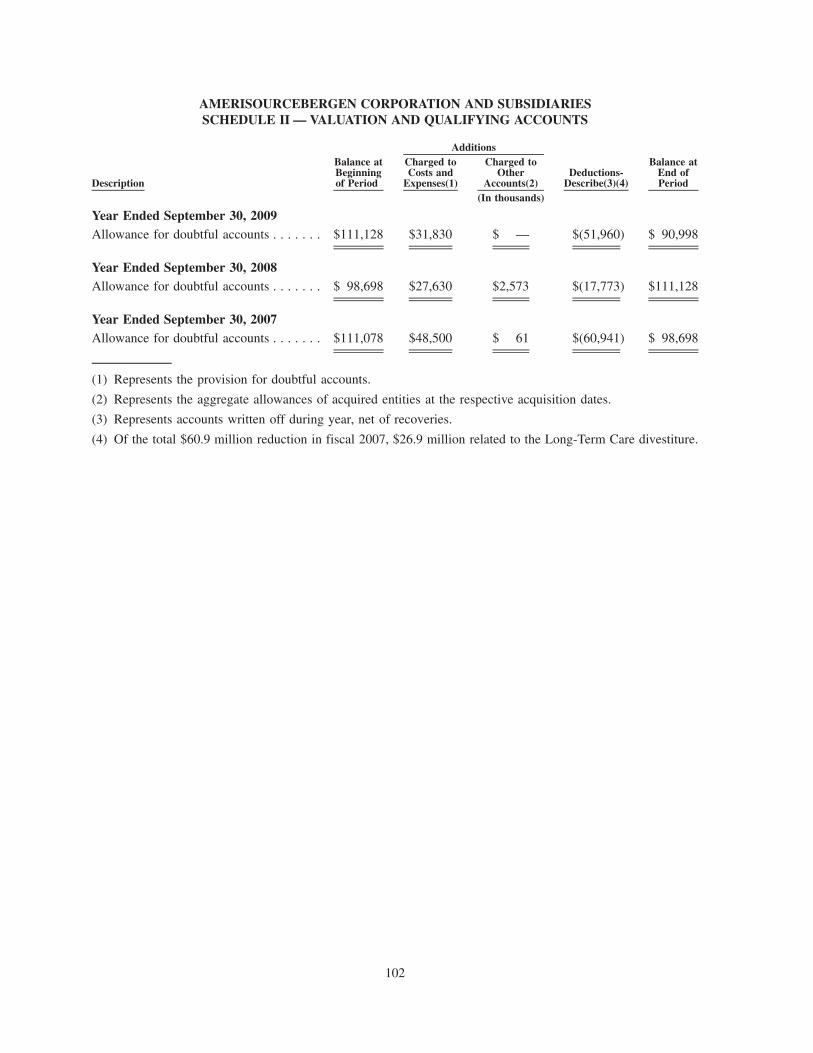
AMERISOURCEBERGEN CORPORATION AND SUBSIDIARIESSCHEDULE II — VALUATION AND QUALIFYING ACCOUNTS
Description
Balance atBeginningof Period
Charged toCosts and
Expenses(1)
Charged toOther
Accounts(2)Deductions-
Describe(3)(4)
Balance atEnd ofPeriod
Additions
(In thousands)
Year Ended September 30, 2009Allowance for doubtful accounts . . . . . . . $111,128 $31,830 $ — $(51,960) $ 90,998
Year Ended September 30, 2008Allowance for doubtful accounts . . . . . . . $ 98,698 $27,630 $2,573 $(17,773) $111,128
Year Ended September 30, 2007Allowance for doubtful accounts . . . . . . . $111,078 $48,500 $ 61 $(60,941) $ 98,698
(1) Represents the provision for doubtful accounts.
(2) Represents the aggregate allowances of acquired entities at the respective acquisition dates.
(3) Represents accounts written off during year, net of recoveries.
(4) Of the total $60.9 million reduction in fiscal 2007, $26.9 million related to the Long-Term Care divestiture.
102

Exhibit 21
Subsidiaries
Name Jurisdiction of FormationAmerisourceBergen Drug Corporation DelawareAmerisource Health Services Corporation DelawareAmerisource Receivables Financial Corporation DelawareAmerisource Heritage Corporation DelawareASD Specialty Healthcare, Inc. CaliforniaInternational Physician Networks, LLC Delaware
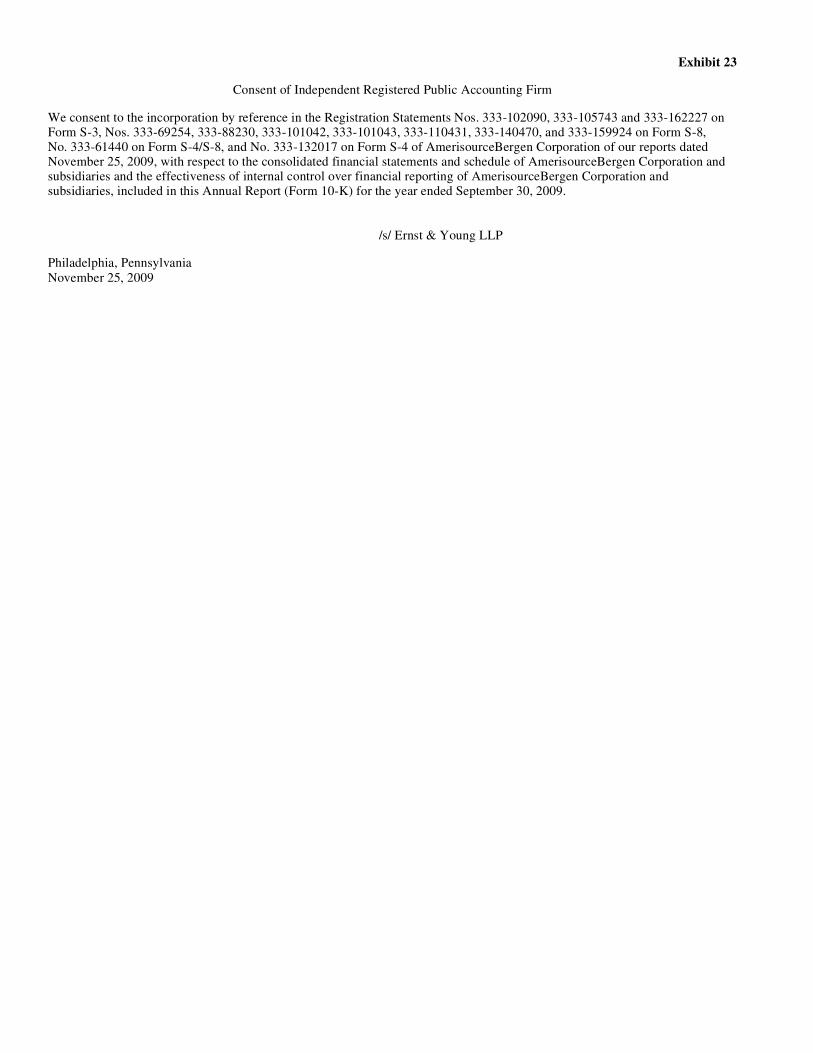
Exhibit 23
Consent of Independent Registered Public Accounting Firm
We consent to the incorporation by reference in the Registration Statements Nos. 333-102090, 333-105743 and 333-162227 on Form S-3, Nos. 333-69254, 333-88230, 333-101042, 333-101043, 333-110431, 333-140470, and 333-159924 on Form S-8, No. 333-61440 on Form S-4/S-8, and No. 333-132017 on Form S-4 of AmerisourceBergen Corporation of our reports dated November 25, 2009, with respect to the consolidated financial statements and schedule of AmerisourceBergen Corporation and subsidiaries and the effectiveness of internal control over financial reporting of AmerisourceBergen Corporation and subsidiaries, included in this Annual Report (Form 10-K) for the year ended September 30, 2009.
Philadelphia, Pennsylvania November 25, 2009
/s/ Ernst & Young LLP
Exhibit 31.1
Rule 13a-14(a)/15d-14(a) Certification of Chief Executive Officer
I, R. David Yost, certify that:
1. I have reviewed this Annual Report on Form 10-K (the “Report”) of AmerisourceBergen Corporation (the“Registrant”);
2. Based on my knowledge, this Report does not contain any untrue statement of a material fact or omit to statea material fact necessary to make the statements made, in light of the circumstances under which such statementswere made, not misleading with respect to the period covered by this Report;
3. Based on my knowledge, the financial statements, and other financial information included in this Report,fairly present in all material respects the financial condition, results of operations and cash flows of the Registrant asof, and for, the periods presented in this Report;
4. The Registrant’s other certifying officer and I are responsible for establishing and maintaining disclosurecontrols and procedures (as defined in Exchange Act Rules 13a-15(e) and 15d-15(e)) and internal control overfinancial reporting (as defined in Exchange Act Rules 13a-15(f) and 15d-15(f)) for the Registrant and have:
(a) Designed such disclosure controls and procedures, or caused such disclosure controls and proceduresto be designed under our supervision, to ensure that material information relating to the Registrant, includingits consolidated subsidiaries, is made known to us by others within those entities, particularly during the periodin which this Report is being prepared;
(b) Designed such internal control over financial reporting, or caused such internal control over financialreporting to be designed under our supervision, to provide reasonable assurance regarding the reliability offinancial reporting and the preparation of financial statements for external purposes in accordance withgenerally accepted accounting principles;
(c) Evaluated the effectiveness of the Registrant’s disclosure controls and procedures and presented inthis Report our conclusions about the effectiveness of the disclosure controls and procedures, as of the end ofthe period covered by this Report based on such evaluation; and
(d) Disclosed in this Report any change in the Registrant’s internal control over financial reporting thatoccurred during the Registrant’s most recent fiscal quarter (the Registrant’s fourth fiscal quarter in the case ofan annual report) that has materially affected, or is reasonably likely to materially affect, the Registrant’sinternal control over financial reporting; and
5. The Registrant’s other certifying officer and I have disclosed, based on our most recent evaluation ofinternal control over financial reporting, to the Registrant’s auditors and the audit committee of Registrant’s boardof directors:
(a) All significant deficiencies and material weaknesses in the design or operation of internal controlover financial reporting which are reasonably likely to adversely affect the Registrant’s ability to record,process, summarize and report financial information; and
(b) Any fraud, whether or not material, that involves management or other employees who have asignificant role in the Registrant’s internal control over financial reporting.
/s/ R. David Yost
R. David YostPresident and Chief Executive Officer
Date: November 25, 2009
Exhibit 31.2
Rule 13a-14(a)/15d-14(a) Certification of Chief Financial Officer
I, Michael D. DiCandilo, certify that:
1. I have reviewed this Annual Report on Form 10-K (the “Report”) of AmerisourceBergen Corporation (the“Registrant”);
2. Based on my knowledge, this Report does not contain any untrue statement of a material fact or omit to statea material fact necessary to make the statements made, in light of the circumstances under which such statementswere made, not misleading with respect to the period covered by this Report;
3. Based on my knowledge, the financial statements, and other financial information included in this Report,fairly present in all material respects the financial condition, results of operations and cash flows of the Registrant asof, and for, the periods presented in this Report;
4. The Registrant’s other certifying officer and I are responsible for establishing and maintaining disclosurecontrols and procedures (as defined in Exchange Act Rules 13a-15(e) and 15d-15(e)) and internal control overfinancial reporting (as defined in Exchange Act Rules 13a-15(f) and 15d-15(f)) for the Registrant and have:
(a) Designed such disclosure controls and procedures, or caused such disclosure controls and proceduresto be designed under our supervision, to ensure that material information relating to the Registrant, includingits consolidated subsidiaries, is made known to us by others within those entities, particularly during the periodin which this Report is being prepared;
(b) Designed such internal control over financial reporting, or caused such internal control over financialreporting to be designed under our supervision, to provide reasonable assurance regarding the reliability offinancial reporting and the preparation of financial statements for external purposes in accordance withgenerally accepted accounting principles;
(c) Evaluated the effectiveness of the Registrant’s disclosure controls and procedures and presented inthis Report our conclusions about the effectiveness of the disclosure controls and procedures, as of the end ofthe period covered by this Report based on such evaluation; and
(d) Disclosed in this Report any change in the Registrant’s internal control over financial reporting thatoccurred during the Registrant’s most recent fiscal quarter (the Registrant’s fourth fiscal quarter in the case ofan annual report) that has materially affected, or is reasonably likely to materially affect, the Registrant’sinternal control over financial reporting; and
5. The Registrant’s other certifying officer and I have disclosed, based on our most recent evaluation ofinternal control over financial reporting, to the Registrant’s auditors and the audit committee of Registrant’s boardof directors:
(a) All significant deficiencies and material weaknesses in the design or operation of internal controlover financial reporting which are reasonably likely to adversely affect the Registrant’s ability to record,process, summarize and report financial information; and
(b) Any fraud, whether or not material, that involves management or other employees who have asignificant role in the Registrant’s internal control over financial reporting.
/s/ Michael D. DiCandilo
Michael D. DiCandiloExecutive Vice President and Chief Financial Officer
Date: November 25, 2009
Exhibit 32.1
Section 1350 Certification of Chief Executive Officer
In connection with the Annual Report of AmerisourceBergen Corporation (the “Company”) on Form 10-K forthe fiscal year ended September 30, 2009 as filed with the Securities and Exchange Commission on the date hereof(the “Report”), I, R. David Yost, President and Chief Executive Officer of the Company, certify, pursuant to18 U.S.C. Section 1350, as adopted pursuant to Section 906 of the Sarbanes-Oxley Act of 2002, that to the best ofmy knowledge:
(1) The Report fully complies with the requirements of Section 13(a) or 15(d) of the Securities ExchangeAct of 1934; and
(2) The information contained in the Report fairly presents, in all material respects, the financialcondition and results of operations of the Company.
/s/ R. David Yost
R. David YostPresident and Chief Executive Officer
November 25, 2009

Exhibit 32.2
Section 1350 Certification of Chief Financial Officer
In connection with the Annual Report of AmerisourceBergen Corporation (the “Company”) on Form 10-K forthe fiscal year ended September 30, 2009 as filed with the Securities and Exchange Commission on the date hereof(the “Report”), I, Michael D. DiCandilo, Executive Vice President and Chief Financial Officer of the Company,certify, pursuant to 18 U.S.C. Section 1350, as adopted pursuant to Section 906 of the Sarbanes-Oxley Act of 2002,that to the best of my knowledge:
(1) The Report fully complies with the requirements of Section 13(a) or 15(d) of the Securities ExchangeAct of 1934; and
(2) The information contained in the Report fairly presents, in all material respects, the financialcondition and results of operations of the Company.
/s/ Michael D. DiCandilo
Michael D. DiCandiloExecutive Vice President and Chief Financial Officer
November 25, 2009