Embed Size (px)
Citation preview
HTC Corporation (Formerly High Tech Computer Corporation) Financial Statements for the Six Months Ended June 30, 2006, 2007 and 2008 and Independent Auditors’ Report
- 1 -
INDEPENDENT AUDITORS’ REPORT The Board of Directors and Stockholders HTC Corporation We have audited the accompanying balance sheets of HTC Corporation (the “Company,” formerly High Tech Computer Corporation) as of June 30, 2006, 2007 and 2008 and the related statements of income, changes in stockholders’ equity, and cash flows for the six months then ended, all expressed in New Taiwan dollars. These financial statements are the responsibility of the Company’s management. Our responsibility is to express an opinion on these financial statements based on our audits. We conducted our audits in accordance with the Rules Governing the Audit of Financial Statements by Certified Public Accountants and auditing standards generally accepted in the Republic of China. Those rules and standards require that we plan and perform the audit to obtain reasonable assurance about whether the financial statements are free of material misstatement. An audit includes examining, on a test basis, evidence supporting the amounts and disclosures in the financial statements. An audit also includes assessing the accounting principles used and significant estimates made by management, as well as evaluating the overall financial statement presentation. We believe that our audits provide a reasonable basis for our opinion. In our opinion, the financial statements referred to above present fairly, in all material respects, the financial position of HTC Corporation as of June 30, 2006, 2007 and 2008, and the results of its operations and its cash flows for the six months then ended, in conformity with the Guidelines Governing the Preparation of Financial Reports by Securities Issuers, requirements of the Business Accounting Law and Guidelines Governing Business Accounting relevant to financial accounting standards, and accounting principles generally accepted in the Republic of China. As discussed in Note 4, the Company has adopted Interpretation 96-052 - “Accounting for Bonuses to Employees, Directors and Supervisors” of the Accounting Research and Development Foundation and adopted early on January 1, 2008 the newly revised Statement of Financial Accounting Standards No. 10 - “Accounting for Inventories.” We have also audited the consolidated financial statements of HTC Corporation as of and for the six months ended June 30, 2006, 2007 and 2008 and have expressed a modified unqualified opinion on those financial statements in our report dated July 17, 2008 (not presented herewith).
- 2 -
Our audits also comprehended the translation of the 2008 New Taiwan dollar amounts into U.S. dollar amounts and, in our opinion, such translation has been made in conformity with the basis stated in Note 3. Such U.S. dollar amounts are presented solely for the convenience of readers. July 17, 2008
Notice to Readers The accompanying financial statements are intended only to present the financial position, results of operations and cash flows in accordance with accounting principles and practices generally accepted in the Republic of China and not those of any other jurisdictions. The standards, procedures and practices to audit such financial statements are those generally accepted and applied in the Republic of China. The auditors’ report and the accompanying financial statements were originally presented in more than one set of Chinese reports. For the convenience of readers, the auditors’ report and the accompanying financial statements have been translated into English from the original Chinese version prepared and used in the Republic of China. If there is any conflict between the English version and the original Chinese version or any difference in the interpretation of the two versions, the Chinese-language auditors’ report and financial statements shall prevail. Also, as stated in Note 2 to the financial statements, the additional footnote disclosures that are not required under generally accepted accounting principles were not translated into English.
- 3 -
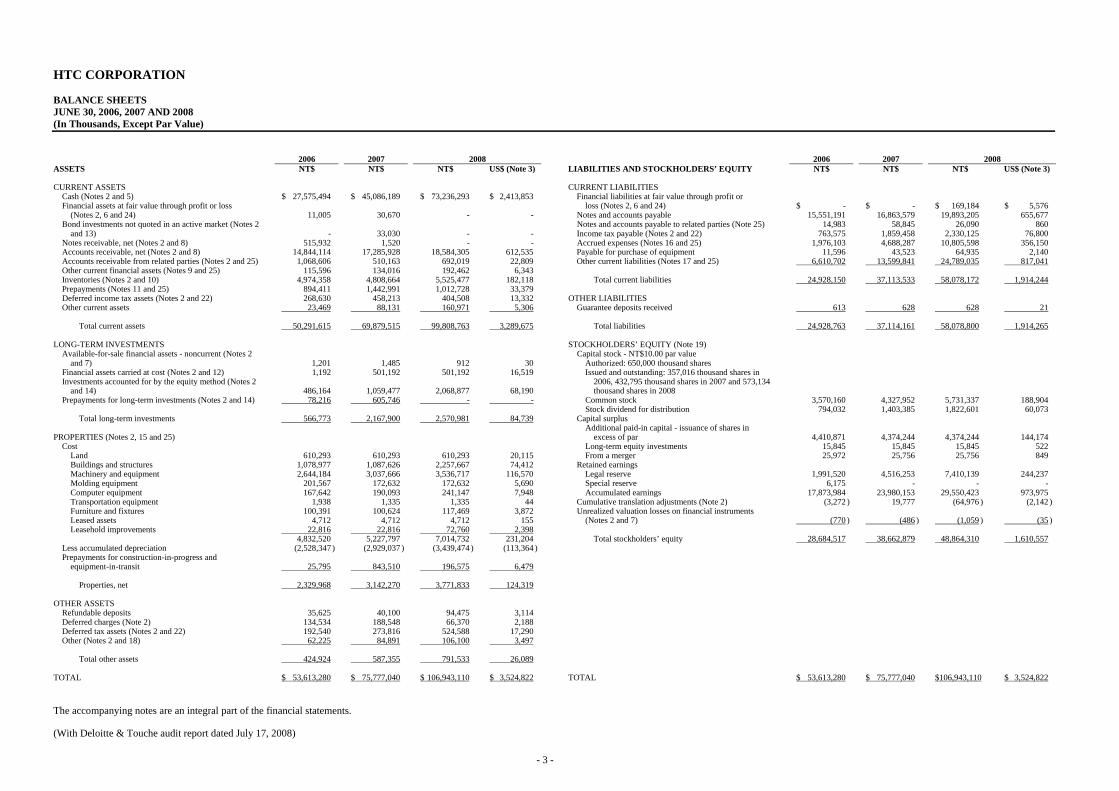
HTC CORPORATION BALANCE SHEETS JUNE 30, 2006, 2007 AND 2008 (In Thousands, Except Par Value) 2006 2007 2008 2006 2007 2008 ASSETS NT$ NT$ NT$ US$ (Note 3) LIABILITIES AND STOCKHOLDERS’ EQUITY NT$ NT$ NT$ US$ (Note 3) CURRENT ASSETS CURRENT LIABILITIES
Cash (Notes 2 and 5) $ 27,575,494 $ 45,086,189 $ 73,236,293 $ 2,413,853 Financial liabilities at fair value through profit or Financial assets at fair value through profit or loss loss (Notes 2, 6 and 24) $ - $ - $ 169,184 $ 5,576 (Notes 2, 6 and 24) 11,005 30,670 - - Notes and accounts payable 15,551,191 16,863,579 19,893,205 655,677 Bond investments not quoted in an active market (Notes 2 Notes and accounts payable to related parties (Note 25) 14,983 58,845 26,090 860 and 13) - 33,030 - - Income tax payable (Notes 2 and 22) 763,575 1,859,458 2,330,125 76,800 Notes receivable, net (Notes 2 and 8) 515,932 1,520 - - Accrued expenses (Notes 16 and 25) 1,976,103 4,688,287 10,805,598 356,150 Accounts receivable, net (Notes 2 and 8) 14,844,114 17,285,928 18,584,305 612,535 Payable for purchase of equipment 11,596 43,523 64,935 2,140 Accounts receivable from related parties (Notes 2 and 25) 1,068,606 510,163 692,019 22,809 Other current liabilities (Notes 17 and 25) 6,610,702 13,599,841 24,789,035 817,041 Other current financial assets (Notes 9 and 25) 115,596 134,016 192,462 6,343 Inventories (Notes 2 and 10) 4,974,358 4,808,664 5,525,477 182,118 Total current liabilities 24,928,150 37,113,533 58,078,172 1,914,244 Prepayments (Notes 11 and 25) 894,411 1,442,991 1,012,728 33,379 Deferred income tax assets (Notes 2 and 22) 268,630 458,213 404,508 13,332 OTHER LIABILITIES Other current assets 23,469 88,131 160,971 5,306 Guarantee deposits received 613 628 628 21
Total current assets 50,291,615 69,879,515 99,808,763 3,289,675 Total liabilities 24,928,763 37,114,161 58,078,800 1,914,265
LONG-TERM INVESTMENTS STOCKHOLDERS’ EQUITY (Note 19)
Available-for-sale financial assets - noncurrent (Notes 2 Capital stock - NT$10.00 par value and 7) 1,201 1,485 912 30 Authorized: 650,000 thousand shares Financial assets carried at cost (Notes 2 and 12) 1,192 501,192 501,192 16,519 Issued and outstanding: 357,016 thousand shares in Investments accounted for by the equity method (Notes 2 2006, 432,795 thousand shares in 2007 and 573,134 and 14) 486,164 1,059,477 2,068,877 68,190 thousand shares in 2008 Prepayments for long-term investments (Notes 2 and 14) 78,216 605,746 - - Common stock 3,570,160 4,327,952 5,731,337 188,904
Stock dividend for distribution 794,032 1,403,385 1,822,601 60,073 Total long-term investments 566,773 2,167,900 2,570,981 84,739 Capital surplus
Additional paid-in capital - issuance of shares in PROPERTIES (Notes 2, 15 and 25) excess of par 4,410,871 4,374,244 4,374,244 144,174
Cost Long-term equity investments 15,845 15,845 15,845 522 Land 610,293 610,293 610,293 20,115 From a merger 25,972 25,756 25,756 849 Buildings and structures 1,078,977 1,087,626 2,257,667 74,412 Retained earnings Machinery and equipment 2,644,184 3,037,666 3,536,717 116,570 Legal reserve 1,991,520 4,516,253 7,410,139 244,237 Molding equipment 201,567 172,632 172,632 5,690 Special reserve 6,175 - - - Computer equipment 167,642 190,093 241,147 7,948 Accumulated earnings 17,873,984 23,980,153 29,550,423 973,975 Transportation equipment 1,938 1,335 1,335 44 Cumulative translation adjustments (Note 2) (3,272 ) 19,777 (64,976 ) (2,142 ) Furniture and fixtures 100,391 100,624 117,469 3,872 Unrealized valuation losses on financial instruments Leased assets 4,712 4,712 4,712 155 (Notes 2 and 7) (770 ) (486 ) (1,059 ) (35 ) Leasehold improvements 22,816 22,816 72,760 2,398
4,832,520 5,227,797 7,014,732 231,204 Total stockholders’ equity 28,684,517 38,662,879 48,864,310 1,610,557 Less accumulated depreciation (2,528,347 ) (2,929,037 ) (3,439,474 ) (113,364 ) Prepayments for construction-in-progress and equipment-in-transit 25,795 843,510 196,575 6,479
Properties, net 2,329,968 3,142,270 3,771,833 124,319
OTHER ASSETS
Refundable deposits 35,625 40,100 94,475 3,114 Deferred charges (Note 2) 134,534 188,548 66,370 2,188 Deferred tax assets (Notes 2 and 22) 192,540 273,816 524,588 17,290 Other (Notes 2 and 18) 62,225 84,891 106,100 3,497
Total other assets 424,924 587,355 791,533 26,089
TOTAL $ 53,613,280 $ 75,777,040 $ 106,943,110 $ 3,524,822 TOTAL $ 53,613,280 $ 75,777,040 $106,943,110 $ 3,524,822 The accompanying notes are an integral part of the financial statements. (With Deloitte & Touche audit report dated July 17, 2008)
- 4 -
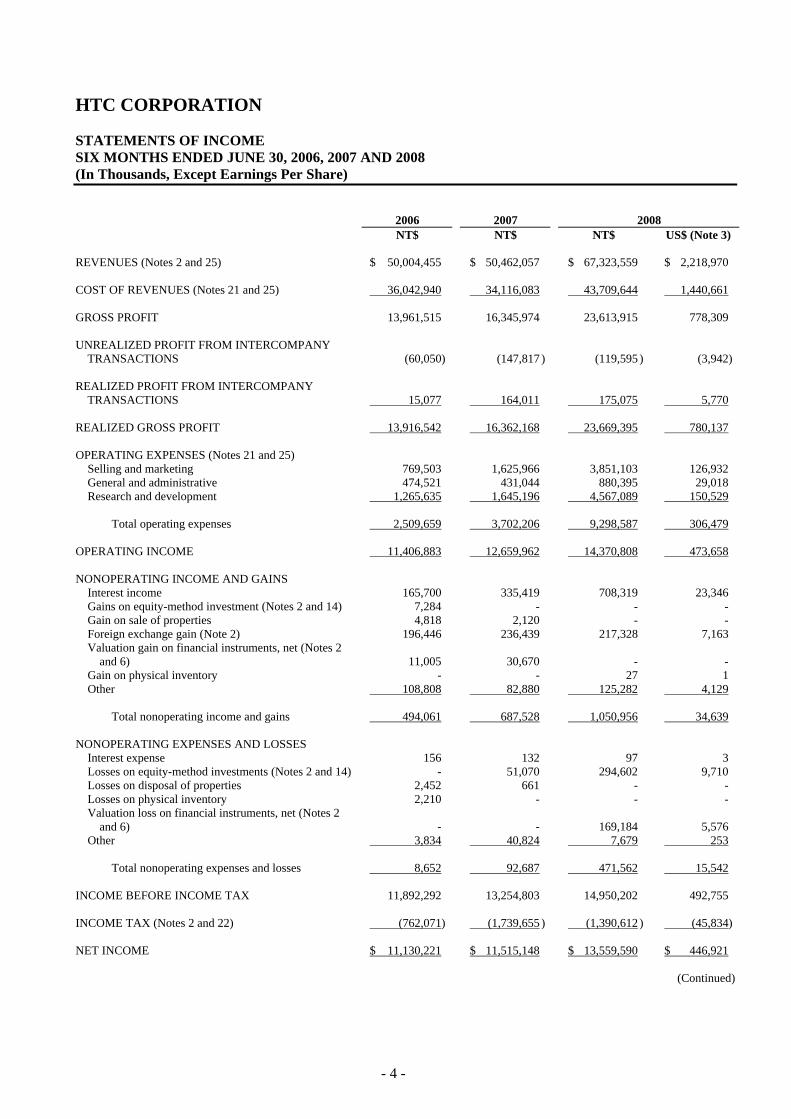
HTC CORPORATION STATEMENTS OF INCOME SIX MONTHS ENDED JUNE 30, 2006, 2007 AND 2008 (In Thousands, Except Earnings Per Share) 2006 2007 2008 NT$ NT$ NT$ US$ (Note 3) REVENUES (Notes 2 and 25) $ 50,004,455 $ 50,462,057 $ 67,323,559 $ 2,218,970 COST OF REVENUES (Notes 21 and 25) 36,042,940 34,116,083 43,709,644 1,440,661 GROSS PROFIT 13,961,515 16,345,974 23,613,915 778,309 UNREALIZED PROFIT FROM INTERCOMPANY
TRANSACTIONS (60,050) (147,817 ) (119,595 ) (3,942) REALIZED PROFIT FROM INTERCOMPANY
TRANSACTIONS 15,077 164,011 175,075 5,770 REALIZED GROSS PROFIT 13,916,542 16,362,168 23,669,395 780,137 OPERATING EXPENSES (Notes 21 and 25)
Selling and marketing 769,503 1,625,966 3,851,103 126,932General and administrative 474,521 431,044 880,395 29,018Research and development 1,265,635 1,645,196 4,567,089 150,529
Total operating expenses 2,509,659 3,702,206 9,298,587 306,479
OPERATING INCOME 11,406,883 12,659,962 14,370,808 473,658 NONOPERATING INCOME AND GAINS
Interest income 165,700 335,419 708,319 23,346Gains on equity-method investment (Notes 2 and 14) 7,284 - - -Gain on sale of properties 4,818 2,120 - -Foreign exchange gain (Note 2) 196,446 236,439 217,328 7,163Valuation gain on financial instruments, net (Notes 2
and 6) 11,005 30,670 - -Gain on physical inventory - - 27 1Other 108,808 82,880 125,282 4,129
Total nonoperating income and gains 494,061 687,528 1,050,956 34,639
NONOPERATING EXPENSES AND LOSSES
Interest expense 156 132 97 3Losses on equity-method investments (Notes 2 and 14) - 51,070 294,602 9,710Losses on disposal of properties 2,452 661 - -Losses on physical inventory 2,210 - - -Valuation loss on financial instruments, net (Notes 2
and 6) - - 169,184 5,576Other 3,834 40,824 7,679 253
Total nonoperating expenses and losses 8,652 92,687 471,562 15,542
INCOME BEFORE INCOME TAX 11,892,292 13,254,803 14,950,202 492,755 INCOME TAX (Notes 2 and 22) (762,071) (1,739,655 ) (1,390,612 ) (45,834) NET INCOME $ 11,130,221 $ 11,515,148 $ 13,559,590 $ 446,921
(Continued)
- 5 -
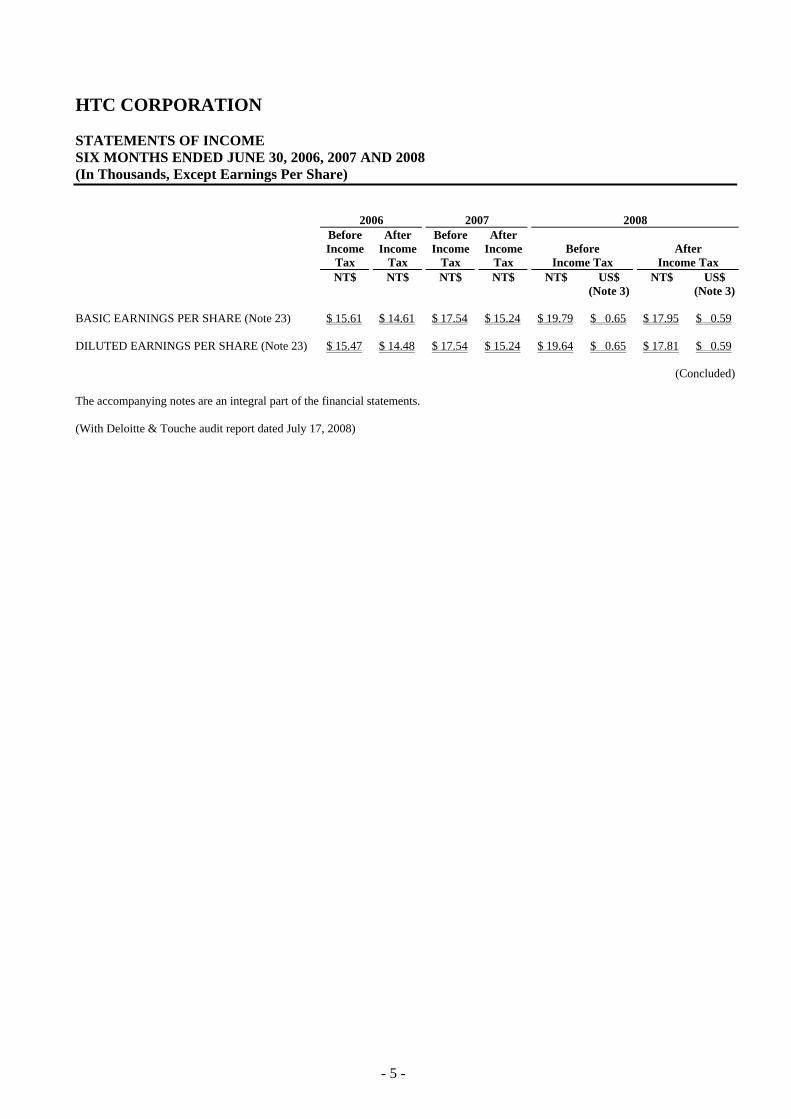
HTC CORPORATION STATEMENTS OF INCOME SIX MONTHS ENDED JUNE 30, 2006, 2007 AND 2008 (In Thousands, Except Earnings Per Share) 2006 2007 2008
Before Income
Tax
After Income
Tax
Before Income
Tax
After Income
Tax Before
Income Tax After
Income Tax NT$ NT$ NT$ NT$ NT$ US$ NT$ US$ (Note 3) (Note 3) BASIC EARNINGS PER SHARE (Note 23) $ 15.61 $ 14.61 $ 17.54 $ 15.24 $ 19.79 $ 0.65 $ 17.95 $ 0.59 DILUTED EARNINGS PER SHARE (Note 23) $ 15.47 $ 14.48 $ 17.54 $ 15.24 $ 19.64 $ 0.65 $ 17.81 $ 0.59
(Concluded) The accompanying notes are an integral part of the financial statements. (With Deloitte & Touche audit report dated July 17, 2008)
- 6 -
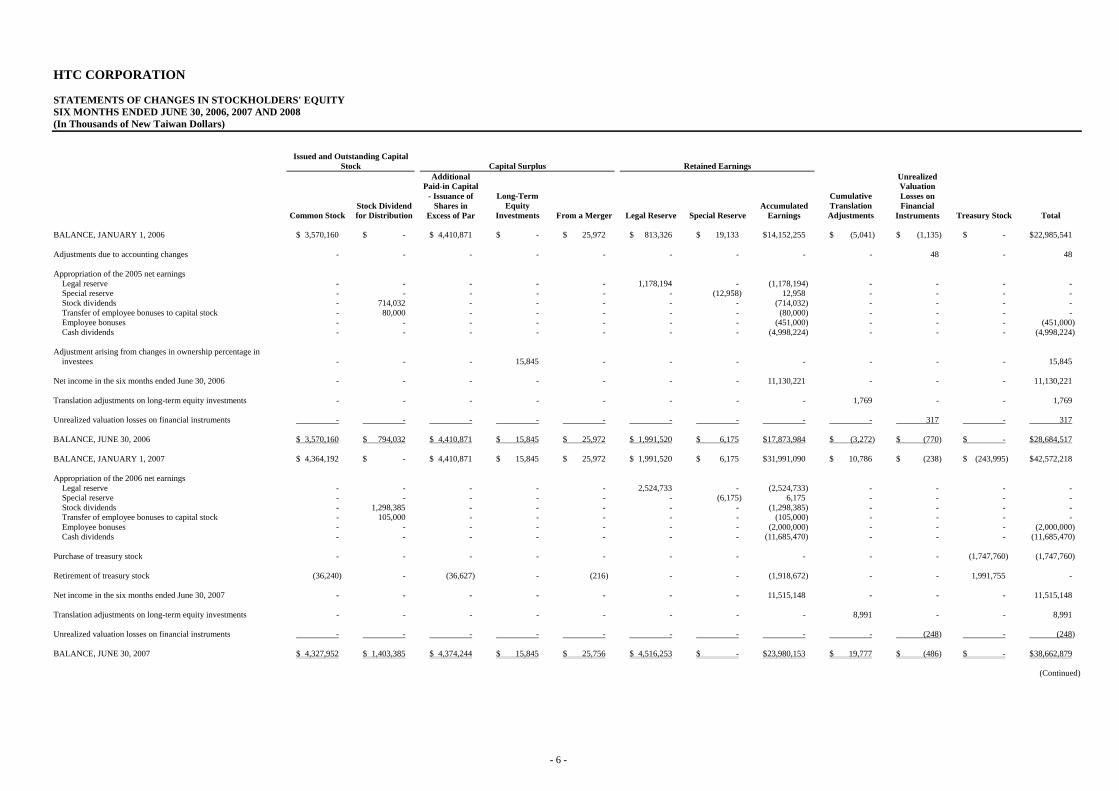
HTC CORPORATION STATEMENTS OF CHANGES IN STOCKHOLDERS' EQUITY SIX MONTHS ENDED JUNE 30, 2006, 2007 AND 2008 (In Thousands of New Taiwan Dollars)
Issued and Outstanding Capital
Stock Capital Surplus Retained Earnings
Common StockStock Dividend for Distribution
Additional Paid-in Capital
- Issuance of Shares in
Excess of Par
Long-Term Equity
Investments From a Merger Legal Reserve Special ReserveAccumulated
Earnings
Cumulative Translation Adjustments
Unrealized Valuation Losses on Financial
Instruments Treasury Stock Total BALANCE, JANUARY 1, 2006 $ 3,570,160 $ - $ 4,410,871 $ - $ 25,972 $ 813,326 $ 19,133 $ 14,152,255 $ (5,041) $ (1,135) $ - $ 22,985,541 Adjustments due to accounting changes - - - - - - - - - 48 - 48 Appropriation of the 2005 net earnings
Legal reserve - - - - - 1,178,194 - (1,178,194) - - - - Special reserve - - - - - - (12,958) 12,958 - - - - Stock dividends - 714,032 - - - - - (714,032) - - - - Transfer of employee bonuses to capital stock - 80,000 - - - - - (80,000) - - - - Employee bonuses - - - - - - - (451,000) - - - (451,000) Cash dividends - - - - - - - (4,998,224) - - - (4,998,224)
Adjustment arising from changes in ownership percentage in
investees - - - 15,845 - - - - - - - 15,845 Net income in the six months ended June 30, 2006 - - - - - - - 11,130,221 - - - 11,130,221 Translation adjustments on long-term equity investments - - - - - - - - 1,769 - - 1,769 Unrealized valuation losses on financial instruments - - - - - - - - - 317 - 317 BALANCE, JUNE 30, 2006 $ 3,570,160 $ 794,032 $ 4,410,871 $ 15,845 $ 25,972 $ 1,991,520 $ 6,175 $ 17,873,984 $ (3,272) $ (770) $ - $ 28,684,517 BALANCE, JANUARY 1, 2007 $ 4,364,192 $ - $ 4,410,871 $ 15,845 $ 25,972 $ 1,991,520 $ 6,175 $ 31,991,090 $ 10,786 $ (238) $ (243,995) $ 42,572,218 Appropriation of the 2006 net earnings
Legal reserve - - - - - 2,524,733 - (2,524,733) - - - - Special reserve - - - - - - (6,175) 6,175 - - - - Stock dividends - 1,298,385 - - - - - (1,298,385) - - - - Transfer of employee bonuses to capital stock - 105,000 - - - - - (105,000) - - - - Employee bonuses - - - - - - - (2,000,000) - - - (2,000,000) Cash dividends - - - - - - - (11,685,470) - - - (11,685,470)
Purchase of treasury stock - - - - - - - - - - (1,747,760) (1,747,760) Retirement of treasury stock (36,240) - (36,627) - (216) - - (1,918,672) - - 1,991,755 - Net income in the six months ended June 30, 2007 - - - - - - - 11,515,148 - - - 11,515,148 Translation adjustments on long-term equity investments - - - - - - - - 8,991 - - 8,991 Unrealized valuation losses on financial instruments - - - - - - - - - (248) - (248) BALANCE, JUNE 30, 2007 $ 4,327,952 $ 1,403,385 $ 4,374,244 $ 15,845 $ 25,756 $ 4,516,253 $ - $ 23,980,153 $ 19,777 $ (486) $ - $ 38,662,879
(Continued)
- 7 -
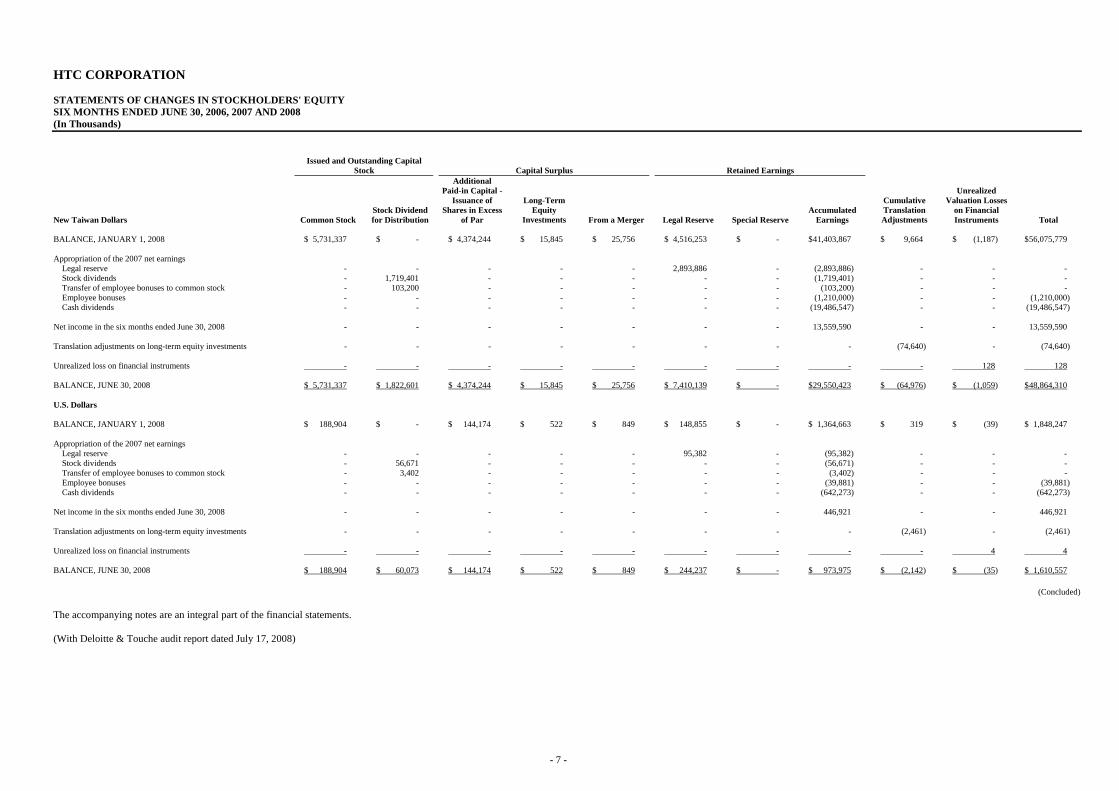
HTC CORPORATION STATEMENTS OF CHANGES IN STOCKHOLDERS' EQUITY SIX MONTHS ENDED JUNE 30, 2006, 2007 AND 2008 (In Thousands)
Issued and Outstanding Capital
Stock Capital Surplus Retained Earnings
New Taiwan Dollars Common StockStock Dividend for Distribution
Additional Paid-in Capital -
Issuance of Shares in Excess
of Par
Long-Term Equity
Investments From a Merger Legal Reserve Special ReserveAccumulated
Earnings
Cumulative Translation Adjustments
Unrealized Valuation Losses
on Financial Instruments Total
BALANCE, JANUARY 1, 2008 $ 5,731,337 $ - $ 4,374,244 $ 15,845 $ 25,756 $ 4,516,253 $ - $ 41,403,867 $ 9,664 $ (1,187) $ 56,075,779 Appropriation of the 2007 net earnings
Legal reserve - - - - - 2,893,886 - (2,893,886) - - - Stock dividends - 1,719,401 - - - - - (1,719,401) - - - Transfer of employee bonuses to common stock - 103,200 - - - - - (103,200) - - - Employee bonuses - - - - - - - (1,210,000) - - (1,210,000) Cash dividends - - - - - - - (19,486,547) - - (19,486,547)
Net income in the six months ended June 30, 2008 - - - - - - - 13,559,590 - - 13,559,590 Translation adjustments on long-term equity investments - - - - - - - - (74,640) - (74,640) Unrealized loss on financial instruments - - - - - - - - - 128 128 BALANCE, JUNE 30, 2008 $ 5,731,337 $ 1,822,601 $ 4,374,244 $ 15,845 $ 25,756 $ 7,410,139 $ - $ 29,550,423 $ (64,976) $ (1,059) $ 48,864,310 U.S. Dollars BALANCE, JANUARY 1, 2008 $ 188,904 $ - $ 144,174 $ 522 $ 849 $ 148,855 $ - $ 1,364,663 $ 319 $ (39) $ 1,848,247 Appropriation of the 2007 net earnings
Legal reserve - - - - - 95,382 - (95,382) - - - Stock dividends - 56,671 - - - - - (56,671) - - - Transfer of employee bonuses to common stock - 3,402 - - - - - (3,402) - - - Employee bonuses - - - - - - - (39,881) - - (39,881) Cash dividends - - - - - - - (642,273) - - (642,273)
Net income in the six months ended June 30, 2008 - - - - - - - 446,921 - - 446,921 Translation adjustments on long-term equity investments - - - - - - - - (2,461) - (2,461) Unrealized loss on financial instruments - - - - - - - - - 4 4 BALANCE, JUNE 30, 2008 $ 188,904 $ 60,073 $ 144,174 $ 522 $ 849 $ 244,237 $ - $ 973,975 $ (2,142) $ (35) $ 1,610,557
(Concluded) The accompanying notes are an integral part of the financial statements. (With Deloitte & Touche audit report dated July 17, 2008)
- 8 -
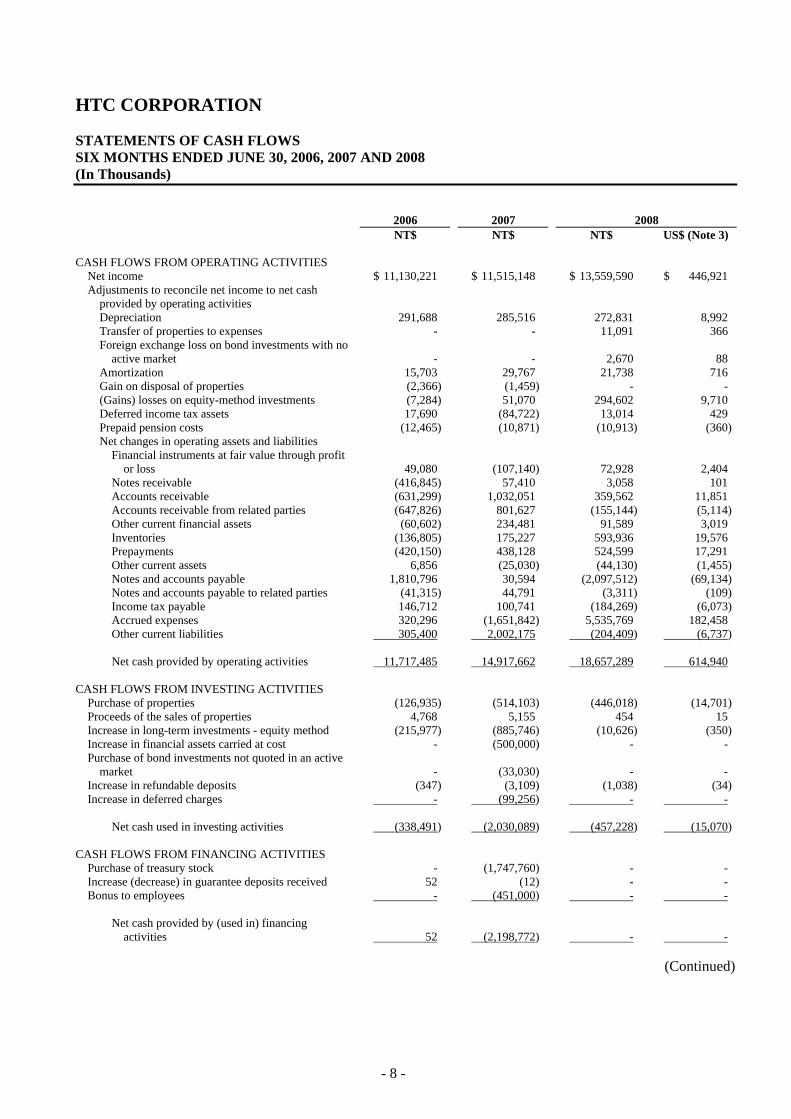
HTC CORPORATION STATEMENTS OF CASH FLOWS SIX MONTHS ENDED JUNE 30, 2006, 2007 AND 2008 (In Thousands) 2006 2007 2008 NT$ NT$ NT$ US$ (Note 3) CASH FLOWS FROM OPERATING ACTIVITIES
Net income $ 11,130,221 $ 11,515,148 $ 13,559,590 $ 446,921Adjustments to reconcile net income to net cash
provided by operating activities Depreciation 291,688 285,516 272,831 8,992Transfer of properties to expenses - - 11,091 366Foreign exchange loss on bond investments with no
active market - - 2,670 88Amortization 15,703 29,767 21,738 716Gain on disposal of properties (2,366) (1,459) - -(Gains) losses on equity-method investments (7,284) 51,070 294,602 9,710Deferred income tax assets 17,690 (84,722) 13,014 429Prepaid pension costs (12,465) (10,871) (10,913) (360)Net changes in operating assets and liabilities
Financial instruments at fair value through profit or loss 49,080 (107,140) 72,928 2,404
Notes receivable (416,845) 57,410 3,058 101Accounts receivable (631,299) 1,032,051 359,562 11,851Accounts receivable from related parties (647,826) 801,627 (155,144) (5,114)Other current financial assets (60,602) 234,481 91,589 3,019Inventories (136,805) 175,227 593,936 19,576Prepayments (420,150) 438,128 524,599 17,291Other current assets 6,856 (25,030) (44,130) (1,455)Notes and accounts payable 1,810,796 30,594 (2,097,512) (69,134)Notes and accounts payable to related parties (41,315) 44,791 (3,311) (109)Income tax payable 146,712 100,741 (184,269) (6,073)Accrued expenses 320,296 (1,651,842) 5,535,769 182,458Other current liabilities 305,400 2,002,175 (204,409) (6,737)
Net cash provided by operating activities 11,717,485 14,917,662 18,657,289 614,940
CASH FLOWS FROM INVESTING ACTIVITIES
Purchase of properties (126,935) (514,103) (446,018) (14,701)Proceeds of the sales of properties 4,768 5,155 454 15Increase in long-term investments - equity method (215,977) (885,746) (10,626) (350)Increase in financial assets carried at cost - (500,000) - -Purchase of bond investments not quoted in an active
market - (33,030) - -Increase in refundable deposits (347) (3,109) (1,038) (34)Increase in deferred charges - (99,256) - -
Net cash used in investing activities (338,491) (2,030,089) (457,228) (15,070)
CASH FLOWS FROM FINANCING ACTIVITIES
Purchase of treasury stock - (1,747,760) - -Increase (decrease) in guarantee deposits received 52 (12) - -Bonus to employees - (451,000) - -
Net cash provided by (used in) financing
activities 52 (2,198,772) - -
(Continued)
- 9 -
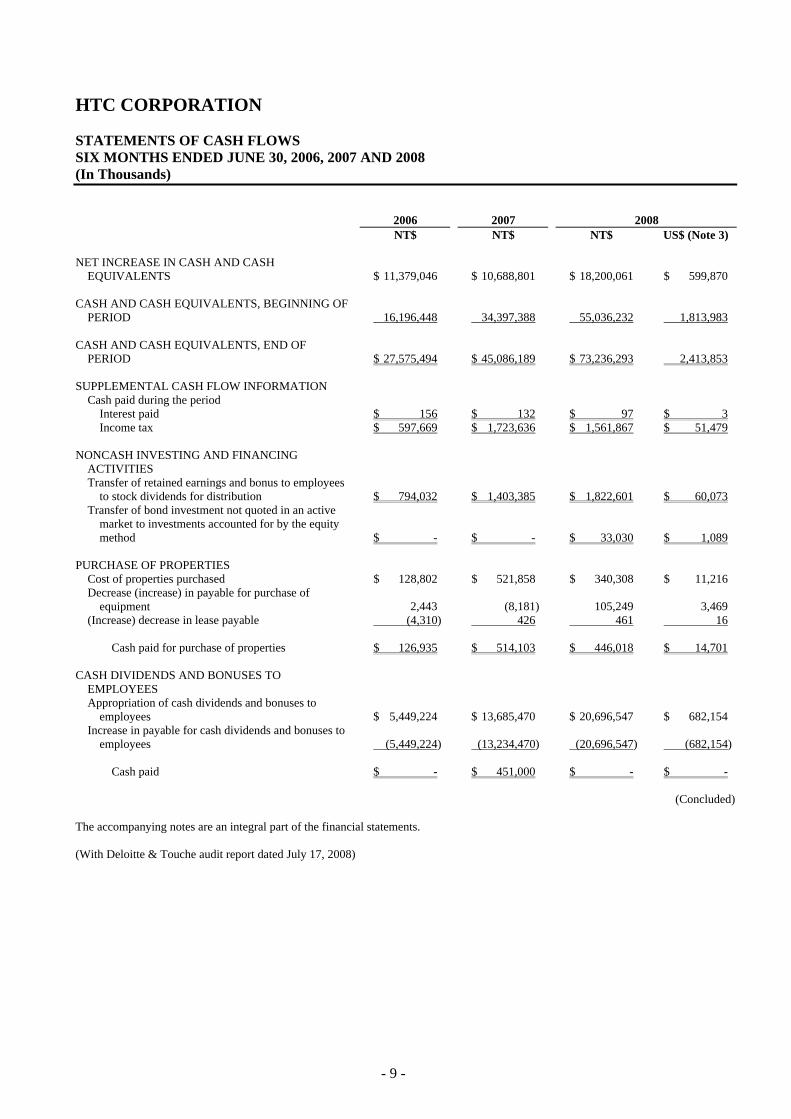
HTC CORPORATION STATEMENTS OF CASH FLOWS SIX MONTHS ENDED JUNE 30, 2006, 2007 AND 2008 (In Thousands) 2006 2007 2008 NT$ NT$ NT$ US$ (Note 3) NET INCREASE IN CASH AND CASH
EQUIVALENTS $ 11,379,046 $ 10,688,801 $ 18,200,061 $ 599,870 CASH AND CASH EQUIVALENTS, BEGINNING OF
PERIOD 16,196,448 34,397,388 55,036,232 1,813,983 CASH AND CASH EQUIVALENTS, END OF
PERIOD $ 27,575,494 $ 45,086,189 $ 73,236,293 2,413,853 SUPPLEMENTAL CASH FLOW INFORMATION
Cash paid during the period Interest paid $ 156 $ 132 $ 97 $ 3Income tax $ 597,669 $ 1,723,636 $ 1,561,867 $ 51,479
NONCASH INVESTING AND FINANCING
ACTIVITIES Transfer of retained earnings and bonus to employees
to stock dividends for distribution $ 794,032 $ 1,403,385 $ 1,822,601 $ 60,073Transfer of bond investment not quoted in an active
market to investments accounted for by the equity method $ - $ - $ 33,030 $ 1,089
PURCHASE OF PROPERTIES
Cost of properties purchased $ 128,802 $ 521,858 $ 340,308 $ 11,216Decrease (increase) in payable for purchase of
equipment 2,443 (8,181) 105,249 3,469(Increase) decrease in lease payable (4,310) 426 461 16
Cash paid for purchase of properties $ 126,935 $ 514,103 $ 446,018 $ 14,701
CASH DIVIDENDS AND BONUSES TO
EMPLOYEES Appropriation of cash dividends and bonuses to
employees $ 5,449,224 $ 13,685,470 $ 20,696,547 $ 682,154Increase in payable for cash dividends and bonuses to
employees (5,449,224) (13,234,470) (20,696,547) (682,154)
Cash paid $ - $ 451,000 $ - $ -
(Concluded) The accompanying notes are an integral part of the financial statements. (With Deloitte & Touche audit report dated July 17, 2008)
- 10 -
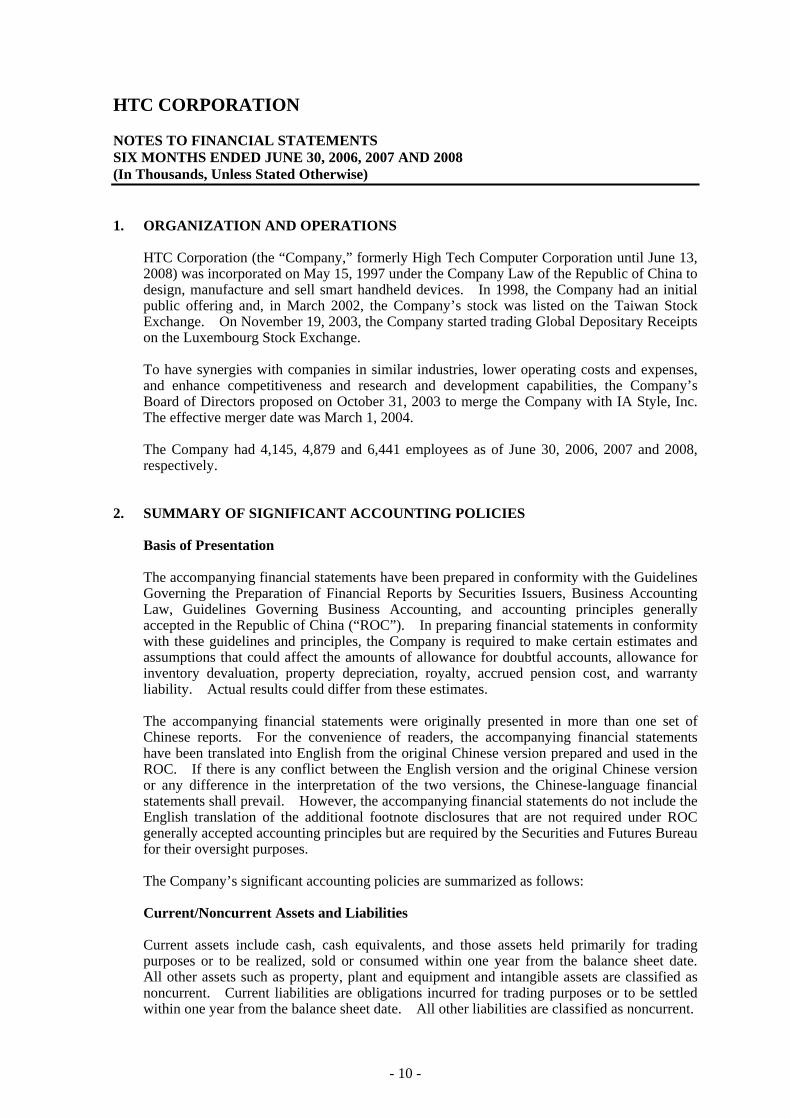
HTC CORPORATION NOTES TO FINANCIAL STATEMENTS SIX MONTHS ENDED JUNE 30, 2006, 2007 AND 2008 (In Thousands, Unless Stated Otherwise) 1. ORGANIZATION AND OPERATIONS
HTC Corporation (the “Company,” formerly High Tech Computer Corporation until June 13, 2008) was incorporated on May 15, 1997 under the Company Law of the Republic of China to design, manufacture and sell smart handheld devices. In 1998, the Company had an initial public offering and, in March 2002, the Company’s stock was listed on the Taiwan Stock Exchange. On November 19, 2003, the Company started trading Global Depositary Receipts on the Luxembourg Stock Exchange. To have synergies with companies in similar industries, lower operating costs and expenses, and enhance competitiveness and research and development capabilities, the Company’s Board of Directors proposed on October 31, 2003 to merge the Company with IA Style, Inc. The effective merger date was March 1, 2004. The Company had 4,145, 4,879 and 6,441 employees as of June 30, 2006, 2007 and 2008, respectively.
2. SUMMARY OF SIGNIFICANT ACCOUNTING POLICIES
Basis of Presentation
The accompanying financial statements have been prepared in conformity with the Guidelines Governing the Preparation of Financial Reports by Securities Issuers, Business Accounting Law, Guidelines Governing Business Accounting, and accounting principles generally accepted in the Republic of China (“ROC”). In preparing financial statements in conformity with these guidelines and principles, the Company is required to make certain estimates and assumptions that could affect the amounts of allowance for doubtful accounts, allowance for inventory devaluation, property depreciation, royalty, accrued pension cost, and warranty liability. Actual results could differ from these estimates. The accompanying financial statements were originally presented in more than one set of Chinese reports. For the convenience of readers, the accompanying financial statements have been translated into English from the original Chinese version prepared and used in the ROC. If there is any conflict between the English version and the original Chinese version or any difference in the interpretation of the two versions, the Chinese-language financial statements shall prevail. However, the accompanying financial statements do not include the English translation of the additional footnote disclosures that are not required under ROC generally accepted accounting principles but are required by the Securities and Futures Bureau for their oversight purposes.
The Company’s significant accounting policies are summarized as follows: Current/Noncurrent Assets and Liabilities
Current assets include cash, cash equivalents, and those assets held primarily for trading purposes or to be realized, sold or consumed within one year from the balance sheet date. All other assets such as property, plant and equipment and intangible assets are classified as noncurrent. Current liabilities are obligations incurred for trading purposes or to be settled within one year from the balance sheet date. All other liabilities are classified as noncurrent.
- 11 -
Financial Assets/Liabilities at Fair Value through Profit or Loss Financial instruments classified as financial assets or financial liabilities at fair value through profit or loss (FVTPL) include financial assets or financial liabilities held for trading and those designated as at FVTPL on initial recognition. The Company recognizes a financial asset or a financial liability in the balance sheet when the Company becomes a party to a financial instrument contract. A financial asset is derecognized when the Company loses its contractual rights to the financial asset. A financial liability is derecognized when the relevant contract ends or is discharged or canceled. Financial instruments at FVTPL are initially measured at fair value. Transaction costs directly attributable to the acquisition of financial assets or financial liabilities at FVTPL are recognized immediately in profit or loss. After the initial recognition, financial assets or financial liabilities at FVTPL are remeasured at fair value at the balance sheet date, with changes in fair value recognized as current gains or losses. Cash dividends received are recognized as income for the year. On the derecognition of a financial asset or a financial liability, the difference between its carrying amount and the sum of the consideration received or receivable or consideration paid or payable is recognized as gain or loss. A derivative that does not meet the criteria for hedge accounting is classified as a financial asset or a financial liability held for trading. If the fair value of the derivative is positive, the derivative is recognized as a financial asset; otherwise, the derivative is recognized as a financial liability. Fair values of financial assets and financial liabilities at the balance sheet date are determined as follows: publicly traded stocks - at closing prices; open-end mutual funds - at net asset values; bonds - at prices quoted by the Taiwan GreTai Securities Market; and financial assets and financial liabilities without quoted prices in an active market - at values determined using valuation techniques. Available-for-Sale Financial Assets Available-for-sale financial assets are initially measured at fair value plus transaction costs that are directly attributable to the acquisition. After the initial recognition, available-for-sale financial assets are remeasured at fair value at the balance sheet date, with changes in fair value recognized in equity until the financial assets are disposed of. On asset disposal, the cumulative gain or loss previously recognized under equity is included in gain or loss for the year. The recognition, derecognition and the fair value bases of available-for-sale financial assets are similar to those of financial assets at FVTPL. Cash dividends are recognized on the stockholders’ declaration under resolutions, except for dividends distributed from the pre-acquisition earnings, which are treated as a reduction of investment cost. Stock dividends are not recognized as investment income but are recorded as an increase in the number of shares. The total number of shares held after this increase is used to recalculate cost per share. The difference between the initial cost of a debt instrument and its maturity amount is amortized using the effective interest method, with the amortized interest recognized as gain or loss. If there is objective evidence that a financial asset is impaired, a loss is recognized. If the impairment loss decreases, the previously recognized impairment loss is reversed to the extent of the decrease and recorded as an adjustment to stockholders’ equity.
- 12 -
Revenue Recognition, Accounts Receivable and Allowance for Doubtful Accounts Revenue from the sale of goods is recognized when the Company has transferred to the buyer the significant risks and rewards of ownership of the goods, primarily upon shipment, because the earnings process has been completed and the economic benefits associated with the transaction have been realized or are realizable. Revenue is measured at the fair value of the consideration received or receivable and represents amounts agreed between the Company and the customers for goods sold in the normal course of business, net of sales discounts and volume rebates. For trade receivables due within one year from the balance sheet date, since the nominal value of the consideration to be received approximates its fair value and sales transactions are frequent, the fair value of the consideration is not determined by discounting all future receipts using an imputed rate of interest. An allowance for doubtful accounts is provided on the basis of a review of the collectibility of accounts receivable. The Company assesses the probability of the collection of accounts receivable by aging analysis and assessing the value of the collaterals provided by customers. Inventories Inventories consist of raw materials, supplies, finished goods and work-in-process. Before January 1, 2008, inventories were stated at the lower of cost or market value. Any write-down was made on a category by category basis. Market value meant replacement cost for raw materials and supplies and net realizable value for finished goods and work in process. As stated in note 4, effective January 1, 2008, inventories are stated at the lower of cost or net realizable value. Inventory write-downs are made item by item, except where it may be appropriate to group similar or related items. Net realizable value is the estimated selling price of inventories less all estimated costs of completion and costs necessary to make the sale. Inventories are recorded and adjusted to approximate weighted-average cost on the balance sheet date. Financial Assets Carried At Cost Investments in equity instruments with no quoted prices in an active market and with fair values that cannot be reliably measured, such as non-publicly traded stocks and stocks traded in the emerging stock market, are measured at their original cost. The accounting treatment for dividends on financial assets carried at cost is similar to that for dividends on available-for-sale financial assets. An impairment loss is recognized when there is objective evidence that the asset is impaired. A reversal of this impairment loss is disallowed. Bond Investments with No Active Market Bond investments with no active market are stated at amortized cost and are classified as current or noncurrent based on their maturities. Bond investments with no active market - current are investments paying fixed or determinable amounts. Other features of these bond investments are as follows: a. The bond investments have not been designated as at fair value through profit or loss. b. The bond investments have not been designated as available for sale.
Those investments that are noncurrent are classified as bond investments with no active market - noncurrent under funds and investments.
- 13 -
Investments Accounted for by the Equity Method
Investments in which the Company holds 20 percent or more of the investees’ voting shares or exercises significant influence over the investees’ operating and financial policy decisions are accounted for by the equity method. Prior to January 1, 2006, the difference between the acquisition cost and the Company’s proportionate share in the investee’s equity was amortized by the straight-line method over five years. Effective January 1, 2006, pursuant to the revised Statement of Financial Accounting Standard (“SFAS”) No. 5, “Long-term Investments Accounted for by Equity Method”, the acquisition cost is allocated to the assets acquired and liabilities assumed based on their fair values at the date of acquisition, and the excess of the acquisition cost over the fair value of the identifiable net assets acquired is recognized as goodwill. Goodwill is not being amortized. The excess of the fair value of the net identifiable assets acquired over the acquisition cost is used to reduce the fair value of each of the noncurrent assets acquired (except for financial assets other than investments accounted for by the equity method, noncurrent assets held for sale, deferred income tax assets, prepaid pension or other postretirement benefit) in proportion to the respective fair values of the noncurrent assets, with any excess recognized as an extraordinary gain. Effective January 1, 2006, the accounting treatment for the unamortized investment premium arising on acquisitions before January 1, 2006 is the same as that for goodwill and the premium is no longer being amortized. For any investment discount arising on acquisitions before January 1, 2006, the unamortized amount continues to be amortized over the remaining year. When the Company subscribes for additional investee shares at a percentage different from its existing equity interest, the resulting change in the Company’s equity in the investee’s net assets is recorded as an adjustment to long-term investments, with the corresponding amount charged or credited to capital surplus. On the balance sheet date, an impairment loss should be recognized if the recoverable amount of the investment is below carrying amount. This loss should be charged to current income.
Properties
Properties are stated at cost less accumulated depreciation. Interest incurred in connection with the purchase or construction of properties is capitalized. Major additions, renewals and betterments are capitalized, while maintenance and repairs are expensed in the period incurred. On the balance sheet date, assets are evaluated for any impairment. If impairment is identified, the Company should evaluate the recoverable amount of the assets. An impairment loss should be recognized whenever the recoverable amount of the properties is below carrying amount, and this loss should be charged to current income. An impairment loss recognized in prior years can be reversed only if there is a change in the estimates used to determine the recoverable amount since the last impairment loss was recognized. However, the amount reversed is only to the extent that the increased carrying amount of an asset should not exceed the asset carrying amount (net of depreciation) that would have been determined had no impairment loss been recognized in prior years. An impairment loss of an asset revalued under certain regulations should be treated as a revaluation increment decrease. A reversal of an impairment loss on a revalued asset is credited directly to equity under the heading revaluation increment. However, to the extent that an impairment loss on the same revalued asset was previously recognized as profit or loss, a reversal of that impairment loss is also recognized as profit or loss.
- 14 -
Assets held under capital leases are initially recognized at the lower of their fair value at the start of the lease or the present value of all future lease payments plus the bargain purchase price. The corresponding liability to the lessor is included in the balance sheet as a capital lease obligation.
Lease payments are apportioned between finance charges and reduction of the lease obligation to have a constant rate of interest on the remaining balance of the liability. Finance charges are charged directly to gain or loss. But if these charges are directly attributable to qualifying assets, they are capitalized in accordance with the Company’s general policy on borrowing costs.
Depreciation is calculated on a straight-line basis over the estimated service lives of the assets plus one additional year for salvage value: buildings(including auxiliary equipments) - 3 to 50 years; machinery and equipment - 3 to 5 years; office equipment - 3 to 5 years; transportation equipment - 5 years; and leasehold improvements - 3 years.
Deferred Charges
Deferred charges are telephone installation charges, computer software costs and deferred license fees. Installation charges and computer software are amortized on a straight-line basis over 3 years, and deferred license fees, over 10 years. Asset Impairment If the recoverable amount of an asset is estimated to be less than its carrying amount, the carrying amount of the asset is reduced to its recoverable amount. An impairment loss is charged to earnings unless the asset is carried at a revalued amount, in which case the impairment loss is treated as a deduction to the unrealized revaluation increment.
If an impairment loss subsequently reverses, the carrying amount of the asset is increased accordingly, but the increased carrying amount may not exceed the carrying amount that would have been determined had no impairment loss been recognized for the asset in prior years. A reversal of an impairment loss is recognized in earnings, unless the asset is carried at a revalued amount, in which case the reversal of the impairment loss is treated as an increase in the unrealized revaluation increment. A reversal of an impairment loss on goodwill is disallowed. For long term equity investments for which the Company has significant influence but with no control, the carrying amount (including goodwill) of each investment is compared with its own recoverable amount for the purpose of impairment testing.
Accrued Marketing Expenses The Company accrues marketing expenses on the basis of agreements, management’s judgment, and any known factors that would significantly affect the accruals. In addition, depending on the nature of relevant events, the accrued marketing expenses are accounted for as an increase in marketing expenses or as a decrease in revenues. Reserve for Warranty Expenses The Company provides warranty service for one to two years depending on the contract with customers. The warranty liability is estimated on the basis of management’s evaluation of the products under warranty, past warranty experience, and pertinent factors.
- 15 -
Product-Related Costs The cost of revenues consists of costs of goods sold, unallocated overheads, abnormal costs, write-downs of inventories and the reversal of write-downs. The provisions for product warranty are estimated and recorded under cost of revenues when sales are recognized. Pension Plan Pension cost under a defined benefit plan is determined by actuarial valuations. Contributions made under a defined contribution plan are recognized as pension cost during the year in which employees render services. Curtailment or settlement gains or losses of the defined benefit plan are recognized as part of the net yearic pension cost for the year. Under SFAS No. 23, “Interim Financial Reporting and Disclosures,” the Company does not have to apply the requirement stated in SFAS No. 18 (“Accounting for Pensions”) of remeasuring the minimum pension liability and pension cost of the current interim period. Income Tax The Company applies intra-year and inter-year allocations for its income tax, whereby (1) a portion of income tax expense is allocated to the cumulative effect of changes in accounting principles; and (2) deferred income tax assets and liabilities are recognized for the tax effects of temporary differences, unused loss carryforward and unused tax credits. Valuation allowances are provided to the extent, if any, that it is more likely than not that deferred income tax assets will not be realized. A deferred tax asset or liability is classified as current or noncurrent in accordance with the classification of its related asset or liability. However, if a deferred income tax asset or liability does not relate to an asset or liability in the financial statements, then it is classified as either current or noncurrent based on the expected length of time before it is realized or settled. Tax credits for purchases of machinery, equipment and technology, research and development expenditures, and personnel training expenditures are recognized using the flow-through method. Adjustments of prior years’ tax liabilities are added to or deducted from the current year’s tax provision. According to the Income Tax Law, an additional tax at 10% of unappropriated earnings is provided for as income tax in the year the stockholders approve to retain the earnings. Stock-Based Employee Compensation Plans
When the grant date of stock-based employee compensation plans is on or after January 1, 2004, the Company applies the accounting guidelines for stock-based compensation issued by the Accounting Research and Development Foundation of the ROC. Under these guidelines, the fair value of option compensation is recorded initially as an asset. This asset is expensed ratably over the service period, which is generally the period over which the options vest. Treasury Stock The Company adopted the Statement of Financial Accounting Standards No. 30 - “Accounting for Treasury Stocks,” which requires the treasury stock held by the Company to be accounted for by the cost method. The cost of treasury stock is shown as a deduction to arrive at stockholders’ equity, while gain or loss from selling treasury stock is treated as an adjustment to capital surplus.
- 16 -
When treasury stocks are sold and the selling price is above the book value, the difference should be credited to the capital surplus - treasury stock transactions. If the selling price is below the book value, the difference should first be offset against capital surplus from the same class of treasury stock transactions, and any remainder should be debited to retained earnings. The carrying value of treasury stocks should be calculated using the weighted-average method. When the Company's treasury stock is retired, the treasury stock account should be credited, and the capital surplus - premium on stock account and capital stock account should be debited proportionately according to the share ratio. The difference should be credited to capital surplus or debited to capital surplus and/or retained earnings. Foreign Currencies
The financial statements of foreign operations are translated into New Taiwan dollars at the following exchange rates:
a. Assets and liabilities - at exchange rates prevailing on the balance sheet date; b. Stockholders’ equity - at historical exchange rates; c. Dividends - at the exchange rate prevailing on the dividend declaration date; and d. Income and expenses - at average exchange rates for the year.
Exchange differences arising from the translation of the financial statements of foreign operations are recognized as a separate component of stockholders’ equity. Such exchange differences are recognized as gain or loss in the year in which the foreign operations are disposed of.
Nonderivative foreign-currency transactions are recorded in New Taiwan dollars at the rates of exchange in effect when the transactions occur. Exchange differences arising from the settlement of foreign-currency assets and liabilities are recognized as gain or loss.
At the balance sheet date, foreign-currency monetary assets and liabilities are revalued at prevailing exchange rates, and the exchange differences are recognized as gain or loss.
At the balance sheet date, foreign-currency nonmonetary assets (such as equity instruments) and liabilities that are measured at fair value are revalued at prevailing exchange rates, with the exchange differences recognized as follows:
a. Under stockholders’ equity if the changes in fair value are recognized in stockholders’
equity; b. As gain or loss if the change in fair value is recognized as gain or loss. Foreign-currency nonmonetary assets and liabilities that are carried at cost continue to be stated at exchange rates at the trade dates. If the functional currency of an equity-method investee is a foreign currency, translation adjustments will result from the translation of the investee’s financial statements into the reporting currency of the Company. These adjustments are accumulated and reported as a separate component of stockholders’ equity.
- 17 -
Mergers
The Company’s acquisition of IA Style, Inc. was accounted for using the Statement of Financial Accounting Standards No. 25 - “Business Combinations - Accounting Treatment under the Purchase Method,” and measured at the fair value of the business acquired. The net assets and net liabilities of the acquired entity were accounted for in the balance sheet as an increase in additional paid-in capital from merger (credit) and as a decrease in retained earnings (debit), respectively.
Reclassifications
Certain 2006 and 2007 accounts have been reclassified to be consistent with the presentation of the financial statements as of and for the six months ended June 30, 2008.
3. TRANSLATION INTO U.S. DOLLARS
The financial statements are stated in New Taiwan dollars. The translation of the 2008 New Taiwan dollar amounts into U.S. dollar amounts are included solely for the convenience of readers, using the noon buying rate of NT$30.34 to US$1.00 quoted by the Bank of Taiwan on June 30, 2008. The convenience translation should not be construed as representations that the New Taiwan dollar amounts have been, could have been, or could in the future be, converted into U.S. dollars at this or any other exchange rate.
4. ACCOUNTING CHANGES
a. Interpretation 96-052 - “Accounting for Bonuses to Employees, Directors and Supervisors”
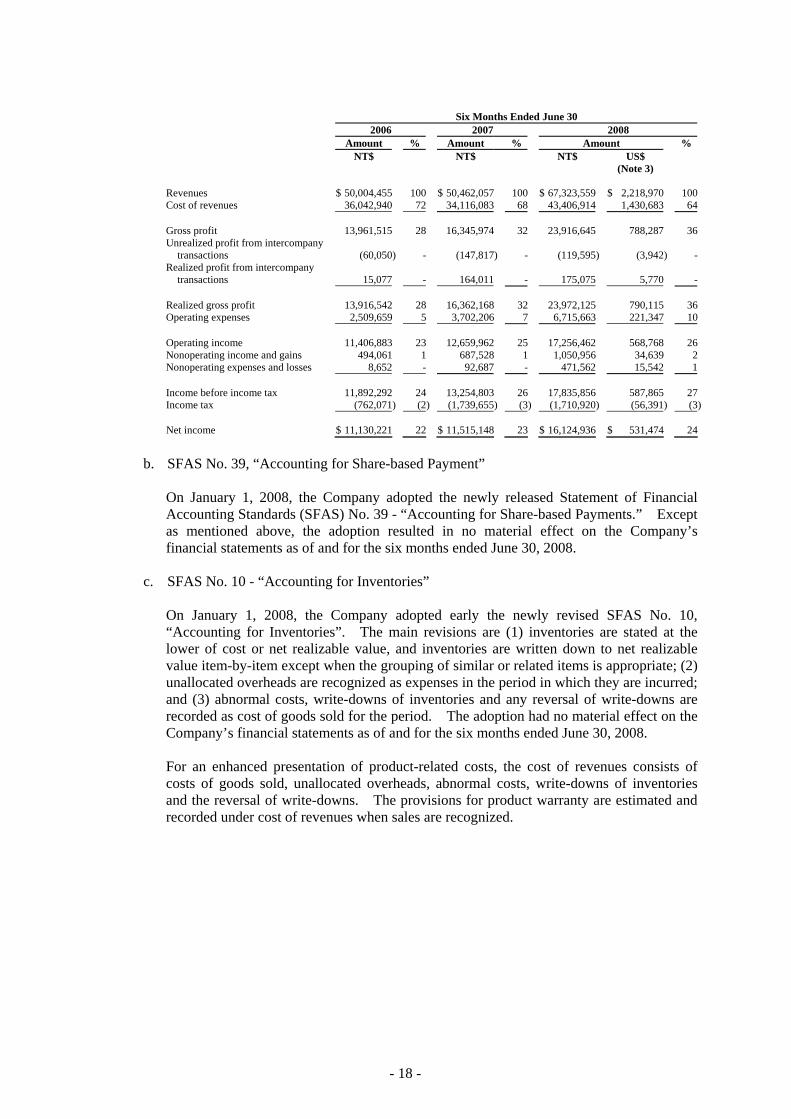
In March 2007, the Accounting Research and Development Foundation issued an interpretation that requires companies to recognize as compensation expenses bonuses paid to employees and remuneration to directors and supervisors beginning January 1, 2008. These bonuses were previously recorded as appropriations from earnings. The adoption of this interpretation resulted in a decrease of NT$2,565,346 thousand (US$ 84,553 thousand) in net income, including employee bonus payable of NT$2,902,488 thousand (US$95,665 thousand), minus the allocation to inventory of NT$16,834 thousand (US$555 thousand) and minus the tax saving of NT$320,308 thousand (US$10,557 thousand), and a decrease in after income tax basic earnings per share of NT$3.40 for the six months ended June 30, 2008. Had the bonuses to employees and remuneration to directors and supervisors not been recognized as compensation expenses, net income would have been calculated as follows:
- 18 -
Six Months Ended June 30 2006 2007 2008 Amount % Amount % Amount % NT$ NT$ NT$ US$ (Note 3) Revenues $ 50,004,455 100 $ 50,462,057 100 $ 67,323,559 $ 2,218,970 100 Cost of revenues 36,042,940 72 34,116,083 68 43,406,914 1,430,683 64 Gross profit 13,961,515 28 16,345,974 32 23,916,645 788,287 36 Unrealized profit from intercompany
transactions (60,050) - (147,817) - (119,595) (3,942) - Realized profit from intercompany
transactions 15,077 - 164,011 - 175,075 5,770 - Realized gross profit 13,916,542 28 16,362,168 32 23,972,125 790,115 36 Operating expenses 2,509,659 5 3,702,206 7 6,715,663 221,347 10 Operating income 11,406,883 23 12,659,962 25 17,256,462 568,768 26 Nonoperating income and gains 494,061 1 687,528 1 1,050,956 34,639 2 Nonoperating expenses and losses 8,652 - 92,687 - 471,562 15,542 1 Income before income tax 11,892,292 24 13,254,803 26 17,835,856 587,865 27 Income tax (762,071) (2) (1,739,655) (3) (1,710,920) (56,391) (3) Net income $ 11,130,221 22 $ 11,515,148 23 $ 16,124,936 $ 531,474 24
b. SFAS No. 39, “Accounting for Share-based Payment”
On January 1, 2008, the Company adopted the newly released Statement of Financial Accounting Standards (SFAS) No. 39 - “Accounting for Share-based Payments.” Except as mentioned above, the adoption resulted in no material effect on the Company’s financial statements as of and for the six months ended June 30, 2008.
c. SFAS No. 10 - “Accounting for Inventories”
On January 1, 2008, the Company adopted early the newly revised SFAS No. 10, “Accounting for Inventories”. The main revisions are (1) inventories are stated at the lower of cost or net realizable value, and inventories are written down to net realizable value item-by-item except when the grouping of similar or related items is appropriate; (2) unallocated overheads are recognized as expenses in the period in which they are incurred; and (3) abnormal costs, write-downs of inventories and any reversal of write-downs are recorded as cost of goods sold for the period. The adoption had no material effect on the Company’s financial statements as of and for the six months ended June 30, 2008. For an enhanced presentation of product-related costs, the cost of revenues consists of costs of goods sold, unallocated overheads, abnormal costs, write-downs of inventories and the reversal of write-downs. The provisions for product warranty are estimated and recorded under cost of revenues when sales are recognized.
- 19 -
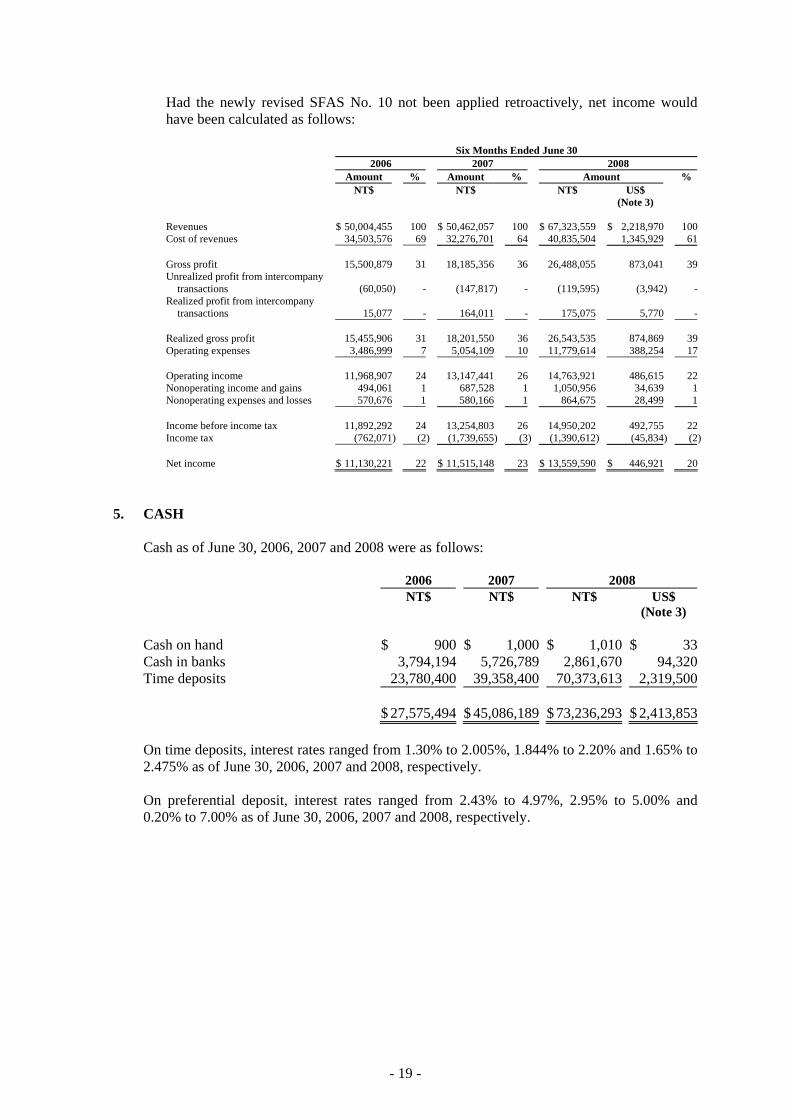
Had the newly revised SFAS No. 10 not been applied retroactively, net income would have been calculated as follows:
Six Months Ended June 30 2006 2007 2008 Amount % Amount % Amount %
NT$ NT$ NT$ US$ (Note 3) Revenues $ 50,004,455 100 $ 50,462,057 100 $ 67,323,559 $ 2,218,970 100 Cost of revenues 34,503,576 69 32,276,701 64 40,835,504 1,345,929 61 Gross profit 15,500,879 31 18,185,356 36 26,488,055 873,041 39 Unrealized profit from intercompany
transactions (60,050) - (147,817) - (119,595) (3,942) - Realized profit from intercompany
transactions 15,077 - 164,011 - 175,075 5,770 - Realized gross profit 15,455,906 31 18,201,550 36 26,543,535 874,869 39 Operating expenses 3,486,999 7 5,054,109 10 11,779,614 388,254 17 Operating income 11,968,907 24 13,147,441 26 14,763,921 486,615 22 Nonoperating income and gains 494,061 1 687,528 1 1,050,956 34,639 1 Nonoperating expenses and losses 570,676 1 580,166 1 864,675 28,499 1 Income before income tax 11,892,292 24 13,254,803 26 14,950,202 492,755 22 Income tax (762,071) (2) (1,739,655) (3) (1,390,612) (45,834) (2) Net income $ 11,130,221 22 $ 11,515,148 23 $ 13,559,590 $ 446,921 20
5. CASH
Cash as of June 30, 2006, 2007 and 2008 were as follows:
2006 2007 2008 NT$ NT$ NT$ US$ (Note 3) Cash on hand $ 900 $ 1,000 $ 1,010 $ 33Cash in banks 3,794,194 5,726,789 2,861,670 94,320Time deposits 23,780,400 39,358,400 70,373,613 2,319,500 $ 27,575,494 $ 45,086,189 $ 73,236,293 $ 2,413,853 On time deposits, interest rates ranged from 1.30% to 2.005%, 1.844% to 2.20% and 1.65% to 2.475% as of June 30, 2006, 2007 and 2008, respectively. On preferential deposit, interest rates ranged from 2.43% to 4.97%, 2.95% to 5.00% and 0.20% to 7.00% as of June 30, 2006, 2007 and 2008, respectively.
- 20 -
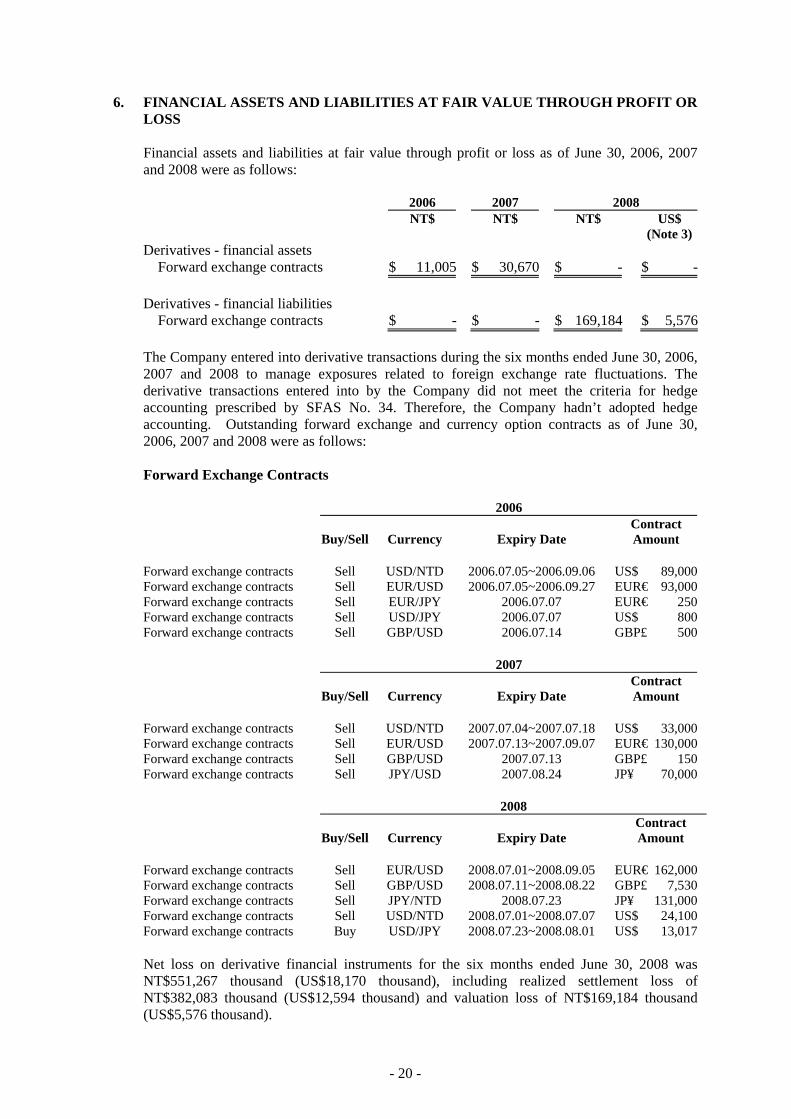
6. FINANCIAL ASSETS AND LIABILITIES AT FAIR VALUE THROUGH PROFIT OR LOSS
Financial assets and liabilities at fair value through profit or loss as of June 30, 2006, 2007 and 2008 were as follows: 2006 2007 2008 NT$ NT$ NT$ US$ (Note 3)Derivatives - financial assets
Forward exchange contracts $ 11,005 $ 30,670 $ - $ - Derivatives - financial liabilities
Forward exchange contracts $ - $ - $ 169,184 $ 5,576
The Company entered into derivative transactions during the six months ended June 30, 2006, 2007 and 2008 to manage exposures related to foreign exchange rate fluctuations. The derivative transactions entered into by the Company did not meet the criteria for hedge accounting prescribed by SFAS No. 34. Therefore, the Company hadn’t adopted hedge accounting. Outstanding forward exchange and currency option contracts as of June 30, 2006, 2007 and 2008 were as follows: Forward Exchange Contracts
2006
Buy/Sell Currency Expiry Date Contract Amount
Forward exchange contracts Sell USD/NTD 2006.07.05~2006.09.06 US$ 89,000Forward exchange contracts Sell EUR/USD 2006.07.05~2006.09.27 EUR€ 93,000Forward exchange contracts Sell EUR/JPY 2006.07.07 EUR€ 250Forward exchange contracts Sell USD/JPY 2006.07.07 US$ 800Forward exchange contracts Sell GBP/USD 2006.07.14 GBP£ 500 2007
Buy/Sell Currency Expiry Date Contract Amount
Forward exchange contracts Sell USD/NTD 2007.07.04~2007.07.18 US$ 33,000Forward exchange contracts Sell EUR/USD 2007.07.13~2007.09.07 EUR€ 130,000Forward exchange contracts Sell GBP/USD 2007.07.13 GBP£ 150Forward exchange contracts Sell JPY/USD 2007.08.24 JP¥ 70,000 2008
Buy/Sell Currency Expiry Date Contract Amount
Forward exchange contracts Sell EUR/USD 2008.07.01~2008.09.05 EUR€ 162,000Forward exchange contracts Sell GBP/USD 2008.07.11~2008.08.22 GBP£ 7,530Forward exchange contracts Sell JPY/NTD 2008.07.23 JP¥ 131,000Forward exchange contracts Sell USD/NTD 2008.07.01~2008.07.07 US$ 24,100Forward exchange contracts Buy USD/JPY 2008.07.23~2008.08.01 US$ 13,017 Net loss on derivative financial instruments for the six months ended June 30, 2008 was NT$551,267 thousand (US$18,170 thousand), including realized settlement loss of NT$382,083 thousand (US$12,594 thousand) and valuation loss of NT$169,184 thousand (US$5,576 thousand).
- 21 -
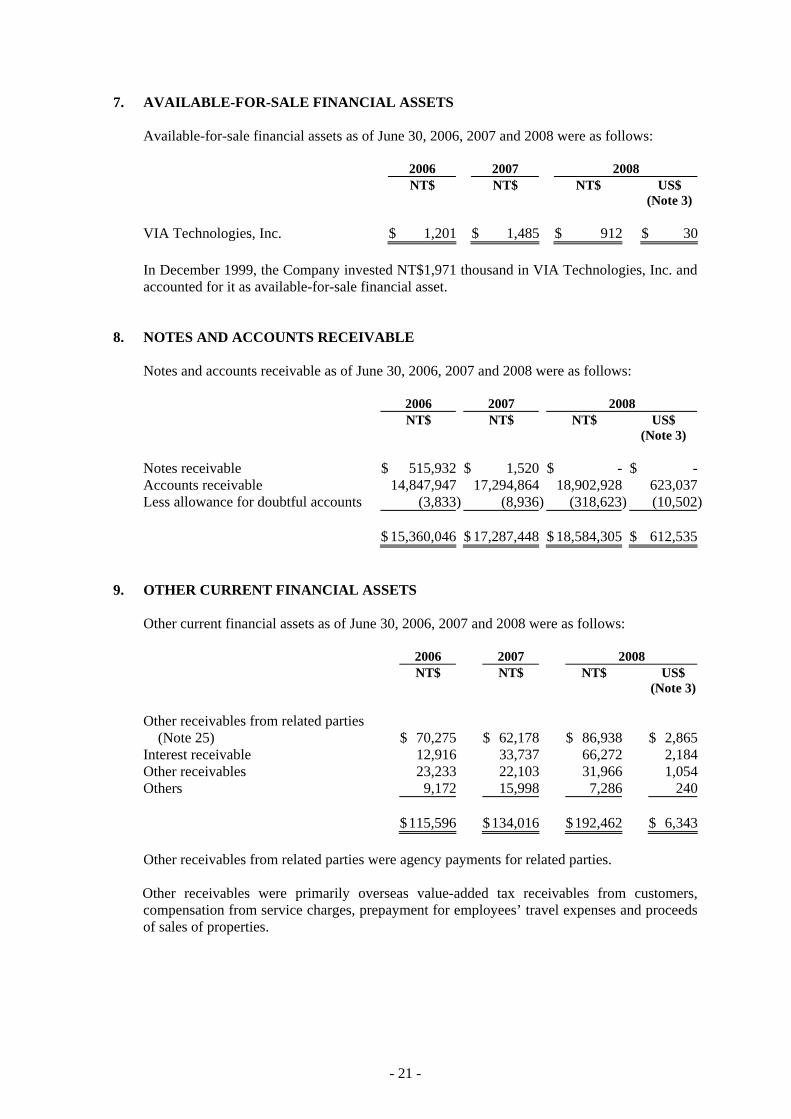
7. AVAILABLE-FOR-SALE FINANCIAL ASSETS Available-for-sale financial assets as of June 30, 2006, 2007 and 2008 were as follows: 2006 2007 2008 NT$ NT$ NT$ US$ (Note 3) VIA Technologies, Inc. $ 1,201 $ 1,485 $ 912 $ 30 In December 1999, the Company invested NT$1,971 thousand in VIA Technologies, Inc. and accounted for it as available-for-sale financial asset.
8. NOTES AND ACCOUNTS RECEIVABLE
Notes and accounts receivable as of June 30, 2006, 2007 and 2008 were as follows:
2006 2007 2008 NT$ NT$ NT$ US$ (Note 3) Notes receivable $ 515,932 $ 1,520 $ - $ -Accounts receivable 14,847,947 17,294,864 18,902,928 623,037Less allowance for doubtful accounts (3,833) (8,936) (318,623) (10,502) $ 15,360,046 $ 17,287,448 $ 18,584,305 $ 612,535
9. OTHER CURRENT FINANCIAL ASSETS
Other current financial assets as of June 30, 2006, 2007 and 2008 were as follows:
2006 2007 2008 NT$ NT$ NT$ US$ (Note 3) Other receivables from related parties
(Note 25) $ 70,275 $ 62,178 $ 86,938 $ 2,865Interest receivable 12,916 33,737 66,272 2,184Other receivables 23,233 22,103 31,966 1,054Others 9,172 15,998 7,286 240 $ 115,596 $ 134,016 $ 192,462 $ 6,343
Other receivables from related parties were agency payments for related parties. Other receivables were primarily overseas value-added tax receivables from customers, compensation from service charges, prepayment for employees’ travel expenses and proceeds of sales of properties.
- 22 -
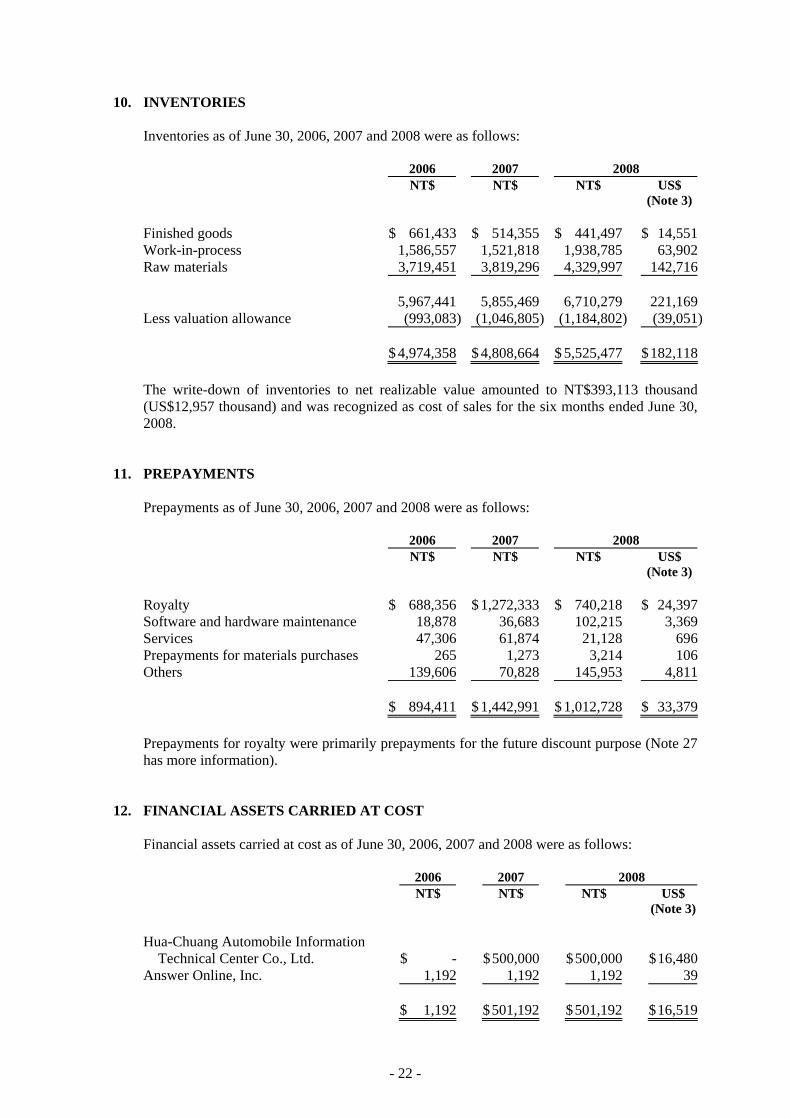
10. INVENTORIES
Inventories as of June 30, 2006, 2007 and 2008 were as follows: 2006 2007 2008 NT$ NT$ NT$ US$ (Note 3) Finished goods $ 661,433 $ 514,355 $ 441,497 $ 14,551Work-in-process 1,586,557 1,521,818 1,938,785 63,902Raw materials 3,719,451 3,819,296 4,329,997 142,716 5,967,441 5,855,469 6,710,279 221,169Less valuation allowance (993,083) (1,046,805) (1,184,802) (39,051) $ 4,974,358 $ 4,808,664 $ 5,525,477 $ 182,118
The write-down of inventories to net realizable value amounted to NT$393,113 thousand (US$12,957 thousand) and was recognized as cost of sales for the six months ended June 30, 2008.
11. PREPAYMENTS
Prepayments as of June 30, 2006, 2007 and 2008 were as follows:
2006 2007 2008 NT$ NT$ NT$ US$ (Note 3) Royalty $ 688,356 $ 1,272,333 $ 740,218 $ 24,397Software and hardware maintenance 18,878 36,683 102,215 3,369Services 47,306 61,874 21,128 696Prepayments for materials purchases 265 1,273 3,214 106Others 139,606 70,828 145,953 4,811 $ 894,411 $ 1,442,991 $ 1,012,728 $ 33,379
Prepayments for royalty were primarily prepayments for the future discount purpose (Note 27 has more information).
12. FINANCIAL ASSETS CARRIED AT COST
Financial assets carried at cost as of June 30, 2006, 2007 and 2008 were as follows:
2006 2007 2008 NT$ NT$ NT$ US$ (Note 3) Hua-Chuang Automobile Information
Technical Center Co., Ltd. $ - $ 500,000 $ 500,000 $ 16,480Answer Online, Inc. 1,192 1,192 1,192 39 $ 1,192 $ 501,192 $ 501,192 $ 16,519
- 23 -
In January 2007, the Company acquired 10% equity interest in Hua-Chuang Automobile Information Technical Center Co., Ltd. for NT$500,000 thousand. The Company also signed a joint venture agreement with Yulon Group, the main stockholder of Hua-Chuang. Under the agreement, the Company and Yulon Group may, between January 1, 2010 and December 31, 2011, submit written requests to each other for Yulon Group to buy back NT$300,000 thousand at original price, some of Hua-Chuang’s shares bought by the Company. In March 2004, the Company merged with IA Style, Inc. (Note 1) and acquired 1.82% equity interest in Answer Online, Inc. as a result of the merger. These unquoted equity instruments were not carried at fair value because their fair value could not be reliably measured; thus, the Company accounted for these investments by the cost method.
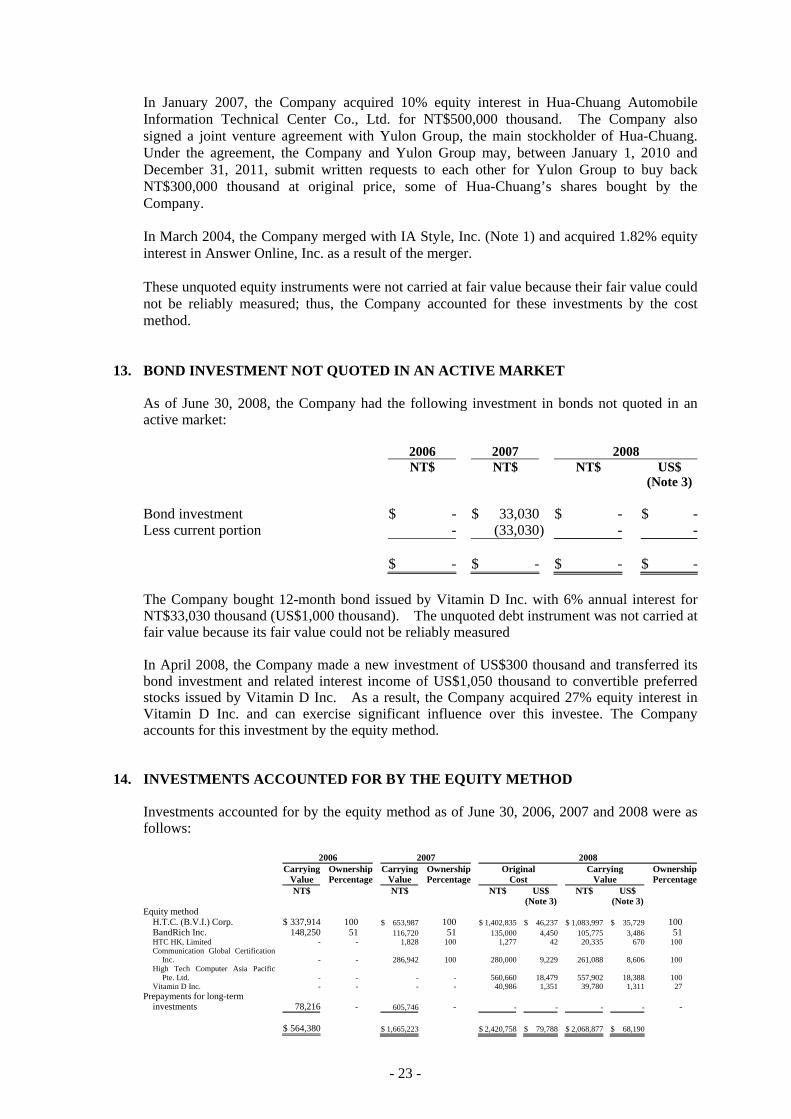
13. BOND INVESTMENT NOT QUOTED IN AN ACTIVE MARKET
As of June 30, 2008, the Company had the following investment in bonds not quoted in an active market: 2006 2007 2008 NT$ NT$ NT$ US$ (Note 3) Bond investment $ - $ 33,030 $ - $ -Less current portion - (33,030) - - $ - $ - $ - $ - The Company bought 12-month bond issued by Vitamin D Inc. with 6% annual interest for NT$33,030 thousand (US$1,000 thousand). The unquoted debt instrument was not carried at fair value because its fair value could not be reliably measured In April 2008, the Company made a new investment of US$300 thousand and transferred its bond investment and related interest income of US$1,050 thousand to convertible preferred stocks issued by Vitamin D Inc. As a result, the Company acquired 27% equity interest in Vitamin D Inc. and can exercise significant influence over this investee. The Company accounts for this investment by the equity method.
14. INVESTMENTS ACCOUNTED FOR BY THE EQUITY METHOD
Investments accounted for by the equity method as of June 30, 2006, 2007 and 2008 were as follows:
2006 2007 2008
Carrying
Value Ownership Percentage
Carrying Value
Ownership Percentage
Original Cost
Carrying Value
Ownership Percentage
NT$ NT$ NT$ US$ NT$ US$ (Note 3) (Note 3) Equity method
H.T.C. (B.V.I.) Corp. $ 337,914 100 $ 653,987 100 $ 1,402,835 $ 46,237 $ 1,083,997 $ 35,729 100 BandRich Inc. 148,250 51 116,720 51 135,000 4,450 105,775 3,486 51 HTC HK, Limited - - 1,828 100 1,277 42 20,335 670 100 Communication Global Certification
Inc. - - 286,942 100 280,000 9,229 261,088 8,606 100 High Tech Computer Asia Pacific
Pte. Ltd. - - - - 560,660 18,479 557,902 18,388 100 Vitamin D Inc. - - - - 40,986 1,351 39,780 1,311 27
Prepayments for long-term investments 78,216 - 605,746 - - - - - -
$ 564,380 $ 1,665,223 $ 2,420,758 $ 79,788 $ 2,068,877 $ 68,190
- 24 -
In August 2000, the Company acquired 100% equity interest in H.T.C. (B.V.I.) Corp. for NT$12,834 thousand and accounted for this investment by the equity method. As of June 30, 2008, the Company had increased this investment to NT$1,402,835 thousand (US$46,237 thousand). H.T.C. (B.V.I.) Corp. makes investments on behalf of the Company. In April 2006, the Company acquired 92% equity interest in BandRich Inc. for NT$135,000 thousand and accounted for this investment by the equity method. In May 2006, BandRich Inc. issued 12,000 thousand shares of common stock at a price of NT$12.50 per share of which the Company didn’t purchase. The Company’s ownership percentage declined from 92% to 51% and resulted in capital surplus - long term equity investments of NT$15,845 thousand. In September 2006, the Company acquired 100% equity interest in HTC HK, Limited for NT$1,277 thousand and accounted for this investment by the equity method. In January 2007, the Company acquired 100% equity interest in Communication Global Certification Inc. for NT$280,000 thousand and accounted for this investment by the equity method. In June 2007, the Company acquired 100% equity interest in High Tech Computer Asia Pacific Pte. Ltd. for NT$560,660 thousand and accounted for this investment by the equity method. In April 2008, the Company made a new investment of US$300 thousand and transferred its bond investment and related interest income of US$1,050 thousand to convertible preferred stocks issued by Vitamin D Inc. As a result, the Company acquired 27% equity interest in Vitamin D Inc. for NT$40,986 thousand and can exercise significant influence over this investee. The Company accounts for this investment by the equity method. On its equity-method investments, the Company had a gain of NT$7,284 thousand and losses of NT$51,070 thousand and NT$294,602 thousand (US$9,710 thousand) for the six months ended June 30, 2006, 2007 and 2008, respectively. The financial statements of equity-method investees had been examined by the Company’s independent auditors. Under the revised Statement of Financial Accounting Standards No. 7, “Consolidated Financial Statements,” which took effect on January 1, 2005, the Company included the accounts of all its direct and indirect subsidiaries in the consolidated financial statements as of and for the six months ended June 30, 2006, 2007 and 2008. All significant intercompany balances and transactions have been eliminated.
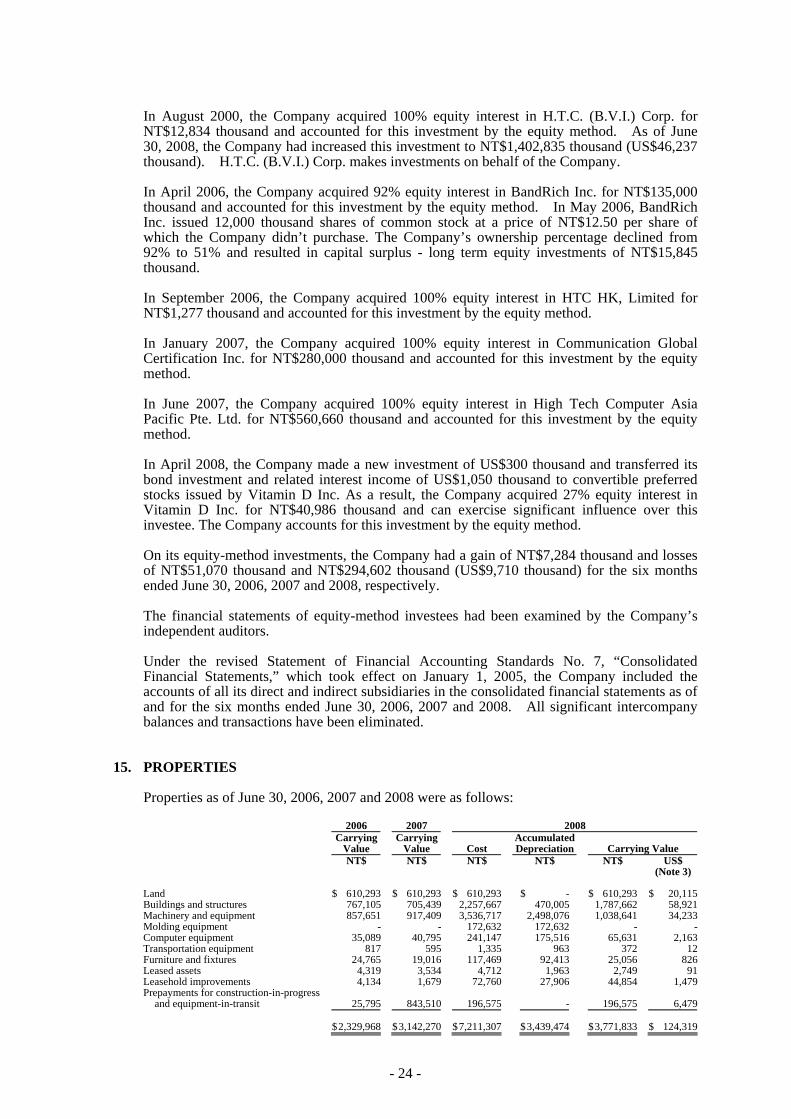
15. PROPERTIES
Properties as of June 30, 2006, 2007 and 2008 were as follows:
2006 2007 2008
Carrying
Value Carrying
Value Cost Accumulated Depreciation Carrying Value
NT$ NT$ NT$ NT$ NT$ US$ (Note 3)
Land $ 610,293 $ 610,293 $ 610,293 $ - $ 610,293 $ 20,115 Buildings and structures 767,105 705,439 2,257,667 470,005 1,787,662 58,921 Machinery and equipment 857,651 917,409 3,536,717 2,498,076 1,038,641 34,233 Molding equipment - - 172,632 172,632 - - Computer equipment 35,089 40,795 241,147 175,516 65,631 2,163 Transportation equipment 817 595 1,335 963 372 12 Furniture and fixtures 24,765 19,016 117,469 92,413 25,056 826 Leased assets 4,319 3,534 4,712 1,963 2,749 91 Leasehold improvements 4,134 1,679 72,760 27,906 44,854 1,479 Prepayments for construction-in-progress
and equipment-in-transit 25,795 843,510 196,575 - 196,575 6,479 $ 2,329,968 $ 3,142,270 $ 7,211,307 $ 3,439,474 $ 3,771,833 $ 124,319
- 25 -
The construction of a new office building was completed in September 2007, and prepayments for construction in progress were transferred to buildings and structures.
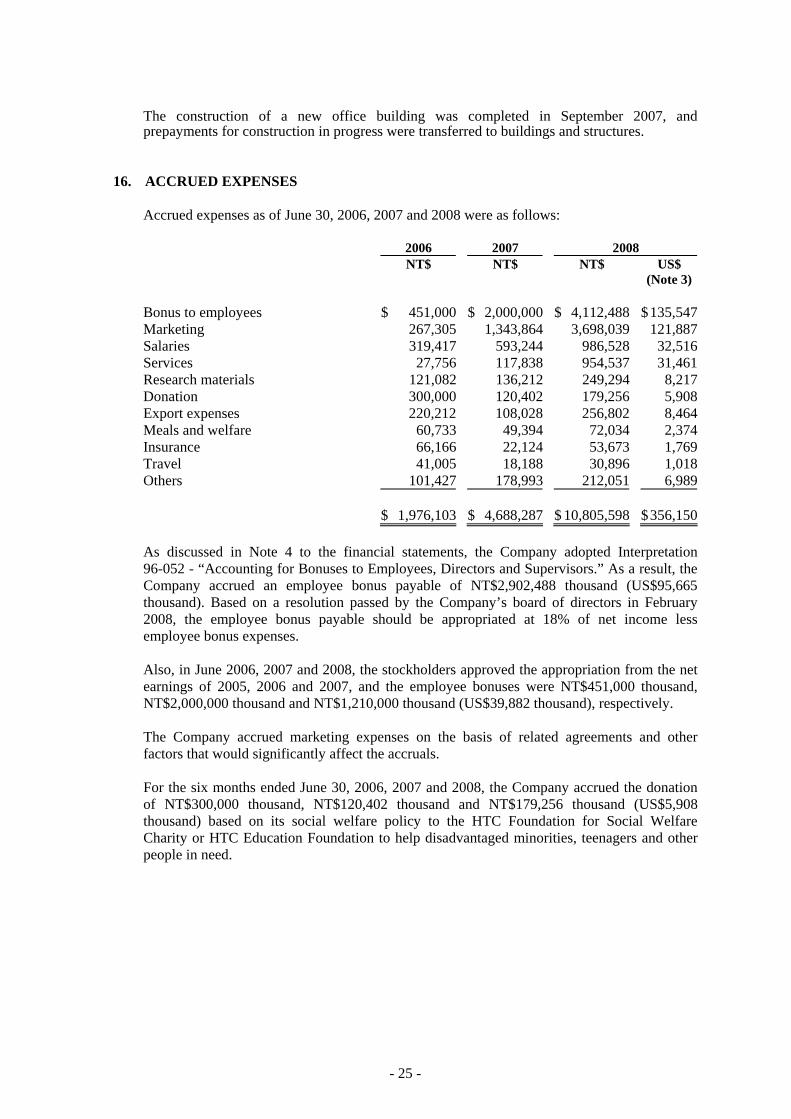
16. ACCRUED EXPENSES
Accrued expenses as of June 30, 2006, 2007 and 2008 were as follows:
2006 2007 2008 NT$ NT$ NT$ US$ (Note 3) Bonus to employees $ 451,000 $ 2,000,000 $ 4,112,488 $ 135,547Marketing 267,305 1,343,864 3,698,039 121,887Salaries 319,417 593,244 986,528 32,516Services 27,756 117,838 954,537 31,461Research materials 121,082 136,212 249,294 8,217Donation 300,000 120,402 179,256 5,908Export expenses 220,212 108,028 256,802 8,464Meals and welfare 60,733 49,394 72,034 2,374Insurance 66,166 22,124 53,673 1,769Travel 41,005 18,188 30,896 1,018Others 101,427 178,993 212,051 6,989 $ 1,976,103 $ 4,688,287 $ 10,805,598 $ 356,150
As discussed in Note 4 to the financial statements, the Company adopted Interpretation 96-052 - “Accounting for Bonuses to Employees, Directors and Supervisors.” As a result, the Company accrued an employee bonus payable of NT$2,902,488 thousand (US$95,665 thousand). Based on a resolution passed by the Company’s board of directors in February 2008, the employee bonus payable should be appropriated at 18% of net income less employee bonus expenses. Also, in June 2006, 2007 and 2008, the stockholders approved the appropriation from the net earnings of 2005, 2006 and 2007, and the employee bonuses were NT$451,000 thousand, NT$2,000,000 thousand and NT$1,210,000 thousand (US$39,882 thousand), respectively. The Company accrued marketing expenses on the basis of related agreements and other factors that would significantly affect the accruals.
For the six months ended June 30, 2006, 2007 and 2008, the Company accrued the donation of NT$300,000 thousand, NT$120,402 thousand and NT$179,256 thousand (US$5,908 thousand) based on its social welfare policy to the HTC Foundation for Social Welfare Charity or HTC Education Foundation to help disadvantaged minorities, teenagers and other people in need.
- 26 -
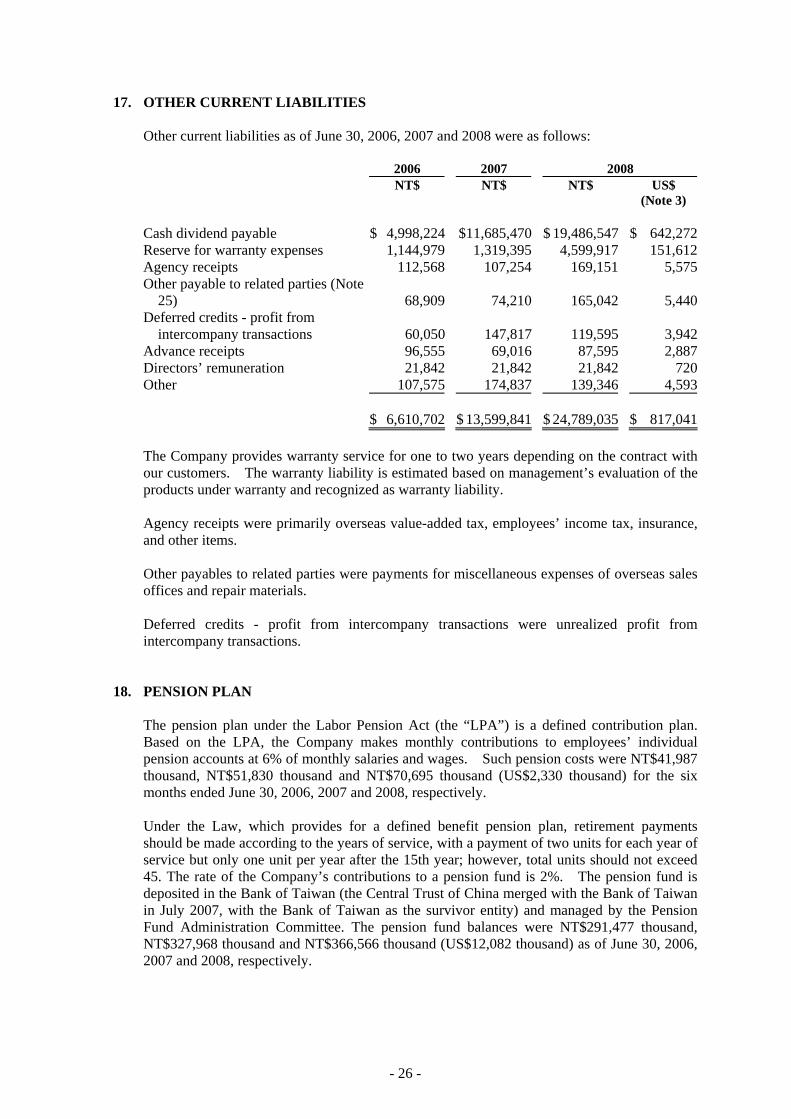
17. OTHER CURRENT LIABILITIES
Other current liabilities as of June 30, 2006, 2007 and 2008 were as follows:
2006 2007 2008 NT$ NT$ NT$ US$ (Note 3) Cash dividend payable $ 4,998,224 $11,685,470 $ 19,486,547 $ 642,272Reserve for warranty expenses 1,144,979 1,319,395 4,599,917 151,612Agency receipts 112,568 107,254 169,151 5,575Other payable to related parties (Note
25) 68,909 74,210 165,042 5,440Deferred credits - profit from
intercompany transactions 60,050 147,817 119,595 3,942Advance receipts 96,555 69,016 87,595 2,887Directors’ remuneration 21,842 21,842 21,842 720Other 107,575 174,837 139,346 4,593 $ 6,610,702 $ 13,599,841 $ 24,789,035 $ 817,041
The Company provides warranty service for one to two years depending on the contract with our customers. The warranty liability is estimated based on management’s evaluation of the products under warranty and recognized as warranty liability. Agency receipts were primarily overseas value-added tax, employees’ income tax, insurance, and other items. Other payables to related parties were payments for miscellaneous expenses of overseas sales offices and repair materials. Deferred credits - profit from intercompany transactions were unrealized profit from intercompany transactions.
18. PENSION PLAN
The pension plan under the Labor Pension Act (the “LPA”) is a defined contribution plan. Based on the LPA, the Company makes monthly contributions to employees’ individual pension accounts at 6% of monthly salaries and wages. Such pension costs were NT$41,987 thousand, NT$51,830 thousand and NT$70,695 thousand (US$2,330 thousand) for the six months ended June 30, 2006, 2007 and 2008, respectively. Under the Law, which provides for a defined benefit pension plan, retirement payments should be made according to the years of service, with a payment of two units for each year of service but only one unit per year after the 15th year; however, total units should not exceed 45. The rate of the Company’s contributions to a pension fund is 2%. The pension fund is deposited in the Bank of Taiwan (the Central Trust of China merged with the Bank of Taiwan in July 2007, with the Bank of Taiwan as the survivor entity) and managed by the Pension Fund Administration Committee. The pension fund balances were NT$291,477 thousand, NT$327,968 thousand and NT$366,566 thousand (US$12,082 thousand) as of June 30, 2006, 2007 and 2008, respectively.
- 27 -
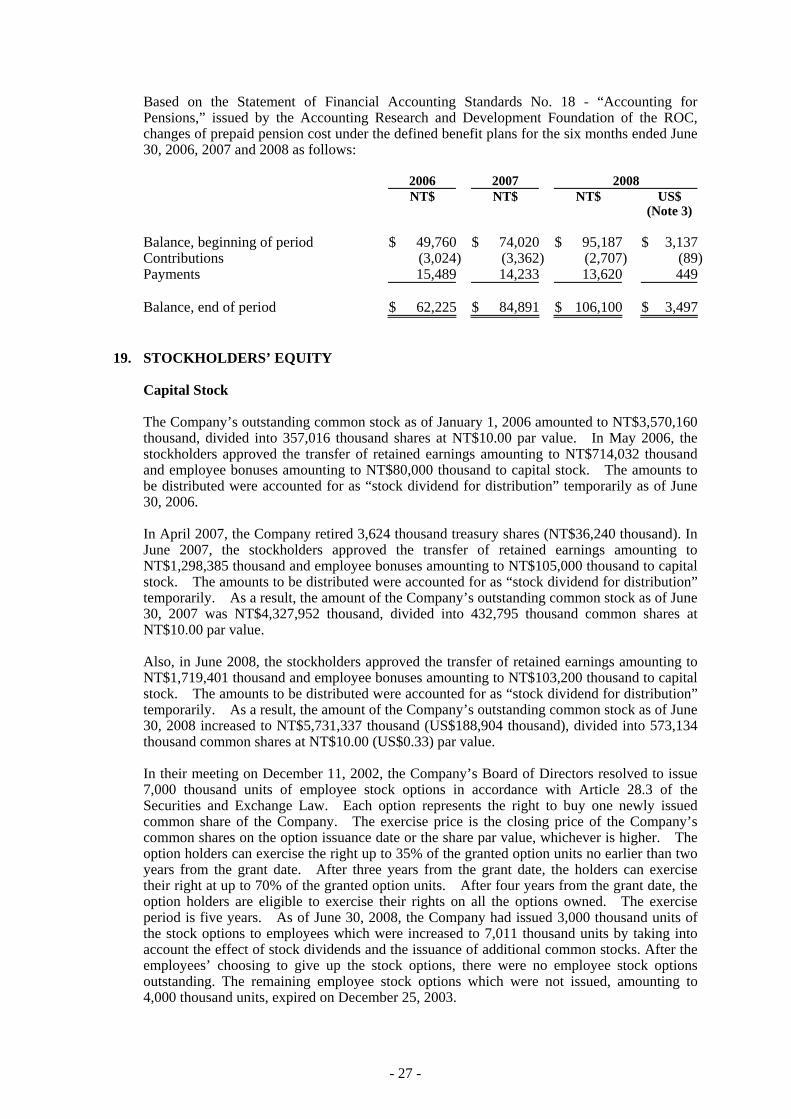
Based on the Statement of Financial Accounting Standards No. 18 - “Accounting for Pensions,” issued by the Accounting Research and Development Foundation of the ROC, changes of prepaid pension cost under the defined benefit plans for the six months ended June 30, 2006, 2007 and 2008 as follows: 2006 2007 2008 NT$ NT$ NT$ US$ (Note 3) Balance, beginning of period $ 49,760 $ 74,020 $ 95,187 $ 3,137Contributions (3,024) (3,362) (2,707) (89)Payments 15,489 14,233 13,620 449 Balance, end of period $ 62,225 $ 84,891 $ 106,100 $ 3,497
19. STOCKHOLDERS’ EQUITY
Capital Stock
The Company’s outstanding common stock as of January 1, 2006 amounted to NT$3,570,160 thousand, divided into 357,016 thousand shares at NT$10.00 par value. In May 2006, the stockholders approved the transfer of retained earnings amounting to NT$714,032 thousand and employee bonuses amounting to NT$80,000 thousand to capital stock. The amounts to be distributed were accounted for as “stock dividend for distribution” temporarily as of June 30, 2006. In April 2007, the Company retired 3,624 thousand treasury shares (NT$36,240 thousand). In June 2007, the stockholders approved the transfer of retained earnings amounting to NT$1,298,385 thousand and employee bonuses amounting to NT$105,000 thousand to capital stock. The amounts to be distributed were accounted for as “stock dividend for distribution” temporarily. As a result, the amount of the Company’s outstanding common stock as of June 30, 2007 was NT$4,327,952 thousand, divided into 432,795 thousand common shares at NT$10.00 par value. Also, in June 2008, the stockholders approved the transfer of retained earnings amounting to NT$1,719,401 thousand and employee bonuses amounting to NT$103,200 thousand to capital stock. The amounts to be distributed were accounted for as “stock dividend for distribution” temporarily. As a result, the amount of the Company’s outstanding common stock as of June 30, 2008 increased to NT$5,731,337 thousand (US$188,904 thousand), divided into 573,134 thousand common shares at NT$10.00 (US$0.33) par value. In their meeting on December 11, 2002, the Company’s Board of Directors resolved to issue 7,000 thousand units of employee stock options in accordance with Article 28.3 of the Securities and Exchange Law. Each option represents the right to buy one newly issued common share of the Company. The exercise price is the closing price of the Company’s common shares on the option issuance date or the share par value, whichever is higher. The option holders can exercise the right up to 35% of the granted option units no earlier than two years from the grant date. After three years from the grant date, the holders can exercise their right at up to 70% of the granted option units. After four years from the grant date, the option holders are eligible to exercise their rights on all the options owned. The exercise period is five years. As of June 30, 2008, the Company had issued 3,000 thousand units of the stock options to employees which were increased to 7,011 thousand units by taking into account the effect of stock dividends and the issuance of additional common stocks. After the employees’ choosing to give up the stock options, there were no employee stock options outstanding. The remaining employee stock options which were not issued, amounting to 4,000 thousand units, expired on December 25, 2003.
- 28 -
Global Depositary Receipts
The Company issued 14,400 thousand common shares corresponding to 3,600 thousand units of Global Depositary Receipts (GDRs). For this GDR issuance, the Company’s stockholders, including Via Technologies, Inc., also issued 12,878.4 thousand common shares, corresponding to 3,219.6 thousand GDR units. Thus, the entire offering consisted of 6,819.6 thousand GDR units. Each GDR represents four common shares, with par value of NT$131.1. For this common share issuance, net of related expenses, NT$1,696,855 thousand was accounted for as capital surplus. This share issuance for cash was completed and registered on November 19, 2003. The holders of these GDRs have same rights and obligation with the stockholders of the Company. However, the distribution of the offering and sales of GDRs and the shares represented thereby in certain jurisdictions may be restricted by law. The GDRs offered hereby and the shares represented thereby are not transferable except in accordance with the restrictions described in the GDRs offering circular and related laws applied in Taiwan. The holders should through the depositary’s custodian in Taiwan exercise these rights as follows: a. Voting right, and b. Entitlement to receive dividends and participate in new share issuance for cash
subscription. Taking into account the effect of stock dividends, the GDRs increased to 7,833.3 thousand units (31,333.2 thousand shares). The holders of these GDRs requested the Company to redeem the GDRs to get the Company’s common shares. As of June 30, 2008, there were 6,063.5 thousand units of GDRs redeemed, representing 24,254 thousand common shares, and the outstanding GDRs represented 7,079 thousand common shares or 1.24% of the Company’s common shares. Capital Surplus Under the Company Law, capital surplus can only be used to offset a deficit. However, the capital surplus from share issued in excess of par (additional paid-in capital from issuance of common shares, conversion of bonds and treasury stock transactions) and donations may be capitalized, which however is limited to a certain percentage of the Company’s paid-in capital. Also, the capital surplus from long-term investments may not be used for any purpose. The additional paid-in capital was NT$4,410,871 thousand as of January 1, 2006. In April 2007, the retirement of treasury stock caused a decrease of additional paid-in capital amounted to 36,627 thousand. As a result, the additional paid-in capital as of June 30, 2008 was NT$4,374,244 thousand (US$144,174 thousand). Under the Company Law, the Company may transfer the capital surplus to common stock if there is no accumulated deficit. When the Company did not subscribe for the new shares issued by BandRich Inc., an adjustment of NT$15,845 thousand was made to the investment’s carrying value and capital surplus. The additional paid-in capital from a merger (Note 1), which took effect on March 1, 2004, was NT$25,972 thousand. Then, because of treasury stock retirement in April 2007, the additional paid-in capital from a merger decreased to NT$25,756 thousand (US$849 thousand).
- 29 -
Appropriation of Retained Earnings and Dividend Policy Based on the Company Law of the ROC and the Company’s Articles of Incorporation, 10% of the Company’s annual net income less any deficit should first be appropriated as legal reserve until this reserve equals its capital. From the remainder, there should be appropriations of not more than 3‰ as remuneration to directors and supervisors and at least 5% as bonuses to employees. The appropriation of retained earnings should be proposed by the board of directors and approved by the stockholders in their annual meeting. As part of a high-technology industry and a growing enterprise, the Company considers its operating environment, industry developments, and long-term interests of stockholders as well as its programs to maintain operating efficiency and meet its capital expenditure budget and financial goals in determining the stock or cash dividends to be paid. The Company’s dividend policy stipulates that at least 50% of total dividends may be distributed as cash dividends. Had the Company recognized the employees’ bonuses of NT$531,000 thousand as expenses in 2005, the pro forma earnings per share in 2005 would have decreased from NT$33.26 to NT$31.76, which were not adjusted retroactively for the effect of stock dividend distribution in later years. Had the Company recognized the employees’ bonuses of NT$2,105,000 thousand as expenses in 2006, the pro forma earnings per share in 2006 would have decreased from NT$57.85 to NT$53.03, which were not adjusted retroactively for the effect of stock dividend distribution in the following year. Had the Company recognized the employees’ bonuses of NT$1,313,200 thousand as expenses in 2007, the pro forma earnings per share in 2007 would have decreased from NT$50.48 to NT$48.19, which were not adjusted retroactively for the effect of stock dividend distribution in the following year. Based on a resolution passed by the Company’s board of directors in February 2008, the employee bonus payable should be appropriated at 18% of net income less employee bonus expenses. Material differences between such estimated amounts and the amounts proposed by the Board of Directors in the following year are retroactively adjusted for in the current year. If the actual amounts subsequently resolved by the stockholders differ from the proposed amounts, the differences are recorded in the year of stockholders’ resolution as a change in accounting estimate. If bonus shares are resolved to be distributed to employees, the number of shares is determined by dividing the amount of bonus by the closing price (after considering the effect of cash and stock dividends) of the shares of the day preceding the stockholders’ meeting.
20. TREASURY STOCK
On December 12, 2006, the Company’s board of directors passed a resolution to buy back 5,000 thousand Company shares from the open market. The repurchase period was between December 13, 2006 and January 19, 2007, and the repurchase price ranged from NT$601 to NT$800 per share. If the Company’s share price was lower than this price range, the Company might continue to buy back its shares.
- 30 -
During the repurchase period, the Company bought back 3,624 thousand shares, which were approved to be retired by the Company’s board of directors in April 2007, for NT$1,991,755 thousand.
Based on the Securities and Exchange Act of the ROC, the number of reacquired shares should not exceed 10% of the Company’s issued and outstanding stocks, and the total purchase amount should not exceed the sum of the retained earnings, additional paid-in capital in excess of par, and realized capital reserve. In addition, the Company should not pledge its treasury shares nor exercise voting rights on the shares before their reissuance.
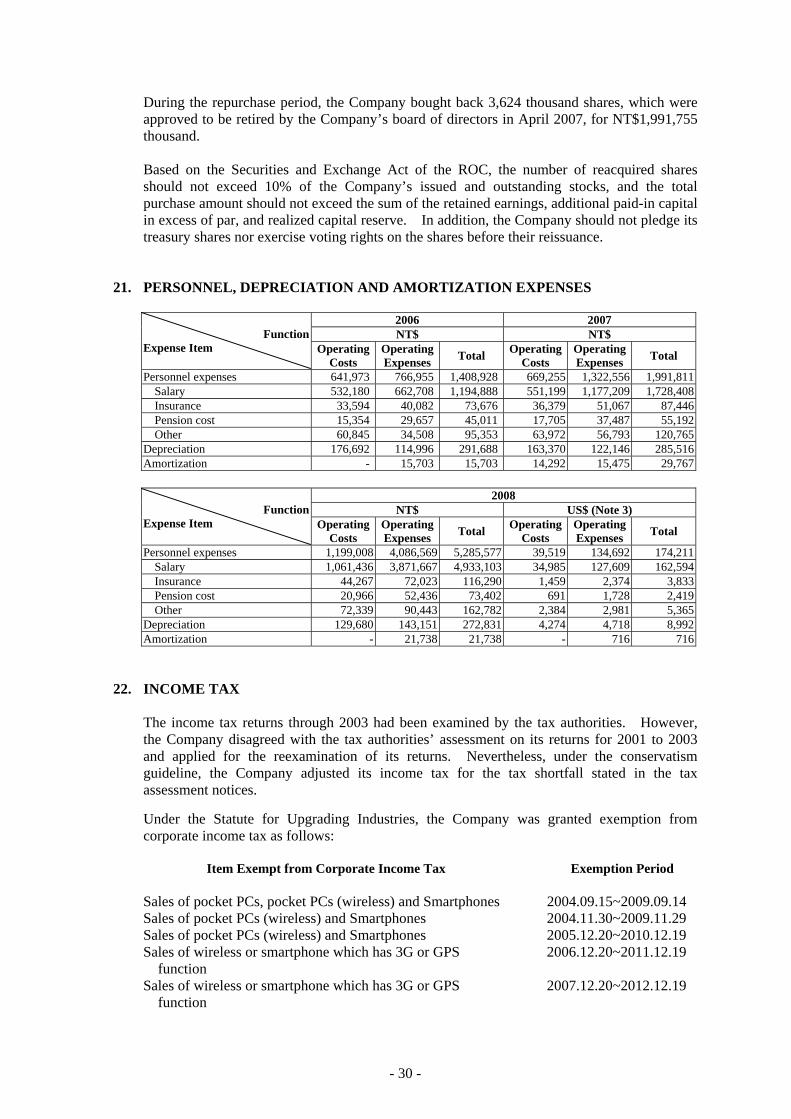
21. PERSONNEL, DEPRECIATION AND AMORTIZATION EXPENSES
2006 2007 NT$ NT$ Function
Expense Item Operating Costs
Operating Expenses Total Operating
Costs Operating Expenses Total
Personnel expenses 641,973 766,955 1,408,928 669,255 1,322,556 1,991,811Salary 532,180 662,708 1,194,888 551,199 1,177,209 1,728,408Insurance 33,594 40,082 73,676 36,379 51,067 87,446Pension cost 15,354 29,657 45,011 17,705 37,487 55,192Other 60,845 34,508 95,353 63,972 56,793 120,765
Depreciation 176,692 114,996 291,688 163,370 122,146 285,516Amortization - 15,703 15,703 14,292 15,475 29,767
2008
NT$ US$ (Note 3) Function Expense Item Operating
Costs Operating Expenses Total Operating
Costs Operating Expenses Total
Personnel expenses 1,199,008 4,086,569 5,285,577 39,519 134,692 174,211 Salary 1,061,436 3,871,667 4,933,103 34,985 127,609 162,594 Insurance 44,267 72,023 116,290 1,459 2,374 3,833 Pension cost 20,966 52,436 73,402 691 1,728 2,419 Other 72,339 90,443 162,782 2,384 2,981 5,365
Depreciation 129,680 143,151 272,831 4,274 4,718 8,992 Amortization - 21,738 21,738 - 716 716
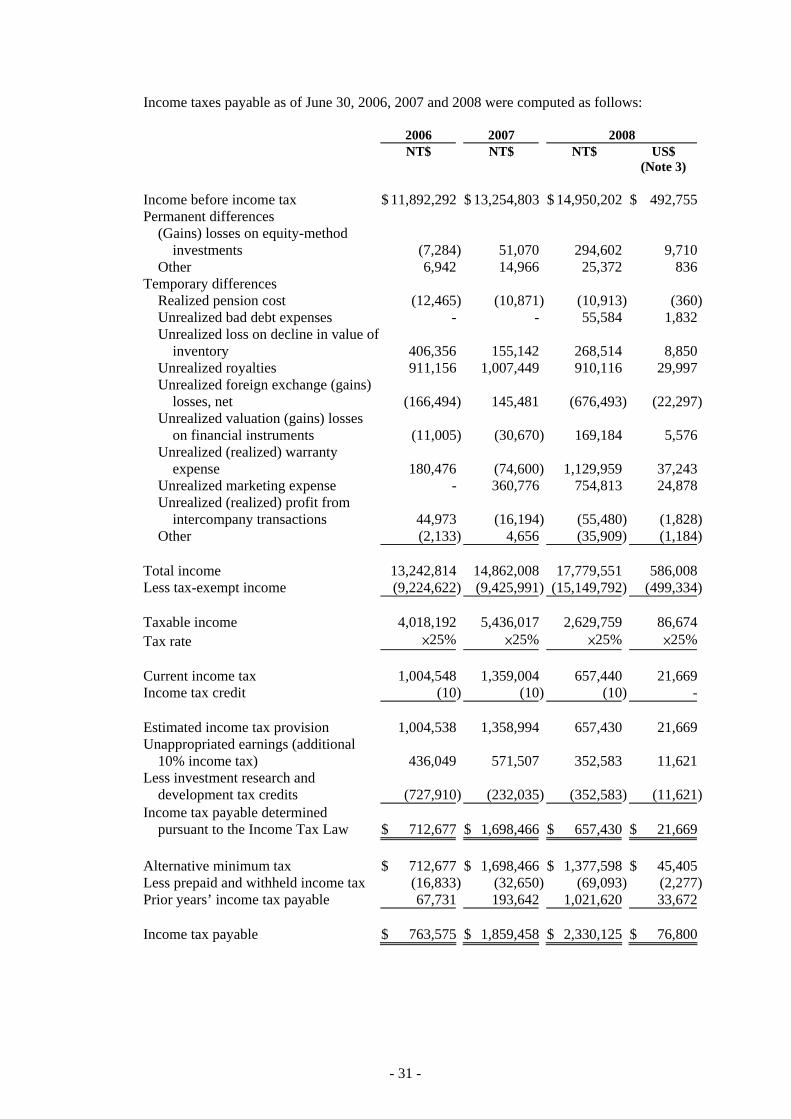
22. INCOME TAX
The income tax returns through 2003 had been examined by the tax authorities. However, the Company disagreed with the tax authorities’ assessment on its returns for 2001 to 2003 and applied for the reexamination of its returns. Nevertheless, under the conservatism guideline, the Company adjusted its income tax for the tax shortfall stated in the tax assessment notices.
Under the Statute for Upgrading Industries, the Company was granted exemption from corporate income tax as follows:
Item Exempt from Corporate Income Tax Exemption Period
Sales of pocket PCs, pocket PCs (wireless) and Smartphones 2004.09.15~2009.09.14Sales of pocket PCs (wireless) and Smartphones 2004.11.30~2009.11.29Sales of pocket PCs (wireless) and Smartphones 2005.12.20~2010.12.19Sales of wireless or smartphone which has 3G or GPS
function 2006.12.20~2011.12.19
Sales of wireless or smartphone which has 3G or GPS function
2007.12.20~2012.12.19
- 31 -
Income taxes payable as of June 30, 2006, 2007 and 2008 were computed as follows:
2006 2007 2008 NT$ NT$ NT$ US$ (Note 3)
Income before income tax $ 11,892,292 $ 13,254,803 $ 14,950,202 $ 492,755Permanent differences
(Gains) losses on equity-method investments (7,284) 51,070 294,602 9,710
Other 6,942 14,966 25,372 836Temporary differences
Realized pension cost (12,465) (10,871) (10,913) (360)Unrealized bad debt expenses - - 55,584 1,832Unrealized loss on decline in value of
inventory 406,356 155,142 268,514 8,850Unrealized royalties 911,156 1,007,449 910,116 29,997Unrealized foreign exchange (gains)
losses, net (166,494) 145,481 (676,493) (22,297)Unrealized valuation (gains) losses
on financial instruments (11,005) (30,670) 169,184 5,576Unrealized (realized) warranty
expense 180,476 (74,600) 1,129,959 37,243Unrealized marketing expense - 360,776 754,813 24,878Unrealized (realized) profit from
intercompany transactions 44,973 (16,194) (55,480) (1,828)Other (2,133) 4,656 (35,909) (1,184)
Total income 13,242,814 14,862,008 17,779,551 586,008Less tax-exempt income (9,224,622) (9,425,991) (15,149,792) (499,334) Taxable income 4,018,192 5,436,017 2,629,759 86,674Tax rate ×25% ×25% ×25% ×25% Current income tax 1,004,548 1,359,004 657,440 21,669Income tax credit (10) (10) (10) - Estimated income tax provision 1,004,538 1,358,994 657,430 21,669Unappropriated earnings (additional
10% income tax) 436,049 571,507 352,583 11,621Less investment research and
development tax credits (727,910) (232,035) (352,583) (11,621)Income tax payable determined
pursuant to the Income Tax Law $ 712,677 $ 1,698,466 $ 657,430 $ 21,669 Alternative minimum tax $ 712,677 $ 1,698,466 $ 1,377,598 $ 45,405Less prepaid and withheld income tax (16,833) (32,650) (69,093) (2,277)Prior years’ income tax payable 67,731 193,642 1,021,620 33,672 Income tax payable $ 763,575 $ 1,859,458 $ 2,330,125 $ 76,800
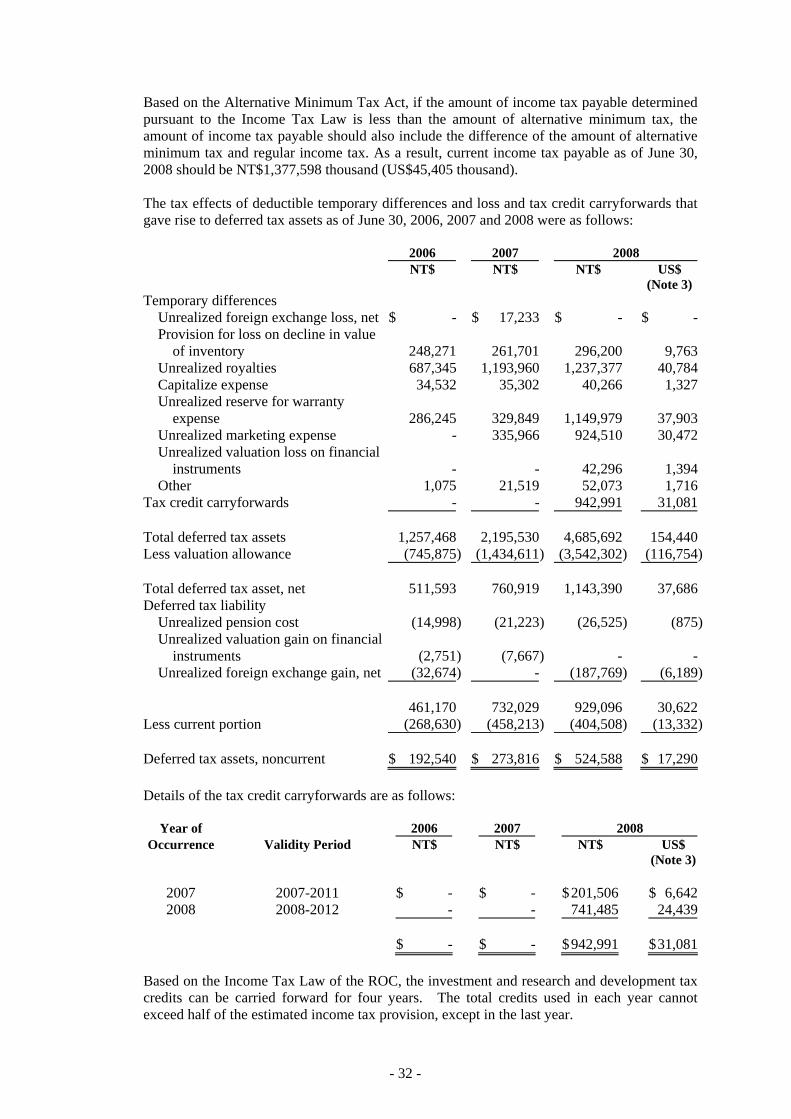
- 32 -
Based on the Alternative Minimum Tax Act, if the amount of income tax payable determined pursuant to the Income Tax Law is less than the amount of alternative minimum tax, the amount of income tax payable should also include the difference of the amount of alternative minimum tax and regular income tax. As a result, current income tax payable as of June 30, 2008 should be NT$1,377,598 thousand (US$45,405 thousand). The tax effects of deductible temporary differences and loss and tax credit carryforwards that gave rise to deferred tax assets as of June 30, 2006, 2007 and 2008 were as follows: 2006 2007 2008 NT$ NT$ NT$ US$ (Note 3)Temporary differences
Unrealized foreign exchange loss, net $ - $ 17,233 $ - $ -Provision for loss on decline in value
of inventory 248,271 261,701 296,200 9,763Unrealized royalties 687,345 1,193,960 1,237,377 40,784Capitalize expense 34,532 35,302 40,266 1,327Unrealized reserve for warranty
expense 286,245 329,849 1,149,979 37,903Unrealized marketing expense - 335,966 924,510 30,472Unrealized valuation loss on financial
instruments - - 42,296 1,394Other 1,075 21,519 52,073 1,716
Tax credit carryforwards - - 942,991 31,081 Total deferred tax assets 1,257,468 2,195,530 4,685,692 154,440Less valuation allowance (745,875) (1,434,611) (3,542,302) (116,754) Total deferred tax asset, net 511,593 760,919 1,143,390 37,686Deferred tax liability
Unrealized pension cost (14,998) (21,223) (26,525) (875)Unrealized valuation gain on financial
instruments (2,751) (7,667) - -Unrealized foreign exchange gain, net (32,674) - (187,769) (6,189)
461,170 732,029 929,096 30,622Less current portion (268,630) (458,213) (404,508) (13,332) Deferred tax assets, noncurrent $ 192,540 $ 273,816 $ 524,588 $ 17,290
Details of the tax credit carryforwards are as follows:
Year of 2006 2007 2008 Occurrence Validity Period NT$ NT$ NT$ US$
(Note 3)
2007 2007-2011 $ - $ - $ 201,506 $ 6,6422008 2008-2012 - - 741,485 24,439
$ - $ - $ 942,991 $ 31,081
Based on the Income Tax Law of the ROC, the investment and research and development tax credits can be carried forward for four years. The total credits used in each year cannot exceed half of the estimated income tax provision, except in the last year.
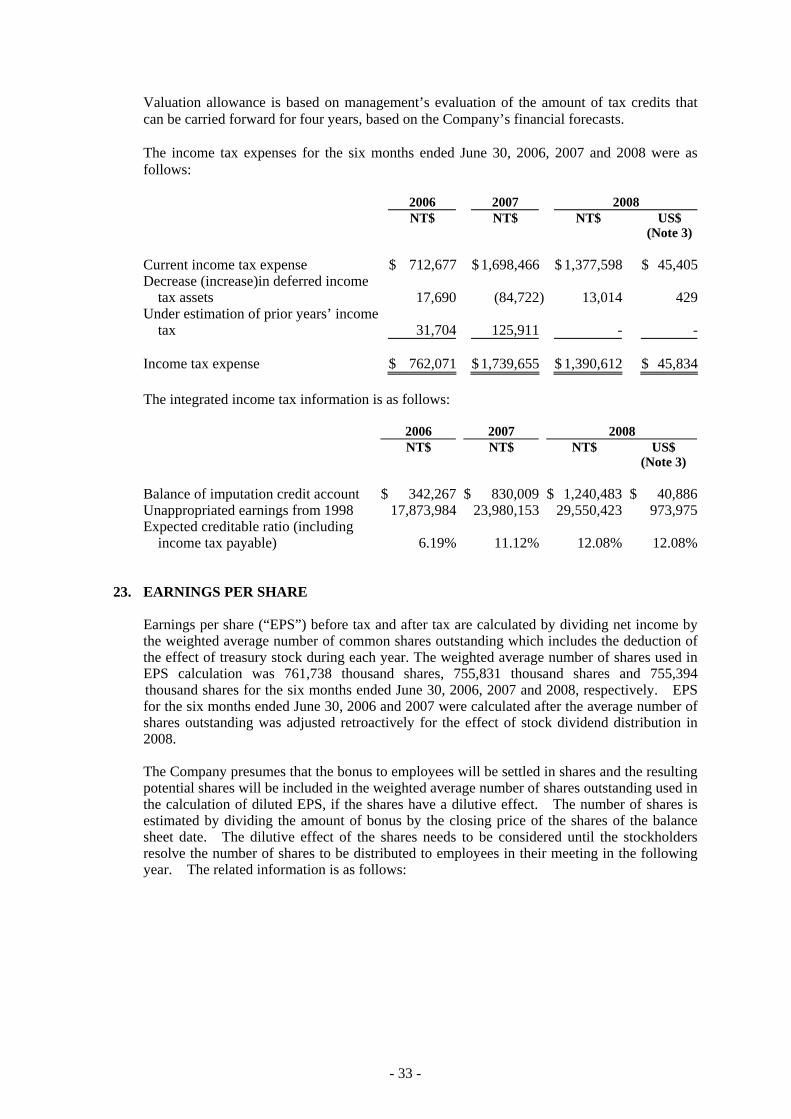
- 33 -
Valuation allowance is based on management’s evaluation of the amount of tax credits that can be carried forward for four years, based on the Company’s financial forecasts. The income tax expenses for the six months ended June 30, 2006, 2007 and 2008 were as follows:
2006 2007 2008 NT$ NT$ NT$ US$ (Note 3) Current income tax expense $ 712,677 $ 1,698,466 $ 1,377,598 $ 45,405Decrease (increase)in deferred income
tax assets 17,690 (84,722) 13,014 429Under estimation of prior years’ income
tax 31,704 125,911 - - Income tax expense $ 762,071 $ 1,739,655 $ 1,390,612 $ 45,834
The integrated income tax information is as follows:
2006 2007 2008
NT$ NT$ NT$ US$ (Note 3)
Balance of imputation credit account $ 342,267 $ 830,009 $ 1,240,483 $ 40,886Unappropriated earnings from 1998 17,873,984 23,980,153 29,550,423 973,975Expected creditable ratio (including
income tax payable) 6.19% 11.12% 12.08% 12.08% 23. EARNINGS PER SHARE
Earnings per share (“EPS”) before tax and after tax are calculated by dividing net income by the weighted average number of common shares outstanding which includes the deduction of the effect of treasury stock during each year. The weighted average number of shares used in EPS calculation was 761,738 thousand shares, 755,831 thousand shares and 755,394 thousand shares for the six months ended June 30, 2006, 2007 and 2008, respectively. EPS for the six months ended June 30, 2006 and 2007 were calculated after the average number of shares outstanding was adjusted retroactively for the effect of stock dividend distribution in 2008. The Company presumes that the bonus to employees will be settled in shares and the resulting potential shares will be included in the weighted average number of shares outstanding used in the calculation of diluted EPS, if the shares have a dilutive effect. The number of shares is estimated by dividing the amount of bonus by the closing price of the shares of the balance sheet date. The dilutive effect of the shares needs to be considered until the stockholders resolve the number of shares to be distributed to employees in their meeting in the following year. The related information is as follows:
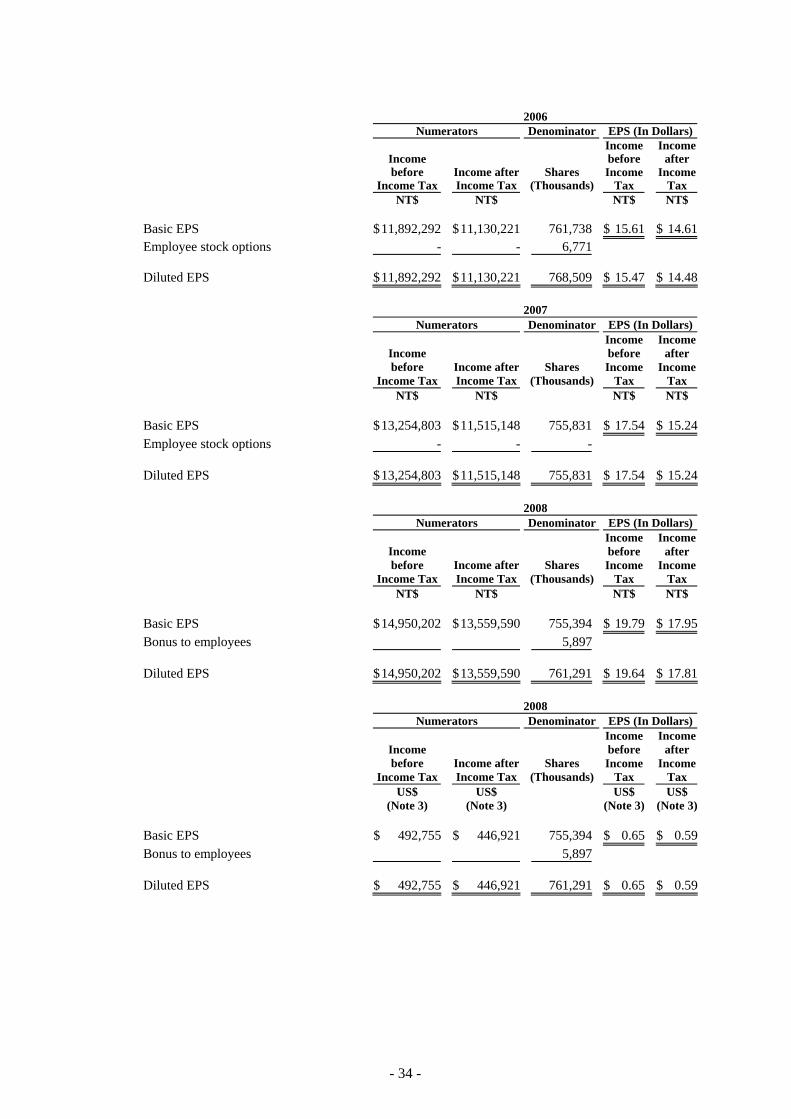
- 34 -
2006 Numerators Denominator EPS (In Dollars)
Income before
Income TaxIncome after Income Tax
Shares (Thousands)
Income before Income
Tax
Income after
Income Tax
NT$ NT$ NT$ NT$ Basic EPS $ 11,892,292 $ 11,130,221 761,738 $ 15.61 $ 14.61Employee stock options - - 6,771 Diluted EPS $ 11,892,292 $ 11,130,221 768,509 $ 15.47 $ 14.48
2007 Numerators Denominator EPS (In Dollars)
Income before
Income TaxIncome after Income Tax
Shares (Thousands)
Income before Income
Tax
Income after
Income Tax
NT$ NT$ NT$ NT$ Basic EPS $ 13,254,803 $ 11,515,148 755,831 $ 17.54 $ 15.24Employee stock options - - - Diluted EPS $ 13,254,803 $ 11,515,148 755,831 $ 17.54 $ 15.24
2008 Numerators Denominator EPS (In Dollars)
Income before
Income TaxIncome after Income Tax
Shares (Thousands)
Income before Income
Tax
Income after
Income Tax
NT$ NT$ NT$ NT$ Basic EPS $ 14,950,202 $ 13,559,590 755,394 $ 19.79 $ 17.95Bonus to employees 5,897 Diluted EPS $ 14,950,202 $ 13,559,590 761,291 $ 19.64 $ 17.81
2008 Numerators Denominator EPS (In Dollars)
Income before
Income TaxIncome after Income Tax
Shares (Thousands)
Income before Income
Tax
Income after
Income Tax
US$ US$ US$ US$ (Note 3) (Note 3) (Note 3) (Note 3) Basic EPS $ 492,755 $ 446,921 755,394 $ 0.65 $ 0.59Bonus to employees 5,897 Diluted EPS $ 492,755 $ 446,921 761,291 $ 0.65 $ 0.59

- 35 -
24. FINANCIAL INSTRUMENTS
Fair Value of Financial Instruments
Nonderivative Financial Instruments
June 30 2006 2007 2008
Carrying Amount
Fair Value
Carrying Amount
Fair Value
Carrying Amount
Fair Value
NT$ NT$ NT$ NT$ NT$ US$ NT$ US$ (Note 3) (Note 3)Assets
Available-for-sale financial assets - noncurrent $ 1,201 $ 1,201 $ 1,485 $ 1,485 $ 912 $ 30 $ 912 $ 30
Financial assets carried at cost 1,192 1,192 501,192 501,192 501,192 16,519 501,192 16,519 Bond investments not quoted in
an active market - - 33,030 33,030 - - - - Investments accounted for by
the equity method 564,380 564,380 1,665,223 1,665,223 2,068,877 68,190 2,068,877 68,190
Derivative Financial Instruments
June 30 2005 2006 2007
Carrying Amount
Fair Value
Carrying Amount
Fair Value Carrying Amount Fair Value
NT$ NT$ NT$ NT$ NT$ US$ NT$ US$ (Note 3)Assets
Financial assets at fair value through profit or loss $ 11,005 $ 11,005 $ 30,670 $ 30,670 $ - $ - $ - $ -
Liabilities Financial liabilities at fair value
through profit or loss - - - - 169,184 5,576 169,184 5,576
Methods and Assumptions Used in Determining Fair Values of Financial Instruments
Not subject to SFAS No. 34 are cash, receivables, other current financial assets, payables, accrued expenses and other current financial liabilities, which have carrying amounts that approximate their fair values. The financial instruments neither include refundable deposits nor guarantee deposits. The fair values of refundable deposits and guarantee deposits received are based on the present value of future cash flows discounted at the average interest rates for time deposits with maturities similar to those of the financial instruments. The fair values of financial instruments at fair value through profit or loss and available-for-sale financial assets are based on quoted market prices in an active market, and their fair values can be reliably measured. If the securities do not have market prices, fair value is measured on the basis of financial or other information. The Company uses estimates and assumptions that are consistent with information that market participants would use in setting a price for these securities.
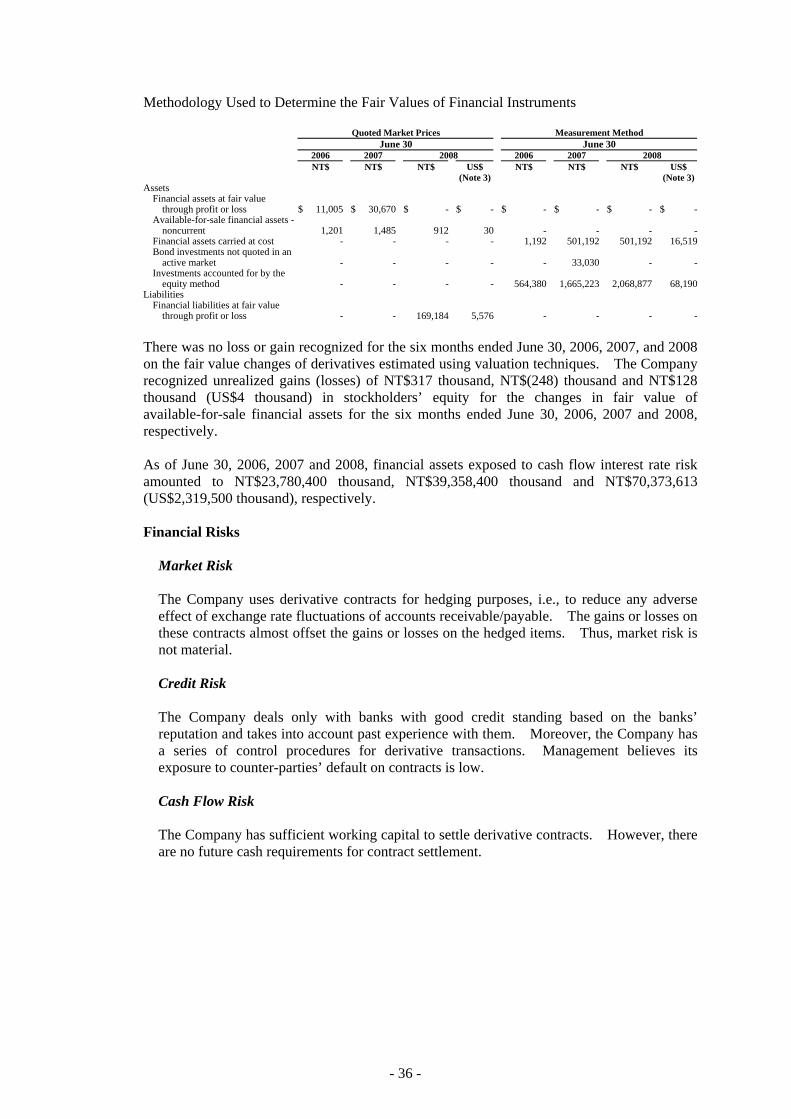
- 36 -
Methodology Used to Determine the Fair Values of Financial Instruments
Quoted Market Prices Measurement Method June 30 June 30
2006 2007 2008 2006 2007 2008 NT$ NT$ NT$ US$ NT$ NT$ NT$ US$ (Note 3) (Note 3)
Assets Financial assets at fair value
through profit or loss $ 11,005 $ 30,670 $ - $ - $ - $ - $ - $ - Available-for-sale financial assets -
noncurrent 1,201 1,485 912 30 - - - - Financial assets carried at cost - - - - 1,192 501,192 501,192 16,519 Bond investments not quoted in an
active market - - - - - 33,030 - - Investments accounted for by the
equity method - - - - 564,380 1,665,223 2,068,877 68,190 Liabilities
Financial liabilities at fair value through profit or loss - - 169,184 5,576 - - - -
There was no loss or gain recognized for the six months ended June 30, 2006, 2007, and 2008 on the fair value changes of derivatives estimated using valuation techniques. The Company recognized unrealized gains (losses) of NT$317 thousand, NT$(248) thousand and NT$128 thousand (US$4 thousand) in stockholders’ equity for the changes in fair value of available-for-sale financial assets for the six months ended June 30, 2006, 2007 and 2008, respectively. As of June 30, 2006, 2007 and 2008, financial assets exposed to cash flow interest rate risk amounted to NT$23,780,400 thousand, NT$39,358,400 thousand and NT$70,373,613 (US$2,319,500 thousand), respectively. Financial Risks
Market Risk
The Company uses derivative contracts for hedging purposes, i.e., to reduce any adverse effect of exchange rate fluctuations of accounts receivable/payable. The gains or losses on these contracts almost offset the gains or losses on the hedged items. Thus, market risk is not material. Credit Risk The Company deals only with banks with good credit standing based on the banks’ reputation and takes into account past experience with them. Moreover, the Company has a series of control procedures for derivative transactions. Management believes its exposure to counter-parties’ default on contracts is low. Cash Flow Risk The Company has sufficient working capital to settle derivative contracts. However, there are no future cash requirements for contract settlement.
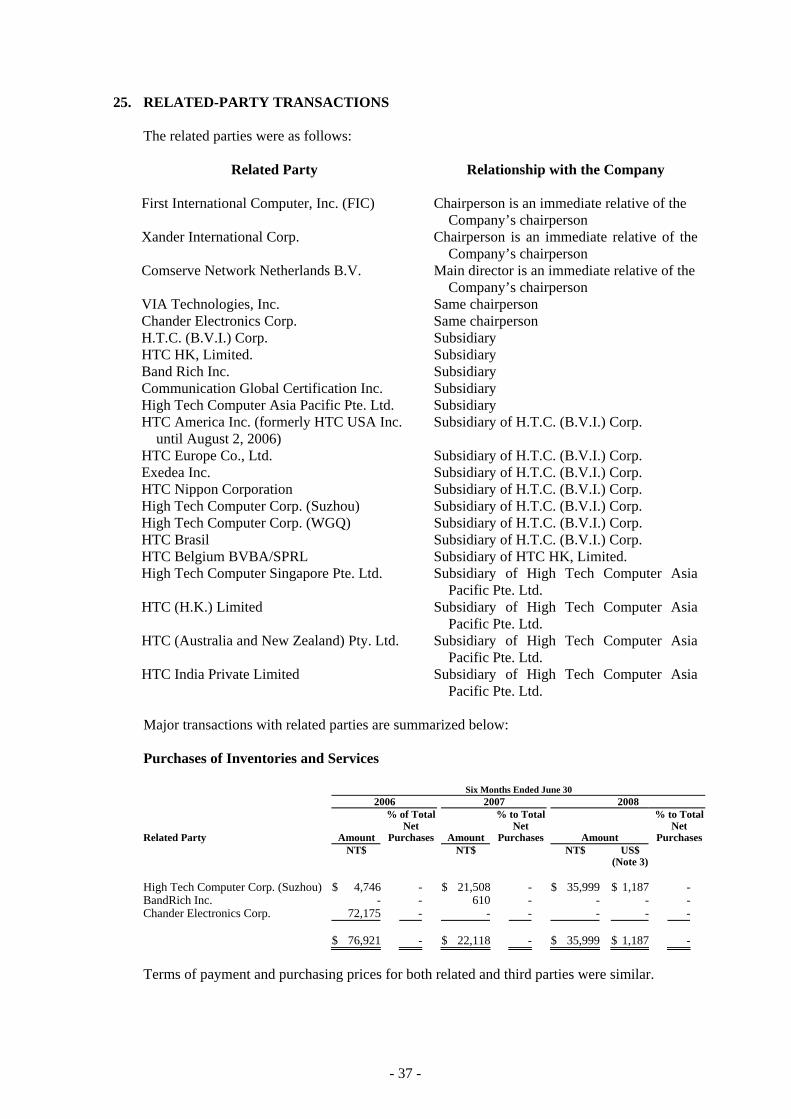
- 37 -
25. RELATED-PARTY TRANSACTIONS
The related parties were as follows:
Related Party Relationship with the Company First International Computer, Inc. (FIC) Chairperson is an immediate relative of the
Company’s chairperson Xander International Corp. Chairperson is an immediate relative of the
Company’s chairperson Comserve Network Netherlands B.V. Main director is an immediate relative of the
Company’s chairperson VIA Technologies, Inc. Same chairperson Chander Electronics Corp. Same chairperson H.T.C. (B.V.I.) Corp. Subsidiary HTC HK, Limited. Subsidiary Band Rich Inc. Subsidiary Communication Global Certification Inc. Subsidiary High Tech Computer Asia Pacific Pte. Ltd. Subsidiary HTC America Inc. (formerly HTC USA Inc.
until August 2, 2006) Subsidiary of H.T.C. (B.V.I.) Corp.
HTC Europe Co., Ltd. Subsidiary of H.T.C. (B.V.I.) Corp. Exedea Inc. Subsidiary of H.T.C. (B.V.I.) Corp. HTC Nippon Corporation Subsidiary of H.T.C. (B.V.I.) Corp. High Tech Computer Corp. (Suzhou) Subsidiary of H.T.C. (B.V.I.) Corp. High Tech Computer Corp. (WGQ) Subsidiary of H.T.C. (B.V.I.) Corp. HTC Brasil Subsidiary of H.T.C. (B.V.I.) Corp. HTC Belgium BVBA/SPRL Subsidiary of HTC HK, Limited. High Tech Computer Singapore Pte. Ltd. Subsidiary of High Tech Computer Asia
Pacific Pte. Ltd. HTC (H.K.) Limited Subsidiary of High Tech Computer Asia
Pacific Pte. Ltd. HTC (Australia and New Zealand) Pty. Ltd. Subsidiary of High Tech Computer Asia
Pacific Pte. Ltd. HTC India Private Limited Subsidiary of High Tech Computer Asia
Pacific Pte. Ltd. Major transactions with related parties are summarized below: Purchases of Inventories and Services
Six Months Ended June 30
2006 2007 2008
Related Party Amount
% of Total Net
Purchases Amount
% to Total Net
Purchases Amount
% to Total Net
Purchases NT$ NT$ NT$ US$ (Note 3) High Tech Computer Corp. (Suzhou) $ 4,746 - $ 21,508 - $ 35,999 $ 1,187 - BandRich Inc. - - 610 - - - - Chander Electronics Corp. 72,175 - - - - - - $ 76,921 - $ 22,118 - $ 35,999 $ 1,187 -
Terms of payment and purchasing prices for both related and third parties were similar.
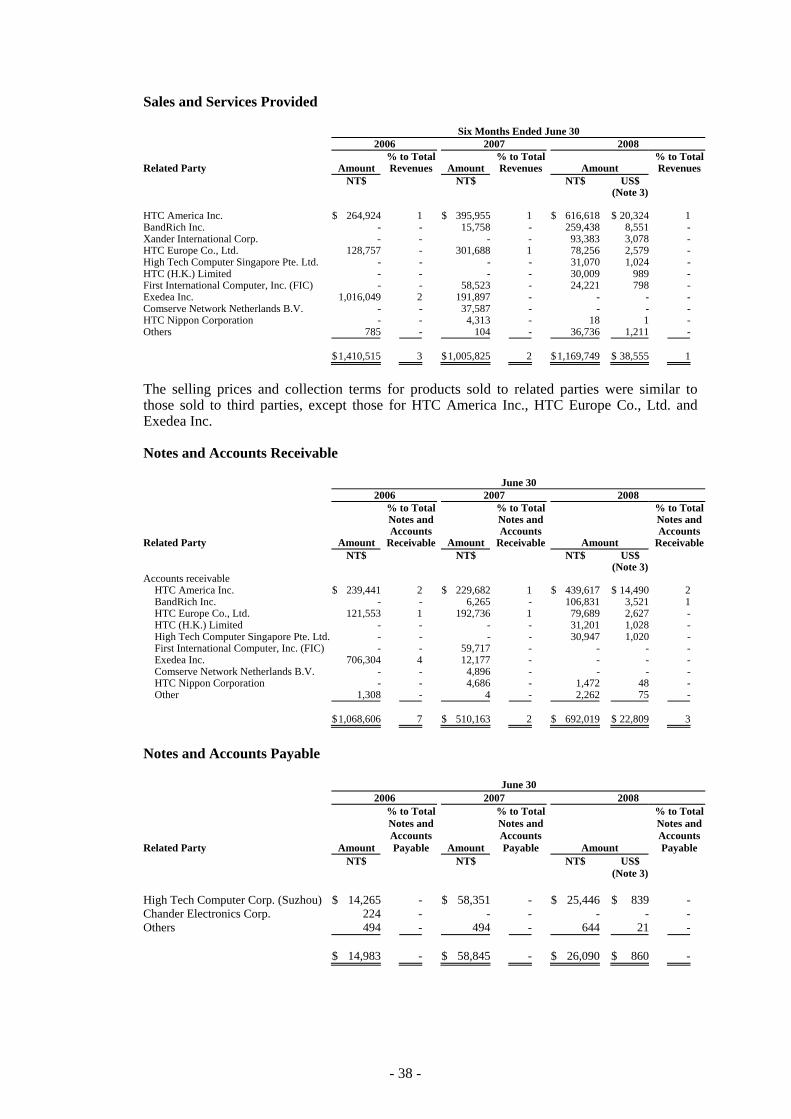
- 38 -
Sales and Services Provided
Six Months Ended June 30 2006 2007 2008
Related Party Amount% to Total Revenues Amount
% to TotalRevenues Amount
% to Total Revenues
NT$ NT$ NT$ US$ (Note 3) HTC America Inc. $ 264,924 1 $ 395,955 1 $ 616,618 $ 20,324 1 BandRich Inc. - - 15,758 - 259,438 8,551 - Xander International Corp. - - - - 93,383 3,078 - HTC Europe Co., Ltd. 128,757 - 301,688 1 78,256 2,579 - High Tech Computer Singapore Pte. Ltd. - - - - 31,070 1,024 - HTC (H.K.) Limited - - - - 30,009 989 - First International Computer, Inc. (FIC) - - 58,523 - 24,221 798 - Exedea Inc. 1,016,049 2 191,897 - - - - Comserve Network Netherlands B.V. - - 37,587 - - - - HTC Nippon Corporation - - 4,313 - 18 1 - Others 785 - 104 - 36,736 1,211 - $ 1,410,515 3 $ 1,005,825 2 $ 1,169,749 $ 38,555 1
The selling prices and collection terms for products sold to related parties were similar to those sold to third parties, except those for HTC America Inc., HTC Europe Co., Ltd. and Exedea Inc. Notes and Accounts Receivable
June 30
2006 2007 2008
Related Party Amount
% to Total Notes and Accounts
Receivable Amount
% to Total Notes and Accounts
Receivable Amount
% to Total Notes and Accounts
Receivable NT$ NT$ NT$ US$ (Note 3) Accounts receivable
HTC America Inc. $ 239,441 2 $ 229,682 1 $ 439,617 $ 14,490 2 BandRich Inc. - - 6,265 - 106,831 3,521 1 HTC Europe Co., Ltd. 121,553 1 192,736 1 79,689 2,627 - HTC (H.K.) Limited - - - - 31,201 1,028 - High Tech Computer Singapore Pte. Ltd. - - - - 30,947 1,020 - First International Computer, Inc. (FIC) - - 59,717 - - - - Exedea Inc. 706,304 4 12,177 - - - - Comserve Network Netherlands B.V. - - 4,896 - - - - HTC Nippon Corporation - - 4,686 - 1,472 48 - Other 1,308 - 4 - 2,262 75 -
$ 1,068,606 7 $ 510,163 2 $ 692,019 $ 22,809 3
Notes and Accounts Payable
June 30
2006 2007 2008
Related Party Amount
% to Total Notes and Accounts Payable Amount
% to Total Notes and Accounts Payable Amount
% to Total Notes and Accounts Payable
NT$ NT$ NT$ US$ (Note 3) High Tech Computer Corp. (Suzhou) $ 14,265 - $ 58,351 - $ 25,446 $ 839 - Chander Electronics Corp. 224 - - - - - - Others 494 - 494 - 644 21 - $ 14,983 - $ 58,845 - $ 26,090 $ 860 -
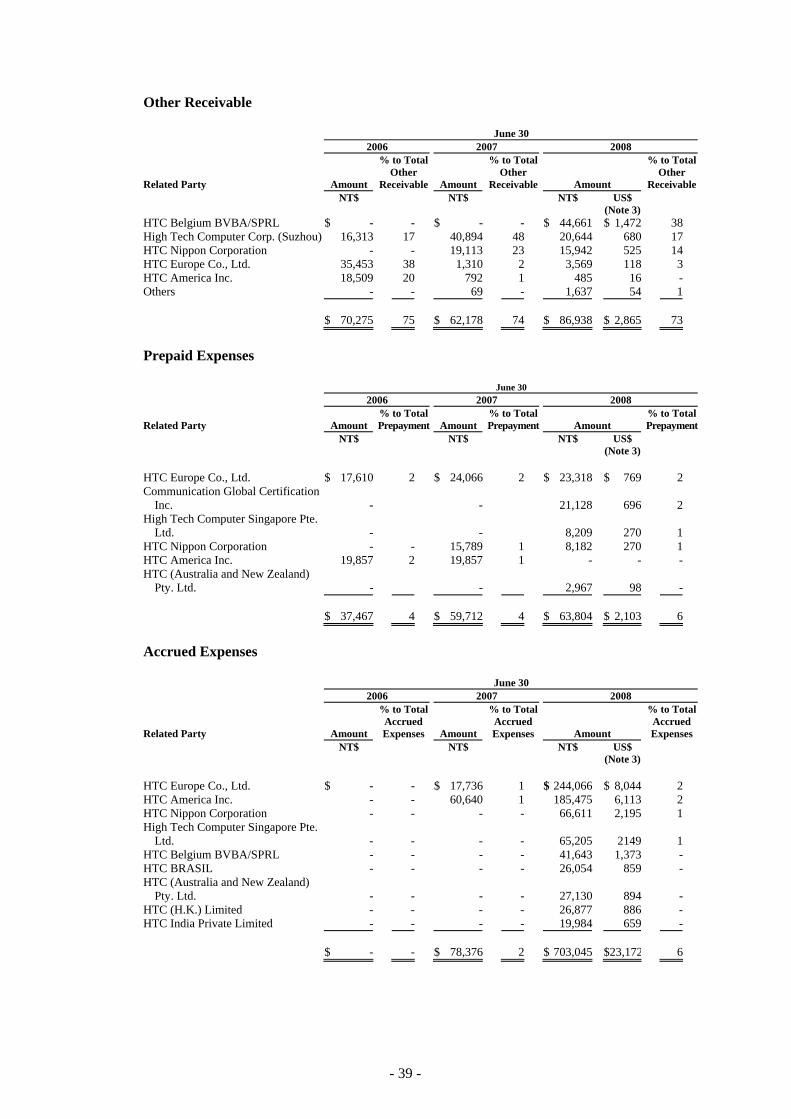
- 39 -
Other Receivable
June 30 2006 2007 2008
Related Party Amount
% to Total Other
Receivable Amount
% to Total Other
Receivable Amount
% to Total Other
Receivable NT$ NT$ NT$ US$ (Note 3) HTC Belgium BVBA/SPRL $ - - $ - - $ 44,661 $ 1,472 38 High Tech Computer Corp. (Suzhou) 16,313 17 40,894 48 20,644 680 17 HTC Nippon Corporation - - 19,113 23 15,942 525 14 HTC Europe Co., Ltd. 35,453 38 1,310 2 3,569 118 3 HTC America Inc. 18,509 20 792 1 485 16 - Others - - 69 - 1,637 54 1 $ 70,275 75 $ 62,178 74 $ 86,938 $ 2,865 73
Prepaid Expenses
June 30
2006 2007 2008
Related Party Amount% to Total Prepayment Amount
% to Total Prepayment Amount
% to Total Prepayment
NT$ NT$ NT$ US$ (Note 3) HTC Europe Co., Ltd. $ 17,610 2 $ 24,066 2 $ 23,318 $ 769 2 Communication Global Certification
Inc. - - 21,128 696 2 High Tech Computer Singapore Pte.
Ltd. - - 8,209 270 1 HTC Nippon Corporation - - 15,789 1 8,182 270 1 HTC America Inc. 19,857 2 19,857 1 - - - HTC (Australia and New Zealand)
Pty. Ltd. - - 2,967 98 - $ 37,467 4 $ 59,712 4 $ 63,804 $ 2,103 6
Accrued Expenses
June 30
2006 2007 2008
Related Party Amount
% to Total Accrued Expenses Amount
% to Total Accrued Expenses Amount
% to Total Accrued Expenses
NT$ NT$ NT$ US$ (Note 3) HTC Europe Co., Ltd. $ - - $ 17,736 1 $ 244,066 $ 8,044 2 HTC America Inc. - - 60,640 1 185,475 6,113 2 HTC Nippon Corporation - - - - 66,611 2,195 1 High Tech Computer Singapore Pte.
Ltd. - - - - 65,205 2149 1 HTC Belgium BVBA/SPRL - - - - 41,643 1,373 - HTC BRASIL - - - - 26,054 859 - HTC (Australia and New Zealand)
Pty. Ltd. - - - - 27,130 894 - HTC (H.K.) Limited - - - - 26,877 886 - HTC India Private Limited - - - - 19,984 659 - $ - - $ 78,376 2 $ 703,045 $23,172 6
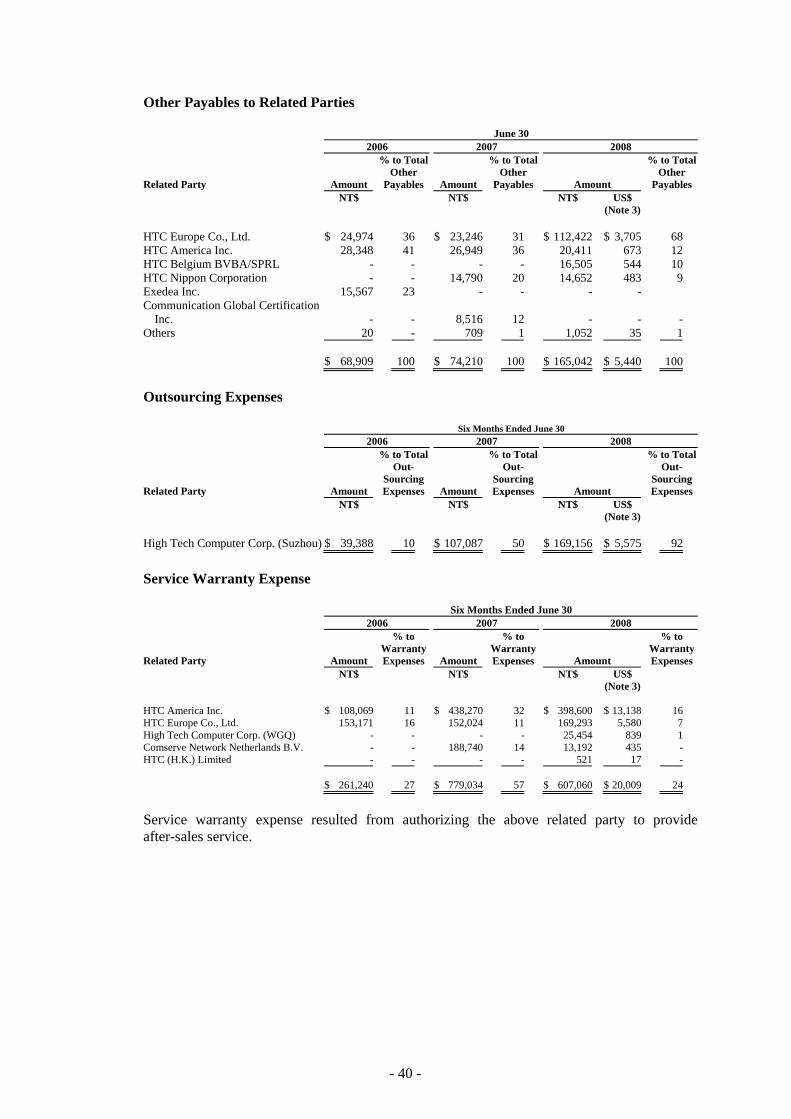
- 40 -
Other Payables to Related Parties
June 30 2006 2007 2008
Related Party Amount
% to Total Other
Payables Amount
% to Total Other
Payables Amount
% to Total Other
Payables NT$ NT$ NT$ US$ (Note 3) HTC Europe Co., Ltd. $ 24,974 36 $ 23,246 31 $ 112,422 $ 3,705 68 HTC America Inc. 28,348 41 26,949 36 20,411 673 12 HTC Belgium BVBA/SPRL - - - - 16,505 544 10 HTC Nippon Corporation - - 14,790 20 14,652 483 9 Exedea Inc. 15,567 23 - - - - Communication Global Certification
Inc. - - 8,516 12 - - - Others 20 - 709 1 1,052 35 1 $ 68,909 100 $ 74,210 100 $ 165,042 $ 5,440 100
Outsourcing Expenses Six Months Ended June 30
2006 2007 2008
Related Party Amount
% to Total Out-
Sourcing Expenses Amount
% to Total Out-
Sourcing Expenses Amount
% to Total Out-
Sourcing Expenses
NT$ NT$ NT$ US$ (Note 3) High Tech Computer Corp. (Suzhou) $ 39,388 10 $ 107,087 50 $ 169,156 $ 5,575 92 Service Warranty Expense
Six Months Ended June 30
2006 2007 2008
Related Party Amount
% to Warranty Expenses Amount
% to Warranty Expenses Amount
% to Warranty Expenses
NT$ NT$ NT$ US$ (Note 3) HTC America Inc. $ 108,069 11 $ 438,270 32 $ 398,600 $ 13,138 16 HTC Europe Co., Ltd. 153,171 16 152,024 11 169,293 5,580 7 High Tech Computer Corp. (WGQ) - - - - 25,454 839 1 Comserve Network Netherlands B.V. - - 188,740 14 13,192 435 - HTC (H.K.) Limited - - - - 521 17 - $ 261,240 27 $ 779,034 57 $ 607,060 $ 20,009 24
Service warranty expense resulted from authorizing the above related party to provide after-sales service.
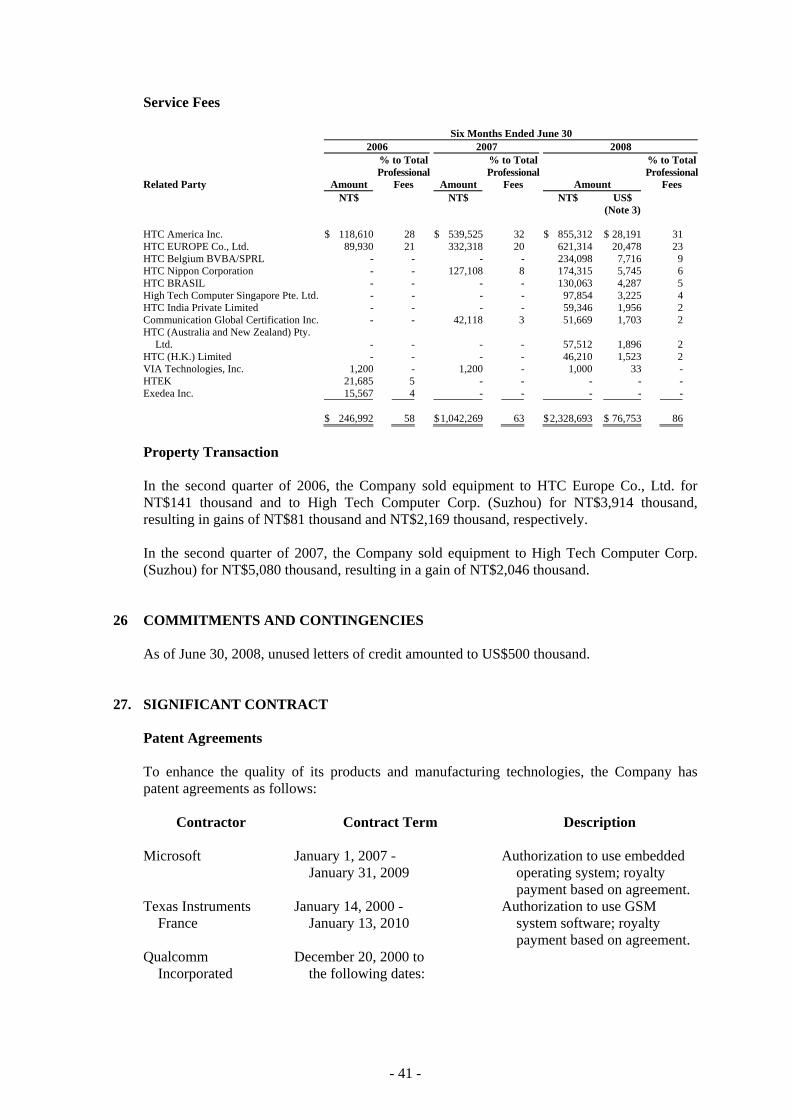
- 41 -
Service Fees
Six Months Ended June 30 2006 2007 2008
Related Party Amount
% to Total Professional
Fees Amount
% to Total Professional
Fees Amount
% to Total Professional
Fees NT$ NT$ NT$ US$ (Note 3) HTC America Inc. $ 118,610 28 $ 539,525 32 $ 855,312 $ 28,191 31 HTC EUROPE Co., Ltd. 89,930 21 332,318 20 621,314 20,478 23 HTC Belgium BVBA/SPRL - - - - 234,098 7,716 9 HTC Nippon Corporation - - 127,108 8 174,315 5,745 6 HTC BRASIL - - - - 130,063 4,287 5 High Tech Computer Singapore Pte. Ltd. - - - - 97,854 3,225 4 HTC India Private Limited - - - - 59,346 1,956 2 Communication Global Certification Inc. - - 42,118 3 51,669 1,703 2 HTC (Australia and New Zealand) Pty.
Ltd. - - - - 57,512 1,896 2 HTC (H.K.) Limited - - - - 46,210 1,523 2 VIA Technologies, Inc. 1,200 - 1,200 - 1,000 33 - HTEK 21,685 5 - - - - - Exedea Inc. 15,567 4 - - - - - $ 246,992 58 $ 1,042,269 63 $ 2,328,693 $ 76,753 86
Property Transaction In the second quarter of 2006, the Company sold equipment to HTC Europe Co., Ltd. for NT$141 thousand and to High Tech Computer Corp. (Suzhou) for NT$3,914 thousand, resulting in gains of NT$81 thousand and NT$2,169 thousand, respectively. In the second quarter of 2007, the Company sold equipment to High Tech Computer Corp. (Suzhou) for NT$5,080 thousand, resulting in a gain of NT$2,046 thousand.
26 COMMITMENTS AND CONTINGENCIES
As of June 30, 2008, unused letters of credit amounted to US$500 thousand. 27. SIGNIFICANT CONTRACT
Patent Agreements
To enhance the quality of its products and manufacturing technologies, the Company has patent agreements as follows:
Contractor Contract Term Description
Microsoft January 1, 2007 -
January 31, 2009 Authorization to use embedded
operating system; royalty payment based on agreement.
Texas Instruments France
January 14, 2000 - January 13, 2010
Authorization to use GSM system software; royalty payment based on agreement.
Qualcomm Incorporated
December 20, 2000 to the following dates:
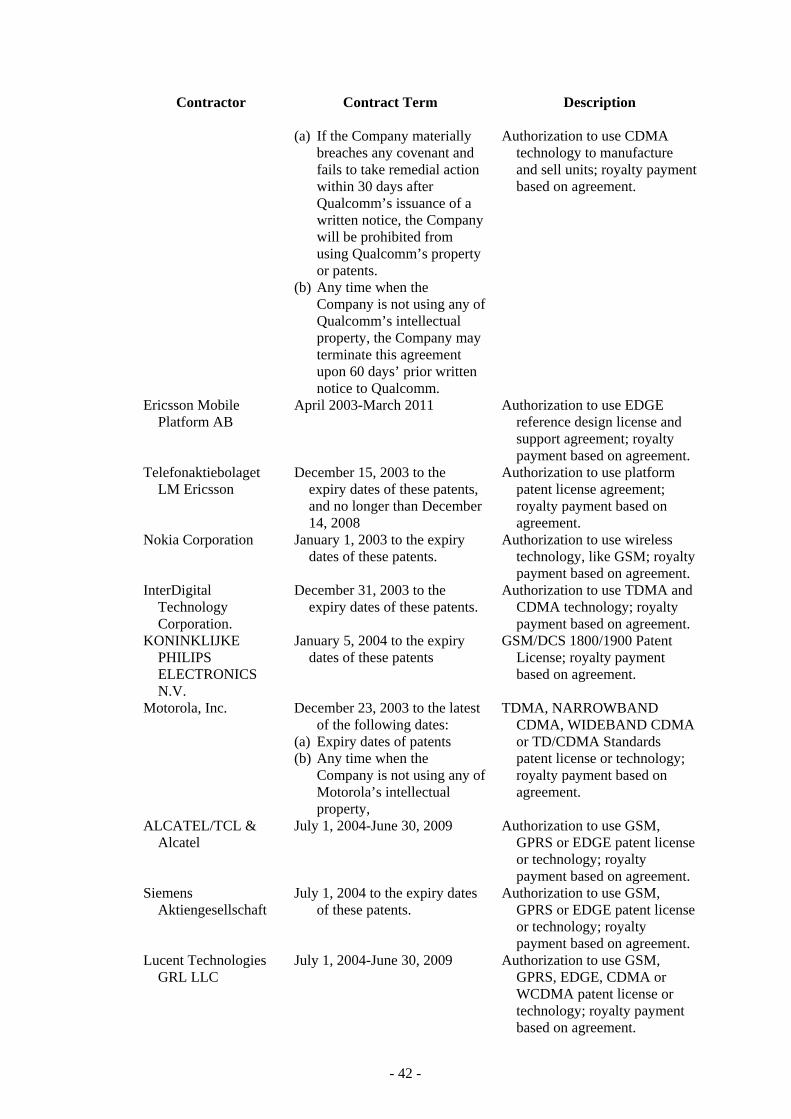
- 42 -
Contractor Contract Term Description (a) If the Company materially
breaches any covenant and fails to take remedial action within 30 days after Qualcomm’s issuance of a written notice, the Company will be prohibited from using Qualcomm’s property or patents.
Authorization to use CDMA technology to manufacture and sell units; royalty payment based on agreement.
(b) Any time when the Company is not using any of Qualcomm’s intellectual property, the Company may terminate this agreement upon 60 days’ prior written notice to Qualcomm.
Ericsson Mobile Platform AB
April 2003-March 2011 Authorization to use EDGE reference design license and support agreement; royalty payment based on agreement.
Telefonaktiebolaget LM Ericsson
December 15, 2003 to the expiry dates of these patents, and no longer than December 14, 2008
Authorization to use platform patent license agreement; royalty payment based on agreement.
Nokia Corporation January 1, 2003 to the expiry dates of these patents.
Authorization to use wireless technology, like GSM; royalty payment based on agreement.
InterDigital Technology Corporation.
December 31, 2003 to the expiry dates of these patents.
Authorization to use TDMA and CDMA technology; royalty payment based on agreement.
KONINKLIJKE PHILIPS ELECTRONICS N.V.
January 5, 2004 to the expiry dates of these patents
GSM/DCS 1800/1900 Patent License; royalty payment based on agreement.
Motorola, Inc. December 23, 2003 to the latest
of the following dates: (a) Expiry dates of patents (b) Any time when the
Company is not using any of Motorola’s intellectual property,
TDMA, NARROWBAND CDMA, WIDEBAND CDMA or TD/CDMA Standards patent license or technology; royalty payment based on agreement.
ALCATEL/TCL &
Alcatel July 1, 2004-June 30, 2009 Authorization to use GSM,
GPRS or EDGE patent license or technology; royalty payment based on agreement.
Siemens Aktiengesellschaft
July 1, 2004 to the expiry dates of these patents.
Authorization to use GSM, GPRS or EDGE patent license or technology; royalty payment based on agreement.
Lucent Technologies GRL LLC
July 1, 2004-June 30, 2009 Authorization to use GSM, GPRS, EDGE, CDMA or WCDMA patent license or technology; royalty payment based on agreement.
- 43 -
28. OTHER EVENT
In May 2007, the board of directors of the Company signed an acquisition agreement with Dopod International Inc. (“Dopod”) to buy the assets of Dopod’s subsidiaries. The purchase price will depend on the book value of the net assets of Dopod’s subsidiaries. These assets had been audited by independent certified public accountants as of June 30, 2007. The Company estimates that the purchase price will not exceed US$14.5 million dollars. On July 1, 2007, the transfer of the subsidiaries’ assets to the Company was completed and the purchase price was paid at US$12.2 million (not including tax) in February 2008. In January and February 2008, the board of directors of the Company resolved to invest in Wei-Hon Electronics (Shanghai) Ltd. through increasing the capital of High Tech Computer Asia Pacific Pte. Ltd. by US$48,000 thousand which will subsequently then be used to increase the capital held in Wei-Hon Electronics (Shanghai) Ltd. for factory construction and purchasing equipment. In February 2008, the board of directors of the Company resolved to buy land for building the Taipei R&D headquarter in Taipei County in Xindian City for NT$3.35 billion (US$110,415 thousand).