Embed Size (px)
Citation preview
UNITED STATESSECURITIES AND EXCHANGE COMMISSION
Washington, D.C. 20549
FORM 10-K(Mark One)☒ ANNUAL REPORT PURSUANT TO SECTION 13 or 15(d) OF THE SECURITIES EXCHANGE ACT OF 1934
For the fiscal year ended December 31, 2021.
or
☐ TRANSITION REPORT PURSUANT TO SECTION 13 OR 15(d) OF THE SECURITIES EXCHANGE ACTOF 1934
For the transition period from to
Commission File Number: 001-36102
Knowles Corporation(Exact name of registrant as specified in its charter)
Delaware 90-1002689(State or other jurisdiction of incorporation or organization) (I.R.S. Employer Identification No.)
1151 Maplewood Drive, Itasca, IL(Address of Principal Executive Offices)
60143(Zip Code)
(630) 250-5100(Registrant’s telephone number, including area code)
Securities registered pursuant to Section 12(b) of the Act:
Title of each class Trading symbol Name of each exchange on which registeredCommon stock, $0.01 par value per share KN New York Stock Exchange
Indicate by check mark if the registrant is a well-known seasoned issuer, as defined in Rule 405 of the Securities Act. Yes ☒ No ☐ Indicate by check mark if the registrant is not required to file reports pursuant to Section 13 or 15(d) of the Act. Yes ☐ No ☒
Indicate by check mark whether the registrant (1) has filed all reports required to be filed by Section 13 or 15(d) of the Securities Exchange Act of 1934 during thepreceding 12 months (or for such shorter period that the registrant was required to file such reports), and (2) has been subject to such filing requirements for thepast 90 days.Yes ☒ No ☐
Indicate by check mark whether the registrant has submitted electronically every Interactive Data File required to be submitted pursuant to Rule 405 of RegulationS-T (§232.405 of this chapter) during the preceding 12 months (or for such shorter period that the registrant was required to submit such files).Yes ☒ No ☐
Indicate by check mark whether the registrant is a large accelerated filer, an accelerated filer, a non-accelerated filer, a smaller reporting company, or an emerginggrowth company. See the definitions of “large accelerated filer,” “accelerated filer,” “smaller reporting company,” and "emerging growth company" in Rule 12b-2of the Exchange Act.
Large accelerated filer ☒ Accelerated filer ☐
Non-accelerated filer ☐ Smaller reporting company ☐
Emerging growth company ☐

If an emerging growth company, indicate by check mark if the registrant has elected not to use the extended transition period for complying with any new orrevised financial accounting standards provided pursuant to Section 13(a) of the Exchange Act. ☐
Indicate by check mark whether the registrant has filed a report on and attestation to its management's assessment of the effectiveness of its internal control overfinancial reporting under Section 404(b) of the Sarbanes-Oxley Act (15 U.S.C. 7262(b)) by the registered public accounting firm that prepared or issued its auditreport. ☒
Indicate by check mark whether the registrant is a shell company (as defined in Rule 12b-2 of the Act). Yes ☐ No ☒
The aggregate market value of the voting and non-voting common stock held by non-affiliates of the registrant as of the close of business on June 30, 2021 wasapproximately $1,791,000,000. The number of outstanding shares of the registrant’s common stock as of February 7, 2022 was 91,813,002.
DOCUMENTS INCORPORATED BY REFERENCE
Portions of the definitive Proxy Statement for the registrant's 2022 Annual Meeting of Stockholders have been incorporated by reference into Part III of thisAnnual Report on Form 10-K.
Table of Contents
PagePART I 3Item 1. Business 3Item 1A. Risk Factors 8Item 1B. Unresolved Staff Comments 19Item 2. Properties 20Item 3. Legal Proceedings 20Item 4. Mine Safety Disclosures 20
Information about our Executive Officers 21
PART II 22Item 5. Market for Registrant's Common Equity, Related Stockholder Matters, and Issuer Purchases of Equity Securities 22Item 6. [Reserved] 23Item 7. Management's Discussion and Analysis of Financial Condition and Results of Operations 24Item 7A. Quantitative and Qualitative Disclosures About Market Risk 40Item 8. Financial Statements and Supplementary Data 41Item 9. Changes in and Disagreements with Accountants on Accounting and Financial Disclosure 84Item 9A. Controls and Procedures 84Item 9B. Other Information 85Item 9C. Disclosure Regarding Foreign Jurisdictions that Prevent Inspections 85
PART III 85Item 10. Directors, Executive Officers, and Corporate Governance 85Item 11. Executive Compensation 86Item 12. Security Ownership of Certain Beneficial Owners and Management and Related Stockholder Matters 86Item 13. Certain Relationships and Related Transactions, and Director Independence 87Item 14. Principal Accountant Fees and Services 87
PART IV 87Item 15. Exhibits and Financial Statement Schedules 87Item 16. Form 10-K Summary 90SIGNATURES 91
2
Table of Contents
PART IITEM 1. BUSINESS
Unless the context otherwise requires, references in this Annual Report on Form 10-K to “Knowles,” the “Company,” “we,” “our,” or “us” refer to KnowlesCorporation and its consolidated subsidiaries.
Our Company
We are a market leader and global provider of advanced micro-acoustic microphones and balanced armature speakers, audio solutions, and high performancecapacitors and radio frequency ("RF") products, serving the consumer electronics, medtech, defense, electric vehicle, industrial, and communications markets. Weuse our leading position in SiSonic™ micro-electro-mechanical systems ("MEMS") microphones and strong capabilities in audio processing technologies tooptimize audio systems and improve the user experience across consumer applications. We are also a leader in hearing health acoustics, high performancecapacitors, and RF solutions for a diverse set of markets. Our focus on the customer, combined with unique technology, proprietary manufacturing techniques, andglobal operational expertise, enables us to deliver innovative solutions across multiple applications. Knowles, founded in 1946 and headquartered in Itasca, Illinois,has approximately 7,000 employees at facilities located in 13 countries around the world.
Our Strategy
The Company is focused on delivering high value, differentiated solutions to a diverse set of end markets.
In our Audio segment, our primary focus is to position the Company to benefit from the positive trends across consumer devices. With products ranging frommobile phones to headsets, and from smart speakers to household appliances, improved audio quality and voice-powered interactions have emerged as critical andnecessary features. Across mobile, ear, computing, and Internet of Things ("IoT") markets, consumers want better audio performance and to engage withtechnology through natural, spoken commands, and original equipment manufacturers (“OEMs") are developing and deploying the technology to enable it. Ourunique capabilities in MEMS microphones, balanced armature speakers, and digital signal processing place us in a competitive position to enhance audioperformance and enable voice input. To benefit from these positive market trends, we leverage our core strengths in audio process technologies and prioritizeresearch and development projects with potential for success in the market.
Our focus on strategically positioning the business to support favorable trends in audio includes significant investments in MEMS microphones and balancedarmature speakers to maintain our leadership positions and optimize our manufacturing capabilities across our business units. We also divested our low-marginspeaker and receiver product line for handsets ("Speaker and Receiver Product Line") in 2016 to focus on higher-value solutions for end markets exhibiting greaterunit growth.
In our Precision Devices segment, we continue to focus on sales growth and improved margins by expanding our presence in profitable markets through organicinitiatives and acquisitions. In 2017, we reshaped our portfolio by divesting our timing device business ("Timing Device Business"). We have also completed fourtuck-in acquisitions where we have strong market positions and attractive margin profiles, including defense, medtech, industrial, electric vehicle, andcommunications applications.
Our Business Segments
Our reportable segments are as follows:
• Audio SegmentOur Audio group designs and manufactures innovative audio products, including microphones, balanced armature speakers, and audio processors used inapplications that serve the mobile, hearing health, True Wireless Stereo ("TWS"), IoT, and computing markets. Audio has sales, support, and engineeringfacilities in North America, Europe, and Asia, as well as manufacturing facilities in Asia.
3
Table of Contents
• Precision Devices ("PD") SegmentOur PD group specializes in the design and delivery of high performance capacitor products and RF solutions for technically demanding applications. Ourhigh performance capacitor products are used in applications such as power supplies and medical implants, which sell to a diverse set of customers formission critical applications across the defense, medtech, industrial, electric vehicle, and communications markets. Our RF solutions solve a broad rangeof frequency filtering challenges for our customers, who use them in satellite communications and radar systems for defense applications. RF solutionsare also used in mmWave 5G communications equipment. PD has sales, support, and engineering facilities in North America, Europe, and Asia as well asmanufacturing facilities in North America and Asia.
We sell our products directly to OEMs and to their contract manufacturers and suppliers and through sales representatives and distributors worldwide.
Market Trends
In our Audio segment, voice has been embraced as a primary user interface across consumer electronic devices. Voice assistants are proliferating throughout avariety of applications from mobile phones to headsets, and from smart speakers to household appliances. Across mobile, ear, and IoT markets, consumers want toengage with technology through natural, spoken commands, and OEMs are developing and deploying the technology to enable it. Our unique capabilities inMEMS microphones, balanced armature speakers, and digital signal processing place us in a competitive position to enhance audio performance and enable voiceinput.
Within the hearing aid market, sales are largely driven by aging demographics, healthcare spending, increasing affluence in emerging markets, and governmentsubsidies.
In our PD segment, we sell high reliability, high voltage and high temperature ceramic capacitors, and electromagnetic interference filters across diverse endmarkets. Portions of this segment face much greater exposure to capital investment cycles and government spending, both direct and indirect, as some of these endmarkets are largely dependent on project upgrades, expansion, and government contracts. We have been experiencing increased demand for our products driven bythe upgrading of large rotary radars, deployment of communication satellites, build-out of 5G communication systems, and the rapid replacement of combustionengine vehicles with electric vehicles. In addition, demand has increased as a result of the expansion of small implantable devices to monitor and correct a host ofchronic health issues.
Geographic Trends
We strive to maintain our manufacturing facilities in close proximity to our direct customers. In Audio, we currently operate 4 facilities in Asia to serve thecontract manufacturers who build OEM equipment on behalf of our end-customers. These contract manufacturers are largely based in China, Taiwan, India,Singapore, Indonesia, and Vietnam. Although end-user demand for consumer electronics and hearing aids is global and marketing activities occur globally, themajority of our manufacturing is located in Asia, primarily in China, Malaysia, and the Philippines.
In PD, we operate 6 facilities in North America and 1 facility in Asia for the manufacturing of products that support our global customers, as well as their suppliersand contract manufacturers.
Competitive Landscape
Success in the electronic components industry is primarily driven by innovation and flexibility as customers compete to gain a share of the growing consumerdevice market. We compete across consumer platforms to deliver superior acoustic performance through customized products. Our investments in research anddevelopment enable us to capture new design wins across consumer OEMs. Our ability to balance and shift between full and semi-automation is key to our abilityto optimize our operations and operating expenses. Additionally, it is important for suppliers to have flexibility and quick time-to-market to meet clients’ needs.Key competitors include:
• Audio - AAC Technologies, Goertek, Infineon, and Sonion; and
• PD - Kyocera Corporation, Yageo Corporation, and Murata.
4
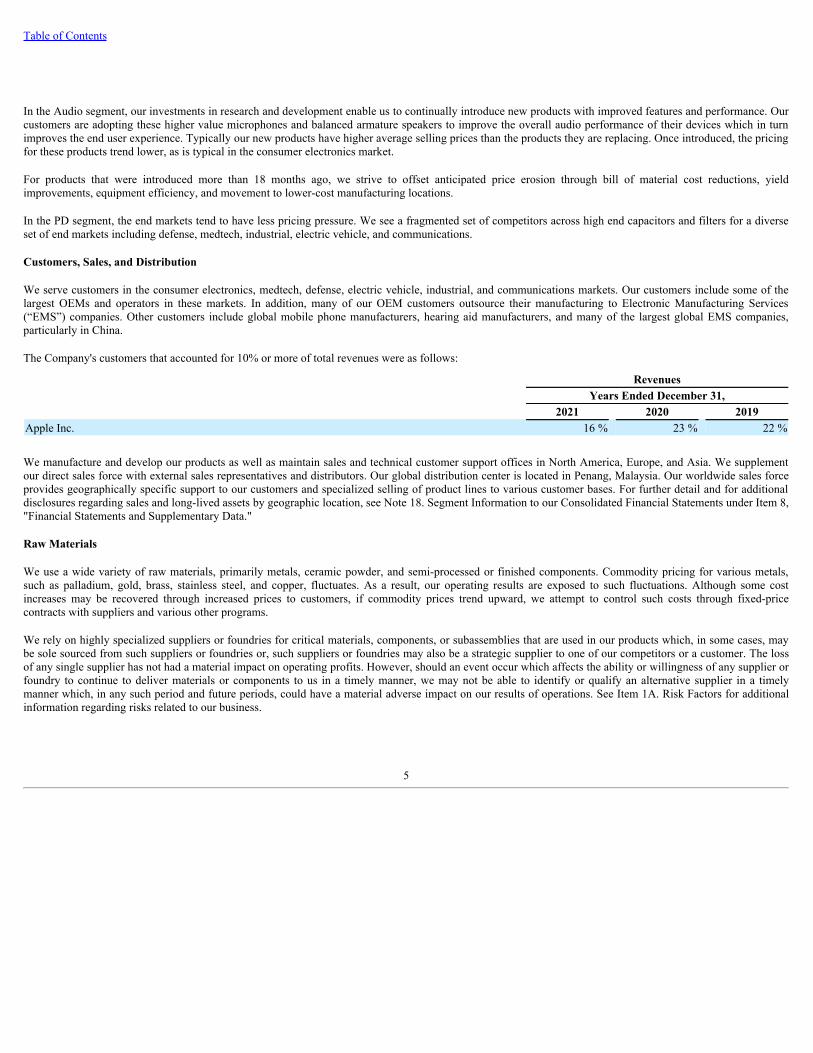
Table of Contents
In the Audio segment, our investments in research and development enable us to continually introduce new products with improved features and performance. Ourcustomers are adopting these higher value microphones and balanced armature speakers to improve the overall audio performance of their devices which in turnimproves the end user experience. Typically our new products have higher average selling prices than the products they are replacing. Once introduced, the pricingfor these products trend lower, as is typical in the consumer electronics market.
For products that were introduced more than 18 months ago, we strive to offset anticipated price erosion through bill of material cost reductions, yieldimprovements, equipment efficiency, and movement to lower-cost manufacturing locations.
In the PD segment, the end markets tend to have less pricing pressure. We see a fragmented set of competitors across high end capacitors and filters for a diverseset of end markets including defense, medtech, industrial, electric vehicle, and communications.
Customers, Sales, and Distribution
We serve customers in the consumer electronics, medtech, defense, electric vehicle, industrial, and communications markets. Our customers include some of thelargest OEMs and operators in these markets. In addition, many of our OEM customers outsource their manufacturing to Electronic Manufacturing Services(“EMS”) companies. Other customers include global mobile phone manufacturers, hearing aid manufacturers, and many of the largest global EMS companies,particularly in China.
The Company's customers that accounted for 10% or more of total revenues were as follows:
RevenuesYears Ended December 31,
2021 2020 2019Apple Inc. 16 % 23 % 22 %
We manufacture and develop our products as well as maintain sales and technical customer support offices in North America, Europe, and Asia. We supplementour direct sales force with external sales representatives and distributors. Our global distribution center is located in Penang, Malaysia. Our worldwide sales forceprovides geographically specific support to our customers and specialized selling of product lines to various customer bases. For further detail and for additionaldisclosures regarding sales and long-lived assets by geographic location, see Note 18. Segment Information to our Consolidated Financial Statements under Item 8,"Financial Statements and Supplementary Data."
Raw Materials
We use a wide variety of raw materials, primarily metals, ceramic powder, and semi-processed or finished components. Commodity pricing for various metals,such as palladium, gold, brass, stainless steel, and copper, fluctuates. As a result, our operating results are exposed to such fluctuations. Although some costincreases may be recovered through increased prices to customers, if commodity prices trend upward, we attempt to control such costs through fixed-pricecontracts with suppliers and various other programs.
We rely on highly specialized suppliers or foundries for critical materials, components, or subassemblies that are used in our products which, in some cases, maybe sole sourced from such suppliers or foundries or, such suppliers or foundries may also be a strategic supplier to one of our competitors or a customer. The lossof any single supplier has not had a material impact on operating profits. However, should an event occur which affects the ability or willingness of any supplier orfoundry to continue to deliver materials or components to us in a timely manner, we may not be able to identify or qualify an alternative supplier in a timelymanner which, in any such period and future periods, could have a material adverse impact on our results of operations. See Item 1A. Risk Factors for additionalinformation regarding risks related to our business.
5
Table of Contents
Research and Development
We concentrate our research and development efforts on the design and development of new products for each of our principal markets. We also fund certain otheremerging product and technology opportunities. Our future success is highly dependent upon our ability to develop complex new products, transfer new productsto volume production, introduce them into the marketplace in a timely fashion, and have them selected for design into our customers’ products at competitiveprices. Our future success may also depend on increasing content in our customers’ products including assisting our customers with integration of our products andsoftware into their new products and providing support from the concept stage through design, launch, and production ramp.
Intellectual Property and Intangible Assets
We rely on patent, copyright, trademark, and trade secret laws to protect our intellectual property, products, and technology. Our U.S. patents expire in calendaryears 2022 through 2041. While our patents are an important element of our success, our business as a whole is not dependent on any one patent or group ofpatents. We do not anticipate any material effect on our business due to any patents expiring in 2022, and we continue to obtain new patents through our ongoingresearch and development. We have maintained U.S. federal trademark registrations for KNOWLES and Knowles logo designs, along with various othertrademarks. These U.S. registrations may be renewed as long as the marks continue to be used in interstate commerce. We have also filed or obtained foreignregistration for these marks in other countries or jurisdictions where we conduct, or anticipate conducting, international business. To complement our own researchand development efforts, we have also licensed and expect to continue to license, a variety of intellectual property and technologies important to our business fromthird parties. See Item 1A. Risk Factors for additional information regarding risks related to our business.
Cybersecurity
We regularly perform risk assessments relating to cybersecurity and technology risks. We have a risk-based cybersecurity program, dedicated to protecting ourdata as well as data belonging to our customers and partners. We utilize a defensive in-depth strategy, with multiple layers of security controls to protect our dataand solutions. We mitigate cybersecurity risks by employing extensive measures, including employee training, systems monitoring and testing, and maintenance ofprotective systems and contingency plans. We continually evaluate ourselves for appropriate business continuity and disaster recovery planning, with test scenariosthat include simulations and penetration tests. We also install and regularly update antivirus software on all Company-managed systems to detect and preventmalicious code from impacting our systems.
For more information on risks related to data security, see Item 1A. "Risk Factors - Risks Related to Intellectual Property and Cybersecurity - Our business andoperations could suffer in the event of security breaches, cybersecurity incident, other unauthorized disclosures, or network disruptions."
Seasonality
In general, our Audio businesses tend to have higher revenues in the third and fourth quarters of each fiscal year. This is particularly true of those businesses thatserve the consumer electronics market. Our Audio businesses tend to have short product cycles and the timing of new OEM product launches can impact quarterlyrevenues, earnings, and cash flow. Our PD business is not typically subject to seasonality.
Human Capital Management
As of December 31, 2021, Knowles had approximately 7,000 employees at facilities located in 13 countries around the world. Approximately 81% of ouremployees are located in Asia and approximately 69% of our employees globally identify as female. In the United States, approximately 42% of our employeesidentify as female and approximately 49% of our employees self-identified as belonging to a racial/ethnic minority group. We believe our success is dependentupon attracting, developing, and retaining high performing employees at all levels of the organization. An important component of achieving this goal is fostering aworkplace environment that embraces diversity and inclusion. Our Chief Human Resources Officer is responsible for developing and executing on our humancapital strategy, with oversight by the Compensation Committee of our Board of Directors. Our key initiatives with respect to human capital management include:
6
Table of Contents
Recruitment, Training, and Development
We utilize a variety of recruitment vehicles to source top talent, including strategic partnerships with search firms, leveraging social media channels, strategicpartnerships with universities and industry organizations, and a robust employee referral program.
We invest in the ongoing training and development of our employees by offering tuition and continuous education reimbursement, leveraging an e-learningplatform, and implementing formal mentorship programs. Additionally, we support the advancement of women and other underrepresented minority groups byproviding accelerated development programs. Knowles has a formal Succession Planning initiative with the primary objective of identifying and developing ournext generation leaders.
Our Chief Human Resources Officer annually reviews with the Board of Directors our overall talent management strategy and progress.
Commitment To Diversity, Inclusion, and Equality
We believe our diverse teams, with their unique ideas, thoughts, and perspectives, form the building blocks for our culture of innovation at Knowles. We strive tocreate and maintain a workplace environment that embraces the diversity of thoughts, ideas, beliefs, and experiences, brought by our team members. We recognizethat nurturing an inclusive workplace enables us to attract, develop, and retain our team members regardless of their race, color, gender identity, language, nationalorigin, religion, orientation, or age. To successfully execute on our strategy, we have established a Diversity and Inclusion Council comprised of employees fromvarious areas of the Company along with members of senior management who serve as executive sponsors. The Council is tasked with advising the managementteam on concrete initiatives we can undertake as an organization to strengthen diversity and inclusion at the Company. Under the Council's leadership, we havecommemorated and celebrated numerous diversity, cultural, and historical events throughout the year.
Knowles is also committed to the advancement of women in the workplace and gender diversity in engineering careers. We endeavor to be known as an Employerof Choice for Women in Engineering and have implemented programs with the goal of increasing the representation of women in the engineering community. Forexample, Knowles is the perennial sponsor of the University of Illinois at Chicago's ("UIC") Women in Engineering Summer Program. We have also supportedUIC's women engineering students with programs such as academic scholarships, summer internship programs, mentorship programs, and full-time employmentopportunities. Our goal is to build a pipeline of multi-generational talent and accelerate the development of women engineers into advanced technical andleadership positions at Knowles. Additionally, we are focused on increasing the representation of women in leadership roles at Knowles. For our 2021 CorporateSummer Internship Program, over 50% of our engineering internship positions were filled by women engineering students.
We are fully committed to supporting our communities and the advancement of underrepresented minority groups. In 2021, we launched our partnership withPEAK (Partnership to Educate and Advance Kids), a Chicago-based nonprofit that is focused on providing academically average students from the city's mostchallenging and under-served neighborhoods with financial, educational, and personal support through their high school years. In addition to providing financialassistance to help fund the students' education, we also launched a tutoring program whereby Knowles employees work with students who need additional helpwith STEM subjects.
To support first generation students from underserved communities who are pursuing STEM degrees, we partnered with the engineering schools at Penn StateUniversity and the University of Illinois at Urbana-Champaign. In 2021, we awarded academic scholarships to first year students in the undergraduate engineeringprograms at each of these universities.
Providing a Competitive Total Rewards Program
To be able to attract and retain the best employees, Knowles provides a competitive total rewards program that incorporates our pay for performance philosophy.Our total rewards program includes market-competitive base pay, broad-based short-term and long-term incentive plans, healthcare benefits, retirement plans, paidtime off, family leave, and employee assistance programs.
7
Table of Contents
Fostering a Safe Work Environment
We believe it is important to provide a healthy and safe workplace for our employees. We continue to maintain an Environmental, Health, and Safety Policy thatreflects our goals to not only reduce our carbon footprint, but to ensure the health, safety, and welfare of our employees. During 2021, environmental, health, andsafety training and instruction were provided at all levels within the Company. In addition, throughout the COVID-19 pandemic, we have adopted enhanced safetymeasures and practices across all of our facilities, including adopting social distancing measures (such as limiting or reducing the number of workers at our sites),enacting enhanced cleaning measures, and providing workers with personal protection equipment.
Additional information regarding Knowles' activities related to its people and sustainability, as well as workforce diversity data, can be found in the Knowles 2021Corporate Sustainability Report, which is located on our website. The contents of our website and our Corporate Sustainability Report are referenced for generalinformation only and are not incorporated into this Annual Report on Form 10-K.
Other Information
The address of our principal executive offices is 1151 Maplewood Drive, Itasca, Illinois 60143. Our telephone number is 630-250-5100.
Our annual reports on Form 10-K, quarterly reports on Form 10-Q, current reports on Form 8-K, and any amendments to these reports are available on the"Financial Information - SEC Filings” link on the Investor Relations section of our website, www.knowles.com, or at www.sec.gov. We post each of these reportson our website as soon as reasonably practicable after the report is filed with or furnished to the Securities and Exchange Commission ("SEC"). Our corporategovernance policies, Code of Business Conduct, and Board committee charters and policies are also posted on the Investor Relations section of our website. Theinformation contained in, and that can be accessed through our website is not incorporated into and does not form a part of this Annual Report on Form 10-K.
ITEM 1A. RISK FACTORS
Cautionary Statement Concerning Forward-Looking Statements
This Annual Report on Form 10-K contains certain statements regarding business strategies, market potential, future financial performance, future action, results,and any other statements that do not directly relate to any historical or current fact which are “forward-looking” statements within the meaning of the SecuritiesAct of 1933, as amended (the "Securities Act"), the Exchange Act, and the Private Securities Litigation Reform Act of 1995. The words “believe,” “expect,”“anticipate,” “project,” “estimate,” “budget,” “continue,” “could,” “intend,” “may,” “plan,” “potential,” “predict,” “seek,” “should,” “will,” “would,” “expect,”“objective,” “forecast,” “goal,” “guidance,” “outlook,” “effort,” “target,” and similar expressions, among others, generally identify forward-looking statements,which speak only as of the date the statements were made.
In particular, information included under the sections entitled “Business,” “Risk Factors,” and “Management’s Discussion and Analysis of Financial Condition andResults of Operations” contain forward-looking statements.
Readers are cautioned that the matters discussed in these forward-looking statements are subject to risks, uncertainties, assumptions, and other factors that aredifficult to predict and which could cause actual results to differ materially from those projected, anticipated, or implied in the forward-looking statements. Where,in any forward-looking statement, an expectation or belief as to future results or events is expressed, such expectation or belief is based on the current plans andexpectations of management and expressed in good faith and believed to have a reasonable basis, but there can be no assurance that the expectation or belief willbe achieved or accomplished. Many factors that could cause actual results or events to differ materially from those anticipated include those risks and uncertaintiesdescribed below and elsewhere in this Annual Report on Form 10-K, including under the section entitled “Management’s Discussion and Analysis of FinancialCondition and Results of Operations.” We caution you not to place undue reliance on these forward-looking statements, which speak only as of the date of thisAnnual Report on Form 10-K and Knowles does not assume any obligation to update any forward-looking statement as a result of new information, future events,or otherwise, except as required by applicable law. All forward-looking statements, expressed or implied, included in this Annual Report on Form 10-K areexpressly qualified in their entirety by this cautionary statement. This cautionary statement should also be considered in connection with any subsequent written ororal forward-looking statements that we may make or persons acting on our behalf may issue.
8
Table of Contents
You should consider each of the following factors as well as the other information in this Annual Report on Form 10-K, including our financial statements and therelated notes, in evaluating our business and our prospects. The risks and uncertainties described below are not the only ones we face. In general, we are subject tothe same general risks and uncertainties that impact many other companies such as general economic, industry, and/or market conditions and growth rates; possiblefuture terrorist threats or armed conflicts and their effect on the worldwide economy; and changes in laws or accounting rules. Additional risks and uncertaintiesnot presently known to us or that we currently consider immaterial may also impair our business operations. If any of these risks occur, our business and financialresults could be harmed. In that case, the trading price of our common stock could decline.
Risks Related to the COVID-19 Pandemic
Financial condition and results of operations have been and are expected to continue to be adversely impacted by the recent COVID-19 pandemic.
The effects on our operations due to the public health crisis caused by the COVID-19 pandemic and the measures being taken to limit COVID-19's spread havenegatively impacted our operations and financial results and future impacts are uncertain and difficult to predict, but may include:
◦ The effects of the COVID-19 pandemic on our business may extend well beyond the current health crisis and immediate related governmental action.Disruptions resulting from COVID-19 may cause some of our customers to take cost-cutting actions. In addition, shifts in consumer spending and marketdownturns due to pandemic fears and the measures taken to contain its spread may negatively impact demand for our products, particularly in our Audiosegment, and may have a significant negative impact to our markets.
◦ We may be restricted or prevented from conducting business activities for indefinite or intermittent periods of time, including as a result of employeehealth and safety concerns, shutdowns, shelter in place orders, travel restrictions, and other actions and restrictions that may be requested or mandated bygovernmental authorities. For example, we experienced a temporary reduction of our manufacturing and operating capacity in China, Malaysia, and thePhilippines as a result of government-mandated actions to control the spread of COVID-19. While those restrictions have been lifted, they may bereinstated as the pandemic continues to evolve. In addition, the recent surge in COVID-19 cases due to variants of the virus has resulted in intermittentworkforce disruptions, particularly in our North American facilities, negatively impacting our operations and resulting in delays in shipments tocustomers.
◦ We have experienced disruption and delays to our supply chain, particularly with respect to the global shortage of semiconductor components. If suchshortages were to continue or worsen or our suppliers' operations were to be significantly impacted, we may need to seek alternative suppliers, which mayresult in higher supply chain costs to us, supplies not being available, or significant delays in shipments to us and subsequently to our customers.
These and other impacts of the COVID-19 pandemic could have the effect of heightening many of the other risks discussed in this Item 1A., Risk Factors. Theultimate impact on our business and results of operations depends on future developments, which are uncertain, rapidly changing, and difficult to predict, includingbut not limited to the severity and duration of the COVID-19 pandemic; the availability, adoption, and efficacy of vaccines; the emergence, spread, and severity ofnew variants of COVID-19; actions taken by governmental authorities and other third parties in response; and when and to what extent normal business, economic,and social activity and conditions resume.
9
Table of Contents
Risks Related To Our Business
Our largest segment, Audio, derives a significant portion of its revenues from a limited number of OEM customers. If revenues derived from these customersdecrease or the timing of such revenues fluctuates, our operating results could be adversely affected.
Our Audio segment accounted for 77% of our consolidated revenues for fiscal 2021. Our Audio segment derives a significant portion of revenues from a smallnumber of OEM customers. For 2021, Audio top five customers accounted for approximately 50% of Audio’s revenues. For the year ended December 31, 2021,Apple Inc. accounted for approximately 21% of Audio’s revenues and 16% of consolidated company revenues. The mobile handset industry is also subject tointense competition that could result in decreased demand and/or declining average selling prices for our products and those of our OEM customers. The loss ofany one of Audio’s top customers or a reduction in the purchases of Audio’s products by such customers would reduce our total revenues and may have a materialadverse effect on our operating results, and any delay of a significant volume of purchases by any one of our top customers, even if only temporary, would reduceour revenues in the period of the delay and may have a material adverse effect on our operating results. Further, concentration of market share among a fewcompanies and the corresponding increase in purchasing power of these companies may result in lower prices for our products which, if not offset by a sufficientincrease in the volume, or favorable changes in the mix, of purchases of our products, could have a material adverse effect on our revenues and margins. Inaddition, the timing, volume, and mix of purchases by our significant customers may be impacted by the timing of such customers’ new or next generation productintroductions, and the timing of such introductions may have a material adverse effect on our operating results. Accordingly, if current market and industrydynamics continue, our Audio segment’s revenues will continue to depend largely upon, and be impacted by the timing, volume, and mix of future purchases by alimited number of our OEM customers.
We derive the majority of our Audio revenues from MEMS microphones and a significant reduction in our sales of MEMS microphones could significantlyreduce our revenues and adversely impact our operating results.
Within our Audio segment, revenues are generated primarily from the sales of our MEMS microphones. Sales of MEMS microphones accounted for approximately56% of our consolidated revenues for fiscal 2021. We expect that a substantial portion of our revenues will continue to be attributable to sales of MEMSmicrophones and any weakening of demand, loss of market share, or other factors adversely affecting our levels and the timing of our sales of MEMSmicrophones, including our customers’ product release cycles, market acceptance, product competition, the performance and reliability of our MEMSmicrophones, and economic and market conditions could cause our Audio revenues to substantially decline, which may have a material adverse effect on ouroperating results.
We rely on highly specialized suppliers for a variety of highly engineered or specialized components, and other inputs for which we may not be able to readilyidentify alternatives or substitutes in the event of a supply disruption or capacity constraint at or by any of these suppliers, which could have a material adverseimpact on our results of operations.
Certain of our businesses rely on highly specialized suppliers or foundries for critical materials, components, or subassemblies that are used in our products. Insome cases, our suppliers or foundries are our sole source of supply, such as with our ASIC and MEMS foundry partners. Additionally, some of our suppliers orfoundries are a strategic supplier to one of our competitors or a customer. Should an event occur which affects the ability or willingness of a key or sole supplier orfoundry to continue to deliver materials or components to us in a timely manner, we may not be able to identify or qualify an alternative supplier in a timelymanner which, in any such period and future periods, could have a material adverse effect on our results of operations. Potential events or occurrences which couldcause business or supply disruptions or affect the ability or willingness of a supplier or foundry to continue to supply us include changes in market strategy, theacquisition of, sale, or other change in control or ownership structure of a supplier or foundry, strategic divestiture, bankruptcy, insolvency or other financialdifficulties, business disruptions (including COVID-19-related supplier plant shutdowns or slowdowns, governmental regulatory and enforcement actions, andwork stoppages), operational issues, or capacity constraints at a supplier or foundry (including as a result of a surge in customer demand). For example, a globalshortage of semiconductors has had an immaterial impact on our MEMS microphone business, however this could escalate in future quarters and cause productiondelays and have a material adverse impact on our results of operations.
10
Table of Contents
If we are unable to offset erosion of average selling prices in our Audio segment our gross margins may be adversely affected.
Like most technology sectors, the mobile handset industry has traditionally experienced an erosion of average selling prices due to a number of factors, includingintense competition, component pricing trends, changes in demand mix, excess inventories, and rapid obsolescence resulting from technology advances. Within ourAudio segment, while average selling prices vary significantly on a product to product basis, we have traditionally been successful with largely offsetting priceerosion by shifting our product mix to new, higher end or higher performance microphones and gradually shifting customers from analog microphones to highervalue digital microphones. To offset average selling price erosion, we must either continue to be successful with these initiatives or increase our selling prices. Ifwe are unable to offset average selling price erosion, the average selling prices of our products may decrease and our future operating results may be materiallyadversely affected.
Our success depends on our ability to attract and retain key employees, and if we are unable to attract and retain such qualified employees, our business andour ability to execute our business strategies may be materially impaired.
Our future success depends largely on the continued service and efforts of our executive officers and other key management and technical personnel and on ourability to continue to identify, attract, retain, and motivate them, particularly in an environment of cost reductions and a general move toward more performance-based compensation for executives and key management.
Implementing our business strategy also requires specialized engineering and other talent, as our revenues are highly dependent on technological and productinnovations. Competition for such experienced technical personnel in our industry and where we are located is intense, and we cannot assure that we can continueto recruit and retain such personnel. For example, there is substantial competition for experienced engineers in China and technical personnel in the U.S. and India,which may make it difficult for us to recruit and retain key employees. If we are unable to attract and retain such qualified employees, our business and our abilityto execute our business strategies may be materially impaired.
We depend on the mobile handset market for a significant portion of our revenues, and any downturn or slower than expected growth in this market couldsignificantly reduce our revenues and adversely impact our operating results.
The mobile handset market accounted for approximately 21% of our consolidated revenues for fiscal 2021. While other markets such as mobile headsets,computing, wearables, and IoT are gaining in significance, we expect that a substantial portion of our consolidated revenues will continue to be attributable to themobile handset market, which is cyclical and characterized by continuous and rapid technological change, product obsolescence, price erosion, evolving standards,short product life cycles, and significant fluctuations in product supply and demand. The mobile handset market has experienced and may continue to experienceperiodic downturns which may be characterized by diminished product demand, production overcapacity, high inventory levels, and accelerated erosion of averageselling prices. While our diversification strategy has tempered the impact of the recent slowing of growth in this market, a significant downturn in the mobilehandset market could have a material adverse effect on our business and operating results. In addition, a decline in global economic conditions, particularly inChina and other geographic regions with high concentrations of mobile handset users, could have adverse, wide-ranging effects on demand for our products ortechnologies.
We have invested and continue to make strategic investments and acquisitions that, if not successful, could have a material adverse effect on our business andfinancial results.
We engage in strategic transactions and make strategic investments including investments in emerging technology companies and intellectual property which arefocused on growth by positioning the Company for expansion into new markets, territories or technologies, exploiting new or growing customer or marketopportunities, and developing new technologies and products. Such acquisitions and strategic investments naturally entail significant risks and uncertainties, someof which are beyond our control. We may not, for example, be able to retain key employees, customers, or suppliers of acquired companies, derive value fromacquired technology or assets and we may experience delays in achieving cost synergies or higher than expected costs in implementing them. In addition, due toour inexperience with certain adjacent or complimentary technologies and doing business in certain geographic regions that may be served by acquired businesses,we may underestimate the costs or overestimate the benefits that we expect to realize from such acquisitions or investments, and we may not achieve them. Wecannot, therefore, provide assurance that each of our acquisitions or strategic investments will be accretive or generate anticipated financial returns. If, for any ofthese or for unforeseen reasons, our strategic acquisitions or investments fail to meet our expectations or forecasts, our business and results of operations may bematerially adversely affected.
11
Table of Contents
Our effective tax rate may fluctuate which will impact our future financial results.
Our effective tax rate is highly dependent upon the geographic composition of our worldwide earnings as we are subject to income taxes in both the U.S. andvarious foreign jurisdictions. Tax regulations governing each region, changes to those regulations, differing statutory tax rates, changes in the valuation of deferredtax assets, tax law, or rate changes could adversely affect our effective tax rate, and ultimately actual taxes payable.
The estimated effects of applicable tax laws, including current interpretation of the Tax Cuts and Jobs Act ("Tax Reform Act"), have been incorporated into ourfinancial results. The U.S. Treasury Department, Internal Revenue Service ("IRS"), and other standard-setting bodies could interpret or issue future legislation orguidance which impact how provisions of the Tax Reform Act will be applied or otherwise administered that is different from our interpretation, which could havea material adverse impact on our effective tax rate as well as our future financial results and tax payments.
Further, our tax returns are subject to periodic reviews or audits by domestic and international authorities, and these audits may result in adjustments to ourprovision for taxes or allocations of income or deductions that result in tax assessments different from amounts that we have estimated. We regularly assess thelikelihood of an adverse outcome resulting from these audits to determine the adequacy of our provision for taxes. There can be no assurance as to the outcome ofthese audits or that our tax provisions will not change materially or be adequate to satisfy any associated tax liability. If our effective tax rates were to increase or ifour tax liabilities exceed our estimates and provisions for such taxes, our financial results could be adversely affected.
Our effective tax rate is favorably impacted by tax holidays granted to us by certain foreign jurisdictions, which lowers the tax rates we are subject to for a periodof time as compared to the countries' statutory tax rates. These tax holidays are subject to the satisfaction of certain conditions, including exceeding certain annualthresholds of operating expenses and gross sales. If we fail to satisfy such conditions, our effective tax rate may be materially adversely impacted. For additionaldetail, see Note 13. Income Taxes to our Consolidated Financial Statements under Item 8, "Financial Statements and Supplementary Data." Moreover, tax rates andlaws in the countries where we operate may change, or tax reforms may be enacted domestically or in foreign jurisdictions which may increase tax uncertainty andmay adversely affect our liquidity, cash flows, and future reported financial results or our ability to continue to structure and conduct our business as is donecurrently. For example, many of the countries where we are subject to taxes, including the U.S., are independently evaluating their tax policy and we may seesignificant changes in legislation, treaties, and regulations concerning taxation. In addition, many countries have politically committed to proposed fundamentalchanges to the international corporate tax system, by the Organization for Economic Co-operation and Development's (the "OECD") Inclusive Framework on BaseErosion and Profit Shifting, including the potential implementation of a minimum tax on global income, amongst other proposals.
Our products are complex and could contain defects, which could result in material costs to us and harm our business, results of operations, and financialcondition.
Our products are complex and could contain defects, which could result in material costs to us. Product development in the markets we serve is becoming morefocused on audio signal processing for improved audio performance and to enable intelligent and more sophisticated audio solutions. The increasing complexity ofour products increases the risk that we or our customers or end users could discover latent defects or subtle faults after significant volumes of product have beenshipped. This could result in material costs and other adverse consequences to us including, but not limited to: loss of customers, reduced margins, damage to ourreputation, a material product recall, replacement costs for product warranty and support, payments to our customers related to recall claims as a result of variousindustry or business practices, a delay in recognition or loss of revenues, loss of market share, or failure to achieve market acceptance, and a diversion of theattention of our engineering personnel from our product development efforts. In addition, any defects or other problems with our products could result in financiallosses or other damages to our customers who could seek damages from us for their losses. A product liability or warranty claim brought against us, even ifunsuccessful, would likely be time consuming and costly to defend. In particular, the sale of systems and components that are incorporated into mobile handsets forthe global mobile phone industry involves a high degree of risk that such claims may be made. Due to the complex nature of our products, quality and reliabilityissues may be identified after significant volumes of a product have been shipped to a large customer. A warranty or product liability claim against us in excess ofour available insurance coverage and established reserves, or a determination that we have liability or an obligation to cover the costs of a customer product recall,could have a material adverse effect on our business, results of operations, and financial condition.
12
Table of Contents
In addition, our products are typically sold to customers at prices that are significantly lower than the cost of the customer’s products in which they areincorporated. Given that a defect in one of our products could give rise to failures in the products that incorporate them, we may face claims for damages that aredisproportionate to the revenues we receive from the products involved and because we are self-insured for matters relating to product quality a significant claimcould have a material adverse effect on our financial condition. Moreover, to the extent a defect in one of our products is caused by a defective component suppliedto us by a third party, we may, nonetheless, be liable to the customer and be unsuccessful in seeking indemnification from that third party.
Our goodwill, other intangible assets, or long-lived assets may become impaired, which could result in a significant charge to earnings.
We hold significant amounts of goodwill, other intangible assets, and long-lived assets, and the balances of these assets could increase in the future if we acquireother businesses. At December 31, 2021, the balance of our goodwill, other intangible assets, and long-lived assets was $1.3 billion and the total market value ofthe Company’s outstanding shares was $2.1 billion. Under generally accepted accounting principles in the United States ("U.S. GAAP"), we review our goodwill,other intangible assets, and long-lived assets for impairment when events or changes in circumstances indicate the carrying value of such goodwill, other intangibleassets, or long-lived assets may not be recoverable. In addition, we test goodwill and other indefinite-lived intangible assets for impairment annually. Factors thatmay be considered a change in circumstances, indicating that the carrying value of our goodwill, other intangible assets, or long-lived assets may not berecoverable, include, but are not limited to, a sustained decline in stock price and market capitalization, significant negative variances between actual and expectedfinancial results, reduced future cash flow estimates, adverse changes in legal factors, failure to realize anticipated synergies from acquisitions, and slower growthrates in our industry. We may be required to record a significant charge to earnings in our financial statements during the period in which any impairment of ourgoodwill, other intangible assets, or long-lived assets is determined to exist, negatively impacting our results of operations. If our market capitalization was to fallbelow the book value of our total stockholders’ equity for a sustained period, we may conclude that the fair value of certain of our intangible or long-lived assets ismaterially impaired. In this case, we would be required under U.S. GAAP to record a non-cash charge to our earnings which could have a material adverse effecton our business, results of operations, and financial condition.
We are subject to potentially material liability for breaches of confidentiality agreements with certain of our top customers.
We have entered into non-disclosure agreements with several of our top customers which require us not to disclose and to protect certain information regarding,among other things, aspects of those customers’ businesses plans, products, and technology. These confidentiality agreements, in some cases, impose strict liabilityon us in the event of any breach of these agreements by us or our employees or agents and, should such a breach occur, any resulting damage award or settlementcould have a material adverse effect on our operating results and financial condition.
Risks Related to Our Industry
Global markets for our products are highly competitive and subject to rapid technological change. If we are unable to develop new products and competeeffectively in these markets, our financial condition and operating results could be materially adversely affected.
We compete in highly competitive, technology-based, industries that are highly dynamic as new technologies are developed and introduced. Our competitors mayintroduce products that are as or more technologically advanced than our products or launch new products faster than we can, which may result in a loss of marketshare or revenue by us. If we are unable to anticipate or match our competitors’ development or launch of new products, identify customer needs and preferenceson a timely basis, or successfully launch or ramp production of our new products, our business and operating results may be materially adversely affected.
13
Table of Contents
We operate in the highly competitive mobile handset industry, which requires us to invest significant capital in developing, qualifying, and ramping productionof new products without any assurance of product sales. If our new products are not designed into a customer's product or qualified by a customer ouroperating results could be negatively impacted.
A significant portion of our consolidated revenues are derived from acoustic components and audio solutions that are required to go through extensive customerqualification processes before being selected by customers for inclusion in their end products. In order to meet the product launch schedules of our top customers,we may invest capital and devote substantial resources, including design, engineering, sales, marketing, and programming efforts, based on non-binding forecastsprovided by these customers, without any assurance that our products will be designed into a customer’s product or qualified by the customer. In such cases, if ourproduct is not designed into or qualified by the customer, we may not recover or realize any return on the capital that we invested and our operating results may bematerially adversely affected.
In addition, the time required and costs incurred by us to ramp-up production for new products can be significant. Certain non-recurring costs and expenditures fortooling and other equipment may not be reusable in manufacturing products for other customers or different products for the same customer. Product rampstypically involve greater volumes of scrap and risks to execution such as higher costs due to inefficiencies and delays in production, all of which can have amaterial adverse effect on our operating results.
Risks Related to Operating a Global Business
Our foreign operations and supply chain are each subject to various risks that could materially adversely impact our results of operations and financialcondition.
Many of our manufacturing operations, research and development operations, vendors, and suppliers are located outside the United States and if we are unable tosuccessfully manage the risks associated with our global operations, our results of operations and financial condition could be negatively impacted. These risksinclude:
o labor unrest and strikes, particularly in Asia, where the majority of our manufacturing operations are located;o earthquakes, tsunamis, floods, and other natural disasters, or catastrophic events (which may occur with more frequency or greater intensity due to
climate change), particularly in Asia, where the majority of our manufacturing operations and suppliers are located;o health crises, including epidemics and pandemics, such as the COVID-19 pandemic, and governmental responses thereto, including by resulting in
quarantines, closures, or other disruptions;o acts of terrorism or armed conflicts;o political or economic instability;o government embargoes, trade restrictions, and import and export controls; ando transportation delays and interruptions.
In addition, increasing focus on environmental, social, and governance ("ESG") responsibility, as well as customer and investor demands, may make our supplychain more complex and may adversely affect our relationships with customers and investors. Some of our customers have adopted, or may adopt, procurementpolicies that include ESG provisions or requirements that their suppliers should comply with, or they may seek to include such provisions or requirements in theirprocurement terms and conditions. Also, an increasing number of investors are requiring companies to disclose corporate ESG policies, practices, and metrics.Legal and regulatory requirements, as well as investor expectations, on corporate ESG practices and disclosure, are subject to change, can be unpredictable, andmay be difficult and expensive for us to comply with, given the complexity of our supply chain and manufacturing. If we are unable to comply, or are unable tocause our suppliers or contract manufacturers to comply, with such policies or provisions or meet the requirements of our customers and our investors, a customermay stop purchasing products from us or an investor may sell their shares, which could have a material adverse effect on our results of operations and ourreputation.
Global economic conditions and changes in U.S. and international trade policy could materially adversely impact our business, results of operations, andfinancial position.
In the past, the Company's business and operating results have been adversely affected by these global economic conditions and remain vulnerable to futureadverse impacts. Any prolonged economic deceleration in China may have a material adverse effect on our sales to customers in China, our operating results, andour financial condition.
14
Table of Contents
Political actions, including trade and/or national security protection policies, or other actions by governments, particularly the U.S. and Chinese governments, havein the past, currently are, and could in the future limit or prevent us from transacting business with certain of our customers or suppliers. The U.S. government hasmade statements and taken certain actions that have led to, and may lead to further, changes to U.S. and international export and import controls or trade policies,including tariffs affecting certain products exported by a number of U.S. trading partners, including China. In response, many of those trading partners, includingChina, have imposed or proposed new or higher tariffs on American products. Given that the majority of our largest manufacturing facilities are located in Chinaand Southeast Asia, trade policy changes in the United States, China, or other countries, such as tariffs and sanctions would present particular risks for us that couldadversely impact our results of operations and financial condition. We cannot predict future foreign trade policy in the United States or other countries, the terms ofany new or renegotiated trade agreements or treaties, or tariffs or the impact of such matters on our business. A trade war involving the United States is likely tonegatively impact world trade and the world economy in various ways and, consequently, have a material adverse effect on our results of operations and financialcondition. To the extent that tariffs, trade restrictions, or sanctions imposed by the United States or other countries increase the price of, affect customer demandfor, affect our ability to supply our products, or create adverse tax consequences, in the United States or other countries, our business and our operating results maybe adversely affected. As a result, changes in international trade policy, changes in trade agreements, the imposition of tariffs or sanctions by the United States orother countries could materially adversely affect our results of operations and our financial condition.
Changes to export restrictions and economic sanction laws may adversely affect our operating results.
As a global company headquartered in the U.S., we are subject to U.S. laws and regulations, including import, export, and economic sanction laws. These lawsmay include prohibitions on the sale or supply of certain products to embargoed or sanctioned countries, regions, governments, persons, and entities, may requirean export license prior to the export of the controlled item, or may otherwise limit and restrict the export of certain products and technologies. Many of ourcustomers and suppliers are foreign companies or have significant foreign operations. The imposition of new or additional economic and trade sanctions againstour major customers or suppliers could result in our inability to sell to, and generate revenue from such customers or purchase materials from such suppliers.Although these restrictions and laws have not significantly restricted our operations in the past, there is a risk that they could do so in the future.
For example, on May 16, 2019, the U.S. Department of Commerce published a final rule in the Federal Register that amended the Export AdministrationRegulations by adding Huawei Technologies Co., Ltd. ("Huawei") and 68 of its affiliates to the “Entity List” for actions contrary to the national security or foreignpolicy interests of the U.S. This rule imposed new export licensing requirements on exports, re-exports, and in-country transfers of all U.S.-regulated products,software, and technology to the designated Huawei entities. To date, this action has not had a material impact on our results of operations. However, if new ordifferent restrictions are placed on sales of our products to our existing or potential customers, this could adversely affect our business and results of operations inthe future.
As a result of restrictive export laws, our customers may also develop their own solutions to replace our products or seek to obtain a greater supply of similar orsubstitute products from our competitors that are not subject to these restrictions, which could materially and adversely affect our business and results ofoperations.
In addition, our association with customers that are or become subject to U.S. regulatory scrutiny or export restrictions could subject us to actual or perceivedreputational harm among current or prospective investors, suppliers or customers, customers of our customers, other parties doing business with us, or the generalpublic. Any such reputational harm could result in the loss of investors, suppliers, or customers, which could harm our business, financial condition, operatingresults, or prospects.
Fluctuations in commodity prices and foreign currency rates could have a material adverse effect on our operating results and financial condition.
We use a wide variety of raw materials in our manufacturing operation and are exposed to market risks associated with changes in commodity prices. Changes incommodity prices (from tariffs or otherwise) cannot always be predicted, hedged, or offset with price increases to eliminate earnings volatility. As a result,significant changes in commodity prices, particularly for various precious metals, could have a substantial adverse effect on our financial condition and results ofoperations.
15
Table of Contents
In addition, we conduct a significant amount of business outside the United States and adverse movements in currency exchange rates, particularly the Malaysianringgit, the Chinese renminbi (yuan), and the Philippine peso, in any period or periods, could have a material adverse effect on our business and our operatingresults due to a number of factors, including, among others:
o our products are manufactured and sold outside the United States which increases our net exposure to changes in foreign exchange rates;o our products, which are typically sold in U.S. dollars, may become less price-competitive outside the United States as a result of unfavorable foreign
exchange rates;o certain of our revenues that are derived from customer sales denominated in foreign currencies could decrease;o our foreign suppliers may raise their prices if they are impacted by currency fluctuations, resulting in higher than expected costs and lower margins;o the cost of materials, products, services, and other expenses outside the United States could be materially impacted by a weakening of the U.S. dollar;
ando a sustained weakening of the U.S. dollar for an extended period could have a material adverse impact on our operating results and financial position.
While we have entered and may in the future enter into derivative financial instruments in an effort to hedge our foreign currency exposure, we remain exposed tothe economic risks of foreign currency fluctuations. See the “Risk Management” section of Item 7 for additional discussion of commodity price and foreigncurrency risks.
Risks Related to Intellectual Property and Cybersecurity
Our revenues and operating results could be materially adversely affected if we are unable to protect or obtain patent and other intellectual property rights or ifintellectual property litigation is successful against us.
We employ various measures to maintain, protect, and defend our intellectual property, including enforcing our intellectual property rights in various jurisdictionsand forums throughout the world. However, policing unauthorized use of our products, technologies, and proprietary information is difficult and time consumingand these measures may not prevent our intellectual property from being challenged, invalidated, copied, disclosed, stolen, or circumvented. If we fail to protectour proprietary rights, our competitors might gain access to our technology, which could adversely affect our ability to compete successfully in our markets andharm our operating results. We also may not be successful in litigation or other actions to enforce our intellectual property rights, particularly in countries whereintellectual property rights are not highly developed or protected, particularly in Asia, where the majority of our manufacturing operations are located. Litigation, ifnecessary, may result in retaliatory legal proceedings alleging infringement by us of intellectual property owned by others. We have had and may in the future havedifficulty in certain circumstances in protecting or enforcing our intellectual property rights, including collecting royalties for use of certain patents included in ourpatent portfolio in certain foreign jurisdictions due to, among other things: policies of foreign governments; challenges to our licensing practices under suchjurisdictions’ competition laws; failure of foreign courts to recognize and enforce judgments of contract breach and damages issued by courts in the United States;and/or challenges pending before foreign patent authorities as to the validity of our patents and those owned by competitors and other parties.
Our competitors or other third parties may also assert infringement or invalidity claims against us in the future. If one of our products is found to infringe on a thirdparty’s rights, we may have liability for damages arising out of past infringement and may need to seek a license to use such intellectual property going forward. Ifa license is not available or if we are unable to obtain a license on terms acceptable to us, we would either have to change our product so that it does not infringe orcease selling the product. Any of these events may have a material adverse effect on our business, operating results, and financial condition.
The expense of protecting, defending, and enforcing our intellectual property, or defending claims that our products, technology, or manufacturing processesinfringe the intellectual property rights of others, can vary significantly period to period and, in any given period, could have a material adverse effect on ouroperating results.
16
Table of Contents
Our business and operations could suffer in the event of security breaches, cybersecurity incident, other unauthorized disclosures, or network disruptions.
While we have taken and continue to actively take measures to protect the various proprietary information, algorithms, source code, and confidential data relatingto both our and our customers’ business and products that is stored on our computer networks, servers, and peripheral devices, as well as on servers owned ormanaged by third party vendors whom we leverage, such data and information remains vulnerable to cyber attacks, cyber breaches, theft, or other unauthorizedaccess. These attacks are increasing in their frequency, sophistication, and intensity and are costly to protect against. In addition, many of the techniques used toobtain unauthorized access, including viruses, worms, and other malicious software programs, are difficult to anticipate until launched against a target and we maybe unable to implement adequate preventative measures. If successful, such cyber attacks or unauthorized access could result in remedial and other expenses, lossof valuable intellectual property, disclosure of confidential customer or commercial data, disclosure of government classified information, or system disruptionsand subject us to civil liability, fines or penalties, damage our brand and reputation or otherwise harm our business, any of which could be material. If any suchsecurity breaches occur, there is no assurance that it can be adequately addressed in a timely manner or that any resulting loss, cost, or damage will be recoverablethrough insurance, legal, or other processes.
Should any security breach result in the disclosure of certain of our customers’ or business partners’ confidential information, we may incur liability to suchcustomers or business partners under confidentiality agreements that we are party to with such parties. In addition, delayed sales, lower margins, or lost customersresulting from security breaches or network disruptions could materially reduce our revenues, materially increase our expenses, damage our reputation, and have amaterial adverse effect on our stock price.
There is also a danger of industrial espionage, unauthorized disclosures, theft of information or assets (including source code), or damage to assets by people whohave gained unauthorized access to the Company's facilities, systems, or information. Such breaches, misuse, or other disruptions could lead to unauthorizeddisclosure of confidential or proprietary information or improper usage or sale of the Company's products or intellectual property without compensation and theft,manipulation, and destruction of private and proprietary data, which could result in defective products, production downtimes, lost revenue, or damage to ourreputation, and have a material adverse effect on our stock price.
Additionally, any disruption, termination, or substandard provision of our communication networks and IT systems, whether as a result of computer ortelecommunication issues (including operational failures, computer viruses, or security breaches), localized conditions (such as power outage, fire, or explosion) orevents or circumstances of broader geographic impact (such as earthquake, storm, flood, other natural disaster, epidemic, strike, act of war, civil unrest, or terroristact), could materially affect our business by disrupting normal operations.
Global privacy legislation, enforcement, and policy activity are rapidly expanding and creating a complex data privacy environment. We are subject to many dataprivacy, data protection, and data breach notification laws and regulations in the United States and around the world. While we have taken measures to assess therequirements of, and to comply with data privacy legislation, there is the potential for fines and penalties, litigation, and reputational harm in the event of a databreach.
Risks Related to Our Indebtedness
Our credit agreement requires us to comply with certain financial covenants and our failure to comply could have a material adverse effect on our business,financial condition, and results of operations.
The credit agreement governing our revolving credit facility contains covenants requiring us to, among other things, maintain a minimum ratio of consolidatedEBITDA to consolidated interest expense and a maximum ratio of consolidated total indebtedness to consolidated EBITDA. In the past, we have obtainedamendments from the lenders under the credit agreement which have allowed us to comply with the financial covenants, but there can be no assurance that in thefuture the lenders will agree to such amendments, and our inability to comply with the covenants could result in an event of default which, if not cured or waived,could have a material adverse effect on our business, financial condition, and operating results.
17
Table of Contents
There are risks associated with our indebtedness, which could have a material adverse effect on our financial condition.
Our outstanding indebtedness and any additional indebtedness we incur may have negative consequences, including:
o requiring us to use cash to pay the principal of and interest on our indebtedness, thereby reducing the amount of cash flow available for other purposes;o limiting our ability to obtain additional financing for working capital, capital expenditures, acquisitions, stock repurchases, dividends, or other general
corporate and other purposes;o limiting our flexibility in planning for, or reacting to, changes in our business and our industry; ando increasing our vulnerability to interest rate fluctuations to the extent a portion of our debt has variable interest rates.
Our ability to make payments of principal and interest on our indebtedness depends upon our future performance, which is subject to general economic conditions,industry cycles, and financial, business, and other factors, many of which are beyond our control. If we are unable to generate sufficient cash flow from operationsin the future to service our debt, we may be required to, among other things: refinance or restructure all or a portion of our indebtedness; reduce or delay plannedcapital or operating expenditures; or sell selected assets. Such measures might not be sufficient to enable us to service our debt. In addition, any such financing,refinancing, or sale of assets might not be available on economically favorable terms or at all, and if prevailing interest rates at the time of any such financingand/or refinancing are higher than our current rates, interest expense related to such financing and/or refinancing would increase. Furthermore, our variable rateindebtedness may use LIBOR as a benchmark for establishing the rate. LIBOR is the subject of recent national, international, and other regulatory guidance andproposals for reform. These reforms and other pressures may cause LIBOR to disappear entirely or to perform differently than in the past. Our credit agreementcontemplates a procedure for transitioning from LIBOR upon the occurrence of specified events. Nevertheless, the consequences of these market developmentscannot be entirely predicted and a transition from LIBOR, even if administered consistent with the credit facility's provisions, could increase the cost of ourvariable rate indebtedness. If there are adverse changes in the ratings assigned to our debt securities by credit rating agencies, our borrowing costs, our ability toaccess debt in the future, and/or the terms of the financing could be adversely affected.
Transactions relating to our Warrants may dilute the ownership interest of our stockholders, or may otherwise depress the price of our common stock.
As discussed in Note 12. Borrowings to our Consolidated Financial Statements under Item 8, "Financial Statements and Supplementary Data", we entered intowarrant transactions (the "Warrants") in the second quarter of 2016, whereby we sold warrants to acquire, subject to anti-dilution adjustments, approximately 9.4million shares of our common stock at an initial strike price of $21.1050 per share. The exercise of some or all of our outstanding Warrants would dilute theownership interests of existing stockholders if the market price of our common stock exceeds the strike price of the Warrants. Any sales in the public market of thecommon stock issuable upon such exercise could adversely affect prevailing market prices of our common stock. Additionally, anticipated exercise of suchWarrants into shares of our common stock could depress the price of our common stock.
Risks Related to Our Corporate Governance and Common Stock
Our business could be negatively affected as a result of the actions of activist or hostile stockholders.
Our business could be negatively affected as a result of stockholder activism, which could cause us to incur significant expense, hinder execution of our businessstrategy, and impact the trading value of our securities. In the past, the Company has been the subject of shareholder activism, and we are subject to the risksassociated with any future such activism. Stockholder activism, including potential proxy contests, requires significant time and attention by management and theBoard of Directors, potentially interfering with our ability to execute our strategic plan. Additionally, such stockholder activism could give rise to perceiveduncertainties as to our future direction, adversely affect our relationships with key executives and business partners, and make it more difficult to attract and retainqualified personnel. Also, we may be required to incur significant legal fees and other expenses related to activist stockholder matters. Any of these impacts couldmaterially and adversely affect our business and operating results. Further, the market price of our common stock could be subject to significant fluctuation orotherwise be adversely affected by stockholder activism.
18
Table of Contents
Certain provisions in our certificate of incorporation, by-laws, and Delaware law may prevent or delay an acquisition of the Company, which could decreasethe trading price of our common stock.
Each of our certificate of incorporation, our by-laws, and Delaware law, as currently in effect, contain provisions that are intended to deter coercive takeoverpractices and inadequate takeover bids by making such practices or bids unacceptably expensive to the bidder and to encourage prospective acquirers to negotiatewith our Board of Directors rather than to attempt a hostile takeover. These provisions include, among others:
o the inability of our stockholders to call a special meeting or act by written consent;o rules regarding how stockholders may present proposals or nominate directors for election at stockholder meetings;o the right of our Board of Directors to issue preferred stock without stockholder approval; ando the ability of our directors, without a stockholder vote, to fill vacancies on our Board of Directors (including those resulting from an enlargement of the
Board of Directors).
In addition, current Delaware law includes provisions which limit the ability of persons that, without prior board approval, acquire more than 15% of theoutstanding voting stock of a Delaware corporation from engaging in any business combination with that corporation, including by merger, consolidation, orpurchases of additional shares, for a three-year period following the acquisition by such persons of more than 15% of the corporation’s outstanding voting stock.
In light of present circumstances, we believe these provisions taken as a whole protect our stockholders from coercive or otherwise unfair takeover tactics byrequiring potential acquirers to negotiate with our Board of Directors and by providing our Board of Directors with more time to assess any acquisition proposal.These provisions are not intended to make us immune from takeovers or prevent changes in the composition of our Board of Directors. However, these provisionscould delay or prevent an acquisition that our Board of Directors determines is not in the best interests of the Company and all of our stockholders.
Our stock price has been and may continue to be volatile and may fluctuate significantly which may adversely impact investor confidence and increase thelikelihood of securities class action litigation.
Our common stock price has experienced substantial volatility in the past and may remain volatile in the future. During 2021, our closing stock price ranged from ahigh of $23.35 per share to a low of $18.12 per share. Volatility in our stock price can be driven by many factors including divergence between our actual oranticipated financial results and published expectations of analysts or the expectations of the market, market conditions in our industry, announcements that we,our competitors, our vendors, or our customers may make regarding their operating results, technological innovations, and the gain or loss of customers, or keyopportunities. Our common stock is also included in certain market indices, and any change in the composition of these indices to exclude our company mayadversely affect our stock price. Increased volatility in the financial markets and/or overall economic conditions may reduce the amounts that we realize in thefuture on our cash equivalents and/or marketable securities and may reduce our earnings as a result of any impairment charges that we record to reduce recordedvalues of marketable securities to their fair values.
Further, securities class action litigation is often brought against a public company following periods of volatility in the market price of its securities. Due tochanges in our stock price, we may be the target of securities litigation in the future. Securities litigation could result in substantial uninsured costs and divertmanagement’s attention and our resources.
ITEM 1B. UNRESOLVED STAFF COMMENTS
None.
19
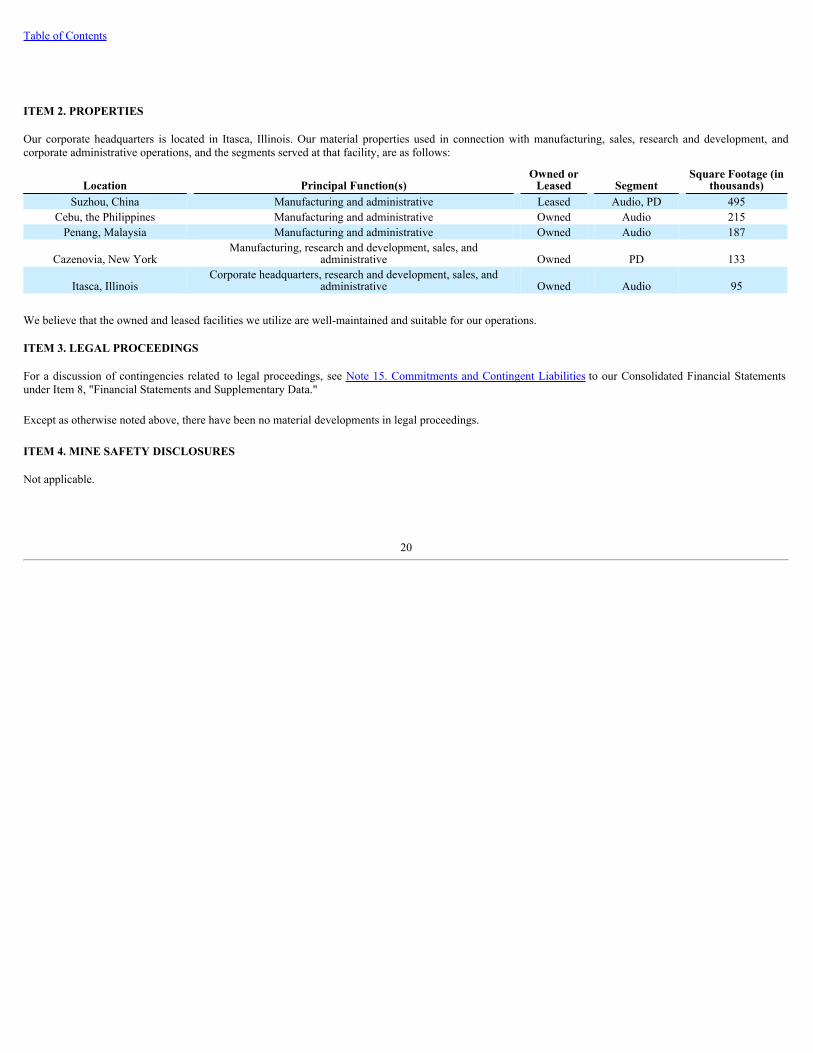
Table of Contents
ITEM 2. PROPERTIES
Our corporate headquarters is located in Itasca, Illinois. Our material properties used in connection with manufacturing, sales, research and development, andcorporate administrative operations, and the segments served at that facility, are as follows:
Location Principal Function(s)Owned or
Leased SegmentSquare Footage (in
thousands)Suzhou, China Manufacturing and administrative Leased Audio, PD 495
Cebu, the Philippines Manufacturing and administrative Owned Audio 215Penang, Malaysia Manufacturing and administrative Owned Audio 187
Cazenovia, New YorkManufacturing, research and development, sales, and
administrative Owned PD 133
Itasca, IllinoisCorporate headquarters, research and development, sales, and
administrative Owned Audio 95
We believe that the owned and leased facilities we utilize are well-maintained and suitable for our operations.
ITEM 3. LEGAL PROCEEDINGS
For a discussion of contingencies related to legal proceedings, see Note 15. Commitments and Contingent Liabilities to our Consolidated Financial Statementsunder Item 8, "Financial Statements and Supplementary Data."
Except as otherwise noted above, there have been no material developments in legal proceedings.
ITEM 4. MINE SAFETY DISCLOSURES
Not applicable.
20
Table of Contents
INFORMATION ABOUT OUR EXECUTIVE OFFICERS
The following sets forth information regarding our executive officers, as of February 9, 2022.
Name Age PositionJeffrey S. Niew 55 President & Chief Executive OfficerJohn S. Anderson 58 Senior Vice President & Chief Financial OfficerRaymond D. Cabrera 55 Senior Vice President, Human Resources & Chief Administrative OfficerDaniel J. Giesecke 54 Senior Vice President & Chief Operating OfficerRobert J. Perna 58 Senior Vice President, General Counsel & Secretary
Jeffrey S. Niew has served as President & Chief Executive Officer since September 2013 and as a member of our Board of Directors since February 2014. FromNovember 2011 until we were spun-off from Dover Corporation in February 2014, Mr. Niew served as a Vice President of Dover Corporation and as President andChief Executive Officer of Dover Communication Technologies. Mr. Niew joined Knowles Electronics LLC (“Knowles Electronics”) in May 2000 and becameChief Operating Officer in January 2007, President in January 2008, and President and Chief Executive Officer in February 2010. Prior to joining KnowlesElectronics, Mr. Niew was employed by Littelfuse, Inc., from 1995 to 2000, where he held various positions in product management, sales, and engineering in theElectronic Products group and by Hewlett-Packard Company, from 1988 to 1994, where he served in various engineering and product management roles in theOptoelectronics Group in California.
John S. Anderson has served as Senior Vice President & Chief Financial Officer since December 2013. From January 2013 until we were spun-off from DoverCorporation in February 2014, Mr. Anderson served as Vice President and Chief Financial Officer of Dover Communication Technologies. Previously,Mr. Anderson served as Vice President and Chief Financial Officer of Dover Energy (August 2010 to January 2013) and Vice President and Chief FinancialOfficer of Dover Fluid Management (October 2009 to August 2010). Previous experience includes the roles of Corporate Controller and Director FinancialPlanning & Analysis for Sauer-Danfoss Inc. (October 2004 to October 2009) and Director of Finance and Controller for Borg Warner Turbo Systems GmbH(August 2002 to October 2004).
Raymond D. Cabrera has served as Senior Vice President, Human Resources & Chief Administrative Officer since February 2014. From November 2011 until wewere spun-off from Dover Corporation in February 2014, Mr. Cabrera served as Vice President, Human Resources of Dover Communication Technologies.Previously, Mr. Cabrera served in the following capacities at Knowles: as Vice President, Human Resources and Chief Administrative Officer (January 2004 toNovember 2011), Vice President, Human Resources (March 2000 to January 2004), and Director, Human Resources (June 1997 to March 2000) of KnowlesElectronics.
Daniel J. Giesecke has served as Senior Vice President & Chief Operating Officer since February 2014. From January 2012 until we were spun-off from DoverCorporation in February 2014, Mr. Giesecke served as Vice President, Global Operations of Dover Communication Technologies. Previously, Mr. Giesecke servedas Vice President, Advanced Manufacturing Engineering, Knowles Electronics (February 2009 to January 2012), Senior Director, Advanced ManufacturingEngineering, Knowles Electronics (January 2008 to February 2009), Director of Engineering Operations, Knowles Electronics (November 2003 to January 2008),and various operations, supply chain, and engineering positions since he joined Knowles Electronics in 1995.
Robert J. Perna has served as Senior Vice President, General Counsel & Secretary since May 2019. Prior to joining Knowles, Mr. Perna served as Senior VicePresident and Chief Legal Officer of The AZEK Company, a manufacturer of commercial and residential building products (November 2018 to April 2019) and asSenior Vice President, General Counsel and Secretary of Rockwell Collins, Inc., a leading producer of cabin interior, communications and aviation systems for theaerospace and defense industry (January 2014 to November 2018). In addition, he served as Vice President, General Counsel and Secretary at A. M. Castle & Co.,a specialty metals and plastics distributor and value-added processor (November 2008 to January 2014) and held various in-house legal positions at CNH Global,Navistar International and GE Capital Rail Services.
21
Table of Contents
PART II
ITEM 5. MARKET FOR REGISTRANT'S COMMON EQUITY, RELATED STOCKHOLDER MATTERS, AND ISSUER PURCHASES OF EQUITYSECURITIES
Market Information
Our common stock is listed on the New York Stock Exchange ("NYSE") under the ticker symbol “KN”.
Dividends
Since our common stock began trading on the NYSE, we have not paid cash dividends and we do not anticipate paying a cash dividend on our common stock inthe immediate future. Any determination to pay dividends in the future will be at the discretion of our Board of Directors and will depend on many factors, such asour financial condition, earnings, capital requirements, debt service obligations, industry practice, legal requirements, regulatory constraints, and other factors thatthe Board of Directors deems relevant. Our ability to pay dividends will depend on our ongoing ability to generate cash from operations and access to the capitalmarkets.
Holders
The number of holders of record of our common stock as of February 7, 2022 was approximately 794.
Recent Sales of Unregistered Securities
None.
Issuer Purchases of Equity Securities
On February 24, 2020, the Company announced that its Board of Directors had authorized a share repurchase program of up to $100 million of the Company'scommon stock. The timing and amount of any shares repurchased will be determined by the Company based on its evaluation of market conditions and otherfactors, and will be made in accordance with applicable securities laws in either the open market or in privately negotiated transactions. The Company is notobligated to purchase any shares under the program, and the program may be suspended or discontinued at any time. The actual timing, number, and share price ofshares repurchased will depend on a number of factors, including the market price of the Company’s common stock, general market and economic conditions, andapplicable legal requirements. Any shares repurchased will be held as treasury stock.
Below is a summary of share repurchases for the three months ended December 31, 2021:
(in millions, except share and per share amounts)
PeriodTotal Number of Shares
PurchasedAverage Price Paid per
Share
Total Number of SharesPurchased as Part of Publicly
Announced Program
Approximate Dollar Value ofShares That May Yet Be
Purchased Under TheProgram
November 2021 350,000 $ 21.44 350,000 $ 56.3 December 2021 778,289 $ 21.89 778,289 $ 39.2
Total Activity 1,128,289 $ 21.75 1,128,289
We exercised our rights under the convertible note hedge transactions on November 1, 2021, which resulted in the receipt of 363,601 shares of our common stockto be held in treasury. For additional detail, see Note 12. Borrowings to our Consolidated Financial Statements under Item 8, “Financial Statements andSupplementary Data.”
22
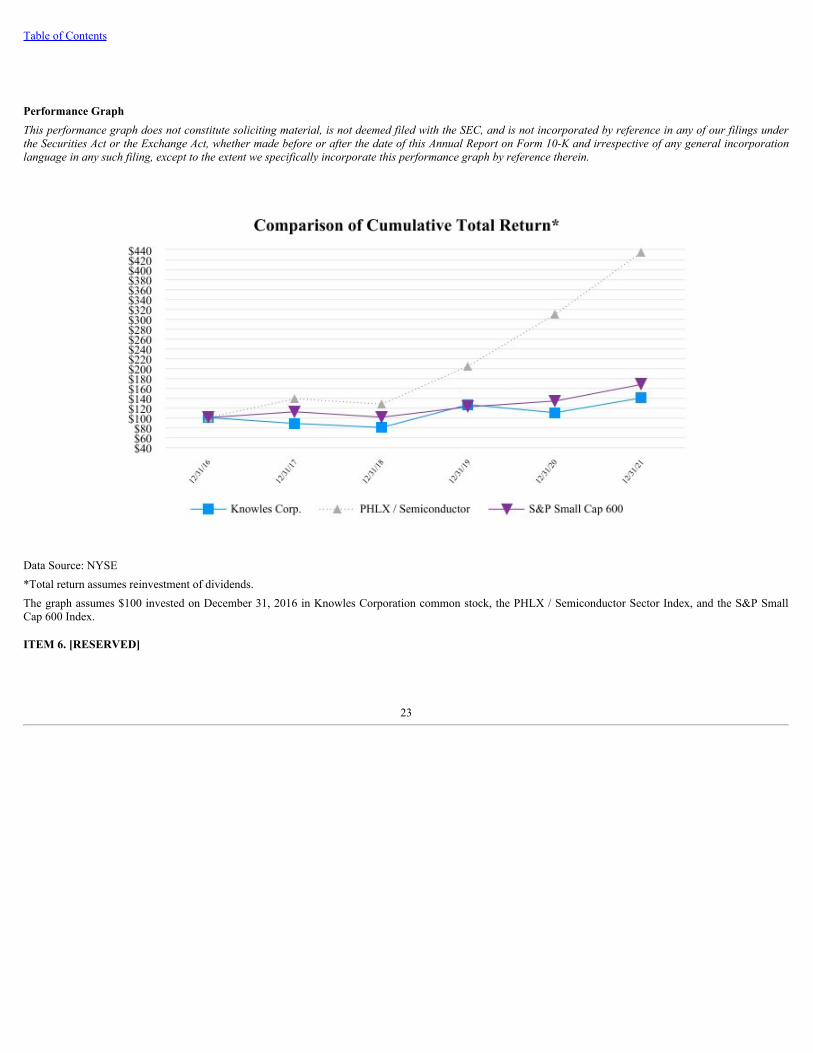
Table of Contents
Performance GraphThis performance graph does not constitute soliciting material, is not deemed filed with the SEC, and is not incorporated by reference in any of our filings underthe Securities Act or the Exchange Act, whether made before or after the date of this Annual Report on Form 10-K and irrespective of any general incorporationlanguage in any such filing, except to the extent we specifically incorporate this performance graph by reference therein.
Data Source: NYSE*Total return assumes reinvestment of dividends.The graph assumes $100 invested on December 31, 2016 in Knowles Corporation common stock, the PHLX / Semiconductor Sector Index, and the S&P SmallCap 600 Index.
ITEM 6. [RESERVED]
23
Table of Contents
ITEM 7. MANAGEMENT'S DISCUSSION AND ANALYSIS OF FINANCIAL CONDITION AND RESULTS OF OPERATIONS
The discussion and analysis presented below refer to and should be read in conjunction with our audited Consolidated Financial Statements and related notes underItem 8. "Financial Statements and Supplementary Data." The following discussion contains forward-looking statements. The matters discussed in these forward-looking statements are subject to risks, uncertainties, and other factors that could cause actual results to differ materially from those made, projected, or implied inthe forward-looking statements. Factors that could cause or contribute to these differences include those discussed below and elsewhere in this Form 10-K,particularly in “Risk Factors” and “Cautionary Statement Concerning Forward-Looking Statements.”
Management’s discussion and analysis, which we refer to as “MD&A,” of our results of operations, financial condition, and cash flows should be read togetherwith the audited Consolidated Financial Statements and accompanying notes included under Item 8. "Financial Statements and Supplementary Data," to provide anunderstanding of our financial condition, changes in financial condition, and results of our operations. We believe the assumptions underlying the ConsolidatedFinancial Statements are reasonable. However, the Consolidated Financial Statements included herein may not necessarily reflect our results of operations,financial position, and cash flows in the future.
As discussed in Note 2. Disposed and Discontinued Operations to our audited Consolidated Financial Statements under Item 8, "Financial Statements andSupplementary Data", we completed the sale of our high-end oscillators business ("Timing Device Business") in the fourth quarter of 2017 and the sale of ourspeaker and receiver product line ("Speaker and Receiver Product Line") in the third quarter of 2016. Accordingly, the results of operations and related assets andliabilities for the Timing Device Business and the Speaker and Receiver Product Line have been reclassified as discontinued operations for all periods presented.Unless otherwise indicated, discussion within this MD&A and elsewhere within this Annual Report on Form 10-K refers to results from continuing operations.
Our Business
We are a market leader and global provider of advanced micro-acoustic microphones and balanced armature speakers, audio solutions, and high performancecapacitors and radio frequency ("RF") products, serving the consumer electronics, medtech, defense, electric vehicle, industrial, and communications markets. Weuse our leading position in SiSonic™ micro-electro-mechanical systems ("MEMS") microphones and strong capabilities in audio processing technologies tooptimize audio systems and improve the user experience across consumer applications. We are also a leader in hearing health acoustics, high performancecapacitors, and RF solutions for a diverse set of markets. Our focus on the customer, combined with unique technology, proprietary manufacturing techniques, andglobal operational expertise, enables us to deliver innovative solutions across multiple applications. References to "Knowles," the "Company," "we," "our," or "us"refer to Knowles Corporation and its consolidated subsidiaries, unless the context otherwise requires.
Our Business Segments
We are organized into two reportable segments based on how management analyzes performance, allocates capital, and makes strategic and operational decisions.These segments were determined in accordance with Financial Accounting Standards Board Accounting Standards Codification 280 - Segment Reporting and arecomprised of (i) Audio and (ii) Precision Devices ("PD"). The segments are aligned around similar product applications serving our key end markets, to enhancefocus on end market growth strategies.
• Audio SegmentOur Audio group designs and manufactures innovative audio products, including microphones, balanced armature speakers, and audio processors used inapplications that serve the mobile, hearing health, True Wireless Stereo ("TWS"), Internet of Things ("IoT"), and computing markets. Audio has sales,support, and engineering facilities in North America, Europe, and Asia, as well as manufacturing facilities in Asia.
24
Table of Contents
• PD SegmentOur PD group specializes in the design and delivery of high performance capacitor products and RF solutions for technically demanding applications. Ourhigh performance capacitor products are used in applications such as power supplies and medical implants, which sell to a diverse set of customers formission critical applications across the defense, medtech, industrial, electric vehicle, and communications markets. Our RF solutions solve a broad rangeof frequency filtering challenges for our customers, who use them in satellite communications and radar systems for defense applications. RF solutionsare also used in mmWave 5G communications equipment. PD has sales, support, and engineering facilities in North America, Europe, and Asia as well asmanufacturing facilities in North America and Asia.
We sell our products directly to original equipment manufacturers ("OEMs") and to their contract manufacturers and suppliers and through distributors worldwide.We have recently been experiencing demand in excess of available capacity. During the second half of 2021, we experienced shortages of raw materials used inproducing MEMS microphones and capacitor products due to supply chain constraints associated with the COVID-19 pandemic. While we anticipate thoseshortages will continue to impact production during 2022, the duration and full extent of the impact of such disruptions is uncertain and depends upon many factorsoutside of our control.
COVID-19 Impact
The COVID-19 pandemic continues to have widespread, rapidly-evolving, and unpredictable impacts in the U.S. and international markets. During 2021, manycountries continued applying containment and mitigation measures, resulting in global business disruption. These measures have impacted our business operations,results of operations, customer demand, and the productivity of our facilities, particularly in China, Malaysia, and the Philippines.
Protecting the health and safety of our employees remains one of our top priorities. We have implemented enhanced safety measures, including screenings, socialdistancing, use of personal protective equipment, and increased frequency in cleaning and disinfecting. We will continue to monitor and evaluate the effects of thepandemic and will continue to take appropriate steps to mitigate the impacts to our employees and on our business results.
Despite economic challenges due to the COVID-19 pandemic, customer demand has returned to pre-pandemic levels. The recovery during fiscal 2021 was partlydue to increased demand for our hearing health products from customers who had either decreased or delayed their orders in the prior year in response to the earlystages of the pandemic.
The situation related to COVID-19 continues to be complex and dynamic. We cannot reasonably estimate the duration of the pandemic or fully ascertain its impactto our future results. As the COVID-19 pandemic evolves, we will continue to actively monitor developments and business conditions and may take actions thatalter business operations as may be required by applicable authorities or that we determine are in the best interests of our employees, customers, suppliers,stockholders, and communities. It is not clear what potential effects any such alterations or modifications may have on our business, including the effects on ourfinancial results.
Recent Developments
On May 3, 2021, we acquired all of the outstanding shares of common stock of Integrated Microwave Corporation ("IMC") for $80.7 million. The acquiredbusiness provides RF filters to the defense, industrial, and communications markets. The acquisition's operations are included in the PD segment. For additionalinformation, refer to Note 3. Acquisitions to our Consolidated Financial Statements under Item 8, "Financial Statements and Supplementary Data."
For discussion related to the results of operations and changes in financial condition for the year ended December 31, 2020 compared to the year ended December31, 2019, refer to Part II, Item 7. Management's Discussion and Analysis of Financial Condition and Results of Operations in our Annual Report on Form 10-K forthe year ended December 31, 2020, which was filed with the SEC on February 10, 2021 and is incorporated by reference herein.
25

Table of Contents
Non-GAAP Financial Measures
In addition to the GAAP financial measures included in this item, we have presented certain non-GAAP financial measures. We use non-GAAP measures assupplements to our GAAP results of operations in evaluating certain aspects of our business, and our executive management team and Board of Directors focus onnon-GAAP items as key measures of our performance for business planning purposes. These measures assist us in comparing our performance between variousreporting periods on a consistent basis, as these measures remove from operating results the impact of items that, in our opinion, do not reflect our core operatingperformance. We believe that our presentation of non-GAAP financial measures is useful because it provides investors and securities analysts with the sameinformation that we use internally for purposes of assessing our core operating performance. The Company does not consider these non-GAAP financial measuresto be a substitute for the information provided by GAAP financial results. For a reconciliation of these non-GAAP financial measures to the most directlycomparable GAAP financial measures, see the reconciliation included herein.
26
Table of Contents
Results of Operations for the Year Ended December 31, 2021 compared with the Year Ended December 31, 2020
Years Ended December 31,(in millions, except per share amounts) 2021 2020 2019Revenues $ 868.1 $ 764.3 $ 854.8
Gross profit $ 359.5 $ 271.2 $ 328.0 Non-GAAP gross profit $ 362.1 $ 275.4 $ 333.6
Earnings from continuing operations before interest and income taxes $ 118.8 $ 27.7 $ 80.8 Adjusted earnings from continuing operations before interest and income taxes $ 174.3 $ 79.3 $ 126.9
(Benefit from) provision for income taxes $ (45.6) $ 8.4 $ 16.6 Non-GAAP provision for income taxes $ 19.8 $ 7.1 $ 17.6
Earnings from continuing operations $ 150.2 $ 2.9 $ 49.7 Non-GAAP net earnings $ 146.9 $ 63.2 $ 101.6 Diluted earnings per share from continuing operations $ 1.59 $ 0.03 $ 0.53 Non-GAAP diluted earnings per share $ 1.53 $ 0.67 $ 1.07
Revenues
Revenues for the year ended December 31, 2021 were $868.1 million, compared with $764.3 million for the year ended December 31, 2020, an increase of $103.8million or 13.6%. Audio revenues increased $75.8 million, primarily due to higher shipping volumes as market conditions have improved from 2020, which wasnegatively impacted by the COVID-19 pandemic. The higher volumes were driven by increased shipments into the hearing health market, exceeding pre-pandemiclevels. In addition, MEMS microphone demand in the IoT and computing markets was above pre-pandemic levels, with the computing market benefiting from thework-from-home and remote-learning trends. The increased demand was partially offset by lower average pricing on mature products and supply constraints. PDrevenues increased $28.0 million due to organic growth and our acquisition of IMC. The organic growth was driven by higher demand from the industrial,medtech, and electric vehicle markets, partially offset by decreased demand in the communications and defense markets. The medtech market, which includes ourhigh-reliability products used in implantable devices and MRI machines, was impacted by the COVID-19 pandemic in the previous period as hospitals had reducedelective procedures. The demand for our medtech products has returned to pre-pandemic levels.
Cost of Goods Sold
Cost of goods sold ("COGS") for the year ended December 31, 2021 was $508.6 million, compared with $490.8 million for the year ended December 31, 2020, anincrease of $17.8 million or 3.6%. This increase was primarily the result of higher shipping volumes, unfavorable foreign currency exchange rate changes, andhigher precious metal costs, partially offset by product cost reductions, higher factory capacity utilization, favorable mix, and net favorable inventory reserveadjustments.
Restructuring Charges
We undertake restructuring programs from time to time to better align our operations with current market conditions. Such activities include facility consolidations,headcount reductions, and other measures to further optimize operations. We may have restructuring charges in the future as we continuously evaluate ouroperational footprint. Details regarding restructuring programs undertaken during the reporting period are as follows:
27
Table of Contents
During the year ended December 31, 2021, we recorded restructuring charges of $0.5 million within Operating expenses. These charges were primarily for actionsassociated with our Intelligent Audio product line, which is included in our Audio segment. During the first quarter of 2022, we committed to additionalrestructuring actions within the Audio segment to further optimize operations.
During the year ended December 31, 2020, we restructured our Intelligent Audio product line. This resulted in a reduction in workforce and the refocusing ofcertain research and development activities. As a result, we recorded restructuring charges of $1.5 million within Gross profit, primarily for fixed asset write-offcosts directly associated with the product line. In addition, we recorded restructuring charges of $6.8 million within Operating expenses, primarily for rationalizingthe research and development workforce and contract termination costs associated with the product line.
In addition, during the year ended December 31, 2020, we recorded restructuring charges of $0.8 million within Gross profit, primarily for actions to rationalize theremainder of the Audio segment workforce, as a direct result of the lower demand we experienced from the COVID-19 pandemic for our remaining Audioproducts. We also recorded restructuring charges of $3.2 million within Operating expenses, primarily for actions associated with rationalizing the remainingAudio workforce.
Gross Profit and Non-GAAP Gross Profit
Gross profit for the year ended December 31, 2021 was $359.5 million, compared with $271.2 million for the year ended December 31, 2020, an increase of $88.3million or 32.6%. Gross profit margin (gross profit as a percentage of revenues) for the year ended December 31, 2021 was 41.4%, compared with 35.5% for theyear ended December 31, 2020. The increases were primarily due to higher shipping volumes, product cost reductions, higher factory capacity utilization,favorable mix, and net favorable inventory reserve adjustments, partially offset by lower average pricing on mature products, unfavorable foreign currencyexchange rate changes, and higher precious metals cost. Our 2021 plant productivity has improved due to our factories returning to pre-pandemic productionlevels.
Non-GAAP gross profit for the year ended December 31, 2021 was $362.1 million, compared with $275.4 million for the year ended December 31, 2020, anincrease of $86.7 million or 31.5%. Non-GAAP gross profit margin (non-GAAP gross profit as a percentage of revenues) for the year ended December 31, 2021was 41.7%, as compared with 36.0% for the year ended December 31, 2020. The increases were primarily due to higher shipping volumes, product cost reductions,higher factory capacity utilization, favorable mix, and net favorable inventory reserve adjustments, partially offset by lower average pricing on mature products,unfavorable foreign currency exchange rate changes, and higher precious metals cost. Our 2021 plant productivity has improved due to our factories returning topre-pandemic production levels.
Research and Development Expenses
Research and development expenses for the years ended December 31, 2021 and 2020 were $92.8 million and $92.9 million, respectively, a decrease of $0.1million or 0.1%. Research and development expenses as a percentage of revenues for the years ended December 31, 2021 and 2020 were 10.7% and 12.2%,respectively. Our expenses have remained consistent, however we have increased development activities in our precision devices, hearing health, and MEMSmicrophones product lines, which were offset by a reduction in development activities in our Intelligent Audio product line. The decrease in expenses as apercentage of revenues was due to the increase in our revenues.
Selling and Administrative Expenses
Selling and administrative expenses for the year ended December 31, 2021 were $146.4 million, compared with $131.5 million for the year ended December 31,2020, an increase of $14.9 million or 11.3%. Selling and administrative expenses as a percentage of revenues for the year ended December 31, 2021 were 16.9%,compared with 17.2% for the year ended December 31, 2020. The increase in expenses was primarily driven by stock-based compensation, incentivecompensation, and our acquisition of IMC. Due to the impacts of the COVID-19 pandemic, stock-based compensation in 2021 increased due to certainmodifications made to previously granted performance share units, while stock-based compensation in 2020 was lowered due to a change in estimated attainmentof certain performance targets. For additional information on stock-based compensation, refer to Note 14. Equity Incentive Program to our Consolidated FinancialStatements under Item 8, "Financial Statements and Supplementary Data." The increase in selling and administrative expenses was partially offset by lower legalexpenses, which were lower due to reduced activity related to the protection of our intellectual property. Expenses as a percentage of revenues have remainedconsistent.
28
Table of Contents
Impairment Charges
Impairment charges for the year ended December 31, 2021 were $4.0 million, compared to $7.6 million for the year ended December 31, 2020 and relate tofacilities in our Intelligent Audio product line. For additional information related to these impairment charges, refer to Note 4. Impairments to our ConsolidatedFinancial Statements under Item 8, "Financial Statements and Supplementary Data."
Interest Expense, net
Interest expense, net for the year ended December 31, 2021 was $14.2 million, compared with $16.4 million for the year ended December 31, 2020, a decrease of$2.2 million or 13.4%. The decrease was primarily due to lower outstanding borrowings. For additional information on borrowings and interest expense, refer toNote 12. Borrowings to our Consolidated Financial Statements under Item 8, "Financial Statements and Supplementary Data."
Other (Income) Expense, net
Other income for the year ended December 31, 2021 was $3.0 million, compared with expense of $1.5 million for the year ended December 31, 2020, a change of$4.5 million. The change was primarily due to the impacts from foreign currency exchange rate changes and the appreciation in our investment balances.
(Benefit from) Provision for Income Taxes and Non-GAAP Provision for Income Taxes
The effective tax rate ("ETR") for the year ended December 31, 2021 was a 43.6% benefit, compared with a 74.3% provision for the year ended December 31,2020. The change in the ETR was primarily due to a $59.1 million benefit in 2021 related to the release of a significant portion of the valuation allowance in theU.S. The U.S. operations were in a cumulative income position as of December 31, 2021, as compared to a cumulative loss position as of December 31, 2020.Based on this change, and other relevant information, we released a significant portion of our valuation allowance related to deferred tax assets that will bebenefited in the U.S. The change in ETR was also impacted by the mix of earnings and losses by taxing jurisdictions.
The non-GAAP ETR for the year ended December 31, 2021 was an 11.9% provision, compared with a 10.1% provision for the year ended December 31, 2020.The increase in the non-GAAP ETR was primarily due to the mix of earnings and losses by taxing jurisdictions.
The ETR and non-GAAP ETR deviate from the statutory U.S. federal income tax rate, mainly due to the taxing jurisdictions where we generate taxable income orloss and the favorable impact of our tax holidays in Malaysia. A significant portion of our pre-tax income is subject to a lower tax rate as a result of our Malaysiantax holidays, subject to our annual satisfaction of certain conditions we expect to continue to satisfy. During the fourth quarter of 2021, our existing significant taxholiday in Malaysia was extended through December 31, 2026. For additional information on these tax holidays, see Note 13. Income Taxes to our ConsolidatedFinancial Statements under Item 8, “Financial Statements and Supplementary Data."
Earnings from Continuing Operations
Earnings from continuing operations for the year ended December 31, 2021 was $150.2 million, compared with $2.9 million for the year ended December 31,2020, an increase of $147.3 million. As described above, the increase was primarily due to increased revenues, a benefit from income taxes, higher gross profitmargin, reduced legal spending, lower restructuring charges, and a reduction of impairment charges, partially offset by higher stock-based compensation andincentive compensation.
Earnings and Adjusted Earnings from Continuing Operations Before Interest and Income Taxes
Earnings before interest and income taxes ("EBIT") from continuing operations for the year ended December 31, 2021 was $118.8 million, compared with $27.7million for the year ended December 31, 2020, an increase of $91.1 million or 328.9%. EBIT margin (EBIT from continuing operations as a percentage ofrevenues) for the year ended December 31, 2021 was 13.7%, as compared with 3.6% for the year ended December 31, 2020. The increase in EBIT was primarilydue to increased revenues, higher gross profit margin, reduced legal spending, lower restructuring charges, and a reduction of impairment charges, partially offsetby higher stock-based compensation and incentive compensation.
29
Table of Contents
Adjusted earnings before interest and income taxes ("Adjusted EBIT") from continuing operations for the year ended December 31, 2021 was $174.3 million,compared with $79.3 million for the year ended December 31, 2020, an increase of $95.0 million or 119.8%. Adjusted EBIT margin (adjusted EBIT fromcontinuing operations as a percentage of revenues) for the year ended December 31, 2021 was 20.1%, as compared with 10.4% for the year ended December 31,2020. The increases in Adjusted EBIT and Adjusted EBIT margin were primarily due to increased revenues, higher non-GAAP gross profit margin, and reducedlegal spending, partially offset by higher incentive compensation.
Earnings from Discontinued Operations, net
Earnings from discontinued operations was $0.2 million for the year ended December 31, 2021, compared with earnings of $3.7 million for the year endedDecember 31, 2020. We recorded a tax benefit during the second quarter of 2021 related to the Speaker and Receiver Product Line. We recorded a tax benefit for arefund received during the first quarter of 2020 related to the Timing Device Business.
Diluted Earnings per Share from Continuing Operations and Non-GAAP Diluted Earnings per Share
Diluted earnings per share from continuing operations was $1.59 for the year ended December 31, 2021, compared with $0.03 for the year ended December 31,2020. As described above, the increase was primarily due to increased revenues, a benefit from income taxes, higher gross profit margin, reduced legal spending,lower restructuring charges, and a reduction of impairment charges, partially offset by higher stock-based compensation and incentive compensation.
Non-GAAP diluted earnings per share for the year ended December 31, 2021 was $1.53, compared with $0.67 for the year ended December 31, 2020. As describedabove, the increase was primarily due to increased revenues, higher non-GAAP gross profit margin, and reduced legal spending, partially offset by higher incometaxes and incentive compensation.
30
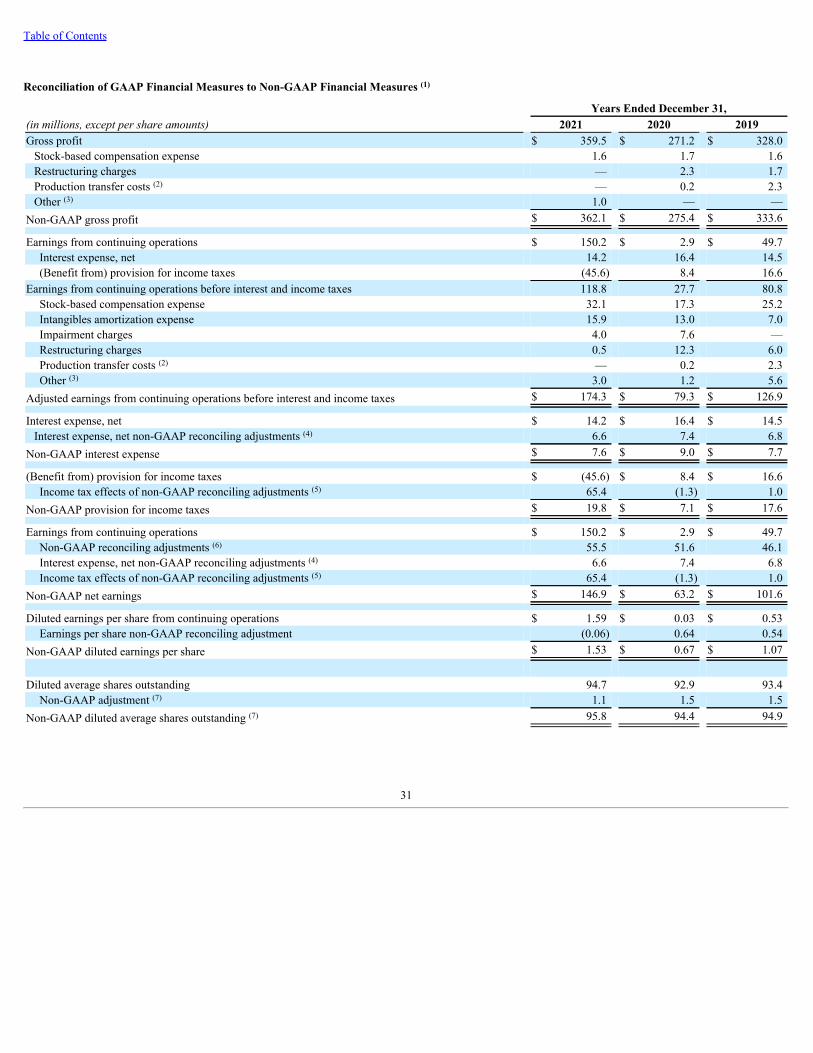
Table of Contents
Reconciliation of GAAP Financial Measures to Non-GAAP Financial Measures
Years Ended December 31,(in millions, except per share amounts) 2021 2020 2019Gross profit $ 359.5 $ 271.2 $ 328.0
Stock-based compensation expense 1.6 1.7 1.6 Restructuring charges — 2.3 1.7 Production transfer costs — 0.2 2.3 Other 1.0 — —
Non-GAAP gross profit $ 362.1 $ 275.4 $ 333.6
Earnings from continuing operations $ 150.2 $ 2.9 $ 49.7 Interest expense, net 14.2 16.4 14.5 (Benefit from) provision for income taxes (45.6) 8.4 16.6
Earnings from continuing operations before interest and income taxes 118.8 27.7 80.8 Stock-based compensation expense 32.1 17.3 25.2 Intangibles amortization expense 15.9 13.0 7.0 Impairment charges 4.0 7.6 — Restructuring charges 0.5 12.3 6.0 Production transfer costs — 0.2 2.3 Other 3.0 1.2 5.6
Adjusted earnings from continuing operations before interest and income taxes $ 174.3 $ 79.3 $ 126.9
Interest expense, net $ 14.2 $ 16.4 $ 14.5 Interest expense, net non-GAAP reconciling adjustments 6.6 7.4 6.8
Non-GAAP interest expense $ 7.6 $ 9.0 $ 7.7
(Benefit from) provision for income taxes $ (45.6) $ 8.4 $ 16.6 Income tax effects of non-GAAP reconciling adjustments 65.4 (1.3) 1.0
Non-GAAP provision for income taxes $ 19.8 $ 7.1 $ 17.6
Earnings from continuing operations $ 150.2 $ 2.9 $ 49.7 Non-GAAP reconciling adjustments 55.5 51.6 46.1 Interest expense, net non-GAAP reconciling adjustments 6.6 7.4 6.8 Income tax effects of non-GAAP reconciling adjustments 65.4 (1.3) 1.0
Non-GAAP net earnings $ 146.9 $ 63.2 $ 101.6
Diluted earnings per share from continuing operations $ 1.59 $ 0.03 $ 0.53 Earnings per share non-GAAP reconciling adjustment (0.06) 0.64 0.54
Non-GAAP diluted earnings per share $ 1.53 $ 0.67 $ 1.07
Diluted average shares outstanding 94.7 92.9 93.4 Non-GAAP adjustment 1.1 1.5 1.5
Non-GAAP diluted average shares outstanding 95.8 94.4 94.9
(1)
(2)
(3)
(2)
(3)
(4)
(5)
(6)
(4)
(5)
(7)
(7)
31
Table of Contents
In addition to the GAAP financial measures included herein, Knowles has presented certain non-GAAP financial measures that exclude certain amounts that areincluded in the most directly comparable GAAP measures. Knowles believes that non-GAAP measures are useful as supplements to its GAAP results ofoperations to evaluate certain aspects of its operations and financial performance, and its management team primarily focuses on non-GAAP items in evaluatingKnowles' performance for business planning purposes. Knowles also believes that these measures assist it with comparing its performance between variousreporting periods on a consistent basis, as these measures remove from operating results the impact of items that, in Knowles' opinion, do not reflect its coreoperating performance. Knowles believes that its presentation of non-GAAP financial measures is useful because it provides investors and securities analystswith the same information that Knowles uses internally for purposes of assessing its core operating performance.
Production transfer costs represent duplicate costs incurred to migrate manufacturing to facilities primarily in Asia. These amounts are included in thecorresponding Gross profit and Earnings from continuing operations before interest and income taxes for each period presented.In 2021, Other expenses represent the ongoing net lease cost (income) related to facilities not used in operations and expenses related to the acquisition of IMCby the PD segment. In 2020, Other expenses represent the ongoing net lease cost (income) related to facilities not used in operations and expenses related toshareholder activism. In 2019, Other expenses of $4.4 million represent expenses related to shareholder activism and the remaining Other expenses relate to theacquisition of the MEMS Microphone Application-specific integrated circuit Design Business (“ASIC Design Business”) by the Audio segment and theacquisition of DITF Interconnect Technology, Inc. ("DITF") by the PD segment.Under GAAP, certain convertible debt instruments that may be settled in cash (or other assets) upon conversion are required to be separately accounted for asliability (debt) and equity (conversion option) components of the instrument in a manner that reflects the issuer’s nonconvertible debt borrowing rate.Accordingly, for GAAP purposes we were required to recognize imputed interest expense on the Company’s $172.5 million of convertible senior notes dueNovember 1, 2021 that were issued in a private placement in May 2016. The imputed interest rate for the convertible notes was 8.12%, while the actual couponinterest rate of the notes was 3.25%. The difference between the imputed interest expense and the coupon interest expense is excluded from management’sassessment of the Company’s operating performance because management believes that this non-cash expense is not indicative of its core, ongoing operatingperformance.
Income tax effects of non-GAAP reconciling adjustments are calculated using the applicable tax rates in the jurisdictions of the underlying adjustments. In2021, these adjustments include a valuation allowance release of $59.1 million for our U.S. subsidiaries.
The non-GAAP reconciling adjustments are those adjustments made to reconcile Earnings from continuing operations before interest and income taxes toAdjusted earnings from continuing operations before interest and income taxes.
The number of shares used in the diluted per share calculations on a non-GAAP basis excludes the impact of stock-based compensation expense expected tobe incurred in future periods and not yet recognized in the financial statements, which would otherwise be assumed to be used to repurchase shares under theGAAP treasury stock method. In addition, the Company entered into convertible note hedge transactions that expired upon maturity of the convertible notes tooffset any potential dilution from the convertible notes. Although the anti-dilutive impact of the convertible note hedges is not reflected under GAAP, theCompany includes the anti-dilutive impact of the convertible note hedges in non-GAAP diluted average shares outstanding, if applicable.
(1)
(2)
(3)
(4)
(5)
(6)
(7)
32
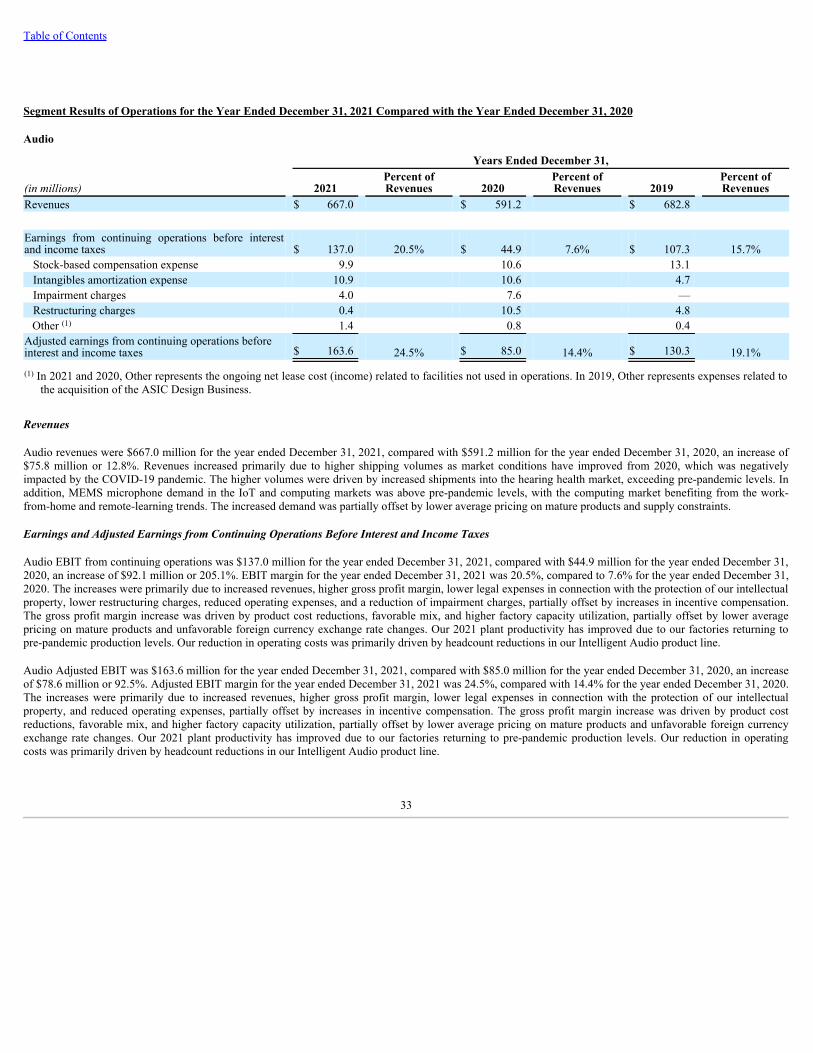
Table of Contents
Segment Results of Operations for the Year Ended December 31, 2021 Compared with the Year Ended December 31, 2020
Audio
Years Ended December 31,
(in millions) 2021Percent ofRevenues 2020
Percent ofRevenues 2019
Percent ofRevenues
Revenues $ 667.0 $ 591.2 $ 682.8
Earnings from continuing operations before interestand income taxes $ 137.0 20.5% $ 44.9 7.6% $ 107.3 15.7% Stock-based compensation expense 9.9 10.6 13.1 Intangibles amortization expense 10.9 10.6 4.7 Impairment charges 4.0 7.6 — Restructuring charges 0.4 10.5 4.8
Other 1.4 0.8 0.4 Adjusted earnings from continuing operations beforeinterest and income taxes $ 163.6 24.5% $ 85.0 14.4% $ 130.3 19.1%
In 2021 and 2020, Other represents the ongoing net lease cost (income) related to facilities not used in operations. In 2019, Other represents expenses related tothe acquisition of the ASIC Design Business.
Revenues
Audio revenues were $667.0 million for the year ended December 31, 2021, compared with $591.2 million for the year ended December 31, 2020, an increase of$75.8 million or 12.8%. Revenues increased primarily due to higher shipping volumes as market conditions have improved from 2020, which was negativelyimpacted by the COVID-19 pandemic. The higher volumes were driven by increased shipments into the hearing health market, exceeding pre-pandemic levels. Inaddition, MEMS microphone demand in the IoT and computing markets was above pre-pandemic levels, with the computing market benefiting from the work-from-home and remote-learning trends. The increased demand was partially offset by lower average pricing on mature products and supply constraints.
Earnings and Adjusted Earnings from Continuing Operations Before Interest and Income Taxes
Audio EBIT from continuing operations was $137.0 million for the year ended December 31, 2021, compared with $44.9 million for the year ended December 31,2020, an increase of $92.1 million or 205.1%. EBIT margin for the year ended December 31, 2021 was 20.5%, compared to 7.6% for the year ended December 31,2020. The increases were primarily due to increased revenues, higher gross profit margin, lower legal expenses in connection with the protection of our intellectualproperty, lower restructuring charges, reduced operating expenses, and a reduction of impairment charges, partially offset by increases in incentive compensation.The gross profit margin increase was driven by product cost reductions, favorable mix, and higher factory capacity utilization, partially offset by lower averagepricing on mature products and unfavorable foreign currency exchange rate changes. Our 2021 plant productivity has improved due to our factories returning topre-pandemic production levels. Our reduction in operating costs was primarily driven by headcount reductions in our Intelligent Audio product line.
Audio Adjusted EBIT was $163.6 million for the year ended December 31, 2021, compared with $85.0 million for the year ended December 31, 2020, an increaseof $78.6 million or 92.5%. Adjusted EBIT margin for the year ended December 31, 2021 was 24.5%, compared with 14.4% for the year ended December 31, 2020.The increases were primarily due to increased revenues, higher gross profit margin, lower legal expenses in connection with the protection of our intellectualproperty, and reduced operating expenses, partially offset by increases in incentive compensation. The gross profit margin increase was driven by product costreductions, favorable mix, and higher factory capacity utilization, partially offset by lower average pricing on mature products and unfavorable foreign currencyexchange rate changes. Our 2021 plant productivity has improved due to our factories returning to pre-pandemic production levels. Our reduction in operatingcosts was primarily driven by headcount reductions in our Intelligent Audio product line.
(1)
(1)
33
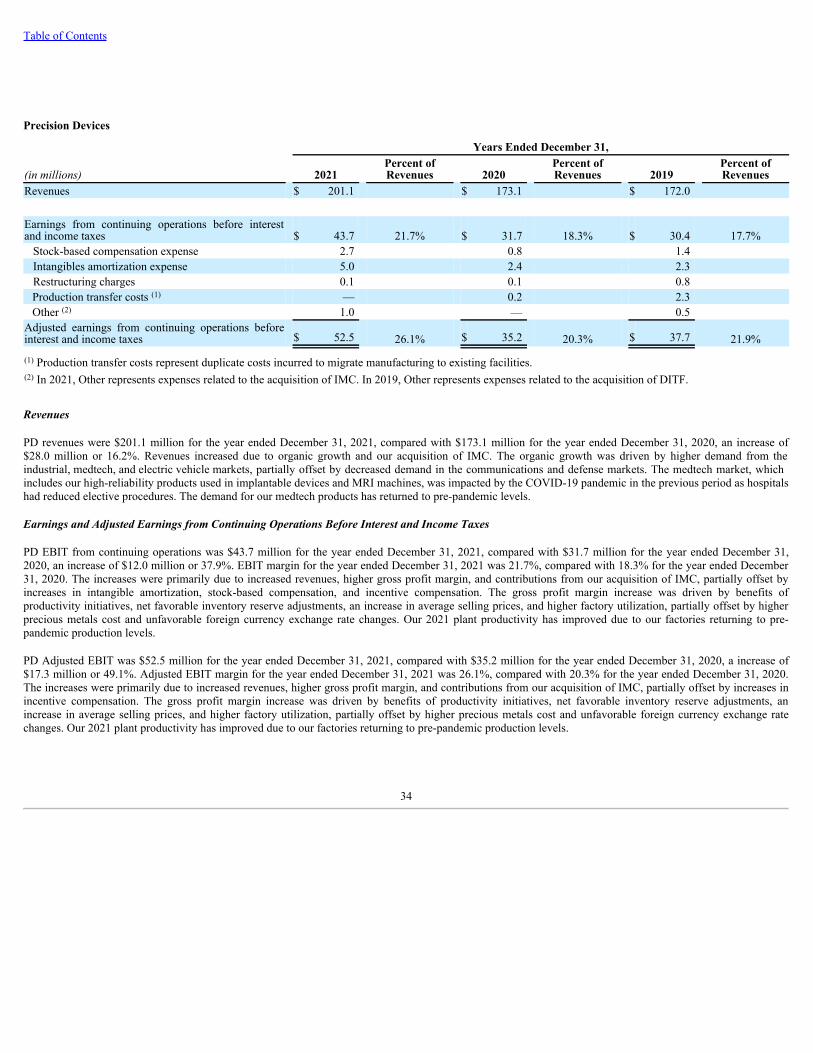
Table of Contents
Precision Devices
Years Ended December 31,
(in millions) 2021Percent ofRevenues 2020
Percent ofRevenues 2019
Percent ofRevenues
Revenues $ 201.1 $ 173.1 $ 172.0
Earnings from continuing operations before interestand income taxes $ 43.7 21.7% $ 31.7 18.3% $ 30.4 17.7% Stock-based compensation expense 2.7 0.8 1.4 Intangibles amortization expense 5.0 2.4 2.3 Restructuring charges 0.1 0.1 0.8
Production transfer costs — 0.2 2.3 Other 1.0 — 0.5
Adjusted earnings from continuing operations beforeinterest and income taxes $ 52.5 26.1% $ 35.2 20.3% $ 37.7 21.9%
Production transfer costs represent duplicate costs incurred to migrate manufacturing to existing facilities. In 2021, Other represents expenses related to the acquisition of IMC. In 2019, Other represents expenses related to the acquisition of DITF.
Revenues
PD revenues were $201.1 million for the year ended December 31, 2021, compared with $173.1 million for the year ended December 31, 2020, an increase of$28.0 million or 16.2%. Revenues increased due to organic growth and our acquisition of IMC. The organic growth was driven by higher demand from theindustrial, medtech, and electric vehicle markets, partially offset by decreased demand in the communications and defense markets. The medtech market, whichincludes our high-reliability products used in implantable devices and MRI machines, was impacted by the COVID-19 pandemic in the previous period as hospitalshad reduced elective procedures. The demand for our medtech products has returned to pre-pandemic levels.
Earnings and Adjusted Earnings from Continuing Operations Before Interest and Income Taxes
PD EBIT from continuing operations was $43.7 million for the year ended December 31, 2021, compared with $31.7 million for the year ended December 31,2020, an increase of $12.0 million or 37.9%. EBIT margin for the year ended December 31, 2021 was 21.7%, compared with 18.3% for the year ended December31, 2020. The increases were primarily due to increased revenues, higher gross profit margin, and contributions from our acquisition of IMC, partially offset byincreases in intangible amortization, stock-based compensation, and incentive compensation. The gross profit margin increase was driven by benefits ofproductivity initiatives, net favorable inventory reserve adjustments, an increase in average selling prices, and higher factory utilization, partially offset by higherprecious metals cost and unfavorable foreign currency exchange rate changes. Our 2021 plant productivity has improved due to our factories returning to pre-pandemic production levels.
PD Adjusted EBIT was $52.5 million for the year ended December 31, 2021, compared with $35.2 million for the year ended December 31, 2020, a increase of$17.3 million or 49.1%. Adjusted EBIT margin for the year ended December 31, 2021 was 26.1%, compared with 20.3% for the year ended December 31, 2020.The increases were primarily due to increased revenues, higher gross profit margin, and contributions from our acquisition of IMC, partially offset by increases inincentive compensation. The gross profit margin increase was driven by benefits of productivity initiatives, net favorable inventory reserve adjustments, anincrease in average selling prices, and higher factory utilization, partially offset by higher precious metals cost and unfavorable foreign currency exchange ratechanges. Our 2021 plant productivity has improved due to our factories returning to pre-pandemic production levels.
(1)
(2)
(1)
(2)
34
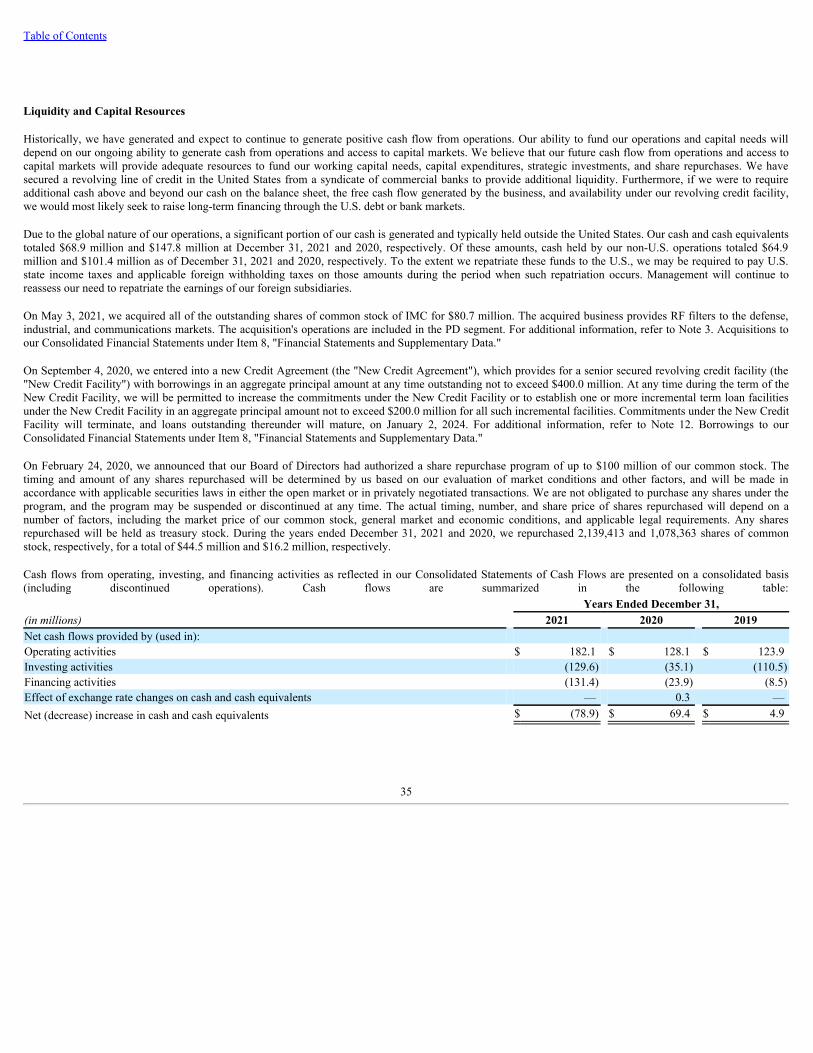
Table of Contents
Liquidity and Capital Resources
Historically, we have generated and expect to continue to generate positive cash flow from operations. Our ability to fund our operations and capital needs willdepend on our ongoing ability to generate cash from operations and access to capital markets. We believe that our future cash flow from operations and access tocapital markets will provide adequate resources to fund our working capital needs, capital expenditures, strategic investments, and share repurchases. We havesecured a revolving line of credit in the United States from a syndicate of commercial banks to provide additional liquidity. Furthermore, if we were to requireadditional cash above and beyond our cash on the balance sheet, the free cash flow generated by the business, and availability under our revolving credit facility,we would most likely seek to raise long-term financing through the U.S. debt or bank markets.
Due to the global nature of our operations, a significant portion of our cash is generated and typically held outside the United States. Our cash and cash equivalentstotaled $68.9 million and $147.8 million at December 31, 2021 and 2020, respectively. Of these amounts, cash held by our non-U.S. operations totaled $64.9million and $101.4 million as of December 31, 2021 and 2020, respectively. To the extent we repatriate these funds to the U.S., we may be required to pay U.S.state income taxes and applicable foreign withholding taxes on those amounts during the period when such repatriation occurs. Management will continue toreassess our need to repatriate the earnings of our foreign subsidiaries.
On May 3, 2021, we acquired all of the outstanding shares of common stock of IMC for $80.7 million. The acquired business provides RF filters to the defense,industrial, and communications markets. The acquisition's operations are included in the PD segment. For additional information, refer to Note 3. Acquisitions toour Consolidated Financial Statements under Item 8, "Financial Statements and Supplementary Data."
On September 4, 2020, we entered into a new Credit Agreement (the "New Credit Agreement"), which provides for a senior secured revolving credit facility (the"New Credit Facility") with borrowings in an aggregate principal amount at any time outstanding not to exceed $400.0 million. At any time during the term of theNew Credit Facility, we will be permitted to increase the commitments under the New Credit Facility or to establish one or more incremental term loan facilitiesunder the New Credit Facility in an aggregate principal amount not to exceed $200.0 million for all such incremental facilities. Commitments under the New CreditFacility will terminate, and loans outstanding thereunder will mature, on January 2, 2024. For additional information, refer to Note 12. Borrowings to ourConsolidated Financial Statements under Item 8, "Financial Statements and Supplementary Data."
On February 24, 2020, we announced that our Board of Directors had authorized a share repurchase program of up to $100 million of our common stock. Thetiming and amount of any shares repurchased will be determined by us based on our evaluation of market conditions and other factors, and will be made inaccordance with applicable securities laws in either the open market or in privately negotiated transactions. We are not obligated to purchase any shares under theprogram, and the program may be suspended or discontinued at any time. The actual timing, number, and share price of shares repurchased will depend on anumber of factors, including the market price of our common stock, general market and economic conditions, and applicable legal requirements. Any sharesrepurchased will be held as treasury stock. During the years ended December 31, 2021 and 2020, we repurchased 2,139,413 and 1,078,363 shares of commonstock, respectively, for a total of $44.5 million and $16.2 million, respectively.
Cash flows from operating, investing, and financing activities as reflected in our Consolidated Statements of Cash Flows are presented on a consolidated basis(including discontinued operations). Cash flows are summarized in the following table: Years Ended December 31,(in millions) 2021 2020 2019Net cash flows provided by (used in): Operating activities $ 182.1 $ 128.1 $ 123.9 Investing activities (129.6) (35.1) (110.5)Financing activities (131.4) (23.9) (8.5)Effect of exchange rate changes on cash and cash equivalents — 0.3 — Net (decrease) increase in cash and cash equivalents $ (78.9) $ 69.4 $ 4.9
35
Table of Contents
Operating Activities
Cash provided by operating activities reflects net earnings adjusted for certain non-cash items, including depreciation expense, amortization of intangible assets,stock-based compensation, changes in deferred income taxes, impairment charges, and the effects of changes in operating assets and liabilities. The increase incash provided by operating activities for 2021 as compared to 2020 was primarily due to higher net earnings compared to the prior period, which was largelydriven by higher revenues and improved gross profit margins. The higher 2021 net earnings was partially offset by an unfavorable change in working capital. Theunfavorable change in working capital was primarily driven by an increase in accounts receivables and inventories, partially offset by an increase in accountspayable. These 2021 working capital changes are attributable to higher customer demand and increased production activity. The lower 2020 net earnings waspartially offset by the favorable change in working capital. The favorable change in working capital in 2020 was primarily driven by a decrease in accountsreceivables and inventories, partially offset by a decrease in accounts payable. These 2020 working capital changes were driven by the timing of cash collections,inventory control initiatives, timing of payments, and reduced spending.
Investing Activities
Cash used in investing activities are primarily used for capital expenditures and acquisitions. Capital expenditures and acquisitions support our manufacturingcapacity expansion, development of new products, advances in our technology, future growth, and achievement of operating efficiencies. Capital expenditureswere $48.6 million and $31.9 million for the years ended December 31, 2021 and 2020, respectively. The cash used in investing activities during 2021 wasprimarily driven by the acquisition of IMC and capital expenditures to support our development of new products and operating efficiencies. The cash used ininvesting activities during 2020 was driven by capital expenditures to support our manufacturing capacity expansion. Our investment activities in 2021 and 2020were funded by our positive cash flow from operating activities.
Our 2021 and 2020 capital expenditures as a percentage of revenues were 5.6% and 4.2%, respectively. In 2022, we expect capital expenditures to be in the rangeof 5% to 6% of revenues. We expect to fund these capital expenditures through our existing cash balances and cash flows from operating activities.
Financing Activities
Cash used in financing activities during 2021 is primarily related to the $172.5 million principal payment on the convertible senior notes, the $44.5 million used torepurchase shares of our common stock in the open market, and the $7.7 million payment of taxes related to net share settlement of equity awards, partially offsetby the $70.0 million of borrowings under our revolving credit facility and proceeds of $25.6 million from the exercise of options. Cash used in financing activitiesduring 2020 is primarily related to the $16.2 million used to repurchase shares of our common stock in the open market and the $6.1 million payment of taxesrelated to net share settlement of equity awards. Our financing activities in 2021 and 2020 were funded by our positive cash flow from operating activities.
Free Cash Flow
In addition to measuring our cash flow generation and usage based upon the operating, investing, and financing classifications included in the ConsolidatedStatements of Cash Flows, we also measure free cash flow and free cash flow as a percentage of revenues. Free cash flow is calculated as cash flow provided byoperating activities less capital expenditures. Our management believes these measures are useful in measuring our cash generated from operations that is availableto repay debt, fund acquisitions, and repurchase Knowles’ common stock. Free cash flow and free cash flow as a percentage of revenues are not presented inaccordance with GAAP and may not be comparable to similarly titled measures used by other companies in our industry. As such, free cash flow and free cashflow as a percentage of revenues should not be considered in isolation from, or as an alternative to, any other liquidity measures determined in accordance withGAAP.
Our Audio businesses tend to have stronger revenues in the third and fourth quarters of each fiscal year. This is particularly true of those businesses that serve theconsumer electronics market. Our Audio businesses tend to have short product cycles due to the highly technical nature of the industries they serve, which canresult in new OEM product launches that can impact quarterly revenues, earnings, and cash flow. Our PD business is not typically subject to seasonality.
36
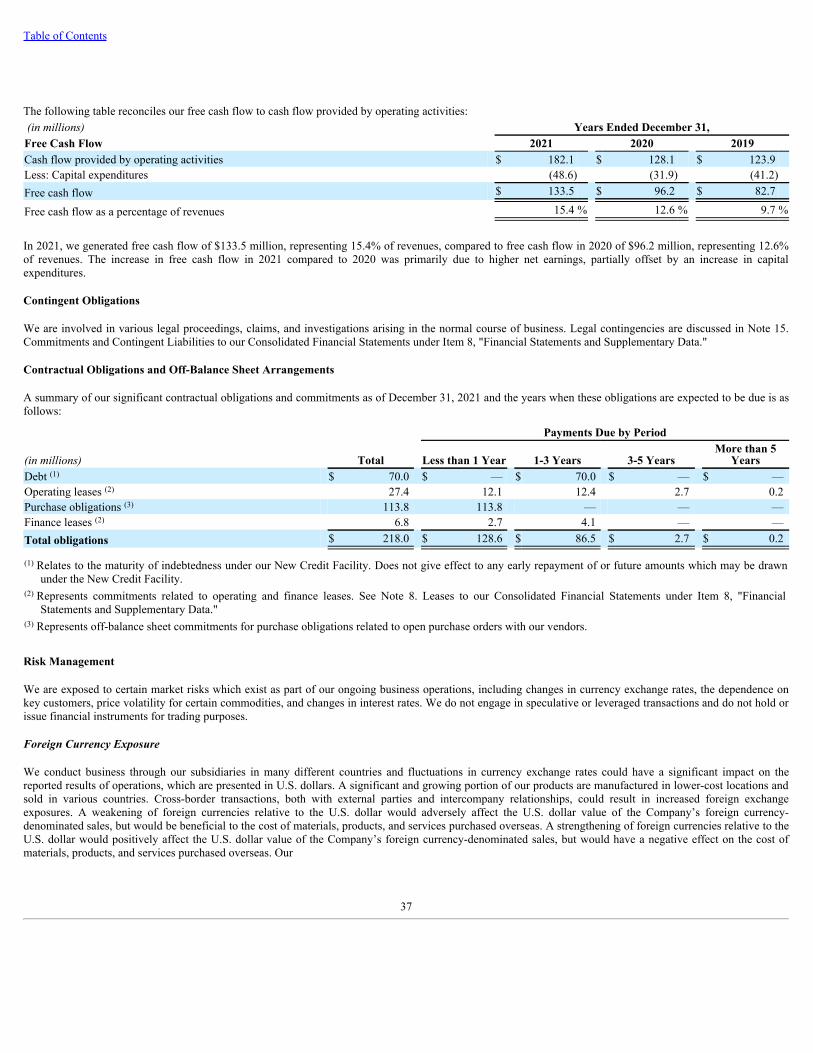
Table of Contents
The following table reconciles our free cash flow to cash flow provided by operating activities: (in millions) Years Ended December 31,Free Cash Flow 2021 2020 2019Cash flow provided by operating activities $ 182.1 $ 128.1 $ 123.9 Less: Capital expenditures (48.6) (31.9) (41.2)Free cash flow $ 133.5 $ 96.2 $ 82.7
Free cash flow as a percentage of revenues 15.4 % 12.6 % 9.7 %
In 2021, we generated free cash flow of $133.5 million, representing 15.4% of revenues, compared to free cash flow in 2020 of $96.2 million, representing 12.6%of revenues. The increase in free cash flow in 2021 compared to 2020 was primarily due to higher net earnings, partially offset by an increase in capitalexpenditures.
Contingent Obligations
We are involved in various legal proceedings, claims, and investigations arising in the normal course of business. Legal contingencies are discussed in Note 15.Commitments and Contingent Liabilities to our Consolidated Financial Statements under Item 8, "Financial Statements and Supplementary Data."
Contractual Obligations and Off-Balance Sheet Arrangements
A summary of our significant contractual obligations and commitments as of December 31, 2021 and the years when these obligations are expected to be due is asfollows:
Payments Due by Period
(in millions) Total Less than 1 Year 1-3 Years 3-5 YearsMore than 5
YearsDebt $ 70.0 $ — $ 70.0 $ — $ — Operating leases 27.4 12.1 12.4 2.7 0.2 Purchase obligations 113.8 113.8 — — — Finance leases 6.8 2.7 4.1 — — Total obligations $ 218.0 $ 128.6 $ 86.5 $ 2.7 $ 0.2
Relates to the maturity of indebtedness under our New Credit Facility. Does not give effect to any early repayment of or future amounts which may be drawnunder the New Credit Facility.
Represents commitments related to operating and finance leases. See Note 8. Leases to our Consolidated Financial Statements under Item 8, "FinancialStatements and Supplementary Data."
Represents off-balance sheet commitments for purchase obligations related to open purchase orders with our vendors.
Risk Management
We are exposed to certain market risks which exist as part of our ongoing business operations, including changes in currency exchange rates, the dependence onkey customers, price volatility for certain commodities, and changes in interest rates. We do not engage in speculative or leveraged transactions and do not hold orissue financial instruments for trading purposes.
Foreign Currency Exposure
We conduct business through our subsidiaries in many different countries and fluctuations in currency exchange rates could have a significant impact on thereported results of operations, which are presented in U.S. dollars. A significant and growing portion of our products are manufactured in lower-cost locations andsold in various countries. Cross-border transactions, both with external parties and intercompany relationships, could result in increased foreign exchangeexposures. A weakening of foreign currencies relative to the U.S. dollar would adversely affect the U.S. dollar value of the Company’s foreign currency-denominated sales, but would be beneficial to the cost of materials, products, and services purchased overseas. A strengthening of foreign currencies relative to theU.S. dollar would positively affect the U.S. dollar value of the Company’s foreign currency-denominated sales, but would have a negative effect on the cost ofmaterials, products, and services purchased overseas. Our
(1)
(2)
(3)
(2)
(1)
(2)
(3)
37

Table of Contents
foreign currency exposure is primarily driven by changes in the Chinese renminbi (yuan), the Malaysian ringgit, and the Philippine peso. Based on our currentsales and manufacturing activity, a sustained 10% weakening of the U.S. dollar for a period of one year would reduce our pre-tax earnings by approximately $20.7million, excluding the impact of our hedging program. See Note 11. Hedging Transactions and Derivative Instruments to our Consolidated Financial Statementsunder Item 8, "Financial Statements and Supplementary Data" for information on the Company's hedges of foreign currency exchange rate risk.
Dependence on Key Customers; Concentration of Credit
The loss of any key customer and our inability to replace revenues provided by a key customer may have a material adverse effect on our business and financialcondition. For the years ended December 31, 2021, 2020, and 2019, Apple Inc. accounted for approximately 16%, 23%, and 22% of our total revenues,respectively. No other customer accounted for more than 10% of total revenues during these periods. If a key customer fails to meet payment obligations, ouroperating results and financial condition could be adversely affected.
Commodity Pricing
We use a wide variety of raw materials, primarily metals, and semi-processed or finished components, which are generally available from a number of sources.While the required raw materials are generally available, commodity pricing for various precious metals, such as palladium, gold, brass, stainless steel, and copper,fluctuates. As a result, our operating results are exposed to such fluctuations. Although some cost increases may be recovered through increased prices tocustomers if commodity prices trend upward, we also attempt to control such costs through fixed-price contracts with suppliers and various other programs throughour global supply chain activities.
Interest Rates
Borrowings under our New Credit Facility are at variable interest rates. A hypothetical 100 basis point increase in interest rates affecting our external variable rateborrowings as of December 31, 2021 would increase our annual interest expense by approximately $0.7 million.
Critical Accounting Estimates
Our Consolidated Financial Statements are based on the application of GAAP. GAAP requires the use of estimates, assumptions, judgments, and subjectiveinterpretations of accounting principles that have an impact on the assets, liabilities, revenues, and expense amounts we report. These estimates can also affectsupplemental information contained in our public disclosures, including information regarding contingencies, risk, and our financial condition. The significantaccounting policies used in the preparation of our Consolidated Financial Statements are discussed in Note 1. Summary of Significant Accounting Policies to theConsolidated Financial Statements under Item 8, "Financial Statements and Supplementary Data." The accounting assumptions and estimates discussed in thesection below are those that we consider most critical to an understanding of our financial statements because they inherently involve significant judgments andestimates. By their nature, these judgments and estimates are subject to an inherent degree of uncertainty. Although we believe our use of estimates and underlyingaccounting assumptions conforms to GAAP and is consistently applied, actual results could differ from our estimates. We review valuations based on estimates forreasonableness on a consistent basis.
Revenue Recognition: Revenue is recognized when control of the promised goods or services is transferred to the customer in an amount that reflects theconsideration we expect to be entitled to in exchange for those goods or services. The terms of a contract or historical business practice can give rise to variableconsideration, including customer discounts, rebates, and returns. We estimate variable consideration using either the expected value or most likely amountmethod. We include amounts in the transaction price to the extent it is probable that a significant reversal of revenue will not occur in a subsequent reportingperiod. Our estimates of variable consideration are based on all reasonably available information (historical, current, and forecasted). Rebates are recognized overthe contract period based on expected revenue levels. Estimation of variable consideration requires judgment and actual results may differ from estimated amounts,which could result in adjustments to revenue.
38
Table of Contents
Inventories: Inventories are stated at the lower of cost or net realizable value, determined on the first-in, first-out ("FIFO") basis. The value of inventory maydecline as a result of surplus inventory, price reductions, or technological obsolescence. It is our policy to carry reserves against the carrying value of inventorywhen items have no future demand (obsolete inventory) and additionally, where inventory items on hand have demand, yet have insufficient forecasted activity toconsume the entire stock within a reasonable period. We recognize reserves against the carrying value of such at-risk inventory items after considering the natureof the risk and any mitigating factors. These estimates require judgment with respect to forecasted future demand and market conditions. Additional reserves couldbe required if actual demand and market conditions differ from our estimates.
Goodwill: Goodwill is tested for impairment at least annually, or more frequently if there are events or circumstances indicating the carrying value of individualreporting units may exceed their respective fair values on a more likely than not basis. We perform our annual impairment assessment in the fourth quarter of eachyear on October 1. Recoverability of goodwill is measured at the reporting unit level by comparing the fair value of each reporting unit to its carrying value.Impairment is measured as the amount by which the carrying value of a reporting unit exceeds its fair value. Fair value is estimated using a discounted cash flowmodel that includes our market participant assumptions, forecasted future cash flows based on historical performance and future estimated results, determinationsof appropriate discount rates, and other assumptions which are considered reasonable and inherent in the discounted cash flow analysis. Significant assumptionsused in the assessment include forecasted revenue and terminal growth rates, profit margins, income taxes, and our weighted average cost of capital. Theseassumptions require significant judgment and actual results may differ from estimated amounts. The fair value of all of our reporting units exceeded their carryingvalues by at least 35%, resulting in no goodwill impairment charges. Potential circumstances that could have a negative effect on the fair value of our reportingunits include, but are not limited to, lower than forecasted growth rates or profit margins and changes in the weighted average cost of capital. A reduction in theestimated fair value of the reporting units could trigger an impairment in the future. We cannot predict the occurrence of certain events or changes in circumstancesthat might adversely affect the carrying value of goodwill. No impairments of goodwill were recorded during the years ended December 31, 2021, 2020, or 2019.Other Intangible and Long-Lived Assets: Long-lived assets and intangible assets with determinable lives are reviewed for impairment whenever events or changesin circumstances indicate that the carrying amount of an asset may not be recoverable. If an indicator of impairment exists for any grouping of assets, an estimateof undiscounted future cash flows is produced and compared to its carrying value. If an asset is determined to be impaired, the loss is measured by the excess of thecarrying amount of the asset over its fair value as determined by an estimate of discounted future cash flows. We recorded impairment charges of $4.0 million and$7.6 million during the years ended December 31, 2021 and 2020, respectively, related to facilities in our Intelligent Audio product line. There were noimpairments recorded during the year ended December 31, 2019. Estimation of future cash flows requires judgment and actual results may differ from estimatedamounts, which could result in impairment charges in the future.
Income Taxes: We use judgment in determining our provision for income taxes, including our assessment of the need for a valuation allowance against ourdeferred tax assets and our determination of whether tax positions will be sustained on examination by taxing authorities based on the technical merits of thepositions. To the extent that the final outcome of these matters is different than the amounts recorded, such differences will affect the provision for income taxes inthe period in which such determination is made and could have a material impact on our financial condition and operating results.
A valuation allowance is recorded to reduce deferred tax assets to the net amount that is more likely than not to be realized. The need to establish valuationallowances for deferred tax assets is assessed at each reporting date. In assessing the requirement for, and amount of, a valuation allowance in accordance with themore-likely-than-not standard, we give appropriate consideration to all positive and negative evidence related to the realization of the deferred tax assets. Thisassessment considers, among other matters, the nature, frequency, and severity of current and cumulative losses, forecasts of future profitability, the duration ofstatutory carryforward periods, our experience with operating loss and tax credit carryforwards not expiring unused, and tax planning strategies.
At December 31, 2021, consistent with the above process, we evaluated the need for a valuation allowance against our U.S. deferred tax assets and determined thatit was more likely than not that most of our deferred tax assets would be realized. As a result, we recognized an income tax benefit of $59.1 million related to thereversal of our deferred tax asset valuation allowance during the fourth quarter of 2021.
39
Table of Contents
In determining the need for the valuation allowance, we considered all positive and negative evidence. We give more weight to evidence that is objective in natureas compared to subjective evidence. Significant weight is given to evidence that directly relates to current financial performance. During the year ended December31, 2021, we emerged from a three-year U.S. cumulative loss position. Recent domestic pre-tax operating earnings is a significant, principal piece of positiveevidence. Other positive evidence we considered in our evaluation at December 31, 2021 included:
• Recovery period of deferred tax assets and deferred reversals. For federal income tax purposes, research and development credits can be carried forwardfor 20 years and foreign tax credits can be carried forward for 10 years. We plan to carryforward these attributes and apply them to future taxable income,allowing us to realize a significant portion of our deferred tax assets. In addition, our anticipated generation of sufficient taxable income will allow forcertain temporary deferred tax assets to be realized in full.
• Recent results. We generated domestic pre-tax income in 2021 and emerged from a three-year U.S. cumulative loss position. Our domestic operationsgenerated year-over-year improvement in key financial metrics such as gross profit and reduced operating expenses.
• Strategic actions. We restructured the Intelligent Audio product line to better align our operations with current market conditions and refocus certainresearch and development activities.
ITEM 7A. QUANTITATIVE AND QUALITATIVE DISCLOSURES ABOUT MARKET RISK
The information required by this section is incorporated by reference to the section “Risk Management,” included in Item 7 of this Annual Report on Form 10-K.
40
Table of Contents
ITEM 8. FINANCIAL STATEMENTS AND SUPPLEMENTARY DATA
INDEX TO CONSOLIDATED FINANCIAL STATEMENTS ANDFINANCIAL STATEMENT SCHEDULE
Page
42 Report of Independent Registered Public Accounting Firm (PCAOB ID: 238)45 Consolidated Statements of Earnings46 Consolidated Statements of Comprehensive Earnings47 Consolidated Balance Sheets48 Consolidated Statements of Stockholders' Equity49 Consolidated Statements of Cash Flows50 Notes to Consolidated Financial Statements84 Financial Statement Schedule - Schedule II, Valuation and Qualifying Accounts
41
Table of Contents
Report of Independent Registered Public Accounting Firm
To the Board of Directors and Stockholders of Knowles Corporation
Opinions on the Financial Statements and Internal Control over Financial Reporting
We have audited the accompanying consolidated balance sheets of Knowles Corporation and its subsidiaries (the “Company”) as of December 31, 2021 and 2020,and the related consolidated statements of earnings, comprehensive earnings, stockholders’ equity and cash flows for each of the three years in the period endedDecember 31, 2021, including the related notes and schedule of valuation and qualifying accounts for each of the three years in the period ended December 31,2021 appearing under Item 8 (collectively referred to as the “consolidated financial statements”). We also have audited the Company's internal control overfinancial reporting as of December 31, 2021, based on criteria established in Internal Control - Integrated Framework (2013) issued by the Committee ofSponsoring Organizations of the Treadway Commission (COSO).
In our opinion, the consolidated financial statements referred to above present fairly, in all material respects, the financial position of the Company as ofDecember 31, 2021 and 2020, and the results of its operations and its cash flows for each of the three years in the period ended December 31, 2021 in conformitywith accounting principles generally accepted in the United States of America. Also in our opinion, the Company maintained, in all material respects, effectiveinternal control over financial reporting as of December 31, 2021, based on criteria established in Internal Control - Integrated Framework (2013) issued by theCOSO.
Basis for Opinions
The Company's management is responsible for these consolidated financial statements, for maintaining effective internal control over financial reporting, and forits assessment of the effectiveness of internal control over financial reporting, included in Management’s Report on Internal Control Over Financial Reporting,appearing under Item 9A. Our responsibility is to express opinions on the Company’s consolidated financial statements and on the Company's internal control overfinancial reporting based on our audits. We are a public accounting firm registered with the Public Company Accounting Oversight Board (United States)(PCAOB) and are required to be independent with respect to the Company in accordance with the U.S. federal securities laws and the applicable rules andregulations of the Securities and Exchange Commission and the PCAOB.
We conducted our audits in accordance with the standards of the PCAOB. Those standards require that we plan and perform the audits to obtain reasonableassurance about whether the consolidated financial statements are free of material misstatement, whether due to error or fraud, and whether effective internalcontrol over financial reporting was maintained in all material respects.
Our audits of the consolidated financial statements included performing procedures to assess the risks of material misstatement of the consolidated financialstatements, whether due to error or fraud, and performing procedures that respond to those risks. Such procedures included examining, on a test basis, evidenceregarding the amounts and disclosures in the consolidated financial statements. Our audits also included evaluating the accounting principles used and significantestimates made by management, as well as evaluating the overall presentation of the consolidated financial statements. Our audit of internal control over financialreporting included obtaining an understanding of internal control over financial reporting, assessing the risk that a material weakness exists, and testing andevaluating the design and operating effectiveness of internal control based on the assessed risk. Our audits also included performing such other procedures as weconsidered necessary in the circumstances. We believe that our audits provide a reasonable basis for our opinions.
Definition and Limitations of Internal Control over Financial Reporting
A company’s internal control over financial reporting is a process designed to provide reasonable assurance regarding the reliability of financial reporting and thepreparation of financial statements for external purposes in accordance with generally accepted accounting principles. A company’s internal control over financialreporting includes those policies and procedures that (i) pertain to the maintenance of records that, in reasonable detail, accurately and fairly reflect the transactionsand dispositions of the assets of the company; (ii) provide reasonable assurance that transactions are recorded as necessary to permit preparation of financialstatements in accordance with generally accepted accounting principles, and that receipts and expenditures of the company are being made only in accordance withauthorizations of management and directors of the company; and (iii) provide reasonable assurance regarding prevention or timely detection of unauthorizedacquisition, use, or disposition of the company’s assets that could have a material effect on the financial statements.
42
Table of Contents
Because of its inherent limitations, internal control over financial reporting may not prevent or detect misstatements. Also, projections of any evaluation ofeffectiveness to future periods are subject to the risk that controls may become inadequate because of changes in conditions, or that the degree of compliance withthe policies or procedures may deteriorate.
Critical Audit Matters
The critical audit matters communicated below are matters arising from the current period audit of the consolidated financial statements that were communicatedor required to be communicated to the audit committee and that (i) relate to accounts or disclosures that are material to the consolidated financial statements and(ii) involved our especially challenging, subjective, or complex judgments. The communication of critical audit matters does not alter in any way our opinion onthe consolidated financial statements, taken as a whole, and we are not, by communicating the critical audit matters below, providing separate opinions on thecritical audit matters or on the accounts or disclosures to which they relate.
Goodwill impairment assessment - Mobile Consumer Electronics (“MCE”) Reporting UnitAs described in Notes 1 and 7 to the consolidated financial statements, the Company’s consolidated goodwill balance was $941.3 million as of December 31, 2021,of which the goodwill associated with the MCE reporting unit was $741.0 million. Management performs its annual impairment assessment in the fourth quarter ofeach year on October 1, or more frequently if there are events or circumstances indicating the carrying value of individual reporting units may exceed theirrespective fair values on a more likely than not basis. Fair value is estimated using a discounted cash flow model. Assumptions used in the assessment includeforecasted revenue and terminal growth rates, profit margins, income taxes, and the Company's weighted average cost of capital.
The principal considerations for our determination that performing procedures relating to the goodwill impairment assessment of the MCE reporting unit is acritical audit matter are (i) the significant judgment by management when determining the fair value estimate of the MCE reporting unit; and (ii) the high degree ofauditor judgment, subjectivity, and effort in performing procedures and evaluating management’s significant assumptions related to forecasted revenue growthrates and profit margins.
Addressing the matter involved performing procedures and evaluating audit evidence in connection with forming our overall opinion on the consolidated financialstatements. These procedures included testing the effectiveness of controls relating to the goodwill impairment assessment, including controls over management’svaluation of the MCE reporting unit. These procedures also included, among others (i) testing management’s process for determining the fair value estimate of theMCE reporting unit; (ii) evaluating the appropriateness of the discounted cash flow model; (iii) testing the completeness and accuracy of the underlying data usedin the discounted cash flow model; and (iv) evaluating the reasonableness of the significant assumptions used by management related to forecasted revenue growthrates and profit margins. Evaluating management’s assumptions related to forecasted revenue growth rates and profit margins involved evaluating whether theassumptions were reasonable considering (i) the current and past performance of the MCE reporting unit; (ii) consistency with external market and industry data;and (iii) whether these assumptions were consistent with evidence obtained in other areas of the audit.
Valuation of the customer relationships intangible asset - Acquisition of Integrated Microwave Corporation
As described in Note 3 to the consolidated financial statements, on May 3, 2021, the Company acquired all of the outstanding shares of common stock ofIntegrated Microwave Corporation for $80.7 million, which included a customer relationships intangible asset valued at $27.7 million. The fair value for thecustomer relationships intangible asset was determined by management using the multi-period excess earnings method under the income approach. Assumptionsused in assessing the fair value of the customer relationships intangible asset include forecasted revenue growth rates, customer attrition rates, profit margins, anddiscount rate.
The principal considerations for our determination that performing procedures relating to the valuation of the customer relationships intangible asset from theIntegrated Microwave Corporation acquisition is a critical audit matter are (i) the significant judgment by management when assessing the fair value estimate ofthe customer relationships intangible asset; (ii) the high degree of auditor judgment, subjectivity, and effort in performing procedures and evaluating management’ssignificant assumptions related to forecasted revenue growth rates and profit margins; and (iii) the audit effort involved the use of professionals with specializedskill and knowledge.
43
Table of Contents
Addressing the matter involved performing procedures and evaluating audit evidence in connection with forming our overall opinion on the consolidated financialstatements. These procedures included testing the effectiveness of controls relating to the acquisition accounting, including controls over management’s valuationof the customer relationships intangible asset. These procedures also included, among others (i) reading the purchase agreement; (ii) testing management’s processfor assessing the fair value estimate of the customer relationships intangible asset; (iii) evaluating the appropriateness of the multi-period excess earnings method;(iv) testing the completeness and accuracy of the underlying data used in the multi-period excess earnings method; and (v) evaluating the reasonableness of thesignificant assumptions used by management related to forecasted revenue growth rates and profit margins. Evaluating management’s assumptions related toforecasted revenue growth rates and profit margins involved evaluating whether the assumptions were reasonable considering (i) the current and past performanceof Integrated Microwave Corporation; (ii) consistency with external market and industry data; and (iii) whether these assumptions were consistent with evidenceobtained in other areas of the audit. Professionals with specialized skill and knowledge were used to assist in evaluating the appropriateness of the multi-periodexcess earnings method.
/s/ PricewaterhouseCoopers LLPChicago, IllinoisFebruary 9, 2022
We have served as the Company’s auditor since 2013.
44
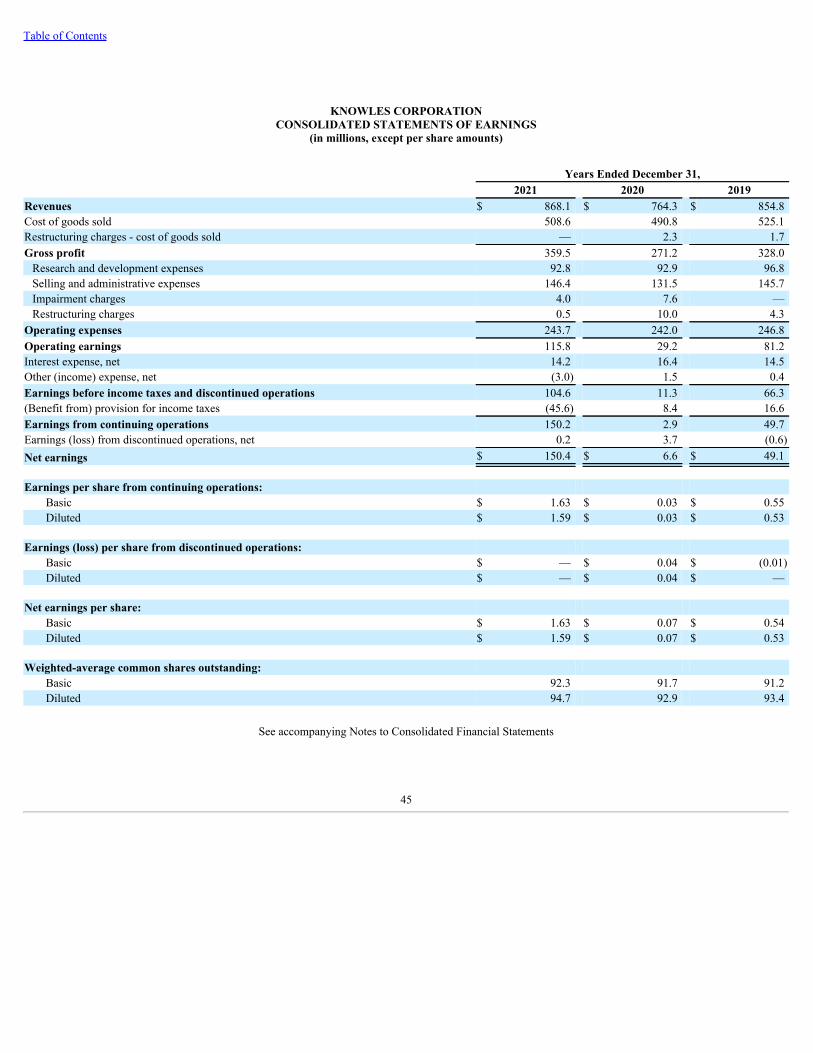
Table of Contents
KNOWLES CORPORATIONCONSOLIDATED STATEMENTS OF EARNINGS
(in millions, except per share amounts)
Years Ended December 31, 2021 2020 2019Revenues $ 868.1 $ 764.3 $ 854.8 Cost of goods sold 508.6 490.8 525.1 Restructuring charges - cost of goods sold — 2.3 1.7 Gross profit 359.5 271.2 328.0
Research and development expenses 92.8 92.9 96.8 Selling and administrative expenses 146.4 131.5 145.7 Impairment charges 4.0 7.6 — Restructuring charges 0.5 10.0 4.3
Operating expenses 243.7 242.0 246.8 Operating earnings 115.8 29.2 81.2 Interest expense, net 14.2 16.4 14.5 Other (income) expense, net (3.0) 1.5 0.4 Earnings before income taxes and discontinued operations 104.6 11.3 66.3 (Benefit from) provision for income taxes (45.6) 8.4 16.6 Earnings from continuing operations 150.2 2.9 49.7 Earnings (loss) from discontinued operations, net 0.2 3.7 (0.6)Net earnings $ 150.4 $ 6.6 $ 49.1
Earnings per share from continuing operations:Basic $ 1.63 $ 0.03 $ 0.55 Diluted $ 1.59 $ 0.03 $ 0.53
Earnings (loss) per share from discontinued operations:Basic $ — $ 0.04 $ (0.01)Diluted $ — $ 0.04 $ —
Net earnings per share:Basic $ 1.63 $ 0.07 $ 0.54 Diluted $ 1.59 $ 0.07 $ 0.53
Weighted-average common shares outstanding:Basic 92.3 91.7 91.2 Diluted 94.7 92.9 93.4
See accompanying Notes to Consolidated Financial Statements
45
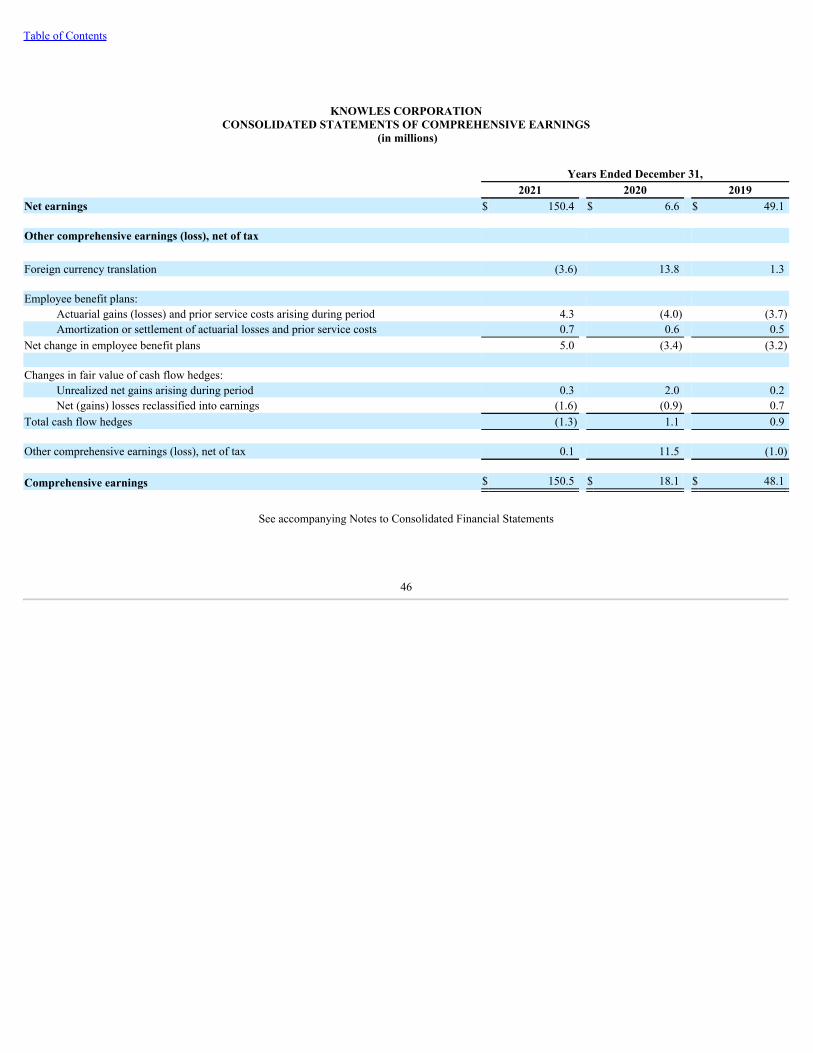
Table of Contents
KNOWLES CORPORATIONCONSOLIDATED STATEMENTS OF COMPREHENSIVE EARNINGS
(in millions)
Years Ended December 31, 2021 2020 2019Net earnings $ 150.4 $ 6.6 $ 49.1
Other comprehensive earnings (loss), net of tax
Foreign currency translation (3.6) 13.8 1.3
Employee benefit plans:Actuarial gains (losses) and prior service costs arising during period 4.3 (4.0) (3.7)Amortization or settlement of actuarial losses and prior service costs 0.7 0.6 0.5
Net change in employee benefit plans 5.0 (3.4) (3.2)
Changes in fair value of cash flow hedges:Unrealized net gains arising during period 0.3 2.0 0.2 Net (gains) losses reclassified into earnings (1.6) (0.9) 0.7
Total cash flow hedges (1.3) 1.1 0.9
Other comprehensive earnings (loss), net of tax 0.1 11.5 (1.0)
Comprehensive earnings $ 150.5 $ 18.1 $ 48.1
See accompanying Notes to Consolidated Financial Statements
46
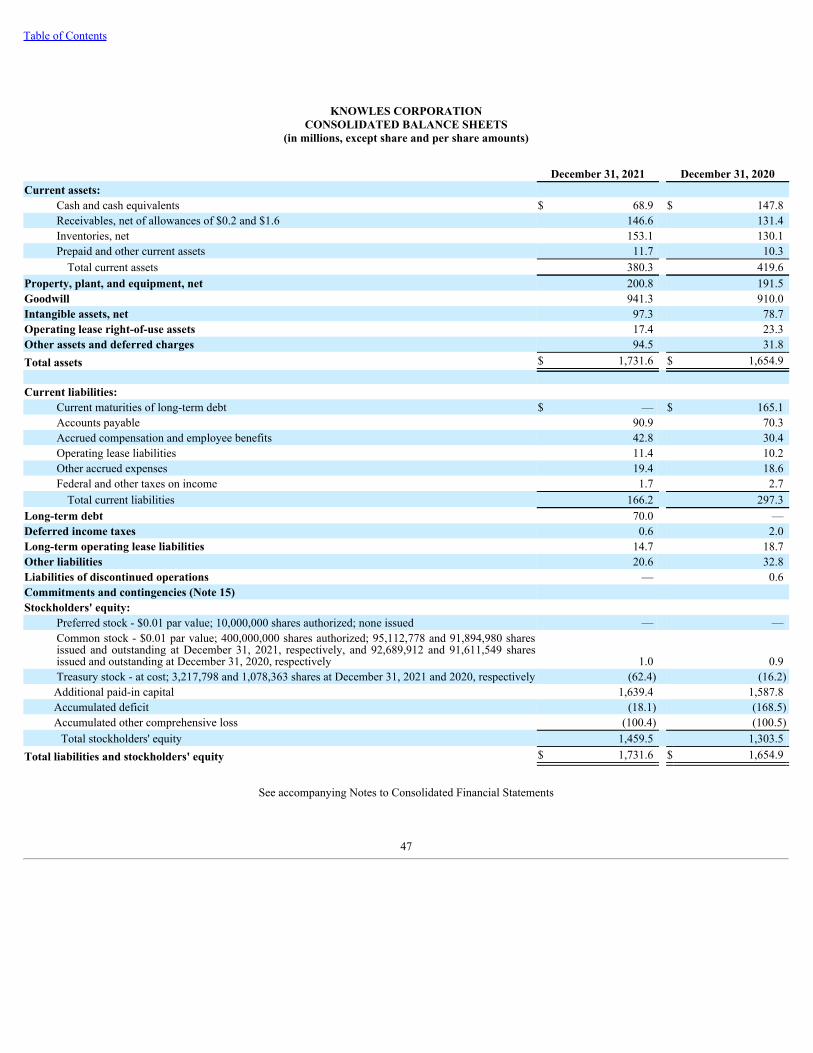
Table of Contents
KNOWLES CORPORATIONCONSOLIDATED BALANCE SHEETS
(in millions, except share and per share amounts)
December 31, 2021 December 31, 2020Current assets:
Cash and cash equivalents $ 68.9 $ 147.8 Receivables, net of allowances of $0.2 and $1.6 146.6 131.4 Inventories, net 153.1 130.1 Prepaid and other current assets 11.7 10.3
Total current assets 380.3 419.6 Property, plant, and equipment, net 200.8 191.5 Goodwill 941.3 910.0 Intangible assets, net 97.3 78.7 Operating lease right-of-use assets 17.4 23.3 Other assets and deferred charges 94.5 31.8 Total assets $ 1,731.6 $ 1,654.9
Current liabilities: Current maturities of long-term debt $ — $ 165.1 Accounts payable 90.9 70.3 Accrued compensation and employee benefits 42.8 30.4 Operating lease liabilities 11.4 10.2 Other accrued expenses 19.4 18.6 Federal and other taxes on income 1.7 2.7
Total current liabilities 166.2 297.3 Long-term debt 70.0 — Deferred income taxes 0.6 2.0 Long-term operating lease liabilities 14.7 18.7 Other liabilities 20.6 32.8 Liabilities of discontinued operations — 0.6 Commitments and contingencies (Note 15)Stockholders' equity:
Preferred stock - $0.01 par value; 10,000,000 shares authorized; none issued — — Common stock - $0.01 par value; 400,000,000 shares authorized; 95,112,778 and 91,894,980 sharesissued and outstanding at December 31, 2021, respectively, and 92,689,912 and 91,611,549 sharesissued and outstanding at December 31, 2020, respectively 1.0 0.9 Treasury stock - at cost; 3,217,798 and 1,078,363 shares at December 31, 2021 and 2020, respectively (62.4) (16.2)Additional paid-in capital 1,639.4 1,587.8 Accumulated deficit (18.1) (168.5)Accumulated other comprehensive loss (100.4) (100.5)
Total stockholders' equity 1,459.5 1,303.5 Total liabilities and stockholders' equity $ 1,731.6 $ 1,654.9
See accompanying Notes to Consolidated Financial Statements
47
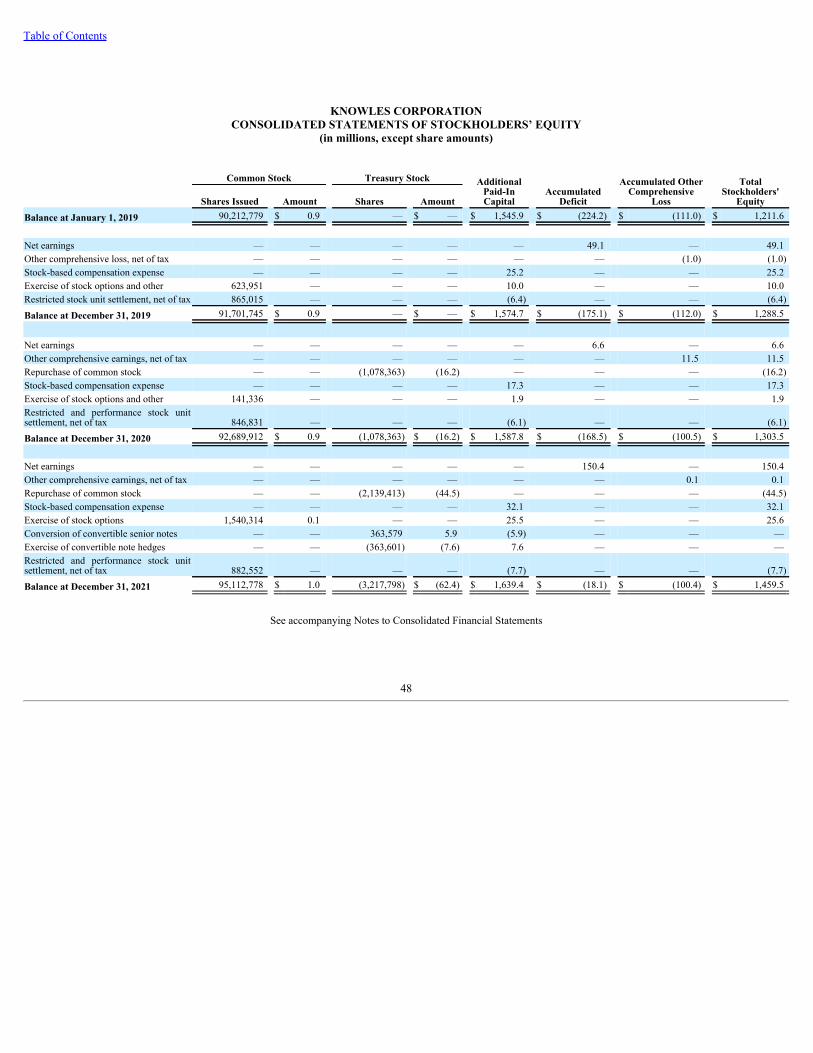
Table of Contents
KNOWLES CORPORATIONCONSOLIDATED STATEMENTS OF STOCKHOLDERS’ EQUITY
(in millions, except share amounts)
Common Stock Treasury Stock AdditionalPaid-InCapital
AccumulatedDeficit
Accumulated OtherComprehensive
Loss
TotalStockholders'
Equity Shares Issued Amount Shares AmountBalance at January 1, 2019 90,212,779 $ 0.9 — $ — $ 1,545.9 $ (224.2) $ (111.0) $ 1,211.6
Net earnings — — — — — 49.1 — 49.1 Other comprehensive loss, net of tax — — — — — — (1.0) (1.0)Stock-based compensation expense — — — — 25.2 — — 25.2 Exercise of stock options and other 623,951 — — — 10.0 — — 10.0 Restricted stock unit settlement, net of tax 865,015 — — — (6.4) — — (6.4)Balance at December 31, 2019 91,701,745 $ 0.9 — $ — $ 1,574.7 $ (175.1) $ (112.0) $ 1,288.5
Net earnings — — — — — 6.6 — 6.6 Other comprehensive earnings, net of tax — — — — — — 11.5 11.5 Repurchase of common stock — — (1,078,363) (16.2) — — — (16.2)Stock-based compensation expense — — — — 17.3 — — 17.3 Exercise of stock options and other 141,336 — — — 1.9 — — 1.9 Restricted and performance stock unitsettlement, net of tax 846,831 — — — (6.1) — — (6.1)Balance at December 31, 2020 92,689,912 $ 0.9 (1,078,363) $ (16.2) $ 1,587.8 $ (168.5) $ (100.5) $ 1,303.5
Net earnings — — — — — 150.4 — 150.4 Other comprehensive earnings, net of tax — — — — — — 0.1 0.1 Repurchase of common stock — — (2,139,413) (44.5) — — — (44.5)Stock-based compensation expense — — — — 32.1 — — 32.1 Exercise of stock options 1,540,314 0.1 — — 25.5 — — 25.6 Conversion of convertible senior notes — — 363,579 5.9 (5.9) — — — Exercise of convertible note hedges — — (363,601) (7.6) 7.6 — — — Restricted and performance stock unitsettlement, net of tax 882,552 — — — (7.7) — — (7.7)Balance at December 31, 2021 95,112,778 $ 1.0 (3,217,798) $ (62.4) $ 1,639.4 $ (18.1) $ (100.4) $ 1,459.5
See accompanying Notes to Consolidated Financial Statements
48
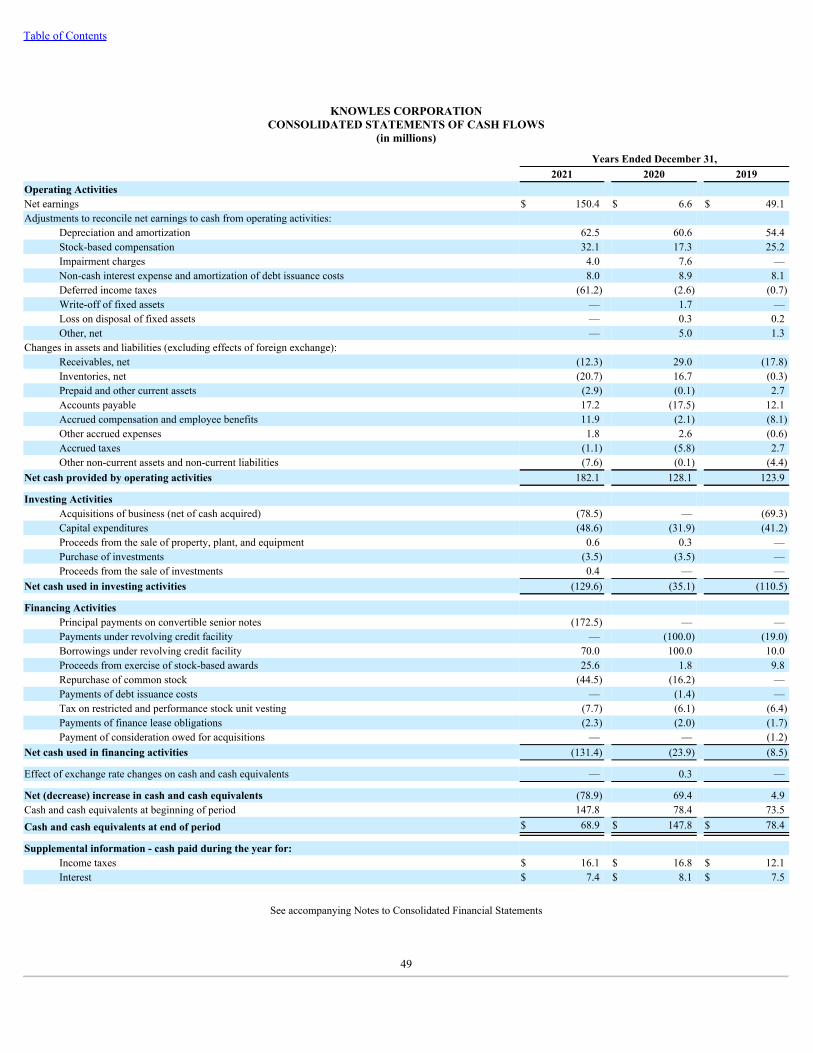
Table of Contents
KNOWLES CORPORATIONCONSOLIDATED STATEMENTS OF CASH FLOWS
(in millions)
Years Ended December 31, 2021 2020 2019Operating Activities Net earnings $ 150.4 $ 6.6 $ 49.1 Adjustments to reconcile net earnings to cash from operating activities:
Depreciation and amortization 62.5 60.6 54.4 Stock-based compensation 32.1 17.3 25.2 Impairment charges 4.0 7.6 — Non-cash interest expense and amortization of debt issuance costs 8.0 8.9 8.1 Deferred income taxes (61.2) (2.6) (0.7)Write-off of fixed assets — 1.7 — Loss on disposal of fixed assets — 0.3 0.2 Other, net — 5.0 1.3
Changes in assets and liabilities (excluding effects of foreign exchange):Receivables, net (12.3) 29.0 (17.8)Inventories, net (20.7) 16.7 (0.3)Prepaid and other current assets (2.9) (0.1) 2.7 Accounts payable 17.2 (17.5) 12.1 Accrued compensation and employee benefits 11.9 (2.1) (8.1)Other accrued expenses 1.8 2.6 (0.6)Accrued taxes (1.1) (5.8) 2.7 Other non-current assets and non-current liabilities (7.6) (0.1) (4.4)
Net cash provided by operating activities 182.1 128.1 123.9
Investing Activities Acquisitions of business (net of cash acquired) (78.5) — (69.3)Capital expenditures (48.6) (31.9) (41.2)Proceeds from the sale of property, plant, and equipment 0.6 0.3 — Purchase of investments (3.5) (3.5) — Proceeds from the sale of investments 0.4 — —
Net cash used in investing activities (129.6) (35.1) (110.5)
Financing Activities Principal payments on convertible senior notes (172.5) — — Payments under revolving credit facility — (100.0) (19.0)Borrowings under revolving credit facility 70.0 100.0 10.0 Proceeds from exercise of stock-based awards 25.6 1.8 9.8 Repurchase of common stock (44.5) (16.2) — Payments of debt issuance costs — (1.4) — Tax on restricted and performance stock unit vesting (7.7) (6.1) (6.4)Payments of finance lease obligations (2.3) (2.0) (1.7)Payment of consideration owed for acquisitions — — (1.2)
Net cash used in financing activities (131.4) (23.9) (8.5)
Effect of exchange rate changes on cash and cash equivalents — 0.3 —
Net (decrease) increase in cash and cash equivalents (78.9) 69.4 4.9 Cash and cash equivalents at beginning of period 147.8 78.4 73.5 Cash and cash equivalents at end of period $ 68.9 $ 147.8 $ 78.4
Supplemental information - cash paid during the year for:Income taxes $ 16.1 $ 16.8 $ 12.1 Interest $ 7.4 $ 8.1 $ 7.5
See accompanying Notes to Consolidated Financial Statements
49
Table of Contents NOTES TO CONSOLIDATED FINANCIAL STATEMENTS
1. Summary of Significant Accounting Policies
Background - Knowles Corporation (NYSE:KN) is a market leader and global provider of advanced micro-acoustic microphones and balanced armature speakers,audio solutions, and high performance capacitors and radio frequency ("RF") products, serving the consumer electronics, medtech, defense, electric vehicle,industrial, and communications markets. The Company uses its leading position in SiSonic micro-electro-mechanical systems ("MEMS") microphones andstrong capabilities in audio processing technologies to optimize audio systems and improve the user experience across consumer applications. Knowles is also aleader in hearing health acoustics, high performance capacitors, and RF solutions for a diverse set of markets. The Company's focus on the customer, combinedwith its unique technology, proprietary manufacturing techniques, and global operational expertise, enable the Company to deliver innovative solutions acrossmultiple applications. References to "Knowles," "the Company," "we," "our," and "us" refer to Knowles Corporation and its consolidated subsidiaries.
On May 3, 2021, the Company acquired all of the outstanding shares of common stock of Integrated Microwave Corporation ("IMC"), a manufacturer of RFfilters. See Note 3. Acquisitions for additional information related to the transaction.
On February 24, 2020, the Company announced that its Board of Directors had authorized a share repurchase program of up to $100 million of the Company'scommon stock. The timing and amount of any shares repurchased will be determined by the Company based on its evaluation of market conditions and otherfactors, and will be made in accordance with applicable securities laws in either the open market or in privately negotiated transactions. The Company is notobligated to purchase any shares under the program, and the program may be suspended or discontinued at any time. The actual timing, number, and share price ofshares repurchased will depend on a number of factors, including the market price of the Company’s common stock, general market and economic conditions, andapplicable legal requirements. Any shares repurchased will be held as treasury stock. During the years ended December 31, 2021 and 2020, the Companyrepurchased 2,139,413 shares and 1,078,363 shares of common stock, respectively, for a total of $44.5 million and $16.2 million, respectively.
On December 20, 2019, the Company acquired substantially all of the assets of the MEMS Microphone Application-specific integrated circuit Design Business(“ASIC Design Business”). See Note 3. Acquisitions for additional information related to the transaction.
On January 3, 2019, the Company acquired substantially all of the assets of DITF Interconnect Technology, Inc. ("DITF"), a thin film components manufacturer.See Note 3. Acquisitions for additional information related to the transaction.
Financial Statement Presentation - The Consolidated Financial Statements included in this Annual Report on Form 10-K are presented in conformity with U.S.generally accepted accounting principles ("U.S. GAAP").
Use of Estimates - The preparation of financial statements in conformity with U.S. GAAP requires management to make estimates and assumptions that affect theamounts reported in the accompanying financial statements and disclosures. These estimates may be adjusted due to changes in future economic, industry, orcustomer financial conditions, as well as changes in technology or demand. Estimates are used in accounting for, among other items, inventory reserves,restructuring reserves, warranty reserves, pension and post-retirement plans, stock-based compensation, useful lives for depreciation and amortization of long-livedassets, future cash flows associated with impairment testing for goodwill, indefinite-lived intangible assets and other long-lived assets, deferred tax assets,uncertain income tax positions, changes in tax laws, and contingencies. Management uses historical experience and all available information to make theseestimates, including considerations for the impact of the COVID-19 pandemic on the macroeconomic environment. The situation related to the COVID-19pandemic continues to be complex and dynamic. The Company cannot reasonably estimate the duration of the COVID-19 pandemic or fully ascertain its impact onthe Company’s future results and market capitalization, which could adversely impact estimates such as the recoverability of goodwill and long-lived assets and therealizability of deferred tax assets. Actual results may ultimately differ from estimates, although management does not believe such differences would materiallyaffect the financial statements in any individual year. Estimates and assumptions are periodically reviewed and the effects of revisions are reflected in theConsolidated Financial Statements in the period that they are determined.
Cash and Cash Equivalents - Cash and cash equivalents include cash on hand, demand deposits, and temporary cash investments with original maturities less thanthree months.
TM
50
Table of Contents NOTES TO CONSOLIDATED FINANCIAL STATEMENTS
Allowance for Doubtful Accounts – The Company maintains allowances for estimated losses as a result of customers' inability to make required payments.Management evaluates the aging of the accounts receivable balances, the financial condition of its customers, historical trends, relevant forecasts, and the timeoutstanding of specific balances to estimate the amount of accounts receivable that may not be collected in the future and records the appropriate provision.
Inventories – Inventories are stated at the lower of cost or net realizable value, determined on the first-in, first-out ("FIFO") basis. The value of inventory maydecline as a result of surplus inventory, price reductions, or technological obsolescence. It is the Company’s policy to carry reserves against the carrying value ofinventory when items have no future demand (obsolete inventory) and additionally, where inventory items on hand have demand, yet have insufficient forecastedactivity to consume the entire stock within a reasonable period. The Company recognizes reserves against the carrying value of such at-risk inventory items afterconsidering the nature of the risk and any mitigating factors.
Property, Plant, and Equipment - Property, plant, and equipment includes the historic cost of land, buildings, equipment, and significant improvements to existingplant and equipment or, in the case of acquisitions, a fair market value appraisal of such assets completed at the time of acquisition. Property, plant, and equipmentalso includes the cost of purchased software. Expenditures for maintenance, repairs, and minor renewals are expensed as incurred. When property or equipment issold or otherwise disposed of, the related cost and accumulated depreciation is removed from the respective accounts, and the gain or loss realized on disposition isreflected in earnings. The Company historically depreciates its assets on a straight-line basis over their estimated useful lives as follows: buildings andimprovements 5 to 31.5 years; machinery and equipment 1.5 to 7 years; furniture and fixtures 2 to 5 years; vehicles 3 to 5 years; and software 3 to 5 years.
Leases - The Company determines whether an arrangement is a lease at contract inception. Lease liabilities and right-of-use assets are recognized on the leasecommencement date based on the net present value of fixed lease payments over the lease term. The Company includes options to extend or terminate a leasewithin the lease term when it is reasonably certain the option will be exercised. Leases with an initial term of 12 months or less are not recorded on theConsolidated Balance Sheets. Lease liabilities represent an obligation to make lease payments arising from a lease while right-of-use assets represent a right to usean underlying asset during the lease term. Right-of-use assets include prepaid fixed lease payments and exclude lease incentives. As the Company's leases do nothave a readily determinable implicit rate, the Company uses its incremental borrowing rate to determine the present value of fixed lease payments based oninformation available at the lease commencement date.
Fixed lease expense for operating leases and right-of-use asset amortization for finance leases are generally recognized on a straight-line basis over the lease term.Variable lease payments, such as payments based on an index rate or usage, are expensed as incurred and excluded from lease liabilities and right-of-use assets.The Company combines lease components and nonlease components such as maintenance into a single lease component, which results in the capitalization of allfixed payments within lease liabilities and right-of-use assets.
Derivative Instruments - The Company uses derivative financial instruments to hedge its exposure to foreign currency exchange rate risk. The Company does notenter into derivative financial instruments for speculative purposes and does not have a material portfolio of derivative financial instruments. Derivative financialinstruments used for hedging purposes must be designated and effective as a hedge of the identified risk exposure at inception of the contract. The Companyrecognizes all derivatives as either assets or liabilities on the Consolidated Balance Sheets and measures those instruments at fair value. For derivatives designatedas cash flow hedges, the effective portion of changes in the fair value of the derivatives is recorded as a component of other comprehensive earnings andsubsequently recognized in net earnings when the hedged items impact earnings.
Goodwill and Indefinite-Lived Intangible Assets - Goodwill represents the excess of purchase consideration over the fair value of the net assets of businessesacquired. Goodwill and certain other intangible assets deemed to have indefinite lives are not amortized. Instead, goodwill and indefinite-lived intangible assets aretested for impairment at least annually, or more frequently if there are events or circumstances indicating the carrying value of individual reporting units or assetsmay exceed their respective fair values on a more likely than not basis. The Company performs its annual impairment assessment in the fourth quarter of each yearon October 1. Recoverability of goodwill is measured at the reporting unit level. The Company has three reporting units. The goodwill balances associated with theMobile Consumer Electronics ("MCE"), Hearing Health Technologies ("HHT"), and Precision Devices ("PD") reporting units were $741.0 million, $137.8 million,and $62.5 million, respectively, as of December 31, 2021.
51
Table of Contents NOTES TO CONSOLIDATED FINANCIAL STATEMENTS
The impairment assessment compares the fair value of each reporting unit to its carrying value. Impairment is measured as the amount by which the carrying valueof a reporting unit exceeds its fair value. Fair value is estimated using a discounted cash flow model that includes the Company’s market participant assumptions,forecasted future cash flows based on historical performance and future estimated results, determinations of appropriate discount rates, and other assumptionswhich are considered reasonable and inherent in the discounted cash flow analysis. Significant assumptions used in the assessment include forecasted revenue andterminal growth rates, profit margins, income taxes, and the Company's weighted average cost of capital. These assumptions require significant judgment andactual results may differ from estimated amounts. The fair value of all of the Company’s reporting units exceeded the carrying values by at least 35%, resulting inno goodwill impairment charges. Potential circumstances that could have a negative effect on the fair value of our reporting units include, but are not limited to,lower than forecasted growth rates or profit margins and changes in the weighted average cost of capital. A reduction in the estimated fair value of the reportingunits could trigger an impairment in the future. The Company cannot predict the occurrence of certain events or changes in circumstances that might adverselyaffect the carrying value of goodwill and intangible assets.
In testing its indefinite-lived trademarks for impairment, the Company uses a relief from royalty method to calculate and compare the fair value of the intangibleasset to its carrying value. This method estimates the fair value of trademarks by calculating the present value of royalty income that could hypothetically beearned by licensing the trademark to a third party. Any excess of carrying value over the estimated fair value is recognized as an impairment loss. No impairmentof indefinite-lived intangibles was indicated for the years ended December 31, 2021, 2020, or 2019.
See Note 7. Goodwill and Other Intangible Assets for additional information on goodwill and indefinite-lived intangible assets.
Other Intangible and Long-Lived Assets - Other intangible assets with determinable lives consist primarily of customer relationships, developed technology, andtrademarks, which are amortized over estimated useful lives typically ranging from 5 to 10 years. There are no capitalized external legal costs incurred in thedefense of patents as of December 31, 2021.
Long-lived assets and intangible assets with determinable lives are reviewed for impairment whenever events or changes in circumstances indicate that the carryingamount of an asset may not be recoverable. If an indicator of impairment exists for any grouping of assets, an estimate of undiscounted future cash flows isproduced and compared to its carrying value. If an asset is determined to be impaired, the loss is measured by the excess of the carrying amount of the asset over itsfair value as determined by an estimate of discounted future cash flows.
The Company recorded impairment charges of $4.0 million and $7.6 million during the years ended December 31, 2021 and 2020, respectively. There were noimpairments recorded during the year ended December 31, 2019. See Note 4. Impairments for additional details.
Other Assets and Deferred Charges - Investments in mutual funds of $6.4 million and $2.5 million are included in Other assets and deferred charges as ofDecember 31, 2021 and 2020, respectively. These investments are carried at fair value based on quoted prices for identical assets in active markets, resulting inclassification within Level 1 of the fair value hierarchy. Gains and losses related to the investments are recorded within the Consolidated Statements of Earnings asa component of Other (income) expense, net. Other assets and deferred charges also include non-current deferred tax assets.
Foreign Currency - Assets and liabilities of non-U.S. subsidiaries, where the functional currency is not the U.S. dollar, are translated into U.S. dollars at year-endexchange rates. Revenue and expense items are translated using weighted-average yearly exchange rates. Foreign currency translation gains and losses are includedas a component of Accumulated other comprehensive loss. Assets and liabilities of an entity that are denominated in currencies other than an entity’s functionalcurrency are re-measured into the functional currency using end of period exchange rates or historical rates where applicable to certain balances. Gains and lossesrelated to these re-measurements are recorded within the Consolidated Statements of Earnings as a component of Other (income) expense, net.
52
Table of Contents NOTES TO CONSOLIDATED FINANCIAL STATEMENTS
Revenue Recognition - Revenue is recognized when control of the promised goods or services is transferred to the customer in an amount that reflects theconsideration the Company expects to be entitled to in exchange for those goods or services. The majority of the Company’s revenue is generated through themanufacture and sale of a broad range of specialized products and components. For product and component sales, each good sold to a customer typically representsa distinct performance obligation. The Company’s performance obligation to provide goods to a customer is typically satisfied at a point in time upon completionof the shipping process as indicated by the terms of the contract, at which point control is transferred to the customer and revenue is recognized. The Company hasno significant arrangements with multiple performance obligations. Remaining performance obligations consist of the aggregate amount of the total transactionprice that is unsatisfied or partially satisfied. As of December 31, 2021 and 2020, our total remaining performance obligations were immaterial. The Companyrecognizes sales-based royalty revenue under third-party license agreements as the related sales are made by licensees.
The terms of a contract or historical business practice can give rise to variable consideration, including customer discounts, rebates, and returns. The Companyestimates variable consideration using either the expected value or most likely amount method. We include amounts in the transaction price to the extent it isprobable that a significant reversal of revenue will not occur in a subsequent reporting period. Our estimates of variable consideration are based on all reasonablyavailable information (historical, current, and forecasted). Rebates are recognized over the contract period based on expected revenue levels. Sales discounts andrebates totaled $5.0 million, $4.2 million, and $4.7 million for the years ended December 31, 2021, 2020, and 2019, respectively. Returns and allowances totaled$4.3 million, $5.4 million, and $6.6 million for the years ended December 31, 2021, 2020, and 2019, respectively.
The Company accounts for shipping and handling activities that occur after control of the related good transfers to the customer as fulfillment activities rather thanevaluating such activities as performance obligations. As a result, all shipping and handling costs related to contracts with customers are recognized in the Cost ofgoods sold line on the Consolidated Statements of Earnings. Additionally, the Company applies the practical expedient allowing incremental costs of obtaining acontract to be expensed as incurred if the amortization period of the resulting asset would have been less than one year. These costs primarily consist of salescommissions and the Company has no such significant costs exceeding the one year limit for applying the practical expedient.
Receivables, net from contracts with customers were $137.7 million and $123.8 million as of December 31, 2021 and 2020, respectively. See Note 18. SegmentInformation for disclosures regarding the disaggregation of revenues.
Stock-Based Compensation – The principal awards issued under the stock-based compensation plans include stock options, restricted stock units ("RSUs"), andperformance share units ("PSUs"). The cost for such awards is measured at the grant date based on the fair value of the award. The value of the portion of theaward that is expected to ultimately vest is generally recognized as expense on a straight-line basis, generally over the explicit service period and is included inCost of goods sold, Research and development expenses, and Selling and administrative expenses in the Consolidated Statements of Earnings, depending on thefunctional area of the underlying employees. At the time of grant, the Company estimates forfeitures, based on historical experience, in order to estimate theportion of the award that will ultimately vest.
The Company uses the Black-Scholes valuation model to estimate the fair value of stock options granted to employees. The fair value of each RSU granted is equalto the share price at the date of the grant. The fair value of each PSU is determined using a Monte Carlo simulation. The cost related to PSUs with performanceconditions is recognized based on the expected attainment of performance targets. Changes in estimates for performance conditions that impact the number ofshares expected to vest are recognized prospectively through cumulative adjustments. The cost for PSUs is recognized regardless of the expected attainment ofmarket conditions as the grant date fair value considers the range of possible stock price and total shareholder return outcomes. See Note 14. Equity IncentiveProgram for additional information related to the Company’s stock-based compensation.
Income Taxes - The Company records a provision for income taxes for the anticipated tax consequences of the reported results of operations using the asset andliability method. Under this method, the Company recognizes deferred tax assets and liabilities for the expected future tax consequences of temporary differencesbetween the financial reporting and tax bases of assets and liabilities, as well as for operating loss and tax credit carryforwards. Deferred tax assets and liabilitiesare measured using the tax rates that are expected to apply to taxable income for the years in which those tax assets and liabilities are expected to be realized orsettled. The Company offsets and presents deferred tax liabilities and assets, as well as any related valuation allowance, as a single non-current amount on theConsolidated Balance Sheets on a jurisdictional basis. The Company's policy is to release income tax effects from accumulated other comprehensive loss in theperiod the underlying item expires.
53
Table of Contents NOTES TO CONSOLIDATED FINANCIAL STATEMENTS
The Company establishes valuation allowances for its deferred tax assets if, based on all available positive and negative evidence, it is more likely than not thatsome portion or all of the deferred tax assets will not be realized. In making such assessments, significant weight is given to evidence that can be objectivelyverified. The assessment of the need for a valuation allowance requires considerable judgment on the part of management with respect to the benefits that could berealized from future taxable income, as well as other positive and negative factors. Management considers the scheduled reversal of deferred tax liabilities,projected future taxable income, and tax-planning strategies in making this assessment.
The Company recognizes tax benefits from uncertain tax positions only if it believes that it is more likely than not that the tax position will be sustained onexamination by the taxing authorities based on the technical merits of the position. Adjustments are made to these reserves when facts and circumstances change,such as the closing of a tax audit or the refinement of an estimate. To the extent that the final tax outcome of these matters is different than the amounts recorded,such differences will affect the provision for income taxes in the period in which such determination is made and could have a material impact on the Company'sfinancial condition and operating results. The provision for income taxes includes the effects of any reserves that are believed to be appropriate, as well as therelated net interest and penalties.
Research and Development Costs – Research and development costs, including qualifying engineering costs, are expensed when incurred.
Non-cash Investing Activities - Purchases of property, plant, and equipment included in accounts payable at December 31, 2021, 2020, and 2019 were $5.4million, $2.0 million, and $4.7 million, respectively. These non-cash amounts are not reflected as Capital expenditures within investing activities of theConsolidated Statements of Cash Flows for the respective periods.
Recently Issued Accounting Standards
In August 2020, the Financial Accounting Standards Board ("FASB") issued Accounting Standards Update ("ASU") 2020-06 to simplify the accounting for certainfinancial instruments with characteristics of liabilities and equity. The standard eliminates certain accounting models that separated embedded conversion featuresfrom host contracts for convertible instruments, requiring bifurcation only if the convertible feature qualifies as a derivative under Accounting StandardsCodification ("ASC") 815 or for convertible instruments issued at a substantial premium. In addition, the guidance requires the if-converted method of calculatingdiluted earnings per share for convertible instruments, which eliminates the use of the treasury stock method for instruments that may be settled in cash or shares.The standard is effective for public business entities for fiscal years beginning after December 15, 2021, including interim periods within those fiscal years. Thestandard can be adopted on a modified retrospective basis to transactions outstanding as of the adoption date or on a fully retrospective basis to all periodspresented. The Company will adopt the standard using the modified retrospective method on January 1, 2022. The Company does not expect the standard to impactthe Consolidated Financial Statements as all of its convertible instruments matured prior to the adoption date. See Note 12. Borrowings for detail on the Company'sconvertible instruments.
2. Disposed and Discontinued Operations
Management and the Board of Directors periodically conduct strategic reviews of the Company's businesses.
On November 28, 2017, the Company completed the sale of its high-end oscillators business (“Timing Device Business”), part of the Precision Devices (“PD”)segment, for $130.0 million, plus purchase price adjustments for a net amount of $135.1 million. On July 7, 2016, the Company completed the sale of its speakerand receiver product line (“Speaker and Receiver Product Line”) for $45.0 million in cash, less purchase price adjustments for a net amount received of$40.6 million.
In accordance with ASC 205-20, Presentation of Financial Statements – Discontinued Operations, the results of operations and financial positions of the TimingDevice Business and Speaker and Receiver Product Line have been reclassified to discontinued operations for all periods presented as these disposals representstrategic shifts that had a major effect on the Company's results of operations.
54
Table of Contents NOTES TO CONSOLIDATED FINANCIAL STATEMENTS
Summarized results of the Company's discontinued operations are as follows:
Years Ended December 31,(in millions) 2021 2020 2019Revenues $ — $ — $ — Operating income — — — Earnings from discontinued operations before taxes — — — (Benefit from) provision for income taxes (0.2) (3.7) 0.6 Earnings (loss) from discontinued operations, net of tax $ 0.2 $ 3.7 $ (0.6)
The Company recorded a tax benefit for a refund received during the first quarter of 2020 related to the Timing Device Business.
Assets and liabilities of discontinued operations are summarized below:
(in millions) December 31, 2020Liabilities of discontinued operations:Other liabilities $ 0.6 Total liabilities $ 0.6
This accrual was attributable to an unrecognized tax benefit recorded during the fourth quarter of 2019 related to the Speaker and Receiver Product Line.
There were no assets and liabilities of discontinued operations as of December 31, 2021.
3. Acquisitions
IMC
On May 3, 2021, the Company acquired all of the outstanding shares of common stock of IMC for $80.7 million. The acquired business provides RF filters to thedefense, industrial, and communications markets. The transaction was accounted for under the acquisition method of accounting and the results of operations areincluded in the Consolidated Financial Statements from the date of acquisition in the PD segment. Included in the Consolidated Statements of Earnings are IMC’srevenues and earnings before income taxes of $11.2 million and $0.3 million, respectively, from the date of acquisition through December 31, 2021.
The table below represents a preliminary allocation of the purchase price to net assets acquired as of May 3, 2021:(in millions)Cash $ 2.2 Receivables 3.0 Inventories 2.6 Property, plant, and equipment 8.3 Customer relationships 27.7 Developed technology 5.2 Trademarks and other amortized intangible assets 1.6 Goodwill 31.3 Assumed current liabilities (1.2)
Total purchase price $ 80.7
The preceding purchase price allocation is subject to change as additional information about the fair values of assets and liabilities becomes available. Any changein the acquisition date fair value of the acquired net assets will change the amount of the purchase price allocated to goodwill. The Company expects to finalize thepurchase price allocation as soon as practicable, but not later than one year from the acquisition date.
(1)
(1)
(1)
(1)
55
Table of Contents NOTES TO CONSOLIDATED FINANCIAL STATEMENTS
The fair value for customer relationships was determined using the multi-period excess earnings method under the income approach. This method reflects thepresent value of expected future cash flows less charges representing the contribution of other assets to those cash flows. The fair value for developed technologywas determined using the relief from royalty method under the income approach. The fair value measurements of intangible assets are based on significantunobservable inputs, and thus represent Level 3 inputs. Significant assumptions used in assessing the fair values of customer relationships and developedtechnology include forecasted revenue growth rates, profit margins, customer attrition rates, royalty rates, and discount rates. Discount rates of 13.0% and 14.0%were applied to the expected future cash flows to reflect the risk related to customer relationships and developed technology, respectively. Customer relationshipsand developed technology will be amortized on a straight-line basis over estimated useful lives of 8 years and 10 years, respectively.
The excess of the total purchase price over the total fair value of the identifiable assets and liabilities was recorded as goodwill. The goodwill recognized isprimarily attributable to synergies and the assembled workforce. All of the goodwill resulting from this acquisition is tax deductible. Goodwill has been allocatedto the PD segment, which is the segment expected to benefit from the acquisition.
The Company believes the fair values assigned to intangible assets are based on reasonable assumptions and estimates that approximate the amounts a marketparticipant would pay for these intangible assets as of the acquisition date. Actual results could differ materially from these estimates.
Pro-forma financial information has not been provided as the acquisition did not have a material impact on the Consolidated Statements of Earnings.
ASIC Design Business
On December 20, 2019, the Company acquired substantially all of the assets of the ASIC Design Business from ams AG for $57.9 million. The acquired business,which does not generate revenues, includes intellectual property and an assembled workforce. The transaction was accounted for under the acquisition method ofaccounting and the results of operations are included in the Consolidated Financial Statements from the date of acquisition in the Audio segment. Included in theConsolidated Statements of Earnings is a loss before income taxes of $0.1 million from the date of acquisition through December 31, 2019.
Unaudited Pro-forma Summary
The following unaudited pro-forma summary presents consolidated financial information as if the ASIC Design Business had been acquired on January 1, 2018.The unaudited pro-forma financial information is based on historical results of operations and financial positions of the Company and the ASIC Design Business.The pro-forma results include estimated amortization of definite-lived intangible assets and exclude cost savings and transaction costs.
The unaudited pro-forma financial information does not necessarily represent the results that would have occurred had the acquisition occurred on January 1, 2018.In addition, the unaudited pro-forma information should not be deemed to be indicative of future results.
(unaudited)(in millions, except per share amounts) Year Ended December 31, 2019Earnings from continuing operations:
As reported $ 49.7 Pro-forma 40.7
Basic earnings per share from continuing operations:As reported $ 0.55 Pro-forma 0.45
Diluted earnings per share from continuing operations:As reported $ 0.53 Pro-forma 0.44
56
Table of Contents NOTES TO CONSOLIDATED FINANCIAL STATEMENTS
Other Acquisitions
On January 3, 2019, the Company acquired substantially all of the assets of DITF for $11.1 million. The acquired business provides thin film components to thedefense, telecommunication, industrial, and medtech markets. The transaction was accounted for under the acquisition method of accounting and the results ofoperations are included in the Consolidated Financial Statements from the date of acquisition in the PD segment. Included in the Consolidated Statements ofEarnings are DITF's revenues and earnings before income taxes of $8.9 million and $0.3 million, respectively, from the date of acquisition through December 31,2019. Pro-forma financial information has not been provided as the acquisition did not have a material impact on the Consolidated Statements of Earnings.
On January 19, 2018, the Company acquired substantially all of the assets of Compex Corporation for $16.0 million, plus purchase price adjustments for a netamount of $18.7 million. The asset purchase agreement relating to the acquisition provided for a $1.0 million holdback that was paid during the third quarter of2019. The acquired business provides single layer electronic components to the telecommunication, fiber optics, and defense markets. The transaction wasaccounted for under the acquisition method of accounting and the results of operations are included in the Consolidated Financial Statements from the date ofacquisition in the PD segment.
4. Impairments
The Company evaluates long-lived assets for impairment whenever events or changes in circumstances indicate that the carrying amount of an asset may not berecoverable. The Company vacated its leased facility in Mountain View, California during the third quarter of 2020, resulting in its classification as a separate assetgroup. This facility was previously used by the Intelligent Audio product line, which is included within the Audio segment. Based on an assessment of marketconditions, in particular the impact of the COVID-19 pandemic, the Company determined that the carrying amount of the asset group was not recoverable throughundiscounted future cash flows, which included estimated sublease proceeds. The fair value of the operating lease right-of-use asset was determined by an estimateof discounted future cash flows that included estimated sublease proceeds and the determination of an appropriate discount rate based on market participantassumptions. The fair value measurements of operating lease right-of-use assets are based on significant unobservable inputs, and thus represent Level 3 inputs.Based on the excess of the carrying amount of the asset group over its fair value, the Company recorded an impairment loss of $5.4 million within Impairmentcharges in Operating expenses during the year ended December 31, 2020. During the third quarter of 2021, the Company determined that the remaining carryingamount of the asset group was not recoverable through undiscounted future cash flows, which included estimated sublease proceeds, due to the prolonged impactof the COVID-19 pandemic on market conditions. Based on the excess of the carrying amount of the asset group over its fair value, the Company recorded animpairment loss of $3.2 million within Impairment charges in Operating expenses during the year ended December 31, 2021.
The Company entered into an operating lease for a research and development facility in Santa Clara, California during the first quarter of 2020 that did notcommence until the second quarter of 2021. During the third quarter of 2020, the Company determined a loss was probable and reasonably estimable under ASC450, Contingencies, based on its plan to sublet a significant portion of the facility due to the restructuring of the Intelligent Audio product line and the negativeimpact of the COVID-19 pandemic on market conditions. The estimated loss was determined by comparing the estimated carrying amount of the operating leaseright-of-use asset to be recognized for the sublet portion of the facility upon lease commencement to an estimate of discounted future cash flows that includedestimated sublease proceeds and the determination of an appropriate discount rate based on market participant assumptions. These measurements are based onsignificant unobservable inputs, and thus represent Level 3 inputs. The Company recorded an estimated loss of $2.2 million within Impairment charges inOperating expenses during the year ended December 31, 2020. The corresponding estimated liability, which was recorded in Other liabilities on the ConsolidatedBalance Sheets as of December 31, 2020, reduced the right-of-use asset upon lease commencement. The lease commenced during the second quarter of 2021,resulting in the recognition of operating lease liabilities of $4.0 million and right-of-use assets of $2.4 million. During the third quarter of 2021, the Companydetermined that the remaining carrying amount of the operating lease right-of-use asset was not recoverable through undiscounted future cash flows, whichincluded estimated sublease proceeds, due to the prolonged impact of the COVID-19 pandemic on market conditions. Based on the excess of the carrying amountof the operating lease right-of-use asset over its fair value, the Company recorded an impairment loss of $0.8 million within Impairment charges in Operatingexpenses during the year ended December 31, 2021.
No impairment charges were recorded during the year ended December 31, 2019. If actual results differ from estimated amounts, additional impairment chargesmay be recorded in the future.
57
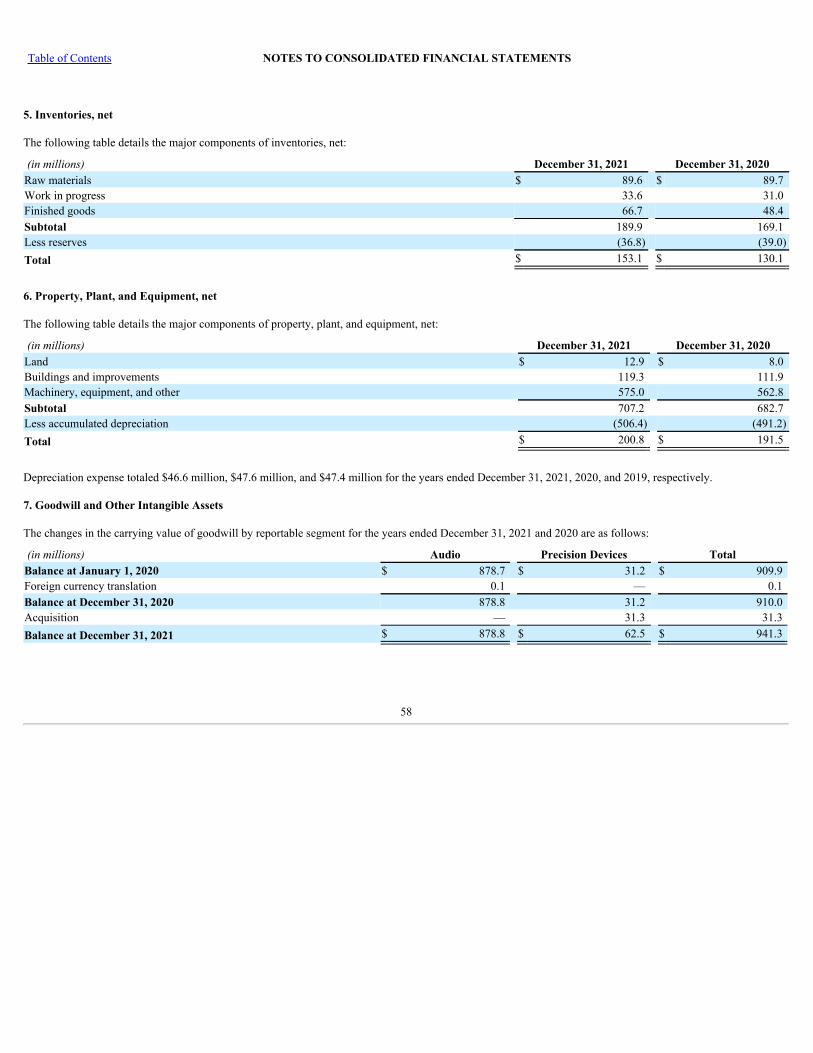
Table of Contents NOTES TO CONSOLIDATED FINANCIAL STATEMENTS
5. Inventories, net
The following table details the major components of inventories, net:
(in millions) December 31, 2021 December 31, 2020Raw materials $ 89.6 $ 89.7 Work in progress 33.6 31.0 Finished goods 66.7 48.4 Subtotal 189.9 169.1 Less reserves (36.8) (39.0)Total $ 153.1 $ 130.1
6. Property, Plant, and Equipment, net
The following table details the major components of property, plant, and equipment, net:
(in millions) December 31, 2021 December 31, 2020Land $ 12.9 $ 8.0 Buildings and improvements 119.3 111.9 Machinery, equipment, and other 575.0 562.8 Subtotal 707.2 682.7 Less accumulated depreciation (506.4) (491.2)Total $ 200.8 $ 191.5
Depreciation expense totaled $46.6 million, $47.6 million, and $47.4 million for the years ended December 31, 2021, 2020, and 2019, respectively.
7. Goodwill and Other Intangible Assets
The changes in the carrying value of goodwill by reportable segment for the years ended December 31, 2021 and 2020 are as follows:
(in millions) Audio Precision Devices TotalBalance at January 1, 2020 $ 878.7 $ 31.2 $ 909.9 Foreign currency translation 0.1 — 0.1 Balance at December 31, 2020 878.8 31.2 910.0 Acquisition — 31.3 31.3 Balance at December 31, 2021 $ 878.8 $ 62.5 $ 941.3
58
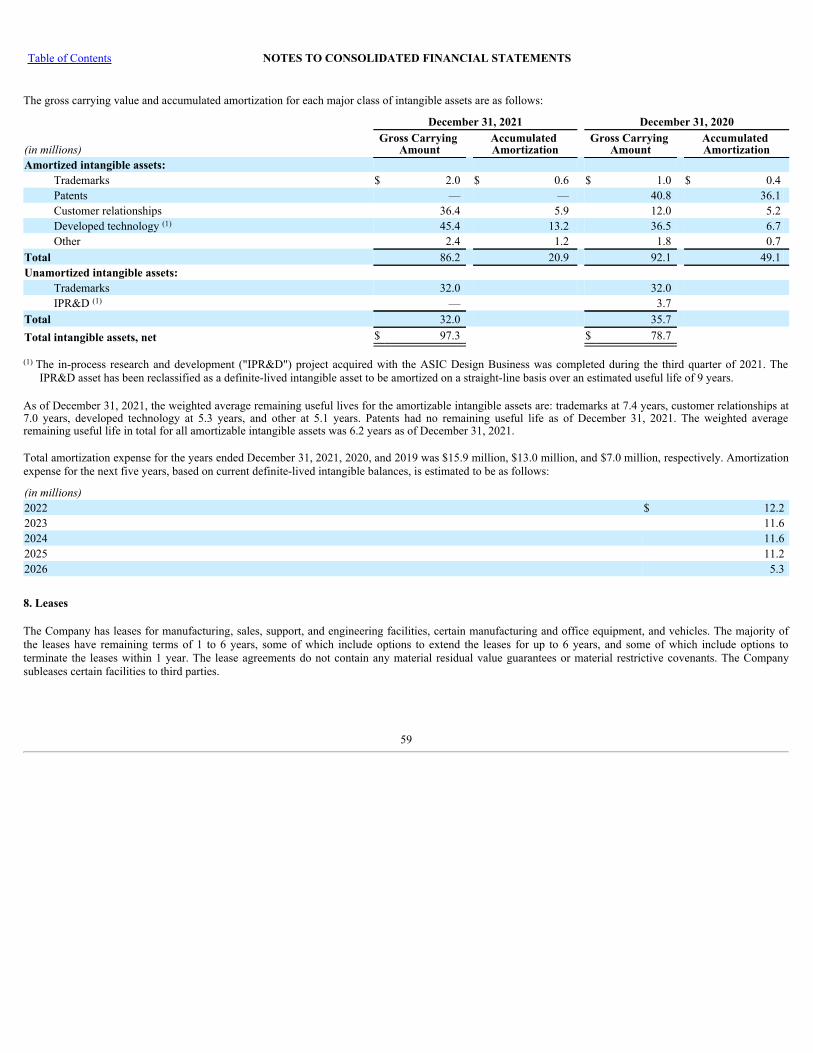
Table of Contents NOTES TO CONSOLIDATED FINANCIAL STATEMENTS
The gross carrying value and accumulated amortization for each major class of intangible assets are as follows:
December 31, 2021 December 31, 2020
(in millions)Gross Carrying
AmountAccumulated Amortization
Gross Carrying Amount
Accumulated Amortization
Amortized intangible assets:Trademarks $ 2.0 $ 0.6 $ 1.0 $ 0.4 Patents — — 40.8 36.1 Customer relationships 36.4 5.9 12.0 5.2 Developed technology 45.4 13.2 36.5 6.7 Other 2.4 1.2 1.8 0.7
Total 86.2 20.9 92.1 49.1 Unamortized intangible assets:
Trademarks 32.0 32.0 IPR&D — 3.7
Total 32.0 35.7 Total intangible assets, net $ 97.3 $ 78.7
The in-process research and development ("IPR&D") project acquired with the ASIC Design Business was completed during the third quarter of 2021. TheIPR&D asset has been reclassified as a definite-lived intangible asset to be amortized on a straight-line basis over an estimated useful life of 9 years.
As of December 31, 2021, the weighted average remaining useful lives for the amortizable intangible assets are: trademarks at 7.4 years, customer relationships at7.0 years, developed technology at 5.3 years, and other at 5.1 years. Patents had no remaining useful life as of December 31, 2021. The weighted averageremaining useful life in total for all amortizable intangible assets was 6.2 years as of December 31, 2021.
Total amortization expense for the years ended December 31, 2021, 2020, and 2019 was $15.9 million, $13.0 million, and $7.0 million, respectively. Amortizationexpense for the next five years, based on current definite-lived intangible balances, is estimated to be as follows:
(in millions)2022 $ 12.2 2023 11.6 2024 11.6 2025 11.2 2026 5.3
8. Leases
The Company has leases for manufacturing, sales, support, and engineering facilities, certain manufacturing and office equipment, and vehicles. The majority ofthe leases have remaining terms of 1 to 6 years, some of which include options to extend the leases for up to 6 years, and some of which include options toterminate the leases within 1 year. The lease agreements do not contain any material residual value guarantees or material restrictive covenants. The Companysubleases certain facilities to third parties.
(1)
(1)
(1)
59
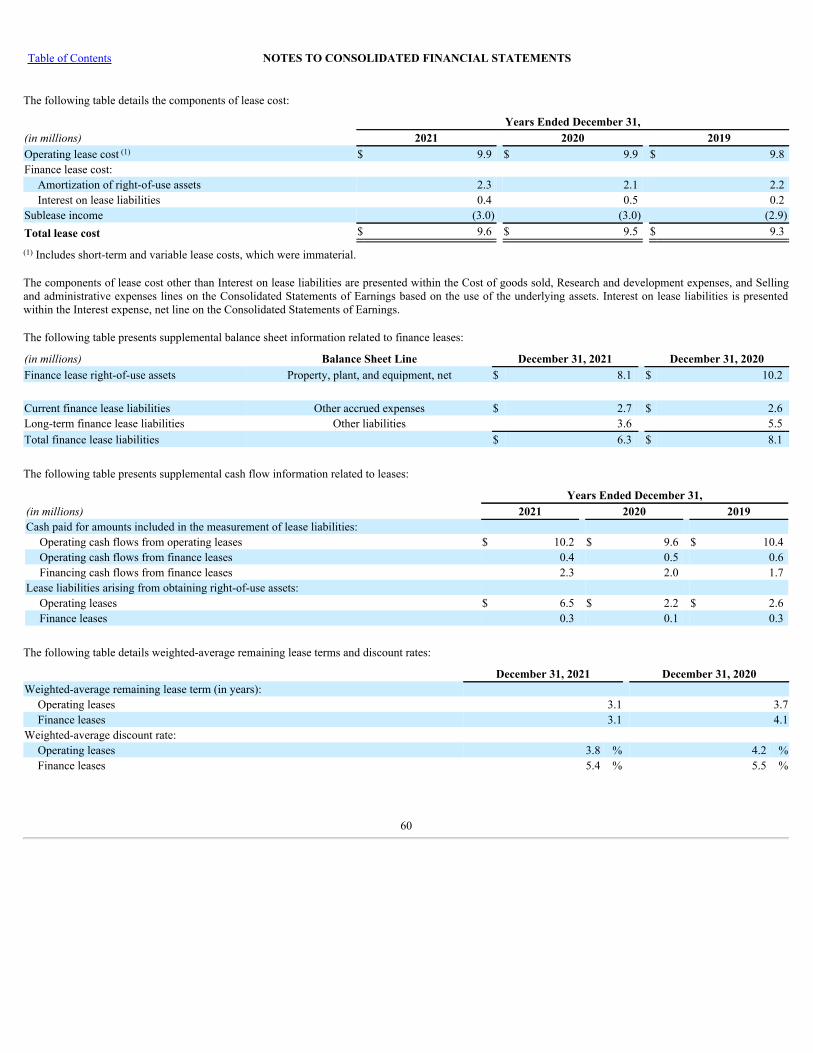
Table of Contents NOTES TO CONSOLIDATED FINANCIAL STATEMENTS
The following table details the components of lease cost:
Years Ended December 31,(in millions) 2021 2020 2019Operating lease cost $ 9.9 $ 9.9 $ 9.8 Finance lease cost:
Amortization of right-of-use assets 2.3 2.1 2.2 Interest on lease liabilities 0.4 0.5 0.2
Sublease income (3.0) (3.0) (2.9)Total lease cost $ 9.6 $ 9.5 $ 9.3
Includes short-term and variable lease costs, which were immaterial.
The components of lease cost other than Interest on lease liabilities are presented within the Cost of goods sold, Research and development expenses, and Sellingand administrative expenses lines on the Consolidated Statements of Earnings based on the use of the underlying assets. Interest on lease liabilities is presentedwithin the Interest expense, net line on the Consolidated Statements of Earnings.
The following table presents supplemental balance sheet information related to finance leases:
(in millions) Balance Sheet Line December 31, 2021 December 31, 2020Finance lease right-of-use assets Property, plant, and equipment, net $ 8.1 $ 10.2
Current finance lease liabilities Other accrued expenses $ 2.7 $ 2.6 Long-term finance lease liabilities Other liabilities 3.6 5.5 Total finance lease liabilities $ 6.3 $ 8.1
The following table presents supplemental cash flow information related to leases:
Years Ended December 31,(in millions) 2021 2020 2019Cash paid for amounts included in the measurement of lease liabilities:
Operating cash flows from operating leases $ 10.2 $ 9.6 $ 10.4 Operating cash flows from finance leases 0.4 0.5 0.6 Financing cash flows from finance leases 2.3 2.0 1.7
Lease liabilities arising from obtaining right-of-use assets:Operating leases $ 6.5 $ 2.2 $ 2.6 Finance leases 0.3 0.1 0.3
The following table details weighted-average remaining lease terms and discount rates:
December 31, 2021 December 31, 2020Weighted-average remaining lease term (in years):
Operating leases 3.1 3.7Finance leases 3.1 4.1
Weighted-average discount rate:Operating leases 3.8 % 4.2 %Finance leases 5.4 % 5.5 %
(1)
(1)
60
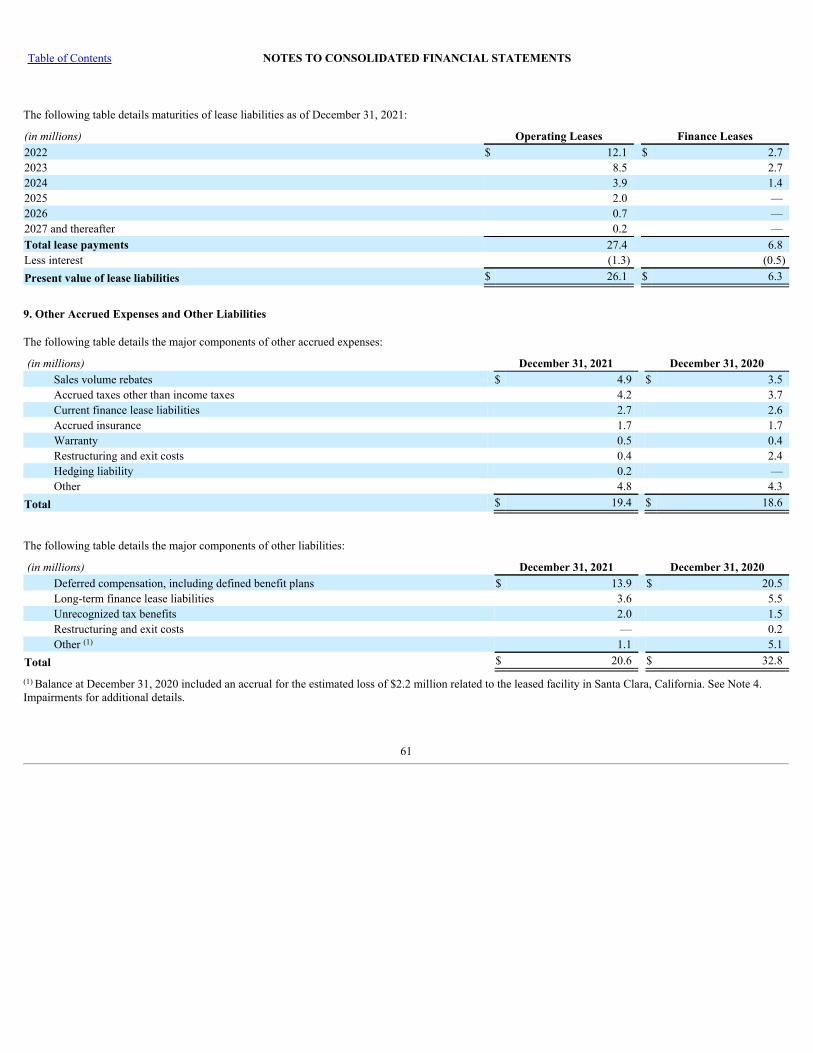
Table of Contents NOTES TO CONSOLIDATED FINANCIAL STATEMENTS
The following table details maturities of lease liabilities as of December 31, 2021:
(in millions) Operating Leases Finance Leases2022 $ 12.1 $ 2.7 2023 8.5 2.7 2024 3.9 1.4 2025 2.0 — 2026 0.7 — 2027 and thereafter 0.2 — Total lease payments 27.4 6.8 Less interest (1.3) (0.5)Present value of lease liabilities $ 26.1 $ 6.3
9. Other Accrued Expenses and Other Liabilities
The following table details the major components of other accrued expenses:
(in millions) December 31, 2021 December 31, 2020Sales volume rebates $ 4.9 $ 3.5 Accrued taxes other than income taxes 4.2 3.7 Current finance lease liabilities 2.7 2.6 Accrued insurance 1.7 1.7 Warranty 0.5 0.4 Restructuring and exit costs 0.4 2.4 Hedging liability 0.2 — Other 4.8 4.3
Total $ 19.4 $ 18.6
The following table details the major components of other liabilities:
(in millions) December 31, 2021 December 31, 2020Deferred compensation, including defined benefit plans $ 13.9 $ 20.5 Long-term finance lease liabilities 3.6 5.5 Unrecognized tax benefits 2.0 1.5 Restructuring and exit costs — 0.2 Other 1.1 5.1
Total $ 20.6 $ 32.8
Balance at December 31, 2020 included an accrual for the estimated loss of $2.2 million related to the leased facility in Santa Clara, California. See Note 4.Impairments for additional details.
(1)
(1)
61
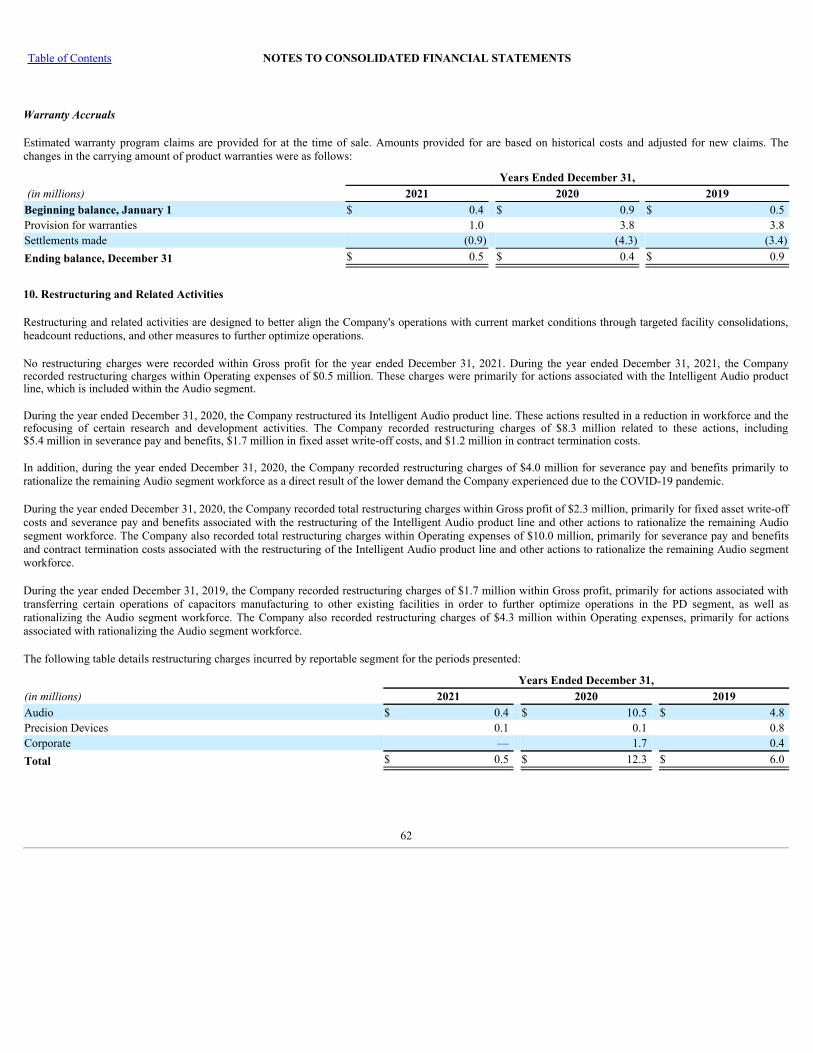
Table of Contents NOTES TO CONSOLIDATED FINANCIAL STATEMENTS
Warranty Accruals
Estimated warranty program claims are provided for at the time of sale. Amounts provided for are based on historical costs and adjusted for new claims. Thechanges in the carrying amount of product warranties were as follows:
Years Ended December 31, (in millions) 2021 2020 2019Beginning balance, January 1 $ 0.4 $ 0.9 $ 0.5 Provision for warranties 1.0 3.8 3.8 Settlements made (0.9) (4.3) (3.4)Ending balance, December 31 $ 0.5 $ 0.4 $ 0.9
10. Restructuring and Related Activities
Restructuring and related activities are designed to better align the Company's operations with current market conditions through targeted facility consolidations,headcount reductions, and other measures to further optimize operations.
No restructuring charges were recorded within Gross profit for the year ended December 31, 2021. During the year ended December 31, 2021, the Companyrecorded restructuring charges within Operating expenses of $0.5 million. These charges were primarily for actions associated with the Intelligent Audio productline, which is included within the Audio segment.
During the year ended December 31, 2020, the Company restructured its Intelligent Audio product line. These actions resulted in a reduction in workforce and therefocusing of certain research and development activities. The Company recorded restructuring charges of $8.3 million related to these actions, including$5.4 million in severance pay and benefits, $1.7 million in fixed asset write-off costs, and $1.2 million in contract termination costs.
In addition, during the year ended December 31, 2020, the Company recorded restructuring charges of $4.0 million for severance pay and benefits primarily torationalize the remaining Audio segment workforce as a direct result of the lower demand the Company experienced due to the COVID-19 pandemic.
During the year ended December 31, 2020, the Company recorded total restructuring charges within Gross profit of $2.3 million, primarily for fixed asset write-offcosts and severance pay and benefits associated with the restructuring of the Intelligent Audio product line and other actions to rationalize the remaining Audiosegment workforce. The Company also recorded total restructuring charges within Operating expenses of $10.0 million, primarily for severance pay and benefitsand contract termination costs associated with the restructuring of the Intelligent Audio product line and other actions to rationalize the remaining Audio segmentworkforce.
During the year ended December 31, 2019, the Company recorded restructuring charges of $1.7 million within Gross profit, primarily for actions associated withtransferring certain operations of capacitors manufacturing to other existing facilities in order to further optimize operations in the PD segment, as well asrationalizing the Audio segment workforce. The Company also recorded restructuring charges of $4.3 million within Operating expenses, primarily for actionsassociated with rationalizing the Audio segment workforce.
The following table details restructuring charges incurred by reportable segment for the periods presented:
Years Ended December 31,(in millions) 2021 2020 2019Audio $ 0.4 $ 10.5 $ 4.8 Precision Devices 0.1 0.1 0.8 Corporate — 1.7 0.4 Total $ 0.5 $ 12.3 $ 6.0
62
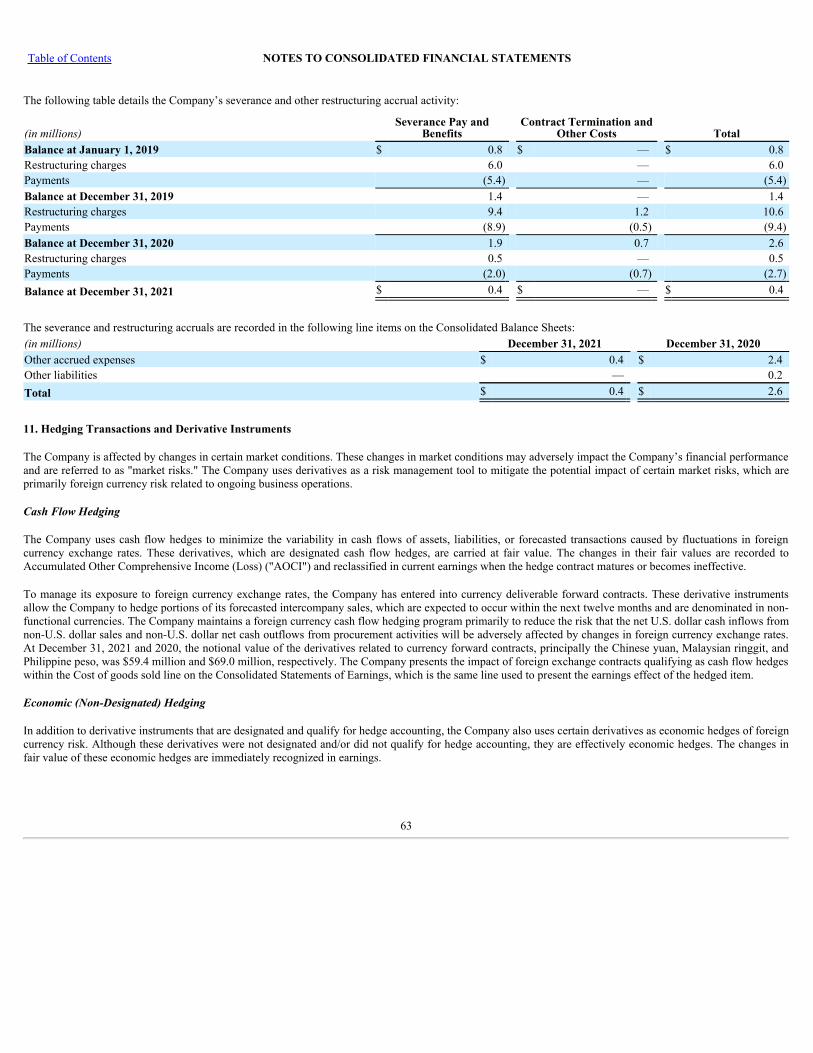
Table of Contents NOTES TO CONSOLIDATED FINANCIAL STATEMENTS
The following table details the Company’s severance and other restructuring accrual activity:
(in millions)Severance Pay and
BenefitsContract Termination and
Other Costs TotalBalance at January 1, 2019 $ 0.8 $ — $ 0.8 Restructuring charges 6.0 — 6.0 Payments (5.4) — (5.4)Balance at December 31, 2019 1.4 — 1.4 Restructuring charges 9.4 1.2 10.6 Payments (8.9) (0.5) (9.4)Balance at December 31, 2020 1.9 0.7 2.6 Restructuring charges 0.5 — 0.5 Payments (2.0) (0.7) (2.7)Balance at December 31, 2021 $ 0.4 $ — $ 0.4
The severance and restructuring accruals are recorded in the following line items on the Consolidated Balance Sheets:(in millions) December 31, 2021 December 31, 2020Other accrued expenses $ 0.4 $ 2.4 Other liabilities — 0.2 Total $ 0.4 $ 2.6
11. Hedging Transactions and Derivative Instruments
The Company is affected by changes in certain market conditions. These changes in market conditions may adversely impact the Company’s financial performanceand are referred to as "market risks." The Company uses derivatives as a risk management tool to mitigate the potential impact of certain market risks, which areprimarily foreign currency risk related to ongoing business operations.
Cash Flow Hedging
The Company uses cash flow hedges to minimize the variability in cash flows of assets, liabilities, or forecasted transactions caused by fluctuations in foreigncurrency exchange rates. These derivatives, which are designated cash flow hedges, are carried at fair value. The changes in their fair values are recorded toAccumulated Other Comprehensive Income (Loss) ("AOCI") and reclassified in current earnings when the hedge contract matures or becomes ineffective.
To manage its exposure to foreign currency exchange rates, the Company has entered into currency deliverable forward contracts. These derivative instrumentsallow the Company to hedge portions of its forecasted intercompany sales, which are expected to occur within the next twelve months and are denominated in non-functional currencies. The Company maintains a foreign currency cash flow hedging program primarily to reduce the risk that the net U.S. dollar cash inflows fromnon-U.S. dollar sales and non-U.S. dollar net cash outflows from procurement activities will be adversely affected by changes in foreign currency exchange rates.At December 31, 2021 and 2020, the notional value of the derivatives related to currency forward contracts, principally the Chinese yuan, Malaysian ringgit, andPhilippine peso, was $59.4 million and $69.0 million, respectively. The Company presents the impact of foreign exchange contracts qualifying as cash flow hedgeswithin the Cost of goods sold line on the Consolidated Statements of Earnings, which is the same line used to present the earnings effect of the hedged item.
Economic (Non-Designated) Hedging
In addition to derivative instruments that are designated and qualify for hedge accounting, the Company also uses certain derivatives as economic hedges of foreigncurrency risk. Although these derivatives were not designated and/or did not qualify for hedge accounting, they are effectively economic hedges. The changes infair value of these economic hedges are immediately recognized in earnings.
63
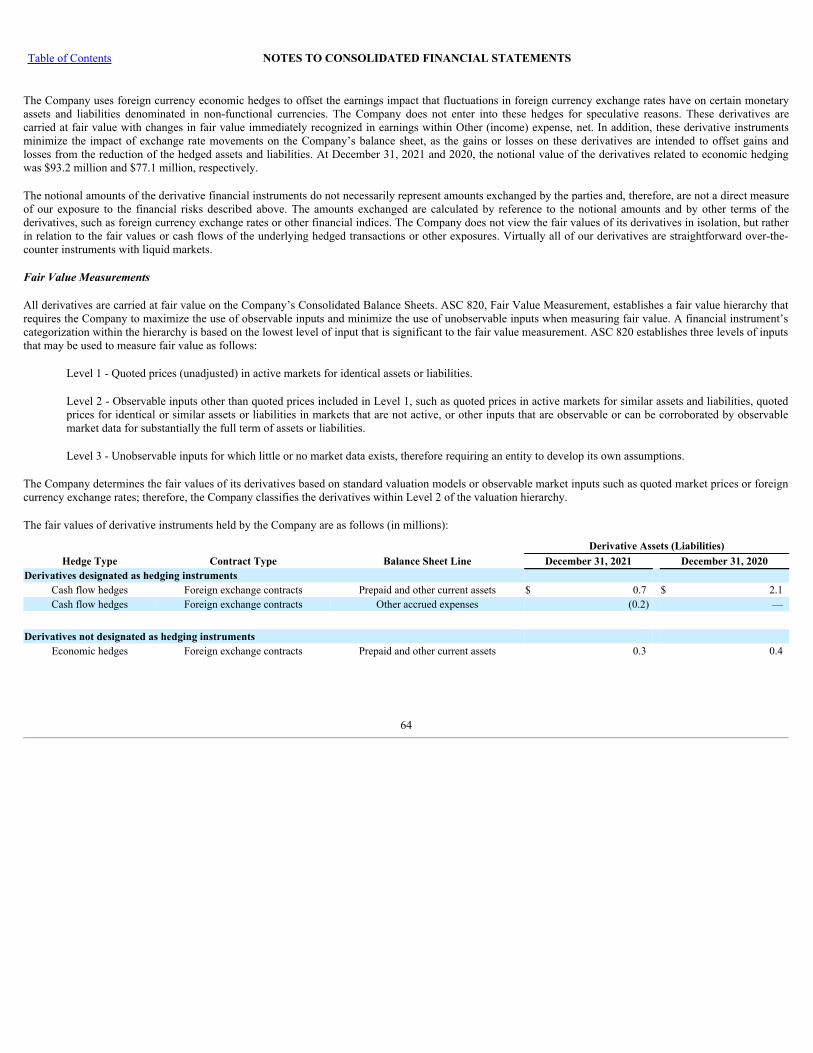
Table of Contents NOTES TO CONSOLIDATED FINANCIAL STATEMENTS
The Company uses foreign currency economic hedges to offset the earnings impact that fluctuations in foreign currency exchange rates have on certain monetaryassets and liabilities denominated in non-functional currencies. The Company does not enter into these hedges for speculative reasons. These derivatives arecarried at fair value with changes in fair value immediately recognized in earnings within Other (income) expense, net. In addition, these derivative instrumentsminimize the impact of exchange rate movements on the Company’s balance sheet, as the gains or losses on these derivatives are intended to offset gains andlosses from the reduction of the hedged assets and liabilities. At December 31, 2021 and 2020, the notional value of the derivatives related to economic hedgingwas $93.2 million and $77.1 million, respectively.
The notional amounts of the derivative financial instruments do not necessarily represent amounts exchanged by the parties and, therefore, are not a direct measureof our exposure to the financial risks described above. The amounts exchanged are calculated by reference to the notional amounts and by other terms of thederivatives, such as foreign currency exchange rates or other financial indices. The Company does not view the fair values of its derivatives in isolation, but ratherin relation to the fair values or cash flows of the underlying hedged transactions or other exposures. Virtually all of our derivatives are straightforward over-the-counter instruments with liquid markets.
Fair Value Measurements
All derivatives are carried at fair value on the Company’s Consolidated Balance Sheets. ASC 820, Fair Value Measurement, establishes a fair value hierarchy thatrequires the Company to maximize the use of observable inputs and minimize the use of unobservable inputs when measuring fair value. A financial instrument’scategorization within the hierarchy is based on the lowest level of input that is significant to the fair value measurement. ASC 820 establishes three levels of inputsthat may be used to measure fair value as follows:
Level 1 - Quoted prices (unadjusted) in active markets for identical assets or liabilities.
Level 2 - Observable inputs other than quoted prices included in Level 1, such as quoted prices in active markets for similar assets and liabilities, quotedprices for identical or similar assets or liabilities in markets that are not active, or other inputs that are observable or can be corroborated by observablemarket data for substantially the full term of assets or liabilities.
Level 3 - Unobservable inputs for which little or no market data exists, therefore requiring an entity to develop its own assumptions.
The Company determines the fair values of its derivatives based on standard valuation models or observable market inputs such as quoted market prices or foreigncurrency exchange rates; therefore, the Company classifies the derivatives within Level 2 of the valuation hierarchy.
The fair values of derivative instruments held by the Company are as follows (in millions):
Derivative Assets (Liabilities)Hedge Type Contract Type Balance Sheet Line December 31, 2021 December 31, 2020
Derivatives designated as hedging instrumentsCash flow hedges Foreign exchange contracts Prepaid and other current assets $ 0.7 $ 2.1 Cash flow hedges Foreign exchange contracts Other accrued expenses (0.2) —
Derivatives not designated as hedging instrumentsEconomic hedges Foreign exchange contracts Prepaid and other current assets 0.3 0.4
64
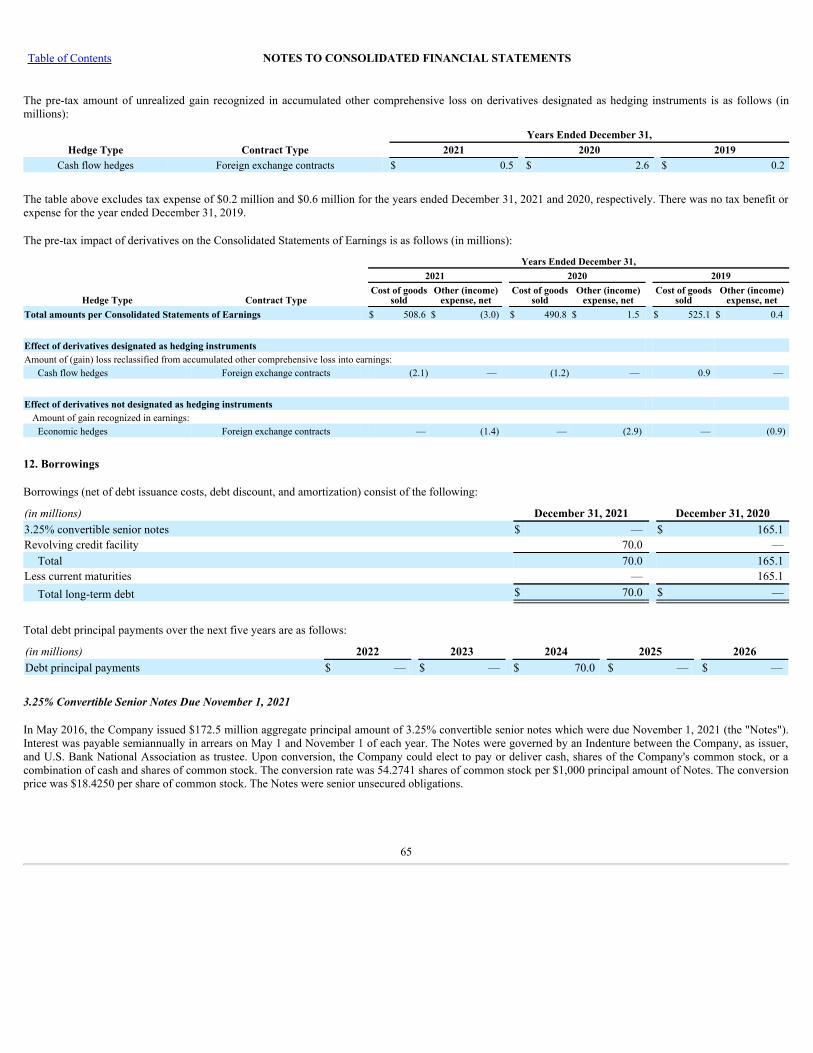
Table of Contents NOTES TO CONSOLIDATED FINANCIAL STATEMENTS
The pre-tax amount of unrealized gain recognized in accumulated other comprehensive loss on derivatives designated as hedging instruments is as follows (inmillions):
Years Ended December 31,Hedge Type Contract Type 2021 2020 2019
Cash flow hedges Foreign exchange contracts $ 0.5 $ 2.6 $ 0.2
The table above excludes tax expense of $0.2 million and $0.6 million for the years ended December 31, 2021 and 2020, respectively. There was no tax benefit orexpense for the year ended December 31, 2019.
The pre-tax impact of derivatives on the Consolidated Statements of Earnings is as follows (in millions):
Years Ended December 31,2021 2020 2019
Hedge Type Contract TypeCost of goods
soldOther (income)
expense, netCost of goods
soldOther (income)
expense, netCost of goods
soldOther (income)
expense, netTotal amounts per Consolidated Statements of Earnings $ 508.6 $ (3.0) $ 490.8 $ 1.5 $ 525.1 $ 0.4
Effect of derivatives designated as hedging instrumentsAmount of (gain) loss reclassified from accumulated other comprehensive loss into earnings:
Cash flow hedges Foreign exchange contracts (2.1) — (1.2) — 0.9 —
Effect of derivatives not designated as hedging instrumentsAmount of gain recognized in earnings:
Economic hedges Foreign exchange contracts — (1.4) — (2.9) — (0.9)
12. Borrowings
Borrowings (net of debt issuance costs, debt discount, and amortization) consist of the following:
(in millions) December 31, 2021 December 31, 20203.25% convertible senior notes $ — $ 165.1 Revolving credit facility 70.0 —
Total 70.0 165.1 Less current maturities — 165.1
Total long-term debt $ 70.0 $ —
Total debt principal payments over the next five years are as follows:
(in millions) 2022 2023 2024 2025 2026Debt principal payments $ — $ — $ 70.0 $ — $ —
3.25% Convertible Senior Notes Due November 1, 2021
In May 2016, the Company issued $172.5 million aggregate principal amount of 3.25% convertible senior notes which were due November 1, 2021 (the "Notes").Interest was payable semiannually in arrears on May 1 and November 1 of each year. The Notes were governed by an Indenture between the Company, as issuer,and U.S. Bank National Association as trustee. Upon conversion, the Company could elect to pay or deliver cash, shares of the Company's common stock, or acombination of cash and shares of common stock. The conversion rate was 54.2741 shares of common stock per $1,000 principal amount of Notes. The conversionprice was $18.4250 per share of common stock. The Notes were senior unsecured obligations.
65
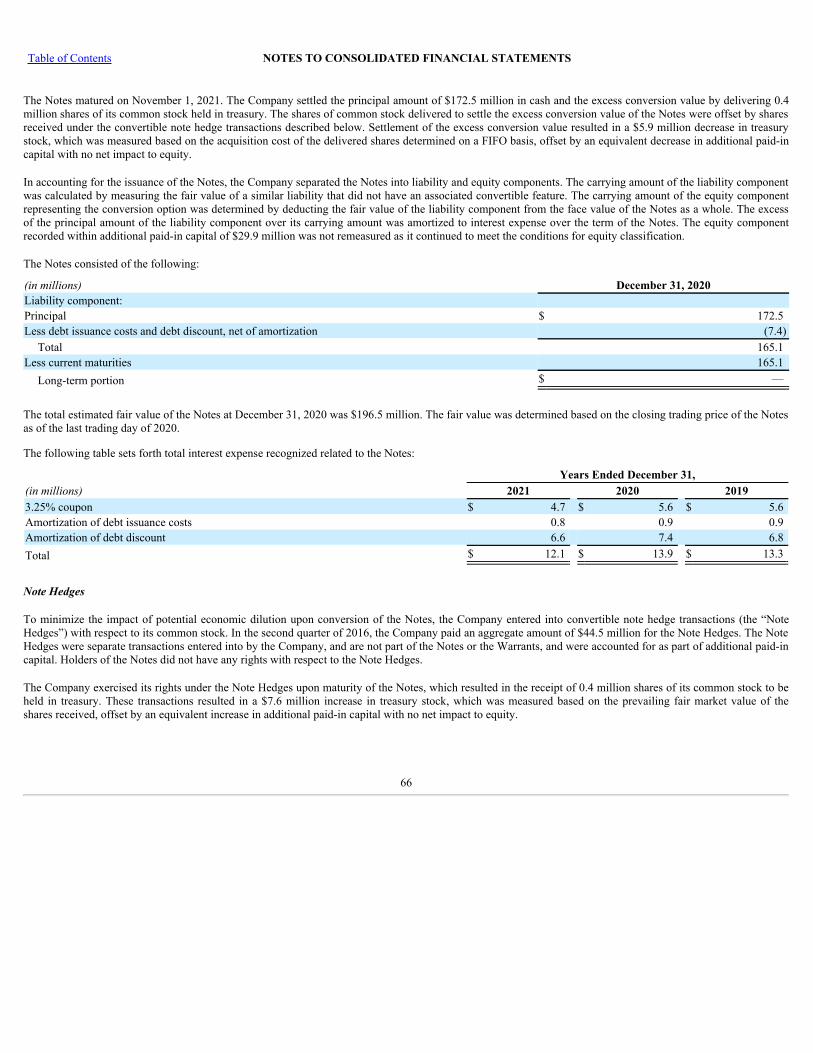
Table of Contents NOTES TO CONSOLIDATED FINANCIAL STATEMENTS
The Notes matured on November 1, 2021. The Company settled the principal amount of $172.5 million in cash and the excess conversion value by delivering 0.4million shares of its common stock held in treasury. The shares of common stock delivered to settle the excess conversion value of the Notes were offset by sharesreceived under the convertible note hedge transactions described below. Settlement of the excess conversion value resulted in a $5.9 million decrease in treasurystock, which was measured based on the acquisition cost of the delivered shares determined on a FIFO basis, offset by an equivalent decrease in additional paid-incapital with no net impact to equity.
In accounting for the issuance of the Notes, the Company separated the Notes into liability and equity components. The carrying amount of the liability componentwas calculated by measuring the fair value of a similar liability that did not have an associated convertible feature. The carrying amount of the equity componentrepresenting the conversion option was determined by deducting the fair value of the liability component from the face value of the Notes as a whole. The excessof the principal amount of the liability component over its carrying amount was amortized to interest expense over the term of the Notes. The equity componentrecorded within additional paid-in capital of $29.9 million was not remeasured as it continued to meet the conditions for equity classification.
The Notes consisted of the following:
(in millions) December 31, 2020Liability component:Principal $ 172.5 Less debt issuance costs and debt discount, net of amortization (7.4)
Total 165.1 Less current maturities 165.1
Long-term portion $ —
The total estimated fair value of the Notes at December 31, 2020 was $196.5 million. The fair value was determined based on the closing trading price of the Notesas of the last trading day of 2020.
The following table sets forth total interest expense recognized related to the Notes:
Years Ended December 31,(in millions) 2021 2020 20193.25% coupon $ 4.7 $ 5.6 $ 5.6 Amortization of debt issuance costs 0.8 0.9 0.9 Amortization of debt discount 6.6 7.4 6.8 Total $ 12.1 $ 13.9 $ 13.3
Note Hedges
To minimize the impact of potential economic dilution upon conversion of the Notes, the Company entered into convertible note hedge transactions (the “NoteHedges”) with respect to its common stock. In the second quarter of 2016, the Company paid an aggregate amount of $44.5 million for the Note Hedges. The NoteHedges were separate transactions entered into by the Company, and are not part of the Notes or the Warrants, and were accounted for as part of additional paid-incapital. Holders of the Notes did not have any rights with respect to the Note Hedges.
The Company exercised its rights under the Note Hedges upon maturity of the Notes, which resulted in the receipt of 0.4 million shares of its common stock to beheld in treasury. These transactions resulted in a $7.6 million increase in treasury stock, which was measured based on the prevailing fair market value of theshares received, offset by an equivalent increase in additional paid-in capital with no net impact to equity.
66
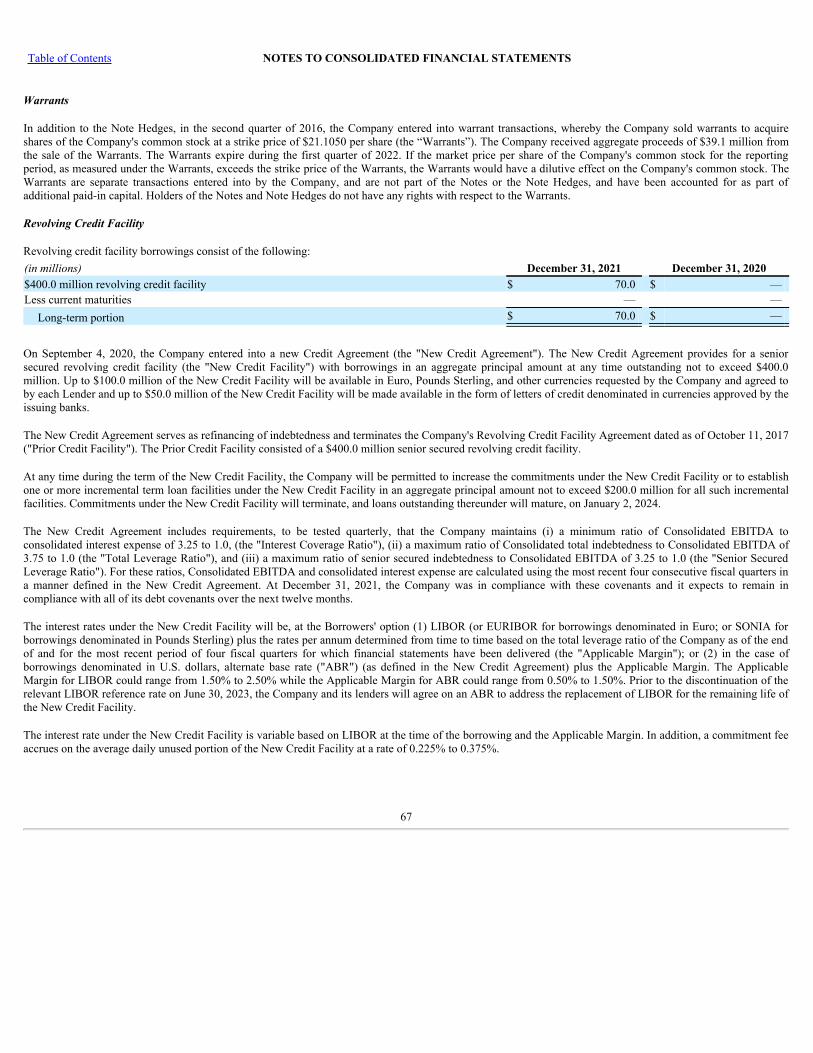
Table of Contents NOTES TO CONSOLIDATED FINANCIAL STATEMENTS
Warrants
In addition to the Note Hedges, in the second quarter of 2016, the Company entered into warrant transactions, whereby the Company sold warrants to acquireshares of the Company's common stock at a strike price of $21.1050 per share (the “Warrants”). The Company received aggregate proceeds of $39.1 million fromthe sale of the Warrants. The Warrants expire during the first quarter of 2022. If the market price per share of the Company's common stock for the reportingperiod, as measured under the Warrants, exceeds the strike price of the Warrants, the Warrants would have a dilutive effect on the Company's common stock. TheWarrants are separate transactions entered into by the Company, and are not part of the Notes or the Note Hedges, and have been accounted for as part ofadditional paid-in capital. Holders of the Notes and Note Hedges do not have any rights with respect to the Warrants.
Revolving Credit Facility
Revolving credit facility borrowings consist of the following: (in millions) December 31, 2021 December 31, 2020$400.0 million revolving credit facility $ 70.0 $ — Less current maturities — —
Long-term portion $ 70.0 $ —
On September 4, 2020, the Company entered into a new Credit Agreement (the "New Credit Agreement"). The New Credit Agreement provides for a seniorsecured revolving credit facility (the "New Credit Facility") with borrowings in an aggregate principal amount at any time outstanding not to exceed $400.0million. Up to $100.0 million of the New Credit Facility will be available in Euro, Pounds Sterling, and other currencies requested by the Company and agreed toby each Lender and up to $50.0 million of the New Credit Facility will be made available in the form of letters of credit denominated in currencies approved by theissuing banks.
The New Credit Agreement serves as refinancing of indebtedness and terminates the Company's Revolving Credit Facility Agreement dated as of October 11, 2017("Prior Credit Facility"). The Prior Credit Facility consisted of a $400.0 million senior secured revolving credit facility.
At any time during the term of the New Credit Facility, the Company will be permitted to increase the commitments under the New Credit Facility or to establishone or more incremental term loan facilities under the New Credit Facility in an aggregate principal amount not to exceed $200.0 million for all such incrementalfacilities. Commitments under the New Credit Facility will terminate, and loans outstanding thereunder will mature, on January 2, 2024.
The New Credit Agreement includes requirements, to be tested quarterly, that the Company maintains (i) a minimum ratio of Consolidated EBITDA toconsolidated interest expense of 3.25 to 1.0, (the "Interest Coverage Ratio"), (ii) a maximum ratio of Consolidated total indebtedness to Consolidated EBITDA of3.75 to 1.0 (the "Total Leverage Ratio"), and (iii) a maximum ratio of senior secured indebtedness to Consolidated EBITDA of 3.25 to 1.0 (the "Senior SecuredLeverage Ratio"). For these ratios, Consolidated EBITDA and consolidated interest expense are calculated using the most recent four consecutive fiscal quarters ina manner defined in the New Credit Agreement. At December 31, 2021, the Company was in compliance with these covenants and it expects to remain incompliance with all of its debt covenants over the next twelve months.
The interest rates under the New Credit Facility will be, at the Borrowers' option (1) LIBOR (or EURIBOR for borrowings denominated in Euro; or SONIA forborrowings denominated in Pounds Sterling) plus the rates per annum determined from time to time based on the total leverage ratio of the Company as of the endof and for the most recent period of four fiscal quarters for which financial statements have been delivered (the "Applicable Margin"); or (2) in the case ofborrowings denominated in U.S. dollars, alternate base rate ("ABR") (as defined in the New Credit Agreement) plus the Applicable Margin. The ApplicableMargin for LIBOR could range from 1.50% to 2.50% while the Applicable Margin for ABR could range from 0.50% to 1.50%. Prior to the discontinuation of therelevant LIBOR reference rate on June 30, 2023, the Company and its lenders will agree on an ABR to address the replacement of LIBOR for the remaining life ofthe New Credit Facility.
The interest rate under the New Credit Facility is variable based on LIBOR at the time of the borrowing and the Applicable Margin. In addition, a commitment feeaccrues on the average daily unused portion of the New Credit Facility at a rate of 0.225% to 0.375%.
67
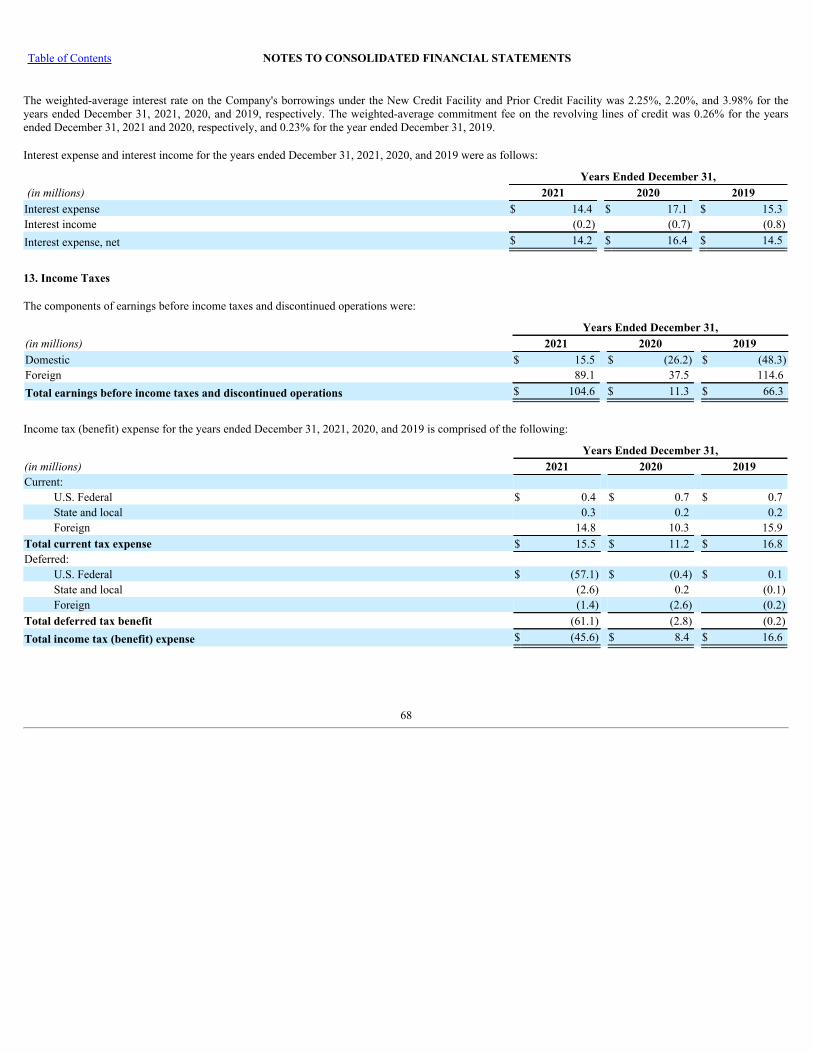
Table of Contents NOTES TO CONSOLIDATED FINANCIAL STATEMENTS
The weighted-average interest rate on the Company's borrowings under the New Credit Facility and Prior Credit Facility was 2.25%, 2.20%, and 3.98% for theyears ended December 31, 2021, 2020, and 2019, respectively. The weighted-average commitment fee on the revolving lines of credit was 0.26% for the yearsended December 31, 2021 and 2020, respectively, and 0.23% for the year ended December 31, 2019.
Interest expense and interest income for the years ended December 31, 2021, 2020, and 2019 were as follows:
Years Ended December 31, (in millions) 2021 2020 2019Interest expense $ 14.4 $ 17.1 $ 15.3 Interest income (0.2) (0.7) (0.8)Interest expense, net $ 14.2 $ 16.4 $ 14.5
13. Income Taxes
The components of earnings before income taxes and discontinued operations were:
Years Ended December 31,(in millions) 2021 2020 2019Domestic $ 15.5 $ (26.2) $ (48.3)Foreign 89.1 37.5 114.6 Total earnings before income taxes and discontinued operations $ 104.6 $ 11.3 $ 66.3
Income tax (benefit) expense for the years ended December 31, 2021, 2020, and 2019 is comprised of the following:
Years Ended December 31,(in millions) 2021 2020 2019Current:
U.S. Federal $ 0.4 $ 0.7 $ 0.7 State and local 0.3 0.2 0.2 Foreign 14.8 10.3 15.9
Total current tax expense $ 15.5 $ 11.2 $ 16.8 Deferred:
U.S. Federal $ (57.1) $ (0.4) $ 0.1 State and local (2.6) 0.2 (0.1)Foreign (1.4) (2.6) (0.2)
Total deferred tax benefit (61.1) (2.8) (0.2)Total income tax (benefit) expense $ (45.6) $ 8.4 $ 16.6
68
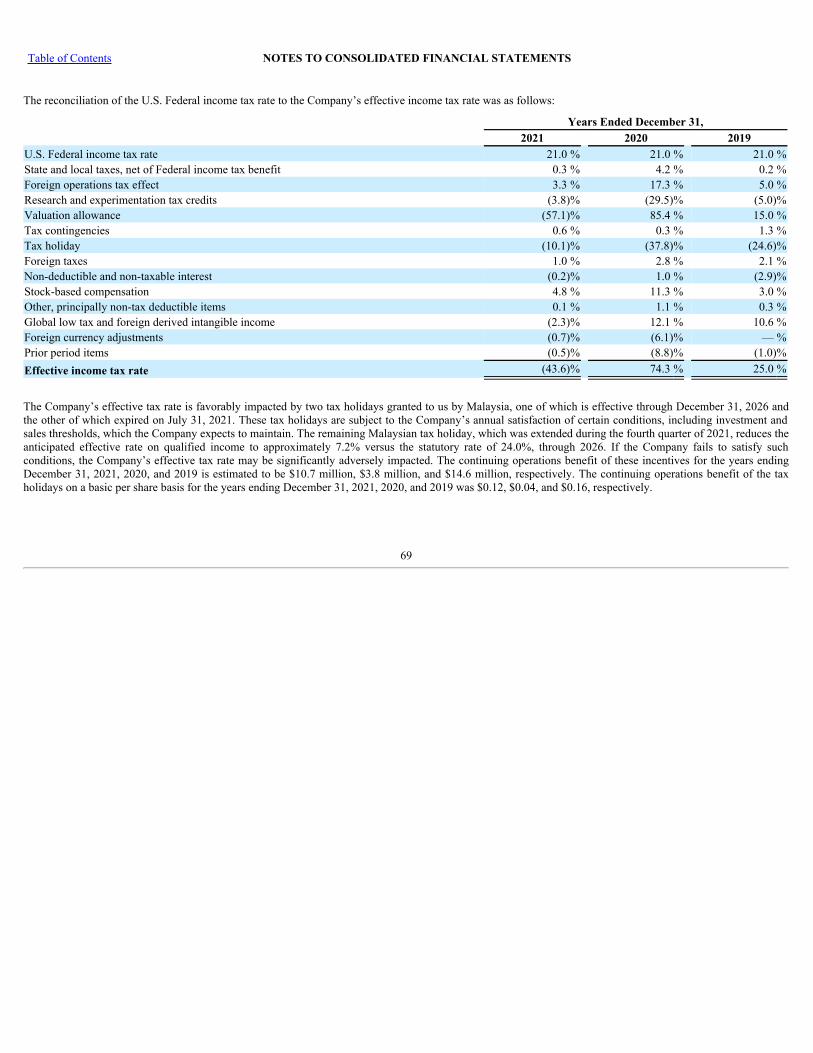
Table of Contents NOTES TO CONSOLIDATED FINANCIAL STATEMENTS
The reconciliation of the U.S. Federal income tax rate to the Company’s effective income tax rate was as follows:
Years Ended December 31, 2021 2020 2019U.S. Federal income tax rate 21.0 % 21.0 % 21.0 %State and local taxes, net of Federal income tax benefit 0.3 % 4.2 % 0.2 %Foreign operations tax effect 3.3 % 17.3 % 5.0 %Research and experimentation tax credits (3.8)% (29.5)% (5.0)%Valuation allowance (57.1)% 85.4 % 15.0 %Tax contingencies 0.6 % 0.3 % 1.3 %Tax holiday (10.1)% (37.8)% (24.6)%Foreign taxes 1.0 % 2.8 % 2.1 %Non-deductible and non-taxable interest (0.2)% 1.0 % (2.9)%Stock-based compensation 4.8 % 11.3 % 3.0 %Other, principally non-tax deductible items 0.1 % 1.1 % 0.3 %Global low tax and foreign derived intangible income (2.3)% 12.1 % 10.6 %Foreign currency adjustments (0.7)% (6.1)% — %Prior period items (0.5)% (8.8)% (1.0)%Effective income tax rate (43.6)% 74.3 % 25.0 %
The Company’s effective tax rate is favorably impacted by two tax holidays granted to us by Malaysia, one of which is effective through December 31, 2026 andthe other of which expired on July 31, 2021. These tax holidays are subject to the Company’s annual satisfaction of certain conditions, including investment andsales thresholds, which the Company expects to maintain. The remaining Malaysian tax holiday, which was extended during the fourth quarter of 2021, reduces theanticipated effective rate on qualified income to approximately 7.2% versus the statutory rate of 24.0%, through 2026. If the Company fails to satisfy suchconditions, the Company’s effective tax rate may be significantly adversely impacted. The continuing operations benefit of these incentives for the years endingDecember 31, 2021, 2020, and 2019 is estimated to be $10.7 million, $3.8 million, and $14.6 million, respectively. The continuing operations benefit of the taxholidays on a basic per share basis for the years ending December 31, 2021, 2020, and 2019 was $0.12, $0.04, and $0.16, respectively.
69
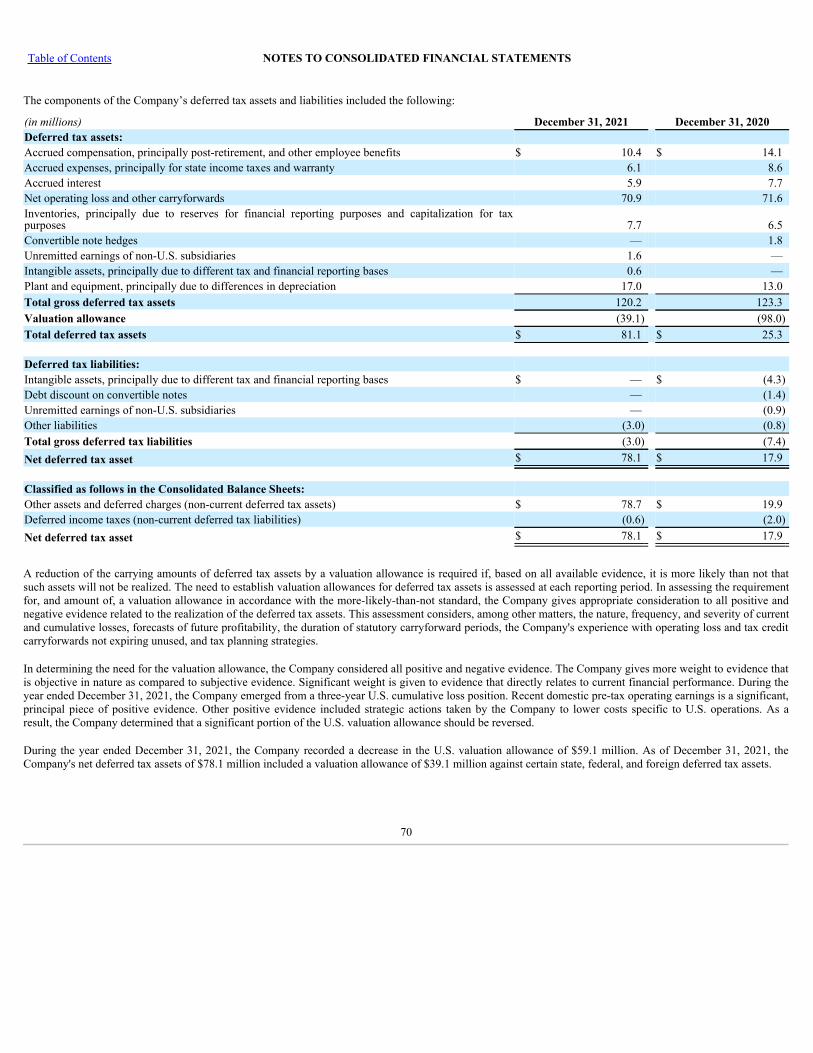
Table of Contents NOTES TO CONSOLIDATED FINANCIAL STATEMENTS
The components of the Company’s deferred tax assets and liabilities included the following:
(in millions) December 31, 2021 December 31, 2020Deferred tax assets:Accrued compensation, principally post-retirement, and other employee benefits $ 10.4 $ 14.1 Accrued expenses, principally for state income taxes and warranty 6.1 8.6 Accrued interest 5.9 7.7 Net operating loss and other carryforwards 70.9 71.6 Inventories, principally due to reserves for financial reporting purposes and capitalization for taxpurposes 7.7 6.5 Convertible note hedges — 1.8 Unremitted earnings of non-U.S. subsidiaries 1.6 — Intangible assets, principally due to different tax and financial reporting bases 0.6 — Plant and equipment, principally due to differences in depreciation 17.0 13.0 Total gross deferred tax assets 120.2 123.3 Valuation allowance (39.1) (98.0)Total deferred tax assets $ 81.1 $ 25.3
Deferred tax liabilities:Intangible assets, principally due to different tax and financial reporting bases $ — $ (4.3)Debt discount on convertible notes — (1.4)Unremitted earnings of non-U.S. subsidiaries — (0.9)Other liabilities (3.0) (0.8)Total gross deferred tax liabilities (3.0) (7.4)Net deferred tax asset $ 78.1 $ 17.9
Classified as follows in the Consolidated Balance Sheets:Other assets and deferred charges (non-current deferred tax assets) $ 78.7 $ 19.9 Deferred income taxes (non-current deferred tax liabilities) (0.6) (2.0)Net deferred tax asset $ 78.1 $ 17.9
A reduction of the carrying amounts of deferred tax assets by a valuation allowance is required if, based on all available evidence, it is more likely than not thatsuch assets will not be realized. The need to establish valuation allowances for deferred tax assets is assessed at each reporting period. In assessing the requirementfor, and amount of, a valuation allowance in accordance with the more-likely-than-not standard, the Company gives appropriate consideration to all positive andnegative evidence related to the realization of the deferred tax assets. This assessment considers, among other matters, the nature, frequency, and severity of currentand cumulative losses, forecasts of future profitability, the duration of statutory carryforward periods, the Company's experience with operating loss and tax creditcarryforwards not expiring unused, and tax planning strategies.
In determining the need for the valuation allowance, the Company considered all positive and negative evidence. The Company gives more weight to evidence thatis objective in nature as compared to subjective evidence. Significant weight is given to evidence that directly relates to current financial performance. During theyear ended December 31, 2021, the Company emerged from a three-year U.S. cumulative loss position. Recent domestic pre-tax operating earnings is a significant,principal piece of positive evidence. Other positive evidence included strategic actions taken by the Company to lower costs specific to U.S. operations. As aresult, the Company determined that a significant portion of the U.S. valuation allowance should be reversed.
During the year ended December 31, 2021, the Company recorded a decrease in the U.S. valuation allowance of $59.1 million. As of December 31, 2021, theCompany's net deferred tax assets of $78.1 million included a valuation allowance of $39.1 million against certain state, federal, and foreign deferred tax assets.
70
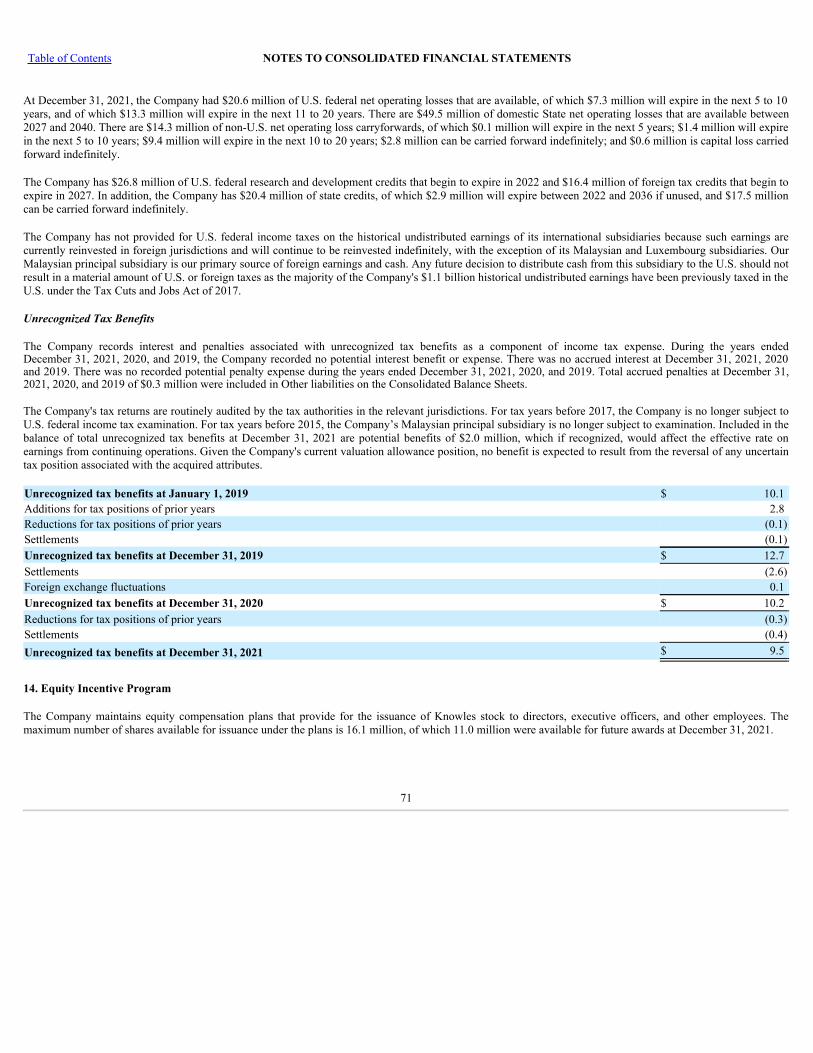
Table of Contents NOTES TO CONSOLIDATED FINANCIAL STATEMENTS
At December 31, 2021, the Company had $20.6 million of U.S. federal net operating losses that are available, of which $7.3 million will expire in the next 5 to 10years, and of which $13.3 million will expire in the next 11 to 20 years. There are $49.5 million of domestic State net operating losses that are available between2027 and 2040. There are $14.3 million of non-U.S. net operating loss carryforwards, of which $0.1 million will expire in the next 5 years; $1.4 million will expirein the next 5 to 10 years; $9.4 million will expire in the next 10 to 20 years; $2.8 million can be carried forward indefinitely; and $0.6 million is capital loss carriedforward indefinitely.
The Company has $26.8 million of U.S. federal research and development credits that begin to expire in 2022 and $16.4 million of foreign tax credits that begin toexpire in 2027. In addition, the Company has $20.4 million of state credits, of which $2.9 million will expire between 2022 and 2036 if unused, and $17.5 millioncan be carried forward indefinitely.
The Company has not provided for U.S. federal income taxes on the historical undistributed earnings of its international subsidiaries because such earnings arecurrently reinvested in foreign jurisdictions and will continue to be reinvested indefinitely, with the exception of its Malaysian and Luxembourg subsidiaries. OurMalaysian principal subsidiary is our primary source of foreign earnings and cash. Any future decision to distribute cash from this subsidiary to the U.S. should notresult in a material amount of U.S. or foreign taxes as the majority of the Company's $1.1 billion historical undistributed earnings have been previously taxed in theU.S. under the Tax Cuts and Jobs Act of 2017.
Unrecognized Tax Benefits
The Company records interest and penalties associated with unrecognized tax benefits as a component of income tax expense. During the years endedDecember 31, 2021, 2020, and 2019, the Company recorded no potential interest benefit or expense. There was no accrued interest at December 31, 2021, 2020and 2019. There was no recorded potential penalty expense during the years ended December 31, 2021, 2020, and 2019. Total accrued penalties at December 31,2021, 2020, and 2019 of $0.3 million were included in Other liabilities on the Consolidated Balance Sheets.
The Company's tax returns are routinely audited by the tax authorities in the relevant jurisdictions. For tax years before 2017, the Company is no longer subject toU.S. federal income tax examination. For tax years before 2015, the Company’s Malaysian principal subsidiary is no longer subject to examination. Included in thebalance of total unrecognized tax benefits at December 31, 2021 are potential benefits of $2.0 million, which if recognized, would affect the effective rate onearnings from continuing operations. Given the Company's current valuation allowance position, no benefit is expected to result from the reversal of any uncertaintax position associated with the acquired attributes.
Unrecognized tax benefits at January 1, 2019 $ 10.1 Additions for tax positions of prior years 2.8 Reductions for tax positions of prior years (0.1)Settlements (0.1)Unrecognized tax benefits at December 31, 2019 $ 12.7 Settlements (2.6)Foreign exchange fluctuations 0.1 Unrecognized tax benefits at December 31, 2020 $ 10.2 Reductions for tax positions of prior years (0.3)Settlements (0.4)Unrecognized tax benefits at December 31, 2021 $ 9.5
14. Equity Incentive Program
The Company maintains equity compensation plans that provide for the issuance of Knowles stock to directors, executive officers, and other employees. Themaximum number of shares available for issuance under the plans is 16.1 million, of which 11.0 million were available for future awards at December 31, 2021.
71
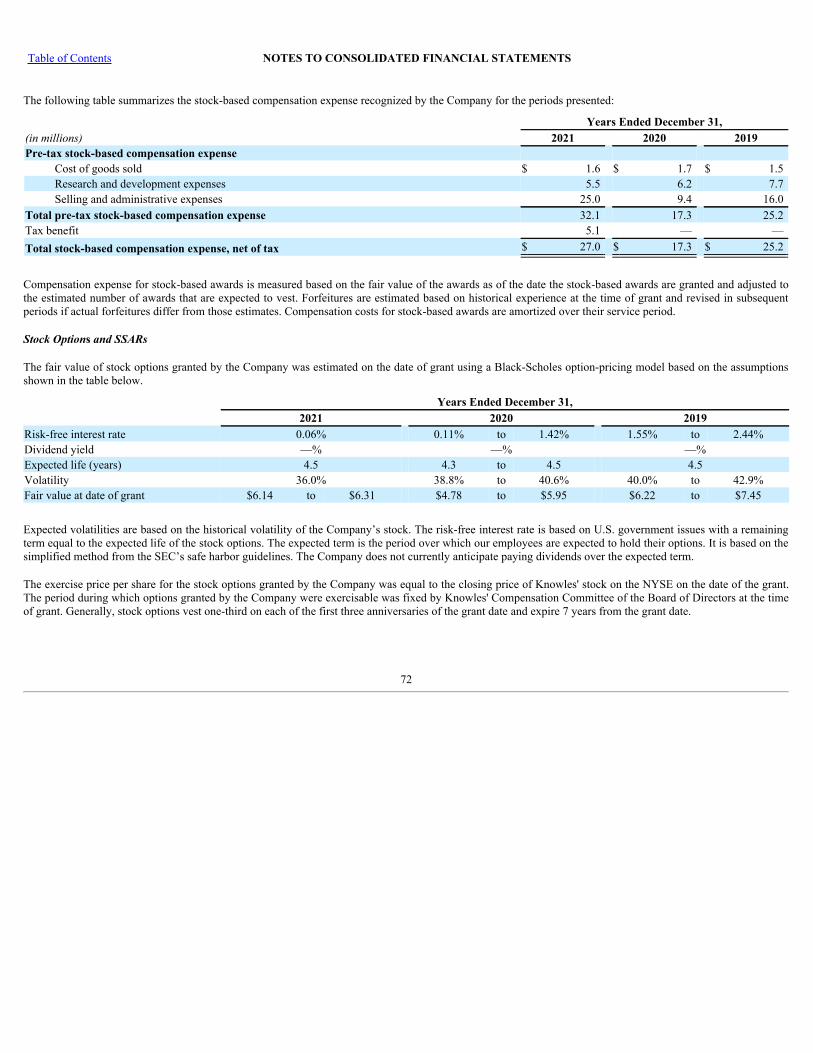
Table of Contents NOTES TO CONSOLIDATED FINANCIAL STATEMENTS
The following table summarizes the stock-based compensation expense recognized by the Company for the periods presented:
Years Ended December 31,(in millions) 2021 2020 2019Pre-tax stock-based compensation expense
Cost of goods sold $ 1.6 $ 1.7 $ 1.5 Research and development expenses 5.5 6.2 7.7 Selling and administrative expenses 25.0 9.4 16.0
Total pre-tax stock-based compensation expense 32.1 17.3 25.2 Tax benefit 5.1 — — Total stock-based compensation expense, net of tax $ 27.0 $ 17.3 $ 25.2
Compensation expense for stock-based awards is measured based on the fair value of the awards as of the date the stock-based awards are granted and adjusted tothe estimated number of awards that are expected to vest. Forfeitures are estimated based on historical experience at the time of grant and revised in subsequentperiods if actual forfeitures differ from those estimates. Compensation costs for stock-based awards are amortized over their service period.
Stock Options and SSARs
The fair value of stock options granted by the Company was estimated on the date of grant using a Black-Scholes option-pricing model based on the assumptionsshown in the table below.
Years Ended December 31,2021 2020 2019
Risk-free interest rate 0.06% 0.11% to 1.42% 1.55% to 2.44%Dividend yield —% —% —%Expected life (years) 4.5 4.3 to 4.5 4.5Volatility 36.0% 38.8% to 40.6% 40.0% to 42.9%Fair value at date of grant $6.14 to $6.31 $4.78 to $5.95 $6.22 to $7.45
Expected volatilities are based on the historical volatility of the Company’s stock. The risk-free interest rate is based on U.S. government issues with a remainingterm equal to the expected life of the stock options. The expected term is the period over which our employees are expected to hold their options. It is based on thesimplified method from the SEC’s safe harbor guidelines. The Company does not currently anticipate paying dividends over the expected term.
The exercise price per share for the stock options granted by the Company was equal to the closing price of Knowles' stock on the NYSE on the date of the grant.The period during which options granted by the Company were exercisable was fixed by Knowles' Compensation Committee of the Board of Directors at the timeof grant. Generally, stock options vest one-third on each of the first three anniversaries of the grant date and expire 7 years from the grant date.
72
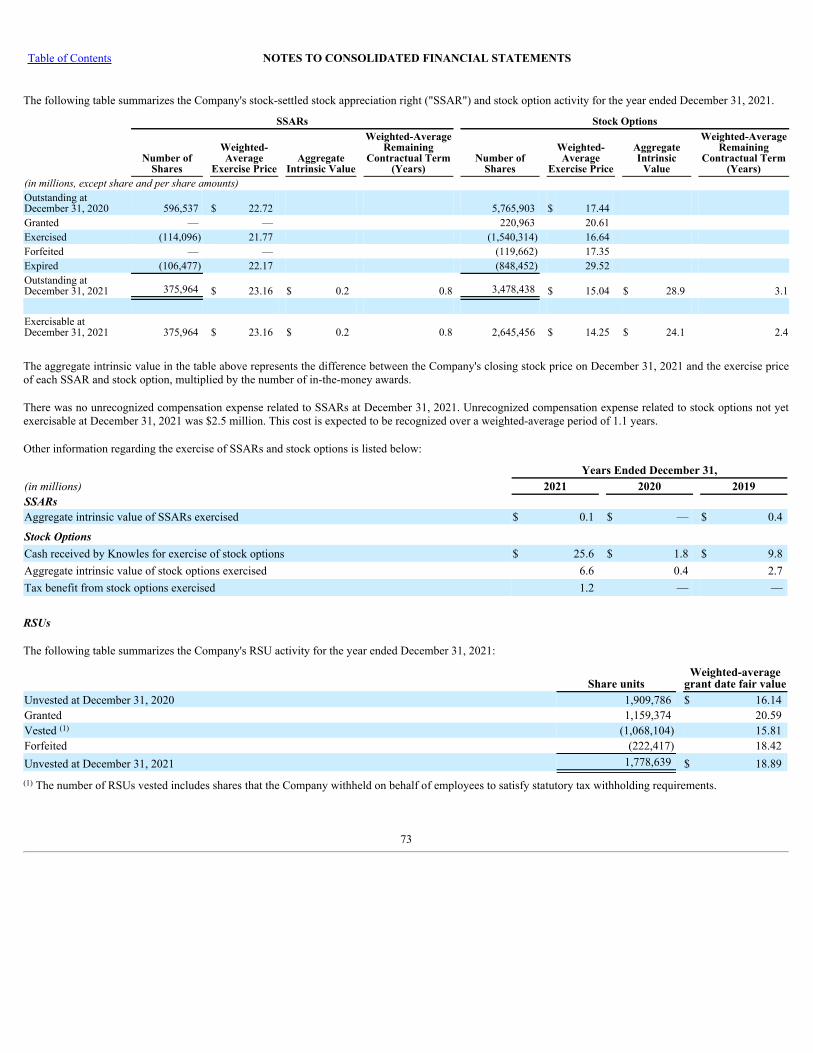
Table of Contents NOTES TO CONSOLIDATED FINANCIAL STATEMENTS
The following table summarizes the Company's stock-settled stock appreciation right ("SSAR") and stock option activity for the year ended December 31, 2021.
SSARs Stock Options
Number of
Shares
Weighted-Average
Exercise PriceAggregate
Intrinsic Value
Weighted-AverageRemaining
Contractual Term(Years)
Number ofShares
Weighted-Average
Exercise Price
AggregateIntrinsic
Value
Weighted-AverageRemaining
Contractual Term(Years)
(in millions, except share and per share amounts)Outstanding atDecember 31, 2020 596,537 $ 22.72 5,765,903 $ 17.44 Granted — — 220,963 20.61 Exercised (114,096) 21.77 (1,540,314) 16.64 Forfeited — — (119,662) 17.35 Expired (106,477) 22.17 (848,452) 29.52 Outstanding atDecember 31, 2021 375,964 $ 23.16 $ 0.2 0.8 3,478,438 $ 15.04 $ 28.9 3.1
Exercisable atDecember 31, 2021 375,964 $ 23.16 $ 0.2 0.8 2,645,456 $ 14.25 $ 24.1 2.4
The aggregate intrinsic value in the table above represents the difference between the Company's closing stock price on December 31, 2021 and the exercise priceof each SSAR and stock option, multiplied by the number of in-the-money awards.
There was no unrecognized compensation expense related to SSARs at December 31, 2021. Unrecognized compensation expense related to stock options not yetexercisable at December 31, 2021 was $2.5 million. This cost is expected to be recognized over a weighted-average period of 1.1 years.
Other information regarding the exercise of SSARs and stock options is listed below:
Years Ended December 31,(in millions) 2021 2020 2019SSARsAggregate intrinsic value of SSARs exercised $ 0.1 $ — $ 0.4
Stock OptionsCash received by Knowles for exercise of stock options $ 25.6 $ 1.8 $ 9.8 Aggregate intrinsic value of stock options exercised 6.6 0.4 2.7 Tax benefit from stock options exercised 1.2 — —
RSUs
The following table summarizes the Company's RSU activity for the year ended December 31, 2021:
Share unitsWeighted-average
grant date fair valueUnvested at December 31, 2020 1,909,786 $ 16.14 Granted 1,159,374 20.59 Vested (1,068,104) 15.81 Forfeited (222,417) 18.42 Unvested at December 31, 2021 1,778,639 $ 18.89
The number of RSUs vested includes shares that the Company withheld on behalf of employees to satisfy statutory tax withholding requirements.
(1)
(1)
73
Table of Contents NOTES TO CONSOLIDATED FINANCIAL STATEMENTS
RSUs vest based on the passage of time. Generally, RSUs have a three year vesting schedule and vest one-third on each of the first three anniversaries of the grantdate. The fair value of RSUs vested during the year ended December 31, 2021 was $21.9 million. At December 31, 2021, $19.7 million of unrecognizedcompensation expense related to RSUs is expected to be recognized over a weighted-average period of 1.6 years.
PSUs
The Company grants PSUs to senior management. In each case, the awards will cliff vest three years following the grant date. PSUs will be settled in shares of theCompany's common stock. Depending on the Company's overall performance relative to the applicable measures, the size of the PSU awards are subject toadjustment, up or down, resulting in awards at the end of the performance period that can range from 0% to 225% of target. The Company will ratably recognizethe expense over the applicable service period for each grant of PSUs and adjust the expense for the expected achievement of performance conditions asappropriate. The fair value of PSUs is determined by using a Monte Carlo simulation. For the awards granted in February 2021, the number of PSUs that may beearned and vest is based on total shareholder return (“TSR”) relative to the component companies of the Russell 2000 Index over a three-year performance period.
The COVID-19 pandemic brought on unique and unprecedented challenges to the Company, particularly in the hearing health and medtech markets. Many of theCompany's executive compensation programs were affected, including outstanding PSU awards. Due to the impact of the COVID-19 pandemic on the Company’soverall business performance, effective February 8, 2021, the Company’s Compensation Committee approved certain modifications to PSUs granted in February2018, 2019, and 2020.
For the awards granted in February 2018 (the “2018 PSUs”), the number of PSUs that may be earned and vest was originally based on the Company’s revenuesand stock price performance over a three-year performance period. The modified award was based on the Company’s revenues and stock price performance overthree separate one-year performance periods to isolate the impact of the COVID-19 pandemic on the Company's fiscal 2020 performance. In addition, theperformance periods corresponding to fiscal 2018 and 2019 were weighted at 25% each while the performance period corresponding to fiscal 2020 was weighted at50%, given the impact of fiscal 2020 performance on shareholders. Service conditions were not modified. The modification of the 2018 PSUs affected nineemployees and resulted in total incremental compensation expense of $3.9 million, which was recognized in the first quarter of 2021 as there was no remainingservice period. In February 2021, the 2018 PSUs were converted from 329,092 PSUs to 190,544 shares of common stock based on achievement of the modifiedconditions.
For the awards granted in February 2019 (the “2019 PSUs”), the number of PSUs that may be earned and vest was originally based on the Company's revenues andTSR relative to the component companies of the S&P Semiconductor Select Industry Index over a three-year performance period. The modified award is based onthe Company’s revenues and TSR relative to the component companies of the S&P Semiconductor Select Industry Index over three separate one-year performanceperiods to isolate the impact of the COVID-19 pandemic on the Company's fiscal 2020 performance. Each period is weighted equally, as the Company expected toface challenges related to the COVID-19 pandemic in fiscal 2021. Service conditions were not modified. The modification of the 2019 PSUs affected eightemployees and resulted in total incremental compensation expense of $2.4 million, which will be recognized over the remaining service period. Incrementalcompensation expense was subject to adjustment for the achievement of the performance condition based on fiscal 2021 revenues.
For the awards granted in February 2020 (the “2020 PSUs”), the number of PSUs that may be earned and vest was originally based on TSR relative to thecomponent companies of the S&P Semiconductor Select Industry Index over a three-year performance period. The modified award replaces the S&PSemiconductor Select Industry Index with the Russell 2000 Index. The Company is a member of the Russell 2000 Index, which represents a broader, morediversified index that better aligns with the Company's strategy. Service conditions were not modified. The modification of the 2020 PSUs affected eightemployees and resulted in total incremental compensation expense of $4.7 million, which will be recognized over the remaining service period.
74
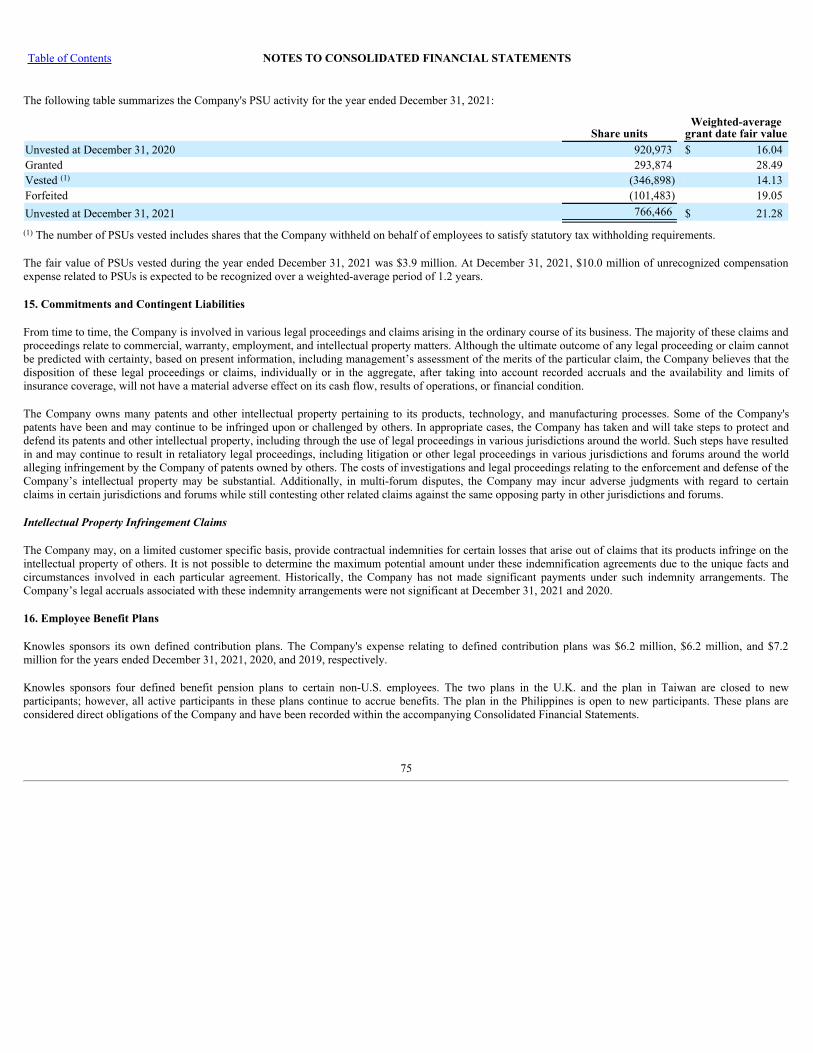
Table of Contents NOTES TO CONSOLIDATED FINANCIAL STATEMENTS
The following table summarizes the Company's PSU activity for the year ended December 31, 2021:
Share unitsWeighted-average
grant date fair valueUnvested at December 31, 2020 920,973 $ 16.04 Granted 293,874 28.49 Vested (346,898) 14.13 Forfeited (101,483) 19.05 Unvested at December 31, 2021 766,466 $ 21.28
The number of PSUs vested includes shares that the Company withheld on behalf of employees to satisfy statutory tax withholding requirements.
The fair value of PSUs vested during the year ended December 31, 2021 was $3.9 million. At December 31, 2021, $10.0 million of unrecognized compensationexpense related to PSUs is expected to be recognized over a weighted-average period of 1.2 years.
15. Commitments and Contingent Liabilities
From time to time, the Company is involved in various legal proceedings and claims arising in the ordinary course of its business. The majority of these claims andproceedings relate to commercial, warranty, employment, and intellectual property matters. Although the ultimate outcome of any legal proceeding or claim cannotbe predicted with certainty, based on present information, including management’s assessment of the merits of the particular claim, the Company believes that thedisposition of these legal proceedings or claims, individually or in the aggregate, after taking into account recorded accruals and the availability and limits ofinsurance coverage, will not have a material adverse effect on its cash flow, results of operations, or financial condition.
The Company owns many patents and other intellectual property pertaining to its products, technology, and manufacturing processes. Some of the Company'spatents have been and may continue to be infringed upon or challenged by others. In appropriate cases, the Company has taken and will take steps to protect anddefend its patents and other intellectual property, including through the use of legal proceedings in various jurisdictions around the world. Such steps have resultedin and may continue to result in retaliatory legal proceedings, including litigation or other legal proceedings in various jurisdictions and forums around the worldalleging infringement by the Company of patents owned by others. The costs of investigations and legal proceedings relating to the enforcement and defense of theCompany’s intellectual property may be substantial. Additionally, in multi-forum disputes, the Company may incur adverse judgments with regard to certainclaims in certain jurisdictions and forums while still contesting other related claims against the same opposing party in other jurisdictions and forums.
Intellectual Property Infringement Claims
The Company may, on a limited customer specific basis, provide contractual indemnities for certain losses that arise out of claims that its products infringe on theintellectual property of others. It is not possible to determine the maximum potential amount under these indemnification agreements due to the unique facts andcircumstances involved in each particular agreement. Historically, the Company has not made significant payments under such indemnity arrangements. TheCompany’s legal accruals associated with these indemnity arrangements were not significant at December 31, 2021 and 2020.
16. Employee Benefit Plans
Knowles sponsors its own defined contribution plans. The Company's expense relating to defined contribution plans was $6.2 million, $6.2 million, and $7.2million for the years ended December 31, 2021, 2020, and 2019, respectively.
Knowles sponsors four defined benefit pension plans to certain non-U.S. employees. The two plans in the U.K. and the plan in Taiwan are closed to newparticipants; however, all active participants in these plans continue to accrue benefits. The plan in the Philippines is open to new participants. These plans areconsidered direct obligations of the Company and have been recorded within the accompanying Consolidated Financial Statements.
(1)
(1)
75
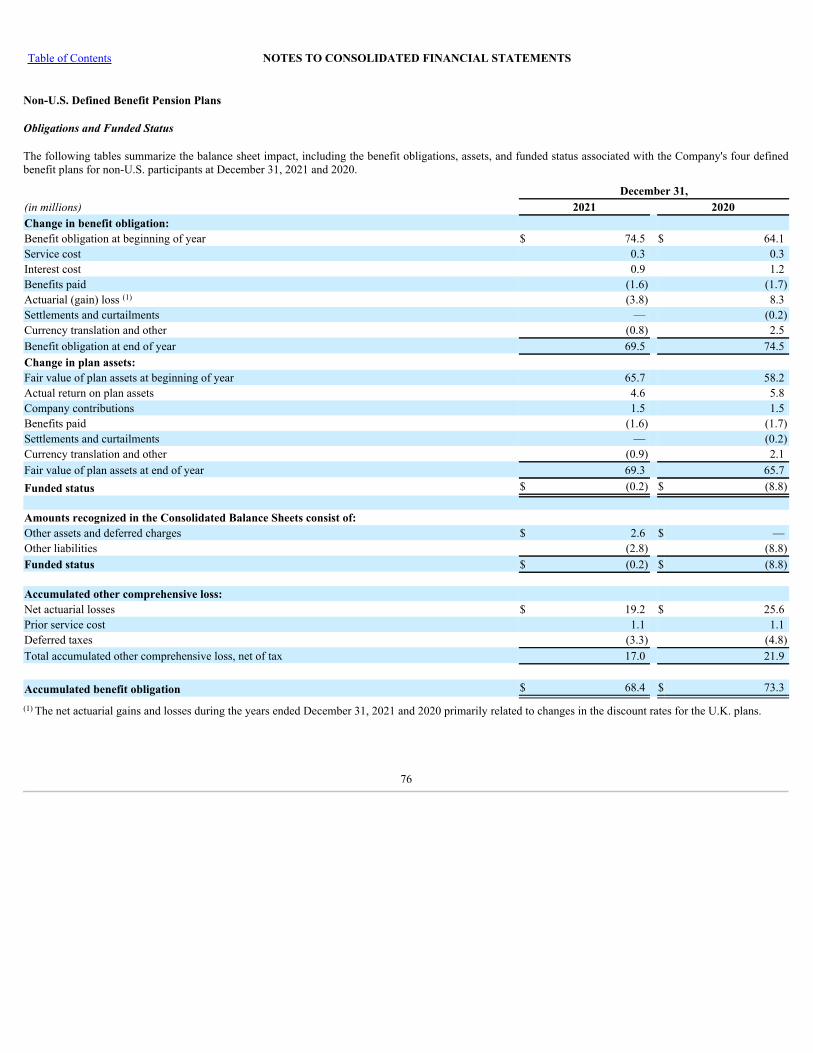
Table of Contents NOTES TO CONSOLIDATED FINANCIAL STATEMENTS
Non-U.S. Defined Benefit Pension Plans
Obligations and Funded Status
The following tables summarize the balance sheet impact, including the benefit obligations, assets, and funded status associated with the Company's four definedbenefit plans for non-U.S. participants at December 31, 2021 and 2020.
December 31,(in millions) 2021 2020Change in benefit obligation: Benefit obligation at beginning of year $ 74.5 $ 64.1 Service cost 0.3 0.3 Interest cost 0.9 1.2 Benefits paid (1.6) (1.7)Actuarial (gain) loss (3.8) 8.3 Settlements and curtailments — (0.2)Currency translation and other (0.8) 2.5 Benefit obligation at end of year 69.5 74.5 Change in plan assets: Fair value of plan assets at beginning of year 65.7 58.2 Actual return on plan assets 4.6 5.8 Company contributions 1.5 1.5 Benefits paid (1.6) (1.7)Settlements and curtailments — (0.2)Currency translation and other (0.9) 2.1 Fair value of plan assets at end of year 69.3 65.7 Funded status $ (0.2) $ (8.8)
Amounts recognized in the Consolidated Balance Sheets consist of: Other assets and deferred charges $ 2.6 $ — Other liabilities (2.8) (8.8)Funded status $ (0.2) $ (8.8)
Accumulated other comprehensive loss:Net actuarial losses $ 19.2 $ 25.6 Prior service cost 1.1 1.1 Deferred taxes (3.3) (4.8)Total accumulated other comprehensive loss, net of tax 17.0 21.9
Accumulated benefit obligation $ 68.4 $ 73.3
The net actuarial gains and losses during the years ended December 31, 2021 and 2020 primarily related to changes in the discount rates for the U.K. plans.
(1)
(1)
76
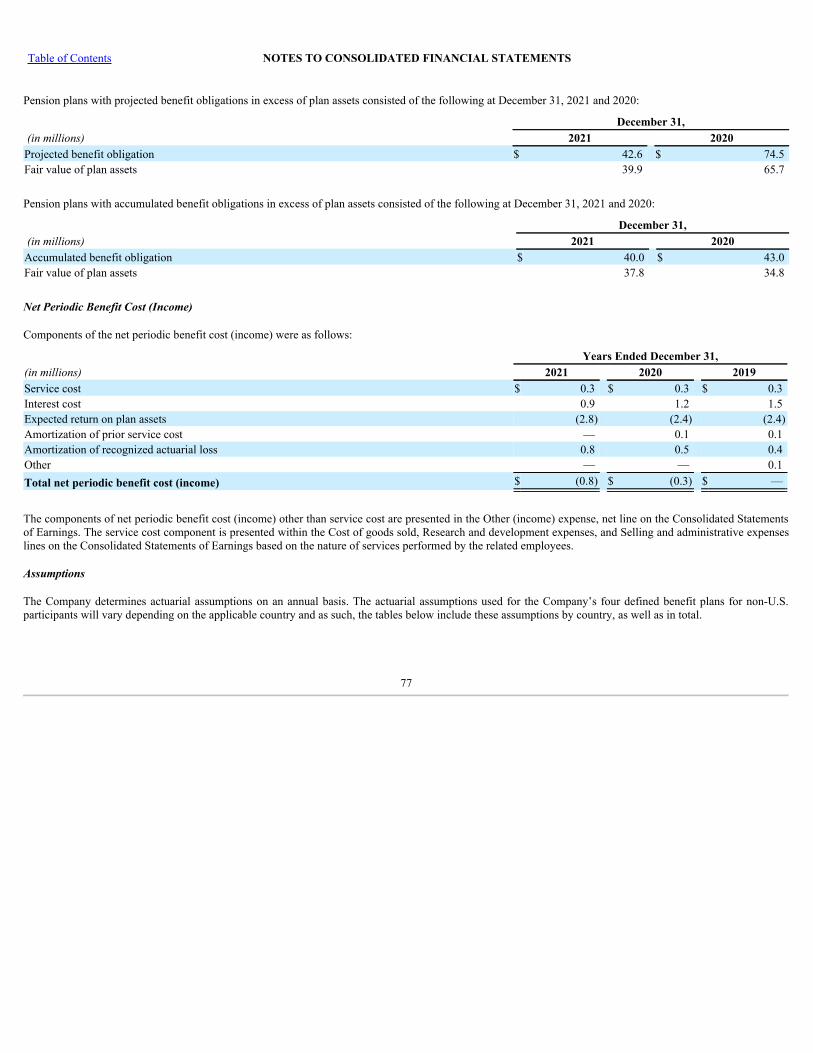
Table of Contents NOTES TO CONSOLIDATED FINANCIAL STATEMENTS
Pension plans with projected benefit obligations in excess of plan assets consisted of the following at December 31, 2021 and 2020:
December 31, (in millions) 2021 2020Projected benefit obligation $ 42.6 $ 74.5 Fair value of plan assets 39.9 65.7
Pension plans with accumulated benefit obligations in excess of plan assets consisted of the following at December 31, 2021 and 2020:
December 31, (in millions) 2021 2020Accumulated benefit obligation $ 40.0 $ 43.0 Fair value of plan assets 37.8 34.8
Net Periodic Benefit Cost (Income)
Components of the net periodic benefit cost (income) were as follows:
Years Ended December 31,(in millions) 2021 2020 2019Service cost $ 0.3 $ 0.3 $ 0.3 Interest cost 0.9 1.2 1.5 Expected return on plan assets (2.8) (2.4) (2.4)Amortization of prior service cost — 0.1 0.1 Amortization of recognized actuarial loss 0.8 0.5 0.4 Other — — 0.1 Total net periodic benefit cost (income) $ (0.8) $ (0.3) $ —
The components of net periodic benefit cost (income) other than service cost are presented in the Other (income) expense, net line on the Consolidated Statementsof Earnings. The service cost component is presented within the Cost of goods sold, Research and development expenses, and Selling and administrative expenseslines on the Consolidated Statements of Earnings based on the nature of services performed by the related employees.
Assumptions
The Company determines actuarial assumptions on an annual basis. The actuarial assumptions used for the Company’s four defined benefit plans for non-U.S.participants will vary depending on the applicable country and as such, the tables below include these assumptions by country, as well as in total.
77
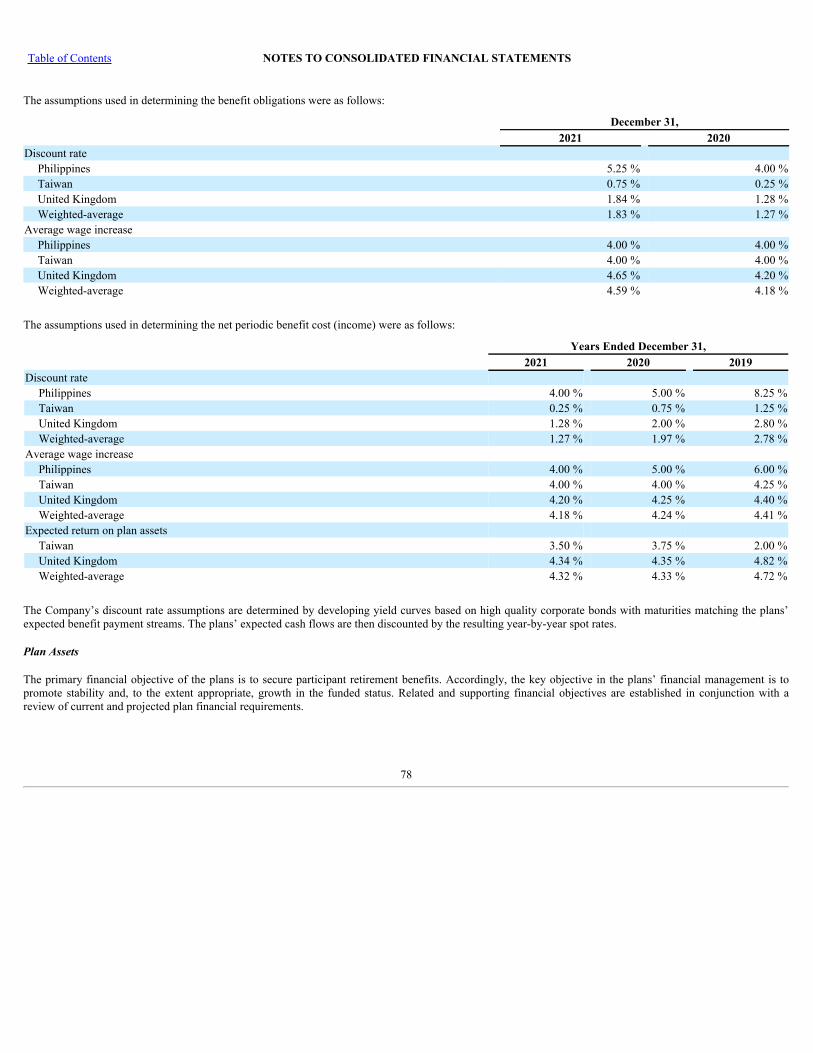
Table of Contents NOTES TO CONSOLIDATED FINANCIAL STATEMENTS
The assumptions used in determining the benefit obligations were as follows:
December 31, 2021 2020Discount rate
Philippines 5.25 % 4.00 %Taiwan 0.75 % 0.25 %United Kingdom 1.84 % 1.28 %Weighted-average 1.83 % 1.27 %
Average wage increasePhilippines 4.00 % 4.00 %Taiwan 4.00 % 4.00 %United Kingdom 4.65 % 4.20 %Weighted-average 4.59 % 4.18 %
The assumptions used in determining the net periodic benefit cost (income) were as follows:
Years Ended December 31, 2021 2020 2019Discount rate
Philippines 4.00 % 5.00 % 8.25 %Taiwan 0.25 % 0.75 % 1.25 %United Kingdom 1.28 % 2.00 % 2.80 %Weighted-average 1.27 % 1.97 % 2.78 %
Average wage increasePhilippines 4.00 % 5.00 % 6.00 %Taiwan 4.00 % 4.00 % 4.25 %United Kingdom 4.20 % 4.25 % 4.40 %Weighted-average 4.18 % 4.24 % 4.41 %
Expected return on plan assetsTaiwan 3.50 % 3.75 % 2.00 %United Kingdom 4.34 % 4.35 % 4.82 %Weighted-average 4.32 % 4.33 % 4.72 %
The Company’s discount rate assumptions are determined by developing yield curves based on high quality corporate bonds with maturities matching the plans’expected benefit payment streams. The plans’ expected cash flows are then discounted by the resulting year-by-year spot rates.
Plan Assets
The primary financial objective of the plans is to secure participant retirement benefits. Accordingly, the key objective in the plans’ financial management is topromote stability and, to the extent appropriate, growth in the funded status. Related and supporting financial objectives are established in conjunction with areview of current and projected plan financial requirements.
78

Table of Contents NOTES TO CONSOLIDATED FINANCIAL STATEMENTS
As it relates to the funded defined benefit pension plans, the Company’s funding policy is consistent with the funding requirements of applicable local non-U.S.laws. The Company is responsible for overseeing the management of the investments of the plans’ assets and otherwise ensuring that the plans’ investmentprograms are in compliance with applicable local law, other relevant legislation, and related plan documents. Where relevant, the Company has retainedprofessional investment managers to manage the plans’ assets and investment process. The investment managers, in executing their investment processes, have theauthority and responsibility to select appropriate investments in the asset classes specified by the terms of their applicable prospectus or investment manageragreements with the plans.
The assets of the plans are invested to achieve an appropriate return for the plans consistent with a prudent level of risk. The asset return objective is to achieve, asa minimum over time, the passively managed return earned by market index funds, weighted in the proportions outlined by the asset class exposures identified inthe plans’ strategic allocation. The expected return on plan assets assumptions are developed through analysis of historical market returns, statistical analysis,current market conditions, and the past experience of plan asset investments.
Fair Value Measurements
The fair values of plan assets by asset category within the ASC 820 hierarchy were as follows at December 31, 2021 and 2020:
December 31, 2021 December 31, 2020
(in millions) Level 1 Level 2 Level 3Total Fair
Value Level 1 Level 2 Level 3Total Fair
ValueAsset category: Fixed income investments $ 3.5 $ 26.1 $ — $ 29.6 $ 3.4 $ 24.9 $ — $ 28.3 Common stock funds — 18.9 — 18.9 — 18.9 — 18.9 Real estate funds — 5.5 — 5.5 — 5.0 — 5.0 Cash and equivalents 0.5 — — 0.5 0.3 — — 0.3 Other 9.0 5.8 — 14.8 7.9 5.3 — 13.2 Total $ 13.0 $ 56.3 $ — $ 69.3 $ 11.6 $ 54.1 $ — $ 65.7
See Note 11. Hedging Transactions and Derivative Instruments for additional information on the fair value hierarchy. There were no significant transfers betweenLevel 1 and Level 2 assets during the years ended December 31, 2021 and 2020.
Fixed income investments include government and municipal securities and corporate bonds, which are valued based on yields currently available on comparablesecurities of issuers with similar credit ratings.
Common stock funds consist of mutual funds and collective trusts. Mutual funds are valued by obtaining quoted prices from nationally recognized securitiesexchanges. Collective trusts are valued using Net Asset Value (the "NAV") as of the last business day of the year. The NAV is based on the underlying value of theassets owned by the fund minus its liabilities and then divided by the number of shares outstanding. The value of the underlying assets is based on quoted prices inactive markets.
The methods described above may produce a fair value calculation that may not be indicative of net realizable value or reflective of future fair values. Furthermore,while the Company believes its valuation methods are appropriate and consistent with other market participants, the use of different methodologies or assumptionsto determine the fair value of certain financial instruments could result in a different fair value measurement at the reporting date.
79
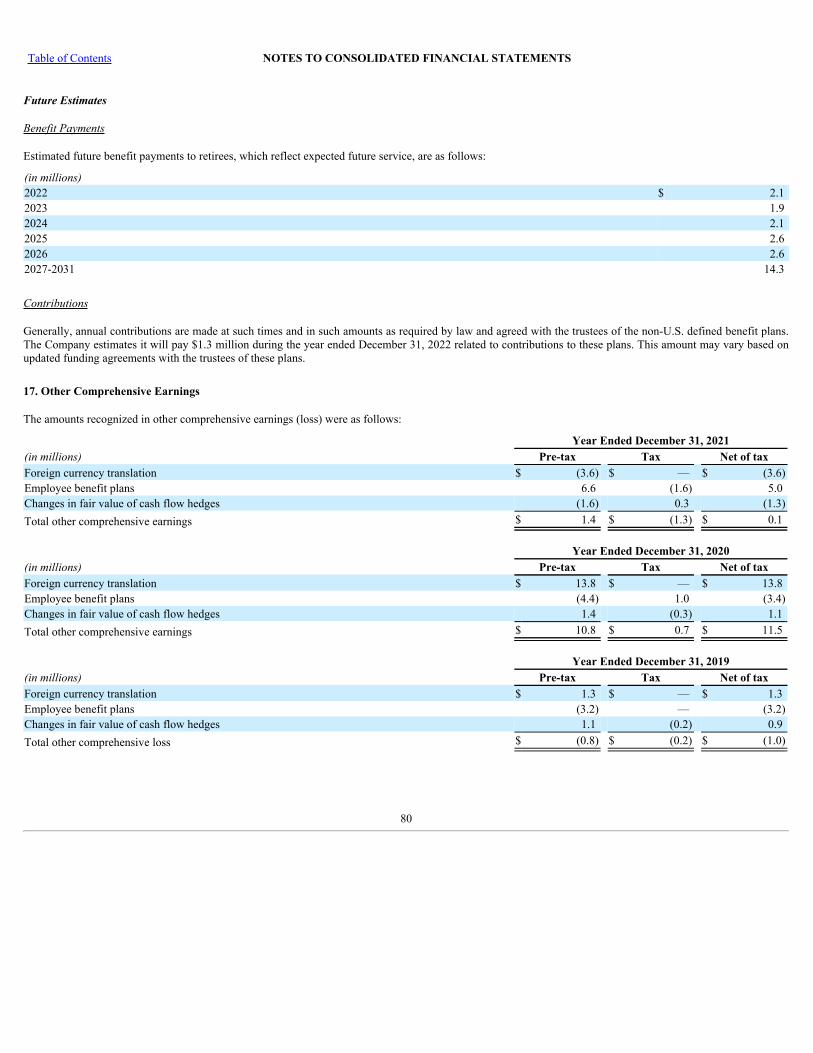
Table of Contents NOTES TO CONSOLIDATED FINANCIAL STATEMENTS
Future Estimates
Benefit Payments
Estimated future benefit payments to retirees, which reflect expected future service, are as follows:
(in millions)2022 $ 2.1 2023 1.9 2024 2.1 2025 2.6 2026 2.6 2027-2031 14.3
Contributions
Generally, annual contributions are made at such times and in such amounts as required by law and agreed with the trustees of the non-U.S. defined benefit plans.The Company estimates it will pay $1.3 million during the year ended December 31, 2022 related to contributions to these plans. This amount may vary based onupdated funding agreements with the trustees of these plans.
17. Other Comprehensive Earnings
The amounts recognized in other comprehensive earnings (loss) were as follows:
Year Ended December 31, 2021(in millions) Pre-tax Tax Net of taxForeign currency translation $ (3.6) $ — $ (3.6)Employee benefit plans 6.6 (1.6) 5.0 Changes in fair value of cash flow hedges (1.6) 0.3 (1.3)Total other comprehensive earnings $ 1.4 $ (1.3) $ 0.1
Year Ended December 31, 2020(in millions) Pre-tax Tax Net of taxForeign currency translation $ 13.8 $ — $ 13.8 Employee benefit plans (4.4) 1.0 (3.4)Changes in fair value of cash flow hedges 1.4 (0.3) 1.1 Total other comprehensive earnings $ 10.8 $ 0.7 $ 11.5
Year Ended December 31, 2019(in millions) Pre-tax Tax Net of taxForeign currency translation $ 1.3 $ — $ 1.3 Employee benefit plans (3.2) — (3.2)Changes in fair value of cash flow hedges 1.1 (0.2) 0.9 Total other comprehensive loss $ (0.8) $ (0.2) $ (1.0)
80
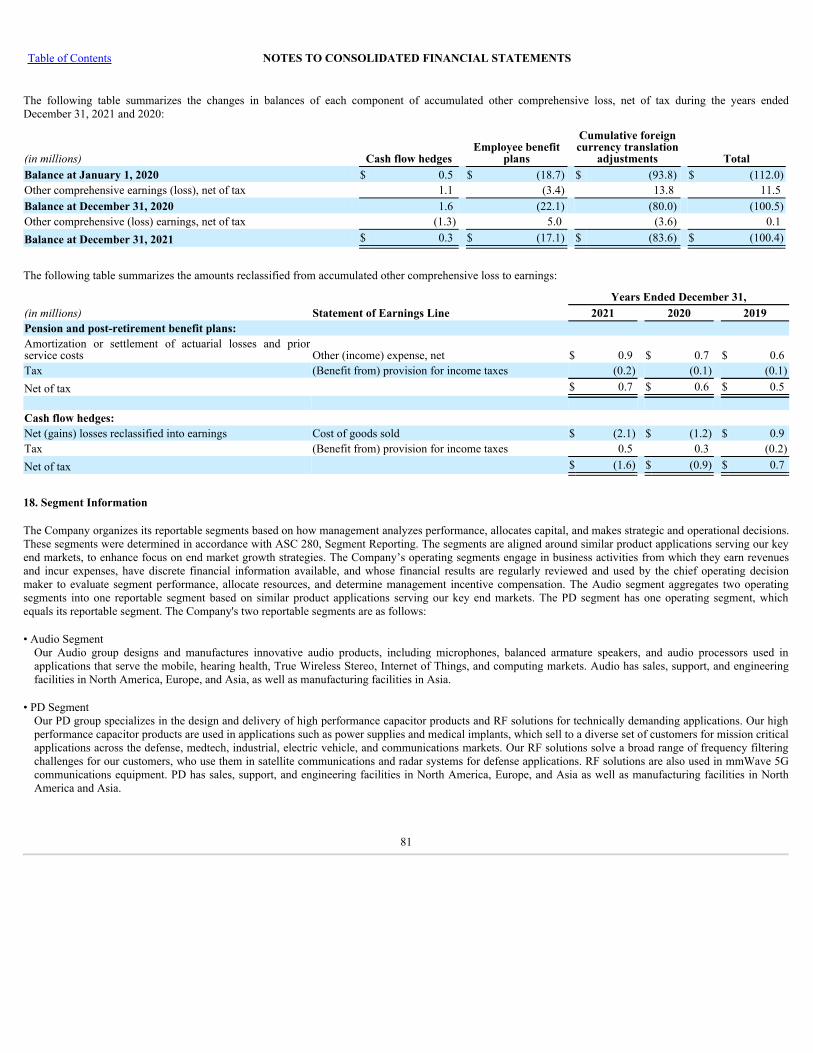
Table of Contents NOTES TO CONSOLIDATED FINANCIAL STATEMENTS
The following table summarizes the changes in balances of each component of accumulated other comprehensive loss, net of tax during the years endedDecember 31, 2021 and 2020:
(in millions) Cash flow hedgesEmployee benefit
plans
Cumulative foreigncurrency translation
adjustments TotalBalance at January 1, 2020 $ 0.5 $ (18.7) $ (93.8) $ (112.0)Other comprehensive earnings (loss), net of tax 1.1 (3.4) 13.8 11.5 Balance at December 31, 2020 1.6 (22.1) (80.0) (100.5)Other comprehensive (loss) earnings, net of tax (1.3) 5.0 (3.6) 0.1 Balance at December 31, 2021 $ 0.3 $ (17.1) $ (83.6) $ (100.4)
The following table summarizes the amounts reclassified from accumulated other comprehensive loss to earnings:
Years Ended December 31,(in millions) Statement of Earnings Line 2021 2020 2019Pension and post-retirement benefit plans:Amortization or settlement of actuarial losses and priorservice costs Other (income) expense, net $ 0.9 $ 0.7 $ 0.6 Tax (Benefit from) provision for income taxes (0.2) (0.1) (0.1)Net of tax $ 0.7 $ 0.6 $ 0.5
Cash flow hedges:Net (gains) losses reclassified into earnings Cost of goods sold $ (2.1) $ (1.2) $ 0.9 Tax (Benefit from) provision for income taxes 0.5 0.3 (0.2)Net of tax $ (1.6) $ (0.9) $ 0.7
18. Segment Information
The Company organizes its reportable segments based on how management analyzes performance, allocates capital, and makes strategic and operational decisions.These segments were determined in accordance with ASC 280, Segment Reporting. The segments are aligned around similar product applications serving our keyend markets, to enhance focus on end market growth strategies. The Company’s operating segments engage in business activities from which they earn revenuesand incur expenses, have discrete financial information available, and whose financial results are regularly reviewed and used by the chief operating decisionmaker to evaluate segment performance, allocate resources, and determine management incentive compensation. The Audio segment aggregates two operatingsegments into one reportable segment based on similar product applications serving our key end markets. The PD segment has one operating segment, whichequals its reportable segment. The Company's two reportable segments are as follows:
• Audio SegmentOur Audio group designs and manufactures innovative audio products, including microphones, balanced armature speakers, and audio processors used inapplications that serve the mobile, hearing health, True Wireless Stereo, Internet of Things, and computing markets. Audio has sales, support, and engineeringfacilities in North America, Europe, and Asia, as well as manufacturing facilities in Asia.
• PD SegmentOur PD group specializes in the design and delivery of high performance capacitor products and RF solutions for technically demanding applications. Our highperformance capacitor products are used in applications such as power supplies and medical implants, which sell to a diverse set of customers for mission criticalapplications across the defense, medtech, industrial, electric vehicle, and communications markets. Our RF solutions solve a broad range of frequency filteringchallenges for our customers, who use them in satellite communications and radar systems for defense applications. RF solutions are also used in mmWave 5Gcommunications equipment. PD has sales, support, and engineering facilities in North America, Europe, and Asia as well as manufacturing facilities in NorthAmerica and Asia.
81
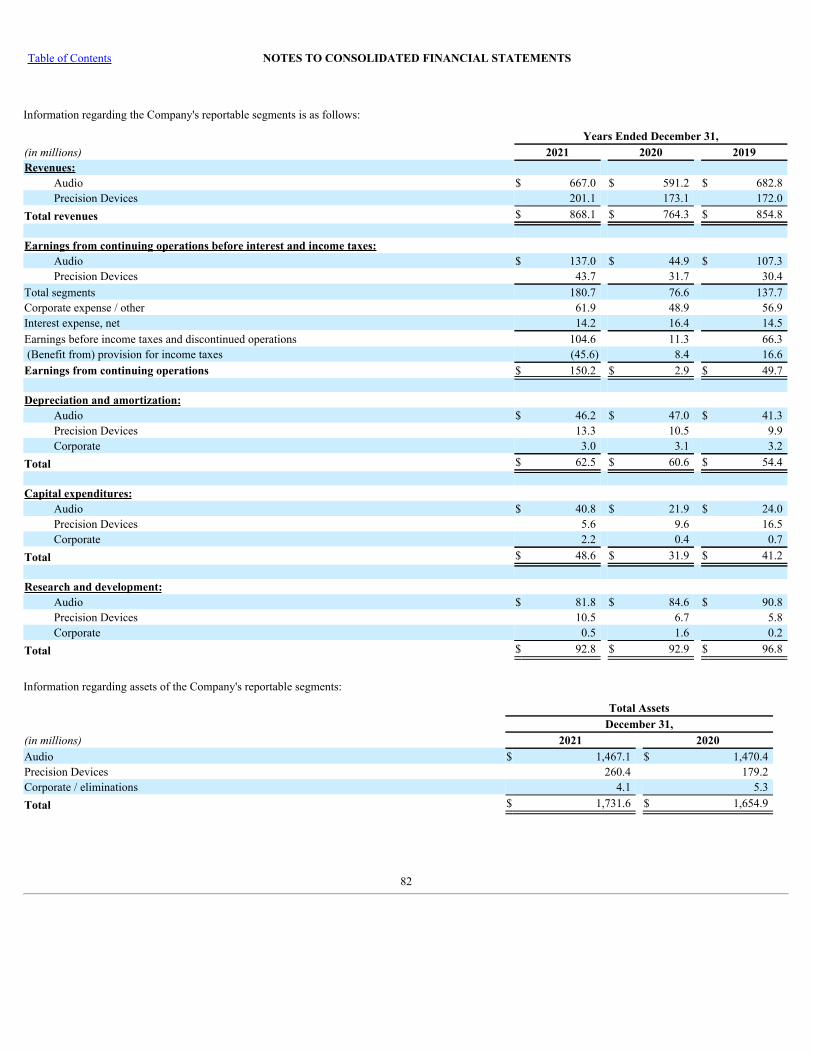
Table of Contents NOTES TO CONSOLIDATED FINANCIAL STATEMENTS
Information regarding the Company's reportable segments is as follows:
Years Ended December 31,(in millions) 2021 2020 2019Revenues:
Audio $ 667.0 $ 591.2 $ 682.8 Precision Devices 201.1 173.1 172.0
Total revenues $ 868.1 $ 764.3 $ 854.8
Earnings from continuing operations before interest and income taxes:Audio $ 137.0 $ 44.9 $ 107.3 Precision Devices 43.7 31.7 30.4
Total segments 180.7 76.6 137.7 Corporate expense / other 61.9 48.9 56.9 Interest expense, net 14.2 16.4 14.5 Earnings before income taxes and discontinued operations 104.6 11.3 66.3 (Benefit from) provision for income taxes (45.6) 8.4 16.6 Earnings from continuing operations $ 150.2 $ 2.9 $ 49.7
Depreciation and amortization:Audio $ 46.2 $ 47.0 $ 41.3 Precision Devices 13.3 10.5 9.9 Corporate 3.0 3.1 3.2
Total $ 62.5 $ 60.6 $ 54.4
Capital expenditures:Audio $ 40.8 $ 21.9 $ 24.0 Precision Devices 5.6 9.6 16.5 Corporate 2.2 0.4 0.7
Total $ 48.6 $ 31.9 $ 41.2
Research and development:Audio $ 81.8 $ 84.6 $ 90.8 Precision Devices 10.5 6.7 5.8 Corporate 0.5 1.6 0.2
Total $ 92.8 $ 92.9 $ 96.8
Information regarding assets of the Company's reportable segments:
Total AssetsDecember 31,
(in millions) 2021 2020Audio $ 1,467.1 $ 1,470.4 Precision Devices 260.4 179.2 Corporate / eliminations 4.1 5.3 Total $ 1,731.6 $ 1,654.9
82
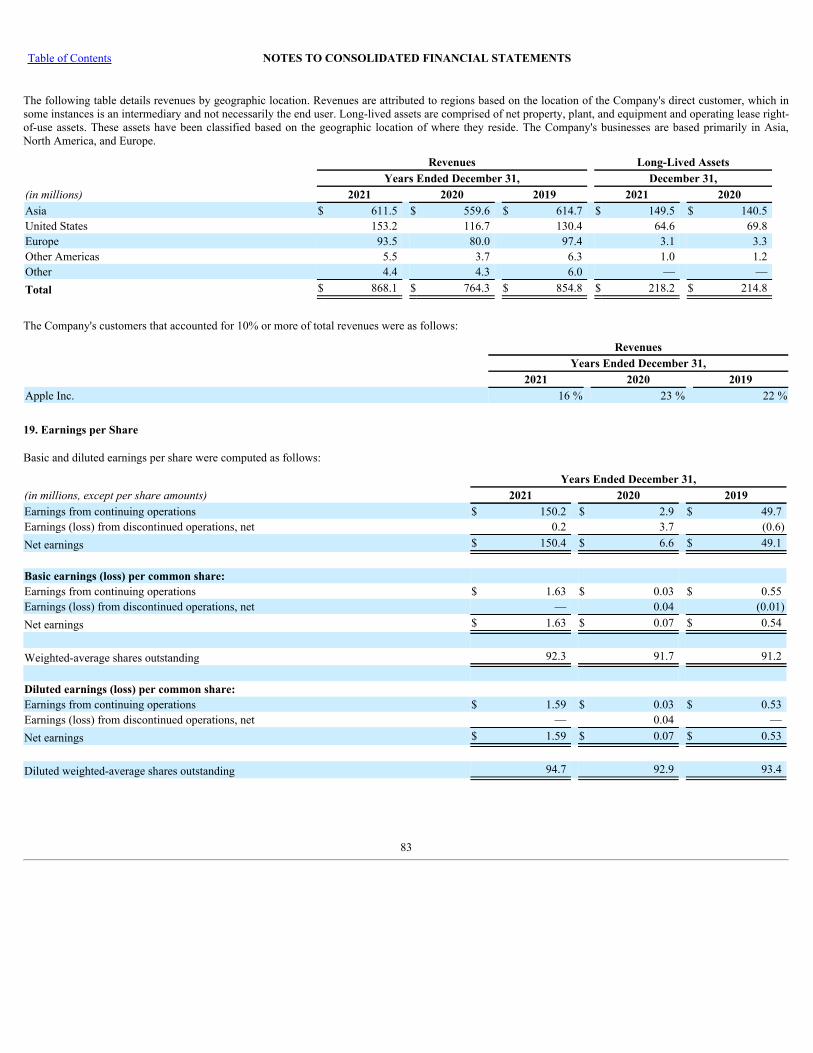
Table of Contents NOTES TO CONSOLIDATED FINANCIAL STATEMENTS
The following table details revenues by geographic location. Revenues are attributed to regions based on the location of the Company's direct customer, which insome instances is an intermediary and not necessarily the end user. Long-lived assets are comprised of net property, plant, and equipment and operating lease right-of-use assets. These assets have been classified based on the geographic location of where they reside. The Company's businesses are based primarily in Asia,North America, and Europe.
Revenues Long-Lived Assets Years Ended December 31, December 31,(in millions) 2021 2020 2019 2021 2020Asia $ 611.5 $ 559.6 $ 614.7 $ 149.5 $ 140.5 United States 153.2 116.7 130.4 64.6 69.8 Europe 93.5 80.0 97.4 3.1 3.3 Other Americas 5.5 3.7 6.3 1.0 1.2 Other 4.4 4.3 6.0 — — Total $ 868.1 $ 764.3 $ 854.8 $ 218.2 $ 214.8
The Company's customers that accounted for 10% or more of total revenues were as follows:
RevenuesYears Ended December 31,
2021 2020 2019Apple Inc. 16 % 23 % 22 %
19. Earnings per Share
Basic and diluted earnings per share were computed as follows:
Years Ended December 31,(in millions, except per share amounts) 2021 2020 2019Earnings from continuing operations $ 150.2 $ 2.9 $ 49.7 Earnings (loss) from discontinued operations, net 0.2 3.7 (0.6)Net earnings $ 150.4 $ 6.6 $ 49.1
Basic earnings (loss) per common share:Earnings from continuing operations $ 1.63 $ 0.03 $ 0.55 Earnings (loss) from discontinued operations, net — 0.04 (0.01)Net earnings $ 1.63 $ 0.07 $ 0.54
Weighted-average shares outstanding 92.3 91.7 91.2
Diluted earnings (loss) per common share:Earnings from continuing operations $ 1.59 $ 0.03 $ 0.53 Earnings (loss) from discontinued operations, net — 0.04 — Net earnings $ 1.59 $ 0.07 $ 0.53
Diluted weighted-average shares outstanding 94.7 92.9 93.4
83
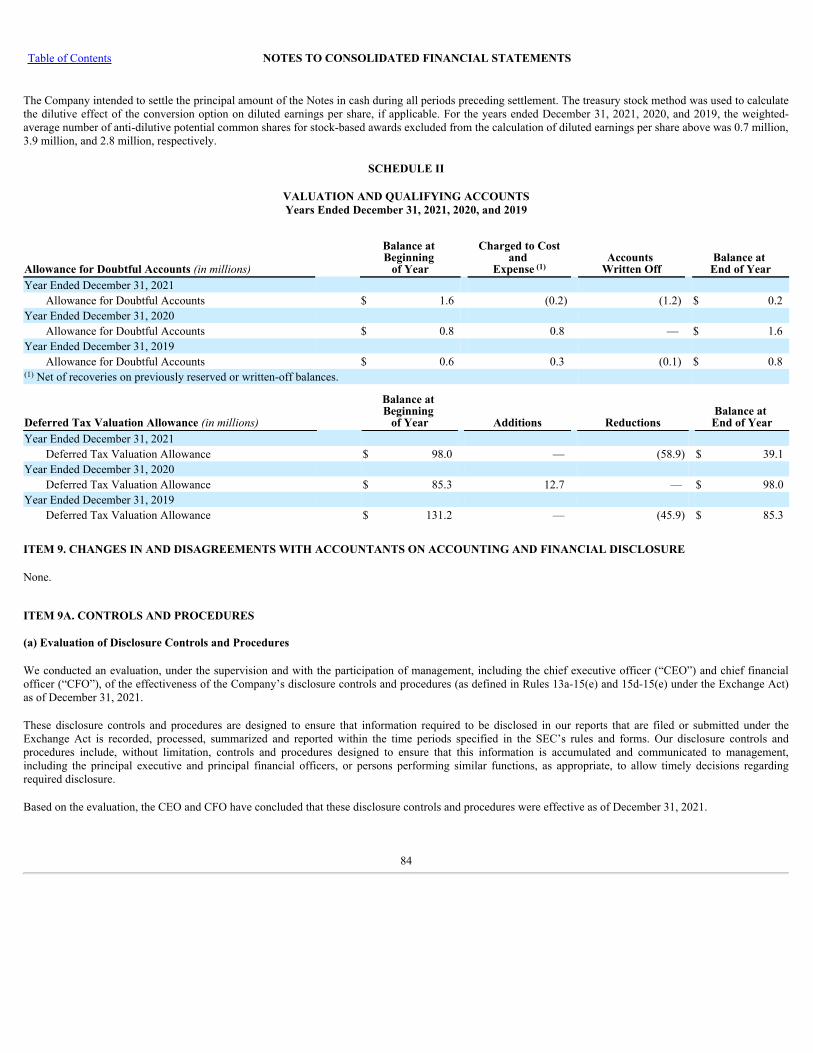
Table of Contents NOTES TO CONSOLIDATED FINANCIAL STATEMENTS
The Company intended to settle the principal amount of the Notes in cash during all periods preceding settlement. The treasury stock method was used to calculatethe dilutive effect of the conversion option on diluted earnings per share, if applicable. For the years ended December 31, 2021, 2020, and 2019, the weighted-average number of anti-dilutive potential common shares for stock-based awards excluded from the calculation of diluted earnings per share above was 0.7 million,3.9 million, and 2.8 million, respectively.
SCHEDULE II
VALUATION AND QUALIFYING ACCOUNTSYears Ended December 31, 2021, 2020, and 2019
Allowance for Doubtful Accounts (in millions)
Balance at Beginning
of Year
Charged to Costand
ExpenseAccounts
Written OffBalance at
End of YearYear Ended December 31, 2021
Allowance for Doubtful Accounts $ 1.6 (0.2) (1.2) $ 0.2 Year Ended December 31, 2020
Allowance for Doubtful Accounts $ 0.8 0.8 — $ 1.6 Year Ended December 31, 2019
Allowance for Doubtful Accounts $ 0.6 0.3 (0.1) $ 0.8 Net of recoveries on previously reserved or written-off balances.
Deferred Tax Valuation Allowance (in millions)
Balance at Beginning
of Year Additions ReductionsBalance at
End of YearYear Ended December 31, 2021
Deferred Tax Valuation Allowance $ 98.0 — (58.9) $ 39.1 Year Ended December 31, 2020
Deferred Tax Valuation Allowance $ 85.3 12.7 — $ 98.0 Year Ended December 31, 2019
Deferred Tax Valuation Allowance $ 131.2 — (45.9) $ 85.3
ITEM 9. CHANGES IN AND DISAGREEMENTS WITH ACCOUNTANTS ON ACCOUNTING AND FINANCIAL DISCLOSURE
None.
ITEM 9A. CONTROLS AND PROCEDURES (a) Evaluation of Disclosure Controls and Procedures
We conducted an evaluation, under the supervision and with the participation of management, including the chief executive officer (“CEO”) and chief financialofficer (“CFO”), of the effectiveness of the Company’s disclosure controls and procedures (as defined in Rules 13a-15(e) and 15d-15(e) under the Exchange Act)as of December 31, 2021.
These disclosure controls and procedures are designed to ensure that information required to be disclosed in our reports that are filed or submitted under theExchange Act is recorded, processed, summarized and reported within the time periods specified in the SEC’s rules and forms. Our disclosure controls andprocedures include, without limitation, controls and procedures designed to ensure that this information is accumulated and communicated to management,including the principal executive and principal financial officers, or persons performing similar functions, as appropriate, to allow timely decisions regardingrequired disclosure.
Based on the evaluation, the CEO and CFO have concluded that these disclosure controls and procedures were effective as of December 31, 2021.
(1)
(1)
84
Table of Contents
(b) Management's Report on Internal Control Over Financial Reporting
Our management is responsible for establishing and maintaining adequate internal control over financial reporting (as defined in Rules 13a-15(f) and 15d-15(f)under the Exchange Act). Under management’s supervision, an evaluation of the effectiveness of the Company’s internal control over financial reporting wasconducted based on the criteria set forth in Internal Control - Integrated Framework (2013) issued by the Committee of Sponsoring Organizations of the TreadwayCommission (“COSO”). Based on our evaluation under the framework in Internal Control - Integrated Framework (2013) issued by the COSO, our managementconcluded that our internal control over financial reporting was effective as of December 31, 2021.
PricewaterhouseCoopers LLP, the Company’s independent registered public accounting firm, has audited the effectiveness of the Company’s internal control overfinancial reporting as of December 31, 2021, as stated in their report which appears herein.
(c) Changes in Internal Control Over Financial Reporting
There has been no change in our internal control over financial reporting that occurred during the fourth quarter of 2021 that has materially affected, or isreasonably likely to materially affect, our internal control over financial reporting.
(d) Inherent Limitations on Effectiveness of Controls
Our management, including the CEO and CFO, do not expect that our disclosure controls or our internal control over financial reporting will prevent or detect allerrors and all fraud. A control system, no matter how well designed and operated, can provide only reasonable, not absolute, assurance that the control system’sobjectives will be met. The design of a control system must reflect the fact that the benefits of controls must be considered relative to their costs. Further, becauseof the inherent limitations in all control systems, no evaluation of controls can provide absolute assurance that misstatements due to error or fraud will not occur orthat all control issues and instances of fraud, if any, will be detected. These inherent limitations include the realities that judgments in decision making can befaulty and that breakdowns can occur because of simple error or mistake. Controls can also be circumvented by the individual acts of some persons, byintentionally falsified documentation, by collusion of two or more individuals within Knowles or third parties, or by management override of the controls. Thedesign of any system of controls is based in part on certain assumptions about the likelihood of future events and there can be no assurance that any design willsucceed in achieving its stated goals under all potential future conditions. Projections of any evaluation of controls effectiveness to future periods are subject torisks. Over time, controls may become inadequate because of changes in conditions or deterioration in the degree of compliance with policies or procedures.
ITEM 9B. OTHER INFORMATION
Not applicable.
ITEM 9C. DISCLOSURE REGARDING FOREIGN JURISDICTIONS THAT PREVENT INSPECTIONS
Not applicable.
PART III
ITEM 10. DIRECTORS, EXECUTIVE OFFICERS, AND CORPORATE GOVERNANCE
The information with respect to the directors and the board committees of the Company and other corporate governance matters required to be included pursuant tothis Item 10 will be included in the section entitled "Proposal 1 - Election of Directors" of the Proxy Statement for its 2022 Annual Meeting of Stockholders (the"2022 Proxy Statement") that will be filed with the SEC pursuant to Rule 14a-6 under the Exchange Act in accordance with applicable SEC deadlines and isincorporated in this Item 10 by reference.
The information with respect to the executive officers of the Company required to be included pursuant to this Item 10 is included under the caption “Informationabout our Executive Officers” in Part I of this Form 10-K and is incorporated in this Item 10 by reference.
85
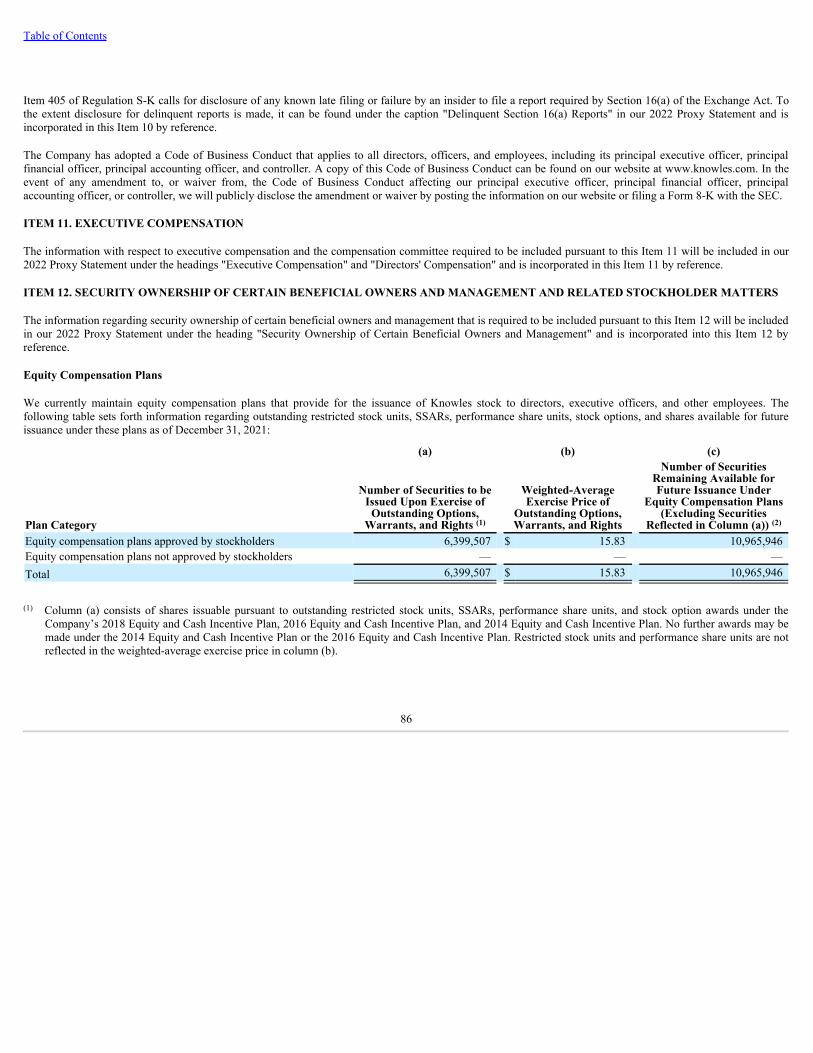
Table of Contents
Item 405 of Regulation S-K calls for disclosure of any known late filing or failure by an insider to file a report required by Section 16(a) of the Exchange Act. Tothe extent disclosure for delinquent reports is made, it can be found under the caption "Delinquent Section 16(a) Reports" in our 2022 Proxy Statement and isincorporated in this Item 10 by reference.
The Company has adopted a Code of Business Conduct that applies to all directors, officers, and employees, including its principal executive officer, principalfinancial officer, principal accounting officer, and controller. A copy of this Code of Business Conduct can be found on our website at www.knowles.com. In theevent of any amendment to, or waiver from, the Code of Business Conduct affecting our principal executive officer, principal financial officer, principalaccounting officer, or controller, we will publicly disclose the amendment or waiver by posting the information on our website or filing a Form 8-K with the SEC.
ITEM 11. EXECUTIVE COMPENSATION
The information with respect to executive compensation and the compensation committee required to be included pursuant to this Item 11 will be included in our2022 Proxy Statement under the headings "Executive Compensation" and "Directors' Compensation" and is incorporated in this Item 11 by reference.
ITEM 12. SECURITY OWNERSHIP OF CERTAIN BENEFICIAL OWNERS AND MANAGEMENT AND RELATED STOCKHOLDER MATTERS
The information regarding security ownership of certain beneficial owners and management that is required to be included pursuant to this Item 12 will be includedin our 2022 Proxy Statement under the heading "Security Ownership of Certain Beneficial Owners and Management" and is incorporated into this Item 12 byreference.
Equity Compensation Plans
We currently maintain equity compensation plans that provide for the issuance of Knowles stock to directors, executive officers, and other employees. Thefollowing table sets forth information regarding outstanding restricted stock units, SSARs, performance share units, stock options, and shares available for futureissuance under these plans as of December 31, 2021:
(a) (b) (c)
Plan Category
Number of Securities to beIssued Upon Exercise of
Outstanding Options,Warrants, and Rights
Weighted-AverageExercise Price of
Outstanding Options,Warrants, and Rights
Number of SecuritiesRemaining Available forFuture Issuance Under
Equity Compensation Plans(Excluding Securities
Reflected in Column (a)) Equity compensation plans approved by stockholders 6,399,507 $ 15.83 10,965,946 Equity compensation plans not approved by stockholders — — — Total 6,399,507 $ 15.83 10,965,946
Column (a) consists of shares issuable pursuant to outstanding restricted stock units, SSARs, performance share units, and stock option awards under theCompany’s 2018 Equity and Cash Incentive Plan, 2016 Equity and Cash Incentive Plan, and 2014 Equity and Cash Incentive Plan. No further awards may bemade under the 2014 Equity and Cash Incentive Plan or the 2016 Equity and Cash Incentive Plan. Restricted stock units and performance share units are notreflected in the weighted-average exercise price in column (b).
(1) (2)
(1)
86
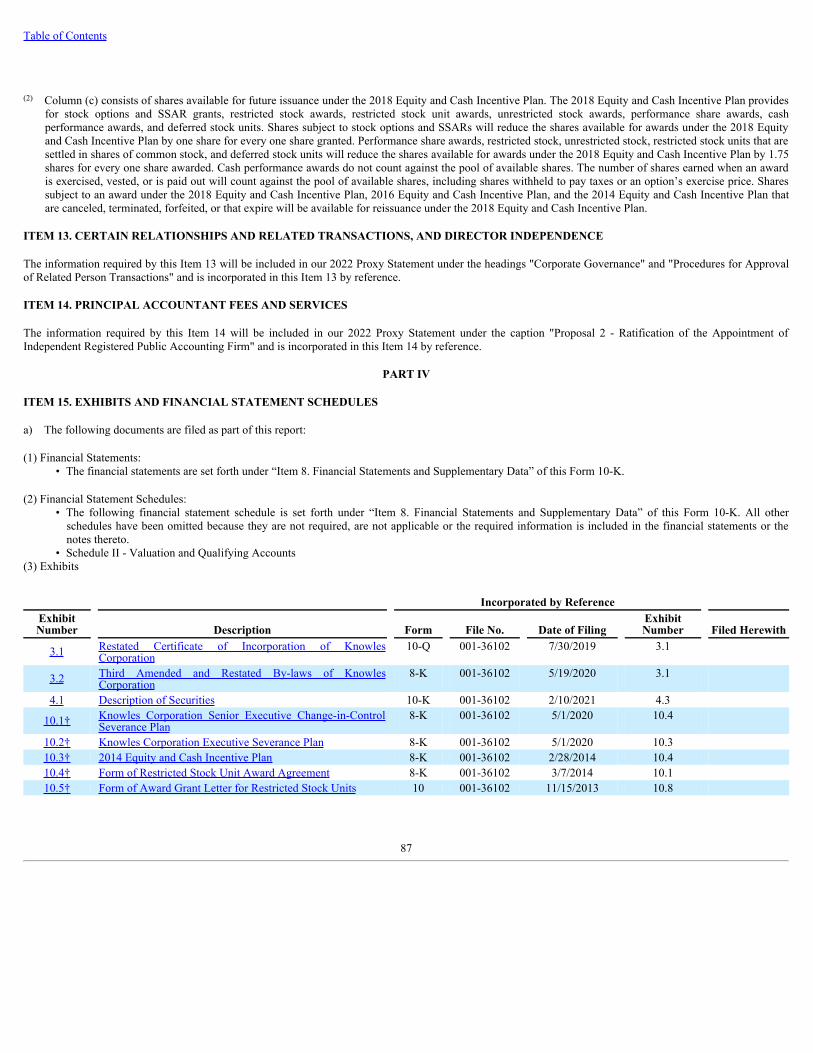
Table of Contents
Column (c) consists of shares available for future issuance under the 2018 Equity and Cash Incentive Plan. The 2018 Equity and Cash Incentive Plan providesfor stock options and SSAR grants, restricted stock awards, restricted stock unit awards, unrestricted stock awards, performance share awards, cashperformance awards, and deferred stock units. Shares subject to stock options and SSARs will reduce the shares available for awards under the 2018 Equityand Cash Incentive Plan by one share for every one share granted. Performance share awards, restricted stock, unrestricted stock, restricted stock units that aresettled in shares of common stock, and deferred stock units will reduce the shares available for awards under the 2018 Equity and Cash Incentive Plan by 1.75shares for every one share awarded. Cash performance awards do not count against the pool of available shares. The number of shares earned when an awardis exercised, vested, or is paid out will count against the pool of available shares, including shares withheld to pay taxes or an option’s exercise price. Sharessubject to an award under the 2018 Equity and Cash Incentive Plan, 2016 Equity and Cash Incentive Plan, and the 2014 Equity and Cash Incentive Plan thatare canceled, terminated, forfeited, or that expire will be available for reissuance under the 2018 Equity and Cash Incentive Plan.
ITEM 13. CERTAIN RELATIONSHIPS AND RELATED TRANSACTIONS, AND DIRECTOR INDEPENDENCE
The information required by this Item 13 will be included in our 2022 Proxy Statement under the headings "Corporate Governance" and "Procedures for Approvalof Related Person Transactions" and is incorporated in this Item 13 by reference.
ITEM 14. PRINCIPAL ACCOUNTANT FEES AND SERVICES
The information required by this Item 14 will be included in our 2022 Proxy Statement under the caption "Proposal 2 - Ratification of the Appointment ofIndependent Registered Public Accounting Firm" and is incorporated in this Item 14 by reference.
PART IV
ITEM 15. EXHIBITS AND FINANCIAL STATEMENT SCHEDULES
a) The following documents are filed as part of this report:
(1) Financial Statements:• The financial statements are set forth under “Item 8. Financial Statements and Supplementary Data” of this Form 10-K.
(2) Financial Statement Schedules:• The following financial statement schedule is set forth under “Item 8. Financial Statements and Supplementary Data” of this Form 10-K. All other
schedules have been omitted because they are not required, are not applicable or the required information is included in the financial statements or thenotes thereto.
• Schedule II - Valuation and Qualifying Accounts(3) Exhibits
Incorporated by ReferenceExhibitNumber Description Form File No. Date of Filing
ExhibitNumber Filed Herewith
3.1 Restated Certificate of Incorporation of KnowlesCorporation
10-Q 001-36102 7/30/2019 3.1
3.2 Third Amended and Restated By-laws of KnowlesCorporation
8-K 001-36102 5/19/2020 3.1
4.1 Description of Securities 10-K 001-36102 2/10/2021 4.3
10.1† Knowles Corporation Senior Executive Change-in-ControlSeverance Plan
8-K 001-36102 5/1/2020 10.4
10.2† Knowles Corporation Executive Severance Plan 8-K 001-36102 5/1/2020 10.310.3† 2014 Equity and Cash Incentive Plan 8-K 001-36102 2/28/2014 10.410.4† Form of Restricted Stock Unit Award Agreement 8-K 001-36102 3/7/2014 10.110.5† Form of Award Grant Letter for Restricted Stock Units 10 001-36102 11/15/2013 10.8
(2)
87
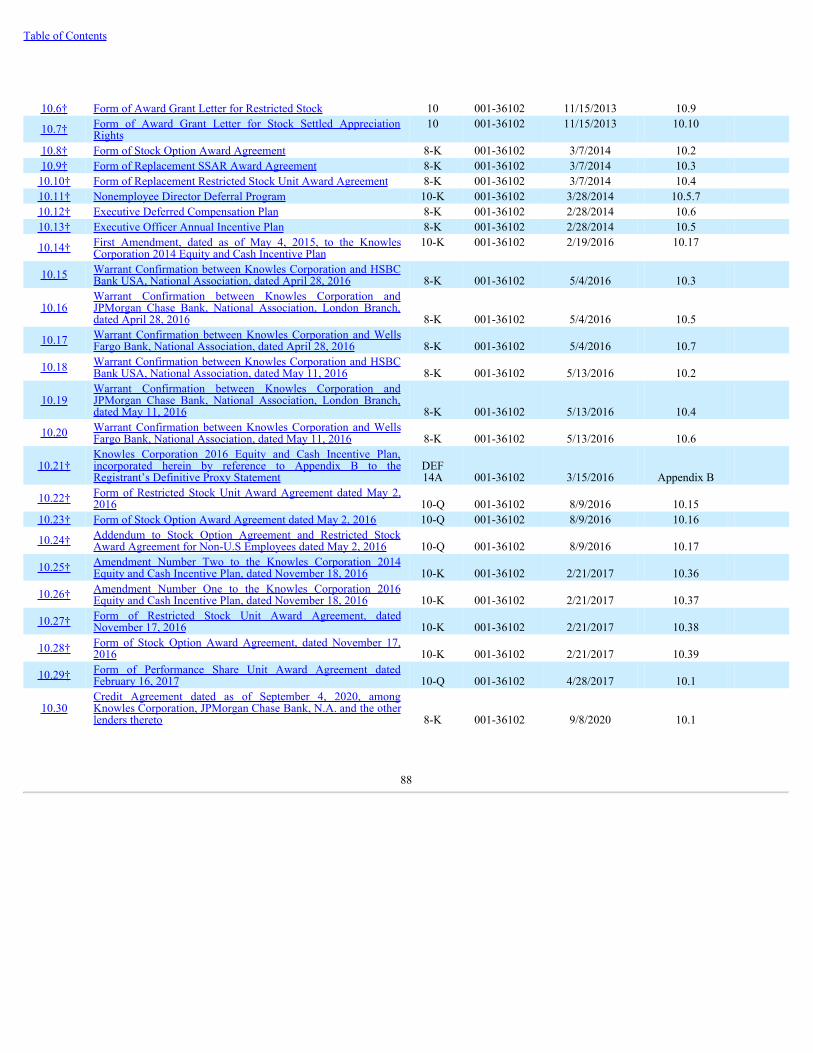
Table of Contents
10.6† Form of Award Grant Letter for Restricted Stock 10 001-36102 11/15/2013 10.9
10.7† Form of Award Grant Letter for Stock Settled AppreciationRights
10 001-36102 11/15/2013 10.10
10.8† Form of Stock Option Award Agreement 8-K 001-36102 3/7/2014 10.210.9† Form of Replacement SSAR Award Agreement 8-K 001-36102 3/7/2014 10.3
10.10† Form of Replacement Restricted Stock Unit Award Agreement 8-K 001-36102 3/7/2014 10.410.11† Nonemployee Director Deferral Program 10-K 001-36102 3/28/2014 10.5.710.12† Executive Deferred Compensation Plan 8-K 001-36102 2/28/2014 10.610.13† Executive Officer Annual Incentive Plan 8-K 001-36102 2/28/2014 10.5
10.14† First Amendment, dated as of May 4, 2015, to the KnowlesCorporation 2014 Equity and Cash Incentive Plan
10-K 001-36102 2/19/2016 10.17
10.15 Warrant Confirmation between Knowles Corporation and HSBCBank USA, National Association, dated April 28, 2016 8-K 001-36102 5/4/2016 10.3
10.16Warrant Confirmation between Knowles Corporation andJPMorgan Chase Bank, National Association, London Branch,dated April 28, 2016 8-K 001-36102 5/4/2016 10.5
10.17 Warrant Confirmation between Knowles Corporation and WellsFargo Bank, National Association, dated April 28, 2016 8-K 001-36102 5/4/2016 10.7
10.18 Warrant Confirmation between Knowles Corporation and HSBCBank USA, National Association, dated May 11, 2016 8-K 001-36102 5/13/2016 10.2
10.19Warrant Confirmation between Knowles Corporation andJPMorgan Chase Bank, National Association, London Branch,dated May 11, 2016 8-K 001-36102 5/13/2016 10.4
10.20 Warrant Confirmation between Knowles Corporation and WellsFargo Bank, National Association, dated May 11, 2016 8-K 001-36102 5/13/2016 10.6
10.21†Knowles Corporation 2016 Equity and Cash Incentive Plan,incorporated herein by reference to Appendix B to theRegistrant’s Definitive Proxy Statement
DEF14A 001-36102 3/15/2016 Appendix B
10.22† Form of Restricted Stock Unit Award Agreement dated May 2,2016 10-Q 001-36102 8/9/2016 10.15
10.23† Form of Stock Option Award Agreement dated May 2, 2016 10-Q 001-36102 8/9/2016 10.16
10.24† Addendum to Stock Option Agreement and Restricted StockAward Agreement for Non-U.S Employees dated May 2, 2016 10-Q 001-36102 8/9/2016 10.17
10.25† Amendment Number Two to the Knowles Corporation 2014Equity and Cash Incentive Plan, dated November 18, 2016 10-K 001-36102 2/21/2017 10.36
10.26† Amendment Number One to the Knowles Corporation 2016Equity and Cash Incentive Plan, dated November 18, 2016 10-K 001-36102 2/21/2017 10.37
10.27† Form of Restricted Stock Unit Award Agreement, datedNovember 17, 2016 10-K 001-36102 2/21/2017 10.38
10.28† Form of Stock Option Award Agreement, dated November 17,2016 10-K 001-36102 2/21/2017 10.39
10.29† Form of Performance Share Unit Award Agreement datedFebruary 16, 2017 10-Q 001-36102 4/28/2017 10.1
10.30Credit Agreement dated as of September 4, 2020, amongKnowles Corporation, JPMorgan Chase Bank, N.A. and the otherlenders thereto 8-K 001-36102 9/8/2020 10.1
88
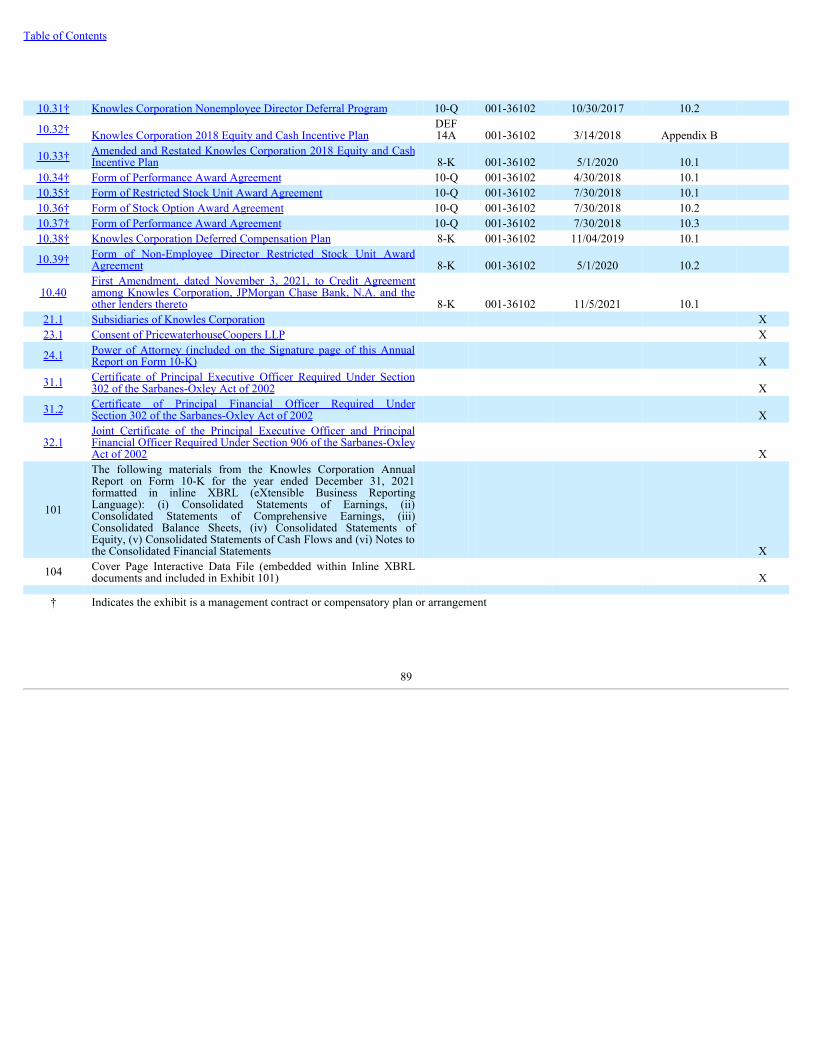
Table of Contents
10.31† Knowles Corporation Nonemployee Director Deferral Program 10-Q 001-36102 10/30/2017 10.2
10.32† Knowles Corporation 2018 Equity and Cash Incentive PlanDEF14A 001-36102 3/14/2018 Appendix B
10.33† Amended and Restated Knowles Corporation 2018 Equity and CashIncentive Plan 8-K 001-36102 5/1/2020 10.1
10.34† Form of Performance Award Agreement 10-Q 001-36102 4/30/2018 10.110.35† Form of Restricted Stock Unit Award Agreement 10-Q 001-36102 7/30/2018 10.110.36† Form of Stock Option Award Agreement 10-Q 001-36102 7/30/2018 10.210.37† Form of Performance Award Agreement 10-Q 001-36102 7/30/2018 10.310.38† Knowles Corporation Deferred Compensation Plan 8-K 001-36102 11/04/2019 10.1
10.39† Form of Non-Employee Director Restricted Stock Unit AwardAgreement 8-K 001-36102 5/1/2020 10.2
10.40First Amendment, dated November 3, 2021, to Credit Agreementamong Knowles Corporation, JPMorgan Chase Bank, N.A. and theother lenders thereto 8-K 001-36102 11/5/2021 10.1
21.1 Subsidiaries of Knowles Corporation X23.1 Consent of PricewaterhouseCoopers LLP X
24.1 Power of Attorney (included on the Signature page of this AnnualReport on Form 10-K) X
31.1 Certificate of Principal Executive Officer Required Under Section302 of the Sarbanes-Oxley Act of 2002 X
31.2 Certificate of Principal Financial Officer Required UnderSection 302 of the Sarbanes-Oxley Act of 2002 X
32.1Joint Certificate of the Principal Executive Officer and PrincipalFinancial Officer Required Under Section 906 of the Sarbanes-OxleyAct of 2002 X
101
The following materials from the Knowles Corporation AnnualReport on Form 10-K for the year ended December 31, 2021formatted in inline XBRL (eXtensible Business ReportingLanguage): (i) Consolidated Statements of Earnings, (ii)Consolidated Statements of Comprehensive Earnings, (iii)Consolidated Balance Sheets, (iv) Consolidated Statements ofEquity, (v) Consolidated Statements of Cash Flows and (vi) Notes tothe Consolidated Financial Statements X
104 Cover Page Interactive Data File (embedded within Inline XBRLdocuments and included in Exhibit 101) X
† Indicates the exhibit is a management contract or compensatory plan or arrangement
89

Table of Contents
ITEM 16. FORM 10-K SUMMARY
None.
90
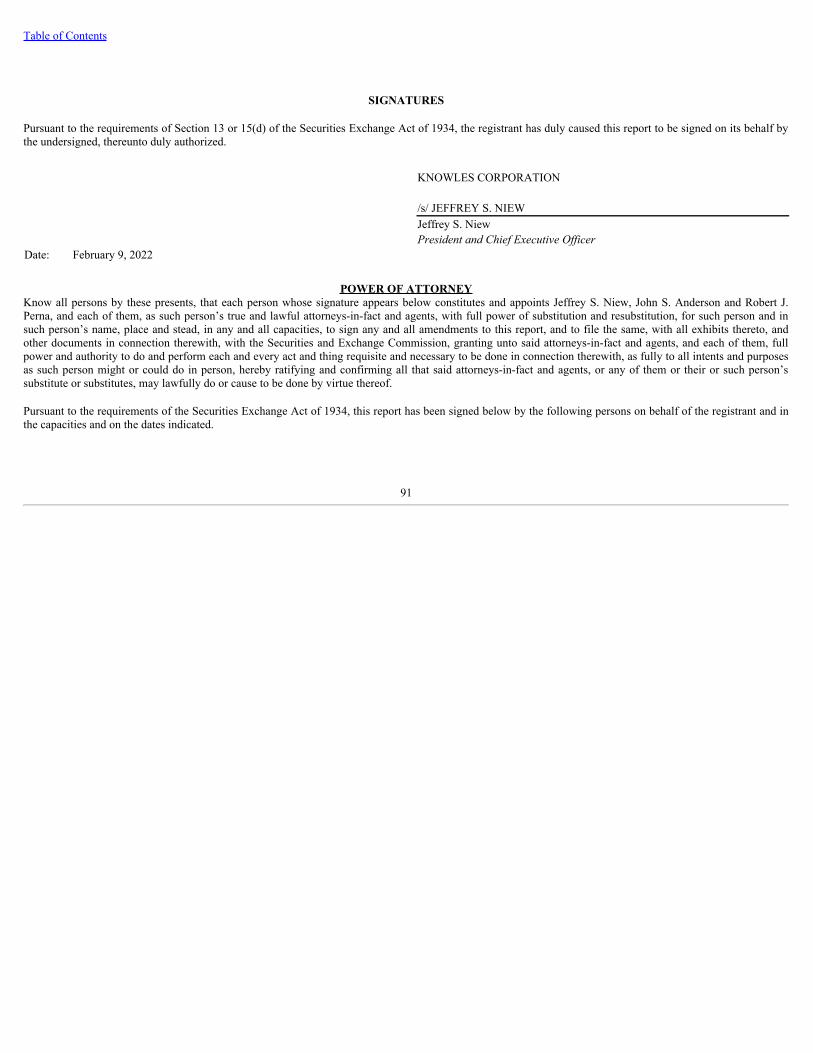
Table of Contents
SIGNATURES
Pursuant to the requirements of Section 13 or 15(d) of the Securities Exchange Act of 1934, the registrant has duly caused this report to be signed on its behalf bythe undersigned, thereunto duly authorized.
KNOWLES CORPORATION
/s/ JEFFREY S. NIEW Jeffrey S. Niew
President and Chief Executive OfficerDate: February 9, 2022
POWER OF ATTORNEYKnow all persons by these presents, that each person whose signature appears below constitutes and appoints Jeffrey S. Niew, John S. Anderson and Robert J.Perna, and each of them, as such person’s true and lawful attorneys-in-fact and agents, with full power of substitution and resubstitution, for such person and insuch person’s name, place and stead, in any and all capacities, to sign any and all amendments to this report, and to file the same, with all exhibits thereto, andother documents in connection therewith, with the Securities and Exchange Commission, granting unto said attorneys-in-fact and agents, and each of them, fullpower and authority to do and perform each and every act and thing requisite and necessary to be done in connection therewith, as fully to all intents and purposesas such person might or could do in person, hereby ratifying and confirming all that said attorneys-in-fact and agents, or any of them or their or such person’ssubstitute or substitutes, may lawfully do or cause to be done by virtue thereof.
Pursuant to the requirements of the Securities Exchange Act of 1934, this report has been signed below by the following persons on behalf of the registrant and inthe capacities and on the dates indicated.
91
Table of Contents
Signature Title Date
/s/ JEFFREY S. NIEW
Chief Executive Officer, President andDirector
(Principal Executive Officer) February 9, 2022Jeffrey S. Niew
/s/ JOHN S. ANDERSON
Senior Vice President and Chief FinancialOfficer
(Principal Financial Officer) February 9, 2022John S. Anderson
/s/ AIR A. BASTARRICA, JR.Vice President, Controller
(Principal Accounting Officer) February 9, 2022Air A. Bastarrica, Jr.
/s/ DONALD MACLEOD Chairman, Board of Directors February 9, 2022Donald Macleod
/s/ KEITH L. BARNES Director February 9, 2022Keith L. Barnes
/s/ HERMANN EUL Director February 9, 2022Hermann Eul
/s/ DIDIER HIRSCH Director February 9, 2022Didier Hirsch
/s/ YE JANE LI Director February 9, 2022Ye Jane Li
/s/ CHERYL SHAVERS Director February 9, 2022Cheryl Shavers
/s/ MICHAEL S. WISHART Director February 9, 2022Michael S. Wishart
92
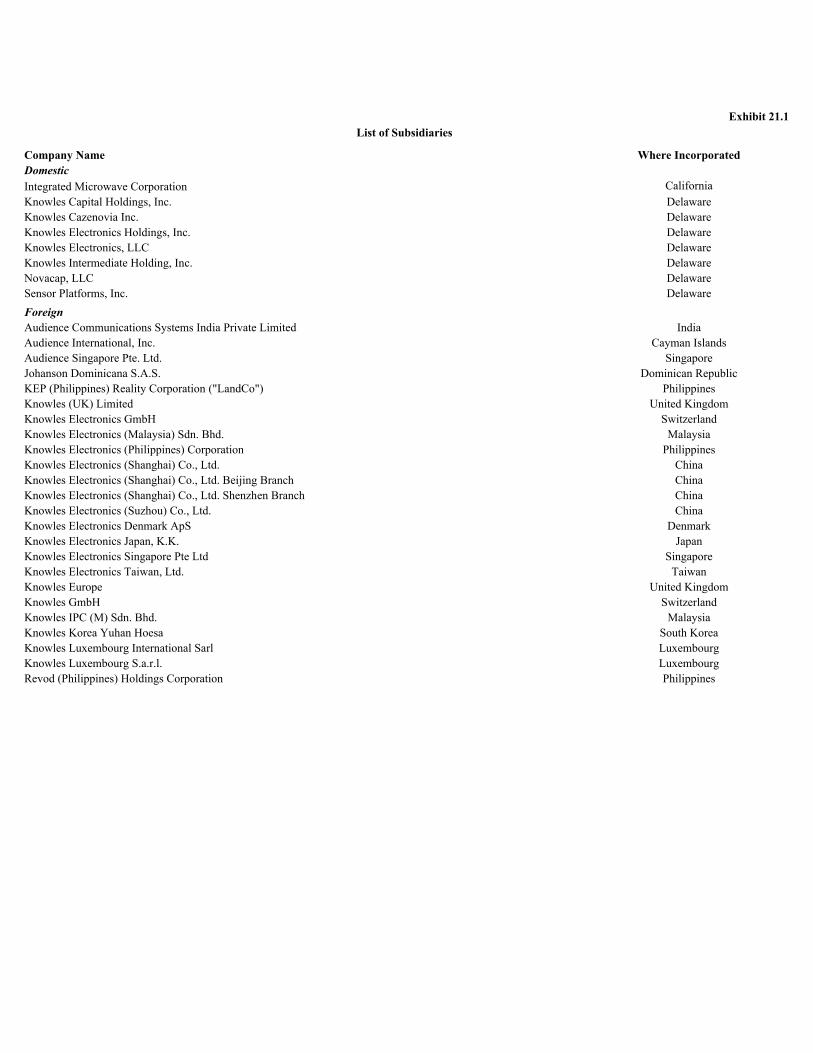
Exhibit 21.1List of Subsidiaries
Company Name Where IncorporatedDomesticIntegrated Microwave Corporation CaliforniaKnowles Capital Holdings, Inc. DelawareKnowles Cazenovia Inc. DelawareKnowles Electronics Holdings, Inc. DelawareKnowles Electronics, LLC DelawareKnowles Intermediate Holding, Inc. DelawareNovacap, LLC DelawareSensor Platforms, Inc. DelawareForeignAudience Communications Systems India Private Limited IndiaAudience International, Inc. Cayman IslandsAudience Singapore Pte. Ltd. SingaporeJohanson Dominicana S.A.S. Dominican RepublicKEP (Philippines) Reality Corporation ("LandCo") PhilippinesKnowles (UK) Limited United KingdomKnowles Electronics GmbH SwitzerlandKnowles Electronics (Malaysia) Sdn. Bhd. MalaysiaKnowles Electronics (Philippines) Corporation PhilippinesKnowles Electronics (Shanghai) Co., Ltd. ChinaKnowles Electronics (Shanghai) Co., Ltd. Beijing Branch ChinaKnowles Electronics (Shanghai) Co., Ltd. Shenzhen Branch ChinaKnowles Electronics (Suzhou) Co., Ltd. ChinaKnowles Electronics Denmark ApS DenmarkKnowles Electronics Japan, K.K. JapanKnowles Electronics Singapore Pte Ltd SingaporeKnowles Electronics Taiwan, Ltd. TaiwanKnowles Europe United KingdomKnowles GmbH SwitzerlandKnowles IPC (M) Sdn. Bhd. MalaysiaKnowles Korea Yuhan Hoesa South KoreaKnowles Luxembourg International Sarl LuxembourgKnowles Luxembourg S.a.r.l. LuxembourgRevod (Philippines) Holdings Corporation Philippines

Exhibit 23.1
CONSENT OF INDEPENDENT REGISTERED PUBLIC ACCOUNTING FIRM
We hereby consent to the incorporation by reference in the Registration Statement on Form S-8 (No. 333-194262, 333-205690, 333-211156, 333-224638, and 333-238253) of Knowles Corporation of our report dated February 9, 2022 relating to the financial statements, financial statement schedule, and the effectiveness ofinternal control over financial reporting, which appears in this Form 10‑K.
/s/ PricewaterhouseCoopers LLPChicago, IllinoisFebruary 9, 2022
Exhibit 31.1CERTIFICATION PURSUANT TO RULE 13a-14(a) AND RULE 15d-14(a)
OF THE SECURITIES EXCHANGE ACT OF 1934I, Jeffrey S. Niew, certify that:
1. I have reviewed this Annual Report on Form 10-K of Knowles Corporation;
2. Based on my knowledge, this report does not contain any untrue statement of a material fact or omit to state a material fact necessary to make thestatements made, in light of the circumstances under which such statements were made, not misleading with respect to the period covered by this report;
3. Based on my knowledge, the financial statements, and other financial information included in this report, fairly present in all material respects thefinancial condition, results of operations and cash flows of the registrant as of, and for, the periods presented in this report;
4. The registrant’s other certifying officer and I are responsible for establishing and maintaining disclosure controls and procedures (as defined in ExchangeAct Rules 13a-15(e) and 15d-15(e)) and internal control over financial reporting (as defined in Exchange Act Rules 13a-15(f) and 15d-15(f)) for theregistrant and have:
a) Designed such disclosure controls and procedures, or caused such disclosure controls and procedures to be designed under our supervision, to ensurethat material information relating to the registrant, including its consolidated subsidiaries, is made known to us by others within those entities,particularly during the period in which this report is being prepared;
b) Designed such internal control over financial reporting, or caused such internal control over financial reporting to be designed under oursupervision, to provide reasonable assurance regarding the reliability of financial reporting and the preparation of financial statements for externalpurposes in accordance with generally accepted accounting principles;
c) Evaluated the effectiveness of the registrant’s disclosure controls and procedures and presented in this report our conclusions about the effectivenessof the disclosure controls and procedures, as of the end of the period covered by this report based on such evaluation; and
d) Disclosed in this report any change in the registrant’s internal control over financial reporting that occurred during the registrant’s most recent fiscalquarter (the registrant’s fourth fiscal quarter in the case of an annual report) that has materially affected, or is reasonably likely to materially affect,the registrant’s internal control over financial reporting; and
5. The registrant’s other certifying officer and I have disclosed, based on our most recent evaluation of internal control over financial reporting, to theregistrant’s auditors and the audit committee of the registrant’s board of directors (or persons performing the equivalent functions):
a) All significant deficiencies and material weaknesses in the design or operation of internal control over financial reporting which are reasonablylikely to adversely affect the registrant’s ability to record, process, summarize and report financial information; and
b) Any fraud, whether or not material, that involves management or other employees who have a significant role in the registrant’s internal control overfinancial reporting.
Date: February 9, 2022
/s/ JEFFREY S. NIEWName: Jeffrey S. NiewTitle: President and Chief Executive Officer
(Principal Executive Officer)
Exhibit 31.2CERTIFICATION PURSUANT TO RULE 13a-14(a) AND RULE 15d-14(a)
OF THE SECURITIES EXCHANGE ACT OF 1934I, John S. Anderson, certify that:
1. I have reviewed this Annual Report on Form 10-K of Knowles Corporation;
2. Based on my knowledge, this report does not contain any untrue statement of a material fact or omit to state a material fact necessary to make thestatements made, in light of the circumstances under which such statements were made, not misleading with respect to the period covered by this report;
3. Based on my knowledge, the financial statements, and other financial information included in this report, fairly present in all material respects thefinancial condition, results of operations and cash flows of the registrant as of, and for, the periods presented in this report;
4. The registrant’s other certifying officer and I are responsible for establishing and maintaining disclosure controls and procedures (as defined in ExchangeAct Rules 13a-15(e) and 15d-15(e)) and internal control over financial reporting (as defined in Exchange Act Rules 13a-15(f) and 15d-15(f)) for theregistrant and have:
a) Designed such disclosure controls and procedures, or caused such disclosure controls and procedures to be designed under our supervision, to ensurethat material information relating to the registrant, including its consolidated subsidiaries, is made known to us by others within those entities,particularly during the period in which this report is being prepared;
b) Designed such internal control over financial reporting, or caused such internal control over financial reporting to be designed under oursupervision, to provide reasonable assurance regarding the reliability of financial reporting and the preparation of financial statements for externalpurposes in accordance with generally accepted accounting principles;
c) Evaluated the effectiveness of the registrant’s disclosure controls and procedures and presented in this report our conclusions about the effectivenessof the disclosure controls and procedures, as of the end of the period covered by this report based on such evaluation; and
d) Disclosed in this report any change in the registrant’s internal control over financial reporting that occurred during the registrant’s most recent fiscalquarter (the registrant’s fourth fiscal quarter in the case of an annual report) that has materially affected, or is reasonably likely to materially affect,the registrant’s internal control over financial reporting; and
5. The registrant’s other certifying officer and I have disclosed, based on our most recent evaluation of internal control over financial reporting, to theregistrant’s auditors and the audit committee of the registrant’s board of directors (or persons performing the equivalent functions):
a) All significant deficiencies and material weaknesses in the design or operation of internal control over financial reporting which are reasonablylikely to adversely affect the registrant’s ability to record, process, summarize and report financial information; and
b) Any fraud, whether or not material, that involves management or other employees who have a significant role in the registrant’s internal control overfinancial reporting.
Date: February 9, 2022
/s/ JOHN S. ANDERSONName: John S. AndersonTitle: Senior Vice President & Chief Financial Officer
(Principal Financial Officer)
Exhibit 32.1
JOINT CERTIFICATION PURSUANT TO18 U.S.C. SECTION 1350,
AS ADOPTED PURSUANT TOSECTION 906 OF THE SARBANES-OXLEY ACT OF 2002
In connection with the Annual Report of Knowles Corporation (the “Company”) on Form 10-K for the year ended December 31, 2021 as filed with theSecurities and Exchange Commission on the date hereof (the “Report”), we, Jeffrey S. Niew and John S. Anderson, the Principal Executive and Financial Officersof the Company, certify, pursuant to and for purposes of 18 U.S.C. ss. 1350, as adopted pursuant to ss. 906 of the Sarbanes-Oxley Act of 2002, that:
(1) the Report fully complies with the requirements of section 13(a) or 15(d) of the Securities Exchange Act of 1934; and
(2) the information contained in the Report fairly presents, in all material respects, the financial condition and results of operations of the Company.
/s/ JEFFREY S. NIEWName: Jeffrey S. NiewTitle: President and Chief Executive Officer
(Principal Executive Officer)Date: February 9, 2022
/s/ JOHN S. ANDERSONName: John S. AndersonTitle: Senior Vice President & Chief Financial Officer
(Principal Financial Officer)Date: February 9, 2022