Embed Size (px)
Citation preview
TOURISM FINANCE CORPORATION (TFC)
FIVE YEAR STRATEGIC PLAN – 2016/17 – 2021/22
April 2017
Five Year Strategic Plan
i
Table of Contents
DISCLAIMER ............................................................................................................................................... 2
GLOSSARY ................................................................................................................................................. 3
LIST OF FIGURES AND TABLES ......................................................................................................................... 4
1 EXECUTIVE SUMMARY ......................................................................................................................... 5
2 INTRODUCTION AND OVERVIEW ........................................................................................................... 6
2.1 BACKGROUND ............................................................................................................................................... 6
2.2 PURPOSE AND PERIOD .................................................................................................................................. 6
2.3 APPROACH AND METHODOLOGY .................................................................................................................... 7
2.4 CRITICAL SUCCESS FACTORS ........................................................................................................................... 8
3 OPERATING ENVIRONMENT OVERVIEW .................................................................................................. 9
3.1 PESTEL ANALYSIS ........................................................................................................................................... 9 3.1.1 Political Environment ....................................................................................................................... 9 3.1.2 Economic Environment ................................................................................................................... 9 3.1.3 Social Environment ....................................................................................................................... 10 3.1.4 Technological Environment ........................................................................................................... 10 3.1.5 Legal and Regulatory Environment ............................................................................................... 11 3.1.6 PESTEL Summary ........................................................................................................................ 12
3.2 TOURISM SECTOR OVERVIEW ...................................................................................................................... 14
3.2.1 Global ............................................................................................................................................ 14 3.2.2 National ......................................................................................................................................... 15 3.2.3 The Tourism Value Chain .............................................................................................................. 17
3.3 DEVELOPMENT FINANCING SECTOR OVERVIEW ............................................................................................ 18
3.4 KEY TOURISM DEVELOPMENT FINANCING PLAYER ANALYSIS ........................................................................ 20
4 REVIEW OF TFC’S PAST STRATEGIC PERFORMANCE ............................................................................... 22
4.1 REVIEW OF PAST FINANCIAL PERFORMANCE .................................................................................................... 22
4.1.1 Key financial performance trends .................................................................................................. 22 4.1.2 Key performance ratios ................................................................................................................. 23 4.1.3 Loan Recoveries ........................................................................................................................... 24 4.1.4 Review of subsidiary performance ................................................................................................ 26
4.2 REVIEW OF PAST STRATEGIC PERFORMANCE ................................................................................................ 28
5 TFC KEY STAKEHOLDER SCORECARD ................................................................................................... 29
5.1 STAKEHOLDER MAPPING ................................................................................................................................ 29
5.2 STAKEHOLDER FEEDBACK ............................................................................................................................ 30
6 SWOT ANALYSIS .............................................................................................................................. 31
7 STRATEGIC DIRECTION ...................................................................................................................... 32
7.1 TFC’S TRANSFORMATION ............................................................................................................................ 32
7.2 VISION ........................................................................................................................................................ 33
7.3 MISSION...................................................................................................................................................... 34
7.4 CORE VALUES ............................................................................................................................................. 35
7.5 TFC’S WINNING STRATEGIC DIRECTION ...................................................................................................... 36
7.6 KEY THEMATIC AREAS ................................................................................................................................. 37
7.7 STRATEGIC BUSINESS UNIT CASCADES ......................................................................................................... 38
7.7.1 Investment ..................................................................................................................................... 38 7.7.2 Credit ............................................................................................................................................. 39 7.7.4 Business Advisory ......................................................................................................................... 40
Five Year Strategic Plan
ii
8 STRATEGIC OBJECTIVES, STRATEGIES AND INITIATIVES ............................................................................ 41
8.1 OBJECTIVE 1 - ACHIEVE KES. 2 B ANNUAL REVENUE AND MAINTAIN 10% RETURN ON ASSETS ....................... 41
8.2 OBJECTIVE 2 - MOBILIZE A TOTAL OF KES 6 B FOR ON LENDING OVER 5 YEARS ............................................. 44 8.3 OBJECTIVE 3 - ENHANCE THE CORPORATIONS BRAND VISIBILITY BY 60% AND MAINTAIN 95% CUSTOMER
SATISFACTION INDEX .................................................................................................................................................. 45 8.4 OBJECTIVE 4 - ENHANCE THE CORPORATION’S SOCIO ECONOMIC IMPACT BY CREATING 8000 JOBS AND
SUPPORTING 200 ENTITIES ......................................................................................................................................... 46 8.5 OBJECTIVE 5 - ACHIEVE 90% OF SERVICE STANDARDS (SLAS), MAINTAIN NON PERFORMING LOANS, NPL OF
LESS THAN 10% IN 3 YEARS AND 5% IN 5 YEARS AND SUSTAIN A COMPLIANCE RATING OF 85% ..................................... 47 8.6 OBJECTIVE 6 - IMPROVE EMPLOYEE PRODUCTIVITY TO KES. 50M IN FIVE YEARS AND MAINTAIN EMPLOYEE
ENGAGEMENT (AND PRODUCTIVITY) AT 85% ANNUALLY ................................................................................................ 48
9 STRATEGIC RISK MANAGEMENT FRAMEWORK ....................................................................................... 49
10 FINANCIAL PROJECTIONS OVERVIEW .................................................................................................. 51
10.1 KEY ASSUMPTIONS...................................................................................................................................... 51
10.2 INCOME STATEMENT SUMMARY ................................................................................................................... 52
10.3 STATEMENT OF FINANCIAL POSITION SUMMARY ........................................................................................... 53
10.4 KEY RATIOS ................................................................................................................................................ 54
11 APPENDIX ....................................................................................................................................... 55
11.1 IMPLEMENTATION PLAN ............................................................................................................................... 55
11.2 MONITORING AND EVALUATION FRAMEWORK ............................................................................................... 68
11.4 ORGANIZATION STRUCTURE ........................................................................................................................ 69
11.4.1 Current structure ........................................................................................................................... 69 11.4.2 Proposed structure (during management retreat).......................................................................... 70 11.4.3 Revised structure .......................................................................................................................... 71 11.4.4 Structure Transition Summary ....................................................................................................... 72
11.5 RESOURCE MOBILIZATION PLAN .................................................................................................................. 73
11.5.1 Introduction ................................................................................................................................... 73 11.5.2 Resources requirements ............................................................................................................... 74 11.5.3 Summary approach for development of resources mobilization framework .................................. 74 11.5.4 Resources mobilization strategies and initiatives .......................................................................... 77 11.5.5 Risks and mitigation plan .............................................................................................................. 79
11.6 DETAILED FINANCIAL PROJECTIONS ............................................................................................................. 81
11.6.1 Projected statement of profit & loss ............................................................................................... 81 11.6.2 Projected statement of financial position ....................................................................................... 83 11.6.3 Projected cash flow statement ...................................................................................................... 85
11.7 DETAILED LISTING OF REVIEWED DOCUMENTS ............................................................................................. 86
11.8 TFC 5O YEAR MILESTONES ........................................................................................................................ 87
11.9 GLOBAL AND REGIONAL TOURISM DATA ....................................................................................................... 88
11.10 DEVELOPMENT FINANCING SOURCES ............................................................................................................ 91
Five Year Strategic Plan
2
Disclaimer
This report is confidential and is addressed solely to named recipients. Altima Africa cannot be
held responsible for its unauthorized copying and distribution. Recipients are respectfully reminded
that this report contains potentially sensitive information and should be kept secure.
The conclusions, findings and opinions expressed in this report are those of Altima unless identified
as those of other parties. We have produced the report specifically for the purposes stated and its
interpretation, use or application for other purposes imposes no obligations on Altima.
A report of this kind is dependent on the completeness, accuracy and reliability of data received
from a variety of sources. ALTIMA makes no warranty or claim as to the accuracy of the information
on which this report is based and cannot be held responsible for any inaccuracies so arising. No
representation or warranty, expressed or implied, is or will be given by ALTIMA, or its respective
directors, employees, or consultants or any other person, as to the accuracy or completeness of
this report and, as far as permitted by law and except in the case of fraud by the party concerned,
no responsibility or liability is accepted for the accuracy or sufficiency thereof, or for any errors,
omissions, or misstatements, negligent or otherwise, relating thereto. In particular, but without
limitation, (subject as aforesaid), no representation or warranty is given as to the achievement of
intended outcomes as a result of the implementation of recommendations, and nothing in this
report is or should be relied on as a promise or representation as to the future.
Accordingly, ALTIMA, nor any of the respective directors, employees, or advisors, nor any other
person, shall be liable for any direct, indirect, or consequential loss or damage suffered by any
person as a result of relying on any statement in or omission from this report and any such liability is
expressly disclaimed.
Five Year Strategic Plan
3
Glossary
[ TFC ] Tourism Finance Corporation [ SDGs ] Sustainable Development Goals
[IDIs ] In depth Interviews [ MTP II ] Second Medium Term Plan
[ DFI ] Development Finance Institutions [ ERP ] Enterprise Resource Planning
[FGDs ] Focus Group Discussions [ IDCSA ] Industrial Development
Corporation- South Africa
[ ADR ] Average Daily Rate [ TFCI ] Tourism Finance Corporation of India
[ RevPar ] Revenue per available room [ TAT ] Turn Around Time
[ NPL ] Non-performing Loans [ SLA ] Service Level Agreement
[ OPEX ] Operating Expenses [ SOP ] Standard Operating Procedure
[ TRA ]Tourism Regulatory Authority [ KTB ] Kenya Tourism Board
[ KATO ]Kenya Association of Tour Operators [ ADB ] Asia Development Bank
[ IFC ] International Finance Corporation [ AFDB ] Africa Development Bank
[ IDB ] Islamic Development Bank [ UN ] United Nations
[ EADB ] East African Development Bank [ JV ] Joint Venture
[ AADI ] Association of African Development
Financing Institutions
[ KFW ] Kreditanstalt für Wiederaufbau (A
German DFI)
[ GoK ] Government of Kenya [ HSBC ] Hongkong and Shanghai Banking
Corporation
[ MoT ] Ministry of Tourism [ FY ] Financial Year
Five Year Strategic Plan
4
List of Figures and Tables
List of Figures
Description Page
Figure 1 – strategy development approach and methodology
Figure 2: global key economic drivers
Figure 3 ; Population demographic highlights Kenya, 2014 &
2020
Figure 4: key technological trends
Figure 5: Legal and Regulatory Environment Summary
Figure 6: Inbound tourism visitor growth worldwide 2008 – 2017
Figure 7: 2015 global visitor exports, travel & tourism
investment; The warmth of Kenyan hospitality
Figure 8: tourism sector competitiveness analysis 2015, Eastern
& Southern African Countries
Figure 9: Key Tourism Industry Players, Kenya
Figure 10: The tourism value chain
Figure 11: Revenue and Net profit trend 2011-2015
Figure 12: Return on Assets Ratio 2011 to 2015
Figure 13: TFC Revenue Streams 2011 to 2015
Figure 14: TFC Revenue Share 2011 to 2015
Figure 15: TFC Profit Margin 2011 to 2015
Figure 16: Loan portfolio movement 2013 to 2016
Figure 17: Loan collections 2016 – 2017
Figure 18: TFC Subsidiary performance summary
Figure 19: Past strategic performance review summary
9
11
12
12
13
16
16
18
18
19
23
24
25
26
26
27
27
29
29
30
30
List of Tables
Description Page
Table 1: Stakeholder mapping and assessment criteria
summary’
Table 2: PESTEL Summary findings and insights
Table 3: East African Inbound Tourist Arrivals ‘000 (2013 & 2014)
Table 4: Hospitality Industry Value and international arrivals
Kenya 2014 – 2020
Table 5: Key Tourism Development Components
Table 6: Tourism Sector Assessment Summary
Table 7: Case study analysis summary
Table 8: TFC Subsidiary performance summary
Table 9: External TFC Stakeholders
Table 10: summary of the projected income statement
Table 11: Projected statement of financial position
Table 12: Key financial projection ratios
10
15
16
18
19
20
22
28
29
51
52
53
Five Year Strategic Plan
5
1 Executive Summary
Strategic planning is a vital process in modern management that guides organizations towards
their desired business destination. It is an organization’s way of ensuring that it is prepared for the
future by envisaging this future and coming up with strategic objectives, strategies and initiatives
for its achievement.
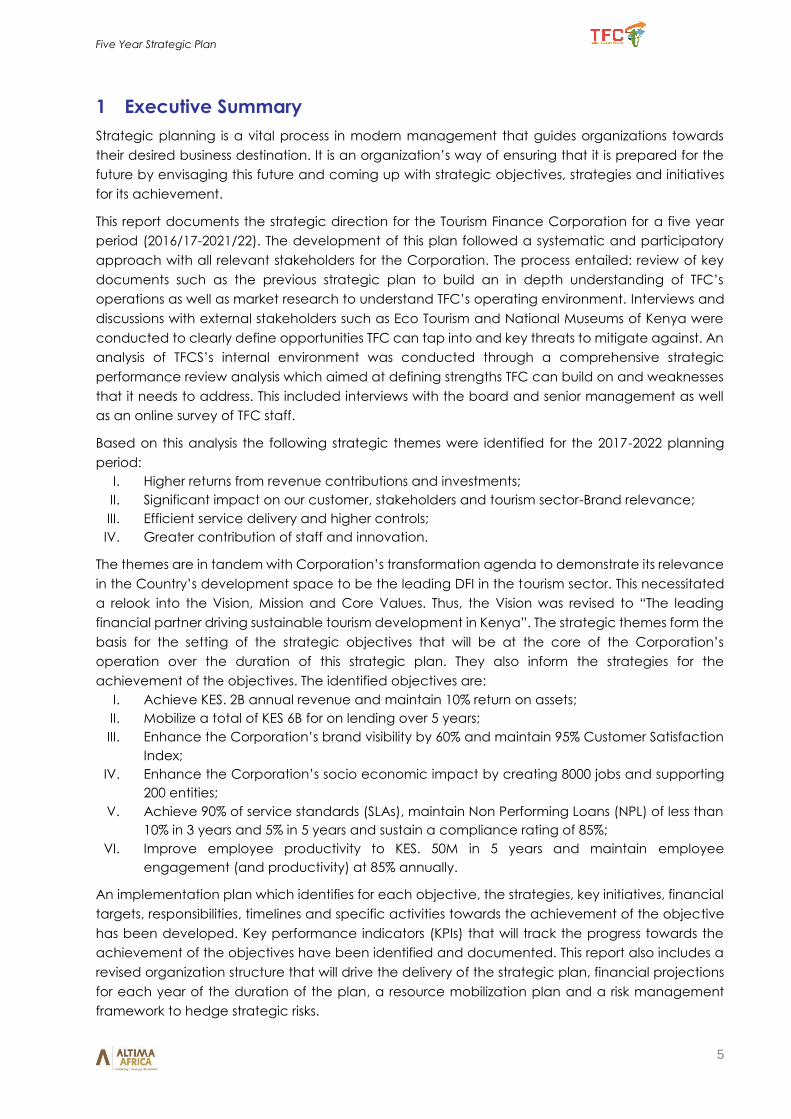
This report documents the strategic direction for the Tourism Finance Corporation for a five year
period (2016/17-2021/22). The development of this plan followed a systematic and participatory
approach with all relevant stakeholders for the Corporation. The process entailed: review of key
documents such as the previous strategic plan to build an in depth understanding of TFC’s
operations as well as market research to understand TFC’s operating environment. Interviews and
discussions with external stakeholders such as Eco Tourism and National Museums of Kenya were
conducted to clearly define opportunities TFC can tap into and key threats to mitigate against. An
analysis of TFCS’s internal environment was conducted through a comprehensive strategic
performance review analysis which aimed at defining strengths TFC can build on and weaknesses
that it needs to address. This included interviews with the board and senior management as well
as an online survey of TFC staff.
Based on this analysis the following strategic themes were identified for the 2017-2022 planning
period:
I. Higher returns from revenue contributions and investments;
II. Significant impact on our customer, stakeholders and tourism sector-Brand relevance;
III. Efficient service delivery and higher controls;
IV. Greater contribution of staff and innovation.
The themes are in tandem with Corporation’s transformation agenda to demonstrate its relevance
in the Country’s development space to be the leading DFI in the tourism sector. This necessitated
a relook into the Vision, Mission and Core Values. Thus, the Vision was revised to “The leading
financial partner driving sustainable tourism development in Kenya”. The strategic themes form the
basis for the setting of the strategic objectives that will be at the core of the Corporation’s
operation over the duration of this strategic plan. They also inform the strategies for the
achievement of the objectives. The identified objectives are:
I. Achieve KES. 2B annual revenue and maintain 10% return on assets;
II. Mobilize a total of KES 6B for on lending over 5 years;
III. Enhance the Corporation’s brand visibility by 60% and maintain 95% Customer Satisfaction
Index;
IV. Enhance the Corporation’s socio economic impact by creating 8000 jobs and supporting
200 entities;
V. Achieve 90% of service standards (SLAs), maintain Non Performing Loans (NPL) of less than
10% in 3 years and 5% in 5 years and sustain a compliance rating of 85%;
VI. Improve employee productivity to KES. 50M in 5 years and maintain employee
engagement (and productivity) at 85% annually.
An implementation plan which identifies for each objective, the strategies, key initiatives, financial
targets, responsibilities, timelines and specific activities towards the achievement of the objective
has been developed. Key performance indicators (KPIs) that will track the progress towards the
achievement of the objectives have been identified and documented. This report also includes a
revised organization structure that will drive the delivery of the strategic plan, financial projections
for each year of the duration of the plan, a resource mobilization plan and a risk management
framework to hedge strategic risks.
Five Year Strategic Plan
6
2 Introduction and Overview
2.1 Background
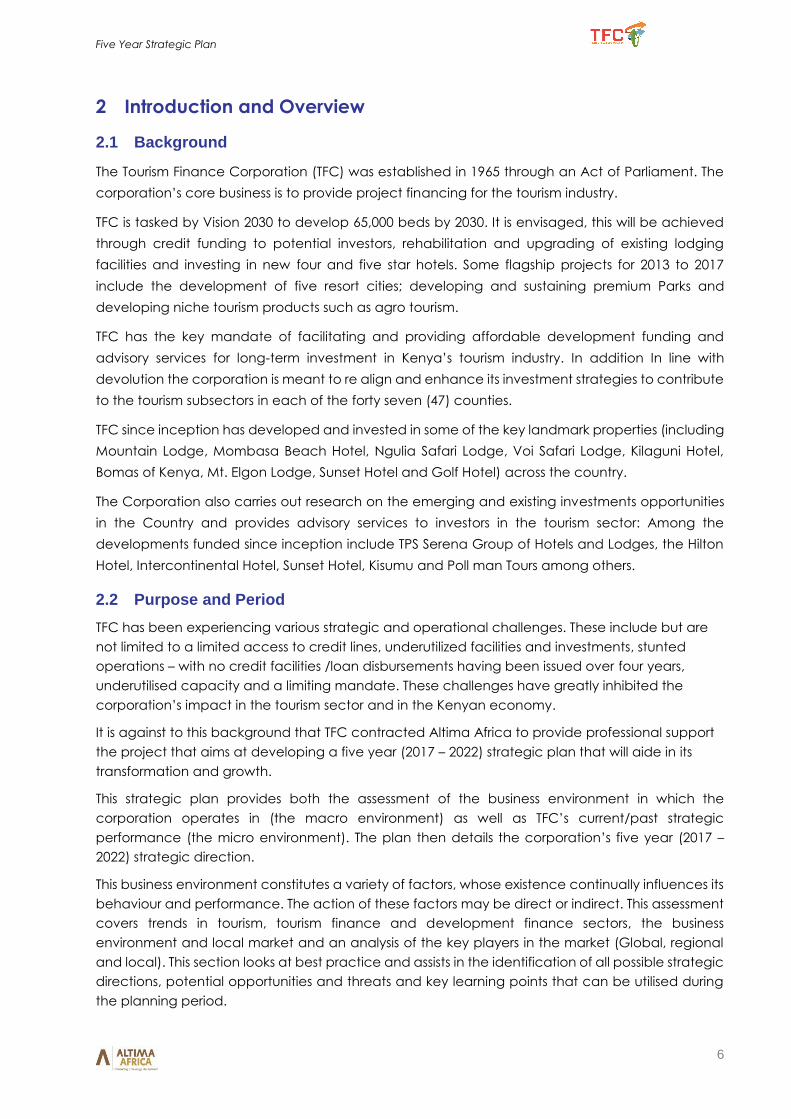
The Tourism Finance Corporation (TFC) was established in 1965 through an Act of Parliament. The
corporation’s core business is to provide project financing for the tourism industry.
TFC is tasked by Vision 2030 to develop 65,000 beds by 2030. It is envisaged, this will be achieved
through credit funding to potential investors, rehabilitation and upgrading of existing lodging
facilities and investing in new four and five star hotels. Some flagship projects for 2013 to 2017
include the development of five resort cities; developing and sustaining premium Parks and
developing niche tourism products such as agro tourism.
TFC has the key mandate of facilitating and providing affordable development funding and
advisory services for long-term investment in Kenya’s tourism industry. In addition In line with
devolution the corporation is meant to re align and enhance its investment strategies to contribute
to the tourism subsectors in each of the forty seven (47) counties.
TFC since inception has developed and invested in some of the key landmark properties (including
Mountain Lodge, Mombasa Beach Hotel, Ngulia Safari Lodge, Voi Safari Lodge, Kilaguni Hotel,
Bomas of Kenya, Mt. Elgon Lodge, Sunset Hotel and Golf Hotel) across the country.
The Corporation also carries out research on the emerging and existing investments opportunities
in the Country and provides advisory services to investors in the tourism sector: Among the
developments funded since inception include TPS Serena Group of Hotels and Lodges, the Hilton
Hotel, Intercontinental Hotel, Sunset Hotel, Kisumu and Poll man Tours among others.
2.2 Purpose and Period
TFC has been experiencing various strategic and operational challenges. These include but are
not limited to a limited access to credit lines, underutilized facilities and investments, stunted
operations – with no credit facilities /loan disbursements having been issued over four years,
underutilised capacity and a limiting mandate. These challenges have greatly inhibited the
corporation’s impact in the tourism sector and in the Kenyan economy.
It is against to this background that TFC contracted Altima Africa to provide professional support
the project that aims at developing a five year (2017 – 2022) strategic plan that will aide in its
transformation and growth.
This strategic plan provides both the assessment of the business environment in which the
corporation operates in (the macro environment) as well as TFC’s current/past strategic
performance (the micro environment). The plan then details the corporation’s five year (2017 –
2022) strategic direction.
This business environment constitutes a variety of factors, whose existence continually influences its
behaviour and performance. The action of these factors may be direct or indirect. This assessment
covers trends in tourism, tourism finance and development finance sectors, the business
environment and local market and an analysis of the key players in the market (Global, regional
and local). This section looks at best practice and assists in the identification of all possible strategic
directions, potential opportunities and threats and key learning points that can be utilised during
the planning period.
Five Year Strategic Plan
7
The assessment of TFC’s current and past performance focuses on internal operations, financial
performance and organizational structure.
Taking all this into consideration, this strategic plan defines TFC’s five year (2017 – 2022) strategic
direction including year zero’ which details strategies between the planning period and the first
year of implementation (i.e. November 2016 to June 2017). The strategic direction contains the
refined Vision statement, Mission and core values. The plan further details the six key objectives,
which define clear targets, crafted to achieve the pre-set vision. These objectives are further
broken down into strategies and initiatives. The plan also details the critical aspects of
implementation defining clear action plans illustrating how and when the objectives, strategies
and initiatives will be executed. An organizational structure has as well been proposed to support
the strategic direction. Key strategic risks have been identified and mitigating actions have been
developed to ensure overall strategic planning success.
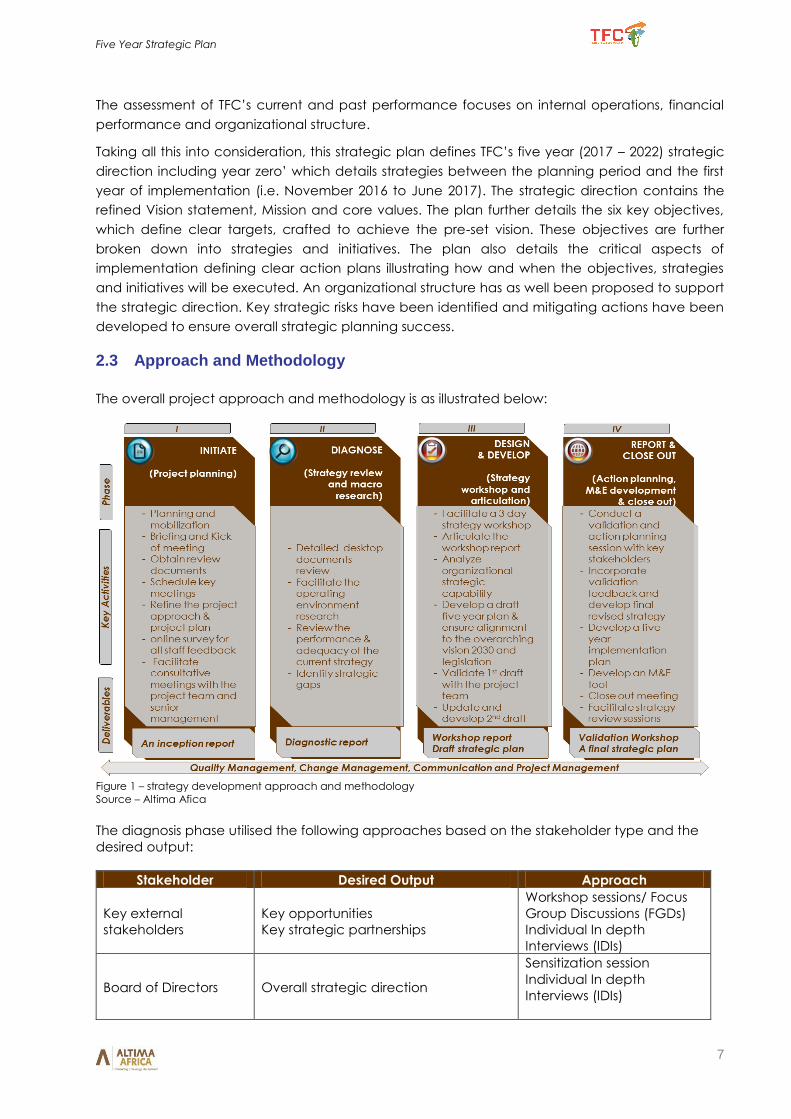
2.3 Approach and Methodology
The overall project approach and methodology is as illustrated below:
Figure 1 – strategy development approach and methodology
Source – Altima Afica
The diagnosis phase utilised the following approaches based on the stakeholder type and the
desired output:
Stakeholder Desired Output Approach
Key external
stakeholders
Key opportunities
Key strategic partnerships
Workshop sessions/ Focus
Group Discussions (FGDs)
Individual In depth
Interviews (IDIs)
Board of Directors Overall strategic direction
Sensitization session
Individual In depth
Interviews (IDIs)
Five Year Strategic Plan
8
Stakeholder Desired Output Approach
Management
Current and past strategic
performance
Strategy management and execution
options
Sensitization session
Individual In depth
Interviews (IDIs)
Staff
Strategy execution roadblocks and
enablers
Operational roadblocks and enablers
Online strategy survey
Table 1: Stakeholder mapping and assessment criteria summary
Source: Altima Analytics
2.4 Critical Success Factors
The critical success factors identified for the successful implementation of this strategic plan are as
highlighted below:
Active endorsement, support and commitment of the Board and the Leadership Team
Effective, regular and timely decision making and communication
Investments in increased loan book size
Transformation of investment and portfolio performance
Enhanced brand visibility, socio economic impact and sector leadership
Systematic strategy implementation that ensures departments and individual employees
own the new strategic direction
Matching staffing to business and growth needs and timely commitment and allocation of
adequate resources to support strategy implementation.
Five Year Strategic Plan
9
3 Operating Environment Overview
This chapter provides a summarised assessment of the corporation’s internal (the micro
environment).and external (the macro environment) business environment. The detailed
assessment is contained in the the comprehensive diagnostic report submitted on 30th November
2016.
This business environment constitutes a variety of factors, whose existence continually influences
the corporation’s behaviour and performance. The action of these factors may be direct or
indirect. The external environment assessment covers trends in tourism, tourism finance and
development finance sectors, the business environment and local market and an analysis of the
key players in the market (Global, regional and local). The internal environment assessment covers
TFC’s current and past performance focuses on internal operations, financial performance and
organizational structure
3.1 PESTEL Analysis
3.1.1 Political Environment
The global political environment is facing numerous challenges such as the US Elections and
changes in foreign policies; the regrouping of the Grand Old Party (GOP);BREXIT and Britain’s
foreign policies; terrorism and religious extremism (ISIS/ ISIL, Al Qaida);the establishment of the
“BRICS Bank” –the New Development Bank; and re-establishment of ties between Cuba and the
US.
The political outlook across Africa includes Nigeria taking over as the key economic powerhouse;
Egypt’s unrest and Islamic State infiltration; a more united Africa and the Advocacy and
Communication Cluster (ACC); a Reenergized COMESA and enhanced China Activity in Sub-
Saharan Africa.
The EAC political scene consists of many joint intergovernmental programs; Burundi and DRC
warned on presidential term limits; South Sudan leadership woes; Tanzania leadership shift and
Kenya’s and Rwanda's uncertainty on succession.
In Kenya the upcoming national elections has seen increased tensions across the country as well
as slowed government projects and foreign investments. In addition, devolution has resulted in
decentralized opportunities; distributed resources and uncertainty in taxation
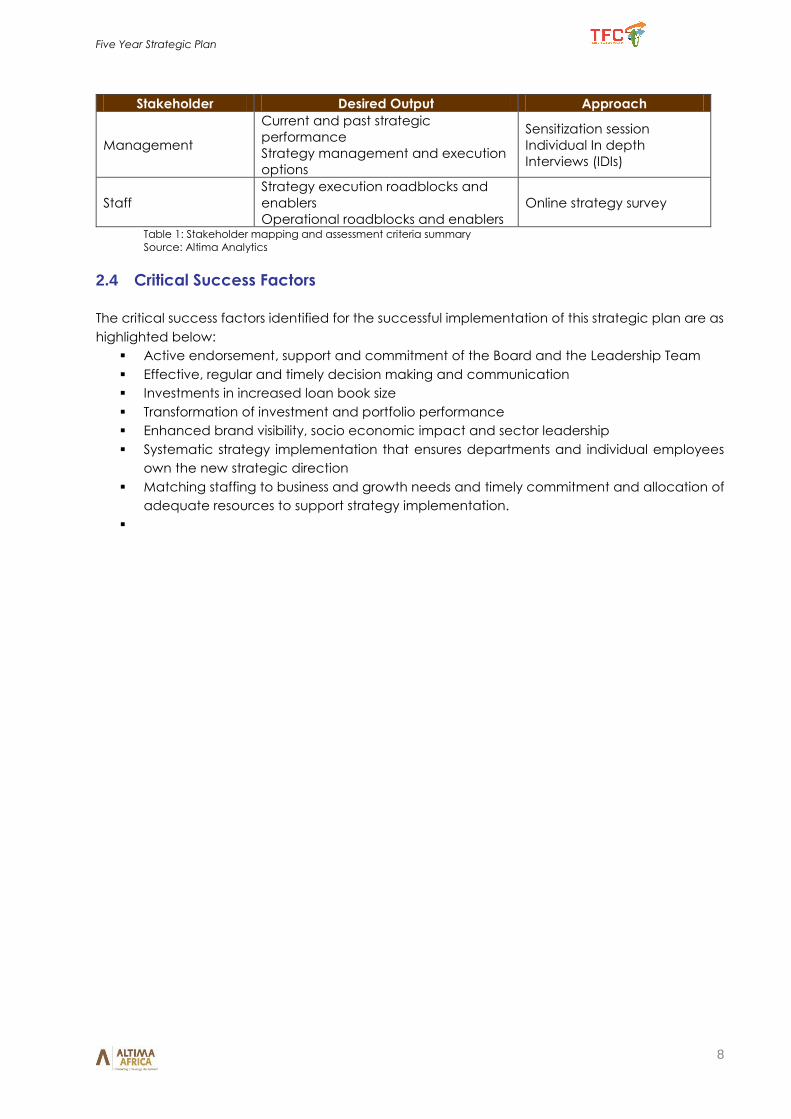
3.1.2 Economic Environment
The global economy is on a narrow path of slow and fragile recovery. Many countries are
struggling with a massive debt burden and high unemployment persisting to bog down their
economies and hampering growth. Commodity prices remain high and will continue to put
further pressure on the global economy. Some of the global key economic drivers are as
illustrated below:
Figure 2: global key economic drivers
Source: Altima Analytics
Five Year Strategic Plan
10
The Kenyan business climate has been rendered unfavourable due to key issues such as corruption,
inflation, tax rates, insecurity, and access to financing, inadequate supply of infrastructure,
inefficient government bureaucracy, and policy instability. However, it is important to note that
doing business in Kenya has significantly improved as ranked by the World Bank ease of doing
business report.
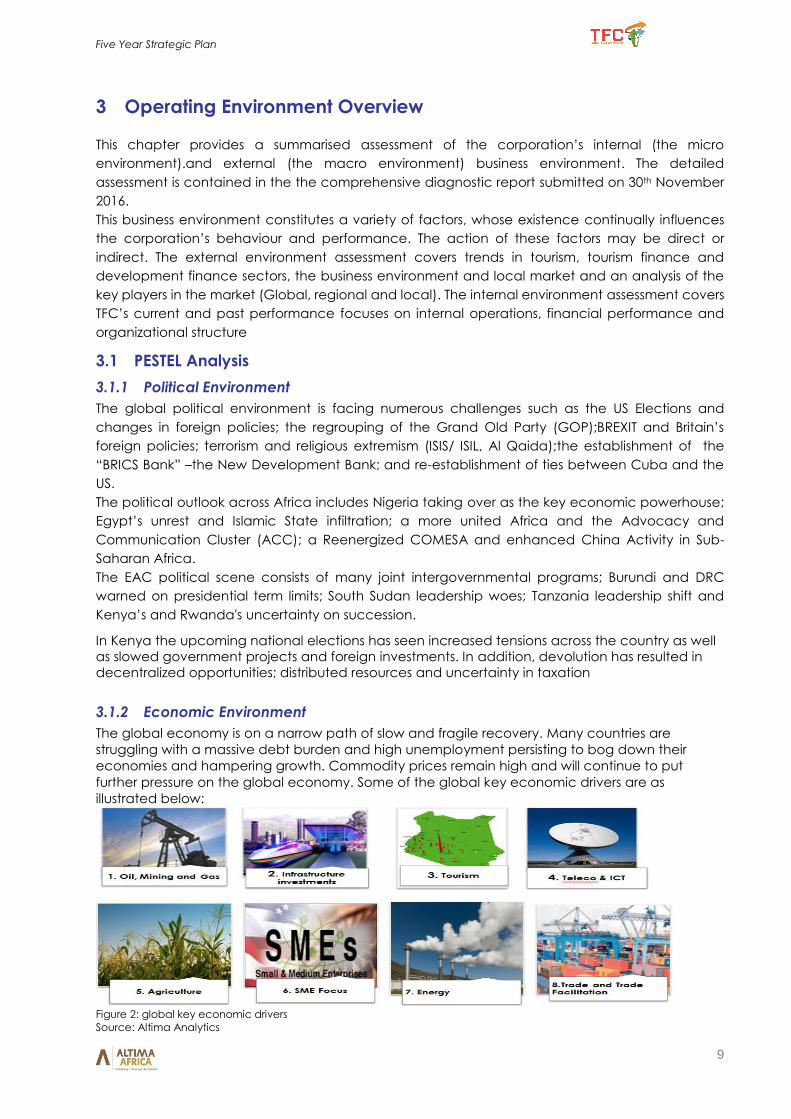
3.1.3 Social Environment
The Kenyan social environment is facing significant growth in the middle class population; rapid
urbanization and focus to new devolved centres; continued focus on creating opportunities for
youth and women; a slowed population growth rate of 1.8% p.a.; improved literacy levels and
enhanced social media evolution. The figure below highlights a projected increase in Kenya’s
working population.
Figure 3 ; Population demographic highlights Kenya, 2014 & 2020
Source: Kenya Bureau of Statistics & CIA World Fact book
Changes of the social environment have a major impact on products, services market and
consumers. Organizations are being staggered and challenged by the opportunities and threats
arising from changes in the social environment which affect the customer needs and the size of
the potential markets. Some of these changes include an increasing middle class with enhancing
purchasing power; a growing mismatch between the skills employers need and the talent
available; rapidly growing population and enhanced urbanization.
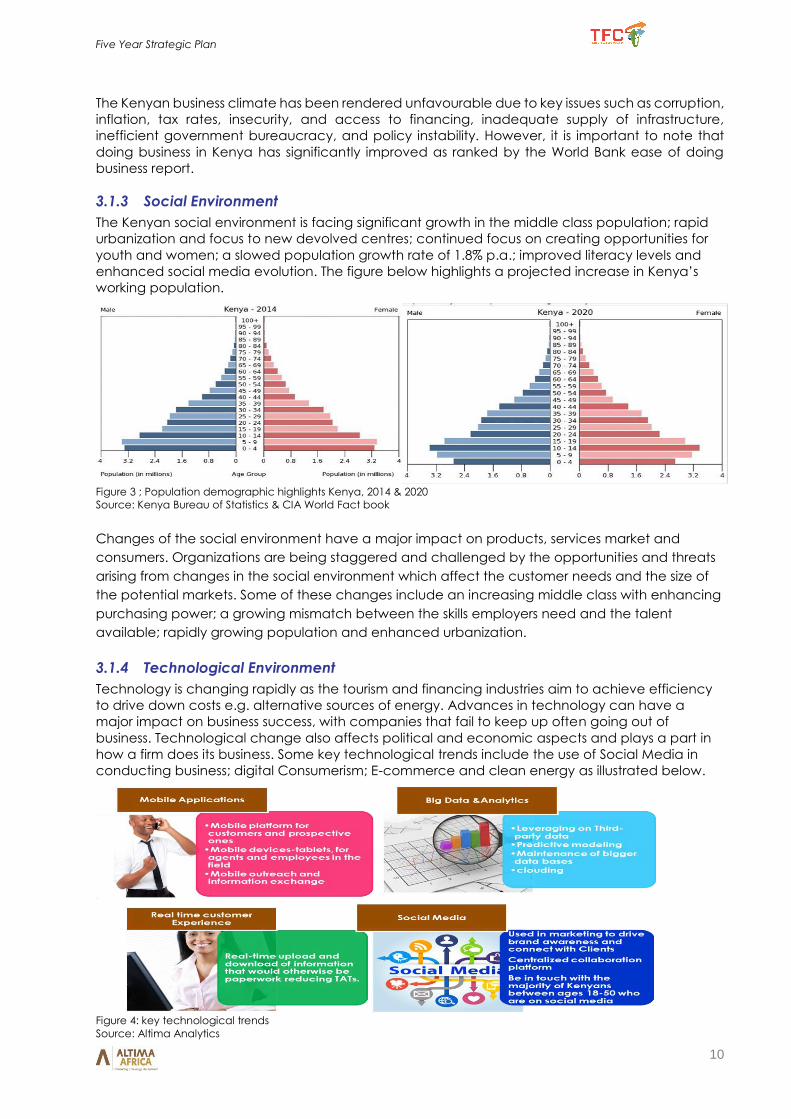
3.1.4 Technological Environment
Technology is changing rapidly as the tourism and financing industries aim to achieve efficiency
to drive down costs e.g. alternative sources of energy. Advances in technology can have a
major impact on business success, with companies that fail to keep up often going out of
business. Technological change also affects political and economic aspects and plays a part in
how a firm does its business. Some key technological trends include the use of Social Media in
conducting business; digital Consumerism; E-commerce and clean energy as illustrated below.
Figure 4: key technological trends Source: Altima Analytics
Five Year Strategic Plan
11
Technology is transforming the global tourism industry: The industry is embracing e-Tourism which
refers to the digitalization of all processes and value chains in the tourism, travel, hospitality and
catering industries that enable organizations to maximise their efficiency and effectiveness.
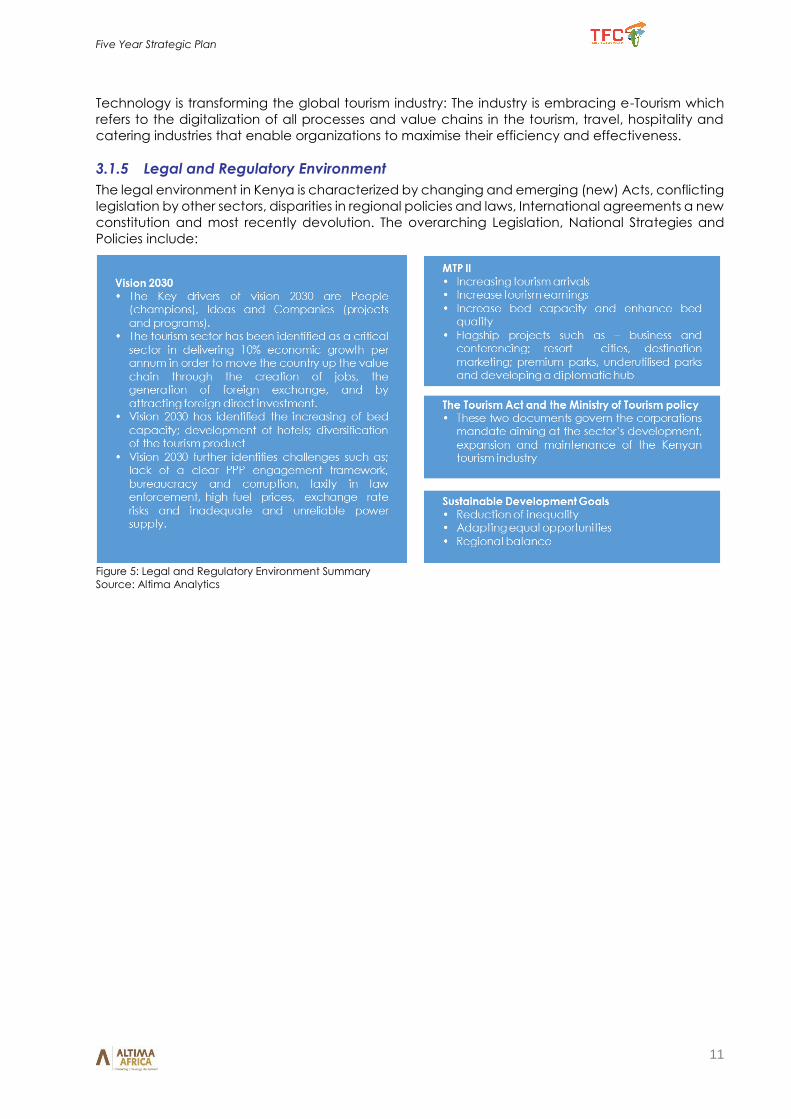
3.1.5 Legal and Regulatory Environment
The legal environment in Kenya is characterized by changing and emerging (new) Acts, conflicting
legislation by other sectors, disparities in regional policies and laws, International agreements a new
constitution and most recently devolution. The overarching Legislation, National Strategies and
Policies include:
Figure 5: Legal and Regulatory Environment Summary
Source: Altima Analytics
Five Year Strategic Plan
12
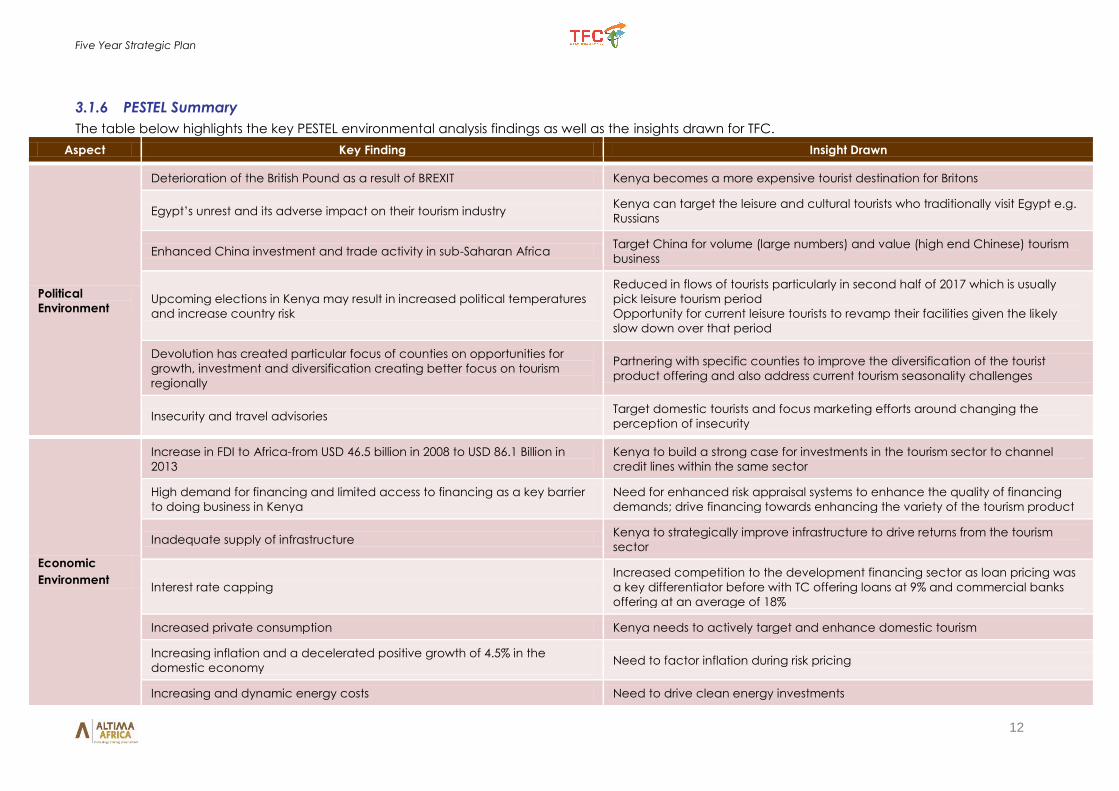
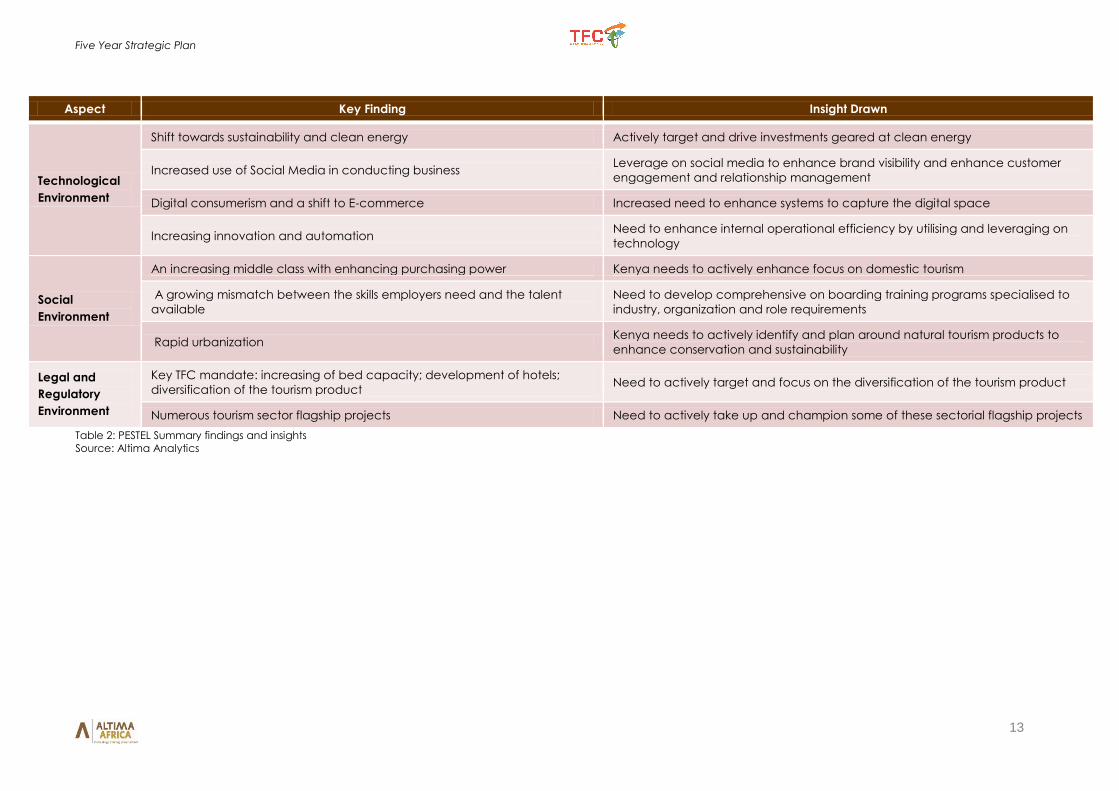
3.1.6 PESTEL Summary
The table below highlights the key PESTEL environmental analysis findings as well as the insights drawn for TFC.
Aspect Key Finding Insight Drawn
Political
Environment
Deterioration of the British Pound as a result of BREXIT Kenya becomes a more expensive tourist destination for Britons
Egypt’s unrest and its adverse impact on their tourism industry Kenya can target the leisure and cultural tourists who traditionally visit Egypt e.g.
Russians
Enhanced China investment and trade activity in sub-Saharan Africa Target China for volume (large numbers) and value (high end Chinese) tourism
business
Upcoming elections in Kenya may result in increased political temperatures
and increase country risk
Reduced in flows of tourists particularly in second half of 2017 which is usually
pick leisure tourism period
Opportunity for current leisure tourists to revamp their facilities given the likely
slow down over that period
Devolution has created particular focus of counties on opportunities for
growth, investment and diversification creating better focus on tourism
regionally
Partnering with specific counties to improve the diversification of the tourist
product offering and also address current tourism seasonality challenges
Insecurity and travel advisories Target domestic tourists and focus marketing efforts around changing the
perception of insecurity
Economic
Environment
Increase in FDI to Africa-from USD 46.5 billion in 2008 to USD 86.1 Billion in
2013
Kenya to build a strong case for investments in the tourism sector to channel
credit lines within the same sector
High demand for financing and limited access to financing as a key barrier
to doing business in Kenya
Need for enhanced risk appraisal systems to enhance the quality of financing
demands; drive financing towards enhancing the variety of the tourism product
Inadequate supply of infrastructure Kenya to strategically improve infrastructure to drive returns from the tourism
sector
Interest rate capping
Increased competition to the development financing sector as loan pricing was
a key differentiator before with TC offering loans at 9% and commercial banks
offering at an average of 18%
Increased private consumption Kenya needs to actively target and enhance domestic tourism
Increasing inflation and a decelerated positive growth of 4.5% in the
domestic economy Need to factor inflation during risk pricing
Increasing and dynamic energy costs Need to drive clean energy investments
Five Year Strategic Plan
13
Aspect Key Finding Insight Drawn
Technological
Environment
Shift towards sustainability and clean energy Actively target and drive investments geared at clean energy
Increased use of Social Media in conducting business Leverage on social media to enhance brand visibility and enhance customer
engagement and relationship management
Digital consumerism and a shift to E-commerce Increased need to enhance systems to capture the digital space
Increasing innovation and automation Need to enhance internal operational efficiency by utilising and leveraging on
technology
Social
Environment
An increasing middle class with enhancing purchasing power Kenya needs to actively enhance focus on domestic tourism
A growing mismatch between the skills employers need and the talent
available
Need to develop comprehensive on boarding training programs specialised to
industry, organization and role requirements
Rapid urbanization Kenya needs to actively identify and plan around natural tourism products to
enhance conservation and sustainability
Legal and
Regulatory
Environment
Key TFC mandate: increasing of bed capacity; development of hotels;
diversification of the tourism product Need to actively target and focus on the diversification of the tourism product
Numerous tourism sector flagship projects Need to actively take up and champion some of these sectorial flagship projects
Table 2: PESTEL Summary findings and insights
Source: Altima Analytics
Five Year Strategic Plan
14
3.2 Tourism Sector Overview
3.2.1 Global and Regional
The travel & tourism sector has developed into an industry with an annual economic impact (direct,
indirect and induced) of around 6.5 trillion U.S. dollars worldwide. In 2012, the number of
international tourist arrivals exceeded the one billion mark for the first time, an increase of almost
50% compared to ten years earlier. International travellers from China, Germany and the United
States are amongst the biggest spenders worldwide.
The global hotel industry generates approximately between 400 and 500 billion U.S. dollars in
revenue each year, one third of that revenue is attributable to the United States. Some of the
biggest hotel chains (groups) are the InterContinental Hotels Group, Marriott International, Hilton
Worldwide, Accor, Starwood Hotels & Resorts, and the Wyndham Hotel Group. Three of the most
important hotel performance indicators are the Average Daily Rate (ADR), the revenue per
available room (RevPar), and the occupancy rate. Some key facts and figures are presented
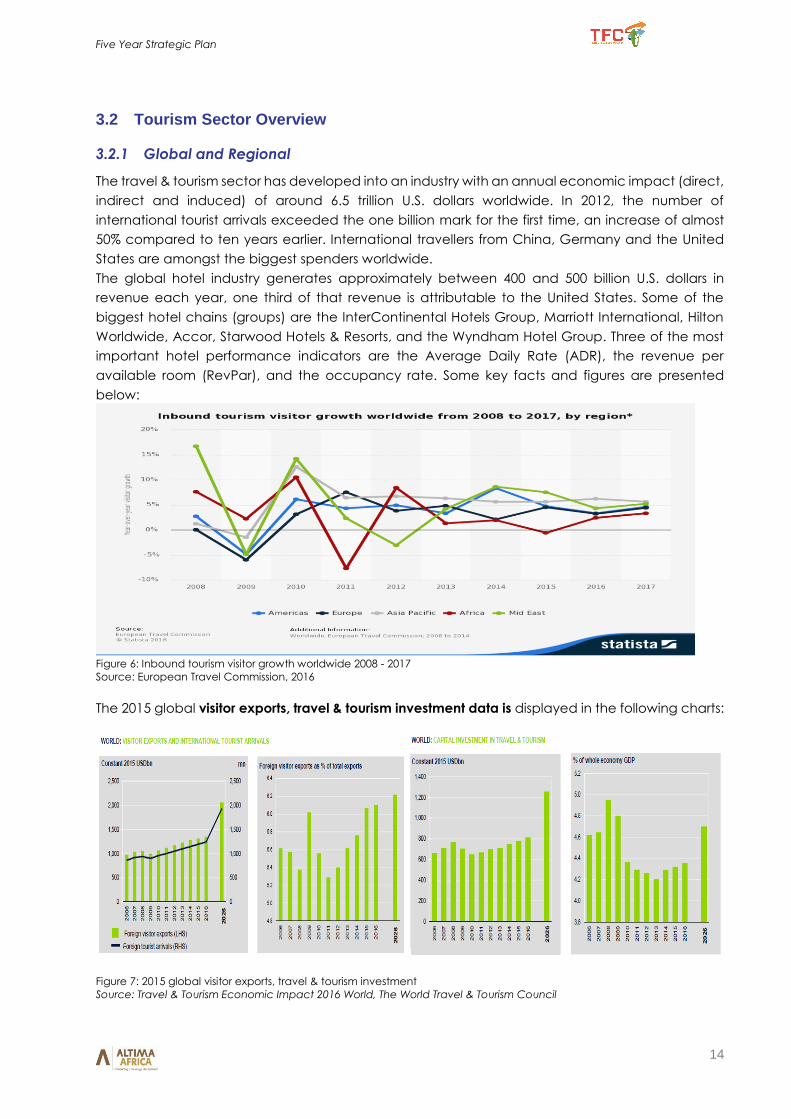
below:
Figure 6: Inbound tourism visitor growth worldwide 2008 - 2017
Source: European Travel Commission, 2016
The 2015 global visitor exports, travel & tourism investment data is displayed in the following charts:
Figure 7: 2015 global visitor exports, travel & tourism investment
Source: Travel & Tourism Economic Impact 2016 World, The World Travel & Tourism Council
Five Year Strategic Plan
15
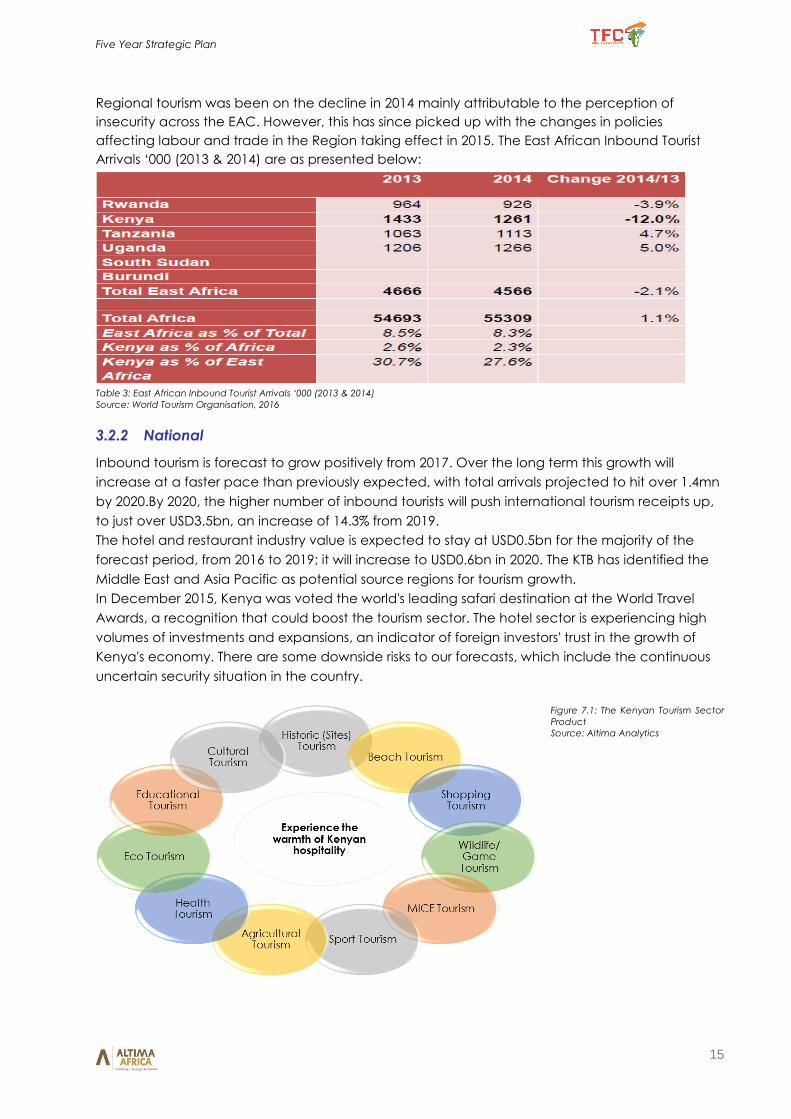
Regional tourism was been on the decline in 2014 mainly attributable to the perception of
insecurity across the EAC. However, this has since picked up with the changes in policies
affecting labour and trade in the Region taking effect in 2015. The East African Inbound Tourist
Arrivals ‘000 (2013 & 2014) are as presented below:
Table 3: East African Inbound Tourist Arrivals ‘000 (2013 & 2014)
Source: World Tourism Organisation, 2016
3.2.2 National
Inbound tourism is forecast to grow positively from 2017. Over the long term this growth will
increase at a faster pace than previously expected, with total arrivals projected to hit over 1.4mn
by 2020.By 2020, the higher number of inbound tourists will push international tourism receipts up,
to just over USD3.5bn, an increase of 14.3% from 2019.
The hotel and restaurant industry value is expected to stay at USD0.5bn for the majority of the
forecast period, from 2016 to 2019; it will increase to USD0.6bn in 2020. The KTB has identified the
Middle East and Asia Pacific as potential source regions for tourism growth.
In December 2015, Kenya was voted the world's leading safari destination at the World Travel
Awards, a recognition that could boost the tourism sector. The hotel sector is experiencing high
volumes of investments and expansions, an indicator of foreign investors' trust in the growth of
Kenya's economy. There are some downside risks to our forecasts, which include the continuous
uncertain security situation in the country.
Figure 7.1: The Kenyan Tourism Sector
Product
Source: Altima Analytics
Five Year Strategic Plan
16
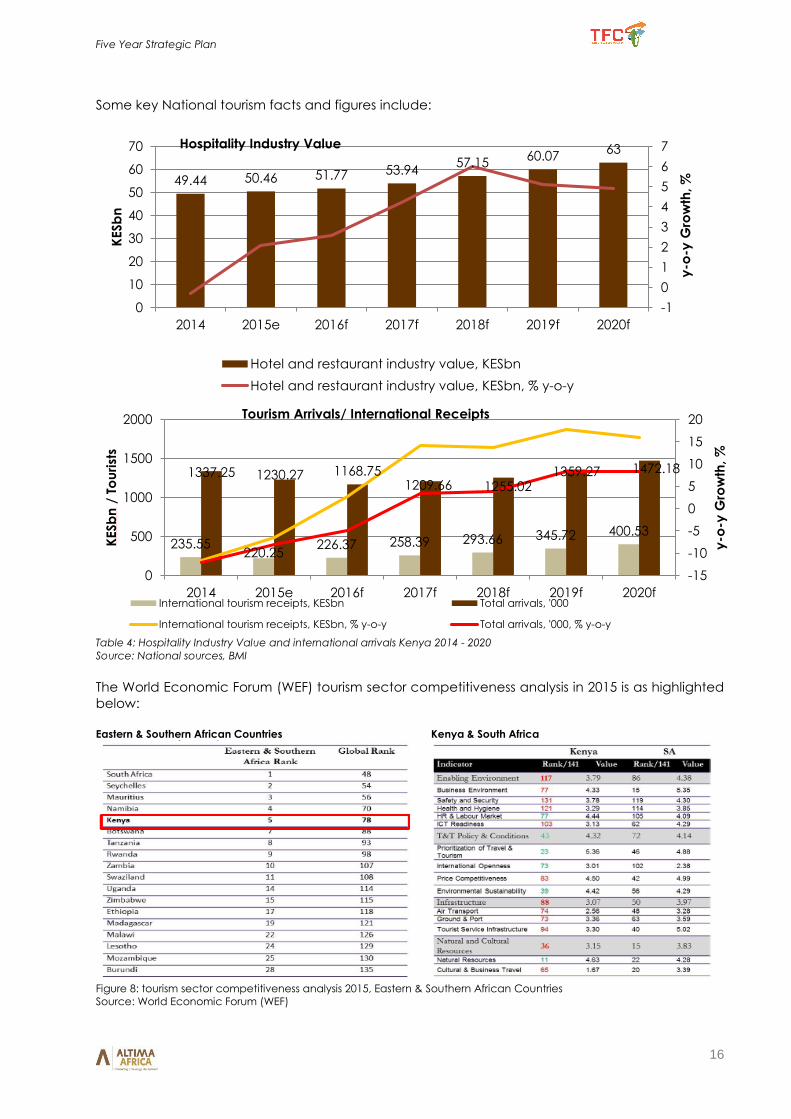
Some key National tourism facts and figures include:
Table 4: Hospitality Industry Value and international arrivals Kenya 2014 - 2020
Source: National sources, BMI
The World Economic Forum (WEF) tourism sector competitiveness analysis in 2015 is as highlighted
below:
Eastern & Southern African Countries Kenya & South Africa
Figure 8: tourism sector competitiveness analysis 2015, Eastern & Southern African Countries
Source: World Economic Forum (WEF)
49.44 50.46 51.77 53.9457.15
60.0763
-1
0
1
2
3
4
5
6
7
0
10
20
30
40
50
60
70
2014 2015e 2016f 2017f 2018f 2019f 2020f
y-o
-y G
row
th,
%
KESb
n
Hospitality Industry Value
Hotel and restaurant industry value, KESbn
Hotel and restaurant industry value, KESbn, % y-o-y
235.55220.25
226.37 258.39 293.66 345.72 400.53
1337.25 1230.27 1168.751209.66 1255.02
1359.27 1472.18
-15
-10
-5
0
5
10
15
20
0
500
1000
1500
2000
2014 2015e 2016f 2017f 2018f 2019f 2020f
y-o
-y G
row
th,
%
KESb
n/
Tou
rist
s
Tourism Arrivals/ International Receipts
International tourism receipts, KESbn Total arrivals, '000
International tourism receipts, KESbn, % y-o-y Total arrivals, '000, % y-o-y
Five Year Strategic Plan
17
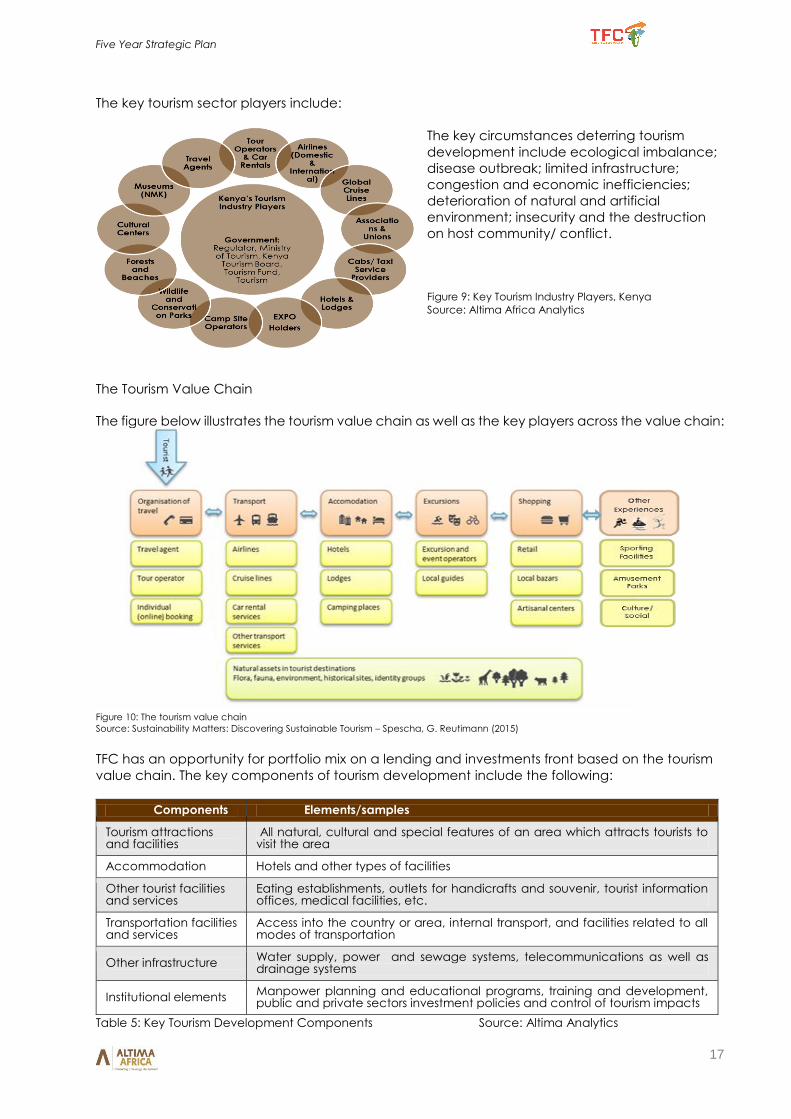
The key tourism sector players include:
The key circumstances deterring tourism
development include ecological imbalance;
disease outbreak; limited infrastructure;
congestion and economic inefficiencies;
deterioration of natural and artificial
environment; insecurity and the destruction
on host community/ conflict.
Figure 9: Key Tourism Industry Players, Kenya
Source: Altima Africa Analytics
The Tourism Value Chain
The figure below illustrates the tourism value chain as well as the key players across the value chain:
Figure 10: The tourism value chain
Source: Sustainability Matters: Discovering Sustainable Tourism – Spescha, G. Reutimann (2015)
TFC has an opportunity for portfolio mix on a lending and investments front based on the tourism
value chain. The key components of tourism development include the following:
Components Elements/samples
Tourism attractions and facilities
All natural, cultural and special features of an area which attracts tourists to visit the area
Accommodation Hotels and other types of facilities
Other tourist facilities and services
Eating establishments, outlets for handicrafts and souvenir, tourist information offices, medical facilities, etc.
Transportation facilities and services
Access into the country or area, internal transport, and facilities related to all modes of transportation
Other infrastructure Water supply, power and sewage systems, telecommunications as well as drainage systems
Institutional elements Manpower planning and educational programs, training and development, public and private sectors investment policies and control of tourism impacts
Table 5: Key Tourism Development Components Source: Altima Analytics
Five Year Strategic Plan
18
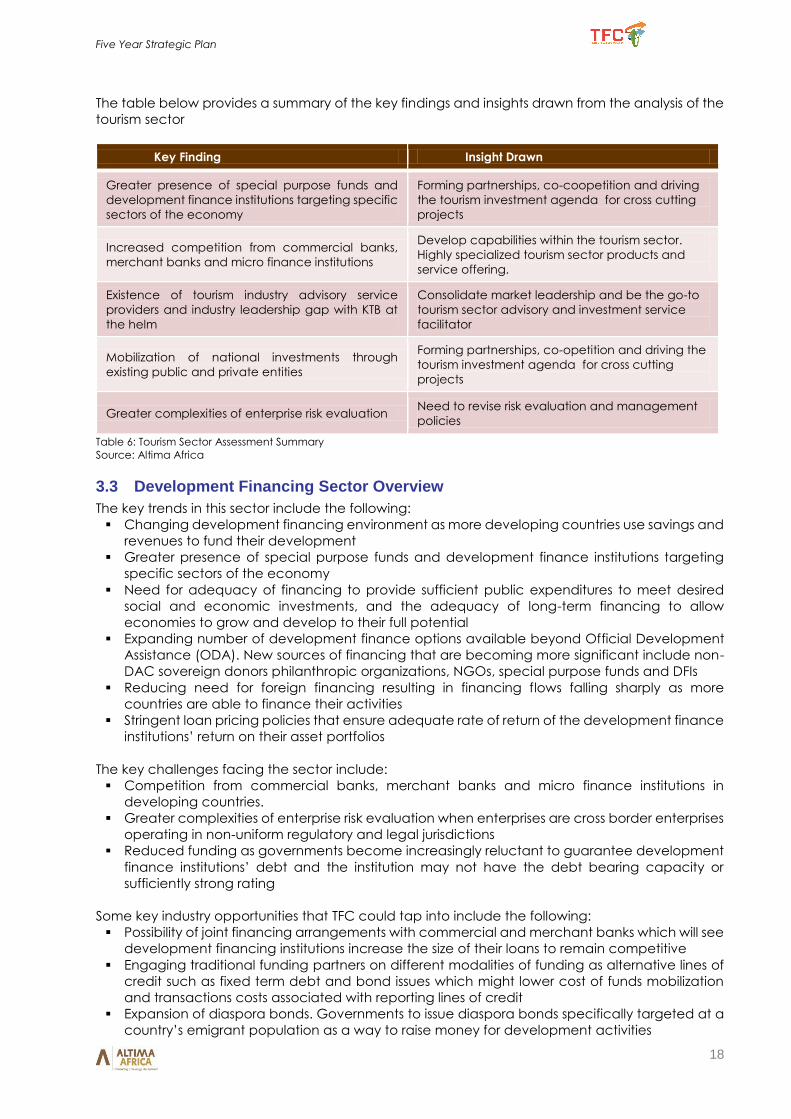
The table below provides a summary of the key findings and insights drawn from the analysis of the
tourism sector
Key Finding Insight Drawn
Greater presence of special purpose funds and
development finance institutions targeting specific
sectors of the economy
Forming partnerships, co-coopetition and driving
the tourism investment agenda for cross cutting
projects
Increased competition from commercial banks,
merchant banks and micro finance institutions
Develop capabilities within the tourism sector.
Highly specialized tourism sector products and
service offering.
Existence of tourism industry advisory service
providers and industry leadership gap with KTB at
the helm
Consolidate market leadership and be the go-to
tourism sector advisory and investment service
facilitator
Mobilization of national investments through
existing public and private entities
Forming partnerships, co-opetition and driving the
tourism investment agenda for cross cutting
projects
Greater complexities of enterprise risk evaluation Need to revise risk evaluation and management
policies
Table 6: Tourism Sector Assessment Summary
Source: Altima Africa
3.3 Development Financing Sector Overview
The key trends in this sector include the following:
Changing development financing environment as more developing countries use savings and
revenues to fund their development
Greater presence of special purpose funds and development finance institutions targeting
specific sectors of the economy
Need for adequacy of financing to provide sufficient public expenditures to meet desired
social and economic investments, and the adequacy of long-term financing to allow
economies to grow and develop to their full potential
Expanding number of development finance options available beyond Official Development
Assistance (ODA). New sources of financing that are becoming more significant include non-
DAC sovereign donors philanthropic organizations, NGOs, special purpose funds and DFIs
Reducing need for foreign financing resulting in financing flows falling sharply as more
countries are able to finance their activities
Stringent loan pricing policies that ensure adequate rate of return of the development finance
institutions’ return on their asset portfolios
The key challenges facing the sector include:
Competition from commercial banks, merchant banks and micro finance institutions in
developing countries.
Greater complexities of enterprise risk evaluation when enterprises are cross border enterprises
operating in non-uniform regulatory and legal jurisdictions
Reduced funding as governments become increasingly reluctant to guarantee development
finance institutions’ debt and the institution may not have the debt bearing capacity or
sufficiently strong rating
Some key industry opportunities that TFC could tap into include the following:
Possibility of joint financing arrangements with commercial and merchant banks which will see
development financing institutions increase the size of their loans to remain competitive
Engaging traditional funding partners on different modalities of funding as alternative lines of
credit such as fixed term debt and bond issues which might lower cost of funds mobilization
and transactions costs associated with reporting lines of credit
Expansion of diaspora bonds. Governments to issue diaspora bonds specifically targeted at a
country’s emigrant population as a way to raise money for development activities
Five Year Strategic Plan
19
DFI Consolidation in Kenya is a key risk facing the Corporation. The key reasons for consolidation
include fluid and ambiguous definition of State Owned Corporations and failure by responsible
persons within government to adhere to the process of establishing the entities. The purpose and
rationale of the consolidation:
Increase efficiency and effectiveness;
Rationalize areas of overlapping mandates;
Improve service delivery;
Enhance the ability of public agencies to meet their core regulatory and developmental
mandates; and
Maximize the contribution to the sectoral and national development goals under vision
2030
Taskforce Recommendation: Consolidation of key public agencies, with minor exceptions as
overarching policy recommendation. Exceptions will be to accommodate the special
requirements of special priority sectors. Consolidation of DFIs under the proposed Kenya
Development Bank (KDB) in an initial phase is the need to create a single, cross-sector DFI with
sufficient scale, scope and resources to play a catalytic role in Kenya’s economic development
through providing long-term financial and other financial, investments and business advisory
services to meet the objectives set under Vision 2030. The taskforce highlighted the following
about the current state of Kenyan DFIs:
Are not significant players in Kenya’s vibrant financial market
Are modest in size and account for less than1% of banking sector assets
Suffer from weak management
Were only effective in the first 15-20 years of operations.
Are on the decline due to interventionist models and narrow credit focus
The tourism industry in Kenya is a high GDP contributor and foreign exchange earner employing
thousands of Kenyans across its value chain and like agriculture is a critical sector. Vision 2030
identifies the sector as a key pillar towards achieving the 10% annual growth. In this regard TFC,
being the sole DFI and financial institution dedicated to this sector, has great potential in driving
socio economic growth and sector diversity and will be more impactful as a standalone DFI.
TFC’s current transformation efforts, including this strategic planning, are geared towards
achieving this impact on the sector.
Five Year Strategic Plan
20
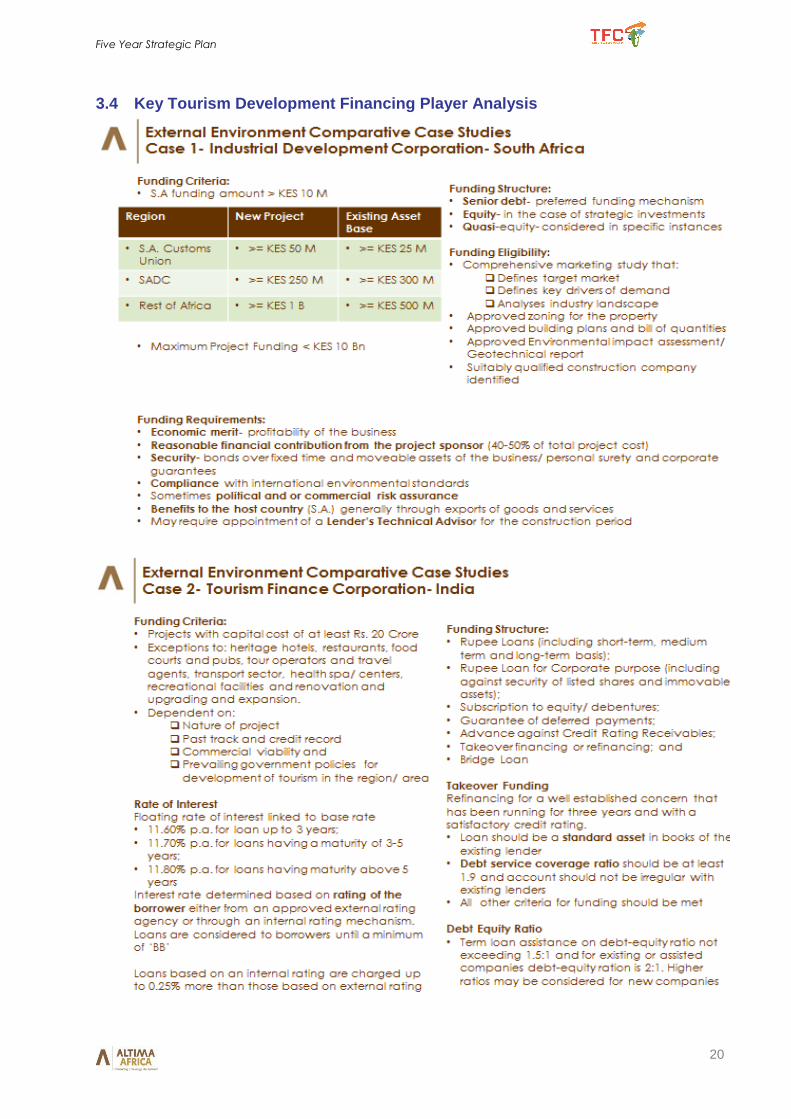
3.4 Key Tourism Development Financing Player Analysis
Five Year Strategic Plan
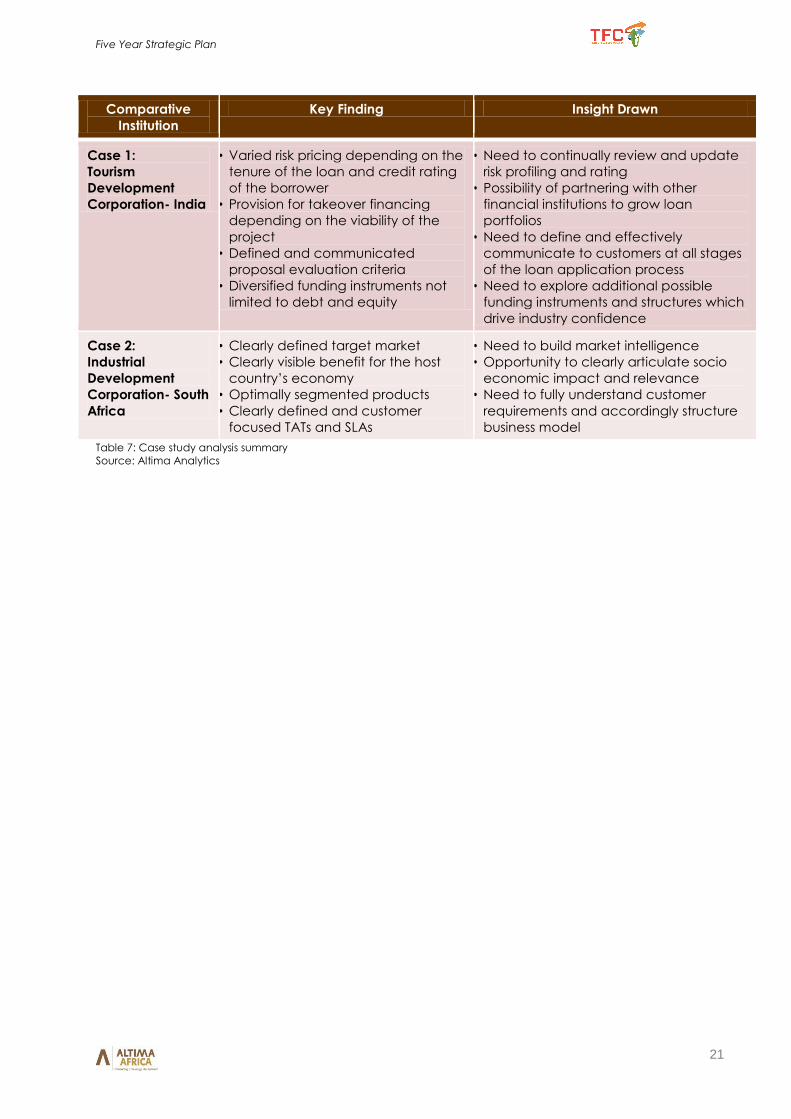
21
Comparative
Institution
Key Finding Insight Drawn
Case 1:
Tourism
Development
Corporation- India
• Varied risk pricing depending on the
tenure of the loan and credit rating
of the borrower
• Provision for takeover financing
depending on the viability of the
project
• Defined and communicated
proposal evaluation criteria
• Diversified funding instruments not
limited to debt and equity
• Need to continually review and update
risk profiling and rating
• Possibility of partnering with other
financial institutions to grow loan
portfolios
• Need to define and effectively
communicate to customers at all stages
of the loan application process
• Need to explore additional possible
funding instruments and structures which
drive industry confidence
Case 2:
Industrial
Development
Corporation- South
Africa
• Clearly defined target market
• Clearly visible benefit for the host
country’s economy
• Optimally segmented products
• Clearly defined and customer
focused TATs and SLAs
• Need to build market intelligence
• Opportunity to clearly articulate socio
economic impact and relevance
• Need to fully understand customer
requirements and accordingly structure
business model
Table 7: Case study analysis summary
Source: Altima Analytics
Five Year Strategic Plan
22
4 Review of TFC’s Past Strategic Performance
A review of the past strategic performance of the Tourism Finance Corporation has been
conducted along the parameters of financial performance and against objectives in both the
current (2016) and past (2013 – 2015) strategic plans.
4.1 Review of Past Financial Performance
Pre-tax Profit – TFC reported a net loss of Kshs. (14.72) million against a target of Kshs. 80.43 million.
Return on Investments – TFC achieved 0.30% against a target of 1.81%. This was mainly attributed
to non-disbursements during the period as there was no Board in place.
Dividend to National Treasury - Due to the fact that the corporation did not post any profit TFC did
not declare any dividend to Treasury. The projected target was Kshs. 2.2m.
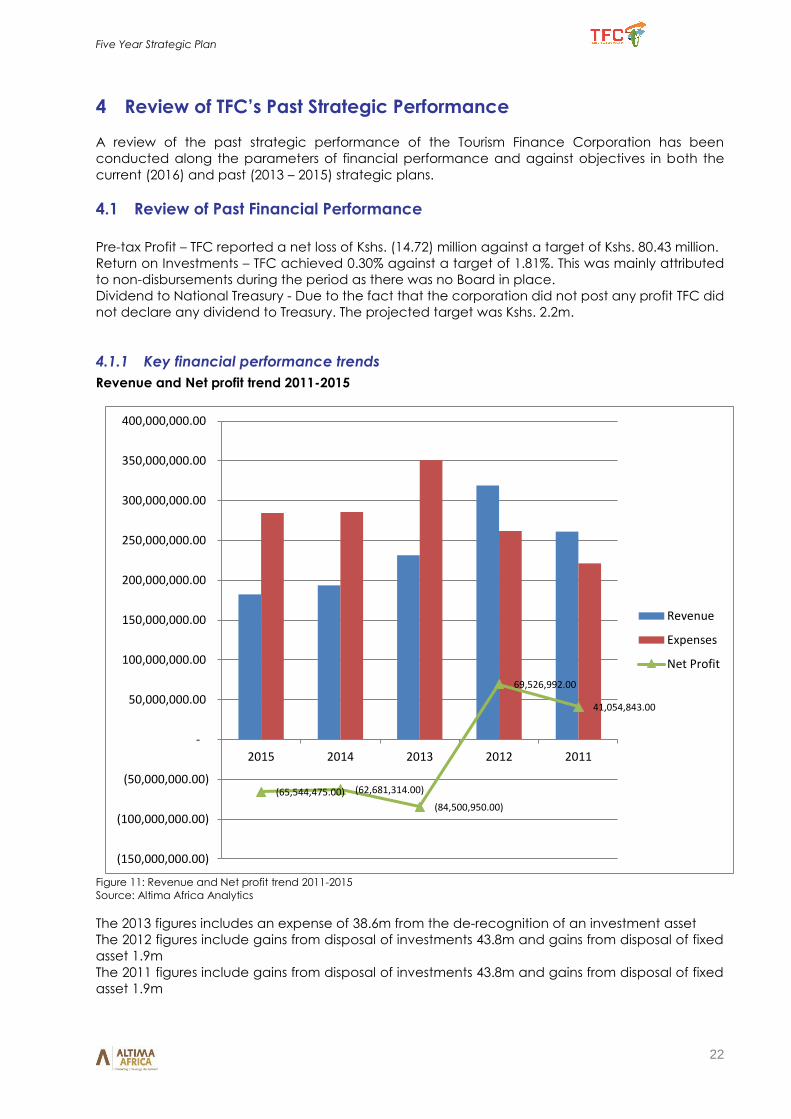
4.1.1 Key financial performance trends
Revenue and Net profit trend 2011-2015
Figure 11: Revenue and Net profit trend 2011-2015
Source: Altima Africa Analytics
The 2013 figures includes an expense of 38.6m from the de-recognition of an investment asset
The 2012 figures include gains from disposal of investments 43.8m and gains from disposal of fixed
asset 1.9m
The 2011 figures include gains from disposal of investments 43.8m and gains from disposal of fixed
asset 1.9m
(65,544,475.00) (62,681,314.00)
(84,500,950.00)
69,526,992.00
41,054,843.00
(150,000,000.00)
(100,000,000.00)
(50,000,000.00)
-
50,000,000.00
100,000,000.00
150,000,000.00
200,000,000.00
250,000,000.00
300,000,000.00
350,000,000.00
400,000,000.00
2015 2014 2013 2012 2011
Revenue
Expenses
Net Profit
Five Year Strategic Plan
23
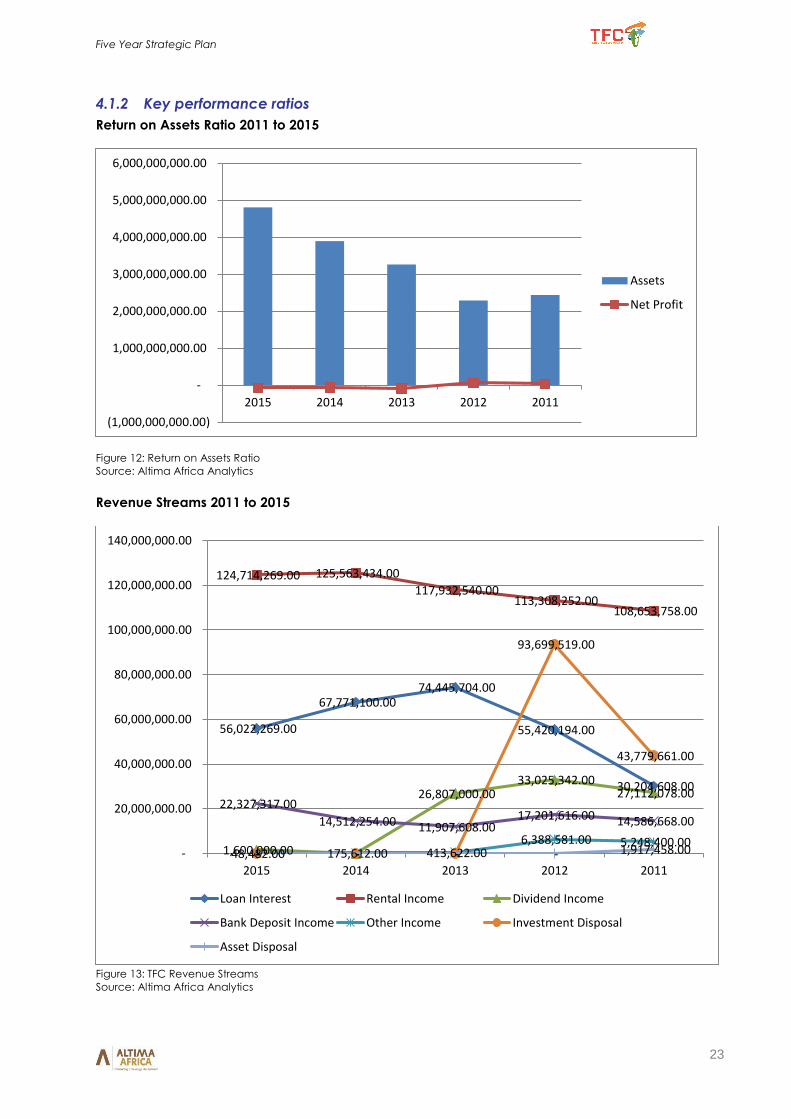
4.1.2 Key performance ratios
Return on Assets Ratio 2011 to 2015
Figure 12: Return on Assets Ratio
Source: Altima Africa Analytics
Revenue Streams 2011 to 2015
Figure 13: TFC Revenue Streams
Source: Altima Africa Analytics
(1,000,000,000.00)
-
1,000,000,000.00
2,000,000,000.00
3,000,000,000.00
4,000,000,000.00
5,000,000,000.00
6,000,000,000.00
2015 2014 2013 2012 2011
Assets
Net Profit
56,022,269.00
67,771,100.00 74,445,704.00
55,420,194.00
30,204,608.00
124,714,269.00 125,563,434.00
117,932,540.00 113,308,252.00
108,653,758.00
1,600,000.00 -
26,807,000.00 33,025,342.00
27,112,078.00 22,327,317.00
14,512,254.00 11,907,608.00 17,201,616.00 14,586,668.00
48,482.00 175,612.00 413,622.00 6,388,581.00 5,248,400.00
- - -
93,699,519.00
43,779,661.00
- - - - 1,917,458.00 -
20,000,000.00
40,000,000.00
60,000,000.00
80,000,000.00
100,000,000.00
120,000,000.00
140,000,000.00
2015 2014 2013 2012 2011
Loan Interest Rental Income Dividend Income
Bank Deposit Income Other Income Investment Disposal
Asset Disposal
Five Year Strategic Plan
24
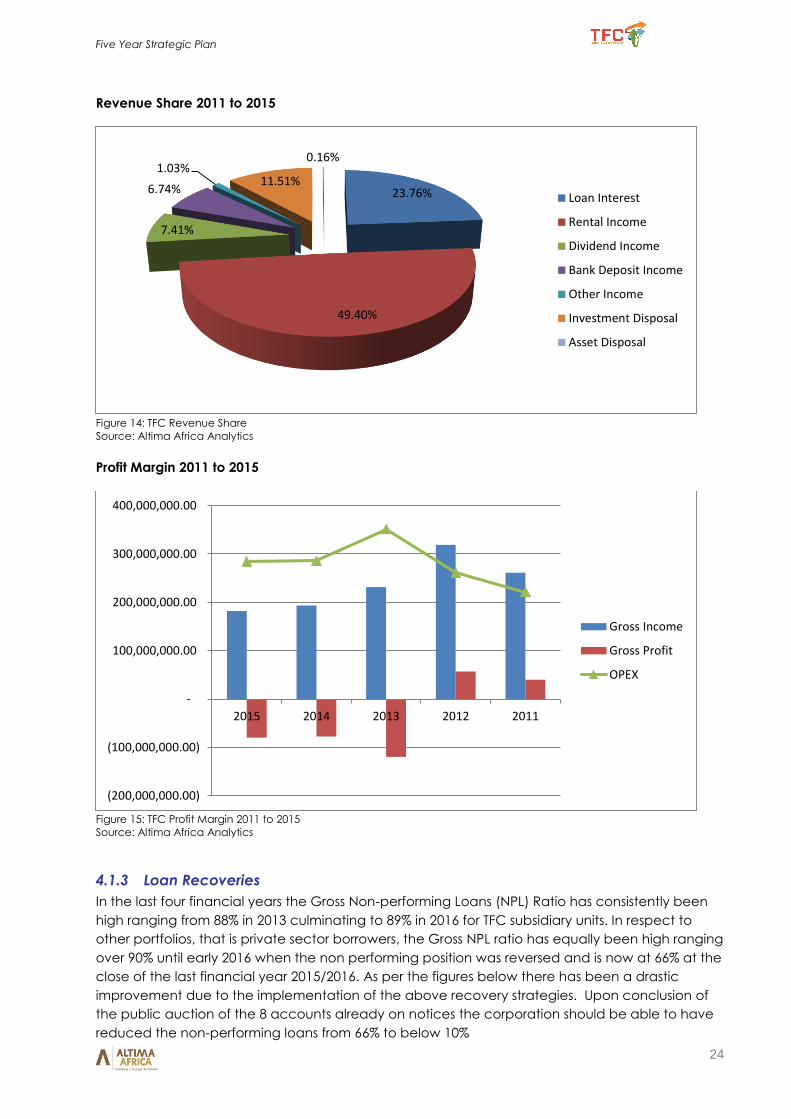
Revenue Share 2011 to 2015
Figure 14: TFC Revenue Share
Source: Altima Africa Analytics
Profit Margin 2011 to 2015
Figure 15: TFC Profit Margin 2011 to 2015
Source: Altima Africa Analytics
4.1.3 Loan Recoveries
In the last four financial years the Gross Non-performing Loans (NPL) Ratio has consistently been
high ranging from 88% in 2013 culminating to 89% in 2016 for TFC subsidiary units. In respect to
other portfolios, that is private sector borrowers, the Gross NPL ratio has equally been high ranging
over 90% until early 2016 when the non performing position was reversed and is now at 66% at the
close of the last financial year 2015/2016. As per the figures below there has been a drastic
improvement due to the implementation of the above recovery strategies. Upon conclusion of
the public auction of the 8 accounts already on notices the corporation should be able to have
reduced the non-performing loans from 66% to below 10%
23.76%
49.40%
7.41%
6.74%
1.03%11.51%
0.16%
Loan Interest
Rental Income
Dividend Income
Bank Deposit Income
Other Income
Investment Disposal
Asset Disposal
(200,000,000.00)
(100,000,000.00)
-
100,000,000.00
200,000,000.00
300,000,000.00
400,000,000.00
2015 2014 2013 2012 2011
Gross Income
Gross Profit
OPEX
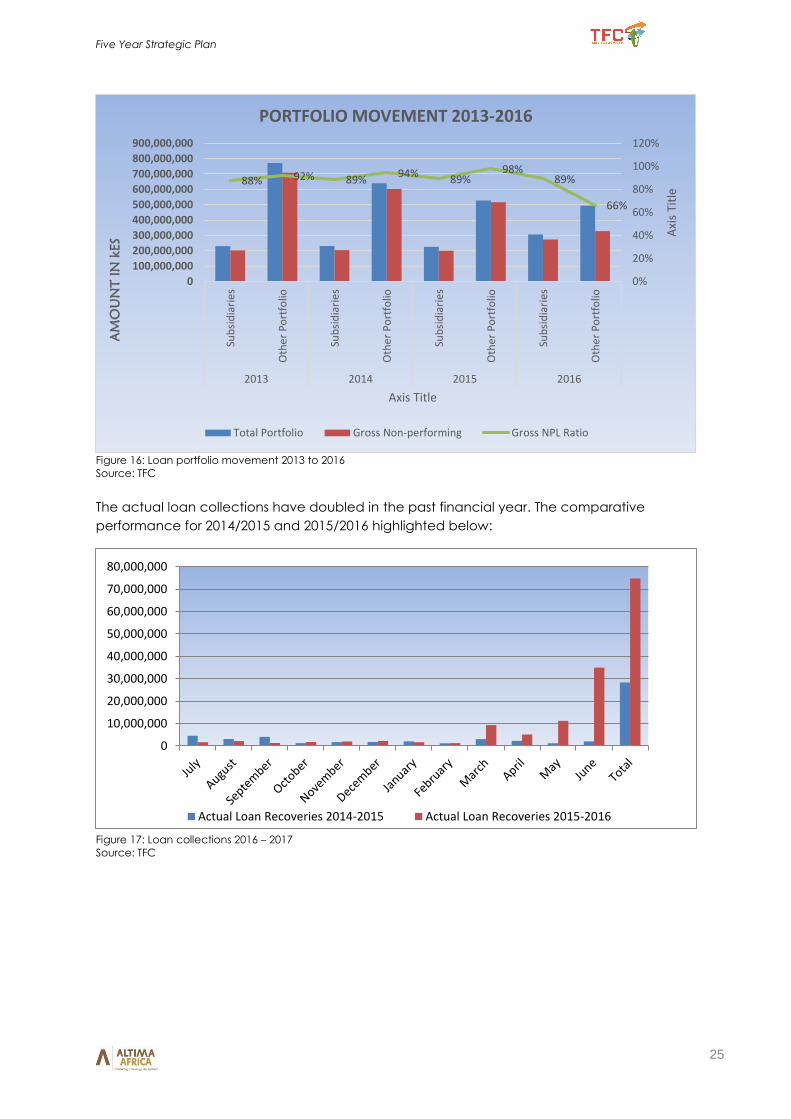
Five Year Strategic Plan
25
Figure 16: Loan portfolio movement 2013 to 2016
Source: TFC
The actual loan collections have doubled in the past financial year. The comparative
performance for 2014/2015 and 2015/2016 highlighted below:
Figure 17: Loan collections 2016 – 2017
Source: TFC
88% 92% 89%94%
89%98%
89%
66%
0%
20%
40%
60%
80%
100%
120%
0
100,000,000
200,000,000
300,000,000
400,000,000
500,000,000
600,000,000
700,000,000
800,000,000
900,000,000
Sub
sid
iari
es
Oth
er
Po
rtfo
lio
Sub
sid
iari
es
Oth
er
Po
rtfo
lio
Sub
sid
iari
es
Oth
er
Po
rtfo
lio
Sub
sid
iari
es
Oth
er
Po
rtfo
lio
2013 2014 2015 2016
Axi
s Ti
tle
AM
OU
NT
IN
kES
Axis Title
PORTFOLIO MOVEMENT 2013-2016
Total Portfolio Gross Non-performing Gross NPL Ratio
0
10,000,000
20,000,000
30,000,000
40,000,000
50,000,000
60,000,000
70,000,000
80,000,000
Actual Loan Recoveries 2014-2015 Actual Loan Recoveries 2015-2016
Strategy Review Diagnostic Report
26
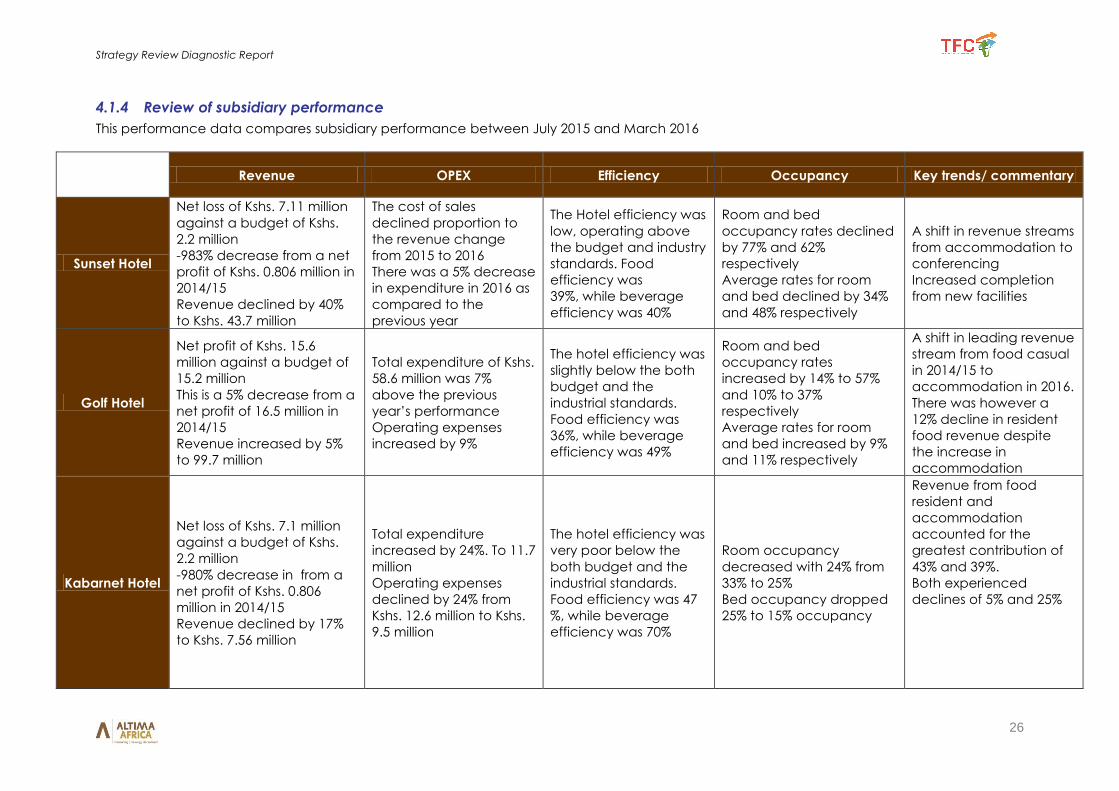
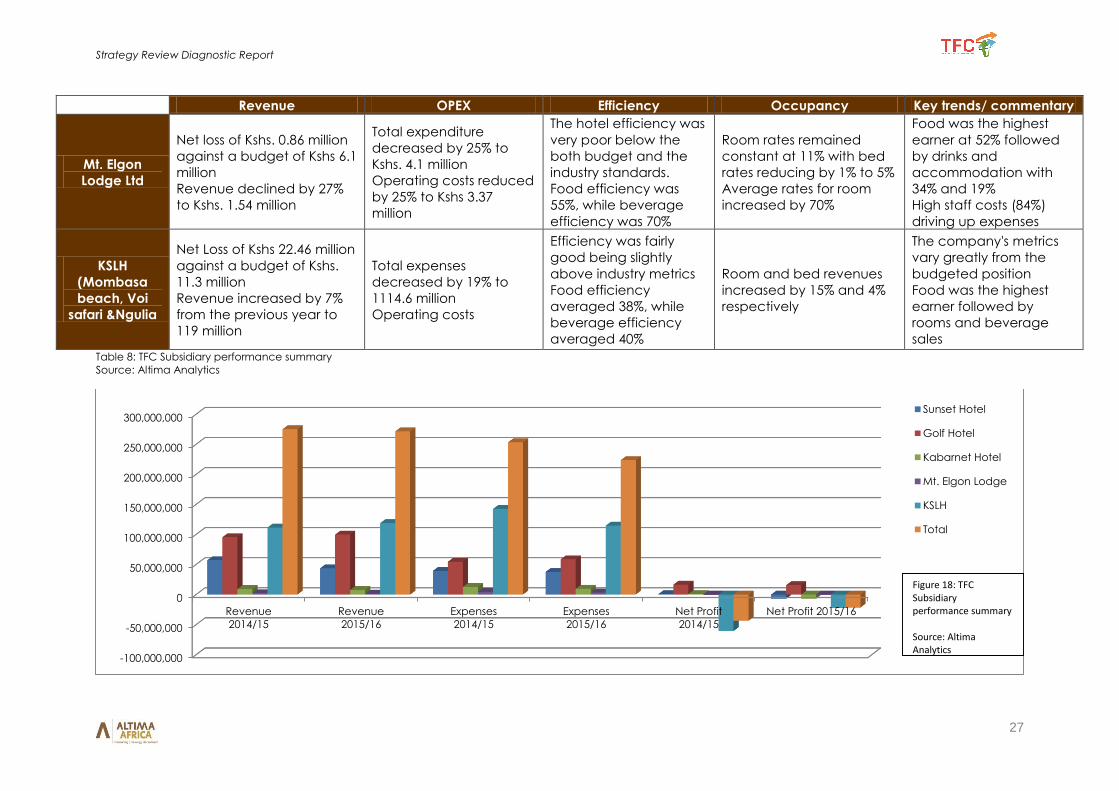
4.1.4 Review of subsidiary performance
This performance data compares subsidiary performance between July 2015 and March 2016
Revenue OPEX Efficiency Occupancy Key trends/ commentary
Sunset Hotel
Net loss of Kshs. 7.11 million
against a budget of Kshs.
2.2 million
-983% decrease from a net
profit of Kshs. 0.806 million in
2014/15
Revenue declined by 40%
to Kshs. 43.7 million
The cost of sales
declined proportion to
the revenue change
from 2015 to 2016
There was a 5% decrease
in expenditure in 2016 as
compared to the
previous year
The Hotel efficiency was
low, operating above
the budget and industry
standards. Food
efficiency was
39%, while beverage
efficiency was 40%
Room and bed
occupancy rates declined
by 77% and 62%
respectively
Average rates for room
and bed declined by 34%
and 48% respectively
A shift in revenue streams
from accommodation to
conferencing
Increased completion
from new facilities
Golf Hotel
Net profit of Kshs. 15.6
million against a budget of
15.2 million
This is a 5% decrease from a
net profit of 16.5 million in
2014/15
Revenue increased by 5%
to 99.7 million
Total expenditure of Kshs.
58.6 million was 7%
above the previous
year’s performance
Operating expenses
increased by 9%
The hotel efficiency was
slightly below the both
budget and the
industrial standards.
Food efficiency was
36%, while beverage
efficiency was 49%
Room and bed
occupancy rates
increased by 14% to 57%
and 10% to 37%
respectively
Average rates for room
and bed increased by 9%
and 11% respectively
A shift in leading revenue
stream from food casual
in 2014/15 to
accommodation in 2016.
There was however a
12% decline in resident
food revenue despite
the increase in
accommodation
Kabarnet Hotel
Net loss of Kshs. 7.1 million
against a budget of Kshs.
2.2 million
-980% decrease in from a
net profit of Kshs. 0.806
million in 2014/15
Revenue declined by 17%
to Kshs. 7.56 million
Total expenditure
increased by 24%. To 11.7
million
Operating expenses
declined by 24% from
Kshs. 12.6 million to Kshs.
9.5 million
The hotel efficiency was
very poor below the
both budget and the
industrial standards.
Food efficiency was 47
%, while beverage
efficiency was 70%
Room occupancy
decreased with 24% from
33% to 25%
Bed occupancy dropped
25% to 15% occupancy
Revenue from food
resident and
accommodation
accounted for the
greatest contribution of
43% and 39%.
Both experienced
declines of 5% and 25%
Strategy Review Diagnostic Report
27
Revenue OPEX Efficiency Occupancy Key trends/ commentary
Mt. Elgon
Lodge Ltd
Net loss of Kshs. 0.86 million
against a budget of Kshs 6.1
million
Revenue declined by 27%
to Kshs. 1.54 million
Total expenditure
decreased by 25% to
Kshs. 4.1 million
Operating costs reduced
by 25% to Kshs 3.37
million
The hotel efficiency was
very poor below the
both budget and the
industry standards.
Food efficiency was
55%, while beverage
efficiency was 70%
Room rates remained
constant at 11% with bed
rates reducing by 1% to 5%
Average rates for room
increased by 70%
Food was the highest
earner at 52% followed
by drinks and
accommodation with
34% and 19%
High staff costs (84%)
driving up expenses
KSLH
(Mombasa
beach, Voi
safari &Ngulia
Net Loss of Kshs 22.46 million
against a budget of Kshs.
11.3 million
Revenue increased by 7%
from the previous year to
119 million
Total expenses
decreased by 19% to
1114.6 million
Operating costs
Efficiency was fairly
good being slightly
above industry metrics
Food efficiency
averaged 38%, while
beverage efficiency
averaged 40%
Room and bed revenues
increased by 15% and 4%
respectively
The company's metrics
vary greatly from the
budgeted position
Food was the highest
earner followed by
rooms and beverage
sales
Table 8: TFC Subsidiary performance summary
Source: Altima Analytics
-100,000,000
-50,000,000
0
50,000,000
100,000,000
150,000,000
200,000,000
250,000,000
300,000,000
Revenue
2014/15
Revenue
2015/16
Expenses
2014/15
Expenses
2015/16
Net Profit
2014/15
Net Profit 2015/16
Sunset Hotel
Golf Hotel
Kabarnet Hotel
Mt. Elgon Lodge
KSLH
Total
Figure 18: TFC Subsidiary performance summary
Source: Altima Analytics
Strategy Review Diagnostic Report
28
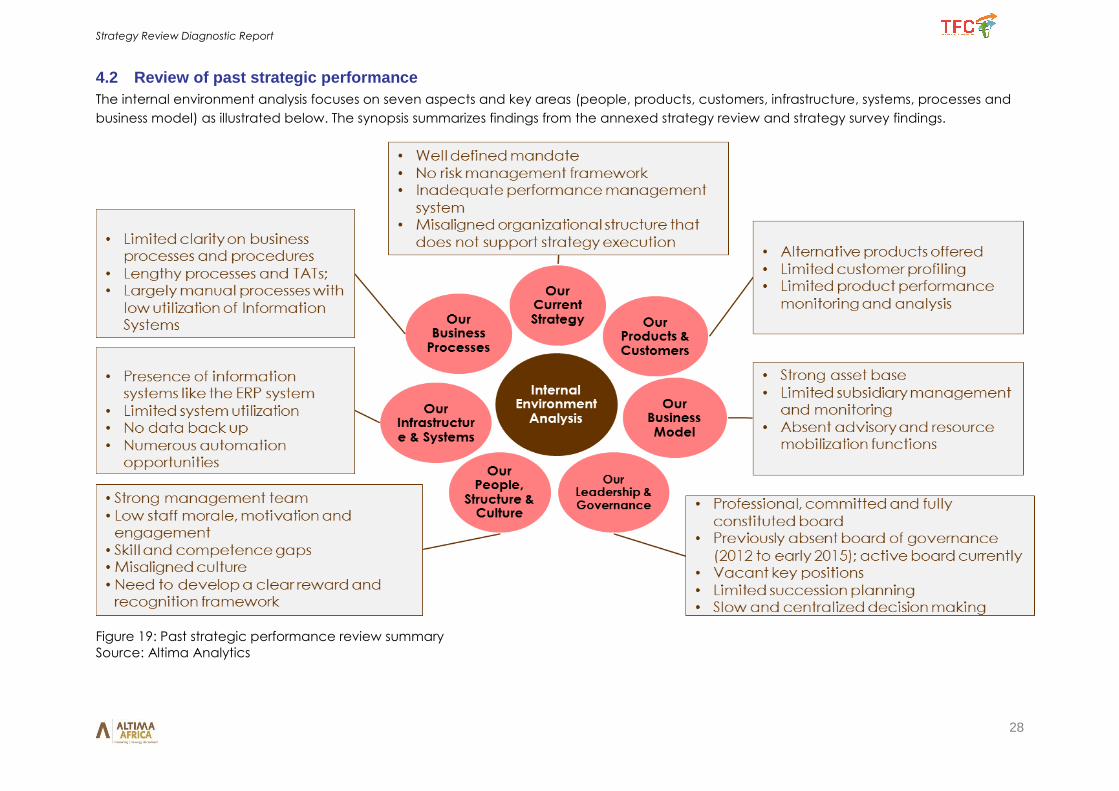
4.2 Review of past strategic performance
The internal environment analysis focuses on seven aspects and key areas (people, products, customers, infrastructure, systems, processes and
business model) as illustrated below. The synopsis summarizes findings from the annexed strategy review and strategy survey findings.
Figure 19: Past strategic performance review summary
Source: Altima Analytics
Strategy Review Diagnostic Report
29
5 TFC Key Stakeholder scorecard
Stakeholders offer critical input to a strategic planning process by virtue of their diverse and
specialised relationship with the organization and the respective roles that they play in the
operating environment. As part of the diagnose phase, key internal (i.e. the board,
management and staff) and key external (i.e. investors, strategic partners, and competitors)
stakeholders were consulted mainly via FGDs and IDIs to identify and analyse any needs, gaps,
strengths and opportunities.
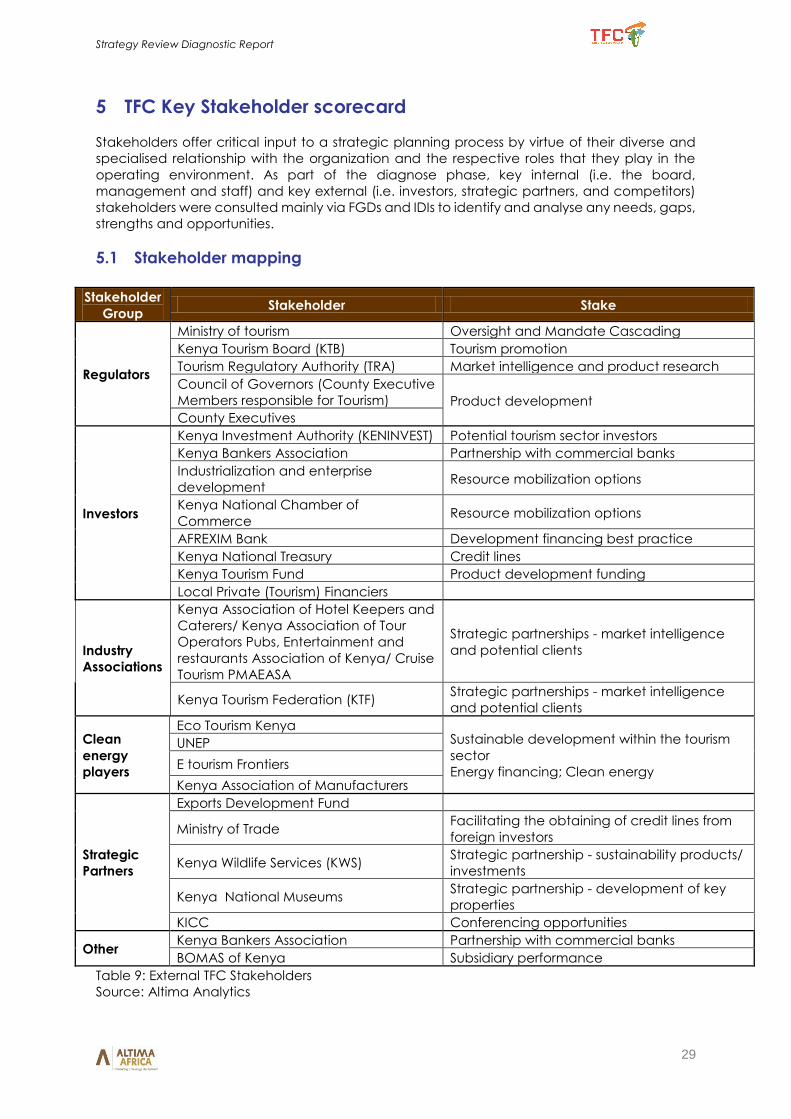
5.1 Stakeholder mapping
Stakeholder
Group Stakeholder Stake
Regulators
Ministry of tourism Oversight and Mandate Cascading
Kenya Tourism Board (KTB) Tourism promotion
Tourism Regulatory Authority (TRA) Market intelligence and product research
Council of Governors (County Executive
Members responsible for Tourism) Product development
County Executives
Investors
Kenya Investment Authority (KENINVEST) Potential tourism sector investors
Kenya Bankers Association Partnership with commercial banks
Industrialization and enterprise
development Resource mobilization options
Kenya National Chamber of
Commerce Resource mobilization options
AFREXIM Bank Development financing best practice
Kenya National Treasury Credit lines
Kenya Tourism Fund Product development funding
Local Private (Tourism) Financiers
Industry
Associations
Kenya Association of Hotel Keepers and
Caterers/ Kenya Association of Tour
Operators Pubs, Entertainment and
restaurants Association of Kenya/ Cruise
Tourism PMAEASA
Strategic partnerships - market intelligence
and potential clients
Kenya Tourism Federation (KTF) Strategic partnerships - market intelligence
and potential clients
Clean
energy
players
Eco Tourism Kenya Sustainable development within the tourism
sector
Energy financing; Clean energy
UNEP
E tourism Frontiers
Kenya Association of Manufacturers
Strategic
Partners
Exports Development Fund
Ministry of Trade Facilitating the obtaining of credit lines from
foreign investors
Kenya Wildlife Services (KWS) Strategic partnership - sustainability products/
investments
Kenya National Museums Strategic partnership - development of key
properties
KICC Conferencing opportunities
Other Kenya Bankers Association Partnership with commercial banks
BOMAS of Kenya Subsidiary performance
Table 9: External TFC Stakeholders
Source: Altima Analytics
Strategy Review Diagnostic Report
30
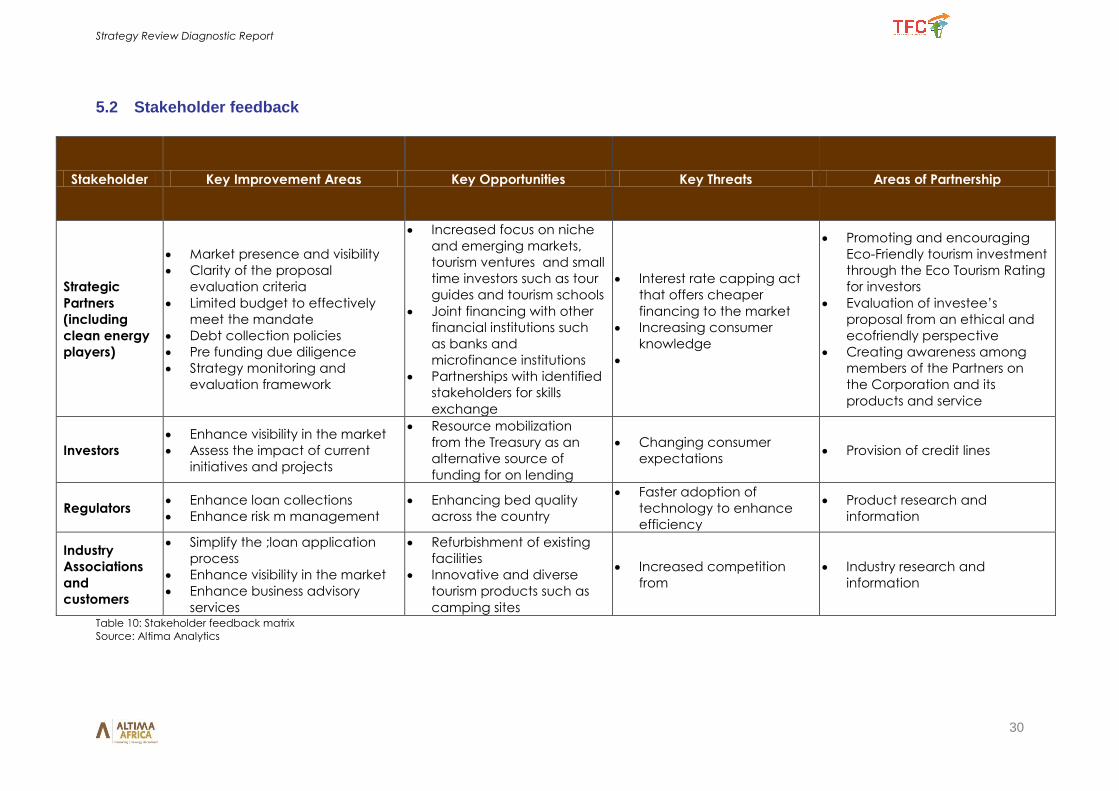
5.2 Stakeholder feedback
Stakeholder Key Improvement Areas Key Opportunities Key Threats Areas of Partnership
Strategic
Partners
(including
clean energy
players)
Market presence and visibility
Clarity of the proposal
evaluation criteria
Limited budget to effectively
meet the mandate
Debt collection policies
Pre funding due diligence
Strategy monitoring and
evaluation framework
Increased focus on niche
and emerging markets,
tourism ventures and small
time investors such as tour
guides and tourism schools
Joint financing with other
financial institutions such
as banks and
microfinance institutions
Partnerships with identified
stakeholders for skills
exchange
Interest rate capping act
that offers cheaper
financing to the market
Increasing consumer
knowledge
Promoting and encouraging
Eco-Friendly tourism investment
through the Eco Tourism Rating
for investors
Evaluation of investee’s
proposal from an ethical and
ecofriendly perspective
Creating awareness among
members of the Partners on
the Corporation and its
products and service
Investors
Enhance visibility in the market
Assess the impact of current
initiatives and projects
Resource mobilization
from the Treasury as an
alternative source of
funding for on lending
Changing consumer
expectations Provision of credit lines
Regulators Enhance loan collections
Enhance risk m management
Enhancing bed quality
across the country
Faster adoption of
technology to enhance
efficiency
Product research and
information
Industry
Associations
and
customers
Simplify the ;loan application
process
Enhance visibility in the market
Enhance business advisory
services
Refurbishment of existing
facilities
Innovative and diverse
tourism products such as
camping sites
Increased competition
from
Industry research and
information
Table 10: Stakeholder feedback matrix
Source: Altima Analytics
First Draft TFC 5 Year Strategic Plan
31
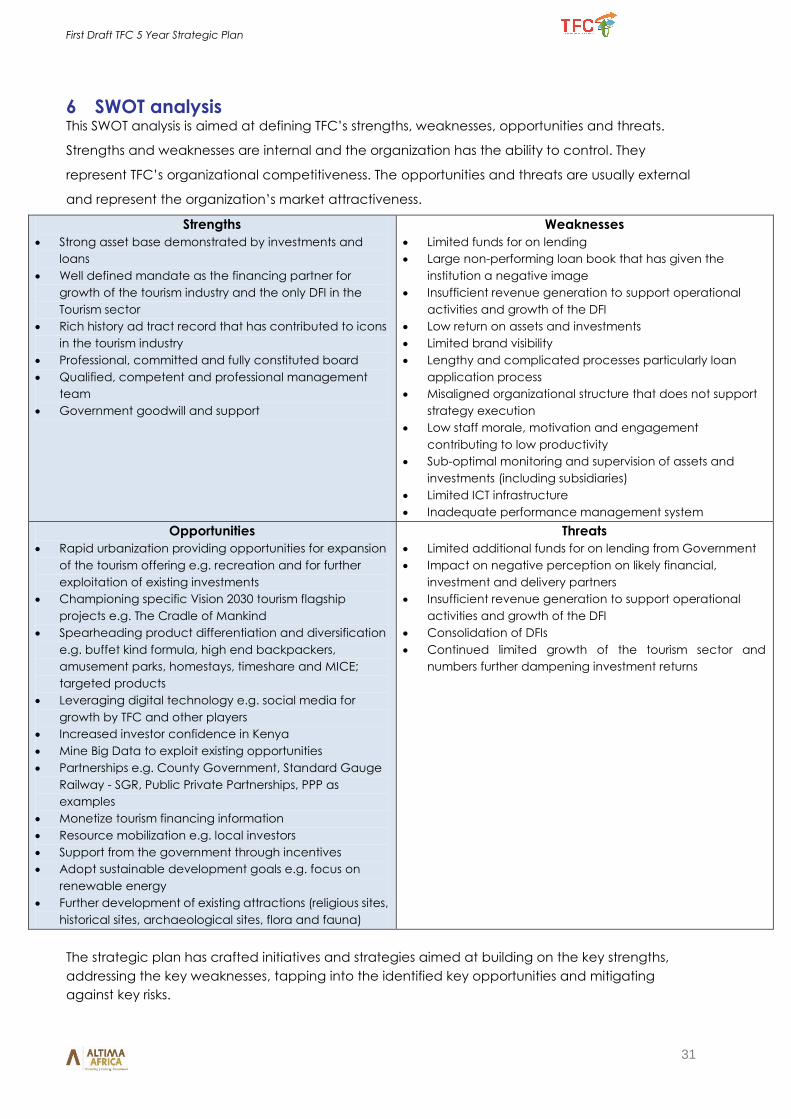
6 SWOT analysis This SWOT analysis is aimed at defining TFC’s strengths, weaknesses, opportunities and threats.
Strengths and weaknesses are internal and the organization has the ability to control. They
represent TFC’s organizational competitiveness. The opportunities and threats are usually external
and represent the organization’s market attractiveness.
Strengths
Strong asset base demonstrated by investments and
loans
Well defined mandate as the financing partner for
growth of the tourism industry and the only DFI in the
Tourism sector
Rich history ad tract record that has contributed to icons
in the tourism industry
Professional, committed and fully constituted board
Qualified, competent and professional management
team
Government goodwill and support
Weaknesses
Limited funds for on lending
Large non-performing loan book that has given the
institution a negative image
Insufficient revenue generation to support operational
activities and growth of the DFI
Low return on assets and investments
Limited brand visibility
Lengthy and complicated processes particularly loan
application process
Misaligned organizational structure that does not support
strategy execution
Low staff morale, motivation and engagement
contributing to low productivity
Sub-optimal monitoring and supervision of assets and
investments (including subsidiaries)
Limited ICT infrastructure
Inadequate performance management system
Opportunities
Rapid urbanization providing opportunities for expansion
of the tourism offering e.g. recreation and for further
exploitation of existing investments
Championing specific Vision 2030 tourism flagship
projects e.g. The Cradle of Mankind
Spearheading product differentiation and diversification
e.g. buffet kind formula, high end backpackers,
amusement parks, homestays, timeshare and MICE;
targeted products
Leveraging digital technology e.g. social media for
growth by TFC and other players
Increased investor confidence in Kenya
Mine Big Data to exploit existing opportunities
Partnerships e.g. County Government, Standard Gauge
Railway - SGR, Public Private Partnerships, PPP as
examples
Monetize tourism financing information
Resource mobilization e.g. local investors
Support from the government through incentives
Adopt sustainable development goals e.g. focus on
renewable energy
Further development of existing attractions (religious sites,
historical sites, archaeological sites, flora and fauna)
Threats
Limited additional funds for on lending from Government
Impact on negative perception on likely financial,
investment and delivery partners
Insufficient revenue generation to support operational
activities and growth of the DFI
Consolidation of DFIs
Continued limited growth of the tourism sector and
numbers further dampening investment returns
The strategic plan has crafted initiatives and strategies aimed at building on the key strengths,
addressing the key weaknesses, tapping into the identified key opportunities and mitigating
against key risks.
First Draft TFC 5 Year Strategic Plan
32
7 Strategic Direction
7.1 TFC’s Transformation
TFC has been experiencing various strategic and operational challenges. These include a limited
access to credit lines, underutilized facilities and investments, stunted operations – with no credit
facilities /loan disbursements having been issued over four years, underutilized capacity and a
limiting mandate. These challenges have greatly inhibited the Corporation’s impact on the tourism
sector.
Despite this history, TFC has been undergoing a radical transformation, for instance; NPLs have
reduced from 89% in 2016 to less than 45% by the beginning of 2017. A fully functional and qualified
Board of Directors has been constituted after a four year period without a board. The lending
moratorium, that was initially placed, has been lifted. The current demand for TFC loans stands at
over Kshs 4B.
From the strategic planning onset and throughout the process, the need for TFC to demonstrate its
relevance had been emphasized. In part, this contributed to a review of its existing Vision, Mission
and Values in line with its mandate. It clearly emerged that TFC had a role to play as a leading DFI
in the tourism sector. Within this context TFC needs to be strategically positioned to focus on
expanding the productive capacity of the industry, improving returns from existing investments and
attracting new capital investment. Largely, it will achieve this overarching goal by:
Identifying and pursuing opportunities that create increased demand for TFC’s products and
services;
Promoting diversification of the tourism industry by opening up new regions, fostering
investments in new products, addressing seasonality and driving value over volume; and
Supporting enterprises in ways that continually improve their productivity, profitability and
returns while driving additional value through the provision of an outstanding client
experience. TFC will achieve this by either supporting players to provide more services with
the same inputs, or provide the same services with fewer inputs.
This transformational agenda is at the core of this strategic plan. This plan is presented in the next
section and details the refined vision, mission, core values, strategic objectives, strategies and
initiatives. This is supported by an implementation plan that details the action points crafted to
achieve the strategy. This plan has necessitated changes to the current organization structure and
core internal business processes to ensure strategic alignment and successful implementation.
First Draft TFC 5 Year Strategic Plan
33
7.2 Vision
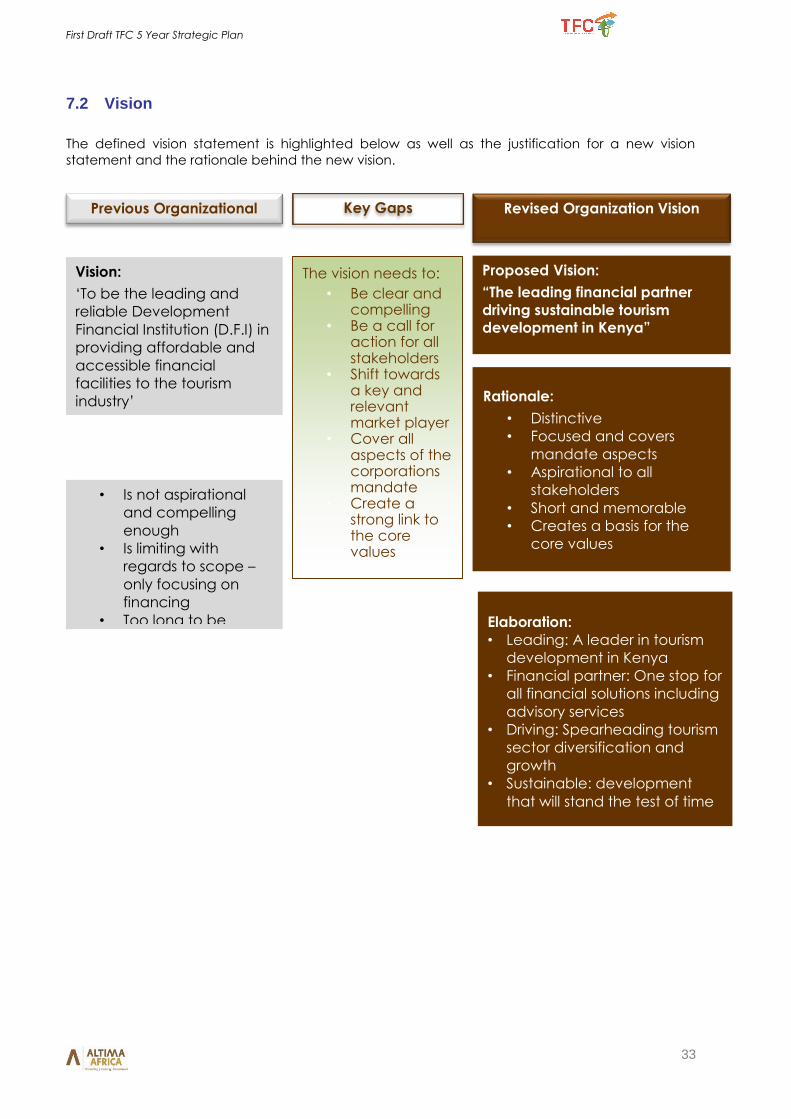
The defined vision statement is highlighted below as well as the justification for a new vision
statement and the rationale behind the new vision.
Revised Organization Vision
Vision:
‘To be the leading and
reliable Development
Financial Institution (D.F.I) in
providing affordable and
accessible financial
facilities to the tourism
industry’
Proposed Vision:
“The leading financial partner
driving sustainable tourism development in Kenya”
Rationale:
• Distinctive
• Focused and covers
mandate aspects
• Aspirational to all
stakeholders
• Short and memorable
• Creates a basis for the
core values
• Is not aspirational
and compelling
enough
• Is limiting with
regards to scope –
only focusing on
financing
• Too long to be
memorable
The vision needs to:
• Be clear and compelling
• Be a call for action for all stakeholders
• Shift towards a key and relevant market player
• Cover all aspects of the corporations mandate
• Create a strong link to the core values
Previous Organizational
Vision
Key Gaps
Elaboration: • Leading: A leader in tourism
development in Kenya
• Financial partner: One stop for
all financial solutions including
advisory services
• Driving: Spearheading tourism
sector diversification and
growth
• Sustainable: development
that will stand the test of time
First Draft TFC 5 Year Strategic Plan
34
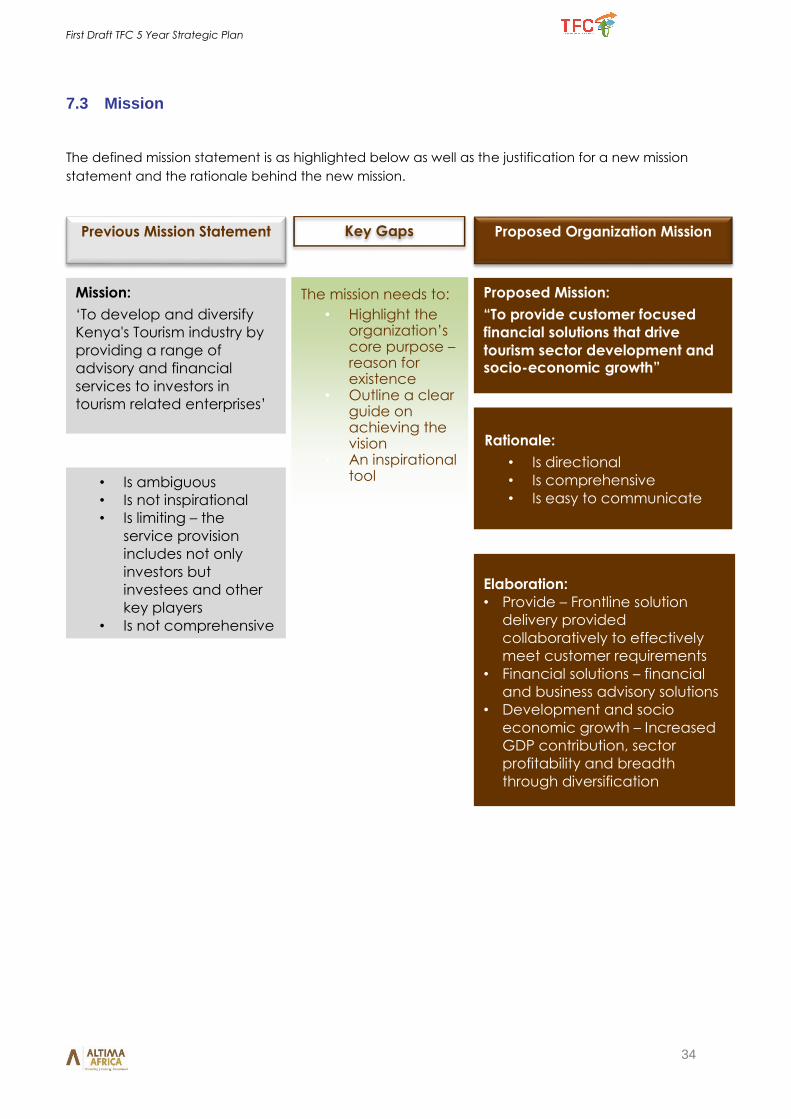
7.3 Mission
The defined mission statement is as highlighted below as well as the justification for a new mission
statement and the rationale behind the new mission.
Proposed Organization Mission
Mission:
‘To develop and diversify
Kenya's Tourism industry by
providing a range of
advisory and financial
services to investors in
tourism related enterprises’
Rationale:
• Is directional
• Is comprehensive
• Is easy to communicate • Is ambiguous
• Is not inspirational
• Is limiting – the
service provision
includes not only
investors but
investees and other
key players
• Is not comprehensive
The mission needs to:
• Highlight the organization’s core purpose – reason for existence
• Outline a clear guide on achieving the vision
• An inspirational tool
Previous Mission Statement
Key Gaps
Proposed Mission:
“To provide customer focused
financial solutions that drive
tourism sector development and socio-economic growth”
Elaboration: • Provide – Frontline solution
delivery provided
collaboratively to effectively
meet customer requirements
• Financial solutions – financial
and business advisory solutions
• Development and socio
economic growth – Increased
GDP contribution, sector
profitability and breadth
through diversification
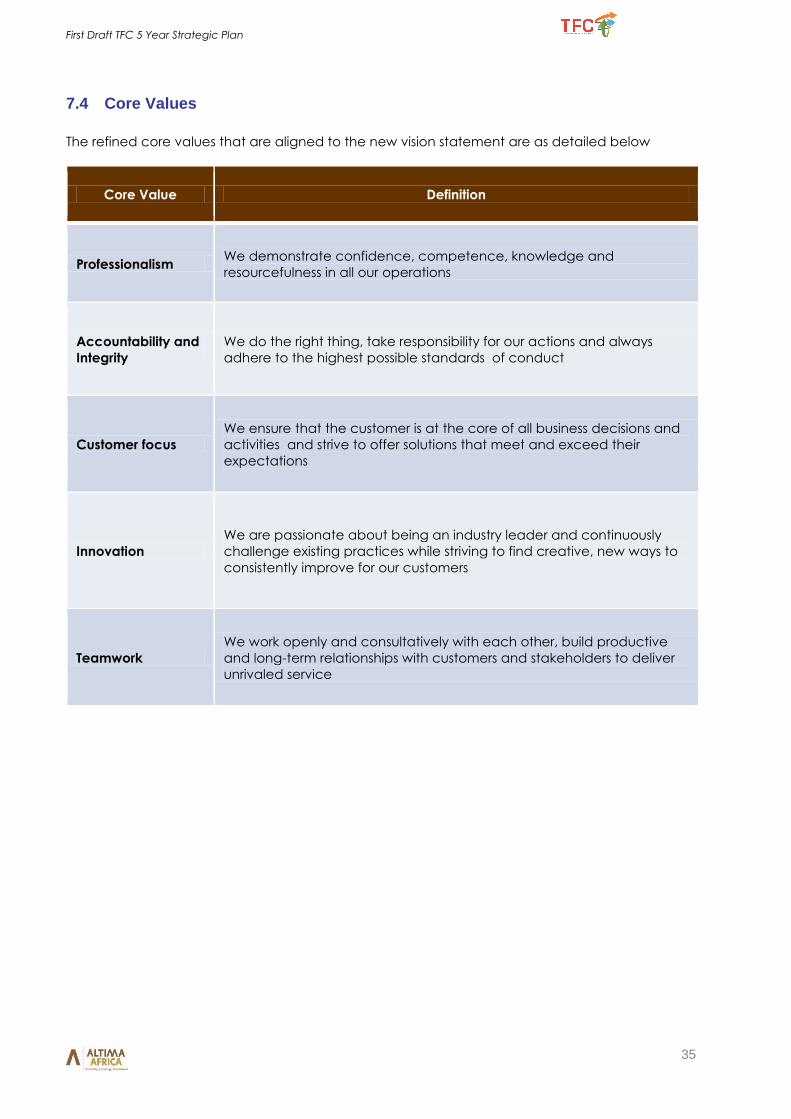
First Draft TFC 5 Year Strategic Plan
35
7.4 Core Values
The refined core values that are aligned to the new vision statement are as detailed below
Core Value Definition
Professionalism We demonstrate confidence, competence, knowledge and
resourcefulness in all our operations
Accountability and
Integrity
We do the right thing, take responsibility for our actions and always
adhere to the highest possible standards of conduct
Customer focus
We ensure that the customer is at the core of all business decisions and
activities and strive to offer solutions that meet and exceed their
expectations
Innovation
We are passionate about being an industry leader and continuously
challenge existing practices while striving to find creative, new ways to
consistently improve for our customers
Teamwork
We work openly and consultatively with each other, build productive
and long-term relationships with customers and stakeholders to deliver
unrivaled service
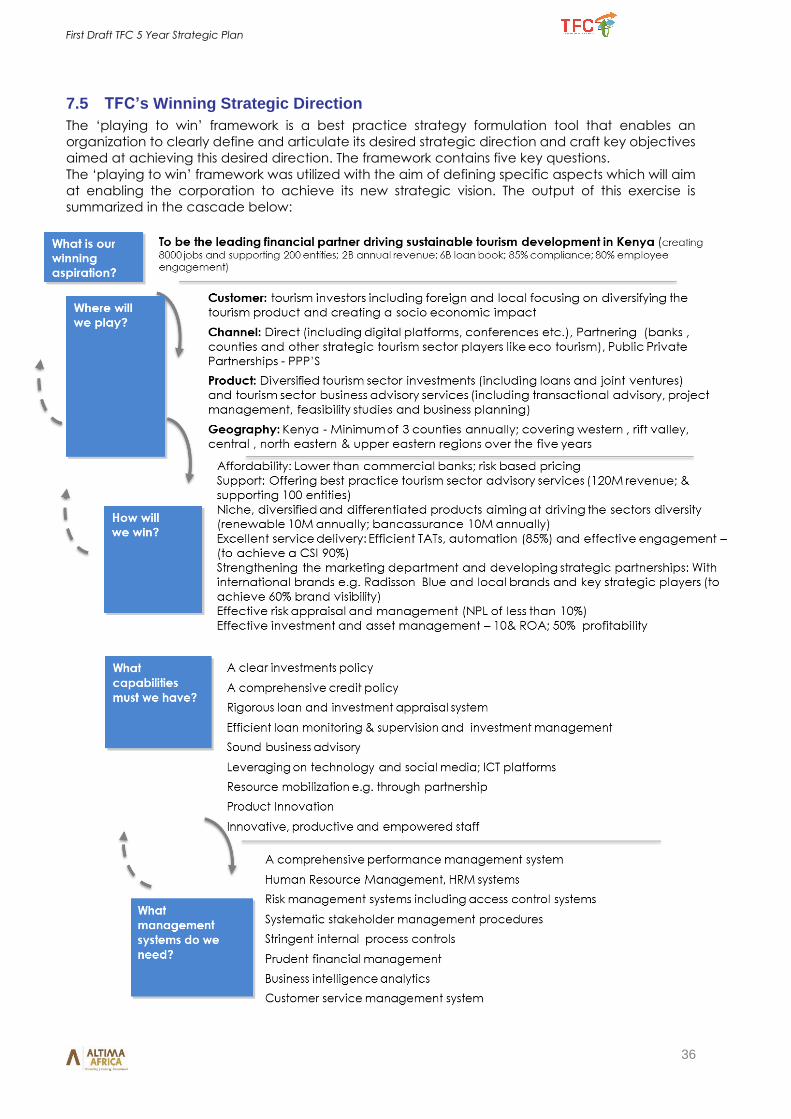
First Draft TFC 5 Year Strategic Plan
36
7.5 TFC’s Winning Strategic Direction
The ‘playing to win’ framework is a best practice strategy formulation tool that enables an
organization to clearly define and articulate its desired strategic direction and craft key objectives
aimed at achieving this desired direction. The framework contains five key questions.
The ‘playing to win’ framework was utilized with the aim of defining specific aspects which will aim
at enabling the corporation to achieve its new strategic vision. The output of this exercise is
summarized in the cascade below:
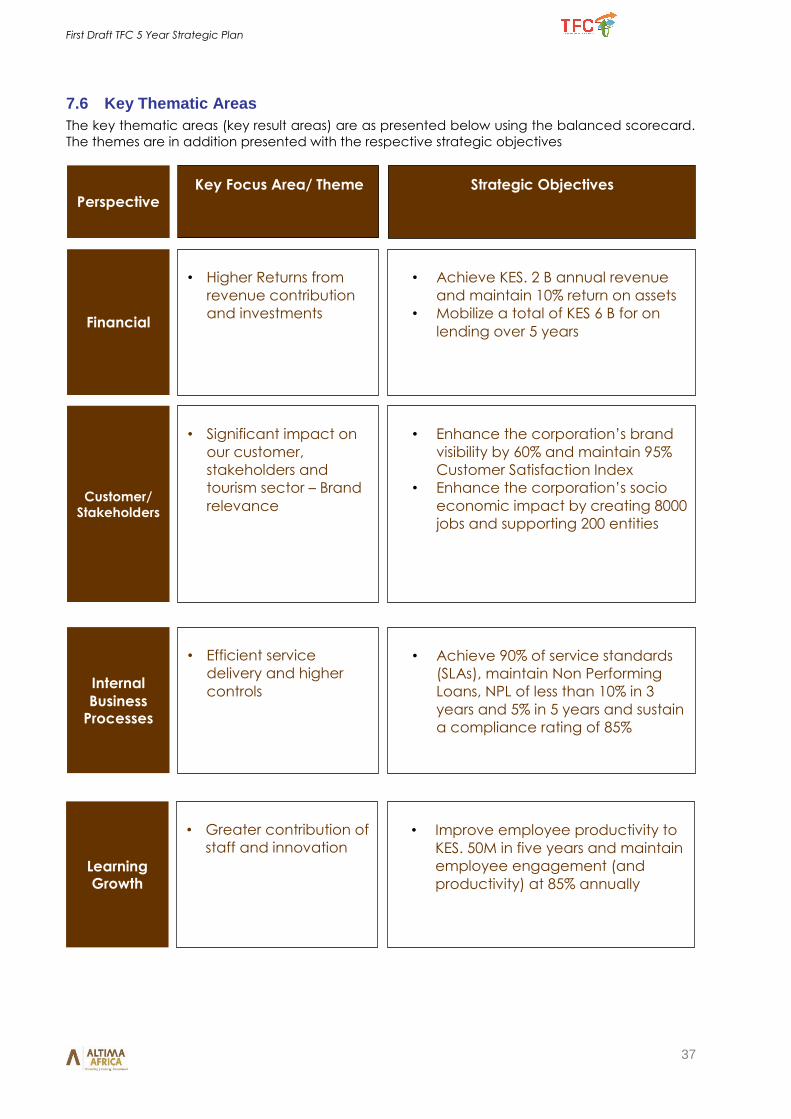
First Draft TFC 5 Year Strategic Plan
37
7.6 Key Thematic Areas
The key thematic areas (key result areas) are as presented below using the balanced scorecard.
The themes are in addition presented with the respective strategic objectives
Financial
• Higher Returns from
revenue contribution
and investments
Customer/ Stakeholders
• Significant impact on
our customer,
stakeholders and
tourism sector – Brand
relevance
Internal
Business Processes
• Efficient service
delivery and higher
controls
Learning Growth
• Greater contribution of
staff and innovation
• Achieve KES. 2 B annual revenue
and maintain 10% return on assets
• Mobilize a total of KES 6 B for on
lending over 5 years
• Enhance the corporation’s brand
visibility by 60% and maintain 95%
Customer Satisfaction Index
• Enhance the corporation’s socio
economic impact by creating 8000
jobs and supporting 200 entities
• Achieve 90% of service standards
(SLAs), maintain Non Performing
Loans, NPL of less than 10% in 3
years and 5% in 5 years and sustain
a compliance rating of 85%
• Improve employee productivity to
KES. 50M in five years and maintain
employee engagement (and
productivity) at 85% annually
Perspective
Key Focus Area/ Theme Strategic Objectives
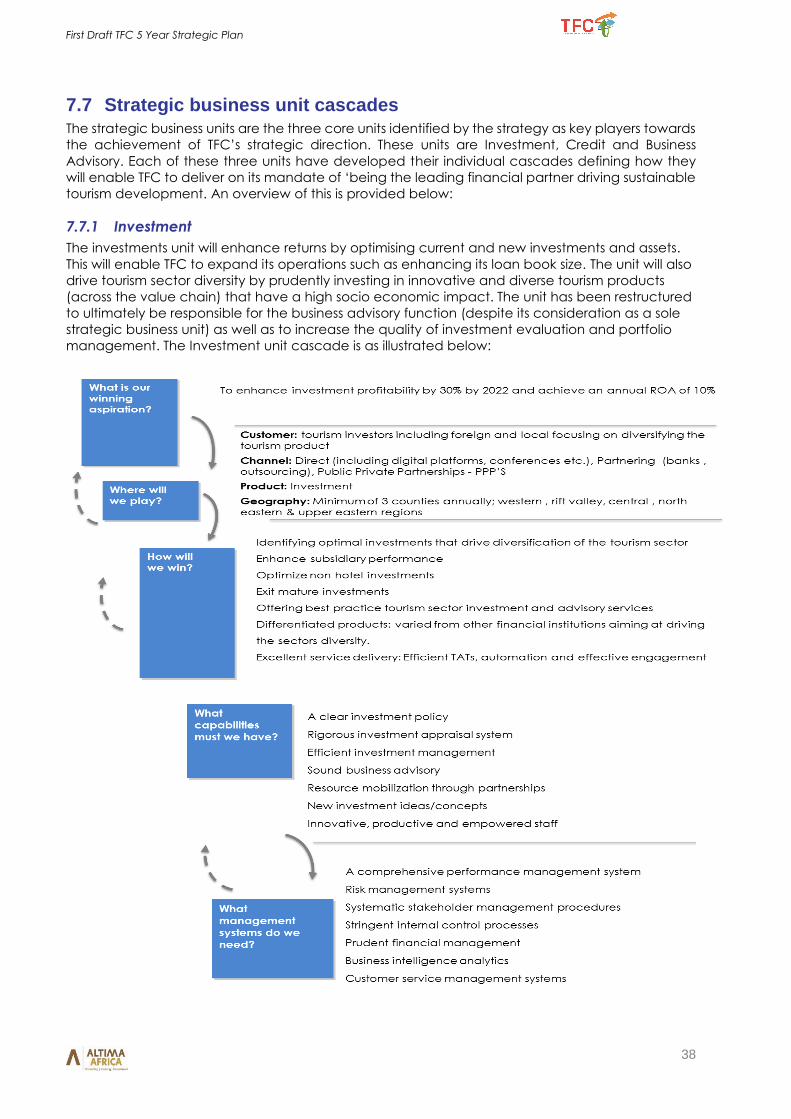
First Draft TFC 5 Year Strategic Plan
38
7.7 Strategic business unit cascades The strategic business units are the three core units identified by the strategy as key players towards
the achievement of TFC’s strategic direction. These units are Investment, Credit and Business
Advisory. Each of these three units have developed their individual cascades defining how they
will enable TFC to deliver on its mandate of ‘being the leading financial partner driving sustainable
tourism development. An overview of this is provided below:
7.7.1 Investment
The investments unit will enhance returns by optimising current and new investments and assets.
This will enable TFC to expand its operations such as enhancing its loan book size. The unit will also
drive tourism sector diversity by prudently investing in innovative and diverse tourism products
(across the value chain) that have a high socio economic impact. The unit has been restructured
to ultimately be responsible for the business advisory function (despite its consideration as a sole
strategic business unit) as well as to increase the quality of investment evaluation and portfolio
management. The Investment unit cascade is as illustrated below:
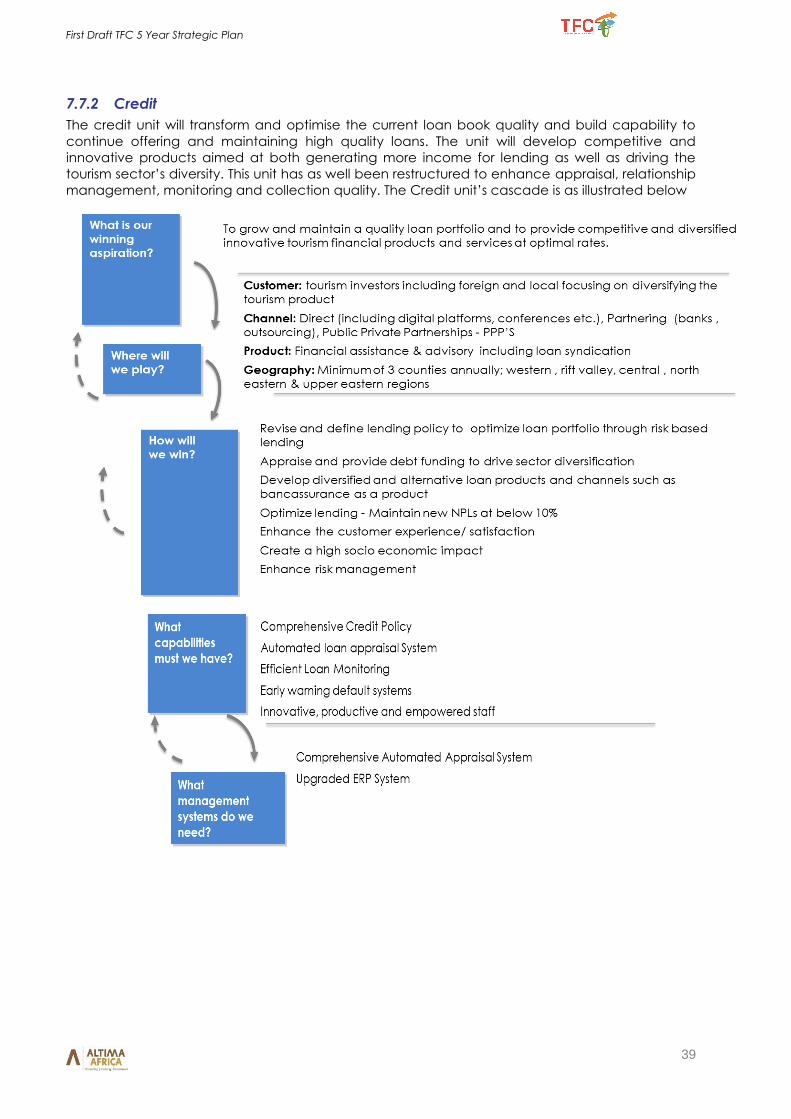
First Draft TFC 5 Year Strategic Plan
39
7.7.2 Credit
The credit unit will transform and optimise the current loan book quality and build capability to
continue offering and maintaining high quality loans. The unit will develop competitive and
innovative products aimed at both generating more income for lending as well as driving the
tourism sector’s diversity. This unit has as well been restructured to enhance appraisal, relationship
management, monitoring and collection quality. The Credit unit’s cascade is as illustrated below
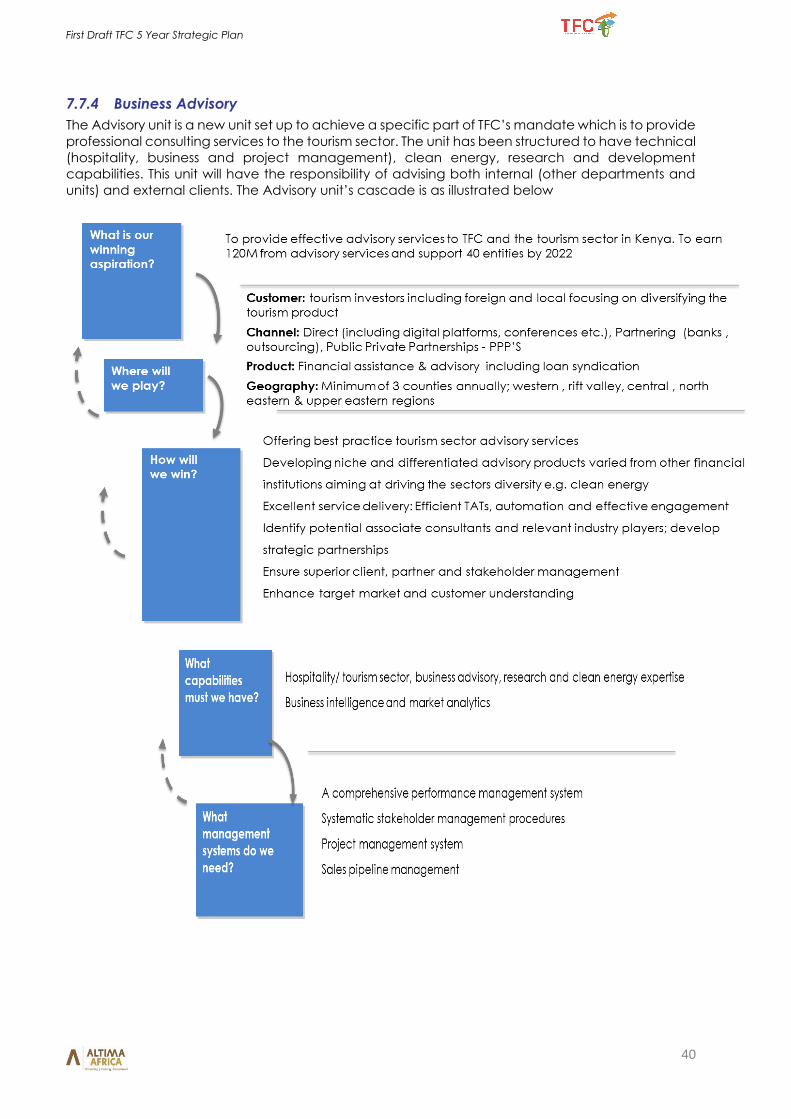
First Draft TFC 5 Year Strategic Plan
40
7.7.4 Business Advisory
The Advisory unit is a new unit set up to achieve a specific part of TFC’s mandate which is to provide
professional consulting services to the tourism sector. The unit has been structured to have technical
(hospitality, business and project management), clean energy, research and development
capabilities. This unit will have the responsibility of advising both internal (other departments and
units) and external clients. The Advisory unit’s cascade is as illustrated below
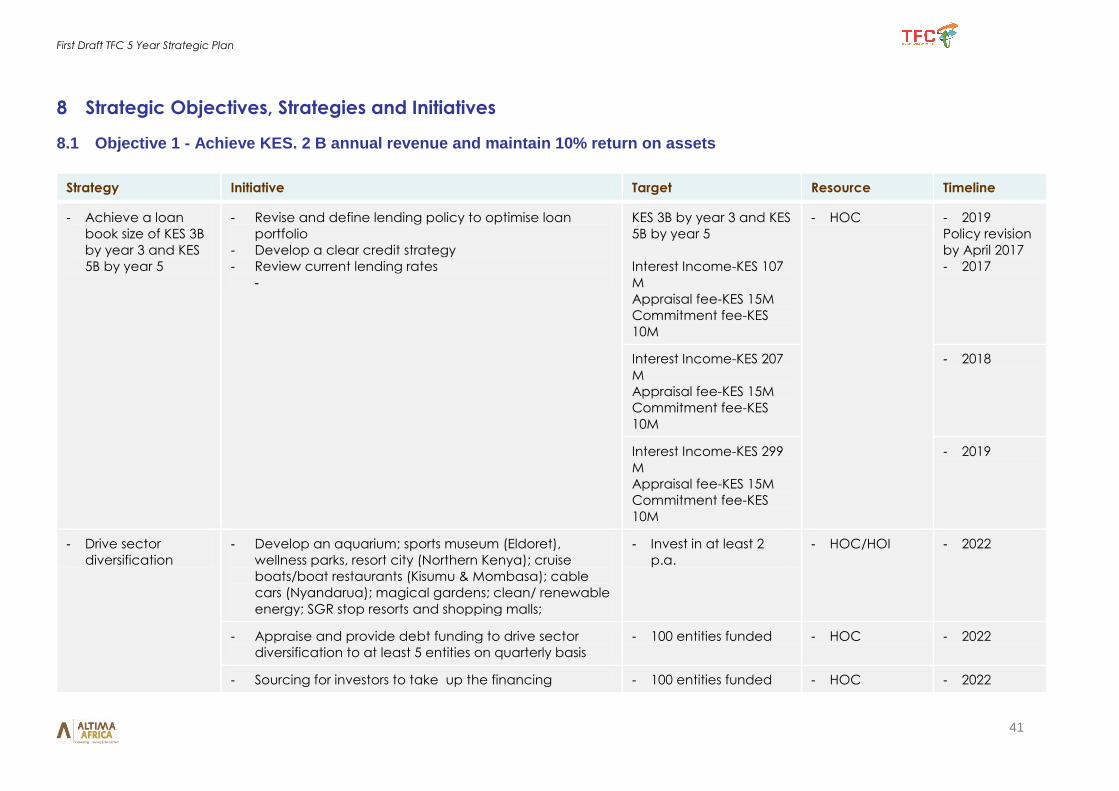
First Draft TFC 5 Year Strategic Plan
41
8 Strategic Objectives, Strategies and Initiatives
8.1 Objective 1 - Achieve KES. 2 B annual revenue and maintain 10% return on assets
Strategy Initiative Target Resource Timeline
- Achieve a loan
book size of KES 3B
by year 3 and KES
5B by year 5
- Revise and define lending policy to optimise loan
portfolio
- Develop a clear credit strategy
- Review current lending rates
-
KES 3B by year 3 and KES
5B by year 5
Interest Income-KES 107
M
Appraisal fee-KES 15M
Commitment fee-KES
10M
- HOC - 2019
Policy revision
by April 2017
- 2017
Interest Income-KES 207
M
Appraisal fee-KES 15M
Commitment fee-KES
10M
- 2018
Interest Income-KES 299
M
Appraisal fee-KES 15M
Commitment fee-KES
10M
- 2019
- Drive sector
diversification
- Develop an aquarium; sports museum (Eldoret),
wellness parks, resort city (Northern Kenya); cruise
boats/boat restaurants (Kisumu & Mombasa); cable
cars (Nyandarua); magical gardens; clean/ renewable
energy; SGR stop resorts and shopping malls;
- Invest in at least 2
p.a.
- HOC/HOI - 2022
- Appraise and provide debt funding to drive sector
diversification to at least 5 entities on quarterly basis
- 100 entities funded - HOC - 2022
- Sourcing for investors to take up the financing - 100 entities funded - HOC - 2022
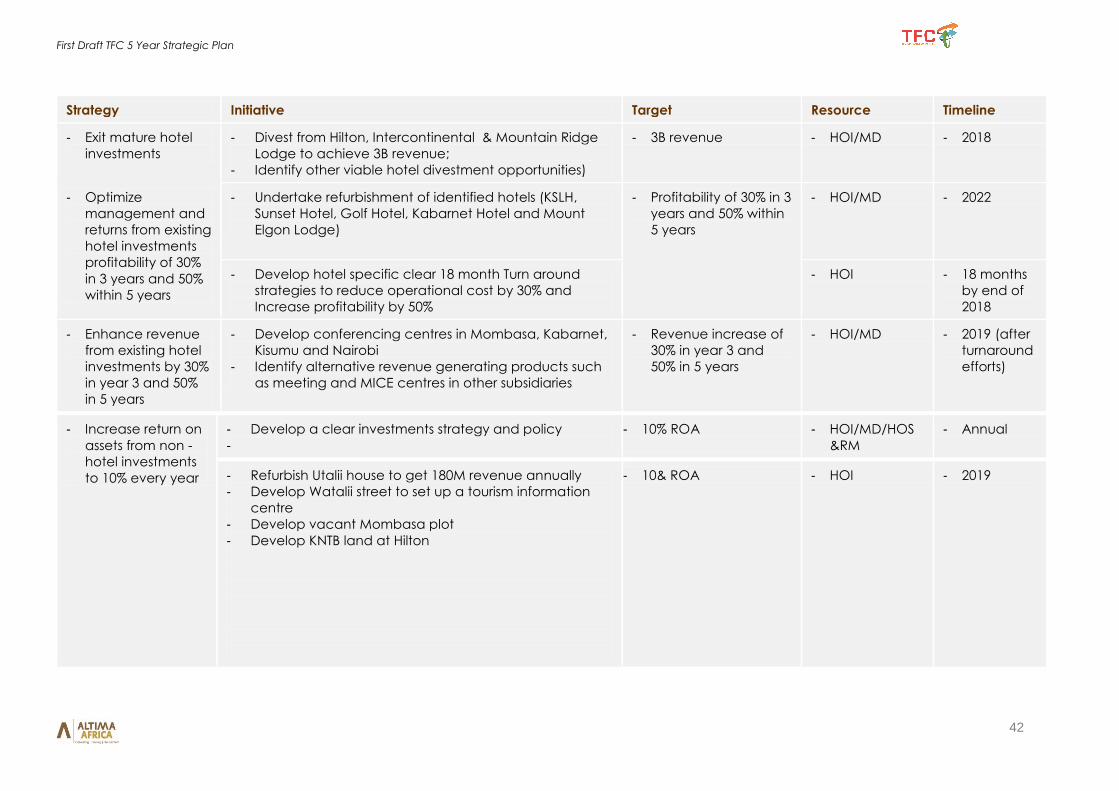
First Draft TFC 5 Year Strategic Plan
42
Strategy Initiative Target Resource Timeline
- Exit mature hotel
investments
- Divest from Hilton, Intercontinental & Mountain Ridge
Lodge to achieve 3B revenue;
- Identify other viable hotel divestment opportunities)
- 3B revenue - HOI/MD - 2018
- Optimize
management and
returns from existing
hotel investments
profitability of 30%
in 3 years and 50%
within 5 years
- Undertake refurbishment of identified hotels (KSLH,
Sunset Hotel, Golf Hotel, Kabarnet Hotel and Mount
Elgon Lodge)
- Profitability of 30% in 3
years and 50% within
5 years
- HOI/MD - 2022
- Develop hotel specific clear 18 month Turn around
strategies to reduce operational cost by 30% and
Increase profitability by 50%
- HOI - 18 months
by end of
2018
- Enhance revenue
from existing hotel
investments by 30%
in year 3 and 50%
in 5 years
- Develop conferencing centres in Mombasa, Kabarnet,
Kisumu and Nairobi
- Identify alternative revenue generating products such
as meeting and MICE centres in other subsidiaries
- Revenue increase of
30% in year 3 and
50% in 5 years
- HOI/MD - 2019 (after
turnaround
efforts)
- Increase return on
assets from non -
hotel investments
to 10% every year
- Develop a clear investments strategy and policy
-
- 10% ROA - HOI/MD/HOS
&RM
- Annual
- Refurbish Utalii house to get 180M revenue annually
- Develop Watalii street to set up a tourism information
centre
- Develop vacant Mombasa plot
- Develop KNTB land at Hilton
- 10& ROA - HOI - 2019
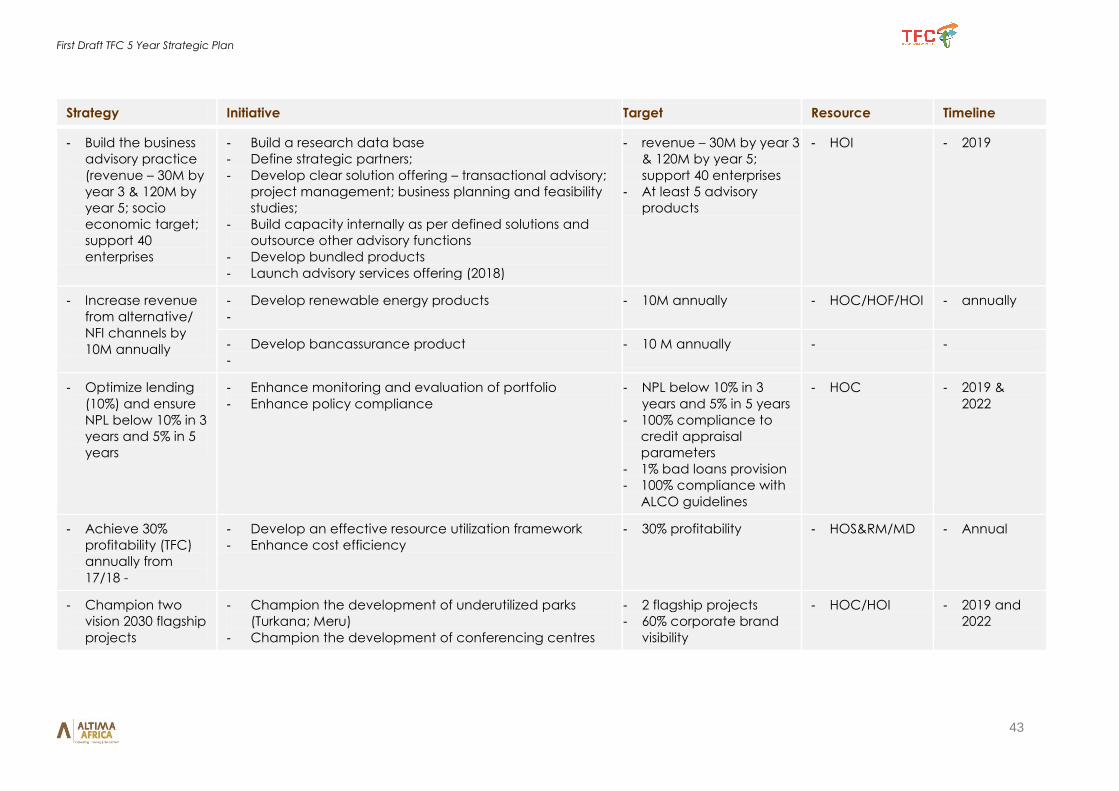
First Draft TFC 5 Year Strategic Plan
43
Strategy Initiative Target Resource Timeline
- Build the business
advisory practice
(revenue – 30M by
year 3 & 120M by
year 5; socio
economic target;
support 40
enterprises
- Build a research data base
- Define strategic partners;
- Develop clear solution offering – transactional advisory;
project management; business planning and feasibility
studies;
- Build capacity internally as per defined solutions and
outsource other advisory functions
- Develop bundled products
- Launch advisory services offering (2018)
- revenue – 30M by year 3
& 120M by year 5;
support 40 enterprises
- At least 5 advisory
products
- HOI - 2019
- Increase revenue
from alternative/
NFI channels by
10M annually
- Develop renewable energy products
-
- 10M annually - HOC/HOF/HOI - annually
- Develop bancassurance product
-
- 10 M annually - -
- Optimize lending
(10%) and ensure
NPL below 10% in 3
years and 5% in 5
years
- Enhance monitoring and evaluation of portfolio
- Enhance policy compliance
- NPL below 10% in 3
years and 5% in 5 years
- 100% compliance to
credit appraisal
parameters
- 1% bad loans provision
- 100% compliance with
ALCO guidelines
- HOC - 2019 &
2022
- Achieve 30%
profitability (TFC)
annually from
17/18 -
- Develop an effective resource utilization framework
- Enhance cost efficiency
- 30% profitability - HOS&RM/MD - Annual
- Champion two
vision 2030 flagship
projects
- Champion the development of underutilized parks
(Turkana; Meru)
- Champion the development of conferencing centres
- 2 flagship projects
- 60% corporate brand
visibility
- HOC/HOI - 2019 and
2022
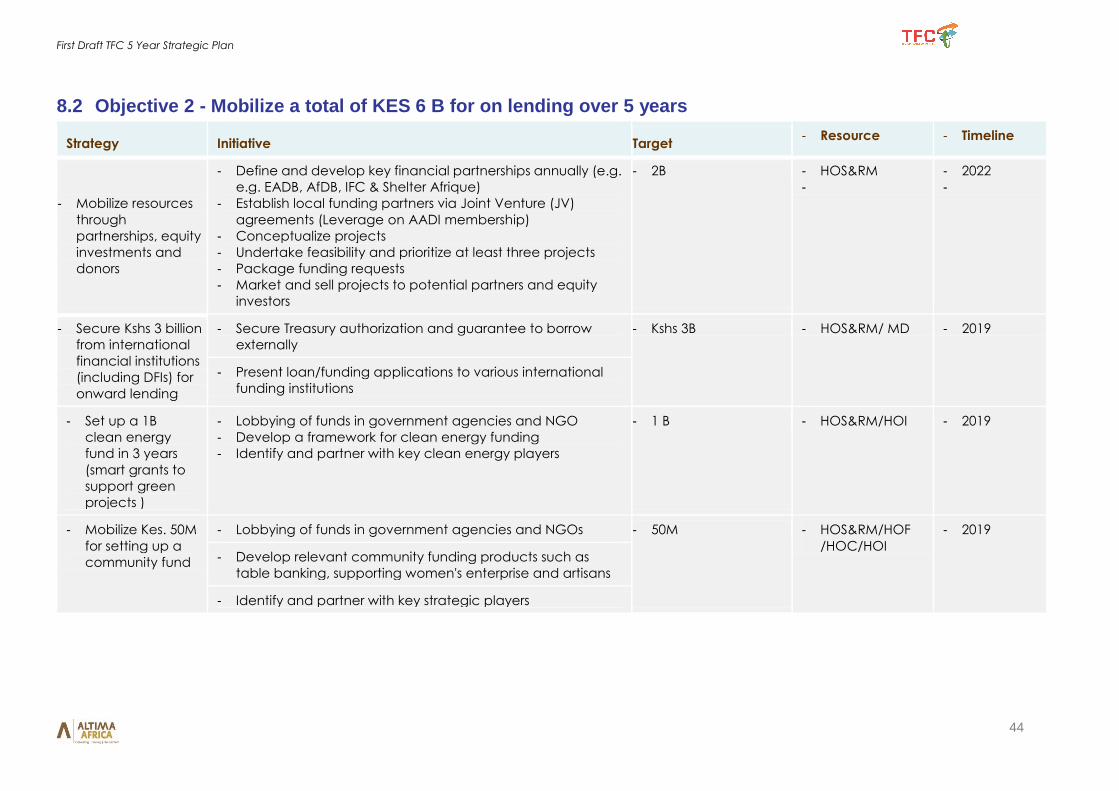
First Draft TFC 5 Year Strategic Plan
44
8.2 Objective 2 - Mobilize a total of KES 6 B for on lending over 5 years
Strategy Initiative Target - Resource - Timeline
- Mobilize resources
through
partnerships, equity
investments and
donors
- Define and develop key financial partnerships annually (e.g.
e.g. EADB, AfDB, IFC & Shelter Afrique)
- Establish local funding partners via Joint Venture (JV)
agreements (Leverage on AADI membership)
- Conceptualize projects
- Undertake feasibility and prioritize at least three projects
- Package funding requests
- Market and sell projects to potential partners and equity
investors
- 2B - HOS&RM
-
- 2022
-
- Secure Kshs 3 billion
from international
financial institutions
(including DFIs) for
onward lending
- Secure Treasury authorization and guarantee to borrow
externally
- Kshs 3B - HOS&RM/ MD - 2019
- Present loan/funding applications to various international
funding institutions
- Set up a 1B
clean energy
fund in 3 years
(smart grants to
support green
projects )
- Lobbying of funds in government agencies and NGO
- Develop a framework for clean energy funding
- Identify and partner with key clean energy players
- 1 B - HOS&RM/HOI - 2019
- Mobilize Kes. 50M
for setting up a
community fund
- Lobbying of funds in government agencies and NGOs - 50M - HOS&RM/HOF
/HOC/HOI
- 2019
- Develop relevant community funding products such as
table banking, supporting women's enterprise and artisans
- Identify and partner with key strategic players
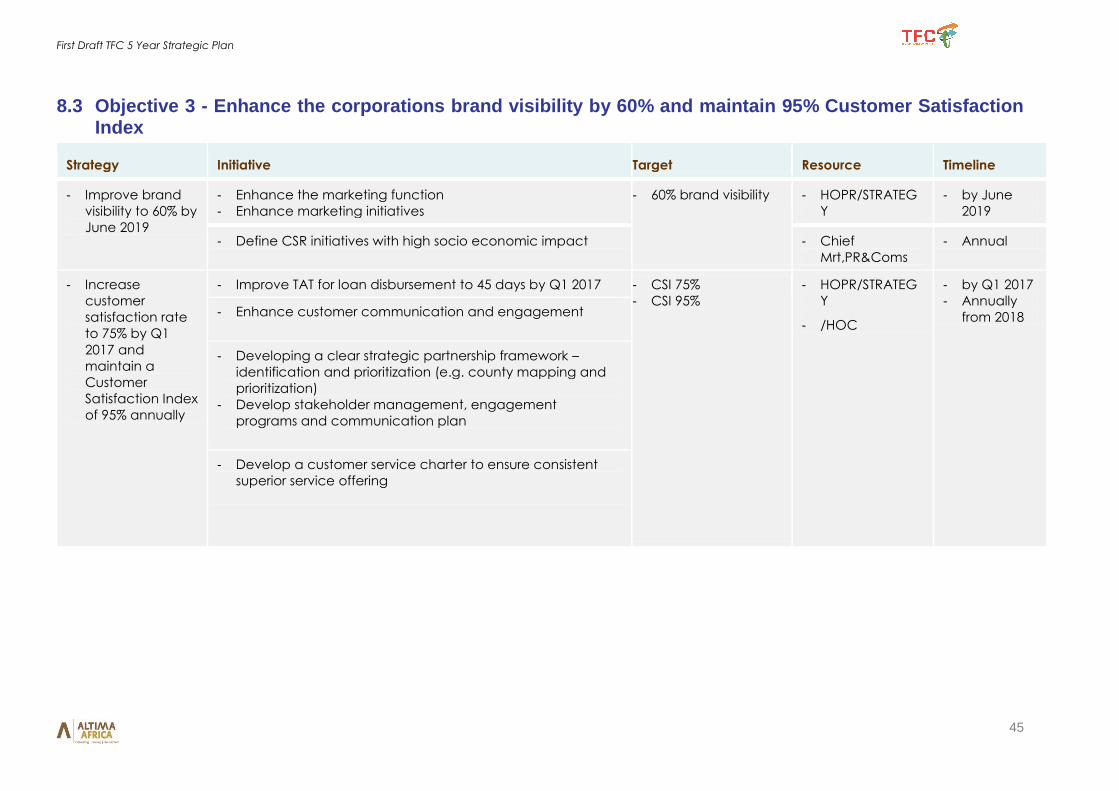
First Draft TFC 5 Year Strategic Plan
45
8.3 Objective 3 - Enhance the corporations brand visibility by 60% and maintain 95% Customer Satisfaction Index
Strategy Initiative Target Resource Timeline
- Improve brand
visibility to 60% by
June 2019
- Enhance the marketing function
- Enhance marketing initiatives
- 60% brand visibility - HOPR/STRATEG
Y
- by June
2019
- Define CSR initiatives with high socio economic impact - Chief
Mrt,PR&Coms
- Annual
- Increase
customer
satisfaction rate
to 75% by Q1
2017 and
maintain a
Customer
Satisfaction Index
of 95% annually
- Improve TAT for loan disbursement to 45 days by Q1 2017 - CSI 75%
- CSI 95%
- HOPR/STRATEG
Y
- /HOC
- by Q1 2017
- Annually
from 2018 - Enhance customer communication and engagement
- Developing a clear strategic partnership framework –
identification and prioritization (e.g. county mapping and
prioritization)
- Develop stakeholder management, engagement
programs and communication plan
- Develop a customer service charter to ensure consistent
superior service offering
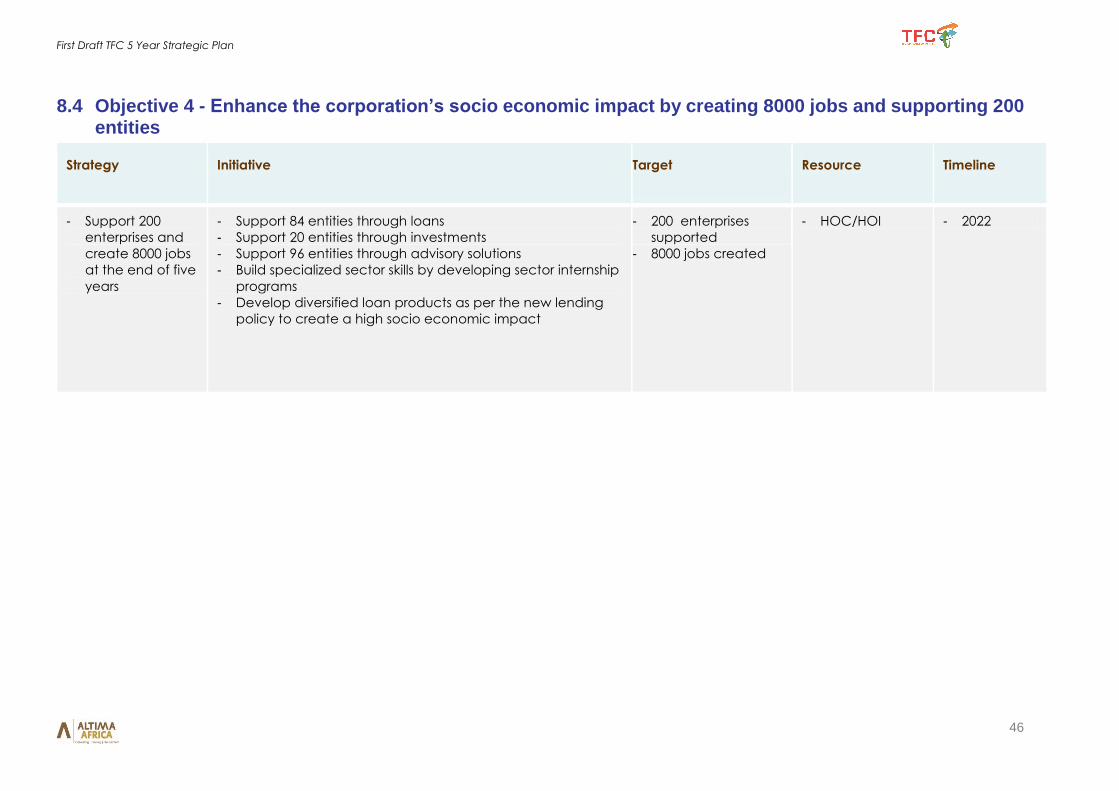
First Draft TFC 5 Year Strategic Plan
46
8.4 Objective 4 - Enhance the corporation’s socio economic impact by creating 8000 jobs and supporting 200 entities
Strategy Initiative Target Resource Timeline
- Support 200
enterprises and
create 8000 jobs
at the end of five
years
- Support 84 entities through loans
- Support 20 entities through investments
- Support 96 entities through advisory solutions
- Build specialized sector skills by developing sector internship
programs
- Develop diversified loan products as per the new lending
policy to create a high socio economic impact
- 200 enterprises
supported
- 8000 jobs created
- HOC/HOI - 2022
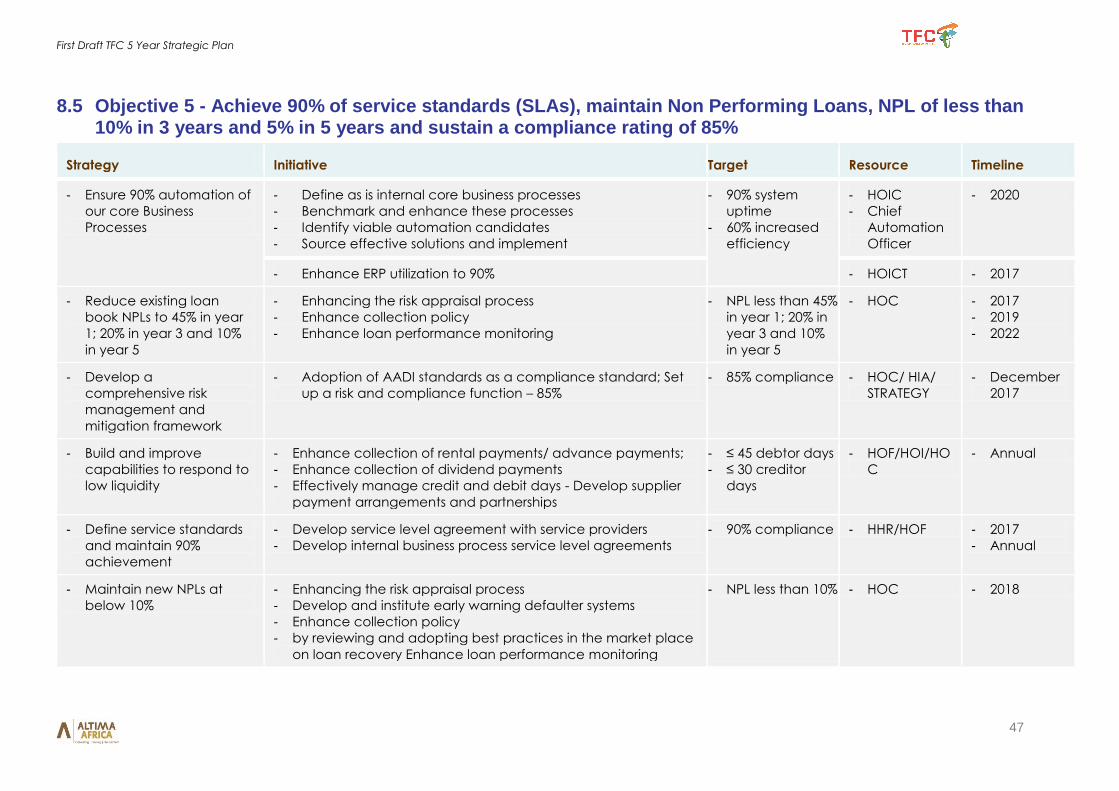
First Draft TFC 5 Year Strategic Plan
47
8.5 Objective 5 - Achieve 90% of service standards (SLAs), maintain Non Performing Loans, NPL of less than 10% in 3 years and 5% in 5 years and sustain a compliance rating of 85%
Strategy Initiative Target Resource Timeline
- Ensure 90% automation of
our core Business
Processes
- Define as is internal core business processes
- Benchmark and enhance these processes
- Identify viable automation candidates
- Source effective solutions and implement
- 90% system
uptime
- 60% increased
efficiency
- HOIC
- Chief
Automation
Officer
- 2020
- Enhance ERP utilization to 90% - HOICT - 2017
- Reduce existing loan
book NPLs to 45% in year
1; 20% in year 3 and 10%
in year 5
- Enhancing the risk appraisal process
- Enhance collection policy
- Enhance loan performance monitoring
- NPL less than 45%
in year 1; 20% in
year 3 and 10%
in year 5
- HOC - 2017
- 2019
- 2022
- Develop a
comprehensive risk
management and
mitigation framework
- Adoption of AADI standards as a compliance standard; Set
up a risk and compliance function – 85%
- 85% compliance - HOC/ HIA/
STRATEGY
- December
2017
- Build and improve
capabilities to respond to
low liquidity
- Enhance collection of rental payments/ advance payments;
- Enhance collection of dividend payments
- Effectively manage credit and debit days - Develop supplier
payment arrangements and partnerships
- ≤ 45 debtor days
- ≤ 30 creditor
days
- HOF/HOI/HO
C
- Annual
- Define service standards
and maintain 90%
achievement
- Develop service level agreement with service providers
- Develop internal business process service level agreements
- 90% compliance - HHR/HOF - 2017
- Annual
- Maintain new NPLs at
below 10%
- Enhancing the risk appraisal process
- Develop and institute early warning defaulter systems
- Enhance collection policy
- by reviewing and adopting best practices in the market place
on loan recovery Enhance loan performance monitoring
- NPL less than 10% - HOC - 2018
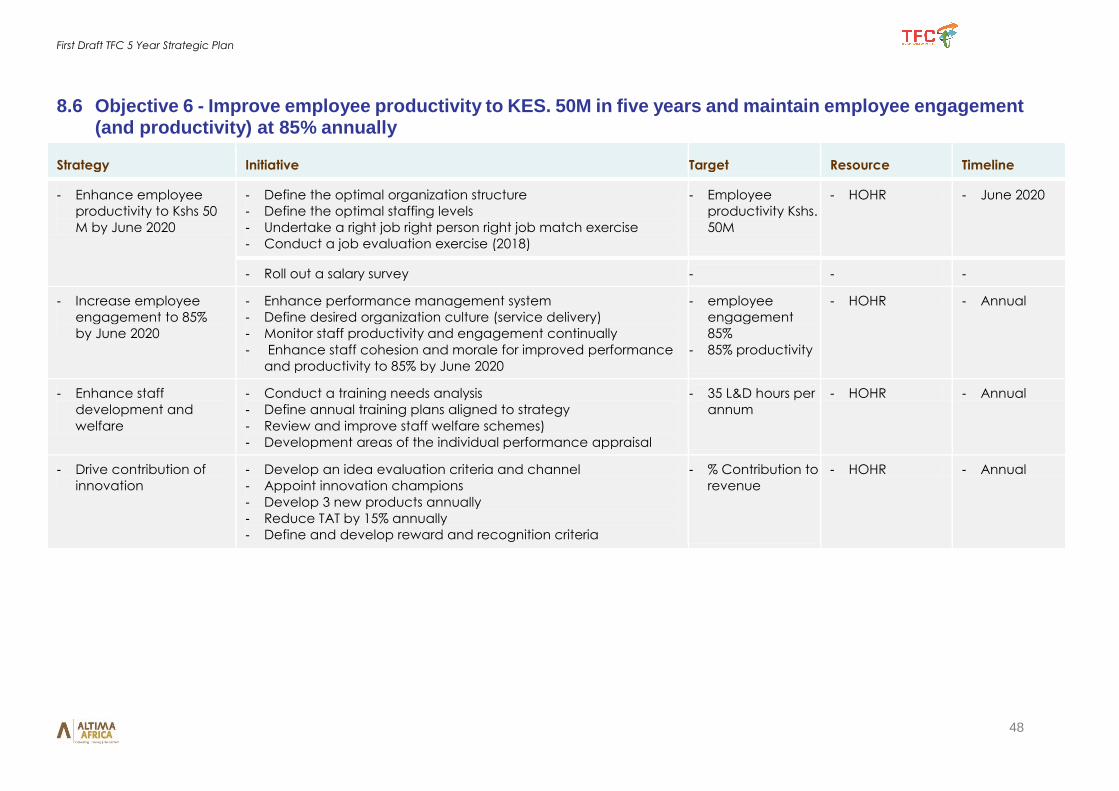
First Draft TFC 5 Year Strategic Plan
48
8.6 Objective 6 - Improve employee productivity to KES. 50M in five years and maintain employee engagement (and productivity) at 85% annually
Strategy Initiative Target Resource Timeline
- Enhance employee
productivity to Kshs 50
M by June 2020
- Define the optimal organization structure
- Define the optimal staffing levels
- Undertake a right job right person right job match exercise
- Conduct a job evaluation exercise (2018)
- Employee
productivity Kshs.
50M
- HOHR - June 2020
- Roll out a salary survey - - -
- Increase employee
engagement to 85%
by June 2020
- Enhance performance management system
- Define desired organization culture (service delivery)
- Monitor staff productivity and engagement continually
- Enhance staff cohesion and morale for improved performance
and productivity to 85% by June 2020
- employee
engagement
85%
- 85% productivity
- HOHR - Annual
- Enhance staff
development and
welfare
- Conduct a training needs analysis
- Define annual training plans aligned to strategy
- Review and improve staff welfare schemes)
- Development areas of the individual performance appraisal
- 35 L&D hours per
annum
- HOHR - Annual
- Drive contribution of
innovation
- Develop an idea evaluation criteria and channel
- Appoint innovation champions
- Develop 3 new products annually
- Reduce TAT by 15% annually
- Define and develop reward and recognition criteria
- % Contribution to
revenue
- HOHR - Annual
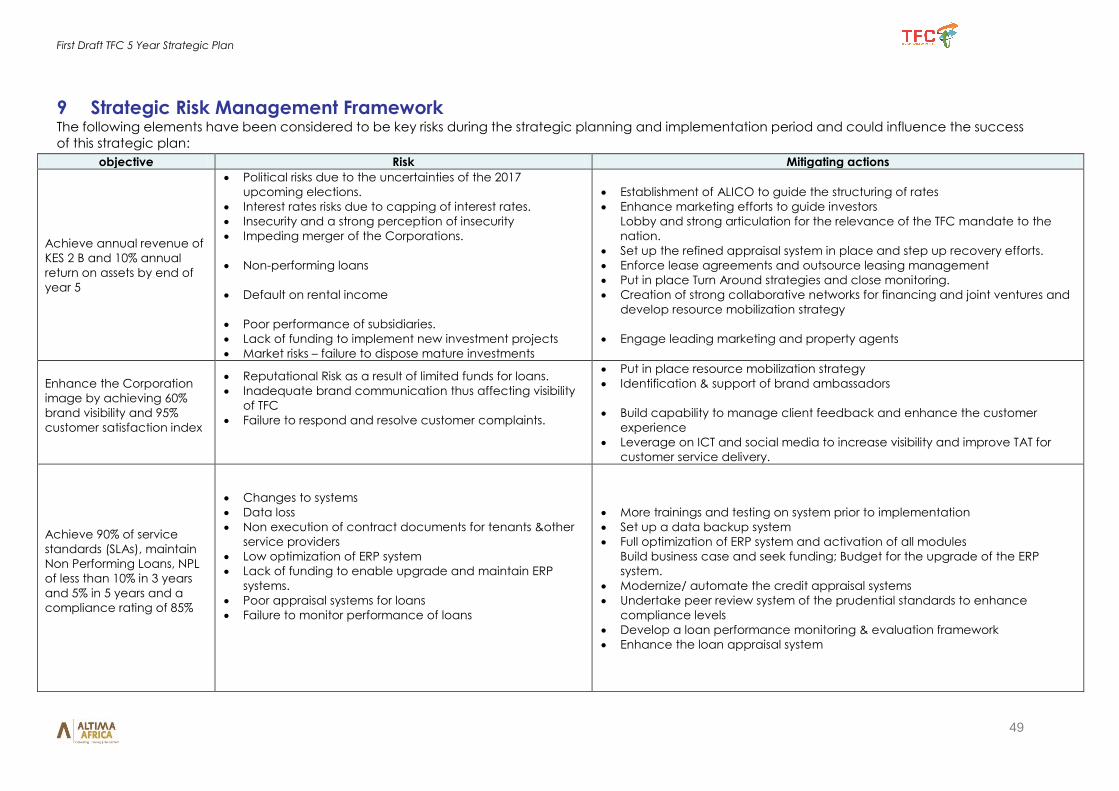
First Draft TFC 5 Year Strategic Plan
49
9 Strategic Risk Management Framework The following elements have been considered to be key risks during the strategic planning and implementation period and could influence the success
of this strategic plan:
objective Risk Mitigating actions
Achieve annual revenue of
KES 2 B and 10% annual
return on assets by end of
year 5
Political risks due to the uncertainties of the 2017
upcoming elections.
Interest rates risks due to capping of interest rates.
Insecurity and a strong perception of insecurity
Impeding merger of the Corporations.
Non-performing loans
Default on rental income
Poor performance of subsidiaries.
Lack of funding to implement new investment projects
Market risks – failure to dispose mature investments
Establishment of ALICO to guide the structuring of rates
Enhance marketing efforts to guide investors
Lobby and strong articulation for the relevance of the TFC mandate to the
nation.
Set up the refined appraisal system in place and step up recovery efforts.
Enforce lease agreements and outsource leasing management
Put in place Turn Around strategies and close monitoring.
Creation of strong collaborative networks for financing and joint ventures and
develop resource mobilization strategy
Engage leading marketing and property agents
Enhance the Corporation
image by achieving 60%
brand visibility and 95%
customer satisfaction index
Reputational Risk as a result of limited funds for loans.
Inadequate brand communication thus affecting visibility
of TFC
Failure to respond and resolve customer complaints.
Put in place resource mobilization strategy
Identification & support of brand ambassadors
Build capability to manage client feedback and enhance the customer
experience
Leverage on ICT and social media to increase visibility and improve TAT for
customer service delivery.
Achieve 90% of service
standards (SLAs), maintain
Non Performing Loans, NPL
of less than 10% in 3 years
and 5% in 5 years and a
compliance rating of 85%
Changes to systems
Data loss
Non execution of contract documents for tenants &other
service providers
Low optimization of ERP system
Lack of funding to enable upgrade and maintain ERP
systems.
Poor appraisal systems for loans
Failure to monitor performance of loans
More trainings and testing on system prior to implementation
Set up a data backup system
Full optimization of ERP system and activation of all modules
Build business case and seek funding; Budget for the upgrade of the ERP
system.
Modernize/ automate the credit appraisal systems
Undertake peer review system of the prudential standards to enhance
compliance levels
Develop a loan performance monitoring & evaluation framework
Enhance the loan appraisal system
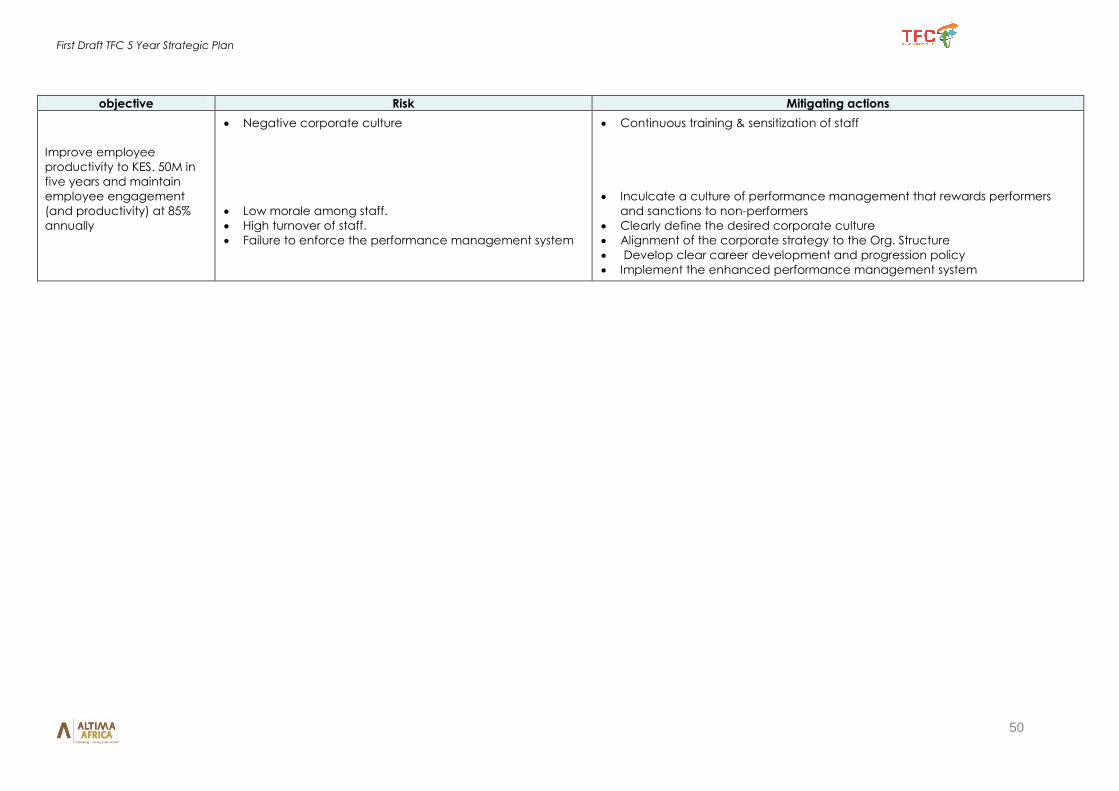
First Draft TFC 5 Year Strategic Plan
50
objective Risk Mitigating actions
Improve employee
productivity to KES. 50M in
five years and maintain
employee engagement
(and productivity) at 85%
annually
Negative corporate culture
Low morale among staff.
High turnover of staff.
Failure to enforce the performance management system
Continuous training & sensitization of staff
Inculcate a culture of performance management that rewards performers
and sanctions to non-performers
Clearly define the desired corporate culture
Alignment of the corporate strategy to the Org. Structure
Develop clear career development and progression policy
Implement the enhanced performance management system
First Draft TFC 5 Year Strategic Plan
51
10 Financial Projections Overview This is a summary of the key financial indicators over the life of the strategy. The summary has key revenue and balance sheet items as well as the key
ratios. The full financial projections are contained in appendix 11.6
10.1 Key Assumptions
The key assumptions taken in developing the five year financial projections are as highlighted below:
I. The planning period covers FY 2017/18 to FY 2021/22 which begins in the month of July to June in line with the GoK fiscal year.
II. During the planning period, the CBK rate will expected to remain stable at about 10%
III. The TFC lending rate will remain relatively about 10%
IV. The cost of living adjustment will be 5% and this will have a direct impact on the staff costs and other operating expenses
V. Grants received for on lending are treated similar to GoK grants
VI. Fund management administration fees are assumed to be 5%
VII. NPL projected to reduce to 20% of the loan portfolio by the 3rd year and 10% by the 5th year
VIII. Rent income to escalate at 10% after the 3rd year
IX. Utalii House, Watalii Street and Mombasa Island properties are to be revalued in Yr1 and expected to gain at 10%
X. Alternative revenue relates to alternative products including bancassurance, non-funded income and other predefined al; the assumed growth
rate is an annual 50%
XI. Provision for bad debts provided at 1% of the loan portfolio as per the current policy
XII. Dividends from subsidiaries will be realised upon profitability which is dependent on refurbishment and turnaround strategy
XIII. The development grants are used for onward lending
XIV. The GOK grant is dependent on Government priorities from one year to another; the assumed annual average is however Kshs 500M
XV. Gain on Revaluation assumed to be at 10%
XVI. Growth in alternative channels 50%
XVII. The costs associated with developing assets include consultancy, research and feasibility study, assumed to be 10%
XVIII. Grant Income is captured under development vote and will be used for onward lending hence cannot be matched with expenditure
XIX. Clean Energy and Community funds are captured under development vote and will be used for onward lending hence cannot be matched
with expenditure
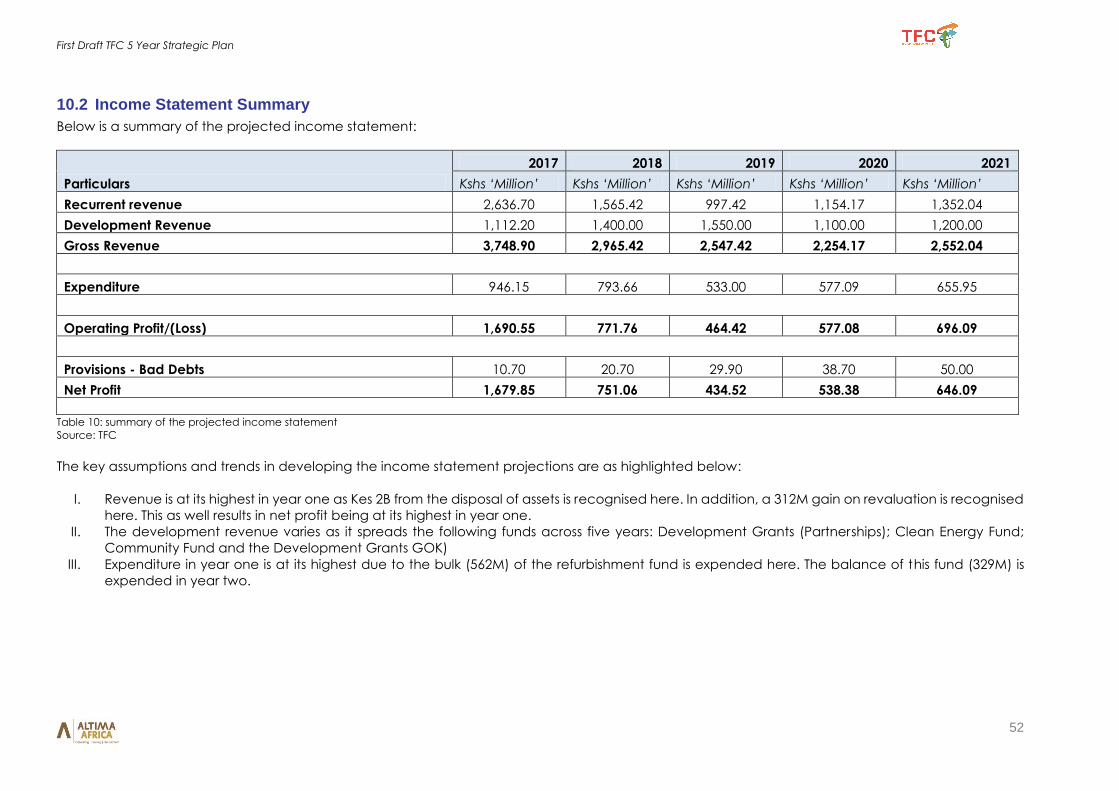
First Draft TFC 5 Year Strategic Plan
52
10.2 Income Statement Summary
Below is a summary of the projected income statement:
Particulars
2017 2018 2019 2020 2021
Kshs ‘Million’ Kshs ‘Million’ Kshs ‘Million’ Kshs ‘Million’ Kshs ‘Million’
Recurrent revenue 2,636.70 1,565.42 997.42 1,154.17 1,352.04
Development Revenue 1,112.20 1,400.00 1,550.00 1,100.00 1,200.00
Gross Revenue 3,748.90 2,965.42 2,547.42 2,254.17 2,552.04
Expenditure 946.15 793.66 533.00 577.09 655.95
Operating Profit/(Loss) 1,690.55 771.76 464.42 577.08 696.09
Provisions - Bad Debts 10.70 20.70 29.90 38.70 50.00
Net Profit 1,679.85 751.06 434.52 538.38 646.09
Table 10: summary of the projected income statement
Source: TFC
The key assumptions and trends in developing the income statement projections are as highlighted below:
I. Revenue is at its highest in year one as Kes 2B from the disposal of assets is recognised here. In addition, a 312M gain on revaluation is recognised
here. This as well results in net profit being at its highest in year one.
II. The development revenue varies as it spreads the following funds across five years: Development Grants (Partnerships); Clean Energy Fund;
Community Fund and the Development Grants GOK)
III. Expenditure in year one is at its highest due to the bulk (562M) of the refurbishment fund is expended here. The balance of this fund (329M) is
expended in year two.
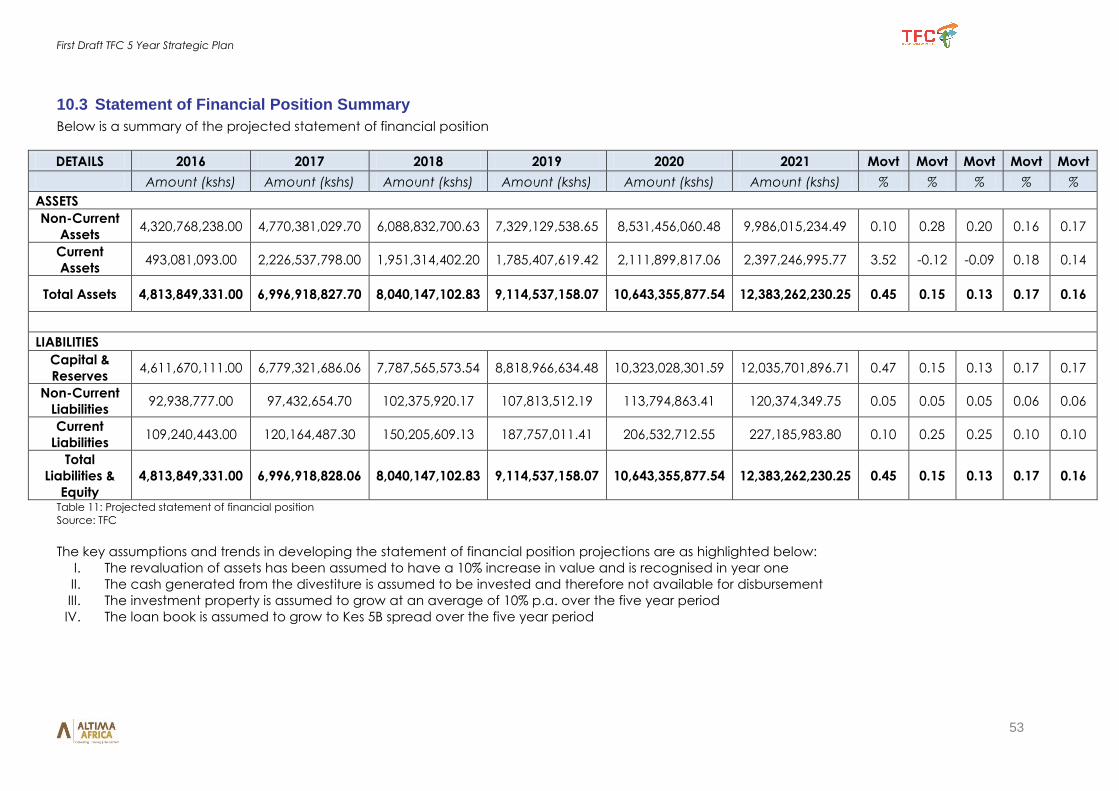
First Draft TFC 5 Year Strategic Plan
53
10.3 Statement of Financial Position Summary
Below is a summary of the projected statement of financial position
DETAILS 2016 2017 2018 2019 2020 2021 Movt Movt Movt Movt Movt
Amount (kshs) Amount (kshs) Amount (kshs) Amount (kshs) Amount (kshs) Amount (kshs) % % % % %
ASSETS
Non-Current
Assets 4,320,768,238.00 4,770,381,029.70 6,088,832,700.63 7,329,129,538.65 8,531,456,060.48 9,986,015,234.49 0.10 0.28 0.20 0.16 0.17
Current
Assets 493,081,093.00 2,226,537,798.00 1,951,314,402.20 1,785,407,619.42 2,111,899,817.06 2,397,246,995.77 3.52 -0.12 -0.09 0.18 0.14
Total Assets 4,813,849,331.00 6,996,918,827.70 8,040,147,102.83 9,114,537,158.07 10,643,355,877.54 12,383,262,230.25 0.45 0.15 0.13 0.17 0.16
LIABILITIES
Capital &
Reserves 4,611,670,111.00 6,779,321,686.06 7,787,565,573.54 8,818,966,634.48 10,323,028,301.59 12,035,701,896.71 0.47 0.15 0.13 0.17 0.17
Non-Current
Liabilities 92,938,777.00 97,432,654.70 102,375,920.17 107,813,512.19 113,794,863.41 120,374,349.75 0.05 0.05 0.05 0.06 0.06
Current
Liabilities 109,240,443.00 120,164,487.30 150,205,609.13 187,757,011.41 206,532,712.55 227,185,983.80 0.10 0.25 0.25 0.10 0.10
Total
Liabilities &
Equity
4,813,849,331.00 6,996,918,828.06 8,040,147,102.83 9,114,537,158.07 10,643,355,877.54 12,383,262,230.25 0.45 0.15 0.13 0.17 0.16
Table 11: Projected statement of financial position
Source: TFC
The key assumptions and trends in developing the statement of financial position projections are as highlighted below:
I. The revaluation of assets has been assumed to have a 10% increase in value and is recognised in year one
II. The cash generated from the divestiture is assumed to be invested and therefore not available for disbursement
III. The investment property is assumed to grow at an average of 10% p.a. over the five year period
IV. The loan book is assumed to grow to Kes 5B spread over the five year period
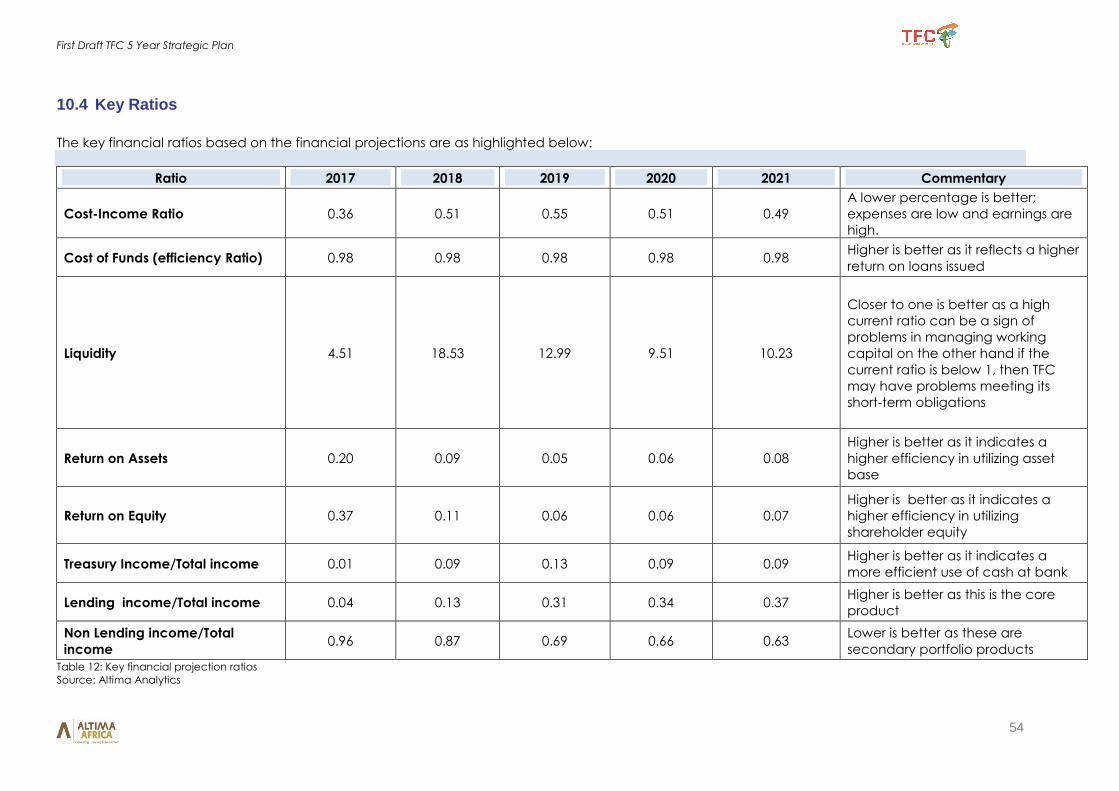
First Draft TFC 5 Year Strategic Plan
54
10.4 Key Ratios
The key financial ratios based on the financial projections are as highlighted below:
Ratio 2017 2018 2019 2020 2021 Commentary
Cost-Income Ratio 0.36 0.51 0.55 0.51 0.49
A lower percentage is better;
expenses are low and earnings are
high.
Cost of Funds (efficiency Ratio) 0.98 0.98 0.98 0.98 0.98 Higher is better as it reflects a higher
return on loans issued
Liquidity 4.51 18.53 12.99 9.51 10.23
Closer to one is better as a high
current ratio can be a sign of
problems in managing working
capital on the other hand if the
current ratio is below 1, then TFC
may have problems meeting its
short-term obligations
Return on Assets 0.20 0.09 0.05 0.06 0.08
Higher is better as it indicates a
higher efficiency in utilizing asset
base
Return on Equity 0.37 0.11 0.06 0.06 0.07
Higher is better as it indicates a
higher efficiency in utilizing
shareholder equity
Treasury Income/Total income 0.01 0.09 0.13 0.09 0.09 Higher is better as it indicates a
more efficient use of cash at bank
Lending income/Total income 0.04 0.13 0.31 0.34 0.37 Higher is better as this is the core
product
Non Lending income/Total
income 0.96 0.87 0.69 0.66 0.63
Lower is better as these are
secondary portfolio products
Table 12: Key financial projection ratios
Source: Altima Analytics
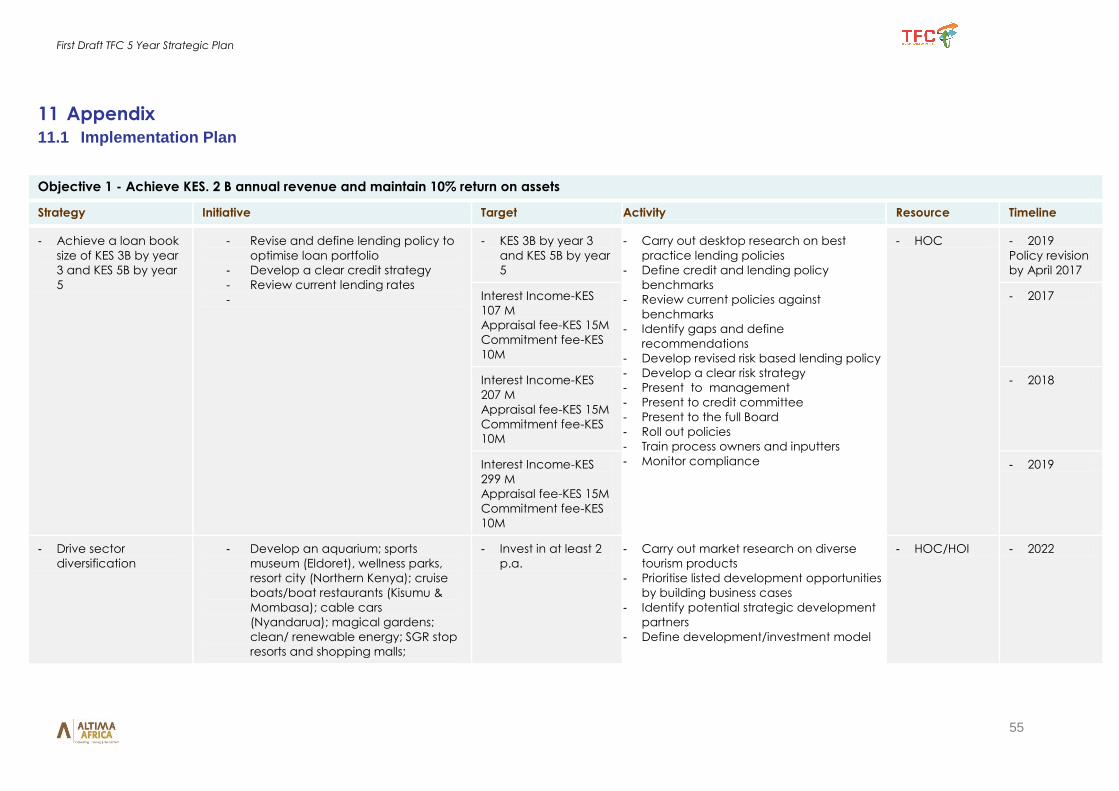
First Draft TFC 5 Year Strategic Plan
55
11 Appendix
11.1 Implementation Plan
Objective 1 - Achieve KES. 2 B annual revenue and maintain 10% return on assets
Strategy Initiative Target Activity Resource Timeline
- Achieve a loan book
size of KES 3B by year
3 and KES 5B by year
5
- Revise and define lending policy to
optimise loan portfolio
- Develop a clear credit strategy
- Review current lending rates
-
- KES 3B by year 3
and KES 5B by year
5
- Carry out desktop research on best
practice lending policies
- Define credit and lending policy
benchmarks
- Review current policies against
benchmarks
- Identify gaps and define
recommendations
- Develop revised risk based lending policy
- Develop a clear risk strategy
- Present to management
- Present to credit committee
- Present to the full Board
- Roll out policies
- Train process owners and inputters
- Monitor compliance
- HOC - 2019
Policy revision
by April 2017
Interest Income-KES
107 M
Appraisal fee-KES 15M
Commitment fee-KES
10M
- 2017
Interest Income-KES
207 M
Appraisal fee-KES 15M
Commitment fee-KES
10M
- 2018
Interest Income-KES
299 M
Appraisal fee-KES 15M
Commitment fee-KES
10M
- 2019
- Drive sector
diversification
- Develop an aquarium; sports
museum (Eldoret), wellness parks,
resort city (Northern Kenya); cruise
boats/boat restaurants (Kisumu &
Mombasa); cable cars
(Nyandarua); magical gardens;
clean/ renewable energy; SGR stop
resorts and shopping malls;
- Invest in at least 2
p.a.
- Carry out market research on diverse
tourism products
- Prioritise listed development opportunities
by building business cases
- Identify potential strategic development
partners
- Define development/investment model
- HOC/HOI - 2022
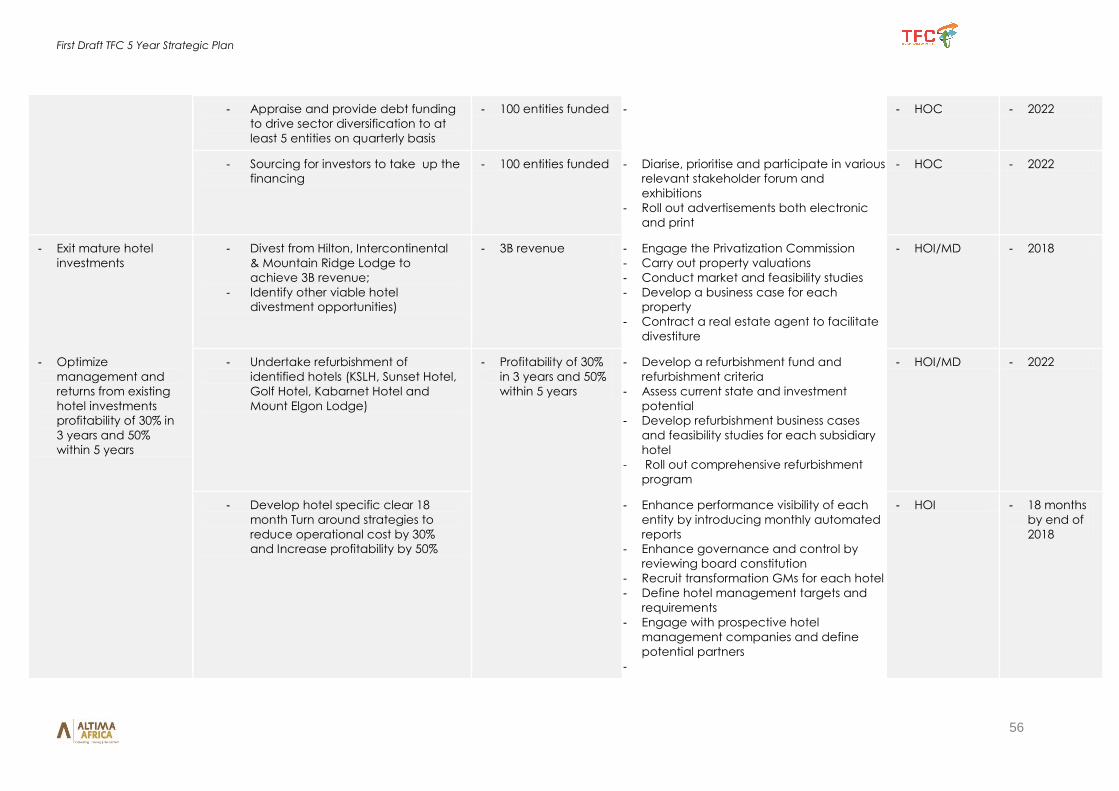
First Draft TFC 5 Year Strategic Plan
56
- Appraise and provide debt funding
to drive sector diversification to at
least 5 entities on quarterly basis
- 100 entities funded - - HOC - 2022
- Sourcing for investors to take up the
financing
- 100 entities funded - Diarise, prioritise and participate in various
relevant stakeholder forum and
exhibitions
- Roll out advertisements both electronic
and print
- HOC - 2022
- Exit mature hotel
investments
- Divest from Hilton, Intercontinental
& Mountain Ridge Lodge to
achieve 3B revenue;
- Identify other viable hotel
divestment opportunities)
- 3B revenue - Engage the Privatization Commission
- Carry out property valuations
- Conduct market and feasibility studies
- Develop a business case for each
property
- Contract a real estate agent to facilitate
divestiture
- HOI/MD - 2018
- Optimize
management and
returns from existing
hotel investments
profitability of 30% in
3 years and 50%
within 5 years
- Undertake refurbishment of
identified hotels (KSLH, Sunset Hotel,
Golf Hotel, Kabarnet Hotel and
Mount Elgon Lodge)
- Profitability of 30%
in 3 years and 50%
within 5 years
- Develop a refurbishment fund and
refurbishment criteria
- Assess current state and investment
potential
- Develop refurbishment business cases
and feasibility studies for each subsidiary
hotel
- Roll out comprehensive refurbishment
program
- HOI/MD - 2022
- Develop hotel specific clear 18
month Turn around strategies to
reduce operational cost by 30%
and Increase profitability by 50%
- Enhance performance visibility of each
entity by introducing monthly automated
reports
- Enhance governance and control by
reviewing board constitution
- Recruit transformation GMs for each hotel
- Define hotel management targets and
requirements
- Engage with prospective hotel
management companies and define
potential partners
-
- HOI - 18 months
by end of
2018
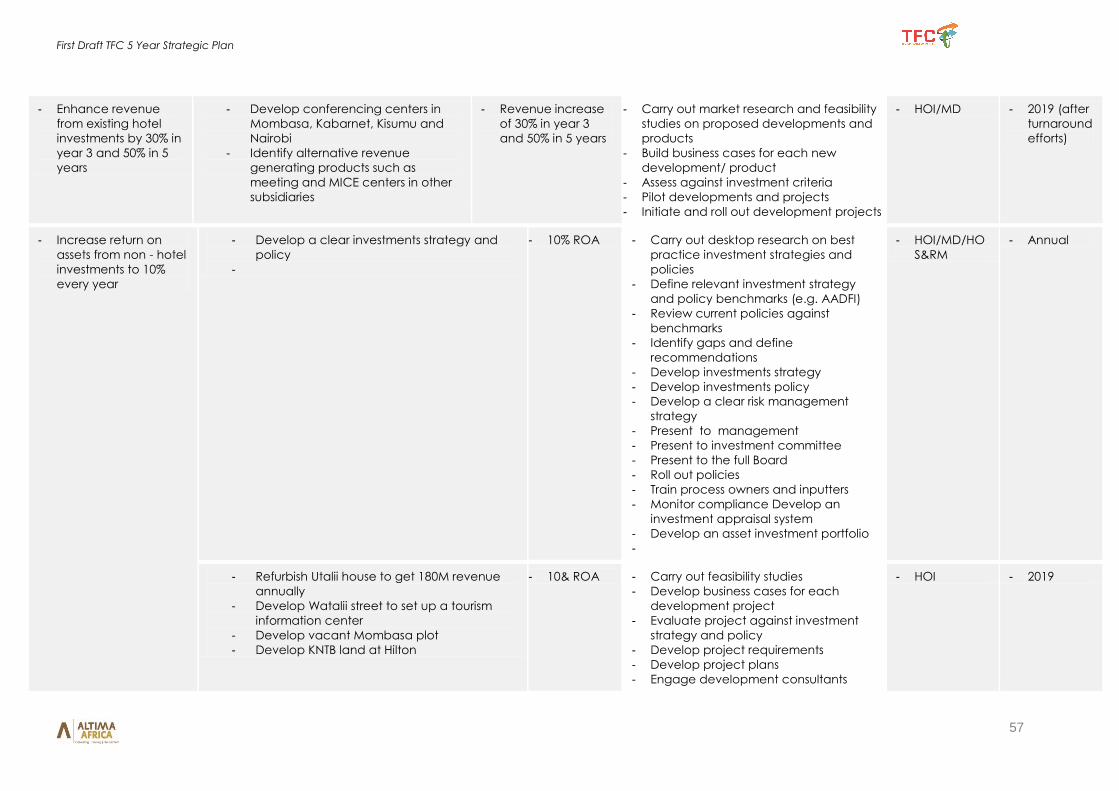
First Draft TFC 5 Year Strategic Plan
57
- Enhance revenue
from existing hotel
investments by 30% in
year 3 and 50% in 5
years
- Develop conferencing centers in
Mombasa, Kabarnet, Kisumu and
Nairobi
- Identify alternative revenue
generating products such as
meeting and MICE centers in other
subsidiaries
- Revenue increase
of 30% in year 3
and 50% in 5 years
- Carry out market research and feasibility
studies on proposed developments and
products
- Build business cases for each new
development/ product
- Assess against investment criteria
- Pilot developments and projects
- Initiate and roll out development projects
- HOI/MD - 2019 (after
turnaround
efforts)
- Increase return on
assets from non - hotel
investments to 10%
every year
- Develop a clear investments strategy and
policy
-
- 10% ROA - Carry out desktop research on best
practice investment strategies and
policies
- Define relevant investment strategy
and policy benchmarks (e.g. AADFI)
- Review current policies against
benchmarks
- Identify gaps and define
recommendations
- Develop investments strategy
- Develop investments policy
- Develop a clear risk management
strategy
- Present to management
- Present to investment committee
- Present to the full Board
- Roll out policies
- Train process owners and inputters
- Monitor compliance Develop an
investment appraisal system
- Develop an asset investment portfolio
-
- HOI/MD/HO
S&RM
- Annual
- Refurbish Utalii house to get 180M revenue
annually
- Develop Watalii street to set up a tourism
information center
- Develop vacant Mombasa plot
- Develop KNTB land at Hilton
- 10& ROA - Carry out feasibility studies
- Develop business cases for each
development project
- Evaluate project against investment
strategy and policy
- Develop project requirements
- Develop project plans
- Engage development consultants
- HOI - 2019
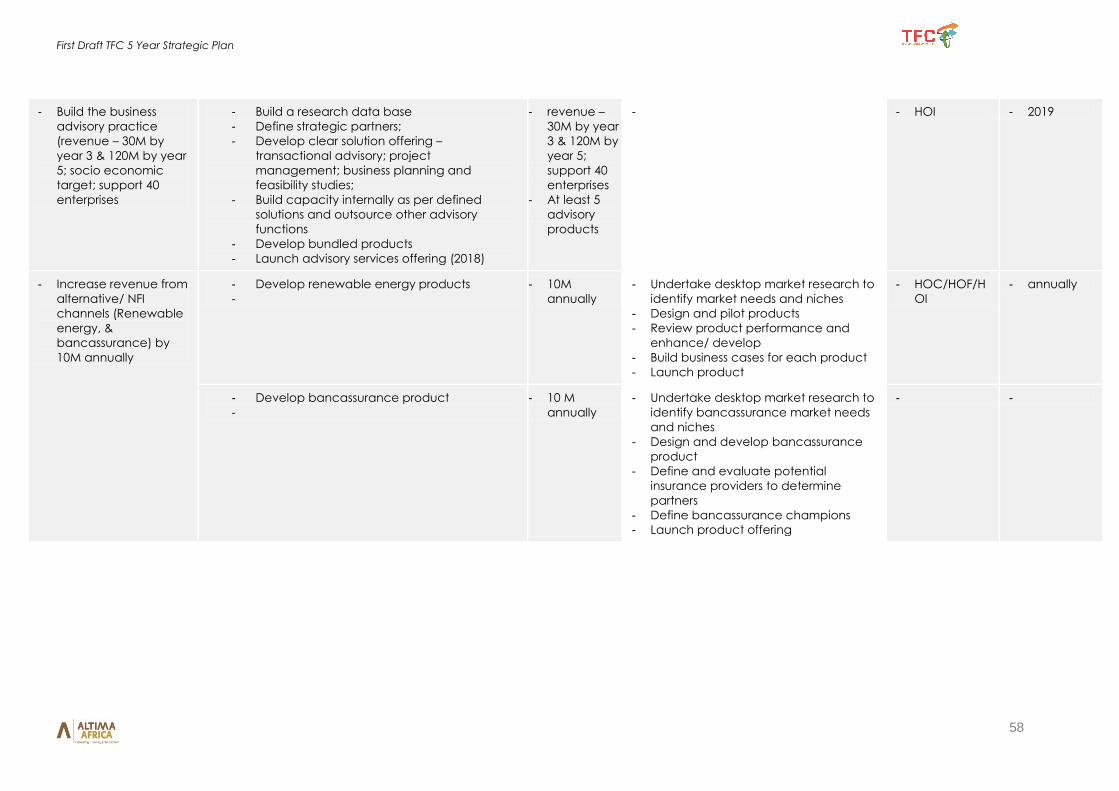
First Draft TFC 5 Year Strategic Plan
58
- Build the business
advisory practice
(revenue – 30M by
year 3 & 120M by year
5; socio economic
target; support 40
enterprises
- Build a research data base
- Define strategic partners;
- Develop clear solution offering –
transactional advisory; project
management; business planning and
feasibility studies;
- Build capacity internally as per defined
solutions and outsource other advisory
functions
- Develop bundled products
- Launch advisory services offering (2018)
- revenue –
30M by year
3 & 120M by
year 5;
support 40
enterprises
- At least 5
advisory
products
- - HOI - 2019
- Increase revenue from
alternative/ NFI
channels (Renewable
energy, &
bancassurance) by
10M annually
- Develop renewable energy products
-
- 10M
annually
- Undertake desktop market research to
identify market needs and niches
- Design and pilot products
- Review product performance and
enhance/ develop
- Build business cases for each product
- Launch product
- HOC/HOF/H
OI
- annually
- Develop bancassurance product
-
- 10 M
annually
- Undertake desktop market research to
identify bancassurance market needs
and niches
- Design and develop bancassurance
product
- Define and evaluate potential
insurance providers to determine
partners
- Define bancassurance champions
- Launch product offering
- -
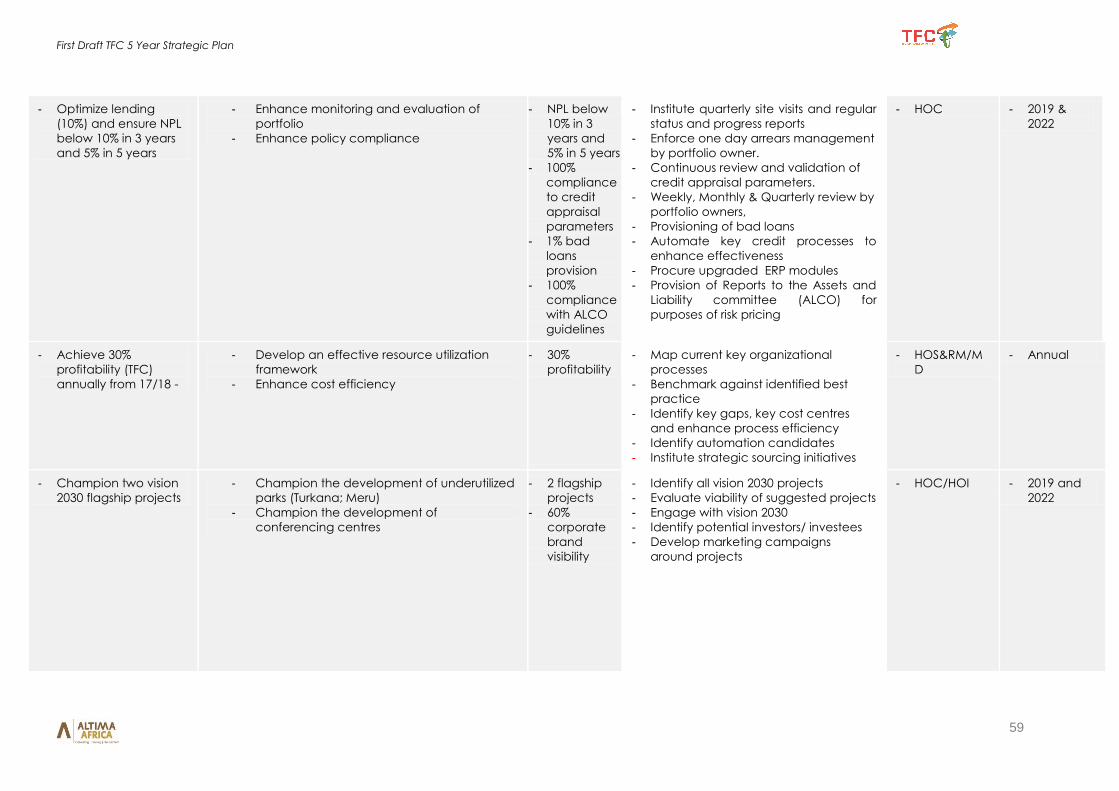
First Draft TFC 5 Year Strategic Plan
59
- Optimize lending
(10%) and ensure NPL
below 10% in 3 years
and 5% in 5 years
- Enhance monitoring and evaluation of
portfolio
- Enhance policy compliance
- NPL below
10% in 3
years and
5% in 5 years
- 100%
compliance
to credit
appraisal
parameters
- 1% bad
loans
provision
- 100%
compliance
with ALCO
guidelines
- Institute quarterly site visits and regular
status and progress reports
- Enforce one day arrears management
by portfolio owner.
- Continuous review and validation of
credit appraisal parameters.
- Weekly, Monthly & Quarterly review by
portfolio owners,
- Provisioning of bad loans
- Automate key credit processes to
enhance effectiveness
- Procure upgraded ERP modules
- Provision of Reports to the Assets and
Liability committee (ALCO) for
purposes of risk pricing
- HOC - 2019 &
2022
- Achieve 30%
profitability (TFC)
annually from 17/18 -
- Develop an effective resource utilization
framework
- Enhance cost efficiency
- 30%
profitability
- Map current key organizational
processes
- Benchmark against identified best
practice
- Identify key gaps, key cost centres
and enhance process efficiency
- Identify automation candidates
- Institute strategic sourcing initiatives
- HOS&RM/M
D
- Annual
- Champion two vision
2030 flagship projects
- Champion the development of underutilized
parks (Turkana; Meru)
- Champion the development of
conferencing centres
- 2 flagship
projects
- 60%
corporate
brand
visibility
- Identify all vision 2030 projects
- Evaluate viability of suggested projects
- Engage with vision 2030
- Identify potential investors/ investees
- Develop marketing campaigns
around projects
- HOC/HOI - 2019 and
2022
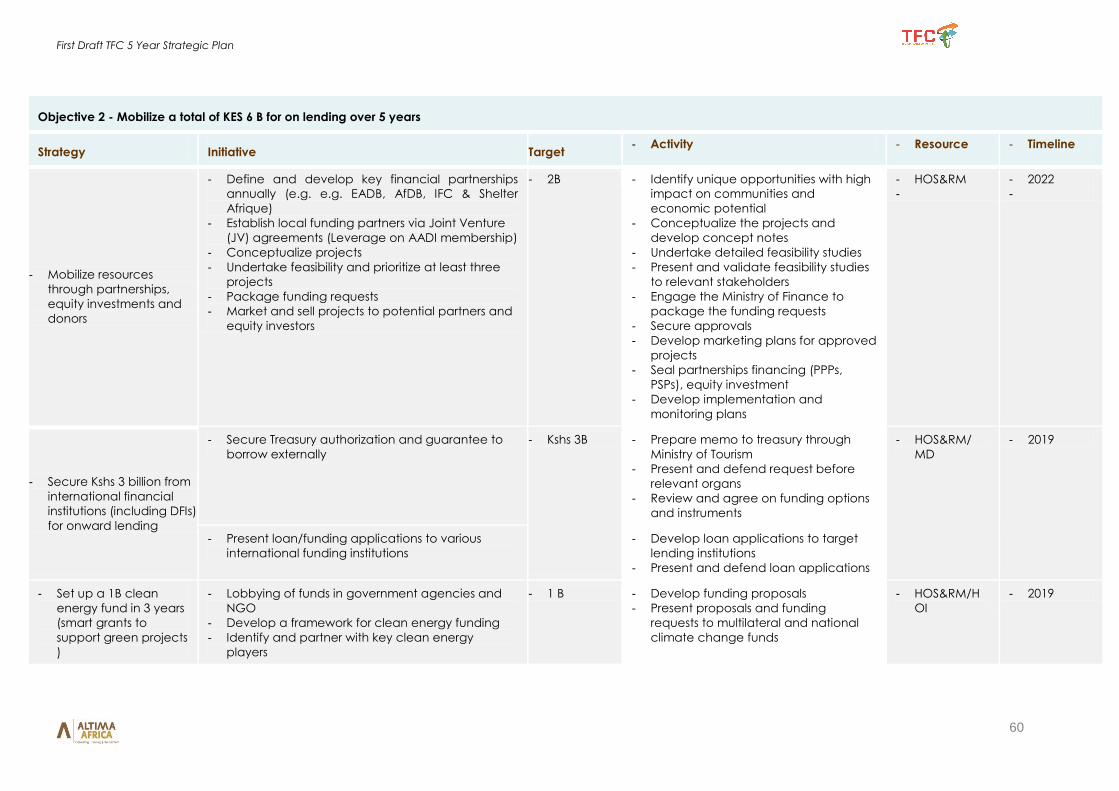
First Draft TFC 5 Year Strategic Plan
60
Objective 2 - Mobilize a total of KES 6 B for on lending over 5 years
Strategy Initiative Target - Activity - Resource - Timeline
- Mobilize resources
through partnerships,
equity investments and
donors
- Define and develop key financial partnerships
annually (e.g. e.g. EADB, AfDB, IFC & Shelter
Afrique)
- Establish local funding partners via Joint Venture
(JV) agreements (Leverage on AADI membership)
- Conceptualize projects
- Undertake feasibility and prioritize at least three
projects
- Package funding requests
- Market and sell projects to potential partners and
equity investors
- 2B - Identify unique opportunities with high
impact on communities and
economic potential
- Conceptualize the projects and
develop concept notes
- Undertake detailed feasibility studies
- Present and validate feasibility studies
to relevant stakeholders
- Engage the Ministry of Finance to
package the funding requests
- Secure approvals
- Develop marketing plans for approved
projects
- Seal partnerships financing (PPPs,
PSPs), equity investment
- Develop implementation and
monitoring plans
- HOS&RM
-
- 2022
-
- Secure Kshs 3 billion from
international financial
institutions (including DFIs)
for onward lending
- Secure Treasury authorization and guarantee to
borrow externally
- Kshs 3B - Prepare memo to treasury through
Ministry of Tourism
- Present and defend request before
relevant organs
- Review and agree on funding options
and instruments
- HOS&RM/
MD
- 2019
- Present loan/funding applications to various
international funding institutions
- Develop loan applications to target
lending institutions
- Present and defend loan applications
- Set up a 1B clean
energy fund in 3 years
(smart grants to
support green projects
)
- Lobbying of funds in government agencies and
NGO
- Develop a framework for clean energy funding
- Identify and partner with key clean energy
players
- 1 B - Develop funding proposals
- Present proposals and funding
requests to multilateral and national
climate change funds
- HOS&RM/H
OI
- 2019
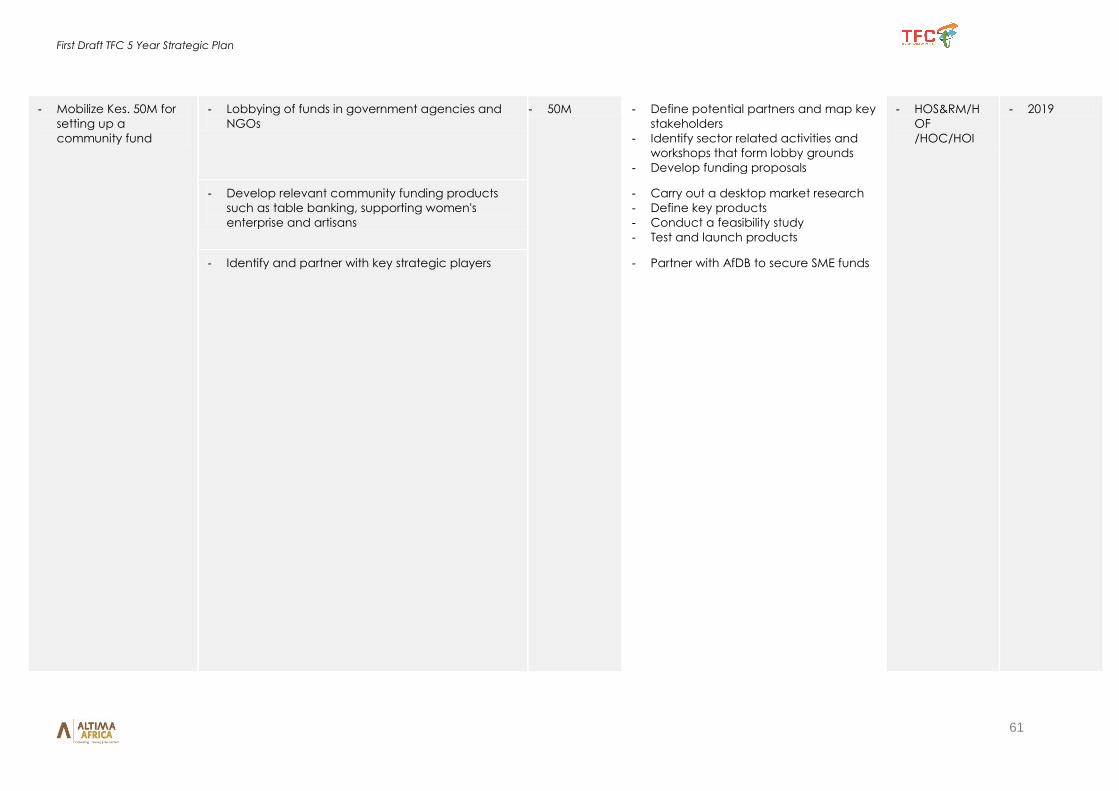
First Draft TFC 5 Year Strategic Plan
61
- Mobilize Kes. 50M for
setting up a
community fund
- Lobbying of funds in government agencies and
NGOs
- 50M - Define potential partners and map key
stakeholders
- Identify sector related activities and
workshops that form lobby grounds
- Develop funding proposals
- HOS&RM/H
OF
/HOC/HOI
- 2019
- Develop relevant community funding products
such as table banking, supporting women's
enterprise and artisans
- Carry out a desktop market research
- Define key products
- Conduct a feasibility study
- Test and launch products
- Identify and partner with key strategic players - Partner with AfDB to secure SME funds
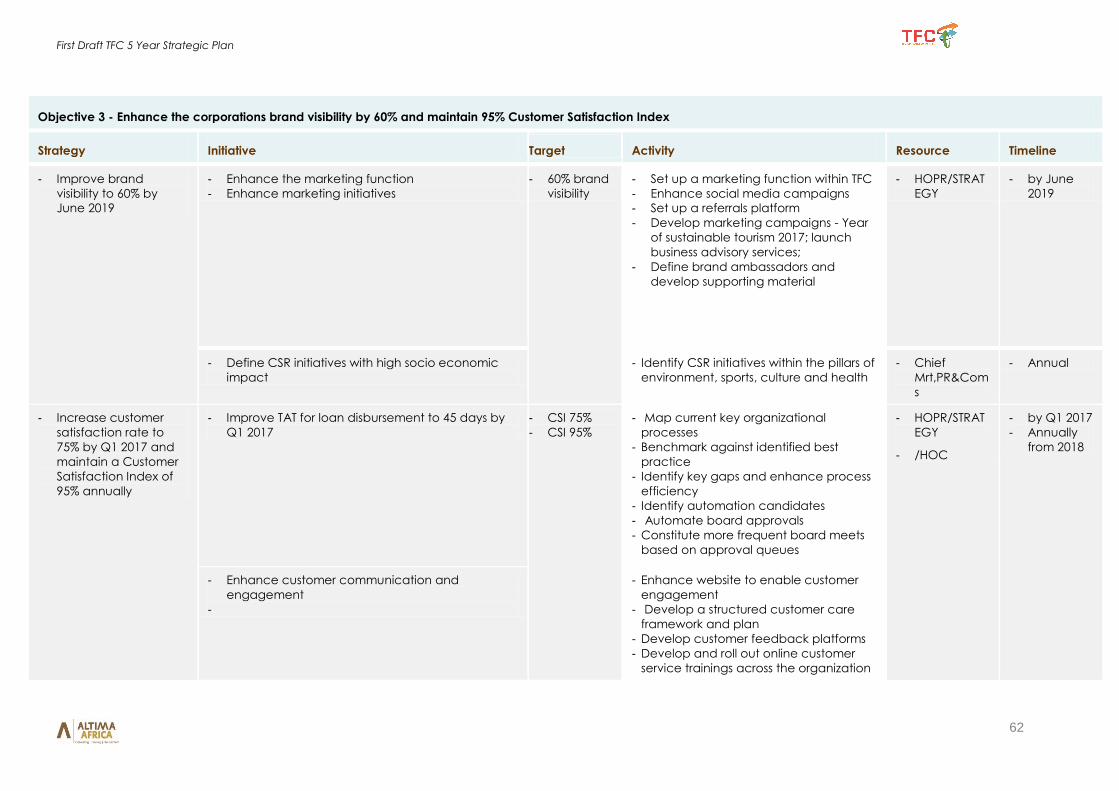
First Draft TFC 5 Year Strategic Plan
62
Objective 3 - Enhance the corporations brand visibility by 60% and maintain 95% Customer Satisfaction Index
Strategy Initiative Target Activity Resource Timeline
- Improve brand
visibility to 60% by
June 2019
- Enhance the marketing function
- Enhance marketing initiatives
- 60% brand
visibility
- Set up a marketing function within TFC
- Enhance social media campaigns
- Set up a referrals platform
- Develop marketing campaigns - Year
of sustainable tourism 2017; launch
business advisory services;
- Define brand ambassadors and
develop supporting material
- HOPR/STRAT
EGY
- by June
2019
- Define CSR initiatives with high socio economic
impact
- Identify CSR initiatives within the pillars of
environment, sports, culture and health
- Chief
Mrt,PR&Com
s
- Annual
- Increase customer
satisfaction rate to
75% by Q1 2017 and
maintain a Customer
Satisfaction Index of
95% annually
- Improve TAT for loan disbursement to 45 days by
Q1 2017
- CSI 75%
- CSI 95%
- Map current key organizational
processes
- Benchmark against identified best
practice
- Identify key gaps and enhance process
efficiency
- Identify automation candidates
- Automate board approvals
- Constitute more frequent board meets
based on approval queues
- HOPR/STRAT
EGY
- /HOC
- by Q1 2017
- Annually
from 2018
- Enhance customer communication and
engagement
-
- Enhance website to enable customer
engagement
- Develop a structured customer care
framework and plan
- Develop customer feedback platforms
- Develop and roll out online customer
service trainings across the organization
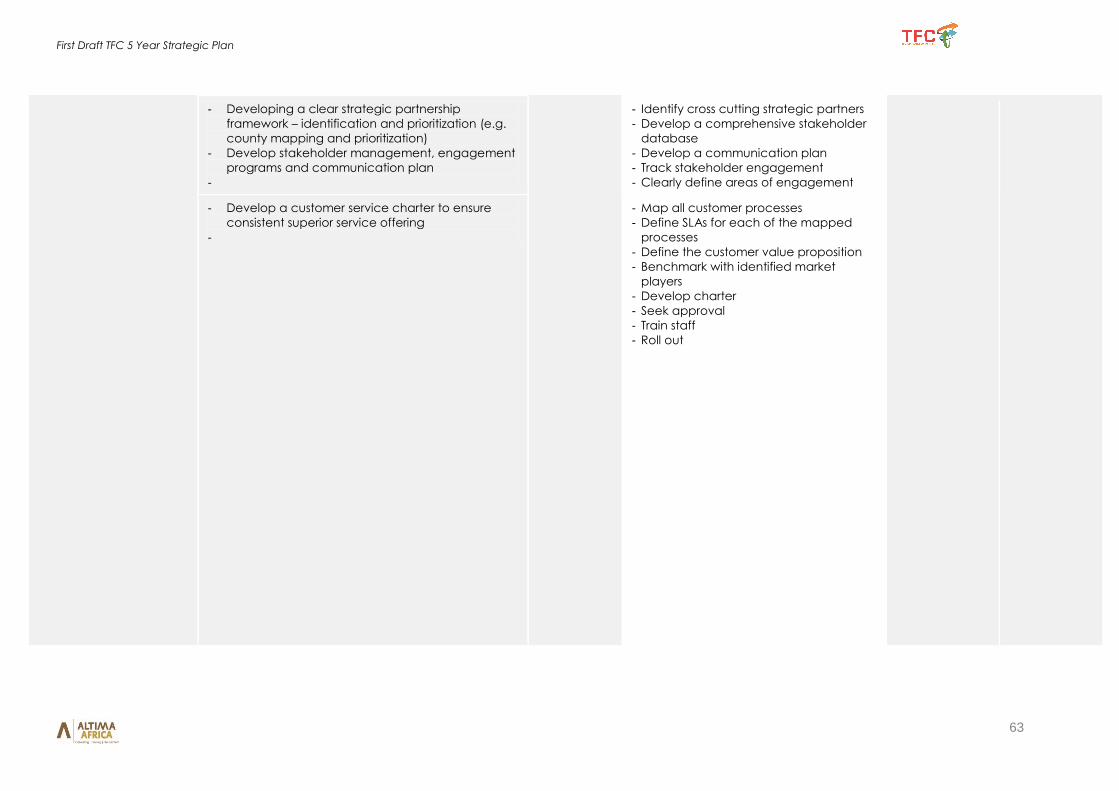
First Draft TFC 5 Year Strategic Plan
63
- Developing a clear strategic partnership
framework – identification and prioritization (e.g.
county mapping and prioritization)
- Develop stakeholder management, engagement
programs and communication plan
-
- Identify cross cutting strategic partners
- Develop a comprehensive stakeholder
database
- Develop a communication plan
- Track stakeholder engagement
- Clearly define areas of engagement
- Develop a customer service charter to ensure
consistent superior service offering
-
- Map all customer processes
- Define SLAs for each of the mapped
processes
- Define the customer value proposition
- Benchmark with identified market
players
- Develop charter
- Seek approval
- Train staff
- Roll out
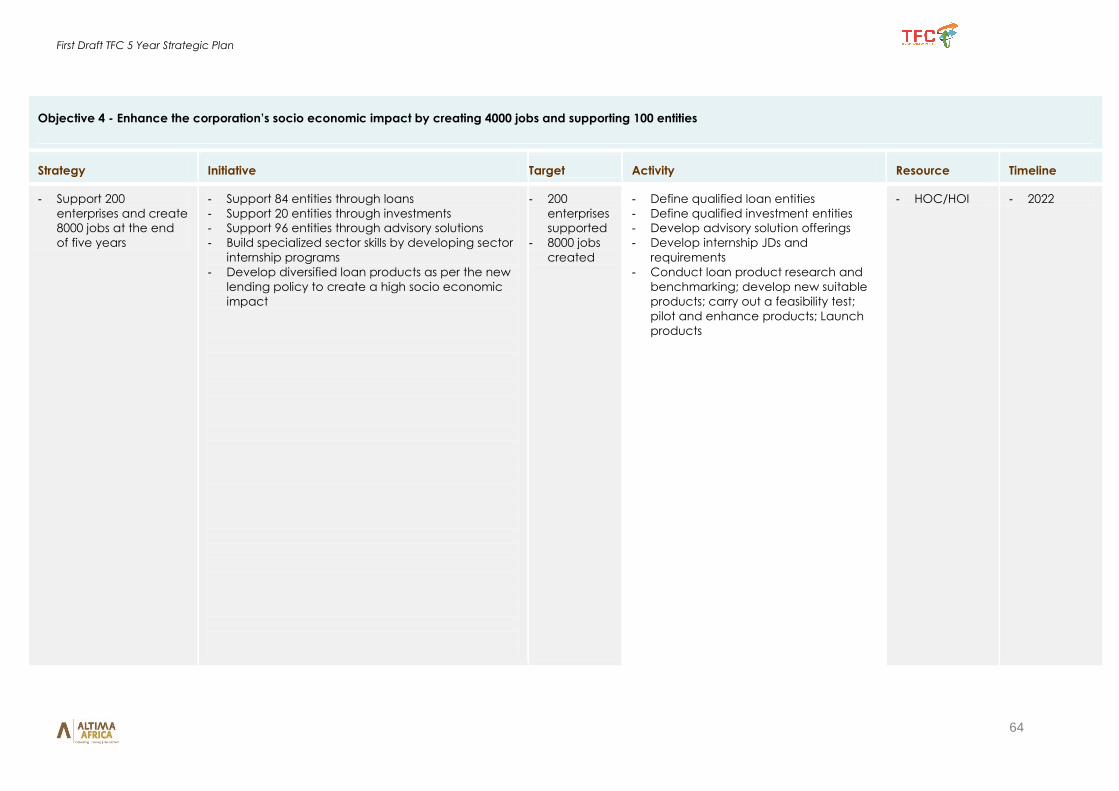
First Draft TFC 5 Year Strategic Plan
64
Objective 4 - Enhance the corporation’s socio economic impact by creating 4000 jobs and supporting 100 entities
Strategy Initiative Target Activity Resource Timeline
- Support 200
enterprises and create
8000 jobs at the end
of five years
- Support 84 entities through loans
- Support 20 entities through investments
- Support 96 entities through advisory solutions
- Build specialized sector skills by developing sector
internship programs
- Develop diversified loan products as per the new
lending policy to create a high socio economic
impact
- 200
enterprises
supported
- 8000 jobs
created
- Define qualified loan entities
- Define qualified investment entities
- Develop advisory solution offerings
- Develop internship JDs and
requirements
- Conduct loan product research and
benchmarking; develop new suitable
products; carry out a feasibility test;
pilot and enhance products; Launch
products
- HOC/HOI - 2022
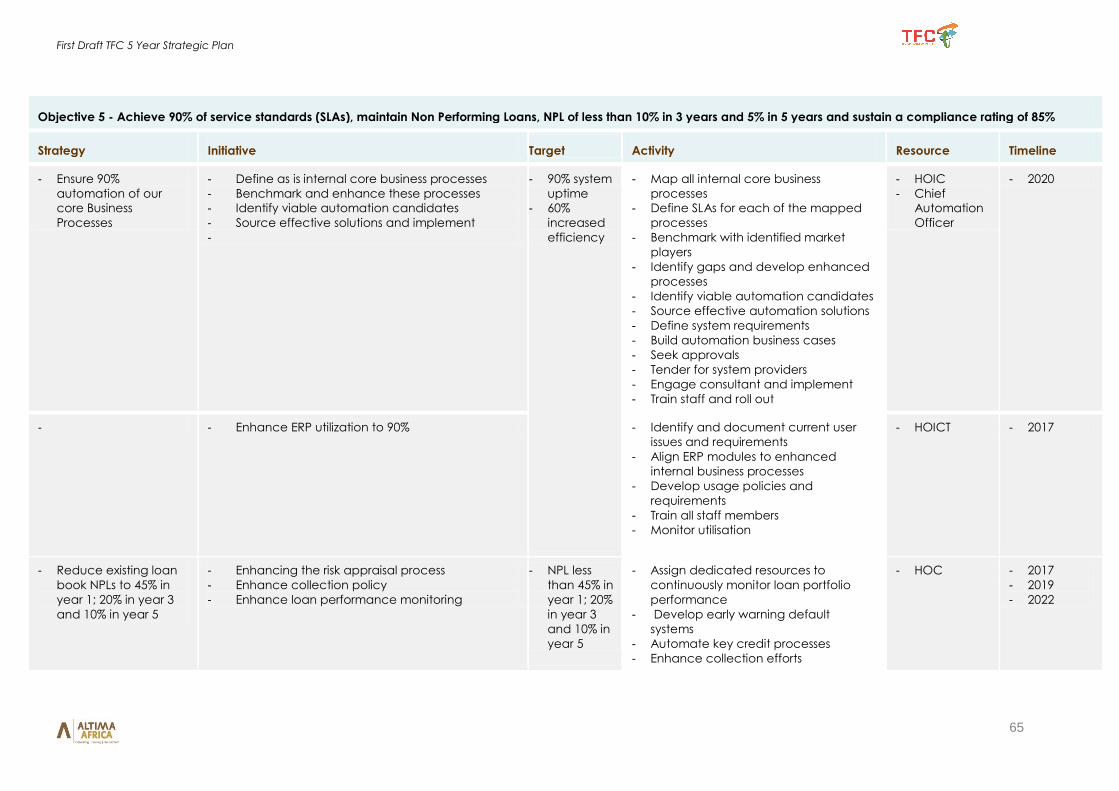
First Draft TFC 5 Year Strategic Plan
65
Objective 5 - Achieve 90% of service standards (SLAs), maintain Non Performing Loans, NPL of less than 10% in 3 years and 5% in 5 years and sustain a compliance rating of 85%
Strategy Initiative Target Activity Resource Timeline
- Ensure 90%
automation of our
core Business
Processes
- Define as is internal core business processes
- Benchmark and enhance these processes
- Identify viable automation candidates
- Source effective solutions and implement
-
- 90% system
uptime
- 60%
increased
efficiency
- Map all internal core business
processes
- Define SLAs for each of the mapped
processes
- Benchmark with identified market
players
- Identify gaps and develop enhanced
processes
- Identify viable automation candidates
- Source effective automation solutions
- Define system requirements
- Build automation business cases
- Seek approvals
- Tender for system providers
- Engage consultant and implement
- Train staff and roll out
- HOIC
- Chief
Automation
Officer
- 2020
- - Enhance ERP utilization to 90% - Identify and document current user
issues and requirements
- Align ERP modules to enhanced
internal business processes
- Develop usage policies and
requirements
- Train all staff members
- Monitor utilisation
- HOICT - 2017
- Reduce existing loan
book NPLs to 45% in
year 1; 20% in year 3
and 10% in year 5
- Enhancing the risk appraisal process
- Enhance collection policy
- Enhance loan performance monitoring
- NPL less
than 45% in
year 1; 20%
in year 3
and 10% in
year 5
- Assign dedicated resources to
continuously monitor loan portfolio
performance
- Develop early warning default
systems
- Automate key credit processes
- Enhance collection efforts
- HOC - 2017
- 2019
- 2022
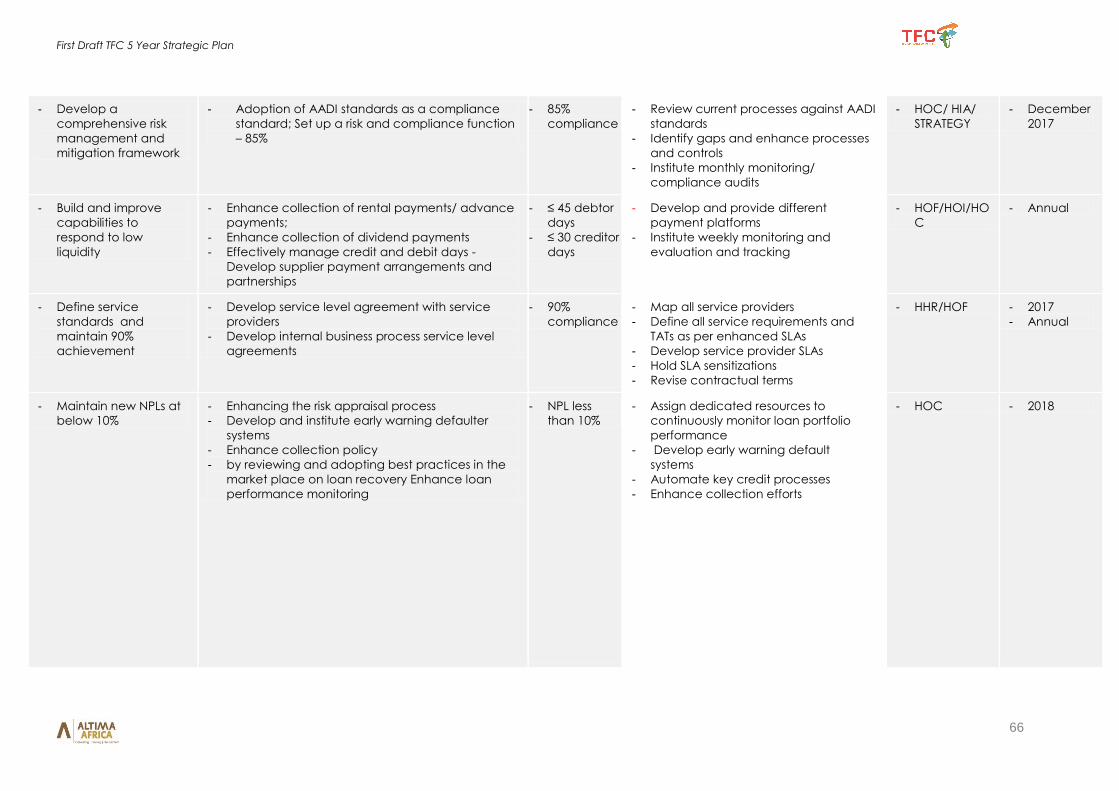
First Draft TFC 5 Year Strategic Plan
66
- Develop a
comprehensive risk
management and
mitigation framework
- Adoption of AADI standards as a compliance
standard; Set up a risk and compliance function
– 85%
- 85%
compliance
- Review current processes against AADI
standards
- Identify gaps and enhance processes
and controls
- Institute monthly monitoring/
compliance audits
- HOC/ HIA/
STRATEGY
- December
2017
- Build and improve
capabilities to
respond to low
liquidity
- Enhance collection of rental payments/ advance
payments;
- Enhance collection of dividend payments
- Effectively manage credit and debit days -
Develop supplier payment arrangements and
partnerships
- ≤ 45 debtor
days
- ≤ 30 creditor
days
- Develop and provide different
payment platforms
- Institute weekly monitoring and
evaluation and tracking
- HOF/HOI/HO
C
- Annual
- Define service
standards and
maintain 90%
achievement
- Develop service level agreement with service
providers
- Develop internal business process service level
agreements
- 90%
compliance
- Map all service providers
- Define all service requirements and
TATs as per enhanced SLAs
- Develop service provider SLAs
- Hold SLA sensitizations
- Revise contractual terms
- HHR/HOF - 2017
- Annual
- Maintain new NPLs at
below 10%
- Enhancing the risk appraisal process
- Develop and institute early warning defaulter
systems
- Enhance collection policy
- by reviewing and adopting best practices in the
market place on loan recovery Enhance loan
performance monitoring
- NPL less
than 10%
- Assign dedicated resources to
continuously monitor loan portfolio
performance
- Develop early warning default
systems
- Automate key credit processes
- Enhance collection efforts
- HOC - 2018
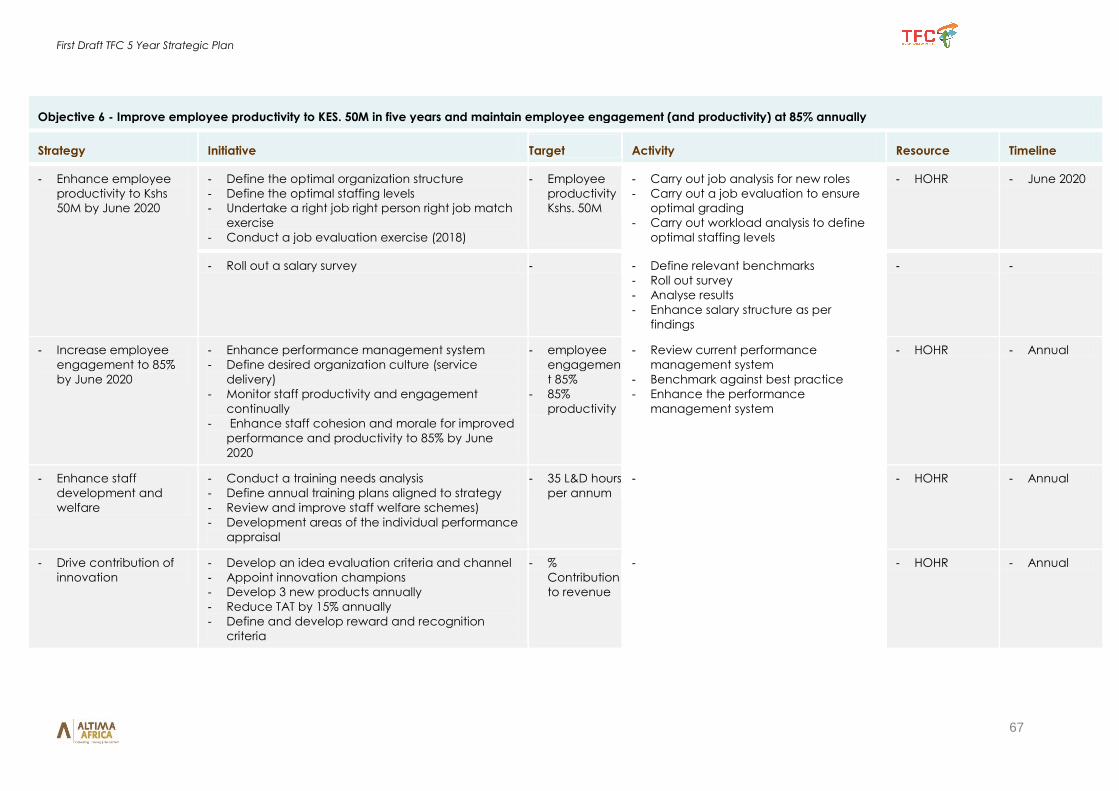
First Draft TFC 5 Year Strategic Plan
67
Objective 6 - Improve employee productivity to KES. 50M in five years and maintain employee engagement (and productivity) at 85% annually
Strategy Initiative Target Activity Resource Timeline
- Enhance employee
productivity to Kshs
50M by June 2020
- Define the optimal organization structure
- Define the optimal staffing levels
- Undertake a right job right person right job match
exercise
- Conduct a job evaluation exercise (2018)
- Employee
productivity
Kshs. 50M
- Carry out job analysis for new roles
- Carry out a job evaluation to ensure
optimal grading
- Carry out workload analysis to define
optimal staffing levels
- HOHR - June 2020
- Roll out a salary survey - - Define relevant benchmarks
- Roll out survey
- Analyse results
- Enhance salary structure as per
findings
- -
- Increase employee
engagement to 85%
by June 2020
- Enhance performance management system
- Define desired organization culture (service
delivery)
- Monitor staff productivity and engagement
continually
- Enhance staff cohesion and morale for improved
performance and productivity to 85% by June
2020
- employee
engagemen
t 85%
- 85%
productivity
- Review current performance
management system
- Benchmark against best practice
- Enhance the performance
management system
- HOHR - Annual
- Enhance staff
development and
welfare
- Conduct a training needs analysis
- Define annual training plans aligned to strategy
- Review and improve staff welfare schemes)
- Development areas of the individual performance
appraisal
- 35 L&D hours
per annum
- - HOHR - Annual
- Drive contribution of
innovation
- Develop an idea evaluation criteria and channel
- Appoint innovation champions
- Develop 3 new products annually
- Reduce TAT by 15% annually
- Define and develop reward and recognition
criteria
- %
Contribution
to revenue
- - HOHR - Annual
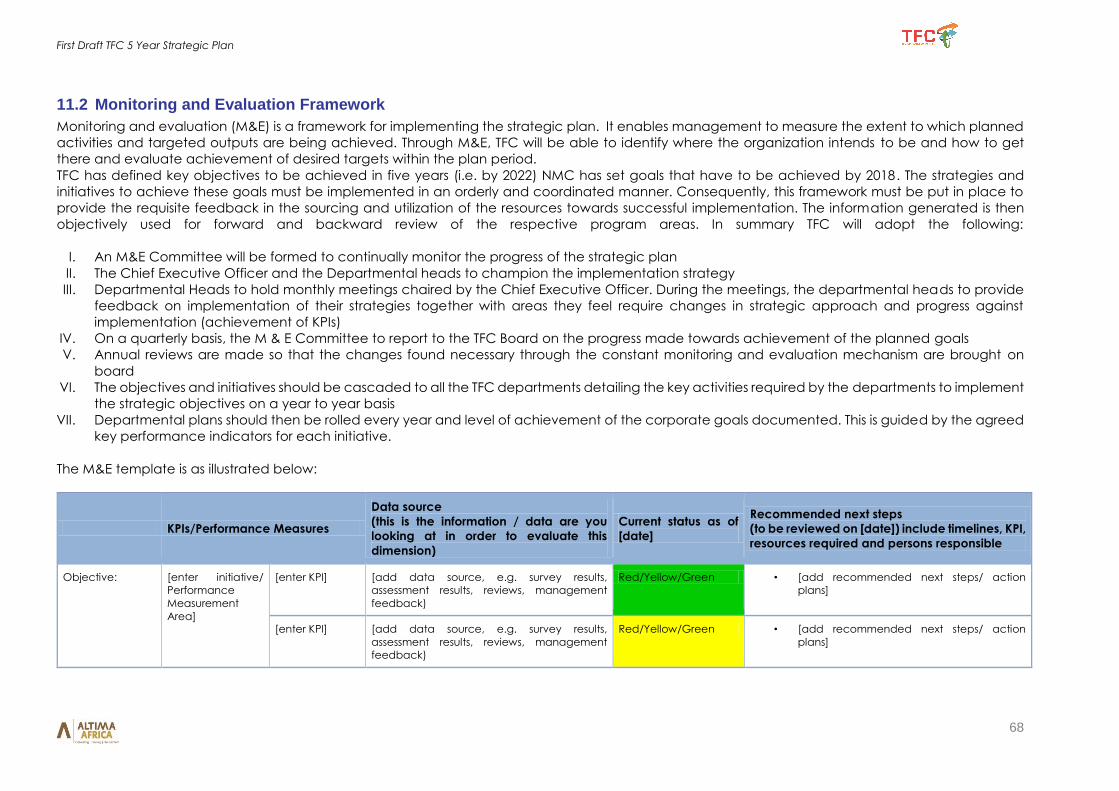
First Draft TFC 5 Year Strategic Plan
68
11.2 Monitoring and Evaluation Framework
Monitoring and evaluation (M&E) is a framework for implementing the strategic plan. It enables management to measure the extent to which planned
activities and targeted outputs are being achieved. Through M&E, TFC will be able to identify where the organization intends to be and how to get
there and evaluate achievement of desired targets within the plan period.
TFC has defined key objectives to be achieved in five years (i.e. by 2022) NMC has set goals that have to be achieved by 2018. The strategies and
initiatives to achieve these goals must be implemented in an orderly and coordinated manner. Consequently, this framework must be put in place to
provide the requisite feedback in the sourcing and utilization of the resources towards successful implementation. The information generated is then
objectively used for forward and backward review of the respective program areas. In summary TFC will adopt the following:
I. An M&E Committee will be formed to continually monitor the progress of the strategic plan
II. The Chief Executive Officer and the Departmental heads to champion the implementation strategy
III. Departmental Heads to hold monthly meetings chaired by the Chief Executive Officer. During the meetings, the departmental heads to provide
feedback on implementation of their strategies together with areas they feel require changes in strategic approach and progress against
implementation (achievement of KPIs)
IV. On a quarterly basis, the M & E Committee to report to the TFC Board on the progress made towards achievement of the planned goals
V. Annual reviews are made so that the changes found necessary through the constant monitoring and evaluation mechanism are brought on
board
VI. The objectives and initiatives should be cascaded to all the TFC departments detailing the key activities required by the departments to implement
the strategic objectives on a year to year basis
VII. Departmental plans should then be rolled every year and level of achievement of the corporate goals documented. This is guided by the agreed
key performance indicators for each initiative.
The M&E template is as illustrated below:
KPIs/Performance Measures
Data source
(this is the information / data are you
looking at in order to evaluate this
dimension)
Current status as of
[date]
Recommended next steps
(to be reviewed on [date]) include timelines, KPI,
resources required and persons responsible
Objective: [enter initiative/
Performance
Measurement
Area]
[enter KPI] [add data source, e.g. survey results,
assessment results, reviews, management
feedback)
Red/Yellow/Green • [add recommended next steps/ action
plans]
[enter KPI] [add data source, e.g. survey results,
assessment results, reviews, management
feedback)
Red/Yellow/Green • [add recommended next steps/ action
plans]
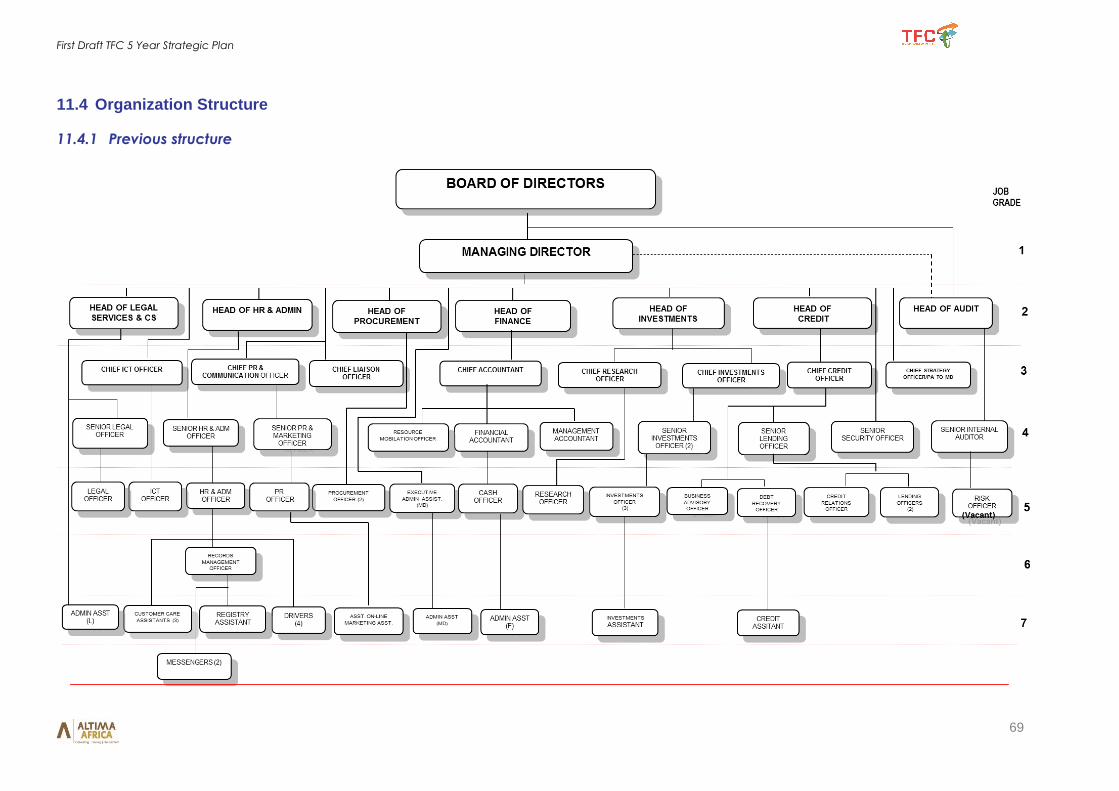
First Draft TFC 5 Year Strategic Plan
69
11.4 Organization Structure
11.4.1 Previous structure
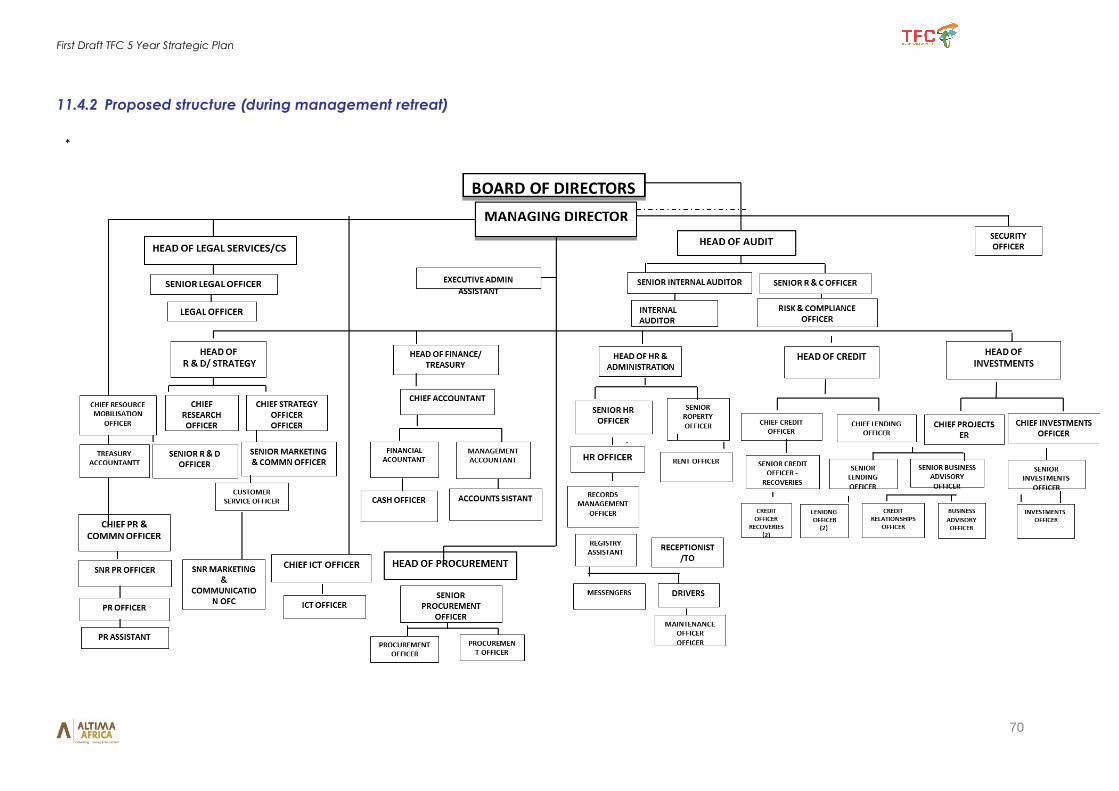
First Draft TFC 5 Year Strategic Plan
70
11.4.2 Proposed structure (during management retreat)
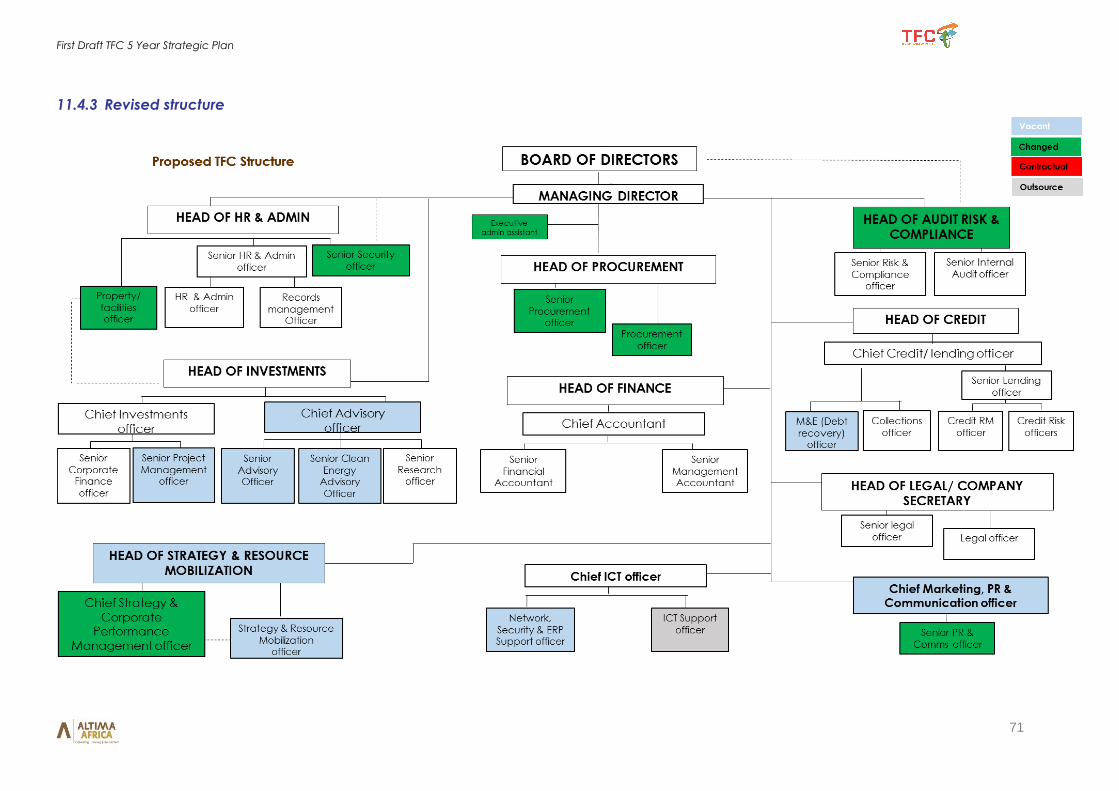
First Draft TFC 5 Year Strategic Plan
71
11.4.3 Revised structure
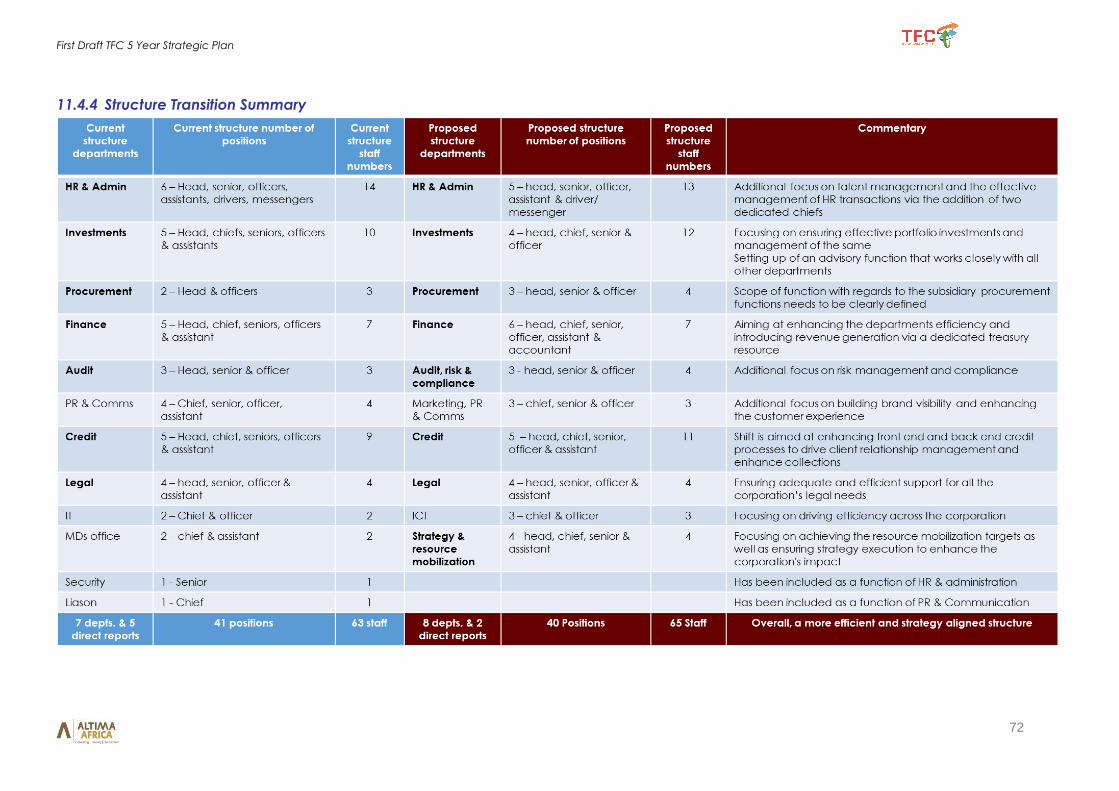
First Draft TFC 5 Year Strategic Plan
72
11.4.4 Structure Transition Summary
First Draft TFC 5 Year Strategic Plan
73
11.5 Resource Mobilization Plan
11.5.1 Introduction
TFC has embarked on the development of an ambitious strategy which is aimed at setting
the institution on a transformation path over the next five years. This comes at the back drop
of below par performance in the delivery of its mandate and a four year period when no
loans were disbursed. Over the period, TFC was only able to mobilize internal resources to
fund its operations and no disbursements for onward lending were received from the
Treasury.
TFC has already started the journey towards financial sustainability anchored on a
conducive resource mobilization environment by developing a draft resources mobilization
policy. The draft policy aims at:
Creating an environment for sustainable funding of the Corporation’s programs and
projects;
Identifying new funding opportunities for the Corporation’s programs;
Promoting collaborations and partnerships in support of the Corporation’s programs;
and
Diversifying and expanding its resources base, developing new thinking and
challenge the old traditions in supporting the achievement of the Corporation’s
mandate.
The resources mobilization function will be operationalized through the following actions,
contained in the draft policy:
The Board of Directors shall establish a Resource Mobilization Department/unit under
the Managing Director’s Office
This Office will be headed by the head of strategy & resource mobilization who
reports to the Office of the Managing Director
The Resource Mobilization Office is mandated to mobilize resources for the
Corporation’s projects and programs
Key challenges encountered in resources mobilization
In its quest to mobilize resources, TFC is faced by various challenges emanating from both the
internal and external environment. The key challenges, which TFC must address during the
strategy period so as to mobilize the required resources, are summarized below.
Lack of a well-defined vision and strategy for resources mobilization;
Inadequate institutional capacity – People/HR, systems and processes, structures and
governance, culture
Limited fiduciary standards and inability to ensure proper management, use,
accountability and risk management
Inadequate government support for credibility and legitimacy – national
government, Treasury and other agencies
Lack of demonstrable focus on transparency, independence to build trust and
confidence with potential partners and financiers
Poor image and lack of a track record of results – a history of success that facilitates
resources attraction and an evidence that resources will cause impact
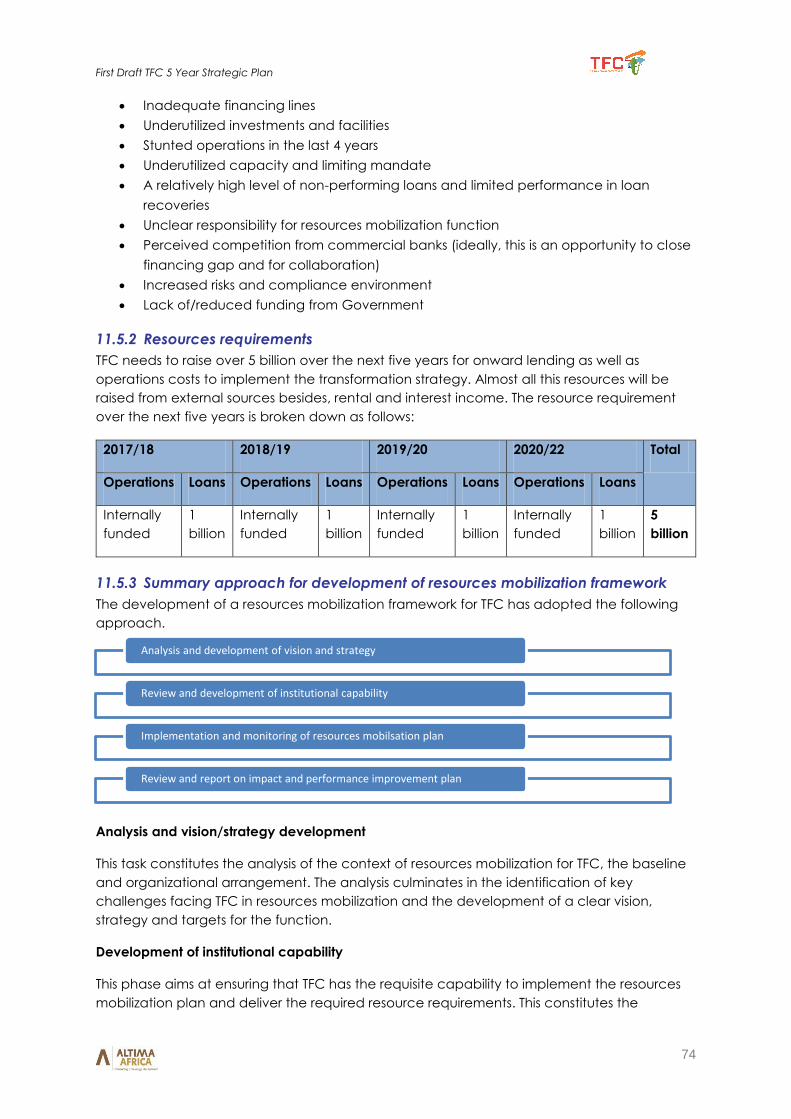
First Draft TFC 5 Year Strategic Plan
74
Inadequate financing lines
Underutilized investments and facilities
Stunted operations in the last 4 years
Underutilized capacity and limiting mandate
A relatively high level of non-performing loans and limited performance in loan
recoveries
Unclear responsibility for resources mobilization function
Perceived competition from commercial banks (ideally, this is an opportunity to close
financing gap and for collaboration)
Increased risks and compliance environment
Lack of/reduced funding from Government
11.5.2 Resources requirements
TFC needs to raise over 5 billion over the next five years for onward lending as well as
operations costs to implement the transformation strategy. Almost all this resources will be
raised from external sources besides, rental and interest income. The resource requirement
over the next five years is broken down as follows:
2017/18 2018/19 2019/20 2020/22 Total
Operations Loans Operations Loans Operations Loans Operations Loans
Internally
funded
1
billion
Internally
funded
1
billion
Internally
funded
1
billion
Internally
funded
1
billion
5
billion
11.5.3 Summary approach for development of resources mobilization framework
The development of a resources mobilization framework for TFC has adopted the following
approach.
Analysis and vision/strategy development
This task constitutes the analysis of the context of resources mobilization for TFC, the baseline
and organizational arrangement. The analysis culminates in the identification of key
challenges facing TFC in resources mobilization and the development of a clear vision,
strategy and targets for the function.
Development of institutional capability
This phase aims at ensuring that TFC has the requisite capability to implement the resources
mobilization plan and deliver the required resource requirements. This constitutes the
Analysis and development of vision and strategy
Review and development of institutional capability
Implementation and monitoring of resources mobilsation plan
Review and report on impact and performance improvement plan
First Draft TFC 5 Year Strategic Plan
75
identification of capacity building initiatives based on desired capacity needs and gaps
established. A capacity building program and plan are developed with specific indicators
and targets for ease of monitoring.
Implementation and monitoring
This phase constitutes the targeting of specific donors and investors to raise targeted
resources. On a continuous basis performance is reported on the yield from various sources
and corrective measures instituted where targets are missed.
Review and performance improvement plan
This phase constitutes the evaluation of the success of the resources mobilization plan in
raising required resources to implement the TFC strategy. Ideally, this is done on annual bases
and a performance improvement plan is put in place to improve the yield of the entire
resource mobilization strategy.
The vision and strategy for resources mobilization
The vision for the resources mobilization plan is to achieve financial sustainability for TFC to
deliver its mandate. Financial sustainability for TFC means raising adequate resources for
operations, projects and onward lending. To implement the current strategic plan TFC
requires an additional Kshs 5 billion over the 5 years to meet its ambitious lending targets,
besides operational costs. TFC also targets to source funding for specific projects in the sector
to the tune of 15 billion in the next five years and beyond. TFC has already secured a 500
million shillings funding from government for onward lending and will lobby for more
resources in the coming years anticipated to increase to 2 billion over the five year period.
TFC will also target tourism growth funds that may be established by the government towards
financing of the Kenya vision 2030 flagship projects.
In diversifying the resources pool, TFC will look beyond government to raise additional funds
to finance its ambitious program. TFC will target international financing institutions and
programs including but not limited to the following: World Bank, International Finance
Corporation (IFC), Africa Development Bank (AfDB), Asia Development Bank (ADB), Islamic
Development Bank (IDB) and the United Nations (UN).
TFC will also target earmarked Government and UN funds in the areas of climate change
mitigation and adaptation to finance green projects in the sector. Key among the targeted
projects will be in renewable energy and sustainable water management in tourism
establishments. Other earmarked funds to be pursued to finance projects include pro-poor
funds, economic empowerment funds, eco-tourism funds and community tourism project
funds.
The main types of funding from these agencies are loans, grants, Guarantees, Equity
investments, credits or leases.
Key objectives and goals
The overall objective of the resources mobilization plan is to raise Kshs 5 billion over the five
year strategy period. The mobilized resources will be in form of investments into projects,
partnerships as well as for onward lending. TFC will target to raise resources from the following
sources:
First Draft TFC 5 Year Strategic Plan
76
International Funding Institutions – IFC, EIB, AfDB, KFW, EADB, HSBC
Development partners with interest in economic empowerment through tourism and
natural resources management - World Bank, EU, UN, USAID, DANIDA Kshs 7 billion
Green Growth Fund, KAM, Business Advocacy Fund (BAF)
Equity Funds – Acacia, Africa Guarantee Fund, Grofin, Emerging Capital Partners,
Aureos, Citadel Africa, Africa Capital Fund, Helios etc.
Climate Change earmarked funds – multilateral, Bilateral and national climate
change funds including MENR/NETFUND for Green Energy and Sustainable Water
Management, NEMA’s Adaptation Fund from UNFCCC, UNFCC Green Climate Fund,
DANIDA Green Growth Fund, KAM, WSTF, Kenya Climate Innovation Centre (KCIC),
Business Advocacy Fund (BAF), Kenya Climate Venture Fund (managed by KCIC)
To achieve the overall objective, TFC will pursue the following goals:
To raise approximately 2 billion through partnerships, equity investments and donors
to finance at least two high impact and unique projects in untapped, high potential
regions
Secure at least Kshs 3 billion from International Financial Institutions (including DFIs) for
onward lending
To negotiate climate smart grants to the tune of Kshs 1 billion to support green
projects in the area of energy and sustainable water management
TFC will implement a variety of strategies to achieve the goals and targets and ultimately
achieve the overall objective of raising Kshs 5 billion over the five years. The strategies are
summarized in the table below for each objective/result area and form the basis for the
development specific initiatives and the of annual work/implementation plans for the
resources mobilization function.
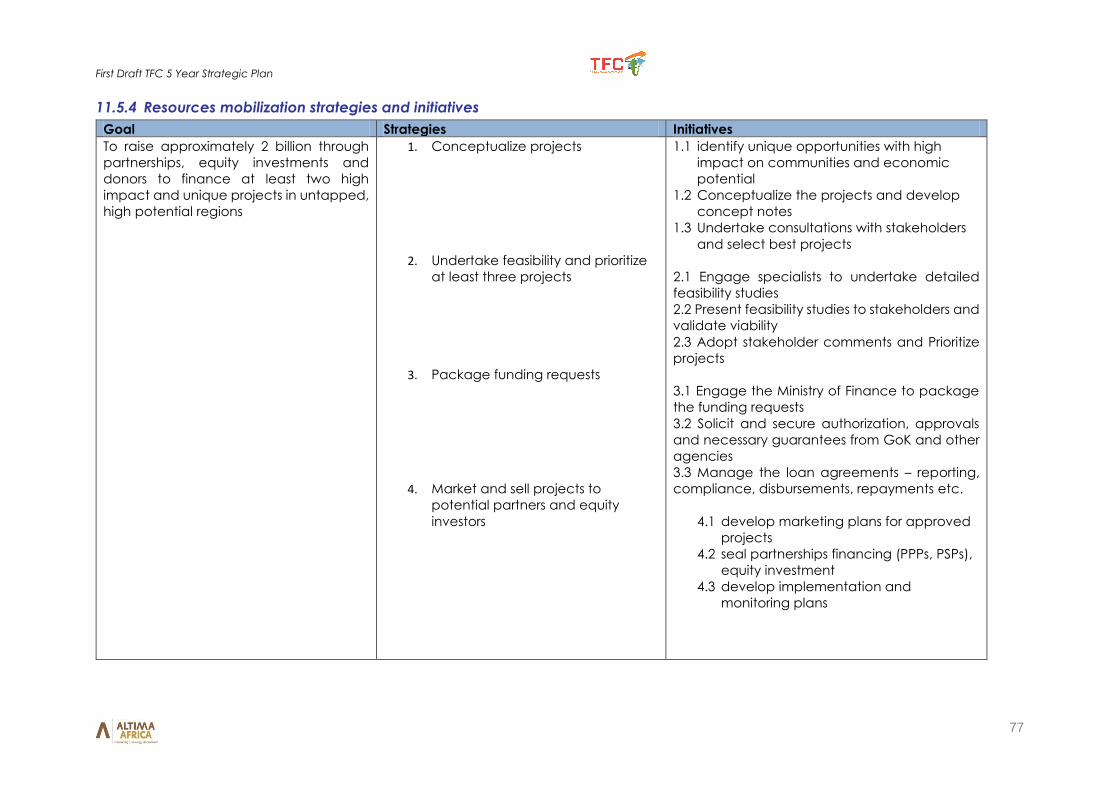
First Draft TFC 5 Year Strategic Plan
77
11.5.4 Resources mobilization strategies and initiatives
Goal Strategies Initiatives
To raise approximately 2 billion through
partnerships, equity investments and
donors to finance at least two high
impact and unique projects in untapped,
high potential regions
1. Conceptualize projects
2. Undertake feasibility and prioritize
at least three projects
3. Package funding requests
4. Market and sell projects to
potential partners and equity
investors
1.1 identify unique opportunities with high
impact on communities and economic
potential
1.2 Conceptualize the projects and develop
concept notes
1.3 Undertake consultations with stakeholders
and select best projects
2.1 Engage specialists to undertake detailed
feasibility studies
2.2 Present feasibility studies to stakeholders and
validate viability
2.3 Adopt stakeholder comments and Prioritize
projects
3.1 Engage the Ministry of Finance to package
the funding requests
3.2 Solicit and secure authorization, approvals
and necessary guarantees from GoK and other
agencies
3.3 Manage the loan agreements – reporting,
compliance, disbursements, repayments etc.
4.1 develop marketing plans for approved
projects
4.2 seal partnerships financing (PPPs, PSPs),
equity investment
4.3 develop implementation and
monitoring plans
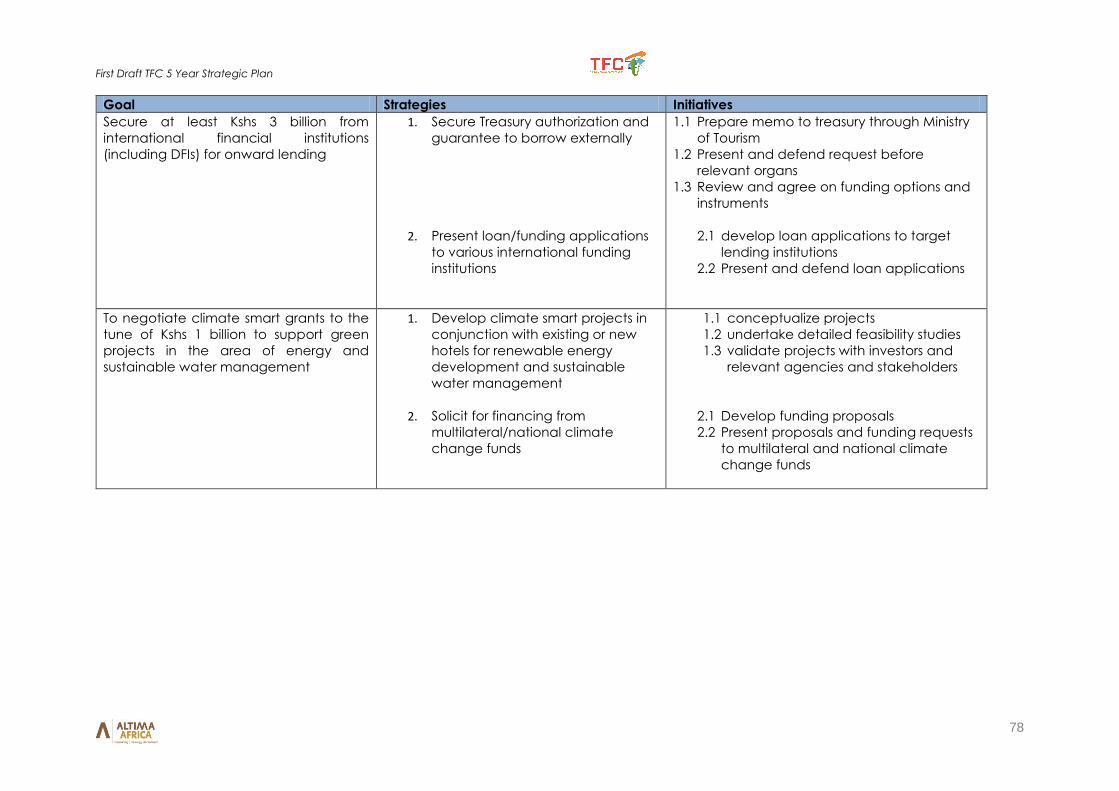
First Draft TFC 5 Year Strategic Plan
78
Goal Strategies Initiatives
Secure at least Kshs 3 billion from
international financial institutions
(including DFIs) for onward lending
1. Secure Treasury authorization and
guarantee to borrow externally
2. Present loan/funding applications
to various international funding
institutions
1.1 Prepare memo to treasury through Ministry
of Tourism
1.2 Present and defend request before
relevant organs
1.3 Review and agree on funding options and
instruments
2.1 develop loan applications to target
lending institutions
2.2 Present and defend loan applications
To negotiate climate smart grants to the
tune of Kshs 1 billion to support green
projects in the area of energy and
sustainable water management
1. Develop climate smart projects in
conjunction with existing or new
hotels for renewable energy
development and sustainable
water management
2. Solicit for financing from
multilateral/national climate
change funds
1.1 conceptualize projects
1.2 undertake detailed feasibility studies
1.3 validate projects with investors and
relevant agencies and stakeholders
2.1 Develop funding proposals
2.2 Present proposals and funding requests
to multilateral and national climate
change funds
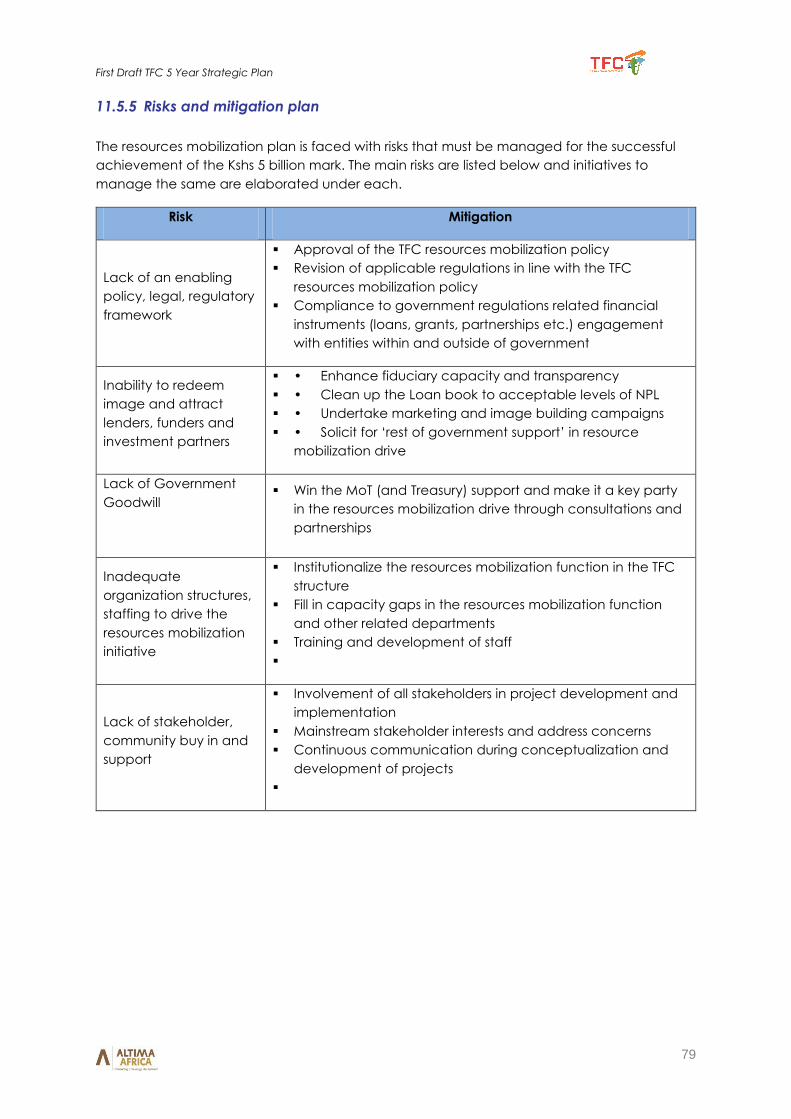
First Draft TFC 5 Year Strategic Plan
79
11.5.5 Risks and mitigation plan
The resources mobilization plan is faced with risks that must be managed for the successful
achievement of the Kshs 5 billion mark. The main risks are listed below and initiatives to
manage the same are elaborated under each.
Risk Mitigation
Lack of an enabling
policy, legal, regulatory
framework
Approval of the TFC resources mobilization policy
Revision of applicable regulations in line with the TFC
resources mobilization policy
Compliance to government regulations related financial
instruments (loans, grants, partnerships etc.) engagement
with entities within and outside of government
Inability to redeem
image and attract
lenders, funders and
investment partners
• Enhance fiduciary capacity and transparency
• Clean up the Loan book to acceptable levels of NPL
• Undertake marketing and image building campaigns
• Solicit for ‘rest of government support’ in resource
mobilization drive
Lack of Government
Goodwill
Win the MoT (and Treasury) support and make it a key party
in the resources mobilization drive through consultations and
partnerships
Inadequate
organization structures,
staffing to drive the
resources mobilization
initiative
Institutionalize the resources mobilization function in the TFC
structure
Fill in capacity gaps in the resources mobilization function
and other related departments
Training and development of staff
Lack of stakeholder,
community buy in and
support
Involvement of all stakeholders in project development and
implementation
Mainstream stakeholder interests and address concerns
Continuous communication during conceptualization and
development of projects
First Draft TFC 5 Year Strategic Plan
80
- Critical success factors
The successful implementation of this resources mobilization framework will be successful if
the following conditions are fulfilled.
Internal organization development – having in place internal systems and process
that make TFC attractive to lenders. Some initiatives towards this include ISO (systems
and processes) certification and undertaking a PEFA/Fiduciary assessment (financial
management)and implementing improvement strategies
People development under the resources mobilization function- high level, skilled and
experienced resource is requisite to the realization of the resources mobilization
agenda. This, coupled with a needs based capacity building program for the
resources mobilization team will deliver or exceed targets set
Championing implementation of the resources mobilization plan – it is critical that this
is championed from the highest office, the MD’s office, and progress reported
periodically as a flagship project for TFC. This will result to production of quality
concept notes, feasibility reports, effective engagement with potential donors etc.
TFC will target potential projects in marginalized areas so as to attract earmarked
poverty grants as well as economic empowerment funds
TFC actively targets green funds available under national and international
frameworks
Having a clear sense and commitment to the TFC vision, mission and strategy;
Constitutes promising programs that yield success
If TFC is able to demonstrate evidence of past success
If there is effective management and leadership – Board, management and staff
Financial systems that provide controls and safeguards
A solid reputation, credibility and good image
Stakeholder linkage through communication, involvement and collaboration
Ability to attract, create, sustain new sources of funds including the private sector
and at community level
Independence of political groups
Cleaning and restructuring its portfolio to rid of the NPLs
Having in its ranks Human Capital trained in tourism
Increased focus on climate change, water management, eco-tourism and
renewable energy to attract earmarked resources
Thorough evaluation of projects at pre, during and after implementation
Alignment of TFC programs to national, sector and county priorities
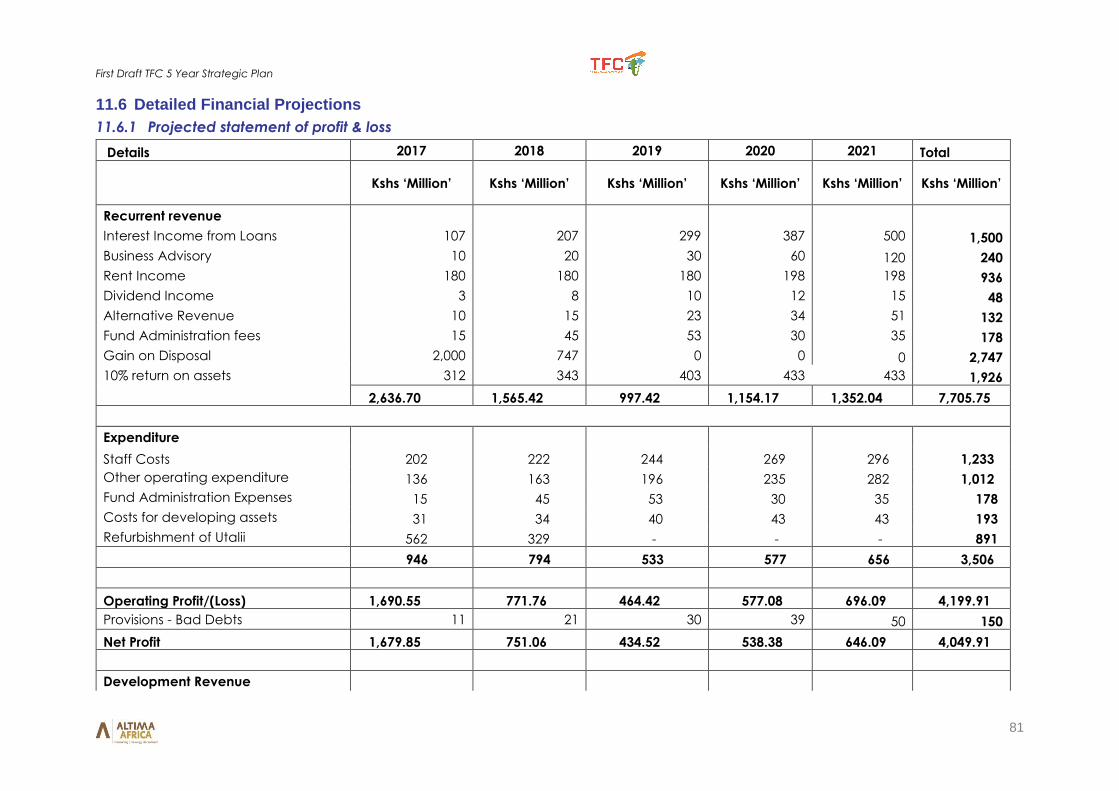
First Draft TFC 5 Year Strategic Plan
81
11.6 Detailed Financial Projections
11.6.1 Projected statement of profit & loss
Details 2017 2018 2019 2020 2021 Total
Kshs ‘Million’ Kshs ‘Million’ Kshs ‘Million’ Kshs ‘Million’ Kshs ‘Million’ Kshs ‘Million’
Recurrent revenue
Interest Income from Loans 107 207 299 387 500 1,500
Business Advisory 10 20 30 60 120 240
Rent Income 180 180 180 198 198 936
Dividend Income 3 8 10 12 15 48
Alternative Revenue 10 15 23 34 51 132
Fund Administration fees 15 45 53 30 35 178
Gain on Disposal 2,000 747 0 0 0 2,747
10% return on assets 312 343 403 433 433 1,926
2,636.70 1,565.42 997.42 1,154.17 1,352.04 7,705.75
Expenditure
Staff Costs 202 222 244 269 296 1,233
Other operating expenditure 136 163 196 235 282 1,012
Fund Administration Expenses 15 45 53 30 35 178
Costs for developing assets 31 34 40 43 43 193
Refurbishment of Utalii 562 329 - - - 891
946 794 533 577 656 3,506
Operating Profit/(Loss) 1,690.55 771.76 464.42 577.08 696.09 4,199.91
Provisions - Bad Debts 11 21 30 39 50 150
Net Profit 1,679.85 751.06 434.52 538.38 646.09 4,049.91
Development Revenue
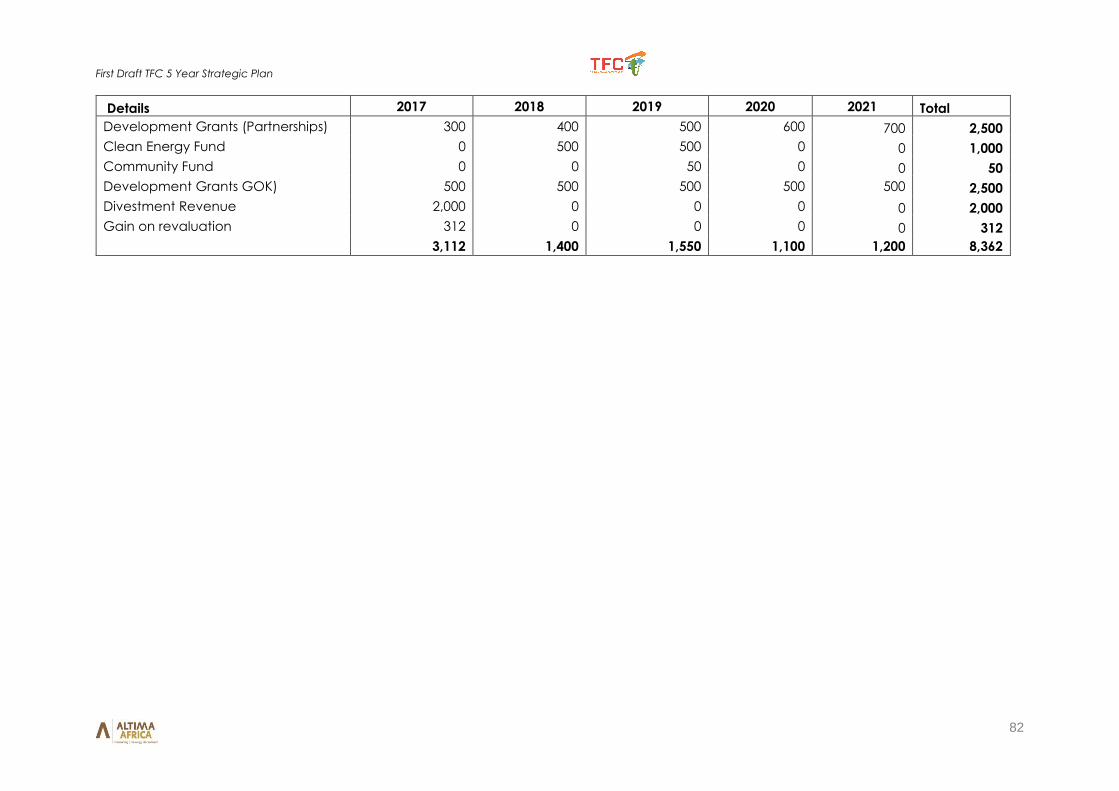
First Draft TFC 5 Year Strategic Plan
82
Details 2017 2018 2019 2020 2021 Total
Development Grants (Partnerships) 300 400 500 600 700 2,500
Clean Energy Fund 0 500 500 0 0 1,000
Community Fund 0 0 50 0 0 50
Development Grants GOK) 500 500 500 500 500 2,500
Divestment Revenue 2,000 0 0 0 0 2,000
Gain on revaluation 312 0 0 0 0 312
3,112 1,400 1,550 1,100 1,200 8,362
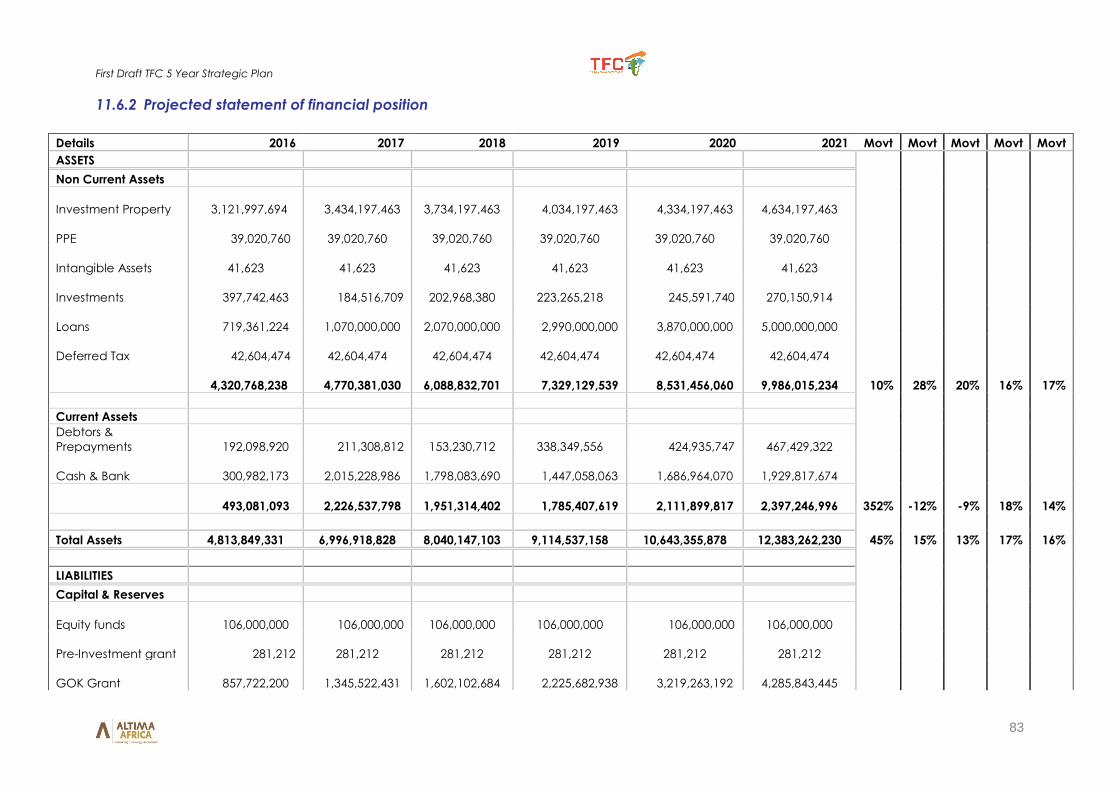
First Draft TFC 5 Year Strategic Plan
83
11.6.2 Projected statement of financial position
Details 2016 2017 2018 2019 2020 2021 Movt Movt Movt Movt Movt
ASSETS
Non Current Assets
Investment Property 3,121,997,694 3,434,197,463
3,734,197,463 4,034,197,463 4,334,197,463
4,634,197,463
PPE 39,020,760
39,020,760
39,020,760
39,020,760
39,020,760
39,020,760
Intangible Assets
41,623
41,623
41,623
41,623
41,623
41,623
Investments 397,742,463 184,516,709
202,968,380
223,265,218 245,591,740
270,150,914
Loans 719,361,224 1,070,000,000
2,070,000,000 2,990,000,000 3,870,000,000
5,000,000,000
Deferred Tax 42,604,474
42,604,474
42,604,474
42,604,474
42,604,474
42,604,474
4,320,768,238 4,770,381,030
6,088,832,701 7,329,129,539 8,531,456,060
9,986,015,234 10% 28% 20% 16% 17%
Current Assets
Debtors &
Prepayments 192,098,920 211,308,812
153,230,712
338,349,556 424,935,747
467,429,322
Cash & Bank 300,982,173 2,015,228,986
1,798,083,690 1,447,058,063 1,686,964,070
1,929,817,674
493,081,093 2,226,537,798
1,951,314,402 1,785,407,619 2,111,899,817
2,397,246,996 352% -12% -9% 18% 14%
Total Assets 4,813,849,331 6,996,918,828 8,040,147,103 9,114,537,158 10,643,355,878 12,383,262,230 45% 15% 13% 17% 16%
LIABILITIES
Capital & Reserves
Equity funds 106,000,000 106,000,000
106,000,000
106,000,000 106,000,000
106,000,000
Pre-Investment grant 281,212
281,212
281,212
281,212
281,212
281,212
GOK Grant 857,722,200 1,345,522,431
1,602,102,684 2,225,682,938 3,219,263,192
4,285,843,445
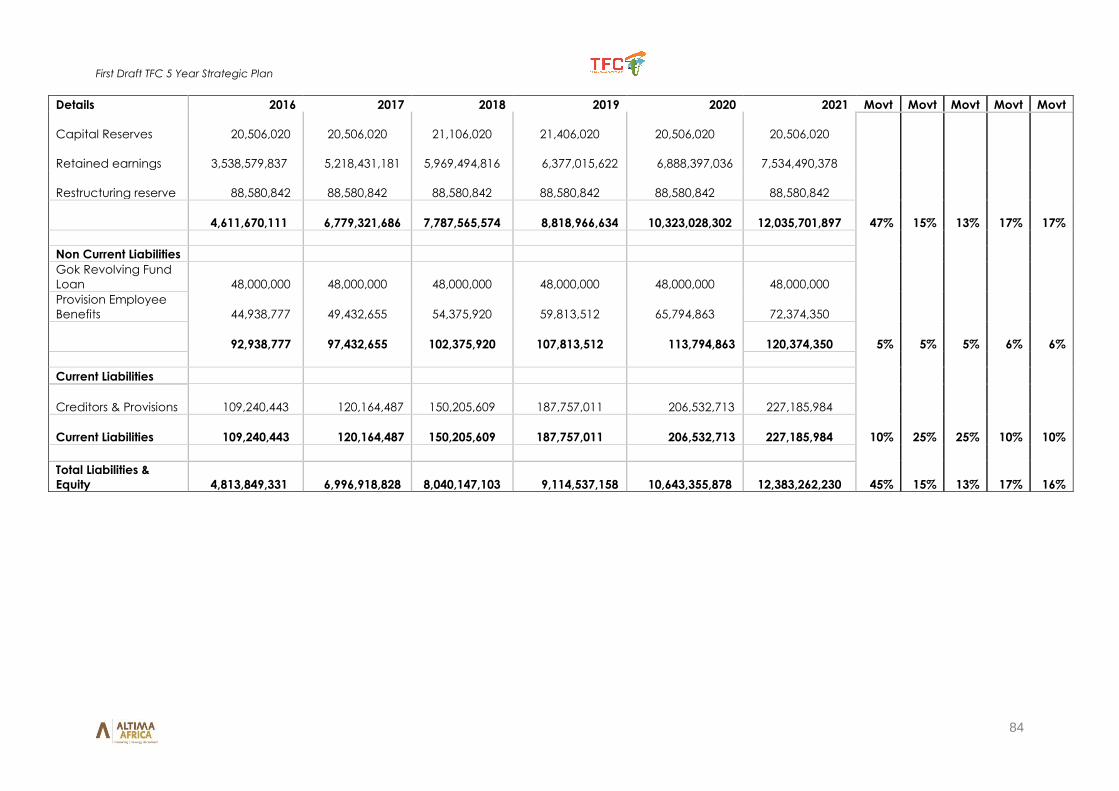
First Draft TFC 5 Year Strategic Plan
84
Details 2016 2017 2018 2019 2020 2021 Movt Movt Movt Movt Movt
Capital Reserves 20,506,020
20,506,020
21,106,020
21,406,020
20,506,020
20,506,020
Retained earnings 3,538,579,837 5,218,431,181
5,969,494,816 6,377,015,622 6,888,397,036
7,534,490,378
Restructuring reserve 88,580,842
88,580,842
88,580,842
88,580,842
88,580,842
88,580,842
4,611,670,111 6,779,321,686
7,787,565,574 8,818,966,634 10,323,028,302
12,035,701,897 47% 15% 13% 17% 17%
Non Current Liabilities
Gok Revolving Fund
Loan 48,000,000
48,000,000
48,000,000
48,000,000
48,000,000
48,000,000
Provision Employee
Benefits 44,938,777
49,432,655
54,375,920
59,813,512
65,794,863
72,374,350
92,938,777
97,432,655
102,375,920
107,813,512 113,794,863
120,374,350 5% 5% 5% 6% 6%
Current Liabilities
Creditors & Provisions 109,240,443 120,164,487
150,205,609
187,757,011 206,532,713
227,185,984
Current Liabilities 109,240,443 120,164,487
150,205,609
187,757,011 206,532,713
227,185,984 10% 25% 25% 10% 10%
Total Liabilities &
Equity 4,813,849,331 6,996,918,828
8,040,147,103 9,114,537,158 10,643,355,878
12,383,262,230 45% 15% 13% 17% 16%
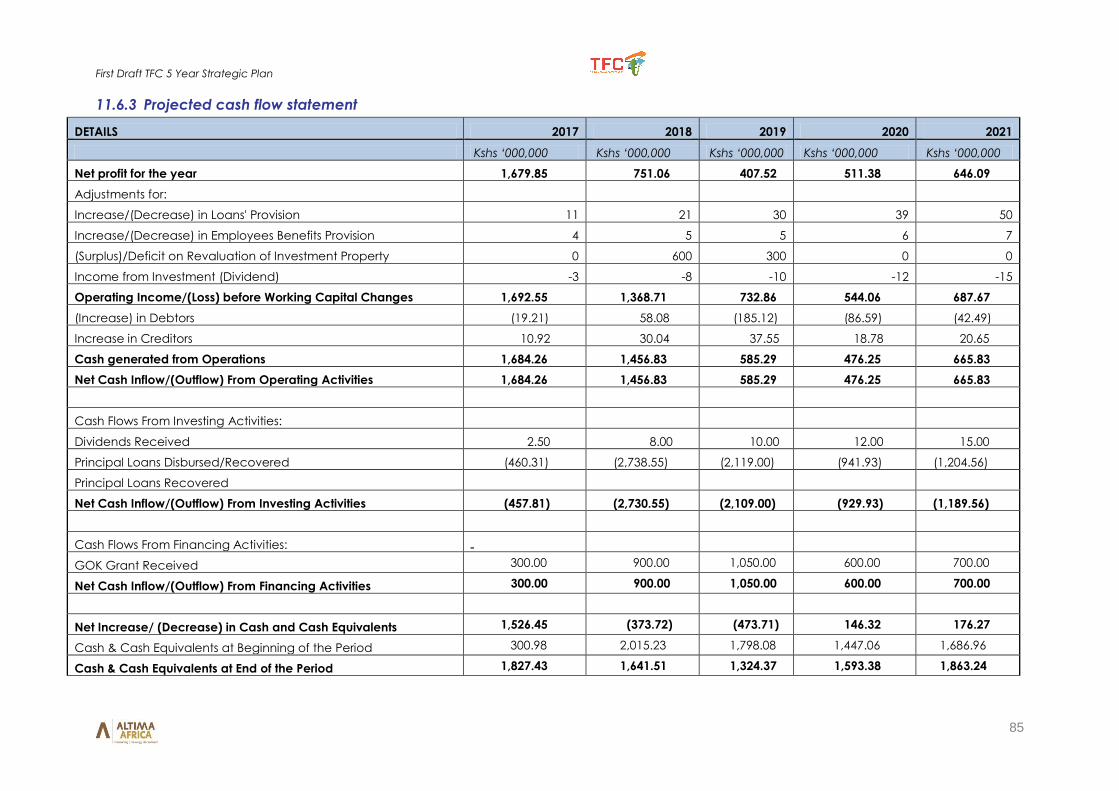
First Draft TFC 5 Year Strategic Plan
85
11.6.3 Projected cash flow statement
DETAILS 2017 2018 2019 2020 2021
Kshs ‘000,000 Kshs ‘000,000 Kshs ‘000,000 Kshs ‘000,000 Kshs ‘000,000
Net profit for the year 1,679.85 751.06 407.52 511.38 646.09
Adjustments for:
Increase/(Decrease) in Loans' Provision 11 21 30 39 50
Increase/(Decrease) in Employees Benefits Provision 4 5 5 6 7
(Surplus)/Deficit on Revaluation of Investment Property 0 600 300 0 0
Income from Investment (Dividend) -3 -8 -10 -12 -15
Operating Income/(Loss) before Working Capital Changes 1,692.55 1,368.71 732.86 544.06 687.67
(Increase) in Debtors (19.21) 58.08 (185.12) (86.59) (42.49)
Increase in Creditors 10.92 30.04 37.55 18.78 20.65
Cash generated from Operations 1,684.26 1,456.83 585.29 476.25 665.83
Net Cash Inflow/(Outflow) From Operating Activities 1,684.26 1,456.83 585.29 476.25 665.83
Cash Flows From Investing Activities:
Dividends Received 2.50 8.00 10.00 12.00 15.00
Principal Loans Disbursed/Recovered (460.31) (2,738.55) (2,119.00) (941.93) (1,204.56)
Principal Loans Recovered
Net Cash Inflow/(Outflow) From Investing Activities (457.81) (2,730.55) (2,109.00) (929.93) (1,189.56)
Cash Flows From Financing Activities:
GOK Grant Received 300.00 900.00 1,050.00 600.00 700.00
Net Cash Inflow/(Outflow) From Financing Activities 300.00 900.00 1,050.00 600.00 700.00
Net Increase/ (Decrease) in Cash and Cash Equivalents 1,526.45 (373.72) (473.71) 146.32 176.27
Cash & Cash Equivalents at Beginning of the Period 300.98 2,015.23 1,798.08 1,447.06 1,686.96
Cash & Cash Equivalents at End of the Period 1,827.43 1,641.51 1,324.37 1,593.38 1,863.24
First Draft TFC 5 Year Strategic Plan
86
11.7 Detailed Listing of Reviewed Documents
Past and current TFC strategic plans (Including departmental plans)
Past and current Ministry of Tourism strategic plan
Strategy review/performance data e.g. financial and operational KPIs and achievements.
Product offerings detail, structure and performance data
Port-folio/ Product performance data (sales):
• Loans;
• Hotels; and
• Other investments.
Key external stakeholders (key customers and partners) listing and contact details
Key internal stakeholder listing
Annual/quarterly/monthly departmental and staff work plans (Performance contracts at organizational
and HOD levels)
Departmental plans/ scorecards
Updated organizational structure
Subsidiary listing and performance data
Current/ past corporate budgets (3 to 5 years)
Past (3 to 5 year) financial statements
Vision 2030 and MTPII
Jubilee Manifesto
The Tourism Act
Industry research reference material
First Draft TFC 5 Year Strategic Plan
87
11.8 TFC 5O Year Milestones
1965 November 9th: The Corporation was established by an Act of Parliament with its mandate
to facilitate and finance development of tourism and tourism related enterprises.
1966: International Hotels (Kenya) Limited was incorporated and the established Hilton Hotel,
Nairobi in 1969. The Corporation shareholding in this five star hotel is 41%.
1967 November 17th: Mountain Lodge Limited Corporation has 39% shareholding. The Lodge
is situated at Mt. Kenya National Park in Nyeri.
1968 June 5th: The Ark Limited was incorporated and its facilities are located at the foot of
Mount Kenya inside Mt. Kenya National Park.
1968: Kenya Safari Lodges and Hotels Limited (KSLH) was established and the Corporation
holds 82% shares. KSLH is a holding company for three facilities Mombasa Beach Hotel; Ngulia
Safari Lodge and Voi Safari Lodge
1972: Bomas of Kenya Ltd, commenced operations with its mission to preserve, maintain and
promote Kenyan cultural values. The Corporation has majority shareholding. Bomas of Kenya
is a fully owned subsidiary of TFC.
1976: Mt. Elgon Lodge Limited was incorporated. It is located next to Mt. Elgon National Park
and the Corporation has 72% shareholding in the Company.
1978: Sunset Hotel Milimani, Kisumu town was incorporated. The Corporation holds 95% shares
in this two star hotel that
1979: Golf Hotel Limited is located in Kakamega town was incorporated. The Corporations
holds 80% shares in this two star hotel that has 62 numbers of rooms
1980: Kabarnet Hotel limited was established. The Corporation holds 98%
2007: The Corporation began a Massive Organization Restructuring which included an
overhaul of the Human Capital, financial re-organization and review of the Business Model.
2011 February: KTDC rebranded with new re-launch and new Logo by former Tourism Assistant
Minister Cecily Mbarire.
2012 September 25 to 26th: KTDC hosted the 1st Ever Africa Hotel Investment Forum (AHIF) jointly
with Bench Events that brought International Brands into Kenya.
2013 September 24 to September 29th: KTDC hosted the Africa Hotel Investment Forum (AHIF)
2013: The Corporation changed its name from KTDC to Tourism Finance Corporation (TFC) in
line with the Tourism Act.
2014: TFC received the Trophy from Livestock Cabinet Secretary Felix Kosgey for the Best
Institution other than Bank at Mambo Leo Showground, Kisumu.
2014: AADFI Recognized TFC and it was awarded “B” in their Peer Review Exercise.
2014: TFC compiled the Tourist Map showing that it funded Investments in all the 47 Counties
in Kenya.
2014: TFC received the International Quality Crown Award by UK based BID Group for being
a leading Development Financial Institution.
2014: TFC won Best Stand other than Bank trophy at the Kisumu ASK Show held at Mambo Leo
Grounds.
2014: Government announced plans to Merge TFC, with ICDC and IDB Capital.
2015: TFC was awarded the International Platinum Star for Quality Award from Jose. E. Preito,
President and CEO of Business Initiatives Direction in Paris.
2015 October 4th: TFC Board of Directors were appointed by President Uhuru Kenyatta.
2016: TFC undertakes effective turn around strategies to enhance efficiency and effectiveness
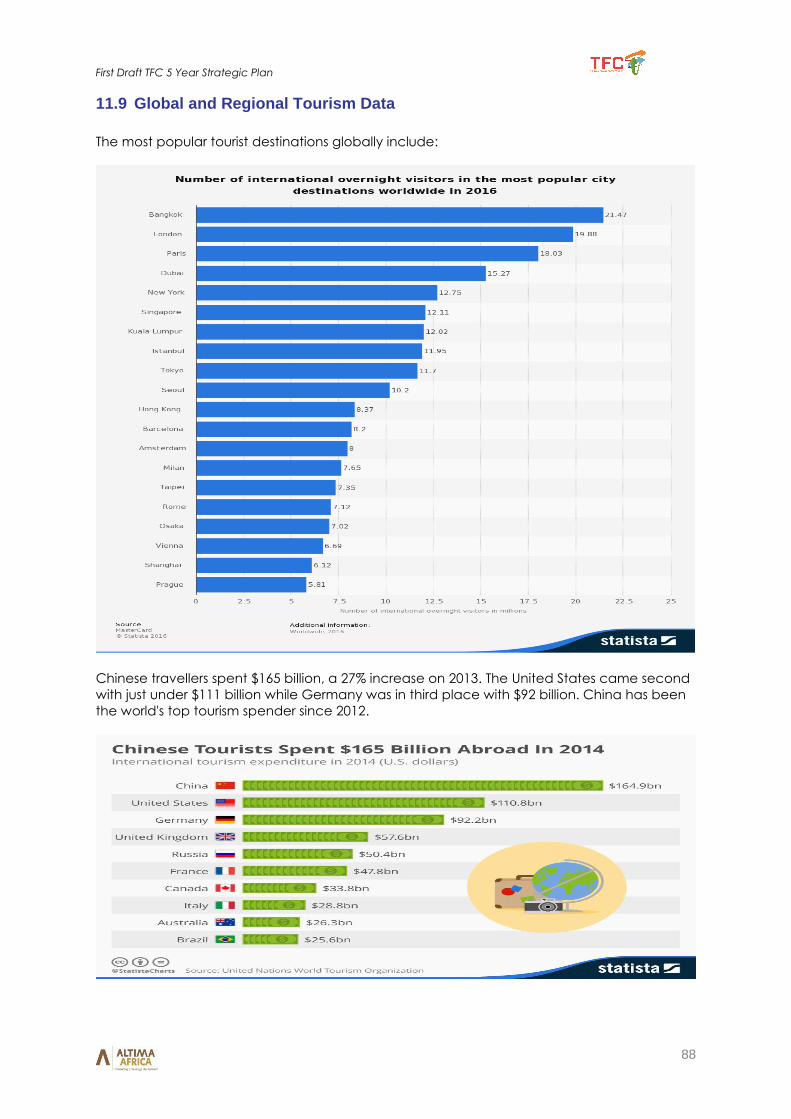
First Draft TFC 5 Year Strategic Plan
88
11.9 Global and Regional Tourism Data
The most popular tourist destinations globally include:
Chinese travellers spent $165 billion, a 27% increase on 2013. The United States came second
with just under $111 billion while Germany was in third place with $92 billion. China has been
the world's top tourism spender since 2012.
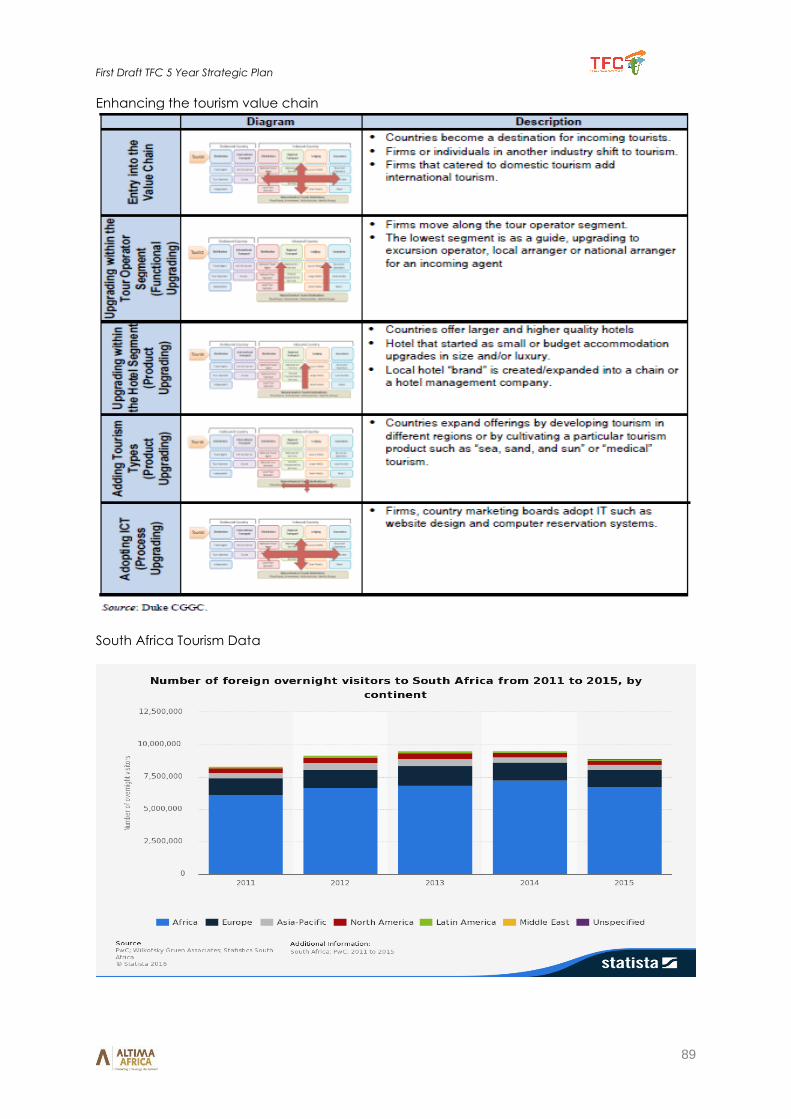
First Draft TFC 5 Year Strategic Plan
89
Enhancing the tourism value chain
South Africa Tourism Data
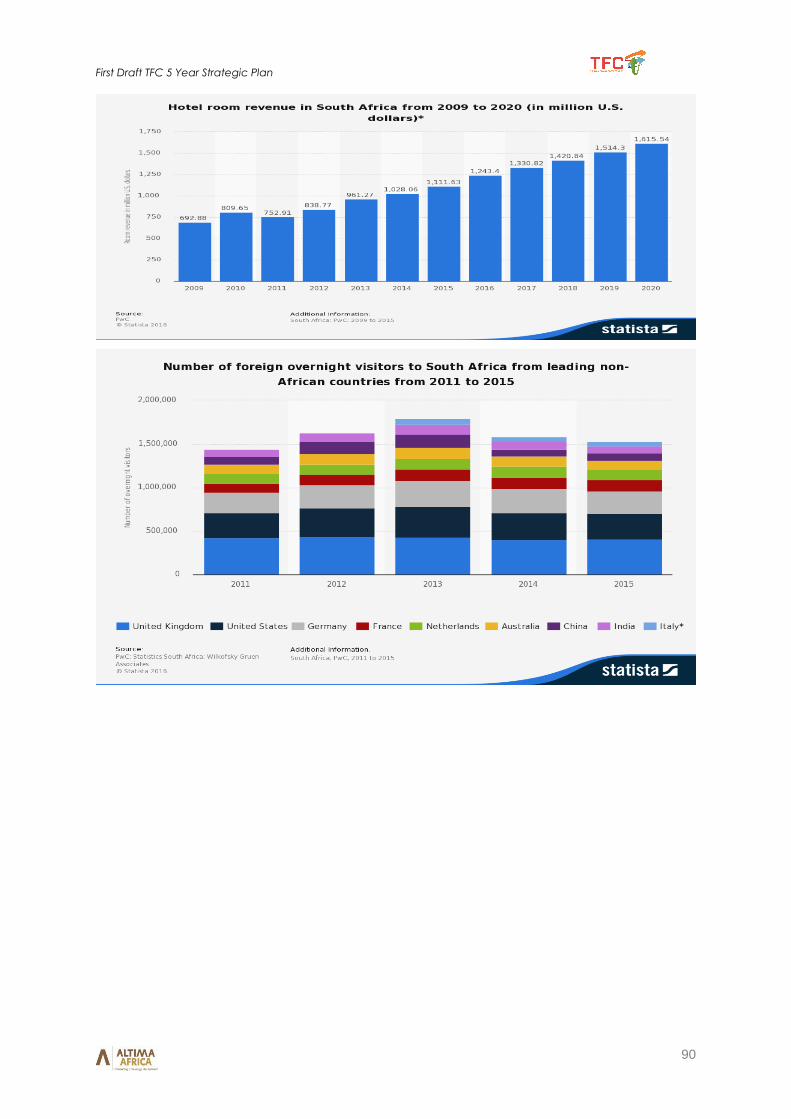
First Draft TFC 5 Year Strategic Plan
90
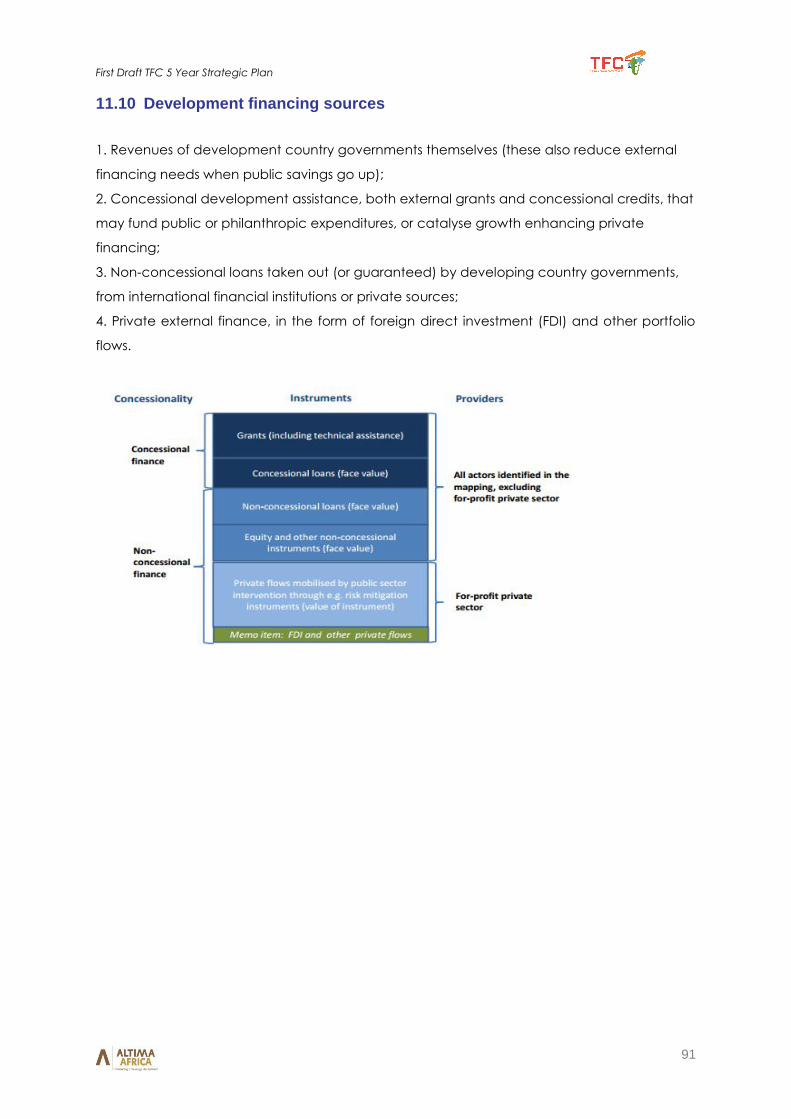
First Draft TFC 5 Year Strategic Plan
91
11.10 Development financing sources
1. Revenues of development country governments themselves (these also reduce external
financing needs when public savings go up);
2. Concessional development assistance, both external grants and concessional credits, that
may fund public or philanthropic expenditures, or catalyse growth enhancing private
financing;
3. Non-concessional loans taken out (or guaranteed) by developing country governments,
from international financial institutions or private sources;
4. Private external finance, in the form of foreign direct investment (FDI) and other portfolio
flows.
First Draft TFC 5 Year Strategic Plan
92