Embed Size (px)
Citation preview

0
Power Finance Corporation Ltd (A Govt of India Undertaking)
Corporate Presentation
September, 2017
1
Company Overview
Key Operational/ Financial Highlights
Sector Overview
Way Forward
Agenda
2
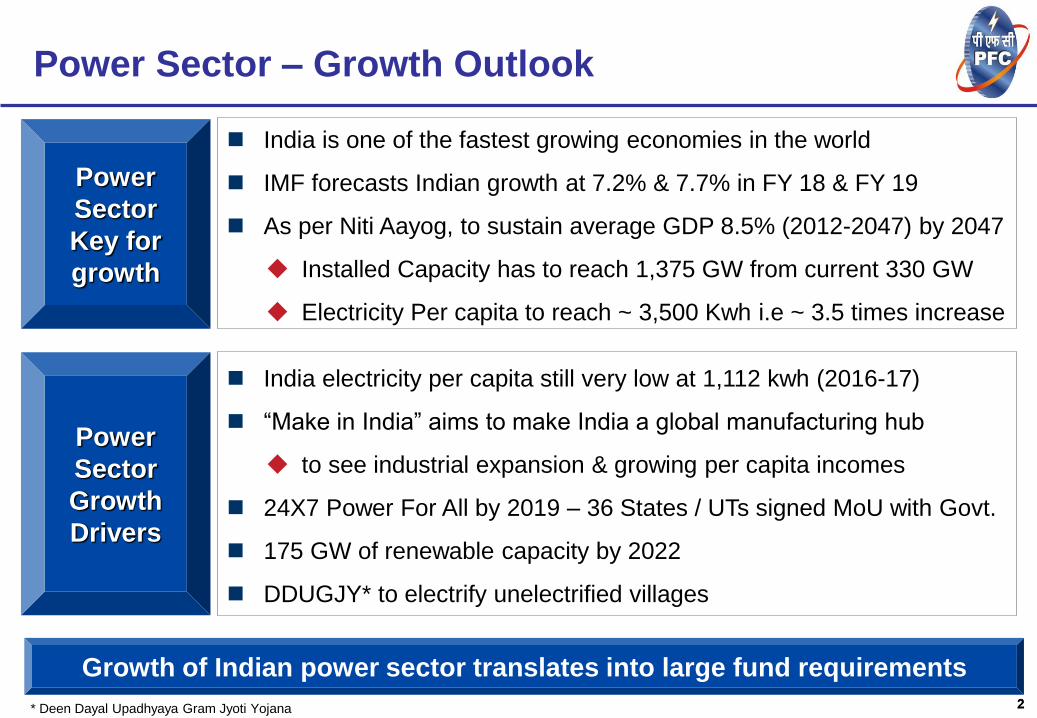
Power Sector – Growth Outlook
2
India is one of the fastest growing economies in the world
IMF forecasts Indian growth at 7.2% & 7.7% in FY 18 & FY 19
As per Niti Aayog, to sustain average GDP 8.5% (2012-2047) by 2047
Installed Capacity has to reach 1,375 GW from current 330 GW
Electricity Per capita to reach ~ 3,500 Kwh i.e ~ 3.5 times increase
India electricity per capita still very low at 1,112 kwh (2016-17)
“Make in India” aims to make India a global manufacturing hub
to see industrial expansion & growing per capita incomes
24X7 Power For All by 2019 – 36 States / UTs signed MoU with Govt.
175 GW of renewable capacity by 2022
DDUGJY* to electrify unelectrified villages
Power
Sector
Key for
growth
Power
Sector
Growth
Drivers
Growth of Indian power sector translates into large fund requirements
* Deen Dayal Upadhyaya Gram Jyoti Yojana
3
Fuel Wise Break-up Sectoral Break-up
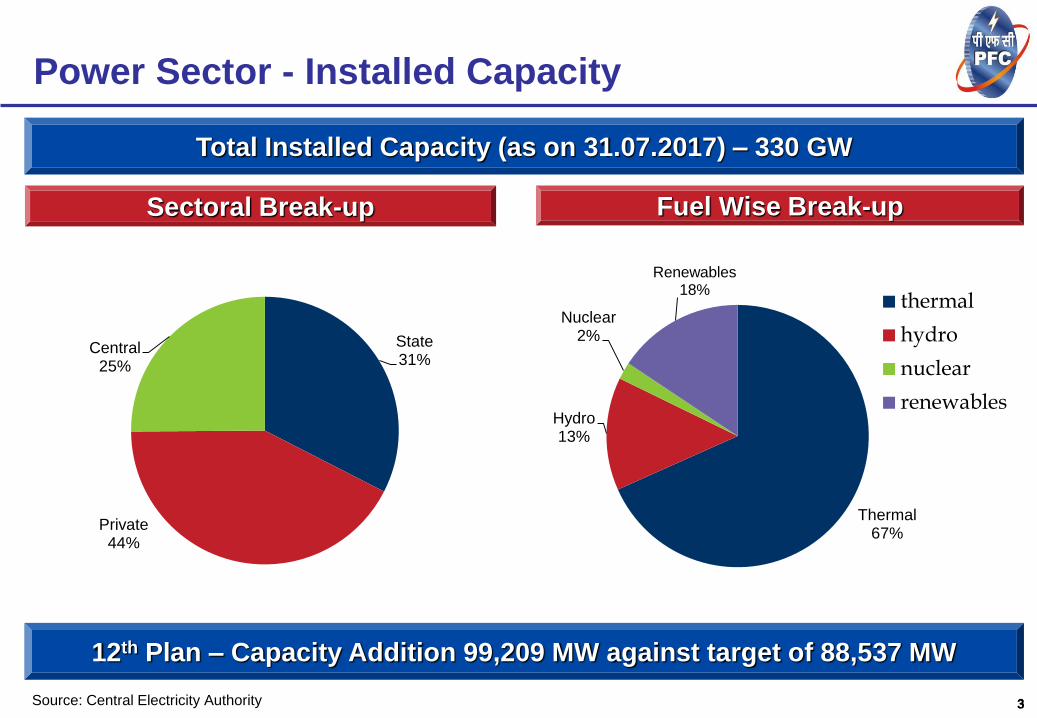
Total Installed Capacity (as on 31.07.2017) – 330 GW
Source: Central Electricity Authority 3
Power Sector - Installed Capacity
Thermal 67%
Hydro 13%
Nuclear 2%
Renewables 18%
thermal
hydro
nuclear
renewables
State 31%
Private 44%
Central 25%
12th Plan – Capacity Addition 99,209 MW against target of 88,537 MW
4 4
Lays out State-wise roadmap for achieving PFA
Envisages building generation, transmission
and distribution capacities
Operational efficiency & reform measures
Address funding gap to achieve PFA by
allocating funds under various GoI Schemes
Envisages a scheme to fund last mile
connectivity to all households
All 36 States/UTs signed PFA documents
Road map laid out for each State / UT for PFA
~ Rs. 12 Lac Crs investment envisaged
Power Sector – Govt. of India Schemes
24X7 Power For All (PFA) by 2019
Progress
Source: Power Ministry
5 5
Reduce AT&C losses to 15% by FY19
Reduce ARR & ACS gap to zero by FY19
All DISCOMs to be profitable by FY19
Rs. 15,000 Crs of savings till Mar, 2017
ARR & ACS gap came down by 14 paisa
~ 1% reduction in AT&C losses during FY17
100% of feeder metering in UDAY States
Tariff revision done by 25 out of 27 States
States to take over DISCOM losses
gradually from current year onwards
Power Sector – Govt. of India Schemes
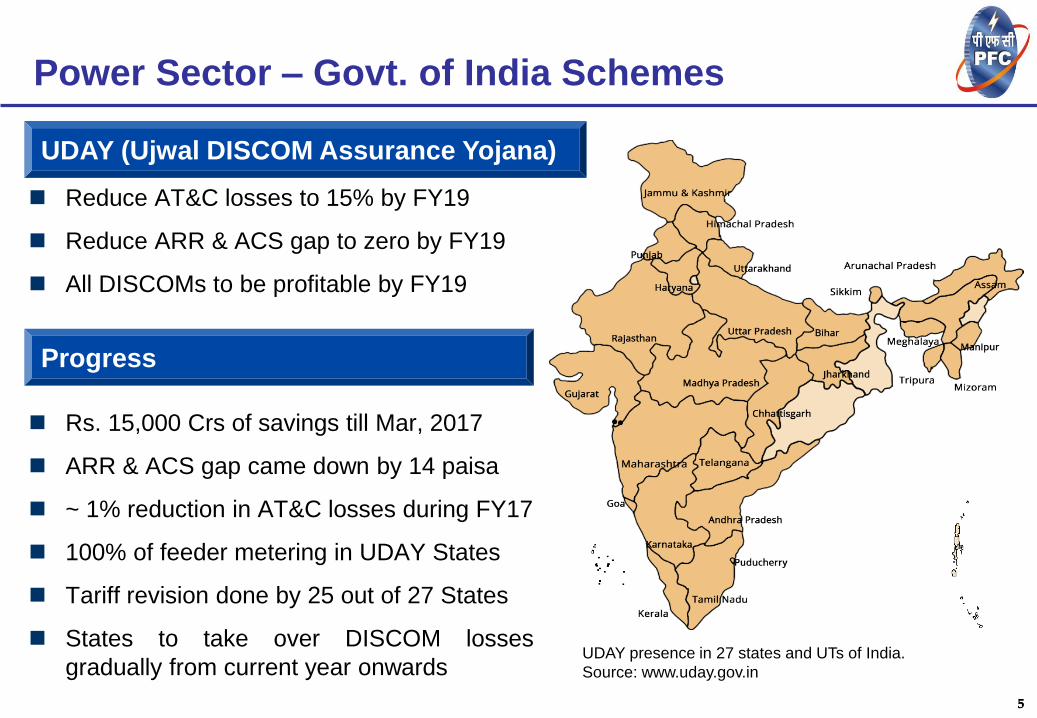
UDAY presence in 27 states and UTs of India.
Source: www.uday.gov.in
UDAY (Ujwal DISCOM Assurance Yojana)
Progress
6 6
Scheme Outlay : Rs. 76,623 Crs
Objective : Strengthening of Sub-T&D, Metering of DTs / feeders / consumers,
IT enablement of urban distribution sector
Progress
1,356 towns achieved Go-Live, out of which 1080 reported AT&C loss reduction
With 222 towns reported AT&C loss reduction upto > 25%
Scheme Outlay : Rs. 75,893 Crs
Objective : Strengthening of Sub-T&D, Metering of DTs / feeders / consumers,
separation of agriculture & non-agriculture feeders
Progress
78% electrified, 17% in progress, 5% yet to start (uninhabited 5%) (Source: GARV App)
Power Sector – Govt. of India Schemes
IPDS (Integrated Power Development Scheme) for urban areas
DDUGJY (Deen Dayal Upadhyaya Gram Jyoti Yojana) for rural areas
7
Company Overview
Key Operational / Financial Highlights
Sector Overview
Way Forward
Agenda
8
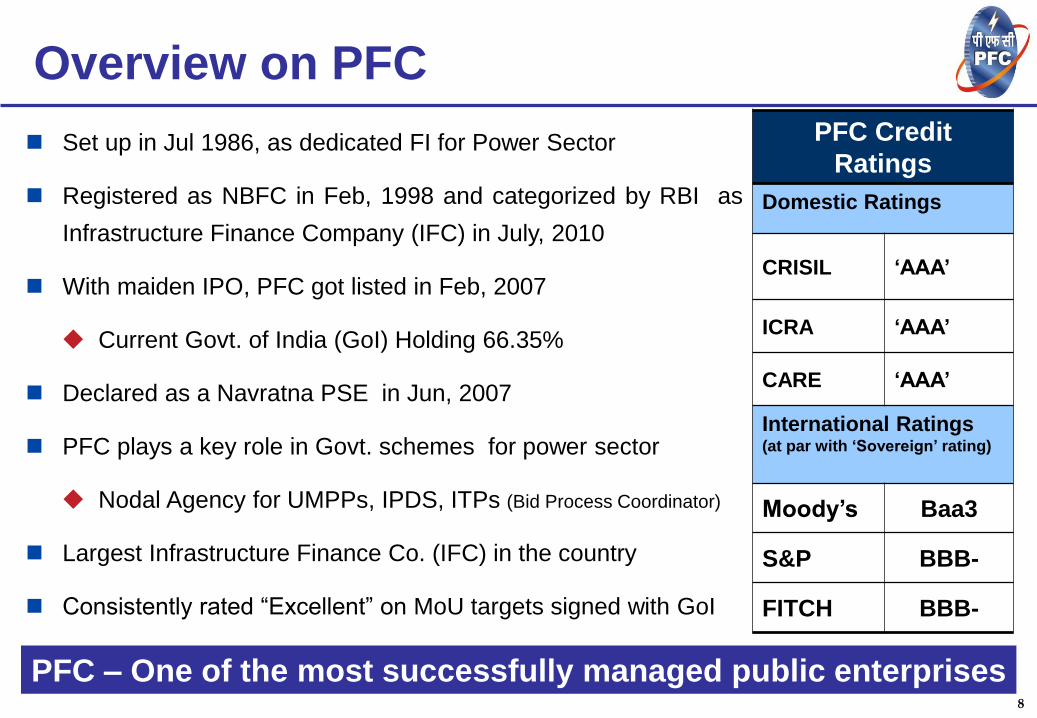
Overview on PFC
Set up in Jul 1986, as dedicated FI for Power Sector
Registered as NBFC in Feb, 1998 and categorized by RBI as
Infrastructure Finance Company (IFC) in July, 2010
With maiden IPO, PFC got listed in Feb, 2007
Current Govt. of India (GoI) Holding 66.35%
Declared as a Navratna PSE in Jun, 2007
PFC plays a key role in Govt. schemes for power sector
Nodal Agency for UMPPs, IPDS, ITPs (Bid Process Coordinator)
Largest Infrastructure Finance Co. (IFC) in the country
Consistently rated “Excellent” on MoU targets signed with GoI
PFC – One of the most successfully managed public enterprises
PFC Credit
Ratings
Domestic Ratings
CRISIL ‘AAA’
ICRA ‘AAA’
CARE ‘AAA’
International Ratings (at par with ‘Sovereign’ rating)
Moody’s Baa3
S&P BBB-
FITCH BBB-
9
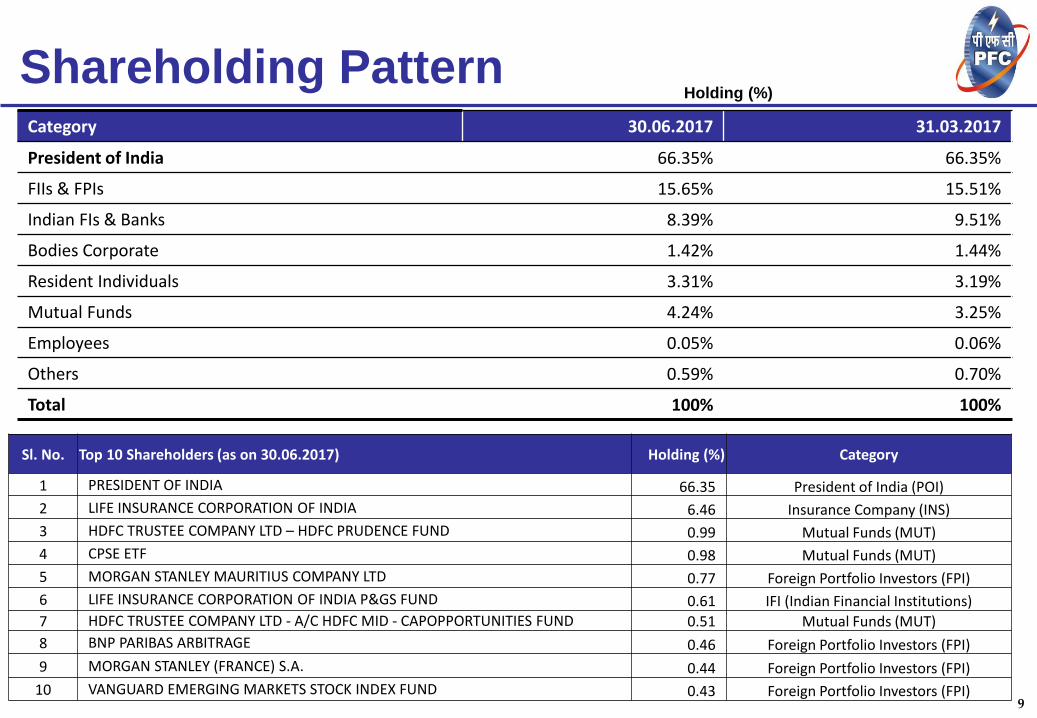
Shareholding Pattern Category 30.06.2017 31.03.2017
President of India 66.35% 66.35%
FIIs & FPIs 15.65% 15.51%
Indian FIs & Banks 8.39% 9.51%
Bodies Corporate 1.42% 1.44%
Resident Individuals 3.31% 3.19%
Mutual Funds 4.24% 3.25%
Employees 0.05% 0.06%
Others 0.59% 0.70%
Total 100% 100%
Sl. No. Top 10 Shareholders (as on 30.06.2017) Holding (%) Category
1 PRESIDENT OF INDIA 66.35 President of India (POI)
2 LIFE INSURANCE CORPORATION OF INDIA 6.46 Insurance Company (INS)
3 HDFC TRUSTEE COMPANY LTD – HDFC PRUDENCE FUND 0.99 Mutual Funds (MUT)
4 CPSE ETF 0.98 Mutual Funds (MUT)
5 MORGAN STANLEY MAURITIUS COMPANY LTD 0.77 Foreign Portfolio Investors (FPI)
6 LIFE INSURANCE CORPORATION OF INDIA P&GS FUND 0.61 IFI (Indian Financial Institutions)
7 HDFC TRUSTEE COMPANY LTD - A/C HDFC MID - CAPOPPORTUNITIES FUND 0.51 Mutual Funds (MUT)
8 BNP PARIBAS ARBITRAGE 0.46 Foreign Portfolio Investors (FPI)
9 MORGAN STANLEY (FRANCE) S.A. 0.44 Foreign Portfolio Investors (FPI)
10 VANGUARD EMERGING MARKETS STOCK INDEX FUND 0.43 Foreign Portfolio Investors (FPI)
Holding (%)
10
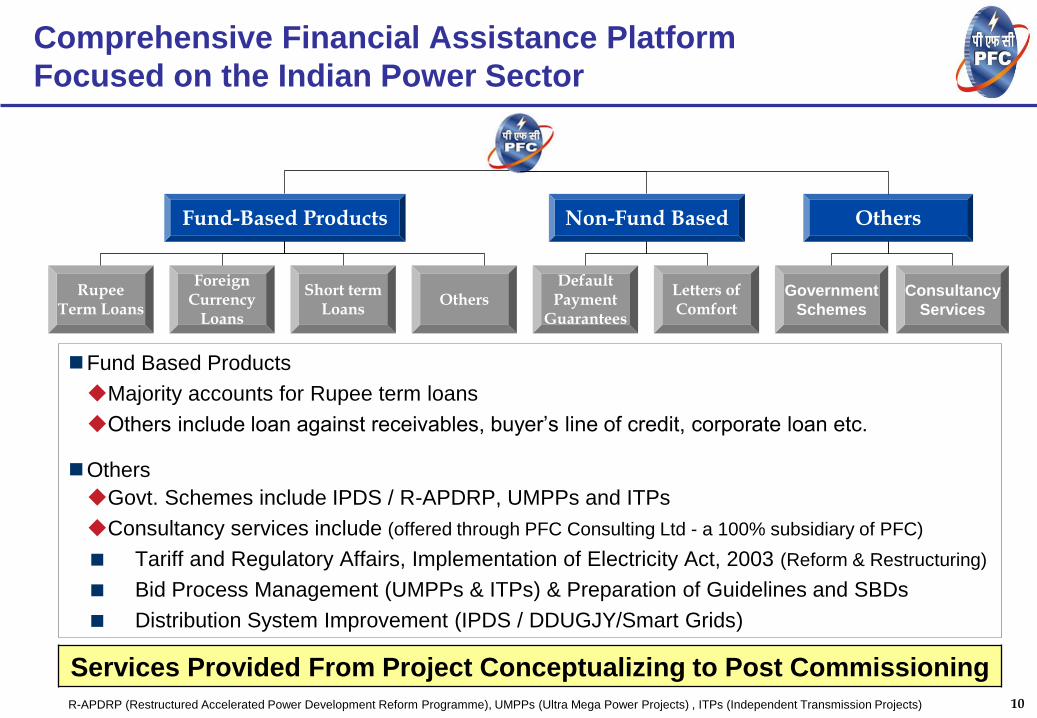
Comprehensive Financial Assistance Platform
Focused on the Indian Power Sector
Fund-Based Products
Rupee Term Loans
Foreign Currency
Loans
Short term Loans
Others Default
Payment Guarantees
Letters of Comfort
Government
Schemes
Consultancy
Services
Non-Fund Based Others
Services Provided From Project Conceptualizing to Post Commissioning
Fund Based Products
Majority accounts for Rupee term loans
Others include loan against receivables, buyer’s line of credit, corporate loan etc.
Others
Govt. Schemes include IPDS / R-APDRP, UMPPs and ITPs
Consultancy services include (offered through PFC Consulting Ltd - a 100% subsidiary of PFC)
Tariff and Regulatory Affairs, Implementation of Electricity Act, 2003 (Reform & Restructuring)
Bid Process Management (UMPPs & ITPs) & Preparation of Guidelines and SBDs
Distribution System Improvement (IPDS / DDUGJY/Smart Grids)
R-APDRP (Restructured Accelerated Power Development Reform Programme), UMPPs (Ultra Mega Power Projects) , ITPs (Independent Transmission Projects)
11
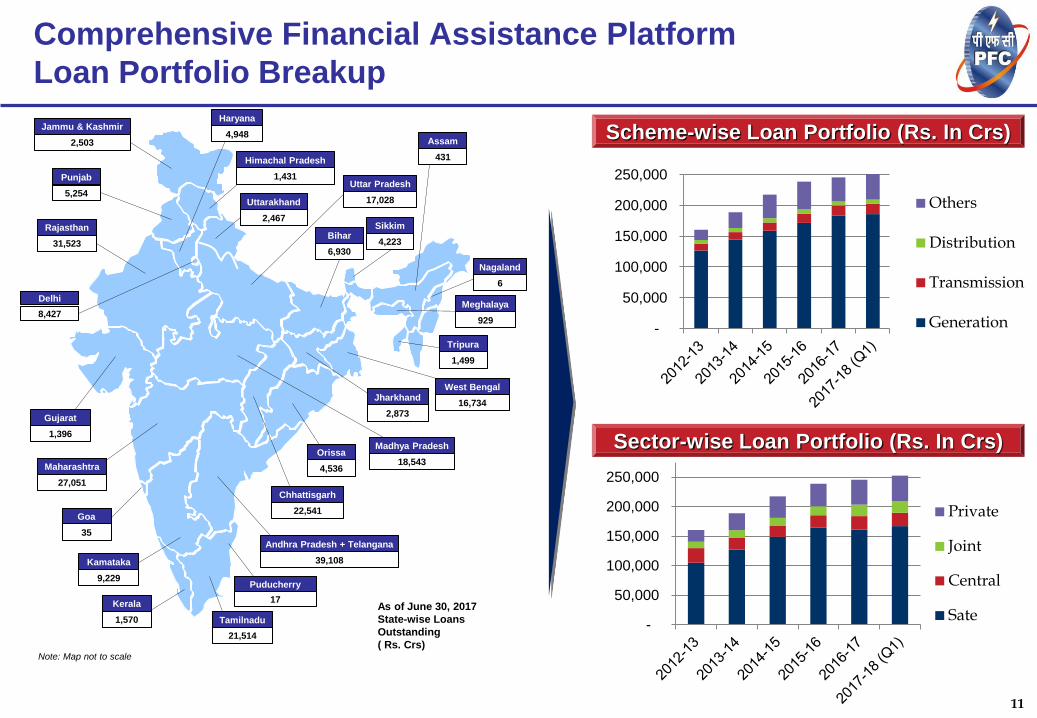
Comprehensive Financial Assistance Platform
Loan Portfolio Breakup
Jammu & Kashmir
2,503
Punjab
5,254
Delhi
8,427
Rajasthan
31,523
Maharashtra
27,051
Uttarakhand
2,467 Sikkim
4,223
Madhya Pradesh
18,543
Tripura
1,499
Meghalaya
929
Assam
431
Bihar
6,930
Haryana
4,948
Himachal Pradesh
1,431 Uttar Pradesh
17,028
Chhattisgarh
22,541
Orissa
4,536
Jharkhand
2,873
West Bengal
16,734
Kerala
1,570
Kamataka
9,229
Gujarat
1,396
Goa
35
Nagaland
6
As of June 30, 2017
State-wise Loans
Outstanding
( Rs. Crs)
Tamilnadu
21,514
Note: Map not to scale
Andhra Pradesh + Telangana
39,108
Puducherry
17
Scheme-wise Loan Portfolio (Rs. In Crs)
Sector-wise Loan Portfolio (Rs. In Crs)
-
50,000
100,000
150,000
200,000
250,000
Others
Distribution
Transmission
Generation
-
50,000
100,000
150,000
200,000
250,000
Private
Joint
Central
Sate
12
Key Achievements
Ranked 49th in the Fortune magazine’s India’s 500 largest Corporations (2016)
Largest Infrastructure Finance Company in India
7th highest profit making PSU based on FY2016 profit (DPE Survey, Mar, 2017)
One of the highest employee productivity among PSUs (Total 499 Employees)
Rs. 54 Crs of Total Income per employee
Consistently rated “Excellent” against MoU targets with Govt. of India
FY 2014 & FY 2015 achieved all targets with highest MoU Score of 1.00
FY 2016 achieved MoU targets entitling PFC to “Excellent” MoU Rating
13
Competitive Strengths of PFC
Majority Government ownership of 66.35%
Operated in power sector for 31 years – Evolved as Principal Financier
Established strong relationship with clients & key power sector players
Infrastructure Finance Company status by RBI gives additional benefits
Competitive cost of funds
Highest domestic rating of AAA & International rating at par with sovereign
Allocation of tax free bonds / 54EC bonds – access to low cost of funds
Borrowing track record of ~ Rs. 4.5 Lakh Crs
Capability to lend long tenor loans & large amounts due to high net worth
Low operating costs (0.07% of loan assets)
Lean and Professional manpower (Total 499 Employees)
F u n d i n g f o r b r i g h t e r t o m o r r o w 13

14
Whole-Time Directors Nominee / Independent Directors
Shri Rajeev
Sharma
Chairman and
Managing Director
Joined PFC in Oct, 2016 as CMD.
Has over 32 years of varied power sector experience out
of which 20 years of power financing including 8 years of
Board Level experience.
Prior to joining PFC, worked as CMD, REC.
Educational Qualifications: B.Tech (Electrical
Engineering) from G.B. Pant, Masters in Engineering
From IIT Roorkee and MBA from FMS, Delhi University.
Shri D. Ravi,
Director
(Commercial)
Joined PFC in 1993
Joined PFC Board as a Director in Nov, 2015
Over 36 years power sector experience
Prior to joining PFC he was with NHPC for 13 years.
Educational Qualifications: B.E. (Electrical & Electronics
Engineering) with diploma in Business Management.
Shri C.
Gangopadhyay,
Director (Projects)
Has been with PFC for 28 years
Joined PFC Board as a Director in Jan, 2017
Over 36 years power sector experience
Has served as a CEO of PFCCL.
Prior to joining PFC / PFCCL, worked with NTPC.
Educational Qualifications: Graduate in Electrical
Engineering from IIT Kharagpur and MBA from FMS,
Delhi University.
Shri N.B. Gupta,
Director (Finance)
Joined PFC in 2005 & Board as a Director in Aug-2017
Over 30 years power sector experience
Has served as Executive Director (Finance).
Prior to joining PFC, worked with Power Grid Corp &
NHPC.
Educational Qualifications: A qualified Chartered
Accountant.
Dr. Arun Kumar Verma
Nominee Director of Govt. of IndiaI; been on PFC’s
Board since Oct, 2015
An Indian Forest Service officer of 1986 Gujarat Cadre.
Has held several posts in Government departments and
is currently Joint Secretary to the Ministry of Power
Educational Qualifications: Master’s in Physics and is an
Associate Member of Indira Gandhi National Forest
Academy (AIGNFA). He has done Ph.D. in Tribal
Development Policy and PG Programme in Public
Policy & Management (PGPPM).
Shri Sitaram Pareek
Joined the board of PFC as an Independent Director in
Feb, 2017
Having over 40 years of experience in Due Diligences,
Statutory Audit of Companies including Listed
Companies, Government Companies, Insurance &
NBFC, Non-Profit making organizations etc.
Educational Qualifications: A qualified Chartered
Accountant, Diploma in Information System Audit
(DISA)
Experienced Management Team and Board of Directors
15
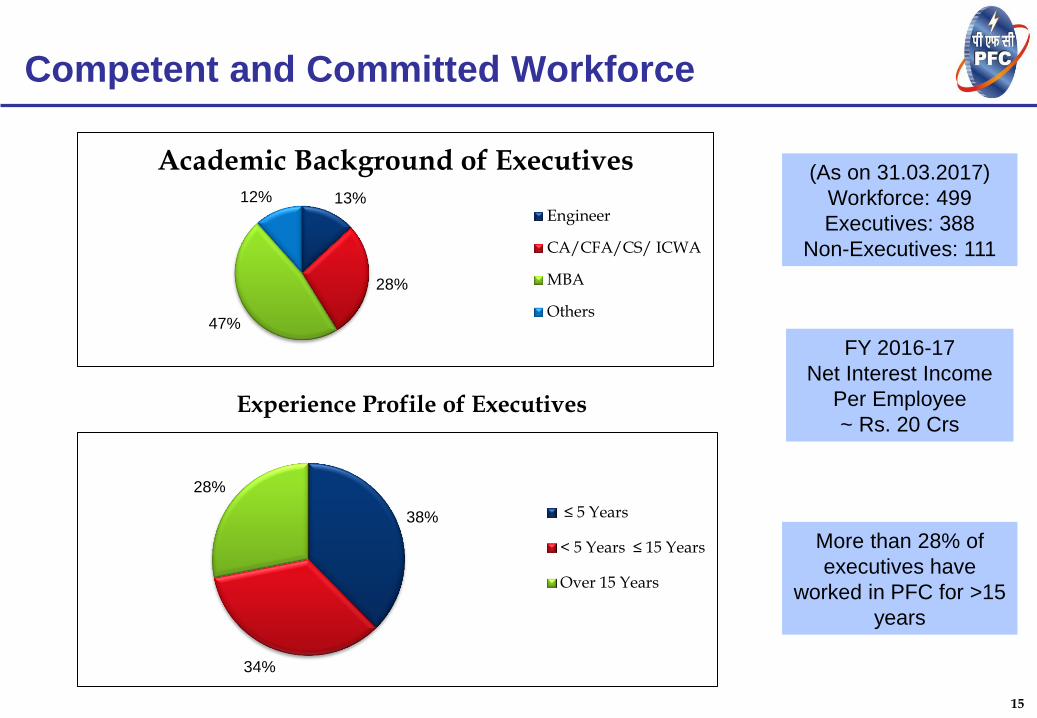
Competent and Committed Workforce
(As on 31.03.2017)
Workforce: 499
Executives: 388
Non-Executives: 111
FY 2016-17
Net Interest Income
Per Employee
~ Rs. 20 Crs
More than 28% of
executives have
worked in PFC for >15
years
38%
34%
28%
≤ 5 Years
< 5 Years ≤ 15 Years
Over 15 Years
Experience Profile of Executives
13%
28%
47%
12%
Academic Background of Executives
Engineer
CA/CFA/CS/ ICWA
MBA
Others
16
Company Overview
Key Operational / Financial Highlights
Sector Overview
Way Forward
Agenda
17
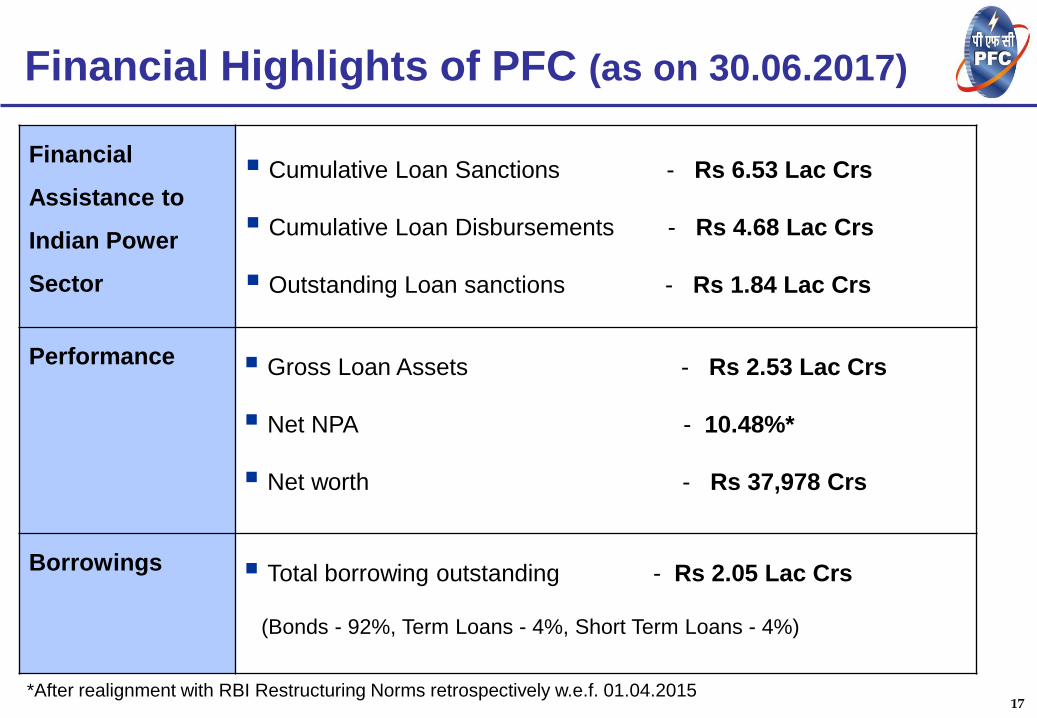
Financial
Assistance to
Indian Power
Sector
Cumulative Loan Sanctions - Rs 6.53 Lac Crs
Cumulative Loan Disbursements - Rs 4.68 Lac Crs
Outstanding Loan sanctions - Rs 1.84 Lac Crs
Performance
Gross Loan Assets - Rs 2.53 Lac Crs
Net NPA - 10.48%*
Net worth - Rs 37,978 Crs
Borrowings Total borrowing outstanding - Rs 2.05 Lac Crs
(Bonds - 92%, Term Loans - 4%, Short Term Loans - 4%)
Financial Highlights of PFC (as on 30.06.2017)
*After realignment with RBI Restructuring Norms retrospectively w.e.f. 01.04.2015
18
Financial Highlights
-
20,000
40,000
60,000
80,000
100,000
120,000
2012-13 2013-14 2014-15 2015-16 2016-17
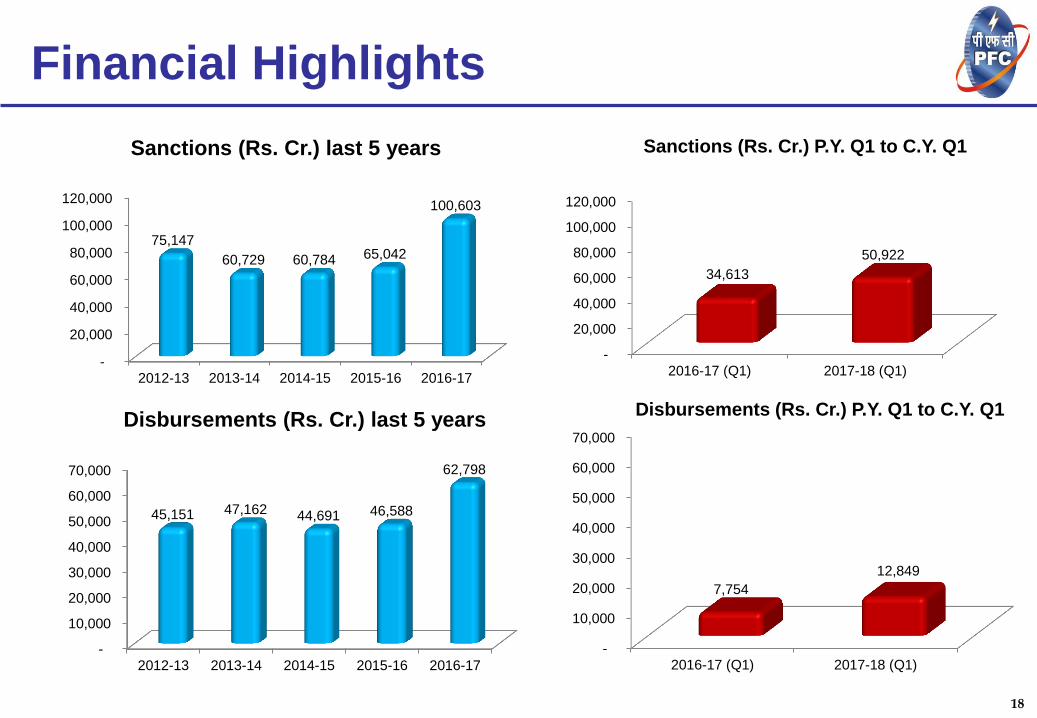
75,147
60,729 60,784 65,042
100,603
Sanctions (Rs. Cr.) last 5 years
-
10,000
20,000
30,000
40,000
50,000
60,000
70,000
2012-13 2013-14 2014-15 2015-16 2016-17
45,151 47,162 44,691 46,588
62,798
Disbursements (Rs. Cr.) last 5 years
-
10,000
20,000
30,000
40,000
50,000
60,000
70,000
2016-17 (Q1) 2017-18 (Q1)
7,754
12,849
Disbursements (Rs. Cr.) P.Y. Q1 to C.Y. Q1
-
20,000
40,000
60,000
80,000
100,000
120,000
2016-17 (Q1) 2017-18 (Q1)
34,613
50,922
Sanctions (Rs. Cr.) P.Y. Q1 to C.Y. Q1
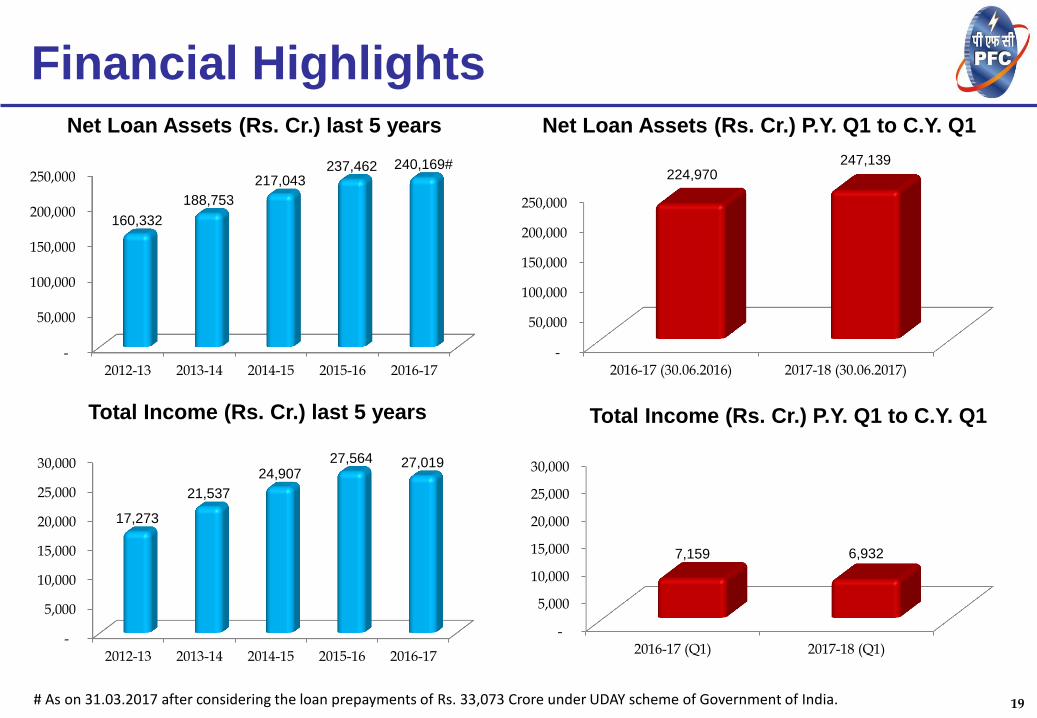
19 # As on 31.03.2017 after considering the loan prepayments of Rs. 33,073 Crore under UDAY scheme of Government of India.
-
50,000
100,000
150,000
200,000
250,000
2012-13 2013-14 2014-15 2015-16 2016-17
160,332
188,753
217,043 237,462 240,169#
Net Loan Assets (Rs. Cr.) last 5 years
-
50,000
100,000
150,000
200,000
250,000
2016-17 (30.06.2016) 2017-18 (30.06.2017)
224,970 247,139
Net Loan Assets (Rs. Cr.) P.Y. Q1 to C.Y. Q1
-
5,000
10,000
15,000
20,000
25,000
30,000
2012-13 2013-14 2014-15 2015-16 2016-17
17,273
21,537
24,907 27,564 27,019
Total Income (Rs. Cr.) last 5 years
-
5,000
10,000
15,000
20,000
25,000
30,000
2016-17 (Q1) 2017-18 (Q1)
7,159 6,932
Total Income (Rs. Cr.) P.Y. Q1 to C.Y. Q1
Financial Highlights
20
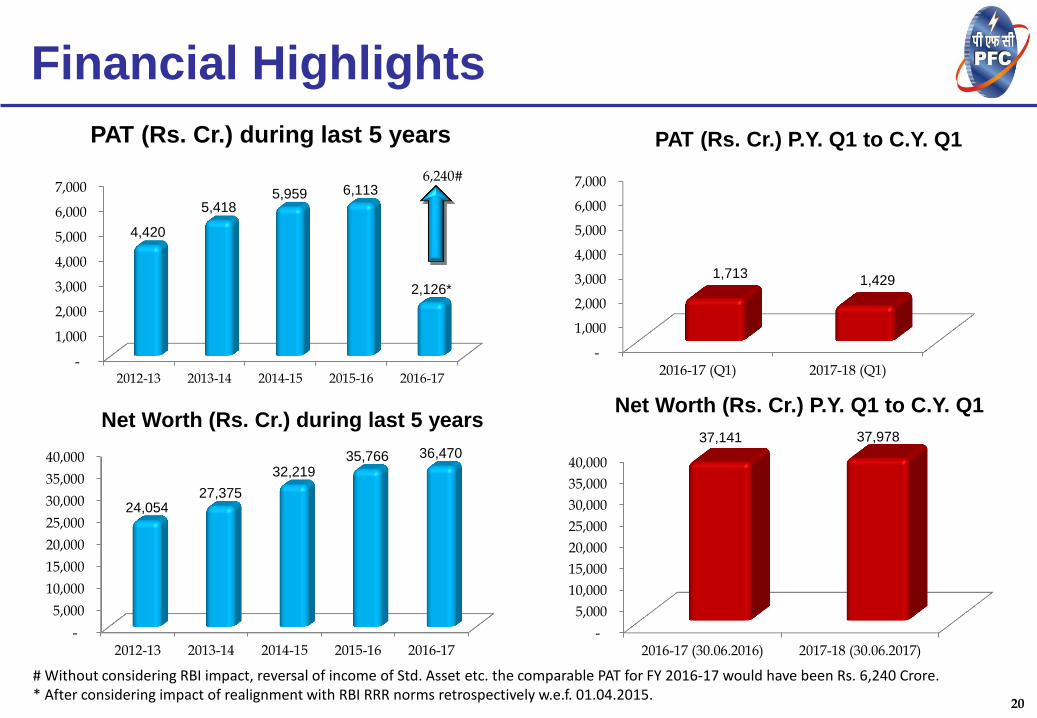
# Without considering RBI impact, reversal of income of Std. Asset etc. the comparable PAT for FY 2016-17 would have been Rs. 6,240 Crore. * After considering impact of realignment with RBI RRR norms retrospectively w.e.f. 01.04.2015.
-
1,000
2,000
3,000
4,000
5,000
6,000
7,000
2012-13 2013-14 2014-15 2015-16 2016-17
4,420
5,418 5,959 6,113
2,126*
PAT (Rs. Cr.) during last 5 years
6,240#
-
5,000
10,000
15,000
20,000
25,000
30,000
35,000
40,000
2012-13 2013-14 2014-15 2015-16 2016-17
24,054 27,375
32,219 35,766 36,470
Net Worth (Rs. Cr.) during last 5 years
-
5,000
10,000
15,000
20,000
25,000
30,000
35,000
40,000
2016-17 (30.06.2016) 2017-18 (30.06.2017)
37,141 37,978
Net Worth (Rs. Cr.) P.Y. Q1 to C.Y. Q1
-
1,000
2,000
3,000
4,000
5,000
6,000
7,000
2016-17 (Q1) 2017-18 (Q1)
1,713 1,429
PAT (Rs. Cr.) P.Y. Q1 to C.Y. Q1
Financial Highlights
21
Financial Highlights
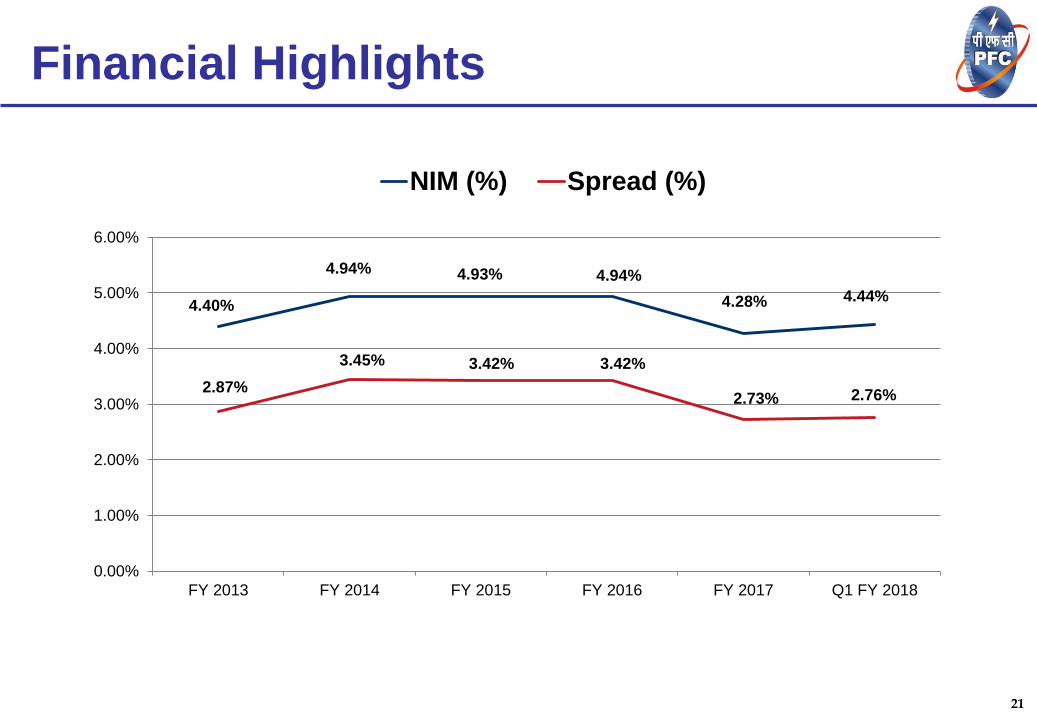
4.40%
4.94% 4.93% 4.94%
4.28% 4.44%
2.87%
3.45% 3.42% 3.42%
2.73% 2.76%
0.00%
1.00%
2.00%
3.00%
4.00%
5.00%
6.00%
FY 2013 FY 2014 FY 2015 FY 2016 FY 2017 Q1 FY 2018
NIM (%) Spread (%)
22
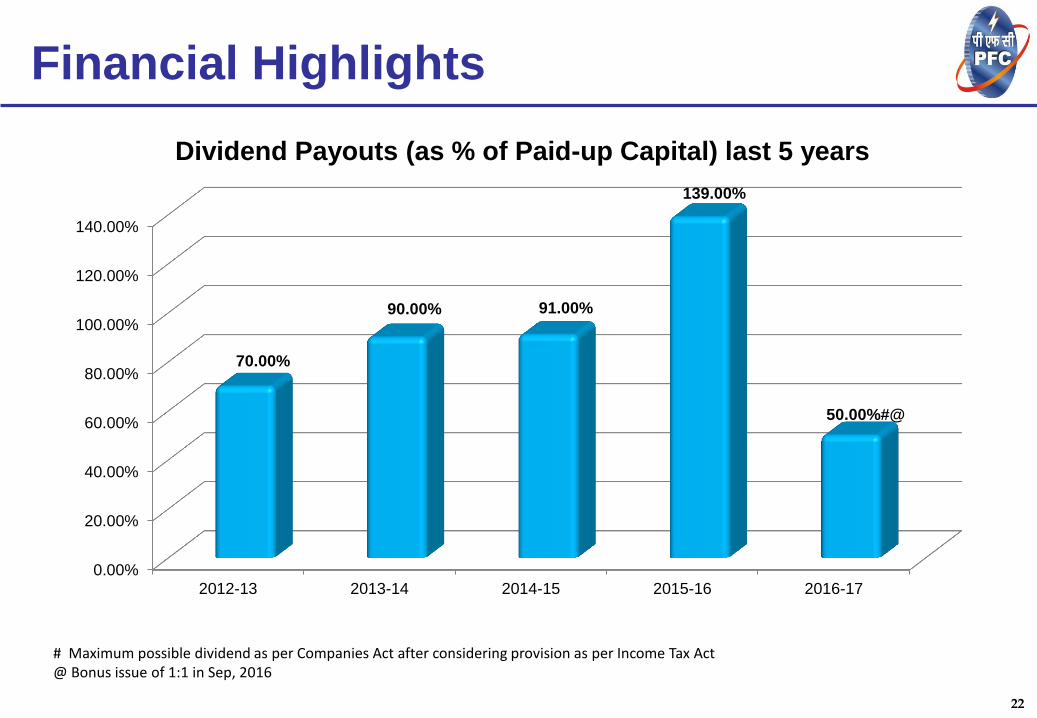
# Maximum possible dividend as per Companies Act after considering provision as per Income Tax Act @ Bonus issue of 1:1 in Sep, 2016
0.00%
20.00%
40.00%
60.00%
80.00%
100.00%
120.00%
140.00%
2012-13 2013-14 2014-15 2015-16 2016-17
70.00%
90.00% 91.00%
139.00%
50.00%#@
Dividend Payouts (as % of Paid-up Capital) last 5 years
Financial Highlights
23
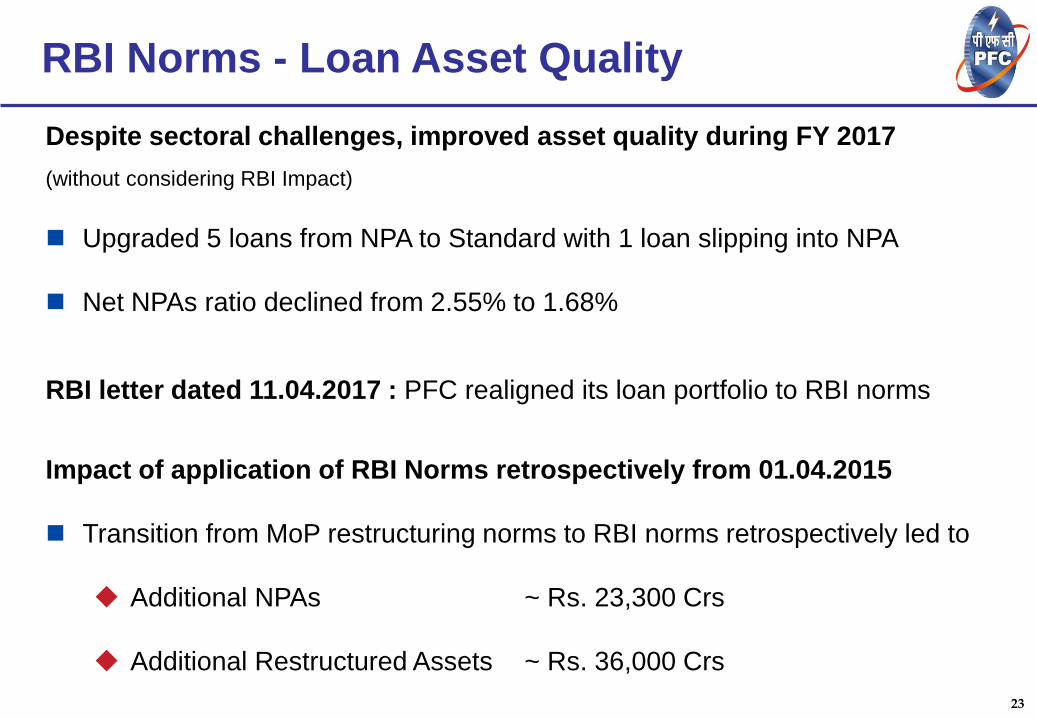
Despite sectoral challenges, improved asset quality during FY 2017
(without considering RBI Impact)
Upgraded 5 loans from NPA to Standard with 1 loan slipping into NPA
Net NPAs ratio declined from 2.55% to 1.68%
RBI letter dated 11.04.2017 : PFC realigned its loan portfolio to RBI norms
Impact of application of RBI Norms retrospectively from 01.04.2015
Transition from MoP restructuring norms to RBI norms retrospectively led to
Additional NPAs ~ Rs. 23,300 Crs
Additional Restructured Assets ~ Rs. 36,000 Crs
RBI Norms - Loan Asset Quality
24
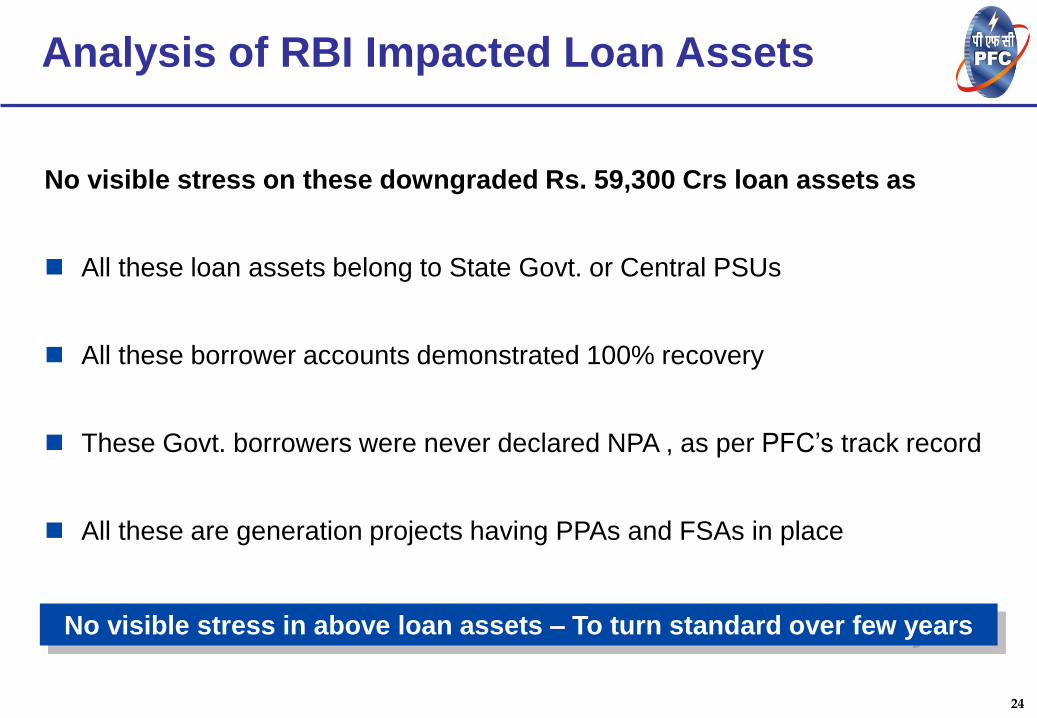
Analysis of RBI Impacted Loan Assets
No visible stress on these downgraded Rs. 59,300 Crs loan assets as
All these loan assets belong to State Govt. or Central PSUs
All these borrower accounts demonstrated 100% recovery
These Govt. borrowers were never declared NPA , as per PFC’s track record
All these are generation projects having PPAs and FSAs in place
No visible stress in above loan assets – To turn standard over few years
25
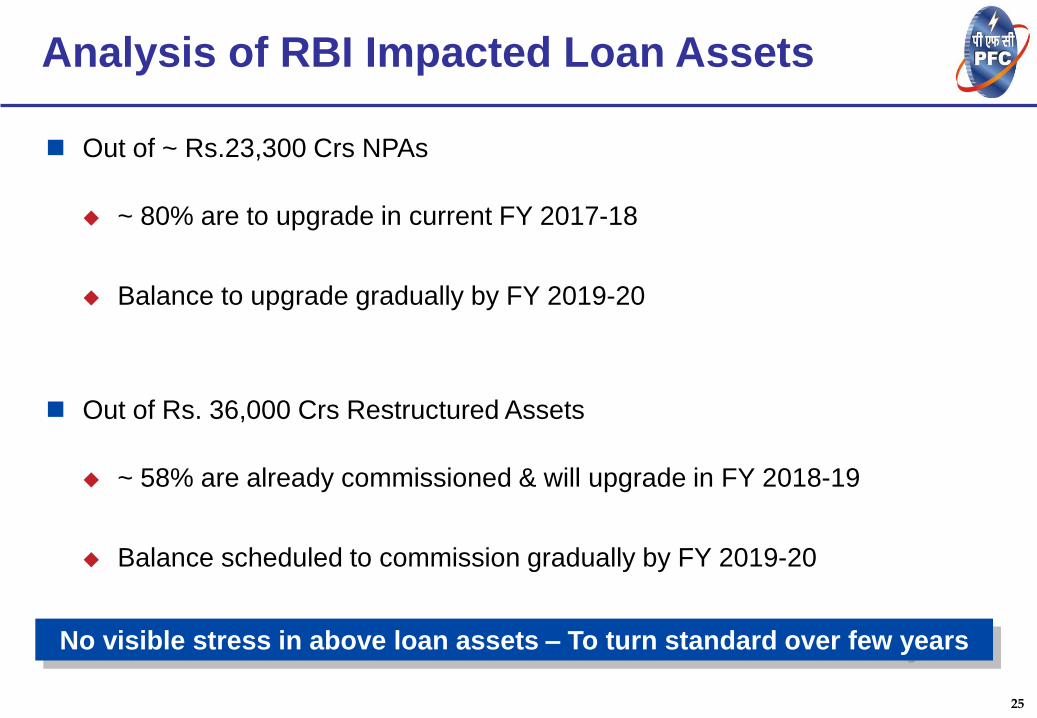
Analysis of RBI Impacted Loan Assets
Out of ~ Rs.23,300 Crs NPAs
~ 80% are to upgrade in current FY 2017-18
Balance to upgrade gradually by FY 2019-20
Out of Rs. 36,000 Crs Restructured Assets
~ 58% are already commissioned & will upgrade in FY 2018-19
Balance scheduled to commission gradually by FY 2019-20
No visible stress in above loan assets – To turn standard over few years
26
Company Overview
Key Operational / Financial Highlights
Sector Overview
Way Forward
Agenda
27
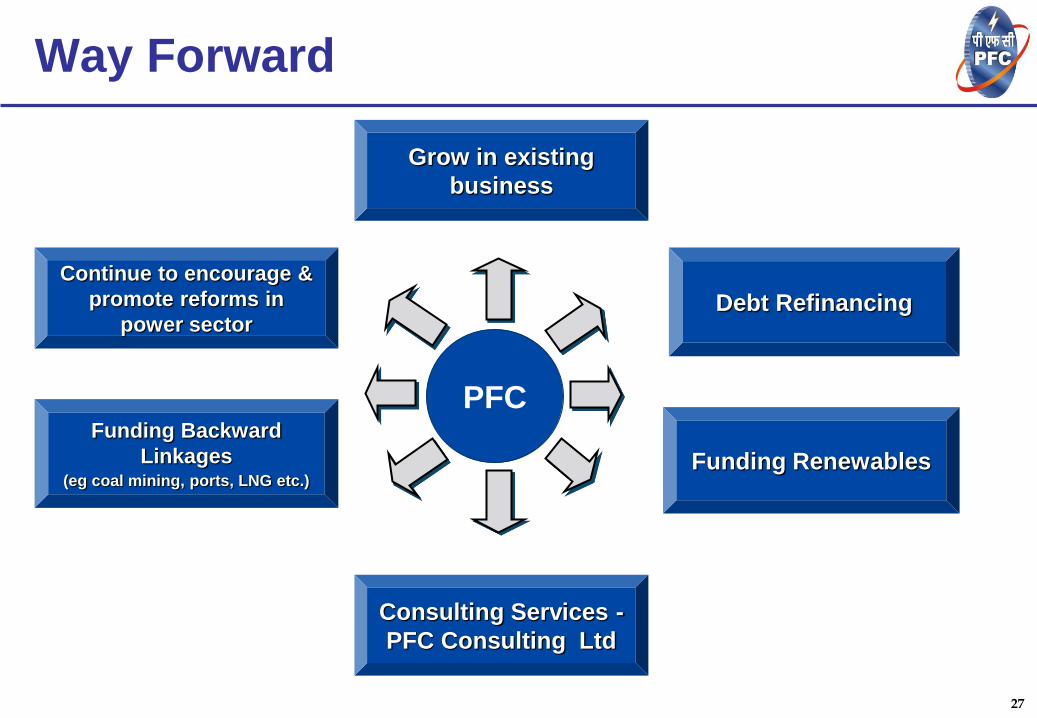
Way Forward
Debt Refinancing
Continue to encourage &
promote reforms in
power sector
Consulting Services -
PFC Consulting Ltd
Funding Renewables
Funding Backward
Linkages (eg coal mining, ports, LNG etc.)
PFC
Grow in existing
business

28
Thank You!
29
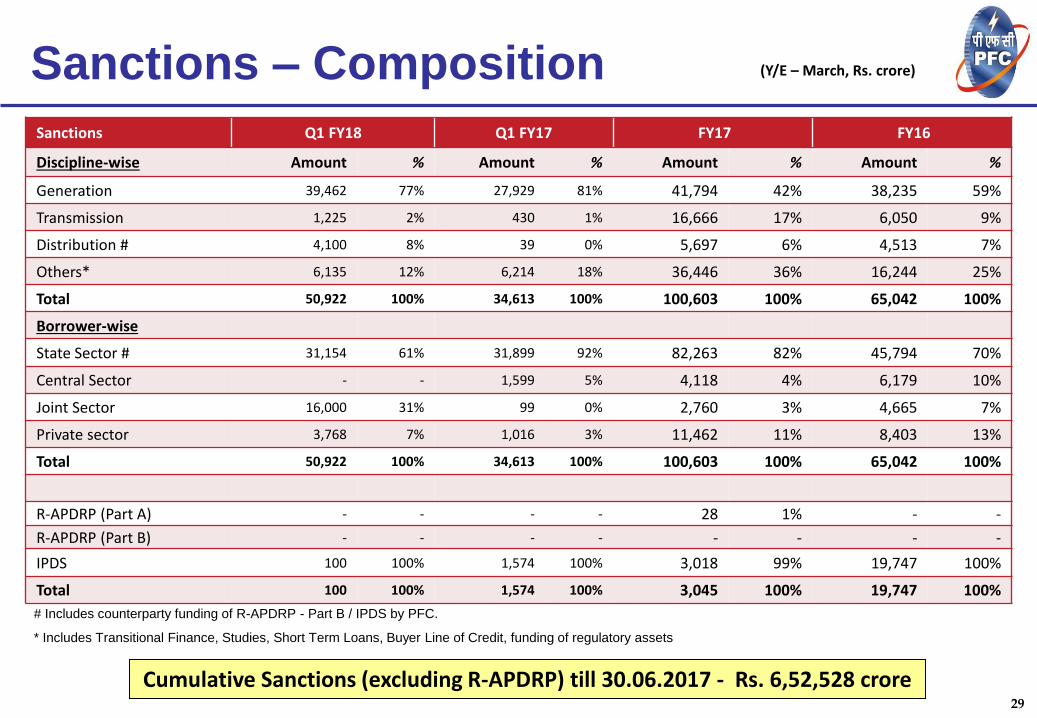
Sanctions – Composition
Sanctions Q1 FY18 Q1 FY17 FY17 FY16
Discipline-wise Amount % Amount % Amount % Amount %
Generation 39,462 77% 27,929 81% 41,794 42% 38,235 59%
Transmission 1,225 2% 430 1% 16,666 17% 6,050 9%
Distribution # 4,100 8% 39 0% 5,697 6% 4,513 7%
Others* 6,135 12% 6,214 18% 36,446 36% 16,244 25%
Total 50,922 100% 34,613 100% 100,603 100% 65,042 100%
Borrower-wise
State Sector # 31,154 61% 31,899 92% 82,263 82% 45,794 70%
Central Sector - - 1,599 5% 4,118 4% 6,179 10%
Joint Sector 16,000 31% 99 0% 2,760 3% 4,665 7%
Private sector 3,768 7% 1,016 3% 11,462 11% 8,403 13%
Total 50,922 100% 34,613 100% 100,603 100% 65,042 100%
R-APDRP (Part A) - - - - 28 1% - -
R-APDRP (Part B) - - - - - - - -
IPDS 100 100% 1,574 100% 3,018 99% 19,747 100%
Total 100 100% 1,574 100% 3,045 100% 19,747 100%
Cumulative Sanctions (excluding R-APDRP) till 30.06.2017 - Rs. 6,52,528 crore
# Includes counterparty funding of R-APDRP - Part B / IPDS by PFC.
* Includes Transitional Finance, Studies, Short Term Loans, Buyer Line of Credit, funding of regulatory assets
(Y/E – March, Rs. crore)
30
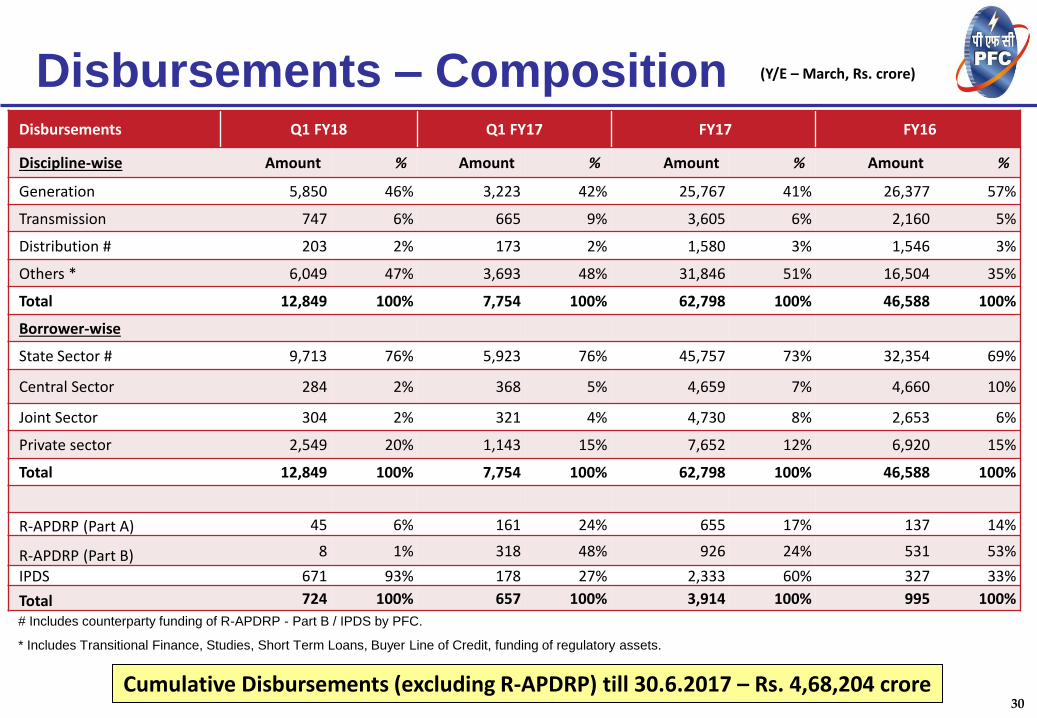
Disbursements – Composition
Cumulative Disbursements (excluding R-APDRP) till 30.6.2017 – Rs. 4,68,204 crore
# Includes counterparty funding of R-APDRP - Part B / IPDS by PFC.
* Includes Transitional Finance, Studies, Short Term Loans, Buyer Line of Credit, funding of regulatory assets.
Disbursements Q1 FY18 Q1 FY17 FY17 FY16
Discipline-wise Amount % Amount % Amount % Amount %
Generation 5,850 46% 3,223 42% 25,767 41% 26,377 57%
Transmission 747 6% 665 9% 3,605 6% 2,160 5%
Distribution # 203 2% 173 2% 1,580 3% 1,546 3%
Others * 6,049 47% 3,693 48% 31,846 51% 16,504 35%
Total 12,849 100% 7,754 100% 62,798 100% 46,588 100%
Borrower-wise
State Sector # 9,713 76% 5,923 76% 45,757 73% 32,354 69%
Central Sector 284 2% 368 5% 4,659 7% 4,660 10%
Joint Sector 304 2% 321 4% 4,730 8% 2,653 6%
Private sector 2,549 20% 1,143 15% 7,652 12% 6,920 15%
Total 12,849 100% 7,754 100% 62,798 100% 46,588 100%
R-APDRP (Part A) 45 6% 161 24% 655 17% 137 14%
R-APDRP (Part B) 8 1% 318 48% 926 24% 531 53%
IPDS 671 93% 178 27% 2,333 60% 327 33%
Total 724 100% 657 100% 3,914 100% 995 100%
(Y/E – March, Rs. crore)
31
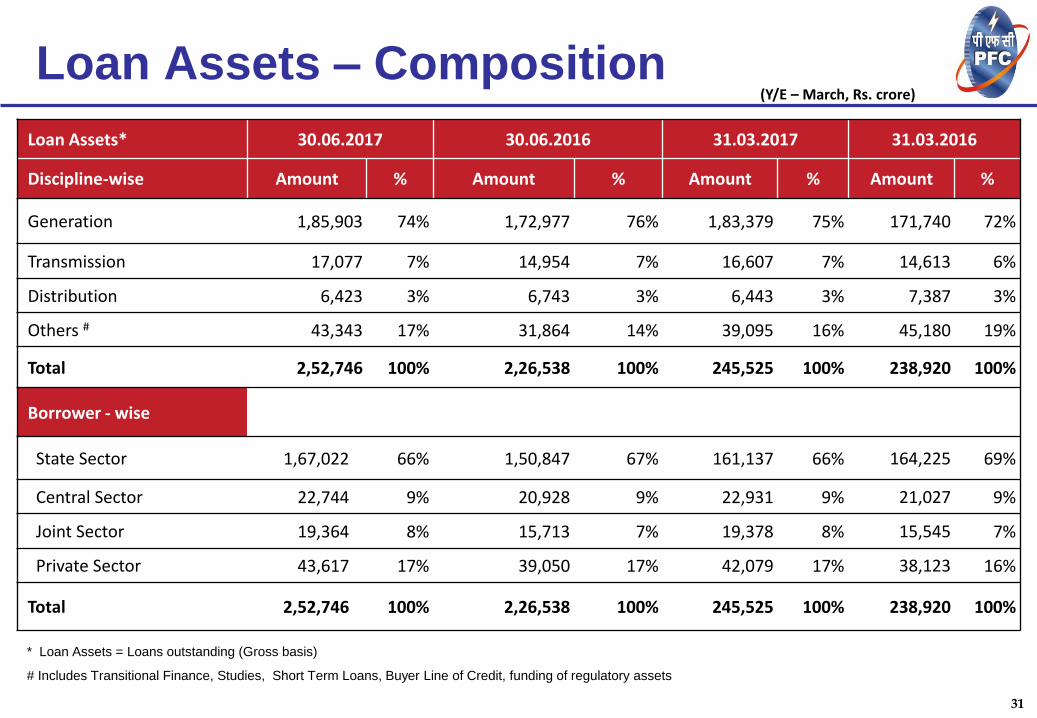
Loan Assets – Composition
Loan Assets* 30.06.2017 30.06.2016 31.03.2017 31.03.2016
Discipline-wise Amount % Amount % Amount % Amount %
Generation 1,85,903 74% 1,72,977 76% 1,83,379 75% 171,740 72%
Transmission 17,077 7% 14,954 7% 16,607 7% 14,613 6%
Distribution 6,423 3% 6,743 3% 6,443 3% 7,387 3%
Others # 43,343 17% 31,864 14% 39,095 16% 45,180 19%
Total 2,52,746 100% 2,26,538 100% 245,525 100% 238,920 100%
Borrower - wise
State Sector 1,67,022 66% 1,50,847 67% 161,137 66% 164,225 69%
Central Sector 22,744 9% 20,928 9% 22,931 9% 21,027 9%
Joint Sector 19,364 8% 15,713 7% 19,378 8% 15,545 7%
Private Sector 43,617 17% 39,050 17% 42,079 17% 38,123 16%
Total 2,52,746 100% 2,26,538 100% 245,525 100% 238,920 100%
* Loan Assets = Loans outstanding (Gross basis)
# Includes Transitional Finance, Studies, Short Term Loans, Buyer Line of Credit, funding of regulatory assets
(Y/E – March, Rs. crore)
32
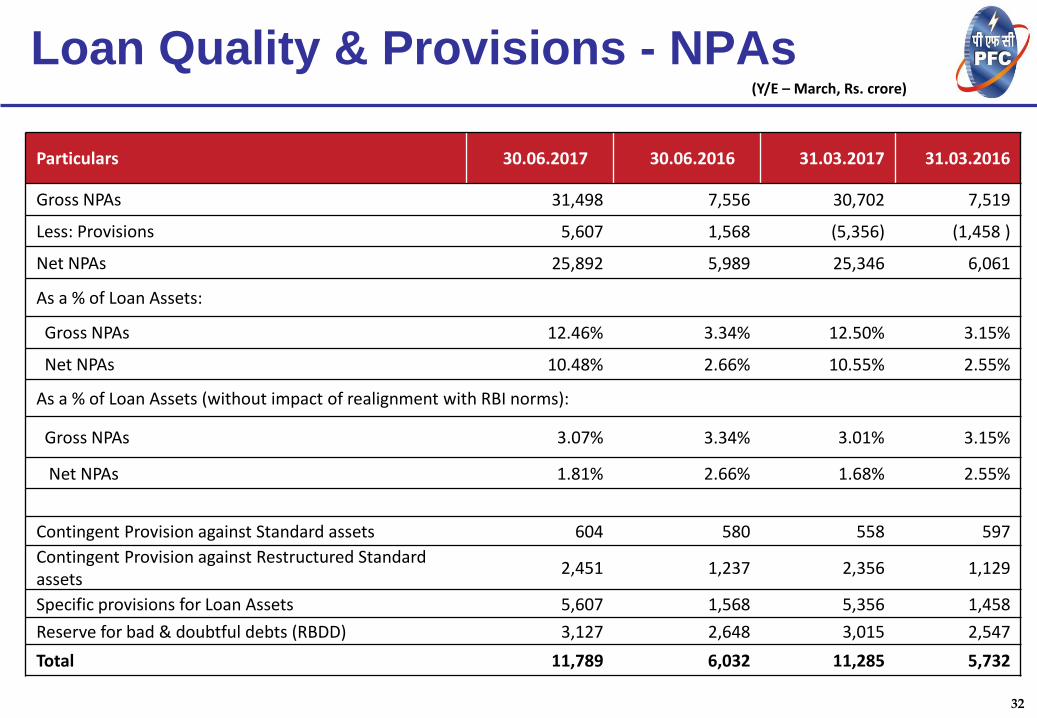
Loan Quality & Provisions - NPAs
Particulars 30.06.2017 30.06.2016 31.03.2017 31.03.2016
Gross NPAs 31,498 7,556 30,702 7,519
Less: Provisions 5,607 1,568 (5,356) (1,458 )
Net NPAs 25,892 5,989 25,346 6,061
As a % of Loan Assets:
Gross NPAs 12.46% 3.34% 12.50% 3.15%
Net NPAs 10.48% 2.66% 10.55% 2.55%
As a % of Loan Assets (without impact of realignment with RBI norms):
Gross NPAs 3.07% 3.34% 3.01% 3.15%
Net NPAs 1.81% 2.66% 1.68% 2.55%
Contingent Provision against Standard assets 604 580 558 597
Contingent Provision against Restructured Standard assets
2,451 1,237 2,356 1,129
Specific provisions for Loan Assets 5,607 1,568 5,356 1,458
Reserve for bad & doubtful debts (RBDD) 3,127 2,648 3,015 2,547
Total 11,789 6,032 11,285 5,732
(Y/E – March, Rs. crore)
33
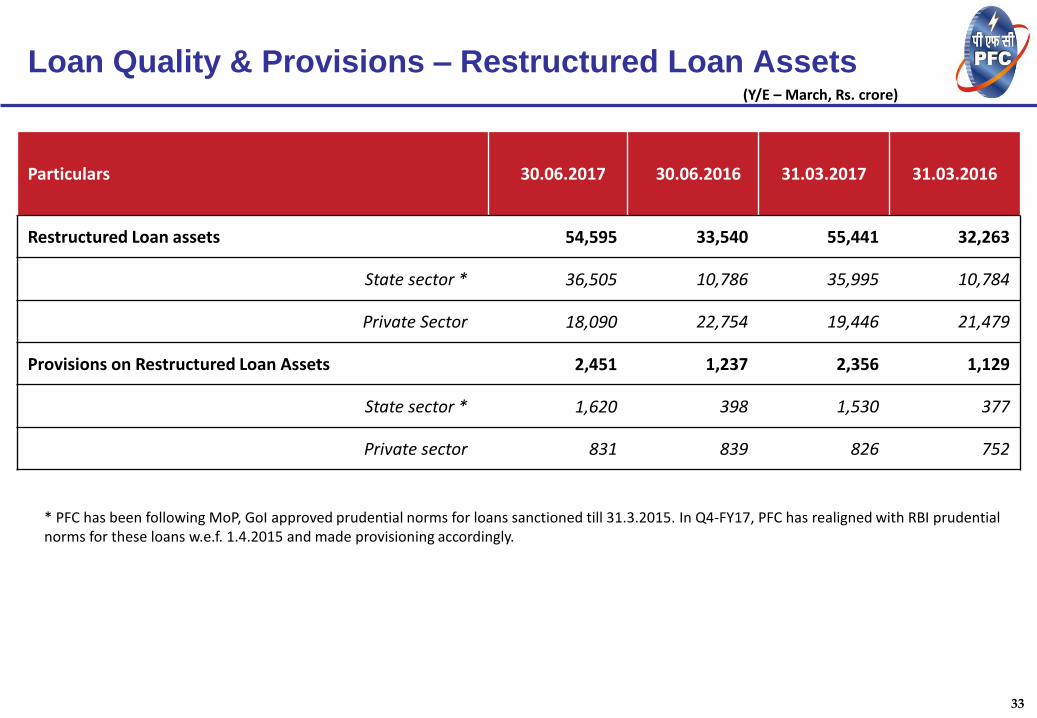
Loan Quality & Provisions – Restructured Loan Assets
Particulars 30.06.2017 30.06.2016 31.03.2017 31.03.2016
Restructured Loan assets 54,595 33,540 55,441 32,263
State sector * 36,505 10,786 35,995 10,784
Private Sector 18,090 22,754 19,446 21,479
Provisions on Restructured Loan Assets 2,451 1,237 2,356 1,129
State sector * 1,620 398 1,530 377
Private sector 831 839 826 752
* PFC has been following MoP, GoI approved prudential norms for loans sanctioned till 31.3.2015. In Q4-FY17, PFC has realigned with RBI prudential norms for these loans w.e.f. 1.4.2015 and made provisioning accordingly.
(Y/E – March, Rs. crore)
34
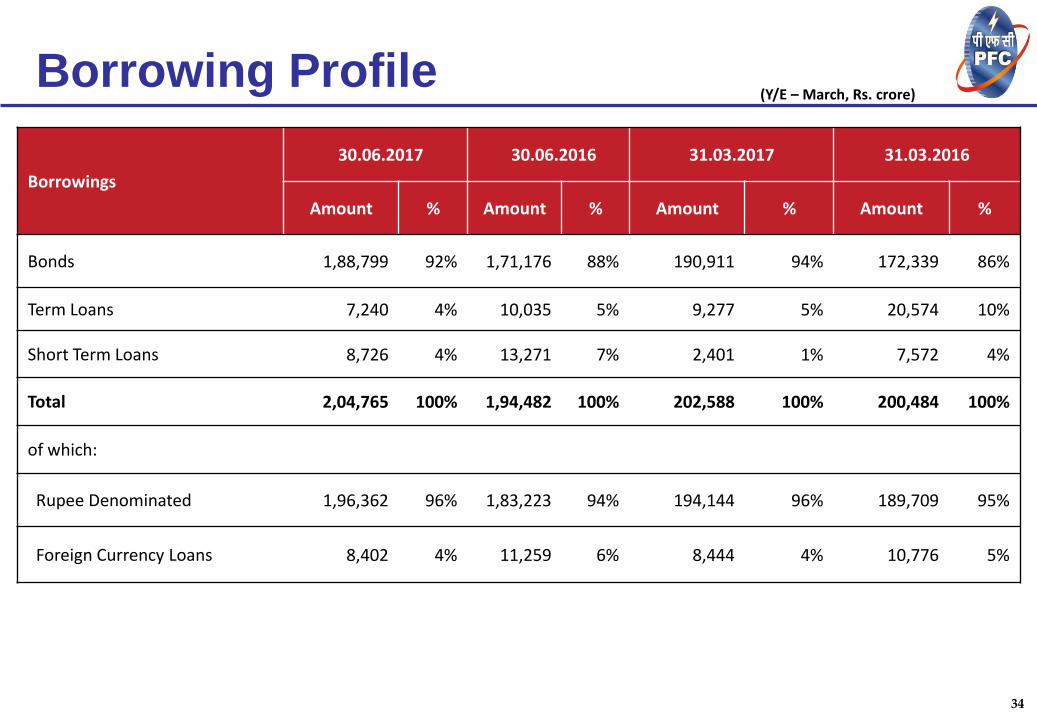
Borrowings
30.06.2017 30.06.2016 31.03.2017 31.03.2016
Amount % Amount % Amount % Amount %
Bonds 1,88,799 92% 1,71,176 88% 190,911 94% 172,339 86%
Term Loans 7,240 4% 10,035 5% 9,277 5% 20,574 10%
Short Term Loans 8,726 4% 13,271 7% 2,401 1% 7,572 4%
Total 2,04,765 100% 1,94,482 100% 202,588 100% 200,484 100%
of which:
Rupee Denominated 1,96,362 96% 1,83,223 94% 194,144 96% 189,709 95%
Foreign Currency Loans 8,402 4% 11,259 6% 8,444 4% 10,776 5%
Borrowing Profile (Y/E – March, Rs. crore)
35
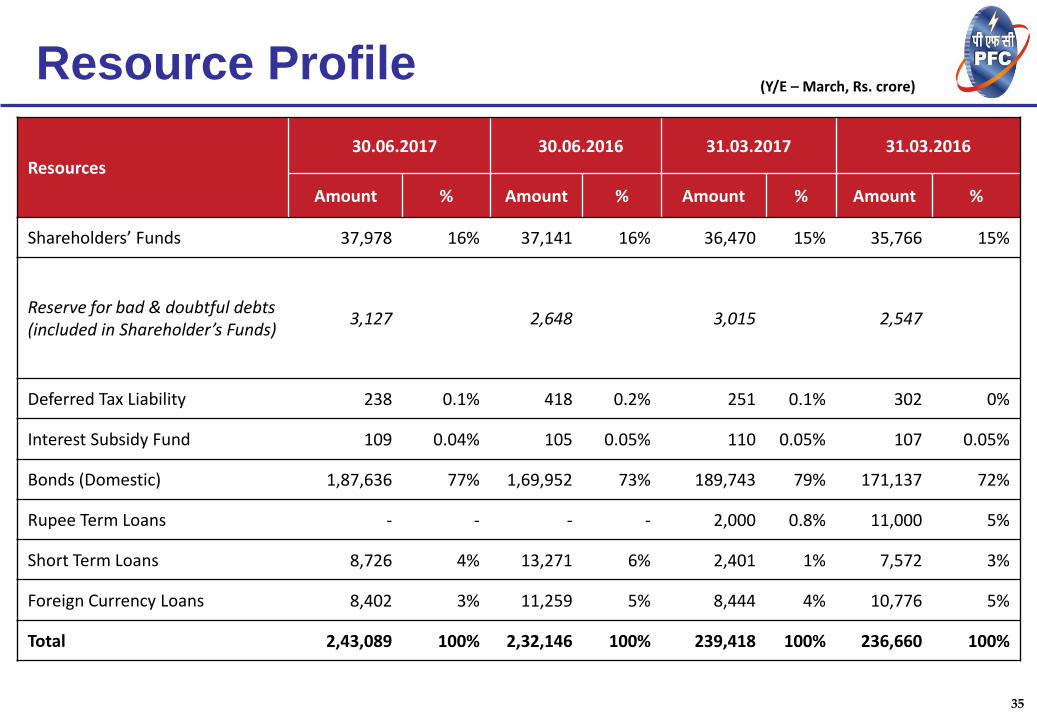
Resource Profile
Resources 30.06.2017 30.06.2016 31.03.2017 31.03.2016
Amount % Amount % Amount % Amount %
Shareholders’ Funds 37,978 16% 37,141 16% 36,470 15% 35,766 15%
Reserve for bad & doubtful debts (included in Shareholder’s Funds)
3,127 2,648 3,015 2,547
Deferred Tax Liability 238 0.1% 418 0.2% 251 0.1% 302 0%
Interest Subsidy Fund 109 0.04% 105 0.05% 110 0.05% 107 0.05%
Bonds (Domestic) 1,87,636 77% 1,69,952 73% 189,743 79% 171,137 72%
Rupee Term Loans - - - - 2,000 0.8% 11,000 5%
Short Term Loans 8,726 4% 13,271 6% 2,401 1% 7,572 3%
Foreign Currency Loans 8,402 3% 11,259 5% 8,444 4% 10,776 5%
Total 2,43,089 100% 2,32,146 100% 239,418 100% 236,660 100%
(Y/E – March, Rs. crore)