Embed Size (px)
Citation preview
Information Statement
International Finance Corporation
International Finance Corporation (“IFC” or the “Corporation”) intends from time to time to issue its notes,bonds, structured debt securities or other evidences of indebtedness (“Securities”), with maturities and on termsdetermined by market conditions at the time of sale. The Securities may be sold to dealers or underwriters thatmay resell them in public offerings or otherwise, or they may be sold by IFC, either directly or through agents.
In connection with the sale of Securities issued at any particular time, the aggregate principal amount,maturity, interest rate(s) or method for determining such rate(s), interest payment dates, redemption premium (ifany), purchase price to be paid to IFC, provisions for redemption or other special terms, form and denominationof such Securities, information as to stock exchange listing and the names of the dealers, underwriters or agentsas well as other relevant information will be set forth in a prospectus, offering circular or informationmemorandum for such issuance or in related offering documents.
Except as otherwise indicated, in this Information Statement (1) all amounts are stated in currentUnited States dollars translated as indicated in the notes to the consolidated financial statements,Note A-Summary of significant accounting and related policies, remeasurement of foreign currency transactions,and (2) all information is given as of June 30, 2018.
AVAILABILITY OF INFORMATION
IFC will provide additional copies of this Information Statement to the public upon request and withoutcharge. Written or telephone requests should be directed to IFC’s principal office at 2121 Pennsylvania Avenue,N.W., Washington, D.C., 20433, Attention: Treasury Department, Tel: (202) 458-9230. IFC’s consolidatedfinancial statements and other information filed with the U.S. Securities and Exchange Commission (the“Commission”) may also be inspected at the offices of the Commission at Room 1580, 100 F Street, N.E.,Washington, D.C., 20549, and copies of such material may be obtained from the Public Reference section of theCommission at the above address at prescribed rates.
The Information Statement is also available on IFC’s website at http://www.ifc.org/investors. Otherdocuments on IFC’s website are not intended to be incorporated by reference in this Information Statement.
Recipients of this Information Statement should retain it for future reference, as it is intended thateach prospectus, offering circular, information memorandum or other offering document will refer to thisInformation Statement for a description of IFC, its operations and financial status.
October 11, 2018
Pub
lic D
iscl
osur
e A
utho
rized
Pub
lic D
iscl
osur
e A
utho
rized
Pub
lic D
iscl
osur
e A
utho
rized
Pub
lic D
iscl
osur
e A
utho
rized
INTERNATIONAL FINANCE CORPORATION
Management’s Discussion and Analysis
SUMMARY INFORMATION
Except as otherwise indicated, all data are as of June 30, 2018.IFC is an international organization, established in 1956 to further economic growth in its developing member countries by promoting
private sector development. IFC is a member of the World Bank Group but is a legal entity separate and distinct from the International Bankfor Reconstruction and Development (“IBRD”), the International Development Association (“IDA”), the Multilateral Investment GuaranteeAgency (“MIGA”), and the International Centre for Settlement of Investment Disputes (“ICSID”) with its own Articles of Agreement, sharecapital, financial structure, management, and staff. Membership in IFC is open only to member countries of IBRD. The obligations of IFC arenot obligations of, or guaranteed by, IBRD or any government.
IFC is an experienced supranational organization providing financing and financial services primarily to the private sector in developingcountries that are members of IFC. It combines the characteristics of a multilateral development bank with those of a private financialinstitution. As of June 30, 2018, IFC’s entire share capital was held by 184 member countries. As of June 30, 2018, member countries of theOrganization for Economic Cooperation and Development (“OECD”) held 65.51% of the voting power of IFC. The five largest of IFC’s184 shareholders are the United States (20.99% of the total voting power), Japan (6.01%), Germany (4.77%), United Kingdom (4.48%), andFrance (4.48%). Generally, IFC charges market-based rates for its loans and seeks market returns on its equity investments and investments indebt securities. Unlike most other multilateral institutions, IFC does not accept host government guarantees of its loans. The financial strengthof IFC is based principally on the quality of its investment portfolio, its substantial paid-in capital and retained earnings, low debt to equityratio, the size of its liquid assets portfolio, its diversified earnings base and its profitability.
Basis of Preparation of IFC’s Consolidated Financial Statements. The accounting and reporting policies of IFC conform toaccounting principles generally accepted in the United States (GAAP). IFC’s accounting policies are discussed in more detail in the Section,Critical Accounting Policies and in Note A to IFC’s Consolidated Financial Statements as of and for the year ended June 30, 2018 (“FY18” or“FY18 Consolidated Financial Statements”).
Investment Products. As of June 30, 2018, IFC’s disbursed loan, equity, and debt securities investment portfolio (“disbursed investmentportfolio”) amounted to United States dollars (“US dollars” or “$”) 41.7 billion. Loans represented 60.3%, equity investments 26.3%, and debtsecurities 13.4% of the disbursed investment portfolio. The disbursed investment portfolio is diversified by country, region, industry, sector, andproject type. Risks are shared with other private sector investors as IFC does not generally provide financing for its own account for more than25% of project cost. IFC’s investment portfolio is subject to a number of key financial policies approved by its Board of Directors.
Liquid Assets. As of June 30, 2018, the fair value of IFC’s liquid assets portfolio (net of associated derivative instruments andsecurities lending activities) amounted to $38.9 billion, down from $39.2 billion at June 30, 2017. IFC’s liquid assets plus undrawnborrowings from IBRD are sufficient to cover all of IFC’s undisbursed loan and equity commitments. IFC’s overall liquidity policy is tomaintain a minimum level of liquidity, plus undrawn borrowing commitments from the IBRD, that would cover at least 45% of the next threeyears estimated cash requirements. IFC invests its liquid assets portfolio in highly rated interest bearing instruments issued by, orunconditionally guaranteed by, governments, government instrumentalities, multilateral organizations, and high quality corporate issuers;these include asset-backed securities (“ABS”) and mortgage-backed securities (“MBS”), time deposits and other unconditional obligations ofbanks and financial institutions. Diversification in multiple dimensions ensures a favorable risk return profile. IFC manages the market riskassociated with these investments through a variety of hedging techniques including derivatives, principally currency and interest rate swapsand financial futures.
Borrowings. IFC raises virtually all of the funds for its lending, equity and debt security investment activities through the issuance ofdebt obligations in the international capital markets, while maintaining a small borrowing window with IBRD. IFC diversifies its borrowingsby currency, country, source and maturity to provide flexibility and cost effectiveness. As of June 30, 2018, IFC’s outstanding borrowings,including fair value adjustments, totaled $53.1 billion. In addition, IFC undertakes a substantial volume of currency swap and interest rateswap transactions to convert its market borrowings into variable-rate US dollar liabilities.
Enterprise Risk Management. In executing its sustainable private sector development business, IFC assumes various risks. Activemanagement of these risks is critical to IFC’s ability to both maintain financial sustainability and achieve development impact.
IFC’s enterprise risk management framework (ERM) is designed to enable the prudent management of financial and reputational impactsthat originate from the Corporation’s business activities. In this context, IFC’s risk management efforts are designed specifically to help alignthe Corporation’s performance with its strategic direction. The ERM framework that IFC adopted in FY14 is aligned broadly with industrystandards and is designed to underpin IFC’s response to risk by defining IFC’s core risk management principles, a common risk taxonomy foruse across the organization, to help ensure that risk management efforts are coordinated and aligned across the distinct parts of theorganization that share responsibility for managing different aspects of risk, a standard classification of roles and responsibilities for riskmanagement, to differentiate and thereby clarify how different parts of the organization contribute towards the overall management of risk,and the structures, processes and methods that are necessary to put active risk management into practice.
Total Capital. As of June 30, 2018, IFC’s total capital amounted to $26.1 billion, including $23.3 billion in retained earnings, of which$0.2 billion has been designated for specific purposes. IFC’s reporting of capital adequacy is “Deployable Strategic Capital.” DeployableStrategic Capital is based on the Corporation’s Board of Director-approved risk based economic capital. Deployable Strategic Capital as apercentage of Total Resources Available (defined as paid-in capital plus retained earnings net of designated retained earnings plus general andspecific reserves against losses on loans) stood at 8.7% at June 30, 2018. Under IFC’s Articles of Agreement, so long as IFC has outstandingindebtedness to IBRD, IFC’s leverage, as measured by the ratio of IFC’s debt (borrowings plus outstanding guarantees) to equity (totalsubscribed capital plus retained earnings), may not exceed 4.0 to 1. At June 30, 2018, this ratio was 2.5 to 1.
The above information is supplemented and qualified by the additional informationand Consolidated Financial Statements and Notes thereto appearing elsewhere in this Information Statement.
2
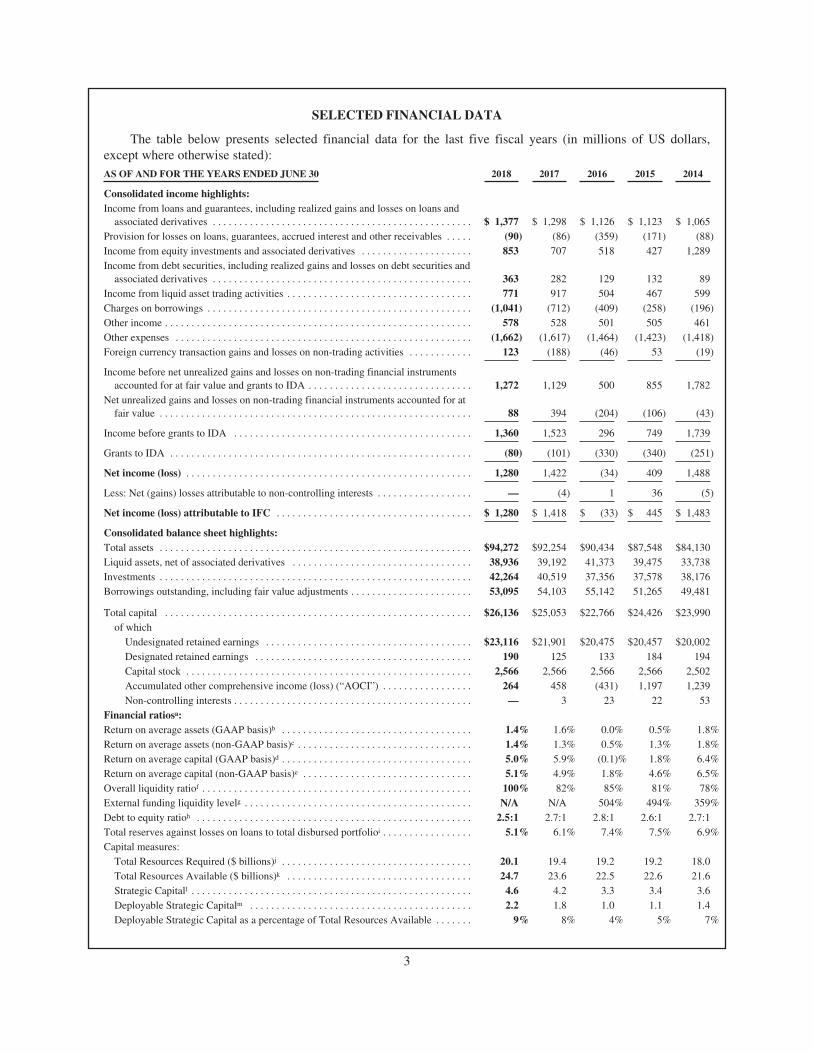
SELECTED FINANCIAL DATA
The table below presents selected financial data for the last five fiscal years (in millions of US dollars,except where otherwise stated):AS OF AND FOR THE YEARS ENDED JUNE 30 2018 2017 2016 2015 2014
Consolidated income highlights:Income from loans and guarantees, including realized gains and losses on loans and
associated derivatives . . . . . . . . . . . . . . . . . . . . . . . . . . . . . . . . . . . . . . . . . . . . . . . . . $ 1,377 $ 1,298 $ 1,126 $ 1,123 $ 1,065Provision for losses on loans, guarantees, accrued interest and other receivables . . . . . (90) (86) (359) (171) (88)Income from equity investments and associated derivatives . . . . . . . . . . . . . . . . . . . . . 853 707 518 427 1,289Income from debt securities, including realized gains and losses on debt securities and
associated derivatives . . . . . . . . . . . . . . . . . . . . . . . . . . . . . . . . . . . . . . . . . . . . . . . . . 363 282 129 132 89Income from liquid asset trading activities . . . . . . . . . . . . . . . . . . . . . . . . . . . . . . . . . . . 771 917 504 467 599Charges on borrowings . . . . . . . . . . . . . . . . . . . . . . . . . . . . . . . . . . . . . . . . . . . . . . . . . . (1,041) (712) (409) (258) (196)Other income . . . . . . . . . . . . . . . . . . . . . . . . . . . . . . . . . . . . . . . . . . . . . . . . . . . . . . . . . . 578 528 501 505 461Other expenses . . . . . . . . . . . . . . . . . . . . . . . . . . . . . . . . . . . . . . . . . . . . . . . . . . . . . . . . (1,662) (1,617) (1,464) (1,423) (1,418)Foreign currency transaction gains and losses on non-trading activities . . . . . . . . . . . . 123 (188) (46) 53 (19)
Income before net unrealized gains and losses on non-trading financial instrumentsaccounted for at fair value and grants to IDA . . . . . . . . . . . . . . . . . . . . . . . . . . . . . . . 1,272 1,129 500 855 1,782
Net unrealized gains and losses on non-trading financial instruments accounted for atfair value . . . . . . . . . . . . . . . . . . . . . . . . . . . . . . . . . . . . . . . . . . . . . . . . . . . . . . . . . . . 88 394 (204) (106) (43)
Income before grants to IDA . . . . . . . . . . . . . . . . . . . . . . . . . . . . . . . . . . . . . . . . . . . . . 1,360 1,523 296 749 1,739
Grants to IDA . . . . . . . . . . . . . . . . . . . . . . . . . . . . . . . . . . . . . . . . . . . . . . . . . . . . . . . . . (80) (101) (330) (340) (251)
Net income (loss) . . . . . . . . . . . . . . . . . . . . . . . . . . . . . . . . . . . . . . . . . . . . . . . . . . . . . . 1,280 1,422 (34) 409 1,488
Less: Net (gains) losses attributable to non-controlling interests . . . . . . . . . . . . . . . . . . — (4) 1 36 (5)
Net income (loss) attributable to IFC . . . . . . . . . . . . . . . . . . . . . . . . . . . . . . . . . . . . . $ 1,280 $ 1,418 $ (33) $ 445 $ 1,483
Consolidated balance sheet highlights:Total assets . . . . . . . . . . . . . . . . . . . . . . . . . . . . . . . . . . . . . . . . . . . . . . . . . . . . . . . . . . . $94,272 $92,254 $90,434 $87,548 $84,130Liquid assets, net of associated derivatives . . . . . . . . . . . . . . . . . . . . . . . . . . . . . . . . . . 38,936 39,192 41,373 39,475 33,738Investments . . . . . . . . . . . . . . . . . . . . . . . . . . . . . . . . . . . . . . . . . . . . . . . . . . . . . . . . . . . 42,264 40,519 37,356 37,578 38,176Borrowings outstanding, including fair value adjustments . . . . . . . . . . . . . . . . . . . . . . . 53,095 54,103 55,142 51,265 49,481
Total capital . . . . . . . . . . . . . . . . . . . . . . . . . . . . . . . . . . . . . . . . . . . . . . . . . . . . . . . . . . $26,136 $25,053 $22,766 $24,426 $23,990of which
Undesignated retained earnings . . . . . . . . . . . . . . . . . . . . . . . . . . . . . . . . . . . . . . . $23,116 $21,901 $20,475 $20,457 $20,002Designated retained earnings . . . . . . . . . . . . . . . . . . . . . . . . . . . . . . . . . . . . . . . . . 190 125 133 184 194Capital stock . . . . . . . . . . . . . . . . . . . . . . . . . . . . . . . . . . . . . . . . . . . . . . . . . . . . . . 2,566 2,566 2,566 2,566 2,502Accumulated other comprehensive income (loss) (“AOCI”) . . . . . . . . . . . . . . . . . 264 458 (431) 1,197 1,239Non-controlling interests . . . . . . . . . . . . . . . . . . . . . . . . . . . . . . . . . . . . . . . . . . . . . — 3 23 22 53
Financial ratiosa:Return on average assets (GAAP basis)b . . . . . . . . . . . . . . . . . . . . . . . . . . . . . . . . . . . . 1.4% 1.6% 0.0% 0.5% 1.8%Return on average assets (non-GAAP basis)c . . . . . . . . . . . . . . . . . . . . . . . . . . . . . . . . . 1.4% 1.3% 0.5% 1.3% 1.8%Return on average capital (GAAP basis)d . . . . . . . . . . . . . . . . . . . . . . . . . . . . . . . . . . . . 5.0% 5.9% (0.1)% 1.8% 6.4%Return on average capital (non-GAAP basis)e . . . . . . . . . . . . . . . . . . . . . . . . . . . . . . . . 5.1% 4.9% 1.8% 4.6% 6.5%Overall liquidity ratiof . . . . . . . . . . . . . . . . . . . . . . . . . . . . . . . . . . . . . . . . . . . . . . . . . . . 100% 82% 85% 81% 78%External funding liquidity levelg . . . . . . . . . . . . . . . . . . . . . . . . . . . . . . . . . . . . . . . . . . . N/A N/A 504% 494% 359%Debt to equity ratioh . . . . . . . . . . . . . . . . . . . . . . . . . . . . . . . . . . . . . . . . . . . . . . . . . . . . 2.5:1 2.7:1 2.8:1 2.6:1 2.7:1Total reserves against losses on loans to total disbursed portfolioi . . . . . . . . . . . . . . . . . 5.1% 6.1% 7.4% 7.5% 6.9%Capital measures:
Total Resources Required ($ billions)j . . . . . . . . . . . . . . . . . . . . . . . . . . . . . . . . . . . . 20.1 19.4 19.2 19.2 18.0Total Resources Available ($ billions)k . . . . . . . . . . . . . . . . . . . . . . . . . . . . . . . . . . . 24.7 23.6 22.5 22.6 21.6Strategic Capitall . . . . . . . . . . . . . . . . . . . . . . . . . . . . . . . . . . . . . . . . . . . . . . . . . . . . . 4.6 4.2 3.3 3.4 3.6Deployable Strategic Capitalm . . . . . . . . . . . . . . . . . . . . . . . . . . . . . . . . . . . . . . . . . . 2.2 1.8 1.0 1.1 1.4Deployable Strategic Capital as a percentage of Total Resources Available . . . . . . . 9% 8% 4% 5% 7%
3
a. Certain financial ratios, as described below, are calculated excluding the effects of unrealized gains and losses on investments, other non trading financialinstruments, AOCI, and impacts from consolidated Variable Interest Entities (VIEs).
b. Net income for the fiscal year as a percentage of the average of total assets at the end of such fiscal year and the previous fiscal year.c. Return on average assets is defined as Net income, excluding unrealized gains/losses on investments accounted for at fair value, income from consolidated
VIEs and net gains/losses on non-trading financial investments, as a percentage of total disbursed loan and equity investments (net of reserves), liquidassets net of repos, and other assets averaged for the current and previous fiscal year.
d. Net income for the fiscal year as a percentage of the average of total capital (excluding payments on account of pending subscriptions) at the end of suchfiscal year and the previous fiscal year.
e. Return on average capital is defined as Net income, excluding unrealized gains/losses on investments accounted for at fair value, income fromconsolidated VIEs and net gains/losses on non-trading financial investments, as percentage of the paid-in share capital and accumulated earnings (beforecertain unrealized gains/losses and excluding cumulative designations not yet expensed) averaged for the current and previous fiscal year.
f. Overall Liquidity Policy states that IFC would at all times maintain a minimum level of liquidity, plus undrawn borrowing commitments from the IBRD,that would cover at least 45% of the next three years’ estimated net cash requirements.
g. This ratio was discontinued at the end of FY17 since it was no longer considered a key ratio for IFC.h. Leverage (Debt/equity) ratio is defined as the number of times outstanding borrowings plus committed guarantees cover paid-in capital and accumulated
earnings (net of retained earnings designations and certain unrealized gains/losses).i. Total reserves against losses on loans to total disbursed loan portfolio is defined as reserve against losses on loans as a percentage of the total disbursed.j. Total resources required (TRR) is the minimum capital required to cover the expected and unexpected loss on IFC’s portfolio, calibrated to maintain IFC’s
triple-A rating. TRR is the sum of the economic capital requirements for IFC’s different assets, and it is determined by the absolute size of the committedportfolio, the product mix (equity, loans, short-term finance, and Treasury portfolio assets), and by operational and other risks.
k. Total resources available (TRA) is the total capital of the Corporation, consisting of (i) paid-in capital; (ii) retained earnings net of designations and someunrealized gains and losses; and (iii) total loan loss reserves. TRA grows based on retained earnings (profit minus distributions) and increases in reserves.
l. Total resources available less total resources required.m. 90% of total resources available less total resources required.
USE OF PROCEEDS
The net proceeds to IFC from the sale of the Securities will normally be used for the general operations ofIFC in accordance with its Articles of Agreement.
FINANCIAL STRUCTURE OF IFC
Total assets were $94.3 billion at June 30, 2018 ($92.3 billion — June 30, 2017), including $38.9 billion inliquid assets, net of associated derivatives ($39.2 billion — June 30, 2017) and $42.3 billion in the investmentportfolio, including fair value and other adjustments, and net of reserves against losses on loans ($40.5 billion —June 30, 2017). Total assets also include $2.8 billion in derivative assets at fair value ($2.6 billion — June 30,2017).
4
MANAGEMENT’S DISCUSSION AND ANALYSISAS OF AND FOR THE YEAR ENDED JUNE 30, 2018
EXECUTIVE SUMMARY
This executive overview of the Management’s Discussion and Analysis (MD&A) highlights selectedinformation and may not contain all of the information that is important to readers of this document. For acomplete description of the financial year’s performance, as well as the risks and critical accounting estimatesaffecting the International Finance Corporation (IFC or the Corporation), this MD&A should be read in itsentirety.
OVERVIEW
IFC is the largest global development institution focused on the private sector in developing countries.Established in 1956, IFC is owned by 184 member countries, a group that collectively determines its policies.IFC is a member of the World Bank Group (WBG)1 but is a legal entity separate and distinct from IBRD, IDA,MIGA, and ICSID, with its own Articles of Agreement, share capital, financial structure, management, and staff.Membership in IFC is open only to member countries of IBRD.
The mission of the WBG is defined by two goals (the Twin Goals): to end extreme poverty by reducing thepercentage of people living on less than $1.90 per day to no more than 3% globally by 2030; and to promoteshared prosperity in a sustainable manner by fostering income growth for the bottom 40% of the population ofevery developing country.
STRATEGY AND BUSINESS OUTLOOK
The Forward Look: A Vision for the World Bank Group in 2030 (the Forward Look), endorsed byshareholders in 2016, crystallized a shared vision for how the WBG can help its clients achieve the Twin Goalsand the 2030 Development Agenda. It describes how the WBG will deliver sustainable and inclusive growth,invest in human capital, and strengthen resilience through four pillars: providing services to all clients; scaling upmobilization, while expanding the use of private sector solutions; taking stronger leadership on global issues; andbuilding a more efficient and effective business model.
The WBG has achieved significant progress in the implementation of the Forward Look. This includes theIDA scale up and strengthened engagement in small states and countries affected by fragility, conflict, andviolence (FCV); the launch of the Cascade/Maximizing Finance for Development approach, which is fosteringgreater partnership across IFC and IBRD; expanded efforts across the WBG on the climate and gender agendasreforms to make each institution of the WBG more agile and cost-effective.
Each WBG entity has outlined common as well as institution-specific directions, and a proposed workprogram and budget trajectory to achieve those directions. The key joint WBG priority over the coming yearswill be to mainstream the Cascade/MFD into operational work, including expanding its scope beyondinfrastructure to the Small and Medium Enterprise (SME), Finance, Human Development and other sectors. Inaddition, the WBG is committed to enhancing synergies that strengthen its global leadership and impact in arange of areas, notably in climate change, gender, jobs, knowledge, and pandemics. In implementing itsindividual strategy, each WBG institution is also committed to promoting greater cost-effectiveness andefficiency.
As part of its mission to serve all clients, IFC will execute its strategy by, inter alia, addressing constraints toprivate sector investment in fragile and low-income countries and directing more financing to these geographies.New tools are being deployed under IFC’s strategy (IFC 3.0) to allow IFC to support upstream market creation inFCS, IDA countries and small states. IFC will also maintain a robust presence in Middle-Income Countries(MICs) — by helping to address challenges such as infrastructure needs, urbanization, and climate change, andby supporting innovative, replicable business models.
1 The other institutions of the World Bank Group are the International Bank for Reconstruction and Development (IBRD), the International DevelopmentAssociation (IDA), the Multilateral Investment Guaranty Agency (MIGA), and the International Centre for Settlement of Investment Disputes (ICSID).
5
Following the Spring Meetings in April 2018, a financing package, comprising: (i) a three-step capitalraising process: Conversion of a portion of retained earnings into paid-in capital, a Selective Capital Increase(SCI) and a General Capital Increase (GCI) that would provide up to $5.5 billion in additional paid-in capital;(ii) a planned suspension of grants to IDA after the conclusion of the IDA 182 replenishment cycle; and(iii) internal measures for increased efficiency was endorsed by the Board of Governors.
BUSINESS MODEL
IFC helps developing countries achieve sustainable growth by financing private sector investment,mobilizing capital in international financial markets, and providing advisory services to businesses andgovernments. IFC’s principal investment products are loans and equity investments, with smaller debt securityand guarantee portfolios. IFC also plays an active and direct role in mobilizing additional funding from otherinvestors and lenders through a variety of means. Such means principally comprise: loan participations, parallelloans, sales of loans, the non-IFC portion of structured finance transactions which meet core mobilizationcriteria, the non-IFC portion of commitments in IFC’s initiatives, and the non-IFC investment portion ofcommitments in funds managed by IFC’s wholly owned subsidiary, IFC Asset Management Company LLC(AMC), (collectively Core Mobilization). Unlike most other development institutions, IFC does not accept hostgovernment guarantees of its exposures. IFC raises virtually all of the funds for its lending activities through theissuance of debt obligations in the international capital markets, while maintaining a small borrowing windowwith IBRD. Equity investments are funded from capital (or net worth).
IFC’s capital base and its assets and liabilities, other than its equity investments, are primarily denominatedin US dollars ($ or US$) or swapped into US dollars but it has a growing portion of debt issuances denominatedin currencies other than USD and which are invested in such currencies. Overall, IFC seeks to minimize foreignexchange and interest rate risks arising from its loans and liquid assets by closely matching the currency and ratebases of its assets in various currencies with liabilities having the same characteristics. IFC generally managesnon-equity investment related and certain lending related residual currency and interest rate risks by utilizingcurrency and interest rate swaps and other derivative instruments.
The Management’s Discussion and Analysis contains forward looking statements which may be identifiedby such terms as “anticipates,” “believes,” “expects,” “intends,” “plans” or words of similar meaning. Suchstatements involve a number of assumptions and estimates that are based on current expectations, which aresubject to risks and uncertainties beyond IFC’s control. Consequently, actual future results could differ materiallyfrom those currently anticipated.
BASIS OF PREPARATION OF IFC’S CONSOLIDATED FINANCIAL STATEMENTS
The accounting and reporting policies of IFC conform to accounting principles generally accepted in theUnited States (GAAP). IFC’s accounting policies are discussed in more detail in Section VI, Critical AccountingPolicies, and in Note A to IFC’s Consolidated Financial Statements as of and for the year ended June 30, 2018(FY18 or FY18 Consolidated Financial Statements).
Management uses income available for designations (Allocable Income) (a non-GAAP measure) as a basisfor designations of retained earnings. Allocable Income generally comprises net income excluding net unrealizedgains and losses on equity investments and net unrealized gains and losses on non-trading financial instrumentsaccounted for at fair value, income from consolidated entities other than AMC, and expenses reported in netincome related to prior year designations.
FINANCIAL PERFORMANCE SUMMARY
From year to year, IFC’s net income is affected by a number of factors that can result in volatile financialperformance.
2 A replenishment occurs every three years and involves donors and borrower representatives determining IDA’s strategic directions, financing, and allocationrules.
6
Global equity markets in emerging economies have been volatile in recent years but there was an overallimproved operating environment in FY18, despite a decline in the fourth quarter of FY18 (FY18 Q4). IFC’smajor investment currencies remained relatively stable against IFC’s reporting currency, the US$, through muchof FY18 until significant depreciation in a number of such currencies during FY18 Q4. Overall commodity pricesrose during FY18, although there were mixed results across the various sectors.
The market volatility, together with project-specific developments, impacts the valuations of IFC’sinvestments and overall financial results. IFC recorded higher income from equity investments and associatedderivatives in FY18, compared to FY17, driven largely by lower impairments. IFC also recorded higher incomefrom loans and guarantees due to the increase in interest rates and an increase in income from debt securitiesdriven by higher average balances. FY17 income from loans was positively impacted by a onetime recognition ofinterest income as a result of a full prepayment of a loan. However, IFC also recorded higher borrowing charges,consistent with the increase in interest rates, and lower income from liquid asset trading activities. Specificprovisions for losses on loans declined substantially in FY18, led by project-specific developments, but wasoffset by an increase in general provisions on loans as FY17 included a one-time release of $156 million from theimplementation of a new risk rating system.
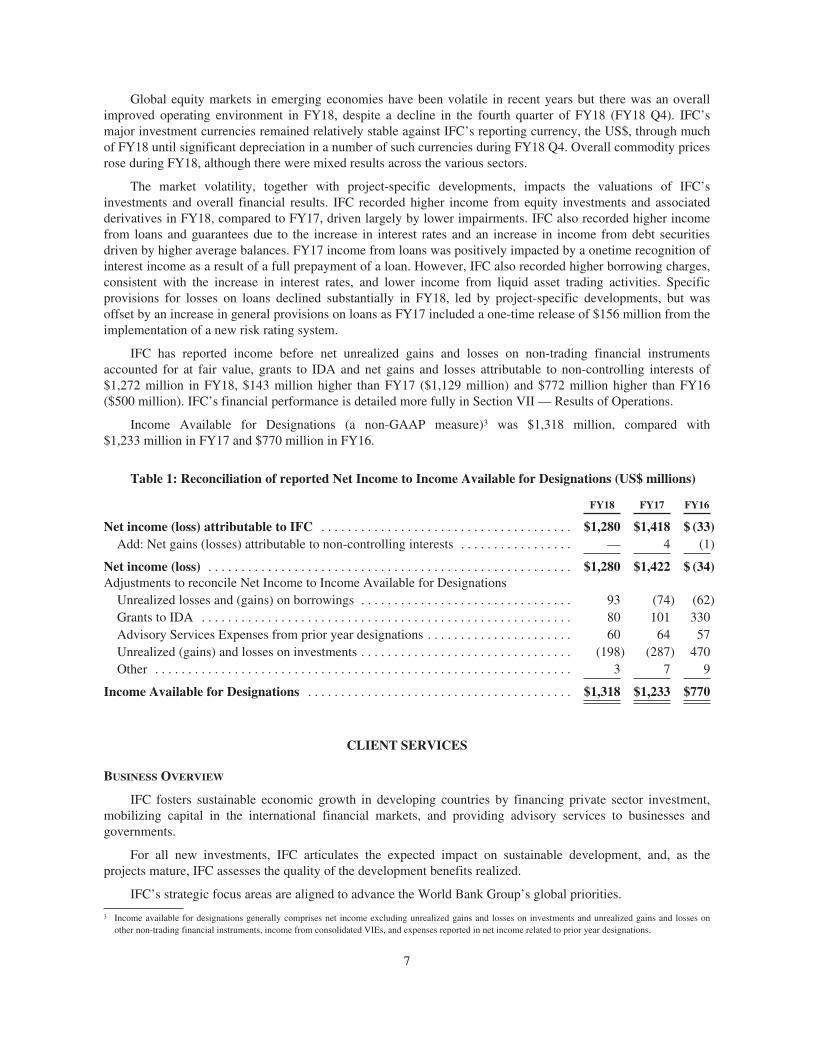
IFC has reported income before net unrealized gains and losses on non-trading financial instrumentsaccounted for at fair value, grants to IDA and net gains and losses attributable to non-controlling interests of$1,272 million in FY18, $143 million higher than FY17 ($1,129 million) and $772 million higher than FY16($500 million). IFC’s financial performance is detailed more fully in Section VII — Results of Operations.
Income Available for Designations (a non-GAAP measure)3 was $1,318 million, compared with$1,233 million in FY17 and $770 million in FY16.
Table 1: Reconciliation of reported Net Income to Income Available for Designations (US$ millions)
FY18 FY17 FY16
Net income (loss) attributable to IFC . . . . . . . . . . . . . . . . . . . . . . . . . . . . . . . . . . . . . . $1,280 $1,418 $ (33)Add: Net gains (losses) attributable to non-controlling interests . . . . . . . . . . . . . . . . . — 4 (1)
Net income (loss) . . . . . . . . . . . . . . . . . . . . . . . . . . . . . . . . . . . . . . . . . . . . . . . . . . . . . . . $1,280 $1,422 $ (34)Adjustments to reconcile Net Income to Income Available for Designations
Unrealized losses and (gains) on borrowings . . . . . . . . . . . . . . . . . . . . . . . . . . . . . . . . 93 (74) (62)Grants to IDA . . . . . . . . . . . . . . . . . . . . . . . . . . . . . . . . . . . . . . . . . . . . . . . . . . . . . . . . 80 101 330Advisory Services Expenses from prior year designations . . . . . . . . . . . . . . . . . . . . . . 60 64 57Unrealized (gains) and losses on investments . . . . . . . . . . . . . . . . . . . . . . . . . . . . . . . . (198) (287) 470Other . . . . . . . . . . . . . . . . . . . . . . . . . . . . . . . . . . . . . . . . . . . . . . . . . . . . . . . . . . . . . . . 3 7 9
Income Available for Designations . . . . . . . . . . . . . . . . . . . . . . . . . . . . . . . . . . . . . . . . $1,318 $1,233 $770
CLIENT SERVICES
BUSINESS OVERVIEW
IFC fosters sustainable economic growth in developing countries by financing private sector investment,mobilizing capital in the international financial markets, and providing advisory services to businesses andgovernments.
For all new investments, IFC articulates the expected impact on sustainable development, and, as theprojects mature, IFC assesses the quality of the development benefits realized.
IFC’s strategic focus areas are aligned to advance the World Bank Group’s global priorities.
3 Income available for designations generally comprises net income excluding unrealized gains and losses on investments and unrealized gains and losses onother non-trading financial instruments, income from consolidated VIEs, and expenses reported in net income related to prior year designations.
7
INVESTMENT SERVICES
IFC’s investments are normally made in its developing member countries. The Articles of Agreementmandate that IFC shall invest in productive private enterprises. The requirement for private ownership does notdisqualify enterprises that are partly owned by the public sector if such enterprises are organized under localcommercial and corporate law, operate free of host government control in a market context and according toprofitability criteria, and/or are in the process of being totally or partially privatized.
IFC provides a range of financial products and services to its clients to promote sustainable enterprises,encourage entrepreneurship, and mobilize resources that wouldn’t otherwise be available. IFC’s financingproducts are tailored to meet the needs of each project. Investment services product lines include: loans, equityinvestments, trade finance, loan participations, structured finance, client risk management services, and blendedfinance.
IFC’s investment project cycle can be divided into the following stages:
• Business Development
• Concept Review
• Appraisal (Due Diligence)
• Investment Review
• Negotiations
• Public Disclosure
• Board of Directors Review and Approval
• Commitment
• Disbursement of funds
• Project Supervision and Development Outcome Tracking
• Evaluation
• Closing
IFC supervises its projects to monitor project performance and compliance with contractual obligations andwith IFC’s internal policies and procedures.
Investment products
Loans — IFC finances projects and companies through loans, typically for seven to twelve years. IFC alsomakes loans to intermediary banks, leasing companies, and other financial institutions for on-lending. IFCprovides long-term local-currency solutions and helps companies access local capital markets through loans fromIFC denominated in local currency, derivatives which allow clients to hedge existing or new foreign currencydenominated liabilities back in to the client’s local currency, and structured finance which enable clients toborrow in local currency from other sources. While IFC’s loans have traditionally been denominated in thecurrencies of major industrial nations, IFC has made it a priority to structure local-currency products based onclient demand and on IFC’s ability to economically hedge loans in these currencies through the use of crosscurrency swaps or forward contracts.
Loans generally have the following characteristics:
• Term — typically amortizing with final maturities generally for seven to twelve years, although someloans have been made for tenors as long as 20 years.
• Currency — primarily in major convertible currencies, principally US dollar, and to a lesser extent, Euro,but with a growing local-currency loan portfolio.
8
• Interest rate — typically variable (or fixed and swapped into variable).
• Pricing — reflects such factors as market conditions and country and project risks.
Equity — IFC’s equity investments provide developmental support and long-term growth capital thatprivate enterprises need. IFC invests directly in companies’ equity, and through private-equity funds. IFCgenerally invests between 5 and 20 percent of a company’s equity. IFC’s equity investments are typically in theform of common or preferred stock which is not mandatorily redeemable by the issuer or puttable to the issuer byIFC. Equity investments are usually denominated in the currency of the country in which the investment is made.IFC also uses put and call options, profit participation features, conversion features, warrants and other types ofinstruments in managing its equity investments.
Debt Securities — Investments typically in the form of bonds and notes issued in bearer or registered form,securitized debt obligations (e.g. asset-backed securities (ABS), mortgage-backed securities (MBS), and othercollateralized debt obligations) and preferred shares that are mandatorily redeemable by the issuer or puttable tothe issuer by IFC.
Guarantees and Partial Credit Guarantees — IFC offers partial credit guarantees to clients covering, on arisk-sharing basis, client obligations on bonds and/or loans. IFC’s guarantee is available for debt instruments andtrade obligations of clients and covers commercial as well as noncommercial risks. IFC will provide localcurrency guarantees, but when a guarantee is called, the client will generally be obligated to reimburse IFC in USdollar terms.
Client Risk Management Services — IFC extends long-maturity risk management products to clients indeveloping countries. IFC provides derivative products to its clients to allow them to hedge their interest rate,currency, or commodity-price exposures. IFC intermediates between clients in developing countries andderivatives market makers to provide such clients with access to risk-management products to bridge the creditgap between its clients and the market.
Loan Mobilization — IFC promotes development by mobilizing financing for the private sector in itsdeveloping member countries. IFC mobilizes funds through loan participation programs, parallel loans and aManaged Co-Lending Portfolio Program (MCPP).
Loan Participations: Through its “B Loan Program”, IFC offers commercial banks and other financialinstitutions the opportunity to lend to IFC-financed projects. These loans are a key part of IFC’s efforts tomobilize additional private sector financing in developing countries, thereby broadening the Corporation’sdevelopmental impact. Through the B Loan Program, financial institutions share fully in the commercial creditrisk of projects, while IFC remains the lender of record. When IFC participates a B Loan, it always maintains anA Loan for its own account. An A Loan Participation (ALP) is an exposure management tool which IFC uses toreduce its risk exposures to a client, country or sector. An ALP is created through the partial sale of an IFC ALoan to commercial banks or other financial institutions and is governed in much the same way as a B Loan. IFCremains the lender of record and an ALP participant shares all project risks with IFC.
Parallel Loans: IFC acts as an arranger (and can also act as an administrative agent) by using its existingmobilization platform, deal-structuring expertise and global presence to identify investments, perform duediligence, and negotiate loan documents in cooperation with parallel lenders.
Managed Co-lending Portfolio Program: MCPP allows institutional investors the opportunity to passivelyparticipate in IFC’s future loan portfolio. Investors provide capital on a portfolio basis, which can be deployed byIFC in individual investments in accordance with IFC’s strategy and processes. Through MCPP, IFC can expandits base of co-lending partners to include investors that do not have the capacity to invest on a “deal by deal”basis.
Trade and Supply Chain Finance — IFC’s Global Trade Finance Program (GTFP) guarantees trade-relatedpayment obligations of approved financial institutions. Separately, the Global Trade Liquidity Program (GTLP)and Critical Commodities Finance Program (CCFP) provides liquidity for trade in developing countries. IFC hasalso commenced a number of other Trade and Supply Chain Finance-related programs, including Global TradeSupplier Finance (GTSF), Global Warehouse Finance Program, Working Capital and Systemic Solutions andGlobal Trade Structured Trade.
9
Structured Finance — IFC uses structured and securitized products to provide forms of financing that maynot otherwise be available to clients to help clients diversify funding, extend maturities, and obtain financing inparticular currencies. Products include partial credit guarantees, structured liquidity facilities, portfolio risktransfer, securitizations, and Islamic finance.
Blended Finance — IFC combines concessional funds, typically from donor partners, with IFC’s resourcesto finance certain projects.
INVESTMENT PROGRAM
Commitments
In FY18, the Long-Term Finance program was $11,630 million, as compared to $11,854 million in FY17and Core Mobilization was $11,671 million, as compared to $7,462 million for FY17, a total increase of 21%.
In addition, the average outstanding balance for Short-Term Finance was $3,435 million at June 30, 2018, ascompared to $3,185 million at June 30, 2017.
Core mobilization
Core Mobilization is financing from entities other than IFC that becomes available to clients due to IFC’sdirect involvement in raising resources. IFC finances only a portion, usually not more than 25%, of the cost ofany project. All IFC-financed projects, therefore, require other financial partners. IFC mobilizes such privatesector finance from other entities through a number of means, as outlined in the Table below.
10
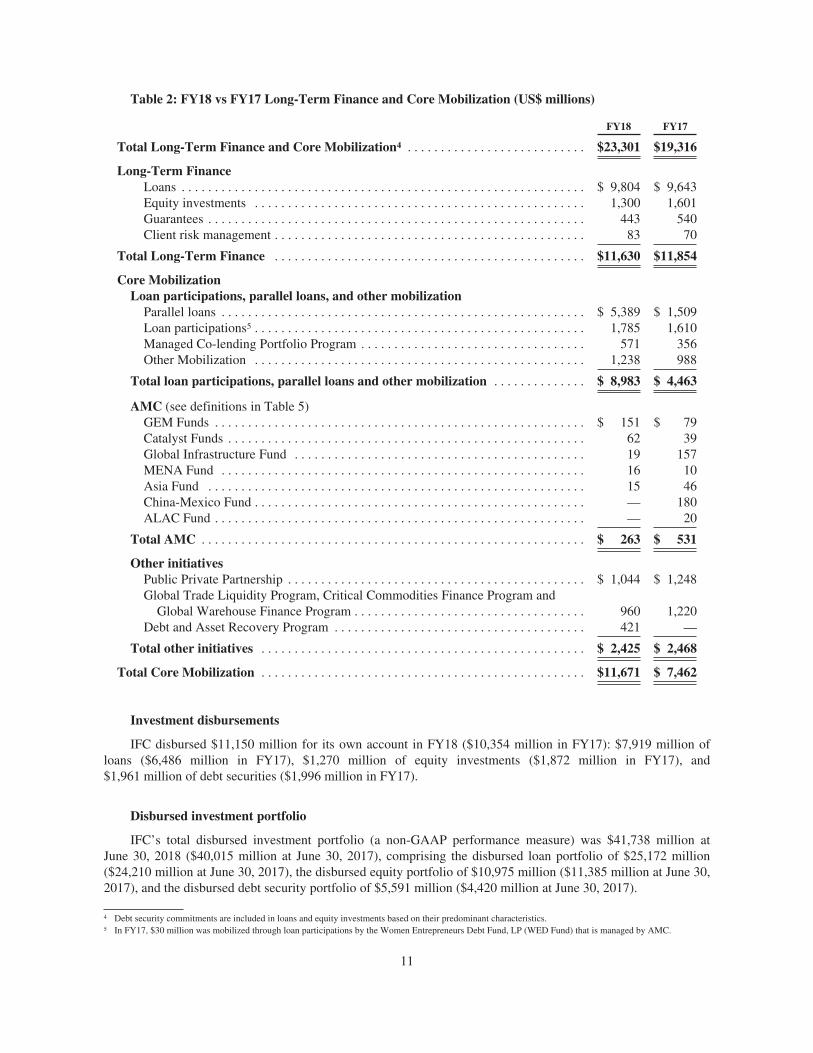
Table 2: FY18 vs FY17 Long-Term Finance and Core Mobilization (US$ millions)
FY18 FY17
Total Long-Term Finance and Core Mobilization4 . . . . . . . . . . . . . . . . . . . . . . . . . . . $23,301 $19,316
Long-Term FinanceLoans . . . . . . . . . . . . . . . . . . . . . . . . . . . . . . . . . . . . . . . . . . . . . . . . . . . . . . . . . . . . . $ 9,804 $ 9,643Equity investments . . . . . . . . . . . . . . . . . . . . . . . . . . . . . . . . . . . . . . . . . . . . . . . . . . 1,300 1,601Guarantees . . . . . . . . . . . . . . . . . . . . . . . . . . . . . . . . . . . . . . . . . . . . . . . . . . . . . . . . . 443 540Client risk management . . . . . . . . . . . . . . . . . . . . . . . . . . . . . . . . . . . . . . . . . . . . . . . 83 70
Total Long-Term Finance . . . . . . . . . . . . . . . . . . . . . . . . . . . . . . . . . . . . . . . . . . . . . . . $11,630 $11,854
Core MobilizationLoan participations, parallel loans, and other mobilization
Parallel loans . . . . . . . . . . . . . . . . . . . . . . . . . . . . . . . . . . . . . . . . . . . . . . . . . . . . . . . $ 5,389 $ 1,509Loan participations5 . . . . . . . . . . . . . . . . . . . . . . . . . . . . . . . . . . . . . . . . . . . . . . . . . . 1,785 1,610Managed Co-lending Portfolio Program . . . . . . . . . . . . . . . . . . . . . . . . . . . . . . . . . . 571 356Other Mobilization . . . . . . . . . . . . . . . . . . . . . . . . . . . . . . . . . . . . . . . . . . . . . . . . . . 1,238 988
Total loan participations, parallel loans and other mobilization . . . . . . . . . . . . . . $ 8,983 $ 4,463
AMC (see definitions in Table 5)GEM Funds . . . . . . . . . . . . . . . . . . . . . . . . . . . . . . . . . . . . . . . . . . . . . . . . . . . . . . . . $ 151 $ 79Catalyst Funds . . . . . . . . . . . . . . . . . . . . . . . . . . . . . . . . . . . . . . . . . . . . . . . . . . . . . . 62 39Global Infrastructure Fund . . . . . . . . . . . . . . . . . . . . . . . . . . . . . . . . . . . . . . . . . . . . 19 157MENA Fund . . . . . . . . . . . . . . . . . . . . . . . . . . . . . . . . . . . . . . . . . . . . . . . . . . . . . . . 16 10Asia Fund . . . . . . . . . . . . . . . . . . . . . . . . . . . . . . . . . . . . . . . . . . . . . . . . . . . . . . . . . 15 46China-Mexico Fund . . . . . . . . . . . . . . . . . . . . . . . . . . . . . . . . . . . . . . . . . . . . . . . . . . — 180ALAC Fund . . . . . . . . . . . . . . . . . . . . . . . . . . . . . . . . . . . . . . . . . . . . . . . . . . . . . . . . — 20
Total AMC . . . . . . . . . . . . . . . . . . . . . . . . . . . . . . . . . . . . . . . . . . . . . . . . . . . . . . . . . . $ 263 $ 531
Other initiativesPublic Private Partnership . . . . . . . . . . . . . . . . . . . . . . . . . . . . . . . . . . . . . . . . . . . . . $ 1,044 $ 1,248Global Trade Liquidity Program, Critical Commodities Finance Program and
Global Warehouse Finance Program . . . . . . . . . . . . . . . . . . . . . . . . . . . . . . . . . . . 960 1,220Debt and Asset Recovery Program . . . . . . . . . . . . . . . . . . . . . . . . . . . . . . . . . . . . . . 421 —
Total other initiatives . . . . . . . . . . . . . . . . . . . . . . . . . . . . . . . . . . . . . . . . . . . . . . . . . $ 2,425 $ 2,468
Total Core Mobilization . . . . . . . . . . . . . . . . . . . . . . . . . . . . . . . . . . . . . . . . . . . . . . . . . $11,671 $ 7,462
Investment disbursements
IFC disbursed $11,150 million for its own account in FY18 ($10,354 million in FY17): $7,919 million ofloans ($6,486 million in FY17), $1,270 million of equity investments ($1,872 million in FY17), and$1,961 million of debt securities ($1,996 million in FY17).
Disbursed investment portfolio
IFC’s total disbursed investment portfolio (a non-GAAP performance measure) was $41,738 million atJune 30, 2018 ($40,015 million at June 30, 2017), comprising the disbursed loan portfolio of $25,172 million($24,210 million at June 30, 2017), the disbursed equity portfolio of $10,975 million ($11,385 million at June 30,2017), and the disbursed debt security portfolio of $5,591 million ($4,420 million at June 30, 2017).
4 Debt security commitments are included in loans and equity investments based on their predominant characteristics.5 In FY17, $30 million was mobilized through loan participations by the Women Entrepreneurs Debt Fund, LP (WED Fund) that is managed by AMC.
11
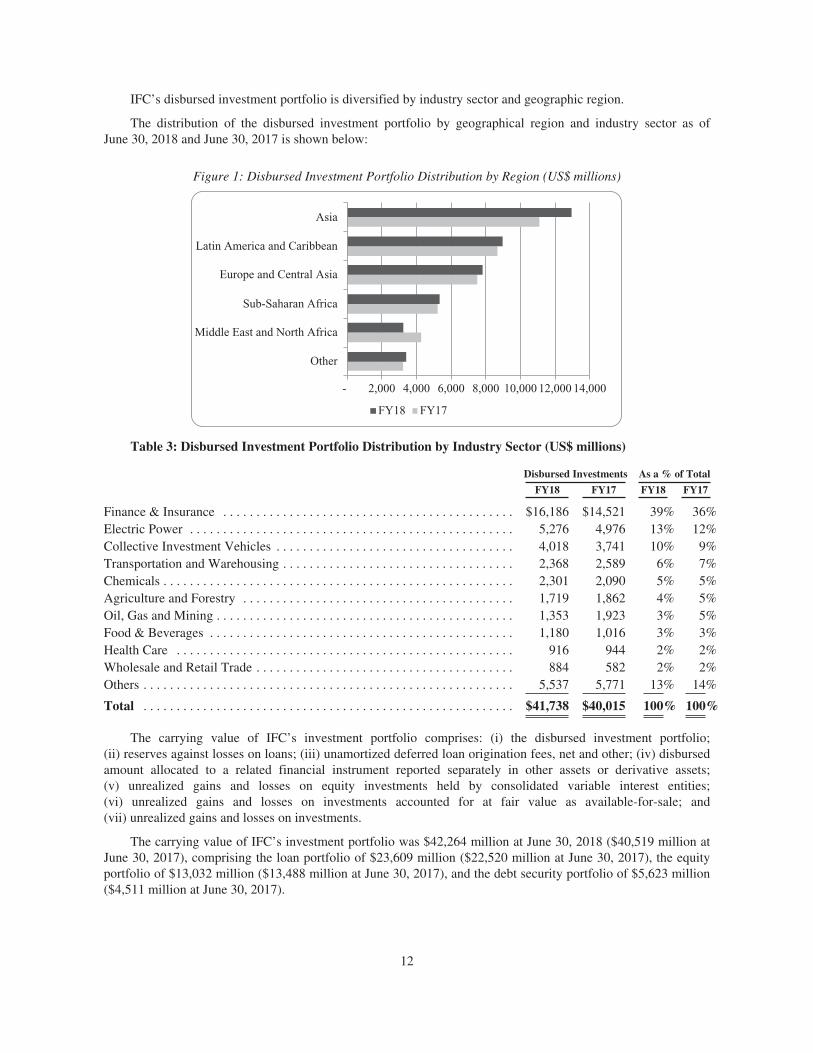
IFC’s disbursed investment portfolio is diversified by industry sector and geographic region.
The distribution of the disbursed investment portfolio by geographical region and industry sector as ofJune 30, 2018 and June 30, 2017 is shown below:
Figure 1: Disbursed Investment Portfolio Distribution by Region (US$ millions)
Other
Middle East and North Africa
Sub-Saharan Africa
Europe and Central Asia
Latin America and Caribbean
Asia
- 2,000 4,000 6,000 8,000 10,000 14,00012,000
FY18 FY17
Table 3: Disbursed Investment Portfolio Distribution by Industry Sector (US$ millions)
Disbursed Investments As a % of Total
FY18 FY17 FY18 FY17
Finance & Insurance . . . . . . . . . . . . . . . . . . . . . . . . . . . . . . . . . . . . . . . . . . . . $16,186 $14,521 39% 36%Electric Power . . . . . . . . . . . . . . . . . . . . . . . . . . . . . . . . . . . . . . . . . . . . . . . . . 5,276 4,976 13% 12%Collective Investment Vehicles . . . . . . . . . . . . . . . . . . . . . . . . . . . . . . . . . . . . 4,018 3,741 10% 9%Transportation and Warehousing . . . . . . . . . . . . . . . . . . . . . . . . . . . . . . . . . . . 2,368 2,589 6% 7%Chemicals . . . . . . . . . . . . . . . . . . . . . . . . . . . . . . . . . . . . . . . . . . . . . . . . . . . . . 2,301 2,090 5% 5%Agriculture and Forestry . . . . . . . . . . . . . . . . . . . . . . . . . . . . . . . . . . . . . . . . . 1,719 1,862 4% 5%Oil, Gas and Mining . . . . . . . . . . . . . . . . . . . . . . . . . . . . . . . . . . . . . . . . . . . . . 1,353 1,923 3% 5%Food & Beverages . . . . . . . . . . . . . . . . . . . . . . . . . . . . . . . . . . . . . . . . . . . . . . 1,180 1,016 3% 3%Health Care . . . . . . . . . . . . . . . . . . . . . . . . . . . . . . . . . . . . . . . . . . . . . . . . . . . 916 944 2% 2%Wholesale and Retail Trade . . . . . . . . . . . . . . . . . . . . . . . . . . . . . . . . . . . . . . . 884 582 2% 2%Others . . . . . . . . . . . . . . . . . . . . . . . . . . . . . . . . . . . . . . . . . . . . . . . . . . . . . . . . 5,537 5,771 13% 14%
Total . . . . . . . . . . . . . . . . . . . . . . . . . . . . . . . . . . . . . . . . . . . . . . . . . . . . . . . . $41,738 $40,015 100% 100%
The carrying value of IFC’s investment portfolio comprises: (i) the disbursed investment portfolio;(ii) reserves against losses on loans; (iii) unamortized deferred loan origination fees, net and other; (iv) disbursedamount allocated to a related financial instrument reported separately in other assets or derivative assets;(v) unrealized gains and losses on equity investments held by consolidated variable interest entities;(vi) unrealized gains and losses on investments accounted for at fair value as available-for-sale; and(vii) unrealized gains and losses on investments.
The carrying value of IFC’s investment portfolio was $42,264 million at June 30, 2018 ($40,519 million atJune 30, 2017), comprising the loan portfolio of $23,609 million ($22,520 million at June 30, 2017), the equityportfolio of $13,032 million ($13,488 million at June 30, 2017), and the debt security portfolio of $5,623 million($4,511 million at June 30, 2017).
12
Loans
Loans comprise 60% of the disbursed investment portfolio as of June 30, 2018 (61% at June 30, 2017) and56% of the carrying amount of the investment portfolio as of June 30, 2018 (56% at June 30, 2017).
IFC’s disbursed loan portfolio totaled $25,172 million at June 30, 2018 ($24,210 million at June 30, 2017), anincrease of 4.0%. The increase in the loan portfolio is due to new disbursements exceeding repayments($1,561 million in FY18), partially offset by reduction in loans outstanding due to write-offs net of recoveries($294 million in FY18) and currency exchange rate fluctuations ($199 million in FY18). IFC’s reporting currency,the US dollar, appreciated significantly against emerging market investment currencies in FY18 such as the Turkishlira, Brazilian real and Indian rupee. The remainder of the change is primarily due to loan sales and capital charges.The carrying amount of IFC’s loan portfolio on IFC’s consolidated balance sheet (comprising the disbursed loanportfolio together with adjustments as detailed in Note D to IFC’s FY18 Consolidated Financial Statements) grew4.8% to $23,609 million at June 30, 2018 ($22,520 million at June 30, 2017).
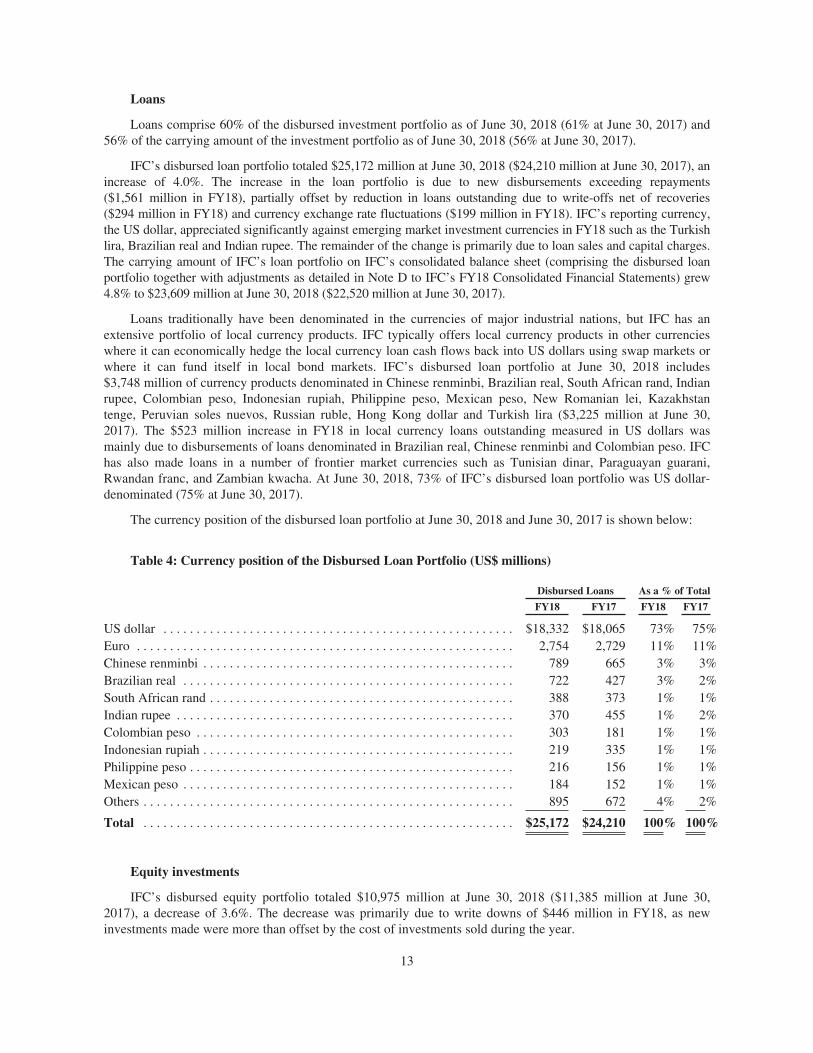
Loans traditionally have been denominated in the currencies of major industrial nations, but IFC has anextensive portfolio of local currency products. IFC typically offers local currency products in other currencieswhere it can economically hedge the local currency loan cash flows back into US dollars using swap markets orwhere it can fund itself in local bond markets. IFC’s disbursed loan portfolio at June 30, 2018 includes$3,748 million of currency products denominated in Chinese renminbi, Brazilian real, South African rand, Indianrupee, Colombian peso, Indonesian rupiah, Philippine peso, Mexican peso, New Romanian lei, Kazakhstantenge, Peruvian soles nuevos, Russian ruble, Hong Kong dollar and Turkish lira ($3,225 million at June 30,2017). The $523 million increase in FY18 in local currency loans outstanding measured in US dollars wasmainly due to disbursements of loans denominated in Brazilian real, Chinese renminbi and Colombian peso. IFChas also made loans in a number of frontier market currencies such as Tunisian dinar, Paraguayan guarani,Rwandan franc, and Zambian kwacha. At June 30, 2018, 73% of IFC’s disbursed loan portfolio was US dollar-denominated (75% at June 30, 2017).
The currency position of the disbursed loan portfolio at June 30, 2018 and June 30, 2017 is shown below:
Table 4: Currency position of the Disbursed Loan Portfolio (US$ millions)
Disbursed Loans As a % of Total
FY18 FY17 FY18 FY17
US dollar . . . . . . . . . . . . . . . . . . . . . . . . . . . . . . . . . . . . . . . . . . . . . . . . . . . . . $18,332 $18,065 73% 75%Euro . . . . . . . . . . . . . . . . . . . . . . . . . . . . . . . . . . . . . . . . . . . . . . . . . . . . . . . . . 2,754 2,729 11% 11%Chinese renminbi . . . . . . . . . . . . . . . . . . . . . . . . . . . . . . . . . . . . . . . . . . . . . . . 789 665 3% 3%Brazilian real . . . . . . . . . . . . . . . . . . . . . . . . . . . . . . . . . . . . . . . . . . . . . . . . . . 722 427 3% 2%South African rand . . . . . . . . . . . . . . . . . . . . . . . . . . . . . . . . . . . . . . . . . . . . . . 388 373 1% 1%Indian rupee . . . . . . . . . . . . . . . . . . . . . . . . . . . . . . . . . . . . . . . . . . . . . . . . . . . 370 455 1% 2%Colombian peso . . . . . . . . . . . . . . . . . . . . . . . . . . . . . . . . . . . . . . . . . . . . . . . . 303 181 1% 1%Indonesian rupiah . . . . . . . . . . . . . . . . . . . . . . . . . . . . . . . . . . . . . . . . . . . . . . . 219 335 1% 1%Philippine peso . . . . . . . . . . . . . . . . . . . . . . . . . . . . . . . . . . . . . . . . . . . . . . . . . 216 156 1% 1%Mexican peso . . . . . . . . . . . . . . . . . . . . . . . . . . . . . . . . . . . . . . . . . . . . . . . . . . 184 152 1% 1%Others . . . . . . . . . . . . . . . . . . . . . . . . . . . . . . . . . . . . . . . . . . . . . . . . . . . . . . . . 895 672 4% 2%
Total . . . . . . . . . . . . . . . . . . . . . . . . . . . . . . . . . . . . . . . . . . . . . . . . . . . . . . . . $25,172 $24,210 100% 100%
Equity investments
IFC’s disbursed equity portfolio totaled $10,975 million at June 30, 2018 ($11,385 million at June 30,2017), a decrease of 3.6%. The decrease was primarily due to write downs of $446 million in FY18, as newinvestments made were more than offset by the cost of investments sold during the year.
13
Equity investments accounted for 26% of IFC’s disbursed investment portfolio at June 30, 2018, comparedwith 28% at June 30, 2017 and 31% of the carrying amount of the investment portfolio at June 30, 2018 (33% atJune 30, 2017).
The carrying amount of IFC’s equity investment portfolio (comprising the disbursed equity portfolio,together with adjustments as detailed in Note D to IFC’s FY18 Consolidated Financial Statements), declined3.4% to $13,032 million at June 30, 2018 ($13,488 million at June 30, 2017).
The fair value of IFC’s equity portfolio6 was $15,283 million at June 30, 2018 ($15,353 million at June 30,2017).
Debt securities
IFC’s disbursed debt securities portfolio totaled $5,591 million at June 30, 2018 ($4,420 million at June 30,2017), an increase of 26%. The increase in the debt securities portfolio is due to new disbursements exceedingrepayments ($1,447 million in FY18), partially offset by reduction in balances outstanding due to currencyexchange rate fluctuations ($193 million in FY18) and other-than-temporary impairments ($39 million in FY18).
Debt securities accounted for 14% of IFC’s disbursed investment portfolio at June 30, 2018 (11% atJune 30, 2017) and 13% of the carrying amount of the investment portfolio at June 30, 2018 (11% at June 30,2017).
The carrying amount of IFC’s debt securities portfolio (comprising the disbursed debt securities portfolio,together with adjustments as detailed in Note D to IFC’s FY18 Consolidated Financial Statements), increased25% to $5,623 million at June 30, 2018 ($4,511 million at June 30, 2017).
Additional information on IFC’s investment portfolio as of and for the years ended June 30, 2018, andJune 30, 2017, can be found in Notes B, D, E, F, G, H, P and R to IFC’s FY18 Consolidated FinancialStatements.
Guarantees and partial credit guarantees
IFC offers partial credit guarantees to clients covering, on a risk-sharing basis, client obligations on bondsand/or loans. IFC’s guarantee is available for debt instruments and trade obligations of clients and coverscommercial as well as noncommercial risks. IFC will provide local currency guarantees, but when a guarantee iscalled, the client will generally be obligated to reimburse IFC in US dollar terms. Guarantee fees are consistentwith IFC’s loan pricing policies.
Guarantees of $4,096 million were outstanding (i.e., not called) at June 30, 2018 ($3,528 million at June 30,2017).
Investment portfolio management
At the core of IFC’s approach to portfolio management is the aim to build and proactively manage aportfolio that produces strong financial results and development impact. IFC achieves this through a combinationof strong presence on the ground and deep sector expertise, that enables IFC to stay close to its clients andmarkets, monitor trends and anticipate impacts on its portfolio of clients.
In order to provide continued corporate oversight to IFC’s portfolio, the Corporate Portfolio Committeeperiodically reviews the investment portfolio, looking both at broad trends as well as select individual assets,which are further complemented by monthly focused in-depth discussions of IFC’s key sector and countryexposures. Quarterly reviews of IFC’s portfolio results are presented to the Board, along with an in-depthanalysis at the end of the Fiscal Year. Our investment and portfolio teams, largely based in field offices,complement global reviews with asset-by-asset quarterly assessments, for both debt and equity investments.
6 Including “equity-like” securities classified as debt securities in IFC’s consolidated balance sheet and equity-related options.
14
At the corporate level, IFC combines the analysis of its portfolio performance with sector expertise andcountry/region market intelligence, and projections of global macroeconomic and market trends to informdecisions about future investments. IFC also regularly conducts stress tests to assess the performance of theportfolio against possible macroeconomic developments, and to identify and address risks.
At the asset level, IFC’s multidisciplinary teams, including investment and sector specialists with deepindustry expertise, closely monitor investment performance and compliance with investment agreements. IFCdoes this, among other things, through site visits to evaluate project implementation, and through activeengagement with sponsors and government officials, where relevant, to identify potential problems early on andformulate appropriate solutions. IFC also systematically and timely tracks environmental and social performance,and measure financial and development results.
Following strong historical growth of its equity portfolio, IFC’s equity portfolio declined in FY18 as a resultof a more moderate pace of new equity commitments combined with continued strong divestments. Additionally,IFC constantly assesses its equity portfolio proactively to identify assets ready for divestments, where IFC’sdevelopment role has been completed. This rebalancing of the equity portfolio is the result of an analysis thattakes into account market conditions, opportunities, expected returns, and risks, and is adjusted periodically asrequired. To strengthen this process, IFC has recently appointed Equity Heads of Industry, who provide centraloversight particularly of IFC’s larger and more complex equity positions.
For projects in financial distress, IFC’s Special Operations Department determines the appropriate remedialactions. It seeks to keep the project operational to achieve the development impact intended at its onset. It alsonegotiates agreements with creditors and shareholders to share the burden of restructuring.
Investors and other partners participating in IFC’s operations are kept regularly informed on projectdevelopments. IFC consults or seeks their consent as appropriate.
At the core of active portfolio management is the need to have timely and accurate information to drivebusiness decisions. IFC continues to invest in information-technology systems to better support the managementof its portfolio, and is in the process of strengthening its portfolio support structure through the creation of theOperations Support Unit at the corporate level, to be further extended to its sector and regional teams.
ASSET MANAGEMENT COMPANY
IFC Asset Management Company, LLC (AMC), a wholly owned subsidiary of IFC, invests third-partycapital and IFC capital, enabling outside investors to benefit from IFC’s expertise in achieving strong equityreturns, as well as positive development impact in the countries in which it invests in developing and frontiermarkets. Investors in funds managed by AMC include sovereign wealth funds, national pension funds,multilateral and bilateral development institutions, national development agencies and international financialinstitutions (IFIs). AMC helps IFC mobilize additional capital resources for investment in productive privateenterprise in developing countries.
Cumulatively through June 30, 2018, AMC raised total funds of $10.1 billion ($9.8 billion at June 30,2017).
15
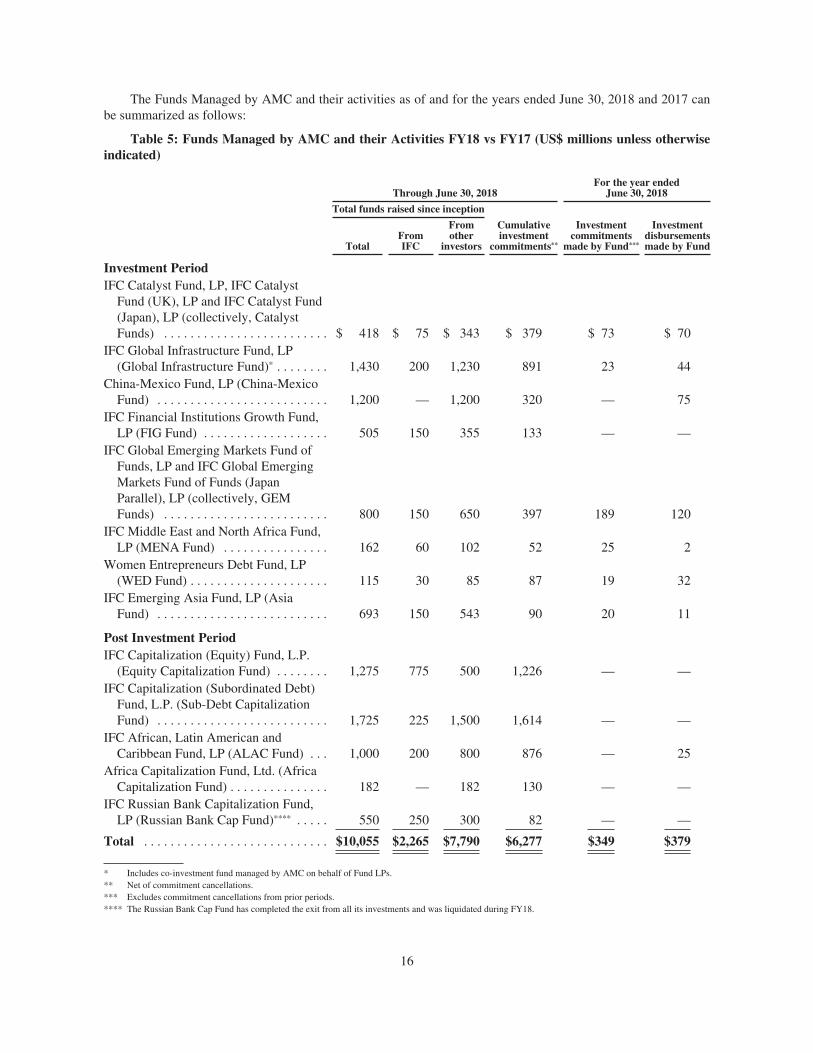
The Funds Managed by AMC and their activities as of and for the years ended June 30, 2018 and 2017 canbe summarized as follows:
Table 5: Funds Managed by AMC and their Activities FY18 vs FY17 (US$ millions unless otherwiseindicated)
Through June 30, 2018For the year ended
June 30, 2018
Total funds raised since inception
Cumulativeinvestment
commitments**
Investmentcommitments
made by Fund***
Investmentdisbursementsmade by FundTotal
FromIFC
Fromother
investors
Investment PeriodIFC Catalyst Fund, LP, IFC Catalyst
Fund (UK), LP and IFC Catalyst Fund(Japan), LP (collectively, CatalystFunds) . . . . . . . . . . . . . . . . . . . . . . . . . $ 418 $ 75 $ 343 $ 379 $ 73 $ 70
IFC Global Infrastructure Fund, LP(Global Infrastructure Fund)* . . . . . . . . 1,430 200 1,230 891 23 44
China-Mexico Fund, LP (China-MexicoFund) . . . . . . . . . . . . . . . . . . . . . . . . . . 1,200 — 1,200 320 — 75
IFC Financial Institutions Growth Fund,LP (FIG Fund) . . . . . . . . . . . . . . . . . . . 505 150 355 133 — —
IFC Global Emerging Markets Fund ofFunds, LP and IFC Global EmergingMarkets Fund of Funds (JapanParallel), LP (collectively, GEMFunds) . . . . . . . . . . . . . . . . . . . . . . . . . 800 150 650 397 189 120
IFC Middle East and North Africa Fund,LP (MENA Fund) . . . . . . . . . . . . . . . . 162 60 102 52 25 2
Women Entrepreneurs Debt Fund, LP(WED Fund) . . . . . . . . . . . . . . . . . . . . . 115 30 85 87 19 32
IFC Emerging Asia Fund, LP (AsiaFund) . . . . . . . . . . . . . . . . . . . . . . . . . . 693 150 543 90 20 11
Post Investment PeriodIFC Capitalization (Equity) Fund, L.P.
(Equity Capitalization Fund) . . . . . . . . 1,275 775 500 1,226 — —IFC Capitalization (Subordinated Debt)
Fund, L.P. (Sub-Debt CapitalizationFund) . . . . . . . . . . . . . . . . . . . . . . . . . . 1,725 225 1,500 1,614 — —
IFC African, Latin American andCaribbean Fund, LP (ALAC Fund) . . . 1,000 200 800 876 — 25
Africa Capitalization Fund, Ltd. (AfricaCapitalization Fund) . . . . . . . . . . . . . . . 182 — 182 130 — —
IFC Russian Bank Capitalization Fund,LP (Russian Bank Cap Fund)**** . . . . . 550 250 300 82 — —
Total . . . . . . . . . . . . . . . . . . . . . . . . . . . . $10,055 $2,265 $7,790 $6,277 $349 $379
* Includes co-investment fund managed by AMC on behalf of Fund LPs.** Net of commitment cancellations.*** Excludes commitment cancellations from prior periods.**** The Russian Bank Cap Fund has completed the exit from all its investments and was liquidated during FY18.
16
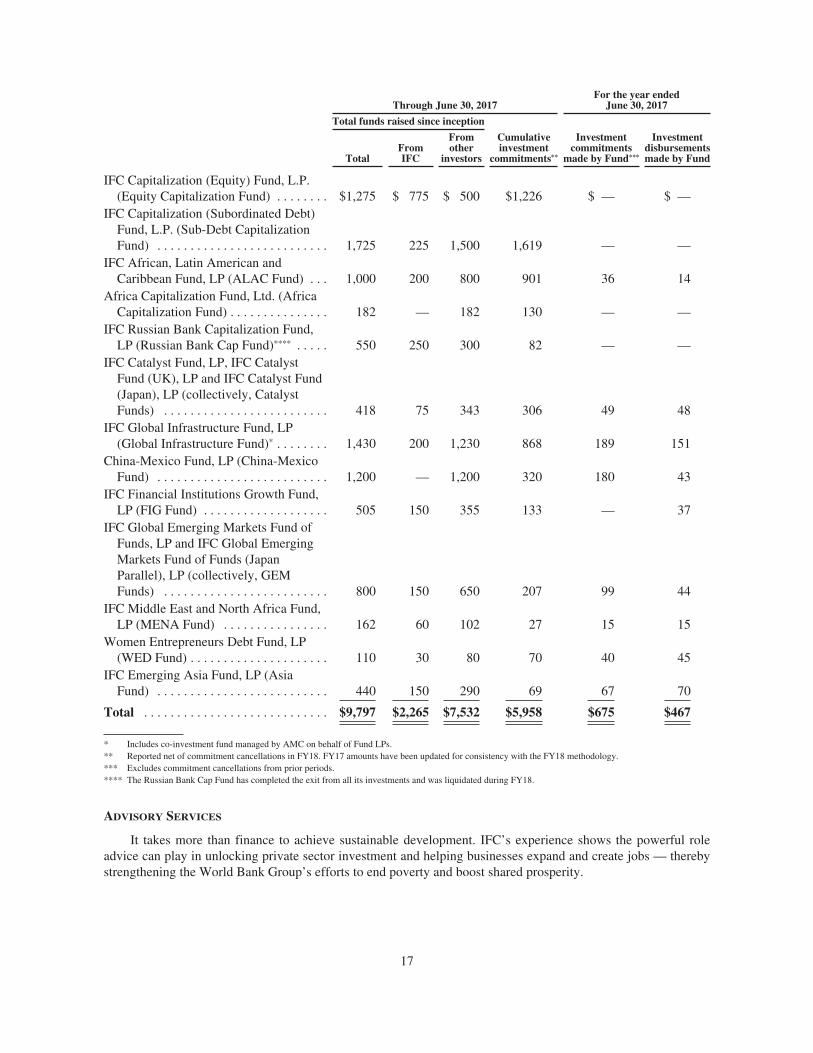
Through June 30, 2017For the year ended
June 30, 2017
Total funds raised since inception
Cumulativeinvestment
commitments**
Investmentcommitments
made by Fund***
Investmentdisbursementsmade by FundTotal
FromIFC
Fromother
investors
IFC Capitalization (Equity) Fund, L.P.(Equity Capitalization Fund) . . . . . . . . $1,275 $ 775 $ 500 $1,226 $ — $ —
IFC Capitalization (Subordinated Debt)Fund, L.P. (Sub-Debt CapitalizationFund) . . . . . . . . . . . . . . . . . . . . . . . . . . 1,725 225 1,500 1,619 — —
IFC African, Latin American andCaribbean Fund, LP (ALAC Fund) . . . 1,000 200 800 901 36 14
Africa Capitalization Fund, Ltd. (AfricaCapitalization Fund) . . . . . . . . . . . . . . . 182 — 182 130 — —
IFC Russian Bank Capitalization Fund,LP (Russian Bank Cap Fund)**** . . . . . 550 250 300 82 — —
IFC Catalyst Fund, LP, IFC CatalystFund (UK), LP and IFC Catalyst Fund(Japan), LP (collectively, CatalystFunds) . . . . . . . . . . . . . . . . . . . . . . . . . 418 75 343 306 49 48
IFC Global Infrastructure Fund, LP(Global Infrastructure Fund)* . . . . . . . . 1,430 200 1,230 868 189 151
China-Mexico Fund, LP (China-MexicoFund) . . . . . . . . . . . . . . . . . . . . . . . . . . 1,200 — 1,200 320 180 43
IFC Financial Institutions Growth Fund,LP (FIG Fund) . . . . . . . . . . . . . . . . . . . 505 150 355 133 — 37
IFC Global Emerging Markets Fund ofFunds, LP and IFC Global EmergingMarkets Fund of Funds (JapanParallel), LP (collectively, GEMFunds) . . . . . . . . . . . . . . . . . . . . . . . . . 800 150 650 207 99 44
IFC Middle East and North Africa Fund,LP (MENA Fund) . . . . . . . . . . . . . . . . 162 60 102 27 15 15
Women Entrepreneurs Debt Fund, LP(WED Fund) . . . . . . . . . . . . . . . . . . . . . 110 30 80 70 40 45
IFC Emerging Asia Fund, LP (AsiaFund) . . . . . . . . . . . . . . . . . . . . . . . . . . 440 150 290 69 67 70
Total . . . . . . . . . . . . . . . . . . . . . . . . . . . . $9,797 $2,265 $7,532 $5,958 $675 $467
* Includes co-investment fund managed by AMC on behalf of Fund LPs.** Reported net of commitment cancellations in FY18. FY17 amounts have been updated for consistency with the FY18 methodology.*** Excludes commitment cancellations from prior periods.**** The Russian Bank Cap Fund has completed the exit from all its investments and was liquidated during FY18.
ADVISORY SERVICES
It takes more than finance to achieve sustainable development. IFC’s experience shows the powerful roleadvice can play in unlocking private sector investment and helping businesses expand and create jobs — therebystrengthening the World Bank Group’s efforts to end poverty and boost shared prosperity.
17
To help address increasingly complex development challenges, IFC initiated a holistic approach to createmarkets and mobilize private investment. Advisory is critical for IFC’s delivery on the new strategy by bringingtogether the diverse World Bank Group actions needed to create markets and by focusing on building a pipelineof bankable projects, especially in IDA and FCS.
Advisory will also continue to deliver proven solutions that support clients to raise their standards, expandtheir market access, enable sector reform and develop level playing field.
During FY18, IFC provided advice in a number of areas critical to development:
Financial Sector: IFC helps increase the availability and affordability of financial services for individualsand for micro, small, and medium enterprises. IFC works with financial institutions to strengthen their riskmanagement and diversify their product offering in areas such as small and medium enterprises (SMEs), housingfinance, and sustainable energy. IFC also supports the development of financial markets — by promotinguniversal access to finance, strengthening capital markets, and establishing credit bureaus and collateral registriesthat open up new avenues for companies to create jobs and grow sustainably.
Investment Climate: IFC helps national and local governments implement reforms that improve thebusiness environment and attract and retain investment — fostering growth, competitive markets, and jobcreation.
Public-Private Partnerships: IFC helps governments design and implement public-private partnerships ininfrastructure and basic public services. IFC’s advice helps solve infrastructure bottlenecks, increase publicaccess to electricity, water, health, and education and helps governments achieve national development goals.
Agribusiness: IFC helps clients improve productivity and standards in agribusiness. IFC’s efforts arefocused on designing efficient value chains and boosting food security — thereby providing valuable social,economic, and environmental benefits for all stakeholders.
Energy & Resource Efficiency: IFC helps clients develop clean, affordable, competitive, and high-qualityenergy solutions across the value chain. IFC accelerates the development of commercial markets to increaserenewable energy production and improve people’s access to modern energy services.
IFC also provides advisory solutions that can be deployed across several industries. This includes helpingbusinesses improve corporate governance and building the capacity of smaller businesses operating within thesupply chains of larger companies, thereby increasing local opportunities while helping clients make better use oflocal suppliers and resources. Central to IFC’s advisory work is helping clients build robust and inclusivebusiness performance by making them aware of, and invest in, the value women can bring either as a definedconsumer segment that can be better served, as employees, as business leaders or as entrepreneurs and suppliers.
The IFC Advisory Services Portfolio7 as of June 30, 2018 totaled $1.5 billion ($1.5 billion at June 30, 2017).FY18 program expenditures with clients was $273 million ($246 million in FY17) with a strong focus in strategicpriority areas of IDA (57%), FCS (19%) and Climate Change (27%) (63%, 20% and 26% respectively in FY17).This emphasis is expected to continue in the coming years, in particular as a result of the implementation of theCreating Market Advisory Window to focus on market creation in IDA-eligible and fragile countries.
7 IFC Advisory Services Portfolio is the total of funds managed by IFC for active advisory projects.
18
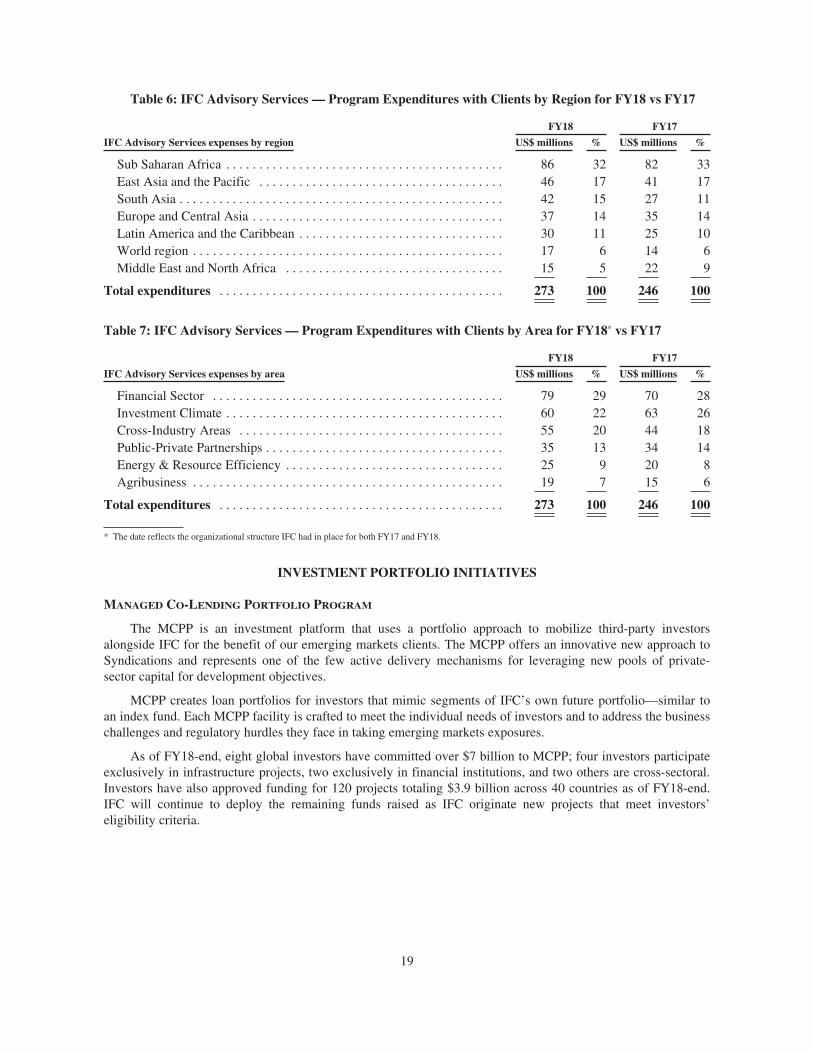
Table 6: IFC Advisory Services — Program Expenditures with Clients by Region for FY18 vs FY17
FY18 FY17
IFC Advisory Services expenses by region US$ millions % US$ millions %
Sub Saharan Africa . . . . . . . . . . . . . . . . . . . . . . . . . . . . . . . . . . . . . . . . . . 86 32 82 33East Asia and the Pacific . . . . . . . . . . . . . . . . . . . . . . . . . . . . . . . . . . . . . 46 17 41 17South Asia . . . . . . . . . . . . . . . . . . . . . . . . . . . . . . . . . . . . . . . . . . . . . . . . . 42 15 27 11Europe and Central Asia . . . . . . . . . . . . . . . . . . . . . . . . . . . . . . . . . . . . . . 37 14 35 14Latin America and the Caribbean . . . . . . . . . . . . . . . . . . . . . . . . . . . . . . . 30 11 25 10World region . . . . . . . . . . . . . . . . . . . . . . . . . . . . . . . . . . . . . . . . . . . . . . . 17 6 14 6Middle East and North Africa . . . . . . . . . . . . . . . . . . . . . . . . . . . . . . . . . 15 5 22 9
Total expenditures . . . . . . . . . . . . . . . . . . . . . . . . . . . . . . . . . . . . . . . . . . . 273 100 246 100
Table 7: IFC Advisory Services — Program Expenditures with Clients by Area for FY18* vs FY17
FY18 FY17
IFC Advisory Services expenses by area US$ millions % US$ millions %
Financial Sector . . . . . . . . . . . . . . . . . . . . . . . . . . . . . . . . . . . . . . . . . . . . 79 29 70 28Investment Climate . . . . . . . . . . . . . . . . . . . . . . . . . . . . . . . . . . . . . . . . . . 60 22 63 26Cross-Industry Areas . . . . . . . . . . . . . . . . . . . . . . . . . . . . . . . . . . . . . . . . 55 20 44 18Public-Private Partnerships . . . . . . . . . . . . . . . . . . . . . . . . . . . . . . . . . . . . 35 13 34 14Energy & Resource Efficiency . . . . . . . . . . . . . . . . . . . . . . . . . . . . . . . . . 25 9 20 8Agribusiness . . . . . . . . . . . . . . . . . . . . . . . . . . . . . . . . . . . . . . . . . . . . . . . 19 7 15 6
Total expenditures . . . . . . . . . . . . . . . . . . . . . . . . . . . . . . . . . . . . . . . . . . . 273 100 246 100
* The date reflects the organizational structure IFC had in place for both FY17 and FY18.
INVESTMENT PORTFOLIO INITIATIVES
MANAGED CO-LENDING PORTFOLIO PROGRAM
The MCPP is an investment platform that uses a portfolio approach to mobilize third-party investorsalongside IFC for the benefit of our emerging markets clients. The MCPP offers an innovative new approach toSyndications and represents one of the few active delivery mechanisms for leveraging new pools of private-sector capital for development objectives.
MCPP creates loan portfolios for investors that mimic segments of IFC’s own future portfolio—similar toan index fund. Each MCPP facility is crafted to meet the individual needs of investors and to address the businesschallenges and regulatory hurdles they face in taking emerging markets exposures.
As of FY18-end, eight global investors have committed over $7 billion to MCPP; four investors participateexclusively in infrastructure projects, two exclusively in financial institutions, and two others are cross-sectoral.Investors have also approved funding for 120 projects totaling $3.9 billion across 40 countries as of FY18-end.IFC will continue to deploy the remaining funds raised as IFC originate new projects that meet investors’eligibility criteria.
19
PRIVATE SECTOR WINDOW
In line with the Forward Look, a $2.5 billion IFC-MIGA Private Sector Window (PSW) was created in the18th replenishment of IDA (the IDA18 Replenishment). Its goal is to mobilize private sector investment inIDA-only and IDA-eligible fragile and conflict-affected countries, with particular emphasis on fragile andconflict-affected countries. The PSW is deployed through four facilities. These facilities have been designed totarget critical challenges faced by the private sector in these difficult markets and will leverage IFC and MIGA’sbusiness platforms and instruments. The facilities are as follows:
• Risk Mitigation Facility: Involves both MIGA and IFC, this facility is designed to provide project-basedguarantees to encourage/mobilize private sector investment in infrastructure projects and public-privatepartnerships.
• Local Currency Facility: Administered by IFC, this facility is designed to provide local currencydenominated loans, investments or hedges to private sector clients who operate in markets where there arelimited currency hedging capabilities. In the absence of currency hedging instruments and creditworthycounterparties, IDA would enter into swaps or indemnity agreement with IFC.
• Blended Finance Facility: Administered by IFC, this facility blends PSW financing support with IFCinvestments to support small and medium enterprises (SMEs), agribusiness and other pioneeringinvestments.
• MIGA Guarantee Facility: Administered by MIGA, this facility is designed to expand the coverage ofMIGA Political Risk Insurance (PRI) products through shared first-loss or risk participation similar toreinsurance.
As of June 30, 2018, $185 million of instruments under the PSW had been approved. IFC entered into acurrency swap of $9 million with IDA under the Local Currency Facility.
LIQUID ASSETS
All liquid assets are managed according to an investment authority approved by the Board of Directors andliquid asset investment guidelines approved by IFC’s Corporate Risk Committee, a subcommittee of IFC’sManagement Team.
IFC funds its liquid assets from two sources, borrowings from the market (funded liquidity) and capital (networth). Liquid assets are managed in a number of portfolios related to these sources.
IFC generally invests its liquid assets in highly rated fixed and floating rate instruments issued by, orunconditionally guaranteed by, governments, government agencies and instrumentalities, multilateralorganizations, and high quality corporate issuers; these include asset-backed securities (ABS) and mortgage-backed securities (MBS), time deposits, and other unconditional obligations of banks and financial institutions.Diversification across multiple dimensions ensures a favorable risk return profile. IFC manages the individualliquid assets portfolios on an aggregate portfolio basis against each portfolios benchmark within specified riskparameters. In implementing these portfolio management strategies, IFC utilizes derivative instruments,principally currency and interest rate swaps and futures and options, and it takes positions in various industrysectors and countries.
IFC’s liquid assets are accounted for as trading portfolios. The net asset value of the liquid assets portfoliowas $38.9 billion at June 30, 2018 ($39.2 billion at June 30, 2017). The decrease in FY18 reflects net redemptionof borrowings and net disbursements for operating activities.
FUNDED LIQUIDITY
The primary funding source for liquid assets for IFC is borrowings from market sources. Proceeds ofborrowings from market sources not immediately disbursed for loans and loan-like debt securities (FundedLiquidity) are managed internally against money market benchmarks. A small portion of Funded Liquidity ismanaged by third parties with the same benchmark as that managed internally.
20
MANAGED NET WORTH
The second funding source of liquid assets is that portion of IFC’s net worth not invested in equity andequity-like investments (Managed Net Worth) which is managed against a U.S. Treasury benchmark. A portionof these assets are managed by third parties with the same benchmark as that part managed internally.
Income from liquid assets trading activities8 was $771 million in FY18, $728 million from Funded Liquidityand $43 million from Managed Net Worth.
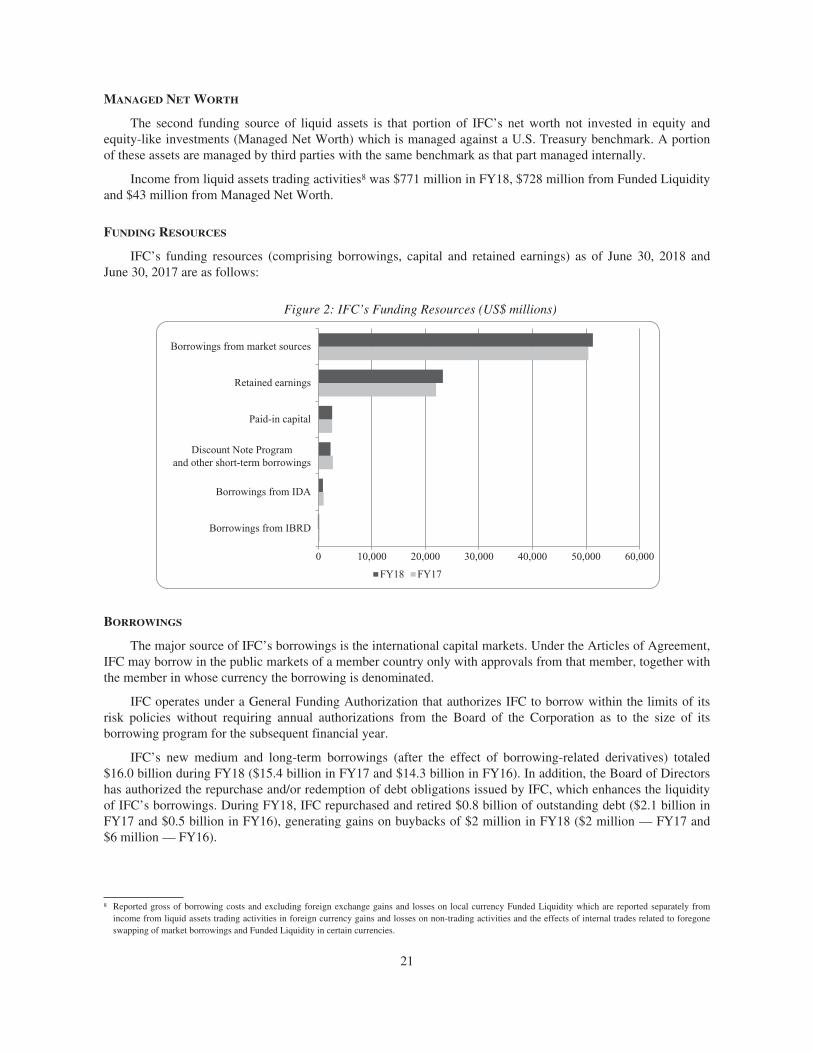
FUNDING RESOURCES
IFC’s funding resources (comprising borrowings, capital and retained earnings) as of June 30, 2018 andJune 30, 2017 are as follows:
Figure 2: IFC’s Funding Resources (US$ millions)
Borrowings from IBRD
0 10,000
FY18 FY17
20,000 30,000 40,000 50,000 60,000
Borrowings from IDA
Paid-in capital
Discount Note Programand other short-term borrowings
Retained earnings
Borrowings from market sources
BORROWINGS
The major source of IFC’s borrowings is the international capital markets. Under the Articles of Agreement,IFC may borrow in the public markets of a member country only with approvals from that member, together withthe member in whose currency the borrowing is denominated.
IFC operates under a General Funding Authorization that authorizes IFC to borrow within the limits of itsrisk policies without requiring annual authorizations from the Board of the Corporation as to the size of itsborrowing program for the subsequent financial year.
IFC’s new medium and long-term borrowings (after the effect of borrowing-related derivatives) totaled$16.0 billion during FY18 ($15.4 billion in FY17 and $14.3 billion in FY16). In addition, the Board of Directorshas authorized the repurchase and/or redemption of debt obligations issued by IFC, which enhances the liquidityof IFC’s borrowings. During FY18, IFC repurchased and retired $0.8 billion of outstanding debt ($2.1 billion inFY17 and $0.5 billion in FY16), generating gains on buybacks of $2 million in FY18 ($2 million — FY17 and$6 million — FY16).
8 Reported gross of borrowing costs and excluding foreign exchange gains and losses on local currency Funded Liquidity which are reported separately fromincome from liquid assets trading activities in foreign currency gains and losses on non-trading activities and the effects of internal trades related to foregoneswapping of market borrowings and Funded Liquidity in certain currencies.
21
IFC diversifies its borrowings by currency, country, source, and maturity to provide flexibility and cost-effectiveness. In FY18 IFC borrowed in 29 currencies and in final maturities ranging from 3 months to 30 years.Borrowings outstanding have a weighted average remaining contractual maturity of 7.4 years at June 30, 2018(6.4 years at June 30, 2017). Actual maturities may differ from contractual maturities due to the existence of callfeatures in certain of IFC’s borrowings.
Market borrowings are generally swapped into floating-rate obligations denominated in US dollars. As ofJune 30, 2018, IFC had gross payables from borrowing-related currency swaps of $21.2 billion ($19.0 billion atJune 30, 2017) and from borrowing-related interest rate swaps in the notional principal payable amount of$31.2 billion ($34.5 billion at June 30, 2017). After the effect of these derivative instruments is taken intoconsideration, 95% of IFC’s market borrowings at June 30, 2018 were variable rate US dollar- denominated(95% - June 30, 2017). The weighted average cost of market borrowings after currency and interest rate swaptransactions was 2.5% at June 30, 2018 (1.4% at June 30, 2017). This increase was mainly due to developmentsin USD funding, where compared to the prior year, US$ six-month LIBOR rates were 1.0% higher and IFC’scredit spread widened by 0.1%.
IFC also uses its borrowings as a tool to promote capital markets development in emerging and frontiermarkets and this can result in raising local currency funds. Proceeds of these issuances not disbursed into loanshave primarily been invested in securities of the related sovereign and sovereign instrumentalities in the currencyof the issuances. Borrowings from market sources at June 30, 2018 with no associated interest rate or currencyswap amounted to 5% of the total borrowings from market sources (5% at June 30, 2017).
As of June 30, 2018, $2.7 billion ($2.1 billion as of June 30, 2017) of such non-US$ denominated marketborrowings were outstanding, denominated in Botswana pula, Chinese renminbi, Dominican peso, Georgian lari,Indian rupee, Kazakhstan tenge, Namibia dollar, New Romanian lei, New Serbian dinar, New Turkish lira,Philippine peso, Rwanda franc and Ukraine hrivnya. Proceeds of such borrowings were invested in such localcurrencies, on-lent to clients and/or partially swapped into US dollars.
IFC has short term discount note programs in US$, Chinese renminbi and Turkish Lira to provide anadditional funding and liquidity management tool for IFC in support of certain of IFC’s trade finance and supplychain initiatives and to expand the availability of short term local currency finance. The discount note programsprovide for issuances with maturities ranging from overnight to one year. The weighted average cost of discountnote borrowing was 1.54% at June 30, 2018. During FY18, IFC issued $12.7 billion of discount notes and$2.3 billion were outstanding as of June 30, 2018 under the short-term discount note programs.
CAPITAL AND RETAINED EARNINGS
Table 8: IFC’s Capital (US$ millions)
June 30,2018
June 30,2017
CapitalCapital stock, authorized . . . . . . . . . . . . . . . . . . . . . . . . . . . . . . . . . . . . . . . . . . . . . . . . . . . . $ 2,580 $ 2,580
Capital stock, subscribed and paid-in . . . . . . . . . . . . . . . . . . . . . . . . . . . . . . . . . . . . . . . . . . $ 2,566 $ 2,566Accumulated other comprehensive income . . . . . . . . . . . . . . . . . . . . . . . . . . . . . . . . . . . . . 264 458Retained earnings . . . . . . . . . . . . . . . . . . . . . . . . . . . . . . . . . . . . . . . . . . . . . . . . . . . . . . . . . 23,306 22,026
Total IFC capital . . . . . . . . . . . . . . . . . . . . . . . . . . . . . . . . . . . . . . . . . . . . . . . . . . . . . . . . . . . $26,136 $25,050Non-controlling interests . . . . . . . . . . . . . . . . . . . . . . . . . . . . . . . . . . . . . . . . . . . . . . . . . . . . — 3
Total capital . . . . . . . . . . . . . . . . . . . . . . . . . . . . . . . . . . . . . . . . . . . . . . . . . . . . . . . . . . . . . . . $26,136 $25,053
22
At June 30, 2018 and June 30, 2017, retained earnings comprised the following:
Table 9: IFC’s Retained Earnings (US$ millions)
June 30,2018
June 30,2017
Undesignated retained earnings . . . . . . . . . . . . . . . . . . . . . . . . . . . . . . . . . . . . . . . . . . . . . . . $23,116 $21,901
Designated retained earnings:Creating Markets Advisory Window (CMAW) . . . . . . . . . . . . . . . . . . . . . . . . . . . . . . . . . . 122 —Advisory services . . . . . . . . . . . . . . . . . . . . . . . . . . . . . . . . . . . . . . . . . . . . . . . . . . . . . . . . . 46 99IFC SME Ventures for IDA countries and Global Infrastructure Project Development
Fund . . . . . . . . . . . . . . . . . . . . . . . . . . . . . . . . . . . . . . . . . . . . . . . . . . . . . . . . . . . . . . . . . . 17 18Performance-based grants . . . . . . . . . . . . . . . . . . . . . . . . . . . . . . . . . . . . . . . . . . . . . . . . . . . 5 8
Total designated retained earnings . . . . . . . . . . . . . . . . . . . . . . . . . . . . . . . . . . . . . . . . . . . . $ 190 $ 125
Total retained earnings . . . . . . . . . . . . . . . . . . . . . . . . . . . . . . . . . . . . . . . . . . . . . . . . . . . . . . $23,306 $22,026
Designations of retained earnings
Amounts available to be designated are determined based on a Board of Directors-approved income-basedformula and, beginning in FY08, on a principles-based Board of Directors-approved financial distribution policy,and are approved by the Board of Directors.
IFC’s Board of Directors approved a change to the sliding-scale formula and the methodology used forcalculating the incremental rate of designation, beginning with the designation in respect of FY17. The revisedapproach establishes a threshold that no designations of any kind can take place if IFC’s Deployable StrategicCapital (DSC) ratio is below 2%, and establishes a framework for prioritizing future designations to advisoryservices and for transfers to IDA based on IFC’s DSC ratio and a cushion for advisory services. IFC has alsocreated a new mechanism that was funded for the first time in FY18, the Creating Markets Advisory Window(CMAW), to focus on market creation in eligible IDA countries and fragile and conflict situations.
The revised approach also establishes a maximum cumulative amount that can be contributed to IDA,during the IDA 18 Replenishment, of $300 million, with no more than $100 million in any given year (plus anyshortfall from earlier years).
The approach also caps transfers to IDA during a fiscal year at IFC’s Net Income, if any, for the ninemonths ended March 31 of that fiscal year with actual transfer to occur in June of that fiscal year. Any amountsdesignated the prior year and not transferred pursuant to this requirement would be deferred to the next fiscalyear. Transfers to IDA will also be deferred to the next fiscal year if capital as reported on IFC’s consolidatedbalance sheet has declined between June 30 of the prior fiscal year and March 31 of that fiscal year.
IFC recognizes designations of retained earnings for Advisory Services and CMAW when the Board ofDirectors approves it and recognizes designation of retained earnings for grants to IDA when it is noted withapproval by the Board of Governors. Expenditures for the various approved designations are recorded asexpenses in IFC’s consolidated income statement in the period in which they occur, and have the effect ofreducing retained earnings designated for this specific purpose.
FY17 designations
On August 3, 2017, the Board of Directors approved a designation of $85 million of IFC’s retained earningsfor IFC’s CMAW, $40 million of IFC’s retained earnings for advisory services, a reallocation of $49 million ofthe unutilized balances of prior year designations related to Advisory Services to CMAW, and, subject to theconditions detailed above, a designation of up to $80 million of IFC’s retained earnings for grants to IDA. Thesedesignations were noted with approval by the Board of Governors on October 13, 2017. On June 20, 2018 IFCrecognized expenditures against designations of retained earnings for grants to IDA of $80 million pursuant tosigning of a grant agreement between IDA and IFC.
23
FY18 designations
Income available for designations in FY18 (a non-GAAP measure) totaled $1,318 million. Based on the newBoard-approved distribution policy outlined above, the maximum amount available for designation was$230 million. On August 9, 2018, the Board of Directors approved a designation of $70 million of IFC’s retainedearnings for IFC’s CMAW, $45 million of IFC’s retained earnings for advisory services, and, subject to theconditions detailed above, a designation of up to $115 million of IFC’s retained earnings for grants to IDA.These designations are expected to be noted with approval by the Board of Governors, and, subject to the aboveconditions, concluded, in FY19.
Deployable Strategic Capital
IFC’s DSC ratio was 8.7% at June 30, 2018, compared with 7.8% at June 30, 2017. Total ResourcesAvailable (TRA) increased to $24.7 billion at the end of FY18 from $23.6 billion at the end of FY17. DSCincreased in FY18 due to an increase in TRA that outweighed the increase in Total Resources Required (TRR).The increase in TRA was driven by strong income and the increase in TRR was largely driven by higher capitalrequired for the Treasury portfolio due in part to the change in capital calculation methodology.
RISK MANAGEMENT
ENTERPRISE RISK MANAGEMENT
IFC provides long-term investments and advisory services to the private sector in emerging markets and istherefore exposed to a range of potential financial and non-financial impacts. Active monitoring and soundmanagement of evolving risks remain critical pillars in terms of fulfilling IFC’s mission.
Enterprise risk management framework
IFC’s enterprise risk management framework (ERM) is designed to enable the prudent management offinancial and reputational impacts that originate from the Corporation’s business activities. In this context, IFC’srisk management efforts are designed specifically to help align the Corporation’s performance with its strategicdirection. The ERM framework that IFC adopted in FY14 remains aligned with industry standards and isdesigned to underpin IFC’s response to risk by defining:
• IFC’s core risk management principles;
• A common risk taxonomy for use across the organization, to help ensure that risk management efforts arecoordinated and aligned across the distinct parts of the organization that share responsibility for managingdifferent aspects of risk;
• A standard classification of roles and responsibilities for risk management, to differentiate and therebyclarify how different parts of the Corporation contribute towards the overall management of risk;
• How emerging and evolving risks are identified, defined, monitored and managed; and
• The structures, processes and methods that are necessary to put active risk management into practice.
Key risk management principles
The key principles that continue to inform IFC’s ERM Framework are:
• Maximizing development impact while maintaining financial sustainability within specified tolerances;
• Ensuring that business decisions are based on a thorough understanding of risks and that risks and rewardsare balanced appropriately;
• Being disciplined and selective in undertaking activities that could cause significant adverse reputationalimpact; and
• Sharing responsibility for risk management across the Corporation.
24
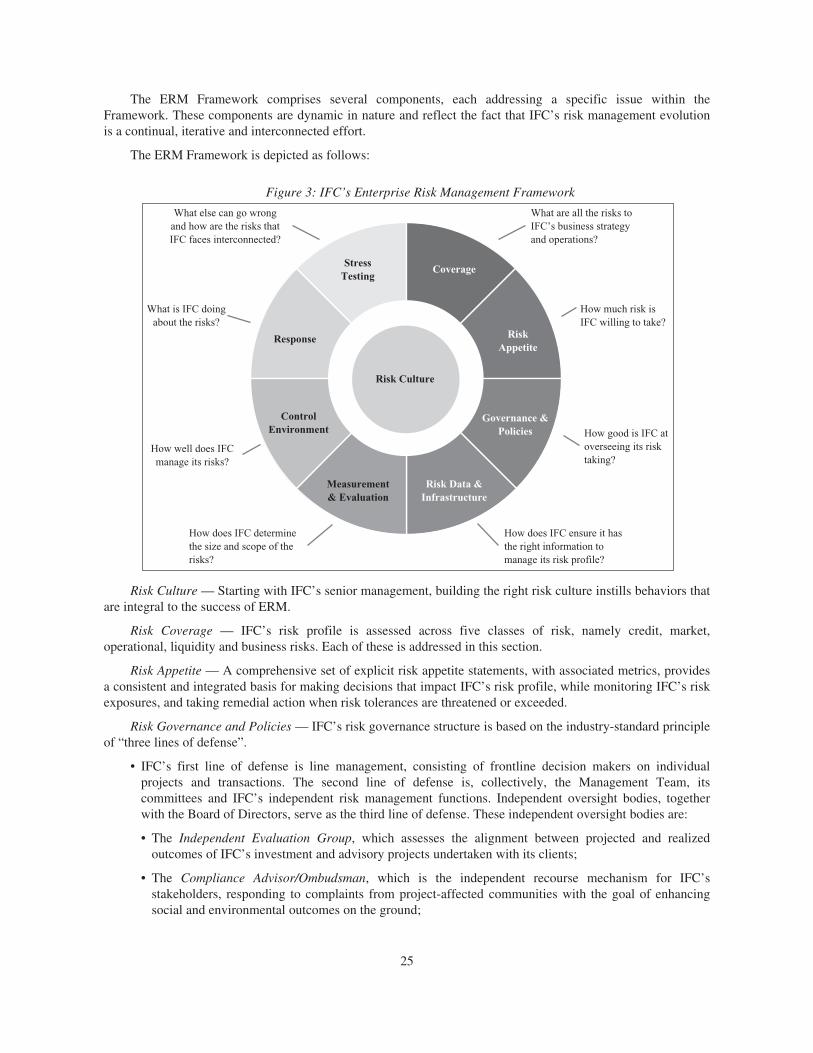
The ERM Framework comprises several components, each addressing a specific issue within theFramework. These components are dynamic in nature and reflect the fact that IFC’s risk management evolutionis a continual, iterative and interconnected effort.
The ERM Framework is depicted as follows:
Figure 3: IFC’s Enterprise Risk Management Framework
StressTesting
What else can go wrongand how are the risks thatIFC faces interconnected?
What is IFC doingabout the risks?
How well does IFCmanage its risks?
How good is IFC atoverseeing its risktaking?
How much risk isIFC willing to take?
What are all the risks toIFC’s business strategyand operations?
Coverage
RiskAppetite
Governance &Policies
Risk Data &Infrastructure
Response
Risk Culture
ControlEnvironment
Measurement& Evaluation
How does IFC determinethe size and scope of therisks?
How does IFC ensure it hasthe right information tomanage its risk profile?
Risk Culture — Starting with IFC’s senior management, building the right risk culture instills behaviors thatare integral to the success of ERM.
Risk Coverage — IFC’s risk profile is assessed across five classes of risk, namely credit, market,operational, liquidity and business risks. Each of these is addressed in this section.
Risk Appetite — A comprehensive set of explicit risk appetite statements, with associated metrics, providesa consistent and integrated basis for making decisions that impact IFC’s risk profile, while monitoring IFC’s riskexposures, and taking remedial action when risk tolerances are threatened or exceeded.
Risk Governance and Policies — IFC’s risk governance structure is based on the industry-standard principleof “three lines of defense”.
• IFC’s first line of defense is line management, consisting of frontline decision makers on individualprojects and transactions. The second line of defense is, collectively, the Management Team, itscommittees and IFC’s independent risk management functions. Independent oversight bodies, togetherwith the Board of Directors, serve as the third line of defense. These independent oversight bodies are:
• The Independent Evaluation Group, which assesses the alignment between projected and realizedoutcomes of IFC’s investment and advisory projects undertaken with its clients;
• The Compliance Advisor/Ombudsman, which is the independent recourse mechanism for IFC’sstakeholders, responding to complaints from project-affected communities with the goal of enhancingsocial and environmental outcomes on the ground;
25
• The World Bank Group’s Internal Audit Vice Presidency, which evaluates the effectiveness of theorganization’s governance, risk management, and control processes; and
• The Integrity Vice-Presidency, which investigates and pursues sanctions related to allegations of fraudand corruption in World Bank Group-financed activities.
• IFC’s risk management policies define the types and amounts of risk that IFC’s Management Team iswilling to assume, via delegated authority from the Board.
Risk Data and Infrastructure — Source data is collected, integrated and analyzed to support decision-making across the Corporation.
Measurement and Evaluation — IFC uses a combination of quantitative and qualitative metrics to manageits risk profile. Key metrics for each category of risk are discussed later in this section.
Control Environment — Management relies on internal controls, modelled on the Committee of SponsoringOrganizations of the Treadway Commission (COSO) Framework, to reduce the level of financial reporting riskto an acceptable level.
Risk Response — Risks are analyzed and monitored by IFC’s risk oversight units and the Corporate RiskCommittee, a subcommittee of IFC’s Management Team, which meets frequently to discuss and decide uponenterprise-level risk issues.
Stress Testing — IFC-wide stress testing provides Management with an additional tool to inform capitalmanagement and decision making. The testing involves multi-year projections of IFC’s financial performanceand capital adequacy under base case and stressed macroeconomic scenarios.
Enterprise level risk appetite
IFC has developed risk appetite statements which set the direction for the Corporation’s willingness to takerisks in fulfilment of its development goals. These statements reflect the Corporation’s core values ofmaximizing development impact, preserving its financial sustainability and safeguarding its reputation.
At the strategic level, IFC has adopted the following risk appetite statements:
• Developmental Impact: IFC will maximize developmental impact by focusing on the World Bank Group’stwin goals of addressing extreme poverty and boosting shared prosperity, while maintaining financialsustainability and safeguarding its brand. IFC applies a rigorous ex-ante and ex-post impact assessmentframework (AIMM) under which projects are scored, incentives are set and trade-offs managed on aportfolio basis.
• Financial Sustainability: IFC will generate and maintain sufficient financial resources, conduct itsbusiness and manage risks consistent with standards implied by a triple-A rating.
• Safeguarding Reputation: In determining what engagement and activities to pursue, IFC will assesswhether any potential adverse impact to its reputation is balanced by the potential development impact.
From a financial sustainability perspective, the capital required to maintain a triple-A rating is assessedusing an economic capital framework, which is the foundation of financial risk management at IFC. Economiccapital acts as a “common currency of risk” across the organization, providing IFC with an objective,quantifiable measure of risk that can be applied consistently across business lines, products, regions and sectors.IFC holds economic capital for credit, market and operational risks. The primary measure of capital adequacy isDSC, which is the capital available to support future commitments over and above the current portfolio plus anadditional capital buffer.
IFC conforms to key financial policies approved by its Board of Directors, as detailed below:
• Capital Adequacy Policy — IFC is required to maintain a minimum level of total resources (includingpaid-in capital, total loss reserves and retained earnings, net of designations) equal to total potential lossesfor all on- and off-balance sheet exposures estimated at levels consistent with maintaining a triple-Arating.
26
• Leverage Policy — IFC’s outstanding debt plus guarantees held must not exceed four times its net worth.
• Overall Liquidity Policy — Minimum liquidity (liquid assets plus undrawn borrowing commitments fromIBRD) must be sufficient at all times to cover at least 45% of IFC’s estimated net cash requirements forthe next three years.
• Matched Funding Policy — Loans are funded with liabilities that have similar characteristics in terms ofinterest rate basis, currency, and duration, except for new products, approved by the Board of Directors,involving asset-liability mismatches.
In order to safeguard its reputation, IFC pays close attention to potential adverse reputational impacts whichmay exceed its risk tolerance, as negative perceptions of IFC held by stakeholders or the general public mayultimately impact IFCs ability to carry out business effectively. In determining which engagements and activitiesto pursue, IFC assesses whether any identified potential adverse impact to its reputation is balanced by theproject’s or program’s potential development impact and financial returns.
One of the key forward-looking tools used by IFC for promoting its brand and managing reputational impact iseffective communication. Communication activities are coordinated by the IFC’s Partnerships, Communications &Outreach Vice Presidency. This unit provides advice on strategic and crisis communications for managing potentialand actual reputational impacts at both the corporate and project levels, throughout the project life cycle. It is alsoresponsible for external and internal communications, campaigns, civil society engagement, brand marketing, andweb, social, and other media. It collaborates across IFC and works in conjunction with other WBG entities todevelop and implement effective communications strategies that strengthen the IFC brand.
TREASURY RISK MANAGEMENT
Treasury risks are managed through a two-tier risk framework: (1) a comprehensive policy framework and(2) an economic capital limit for treasury activities. The policy framework is based on four principles:
• Investment in high quality assets;
• Diversification via position size/concentration limits;
• Limits on market risks (credit spread, interest rate and foreign exchange risk); and
• Proactive portfolio surveillance.
In line with regulatory changes in global financial markets, IFC enhanced its Treasury risk managementframework in FY18, including changes to economic capital methodology.
CREDIT RISK MANAGEMENT
Definition and Scope of Credit Risk
IFC defines credit risk as the risk of loss of principal or loss of an expected financial return due to creditevents such as a default or downgrade in credit ratings or any other failure to meet a contractual obligation thatresults in financial loss. IFC is exposed to credit risk in its loan portfolio and in the form of counterparty creditrisk in its Treasury portfolios.
27
Investment operations
Credit risk in investment projects is actively managed throughout the project life cycle. Investment teamsare responsible for gathering the necessary information from the client to verify the financial viability of theproject, and for assigning a credit rating (CR) at defined stages in the project approval process. The CR, theinvestment size and the product type determine the authority level required for transaction approval. All projectsare subject to independent credit assessment by a credit officer within the independent Risk and FinancialSustainability Vice Presidency and who participates in the project approval process. Projects are approved withreference to a number of operational and prudential limits approved by the Corporate Risk Committee, includinglimits related to single project or client exposure, single country exposure, and sector concentration; these aredetailed below:
• IFC’s total exposure to a country, for the purpose of setting exposure limits, is measured as the amount ofeconomic capital required to support its investment portfolio in that country. Exposure limits are set foreach country based on the size of its economy and its risk rating. Sub-limits apply for certain sectorexposures within a country.
• IFC’s total exposure to a single client or client group may not exceed stipulated economic capital andnominal limits based on the CR for the client.
• Individual Investment Limits are applied at the individual project or client level to prevent excessiveconcentrations.
• Preferential debt exposure to a country is limited by reference to that country’s total medium and long-term external debt.
• IFC’s total equity and quasi-equity exposure (outstanding exposure net of impairments) shall not exceedIFC’s net worth.
IFC’s investment projects are actively supervised after commitment. CRs are reviewed regularly for each project,and revised if required. In addition, an independent corporate portfolio team in the Risk and Financial SustainabilityVice Presidency monitors and assesses IFC’s portfolio, including stress testing of exposure to emerging risks. Whenprojects show sign of financial distress, immediate attention is key for improving potential outcomes. Seasoned“workout” professionals from IFC’s Department of Special Operations in the Risk and Financial Sustainability VicePresidency focus on projects, to implement the restructuring, or possible recovery, of IFC’s exposure.
The credit risk of loans is quantified in terms of the probability of default, loss given default and exposure atrisk. These risk parameters are used to determine risk-based economic capital for capital adequacy, capitalallocation and internal risk management purposes, as well as for setting the general reserve against losses onloans and exposure limits.
Treasury operations
IFC manages its exposures to counterparties in its Treasury operations to mitigate potential losses from thefailure by a counterparty to fulfill its contractual obligations. Conservative counterparty eligibility criteria are set byAuthorizations from the Board of Directors and by Directives approved by IFC’s Corporate Risk Committee.Eligible counterparties are predominantly banks and financial institutions with high quality credit ratings issued byleading international credit rating agencies. Details of applicable financial policies and guidelines are given below:
• Counterparties are selected based on standard eligibility criteria, with a tenor limit for deposits andrepurchase agreements.
• Counterparties for derivative instruments are generally restricted to banks and financial institutions withhigh quality credit ratings from leading international credit rating agencies; for the sole purpose of fundinglocal currency loans, eligibility is extended to central banks and select local banks.
• Exposures to individual counterparties are subject to exposure limits. For derivatives, exposure ismeasured in terms of total potential future exposure based on replacement cost.
28
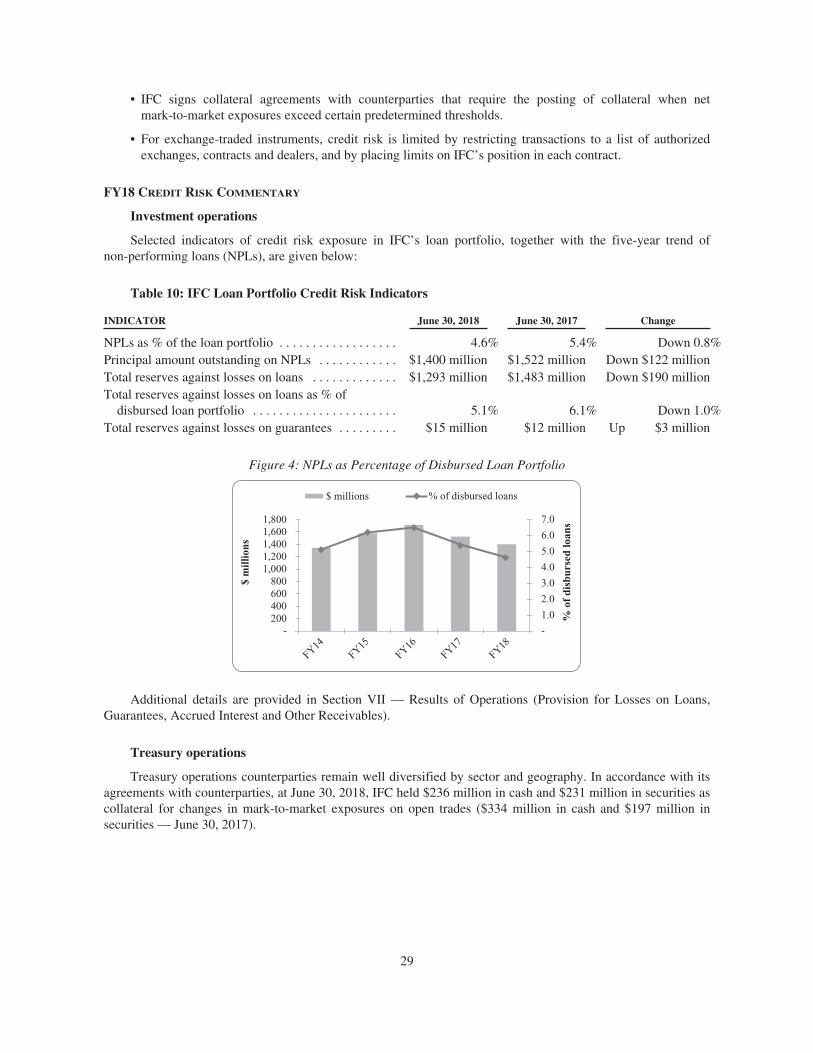
• IFC signs collateral agreements with counterparties that require the posting of collateral when netmark-to-market exposures exceed certain predetermined thresholds.
• For exchange-traded instruments, credit risk is limited by restricting transactions to a list of authorizedexchanges, contracts and dealers, and by placing limits on IFC’s position in each contract.
FY18 CREDIT RISK COMMENTARY
Investment operations
Selected indicators of credit risk exposure in IFC’s loan portfolio, together with the five-year trend ofnon-performing loans (NPLs), are given below:
Table 10: IFC Loan Portfolio Credit Risk Indicators
INDICATOR June 30, 2018 June 30, 2017 Change
NPLs as % of the loan portfolio . . . . . . . . . . . . . . . . . . 4.6% 5.4% Down 0.8%Principal amount outstanding on NPLs . . . . . . . . . . . . $1,400 million $1,522 million Down $122 millionTotal reserves against losses on loans . . . . . . . . . . . . . $1,293 million $1,483 million Down $190 millionTotal reserves against losses on loans as % of
disbursed loan portfolio . . . . . . . . . . . . . . . . . . . . . . 5.1% 6.1% Down 1.0%Total reserves against losses on guarantees . . . . . . . . . $15 million $12 million Up $3 million
Figure 4: NPLs as Percentage of Disbursed Loan Portfolio
1,8001,6001,4001,2001,000
800600400200 1.0
2.0
3.0
4.0
5.0
% of disbursed loans$ millions
$ m
illio
ns
% o
f di
sbur
sed
loan
s
6.0
7.0
FY14FY15
FY16FY17
FY18- -
Additional details are provided in Section VII — Results of Operations (Provision for Losses on Loans,Guarantees, Accrued Interest and Other Receivables).
Treasury operations
Treasury operations counterparties remain well diversified by sector and geography. In accordance with itsagreements with counterparties, at June 30, 2018, IFC held $236 million in cash and $231 million in securities ascollateral for changes in mark-to-market exposures on open trades ($334 million in cash and $197 million insecurities — June 30, 2017).
29
MARKET RISK MANAGEMENT
Definition and scope of market risk
Market risk is the risk of losses in positions arising from movements in market prices. IFC’s exposure tomarket risk is mitigated by its matched funding policy, whereby it uses derivative instruments to convert loansfunded from market borrowings, and the market borrowings themselves, into floating rate US dollar assets andliabilities with similar duration. Similarly, market risk resulting from derivative transactions with clients, tofacilitate clients’ risk management, is typically mitigated by entering into offsetting positions with highly ratedmarket counterparties. IFC’s residual exposure to market risk arises primarily from its listed and unlisted equityinvestments in emerging markets, from its Treasury liquid asset portfolios, and also from its aggregate asset andliability management positions.
Equity investments
The risk of loss in value of IFC’s emerging markets equity investments is mitigated primarily by applyingthe same limits framework, decision making process and portfolio management methods as described above forits lending operations. IFC has a multi-year horizon for its equity investments and accepts short term pricevolatility of these investments, which can be significant.
Liquid asset portfolios
Market risk in IFC’s liquid assets portfolios is managed to the chosen risk profile of the respective portfoliobenchmarks, using derivative and other financial instruments such as over-the-counter foreign exchange forwardagreements, interest rate and currency swaps, and exchange-traded interest rate futures and options. Overallmarket risk exposure is also subject to daily monitoring, based on Directives approved by the Corporate RiskCommittee, which limit interest rate, credit spread, and foreign exchange risk.
Asset-liability management
While IFC’s matched-funding policy helps mitigate currency and interest rate risk, IFC is still exposed toresidual market risks in the market borrowings-funded portion of the balance sheet. Residual currency risk arisesfrom factors such as changes in the level of reserves for losses on non-US dollar loans. The aggregate position ineach lending currency is monitored and the risk is managed within a range of +/- $5 million equivalent in eachcurrency. Residual interest rate risk may arise from differing interest rate reset dates on assets and liabilities, orfrom assets that are fully match-funded at inception, but become mismatched over time due to write-downs,prepayments, or rescheduling. The residual interest rate risk is managed by measuring the sensitivity of thepresent value of assets and liabilities in each currency to a one basis point change in interest rates and managingexposures to within a potential change in value of +/- $50,000.
FY18 MARKET RISK COMMENTARY
Liquid asset portfolios
IFC’s liquid asset portfolios have minimal interest rate risk due to short-tenor benchmarks and becausedeviations from those benchmarks are small. The overall level of risk in IFC’s Treasury operations reducedmodestly in FY18 due to lower credit spread exposure. In addition, the liquid asset portfolios reduced riskexposure to more capital-intensive sectors such as securitized products and increased risk exposure to lesscapital-intensive sectors. Interest rate, foreign exchange, and spread risks are all controlled on a daily basis usinga system of limits that remained in compliance during FY18.
30
Equity investments
Emerging market equities rallied during the first part of the fiscal year (up 28% from the end of June 2017to all-time highs in January 2018), then gave up some of those gains in the second half, to end up 9% for thefiscal year. The early market gains came during a global rally, where emerging markets outperformed due to aperceived relative undervaluation, while the later retreat was driven by concerns of the impact of a strengtheningdollar and potential trade wars. Oil (WTI) jumped from $46/barrel at the beginning of the fiscal year to$74/barrel at the end of the period, helping producers but hurting importers. The U.S. dollar strengthenedsignificantly during the later months of FY18, with the JP Morgan Emerging Markets Currency Index declining6% versus the U.S. dollar over the fiscal year, as the expectations of further Fed hikes increased. Some currenciessaw significant devaluations, driven by political events, including in Turkey, Brazil and Argentina. IFC continuesto focus on selectivity, active management of its portfolio through close monitoring, portfolio reviews andoversight. Active management enabled the Corporation to continue its judicious divestitures in FY18 and takeadvantage of market opportunities to generate significant realized gains from its mature exposures.
LIQUIDITY RISK MANAGEMENT
IFC defines liquidity risk as the risk of a financial loss arising from the inability to liquidate financial assetsor to raise additional funds in the expected time frame to meet contractual obligations. IFC faces liquidity risk inits core development finance activities because its investments are predominantly illiquid in nature, due to thelack of capital flows, the infrequency of transactions, and the lack of price transparency in many emergingmarkets. To offset this risk, IFC maintains appropriate liquid asset portfolios funded by market borrowings.
Liquid asset portfolios
Liquidity risk in the liquid asset portfolios is addressed by strict eligibility criteria defined in Directivesapproved by the Corporate Risk Committee. Examples include minimum sizes for bond issuances, and limits onsingle bond issue concentration and on the percentage of total bond issuance held by IFC. Consequently, asignificant portion of the liquid asset portfolio is invested in highly liquid securities such as high-qualitysovereign, sovereign-guaranteed, and supranational fixed income instruments. IFC expects to continue to be ableto realize these assets as needed to meet its cash requirements, even in a liquidity crisis.
Funding
IFC’s funding operations ensure that IFC has the funds it needs for its lending operations, and that it hassufficient liquidity to safeguard its triple-A rating and fulfill IFC’s counter-cyclical role. IFC is able to access avariety of funding markets, including the US dollar market, the Australian dollar market as well as privateplacement and retail markets. IFC’s discount note program complements IFC’s traditional funding sources byproviding swift access to funded liquidity. IFC’s triple-A rating is critical to the Corporation’s ability to maintainits low cost of funds. Regular issuance in a variety of markets serves to sustain investor confidence and maintaina diversified investor base. IFC continues to enjoy one of the lowest funding costs of any multilateraldevelopment bank.
FY18 LIQUIDITY RISK COMMENTARY
On June 30, 2018, IFC’s liquid asset portfolios totaled $38.9 billion (June 30, 2017 — $39.2 billion). TheCorporation’s overall liquidity coverage ratio as a percentage of next three years’ estimated net cash needs stoodat 100%, above the minimum requirement of 45%. During FY18, IFC raised $16.0 billion in market borrowings,net of derivatives (FY17 — $15.4 billion). The outstanding balance under the Discount Note Program at June 30,2018 was $2.3 billion (June 30, 2017 — $2.7 billion). In FY18, IFC’s funding costs vs US dollar 6 month Liborincreased slightly when compared with FY17 due to the increase in the weighted average maturity of the FY18funding program.
31
OPERATIONAL RISK MANAGEMENT
Consistent with the Basel Framework, IFC defines operational risk as the risk of loss resulting frominadequate or failed internal processes, people and systems, or from external events and holds economic capitalagainst such risks. Given IFC’s business model, both financial and non-financial potential impacts are consideredin assessment of risks.
IFC’s Operational Risk Management (ORM) program conforms to a Directive approved by the CorporateRisk Committee, which defines the management of, and roles and responsibilities for, operational riskmanagement in the Corporation. IFC’s ORM approach is designed to ensure that operational risks are identified,assessed, and managed to enable senior management to determine which risks IFC will accept, mitigate ortransfer. IFC seeks to manage key risks by maintaining a comprehensive set of business processes and internalcontrols.
IFC utilizes risk transfer mechanisms, including insurance, at both the project and the institutional levels formitigation of low probability/frequency and high impact operational risks. IFC identifies and evaluatesoperational risks from a standard likelihood-potential impact approach, determines available contractual transferand insurance options to bring residual risk within tolerance, implements the recommended/approved structuringof that risk, and tracks its effectiveness over time. IFC insures its corporate assets and operations againstcatastrophic losses where commercially viable.
FY18 OPERATIONAL RISK COMMENTARY
IFC continues to develop and implement enhanced methodologies to identify, measure, monitor and managematerial operational risks in its key activities. IFC has an enterprise-level approach to assess risk and continues todevelop this methodology for operational risk.
IFC therefore periodically assesses operational risks in the processes that support IFC’s key business pillars,namely, equity, debt, loans and treasury products, as well as advisory services and provides an ORM report toCRC on a quarterly basis. IFC also continues to focus on its preparedness to react to significant events that coulddisrupt its normal operations through the Business Continuity Management program, which covers criticalbusiness processes across all IFC offices.
In common with both private-sector financial institutions and its IFI peers, IFC continues to face anincreasingly challenging cyber risk environment, including a higher active threat context and increasinglydemanding compliance expectations. Accordingly, IFC is continually assessing its cybersecurity stance in linewith financial services industry expectations and practices, including risk governance processes and enhanceddata incident response practices. IFC has also adopted a privacy policy reflecting global practices, includingappropriate procedural and technical standards, which is expected to be implemented over the next few years.
Among the key risk management concerns implicated are (a) increased reliance on third party vendors;(b) heightened privacy and confidential information requirements; and (c) heightened cyber risk governanceexpectations overall, including effective information governance, and integration of cyber risk management intoenterprise-level ORM.
None of the issues described above is unique to IFC specifically, or even IFIs generally, but represent keyemerging sources of potential financial and reputational impacts for the Corporation in the medium term.
BUSINESS RISK MANAGEMENT
Definition and scope of business risk
Business risk is risk that is specific to IFC given its mission and strategy and that is not covered by otherrisk dimensions. It has the following components, which are described in the paragraphs below together with thespecific risk mitigation measures that are adopted: environment and social; corporate governance; integrity; anti-money laundering and combating the financing of terrorism (AML/CFT); use of offshore financial centers(OFCs); data access, security and privacy; operational conflict of interest; management of policies & proceduresframework; and risks associated with external financing.
32
Environment and social risk
Environment and social (E&S) risk is the risk that IFC does not effectively engage and influence clients tofulfill the requirements of the Performance Standards on Environmental and Social Sustainability, potentiallycausing harm to people or the environment. The Performance Standards form part of IFC’s SustainabilityFramework, articulating the Corporation’s strategic commitment to sustainable development:
• The Performance Standards guide clients on sustainable business practices, including continuallyidentifying and managing risks through: analytical work such as environmental and social assessments;stakeholder engagement; and client disclosure obligations in relation to project-level activities.
• The Policy on Environmental and Social Sustainability describes IFC’s commitments, roles andresponsibilities in relation to environmental and social sustainability.
• IFC’s Access to Information Policy reflects the Corporation’s commitment to transparency and goodgovernance and outlines institutional disclosure obligations.
IFC uses the Sustainability Framework along with other strategies, policies and initiatives to focus businessactivities on achieving the Corporation’s development objectives. All project teams are required to recordexpectations of development outcomes with time-bound targets using standard indicators. These indicators aretracked and performance is rated on an annual basis for the duration of every project.
Figure 5 on page 35 shows the historic Environmental and Social Risk Rating (ESRR) distribution by fiscalyear. This distribution depicts a broad E&S risk profile of our portfolio. There was a measurable improvement inthe last three fiscal years.
Client corporate governance risk
Corporate governance risk is the risk that IFC’s clients have inefficient or ineffective corporate governancepractices, leading to adverse reputational or financial impact on IFC. IFC manages corporate governance riskprimarily by conducting a structured evaluation of every new investment project, covering the following fiveareas:
• Effectiveness of the Board of Directors;
• Sufficiency of internal controls, audit, risk management and compliance;
• Adequacy of financial and non-financial disclosures;
• Adequacy of shareholders’ rights; and
• Demonstration of the client’s commitment to implement high quality corporate governance policies andpractices.
The findings from these assessments are considered in the decision on whether to proceed with the project.
Integrity risk, AML/CFT risks and use of OFCs
Integrity risk is the risk of engaging with external institutions or persons whose background or activitiesmay have adverse reputational and/or financial impact on IFC. IFC works with a wide range of partners in bothInvestment Operations and Advisory Services, from multi-national to small companies, and from governmentinstitutions to non-governmental organizations. Thus, each transaction or service opportunity presents uniqueintegrity risks, affected by different factors, including the type of engagement, financial instrument, structure,and duration of the engagement. IFC has defined procedures for conducting Integrity Due Diligence and these areused to:
• Uncover integrity risk issues related to a prospective project or engagement and the institutions andpersons involved;
• Evaluate and assess integrity risks, including deciding on how to mitigate and whether to accept the risks,and determining next steps, which may include escalation to IFC senior management and Board approval;
33
• Appropriately classify integrity risks; and
• Monitor integrity risks throughout the life of the project or engagement.
IFC conducts AML/CFT due diligence on financial institution clients to determine whether the client hasarrangements to ensure that:
• Client AML/CFT procedures and controls are in compliance with relevant national AML/CFT laws andregulations;
• AML/CFT procedures and controls are appropriate for the client’s business and operating environments;and
• Implementation of the client’s AML/CFT controls is effective.
IFC also has defined procedures for analyzing the use of offshore financial centers (OFCs) by clients andsponsors and related tax issues by:
• Determining whether an OFC is eligible to serve as an intermediary jurisdiction for a project byreferencing the Global Forum’s published peer reviews (which provides a broad internationalperspective); and
• Requiring the client to provide information to support the determination that the project’s corporatestructure is legitimate and has not been designed for tax evasion/abuse or other illegitimate purposes.
Operational conflict of interest risk
Operational conflicts of interest can arise when IFC acts in the interests of more than one party, where theinterests of those parties might be, or might be perceived to be, inconsistent. Given the nature and scope ofproducts and services that IFC provides to its clients in furtherance of its development mandate, and the differentroles played by other World Bank Group entities, actual or perceived operational conflicts of interest can arise inthe normal course of its activities. IFC recognizes that adverse legal, reputational, client relationship and otherimplications may arise if such conflicts are not managed. IFC has implemented policies and procedures tomanage these risks.
External financing risk
As well as using its own resources to invest in and provide advice to clients, IFC raises additional fundsfrom public and private sector institutional investors, lenders and donors through several different mechanisms.External financing risk is the risk that when entrusted with oversight of such funds, IFC does not meet itscontractual obligations to the third parties involved.
To mitigate this risk, IFC works within agreed frameworks which establish IFC’s responsibilities andobligations with respect to the third parties. For example, where financing to clients is mobilized through BLoans or the MCPP, the specialized Syndications Department follows defined processes to identify co-financiers,advise on structuring, and monitor compliance with investment agreements. In some cases, financing from thirdparties, including donors, is administered through trust funds. A separate unit within IFC follows predefinedprocedures for clearing all IFC trust fund proposals and agreements and overseeing IFC’s trust fund portfolio.Finally, AMC, a wholly-owned subsidiary, provides for an independent governance process making decisions forthe benefit of investors in AMC-managed funds and AMC compliance matters are subject to IFC oversight.
FY18 BUSINESS RISK COMMENTARY
Focused supervision efforts in the last three fiscal years have improved the E&S risk profile of IFC’sinvestment portfolio by reducing the number of poor performing projects, defined as a historical environmentaland social risk rating (ESRR) of 3 and 4. The ESRR evaluates a client’s management of E&S risks and avoidanceand control of adverse outcomes.
34
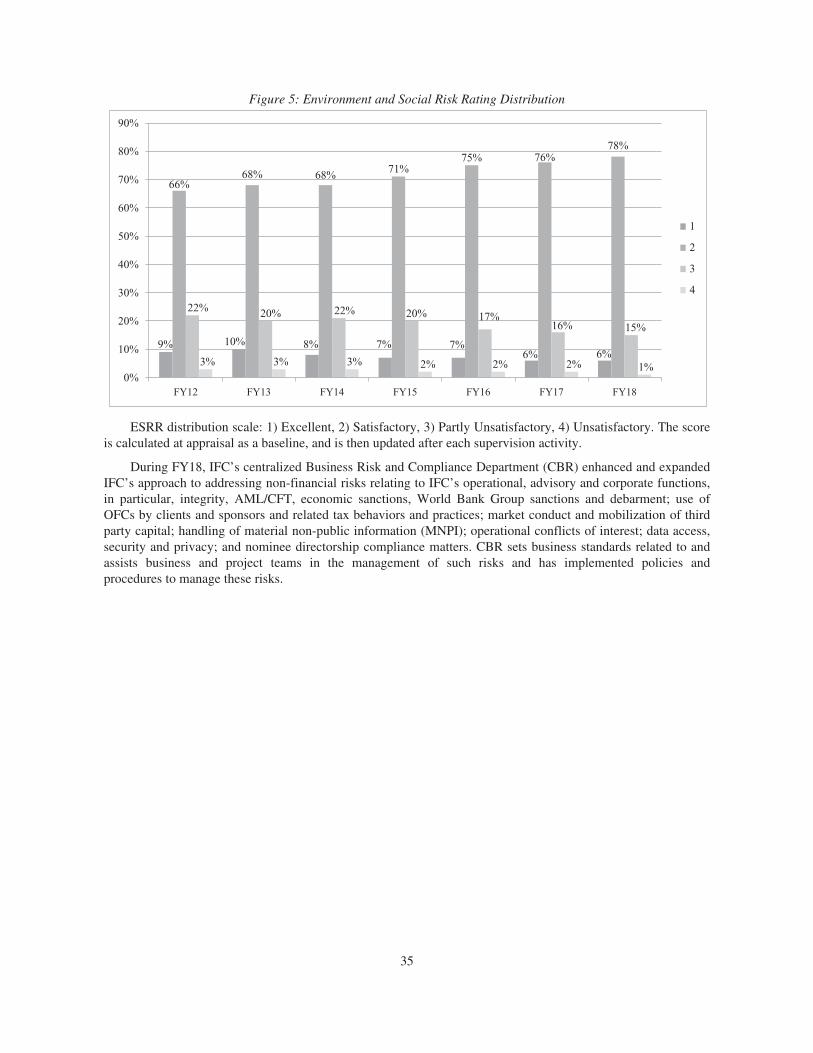
Figure 5: Environment and Social Risk Rating Distribution
FY120%
10%
4
3
2
1
66%68% 68%
71%75% 76%
78%
3% 2%
8% 7%
2% 2%6%
20%
30%
40%
50%
60%
70%
80%
90%
FY13 FY14 FY15 FY16 FY17 FY18
9%
22% 20% 22%
10%
3% 3%
20%
7%
17%16% 15%
1%6%
ESRR distribution scale: 1) Excellent, 2) Satisfactory, 3) Partly Unsatisfactory, 4) Unsatisfactory. The scoreis calculated at appraisal as a baseline, and is then updated after each supervision activity.
During FY18, IFC’s centralized Business Risk and Compliance Department (CBR) enhanced and expandedIFC’s approach to addressing non-financial risks relating to IFC’s operational, advisory and corporate functions,in particular, integrity, AML/CFT, economic sanctions, World Bank Group sanctions and debarment; use ofOFCs by clients and sponsors and related tax behaviors and practices; market conduct and mobilization of thirdparty capital; handling of material non-public information (MNPI); operational conflicts of interest; data access,security and privacy; and nominee directorship compliance matters. CBR sets business standards related to andassists business and project teams in the management of such risks and has implemented policies andprocedures to manage these risks.
35
CRITICAL ACCOUNTING POLICIES
Note A to IFC’s FY18 Consolidated Financial Statements contain a summary of IFC’s significantaccounting policies, including a discussion of recently adopted accounting standards and accounting andfinancial reporting developments. Certain of these policies are considered to be “critical” to the portrayal ofIFC’s financial condition and results of operations, since they require management to make difficult, complex orsubjective judgments, some of which may relate to matters that are inherently uncertain.
These policies include:
• Determining the level of reserves against losses in the loan portfolio;
• Determining the level and nature of impairment for equity investments and debt securities carried at fairvalue with changes in fair value being reported in other comprehensive income (OCI) and for equityinvestments accounted for at cost less impairment (where impairment is determined with reference to fairvalue);
• Determining the fair value of certain equity investments, debt securities, loans, liquid assets, borrowingsand derivatives, which have no quoted market prices and are accounted for at fair value; and
• Determining the future pension and postretirement benefit costs and obligations using actuarialassumptions based on financial market interest rates, past experience, and management’s best estimate offuture benefit cost changes and economic conditions.
Many of IFC’s financial instruments are classified in accordance with the fair value hierarchy established byaccounting standards for fair value measurements and disclosures where the fair value and/or impairment isestimated based on internally developed models or methodologies utilizing significant inputs that arenon-observable.
RESERVE AGAINST LOSSES ON LOANS
IFC considers a loan as impaired when, based on current information and events, it is probable that IFC willbe unable to collect all amounts due according to the loan’s contractual terms. The reserve against losses forimpaired loans reflects management’s judgment of the present value of expected future cash flows discounted atthe loan’s effective interest rate. The reserve against losses for loans also includes an estimate of probable losseson loans inherent in the portfolio but not specifically identifiable. The reserve is established through periodiccharges to income in the form of a provision for losses on loans. Loans written off, as well as any subsequentrecoveries, are recorded through the reserve.
The assessment of the adequacy of reserves against losses for loans is highly dependent on management’sjudgment about factors such as its assessment of the financial capacity of borrowers, geographical concentration,industry, regional and macroeconomic conditions, and historical trends. Due to the inherent limitation of anyparticular estimation technique, management utilizes a capital pricing and risk framework to estimate theprobable losses on loans inherent in the portfolio but not specifically identifiable. This Board of Directors-approved framework uses actual loan loss history and aligns the loan loss provisioning framework with IFC’scapital adequacy framework.
The reserve against losses on loans is separately reported in the consolidated balance sheet as a reduction ofIFC’s total loans. Increases or decreases in the reserve level are reported in the income statement as provision forlosses or release of provision for losses on loans, and guarantees. The reserve against losses on loans relates onlyto the Investment services segment of IFC (see Note S to the FY18 Consolidated Financial Statements for furtherdiscussion of IFC’s business segments).
36
OTHER-THAN-TEMPORARY IMPAIRMENTS ON EQUITY INVESTMENTS AND DEBT SECURITIES
IFC assesses all equity investments accounted for at fair value through OCI and all equity investmentsaccounted for at cost less impairment for impairment each quarter. When impairment is identified and is deemedto be other-than-temporary, the equity investment is written down to its impaired value, which becomes the newcost basis in the equity investment. IFC generally presumes that all equity impairments are deemed to be other-than-temporary. Impairment losses on equity investments accounted for at cost less impairment are not reversedfor subsequent recoveries in value of the equity investment until it is sold. Recoveries in value on equityinvestments accounted for at fair value through OCI that have been the subject of an other-than-temporaryimpairments are reported in OCI until sold.
IFC assesses all debt security investments accounted for at fair value through OCI for impairment eachquarter. When impairment is identified, the entire impairment is recognized in net income if certain conditionsare met (as detailed in Note A to IFC’s FY18 Consolidated Financial Statements). However, if IFC does notintend to sell the debt security and it is not more likely than not that IFC will be required to sell the security, butthe security has suffered a credit loss, the credit-related impairment loss is recognized in net income and thenon-credit related loss is recognized in OCI.
VALUATION OF FINANCIAL INSTRUMENTS WITH NO QUOTED MARKET PRICES
IFC reports at fair value all of its derivative instruments, all of its liquid asset trading securities and certainborrowings, loans, equity investments and debt securities. In addition, various investment agreements containembedded or stand-alone derivatives that, for accounting purposes, are separately accounted as either derivativeassets or liabilities, including puts, caps, floors, and forwards. IFC classifies all financial instruments accountedfor at fair value based on the fair value hierarchy established by accounting standards for fair valuemeasurements and disclosures as described in more detail in Notes A and R to IFC’s FY18 ConsolidatedFinancial Statements.
Many of IFC’s financial instruments accounted for at fair value are valued based on unadjusted quotedmarket prices or using models where the significant assumptions and inputs are market-observable. The fairvalues of financial instruments valued using models where the significant assumptions and inputs are not market-observable are generally estimated using complex pricing models of the net present value of estimated futurecash flows. Management makes numerous assumptions in developing pricing models, including an assessmentabout the counterparty’s financial position and prospects, the appropriate discount rates, interest rates, and relatedvolatility and expected movement in foreign currency exchange rates. Changes in assumptions could have asignificant impact on the amounts reported as assets and liabilities and the related unrealized gains and lossesreported in the income statement and statement of OCI. The fair value computations affect both the Investmentservices and Treasury segments of IFC (see Note S to the FY18 Consolidated Financial Statements for furtherdiscussion of IFC’s business segments).
PENSION AND OTHER POSTRETIREMENT BENEFITS
IFC participates, along with IBRD and MIGA, in pension and postretirement benefit plans that coversubstantially all of their staff members. All costs, assets and liabilities associated with the plans are allocatedbetween IBRD, IFC and MIGA based upon their employees’ respective participation in the plans. The underlyingactuarial assumptions used to determine the projected benefit obligations, the fair value of plan assets and thefunded status associated with these plans are based on financial market interest rates, past experience, andmanagement’s best estimate of future benefit cost changes and economic conditions. For further details, pleaserefer to Note V to the FY18 Consolidated Financial Statements.
37
RESULTS OF OPERATIONS
OVERVIEW
The overall market environment has a significant influence on IFC’s financial performance. The mainelements of IFC’s net income (loss) and comprehensive income (loss) and influences on the level and variabilityof net income and comprehensive income (loss) from year to year are:
Table 11: Main Elements of Net Income (Loss) and Comprehensive Income (Loss)
ELEMENTS SIGNIFICANT INFLUENCES
Net income:
Yield on interest earning assets Market conditions including spread levels and degreeof competition. Nonaccruals and recoveries of intereston loans formerly in nonaccrual status and incomefrom participation notes on individual loans are alsoincluded in income from loans.
Liquid asset income Realized and unrealized gains and losses on the liquidasset portfolios, which are driven by external factorssuch as: the interest rate environment and liquidity ofcertain asset classes within the liquid asset portfolio.
Income from the equity investment portfolio Global climate for emerging markets equities,fluctuations in currency and commodity markets andcompany-specific performance for equity investments.Performance of the equity portfolio (principallyrealized capital gains, dividends, equity impairments,gains on non-monetary exchanges and unrealizedgains and losses on equity investments).
Provisions for losses on loans and guarantees Risk assessment of borrowers and probability ofdefault and loss given default.
Other income and expenses Level of advisory services provided by IFC to itsclients, the level of expense from the staff retirementand other benefits plans, and the approved and actualadministrative expenses and other budgets.
Gains and losses on other non-trading financialinstruments accounted for at fair value
Principally, differences between changes in fair valuesof borrowings, including IFC’s credit spread, andassociated derivative instruments and unrealized gainsor losses associated with the investment portfolioincluding puts, warrants and stock options which inpart are dependent on the global climate for emergingmarkets. These securities are valued using internallydeveloped models or methodologies utilizing inputsthat may be observable or non-observable.
Grants to IDA Level of the Board of Governors-approved grants toIDA.
38
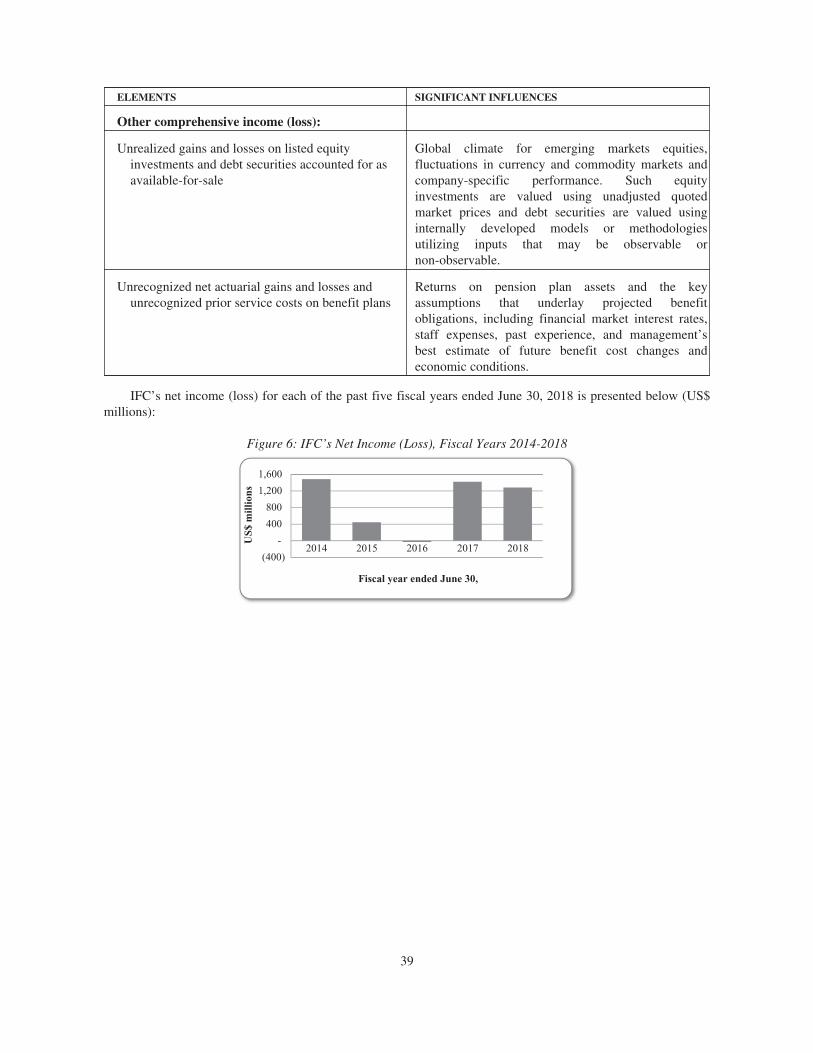
ELEMENTS SIGNIFICANT INFLUENCES
Other comprehensive income (loss):
Unrealized gains and losses on listed equityinvestments and debt securities accounted for asavailable-for-sale
Global climate for emerging markets equities,fluctuations in currency and commodity markets andcompany-specific performance. Such equityinvestments are valued using unadjusted quotedmarket prices and debt securities are valued usinginternally developed models or methodologiesutilizing inputs that may be observable ornon-observable.
Unrecognized net actuarial gains and losses andunrecognized prior service costs on benefit plans
Returns on pension plan assets and the keyassumptions that underlay projected benefitobligations, including financial market interest rates,staff expenses, past experience, and management’sbest estimate of future benefit cost changes andeconomic conditions.
IFC’s net income (loss) for each of the past five fiscal years ended June 30, 2018 is presented below (US$millions):
Figure 6: IFC’s Net Income (Loss), Fiscal Years 2014-2018
US$
mill
ions
1,600
1,200
800
400
2014 2015 2016 2017 2018(400)
-
Fiscal year ended June 30,
39
The following paragraphs detail significant variances between FY18 vs FY17 and FY17 vs FY16, coveringthe periods included in IFC’s FY18 Consolidated Financial Statements.
FY18 VERSUS FY17
Net income
IFC has reported income before net unrealized gains and losses on non-trading financial instrumentsaccounted for at fair value, grants to IDA and net gains and losses attributable to non-controlling interest of$1,272 million in FY18, as compared to $1,129 million in FY17. The $143 million increase in FY18 whencompared to FY17 was principally a result of the following:
Table 12: Change in Net Income FY18 vs FY17 (US$ millions)
Increase(decrease) FY18
vs FY17
Higher foreign currency transaction gains on non-trading activities . . . . . . . . . . . . . . . . . . . . . . . . $ 311Lower other-than-temporary impairments on equity investments and debt securities . . . . . . . . . . . 150Higher income from loans and guarantees, realized gains and losses on loans and associated
derivatives . . . . . . . . . . . . . . . . . . . . . . . . . . . . . . . . . . . . . . . . . . . . . . . . . . . . . . . . . . . . . . . . . . . 79Higher debt securities income . . . . . . . . . . . . . . . . . . . . . . . . . . . . . . . . . . . . . . . . . . . . . . . . . . . . . . 66Higher unrealized gains on equity investments and associated derivatives, net . . . . . . . . . . . . . . . . 50Higher other income . . . . . . . . . . . . . . . . . . . . . . . . . . . . . . . . . . . . . . . . . . . . . . . . . . . . . . . . . . . . . 50Lower pension expenses . . . . . . . . . . . . . . . . . . . . . . . . . . . . . . . . . . . . . . . . . . . . . . . . . . . . . . . . . . 49Higher administrative expenses . . . . . . . . . . . . . . . . . . . . . . . . . . . . . . . . . . . . . . . . . . . . . . . . . . . . (67)Lower realized gains on equity investments and associated derivatives, net . . . . . . . . . . . . . . . . . . (81)Lower income from liquid asset trading activities . . . . . . . . . . . . . . . . . . . . . . . . . . . . . . . . . . . . . . (146)Higher charges on borrowings . . . . . . . . . . . . . . . . . . . . . . . . . . . . . . . . . . . . . . . . . . . . . . . . . . . . . (329)Other, net . . . . . . . . . . . . . . . . . . . . . . . . . . . . . . . . . . . . . . . . . . . . . . . . . . . . . . . . . . . . . . . . . . . . . . 11
Change in income before net unrealized gains and losses on non-trading financialinstruments accounted for at fair value, grants to IDA and net gains and lossesattributable to non-controlling interests . . . . . . . . . . . . . . . . . . . . . . . . . . . . . . . . . . . . . . . . . . $ 143
FY18 FY17
Income before net unrealized gains and losses on non-trading financial instrumentsaccounted for at fair value, grants to IDA and net gains and losses attributable tonon-controlling interests . . . . . . . . . . . . . . . . . . . . . . . . . . . . . . . . . . . . . . . . . . . . . . . . . . . . . $1,272 $1,129Net unrealized gains and losses on non-trading financial instruments accounted for at fair
value . . . . . . . . . . . . . . . . . . . . . . . . . . . . . . . . . . . . . . . . . . . . . . . . . . . . . . . . . . . . . . . . . . . 88 394
Income before grants to IDA . . . . . . . . . . . . . . . . . . . . . . . . . . . . . . . . . . . . . . . . . . . . . . . . . . . 1,360 1,523Grants to IDA . . . . . . . . . . . . . . . . . . . . . . . . . . . . . . . . . . . . . . . . . . . . . . . . . . . . . . . . . . . . . . (80) (101)
Net Income . . . . . . . . . . . . . . . . . . . . . . . . . . . . . . . . . . . . . . . . . . . . . . . . . . . . . . . . . . . . . . . . . . 1,280 1,422Net (gains) losses attributable to non-controlling interests . . . . . . . . . . . . . . . . . . . . . . . . . . . . — (4)
Net Income (Loss) attributable to IFC . . . . . . . . . . . . . . . . . . . . . . . . . . . . . . . . . . . . . . . . . . . $1,280 $1,418
A more detailed analysis of the components of IFC’s net income follows.
Income from Loans and Guarantees, including Realized Gains and Losses on Loans and AssociatedDerivatives
IFC’s primary interest earning asset is its loan portfolio. Income from loans and guarantees, includingrealized gains and losses on loans and associated derivatives for FY18 totaled $1,377 million, compared with$1,298 million in FY17, an increase of $79 million.
40
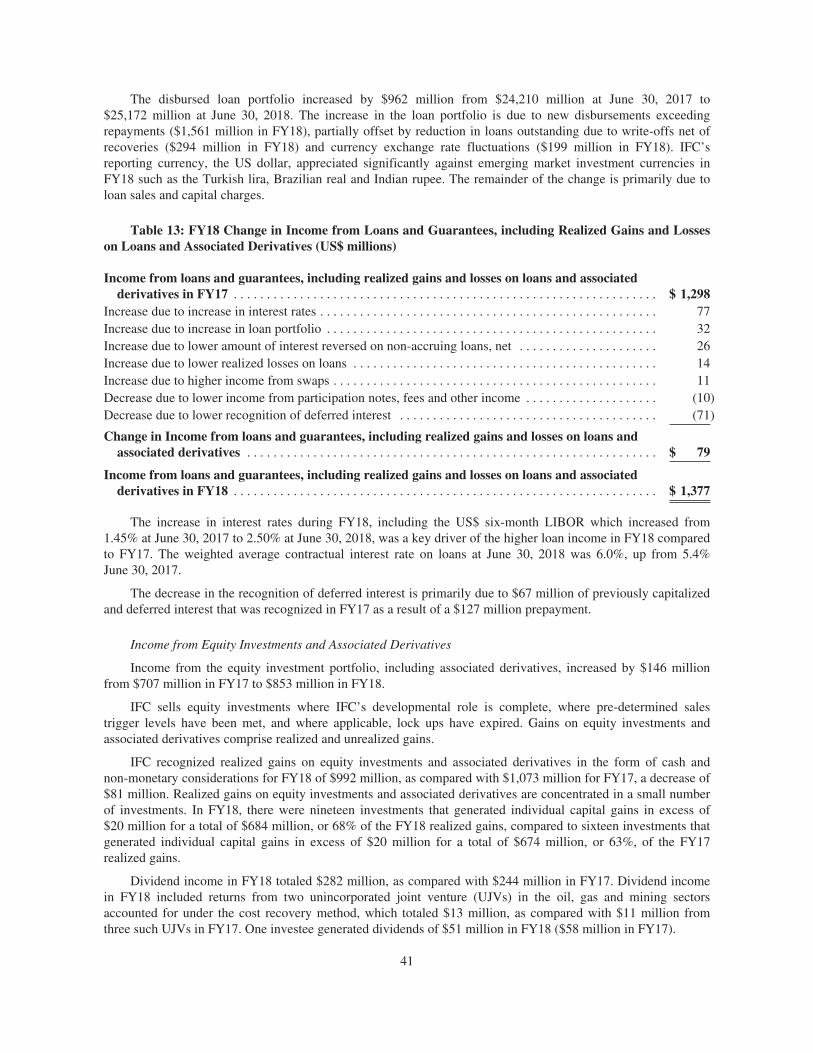
The disbursed loan portfolio increased by $962 million from $24,210 million at June 30, 2017 to$25,172 million at June 30, 2018. The increase in the loan portfolio is due to new disbursements exceedingrepayments ($1,561 million in FY18), partially offset by reduction in loans outstanding due to write-offs net ofrecoveries ($294 million in FY18) and currency exchange rate fluctuations ($199 million in FY18). IFC’sreporting currency, the US dollar, appreciated significantly against emerging market investment currencies inFY18 such as the Turkish lira, Brazilian real and Indian rupee. The remainder of the change is primarily due toloan sales and capital charges.
Table 13: FY18 Change in Income from Loans and Guarantees, including Realized Gains and Losseson Loans and Associated Derivatives (US$ millions)
Income from loans and guarantees, including realized gains and losses on loans and associatedderivatives in FY17 . . . . . . . . . . . . . . . . . . . . . . . . . . . . . . . . . . . . . . . . . . . . . . . . . . . . . . . . . . . . . . . . $ 1,298
Increase due to increase in interest rates . . . . . . . . . . . . . . . . . . . . . . . . . . . . . . . . . . . . . . . . . . . . . . . . . . . 77Increase due to increase in loan portfolio . . . . . . . . . . . . . . . . . . . . . . . . . . . . . . . . . . . . . . . . . . . . . . . . . . 32Increase due to lower amount of interest reversed on non-accruing loans, net . . . . . . . . . . . . . . . . . . . . . 26Increase due to lower realized losses on loans . . . . . . . . . . . . . . . . . . . . . . . . . . . . . . . . . . . . . . . . . . . . . . 14Increase due to higher income from swaps . . . . . . . . . . . . . . . . . . . . . . . . . . . . . . . . . . . . . . . . . . . . . . . . . 11Decrease due to lower income from participation notes, fees and other income . . . . . . . . . . . . . . . . . . . . (10)Decrease due to lower recognition of deferred interest . . . . . . . . . . . . . . . . . . . . . . . . . . . . . . . . . . . . . . . (71)
Change in Income from loans and guarantees, including realized gains and losses on loans andassociated derivatives . . . . . . . . . . . . . . . . . . . . . . . . . . . . . . . . . . . . . . . . . . . . . . . . . . . . . . . . . . . . . . $ 79
Income from loans and guarantees, including realized gains and losses on loans and associatedderivatives in FY18 . . . . . . . . . . . . . . . . . . . . . . . . . . . . . . . . . . . . . . . . . . . . . . . . . . . . . . . . . . . . . . . . $ 1,377
The increase in interest rates during FY18, including the US$ six-month LIBOR which increased from1.45% at June 30, 2017 to 2.50% at June 30, 2018, was a key driver of the higher loan income in FY18 comparedto FY17. The weighted average contractual interest rate on loans at June 30, 2018 was 6.0%, up from 5.4%June 30, 2017.
The decrease in the recognition of deferred interest is primarily due to $67 million of previously capitalizedand deferred interest that was recognized in FY17 as a result of a $127 million prepayment.
Income from Equity Investments and Associated Derivatives
Income from the equity investment portfolio, including associated derivatives, increased by $146 millionfrom $707 million in FY17 to $853 million in FY18.
IFC sells equity investments where IFC’s developmental role is complete, where pre-determined salestrigger levels have been met, and where applicable, lock ups have expired. Gains on equity investments andassociated derivatives comprise realized and unrealized gains.
IFC recognized realized gains on equity investments and associated derivatives in the form of cash andnon-monetary considerations for FY18 of $992 million, as compared with $1,073 million for FY17, a decrease of$81 million. Realized gains on equity investments and associated derivatives are concentrated in a small numberof investments. In FY18, there were nineteen investments that generated individual capital gains in excess of$20 million for a total of $684 million, or 68% of the FY18 realized gains, compared to sixteen investments thatgenerated individual capital gains in excess of $20 million for a total of $674 million, or 63%, of the FY17realized gains.
Dividend income in FY18 totaled $282 million, as compared with $244 million in FY17. Dividend incomein FY18 included returns from two unincorporated joint venture (UJVs) in the oil, gas and mining sectorsaccounted for under the cost recovery method, which totaled $13 million, as compared with $11 million fromthree such UJVs in FY17. One investee generated dividends of $51 million in FY18 ($58 million in FY17).
41
Other-than-temporary impairments on equity investments totaled $446 million in FY18 ($264 million onequity investments accounted for at cost less impairment; and $182 million on equity investments accounted foras available-for-sale), as compared with $581 million in FY17 ($365 million on equity investments accounted forat cost less impairment; and $216 million on equity investments accounted for as available-for-sale), a decreaseof $135 million. The largest amount of impairments in FY18 were from the South Asia, Europe and Central Asiaregions, primarily in the Manufacturing, Agribusiness and Services and Financial Markets sectors. In FY18, fiveinvestments generated individual other-than-temporary impairments in excess of $20 million for a total of$155 million. In FY17, seven investments generated an individual other-than-temporary impairment in excess of$20 million for a total of $267 million.
Net unrealized gains on equity investments and associated derivatives totaled $17 million (Net unrealizedlosses of $33 million in FY17) reflecting an overall improvement in the macro environment for emerging marketequities.
Income from Debt Securities and Realized Gains and Losses on Debt Securities and Associated Derivatives
Income from debt securities and realized gains and losses on debt securities and associated derivativesincreased to $363 million in FY18 from $282 million in FY17. The increase was primarily due an increase ininterest income of $128 million in FY18 when compared with FY17 due to higher average balances, partiallyoffset by a $60 million decrease in realized gains ($93 million in FY18) when compared to FY17 ($153 million).
Provision for Losses on Loans, Guarantees, Accrued Interest and Other Receivables
The quality of the loan portfolio, as measured by the weighted average country risk ratings and the weightedaverage credit ratings, experienced some marginal improvement in FY18. Non-performing loans (NPLs)decreased by $122 million, from $1,522 million of the disbursed loan portfolio at June 30, 2017 to$1,400 million9 at June 30, 2018. The decrease of $122 million was comprised of $376 million of loans and loan-like debt securities being placed in NPL status, $319 million being removed from NPL status due to write-offs,$146 million being removed from NPL status due to positive developments such as repayments, prepayments andimprovements and other changes of $33 million. In FY18, ten loans greater than $10 million, and totaling$300 million, were placed in NPL status.
IFC recorded a net provision for losses on loans, guarantees, accrued interest and other receivables of$90 million in FY18 ($82 million of specific provisions on loans, $2 million of portfolio provisions on loans,$1 million net release of provision on guarantees and other receivables and $7 million provision on accruedinterest) as compared to a provision of $86 million in FY17 ($268 million of specific provisions on loanspartially offset by $171 million release of portfolio provisions on loans and an $11 million release of provisionon guarantees). Project-specific developments on ten loans comprised 68% of the specific provision for losses onloans in FY18 (excluding release of provisions).
At June 30, 2018, IFC’s total reserves against losses on loans were $1,293 million or 5.1% of the disbursedloan portfolio ($1,483 million; 6.1% at June 30, 2017), a decrease of $190 million from June 30, 2017. Thedecrease in reserves against losses on loans due to write-offs, net of recoveries of $285 million, and foreignexchange gains related to reserves held against non-U.S. dollar-denominated loans ($5 million), was partiallyoffset by provisions of $84 million and other adjustments ($16 million).
Specific reserves against losses on loans at June 30, 2018 of $651 million ($841 million at June 30, 2017)are held against impaired loans of $1,258 million ($1,675 million at June 30, 2017), a coverage ratio of 52%(50% at June 30, 2017).
9 Includes $23 million reported as debt securities on the Balance Sheet as of June 30, 2018 ($101 million — June 30, 2017).
42
In FY17 Q3, IFC completed the implementation of the Investment Risk Platform (IRP), which replacedIFC’s previous credit risk rating system and economic capital engine. The new rating system better aligns IFC’spractice to internationally recognized standards, where appropriate, given IFC’s portfolio and IRP allows foreasier comparison between external ratings and IFC’s internal ratings. More granular ratings are expected to leadto better differentiation and a better understanding of client credit standing which will allow for more focus onthose credits that most warrant scrutiny. The improved predictive power for probability of default and loss givendefault is also anticipated to lead to more informed investment decisions. As a result of implementing IRP, IFCreviewed its methodology for estimating the portfolio reserve against losses, in particular the estimation of theprobability of default and loss given default. The implementation of IRP resulted in a $156 million release ofportfolio provision related to this change in estimate that was reported in FY17 Q3.
Income from Liquid Asset Trading Activities
The liquid assets portfolio, net of derivatives and securities lending activities, decreased by $0.3 billion from$39.2 billion at June 30, 2017, to $38.9 billion at June 30, 2018. Gross income from liquid asset trading activitiestotaled $771 million in FY18 compared to $917 million in FY17, a decrease of $146 million. The decrease ingross income was primarily attributable to a decrease in the performance of liquid assets net of benchmarks. Theperformance in FY17 was exceptionally strong, especially in FY17 Q1, due to a rebound from the post-BREXITmark-to-market losses suffered in FY16 Q4.
Interest income in FY18 totaled $664 million, compared to $582 million in FY17. Holdings in productsother than ABS and MBS, including US Treasuries, global government bonds, high quality corporate bonds andderivatives generated $134 million of gains in FY18. The portfolio of ABS and MBS experienced fair valuelosses totaling $27 million in FY18, for a total net gain of $107 million (realized and unrealized). This comparesto a total gain (realized and unrealized) of $335 million in FY17.
Performance over the course of FY18 was supported by narrowing spreads for high-quality ABS,contributions from cross-currency basis spreads, and deviations from interest-rate parity in foreign-exchangeforward rates. In FY18 Q4, performance benefitted primarily from narrowing cross-currency basis swap spreadsand movements in forward foreign exchange rates towards interest-rate parity. The Corporation reduced itsexposure to credit spreads during FY18 and increased its exposure to deposits and other money-marketinstruments. Liquid asset holdings remain well diversified geographically and are concentrated in money-marketinstruments.
Improving economic growth in the U.S. accompanied by rising inflation allowed the U.S. Federal Reserveto continue its tightening of monetary policy. The Fed raised its benchmark policy rate 3 times in 25 bpsincrements over the course of the fiscal year, and the U.S. Treasury market reacted by flattening the spreadbetween long-term and short-term yields. The 2-year Note yield rose 115 bps, while the 10-year Note yield rose59 bps. The increase in the front-end of the yield curve was considerably faster than the pace embedded in theyield curve such that the benchmark for the Treasury Managed Portion of the Corporation’s net worth, the 1 to3-year U.S. Treasury index, had a total return of close to zero. The performance of non-USD liquid assets indeveloped markets benefitted from a reduction in USD funding pressures, which resulted in less-negative cross-currency bases and adjustments in foreign-currency forward rates that contributed to returns.
During FY18 Q4, short-term US Treasury yields rose more than long-term yields with the 2-year Note yieldrising 26 bps, and the 10-year Note yield up 12 bps. The U.S. Federal Reserve tightened monetary policy in June,in line with expectations, but they increased the projected number of interest rate hikes for 2018 from 3 to 4. TheS&P 500 equity index was up modestly over the quarter, 2.9%, and credit spreads widened slightly. The IFCtreasury managed portion of net worth gained $23 million during FY18 Q4 despite the increase in short-terminterest rates. While the increase in yields resulted in a return for the benchmark that was considerably lower thanthe yield of the benchmark at the outset of the quarter, the portfolio benefited from an increase in its size, and thisincome was enhanced by the use of securities lending to make additional investments.
In FY18 and FY17, all internally managed liquid asset portfolios outperformed their respective benchmarks.
At June 30, 2018, trading securities with a fair value of $18 million are classified as Level 3 securities,which is 0.1% of total trading securities at fair value ($19 million — June 30, 2017).
43
Charges on Borrowings
IFC’s charges on borrowings increased by $329 million, from $712 million in FY17 (net of $2 million gainon extinguishment of borrowings) to $1,041 million in FY18 (net of $2 million gain on extinguishment ofborrowings), largely attributable to rising LIBOR rates and increased term of new borrowings.
The weighted average cost of IFC’s borrowings outstanding from market sources, after the effects ofborrowing-related derivatives, and excluding short-term borrowings from market and other sources, was 2.5% atJune 30, 2018, an increase from 1.4% at June 30, 2017. The size of the borrowings portfolio (excluding short-term borrowings), net of borrowing-related derivatives and before unamortized discounts, net, and fair valueadjustments, increased by $1.4 billion during FY18 from $52.0 billion at June 30, 2017, to $53.4 billion atJune 30, 2018.
Other Income
Other income of $578 million for FY18 was $50 million higher than in FY17 ($528 million) due to a$20 million increase in service fees from FY17 to FY18, primarily in mobilization fees, which reflected CoreMobilization of $11,671 million in FY18 which was $4,209 million higher than in FY17 and higher income fromAdvisory Services, predominantly contributions from donors, of $305 million ($277 million in FY17). In FY18,income from advisory services comprised $252 million of donor funds utilized ($229 million — FY17) and$53 million of fees from clients and administrative fees from donors ($48 million — FY17).
Other Expenses
Administrative expenses (the principal component of other expenses) increased $67 million from$962 million in FY17 to $1,029 million in FY18. The increase in FY18 is principally due to higher staff costswhich increased by $66 million in FY18.
Advisory services expenses totaled $354 million in FY18 ($327 million in FY17); the increase from FY17 isconsistent with the increase in advisory services income.
IFC recorded expenses from pension and other postretirement benefit plans in FY18 of $244 million,compared with $293 million in FY17. This decrease, based on the beginning of the year actuarial assumptionsand calculations reflecting the funding status of the plans at FY17-end, was primarily driven by loweramortization of unrecognized net actuarial losses resulting largely from an increase in the discount rates used todetermine the projected benefit obligation between FY16-end and FY17-end. The discount rate used to determinethe projected benefit obligation for the Staff Retirement Plan, was 3.70% at FY17-end versus 3.40% atFY16-end.
Foreign Currency Transaction Gains and Losses on Non-Trading Activities
Foreign currency transaction gains reported in net income in FY18 totaled $123 million (losses of $188million — FY17). Foreign currency transaction losses on debt securities accounted for as available-for-sale of$193 million in FY18 (gains of $64 million — FY17) are reported in Other Comprehensive Income, while gainsand losses on the derivatives economically hedging such debt securities are reported in Net Income. Additionally,these foreign currency gains and losses reported in Other Comprehensive Income are reclassified to Net Incomeupon sale or repayment. In FY18, this resulted in a loss of $73 million ($12 million — FY17), of which$62 million resulted from a single repayment of an available-for-sale debt security.
Largely due to a small population of unhedged non-U.S. dollar-denominated loans and debt securities andthe U.S. dollar strengthening against such currencies, IFC has recorded overall foreign exchange related losses ina combination of Net Income and Other Comprehensive Income of $70 million in FY18 (losses of$124 million — FY17).
44
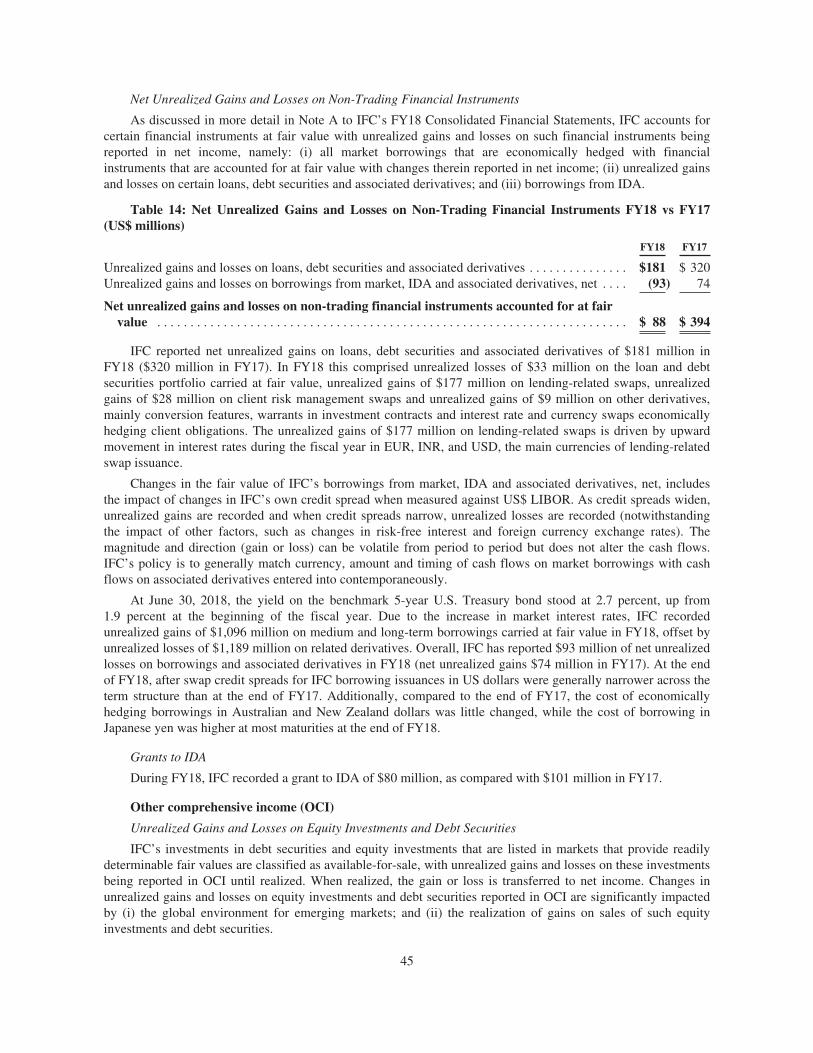
Net Unrealized Gains and Losses on Non-Trading Financial Instruments
As discussed in more detail in Note A to IFC’s FY18 Consolidated Financial Statements, IFC accounts forcertain financial instruments at fair value with unrealized gains and losses on such financial instruments beingreported in net income, namely: (i) all market borrowings that are economically hedged with financialinstruments that are accounted for at fair value with changes therein reported in net income; (ii) unrealized gainsand losses on certain loans, debt securities and associated derivatives; and (iii) borrowings from IDA.
Table 14: Net Unrealized Gains and Losses on Non-Trading Financial Instruments FY18 vs FY17(US$ millions)
FY18 FY17
Unrealized gains and losses on loans, debt securities and associated derivatives . . . . . . . . . . . . . . . $181 $ 320Unrealized gains and losses on borrowings from market, IDA and associated derivatives, net . . . . (93) 74
Net unrealized gains and losses on non-trading financial instruments accounted for at fairvalue . . . . . . . . . . . . . . . . . . . . . . . . . . . . . . . . . . . . . . . . . . . . . . . . . . . . . . . . . . . . . . . . . . . . . . . $ 88 $ 394
IFC reported net unrealized gains on loans, debt securities and associated derivatives of $181 million inFY18 ($320 million in FY17). In FY18 this comprised unrealized losses of $33 million on the loan and debtsecurities portfolio carried at fair value, unrealized gains of $177 million on lending-related swaps, unrealizedgains of $28 million on client risk management swaps and unrealized gains of $9 million on other derivatives,mainly conversion features, warrants in investment contracts and interest rate and currency swaps economicallyhedging client obligations. The unrealized gains of $177 million on lending-related swaps is driven by upwardmovement in interest rates during the fiscal year in EUR, INR, and USD, the main currencies of lending-relatedswap issuance.
Changes in the fair value of IFC’s borrowings from market, IDA and associated derivatives, net, includesthe impact of changes in IFC’s own credit spread when measured against US$ LIBOR. As credit spreads widen,unrealized gains are recorded and when credit spreads narrow, unrealized losses are recorded (notwithstandingthe impact of other factors, such as changes in risk-free interest and foreign currency exchange rates). Themagnitude and direction (gain or loss) can be volatile from period to period but does not alter the cash flows.IFC’s policy is to generally match currency, amount and timing of cash flows on market borrowings with cashflows on associated derivatives entered into contemporaneously.
At June 30, 2018, the yield on the benchmark 5-year U.S. Treasury bond stood at 2.7 percent, up from1.9 percent at the beginning of the fiscal year. Due to the increase in market interest rates, IFC recordedunrealized gains of $1,096 million on medium and long-term borrowings carried at fair value in FY18, offset byunrealized losses of $1,189 million on related derivatives. Overall, IFC has reported $93 million of net unrealizedlosses on borrowings and associated derivatives in FY18 (net unrealized gains $74 million in FY17). At the endof FY18, after swap credit spreads for IFC borrowing issuances in US dollars were generally narrower across theterm structure than at the end of FY17. Additionally, compared to the end of FY17, the cost of economicallyhedging borrowings in Australian and New Zealand dollars was little changed, while the cost of borrowing inJapanese yen was higher at most maturities at the end of FY18.
Grants to IDA
During FY18, IFC recorded a grant to IDA of $80 million, as compared with $101 million in FY17.
Other comprehensive income (OCI)
Unrealized Gains and Losses on Equity Investments and Debt Securities
IFC’s investments in debt securities and equity investments that are listed in markets that provide readilydeterminable fair values are classified as available-for-sale, with unrealized gains and losses on these investmentsbeing reported in OCI until realized. When realized, the gain or loss is transferred to net income. Changes inunrealized gains and losses on equity investments and debt securities reported in OCI are significantly impactedby (i) the global environment for emerging markets; and (ii) the realization of gains on sales of such equityinvestments and debt securities.
45
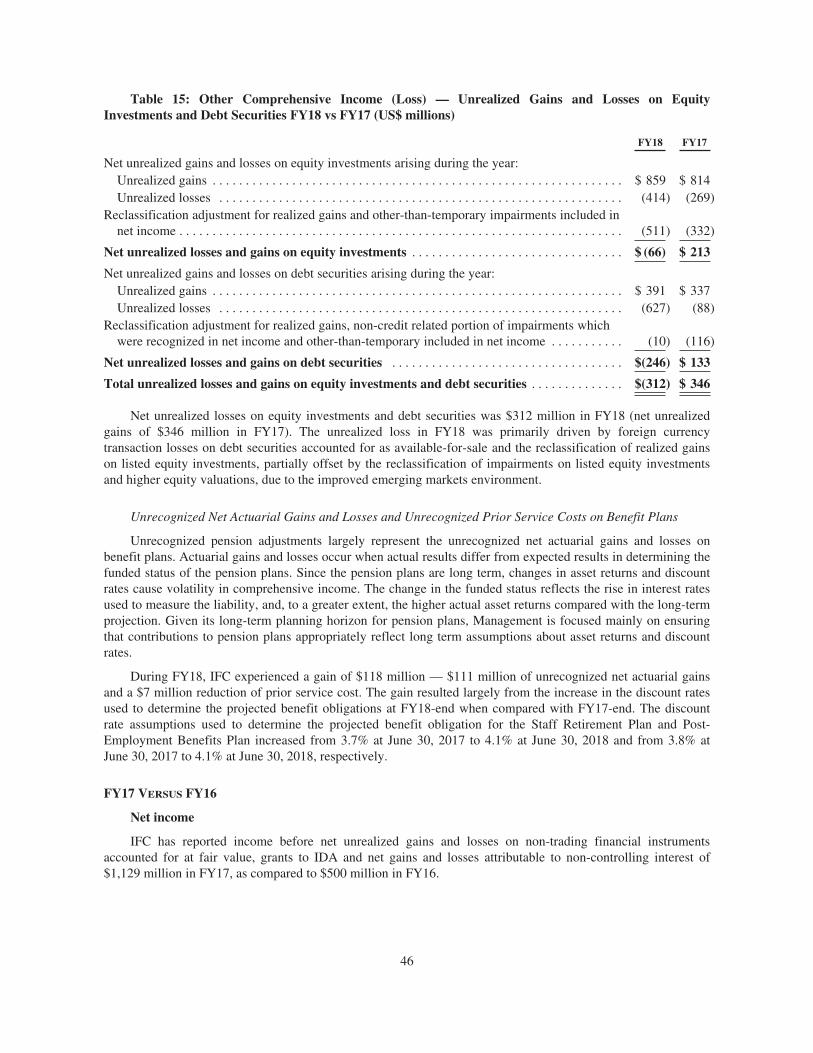
Table 15: Other Comprehensive Income (Loss) — Unrealized Gains and Losses on EquityInvestments and Debt Securities FY18 vs FY17 (US$ millions)
FY18 FY17
Net unrealized gains and losses on equity investments arising during the year:Unrealized gains . . . . . . . . . . . . . . . . . . . . . . . . . . . . . . . . . . . . . . . . . . . . . . . . . . . . . . . . . . . . . . $ 859 $ 814Unrealized losses . . . . . . . . . . . . . . . . . . . . . . . . . . . . . . . . . . . . . . . . . . . . . . . . . . . . . . . . . . . . . (414) (269)
Reclassification adjustment for realized gains and other-than-temporary impairments included innet income . . . . . . . . . . . . . . . . . . . . . . . . . . . . . . . . . . . . . . . . . . . . . . . . . . . . . . . . . . . . . . . . . . . (511) (332)
Net unrealized losses and gains on equity investments . . . . . . . . . . . . . . . . . . . . . . . . . . . . . . . . $ (66) $ 213
Net unrealized gains and losses on debt securities arising during the year:Unrealized gains . . . . . . . . . . . . . . . . . . . . . . . . . . . . . . . . . . . . . . . . . . . . . . . . . . . . . . . . . . . . . . $ 391 $ 337Unrealized losses . . . . . . . . . . . . . . . . . . . . . . . . . . . . . . . . . . . . . . . . . . . . . . . . . . . . . . . . . . . . . (627) (88)
Reclassification adjustment for realized gains, non-credit related portion of impairments whichwere recognized in net income and other-than-temporary included in net income . . . . . . . . . . . (10) (116)
Net unrealized losses and gains on debt securities . . . . . . . . . . . . . . . . . . . . . . . . . . . . . . . . . . . $(246) $ 133
Total unrealized losses and gains on equity investments and debt securities . . . . . . . . . . . . . . $(312) $ 346
Net unrealized losses on equity investments and debt securities was $312 million in FY18 (net unrealizedgains of $346 million in FY17). The unrealized loss in FY18 was primarily driven by foreign currencytransaction losses on debt securities accounted for as available-for-sale and the reclassification of realized gainson listed equity investments, partially offset by the reclassification of impairments on listed equity investmentsand higher equity valuations, due to the improved emerging markets environment.
Unrecognized Net Actuarial Gains and Losses and Unrecognized Prior Service Costs on Benefit Plans
Unrecognized pension adjustments largely represent the unrecognized net actuarial gains and losses onbenefit plans. Actuarial gains and losses occur when actual results differ from expected results in determining thefunded status of the pension plans. Since the pension plans are long term, changes in asset returns and discountrates cause volatility in comprehensive income. The change in the funded status reflects the rise in interest ratesused to measure the liability, and, to a greater extent, the higher actual asset returns compared with the long-termprojection. Given its long-term planning horizon for pension plans, Management is focused mainly on ensuringthat contributions to pension plans appropriately reflect long term assumptions about asset returns and discountrates.
During FY18, IFC experienced a gain of $118 million — $111 million of unrecognized net actuarial gainsand a $7 million reduction of prior service cost. The gain resulted largely from the increase in the discount ratesused to determine the projected benefit obligations at FY18-end when compared with FY17-end. The discountrate assumptions used to determine the projected benefit obligation for the Staff Retirement Plan and Post-Employment Benefits Plan increased from 3.7% at June 30, 2017 to 4.1% at June 30, 2018 and from 3.8% atJune 30, 2017 to 4.1% at June 30, 2018, respectively.
FY17 VERSUS FY16
Net income
IFC has reported income before net unrealized gains and losses on non-trading financial instrumentsaccounted for at fair value, grants to IDA and net gains and losses attributable to non-controlling interest of$1,129 million in FY17, as compared to $500 million in FY16.
46
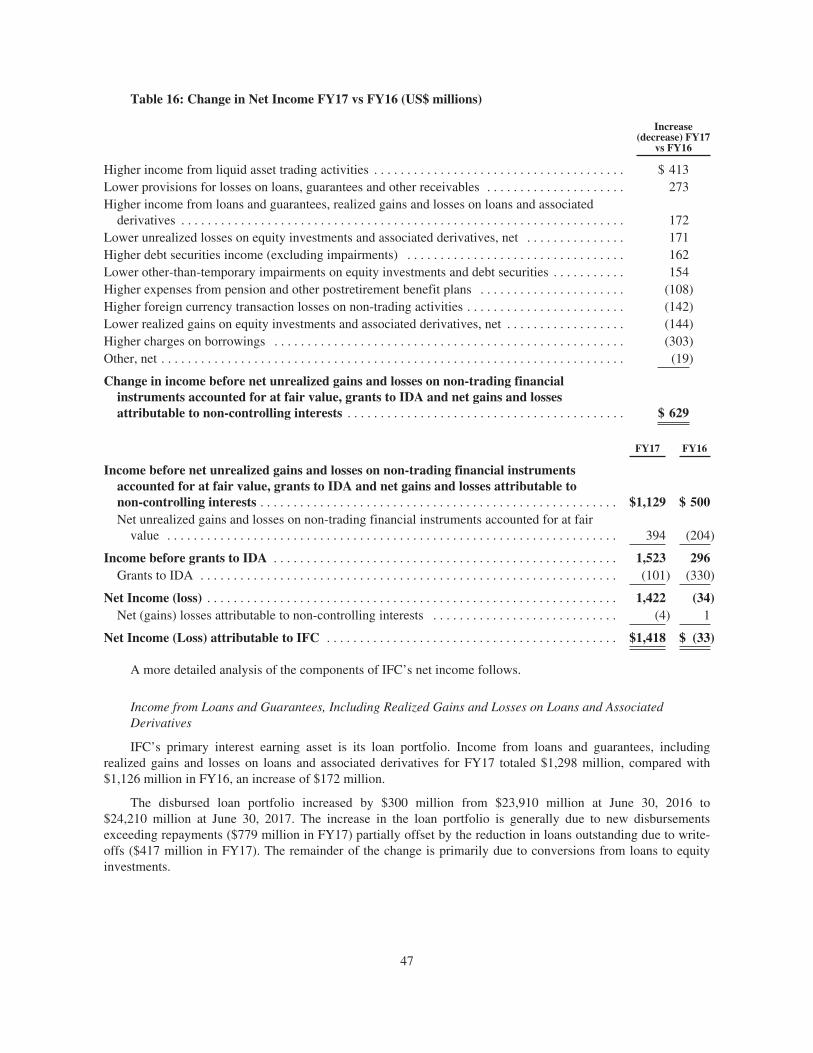
Table 16: Change in Net Income FY17 vs FY16 (US$ millions)
Increase(decrease) FY17
vs FY16
Higher income from liquid asset trading activities . . . . . . . . . . . . . . . . . . . . . . . . . . . . . . . . . . . . . . $ 413Lower provisions for losses on loans, guarantees and other receivables . . . . . . . . . . . . . . . . . . . . . 273Higher income from loans and guarantees, realized gains and losses on loans and associated
derivatives . . . . . . . . . . . . . . . . . . . . . . . . . . . . . . . . . . . . . . . . . . . . . . . . . . . . . . . . . . . . . . . . . . . 172Lower unrealized losses on equity investments and associated derivatives, net . . . . . . . . . . . . . . . 171Higher debt securities income (excluding impairments) . . . . . . . . . . . . . . . . . . . . . . . . . . . . . . . . . 162Lower other-than-temporary impairments on equity investments and debt securities . . . . . . . . . . . 154Higher expenses from pension and other postretirement benefit plans . . . . . . . . . . . . . . . . . . . . . . (108)Higher foreign currency transaction losses on non-trading activities . . . . . . . . . . . . . . . . . . . . . . . . (142)Lower realized gains on equity investments and associated derivatives, net . . . . . . . . . . . . . . . . . . (144)Higher charges on borrowings . . . . . . . . . . . . . . . . . . . . . . . . . . . . . . . . . . . . . . . . . . . . . . . . . . . . . (303)Other, net . . . . . . . . . . . . . . . . . . . . . . . . . . . . . . . . . . . . . . . . . . . . . . . . . . . . . . . . . . . . . . . . . . . . . . (19)
Change in income before net unrealized gains and losses on non-trading financialinstruments accounted for at fair value, grants to IDA and net gains and lossesattributable to non-controlling interests . . . . . . . . . . . . . . . . . . . . . . . . . . . . . . . . . . . . . . . . . . $ 629
FY17 FY16
Income before net unrealized gains and losses on non-trading financial instrumentsaccounted for at fair value, grants to IDA and net gains and losses attributable tonon-controlling interests . . . . . . . . . . . . . . . . . . . . . . . . . . . . . . . . . . . . . . . . . . . . . . . . . . . . . . $1,129 $ 500Net unrealized gains and losses on non-trading financial instruments accounted for at fair
value . . . . . . . . . . . . . . . . . . . . . . . . . . . . . . . . . . . . . . . . . . . . . . . . . . . . . . . . . . . . . . . . . . . . 394 (204)
Income before grants to IDA . . . . . . . . . . . . . . . . . . . . . . . . . . . . . . . . . . . . . . . . . . . . . . . . . . . . 1,523 296Grants to IDA . . . . . . . . . . . . . . . . . . . . . . . . . . . . . . . . . . . . . . . . . . . . . . . . . . . . . . . . . . . . . . . (101) (330)
Net Income (loss) . . . . . . . . . . . . . . . . . . . . . . . . . . . . . . . . . . . . . . . . . . . . . . . . . . . . . . . . . . . . . . 1,422 (34)Net (gains) losses attributable to non-controlling interests . . . . . . . . . . . . . . . . . . . . . . . . . . . . (4) 1
Net Income (Loss) attributable to IFC . . . . . . . . . . . . . . . . . . . . . . . . . . . . . . . . . . . . . . . . . . . . $1,418 $ (33)
A more detailed analysis of the components of IFC’s net income follows.
Income from Loans and Guarantees, Including Realized Gains and Losses on Loans and AssociatedDerivatives
IFC’s primary interest earning asset is its loan portfolio. Income from loans and guarantees, includingrealized gains and losses on loans and associated derivatives for FY17 totaled $1,298 million, compared with$1,126 million in FY16, an increase of $172 million.
The disbursed loan portfolio increased by $300 million from $23,910 million at June 30, 2016 to$24,210 million at June 30, 2017. The increase in the loan portfolio is generally due to new disbursementsexceeding repayments ($779 million in FY17) partially offset by the reduction in loans outstanding due to write-offs ($417 million in FY17). The remainder of the change is primarily due to conversions from loans to equityinvestments.
47
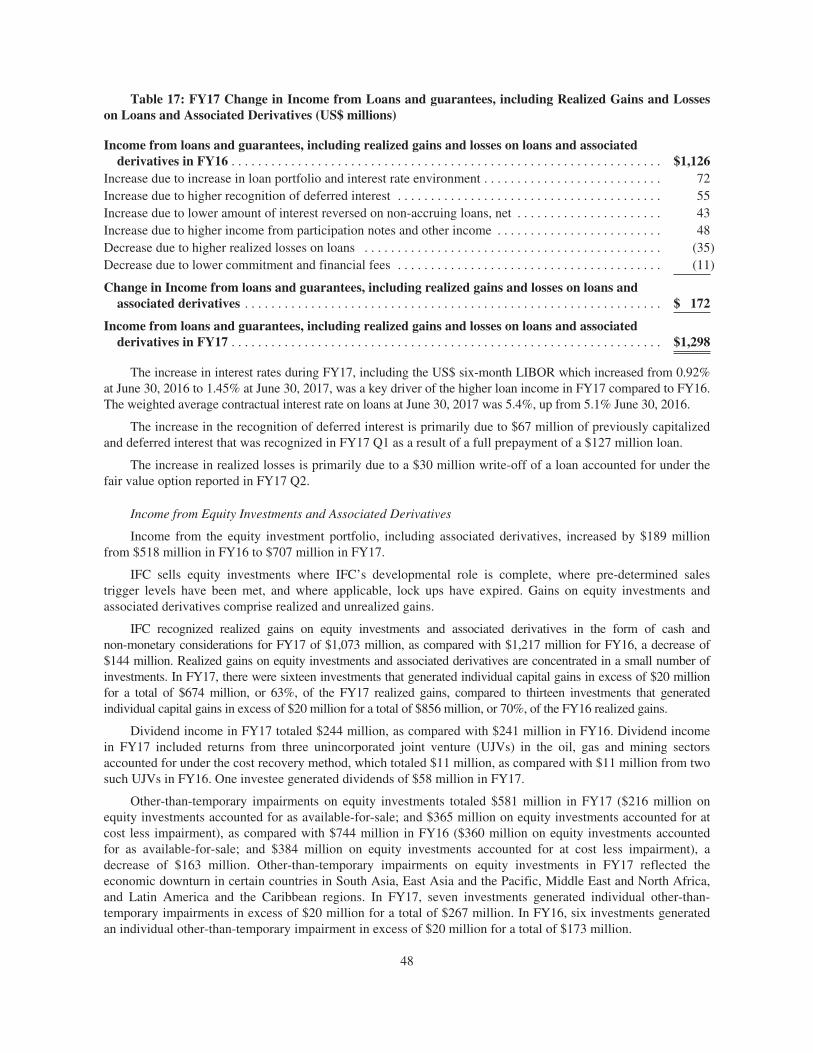
Table 17: FY17 Change in Income from Loans and guarantees, including Realized Gains and Losseson Loans and Associated Derivatives (US$ millions)
Income from loans and guarantees, including realized gains and losses on loans and associatedderivatives in FY16 . . . . . . . . . . . . . . . . . . . . . . . . . . . . . . . . . . . . . . . . . . . . . . . . . . . . . . . . . . . . . . . . . $1,126
Increase due to increase in loan portfolio and interest rate environment . . . . . . . . . . . . . . . . . . . . . . . . . . . 72Increase due to higher recognition of deferred interest . . . . . . . . . . . . . . . . . . . . . . . . . . . . . . . . . . . . . . . . 55Increase due to lower amount of interest reversed on non-accruing loans, net . . . . . . . . . . . . . . . . . . . . . . 43Increase due to higher income from participation notes and other income . . . . . . . . . . . . . . . . . . . . . . . . . 48Decrease due to higher realized losses on loans . . . . . . . . . . . . . . . . . . . . . . . . . . . . . . . . . . . . . . . . . . . . . (35)Decrease due to lower commitment and financial fees . . . . . . . . . . . . . . . . . . . . . . . . . . . . . . . . . . . . . . . . (11)
Change in Income from loans and guarantees, including realized gains and losses on loans andassociated derivatives . . . . . . . . . . . . . . . . . . . . . . . . . . . . . . . . . . . . . . . . . . . . . . . . . . . . . . . . . . . . . . . $ 172
Income from loans and guarantees, including realized gains and losses on loans and associatedderivatives in FY17 . . . . . . . . . . . . . . . . . . . . . . . . . . . . . . . . . . . . . . . . . . . . . . . . . . . . . . . . . . . . . . . . . $1,298
The increase in interest rates during FY17, including the US$ six-month LIBOR which increased from 0.92%at June 30, 2016 to 1.45% at June 30, 2017, was a key driver of the higher loan income in FY17 compared to FY16.The weighted average contractual interest rate on loans at June 30, 2017 was 5.4%, up from 5.1% June 30, 2016.
The increase in the recognition of deferred interest is primarily due to $67 million of previously capitalizedand deferred interest that was recognized in FY17 Q1 as a result of a full prepayment of a $127 million loan.
The increase in realized losses is primarily due to a $30 million write-off of a loan accounted for under thefair value option reported in FY17 Q2.
Income from Equity Investments and Associated Derivatives
Income from the equity investment portfolio, including associated derivatives, increased by $189 millionfrom $518 million in FY16 to $707 million in FY17.
IFC sells equity investments where IFC’s developmental role is complete, where pre-determined salestrigger levels have been met, and where applicable, lock ups have expired. Gains on equity investments andassociated derivatives comprise realized and unrealized gains.
IFC recognized realized gains on equity investments and associated derivatives in the form of cash andnon-monetary considerations for FY17 of $1,073 million, as compared with $1,217 million for FY16, a decrease of$144 million. Realized gains on equity investments and associated derivatives are concentrated in a small number ofinvestments. In FY17, there were sixteen investments that generated individual capital gains in excess of $20 millionfor a total of $674 million, or 63%, of the FY17 realized gains, compared to thirteen investments that generatedindividual capital gains in excess of $20 million for a total of $856 million, or 70%, of the FY16 realized gains.
Dividend income in FY17 totaled $244 million, as compared with $241 million in FY16. Dividend incomein FY17 included returns from three unincorporated joint venture (UJVs) in the oil, gas and mining sectorsaccounted for under the cost recovery method, which totaled $11 million, as compared with $11 million from twosuch UJVs in FY16. One investee generated dividends of $58 million in FY17.
Other-than-temporary impairments on equity investments totaled $581 million in FY17 ($216 million onequity investments accounted for as available-for-sale; and $365 million on equity investments accounted for atcost less impairment), as compared with $744 million in FY16 ($360 million on equity investments accountedfor as available-for-sale; and $384 million on equity investments accounted for at cost less impairment), adecrease of $163 million. Other-than-temporary impairments on equity investments in FY17 reflected theeconomic downturn in certain countries in South Asia, East Asia and the Pacific, Middle East and North Africa,and Latin America and the Caribbean regions. In FY17, seven investments generated individual other-than-temporary impairments in excess of $20 million for a total of $267 million. In FY16, six investments generatedan individual other-than-temporary impairment in excess of $20 million for a total of $173 million.
48
Net unrealized losses on equity investments and associated derivatives totaled $33 million (Net unrealizedlosses of $204 million in FY16) reflecting the realization of gains and overall improvement in the macroenvironment for emerging market equities.
Income from Debt Securities and Realized Gains and Losses on Debt Securities and Associated Derivatives
Income from debt securities and realized gains and losses on debt securities and associated derivativesincreased to $282 million in FY17 from $129 million in FY16. The largest changes were higher realized gains ondebt securities and associated derivatives of $114 million, higher interest income of $53 million, partially offsetby higher other-than-temporary impairments of $9 million in FY17 when compared with FY16. One investmentgenerated a $102 million realized gain from a debt security to equity conversion in FY17 Q4 and overall higheraverage balances was the other main cause for the increase.
Provision for Losses on Loans, Guarantees and Other Receivables
The quality of the loan portfolio, as measured by the weighted average country risk ratings and the weightedaverage credit ratings, experienced some marginal improvement in FY17. NPLs decreased by $190 million, from$1,712 million of the disbursed loan portfolio at June 30, 2016 to $1,522 million10 at June 30, 2017. The decreaseof $190 million was comprised of $508 million of loans and loan-like debt securities being placed in NPL status,$239 million being removed from NPL status due to positive developments such as repayments, prepayments andimprovements resulting in moving to performing status, $468 million being removed from NPL status due towrite-offs and other changes of $9 million. In FY17, fifteen loans greater than $10 million, and totaling$451 million, were placed in NPL status.
IFC recorded a net provision for losses on loans, guarantees and other receivables of $86 million in FY17($268 million of specific provisions on loans partially offset by $171 million release of portfolio provisions onloans and an $11 million release of provision on guarantees) as compared to a provision of $359 million in FY16($319 million of specific provisions for losses on loans; $36 million of portfolio provisions for losses on loans;and a net $4 million of provision for losses on guarantees and other receivables). Adverse project-specificdevelopments on ten loans comprised 81% of the specific provision for losses on loans in FY17 (excludingrelease of provisions and recoveries).
In FY17, IFC completed the implementation of IRP, which replaced IFC’s previous credit risk rating systemand economic capital engine. The new rating system better aligns IFC’s practice to internationally recognizedstandards, where appropriate, given IFC’s portfolio and IRP allows for easier comparison between externalratings and IFC’s internal ratings. More granular ratings are expected to lead to better differentiation and a betterunderstanding of client credit standing which will allow for more focus on those credits that most warrantscrutiny. The improved predictive power for probability of default and loss given default is also anticipated tolead to more informed investment decisions. As a result of implementing IRP, IFC reviewed its methodology forestimating the portfolio reserve against losses, in particular the estimation of the probability of default and lossgiven default. The $171 million release of portfolio provisions in FY17 includes a $156 million release ofprovision related to this change in estimate that was reported in FY17 Q3. The additional release of portfolioprovisions of $15 million was largely due to the impact of unimpaired loans becoming impaired during FY17,which had a resulting negative impact on specific provisions.
At June 30, 2017, IFC’s total reserves against losses on loans were $1,483 million or 6.1% of the disbursedloan portfolio ($1,775 million; 7.4% at June 30, 2016), a decrease of $292 million from June 30, 2016. Thedecrease in reserves against losses on loans due to write-offs, net of recoveries of $415 million has been partiallyoffset by provisions of $97 million, foreign exchange losses related to reserves held against non-U.S. dollar-denominated loans of $6 million and other adjustments of $20 million. In FY17, IFC actively exited a number ofloans through settlement or sale or upon a recognition that the possibility of recovery was remote resulting in asignificant amount of exits — 23 loans exited NPL status in FY17 upon write-off.
10 Includes $101 million reported as debt securities on the Balance Sheet as of June 30, 2017 ($66 million — June 30, 2016).
49
Specific reserves against losses on loans at June 30, 2017 of $841 million ($965 million at June 30, 2016)are held against impaired loans of $1,675 million ($1,752 million at June 30, 2016), a coverage ratio of 50%(55% at June 30, 2016).
Income from Liquid Asset Trading Activities
The liquid assets portfolio, net of derivatives and securities lending activities, decreased by $2.2 billion from$41.4 billion at June 30, 2016, to $39.2 billion at June 30, 2017. Gross income from liquid asset trading activitiestotaled $917 million in FY17 compared to $504 million in FY16, an increase of $413 million. The increase ingross income was primarily attributable to an increase in the performance of liquid assets net of benchmarks and,to a lesser extent, the increase in money-market rates and short-term U.S. Treasury yields. The related increase inLIBOR resets will also be reflected in an increased funding cost (charges on borrowings) of the Corporation.
Interest income in FY17 totaled $582 million, compared to $561 million in FY16. Holdings in productsother than ABS and MBS, including US Treasuries, global government bonds, high quality corporate bonds andderivatives generated $285 million of gains in FY17. The portfolio of ABS and MBS experienced fair valuegains totaling $50 million in FY17, for a total gain of $335 million (realized and unrealized). This compares to atotal loss (realized and unrealized) of $57 million in FY16.
In FY17, the liquid assets portfolios outperformed their benchmarks by $408 million. FY17 began in thewake of the “BREXIT” vote, which had raised risk premia across the developed markets and dampened returns atthe very end of FY16. The rebound in asset prices as the market adapted to the news of the result wastremendous. In fact, certain U.K. securities not only recaptured their FY16 mark-to-market losses but generatedgains in excess of those losses. Increasing clarity around the rating actions impacting U.S. student loan securitiesalso contributed to a recovery in assets that were negatively impacted in FY16. In addition, improving economicgrowth across much of the world, especially during the first half of FY17 contributed to tighter credit spreads.Tighter credit spreads contributed to a strong performance for the Funded Liquidity portfolios. The Corporationreduced its exposure to credit spreads over the course of FY17 and increased its exposure to deposits and money-market instruments. Liquid asset holdings remain well diversified both geographically and across the eligiblesectors of the eligible interest-bearing investment universe.
Stable U.S. economic growth, an improving labor market, and an increase in the pace of inflation, at least inthe first half of FY17, allowed the U.S. Federal Reserve to raise the range for its benchmark overnight rate for asecond time in December and two more times in the second half of FY17. This resulted in negative returns forthe Treasury Managed Portion of the Corporation’s net worth, which is invested in U.S. Treasuries. Interest ratesrose significantly across the yield curve led by the “belly”. The yield for the on-the-run 2-year U.S. Treasury rose80 bps, the 5-year yield rose 89 bps, the 10-year yield rose 83 bps, and the 30-year yield rose 55 bps over thefiscal year. The Treasury Managed Portion of IFC’s net worth is benchmarked to the 1 to 3-year U.S. Treasuryindex. As a result, the portfolio suffered a small loss as the income was not sufficient to offset the capital lossesas yields rose. USD LIBOR-Swap yields rose more than U.S. Treasury yields, reversing some of the movementin FY16. With the yield spreads for the Corporation’s high-quality USD assets remaining stable relative to U.S.Treasuries, the spreads relative to the LIBOR-based benchmark narrowed, contributing to the performance ofUSD-denominated assets. The performance of non-USD liquid assets benefitted from a reduction in USDfunding pressures, which resulted in less-negative cross-currency bases and adjustments in foreign-currencyforward rates that contributed to returns.
During FY17 Q4, short-term US Treasury yields rose, while long-term yields declined. The US FederalReserve tightened monetary policy in June despite weaker-than-expected inflation readings during the quarter.The S&P 500 equity index was up modestly over the quarter, and credit spreads narrowed, but at a slower pace.Option-implied volatilities remained at historically low levels. This resulted in positive excess returns for thehigh-quality securities in IFC’s Liquid Asset Portfolios. The IFC treasury managed portion of net worth gained$17 million during the quarter despite the increase in short-term interest rates. An increase in the size of theportfolio and the slow pace of increase in yields on 1 to 3-year Treasuries supported interest income, and thisincome was enhanced by the use of securities lending to make additional investments.
50
In FY17 and FY16, all internally managed liquid asset portfolios outperformed their respective benchmarks.
At June 30, 2017, trading securities with a fair value of $19 million are classified as Level 3 securities,which is 0.1% of total trading securities at fair value ($68 million — June 30, 2016).
Charges on Borrowings
IFC’s charges on borrowings increased by $303 million, from $409 million in FY16 (net of $6 million gainon extinguishment of borrowings) to $712 million in FY17 (net of $2 million gain on extinguishment ofborrowings), largely attributable to rising LIBOR rates and increased interest charges on the back of pricing inthe SSA (Sovereigns, Supranational and Agency) market becoming more expensive due to USD swap curvetightening and widening borrowing spreads vs. LIBOR.
The weighted average cost of IFC’s borrowings outstanding from market sources, after the effects ofborrowing-related derivatives, and excluding short-term borrowings from market and other sources, was 1.4% atJune 30, 2017, an increase from 1.1% at June 30, 2016. The size of the borrowings portfolio (excluding the short-term borrowings), net of borrowing-related derivatives and before fair value adjustments, decreased by$1.9 billion during FY17 from $53.9 billion at June 30, 2016, to $52.0 billion at June 30, 2017.
Other income
Other income of $528 million for FY17 was $27 million higher than in FY16 ($501 million). There werehigher returns on the Post Employment Benefit Plan (PEBP) assets which are partly invested in global equitiesand reflected the improved market for equity investments in FY17 as compared to the same period in FY16. Thedecline in service fees from FY16 to FY17 was primarily due to a decrease in mobilization fees.
Other income also includes management and other fees from IFC’s consolidated subsidiary, AMC, of$79 million ($66 million in FY16) with the increase coming from increased number of funds and assets undermanagement and income from Advisory Services, predominantly contributions from donors, of $277 million($266 million in FY16). In FY17, income from advisory services comprised $229 million of donor funds utilized($217 million — FY16) and $48 million of fees from clients and administrative fees from donors ($49 million —FY16).
Other expenses
Administrative expenses (the principal component of other expenses) increased by $29 million from$933 million in FY16 to $962 million in FY17. The increase in FY17 is due to higher salary costs and highervariable expenses, primarily consultants and travel.
Advisory services expenses totaled $327 million in FY17 ($308 million in FY16) with the increase fromFY16 consistent with the increase in advisory services income.
IFC recorded expenses from pension and other postretirement benefit plans in FY17 of $293 million,compared with $185 million in FY16. This increase, based on the beginning of the year actuarial assumptionsand calculations based on the funding status of the plans at FY16-end, was driven by higher service cost andlower interest costs, partially offset by higher expected returns on plan assets and higher amortization ofunrecognized net actuarial losses resulting largely from the decrease in the discount rates used to determine theprojected benefit obligation.
Foreign Currency Transaction Gains and Losses on Non-Trading Activities
Foreign currency transaction losses reported in net income in FY17 totaled $188 million (losses of $46million — FY16). Foreign currency transaction gains on debt securities accounted for as available-for-sale in theamount of $64 million in FY17 (losses of $49 million — FY16) are reported in Other Comprehensive Income,while gains and losses on the derivatives economically hedging such debt securities are reported in net income.
51
Largely due to IFC having a small population of unhedged non-U.S. dollar-denominated loans and debtsecurities and the U.S. dollar strengthening against such currencies, IFC has recorded overall foreign exchangerelated losses in a combination of Net Income and Other Comprehensive Income of $124 million in FY17 (lossesof $95 million — FY16).
Net Unrealized Gains and Losses on Non-Trading Financial Instruments
As discussed in more detail in Note A to IFC’s FY17 Consolidated Financial Statements, IFC accounts forcertain financial instruments at fair value with unrealized gains and losses on such financial instruments beingreported in net income, namely: (i) all market borrowings that are economically hedged with financialinstruments that are accounted for at fair value with changes therein reported in net income; (ii) unrealized gainsand losses on certain loans, debt securities and associated derivatives; and (iii) borrowings from IDA.
Table 18: Net Unrealized Gains and Losses on Non-Trading Financial Instruments FY17 vs FY16(US$ millions)
FY17 FY16
Unrealized gains and losses on loans, debt securities and associated derivatives . . . . . . . . . . . . . . . $320 $(266)Unrealized gains and losses on borrowings from market, IDA and associated derivatives, net . . . . 74 62
Net unrealized gains and losses on non-trading financial instruments accounted for at fairvalue . . . . . . . . . . . . . . . . . . . . . . . . . . . . . . . . . . . . . . . . . . . . . . . . . . . . . . . . . . . . . . . . . . . . . . . $394 $(204)
IFC reported net unrealized gains on loans, debt securities and associated derivatives of $320 million inFY17 (net unrealized losses of $266 million in FY16). In FY17 this comprised unrealized gains of $102 millionon the loan and debt securities portfolio carried at fair value, unrealized gains of $128 million on lending-relatedswaps, unrealized gains of $81 million on client risk management swaps and unrealized gains of $9 million onother derivatives, mainly conversion features, warrants in investment contracts and interest rate and currencyswaps economically hedging client obligations. The unrealized gains of $128 million on lending-related swaps isdriven by the increase in value of the pay fixed and receive floating swaps as LIBOR rates have increased.
Changes in the fair value of IFC’s borrowings from market, IDA and associated derivatives, net, includesthe impact of changes in IFC’s own credit spread when measured against US$ LIBOR. As credit spreads widen,unrealized gains are recorded and when credit spreads narrow, unrealized losses are recorded (notwithstandingthe impact of other factors, such as changes in risk-free interest and foreign currency exchange rates). Themagnitude and direction (gain or loss) can be volatile from period to period but do not alter the cash flows. IFC’spolicy is to generally match currency, amount and timing of cash flows on market borrowings with cash flows onassociated derivatives entered into contemporaneously.
Due to the increase in market interest rates, IFC recorded unrealized gains of $991 million on marketborrowings in FY17, more than offsetting $949 million of unrealized losses recorded on derivatives associatedwith market borrowings. At the end of FY17, the cost of economically hedging borrowings in U.S. dollars,Australian dollars, and New Zealand dollars was marginally more favorable to IFC as compared to the end ofFY16. Additionally, credit spreads for IFC borrowing issuances were generally narrower across the termstructure than at the end of FY16.
Overall, IFC has reported $74 million of net unrealized gains on borrowings and associated derivatives inFY17 ($62 million in FY16).
Grants to IDA
During FY17, IFC recorded a grant to IDA of $101 million, as compared with $330 million in FY16.
52
Other comprehensive income (OCI)
Unrealized Gains and Losses on Equity Investments and Debt Securities
IFC’s investments in debt securities and equity investments that are listed in markets that provide readilydeterminable fair values are classified as available-for-sale, with unrealized gains and losses on these investmentsbeing reported in OCI until realized. When realized, the gain or loss is transferred to net income. Changes inunrealized gains and losses on equity investments and debt securities reported in OCI are significantly impactedby (i) the global environment for emerging markets; and (ii) the realization of gains on sales of such equityinvestments and debt securities.
Table 19: Other Comprehensive Income (Loss) — Unrealized Gains and Losses on EquityInvestments and Debt Securities FY17 vs FY16 (US$ millions)
FY17 FY16
Net unrealized gains and losses on equity investments arising during the year:Unrealized gains . . . . . . . . . . . . . . . . . . . . . . . . . . . . . . . . . . . . . . . . . . . . . . . . . . . . . . . . . . . . . . $ 814 $ 355Unrealized losses . . . . . . . . . . . . . . . . . . . . . . . . . . . . . . . . . . . . . . . . . . . . . . . . . . . . . . . . . . . . . (269) (871)
Reclassification adjustment for realized gains and other-than-temporary impairments included innet income . . . . . . . . . . . . . . . . . . . . . . . . . . . . . . . . . . . . . . . . . . . . . . . . . . . . . . . . . . . . . . . . . . . (332) (281)
Net unrealized gains and losses on equity investments . . . . . . . . . . . . . . . . . . . . . . . . . . . . . . . . $ 213 $(797)
Net unrealized gains and losses on debt securities arising during the year:Unrealized gains . . . . . . . . . . . . . . . . . . . . . . . . . . . . . . . . . . . . . . . . . . . . . . . . . . . . . . . . . . . . . . $ 337 $ 103Unrealized losses . . . . . . . . . . . . . . . . . . . . . . . . . . . . . . . . . . . . . . . . . . . . . . . . . . . . . . . . . . . . . (88) (180)
Reclassification adjustment for realized gains, non-credit related portion of impairments whichwere recognized in net income and other-than-temporary included in net income . . . . . . . . . . . (116) 10
Net unrealized gains and losses on debt securities . . . . . . . . . . . . . . . . . . . . . . . . . . . . . . . . . . . $ 133 $ (67)
Total unrealized gains and losses on equity investments and debt securities . . . . . . . . . . . . . . $ 346 $(864)
Net unrealized gains on equity investments and debt securities was $346 million in FY17. This wasprimarily driven by higher equity valuations, as a result of the improved emerging markets environment, and thereclassification of write-downs of listed equity investments, partially offset by the reclassification of realizedgains on listed equities.
Unrecognized Net Actuarial Gains and Losses and Unrecognized Prior Service Costs on Benefit Plans
Unrecognized pension adjustments largely represent the unrecognized net actuarial gains and losses onbenefit plans. Actuarial gains and losses occur when actual results differ from expected results in determining thefunded status of the pension plans. Since the pension plans are long term, changes in asset returns and discountrates cause volatility in comprehensive income. The improvement in the funded status reflects the rise in interestrates used to measure the liability, and to a greater extent the higher actual asset returns compared with the long-term projection. Given its long-term planning horizon for pension plans, Management is focused mainly onensuring that contributions to pension plans appropriately reflect long term assumptions about asset returns anddiscount rates.
During FY17, IFC experienced a gain of $543 million primarily due to $537 million of unrecognized netactuarial gains and a $6 million reduction of prior service cost. The gain resulted largely from the increase in thediscount rates used to determine the projected benefit obligations at FY17-end when compared with FY16-end.The discount rate assumptions used to determine the projected benefit obligation for the Staff Retirement Planand Post-Employment Benefits Plan increased from 3.4% at June 30, 2016 to 3.7% at June 30, 2017 and from3.5% at June 30, 2016 to 3.8% at June 30, 2017, respectively.
53
GOVERNANCE AND CONTROL
GENERAL GOVERNANCE
IFC’s decision-making structure consists of the Board of Governors, the Board of Directors, the President,the Executive Vice President and CEO, management and staff. The Board of Governors is the highest decision-making authority. Governors are appointed by their member governments for a five-year term, which isrenewable. The Board of Governors may delegate authority to the Board of Directors to exercise any of itspowers, except those reserved to the Board of Governors under the Articles of Agreement.
BOARD MEMBERSHIP
In accordance with its Articles of Agreement, Directors are appointed or elected every two years by theirmember governments. The Board currently has 25 Directors who represent all member countries. Directors areneither officers nor staff of IFC. The President is the only member of the Board from management, and he servesas a non-voting member and as Chairman of the Board.
The Board and its committees are in continuous session at the main IBRD offices in Washington DC, asbusiness requires. Each committee’s terms of reference establishes its respective roles and responsibilities. Ascommittees do not vote on issues, their role is primarily to serve the Board in discharging its responsibilities.
The committees are made up of eight members and function under their respective stipulated terms ofreference. These committees are as follows:
• Audit Committee — assists the Board in overseeing IFC’s finances, accounting, risk management andinternal controls (see further explanation below).
• Budget Committee — assists the Board in approving IFC’s budget and in overseeing the preparation andexecution of IFC’s strategy and business plans. The committee provides guidance to management onstrategic directions.
• Committee on Development Effectiveness — supports the Board in assessing IFC’s developmenteffectiveness, providing guidance on strategic directions, and monitoring the quality and results ofoperations.
• Committee on Governance and Directors’ Administrative Matters — assists the Board on issues related togovernance, the Board’s own effectiveness, and the administrative policy applicable to Directors’ offices.
• Human Resources Committee — strengthens the efficiency and effectiveness of the Board in dischargingits oversight responsibility on IFC’s human resources strategy, policies and practices, and their alignmentwith the business needs of the organization.
The Board is required to consider proposals made by the President on the use of IFC’s net income: retainedearnings and designation of retained earnings and on other policies that affect its general operations. The Board isalso responsible for presenting to the Board of Governors, at the Annual meetings, audited accounts, anadministrative budget, and an annual report on operations and policies and on other matters.
AUDIT COMMITTEE
Membership
The Audit Committee consists of eight Directors. Membership in the Committee is determined by theBoard, based on nominations by the Chairman of the Board, following informal consultation with Directors.
Key responsibilities
The Audit Committee is appointed by the Board for the primary purpose of assisting the Board inoverseeing IFC’s finances, accounting, risk management, internal controls and institutional integrity, specificresponsibilities include:
• Oversight of the integrity of IFC’s financial statements.
54
• Appointment, qualifications, independence and performance of the External Auditor.
• Performance of the Internal Audit Department.
• Adequacy and effectiveness of financial and accounting policies and internal controls and the mechanismsto deter, prevent and penalize fraud and corruption in IFC operations and corporate procurement.
• Effective management of financial, fiduciary, compliance in IFC.
• Oversight of the institutional arrangements and processes for risk management across IFC.
In carrying out its role, the Audit Committee discusses financial issues and policies that affect IFC’sfinancial position and capital adequacy with Management, external auditors, and internal auditors. It recommendsthe annual audited financial statements for approval to the Board. The Audit Committee monitors and reviewsdevelopments in corporate governance and its own role on an ongoing basis.
Executive sessions
Under the Audit Committee’s terms of reference, it may convene in executive session at any time, withoutManagement’s presence. The Audit Committee meets separately in executive session with the external andinternal auditors.
Access to resources and to management
Throughout the year, the Audit Committee receives a large volume of information to enable it to carry outits duties, and meets both formally and informally throughout the year to discuss relevant matters. It hascomplete access to Management and reviews and discusses with Management topics considered in its terms ofreference.
The Audit Committee has the authority to seek advice and assistance from outside legal, accounting, orother advisors as it deems necessary.
BUSINESS CONDUCT
The WBG promotes a positive work environment in which staff members understand their ethicalobligations to the institutions. In support of this commitment, the institutions have a Code of Conduct in place.The WBG has both an Ethics HelpLine and a Fraud and Corruption hotline. A third-party service offers manymethods of worldwide communication. Reporting channels include telephone, mail, email, or confidentialsubmission through a website.
IFC has in place procedures for receiving, retaining, and handling recommendations and concerns relating tobusiness conduct identified during the accounting, internal control and auditing processes.
WBG staff rules clarify and codify the staff’s obligations in reporting suspected fraud, corruption, or othermisconduct that may threaten the operations or governance of the WBG. These rules also offer protection fromretaliation.
AUDITOR INDEPENDENCE
The appointment of the external auditor for IFC is governed by a set of Board-approved principles. Theseinclude:
• Until the completion of the FY18 audit and audit-related work, prohibiting the external auditor fromproviding any non-audit-related services;
• Requiring all audit-related services to be pre-approved on a case-by-case basis by the Board, uponrecommendation of the Audit Committee; and
55
• Mandatory rebidding of the external audit contract every five years, with a limit of two consecutive termsand mandatory rotation thereafter, provided however, that the Audit Committee may exceptionallyrecommend that the incumbent audit firm should be allowed to participate in the re-bidding.
The external auditor is appointed to a five-year term, with a limit of two consecutive terms, and is subject toannual reappointment based on the recommendation of the Audit Committee and approval of a resolution by theBoard. FY18 is the final year of KPMG LLP’s second term as IFC’s external auditor.
On November 28, 2017, following a mandatory rebidding of the external audit contract, IFC’s Directorsapproved the appointment of Deloitte as IFC’s external auditor for a five-year term commencing FY19.
Communication between the external auditor and the Audit Committee is ongoing and carried out as oftenas deemed necessary by either party. The Audit Committee meets periodically with the external auditor andindividual committee members have independent access to the external auditor. IFC’s external auditors alsofollow the communication requirements with the Audit Committees set out under generally accepted auditingstandards in the United States.
During FY17, the Board approved amendments to the policy on the appointment of an external auditorwhich will come into effect for the FY19 audit period. The primary amendments now permit the external auditorto provide non-prohibited non-audit related services subject to monetary limits. Broadly, the list of prohibitednon-audit services include those that would put the external auditor in the roles typically performed bymanagement or in a position of auditing their own work, such as accounting services, internal audit services, andprovision of investment advice. The total non-audit services fees over the term of the relevant external auditcontract shall not exceed 70 percent of the audit fees over the same period.
INTERNAL CONTROL
Internal control over external financial reporting
Each fiscal year, Management evaluates the internal controls over external financial reporting to determinewhether any changes made in these controls during the fiscal year materially affect, or would be reasonablylikely to materially affect IFC’s internal control over external financial reporting. The internal control frameworkpromulgated by the COSO, “Internal Control — Integrated Framework (2013)” provides guidance for designing,implementing and conducting internal control and assessing its effectiveness. Since FY16, IFC has been usingthe 2013 COSO framework to assess the effectiveness of the internal control over external financial reporting. Asof June 30, 2018, these controls were determined to be effective. See “Management’s report regardingeffectiveness of Internal Control over External Financial Reporting” on Page 64.
Concurrently, IFC’s external auditor provides a report stating IFC maintained, in all material respects,effective internal control over external financial reporting. See Independent Auditors’ Report on effectiveness ofinternal control over financial reporting on Page 66.
Disclosure controls and procedures
Disclosure controls and procedures are designed to ensure that information required to be disclosed isgathered and communicated to Management as appropriate, to allow timely decisions regarding requireddisclosure by IFC. Management conducted an evaluation of the effectiveness of such controls and procedures andthe President, the Chief Executive Officer, the Vice President, Risk and Financial Sustainability and Controllerhave concluded that these controls and procedures were effective as of June 30, 2018.
56
AUDIT FEES
For FY18 and FY17, KPMG served as IFC’s independent external auditors. The aggregate fees forprofessional services rendered for IFC, including reimbursable expenses, by KPMG for FY18 and FY17 are asfollows: Fees earned by KPMG for audit and audit-related services rendered to IFC, AMC and funds managed byAMC totaled $3.98 million ($3.60 million — FY17), comprising $3.52 million of audit services ($3.20 million— FY17) and $0.46 million of audit-related services ($0.40 million —FY17). Audit-related services performedby KPMG are closely related to audit services and in many cases could only be provided by IFC’s independentexternal auditors. Such audit-related services include accounting consultations, financial statement translationservices, comfort letters and other reporting in support of IFC’s borrowing activities, and certain attestationservices such as agreed upon procedures.
ORGANIZATION AND ADMINISTRATION OF IFC
MEMBERSHIP
IFC was organized in 1956 with an original membership of 56 countries, which has since grown to 184member countries at June 30, 2018. Membership in IFC is open to members of IBRD at such times and inaccordance with such terms and conditions as IFC shall prescribe.
Although any member may withdraw from membership in IFC by delivering notice thereof in writing, anygovernment which ceases to be a member remains liable for all its obligations to IFC. In the event of withdrawal,IFC will arrange for the repurchase of that government’s capital stock in IFC. Also, a member may be suspendedby a decision of a majority of the Board of Governors exercising a majority of IFC’s total voting power if suchmember fails to fulfil any of its obligations to IFC.
ADMINISTRATION
IFC’s administration is comprised of the Board of Governors, the Board of Directors, the President, theChief Executive Officer, other officers and staff.
All of the powers of IFC are vested in the Board of Governors which is composed of a Governor (and anAlternate Governor) appointed by each member country of IFC. The voting power of each member shall be equalto the sum of its basic votes and share votes. The basic votes of each member shall be the number of votes thatresults from the equal distribution among all members of 5.55 percent of the aggregate sum of the voting powerof all the members, provided that there shall be no fractional basic votes. The share votes of each member shallbe the number of votes that results from the allocation of one vote for each share of stock held. Except asotherwise expressly provided in the Articles of Agreement, all matters before IFC are decided by a majority ofthe votes cast. The Board of Governors holds regular annual meetings, but has delegated to the Board ofDirectors authority to exercise all of the powers of IFC except those reserved to the Board of Governors underthe Articles of Agreement.
The Board of Directors is responsible for the conduct of the general operations of IFC. It is composed ofeach Executive Director of IBRD who has been either (i) appointed by a member of IBRD which is also amember of IFC, or (ii) elected in an election in which the votes of at least one member of IBRD which is also amember of IFC shall have counted toward his or her election. Each Director is entitled to cast the number ofvotes which the member by which he or she was appointed, or the member (or members) that voted for his or herelection, is entitled to cast. The Board of Directors presently consists of 25 Directors. Five Directors areappointed by individual members and the remaining 20 are elected by the Board of Governors representing theother members. The President of IBRD is ex officio Chairman of the Board of Directors of IFC.
The President is the chief of the operating staff of IFC and is appointed by the Board of Directors. Under thedirection and control of the Board of Directors, the President is responsible for the organization, appointment anddismissal of the officers and staff. The authority to conduct the ordinary business of IFC is vested in the ChiefExecutive Officer.
57
The following is a list of the principal officers of IFC as of June 30, 2017:
President . . . . . . . . . . . . . . . . . . . . . . . . . . . . . . . . . . . . . . . . Dr. Jim Yong KimChief Executive Officer . . . . . . . . . . . . . . . . . . . . . . . . . . . . Philippe Le HouérouVice President, New Business . . . . . . . . . . . . . . . . . . . . . . . . Dimitris Tsitsiragos(*)
Vice President, Blended Finance and Partnerships . . . . . . . . Nena StoiljkovicVice President, General Counsel and Vice President, Legal,
Compliance Risk, and ESG Sustainability . . . . . . . . . . . . Ethiopis TafaraVice President, Portfolio Management . . . . . . . . . . . . . . . . . Saran Kebet-Koulibaly(**)
Vice President, Risk and Financial Sustainability . . . . . . . . Mohamed GouledVice President, Corporate Strategy and Resources . . . . . . . . Stephanie von Friedeburg(****)
Vice President, Treasury and Syndications . . . . . . . . . . . . . . Jingdong HuaVice President, WBG Controller . . . . . . . . . . . . . . . . . . . . . . Bernard LauwersVice President, Economics and Private Sector
Development . . . . . . . . . . . . . . . . . . . . . . . . . . . . . . . . . . . Hans Peter LankesVice President, CEO, IFC Asset Management Company
LLC (a wholly-owned subsidiary of IFC) . . . . . . . . . . . . . Gavin E.R. Wilson(***)
Vice President, Communications and Outreach . . . . . . . . . . Karin Finkelston
(*) Dimitris Tsitsiragos left IFC in November 2017.(**) Saran Kebet-Koulibaly left IFC in November 2017.(***) Gavin E.R. Wilson left IFC and AMC in October 2017 and Marcos Brujis became AMC Chief Executive Officer and Vice President, IFC AMC Services
effective November 1, 2017.(****) Stephanie von Friedeburg was appointed to the new position of IFC’s Chief Operating Officer, effective January 1, 2018. Stephanie temporarily assumed
the position of Vice President, New Business on November 1, 2017.
IFC has realigned the organization to include a greater focus at the regional and country level in order toimplement the IFC 3.0 strategy. The changes include the creation of the above mentioned new position of ChiefOperating Officer, to oversee all IFC operations and drive the implementation of the IFC strategy, and thecreation of three Regional Vice President positions who will report to the Chief Operating Officer. Accordingly,
IFC announced the following appointments effective January 1, 2018:
• The appointment of Georgina Baker, Regional Vice President, Latin America & Caribbean and Europe &Central Asia.
• The appointment of Sérgio Pimenta, Regional Vice President, Middle-East and Africa.
• The reassignment of Nena Stoiljkovic, to the position of Regional Vice President, South Asia and EastAsia & Pacific.
IFC has also appointed Monish Mahurkar as Vice President, Corporate Strategy and Resources, includingHuman Resources and Information Technology, and Mohamed Gouled assumed the IFC Controllers functionwithin the Risk and Financial Sustainability Vice Presidency, both effective January 1, 2018.
58
Accordingly, the following is a list of the principal officers of IFC as of June 30, 2018:
President . . . . . . . . . . . . . . . . . . . . . . . . . . . . . . . . . . . . . . . . . . . Dr. Jim Yong KimChief Executive Officer . . . . . . . . . . . . . . . . . . . . . . . . . . . . . . . Philippe Le HouérouChief Operating Officer . . . . . . . . . . . . . . . . . . . . . . . . . . . . . . . Stephanie von FriedeburgRegional Vice President, Latin America & Caribbean and
Europe & Central Asia . . . . . . . . . . . . . . . . . . . . . . . . . . . . . .Georgina Baker
Regional Vice President, Middle-East and Africa . . . . . . . . . . . Sérgio PimentaRegional Vice President, South Asia and East Asia &
Pacific . . . . . . . . . . . . . . . . . . . . . . . . . . . . . . . . . . . . . . . . . . . Nena StoiljkovicVice President and General Counsel, Legal, Compliance Risk,
and ESG Sustainability . . . . . . . . . . . . . . . . . . . . . . . . . . . . . .Ethiopis Tafara
Vice President, Risk and Financial Sustainability(*) . . . . . . . . . . Mohamed GouledVice President, Corporate Strategy and Resources . . . . . . . . . . . Monish MahurkarVice President, Treasury and Syndications . . . . . . . . . . . . . . . . . Jingdong HuaVice President, Economics and Private Sector Development . . . Hans Peter LankesVice President, CEO, IFC Asset Management Company LLC
(a wholly-owned subsidiary of IFC) . . . . . . . . . . . . . . . . . . . . Marcos BrujisVice President, Partnerships, Communications and Outreach . . Karin Finkelston
(*) Renamed Risk and Finance effective July 1, 2018.
THE ARTICLES OF AGREEMENT
The Articles of Agreement constitute IFC’s governing charter. They prescribe IFC’s purpose, capitalstructure and organization, authorize the operations in which it may engage, prescribe limitations on the carryingon of those operations and establish the status, privileges and immunities of IFC in its member countries. TheArticles of Agreement also contain provisions with respect to the admission of additional members, the increaseof the authorized capital stock of IFC, the terms and conditions under which IFC may invest its funds, thedistribution of the net income of IFC to its members, the withdrawal and suspension of members and thesuspension of operations of IFC.
Pursuant to its provisions, the Articles of Agreement may be amended only by a vote of three-fifths of theGovernors exercising 85% of the total voting power (except for certain provisions the amendment of whichrequires the affirmative vote of all Governors). The Articles of Agreement further provide that questions ofinterpretation of provisions of the Articles of Agreement arising between any member and IFC or betweenmembers of IFC shall be decided by the Board of Directors. Its decisions may be referred by any member to theBoard of Governors, whose decision is final. Pending the result of such reference, IFC may act on the basis of thedecision of the Board of Directors.
Copies of the full text of the Articles of Agreement are available for inspection and distribution at IFC’shead office in Washington, D.C. and are available at www.ifc.org.
LEGAL STATUS, IMMUNITIES AND PRIVILEGES
The Articles of Agreement contain provisions which accord to IFC legal status and certain immunities andprivileges in the territories of each of its members, including those summarized below.
IFC has full juridical personality with capacity to make contracts, to acquire and dispose of property and tosue and be sued. Actions may be brought against IFC only in a court of competent jurisdiction in the territories ofa member in which IFC has an office, has appointed an agent to accept service of process, or has issued orguaranteed securities, but no action may be brought against IFC by a member or persons acting for or derivingclaims from a member.
The Governors, Directors, Alternates and the officers, and employees of IFC are immune from legal processfor acts performed by them in their official capacities.
59
The archives of IFC are inviolable and the property and assets of IFC are immune from seizure, attachmentor execution prior to delivery of final judgment against IFC. The property and assets of IFC are also immunefrom search, requisition, confiscation, expropriation or any other form of seizure by executive or legislativeaction.
IFC, its assets, property, income and its operations and transactions authorized by the Articles ofAgreement, are immune from all taxation and customs duties imposed by a member country. IFC is also immunefrom liability for the collection or payment of any tax or duty.
Under the Articles of Agreement, securities issued or guaranteed by IFC and the interest or dividendsthereon are not subject to any tax (a) which discriminates against such securities solely because they are issued orguaranteed by IFC or (b) if the sole jurisdictional basis for the tax is the place or currency in which suchsecurities are issued, made payable or paid, or the location of any office or place of business maintained by IFC.
IFC in its discretion may waive any of the privileges and immunities conferred under the Articles ofAgreement upon such conditions as it may determine.
60
INDEX TO CONSOLIDATED FINANCIAL STATEMENTS AND INTERNAL CONTROL REPORTSJune 30, 2018
Page
Management’s financial reporting assurance . . . . . . . . . . . . . . . . . . . . . . . . . . . . . . . . . . . . . . . . . . . . . . . . . . 62Management’s report regarding effectiveness of internal control over external financial reporting . . . . . . . . 64Independent auditors’ report on the effectiveness of internal control over external financial reporting . . . . . 66Consolidated balance sheets . . . . . . . . . . . . . . . . . . . . . . . . . . . . . . . . . . . . . . . . . . . . . . . . . . . . . . . . . . . . . . . 68Consolidated statements of operations . . . . . . . . . . . . . . . . . . . . . . . . . . . . . . . . . . . . . . . . . . . . . . . . . . . . . . . 69Consolidated statements of comprehensive income (loss) . . . . . . . . . . . . . . . . . . . . . . . . . . . . . . . . . . . . . . . . 70Consolidated statements of changes in capital . . . . . . . . . . . . . . . . . . . . . . . . . . . . . . . . . . . . . . . . . . . . . . . . . 71Consolidated statements of cash flows . . . . . . . . . . . . . . . . . . . . . . . . . . . . . . . . . . . . . . . . . . . . . . . . . . . . . . . 73Consolidated statement of capital stock and voting power . . . . . . . . . . . . . . . . . . . . . . . . . . . . . . . . . . . . . . . 75Notes to consolidated financial statements . . . . . . . . . . . . . . . . . . . . . . . . . . . . . . . . . . . . . . . . . . . . . . . . . . . . 80Independent Auditors’ Report . . . . . . . . . . . . . . . . . . . . . . . . . . . . . . . . . . . . . . . . . . . . . . . . . . . . . . . . . . . . . 163
61
Management’s Financial Reporting Assurance
August 9, 2018
Audit Committee of the Board of DirectorsInternational Finance Corporation
We have reviewed the consolidated financial statements for the period ending on June 30, 2018, and theaccompanying management’s discussion and analysis of the International Finance Corporation (IFC)(collectively, the “Reports”). Based on our knowledge, the Reports do not (1) contain any untrue statement of amaterial fact, or (2) omit to state a material fact necessary to make the statements made, in light of thecircumstances under which such statements were made, not misleading with respect to the period covered by theReports.
Based on our knowledge, the consolidated financial statements and other financial information included inthe Reports fairly present in all material respects the financial condition, results of operations, changes in netassets, and cash flows of IFC for the periods presented in the Reports.
Management is responsible for establishing and maintaining internal controls and procedures over externalfinancial reporting for IFC. As part of carrying out these responsibilities, Management has:
• designed internal controls and procedures to ensure that material information required to meet theaccuracy and completeness standards set forth above with regard to the Reports is recorded, processed,summarized and reported in a timely manner, as well as to ensure that such information is accumulatedand communicated to Management as appropriate to allow timely decisions regarding required disclosure;and
• designed internal controls over external financial reporting to provide reasonable assurance regarding thereliability of financial reporting and the preparation of consolidated financial statements for externalpurposes in accordance with generally accepted accounting principles.
Management has evaluated the effectiveness of IFC’s internal controls and procedures as of the date of theReports; and presented in management's discussion and analysis its conclusions about the effectiveness of suchcontrols and procedures, as of the end of the period covered by the Reports, based on such evaluation.Management has disclosed in the Reports any change in IFC’s internal controls over external financial reportingthat occurred during the period covered by the Reports that has materially affected, or is reasonably likely tomaterially affect, IFC’s internal controls over external financial reporting.
Further, Management has disclosed, based on its most recent evaluation of internal controls over externalfinancial reporting, to IFC’s external auditors and the Audit Committee of IFC’s Board of Directors:
• all significant deficiencies in the design or operation of internal controls over external financial reportingwhich are reasonably likely to adversely affect IFC’s ability to record, process, summarize, and reportfinancial information; and
• any fraud, material or not, that involves Management or other employees who have a significant role inIFC’s internal controls over external financial reporting.
62

Jim Yong KimPresident
Philippe H. Le HouérouChief Executive Officer
Mohamed GouledVice President, Risk and Finance
Paul B. BraveryActing Controller and Director
63
Management’s Report Regarding Effectiveness ofInternal Control over External Financial Reporting
August 9, 2018
The management of the International Finance Corporation (IFC) is responsible for the preparation, integrity,and fair presentation of its published consolidated financial statements. The consolidated financial statementshave been prepared in accordance with accounting principles generally accepted in the United States of America(US GAAP) and, as such, include amounts based on informed judgments and estimates made by management.
The consolidated financial statements have been audited by an independent audit firm, which was givenunrestricted access to all financial records and related data, including minutes of all meetings of the Board ofDirectors and their Committees. Management believes that all representations made to the independent auditorsduring their audit of IFC’s consolidated financial statements and audit of its internal control over externalfinancial reporting were valid and appropriate. The independent auditor’s reports accompany the auditedconsolidated financial statements.
Management is responsible for establishing and maintaining effective internal control over external financialreporting for financial statement presentations in conformity with US GAAP. Management maintains acomprehensive system of controls intended to ensure that transactions are executed in accordance withmanagement’s authorization, assets are safeguarded and financial records are reliable. The system of internalcontrol contains monitoring mechanisms, and actions are taken to correct deficiencies identified. Managementbelieves that internal controls over external financial reporting, which are subject to scrutiny by management andthe internal auditors, and are revised as considered necessary, support the integrity and reliability of the externalconsolidated financial statements.
There are inherent limitations in the effectiveness of any internal control, including the possibility of humanerror and the circumvention or overriding of controls. Accordingly, even effective internal control can provideonly reasonable assurance with respect to financial statements preparation. Further, because of changes inconditions, the effectiveness of internal control may vary over time.
IFC assessed its internal control over external financial reporting for financial statement presentation inconformity with US GAAP as of June 30, 2018. This assessment was based on the criteria for effective internalcontrol over external financial reporting described in Internal Control — Integrated Framework (2013) issued bythe Committee of Sponsoring Organizations of the Treadway Commission. Based upon this assessment,management believes that IFC maintained effective internal control over external financial reporting presented inconformity with US GAAP as of June 30, 2018. The independent audit firm that audited the consolidatedfinancial statements has issued an Independent Auditors Report which expresses an opinion on IFC’s internalcontrol over external financial reporting.
The Board of Directors has appointed an Audit Committee responsible for monitoring the accountingpractices and internal controls of IFC. The Audit Committee is comprised entirely of Directors who areindependent of IFC’s management. The Audit Committee is responsible for recommending to the Board ofDirectors the selection of independent auditors. It meets periodically with management, the independent auditors,and the internal auditors to ensure that they are carrying out their responsibilities. The Audit Committee isresponsible for performing an oversight role by reviewing and monitoring the financial, accounting and auditingprocedures of IFC in addition to reviewing IFC’s financial reports. The independent auditors and the internalauditors have full and free access to the Audit Committee, with or without the presence of management todiscuss the adequacy of internal control over external financial reporting and any other matters which theybelieve should be brought to the attention of the Audit Committee.
64

Jim Yong KimPresident
Philippe H. Le HouérouChief Executive Officer
Mohamed GouledVice President, Risk and Finance
Paul B. BraveryActing Controller and Director
65
KPMG LLPSuite 120001801 K Street, NWWashington, DC 20006
Independent Auditors’ Report
President and Board of DirectorsInternational Finance Corporation:
We have audited the International Finance Corporation and subsidiaries’ (IFC) internal control overfinancial reporting as of June 30, 2018, based on criteria established in the Internal Control — IntegratedFramework (2013) issued by the Committee of Sponsoring Organizations of the Treadway Commission (COSO).
Management’s Responsibility for Internal Control Over Financial Reporting
Management is responsible for designing, implementing, and maintaining effective internal control overfinancial reporting, and for its assessment about the effectiveness of internal control over financial reporting,included in the accompanying Management’s Report Regarding Effectiveness of Internal Control Over ExternalFinancial Reporting.
Auditors’ Responsibility
Our responsibility is to express an opinion on the entity’s internal control over financial reporting based onour audit. We conducted our audit in accordance with auditing standards generally accepted in the United Statesof America. Those standards require that we plan and perform the audit to obtain reasonable assurance aboutwhether effective internal control over financial reporting was maintained in all material respects.
An audit of internal control over financial reporting involves performing procedures to obtain audit evidenceabout whether a material weakness exists. The procedures selected depend on the auditors’ judgment, includingthe assessment of the risks that a material weakness exists. An audit includes obtaining an understanding ofinternal control over financial reporting and testing and evaluating the design and operating effectiveness ofinternal control over financial reporting based on the assessed risk.
We believe that the audit evidence we have obtained is sufficient and appropriate to provide a basis for ouraudit opinion.
Definition and Inherent Limitations of Internal Control Over Financial Reporting
An entity’s internal control over financial reporting is a process effected by those charged with governance,management, and other personnel, designed to provide reasonable assurance regarding the preparation of reliablefinancial statements in accordance with U.S. generally accepted accounting principles. An entity’s internalcontrol over financial reporting includes those policies and procedures that (1) pertain to the maintenance ofrecords that, in reasonable detail, accurately and fairly reflect the transactions and dispositions of the assets of theentity; (2) provide reasonable assurance that transactions are recorded as necessary to permit preparation offinancial statements in accordance with U.S. generally accepted accounting principles, and that receipts andexpenditures of the entity are being made only in accordance with authorizations of management and thosecharged with governance; and (3) provide reasonable assurance regarding prevention, or timely detection andcorrection, of unauthorized acquisition, use, or disposition of the entity’s assets that could have a material effecton the financial statements.
66
Because of its inherent limitations, internal control over financial reporting may not prevent, or detect andcorrect, misstatements. Also, projections of any assessment of effectiveness to future periods are subject to therisk that controls may become inadequate because of changes in conditions, or that the degree of compliance withthe policies or procedures may deteriorate.
Opinion
In our opinion, IFC maintained, in all material respects, effective internal control over financial reporting asof June 30, 2018, based on criteria established in the Internal Control — Integrated Framework (2013) issued bythe Committee of Sponsoring Organizations of the Treadway Commission (COSO).
Report on Consolidated Financial Statements
We also have audited, in accordance with auditing standards generally accepted in the United States ofAmerica, the accompanying consolidated financial statements of IFC, which comprise the consolidated balancesheets as of June 30, 2018 and 2017, and the related consolidated statements of operations, comprehensiveincome (loss), changes in capital and cash flows for each of the years in the three-year period ended June 30,2018, and our report dated August 9, 2018 expressed an unmodified opinion on those consolidated financialstatements.
Washington, D.C.August 9, 2018
67
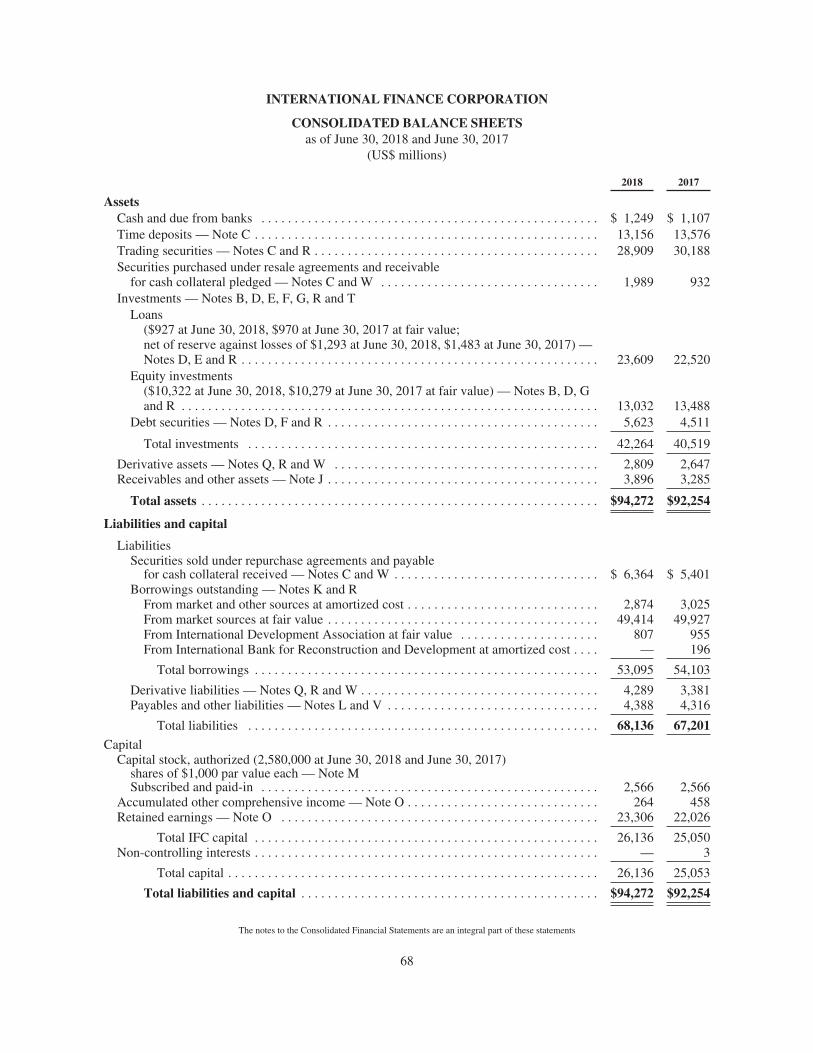
INTERNATIONAL FINANCE CORPORATION
CONSOLIDATED BALANCE SHEETSas of June 30, 2018 and June 30, 2017
(US$ millions)
2018 2017
AssetsCash and due from banks . . . . . . . . . . . . . . . . . . . . . . . . . . . . . . . . . . . . . . . . . . . . . . . . . . . $ 1,249 $ 1,107Time deposits — Note C . . . . . . . . . . . . . . . . . . . . . . . . . . . . . . . . . . . . . . . . . . . . . . . . . . . . 13,156 13,576Trading securities — Notes C and R . . . . . . . . . . . . . . . . . . . . . . . . . . . . . . . . . . . . . . . . . . . 28,909 30,188Securities purchased under resale agreements and receivable
for cash collateral pledged — Notes C and W . . . . . . . . . . . . . . . . . . . . . . . . . . . . . . . . . 1,989 932Investments — Notes B, D, E, F, G, R and T
Loans($927 at June 30, 2018, $970 at June 30, 2017 at fair value;net of reserve against losses of $1,293 at June 30, 2018, $1,483 at June 30, 2017) —Notes D, E and R . . . . . . . . . . . . . . . . . . . . . . . . . . . . . . . . . . . . . . . . . . . . . . . . . . . . . . 23,609 22,520
Equity investments($10,322 at June 30, 2018, $10,279 at June 30, 2017 at fair value) — Notes B, D, Gand R . . . . . . . . . . . . . . . . . . . . . . . . . . . . . . . . . . . . . . . . . . . . . . . . . . . . . . . . . . . . . . . 13,032 13,488
Debt securities — Notes D, F and R . . . . . . . . . . . . . . . . . . . . . . . . . . . . . . . . . . . . . . . . . 5,623 4,511
Total investments . . . . . . . . . . . . . . . . . . . . . . . . . . . . . . . . . . . . . . . . . . . . . . . . . . . . . 42,264 40,519
Derivative assets — Notes Q, R and W . . . . . . . . . . . . . . . . . . . . . . . . . . . . . . . . . . . . . . . . 2,809 2,647Receivables and other assets — Note J . . . . . . . . . . . . . . . . . . . . . . . . . . . . . . . . . . . . . . . . . 3,896 3,285
Total assets . . . . . . . . . . . . . . . . . . . . . . . . . . . . . . . . . . . . . . . . . . . . . . . . . . . . . . . . . . . . $94,272 $92,254
Liabilities and capital
LiabilitiesSecurities sold under repurchase agreements and payable
for cash collateral received — Notes C and W . . . . . . . . . . . . . . . . . . . . . . . . . . . . . . . $ 6,364 $ 5,401Borrowings outstanding — Notes K and R
From market and other sources at amortized cost . . . . . . . . . . . . . . . . . . . . . . . . . . . . . 2,874 3,025From market sources at fair value . . . . . . . . . . . . . . . . . . . . . . . . . . . . . . . . . . . . . . . . . 49,414 49,927From International Development Association at fair value . . . . . . . . . . . . . . . . . . . . . 807 955From International Bank for Reconstruction and Development at amortized cost . . . . — 196
Total borrowings . . . . . . . . . . . . . . . . . . . . . . . . . . . . . . . . . . . . . . . . . . . . . . . . . . . . 53,095 54,103
Derivative liabilities — Notes Q, R and W . . . . . . . . . . . . . . . . . . . . . . . . . . . . . . . . . . . . 4,289 3,381Payables and other liabilities — Notes L and V . . . . . . . . . . . . . . . . . . . . . . . . . . . . . . . . 4,388 4,316
Total liabilities . . . . . . . . . . . . . . . . . . . . . . . . . . . . . . . . . . . . . . . . . . . . . . . . . . . . . 68,136 67,201Capital
Capital stock, authorized (2,580,000 at June 30, 2018 and June 30, 2017)shares of $1,000 par value each — Note MSubscribed and paid-in . . . . . . . . . . . . . . . . . . . . . . . . . . . . . . . . . . . . . . . . . . . . . . . . . . . 2,566 2,566
Accumulated other comprehensive income — Note O . . . . . . . . . . . . . . . . . . . . . . . . . . . . . 264 458Retained earnings — Note O . . . . . . . . . . . . . . . . . . . . . . . . . . . . . . . . . . . . . . . . . . . . . . . . 23,306 22,026
Total IFC capital . . . . . . . . . . . . . . . . . . . . . . . . . . . . . . . . . . . . . . . . . . . . . . . . . . . . 26,136 25,050Non-controlling interests . . . . . . . . . . . . . . . . . . . . . . . . . . . . . . . . . . . . . . . . . . . . . . . . . . . . — 3
Total capital . . . . . . . . . . . . . . . . . . . . . . . . . . . . . . . . . . . . . . . . . . . . . . . . . . . . . . . . 26,136 25,053
Total liabilities and capital . . . . . . . . . . . . . . . . . . . . . . . . . . . . . . . . . . . . . . . . . . . . . $94,272 $92,254
The notes to the Consolidated Financial Statements are an integral part of these statements
68
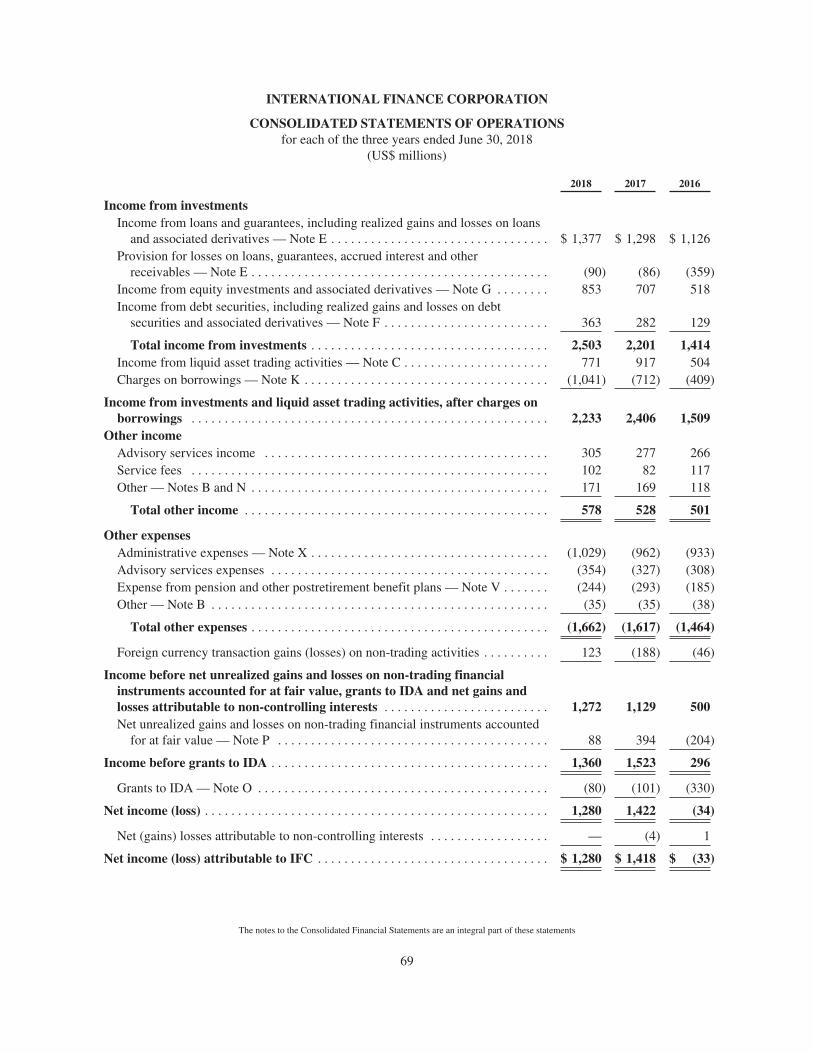
INTERNATIONAL FINANCE CORPORATION
CONSOLIDATED STATEMENTS OF OPERATIONSfor each of the three years ended June 30, 2018
(US$ millions)
2018 2017 2016
Income from investmentsIncome from loans and guarantees, including realized gains and losses on loans
and associated derivatives — Note E . . . . . . . . . . . . . . . . . . . . . . . . . . . . . . . . . $ 1,377 $ 1,298 $ 1,126Provision for losses on loans, guarantees, accrued interest and other
receivables — Note E . . . . . . . . . . . . . . . . . . . . . . . . . . . . . . . . . . . . . . . . . . . . . (90) (86) (359)Income from equity investments and associated derivatives — Note G . . . . . . . . 853 707 518Income from debt securities, including realized gains and losses on debt
securities and associated derivatives — Note F . . . . . . . . . . . . . . . . . . . . . . . . . 363 282 129
Total income from investments . . . . . . . . . . . . . . . . . . . . . . . . . . . . . . . . . . . . 2,503 2,201 1,414Income from liquid asset trading activities — Note C . . . . . . . . . . . . . . . . . . . . . . 771 917 504Charges on borrowings — Note K . . . . . . . . . . . . . . . . . . . . . . . . . . . . . . . . . . . . . (1,041) (712) (409)
Income from investments and liquid asset trading activities, after charges onborrowings . . . . . . . . . . . . . . . . . . . . . . . . . . . . . . . . . . . . . . . . . . . . . . . . . . . . . . 2,233 2,406 1,509
Other incomeAdvisory services income . . . . . . . . . . . . . . . . . . . . . . . . . . . . . . . . . . . . . . . . . . . 305 277 266Service fees . . . . . . . . . . . . . . . . . . . . . . . . . . . . . . . . . . . . . . . . . . . . . . . . . . . . . . 102 82 117Other — Notes B and N . . . . . . . . . . . . . . . . . . . . . . . . . . . . . . . . . . . . . . . . . . . . . 171 169 118
Total other income . . . . . . . . . . . . . . . . . . . . . . . . . . . . . . . . . . . . . . . . . . . . . . 578 528 501
Other expensesAdministrative expenses — Note X . . . . . . . . . . . . . . . . . . . . . . . . . . . . . . . . . . . . (1,029) (962) (933)Advisory services expenses . . . . . . . . . . . . . . . . . . . . . . . . . . . . . . . . . . . . . . . . . . (354) (327) (308)Expense from pension and other postretirement benefit plans — Note V . . . . . . . (244) (293) (185)Other — Note B . . . . . . . . . . . . . . . . . . . . . . . . . . . . . . . . . . . . . . . . . . . . . . . . . . . (35) (35) (38)
Total other expenses . . . . . . . . . . . . . . . . . . . . . . . . . . . . . . . . . . . . . . . . . . . . . (1,662) (1,617) (1,464)
Foreign currency transaction gains (losses) on non-trading activities . . . . . . . . . . 123 (188) (46)
Income before net unrealized gains and losses on non-trading financialinstruments accounted for at fair value, grants to IDA and net gains andlosses attributable to non-controlling interests . . . . . . . . . . . . . . . . . . . . . . . . . 1,272 1,129 500Net unrealized gains and losses on non-trading financial instruments accounted
for at fair value — Note P . . . . . . . . . . . . . . . . . . . . . . . . . . . . . . . . . . . . . . . . . 88 394 (204)
Income before grants to IDA . . . . . . . . . . . . . . . . . . . . . . . . . . . . . . . . . . . . . . . . . . 1,360 1,523 296
Grants to IDA — Note O . . . . . . . . . . . . . . . . . . . . . . . . . . . . . . . . . . . . . . . . . . . . (80) (101) (330)
Net income (loss) . . . . . . . . . . . . . . . . . . . . . . . . . . . . . . . . . . . . . . . . . . . . . . . . . . . . 1,280 1,422 (34)
Net (gains) losses attributable to non-controlling interests . . . . . . . . . . . . . . . . . . — (4) 1
Net income (loss) attributable to IFC . . . . . . . . . . . . . . . . . . . . . . . . . . . . . . . . . . . $ 1,280 $ 1,418 $ (33)
The notes to the Consolidated Financial Statements are an integral part of these statements
69
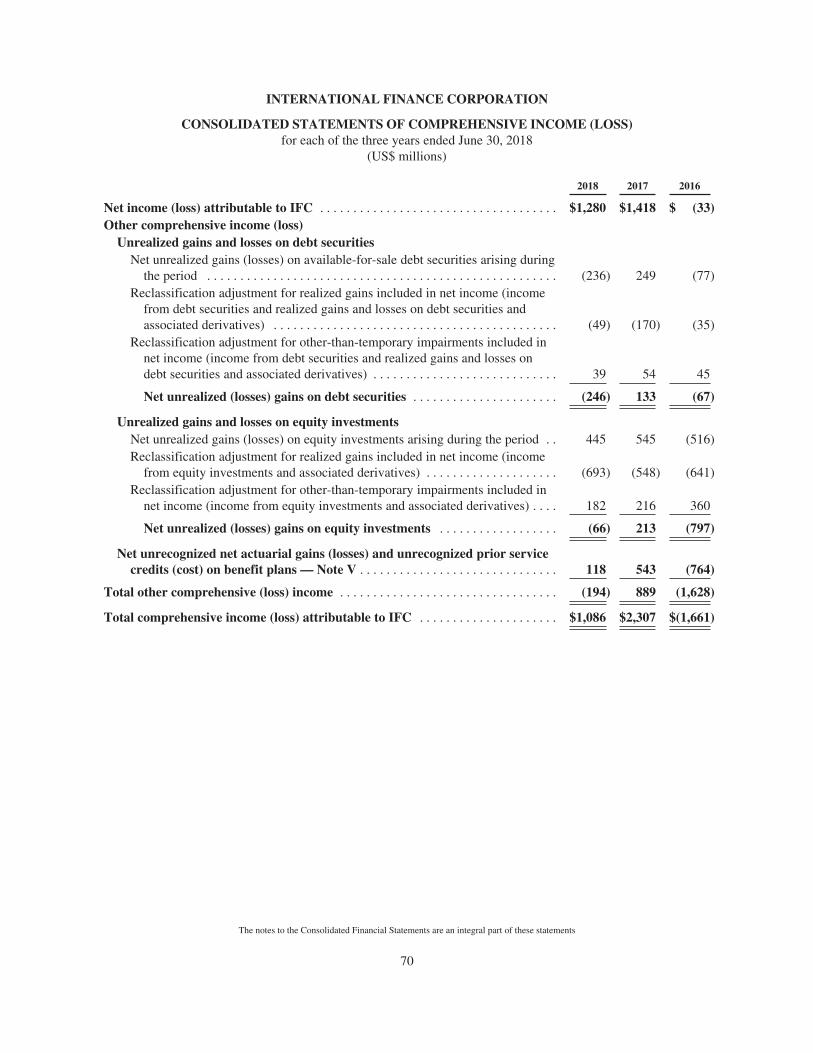
INTERNATIONAL FINANCE CORPORATION
CONSOLIDATED STATEMENTS OF COMPREHENSIVE INCOME (LOSS)for each of the three years ended June 30, 2018
(US$ millions)
2018 2017 2016
Net income (loss) attributable to IFC . . . . . . . . . . . . . . . . . . . . . . . . . . . . . . . . . . . . $1,280 $1,418 $ (33)Other comprehensive income (loss)
Unrealized gains and losses on debt securitiesNet unrealized gains (losses) on available-for-sale debt securities arising during
the period . . . . . . . . . . . . . . . . . . . . . . . . . . . . . . . . . . . . . . . . . . . . . . . . . . . . . (236) 249 (77)Reclassification adjustment for realized gains included in net income (income
from debt securities and realized gains and losses on debt securities andassociated derivatives) . . . . . . . . . . . . . . . . . . . . . . . . . . . . . . . . . . . . . . . . . . . (49) (170) (35)
Reclassification adjustment for other-than-temporary impairments included innet income (income from debt securities and realized gains and losses ondebt securities and associated derivatives) . . . . . . . . . . . . . . . . . . . . . . . . . . . . 39 54 45
Net unrealized (losses) gains on debt securities . . . . . . . . . . . . . . . . . . . . . . (246) 133 (67)
Unrealized gains and losses on equity investmentsNet unrealized gains (losses) on equity investments arising during the period . . 445 545 (516)Reclassification adjustment for realized gains included in net income (income
from equity investments and associated derivatives) . . . . . . . . . . . . . . . . . . . . (693) (548) (641)Reclassification adjustment for other-than-temporary impairments included in
net income (income from equity investments and associated derivatives) . . . . 182 216 360
Net unrealized (losses) gains on equity investments . . . . . . . . . . . . . . . . . . (66) 213 (797)
Net unrecognized net actuarial gains (losses) and unrecognized prior servicecredits (cost) on benefit plans — Note V . . . . . . . . . . . . . . . . . . . . . . . . . . . . . . 118 543 (764)
Total other comprehensive (loss) income . . . . . . . . . . . . . . . . . . . . . . . . . . . . . . . . . (194) 889 (1,628)
Total comprehensive income (loss) attributable to IFC . . . . . . . . . . . . . . . . . . . . . $1,086 $2,307 $(1,661)
The notes to the Consolidated Financial Statements are an integral part of these statements
70
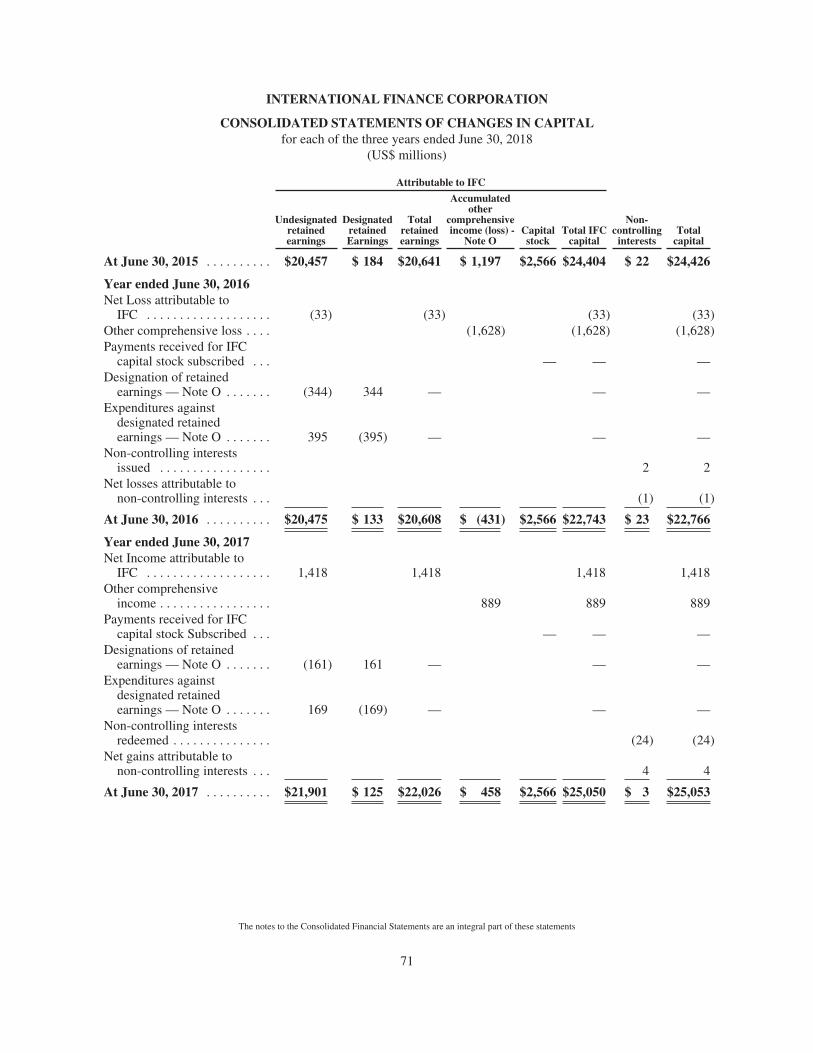
INTERNATIONAL FINANCE CORPORATION
CONSOLIDATED STATEMENTS OF CHANGES IN CAPITALfor each of the three years ended June 30, 2018
(US$ millions)
Attributable to IFC
Undesignatedretainedearnings
DesignatedretainedEarnings
Totalretainedearnings
Accumulatedother
comprehensiveincome (loss) -
Note OCapitalstock
Total IFCcapital
Non-controlling
interestsTotal
capital
At June 30, 2015 . . . . . . . . . . $20,457 $ 184 $20,641 $ 1,197 $2,566 $24,404 $ 22 $24,426
Year ended June 30, 2016Net Loss attributable to
IFC . . . . . . . . . . . . . . . . . . . (33) (33) (33) (33)Other comprehensive loss . . . . (1,628) (1,628) (1,628)Payments received for IFC
capital stock subscribed . . . — — —Designation of retained
earnings — Note O . . . . . . . (344) 344 — — —Expenditures against
designated retainedearnings — Note O . . . . . . . 395 (395) — — —
Non-controlling interestsissued . . . . . . . . . . . . . . . . . 2 2
Net losses attributable tonon-controlling interests . . . (1) (1)
At June 30, 2016 . . . . . . . . . . $20,475 $ 133 $20,608 $ (431) $2,566 $22,743 $ 23 $22,766
Year ended June 30, 2017Net Income attributable to
IFC . . . . . . . . . . . . . . . . . . . 1,418 1,418 1,418 1,418Other comprehensive
income . . . . . . . . . . . . . . . . . 889 889 889Payments received for IFC
capital stock Subscribed . . . — — —Designations of retained
earnings — Note O . . . . . . . (161) 161 — — —Expenditures against
designated retainedearnings — Note O . . . . . . . 169 (169) — — —
Non-controlling interestsredeemed . . . . . . . . . . . . . . . (24) (24)
Net gains attributable tonon-controlling interests . . . 4 4
At June 30, 2017 . . . . . . . . . . $21,901 $ 125 $22,026 $ 458 $2,566 $25,050 $ 3 $25,053
The notes to the Consolidated Financial Statements are an integral part of these statements
71
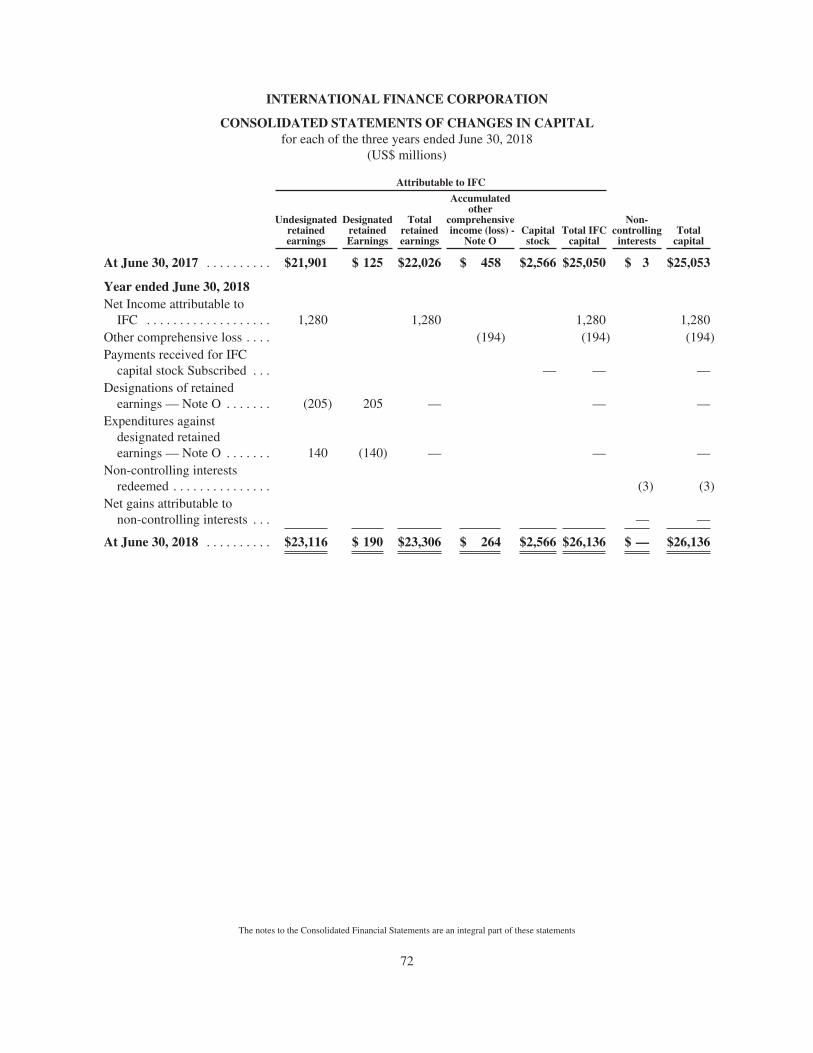
INTERNATIONAL FINANCE CORPORATION
CONSOLIDATED STATEMENTS OF CHANGES IN CAPITALfor each of the three years ended June 30, 2018
(US$ millions)
Attributable to IFC
Undesignatedretainedearnings
DesignatedretainedEarnings
Totalretainedearnings
Accumulatedother
comprehensiveincome (loss) -
Note OCapitalstock
Total IFCcapital
Non-controlling
interestsTotal
capital
At June 30, 2017 . . . . . . . . . . $21,901 $ 125 $22,026 $ 458 $2,566 $25,050 $ 3 $25,053
Year ended June 30, 2018Net Income attributable to
IFC . . . . . . . . . . . . . . . . . . . 1,280 1,280 1,280 1,280Other comprehensive loss . . . . (194) (194) (194)Payments received for IFC
capital stock Subscribed . . . — — —Designations of retained
earnings — Note O . . . . . . . (205) 205 — — —Expenditures against
designated retainedearnings — Note O . . . . . . . 140 (140) — — —
Non-controlling interestsredeemed . . . . . . . . . . . . . . . (3) (3)
Net gains attributable tonon-controlling interests . . . — —
At June 30, 2018 . . . . . . . . . . $23,116 $ 190 $23,306 $ 264 $2,566 $26,136 $ — $26,136
The notes to the Consolidated Financial Statements are an integral part of these statements
72
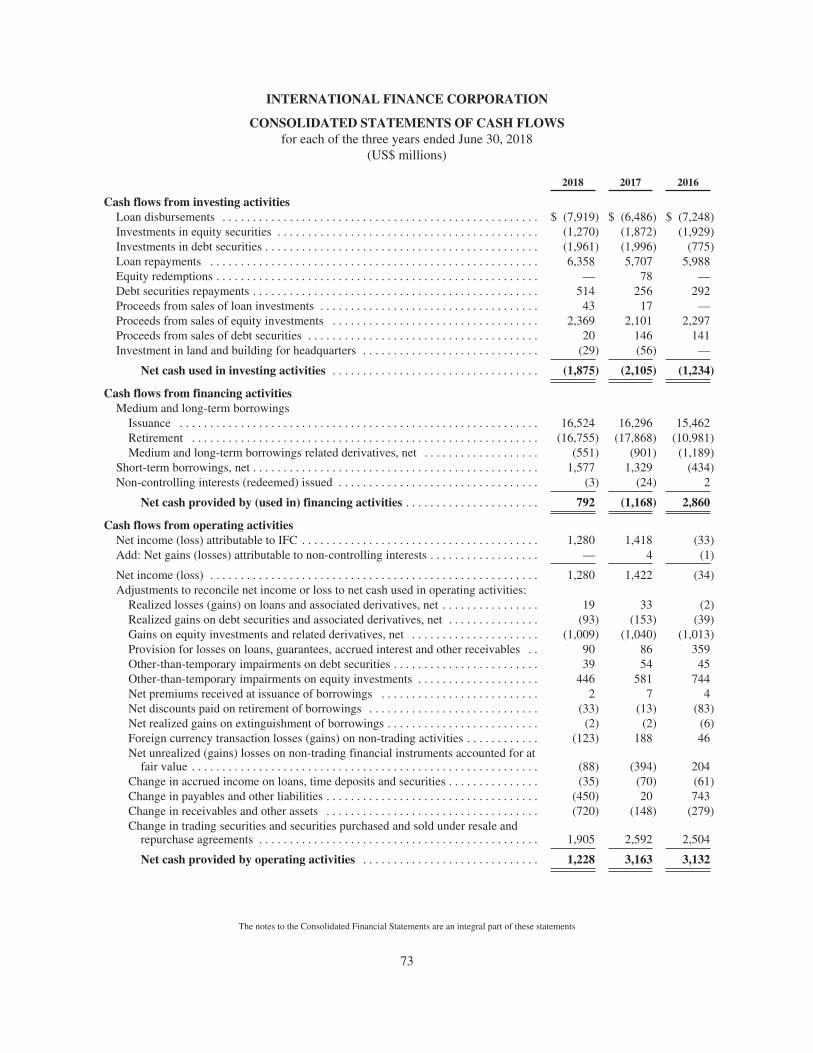
INTERNATIONAL FINANCE CORPORATION
CONSOLIDATED STATEMENTS OF CASH FLOWSfor each of the three years ended June 30, 2018
(US$ millions)
2018 2017 2016
Cash flows from investing activitiesLoan disbursements . . . . . . . . . . . . . . . . . . . . . . . . . . . . . . . . . . . . . . . . . . . . . . . . . . . . $ (7,919) $ (6,486) $ (7,248)Investments in equity securities . . . . . . . . . . . . . . . . . . . . . . . . . . . . . . . . . . . . . . . . . . . (1,270) (1,872) (1,929)Investments in debt securities . . . . . . . . . . . . . . . . . . . . . . . . . . . . . . . . . . . . . . . . . . . . . (1,961) (1,996) (775)Loan repayments . . . . . . . . . . . . . . . . . . . . . . . . . . . . . . . . . . . . . . . . . . . . . . . . . . . . . . 6,358 5,707 5,988Equity redemptions . . . . . . . . . . . . . . . . . . . . . . . . . . . . . . . . . . . . . . . . . . . . . . . . . . . . . — 78 —Debt securities repayments . . . . . . . . . . . . . . . . . . . . . . . . . . . . . . . . . . . . . . . . . . . . . . . 514 256 292Proceeds from sales of loan investments . . . . . . . . . . . . . . . . . . . . . . . . . . . . . . . . . . . . 43 17 —Proceeds from sales of equity investments . . . . . . . . . . . . . . . . . . . . . . . . . . . . . . . . . . 2,369 2,101 2,297Proceeds from sales of debt securities . . . . . . . . . . . . . . . . . . . . . . . . . . . . . . . . . . . . . . 20 146 141Investment in land and building for headquarters . . . . . . . . . . . . . . . . . . . . . . . . . . . . . (29) (56) —
Net cash used in investing activities . . . . . . . . . . . . . . . . . . . . . . . . . . . . . . . . . . (1,875) (2,105) (1,234)
Cash flows from financing activitiesMedium and long-term borrowings
Issuance . . . . . . . . . . . . . . . . . . . . . . . . . . . . . . . . . . . . . . . . . . . . . . . . . . . . . . . . . . . 16,524 16,296 15,462Retirement . . . . . . . . . . . . . . . . . . . . . . . . . . . . . . . . . . . . . . . . . . . . . . . . . . . . . . . . . (16,755) (17,868) (10,981)Medium and long-term borrowings related derivatives, net . . . . . . . . . . . . . . . . . . . (551) (901) (1,189)
Short-term borrowings, net . . . . . . . . . . . . . . . . . . . . . . . . . . . . . . . . . . . . . . . . . . . . . . . 1,577 1,329 (434)Non-controlling interests (redeemed) issued . . . . . . . . . . . . . . . . . . . . . . . . . . . . . . . . . (3) (24) 2
Net cash provided by (used in) financing activities . . . . . . . . . . . . . . . . . . . . . . 792 (1,168) 2,860
Cash flows from operating activitiesNet income (loss) attributable to IFC . . . . . . . . . . . . . . . . . . . . . . . . . . . . . . . . . . . . . . . 1,280 1,418 (33)Add: Net gains (losses) attributable to non-controlling interests . . . . . . . . . . . . . . . . . . — 4 (1)
Net income (loss) . . . . . . . . . . . . . . . . . . . . . . . . . . . . . . . . . . . . . . . . . . . . . . . . . . . . . . 1,280 1,422 (34)Adjustments to reconcile net income or loss to net cash used in operating activities:
Realized losses (gains) on loans and associated derivatives, net . . . . . . . . . . . . . . . . 19 33 (2)Realized gains on debt securities and associated derivatives, net . . . . . . . . . . . . . . . (93) (153) (39)Gains on equity investments and related derivatives, net . . . . . . . . . . . . . . . . . . . . . (1,009) (1,040) (1,013)Provision for losses on loans, guarantees, accrued interest and other receivables . . 90 86 359Other-than-temporary impairments on debt securities . . . . . . . . . . . . . . . . . . . . . . . . 39 54 45Other-than-temporary impairments on equity investments . . . . . . . . . . . . . . . . . . . . 446 581 744Net premiums received at issuance of borrowings . . . . . . . . . . . . . . . . . . . . . . . . . . 2 7 4Net discounts paid on retirement of borrowings . . . . . . . . . . . . . . . . . . . . . . . . . . . . (33) (13) (83)Net realized gains on extinguishment of borrowings . . . . . . . . . . . . . . . . . . . . . . . . . (2) (2) (6)Foreign currency transaction losses (gains) on non-trading activities . . . . . . . . . . . . (123) 188 46Net unrealized (gains) losses on non-trading financial instruments accounted for at
fair value . . . . . . . . . . . . . . . . . . . . . . . . . . . . . . . . . . . . . . . . . . . . . . . . . . . . . . . . . (88) (394) 204Change in accrued income on loans, time deposits and securities . . . . . . . . . . . . . . . (35) (70) (61)Change in payables and other liabilities . . . . . . . . . . . . . . . . . . . . . . . . . . . . . . . . . . . (450) 20 743Change in receivables and other assets . . . . . . . . . . . . . . . . . . . . . . . . . . . . . . . . . . . (720) (148) (279)Change in trading securities and securities purchased and sold under resale and
repurchase agreements . . . . . . . . . . . . . . . . . . . . . . . . . . . . . . . . . . . . . . . . . . . . . . 1,905 2,592 2,504
Net cash provided by operating activities . . . . . . . . . . . . . . . . . . . . . . . . . . . . . 1,228 3,163 3,132
The notes to the Consolidated Financial Statements are an integral part of these statements
73
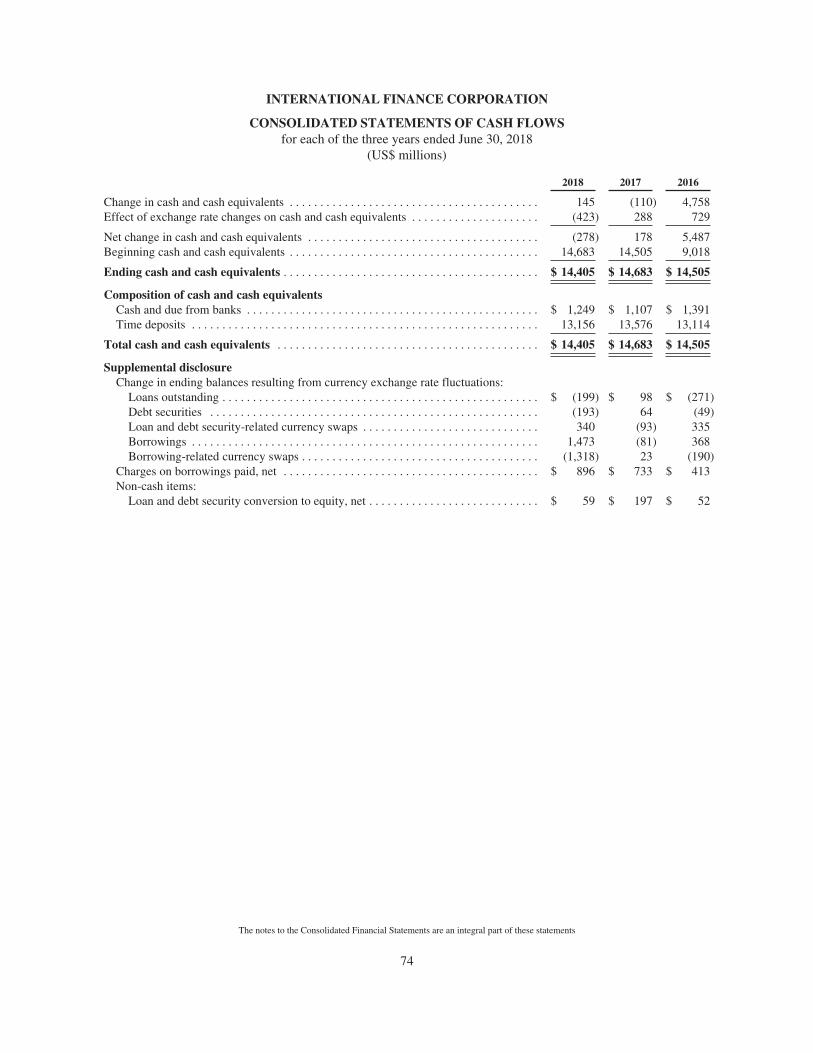
INTERNATIONAL FINANCE CORPORATION
CONSOLIDATED STATEMENTS OF CASH FLOWSfor each of the three years ended June 30, 2018
(US$ millions)
2018 2017 2016
Change in cash and cash equivalents . . . . . . . . . . . . . . . . . . . . . . . . . . . . . . . . . . . . . . . . . 145 (110) 4,758Effect of exchange rate changes on cash and cash equivalents . . . . . . . . . . . . . . . . . . . . . (423) 288 729
Net change in cash and cash equivalents . . . . . . . . . . . . . . . . . . . . . . . . . . . . . . . . . . . . . . (278) 178 5,487Beginning cash and cash equivalents . . . . . . . . . . . . . . . . . . . . . . . . . . . . . . . . . . . . . . . . . 14,683 14,505 9,018
Ending cash and cash equivalents . . . . . . . . . . . . . . . . . . . . . . . . . . . . . . . . . . . . . . . . . . $ 14,405 $ 14,683 $ 14,505
Composition of cash and cash equivalentsCash and due from banks . . . . . . . . . . . . . . . . . . . . . . . . . . . . . . . . . . . . . . . . . . . . . . . . $ 1,249 $ 1,107 $ 1,391Time deposits . . . . . . . . . . . . . . . . . . . . . . . . . . . . . . . . . . . . . . . . . . . . . . . . . . . . . . . . . 13,156 13,576 13,114
Total cash and cash equivalents . . . . . . . . . . . . . . . . . . . . . . . . . . . . . . . . . . . . . . . . . . . $ 14,405 $ 14,683 $ 14,505
Supplemental disclosureChange in ending balances resulting from currency exchange rate fluctuations:
Loans outstanding . . . . . . . . . . . . . . . . . . . . . . . . . . . . . . . . . . . . . . . . . . . . . . . . . . . . $ (199) $ 98 $ (271)Debt securities . . . . . . . . . . . . . . . . . . . . . . . . . . . . . . . . . . . . . . . . . . . . . . . . . . . . . . (193) 64 (49)Loan and debt security-related currency swaps . . . . . . . . . . . . . . . . . . . . . . . . . . . . . 340 (93) 335Borrowings . . . . . . . . . . . . . . . . . . . . . . . . . . . . . . . . . . . . . . . . . . . . . . . . . . . . . . . . . 1,473 (81) 368Borrowing-related currency swaps . . . . . . . . . . . . . . . . . . . . . . . . . . . . . . . . . . . . . . . (1,318) 23 (190)
Charges on borrowings paid, net . . . . . . . . . . . . . . . . . . . . . . . . . . . . . . . . . . . . . . . . . . $ 896 $ 733 $ 413Non-cash items:
Loan and debt security conversion to equity, net . . . . . . . . . . . . . . . . . . . . . . . . . . . . $ 59 $ 197 $ 52
The notes to the Consolidated Financial Statements are an integral part of these statements
74
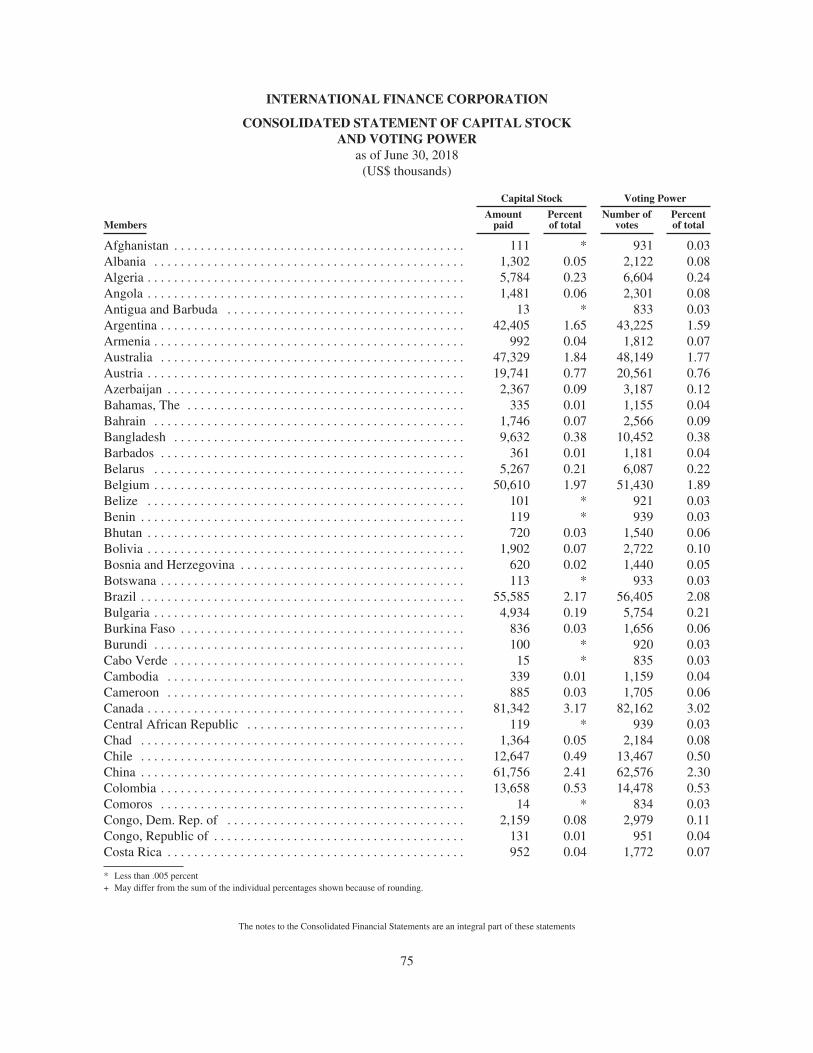
INTERNATIONAL FINANCE CORPORATION
CONSOLIDATED STATEMENT OF CAPITAL STOCKAND VOTING POWER
as of June 30, 2018(US$ thousands)
Members
Capital Stock Voting Power
Amountpaid
Percentof total
Number ofvotes
Percentof total
Afghanistan . . . . . . . . . . . . . . . . . . . . . . . . . . . . . . . . . . . . . . . . . . . . 111 * 931 0.03Albania . . . . . . . . . . . . . . . . . . . . . . . . . . . . . . . . . . . . . . . . . . . . . . . 1,302 0.05 2,122 0.08Algeria . . . . . . . . . . . . . . . . . . . . . . . . . . . . . . . . . . . . . . . . . . . . . . . . 5,784 0.23 6,604 0.24Angola . . . . . . . . . . . . . . . . . . . . . . . . . . . . . . . . . . . . . . . . . . . . . . . . 1,481 0.06 2,301 0.08Antigua and Barbuda . . . . . . . . . . . . . . . . . . . . . . . . . . . . . . . . . . . . 13 * 833 0.03Argentina . . . . . . . . . . . . . . . . . . . . . . . . . . . . . . . . . . . . . . . . . . . . . . 42,405 1.65 43,225 1.59Armenia . . . . . . . . . . . . . . . . . . . . . . . . . . . . . . . . . . . . . . . . . . . . . . . 992 0.04 1,812 0.07Australia . . . . . . . . . . . . . . . . . . . . . . . . . . . . . . . . . . . . . . . . . . . . . . 47,329 1.84 48,149 1.77Austria . . . . . . . . . . . . . . . . . . . . . . . . . . . . . . . . . . . . . . . . . . . . . . . . 19,741 0.77 20,561 0.76Azerbaijan . . . . . . . . . . . . . . . . . . . . . . . . . . . . . . . . . . . . . . . . . . . . . 2,367 0.09 3,187 0.12Bahamas, The . . . . . . . . . . . . . . . . . . . . . . . . . . . . . . . . . . . . . . . . . . 335 0.01 1,155 0.04Bahrain . . . . . . . . . . . . . . . . . . . . . . . . . . . . . . . . . . . . . . . . . . . . . . . 1,746 0.07 2,566 0.09Bangladesh . . . . . . . . . . . . . . . . . . . . . . . . . . . . . . . . . . . . . . . . . . . . 9,632 0.38 10,452 0.38Barbados . . . . . . . . . . . . . . . . . . . . . . . . . . . . . . . . . . . . . . . . . . . . . . 361 0.01 1,181 0.04Belarus . . . . . . . . . . . . . . . . . . . . . . . . . . . . . . . . . . . . . . . . . . . . . . . 5,267 0.21 6,087 0.22Belgium . . . . . . . . . . . . . . . . . . . . . . . . . . . . . . . . . . . . . . . . . . . . . . . 50,610 1.97 51,430 1.89Belize . . . . . . . . . . . . . . . . . . . . . . . . . . . . . . . . . . . . . . . . . . . . . . . . 101 * 921 0.03Benin . . . . . . . . . . . . . . . . . . . . . . . . . . . . . . . . . . . . . . . . . . . . . . . . . 119 * 939 0.03Bhutan . . . . . . . . . . . . . . . . . . . . . . . . . . . . . . . . . . . . . . . . . . . . . . . . 720 0.03 1,540 0.06Bolivia . . . . . . . . . . . . . . . . . . . . . . . . . . . . . . . . . . . . . . . . . . . . . . . . 1,902 0.07 2,722 0.10Bosnia and Herzegovina . . . . . . . . . . . . . . . . . . . . . . . . . . . . . . . . . . 620 0.02 1,440 0.05Botswana . . . . . . . . . . . . . . . . . . . . . . . . . . . . . . . . . . . . . . . . . . . . . . 113 * 933 0.03Brazil . . . . . . . . . . . . . . . . . . . . . . . . . . . . . . . . . . . . . . . . . . . . . . . . . 55,585 2.17 56,405 2.08Bulgaria . . . . . . . . . . . . . . . . . . . . . . . . . . . . . . . . . . . . . . . . . . . . . . . 4,934 0.19 5,754 0.21Burkina Faso . . . . . . . . . . . . . . . . . . . . . . . . . . . . . . . . . . . . . . . . . . . 836 0.03 1,656 0.06Burundi . . . . . . . . . . . . . . . . . . . . . . . . . . . . . . . . . . . . . . . . . . . . . . . 100 * 920 0.03Cabo Verde . . . . . . . . . . . . . . . . . . . . . . . . . . . . . . . . . . . . . . . . . . . . 15 * 835 0.03Cambodia . . . . . . . . . . . . . . . . . . . . . . . . . . . . . . . . . . . . . . . . . . . . . 339 0.01 1,159 0.04Cameroon . . . . . . . . . . . . . . . . . . . . . . . . . . . . . . . . . . . . . . . . . . . . . 885 0.03 1,705 0.06Canada . . . . . . . . . . . . . . . . . . . . . . . . . . . . . . . . . . . . . . . . . . . . . . . . 81,342 3.17 82,162 3.02Central African Republic . . . . . . . . . . . . . . . . . . . . . . . . . . . . . . . . . 119 * 939 0.03Chad . . . . . . . . . . . . . . . . . . . . . . . . . . . . . . . . . . . . . . . . . . . . . . . . . 1,364 0.05 2,184 0.08Chile . . . . . . . . . . . . . . . . . . . . . . . . . . . . . . . . . . . . . . . . . . . . . . . . . 12,647 0.49 13,467 0.50China . . . . . . . . . . . . . . . . . . . . . . . . . . . . . . . . . . . . . . . . . . . . . . . . . 61,756 2.41 62,576 2.30Colombia . . . . . . . . . . . . . . . . . . . . . . . . . . . . . . . . . . . . . . . . . . . . . . 13,658 0.53 14,478 0.53Comoros . . . . . . . . . . . . . . . . . . . . . . . . . . . . . . . . . . . . . . . . . . . . . . 14 * 834 0.03Congo, Dem. Rep. of . . . . . . . . . . . . . . . . . . . . . . . . . . . . . . . . . . . . 2,159 0.08 2,979 0.11Congo, Republic of . . . . . . . . . . . . . . . . . . . . . . . . . . . . . . . . . . . . . . 131 0.01 951 0.04Costa Rica . . . . . . . . . . . . . . . . . . . . . . . . . . . . . . . . . . . . . . . . . . . . . 952 0.04 1,772 0.07
* Less than .005 percent+ May differ from the sum of the individual percentages shown because of rounding.
The notes to the Consolidated Financial Statements are an integral part of these statements
75
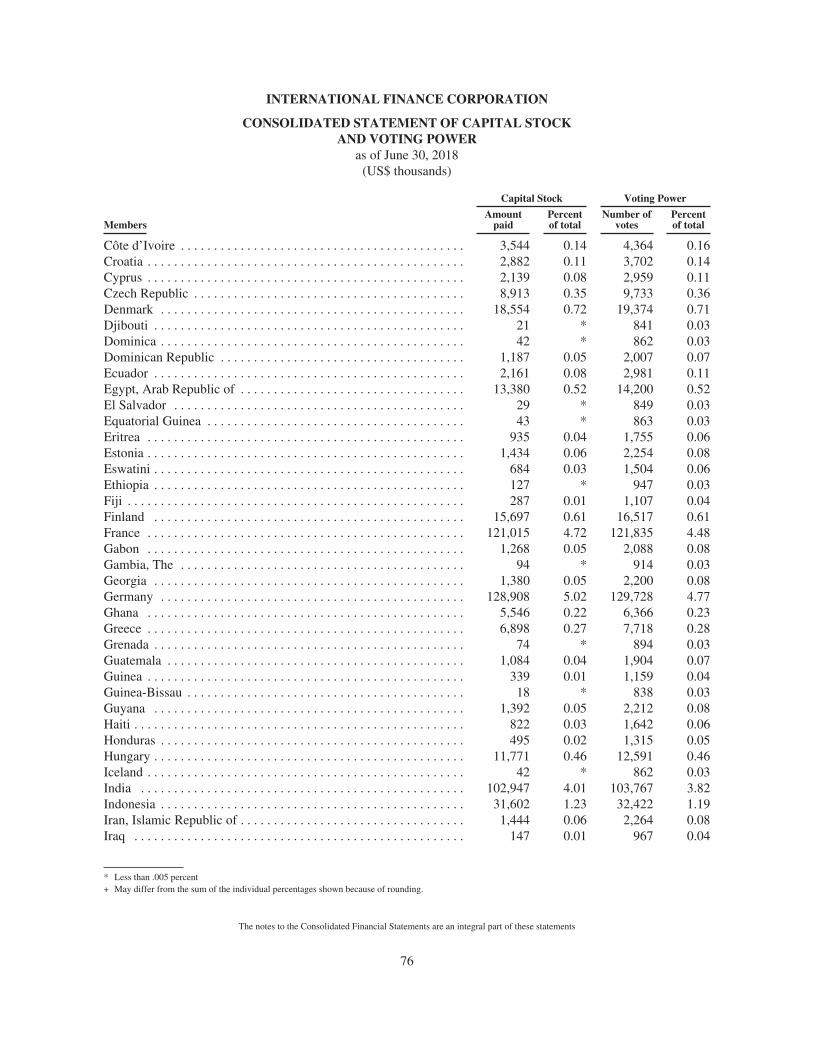
INTERNATIONAL FINANCE CORPORATION
CONSOLIDATED STATEMENT OF CAPITAL STOCKAND VOTING POWER
as of June 30, 2018(US$ thousands)
Members
Capital Stock Voting Power
Amountpaid
Percentof total
Number ofvotes
Percentof total
Côte d’Ivoire . . . . . . . . . . . . . . . . . . . . . . . . . . . . . . . . . . . . . . . . . . . 3,544 0.14 4,364 0.16Croatia . . . . . . . . . . . . . . . . . . . . . . . . . . . . . . . . . . . . . . . . . . . . . . . . 2,882 0.11 3,702 0.14Cyprus . . . . . . . . . . . . . . . . . . . . . . . . . . . . . . . . . . . . . . . . . . . . . . . . 2,139 0.08 2,959 0.11Czech Republic . . . . . . . . . . . . . . . . . . . . . . . . . . . . . . . . . . . . . . . . . 8,913 0.35 9,733 0.36Denmark . . . . . . . . . . . . . . . . . . . . . . . . . . . . . . . . . . . . . . . . . . . . . . 18,554 0.72 19,374 0.71Djibouti . . . . . . . . . . . . . . . . . . . . . . . . . . . . . . . . . . . . . . . . . . . . . . . 21 * 841 0.03Dominica . . . . . . . . . . . . . . . . . . . . . . . . . . . . . . . . . . . . . . . . . . . . . . 42 * 862 0.03Dominican Republic . . . . . . . . . . . . . . . . . . . . . . . . . . . . . . . . . . . . . 1,187 0.05 2,007 0.07Ecuador . . . . . . . . . . . . . . . . . . . . . . . . . . . . . . . . . . . . . . . . . . . . . . . 2,161 0.08 2,981 0.11Egypt, Arab Republic of . . . . . . . . . . . . . . . . . . . . . . . . . . . . . . . . . . 13,380 0.52 14,200 0.52El Salvador . . . . . . . . . . . . . . . . . . . . . . . . . . . . . . . . . . . . . . . . . . . . 29 * 849 0.03Equatorial Guinea . . . . . . . . . . . . . . . . . . . . . . . . . . . . . . . . . . . . . . . 43 * 863 0.03Eritrea . . . . . . . . . . . . . . . . . . . . . . . . . . . . . . . . . . . . . . . . . . . . . . . . 935 0.04 1,755 0.06Estonia . . . . . . . . . . . . . . . . . . . . . . . . . . . . . . . . . . . . . . . . . . . . . . . . 1,434 0.06 2,254 0.08Eswatini . . . . . . . . . . . . . . . . . . . . . . . . . . . . . . . . . . . . . . . . . . . . . . . 684 0.03 1,504 0.06Ethiopia . . . . . . . . . . . . . . . . . . . . . . . . . . . . . . . . . . . . . . . . . . . . . . . 127 * 947 0.03Fiji . . . . . . . . . . . . . . . . . . . . . . . . . . . . . . . . . . . . . . . . . . . . . . . . . . . 287 0.01 1,107 0.04Finland . . . . . . . . . . . . . . . . . . . . . . . . . . . . . . . . . . . . . . . . . . . . . . . 15,697 0.61 16,517 0.61France . . . . . . . . . . . . . . . . . . . . . . . . . . . . . . . . . . . . . . . . . . . . . . . . 121,015 4.72 121,835 4.48Gabon . . . . . . . . . . . . . . . . . . . . . . . . . . . . . . . . . . . . . . . . . . . . . . . . 1,268 0.05 2,088 0.08Gambia, The . . . . . . . . . . . . . . . . . . . . . . . . . . . . . . . . . . . . . . . . . . . 94 * 914 0.03Georgia . . . . . . . . . . . . . . . . . . . . . . . . . . . . . . . . . . . . . . . . . . . . . . . 1,380 0.05 2,200 0.08Germany . . . . . . . . . . . . . . . . . . . . . . . . . . . . . . . . . . . . . . . . . . . . . . 128,908 5.02 129,728 4.77Ghana . . . . . . . . . . . . . . . . . . . . . . . . . . . . . . . . . . . . . . . . . . . . . . . . 5,546 0.22 6,366 0.23Greece . . . . . . . . . . . . . . . . . . . . . . . . . . . . . . . . . . . . . . . . . . . . . . . . 6,898 0.27 7,718 0.28Grenada . . . . . . . . . . . . . . . . . . . . . . . . . . . . . . . . . . . . . . . . . . . . . . . 74 * 894 0.03Guatemala . . . . . . . . . . . . . . . . . . . . . . . . . . . . . . . . . . . . . . . . . . . . . 1,084 0.04 1,904 0.07Guinea . . . . . . . . . . . . . . . . . . . . . . . . . . . . . . . . . . . . . . . . . . . . . . . . 339 0.01 1,159 0.04Guinea-Bissau . . . . . . . . . . . . . . . . . . . . . . . . . . . . . . . . . . . . . . . . . . 18 * 838 0.03Guyana . . . . . . . . . . . . . . . . . . . . . . . . . . . . . . . . . . . . . . . . . . . . . . . 1,392 0.05 2,212 0.08Haiti . . . . . . . . . . . . . . . . . . . . . . . . . . . . . . . . . . . . . . . . . . . . . . . . . . 822 0.03 1,642 0.06Honduras . . . . . . . . . . . . . . . . . . . . . . . . . . . . . . . . . . . . . . . . . . . . . . 495 0.02 1,315 0.05Hungary . . . . . . . . . . . . . . . . . . . . . . . . . . . . . . . . . . . . . . . . . . . . . . . 11,771 0.46 12,591 0.46Iceland . . . . . . . . . . . . . . . . . . . . . . . . . . . . . . . . . . . . . . . . . . . . . . . . 42 * 862 0.03India . . . . . . . . . . . . . . . . . . . . . . . . . . . . . . . . . . . . . . . . . . . . . . . . . 102,947 4.01 103,767 3.82Indonesia . . . . . . . . . . . . . . . . . . . . . . . . . . . . . . . . . . . . . . . . . . . . . . 31,602 1.23 32,422 1.19Iran, Islamic Republic of . . . . . . . . . . . . . . . . . . . . . . . . . . . . . . . . . . 1,444 0.06 2,264 0.08Iraq . . . . . . . . . . . . . . . . . . . . . . . . . . . . . . . . . . . . . . . . . . . . . . . . . . 147 0.01 967 0.04
* Less than .005 percent+ May differ from the sum of the individual percentages shown because of rounding.
The notes to the Consolidated Financial Statements are an integral part of these statements
76
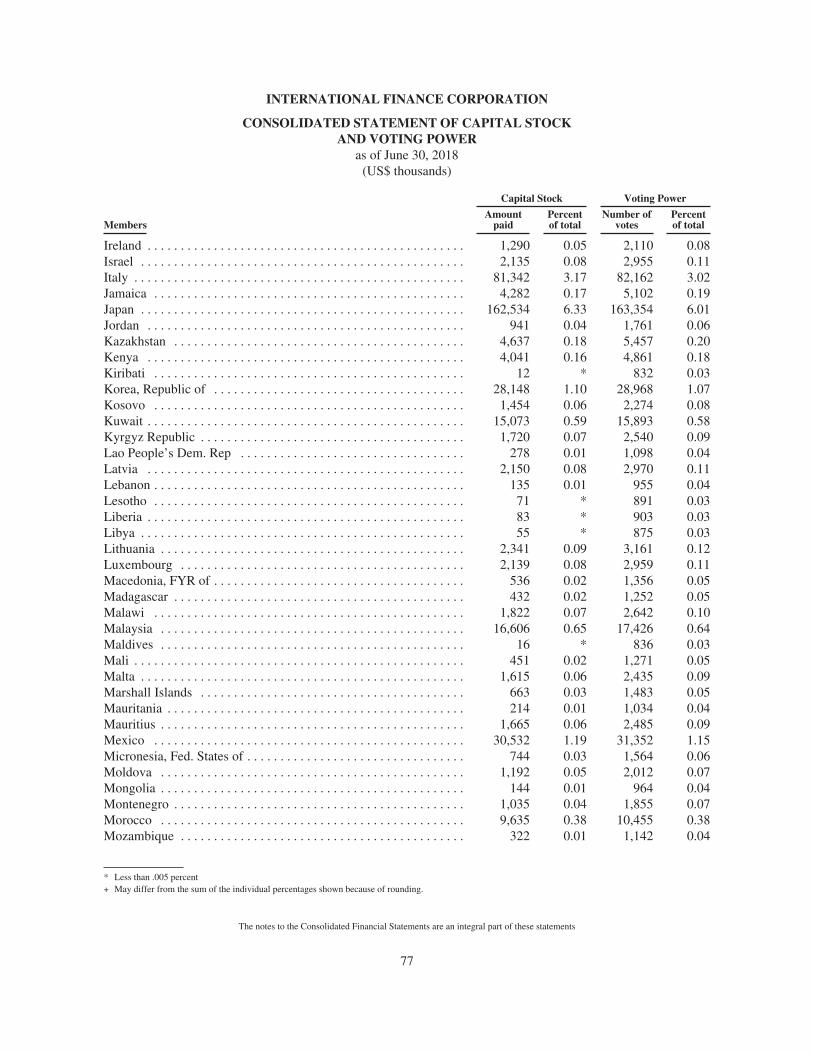
INTERNATIONAL FINANCE CORPORATION
CONSOLIDATED STATEMENT OF CAPITAL STOCKAND VOTING POWER
as of June 30, 2018(US$ thousands)
Members
Capital Stock Voting Power
Amountpaid
Percentof total
Number ofvotes
Percentof total
Ireland . . . . . . . . . . . . . . . . . . . . . . . . . . . . . . . . . . . . . . . . . . . . . . . . 1,290 0.05 2,110 0.08Israel . . . . . . . . . . . . . . . . . . . . . . . . . . . . . . . . . . . . . . . . . . . . . . . . . 2,135 0.08 2,955 0.11Italy . . . . . . . . . . . . . . . . . . . . . . . . . . . . . . . . . . . . . . . . . . . . . . . . . . 81,342 3.17 82,162 3.02Jamaica . . . . . . . . . . . . . . . . . . . . . . . . . . . . . . . . . . . . . . . . . . . . . . . 4,282 0.17 5,102 0.19Japan . . . . . . . . . . . . . . . . . . . . . . . . . . . . . . . . . . . . . . . . . . . . . . . . . 162,534 6.33 163,354 6.01Jordan . . . . . . . . . . . . . . . . . . . . . . . . . . . . . . . . . . . . . . . . . . . . . . . . 941 0.04 1,761 0.06Kazakhstan . . . . . . . . . . . . . . . . . . . . . . . . . . . . . . . . . . . . . . . . . . . . 4,637 0.18 5,457 0.20Kenya . . . . . . . . . . . . . . . . . . . . . . . . . . . . . . . . . . . . . . . . . . . . . . . . 4,041 0.16 4,861 0.18Kiribati . . . . . . . . . . . . . . . . . . . . . . . . . . . . . . . . . . . . . . . . . . . . . . . 12 * 832 0.03Korea, Republic of . . . . . . . . . . . . . . . . . . . . . . . . . . . . . . . . . . . . . . 28,148 1.10 28,968 1.07Kosovo . . . . . . . . . . . . . . . . . . . . . . . . . . . . . . . . . . . . . . . . . . . . . . . 1,454 0.06 2,274 0.08Kuwait . . . . . . . . . . . . . . . . . . . . . . . . . . . . . . . . . . . . . . . . . . . . . . . . 15,073 0.59 15,893 0.58Kyrgyz Republic . . . . . . . . . . . . . . . . . . . . . . . . . . . . . . . . . . . . . . . . 1,720 0.07 2,540 0.09Lao People’s Dem. Rep . . . . . . . . . . . . . . . . . . . . . . . . . . . . . . . . . . 278 0.01 1,098 0.04Latvia . . . . . . . . . . . . . . . . . . . . . . . . . . . . . . . . . . . . . . . . . . . . . . . . 2,150 0.08 2,970 0.11Lebanon . . . . . . . . . . . . . . . . . . . . . . . . . . . . . . . . . . . . . . . . . . . . . . . 135 0.01 955 0.04Lesotho . . . . . . . . . . . . . . . . . . . . . . . . . . . . . . . . . . . . . . . . . . . . . . . 71 * 891 0.03Liberia . . . . . . . . . . . . . . . . . . . . . . . . . . . . . . . . . . . . . . . . . . . . . . . . 83 * 903 0.03Libya . . . . . . . . . . . . . . . . . . . . . . . . . . . . . . . . . . . . . . . . . . . . . . . . . 55 * 875 0.03Lithuania . . . . . . . . . . . . . . . . . . . . . . . . . . . . . . . . . . . . . . . . . . . . . . 2,341 0.09 3,161 0.12Luxembourg . . . . . . . . . . . . . . . . . . . . . . . . . . . . . . . . . . . . . . . . . . . 2,139 0.08 2,959 0.11Macedonia, FYR of . . . . . . . . . . . . . . . . . . . . . . . . . . . . . . . . . . . . . . 536 0.02 1,356 0.05Madagascar . . . . . . . . . . . . . . . . . . . . . . . . . . . . . . . . . . . . . . . . . . . . 432 0.02 1,252 0.05Malawi . . . . . . . . . . . . . . . . . . . . . . . . . . . . . . . . . . . . . . . . . . . . . . . 1,822 0.07 2,642 0.10Malaysia . . . . . . . . . . . . . . . . . . . . . . . . . . . . . . . . . . . . . . . . . . . . . . 16,606 0.65 17,426 0.64Maldives . . . . . . . . . . . . . . . . . . . . . . . . . . . . . . . . . . . . . . . . . . . . . . 16 * 836 0.03Mali . . . . . . . . . . . . . . . . . . . . . . . . . . . . . . . . . . . . . . . . . . . . . . . . . . 451 0.02 1,271 0.05Malta . . . . . . . . . . . . . . . . . . . . . . . . . . . . . . . . . . . . . . . . . . . . . . . . . 1,615 0.06 2,435 0.09Marshall Islands . . . . . . . . . . . . . . . . . . . . . . . . . . . . . . . . . . . . . . . . 663 0.03 1,483 0.05Mauritania . . . . . . . . . . . . . . . . . . . . . . . . . . . . . . . . . . . . . . . . . . . . . 214 0.01 1,034 0.04Mauritius . . . . . . . . . . . . . . . . . . . . . . . . . . . . . . . . . . . . . . . . . . . . . . 1,665 0.06 2,485 0.09Mexico . . . . . . . . . . . . . . . . . . . . . . . . . . . . . . . . . . . . . . . . . . . . . . . 30,532 1.19 31,352 1.15Micronesia, Fed. States of . . . . . . . . . . . . . . . . . . . . . . . . . . . . . . . . . 744 0.03 1,564 0.06Moldova . . . . . . . . . . . . . . . . . . . . . . . . . . . . . . . . . . . . . . . . . . . . . . 1,192 0.05 2,012 0.07Mongolia . . . . . . . . . . . . . . . . . . . . . . . . . . . . . . . . . . . . . . . . . . . . . . 144 0.01 964 0.04Montenegro . . . . . . . . . . . . . . . . . . . . . . . . . . . . . . . . . . . . . . . . . . . . 1,035 0.04 1,855 0.07Morocco . . . . . . . . . . . . . . . . . . . . . . . . . . . . . . . . . . . . . . . . . . . . . . 9,635 0.38 10,455 0.38Mozambique . . . . . . . . . . . . . . . . . . . . . . . . . . . . . . . . . . . . . . . . . . . 322 0.01 1,142 0.04
* Less than .005 percent+ May differ from the sum of the individual percentages shown because of rounding.
The notes to the Consolidated Financial Statements are an integral part of these statements
77
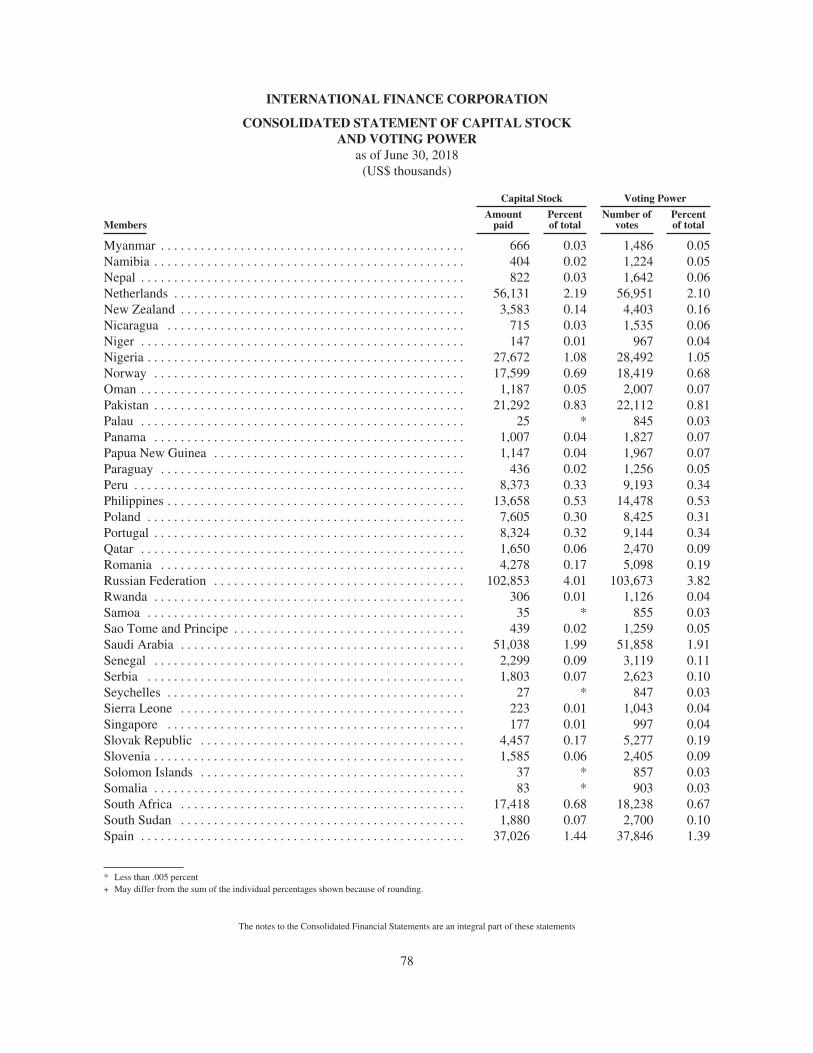
INTERNATIONAL FINANCE CORPORATION
CONSOLIDATED STATEMENT OF CAPITAL STOCKAND VOTING POWER
as of June 30, 2018(US$ thousands)
Members
Capital Stock Voting Power
Amountpaid
Percentof total
Number ofvotes
Percentof total
Myanmar . . . . . . . . . . . . . . . . . . . . . . . . . . . . . . . . . . . . . . . . . . . . . . 666 0.03 1,486 0.05Namibia . . . . . . . . . . . . . . . . . . . . . . . . . . . . . . . . . . . . . . . . . . . . . . . 404 0.02 1,224 0.05Nepal . . . . . . . . . . . . . . . . . . . . . . . . . . . . . . . . . . . . . . . . . . . . . . . . . 822 0.03 1,642 0.06Netherlands . . . . . . . . . . . . . . . . . . . . . . . . . . . . . . . . . . . . . . . . . . . . 56,131 2.19 56,951 2.10New Zealand . . . . . . . . . . . . . . . . . . . . . . . . . . . . . . . . . . . . . . . . . . . 3,583 0.14 4,403 0.16Nicaragua . . . . . . . . . . . . . . . . . . . . . . . . . . . . . . . . . . . . . . . . . . . . . 715 0.03 1,535 0.06Niger . . . . . . . . . . . . . . . . . . . . . . . . . . . . . . . . . . . . . . . . . . . . . . . . . 147 0.01 967 0.04Nigeria . . . . . . . . . . . . . . . . . . . . . . . . . . . . . . . . . . . . . . . . . . . . . . . . 27,672 1.08 28,492 1.05Norway . . . . . . . . . . . . . . . . . . . . . . . . . . . . . . . . . . . . . . . . . . . . . . . 17,599 0.69 18,419 0.68Oman . . . . . . . . . . . . . . . . . . . . . . . . . . . . . . . . . . . . . . . . . . . . . . . . . 1,187 0.05 2,007 0.07Pakistan . . . . . . . . . . . . . . . . . . . . . . . . . . . . . . . . . . . . . . . . . . . . . . . 21,292 0.83 22,112 0.81Palau . . . . . . . . . . . . . . . . . . . . . . . . . . . . . . . . . . . . . . . . . . . . . . . . . 25 * 845 0.03Panama . . . . . . . . . . . . . . . . . . . . . . . . . . . . . . . . . . . . . . . . . . . . . . . 1,007 0.04 1,827 0.07Papua New Guinea . . . . . . . . . . . . . . . . . . . . . . . . . . . . . . . . . . . . . . 1,147 0.04 1,967 0.07Paraguay . . . . . . . . . . . . . . . . . . . . . . . . . . . . . . . . . . . . . . . . . . . . . . 436 0.02 1,256 0.05Peru . . . . . . . . . . . . . . . . . . . . . . . . . . . . . . . . . . . . . . . . . . . . . . . . . . 8,373 0.33 9,193 0.34Philippines . . . . . . . . . . . . . . . . . . . . . . . . . . . . . . . . . . . . . . . . . . . . . 13,658 0.53 14,478 0.53Poland . . . . . . . . . . . . . . . . . . . . . . . . . . . . . . . . . . . . . . . . . . . . . . . . 7,605 0.30 8,425 0.31Portugal . . . . . . . . . . . . . . . . . . . . . . . . . . . . . . . . . . . . . . . . . . . . . . . 8,324 0.32 9,144 0.34Qatar . . . . . . . . . . . . . . . . . . . . . . . . . . . . . . . . . . . . . . . . . . . . . . . . . 1,650 0.06 2,470 0.09Romania . . . . . . . . . . . . . . . . . . . . . . . . . . . . . . . . . . . . . . . . . . . . . . 4,278 0.17 5,098 0.19Russian Federation . . . . . . . . . . . . . . . . . . . . . . . . . . . . . . . . . . . . . . 102,853 4.01 103,673 3.82Rwanda . . . . . . . . . . . . . . . . . . . . . . . . . . . . . . . . . . . . . . . . . . . . . . . 306 0.01 1,126 0.04Samoa . . . . . . . . . . . . . . . . . . . . . . . . . . . . . . . . . . . . . . . . . . . . . . . . 35 * 855 0.03Sao Tome and Principe . . . . . . . . . . . . . . . . . . . . . . . . . . . . . . . . . . . 439 0.02 1,259 0.05Saudi Arabia . . . . . . . . . . . . . . . . . . . . . . . . . . . . . . . . . . . . . . . . . . . 51,038 1.99 51,858 1.91Senegal . . . . . . . . . . . . . . . . . . . . . . . . . . . . . . . . . . . . . . . . . . . . . . . 2,299 0.09 3,119 0.11Serbia . . . . . . . . . . . . . . . . . . . . . . . . . . . . . . . . . . . . . . . . . . . . . . . . 1,803 0.07 2,623 0.10Seychelles . . . . . . . . . . . . . . . . . . . . . . . . . . . . . . . . . . . . . . . . . . . . . 27 * 847 0.03Sierra Leone . . . . . . . . . . . . . . . . . . . . . . . . . . . . . . . . . . . . . . . . . . . 223 0.01 1,043 0.04Singapore . . . . . . . . . . . . . . . . . . . . . . . . . . . . . . . . . . . . . . . . . . . . . 177 0.01 997 0.04Slovak Republic . . . . . . . . . . . . . . . . . . . . . . . . . . . . . . . . . . . . . . . . 4,457 0.17 5,277 0.19Slovenia . . . . . . . . . . . . . . . . . . . . . . . . . . . . . . . . . . . . . . . . . . . . . . . 1,585 0.06 2,405 0.09Solomon Islands . . . . . . . . . . . . . . . . . . . . . . . . . . . . . . . . . . . . . . . . 37 * 857 0.03Somalia . . . . . . . . . . . . . . . . . . . . . . . . . . . . . . . . . . . . . . . . . . . . . . . 83 * 903 0.03South Africa . . . . . . . . . . . . . . . . . . . . . . . . . . . . . . . . . . . . . . . . . . . 17,418 0.68 18,238 0.67South Sudan . . . . . . . . . . . . . . . . . . . . . . . . . . . . . . . . . . . . . . . . . . . 1,880 0.07 2,700 0.10Spain . . . . . . . . . . . . . . . . . . . . . . . . . . . . . . . . . . . . . . . . . . . . . . . . . 37,026 1.44 37,846 1.39
* Less than .005 percent+ May differ from the sum of the individual percentages shown because of rounding.
The notes to the Consolidated Financial Statements are an integral part of these statements
78
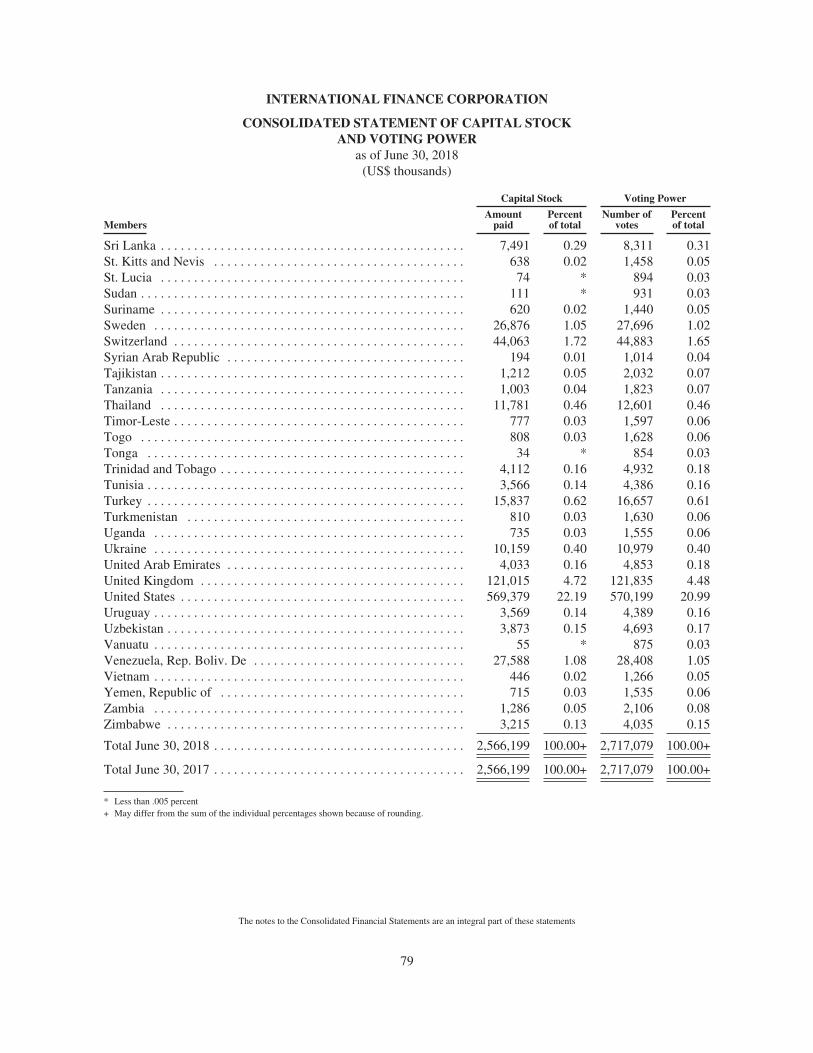
INTERNATIONAL FINANCE CORPORATION
CONSOLIDATED STATEMENT OF CAPITAL STOCKAND VOTING POWER
as of June 30, 2018(US$ thousands)
Members
Capital Stock Voting Power
Amountpaid
Percentof total
Number ofvotes
Percentof total
Sri Lanka . . . . . . . . . . . . . . . . . . . . . . . . . . . . . . . . . . . . . . . . . . . . . . 7,491 0.29 8,311 0.31St. Kitts and Nevis . . . . . . . . . . . . . . . . . . . . . . . . . . . . . . . . . . . . . . 638 0.02 1,458 0.05St. Lucia . . . . . . . . . . . . . . . . . . . . . . . . . . . . . . . . . . . . . . . . . . . . . . 74 * 894 0.03Sudan . . . . . . . . . . . . . . . . . . . . . . . . . . . . . . . . . . . . . . . . . . . . . . . . . 111 * 931 0.03Suriname . . . . . . . . . . . . . . . . . . . . . . . . . . . . . . . . . . . . . . . . . . . . . . 620 0.02 1,440 0.05Sweden . . . . . . . . . . . . . . . . . . . . . . . . . . . . . . . . . . . . . . . . . . . . . . . 26,876 1.05 27,696 1.02Switzerland . . . . . . . . . . . . . . . . . . . . . . . . . . . . . . . . . . . . . . . . . . . . 44,063 1.72 44,883 1.65Syrian Arab Republic . . . . . . . . . . . . . . . . . . . . . . . . . . . . . . . . . . . . 194 0.01 1,014 0.04Tajikistan . . . . . . . . . . . . . . . . . . . . . . . . . . . . . . . . . . . . . . . . . . . . . . 1,212 0.05 2,032 0.07Tanzania . . . . . . . . . . . . . . . . . . . . . . . . . . . . . . . . . . . . . . . . . . . . . . 1,003 0.04 1,823 0.07Thailand . . . . . . . . . . . . . . . . . . . . . . . . . . . . . . . . . . . . . . . . . . . . . . 11,781 0.46 12,601 0.46Timor-Leste . . . . . . . . . . . . . . . . . . . . . . . . . . . . . . . . . . . . . . . . . . . . 777 0.03 1,597 0.06Togo . . . . . . . . . . . . . . . . . . . . . . . . . . . . . . . . . . . . . . . . . . . . . . . . . 808 0.03 1,628 0.06Tonga . . . . . . . . . . . . . . . . . . . . . . . . . . . . . . . . . . . . . . . . . . . . . . . . 34 * 854 0.03Trinidad and Tobago . . . . . . . . . . . . . . . . . . . . . . . . . . . . . . . . . . . . . 4,112 0.16 4,932 0.18Tunisia . . . . . . . . . . . . . . . . . . . . . . . . . . . . . . . . . . . . . . . . . . . . . . . . 3,566 0.14 4,386 0.16Turkey . . . . . . . . . . . . . . . . . . . . . . . . . . . . . . . . . . . . . . . . . . . . . . . . 15,837 0.62 16,657 0.61Turkmenistan . . . . . . . . . . . . . . . . . . . . . . . . . . . . . . . . . . . . . . . . . . 810 0.03 1,630 0.06Uganda . . . . . . . . . . . . . . . . . . . . . . . . . . . . . . . . . . . . . . . . . . . . . . . 735 0.03 1,555 0.06Ukraine . . . . . . . . . . . . . . . . . . . . . . . . . . . . . . . . . . . . . . . . . . . . . . . 10,159 0.40 10,979 0.40United Arab Emirates . . . . . . . . . . . . . . . . . . . . . . . . . . . . . . . . . . . . 4,033 0.16 4,853 0.18United Kingdom . . . . . . . . . . . . . . . . . . . . . . . . . . . . . . . . . . . . . . . . 121,015 4.72 121,835 4.48United States . . . . . . . . . . . . . . . . . . . . . . . . . . . . . . . . . . . . . . . . . . . 569,379 22.19 570,199 20.99Uruguay . . . . . . . . . . . . . . . . . . . . . . . . . . . . . . . . . . . . . . . . . . . . . . . 3,569 0.14 4,389 0.16Uzbekistan . . . . . . . . . . . . . . . . . . . . . . . . . . . . . . . . . . . . . . . . . . . . . 3,873 0.15 4,693 0.17Vanuatu . . . . . . . . . . . . . . . . . . . . . . . . . . . . . . . . . . . . . . . . . . . . . . . 55 * 875 0.03Venezuela, Rep. Boliv. De . . . . . . . . . . . . . . . . . . . . . . . . . . . . . . . . 27,588 1.08 28,408 1.05Vietnam . . . . . . . . . . . . . . . . . . . . . . . . . . . . . . . . . . . . . . . . . . . . . . . 446 0.02 1,266 0.05Yemen, Republic of . . . . . . . . . . . . . . . . . . . . . . . . . . . . . . . . . . . . . 715 0.03 1,535 0.06Zambia . . . . . . . . . . . . . . . . . . . . . . . . . . . . . . . . . . . . . . . . . . . . . . . 1,286 0.05 2,106 0.08Zimbabwe . . . . . . . . . . . . . . . . . . . . . . . . . . . . . . . . . . . . . . . . . . . . . 3,215 0.13 4,035 0.15
Total June 30, 2018 . . . . . . . . . . . . . . . . . . . . . . . . . . . . . . . . . . . . . . 2,566,199 100.00+ 2,717,079 100.00+
Total June 30, 2017 . . . . . . . . . . . . . . . . . . . . . . . . . . . . . . . . . . . . . . 2,566,199 100.00+ 2,717,079 100.00+
* Less than .005 percent+ May differ from the sum of the individual percentages shown because of rounding.
The notes to the Consolidated Financial Statements are an integral part of these statements
79
INTERNATIONAL FINANCE CORPORATION
NOTES TO CONSOLIDATED FINANCIAL STATEMENTS
PURPOSE
The International Finance Corporation (IFC), an international organization, was established in 1956 tofurther economic development in its member countries by encouraging the growth of private enterprise. IFC is amember of the World Bank Group (WBG), which also comprises the International Bank for Reconstruction andDevelopment (IBRD), the International Development Association (IDA), the Multilateral Investment GuaranteeAgency (MIGA), and the International Centre for Settlement of Investment Disputes (ICSID). Each member islegally and financially independent. Transactions with other World Bank Group members are disclosed in thenotes that follow. IFC’s activities are closely coordinated with and complement the overall developmentobjectives of the other World Bank Group institutions. IFC, together with private investors, assists in financingthe establishment, improvement and expansion of private sector enterprises by making loans, equity investmentsand investments in debt securities where sufficient private capital is not otherwise available on reasonable terms.IFC’s share capital is provided by its member countries. It raises most of the funds for its investment activitiesthrough the issuance of notes, bonds and other debt securities in the international capital markets. IFC also playsa catalytic role in mobilizing additional funding from other investors and lenders through parallel loans, loanparticipations, partial credit guarantees, securitizations, loan sales, risk sharing facilities, and fund investmentsthrough the IFC Asset Management Company, LLC and other IFC crisis initiatives. In addition to project financeand mobilization, IFC offers an array of financial and technical advisory services to private businesses in thedeveloping world to increase their chances of success. It also advises governments on how to create anenvironment hospitable to the growth of private enterprise and foreign investment.
NOTE A — SUMMARY OF SIGNIFICANT ACCOUNTING AND RELATED POLICIES
The Consolidated Financial Statements include the financial statements of IFC and consolidated subsidiariesas detailed in Note B. The accounting and reporting policies of IFC conform with accounting principles generallyaccepted in the United States of America (US GAAP). In the opinion of management, the Consolidated FinancialStatements reflect all adjustments necessary for the fair presentation of IFC’s financial position and results ofoperation.
Consolidated Financial Statements presentation — Certain amounts in prior years have been changed toconform to the current year’s presentation.
Advisory services — Funding received for IFC advisory services from governments and other donors arerecognized as contribution revenue when the conditions on which they depend are substantially met. Advisoryservices expenses are recognized in the period incurred. Advisory client fees and administration fees arerecognized as income when earned. See Notes S and U.
Functional currency — IFC’s functional currency is the United States dollar (US dollars or $).
Use of estimates — The preparation of the Consolidated Financial Statements requires management tomake estimates and assumptions that affect the reported amounts of assets and liabilities and disclosure ofcontingent assets and liabilities at the date of the Consolidated Financial Statements and the reported amounts ofincome and expense during the reporting periods. Actual results could differ from these estimates. A significantdegree of judgment has been used in the determination of: the reserve against losses on loans and impairment ofdebt securities and equity investments; estimated fair values of financial instruments accounted for at fair value(including equity investments, debt securities, loans, trading securities and derivative instruments); projectedbenefit obligations, fair value of pension and other postretirement benefit plan assets, and net periodic pensionincome or expense. There are inherent risks and uncertainties related to IFC’s operations. The possibility existsthat changing economic conditions could have an adverse effect on the financial position of IFC.
80
INTERNATIONAL FINANCE CORPORATION
NOTES TO CONSOLIDATED FINANCIAL STATEMENTS
NOTE A — SUMMARY OF SIGNIFICANT ACCOUNTING AND RELATED POLICIES (continued)
IFC uses internal models to determine the fair values of derivative and other financial instruments and theaggregate level of the reserve against losses on loans and impairment of equity investments. IFC undertakescontinuous review and analysis of these models with the objective of refining its estimates, consistent withevolving best practices appropriate to its operations. Changes in estimates resulting from refinements in theassumptions and methodologies incorporated in the models are reflected in net income in the period in which theenhanced models are first applied.
Consolidation, non-controlling interests and variable interest entities — IFC consolidates:
i) all majority-owned subsidiaries;
ii) limited partnerships in which it is the general partner, unless the presumption of control isovercome by certain management participation or other rights held by minority shareholders/limited partners; and
iii) variable interest entities (VIEs) for which IFC is deemed to be the VIE’s primary beneficiary(together, consolidated subsidiaries).
Significant intercompany accounts and transactions are eliminated in consolidation.
Equity interests in consolidated subsidiaries held by third parties are referred to as non-controlling interests.Such interests and the amount of consolidated net income/loss attributable to those interests are identified withinIFC’s consolidated balance sheet and consolidated income statement as “non-controlling interests” and “netgains/losses attributable to non-controlling interests”, respectively.
An entity is a VIE if:
i) its equity is not sufficient to permit the entity to finance its activities without additionalsubordinated financial support from other parties;
ii) its equity investors do not have decision-making rights about the entity’s operations; or
iii) its equity investors do not absorb the expected losses or receive the expected returns of the entityproportionally to their voting rights.
A variable interest is a contractual, ownership or other interest whose value changes as the fair value of theVIE’s net assets change. IFC’s variable interests in VIEs arise from financial instruments, service contracts,guarantees, leases or other monetary interests in those entities.
IFC is considered to be the primary beneficiary of a VIE if it has the power to direct the VIE’s activities thatmost significantly impact its economic performance and the obligation to absorb losses of or the right to receivebenefits from the VIE that could potentially be significant to the VIE.
Fair Value Option and Fair Value Measurements — IFC has adopted FASB Accounting StandardsCodification (ASC) Topic 820, Fair Value Measurements and Disclosures (ASC 820) and the Fair Value Optionsubsections of ASC Topic 825, Financial Instruments (ASC 825 or the Fair Value Option). ASC 820 defines fairvalue, establishes a framework for measuring fair value and a fair value hierarchy that prioritizes the inputs tovaluation techniques used to measure fair value into three broad levels and applies to all items measured at fairvalue, including items for which impairment measures are based on fair value. ASC 825 permits themeasurement of eligible financial assets, financial liabilities and firm commitments at fair value on aninstrument-by-instrument basis, that are not otherwise permitted to be accounted for at fair value under otheraccounting standards. The election to use the Fair Value Option is available when an entity first recognizes afinancial asset or liability or upon entering into a firm commitment.
81
INTERNATIONAL FINANCE CORPORATION
NOTES TO CONSOLIDATED FINANCIAL STATEMENTS
NOTE A — SUMMARY OF SIGNIFICANT ACCOUNTING AND RELATED POLICIES (continued)
The Fair Value Option
IFC has elected the Fair Value Option (FVO) for the following financial assets and financial liabilities:
i) investees in which IFC has significant influence:
a) direct investments in securities issued by the investee and, if IFC would have otherwise beenrequired to apply equity method accounting, all other financial interests in the investee (e.g.,loans);
b) investments in Limited Liability Partnerships (LLPs), Limited Liability Companies (LLCs) andother investment fund structures that maintain specific ownership accounts and loans orguarantees to such;
ii) direct equity investments representing 20 percent or more ownership but in which IFC does not havesignificant influence;
iii) all equity interests in private equity funds;
iv) certain hybrid instruments in the investment portfolio;
v) all market borrowings and investments in certain debt securities that are economically hedged withfinancial instruments that are accounted for at fair value with changes therein reported in earnings; and
vi) borrowings from IDA.
All borrowings and investments in debt securities for which the Fair Value Option has been elected areeconomically hedged with derivative or other financial instruments that are accounted for at fair value withchanges in fair value reported in earnings as such changes occur. Measuring at fair value those borrowings andinvestments for which the Fair Value Option has been elected mitigates the earnings volatility that wouldotherwise occur, due to measuring the borrowings and investments and related economic hedges differently,without having to apply ASC Topic 815’s, Derivatives and Hedging (ASC 815) complex hedge accountingrequirements.
Measuring at fair value those equity investments that would otherwise require equity method accountingsimplifies the accounting and renders a carrying amount on the consolidated balance sheet based on a measure(fair value) that IFC considers preferable to equity method accounting. For the investments that otherwise wouldrequire equity method accounting for which the Fair Value Option is elected, ASC 825 requires the Fair ValueOption to also be applied to all eligible financial interests in the same entity. IFC has disbursed loans to certain ofsuch investees; therefore, the Fair Value Option is also applied to those loans. IFC elected the Fair Value Optionfor equity investments with 20% or more ownership where it does not have significant influence so that the samemeasurement method (fair value) will be applied to all equity investments with more than 20% ownership.
The FVO has been elected for certain hybrid instruments in the investment portfolio that would otherwiserequire bifurcation of the host and embedded derivative. Election of the FVO for these instruments eliminates thebifurcation requirement.
Equity securities held by consolidated subsidiaries that are investment companies
Pursuant to ASC Topic 946, Financial Services — Investment Companies (ASC 946) and ASC Topic 810,Consolidation, equity securities held by consolidated subsidiaries that are investment companies are accountedfor at fair value, with unrealized gains and losses reported in earnings.
82
INTERNATIONAL FINANCE CORPORATION
NOTES TO CONSOLIDATED FINANCIAL STATEMENTS
NOTE A — SUMMARY OF SIGNIFICANT ACCOUNTING AND RELATED POLICIES (continued)
Fair Value Measurements
ASC 820 defines fair value as the price that would be received to sell an asset or transfer a liability (i.e., anexit price) in an orderly transaction between independent, knowledgeable and willing market participants at themeasurement date assuming the transaction occurs in the entity’s principal (or most advantageous) market. Fairvalue must be based on assumptions market participants would use (inputs) in determining the price andmeasured assuming that market participants act in their economic best interest, therefore, their fair values aredetermined based on a transaction to sell or transfer the asset or liability on a standalone basis. Under ASC 820,fair value measurements are not adjusted for transaction costs.
Pursuant to ASC Topic 320, Investments — Debt and Equity Securities (ASC 320), IFC reports equityinvestments that are listed in markets that provide readily determinable fair values at fair value, with unrealizedgains and losses being reported in other comprehensive income.
ASC 820 established a fair value hierarchy which gives the highest priority to unadjusted quoted prices inactive markets for identical unrestricted assets and liabilities (Level 1), the next highest priority to observablemarket based inputs or unobservable inputs that are corroborated by market data from independent sources(Level 2) and the lowest priority to unobservable inputs that are not corroborated by market data (Level 3). Fairvalue measurements are required to maximize the use of available observable inputs.
Level 1: Unadjusted quoted prices in active markets for identical assets or liabilities accessible to thereporting entity at the measurement date. It includes IFC’s debt securities and equity investments, which arelisted in markets that provide readily determinable fair values, government issues and money market funds in theliquid assets portfolio, and market borrowings that are listed on exchanges.
Level 2: Other than quoted prices included in Level 1 inputs that are observable for the asset or liability,either directly or indirectly for substantially the full term of the asset or liability. It includes financial instrumentsthat are valued using models and other valuation methodologies. These models consider various assumptions andinputs, including time value, yield curves, volatility factors, prepayment speeds, default rates, loss severity andcurrent market and contractual pricing for the underlying asset, as well as other relevant economic measures.Substantially all of these inputs are observable in the market place, can be derived from observable data or aresupported by observable levels at which market transactions are executed. Financial instruments categorized asLevel 2 include non-exchange-traded derivatives such as interest rate swaps, cross-currency swaps, certain asset-backed securities, as well as the majority of trading securities in the liquid asset portfolio, and the portion ofIFC’s borrowings accounted for at fair value not included in Level 1.
Level 3: Unobservable inputs for the asset or liability used to measure fair value to the extent thatobservable inputs are not available, thereby allowing for situations in which there is little, if any, market activityfor the asset or liability at the measurement date. It consists of financial instruments whose fair value is estimatedbased on internally developed models or methodologies utilizing significant inputs that are non-observable. Italso includes financial instruments whose fair value is estimated based on price information from independentsources that cannot be corroborated by observable market data. Level 3 includes equity and debt securities in theinvestment portfolios that are not listed in markets that provide readily determinable fair values, all loans forwhich IFC has elected the Fair Value Option, and certain hard-to-price securities in the liquid assets portfolio.
IFC estimates the fair value of its investments in private equity funds that do not have readily determinablefair value based on the funds’ net asset values (NAVs) per share as a practical expedient to the extent that a fundreports its investment assets at fair value and has all the attributes of an investment company, pursuant to ASC946. If the NAV is not as of IFC’s measurement date, IFC adjusts the most recent NAV, as necessary, to estimatea NAV for the investment that is calculated in a manner consistent with the fair value measurement principlesestablished by ASC 820.
83
INTERNATIONAL FINANCE CORPORATION
NOTES TO CONSOLIDATED FINANCIAL STATEMENTS
NOTE A — SUMMARY OF SIGNIFICANT ACCOUNTING AND RELATED POLICIES (continued)
Remeasurement of foreign currency transactions — Assets and liabilities not denominated in US dollars,other than disbursed equity investments, are expressed in US dollars at the exchange rates prevailing at June 30,2018 and June 30, 2017. Disbursed equity investments, other than those accounted for at fair value, are expressedin US dollars at the prevailing exchange rates at the time of disbursement. Income and expenses are recordedbased on the rates of exchange prevailing at the time of the transaction. Transaction gains and losses are creditedor charged to income.
Loans — IFC originates loans to facilitate project finance, restructuring, refinancing, corporate finance,and/or other developmental objectives. Loans are recorded as assets when disbursed. Loans are generally carriedat the principal amounts outstanding adjusted for net unamortized loan origination costs and fees. It is IFC’spractice to obtain collateral security such as, but not limited to, mortgages and third-party guarantees.
Certain loans are carried at fair value in accordance with the Fair Value Option as discussed above.Unrealized gains and losses on loans accounted for at fair value under the Fair Value Option are reported in Netunrealized gains and losses on non-trading financial instruments accounted for at fair value on the consolidatedincome statement.
Certain loans originated by IFC contain income participation, prepayment and conversion features. Thesefeatures are bifurcated and separately accounted for in accordance with ASC 815 if IFC has not elected the FairValue Option for the loan host contracts and the features meet the definition of a derivative and are notconsidered to be clearly and closely related to their host loan contracts. Otherwise, these features are accountedfor as part of their host loan contracts in accordance with IFC’s accounting policies for loans as indicated herein.
Loans held for sale are carried at the lower of cost or fair value. The excess, if any, of amortized cost overfair value is accounted for as a valuation allowance. Changes in the valuation allowance are recognized in netincome as they occur.
Revenue recognition on loans — Interest income and commitment fees on loans are recorded as income onan accrual basis. Loan origination fees and direct loan origination costs are deferred and amortized over theestimated life of the originated loan; such amortization is determined using the interest method unless the loan isa revolving credit facility in which case amortization is determined using the straight-line method. Prepaymentfees are recorded as income when received.
IFC does not recognize income on loans where collectability is in doubt or payments of interest or principalare past due more than 60 days unless management anticipates that collection of interest will occur in the nearfuture. Any interest accrued on a loan placed in nonaccrual status is reversed out of income and is thereafterrecognized as income only when the actual payment is received. Interest not previously recognized butcapitalized as part of a debt restructuring is recorded as deferred income, included in the consolidated balancesheet in payables and other liabilities, and credited to income only when the related principal is received. Suchcapitalized interest is considered in the computation of the reserve against losses on loans in the consolidatedbalance sheet.
Reserve against losses on loans — IFC recognizes impairment on loans not carried at fair value in theconsolidated balance sheet through the reserve against losses on loans, recording a provision or release ofprovision for losses on loans in net income, which increases or decreases the reserve against losses on loans.Individually impaired loans are measured based on the present value of expected future cash flows to bereceived, observable market prices, or for loans that are dependent on collateral for repayment, the estimated fairvalue of the collateral.
84
INTERNATIONAL FINANCE CORPORATION
NOTES TO CONSOLIDATED FINANCIAL STATEMENTS
NOTE A — SUMMARY OF SIGNIFICANT ACCOUNTING AND RELATED POLICIES (continued)
The reserve against losses on loans reflects management’s estimates of both identified probable losses onindividual loans (specific reserves) and probable losses inherent in the portfolio but not specifically identifiable(portfolio reserves). The determination of identified probable losses represents management’s judgment of thecreditworthiness of the borrower. Reserves against losses are established through a review of individual loansundertaken on a quarterly basis. IFC considers a loan as impaired when, based on current information and events,it is probable that IFC will be unable to collect all amounts due according to the loan’s contractual terms.Information and events, with respect to the borrower and/or the economic and political environment in which itoperates, considered in determining that a loan is impaired include, but are not limited to, the borrower’sfinancial difficulties, breach of contract, bankruptcy/reorganization, credit rating downgrade as well asgeopolitical conflict, financial/economic crisis, commodity price decline, adverse local government action andnatural disaster. Unidentified probable losses are the losses incurred at the reporting date that have not yet beenspecifically identified. The risks inherent in the portfolio that are considered in determining unidentified probablelosses are those proven to exist by past experience and include: country systemic risk; the risk of correlation orcontagion of losses between markets; uninsured and uninsurable risks; nonperformance under guarantees andsupport agreements; and opacity of, or misrepresentation in, financial statements.
For purposes of providing certain disclosures about IFC’s entire reserve against losses on loans, IFCconsiders its entire loan portfolio to comprise one portfolio segment. A portfolio segment is the level at which themethod for estimating the reserve against losses on loans is developed and documented.
Loans are written-off when IFC has exhausted all possible means of recovery, by reducing the reserveagainst losses on loans. Such reductions in the reserve are partially offset by recoveries, if any, associated withpreviously written-off loans.
Equity investments — IFC invests primarily for developmental impact; IFC does not seek to takeoperational, controlling, or strategic equity positions within its investees. Equity investments are acquiredthrough direct ownership of equity instruments of investees, as a limited partner in LLPs and LLCs, and/or as aninvestor in private equity funds.
Revenue recognition on equity investments — Equity investments, which are listed in markets thatprovide readily determinable fair values, are accounted for as available-for-sale securities at fair value withunrealized gains and losses reported in other comprehensive income in accordance with ASC 320. As notedabove under “Fair Value Option and Fair Value Measurements”, direct equity investments and investments inLLPs and LLCs that maintain separate ownership accounts in which IFC has significant influence, direct equityinvestments representing 20 percent or more ownership but in which IFC does not have significant influence andall new equity interests in funds are accounted for at fair value under the Fair Value Option. Direct equityinvestments in which IFC does not have significant influence and which are not listed in markets that providereadily determinable fair values are carried at cost, less impairment. Notwithstanding the foregoing, equitysecurities held by consolidated subsidiaries that are investment companies are accounted for at fair value, withunrealized gains and losses reported in earnings.
IFC’s investments in certain private equity funds in which IFC is deemed to have a controlling financialinterest, are fully consolidated by IFC, as the presumption of control by the fund manager or the general partnerhas been overcome. Certain equity investments, for which recovery of invested capital is uncertain, are accountedfor under the cost recovery method, such that receipts are first applied to recovery of invested capital and then toincome from equity investments. The cost recovery method is applied to IFC’s investments in its oil and gasunincorporated joint ventures (UJVs). IFC’s share of conditional asset retirement obligations related toinvestments in UJVs are recorded when the fair value of the obligations can be reasonably estimated. Theobligations are capitalized and systematically amortized over the estimated economic useful lives.
85
INTERNATIONAL FINANCE CORPORATION
NOTES TO CONSOLIDATED FINANCIAL STATEMENTS
NOTE A — SUMMARY OF SIGNIFICANT ACCOUNTING AND RELATED POLICIES (continued)
Unrealized gains and losses on equity investments accounted for at fair value under the Fair Value Optionare reported in income from equity investments and associated derivatives on the consolidated income statement.Unrealized gains and losses on equity investments listed in markets that provide readily determinable fair valueswhich are accounted for as available-for-sale are reported in other comprehensive income. Realized gains on thesale or redemption of equity investments are measured against the average cost of the investments sold.
Dividends on listed equity investments are recorded on the ex-dividend date, and dividends on unlistedequity investments are recorded upon receipt of notice of declaration. Realized gains on listed equity investmentsare recorded upon trade date, and realized gains on unlisted equity investments are recorded upon incurring theobligation to deliver the applicable shares. Losses are recognized when incurred.
IFC enters into put and call option and warrant agreements in connection with certain equity investments;these are accounted for in accordance with ASC 815 to the extent they meet the definition of a derivative.
Gains and losses on debt conversions and exchanges of equity interests — Loan and debt securityconversions to equity interests are based on the fair value of the equity interests received. Transfers of equityinterests in exchange for equity interests in other entities and other non-cash transactions are generally accountedfor based on the fair value of the asset relinquished unless the fair value of the asset received is more clearlyevident in which case the accounting is based on the fair value of the asset received. The difference between thefair value of the asset received and the recorded amount of the asset relinquished is recorded as a gain or loss inthe income statement.
Impairment of equity investments — Equity investments accounted for at cost, less impairment andavailable-for-sale are assessed for impairment each quarter. When impairment is identified, it is generallydeemed to be other-than-temporary, and the equity investment is written down to the impaired value, whichbecomes the new cost basis in the equity investment. Such other-than-temporary impairments are recognized innet income. Subsequent increases in the fair value of available-for-sale equity investments are included in othercomprehensive income, while subsequent decreases in fair value, if not other-than-temporary impairment, alsoare included in other comprehensive income.
Debt securities — Debt securities in the investment portfolio are classified as available-for-sale and carriedat fair value on the consolidated balance sheet with unrealized gains and losses included in accumulated othercomprehensive income until realized. Realized gains on sales of debt securities and interest on debt securities isincluded in income from debt securities and realized gains and losses on debt securities and associatedderivatives on the consolidated income statement.
Certain debt securities are carried at fair value in accordance with the Fair Value Option as discussed above.Unrealized gains and losses on debt securities accounted for at fair value under the Fair Value Option arereported in net unrealized gains and losses on non-trading financial instruments accounted for at fair value on theconsolidated income statement.
IFC invests in certain debt securities with conversion features; these features are accounted for inaccordance with ASC 815 to the extent they meet the definition of a derivative.
Impairment of debt securities — In determining whether an unrealized loss on debt securities is other-than-temporary, IFC considers all relevant information including the length of time and the extent to which fairvalue has been less than amortized cost, whether IFC intends to sell the debt security or whether it is more likelythan not that IFC will be required to sell the debt security, the payment structure of the obligation and the abilityof the issuer to make scheduled interest or principal payments, any changes to the ratings of a security, andrelevant adverse conditions specifically related to the security, an industry or geographic sector.
86
INTERNATIONAL FINANCE CORPORATION
NOTES TO CONSOLIDATED FINANCIAL STATEMENTS
NOTE A — SUMMARY OF SIGNIFICANT ACCOUNTING AND RELATED POLICIES (continued)
Debt securities in the investment portfolio are assessed for impairment each quarter. When impairment isidentified, the entire impairment is recognized in net income if (1) IFC intends to sell the security, or (2) it ismore likely than not that IFC will be required to sell the security before recovery. However, if IFC does notintend to sell the security and it is not more likely than not that IFC will be required to sell the security but thesecurity has a credit loss, the impairment charge will be separated into the credit loss component, which isrecognized in net income, and the remainder which is recorded in other comprehensive income. The impairedvalue becomes the new amortized cost basis of the debt security. Subsequent fair value increases and decreases inthe fair value of debt securities, if not an additional other-than-temporary impairment, are included in othercomprehensive income.
The difference between the new amortized cost basis of debt securities for which an other-than-temporaryimpairment has been recognized in net income and the cash flows expected to be collected is accreted to interestincome using the effective yield method. Significant subsequent increases in the expected or actual cash flowspreviously expected are recognized as a prospective adjustment of the yield.
Guarantees — IFC extends financial guarantee facilities to its clients to provide credit enhancement fortheir debt securities and trade obligations. As part of these financial guarantee facilities, IFC offers partial creditguarantees to clients covering, on a risk-sharing basis, client obligations on bonds or loans. Under the terms ofIFC’s guarantees, IFC agrees to assume responsibility for the client’s financial obligations in the event of defaultby the client (i.e., failure to pay when payment is due). Guarantees are regarded as issued when IFC commits tothe guarantee. Guarantees are regarded as outstanding when the underlying financial obligation of the client isincurred, and this date is considered to be the “inception” of the guarantee. Guarantees are regarded as calledwhen IFC’s obligation under the guarantee has been invoked. There are two liabilities associated with theguarantees: (i) the stand-ready obligation to perform and (ii) the contingent liability. The fair value of the stand-ready obligation to perform is recognized at the inception of the guarantee unless a contingent liability exists atthat time or is expected to exist in the near term. The contingent liability associated with the financial guaranteeis recognized when it is probable the guarantee will be called and when the amount of guarantee called can bereasonably estimated. When the guarantees are called, the amount disbursed is recorded as a new loan, andspecific reserves against losses are established, based on the estimated probable loss. Guarantee fees are recordedin income as the stand-ready obligation to perform is fulfilled. Commitment fees on guarantees are recorded asincome on an accrual basis. All liabilities associated with guarantees are included in payables and otherliabilities, and the receivables are included in other assets on the consolidated balance sheet.
Designations of retained earnings — IFC establishes funding mechanisms for specific Board approvedpurposes through designations of retained earnings. Designations of retained earnings for grants to IDA arerecorded as a transfer from undesignated retained earnings to designated retained earnings when the designationis approved by the Board of Governors. All other designations are recorded as a transfer from undesignatedretained earnings to designated retained earnings when the designation is noted with approval by the Board ofDirectors. Total designations of retained earnings are determined based on IFC’s annual income beforeexpenditures against designated retained earnings and net unrealized gains and losses on non-trading financialinstruments accounted for at fair value in excess of $150 million, and contemplating the financial capacity andstrategic priorities of IFC.
87
INTERNATIONAL FINANCE CORPORATION
NOTES TO CONSOLIDATED FINANCIAL STATEMENTS
NOTE A — SUMMARY OF SIGNIFICANT ACCOUNTING AND RELATED POLICIES (continued)
Expenditures resulting from such designations are recorded as expenses in IFC’s consolidated incomestatement in the year in which they are incurred and reduces the respective designated retained earnings for suchpurposes. Expenditures are deemed to have been incurred when IFC has ceded control of the funds to therecipient. If the recipient is deemed to be controlled by IFC, the expenditure is deemed to have been incurredonly when the recipient disburses the funds to a non-related party. On occasion, recipients who are deemed to becontrolled by IFC make investments. In such cases, IFC includes those assets on its consolidated balance sheetuntil the recipient disposes of or transfers the asset or IFC is deemed to no longer be in control of the recipient.These investments have had no material impact on IFC’s financial position, results of operations, or cash flows.Investments resulting from such designations are recorded on IFC’s consolidated balance sheet in the year inwhich they occur, also having the effect of reducing the respective designated retained earnings for suchpurposes.
Liquid asset portfolio — The liquid asset portfolio, as defined by IFC, consists of: time deposits andsecurities; related derivative instruments; securities purchased under resale agreements and receivable for cashcollateral pledged, securities sold under repurchase agreements and payable for cash collateral received;receivables from sales of securities and payables for purchases of securities; and related accrued income andcharges. IFC’s liquid funds are invested in government, agency and government-sponsored agency obligations,time deposits and asset-backed, including mortgage-backed, securities. Government and agency obligationsinclude positions in high quality fixed rate bonds, notes, bills, and other obligations issued or unconditionallyguaranteed by governments of countries or other official entities including government agencies andinstrumentalities or by multilateral organizations. Asset-backed and mortgage-backed securities include agencyand non-agency residential mortgage-backed securities, commercial mortgage-backed securities, consumer, autoand student loan-backed securities, commercial real estate collateralized debt obligations and collateralized loanobligations.
Securities and related derivative instruments within IFC’s liquid asset portfolio are classified as trading andare carried at fair value with any changes in fair value reported in income from liquid asset trading activities.Interest on securities and amortization of premiums and accretion of discounts are also reported in income fromliquid asset trading activities. Gains and losses realized on the sale of trading securities are computed on aspecific security basis.
IFC classifies cash and due from banks and time deposits (collectively, cash and cash equivalents) as cashand as cash equivalents in the consolidated statement of cash flows because they are generally readily convertibleto known amounts of cash within 90 days of acquisition generally when the original maturities for suchinstruments are under 90 days or in some cases are under 180 days.
Repurchase, resale and securities lending agreements — Repurchase agreements are contracts underwhich a party sells securities and simultaneously agrees to repurchase the same securities at a specified futuredate at a fixed price. Resale agreements are contracts under which a party purchases securities andsimultaneously agrees to resell the same securities at a specified future date at a fixed price. Securities lendingagreements are similar to repurchase agreements except that the securities loaned are securities that IFC hasreceived as collateral under unrelated agreements and allowed by contract to rehypothecate. Amounts due undersecurities lending agreements are included in securities sold under repurchase agreements and payable for cashcollateral received on the consolidated balance sheet.
It is IFC’s policy to take possession of securities purchased under resale agreements, which are primarilyliquid government securities. The market value of these securities is monitored and, within parameters defined inthe agreements, additional collateral is obtained when their value declines. IFC also monitors its exposure withrespect to securities sold under repurchase agreements and, in accordance with the terms of the agreements,requests the return of excess securities held by the counterparty when their value increases.
88
INTERNATIONAL FINANCE CORPORATION
NOTES TO CONSOLIDATED FINANCIAL STATEMENTS
NOTE A — SUMMARY OF SIGNIFICANT ACCOUNTING AND RELATED POLICIES (continued)
Repurchase, resale and securities lending agreements are accounted for as collateralized financingtransactions and recorded at the amount at which the securities were acquired or sold plus accrued interest.
Borrowings — To diversify its access to funding, and reduce its borrowing costs, IFC borrows in a varietyof currencies and uses a number of borrowing structures, including foreign exchange rate-linked, inverse floatingrate and zero coupon notes. In managing the currency exposure inherent in borrowing in a variety of currencies,generally, IFC either simultaneously converts such borrowings into variable rate US dollar borrowings throughthe use of currency and interest rate swap transactions or utilizes liquid asset portfolio or debt investmentsdenominated in the same currency to economically hedge changes in the fair value of certain borrowings. Undercertain outstanding borrowing agreements, IFC is not permitted to mortgage or allow a lien to be placed on itsassets (other than purchase money security interests) without extending equivalent security to the holders of suchborrowings.
Substantially all borrowings are carried at fair value under the Fair Value Option with changes in fair valuereported in net unrealized gains and losses on non-trading financial instruments accounted for at fair value in theconsolidated income statement.
Interest on borrowings and amortization of premiums and accretion of discounts are reported in charges onborrowings.
Risk management and use of derivative instruments — IFC enters into transactions in various derivativeinstruments primarily for financial risk management purposes in connection with its principal business activities,including lending, investing in debt securities and equity investments, client risk management, borrowing, liquidasset portfolio management and asset and liability management. There are no derivatives designated asaccounting hedges.
All derivative instruments are recorded on the consolidated balance sheet at fair value as derivative assets orderivative liabilities. Where they are not clearly and closely related to the host contract, certain derivativeinstruments embedded in loans, debt securities and equity investments are bifurcated from the host contract andrecorded at fair value as derivative assets or liabilities unless the hybrid instrument is accounted for at fair valuewith any changes in fair value reported in income. The fair value at inception of such embedded derivatives isexcluded from the carrying amount of the host contracts on the consolidated balance sheet. Changes in fair valuesof derivative instruments used in the liquid asset portfolio are recorded in income from liquid asset tradingactivities. Changes in fair values of derivative instruments other than those in the liquid asset portfolio and thoseassociated with equity investments are recorded in net unrealized gains and losses on non-trading financialinstruments accounted for at fair value. The risk management policy for each of IFC’s principal businessactivities and the accounting policies particular to them are described below.
Lending activities IFC’s policy is to closely match the currency, interest rate basis, and maturity of its loansand borrowings. Derivative instruments are used to convert the cash flows from fixed rate US dollar or non-USdollar loans into variable rate US dollars.
Client risk management activities IFC enters into derivatives transactions with its clients to help them hedgetheir own currency, interest rate, or commodity risk, which, in turn, improves the overall quality of IFC’s loanportfolio. To hedge the market risks that arise from these transactions with clients, IFC enters into offsettingderivative transactions with matching terms with authorized market counterparties. Changes in fair value of allderivatives associated with these activities are reported in net income in net unrealized gains and losses onnon-trading financial instruments accounted for at fair value.
89
INTERNATIONAL FINANCE CORPORATION
NOTES TO CONSOLIDATED FINANCIAL STATEMENTS
NOTE A — SUMMARY OF SIGNIFICANT ACCOUNTING AND RELATED POLICIES (continued)
Borrowing activities IFC issues debt securities in various capital markets with the objectives of minimizingits borrowing costs, diversifying funding sources, and developing member countries’ capital markets, sometimesusing complex structures. These structures include borrowings payable in multiple currencies, or borrowingswith principal and/or interest determined by reference to a specified index such as a stock market index, areference interest rate, a commodity index, or one or more foreign exchange rates. IFC generally uses derivativeinstruments with matching terms, primarily currency and interest rate swaps, to convert certain of suchborrowings into variable rate US dollar obligations, consistent with IFC’s matched funding policy. IFC elects tocarry at fair value, under the Fair Value Option, all market borrowings for which a derivative instrument, liquidasset portfolio investment or debt investment is used to create an economic hedge. Changes in the fair value ofsuch borrowings and the associated derivatives are reported in net unrealized gains and losses on non-tradingfinancial instruments accounted for at fair value in the consolidated income statement.
Liquid asset portfolio management activities IFC manages the interest rate, currency and other market risksassociated with certain of the time deposits and securities in its liquid asset portfolio by entering into derivativetransactions to convert the cash flows from those instruments into variable rate US dollars or by utilizing marketborrowings denominated in the same currency to economically hedge changes in the fair value of certain liquidasset portfolio investments. The derivative instruments used include short-term, over-the-counter foreignexchange forwards (covered forwards), interest rate and currency swaps, and exchange-traded interest ratefutures and options. As the entire liquid asset portfolio is classified as trading portfolio, all securities (includingderivatives) are carried at fair value with changes in fair value reported in income from liquid asset tradingactivities.
Asset and liability management In addition to the risk managed in the context of its business activitiesdetailed above, IFC faces residual market risk in its overall asset and liability management. Residual currencyrisk is managed by monitoring the aggregate position in each lending currency and reducing the net excess assetor liability position through sales or purchases of currency. Interest rate risk arising from mismatches due towrite-downs, prepayments and re-schedulings, and residual reset date mismatches is monitored by measuring thesensitivity of the present value of assets and liabilities in each currency to each basis point change in interestrates.
IFC monitors the credit risk associated with these activities by careful assessment and monitoring ofprospective and actual clients and counterparties. In respect of liquid assets and derivatives transactions, creditrisk is managed by establishing exposure limits based on the credit rating and size of the individual counterparty.In addition, IFC has entered into master agreements with its derivative market counterparties governingderivative transactions that contain close-out and netting provisions and collateral arrangements. Under theseagreements, if the credit exposure to one of the parties to the agreement, on a mark-to-market basis, exceeds aspecified level, that party must post collateral to cover the excess, generally in the form of liquid governmentsecurities or cash. IFC does not offset the fair value amounts of derivatives and obligations to return, or rights toreceive, cash collateral associated with these master-netting agreements.
Loan participations — IFC mobilizes funds from commercial banks and other financial institutions(Participants) by facilitating loan participations, without recourse. These loan participations are administered andserviced by IFC on behalf of the Participants. The disbursed and outstanding balances of loan participations thatmeet the applicable accounting criteria are accounted for as sales and are not included in IFC’s consolidatedbalance sheet. All other loan participations are accounted for as secured borrowings and are included in loans onIFC’s consolidated balance sheet, with the related secured borrowings included in payables and other liabilitieson IFC’s consolidated balance sheet.
Pension and other postretirement benefits — IBRD has a defined benefit Staff Retirement Plan (SRP), aRetired Staff Benefits Plan (RSBP) and a Post-Employment Benefits Plan (PEBP) that cover substantially all ofits staff members as well as the staff of IFC and of MIGA.
90
INTERNATIONAL FINANCE CORPORATION
NOTES TO CONSOLIDATED FINANCIAL STATEMENTS
NOTE A — SUMMARY OF SIGNIFICANT ACCOUNTING AND RELATED POLICIES (continued)
The SRP provides regular pension benefits and includes a cash balance plan. The RSBP provides certainhealth and life insurance benefits to eligible retirees. The PEBP provides pension benefits administered outsidethe SRP. All costs associated with these plans are allocated between IBRD, IFC, and MIGA based upon theiremployees’ respective participation in the plans. In addition, IFC and MIGA reimburse IBRD for their share ofany contributions made to these plans by IBRD.
The net periodic pension and other postretirement benefit income or expense allocated to IFC is included inincome or expense from pension and other postretirement benefit plans in the consolidated income statement.IFC includes a receivable from IBRD in receivables and other assets, representing prepaid pension and otherpostretirement benefit costs.
Recently adopted accounting standards — In November 2014, the FASB issued ASU 2014-16,Determining Whether the Host Contract in a Hybrid Financial Instrument Issued in the Form of a Share Is MoreAkin to Debt or to Equity (ASU 2014-16). ASU 2014-16 requires, for purposes of evaluating embedded featuresfor bifurcation under ASU 815, the determination of the nature of a host contract issued in share form to be basedon the economic characteristics and risks of the entire hybrid instrument, including the embedded feature beingevaluated. Further, the ASU stipulates that the existence or omission of any single term or feature does notnecessarily determine the economic characteristics and risks of the host. ASU 2014-16 is effective for fiscalyears, and interim periods within those fiscal years, beginning after December 15, 2015 (which was the yearending June 30, 2017 for IFC). As permitted, IFC early adopted ASU 2014-16 on January 1, 2016 with nomaterial impact on IFC’s financial position, results of operations or cash flows.
In August 2014, the FASB issued ASU 2014-15, Presentation of Financial Instruments — Going Concern(ASU 2014-15). ASU 2014-15 requires reporting entities to perform interim and annual assessments of theirability to continue as a going concern within one year of the date of issuance of the entity’s financial statements(or within one year of the date on which the financial statements are available to be issued). A reporting entitywill be required to make certain disclosures if there is substantial doubt about the entity’s ability to continue to asa going concern. ASU 2014-15 is effective for annual periods ending after December 15, 2016 (which was theyear ending June 30, 2017 for IFC) and for interim periods thereafter. IFC adopted ASU 2014-15, effectiveJune 30, 2017, with no material impact on IFC’s financial position, results of operations or cash flows.
In March 2016, the FASB issued ASU 2016-06, Contingent Put and Call Options in Debt Instruments; ASU2016-07, Simplifying the Transition to the Equity Method of Accounting; and ASU 2016-08, Principal versusAgent Considerations (Reporting Revenue Gross Versus Net). ASU 2016-06 clarifies certain matters regardingthe assessment required under ASC 815 of whether contingent puts and calls embedded in debt instrumentsrequire bifurcation. ASU 2016-06 is effective for fiscal years, and interim periods within those fiscal years,beginning after December 15, 2016, (which is the year ended June 30, 2018 for IFC). Early adoption is permitted.IFC adopted ASU 2016-06 on July 1, 2017 with no material impact on IFC’s financial position, results ofoperations or cash flows.
ASU 2016-07 simplifies the equity method of accounting by eliminating the requirement to retroactivelyapply the equity method to an investment that subsequently qualifies for such accounting as a result of anincrease in ownership and/or degree of influence. Consequently, when an investment qualifies for equity methodaccounting, the cost of acquiring the additional ownership would be added to the investor’s previous cost basisand the equity method subsequently applied upon the date the investor obtains the ability to exercise significantinfluence over the investee. ASU 2016-07 is effective for fiscal years, including interim periods within thosefiscal years, beginning after December 15, 2016, (which is the year ended June 30, 2018 for IFC). Given IFC’scurrent election of the FVO for all investments that otherwise qualify for equity method accounting, IFC adoptedASU 2016-07 effective July 1, 2017 with no material impact on IFC’s financial position, results of operations orcash flows.
91
INTERNATIONAL FINANCE CORPORATION
NOTES TO CONSOLIDATED FINANCIAL STATEMENTS
NOTE A — SUMMARY OF SIGNIFICANT ACCOUNTING AND RELATED POLICIES (continued)
In October, 2016, the FASB issued ASU 2016-17, Consolidation (Topic 810): Interests Held throughRelated Parties That are under Common Control (ASC 2016-17). ASC 2016-17 amends Topic 810 so that asingle decision maker with respect to a VIE is not required to consider interests held through related parties thatare under common control with the single decision maker to be the equivalent of direct interests in their entirety.Instead, the entity is required to include those interests on a proportional basis consistent with interests heldthrough other related parties. ASC 2016-17 is effective for fiscal years, and interim periods within those annualperiods, beginning after December 5, 2016 (which is the year ended June 30, 2018 for IFC). IFC adopted ASU2016-17 effective July 1, 2017 with no material impact on IFC’s financial position, results of operations or cashflows.
Accounting standards under evaluation — In July 2010, the Dodd-Frank Wall Street Reform andConsumer Protection Act (the Act) became law. The Act seeks to reform the U.S. financial regulatory system byintroducing new regulators and extending regulation over new markets, entities, and activities. Theimplementation of the Act is dependent on the development of various rules to clarify and interpret itsrequirements. Pending the development of these rules, no impact on IFC has been determined as of June 30,2018. IFC continues to evaluate the potential future implications of the Act.
In May 2014, the FASB issued ASU 2014-09, Revenue from Contracts with Customers (ASU 2014-09).ASU 2014-09 replaces most existing revenue recognition guidance by establishing a single recognition model forrevenue arising from contracts with customers to deliver goods and services and requires additional disclosureregarding those revenues — it does not change current accounting guidance for derivative contracts, investmentsin and transfers of financial instruments or guarantees. ASU 2014-09 is currently applicable for annual reportingperiods and interim periods within those annual periods, beginning after December 15, 2017 (which is the yearending June 30, 2019 for IFC). IFC does not expect ASU 2014-09 to have a material impact on IFC’s financialposition, results of operations or cash flows.
In January 2016, the FASB issued ASU 2016-01, Recognition and Measurement of Financial Assets andLiabilities (ASU 2016-01). ASU 2016-01 requires all investments in equity securities to be accounted for at fairvalue through net income (except investments accounted for under the equity method and those that result inconsolidation of the investee), and separate presentation in other comprehensive income (OCI) the portion of thetotal change in fair value resulting from a change in the instrument-specific credit risk when the entity has electedto measure a liability at fair value under the FVO. Given the magnitude of its investments in equity securities andthe inherent volatility of prices for equity securities, the adoption of ASU 2016-01 will have a significant impacton IFC’s future reported net earnings. IFC adopted ASU 2016-01 on July 1, 2018. As of that date, IFCreclassified accumulated net unrealized gains related to available-for-sale equity investments of approximately$1.4 billion from accumulated other comprehensive income to retained earnings, and recognized in retainedearnings accumulated net unrealized gains of approximately $1.5 billion related to equity investments at cost lessimpairment. In addition, the portion of the total cumulative change in the fair value of liabilities for which theFVO is applied that results from a change in the instrument-specific credit risk of $43 million was reclassifiedfrom retained earnings to accumulated other comprehensive income.
In February 2016, the FASB issued ASU 2016-02, Leases. ASU 2016-02 introduces a new accountingmodel that will result in lessees recording most leases on the balance sheet, aligns many of the underlying profitrecognition principles with those in ASU 2014-09 and eliminates the use of “bright line” tests currently requiredfor determining lease classification. ASU 2016-02 is effective for fiscal years, and interim periods within thefiscal years, beginning after December 15, 2018, (which is the year ending June 30, 2020 for IFC). Earlieradoption is permitted. IFC is currently evaluating the impact of ASU 2016-02.
92
INTERNATIONAL FINANCE CORPORATION
NOTES TO CONSOLIDATED FINANCIAL STATEMENTS
NOTE A — SUMMARY OF SIGNIFICANT ACCOUNTING AND RELATED POLICIES (continued)
In March 2016, the FASB issued ASU 2016-08, Principal versus Agent Considerations (Reporting RevenueGross versus Net), that amends ASU 2014-09’s principal-versus-agent guidance. It requires a reporting entity toevaluate whether it is a principal or agent for each specified good or service in a contract with a customer andclarifies the application of the related indicators in accordance with ASC 2014-09’s control principle. ASU2016-08 has the same effective date as 2014-09, (which is the year ending June 30, 2019 for IFC). IFC iscurrently evaluating the impact of ASU 2016-08.
In June 2016, the FASB issued ASU 2016-13, Measurement of Credit Losses on Financial Instruments(ASU 2016-13). ASU 2016-13 requires the measurement of estimated credit losses on financial instruments heldat the balance sheet date based on historical loss experience, current conditions, and reasonable and supportableforecasts of future economic conditions. Contrary to the incurred impairment loss accounting model currently inplace, this forward-looking approach is intended to result in the immediate recognition of all estimated creditlosses expected to occur over the remaining life of the instruments. The resulting allowance for current expectedcredit losses (CECL) reduces the amortized cost basis of a financial asset to an amount expected to be collected.For future periods which cannot be forecasted in a reasonable and supportable manner, the reporting entity willrevert to historical loss experience. Although ASU 2016-13 does not prescribe a specific methodology, it requiresa collective assessment for financial assets with similar risk characteristics. Credit losses for financial assets thatdo not share similar risk characteristics with other financial assets will be measured individually. Impairment ofinvestments in available-for-sale debt securities will be recognized via the allowance method, which allows forimmediate reversals of credit losses. ASU 2016-13 is effective for fiscal years, and interim periods within thosefiscal years, beginning after December 15, 2019 (which is the year ended June 30, 2021 for IFC). IFC is currentlyevaluating the impact of ASU 2016-13.
In March, 2017, The FASB issued ASU 2017-07, Improving the Presentation of Net Periodic Pension Costand Net Periodic Postretirement Benefit Cost (ASU 2017-07). ASU 2017-07 requires entities to (1) disaggregatethe current-service-cost component from other components of net periodic benefit cost and present it with othercurrent period compensation costs for related employees in the income statement, and (2) present the othercomponents elsewhere in the income statement and outside of income from operations if that subtotal ispresented. In addition, ASU 2017-07 requires entities to disclose the income statement lines that contain the othercomponents if they are not presented on appropriately described lines. For IFC, this ASU will be effective fromthe quarter ending September 30, 2018. Implementation will result in a modification in the presentation of IFC’sStatement of Income, with no impact on net income, as well as additional disclosures in the notes to the financialstatements.
In March, 2017, The FASB issued ASU 2017-08, Premium Amortization on Purchased Callable DebtSecurities (ASU 2017-08). ASU 2017-08 shortens the amortization period for certain investments in callable debtsecurities purchased at a premium by requiring the premium to be amortized to the earliest call date. ASU2017-08 is effective for annual periods, and interim periods within those annual periods, beginning afterDecember 15, 2018 (which is the year ended June 30, 2020 for IFC). ASU 2017-08 is not expected to have amaterial impact on IFC’s financial position, results of operations or cash flows.
In June 2018, the FASB issued ASU 2018-08, Clarifying the Scope and Accounting Guidance forContributions made and Contributions Received (ASU 2018-08). ASU 2018-08 provides guidance to assistentities in evaluating whether transactions are contributions and whether a contribution is conditional. ASU2019-08 is effective for annual periods beginning after June 30, 2018, including interim periods within thoseannual periods (which is the year ended June 30, 2019 for IFC). IFC is currently evaluating the impact of ASU2018-08.
In addition, during the year ended June 30, 2018, the FASB issued and/or approved various other ASUs.IFC analyzed and implemented the new guidance, as appropriate, with no material impact on the financialposition, results of operations or cash flows of IFC.
93
INTERNATIONAL FINANCE CORPORATION
NOTES TO CONSOLIDATED FINANCIAL STATEMENTS
NOTE B — SCOPE OF CONSOLIDATION
IFC Asset Management Company, LLC (AMC) and AMC Funds
IFC, through its wholly owned subsidiary, AMC, mobilizes capital from outside IFC’s traditional investorpool and manages third-party capital. AMC is consolidated into IFC’s financial statements. At June 30, 2018,IFC has provided $2 million of capital to AMC ($2 million — June 30, 2017).
As a result of the consolidation of AMC, amounts included in IFC’s consolidated balance sheet at June 30,2018 and June 30, 2017 comprise (US$ millions):
June 30,2018
June 30,2017
Cash, receivables and other assets . . . . . . . . . . . . . . . . . . . . . . . . . . . . . . . . . . . . . . . . . . . . $55 $58Equity investments . . . . . . . . . . . . . . . . . . . . . . . . . . . . . . . . . . . . . . . . . . . . . . . . . . . . . . . . * *Payables and other liabilities . . . . . . . . . . . . . . . . . . . . . . . . . . . . . . . . . . . . . . . . . . . . . . . . 2 2
* Less than $0.5 million.
As a result of the consolidation of AMC, amounts included in IFC’s consolidated statement of operations forthe years ended June 30, 2018, June 30, 2017 and June 30, 2016 comprise (US$ millions):
2018 2017 2016
Other income . . . . . . . . . . . . . . . . . . . . . . . . . . . . . . . . . . . . . . . . . . . . . . . . . . . . . . . . . . . . . . . . $80 $79 $66Other expenses . . . . . . . . . . . . . . . . . . . . . . . . . . . . . . . . . . . . . . . . . . . . . . . . . . . . . . . . . . . . . . . 24 23 24
At June 30, 2018, AMC managed twelve funds (collectively referred to as the AMC Funds). All AMCFunds are investment companies and are required to report their investment assets at fair value through netincome. IFC’s ownership interests in these AMC Funds are shown in the following table:
AMC Funds IFC’s ownership interest
IFC Capitalization (Equity) Fund, L.P. . . . . . . . . . . . . . . . . . . . . . . . . . . . . . . . . . . . . . . . . . 61%**IFC Capitalization (Subordinated Debt) Fund, L.P. . . . . . . . . . . . . . . . . . . . . . . . . . . . . . . . 13%IFC African, Latin American and Caribbean Fund, LP . . . . . . . . . . . . . . . . . . . . . . . . . . . . 20%Africa Capitalization Fund, Ltd. . . . . . . . . . . . . . . . . . . . . . . . . . . . . . . . . . . . . . . . . . . . . . . —IFC Catalyst Funds . . . . . . . . . . . . . . . . . . . . . . . . . . . . . . . . . . . . . . . . . . . . . . . . . . . . . . . . 18%***IFC Global Infrastructure Fund, LP . . . . . . . . . . . . . . . . . . . . . . . . . . . . . . . . . . . . . . . . . . . 17%China-Mexico Fund, LP . . . . . . . . . . . . . . . . . . . . . . . . . . . . . . . . . . . . . . . . . . . . . . . . . . . . —IFC Financial Institutions Growth Fund, LP . . . . . . . . . . . . . . . . . . . . . . . . . . . . . . . . . . . . . 30%IFC Global Emerging Markets Fund of Funds . . . . . . . . . . . . . . . . . . . . . . . . . . . . . . . . . . . 19%****IFC Middle East and North Africa Fund, LP . . . . . . . . . . . . . . . . . . . . . . . . . . . . . . . . . . . . 37%Women Entrepreneurs Debt Fund, LP . . . . . . . . . . . . . . . . . . . . . . . . . . . . . . . . . . . . . . . . . 26%IFC Emerging Asia Fund, LP . . . . . . . . . . . . . . . . . . . . . . . . . . . . . . . . . . . . . . . . . . . . . . . . 22%
** By virtue of certain rights granted to non-IFC limited partner interests, IFC does not control or consolidate this fund.*** The ownership interest of 18% reflects IFC’s ownership interest taking into consideration the overall commitments for the IFC Catalyst Funds, which is
comprised of IFC Catalyst Fund, LP, IFC Catalyst Fund (UK), LP and IFC Catalyst Fund (Japan), LP (collectively, IFC Catalyst Funds). IFC does not havean ownership interest in either the IFC Catalyst Fund (UK), LP or the IFC Catalyst Fund (Japan), LP.
**** The ownership interest of 19% reflects IFC’s ownership interest taking into consideration the current committed amounts for the IFC Global EmergingMarkets Fund of Funds, which are comprised of IFC Global Emerging Markets Fund of Funds, LP and IFC Global Emerging Markets Fund of Funds,(Japan Parallel) LP. IFC does not have an ownership interest in the IFC Global Emerging Markets Fund of Funds, (Japan Parallel) LP.
94
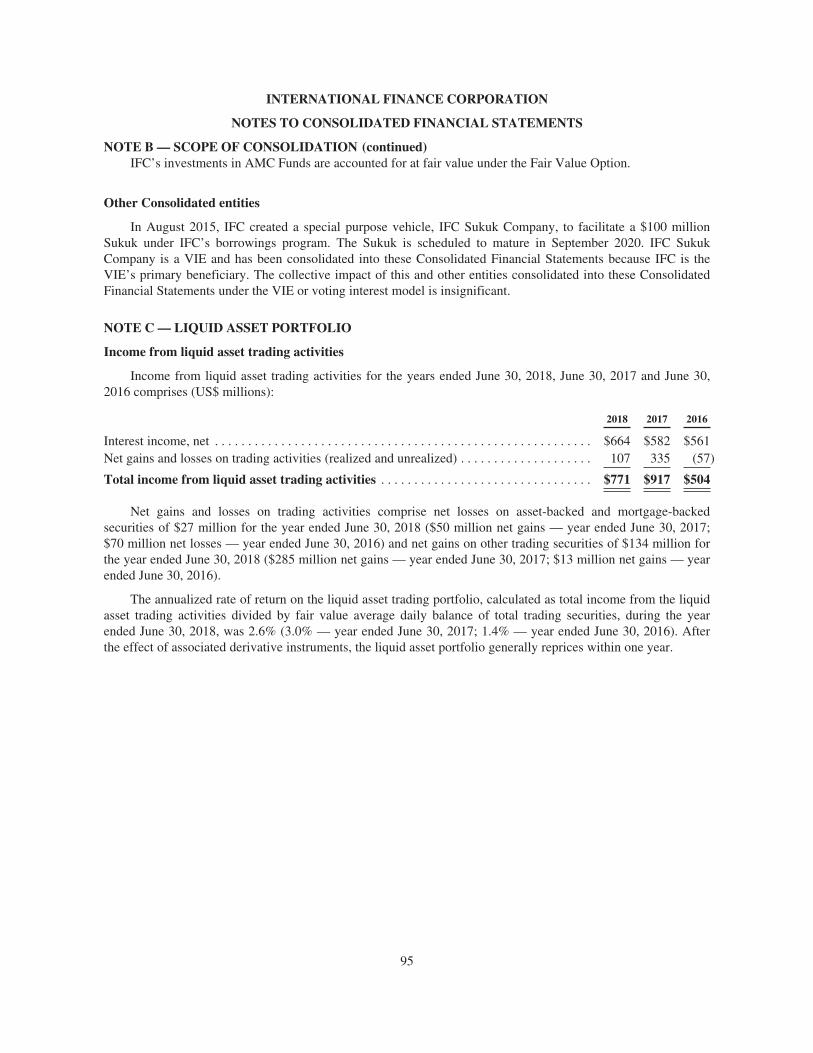
INTERNATIONAL FINANCE CORPORATION
NOTES TO CONSOLIDATED FINANCIAL STATEMENTS
NOTE B — SCOPE OF CONSOLIDATION (continued)IFC’s investments in AMC Funds are accounted for at fair value under the Fair Value Option.
Other Consolidated entities
In August 2015, IFC created a special purpose vehicle, IFC Sukuk Company, to facilitate a $100 millionSukuk under IFC’s borrowings program. The Sukuk is scheduled to mature in September 2020. IFC SukukCompany is a VIE and has been consolidated into these Consolidated Financial Statements because IFC is theVIE’s primary beneficiary. The collective impact of this and other entities consolidated into these ConsolidatedFinancial Statements under the VIE or voting interest model is insignificant.
NOTE C — LIQUID ASSET PORTFOLIO
Income from liquid asset trading activities
Income from liquid asset trading activities for the years ended June 30, 2018, June 30, 2017 and June 30,2016 comprises (US$ millions):
2018 2017 2016
Interest income, net . . . . . . . . . . . . . . . . . . . . . . . . . . . . . . . . . . . . . . . . . . . . . . . . . . . . . . . . . $664 $582 $561Net gains and losses on trading activities (realized and unrealized) . . . . . . . . . . . . . . . . . . . . 107 335 (57)
Total income from liquid asset trading activities . . . . . . . . . . . . . . . . . . . . . . . . . . . . . . . . $771 $917 $504
Net gains and losses on trading activities comprise net losses on asset-backed and mortgage-backedsecurities of $27 million for the year ended June 30, 2018 ($50 million net gains — year ended June 30, 2017;$70 million net losses — year ended June 30, 2016) and net gains on other trading securities of $134 million forthe year ended June 30, 2018 ($285 million net gains — year ended June 30, 2017; $13 million net gains — yearended June 30, 2016).
The annualized rate of return on the liquid asset trading portfolio, calculated as total income from the liquidasset trading activities divided by fair value average daily balance of total trading securities, during the yearended June 30, 2018, was 2.6% (3.0% — year ended June 30, 2017; 1.4% — year ended June 30, 2016). Afterthe effect of associated derivative instruments, the liquid asset portfolio generally reprices within one year.
95
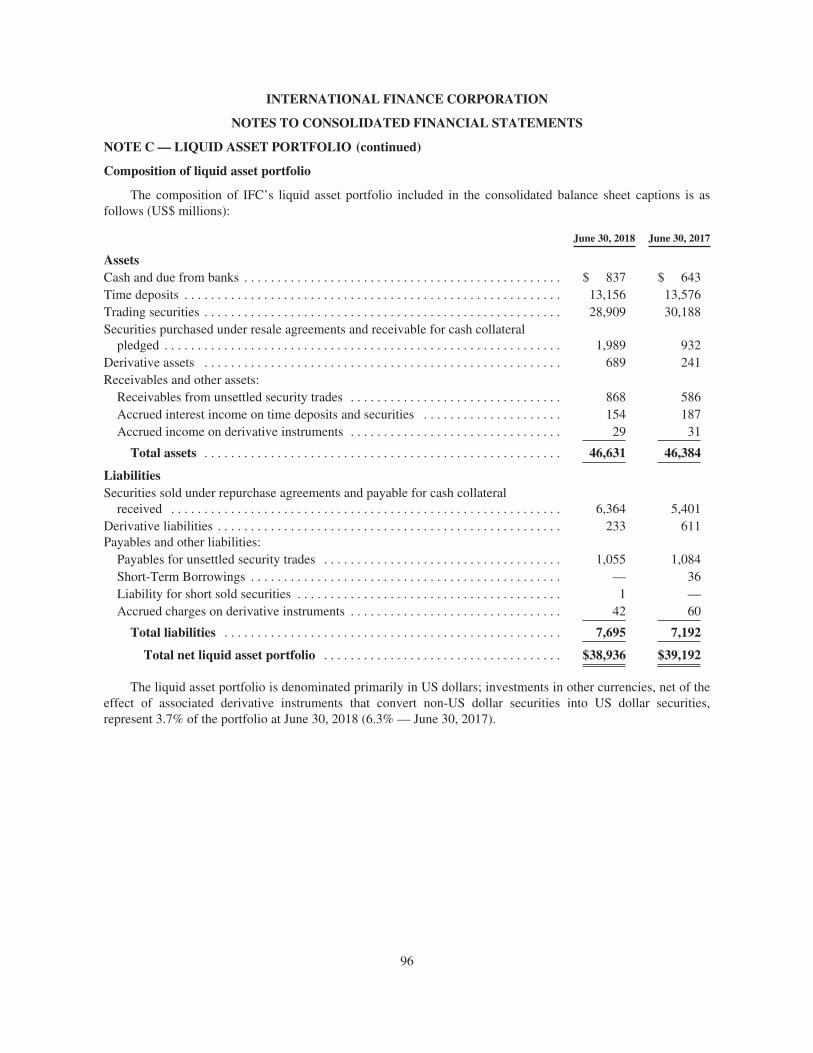
INTERNATIONAL FINANCE CORPORATION
NOTES TO CONSOLIDATED FINANCIAL STATEMENTS
NOTE C — LIQUID ASSET PORTFOLIO (continued)
Composition of liquid asset portfolio
The composition of IFC’s liquid asset portfolio included in the consolidated balance sheet captions is asfollows (US$ millions):
June 30, 2018 June 30, 2017
AssetsCash and due from banks . . . . . . . . . . . . . . . . . . . . . . . . . . . . . . . . . . . . . . . . . . . . . . . . $ 837 $ 643Time deposits . . . . . . . . . . . . . . . . . . . . . . . . . . . . . . . . . . . . . . . . . . . . . . . . . . . . . . . . . 13,156 13,576Trading securities . . . . . . . . . . . . . . . . . . . . . . . . . . . . . . . . . . . . . . . . . . . . . . . . . . . . . . 28,909 30,188Securities purchased under resale agreements and receivable for cash collateral
pledged . . . . . . . . . . . . . . . . . . . . . . . . . . . . . . . . . . . . . . . . . . . . . . . . . . . . . . . . . . . . 1,989 932Derivative assets . . . . . . . . . . . . . . . . . . . . . . . . . . . . . . . . . . . . . . . . . . . . . . . . . . . . . . 689 241Receivables and other assets:
Receivables from unsettled security trades . . . . . . . . . . . . . . . . . . . . . . . . . . . . . . . . 868 586Accrued interest income on time deposits and securities . . . . . . . . . . . . . . . . . . . . . 154 187Accrued income on derivative instruments . . . . . . . . . . . . . . . . . . . . . . . . . . . . . . . . 29 31
Total assets . . . . . . . . . . . . . . . . . . . . . . . . . . . . . . . . . . . . . . . . . . . . . . . . . . . . . . 46,631 46,384
LiabilitiesSecurities sold under repurchase agreements and payable for cash collateral
received . . . . . . . . . . . . . . . . . . . . . . . . . . . . . . . . . . . . . . . . . . . . . . . . . . . . . . . . . . . 6,364 5,401Derivative liabilities . . . . . . . . . . . . . . . . . . . . . . . . . . . . . . . . . . . . . . . . . . . . . . . . . . . . 233 611Payables and other liabilities:
Payables for unsettled security trades . . . . . . . . . . . . . . . . . . . . . . . . . . . . . . . . . . . . 1,055 1,084Short-Term Borrowings . . . . . . . . . . . . . . . . . . . . . . . . . . . . . . . . . . . . . . . . . . . . . . . — 36Liability for short sold securities . . . . . . . . . . . . . . . . . . . . . . . . . . . . . . . . . . . . . . . . 1 —Accrued charges on derivative instruments . . . . . . . . . . . . . . . . . . . . . . . . . . . . . . . . 42 60
Total liabilities . . . . . . . . . . . . . . . . . . . . . . . . . . . . . . . . . . . . . . . . . . . . . . . . . . . 7,695 7,192
Total net liquid asset portfolio . . . . . . . . . . . . . . . . . . . . . . . . . . . . . . . . . . . . $38,936 $39,192
The liquid asset portfolio is denominated primarily in US dollars; investments in other currencies, net of theeffect of associated derivative instruments that convert non-US dollar securities into US dollar securities,represent 3.7% of the portfolio at June 30, 2018 (6.3% — June 30, 2017).
96
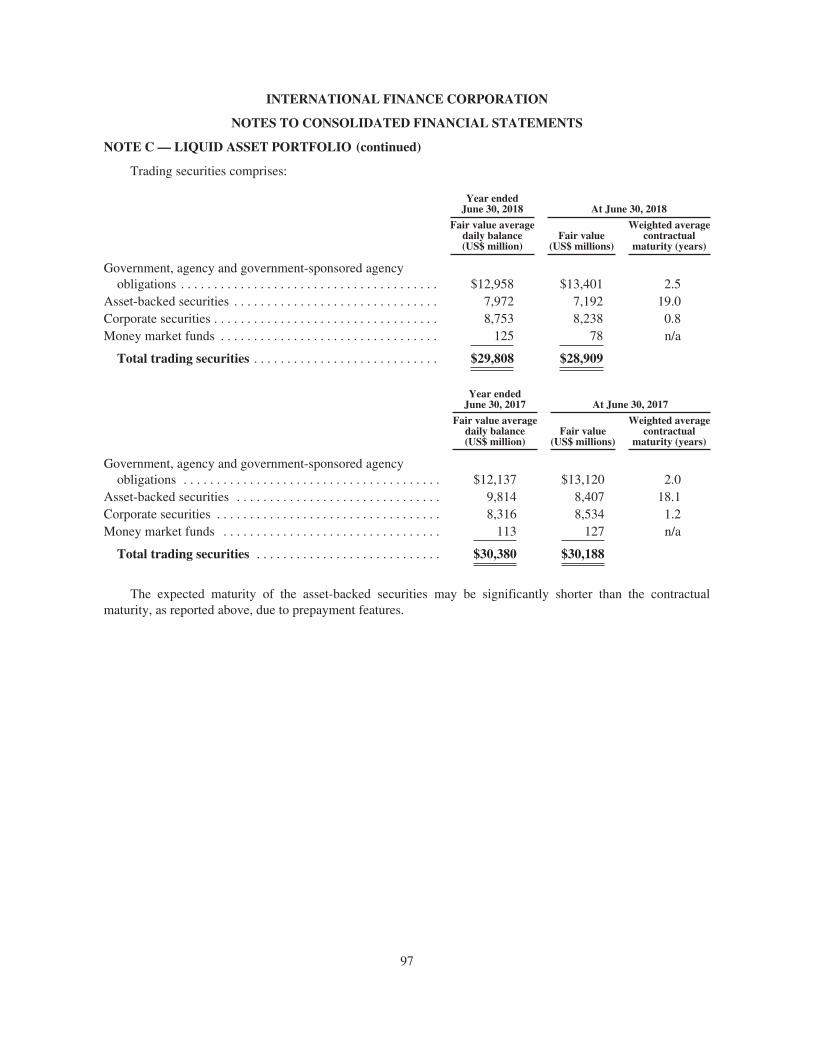
INTERNATIONAL FINANCE CORPORATION
NOTES TO CONSOLIDATED FINANCIAL STATEMENTS
NOTE C — LIQUID ASSET PORTFOLIO (continued)
Trading securities comprises:
Year endedJune 30, 2018 At June 30, 2018
Fair value averagedaily balance(US$ million)
Fair value(US$ millions)
Weighted averagecontractual
maturity (years)
Government, agency and government-sponsored agencyobligations . . . . . . . . . . . . . . . . . . . . . . . . . . . . . . . . . . . . . . . $12,958 $13,401 2.5
Asset-backed securities . . . . . . . . . . . . . . . . . . . . . . . . . . . . . . . 7,972 7,192 19.0Corporate securities . . . . . . . . . . . . . . . . . . . . . . . . . . . . . . . . . . 8,753 8,238 0.8Money market funds . . . . . . . . . . . . . . . . . . . . . . . . . . . . . . . . . 125 78 n/a
Total trading securities . . . . . . . . . . . . . . . . . . . . . . . . . . . . $29,808 $28,909
Year endedJune 30, 2017 At June 30, 2017
Fair value averagedaily balance(US$ million)
Fair value(US$ millions)
Weighted averagecontractual
maturity (years)
Government, agency and government-sponsored agencyobligations . . . . . . . . . . . . . . . . . . . . . . . . . . . . . . . . . . . . . . . $12,137 $13,120 2.0
Asset-backed securities . . . . . . . . . . . . . . . . . . . . . . . . . . . . . . . 9,814 8,407 18.1Corporate securities . . . . . . . . . . . . . . . . . . . . . . . . . . . . . . . . . . 8,316 8,534 1.2Money market funds . . . . . . . . . . . . . . . . . . . . . . . . . . . . . . . . . 113 127 n/a
Total trading securities . . . . . . . . . . . . . . . . . . . . . . . . . . . . $30,380 $30,188
The expected maturity of the asset-backed securities may be significantly shorter than the contractualmaturity, as reported above, due to prepayment features.
97
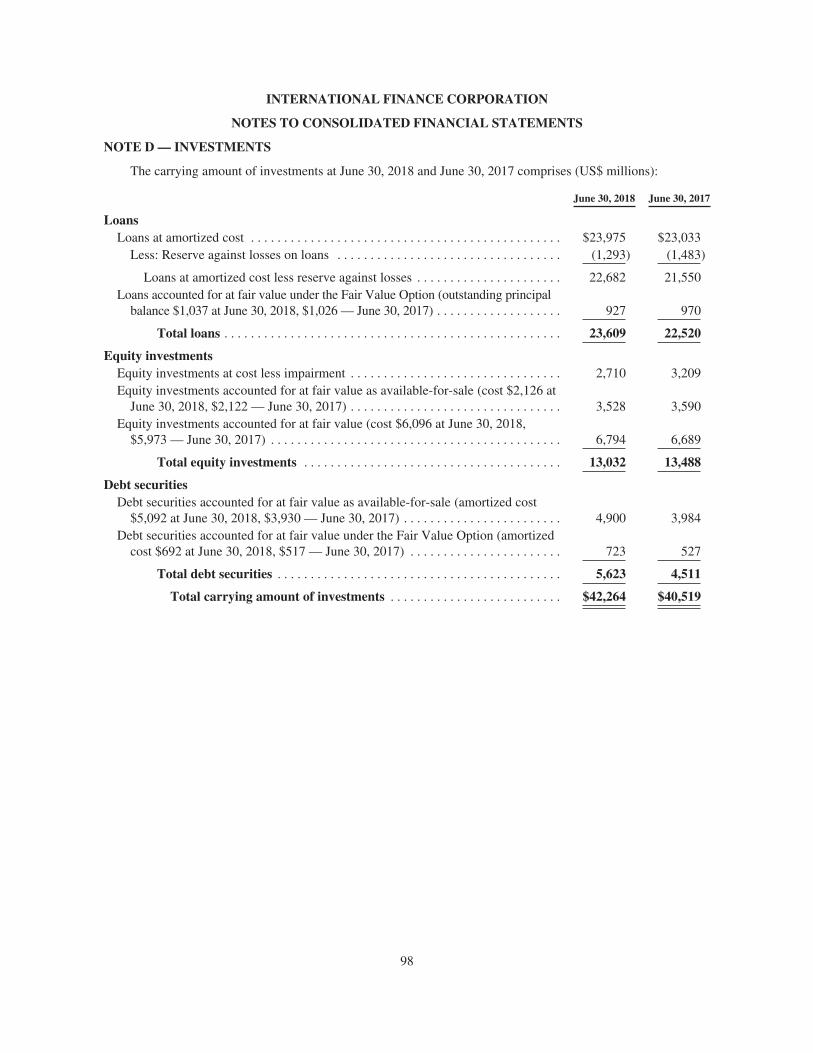
INTERNATIONAL FINANCE CORPORATION
NOTES TO CONSOLIDATED FINANCIAL STATEMENTS
NOTE D — INVESTMENTS
The carrying amount of investments at June 30, 2018 and June 30, 2017 comprises (US$ millions):
June 30, 2018 June 30, 2017
LoansLoans at amortized cost . . . . . . . . . . . . . . . . . . . . . . . . . . . . . . . . . . . . . . . . . . . . . . . $23,975 $23,033
Less: Reserve against losses on loans . . . . . . . . . . . . . . . . . . . . . . . . . . . . . . . . . . (1,293) (1,483)
Loans at amortized cost less reserve against losses . . . . . . . . . . . . . . . . . . . . . . 22,682 21,550Loans accounted for at fair value under the Fair Value Option (outstanding principal
balance $1,037 at June 30, 2018, $1,026 — June 30, 2017) . . . . . . . . . . . . . . . . . . . 927 970
Total loans . . . . . . . . . . . . . . . . . . . . . . . . . . . . . . . . . . . . . . . . . . . . . . . . . . . 23,609 22,520
Equity investmentsEquity investments at cost less impairment . . . . . . . . . . . . . . . . . . . . . . . . . . . . . . . . 2,710 3,209Equity investments accounted for at fair value as available-for-sale (cost $2,126 at
June 30, 2018, $2,122 — June 30, 2017) . . . . . . . . . . . . . . . . . . . . . . . . . . . . . . . . 3,528 3,590Equity investments accounted for at fair value (cost $6,096 at June 30, 2018,
$5,973 — June 30, 2017) . . . . . . . . . . . . . . . . . . . . . . . . . . . . . . . . . . . . . . . . . . . . 6,794 6,689
Total equity investments . . . . . . . . . . . . . . . . . . . . . . . . . . . . . . . . . . . . . . . 13,032 13,488
Debt securitiesDebt securities accounted for at fair value as available-for-sale (amortized cost
$5,092 at June 30, 2018, $3,930 — June 30, 2017) . . . . . . . . . . . . . . . . . . . . . . . . 4,900 3,984Debt securities accounted for at fair value under the Fair Value Option (amortized
cost $692 at June 30, 2018, $517 — June 30, 2017) . . . . . . . . . . . . . . . . . . . . . . . 723 527
Total debt securities . . . . . . . . . . . . . . . . . . . . . . . . . . . . . . . . . . . . . . . . . . . 5,623 4,511
Total carrying amount of investments . . . . . . . . . . . . . . . . . . . . . . . . . . $42,264 $40,519
98
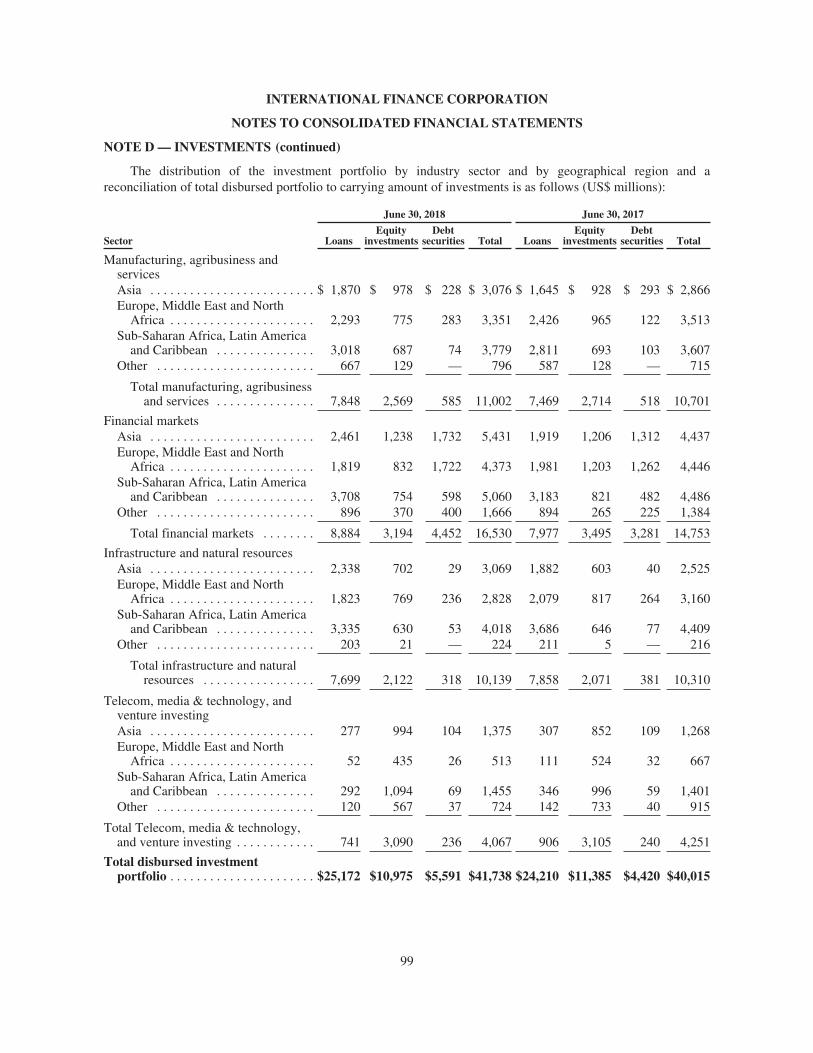
INTERNATIONAL FINANCE CORPORATION
NOTES TO CONSOLIDATED FINANCIAL STATEMENTS
NOTE D — INVESTMENTS (continued)
The distribution of the investment portfolio by industry sector and by geographical region and areconciliation of total disbursed portfolio to carrying amount of investments is as follows (US$ millions):
June 30, 2018 June 30, 2017
Sector LoansEquity
investmentsDebt
securities Total LoansEquity
investmentsDebt
securities Total
Manufacturing, agribusiness andservicesAsia . . . . . . . . . . . . . . . . . . . . . . . . . $ 1,870 $ 978 $ 228 $ 3,076 $ 1,645 $ 928 $ 293 $ 2,866Europe, Middle East and North
Africa . . . . . . . . . . . . . . . . . . . . . . 2,293 775 283 3,351 2,426 965 122 3,513Sub-Saharan Africa, Latin America
and Caribbean . . . . . . . . . . . . . . . 3,018 687 74 3,779 2,811 693 103 3,607Other . . . . . . . . . . . . . . . . . . . . . . . . 667 129 — 796 587 128 — 715
Total manufacturing, agribusinessand services . . . . . . . . . . . . . . . 7,848 2,569 585 11,002 7,469 2,714 518 10,701
Financial marketsAsia . . . . . . . . . . . . . . . . . . . . . . . . . 2,461 1,238 1,732 5,431 1,919 1,206 1,312 4,437Europe, Middle East and North
Africa . . . . . . . . . . . . . . . . . . . . . . 1,819 832 1,722 4,373 1,981 1,203 1,262 4,446Sub-Saharan Africa, Latin America
and Caribbean . . . . . . . . . . . . . . . 3,708 754 598 5,060 3,183 821 482 4,486Other . . . . . . . . . . . . . . . . . . . . . . . . 896 370 400 1,666 894 265 225 1,384
Total financial markets . . . . . . . . 8,884 3,194 4,452 16,530 7,977 3,495 3,281 14,753
Infrastructure and natural resourcesAsia . . . . . . . . . . . . . . . . . . . . . . . . . 2,338 702 29 3,069 1,882 603 40 2,525Europe, Middle East and North
Africa . . . . . . . . . . . . . . . . . . . . . . 1,823 769 236 2,828 2,079 817 264 3,160Sub-Saharan Africa, Latin America
and Caribbean . . . . . . . . . . . . . . . 3,335 630 53 4,018 3,686 646 77 4,409Other . . . . . . . . . . . . . . . . . . . . . . . . 203 21 — 224 211 5 — 216
Total infrastructure and naturalresources . . . . . . . . . . . . . . . . . 7,699 2,122 318 10,139 7,858 2,071 381 10,310
Telecom, media & technology, andventure investingAsia . . . . . . . . . . . . . . . . . . . . . . . . . 277 994 104 1,375 307 852 109 1,268Europe, Middle East and North
Africa . . . . . . . . . . . . . . . . . . . . . . 52 435 26 513 111 524 32 667Sub-Saharan Africa, Latin America
and Caribbean . . . . . . . . . . . . . . . 292 1,094 69 1,455 346 996 59 1,401Other . . . . . . . . . . . . . . . . . . . . . . . . 120 567 37 724 142 733 40 915
Total Telecom, media & technology,and venture investing . . . . . . . . . . . . 741 3,090 236 4,067 906 3,105 240 4,251
Total disbursed investmentportfolio . . . . . . . . . . . . . . . . . . . . . . $25,172 $10,975 $5,591 $41,738 $24,210 $11,385 $4,420 $40,015
99
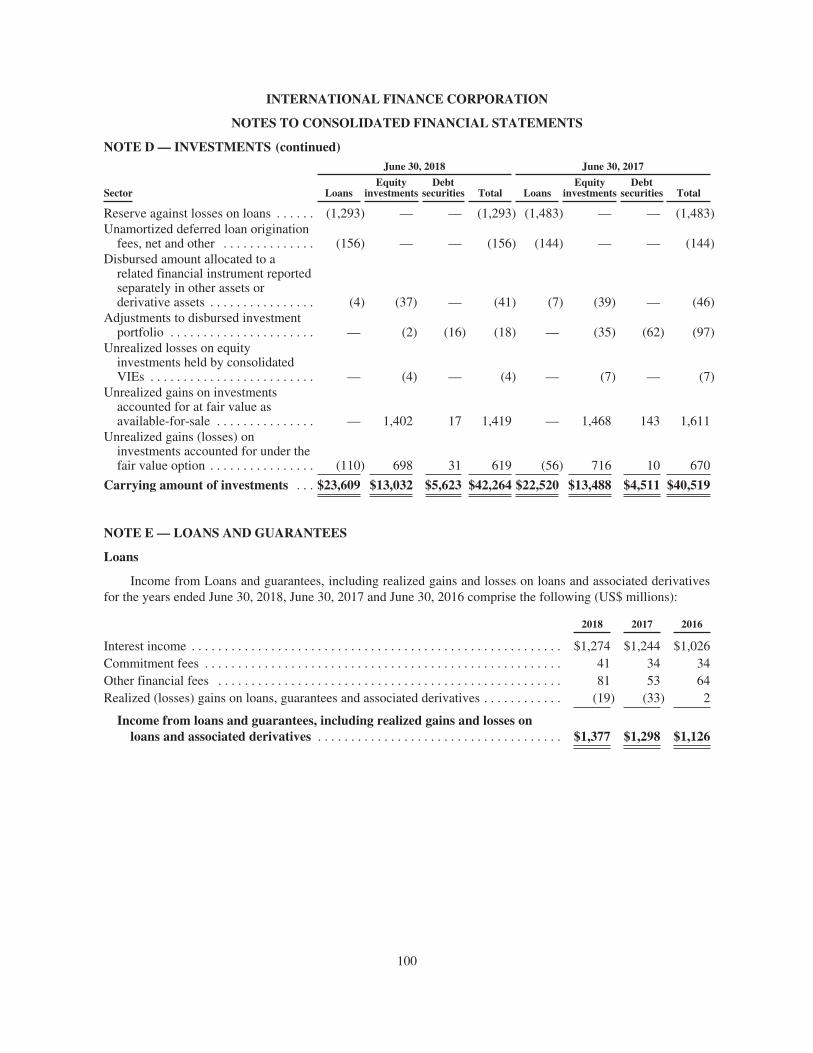
INTERNATIONAL FINANCE CORPORATION
NOTES TO CONSOLIDATED FINANCIAL STATEMENTS
NOTE D — INVESTMENTS (continued)June 30, 2018 June 30, 2017
Sector LoansEquity
investmentsDebt
securities Total LoansEquity
investmentsDebt
securities Total
Reserve against losses on loans . . . . . . (1,293) — — (1,293) (1,483) — — (1,483)Unamortized deferred loan origination
fees, net and other . . . . . . . . . . . . . . (156) — — (156) (144) — — (144)Disbursed amount allocated to a
related financial instrument reportedseparately in other assets orderivative assets . . . . . . . . . . . . . . . . (4) (37) — (41) (7) (39) — (46)
Adjustments to disbursed investmentportfolio . . . . . . . . . . . . . . . . . . . . . . — (2) (16) (18) — (35) (62) (97)
Unrealized losses on equityinvestments held by consolidatedVIEs . . . . . . . . . . . . . . . . . . . . . . . . . — (4) — (4) — (7) — (7)
Unrealized gains on investmentsaccounted for at fair value asavailable-for-sale . . . . . . . . . . . . . . . — 1,402 17 1,419 — 1,468 143 1,611
Unrealized gains (losses) oninvestments accounted for under thefair value option . . . . . . . . . . . . . . . . (110) 698 31 619 (56) 716 10 670
Carrying amount of investments . . . $23,609 $13,032 $5,623 $42,264 $22,520 $13,488 $4,511 $40,519
NOTE E — LOANS AND GUARANTEES
Loans
Income from Loans and guarantees, including realized gains and losses on loans and associated derivativesfor the years ended June 30, 2018, June 30, 2017 and June 30, 2016 comprise the following (US$ millions):
2018 2017 2016
Interest income . . . . . . . . . . . . . . . . . . . . . . . . . . . . . . . . . . . . . . . . . . . . . . . . . . . . . . . . $1,274 $1,244 $1,026Commitment fees . . . . . . . . . . . . . . . . . . . . . . . . . . . . . . . . . . . . . . . . . . . . . . . . . . . . . . 41 34 34Other financial fees . . . . . . . . . . . . . . . . . . . . . . . . . . . . . . . . . . . . . . . . . . . . . . . . . . . . 81 53 64Realized (losses) gains on loans, guarantees and associated derivatives . . . . . . . . . . . . (19) (33) 2
Income from loans and guarantees, including realized gains and losses onloans and associated derivatives . . . . . . . . . . . . . . . . . . . . . . . . . . . . . . . . . . . . . $1,377 $1,298 $1,126
100
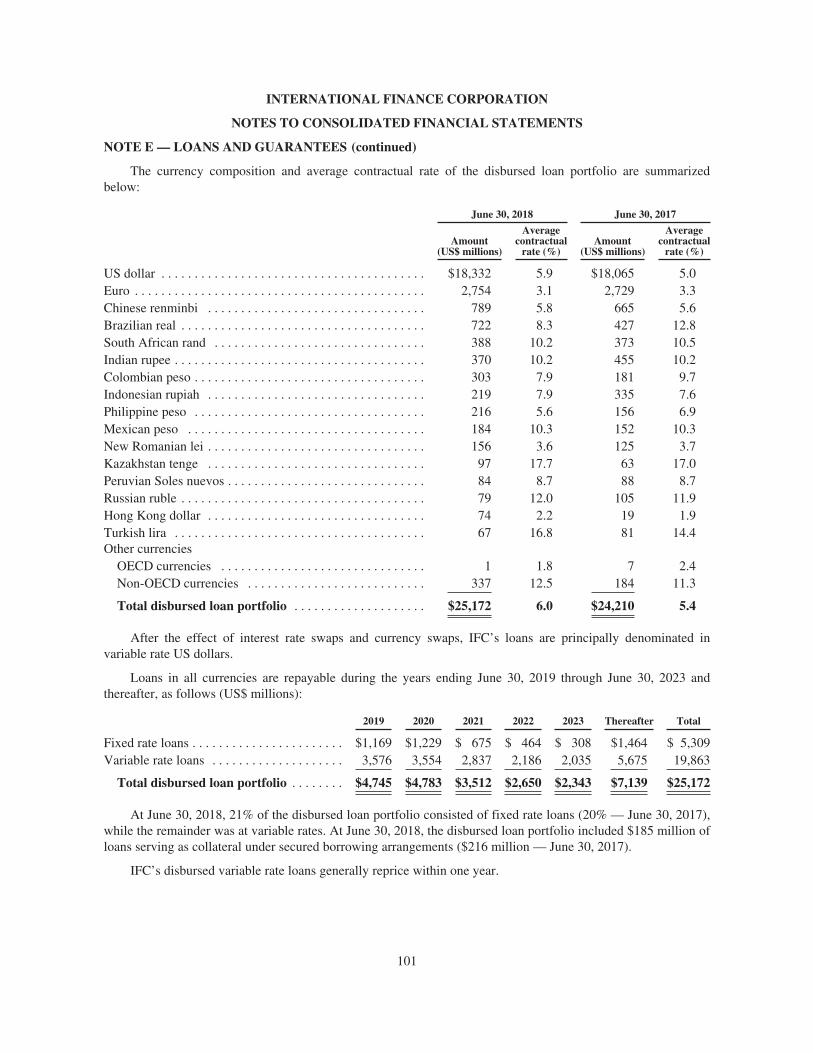
INTERNATIONAL FINANCE CORPORATION
NOTES TO CONSOLIDATED FINANCIAL STATEMENTS
NOTE E — LOANS AND GUARANTEES (continued)
The currency composition and average contractual rate of the disbursed loan portfolio are summarizedbelow:
June 30, 2018 June 30, 2017
Amount(US$ millions)
Averagecontractual
rate (%)Amount
(US$ millions)
Averagecontractual
rate (%)
US dollar . . . . . . . . . . . . . . . . . . . . . . . . . . . . . . . . . . . . . . . . $18,332 5.9 $18,065 5.0Euro . . . . . . . . . . . . . . . . . . . . . . . . . . . . . . . . . . . . . . . . . . . . 2,754 3.1 2,729 3.3Chinese renminbi . . . . . . . . . . . . . . . . . . . . . . . . . . . . . . . . . 789 5.8 665 5.6Brazilian real . . . . . . . . . . . . . . . . . . . . . . . . . . . . . . . . . . . . . 722 8.3 427 12.8South African rand . . . . . . . . . . . . . . . . . . . . . . . . . . . . . . . . 388 10.2 373 10.5Indian rupee . . . . . . . . . . . . . . . . . . . . . . . . . . . . . . . . . . . . . . 370 10.2 455 10.2Colombian peso . . . . . . . . . . . . . . . . . . . . . . . . . . . . . . . . . . . 303 7.9 181 9.7Indonesian rupiah . . . . . . . . . . . . . . . . . . . . . . . . . . . . . . . . . 219 7.9 335 7.6Philippine peso . . . . . . . . . . . . . . . . . . . . . . . . . . . . . . . . . . . 216 5.6 156 6.9Mexican peso . . . . . . . . . . . . . . . . . . . . . . . . . . . . . . . . . . . . 184 10.3 152 10.3New Romanian lei . . . . . . . . . . . . . . . . . . . . . . . . . . . . . . . . . 156 3.6 125 3.7Kazakhstan tenge . . . . . . . . . . . . . . . . . . . . . . . . . . . . . . . . . 97 17.7 63 17.0Peruvian Soles nuevos . . . . . . . . . . . . . . . . . . . . . . . . . . . . . . 84 8.7 88 8.7Russian ruble . . . . . . . . . . . . . . . . . . . . . . . . . . . . . . . . . . . . . 79 12.0 105 11.9Hong Kong dollar . . . . . . . . . . . . . . . . . . . . . . . . . . . . . . . . . 74 2.2 19 1.9Turkish lira . . . . . . . . . . . . . . . . . . . . . . . . . . . . . . . . . . . . . . 67 16.8 81 14.4Other currencies
OECD currencies . . . . . . . . . . . . . . . . . . . . . . . . . . . . . . . 1 1.8 7 2.4Non-OECD currencies . . . . . . . . . . . . . . . . . . . . . . . . . . . 337 12.5 184 11.3
Total disbursed loan portfolio . . . . . . . . . . . . . . . . . . . . $25,172 6.0 $24,210 5.4
After the effect of interest rate swaps and currency swaps, IFC’s loans are principally denominated invariable rate US dollars.
Loans in all currencies are repayable during the years ending June 30, 2019 through June 30, 2023 andthereafter, as follows (US$ millions):
2019 2020 2021 2022 2023 Thereafter Total
Fixed rate loans . . . . . . . . . . . . . . . . . . . . . . . $1,169 $1,229 $ 675 $ 464 $ 308 $1,464 $ 5,309Variable rate loans . . . . . . . . . . . . . . . . . . . . 3,576 3,554 2,837 2,186 2,035 5,675 19,863
Total disbursed loan portfolio . . . . . . . . $4,745 $4,783 $3,512 $2,650 $2,343 $7,139 $25,172
At June 30, 2018, 21% of the disbursed loan portfolio consisted of fixed rate loans (20% — June 30, 2017),while the remainder was at variable rates. At June 30, 2018, the disbursed loan portfolio included $185 million ofloans serving as collateral under secured borrowing arrangements ($216 million — June 30, 2017).
IFC’s disbursed variable rate loans generally reprice within one year.
101
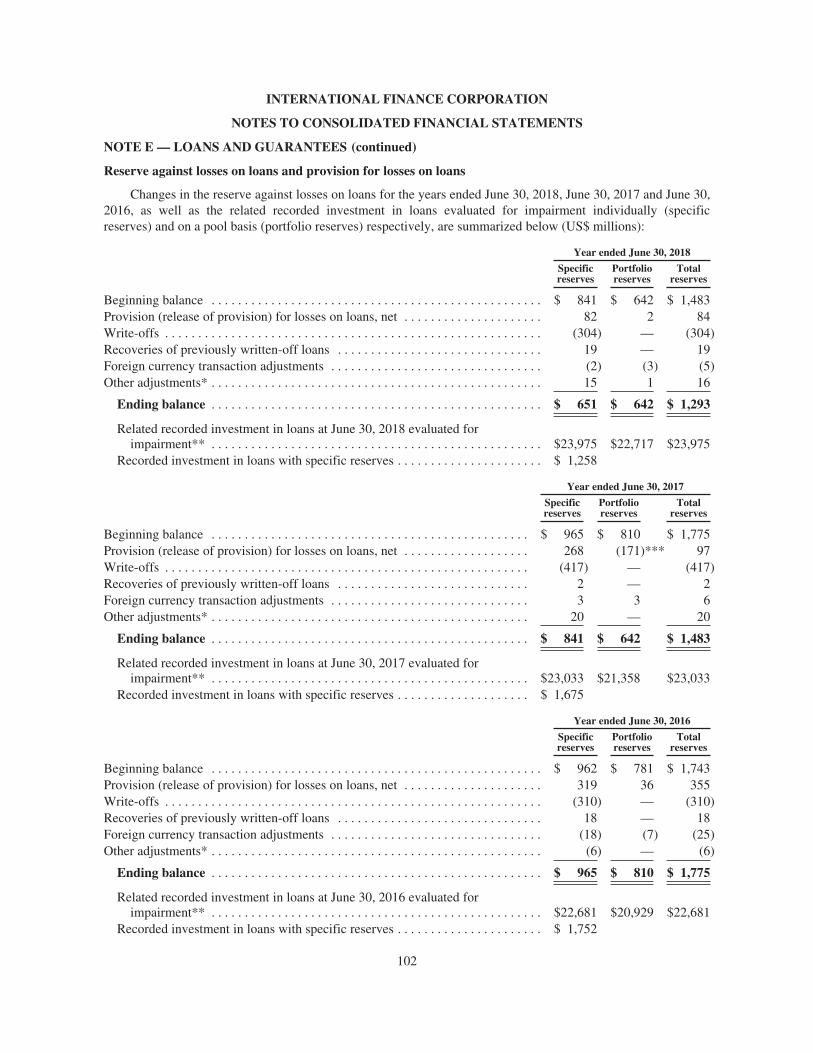
INTERNATIONAL FINANCE CORPORATION
NOTES TO CONSOLIDATED FINANCIAL STATEMENTS
NOTE E — LOANS AND GUARANTEES (continued)
Reserve against losses on loans and provision for losses on loans
Changes in the reserve against losses on loans for the years ended June 30, 2018, June 30, 2017 and June 30,2016, as well as the related recorded investment in loans evaluated for impairment individually (specificreserves) and on a pool basis (portfolio reserves) respectively, are summarized below (US$ millions):
Year ended June 30, 2018
Specificreserves
Portfolioreserves
Totalreserves
Beginning balance . . . . . . . . . . . . . . . . . . . . . . . . . . . . . . . . . . . . . . . . . . . . . . . . . . $ 841 $ 642 $ 1,483Provision (release of provision) for losses on loans, net . . . . . . . . . . . . . . . . . . . . . 82 2 84Write-offs . . . . . . . . . . . . . . . . . . . . . . . . . . . . . . . . . . . . . . . . . . . . . . . . . . . . . . . . . (304) — (304)Recoveries of previously written-off loans . . . . . . . . . . . . . . . . . . . . . . . . . . . . . . . 19 — 19Foreign currency transaction adjustments . . . . . . . . . . . . . . . . . . . . . . . . . . . . . . . . (2) (3) (5)Other adjustments* . . . . . . . . . . . . . . . . . . . . . . . . . . . . . . . . . . . . . . . . . . . . . . . . . . 15 1 16
Ending balance . . . . . . . . . . . . . . . . . . . . . . . . . . . . . . . . . . . . . . . . . . . . . . . . . . $ 651 $ 642 $ 1,293
Related recorded investment in loans at June 30, 2018 evaluated forimpairment** . . . . . . . . . . . . . . . . . . . . . . . . . . . . . . . . . . . . . . . . . . . . . . . . . . $23,975 $22,717 $23,975
Recorded investment in loans with specific reserves . . . . . . . . . . . . . . . . . . . . . . $ 1,258
Year ended June 30, 2017
Specificreserves
Portfolioreserves
Totalreserves
Beginning balance . . . . . . . . . . . . . . . . . . . . . . . . . . . . . . . . . . . . . . . . . . . . . . . . $ 965 $ 810 $ 1,775Provision (release of provision) for losses on loans, net . . . . . . . . . . . . . . . . . . . 268 (171)*** 97Write-offs . . . . . . . . . . . . . . . . . . . . . . . . . . . . . . . . . . . . . . . . . . . . . . . . . . . . . . . (417) — (417)Recoveries of previously written-off loans . . . . . . . . . . . . . . . . . . . . . . . . . . . . . 2 — 2Foreign currency transaction adjustments . . . . . . . . . . . . . . . . . . . . . . . . . . . . . . 3 3 6Other adjustments* . . . . . . . . . . . . . . . . . . . . . . . . . . . . . . . . . . . . . . . . . . . . . . . . 20 — 20
Ending balance . . . . . . . . . . . . . . . . . . . . . . . . . . . . . . . . . . . . . . . . . . . . . . . . $ 841 $ 642 $ 1,483
Related recorded investment in loans at June 30, 2017 evaluated forimpairment** . . . . . . . . . . . . . . . . . . . . . . . . . . . . . . . . . . . . . . . . . . . . . . . . $23,033 $21,358 $23,033
Recorded investment in loans with specific reserves . . . . . . . . . . . . . . . . . . . . $ 1,675
Year ended June 30, 2016
Specificreserves
Portfolioreserves
Totalreserves
Beginning balance . . . . . . . . . . . . . . . . . . . . . . . . . . . . . . . . . . . . . . . . . . . . . . . . . . $ 962 $ 781 $ 1,743Provision (release of provision) for losses on loans, net . . . . . . . . . . . . . . . . . . . . . 319 36 355Write-offs . . . . . . . . . . . . . . . . . . . . . . . . . . . . . . . . . . . . . . . . . . . . . . . . . . . . . . . . . (310) — (310)Recoveries of previously written-off loans . . . . . . . . . . . . . . . . . . . . . . . . . . . . . . . 18 — 18Foreign currency transaction adjustments . . . . . . . . . . . . . . . . . . . . . . . . . . . . . . . . (18) (7) (25)Other adjustments* . . . . . . . . . . . . . . . . . . . . . . . . . . . . . . . . . . . . . . . . . . . . . . . . . . (6) — (6)
Ending balance . . . . . . . . . . . . . . . . . . . . . . . . . . . . . . . . . . . . . . . . . . . . . . . . . . $ 965 $ 810 $ 1,775
Related recorded investment in loans at June 30, 2016 evaluated forimpairment** . . . . . . . . . . . . . . . . . . . . . . . . . . . . . . . . . . . . . . . . . . . . . . . . . . $22,681 $20,929 $22,681
Recorded investment in loans with specific reserves . . . . . . . . . . . . . . . . . . . . . . $ 1,752
102
INTERNATIONAL FINANCE CORPORATION
NOTES TO CONSOLIDATED FINANCIAL STATEMENTS
NOTE E — LOANS AND GUARANTEES (continued)
* Other adjustments comprise reserves against interest capitalized as part of a debt restructuring.** IFC individually evaluates all loans for impairment. Portfolio reserves are established for losses incurred, but not specifically identifiable, on loans for
which no specific reserve is established.*** Includes $156 million release of provision in FY17 Q3 due to a change in estimate as a result of reviewing IFC’s methodology for estimating the portfolio
reserves against losses, in particular the probability of default and loss given default, pursuant to the implementation of a new Investment Risk Platform(IRP), which replaced IFC’s previous credit risk rating system.
Reserve for losses on guarantees and other receivables and provision for losses on guarantees and otherreceivables
Changes in the reserve against losses on guarantees for the years ended June 30, 2018, June 30, 2017 andJune 30, 2016, are summarized below (US$ millions):
2018 2017 2016
Beginning balance . . . . . . . . . . . . . . . . . . . . . . . . . . . . . . . . . . . . . . . . . . . . . . . . . . . . . . . . . . $ 12 $ 23 $ 20Provision (release of provision) for losses on guarantees . . . . . . . . . . . . . . . . . . . . . . . . . . . . 3 (11) 3
Ending balance . . . . . . . . . . . . . . . . . . . . . . . . . . . . . . . . . . . . . . . . . . . . . . . . . . . . . . . . . $ 15 $ 12 $ 23
Changes in the reserve against losses on other receivables for the years ended June 30, 2018, June 30, 2017and June 30, 2016, are summarized below (US$ millions):
2018 2017 2016
Beginning balance . . . . . . . . . . . . . . . . . . . . . . . . . . . . . . . . . . . . . . . . . . . . . . . . . . . . . . . . . . . . $ 8 $ 8 $ 7Provision (release of provision) for losses on other receivables . . . . . . . . . . . . . . . . . . . . . . . . . (4) * 1Write-offs . . . . . . . . . . . . . . . . . . . . . . . . . . . . . . . . . . . . . . . . . . . . . . . . . . . . . . . . . . . . . . . . . . . (2) — —Foreign currency transaction adjustments . . . . . . . . . . . . . . . . . . . . . . . . . . . . . . . . . . . . . . . . . . (1) — —
Ending balance . . . . . . . . . . . . . . . . . . . . . . . . . . . . . . . . . . . . . . . . . . . . . . . . . . . . . . . . . . . . $ 1 $ 8 $ 8
* Less than $0.5 million.
Provision (release of provision) for losses on loans, guarantees, accrued interest and other receivablesincludes $7 million of provision for accrued interest in the year ended 30 June, 2018 ($0 for the years ended30 June, 2017 and 2016).
Impaired loans
The average recorded investment and the recorded investment in loans at amortized cost that are impaired atJune 30, 2018 and June 30, 2017 are as follows (US$ millions):
June 30, 2018 June 30, 2017
Average recorded investment in loans at amortized cost that are impaired . . . . . . . . . $1,357 $1,792Recorded investment in loans at amortized cost that are impaired . . . . . . . . . . . . . . . . 1,258 1,675
103

INTERNATIONAL FINANCE CORPORATION
NOTES TO CONSOLIDATED FINANCIAL STATEMENTS
NOTE E — LOANS AND GUARANTEES (continued)
Loans at amortized cost that are impaired with specific reserves are summarized by industry sector andgeographic region as follows (US$ millions):
June 30, 2018
Recordedinvestment
Unpaidprincipalbalance
Relatedspecificreserve
Averagerecorded
investment
Interestincome
recognized
Manufacturing, agribusiness and servicesAsia . . . . . . . . . . . . . . . . . . . . . . . . . . . . . . . . . . . . . . . . . $ 74 $ 177 $ 40 $ 86 $ 2Europe, Middle East and North Africa . . . . . . . . . . . . . . 278 354 118 315 4Sub-Saharan Africa, Latin America and Caribbean . . . . 158 177 64 163 7Other . . . . . . . . . . . . . . . . . . . . . . . . . . . . . . . . . . . . . . . . — 15 — — —
Total manufacturing, agribusiness and services . . . . . 510 723 222 564 13
Financial marketsAsia . . . . . . . . . . . . . . . . . . . . . . . . . . . . . . . . . . . . . . . . . — 2 — — —Europe, Middle East and North Africa . . . . . . . . . . . . . . 17 26 17 27 2Sub-Saharan Africa, Latin America and Caribbean . . . . 41 69 37 46 1
Total financial markets . . . . . . . . . . . . . . . . . . . . . . . . 58 97 54 73 3
Infrastructure and natural resourcesAsia . . . . . . . . . . . . . . . . . . . . . . . . . . . . . . . . . . . . . . . . . 109 131 77 95 —Europe, Middle East and North Africa . . . . . . . . . . . . . . 186 211 127 188 2Sub-Saharan Africa, Latin America and Caribbean . . . . 317 364 146 353 6
Total infrastructure and natural resources . . . . . . . . . . 612 706 350 636 8
Telecom, media & technology, and venture investingAsia . . . . . . . . . . . . . . . . . . . . . . . . . . . . . . . . . . . . . . . . . 46 46 10 46 —
Europe, Middle East and North Africa . . . . . . . . . . . . 12 12 1 17 1Sub-Saharan Africa, Latin America and Caribbean . . 20 20 14 21 —
Total Telecom, media & technology, and ventureinvesting . . . . . . . . . . . . . . . . . . . . . . . . . . . . . . . . . . 78 78 25 84 1
Total $1,258 $1,604 $651 $1,357 $25
104
INTERNATIONAL FINANCE CORPORATION
NOTES TO CONSOLIDATED FINANCIAL STATEMENTS
NOTE E — LOANS AND GUARANTEES (continued)
All impaired loans at June 30, 2018 had specific reserves.June 30, 2017
Recordedinvestment
Unpaidprincipalbalance
Relatedspecificreserve
Averagerecorded
investment
Interestincome
recognized
Manufacturing, agribusiness and servicesAsia . . . . . . . . . . . . . . . . . . . . . . . . . . . . . . . . . . . . . . . . . $ 101 $ 153 $ 84 $ 102 $ 1Europe, Middle East and North Africa . . . . . . . . . . . . . . 447 682 226 600 12Sub-Saharan Africa, Latin America and Caribbean . . . . 167 189 58 167 9Other . . . . . . . . . . . . . . . . . . . . . . . . . . . . . . . . . . . . . . . . — 15 — 10 —
Total manufacturing, agribusiness and services . . . . . 715 1,039 368 879 22
Financial marketsAsia . . . . . . . . . . . . . . . . . . . . . . . . . . . . . . . . . . . . . . . . . — 2 — — —Europe, Middle East and North Africa . . . . . . . . . . . . . . 33 38 18 35 3Sub-Saharan Africa, Latin America and Caribbean . . . . 45 70 15 43 1
Total financial markets . . . . . . . . . . . . . . . . . . . . . . . . 78 110 33 78 4
Infrastructure and natural resourcesAsia . . . . . . . . . . . . . . . . . . . . . . . . . . . . . . . . . . . . . . . . . 105 119 67 112 —Europe, Middle East and North Africa . . . . . . . . . . . . . . 167 176 108 155 4Sub-Saharan Africa, Latin America and Caribbean . . . . 524 535 241 478 20
Total infrastructure and natural resources . . . . . . . . . . 796 830 416 745 24
Telecom, media & technology, and venture investingEurope, Middle East and North Africa . . . . . . . . . . . . . . 65 65 13 68 3Sub-Saharan Africa, Latin America and Caribbean . . . . 21 21 11 22 1
Total Telecom, media & technology, and ventureinvesting . . . . . . . . . . . . . . . . . . . . . . . . . . . . . . . . . . 86 86 24 90 4
Total . . . . . . . . . . . . . . . . . . . . . . . . . . . . . . . . . . . . $1,675 $2,065 $841 $1,792 $54
All impaired loans at June 30, 2017 had specific reserves.
Nonaccruing loans
Loans on which the accrual of interest has been discontinued amounted to $1,377 million at June 30, 2018($1,421 million — June 30, 2017). The interest income on such loans for the years ended June 30, 2018, June 30,2017 and June 30, 2016 is summarized as follows (US$ millions):
2018 2017 2016
Interest income not recognized on nonaccruing loans . . . . . . . . . . . . . . . . . . . . . . . . . . . . . . . . . 201 121 157Interest income recognized on loans in nonaccrual status related to current and prior years, on
a cash basis . . . . . . . . . . . . . . . . . . . . . . . . . . . . . . . . . . . . . . . . . . . . . . . . . . . . . . . . . . . . . . . . 48 41 34
105
INTERNATIONAL FINANCE CORPORATION
NOTES TO CONSOLIDATED FINANCIAL STATEMENTS
NOTE E — LOANS AND GUARANTEES (continued)
The recorded investment in nonaccruing loans at amortized cost at June 30, 2018 and June 30, 2017 issummarized by industry sector and geographic region as follow (US$ millions):
June 30, 2018
Manufacturing,agribusinessand services
Financialmarkets
Infrastructureand naturalresources
Telecom,media &
technology,and venture
investing
Totalrecorded
investment innonaccruing
loans
Asia . . . . . . . . . . . . . . . . . . . . . . . . . . . . . . . . . $ 71 $ — $123 $46 $ 240Europe, Middle East and North Africa . . . . . . 257 35 236 20 548Sub-Saharan Africa, Latin America and
Caribbean . . . . . . . . . . . . . . . . . . . . . . . . . . 242 53 295 20 610Other . . . . . . . . . . . . . . . . . . . . . . . . . . . . . . . . — — — 2 2
Total disbursed loans at amortizedcost . . . . . . . . . . . . . . . . . . . . . . . . . . . . . $570 $ 88 $654 $88 $1,400
June 30, 2017
Manufacturing,agribusinessand services
Financialmarkets
Infrastructureand naturalresources
Telecom,media &
technology,and venture
investing
Totalrecorded
investment innonaccruing
loans
Asia . . . . . . . . . . . . . . . . . . . . . . . . . . . . . . . . . $106 $ — $105 $ — $ 211Europe, Middle East and North Africa . . . . . . 392 33 129 64 618Sub-Saharan Africa, Latin America and
Caribbean . . . . . . . . . . . . . . . . . . . . . . . . . . 165 45 271 22 503
Total disbursed loans at amortizedcost . . . . . . . . . . . . . . . . . . . . . . . . . . . . . $663 $ 78 $505 $ 86 $1,332
106
INTERNATIONAL FINANCE CORPORATION
NOTES TO CONSOLIDATED FINANCIAL STATEMENTS
NOTE E — LOANS AND GUARANTEES (continued)
Past due loans
An age analysis, based on contractual terms, of IFC’s loans at amortized cost by industry sector andgeographic region follows (US$ millions):
June 30, 2018
30-59days
past due
60-89days
past due
90 daysor greaterpast due
Totalpast due Current
Totalloans
Manufacturing, agribusiness and servicesAsia . . . . . . . . . . . . . . . . . . . . . . . . . . . . . . . . . . . . . . . . . . $ — $ — $ 54 $ 54 $ 1,790 $ 1,844Europe, Middle East and North Africa . . . . . . . . . . . . . . . — 14 184 198 2,049 2,247Sub-Saharan Africa, Latin America and Caribbean . . . . . 14 5 150 169 2,734 2,903Other . . . . . . . . . . . . . . . . . . . . . . . . . . . . . . . . . . . . . . . . . — — — — 667 667
Total manufacturing, agribusiness and services . . . . . . 14 19 388 421 7,240 7,661
Financial marketsAsia . . . . . . . . . . . . . . . . . . . . . . . . . . . . . . . . . . . . . . . . . . — — — — 2,371 2,371Europe, Middle East and North Africa . . . . . . . . . . . . . . . — — 2 2 1,797 1,799Sub-Saharan Africa, Latin America and Caribbean . . . . . — 2 26 28 3,602 3,630Other . . . . . . . . . . . . . . . . . . . . . . . . . . . . . . . . . . . . . . . . . — — — — 897 897
Total financial markets . . . . . . . . . . . . . . . . . . . . . . . . . — 2 28 30 8,667 8,697
Infrastructure and natural resourcesAsia . . . . . . . . . . . . . . . . . . . . . . . . . . . . . . . . . . . . . . . . . . — — 62 62 2,128 2,190Europe, Middle East and North Africa . . . . . . . . . . . . . . . 34 — 146 180 1,339 1,519Sub-Saharan Africa, Latin America and Caribbean . . . . . — — 88 88 3,185 3,273Other . . . . . . . . . . . . . . . . . . . . . . . . . . . . . . . . . . . . . . . . . — — — — 202 202
Total infrastructure and natural resources . . . . . . . . . . . 34 — 296 330 6,854 7,184
Telecom, media & technology, and venture investingAsia . . . . . . . . . . . . . . . . . . . . . . . . . . . . . . . . . . . . . . . . . . — — 46 46 226 272Europe, Middle East and North Africa . . . . . . . . . . . . . . . — — — — 45 45Sub-Saharan Africa, Latin America and Caribbean . . . . . — — 16 16 260 276
Total Telecom, media & technology, and ventureinvesting . . . . . . . . . . . . . . . . . . . . . . . . . . . . . . . . . . — — 62 62 531 593
Total disbursed loans at amortized cost . . . . . . . . $ 48 $ 21 $774 $843 $23,292 $24,135
Unamortized deferred loan origination fees, net andother . . . . . . . . . . . . . . . . . . . . . . . . . . . . . . . . . . . . . . . . . . (156)
Disbursed amount allocated to a related financialinstrument reported separately in other assets orderivative assets . . . . . . . . . . . . . . . . . . . . . . . . . . . . . . . . (4)
Recorded investment in loans at amortized cost . . . . . . . $23,975
At June 30, 2018, loans 90 days or greater past due still accruing were insignificant.
107
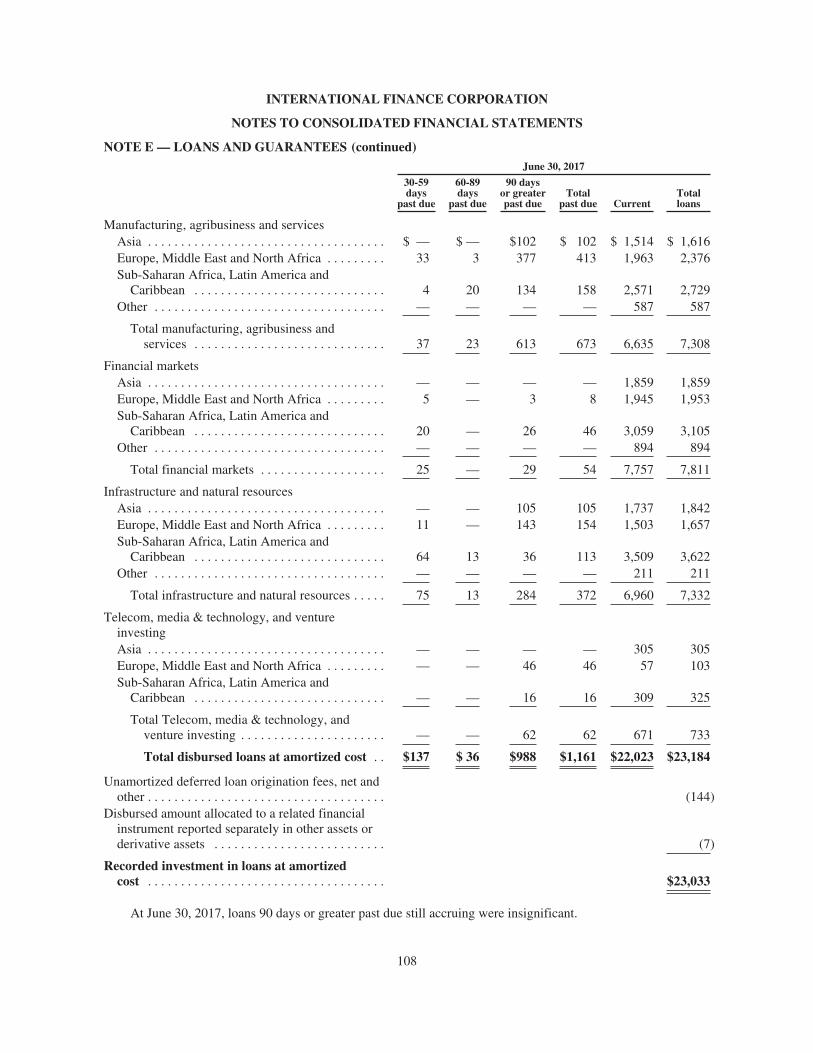
INTERNATIONAL FINANCE CORPORATION
NOTES TO CONSOLIDATED FINANCIAL STATEMENTS
NOTE E — LOANS AND GUARANTEES (continued)June 30, 2017
30-59days
past due
60-89days
past due
90 daysor greaterpast due
Totalpast due Current
Totalloans
Manufacturing, agribusiness and servicesAsia . . . . . . . . . . . . . . . . . . . . . . . . . . . . . . . . . . . . $ — $ — $102 $ 102 $ 1,514 $ 1,616Europe, Middle East and North Africa . . . . . . . . . 33 3 377 413 1,963 2,376Sub-Saharan Africa, Latin America and
Caribbean . . . . . . . . . . . . . . . . . . . . . . . . . . . . . 4 20 134 158 2,571 2,729Other . . . . . . . . . . . . . . . . . . . . . . . . . . . . . . . . . . . — — — — 587 587
Total manufacturing, agribusiness andservices . . . . . . . . . . . . . . . . . . . . . . . . . . . . . 37 23 613 673 6,635 7,308
Financial marketsAsia . . . . . . . . . . . . . . . . . . . . . . . . . . . . . . . . . . . . — — — — 1,859 1,859Europe, Middle East and North Africa . . . . . . . . . 5 — 3 8 1,945 1,953Sub-Saharan Africa, Latin America and
Caribbean . . . . . . . . . . . . . . . . . . . . . . . . . . . . . 20 — 26 46 3,059 3,105Other . . . . . . . . . . . . . . . . . . . . . . . . . . . . . . . . . . . — — — — 894 894
Total financial markets . . . . . . . . . . . . . . . . . . . 25 — 29 54 7,757 7,811
Infrastructure and natural resourcesAsia . . . . . . . . . . . . . . . . . . . . . . . . . . . . . . . . . . . . — — 105 105 1,737 1,842Europe, Middle East and North Africa . . . . . . . . . 11 — 143 154 1,503 1,657Sub-Saharan Africa, Latin America and
Caribbean . . . . . . . . . . . . . . . . . . . . . . . . . . . . . 64 13 36 113 3,509 3,622Other . . . . . . . . . . . . . . . . . . . . . . . . . . . . . . . . . . . — — — — 211 211
Total infrastructure and natural resources . . . . . 75 13 284 372 6,960 7,332
Telecom, media & technology, and ventureinvestingAsia . . . . . . . . . . . . . . . . . . . . . . . . . . . . . . . . . . . . — — — — 305 305Europe, Middle East and North Africa . . . . . . . . . — — 46 46 57 103Sub-Saharan Africa, Latin America and
Caribbean . . . . . . . . . . . . . . . . . . . . . . . . . . . . . — — 16 16 309 325
Total Telecom, media & technology, andventure investing . . . . . . . . . . . . . . . . . . . . . . — — 62 62 671 733
Total disbursed loans at amortized cost . . $137 $ 36 $988 $1,161 $22,023 $23,184
Unamortized deferred loan origination fees, net andother . . . . . . . . . . . . . . . . . . . . . . . . . . . . . . . . . . . . (144)
Disbursed amount allocated to a related financialinstrument reported separately in other assets orderivative assets . . . . . . . . . . . . . . . . . . . . . . . . . . (7)
Recorded investment in loans at amortizedcost . . . . . . . . . . . . . . . . . . . . . . . . . . . . . . . . . . . . $23,033
At June 30, 2017, loans 90 days or greater past due still accruing were insignificant.
108
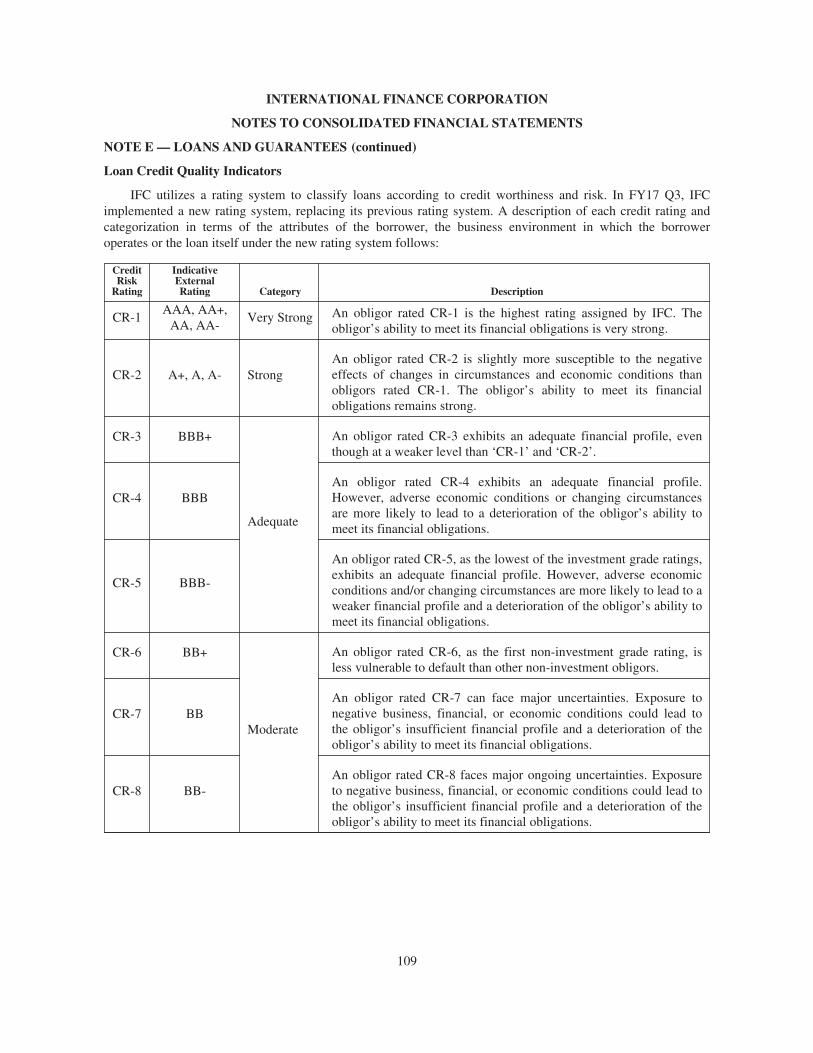
INTERNATIONAL FINANCE CORPORATION
NOTES TO CONSOLIDATED FINANCIAL STATEMENTS
NOTE E — LOANS AND GUARANTEES (continued)
Loan Credit Quality Indicators
IFC utilizes a rating system to classify loans according to credit worthiness and risk. In FY17 Q3, IFCimplemented a new rating system, replacing its previous rating system. A description of each credit rating andcategorization in terms of the attributes of the borrower, the business environment in which the borroweroperates or the loan itself under the new rating system follows:
CreditRisk
Rating
IndicativeExternalRating Category Description
CR-1AAA, AA+,
AA, AA-Very Strong An obligor rated CR-1 is the highest rating assigned by IFC. The
obligor’s ability to meet its financial obligations is very strong.
CR-2 A+, A, A- StrongAn obligor rated CR-2 is slightly more susceptible to the negativeeffects of changes in circumstances and economic conditions thanobligors rated CR-1. The obligor’s ability to meet its financialobligations remains strong.
CR-3 BBB+
Adequate
An obligor rated CR-3 exhibits an adequate financial profile, eventhough at a weaker level than ‘CR-1’ and ‘CR-2’.
CR-4 BBBAn obligor rated CR-4 exhibits an adequate financial profile.However, adverse economic conditions or changing circumstancesare more likely to lead to a deterioration of the obligor’s ability tomeet its financial obligations.
CR-5 BBB-
An obligor rated CR-5, as the lowest of the investment grade ratings,exhibits an adequate financial profile. However, adverse economicconditions and/or changing circumstances are more likely to lead to aweaker financial profile and a deterioration of the obligor’s ability tomeet its financial obligations.
CR-6 BB+
Moderate
An obligor rated CR-6, as the first non-investment grade rating, isless vulnerable to default than other non-investment obligors.
CR-7 BBAn obligor rated CR-7 can face major uncertainties. Exposure tonegative business, financial, or economic conditions could lead tothe obligor’s insufficient financial profile and a deterioration of theobligor’s ability to meet its financial obligations.
CR-8 BB-An obligor rated CR-8 faces major ongoing uncertainties. Exposureto negative business, financial, or economic conditions could lead tothe obligor’s insufficient financial profile and a deterioration of theobligor’s ability to meet its financial obligations.
109
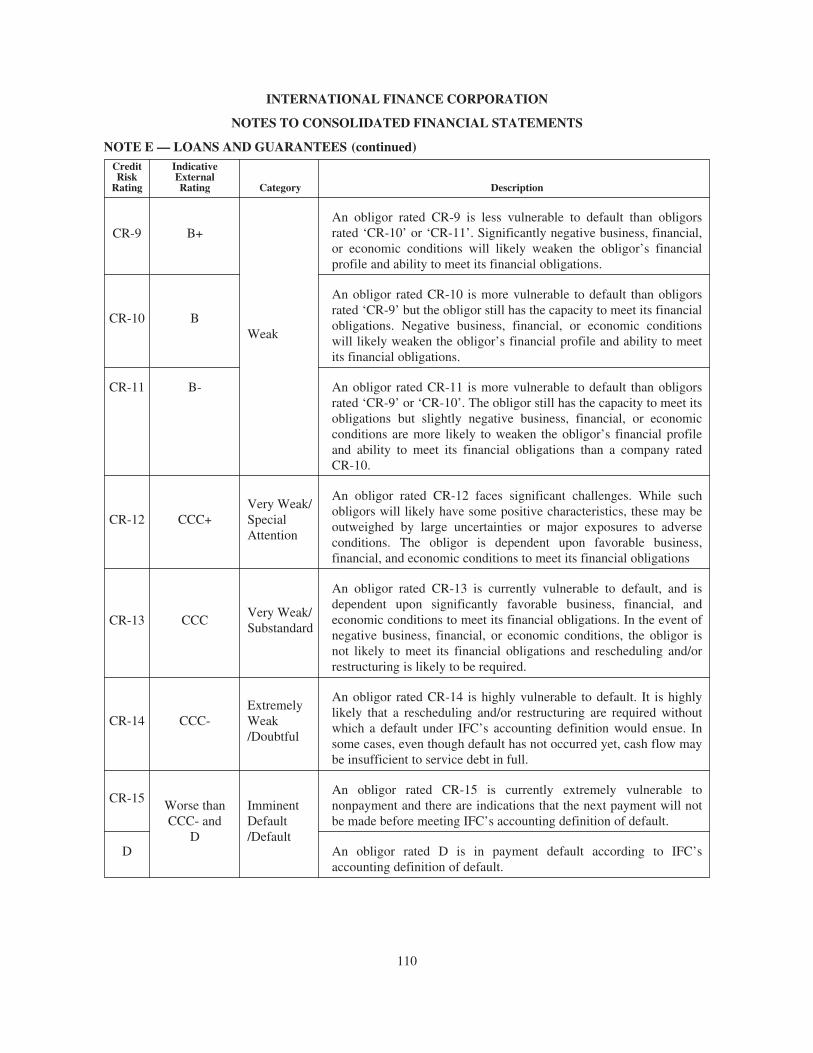
INTERNATIONAL FINANCE CORPORATION
NOTES TO CONSOLIDATED FINANCIAL STATEMENTS
NOTE E — LOANS AND GUARANTEES (continued)CreditRisk
Rating
IndicativeExternalRating Category Description
CR-9 B+
Weak
An obligor rated CR-9 is less vulnerable to default than obligorsrated ‘CR-10’ or ‘CR-11’. Significantly negative business, financial,or economic conditions will likely weaken the obligor’s financialprofile and ability to meet its financial obligations.
CR-10 B
An obligor rated CR-10 is more vulnerable to default than obligorsrated ‘CR-9’ but the obligor still has the capacity to meet its financialobligations. Negative business, financial, or economic conditionswill likely weaken the obligor’s financial profile and ability to meetits financial obligations.
CR-11 B- An obligor rated CR-11 is more vulnerable to default than obligorsrated ‘CR-9’ or ‘CR-10’. The obligor still has the capacity to meet itsobligations but slightly negative business, financial, or economicconditions are more likely to weaken the obligor’s financial profileand ability to meet its financial obligations than a company ratedCR-10.
CR-12 CCC+Very Weak/SpecialAttention
An obligor rated CR-12 faces significant challenges. While suchobligors will likely have some positive characteristics, these may beoutweighed by large uncertainties or major exposures to adverseconditions. The obligor is dependent upon favorable business,financial, and economic conditions to meet its financial obligations
CR-13 CCCVery Weak/Substandard
An obligor rated CR-13 is currently vulnerable to default, and isdependent upon significantly favorable business, financial, andeconomic conditions to meet its financial obligations. In the event ofnegative business, financial, or economic conditions, the obligor isnot likely to meet its financial obligations and rescheduling and/orrestructuring is likely to be required.
CR-14 CCC-ExtremelyWeak/Doubtful
An obligor rated CR-14 is highly vulnerable to default. It is highlylikely that a rescheduling and/or restructuring are required withoutwhich a default under IFC’s accounting definition would ensue. Insome cases, even though default has not occurred yet, cash flow maybe insufficient to service debt in full.
CR-15 Worse thanCCC- and
D
ImminentDefault/Default
An obligor rated CR-15 is currently extremely vulnerable tononpayment and there are indications that the next payment will notbe made before meeting IFC’s accounting definition of default.
D An obligor rated D is in payment default according to IFC’saccounting definition of default.
110
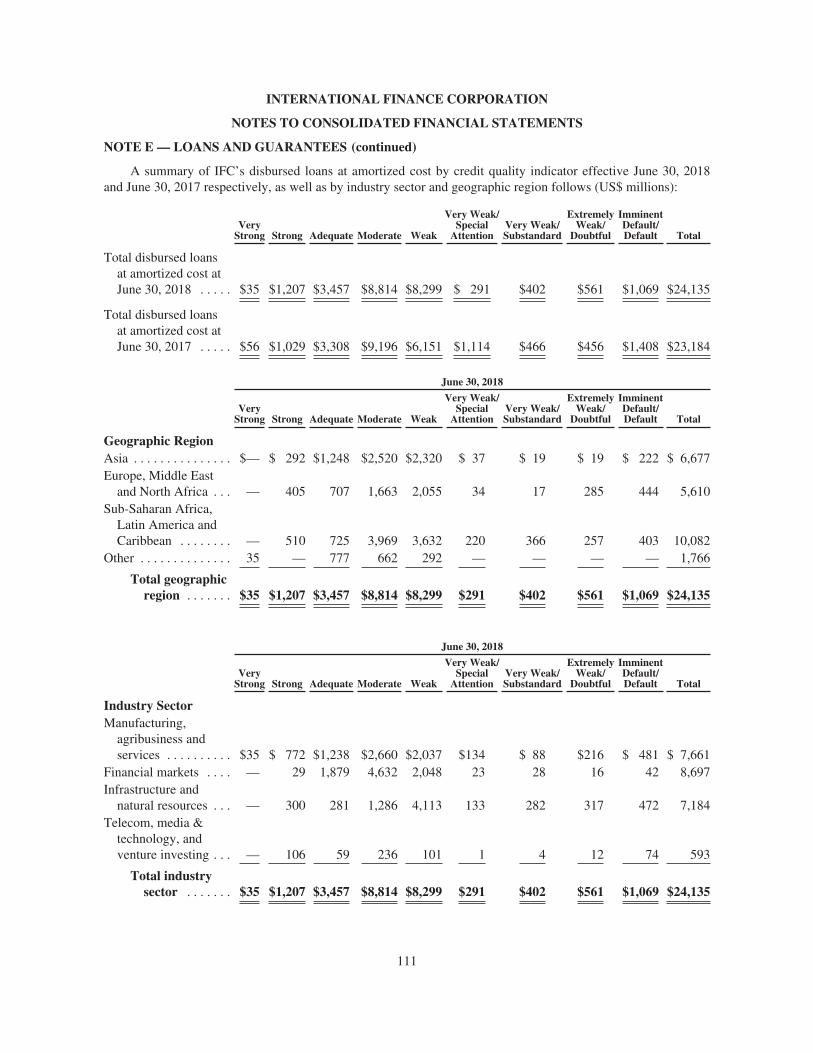
INTERNATIONAL FINANCE CORPORATION
NOTES TO CONSOLIDATED FINANCIAL STATEMENTS
NOTE E — LOANS AND GUARANTEES (continued)
A summary of IFC’s disbursed loans at amortized cost by credit quality indicator effective June 30, 2018and June 30, 2017 respectively, as well as by industry sector and geographic region follows (US$ millions):
VeryStrong Strong Adequate Moderate Weak
Very Weak/Special
AttentionVery Weak/Substandard
ExtremelyWeak/
Doubtful
ImminentDefault/Default Total
Total disbursed loansat amortized cost atJune 30, 2018 . . . . . $35 $1,207 $3,457 $8,814 $8,299 $ 291 $402 $561 $1,069 $24,135
Total disbursed loansat amortized cost atJune 30, 2017 . . . . . $56 $1,029 $3,308 $9,196 $6,151 $1,114 $466 $456 $1,408 $23,184
June 30, 2018
VeryStrong Strong Adequate Moderate Weak
Very Weak/Special
AttentionVery Weak/Substandard
ExtremelyWeak/
Doubtful
ImminentDefault/Default Total
Geographic RegionAsia . . . . . . . . . . . . . . . $— $ 292 $1,248 $2,520 $2,320 $ 37 $ 19 $ 19 $ 222 $ 6,677Europe, Middle East
and North Africa . . . — 405 707 1,663 2,055 34 17 285 444 5,610Sub-Saharan Africa,
Latin America andCaribbean . . . . . . . . — 510 725 3,969 3,632 220 366 257 403 10,082
Other . . . . . . . . . . . . . . 35 — 777 662 292 — — — — 1,766
Total geographicregion . . . . . . . $35 $1,207 $3,457 $8,814 $8,299 $291 $402 $561 $1,069 $24,135
June 30, 2018
VeryStrong Strong Adequate Moderate Weak
Very Weak/Special
AttentionVery Weak/Substandard
ExtremelyWeak/
Doubtful
ImminentDefault/Default Total
Industry SectorManufacturing,
agribusiness andservices . . . . . . . . . . $35 $ 772 $1,238 $2,660 $2,037 $134 $ 88 $216 $ 481 $ 7,661
Financial markets . . . . — 29 1,879 4,632 2,048 23 28 16 42 8,697Infrastructure and
natural resources . . . — 300 281 1,286 4,113 133 282 317 472 7,184Telecom, media &
technology, andventure investing . . . — 106 59 236 101 1 4 12 74 593
Total industrysector . . . . . . . $35 $1,207 $3,457 $8,814 $8,299 $291 $402 $561 $1,069 $24,135
111
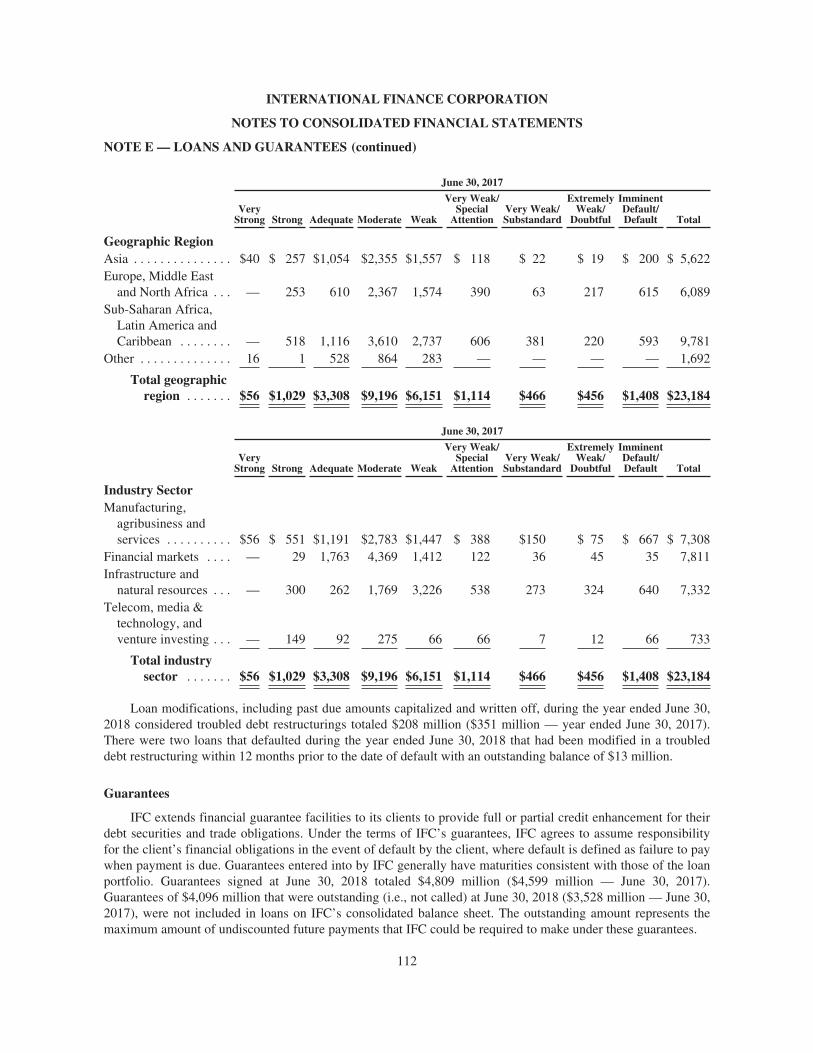
INTERNATIONAL FINANCE CORPORATION
NOTES TO CONSOLIDATED FINANCIAL STATEMENTS
NOTE E — LOANS AND GUARANTEES (continued)
June 30, 2017
VeryStrong Strong Adequate Moderate Weak
Very Weak/Special
AttentionVery Weak/Substandard
ExtremelyWeak/
Doubtful
ImminentDefault/Default Total
Geographic RegionAsia . . . . . . . . . . . . . . . $40 $ 257 $1,054 $2,355 $1,557 $ 118 $ 22 $ 19 $ 200 $ 5,622Europe, Middle East
and North Africa . . . — 253 610 2,367 1,574 390 63 217 615 6,089Sub-Saharan Africa,
Latin America andCaribbean . . . . . . . . — 518 1,116 3,610 2,737 606 381 220 593 9,781
Other . . . . . . . . . . . . . . 16 1 528 864 283 — — — — 1,692
Total geographicregion . . . . . . . $56 $1,029 $3,308 $9,196 $6,151 $1,114 $466 $456 $1,408 $23,184
June 30, 2017
VeryStrong Strong Adequate Moderate Weak
Very Weak/Special
AttentionVery Weak/Substandard
ExtremelyWeak/
Doubtful
ImminentDefault/Default Total
Industry SectorManufacturing,
agribusiness andservices . . . . . . . . . . $56 $ 551 $1,191 $2,783 $1,447 $ 388 $150 $ 75 $ 667 $ 7,308
Financial markets . . . . — 29 1,763 4,369 1,412 122 36 45 35 7,811Infrastructure and
natural resources . . . — 300 262 1,769 3,226 538 273 324 640 7,332Telecom, media &
technology, andventure investing . . . — 149 92 275 66 66 7 12 66 733
Total industrysector . . . . . . . $56 $1,029 $3,308 $9,196 $6,151 $1,114 $466 $456 $1,408 $23,184
Loan modifications, including past due amounts capitalized and written off, during the year ended June 30,2018 considered troubled debt restructurings totaled $208 million ($351 million — year ended June 30, 2017).There were two loans that defaulted during the year ended June 30, 2018 that had been modified in a troubleddebt restructuring within 12 months prior to the date of default with an outstanding balance of $13 million.
Guarantees
IFC extends financial guarantee facilities to its clients to provide full or partial credit enhancement for theirdebt securities and trade obligations. Under the terms of IFC’s guarantees, IFC agrees to assume responsibilityfor the client’s financial obligations in the event of default by the client, where default is defined as failure to paywhen payment is due. Guarantees entered into by IFC generally have maturities consistent with those of the loanportfolio. Guarantees signed at June 30, 2018 totaled $4,809 million ($4,599 million — June 30, 2017).Guarantees of $4,096 million that were outstanding (i.e., not called) at June 30, 2018 ($3,528 million — June 30,2017), were not included in loans on IFC’s consolidated balance sheet. The outstanding amount represents themaximum amount of undiscounted future payments that IFC could be required to make under these guarantees.
112
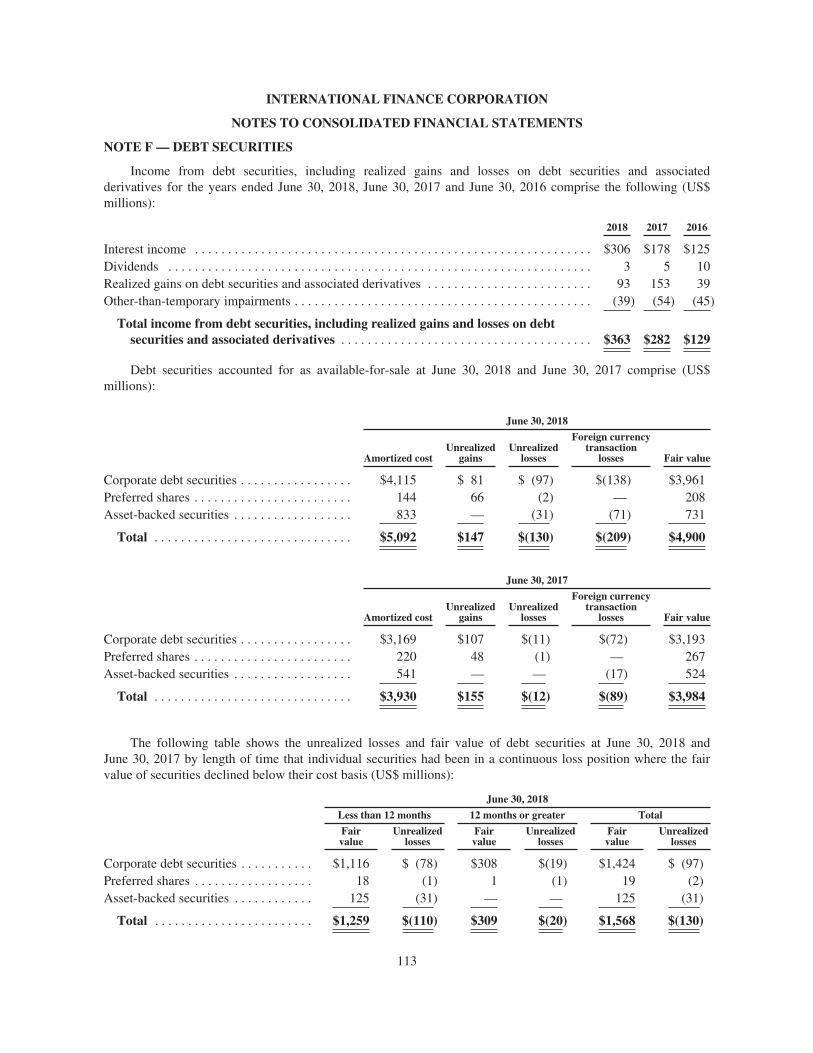
INTERNATIONAL FINANCE CORPORATION
NOTES TO CONSOLIDATED FINANCIAL STATEMENTS
NOTE F — DEBT SECURITIES
Income from debt securities, including realized gains and losses on debt securities and associatedderivatives for the years ended June 30, 2018, June 30, 2017 and June 30, 2016 comprise the following (US$millions):
2018 2017 2016
Interest income . . . . . . . . . . . . . . . . . . . . . . . . . . . . . . . . . . . . . . . . . . . . . . . . . . . . . . . . . . . . $306 $178 $125Dividends . . . . . . . . . . . . . . . . . . . . . . . . . . . . . . . . . . . . . . . . . . . . . . . . . . . . . . . . . . . . . . . . 3 5 10Realized gains on debt securities and associated derivatives . . . . . . . . . . . . . . . . . . . . . . . . . 93 153 39Other-than-temporary impairments . . . . . . . . . . . . . . . . . . . . . . . . . . . . . . . . . . . . . . . . . . . . . (39) (54) (45)
Total income from debt securities, including realized gains and losses on debtsecurities and associated derivatives . . . . . . . . . . . . . . . . . . . . . . . . . . . . . . . . . . . . . . $363 $282 $129
Debt securities accounted for as available-for-sale at June 30, 2018 and June 30, 2017 comprise (US$millions):
June 30, 2018
Amortized costUnrealized
gainsUnrealized
losses
Foreign currencytransaction
losses Fair value
Corporate debt securities . . . . . . . . . . . . . . . . . $4,115 $ 81 $ (97) $(138) $3,961Preferred shares . . . . . . . . . . . . . . . . . . . . . . . . 144 66 (2) — 208Asset-backed securities . . . . . . . . . . . . . . . . . . 833 — (31) (71) 731
Total . . . . . . . . . . . . . . . . . . . . . . . . . . . . . . $5,092 $147 $(130) $(209) $4,900
June 30, 2017
Amortized costUnrealized
gainsUnrealized
losses
Foreign currencytransaction
losses Fair value
Corporate debt securities . . . . . . . . . . . . . . . . . $3,169 $107 $(11) $(72) $3,193Preferred shares . . . . . . . . . . . . . . . . . . . . . . . . 220 48 (1) — 267Asset-backed securities . . . . . . . . . . . . . . . . . . 541 — — (17) 524
Total . . . . . . . . . . . . . . . . . . . . . . . . . . . . . . $3,930 $155 $(12) $(89) $3,984
The following table shows the unrealized losses and fair value of debt securities at June 30, 2018 andJune 30, 2017 by length of time that individual securities had been in a continuous loss position where the fairvalue of securities declined below their cost basis (US$ millions):
June 30, 2018
Less than 12 months 12 months or greater Total
Fairvalue
Unrealizedlosses
Fairvalue
Unrealizedlosses
Fairvalue
Unrealizedlosses
Corporate debt securities . . . . . . . . . . . $1,116 $ (78) $308 $(19) $1,424 $ (97)Preferred shares . . . . . . . . . . . . . . . . . . 18 (1) 1 (1) 19 (2)Asset-backed securities . . . . . . . . . . . . 125 (31) — — 125 (31)
Total . . . . . . . . . . . . . . . . . . . . . . . . $1,259 $(110) $309 $(20) $1,568 $(130)
113
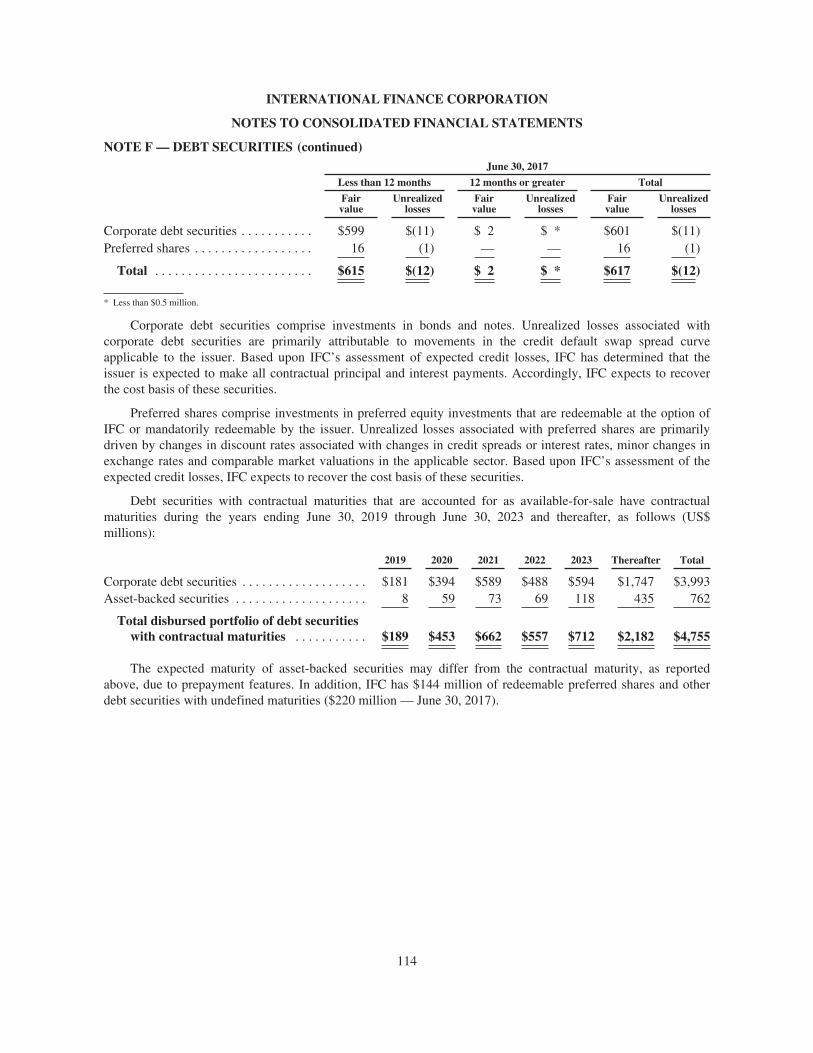
INTERNATIONAL FINANCE CORPORATION
NOTES TO CONSOLIDATED FINANCIAL STATEMENTS
NOTE F — DEBT SECURITIES (continued)June 30, 2017
Less than 12 months 12 months or greater Total
Fairvalue
Unrealizedlosses
Fairvalue
Unrealizedlosses
Fairvalue
Unrealizedlosses
Corporate debt securities . . . . . . . . . . . $599 $(11) $ 2 $ * $601 $(11)Preferred shares . . . . . . . . . . . . . . . . . . 16 (1) — — 16 (1)
Total . . . . . . . . . . . . . . . . . . . . . . . . $615 $(12) $ 2 $ * $617 $(12)
* Less than $0.5 million.
Corporate debt securities comprise investments in bonds and notes. Unrealized losses associated withcorporate debt securities are primarily attributable to movements in the credit default swap spread curveapplicable to the issuer. Based upon IFC’s assessment of expected credit losses, IFC has determined that theissuer is expected to make all contractual principal and interest payments. Accordingly, IFC expects to recoverthe cost basis of these securities.
Preferred shares comprise investments in preferred equity investments that are redeemable at the option ofIFC or mandatorily redeemable by the issuer. Unrealized losses associated with preferred shares are primarilydriven by changes in discount rates associated with changes in credit spreads or interest rates, minor changes inexchange rates and comparable market valuations in the applicable sector. Based upon IFC’s assessment of theexpected credit losses, IFC expects to recover the cost basis of these securities.
Debt securities with contractual maturities that are accounted for as available-for-sale have contractualmaturities during the years ending June 30, 2019 through June 30, 2023 and thereafter, as follows (US$millions):
2019 2020 2021 2022 2023 Thereafter Total
Corporate debt securities . . . . . . . . . . . . . . . . . . . $181 $394 $589 $488 $594 $1,747 $3,993Asset-backed securities . . . . . . . . . . . . . . . . . . . . 8 59 73 69 118 435 762
Total disbursed portfolio of debt securitieswith contractual maturities . . . . . . . . . . . $189 $453 $662 $557 $712 $2,182 $4,755
The expected maturity of asset-backed securities may differ from the contractual maturity, as reportedabove, due to prepayment features. In addition, IFC has $144 million of redeemable preferred shares and otherdebt securities with undefined maturities ($220 million — June 30, 2017).
114
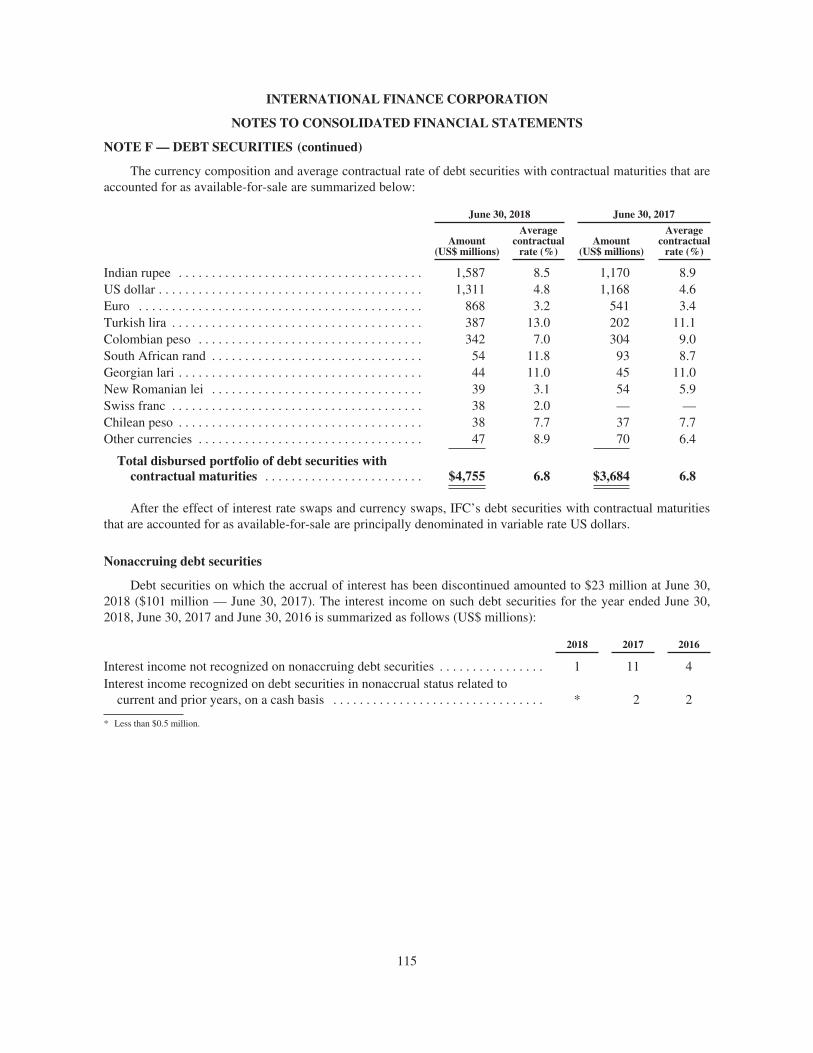
INTERNATIONAL FINANCE CORPORATION
NOTES TO CONSOLIDATED FINANCIAL STATEMENTS
NOTE F — DEBT SECURITIES (continued)
The currency composition and average contractual rate of debt securities with contractual maturities that areaccounted for as available-for-sale are summarized below:
June 30, 2018 June 30, 2017
Amount(US$ millions)
Averagecontractual
rate (%)Amount
(US$ millions)
Averagecontractual
rate (%)
Indian rupee . . . . . . . . . . . . . . . . . . . . . . . . . . . . . . . . . . . . . 1,587 8.5 1,170 8.9US dollar . . . . . . . . . . . . . . . . . . . . . . . . . . . . . . . . . . . . . . . . 1,311 4.8 1,168 4.6Euro . . . . . . . . . . . . . . . . . . . . . . . . . . . . . . . . . . . . . . . . . . . 868 3.2 541 3.4Turkish lira . . . . . . . . . . . . . . . . . . . . . . . . . . . . . . . . . . . . . . 387 13.0 202 11.1Colombian peso . . . . . . . . . . . . . . . . . . . . . . . . . . . . . . . . . . 342 7.0 304 9.0South African rand . . . . . . . . . . . . . . . . . . . . . . . . . . . . . . . . 54 11.8 93 8.7Georgian lari . . . . . . . . . . . . . . . . . . . . . . . . . . . . . . . . . . . . . 44 11.0 45 11.0New Romanian lei . . . . . . . . . . . . . . . . . . . . . . . . . . . . . . . . 39 3.1 54 5.9Swiss franc . . . . . . . . . . . . . . . . . . . . . . . . . . . . . . . . . . . . . . 38 2.0 — —Chilean peso . . . . . . . . . . . . . . . . . . . . . . . . . . . . . . . . . . . . . 38 7.7 37 7.7Other currencies . . . . . . . . . . . . . . . . . . . . . . . . . . . . . . . . . . 47 8.9 70 6.4
Total disbursed portfolio of debt securities withcontractual maturities . . . . . . . . . . . . . . . . . . . . . . . . $4,755 6.8 $3,684 6.8
After the effect of interest rate swaps and currency swaps, IFC’s debt securities with contractual maturitiesthat are accounted for as available-for-sale are principally denominated in variable rate US dollars.
Nonaccruing debt securities
Debt securities on which the accrual of interest has been discontinued amounted to $23 million at June 30,2018 ($101 million — June 30, 2017). The interest income on such debt securities for the year ended June 30,2018, June 30, 2017 and June 30, 2016 is summarized as follows (US$ millions):
2018 2017 2016
Interest income not recognized on nonaccruing debt securities . . . . . . . . . . . . . . . . 1 11 4Interest income recognized on debt securities in nonaccrual status related to
current and prior years, on a cash basis . . . . . . . . . . . . . . . . . . . . . . . . . . . . . . . . * 2 2
* Less than $0.5 million.
115
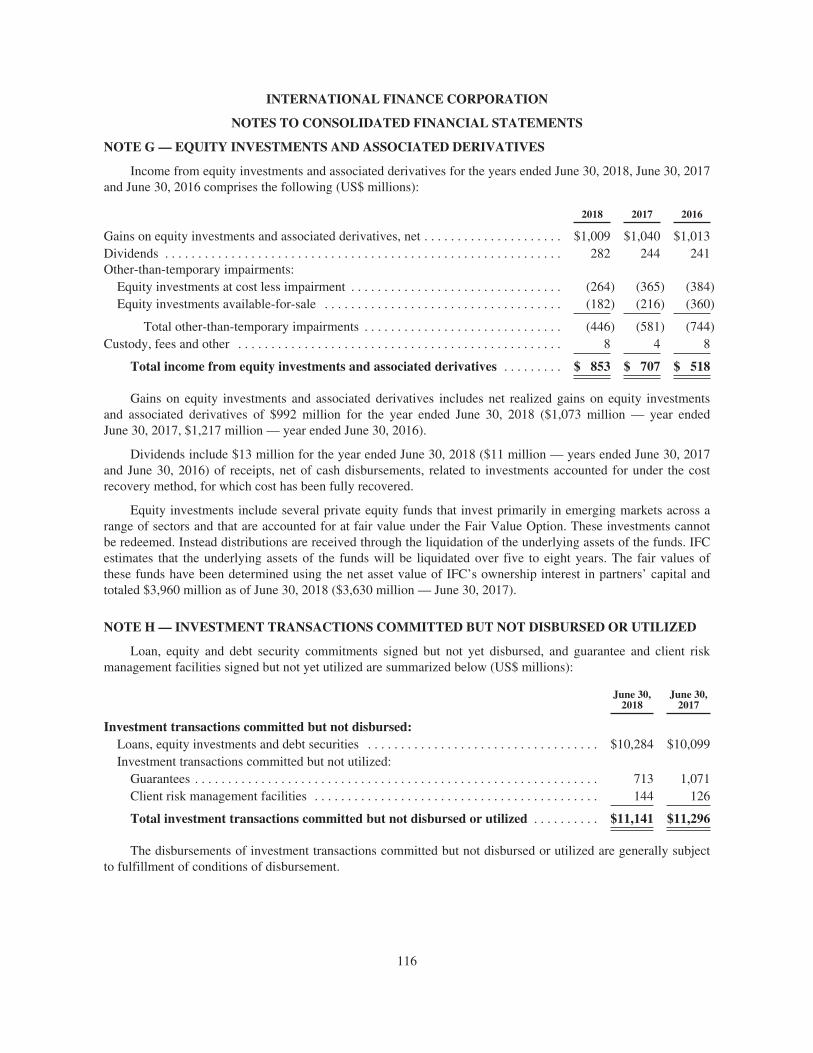
INTERNATIONAL FINANCE CORPORATION
NOTES TO CONSOLIDATED FINANCIAL STATEMENTS
NOTE G — EQUITY INVESTMENTS AND ASSOCIATED DERIVATIVES
Income from equity investments and associated derivatives for the years ended June 30, 2018, June 30, 2017and June 30, 2016 comprises the following (US$ millions):
2018 2017 2016
Gains on equity investments and associated derivatives, net . . . . . . . . . . . . . . . . . . . . . $1,009 $1,040 $1,013Dividends . . . . . . . . . . . . . . . . . . . . . . . . . . . . . . . . . . . . . . . . . . . . . . . . . . . . . . . . . . . . 282 244 241Other-than-temporary impairments:
Equity investments at cost less impairment . . . . . . . . . . . . . . . . . . . . . . . . . . . . . . . . (264) (365) (384)Equity investments available-for-sale . . . . . . . . . . . . . . . . . . . . . . . . . . . . . . . . . . . . (182) (216) (360)
Total other-than-temporary impairments . . . . . . . . . . . . . . . . . . . . . . . . . . . . . . (446) (581) (744)Custody, fees and other . . . . . . . . . . . . . . . . . . . . . . . . . . . . . . . . . . . . . . . . . . . . . . . . . 8 4 8
Total income from equity investments and associated derivatives . . . . . . . . . $ 853 $ 707 $ 518
Gains on equity investments and associated derivatives includes net realized gains on equity investmentsand associated derivatives of $992 million for the year ended June 30, 2018 ($1,073 million — year endedJune 30, 2017, $1,217 million — year ended June 30, 2016).
Dividends include $13 million for the year ended June 30, 2018 ($11 million — years ended June 30, 2017and June 30, 2016) of receipts, net of cash disbursements, related to investments accounted for under the costrecovery method, for which cost has been fully recovered.
Equity investments include several private equity funds that invest primarily in emerging markets across arange of sectors and that are accounted for at fair value under the Fair Value Option. These investments cannotbe redeemed. Instead distributions are received through the liquidation of the underlying assets of the funds. IFCestimates that the underlying assets of the funds will be liquidated over five to eight years. The fair values ofthese funds have been determined using the net asset value of IFC’s ownership interest in partners’ capital andtotaled $3,960 million as of June 30, 2018 ($3,630 million — June 30, 2017).
NOTE H — INVESTMENT TRANSACTIONS COMMITTED BUT NOT DISBURSED OR UTILIZED
Loan, equity and debt security commitments signed but not yet disbursed, and guarantee and client riskmanagement facilities signed but not yet utilized are summarized below (US$ millions):
June 30,2018
June 30,2017
Investment transactions committed but not disbursed:Loans, equity investments and debt securities . . . . . . . . . . . . . . . . . . . . . . . . . . . . . . . . . . . $10,284 $10,099Investment transactions committed but not utilized:
Guarantees . . . . . . . . . . . . . . . . . . . . . . . . . . . . . . . . . . . . . . . . . . . . . . . . . . . . . . . . . . . . . 713 1,071Client risk management facilities . . . . . . . . . . . . . . . . . . . . . . . . . . . . . . . . . . . . . . . . . . . 144 126
Total investment transactions committed but not disbursed or utilized . . . . . . . . . . $11,141 $11,296
The disbursements of investment transactions committed but not disbursed or utilized are generally subjectto fulfillment of conditions of disbursement.
116
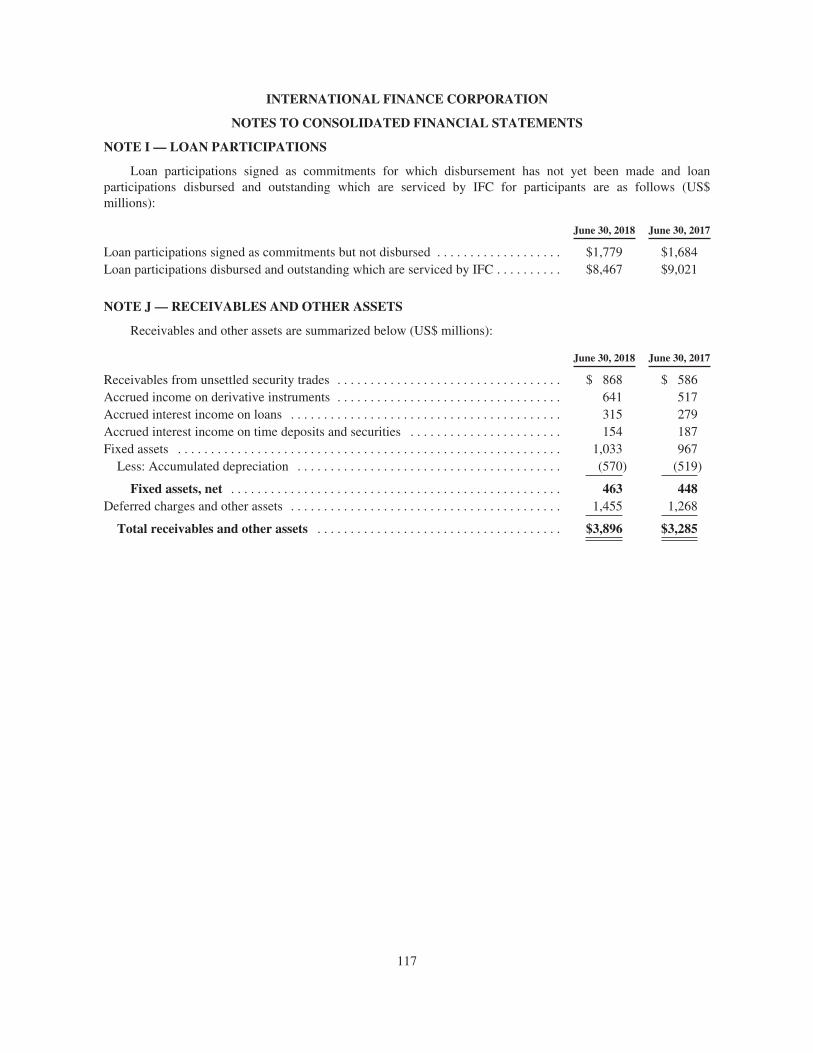
INTERNATIONAL FINANCE CORPORATION
NOTES TO CONSOLIDATED FINANCIAL STATEMENTS
NOTE I — LOAN PARTICIPATIONS
Loan participations signed as commitments for which disbursement has not yet been made and loanparticipations disbursed and outstanding which are serviced by IFC for participants are as follows (US$millions):
June 30, 2018 June 30, 2017
Loan participations signed as commitments but not disbursed . . . . . . . . . . . . . . . . . . . $1,779 $1,684Loan participations disbursed and outstanding which are serviced by IFC . . . . . . . . . . $8,467 $9,021
NOTE J — RECEIVABLES AND OTHER ASSETS
Receivables and other assets are summarized below (US$ millions):
June 30, 2018 June 30, 2017
Receivables from unsettled security trades . . . . . . . . . . . . . . . . . . . . . . . . . . . . . . . . . . $ 868 $ 586Accrued income on derivative instruments . . . . . . . . . . . . . . . . . . . . . . . . . . . . . . . . . . 641 517Accrued interest income on loans . . . . . . . . . . . . . . . . . . . . . . . . . . . . . . . . . . . . . . . . . 315 279Accrued interest income on time deposits and securities . . . . . . . . . . . . . . . . . . . . . . . 154 187Fixed assets . . . . . . . . . . . . . . . . . . . . . . . . . . . . . . . . . . . . . . . . . . . . . . . . . . . . . . . . . . 1,033 967
Less: Accumulated depreciation . . . . . . . . . . . . . . . . . . . . . . . . . . . . . . . . . . . . . . . . (570) (519)
Fixed assets, net . . . . . . . . . . . . . . . . . . . . . . . . . . . . . . . . . . . . . . . . . . . . . . . . . . 463 448Deferred charges and other assets . . . . . . . . . . . . . . . . . . . . . . . . . . . . . . . . . . . . . . . . . 1,455 1,268
Total receivables and other assets . . . . . . . . . . . . . . . . . . . . . . . . . . . . . . . . . . . . . $3,896 $3,285
117
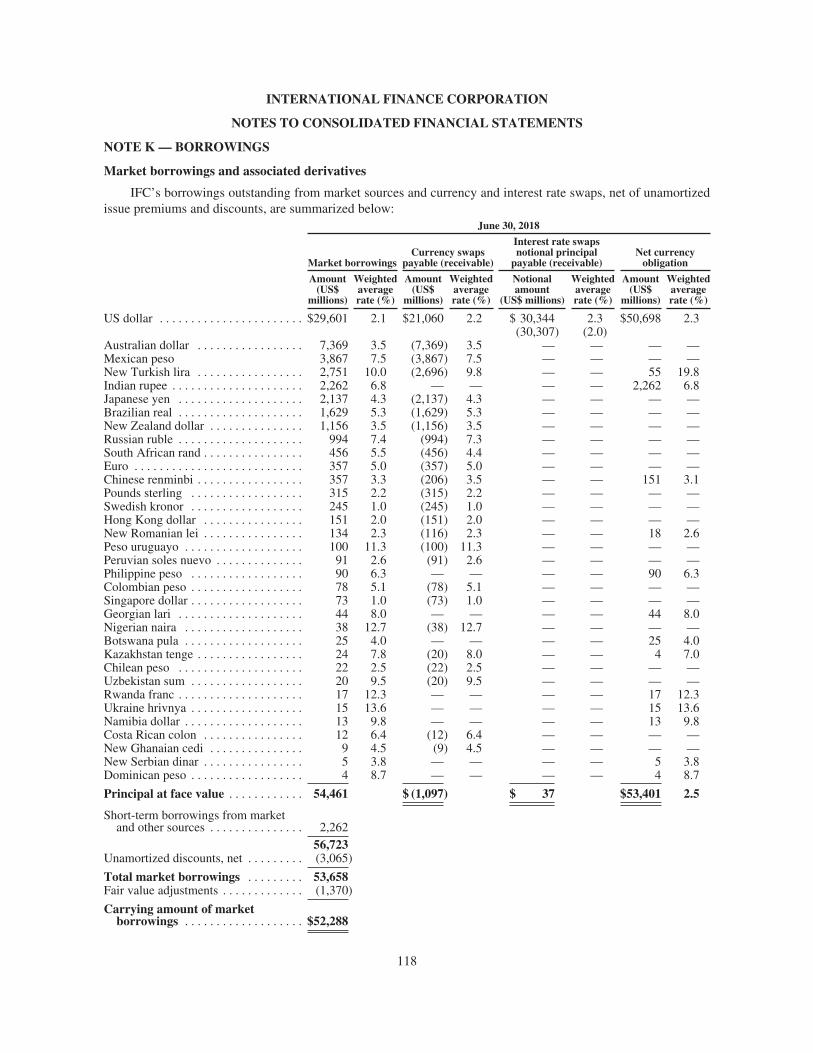
INTERNATIONAL FINANCE CORPORATION
NOTES TO CONSOLIDATED FINANCIAL STATEMENTS
NOTE K — BORROWINGS
Market borrowings and associated derivatives
IFC’s borrowings outstanding from market sources and currency and interest rate swaps, net of unamortizedissue premiums and discounts, are summarized below:
June 30, 2018
Market borrowingsCurrency swaps
payable (receivable)
Interest rate swapsnotional principal
payable (receivable)Net currency
obligation
Amount(US$
millions)
Weightedaveragerate (%)
Amount(US$
millions)
Weightedaveragerate (%)
Notionalamount
(US$ millions)
Weightedaveragerate (%)
Amount(US$
millions)
Weightedaveragerate (%)
US dollar . . . . . . . . . . . . . . . . . . . . . . . $29,601 2.1 $21,060 2.2 $ 30,344 2.3 $50,698 2.3(30,307) (2.0)
Australian dollar . . . . . . . . . . . . . . . . . 7,369 3.5 (7,369) 3.5 — — — —Mexican peso 3,867 7.5 (3,867) 7.5 — — — —New Turkish lira . . . . . . . . . . . . . . . . . 2,751 10.0 (2,696) 9.8 — — 55 19.8Indian rupee . . . . . . . . . . . . . . . . . . . . . 2,262 6.8 — — — — 2,262 6.8Japanese yen . . . . . . . . . . . . . . . . . . . . 2,137 4.3 (2,137) 4.3 — — — —Brazilian real . . . . . . . . . . . . . . . . . . . . 1,629 5.3 (1,629) 5.3 — — — —New Zealand dollar . . . . . . . . . . . . . . . 1,156 3.5 (1,156) 3.5 — — — —Russian ruble . . . . . . . . . . . . . . . . . . . . 994 7.4 (994) 7.3 — — — —South African rand . . . . . . . . . . . . . . . . 456 5.5 (456) 4.4 — — — —Euro . . . . . . . . . . . . . . . . . . . . . . . . . . . 357 5.0 (357) 5.0 — — — —Chinese renminbi . . . . . . . . . . . . . . . . . 357 3.3 (206) 3.5 — — 151 3.1Pounds sterling . . . . . . . . . . . . . . . . . . 315 2.2 (315) 2.2 — — — —Swedish kronor . . . . . . . . . . . . . . . . . . 245 1.0 (245) 1.0 — — — —Hong Kong dollar . . . . . . . . . . . . . . . . 151 2.0 (151) 2.0 — — — —New Romanian lei . . . . . . . . . . . . . . . . 134 2.3 (116) 2.3 — — 18 2.6Peso uruguayo . . . . . . . . . . . . . . . . . . . 100 11.3 (100) 11.3 — — — —Peruvian soles nuevo . . . . . . . . . . . . . . 91 2.6 (91) 2.6 — — — —Philippine peso . . . . . . . . . . . . . . . . . . 90 6.3 — — — — 90 6.3Colombian peso . . . . . . . . . . . . . . . . . . 78 5.1 (78) 5.1 — — — —Singapore dollar . . . . . . . . . . . . . . . . . . 73 1.0 (73) 1.0 — — — —Georgian lari . . . . . . . . . . . . . . . . . . . . 44 8.0 — — — — 44 8.0Nigerian naira . . . . . . . . . . . . . . . . . . . 38 12.7 (38) 12.7 — — — —Botswana pula . . . . . . . . . . . . . . . . . . . 25 4.0 — — — — 25 4.0Kazakhstan tenge . . . . . . . . . . . . . . . . . 24 7.8 (20) 8.0 — — 4 7.0Chilean peso . . . . . . . . . . . . . . . . . . . . 22 2.5 (22) 2.5 — — — —Uzbekistan sum . . . . . . . . . . . . . . . . . . 20 9.5 (20) 9.5 — — — —Rwanda franc . . . . . . . . . . . . . . . . . . . . 17 12.3 — — — — 17 12.3Ukraine hrivnya . . . . . . . . . . . . . . . . . . 15 13.6 — — — — 15 13.6Namibia dollar . . . . . . . . . . . . . . . . . . . 13 9.8 — — — — 13 9.8Costa Rican colon . . . . . . . . . . . . . . . . 12 6.4 (12) 6.4 — — — —New Ghanaian cedi . . . . . . . . . . . . . . . 9 4.5 (9) 4.5 — — — —New Serbian dinar . . . . . . . . . . . . . . . . 5 3.8 — — — — 5 3.8Dominican peso . . . . . . . . . . . . . . . . . . 4 8.7 — — — — 4 8.7
Principal at face value . . . . . . . . . . . . 54,461 $ (1,097) $ 37 $53,401 2.5
Short-term borrowings from marketand other sources . . . . . . . . . . . . . . . 2,262
56,723Unamortized discounts, net . . . . . . . . . (3,065)
Total market borrowings . . . . . . . . . 53,658Fair value adjustments . . . . . . . . . . . . . (1,370)
Carrying amount of marketborrowings . . . . . . . . . . . . . . . . . . . $52,288
118
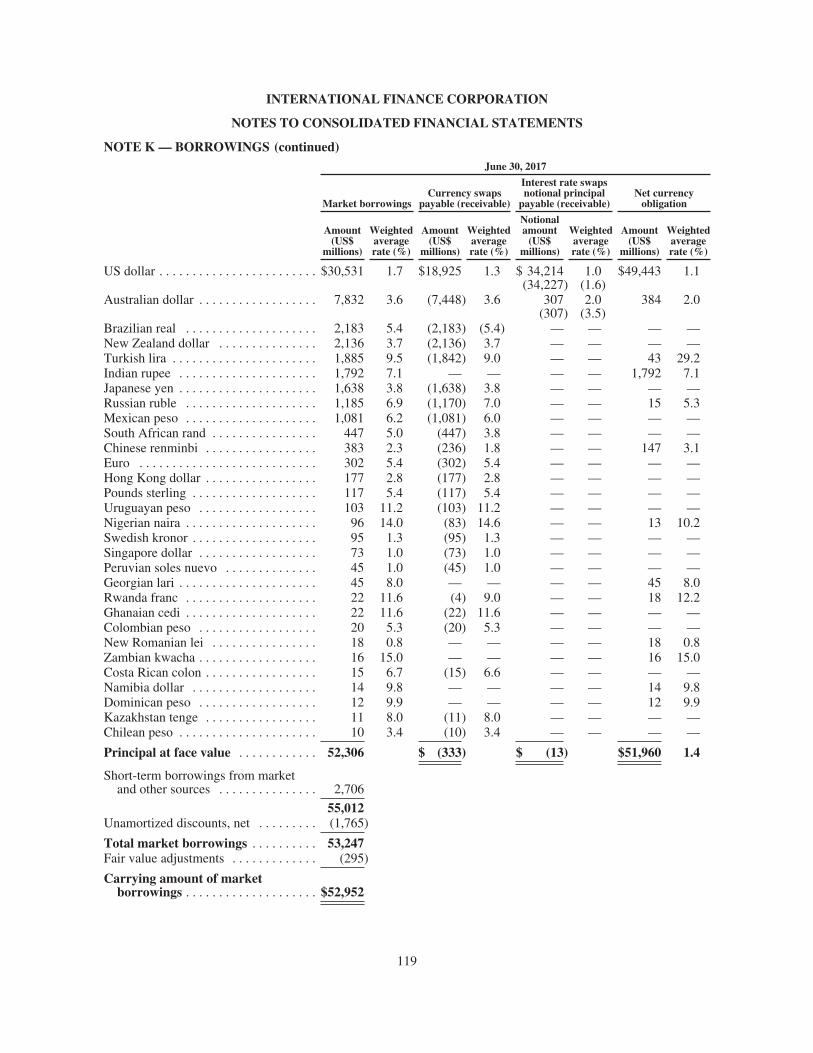
INTERNATIONAL FINANCE CORPORATION
NOTES TO CONSOLIDATED FINANCIAL STATEMENTS
NOTE K — BORROWINGS (continued)June 30, 2017
Market borrowingsCurrency swaps
payable (receivable)
Interest rate swapsnotional principal
payable (receivable)Net currency
obligation
Amount(US$
millions)
Weightedaveragerate (%)
Amount(US$
millions)
Weightedaveragerate (%)
Notionalamount
(US$millions)
Weightedaveragerate (%)
Amount(US$
millions)
Weightedaveragerate (%)
US dollar . . . . . . . . . . . . . . . . . . . . . . . . $30,531 1.7 $18,925 1.3 $ 34,214 1.0 $49,443 1.1(34,227) (1.6)
Australian dollar . . . . . . . . . . . . . . . . . . 7,832 3.6 (7,448) 3.6 307 2.0 384 2.0(307) (3.5)
Brazilian real . . . . . . . . . . . . . . . . . . . . 2,183 5.4 (2,183) (5.4) — — — —New Zealand dollar . . . . . . . . . . . . . . . 2,136 3.7 (2,136) 3.7 — — — —Turkish lira . . . . . . . . . . . . . . . . . . . . . . 1,885 9.5 (1,842) 9.0 — — 43 29.2Indian rupee . . . . . . . . . . . . . . . . . . . . . 1,792 7.1 — — — — 1,792 7.1Japanese yen . . . . . . . . . . . . . . . . . . . . . 1,638 3.8 (1,638) 3.8 — — — —Russian ruble . . . . . . . . . . . . . . . . . . . . 1,185 6.9 (1,170) 7.0 — — 15 5.3Mexican peso . . . . . . . . . . . . . . . . . . . . 1,081 6.2 (1,081) 6.0 — — — —South African rand . . . . . . . . . . . . . . . . 447 5.0 (447) 3.8 — — — —Chinese renminbi . . . . . . . . . . . . . . . . . 383 2.3 (236) 1.8 — — 147 3.1Euro . . . . . . . . . . . . . . . . . . . . . . . . . . . 302 5.4 (302) 5.4 — — — —Hong Kong dollar . . . . . . . . . . . . . . . . . 177 2.8 (177) 2.8 — — — —Pounds sterling . . . . . . . . . . . . . . . . . . . 117 5.4 (117) 5.4 — — — —Uruguayan peso . . . . . . . . . . . . . . . . . . 103 11.2 (103) 11.2 — — — —Nigerian naira . . . . . . . . . . . . . . . . . . . . 96 14.0 (83) 14.6 — — 13 10.2Swedish kronor . . . . . . . . . . . . . . . . . . . 95 1.3 (95) 1.3 — — — —Singapore dollar . . . . . . . . . . . . . . . . . . 73 1.0 (73) 1.0 — — — —Peruvian soles nuevo . . . . . . . . . . . . . . 45 1.0 (45) 1.0 — — — —Georgian lari . . . . . . . . . . . . . . . . . . . . . 45 8.0 — — — — 45 8.0Rwanda franc . . . . . . . . . . . . . . . . . . . . 22 11.6 (4) 9.0 — — 18 12.2Ghanaian cedi . . . . . . . . . . . . . . . . . . . . 22 11.6 (22) 11.6 — — — —Colombian peso . . . . . . . . . . . . . . . . . . 20 5.3 (20) 5.3 — — — —New Romanian lei . . . . . . . . . . . . . . . . 18 0.8 — — — — 18 0.8Zambian kwacha . . . . . . . . . . . . . . . . . . 16 15.0 — — — — 16 15.0Costa Rican colon . . . . . . . . . . . . . . . . . 15 6.7 (15) 6.6 — — — —Namibia dollar . . . . . . . . . . . . . . . . . . . 14 9.8 — — — — 14 9.8Dominican peso . . . . . . . . . . . . . . . . . . 12 9.9 — — — — 12 9.9Kazakhstan tenge . . . . . . . . . . . . . . . . . 11 8.0 (11) 8.0 — — — —Chilean peso . . . . . . . . . . . . . . . . . . . . . 10 3.4 (10) 3.4 — — — —
Principal at face value . . . . . . . . . . . . 52,306 $ (333) $ (13) $51,960 1.4
Short-term borrowings from marketand other sources . . . . . . . . . . . . . . . 2,706
55,012Unamortized discounts, net . . . . . . . . . (1,765)
Total market borrowings . . . . . . . . . . 53,247Fair value adjustments . . . . . . . . . . . . . (295)
Carrying amount of marketborrowings . . . . . . . . . . . . . . . . . . . . $52,952
119
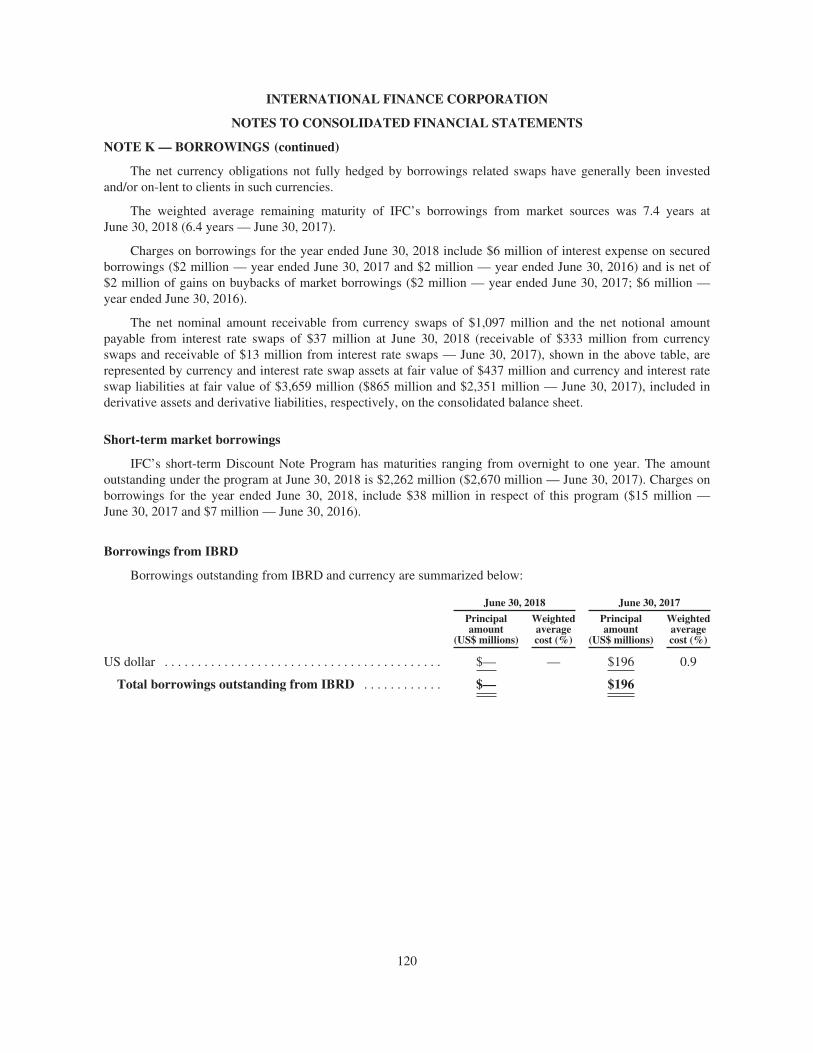
INTERNATIONAL FINANCE CORPORATION
NOTES TO CONSOLIDATED FINANCIAL STATEMENTS
NOTE K — BORROWINGS (continued)
The net currency obligations not fully hedged by borrowings related swaps have generally been investedand/or on-lent to clients in such currencies.
The weighted average remaining maturity of IFC’s borrowings from market sources was 7.4 years atJune 30, 2018 (6.4 years — June 30, 2017).
Charges on borrowings for the year ended June 30, 2018 include $6 million of interest expense on securedborrowings ($2 million — year ended June 30, 2017 and $2 million — year ended June 30, 2016) and is net of$2 million of gains on buybacks of market borrowings ($2 million — year ended June 30, 2017; $6 million —year ended June 30, 2016).
The net nominal amount receivable from currency swaps of $1,097 million and the net notional amountpayable from interest rate swaps of $37 million at June 30, 2018 (receivable of $333 million from currencyswaps and receivable of $13 million from interest rate swaps — June 30, 2017), shown in the above table, arerepresented by currency and interest rate swap assets at fair value of $437 million and currency and interest rateswap liabilities at fair value of $3,659 million ($865 million and $2,351 million — June 30, 2017), included inderivative assets and derivative liabilities, respectively, on the consolidated balance sheet.
Short-term market borrowings
IFC’s short-term Discount Note Program has maturities ranging from overnight to one year. The amountoutstanding under the program at June 30, 2018 is $2,262 million ($2,670 million — June 30, 2017). Charges onborrowings for the year ended June 30, 2018, include $38 million in respect of this program ($15 million —June 30, 2017 and $7 million — June 30, 2016).
Borrowings from IBRD
Borrowings outstanding from IBRD and currency are summarized below:
June 30, 2018 June 30, 2017
Principalamount
(US$ millions)
Weightedaveragecost (%)
Principalamount
(US$ millions)
Weightedaveragecost (%)
US dollar . . . . . . . . . . . . . . . . . . . . . . . . . . . . . . . . . . . . . . . . . . $— — $196 0.9
Total borrowings outstanding from IBRD . . . . . . . . . . . . $— $196
120
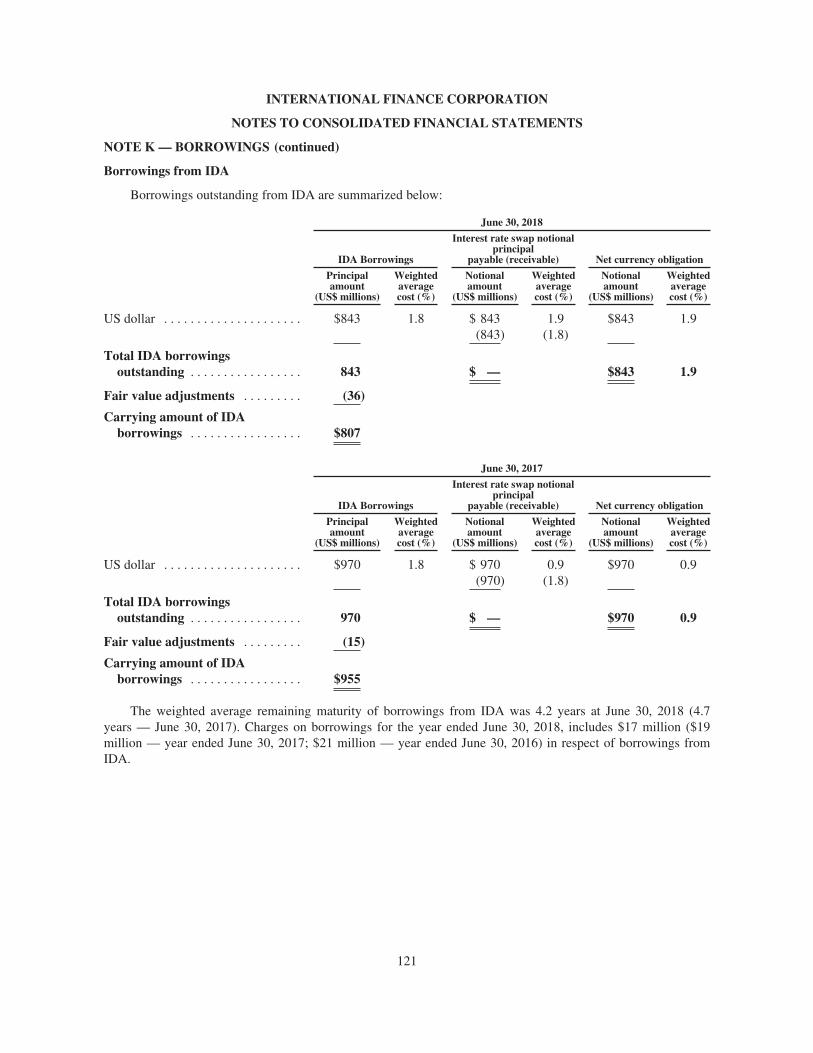
INTERNATIONAL FINANCE CORPORATION
NOTES TO CONSOLIDATED FINANCIAL STATEMENTS
NOTE K — BORROWINGS (continued)
Borrowings from IDA
Borrowings outstanding from IDA are summarized below:
June 30, 2018
IDA Borrowings
Interest rate swap notionalprincipal
payable (receivable) Net currency obligation
Principalamount
(US$ millions)
Weightedaveragecost (%)
Notionalamount
(US$ millions)
Weightedaveragecost (%)
Notionalamount
(US$ millions)
Weightedaveragecost (%)
US dollar . . . . . . . . . . . . . . . . . . . . . $843 1.8 $ 843 1.9 $843 1.9(843) (1.8)
Total IDA borrowingsoutstanding . . . . . . . . . . . . . . . . . 843 $ — $843 1.9
Fair value adjustments . . . . . . . . . (36)
Carrying amount of IDAborrowings . . . . . . . . . . . . . . . . . $807
June 30, 2017
IDA Borrowings
Interest rate swap notionalprincipal
payable (receivable) Net currency obligation
Principalamount
(US$ millions)
Weightedaveragecost (%)
Notionalamount
(US$ millions)
Weightedaveragecost (%)
Notionalamount
(US$ millions)
Weightedaveragecost (%)
US dollar . . . . . . . . . . . . . . . . . . . . . $970 1.8 $ 970 0.9 $970 0.9(970) (1.8)
Total IDA borrowingsoutstanding . . . . . . . . . . . . . . . . . 970 $ — $970 0.9
Fair value adjustments . . . . . . . . . (15)
Carrying amount of IDAborrowings . . . . . . . . . . . . . . . . . $955
The weighted average remaining maturity of borrowings from IDA was 4.2 years at June 30, 2018 (4.7years — June 30, 2017). Charges on borrowings for the year ended June 30, 2018, includes $17 million ($19million — year ended June 30, 2017; $21 million — year ended June 30, 2016) in respect of borrowings fromIDA.
121
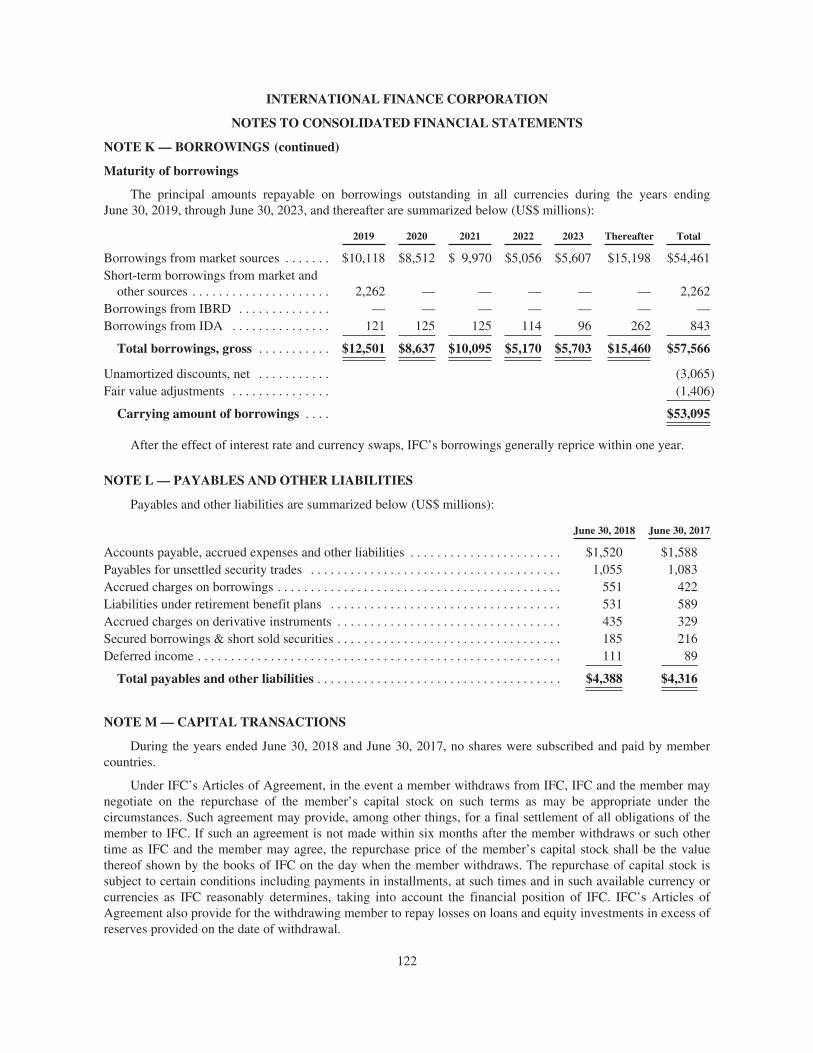
INTERNATIONAL FINANCE CORPORATION
NOTES TO CONSOLIDATED FINANCIAL STATEMENTS
NOTE K — BORROWINGS (continued)
Maturity of borrowings
The principal amounts repayable on borrowings outstanding in all currencies during the years endingJune 30, 2019, through June 30, 2023, and thereafter are summarized below (US$ millions):
2019 2020 2021 2022 2023 Thereafter Total
Borrowings from market sources . . . . . . . $10,118 $8,512 $ 9,970 $5,056 $5,607 $15,198 $54,461Short-term borrowings from market and
other sources . . . . . . . . . . . . . . . . . . . . . 2,262 — — — — — 2,262Borrowings from IBRD . . . . . . . . . . . . . . — — — — — — —Borrowings from IDA . . . . . . . . . . . . . . . 121 125 125 114 96 262 843
Total borrowings, gross . . . . . . . . . . . $12,501 $8,637 $10,095 $5,170 $5,703 $15,460 $57,566
Unamortized discounts, net . . . . . . . . . . . (3,065)Fair value adjustments . . . . . . . . . . . . . . . (1,406)
Carrying amount of borrowings . . . . $53,095
After the effect of interest rate and currency swaps, IFC’s borrowings generally reprice within one year.
NOTE L — PAYABLES AND OTHER LIABILITIES
Payables and other liabilities are summarized below (US$ millions):
June 30, 2018 June 30, 2017
Accounts payable, accrued expenses and other liabilities . . . . . . . . . . . . . . . . . . . . . . . $1,520 $1,588Payables for unsettled security trades . . . . . . . . . . . . . . . . . . . . . . . . . . . . . . . . . . . . . . 1,055 1,083Accrued charges on borrowings . . . . . . . . . . . . . . . . . . . . . . . . . . . . . . . . . . . . . . . . . . . 551 422Liabilities under retirement benefit plans . . . . . . . . . . . . . . . . . . . . . . . . . . . . . . . . . . . 531 589Accrued charges on derivative instruments . . . . . . . . . . . . . . . . . . . . . . . . . . . . . . . . . . 435 329Secured borrowings & short sold securities . . . . . . . . . . . . . . . . . . . . . . . . . . . . . . . . . . 185 216Deferred income . . . . . . . . . . . . . . . . . . . . . . . . . . . . . . . . . . . . . . . . . . . . . . . . . . . . . . . 111 89
Total payables and other liabilities . . . . . . . . . . . . . . . . . . . . . . . . . . . . . . . . . . . . . $4,388 $4,316
NOTE M — CAPITAL TRANSACTIONS
During the years ended June 30, 2018 and June 30, 2017, no shares were subscribed and paid by membercountries.
Under IFC’s Articles of Agreement, in the event a member withdraws from IFC, IFC and the member maynegotiate on the repurchase of the member’s capital stock on such terms as may be appropriate under thecircumstances. Such agreement may provide, among other things, for a final settlement of all obligations of themember to IFC. If such an agreement is not made within six months after the member withdraws or such othertime as IFC and the member may agree, the repurchase price of the member’s capital stock shall be the valuethereof shown by the books of IFC on the day when the member withdraws. The repurchase of capital stock issubject to certain conditions including payments in installments, at such times and in such available currency orcurrencies as IFC reasonably determines, taking into account the financial position of IFC. IFC’s Articles ofAgreement also provide for the withdrawing member to repay losses on loans and equity investments in excess ofreserves provided on the date of withdrawal.
122
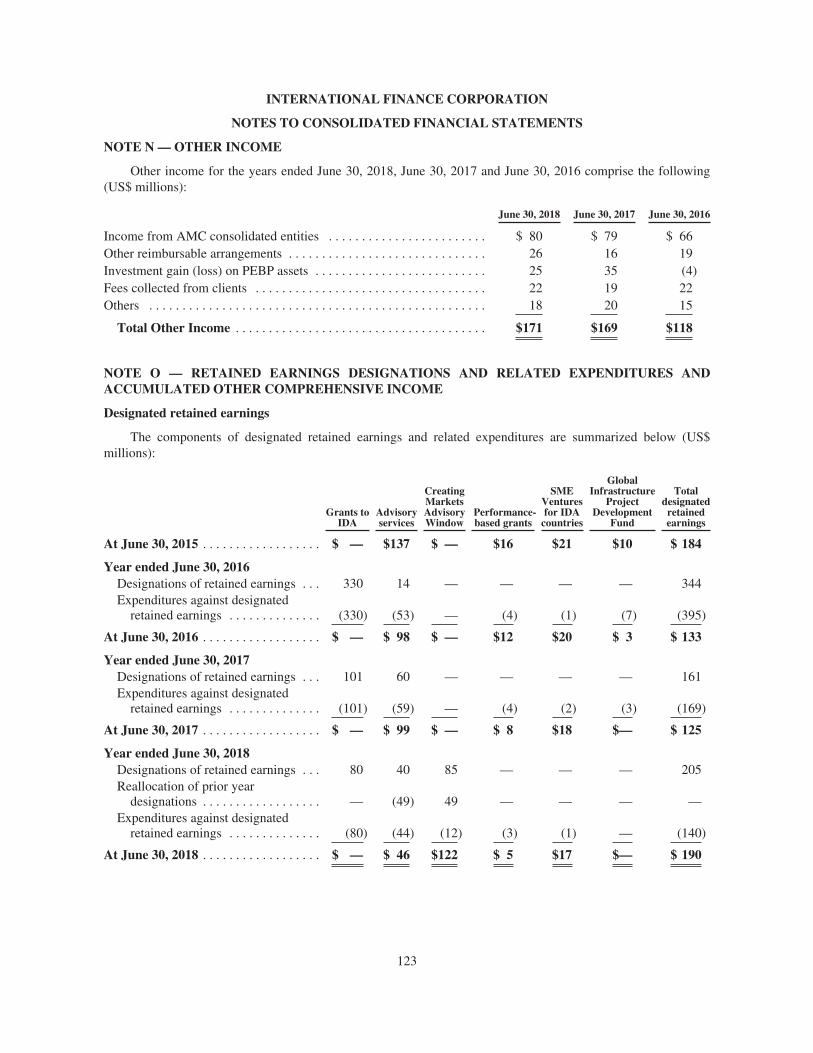
INTERNATIONAL FINANCE CORPORATION
NOTES TO CONSOLIDATED FINANCIAL STATEMENTS
NOTE N — OTHER INCOME
Other income for the years ended June 30, 2018, June 30, 2017 and June 30, 2016 comprise the following(US$ millions):
June 30, 2018 June 30, 2017 June 30, 2016
Income from AMC consolidated entities . . . . . . . . . . . . . . . . . . . . . . . . $ 80 $ 79 $ 66Other reimbursable arrangements . . . . . . . . . . . . . . . . . . . . . . . . . . . . . . 26 16 19Investment gain (loss) on PEBP assets . . . . . . . . . . . . . . . . . . . . . . . . . . 25 35 (4)Fees collected from clients . . . . . . . . . . . . . . . . . . . . . . . . . . . . . . . . . . . 22 19 22Others . . . . . . . . . . . . . . . . . . . . . . . . . . . . . . . . . . . . . . . . . . . . . . . . . . . 18 20 15
Total Other Income . . . . . . . . . . . . . . . . . . . . . . . . . . . . . . . . . . . . . . $171 $169 $118
NOTE O — RETAINED EARNINGS DESIGNATIONS AND RELATED EXPENDITURES ANDACCUMULATED OTHER COMPREHENSIVE INCOME
Designated retained earnings
The components of designated retained earnings and related expenditures are summarized below (US$millions):
Grants toIDA
Advisoryservices
CreatingMarketsAdvisoryWindow
Performance-based grants
SMEVenturesfor IDA
countries
GlobalInfrastructure
ProjectDevelopment
Fund
Totaldesignatedretainedearnings
At June 30, 2015 . . . . . . . . . . . . . . . . . . $ — $137 $ — $16 $21 $10 $ 184
Year ended June 30, 2016Designations of retained earnings . . . 330 14 — — — — 344Expenditures against designated
retained earnings . . . . . . . . . . . . . . (330) (53) — (4) (1) (7) (395)
At June 30, 2016 . . . . . . . . . . . . . . . . . . $ — $ 98 $ — $12 $20 $ 3 $ 133
Year ended June 30, 2017Designations of retained earnings . . . 101 60 — — — — 161Expenditures against designated
retained earnings . . . . . . . . . . . . . . (101) (59) — (4) (2) (3) (169)
At June 30, 2017 . . . . . . . . . . . . . . . . . . $ — $ 99 $ — $ 8 $18 $— $ 125
Year ended June 30, 2018Designations of retained earnings . . . 80 40 85 — — — 205Reallocation of prior year
designations . . . . . . . . . . . . . . . . . . — (49) 49 — — — —Expenditures against designated
retained earnings . . . . . . . . . . . . . . (80) (44) (12) (3) (1) — (140)
At June 30, 2018 . . . . . . . . . . . . . . . . . . $ — $ 46 $122 $ 5 $17 $— $ 190
123
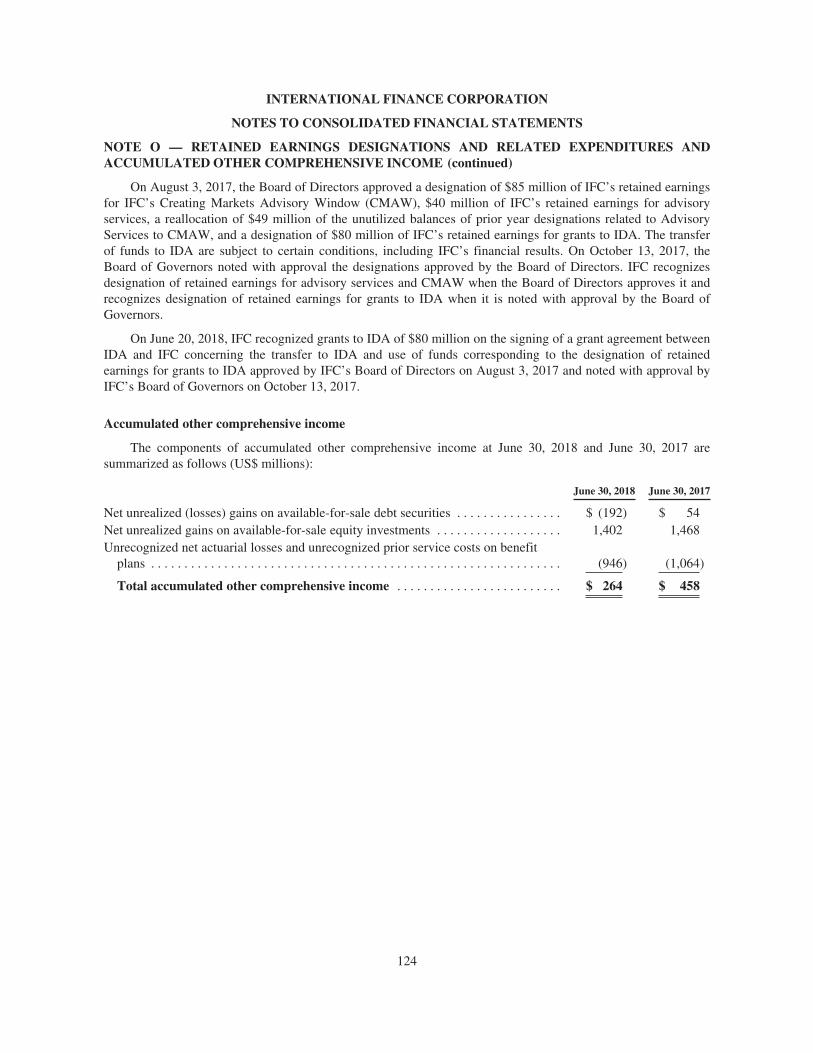
INTERNATIONAL FINANCE CORPORATION
NOTES TO CONSOLIDATED FINANCIAL STATEMENTS
NOTE O — RETAINED EARNINGS DESIGNATIONS AND RELATED EXPENDITURES ANDACCUMULATED OTHER COMPREHENSIVE INCOME (continued)
On August 3, 2017, the Board of Directors approved a designation of $85 million of IFC’s retained earningsfor IFC’s Creating Markets Advisory Window (CMAW), $40 million of IFC’s retained earnings for advisoryservices, a reallocation of $49 million of the unutilized balances of prior year designations related to AdvisoryServices to CMAW, and a designation of $80 million of IFC’s retained earnings for grants to IDA. The transferof funds to IDA are subject to certain conditions, including IFC’s financial results. On October 13, 2017, theBoard of Governors noted with approval the designations approved by the Board of Directors. IFC recognizesdesignation of retained earnings for advisory services and CMAW when the Board of Directors approves it andrecognizes designation of retained earnings for grants to IDA when it is noted with approval by the Board ofGovernors.
On June 20, 2018, IFC recognized grants to IDA of $80 million on the signing of a grant agreement betweenIDA and IFC concerning the transfer to IDA and use of funds corresponding to the designation of retainedearnings for grants to IDA approved by IFC’s Board of Directors on August 3, 2017 and noted with approval byIFC’s Board of Governors on October 13, 2017.
Accumulated other comprehensive income
The components of accumulated other comprehensive income at June 30, 2018 and June 30, 2017 aresummarized as follows (US$ millions):
June 30, 2018 June 30, 2017
Net unrealized (losses) gains on available-for-sale debt securities . . . . . . . . . . . . . . . . $ (192) $ 54Net unrealized gains on available-for-sale equity investments . . . . . . . . . . . . . . . . . . . 1,402 1,468Unrecognized net actuarial losses and unrecognized prior service costs on benefit
plans . . . . . . . . . . . . . . . . . . . . . . . . . . . . . . . . . . . . . . . . . . . . . . . . . . . . . . . . . . . . . . (946) (1,064)
Total accumulated other comprehensive income . . . . . . . . . . . . . . . . . . . . . . . . . $ 264 $ 458
124
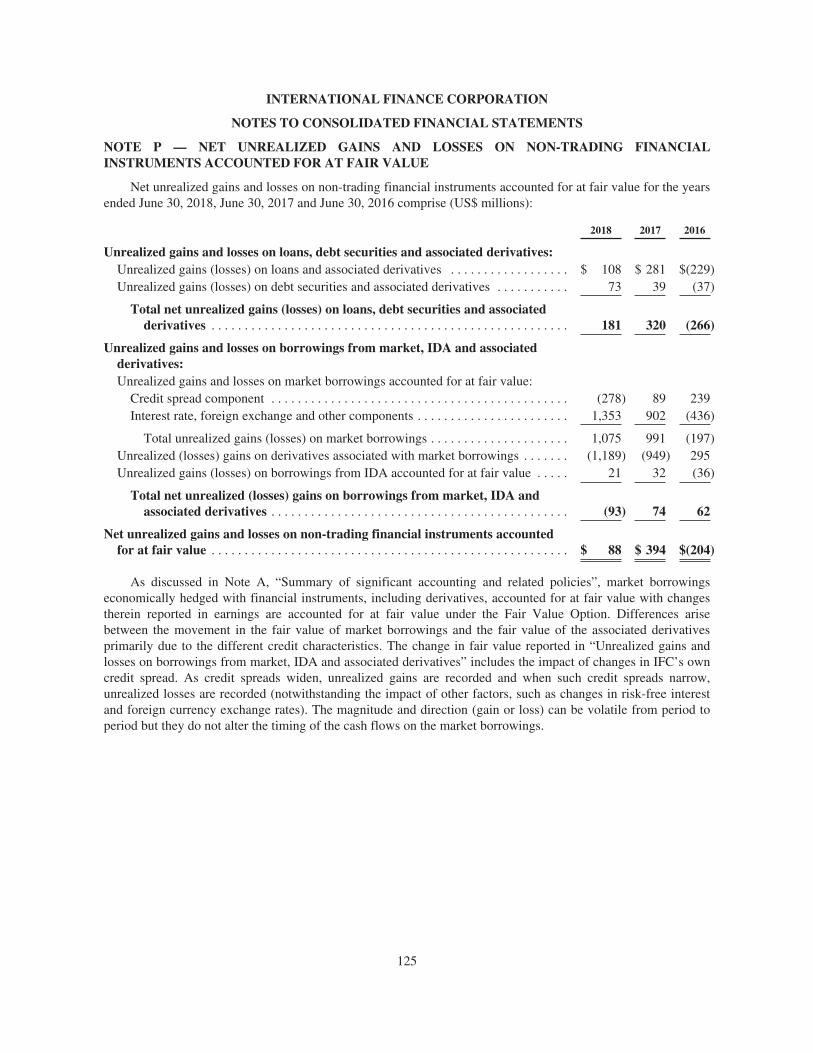
INTERNATIONAL FINANCE CORPORATION
NOTES TO CONSOLIDATED FINANCIAL STATEMENTS
NOTE P — NET UNREALIZED GAINS AND LOSSES ON NON-TRADING FINANCIALINSTRUMENTS ACCOUNTED FOR AT FAIR VALUE
Net unrealized gains and losses on non-trading financial instruments accounted for at fair value for the yearsended June 30, 2018, June 30, 2017 and June 30, 2016 comprise (US$ millions):
2018 2017 2016
Unrealized gains and losses on loans, debt securities and associated derivatives:Unrealized gains (losses) on loans and associated derivatives . . . . . . . . . . . . . . . . . . $ 108 $ 281 $(229)Unrealized gains (losses) on debt securities and associated derivatives . . . . . . . . . . . 73 39 (37)
Total net unrealized gains (losses) on loans, debt securities and associatedderivatives . . . . . . . . . . . . . . . . . . . . . . . . . . . . . . . . . . . . . . . . . . . . . . . . . . . . . . 181 320 (266)
Unrealized gains and losses on borrowings from market, IDA and associatedderivatives:Unrealized gains and losses on market borrowings accounted for at fair value:
Credit spread component . . . . . . . . . . . . . . . . . . . . . . . . . . . . . . . . . . . . . . . . . . . . . (278) 89 239Interest rate, foreign exchange and other components . . . . . . . . . . . . . . . . . . . . . . . 1,353 902 (436)
Total unrealized gains (losses) on market borrowings . . . . . . . . . . . . . . . . . . . . . 1,075 991 (197)Unrealized (losses) gains on derivatives associated with market borrowings . . . . . . . (1,189) (949) 295Unrealized gains (losses) on borrowings from IDA accounted for at fair value . . . . . 21 32 (36)
Total net unrealized (losses) gains on borrowings from market, IDA andassociated derivatives . . . . . . . . . . . . . . . . . . . . . . . . . . . . . . . . . . . . . . . . . . . . . (93) 74 62
Net unrealized gains and losses on non-trading financial instruments accountedfor at fair value . . . . . . . . . . . . . . . . . . . . . . . . . . . . . . . . . . . . . . . . . . . . . . . . . . . . . . $ 88 $ 394 $(204)
As discussed in Note A, “Summary of significant accounting and related policies”, market borrowingseconomically hedged with financial instruments, including derivatives, accounted for at fair value with changestherein reported in earnings are accounted for at fair value under the Fair Value Option. Differences arisebetween the movement in the fair value of market borrowings and the fair value of the associated derivativesprimarily due to the different credit characteristics. The change in fair value reported in “Unrealized gains andlosses on borrowings from market, IDA and associated derivatives” includes the impact of changes in IFC’s owncredit spread. As credit spreads widen, unrealized gains are recorded and when such credit spreads narrow,unrealized losses are recorded (notwithstanding the impact of other factors, such as changes in risk-free interestand foreign currency exchange rates). The magnitude and direction (gain or loss) can be volatile from period toperiod but they do not alter the timing of the cash flows on the market borrowings.
125
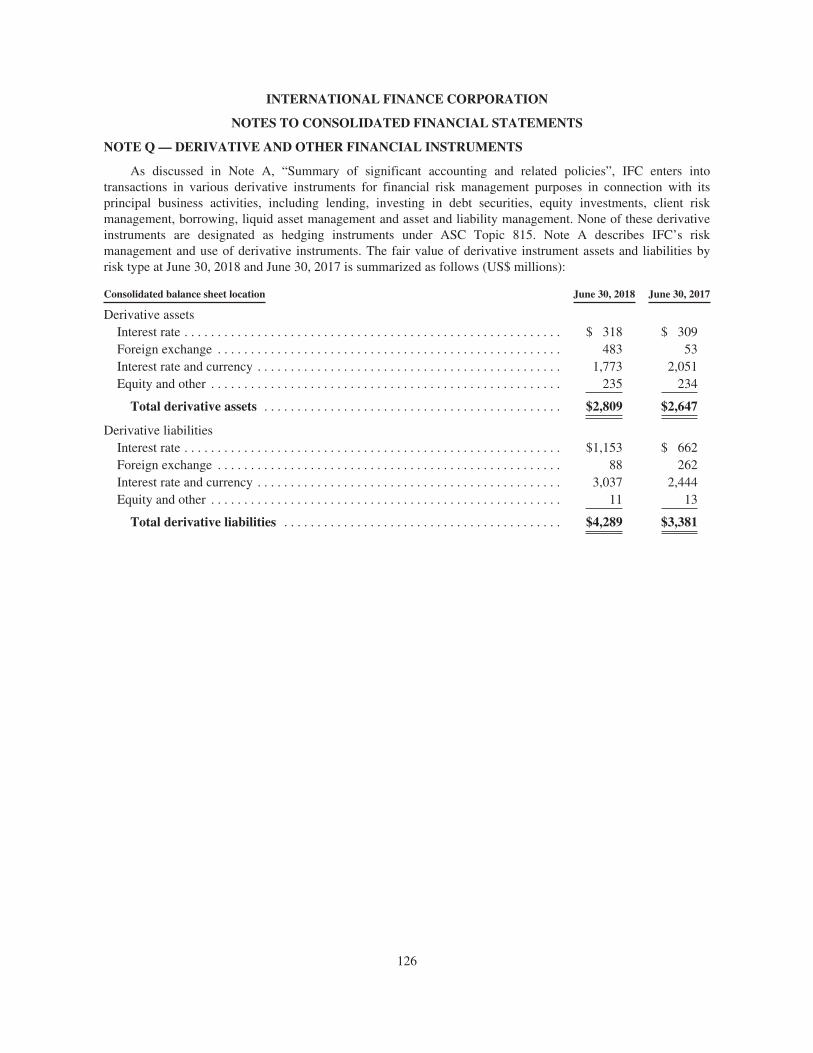
INTERNATIONAL FINANCE CORPORATION
NOTES TO CONSOLIDATED FINANCIAL STATEMENTS
NOTE Q — DERIVATIVE AND OTHER FINANCIAL INSTRUMENTS
As discussed in Note A, “Summary of significant accounting and related policies”, IFC enters intotransactions in various derivative instruments for financial risk management purposes in connection with itsprincipal business activities, including lending, investing in debt securities, equity investments, client riskmanagement, borrowing, liquid asset management and asset and liability management. None of these derivativeinstruments are designated as hedging instruments under ASC Topic 815. Note A describes IFC’s riskmanagement and use of derivative instruments. The fair value of derivative instrument assets and liabilities byrisk type at June 30, 2018 and June 30, 2017 is summarized as follows (US$ millions):
Consolidated balance sheet location June 30, 2018 June 30, 2017
Derivative assetsInterest rate . . . . . . . . . . . . . . . . . . . . . . . . . . . . . . . . . . . . . . . . . . . . . . . . . . . . . . . . . $ 318 $ 309Foreign exchange . . . . . . . . . . . . . . . . . . . . . . . . . . . . . . . . . . . . . . . . . . . . . . . . . . . . 483 53Interest rate and currency . . . . . . . . . . . . . . . . . . . . . . . . . . . . . . . . . . . . . . . . . . . . . . 1,773 2,051Equity and other . . . . . . . . . . . . . . . . . . . . . . . . . . . . . . . . . . . . . . . . . . . . . . . . . . . . . 235 234
Total derivative assets . . . . . . . . . . . . . . . . . . . . . . . . . . . . . . . . . . . . . . . . . . . . . $2,809 $2,647
Derivative liabilitiesInterest rate . . . . . . . . . . . . . . . . . . . . . . . . . . . . . . . . . . . . . . . . . . . . . . . . . . . . . . . . . $1,153 $ 662Foreign exchange . . . . . . . . . . . . . . . . . . . . . . . . . . . . . . . . . . . . . . . . . . . . . . . . . . . . 88 262Interest rate and currency . . . . . . . . . . . . . . . . . . . . . . . . . . . . . . . . . . . . . . . . . . . . . . 3,037 2,444Equity and other . . . . . . . . . . . . . . . . . . . . . . . . . . . . . . . . . . . . . . . . . . . . . . . . . . . . . 11 13
Total derivative liabilities . . . . . . . . . . . . . . . . . . . . . . . . . . . . . . . . . . . . . . . . . . $4,289 $3,381
126
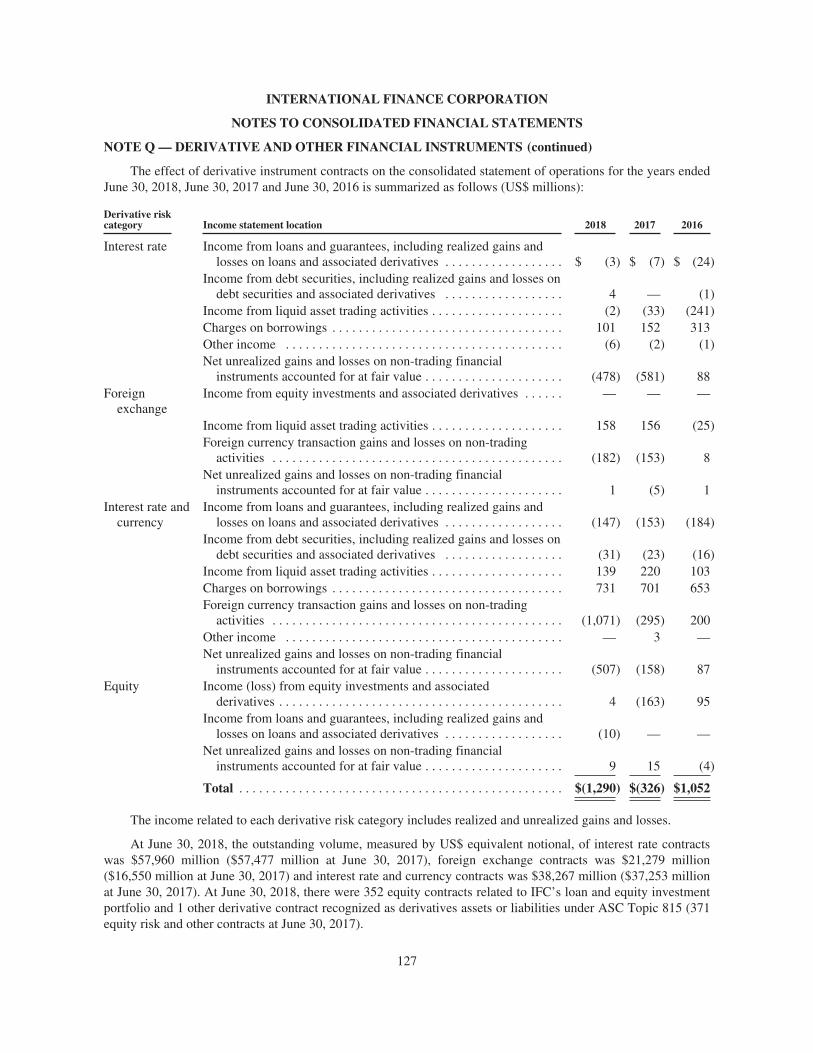
INTERNATIONAL FINANCE CORPORATION
NOTES TO CONSOLIDATED FINANCIAL STATEMENTS
NOTE Q — DERIVATIVE AND OTHER FINANCIAL INSTRUMENTS (continued)
The effect of derivative instrument contracts on the consolidated statement of operations for the years endedJune 30, 2018, June 30, 2017 and June 30, 2016 is summarized as follows (US$ millions):
Derivative riskcategory Income statement location 2018 2017 2016
Interest rate Income from loans and guarantees, including realized gains andlosses on loans and associated derivatives . . . . . . . . . . . . . . . . . . $ (3) $ (7) $ (24)
Income from debt securities, including realized gains and losses ondebt securities and associated derivatives . . . . . . . . . . . . . . . . . . 4 — (1)
Income from liquid asset trading activities . . . . . . . . . . . . . . . . . . . . (2) (33) (241)Charges on borrowings . . . . . . . . . . . . . . . . . . . . . . . . . . . . . . . . . . . 101 152 313Other income . . . . . . . . . . . . . . . . . . . . . . . . . . . . . . . . . . . . . . . . . . (6) (2) (1)Net unrealized gains and losses on non-trading financial
instruments accounted for at fair value . . . . . . . . . . . . . . . . . . . . . (478) (581) 88Foreign
exchangeIncome from equity investments and associated derivatives . . . . . . — — —
Income from liquid asset trading activities . . . . . . . . . . . . . . . . . . . . 158 156 (25)Foreign currency transaction gains and losses on non-trading
activities . . . . . . . . . . . . . . . . . . . . . . . . . . . . . . . . . . . . . . . . . . . . (182) (153) 8Net unrealized gains and losses on non-trading financial
instruments accounted for at fair value . . . . . . . . . . . . . . . . . . . . . 1 (5) 1Interest rate and
currencyIncome from loans and guarantees, including realized gains and
losses on loans and associated derivatives . . . . . . . . . . . . . . . . . . (147) (153) (184)Income from debt securities, including realized gains and losses on
debt securities and associated derivatives . . . . . . . . . . . . . . . . . . (31) (23) (16)Income from liquid asset trading activities . . . . . . . . . . . . . . . . . . . . 139 220 103Charges on borrowings . . . . . . . . . . . . . . . . . . . . . . . . . . . . . . . . . . . 731 701 653Foreign currency transaction gains and losses on non-trading
activities . . . . . . . . . . . . . . . . . . . . . . . . . . . . . . . . . . . . . . . . . . . . (1,071) (295) 200Other income . . . . . . . . . . . . . . . . . . . . . . . . . . . . . . . . . . . . . . . . . . — 3 —Net unrealized gains and losses on non-trading financial
instruments accounted for at fair value . . . . . . . . . . . . . . . . . . . . . (507) (158) 87Equity Income (loss) from equity investments and associated
derivatives . . . . . . . . . . . . . . . . . . . . . . . . . . . . . . . . . . . . . . . . . . . 4 (163) 95Income from loans and guarantees, including realized gains and
losses on loans and associated derivatives . . . . . . . . . . . . . . . . . . (10) — —Net unrealized gains and losses on non-trading financial
instruments accounted for at fair value . . . . . . . . . . . . . . . . . . . . . 9 15 (4)
Total . . . . . . . . . . . . . . . . . . . . . . . . . . . . . . . . . . . . . . . . . . . . . . . . . $(1,290) $(326) $1,052
The income related to each derivative risk category includes realized and unrealized gains and losses.
At June 30, 2018, the outstanding volume, measured by US$ equivalent notional, of interest rate contractswas $57,960 million ($57,477 million at June 30, 2017), foreign exchange contracts was $21,279 million($16,550 million at June 30, 2017) and interest rate and currency contracts was $38,267 million ($37,253 millionat June 30, 2017). At June 30, 2018, there were 352 equity contracts related to IFC’s loan and equity investmentportfolio and 1 other derivative contract recognized as derivatives assets or liabilities under ASC Topic 815 (371equity risk and other contracts at June 30, 2017).
127
INTERNATIONAL FINANCE CORPORATION
NOTES TO CONSOLIDATED FINANCIAL STATEMENTS
NOTE R — FAIR VALUE MEASUREMENTS
Many of IFC’s financial instruments are not actively traded in any market. Accordingly, estimates andpresent value calculations of future cash flows are used to estimate the fair values. Determining future cash flowsfor fair value estimation is subjective and imprecise, and minor changes in assumptions or methodologies maymaterially affect the estimated values. The excess or deficit resulting from the difference between the carryingamounts and the fair values presented does not necessarily reflect the values which will ultimately be realized,since IFC generally holds loans, borrowings and other financial instruments with contractual maturities with theaim of realizing their contractual cash flows.
The estimated fair values as of June 30, 2018 and June 30, 2017 reflect multiple factors such as interestrates, credit risk, foreign currency exchange rates and commodity prices. Reasonable comparability of fair valuesamong financial institutions is not likely because of the wide range of permitted valuation techniques andnumerous estimates that must be made in the absence of secondary market prices. This lack of objective pricingstandard in the market introduces a greater degree of subjectivity and volatility to these derived or estimated fairvalues. Therefore, while disclosure of estimated fair values of financial instruments is required, readers arecautioned in using these data for purposes of evaluating the financial condition of IFC. The fair values of theindividual financial instruments do not represent the fair value of IFC taken as a whole.
All of IFC’s financial instruments in its liquid assets portfolio are managed according to an investmentauthority approved by the Board of Directors and investment guidelines approved by IFC’s Corporate RiskCommittee (CRC), a subcommittee of IFC’s Management Team. Third party independent vendor prices are usedto price the vast majority of the liquid assets. The vendor prices are evaluated by IFC’s Treasury department andIFC’s Corporate and Portfolio Risk Management department maintains oversight for the pricing of liquid assets.
IFC’s regional and industry departments are primarily responsible for fair valuing IFC’s investmentportfolio (equity investments, debt securities, loan investments and related derivatives). IFC’s PortfolioValuation Unit, in Risk & Financial Sustainability, and Portfolio Review Unit, in Finance and Accounting,provide oversight over the fair valuation process by monitoring and reviewing the fair values of IFC’s investmentportfolio. A Portfolio Committee, a committee of IFC’s management team, was established effective FY18 Q1with responsibilities that include oversight of portfolio valuations.
IFC’s borrowings are fair valued by the Quantitative Analysis and Modeling Group in IFC’s Treasurydepartment under the oversight of the Corporate Portfolio and Risk Management department.
The methodologies used and key assumptions made to estimate fair values as of June 30, 2018, and June 30,2017, are summarized below.
Liquid assets — The primary pricing source for the liquid assets is valuations obtained from externalpricing services (vendor prices). The most liquid securities in the liquid asset portfolio are exchange tradedfutures, options, and US Treasuries. For exchange traded futures and options, exchange quoted prices areobtained and these are classified as Level 1 in accordance with ASC 820. Liquid assets valued using quotedmarket prices are also classified as Level 1. Securities valued using vendor prices for which there is evidence ofhigh market trade activity may also be classified as Level 1. US Treasuries are valued using index prices and alsoclassified as Level 1. The remaining liquid assets valued using vendor prices are classified as Level 2 or Level 3based on the results of IFC’s evaluation of the vendor’s pricing methodologies and individual security facts andcircumstances. Most vendor prices use some form of matrix pricing methodology to derive the inputs forprojecting cash flows or to derive prices. When vendor prices are not available, liquid assets are valued internallyby IFC using yield-pricing approach or comparables model approach and these are classified as Level 2 orLevel 3 depending on the degree that the inputs are observable in the market.
128
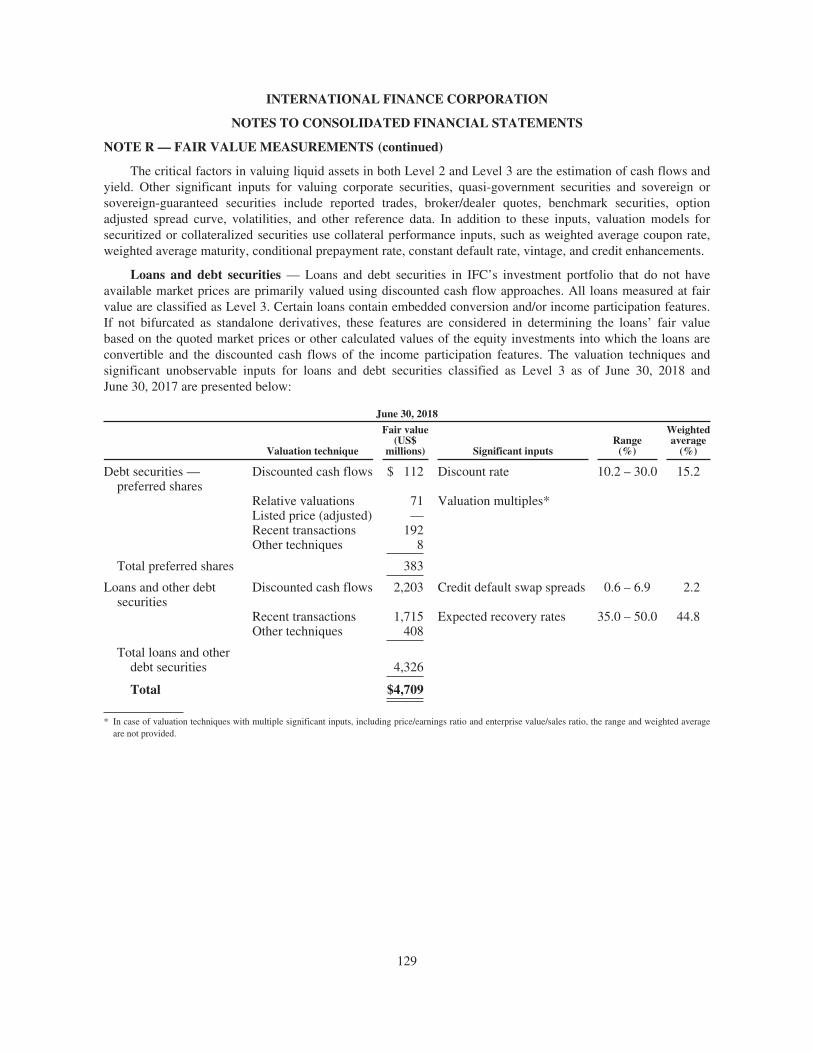
INTERNATIONAL FINANCE CORPORATION
NOTES TO CONSOLIDATED FINANCIAL STATEMENTS
NOTE R — FAIR VALUE MEASUREMENTS (continued)
The critical factors in valuing liquid assets in both Level 2 and Level 3 are the estimation of cash flows andyield. Other significant inputs for valuing corporate securities, quasi-government securities and sovereign orsovereign-guaranteed securities include reported trades, broker/dealer quotes, benchmark securities, optionadjusted spread curve, volatilities, and other reference data. In addition to these inputs, valuation models forsecuritized or collateralized securities use collateral performance inputs, such as weighted average coupon rate,weighted average maturity, conditional prepayment rate, constant default rate, vintage, and credit enhancements.
Loans and debt securities — Loans and debt securities in IFC’s investment portfolio that do not haveavailable market prices are primarily valued using discounted cash flow approaches. All loans measured at fairvalue are classified as Level 3. Certain loans contain embedded conversion and/or income participation features.If not bifurcated as standalone derivatives, these features are considered in determining the loans’ fair valuebased on the quoted market prices or other calculated values of the equity investments into which the loans areconvertible and the discounted cash flows of the income participation features. The valuation techniques andsignificant unobservable inputs for loans and debt securities classified as Level 3 as of June 30, 2018 andJune 30, 2017 are presented below:
June 30, 2018
Valuation technique
Fair value(US$
millions) Significant inputsRange
(%)
Weightedaverage
(%)
Debt securities —preferred shares
Discounted cash flows $ 112 Discount rate 10.2 – 30.0 15.2
Relative valuations 71 Valuation multiples*Listed price (adjusted) —Recent transactions 192Other techniques 8
Total preferred shares 383
Loans and other debtsecurities
Discounted cash flows 2,203 Credit default swap spreads 0.6 – 6.9 2.2
Recent transactions 1,715 Expected recovery rates 35.0 – 50.0 44.8Other techniques 408
Total loans and otherdebt securities 4,326
Total $4,709
* In case of valuation techniques with multiple significant inputs, including price/earnings ratio and enterprise value/sales ratio, the range and weighted averageare not provided.
129
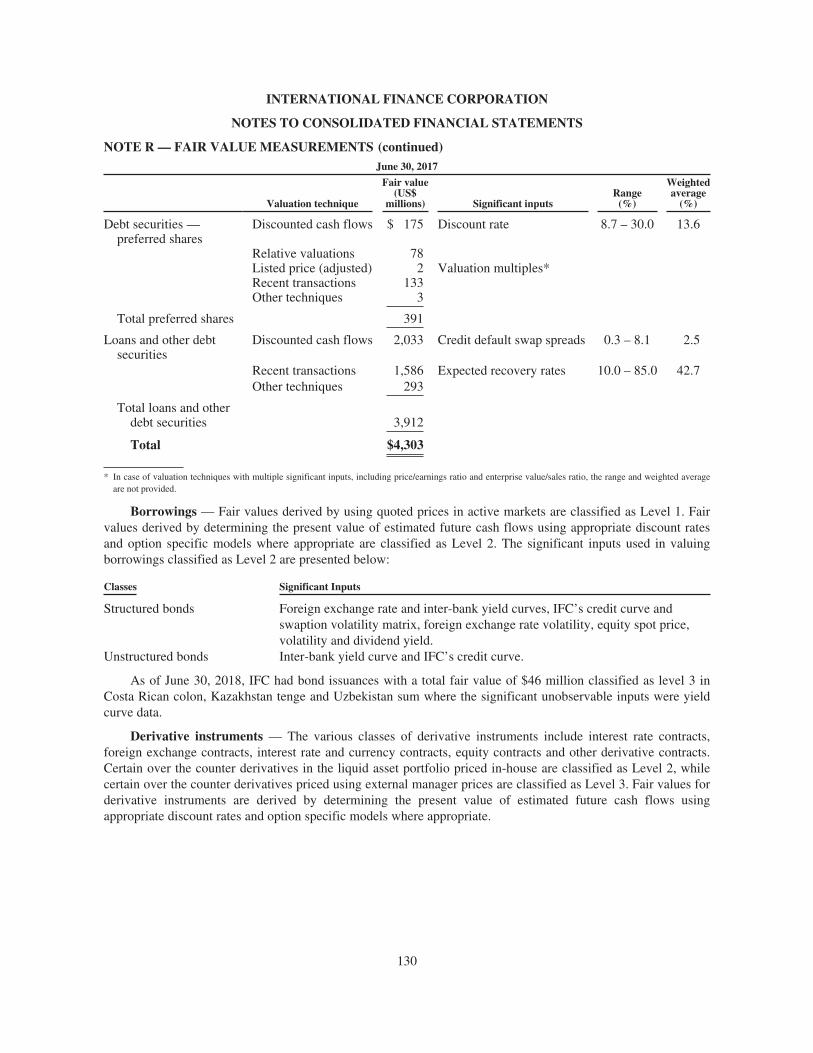
INTERNATIONAL FINANCE CORPORATION
NOTES TO CONSOLIDATED FINANCIAL STATEMENTS
NOTE R — FAIR VALUE MEASUREMENTS (continued)June 30, 2017
Valuation technique
Fair value(US$
millions) Significant inputsRange
(%)
Weightedaverage
(%)
Debt securities —preferred shares
Discounted cash flows $ 175 Discount rate 8.7 – 30.0 13.6
Relative valuationsListed price (adjusted)
782 Valuation multiples*
Recent transactions 133Other techniques 3
Total preferred shares 391
Loans and other debtsecurities
Discounted cash flows 2,033 Credit default swap spreads 0.3 – 8.1 2.5
Recent transactions 1,586 Expected recovery rates 10.0 – 85.0 42.7Other techniques 293
Total loans and otherdebt securities 3,912
Total $4,303
* In case of valuation techniques with multiple significant inputs, including price/earnings ratio and enterprise value/sales ratio, the range and weighted averageare not provided.
Borrowings — Fair values derived by using quoted prices in active markets are classified as Level 1. Fairvalues derived by determining the present value of estimated future cash flows using appropriate discount ratesand option specific models where appropriate are classified as Level 2. The significant inputs used in valuingborrowings classified as Level 2 are presented below:
Classes Significant Inputs
Structured bonds Foreign exchange rate and inter-bank yield curves, IFC’s credit curve andswaption volatility matrix, foreign exchange rate volatility, equity spot price,volatility and dividend yield.
Unstructured bonds Inter-bank yield curve and IFC’s credit curve.
As of June 30, 2018, IFC had bond issuances with a total fair value of $46 million classified as level 3 inCosta Rican colon, Kazakhstan tenge and Uzbekistan sum where the significant unobservable inputs were yieldcurve data.
Derivative instruments — The various classes of derivative instruments include interest rate contracts,foreign exchange contracts, interest rate and currency contracts, equity contracts and other derivative contracts.Certain over the counter derivatives in the liquid asset portfolio priced in-house are classified as Level 2, whilecertain over the counter derivatives priced using external manager prices are classified as Level 3. Fair values forderivative instruments are derived by determining the present value of estimated future cash flows usingappropriate discount rates and option specific models where appropriate.
130
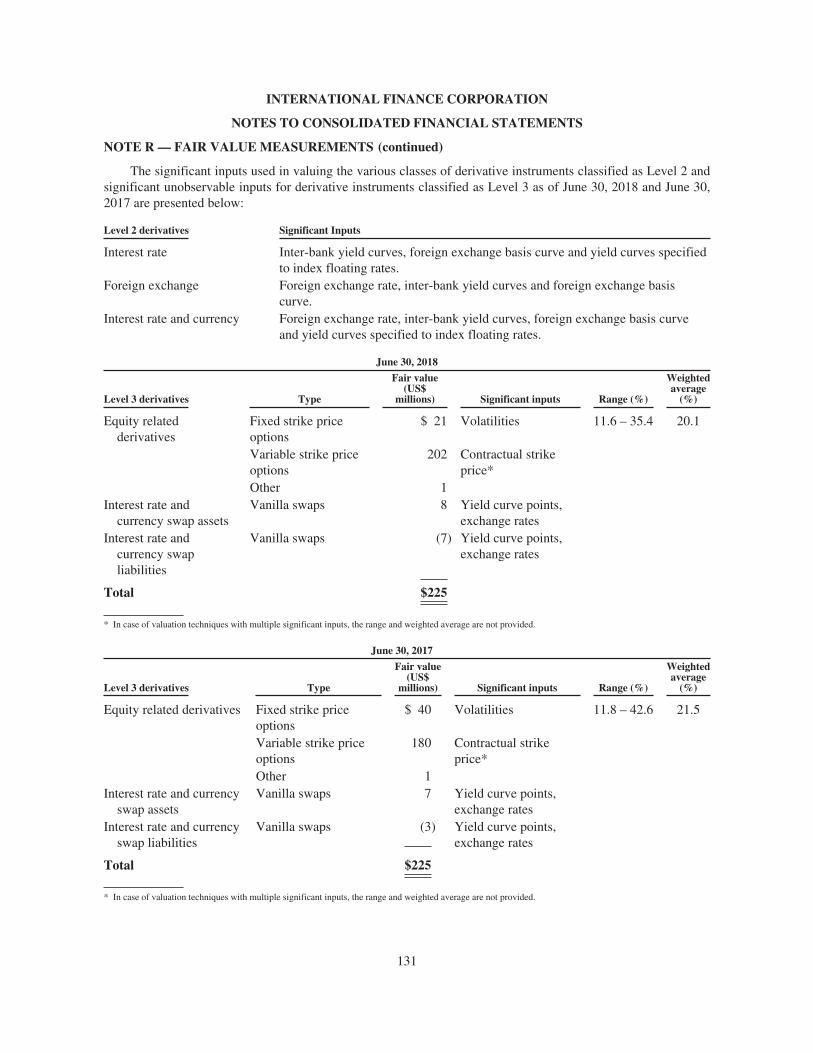
INTERNATIONAL FINANCE CORPORATION
NOTES TO CONSOLIDATED FINANCIAL STATEMENTS
NOTE R — FAIR VALUE MEASUREMENTS (continued)
The significant inputs used in valuing the various classes of derivative instruments classified as Level 2 andsignificant unobservable inputs for derivative instruments classified as Level 3 as of June 30, 2018 and June 30,2017 are presented below:
Level 2 derivatives Significant Inputs
Interest rate Inter-bank yield curves, foreign exchange basis curve and yield curves specifiedto index floating rates.
Foreign exchange Foreign exchange rate, inter-bank yield curves and foreign exchange basiscurve.
Interest rate and currency Foreign exchange rate, inter-bank yield curves, foreign exchange basis curveand yield curves specified to index floating rates.
June 30, 2018
Level 3 derivatives Type
Fair value(US$
millions) Significant inputs Range (%)
Weightedaverage
(%)
Equity relatedderivatives
Fixed strike priceoptions
$ 21 Volatilities 11.6 – 35.4 20.1
Variable strike priceoptions
202 Contractual strikeprice*
Other 1Interest rate and
currency swap assetsVanilla swaps 8 Yield curve points,
exchange ratesInterest rate and
currency swapliabilities
Vanilla swaps (7) Yield curve points,exchange rates
Total $225
* In case of valuation techniques with multiple significant inputs, the range and weighted average are not provided.
June 30, 2017
Level 3 derivatives Type
Fair value(US$
millions) Significant inputs Range (%)
Weightedaverage
(%)
Equity related derivatives Fixed strike priceoptions
$ 40 Volatilities 11.8 – 42.6 21.5
Variable strike priceoptions
180 Contractual strikeprice*
Other 1Interest rate and currency
swap assetsVanilla swaps 7 Yield curve points,
exchange ratesInterest rate and currency
swap liabilitiesVanilla swaps (3) Yield curve points,
exchange rates
Total $225
* In case of valuation techniques with multiple significant inputs, the range and weighted average are not provided.
131
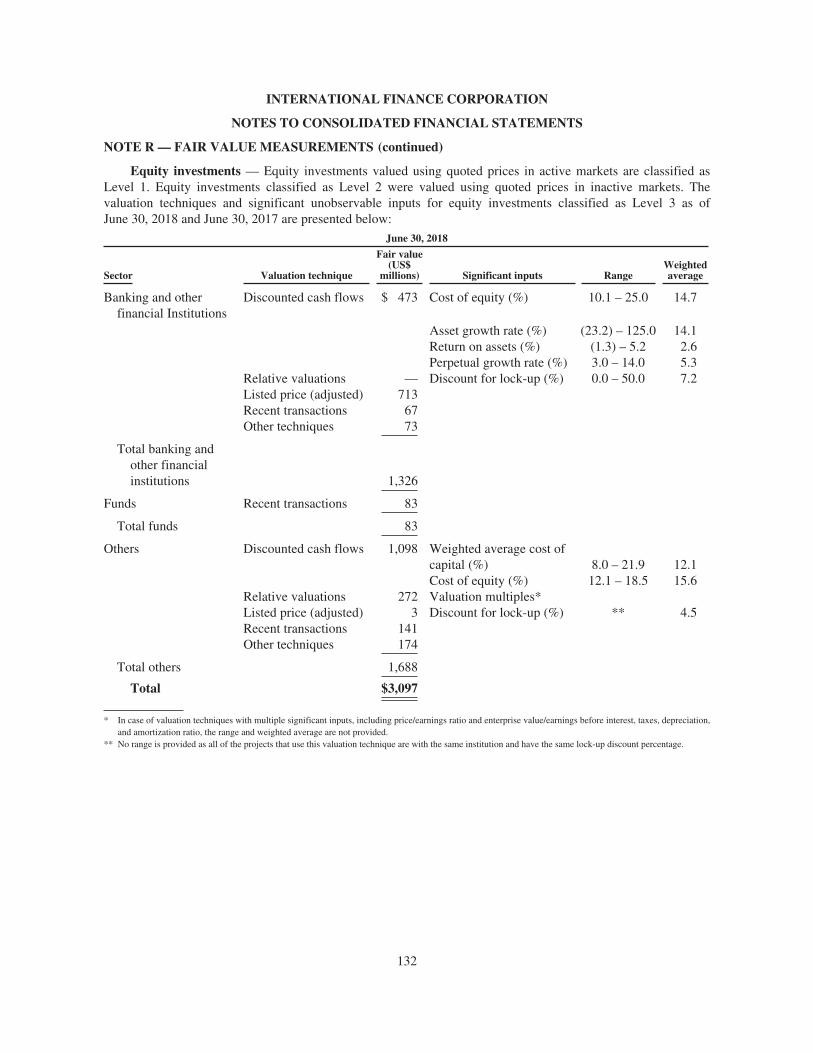
INTERNATIONAL FINANCE CORPORATION
NOTES TO CONSOLIDATED FINANCIAL STATEMENTS
NOTE R — FAIR VALUE MEASUREMENTS (continued)
Equity investments — Equity investments valued using quoted prices in active markets are classified asLevel 1. Equity investments classified as Level 2 were valued using quoted prices in inactive markets. Thevaluation techniques and significant unobservable inputs for equity investments classified as Level 3 as ofJune 30, 2018 and June 30, 2017 are presented below:
June 30, 2018
Sector Valuation technique
Fair value(US$
millions) Significant inputs RangeWeightedaverage
Banking and otherfinancial Institutions
Discounted cash flows $ 473 Cost of equity (%) 10.1 – 25.0 14.7
Asset growth rate (%) (23.2) – 125.0 14.1Return on assets (%) (1.3) – 5.2 2.6Perpetual growth rate (%) 3.0 – 14.0 5.3
Relative valuations — Discount for lock-up (%) 0.0 – 50.0 7.2Listed price (adjusted) 713Recent transactions 67Other techniques 73
Total banking andother financialinstitutions 1,326
Funds Recent transactions 83
Total funds 83
Others Discounted cash flows 1,098 Weighted average cost ofcapital (%) 8.0 – 21.9 12.1Cost of equity (%) 12.1 – 18.5 15.6
Relative valuations 272 Valuation multiples*Listed price (adjusted) 3 Discount for lock-up (%) ** 4.5Recent transactions 141Other techniques 174
Total others 1,688
Total $3,097
* In case of valuation techniques with multiple significant inputs, including price/earnings ratio and enterprise value/earnings before interest, taxes, depreciation,and amortization ratio, the range and weighted average are not provided.
** No range is provided as all of the projects that use this valuation technique are with the same institution and have the same lock-up discount percentage.
132
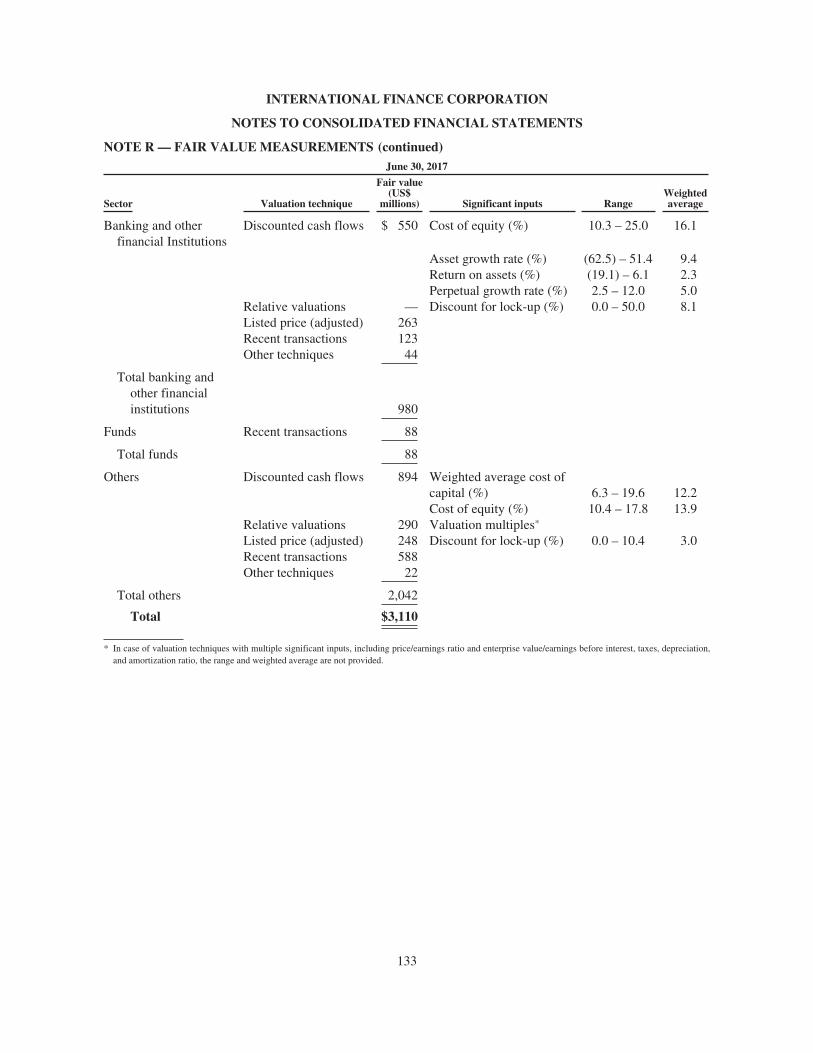
INTERNATIONAL FINANCE CORPORATION
NOTES TO CONSOLIDATED FINANCIAL STATEMENTS
NOTE R — FAIR VALUE MEASUREMENTS (continued)June 30, 2017
Sector Valuation technique
Fair value(US$
millions) Significant inputs RangeWeightedaverage
Banking and otherfinancial Institutions
Discounted cash flows $ 550 Cost of equity (%) 10.3 – 25.0 16.1
Asset growth rate (%) (62.5) – 51.4 9.4Return on assets (%) (19.1) – 6.1 2.3Perpetual growth rate (%) 2.5 – 12.0 5.0
Relative valuations — Discount for lock-up (%) 0.0 – 50.0 8.1Listed price (adjusted) 263Recent transactions 123Other techniques 44
Total banking andother financialinstitutions 980
Funds Recent transactions 88
Total funds 88
Others Discounted cash flows 894 Weighted average cost ofcapital (%) 6.3 – 19.6 12.2Cost of equity (%) 10.4 – 17.8 13.9
Relative valuations 290 Valuation multiples*
Listed price (adjusted) 248 Discount for lock-up (%) 0.0 – 10.4 3.0Recent transactions 588Other techniques 22
Total others 2,042
Total $3,110
* In case of valuation techniques with multiple significant inputs, including price/earnings ratio and enterprise value/earnings before interest, taxes, depreciation,and amortization ratio, the range and weighted average are not provided.
133
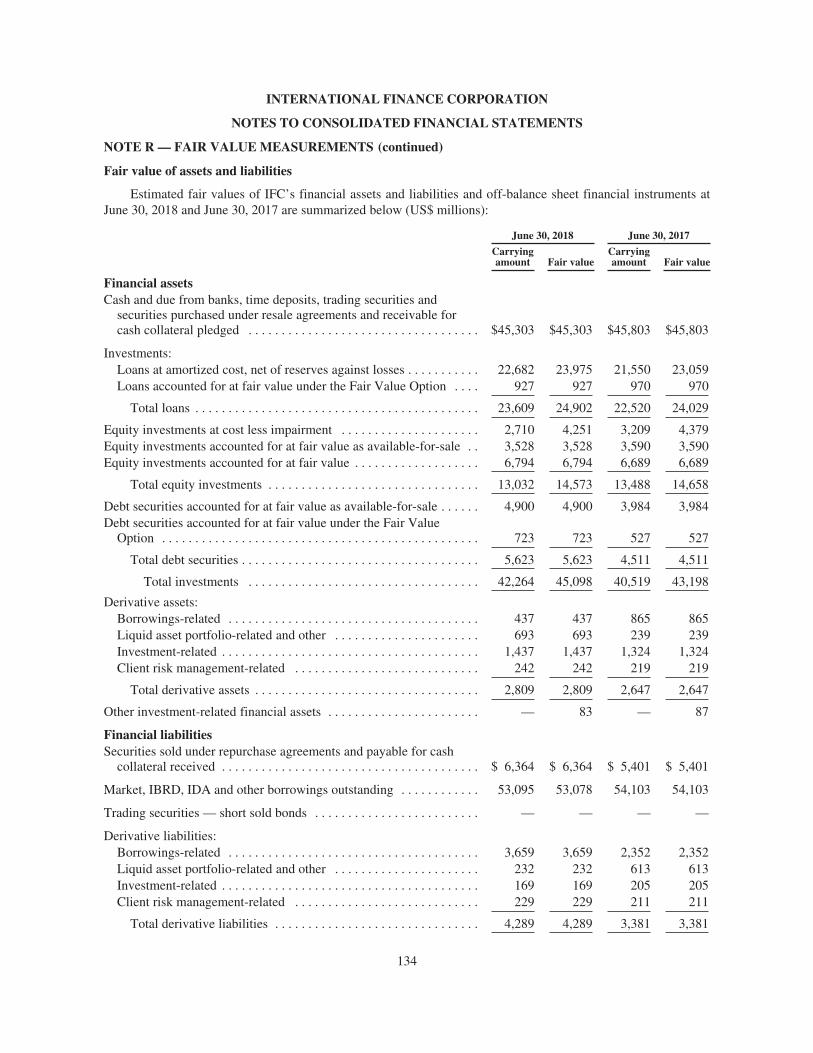
INTERNATIONAL FINANCE CORPORATION
NOTES TO CONSOLIDATED FINANCIAL STATEMENTS
NOTE R — FAIR VALUE MEASUREMENTS (continued)
Fair value of assets and liabilities
Estimated fair values of IFC’s financial assets and liabilities and off-balance sheet financial instruments atJune 30, 2018 and June 30, 2017 are summarized below (US$ millions):
June 30, 2018 June 30, 2017
Carryingamount Fair value
Carryingamount Fair value
Financial assetsCash and due from banks, time deposits, trading securities and
securities purchased under resale agreements and receivable forcash collateral pledged . . . . . . . . . . . . . . . . . . . . . . . . . . . . . . . . . . . $45,303 $45,303 $45,803 $45,803
Investments:Loans at amortized cost, net of reserves against losses . . . . . . . . . . . 22,682 23,975 21,550 23,059Loans accounted for at fair value under the Fair Value Option . . . . 927 927 970 970
Total loans . . . . . . . . . . . . . . . . . . . . . . . . . . . . . . . . . . . . . . . . . . . 23,609 24,902 22,520 24,029
Equity investments at cost less impairment . . . . . . . . . . . . . . . . . . . . . 2,710 4,251 3,209 4,379Equity investments accounted for at fair value as available-for-sale . . 3,528 3,528 3,590 3,590Equity investments accounted for at fair value . . . . . . . . . . . . . . . . . . . 6,794 6,794 6,689 6,689
Total equity investments . . . . . . . . . . . . . . . . . . . . . . . . . . . . . . . . 13,032 14,573 13,488 14,658
Debt securities accounted for at fair value as available-for-sale . . . . . . 4,900 4,900 3,984 3,984Debt securities accounted for at fair value under the Fair Value
Option . . . . . . . . . . . . . . . . . . . . . . . . . . . . . . . . . . . . . . . . . . . . . . . . 723 723 527 527
Total debt securities . . . . . . . . . . . . . . . . . . . . . . . . . . . . . . . . . . . . 5,623 5,623 4,511 4,511
Total investments . . . . . . . . . . . . . . . . . . . . . . . . . . . . . . . . . . . 42,264 45,098 40,519 43,198
Derivative assets:Borrowings-related . . . . . . . . . . . . . . . . . . . . . . . . . . . . . . . . . . . . . . 437 437 865 865Liquid asset portfolio-related and other . . . . . . . . . . . . . . . . . . . . . . 693 693 239 239Investment-related . . . . . . . . . . . . . . . . . . . . . . . . . . . . . . . . . . . . . . . 1,437 1,437 1,324 1,324Client risk management-related . . . . . . . . . . . . . . . . . . . . . . . . . . . . 242 242 219 219
Total derivative assets . . . . . . . . . . . . . . . . . . . . . . . . . . . . . . . . . . 2,809 2,809 2,647 2,647
Other investment-related financial assets . . . . . . . . . . . . . . . . . . . . . . . — 83 — 87
Financial liabilitiesSecurities sold under repurchase agreements and payable for cash
collateral received . . . . . . . . . . . . . . . . . . . . . . . . . . . . . . . . . . . . . . . $ 6,364 $ 6,364 $ 5,401 $ 5,401
Market, IBRD, IDA and other borrowings outstanding . . . . . . . . . . . . 53,095 53,078 54,103 54,103
Trading securities — short sold bonds . . . . . . . . . . . . . . . . . . . . . . . . . — — — —
Derivative liabilities:Borrowings-related . . . . . . . . . . . . . . . . . . . . . . . . . . . . . . . . . . . . . . 3,659 3,659 2,352 2,352Liquid asset portfolio-related and other . . . . . . . . . . . . . . . . . . . . . . 232 232 613 613Investment-related . . . . . . . . . . . . . . . . . . . . . . . . . . . . . . . . . . . . . . . 169 169 205 205Client risk management-related . . . . . . . . . . . . . . . . . . . . . . . . . . . . 229 229 211 211
Total derivative liabilities . . . . . . . . . . . . . . . . . . . . . . . . . . . . . . . 4,289 4,289 3,381 3,381
134
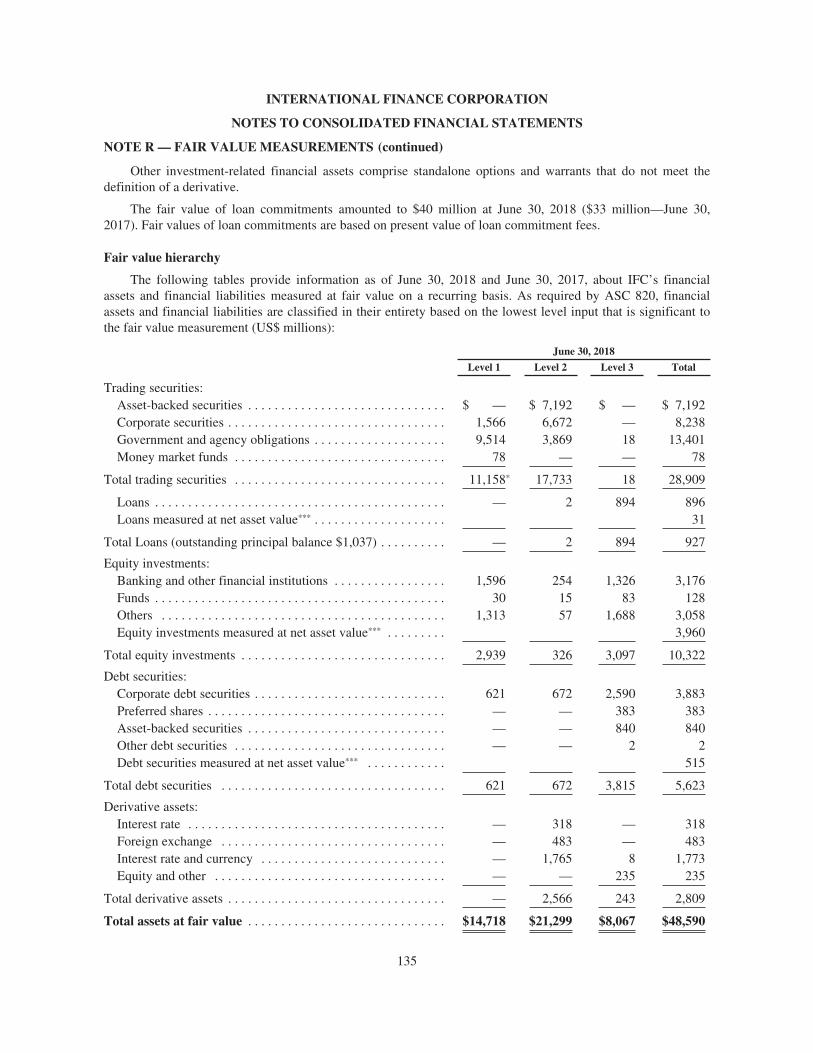
INTERNATIONAL FINANCE CORPORATION
NOTES TO CONSOLIDATED FINANCIAL STATEMENTS
NOTE R — FAIR VALUE MEASUREMENTS (continued)
Other investment-related financial assets comprise standalone options and warrants that do not meet thedefinition of a derivative.
The fair value of loan commitments amounted to $40 million at June 30, 2018 ($33 million—June 30,2017). Fair values of loan commitments are based on present value of loan commitment fees.
Fair value hierarchy
The following tables provide information as of June 30, 2018 and June 30, 2017, about IFC’s financialassets and financial liabilities measured at fair value on a recurring basis. As required by ASC 820, financialassets and financial liabilities are classified in their entirety based on the lowest level input that is significant tothe fair value measurement (US$ millions):
June 30, 2018
Level 1 Level 2 Level 3 Total
Trading securities:Asset-backed securities . . . . . . . . . . . . . . . . . . . . . . . . . . . . . . $ — $ 7,192 $ — $ 7,192Corporate securities . . . . . . . . . . . . . . . . . . . . . . . . . . . . . . . . . 1,566 6,672 — 8,238Government and agency obligations . . . . . . . . . . . . . . . . . . . . 9,514 3,869 18 13,401Money market funds . . . . . . . . . . . . . . . . . . . . . . . . . . . . . . . . 78 — — 78
Total trading securities . . . . . . . . . . . . . . . . . . . . . . . . . . . . . . . . 11,158* 17,733 18 28,909
Loans . . . . . . . . . . . . . . . . . . . . . . . . . . . . . . . . . . . . . . . . . . . . — 2 894 896Loans measured at net asset value*** . . . . . . . . . . . . . . . . . . . . 31
Total Loans (outstanding principal balance $1,037) . . . . . . . . . . — 2 894 927
Equity investments:Banking and other financial institutions . . . . . . . . . . . . . . . . . 1,596 254 1,326 3,176Funds . . . . . . . . . . . . . . . . . . . . . . . . . . . . . . . . . . . . . . . . . . . . 30 15 83 128Others . . . . . . . . . . . . . . . . . . . . . . . . . . . . . . . . . . . . . . . . . . . 1,313 57 1,688 3,058Equity investments measured at net asset value*** . . . . . . . . . 3,960
Total equity investments . . . . . . . . . . . . . . . . . . . . . . . . . . . . . . . 2,939 326 3,097 10,322
Debt securities:Corporate debt securities . . . . . . . . . . . . . . . . . . . . . . . . . . . . . 621 672 2,590 3,883Preferred shares . . . . . . . . . . . . . . . . . . . . . . . . . . . . . . . . . . . . — — 383 383Asset-backed securities . . . . . . . . . . . . . . . . . . . . . . . . . . . . . . — — 840 840Other debt securities . . . . . . . . . . . . . . . . . . . . . . . . . . . . . . . . — — 2 2Debt securities measured at net asset value*** . . . . . . . . . . . . 515
Total debt securities . . . . . . . . . . . . . . . . . . . . . . . . . . . . . . . . . . 621 672 3,815 5,623
Derivative assets:Interest rate . . . . . . . . . . . . . . . . . . . . . . . . . . . . . . . . . . . . . . . — 318 — 318Foreign exchange . . . . . . . . . . . . . . . . . . . . . . . . . . . . . . . . . . — 483 — 483Interest rate and currency . . . . . . . . . . . . . . . . . . . . . . . . . . . . — 1,765 8 1,773Equity and other . . . . . . . . . . . . . . . . . . . . . . . . . . . . . . . . . . . — — 235 235
Total derivative assets . . . . . . . . . . . . . . . . . . . . . . . . . . . . . . . . . — 2,566 243 2,809
Total assets at fair value . . . . . . . . . . . . . . . . . . . . . . . . . . . . . . $14,718 $21,299 $8,067 $48,590
135
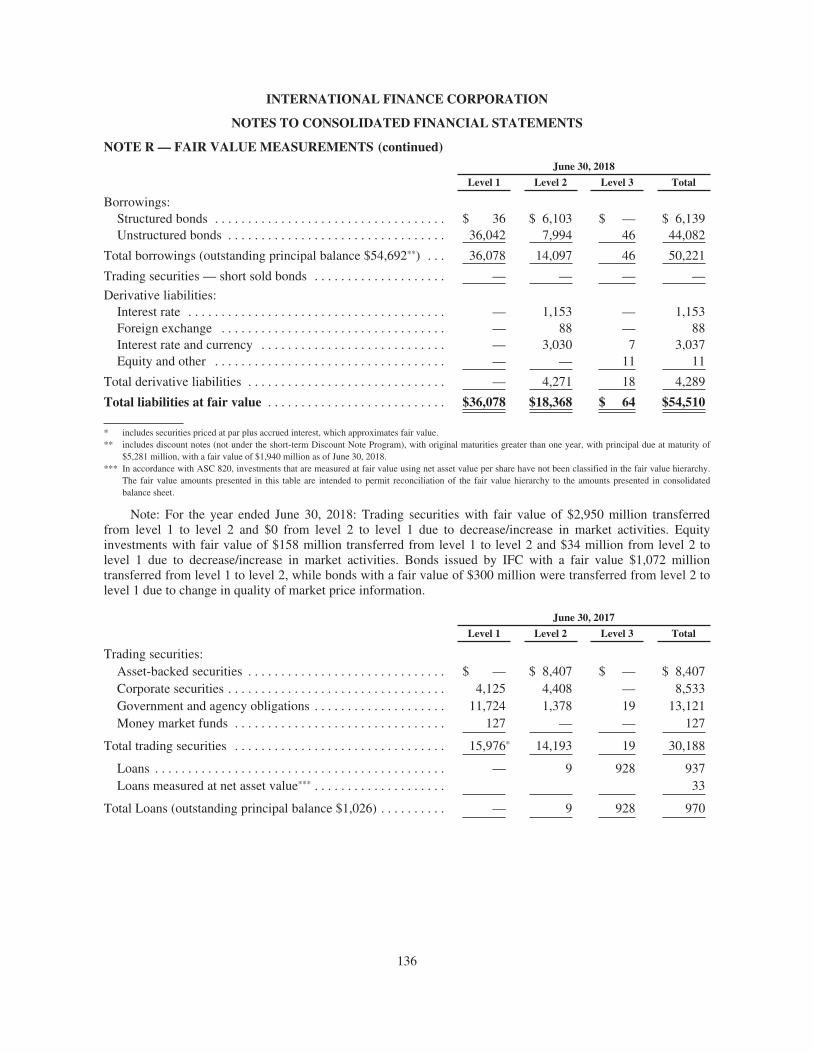
INTERNATIONAL FINANCE CORPORATION
NOTES TO CONSOLIDATED FINANCIAL STATEMENTS
NOTE R — FAIR VALUE MEASUREMENTS (continued)June 30, 2018
Level 1 Level 2 Level 3 Total
Borrowings:Structured bonds . . . . . . . . . . . . . . . . . . . . . . . . . . . . . . . . . . . $ 36 $ 6,103 $ — $ 6,139Unstructured bonds . . . . . . . . . . . . . . . . . . . . . . . . . . . . . . . . . 36,042 7,994 46 44,082
Total borrowings (outstanding principal balance $54,692**) . . . 36,078 14,097 46 50,221
Trading securities — short sold bonds . . . . . . . . . . . . . . . . . . . . — — — —
Derivative liabilities:Interest rate . . . . . . . . . . . . . . . . . . . . . . . . . . . . . . . . . . . . . . . — 1,153 — 1,153Foreign exchange . . . . . . . . . . . . . . . . . . . . . . . . . . . . . . . . . . — 88 — 88Interest rate and currency . . . . . . . . . . . . . . . . . . . . . . . . . . . . — 3,030 7 3,037Equity and other . . . . . . . . . . . . . . . . . . . . . . . . . . . . . . . . . . . — — 11 11
Total derivative liabilities . . . . . . . . . . . . . . . . . . . . . . . . . . . . . . — 4,271 18 4,289
Total liabilities at fair value . . . . . . . . . . . . . . . . . . . . . . . . . . . $36,078 $18,368 $ 64 $54,510
* includes securities priced at par plus accrued interest, which approximates fair value.** includes discount notes (not under the short-term Discount Note Program), with original maturities greater than one year, with principal due at maturity of
$5,281 million, with a fair value of $1,940 million as of June 30, 2018.*** In accordance with ASC 820, investments that are measured at fair value using net asset value per share have not been classified in the fair value hierarchy.
The fair value amounts presented in this table are intended to permit reconciliation of the fair value hierarchy to the amounts presented in consolidatedbalance sheet.
Note: For the year ended June 30, 2018: Trading securities with fair value of $2,950 million transferredfrom level 1 to level 2 and $0 from level 2 to level 1 due to decrease/increase in market activities. Equityinvestments with fair value of $158 million transferred from level 1 to level 2 and $34 million from level 2 tolevel 1 due to decrease/increase in market activities. Bonds issued by IFC with a fair value $1,072 milliontransferred from level 1 to level 2, while bonds with a fair value of $300 million were transferred from level 2 tolevel 1 due to change in quality of market price information.
June 30, 2017
Level 1 Level 2 Level 3 Total
Trading securities:Asset-backed securities . . . . . . . . . . . . . . . . . . . . . . . . . . . . . . $ — $ 8,407 $ — $ 8,407Corporate securities . . . . . . . . . . . . . . . . . . . . . . . . . . . . . . . . . 4,125 4,408 — 8,533Government and agency obligations . . . . . . . . . . . . . . . . . . . . 11,724 1,378 19 13,121Money market funds . . . . . . . . . . . . . . . . . . . . . . . . . . . . . . . . 127 — — 127
Total trading securities . . . . . . . . . . . . . . . . . . . . . . . . . . . . . . . . 15,976* 14,193 19 30,188
Loans . . . . . . . . . . . . . . . . . . . . . . . . . . . . . . . . . . . . . . . . . . . . — 9 928 937Loans measured at net asset value*** . . . . . . . . . . . . . . . . . . . . 33
Total Loans (outstanding principal balance $1,026) . . . . . . . . . . — 9 928 970
136
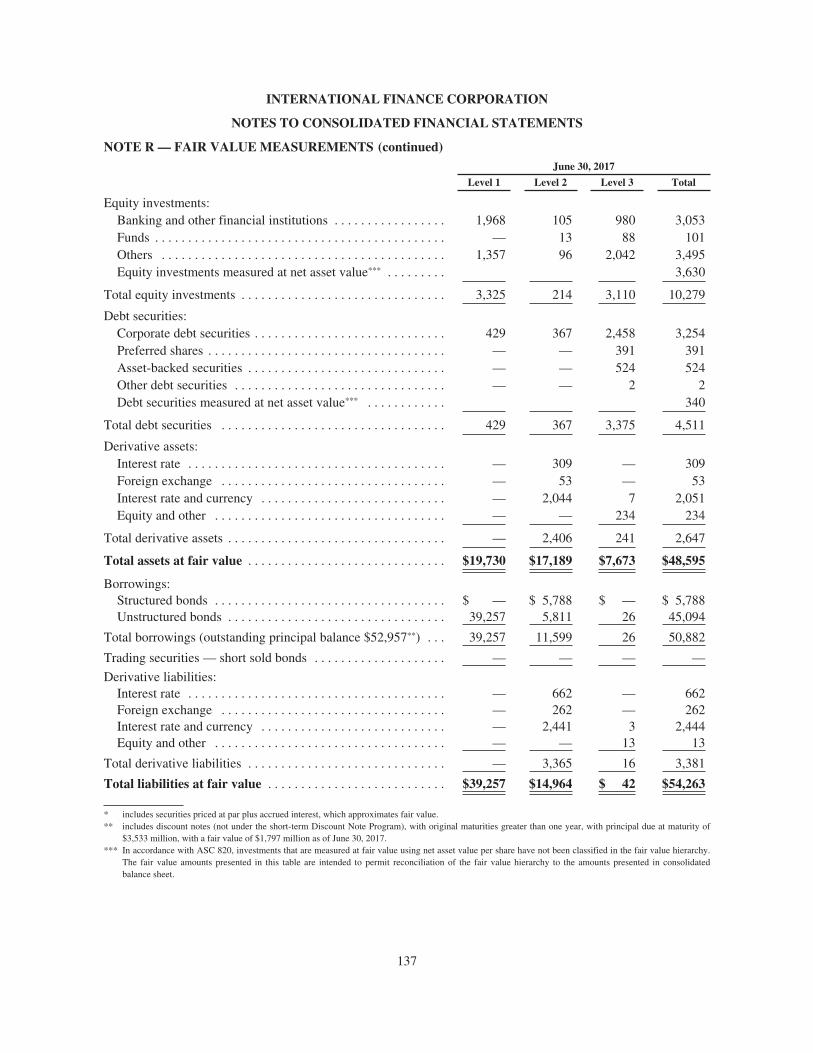
INTERNATIONAL FINANCE CORPORATION
NOTES TO CONSOLIDATED FINANCIAL STATEMENTS
NOTE R — FAIR VALUE MEASUREMENTS (continued)June 30, 2017
Level 1 Level 2 Level 3 Total
Equity investments:Banking and other financial institutions . . . . . . . . . . . . . . . . . 1,968 105 980 3,053Funds . . . . . . . . . . . . . . . . . . . . . . . . . . . . . . . . . . . . . . . . . . . . — 13 88 101Others . . . . . . . . . . . . . . . . . . . . . . . . . . . . . . . . . . . . . . . . . . . 1,357 96 2,042 3,495Equity investments measured at net asset value*** . . . . . . . . . 3,630
Total equity investments . . . . . . . . . . . . . . . . . . . . . . . . . . . . . . . 3,325 214 3,110 10,279
Debt securities:Corporate debt securities . . . . . . . . . . . . . . . . . . . . . . . . . . . . . 429 367 2,458 3,254Preferred shares . . . . . . . . . . . . . . . . . . . . . . . . . . . . . . . . . . . . — — 391 391Asset-backed securities . . . . . . . . . . . . . . . . . . . . . . . . . . . . . . — — 524 524Other debt securities . . . . . . . . . . . . . . . . . . . . . . . . . . . . . . . . — — 2 2Debt securities measured at net asset value*** . . . . . . . . . . . . 340
Total debt securities . . . . . . . . . . . . . . . . . . . . . . . . . . . . . . . . . . 429 367 3,375 4,511
Derivative assets:Interest rate . . . . . . . . . . . . . . . . . . . . . . . . . . . . . . . . . . . . . . . — 309 — 309Foreign exchange . . . . . . . . . . . . . . . . . . . . . . . . . . . . . . . . . . — 53 — 53Interest rate and currency . . . . . . . . . . . . . . . . . . . . . . . . . . . . — 2,044 7 2,051Equity and other . . . . . . . . . . . . . . . . . . . . . . . . . . . . . . . . . . . — — 234 234
Total derivative assets . . . . . . . . . . . . . . . . . . . . . . . . . . . . . . . . . — 2,406 241 2,647
Total assets at fair value . . . . . . . . . . . . . . . . . . . . . . . . . . . . . . $19,730 $17,189 $7,673 $48,595
Borrowings:Structured bonds . . . . . . . . . . . . . . . . . . . . . . . . . . . . . . . . . . . $ — $ 5,788 $ — $ 5,788Unstructured bonds . . . . . . . . . . . . . . . . . . . . . . . . . . . . . . . . . 39,257 5,811 26 45,094
Total borrowings (outstanding principal balance $52,957**) . . . 39,257 11,599 26 50,882
Trading securities — short sold bonds . . . . . . . . . . . . . . . . . . . . — — — —
Derivative liabilities:Interest rate . . . . . . . . . . . . . . . . . . . . . . . . . . . . . . . . . . . . . . . — 662 — 662Foreign exchange . . . . . . . . . . . . . . . . . . . . . . . . . . . . . . . . . . — 262 — 262Interest rate and currency . . . . . . . . . . . . . . . . . . . . . . . . . . . . — 2,441 3 2,444Equity and other . . . . . . . . . . . . . . . . . . . . . . . . . . . . . . . . . . . — — 13 13
Total derivative liabilities . . . . . . . . . . . . . . . . . . . . . . . . . . . . . . — 3,365 16 3,381
Total liabilities at fair value . . . . . . . . . . . . . . . . . . . . . . . . . . . $39,257 $14,964 $ 42 $54,263
* includes securities priced at par plus accrued interest, which approximates fair value.** includes discount notes (not under the short-term Discount Note Program), with original maturities greater than one year, with principal due at maturity of
$3,533 million, with a fair value of $1,797 million as of June 30, 2017.*** In accordance with ASC 820, investments that are measured at fair value using net asset value per share have not been classified in the fair value hierarchy.
The fair value amounts presented in this table are intended to permit reconciliation of the fair value hierarchy to the amounts presented in consolidatedbalance sheet.
137
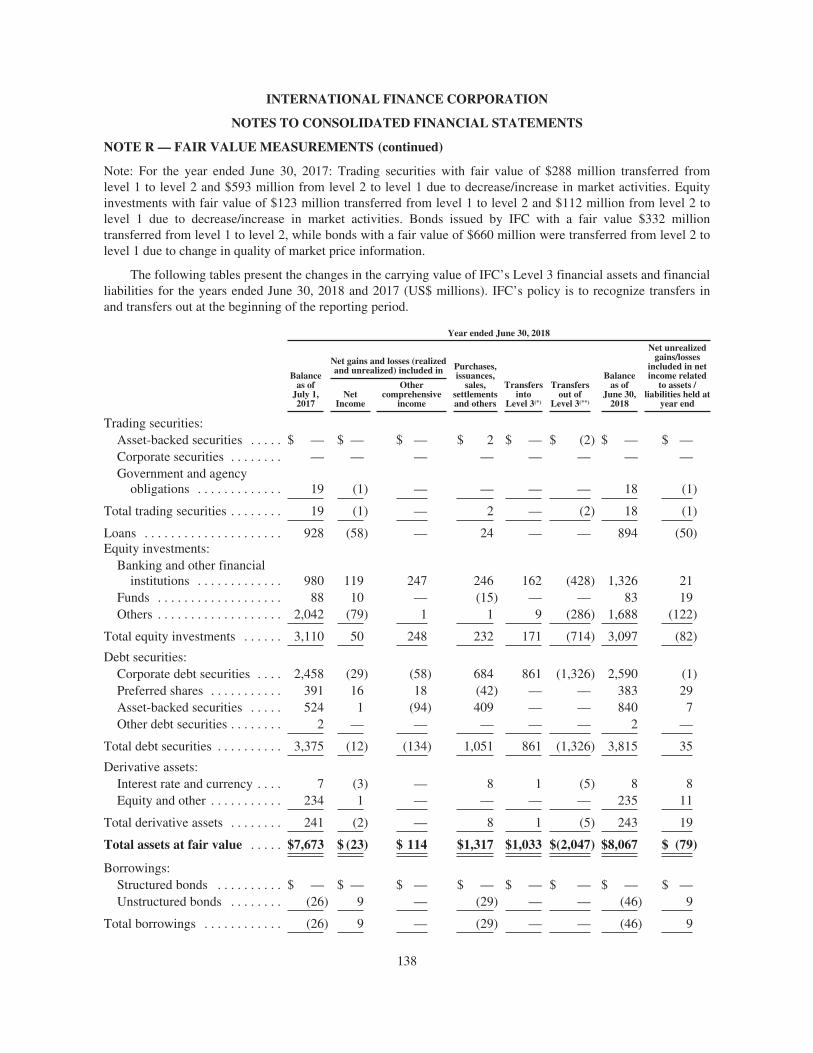
INTERNATIONAL FINANCE CORPORATION
NOTES TO CONSOLIDATED FINANCIAL STATEMENTS
NOTE R — FAIR VALUE MEASUREMENTS (continued)
Note: For the year ended June 30, 2017: Trading securities with fair value of $288 million transferred fromlevel 1 to level 2 and $593 million from level 2 to level 1 due to decrease/increase in market activities. Equityinvestments with fair value of $123 million transferred from level 1 to level 2 and $112 million from level 2 tolevel 1 due to decrease/increase in market activities. Bonds issued by IFC with a fair value $332 milliontransferred from level 1 to level 2, while bonds with a fair value of $660 million were transferred from level 2 tolevel 1 due to change in quality of market price information.
The following tables present the changes in the carrying value of IFC’s Level 3 financial assets and financialliabilities for the years ended June 30, 2018 and 2017 (US$ millions). IFC’s policy is to recognize transfers inand transfers out at the beginning of the reporting period.
Year ended June 30, 2018
Balanceas of
July 1,2017
Net gains and losses (realizedand unrealized) included in Purchases,
issuances,sales,
settlementsand others
Transfersinto
Level 3(*)
Transfersout of
Level 3(**)
Balanceas of
June 30,2018
Net unrealizedgains/losses
included in netincome related
to assets /liabilities held at
year endNet
Income
Othercomprehensive
income
Trading securities:Asset-backed securities . . . . . $ — $ — $ — $ 2 $ — $ (2) $ — $ —Corporate securities . . . . . . . . — — — — — — — —Government and agency
obligations . . . . . . . . . . . . . 19 (1) — — — — 18 (1)
Total trading securities . . . . . . . . 19 (1) — 2 — (2) 18 (1)
Loans . . . . . . . . . . . . . . . . . . . . . 928 (58) — 24 — — 894 (50)Equity investments:
Banking and other financialinstitutions . . . . . . . . . . . . . 980 119 247 246 162 (428) 1,326 21
Funds . . . . . . . . . . . . . . . . . . . 88 10 — (15) — — 83 19Others . . . . . . . . . . . . . . . . . . . 2,042 (79) 1 1 9 (286) 1,688 (122)
Total equity investments . . . . . . 3,110 50 248 232 171 (714) 3,097 (82)
Debt securities:Corporate debt securities . . . . 2,458 (29) (58) 684 861 (1,326) 2,590 (1)Preferred shares . . . . . . . . . . . 391 16 18 (42) — — 383 29Asset-backed securities . . . . . 524 1 (94) 409 — — 840 7Other debt securities . . . . . . . . 2 — — — — — 2 —
Total debt securities . . . . . . . . . . 3,375 (12) (134) 1,051 861 (1,326) 3,815 35
Derivative assets:Interest rate and currency . . . . 7 (3) — 8 1 (5) 8 8Equity and other . . . . . . . . . . . 234 1 — — — — 235 11
Total derivative assets . . . . . . . . 241 (2) — 8 1 (5) 243 19
Total assets at fair value . . . . . $7,673 $ (23) $ 114 $1,317 $1,033 $(2,047) $8,067 $ (79)
Borrowings:Structured bonds . . . . . . . . . . $ — $ — $ — $ — $ — $ — $ — $ —Unstructured bonds . . . . . . . . (26) 9 — (29) — — (46) 9
Total borrowings . . . . . . . . . . . . (26) 9 — (29) — — (46) 9
138
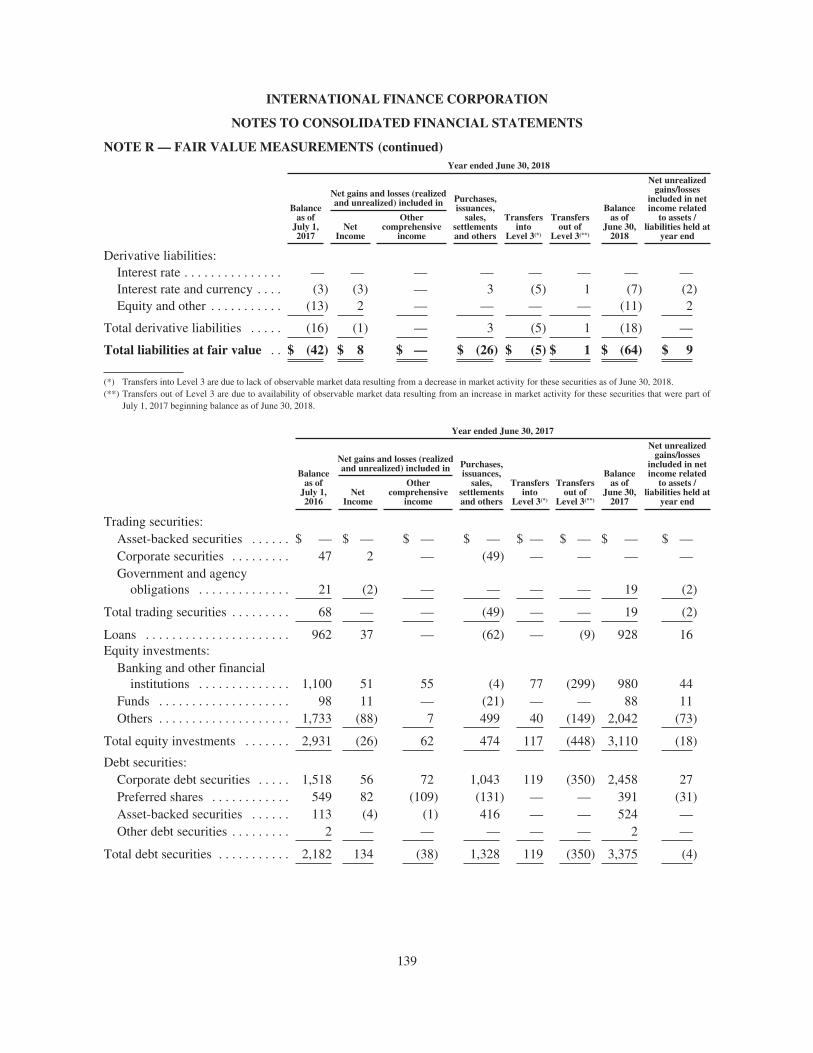
INTERNATIONAL FINANCE CORPORATION
NOTES TO CONSOLIDATED FINANCIAL STATEMENTS
NOTE R — FAIR VALUE MEASUREMENTS (continued)Year ended June 30, 2018
Balanceas of
July 1,2017
Net gains and losses (realizedand unrealized) included in Purchases,
issuances,sales,
settlementsand others
Transfersinto
Level 3(*)
Transfersout of
Level 3(**)
Balanceas of
June 30,2018
Net unrealizedgains/losses
included in netincome related
to assets /liabilities held at
year endNet
Income
Othercomprehensive
income
Derivative liabilities:Interest rate . . . . . . . . . . . . . . . — — — — — — — —Interest rate and currency . . . . (3) (3) — 3 (5) 1 (7) (2)Equity and other . . . . . . . . . . . (13) 2 — — — — (11) 2
Total derivative liabilities . . . . . (16) (1) — 3 (5) 1 (18) —
Total liabilities at fair value . . $ (42) $ 8 $ — $ (26) $ (5) $ 1 $ (64) $ 9
(*) Transfers into Level 3 are due to lack of observable market data resulting from a decrease in market activity for these securities as of June 30, 2018.(**) Transfers out of Level 3 are due to availability of observable market data resulting from an increase in market activity for these securities that were part of
July 1, 2017 beginning balance as of June 30, 2018.
Year ended June 30, 2017
Balanceas of
July 1,2016
Net gains and losses (realizedand unrealized) included in Purchases,
issuances,sales,
settlementsand others
Transfersinto
Level 3(*)
Transfersout of
Level 3(**)
Balanceas of
June 30,2017
Net unrealizedgains/losses
included in netincome related
to assets /liabilities held at
year endNet
Income
Othercomprehensive
income
Trading securities:Asset-backed securities . . . . . . $ — $ — $ — $ — $ — $ — $ — $ —Corporate securities . . . . . . . . . 47 2 — (49) — — — —Government and agency
obligations . . . . . . . . . . . . . . 21 (2) — — — — 19 (2)
Total trading securities . . . . . . . . . 68 — — (49) — — 19 (2)
Loans . . . . . . . . . . . . . . . . . . . . . . 962 37 — (62) — (9) 928 16Equity investments:
Banking and other financialinstitutions . . . . . . . . . . . . . . 1,100 51 55 (4) 77 (299) 980 44
Funds . . . . . . . . . . . . . . . . . . . . 98 11 — (21) — — 88 11Others . . . . . . . . . . . . . . . . . . . . 1,733 (88) 7 499 40 (149) 2,042 (73)
Total equity investments . . . . . . . 2,931 (26) 62 474 117 (448) 3,110 (18)
Debt securities:Corporate debt securities . . . . . 1,518 56 72 1,043 119 (350) 2,458 27Preferred shares . . . . . . . . . . . . 549 82 (109) (131) — — 391 (31)Asset-backed securities . . . . . . 113 (4) (1) 416 — — 524 —Other debt securities . . . . . . . . . 2 — — — — — 2 —
Total debt securities . . . . . . . . . . . 2,182 134 (38) 1,328 119 (350) 3,375 (4)
139
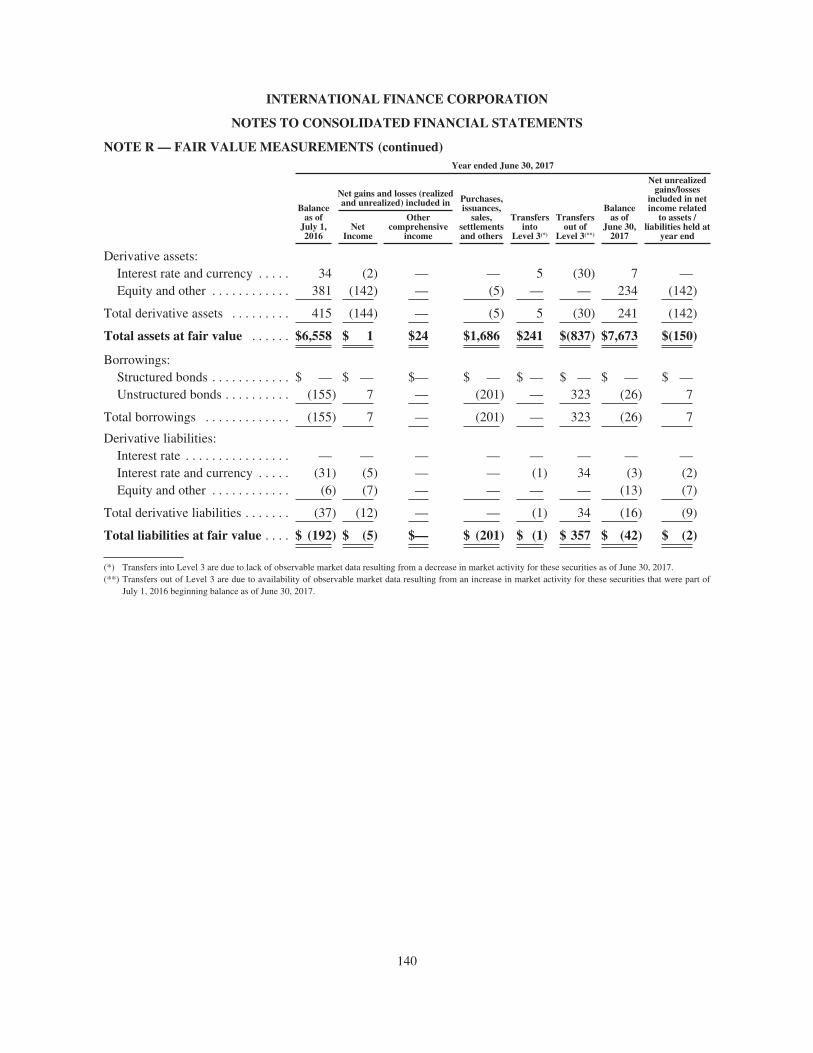
INTERNATIONAL FINANCE CORPORATION
NOTES TO CONSOLIDATED FINANCIAL STATEMENTS
NOTE R — FAIR VALUE MEASUREMENTS (continued)Year ended June 30, 2017
Balanceas of
July 1,2016
Net gains and losses (realizedand unrealized) included in Purchases,
issuances,sales,
settlementsand others
Transfersinto
Level 3(*)
Transfersout of
Level 3(**)
Balanceas of
June 30,2017
Net unrealizedgains/losses
included in netincome related
to assets /liabilities held at
year endNet
Income
Othercomprehensive
income
Derivative assets:Interest rate and currency . . . . . 34 (2) — — 5 (30) 7 —Equity and other . . . . . . . . . . . . 381 (142) — (5) — — 234 (142)
Total derivative assets . . . . . . . . . 415 (144) — (5) 5 (30) 241 (142)
Total assets at fair value . . . . . . $6,558 $ 1 $24 $1,686 $241 $(837) $7,673 $(150)
Borrowings:Structured bonds . . . . . . . . . . . . $ — $ — $— $ — $ — $ — $ — $ —Unstructured bonds . . . . . . . . . . (155) 7 — (201) — 323 (26) 7
Total borrowings . . . . . . . . . . . . . (155) 7 — (201) — 323 (26) 7
Derivative liabilities:Interest rate . . . . . . . . . . . . . . . . — — — — — — — —Interest rate and currency . . . . . (31) (5) — — (1) 34 (3) (2)Equity and other . . . . . . . . . . . . (6) (7) — — — — (13) (7)
Total derivative liabilities . . . . . . . (37) (12) — — (1) 34 (16) (9)
Total liabilities at fair value . . . . $ (192) $ (5) $— $ (201) $ (1) $ 357 $ (42) $ (2)
(*) Transfers into Level 3 are due to lack of observable market data resulting from a decrease in market activity for these securities as of June 30, 2017.(**) Transfers out of Level 3 are due to availability of observable market data resulting from an increase in market activity for these securities that were part of
July 1, 2016 beginning balance as of June 30, 2017.
140
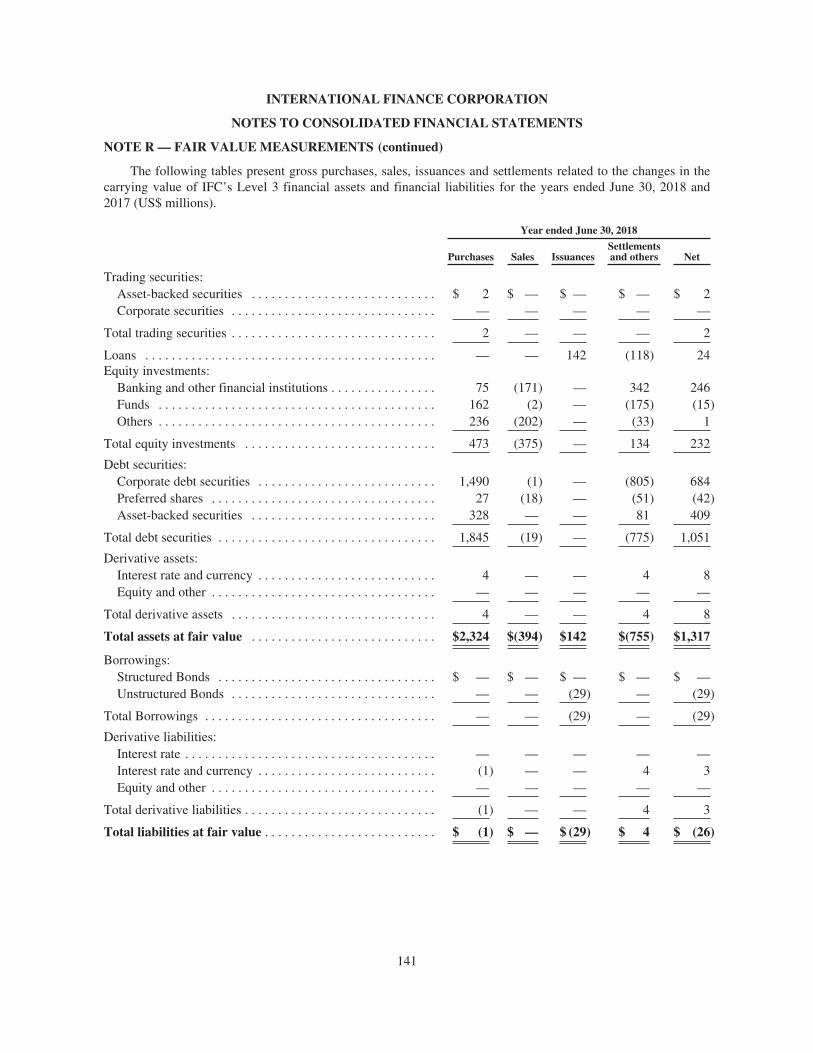
INTERNATIONAL FINANCE CORPORATION
NOTES TO CONSOLIDATED FINANCIAL STATEMENTS
NOTE R — FAIR VALUE MEASUREMENTS (continued)
The following tables present gross purchases, sales, issuances and settlements related to the changes in thecarrying value of IFC’s Level 3 financial assets and financial liabilities for the years ended June 30, 2018 and2017 (US$ millions).
Year ended June 30, 2018
Purchases Sales IssuancesSettlementsand others Net
Trading securities:Asset-backed securities . . . . . . . . . . . . . . . . . . . . . . . . . . . . $ 2 $ — $ — $ — $ 2Corporate securities . . . . . . . . . . . . . . . . . . . . . . . . . . . . . . . — — — — —
Total trading securities . . . . . . . . . . . . . . . . . . . . . . . . . . . . . . . 2 — — — 2
Loans . . . . . . . . . . . . . . . . . . . . . . . . . . . . . . . . . . . . . . . . . . . . — — 142 (118) 24Equity investments:
Banking and other financial institutions . . . . . . . . . . . . . . . . 75 (171) — 342 246Funds . . . . . . . . . . . . . . . . . . . . . . . . . . . . . . . . . . . . . . . . . . 162 (2) — (175) (15)Others . . . . . . . . . . . . . . . . . . . . . . . . . . . . . . . . . . . . . . . . . . 236 (202) — (33) 1
Total equity investments . . . . . . . . . . . . . . . . . . . . . . . . . . . . . 473 (375) — 134 232
Debt securities:Corporate debt securities . . . . . . . . . . . . . . . . . . . . . . . . . . . 1,490 (1) — (805) 684Preferred shares . . . . . . . . . . . . . . . . . . . . . . . . . . . . . . . . . . 27 (18) — (51) (42)Asset-backed securities . . . . . . . . . . . . . . . . . . . . . . . . . . . . 328 — — 81 409
Total debt securities . . . . . . . . . . . . . . . . . . . . . . . . . . . . . . . . . 1,845 (19) — (775) 1,051
Derivative assets:Interest rate and currency . . . . . . . . . . . . . . . . . . . . . . . . . . . 4 — — 4 8Equity and other . . . . . . . . . . . . . . . . . . . . . . . . . . . . . . . . . . — — — — —
Total derivative assets . . . . . . . . . . . . . . . . . . . . . . . . . . . . . . . 4 — — 4 8
Total assets at fair value . . . . . . . . . . . . . . . . . . . . . . . . . . . . $2,324 $(394) $142 $(755) $1,317
Borrowings:Structured Bonds . . . . . . . . . . . . . . . . . . . . . . . . . . . . . . . . . $ — $ — $ — $ — $ —Unstructured Bonds . . . . . . . . . . . . . . . . . . . . . . . . . . . . . . . — — (29) — (29)
Total Borrowings . . . . . . . . . . . . . . . . . . . . . . . . . . . . . . . . . . . — — (29) — (29)
Derivative liabilities:Interest rate . . . . . . . . . . . . . . . . . . . . . . . . . . . . . . . . . . . . . . — — — — —Interest rate and currency . . . . . . . . . . . . . . . . . . . . . . . . . . . (1) — — 4 3Equity and other . . . . . . . . . . . . . . . . . . . . . . . . . . . . . . . . . . — — — — —
Total derivative liabilities . . . . . . . . . . . . . . . . . . . . . . . . . . . . . (1) — — 4 3
Total liabilities at fair value . . . . . . . . . . . . . . . . . . . . . . . . . . $ (1) $ — $ (29) $ 4 $ (26)
141
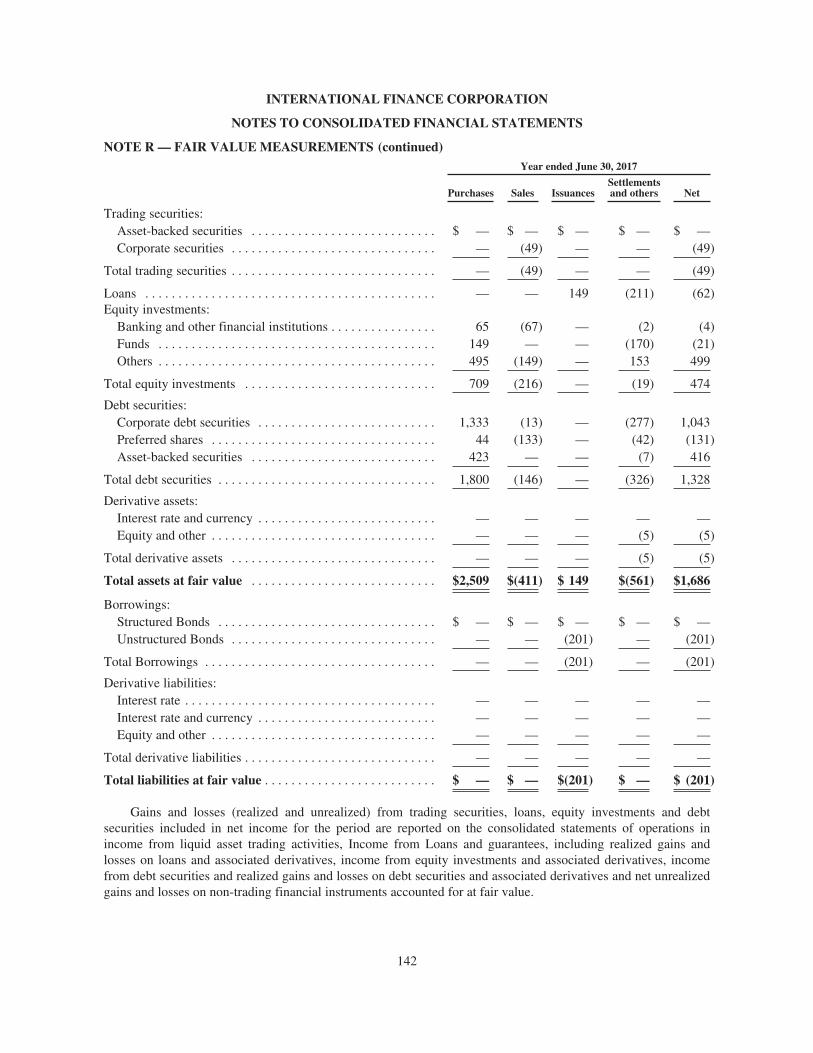
INTERNATIONAL FINANCE CORPORATION
NOTES TO CONSOLIDATED FINANCIAL STATEMENTS
NOTE R — FAIR VALUE MEASUREMENTS (continued)Year ended June 30, 2017
Purchases Sales IssuancesSettlementsand others Net
Trading securities:Asset-backed securities . . . . . . . . . . . . . . . . . . . . . . . . . . . . $ — $ — $ — $ — $ —Corporate securities . . . . . . . . . . . . . . . . . . . . . . . . . . . . . . . — (49) — — (49)
Total trading securities . . . . . . . . . . . . . . . . . . . . . . . . . . . . . . . — (49) — — (49)
Loans . . . . . . . . . . . . . . . . . . . . . . . . . . . . . . . . . . . . . . . . . . . . — — 149 (211) (62)Equity investments:
Banking and other financial institutions . . . . . . . . . . . . . . . . 65 (67) — (2) (4)Funds . . . . . . . . . . . . . . . . . . . . . . . . . . . . . . . . . . . . . . . . . . 149 — — (170) (21)Others . . . . . . . . . . . . . . . . . . . . . . . . . . . . . . . . . . . . . . . . . . 495 (149) — 153 499
Total equity investments . . . . . . . . . . . . . . . . . . . . . . . . . . . . . 709 (216) — (19) 474
Debt securities:Corporate debt securities . . . . . . . . . . . . . . . . . . . . . . . . . . . 1,333 (13) — (277) 1,043Preferred shares . . . . . . . . . . . . . . . . . . . . . . . . . . . . . . . . . . 44 (133) — (42) (131)Asset-backed securities . . . . . . . . . . . . . . . . . . . . . . . . . . . . 423 — — (7) 416
Total debt securities . . . . . . . . . . . . . . . . . . . . . . . . . . . . . . . . . 1,800 (146) — (326) 1,328
Derivative assets:Interest rate and currency . . . . . . . . . . . . . . . . . . . . . . . . . . . — — — — —Equity and other . . . . . . . . . . . . . . . . . . . . . . . . . . . . . . . . . . — — — (5) (5)
Total derivative assets . . . . . . . . . . . . . . . . . . . . . . . . . . . . . . . — — — (5) (5)
Total assets at fair value . . . . . . . . . . . . . . . . . . . . . . . . . . . . $2,509 $(411) $ 149 $(561) $1,686
Borrowings:Structured Bonds . . . . . . . . . . . . . . . . . . . . . . . . . . . . . . . . . $ — $ — $ — $ — $ —Unstructured Bonds . . . . . . . . . . . . . . . . . . . . . . . . . . . . . . . — — (201) — (201)
Total Borrowings . . . . . . . . . . . . . . . . . . . . . . . . . . . . . . . . . . . — — (201) — (201)
Derivative liabilities:Interest rate . . . . . . . . . . . . . . . . . . . . . . . . . . . . . . . . . . . . . . — — — — —Interest rate and currency . . . . . . . . . . . . . . . . . . . . . . . . . . . — — — — —Equity and other . . . . . . . . . . . . . . . . . . . . . . . . . . . . . . . . . . — — — — —
Total derivative liabilities . . . . . . . . . . . . . . . . . . . . . . . . . . . . . — — — — —
Total liabilities at fair value . . . . . . . . . . . . . . . . . . . . . . . . . . $ — $ — $(201) $ — $ (201)
Gains and losses (realized and unrealized) from trading securities, loans, equity investments and debtsecurities included in net income for the period are reported on the consolidated statements of operations inincome from liquid asset trading activities, Income from Loans and guarantees, including realized gains andlosses on loans and associated derivatives, income from equity investments and associated derivatives, incomefrom debt securities and realized gains and losses on debt securities and associated derivatives and net unrealizedgains and losses on non-trading financial instruments accounted for at fair value.
142
INTERNATIONAL FINANCE CORPORATION
NOTES TO CONSOLIDATED FINANCIAL STATEMENTS
NOTE R — FAIR VALUE MEASUREMENTS (continued)
As of June 30, 2018, equity investments, accounted for at cost less impairment, with a carrying amount of$986 million were written down to their fair value of $722 million ($1,537 million and $1,172 million —June 30, 2017), resulting in a loss of $264 million, which was included in income from equity investments andassociated derivatives in the consolidated statements of operations during the year ended June 30, 2018 (loss of$365 million — year ended June 30, 2017). The amount of the write-down was based on a Level 3 measure offair value.
NOTE S — SEGMENT REPORTING
For management purposes, IFC’s business comprises three segments: investment services, treasury servicesand advisory services. The investment services segment consists primarily of lending and investing in debt andequity securities. The investment services segment also includes AMC, which is not separately disclosed due toits immaterial impact. Further information about the impact of AMC on IFC’s consolidated balance sheets andstatements of operations can be found in Note B. Operationally, the treasury services segment consists of theborrowing, liquid asset management, asset and liability management and client risk management activities.Advisory services provide consultation services to governments and the private sector. Consistent with internalreporting, net income or expense from asset and liability management and client risk management activities insupport of investment services is allocated from the treasury segment to the investment services segment.
The performance of investment services, treasury services and advisory services is assessed by seniormanagement on the basis of net income for each segment, return on assets, and return on capital employed.Advisory services are primarily assessed based on the level and adequacy of its funding sources (See Note U).IFC’s management reporting system and policies are used to determine revenues and expenses attributable toeach segment. Consistent with internal reporting, administrative expenses are allocated to each segment basedlargely upon personnel costs and segment headcounts. Transactions between segments are immaterial and, thus,are not a factor in reconciling to the consolidated data.
143
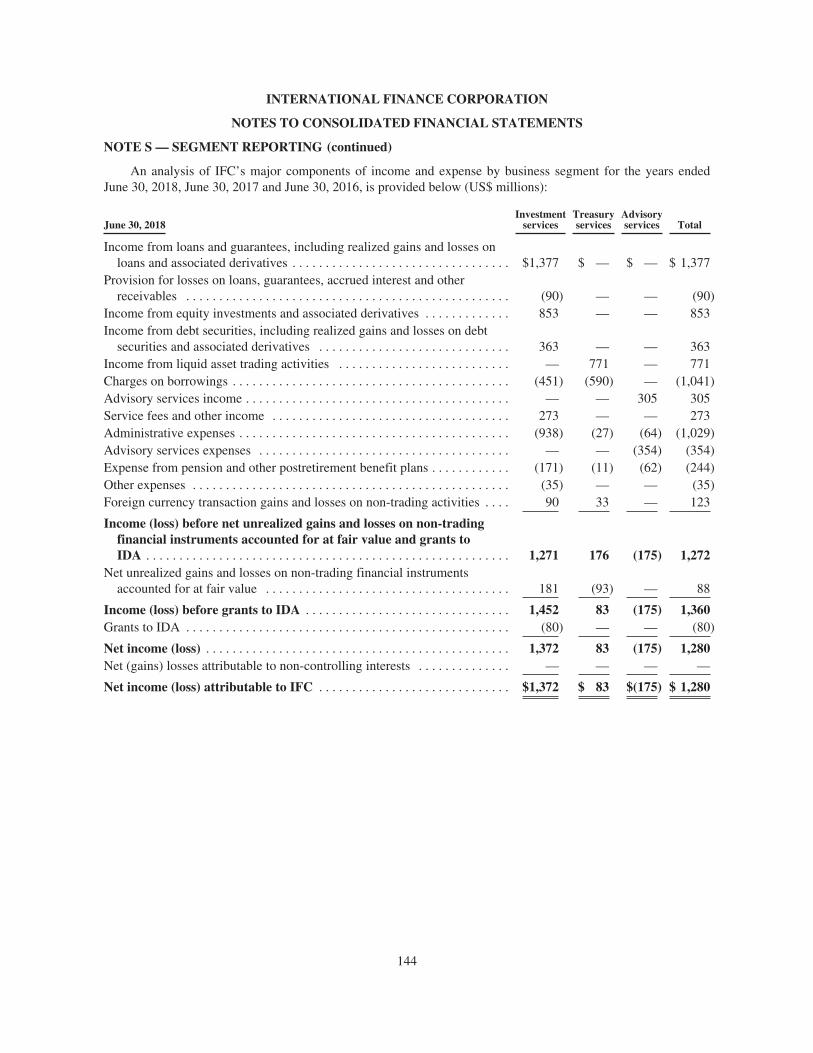
INTERNATIONAL FINANCE CORPORATION
NOTES TO CONSOLIDATED FINANCIAL STATEMENTS
NOTE S — SEGMENT REPORTING (continued)
An analysis of IFC’s major components of income and expense by business segment for the years endedJune 30, 2018, June 30, 2017 and June 30, 2016, is provided below (US$ millions):
June 30, 2018Investment
servicesTreasuryservices
Advisoryservices Total
Income from loans and guarantees, including realized gains and losses onloans and associated derivatives . . . . . . . . . . . . . . . . . . . . . . . . . . . . . . . . . $1,377 $ — $ — $ 1,377
Provision for losses on loans, guarantees, accrued interest and otherreceivables . . . . . . . . . . . . . . . . . . . . . . . . . . . . . . . . . . . . . . . . . . . . . . . . . (90) — — (90)
Income from equity investments and associated derivatives . . . . . . . . . . . . . 853 — — 853Income from debt securities, including realized gains and losses on debt
securities and associated derivatives . . . . . . . . . . . . . . . . . . . . . . . . . . . . . 363 — — 363Income from liquid asset trading activities . . . . . . . . . . . . . . . . . . . . . . . . . . — 771 — 771Charges on borrowings . . . . . . . . . . . . . . . . . . . . . . . . . . . . . . . . . . . . . . . . . . (451) (590) — (1,041)Advisory services income . . . . . . . . . . . . . . . . . . . . . . . . . . . . . . . . . . . . . . . . — — 305 305Service fees and other income . . . . . . . . . . . . . . . . . . . . . . . . . . . . . . . . . . . . 273 — — 273Administrative expenses . . . . . . . . . . . . . . . . . . . . . . . . . . . . . . . . . . . . . . . . . (938) (27) (64) (1,029)Advisory services expenses . . . . . . . . . . . . . . . . . . . . . . . . . . . . . . . . . . . . . . — — (354) (354)Expense from pension and other postretirement benefit plans . . . . . . . . . . . . (171) (11) (62) (244)Other expenses . . . . . . . . . . . . . . . . . . . . . . . . . . . . . . . . . . . . . . . . . . . . . . . . (35) — — (35)Foreign currency transaction gains and losses on non-trading activities . . . . 90 33 — 123
Income (loss) before net unrealized gains and losses on non-tradingfinancial instruments accounted for at fair value and grants toIDA . . . . . . . . . . . . . . . . . . . . . . . . . . . . . . . . . . . . . . . . . . . . . . . . . . . . . . . 1,271 176 (175) 1,272
Net unrealized gains and losses on non-trading financial instrumentsaccounted for at fair value . . . . . . . . . . . . . . . . . . . . . . . . . . . . . . . . . . . . . 181 (93) — 88
Income (loss) before grants to IDA . . . . . . . . . . . . . . . . . . . . . . . . . . . . . . . 1,452 83 (175) 1,360Grants to IDA . . . . . . . . . . . . . . . . . . . . . . . . . . . . . . . . . . . . . . . . . . . . . . . . . (80) — — (80)
Net income (loss) . . . . . . . . . . . . . . . . . . . . . . . . . . . . . . . . . . . . . . . . . . . . . . 1,372 83 (175) 1,280Net (gains) losses attributable to non-controlling interests . . . . . . . . . . . . . . — — — —
Net income (loss) attributable to IFC . . . . . . . . . . . . . . . . . . . . . . . . . . . . . $1,372 $ 83 $(175) $ 1,280
144
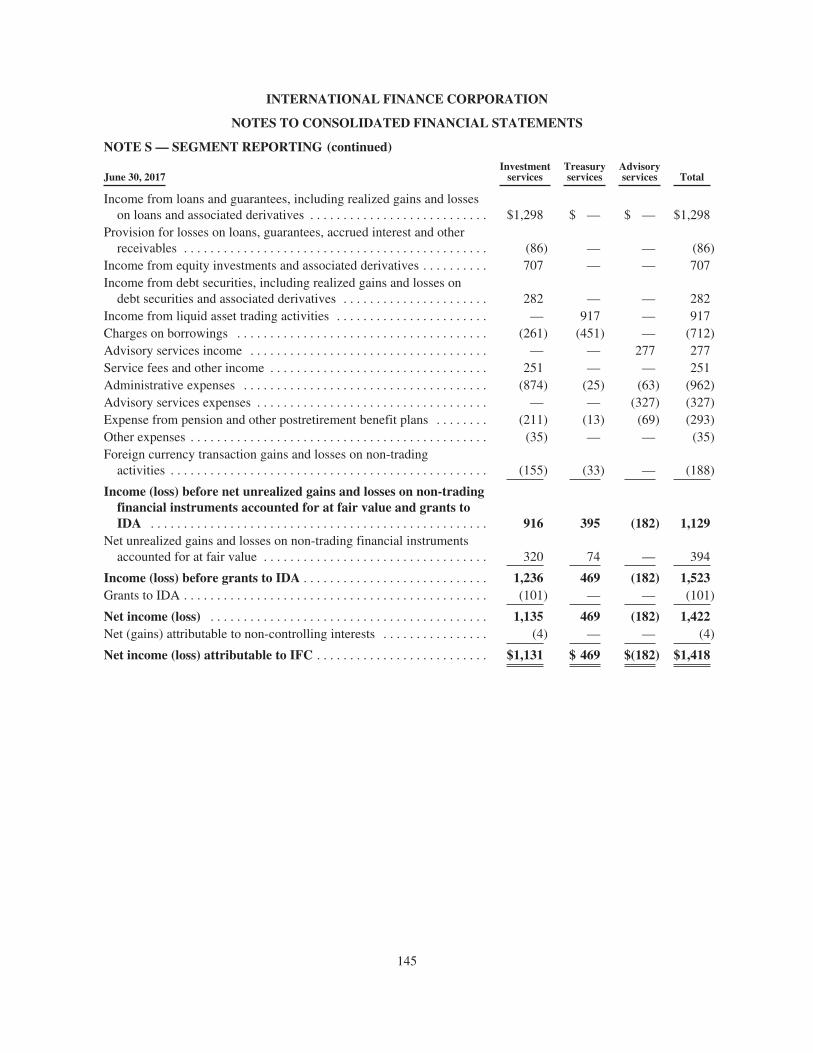
INTERNATIONAL FINANCE CORPORATION
NOTES TO CONSOLIDATED FINANCIAL STATEMENTS
NOTE S — SEGMENT REPORTING (continued)
June 30, 2017Investment
servicesTreasuryservices
Advisoryservices Total
Income from loans and guarantees, including realized gains and losseson loans and associated derivatives . . . . . . . . . . . . . . . . . . . . . . . . . . . $1,298 $ — $ — $1,298
Provision for losses on loans, guarantees, accrued interest and otherreceivables . . . . . . . . . . . . . . . . . . . . . . . . . . . . . . . . . . . . . . . . . . . . . . (86) — — (86)
Income from equity investments and associated derivatives . . . . . . . . . . 707 — — 707Income from debt securities, including realized gains and losses on
debt securities and associated derivatives . . . . . . . . . . . . . . . . . . . . . . 282 — — 282Income from liquid asset trading activities . . . . . . . . . . . . . . . . . . . . . . . — 917 — 917Charges on borrowings . . . . . . . . . . . . . . . . . . . . . . . . . . . . . . . . . . . . . . (261) (451) — (712)Advisory services income . . . . . . . . . . . . . . . . . . . . . . . . . . . . . . . . . . . . — — 277 277Service fees and other income . . . . . . . . . . . . . . . . . . . . . . . . . . . . . . . . . 251 — — 251Administrative expenses . . . . . . . . . . . . . . . . . . . . . . . . . . . . . . . . . . . . . (874) (25) (63) (962)Advisory services expenses . . . . . . . . . . . . . . . . . . . . . . . . . . . . . . . . . . . — — (327) (327)Expense from pension and other postretirement benefit plans . . . . . . . . (211) (13) (69) (293)Other expenses . . . . . . . . . . . . . . . . . . . . . . . . . . . . . . . . . . . . . . . . . . . . . (35) — — (35)Foreign currency transaction gains and losses on non-trading
activities . . . . . . . . . . . . . . . . . . . . . . . . . . . . . . . . . . . . . . . . . . . . . . . . (155) (33) — (188)
Income (loss) before net unrealized gains and losses on non-tradingfinancial instruments accounted for at fair value and grants toIDA . . . . . . . . . . . . . . . . . . . . . . . . . . . . . . . . . . . . . . . . . . . . . . . . . . . 916 395 (182) 1,129
Net unrealized gains and losses on non-trading financial instrumentsaccounted for at fair value . . . . . . . . . . . . . . . . . . . . . . . . . . . . . . . . . . 320 74 — 394
Income (loss) before grants to IDA . . . . . . . . . . . . . . . . . . . . . . . . . . . . 1,236 469 (182) 1,523Grants to IDA . . . . . . . . . . . . . . . . . . . . . . . . . . . . . . . . . . . . . . . . . . . . . . (101) — — (101)
Net income (loss) . . . . . . . . . . . . . . . . . . . . . . . . . . . . . . . . . . . . . . . . . . 1,135 469 (182) 1,422Net (gains) attributable to non-controlling interests . . . . . . . . . . . . . . . . (4) — — (4)
Net income (loss) attributable to IFC . . . . . . . . . . . . . . . . . . . . . . . . . . $1,131 $ 469 $(182) $1,418
145
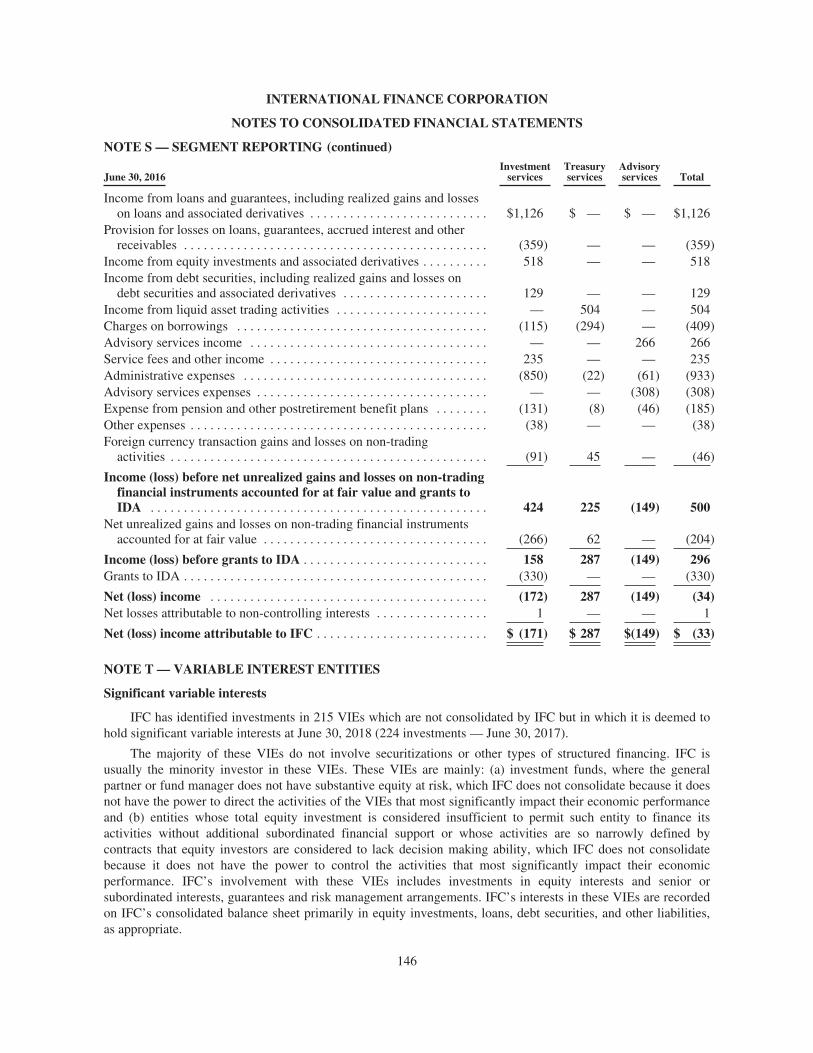
INTERNATIONAL FINANCE CORPORATION
NOTES TO CONSOLIDATED FINANCIAL STATEMENTS
NOTE S — SEGMENT REPORTING (continued)
June 30, 2016Investment
servicesTreasuryservices
Advisoryservices Total
Income from loans and guarantees, including realized gains and losseson loans and associated derivatives . . . . . . . . . . . . . . . . . . . . . . . . . . . $1,126 $ — $ — $1,126
Provision for losses on loans, guarantees, accrued interest and otherreceivables . . . . . . . . . . . . . . . . . . . . . . . . . . . . . . . . . . . . . . . . . . . . . . (359) — — (359)
Income from equity investments and associated derivatives . . . . . . . . . . 518 — — 518Income from debt securities, including realized gains and losses on
debt securities and associated derivatives . . . . . . . . . . . . . . . . . . . . . . 129 — — 129Income from liquid asset trading activities . . . . . . . . . . . . . . . . . . . . . . . — 504 — 504Charges on borrowings . . . . . . . . . . . . . . . . . . . . . . . . . . . . . . . . . . . . . . (115) (294) — (409)Advisory services income . . . . . . . . . . . . . . . . . . . . . . . . . . . . . . . . . . . . — — 266 266Service fees and other income . . . . . . . . . . . . . . . . . . . . . . . . . . . . . . . . . 235 — — 235Administrative expenses . . . . . . . . . . . . . . . . . . . . . . . . . . . . . . . . . . . . . (850) (22) (61) (933)Advisory services expenses . . . . . . . . . . . . . . . . . . . . . . . . . . . . . . . . . . . — — (308) (308)Expense from pension and other postretirement benefit plans . . . . . . . . (131) (8) (46) (185)Other expenses . . . . . . . . . . . . . . . . . . . . . . . . . . . . . . . . . . . . . . . . . . . . . (38) — — (38)Foreign currency transaction gains and losses on non-trading
activities . . . . . . . . . . . . . . . . . . . . . . . . . . . . . . . . . . . . . . . . . . . . . . . . (91) 45 — (46)
Income (loss) before net unrealized gains and losses on non-tradingfinancial instruments accounted for at fair value and grants toIDA . . . . . . . . . . . . . . . . . . . . . . . . . . . . . . . . . . . . . . . . . . . . . . . . . . . 424 225 (149) 500
Net unrealized gains and losses on non-trading financial instrumentsaccounted for at fair value . . . . . . . . . . . . . . . . . . . . . . . . . . . . . . . . . . (266) 62 — (204)
Income (loss) before grants to IDA . . . . . . . . . . . . . . . . . . . . . . . . . . . . 158 287 (149) 296Grants to IDA . . . . . . . . . . . . . . . . . . . . . . . . . . . . . . . . . . . . . . . . . . . . . . (330) — — (330)
Net (loss) income . . . . . . . . . . . . . . . . . . . . . . . . . . . . . . . . . . . . . . . . . . (172) 287 (149) (34)Net losses attributable to non-controlling interests . . . . . . . . . . . . . . . . . 1 — — 1
Net (loss) income attributable to IFC . . . . . . . . . . . . . . . . . . . . . . . . . . $ (171) $ 287 $(149) $ (33)
NOTE T — VARIABLE INTEREST ENTITIES
Significant variable interests
IFC has identified investments in 215 VIEs which are not consolidated by IFC but in which it is deemed tohold significant variable interests at June 30, 2018 (224 investments — June 30, 2017).
The majority of these VIEs do not involve securitizations or other types of structured financing. IFC isusually the minority investor in these VIEs. These VIEs are mainly: (a) investment funds, where the generalpartner or fund manager does not have substantive equity at risk, which IFC does not consolidate because it doesnot have the power to direct the activities of the VIEs that most significantly impact their economic performanceand (b) entities whose total equity investment is considered insufficient to permit such entity to finance itsactivities without additional subordinated financial support or whose activities are so narrowly defined bycontracts that equity investors are considered to lack decision making ability, which IFC does not consolidatebecause it does not have the power to control the activities that most significantly impact their economicperformance. IFC’s involvement with these VIEs includes investments in equity interests and senior orsubordinated interests, guarantees and risk management arrangements. IFC’s interests in these VIEs are recordedon IFC’s consolidated balance sheet primarily in equity investments, loans, debt securities, and other liabilities,as appropriate.
146
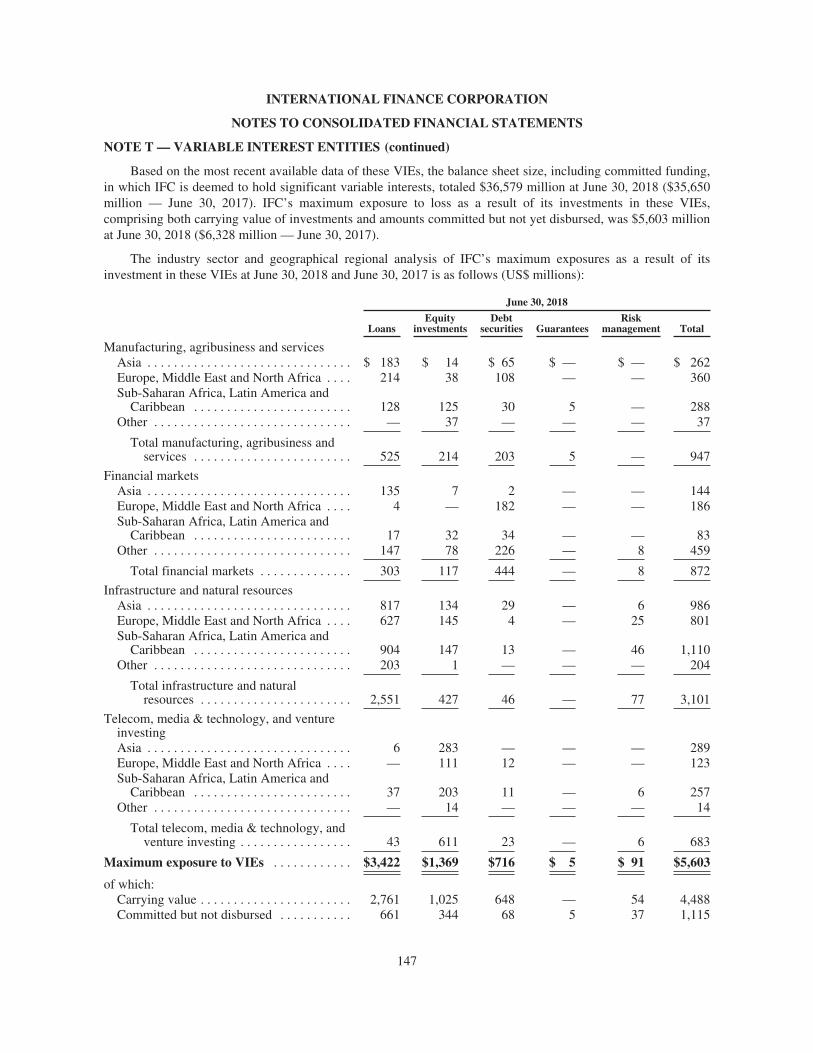
INTERNATIONAL FINANCE CORPORATION
NOTES TO CONSOLIDATED FINANCIAL STATEMENTS
NOTE T — VARIABLE INTEREST ENTITIES (continued)
Based on the most recent available data of these VIEs, the balance sheet size, including committed funding,in which IFC is deemed to hold significant variable interests, totaled $36,579 million at June 30, 2018 ($35,650million — June 30, 2017). IFC’s maximum exposure to loss as a result of its investments in these VIEs,comprising both carrying value of investments and amounts committed but not yet disbursed, was $5,603 millionat June 30, 2018 ($6,328 million — June 30, 2017).
The industry sector and geographical regional analysis of IFC’s maximum exposures as a result of itsinvestment in these VIEs at June 30, 2018 and June 30, 2017 is as follows (US$ millions):
June 30, 2018
LoansEquity
investmentsDebt
securities GuaranteesRisk
management Total
Manufacturing, agribusiness and servicesAsia . . . . . . . . . . . . . . . . . . . . . . . . . . . . . . . $ 183 $ 14 $ 65 $ — $ — $ 262Europe, Middle East and North Africa . . . . 214 38 108 — — 360Sub-Saharan Africa, Latin America and
Caribbean . . . . . . . . . . . . . . . . . . . . . . . . 128 125 30 5 — 288Other . . . . . . . . . . . . . . . . . . . . . . . . . . . . . . — 37 — — — 37
Total manufacturing, agribusiness andservices . . . . . . . . . . . . . . . . . . . . . . . . 525 214 203 5 — 947
Financial marketsAsia . . . . . . . . . . . . . . . . . . . . . . . . . . . . . . . 135 7 2 — — 144Europe, Middle East and North Africa . . . . 4 — 182 — — 186Sub-Saharan Africa, Latin America and
Caribbean . . . . . . . . . . . . . . . . . . . . . . . . 17 32 34 — — 83Other . . . . . . . . . . . . . . . . . . . . . . . . . . . . . . 147 78 226 — 8 459
Total financial markets . . . . . . . . . . . . . . 303 117 444 — 8 872
Infrastructure and natural resourcesAsia . . . . . . . . . . . . . . . . . . . . . . . . . . . . . . . 817 134 29 — 6 986Europe, Middle East and North Africa . . . . 627 145 4 — 25 801Sub-Saharan Africa, Latin America and
Caribbean . . . . . . . . . . . . . . . . . . . . . . . . 904 147 13 — 46 1,110Other . . . . . . . . . . . . . . . . . . . . . . . . . . . . . . 203 1 — — — 204
Total infrastructure and naturalresources . . . . . . . . . . . . . . . . . . . . . . . 2,551 427 46 — 77 3,101
Telecom, media & technology, and ventureinvestingAsia . . . . . . . . . . . . . . . . . . . . . . . . . . . . . . . 6 283 — — — 289Europe, Middle East and North Africa . . . . — 111 12 — — 123Sub-Saharan Africa, Latin America and
Caribbean . . . . . . . . . . . . . . . . . . . . . . . . 37 203 11 — 6 257Other . . . . . . . . . . . . . . . . . . . . . . . . . . . . . . — 14 — — — 14
Total telecom, media & technology, andventure investing . . . . . . . . . . . . . . . . . 43 611 23 — 6 683
Maximum exposure to VIEs . . . . . . . . . . . . $3,422 $1,369 $716 $ 5 $ 91 $5,603
of which:Carrying value . . . . . . . . . . . . . . . . . . . . . . . 2,761 1,025 648 — 54 4,488Committed but not disbursed . . . . . . . . . . . 661 344 68 5 37 1,115
147
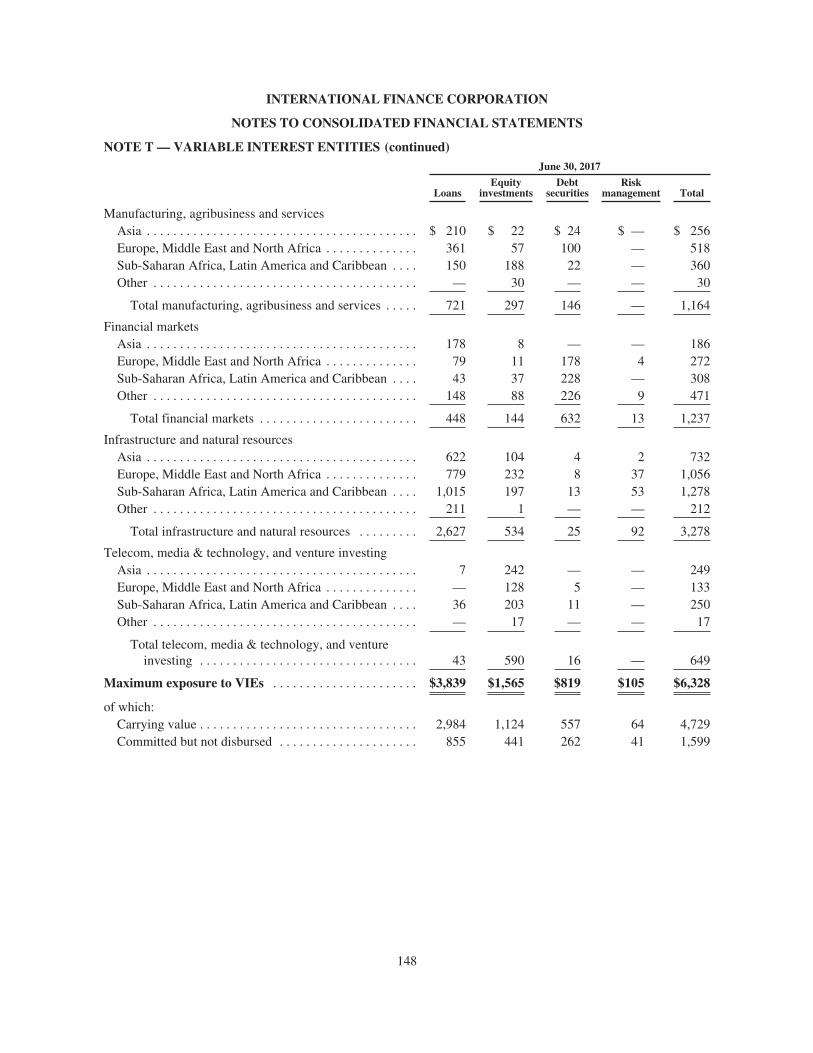
INTERNATIONAL FINANCE CORPORATION
NOTES TO CONSOLIDATED FINANCIAL STATEMENTS
NOTE T — VARIABLE INTEREST ENTITIES (continued)June 30, 2017
LoansEquity
investmentsDebt
securitiesRisk
management Total
Manufacturing, agribusiness and servicesAsia . . . . . . . . . . . . . . . . . . . . . . . . . . . . . . . . . . . . . . . . . $ 210 $ 22 $ 24 $ — $ 256Europe, Middle East and North Africa . . . . . . . . . . . . . . 361 57 100 — 518Sub-Saharan Africa, Latin America and Caribbean . . . . 150 188 22 — 360Other . . . . . . . . . . . . . . . . . . . . . . . . . . . . . . . . . . . . . . . . — 30 — — 30
Total manufacturing, agribusiness and services . . . . . 721 297 146 — 1,164
Financial marketsAsia . . . . . . . . . . . . . . . . . . . . . . . . . . . . . . . . . . . . . . . . . 178 8 — — 186Europe, Middle East and North Africa . . . . . . . . . . . . . . 79 11 178 4 272Sub-Saharan Africa, Latin America and Caribbean . . . . 43 37 228 — 308Other . . . . . . . . . . . . . . . . . . . . . . . . . . . . . . . . . . . . . . . . 148 88 226 9 471
Total financial markets . . . . . . . . . . . . . . . . . . . . . . . . 448 144 632 13 1,237
Infrastructure and natural resourcesAsia . . . . . . . . . . . . . . . . . . . . . . . . . . . . . . . . . . . . . . . . . 622 104 4 2 732Europe, Middle East and North Africa . . . . . . . . . . . . . . 779 232 8 37 1,056Sub-Saharan Africa, Latin America and Caribbean . . . . 1,015 197 13 53 1,278Other . . . . . . . . . . . . . . . . . . . . . . . . . . . . . . . . . . . . . . . . 211 1 — — 212
Total infrastructure and natural resources . . . . . . . . . 2,627 534 25 92 3,278
Telecom, media & technology, and venture investingAsia . . . . . . . . . . . . . . . . . . . . . . . . . . . . . . . . . . . . . . . . . 7 242 — — 249Europe, Middle East and North Africa . . . . . . . . . . . . . . — 128 5 — 133Sub-Saharan Africa, Latin America and Caribbean . . . . 36 203 11 — 250Other . . . . . . . . . . . . . . . . . . . . . . . . . . . . . . . . . . . . . . . . — 17 — — 17
Total telecom, media & technology, and ventureinvesting . . . . . . . . . . . . . . . . . . . . . . . . . . . . . . . . . 43 590 16 — 649
Maximum exposure to VIEs . . . . . . . . . . . . . . . . . . . . . . $3,839 $1,565 $819 $105 $6,328
of which:Carrying value . . . . . . . . . . . . . . . . . . . . . . . . . . . . . . . . . 2,984 1,124 557 64 4,729Committed but not disbursed . . . . . . . . . . . . . . . . . . . . . 855 441 262 41 1,599
148
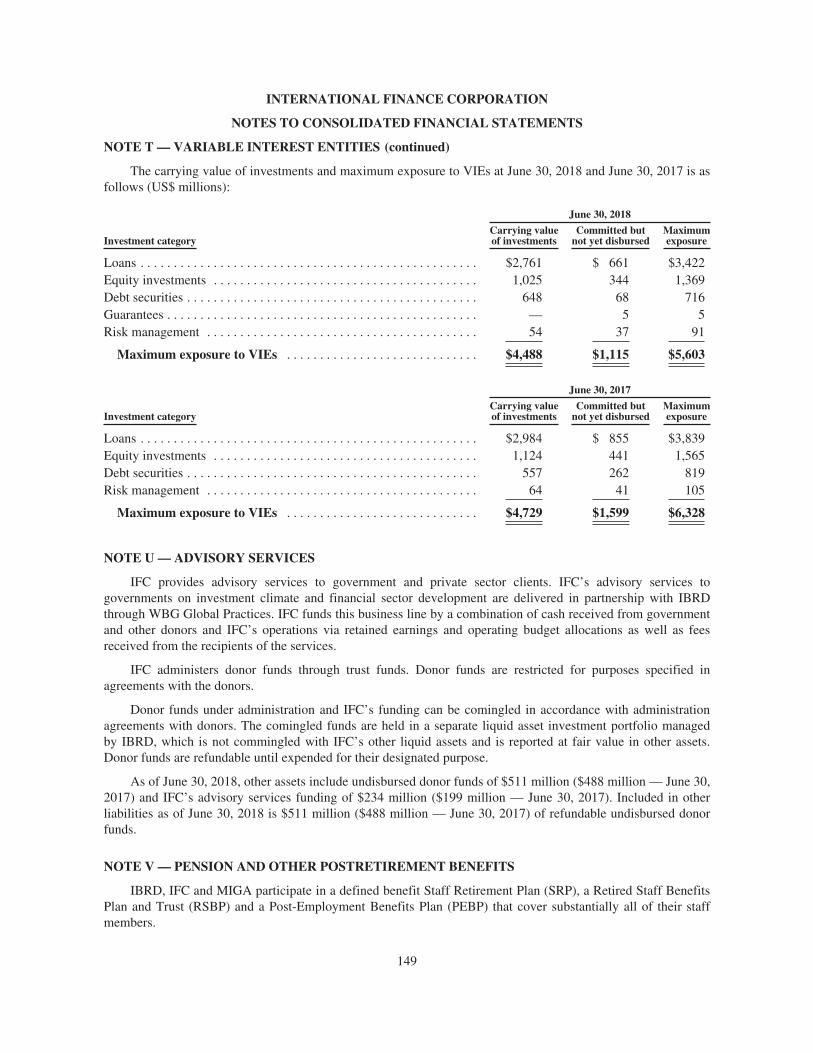
INTERNATIONAL FINANCE CORPORATION
NOTES TO CONSOLIDATED FINANCIAL STATEMENTS
NOTE T — VARIABLE INTEREST ENTITIES (continued)
The carrying value of investments and maximum exposure to VIEs at June 30, 2018 and June 30, 2017 is asfollows (US$ millions):
June 30, 2018
Investment categoryCarrying valueof investments
Committed butnot yet disbursed
Maximumexposure
Loans . . . . . . . . . . . . . . . . . . . . . . . . . . . . . . . . . . . . . . . . . . . . . . . . . . . $2,761 $ 661 $3,422Equity investments . . . . . . . . . . . . . . . . . . . . . . . . . . . . . . . . . . . . . . . . 1,025 344 1,369Debt securities . . . . . . . . . . . . . . . . . . . . . . . . . . . . . . . . . . . . . . . . . . . . 648 68 716Guarantees . . . . . . . . . . . . . . . . . . . . . . . . . . . . . . . . . . . . . . . . . . . . . . . — 5 5Risk management . . . . . . . . . . . . . . . . . . . . . . . . . . . . . . . . . . . . . . . . . 54 37 91
Maximum exposure to VIEs . . . . . . . . . . . . . . . . . . . . . . . . . . . . . $4,488 $1,115 $5,603
June 30, 2017
Investment categoryCarrying valueof investments
Committed butnot yet disbursed
Maximumexposure
Loans . . . . . . . . . . . . . . . . . . . . . . . . . . . . . . . . . . . . . . . . . . . . . . . . . . . $2,984 $ 855 $3,839Equity investments . . . . . . . . . . . . . . . . . . . . . . . . . . . . . . . . . . . . . . . . 1,124 441 1,565Debt securities . . . . . . . . . . . . . . . . . . . . . . . . . . . . . . . . . . . . . . . . . . . . 557 262 819Risk management . . . . . . . . . . . . . . . . . . . . . . . . . . . . . . . . . . . . . . . . . 64 41 105
Maximum exposure to VIEs . . . . . . . . . . . . . . . . . . . . . . . . . . . . . $4,729 $1,599 $6,328
NOTE U — ADVISORY SERVICES
IFC provides advisory services to government and private sector clients. IFC’s advisory services togovernments on investment climate and financial sector development are delivered in partnership with IBRDthrough WBG Global Practices. IFC funds this business line by a combination of cash received from governmentand other donors and IFC’s operations via retained earnings and operating budget allocations as well as feesreceived from the recipients of the services.
IFC administers donor funds through trust funds. Donor funds are restricted for purposes specified inagreements with the donors.
Donor funds under administration and IFC’s funding can be comingled in accordance with administrationagreements with donors. The comingled funds are held in a separate liquid asset investment portfolio managedby IBRD, which is not commingled with IFC’s other liquid assets and is reported at fair value in other assets.Donor funds are refundable until expended for their designated purpose.
As of June 30, 2018, other assets include undisbursed donor funds of $511 million ($488 million — June 30,2017) and IFC’s advisory services funding of $234 million ($199 million — June 30, 2017). Included in otherliabilities as of June 30, 2018 is $511 million ($488 million — June 30, 2017) of refundable undisbursed donorfunds.
NOTE V — PENSION AND OTHER POSTRETIREMENT BENEFITS
IBRD, IFC and MIGA participate in a defined benefit Staff Retirement Plan (SRP), a Retired Staff BenefitsPlan and Trust (RSBP) and a Post-Employment Benefits Plan (PEBP) that cover substantially all of their staffmembers.
149
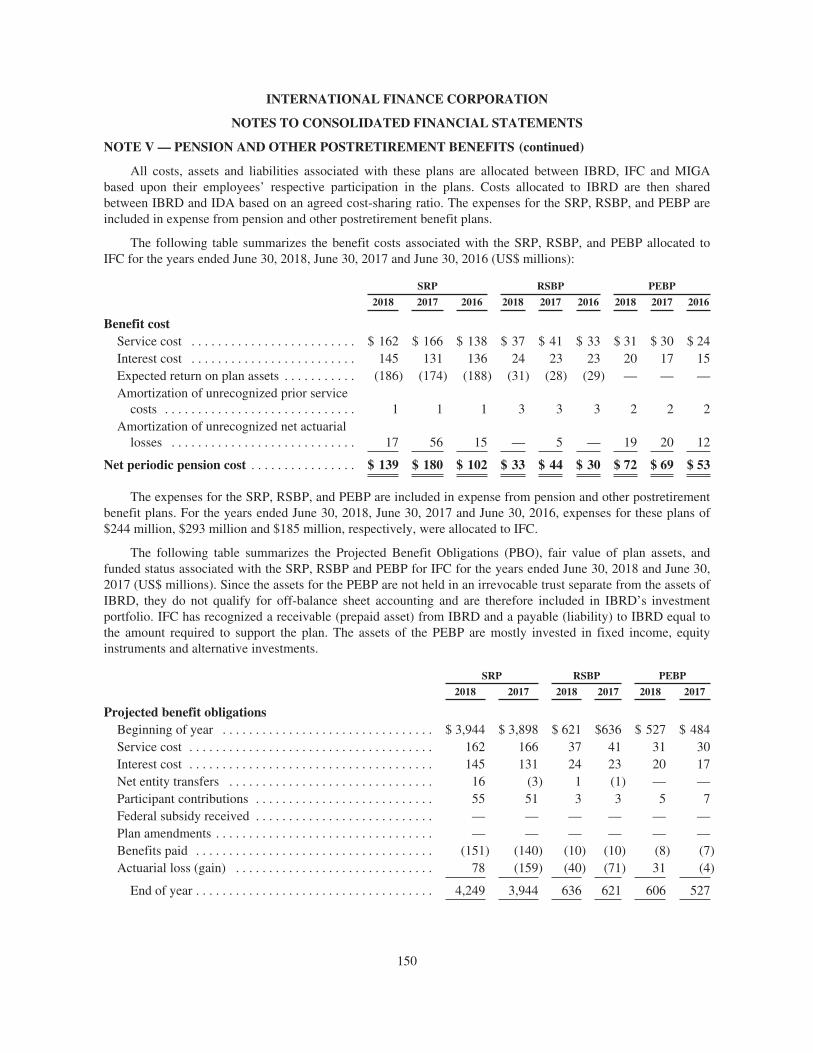
INTERNATIONAL FINANCE CORPORATION
NOTES TO CONSOLIDATED FINANCIAL STATEMENTS
NOTE V — PENSION AND OTHER POSTRETIREMENT BENEFITS (continued)
All costs, assets and liabilities associated with these plans are allocated between IBRD, IFC and MIGAbased upon their employees’ respective participation in the plans. Costs allocated to IBRD are then sharedbetween IBRD and IDA based on an agreed cost-sharing ratio. The expenses for the SRP, RSBP, and PEBP areincluded in expense from pension and other postretirement benefit plans.
The following table summarizes the benefit costs associated with the SRP, RSBP, and PEBP allocated toIFC for the years ended June 30, 2018, June 30, 2017 and June 30, 2016 (US$ millions):
SRP RSBP PEBP
2018 2017 2016 2018 2017 2016 2018 2017 2016
Benefit costService cost . . . . . . . . . . . . . . . . . . . . . . . . . $ 162 $ 166 $ 138 $ 37 $ 41 $ 33 $ 31 $ 30 $ 24Interest cost . . . . . . . . . . . . . . . . . . . . . . . . . 145 131 136 24 23 23 20 17 15Expected return on plan assets . . . . . . . . . . . (186) (174) (188) (31) (28) (29) — — —Amortization of unrecognized prior service
costs . . . . . . . . . . . . . . . . . . . . . . . . . . . . . 1 1 1 3 3 3 2 2 2Amortization of unrecognized net actuarial
losses . . . . . . . . . . . . . . . . . . . . . . . . . . . . 17 56 15 — 5 — 19 20 12
Net periodic pension cost . . . . . . . . . . . . . . . . $ 139 $ 180 $ 102 $ 33 $ 44 $ 30 $ 72 $ 69 $ 53
The expenses for the SRP, RSBP, and PEBP are included in expense from pension and other postretirementbenefit plans. For the years ended June 30, 2018, June 30, 2017 and June 30, 2016, expenses for these plans of$244 million, $293 million and $185 million, respectively, were allocated to IFC.
The following table summarizes the Projected Benefit Obligations (PBO), fair value of plan assets, andfunded status associated with the SRP, RSBP and PEBP for IFC for the years ended June 30, 2018 and June 30,2017 (US$ millions). Since the assets for the PEBP are not held in an irrevocable trust separate from the assets ofIBRD, they do not qualify for off-balance sheet accounting and are therefore included in IBRD’s investmentportfolio. IFC has recognized a receivable (prepaid asset) from IBRD and a payable (liability) to IBRD equal tothe amount required to support the plan. The assets of the PEBP are mostly invested in fixed income, equityinstruments and alternative investments.
SRP RSBP PEBP
2018 2017 2018 2017 2018 2017
Projected benefit obligationsBeginning of year . . . . . . . . . . . . . . . . . . . . . . . . . . . . . . . . $ 3,944 $ 3,898 $ 621 $636 $ 527 $ 484Service cost . . . . . . . . . . . . . . . . . . . . . . . . . . . . . . . . . . . . . 162 166 37 41 31 30Interest cost . . . . . . . . . . . . . . . . . . . . . . . . . . . . . . . . . . . . . 145 131 24 23 20 17Net entity transfers . . . . . . . . . . . . . . . . . . . . . . . . . . . . . . . 16 (3) 1 (1) — —Participant contributions . . . . . . . . . . . . . . . . . . . . . . . . . . . 55 51 3 3 5 7Federal subsidy received . . . . . . . . . . . . . . . . . . . . . . . . . . . — — — — — —Plan amendments . . . . . . . . . . . . . . . . . . . . . . . . . . . . . . . . . — — — — — —Benefits paid . . . . . . . . . . . . . . . . . . . . . . . . . . . . . . . . . . . . (151) (140) (10) (10) (8) (7)Actuarial loss (gain) . . . . . . . . . . . . . . . . . . . . . . . . . . . . . . 78 (159) (40) (71) 31 (4)
End of year . . . . . . . . . . . . . . . . . . . . . . . . . . . . . . . . . . . . 4,249 3,944 636 621 606 527
150
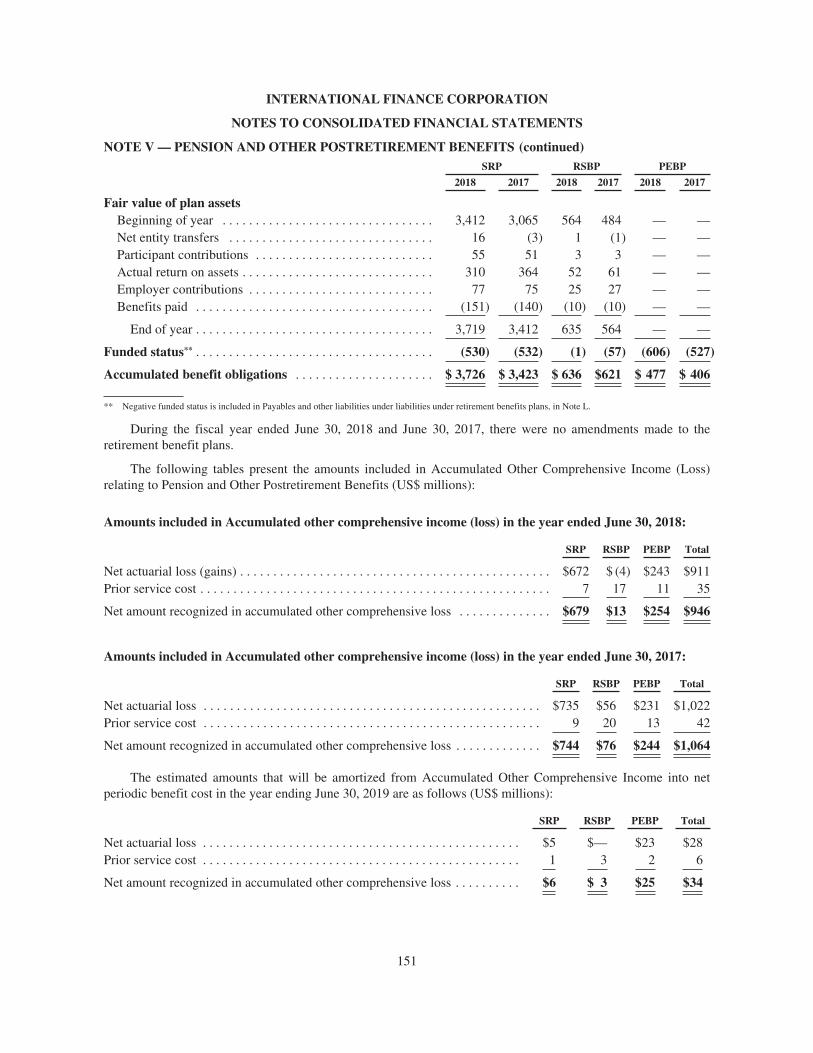
INTERNATIONAL FINANCE CORPORATION
NOTES TO CONSOLIDATED FINANCIAL STATEMENTS
NOTE V — PENSION AND OTHER POSTRETIREMENT BENEFITS (continued)SRP RSBP PEBP
2018 2017 2018 2017 2018 2017
Fair value of plan assetsBeginning of year . . . . . . . . . . . . . . . . . . . . . . . . . . . . . . . . 3,412 3,065 564 484 — —Net entity transfers . . . . . . . . . . . . . . . . . . . . . . . . . . . . . . . 16 (3) 1 (1) — —Participant contributions . . . . . . . . . . . . . . . . . . . . . . . . . . . 55 51 3 3 — —Actual return on assets . . . . . . . . . . . . . . . . . . . . . . . . . . . . . 310 364 52 61 — —Employer contributions . . . . . . . . . . . . . . . . . . . . . . . . . . . . 77 75 25 27 — —Benefits paid . . . . . . . . . . . . . . . . . . . . . . . . . . . . . . . . . . . . (151) (140) (10) (10) — —
End of year . . . . . . . . . . . . . . . . . . . . . . . . . . . . . . . . . . . . 3,719 3,412 635 564 — —
Funded status** . . . . . . . . . . . . . . . . . . . . . . . . . . . . . . . . . . . . (530) (532) (1) (57) (606) (527)
Accumulated benefit obligations . . . . . . . . . . . . . . . . . . . . . $ 3,726 $ 3,423 $ 636 $621 $ 477 $ 406
** Negative funded status is included in Payables and other liabilities under liabilities under retirement benefits plans, in Note L.
During the fiscal year ended June 30, 2018 and June 30, 2017, there were no amendments made to theretirement benefit plans.
The following tables present the amounts included in Accumulated Other Comprehensive Income (Loss)relating to Pension and Other Postretirement Benefits (US$ millions):
Amounts included in Accumulated other comprehensive income (loss) in the year ended June 30, 2018:
SRP RSBP PEBP Total
Net actuarial loss (gains) . . . . . . . . . . . . . . . . . . . . . . . . . . . . . . . . . . . . . . . . . . . . . . . $672 $ (4) $243 $911Prior service cost . . . . . . . . . . . . . . . . . . . . . . . . . . . . . . . . . . . . . . . . . . . . . . . . . . . . . 7 17 11 35
Net amount recognized in accumulated other comprehensive loss . . . . . . . . . . . . . . $679 $13 $254 $946
Amounts included in Accumulated other comprehensive income (loss) in the year ended June 30, 2017:
SRP RSBP PEBP Total
Net actuarial loss . . . . . . . . . . . . . . . . . . . . . . . . . . . . . . . . . . . . . . . . . . . . . . . . . . . $735 $56 $231 $1,022Prior service cost . . . . . . . . . . . . . . . . . . . . . . . . . . . . . . . . . . . . . . . . . . . . . . . . . . . 9 20 13 42
Net amount recognized in accumulated other comprehensive loss . . . . . . . . . . . . . $744 $76 $244 $1,064
The estimated amounts that will be amortized from Accumulated Other Comprehensive Income into netperiodic benefit cost in the year ending June 30, 2019 are as follows (US$ millions):
SRP RSBP PEBP Total
Net actuarial loss . . . . . . . . . . . . . . . . . . . . . . . . . . . . . . . . . . . . . . . . . . . . . . . . $5 $— $23 $28Prior service cost . . . . . . . . . . . . . . . . . . . . . . . . . . . . . . . . . . . . . . . . . . . . . . . . 1 3 2 6
Net amount recognized in accumulated other comprehensive loss . . . . . . . . . . $6 $ 3 $25 $34
151
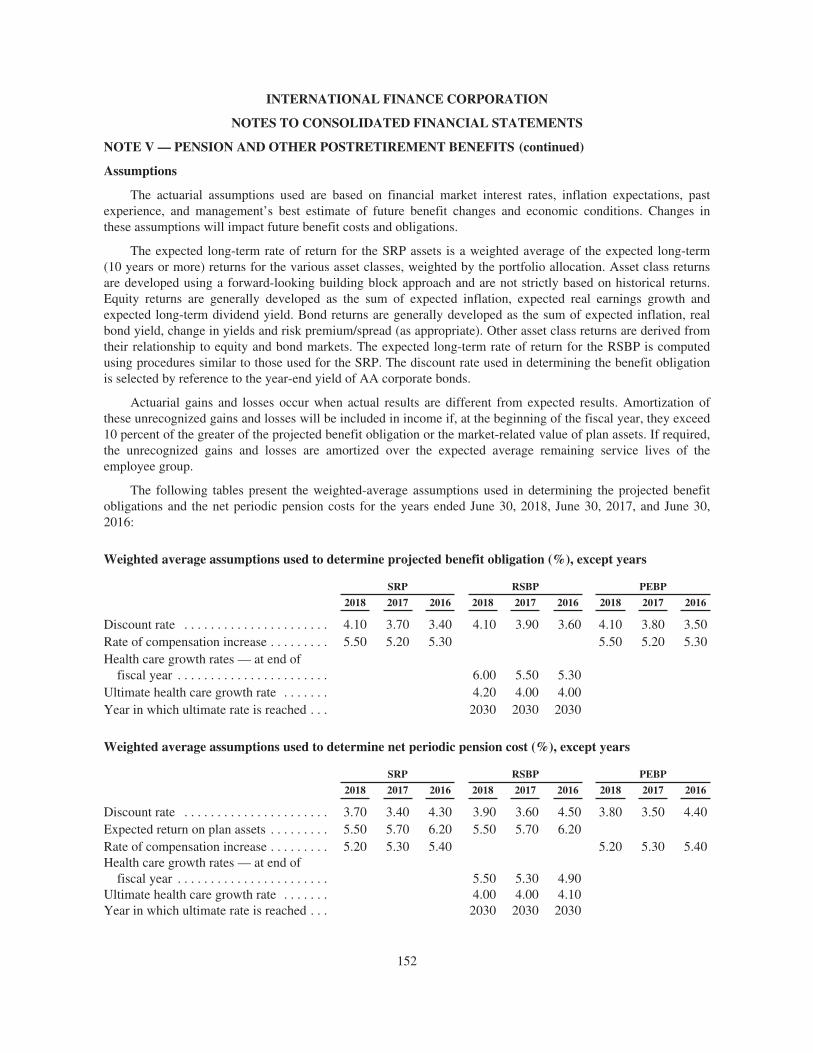
INTERNATIONAL FINANCE CORPORATION
NOTES TO CONSOLIDATED FINANCIAL STATEMENTS
NOTE V — PENSION AND OTHER POSTRETIREMENT BENEFITS (continued)
Assumptions
The actuarial assumptions used are based on financial market interest rates, inflation expectations, pastexperience, and management’s best estimate of future benefit changes and economic conditions. Changes inthese assumptions will impact future benefit costs and obligations.
The expected long-term rate of return for the SRP assets is a weighted average of the expected long-term(10 years or more) returns for the various asset classes, weighted by the portfolio allocation. Asset class returnsare developed using a forward-looking building block approach and are not strictly based on historical returns.Equity returns are generally developed as the sum of expected inflation, expected real earnings growth andexpected long-term dividend yield. Bond returns are generally developed as the sum of expected inflation, realbond yield, change in yields and risk premium/spread (as appropriate). Other asset class returns are derived fromtheir relationship to equity and bond markets. The expected long-term rate of return for the RSBP is computedusing procedures similar to those used for the SRP. The discount rate used in determining the benefit obligationis selected by reference to the year-end yield of AA corporate bonds.
Actuarial gains and losses occur when actual results are different from expected results. Amortization ofthese unrecognized gains and losses will be included in income if, at the beginning of the fiscal year, they exceed10 percent of the greater of the projected benefit obligation or the market-related value of plan assets. If required,the unrecognized gains and losses are amortized over the expected average remaining service lives of theemployee group.
The following tables present the weighted-average assumptions used in determining the projected benefitobligations and the net periodic pension costs for the years ended June 30, 2018, June 30, 2017, and June 30,2016:
Weighted average assumptions used to determine projected benefit obligation (%), except years
SRP RSBP PEBP
2018 2017 2016 2018 2017 2016 2018 2017 2016
Discount rate . . . . . . . . . . . . . . . . . . . . . . 4.10 3.70 3.40 4.10 3.90 3.60 4.10 3.80 3.50Rate of compensation increase . . . . . . . . . 5.50 5.20 5.30 5.50 5.20 5.30Health care growth rates — at end of
fiscal year . . . . . . . . . . . . . . . . . . . . . . . 6.00 5.50 5.30Ultimate health care growth rate . . . . . . . 4.20 4.00 4.00Year in which ultimate rate is reached . . . 2030 2030 2030
Weighted average assumptions used to determine net periodic pension cost (%), except years
SRP RSBP PEBP
2018 2017 2016 2018 2017 2016 2018 2017 2016
Discount rate . . . . . . . . . . . . . . . . . . . . . . 3.70 3.40 4.30 3.90 3.60 4.50 3.80 3.50 4.40Expected return on plan assets . . . . . . . . . 5.50 5.70 6.20 5.50 5.70 6.20Rate of compensation increase . . . . . . . . . 5.20 5.30 5.40 5.20 5.30 5.40Health care growth rates — at end of
fiscal year . . . . . . . . . . . . . . . . . . . . . . . 5.50 5.30 4.90Ultimate health care growth rate . . . . . . . 4.00 4.00 4.10Year in which ultimate rate is reached . . . 2030 2030 2030
152
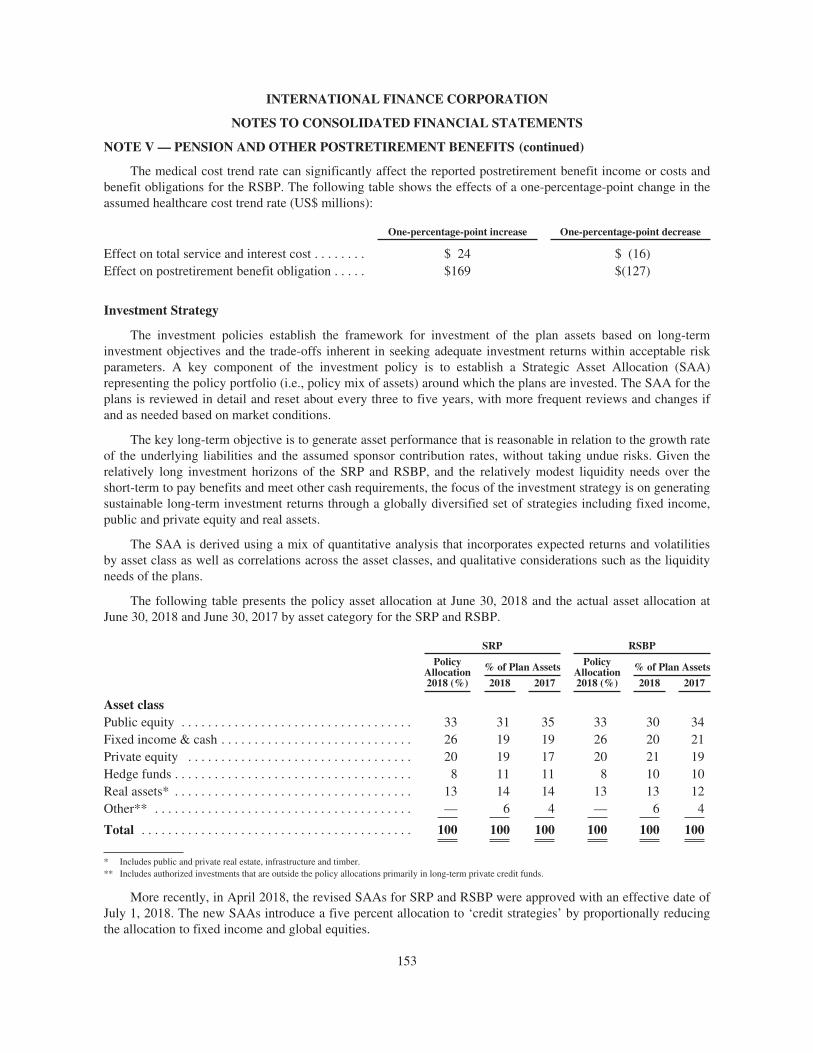
INTERNATIONAL FINANCE CORPORATION
NOTES TO CONSOLIDATED FINANCIAL STATEMENTS
NOTE V — PENSION AND OTHER POSTRETIREMENT BENEFITS (continued)
The medical cost trend rate can significantly affect the reported postretirement benefit income or costs andbenefit obligations for the RSBP. The following table shows the effects of a one-percentage-point change in theassumed healthcare cost trend rate (US$ millions):
One-percentage-point increase One-percentage-point decrease
Effect on total service and interest cost . . . . . . . . $ 24 $ (16)Effect on postretirement benefit obligation . . . . . $169 $(127)
Investment Strategy
The investment policies establish the framework for investment of the plan assets based on long-terminvestment objectives and the trade-offs inherent in seeking adequate investment returns within acceptable riskparameters. A key component of the investment policy is to establish a Strategic Asset Allocation (SAA)representing the policy portfolio (i.e., policy mix of assets) around which the plans are invested. The SAA for theplans is reviewed in detail and reset about every three to five years, with more frequent reviews and changes ifand as needed based on market conditions.
The key long-term objective is to generate asset performance that is reasonable in relation to the growth rateof the underlying liabilities and the assumed sponsor contribution rates, without taking undue risks. Given therelatively long investment horizons of the SRP and RSBP, and the relatively modest liquidity needs over theshort-term to pay benefits and meet other cash requirements, the focus of the investment strategy is on generatingsustainable long-term investment returns through a globally diversified set of strategies including fixed income,public and private equity and real assets.
The SAA is derived using a mix of quantitative analysis that incorporates expected returns and volatilitiesby asset class as well as correlations across the asset classes, and qualitative considerations such as the liquidityneeds of the plans.
The following table presents the policy asset allocation at June 30, 2018 and the actual asset allocation atJune 30, 2018 and June 30, 2017 by asset category for the SRP and RSBP.
SRP RSBP
PolicyAllocation2018 (%)
% of Plan Assets PolicyAllocation2018 (%)
% of Plan Assets
2018 2017 2018 2017
Asset classPublic equity . . . . . . . . . . . . . . . . . . . . . . . . . . . . . . . . . . . 33 31 35 33 30 34Fixed income & cash . . . . . . . . . . . . . . . . . . . . . . . . . . . . . 26 19 19 26 20 21Private equity . . . . . . . . . . . . . . . . . . . . . . . . . . . . . . . . . . 20 19 17 20 21 19Hedge funds . . . . . . . . . . . . . . . . . . . . . . . . . . . . . . . . . . . . 8 11 11 8 10 10Real assets* . . . . . . . . . . . . . . . . . . . . . . . . . . . . . . . . . . . . 13 14 14 13 13 12Other** . . . . . . . . . . . . . . . . . . . . . . . . . . . . . . . . . . . . . . . — 6 4 — 6 4
Total . . . . . . . . . . . . . . . . . . . . . . . . . . . . . . . . . . . . . . . . . 100 100 100 100 100 100
* Includes public and private real estate, infrastructure and timber.** Includes authorized investments that are outside the policy allocations primarily in long-term private credit funds.
More recently, in April 2018, the revised SAAs for SRP and RSBP were approved with an effective date ofJuly 1, 2018. The new SAAs introduce a five percent allocation to ‘credit strategies’ by proportionally reducingthe allocation to fixed income and global equities.
153
INTERNATIONAL FINANCE CORPORATION
NOTES TO CONSOLIDATED FINANCIAL STATEMENTS
NOTE V — PENSION AND OTHER POSTRETIREMENT BENEFITS (continued)
Significant concentrations of risk in plan assets
The assets of the SRP and RSBP are diversified across a variety of asset classes. Investments in these assetclasses are further diversified across funds, managers, strategies, geographies and sectors, to limit the impact ofany individual investment. In spite of such level of diversification, equity market risk remains the primary sourceof the overall return volatility of the Plans. As of June 30, 2018, the largest exposure to a single counterparty was7% and 5% of the plan assets in SRP and RSBP, respectively.
Risk management practices
Managing investment risk is an integral part of managing the assets of the Plans. Asset diversification andconsideration of the characteristics of the liabilities are central to the overall investment strategy and riskmanagement approach for the SRP. Absolute risk indicators such as the overall return volatility and drawdown ofthe Plans are the primary measures used to define the risk tolerance level and establish the overall level ofinvestment risk. In addition, the level of active risk (defined as the annualized standard deviation of portfolioreturns relative to those of the policy portfolio) is closely monitored and managed on ongoing basis.
Market risk is regularly monitored at the absolute level, as well as at the relative levels with respect to theinvestment policy, manager benchmarks, and liabilities of the Plans. Stress tests are performed periodically usingrelevant market scenarios to assess the impact of extreme market events.
Monitoring of performance (at both manager and asset class levels) against benchmarks, and compliancewith investment guidelines, is carried out on a regular basis as part of the risk monitoring process. Riskmanagement for different asset classes is tailored to their specific characteristics and is an integral part of theexternal managers’ due diligence and monitoring processes.
Credit risk is monitored on a regular basis and assessed for possible credit event impacts. The liquidityposition of the Plans is analyzed at regular intervals and periodically tested using various stress scenarios toensure that the Plans have sufficient liquidity to meet all cash flow requirements. In addition, the long-term cashflow needs of the Plans are considered during the SAA exercise and are one of the main drivers in determiningmaximum allocation to the illiquid investment vehicles. The plans mitigate operational risk by maintaining asystem of internal controls along with other checks and balances at various levels.
154
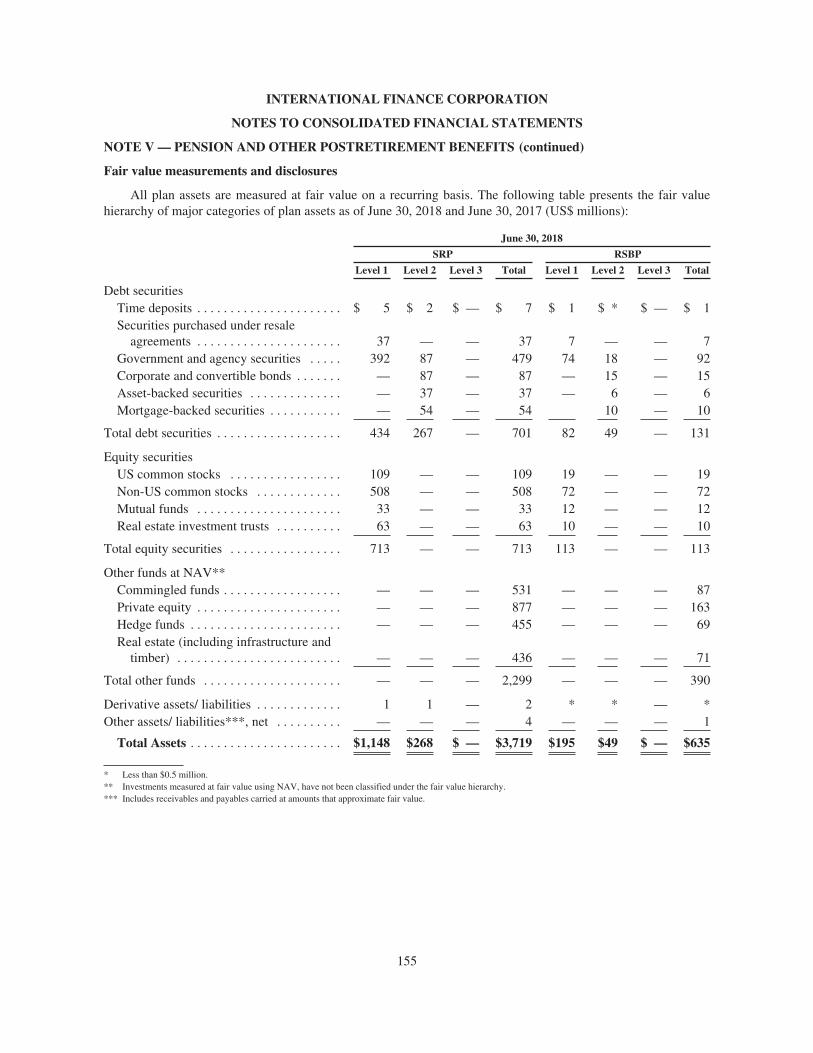
INTERNATIONAL FINANCE CORPORATION
NOTES TO CONSOLIDATED FINANCIAL STATEMENTS
NOTE V — PENSION AND OTHER POSTRETIREMENT BENEFITS (continued)
Fair value measurements and disclosures
All plan assets are measured at fair value on a recurring basis. The following table presents the fair valuehierarchy of major categories of plan assets as of June 30, 2018 and June 30, 2017 (US$ millions):
June 30, 2018
SRP RSBP
Level 1 Level 2 Level 3 Total Level 1 Level 2 Level 3 Total
Debt securitiesTime deposits . . . . . . . . . . . . . . . . . . . . . . $ 5 $ 2 $ — $ 7 $ 1 $ * $ — $ 1Securities purchased under resale
agreements . . . . . . . . . . . . . . . . . . . . . . 37 — — 37 7 — — 7Government and agency securities . . . . . 392 87 — 479 74 18 — 92Corporate and convertible bonds . . . . . . . — 87 — 87 — 15 — 15Asset-backed securities . . . . . . . . . . . . . . — 37 — 37 — 6 — 6Mortgage-backed securities . . . . . . . . . . . — 54 — 54 10 — 10
Total debt securities . . . . . . . . . . . . . . . . . . . 434 267 — 701 82 49 — 131
Equity securitiesUS common stocks . . . . . . . . . . . . . . . . . 109 — — 109 19 — — 19Non-US common stocks . . . . . . . . . . . . . 508 — — 508 72 — — 72Mutual funds . . . . . . . . . . . . . . . . . . . . . . 33 — — 33 12 — — 12Real estate investment trusts . . . . . . . . . . 63 — — 63 10 — — 10
Total equity securities . . . . . . . . . . . . . . . . . 713 — — 713 113 — — 113
Other funds at NAV**Commingled funds . . . . . . . . . . . . . . . . . . — — — 531 — — — 87Private equity . . . . . . . . . . . . . . . . . . . . . . — — — 877 — — — 163Hedge funds . . . . . . . . . . . . . . . . . . . . . . . — — — 455 — — — 69Real estate (including infrastructure and
timber) . . . . . . . . . . . . . . . . . . . . . . . . . — — — 436 — — — 71
Total other funds . . . . . . . . . . . . . . . . . . . . . — — — 2,299 — — — 390
Derivative assets/ liabilities . . . . . . . . . . . . . 1 1 — 2 * * — *Other assets/ liabilities***, net . . . . . . . . . . — — — 4 — — — 1
Total Assets . . . . . . . . . . . . . . . . . . . . . . . $1,148 $268 $ — $3,719 $195 $49 $ — $635
* Less than $0.5 million.** Investments measured at fair value using NAV, have not been classified under the fair value hierarchy.*** Includes receivables and payables carried at amounts that approximate fair value.
155
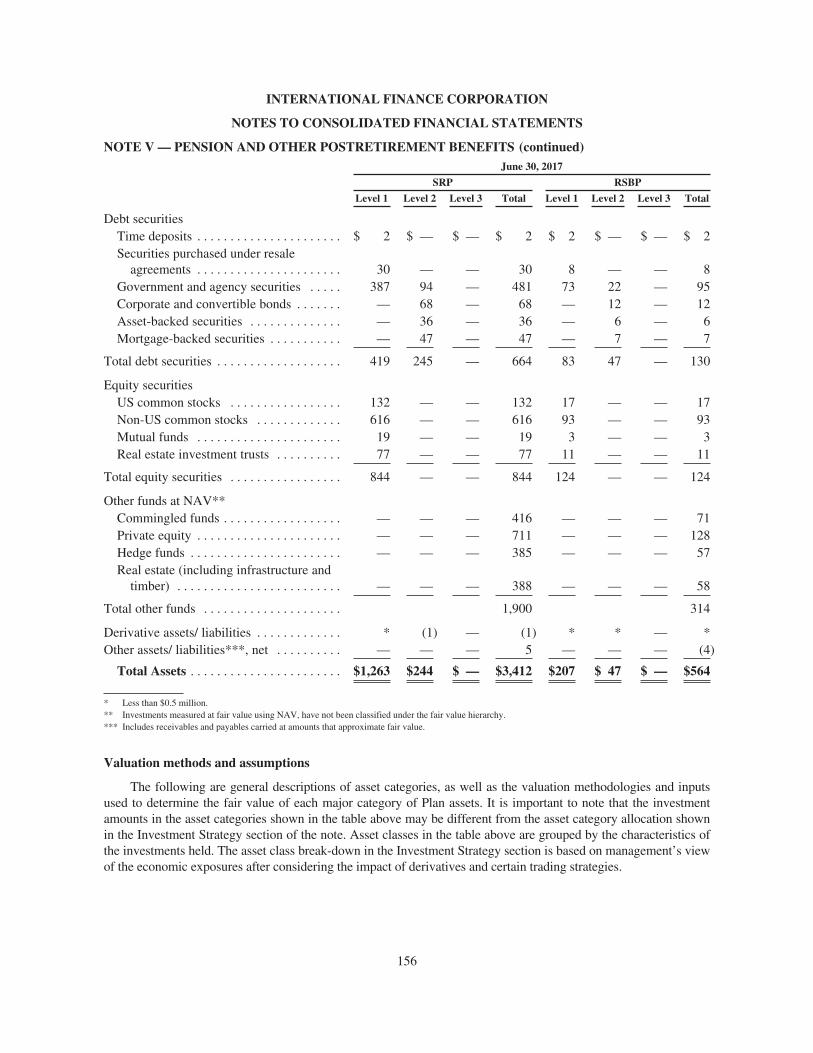
INTERNATIONAL FINANCE CORPORATION
NOTES TO CONSOLIDATED FINANCIAL STATEMENTS
NOTE V — PENSION AND OTHER POSTRETIREMENT BENEFITS (continued)June 30, 2017
SRP RSBP
Level 1 Level 2 Level 3 Total Level 1 Level 2 Level 3 Total
Debt securitiesTime deposits . . . . . . . . . . . . . . . . . . . . . . $ 2 $ — $ — $ 2 $ 2 $ — $ — $ 2Securities purchased under resale
agreements . . . . . . . . . . . . . . . . . . . . . . 30 — — 30 8 — — 8Government and agency securities . . . . . 387 94 — 481 73 22 — 95Corporate and convertible bonds . . . . . . . — 68 — 68 — 12 — 12Asset-backed securities . . . . . . . . . . . . . . — 36 — 36 — 6 — 6Mortgage-backed securities . . . . . . . . . . . — 47 — 47 — 7 — 7
Total debt securities . . . . . . . . . . . . . . . . . . . 419 245 — 664 83 47 — 130
Equity securitiesUS common stocks . . . . . . . . . . . . . . . . . 132 — — 132 17 — — 17Non-US common stocks . . . . . . . . . . . . . 616 — — 616 93 — — 93Mutual funds . . . . . . . . . . . . . . . . . . . . . . 19 — — 19 3 — — 3Real estate investment trusts . . . . . . . . . . 77 — — 77 11 — — 11
Total equity securities . . . . . . . . . . . . . . . . . 844 — — 844 124 — — 124
Other funds at NAV**Commingled funds . . . . . . . . . . . . . . . . . . — — — 416 — — — 71Private equity . . . . . . . . . . . . . . . . . . . . . . — — — 711 — — — 128Hedge funds . . . . . . . . . . . . . . . . . . . . . . . — — — 385 — — — 57Real estate (including infrastructure and
timber) . . . . . . . . . . . . . . . . . . . . . . . . . — — — 388 — — — 58
Total other funds . . . . . . . . . . . . . . . . . . . . . 1,900 314
Derivative assets/ liabilities . . . . . . . . . . . . . * (1) — (1) * * — *Other assets/ liabilities***, net . . . . . . . . . . — — — 5 — — — (4)
Total Assets . . . . . . . . . . . . . . . . . . . . . . . $1,263 $244 $ — $3,412 $207 $ 47 $ — $564
* Less than $0.5 million.** Investments measured at fair value using NAV, have not been classified under the fair value hierarchy.*** Includes receivables and payables carried at amounts that approximate fair value.
Valuation methods and assumptions
The following are general descriptions of asset categories, as well as the valuation methodologies and inputsused to determine the fair value of each major category of Plan assets. It is important to note that the investmentamounts in the asset categories shown in the table above may be different from the asset category allocation shownin the Investment Strategy section of the note. Asset classes in the table above are grouped by the characteristics ofthe investments held. The asset class break-down in the Investment Strategy section is based on management’s viewof the economic exposures after considering the impact of derivatives and certain trading strategies.
156
INTERNATIONAL FINANCE CORPORATION
NOTES TO CONSOLIDATED FINANCIAL STATEMENTS
NOTE V — PENSION AND OTHER POSTRETIREMENT BENEFITS (continued)
Debt securities
Debt securities include time deposits, U.S. treasuries and agencies, debt obligations of foreign governments,sub-sovereigns and debt obligations in corporations of domestic and foreign issuers. Fixed income also includesinvestments in ABS such as collateralized mortgage obligations and mortgage backed securities. These securitiesare valued by independent pricing vendors at quoted market prices for the same or similar securities, whereavailable. If quoted market prices are not available, fair values are based on discounted cash flow models usingmarket-based parameters such as yield curves, interest rates, volatilities, foreign exchange rates and credit curves.Some debt securities are valued using techniques which require significant unobservable inputs. The selection ofthese inputs may involve some judgment. Management believes its estimates of fair value are reasonable givenits processes for obtaining securities prices from multiple independent third-party vendors, ensuring thatvaluation models are reviewed and validated, and applying its approach consistently from period to period.Unless quoted prices are available, money market instruments and securities purchased under resale agreementsare reported at face value which approximates fair value.
Equity securities
Equity securities (including REITs) represent investments in companies in various industries and countries.Investments in public equity listed on securities exchanges are valued at the last reported sale price on the lastbusiness day of the fiscal year.
Commingled funds
Commingled funds are typically collective investment vehicles, such as trusts that are reported at NAV asprovided by the investment manager or sponsor of the fund based on valuation of underlying investments.
Private equity
Private equity includes investments primarily in leveraged buyouts, distressed investments and venturecapital funds across North America, Europe and Asia in a variety of sectors. A large number of these funds are inthe investment phase of their life cycle. Private Equity investments do not have a readily determinable fairmarket value and are reported at NAV provided by the fund managers, taking into consideration the latest auditedfinancial statements of the funds. The underlying investments are valued using inputs such as cost, operatingresults, discounted future cash flows and trading multiples of comparable public securities.
Real estate
Real estate includes several funds which invest in core real estate as well as non-core type of real estateinvestments such as debt, value add, and opportunistic equity investments. Real estate investments do not have areadily determinable fair market value and are reported at NAV provided by the fund managers, taking intoconsideration the latest audited financial statements of the funds. The valuations of underlying investments arebased on income and/or cost approaches or comparable sales approach, and taking into account discount andcapitalization rates, financial conditions, local market conditions among others.
Hedge fund investments
Hedge fund investments include those seeking to maximize absolute returns using a broad range ofstrategies to enhance returns and provide additional diversification. Hedge Funds include investments in equity,event driven, fixed income, multi strategy and macro relative value strategies. These investments do not have areadily determinable fair market value and are reported at NAV provided by external managers or fundadministrators (based on the valuations of underlying investments) on a monthly basis, taking into considerationthe latest audited financial statements of the funds.
157
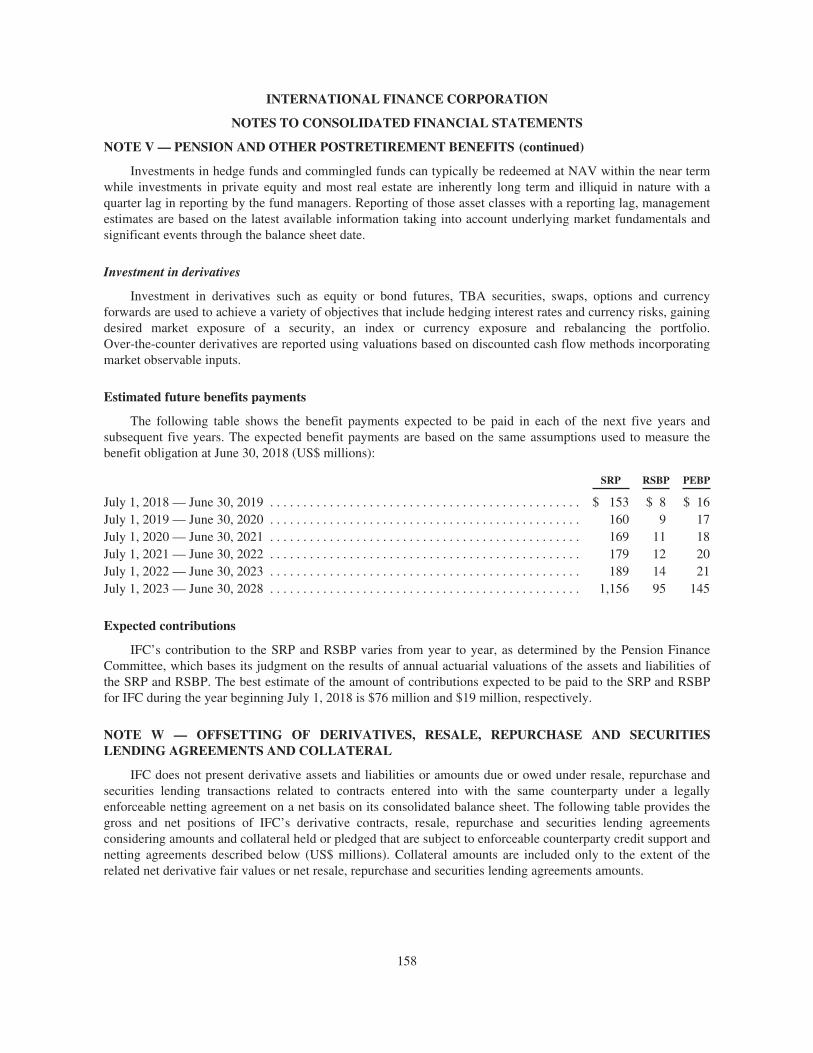
INTERNATIONAL FINANCE CORPORATION
NOTES TO CONSOLIDATED FINANCIAL STATEMENTS
NOTE V — PENSION AND OTHER POSTRETIREMENT BENEFITS (continued)
Investments in hedge funds and commingled funds can typically be redeemed at NAV within the near termwhile investments in private equity and most real estate are inherently long term and illiquid in nature with aquarter lag in reporting by the fund managers. Reporting of those asset classes with a reporting lag, managementestimates are based on the latest available information taking into account underlying market fundamentals andsignificant events through the balance sheet date.
Investment in derivatives
Investment in derivatives such as equity or bond futures, TBA securities, swaps, options and currencyforwards are used to achieve a variety of objectives that include hedging interest rates and currency risks, gainingdesired market exposure of a security, an index or currency exposure and rebalancing the portfolio.Over-the-counter derivatives are reported using valuations based on discounted cash flow methods incorporatingmarket observable inputs.
Estimated future benefits payments
The following table shows the benefit payments expected to be paid in each of the next five years andsubsequent five years. The expected benefit payments are based on the same assumptions used to measure thebenefit obligation at June 30, 2018 (US$ millions):
SRP RSBP PEBP
July 1, 2018 — June 30, 2019 . . . . . . . . . . . . . . . . . . . . . . . . . . . . . . . . . . . . . . . . . . . . . . . $ 153 $ 8 $ 16July 1, 2019 — June 30, 2020 . . . . . . . . . . . . . . . . . . . . . . . . . . . . . . . . . . . . . . . . . . . . . . . 160 9 17July 1, 2020 — June 30, 2021 . . . . . . . . . . . . . . . . . . . . . . . . . . . . . . . . . . . . . . . . . . . . . . . 169 11 18July 1, 2021 — June 30, 2022 . . . . . . . . . . . . . . . . . . . . . . . . . . . . . . . . . . . . . . . . . . . . . . . 179 12 20July 1, 2022 — June 30, 2023 . . . . . . . . . . . . . . . . . . . . . . . . . . . . . . . . . . . . . . . . . . . . . . . 189 14 21July 1, 2023 — June 30, 2028 . . . . . . . . . . . . . . . . . . . . . . . . . . . . . . . . . . . . . . . . . . . . . . . 1,156 95 145
Expected contributions
IFC’s contribution to the SRP and RSBP varies from year to year, as determined by the Pension FinanceCommittee, which bases its judgment on the results of annual actuarial valuations of the assets and liabilities ofthe SRP and RSBP. The best estimate of the amount of contributions expected to be paid to the SRP and RSBPfor IFC during the year beginning July 1, 2018 is $76 million and $19 million, respectively.
NOTE W — OFFSETTING OF DERIVATIVES, RESALE, REPURCHASE AND SECURITIESLENDING AGREEMENTS AND COLLATERAL
IFC does not present derivative assets and liabilities or amounts due or owed under resale, repurchase andsecurities lending transactions related to contracts entered into with the same counterparty under a legallyenforceable netting agreement on a net basis on its consolidated balance sheet. The following table provides thegross and net positions of IFC’s derivative contracts, resale, repurchase and securities lending agreementsconsidering amounts and collateral held or pledged that are subject to enforceable counterparty credit support andnetting agreements described below (US$ millions). Collateral amounts are included only to the extent of therelated net derivative fair values or net resale, repurchase and securities lending agreements amounts.
158
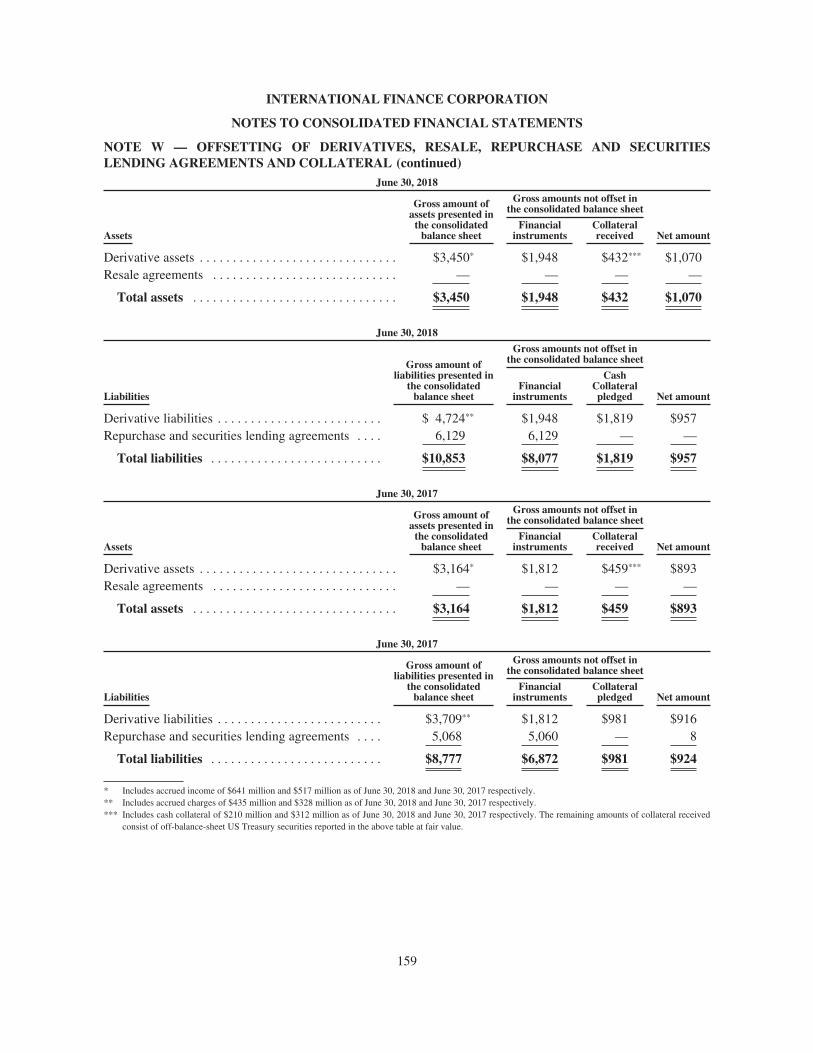
INTERNATIONAL FINANCE CORPORATION
NOTES TO CONSOLIDATED FINANCIAL STATEMENTS
NOTE W — OFFSETTING OF DERIVATIVES, RESALE, REPURCHASE AND SECURITIESLENDING AGREEMENTS AND COLLATERAL (continued)
June 30, 2018
Assets
Gross amount ofassets presented in
the consolidatedbalance sheet
Gross amounts not offset inthe consolidated balance sheet
Financialinstruments
Collateralreceived Net amount
Derivative assets . . . . . . . . . . . . . . . . . . . . . . . . . . . . . . $3,450* $1,948 $432*** $1,070Resale agreements . . . . . . . . . . . . . . . . . . . . . . . . . . . . — — — —
Total assets . . . . . . . . . . . . . . . . . . . . . . . . . . . . . . . $3,450 $1,948 $432 $1,070
June 30, 2018
Liabilities
Gross amount ofliabilities presented in
the consolidatedbalance sheet
Gross amounts not offset inthe consolidated balance sheet
Financialinstruments
CashCollateralpledged Net amount
Derivative liabilities . . . . . . . . . . . . . . . . . . . . . . . . . $ 4,724** $1,948 $1,819 $957Repurchase and securities lending agreements . . . . 6,129 6,129 — —
Total liabilities . . . . . . . . . . . . . . . . . . . . . . . . . . $10,853 $8,077 $1,819 $957
June 30, 2017
Assets
Gross amount ofassets presented in
the consolidatedbalance sheet
Gross amounts not offset inthe consolidated balance sheet
Financialinstruments
Collateralreceived Net amount
Derivative assets . . . . . . . . . . . . . . . . . . . . . . . . . . . . . . $3,164* $1,812 $459*** $893Resale agreements . . . . . . . . . . . . . . . . . . . . . . . . . . . . — — — —
Total assets . . . . . . . . . . . . . . . . . . . . . . . . . . . . . . . $3,164 $1,812 $459 $893
June 30, 2017
Liabilities
Gross amount ofliabilities presented in
the consolidatedbalance sheet
Gross amounts not offset inthe consolidated balance sheet
Financialinstruments
Collateralpledged Net amount
Derivative liabilities . . . . . . . . . . . . . . . . . . . . . . . . . $3,709** $1,812 $981 $916Repurchase and securities lending agreements . . . . 5,068 5,060 — 8
Total liabilities . . . . . . . . . . . . . . . . . . . . . . . . . . $8,777 $6,872 $981 $924
* Includes accrued income of $641 million and $517 million as of June 30, 2018 and June 30, 2017 respectively.** Includes accrued charges of $435 million and $328 million as of June 30, 2018 and June 30, 2017 respectively.*** Includes cash collateral of $210 million and $312 million as of June 30, 2018 and June 30, 2017 respectively. The remaining amounts of collateral received
consist of off-balance-sheet US Treasury securities reported in the above table at fair value.
159
INTERNATIONAL FINANCE CORPORATION
NOTES TO CONSOLIDATED FINANCIAL STATEMENTS
NOTE W — OFFSETTING OF DERIVATIVES, RESALE, REPURCHASE AND SECURITIESLENDING AGREEMENTS AND COLLATERAL (continued)
IFC’s derivative contracts with market counterparties are entered into under standardized master agreementspublished by the International Swaps and Derivatives Association (“ISDA” Agreements). ISDA Agreementsprovide for a single lump sum settlement amount upon the early termination of transactions following a defaultor termination event whereby amounts payable by the non-defaulting party to the other party may be applied toreduce any amounts that the other party owes the non-defaulting party. This setoff effectively reduces anyamount payable by the non-defaulting party to the defaulting party.
IFC’s ISDA Agreements are appended by a Credit Support Annex (“CSA”) that provides for the receipt, andin some cases, posting, of collateral in the form of cash, U.S. Treasury securities or U.K. gilts to reduce mark-tomarket exposure among derivative market counterparties. IFC recognizes cash collateral received and acorresponding liability on its balance sheet for the obligation to return it. Securities received as collateral are notrecognized on IFC’s balance sheet. As of June 30, 2018, $1,987 million of cash collateral was posted underCSAs ($932 June 30, 2017). IFC recognizes a receivable on its balance sheet for its rights to cash collateralposted. In accordance with the CSAs, IFC may rehypothecate securities received as collateral, subject to theobligation to return such collateral and any related distributions received. In the event of a counterparty default,IFC may exercise certain rights and remedies, including the right to set off any amounts payable by thecounterparty against any collateral held by IFC and the right to liquidate any collateral held. As of June 30, 2018,IFC had $236 million ($334 million at June 30, 2017) of outstanding obligations to return cash collateral underCSAs. The estimated fair value of all securities received and held as collateral under CSAs of June 30, 2018, allof which may be rehypothecated was $231 million ($197 million — June 30, 2017). As of June 30, 2018,$8 million of such collateral was rehypothecated under securities lending agreements ($200 million — June 30,2017).
Collateral posted by IFC in connection with repurchase agreements approximates the amounts classified asSecurities sold under repurchase agreements. At June 30, 2018, trading securities with a carrying amount (fairvalue) of $202 million ($197 million—June 30, 2017) were pledged in connection with borrowings under a short-term discount note program, the carrying amount of which was $2,262 million ($2,670 million — June 30, 2017).
Under certain CSA’s IFC is not required to pledge collateral unless its credit rating is downgraded from itscurrent AAA/Aaa. The aggregate fair value of derivatives containing such a credit risk-linked contingent featurein a net liability position was $61 million at June 30, 2018 ($321 million at June 30, 2017). At June 30, 2018, IFChad no collateral posted under these agreements. If IFC’s credit rating were to be downgraded from its currentAAA/Aaa to AA+/Aa1 or below, then collateral in the amount of $0 would be required to be posted against netliability positions with counterparties at June 30, 2018 ($12 million at June 30, 2017).
IFC’s resale, repurchase and securities lending transactions are entered into with counterparties underindustry standard master netting agreements which generally provide the right to offset amounts owed oneanother with respect to multiple transactions under such master netting agreement and liquidate the purchased orborrowed securities in the event of counterparty default. The estimated fair value of all securities received andheld as collateral under these master netting agreements as of June 30, 2018 was $0 ($0 — June 30, 2017).
160
INTERNATIONAL FINANCE CORPORATION
NOTES TO CONSOLIDATED FINANCIAL STATEMENTS
NOTE W — OFFSETTING OF DERIVATIVES, RESALE, REPURCHASE AND SECURITIESLENDING AGREEMENTS AND COLLATERAL (continued)
The following table presents an analysis of IFC’s repurchase and securities lending transactions by (1) classof collateral pledged and (2) their remaining contractual maturity as of June 30, 2018 and June 30, 2017 (US$millions):
Remaining Contractual Maturity of the Agreements —June 30, 2018
Overnight andContinuous
Up to 30days
30-90days
Greater than90 days Total
Repurchase agreementsU.S. Treasury securities . . . . . . . . . . . . . . . . . . . . . . . . . $ — $6,128 $ — $ — $6,128Agency securities . . . . . . . . . . . . . . . . . . . . . . . . . . . . . . — — — — —Municipal securities and other . . . . . . . . . . . . . . . . . . . . — — — — —
Total Repurchase agreements . . . . . . . . . . . . . . . . — 6,128 — — 6,128
Securities lending transactions — — — — —U.S. Treasury securities . . . . . . . . . . . . . . . . . . . . . . . . . $ 8 $ — $ — $ — $ 8
Total Securities lending transactions . . . . . . . . . . . 8 — — — 8
Total Repurchase agreements and Securities lendingtransactions . . . . . . . . . . . . . . . . . . . . . . . . . . . . . . . . . $ 8 $6,128 $ — $ — $6,136*
As of June 30, 2018, IFC has no repurchase-to-maturity transactions outstanding.
* Includes accrued interest.
Remaining Contractual Maturity of the Agreements —June 30, 2017
Overnight andContinuous
Up to 30days
30-90days
Greater than90 days Total
Repurchase agreementsU.S. Treasury securities . . . . . . . . . . . . . . . . . . . . . . . . . $ — $4,871 $ — $ — $4,871Agency securities . . . . . . . . . . . . . . . . . . . . . . . . . . . . . . — — — — —Municipal securities and other . . . . . . . . . . . . . . . . . . . . — — — — —
Total Repurchase agreements . . . . . . . . . . . . . . . . — 4,871 — — 4,871
Securities lending transactionsU.S. Treasury securities . . . . . . . . . . . . . . . . . . . . . . . . . $ 199 $ — $ — $ — $ 199
Total Securities lending transactions . . . . . . . . . . . 199 — — — 199
Total Repurchase agreements and Securities lendingtransactions . . . . . . . . . . . . . . . . . . . . . . . . . . . . . . . . . $ 199 $4,871 $ — $ — $5,070*
As of June 30, 2017, IFC has no repurchase-to-maturity transactions outstanding.
* Includes accrued interest.
161
INTERNATIONAL FINANCE CORPORATION
NOTES TO CONSOLIDATED FINANCIAL STATEMENTS
NOTE X — SERVICE AND SUPPORT PAYMENTS
IFC obtains certain administrative and overhead services from IBRD in those areas where common servicescan be efficiently provided by IBRD. This includes shared costs of the Boards of Governors and Directors, andother services such as communications, internal auditing, administrative support, supplies, and insurance. IFCmakes payments for these services to IBRD based on negotiated fees, chargebacks and allocated charges, wherechargeback is not feasible. Expenses allocated to IFC for the year ended June 30, 2018, were $110 million ($109million — year ended June 30, 2017; $113 million — year ended June 30, 2016). Other chargebacks include$22 million for the year ended June 30, 2018 ($20 million — year ended June 30, 2017; $18 million — yearended June 30, 2016).
NOTE Y — RELATED PARTY TRANSACTIONS
On December 22, 2017, IFC entered into a currency swap agreement with IDA for a period of 12 years. IFCwill receive a fixed rate of 2.49% annually on a USD notional of 9 million and will pay 3.27% annually on aWest African CFA franc (XOF) notional of 5.0 billion. As of June 30, 2018, the derivative had a fair value of$1 million.
During the quarter ended September 30, 2014, IFC issued an amortizing, non-interest bearing promissorynote, maturing September 15, 2039, to IDA (the Note) in exchange for $1,179 million. The Note requirespayments totaling $1,318 million, resulting in an effective interest rate of 1.84%. With IFC’s consent, IDA mayredeem the Note after September 2, 2019, upon an adverse change in its financial condition or outlook. Theamount due to IDA upon such redemption is equal to the present value of the all unpaid amounts discounted atthe effective interest rate. IDA may transfer the Note; however, its redemption right is not transferrable. IFC haselected the Fair Value Option for the Note.
NOTE Z — CONTINGENCIES
In the normal course of its business, IFC is from time to time named as a defendant or co-defendant invarious legal actions on different grounds in various jurisdictions. Although there can be no assurances, based onthe information currently available, IFC’s Management does not believe the outcome of any of the variousexisting legal actions will have a material adverse effect on IFC’s financial position, results of operations or cashflows.
162
KPMG LLPSuite 120001801 K Street, NWWashington, DC 20006
Independent Auditors’ Report
President and Board of DirectorsInternational Finance Corporation:
We have audited the accompanying consolidated financial statements of the International FinanceCorporation and its subsidiaries (IFC), which comprise the consolidated balance sheets as of June 30, 2018 and2017, and the related consolidated statements of operations, comprehensive income (loss), changes in capital andcash flows for each of the years in the three-year period ended June 30, 2018, and the related notes to thefinancial statements.
Management’s Responsibility for the Financial Statements
Management is responsible for the preparation and fair presentation of these financial statements inaccordance with U.S. generally accepted accounting principles; this includes the design, implementation, andmaintenance of internal control relevant to the preparation and fair presentation of financial statements that arefree from material misstatement, whether due to fraud or error.
Auditors’ Responsibility
Our responsibility is to express an opinion on these financial statements based on our audits. We conductedour audits in accordance with auditing standards generally accepted in the United States of America. Thosestandards require that we plan and perform the audit to obtain reasonable assurance about whether the financialstatements are free from material misstatement, whether due to fraud or error.
An audit involves performing procedures to obtain audit evidence about the amounts and disclosures in thefinancial statements. The procedures selected depend on the auditors’ judgment, including the assessment of therisks of material misstatement of the financial statements, whether due to fraud or error. In making those riskassessments, the auditor considers internal control relevant to the entity’s preparation and fair presentation of thefinancial statements in order to design audit procedures that are appropriate in the circumstances. An audit alsoincludes evaluating the appropriateness of accounting policies used and the reasonableness of significantaccounting estimates made by management, as well as evaluating the overall presentation of the financialstatements.
We believe that the audit evidence we have obtained is sufficient and appropriate to provide a basis for ouraudit opinion.
Opinion
In our opinion, the financial statements referred to above present fairly, in all material respects, the financialposition of International Finance Corporation and its subsidiaries as of June 30, 2018 and 2017, and the results oftheir operations and their cash flows for each of the years in the three-year period ended June 30, 2018 inaccordance with U.S. generally accepted accounting principles.
163
Other Matter
Our audit was conducted for the purpose of forming an opinion on the financial statements as a whole. Theconsolidated statement of capital stock and voting power as of June 30, 2018 is presented for purposes ofadditional analysis and are not a required part of the financial statements. Such information is the responsibilityof management and was derived from and relates directly to the underlying accounting and other records used toprepare the financial statements. The information has been subjected to the auditing procedures applied in theaudit of the financial statements and certain additional procedures, including comparing and reconciling suchinformation directly to the underlying accounting and other records used to prepare the financial statements or tothe financial statements themselves, and other additional procedures in accordance with auditing standardsgenerally accepted in the United States of America. In our opinion, the information is fairly stated in all materialrespects in relation to the financial statements as a whole.
Report on Internal Control over Financial Reporting
We also have audited, in accordance with auditing standards generally accepted in the United States ofAmerica, IFC’s internal control over financial reporting as of June 30, 2018, based on criteria established in theInternal Control — Integrated Framework (2013) issued by the Committee of Sponsoring Organizations of theTreadway Commission (COSO) and our report dated August 9, 2018 expressed an unmodified opinion on theeffectiveness of IFC’s internal control over financial reporting.
Washington, D.C.August 9, 2018
164
Information Statement
International Finance Corporation
No person is authorized to give any information or to make any representation not contained in thisInformation Statement, or any prospectus, information memorandum or offering circular, or related offeringdocument. Any information or representation not contained herein must not be relied upon as having beenauthorized by IFC or by any dealer, underwriter or agent of IFC. Neither this Information Statement nor any suchprospectus, information memorandum or offering circular, or related offering document, constitutes an offer tosell or solicitation of an offer to buy Securities in any jurisdiction to any person to whom it is unlawful to makesuch an offer or solicitation in such jurisdiction.
Except as otherwise indicated, in this Information Statement (1) all amounts are stated in current UnitedStates dollars translated as indicated in the notes to the consolidated financial statements, Note A — Summary ofsignificant accounting and related policies, translation of currencies and (2) all information in this InformationStatement is given as of June 30, 2018.
TABLE OF CONTENTS
Page
Availability of information . . . . . . . . . . . . . . . . . . . . . . . . . . . . . . . . . . . . . . . . . . . . . . . . . . . . . . . . . . . . . . . . 1Summary information . . . . . . . . . . . . . . . . . . . . . . . . . . . . . . . . . . . . . . . . . . . . . . . . . . . . . . . . . . . . . . . . . . . . 2Selected financial data . . . . . . . . . . . . . . . . . . . . . . . . . . . . . . . . . . . . . . . . . . . . . . . . . . . . . . . . . . . . . . . . . . . 3Use of Proceeds . . . . . . . . . . . . . . . . . . . . . . . . . . . . . . . . . . . . . . . . . . . . . . . . . . . . . . . . . . . . . . . . . . . . . . . . 4Financial structure of IFC . . . . . . . . . . . . . . . . . . . . . . . . . . . . . . . . . . . . . . . . . . . . . . . . . . . . . . . . . . . . . . . . . 4Management’s Discussion and Analysis as of and for the year ended June 30, 2018 . . . . . . . . . . . . . . . . . . . 5Organization and administration of IFC . . . . . . . . . . . . . . . . . . . . . . . . . . . . . . . . . . . . . . . . . . . . . . . . . . . . . . 57Index to consolidated financial statements and internal control reports as of and for the year ended
June 30, 2018 . . . . . . . . . . . . . . . . . . . . . . . . . . . . . . . . . . . . . . . . . . . . . . . . . . . . . . . . . . . . . . . . . . . . . . . . 61