Embed Size (px)
Citation preview
THE UNSEEN SECTORA REPORT ON THE MSME OPPORTUNITY IN SOUTH AFRICA
© International Finance Corporation [2018]. All rights reserved.2121 Pennsylvania Avenue, N.W.Washington, D.C. 20433Internet: www.ifc.org
The material in this work is copyrighted. Copying and/or transmitting portions or all of this work without permission may be a violation of applicable law. IFC encourages dissemination of its work and will normally grant permission to reproduce portions of the work promptly, and when the reproduction is for educational and non-commercial purposes, without a fee, subject to such attributions and notices as we may reasonably require.
IFC does not guarantee the accuracy, reliability, or completeness of the content included in this work, or for the conclusions or judgments described herein, and accepts no responsibility or liability for any omissions or errors (including, without limitation, typographical errors and technical errors) in the content whatsoever or for reliance thereon. The findings, interpretations, and conclusions expressed in this volume do not necessarily reflect the views of the Executive Directors of the World Bank or the governments they represent.
The contents of this work are intended for general informational purposes only and are not intended to constitute legal, securities, or investment advice, an opinion regarding the appropriateness of any investment, or a solicitation of any type. IFC or its affiliates may have an investment in, provide other advice or services to, or otherwise have a financial interest in, certain of the companies and parties named herein.
All other queries on rights and licenses, including subsidiary rights, should be addressed to IFC Communications, 2121 Pennsylvania Avenue, N.W., Washington, D.C. 20433. International Finance Corporation is an international organization established by Articles of Agreement among its member countries, and a member of the World Bank Group. All names, logos, and trademarks are the property of IFC and you may not use any of such materials for any purpose without the express written consent of IFC. Additionally, “International Finance Corporation” and “IFC” are registered trademarks of IFC and are protected under international law.
November 2018
Front cover:The team at Est Est Alea restaurant, Johannesburg, prepare for lunch. Mercantile Bank supported Est Est Alea in the launch at their new location. Photo: IFC / Karel Prinsloo
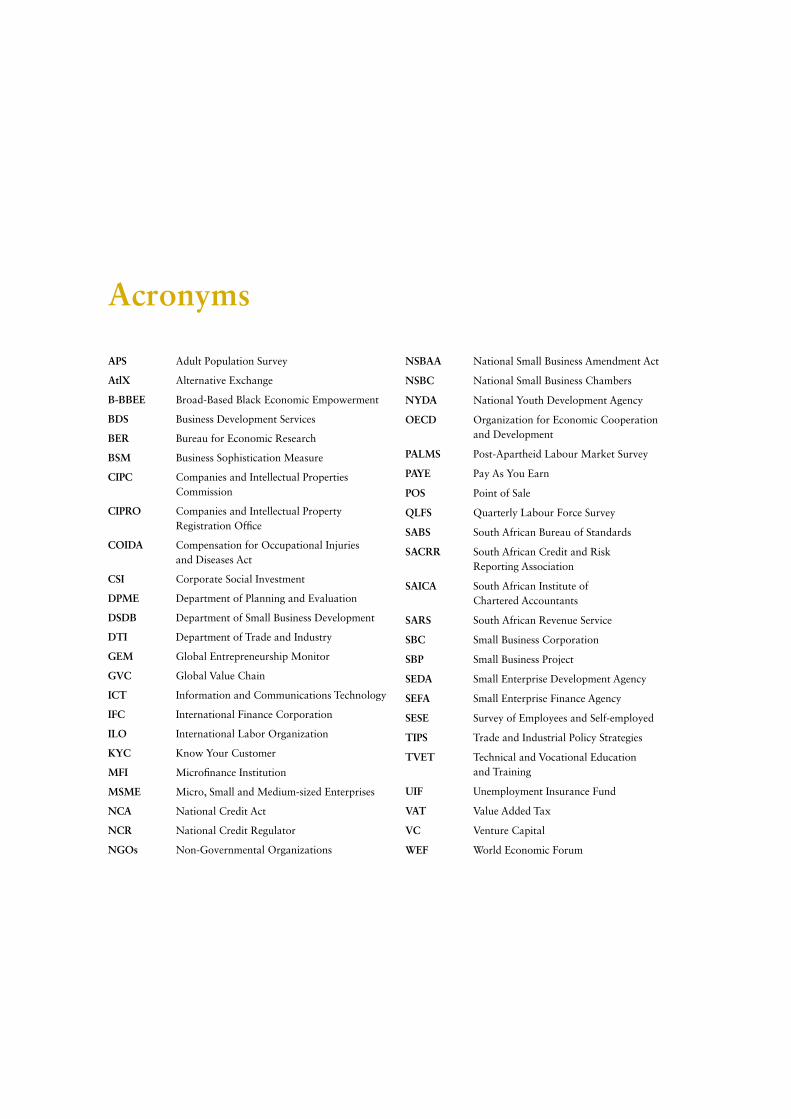
Acronyms
APS Adult Population Survey
AtlX Alternative Exchange
B-BBEE Broad-Based Black Economic Empowerment
BDS Business Development Services
BER Bureau for Economic Research
BSM Business Sophistication Measure
CIPC Companies and Intellectual Properties Commission
CIPRO Companies and Intellectual Property Registration Office
COIDA Compensation for Occupational Injuries and Diseases Act
CSI Corporate Social Investment
DPME Department of Planning and Evaluation
DSDB Department of Small Business Development
DTI Department of Trade and Industry
GEM Global Entrepreneurship Monitor
GVC Global Value Chain
ICT Information and Communications Technology
IFC International Finance Corporation
ILO International Labor Organization
KYC Know Your Customer
MFI Microfinance Institution
MSME Micro, Small and Medium-sized Enterprises
NCA National Credit Act
NCR National Credit Regulator
NGOs Non-Governmental Organizations
NSBAA National Small Business Amendment Act
NSBC National Small Business Chambers
NYDA National Youth Development Agency
OECD Organization for Economic Cooperation and Development
PALMS Post-Apartheid Labour Market Survey
PAYE Pay As You Earn
POS Point of Sale
QLFS Quarterly Labour Force Survey
SABS South African Bureau of Standards
SACRR South African Credit and Risk Reporting Association
SAICA South African Institute of Chartered Accountants
SARS South African Revenue Service
SBC Small Business Corporation
SBP Small Business Project
SEDA Small Enterprise Development Agency
SEFA Small Enterprise Finance Agency
SESE Survey of Employees and Self-employed
TIPS Trade and Industrial Policy Strategies
TVET Technical and Vocational Education and Training
UIF Unemployment Insurance Fund
VAT Value Added Tax
VC Venture Capital
WEF World Economic Forum
4 A REPORT ON THE MSME LANDSCAPE IN SOUTH AFRICA
THE UNSEEN SECTOR
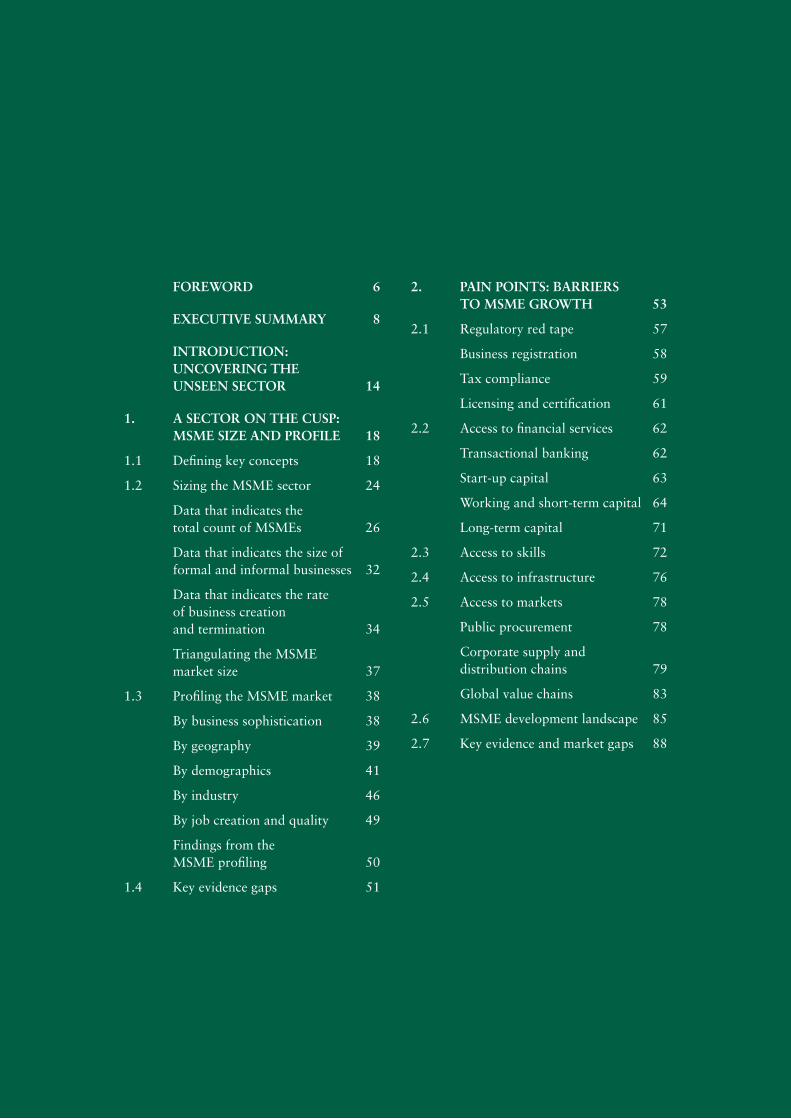
FOREWORD 6
EXECUTIVE SUMMARY 8
INTRODUCTION: UNCOVERING THE UNSEEN SECTOR 14
1. A SECTOR ON THE CUSP: MSME SIZE AND PROFILE 18
1.1 Defining key concepts 18
1.2 Sizing the MSME sector 24
Data that indicates the total count of MSMEs 26
Data that indicates the size of formal and informal businesses 32
Data that indicates the rate of business creation and termination 34
Triangulating the MSME market size 37
1.3 Profiling the MSME market 38
By business sophistication 38
By geography 39
By demographics 41
By industry 46
By job creation and quality 49
Findings from the MSME profiling 50
1.4 Key evidence gaps 51
2. PAIN POINTS: BARRIERS TO MSME GROWTH 53
2.1 Regulatory red tape 57
Business registration 58
Tax compliance 59
Licensing and certification 61
2.2 Access to financial services 62
Transactional banking 62
Start-up capital 63
Working and short-term capital 64
Long-term capital 71
2.3 Access to skills 72
2.4 Access to infrastructure 76
2.5 Access to markets 78
Public procurement 78
Corporate supply and distribution chains 79
Global value chains 83
2.6 MSME development landscape 85
2.7 Key evidence and market gaps 88
A REPORT ON THE MSME LANDSCAPE IN SOUTH AFRICA 5
THE UNSEEN SECTOR
3. UNLOCKING POTENTIAL: MSME FINANCING 90
3.1 Bank financing 91
Challenges for banks 95
Solutions being considered by banks 98
3.2 Non-bank financing 99
Private equity and venture capital 99
Microfinance institutions 99
Fintechs 101
Corporates 101
Other private stakeholders 101
Small Enterprise Financing Agency 102
3.3 The role of government in MSME financing 103
Challenges 103
Possible solutions 104
4. BUILDING A NEW PLAYING FIELD FOR SMALL BUSINESS 108
Better data on the MSME sector 108
Sharpened policy focus 109
Increased formalization 110
Improved financing and support 110
Summary of recommendations 112
APPENDIX I – WORLD BANK GROUP MSME INITIATIVES 114
APPENDIX II - METHODOLOGY 115
Primary research 115
Desk research 116
REFERENCES 120
6 A REPORT ON THE MSME LANDSCAPE IN SOUTH AFRICA
THE UNSEEN SECTOR
6 A REPORT ON THE MSME LANDSCAPE IN SOUTH AFRICA
THE UNSEEN SECTOR
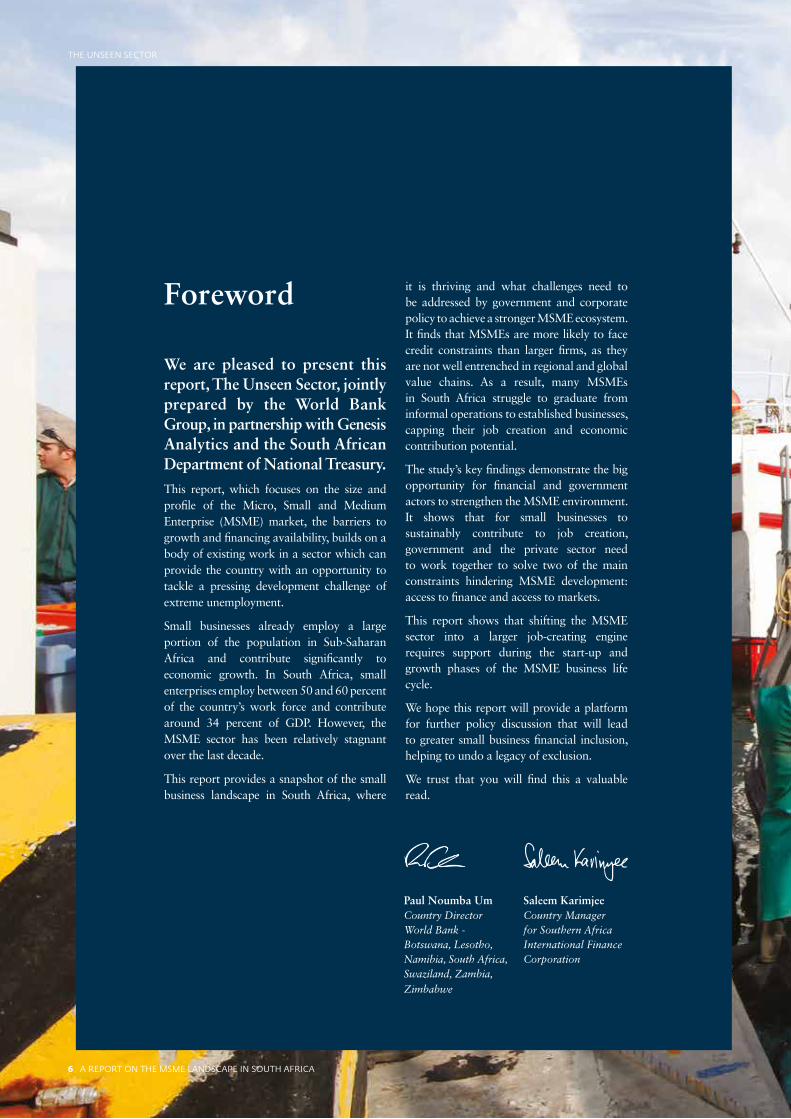
Paul Noumba Um Country Director World Bank - Botswana, Lesotho, Namibia, South Africa, Swaziland, Zambia, Zimbabwe
Saleem Karimjee Country Manager for Southern Africa International Finance Corporation
Foreword
We are pleased to present this report, The Unseen Sector, jointly prepared by the World Bank Group, in partnership with Genesis Analytics and the South African Department of National Treasury.This report, which focuses on the size and profile of the Micro, Small and Medium Enterprise (MSME) market, the barriers to growth and financing availability, builds on a body of existing work in a sector which can provide the country with an opportunity to tackle a pressing development challenge of extreme unemployment.
Small businesses already employ a large portion of the population in Sub-Saharan Africa and contribute significantly to economic growth. In South Africa, small enterprises employ between 50 and 60 percent of the country’s work force and contribute around 34 percent of GDP. However, the MSME sector has been relatively stagnant over the last decade.
This report provides a snapshot of the small business landscape in South Africa, where
it is thriving and what challenges need to be addressed by government and corporate policy to achieve a stronger MSME ecosystem. It finds that MSMEs are more likely to face credit constraints than larger firms, as they are not well entrenched in regional and global value chains. As a result, many MSMEs in South Africa struggle to graduate from informal operations to established businesses, capping their job creation and economic contribution potential.
The study’s key findings demonstrate the big opportunity for financial and government actors to strengthen the MSME environment. It shows that for small businesses to sustainably contribute to job creation, government and the private sector need to work together to solve two of the main constraints hindering MSME development: access to finance and access to markets.
This report shows that shifting the MSME sector into a larger job-creating engine requires support during the start-up and growth phases of the MSME business life cycle.
We hope this report will provide a platform for further policy discussion that will lead to greater small business financial inclusion, helping to undo a legacy of exclusion.
We trust that you will find this a valuable read.
A REPORT ON THE MSME LANDSCAPE IN SOUTH AFRICA 7
THE UNSEEN SECTOR
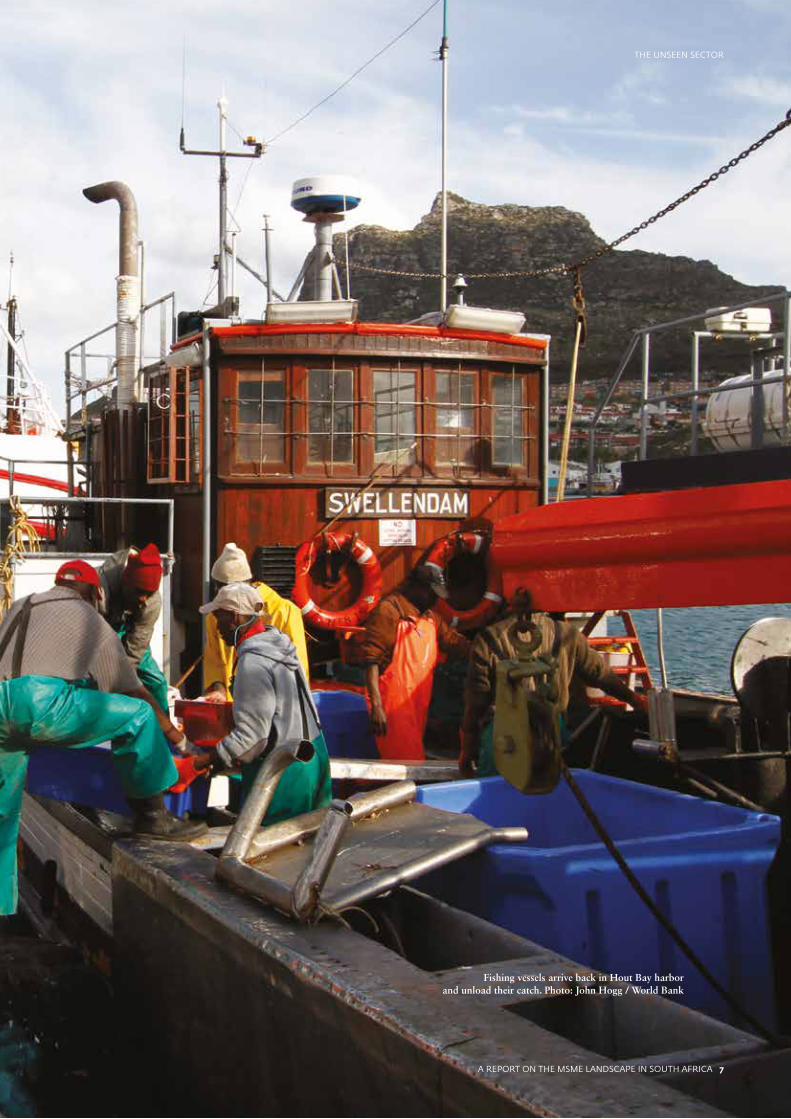
Fishing vessels arrive back in Hout Bay harbor and unload their catch. Photo: John Hogg / World Bank
A REPORT ON THE MSME LANDSCAPE IN SOUTH AFRICA 7
THE UNSEEN SECTOR
8 A REPORT ON THE MSME LANDSCAPE IN SOUTH AFRICA
THE UNSEEN SECTOR
Executive Summary
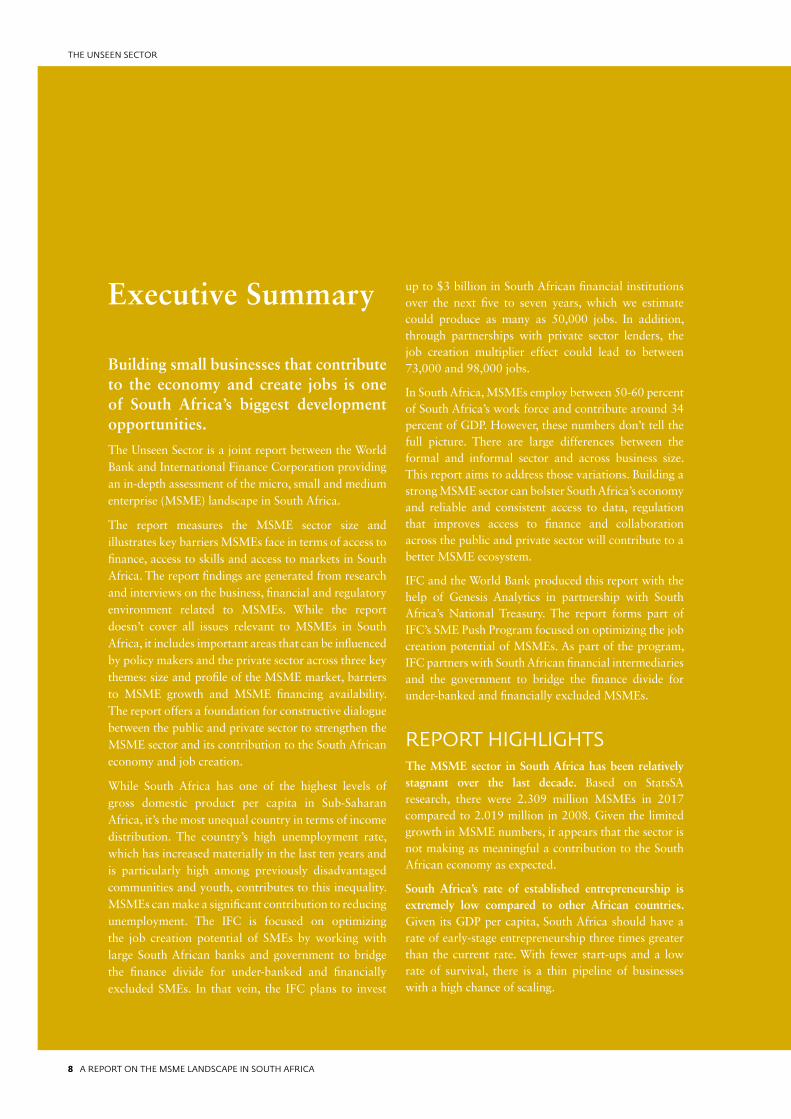
Building small businesses that contribute to the economy and create jobs is one of South Africa’s biggest development opportunities.
The Unseen Sector is a joint report between the World Bank and International Finance Corporation providing an in-depth assessment of the micro, small and medium enterprise (MSME) landscape in South Africa.
The report measures the MSME sector size and illustrates key barriers MSMEs face in terms of access to finance, access to skills and access to markets in South Africa. The report findings are generated from research and interviews on the business, financial and regulatory environment related to MSMEs. While the report doesn’t cover all issues relevant to MSMEs in South Africa, it includes important areas that can be influenced by policy makers and the private sector across three key themes: size and profile of the MSME market, barriers to MSME growth and MSME financing availability. The report offers a foundation for constructive dialogue between the public and private sector to strengthen the MSME sector and its contribution to the South African economy and job creation.
While South Africa has one of the highest levels of gross domestic product per capita in Sub-Saharan Africa, it’s the most unequal country in terms of income distribution. The country’s high unemployment rate, which has increased materially in the last ten years and is particularly high among previously disadvantaged communities and youth, contributes to this inequality. MSMEs can make a significant contribution to reducing unemployment. The IFC is focused on optimizing the job creation potential of SMEs by working with large South African banks and government to bridge the finance divide for under-banked and financially excluded SMEs. In that vein, the IFC plans to invest
up to $3 billion in South African financial institutions over the next five to seven years, which we estimate could produce as many as 50,000 jobs. In addition, through partnerships with private sector lenders, the job creation multiplier effect could lead to between 73,000 and 98,000 jobs.
In South Africa, MSMEs employ between 50-60 percent of South Africa’s work force and contribute around 34 percent of GDP. However, these numbers don’t tell the full picture. There are large differences between the formal and informal sector and across business size. This report aims to address those variations. Building a strong MSME sector can bolster South Africa’s economy and reliable and consistent access to data, regulation that improves access to finance and collaboration across the public and private sector will contribute to a better MSME ecosystem.
IFC and the World Bank produced this report with the help of Genesis Analytics in partnership with South Africa’s National Treasury. The report forms part of IFC’s SME Push Program focused on optimizing the job creation potential of MSMEs. As part of the program, IFC partners with South African financial intermediaries and the government to bridge the finance divide for under-banked and financially excluded MSMEs.
REPORT HIGHLIGHTSThe MSME sector in South Africa has been relatively stagnant over the last decade. Based on StatsSA research, there were 2.309 million MSMEs in 2017 compared to 2.019 million in 2008. Given the limited growth in MSME numbers, it appears that the sector is not making as meaningful a contribution to the South African economy as expected.
South Africa’s rate of established entrepreneurship is extremely low compared to other African countries. Given its GDP per capita, South Africa should have a rate of early-stage entrepreneurship three times greater than the current rate. With fewer start-ups and a low rate of survival, there is a thin pipeline of businesses with a high chance of scaling.
A REPORT ON THE MSME LANDSCAPE IN SOUTH AFRICA 9
THE UNSEEN SECTOR
A significant portion of informal entrepreneurial activity is driven by necessity, largely unemployed individuals with no alternative source of income. This limits the MSME sector’s potential to contribute to South Africa’s employment needs in a real and sustainable way.
We estimate the total size of South Africa’s MSME market, including formal and informal enterprises, is 5.78 million of which only 14 percent is formalized, based on available data sources. Many micro and very small enterprises are creating opportunities for self-employment, while only a few medium- to large-sized enterprises have the capacity to employ more people.
MSME activity indicates increased urbanization in the past 10 years. The proportion of MSMEs in urban areas increased to 69 percent in 2017 from 62 percent in 2008. Gauteng accounts for more than half of MSMEs.
Black ownership declined in the past 10 years to 76 percent in 2017 from 79 percent in 2008. Black ownership remains heavily concentrated amongst micro enterprises, and then decreases steadily as the size of the business grows, representing less than a third of medium-sized enterprises. White ownership increases as firm size grows, from 8 percent amongst micro enterprises to 46 percent amongst medium-sized enterprises.
Female ownership declined significantly over the past decade to 38 percent in 2017 from 48 percent in 2008. Female ownership is also concentrated in micro and small businesses – 41 percent of micro enterprises are female-owned and then female ownership drops to only 27 percent amongst medium-sized enterprises, with male ownership dominating at 73 percent.
MSME ownership reflects South Africa’s socio-economic undercurrents of racial and gender inequality. Black and female ownership of MSMEs is more prevalent in the informal sector, where the majority of micro enterprises are concentrated.
The MSME sector is not contributing significantly to youth employment creation. Youth represent 25 percent of South Africa’s MSME ownership and there’s a high rate of youth unemployment in the country. Youth MSME ownership has stagnated since 2008 in the 25-34 age bracket, and declined in the 18-24 age bracket. Entrepreneurial activity is also less in the 18-24 and 25-34 age groups than in age brackets above 35 years. The data also suggests that the informal sector is not providing the youth with significant employment opportunities compared to the formal sector.
Access to finance is higher for formal MSMEs and those on the upper-end of the firm size spectrum. The IFC estimates the total MSME finance gap between supply and demand to be $30 billion.
Total funding provided to the MSME sector is currently $16 billion (230 billion rand). Commercial banks account for the majority of the financing extended to formal MSMEs, representing 68.9 percent, or $11 billion (160 billion rand), of the current formal MSME funding supply. Bank funding is biased toward longer-term (vehicle or property) financing compared to short-term (working capital) financing. Government and microfinance institutions account for the bulk of finance extended to the informal sector.
10 A REPORT ON THE MSME LANDSCAPE IN SOUTH AFRICA
THE UNSEEN SECTOR
STRENGTHENING INITIATIVES
The study’s key findings demonstrate the big opportunity for financial and government actors to strengthen the MSME environment. Shifting the MSME sector into a larger job-creating engine requires support during the start-up and growth phases of the MSME business life cycle. We break our recommended initiatives into four pillars of activity aimed at promoting small business development.
Build better dataCollect and digitize more accurate and comprehensive data that can be easily accessed by all stakeholders. Right now South Africa relies heavily on proxy indicators to measure MSME activity and to understand their needs. A key study recommendation is to design and implement a regular and comprehensive update on the state of the MSME sector in South Africa such as collecting a richer set of data from business owners interviewed in regular household surveys or through focused nationally-representative surveys of MSME owners. Key to building better data would be a deliberate effort to reduce the level of data fragmentation by developing a common MSME data framework for adoption by public and private sector funding providers to measure the supply of MSME finance as well as identify areas requiring further focus and development.
Sharpen policyMSME policies in South Africa have not been as effective as they were intended. Policy effectiveness requires a more coordinated approach. There is an opportunity for the Department of Small Business to be the key coordinator of MSME support programs among government stakeholders – for example between the Small Enterprise Finance Agency and the Small Enterprise Development Agency, as well as other government agencies working on MSME support such as the South African Revenue Service, the Department of Trade and Industry, the National Credit Regulator and development banks. Greater MSME policy coordination will help support South Africa’s broad development objectives, such as creating youth employment, by aligning the activities of focused institutions – such as the National Youth Development Agency – with MSME support policies.
Increase formalizationThe study found that 85 percent of the MSME sector is informal and survivalist businesses. Businesses struggle to grow out of this classification in large part because of the poor business environment for MSMEs, particularly regulatory red tape and uncoordinated support for MSME development. The constraints lead to poor rates of formalization and business sustainability and can be eased by developing one-stop-shops and technology-enabled business registration, reducing red tape for MSMEs and tax regime adjustments to minimize the tax burden on small businesses.
Expand access to finance and marketsAccess to markets, finance and skills remain some of the biggest barriers to MSME growth. Increasing financial inclusion for South Africa’s small businesses requires support from financial institutions and the government. Recommended actions include developing credit scorecard innovations for MSMEs, the introduction of a movable collateral registry and implementation of facilitation tools.
A REPORT ON THE MSME LANDSCAPE IN SOUTH AFRICA 11
THE UNSEEN SECTOR
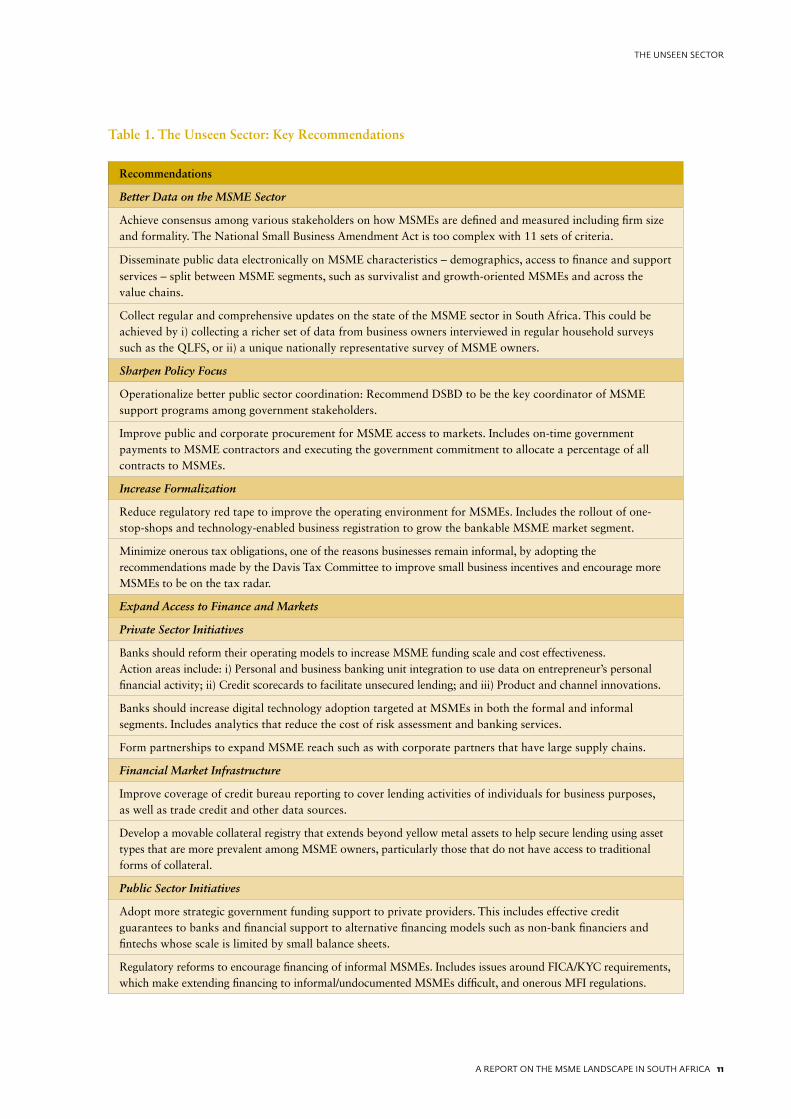
Table 1. The Unseen Sector: Key Recommendations
Recommendations
Better Data on the MSME Sector
Achieve consensus among various stakeholders on how MSMEs are defined and measured including firm size and formality. The National Small Business Amendment Act is too complex with 11 sets of criteria.
Disseminate public data electronically on MSME characteristics – demographics, access to finance and support services – split between MSME segments, such as survivalist and growth-oriented MSMEs and across the value chains.
Collect regular and comprehensive updates on the state of the MSME sector in South Africa. This could be achieved by i) collecting a richer set of data from business owners interviewed in regular household surveys such as the QLFS, or ii) a unique nationally representative survey of MSME owners.
Sharpen Policy Focus
Operationalize better public sector coordination: Recommend DSBD to be the key coordinator of MSME support programs among government stakeholders.
Improve public and corporate procurement for MSME access to markets. Includes on-time government payments to MSME contractors and executing the government commitment to allocate a percentage of all contracts to MSMEs.
Increase Formalization
Reduce regulatory red tape to improve the operating environment for MSMEs. Includes the rollout of one-stop-shops and technology-enabled business registration to grow the bankable MSME market segment.
Minimize onerous tax obligations, one of the reasons businesses remain informal, by adopting the recommendations made by the Davis Tax Committee to improve small business incentives and encourage more MSMEs to be on the tax radar.
Expand Access to Finance and Markets
Private Sector Initiatives
Banks should reform their operating models to increase MSME funding scale and cost effectiveness. Action areas include: i) Personal and business banking unit integration to use data on entrepreneur’s personal financial activity; ii) Credit scorecards to facilitate unsecured lending; and iii) Product and channel innovations.
Banks should increase digital technology adoption targeted at MSMEs in both the formal and informal segments. Includes analytics that reduce the cost of risk assessment and banking services.
Form partnerships to expand MSME reach such as with corporate partners that have large supply chains.
Financial Market Infrastructure
Improve coverage of credit bureau reporting to cover lending activities of individuals for business purposes, as well as trade credit and other data sources.
Develop a movable collateral registry that extends beyond yellow metal assets to help secure lending using asset types that are more prevalent among MSME owners, particularly those that do not have access to traditional forms of collateral.
Public Sector Initiatives
Adopt more strategic government funding support to private providers. This includes effective credit guarantees to banks and financial support to alternative financing models such as non-bank financiers and fintechs whose scale is limited by small balance sheets.
Regulatory reforms to encourage financing of informal MSMEs. Includes issues around FICA/KYC requirements, which make extending financing to informal/undocumented MSMEs difficult, and onerous MFI regulations.
12 A REPORT ON THE MSME LANDSCAPE IN SOUTH AFRICA
THE UNSEEN SECTOR
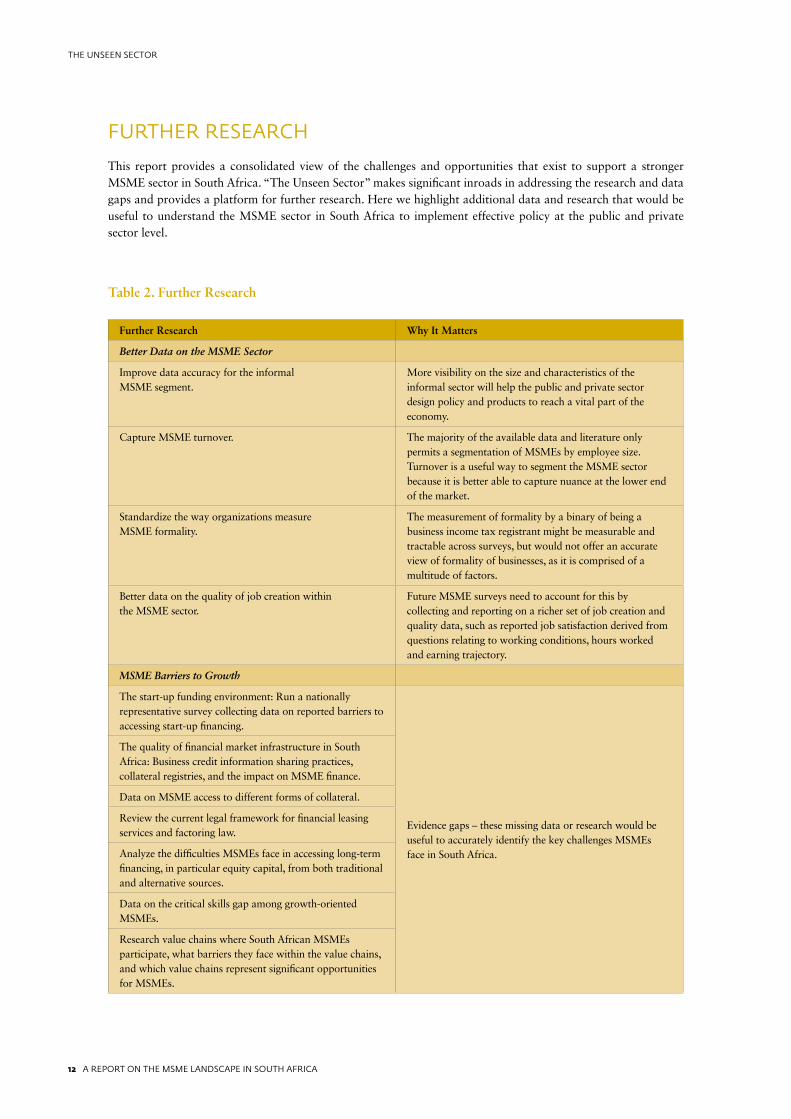
Table 2. Further Research
Further Research Why It Matters
Better Data on the MSME Sector
Improve data accuracy for the informal MSME segment.
More visibility on the size and characteristics of the informal sector will help the public and private sector design policy and products to reach a vital part of the economy.
Capture MSME turnover. The majority of the available data and literature only permits a segmentation of MSMEs by employee size. Turnover is a useful way to segment the MSME sector because it is better able to capture nuance at the lower end of the market.
Standardize the way organizations measure MSME formality.
The measurement of formality by a binary of being a business income tax registrant might be measurable and tractable across surveys, but would not offer an accurate view of formality of businesses, as it is comprised of a multitude of factors.
Better data on the quality of job creation within the MSME sector.
Future MSME surveys need to account for this by collecting and reporting on a richer set of job creation and quality data, such as reported job satisfaction derived from questions relating to working conditions, hours worked and earning trajectory.
MSME Barriers to Growth
The start-up funding environment: Run a nationally representative survey collecting data on reported barriers to accessing start-up financing.
Evidence gaps – these missing data or research would be useful to accurately identify the key challenges MSMEs face in South Africa.
The quality of financial market infrastructure in South Africa: Business credit information sharing practices, collateral registries, and the impact on MSME finance.
Data on MSME access to different forms of collateral.
Review the current legal framework for financial leasing services and factoring law.
Analyze the difficulties MSMEs face in accessing long-term financing, in particular equity capital, from both traditional and alternative sources.
Data on the critical skills gap among growth-oriented MSMEs.
Research value chains where South African MSMEs participate, what barriers they face within the value chains, and which value chains represent significant opportunities for MSMEs.
FURTHER RESEARCH
This report provides a consolidated view of the challenges and opportunities that exist to support a stronger MSME sector in South Africa. “The Unseen Sector” makes significant inroads in addressing the research and data gaps and provides a platform for further research. Here we highlight additional data and research that would be useful to understand the MSME sector in South Africa to implement effective policy at the public and private sector level.
A REPORT ON THE MSME LANDSCAPE IN SOUTH AFRICA 13
THE UNSEEN SECTOR
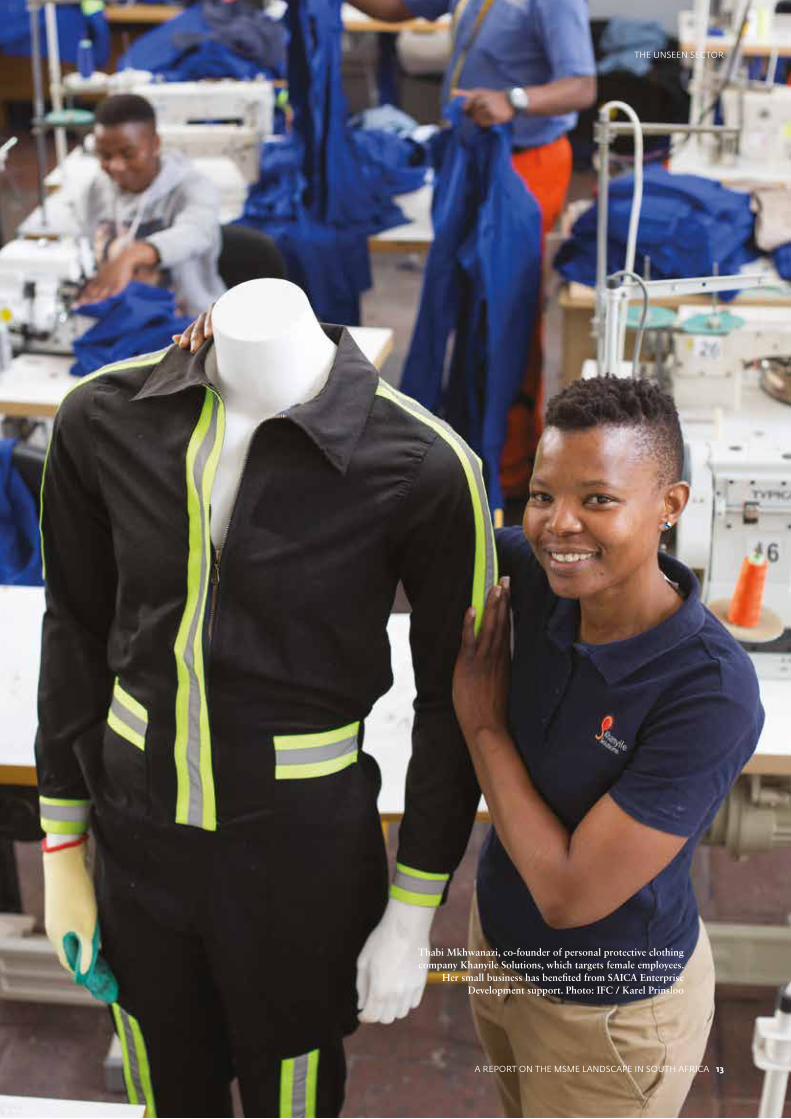
Thabi Mkhwanazi, co-founder of personal protective clothing company Khanyile Solutions, which targets female employees.
Her small business has benefited from SAICA Enterprise Development support. Photo: IFC / Karel Prinsloo
A REPORT ON THE MSME LANDSCAPE IN SOUTH AFRICA 13
THE UNSEEN SECTOR
14 A REPORT ON THE MSME LANDSCAPE IN SOUTH AFRICA
THE UNSEEN SECTOR
1 The Global Findex Database 2017: Measuring Financial Inclusion, World Bank2 Makina et al., 2015, Financial Access and SME Size in South Africa, prepared for FinMark Trust3 FinScope South Africa Small Business Survey 2010; SBP MSME Growth Index 20144 Banking Association of South Africa, 2017, SME Enterprise5 UCT Graduate School of Business, 2017, SA needs SMEs; and Fin24, 2017, Why SMEs have the potential to transform the economy6 StatsSA, 2018, Quarterly Labour Force Survey – QLFS Q1:20187 Fatoki, O. and Odeyemi, A., 2010, Which new small and medium enterprises in South Africa have access to bank credit? 8 Banking Association of South Africa, 2010, Unlocking SME credit and unleashing SME potential: Survey on hurdles to SME financing9 Please see Figure 19 and Appendix II for a description of these sources.
Introduction: Uncovering the Unseen Sector
While South Africa has a relatively sophisticated banking market, where 69 percent of adults were banked in 2017,1 the country’s micro, small and medium-sized enterprises face significant challenges in terms of access to finance.
One of the key reasons for the low survival rate of MSMEs in South Africa is the lack of access to external finance, meaning MSMEs have to rely on internally generated funds which are typically not sufficient to finance expansion and growth, according to FinMark Trust.2 Recent estimates of MSME access to formal credit in South Africa vary but are low, ranging from 3 percent reported by the 2010 FinScope Small Business Survey to 22 percent reported by the 2014 Small Business Project SME Growth Index.3
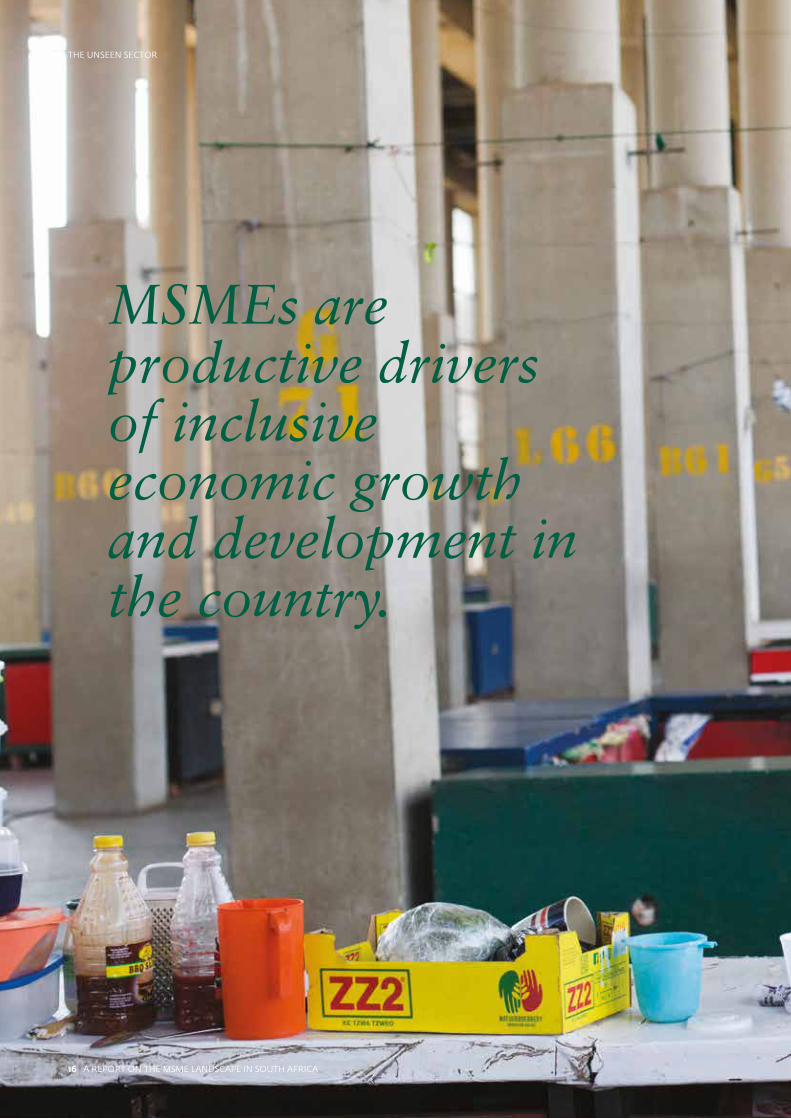
MSMEs are productive drivers of inclusive economic growth and development in the country – with estimates suggesting that MSMEs constitute over 90 percent of formalized businesses,4 provide employment to between 50 percent and 60 percent of the work force and contribute around 34 percent to South Africa’s Gross Domestic Product.5 MSMEs are particularly important to the economy, given their role in reducing unemployment in a country where the unemployment rate at the beginning of 2018 was 26.7 percent,
the youth unemployment rate was 38.2 percent, and the formal sector continues to shed jobs.6
The potential for the MSME sector to drive economic growth and employment could be better utilized if MSMEs were able to access productive financing. MSMEs face serious challenges gaining access to finance, especially from banks. One estimate suggests that 75 percent of MSME credit applications are rejected, while only 2 percent of new MSMEs are able to access bank loans.7 Constrained access to finance is especially acute at the lower end of the MSME market where a “missing middle” – those firms too big for micro-finance but too small for traditional institutional financing – leads to MSMEs being under-served.8 This is due to a combination of factors affecting the supply of finance by bank and non-bank financial institutions, such as regulation, as well as MSME-specific characteristics, such as a lack of basic business or financial skills.
Significant ground has already been covered in identifying and understanding the barriers affecting access to finance by MSMEs, as well as many of the regulatory and business environment constraints affecting the market. The literature is expansive and a variety of contributions were made over the past decade from government (DTI, SEFA, SEDA, StatsSA and others) and from industry associations, consulting firms and international development organizations.9 While this literature covers a broad range of topics, its coverage of the MSME market is not uniform. The presence of a single and trusted data source to profile the size and features of the MSME market is a particular gap. There is no single study that provides a holistic view of public and private sector initiatives or programs that target the MSME market in particular.
A REPORT ON THE MSME LANDSCAPE IN SOUTH AFRICA 15
THE UNSEEN SECTOR
This study attempts to address the information gaps. It provides an in-depth market assessment of the MSME sector in South Africa by researching the business, financial and regulatory environment related to MSMEs, quantifying the size of the MSME sector and illustrating some of the key barriers faced by MSMEs in terms of access to finance, access to skills and access to markets in South Africa. In doing so, this study aims to identify industry variations in MSME access to finance and to highlight possible implications for key stakeholders including government policymakers, banks, non-bank financial institutions and international organizations supporting the growth of the MSME market in South Africa.
This report is structured as follows: Chapter 1 integrates all the data that is publicly available to provide a detailed sizing and profiling of the MSME market in South Africa.
Chapter 2 follows with an assessment of the barriers
and constraints to MSME growth, including access
to finance, market and skills constraints, as well as a
review of government and private sector interventions
designed to address these barriers.
Chapter 3 draws on a series of interviews with
stakeholders across the market to provide a more in-
depth analysis of the drivers of the MSME finance gap
in South Africa and to identify the reasons why certain
MSME segments remain underserved.
Chapter 4 concludes by identifying key evidence and
market gaps, and outlines recommended actions for
government, banks and non-bank financial service
providers to improve the outcomes facing MSMEs in
South Africa.
16 A REPORT ON THE MSME LANDSCAPE IN SOUTH AFRICA
THE UNSEEN SECTOR
MSMEs are productive drivers of inclusive economic growth and development in the country.
16 A REPORT ON THE MSME LANDSCAPE IN SOUTH AFRICA
THE UNSEEN SECTOR
A REPORT ON THE MSME LANDSCAPE IN SOUTH AFRICA 17
THE UNSEEN SECTOR
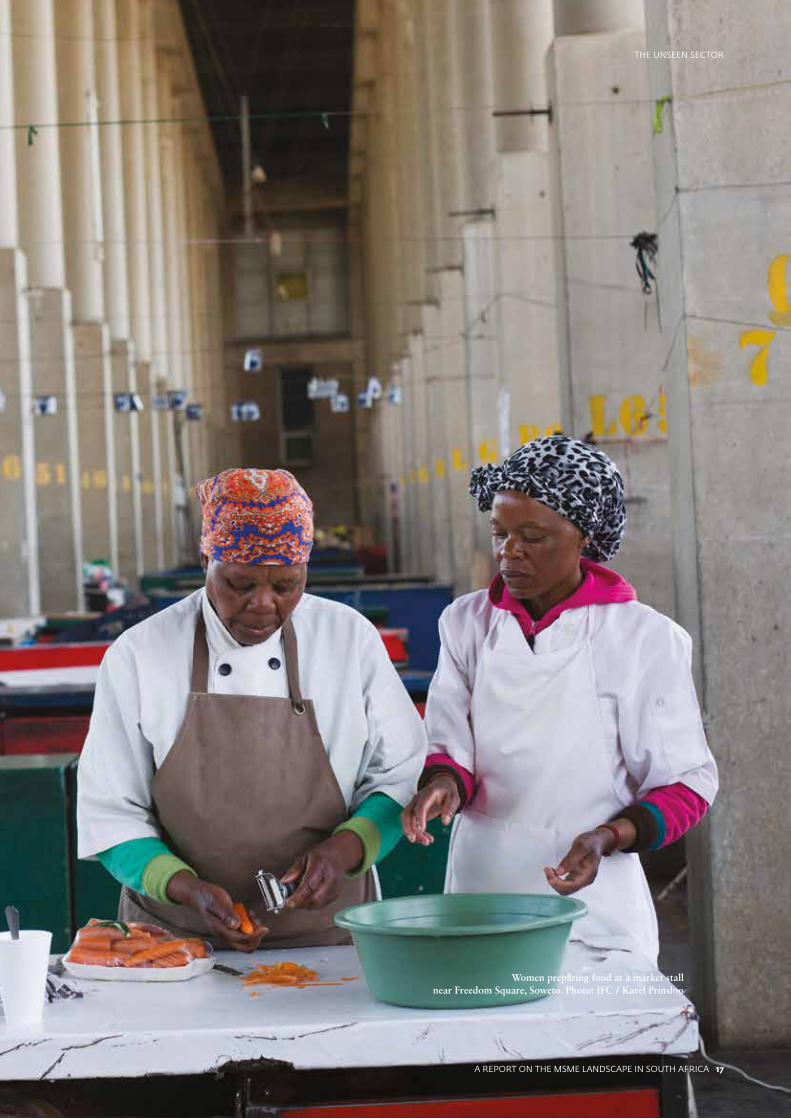
Women preparing food at a market stall near Freedom Square, Soweto. Photo: IFC / Karel Prinsloo
A REPORT ON THE MSME LANDSCAPE IN SOUTH AFRICA 17
THE UNSEEN SECTOR
18 A REPORT ON THE MSME LANDSCAPE IN SOUTH AFRICA
THE UNSEEN SECTOR
1. A Sector on the Cusp: MSME Size and Profile
A vibrant and growing MSME market is fundamental to achieve long-term economic growth and to create sustainable work opportunities for the growing working adult population.
Having a good understanding of the size, growth and composition of the market is therefore critical to the design of policy and private interventions aimed at creating jobs in the country. An accurate measurement and description of the state of the sector is also an important monitoring tool for government to assess the effectiveness of public initiatives designed to promote economic growth through MSME development. It also provides private sector stakeholders, such as banks and other financial and non-financial service providers, with a view of the opportunity to serve the MSME market.
This Chapter draws on existing public data to provide a detailed and up-to-date segmentation of the MSME market in South Africa. This segmentation has two purposes. First, to identify the size, location, level of formality and demographic characteristics of MSMEs across the country; and, second, to identify key evidence and data gaps that, if addressed, could improve government and the banking sector’s understanding of the financing needs and environmental constraints facing MSMEs.
1.1 Defining key concepts
A starting point in any exercise to segment and profile the MSME sector is to establish clear definitions of what constitutes, and differentiates, a micro, small and medium enterprise. This is especially relevant in the context of little consensus on how best to define and profile the MSME sector, despite the large body of research on the topic. This section reviews some of the challenges to defining MSMEs, and offers a working definition as a basis to estimate the current MSME market in South Africa.
Firm sizeThere are three main approaches to establish firm size criteria in existing research: number of employees, annual turnover and total assets. The purpose of setting criteria is to identify firms with characteristics that are desired for policy or product fit. A key challenge is that different stakeholders find different criteria more useful. For example, a government department aiming to grow employment creation through MSME development would likely be more interested in the number of employees as an indication of employment creation potential. A bank designing credit products for MSMEs, however, would likely be more interested in annual turnover as an indication of cash flow. The different criteria are also not necessarily interchangeable – a retail trader, for example, may have few employees (meeting the micro criteria for employee count) but generate relatively high income selling high-value goods (meeting the medium criteria for annual turnover or total assets).
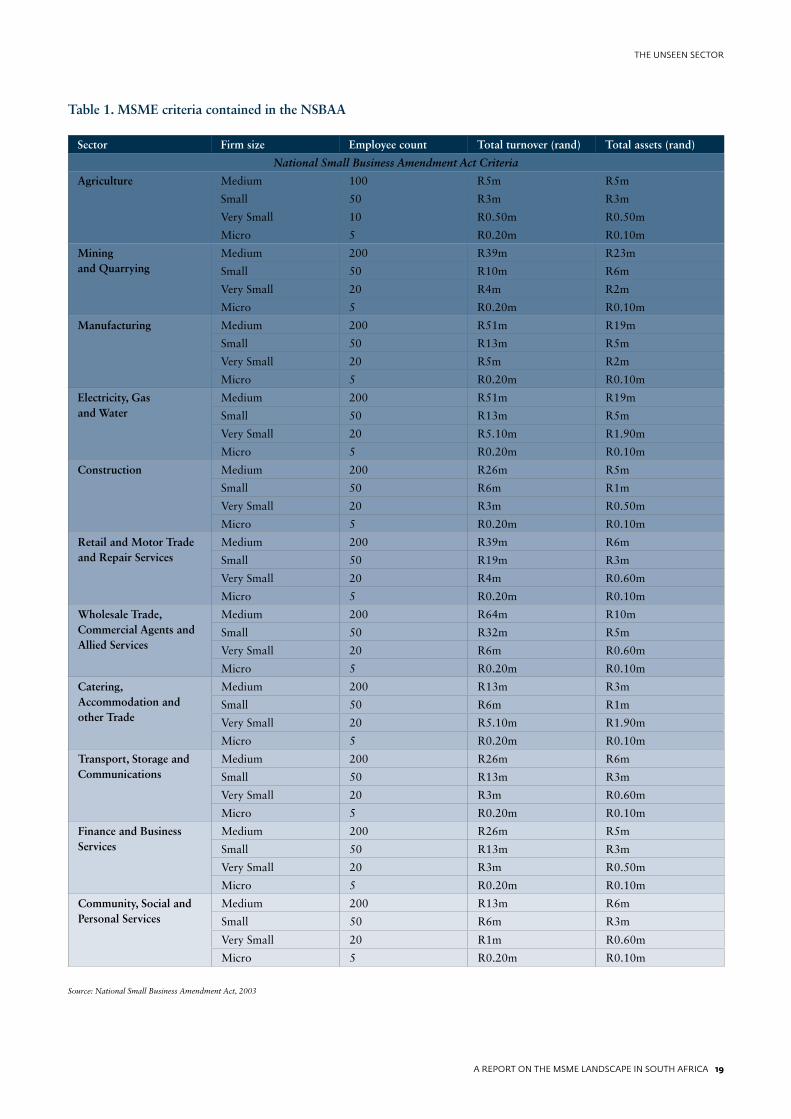
Within South African public policy, the only statute that deals specifically with the classification of MSMEs is the National Small Business Amendment Act 2003. The NSBAA adopted a complex set of criteria thresholds using all three approaches, with different thresholds for firms operating in different sectors, as shown in Table 1.
A REPORT ON THE MSME LANDSCAPE IN SOUTH AFRICA 19
THE UNSEEN SECTOR
Sector Firm size Employee count Total turnover (rand) Total assets (rand)
National Small Business Amendment Act Criteria
Agriculture Medium 100 R5m R5m
Small 50 R3m R3m
Very Small 10 R0.50m R0.50m
Micro 5 R0.20m R0.10m
Mining and Quarrying
Medium 200 R39m R23m
Small 50 R10m R6m
Very Small 20 R4m R2m
Micro 5 R0.20m R0.10m
Manufacturing Medium 200 R51m R19m
Small 50 R13m R5m
Very Small 20 R5m R2m
Micro 5 R0.20m R0.10m
Electricity, Gas and Water
Medium 200 R51m R19m
Small 50 R13m R5m
Very Small 20 R5.10m R1.90m
Micro 5 R0.20m R0.10m
Construction Medium 200 R26m R5m
Small 50 R6m R1m
Very Small 20 R3m R0.50m
Micro 5 R0.20m R0.10m
Retail and Motor Trade and Repair Services
Medium 200 R39m R6m
Small 50 R19m R3m
Very Small 20 R4m R0.60m
Micro 5 R0.20m R0.10m
Wholesale Trade, Commercial Agents and Allied Services
Medium 200 R64m R10m
Small 50 R32m R5m
Very Small 20 R6m R0.60m
Micro 5 R0.20m R0.10m
Catering, Accommodation and other Trade
Medium 200 R13m R3m
Small 50 R6m R1m
Very Small 20 R5.10m R1.90m
Micro 5 R0.20m R0.10m
Transport, Storage and Communications
Medium 200 R26m R6m
Small 50 R13m R3m
Very Small 20 R3m R0.60m
Micro 5 R0.20m R0.10m
Finance and Business Services
Medium 200 R26m R5m
Small 50 R13m R3m
Very Small 20 R3m R0.50m
Micro 5 R0.20m R0.10m
Community, Social and Personal Services
Medium 200 R13m R6m
Small 50 R6m R3m
Very Small 20 R1m R0.60m
Micro 5 R0.20m R0.10m
Table 1. MSME criteria contained in the NSBAA
Source: National Small Business Amendment Act, 2003
20 A REPORT ON THE MSME LANDSCAPE IN SOUTH AFRICA
THE UNSEEN SECTOR
While the two MSME government development agencies, SEDA and SEFA, reporting to the Department of Small Business Development use these definitions, not all government agencies employ the same approach. The South African Revenue Service, for example, has its own set of requirements to identify businesses that are eligible to participate in the Small Business Corporation tax regime and the Turnover Tax regime intended specifically for micro enterprises, with no mention of requirements for medium-sized firms. The SARS turnover requirements are less than 1 million rand per year for micro enterprises to be eligible for Turnover Tax, and less than 20 million rand for enterprises that can be assessed as Small Business Corporations. In addition to these turnover thresholds, SARS also applies a range of other requirements relating
to the source of business income and to composition of shareholders to identify firms that are eligible for its MSME tax regimes.10
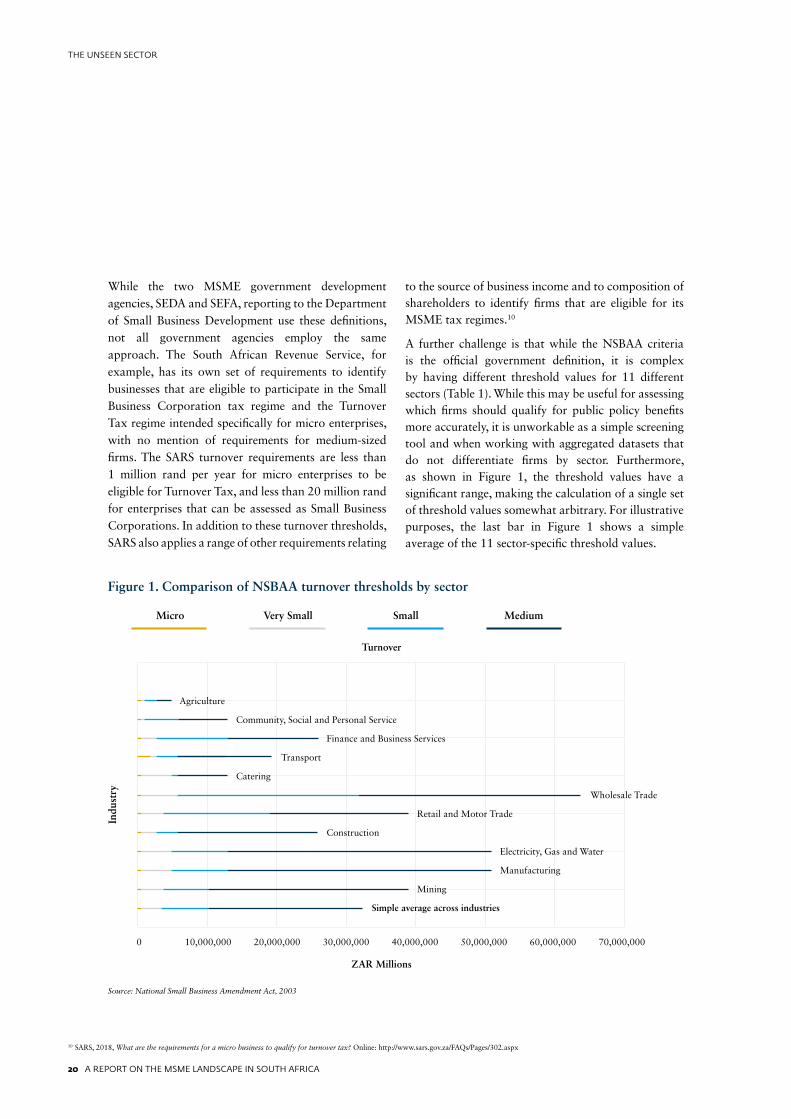
A further challenge is that while the NSBAA criteria is the official government definition, it is complex by having different threshold values for 11 different sectors (Table 1). While this may be useful for assessing which firms should qualify for public policy benefits more accurately, it is unworkable as a simple screening tool and when working with aggregated datasets that do not differentiate firms by sector. Furthermore, as shown in Figure 1, the threshold values have a significant range, making the calculation of a single set of threshold values somewhat arbitrary. For illustrative purposes, the last bar in Figure 1 shows a simple average of the 11 sector-specific threshold values.
10 SARS, 2018, What are the requirements for a micro business to qualify for turnover tax? Online: http://www.sars.gov.za/FAQs/Pages/302.aspx
Source: National Small Business Amendment Act, 2003
Figure 1. Comparison of NSBAA turnover thresholds by sector
0 10,000,000 20,000,000 30,000,000 40,000,000 50,000,000 60,000,000 70,000,000
Turnover
ZAR Millions
Indu
stry
Micro Very Small Small Medium
Agriculture
Community, Social and Personal Service
Finance and Business Services
Transport
Catering
Wholesale Trade
Retail and Motor Trade
Construction
Electricity, Gas and Water
Manufacturing
Mining
Simple average across industries
A REPORT ON THE MSME LANDSCAPE IN SOUTH AFRICA 21
THE UNSEEN SECTOR
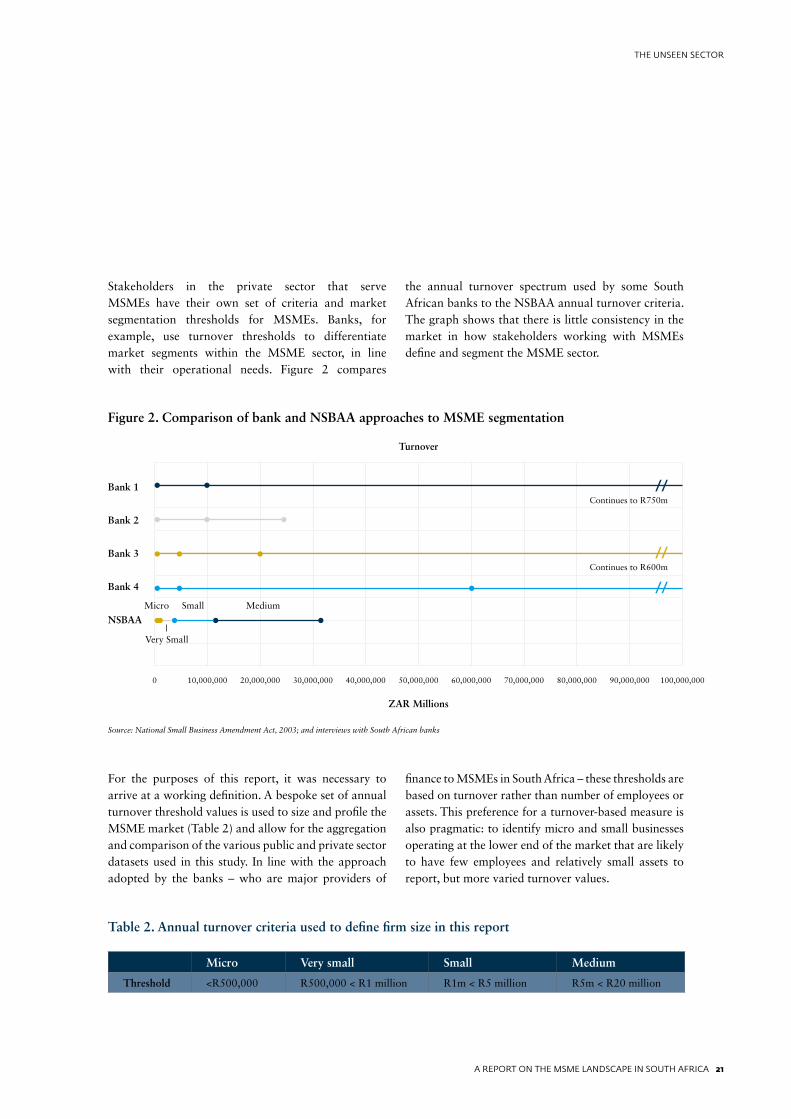
Stakeholders in the private sector that serve MSMEs have their own set of criteria and market segmentation thresholds for MSMEs. Banks, for example, use turnover thresholds to differentiate market segments within the MSME sector, in line with their operational needs. Figure 2 compares
the annual turnover spectrum used by some South African banks to the NSBAA annual turnover criteria. The graph shows that there is little consistency in the market in how stakeholders working with MSMEs define and segment the MSME sector.
For the purposes of this report, it was necessary to arrive at a working definition. A bespoke set of annual turnover threshold values is used to size and profile the MSME market (Table 2) and allow for the aggregation and comparison of the various public and private sector datasets used in this study. In line with the approach adopted by the banks – who are major providers of
finance to MSMEs in South Africa – these thresholds are based on turnover rather than number of employees or assets. This preference for a turnover-based measure is also pragmatic: to identify micro and small businesses operating at the lower end of the market that are likely to have few employees and relatively small assets to report, but more varied turnover values.
Source: National Small Business Amendment Act, 2003; and interviews with South African banks
Figure 2. Comparison of bank and NSBAA approaches to MSME segmentation
Table 2. Annual turnover criteria used to define firm size in this report
Micro Very small Small Medium
Threshold <R500,000 R500,000 < R1 million R1m < R5 million R5m < R20 million
0 10,000,000 20,000,000 30,000,000 40,000,000 50,000,000 60,000,000 70,000,000 80,000,000 90,000,000 100,000,000
Bank 1
Bank 2
Bank 3
Bank 4
NSBAA
Turnover
ZAR Millions
Micro Small Medium
Very Small
//Continues to R750m
//Continues to R600m
//
22 A REPORT ON THE MSME LANDSCAPE IN SOUTH AFRICA
THE UNSEEN SECTOR
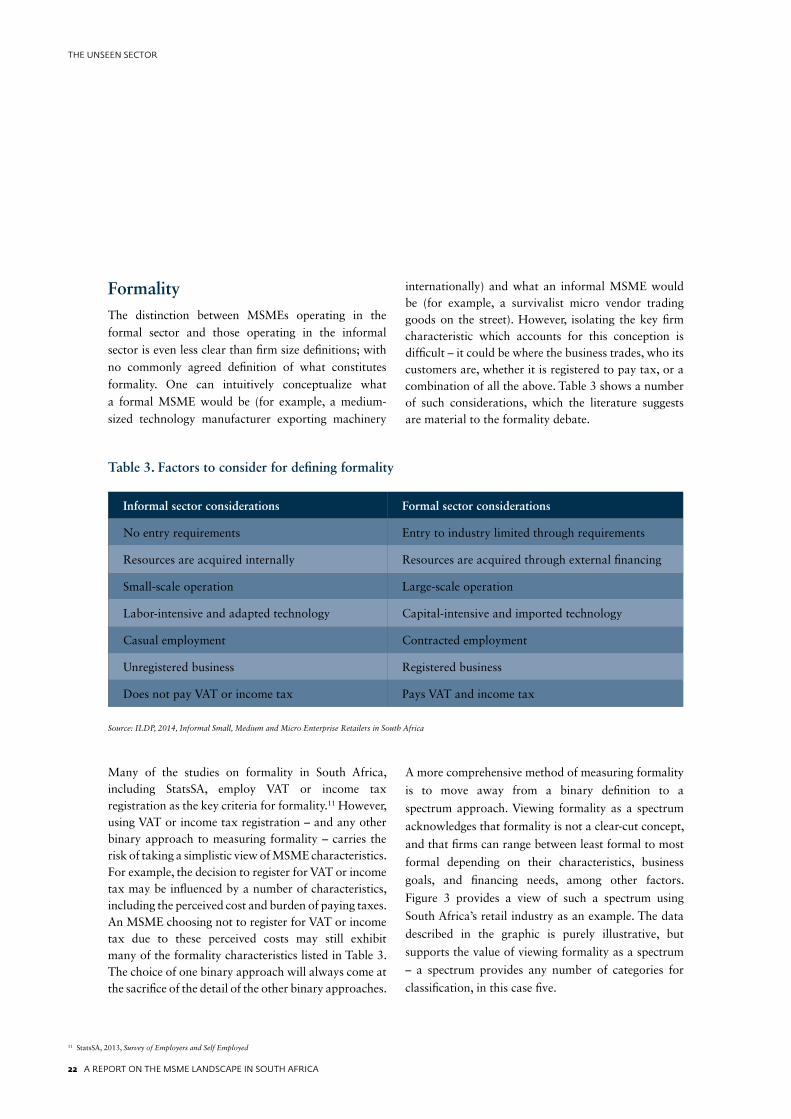
FormalityThe distinction between MSMEs operating in the formal sector and those operating in the informal sector is even less clear than firm size definitions; with no commonly agreed definition of what constitutes formality. One can intuitively conceptualize what a formal MSME would be (for example, a medium-sized technology manufacturer exporting machinery
internationally) and what an informal MSME would be (for example, a survivalist micro vendor trading goods on the street). However, isolating the key firm characteristic which accounts for this conception is difficult – it could be where the business trades, who its customers are, whether it is registered to pay tax, or a combination of all the above. Table 3 shows a number of such considerations, which the literature suggests are material to the formality debate.
Many of the studies on formality in South Africa, including StatsSA, employ VAT or income tax registration as the key criteria for formality.11 However, using VAT or income tax registration – and any other binary approach to measuring formality – carries the risk of taking a simplistic view of MSME characteristics. For example, the decision to register for VAT or income tax may be influenced by a number of characteristics, including the perceived cost and burden of paying taxes. An MSME choosing not to register for VAT or income tax due to these perceived costs may still exhibit many of the formality characteristics listed in Table 3. The choice of one binary approach will always come at the sacrifice of the detail of the other binary approaches.
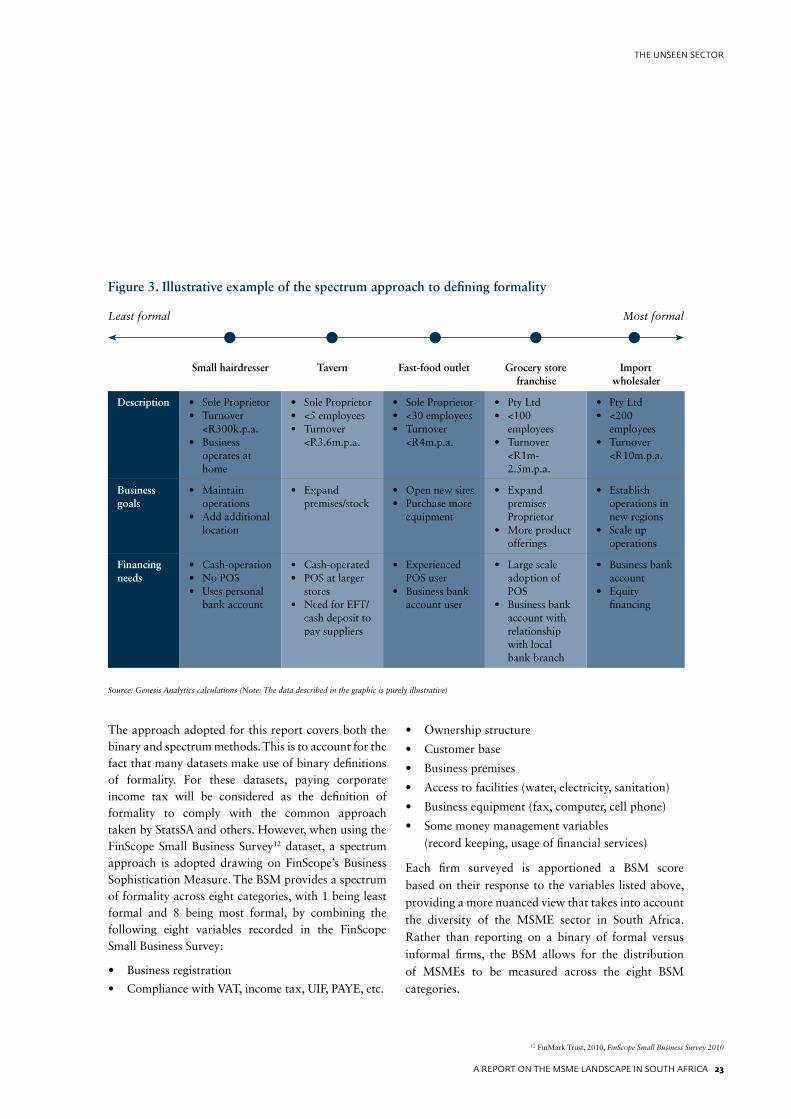
A more comprehensive method of measuring formality
is to move away from a binary definition to a
spectrum approach. Viewing formality as a spectrum
acknowledges that formality is not a clear-cut concept,
and that firms can range between least formal to most
formal depending on their characteristics, business
goals, and financing needs, among other factors.
Figure 3 provides a view of such a spectrum using
South Africa’s retail industry as an example. The data
described in the graphic is purely illustrative, but
supports the value of viewing formality as a spectrum
– a spectrum provides any number of categories for
classification, in this case five.
Table 3. Factors to consider for defining formality
Informal sector considerations Formal sector considerations
No entry requirements Entry to industry limited through requirements
Resources are acquired internally Resources are acquired through external financing
Small-scale operation Large-scale operation
Labor-intensive and adapted technology Capital-intensive and imported technology
Casual employment Contracted employment
Unregistered business Registered business
Does not pay VAT or income tax Pays VAT and income tax
Source: ILDP, 2014, Informal Small, Medium and Micro Enterprise Retailers in South Africa
11 StatsSA, 2013, Survey of Employers and Self Employed
A REPORT ON THE MSME LANDSCAPE IN SOUTH AFRICA 23
THE UNSEEN SECTOR
The approach adopted for this report covers both the binary and spectrum methods. This is to account for the fact that many datasets make use of binary definitions of formality. For these datasets, paying corporate income tax will be considered as the definition of formality to comply with the common approach taken by StatsSA and others. However, when using the FinScope Small Business Survey12 dataset, a spectrum approach is adopted drawing on FinScope’s Business Sophistication Measure. The BSM provides a spectrum of formality across eight categories, with 1 being least formal and 8 being most formal, by combining the following eight variables recorded in the FinScope Small Business Survey:
• Business registration
• Compliance with VAT, income tax, UIF, PAYE, etc.
• Ownership structure
• Customer base
• Business premises
• Access to facilities (water, electricity, sanitation)
• Business equipment (fax, computer, cell phone)
• Some money management variables (record keeping, usage of financial services)
Each firm surveyed is apportioned a BSM score based on their response to the variables listed above, providing a more nuanced view that takes into account the diversity of the MSME sector in South Africa. Rather than reporting on a binary of formal versus informal firms, the BSM allows for the distribution of MSMEs to be measured across the eight BSM categories.
Small hairdresser Tavern Fast-food outlet Grocery store franchise
Import wholesaler
Description • Sole Proprietor• Turnover
<R300k.p.a.• Business
operates at home
• Sole Proprietor• <5 employees• Turnover
<R3.6m.p.a.
• Sole Proprietor• <30 employees• Turnover
<R4m.p.a.
• Pty Ltd• <100
employees• Turnover
<R1m-2.5m.p.a.
• Pty Ltd• <200
employees• Turnover
<R10m.p.a.
Business goals
• Maintain operations
• Add additional location
• Expand premises/stock
• Open new sites• Purchase more
equipment
• Expand premises Proprietor
• More product offerings
• Establish operations in new regions
• Scale up operations
Financing needs
• Cash-operation• No POS• Uses personal
bank account
• Cash-operated• POS at larger
stores• Need for EFT/
cash deposit to pay suppliers
• Experienced POS user
• Business bank account user
• Large scale adoption of POS
• Business bank account with relationship with local bank branch
• Business bank account
• Equity financing
Source: Genesis Analytics calculations (Note: The data described in the graphic is purely illustrative)
Figure 3. Illustrative example of the spectrum approach to defining formality
Least formal Most formal
12 FinMark Trust, 2010, FinScope Small Business Survey 2010
24 A REPORT ON THE MSME LANDSCAPE IN SOUTH AFRICA
THE UNSEEN SECTOR
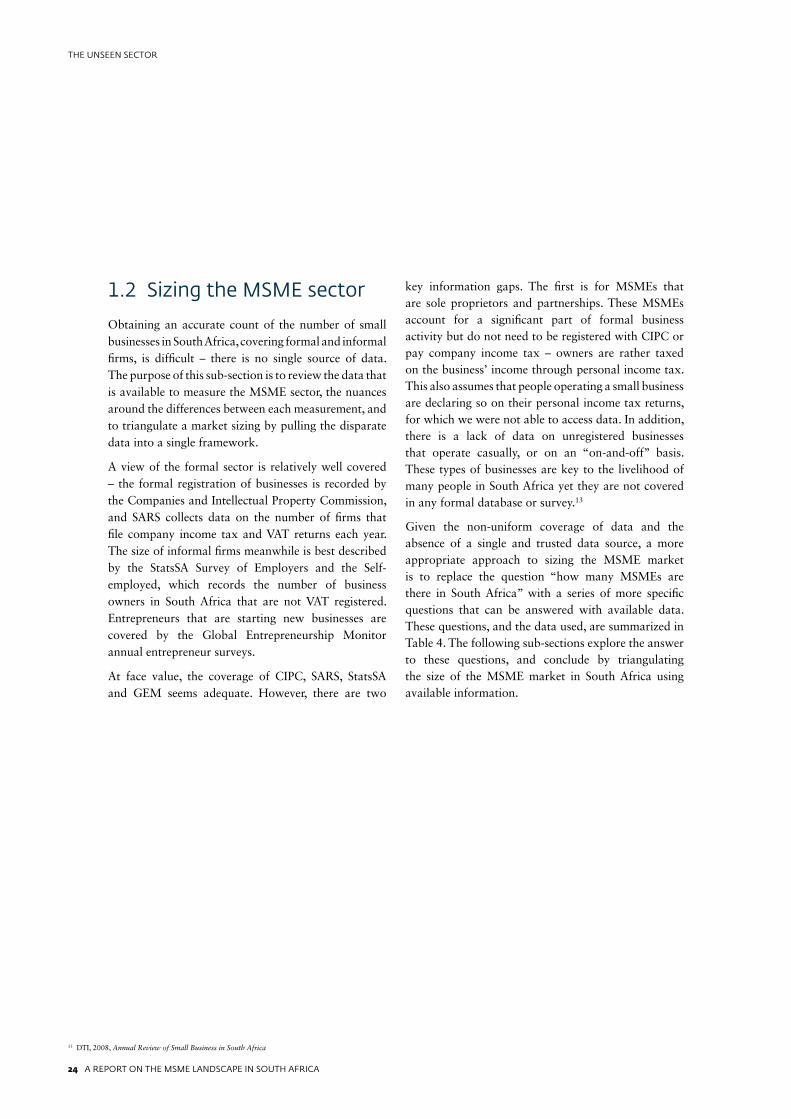
1.2 Sizing the MSME sector
Obtaining an accurate count of the number of small businesses in South Africa, covering formal and informal firms, is difficult – there is no single source of data. The purpose of this sub-section is to review the data that is available to measure the MSME sector, the nuances around the differences between each measurement, and to triangulate a market sizing by pulling the disparate data into a single framework.
A view of the formal sector is relatively well covered – the formal registration of businesses is recorded by the Companies and Intellectual Property Commission, and SARS collects data on the number of firms that file company income tax and VAT returns each year. The size of informal firms meanwhile is best described by the StatsSA Survey of Employers and the Self-employed, which records the number of business owners in South Africa that are not VAT registered. Entrepreneurs that are starting new businesses are covered by the Global Entrepreneurship Monitor annual entrepreneur surveys.
At face value, the coverage of CIPC, SARS, StatsSA and GEM seems adequate. However, there are two
key information gaps. The first is for MSMEs that are sole proprietors and partnerships. These MSMEs account for a significant part of formal business activity but do not need to be registered with CIPC or pay company income tax – owners are rather taxed on the business’ income through personal income tax. This also assumes that people operating a small business are declaring so on their personal income tax returns, for which we were not able to access data. In addition, there is a lack of data on unregistered businesses that operate casually, or on an “on-and-off” basis. These types of businesses are key to the livelihood of many people in South Africa yet they are not covered in any formal database or survey.13
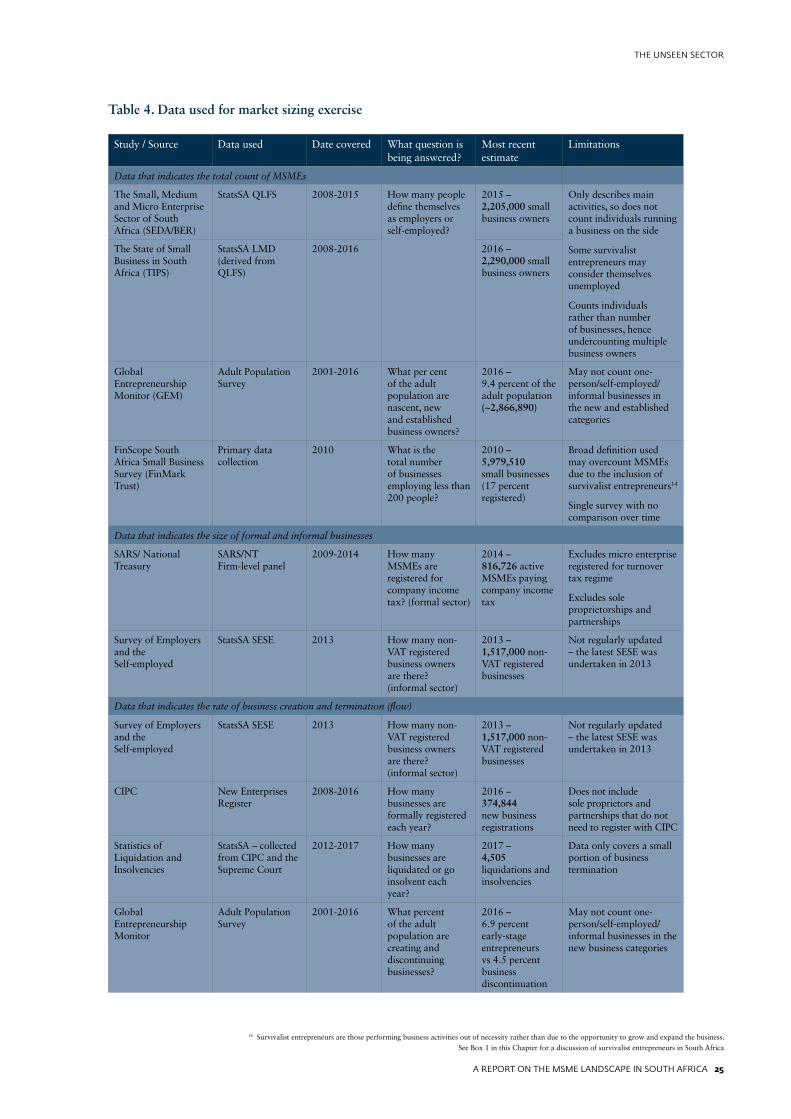
Given the non-uniform coverage of data and the absence of a single and trusted data source, a more appropriate approach to sizing the MSME market is to replace the question “how many MSMEs are there in South Africa” with a series of more specific questions that can be answered with available data. These questions, and the data used, are summarized in Table 4. The following sub-sections explore the answer to these questions, and conclude by triangulating the size of the MSME market in South Africa using available information.
13 DTI, 2008, Annual Review of Small Business in South Africa
A REPORT ON THE MSME LANDSCAPE IN SOUTH AFRICA 25
THE UNSEEN SECTOR
Study / Source Data used Date covered What question is being answered?
Most recent estimate
Limitations
Data that indicates the total count of MSMEs
The Small, Medium and Micro Enterprise Sector of South Africa (SEDA/BER)
StatsSA QLFS 2008-2015 How many people define themselves as employers or self-employed?
2015 – 2,205,000 small business owners
Only describes main activities, so does not count individuals running a business on the side
Some survivalist entrepreneurs may consider themselves unemployed
Counts individuals rather than number of businesses, hence undercounting multiple business owners
The State of Small Business in South Africa (TIPS)
StatsSA LMD (derived from QLFS)
2008-2016 2016 – 2,290,000 small business owners
Global Entrepreneurship Monitor (GEM)
Adult Population Survey
2001-2016 What per cent of the adult population are nascent, new and established business owners?
2016 – 9.4 percent of the adult population (~2,866,890)
May not count one-person/self-employed/informal businesses in the new and established categories
FinScope South Africa Small Business Survey (FinMark Trust)
Primary data collection
2010 What is the total number of businesses employing less than 200 people?
2010 – 5,979,510 small businesses (17 percent registered)
Broad definition used may overcount MSMEs due to the inclusion of survivalist entrepreneurs14
Single survey with no comparison over time
Data that indicates the size of formal and informal businesses
SARS/ National Treasury
SARS/NT Firm-level panel
2009-2014 How many MSMEs are registered for company income tax? (formal sector)
2014 – 816,726 active MSMEs paying company income tax
Excludes micro enterprise registered for turnover tax regime
Excludes sole proprietorships and partnerships
Survey of Employers and the Self-employed
StatsSA SESE 2013 How many non-VAT registered business owners are there? (informal sector)
2013 – 1,517,000 non-VAT registered businesses
Not regularly updated – the latest SESE was undertaken in 2013
Data that indicates the rate of business creation and termination (flow)
Survey of Employers and the Self-employed
StatsSA SESE 2013 How many non-VAT registered business owners are there? (informal sector)
2013 – 1,517,000 non-VAT registered businesses
Not regularly updated – the latest SESE was undertaken in 2013
CIPC New Enterprises Register
2008-2016 How many businesses are formally registered each year?
2016 – 374,844 new business registrations
Does not include sole proprietors and partnerships that do not need to register with CIPC
Statistics of Liquidation and Insolvencies
StatsSA – collected from CIPC and the Supreme Court
2012-2017 How many businesses are liquidated or go insolvent each year?
2017 – 4,505 liquidations and insolvencies
Data only covers a small portion of business termination
Global Entrepreneurship Monitor
Adult Population Survey
2001-2016 What percent of the adult population are creating and discontinuing businesses?
2016 – 6.9 percent early-stage entrepreneurs vs 4.5 percent business discontinuation
May not count one-person/self-employed/informal businesses in the new business categories
Table 4. Data used for market sizing exercise
14 Survivalist entrepreneurs are those performing business activities out of necessity rather than due to the opportunity to grow and expand the business. See Box 1 in this Chapter for a discussion of survivalist entrepreneurs in South Africa
26 A REPORT ON THE MSME LANDSCAPE IN SOUTH AFRICA
THE UNSEEN SECTOR
15 Genesis Analytics calculations using the StatsSA PALMS dataset, using Stata16 This is the compound annual growth rate (CAGR) between years17 StatsSA, 2009-2016, Mid-year population estimates statistical release18 Herrington et al, 2017, GEM South Africa Report 2016/2017, Can Small Business Survive in South Africa?
Data that indicates the total count of MSMEsStatsSA QLFS data is the most common dataset used
to estimate the total count of MSMEs in South Africa.
The StatsSA methodology is described in Appendix I.
While the StatsSA survey method does not segment
MSMEs by firm size, it does provide a rough estimate
of the count of MSMEs using as a proxy the number of
individuals who define themselves as being employers
or are self-employed. Using this proxy, the SEDA/BER
report in 2016 and the Trade and Industrial Policy
Strategies report in 2017 both estimated the total count
of formal and informal MSMEs over 2015/2016 at
around 2.2 million.
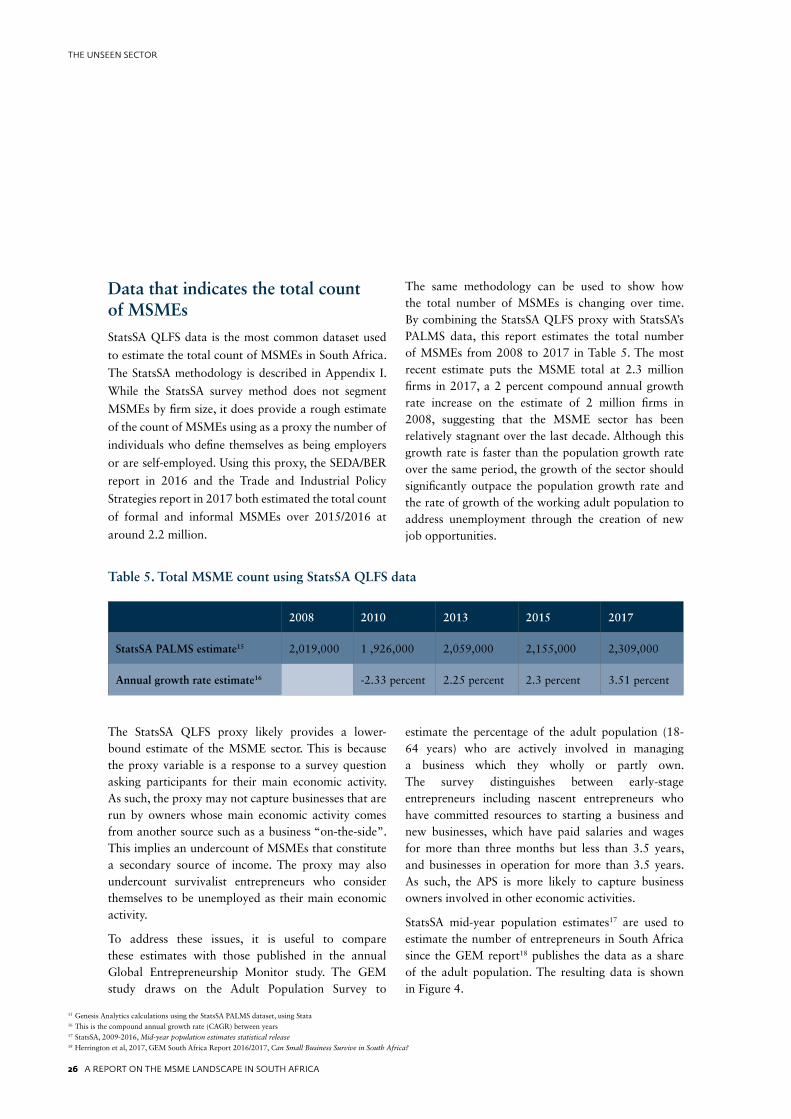
The same methodology can be used to show how the total number of MSMEs is changing over time. By combining the StatsSA QLFS proxy with StatsSA’s PALMS data, this report estimates the total number of MSMEs from 2008 to 2017 in Table 5. The most recent estimate puts the MSME total at 2.3 million firms in 2017, a 2 percent compound annual growth rate increase on the estimate of 2 million firms in 2008, suggesting that the MSME sector has been relatively stagnant over the last decade. Although this growth rate is faster than the population growth rate over the same period, the growth of the sector should significantly outpace the population growth rate and the rate of growth of the working adult population to address unemployment through the creation of new job opportunities.
The StatsSA QLFS proxy likely provides a lower-bound estimate of the MSME sector. This is because the proxy variable is a response to a survey question asking participants for their main economic activity. As such, the proxy may not capture businesses that are run by owners whose main economic activity comes from another source such as a business “on-the-side”. This implies an undercount of MSMEs that constitute a secondary source of income. The proxy may also undercount survivalist entrepreneurs who consider themselves to be unemployed as their main economic activity.
To address these issues, it is useful to compare these estimates with those published in the annual Global Entrepreneurship Monitor study. The GEM study draws on the Adult Population Survey to
estimate the percentage of the adult population (18-64 years) who are actively involved in managing a business which they wholly or partly own. The survey distinguishes between early-stage entrepreneurs including nascent entrepreneurs who have committed resources to starting a business and new businesses, which have paid salaries and wages for more than three months but less than 3.5 years, and businesses in operation for more than 3.5 years. As such, the APS is more likely to capture business owners involved in other economic activities.
StatsSA mid-year population estimates17 are used to estimate the number of entrepreneurs in South Africa since the GEM report18 publishes the data as a share of the adult population. The resulting data is shown in Figure 4.
Table 5. Total MSME count using StatsSA QLFS data
2008 2010 2013 2015 2017
StatsSA PALMS estimate15 2,019,000 1 ,926,000 2,059,000 2,155,000 2,309,000
Annual growth rate estimate16 -2.33 percent 2.25 percent 2.3 percent 3.51 percent
A REPORT ON THE MSME LANDSCAPE IN SOUTH AFRICA 27
THE UNSEEN SECTOR
19 Note: The GEM data counts the number of entrepreneurs, not the number of SMEs. The number of entrepreneurs is being used as a proxy for the number of SMEs here, but there is likely a small undercount among entrepreneurs owning more than one business.
20 Herrington et al, 2017, GEM South Africa Report 2016/2017, Can Small Business Survive in South Africa?
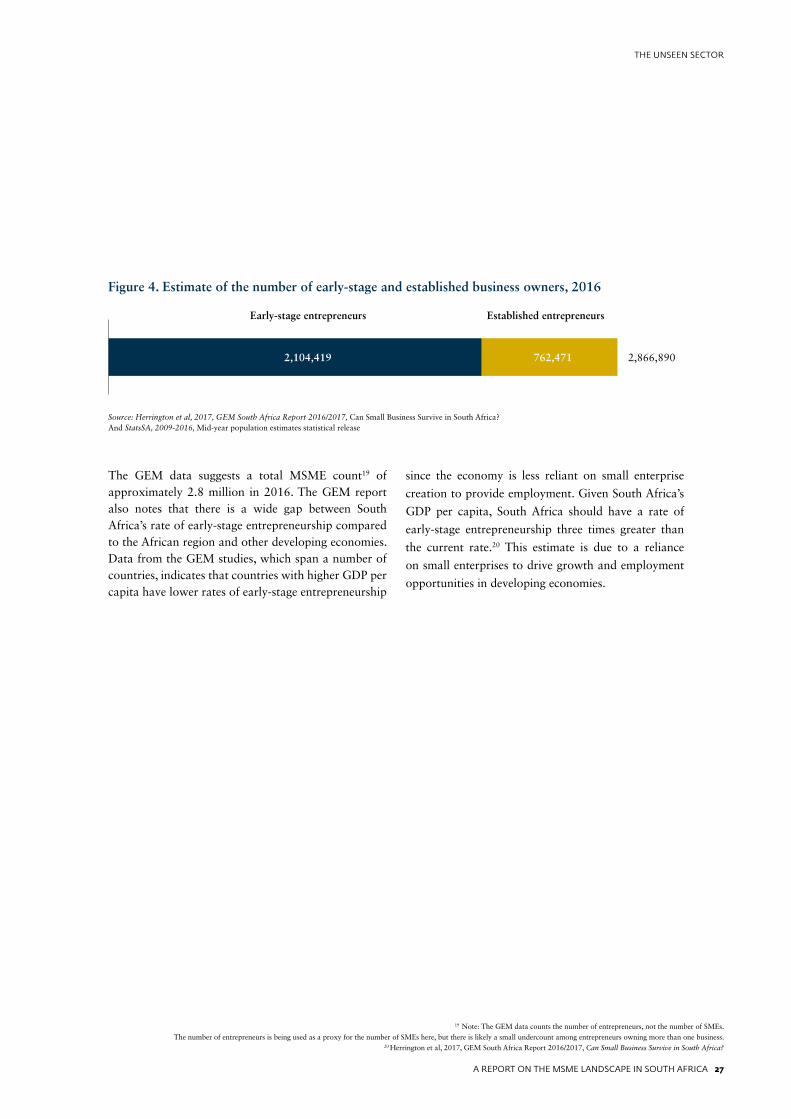
Figure 4. Estimate of the number of early-stage and established business owners, 2016
Source: Herrington et al, 2017, GEM South Africa Report 2016/2017, Can Small Business Survive in South Africa? And StatsSA, 2009-2016, Mid-year population estimates statistical release
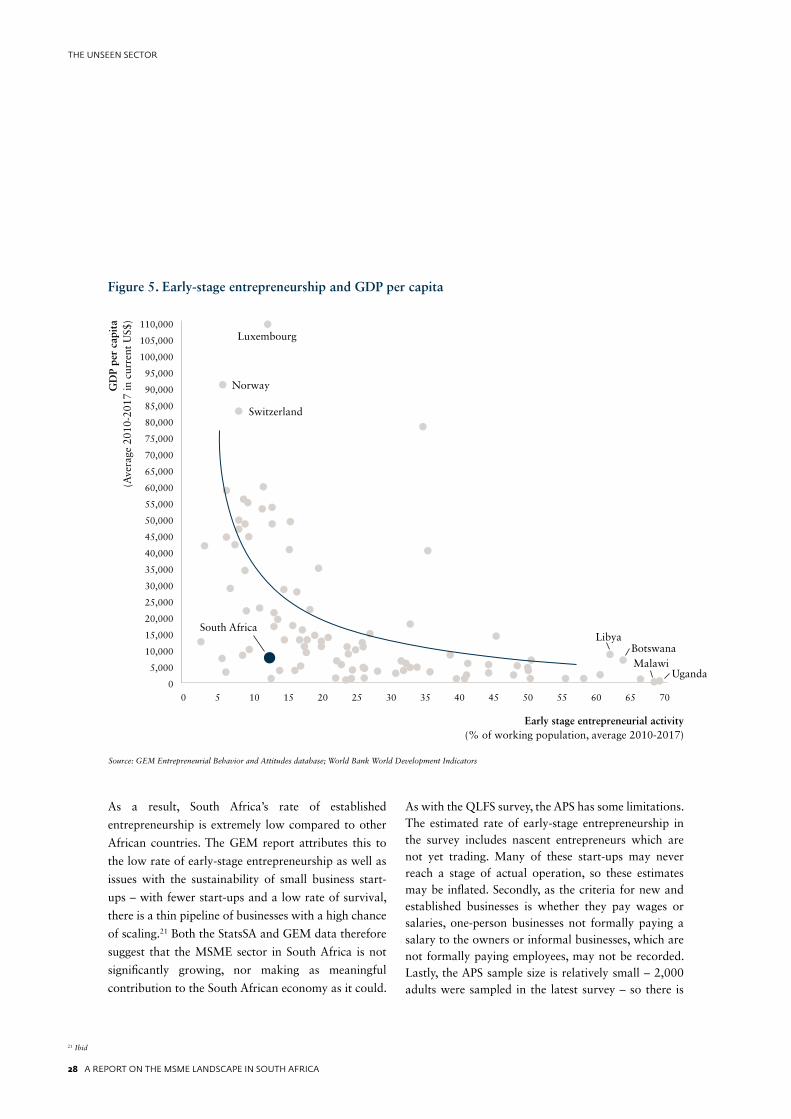
The GEM data suggests a total MSME count19 of approximately 2.8 million in 2016. The GEM report also notes that there is a wide gap between South Africa’s rate of early-stage entrepreneurship compared to the African region and other developing economies. Data from the GEM studies, which span a number of countries, indicates that countries with higher GDP per capita have lower rates of early-stage entrepreneurship
since the economy is less reliant on small enterprise
creation to provide employment. Given South Africa’s
GDP per capita, South Africa should have a rate of
early-stage entrepreneurship three times greater than
the current rate.20 This estimate is due to a reliance
on small enterprises to drive growth and employment
opportunities in developing economies.
Early-stage entrepreneurs Established entrepreneurs
2,866,8902,104,419 762,471
28 A REPORT ON THE MSME LANDSCAPE IN SOUTH AFRICA
THE UNSEEN SECTOR
Early stage entrepreneurial activity(% of working population, average 2010-2017)
Luxembourg
Switzerland
South AfricaLibya
Botswana
UgandaMalawi
NorwayGD
P pe
r ca
pita
(Ave
rage
201
0-20
17 in
cur
rent
US$
)
Figure 5. Early-stage entrepreneurship and GDP per capita
110,000
105,000
100,000
95,000
90,000
85,000
80,000
75,000
70,000
65,000
60,000
55,000
50,000
45,000
40,000
35,000
30,000
25,000
20,000
15,000
10,000
5,000
00 5 10 15 20 25 30 35 40 45 50 55 60 65 70
Source: GEM Entrepreneurial Behavior and Attitudes database; World Bank World Development Indicators
21 Ibid
As a result, South Africa’s rate of established
entrepreneurship is extremely low compared to other
African countries. The GEM report attributes this to
the low rate of early-stage entrepreneurship as well as
issues with the sustainability of small business start-
ups – with fewer start-ups and a low rate of survival,
there is a thin pipeline of businesses with a high chance
of scaling.21 Both the StatsSA and GEM data therefore
suggest that the MSME sector in South Africa is not
significantly growing, nor making as meaningful
contribution to the South African economy as it could.
As with the QLFS survey, the APS has some limitations. The estimated rate of early-stage entrepreneurship in the survey includes nascent entrepreneurs which are not yet trading. Many of these start-ups may never reach a stage of actual operation, so these estimates may be inflated. Secondly, as the criteria for new and established businesses is whether they pay wages or salaries, one-person businesses not formally paying a salary to the owners or informal businesses, which are not formally paying employees, may not be recorded. Lastly, the APS sample size is relatively small – 2,000 adults were sampled in the latest survey – so there is
A REPORT ON THE MSME LANDSCAPE IN SOUTH AFRICA 29
THE UNSEEN SECTOR
more scope for error and year-to-year fluctuations when calculating national estimates compared to studies with larger samples, such as the QLFS and FinScope Small Business Survey.
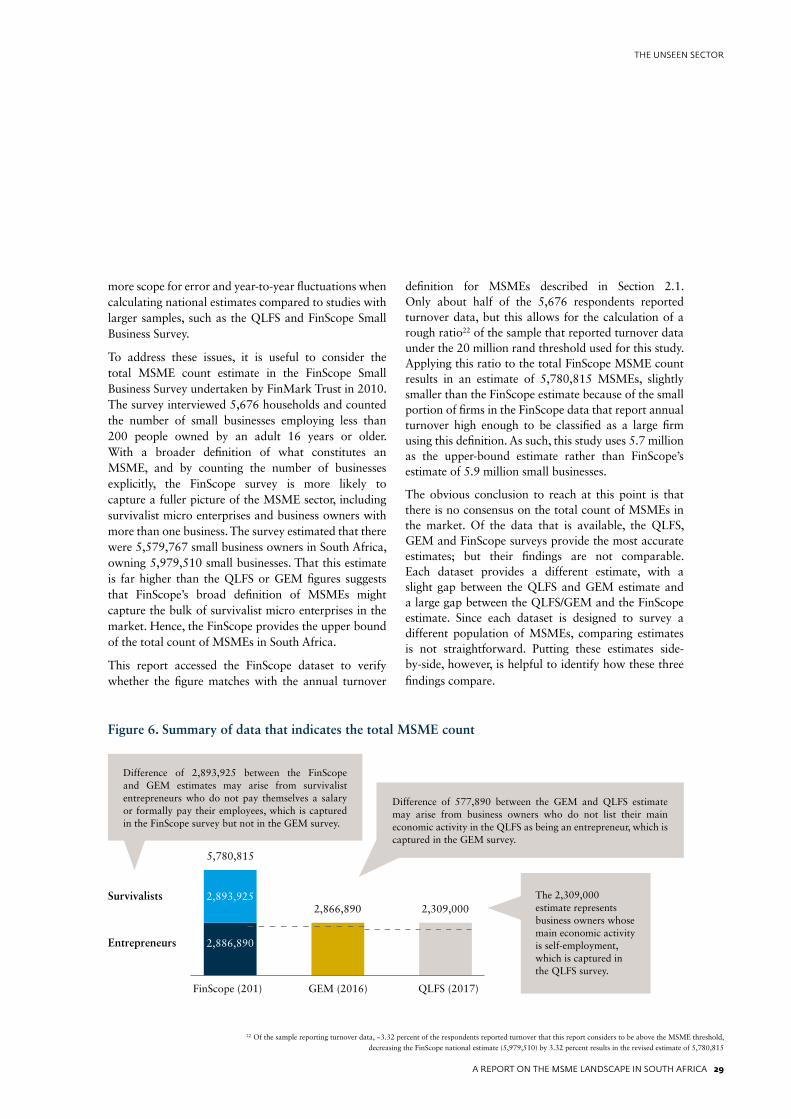
To address these issues, it is useful to consider the total MSME count estimate in the FinScope Small Business Survey undertaken by FinMark Trust in 2010. The survey interviewed 5,676 households and counted the number of small businesses employing less than 200 people owned by an adult 16 years or older. With a broader definition of what constitutes an MSME, and by counting the number of businesses explicitly, the FinScope survey is more likely to capture a fuller picture of the MSME sector, including survivalist micro enterprises and business owners with more than one business. The survey estimated that there were 5,579,767 small business owners in South Africa, owning 5,979,510 small businesses. That this estimate is far higher than the QLFS or GEM figures suggests that FinScope’s broad definition of MSMEs might capture the bulk of survivalist micro enterprises in the market. Hence, the FinScope provides the upper bound of the total count of MSMEs in South Africa.
This report accessed the FinScope dataset to verify whether the figure matches with the annual turnover
definition for MSMEs described in Section 2.1. Only about half of the 5,676 respondents reported turnover data, but this allows for the calculation of a rough ratio22 of the sample that reported turnover data under the 20 million rand threshold used for this study. Applying this ratio to the total FinScope MSME count results in an estimate of 5,780,815 MSMEs, slightly smaller than the FinScope estimate because of the small portion of firms in the FinScope data that report annual turnover high enough to be classified as a large firm using this definition. As such, this study uses 5.7 million as the upper-bound estimate rather than FinScope’s estimate of 5.9 million small businesses.
The obvious conclusion to reach at this point is that there is no consensus on the total count of MSMEs in the market. Of the data that is available, the QLFS, GEM and FinScope surveys provide the most accurate estimates; but their findings are not comparable. Each dataset provides a different estimate, with a slight gap between the QLFS and GEM estimate and a large gap between the QLFS/GEM and the FinScope estimate. Since each dataset is designed to survey a different population of MSMEs, comparing estimates is not straightforward. Putting these estimates side-by-side, however, is helpful to identify how these three findings compare.
22 Of the sample reporting turnover data, ~3.32 percent of the respondents reported turnover that this report considers to be above the MSME threshold, decreasing the FinScope national estimate (5,979,510) by 3.32 percent results in the revised estimate of 5,780,815
Figure 6. Summary of data that indicates the total MSME count
The 2,309,000 estimate represents business owners whose main economic activity is self-employment, which is captured in the QLFS survey.
Difference of 2,893,925 between the FinScope and GEM estimates may arise from survivalist entrepreneurs who do not pay themselves a salary or formally pay their employees, which is captured in the FinScope survey but not in the GEM survey.
Difference of 577,890 between the GEM and QLFS estimate may arise from business owners who do not list their main economic activity in the QLFS as being an entrepreneur, which is captured in the GEM survey.
2,893,925
2,886,890
5,780,815
2,866,890 2,309,000
FinScope (201) GEM (2016) QLFS (2017)
Survivalists
Entrepreneurs
30 A REPORT ON THE MSME LANDSCAPE IN SOUTH AFRICA
THE UNSEEN SECTOR
South Africa’s rate of established entrepreneurship is extremely low compared to other African countries.
30 A REPORT ON THE MSME LANDSCAPE IN SOUTH AFRICA
THE UNSEEN SECTOR

A REPORT ON THE MSME LANDSCAPE IN SOUTH AFRICA 31
THE UNSEEN SECTOR
Dr Mantsha Manthata, a dentist, and now small business owner, checks x-rays at her new clinic, the Innovative Medical Centre.
Photo: IFC / Karel Prinsloo
A REPORT ON THE MSME LANDSCAPE IN SOUTH AFRICA 31
THE UNSEEN SECTOR
32 A REPORT ON THE MSME LANDSCAPE IN SOUTH AFRICA
THE UNSEEN SECTOR
23 National Treasury and South African Revenue Service, 2017, 2017 Tax Statistics24 Davis Tax Committee, 2016, Second and final report on small and medium enterprises
Data that indicates the size of formal and informal businessesThe size of the formal business sector in South Africa can be established in two ways: through business registration, captured by CIPC, or by the payment of company income or value-added tax, captured by SARS. As there is no commonly-agreed definition for formality, this report uses the second approach to size the formal sector.
The 2017 Tax Statistics published by SARS and National Treasury indicate that there were nearly 3.7 million businesses on the company income tax register as at March 2017, but only 884,459 submitted returns for the 2016 tax year.23 The reason for this discrepancy is that the company income tax register contains a large number of dormant or inactive businesses not currently operating. While the SARS database automatically registers all new companies as tax payers when they register with CIPC, the reverse is not true – firms that cease operating are not de-registered from the SARS
company income tax database. Nonetheless, the number of active firms submitting company income tax returns provides a good estimate for the total number of firms in the formal sector.
In order to size the number of MSMEs registered for company income tax, this report made use of the SARS-National Treasury firm panel dataset which aggregates several sources of administrative tax data on firms registered for company income tax, VAT, employee tax, and customs tax. The panel runs from 2009 to 2014 and excludes sole proprietors, partnerships and micro enterprises registered for the turnover tax regime because they do not pay company income tax. As the dataset contains calculations on the annual turnover of each firm in the panel, this report used the panel to segment the firms by annual turnover using the thresholds defined in Table 2 of Chapter 3. This provides a count of the number of active MSMEs registered for company
income tax, which is shown in Figure 7.
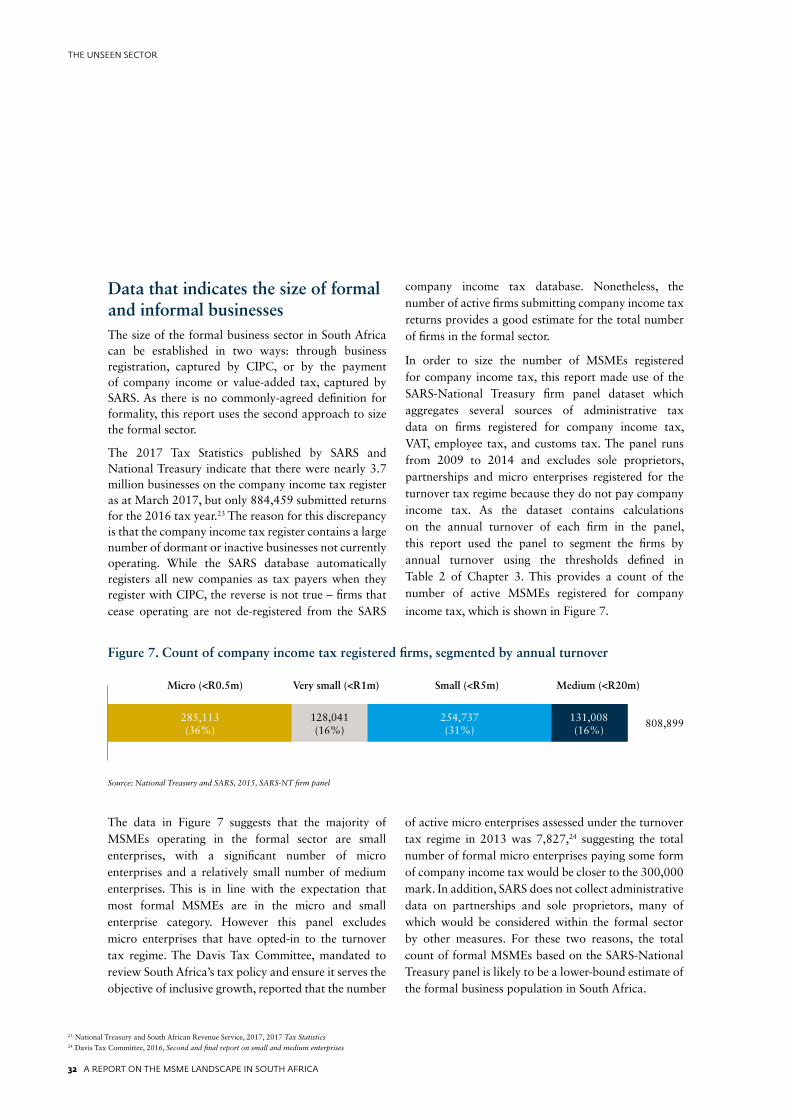
Figure 7. Count of company income tax registered firms, segmented by annual turnover
Source: National Treasury and SARS, 2015, SARS-NT firm panel
Micro (<R0.5m) Very small (<R1m) Small (<R5m) Medium (<R20m)
808,899285,113(36%)
128,041(16%)
131,008(16%)
254,737(31%)
The data in Figure 7 suggests that the majority of MSMEs operating in the formal sector are small enterprises, with a significant number of micro enterprises and a relatively small number of medium enterprises. This is in line with the expectation that most formal MSMEs are in the micro and small enterprise category. However this panel excludes micro enterprises that have opted-in to the turnover tax regime. The Davis Tax Committee, mandated to review South Africa’s tax policy and ensure it serves the objective of inclusive growth, reported that the number
of active micro enterprises assessed under the turnover tax regime in 2013 was 7,827,24 suggesting the total number of formal micro enterprises paying some form of company income tax would be closer to the 300,000 mark. In addition, SARS does not collect administrative data on partnerships and sole proprietors, many of which would be considered within the formal sector by other measures. For these two reasons, the total count of formal MSMEs based on the SARS-National Treasury panel is likely to be a lower-bound estimate of the formal business population in South Africa.
A REPORT ON THE MSME LANDSCAPE IN SOUTH AFRICA 33
THE UNSEEN SECTOR
Counting the number of MSMEs operating in the informal sector is more difficult – the informal sector by nature comprises firms that are unregistered or that do not pay tax. The size of the informal sector can therefore only be estimated, for example, through nationally-representative surveys rather than counted in the formal sector. The StatsSA Survey of Employers and Self-employed provides an estimate of the number of non-VAT registered firms in South Africa.
The SESE is a household survey which tracks individuals identified in the QLFS as running businesses, collecting a richer set of data on those individuals whose businesses are not registered for VAT. The survey also measures which of the non-VAT registered businesses pay corporate income tax, so it is possible to isolate the firms which do not pay VAT or corporate income tax, providing a stricter estimate of the informal sector. The results from the 2013 SESE are shown in Figure 8.
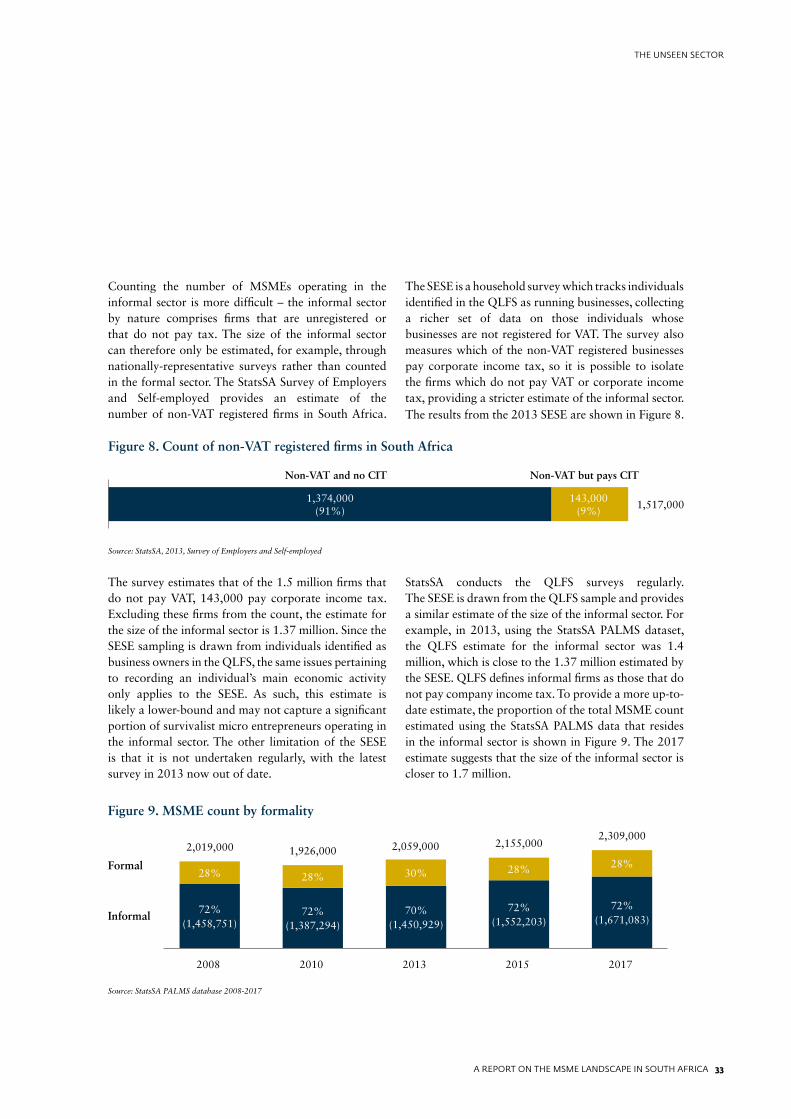
Figure 8. Count of non-VAT registered firms in South Africa
Source: StatsSA, 2013, Survey of Employers and Self-employed
Non-VAT and no CIT Non-VAT but pays CIT
1,517,0001,374,000
(91%)143,000
(9%)
The survey estimates that of the 1.5 million firms that do not pay VAT, 143,000 pay corporate income tax. Excluding these firms from the count, the estimate for the size of the informal sector is 1.37 million. Since the SESE sampling is drawn from individuals identified as business owners in the QLFS, the same issues pertaining to recording an individual’s main economic activity only applies to the SESE. As such, this estimate is likely a lower-bound and may not capture a significant portion of survivalist micro entrepreneurs operating in the informal sector. The other limitation of the SESE is that it is not undertaken regularly, with the latest survey in 2013 now out of date.
StatsSA conducts the QLFS surveys regularly. The SESE is drawn from the QLFS sample and provides a similar estimate of the size of the informal sector. For example, in 2013, using the StatsSA PALMS dataset, the QLFS estimate for the informal sector was 1.4 million, which is close to the 1.37 million estimated by the SESE. QLFS defines informal firms as those that do not pay company income tax. To provide a more up-to-date estimate, the proportion of the total MSME count estimated using the StatsSA PALMS data that resides in the informal sector is shown in Figure 9. The 2017 estimate suggests that the size of the informal sector is closer to 1.7 million.
Figure 9. MSME count by formality
72%(1,458,751)
72%(1,387,294)
72%(1,552,203)
72%(1,671,083)
70%(1,450,929)
Source: StatsSA PALMS database 2008-2017
Formal
Informal
2,019,000
28% 28%28% 28%
30%
1,926,000 2,059,000 2,155,0002,309,000
2008 2010 2013 2015 2017
34 A REPORT ON THE MSME LANDSCAPE IN SOUTH AFRICA
THE UNSEEN SECTOR
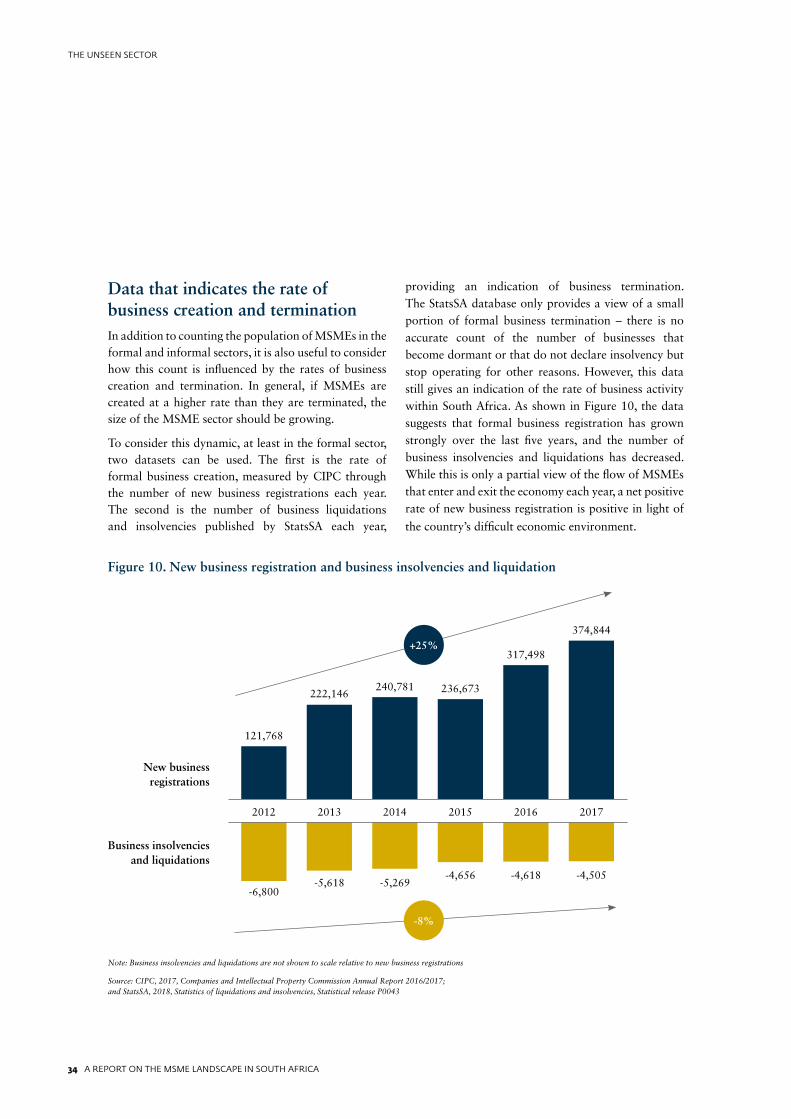
Data that indicates the rate of business creation and terminationIn addition to counting the population of MSMEs in the formal and informal sectors, it is also useful to consider how this count is influenced by the rates of business creation and termination. In general, if MSMEs are created at a higher rate than they are terminated, the size of the MSME sector should be growing.
To consider this dynamic, at least in the formal sector, two datasets can be used. The first is the rate of formal business creation, measured by CIPC through the number of new business registrations each year. The second is the number of business liquidations and insolvencies published by StatsSA each year,
providing an indication of business termination. The StatsSA database only provides a view of a small portion of formal business termination – there is no accurate count of the number of businesses that become dormant or that do not declare insolvency but stop operating for other reasons. However, this data still gives an indication of the rate of business activity within South Africa. As shown in Figure 10, the data suggests that formal business registration has grown strongly over the last five years, and the number of business insolvencies and liquidations has decreased. While this is only a partial view of the flow of MSMEs that enter and exit the economy each year, a net positive rate of new business registration is positive in light of
the country’s difficult economic environment.
Note: Business insolvencies and liquidations are not shown to scale relative to new business registrations
Source: CIPC, 2017, Companies and Intellectual Property Commission Annual Report 2016/2017; and StatsSA, 2018, Statistics of liquidations and insolvencies, Statistical release P0043
Figure 10. New business registration and business insolvencies and liquidation
-6,800-5,618 -5,269
-4,505-4,618-4,656
New business registrations
Business insolvencies and liquidations
121,768
2012 2013
222,146
2014
240,781
2017
374,844
2016
317,498
2015
236,673
+25%
-8%
A REPORT ON THE MSME LANDSCAPE IN SOUTH AFRICA 35
THE UNSEEN SECTOR
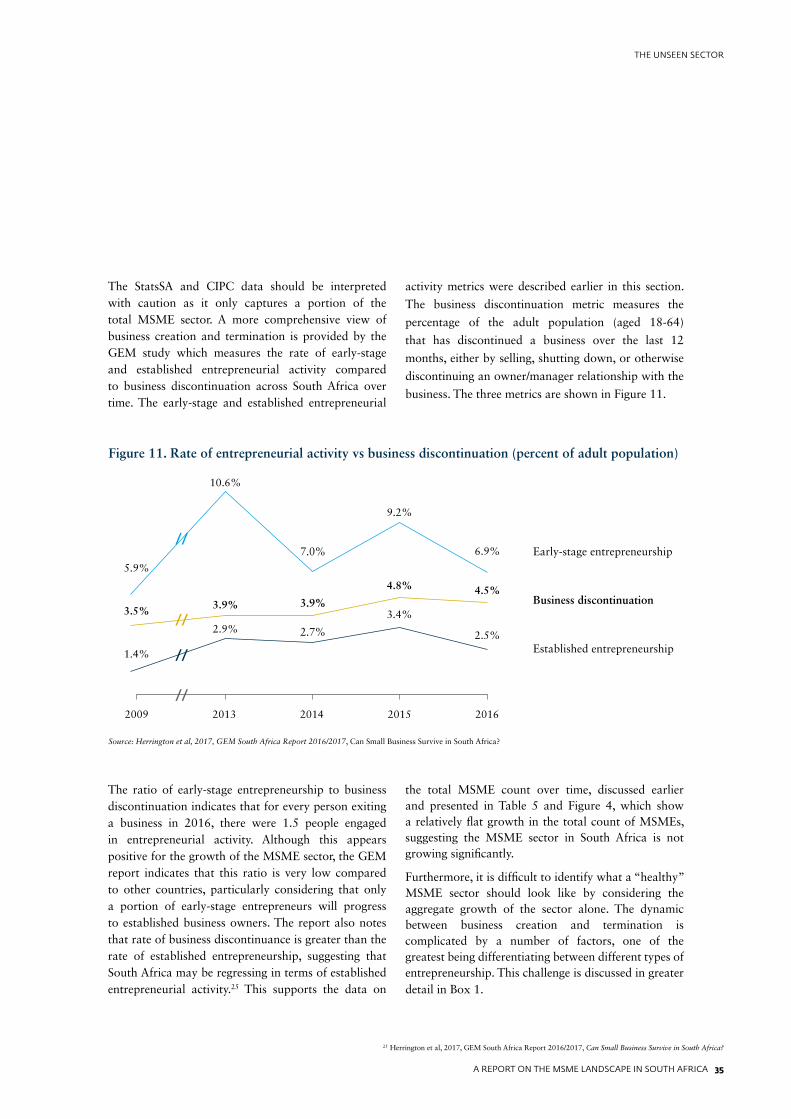
The StatsSA and CIPC data should be interpreted with caution as it only captures a portion of the total MSME sector. A more comprehensive view of business creation and termination is provided by the GEM study which measures the rate of early-stage and established entrepreneurial activity compared to business discontinuation across South Africa over time. The early-stage and established entrepreneurial
activity metrics were described earlier in this section.
The business discontinuation metric measures the
percentage of the adult population (aged 18-64)
that has discontinued a business over the last 12
months, either by selling, shutting down, or otherwise
discontinuing an owner/manager relationship with the
business. The three metrics are shown in Figure 11.
Figure 11. Rate of entrepreneurial activity vs business discontinuation (percent of adult population)
Source: Herrington et al, 2017, GEM South Africa Report 2016/2017, Can Small Business Survive in South Africa?
Early-stage entrepreneurship
Business discontinuation
Established entrepreneurship
2009 2013 2014 2015 2016
//
//
//
//
10.6%
3.9%
2.9%
7.0%
3.9%
2.7%
9.2%
4.8%
3.4%
6.9%
4.5%
2.5%
5.9%
3.5%
1.4%
The ratio of early-stage entrepreneurship to business discontinuation indicates that for every person exiting a business in 2016, there were 1.5 people engaged in entrepreneurial activity. Although this appears positive for the growth of the MSME sector, the GEM report indicates that this ratio is very low compared to other countries, particularly considering that only a portion of early-stage entrepreneurs will progress to established business owners. The report also notes that rate of business discontinuance is greater than the rate of established entrepreneurship, suggesting that South Africa may be regressing in terms of established entrepreneurial activity.25 This supports the data on
the total MSME count over time, discussed earlier and presented in Table 5 and Figure 4, which show a relatively flat growth in the total count of MSMEs, suggesting the MSME sector in South Africa is not growing significantly.
Furthermore, it is difficult to identify what a “healthy” MSME sector should look like by considering the aggregate growth of the sector alone. The dynamic between business creation and termination is complicated by a number of factors, one of the greatest being differentiating between different types of entrepreneurship. This challenge is discussed in greater detail in Box 1.
25 Herrington et al, 2017, GEM South Africa Report 2016/2017, Can Small Business Survive in South Africa?
36 A REPORT ON THE MSME LANDSCAPE IN SOUTH AFRICA
THE UNSEEN SECTOR
BOX 1 DIFFERENTIATING OPPORTUNITY-DRIVEN AND SURVIVALIST ENTREPRENEURSHIP WHEN CONSIDERING MSME GROWTH
The distinction between opportunity-driven and survivalist entrepreneurs is material – the former is more likely to be a source of growth and employment creation in the formal sector, and the latter often resulting from necessity and a lack of formal work opportunities. The growth of survivalist entrepreneurs is therefore likely to be counter-cyclical to economic growth – more people turn to survivalist entrepreneurship in times of economic downturn; and in times of economic prosperity fewer people need to rely on survivalist entrepreneurship as other work opportunities are created.
Differentiating between the type of entrepreneurship that leads to positive economic development and
entrepreneurship that is a result of poor economic development is important to understand whether MSME sector growth is healthy. Put differently, if the total count of MSMEs is rising considerably, it may not necessarily be positive if survivalist entrepreneurs that cannot find alternative work opportunities in the formal economy drive most of this growth.
The GEM and SESE both provide an indication of what motivates entrepreneurs to seek self-employment. GEM distinguishes between necessity- and opportunity-driven entrepreneurs, with necessity-driven ones defined as having no better choice for work. SESE meanwhile provides a number of reasons why non-VAT registered business owners decided to start their business, one of which is “unemployed or have no alternative income source”, the quintessential definition of survivalist entrepreneurship. Table 6 shows the ratio of necessity-driven or survivalist entrepreneurs in South Africa cited by both sources for the dates where data is available.
The SESE data shows that survivalist entrepreneurship is more prevalent among MSMEs in the informal sector, and that the prevalence of survivalist entrepreneurs within the informal sector has been growing since 2001. The GEM data is more varied over a similar time period, and the relatively low ratio of necessity-driven entrepreneurs within the sample confirms that the GEM study did not capture a significant portion of survivalist enterprises. Furthermore, the GEM report notes that the ratio of improvement-driven opportunity
entrepreneurs – those wishing to increase their income through growth – was 41.9 percent in 2016, suggesting that almost 60 percent of entrepreneurs in the sample were not driven by expanding, and therefore employing more people.26 This implies that their motivation for entrepreneurship is primarily for subsistence. The GEM sample appears to be skewed toward more formal and opportunity-driven enterprises, and this may be of concern given the MSME sector’s potential for contributing to South Africa’s employment crisis.
Table 6. Percent of entrepreneurs that are survivalist
Source 2001 2005 2009 2010 2013 2014 2015 2016
Global Entrepreneurship Monitor
18.2 39.5 36 30.3 28.2 33.2 23.6
Survey of Employers and Self-employed
60.6 68.2 68.3 69.2
Source: Herrington et al, 2017, GEM South Africa Report 2016/2017, Can Small Business Survive in South Africa? and StatsSA, 2013, Survey of Employers and Self-employed
26 Herrington et al, 2017, GEM South Africa Report 2016/2017, Can Small Business Survive in South Africa?, and StatsSA, 2013, Survey of Employers and Self-employed
A REPORT ON THE MSME LANDSCAPE IN SOUTH AFRICA 37
THE UNSEEN SECTOR
Triangulating the MSME market sizeEstimating the number of MSMEs in South Africa is useful to track the sector development. Combining the data points from the QLFS, GEM, FinScope, and SARS-National Treasury datasets into a single count of the MSME sector is not possible. Attempting to do so would be highly problematic for a number of reasons. The various surveys make use of different sampling frameworks, sample sizes, and methods for calculating national estimates. These surveys also take place over different time periods. Most importantly, the surveys use different MSME definitions. The nature of questionnaires allows survey respondents to self-select into, or out of, these definitions based on different criteria. This section identies the inconsistencies and limitations, and in some cases posits the possible reasons for discrepancies in the estimates.
However, pulling this data together into a framework for understanding what the MSME landscape in South Africa looks like is important and has value to the national debate on how to reinvigorate the MSME market. While this study is not intended to add or subtract estimates to arrive at a single estimate of the size of the MSME market, a comparison of upper- and lower-bound estimates coupled with an understanding of what drives these bounds helps sketch a picture of the size of the MSME market in South Africa and how it is changing.
Given the complexity distinguishing between MSMEs and sizing the market, Figure 12 visualizes the data presented in this section within a framework that separates survivalist micro enterprises from firms that are more opportunity-driven. The framework also identifies the data describing micro, small and medium enterprises as well as formal and informal firms within each of these segments.
The following elements and assumptions were used to put this framework together:
• Survivalist entrepreneurs. Individuals who may be recipients of social grants, engaging in casual work, or otherwise unemployed who engage in a form of self-employment to earn some income. These individuals may not be considered a “firm” depending on the definition of what constitutes a business:
o The FinScope estimate provides the upper-bound of the total MSME count due to the most broad MSME definition being employed.
o The QLFS/GEM surveys do not capture a significant portion of survivalist micro enterprises (for the reasons discussed above).
o An approximation of the size of the survivalist micro enterprise segment (2,893,925) is reached by subtracting the most recent GEM estimate of 2,866,890 from the FinScope estimate of 5,780,815.
• Formal MSMEs:
o This uses “pays corporate income tax” as the definition of a formal enterprise and the count in the SARS-NT firm panel of 808,899.
o 7,827 micro enterprises registered for the turnover tax regime are added to the total.
o Sole proprietors and partnerships are excluded from this estimate because they are not registered for company income tax.
• Informal MSMEs:
o Assuming that FinScope provides the upper-bound estimate, informal MSMEs are the remainder from the upper-bound estimate totaling 5,780,815 after subtracting the known number of formal MSMEs of 816,726 and the estimate for survivalist entrepreneurs of 2,893,925.
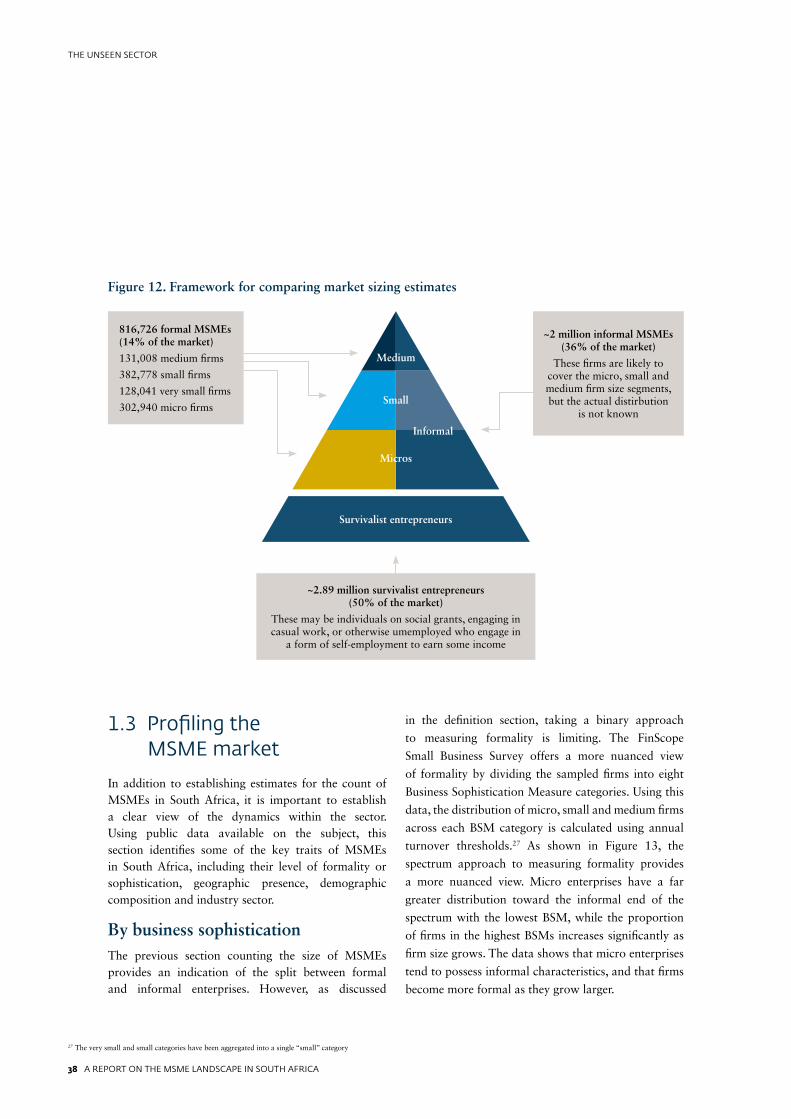
38 A REPORT ON THE MSME LANDSCAPE IN SOUTH AFRICA
THE UNSEEN SECTOR
Figure 12. Framework for comparing market sizing estimates
816,726 formal MSMEs (14% of the market)
131,008 medium firms
382,778 small firms
128,041 very small firms
302,940 micro firms
~2 million informal MSMEs (36% of the market)
These firms are likely to cover the micro, small and medium firm size segments, but the actual distirbution
is not known
~2.89 million survivalist entrepreneurs (50% of the market)
These may be individuals on social grants, engaging in casual work, or otherwise umemployed who engage in
a form of self-employment to earn some income
Medium
Small
Informal
Micros
Survivalist entrepreneurs
1.3 Profiling the MSME market
In addition to establishing estimates for the count of MSMEs in South Africa, it is important to establish a clear view of the dynamics within the sector. Using public data available on the subject, this section identifies some of the key traits of MSMEs in South Africa, including their level of formality or sophistication, geographic presence, demographic composition and industry sector.
By business sophisticationThe previous section counting the size of MSMEs provides an indication of the split between formal and informal enterprises. However, as discussed
in the definition section, taking a binary approach
to measuring formality is limiting. The FinScope
Small Business Survey offers a more nuanced view
of formality by dividing the sampled firms into eight
Business Sophistication Measure categories. Using this
data, the distribution of micro, small and medium firms
across each BSM category is calculated using annual
turnover thresholds.27 As shown in Figure 13, the
spectrum approach to measuring formality provides
a more nuanced view. Micro enterprises have a far
greater distribution toward the informal end of the
spectrum with the lowest BSM, while the proportion
of firms in the highest BSMs increases significantly as
firm size grows. The data shows that micro enterprises
tend to possess informal characteristics, and that firms
become more formal as they grow larger.
27 The very small and small categories have been aggregated into a single “small” category
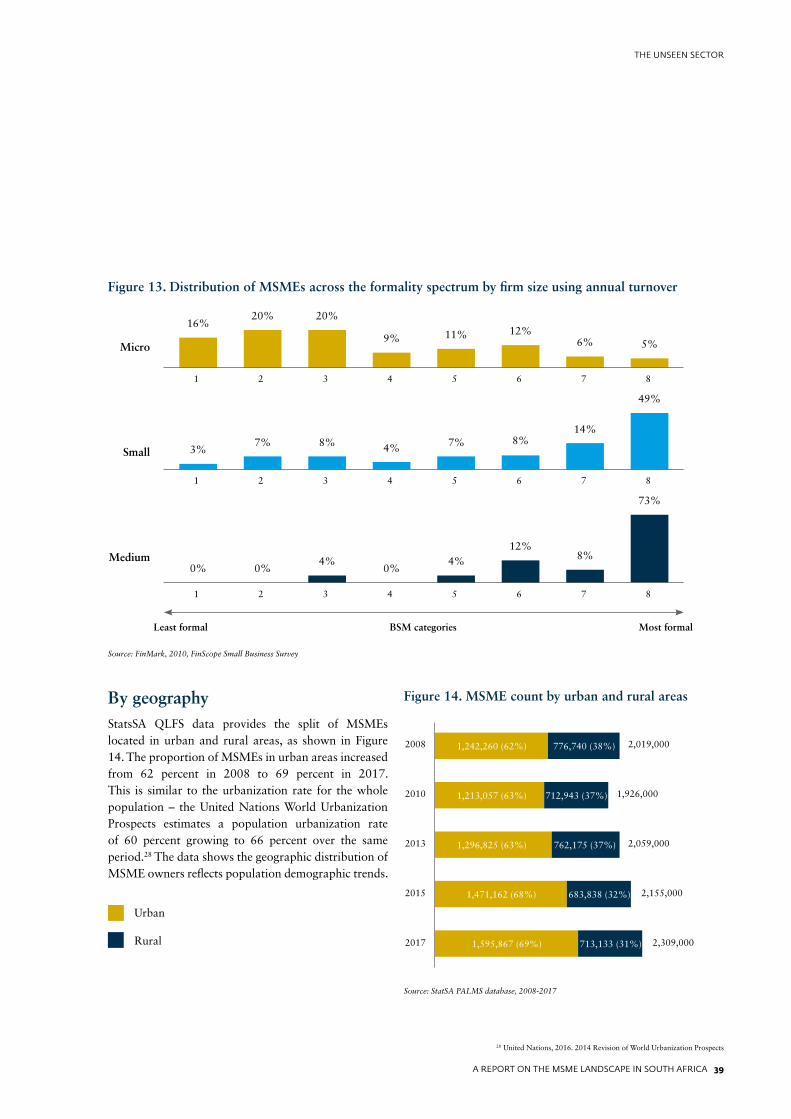
A REPORT ON THE MSME LANDSCAPE IN SOUTH AFRICA 39
THE UNSEEN SECTOR
28 United Nations, 2016. 2014 Revision of World Urbanization Prospects
Source: FinMark, 2010, FinScope Small Business Survey
Figure 13. Distribution of MSMEs across the formality spectrum by firm size using annual turnover
Source: StatSA PALMS database, 2008-2017
Figure 14. MSME count by urban and rural areasBy geographyStatsSA QLFS data provides the split of MSMEs located in urban and rural areas, as shown in Figure 14. The proportion of MSMEs in urban areas increased from 62 percent in 2008 to 69 percent in 2017. This is similar to the urbanization rate for the whole population – the United Nations World Urbanization Prospects estimates a population urbanization rate of 60 percent growing to 66 percent over the same period.28 The data shows the geographic distribution of MSME owners reflects population demographic trends.
Urban
Rural
Micro
Small
Medium
16%
3%
0%
7%
0% 0%
7% 8%
12%
14%
8%
49%
73%
8% 4%
4% 4%
20% 20%
9% 11% 12%6% 5%
1 2 3 4 5 6 7 8
1 2 3 4 5 6 7 8
1 2 3 4 5 6 7 8
Least formal BSM categories Most formal
2008
2010
2013
2015
2017
2,019,000
1,926,000
2,059,000
2,155,000
2,309,000
1,242,260 (62%)
1,213,057 (63%)
1,296,825 (63%)
1,471,162 (68%)
1,595,867 (69%) 713,133 (31%)
683,838 (32%)
712,943 (37%)
762,175 (37%)
776,740 (38%)
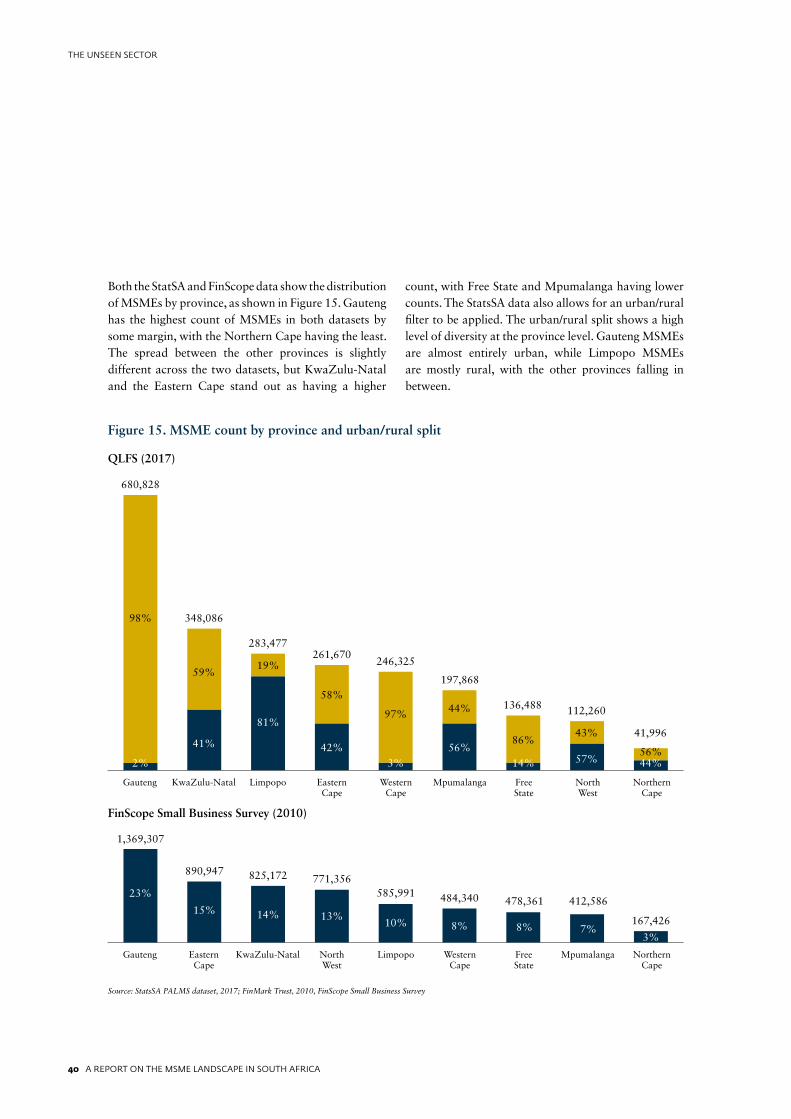
40 A REPORT ON THE MSME LANDSCAPE IN SOUTH AFRICA
THE UNSEEN SECTOR
Both the StatSA and FinScope data show the distribution of MSMEs by province, as shown in Figure 15. Gauteng has the highest count of MSMEs in both datasets by some margin, with the Northern Cape having the least. The spread between the other provinces is slightly different across the two datasets, but KwaZulu-Natal and the Eastern Cape stand out as having a higher
count, with Free State and Mpumalanga having lower counts. The StatsSA data also allows for an urban/rural filter to be applied. The urban/rural split shows a high level of diversity at the province level. Gauteng MSMEs are almost entirely urban, while Limpopo MSMEs are mostly rural, with the other provinces falling in between.
Figure 15. MSME count by province and urban/rural split
QLFS (2017)
FinScope Small Business Survey (2010)
Source: StatsSA PALMS dataset, 2017; FinMark Trust, 2010, FinScope Small Business Survey
680,828
283,477
348,086
261,670246,325
197,868
136,488 112,260
41,996
Gauteng KwaZulu-Natal Limpopo Eastern Cape
Western Cape
Mpumalanga Free State
North West
Northern Cape
98%
59%
41%
19%
81%
58%
97% 44%
86%43%
57%14%56%
3%42%
2%56%44%
Gauteng Eastern Cape
KwaZulu-Natal North West
Limpopo Western Cape
Free State
Mpumalanga Northern Cape
1,369,307
23%
890,947
15%
825,172
14%
771,356
13%
585,991
10%
484,340
8%
478,361
8%
412,586
7%167,426
3%
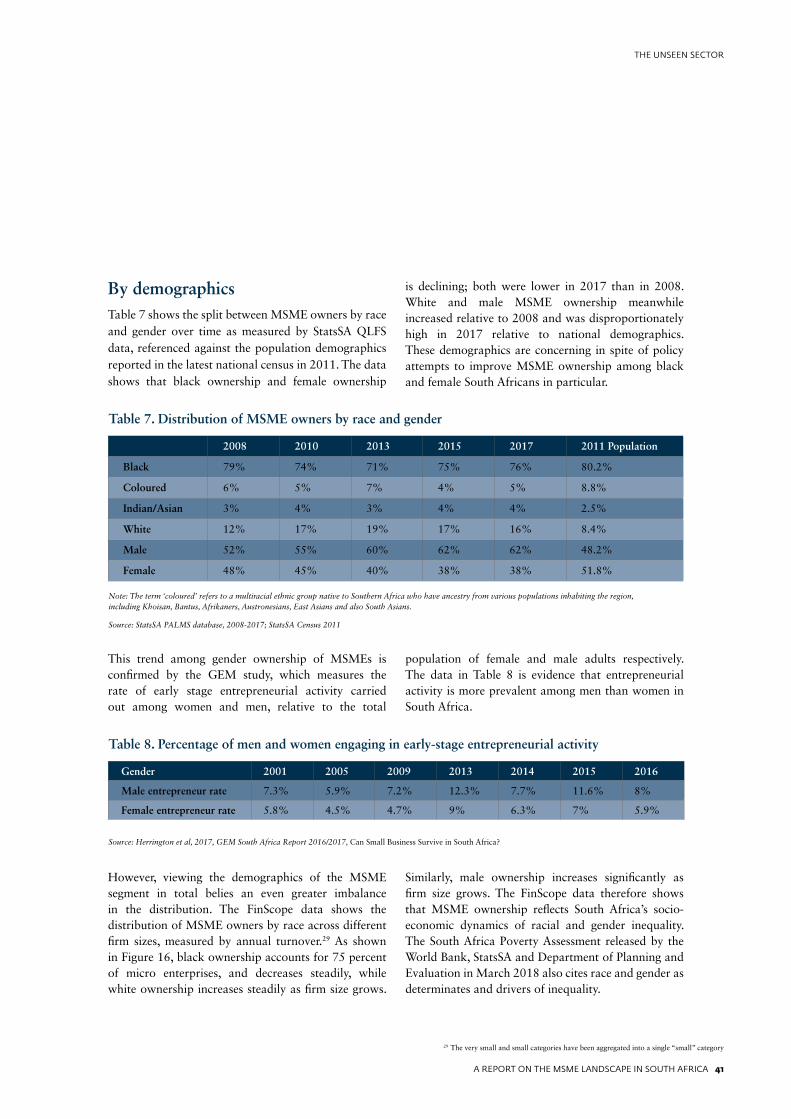
A REPORT ON THE MSME LANDSCAPE IN SOUTH AFRICA 41
THE UNSEEN SECTOR
By demographicsTable 7 shows the split between MSME owners by race and gender over time as measured by StatsSA QLFS data, referenced against the population demographics reported in the latest national census in 2011. The data shows that black ownership and female ownership
is declining; both were lower in 2017 than in 2008. White and male MSME ownership meanwhile increased relative to 2008 and was disproportionately high in 2017 relative to national demographics. These demographics are concerning in spite of policy attempts to improve MSME ownership among black and female South Africans in particular.
This trend among gender ownership of MSMEs is confirmed by the GEM study, which measures the rate of early stage entrepreneurial activity carried out among women and men, relative to the total
population of female and male adults respectively. The data in Table 8 is evidence that entrepreneurial activity is more prevalent among men than women in South Africa.
Table 7. Distribution of MSME owners by race and gender
Note: The term ‘coloured’ refers to a multiracial ethnic group native to Southern Africa who have ancestry from various populations inhabiting the region, including Khoisan, Bantus, Afrikaners, Austronesians, East Asians and also South Asians.
Source: StatsSA PALMS database, 2008-2017; StatsSA Census 2011
2008 2010 2013 2015 2017 2011 Population
Black 79% 74% 71% 75% 76% 80.2%
Coloured 6% 5% 7% 4% 5% 8.8%
Indian/Asian 3% 4% 3% 4% 4% 2.5%
White 12% 17% 19% 17% 16% 8.4%
Male 52% 55% 60% 62% 62% 48.2%
Female 48% 45% 40% 38% 38% 51.8%
Table 8. Percentage of men and women engaging in early-stage entrepreneurial activity
Source: Herrington et al, 2017, GEM South Africa Report 2016/2017, Can Small Business Survive in South Africa?
Gender 2001 2005 2009 2013 2014 2015 2016
Male entrepreneur rate 7.3% 5.9% 7.2% 12.3% 7.7% 11.6% 8%
Female entrepreneur rate 5.8% 4.5% 4.7% 9% 6.3% 7% 5.9%
However, viewing the demographics of the MSME segment in total belies an even greater imbalance in the distribution. The FinScope data shows the distribution of MSME owners by race across different firm sizes, measured by annual turnover.29 As shown in Figure 16, black ownership accounts for 75 percent of micro enterprises, and decreases steadily, while white ownership increases steadily as firm size grows.
Similarly, male ownership increases significantly as firm size grows. The FinScope data therefore shows that MSME ownership reflects South Africa’s socio-economic dynamics of racial and gender inequality. The South Africa Poverty Assessment released by the World Bank, StatsSA and Department of Planning and Evaluation in March 2018 also cites race and gender as determinates and drivers of inequality.
29 The very small and small categories have been aggregated into a single “small” category
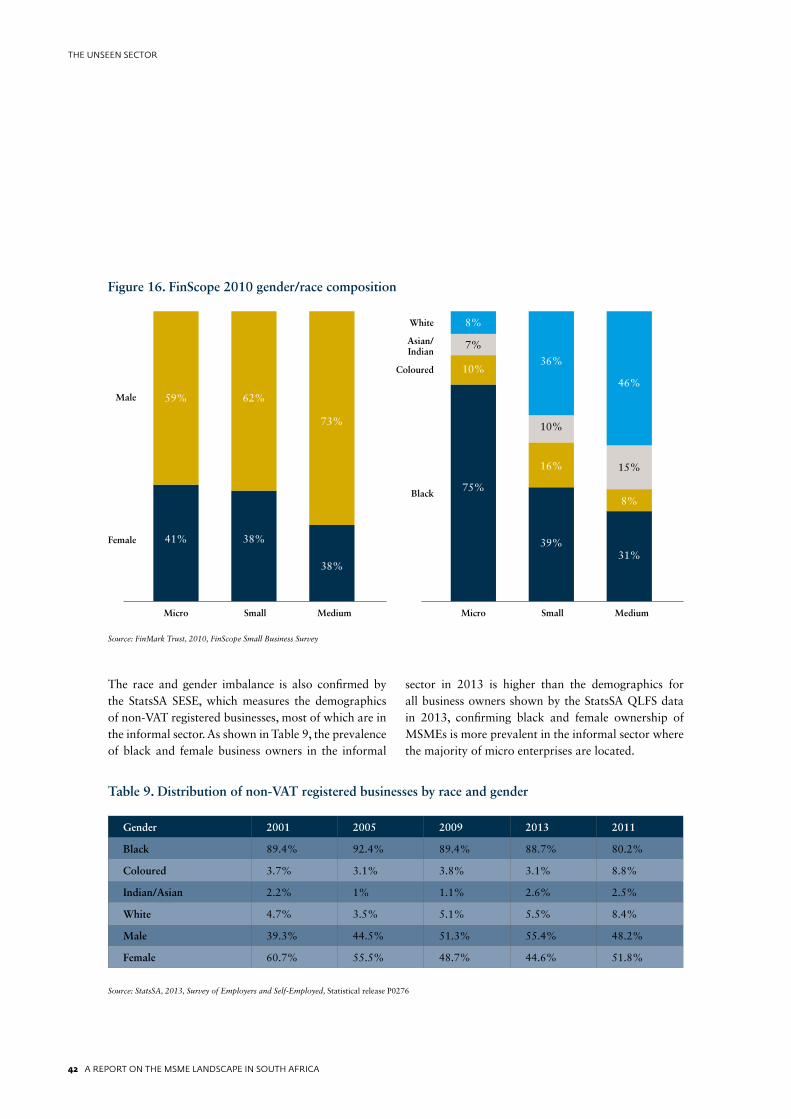
42 A REPORT ON THE MSME LANDSCAPE IN SOUTH AFRICA
THE UNSEEN SECTOR
Figure 16. FinScope 2010 gender/race composition
Source: FinMark Trust, 2010, FinScope Small Business Survey
The race and gender imbalance is also confirmed by the StatsSA SESE, which measures the demographics of non-VAT registered businesses, most of which are in the informal sector. As shown in Table 9, the prevalence of black and female business owners in the informal
sector in 2013 is higher than the demographics for all business owners shown by the StatsSA QLFS data in 2013, confirming black and female ownership of MSMEs is more prevalent in the informal sector where the majority of micro enterprises are located.
Table 9. Distribution of non-VAT registered businesses by race and gender
Source: StatsSA, 2013, Survey of Employers and Self-Employed, Statistical release P0276
Gender 2001 2005 2009 2013 2011
Black 89.4% 92.4% 89.4% 88.7% 80.2%
Coloured 3.7% 3.1% 3.8% 3.1% 8.8%
Indian/Asian 2.2% 1% 1.1% 2.6% 2.5%
White 4.7% 3.5% 5.1% 5.5% 8.4%
Male 39.3% 44.5% 51.3% 55.4% 48.2%
Female 60.7% 55.5% 48.7% 44.6% 51.8%
Micro Small Medium Micro Small Medium
Male
Female
White
Asian/Indian
Coloured
Black
59%
41%
8%
7%
10%
75%
36%
10%
16%
39%
46%
15%
8%
31%
62%
38%
73%
38%
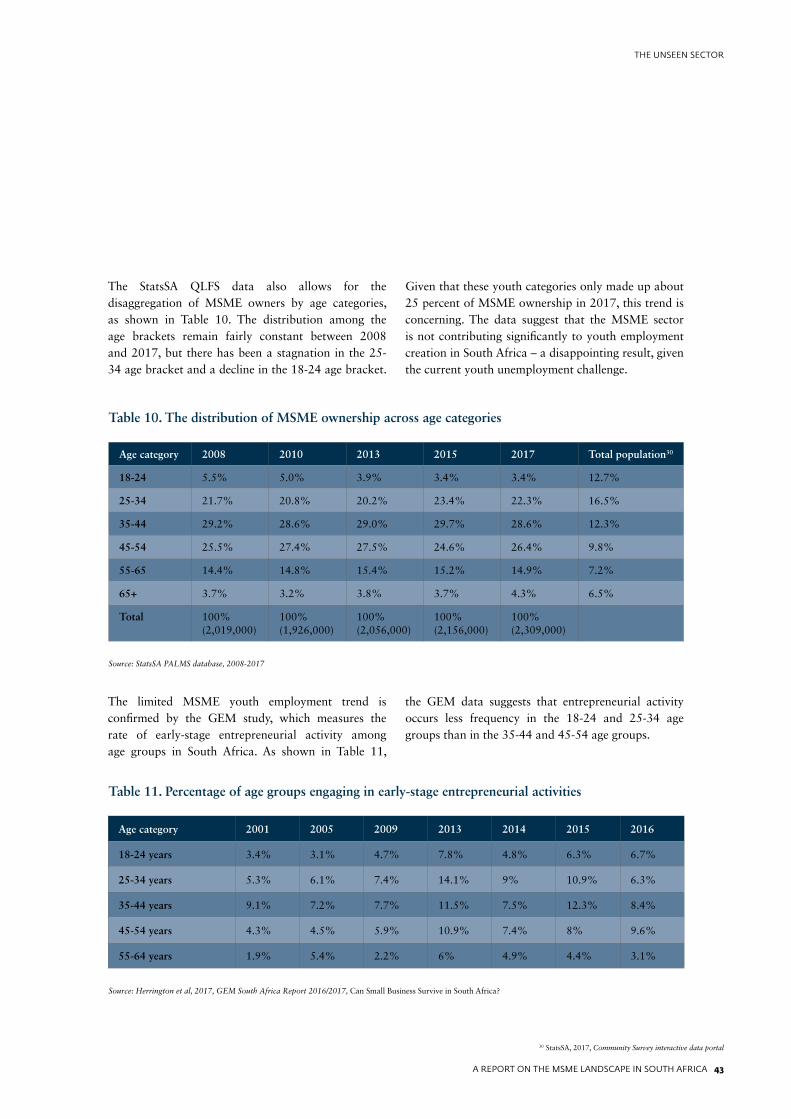
A REPORT ON THE MSME LANDSCAPE IN SOUTH AFRICA 43
THE UNSEEN SECTOR
30 StatsSA, 2017, Community Survey interactive data portal
The StatsSA QLFS data also allows for the disaggregation of MSME owners by age categories, as shown in Table 10. The distribution among the age brackets remain fairly constant between 2008 and 2017, but there has been a stagnation in the 25-34 age bracket and a decline in the 18-24 age bracket.
Given that these youth categories only made up about 25 percent of MSME ownership in 2017, this trend is concerning. The data suggest that the MSME sector is not contributing significantly to youth employment creation in South Africa – a disappointing result, given the current youth unemployment challenge.
The limited MSME youth employment trend is confirmed by the GEM study, which measures the rate of early-stage entrepreneurial activity among age groups in South Africa. As shown in Table 11,
the GEM data suggests that entrepreneurial activity occurs less frequency in the 18-24 and 25-34 age groups than in the 35-44 and 45-54 age groups.
Table 10. The distribution of MSME ownership across age categories
Table 11. Percentage of age groups engaging in early-stage entrepreneurial activities
Source: StatsSA PALMS database, 2008-2017
Source: Herrington et al, 2017, GEM South Africa Report 2016/2017, Can Small Business Survive in South Africa?
Age category 2008 2010 2013 2015 2017 Total population30
18-24 5.5% 5.0% 3.9% 3.4% 3.4% 12.7%
25-34 21.7% 20.8% 20.2% 23.4% 22.3% 16.5%
35-44 29.2% 28.6% 29.0% 29.7% 28.6% 12.3%
45-54 25.5% 27.4% 27.5% 24.6% 26.4% 9.8%
55-65 14.4% 14.8% 15.4% 15.2% 14.9% 7.2%
65+ 3.7% 3.2% 3.8% 3.7% 4.3% 6.5%
Total 100%(2,019,000)
100%(1,926,000)
100%(2,056,000)
100%(2,156,000)
100%(2,309,000)
Age category 2001 2005 2009 2013 2014 2015 2016
18-24 years 3.4% 3.1% 4.7% 7.8% 4.8% 6.3% 6.7%
25-34 years 5.3% 6.1% 7.4% 14.1% 9% 10.9% 6.3%
35-44 years 9.1% 7.2% 7.7% 11.5% 7.5% 12.3% 8.4%
45-54 years 4.3% 4.5% 5.9% 10.9% 7.4% 8% 9.6%
55-64 years 1.9% 5.4% 2.2% 6% 4.9% 4.4% 3.1%
44 A REPORT ON THE MSME LANDSCAPE IN SOUTH AFRICA
THE UNSEEN SECTOR
44 A REPORT ON THE MSME LANDSCAPE IN SOUTH AFRICA
THE UNSEEN SECTOR
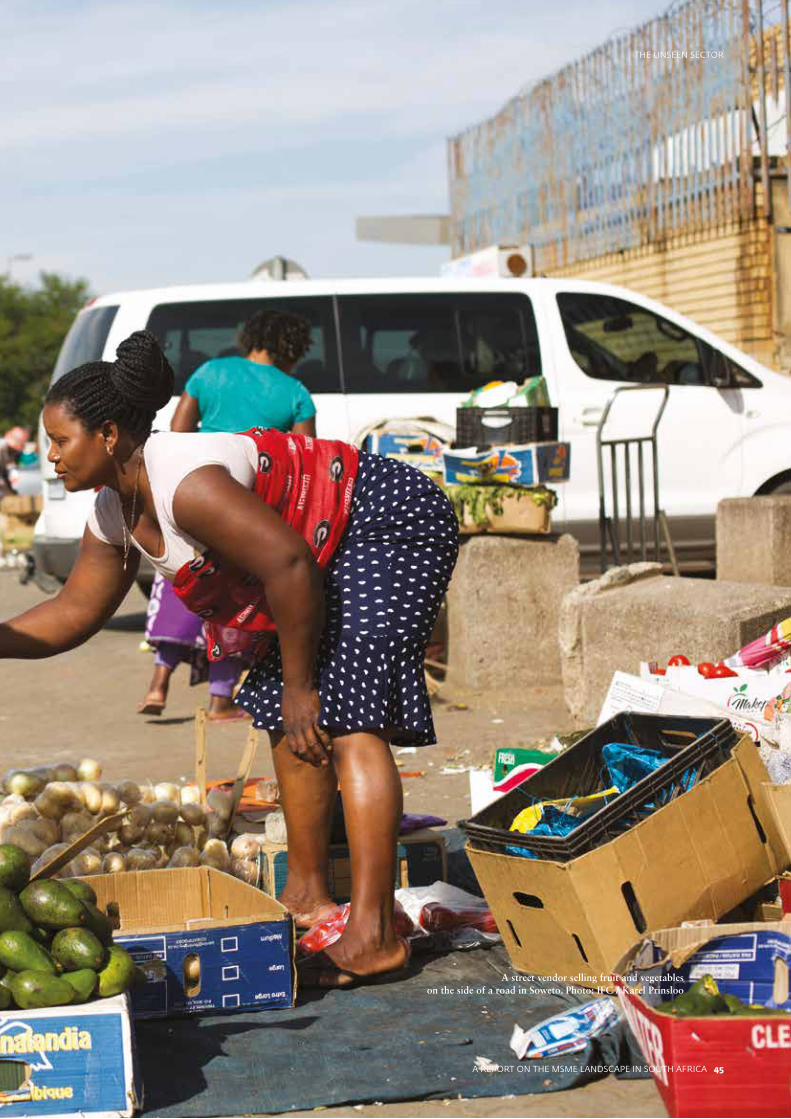
A REPORT ON THE MSME LANDSCAPE IN SOUTH AFRICA 45
THE UNSEEN SECTOR
A street vendor selling fruit and vegetables on the side of a road in Soweto. Photo: IFC / Karel Prinsloo
A REPORT ON THE MSME LANDSCAPE IN SOUTH AFRICA 45
THE UNSEEN SECTOR
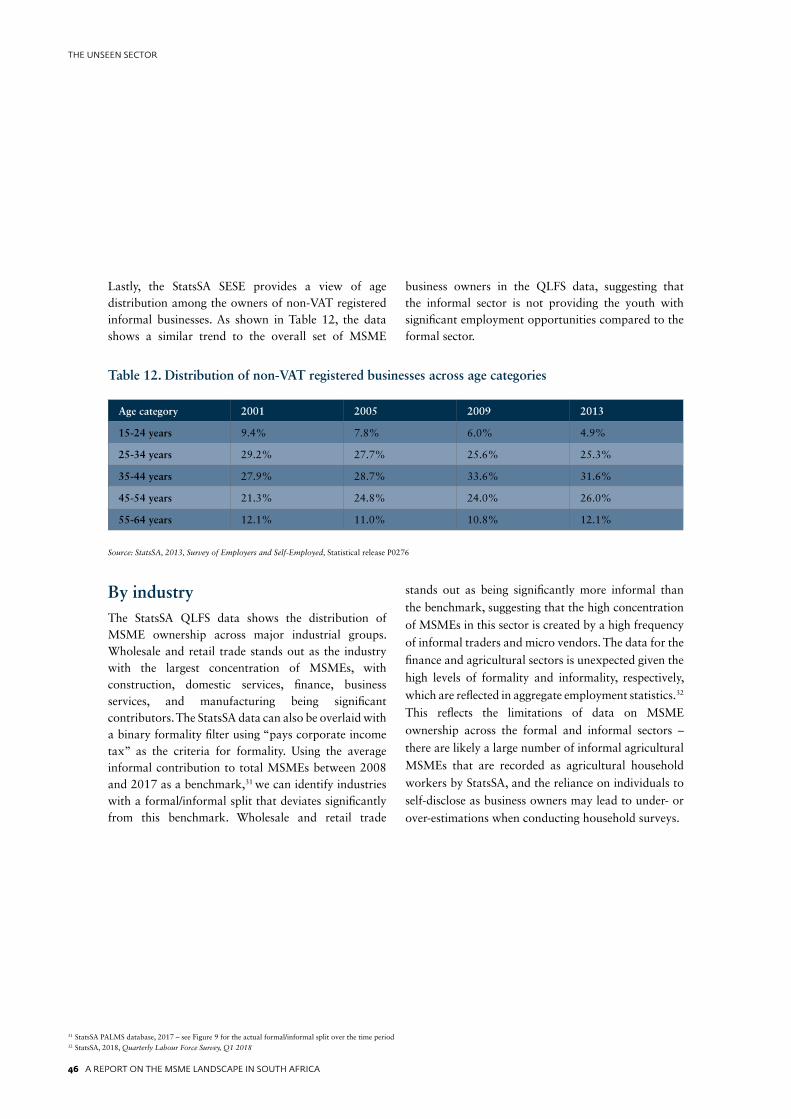
46 A REPORT ON THE MSME LANDSCAPE IN SOUTH AFRICA
THE UNSEEN SECTOR
Table 12. Distribution of non-VAT registered businesses across age categories
Source: StatsSA, 2013, Survey of Employers and Self-Employed, Statistical release P0276
Age category 2001 2005 2009 2013
15-24 years 9.4% 7.8% 6.0% 4.9%
25-34 years 29.2% 27.7% 25.6% 25.3%
35-44 years 27.9% 28.7% 33.6% 31.6%
45-54 years 21.3% 24.8% 24.0% 26.0%
55-64 years 12.1% 11.0% 10.8% 12.1%
Lastly, the StatsSA SESE provides a view of age distribution among the owners of non-VAT registered informal businesses. As shown in Table 12, the data shows a similar trend to the overall set of MSME
business owners in the QLFS data, suggesting that the informal sector is not providing the youth with significant employment opportunities compared to the formal sector.
By industryThe StatsSA QLFS data shows the distribution of MSME ownership across major industrial groups. Wholesale and retail trade stands out as the industry with the largest concentration of MSMEs, with construction, domestic services, finance, business services, and manufacturing being significant contributors. The StatsSA data can also be overlaid with a binary formality filter using “pays corporate income tax” as the criteria for formality. Using the average informal contribution to total MSMEs between 2008 and 2017 as a benchmark,31 we can identify industries with a formal/informal split that deviates significantly from this benchmark. Wholesale and retail trade
stands out as being significantly more informal than
the benchmark, suggesting that the high concentration
of MSMEs in this sector is created by a high frequency
of informal traders and micro vendors. The data for the
finance and agricultural sectors is unexpected given the
high levels of formality and informality, respectively,
which are reflected in aggregate employment statistics.32
This reflects the limitations of data on MSME
ownership across the formal and informal sectors –
there are likely a large number of informal agricultural
MSMEs that are recorded as agricultural household
workers by StatsSA, and the reliance on individuals to
self-disclose as business owners may lead to under- or
over-estimations when conducting household surveys.
31 StatsSA PALMS database, 2017 – see Figure 9 for the actual formal/informal split over the time period32 StatsSA, 2018, Quarterly Labour Force Survey, Q1 2018
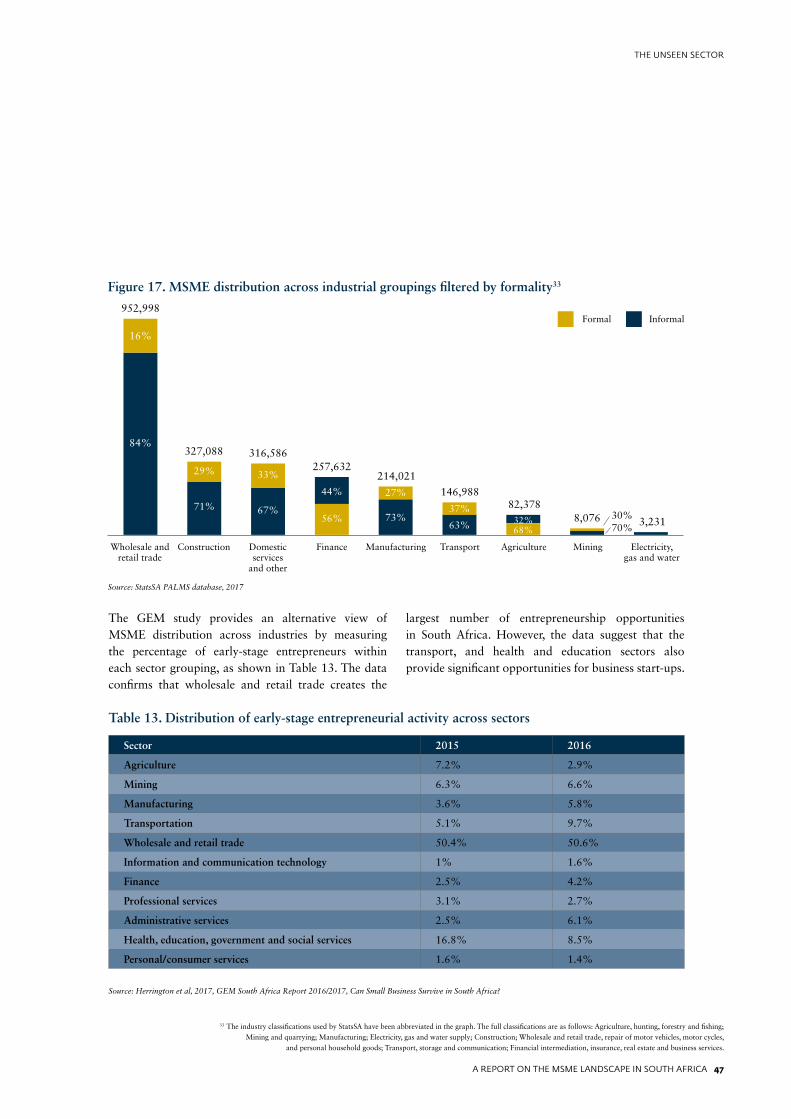
A REPORT ON THE MSME LANDSCAPE IN SOUTH AFRICA 47
THE UNSEEN SECTOR
33 The industry classifications used by StatsSA have been abbreviated in the graph. The full classifications are as follows: Agriculture, hunting, forestry and fishing; Mining and quarrying; Manufacturing; Electricity, gas and water supply; Construction; Wholesale and retail trade, repair of motor vehicles, motor cycles,
and personal household goods; Transport, storage and communication; Financial intermediation, insurance, real estate and business services.
Figure 17. MSME distribution across industrial groupings filtered by formality33
Source: StatsSA PALMS database, 2017
The GEM study provides an alternative view of MSME distribution across industries by measuring the percentage of early-stage entrepreneurs within each sector grouping, as shown in Table 13. The data confirms that wholesale and retail trade creates the
largest number of entrepreneurship opportunities in South Africa. However, the data suggest that the transport, and health and education sectors also provide significant opportunities for business start-ups.
Table 13. Distribution of early-stage entrepreneurial activity across sectors
Source: Herrington et al, 2017, GEM South Africa Report 2016/2017, Can Small Business Survive in South Africa?
Sector 2015 2016
Agriculture 7.2% 2.9%
Mining 6.3% 6.6%
Manufacturing 3.6% 5.8%
Transportation 5.1% 9.7%
Wholesale and retail trade 50.4% 50.6%
Information and communication technology 1% 1.6%
Finance 2.5% 4.2%
Professional services 3.1% 2.7%
Administrative services 2.5% 6.1%
Health, education, government and social services 16.8% 8.5%
Personal/consumer services 1.6% 1.4%
Wholesale and retail trade
Construction Domestic services
and other
Finance Manufacturing Transport Agriculture Mining Electricity, gas and water
Formal Informal952,998
16%
84%
29%
71%
33%
67%
44%
56%
27%
73%37%
63%30%70%
32%68%
327,088 316,586257,632
214,021
146,98882,378
8,076 3,231
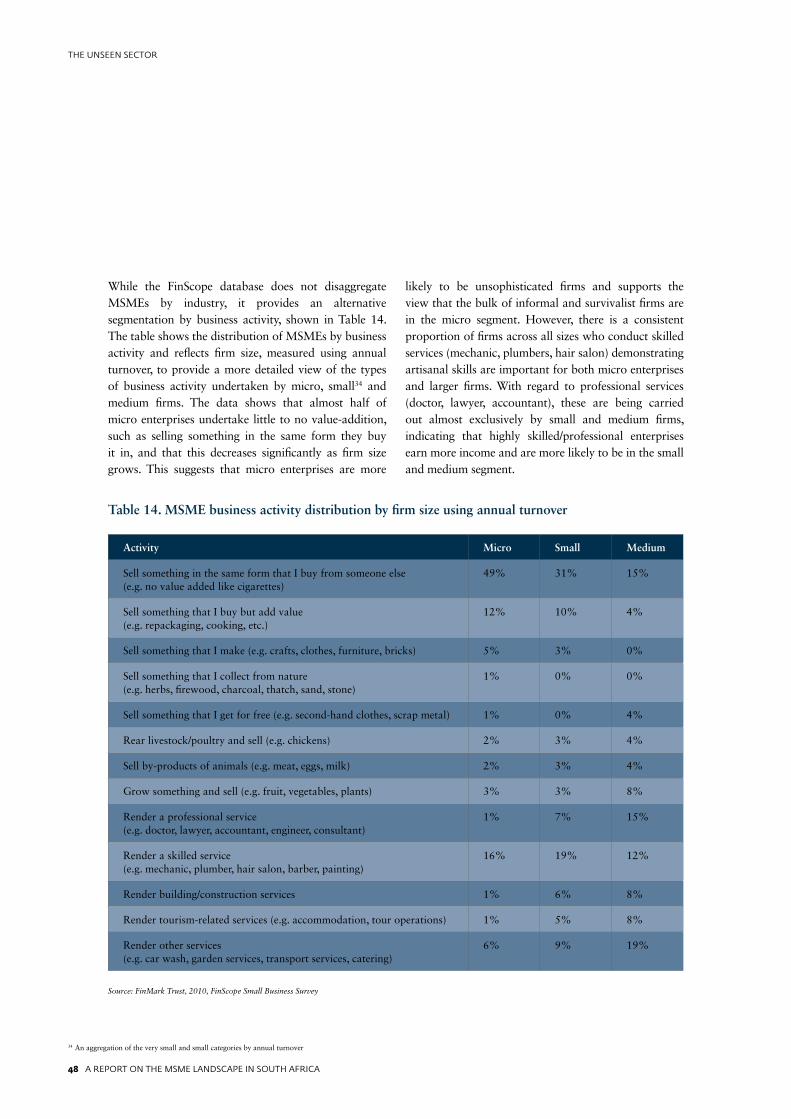
48 A REPORT ON THE MSME LANDSCAPE IN SOUTH AFRICA
THE UNSEEN SECTOR
While the FinScope database does not disaggregate MSMEs by industry, it provides an alternative segmentation by business activity, shown in Table 14. The table shows the distribution of MSMEs by business activity and reflects firm size, measured using annual turnover, to provide a more detailed view of the types of business activity undertaken by micro, small34 and medium firms. The data shows that almost half of micro enterprises undertake little to no value-addition, such as selling something in the same form they buy it in, and that this decreases significantly as firm size grows. This suggests that micro enterprises are more
likely to be unsophisticated firms and supports the view that the bulk of informal and survivalist firms are in the micro segment. However, there is a consistent proportion of firms across all sizes who conduct skilled services (mechanic, plumbers, hair salon) demonstrating artisanal skills are important for both micro enterprises and larger firms. With regard to professional services (doctor, lawyer, accountant), these are being carried out almost exclusively by small and medium firms, indicating that highly skilled/professional enterprises earn more income and are more likely to be in the small and medium segment.
Table 14. MSME business activity distribution by firm size using annual turnover
Source: FinMark Trust, 2010, FinScope Small Business Survey
Activity Micro Small Medium
Sell something in the same form that I buy from someone else (e.g. no value added like cigarettes)
49% 31% 15%
Sell something that I buy but add value (e.g. repackaging, cooking, etc.)
12% 10% 4%
Sell something that I make (e.g. crafts, clothes, furniture, bricks) 5% 3% 0%
Sell something that I collect from nature (e.g. herbs, firewood, charcoal, thatch, sand, stone)
1% 0% 0%
Sell something that I get for free (e.g. second-hand clothes, scrap metal) 1% 0% 4%
Rear livestock/poultry and sell (e.g. chickens) 2% 3% 4%
Sell by-products of animals (e.g. meat, eggs, milk) 2% 3% 4%
Grow something and sell (e.g. fruit, vegetables, plants) 3% 3% 8%
Render a professional service (e.g. doctor, lawyer, accountant, engineer, consultant)
1% 7% 15%
Render a skilled service (e.g. mechanic, plumber, hair salon, barber, painting)
16% 19% 12%
Render building/construction services 1% 6% 8%
Render tourism-related services (e.g. accommodation, tour operations) 1% 5% 8%
Render other services (e.g. car wash, garden services, transport services, catering)
6% 9% 19%
34 An aggregation of the very small and small categories by annual turnover
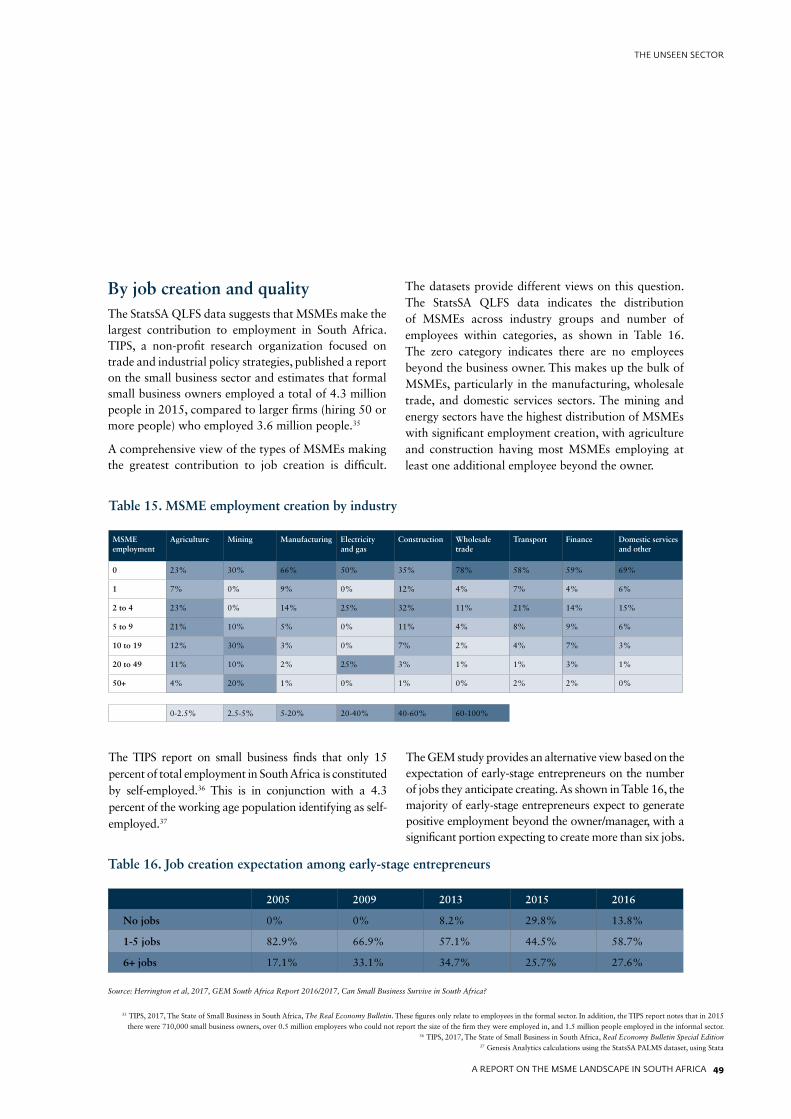
A REPORT ON THE MSME LANDSCAPE IN SOUTH AFRICA 49
THE UNSEEN SECTOR
35 TIPS, 2017, The State of Small Business in South Africa, The Real Economy Bulletin. These figures only relate to employees in the formal sector. In addition, the TIPS report notes that in 2015 there were 710,000 small business owners, over 0.5 million employees who could not report the size of the firm they were employed in, and 1.5 million people employed in the informal sector.
36 TIPS, 2017, The State of Small Business in South Africa, Real Economy Bulletin Special Edition37 Genesis Analytics calculations using the StatsSA PALMS dataset, using Stata
By job creation and qualityThe StatsSA QLFS data suggests that MSMEs make the largest contribution to employment in South Africa. TIPS, a non-profit research organization focused on trade and industrial policy strategies, published a report on the small business sector and estimates that formal small business owners employed a total of 4.3 million people in 2015, compared to larger firms (hiring 50 or more people) who employed 3.6 million people.35
A comprehensive view of the types of MSMEs making the greatest contribution to job creation is difficult.
The datasets provide different views on this question. The StatsSA QLFS data indicates the distribution of MSMEs across industry groups and number of employees within categories, as shown in Table 16. The zero category indicates there are no employees beyond the business owner. This makes up the bulk of MSMEs, particularly in the manufacturing, wholesale trade, and domestic services sectors. The mining and energy sectors have the highest distribution of MSMEs with significant employment creation, with agriculture and construction having most MSMEs employing at least one additional employee beyond the owner.
Table 15. MSME employment creation by industry
MSME employment
Agriculture Mining Manufacturing Electricity and gas
Construction Wholesale trade
Transport Finance Domestic services and other
0 23% 30% 66% 50% 35% 78% 58% 59% 69%
1 7% 0% 9% 0% 12% 4% 7% 4% 6%
2 to 4 23% 0% 14% 25% 32% 11% 21% 14% 15%
5 to 9 21% 10% 5% 0% 11% 4% 8% 9% 6%
10 to 19 12% 30% 3% 0% 7% 2% 4% 7% 3%
20 to 49 11% 10% 2% 25% 3% 1% 1% 3% 1%
50+ 4% 20% 1% 0% 1% 0% 2% 2% 0%
0-2.5% 2.5-5% 5-20% 20-40% 40-60% 60-100%
The TIPS report on small business finds that only 15 percent of total employment in South Africa is constituted by self-employed.36 This is in conjunction with a 4.3 percent of the working age population identifying as self-employed.37
The GEM study provides an alternative view based on the expectation of early-stage entrepreneurs on the number of jobs they anticipate creating. As shown in Table 16, the majority of early-stage entrepreneurs expect to generate positive employment beyond the owner/manager, with a significant portion expecting to create more than six jobs.
Table 16. Job creation expectation among early-stage entrepreneurs
Source: Herrington et al, 2017, GEM South Africa Report 2016/2017, Can Small Business Survive in South Africa?
2005 2009 2013 2015 2016
No jobs 0% 0% 8.2% 29.8% 13.8%
1-5 jobs 82.9% 66.9% 57.1% 44.5% 58.7%
6+ jobs 17.1% 33.1% 34.7% 25.7% 27.6%
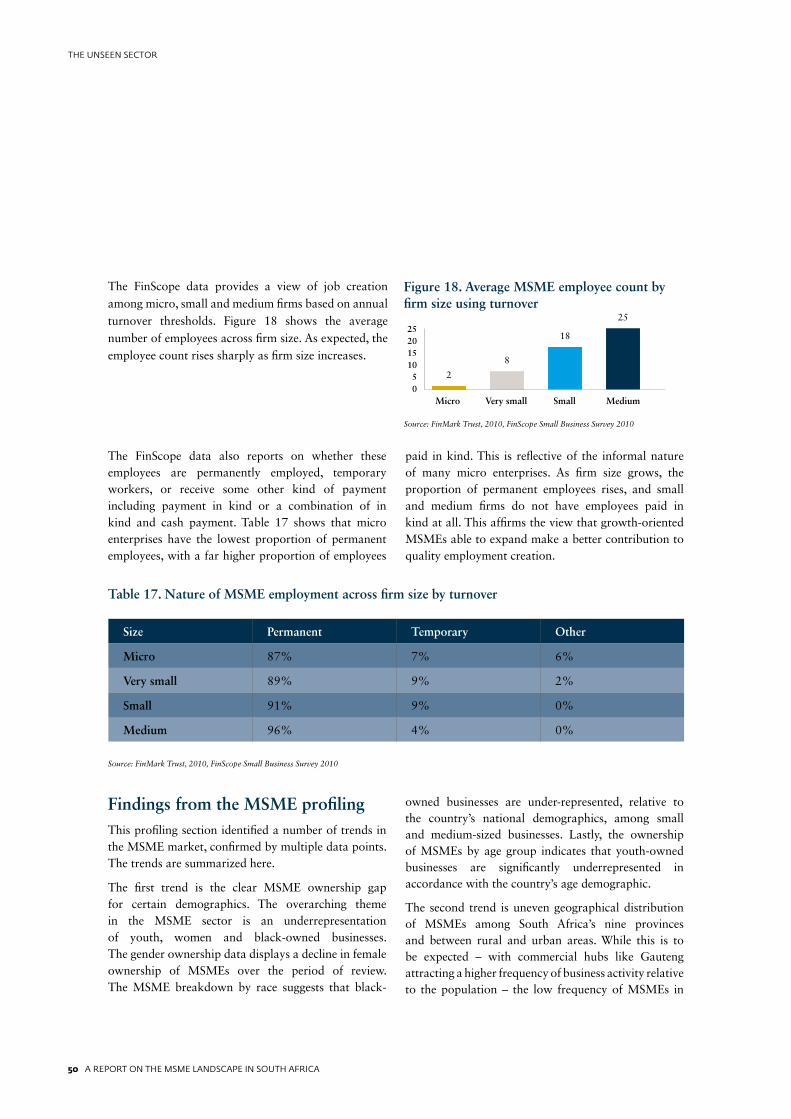
50 A REPORT ON THE MSME LANDSCAPE IN SOUTH AFRICA
THE UNSEEN SECTOR
The FinScope data provides a view of job creation among micro, small and medium firms based on annual turnover thresholds. Figure 18 shows the average number of employees across firm size. As expected, the employee count rises sharply as firm size increases.
The FinScope data also reports on whether these employees are permanently employed, temporary workers, or receive some other kind of payment including payment in kind or a combination of in kind and cash payment. Table 17 shows that micro enterprises have the lowest proportion of permanent employees, with a far higher proportion of employees
paid in kind. This is reflective of the informal nature of many micro enterprises. As firm size grows, the proportion of permanent employees rises, and small and medium firms do not have employees paid in kind at all. This affirms the view that growth-oriented MSMEs able to expand make a better contribution to quality employment creation.
Findings from the MSME profilingThis profiling section identified a number of trends in the MSME market, confirmed by multiple data points. The trends are summarized here.
The first trend is the clear MSME ownership gap for certain demographics. The overarching theme in the MSME sector is an underrepresentation of youth, women and black-owned businesses. The gender ownership data displays a decline in female ownership of MSMEs over the period of review. The MSME breakdown by race suggests that black-
owned businesses are under-represented, relative to the country’s national demographics, among small and medium-sized businesses. Lastly, the ownership of MSMEs by age group indicates that youth-owned businesses are significantly underrepresented in accordance with the country’s age demographic.
The second trend is uneven geographical distribution of MSMEs among South Africa’s nine provinces and between rural and urban areas. While this is to be expected – with commercial hubs like Gauteng attracting a higher frequency of business activity relative to the population – the low frequency of MSMEs in
Table 17. Nature of MSME employment across firm size by turnover
Source: FinMark Trust, 2010, FinScope Small Business Survey 2010
Size Permanent Temporary Other
Micro 87% 7% 6%
Very small 89% 9% 2%
Small 91% 9% 0%
Medium 96% 4% 0%
Source: FinMark Trust, 2010, FinScope Small Business Survey 2010
Figure 18. Average MSME employee count by firm size using turnover
Micro Very small Small Medium
25201510
50
2
8
18
25
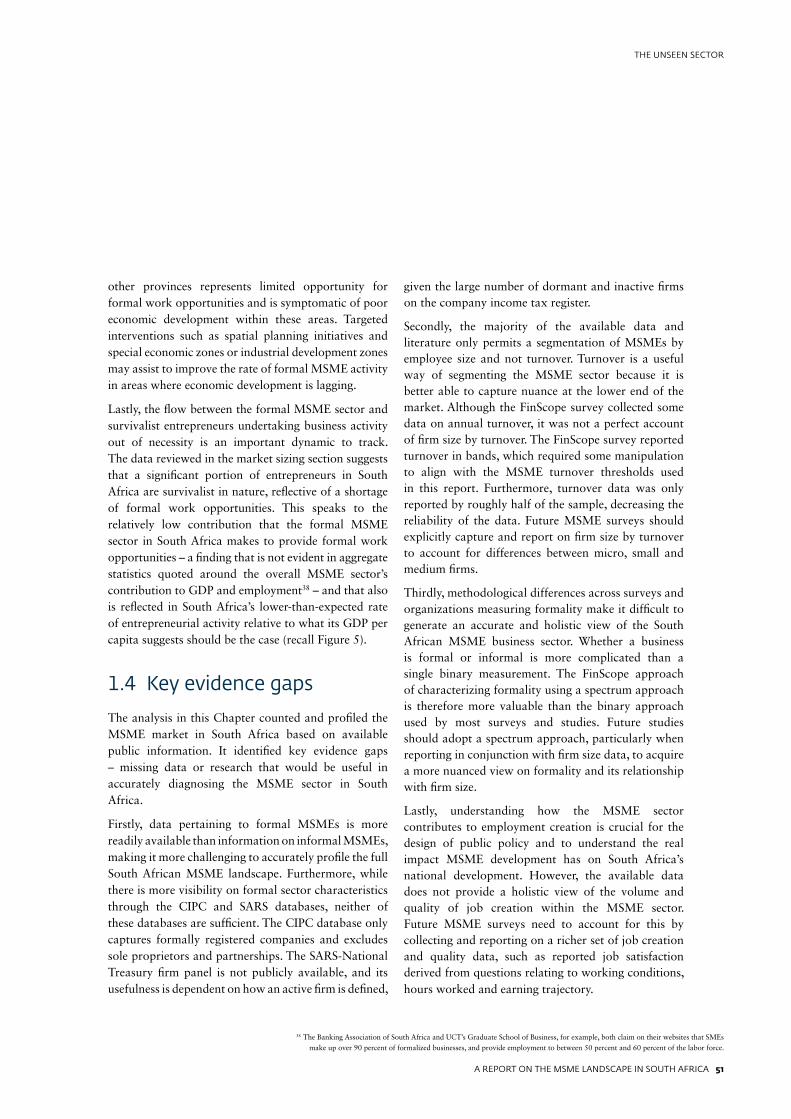
A REPORT ON THE MSME LANDSCAPE IN SOUTH AFRICA 51
THE UNSEEN SECTOR
38 The Banking Association of South Africa and UCT’s Graduate School of Business, for example, both claim on their websites that SMEs make up over 90 percent of formalized businesses, and provide employment to between 50 percent and 60 percent of the labor force.
other provinces represents limited opportunity for formal work opportunities and is symptomatic of poor economic development within these areas. Targeted interventions such as spatial planning initiatives and special economic zones or industrial development zones may assist to improve the rate of formal MSME activity in areas where economic development is lagging.
Lastly, the flow between the formal MSME sector and survivalist entrepreneurs undertaking business activity out of necessity is an important dynamic to track. The data reviewed in the market sizing section suggests that a significant portion of entrepreneurs in South Africa are survivalist in nature, reflective of a shortage of formal work opportunities. This speaks to the relatively low contribution that the formal MSME sector in South Africa makes to provide formal work opportunities – a finding that is not evident in aggregate statistics quoted around the overall MSME sector’s contribution to GDP and employment38 – and that also is reflected in South Africa’s lower-than-expected rate of entrepreneurial activity relative to what its GDP per capita suggests should be the case (recall Figure 5).
1.4 Key evidence gaps
The analysis in this Chapter counted and profiled the MSME market in South Africa based on available public information. It identified key evidence gaps – missing data or research that would be useful in accurately diagnosing the MSME sector in South Africa.
Firstly, data pertaining to formal MSMEs is more readily available than information on informal MSMEs, making it more challenging to accurately profile the full South African MSME landscape. Furthermore, while there is more visibility on formal sector characteristics through the CIPC and SARS databases, neither of these databases are sufficient. The CIPC database only captures formally registered companies and excludes sole proprietors and partnerships. The SARS-National Treasury firm panel is not publicly available, and its usefulness is dependent on how an active firm is defined,
given the large number of dormant and inactive firms on the company income tax register.
Secondly, the majority of the available data and literature only permits a segmentation of MSMEs by employee size and not turnover. Turnover is a useful way of segmenting the MSME sector because it is better able to capture nuance at the lower end of the market. Although the FinScope survey collected some data on annual turnover, it was not a perfect account of firm size by turnover. The FinScope survey reported turnover in bands, which required some manipulation to align with the MSME turnover thresholds used in this report. Furthermore, turnover data was only reported by roughly half of the sample, decreasing the reliability of the data. Future MSME surveys should explicitly capture and report on firm size by turnover to account for differences between micro, small and medium firms.
Thirdly, methodological differences across surveys and organizations measuring formality make it difficult to generate an accurate and holistic view of the South African MSME business sector. Whether a business is formal or informal is more complicated than a single binary measurement. The FinScope approach of characterizing formality using a spectrum approach is therefore more valuable than the binary approach used by most surveys and studies. Future studies should adopt a spectrum approach, particularly when reporting in conjunction with firm size data, to acquire a more nuanced view on formality and its relationship with firm size.
Lastly, understanding how the MSME sector contributes to employment creation is crucial for the design of public policy and to understand the real impact MSME development has on South Africa’s national development. However, the available data does not provide a holistic view of the volume and quality of job creation within the MSME sector. Future MSME surveys need to account for this by collecting and reporting on a richer set of job creation and quality data, such as reported job satisfaction derived from questions relating to working conditions, hours worked and earning trajectory.
52 A REPORT ON THE MSME LANDSCAPE IN SOUTH AFRICA
THE UNSEEN SECTOR
What stands out from the data review conducted for this report is that South Africa needs a more targeted, current and nationally-representative market survey to provide a consistent and accurate view of MSMEs. This survey should also profile and segment the informal MSME market, which has been largely overlooked to date. Because the FinScope Small Business Survey takes the broadest approach to defining MSMEs, it provides a broad view of the MSME sector, but only covers 2010. Since a second FinScope survey has not been conducted, a time series panel is not available, and so the results of the 2010 survey are increasingly dated. The StatsSA QLFS data do offer a panel dynamic which is updated annually, but the information is collected at an individual level rather than at a firm level, meaning that proxies have to be overlaid onto the survey data to accurately profile MSMEs.
For a new nationally-representative survey to successfully fill these gaps, it would need to be clear on a number of definitions, rather than taking a broad approach, given the lack of consensus currently on how to isolate the MSME sector. Once this definition is decided, the survey can then capture key information on firms that meet this definition.
The definitional considerations that need to be taken include:
• What constitutes an active firm? Should the definition include firms at the start-up stage, or only firms that have been trading for a set period of time? Should survivalist entrepreneurs be considered business owners, or only opportunity-driven entrepreneurs? Should firms that have employment and sales activity be considered active, or should a less stringent definition of firm activity be employed?
• What is the definition of MSMEs? Should annual turnover, employee count, total assets, or another form of criteria be used? If it is annual turnover, which turnover thresholds should be used?
• What distinguishes formal from informal firms? Is it being formally registered as a business, and if so how do partnership and sole proprietors fit into this definition? Is it paying some form of tax, in which case should VAT or company income tax be the criteria used? Or should a spectrum approach be taken which measures formality on a host of characteristics traditionally associated with the formal and informal sectors?
A REPORT ON THE MSME LANDSCAPE IN SOUTH AFRICA 53
THE UNSEEN SECTOR
2. Pain Points: Barriers to MSME Growth
Understanding the barriers hindering greater small business growth and job creation is key to designing effective policy and private sector engagement.
The literature on small business development in South Africa is expansive, with contributions from policymakers, academia, think tanks, market facilitators and industry associations. Recent work by SEDA,39 TIPS,40 and FinMark41 in particular covers a lot of ground and adds to an already rich literature describing the landscape and identifying the challenges in the enabling environment facing MSMEs.
This evidence is strengthened by periodic surveys on the small business sector (conducted by FinMark,42 NSBC,43 SAICA,44 or SBP45), on entrepreneurship
(GEM,46 Seed Academy47), and a wealth of occasional
academic or policy research on MSMEs.
From a review of the survey evidence it is clear that
the challenges small businesses face in South Africa are
not dissimilar to those encountered in other markets
(Figure 19). Further, the severity of challenges facing
MSMEs differs, depending on business size and life
cycle, whether start-up or growing. Start-ups report
a combination of market demand, access to finance
and competition as their main challenges. Growing
businesses, meanwhile, report a more varied set,
including access to finance and competition, but also
access to skills, technology, labor and burdensome
regulation – an issue often cited by experts, together
with policy, tax or education.
This report attempts to address the information gaps.
It provides an in-depth market assessment of the
MSME sector in South Africa by researching the
business, financial and regulatory environment related
to MSMEs, quantifying the size of the MSME sector
and illustrating some of the key barriers faced by
MSMEs in terms of access to finance, access to skills
and access to markets in South Africa.
39 SEDA and BER, 2016, The Small, Medium and Micro Enterprise Sector of South Africa40 TIPS, 2017, The Real Economy Bulletin: Special Edition on the State of Small Businesses in South Africa
41 FinMark Trust, 2015, Financial Access and SME Size in South Africa42 FinMark Trust, 2010, FinScope South Africa Small Business Survey
43 NSBC, 2016, National Small Business Survey44 SAICA, 2016, MSME Insight Report
45 SBP, 2015, SME Growth Index46 GEM, 2016, South Africa Report: Can Small Business Survive in South Africa?
47 Seed Academy, 2016, Second Annual Startup Survey Results

54 A REPORT ON THE MSME LANDSCAPE IN SOUTH AFRICA
THE UNSEEN SECTOR
54 A REPORT ON THE MSME LANDSCAPE IN SOUTH AFRICA
THE UNSEEN SECTOR
A REPORT ON THE MSME LANDSCAPE IN SOUTH AFRICA 55
THE UNSEEN SECTOR
A small business owner makes breakfast pastries called ‘Magwenya’ in Freedom Square, Soweto.
Photo: IFC / Karel Prinsloo
Issues of competition and market demand are foremost challenges in the minds of business owners.
A REPORT ON THE MSME LANDSCAPE IN SOUTH AFRICA 55
THE UNSEEN SECTOR
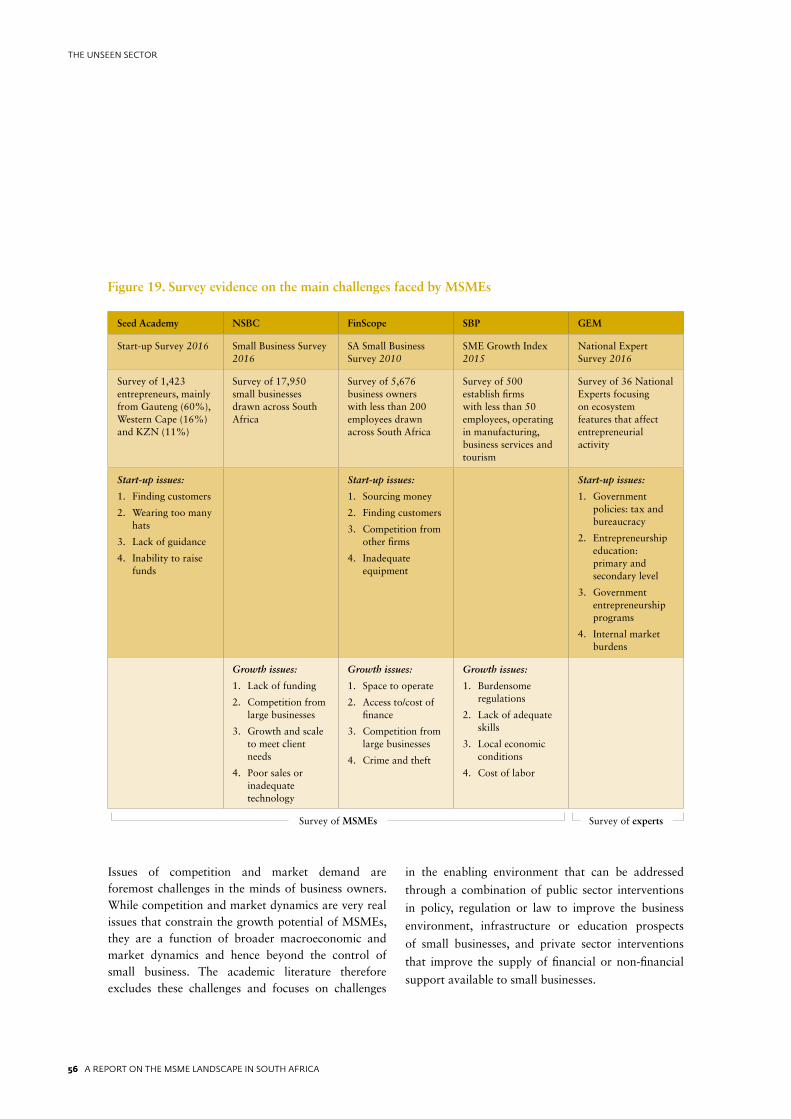
56 A REPORT ON THE MSME LANDSCAPE IN SOUTH AFRICA
THE UNSEEN SECTOR
Figure 19. Survey evidence on the main challenges faced by MSMEs
Seed Academy NSBC FinScope SBP GEM
Start-up Survey 2016 Small Business Survey 2016
SA Small Business Survey 2010
SME Growth Index 2015
National Expert Survey 2016
Survey of 1,423 entrepreneurs, mainly from Gauteng (60%), Western Cape (16%) and KZN (11%)
Survey of 17,950 small businesses drawn across South Africa
Survey of 5,676 business owners with less than 200 employees drawn across South Africa
Survey of 500 establish firms with less than 50 employees, operating in manufacturing, business services and tourism
Survey of 36 National Experts focusing on ecosystem features that affect entrepreneurial activity
Start-up issues:
1. Finding customers
2. Wearing too many hats
3. Lack of guidance
4. Inability to raise funds
Start-up issues:
1. Sourcing money
2. Finding customers
3. Competition from other firms
4. Inadequate equipment
Start-up issues:
1. Government policies: tax and bureaucracy
2. Entrepreneurship education: primary and secondary level
3. Government entrepreneurship programs
4. Internal market burdens
Growth issues:
1. Lack of funding
2. Competition from large businesses
3. Growth and scale to meet client needs
4. Poor sales or inadequate technology
Growth issues:
1. Space to operate
2. Access to/cost of finance
3. Competition from large businesses
4. Crime and theft
Growth issues:
1. Burdensome regulations
2. Lack of adequate skills
3. Local economic conditions
4. Cost of labor
Survey of MSMEs Survey of experts
Issues of competition and market demand are foremost challenges in the minds of business owners. While competition and market dynamics are very real issues that constrain the growth potential of MSMEs, they are a function of broader macroeconomic and market dynamics and hence beyond the control of small business. The academic literature therefore excludes these challenges and focuses on challenges
in the enabling environment that can be addressed
through a combination of public sector interventions
in policy, regulation or law to improve the business
environment, infrastructure or education prospects
of small businesses, and private sector interventions
that improve the supply of financial or non-financial
support available to small businesses.
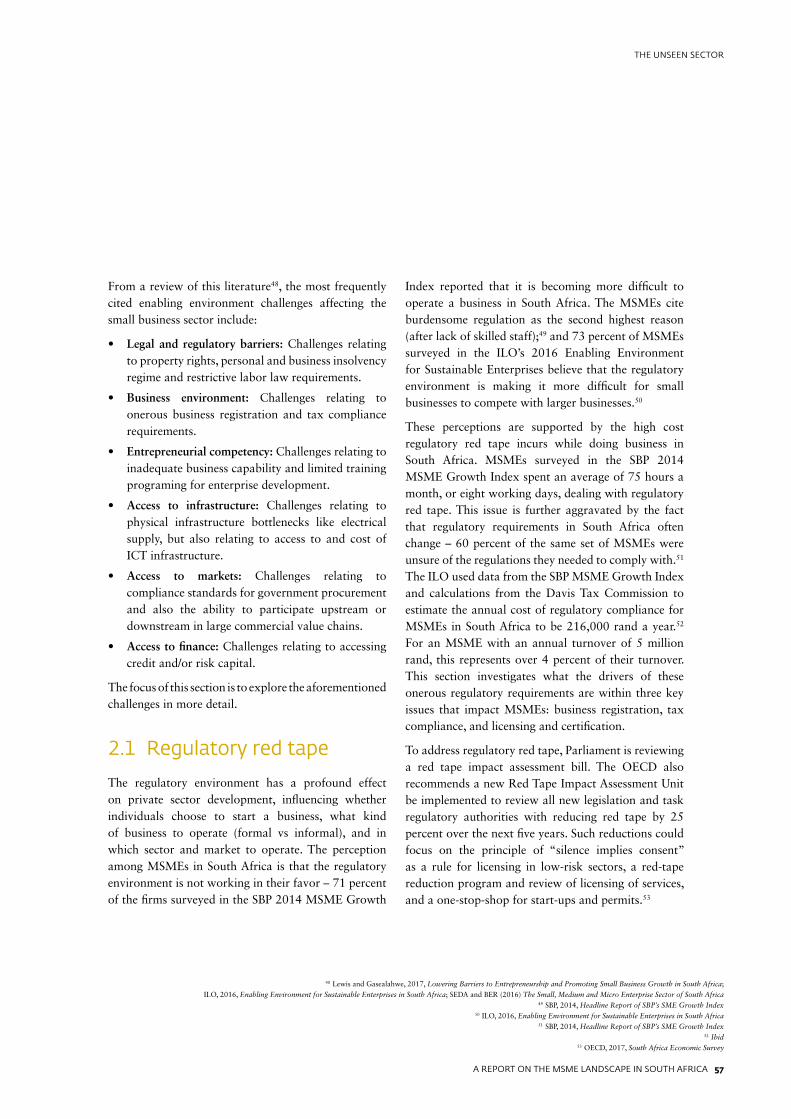
A REPORT ON THE MSME LANDSCAPE IN SOUTH AFRICA 57
THE UNSEEN SECTOR
From a review of this literature48, the most frequently cited enabling environment challenges affecting the small business sector include:
• Legal and regulatory barriers: Challenges relating to property rights, personal and business insolvency regime and restrictive labor law requirements.
• Business environment: Challenges relating to onerous business registration and tax compliance requirements.
• Entrepreneurial competency: Challenges relating to inadequate business capability and limited training programing for enterprise development.
• Access to infrastructure: Challenges relating to physical infrastructure bottlenecks like electrical supply, but also relating to access to and cost of ICT infrastructure.
• Access to markets: Challenges relating to compliance standards for government procurement and also the ability to participate upstream or downstream in large commercial value chains.
• Access to finance: Challenges relating to accessing credit and/or risk capital.
The focus of this section is to explore the aforementioned challenges in more detail.
2.1 Regulatory red tape
The regulatory environment has a profound effect on private sector development, influencing whether individuals choose to start a business, what kind of business to operate (formal vs informal), and in which sector and market to operate. The perception among MSMEs in South Africa is that the regulatory environment is not working in their favor – 71 percent of the firms surveyed in the SBP 2014 MSME Growth
Index reported that it is becoming more difficult to operate a business in South Africa. The MSMEs cite burdensome regulation as the second highest reason (after lack of skilled staff);49 and 73 percent of MSMEs surveyed in the ILO’s 2016 Enabling Environment for Sustainable Enterprises believe that the regulatory environment is making it more difficult for small businesses to compete with larger businesses.50
These perceptions are supported by the high cost regulatory red tape incurs while doing business in South Africa. MSMEs surveyed in the SBP 2014 MSME Growth Index spent an average of 75 hours a month, or eight working days, dealing with regulatory red tape. This issue is further aggravated by the fact that regulatory requirements in South Africa often change – 60 percent of the same set of MSMEs were unsure of the regulations they needed to comply with.51 The ILO used data from the SBP MSME Growth Index and calculations from the Davis Tax Commission to estimate the annual cost of regulatory compliance for MSMEs in South Africa to be 216,000 rand a year.52 For an MSME with an annual turnover of 5 million rand, this represents over 4 percent of their turnover. This section investigates what the drivers of these onerous regulatory requirements are within three key issues that impact MSMEs: business registration, tax compliance, and licensing and certification.
To address regulatory red tape, Parliament is reviewing a red tape impact assessment bill. The OECD also recommends a new Red Tape Impact Assessment Unit be implemented to review all new legislation and task regulatory authorities with reducing red tape by 25 percent over the next five years. Such reductions could focus on the principle of “silence implies consent” as a rule for licensing in low-risk sectors, a red-tape reduction program and review of licensing of services, and a one-stop-shop for start-ups and permits.53
48 Lewis and Gasealahwe, 2017, Lowering Barriers to Entrepreneurship and Promoting Small Business Growth in South Africa; ILO, 2016, Enabling Environment for Sustainable Enterprises in South Africa; SEDA and BER (2016) The Small, Medium and Micro Enterprise Sector of South Africa
49 SBP, 2014, Headline Report of SBP’s SME Growth Index50 ILO, 2016, Enabling Environment for Sustainable Enterprises in South Africa
51 SBP, 2014, Headline Report of SBP’s SME Growth Index52 Ibid
53 OECD, 2017, South Africa Economic Survey
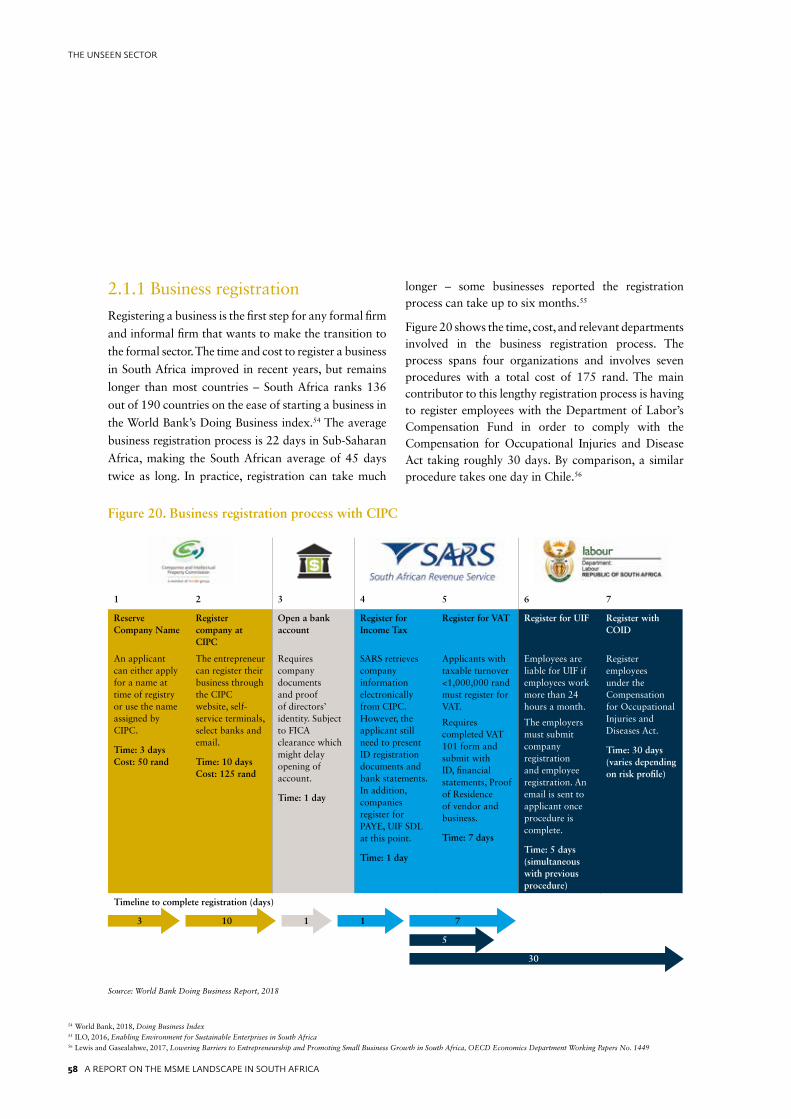
58 A REPORT ON THE MSME LANDSCAPE IN SOUTH AFRICA
THE UNSEEN SECTOR
2.1.1 Business registration
Registering a business is the first step for any formal firm
and informal firm that wants to make the transition to
the formal sector. The time and cost to register a business
in South Africa improved in recent years, but remains
longer than most countries – South Africa ranks 136
out of 190 countries on the ease of starting a business in
the World Bank’s Doing Business index.54 The average
business registration process is 22 days in Sub-Saharan
Africa, making the South African average of 45 days
twice as long. In practice, registration can take much
longer – some businesses reported the registration process can take up to six months.55
Figure 20 shows the time, cost, and relevant departments involved in the business registration process. The process spans four organizations and involves seven procedures with a total cost of 175 rand. The main contributor to this lengthy registration process is having to register employees with the Department of Labor’s Compensation Fund in order to comply with the Compensation for Occupational Injuries and Disease Act taking roughly 30 days. By comparison, a similar procedure takes one day in Chile.56
Figure 20. Business registration process with CIPC
Source: World Bank Doing Business Report, 2018
54 World Bank, 2018, Doing Business Index55 ILO, 2016, Enabling Environment for Sustainable Enterprises in South Africa56 Lewis and Gasealahwe, 2017, Lowering Barriers to Entrepreneurship and Promoting Small Business Growth in South Africa, OECD Economics Department Working Papers No. 1449
1 2 3 4 5 6 7
Reserve Company Name
Register company at CIPC
Open a bank account
Register for Income Tax
Register for VAT Register for UIF Register with COID
An applicant can either apply for a name at time of registry or use the name assigned by CIPC.
Time: 3 daysCost: 50 rand
The entrepreneur can register their business through the CIPC website, self-service terminals, select banks and email.
Time: 10 daysCost: 125 rand
Requires company documents and proof of directors’ identity. Subject to FICA clearance which might delay opening of account.
Time: 1 day
SARS retrieves company information electronically from CIPC. However, the applicant still need to present ID registration documents and bank statements. In addition, companies register for PAYE, UIF SDL at this point.
Time: 1 day
Applicants with taxable turnover <1,000,000 rand must register for VAT.
Requires completed VAT 101 form and submit with ID, financial statements, Proof of Residence of vendor and business.
Time: 7 days
Employees are liable for UIF if employees work more than 24 hours a month.
The employers must submit company registration and employee registration. An email is sent to applicant once procedure is complete.
Time: 5 days (simultaneous with previous procedure)
Register employees under the Compensation for Occupational Injuries and Diseases Act.
Time: 30 days (varies depending on risk profile)
Timeline to complete registration (days)
3 10 1 1 7
5
30
A REPORT ON THE MSME LANDSCAPE IN SOUTH AFRICA 59
THE UNSEEN SECTOR
The length of the business registration process also impacts the likelihood that informal firms will formalize. The literature categorizes the barriers to formalization into financial and non-financial barriers. Across both categories, costly and burdensome government regulations have been identified as the most significant.57 On the non-financial side, the lengthy registration process adds to the perception that becoming formal requires standing in long queues with excessive paperwork. On the financial side, the main concerns regard compliance with costly environmental protection, employee welfare and tax regulations.58 In addition, while the 175 rand cost of registering a business is relatively low, the opportunity cost of the time and effort required to undergo the process may be significant. This is particularly so for informal micro enterprises, where any time spent on administrative processes is foregone revenue, and where low awareness of regulatory compliance issues, such as tax, would require seeking external help.
Barriers stemming from business registration have been well researched and there are no large evidence gaps in understanding how these barriers impact MSME growth. However the research identifies a clear market gap in having an easy, fast and cheap business registration process that is central to increasing the number of formal firms and driving private sector growth. The IFC recommends a one-stop shop approach for the business registration process which incorporates technology to improve efficiency.59 There are a number of initiatives currently underway which would contribute to this – the automation of company registration at CIPC should reduce the time for business registration to a day, and a number of commercial banks now allow the opening of bank accounts to happen concurrently with business registration.60 The World Bank is working with government departments to use the variation in the Doing Business indicators to identify the best-
performing municipalities to inform peer-learning through workshops.61 The government has also introduced one-stop shops in three provinces in 2017, with plans to expand to all provinces over the next three years, but these are largely catering to foreign investors.62 Co-locating these with local government or other government services and creating a virtual one-stop-shop by continuing to join up processing among government departments digitally has great scope to remove duplication and speed up the business registration and local government licensing process.63
2.1.2 Tax complianceCompany tax policy influences the business environment and corporate owners take it into account when choosing registration and operational jurisdictions. MSMEs are perhaps more significantly impacted by tax policy, both because they are less likely to be able to move to a more favorable tax jurisdiction, and because they have fewer resources to comply with tax regulation. Issues relating to company tax in South Africa can be divided into tax registration, tax compliance, and rebate collection issues. As tax registration has been covered in the preceding sub-section, the focus here is on compliance and rebate collection issues.
South Africa performs relatively well on the ease of paying taxes metric in the World Bank’s Doing Business index – ranking 46 out of 190 countries. On average, businesses are required to make seven payments to SARS per year taking 210 hours, better than the sub-Saharan Africa average of 280 hours but worse than the OECD average of 160 hours.64 However, this tax compliance burden is more severely felt by MSMEs. The Davis Tax Committee identified a median tax compliance cost of 20,500 rand for small businesses65 – for micro enterprises this represents a minimum of 4 percent of the firm’s annual turnover, but could take up much more.66
57 Tassin, 2014, Transiting from the informal to formal business: motives, challenges and the coping mechanism of selected transited businesses in the Bloemfontein area58 ILDP, 2014, Informal Small Medium and Micro Enterprise Retailers in South Africa
59 IFC, 2013. Reforming Business Registration: a Toolkit for the Practitioners, Investment Climate 84014 60 CIPC, 2016. Strategic Plan: 2016/2017-2019/2020
61 Lewis and Gasealahwe, 2017, Lowering Barriers to Entrepreneurship and Promoting Small Business Growth in South Africa, OECD Economics Department Working Papers No. 1449 62 Lewis and Gasealahwe, 2017, Lowering Barriers to Entrepreneurship and Promoting Small Business Growth in South Africa, OECD Economics Department Working Papers No. 1449
63 OECD, 2017, South Africa Economic Survey64 World Bank, 2018, Doing Business Index
65 Davis Tax Committee, 2014, Small and Medium Enterprises: Taxation Considerations, Interim Report66 Minimum calculated using an annual turnover threshold of R500,000 or less to define a micro enterprise
60 A REPORT ON THE MSME LANDSCAPE IN SOUTH AFRICA
THE UNSEEN SECTOR
67 SBP, 2014, Growth and Competitiveness for Small Business in South Africa, Headline Report of SBP’s SME Growth Index68 Lewis and Gasealahwe, 2017, Lowering Barriers to Entrepreneurship and Promoting Small Business Growth in South Africa, OECD Economics Department Working Papers No. 144969 Davis Tax Commission, 2016, Second and Final Report on Small and Medium Enterprises 70 Lewis and Gasealahwe, 2017, Lowering Barriers to Entrepreneurship and Promoting Small Business Growth in South Africa, OECD Economics Department Working Papers No. 144971 SARS, 2018, Small Business Relief, online: http://www.sars.gov.za/ClientSegments/Businesses/SmallBusinesses/Small-business-relief/Pages/default.aspx72 SARS, 2018, Turnover Tax, online: http://www.sars.gov.za/TaxTypes/TT/Pages/default.aspx
BOX 2 SMALL BUSINESS CORPORATION AND TURNOVER TAX REGIMES
The Small Business Corporation regime provides tax concessions for small businesses according to their taxable income. A small business qualifying as an SBC pays no income tax on the first 78,150 rand of taxable income, with a progressive tax rate starting from 7 percent up to the normal corporate income tax rate of 28 percent for the remaining taxable income. The regime also allows for the accelerated depreciation of assets.71
The turnover tax regime was introduced in 2008 to reduce the compliance burden for micro enterprises in particular. The regime provides a simplified tax system for micro enterprises with a qualifying annual turnover of 1 million rand or less by replacing income tax, VAT, provisional tax, capital gains tax, and dividend tax into a single tax payment. However, micro businesses registered for turnover tax can elect to remain in the VAT system. Businesses complying with the turnover tax regime pay no tax on the first 335,000 rand of their turnover, with a progressive tax rate starting from 1 percent up to 3 percent for the remaining turnover.72
Part of this issue is the number of procedures and payments MSMEs have to make to SARS – the SBP MSME growth index identified SARS as the most burdensome regulatory authority that MSMEs have to deal with in South Africa.67 The other part of this issue is the fact that MSMEs have to comply with similar tax requirements as larger firms, but with fewer resources and less access to specialized skills. In the 2013/2014 tax year, 61 percent of small business company income tax filings were late, a possible indication MSMEs struggle to understand company tax compliance and encounter difficulties in compiling returns.68
South Africa introduced two special tax regimes for small businesses to address some of these concerns – the small business corporation regime and the turnover tax regime. These are explained in Box 2. While these regimes are important developments, their success in removing the MSME tax compliance burden is limited. The Davis Tax Committee reports that only 7,827 active firms were registered for the turnover tax regime in 2013, while there were over 60,000 company income tax registered micro enterprises on average between 2010 and 2014.69 The Commission noted the tax regime could be made less burdensome by allowing firms to opt out of the regime annually (currently firms have to opt in for three years) and by reducing the number of payments from biannual to annual. The Commission also found that the small business corporation regime has been fundamentally ineffective, with a large portion of the tax benefit enjoyed by service-related small businesses that were not the intended target of the regime. SARS also introduced small business desks at its branches to assist MSMEs with tax compliance issues.70
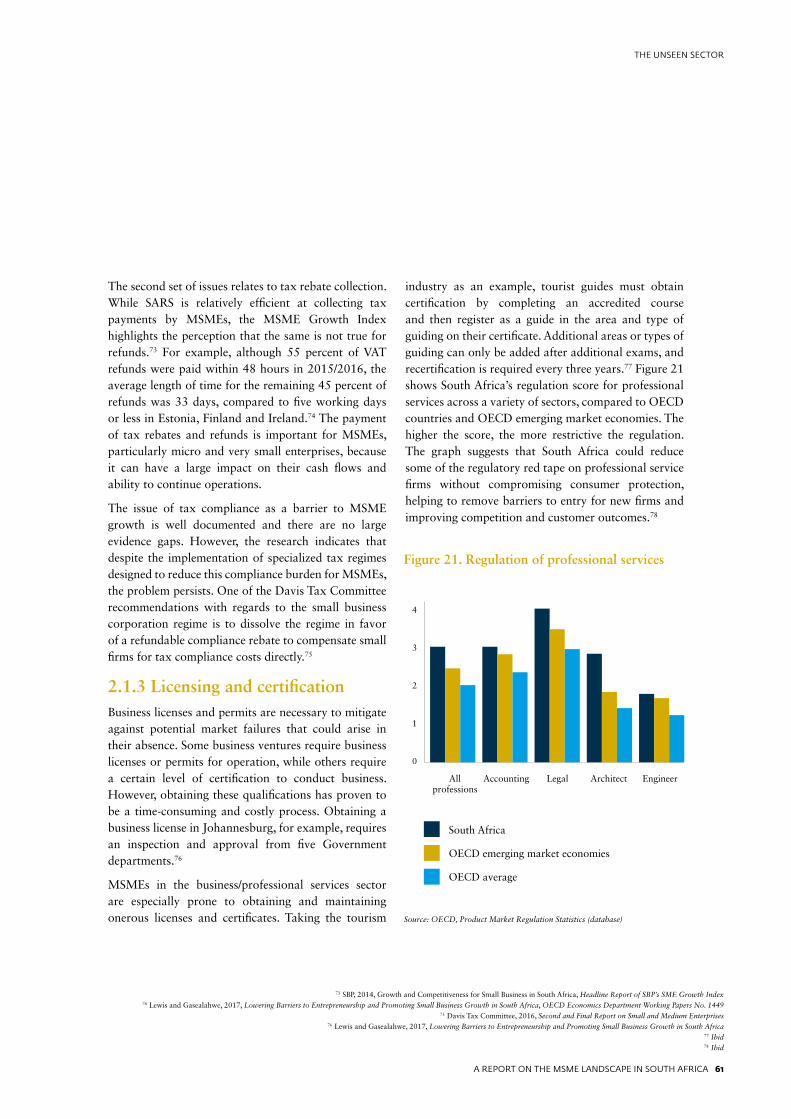
A REPORT ON THE MSME LANDSCAPE IN SOUTH AFRICA 61
THE UNSEEN SECTOR
The second set of issues relates to tax rebate collection. While SARS is relatively efficient at collecting tax payments by MSMEs, the MSME Growth Index highlights the perception that the same is not true for refunds.73 For example, although 55 percent of VAT refunds were paid within 48 hours in 2015/2016, the average length of time for the remaining 45 percent of refunds was 33 days, compared to five working days or less in Estonia, Finland and Ireland.74 The payment of tax rebates and refunds is important for MSMEs, particularly micro and very small enterprises, because it can have a large impact on their cash flows and ability to continue operations.
The issue of tax compliance as a barrier to MSME growth is well documented and there are no large evidence gaps. However, the research indicates that despite the implementation of specialized tax regimes designed to reduce this compliance burden for MSMEs, the problem persists. One of the Davis Tax Committee recommendations with regards to the small business corporation regime is to dissolve the regime in favor of a refundable compliance rebate to compensate small firms for tax compliance costs directly.75
2.1.3 Licensing and certificationBusiness licenses and permits are necessary to mitigate against potential market failures that could arise in their absence. Some business ventures require business licenses or permits for operation, while others require a certain level of certification to conduct business. However, obtaining these qualifications has proven to be a time-consuming and costly process. Obtaining a business license in Johannesburg, for example, requires an inspection and approval from five Government departments.76
MSMEs in the business/professional services sector are especially prone to obtaining and maintaining onerous licenses and certificates. Taking the tourism
industry as an example, tourist guides must obtain certification by completing an accredited course and then register as a guide in the area and type of guiding on their certificate. Additional areas or types of guiding can only be added after additional exams, and recertification is required every three years.77 Figure 21 shows South Africa’s regulation score for professional services across a variety of sectors, compared to OECD countries and OECD emerging market economies. The higher the score, the more restrictive the regulation. The graph suggests that South Africa could reduce some of the regulatory red tape on professional service firms without compromising consumer protection, helping to remove barriers to entry for new firms and improving competition and customer outcomes.78
Figure 21. Regulation of professional services
Source: OECD, Product Market Regulation Statistics (database)
73 SBP, 2014, Growth and Competitiveness for Small Business in South Africa, Headline Report of SBP’s SME Growth Index74 Lewis and Gasealahwe, 2017, Lowering Barriers to Entrepreneurship and Promoting Small Business Growth in South Africa, OECD Economics Department Working Papers No. 1449
75 Davis Tax Committee, 2016, Second and Final Report on Small and Medium Enterprises76 Lewis and Gasealahwe, 2017, Lowering Barriers to Entrepreneurship and Promoting Small Business Growth in South Africa
77 Ibid78 Ibid
All professions
Accounting Legal Architect Engineer
4
3
2
1
0
South Africa
OECD emerging market economies
OECD average
62 A REPORT ON THE MSME LANDSCAPE IN SOUTH AFRICA
THE UNSEEN SECTOR
79 The Global Findex Database 2017: Measuring Financial Inclusion, World Bank80 Genesis Analytics, 2017, The Impact of the Fourth Industrial Revolution on Financial Services in South Africa, Centre for Excellence in Financial Services Research Report81 World Bank, 2007, Enterprise Surveys, South Africa Country Profile 200782 Finmark Trust, 2010, FinScope South Africa Small Business Survey 201083 Ibid84 Genesis Analytics, 2017, The Impact of the Fourth Industrial Revolution on Financial Services in South Africa, Centre for Excellence in Financial Services Research Report
2.2 Access to financial services
Financial services offer critical support for MSMEs to be able to grow, from being able to carry out everyday transactions more easily to financing expansion. The financial services MSMEs require differ significantly according to their size, degree of formality, and growth stage – but most firms will require some form of transactional banking or payment product to help them transact with their suppliers, customers and staff; and credit to help sustain or grow the firm. The latter requirement typically depends on the lifecycle stage the firm is in, and can be categorized into three groups: start-up capital at inception, working capital once the firm is established, and long-term capital when the firm wants to grow. These four components are explored in this sub-section, focusing on where the barriers to accessing finance exist in South Africa. A more detailed analysis of financial inclusion and access to finance among MSMEs is provided in Section 3 of this study.
2.2.1 Transactional bankingBank accounts are traditionally the means by which individuals and businesses conduct financial transactions with one another. South Africa has a well-developed banking system with 69 percent of the adult population formally banked in 2017.79 According to the COEFS research report, a number of global payment innovations provide an alternative to bank accounts, such as mobile money, crypto currencies or cash-based remittance products. Payment innovations have been less successful in South Africa, partly due to the sophistication and high penetration of the banking sector.80
Current MSME access to business bank accounts in South Africa varies according to different sources. The World Bank’s 2007 Enterprise Survey puts the figure at 97.9 percent,81 while FinMark’s 2010 FinScope Small Business Survey puts the figure at 46.9 percent.82 The difference between the figures can likely be accounted for by the types of firms surveyed – the World Bank survey only considered formal firms and excluded the agricultural sector entirely, while the Finmark survey included informal firms across a variety of sectors. The distinction highlights an import point – not all firms want to make use of a business banking account to conduct their transactions. The relatively low figure of 46.9 percent access to bank accounts reported by FinMark could be explained by the fact that many informal firms may prefer to use their personal bank accounts to conduct their business, or operate entirely in cash. The vast majority of firms surveyed in the FinScope Small Business Survey in 2010 cited low income as the reason for not having a business bank account, suggesting that a business account is only perceived as necessary once a firm is more established.83
In addition, given that the majority of MSMEs in South Africa fall in the micro and informal segment, the issues impacting bank account use among individuals are likely to apply equally to business owners. According to the COEFS research report, South Africa’s high bank penetration rate belies a poor usage of formal financial services driven by a dependence on cash within the informal economy, and poor levels of financial product knowledge and understanding.84 This is evidenced by Figure 22, which shows the rate of access to four types of financial services among small businesses in South Africa, including informal financial services. The graph shows that while small businesses typically have access to transactional and savings products, the use of insurance and credit products are comparatively very low.
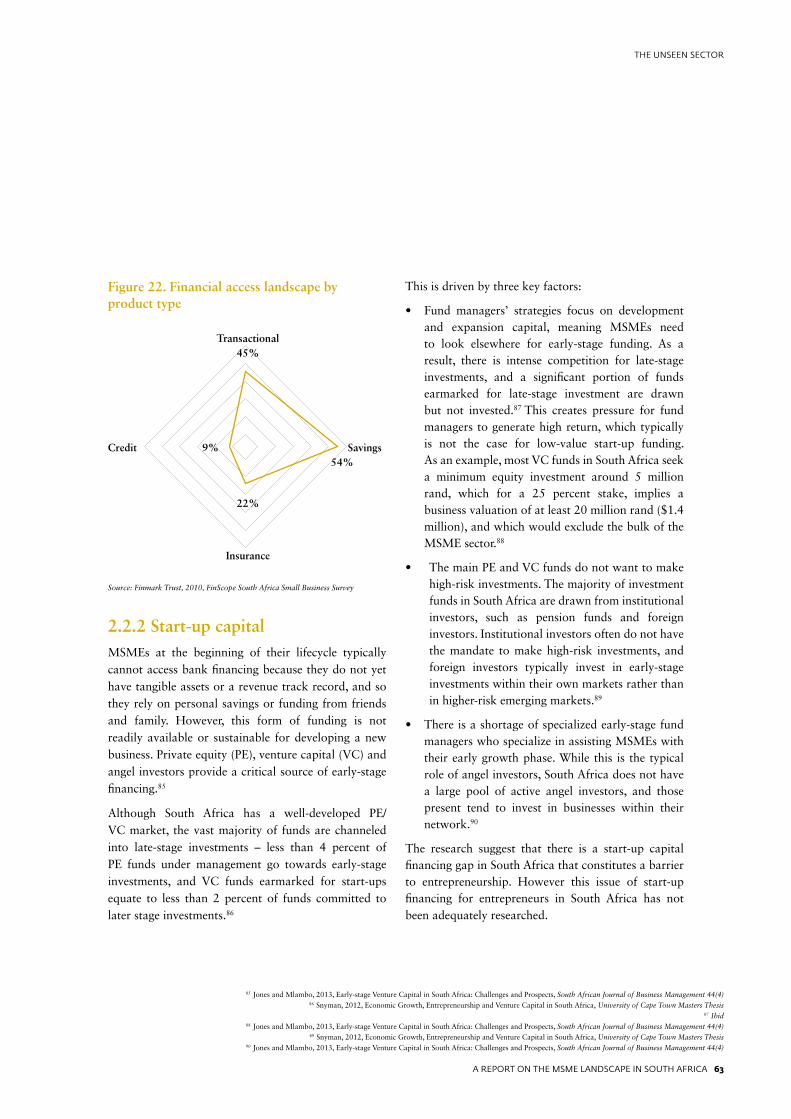
A REPORT ON THE MSME LANDSCAPE IN SOUTH AFRICA 63
THE UNSEEN SECTOR
Figure 22. Financial access landscape by product type
2.2.2 Start-up capitalMSMEs at the beginning of their lifecycle typically cannot access bank financing because they do not yet have tangible assets or a revenue track record, and so they rely on personal savings or funding from friends and family. However, this form of funding is not readily available or sustainable for developing a new business. Private equity (PE), venture capital (VC) and angel investors provide a critical source of early-stage financing.85
Although South Africa has a well-developed PE/VC market, the vast majority of funds are channeled into late-stage investments – less than 4 percent of PE funds under management go towards early-stage investments, and VC funds earmarked for start-ups equate to less than 2 percent of funds committed to later stage investments.86
This is driven by three key factors:
• Fund managers’ strategies focus on development and expansion capital, meaning MSMEs need to look elsewhere for early-stage funding. As a result, there is intense competition for late-stage investments, and a significant portion of funds earmarked for late-stage investment are drawn but not invested.87 This creates pressure for fund managers to generate high return, which typically is not the case for low-value start-up funding. As an example, most VC funds in South Africa seek a minimum equity investment around 5 million rand, which for a 25 percent stake, implies a business valuation of at least 20 million rand ($1.4 million), and which would exclude the bulk of the MSME sector.88
• The main PE and VC funds do not want to make high-risk investments. The majority of investment funds in South Africa are drawn from institutional investors, such as pension funds and foreign investors. Institutional investors often do not have the mandate to make high-risk investments, and foreign investors typically invest in early-stage investments within their own markets rather than in higher-risk emerging markets.89
• There is a shortage of specialized early-stage fund managers who specialize in assisting MSMEs with their early growth phase. While this is the typical role of angel investors, South Africa does not have a large pool of active angel investors, and those present tend to invest in businesses within their network.90
The research suggest that there is a start-up capital financing gap in South Africa that constitutes a barrier to entrepreneurship. However this issue of start-up financing for entrepreneurs in South Africa has not been adequately researched.
Transactional45%
22%
Insurance
85 Jones and Mlambo, 2013, Early-stage Venture Capital in South Africa: Challenges and Prospects, South African Journal of Business Management 44(4)86 Snyman, 2012, Economic Growth, Entrepreneurship and Venture Capital in South Africa, University of Cape Town Masters Thesis
87 Ibid88 Jones and Mlambo, 2013, Early-stage Venture Capital in South Africa: Challenges and Prospects, South African Journal of Business Management 44(4)
89 Snyman, 2012, Economic Growth, Entrepreneurship and Venture Capital in South Africa, University of Cape Town Masters Thesis90 Jones and Mlambo, 2013, Early-stage Venture Capital in South Africa: Challenges and Prospects, South African Journal of Business Management 44(4)
Source: Finmark Trust, 2010, FinScope South Africa Small Business Survey
Credit 9% Savings 54%
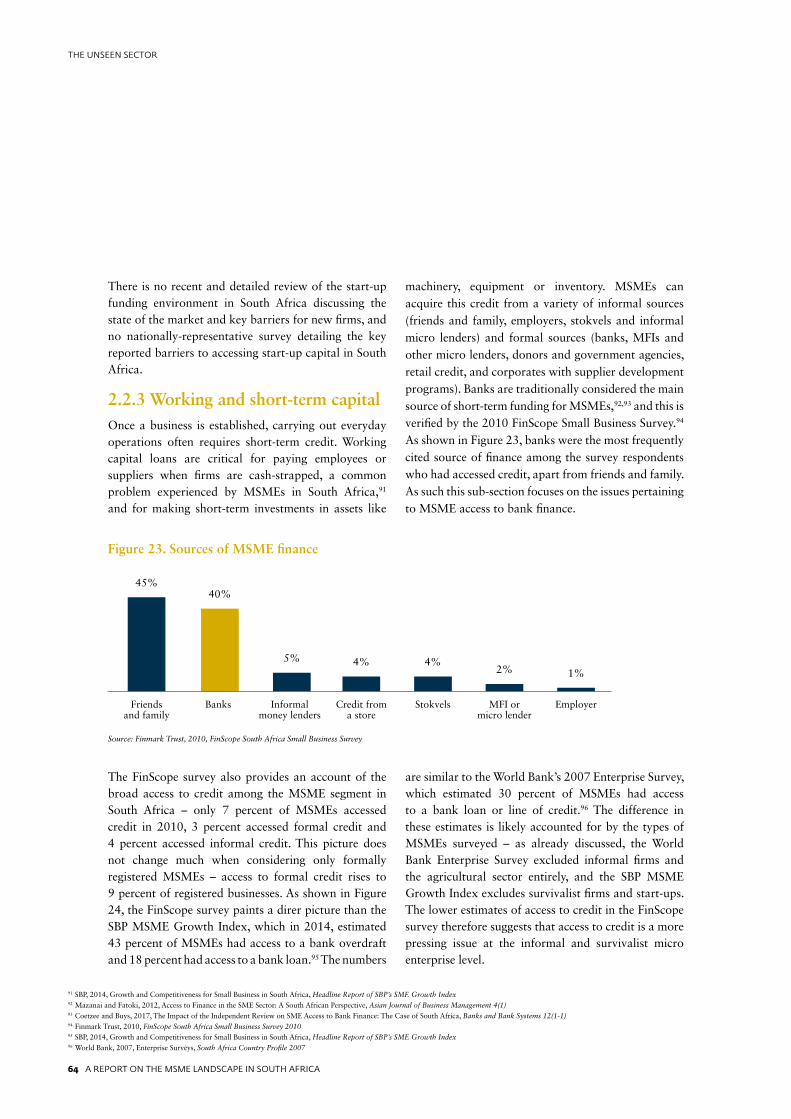
64 A REPORT ON THE MSME LANDSCAPE IN SOUTH AFRICA
THE UNSEEN SECTOR
91 SBP, 2014, Growth and Competitiveness for Small Business in South Africa, Headline Report of SBP’s SME Growth Index 92 Mazanai and Fatoki, 2012, Access to Finance in the SME Sector: A South African Perspective, Asian Journal of Business Management 4(1)93 Coetzee and Buys, 2017, The Impact of the Independent Review on SME Access to Bank Finance: The Case of South Africa, Banks and Bank Systems 12(1-1)94 Finmark Trust, 2010, FinScope South Africa Small Business Survey 201095 SBP, 2014, Growth and Competitiveness for Small Business in South Africa, Headline Report of SBP’s SME Growth Index96 World Bank, 2007, Enterprise Surveys, South Africa Country Profile 2007
There is no recent and detailed review of the start-up funding environment in South Africa discussing the state of the market and key barriers for new firms, and no nationally-representative survey detailing the key reported barriers to accessing start-up capital in South Africa.
2.2.3 Working and short-term capitalOnce a business is established, carrying out everyday operations often requires short-term credit. Working capital loans are critical for paying employees or suppliers when firms are cash-strapped, a common problem experienced by MSMEs in South Africa,91
and for making short-term investments in assets like
machinery, equipment or inventory. MSMEs can acquire this credit from a variety of informal sources (friends and family, employers, stokvels and informal micro lenders) and formal sources (banks, MFIs and other micro lenders, donors and government agencies, retail credit, and corporates with supplier development programs). Banks are traditionally considered the main source of short-term funding for MSMEs,92,93 and this is verified by the 2010 FinScope Small Business Survey.94 As shown in Figure 23, banks were the most frequently cited source of finance among the survey respondents who had accessed credit, apart from friends and family. As such this sub-section focuses on the issues pertaining to MSME access to bank finance.
The FinScope survey also provides an account of the broad access to credit among the MSME segment in South Africa – only 7 percent of MSMEs accessed credit in 2010, 3 percent accessed formal credit and 4 percent accessed informal credit. This picture does not change much when considering only formally registered MSMEs – access to formal credit rises to 9 percent of registered businesses. As shown in Figure 24, the FinScope survey paints a direr picture than the SBP MSME Growth Index, which in 2014, estimated 43 percent of MSMEs had access to a bank overdraft and 18 percent had access to a bank loan.95 The numbers
are similar to the World Bank’s 2007 Enterprise Survey, which estimated 30 percent of MSMEs had access to a bank loan or line of credit.96 The difference in these estimates is likely accounted for by the types of MSMEs surveyed – as already discussed, the World Bank Enterprise Survey excluded informal firms and the agricultural sector entirely, and the SBP MSME Growth Index excludes survivalist firms and start-ups. The lower estimates of access to credit in the FinScope survey therefore suggests that access to credit is a more pressing issue at the informal and survivalist micro enterprise level.
Source: Finmark Trust, 2010, FinScope South Africa Small Business Survey
Figure 23. Sources of MSME finance
45%40%
5% 4% 4%2% 1%
Friends and family
Banks Informal money lenders
Credit from a store
Stokvels MFI or micro lender
Employer
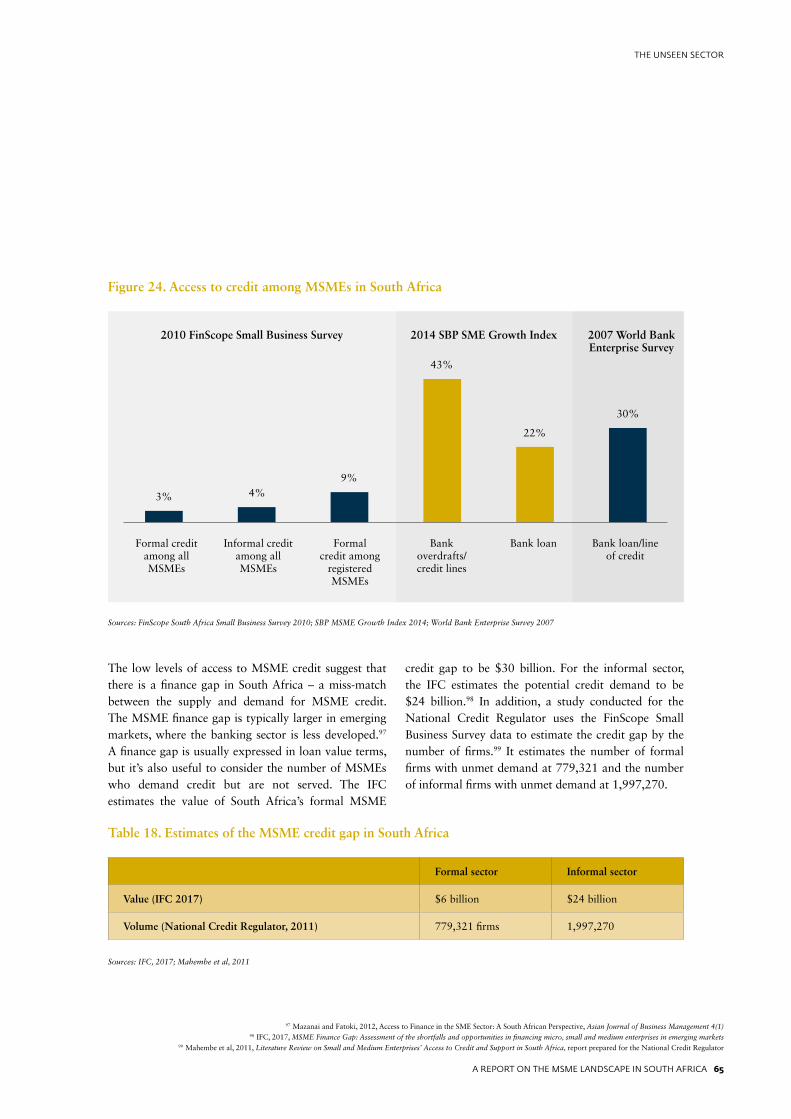
A REPORT ON THE MSME LANDSCAPE IN SOUTH AFRICA 65
THE UNSEEN SECTOR
Sources: FinScope South Africa Small Business Survey 2010; SBP MSME Growth Index 2014; World Bank Enterprise Survey 2007
Figure 24. Access to credit among MSMEs in South Africa
The low levels of access to MSME credit suggest that there is a finance gap in South Africa – a miss-match between the supply and demand for MSME credit. The MSME finance gap is typically larger in emerging markets, where the banking sector is less developed.97
A finance gap is usually expressed in loan value terms, but it’s also useful to consider the number of MSMEs who demand credit but are not served. The IFC estimates the value of South Africa’s formal MSME
credit gap to be $30 billion. For the informal sector, the IFC estimates the potential credit demand to be $24 billion.98 In addition, a study conducted for the National Credit Regulator uses the FinScope Small Business Survey data to estimate the credit gap by the number of firms.99 It estimates the number of formal firms with unmet demand at 779,321 and the number of informal firms with unmet demand at 1,997,270.
Table 18. Estimates of the MSME credit gap in South Africa
Sources: IFC, 2017; Mahembe et al, 2011
Formal sector Informal sector
Value (IFC 2017) $6 billion $24 billion
Volume (National Credit Regulator, 2011) 779,321 firms 1,997,270
97 Mazanai and Fatoki, 2012, Access to Finance in the SME Sector: A South African Perspective, Asian Journal of Business Management 4(1)98 IFC, 2017, MSME Finance Gap: Assessment of the shortfalls and opportunities in financing micro, small and medium enterprises in emerging markets
99 Mahembe et al, 2011, Literature Review on Small and Medium Enterprises’ Access to Credit and Support in South Africa, report prepared for the National Credit Regulator
Formal credit among all MSMEs
Informal credit among all MSMEs
Formal credit among
registered MSMEs
Bank overdrafts/credit lines
Bank loan Bank loan/line of credit
2010 FinScope Small Business Survey 2014 SBP SME Growth Index 2007 World Bank Enterprise Survey
3% 4%9%
43%
22%
30%
66 A REPORT ON THE MSME LANDSCAPE IN SOUTH AFRICA
THE UNSEEN SECTOR
66 A REPORT ON THE MSME LANDSCAPE IN SOUTH AFRICA
THE UNSEEN SECTOR
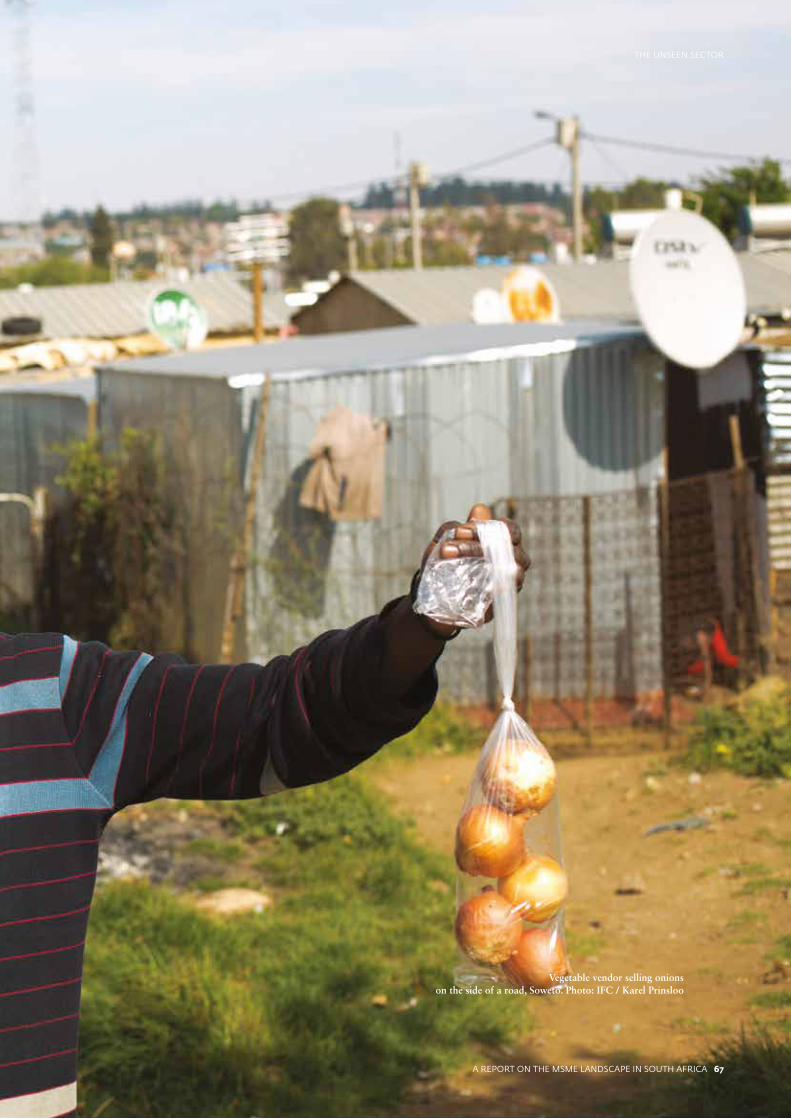
A REPORT ON THE MSME LANDSCAPE IN SOUTH AFRICA 67
THE UNSEEN SECTOR
Vegetable vendor selling onions on the side of a road, Soweto. Photo: IFC / Karel Prinsloo
A REPORT ON THE MSME LANDSCAPE IN SOUTH AFRICA 67
THE UNSEEN SECTOR
68 A REPORT ON THE MSME LANDSCAPE IN SOUTH AFRICA
THE UNSEEN SECTOR
The financing gap is caused by a combination of supply and demand-side issues, ranging from macroeconomic conditions to a lack of MSME expertise at banks to negative perceptions among MSMEs on borrowing.100 Another key driver of the gap not often discussed is information asymmetry. Borrowers know more about the viability of their investments and their ability and intention to repay compared to banks. As such, banks price credit with imperfect information and, being relatively risk-averse, err on the side of caution.101 The result is credit rationing practices among banks and the setting of higher interest rates to compensate for the risk. The pricing may further exclude potential MSME borrowers who have low-risk investments and are unwilling to pay higher interest rates, an adverse selection problem.102 Banks price MSME finance as high-risk in the absence of better information and only the high-risk small businesses are willing to pay this price.
High administration and information collection costs: MSMEs require small loan values, but the transaction cost associated with screening and processing MSME loans are fixed, making the administration costs of serving MSMEs relatively high. Techniques such as automated credit scoring partially address this by allowing for economies of scale to be reached through volume, but require greater access to reliable and consistent information to accurately score firms.103
Small businesses, particularly informal micro enterprises, are more likely to be located in rural and peri-urban areas compared to large firms, meaning the cost of information collection is greater.104 South Africa’s credit registry infrastructure is well developed and sophisticated with 64 percent of adults covered by 14 credit bureaus.105 South African banks use credit bureau data to automate credit scoring106 but the coverage of credit data for businesses is not comprehensive, particularly in the informal sector. Personal credit information is well captured by the
credit bureaus, provided by banks and retail credit providers, but it is not clear when personal lending is used to finance business operations. The coverage of credit data for businesses is less comprehensive than personal lending in South Africa, and does not include retail credit extended to firms in the informal sector, missing a significant view of small vendors and traders in the retail sector.107
Poor financial record keeping: MSMEs are not legally obliged to produce the same audited financial statements as large firms are, removing a key piece of information banks traditionally use to assess credit risk. Some studies find a direct relationship between audited financial statements and successful small business loan applications while others do not. Coetzee and Buys investigated this issue in South Africa and found post the financial crisis that banks are more interested in MSMEs’ current and projected financial performance than their historical performance, requiring a view of their cash flow and management statements rather than audited financial statements. The researchers attribute the shift to a more risk-averse credit approval process after the financial crisis, and to the new Companies Act of 2008, which abolished the statutory audit requirement for qualifying companies.108
The prevalence of good quality financial record keeping among MSMEs in South Africa is low, either because MSMEs do not have an accounting system in place to generate records, or because there is a desire to remain opaque to evade tax.109 The FinScope Small Business Survey indicates that only 46 percent of small businesses keep financial records, and that no record keeping is more prevalent among micro and informal firms. The survey also reveals that when information is collected, it relates to sales rather than cash flow or net income, making it difficult for banks to accurately measure risk. This is shown in Figures 25 and 26.
100 Mazanai and Fatoki, 2012, Access to Finance in the SME Sector: A South African Perspective, Asian Journal of Business Management 4(1)101 Coetzee and Buys, 2017, The Impact of the Independent Review on SME Access to Bank Finance: The Case of South Africa, Banks and Bank Systems 12(1-1)102 Mazanai and Fatoki, 2012, Access to Finance in the SME Sector: A South African Perspective, Asian Journal of Business Management 4(1)103 Mazanai and Fatoki, 2012, Access to Finance in the SME Sector: A South African Perspective, Asian Journal of Business Management 4(1)104 Mazanai and Fatoki, 2012, Access to Finance in the SME Sector: A South African Perspective, Asian Journal of Business Management 4(1)105 World Bank, 2018, Doing Business Index106 Turner et al, 2008, Information Sharing and MSME Financing in South Africa107 Turner et al, 2008, Information Sharing and MSME Financing in South Africa108 Coetzee and Buys, 2017, The impact of the independent review on SME access to bank finance: the case of South Africa, Banks and Bank Systems 12(1-1)109 Makina et al., 2015, Financial Access and SME Size in South Africa, prepared for FinMark Trust
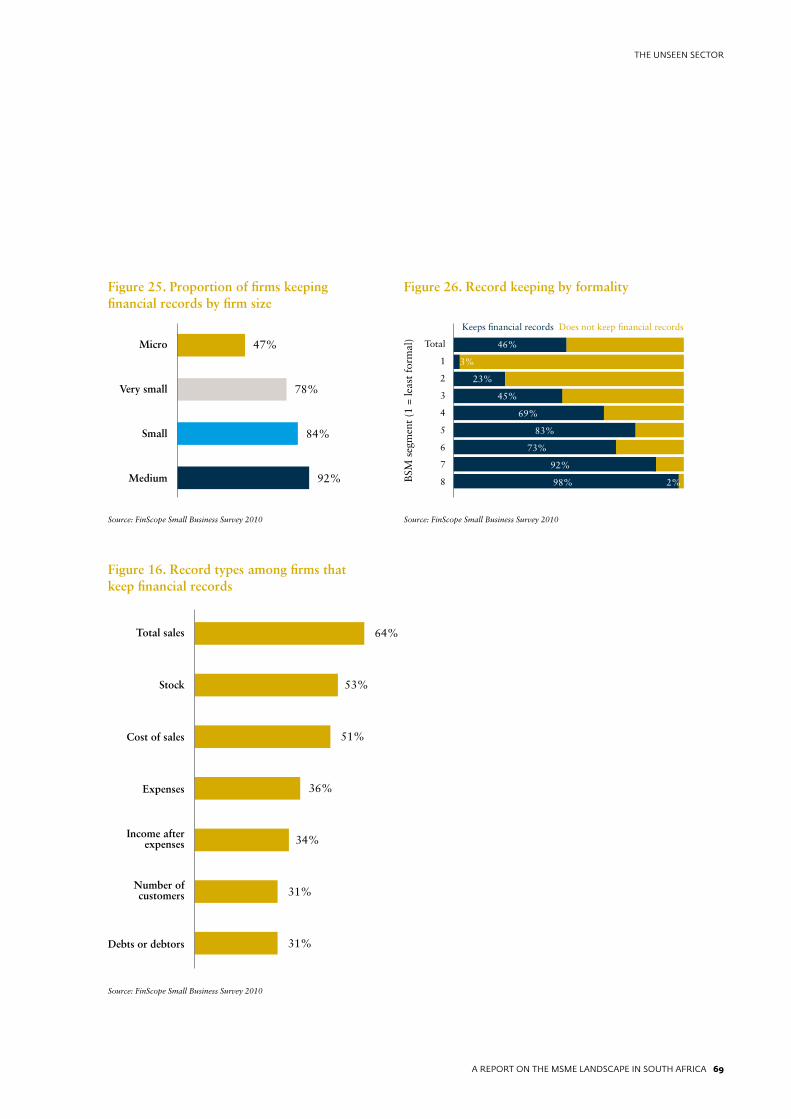
A REPORT ON THE MSME LANDSCAPE IN SOUTH AFRICA 69
THE UNSEEN SECTOR
Source: FinScope Small Business Survey 2010 Source: FinScope Small Business Survey 2010
Source: FinScope Small Business Survey 2010
Figure 25. Proportion of firms keeping financial records by firm size
Figure 26. Record keeping by formality
Figure 16. Record types among firms that keep financial records
BSM
seg
men
t (1
= le
ast
form
al)
Keeps financial records Does not keep financial records
Total
1
2
3
4
5
6
7
8
Total sales
Stock
Cost of sales
Expenses
Income after expenses
Number of customers
Debts or debtors
64%
53%
51%
36%
34%
31%
31%
Micro
Very small
Small
Medium
47%
78%
84%
92%
46%
3%
23%
45%
69%
83%
73%
92%
98% 2%
70 A REPORT ON THE MSME LANDSCAPE IN SOUTH AFRICA
THE UNSEEN SECTOR
Limited access to collateral: As a result of apartheid, South Africa has a skewed proportion of asset ownership across racial groups. This impacts access to collateral and related financial resources. As a result of information asymmetry, banks rely on tools to address moral hazard to assess credit risk and ensure repayment of the loans. According to the World Bank Enterprise Survey, the most popular tool banks use is securing loans with collateral. In South Africa, 75 percent of loans are secured by collateral.110 Banks moved away from using audited financial statements, preferring to get a sense of the financial position of key stakeholders within the business.111 The World Bank Enterprise survey reported that 70 percent of MSME loans in 2007 were secured with collateral, with the value of the collateral required over 100 percent of the loan amount. As such, MSME lending favors firms with access to collateral. According to research, this prejudices certain types of firms, such as technology firms who typically do not have large assets, and firms owned by women and black South Africans who have less access to economic opportunities and earning potential.112 A study in 2002 analyzing South African MSME loan application rejections found that the largest reason cited was lack of collateral. The study showed 45 percent of loans were rejected for lack of capital compared to 12 percent for not keeping financial records.113
A significant aggravator of this issue is banks’ preference for immovable assets such as property as a form of security.114 Secured lending focuses almost exclusively on real property because there is a legal and registry framework, which makes property less risky.
South Africa’s deeds registry provides notice of land rights and is generally considered to be a modern institution conforming to international best practice.115 Although there is a variety of movable security devices recognized by South African law – including pledges, notarial bonds, cessions – they do not provide banks with full legal certainty, and the lack of a consolidated movable collateral registry means banks do not easily have notice when a movable asset is used to secure finance from another provider. The deeds registry does allow for the registering of some security interest on movables, such as notarial bonds, but this registry is not a uniform and centralized system. As with real estate, the procedures attached to some categories of notarial bonds does not provide for complete legal certainty from loan issuance and the existence of other specialized registries makes searching for and discovering movable security interests difficult.116 Banks’ preference for immovable security aligns poorly with the asset composition of small businesses, which typically have assets concentrated in immovable property (such as vehicles and equipment) and accounts receivable.
The issues of information asymmetry are well documented internationally, and a number of academic studies in South Africa make reference to them. However, the specific drivers of this information asymmetry have not been adequately covered by recent research. A recent review of the state of business credit information sharing and collateral registries in South Africa is missing, as is data on MSME access to different types of collateral.
110 IFC, 2015, Collateral Registries for Movable Assets: Does Their Introduction Spur Firms’ Access to Bank Finance?111 Coetzee and Buys, 2017, The Impact of the Independent Review on SME Access to Bank Finance: The Case of South Africa, Banks and Bank Systems 12(1-1)112 Mazanai and Fatoki, 2012, Access to Finance in the SME Sector: A South African Perspective, Asian Journal of Business Management 4(1)113 Foxcroft et al, 2002, Global Entrepreneurship Monitor: South African Executive Report114 Mazanai and Fatoki, 2012, Access to Finance in the SME Sector: A South African Perspective, Asian Journal of Business Management 4(1)115 World Bank, 2015, Secured Transactions Collateral Registries: Diagnostic for the Republic of South Africa116 Ibid
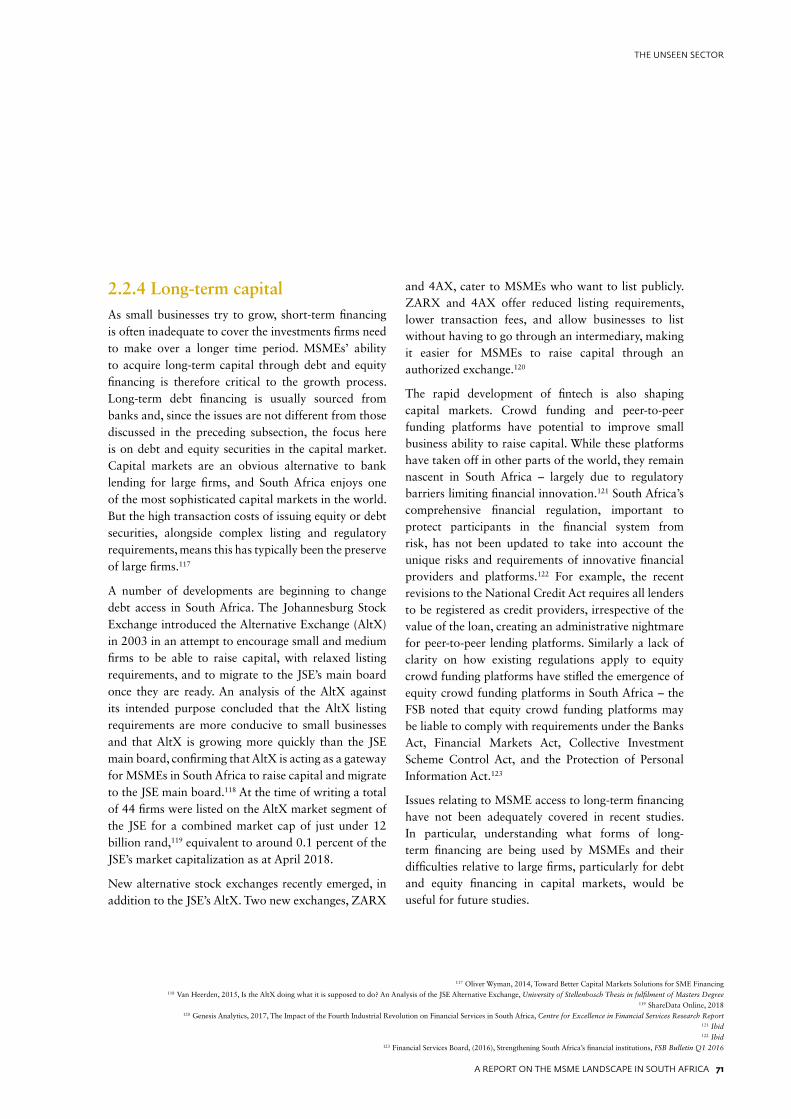
A REPORT ON THE MSME LANDSCAPE IN SOUTH AFRICA 71
THE UNSEEN SECTOR
2.2.4 Long-term capitalAs small businesses try to grow, short-term financing is often inadequate to cover the investments firms need to make over a longer time period. MSMEs’ ability to acquire long-term capital through debt and equity financing is therefore critical to the growth process. Long-term debt financing is usually sourced from banks and, since the issues are not different from those discussed in the preceding subsection, the focus here is on debt and equity securities in the capital market. Capital markets are an obvious alternative to bank lending for large firms, and South Africa enjoys one of the most sophisticated capital markets in the world. But the high transaction costs of issuing equity or debt securities, alongside complex listing and regulatory requirements, means this has typically been the preserve of large firms.117
A number of developments are beginning to change debt access in South Africa. The Johannesburg Stock Exchange introduced the Alternative Exchange (AltX) in 2003 in an attempt to encourage small and medium firms to be able to raise capital, with relaxed listing requirements, and to migrate to the JSE’s main board once they are ready. An analysis of the AltX against its intended purpose concluded that the AltX listing requirements are more conducive to small businesses and that AltX is growing more quickly than the JSE main board, confirming that AltX is acting as a gateway for MSMEs in South Africa to raise capital and migrate to the JSE main board.118 At the time of writing a total of 44 firms were listed on the AltX market segment of the JSE for a combined market cap of just under 12 billion rand,119 equivalent to around 0.1 percent of the JSE’s market capitalization as at April 2018.
New alternative stock exchanges recently emerged, in addition to the JSE’s AltX. Two new exchanges, ZARX
and 4AX, cater to MSMEs who want to list publicly. ZARX and 4AX offer reduced listing requirements, lower transaction fees, and allow businesses to list without having to go through an intermediary, making it easier for MSMEs to raise capital through an authorized exchange.120
The rapid development of fintech is also shaping capital markets. Crowd funding and peer-to-peer funding platforms have potential to improve small business ability to raise capital. While these platforms have taken off in other parts of the world, they remain nascent in South Africa – largely due to regulatory barriers limiting financial innovation.121 South Africa’s comprehensive financial regulation, important to protect participants in the financial system from risk, has not been updated to take into account the unique risks and requirements of innovative financial providers and platforms.122 For example, the recent revisions to the National Credit Act requires all lenders to be registered as credit providers, irrespective of the value of the loan, creating an administrative nightmare for peer-to-peer lending platforms. Similarly a lack of clarity on how existing regulations apply to equity crowd funding platforms have stifled the emergence of equity crowd funding platforms in South Africa – the FSB noted that equity crowd funding platforms may be liable to comply with requirements under the Banks Act, Financial Markets Act, Collective Investment Scheme Control Act, and the Protection of Personal Information Act.123
Issues relating to MSME access to long-term financing have not been adequately covered in recent studies. In particular, understanding what forms of long-term financing are being used by MSMEs and their difficulties relative to large firms, particularly for debt and equity financing in capital markets, would be useful for future studies.
117 Oliver Wyman, 2014, Toward Better Capital Markets Solutions for SME Financing118 Van Heerden, 2015, Is the AltX doing what it is supposed to do? An Analysis of the JSE Alternative Exchange, University of Stellenbosch Thesis in fulfilment of Masters Degree
119 ShareData Online, 2018120 Genesis Analytics, 2017, The Impact of the Fourth Industrial Revolution on Financial Services in South Africa, Centre for Excellence in Financial Services Research Report
121 Ibid122 Ibid
123 Financial Services Board, (2016), Strengthening South Africa’s financial institutions, FSB Bulletin Q1 2016
72 A REPORT ON THE MSME LANDSCAPE IN SOUTH AFRICA
THE UNSEEN SECTOR
2.3 Access to skills
Skills are a critical enabler of MSME development in two ways. Firstly, business owners require a set of entrepreneurial skills related to recognizing opportunities and solving problems, and business acumen relating to balancing accounts and seeking funding. Business owners will struggle to maintain a sustainable business without these skills. Secondly, once MSMEs begin growing, they need to draw on the labor market to source additional employees – particularly skilled/professional labor when growing into medium-sized businesses.
Both of these enablers are negatively impacted by the quality of education and resulting critical skills shortage in South Africa. The education level and skill base of South Africa’s labor force is lower than many other productive economies – only 20 percent of the employed population have a tertiary qualification, 32 percent have completed secondary education, and close to half do not have a grade 12 certificate. While access to schools, universities and technical and vocational colleges improved, many people still don’t have access to quality education and there are low completion rates and poor progression from primary to secondary through to tertiary education.124
Education has an impact on South African business owners’ ability to successfully become entrepreneurs. The Global Entrepreneurship index ranks South Africa’s
entrepreneurial ecosystem on a set on indicators. While South Africa’s aggregate score is above the global trend, the weakest component is start-up skills.125 A survey carried out by the SAB Foundation,126 an independent trust established by South African beer maker SAB Ltd, shows that a lack of skills to operate and grow the business was found to be the third biggest barrier to entrepreneurial success, after access to finance and markets. Using StatsSA data, the Bureau of Economic Research estimated that roughly 80 percent of small business owners have no tertiary education.127
The skills shortage also hampers small business’ ability to grow employment, particularly skilled labor. The World Bank’s Systematic Country Diagnostic for South Africa identified insufficient skills as the country’s most important constraint and priority area to address in order to reduce poverty and inequality in South Africa.128 In addition to stringent labor law, the MSME Growth Index identified skills as the second highest constraint to MSMEs employing staff, although the reporting of skills as a constraint relative to labor regulation was more frequent among high growth firms who seek additional labor. As shown in Figure 28, firms in the business services sector reported skills as the greatest constraint, indicating the shortage of skilled labor in particular. Labor regulation remains the largest constraint for hiring employees among firms in the manufacturing and tourism sectors, and when considering firms overall.129
124 Reddy et al, 2016, Skills Supply and Demand in South Africa125 The Global Entrepreneurship and Development Institute, 2018, Global Entrepreneurship Index 126 SAB Foundation, 2017, The Entrepreneurial Ecosystem of South Africa: A Strategy for Global Leadership 127 BER, 2016, The small, medium and micro enterprise sector of South Africa128 World Bank, 2018, Republic of South Africa - Systematic country diagnostic: an incomplete transition - overcoming the legacy of exclusion in South Africa (English). Washington, D.C.: World Bank Group129 SBP, 2014, Growth and Competitiveness for Small Business in South Africa
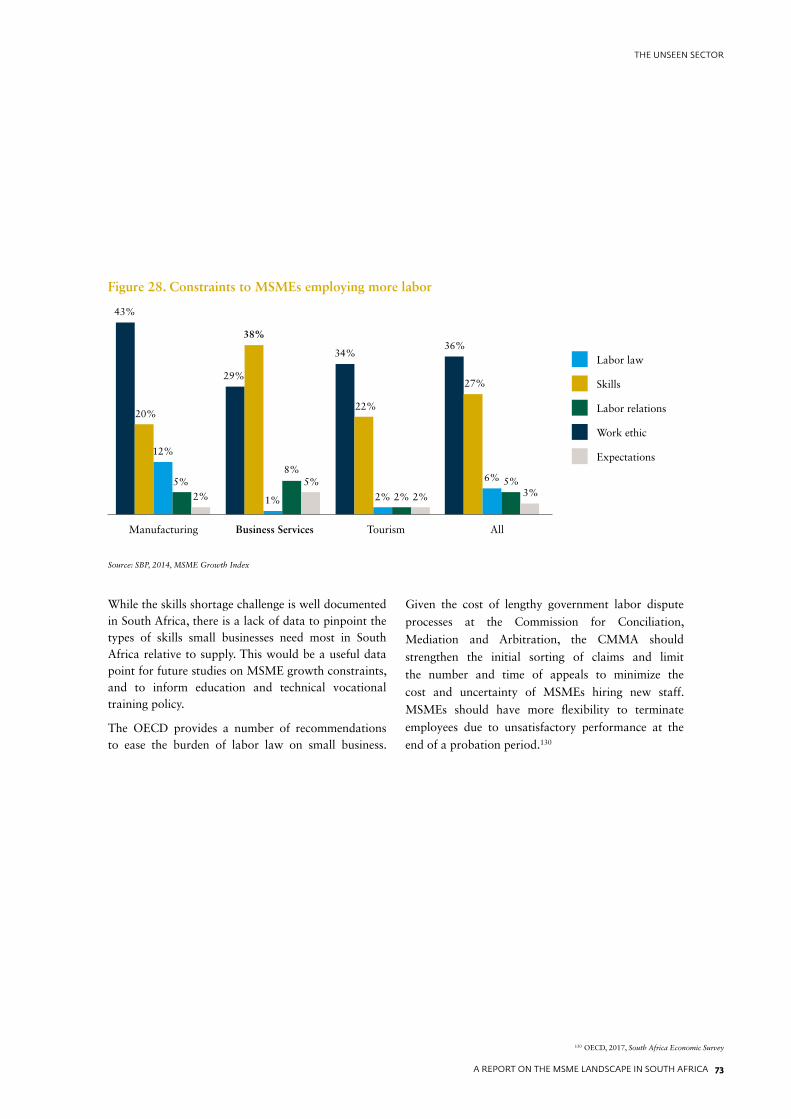
A REPORT ON THE MSME LANDSCAPE IN SOUTH AFRICA 73
THE UNSEEN SECTOR
While the skills shortage challenge is well documented in South Africa, there is a lack of data to pinpoint the types of skills small businesses need most in South Africa relative to supply. This would be a useful data point for future studies on MSME growth constraints, and to inform education and technical vocational training policy.
The OECD provides a number of recommendations to ease the burden of labor law on small business.
Given the cost of lengthy government labor dispute
processes at the Commission for Conciliation,
Mediation and Arbitration, the CMMA should
strengthen the initial sorting of claims and limit
the number and time of appeals to minimize the
cost and uncertainty of MSMEs hiring new staff.
MSMEs should have more flexibility to terminate
employees due to unsatisfactory performance at the
end of a probation period.130
130 OECD, 2017, South Africa Economic Survey
Figure 28. Constraints to MSMEs employing more labor
Source: SBP, 2014, MSME Growth Index
Manufacturing Business Services Tourism All
Labor law
Skills
Labor relations
Work ethic
Expectations12%
43%
29%
34%36%
27%
22%
38%
5%
2%
6% 5%3%2% 2% 2%1%
8%5%
20%
74 A REPORT ON THE MSME LANDSCAPE IN SOUTH AFRICA
THE UNSEEN SECTOR
74 A REPORT ON THE MSME LANDSCAPE IN SOUTH AFRICA
THE UNSEEN SECTOR

A REPORT ON THE MSME LANDSCAPE IN SOUTH AFRICA 75
THE UNSEEN SECTOR
Andiswa Silinga is co-founder of Gemini: GIS and Environmental Services. SAICA Enterprise Development helped the small business grow.
Photo: IFC / Karel Prinsloo
Education has an impact on South African business owners’ ability to successfully become an entrepreneur.
A REPORT ON THE MSME LANDSCAPE IN SOUTH AFRICA 75
THE UNSEEN SECTOR
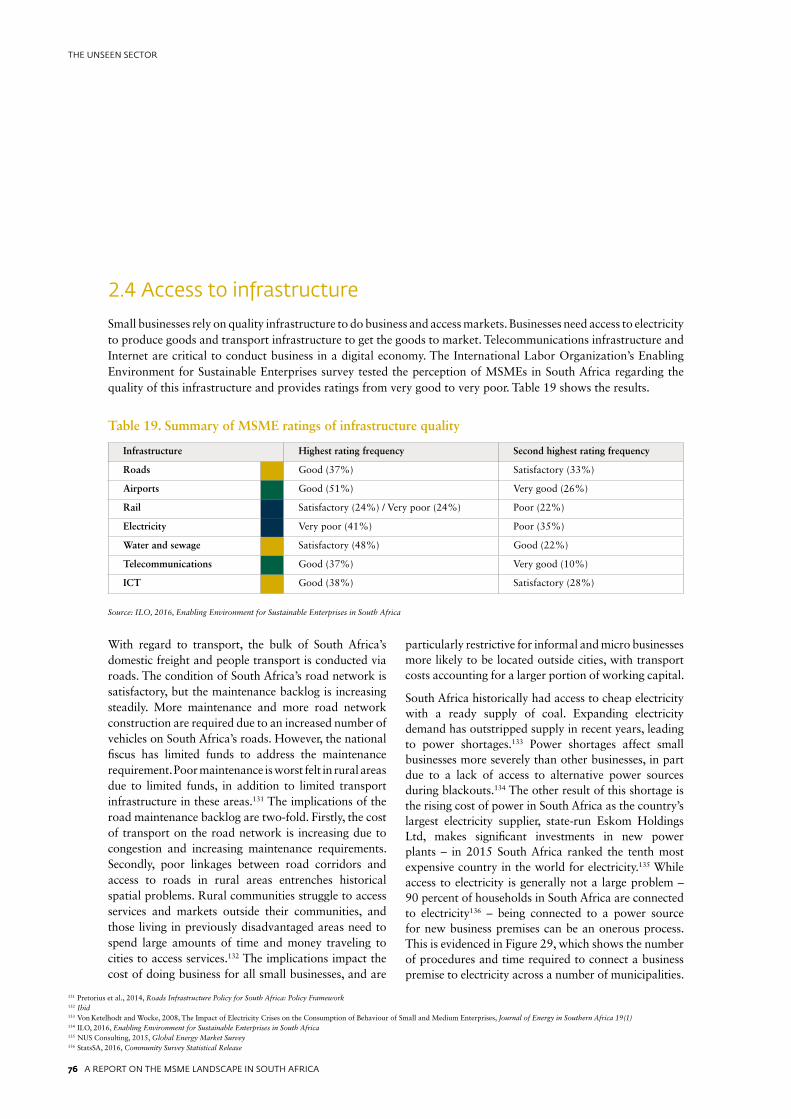
76 A REPORT ON THE MSME LANDSCAPE IN SOUTH AFRICA
THE UNSEEN SECTOR
2.4 Access to infrastructure
Small businesses rely on quality infrastructure to do business and access markets. Businesses need access to electricity to produce goods and transport infrastructure to get the goods to market. Telecommunications infrastructure and Internet are critical to conduct business in a digital economy. The International Labor Organization’s Enabling Environment for Sustainable Enterprises survey tested the perception of MSMEs in South Africa regarding the quality of this infrastructure and provides ratings from very good to very poor. Table 19 shows the results.
With regard to transport, the bulk of South Africa’s domestic freight and people transport is conducted via roads. The condition of South Africa’s road network is satisfactory, but the maintenance backlog is increasing steadily. More maintenance and more road network construction are required due to an increased number of vehicles on South Africa’s roads. However, the national fiscus has limited funds to address the maintenance requirement. Poor maintenance is worst felt in rural areas due to limited funds, in addition to limited transport infrastructure in these areas.131 The implications of the road maintenance backlog are two-fold. Firstly, the cost of transport on the road network is increasing due to congestion and increasing maintenance requirements. Secondly, poor linkages between road corridors and access to roads in rural areas entrenches historical spatial problems. Rural communities struggle to access services and markets outside their communities, and those living in previously disadvantaged areas need to spend large amounts of time and money traveling to cities to access services.132 The implications impact the cost of doing business for all small businesses, and are
particularly restrictive for informal and micro businesses more likely to be located outside cities, with transport costs accounting for a larger portion of working capital.
South Africa historically had access to cheap electricity with a ready supply of coal. Expanding electricity demand has outstripped supply in recent years, leading to power shortages.133 Power shortages affect small businesses more severely than other businesses, in part due to a lack of access to alternative power sources during blackouts.134 The other result of this shortage is the rising cost of power in South Africa as the country’s largest electricity supplier, state-run Eskom Holdings Ltd, makes significant investments in new power plants – in 2015 South Africa ranked the tenth most expensive country in the world for electricity.135 While access to electricity is generally not a large problem – 90 percent of households in South Africa are connected to electricity136 – being connected to a power source for new business premises can be an onerous process. This is evidenced in Figure 29, which shows the number of procedures and time required to connect a business premise to electricity across a number of municipalities.
Table 19. Summary of MSME ratings of infrastructure quality
Source: ILO, 2016, Enabling Environment for Sustainable Enterprises in South Africa
Infrastructure Highest rating frequency Second highest rating frequency
Roads Good (37%) Satisfactory (33%)
Airports Good (51%) Very good (26%)
Rail Satisfactory (24%) / Very poor (24%) Poor (22%)
Electricity Very poor (41%) Poor (35%)
Water and sewage Satisfactory (48%) Good (22%)
Telecommunications Good (37%) Very good (10%)
ICT Good (38%) Satisfactory (28%)
131 Pretorius et al., 2014, Roads Infrastructure Policy for South Africa: Policy Framework132 Ibid133 Von Ketelhodt and Wocke, 2008, The Impact of Electricity Crises on the Consumption of Behaviour of Small and Medium Enterprises, Journal of Energy in Southern Africa 19(1) 134 ILO, 2016, Enabling Environment for Sustainable Enterprises in South Africa135 NUS Consulting, 2015, Global Energy Market Survey136 StatsSA, 2016, Community Survey Statistical Release

A REPORT ON THE MSME LANDSCAPE IN SOUTH AFRICA 77
THE UNSEEN SECTOR
Figure 29. Administrative burden of connecting to electricity
Source: World Bank, 2015, Doing Business in South Africa 2015
137 MasterCard and Fletcher, 2014, Digital Evolution Index 138 We are Social, 2017, Digital in 2017
139 WEF, 2016, Networked Readiness Index140 ITU, 2017, ICT Development Index 2017
141 ResearchICTAfrica.net, 2017, Cheapest price for 1GB basket in Africa by country
With regard to ICT, South Africa was rated as the most developed digital economy in Africa by the Digital Evolution Index.137 Mobile phone penetration in 2017 exceeded 90 percent of the population and Internet penetration rose to 52 percent in 2017 from 46 percent in 2015.138 However, South Africa’s overall ICT infrastructure development lags behind developing countries in other regions. South Africa ranked 65 out of 139 countries in the WEF Networked Readiness Index, lower than comparable countries Turkey and Chile.139 Limited implementation of plans to reform the ICT sector is reflected in the decline in South Africa’s ranking in the ICT Development Index, which stands
at 92 out of 176 countries in 2017 compared to 72 in 2002.140 Furthermore, access to existing infrastructure is constrained by affordability. As shown in Figure 30, South Africa’s positive WEF Networked Readiness ranking in terms of mobile network coverage and bandwidth are contrasted by poorer rankings on mobile cellular and broadband internet tariffs. The implication for small businesses is that cost may be a significant barrier to accessing the digital economy, particularly for survivalist micro enterprises where the average cost of $7.50 to access 1GB of data may be prohibitive, compared to an average cost of $4.90 in Kenya, $2.80 in Uganda and $2.30 in Tanzania.141
Figure 30: ICT infrastructure and affordability in South Africa
Source: WEF, 2016, Networked Readiness Index
66
6 6 6
5 5 5
4 4
90 9880
184
104
333
87
226
Buffalo City Ekurhuleni eThekwini Mangaung Msunduzi Tshwane Nelson Mandela Bay
Cape Town Johannesburg
Time (days)Number of procedures
5
WE
F N
etw
orke
d R
eadl
ines
s, 2
016
Inde
x R
ank
/ 13
9 (1
is b
est)
Mobile network coverage
Internet bandwith per user
Mobile cellular tariffs
Broadband internet tariffs
37
18
58
61
78 A REPORT ON THE MSME LANDSCAPE IN SOUTH AFRICA
THE UNSEEN SECTOR
2.5 Access to markets
Small businesses are at a natural disadvantage when it comes to market access relative to large firms – they tend to have smaller distribution networks, less established brands, and fewer resources to commit to marketing. Market access issues for survivalist and informal micro enterprises are different to more formal, growth-oriented MSMEs. The former mostly sell to customers in their immediate geographic location, so getting to market relates more to the infrastructure issues discussed in the previous sub-section. For the latter, however, participation in large value chains, whether they are domestic, regional or international, presents MSMEs with an opportunity to expand their market reach and to potentially achieve economies of scale. Accessing value chains typically requires MSMEs to meet some form of sector-specific standards, licenses, or entry requirements that participating enterprises must comply with. Therefore the extent to which MSMEs can access markets rests on the ease with which these requirements can be met. This issue is discussed in the context of three situations: public procurement, domestic corporate supply chains, and global value chains.
2.5.1 Public procurementGiven the difficulty most small businesses have integrating with private sector supply chains, public procurement is a useful industrial policy tool for encouraging the development of the MSME sector. Public procurement regulations were revised in 2017 to increase state support to MSMEs and other designated groups and promote local industrial development.142
South Africa’s public procurement spend is roughly 500 billion rand,143 a sizable opportunity if MSMEs are able to capture even a small share. The South African government’s primary tool for directing public procurement toward development objectives is the
Broad-Based Black Economic Empowerment scoring system aimed at developing black-owned businesses. All government suppliers must have a B-BBEE certificate, and the B-BBEE score makes up between 10 percent and 20 percent of the total tendering score.144 The system was adapted in 2017 to place a heavier focus of MSMEs – 30 percent of all large contracts must be sub-contracted to micro enterprises and black-owned small businesses, where possible, and additional B-BBEE points are awarded to suppliers that invest in enterprise and supplier development.145
However, participating in public supply chains is costly for small businesses. Firms with a turnover below 10 million rand or are younger than one year can receive a B-BBEE certificate by submitting an affidavit, but other qualifying small firms that are not majority-black owned must comply with the scorecard elements. These elements include supplier and skills development and require verification by an external accredited agent.146 Compliance costs are prohibitive – 70 percent of the small businesses surveyed in the SAICA 2015 MSME Insights Report did no business with government, and 40 percent were not B-BBEE compliant.147 In the International Labor Organization’s Enabling Environment for Sustainable Enterprises Survey, 76 percent of MSMEs surveyed did not believe that B-BBEE leads to growing their small business, suggesting that MSMEs do not view the cost-benefit trade-off of being B-BBEE compliant as positive.148
In addition, being a government supplier can be harmful for small business cash flow. In the 2015-2016 South African financial year, 45 percent of the 457 government departments and public entities were unable to meet their own 30-day payment rule, with 13 percent taking over 90 days to complete payments. Government departments cited poor financial management and cash flow problems as the main causes.149 This can make it difficult for smaller businesses to stay afloat, particularly if they cannot get access to working capital finance.
142 World Bank, 2018, Republic of South Africa - Systematic country diagnostic: an incomplete transition - overcoming the legacy of exclusion in South Africa (English). Washington, D.C.: World Bank Group143 Bolton, 2016, Public Procurement as a Tool to Drive Innovation in South Africa, Potchefstroomse Elektroniese Regsblad 19(1)144 Lewis and Gasealahwe, 2017, Lowering Barriers to Entrepreneurship and Promoting Small Business Growth in South Africa, OECD Economics Department Working Papers No. 1449 145 OECD, 2017, Policies that Promote SME Participation in Public Procurement, Business Environment Working Group Technical Report146 Lewis and Gasealahwe, 2017, Lowering Barriers to Entrepreneurship and Promoting Small Business Growth in South Africa, OECD Economics Department Working Papers No. 1449147 SAICA, 2015, 2015 SME Insights Report148 ILO, 2016, Enabling Environment for Sustainable Enterprises in South Africa149 Lewis and Gasealahwe, 2017, Lowering Barriers to Entrepreneurship and Promoting Small Business Growth in South Africa, OECD Economics Department Working Papers No. 1449
A REPORT ON THE MSME LANDSCAPE IN SOUTH AFRICA 79
THE UNSEEN SECTOR
150 Based on interview with CCBSA, May 2018
2.5.2 Corporate supply and distribution chainsLarge corporates in South Africa are anchors in a number of value chains, drawing inputs from other supplier firms and distributing their products through other firms in the retail sector. As an example, Coca-Cola Beverages South Africa works with thousands of small businesses in markets where they operate as suppliers, distributors and
retailers.150 Small business engagement includes small corner shops known as spaza shops, a truck distribution service and hawkers selling items on the side of the road. How small businesses are integrated into Coca-Cola’s distribution chain is described in Box 3. Backward and forward linkages exist in a number of industries, such as clothing and textiles, automotive, and food and beverage manufacturing, and provide significant opportunities to small businesses in South Africa to access value chains.
BOX 3MSMEs IN COCA-COLA BEVERAGES SOUTH AFRICA DISTRIBUTION CHAIN
Coca-Cola Beverages South Africa has a well-established supply chain network, which includes a number of formal and informal small businesses. CCBSA provides support to MSMEs through five channels: truck driver-owners distributing to the formal market; warehouse operators distributing to the informal market such as spaza shops and taverns; the Bizniz in a Box enterprise development program; informal hawkers/vendors; and direct support to spaza shops and taverns.
• The truck driver-owner campaign aims to empower truck drivers to become micro enterprise owners – providing delivery services to CCBSA. For the first two years of the support program, CCBSA rents their own trucks to the drivers. Thereafter, CCBSA stands surety so the drivers can purchase their own trucks from a commercial bank. The drivers are provided with petrol cards for the maintenance of their trucks and working capital loans. The program also includes business support through weekly meetings with business advisors. The program has a graduation rate of 90 percent (graduation to a sustainable micro enterprise) citing both well-rounded financial and non-financial support.
• CCBSA provides warehouse operators in informal markets with rental space to run their distribution businesses in townships. In addition to access to
premises, the distributors are provided with 30-day trade credit and digital stock management systems as well as training.
• The CCBSA Bizniz in a Box program provides business opportunities for youth (18-34) to develop their theoretical and practical business knowledge. In partnership with SEFA, CCBSA provides container premises and stock, usually in the form of fast-food and grocery stores. The businesses are supplied with A2Pay, an innovative vending and distribution technology including a POS device, which monitors business performance and manages level of stock. The Bizniz in a Box program is supplemented with intensive training. Prospective entrants require a matric certificate and prior entrepreneurial experience.
• Spaza shops and other informal retailers are supplied with fridges used to stock Coca-Cola products and marketing material. This is an integral part of ensuring Coca-Cola remains front of mind while also aiding businesses by covering cost of refrigeration, a form of asset financing.
• CCBSA runs a hawker program aimed at individuals who want to enter the Coca-Cola value chain by providing stock and a week-long intensive training program. The primary aim is to create an entry point into CCBSA’s development programs with a view of graduating them into the spaza shop program. The hawkers are provided with asset financing in the form of trolleys and stands.
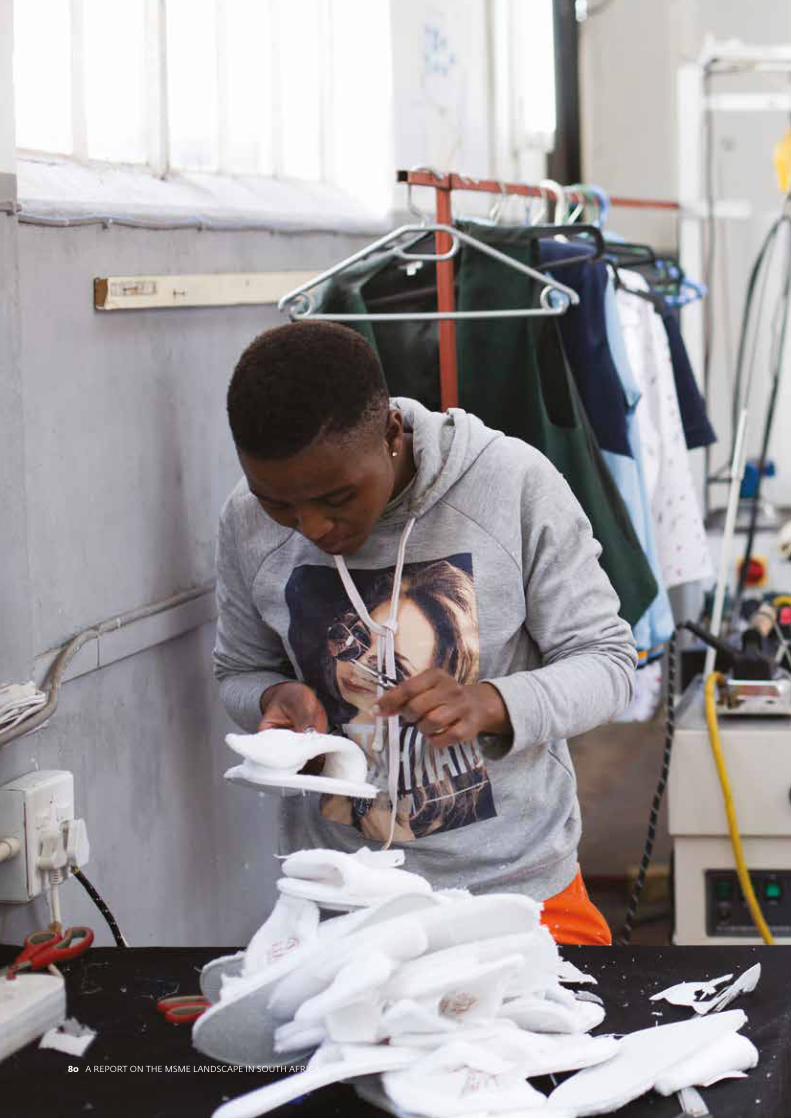
80 A REPORT ON THE MSME LANDSCAPE IN SOUTH AFRICA
THE UNSEEN SECTOR
80 A REPORT ON THE MSME LANDSCAPE IN SOUTH AFRICA
THE UNSEEN SECTOR
A REPORT ON THE MSME LANDSCAPE IN SOUTH AFRICA 81
THE UNSEEN SECTOR
Employees prepare materials at Khanyile Solutions, a small clothing manufacturer in Johannesburg.
Photo: IFC / Karel Prinsloo
A REPORT ON THE MSME LANDSCAPE IN SOUTH AFRICA 81
THE UNSEEN SECTOR
82 A REPORT ON THE MSME LANDSCAPE IN SOUTH AFRICA
THE UNSEEN SECTOR
Small business linkages to corporate value chains is facilitated by a variety of mechanisms. In some markets, industrial policy requires large corporates to integrate MSMEs into their supply chains, or it provides incentives for using local suppliers. The B-BBEE scorecard discussed in the previous sub-section is such an example in South Africa. Another example is the recent competition case where global retailer Walmart Inc. merged with South African retailer Massmart Holdings Ltd, the outcome of which was a government requirement for Massmart to finance an MSME supplier development fund. The fund is targeted at MSME local manufacturers, producers and assemblers of products that are resold in Massmart retail divisions. The goal of the fund is to enhance the quality of MSME products and improve their production capacities.151 In other cases, corporates see it in their own interest to create enterprise or supplier development programs, either to gain points on public procurement scorecards as part of their CSI, or as part of their business strategy, particularly for distribution chains. Some examples of established enterprise and supplier development programs include:
• British American Tobacco has a well-developed distribution network of spaza shops where its products are delivered directly, and it sources tobacco from local farmers, some of which are smallholders.152
• South African Breweries has a supplier development program focused on creating a diversified and inclusive supply chain that supports the growth of black-owned suppliers.153 The company also has a broad distribution chain including a number of informal MSMEs such as taverns, and supplies these retailers with branding and fridges, a form of asset financing.154
Established supply chain relationships between MSMEs and large corporates offer scope for opportunities beyond purchasing of goods, including training, mentoring and supply chain financing solutions.155 This has been found to significantly reduce the risk profile of the MSME, which is based on the longevity of the MSME-corporate relationship, while giving it the benefit of:
• Accessing working capital given their linkage to the larger corporate,
• Having certainty of supply, in the case of an MSME buyer, or distribution, in the case of an MSME seller, thereby alleviating cash flow problems,
• Quantifying financing needs based on selling or purchasing orders, and
• Encouraging collaboration rather than competition.
Enterprise development programs are necessary because MSMEs typically struggle to access large corporate supply chains, and find working with large corporates difficult once they do. This is due to a range of characteristic and perception issues among both corporates and MSMEs identified in a 2012 SEDA study. The study collected views from corporates and MSMEs on the challenges of working with one another, the results of which are shown in Figure 31. The survey indicates that MSMEs largely struggle with financial issues such as late payment and cash flow, while corporates have concerns regarding the reliability, sustainability, and quality of MSME suppliers.
151 Massmart Supplier Development Fund, online: http://www.massmart.co.za/iar2013/summary-relating-to-the-supplier-development-fund/152 British American Tobacco: Our South African economic impact, online: http://www.batsa.co.za/group/sites/BAT_A2ELAD.nsf/vwPagesWebLive/DO9YABCP?opendocument153 SAB Supplier Development, online: https://www.sabentrepreneurship.co.za/suppliers154 Genesis Analytics, 2017, Nation-wide Informal Enterprise and Customer Survey155 PWC, 2017, Understanding Supply Chain Finance
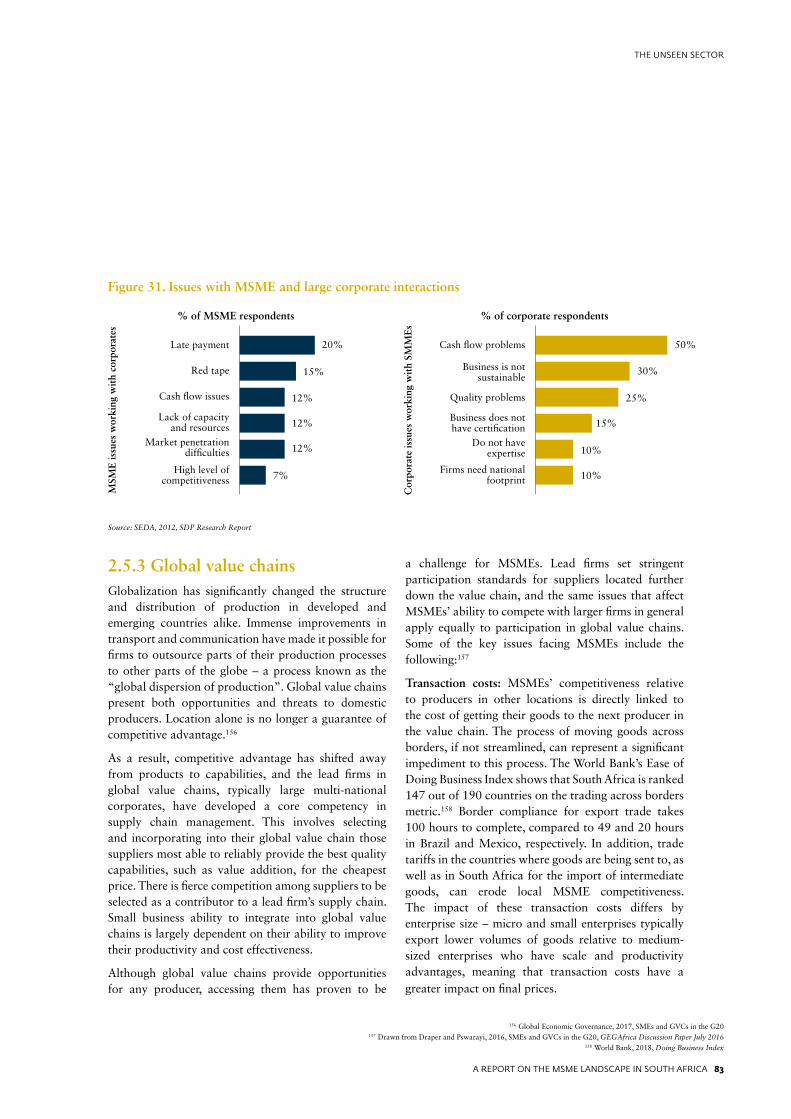
A REPORT ON THE MSME LANDSCAPE IN SOUTH AFRICA 83
THE UNSEEN SECTOR
Figure 31. Issues with MSME and large corporate interactions
Source: SEDA, 2012, SDP Research Report
2.5.3 Global value chainsGlobalization has significantly changed the structure and distribution of production in developed and emerging countries alike. Immense improvements in transport and communication have made it possible for firms to outsource parts of their production processes to other parts of the globe – a process known as the “global dispersion of production”. Global value chains present both opportunities and threats to domestic producers. Location alone is no longer a guarantee of competitive advantage.156
As a result, competitive advantage has shifted away from products to capabilities, and the lead firms in global value chains, typically large multi-national corporates, have developed a core competency in supply chain management. This involves selecting and incorporating into their global value chain those suppliers most able to reliably provide the best quality capabilities, such as value addition, for the cheapest price. There is fierce competition among suppliers to be selected as a contributor to a lead firm’s supply chain. Small business ability to integrate into global value chains is largely dependent on their ability to improve their productivity and cost effectiveness.
Although global value chains provide opportunities for any producer, accessing them has proven to be
a challenge for MSMEs. Lead firms set stringent participation standards for suppliers located further down the value chain, and the same issues that affect MSMEs’ ability to compete with larger firms in general apply equally to participation in global value chains. Some of the key issues facing MSMEs include the following:157
Transaction costs: MSMEs’ competitiveness relative to producers in other locations is directly linked to the cost of getting their goods to the next producer in the value chain. The process of moving goods across borders, if not streamlined, can represent a significant impediment to this process. The World Bank’s Ease of Doing Business Index shows that South Africa is ranked 147 out of 190 countries on the trading across borders metric.158 Border compliance for export trade takes 100 hours to complete, compared to 49 and 20 hours in Brazil and Mexico, respectively. In addition, trade tariffs in the countries where goods are being sent to, as well as in South Africa for the import of intermediate goods, can erode local MSME competitiveness. The impact of these transaction costs differs by enterprise size – micro and small enterprises typically export lower volumes of goods relative to medium-sized enterprises who have scale and productivity advantages, meaning that transaction costs have a greater impact on final prices.
156 Global Economic Governance, 2017, SMEs and GVCs in the G20157 Drawn from Draper and Pswarayi, 2016, SMEs and GVCs in the G20, GEGAfrica Discussion Paper July 2016
158 World Bank, 2018, Doing Business Index
MSM
E is
sues
wor
king
wit
h co
rpor
ates
Cor
pora
te is
sues
wor
king
wit
h SM
ME
s
% of MSME respondents % of corporate respondents
Late payment
Red tape
Cash flow issues
Lack of capacity and resources
Market penetration difficulties
High level of competitiveness
20%
15%
12%
12%
12%
7%
Cash flow problems
Business is not sustainable
Quality problems
Business does not have certification
Do not have expertise
Firms need national footprint
50%
30%
25%
15%
10%
10%
84 A REPORT ON THE MSME LANDSCAPE IN SOUTH AFRICA
THE UNSEEN SECTOR
Expertise in cross-border processes minimizes the overall transaction costs incurred by established MSMEs in comparison to less established ones.
Managing standards and certification: Multi-national corporations, typically the lead firms in global value chains, set stringent quality, safety and environmental protection standards for the goods and services they source as part of their supply chains. The biggest issues MSMEs have in meeting these standards are a lack of awareness and capacity to understand the standards, and the cost of implementation and certification.159 MSMEs often lack the awareness and capacity to research and understand the complicated standards and certification requirements of the larger and more established firms. The dissemination of information on the requirements for meeting these standards is therefore a key MSME development tool within public policy. The South African Bureau of Standards is the sole standard-setting organization in the country and reports to the Department of Trade and Industry. While the South African Bureau of Standards is regarded as playing a key role in promoting standards across sectors, it finds it challenging to reach MSMEs. Informal MSMEs are especially affected by standards and certification, given their typical geographic locations, and rural-based MSMEs, particularly those owned by women and youth, are hard to reach. South African Bureau of Standards’ programs success has been limited. The financial and opportunity costs for small businesses accessing programs outweighed the perceived benefits.160 On the second issue of cost, MSMEs often struggle to finance the costly certification or standards implementation process which only yields a payoff in the medium to long term, particularly for smaller firms where these fixed costs represent a larger share of their working capital.161
Trade finance: Export finance is critical for MSMEs engaging in global value chains because flexibility is a key requirement for lead firms selecting suppliers. In sectors like retail, where customer preferences shift quickly according to trends, suppliers are required to execute large orders in a short time frame, with the nature of the order changing often. This is difficult for MSMEs, typically with less working capital to invest in inventory for large orders, thus they require a form of export finance. There have been no surveys undertaken specifically of MSME access to export finance, but the World Bank’s 2010 Financial Crisis survey generated some data on MSME exporters in South Africa. The survey found MSMEs that are “export finance ready” are more likely to be approved for trade finance by banks, including having a history of exporting and having more administrative staff, such as administrative and management staff who have experience with the exporting process.162 This suggests that, as with other types of financing, capacity building is required for MSMEs to become better trade financing candidates. A combination of financing and capacity building is required to boost MSMEs’ ability to export using global value chains.
Upgrading: MSMEs face strong competition from producers in other areas when they engage global value chains. As such, their ability to improve their cost management, quality control, and flexibility, such as ability to meet demand for large orders quickly, is critical to their ability to participate. Furthermore, the structure of global production has changed amid the developed-developing world paradigm where firms in the developing world tend to undertake activities that are lower down on the value-addition ladders, reaping fewer rewards than firms undertaking higher value-addition activities.
159 Ngarachu et al, 2017, Are Private Sustainability Standards Obstacles to, or Enablers of, SME Participation in Value Chains? Global Economic Governance Discussion Paper September 2017160 Ibid161 Ibid162 Matthee and Heymans, 2013, How South African SMEs Can Become Better Candidates for Export Finance163 Commonwealth secretariat, 2015, Clothing Global Value Chains and sub-Saharan Africa: Global Exports, Regional Dynamics, Industrial Development Outcomes
A REPORT ON THE MSME LANDSCAPE IN SOUTH AFRICA 85
THE UNSEEN SECTOR
164 Morris, 2012, Wal-Mart/Massmart Study for the Competition Appeal Court, Expert Report165 Lewis and Gasealahwe, 2017, Lowering Barriers to Entrepreneurship and Promoting Small Business Growth in South Africa
The process of improving productivity and competitiveness to access global value chains and move into higher value-addition activities is called upgrading.163 While finance can help small businesses expand production or purchase costly capital equipment, firms really need the knowledge and expertise related to upgrading within their respective value chain. An industry emerged related specifically to supply chain upgrading and a number of specialist firms in South Africa and internationally have the technical know-how and expertise related to this process.
These are often the same firms multinational corporations use for their own supply chain development. The upgrading process takes place in two stages and involves outsourcing to two different specialist parties. The first process is a diagnostic procedure, which identifies the key challenges or constraints to a supplier’s competitiveness. The second process then builds on the first by assisting the firm in overcoming the problems, which were identified in the first phase.164
While the issue of MSME participation is well researched globally, research on specific value chains that South African small businesses participate in, and the difficulties they face within these, is not comprehensive. Value chains such as retail have received a fair amount of attention, but there is scope for more detailed studies to understand the value chains with the greatest opportunity for MSMEs in South Africa.
2.6 MSME development landscape
Beyond regulatory reforms to improve the business environment and make it easier for entrepreneurs to start and stabilize their own businesses, the public sector plays a crucial role in providing additional support and development services to MSMEs. This support is designed to counteract market failures that inhibit the growth of the MSME sector, such as poor skills development and lack of access to finance, information or markets. In addition, NGOs and the private sector provide similar support services.
In South Africa, the importance of MSMEs is explicitly recognized within the country’s national development plans and a number of public MSME support institutions were created. After establishing an Integrated Small Business Development Strategy in 1995 and creating the Small Business Act in 1996, government created a new department in 2014 to consolidate public sector support and channel additional funding to MSMEs and co-operatives in South Africa.165 The Department of Small Business Development was formed out of the Department of Trade and Industry, with many of the latter’s MSME support programs and agencies moving to the new department. Figure 32 summarizes some of the key national government departments and their agencies or programs focused on MSME development in South Africa.
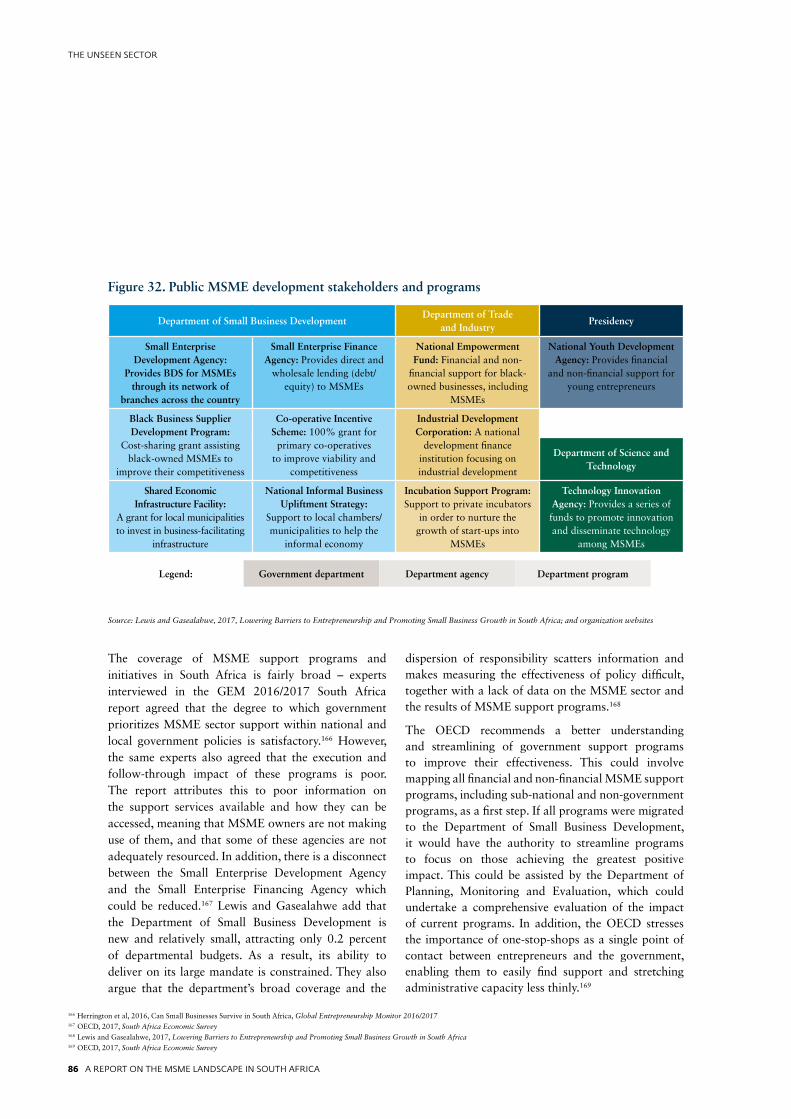
86 A REPORT ON THE MSME LANDSCAPE IN SOUTH AFRICA
THE UNSEEN SECTOR
The coverage of MSME support programs and initiatives in South Africa is fairly broad – experts interviewed in the GEM 2016/2017 South Africa report agreed that the degree to which government prioritizes MSME sector support within national and local government policies is satisfactory.166 However, the same experts also agreed that the execution and follow-through impact of these programs is poor. The report attributes this to poor information on the support services available and how they can be accessed, meaning that MSME owners are not making use of them, and that some of these agencies are not adequately resourced. In addition, there is a disconnect between the Small Enterprise Development Agency and the Small Enterprise Financing Agency which could be reduced.167 Lewis and Gasealahwe add that the Department of Small Business Development is new and relatively small, attracting only 0.2 percent of departmental budgets. As a result, its ability to deliver on its large mandate is constrained. They also argue that the department’s broad coverage and the
dispersion of responsibility scatters information and makes measuring the effectiveness of policy difficult, together with a lack of data on the MSME sector and the results of MSME support programs.168
The OECD recommends a better understanding and streamlining of government support programs to improve their effectiveness. This could involve mapping all financial and non-financial MSME support programs, including sub-national and non-government programs, as a first step. If all programs were migrated to the Department of Small Business Development, it would have the authority to streamline programs to focus on those achieving the greatest positive impact. This could be assisted by the Department of Planning, Monitoring and Evaluation, which could undertake a comprehensive evaluation of the impact of current programs. In addition, the OECD stresses the importance of one-stop-shops as a single point of contact between entrepreneurs and the government, enabling them to easily find support and stretching administrative capacity less thinly.169
Figure 32. Public MSME development stakeholders and programs
Source: Lewis and Gasealahwe, 2017, Lowering Barriers to Entrepreneurship and Promoting Small Business Growth in South Africa; and organization websites
166 Herrington et al, 2016, Can Small Businesses Survive in South Africa, Global Entrepreneurship Monitor 2016/2017167 OECD, 2017, South Africa Economic Survey168 Lewis and Gasealahwe, 2017, Lowering Barriers to Entrepreneurship and Promoting Small Business Growth in South Africa169 OECD, 2017, South Africa Economic Survey
Department of Small Business DevelopmentDepartment of Trade
and IndustryPresidency
Small Enterprise Development Agency:
Provides BDS for MSMEs through its network of
branches across the country
Small Enterprise Finance Agency: Provides direct and
wholesale lending (debt/equity) to MSMEs
National Empowerment Fund: Financial and non-
financial support for black-owned businesses, including
MSMEs
National Youth Development Agency: Provides financial
and non-financial support for young entrepreneurs
Black Business Supplier Development Program:
Cost-sharing grant assisting black-owned MSMEs to
improve their competitiveness
Co-operative Incentive Scheme: 100% grant for primary co-operatives
to improve viability and competitiveness
Industrial Development Corporation: A national
development finance institution focusing on industrial development
Department of Science and Technology
Shared Economic Infrastructure Facility:
A grant for local municipalities to invest in business-facilitating
infrastructure
National Informal Business Upliftment Strategy:
Support to local chambers/municipalities to help the
informal economy
Incubation Support Program: Support to private incubators
in order to nurture the growth of start-ups into
MSMEs
Technology Innovation Agency: Provides a series of funds to promote innovation and disseminate technology
among MSMEs
Legend: Government department Department agency Department program
A REPORT ON THE MSME LANDSCAPE IN SOUTH AFRICA 87
THE UNSEEN SECTOR
Addressing the impediments to small business development has far-reaching effects on the ability to become sustainable enterprises and contribute to private sector development. Various private sector stakeholders have established small business initiatives to provide financial and non-financial support to MSMEs. Similar to SEDA’s incubation footprint, there is a network of private and non-profit incubators nation-wide
including several business accelerators affiliated with the Silicon Cape Initiative – a non-profit organization that seeks to drive the technology ecosystem in South Africa. The business accelerator landscape therefore predominantly favors MSMEs in the technology space. Government-led business incubators and accelerators largely support non-tech sectors. Box 4 provides detail on three incubator examples.
BOX 4EXAMPLES OF MSME INCUBATORS IN SOUTH AFRICA
Awethu Project
Profile: South African business incubator targeting high performing micro and small entrepreneurs to integrate with corporate supply chains. Awethu has supported over 2,000 entrepreneurs.
Core offering: Awethu offers marketing, financial and support of day-to-day running of businesses. The program is offered as an intensive six-month training and is supplemented with a virtual incubator through a mobile app to provide continual business support and a platform for entrepreneurs to network
Raizcorp
Profile: South African unfunded business incubator with a strong vetting process targeting high-potential businesses. Currently incubating over 500 firms and over 1,500 firms have graduated through their system.
Core offering: Raizcorp offers access to finance, access to markets, business guidance, back-office support, entrepreneurial learning and access to infrastructure.
The overarching theme is that Raizcorp offers a wide array of business support.
Shanduka Black Umbrellas
Profile: Black Umbrellas is a non-profit enterprise development incubation organization partnering with
the private sector, government and civil society, which aims to improve the prospects of 100 percent black-owned business.
Core Offering: Black Umbrellas offers a pre-incubation three-month program, a prerequisite for the full three-year incubation. This includes bookkeeping services at standard rates, access to networking and marketing events, ongoing mentoring, assistance with finance access and workshops aimed at business and personal development.
The Innovation Hub
Profile: Established by the Gauteng Provincial Government through its Department of Economic Development to promote economic development and competitiveness of Gauteng businesses by fostering innovation and entrepreneurship.
Core offering: The Innovation Hub offers a number of incubation programs in the Bioeconomy (agroprocessing and pharmaceutical), Smart Industries (ICT and advanced manufacturing) and Green Economy (water purification, waste management and renewable energy).
These three examples highlight a few of the types of incubator services. Where incubators offer similar services, they are often housed in different geographical locations or aim to serve a mandate of fostering growth in a specific area. For example, the Innovation Hub offers support to science and technology start-ups in Gauteng.
88 A REPORT ON THE MSME LANDSCAPE IN SOUTH AFRICA
THE UNSEEN SECTOR
2.7 Key evidence and market gaps
As with the previous section on market sizing, this sub-section identifies two key types of gaps emerging from this review of MSME barriers to growth in South Africa. The first is evidence gaps – missing data or research that would be useful to accurately identify the key challenges small businesses in South Africa face. The second are market gaps – market elements important for MSME development that the available data and research indicates are missing in South Africa.
With regards to evidence gaps, the challenges related to MSME development in South Africa are generally well researched and documented. Most of the evidence gaps relate to the issue of MSME financing in South Africa. While this topic is generally well covered, a recent comprehensive review of size and drivers of the MSME finance gap in South Africa is missing.
With regards to market gaps, the traditional issues relating to MSME development ring true in the South African context – shortage of skills, access to finance, and access to markets. Beyond this, a consistent theme in South African literature is a need for tailored regulation, coordinated public sector programming and greater use of innovation to support lending to MSMEs to address these market imperfections.
The evidence and market gaps that have been discussed throughout this section are summarized here:
Evidence gaps• No recent review of the start-up funding
environment or nationally-representative survey collecting data on reported barriers to accessing start-up financing.
• No recent review of the quality of financial market infrastructure in South Africa, particularly business credit information sharing practices and collateral registries, and its impact on MSME finance is missing.
• No data on MSME access to different forms of collateral.
• No comprehensive review of the current legal framework for financial leasing services and factoring law.
• Limited analysis on the difficulties MSMEs face in accessing long-term financing, in particular equity capital, from both traditional and alternative sources.
• No data on the most critical skills gap among growth-oriented MSMEs that demand additional employees to expand.
• Limited research on which value chains South African MSMEs participate in, what barriers they face within these value chains, and which value chains represent the most significant opportunities for MSMEs.
Market gaps• No one-stop-shop approach to business registration
using technology to integrate processes and provide easy, fast and cheap business registration.
• No effective MSME tax regime that compensates small businesses for the burden of tax compliance, such as through a refundable compliance rebate.
• A mismatch between the supply and demand of MSME financing driven by information asymmetry.
• Inadequate coverage of business credit information sharing.
• No functional and accessible movable collateral registry.
• A shortage of skills, both relating to entrepreneurial and business acumen, and relating to technical/professional skills.
• Limited effectiveness of public procurement contracting and payment certainty, something which stifles the growth and funding prospects of MSMEs.
• Limited effectiveness of government programs designed to support MSME development, largely a result of poor coordination among various stakeholders.

A REPORT ON THE MSME LANDSCAPE IN SOUTH AFRICA 89
THE UNSEEN SECTOR
Small businesses come in all forms. The Mngomezulu family runs the Soweto Snake Show up the road from Nelson Mandela’s
old home on Vilakazi Street. Photo: IFC / Karel Prinsloo
A REPORT ON THE MSME LANDSCAPE IN SOUTH AFRICA 89
THE UNSEEN SECTOR
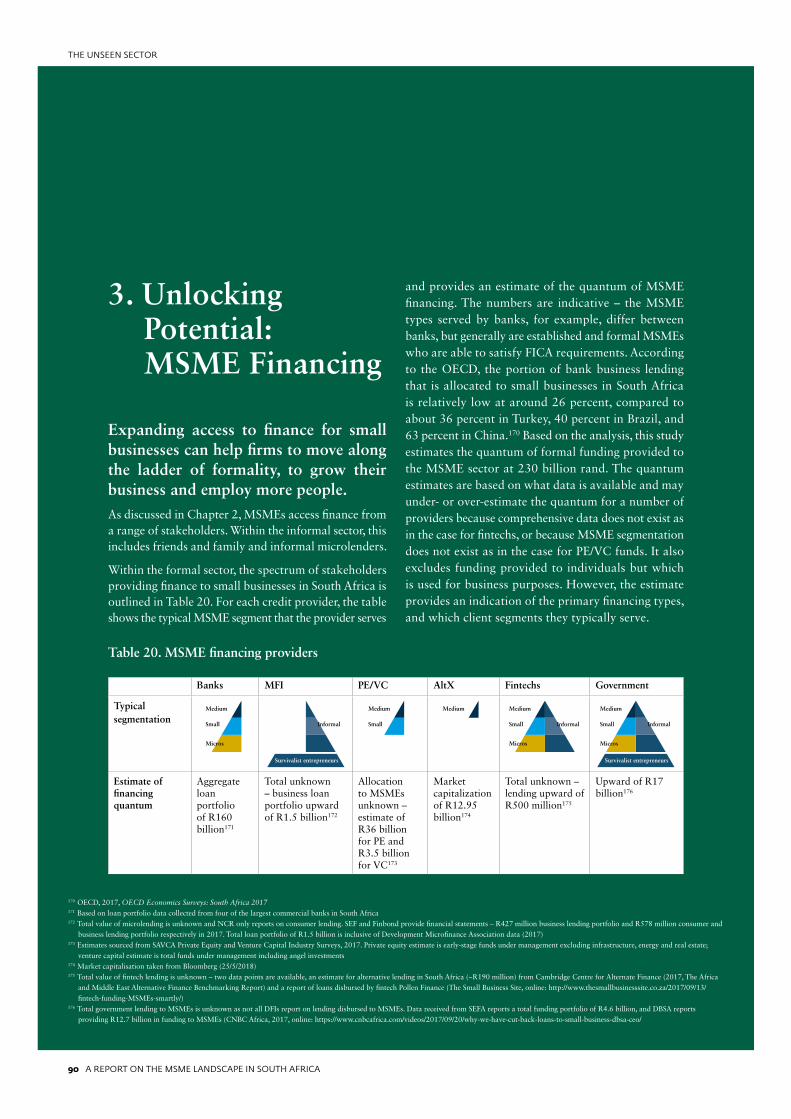
90 A REPORT ON THE MSME LANDSCAPE IN SOUTH AFRICA
THE UNSEEN SECTOR
3. Unlocking Potential: MSME Financing
Expanding access to finance for small businesses can help firms to move along the ladder of formality, to grow their business and employ more people.As discussed in Chapter 2, MSMEs access finance from a range of stakeholders. Within the informal sector, this includes friends and family and informal microlenders.
Within the formal sector, the spectrum of stakeholders providing finance to small businesses in South Africa is outlined in Table 20. For each credit provider, the table shows the typical MSME segment that the provider serves
and provides an estimate of the quantum of MSME financing. The numbers are indicative – the MSME types served by banks, for example, differ between banks, but generally are established and formal MSMEs who are able to satisfy FICA requirements. According to the OECD, the portion of bank business lending that is allocated to small businesses in South Africa is relatively low at around 26 percent, compared to about 36 percent in Turkey, 40 percent in Brazil, and 63 percent in China.170 Based on the analysis, this study estimates the quantum of formal funding provided to the MSME sector at 230 billion rand. The quantum estimates are based on what data is available and may under- or over-estimate the quantum for a number of providers because comprehensive data does not exist as in the case for fintechs, or because MSME segmentation does not exist as in the case for PE/VC funds. It also excludes funding provided to individuals but which is used for business purposes. However, the estimate provides an indication of the primary financing types, and which client segments they typically serve.
170 OECD, 2017, OECD Economics Surveys: South Africa 2017171 Based on loan portfolio data collected from four of the largest commercial banks in South Africa172 Total value of microlending is unknown and NCR only reports on consumer lending. SEF and Finbond provide financial statements – R427 million business lending portfolio and R578 million consumer and business lending portfolio respectively in 2017. Total loan portfolio of R1.5 billion is inclusive of Development Microfinance Association data (2017)173 Estimates sourced from SAVCA Private Equity and Venture Capital Industry Surveys, 2017. Private equity estimate is early-stage funds under management excluding infrastructure, energy and real estate; venture capital estimate is total funds under management including angel investments174 Market capitalisation taken from Bloomberg (25/5/2018)175 Total value of fintech lending is unknown – two data points are available, an estimate for alternative lending in South Africa (~R190 million) from Cambridge Centre for Alternate Finance (2017, The Africa and Middle East Alternative Finance Benchmarking Report) and a report of loans disbursed by fintech Pollen Finance (The Small Business Site, online: http://www.thesmallbusinesssite.co.za/2017/09/13/ fintech-funding-MSMEs-smartly/)176 Total government lending to MSMEs is unknown as not all DFIs report on lending disbursed to MSMEs. Data received from SEFA reports a total funding portfolio of R4.6 billion, and DBSA reports providing R12.7 billion in funding to MSMEs (CNBC Africa, 2017, online: https://www.cnbcafrica.com/videos/2017/09/20/why-we-have-cut-back-loans-to-small-business-dbsa-ceo/
Table 20. MSME financing providers
Banks MFI PE/VC AltX Fintechs Government
Typical segmentation
Estimate of financing quantum
Aggregate loan portfolio of R160 billion171
Total unknown – business loan portfolio upward of R1.5 billion172
Allocation to MSMEs unknown – estimate of R36 billion for PE and R3.5 billion for VC173
Market capitalization of R12.95 billion174
Total unknown – lending upward of R500 million175
Upward of R17 billion176
Medium
Small Informal
Micros
Survivalist entrepreneurs
Medium
Small Informal
Micros
Medium
Small
Micros
Medium
Small
Medium
Informal
Survivalist entrepreneurs
A REPORT ON THE MSME LANDSCAPE IN SOUTH AFRICA 91
THE UNSEEN SECTOR
Table 20 shows that commercial banks remain the major lender to MSMEs in South Africa in terms of quantum – with all non-bank financing including government making up less than half of the estimate of bank financing to MSMEs. Commercial banks, at 160 billion rand, represent 68.9 percent of the current supply of formal MSME funding in South Africa. The following sections investigate some of the challenges and potential solutions to MSME financing among some of the provider types detailed in Table 20, drawn from interviews conducted for this study. As banks provide the largest quantum of financing and were able to contribute segmented portfolio data for the purposes of this report, the focus of further analysis in this section is on bank financing. The section at the end concludes by considering the role government plays in creating an enabling environment for MSME financing, beyond being a direct financier.
3.1 Bank financing
As discussed in Section 3.2.1, bank financing extends beyond the provision of credit to transactional and investment banking products that help MSMEs to conduct business and finance themselves. MSME portfolio data collected from three of the largest commercial banks in South Africa suggest that there are more than 1.2 million business current and transaction accounts used by small businesses as at December 2017. In relation to the market sizing exercise conducted in Chapter 2, this suggests that only about 45 percent of the market opportunity among formal and informal MSMEs is currently being captured. This estimate is similar to the FinScope Small Business Survey 2010, which estimated that only 46.9 percent of MSMEs are formally banked. However, when including the large number of survivalist entrepreneurs identified in the market sizing exercise in this calculation, the ratio drops significantly to 22 percent. There are a number of caveats to these calculations – some MSMEs may have multiple bank accounts, inflating the count; and a large portion of entrepreneurs may be using their personal bank accounts to conduct business, which would be excluded from the count.
In addition to transactional banking, the same portfolio data suggests that there were more than 830,000 small business borrowers accessing formal lending products among the three large commercial banks as at December 2017. Again there are caveats – some MSMEs may have multiple loan accounts, and others may be using personal loan products to finance their businesses. Caveats aside, comparing the number of borrowers against transactional account holders suggests that banks are playing an important financial inclusion role among MSMEs in providing bank account access, but that this is true to a lesser extent for credit products where there are fewer borrowers. Moreover, the growth rate in the number of small business borrowers has decreased over the last three years, with a contraction in the number of borrowers of 3 percent between December 2016 and December 2017.
This dynamic of greater MSME coverage for transactional banking compared to lending suggested by volume data is also borne out by value data. The same set of banks report an aggregate value of transactional and savings deposits of approximately 309 billion rand, compared to the value of MSME lending across product segments of approximately 160 billion rand. As discussed in Section 3.2.3 on short-term bank financing, the lower coverage of lending products relates to issues of information asymmetry and moral hazard when lending to MSMEs. Banks employ a variety of methods to deal with the credit or default risk that arises – information on the MSME’s cash flow, capital and credit history indicates their ability and willingness to repay, and the provision of immovable assets and vehicles acts as security against default.177 This tends to exclude a portion of the MSME market from accessing formal finance due to the lack of available information or access to immovable assets.
Some banks in South Africa are increasingly making use of their own credit scorecards as an input to the lending decision process, meaning that reliance on traditional collateral is being reduced and working capital financing is increasingly being provided on an unsecured basis.178
177 Mutezo, 2013, Credit Rationing and Risk Management for SMEs: The Way Forward for South Africa, Corporate Ownership and Control, 10(2) 178 Based on interviews conducted by IFC and Genesis Analytics with major banks in South Africa, May 2018
92 A REPORT ON THE MSME LANDSCAPE IN SOUTH AFRICA
THE UNSEEN SECTOR
Scorecards go some way toward reducing the high cost of risk assessment and taking of security among higher-risk MSME segments. However, this method is unlikely to fill the significant financing gap if a large segment of the MSME sector remains informal and cash-based, as banks require data over a time period to apply this method.
The use of scorecards is progressive relative to other markets – a World Bank study reports that over 80 percent of developing market banks use traditional risk assessment methods for small businesses179 – but requires significant data to build predictive models. As such, this model of unsecured lending is best suited to market segments where sufficient data is available, with a bias toward formal and established MSMEs. In addition, this type of lending often requires personal surety from the business owner, excluding entrepreneurs without sufficient income to stand surety in their personal capacity. As such, typical MSME bank customers in South Africa continue to remain formal and established enterprises. The requirements for opening an SME business bank account vary by bank and depending on the type of business. For example sole proprietor does not require company registration documents, but companies do. The list of documents that may be required include a valid South African ID, proof of residence for business members/directors, proof of business operating address, company registration documents, company resolution, bank statements of business if it is not a start-up or personal bank statements of business owners. Some banks require a deposit to be made to activate the bank account, while others have no minimum deposit requirements.180
As an indication of this, Table 21 provides a breakdown of bank lending to different MSME segments for a
selection of three large commercial banks. Note that the “large” category in the firm size segmentation captures businesses that are included in the bank’s MSME segmentation with a turnover greater than 20 million rand, the MSME threshold selected for this report. The data shows that the majority of bank lending to MSMEs is at the lower end of the firm size spectrum according to the number of borrowers, but that most of the lending by value goes to MSMEs of a larger firm size. This is to be expected as firms of a larger size typically require larger loan amounts, but it could also suggest that smaller MSMEs struggle to access higher-value loans. This is confirmed by the loan size data, which shows that the majority of MSME borrowers are receiving small loan sizes that together constitute a relatively small share of total MSME lending by value. Data provided by the banks revealed that at the micro and very small business end of the spectrum, NPLs were consistently high double digit figures, whilst at the medium to large enterprise end of the spectrum they were in low single digits, confirming that lending to micro and small businesses carry higher risk.
In terms of product type, a significant portion of lending is channeled to longer-term loans such as vehicle and property finance when measured by value. The positive growth in these product segments by value, compared to the contraction in other term lending, suggests that MSMEs are making use of vehicle and property financing because it does not require other assets to be used as collateral. The vehicle or property acts as the underlying collateral. However, when considered by volume, the majority of small businesses use of short-term lending in the form of overdrafts and credit cards. Again, the benefit of this type of lending for MSMEs is that assessments tend to be based on cash flow rather than collateral requirements.
179 World Bank, 2008, Banking SMEs around the World: Lending practices, business models, drivers and obstacles180 Information collected from the websites of large commercial banks in South Africa, valid at August 2018
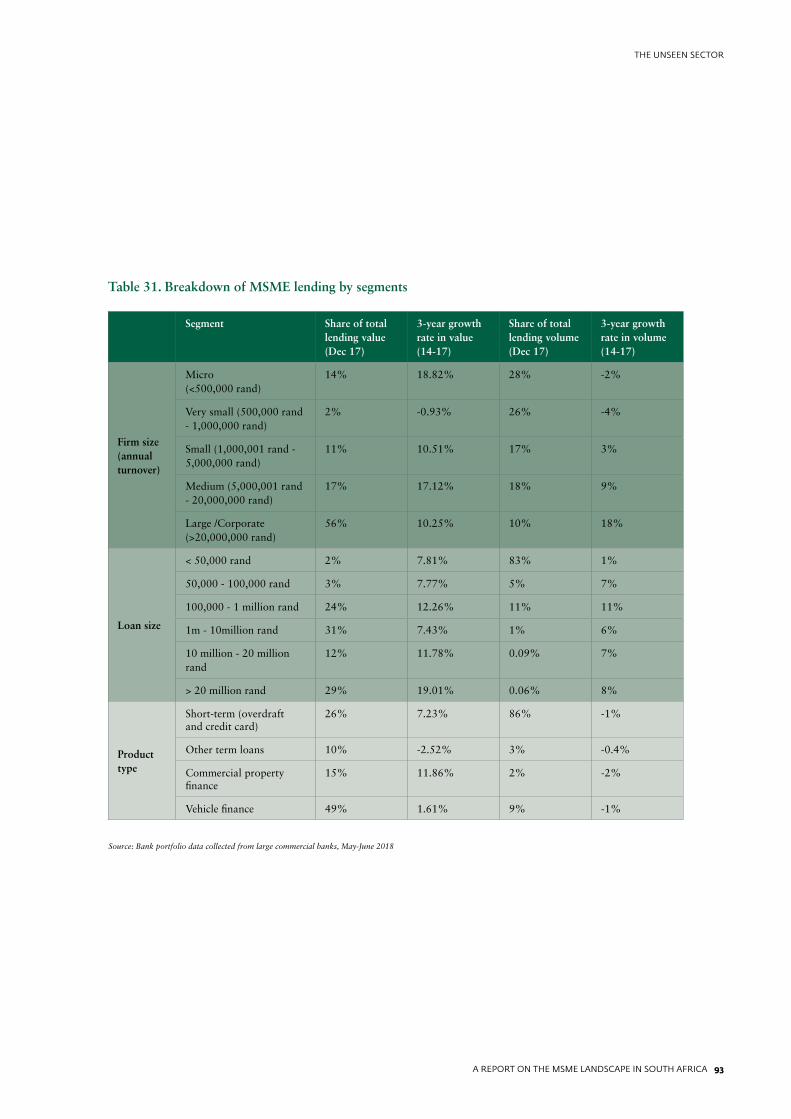
A REPORT ON THE MSME LANDSCAPE IN SOUTH AFRICA 93
THE UNSEEN SECTOR
Table 31. Breakdown of MSME lending by segments
Segment Share of total lending value (Dec 17)
3-year growth rate in value (14-17)
Share of total lending volume (Dec 17)
3-year growth rate in volume (14-17)
Firm size (annual turnover)
Micro (<500,000 rand)
14% 18.82% 28% -2%
Very small (500,000 rand - 1,000,000 rand)
2% -0.93% 26% -4%
Small (1,000,001 rand - 5,000,000 rand)
11% 10.51% 17% 3%
Medium (5,000,001 rand - 20,000,000 rand)
17% 17.12% 18% 9%
Large /Corporate (>20,000,000 rand)
56% 10.25% 10% 18%
Loan size
< 50,000 rand 2% 7.81% 83% 1%
50,000 - 100,000 rand 3% 7.77% 5% 7%
100,000 - 1 million rand 24% 12.26% 11% 11%
1m - 10million rand 31% 7.43% 1% 6%
10 million - 20 million rand
12% 11.78% 0.09% 7%
> 20 million rand 29% 19.01% 0.06% 8%
Product type
Short-term (overdraft and credit card)
26% 7.23% 86% -1%
Other term loans 10% -2.52% 3% -0.4%
Commercial property finance
15% 11.86% 2% -2%
Vehicle finance 49% 1.61% 9% -1%
Source: Bank portfolio data collected from large commercial banks, May-June 2018
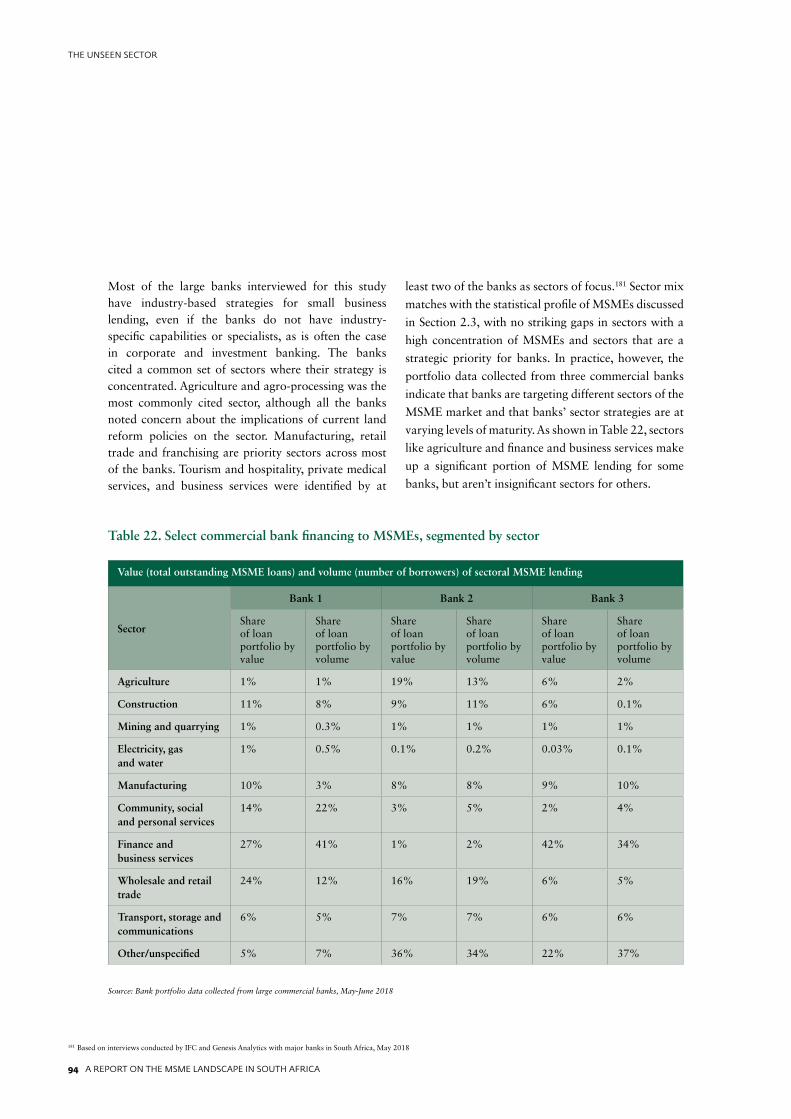
94 A REPORT ON THE MSME LANDSCAPE IN SOUTH AFRICA
THE UNSEEN SECTOR
Most of the large banks interviewed for this study have industry-based strategies for small business lending, even if the banks do not have industry-specific capabilities or specialists, as is often the case in corporate and investment banking. The banks cited a common set of sectors where their strategy is concentrated. Agriculture and agro-processing was the most commonly cited sector, although all the banks noted concern about the implications of current land reform policies on the sector. Manufacturing, retail trade and franchising are priority sectors across most of the banks. Tourism and hospitality, private medical services, and business services were identified by at
least two of the banks as sectors of focus.181 Sector mix
matches with the statistical profile of MSMEs discussed
in Section 2.3, with no striking gaps in sectors with a
high concentration of MSMEs and sectors that are a
strategic priority for banks. In practice, however, the
portfolio data collected from three commercial banks
indicate that banks are targeting different sectors of the
MSME market and that banks’ sector strategies are at
varying levels of maturity. As shown in Table 22, sectors
like agriculture and finance and business services make
up a significant portion of MSME lending for some
banks, but aren’t insignificant sectors for others.
181 Based on interviews conducted by IFC and Genesis Analytics with major banks in South Africa, May 2018
Table 22. Select commercial bank financing to MSMEs, segmented by sector
Value (total outstanding MSME loans) and volume (number of borrowers) of sectoral MSME lending
Sector
Bank 1 Bank 2 Bank 3
Share of loan portfolio by value
Share of loan portfolio by volume
Share of loan portfolio by value
Share of loan portfolio by volume
Share of loan portfolio by value
Share of loan portfolio by volume
Agriculture 1% 1% 19% 13% 6% 2%
Construction 11% 8% 9% 11% 6% 0.1%
Mining and quarrying 1% 0.3% 1% 1% 1% 1%
Electricity, gas and water
1% 0.5% 0.1% 0.2% 0.03% 0.1%
Manufacturing 10% 3% 8% 8% 9% 10%
Community, social and personal services
14% 22% 3% 5% 2% 4%
Finance and business services
27% 41% 1% 2% 42% 34%
Wholesale and retail trade
24% 12% 16% 19% 6% 5%
Transport, storage and communications
6% 5% 7% 7% 6% 6%
Other/unspecified 5% 7% 36% 34% 22% 37%
Source: Bank portfolio data collected from large commercial banks, May-June 2018
A REPORT ON THE MSME LANDSCAPE IN SOUTH AFRICA 95
THE UNSEEN SECTOR
182 Based on interviews conducted by IFC and Genesis Analytics with major banks in South Africa, May 2018183 Based on feedback from bank portfolio data requests, submitted in April 2018
184 Land Bank, 2015, Short Term Loans, online: https://landbank.co.za185 Based on interviews conducted by IFC and Genesis Analytics with major banks in South Africa, May 2018
Challenge for banksThe bank interviews revealed a number of institutional challenges banks face in addressing the small business market. How best to segment the MSME market is not clear. Most banks use sales, or turnover, but they are also experimenting with other data points such as employees, assets or sector thus making it difficult to tailor products and operating models to the right MSME segments. As discussed in Section 2.1, while all banks are using turnover to segment the MSME market, their segmentation differs considerably. Secondly, limited operational integration of personal and business banking, which constitutes the largest proportion of the market, is a constraint for entrepreneurial start-ups or owner-run businesses. Business turnover reflected in personal bank accounts are typically not considered for formal MSME lending because the data cannot be segregated. The significant number of MSMEs operating as sole proprietorships as well as the quantum of informality highlighted in Section 2.2 makes it difficult to fund a large segment of the MSME market. Furthermore, levels of personal indebtedness, a history of default behavior and blacklisting prohibit a material portion of business owners from accessing funding for their businesses. Lastly, there are sometimes silos between staff members who manage MSME relationships and those making centralized credit decisions. Generally MSME banking has to compete commercially with a broad set of other priorities within the banks, most of which are larger-scale than MSME financing.182
Bank representatives interviewed consistently noted that MSMEs require further education on cash flow and debt management. Small businesses have limited knowledge of balance sheet structuring and balance sheet management. MSMEs are often not pre-empting and planning their finance requirements based on their growth trajectory and often do not reinvest their profits back into the business to grow their balance sheet and ability to provide collateral in future. In other cases, MSMEs self-fund too extensively instead of leveraging the benefits of using debt finance.
Banks continue to face traditional challenges relating to MSME risk assessment and information asymmetry. Even when automated scorecards are used, the cost of risk assessment is fixed meaning that small loan sizes are
less profitable. Furthermore, many MSMEs operate as sole proprietorships and therefore interest rates on loans to such enterprises are capped under the National Credit Act. Credit reporting on small businesses is thin and there is no way of accounting for personal loans used for business purposes. MSMEs lack governance and it is often too easy to cease operations with few MSMEs formally liquidating.
Collateral to secure loans was not cited as a significant issue among the bank interviewees, however, beyond vehicle and asset finance where the asset is the underlying security for the loan, the limited use of movable assets as collateral constrains banks’ ability to capture opportunities at the lower end of the market. Symptomatic of this limited reliance on alternative collateral types is the fact that is it not captured consistently in bank systems. This seems to be primarily a system issue because it is captured in loan application documentation but not in the bank management information system.183 The same was found in the case of SEFA and South Africa’s Industrial Development Corporation. Accepting movable collateral is relevant for all MSMEs. Key sectors such as agribusiness use alternative collateral such as crop receipts by the Land Bank as a form of warehouse receipt to help secure lending based on field assets.184
The banks also noted a number of regulatory challenges, which contribute to a poor operating environment for MSME financing. The Financial Intelligence Centre Act requirements for customer due diligence continue to be a barrier to basic bank account access and financing, particularly the requirement that ID and proof of address cannot be older than three months and the restrictions on KYC for foreign nationals. The NCA requirement for three months’ bank statements limit the provision of seed funding for start-ups and the requirement within South Africa’s current legislation to have surety agreements signed in person rather than digitally is another barrier to banking digitally.
The South African Reserve Bank requirement to allocate customers with no credit history with a relatively high default risk grading constrains credit allocation to underserved clients, and the IFRS 9 requirements implemented in 2018 are expected to make lending to riskier market segments more difficult.185
96 A REPORT ON THE MSME LANDSCAPE IN SOUTH AFRICA
THE UNSEEN SECTOR
96 A REPORT ON THE MSME LANDSCAPE IN SOUTH AFRICA
THE UNSEEN SECTOR
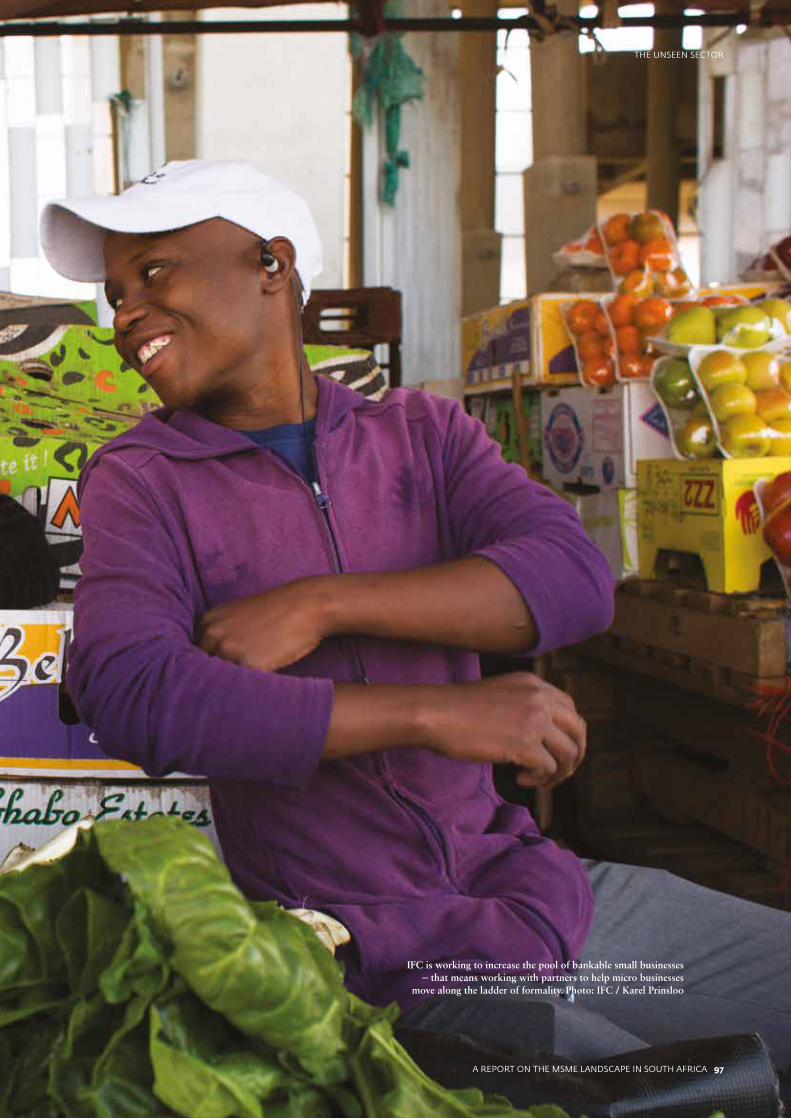
A REPORT ON THE MSME LANDSCAPE IN SOUTH AFRICA 97
THE UNSEEN SECTOR
IFC is working to increase the pool of bankable small businesses – that means working with partners to help micro businesses
move along the ladder of formality. Photo: IFC / Karel Prinsloo
A REPORT ON THE MSME LANDSCAPE IN SOUTH AFRICA 97
THE UNSEEN SECTOR
98 A REPORT ON THE MSME LANDSCAPE IN SOUTH AFRICA
THE UNSEEN SECTOR
Solutions being considered by banksThe banks discussed a number of solutions they are investigating to overcome these challenges:
• Collecting more data on the currently opaque MSME sector, particularly for informal firms, in order to better assess risk is a priority, particularly to feed into scorecard lending. This includes extending electronic payment solutions to informal enterprises to provide banks with a view of their cash flow, extending access to basic business accounts to collect proprietary data on MSME transactions and financial behavior, as well as providing MSMEs with record-keeping solutions. Bringing more MSMEs into formal banking services and assisting the market to formalize will help banks collect more data on the MSME sector and develop scoring models that account for their unique characteristics.186 Digitization and digital financial services play a vital role in achieving this. Secondly, removing the silo between personal and business banking will assist banks in using the transactional data of an entrepreneur to support business-lending decisions. This needs to be managed carefully with appropriate safeguards. Lastly, although outside the control of banks, improving credit bureau coverage and data on the credit worthiness of MSMEs is important. This can be done by including more sources of non-bank financing such as trade credit, payment profile data of MSMEs, distinguishing consumer loans from personal loans used for commercial purposes, and collecting a richer set of financial data such as financial statement information in addition to credit history.
• Developing innovative and tailored products will become more important as banks become better able to include underserved segments in their scoring models, and as technology allows for lower cost coverage of key MSME segments. Banks are beginning to offer mobile POS solutions for informal enterprises that want to offer cashless transactions but cannot afford traditional POS devices. Reverse factoring is provided to companies who have MSME suppliers within their value
chains, making it easier for MSMEs to access bank financing compared to traditional factoring due to the lead firm’s established relationship with the bank. Banks are making use of digital innovation to improve their reach and decrease their cost of serving MSMEs, including digital KYC and account-opening procedures through banking apps187 and digital MSME banking platforms that remove the need to bank in-branch.188 Banks are also using their view of MSME customer data and analytic capabilities to offer value-added services beyond traditional financing products, such as analyzing POS data to generate customer insights for small businesses.189
• Strategic partnerships to extend banks’ reach among MSMEs are promising. Most of the banks interviewed have identified corporate supply chains as an area of strategic focus. The knowledge of a corporate contract in place creates confidence of revenue and cash flow projections, and the corporates can provide surety for loans. Some banks are able to provide these MSMEs with a comprehensive suite of products including invoice discounting, purchase order capabilities, asset finance, working capital, and term loans without requiring any collateral. Banks are also partnering with companies and large corporates with existing distribution networks in informal markets, such as beverage manufacturers, to create relationships with informal firms that have established operations and a connection to the formal sector.
• MSME financing is not just about access to money. Banks are equipping MSMEs with the ability to use credit successfully. For example, one bank is supplying an accounting software package to more than 200,000 MSME users. Most banks provide their small business clients with enterprise support, either in the form of education, business training or post-lending management advice through MSME centers, or the use of accounting and invoicing software or other business resources for free. Some banks are also innovating in this space by providing BDS to MSMEs digitally through their app, making BDS available to entrepreneurs at their convenience.
186 Ibid187 Biztech Africa, 2018, FNB solves for SME needs through digital innovation, Biztechafrica.com, online: http://www.biztechafrica.com/article/fnb-solves-sme-needs-through-digital-innovation/13564/188 Letsebe, 2018, Sasfin Introduces Digital Banking Platform for SMEs, ITWeb, online: https://www.itweb.co.za/content/nWJad7b8ppDqbjO1189 Pazvakavambwa, 2015, Nedbank Data Analytics Tool Gets Global Recognition, ITWeb, online: https://www.itweb.co.za/content/JOlx4z7kQb4q56km
A REPORT ON THE MSME LANDSCAPE IN SOUTH AFRICA 99
THE UNSEEN SECTOR
3.2 Non-bank financing
Private equity and venture capitalThe availability of equity financing for MSMEs in South Africa is improving as fundraising activities increase and the pipeline of investment-ready small businesses expands. However, the increase is off a low base and as a result of a number of issues this market remains small relative to other financing providers.190 Investors tend to invest in businesses they are familiar with from their network. Generating quality deal flow at the right economics remains a challenge for private equity and venture capital firms. Pitching competitions have had limited success. Many accelerators have also become pitch platforms over time.
Data on private equity and venture capital financing provided to small businesses is not available. However, using Southern Africa Venture Capital and Private Equity Association’s Private Equity and Venture Capital annual survey, an approximation of the quantum of financing provided to MSMEs can be estimated. For private equity funding, the estimate takes the value of early-stage funds under management, assuming early-stage funding is going to MSMEs as opposed to larger ventures, but excludes the funding provided to the infrastructure, energy and real estate sectors where early-stage funding is likely going to larger firms. This provides an estimate of 36 billion rand of private equity funding. For venture capital, which tends to be invested in early-stage ventures, the total value of funds invested from venture capital deals is estimated at 3.5 billion rand.191
Poor business plans and unrealistic valuations are common amongst small businesses looking for finance. Together with low rates of financial literacy and business readiness and the skills shortage in the MSME sector, this makes due diligence difficult and expensive to scale. Furthermore, as a number of MSMEs are owner-run, diluted ownership is often not desired and may have negative effects on the owner’s incentive to run their business.
As a result of these demand-side constraints, there are few fund managers specializing in MSME investments. Consequently – or perhaps the reason for this issue – institutional funds, where most funds are raised from, are not allocated to early-stage investments. One solution would be to make early-stage investments a mainstream asset class by earmarking some institutional funds for this purpose, which would likely see a rise in specialist fund managers.192 Additionally, the Davis Tax Committee reports that the venture capital company tax incentive as per Section 12J of the Income Tax Act does little to encourage equity investments in micro enterprises. The Committee recommends an additional tax incentive be created to encourage angel investors to fund MSMEs, perhaps through the extension of the Bad Debt allowance to failed investments in micro enterprises.193
In South Africa, equity financing for MSMEs remains heavily reliant on angels. However, local venture capital should be recognized as an asset class and attract institutional funding to scale the impact and build capacity to support MSMEs as they grow and expand.
Microfinance institutionsMFIs are important credit providers to survivalist entrepreneurs and informal small businesses. Informal businesses struggle to get funding from larger financial institutions. While there are a mix of lending models used – ranging from the group-lending model employed by non-profit lenders, to online lenders, loan aggregators, retail store-based lenders and brick-and-mortar lenders in the for-profit space – most MFIs cater to the lower end of the market. The sector is divided between not-for-profit developmental finance providers, represented by the Development Microfinance Association, and for-profit microlenders, represented by Microfinance South Africa. Development Microfinance Association’s membership reduced over recent years from 37 to seven members. The market contracted during this period and DMA’s current members represent 112 branches or outlets and 187,225 active clients (group loans) and 190,174 active loans.
190 Based on interview conducted by IFC and Genesis Analytics with market participants in South Africa, May 2018 191 SAVCA, 2017, Private Equity and Venture Capital Industry Surveys, 2017
192 Based on interview conducted by IFC and Genesis Analytics with market participants in South Africa, May 2018 193 Davis Tax Committee, 2016, Second and Final Report on Small and Medium Enterprises
100 A REPORT ON THE MSME LANDSCAPE IN SOUTH AFRICA
THE UNSEEN SECTOR
Development Microfinance Association data indicates that 90 percent of clients are female, 23 percent of clients are classified as youth and 85 percent of loans are classified as rural and peri-urban. Loan sizes range between 500 rand and 27,000 rand. Microfinance South Africa represents 460 for-profit members, who in turn represent 1,200 offices across South Africa and five to seven million customers. Microfinance South Africa members mostly provide short term unsecured consumer loans with typical loan sizes below 80,000 rand, although most loans are below 8,000 rand.
Data on the microfinance sector is very fragmented and difficult to obtain at an aggregate level. Impact reporting is limited – the latest Poverty Probability Index for South Africa dates back to April 2009 and data from The Consultative Group to Assist the Poor and Mix Market is outdated. Microfinance South Africa members report directly to the National Credit Regulator on either a quarterly or annual basis as well as report credit and risk performance data to South African Credit and Risk Reporting Association. The National Credit Regulator only publishes data on consumer loans, not business loans. DMA collects data from its members directly, which indicates that not-for-profit developmental finance providers have disbursed more than 2,613,901 loans to the value of 5.6 billion rand since inception. Over the past 12 months, DMA members have disbursed 56,287 loans to the value of 1.1 billion rand with a gross loan book of 490 million rand.194
According to interviews with market players, the microfinance industry carries a number of challenges including poor financial literacy, lack of birth certificates, identity documents and proof of address, high levels of indebtedness (mixing formal and informal credit), and the use of loans for consumption rather than productive purposes – all of which make this a high-risk segment to serve.195
In addition to these demand-side issues, formal MFIs face a difficult regulatory environment. MFIs are subject to the same set of regulations as banks including the FIC Act, Protection of Personal Information Act,
National Credit Act, caps on interest rates and credit life fees, data collection and submission requirements, among others. As a result, South Africa has a significant number of invisible and illegal credit providers. Most registered MFIs place emphasis on reaching the financially excluded. However, in practice, this means assisting potential borrowers to obtain birth certificates, identity documents and to open bank accounts.
Furthermore, MFIs face the cost of financial literacy training, high staff turnover, manual reconciliation processes, operational controls to prevent fraud, the cost of physical rather than electronic and automated credit evaluation, travel costs and the cost of disbursement and collection processes, which utilizes bank infrastructure in a model that is very dependent on cash, and in particular, coins. As such, for-profit microlenders struggle to profitably serve high-risk clients profitably, meaning potential customers are forced into an unregulated illegal microlending market.196 A potential solution could be to develop a “compliance lite” regulatory framework for MFIs that support microlenders to lend legally to high-risk customer segments sustainably and at large scale.
MFIs also find it challenging to access appropriately structured funding. Funding is typically directed to large, existing players rather than growing the sector. There is also a lack of patient capital and access to revolving facilities, which allow smaller MFIs to build a track record and scale.
Across the sector, the development of standardized and accredited financial literacy training modules could substantially reduce operational costs for MFIs and increase the impact of financial education. In addition, the establishment of a record-keeping and reporting system for MFIs can further reduce the cost of compliance, increase the accuracy of impact measurement and reduce the risk of over-indebtedness across the sector.
To increase access to finance for micro businesses, financial inclusion in the form of citizens with bank accounts are paramount. South Africans have to have proof of identity and proof of address to achieve this.
194 Based on interview conducted by IFC and Genesis Analytics with market participants in South Africa, May 2018195 Based on interview conducted by IFC and Genesis Analytics with market participants in South Africa, May 2018196 Ibid
A REPORT ON THE MSME LANDSCAPE IN SOUTH AFRICA 101
THE UNSEEN SECTOR
FintechsSouth Africa has a small but growing fintech industry that is producing some world-class innovation – three South African fintechs made it on the Fintech 100 list in 2016.197 However, the focus is on relatively affluent and digitally savvy consumers, possibly constraining the uptake of fintech solutions in the informal sector.198 Perhaps as a result, there is still significant scope for fintechs in South Africa to fill the remaining MSME financing gaps among informal enterprises.
The Fintech opportunity covers a number of aspects of MSME financing. Affordable electronic payment services such as Yoco help make informal MSMEs more visible and reduce cost to serve banks and other types of financial services providers, improving credit scoring. Alternative financing models such as Merchant Capital facilitate unsecured lending to MSMEs where repayment is recovered through a pre-negotiated percentage of all card swipes and scoring is conducted using a proprietary algorithm based on sales data. Peer-to-peer (P2P) lending platforms such as Rainfin allow MSME funding to be crowd sourced using alternative datasets and predictive analytics to develop alternative scoring frameworks, with potential application to traditional financial institutions. An opportunity exists for fintechs to utilize application-programing interfaces to access bank client data, which in turn could assist with risk assessment and increased access to finance for MSMEs.
As discussed in Section 3.2.4, the regulatory environment in South Africa may constrain the fintech potential to support small business development. However, a number of recent developments indicate that the regulatory environment may improve: the South African Reserve Bank established a dedicated fintech unit,199 the Inter-governmental Fintech Working Group is expanding its members,200 and there is appetite among regulators to implement innovation facilitation tools like regulatory sandboxes and innovation hubs.201 These facilitation tools can encourage fintechs to focus on solving remaining challenges in small business financing through the design of entry requirements and incentives.
CorporatesWhile most corporates are not technically financiers, a number play an important role providing financing for the small businesses within their value chain. This includes providing trade credit, short-term loans, standing surety for longer-term credit from financial institutions, and providing assets and marketing material to suppliers and distributors. It often also includes non-financial support, such as entrepreneurial training and business support. The Coca-Cola Beverages South Africa case study in Section 3.5.2 highlighted the different types of financing and non-financial support provided by a beverage producer to the small businesses within its distribution chain.
The interviews conducted for this study uncovered different views on the impact of corporate value chain development for MSME financing. There was some skepticism regarding whether enterprise supplier development programs are reaching scale, and whether they are a genuine part of the corporate’s business operations versus a way to earn more points on the public procurement scorecard. There was also some concern that MSMEs within these chains are more like contract workers than fully-fledged enterprises. However, a number of banks identified MSMEs within corporate supply chains as a key opportunity, and the fact that many corporates have established distribution chains within informal markets means that they are key partners to extend financing to informal MSMEs through bank and corporate partnerships.
Other private stakeholdersIn addition to the financiers discussed, there is a broad variety of stakeholders in the private sector that provide a mix of funding, investment and business development services to MSMEs within different models. As discussed in Section 3.6, there are a number of incubators and accelerators in South Africa supporting MSME development. Some of these have associated investment or financing programs, such as the Awethu Project, which aims to provide business development support and connect MSMEs to funding opportunities within an intensive six-month training program.
197 BusinessTech, 2016, These 3 South African Fintech companies rank among the best in the world, BusinessTech, online: https://businesstech.co.za/news/it-services/141163/these-3-south-african-fintech-companies-rank-among-the-best-in-the-world/
198 Genesis Analytics, 2017, The Impact of the Fourth Industrial Revolution on South Africa’s Financial Services Market, Centre of Excellence in Financial Services Research Report199 Khumalo, 2018, Reserve Bank Sets up 3-Man Fintech Group, IOL, online: https://www.iol.co.za/business-report/companies/reserve-bank-sets-up-3-man-fintech-group-13008251
200 Khumalo, 2018, SARB Urges Harmonisation in Fintech, IOL, online: https://www.iol.co.za/business-report/technology/sarb-urges-harmonisation-in-fintech-14599126 201 Crawford, 2018, SARB Announces Establishment of Fintech Programme, Financial Institutions Legal Snapshot, online: https://www.financialinstitutionslegalsnapshot.com/2018/02/sarb-announces-
establishment-of-fintech-programme/
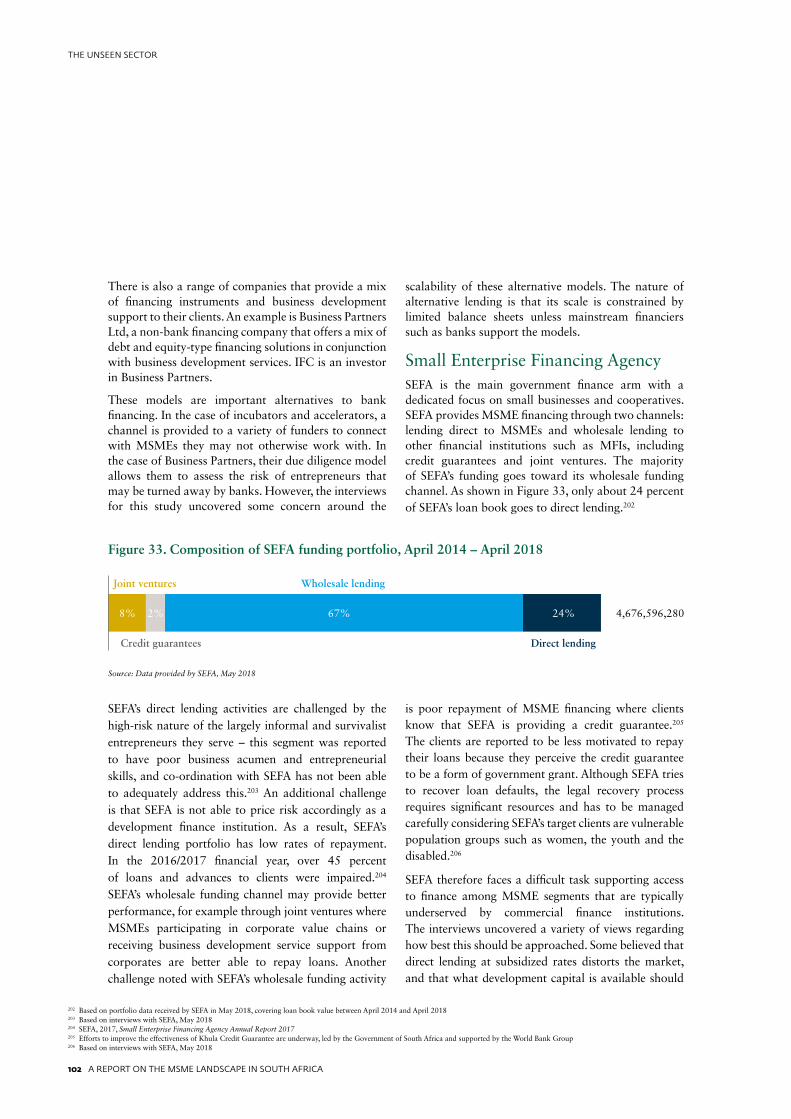
102 A REPORT ON THE MSME LANDSCAPE IN SOUTH AFRICA
THE UNSEEN SECTOR
There is also a range of companies that provide a mix of financing instruments and business development support to their clients. An example is Business Partners Ltd, a non-bank financing company that offers a mix of debt and equity-type financing solutions in conjunction with business development services. IFC is an investor in Business Partners.
These models are important alternatives to bank financing. In the case of incubators and accelerators, a channel is provided to a variety of funders to connect with MSMEs they may not otherwise work with. In the case of Business Partners, their due diligence model allows them to assess the risk of entrepreneurs that may be turned away by banks. However, the interviews for this study uncovered some concern around the
scalability of these alternative models. The nature of alternative lending is that its scale is constrained by limited balance sheets unless mainstream financiers such as banks support the models.
Small Enterprise Financing AgencySEFA is the main government finance arm with a dedicated focus on small businesses and cooperatives. SEFA provides MSME financing through two channels: lending direct to MSMEs and wholesale lending to other financial institutions such as MFIs, including credit guarantees and joint ventures. The majority of SEFA’s funding goes toward its wholesale funding channel. As shown in Figure 33, only about 24 percent of SEFA’s loan book goes to direct lending.202
SEFA’s direct lending activities are challenged by the high-risk nature of the largely informal and survivalist entrepreneurs they serve – this segment was reported to have poor business acumen and entrepreneurial skills, and co-ordination with SEFA has not been able to adequately address this.203 An additional challenge is that SEFA is not able to price risk accordingly as a development finance institution. As a result, SEFA’s direct lending portfolio has low rates of repayment. In the 2016/2017 financial year, over 45 percent of loans and advances to clients were impaired.204 SEFA’s wholesale funding channel may provide better performance, for example through joint ventures where MSMEs participating in corporate value chains or receiving business development service support from corporates are better able to repay loans. Another challenge noted with SEFA’s wholesale funding activity
is poor repayment of MSME financing where clients know that SEFA is providing a credit guarantee.205 The clients are reported to be less motivated to repay their loans because they perceive the credit guarantee to be a form of government grant. Although SEFA tries to recover loan defaults, the legal recovery process requires significant resources and has to be managed carefully considering SEFA’s target clients are vulnerable population groups such as women, the youth and the disabled.206
SEFA therefore faces a difficult task supporting access to finance among MSME segments that are typically underserved by commercial finance institutions. The interviews uncovered a variety of views regarding how best this should be approached. Some believed that direct lending at subsidized rates distorts the market, and that what development capital is available should
Figure 33. Composition of SEFA funding portfolio, April 2014 – April 2018
Source: Data provided by SEFA, May 2018
Joint ventures Wholesale lending
Credit guarantees Direct lending
4,676,596,2808% 2% 67% 24%
202 Based on portfolio data received by SEFA in May 2018, covering loan book value between April 2014 and April 2018203 Based on interviews with SEFA, May 2018204 SEFA, 2017, Small Enterprise Financing Agency Annual Report 2017205 Efforts to improve the effectiveness of Khula Credit Guarantee are underway, led by the Government of South Africa and supported by the World Bank Group206 Based on interviews with SEFA, May 2018
A REPORT ON THE MSME LANDSCAPE IN SOUTH AFRICA 103
THE UNSEEN SECTOR
be used to unlock the far greater value of private capital, either through credit guarantees or subsidizing the cost of risk assessment among underserved segments. Others believed that development finance is critical for underserved segments, but that other vehicles of direct lending should be investigated such as a government-owned MFI, which could scale significantly and add innovation to the market.
3.3 The role of government in MSME financingThe government has a fundamental role to play in creating an enabling environment for entrepreneurship and small business to thrive in South Africa. The government’s role is multifaceted, with a responsibility for policy coordination, supportive regulation, and the provision of financing and capacity building support to MSMEs. Government offices, both national and local, should coordinate to support the registration and licensing of new businesses. A permissive tax regime also needs to be in place to support the formalization of informal enterprises. Regulation governing MSME access to finance, to markets, to skills and infrastructure needs to be coordinated so it doesn’t stifle entrepreneurship and start-up activity. In addition, the government has a more direct role to play in supporting the growth of MSMEs; through strengthening the capacity of institutions that support MSMEs, and providing targeted guarantees or deploying blended finance instruments that reduce the public or private risk of lending into the segment.
From the research and interviews conducted for this report, the government’s support for MSMEs is seen as effective in a number of cases. Interviewees, for example, spoke highly of the work by SARS to establish MSME desks and to institute a more enabling turnover-based tax regime for small businesses. Interviewees also praised SARS’ efforts to establish preferential tax regimes for small business financing entities and venture capital companies – though questions remain about the limited reach of these initiatives. Banks interviewed
for this report also spoke positively about the lending, guarantee fund and joint venture support of the Industrial Development Corporation, and, to a lesser extent, of SEFA’s wholesale support to microlenders and joint ventures with large corporates like mining company Anglo American, and Coca-Cola. The DBSA’s support for MSMEs was also acknowledged, though this is not a primary aim of the bank. Beyond financing support, interviewees remarked on the effectiveness of Bankseta’s capacity building efforts, particularly in training microlender staff, but also on the reach but as yet unrealized potential of SEDA’s Incubation Centers.
Challenges
While the government has taken active steps to improve the effectiveness of DFIs and the efficiency of tax administration and business registration, more needs to be done to remove regulatory red tape and address government procurement to improve the financing prospects of MSMEs. As discussed in Section 3.1 on regulatory red tape, the time to process tax refunds needs to be reduced as a matter of priority. The registration of employees for the occupational injuries compensation fund and other government services should be digitized. Licenses or sector-specific permit systems administered by local governments also need to be streamlined and integrated into one-stop shops. Tourism, food and beverage, legal and courier services would benefit the most from a one-stop shop.
Reforms to these business environment indicators are necessary because the current regulatory red tape stifles financing to MSMEs. Burdened by, and weary of, the requirements to formalize a business, new and small firms struggle to become established, to operate and hence to grow and generate positive cash flow, all essential prerequisites to obtain finance and build an established business. Regulation is also a burden on lenders and financiers; and smaller banks and non-bank lenders feel the impact of a regulatory architecture that is designed to supervise large commercial banks disproportionately.
104 A REPORT ON THE MSME LANDSCAPE IN SOUTH AFRICA
THE UNSEEN SECTOR
In combination, a high regulatory burden on lenders and a dearth of small businesses equipped with the prerequisites to obtain finance, access to finance in South Africa is restricted. If the policy goal is to create a more inclusive MSME sector that is “bankable”, improvements to the ease with which new and small firms can formalize, are critical.
Stakeholders that were interviewed for this study unanimously reported that the reduction of regulatory red tape should be a key public policy issue. They also highlighted two other policy issues that impact the financing prospects of small businesses. The first – and indeed primary concern of lenders and other financiers – is the effectiveness of government procurement processes; with contract certainty and payment continuity widely cited as a shared stumbling block for MSMEs and those financing their growth prospects. The concern expressed is that many of the payments made by government departments, offices or even state-owned enterprises are irregular, delayed or contracts are cancelled unilaterally – all outcomes that starve MSMEs of cash flow certainty and reduce the incentive for banks to finance MSMEs that have public sector contracts. Banks also spoke about the challenges of serving MSMEs that are poorly educated or that lack critical business skills. To address this, they suggested a need for a coordinated government response to critical skills shortages as a way of creating a more “bankable” MSME sector, which is primed for growth. Here the coordination between SEFA and SEDA came up repeatedly in the interviews, as did the coordination between the DTI and the DSBD.
Possible solutionsDrawing on the interviews conducted for this study and a review of the local literature, a number of solutions are suggested to strengthen the role of government in MSME financing. These include:
• Coordination within government and with the private sector. There is widespread agreement that government support for new and small businesses could be better coordinated to improve the effectiveness of policy-making. A priority is to improve coordination within government, particularly among government departments and programs reporting to the DSBD but also more broadly to those with linkages to the National Treasury, DTI and SARS. The DSBD in particular needs to play a more active role in urging other government offices to improve enabling environment issues that affect the growth of MSMEs. A coordinated response is especially relevant to address the persistent shortage of business skills and to streamline public financing across the MSME sector.
Aside from improving inter-governmental coordination there is a need for policymakers (DTI and DBSA) and regulators (National Credit Regulator in particular) to strengthen ties to the private sector, including industry associations (BASA, DMASA, MFSA and SAVCA) but also with private sector incubators, business accelerators and training providers to facilitate information sharing and to jointly address MSME development issues. Effective coordination of skills development and training in particular can be achieved by introducing a standard or certification for business development service providers.
• Policy focused on supporting the formalization of MSMEs. Improved coordination alone is unlikely to materially improve the prospects of MSMEs. A burdensome regulatory environment is part of the problem: compliance to onerous registration, licensing, permit, tax and business rescue
A REPORT ON THE MSME LANDSCAPE IN SOUTH AFRICA 105
THE UNSEEN SECTOR
requirements are disproportionately more costly for new and small firms, and discourages informal firms from formalizing. A way to deal with this is to make the formalization of MSMEs a specific policy objective, and to target improvements from the World Bank’s ease of doing business indicators mentioned in this report so that MSMEs are better able to attract, deploy and repay financing. This could take the shape of a comprehensive government program of red tape reduction, of the kind that the World Bank is currently supporting, focused on alleviating the regulatory burden of licensing and permits, simplifying rules and procedures for lenders focused on MSMEs, and introducing one-stop shops for start-ups and permits.
• Better information and data to support decision-making. A recurring finding of this research is that data pertaining to MSME access to finance is not easy to come by, and, when it is, only describes a particular segment of the market. Existing data either defines MSMEs very narrowly or too broadly, and doesn’t report adequately on an aggregate view of the market for MSME finance, including portfolio information from banks, microlenders, private providers of risk capital, government programs and DFIs. Interviews with stakeholders suggest a particular need to improve the disclosure of credit data from the National Credit Regulator to identify lending directed to small businesses. Comprehensive national surveys like that conducted by Finmark in 2010,207 meanwhile should be commissioned regularly and findings should inform a national debate on gaps in financing coverage.
Two other cases for information are worth highlighting. The first is a single-point capture technology to streamline information flows within government such that MSMEs only provide information to the government once. The second is for information to support more effective policy-making through a more deliberate program of impact evaluations conducted across government programs that provide financial and non-financial support to MSMEs.
• Improving the effectiveness of government funding. Stakeholders interviewed for this study debated the effectiveness of government funding for MSMEs at length. Most identified a continued role for government to provide financial support to MSMEs, but highlighted a need for more coordination among DFIs, with SEFA and SEDA figuring prominently in most discussions. Banks interviewed for this study argued for greater use of credit guarantees or subsidies on the cost of risk assessment to support their efforts to lend to higher risk segments of the market. Future guarantee schemes should be designed to address the unique context of MSMEs in South Africa, such as informal businesses, sole proprietorships with individuals borrowing for business purposes, simplified conditions and lower fees.
207 FinMark Trust, 2010, Finscope Small Business Survey
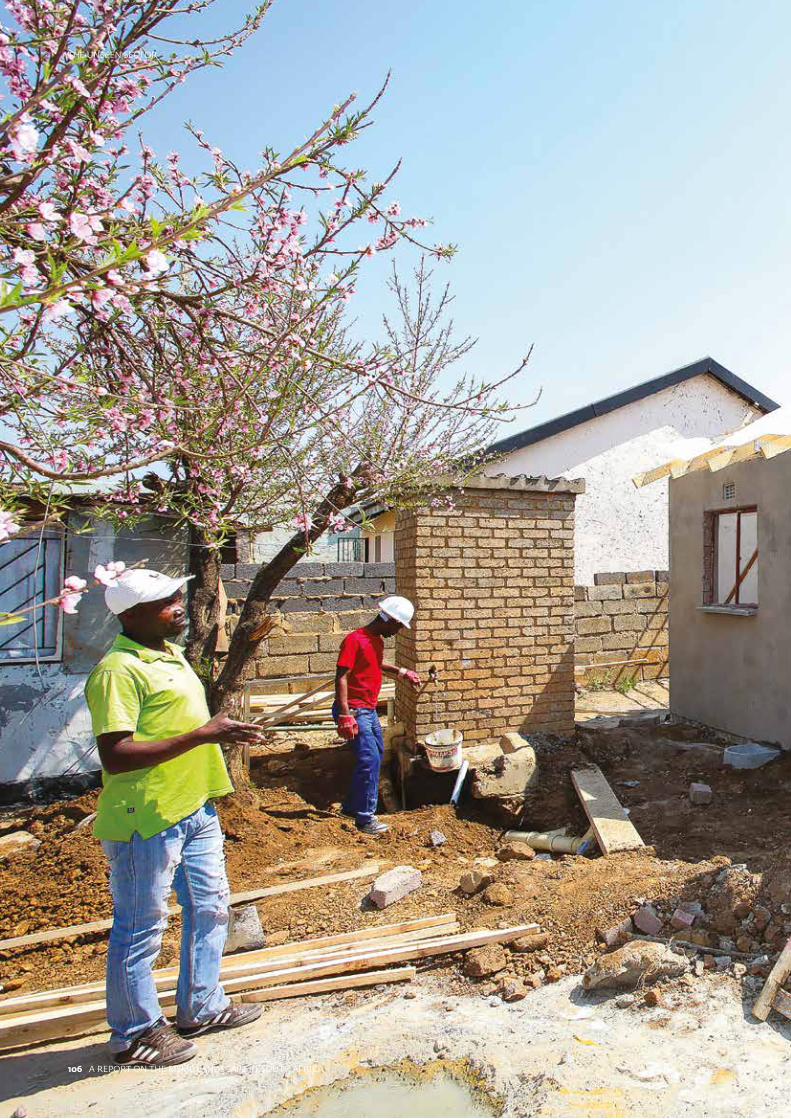
106 A REPORT ON THE MSME LANDSCAPE IN SOUTH AFRICA
THE UNSEEN SECTOR
106 A REPORT ON THE MSME LANDSCAPE IN SOUTH AFRICA
THE UNSEEN SECTOR
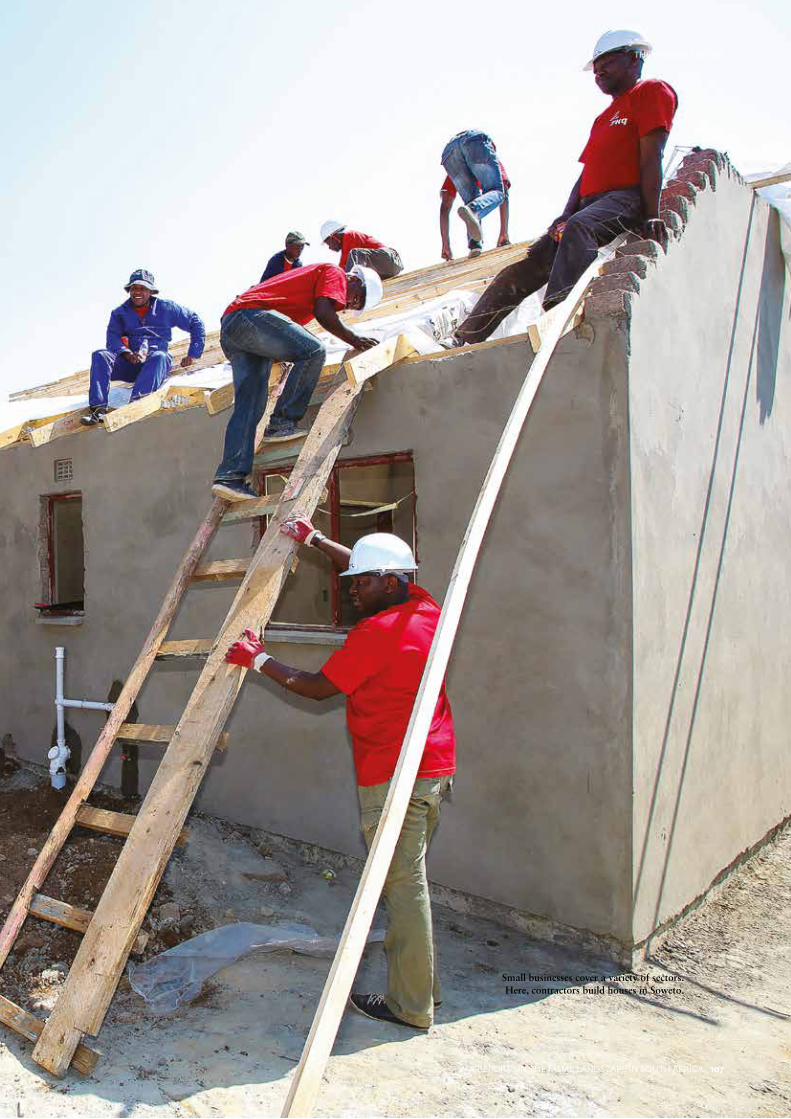
A REPORT ON THE MSME LANDSCAPE IN SOUTH AFRICA 107
THE UNSEEN SECTOR
Small businesses cover a variety of sectors. Here, contractors build houses in Soweto.
A REPORT ON THE MSME LANDSCAPE IN SOUTH AFRICA 107
THE UNSEEN SECTOR
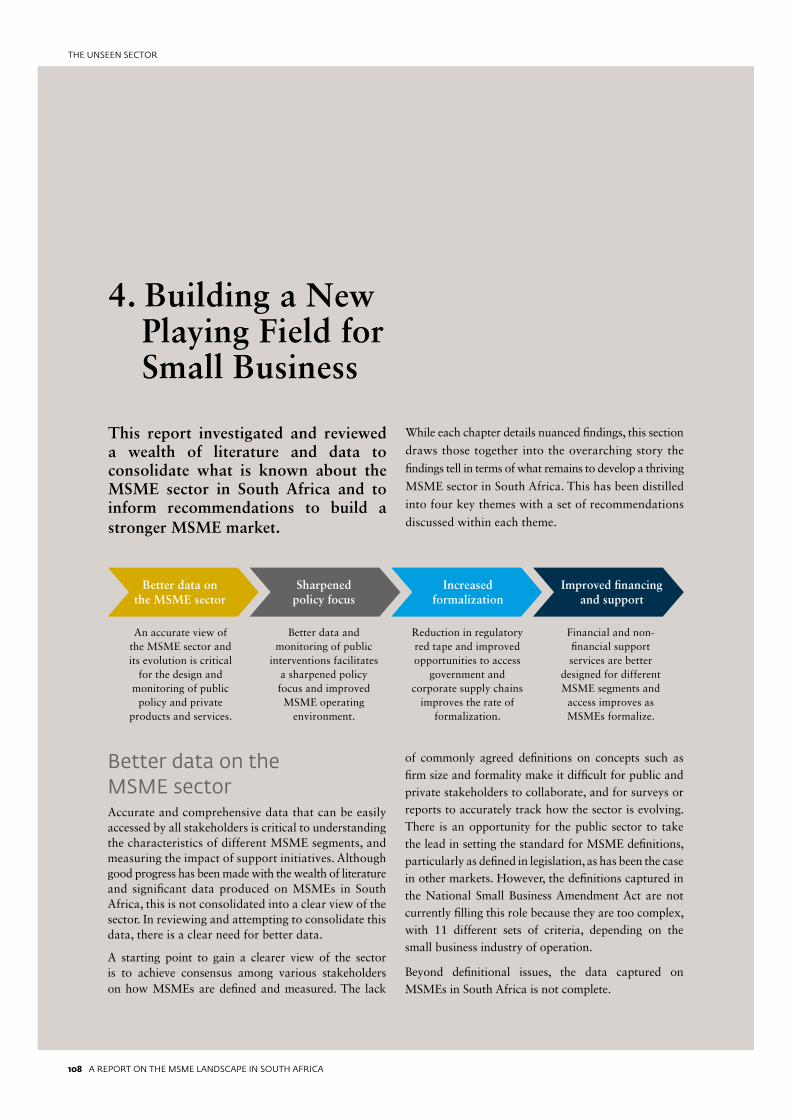
108 A REPORT ON THE MSME LANDSCAPE IN SOUTH AFRICA
THE UNSEEN SECTOR
4. Building a New Playing Field for Small Business
This report investigated and reviewed a wealth of literature and data to consolidate what is known about the MSME sector in South Africa and to inform recommendations to build a stronger MSME market.
While each chapter details nuanced findings, this section
draws those together into the overarching story the
findings tell in terms of what remains to develop a thriving
MSME sector in South Africa. This has been distilled
into four key themes with a set of recommendations
discussed within each theme.
Better data on the MSME sector
Sharpened policy focus
Increased formalization
Improved financing and support
An accurate view of the MSME sector and its evolution is critical
for the design and monitoring of public
policy and private products and services.
Better data and monitoring of public
interventions facilitates a sharpened policy focus and improved MSME operating
environment.
Reduction in regulatory red tape and improved opportunities to access
government and corporate supply chains
improves the rate of formalization.
Financial and non-financial support services are better
designed for different MSME segments and
access improves as MSMEs formalize.
Better data on the MSME sectorAccurate and comprehensive data that can be easily accessed by all stakeholders is critical to understanding the characteristics of different MSME segments, and measuring the impact of support initiatives. Although good progress has been made with the wealth of literature and significant data produced on MSMEs in South Africa, this is not consolidated into a clear view of the sector. In reviewing and attempting to consolidate this data, there is a clear need for better data.
A starting point to gain a clearer view of the sector is to achieve consensus among various stakeholders on how MSMEs are defined and measured. The lack
of commonly agreed definitions on concepts such as firm size and formality make it difficult for public and private stakeholders to collaborate, and for surveys or reports to accurately track how the sector is evolving. There is an opportunity for the public sector to take the lead in setting the standard for MSME definitions, particularly as defined in legislation, as has been the case in other markets. However, the definitions captured in the National Small Business Amendment Act are not currently filling this role because they are too complex, with 11 different sets of criteria, depending on the small business industry of operation.
Beyond definitional issues, the data captured on MSMEs in South Africa is not complete.
A REPORT ON THE MSME LANDSCAPE IN SOUTH AFRICA 109
THE UNSEEN SECTOR
The use of proxies in frequently conducted surveys, such as the StatsSA QLFS, to measure MSMEs is problematic and does not provide a rich view of MSME development over time. Key public data on MSME growth, such as the CIPC business register and the SARS-NT panel, are not easily available, even between government departments, and can also be difficult to use. There are gaps in some public data on MSMEs, such as the CIPC database which records business registrations but not business closure. In addition, there is an opportunity for public data to be captured more strategically – SARS is already collecting data from MSMEs electronically, and CIPC could benefit from the same efficiency and coverage gains from electronic data submissions. Lastly, data from the private sector on which MSME segments are being served is difficult to collect and is not publicly available.
A key recommendation of this study is the need for a regular and comprehensive update on the state of the MSME sector in South Africa. This could be achieved by collecting a richer set of data from business owners interviewed in regular household surveys such as the QLFS. A more accurate view would be achieved by a nationally representative survey of MSME owners. In particular, data needs to be collected on MSME characteristics (demographics, access to finance and support services), split between MSME segments, such as survivalist and growth-oriented MSMEs and across the value chains (local, regional and global) where productive MSMEs operate.
Another recommendation stems from the difficulty of gaining an accurate view of commercial lending to MSMEs in South Africa. It would be beneficial for future studies on MSME financing to include some loan portfolio analysis among commercial lenders, and compare this to aggregate statistics on the size of the MSME market in South Africa. Aspects to include would be financial product penetration (number of transactional accounts and loan products per MSME), the total value of bank lending to MSMEs by firm size and sector, the spread of working capital versus long term financing, and trend analysis over time – whether
MSME financing is growing, whether portfolio quality is decreasing, and how MSME lending is growing compared to overall lending. It would also be useful to collect data on a broader array of financial services including insurance, digital financial services and electronic banking, and payment behavior and preferences among MSMEs. Lastly, data on MSME credit demand – including loan application data, loan approval rates, and loan take-up rates – would be valuable to analyze the gap between supply and demand.
Sharpened policy focus The benefit of accurate and up-to-date MSME data is the ability to design and monitor effective policy on MSME development. The literature and interviews conducted for this study confirm that policies designed to develop a thriving MSME sector in South Africa have not been as effective as they were intended. Policies are scattered across a number of different government departments and levels, and are not always aligned. Sharp policy focus requires a clear sense of what types of MSME segments are able to create the desired policy objectives, such as growth and job creation, based on sound data on the sector, and provide tailored support for these segments to achieve their potential.
There is an opportunity for the DSBD to be the key coordinator of MSME support programs among government stakeholders, for example between SEFA and SEDA, as well as other government agencies working on MSME support such as SARS, the DTI, the NCR and development banks. Greater MSME policy coordination will help support South Africa’s broad development objectives, such as creating youth employment, by aligning the activities of focused institutions with MSME support policies. The DSBD’s role could also be to act as a stronger advocate for business environment reforms required in other government departments. Successfully fulfilling this role would require the DSBD to be adequately resourced, and given the executive authority to drive policy reforms impacting the MSME sector.
110 A REPORT ON THE MSME LANDSCAPE IN SOUTH AFRICA
THE UNSEEN SECTOR
In addition, the large number of stakeholders working on MSME development across the public and private sector require a strong convener to coordinate public and private support and gain consensus on the key issues to be addressed. In addition to the public stakeholders mentioned above, this includes private sector stakeholders such as industry associations (BASA, DMA and MFSA, and SAVCA) and the network of accelerators, incubators and BDS providers. This is another opportunity for the DSBD to play a stronger convening and coordinating role within the sector.
In addition to coordinated support, the importance of public and corporate procurement for MSME access to markets was stressed in the reviewed literature and interviews. There is an opportunity for the public policy designed to support this to be better implemented. This would require addressing issues of MSMEs not being paid on time by government departments, and following through on the requirement for government departments to allocate a percentage of their contracts to MSMEs. There is also opportunity for greater transparency of public contracts awarded to MSMEs, for example by compiling a national registry of public procurement, to make the validation of government contracts easier when MSMEs access financing and to make the monitoring of government procurement easier. In addition to government procurement, access to corporate supply chains was identified as a critical opportunity for MSME development in South Africa. Public policy should therefore also consider how best to encourage corporates to include and develop MSMEs within their value chains.
Increased formalizationThe market sizing and profiling exercise in this study identified that the MSME sector in South Africa is growing slowly with an under-representation of black, female and young MSME owners. This is a concern, given the potential the small business sector has to contribute to job creation and the transformation of capital ownership within the country. In particular, given 85 percent of
the MSME sector comprises informal and survivalist businesses, the sector could do more to contribute to economic growth and employment creation. Two key causes emerging from the literature and interviews of this dynamic are the poor business environment for MSMEs, particularly regulatory red tape, and uncoordinated support for MSME development – both of which are leading to poor rates of formalization and business sustainability.
Formalization is therefore an important objective of public policy because formal MSMEs are more likely to be productive employment creators, and because formal MSMEs are better able to access financing and other support services in order to grow and employ more people. The formal-informal split among MSMEs in South Africa has become more severe since closed corporations were removed as a registration option – MSMEs can either be formally registered as Pty Ltd. companies or remain informal as sole traders or partnerships.
The current initiatives aimed at addressing these issues and improving the business environment for MSMEs to promote formalization should be continued and intensified. These include the work with the World Bank to reduce regulatory red tape and to improve the operating environment for MSMEs, including the launch of one-stop-shops and technology-enabled business registration. Since onerous tax obligations are one of the reasons businesses remain informal, this also needs to include work on the tax regime. The recommendations made by the Davis Tax Committee to improve the tax regime and associated incentives for small business, among others, should be adopted to encourage MSMEs to be on the radar of tax authorities without being subject to a heavy tax burden.
Improved financing and supportBeyond issues of regulatory red tape and the business environment, access to market, skills and financing are key requirements for MSME growth. While access to finance is often cited as the main barrier to MSME growth,
A REPORT ON THE MSME LANDSCAPE IN SOUTH AFRICA 111
THE UNSEEN SECTOR
it is difficult to isolate funding from these other issues. The interviews conducted for this report emphasized the importance of access to markets (for example having certainty around government or corporate contracts) and skills (business acumen and entrepreneurial competence). Access to credit is not useful if an entrepreneur cannot manage their finances or a business is not able to use the credit productively to expand.
As such, access to finance is closely intertwined with skills and market access, which together make up a broader support environment for small businesses. Encouraging the inclusion of MSMEs into corporate and public procurement, and bridging clear skills gaps through incubators and accelerators, that work remains important. The review of MSME finance supply in this report highlights the different stakeholders serving different MSME segments, with the majority of funding provided by banks to established and formal MSMEs. As such, scaling access to finance among MSMEs will require growing the size of the “bankable” MSME segment by encouraging formalization and improving the visibility of informal businesses to financial service providers.
To this end, banks need to continue supporting initiatives that shift away from the traditional banking model, which is better suited to economies where access to collateral is high. Bank innovation needs to happen for access to finance to contribute to transformation within the MSME sector, given that access to collateral is lowest among black, female and young MSME owners. This includes reforms to bank operating models, better integrated personal and business banking units to use data on entrepreneur’s personal financial activity, credit scorecards to facilitate unsecured lending, and product and channel innovations, to ultimately reduce the cost to serve and enable scale. In particular, the use of digital technology to extend coverage of formal financial services to the informal sector, and analytics that reduce the cost of risk assessment and banking services, are essential.
Improved finance access needs to be better supported by financial market infrastructure. The coverage of credit bureau reporting should be improved to cover lending
activities of individuals for business purposes, as well as trade credit and other data sources. This will help banks view small buisness payment profiles by providing data beyond the MSME’s level of indebtedness, a metric becoming less relevant with credit scorecard lending. A modern movable collateral registry that extends beyond yellow metal assets would also help secure lending using asset types that are more prevalent among MSME owners, particularly those that do not have access to traditional forms of collateral.
There is also scope for more strategic support from government funding to private providers. This includes more credit guarantees to banks and financial support to alternative financing models such as non-bank financiers and fintechs whose scale is limited by small balance sheets. In addition, addressing regulatory issues around small business financing is essential. This includes issues around FICA/KYC requirements, which make extending financing to informal and undocumented MSMEs difficult, and the same regulatory red tape that MFIs have to adhere to under the NCR as banks do, suggesting the need for tiered regulatory requirements. It also includes introducing innovation facilitation tools for fintechs working on MSME financing issues, which could have a significant impact on the operating environment for MSME funders.
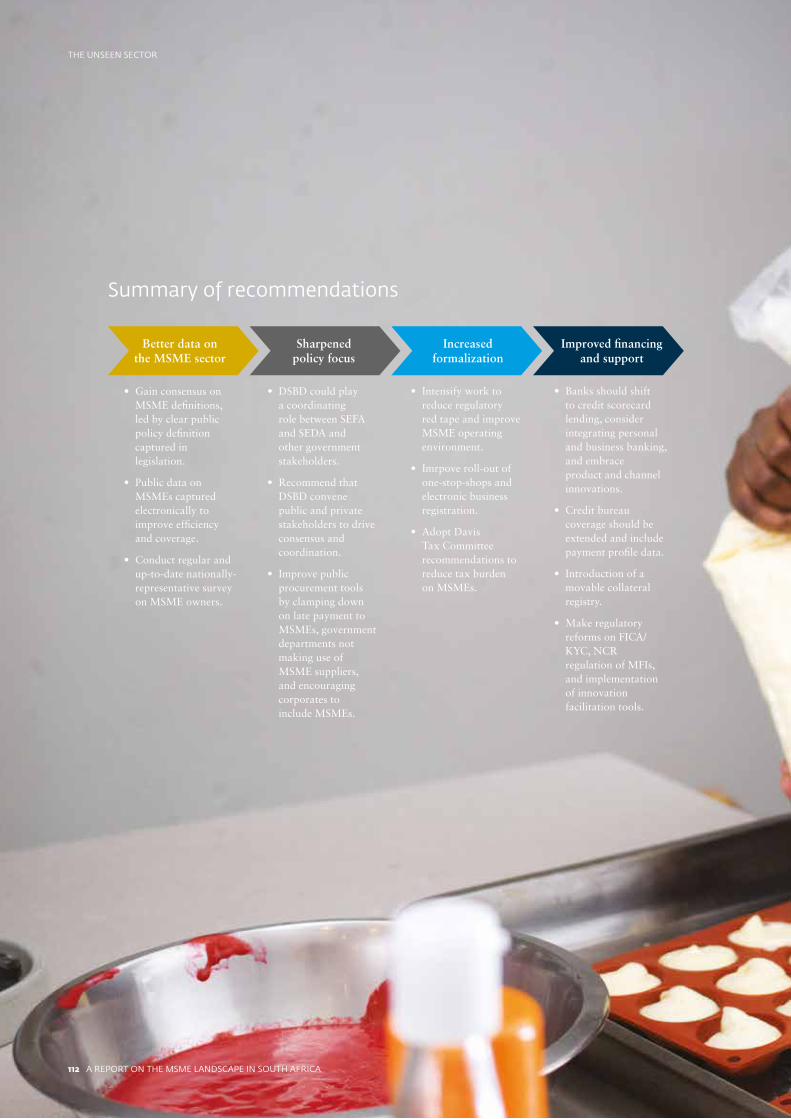
112 A REPORT ON THE MSME LANDSCAPE IN SOUTH AFRICA
THE UNSEEN SECTOR
Better data on the MSME sector
Sharpened policy focus
Increased formalization
Improved financing and support
• Gain consensus on MSME definitions, led by clear public policy definition captured in legislation.
• Public data on MSMEs captured electronically to improve efficiency and coverage.
• Conduct regular and up-to-date nationally-representative survey on MSME owners.
• DSBD could play a coordinating role between SEFA and SEDA and other government stakeholders.
• Recommend that DSBD convene public and private stakeholders to drive consensus and coordination.
• Improve public procurement tools by clamping down on late payment to MSMEs, government departments not making use of MSME suppliers, and encouraging corporates to include MSMEs.
• Intensify work to reduce regulatory red tape and improve MSME operating environment.
• Imrpove roll-out of one-stop-shops and electronic business registration.
• Adopt Davis Tax Committee recommendations to reduce tax burden on MSMEs.
• Banks should shift to credit scorecard lending, consider integrating personal and business banking, and embrace product and channel innovations.
• Credit bureau coverage should be extended and include payment profile data.
• Introduction of a movable collateral registry.
• Make regulatory reforms on FICA/KYC, NCR regulation of MFIs, and implementation of innovation facilitation tools.
Summary of recommendations
112 A REPORT ON THE MSME LANDSCAPE IN SOUTH AFRICA
THE UNSEEN SECTOR
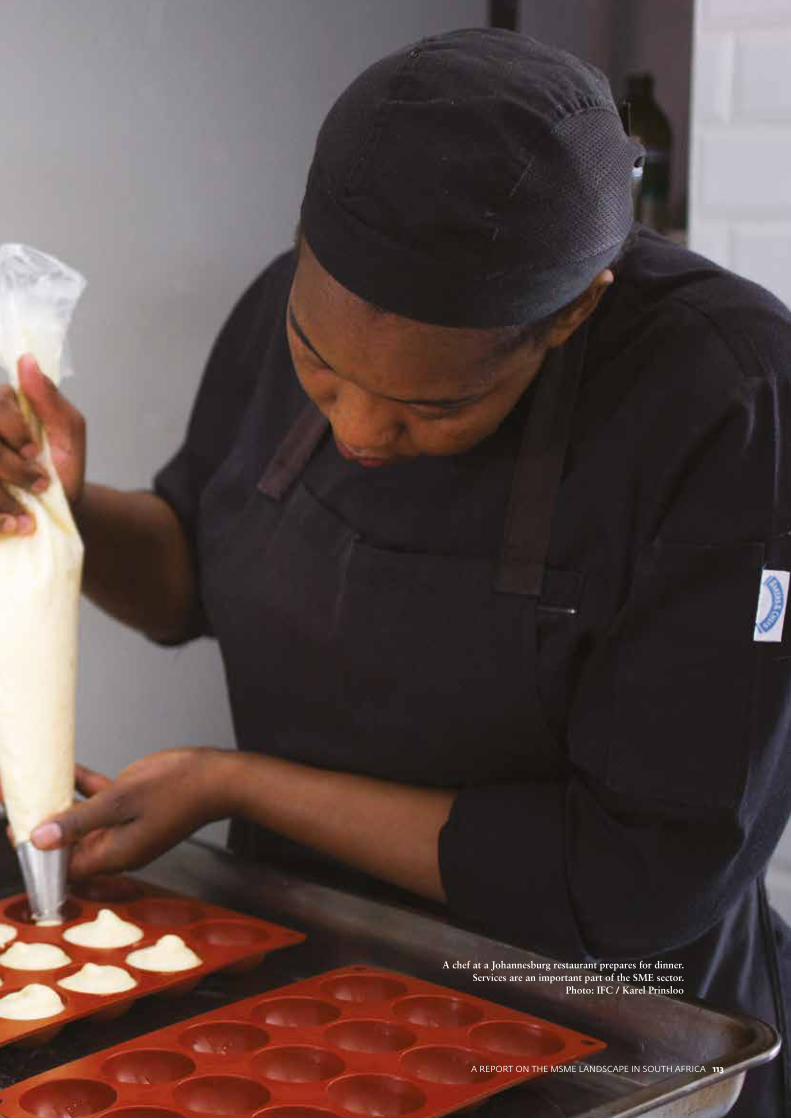
A REPORT ON THE MSME LANDSCAPE IN SOUTH AFRICA 113
THE UNSEEN SECTORTHE UNSEEN SECTOR
A chef at a Johannesburg restaurant prepares for dinner. Services are an important part of the SME sector.
Photo: IFC / Karel Prinsloo
A REPORT ON THE MSME LANDSCAPE IN SOUTH AFRICA 113
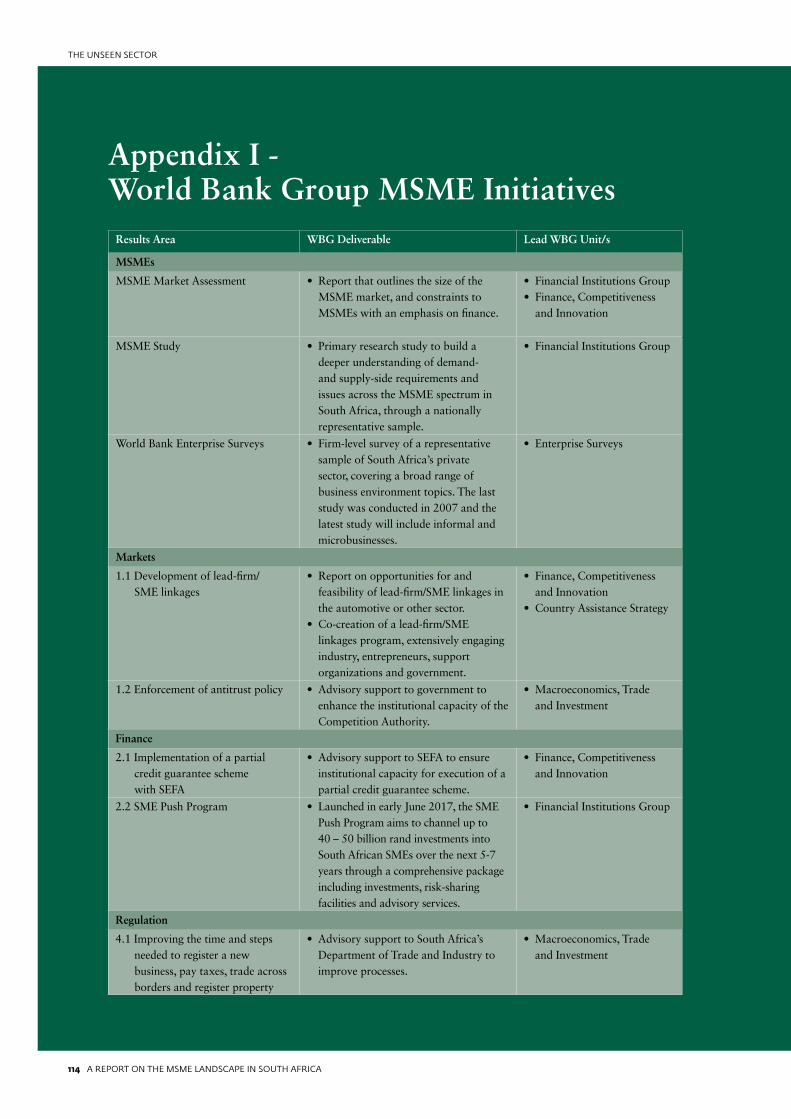
114 A REPORT ON THE MSME LANDSCAPE IN SOUTH AFRICA
THE UNSEEN SECTOR
Appendix I - World Bank Group MSME Initiatives
Results Area WBG Deliverable Lead WBG Unit/s
MSMEs
MSME Market Assessment • Report that outlines the size of the MSME market, and constraints to MSMEs with an emphasis on finance.
• Financial Institutions Group• Finance, Competitiveness
and Innovation
MSME Study • Primary research study to build a deeper understanding of demand- and supply-side requirements and issues across the MSME spectrum in South Africa, through a nationally representative sample.
• Financial Institutions Group
World Bank Enterprise Surveys • Firm-level survey of a representative sample of South Africa’s private sector, covering a broad range of business environment topics. The last study was conducted in 2007 and the latest study will include informal and microbusinesses.
• Enterprise Surveys
Markets
1.1 Development of lead-firm/ SME linkages
• Report on opportunities for and feasibility of lead-firm/SME linkages in the automotive or other sector.
• Co-creation of a lead-firm/SME linkages program, extensively engaging industry, entrepreneurs, support organizations and government.
• Finance, Competitiveness and Innovation
• Country Assistance Strategy
1.2 Enforcement of antitrust policy • Advisory support to government to enhance the institutional capacity of the Competition Authority.
• Macroeconomics, Trade and Investment
Finance
2.1 Implementation of a partial credit guarantee scheme with SEFA
• Advisory support to SEFA to ensure institutional capacity for execution of a partial credit guarantee scheme.
• Finance, Competitiveness and Innovation
2.2 SME Push Program • Launched in early June 2017, the SME Push Program aims to channel up to 40 – 50 billion rand investments into South African SMEs over the next 5-7 years through a comprehensive package including investments, risk-sharing facilities and advisory services.
• Financial Institutions Group
Regulation
4.1 Improving the time and steps needed to register a new business, pay taxes, trade across borders and register property
• Advisory support to South Africa’s Department of Trade and Industry to improve processes.
• Macroeconomics, Trade and Investment
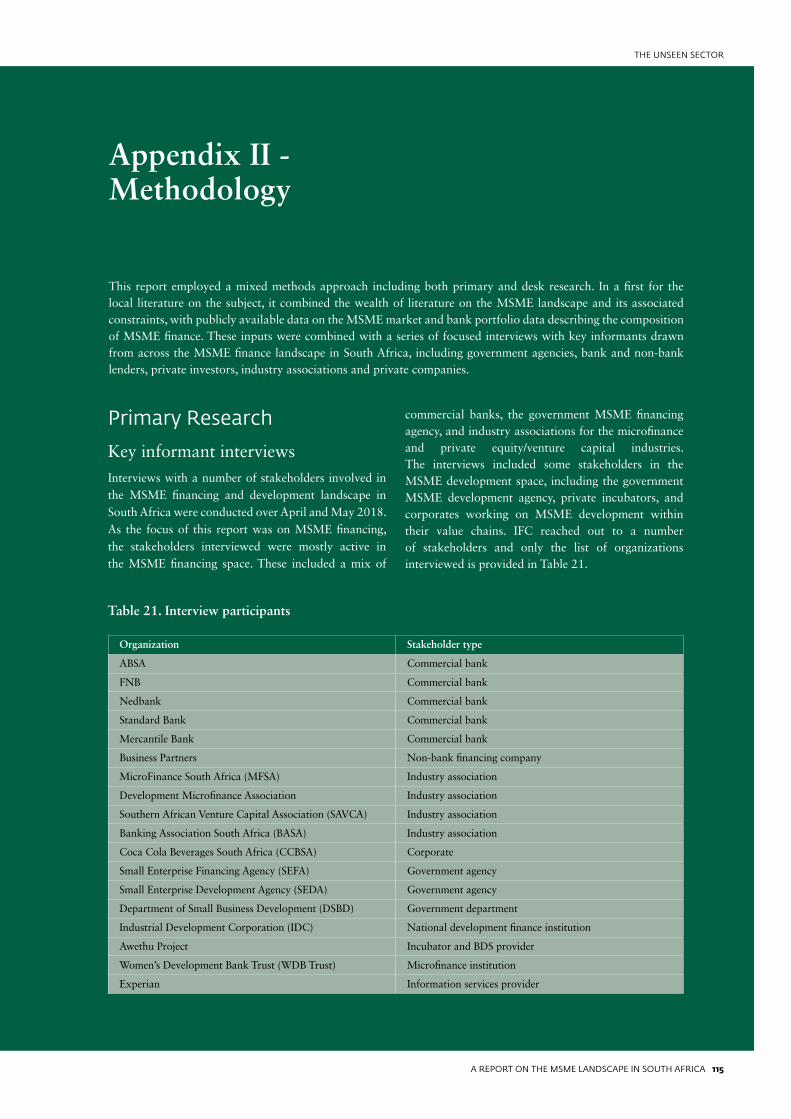
A REPORT ON THE MSME LANDSCAPE IN SOUTH AFRICA 115
THE UNSEEN SECTOR
Appendix II - Methodology
Organization Stakeholder type
ABSA Commercial bank
FNB Commercial bank
Nedbank Commercial bank
Standard Bank Commercial bank
Mercantile Bank Commercial bank
Business Partners Non-bank financing company
MicroFinance South Africa (MFSA) Industry association
Development Microfinance Association Industry association
Southern African Venture Capital Association (SAVCA) Industry association
Banking Association South Africa (BASA) Industry association
Coca Cola Beverages South Africa (CCBSA) Corporate
Small Enterprise Financing Agency (SEFA) Government agency
Small Enterprise Development Agency (SEDA) Government agency
Department of Small Business Development (DSBD) Government department
Industrial Development Corporation (IDC) National development finance institution
Awethu Project Incubator and BDS provider
Women’s Development Bank Trust (WDB Trust) Microfinance institution
Experian Information services provider
This report employed a mixed methods approach including both primary and desk research. In a first for the local literature on the subject, it combined the wealth of literature on the MSME landscape and its associated constraints, with publicly available data on the MSME market and bank portfolio data describing the composition of MSME finance. These inputs were combined with a series of focused interviews with key informants drawn from across the MSME finance landscape in South Africa, including government agencies, bank and non-bank lenders, private investors, industry associations and private companies.
Table 21. Interview participants
Primary Research
Key informant interviewsInterviews with a number of stakeholders involved in the MSME financing and development landscape in South Africa were conducted over April and May 2018. As the focus of this report was on MSME financing, the stakeholders interviewed were mostly active in the MSME financing space. These included a mix of
commercial banks, the government MSME financing agency, and industry associations for the microfinance and private equity/venture capital industries. The interviews included some stakeholders in the MSME development space, including the government MSME development agency, private incubators, and corporates working on MSME development within their value chains. IFC reached out to a number of stakeholders and only the list of organizations interviewed is provided in Table 21.
116 A REPORT ON THE MSME LANDSCAPE IN SOUTH AFRICA
THE UNSEEN SECTOR
Bank portfolio dataIn addition to the key informant interviews, this report collected portfolio data from a selection of commercial banks detailing their MSME loan portfolio and deposit accounts. Data was requested on the value and volume of MSME lending, segmented by firm size measured using annual turnover, sector, and product type. Data was also requested on the value and volume of deposit accounts used by MSME clients, segmented by transactional, savings, and term-deposit savings or investment accounts.
Desk Research
Market sizingConducting a market sizing exercise requires data, which can be used to estimate the magnitude and composition of the MSME sector, and methods of triangulation where data is missing or imperfect. The most comprehensive MSME market sizing exercise in South Africa was undertaken by the DTI in their 2008 Annual Review of Small Business in South Africa, covering the period 2005-2007.208 The review noted the difficulties gaining an accurate view of the formal and informal MSME sector in South Africa due to data limitations – the formal sector was well covered by the Integrated Business Register and CIPRO database, but a view of the informal sector had to be triangulated through StatsSA household surveys, particularly the labor force survey and survey of employers and self-employed.
This methodology using StatsSA household surveys as a proxy for the MSME sector was later replicated by two further market sizing studies – a SEDA paper on the MSME sector of South Africa undertaken by the Bureau for Economic Research in 2016209 and a TIPS paper on the state of small business in South Africa
in 2017.210 The proxy is based on StatsSA’s approach to measuring employment status in its labor force surveys. The surveys report on the number of people in South Africa who report working for a salary, who employ others and themselves, and who only employ themselves (own-account workers). The approach adds the number of people who employ others and themselves to own-account workers to arrive at a total count of MSME owners, keeping those who engage in unpaid household work and those who are employed by others out of the estimation. BER finds that this methodology provides a good proxy for sizing the formal and informal MSME sector in South Africa by comparing the proxy estimate for 2008 to the DTI’s 2007 estimate making use of a more comprehensive methodology – there is only a 3 percent difference between the two approaches.211
Using the StatsSA labor force data as a proxy is particularly useful because the survey is undertaken regularly each year – allowing for a dynamic time series analysis – and because it can be filtered by the many other variables StatsSA records with the survey, such as geography, gender, race, age and formality. This study makes use of the StatsSA Post-Apartheid Labor Market Series dataset, which aggregates the Quarterly Labour Force Surveys into an annualized panel dataset, making comparisons between years easier. This data was used to count the total number of MSMEs in South Africa over time, and to segment the MSME sector by a number of geographic and demographic variables. However, this proxy is not perfect and has its own limitations. It is not possible to isolate MSME business owners in the proxy from large business owners, and because StatsSA records the main employment activity of an individual, people who own a business on the side while being employed elsewhere will not be counted.
In addition to the StatsSA surveys, the annual Global Entrepreneurship Monitor study in South Africa conducts a survey among a representative sample of
208 Department of Trade and Industry, 2008, Annual Review of Small Business in South Africa 2005-2007209 BER, 2016, The Small, Medium and Micro Enterprise Sector of South Africa, SEDA Research Note No. 1210 TIPS, 2017, The State of Small Business in South Africa, Real Economy Bulletin Special Edition211 BER, 2016, The Small, Medium and Micro Enterprise Sector of South Africa, SEDA Research Note No. 1
A REPORT ON THE MSME LANDSCAPE IN SOUTH AFRICA 117
THE UNSEEN SECTOR
adults in South Africa, called the Adult Population Survey. The survey documents the characteristics of nascent, new and established entrepreneurs, and counts their frequency as a percentage of the adult population in South Africa. Expressing these frequencies as a percentage of the adult population allows comparisons with other countries where the APS is conducted, but means that the count of entrepreneurs is not expressed in actual terms. Furthermore, like the StatsSA surveys, the APS counts the number of entrepreneurs, not the number of businesses.
As such, it is useful to compare the StatsSA proxy and GEMS/APS findings with another estimate arrived at through a more direct methodology – conducting a representative survey of MSME owners in South Africa, rather than a survey of individuals. While a number of surveys have been conducted on the small business sector in South Africa, the key to this methodology is surveying a representative sample of the total MSME population in order to calculate a total national estimate, and to ensure that regional differences do not skew the results. To date, only one such survey has been undertaken – FinMark Trust’s 2010 FinScope Small Business Survey. The survey interviewed a representative sample of formal and informal small business owners across South Africa, and used this sample to estimate a national count of MSMEs. This study was able to access the survey’s raw data, which was used to segment the total MSME estimate against this report’s definition of firm size using annual turnover rather than employee count, as well as a variety of other geographic and demographic variables.
In addition to these two methodologies, which provide a national estimate of both formal and informal MSMEs, it is also useful to consider other data sources which count the number of firms in the formal sector by various definitions. Two common definitions of
formality are business registration and tax registration. The CIPC and SARS databases which register the number of registered businesses and the number of the number of businesses registered for VAT or corporate income tax can be used to this end.
Lastly, it is useful to gain a view of the flow of MSMEs in South Africa; that is the rate at which new businesses are formed and dissolve. A partial is available in data provided by CIPC and StatsSA. CIPC’s provides a time series of the number of new business registrations each year in the country. This provides an indication of the rate of formal business registration. StatsSA meanwhile regularly publishes data on the number of business insolvencies and liquidation. This provides an indication of the rate of formal business termination. However, these sources are not comprehensive – the CIPC registration data does not consider the formation of sole proprietorships or partnerships, and businesses in the informal sector; and the StatsSA liquidation and insolvency data only captures a portion of terminated businesses. As such, making use of survey data to estimate the rate of business formation and termination may provide a fuller picture. The GEM APS provides this view by estimating the number of nascent entrepreneurs, those intending on starting a business but not yet in operation for three months, and business termination as a percent of the adult population.
Barriers to MSME growthBeyond an assessment of the size and profile of the MSME market, this report also drew on a wide range of literature to review the key barriers and constraints to the growth of MSMEs in South Africa. The literature that was reviewed by this report was two types: research that broadly diagnoses the landscape and identifies general barriers to the development of MSMEs; and research that focuses on specific issues within MSME development. The key sources for the former are summarized in Table 22.
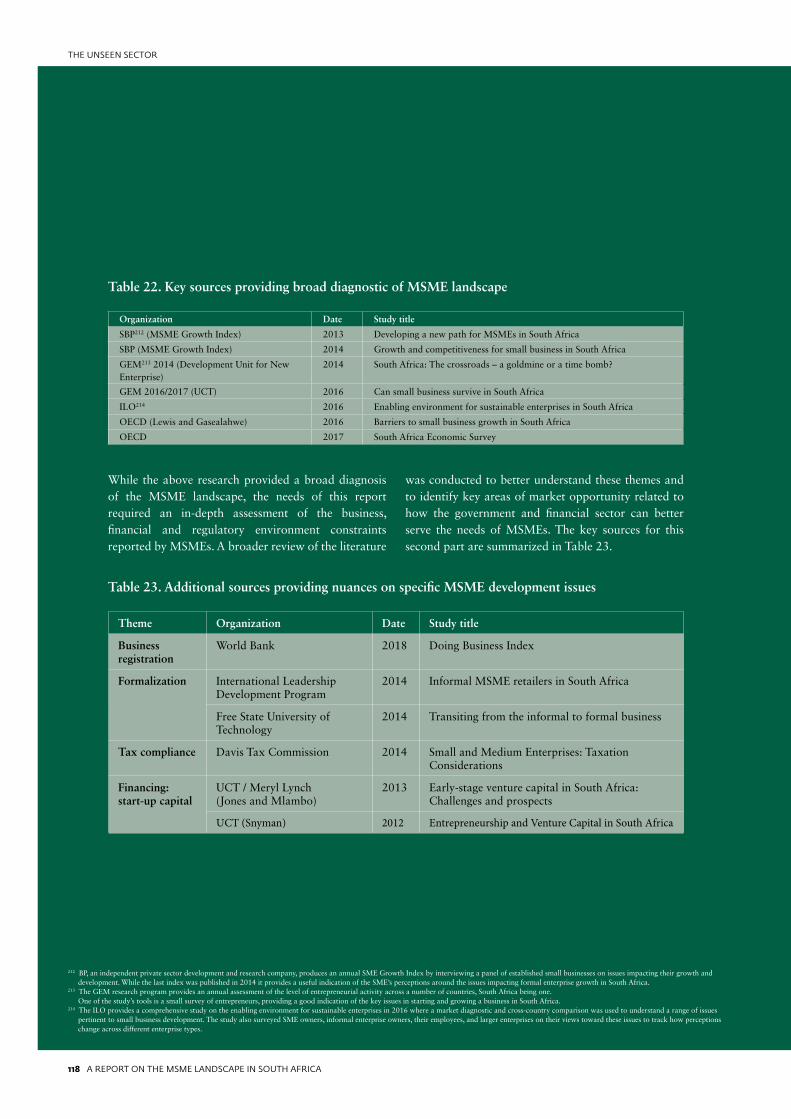
118 A REPORT ON THE MSME LANDSCAPE IN SOUTH AFRICA
THE UNSEEN SECTOR
Table 23. Additional sources providing nuances on specific MSME development issues
Theme Organization Date Study title
Business registration
World Bank 2018 Doing Business Index
Formalization International Leadership Development Program
2014 Informal MSME retailers in South Africa
Free State University of Technology
2014 Transiting from the informal to formal business
Tax compliance Davis Tax Commission 2014 Small and Medium Enterprises: Taxation Considerations
Financing: start-up capital
UCT / Meryl Lynch(Jones and Mlambo)
2013 Early-stage venture capital in South Africa: Challenges and prospects
UCT (Snyman) 2012 Entrepreneurship and Venture Capital in South Africa
While the above research provided a broad diagnosis of the MSME landscape, the needs of this report required an in-depth assessment of the business, financial and regulatory environment constraints reported by MSMEs. A broader review of the literature
was conducted to better understand these themes and to identify key areas of market opportunity related to how the government and financial sector can better serve the needs of MSMEs. The key sources for this second part are summarized in Table 23.
Table 22. Key sources providing broad diagnostic of MSME landscape
Organization Date Study title
SBP212 (MSME Growth Index) 2013 Developing a new path for MSMEs in South Africa
SBP (MSME Growth Index) 2014 Growth and competitiveness for small business in South Africa
GEM213 2014 (Development Unit for New Enterprise)
2014 South Africa: The crossroads – a goldmine or a time bomb?
GEM 2016/2017 (UCT) 2016 Can small business survive in South Africa
ILO214 2016 Enabling environment for sustainable enterprises in South Africa
OECD (Lewis and Gasealahwe) 2016 Barriers to small business growth in South Africa
OECD 2017 South Africa Economic Survey
212 BP, an independent private sector development and research company, produces an annual SME Growth Index by interviewing a panel of established small businesses on issues impacting their growth and development. While the last index was published in 2014 it provides a useful indication of the SME’s perceptions around the issues impacting formal enterprise growth in South Africa.213 The GEM research program provides an annual assessment of the level of entrepreneurial activity across a number of countries, South Africa being one. One of the study’s tools is a small survey of entrepreneurs, providing a good indication of the key issues in starting and growing a business in South Africa. 214 The ILO provides a comprehensive study on the enabling environment for sustainable enterprises in 2016 where a market diagnostic and cross-country comparison was used to understand a range of issues pertinent to small business development. The study also surveyed SME owners, informal enterprise owners, their employees, and larger enterprises on their views toward these issues to track how perceptions change across different enterprise types.
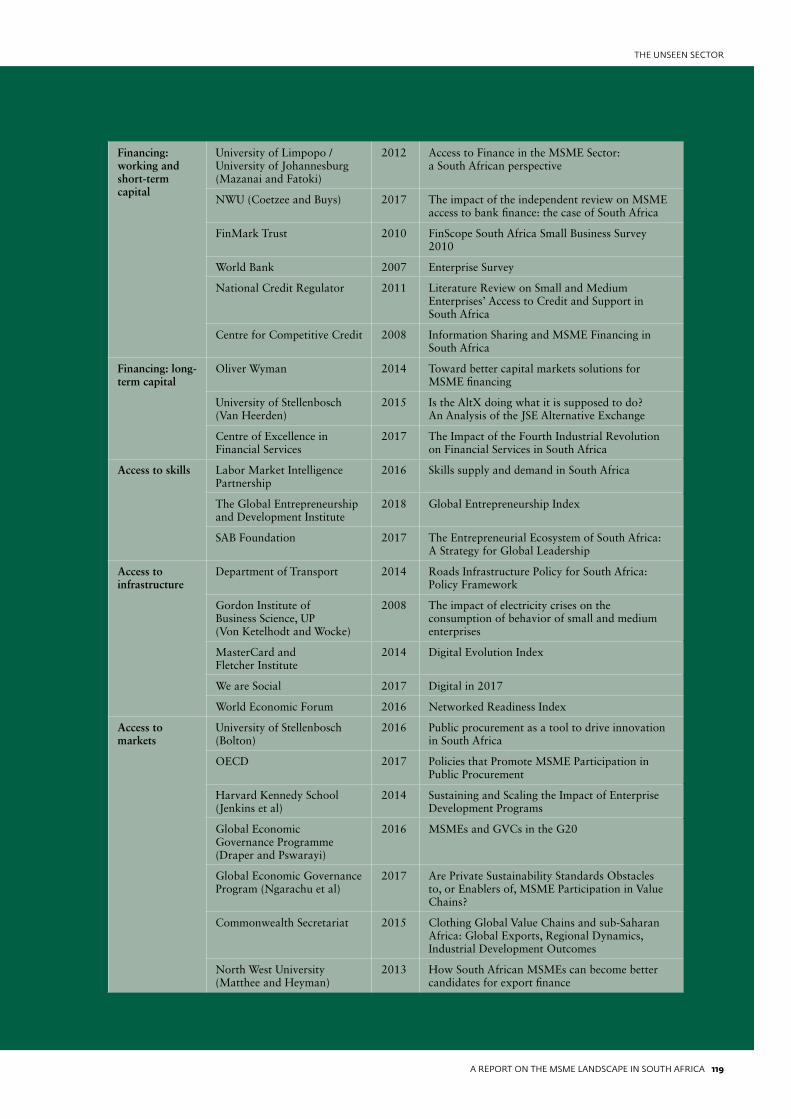
A REPORT ON THE MSME LANDSCAPE IN SOUTH AFRICA 119
THE UNSEEN SECTOR
Financing: working and short-term capital
University of Limpopo / University of Johannesburg (Mazanai and Fatoki)
2012 Access to Finance in the MSME Sector: a South African perspective
NWU (Coetzee and Buys) 2017 The impact of the independent review on MSME access to bank finance: the case of South Africa
FinMark Trust 2010 FinScope South Africa Small Business Survey 2010
World Bank 2007 Enterprise Survey
National Credit Regulator 2011 Literature Review on Small and Medium Enterprises’ Access to Credit and Support in South Africa
Centre for Competitive Credit 2008 Information Sharing and MSME Financing in South Africa
Financing: long-term capital
Oliver Wyman 2014 Toward better capital markets solutions for MSME financing
University of Stellenbosch (Van Heerden)
2015 Is the AltX doing what it is supposed to do? An Analysis of the JSE Alternative Exchange
Centre of Excellence in Financial Services
2017 The Impact of the Fourth Industrial Revolution on Financial Services in South Africa
Access to skills Labor Market Intelligence Partnership
2016 Skills supply and demand in South Africa
The Global Entrepreneurship and Development Institute
2018 Global Entrepreneurship Index
SAB Foundation 2017 The Entrepreneurial Ecosystem of South Africa: A Strategy for Global Leadership
Access to infrastructure
Department of Transport 2014 Roads Infrastructure Policy for South Africa: Policy Framework
Gordon Institute of Business Science, UP (Von Ketelhodt and Wocke)
2008 The impact of electricity crises on the consumption of behavior of small and medium enterprises
MasterCard and Fletcher Institute
2014 Digital Evolution Index
We are Social 2017 Digital in 2017
World Economic Forum 2016 Networked Readiness Index
Access to markets
University of Stellenbosch (Bolton)
2016 Public procurement as a tool to drive innovation in South Africa
OECD 2017 Policies that Promote MSME Participation in Public Procurement
Harvard Kennedy School (Jenkins et al)
2014 Sustaining and Scaling the Impact of Enterprise Development Programs
Global Economic Governance Programme (Draper and Pswarayi)
2016 MSMEs and GVCs in the G20
Global Economic Governance Program (Ngarachu et al)
2017 Are Private Sustainability Standards Obstacles to, or Enablers of, MSME Participation in Value Chains?
Commonwealth Secretariat 2015 Clothing Global Value Chains and sub-Saharan Africa: Global Exports, Regional Dynamics, Industrial Development Outcomes
North West University (Matthee and Heyman)
2013 How South African MSMEs can become better candidates for export finance
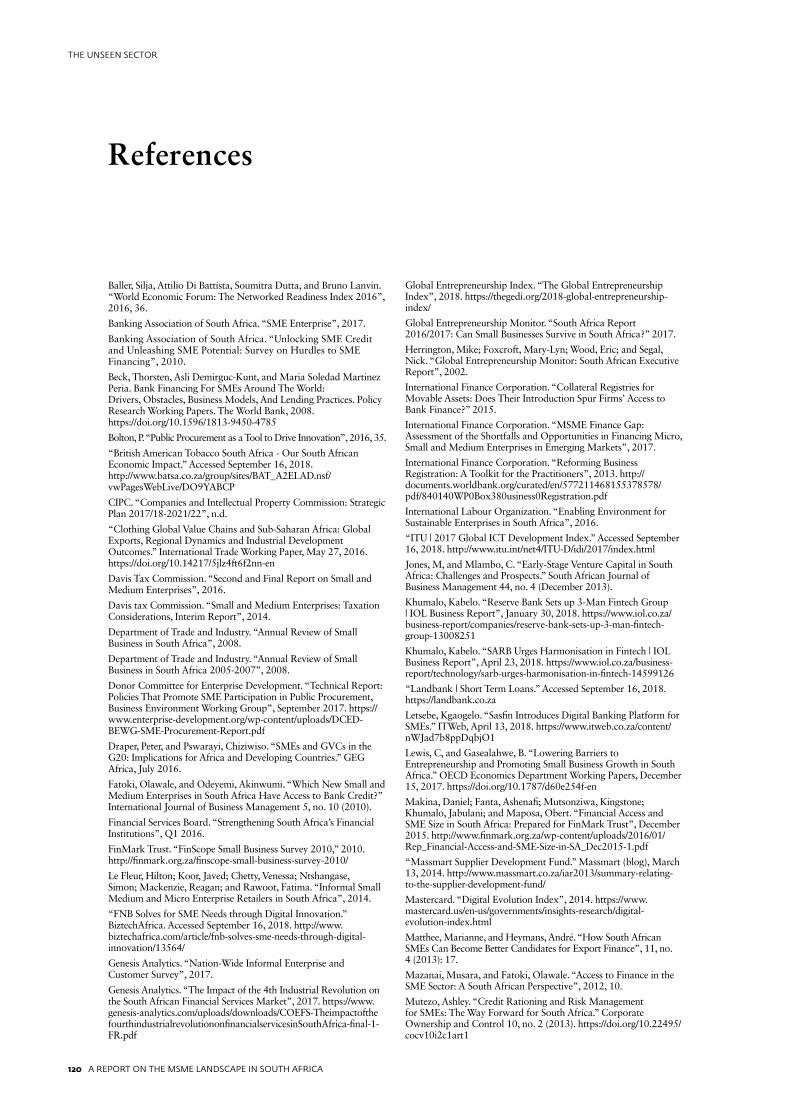
120 A REPORT ON THE MSME LANDSCAPE IN SOUTH AFRICA
THE UNSEEN SECTOR
References
Baller, Silja, Attilio Di Battista, Soumitra Dutta, and Bruno Lanvin. “World Economic Forum: The Networked Readiness Index 2016”, 2016, 36.
Banking Association of South Africa. “SME Enterprise”, 2017.
Banking Association of South Africa. “Unlocking SME Credit and Unleashing SME Potential: Survey on Hurdles to SME Financing”, 2010.
Beck, Thorsten, Asli Demirguc-Kunt, and Maria Soledad Martinez Peria. Bank Financing For SMEs Around The World: Drivers, Obstacles, Business Models, And Lending Practices. Policy Research Working Papers. The World Bank, 2008. https://doi.org/10.1596/1813-9450-4785
Bolton, P. “Public Procurement as a Tool to Drive Innovation”, 2016, 35.
“British American Tobacco South Africa - Our South African Economic Impact.” Accessed September 16, 2018. http://www.batsa.co.za/group/sites/BAT_A2ELAD.nsf/vwPagesWebLive/DO9YABCP
CIPC. “Companies and Intellectual Property Commission: Strategic Plan 2017/18-2021/22”, n.d.
“Clothing Global Value Chains and Sub-Saharan Africa: Global Exports, Regional Dynamics and Industrial Development Outcomes.” International Trade Working Paper, May 27, 2016. https://doi.org/10.14217/5jlz4ft6f2nn-en
Davis Tax Commission. “Second and Final Report on Small and Medium Enterprises”, 2016.
Davis tax Commission. “Small and Medium Enterprises: Taxation Considerations, Interim Report”, 2014.
Department of Trade and Industry. “Annual Review of Small Business in South Africa”, 2008.
Department of Trade and Industry. “Annual Review of Small Business in South Africa 2005-2007”, 2008.
Donor Committee for Enterprise Development. “Technical Report: Policies That Promote SME Participation in Public Procurement, Business Environment Working Group”, September 2017. https://www.enterprise-development.org/wp-content/uploads/DCED-BEWG-SME-Procurement-Report.pdf
Draper, Peter, and Pswarayi, Chiziwiso. “SMEs and GVCs in the G20: Implications for Africa and Developing Countries.” GEG Africa, July 2016.
Fatoki, Olawale, and Odeyemi, Akinwumi. “Which New Small and Medium Enterprises in South Africa Have Access to Bank Credit?” International Journal of Business Management 5, no. 10 (2010).
Financial Services Board. “Strengthening South Africa’s Financial Institutions”, Q1 2016.
FinMark Trust. “FinScope Small Business Survey 2010,” 2010. http://finmark.org.za/finscope-small-business-survey-2010/
Le Fleur, Hilton; Koor, Javed; Chetty, Venessa; Ntshangase, Simon; Mackenzie, Reagan; and Rawoot, Fatima. “Informal Small Medium and Micro Enterprise Retailers in South Africa”, 2014.
“FNB Solves for SME Needs through Digital Innovation.” BiztechAfrica. Accessed September 16, 2018. http://www.biztechafrica.com/article/fnb-solves-sme-needs-through-digital-innovation/13564/
Genesis Analytics. “Nation-Wide Informal Enterprise and Customer Survey”, 2017.
Genesis Analytics. “The Impact of the 4th Industrial Revolution on the South African Financial Services Market”, 2017. https://www.genesis-analytics.com/uploads/downloads/COEFS-TheimpactofthefourthindustrialrevolutiononfinancialservicesinSouthAfrica-final-1-FR.pdf
Global Entrepreneurship Index. “The Global Entrepreneurship Index”, 2018. https://thegedi.org/2018-global-entrepreneurship-index/
Global Entrepreneurship Monitor. “South Africa Report 2016/2017: Can Small Businesses Survive in South Africa?” 2017.
Herrington, Mike; Foxcroft, Mary-Lyn; Wood, Eric; and Segal, Nick. “Global Entrepreneurship Monitor: South African Executive Report”, 2002.
International Finance Corporation. “Collateral Registries for Movable Assets: Does Their Introduction Spur Firms’ Access to Bank Finance?” 2015.
International Finance Corporation. “MSME Finance Gap: Assessment of the Shortfalls and Opportunities in Financing Micro, Small and Medium Enterprises in Emerging Markets”, 2017.
International Finance Corporation. “Reforming Business Registration: A Toolkit for the Practitioners”, 2013. http://documents.worldbank.org/curated/en/577211468155378578/pdf/840140WP0Box380usiness0Registration.pdf
International Labour Organization. “Enabling Environment for Sustainable Enterprises in South Africa”, 2016.
“ITU | 2017 Global ICT Development Index.” Accessed September 16, 2018. http://www.itu.int/net4/ITU-D/idi/2017/index.html
Jones, M, and Mlambo, C. “Early-Stage Venture Capital in South Africa: Challenges and Prospects.” South African Journal of Business Management 44, no. 4 (December 2013).
Khumalo, Kabelo. “Reserve Bank Sets up 3-Man Fintech Group | IOL Business Report”, January 30, 2018. https://www.iol.co.za/business-report/companies/reserve-bank-sets-up-3-man-fintech-group-13008251
Khumalo, Kabelo. “SARB Urges Harmonisation in Fintech | IOL Business Report”, April 23, 2018. https://www.iol.co.za/business-report/technology/sarb-urges-harmonisation-in-fintech-14599126
“Landbank | Short Term Loans.” Accessed September 16, 2018. https://landbank.co.za
Letsebe, Kgaogelo. “Sasfin Introduces Digital Banking Platform for SMEs.” ITWeb, April 13, 2018. https://www.itweb.co.za/content/nWJad7b8ppDqbjO1
Lewis, C, and Gasealahwe, B. “Lowering Barriers to Entrepreneurship and Promoting Small Business Growth in South Africa.” OECD Economics Department Working Papers, December 15, 2017. https://doi.org/10.1787/d60e254f-en
Makina, Daniel; Fanta, Ashenafi; Mutsonziwa, Kingstone; Khumalo, Jabulani; and Maposa, Obert. “Financial Access and SME Size in South Africa: Prepared for FinMark Trust”, December 2015. http://www.finmark.org.za/wp-content/uploads/2016/01/Rep_Financial-Access-and-SME-Size-in-SA_Dec2015-1.pdf
“Massmart Supplier Development Fund.” Massmart (blog), March 13, 2014. http://www.massmart.co.za/iar2013/summary-relating-to-the-supplier-development-fund/
Mastercard. “Digital Evolution Index”, 2014. https://www.mastercard.us/en-us/governments/insights-research/digital-evolution-index.html
Matthee, Marianne, and Heymans, André. “How South African SMEs Can Become Better Candidates for Export Finance”, 11, no. 4 (2013): 17.
Mazanai, Musara, and Fatoki, Olawale. “Access to Finance in the SME Sector: A South African Perspective”, 2012, 10.
Mutezo, Ashley. “Credit Rationing and Risk Management for SMEs: The Way Forward for South Africa.” Corporate Ownership and Control 10, no. 2 (2013). https://doi.org/10.22495/cocv10i2c1art1
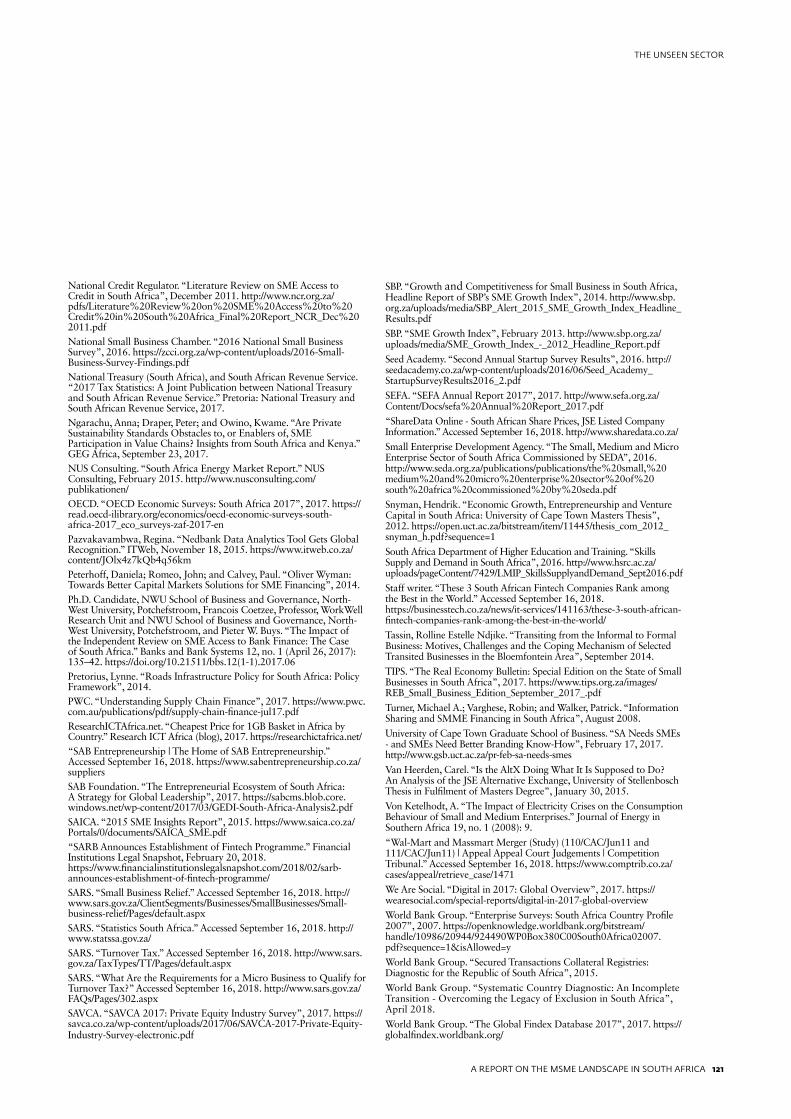
A REPORT ON THE MSME LANDSCAPE IN SOUTH AFRICA 121
THE UNSEEN SECTOR
National Credit Regulator. “Literature Review on SME Access to Credit in South Africa”, December 2011. http://www.ncr.org.za/pdfs/Literature%20Review%20on%20SME%20Access%20to%20Credit%20in%20South%20Africa_Final%20Report_NCR_Dec%202011.pdfNational Small Business Chamber. “2016 National Small Business Survey”, 2016. https://zcci.org.za/wp-content/uploads/2016-Small-Business-Survey-Findings.pdfNational Treasury (South Africa), and South African Revenue Service. “2017 Tax Statistics: A Joint Publication between National Treasury and South African Revenue Service.” Pretoria: National Treasury and South African Revenue Service, 2017.Ngarachu, Anna; Draper, Peter; and Owino, Kwame. “Are Private Sustainability Standards Obstacles to, or Enablers of, SME Participation in Value Chains? Insights from South Africa and Kenya.” GEG Africa, September 23, 2017.NUS Consulting. “South Africa Energy Market Report.” NUS Consulting, February 2015. http://www.nusconsulting.com/publikationen/OECD. “OECD Economic Surveys: South Africa 2017”, 2017. https://read.oecd-ilibrary.org/economics/oecd-economic-surveys-south-africa-2017_eco_surveys-zaf-2017-enPazvakavambwa, Regina. “Nedbank Data Analytics Tool Gets Global Recognition.” ITWeb, November 18, 2015. https://www.itweb.co.za/content/JOlx4z7kQb4q56kmPeterhoff, Daniela; Romeo, John; and Calvey, Paul. “Oliver Wyman: Towards Better Capital Markets Solutions for SME Financing”, 2014.Ph.D. Candidate, NWU School of Business and Governance, North-West University, Potchefstroom, Francois Coetzee, Professor, WorkWell Research Unit and NWU School of Business and Governance, North-West University, Potchefstroom, and Pieter W. Buys. “The Impact of the Independent Review on SME Access to Bank Finance: The Case of South Africa.” Banks and Bank Systems 12, no. 1 (April 26, 2017): 135–42. https://doi.org/10.21511/bbs.12(1-1).2017.06Pretorius, Lynne. “Roads Infrastructure Policy for South Africa: Policy Framework”, 2014.PWC. “Understanding Supply Chain Finance”, 2017. https://www.pwc.com.au/publications/pdf/supply-chain-finance-jul17.pdfResearchICTAfrica.net. “Cheapest Price for 1GB Basket in Africa by Country.” Research ICT Africa (blog), 2017. https://researchictafrica.net/“SAB Entrepreneurship | The Home of SAB Entrepreneurship.” Accessed September 16, 2018. https://www.sabentrepreneurship.co.za/suppliersSAB Foundation. “The Entrepreneurial Ecosystem of South Africa: A Strategy for Global Leadership”, 2017. https://sabcms.blob.core.windows.net/wp-content/2017/03/GEDI-South-Africa-Analysis2.pdfSAICA. “2015 SME Insights Report”, 2015. https://www.saica.co.za/Portals/0/documents/SAICA_SME.pdf“SARB Announces Establishment of Fintech Programme.” Financial Institutions Legal Snapshot, February 20, 2018. https://www.financialinstitutionslegalsnapshot.com/2018/02/sarb-announces-establishment-of-fintech-programme/SARS. “Small Business Relief.” Accessed September 16, 2018. http://www.sars.gov.za/ClientSegments/Businesses/SmallBusinesses/Small-business-relief/Pages/default.aspxSARS. “Statistics South Africa.” Accessed September 16, 2018. http://www.statssa.gov.za/SARS. “Turnover Tax.” Accessed September 16, 2018. http://www.sars.gov.za/TaxTypes/TT/Pages/default.aspxSARS. “What Are the Requirements for a Micro Business to Qualify for Turnover Tax?” Accessed September 16, 2018. http://www.sars.gov.za/FAQs/Pages/302.aspxSAVCA. “SAVCA 2017: Private Equity Industry Survey”, 2017. https://savca.co.za/wp-content/uploads/2017/06/SAVCA-2017-Private-Equity-Industry-Survey-electronic.pdf
SBP. “Growth and Competitiveness for Small Business in South Africa, Headline Report of SBP’s SME Growth Index”, 2014. http://www.sbp.org.za/uploads/media/SBP_Alert_2015_SME_Growth_Index_Headline_Results.pdf
SBP. “SME Growth Index”, February 2013. http://www.sbp.org.za/uploads/media/SME_Growth_Index_-_2012_Headline_Report.pdf
Seed Academy. “Second Annual Startup Survey Results”, 2016. http://seedacademy.co.za/wp-content/uploads/2016/06/Seed_Academy_StartupSurveyResults2016_2.pdf
SEFA. “SEFA Annual Report 2017”, 2017. http://www.sefa.org.za/Content/Docs/sefa%20Annual%20Report_2017.pdf
“ShareData Online - South African Share Prices, JSE Listed Company Information.” Accessed September 16, 2018. http://www.sharedata.co.za/
Small Enterprise Development Agency. “The Small, Medium and Micro Enterprise Sector of South Africa Commissioned by SEDA”, 2016. http://www.seda.org.za/publications/publications/the%20small,%20medium%20and%20micro%20enterprise%20sector%20of%20south%20africa%20commissioned%20by%20seda.pdf
Snyman, Hendrik. “Economic Growth, Entrepreneurship and Venture Capital in South Africa: University of Cape Town Masters Thesis”, 2012. https://open.uct.ac.za/bitstream/item/11445/thesis_com_2012_snyman_h.pdf?sequence=1
South Africa Department of Higher Education and Training. “Skills Supply and Demand in South Africa”, 2016. http://www.hsrc.ac.za/uploads/pageContent/7429/LMIP_SkillsSupplyandDemand_Sept2016.pdf
Staff writer. “These 3 South African Fintech Companies Rank among the Best in the World.” Accessed September 16, 2018. https://businesstech.co.za/news/it-services/141163/these-3-south-african-fintech-companies-rank-among-the-best-in-the-world/
Tassin, Rolline Estelle Ndjike. “Transiting from the Informal to Formal Business: Motives, Challenges and the Coping Mechanism of Selected Transited Businesses in the Bloemfontein Area”, September 2014.
TIPS. “The Real Economy Bulletin: Special Edition on the State of Small Businesses in South Africa”, 2017. https://www.tips.org.za/images/REB_Small_Business_Edition_September_2017_.pdf
Turner, Michael A.; Varghese, Robin; and Walker, Patrick. “Information Sharing and SMME Financing in South Africa”, August 2008.
University of Cape Town Graduate School of Business. “SA Needs SMEs - and SMEs Need Better Branding Know-How”, February 17, 2017. http://www.gsb.uct.ac.za/pr-feb-sa-needs-smes
Van Heerden, Carel. “Is the AltX Doing What It Is Supposed to Do? An Analysis of the JSE Alternative Exchange, University of Stellenbosch Thesis in Fulfilment of Masters Degree”, January 30, 2015.
Von Ketelhodt, A. “The Impact of Electricity Crises on the Consumption Behaviour of Small and Medium Enterprises.” Journal of Energy in Southern Africa 19, no. 1 (2008): 9.
“Wal-Mart and Massmart Merger (Study) (110/CAC/Jun11 and 111/CAC/Jun11) | Appeal Appeal Court Judgements | Competition Tribunal.” Accessed September 16, 2018. https://www.comptrib.co.za/cases/appeal/retrieve_case/1471
We Are Social. “Digital in 2017: Global Overview”, 2017. https://wearesocial.com/special-reports/digital-in-2017-global-overview
World Bank Group. “Enterprise Surveys: South Africa Country Profile 2007”, 2007. https://openknowledge.worldbank.org/bitstream/handle/10986/20944/924490WP0Box380C00South0Africa02007.pdf?sequence=1&isAllowed=y
World Bank Group. “Secured Transactions Collateral Registries: Diagnostic for the Republic of South Africa”, 2015.
World Bank Group. “Systematic Country Diagnostic: An Incomplete Transition - Overcoming the Legacy of Exclusion in South Africa”, April 2018.
World Bank Group. “The Global Findex Database 2017”, 2017. https://globalfindex.worldbank.org/
122 A REPORT ON THE MSME LANDSCAPE IN SOUTH AFRICA
THE UNSEEN SECTOR
Acknowledgements
This publication was led by Amrei Botha (Senior SME Banking Specialist, IFC) and Ayanda Mokgolo (Financial Sector Specialist, World Bank). The publication was peer reviewed by Ghada Teima (Lead Financial Sector Specialist, World Bank), Ivor Istuk (Senior Financial Sector Specialist, World Bank), John Wilson (Manager, IFC) and Sanjay Kalpage (Senior Financial Sector Specialist, IFC). The report has also been reviewed and edited by Devon Maylie (Communications Officer, IFC) and Zandi Ratshitanga (Senior Communication Officer, World Bank). The team included the following World Bank Group staff. International Finance Corporation: John Wilson, Riadh Naouar, Sandra Antunes Boumah and Desmond Dodd. World Bank: Gavin McCosker, Sebastien Dessus, Ajai Nair, Douglas Pearce, Marek Hanusch, Gabriel Goddard and Ellen Olafsen.
Generous funding was provided by the Swiss State Secretariat for Economic Affairs (SECO). The team also thanks Genesis Analytics, and in particular, Richard
Ketley, Mauro Mela, Mark Schoeman and Yaseen Brey for their close collaboration, as well as Titanium Room for the design and production of the report. The team further acknowledges the following private and public sector partners and experts for their contributions through various constructive interactions sharing their experiences and perspectives on the MSME sector in South Africa: First National Bank, absa, Standard Bank, Nedbank, Mercantile Bank, Business Partners, Landbank, Microfinance South Africa (MFSA), Development Microfinance Association (DMA), Women’s Development Bank Trust (WDB Trust), Southern African Venture Capital Association (SAVCA), Banking Association South Africa (BASA), Coca Cola Beverages South Africa, Awethu Project, Experian, Industrial Development Corporation (IDC), Small Enterprise Financing Agency (SEFA), Small Enterprise Development Agency (SEDA), National Treasury and the Department of Small Business Development (DBSA).