Embed Size (px)
Citation preview
Discussion Paper No. 65
The Origins of the German Corporation – Finance, Ownership and Control
Julian Franks* Colin Mayer**
Hannes F. Wagner***
October 2005
* Julian Franks, London Business School, Sussex Place Regent’s Park, London NW1 4SA, England, [email protected]
** Colin Mayer, Saïd Business School, University of Oxford, Park End Street, OX1 1HP Oxford, England, [email protected]
*** Hannes F. Wagner, Munich School of Management, Ludwig Maximilians University of Munich, Schackstrasse 4, D-80539 Muenchen, Germany, [email protected]
Financial support from the Deutsche Forschungsgemeinschaft through SFB/TR 15 is gratefully acknowledged.
Sonderforschungsbereich/Transregio 15 · www.gesy.uni-mannheim.de Universität Mannheim · Freie Universität Berlin · Humboldt-Universität zu Berlin · Ludwig-Maximilians-Universität München
Rheinische Friedrich-Wilhelms-Universität Bonn · Zentrum für Europäische Wirtschaftsforschung Mannheim
Speaker: Prof. Konrad Stahl, Ph.D. · Department of Economics · University of Mannheim · D-68131 Mannheim, Phone: +49(0621)1812786 · Fax: +49(0621)1812785
The Origins of the German Corporation – Finance, Ownership and Control
Julian Franks
Professor of Finance
London Business School
Colin Mayer
Peter Moores Professor of Finance
Saïd Business School
University of Oxford
Hannes F. Wagner
Saïd Business School
University of Oxford
We are grateful for helpful suggestions from participants at the CEPR Early Securities
Markets Conference, Berlin, October 2004, the Asian Corporate Governance
Conference, Seoul, May 2005, the European Finance Association Meeting, Moscow,
August 2005 and to workshop participants at the University of Oxford. We have
received valuable comments from Caroline Fohlin, Leslie Hannah, Ekkehard Wenger
and an anonymous referee. We are also grateful to the Historical Institute of Deutsche
Bank AG, the Hessisches Wirtschaftsarchiv and the Bayerisches Wirtschaftsarchiv for
access to their data sources.
Abstract
The ownership of German corporations is quite different today from that of Anglo-American firms. How did this come about? To what extent is it attributable to regulation? A specially constructed data set on financing and ownership of German corporations from the end of the 19th century reveals that, as in the UK, there was a high degree of activity on German stock markets with firms issuing equity in preference to borrowing from banks, and insider and family ownership declining rapidly. However, unlike in the UK, other companies and banks emerged as the main holders of equity, with banks holding shares primarily as custodians of other investors rather than on their own account. The changing pattern of ownership concentration was therefore very different from that of the UK with regulation reinforcing the control that banks exercised on behalf of other investors. Key words: Evolution of ownership, German stock markets, financial regulation JEL Classifications: G32, N23/4
1
1 Introduction Ownership of corporations in Germany is today highly concentrated in the hands of
families and other companies. In contrast, in the UK and US it is dispersed among a
large number of individual and institutional investors. Recent work by Franks, Mayer
and Rossi [FMR] (2004 and 2005) has provided some insights into how this occurred
in the UK. They record that dispersed ownership emerged early in 20th century
Britain when insider and family share ownership was rapidly diluted by share
issuance to fund growth through acquisitions.
FMR explore the law and finance thesis that the UK’s regulatory system is the
explanation for this rapid dispersion of ownership. Consistent with this law and
finance view, dispersed ownership in the UK today is associated with a high level of
investor protection. But in the early part of the century, rapid dispersion of ownership
occurred against the backdrop of low investor protection. Regulation on its own is
unlikely to be an adequate explanation for dispersed ownership in the UK.1
What about Germany? Does a regulatory explanation fare better there? We
currently know very little about Germany since there have been few studies of the
evolution of ownership of German firms before 1960.2 What we do know is that by
international standards investor protection is weak in Germany today or at least has
been until comparatively recently. According to the law and finance thesis, that is
consistent with current high levels of concentration of ownership. But was it always
like this? Has ownership always been concentrated and has investor protection
always been weak?
This paper provides the first long-run study of ownership and control of
German corporations by assembling data on the ownership and financing of firms
from samples spanning almost a century from 1860 to 1950. At first sight, German
financial markets look remarkably similar to their UK counterparts. There were a
large number of firms listed on German stock markets and firms raised large amounts
of equity finance. This runs counter to the conventional view of Germany as a bank
oriented financial system. Firms raised little finance from banks and surprisingly
large amounts from stock markets.
1 See FMR (2004) for a description of the development of regulation and stock markets in the UK during the 19th and 20th centuries. Background material is available in Davis and Huttenback (1986), Edelstein (1982), Morgan and Thomas (1969) and Ripley (1934). 2 However, see Fohlin (1998) and (2005) for analyses of early German capital markets.
2
As in the UK, issuance of equity caused the ownership of founding families
and insider directors to be rapidly diluted. Even by the start of our analysis, founding
family ownership was modest and ownership by members of firms’ supervisory
boards, which was large at the beginning of the century, declined rapidly thereafter.
But there was one important difference between Germany and the UK. In the UK,
much of the new equity issuance went to funding acquisitions and mergers. In
Germany it did not. To the extent that companies invested in other firms it was in the
form of partial share stakes rather than full acquisitions. As a consequence, new
equity was frequently purchased by other companies in blocks rather than by
dispersed shareholders.
Furthermore, where equity was widely held by individual investors it was
generally held on their behalf by custodian banks. Banks were able to cast a large
number of votes at shareholder meetings, not only in respect of their own
shareholdings which were in general modest, but as proxies for other shareholders.
As a result, concentration of ownership did not decline at anything like the rate
observed in the UK over the same period. This is the case, even if one assumes that
all bank proxies were voted on behalf of dispersed shareholders. Thus, a central
conclusion of the paper is that concentration of ownership declined much less than in
the UK.
Regulation, or rather existing measures of investor protection, do not explain
these differences. Indices of both shareholder anti-director rights and levels of private
enforcement are identical and equally low in Germany and the UK in the first three
decades of the twentieth century. In this regard, the high level of stock market
activity at the beginning of the 20th century is surprising in both countries. We would
not have expected small investors to subscribe to new equity issues in the absence of
either strong anti-director or private enforcement provisions. Something else must
have encouraged them to participate. In the case of the UK, FMR point to trust
between investors and firms in local stock markets as the additional ingredient. Trust
mechanisms were different in Germany; we believe that in the case of Germany they
were associated with the role of banks as promoters of new equity issues, custodians
of individual shareholdings and voters of proxies on behalf of individual investors.
An English economic historian Lavington (1921) argued that banks provided a more
secure basis for the issuance of IPOs in Germany than promoters in the UK whose
interests were primarily confined to selling issues rather than ongoing relationships
3
with companies. Regulation at the end of the 19th century contributed to this by
conferring rights not on minority investors but on the banks, which as the promoters
of corporate equity were able to control firms’ access to the German stock markets.
In the same way as firms in Britain sought to uphold their reputation amongst local
investors to gain access to equity finance, so German firms were dependent on banks
as the gatekeepers to securities markets. How the two arrangements compared in
protecting the interests of investors is an issue that we explore in the final section.
Section 2 begins by describing the structure of German financial markets at the
end of the 19th and the beginning of the 20th centuries. It discusses the main
developments that occurred in the regulation of German capital markets up to WW2.
Section 3 describes the data that we have collected. Section 4 analyses the manner in
which firms in the sample grew and financed their growth through acquisitions and
internal investment. Section 5 examines the ownership of firms and the way in which
ownership changed during the course of the twentieth century including the role of
banks as agents of shareholders in company meetings. Section 6 concludes the article.
2 The structure and regulation of German financial markets
2.1 The stock corporation and stock market regulation
There were five joint-stock companies in Prussia before 1800 (Kropff and Semler
(2000)) but, as in many other countries, it was the arrival of the railroads with their
substantial external financing requirements that provided the real impetus for the
development of the joint-stock corporation. The 1843 Prussian Joint-Stock
Companies Act (Preußisches Gesetz über Aktiengesellschaften) established the legal
foundation for the joint-stock company but restricted incorporations to concessions
from the state. Table 1 provides an overview of the development of joint stock-
company legislation in Germany. The Common German Commercial Code
(Allgemeines Deutsches Handelsgesetzbuch) of 1861 extended the concession system
to other states and introduced a voluntary two-tier board structure with separate
4
supervisory (“Aufsichtsrat”) and management boards (“Vorstand”).3 The concession
system was removed and free incorporation permitted by the First Joint-Stock
Modification (Erste Aktiennovelle) of 1870, while the two-tier board structure was
made mandatory.4
The joint stock corporation took off in Germany with the introduction of the
1870 company law. Victory in the war against France and large payments by the
French government contributed to the hot issue market (the ‘Founder’s Boom’ -
“Gründerboom”) of 1871 to 1873. 432 companies went public on German stock
exchanges in 1872 alone and quoted companies raised large amounts of capital
through seasoned issues. The number of joint-stock companies increased from around
200 before 1870 to more than 1,000 shortly thereafter.
There were no strict listing rules for entry into stock exchanges and firms
frequently sold their stock directly to the public without publishing a prospectus
(Goemmel (1992)). There was widespread fraud. The ‘Founders’ Scam’ , a crash in
1873 and a wave of bankruptcies led to calls for corporate law reform, including the
abolition of the joint-stock corporation. In 1884 the Second Joint-stock Modification
(Zweite Aktiennovelle) introduced a new stock corporation law (“Gesetz betreffend
die Kommanditgesellschaften auf Aktien und die Aktiengesellschaften“) that replaced
large sections of the Commercial Code (“Handelsgesetzbuch”) focusing on the
incorporation process, establishing legal liability for fraud and requiring firms to file
annual profit and loss and balance sheet statements This is in contrast to the UK
3 The 1870 articles of association of Deutsche Bank stated that “the management board conducts the company’s affairs in accordance with these articles of association and the instructions given to it by the administrative board….The administrative board shall oversee the execution of these articles of association by the management, supervise the latter’s activities and give it instructions….The administrative board decides on land purchases for business premises, on the establishing of branches, agencies and subsidiaries and any agreements to be concluded in connection therewith, on amounts of outstanding credit to be granted, and on purchases and sales of shares, bonds and securities of all kinds” (reproduced in Gall et al (1995) p. 118). Management resolutely opposed these provisions as interferences in the running of the business. Georg Siemens, the head of the management board of Deutsche Bank, complained that “when twenty-four people try to run a bank, it is like a wench with twenty-four suitors. None of them marries her. But she still ends up with a child!” (reproduced in Gall et al (1995), p.118). 4 There is some evidence that two-tier boards evolved by accident. The so-called supervisory boards were places where large shareholders met to resolve their different interests. An accident of drafting at the Nuremberg Conference in 1857 transformed what were previously described as administrative into supervisory boards. The Nuremberg Conference originally had suggested a mandatory supervisory board only for associations limited by shares (“Kommanditgesellschaften auf Aktien”). As Passow (1909, 1922) shows, the minutes of the Conference strongly suggest that the supervisory board was only introduced for joint-stock corporations because similar language was borrowed from that relating to associations.
5
where a legal requirement for issuing of prospectuses was only introduced 45 years
later in the Companies Act of 1929. In Germany, the 1884 Act also separated the
functions of the supervisory and the management board, restricting the supervisory
board to a controlling body and strengthening its fiduciary responsibilities. The Act is
widely regarded as the foundation of modern German corporation law and it remained
largely unchanged until 1937. The Limited Liability Company Act (“GmbH-Gesetz”)
of 1892 established the non-publicly traded limited liability company (“GmbH”).
The number of public limited companies, Aktiengesellschaften (AG,)
expanded to more than 2,000 in 1886 and 3,000 at the beginning of the 1890’s (Fohlin
(2004)). The boom and bust in the stock market at the end of the 1880’s and the
beginning of the 1890’s, and in particular the disastrous banking failures in Berlin in
1891, created further demands for reform and in 1896 the German Exchange Act was
introduced.
Before the Act there was a virtual complete absence of regulation of
transactions on the exchanges but the new legislation provided Germany with “the
most elaborate attempt ever made to regulate speculative markets” (Emery (1898), p.
286). It laid down rules relating to membership of exchanges (excluded bankrupts,
former convicts and women), quotation of official prices and admission of securities.
“The act provides for the issue of a prospectus by every applicant for list, the
character of which has been prescribed in minute detail by the Bundesrat in its order
of December 11, 1896” (Emery (1898), p313). In the event of false statements, the
underwriters and the promoters were jointly liable and in the event of a fall in price in
the security due to fraud or negligence, actions could be taken to recover losses
against either party.5
This article was written immediately after the 1896 legislation had become law
without any experience of its effectiveness. Moreover, it suggests that the new
legislation was primarily aimed at commodity rather than securities exchanges. It
further describes how the banks operated as jobbers on the stock exchange as well as
5 There is some evidence that the duty of care of directors was higher in Germany than in the UK. Case law in the UK suggests that for directors to be culpable they must not only have been negligent but reckless. As a result the main protection for shareholders against directors was against fraud (the Larceny Act) rather than negligence. In Germany, directors owed a duty of care that went beyond shareholders. For example, Karl Esser former CEO of Mannesmann was accused of not taking shareholder interests fully into consideration when he recommended the takeover by Vodafone. Franks and Mayer (2001) cite a case where the Vorstand refused to take actions ordered by a majority owner because of a duty of care owed to the company as distinct from its shareholders.
6
promoters of securities. As a result, banks traded on their own account as well as
making markets in securities, creating the potential for both conflicts of interest and
monopoly. “A very interesting result of these practices is the development of the
banks as independent markets for securities…In this way an increasing volume of
business is being done outside the exchange and this is greatly stimulated by the
restrictions the new legislation puts on exchange trading. The exchange in so far
declines in importance, and the large banks through whom this business goes become
increasingly influential….The recently published bank reports for the year 1897 show
a material gain over 1896 in the earnings of the large banks from commissions”
(Emery (1898), pp. 311 and 319).
From 1897, companies started issuing multiple classes of shares. In particular,
during the hyperinflation period of the 1920’s, they placed preference shares with a
high ratio of voting rights to ordinary shares in the hands of management and friendly
investors to prevent control of German corporations being transferred to foreign
investors. Aron (1927) reports that more than half of a sample of 1595 firms had
multiple voting shares and these accounted for 38.2 percent of votes but only 2.4
percent of nominal capital. In contrast, in the UK there were very few examples of
dual class shares until the 1960’s when hostile takeovers emerged.
There was little change in joint-stock company legislation until the 1930s, with
the exception of the temporary re-introduction of the concession system of granting
incorporation during the war. During the 1920s, the principle of “the company in
itself” (“das Unternehmen an sich”) first formulated by Walter Rathenau in his work
“Vom Aktienwesen” in 1917 began to appear. According to this concept, the
company had a broad social obligation to create and preserve jobs and to serve the
needs of the state. The “Unternehmen an sich” concept was adopted by the National
Socialist regime and codified in the “Fuehrer Principle”, section 70 of the Stock
Corporation Act of 1937, which stated that: “The managing board is responsible for
directing the company as its well-being and that of the nation and state demand”.6 No
reference was made to the interests of shareholders and the Act in fact stated that, “in
the execution of its tasks, the management board must not be as dependent as it has
been in the past on the mass of irresponsible shareholders, who do not in general have
the necessary appreciation of the business situation.” Calls to exclude shareholders 6 Part of the 1937 Act had previously been implemented by emergency decrees (“Notverordnungen”) in 1931 in response to the implosion of several of the largest German banks.
7
from the stock corporation altogether were resisted and “the legislator deemed the
Führer principle consistent with the shareholder being given co-administration in the
form of the right to vote” (Spindelmann (1938)). The political climate had moved
significantly against the interests of the individual investor.7 Legislation remained
largely unchanged until the Revision of the Stock Corporation Act in 1965 (Kropff
and Semler (1995)).8 2.2 Investor protection
Table 2 summarizes minority protection rules and control thresholds. A striking
feature of investor protection in Germany was its inertia during the 20th century. In
many respects, at the beginning of the century it was well ahead of other countries.
For example, provisions for shareholders to force an extraordinary general meeting
(EGM) with 10 percent of voting equity capital were introduced in 1861, 87 years
earlier than in the UK. Likewise, the Second Joint-stock Modification introduced
formal rules for proxy voting and outlawed proxy voting without explicit consent in
1884 - proxy voting in the UK was only introduced in the Companies Act in 1948.
But German banks effectively circumvented this requirement of explicit consent by
inserting statements in their general terms of business about using the votes of
deposited shares.9
Table 2 also shows that after 1897 there were no further changes in investor
protection for a considerable time. Even insider trading was only formally prohibited
7 The legal consequences were less pronounced than the political rhetoric. In fact, it was argued that minority investors were required to counterbalance the increased authority of management. (Spindelmann (1938)). 8 The impact of the Nazi regime and WWII were economically and legally very significant. Banking was viewed as being dominated by Jewish interests and subject to extensive repression. As early as 1933, Deutsche Bank removed Jewish members of the board of directors and the supervisory board. Banks were in turn used by party officials to press firms to remove Jewish directors and workers (Gall et al (1995)). By 1938, it was illegal to have Jewish board members or more than a quarter of shares or half of votes in the hands of Jewish investors. In one of our sample firms, a brewery in Frankfurt, a letter was written by an Aufsichtsrat member in 1938, refuting allegations that the company might be controlled by Jewish shareholders. 9 Proxy voting was commonplace in Germany after 1870. The first documented use of the “Depotstimmrecht” - proxy voting of custodian banks on behalf of custodian clients at a general meeting as codified in the 1884 Act, is the case of Deutsche Edison Gesellschaft, which reincorporated as Allgemeine Electricitäts-Gesellschaft (AEG) in 1887. Emil Ratenau, the founder of AEG, asked the banks `to agree to represent, at no cost, those shareholders who intended to vote in favour of the agenda`. This practice was not uncontroversial at that time but widely in use by the end of the century. Big banks had begun to incorporate statements about deposited shares voting rights in their general terms of business and their use is first documented by Deutsche Bank in 1900. Increasing dispersion of ownership and a growing number of minority shareholders made proxy voting of increased importance during the Weimar Republic.
8
in 1994 with the Second Financial Market Promotion Act. The contrast with the UK
is striking in this regard. While there was no substantive investor protection
legislation in Germany between 1937 and 1994 there were no less than six separate
Companies Acts in the UK as well as considerable regulation associated with the
creation of the Takeover Panel in 1967.
Panel A of Table 3 records the development of the LLSV index of investor
protection. The score of 1 was reached with the introduction of the Common
Commercial Code in 1861. The 10 percent threshold required to force an EGM,
introduced in 1861, was lowered to 5 percent with the Second Joint-Stock
Modification in 1884.10 If the LLSV index is a good measure of investor protection,
the rights of minority shareholders today are largely a product of legislation enacted in
the late 19th and early 20th centuries.
Panels B and C of Table 3 present more detailed indices of investor protection,
private and public enforcement, described in La Porta et al (2004). The private
enforcement index is 0.21 today and in 1900 it was zero. It remained at zero until
1987 when new prospectus requirements were introduced. Levels of private
enforcement have therefore been low throughout the twentieth century reflecting the
difficulty that a plaintiff faces in a German court in seeking compensation for
damages.
The score of 1 on the LLSV index is identical to that recorded by FMR for the
UK in the first half of the twentieth century. The score of zero on the private
enforcement index is also identical to that of the UK in the first three decades of the
twentieth century. Thereafter, private enforcement increases rapidly in the UK to 0.5
in 1929, 0.67 in 1948 and 0.75 in 1967 while it remains at zero in Germany until
1987. The LLSV and La Porta et al measures of investor protection cannot therefore
account for differences in evolution of ownership in Germany and the UK in the first
three decades of the twentieth century and they would predict that pronounced
differences would emerge thereafter and in particular in the second half of the
twentieth century.
10 The LLSV measure increased from 1 to 2 with the introduction of the Act on “Registered Shares and Facilitating the Exercise of Voting Rights” (NaStraG), passed in January 2001. According to this, shareholders are permitted to authorize individuals, company representatives or banks to exercise their voting rights by the use of electronic communication. This electronic proxy voting has for example been used in the general meetings of Allianz AG since July 2001. While this is not direct absentee voting in the legal sense, since a shareholder needs to name a representative at the meeting, this is effectively the same as absentee voting in the LLSV sense.
9
Table 4 provides an overview of disclosure rules. The Common Commercial
Code of 1861 required firms to file records of general meetings at register courts. In
1884, filing requirements were extended to P&L accounts and balance sheets and the
Stock Exchange Act of 1896 required prospectuses to be filed with the Board of
Admissions of stock exchanges. Prospectuses had to include the intended use of
issued capital and any special rights attached to securities.
Shareholder lists of general meetings had to state when votes were cast as
proxies on behalf of other shareholders from the revised Joint-Stock Companies Act
(Aktiengesetz) of 1937. This represents the date from which we have comprehensive
information on proxy voting. The Act required the written consent of shareholders for
proxy voting by a bank and the consent was valid for a maximum of 15 months. In
1965, the Joint-Stock Companies Act revision required disclosure of shareholding
blocks when thresholds of 25 percent and 50 percent were reached.11 Total
compensation of board members, directors’ shareholdings, irregular contracts and
transactions with related parties had to be disclosed under the Stock Exchange
Admission Regulation of 1987 (Börsenzulassungsverordnung).12 Disclosure of
insider information, more detailed block holding data and the compulsory publication
of cash flow statements and industry segment data were only introduced during the
1990s.
The picture that emerges is that there was little change in the information that
firms had to disclose for a long period after 1896 and disclosure requirements that
were eventually enacted were modest by international standards. While German
regulation therefore was at least on a par with that in the UK until the second half of
the 1930’s, it subsequently fell far behind.
2.3 Bank influence and investor protection
Two important facts emerge from the previous sections. First, using law and finance
measures, investor protection was similar in Germany and the UK for at least the first
30 years of the 20th century, and according to some measures may in fact have been
stronger. Second, much of the legislation had the effect of conferring considerable
control on banks.
11 Note that around this time the disclosure threshold in the UK was 5%. 12 These prospectus items are part of the disclosure index in La Porta et al (2004).
10
The LLSV (1998) and LLS(2004) measures suggest that investor protection
was identical in Germany and the UK from 1861 until the UK 1929 Companies Act.
The LLSV and LLV indices for Germany (Table 3) and the UK (see FMR (2004))
show that the anti-director index (LLSV (1998)) and the disclosure requirement, the
burden of proof and the public enforcement indices (LLS(2004)) are all identical for
both countries over this period.
However, there are other aspects of investor protection not captured by the
LLSV approach which suggest it was stronger in Germany than in the UK prior to
1929. From 1896, German minority shareholders could demand an EGM with 10% of
votes, a provision that was not available in the UK until 1948. The 1884 Act in
Germany imposed liability on underwriters and issue promoters for errors in
prospectuses as well provision for proxy voting for minority shareholders, neither of
which are included in the LLS indices (2004). These provisions were introduced much
later in 1929 in the UK.
As previously described, much of the legislation had the effect of conferring
considerable control on banks. Rather than strengthening investor protection this
have created conflicts between the interests of banks and minority investors. As
Emery (1898) noted “a very interesting result of these practices is the development of
the banks as independent markets for securities” and “brokers complain bitterly [about
the] large transfers which the banks make in themselves.” (see also Gömmel (1992)).
More recently Franks and Mayer (1998) have noted the conflicts that can arise
between banks and minority investors when banks are able to exercise control through
boards and proxy voting. The history of German capital markets therefore suggests a
more subtle influence of regulation than that considered to date. It may not merely
strengthen or weaken investor protection but instead consolidate the position of third
parties, in this case banks, which may or may not then act in the interest of minority
investors.
3 Data
Until recently, most shares in German companies have been held in bearer form. As a
consequence, there is no official register of the shareholders of a firm. However,
extensive information had to be provided to stock exchanges for initial public and
subsequent offerings. This information in most cases included the register of all
11
shareholders present at the preceding general meeting, the offering prospectus and the
company accounts for several previous years. We have obtained data on individual
firms from three archive sources in Germany – the Hessisches Wirtschaftsarchiv
(Hessian Economic Archive), the Bayerisches Wirtschaftsarchiv (Bavarian Economic
Archive) and the Deutsche Bank AG Historical Institute.
The Hessian and Bavarian Economic Archives contain filings of the Frankfurt
Stock Exchange and Munich Stock Exchange, which include the above-mentioned
documentation relating to equity offerings and annual reports and records of
shareholder meetings. The archives of the Historical Institute of Deutsche Bank are a
product of its relationships with industrial firms and other banks and include offering
prospectuses and files connected to the equity offerings in which it participated.13
We collected the shareholder lists of the general meetings from the Hessian
Economic Archive, the Bavarian Economic Archive and Deutsche Bank. From the
shareholder lists, most of which are hand-written before 1920 and the oldest date back
to 1862, we extracted the name and title of every shareholder, his or her city of
residence, and the number of votes cast. We matched these data with lists of members
of the management board (Vorstand) and the supervisory board (Aufsichtsrat), which
came from annual reports, prospectuses, and reports of the general meetings. We
classified shareholders as management shareholders, supervisory shareholders, or
outside shareholders. We also collected information on whether director votes are
own votes or proxy votes.
We collected information on the type of shareholder (banks, other German
companies, insurance companies, institutional investors, members of founding
families, the German State or other authorities, and individual investors) and whether
the votes were own votes or proxy votes. To illustrate, shareholders were classified as
banks if the name of the company indicated a banking business, if the shareholder
carried the title “bank director” or a similar title or if we could identify individuals as
being members of the boards of banks from other companies’ prospectuses, annual
reports, and correspondence with banks, shareholders or stock exchanges. If there
were overlapping cases with one type of shareholder owning the shares and another
voting them then ownership was given dominance. For instance, if we had 13 With the exception of Deutsche Bank itself, all firms in our sample have data available from other sources. Our use of material from Deutsche Bank is mainly to amend other archives’ information and therefore avoids any selection bias that might be introduced by relying on Deutsche Bank, a consortium leader in a considerable percentage of IPOs, as a primary information source.
12
information that a company was voting shares that were owned by a member of the
founding family, we classified the votes as being non-proxy votes exercised by a
founding family shareholder. In identifying foreign ownership we accounted for the
shifting frontiers of Germany during our sample period. Foreign companies included
banks, and other financial institutions were classified as foreign if they were not part
of German territory in 1914 (which included among others Breslau, Danzig,
Königsberg, Metz, Posen, and Strasbourg, all of which are cities of residence for
significant numbers of shareholders in our sample).
We undertook extensive crosschecks on the data and performed a variety of
consistency tests. For a small number of companies, additional data on the breakdown
of proxy votes (exercised by companies and banks) are are available. We checked the
shareholder lists in combination with annual reports and prospectus information to
determine whether shares carried multiple votes.
We collected financial statements from prospectuses and company accounts.
From the same source we collected data on issued equity and how the funds were
applied. Reasons cited include takeovers, joint ventures, investments in other
companies, increases in working capital and other events, for example, currency
changes following the introduction of the Reichsmark in 1924. We classified balance
sheet items according to their sources as firms’ equity (ordinary, preferred and other
equity) and debt (bank finance, bond finance and other). The classification involved
dozens of items, most of which did not conform to modern accounting methodology
and some of which were unclassified even in German accounting literature from the
beginning of the 20th century. We classified items according to the then prevailing
accounting conventions; if no convention existed we classified items as ‘other equity’
if there was no apparent legal liability associated with the form of finance, and
otherwise as ‘other debt’. In case of doubt we only classified debt items as bank
finance or bond finance if the items were unequivocally identifiable, otherwise they
were classified as ‘other debt’. Wherever possible we made use of data about bank
loans provided in the notes to the balance sheet.
Data were available for 55 companies for the period 1860 to 1950. Table 5
reports the sample characteristics. Firm observations are allocated to the nearest
corresponding decade, four observations preceding 1885 are grouped into the 1890
decade. As Panel A shows, there are 5 firms with eight observations in the 1890
decade, rising to 32 firms with 41 observations in the 1920 decade. In total, the
13
sample contains 156 firm-year observations. The changing ratio of observations per
company across decades is the result of our sample construction. As we only record
an observation when a company issues a prospectus, Panel A clearly shows how the
frequencies vary across firms and across time. Panel B shows that the industries most
strongly represented in our sample are banks, breweries, chemicals, electric
equipment, engineering, paper, and textiles. Panel C shows the mean (median)
number of observations per company is 2.48 (2) and the mean (median) duration for
which a firm is included in the sample is 15.2 (12) years.
The size of the firms in our sample is of particular importance, as very large
firms exhibit growth and financing patterns different from the average firm.14 The
initial size of a firm is measured as total assets in the first year, in which the firm is
included in our sample. Mean (median) initial size is Mark 53.5 (6.01) million for
firms with an initial observation until 1918 using the Mitchell (1992) consumer price
index to deflate assets to 1900 prices. We truncate firms after this year since the
hyperinflation period, which peaked in 1923 and triggered the introduction of the
Reichsmark in 1924, distorts total asset value. Firm size in our sample is very similar
to that of UK firms in FMR (2004). We use total issued equity for the 40 UK
companies from FMR (2004) in 1900 since total assets are not generally available for
UK firms before 1929. Mean (median) total issued equity measured at 1900 prices for
our sample is 6.6 (2.4) million Marks for firms with observations before 1919
compared to mean (median) total issued equity of 10.1 (2.9) million Marks in 1900
for the FMR UK sample.15 Finally, since representativeness of our sample is of
particular importance in light of our limited sample size, we perform a detailed
comparison of our sample with the total population of publicly traded German firms
in the subsequent section.
The mean (median) annual growth rates of the truncated sample of firms are
10.1 percent (4.32 percent) in nominal terms and 6.93 percent (1.69 percent) in real
terms. These figures are comparable to the results of Rettig (1978), who finds annual
14 Large firms were concentrated in certain industries. Siegrist (1980) shows that of the largest 100 German corporations in 1887, 1907, and 1927, 68 percent, 67 percent and 51 percent were heavy industry and engineering firms. These firms accounted for large parts of total equity raised. For example, Jeidels (1905) shows that 57 percent of total capital raised in initial public offerings between 1900-1903 was raised by heavy industry firms. Case studies of large heavy industry firms by Wellhoener (1989) suggest that the fast growth of large firms is quite different from the average firm. 15 Pound Sterling are converted to Mark using year-average London exchange rate quotes provided in Goemmel (1991), p. 95-97.
14
growth rates of between 3.67 and 5.21 percent for a sample of large German firms for
the time period 1880-1911.
All firms were exchange traded on Frankfurt or Munich exchanges amongst
others at some time over the period but not necessarily throughout the period. Less
than 20 percent are still operating today, in most cases as part of a different legal
entity, including Deutsche Bank, Krauss-Maffei, Krupp, MAN, and Siemens.
From these data, we have constructed three types of information. First,
shareholdings were categorized as belonging to one of “other German companies,
family groups, banks, supervisory and management board representatives”. Second,
sources of capital from balance sheets were classified as firms’ equity (ordinary,
preferred and other equity) and debt (bank finance, bond finance and other). Third,
stated reasons for new equity issues were classified as takeovers, joint ventures,
investments in other companies, increases of operational capital and other events
including changes in currency, for example, from the Mark to the Reichsmark in
1924.
4 Growth and financing of German firms 4.1 Results
Table 6 reports the balance sheets of the sample of firms by decade from 1890 to
1950. Firm observations have been allocated to the nearest corresponding decade.
There are several striking features of this table. The first is the relative modest
proportion of debt finance. In aggregate approximately two-thirds of assets are
financed from equity and only one-third from debt. Second, within the debt category,
the contribution of bank finance is particularly modest, averaging less than 10 percent
over the period as a whole. The third feature is that the proportion of bank finance has
been falling from over 10 percent at the beginning of the century to less than 5 percent
by the middle of the century. Bond finance has also declined and the difference has
been taken up by other debt. This comprises mainly trade credit, bills of exchange,
guarantees, remuneration outstanding, tax reserve funds and other loans.
The largest source of funding is issued equity. At the beginning of the century
it amounted to more than 50 percent of the balance sheet. At the middle of the century
15
it was still approximately 40 percent. Reserves have been constant at between 15 and
20 percent of capital.16
The question raised by the dominance of equity raises is, for what purpose was
it issued? In the case of the UK, FMR (2004) report that issued equity capital
accounted for a high proportion of the growth of a sample of firms incorporated
around 1900. Very surprisingly, stock markets therefore contributed appreciably to
the growth of both German and UK firms. In the case of the UK, it is surprising
because, as FMR describe this equity issuance occurred in the absence of strong
investor protection. In the case of Germany, it is surprising because Germany is
regarded as the archetypal banking system and bank finance is widely thought to have
contributed appreciably to the growth of German firms. This is not the case. Bank
finance was a minor source of finance for German firms. Instead, stock market issues
were much more significant. However, there is an important difference in the role of
stock markets in the two countries.
To examine the purpose to which the new equity finance was put, we
examined the issue prospectuses of all new issues made by firms over the period for
which we had observations. We were particularly interested in whether the new
equity issues were used for internal investment or acquisition. In the UK, FMR
observed that a high proportion of new equity was issued to fund direct exchanges of
shares in acquisitions. Very little finance from stock markets was used for internal
investment. As Panel B shows, in Germany, less than 10 percent of new issues were
used to finance acquisitions.
This difference is reflected in data on aggregate levels of acquisition activity.
Nelson (1959) reports that in the US at its peak in 1899, the US merger wave involved
the disappearance of 979 firms valued at over $2,000 million and that during the
merger wave between 1896 and 1905 the largest 100 corporations increased their size
by on average a factor of four to control around 40 percent of the nation’s industrial
capital. As Hannah (1974) reports there was a merger wave at the same time in the
UK, though it was more modest in scale and overall resulted in a smaller increase in
concentration. In contrast, Tilly (1982) notes that external growth through mergers
only accounts for about one-fifth of overall growth of German enterprises over the
period 1880 to 1913. He concludes that while the level of merger activity in the US 16 Edwards and Fischer (1994) document a much larger contribution of debt to German company financing in the latter part of the century but their method of estimation is very different from ours.
16
was approximately three times that in the UK over the period 1895 to 1913, the
British level of mergers was appreciably higher than that in Germany.
The striking pattern therefore to emerge to date is of German firms growing
rapidly at the beginning of the 20th century through issues of new equity like their UK
counterparts but with the UK capital market primarily used to finance acquisitions
while the German capital market was not. In the next section we consider the
consequences of this form of growth for the ownership of German corporations in the
first half of the 20th century.
4.2 Representativeness of sample and conditioning bias
Establishing representativeness of our sample is of particular importance since in the
majority of cases firms have to satisfy our selection criterion of having issued equity
to be included in our sample. Conditioning on equity finance could therefore
introduce a selection bias. To confirm whether our results are influenced by any
sample bias we construct a second, completely random sample of 100 firms from all
publicly traded firms in Germany in 1900. We are able to do this by using an
independent data source, the Saling Stock Exchange Yearbook of 1900, which
contains data for all firms listed on any German stock exchange. We restrict the
sampling population to firms with the Berlin Stock Exchange, by far the largest
German stock exchange in 1900, as their primary or secondary listing. After
excluding all German Banks of Issue, banks or industrial firms not incorporated on
German territory of 1900, all German and foreign railroad companies as well as firms
in liquidation and traded firms with worthless shares, the parent distribution contains
759 firms. From this we draw an unstratified random sample of 100 firms and collect
individual balance sheet datafrom the latest complete financial year preceding 1900.
Using the same procedure as before, we classify sources of finance as bank, bond,
other debt, issued equity and reserves and calculate financing ratios as a percentage of
total assets.
The results for this representative sample are reported in Table 7. As Panel A shows,
firm size measured by total assets is positively skewed with a mean (median) of 31.7
(6.4) million Marks. This compares with mean (median) total assets of 50.8 (6.03)
million Marks for firms in our sample with first observations before 1919 and deflated
to 1900 prices. The higher mean for our sample is entirely due to a large mortgage
bank, and removing it from the sample lowers the mean total assets to 18.0 million
17
Marks. A two-sided Kolmogorov-Smirnoff test cannot reject the hypothesis of equal
distributions of total assets for both samples. Our sample of 55 firms therefore has a
very similar size distribution to the total population of publicly traded firms.
Panel B shows the distribution of financing sources as a percentage of total
assets for the representative sample. This confirms our previous resultsthat i) two
thirds of assets are financed from equity, ii) the largest financing source is issued
equity at 52 percent of total assets and iii) within the remaining third of debt
financing, bank finance (13 percent) is not the dominant form of debt. The higher
percentage of bank finance and lower percentage of bond finance is probably due to
the more frequent use of bank debt at the beginning of the 20th century, as previously
noted in our original sample. The representative sample is therefore very similar to
our original sample in respect of capital structure and financing sources. We therefore
conclude that our observations are not subject to sample selection bias.
5 The development of ownership In this section we examine concentration of ownership (Section 5.1), the degree of
ownership and control exercised by insiders (Section 5.2), and the different types of
shareholders (Section 5.3). We then report regressions of changes in ownership in
Section 5.4 and tests of robustness in Section 5.5.
5.1 Concentration of ownership
Table 8 shows means, medians, and the maximum and minimum number of
shareholders for the decades 1890 to 1950, where firm observations have been
allocated to the nearest corresponding decade. The striking feature of Table 8 is how
little change there is in the total number of shareholders. In 1890, the mean number
of shareholders is 21.9, rising to a maximum value of 31.5 in 1900 and then dropping
back to 26.3 in 1940. The median number of shareholders shows even less variation
between 13 and 17. The maximum (which in general refers to Deutsche Bank) is
substantially greater at over 250, demonstrating that the methodology is perfectly
capable of identifying large number of shareholders where they exist. It should be
borne in mind that the averages refer to different cross-sections of firms but
nevertheless the table is a striking contrast to the rapidly rising number of
shareholders reported by FMR (2004) in the UK over the 20th century. These
18
statistics understate the number of ultimate shareholders because bank holdings of
proxy votes are recorded as direct holdings. We show below that, even once
allowance is made for these indirect holdings, levels of concentration remain much
higher in Germany.
We report concentration of ownership measures in Table 9. Panel A shows
C1, C3, and C5 - the combined votes of the largest, the three largest, and the five
largest shareholders – for the decades 1890 to 1950. It also records C3i and C3o, the
combined votes of the three largest inside and outside shareholders respectively,
where inside shareholders are directors, i.e. members of the supervisory or
management board of a firm. Ctrl is defined as the minimum number of shareholders
necessary to cast 25 percent of the votes in a company. Dir are the combined votes
exercised by all directors and Herfindahl is the average Herfindahl index of the firms
in the cross-sections. All reported figures are means calculated for the respective
decade.
The table records that concentration of ownership increased continuously from
1890 to 1940 before falling back in 1950. By 1940, on average one shareholder
exercised over 50 percent of all votes and the five largest shareholders exercised 90
percent of votes. The Herfindahl index increases from 0.18 in 1890 to 0.37 in 1940
before declining to 0.31 in 1950 and the Ctrl variable drops from 1.9 in 1890 to 1 in
1940. In 1900 only a quarter of the firms in our sample had one shareholder
controlling more than 25 percent of all votes. By 1910, this had risen to 75 percent
and by 1932 to 100 percent.
This was associated with accumulation of shares in the hands of outside
shareholders, as shown by C3o rising from 0.17 in 1890 to 0.52 in 1940, before
falling again to 0.21 in 1950. The increase in control of outsiders came at the expense
of insiders: C3i declined from 0.56 in 1890 to 0.33 in 1940 before leaping again to
0.63 in 1950 and the proportion of votes cast by directors fell from 0.70 in 1890 to
0.36 in 1940 before rising to 0.72 in 1950.17
Panel B controls for changes in composition of samples by reporting
concentration measures for fixed panels of firms over two periods, 1900/10 to
1920/30 and 1905/15 to 1925/35. Other time intervals, not reported here, were 17 The 1950s data have to be treated with caution as we have only 6 observations between 1946 and 1952. In addition, the intervention of Allied control in dismembering firms such as Deutsche Bank and IG Farben had a fundamental effect on the ownership and control of German firms in the immediate post-war period.
19
examined but in each case they confirmed the patterns reported in Panel A of
increasing concentration of ownership both in the hands of inside and outside
shareholders.
These results are very different from those observed in the UK (FMR (2004)).
While ownership concentration is steadily decreasing in the UK over the period 1890
to 1950, it is not in Germany. Figure 1a plots the different movements in
concentration measures in Germany and the UK and Figure 1b contrasts both of these
with Deutsche Bank, a widely held German company almost from incorporation.
5.2 Insider ownership and voting
In this section we look at the relation between share ownership and board
representation. While several studies have noted the importance of director
ownership in pre-war Germany, as far as we are aware it has not previously been
measured. We also distinguish between votes cast by directors as owners from those
cast on behalf of others as proxies.18
Table 10 reports ownership and voting percentages for management board
members, supervisory board members and all directors combined. The results of
Table 10 can be summarized as follows:
1. Voting by managers, members of the Vorstand, has been modest throughout,
though there is some evidence of an increase over the period. Managers rarely
cast proxy votes.
2. In 1890, supervisory board members cast more than 50 percent of votes
through their own shareholdings. This then steadily declined until 1940.
Supervisory board members also cast proxy votes on a small scale.
3. The combined votes exercised by directors decline from over 60 percent at the
beginning of the 20th century to less than 40 percent in 1940.
It is interesting to interpret these observations in the context of the separation of
ownership and control that Berle and Means (1932) document in the US in the first
half of the twentieth century. On the one hand, one can argue that the low ownership
18 While board membership can be readily identified and crosschecked from annual reports, prospectuses, and reports of the General Meetings, distinguishing between proxy and own voting is less precise. As a result, own voting may be overstated and proxy voting understated but the discrepancies are probably small.
20
by Vorstand members is indicative of a similar process in Germany.19 On the other
hand, unlike in the US, the disengagement of ownership by managers was a feature of
German corporations from their inception in the 19th century rather than a gradual
development during the 20th century.
Secondly, while Vorstand ownership is small, Aufsichtsrat is not, even though it
was declining during the century. If one equates Aufsichtsrat members with the non-
executives of Anglo-American corporations, one can therefore argue that non-
executive share ownership was large even though executive ownership was not.
Finally, in almost every decade we observe i) some companies controlled by owner-
managers, ii) companies controlled by owners who are supervisory board members,
and iii) companies controlled by proxy votes exercised by supervisory board members
(as can be seen from the maximum values reported in the table). Separation of
ownership and control did not therefore occur to the same extent or in the same way
in Germany as in the US.
Table 11 reports voting by directors at the dates at which new issues occur
(event time) and by calendar year. Panel A reports the average combined votes cast
by directors in relation to new issue proposals. t0 is the first recorded new issue by a
company, t1 the second etc. We have 13 firms for which at least 4 events are
reported, 25 firms with at least 3 events, and 45 firms with at least 2 events. Panel B
refers to panels of firms with events during the periods 1900 to 1910 and 1920 to
1930 and Panel C to panels of firms with events during the periods 1905 to 1915 and
1925 to 1935. The results from Table 11 tell a story consistent with that of Table 10
of substantial but declining voting by supervisory board members, low levels and
slightly rising managerial voting but overall falling director voting.
5.3 Shareholder types and the role of banks
Our data set allows us to identify the type as well as overall levels of concentration of
ownership. We classify shareholders as i) other German companies, ii) insurance
companies, iii) institutional investors, iv) founding families, v) banks, vi) the German
state or other authorities, vii) foreign companies, or viii) individuals or unknown
investors. Table 12 records ownership composition. Panel A shows results for the
19 Even these figures are arguably overstated, as managers of some firms were committed to hold shares by their articles of association.
21
complete sample by decade and Panel B the panels of firms with observations in the
two ten year periods described above.
The table reveals a pronounced move of voting away from individuals to
companies and banks. Votes cast by individuals declined from an average of 72.1
percent in 1890 to 11.1 percent in 1940. Even over the twenty year periods in the firm
panels in Panel B there were dramatic declines from 61.3 to 47.8 percent and 65.1 to
16.1 percent. Over the period 1890 to 1940 bank holdings increased from 13.3
percent to 41.8 percent. In the panels it increases from 14.6 percent to 21.0 percent
and 17.6 percent to 32.4 percent. The increase in bank voting may not reflect their
own shareholdings but proxy voting on behalf of individual investors. We pursue this
further below.
Other company holdings decline initially from 14.5 percent to 8.8 percent
between 1890 and 1920 but then increase rapidly to 33.4 percent in 1940. In the
panels they rise from 9.5 percent to 13.2 percent and 17.3 percent to 29.6 percent.
The median holdings show pronounced movements in similar directions to the means
for the three categories of shareholders in Panel A. Founding family holdings are
more modest and fluctuate considerably.20 They are examined in more detail below.
Other investor groups have small or zero holdings.
5.4 Time trend regressions
In this section we report the results of regressions of ownership concentration and
composition on time trends of Table 13. All regressions include a time trend and firm
dummies, which in addition to capturing firm-specific effects filter out all firms for
which we have only one observation.
As reported above, there is evidence of increasing overall concentration of
ownership. C3 and C5 both have significantly positive time trends and the number of
shareholders required to control 25 percent of votes (Ctrl) has a significantly negative
time trend.21 Insider ownership is declining – the time trends on C3i and directors’
holdings are significantly negative. The decline in insider control is attributable to a
20 Family ownership may be understated for two reasons. First, we are unable to track all kinship or name changes across generations when, for example, the daughter of a founder marries. Second, before 1937 disclosure of proxy voting was voluntary and some family voting may therefore have occurred by undisclosed proxy. 21 The total number of shareholders is significantly increasing but this is entirely due to Deutsche Bank, whose ownership pattern as shown in Figure 1 is quite different from that of other firms. When Deutsche Bank is excluded the time trend becomes negative and insignificantly different from zero.
22
negative time trend on voting by supervisory board members. The time trend on
management board voting is positive but insignificant. The overall increase in
concentration is associated with a significant positive time trend on outsiders, C3o.
We performed several tests of robustness of the results. First, we examined
whether there were structural breaks in the time trends by splitting them at various
points, including the middle of the sample in 1920. We did not find evidence of
significant changes. Second, we use the fractional response variable technique
described by Papke and Wooldridge (1996) to take account of the fact that the
variables C1, C3, C3i, C3o, C5, Herfindahl, Dir, MBoard and DBoard are bounded
between 0 and 1. The quasi-likelihood estimation suggested by Papke and Wooldridge
has the advantage over the more common logistic transformation that it still holds if
the dependent variable takes the value 0 or 1 with positive probability, as happens in
our sample. The results are qualitatively similar to the OLS estimates.22 In summary,
the time trend regressions confirm the previous results. There is increasing
concentration of ownership in the hands of large shareholders, with outsider block
holders replacing insiders. The decrease in insider control is attributable to declining
votes of members of the supervisory board.
5.5 Proxy votes, general meeting attendance and family ownership
In this section we examine proxy voting and family ownership in detail. We have
detailed information for a sub-sample of firms on whether votes cast by companies,
banks, and other shareholder types, are in respect of their own shares or are proxy
votes on behalf of other investors’ shares. This allows us to relate voting to
ownership. To date, we have treated votes cast by banks as single blocks, irrespective
of whether they are in respect of their own shares or those of other shareholders. This
clearly overstates the degree of concentration of control if individual shareholders
determine the way in which their proxies are cast. To establish the significance of
this, we construct another set of measures of concentration making the opposite
extreme assumption that all proxy votes are dispersed amongst small shareholders.
We describe this procedure below.
22 We also perform OLS regressions using Newey-West standard errors robust to heteroskedasticity and serial correlation. As expected, standard errors increase, rendering the parameter estimates for the total number of shareholders and Ctrl insignificant, where previously they were only marginally significant. Otherwise our results are unchanged.
23
The breakdown of proxy votes by shareholder type is reported in Table 14.
Thirteen observations in our sample were subject to the 1937 Revision of the Stock
Corporation Act and report proxy and non-proxy votes separately. Panel A reports
the different shareholder types as a percentage of all votes. We report bank, other
German company, founding family, and individual or unknown type shareholders. To
illustrate, proxy votes exercised by banks on average account for 39 percent of all
votes and all exercised proxy votes on average account for 47 percent of all votes.
Companies and founding family members do not exercise statistically significant
percentages of proxy votes, while individuals exercise four percent of all votes as
proxy votes. The data show that only banks hold a substantial number of proxy votes.
Panel B reports proxy votes as a percentage of all votes exercised by the
different shareholder types. On average 89.5 percent of banks’ votes are proxies (the
median being 99.5 percent). Proxies account for 12.9 percent of company shares,
41.8 percent of founding families’ shares and 40.5 percent of individuals’ shares. The
high values for founding families and individuals are consistent with the low figures
in Panel A because, as Table 12 records, families and individuals hold a small
proportion of shares in the post 1937 period to which Table 14 refers.23 Banks are
therefore the only shareholder class that casts large numbers of proxy votes and
almost all banks votes derive from proxy votes rather than their own shares. The data
therefore suggest that the large increase in votes cast by banks over our sample period
is entirely due to proxy votes, not increases in own shareholdings by banks.
Next, we turn to the possible overstatement of concentration of ownership that
this dominance of proxy voting by banks might imply. If proxies are actually
exercised by dispersed shareholders then treating all bank votes as cast by single
shareholders clearly overstates concentration of ownership. We address this issue by
taking the opposite extreme and assuming that all bank proxies are widely dispersed.
Since on average 90 percent of bank votes are proxies, we reduce banks’ holdings to
10 percent of their measured value and regard the remaining 90 percent as being
dispersed. This adjustment only affects the numerator of the C3 and C5 calculations,
the total number of shares in the denominator remaining unchanged.
The results are shown in Figure 2, where we contrast the adjusted C3 and C5
measures with the C3 and C5 measures from FMR (2004). The picture does change 23 The figures in Panel A of Table 13 are essentially those in Panel B times the figures for the appropriate shareholding category over the relevant (post 1937) periods in Table 11
24
in so far as we now do not observe increasing but constant concentration of ownership
for Germany. Still, the contrast with continually increasing dispersion of ownership
in the UK remains.
We take this adjustment of our data one step further by addressing the concern
of low general meeting attendance. To our knowledge no previous information exists
on what percentage of total voting or cash flow rights attended general meetings
before the 1960s in Germany, or for that matter in any other country. If only a small
percentage of capital was present at shareholder meetings and non-attending shares
were widely dispersed, our result of increasing or constant ownership concentration
for German firms would be misleading. However, that objection does not apply.
Using actual attendance data from a large number of shareholder meetings in our
sample we show that i) shareholder attendance at meetings is on average two thirds or
more of cash flow and voting rights between 1890 and 1950, ii) assuming completely
dispersed ownership of non-attending shares does not change our previous results of
constant or increasing ownership concentration during this time period and iii)
assuming completely dispersed ownership of non-attending shares and completely
dispersed ownership of 90 percent of bank votes again does not change the results of
constant or increasing ownership concentration.
Table 15 reports general meeting attendance levels for 72 firm year
observations for which both attendance data from shareholder registers and complete
data on share capital decomposition before and after the general meeting is available.
Panel A shows that between 1890 and 1950 general meeting attendance is high with a
median of 71 percent of all votes attending. Taking into account that our sample
period includes both World Wars we observe remarkably high attendance levels. As
Panel A further shows, differences between attending cash flow and voting rights due
to multiple voting shares are small. For these observations capital (votes) attending is
calculated as the sum of capital (votes) registered for the general meeting over total
capital (votes) outstanding, adjusted for capital changes due to the respective general
meeting. In Panel B, non-attending votes are assumed to be completely cast by
dispersed shareholders. In Panel C, C1, C3 and C5 are adjusted as follows: non-
attending votes are assumed to be completely dispersed and the number of votes
exercised by banks is reduced to 10 percent of their reported number to account for
proxy voting, while the total number of shares in the denominator of C3 and C5
remains unchanged.
25
Finally, we provide a more detailed analysis of family firms. Table 12
reported low average levels of ownership by founding families. But this picture may
be distorted by the large number of cases in which ownership does not remain in the
hands of founding families, or those where we fail to identify a founding family
because of a name change. In Table 16 we isolate family firms where a family firm is
defined as one where there is at least one observation with a founding family
shareholder. This applies to 13 of the 55 firms in our sample. Of these firms, we use
ten that have two or more available observations. We calculate ownership measures
for these firms in event-time where, as described in Table 11, an event is the issuing
of a prospectus. Of the ten firms, seven have at least three and three firms at least
four observations.
The first feature that Table 16 brings out is that founding family ownership is
rather modest. The very fact that we were able to identify only 13 firms out of a total
of 55 with founding families at any of the event dates and furthermore only 10 of
these with more than one observation suggests that the common perception of
corporate Germany being dominated by families is not accurate. Secondly, the
concentration of ownership of those firms that have a family owner is high. C3
measures are around 80 percent in Table 16 during the first event as against initial
levels of concentration of ownership of between 60 and 70 percent in Table 9.
Thirdly, while overall concentration of ownership is increasing in the total sample, it
is decreasing in family firms. Outside ownership concentration is increasing as it
does in the full sample but not sufficiently to offset the declining inside ownership
concentration. The figures below show that this is due to the rapidly declining
concentration of family ownership. Bank and other company ownership
concentration levels are increasing as they do in other firms but again not sufficiently
fast to maintain overall levels of ownership concentration. As FMR report in the UK,
family firms are therefore losing their ownership. In the case of Germany however,
this is associated with a transfer of much of their ownership to banks and companies
so that while their overall ownership concentration is decreasing, it is not doing so
nearly as rapidly as it does in the UK. This is quite similar to the process that
Goergen (1999) reports in recent IPOs in Germany where shares are in large part
transferred as blocks to other large investors while modest dispersion of ownership on
stock markets occurs.
26
The declining role of families is reflected in board representation. The bottom
section of Table 16 shows that in contrast to other firms, there is large ownership by
members of the management board. Approximately 40 percent shares are voted by
members of the management board as against 10 percent or less in Panel A of Table
10. There are therefore a large number of owner-managers in family firms. This is
reinforced by the time patterns in Table 16: while there is declining overall director
ownership, as in the total sample, in the case of family firms this is attributable to
falling ownership of members of the management rather than the supervisory board.
As family ownership declines so too does management ownership, while supervisory
ownership remains quite stable. However, this raises an interesting question as to
whether our family ownership measures are understated. Suppose because of name
changes, it is not possible to trace back ownership to the original founding families.
New family ownership may have come in or name changes may have occurred while
links to the original founders were retained. In either case we are understating family
ownership. An alternative measure of family ownership is stakes held by members of
the supervisory board that do not have an identifiable affiliation with another
company or bank. Passow (1922) notes that supervisory board members are most
often family members, bank representatives or other company representatives. Much
less frequently they are representatives of a group of minority shareholders, technical
experts, decorative individuals or workers’ representatives and these groups are never
major shareholders. On this basis, family ownership shows a more consistent pattern
than in Table 12. Using this supervisory board adjustment, we obtain mean (median)
family ownership of 27 (11) percent during the sample period, as compared with 10
(0) percent in Table 12. Mean (median) adjusted family ownership steadily declines
over the sample period from 43 (43) percent in 1890 to 20 (10) percent in 1930. This
is probably an upper bound on founding family ownership.
Another possible qualification arises from the interrelation between family
ownership and equity issuance. Family ownership in our sample may be understated
because families are unwilling to suffer the control dilution consequences of equity
issuance. As a result they rely more on bond and bank finance than equity issuance.
One test of this is to determine whether there is a relation between the frequency of
equity issuance and family ownership. We find that the 13 firms identified as family
firms have on average exactly as many observations available (2.85) as non-family
firms (2.83). On the other hand, if we calculate nominal and real annual growth rates
27
of total assets as in Panel C of Table 5 (using only observations prior to 1919 to avoid
bias from hyperinflation) we observe real (nominal) growth rates for non-family firms
of 10.9 (14.7) percent as opposed to 2.2 (4.3) percent for family firms. Since we only
have data available on three family firms in this analysis, the result can only provide
an indication that family firms grow slower and issue less equity than non-family
firms.
In summary, this section reports that proxy votes account for a very high
proportion of banks overall votes and that proxy voting by banks accounts for a high
proportion of total voting in the first half of the 20th century. Nevertheless, even once
account is taken of the potential dispersion of the holders of proxies, estimated
concentration of voting remains high in Germany.
In contrast, ownership by founding families is not widespread. Where it does
occur then it is associated with high and quite stable levels of concentration of
ownership. Family ownership is rapidly diluted but not dispersed as in the UK.
Instead, it is transferred in blocks to companies and other investors.
6 Conclusions
This paper has examined the ownership and financing of German companies using a
unique data set on voting at shareholder meetings. It reports results that are quite at
variance, not only with those reported in other countries, most notably in the UK, but
also with conventional views of Germany.
The firms in our sample were growing rapidly at the end of the 19th and the
beginning of the 20th centuries. They were raising large amounts of finance externally
to fund this growth. This did not, as perhaps might be expected of a supposedly bank-
oriented system, come in the form of debt from banks. Instead, it was in large part
raised as equity. In that respect, Germany looks quite similar to the UK at the
beginning of the 20th century. Where it differs however is in the purpose to which the
equity was put. While in the UK, it in large part went to fund growth through
acquisition, in Germany it was devoted principally to internal investment and to
acquiring partial stakes in other firms.
In the UK, the issuance of equity for acquisition caused a rapid decline in
concentration of ownership. In Germany, ownership of concentration remained high
and according to some measures actually increased. Insider ownership declined and
was replaced by outsider ownership. In some respects, the separation of ownership
28
and control documented for the UK and US was therefore also a feature of early
German corporate history. But there are two important differences. Firstly, most
insider ownership was associated with members of the supervisory rather than the
management board and the decline in insider ownership was at the expense of
supervisory rather than management board members. Secondly, the decline in insider
ownership was offset by an increase in outsider ownership concentration. This was
associated with increasing ownership in the hands of banks and other companies, the
latter especially so from the 1930s onwards. The holdings of banks were not however
in general their own. For the most part, banks were casting votes on behalf of other
investors. As insider control declined it was replaced by control by other companies
and by banks casting proxy rather than their own shareholding votes.
Founding family ownership was not widespread and ownership by founding
families declined rapidly. It too was replaced by other company and bank ownership.
In marked contrast to the UK, declining family ownership was therefore associated
with only modest declines in overall concentration in German companies.
What then was going on? The overall picture that emerges is of firms issuing
equity to fund their growth to other companies and individual investors. They were
not growing through full acquisitions but through companies taking partial stakes in
each other and individuals holding shares via banks. Equity finance was therefore
intermediated by companies and banks. In contrast, in Britain, there was little
intermediation by financial institutions until the second half of the twentieth century
and then it came from pension funds and life assurance companies rather than credit
institutions. There has never been significant intermediation by inter-corporate
pyramids in Britain.
In essence, this paper documents the creation of the “insider system” of
ownership that Franks and Mayer (1995) and (2001) describe in modern-day
corporate Germany. This is characterized by inter-corporate holdings in the form of
pyramids and complex webs of shareholdings, extensive bank proxy voting and
family ownership. What distinguished its emergence from the dispersed ownership of
the UK were two things: firstly, the partial rather than full acquisition of shares by one
company in another thereby creating corporate pyramids and inter-corporate holdings
and, secondly, the intermediation of equity shareholdings by banks. It is therefore
insider not in the sense of ownership by directors but in terms of voting control
29
remaining within the corporate and banking sector rather than being transferred to
outside individual shareholders as in the UK and US.
Can regulation explain these developments? At one level, the clear answer to
emerge from this paper is no. Investor protection was equally weak in Germany and
the UK in the first three decades of the century when most of the developments
documented in this paper occurred. But that response is probably more a reflection of
the inadequacies of existing measures of investor protection than of the irrelevance of
law and regulation. By the beginning of the twentieth century Germany had enacted a
corporate code that provided more extensive corporate governance than existed in
virtually any other country at the time. This may have been critical to the rapid
development of the German stock market at the end of the 19th and the beginning of
the 20th century.
Furthermore, the Exchange Act of 1896 reinforced the control of the banks
over German securities markets. Companies became dependent on banks for access
to securities markets in the way in which firms in Britain were dependent on local
investors for sources of equity. And since banks acted as custodians of minority
investor shares, they could also in principle encourage firms to uphold minority
shareholder as well as their own interests. Whether they did or whether their dual role
as investors and custodians was a source of conflict is a critical issue.
The fact that companies were able to raise so much external equity finance
suggests that the system worked reasonably well. But the acquisition of partial share
stakes in firms rather than full bids points to a potential problem. FMR note that
despite the fact that there was no regulation requiring it in the first half of the 20th
century, directors of British companies nevertheless ensured that all shareholders of
target firms received the same price for their shares. Franks and Mayer (2001) note
that even recently this was not the case in Germany. Minority shareholders typically
received little or no premium in takeovers at the same time as large shareholders
received on average a premium of around 10%. Franks and Mayer (1998) further
document cases of where banks own and their custodian shareholder interests were in
conflict and contributed to low returns to minority investors in takeovers. Dispersed
but geographically concentrated shareholders in Britain may therefore have been
better able to protect their interests than shareholders represented by banks in
Germany.
30
References
Aron, A. (1927): Die Kapitalveränderungen deutscher Aktiengesellschaften nach dem Kriege. Industrieverlag Spaeth & Linde, Berlin. Berle, A. A., and G. C. Means (1932): The Modern Corporation and Private Property. Macmillan, New York (NY). Davis, L. E., and R. A. Huttenback (1986): Mammon and the Pursuit of Empire: The Economics of British Imperialism. Cambridge University Press, Cambridge. Edelstein, M. (1982): Overseas Investment in the Age of High Imperialism: The United Kingdom, 1850-1914. Methuen, London. Edwards, J. and K. Fischer (1994): Banks, Finance and Investment in Germany. Cambridge University Press, Cambridge. Edwards, J., and S. Ogilvie (1996): “Universal Banks and German Industrialization: A Reappraisal,” Economic History Review, 49, 427–446. Emery, H. (1898): “The results of the German Exchange Act of 1896”, Political Science Quarterly, 13, 286-320.
Fohlin, C. (1998), “Relationship Banking, Liquidity and Investment in the German Industrialization, Journal of Finance, 53, 1737-1758.
Fohlin, C. (2005): “The History of Corporate Ownership and Control in Germany,” in The History of Corporate Governance Around the World: Family Business Groups to Professional Managers, ed. by R. K. Morck, forthcoming. University of Chicago Press, Chicago, IL. Franks, J. and C. Mayer (1995): "Ownership and Control" in H. Siebert (ed) Trends in Business Organization: Do Participation and Cooperation Increase Competitiveness? Mohr: Tubingen. Franks, J. and C. Mayer, (1998): "Bank Control, Takeovers and Corporate Governance in Germany", Journal of Banking & Finance, 22, 1385-1403, Franks, J. and C. Mayer (2001): “The Ownership and Control of German Corporations”, Review of Financial Studies, 14, 943-977., Franks, J., C. Mayer, and S. Rossi (2004): “Ownership: Evolution and Regulation,” Working Paper 2003-FE-14, Oxford Financial Research Centre. Franks, J., C. Mayer, and S. Rossi (2005): “Spending Less Time with the Family: The Decline of Family Ownership in the UK,” in The History of Corporate Governance Around the World: Family Business Groups to Professional Managers, ed. by R. K. Morck, forthcoming. University of Chicago Press, Chicago, IL.
31
Gall, L., G. D. Feldman, H. James, C.-L. Holtfrerich, and H. E. Büschgen (1995): The Deutsche Bank 1870-1995. Weidenfeld & Nicolson, London. Goergen, M. (1999): Corporate Governance and Financial Performance: A Study of German and UK Initial Public Offerings, Edward Elgar. Gömmel, R. (1992): “Entstehung und Entwicklung der Effektenbörse im 19. Jahrhundert bis 1914,” in Deutsche Börsengeschichte, ed. by H. Pohl, pp. 135–207. Verlag Fritz Knapp, Frankfurt/Main. Gömmel, R., and J. Schneider (1991): Währungen der Welt I, Europäische und Nordamerikanische Devisenkurse 1777-1914. Franz Steiner, Stuttgart. Hannah, L. (1974), “Mergers in British Manufacturing Industry, 1880-1918,“ Oxford Economic Papers, 26, 1-20. Jeidels, O. (1905): Das Verhältnis der Deutschen Großbanken zur Industrie. Duncker & Humblot, Leipzig. Kindleberger, C. P. (1989): Manias, Panics and Crashes: A History of Financial Crises. Macmillan, Basingstoke, 2nd edn. Kropff, B., and J. Semler (2000): Münchener Kommentar zum Aktiengesetz. Beck, Munich, 2nd edn. Lavington, F. (1921): The English Capital Market. Methuen, London. La Porta, R., F. Lopez-de Silanes, A. Shleifer, and R. W. Vishny (1998): “Law and Finance,” Journal of Political Economy, 101, 678–709. La Porta, R., F. Lopez-de Silanes, and A. Shleifer (2004): “What Works in Securities Laws?,” National Bureau of Economic Research Working Paper 9882. Mitchell, B. R. (1992): International Historical Statistics: Europe: 1750-1988. Macmillan, Basingstoke, 3rd edn. Morgan, E. V., and W. A. Thomas (1969): The Stock Exchange: Its History and Functions. Elek Books, London, 2nd edn. Nelson, R. (1959): Merger Movements in American Industry 1895-1956. Princeton University Press, Princeton. Newey, W., and K. West (1987): “A Simple Positive Semi-Definite, Heteroskedas-ticity and Autocorrelation Consistent Covariance Matrix,” Econometrica, 55, 703–708. Papke, L. E., and J. M. Wooldridge (1996): “Econometric Methods for Fractional Response Variables With an Application to 401 (K) Plan Participation Rates,” Journal of Applied Econometrics, 11, 619–632.
32
Passow, R. (1909): “Die Entstehung Des Aufsichtsrats der Aktiengesellschaft,” Zeitschrift fuer das gesamte Handelsrecht und Konkursrecht, 64, 27–57. Passow, R. (1922): Die Aktiengesellschaft: Eine Wirtschaftswissenschaftliche Studie. Fischer, Jena, 2nd edn. Petersen, J. (1890): Gesetz betreffend die Kommanditgesellschaften auf Aktien und die Aktiengesellschaften (18.7.1884). Roßberg, Leipzig. Rettig, R. (1978): “Das Investitions- und Finanzierungsverhalten deutscher Großunternehmen, 1880-1911,” Ph.D. thesis, University of Münster. Ripley, P. (1934): A Short History of Investment. Sir Isaac Pitman & Sons, London. Siegrist, H. (1980): “Deutsche Großunternehmen vom späten 19. Jahrhundert bis zur Weimarer Republik. Integration, Diversifikation und Organisation bei den hundert größten deutschen Industrieunternehmen (1887-1927) in international vergleichender Perspektive,” Geschichte und Gesellschaft, 6, 60–102. Spindelmann, H. (1938): “Das Führerprinzip im Aktienrecht und seine Auswirkungen auf die Rechtsstellung des Aktionärs,” Ph.D. thesis, University of Münster. Tilly, R. (1982): “Mergers, External Growth, and Finance in the Development of Large-Scale Enterprise in Germany, 1880-1913,” Journal of Economic History, 42, 629–658. Wellhöner, V. (1989): Großbanken und Großindustrie im Kaiserreich. Vandenhoeck & Ruprecht, Göttingen.
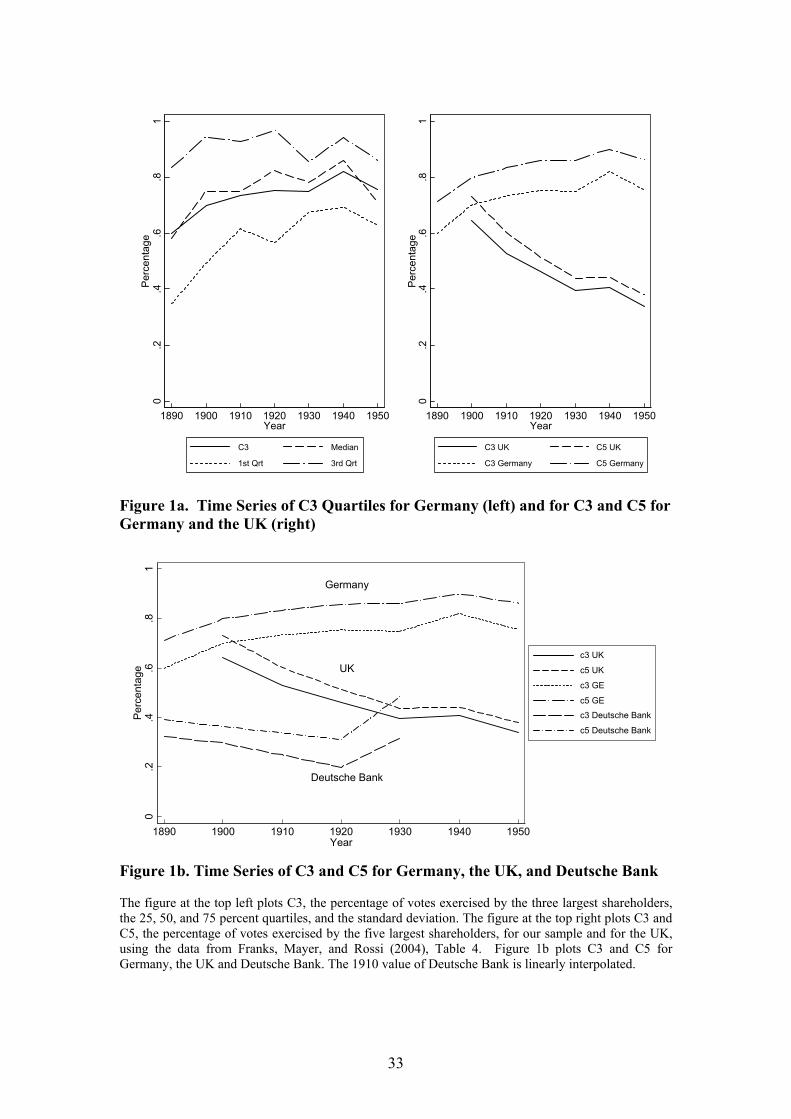
33
0.2
.4.6
.81
Per
cent
age
1890 1900 1910 1920 1930 1940 1950Year
C3 Median
1st Qrt 3rd Qrt
0.2
.4.6
.81
Per
cent
age
1890 1900 1910 1920 1930 1940 1950Year
C3 UK C5 UK
C3 Germany C5 Germany
Figure 1a. Time Series of C3 Quartiles for Germany (left) and for C3 and C5 for Germany and the UK (right)
0.2
.4.6
.81
Perc
enta
ge
1890 1900 1910 1920 1930 1940 1950Year
c3 UK
c5 UK
c3 GE
c5 GE
c3 Deutsche Bank
c5 Deutsche Bank
Figure 1b. Time Series of C3 and C5 for Germany, the UK, and Deutsche Bank The figure at the top left plots C3, the percentage of votes exercised by the three largest shareholders, the 25, 50, and 75 percent quartiles, and the standard deviation. The figure at the top right plots C3 and C5, the percentage of votes exercised by the five largest shareholders, for our sample and for the UK, using the data from Franks, Mayer, and Rossi (2004), Table 4. Figure 1b plots C3 and C5 for Germany, the UK and Deutsche Bank. The 1910 value of Deutsche Bank is linearly interpolated.
UK
Germany
Deutsche Bank
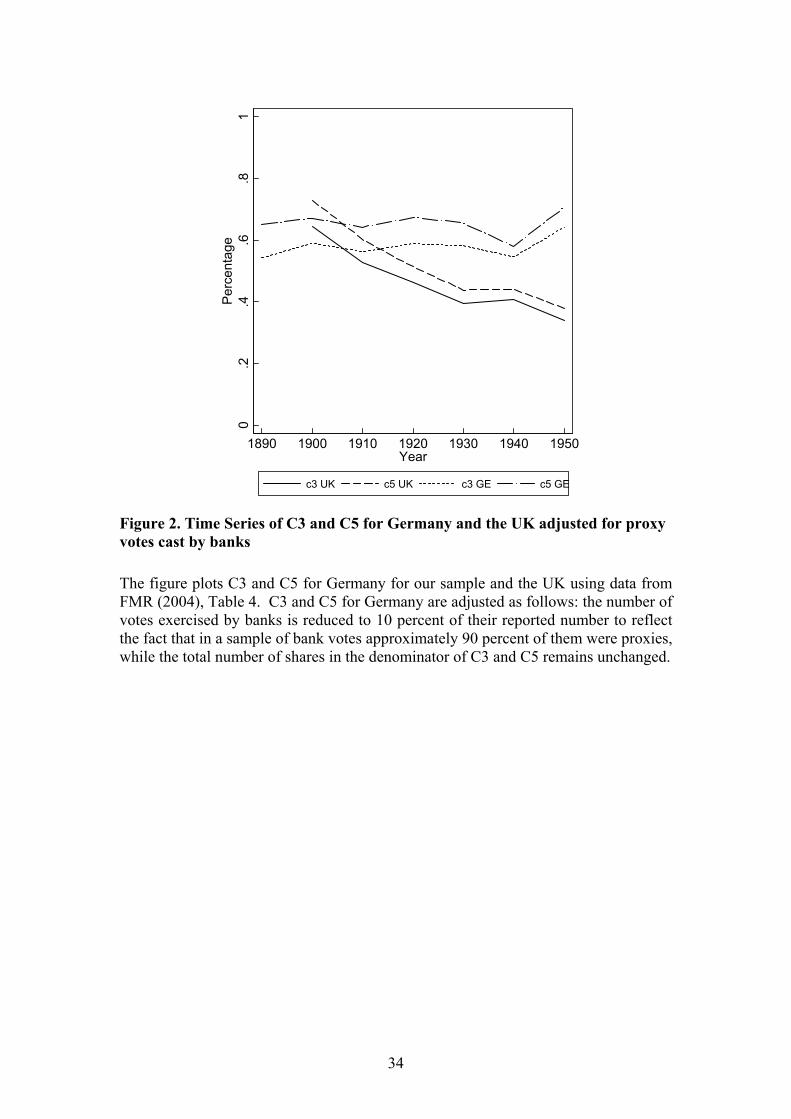
34
0.2
.4.6
.81
Per
cent
age
1890 1900 1910 1920 1930 1940 1950Year
c3 UK c5 UK c3 GE c5 GE
Figure 2. Time Series of C3 and C5 for Germany and the UK adjusted for proxy votes cast by banks
The figure plots C3 and C5 for Germany for our sample and the UK using data from FMR (2004), Table 4. C3 and C5 for Germany are adjusted as follows: the number of votes exercised by banks is reduced to 10 percent of their reported number to reflect the fact that in a sample of bank votes approximately 90 percent of them were proxies, while the total number of shares in the denominator of C3 and C5 remains unchanged.
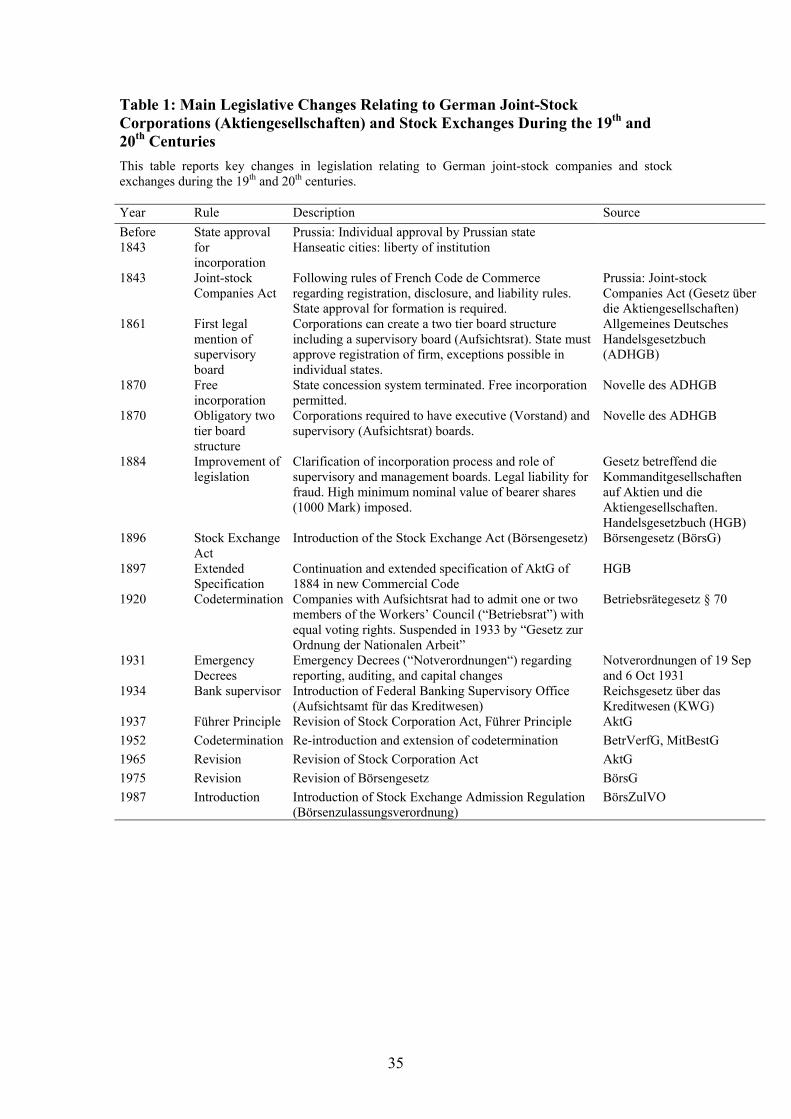
35
Table 1: Main Legislative Changes Relating to German Joint-Stock Corporations (Aktiengesellschaften) and Stock Exchanges During the 19th and 20th Centuries This table reports key changes in legislation relating to German joint-stock companies and stock exchanges during the 19th and 20th centuries. Year Rule Description Source Before 1843
State approval for incorporation
Prussia: Individual approval by Prussian state Hanseatic cities: liberty of institution
1843 Joint-stock Companies Act
Following rules of French Code de Commerce regarding registration, disclosure, and liability rules. State approval for formation is required.
Prussia: Joint-stock Companies Act (Gesetz über die Aktiengesellschaften)
1861 First legal mention of supervisory board
Corporations can create a two tier board structure including a supervisory board (Aufsichtsrat). State must approve registration of firm, exceptions possible in individual states.
Allgemeines Deutsches Handelsgesetzbuch (ADHGB)
1870 Free incorporation
State concession system terminated. Free incorporation permitted.
Novelle des ADHGB
1870 Obligatory two tier board structure
Corporations required to have executive (Vorstand) and supervisory (Aufsichtsrat) boards.
Novelle des ADHGB
1884 Improvement of legislation
Clarification of incorporation process and role of supervisory and management boards. Legal liability for fraud. High minimum nominal value of bearer shares (1000 Mark) imposed.
Gesetz betreffend die Kommanditgesellschaften auf Aktien und die Aktiengesellschaften. Handelsgesetzbuch (HGB)
1896 Stock Exchange Act
Introduction of the Stock Exchange Act (Börsengesetz) Börsengesetz (BörsG)
1897 Extended Specification
Continuation and extended specification of AktG of 1884 in new Commercial Code
HGB
1920 Codetermination Companies with Aufsichtsrat had to admit one or two members of the Workers’ Council (“Betriebsrat”) with equal voting rights. Suspended in 1933 by “Gesetz zur Ordnung der Nationalen Arbeit”
Betriebsrätegesetz § 70
1931 Emergency Decrees
Emergency Decrees (“Notverordnungen“) regarding reporting, auditing, and capital changes
Notverordnungen of 19 Sep and 6 Oct 1931
1934 Bank supervisor Introduction of Federal Banking Supervisory Office (Aufsichtsamt für das Kreditwesen)
Reichsgesetz über das Kreditwesen (KWG)
1937 Führer Principle Revision of Stock Corporation Act, Führer Principle AktG 1952 Codetermination Re-introduction and extension of codetermination BetrVerfG, MitBestG 1965 Revision Revision of Stock Corporation Act AktG 1975 Revision Revision of Börsengesetz BörsG 1987 Introduction Introduction of Stock Exchange Admission Regulation
(Börsenzulassungsverordnung) BörsZulVO
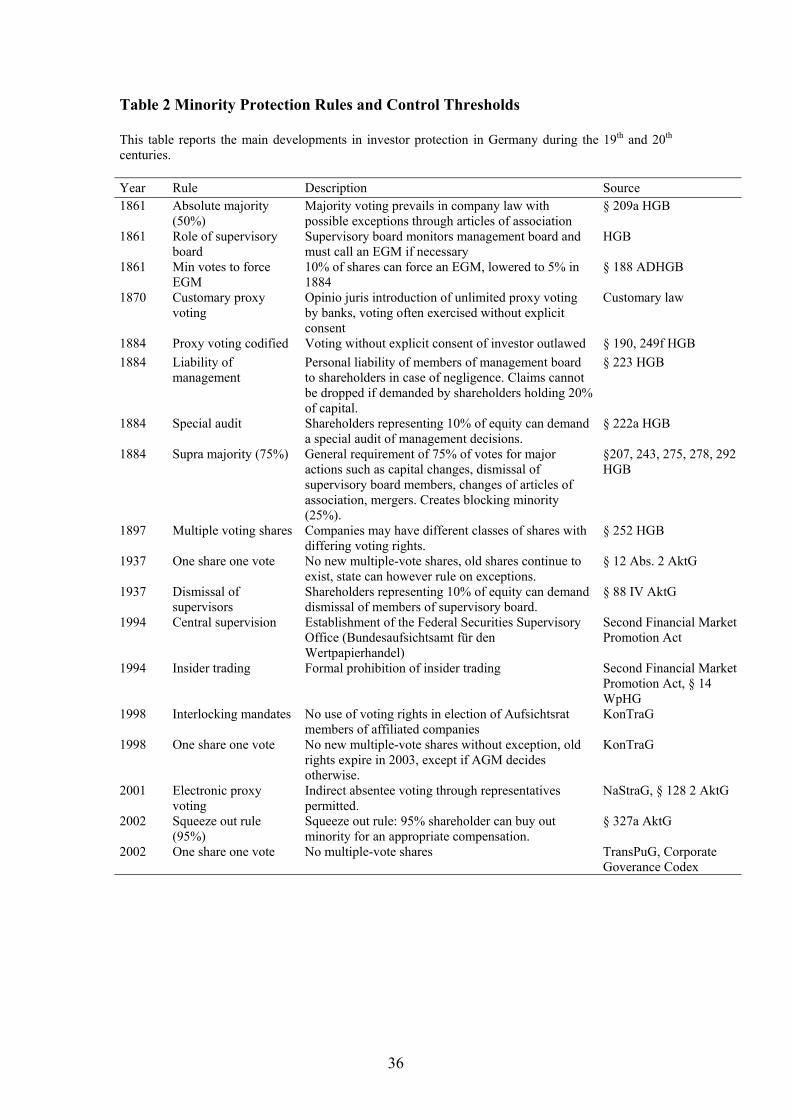
36
Table 2 Minority Protection Rules and Control Thresholds This table reports the main developments in investor protection in Germany during the 19th and 20th centuries. Year Rule Description Source 1861 Absolute majority
(50%) Majority voting prevails in company law with possible exceptions through articles of association
§ 209a HGB
1861 Role of supervisory board
Supervisory board monitors management board and must call an EGM if necessary
HGB
1861 Min votes to force EGM
10% of shares can force an EGM, lowered to 5% in 1884
§ 188 ADHGB
1870 Customary proxy voting
Opinio juris introduction of unlimited proxy voting by banks, voting often exercised without explicit consent
Customary law
1884 Proxy voting codified Voting without explicit consent of investor outlawed § 190, 249f HGB 1884 Liability of
management Personal liability of members of management board to shareholders in case of negligence. Claims cannot be dropped if demanded by shareholders holding 20% of capital.
§ 223 HGB
1884 Special audit Shareholders representing 10% of equity can demand a special audit of management decisions.
§ 222a HGB
1884 Supra majority (75%) General requirement of 75% of votes for major actions such as capital changes, dismissal of supervisory board members, changes of articles of association, mergers. Creates blocking minority (25%).
§207, 243, 275, 278, 292 HGB
1897 Multiple voting shares Companies may have different classes of shares with differing voting rights.
§ 252 HGB
1937 One share one vote No new multiple-vote shares, old shares continue to exist, state can however rule on exceptions.
§ 12 Abs. 2 AktG
1937 Dismissal of supervisors
Shareholders representing 10% of equity can demand dismissal of members of supervisory board.
§ 88 IV AktG
1994 Central supervision Establishment of the Federal Securities Supervisory Office (Bundesaufsichtsamt für den Wertpapierhandel)
Second Financial Market Promotion Act
1994 Insider trading Formal prohibition of insider trading Second Financial Market Promotion Act, § 14 WpHG
1998 Interlocking mandates No use of voting rights in election of Aufsichtsrat members of affiliated companies
KonTraG
1998 One share one vote No new multiple-vote shares without exception, old rights expire in 2003, except if AGM decides otherwise.
KonTraG
2001 Electronic proxy voting
Indirect absentee voting through representatives permitted.
NaStraG, § 128 2 AktG
2002 Squeeze out rule (95%)
Squeeze out rule: 95% shareholder can buy out minority for an appropriate compensation.
§ 327a AktG
2002 One share one vote No multiple-vote shares TransPuG, Corporate Goverance Codex
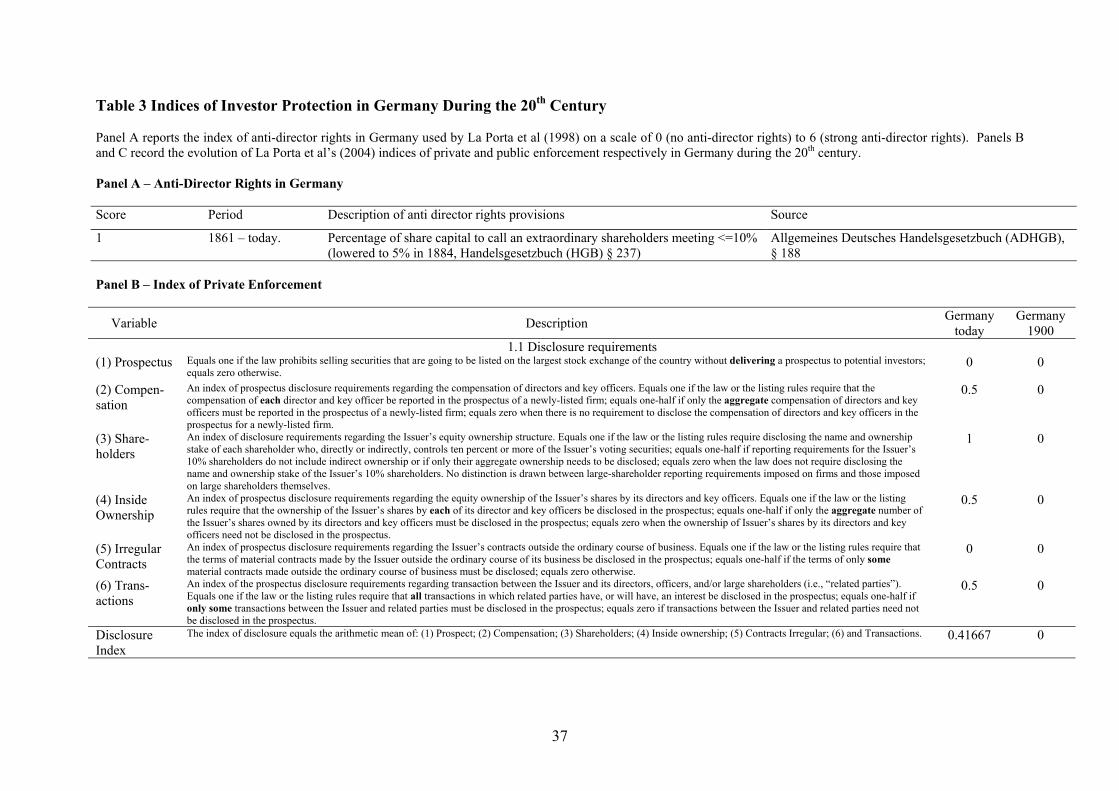
37
Table 3 Indices of Investor Protection in Germany During the 20th Century Panel A reports the index of anti-director rights in Germany used by La Porta et al (1998) on a scale of 0 (no anti-director rights) to 6 (strong anti-director rights). Panels B and C record the evolution of La Porta et al’s (2004) indices of private and public enforcement respectively in Germany during the 20th century. Panel A – Anti-Director Rights in Germany Score Period Description of anti director rights provisions Source
1 1861 – today. Percentage of share capital to call an extraordinary shareholders meeting <=10% (lowered to 5% in 1884, Handelsgesetzbuch (HGB) § 237)
Allgemeines Deutsches Handelsgesetzbuch (ADHGB), § 188
Panel B – Index of Private Enforcement
Variable Description Germany today
Germany 1900
1.1 Disclosure requirements (1) Prospectus Equals one if the law prohibits selling securities that are going to be listed on the largest stock exchange of the country without delivering a prospectus to potential investors;
equals zero otherwise. 0 0
(2) Compen-sation
An index of prospectus disclosure requirements regarding the compensation of directors and key officers. Equals one if the law or the listing rules require that the compensation of each director and key officer be reported in the prospectus of a newly-listed firm; equals one-half if only the aggregate compensation of directors and key officers must be reported in the prospectus of a newly-listed firm; equals zero when there is no requirement to disclose the compensation of directors and key officers in the prospectus for a newly-listed firm.
0.5 0
(3) Share-holders
An index of disclosure requirements regarding the Issuer’s equity ownership structure. Equals one if the law or the listing rules require disclosing the name and ownership stake of each shareholder who, directly or indirectly, controls ten percent or more of the Issuer’s voting securities; equals one-half if reporting requirements for the Issuer’s 10% shareholders do not include indirect ownership or if only their aggregate ownership needs to be disclosed; equals zero when the law does not require disclosing the name and ownership stake of the Issuer’s 10% shareholders. No distinction is drawn between large-shareholder reporting requirements imposed on firms and those imposed on large shareholders themselves.
1 0
(4) Inside Ownership
An index of prospectus disclosure requirements regarding the equity ownership of the Issuer’s shares by its directors and key officers. Equals one if the law or the listing rules require that the ownership of the Issuer’s shares by each of its director and key officers be disclosed in the prospectus; equals one-half if only the aggregate number of the Issuer’s shares owned by its directors and key officers must be disclosed in the prospectus; equals zero when the ownership of Issuer’s shares by its directors and key officers need not be disclosed in the prospectus.
0.5 0
(5) Irregular Contracts
An index of prospectus disclosure requirements regarding the Issuer’s contracts outside the ordinary course of business. Equals one if the law or the listing rules require that the terms of material contracts made by the Issuer outside the ordinary course of its business be disclosed in the prospectus; equals one-half if the terms of only some material contracts made outside the ordinary course of business must be disclosed; equals zero otherwise.
0 0
(6) Trans-actions
An index of the prospectus disclosure requirements regarding transaction between the Issuer and its directors, officers, and/or large shareholders (i.e., “related parties”). Equals one if the law or the listing rules require that all transactions in which related parties have, or will have, an interest be disclosed in the prospectus; equals one-half if only some transactions between the Issuer and related parties must be disclosed in the prospectus; equals zero if transactions between the Issuer and related parties need not be disclosed in the prospectus.
0.5 0
Disclosure Index
The index of disclosure equals the arithmetic mean of: (1) Prospect; (2) Compensation; (3) Shareholders; (4) Inside ownership; (5) Contracts Irregular; (6) and Transactions. 0.41667 0
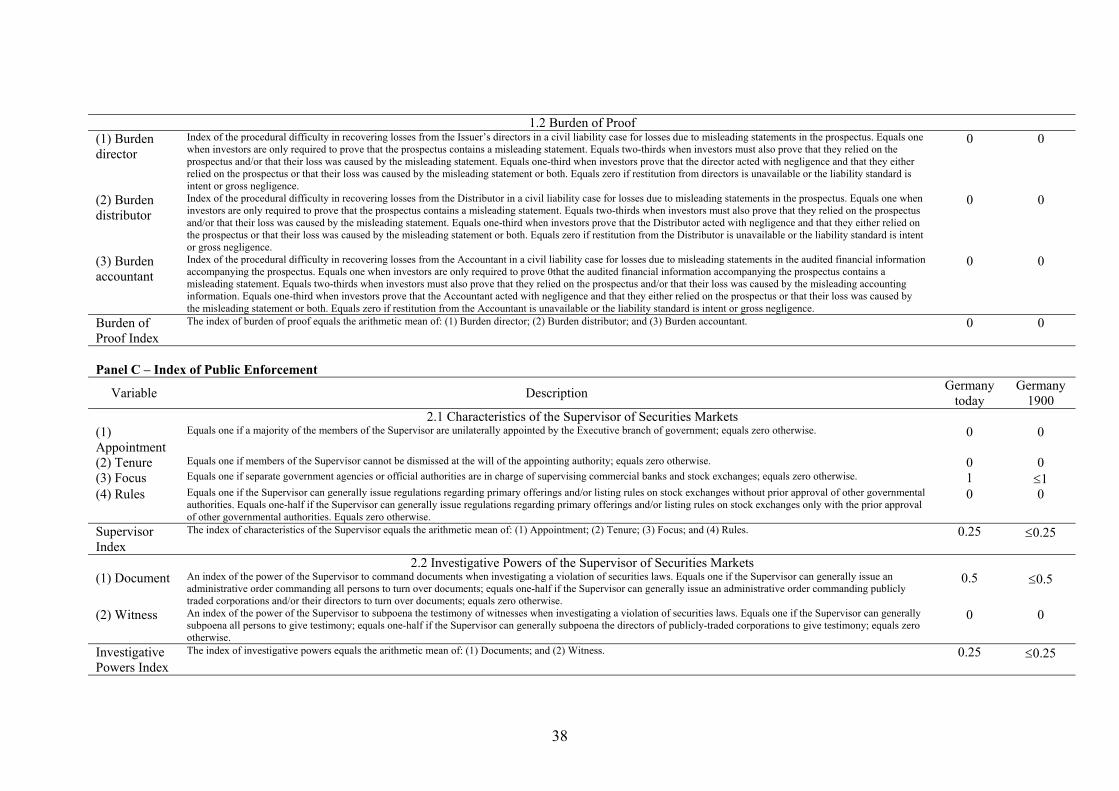
38
1.2 Burden of Proof
(1) Burden director
Index of the procedural difficulty in recovering losses from the Issuer’s directors in a civil liability case for losses due to misleading statements in the prospectus. Equals one when investors are only required to prove that the prospectus contains a misleading statement. Equals two-thirds when investors must also prove that they relied on the prospectus and/or that their loss was caused by the misleading statement. Equals one-third when investors prove that the director acted with negligence and that they either relied on the prospectus or that their loss was caused by the misleading statement or both. Equals zero if restitution from directors is unavailable or the liability standard is intent or gross negligence.
0 0
(2) Burden distributor
Index of the procedural difficulty in recovering losses from the Distributor in a civil liability case for losses due to misleading statements in the prospectus. Equals one when investors are only required to prove that the prospectus contains a misleading statement. Equals two-thirds when investors must also prove that they relied on the prospectus and/or that their loss was caused by the misleading statement. Equals one-third when investors prove that the Distributor acted with negligence and that they either relied on the prospectus or that their loss was caused by the misleading statement or both. Equals zero if restitution from the Distributor is unavailable or the liability standard is intent or gross negligence.
0 0
(3) Burden accountant
Index of the procedural difficulty in recovering losses from the Accountant in a civil liability case for losses due to misleading statements in the audited financial information accompanying the prospectus. Equals one when investors are only required to prove 0that the audited financial information accompanying the prospectus contains a misleading statement. Equals two-thirds when investors must also prove that they relied on the prospectus and/or that their loss was caused by the misleading accounting information. Equals one-third when investors prove that the Accountant acted with negligence and that they either relied on the prospectus or that their loss was caused by the misleading statement or both. Equals zero if restitution from the Accountant is unavailable or the liability standard is intent or gross negligence.
0 0
Burden of Proof Index
The index of burden of proof equals the arithmetic mean of: (1) Burden director; (2) Burden distributor; and (3) Burden accountant. 0 0
Panel C – Index of Public Enforcement
Variable Description Germany today
Germany 1900
2.1 Characteristics of the Supervisor of Securities Markets (1) Appointment
Equals one if a majority of the members of the Supervisor are unilaterally appointed by the Executive branch of government; equals zero otherwise. 0 0
(2) Tenure Equals one if members of the Supervisor cannot be dismissed at the will of the appointing authority; equals zero otherwise. 0 0 (3) Focus Equals one if separate government agencies or official authorities are in charge of supervising commercial banks and stock exchanges; equals zero otherwise. 1 ≤1 (4) Rules Equals one if the Supervisor can generally issue regulations regarding primary offerings and/or listing rules on stock exchanges without prior approval of other governmental
authorities. Equals one-half if the Supervisor can generally issue regulations regarding primary offerings and/or listing rules on stock exchanges only with the prior approval of other governmental authorities. Equals zero otherwise.
0 0
Supervisor Index
The index of characteristics of the Supervisor equals the arithmetic mean of: (1) Appointment; (2) Tenure; (3) Focus; and (4) Rules. 0.25 ≤0.25
2.2 Investigative Powers of the Supervisor of Securities Markets (1) Document An index of the power of the Supervisor to command documents when investigating a violation of securities laws. Equals one if the Supervisor can generally issue an
administrative order commanding all persons to turn over documents; equals one-half if the Supervisor can generally issue an administrative order commanding publicly traded corporations and/or their directors to turn over documents; equals zero otherwise.
0.5 ≤0.5
(2) Witness An index of the power of the Supervisor to subpoena the testimony of witnesses when investigating a violation of securities laws. Equals one if the Supervisor can generally subpoena all persons to give testimony; equals one-half if the Supervisor can generally subpoena the directors of publicly-traded corporations to give testimony; equals zero otherwise.
0 0
Investigative Powers Index
The index of investigative powers equals the arithmetic mean of: (1) Documents; and (2) Witness. 0.25 ≤0.25
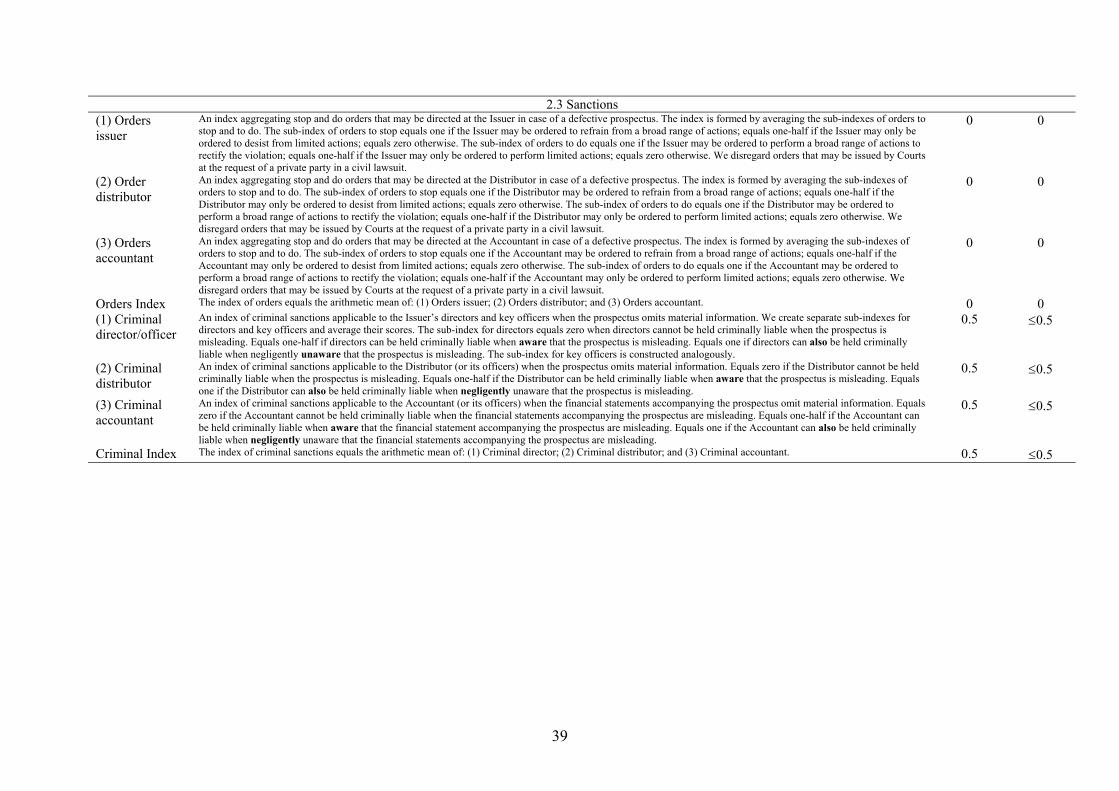
39
2.3 Sanctions (1) Orders issuer
An index aggregating stop and do orders that may be directed at the Issuer in case of a defective prospectus. The index is formed by averaging the sub-indexes of orders to stop and to do. The sub-index of orders to stop equals one if the Issuer may be ordered to refrain from a broad range of actions; equals one-half if the Issuer may only be ordered to desist from limited actions; equals zero otherwise. The sub-index of orders to do equals one if the Issuer may be ordered to perform a broad range of actions to rectify the violation; equals one-half if the Issuer may only be ordered to perform limited actions; equals zero otherwise. We disregard orders that may be issued by Courts at the request of a private party in a civil lawsuit.
0 0
(2) Order distributor
An index aggregating stop and do orders that may be directed at the Distributor in case of a defective prospectus. The index is formed by averaging the sub-indexes of orders to stop and to do. The sub-index of orders to stop equals one if the Distributor may be ordered to refrain from a broad range of actions; equals one-half if the Distributor may only be ordered to desist from limited actions; equals zero otherwise. The sub-index of orders to do equals one if the Distributor may be ordered to perform a broad range of actions to rectify the violation; equals one-half if the Distributor may only be ordered to perform limited actions; equals zero otherwise. We disregard orders that may be issued by Courts at the request of a private party in a civil lawsuit.
0 0
(3) Orders accountant
An index aggregating stop and do orders that may be directed at the Accountant in case of a defective prospectus. The index is formed by averaging the sub-indexes of orders to stop and to do. The sub-index of orders to stop equals one if the Accountant may be ordered to refrain from a broad range of actions; equals one-half if the Accountant may only be ordered to desist from limited actions; equals zero otherwise. The sub-index of orders to do equals one if the Accountant may be ordered to perform a broad range of actions to rectify the violation; equals one-half if the Accountant may only be ordered to perform limited actions; equals zero otherwise. We disregard orders that may be issued by Courts at the request of a private party in a civil lawsuit.
0 0
Orders Index The index of orders equals the arithmetic mean of: (1) Orders issuer; (2) Orders distributor; and (3) Orders accountant. 0 0 (1) Criminal director/officer
An index of criminal sanctions applicable to the Issuer’s directors and key officers when the prospectus omits material information. We create separate sub-indexes for directors and key officers and average their scores. The sub-index for directors equals zero when directors cannot be held criminally liable when the prospectus is misleading. Equals one-half if directors can be held criminally liable when aware that the prospectus is misleading. Equals one if directors can also be held criminally liable when negligently unaware that the prospectus is misleading. The sub-index for key officers is constructed analogously.
0.5 ≤0.5
(2) Criminal distributor
An index of criminal sanctions applicable to the Distributor (or its officers) when the prospectus omits material information. Equals zero if the Distributor cannot be held criminally liable when the prospectus is misleading. Equals one-half if the Distributor can be held criminally liable when aware that the prospectus is misleading. Equals one if the Distributor can also be held criminally liable when negligently unaware that the prospectus is misleading.
0.5 ≤0.5
(3) Criminal accountant
An index of criminal sanctions applicable to the Accountant (or its officers) when the financial statements accompanying the prospectus omit material information. Equals zero if the Accountant cannot be held criminally liable when the financial statements accompanying the prospectus are misleading. Equals one-half if the Accountant can be held criminally liable when aware that the financial statement accompanying the prospectus are misleading. Equals one if the Accountant can also be held criminally liable when negligently unaware that the financial statements accompanying the prospectus are misleading.
0.5 ≤0.5
Criminal Index The index of criminal sanctions equals the arithmetic mean of: (1) Criminal director; (2) Criminal distributor; and (3) Criminal accountant. 0.5 ≤0.5
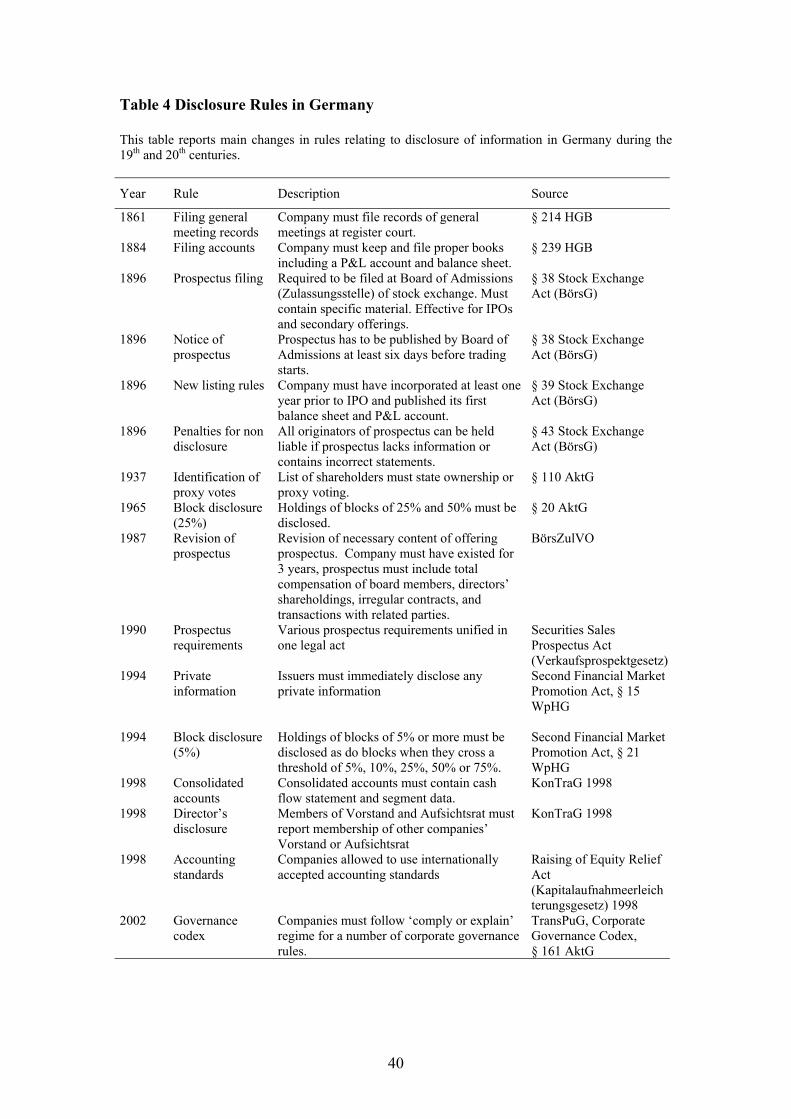
40
Table 4 Disclosure Rules in Germany This table reports main changes in rules relating to disclosure of information in Germany during the 19th and 20th centuries.
Year Rule Description Source
1861 Filing general meeting records
Company must file records of general meetings at register court.
§ 214 HGB
1884 Filing accounts Company must keep and file proper books including a P&L account and balance sheet.
§ 239 HGB
1896 Prospectus filing Required to be filed at Board of Admissions (Zulassungsstelle) of stock exchange. Must contain specific material. Effective for IPOs and secondary offerings.
§ 38 Stock Exchange Act (BörsG)
1896 Notice of prospectus
Prospectus has to be published by Board of Admissions at least six days before trading starts.
§ 38 Stock Exchange Act (BörsG)
1896 New listing rules Company must have incorporated at least one year prior to IPO and published its first balance sheet and P&L account.
§ 39 Stock Exchange Act (BörsG)
1896 Penalties for non disclosure
All originators of prospectus can be held liable if prospectus lacks information or contains incorrect statements.
§ 43 Stock Exchange Act (BörsG)
1937 Identification of proxy votes
List of shareholders must state ownership or proxy voting.
§ 110 AktG
1965 Block disclosure (25%)
Holdings of blocks of 25% and 50% must be disclosed.
§ 20 AktG
1987 Revision of prospectus
Revision of necessary content of offering prospectus. Company must have existed for 3 years, prospectus must include total compensation of board members, directors’ shareholdings, irregular contracts, and transactions with related parties.
BörsZulVO
1990 Prospectus requirements
Various prospectus requirements unified in one legal act
Securities Sales Prospectus Act (Verkaufsprospektgesetz)
1994 Private information
Issuers must immediately disclose any private information
Second Financial Market Promotion Act, § 15 WpHG
1994 Block disclosure (5%)
Holdings of blocks of 5% or more must be disclosed as do blocks when they cross a threshold of 5%, 10%, 25%, 50% or 75%.
Second Financial Market Promotion Act, § 21 WpHG
1998 Consolidated accounts
Consolidated accounts must contain cash flow statement and segment data.
KonTraG 1998
1998 Director’s disclosure
Members of Vorstand and Aufsichtsrat must report membership of other companies’ Vorstand or Aufsichtsrat
KonTraG 1998
1998 Accounting standards
Companies allowed to use internationally accepted accounting standards
Raising of Equity Relief Act (Kapitalaufnahmeerleichterungsgesetz) 1998
2002 Governance codex
Companies must follow ‘comply or explain’ regime for a number of corporate governance rules.
TransPuG, Corporate Governance Codex, § 161 AktG
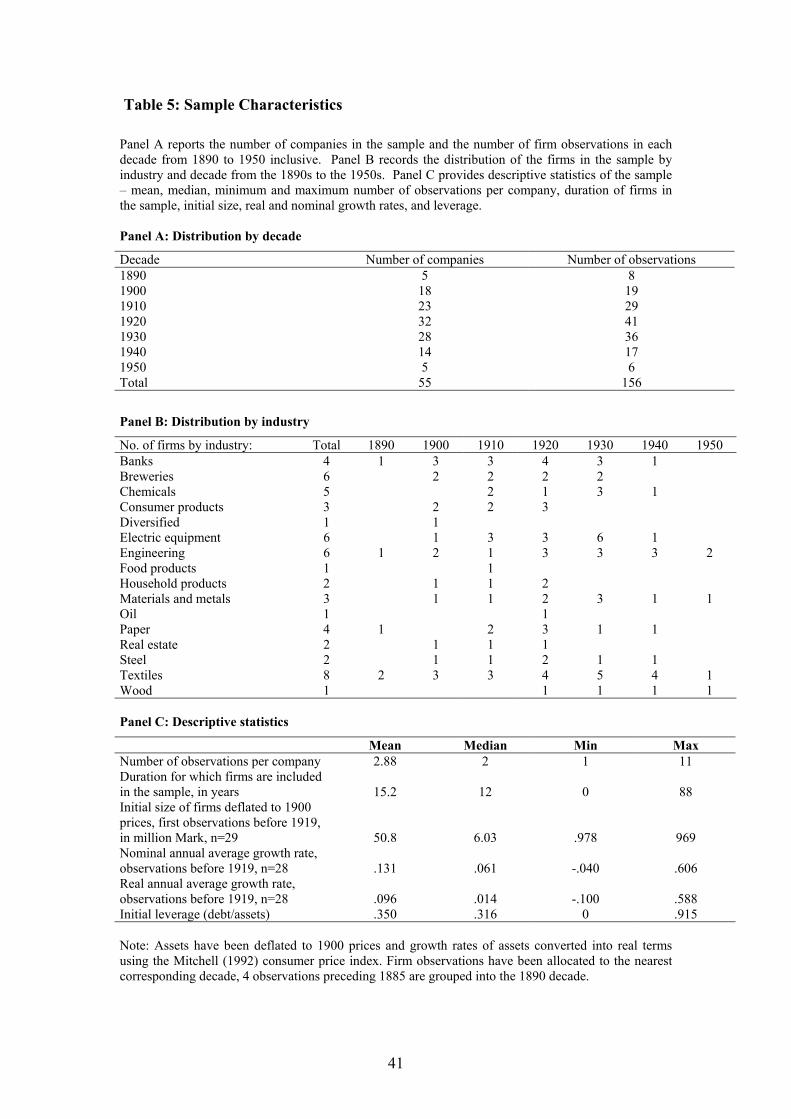
41
Table 5: Sample Characteristics
Panel A reports the number of companies in the sample and the number of firm observations in each decade from 1890 to 1950 inclusive. Panel B records the distribution of the firms in the sample by industry and decade from the 1890s to the 1950s. Panel C provides descriptive statistics of the sample – mean, median, minimum and maximum number of observations per company, duration of firms in the sample, initial size, real and nominal growth rates, and leverage. Panel A: Distribution by decade
Decade Number of companies Number of observations 1890 5 8 1900 18 19 1910 23 29 1920 32 41 1930 28 36 1940 14 17 1950 5 6 Total 55 156
Panel B: Distribution by industry
No. of firms by industry: Total 1890 1900 1910 1920 1930 1940 1950 Banks 4 1 3 3 4 3 1 Breweries 6 2 2 2 2 Chemicals 5 2 1 3 1 Consumer products 3 2 2 3 Diversified 1 1 Electric equipment 6 1 3 3 6 1 Engineering 6 1 2 1 3 3 3 2 Food products 1 1 Household products 2 1 1 2 Materials and metals 3 1 1 2 3 1 1 Oil 1 1 Paper 4 1 2 3 1 1 Real estate 2 1 1 1 Steel 2 1 1 2 1 1 Textiles 8 2 3 3 4 5 4 1 Wood 1 1 1 1 1 Panel C: Descriptive statistics
Mean Median Min Max Number of observations per company 2.88 2 1 11 Duration for which firms are included in the sample, in years 15.2 12 0 88 Initial size of firms deflated to 1900 prices, first observations before 1919, in million Mark, n=29 50.8 6.03 .978 969 Nominal annual average growth rate, observations before 1919, n=28 .131 .061 -.040 .606 Real annual average growth rate, observations before 1919, n=28 .096 .014 -.100 .588 Initial leverage (debt/assets) .350 .316 0 .915 Note: Assets have been deflated to 1900 prices and growth rates of assets converted into real terms using the Mitchell (1992) consumer price index. Firm observations have been allocated to the nearest corresponding decade, 4 observations preceding 1885 are grouped into the 1890 decade.
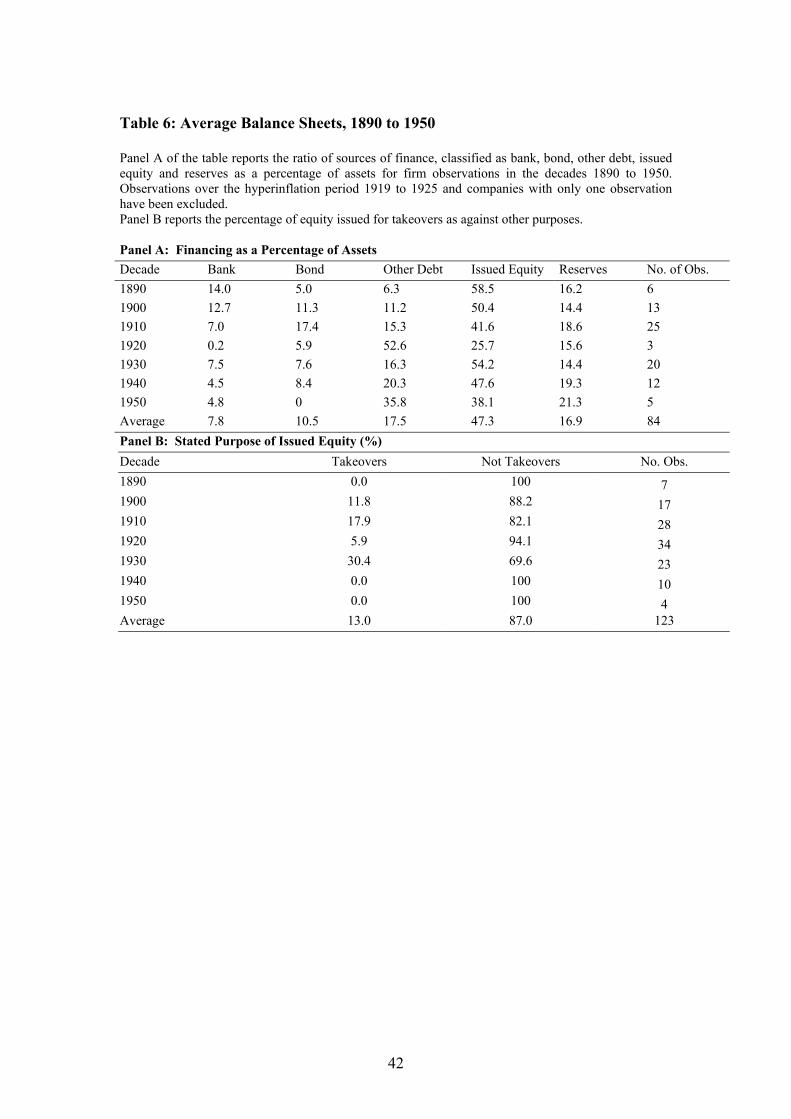
42
Table 6: Average Balance Sheets, 1890 to 1950
Panel A of the table reports the ratio of sources of finance, classified as bank, bond, other debt, issued equity and reserves as a percentage of assets for firm observations in the decades 1890 to 1950. Observations over the hyperinflation period 1919 to 1925 and companies with only one observation have been excluded. Panel B reports the percentage of equity issued for takeovers as against other purposes. Panel A: Financing as a Percentage of Assets Decade Bank Bond Other Debt Issued Equity Reserves No. of Obs. 1890 14.0 5.0 6.3 58.5 16.2 6 1900 12.7 11.3 11.2 50.4 14.4 13 1910 7.0 17.4 15.3 41.6 18.6 25 1920 0.2 5.9 52.6 25.7 15.6 3 1930 7.5 7.6 16.3 54.2 14.4 20 1940 4.5 8.4 20.3 47.6 19.3 12 1950 4.8 0 35.8 38.1 21.3 5 Average 7.8 10.5 17.5 47.3 16.9 84 Panel B: Stated Purpose of Issued Equity (%) Decade Takeovers Not Takeovers No. Obs. 1890 0.0 100 7 1900 11.8 88.2 17 1910 17.9 82.1 28 1920 5.9 94.1 34 1930 30.4 69.6 23 1940 0.0 100 10 1950 0.0 100 4 Average 13.0 87.0 123
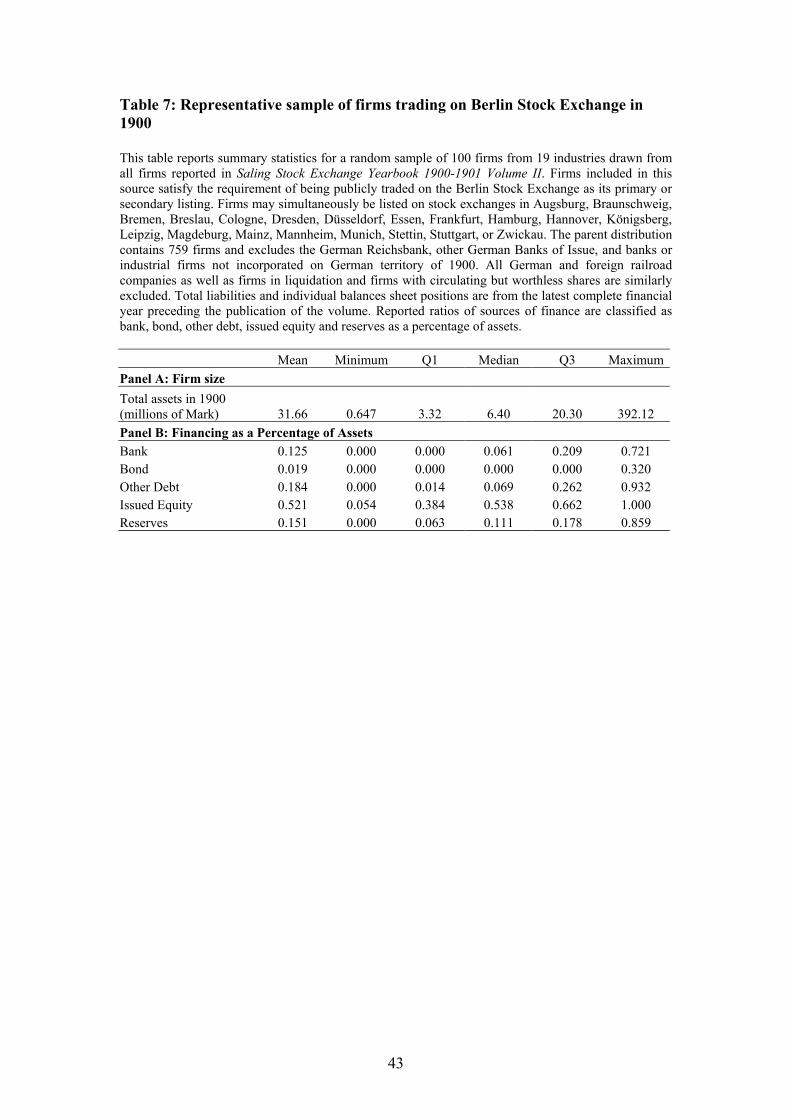
43
Table 7: Representative sample of firms trading on Berlin Stock Exchange in 1900
This table reports summary statistics for a random sample of 100 firms from 19 industries drawn from all firms reported in Saling Stock Exchange Yearbook 1900-1901 Volume II. Firms included in this source satisfy the requirement of being publicly traded on the Berlin Stock Exchange as its primary or secondary listing. Firms may simultaneously be listed on stock exchanges in Augsburg, Braunschweig, Bremen, Breslau, Cologne, Dresden, Düsseldorf, Essen, Frankfurt, Hamburg, Hannover, Königsberg, Leipzig, Magdeburg, Mainz, Mannheim, Munich, Stettin, Stuttgart, or Zwickau. The parent distribution contains 759 firms and excludes the German Reichsbank, other German Banks of Issue, and banks or industrial firms not incorporated on German territory of 1900. All German and foreign railroad companies as well as firms in liquidation and firms with circulating but worthless shares are similarly excluded. Total liabilities and individual balances sheet positions are from the latest complete financial year preceding the publication of the volume. Reported ratios of sources of finance are classified as bank, bond, other debt, issued equity and reserves as a percentage of assets. Mean Minimum Q1 Median Q3 MaximumPanel A: Firm size Total assets in 1900 (millions of Mark) 31.66 0.647 3.32 6.40 20.30 392.12 Panel B: Financing as a Percentage of Assets Bank 0.125 0.000 0.000 0.061 0.209 0.721 Bond 0.019 0.000 0.000 0.000 0.000 0.320 Other Debt 0.184 0.000 0.014 0.069 0.262 0.932 Issued Equity 0.521 0.054 0.384 0.538 0.662 1.000 Reserves 0.151 0.000 0.063 0.111 0.178 0.859
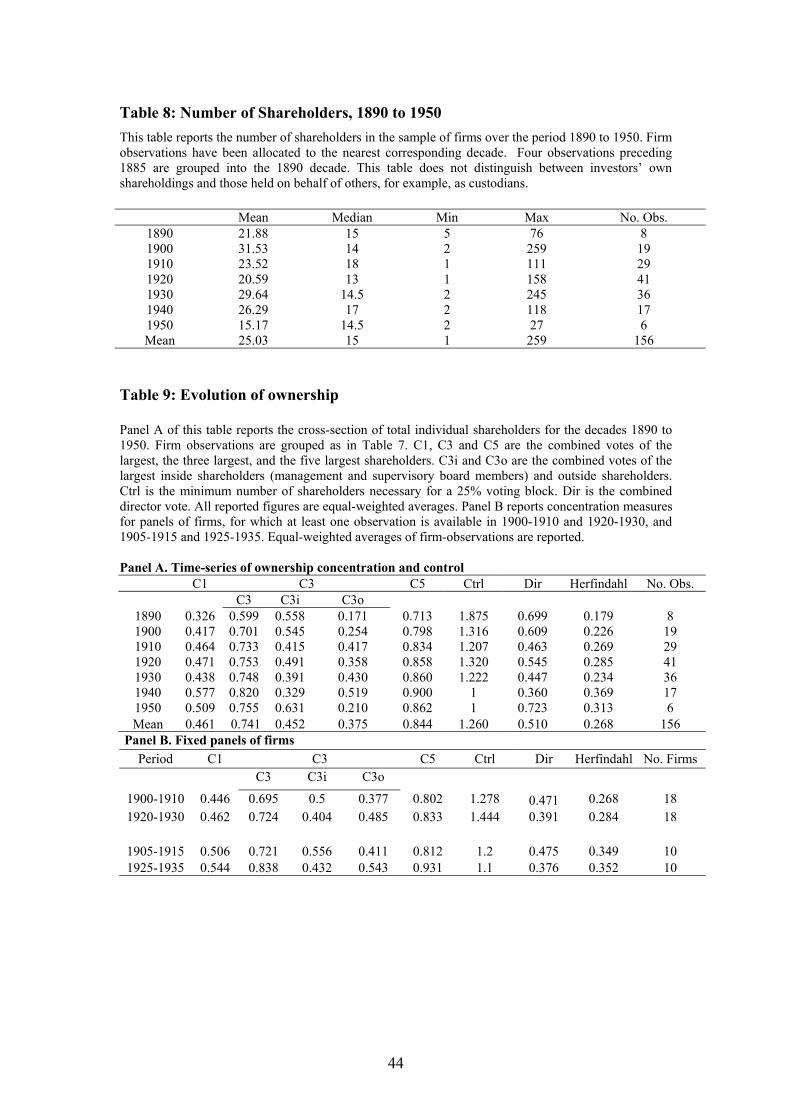
44
Table 8: Number of Shareholders, 1890 to 1950 This table reports the number of shareholders in the sample of firms over the period 1890 to 1950. Firm observations have been allocated to the nearest corresponding decade. Four observations preceding 1885 are grouped into the 1890 decade. This table does not distinguish between investors’ own shareholdings and those held on behalf of others, for example, as custodians.
Mean Median Min Max No. Obs. 1890 21.88 15 5 76 8 1900 31.53 14 2 259 19 1910 23.52 18 1 111 29 1920 20.59 13 1 158 41 1930 29.64 14.5 2 245 36 1940 26.29 17 2 118 17 1950 15.17 14.5 2 27 6 Mean 25.03 15 1 259 156
Table 9: Evolution of ownership Panel A of this table reports the cross-section of total individual shareholders for the decades 1890 to 1950. Firm observations are grouped as in Table 7. C1, C3 and C5 are the combined votes of the largest, the three largest, and the five largest shareholders. C3i and C3o are the combined votes of the largest inside shareholders (management and supervisory board members) and outside shareholders. Ctrl is the minimum number of shareholders necessary for a 25% voting block. Dir is the combined director vote. All reported figures are equal-weighted averages. Panel B reports concentration measures for panels of firms, for which at least one observation is available in 1900-1910 and 1920-1930, and 1905-1915 and 1925-1935. Equal-weighted averages of firm-observations are reported. Panel A. Time-series of ownership concentration and control
C1 C3 C5 Ctrl Dir Herfindahl No. Obs. C3 C3i C3o
1890 0.326 0.599 0.558 0.171 0.713 1.875 0.699 0.179 8 1900 0.417 0.701 0.545 0.254 0.798 1.316 0.609 0.226 19 1910 0.464 0.733 0.415 0.417 0.834 1.207 0.463 0.269 29 1920 0.471 0.753 0.491 0.358 0.858 1.320 0.545 0.285 41 1930 0.438 0.748 0.391 0.430 0.860 1.222 0.447 0.234 36 1940 0.577 0.820 0.329 0.519 0.900 1 0.360 0.369 17 1950 0.509 0.755 0.631 0.210 0.862 1 0.723 0.313 6 Mean 0.461 0.741 0.452 0.375 0.844 1.260 0.510 0.268 156
Panel B. Fixed panels of firms Period C1 C3 C5 Ctrl Dir Herfindahl No. Firms
C3 C3i C3o
1900-1910 0.446 0.695 0.5 0.377 0.802 1.278 0.471 0.268 18 1920-1930 0.462 0.724 0.404 0.485 0.833 1.444 0.391 0.284 18
1905-1915 0.506 0.721 0.556 0.411 0.812 1.2 0.475 0.349 10 1925-1935 0.544 0.838 0.432 0.543 0.931 1.1 0.376 0.352 10
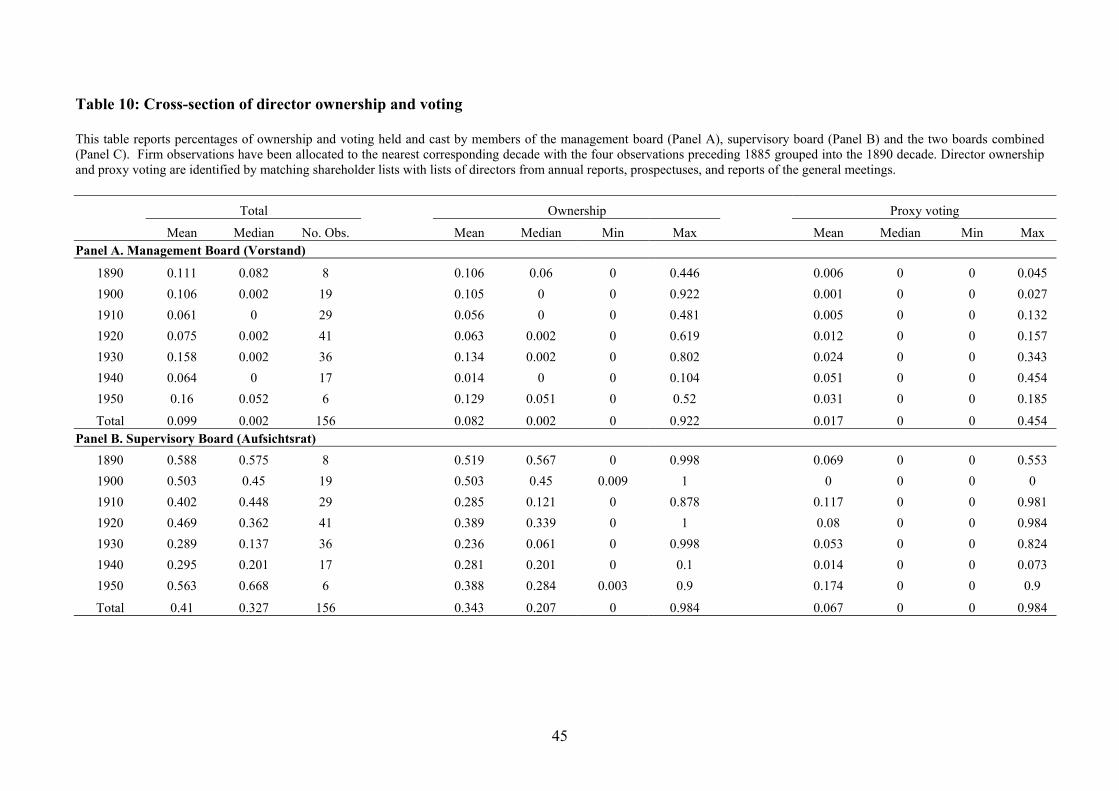
45
Table 10: Cross-section of director ownership and voting This table reports percentages of ownership and voting held and cast by members of the management board (Panel A), supervisory board (Panel B) and the two boards combined (Panel C). Firm observations have been allocated to the nearest corresponding decade with the four observations preceding 1885 grouped into the 1890 decade. Director ownership and proxy voting are identified by matching shareholder lists with lists of directors from annual reports, prospectuses, and reports of the general meetings.
Total Ownership Proxy voting
Mean Median No. Obs. Mean Median Min Max Mean Median Min Max Panel A. Management Board (Vorstand)
1890 0.111 0.082 8 0.106 0.06 0 0.446 0.006 0 0 0.045 1900 0.106 0.002 19 0.105 0 0 0.922 0.001 0 0 0.027 1910 0.061 0 29 0.056 0 0 0.481 0.005 0 0 0.132 1920 0.075 0.002 41 0.063 0.002 0 0.619 0.012 0 0 0.157 1930 0.158 0.002 36 0.134 0.002 0 0.802 0.024 0 0 0.343 1940 0.064 0 17 0.014 0 0 0.104 0.051 0 0 0.454 1950 0.16 0.052 6 0.129 0.051 0 0.52 0.031 0 0 0.185
Total 0.099 0.002 156 0.082 0.002 0 0.922 0.017 0 0 0.454 Panel B. Supervisory Board (Aufsichtsrat)
1890 0.588 0.575 8 0.519 0.567 0 0.998 0.069 0 0 0.553 1900 0.503 0.45 19 0.503 0.45 0.009 1 0 0 0 0 1910 0.402 0.448 29 0.285 0.121 0 0.878 0.117 0 0 0.981 1920 0.469 0.362 41 0.389 0.339 0 1 0.08 0 0 0.984 1930 0.289 0.137 36 0.236 0.061 0 0.998 0.053 0 0 0.824 1940 0.295 0.201 17 0.281 0.201 0 0.1 0.014 0 0 0.073 1950 0.563 0.668 6 0.388 0.284 0.003 0.9 0.174 0 0 0.9
Total 0.41 0.327 156 0.343 0.207 0 0.984 0.067 0 0 0.984
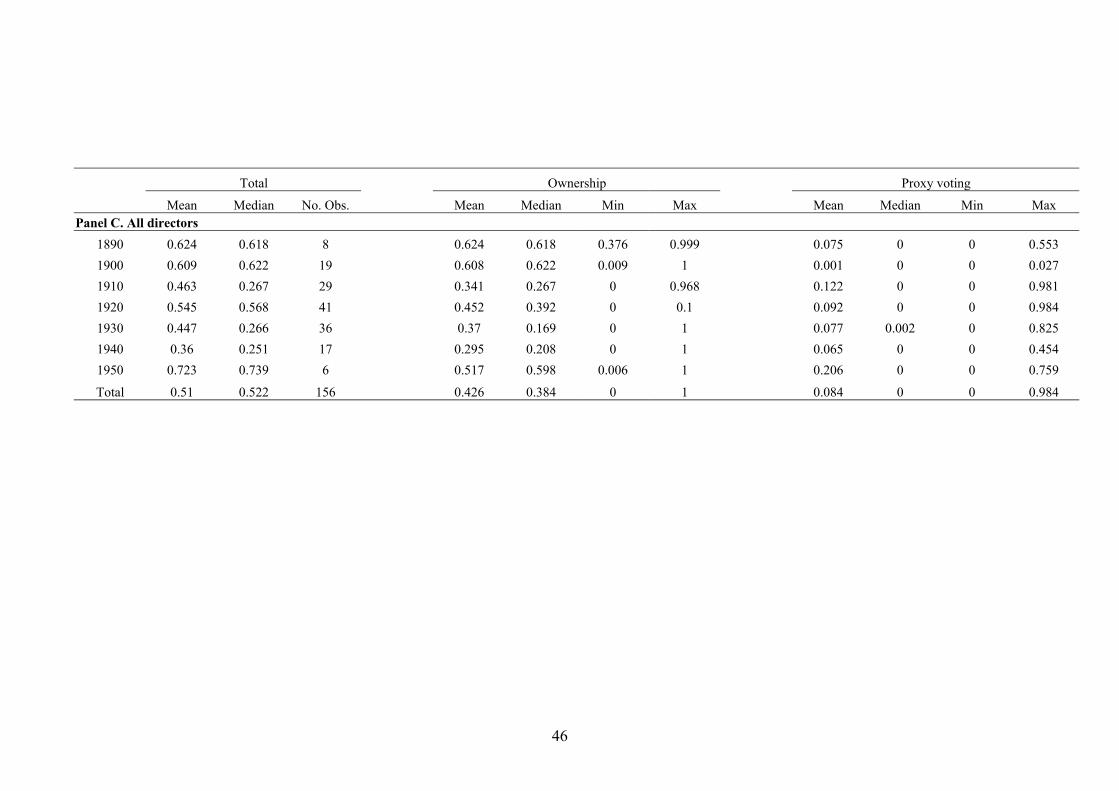
46
Total Ownership Proxy voting
Mean Median No. Obs. Mean Median Min Max Mean Median Min Max Panel C. All directors
1890 0.624 0.618 8 0.624 0.618 0.376 0.999 0.075 0 0 0.553 1900 0.609 0.622 19 0.608 0.622 0.009 1 0.001 0 0 0.027 1910 0.463 0.267 29 0.341 0.267 0 0.968 0.122 0 0 0.981 1920 0.545 0.568 41 0.452 0.392 0 0.1 0.092 0 0 0.984 1930 0.447 0.266 36 0.37 0.169 0 1 0.077 0.002 0 0.825 1940 0.36 0.251 17 0.295 0.208 0 1 0.065 0 0 0.454 1950 0.723 0.739 6 0.517 0.598 0.006 1 0.206 0 0 0.759
Total 0.51 0.522 156 0.426 0.384 0 1 0.084 0 0 0.984
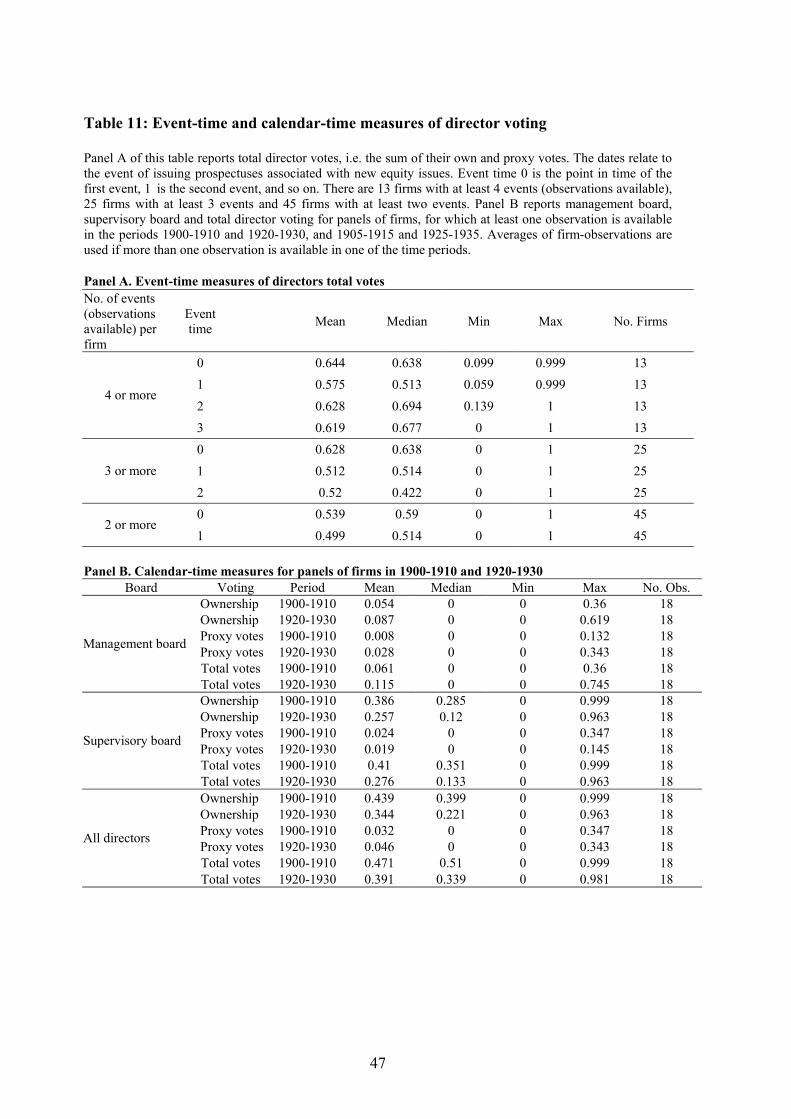
47
Table 11: Event-time and calendar-time measures of director voting Panel A of this table reports total director votes, i.e. the sum of their own and proxy votes. The dates relate to the event of issuing prospectuses associated with new equity issues. Event time 0 is the point in time of the first event, 1 is the second event, and so on. There are 13 firms with at least 4 events (observations available), 25 firms with at least 3 events and 45 firms with at least two events. Panel B reports management board, supervisory board and total director voting for panels of firms, for which at least one observation is available in the periods 1900-1910 and 1920-1930, and 1905-1915 and 1925-1935. Averages of firm-observations are used if more than one observation is available in one of the time periods. Panel A. Event-time measures of directors total votes No. of events (observations available) per firm
Event time Mean Median Min Max No. Firms
0 0.644 0.638 0.099 0.999 13 1 0.575 0.513 0.059 0.999 13 2 0.628 0.694 0.139 1 13
4 or more
3 0.619 0.677 0 1 13 0 0.628 0.638 0 1 25 1 0.512 0.514 0 1 25 3 or more
2 0.52 0.422 0 1 25 0 0.539 0.59 0 1 45
2 or more 1 0.499 0.514 0 1 45
Panel B. Calendar-time measures for panels of firms in 1900-1910 and 1920-1930
Board Voting Period Mean Median Min Max No. Obs. Ownership 1900-1910 0.054 0 0 0.36 18 Ownership 1920-1930 0.087 0 0 0.619 18 Proxy votes 1900-1910 0.008 0 0 0.132 18 Proxy votes 1920-1930 0.028 0 0 0.343 18 Total votes 1900-1910 0.061 0 0 0.36 18
Management board
Total votes 1920-1930 0.115 0 0 0.745 18 Ownership 1900-1910 0.386 0.285 0 0.999 18 Ownership 1920-1930 0.257 0.12 0 0.963 18 Proxy votes 1900-1910 0.024 0 0 0.347 18 Proxy votes 1920-1930 0.019 0 0 0.145 18 Total votes 1900-1910 0.41 0.351 0 0.999 18
Supervisory board
Total votes 1920-1930 0.276 0.133 0 0.963 18 Ownership 1900-1910 0.439 0.399 0 0.999 18 Ownership 1920-1930 0.344 0.221 0 0.963 18 Proxy votes 1900-1910 0.032 0 0 0.347 18 Proxy votes 1920-1930 0.046 0 0 0.343 18 Total votes 1900-1910 0.471 0.51 0 0.999 18
All directors
Total votes 1920-1930 0.391 0.339 0 0.981 18
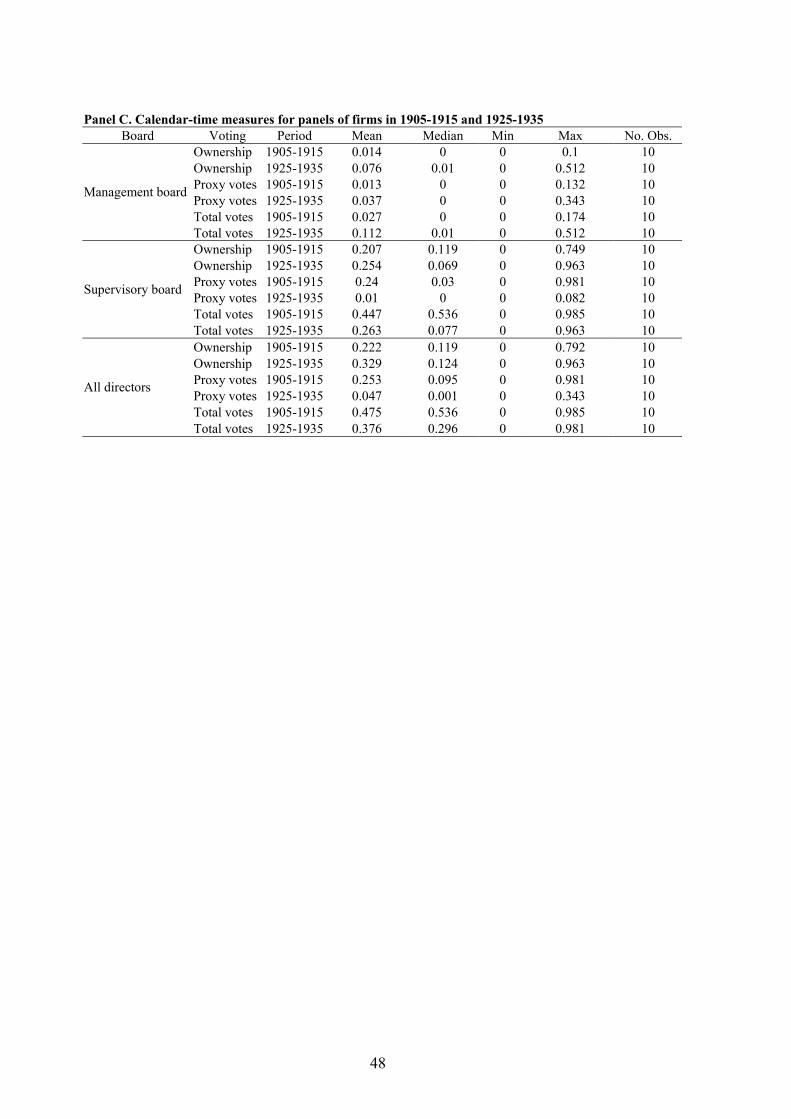
48
Panel C. Calendar-time measures for panels of firms in 1905-1915 and 1925-1935
Board Voting Period Mean Median Min Max No. Obs. Ownership 1905-1915 0.014 0 0 0.1 10 Ownership 1925-1935 0.076 0.01 0 0.512 10 Proxy votes 1905-1915 0.013 0 0 0.132 10 Proxy votes 1925-1935 0.037 0 0 0.343 10 Total votes 1905-1915 0.027 0 0 0.174 10
Management board
Total votes 1925-1935 0.112 0.01 0 0.512 10 Ownership 1905-1915 0.207 0.119 0 0.749 10 Ownership 1925-1935 0.254 0.069 0 0.963 10 Proxy votes 1905-1915 0.24 0.03 0 0.981 10 Proxy votes 1925-1935 0.01 0 0 0.082 10 Total votes 1905-1915 0.447 0.536 0 0.985 10
Supervisory board
Total votes 1925-1935 0.263 0.077 0 0.963 10 Ownership 1905-1915 0.222 0.119 0 0.792 10 Ownership 1925-1935 0.329 0.124 0 0.963 10 Proxy votes 1905-1915 0.253 0.095 0 0.981 10 Proxy votes 1925-1935 0.047 0.001 0 0.343 10 Total votes 1905-1915 0.475 0.536 0 0.985 10
All directors
Total votes 1925-1935 0.376 0.296 0 0.981 10
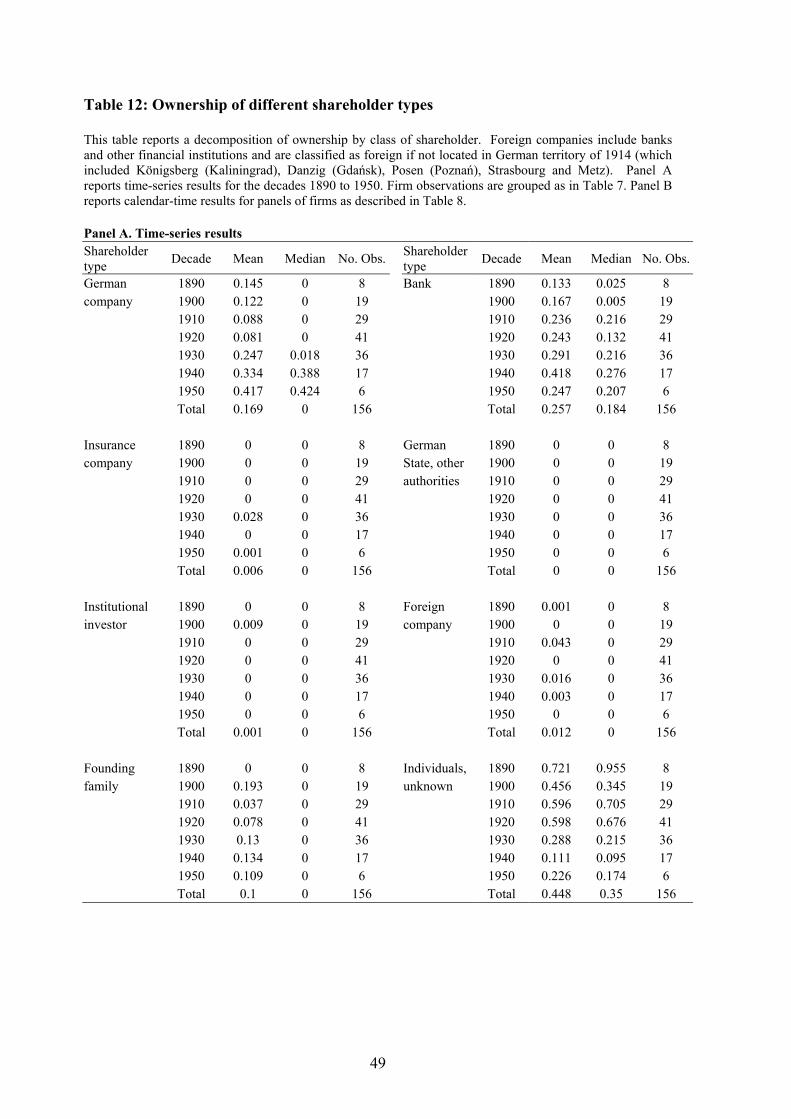
49
Table 12: Ownership of different shareholder types This table reports a decomposition of ownership by class of shareholder. Foreign companies include banks and other financial institutions and are classified as foreign if not located in German territory of 1914 (which included Königsberg (Kaliningrad), Danzig (Gdańsk), Posen (Poznań), Strasbourg and Metz). Panel A reports time-series results for the decades 1890 to 1950. Firm observations are grouped as in Table 7. Panel B reports calendar-time results for panels of firms as described in Table 8. Panel A. Time-series results Shareholder type Decade Mean Median No. Obs. Shareholder
type Decade Mean Median No. Obs.
German 1890 0.145 0 8 Bank 1890 0.133 0.025 8 company 1900 0.122 0 19 1900 0.167 0.005 19 1910 0.088 0 29 1910 0.236 0.216 29 1920 0.081 0 41 1920 0.243 0.132 41 1930 0.247 0.018 36 1930 0.291 0.216 36 1940 0.334 0.388 17 1940 0.418 0.276 17 1950 0.417 0.424 6 1950 0.247 0.207 6 Total 0.169 0 156 Total 0.257 0.184 156 Insurance 1890 0 0 8 German 1890 0 0 8 company 1900 0 0 19 State, other 1900 0 0 19 1910 0 0 29 authorities 1910 0 0 29 1920 0 0 41 1920 0 0 41 1930 0.028 0 36 1930 0 0 36 1940 0 0 17 1940 0 0 17 1950 0.001 0 6 1950 0 0 6 Total 0.006 0 156 Total 0 0 156 Institutional 1890 0 0 8 Foreign 1890 0.001 0 8 investor 1900 0.009 0 19 company 1900 0 0 19 1910 0 0 29 1910 0.043 0 29 1920 0 0 41 1920 0 0 41 1930 0 0 36 1930 0.016 0 36 1940 0 0 17 1940 0.003 0 17 1950 0 0 6 1950 0 0 6 Total 0.001 0 156 Total 0.012 0 156 Founding 1890 0 0 8 Individuals, 1890 0.721 0.955 8 family 1900 0.193 0 19 unknown 1900 0.456 0.345 19 1910 0.037 0 29 1910 0.596 0.705 29 1920 0.078 0 41 1920 0.598 0.676 41 1930 0.13 0 36 1930 0.288 0.215 36 1940 0.134 0 17 1940 0.111 0.095 17 1950 0.109 0 6 1950 0.226 0.174 6 Total 0.1 0 156 Total 0.448 0.35 156
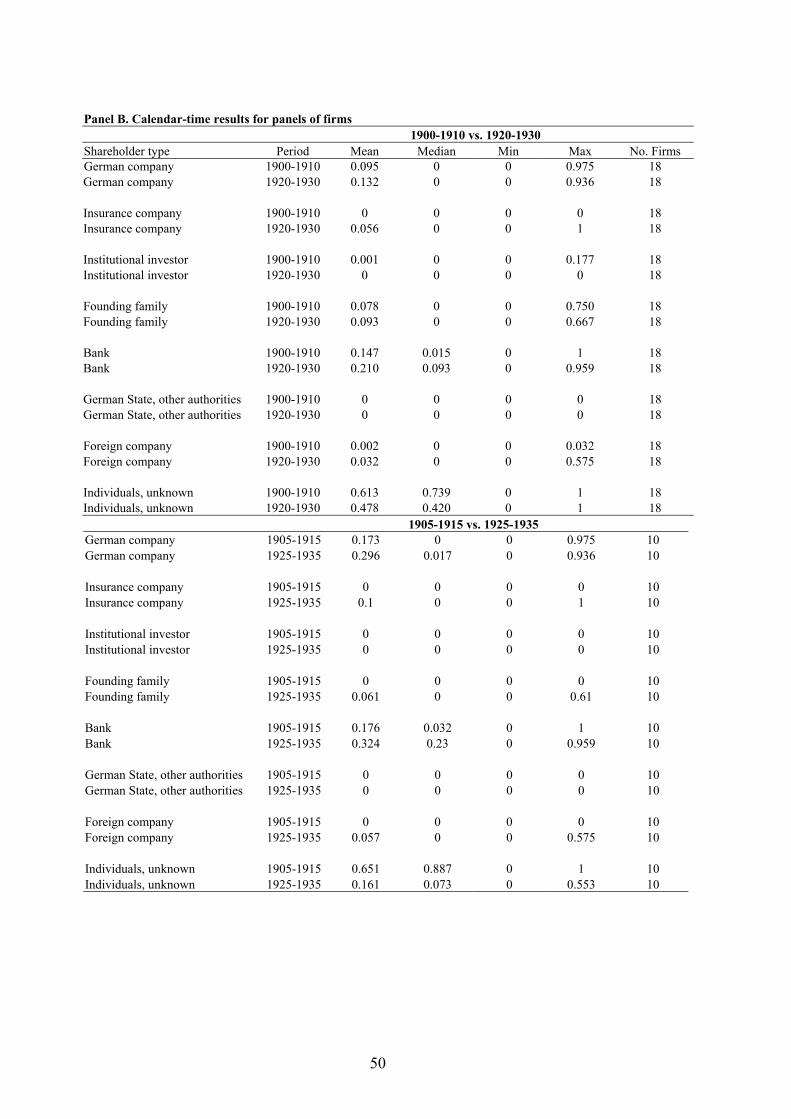
50
Panel B. Calendar-time results for panels of firms 1900-1910 vs. 1920-1930 Shareholder type Period Mean Median Min Max No. Firms German company 1900-1910 0.095 0 0 0.975 18 German company 1920-1930 0.132 0 0 0.936 18 Insurance company 1900-1910 0 0 0 0 18 Insurance company 1920-1930 0.056 0 0 1 18 Institutional investor 1900-1910 0.001 0 0 0.177 18 Institutional investor 1920-1930 0 0 0 0 18 Founding family 1900-1910 0.078 0 0 0.750 18 Founding family 1920-1930 0.093 0 0 0.667 18 Bank 1900-1910 0.147 0.015 0 1 18 Bank 1920-1930 0.210 0.093 0 0.959 18 German State, other authorities 1900-1910 0 0 0 0 18 German State, other authorities 1920-1930 0 0 0 0 18 Foreign company 1900-1910 0.002 0 0 0.032 18 Foreign company 1920-1930 0.032 0 0 0.575 18 Individuals, unknown 1900-1910 0.613 0.739 0 1 18 Individuals, unknown 1920-1930 0.478 0.420 0 1 18 1905-1915 vs. 1925-1935 German company 1905-1915 0.173 0 0 0.975 10 German company 1925-1935 0.296 0.017 0 0.936 10 Insurance company 1905-1915 0 0 0 0 10 Insurance company 1925-1935 0.1 0 0 1 10 Institutional investor 1905-1915 0 0 0 0 10 Institutional investor 1925-1935 0 0 0 0 10 Founding family 1905-1915 0 0 0 0 10 Founding family 1925-1935 0.061 0 0 0.61 10 Bank 1905-1915 0.176 0.032 0 1 10 Bank 1925-1935 0.324 0.23 0 0.959 10 German State, other authorities 1905-1915 0 0 0 0 10 German State, other authorities 1925-1935 0 0 0 0 10 Foreign company 1905-1915 0 0 0 0 10 Foreign company 1925-1935 0.057 0 0 0.575 10 Individuals, unknown 1905-1915 0.651 0.887 0 1 10 Individuals, unknown 1925-1935 0.161 0.073 0 0.553 10
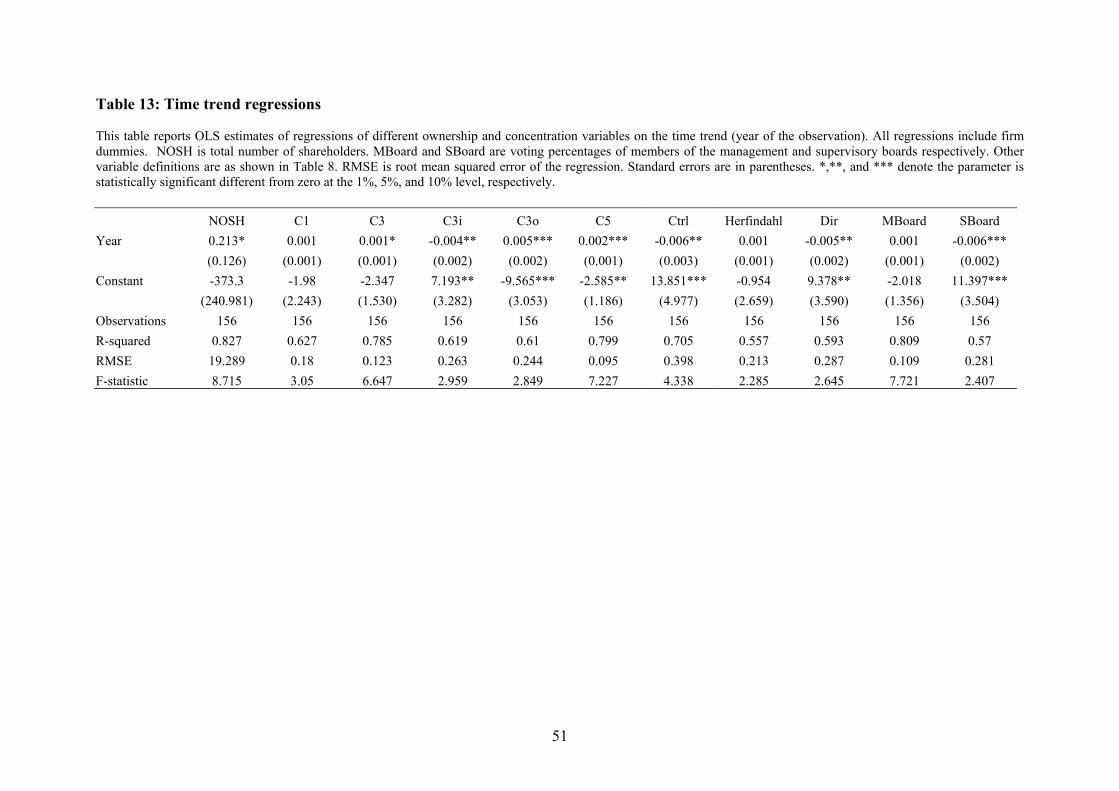
51
Table 13: Time trend regressions This table reports OLS estimates of regressions of different ownership and concentration variables on the time trend (year of the observation). All regressions include firm dummies. NOSH is total number of shareholders. MBoard and SBoard are voting percentages of members of the management and supervisory boards respectively. Other variable definitions are as shown in Table 8. RMSE is root mean squared error of the regression. Standard errors are in parentheses. *,**, and *** denote the parameter is statistically significant different from zero at the 1%, 5%, and 10% level, respectively. NOSH C1 C3 C3i C3o C5 Ctrl Herfindahl Dir MBoard SBoard Year 0.213* 0.001 0.001* -0.004** 0.005*** 0.002*** -0.006** 0.001 -0.005** 0.001 -0.006*** (0.126) (0.001) (0.001) (0.002) (0.002) (0.001) (0.003) (0.001) (0.002) (0.001) (0.002) Constant -373.3 -1.98 -2.347 7.193** -9.565*** -2.585** 13.851*** -0.954 9.378** -2.018 11.397*** (240.981) (2.243) (1.530) (3.282) (3.053) (1.186) (4.977) (2.659) (3.590) (1.356) (3.504) Observations 156 156 156 156 156 156 156 156 156 156 156 R-squared 0.827 0.627 0.785 0.619 0.61 0.799 0.705 0.557 0.593 0.809 0.57 RMSE 19.289 0.18 0.123 0.263 0.244 0.095 0.398 0.213 0.287 0.109 0.281 F-statistic 8.715 3.05 6.647 2.959 2.849 7.227 4.338 2.285 2.645 7.721 2.407
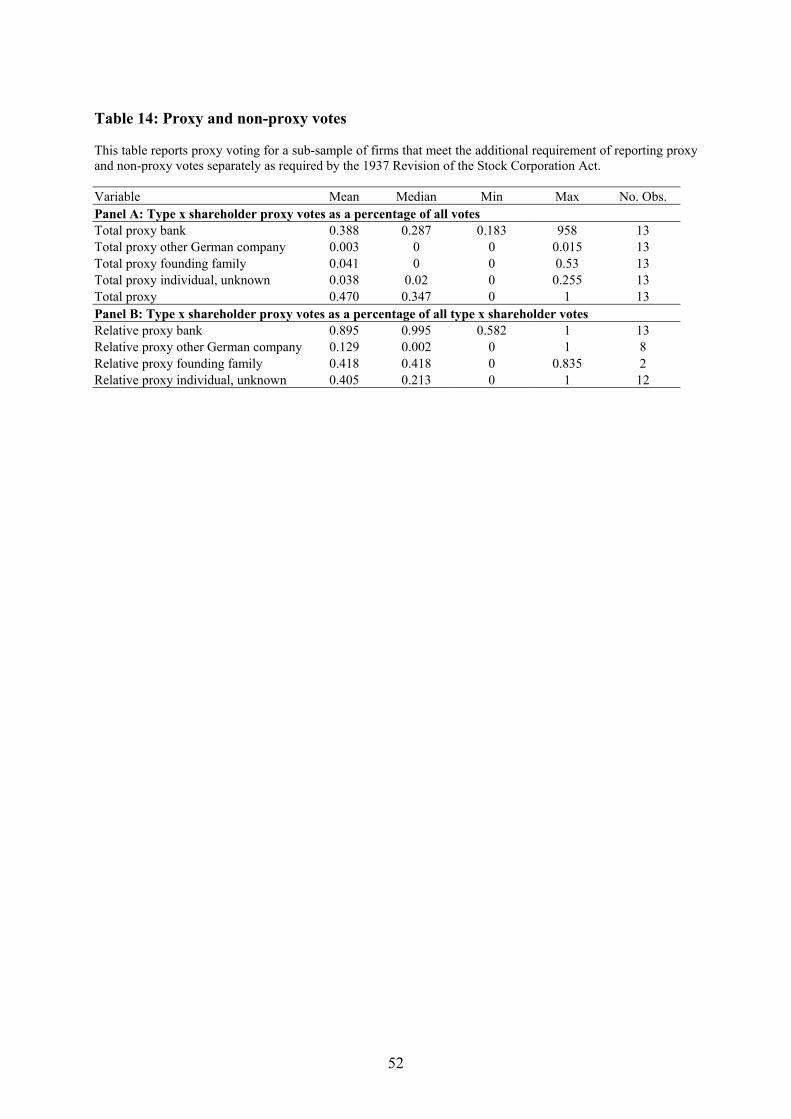
52
Table 14: Proxy and non-proxy votes This table reports proxy voting for a sub-sample of firms that meet the additional requirement of reporting proxy and non-proxy votes separately as required by the 1937 Revision of the Stock Corporation Act. Variable Mean Median Min Max No. Obs. Panel A: Type x shareholder proxy votes as a percentage of all votes Total proxy bank 0.388 0.287 0.183 958 13 Total proxy other German company 0.003 0 0 0.015 13 Total proxy founding family 0.041 0 0 0.53 13 Total proxy individual, unknown 0.038 0.02 0 0.255 13 Total proxy 0.470 0.347 0 1 13 Panel B: Type x shareholder proxy votes as a percentage of all type x shareholder votes Relative proxy bank 0.895 0.995 0.582 1 13 Relative proxy other German company 0.129 0.002 0 1 8 Relative proxy founding family 0.418 0.418 0 0.835 2 Relative proxy individual, unknown 0.405 0.213 0 1 12
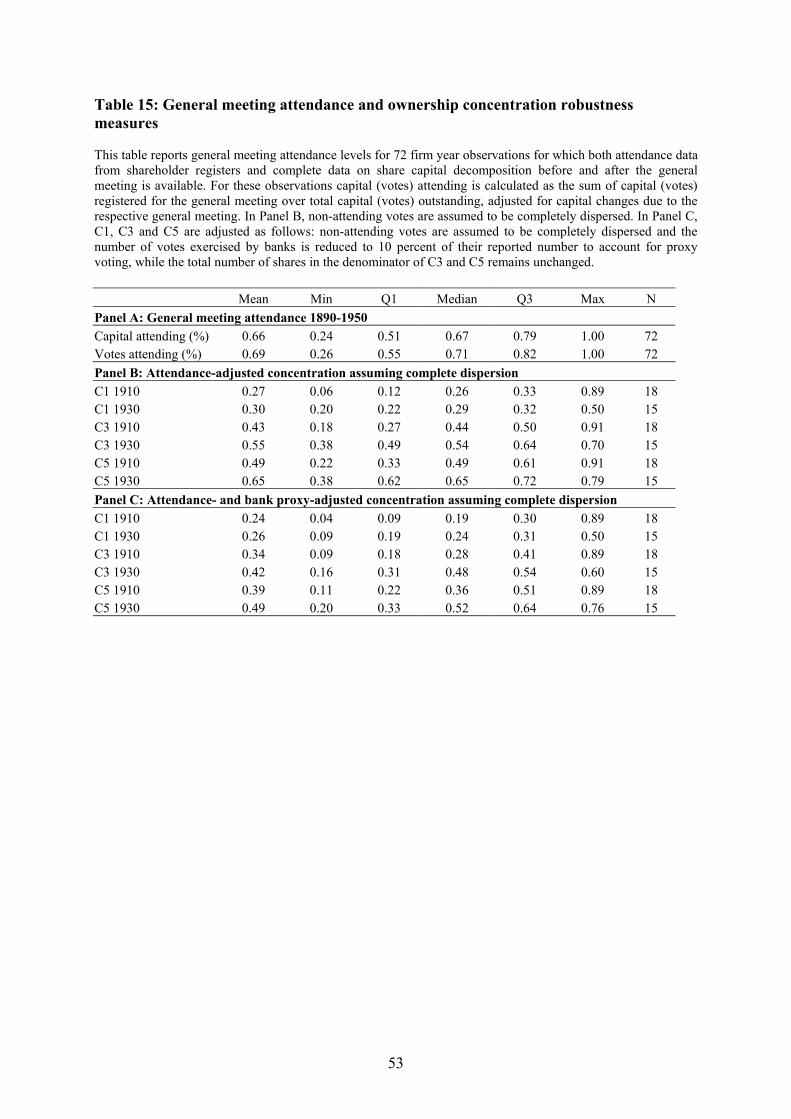
53
Table 15: General meeting attendance and ownership concentration robustness measures This table reports general meeting attendance levels for 72 firm year observations for which both attendance data from shareholder registers and complete data on share capital decomposition before and after the general meeting is available. For these observations capital (votes) attending is calculated as the sum of capital (votes) registered for the general meeting over total capital (votes) outstanding, adjusted for capital changes due to the respective general meeting. In Panel B, non-attending votes are assumed to be completely dispersed. In Panel C, C1, C3 and C5 are adjusted as follows: non-attending votes are assumed to be completely dispersed and the number of votes exercised by banks is reduced to 10 percent of their reported number to account for proxy voting, while the total number of shares in the denominator of C3 and C5 remains unchanged. Mean Min Q1 Median Q3 Max N Panel A: General meeting attendance 1890-1950 Capital attending (%) 0.66 0.24 0.51 0.67 0.79 1.00 72 Votes attending (%) 0.69 0.26 0.55 0.71 0.82 1.00 72 Panel B: Attendance-adjusted concentration assuming complete dispersion C1 1910 0.27 0.06 0.12 0.26 0.33 0.89 18 C1 1930 0.30 0.20 0.22 0.29 0.32 0.50 15 C3 1910 0.43 0.18 0.27 0.44 0.50 0.91 18 C3 1930 0.55 0.38 0.49 0.54 0.64 0.70 15 C5 1910 0.49 0.22 0.33 0.49 0.61 0.91 18 C5 1930 0.65 0.38 0.62 0.65 0.72 0.79 15 Panel C: Attendance- and bank proxy-adjusted concentration assuming complete dispersion C1 1910 0.24 0.04 0.09 0.19 0.30 0.89 18 C1 1930 0.26 0.09 0.19 0.24 0.31 0.50 15 C3 1910 0.34 0.09 0.18 0.28 0.41 0.89 18 C3 1930 0.42 0.16 0.31 0.48 0.54 0.60 15 C5 1910 0.39 0.11 0.22 0.36 0.51 0.89 18 C5 1930 0.49 0.20 0.33 0.52 0.64 0.76 15
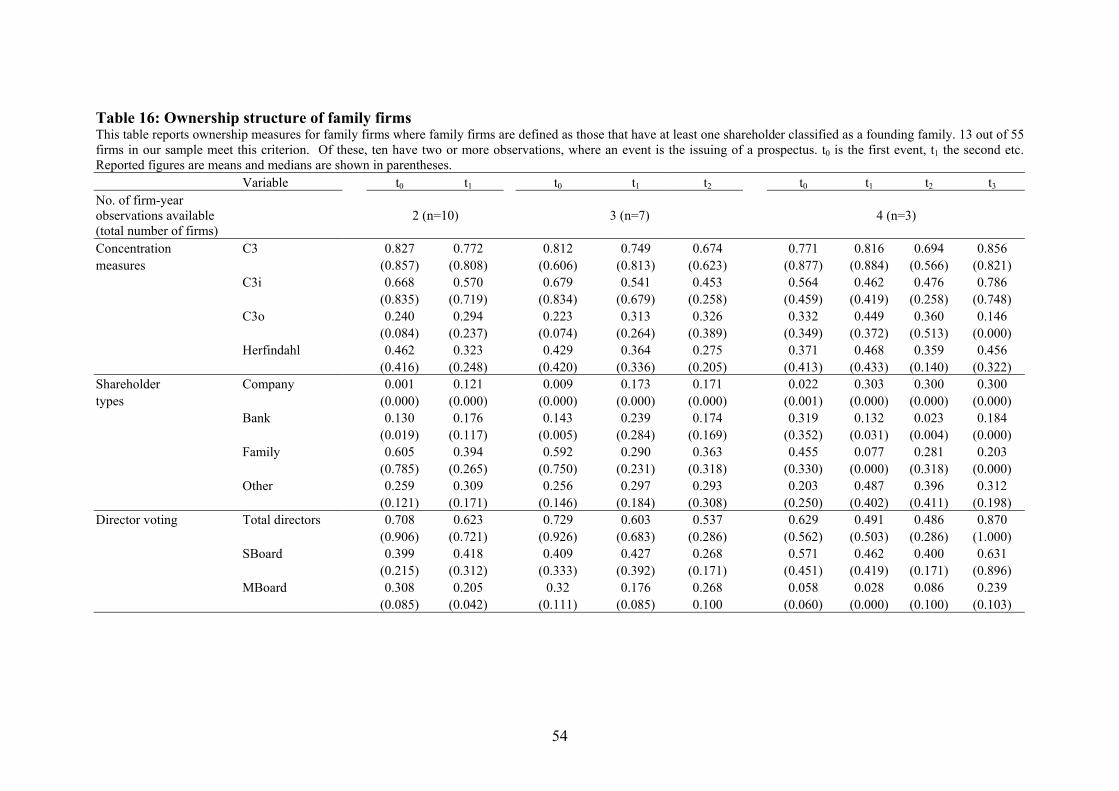
54
Table 16: Ownership structure of family firms This table reports ownership measures for family firms where family firms are defined as those that have at least one shareholder classified as a founding family. 13 out of 55 firms in our sample meet this criterion. Of these, ten have two or more observations, where an event is the issuing of a prospectus. t0 is the first event, t1 the second etc. Reported figures are means and medians are shown in parentheses. Variable t0 t1 t0 t1 t2 t0 t1 t2 t3 No. of firm-year observations available (total number of firms)
2 (n=10) 3 (n=7) 4 (n=3)
Concentration C3 0.827 0.772 0.812 0.749 0.674 0.771 0.816 0.694 0.856 measures (0.857) (0.808) (0.606) (0.813) (0.623) (0.877) (0.884) (0.566) (0.821) C3i 0.668 0.570 0.679 0.541 0.453 0.564 0.462 0.476 0.786 (0.835) (0.719) (0.834) (0.679) (0.258) (0.459) (0.419) (0.258) (0.748) C3o 0.240 0.294 0.223 0.313 0.326 0.332 0.449 0.360 0.146 (0.084) (0.237) (0.074) (0.264) (0.389) (0.349) (0.372) (0.513) (0.000) Herfindahl 0.462 0.323 0.429 0.364 0.275 0.371 0.468 0.359 0.456 (0.416) (0.248) (0.420) (0.336) (0.205) (0.413) (0.433) (0.140) (0.322) Shareholder Company 0.001 0.121 0.009 0.173 0.171 0.022 0.303 0.300 0.300 types (0.000) (0.000) (0.000) (0.000) (0.000) (0.001) (0.000) (0.000) (0.000) Bank 0.130 0.176 0.143 0.239 0.174 0.319 0.132 0.023 0.184 (0.019) (0.117) (0.005) (0.284) (0.169) (0.352) (0.031) (0.004) (0.000) Family 0.605 0.394 0.592 0.290 0.363 0.455 0.077 0.281 0.203 (0.785) (0.265) (0.750) (0.231) (0.318) (0.330) (0.000) (0.318) (0.000) Other 0.259 0.309 0.256 0.297 0.293 0.203 0.487 0.396 0.312 (0.121) (0.171) (0.146) (0.184) (0.308) (0.250) (0.402) (0.411) (0.198) Director voting Total directors 0.708 0.623 0.729 0.603 0.537 0.629 0.491 0.486 0.870 (0.906) (0.721) (0.926) (0.683) (0.286) (0.562) (0.503) (0.286) (1.000) SBoard 0.399 0.418 0.409 0.427 0.268 0.571 0.462 0.400 0.631 (0.215) (0.312) (0.333) (0.392) (0.171) (0.451) (0.419) (0.171) (0.896) MBoard 0.308 0.205 0.32 0.176 0.268 0.058 0.028 0.086 0.239 (0.085) (0.042) (0.111) (0.085) 0.100 (0.060) (0.000) (0.100) (0.103)


