Embed Size (px)
Citation preview


International Journal of Commerce and Finance ISTABUL COMMERCE UNIVERSITY JOURNAL
| Published bi-annually | e-ISSN 2149-9608
Owner: On behalf of Istanbul Commerce University Nazım Ekren, Turkey, Rector
Editorial Board: Mustafa Emre Civelek,Istanbul Commerce University, Turkey, Editor-in-Chief Anna Konert,Lazarski University, Poland, Member Mamou F. Othman,University of Duhok,Iraq, Member Mosleh Duhoky, University of Duhok,Iraq, Member Grzegorz Zajac,University of Information Technology and Management,Poland, Member Mehmet Asutay,Durham University, UK, Member Edgar Muniz Avila, Tecnológico de Monterrey,Mexico, Member Jorge Alberto Gamez Gutierrez, La Salle University, Colombia, Member Francisco Javier Del Rio Sanchez, Universidad Alfonso X El Sabio, Spain, Member Regina Garcimartin, University of Zaragoza, Spain, Member Roszaini Haniffa, Heriot-Watt University, UK, Member Dominika Harasimiuk,Lazarski University, Poland, Member Peter Jakson, University of Leicester, UK, Member José Manuel Saiz Álvarez , Nebrija University, Spain, Member Guillermo Calleja Leal , Nebrija University, Spain, Member Anna Sroka , University of Warsaw, Poland, Member Richard Roca Garay, Universidad Nacional Mayor de San Marcos, Peru, Member Mariusz Zalucki, AFM Krakow University, Poland, Member Kriengkrai Boonlert-U-Thai, Chulalongkom University, Thailand, Member İsmail Ertürk, The University of Manchester, UK, Member Gregory James, Loughborough University, UK, Member María Jesús Guerrero Lebrón, Pablo de Olavide University, Member
Advisory Board: İbrahim Çağlar, President of Istanbul Chamber of Commerce, Turkey, Member Mehmet Ali Akben, Chairman of Banking Regulation & Supevision Agency, Turkey, Member Erdem Başçı, Governor of the Central Bank of the Republic of Turkey , Turkey, Member Mehmet Büyükekşi, Chairman of Turkish Exporters Assembly, Turkey, Member Cavit Dağdaş, Chairman of Turk Exim Bank, Turkey, Member Vahdettin Ertaş, Chairman of Capital Markets Board of Turkey, Turkey, Member Oral Erdoğan, Rector of Piri Reis University, Turkey, Member Adem Şahin, Rector of TOBB University of Economics & Technology, Turkey, Member Bayram Sade, Rector of KTO Karatay University, Turkey, Member Oğuz Esen, Rector of Izmir University of Economics, Turkey, Member
International Journal of Commerce and Finance (e-ISSN 2149-9608) is a refereed, bi-annual, periodical journal containing original papers in English. Published since 2015, all research articles in the Journal are being reviewed by at least two referees after an initial editorial screening. The views expressed in the papers are under the responsibility of authors. The editors do not necessarily agree with the views expressed in the papers. All the copyright privileges of the papers accepted for the publication belong to International Journal of Commerce and Finance. International Journal of Commerce and Finance is published under the auspices of Istanbul Commerce University.
Head Office: Küçükyalı E-5 Kavşağı, İnönü Caddesi, No: 4 Küçükyalı, Maltepe Phone: +90 216 444 79 97 - Fax: +90 216 544 55 32
E-mail: [email protected] URL : http://ijcf.ticaret.edu.tr/index.php/ijcf/index

Vol 2, No 2 (2016): October Table of Contents Ertuğrul Köse The Effect of Decision Making Competence on Managerial Performance ....................................... 1-12 Ayben Koy, İhsan Ersan Exchange Rates’ Effect on Spot and Futures Equity Index Markets: A Study on Borsa Istanbul ............................................................................................................................................. 13-25 Hülya Aslan, Nilay Gemlik Gülfer Bektaş Determination of Anger Expression and Anger Management Styles and an Application on Operating Room Nurses ............................................................................................... 27-35 Bilal Ahmad Pandow Selectivity Skills of Mutual Fund Managers in India: An Analysis ..................................................... 41-59 Mehmet Saim Aşçı Benefiting from the Collective Labor Agreement in Turkish Collective Bargaining System ...................................................................................................................................... 61-70 Emin Avcı Day of The Week Effect in Conventional and Islamic Stock Indexes ............................................. 71-83 Serhat Yüksel, Mustafa Özsarı, İsmail Canöz Influencing Factors of Currency Risk of Deposit Banks in Turkey by Using Probit Method ............................................................................................................................................ 85-95

International Journal of Commerce and Finance, Vol. 2, Issue 2, 2016, 1-12
THE EFFECT OF DECISION MAKING COMPETENCE ON MANAGERIAL PERFORMANCE
Ertuğrul Köse, (Ph. D. Candidate)
Istanbul Commerce University, Istanbul
Hüner Şencan, (Prof. Dr.)
Istanbul Commerce University, Istanbul
Abstract: The performance of the manager, is partly related with decision-making competence. Making decisions properly at the right time and in the best period has the potential to increase the overall success of the manager. Decision-making which means comprehending, thinking, evalu-ating the alternatives and choosing one of the alternatives is a factor that affects manager’s performance directly and provides a competitive advantage for organisations. In this research, the relationships between decision-making competence and managerial performance were discussed. The main thesis of this research is that the managers who have high decision-making competence will have high managerial performance. The research was carried out with a population of 424 managers, subordinates, executives and customers/farmers. The evaluation of managerial performance was conducted by taking the factors of subordinates, executives and customers into consideration. The research scales compiled from the literature review and measurement tools developed by the researcher were used in the research. The test of hypothesis was examined by the method of linear regression analysis. The results of this research provided that there was a statisti-cally significant relationship between the decision-making competence of the managers and managerial performance. However, this prelimi-nary study needs to be tested in other businesses and sectors because the data of this study were gathered from a single institution of busi-ness.
Keywords: Decision-Making Competence, Self-Confidence, Performance, Managerial Performance
1. Introduction Decision-making is to be able to choose one of the alternatives. Like interpersonal relations-hips and information sharing, decision-making is one of the basic functions of a manager. Nowadays in which competition reveals itself evident, decisions given by the managers reflect on both personal performance and the company’s outcomes. While the right decisions made by the managers contribute to the value of the company, wrong decisions may lead the company to go down. Making right decisions is a critical issue for managers and organizations. In the literature about decision-making competence, the factors and the aspects of decision-making competency, interactions between these aspects, the relationships between decision-making competence and demographic factors were examined. It was observed that relatively limited number of studies investigating the relationships between decision-making and performance exist.
2. Literature Review and Hypothesis Development Decision-making competence is defined as the ability of evaluating, comprehending and expressing a choice (Bavo-lar, 2013, p. 386). According to Finucane and Lees, decision-making competence is a multidimensional concept that expresses certain abilities needed to make the right decisions. Among the dimensions of decision-making compe-tence; there exist (a) understanding the relevant information regarding to the decision, (b) configuring the decision problem, (c) integrating information and reason, and (d) being aware of the personal significance of information and the limits of one’s decision-making skills (Finucane and Lees, 2005, p. 2; Finucane and Gullion, 2010, p. 272). In terms of normative decision-making models, decision-making competence is the ability or set of skills that are need-ed to make the proper decisions (Appelt, Milch, Handgraaf and Weber, 2011, p. 254).
Inte
rnati
on
al
Jou
rnal
of
Co
mm
erc
e a
nd
Fin
an
ce

2 Ertuğrul Köse & Hüner Şencan
http://ijcf.ticaret.edu.tr
In the studies about decision-making processes, four fundamental skills are emphasized: (a) evaluating the belief that considers the likelihood of outcomes, (b) assessing the values that review the results, (c) integrating the values and beliefs in order to define the choices for decision-making and (d) metacognition consist of trust, process manage-ment and cognitive control (Parker and Fischhoff, 2005, p. 3; Bruine de Bruin, Parker and Fischhoff, 2007, pp. 939-940). Performance for each skill regarding the decision-making competence is measured in terms of accuracy or internal consistency. Parker and Fischhoff (2005) defined seven dimensions involving decision-making abilities and the standards of accu-racy and consistency in order to develope an extensive model of decision-making competence. These are; (a) con-sistency in risk perception, (b) recognizing social norms, (c) resistance to sunk costs, (d) resistance to framing, (e) applying decision rules, (f) freedom of choice and (g) under/overconfidence. In that research examining the young, the researchers found that causal inferences related to decision-making are valid. They found that there is a relation-ship between decision-making performance and the measurements of basic cognitive abilities, cognitive manners, conditions of growing and risk-taking behavior (Parker and Fischhoff, 2005, pp. 1-16). The decision-making compe-tency model developed by Parker and Fischhoff is based on the principles of making proper evaluations for the problems by applying decision rules in normative context and showing a consistent approach within the scope of cognitive competence (Parker, Bruine de Bruin and Fischhoff, 2015, p. 2). In 2007, Parker and Fischhoff with Bruin de Bruin’s participation developed Adult Decision-Making Competence Scale (A-DMC). In this study, Young Decision-Making Competence Scale (Y-DMC) which Parker and Fischhoff developed in 2005 was used as a base. Adult Decision-Making Competence was defined in the form of six sub-dimensions: (a) resistance to framing, (b) recognizing social norms, (c) under/overconfidence, (d) applying decision rules, (e) consistency in risk perceptions, and (f) resistance to sunk costs (Del Missier, Mantyla and Bruine de Bruin, 2012, s. 332). With A-DMC Scale, four basic competences including belief assessment, value assessment, integration and metacognition assessed. Belief assessment involves the measurement of the probability of outcomes; value as-sessment includes the measurement of reviewing the results of a behavior; integration contains the measurement of considering the beliefs and values together; and metacognition involves the measurement of one’s potential in coping up with the problems while determining the decision-making competence (Bavolar, 2013, p. 387; Weller, Ceschi and Randolph, 2015, p. 4). In Adult Decision-Making Competence Scale developed by Bruin de Bruin et. al., resistance to framing, which is one of the six dimensions, measures whether irrelevant variations affect the choice or not in identifying problems. Rec-ognizing social norms deals with the evaluations of participants about basic social norms. The dimension of un-der/overconfidence discusses to what extent the participants trust their own knowledge. High scores taken in this sub-dimension reflect high performance. In the dimension of applying decision rules, the study made by Payne, Bettman and Johnson (1993) was taken into account and the participants’ competences of applying the principles of decision making is measured. The dimension of consistency in risk perception measures the participants’ ability to follow the probability rules. Resistance to sunk costs is based on the studies of Arkes and Blumer (1985) and evalu-ates whether sunk costs of former investments are taken into consideration or not while making a decision (Bruine de Bruin, Parker and Fischhoff, 2007, pp. 941-942; Del Missier et al, 2013, pp. 6-7). When the researches about managerial performance were examined after those about decision-making competence, it was seen that these researches go back to the period of classical management. Since Fayol published the study called “General and Industrial Management” in 1916, the concepts of management and performance have continued to arouse the researchers’ attention. It was observed that manager’s roles are evalu-ated with regard to function, trait and decision-making. Gullick (1937), Koontz and O’Donnell (1976) and Luthans (1976) who addressed the roles of the manager from functional perspective featured planning, organizing, directing, controlling and educating the employees in their studies (Borman and Brush, 1993, pp. 2-4).
The Effect of Decision – Making Competence on Managerial Performance 3
http://ijcf.ticaret.edu.tr
Mahoney et. al. (1965), who viewed managerial performance from the point of function, de-fined eight functions of manager by taking the time that the managers spend in daily works into consideration. These are planning, coordinat-ing, evaluating, investigating, supervising, staffing, negotiating and representing (Lau, 2015, p. 152). Allan researching in the same sub-ject focused on supervision of employees, harmonizing, information handling, analytical-evaluative approach, change-initiating and monitoring among the fundamental functions of managers (Allan, 1981, p. 616). Researchers also addressed the concept of managerial performance from the perspectives of role, skills and traits. Katz (1974) evaluating from the point of skill asserted that an efficient manager should have technical, human and conceptual skills. Technical skill implies specialized knowledge, analytical ability and proficiency that a manager about the field that she is responsible; human skill means reaching activeness by encouraging collaboration among the group that a manager leads. Conceptual skill is being able to regard the organization as a who-le. A manager should evaluate interrelations of the units in the organization, changes and the effects of internal and external factors as a whole and should make a decision within this framework (Katz, 1974, pp. 94-98). Smit and Kandell (1963) included communication, problem solving, business knowledge, time management, motivation and leadership as the criteria of managerial performance of the manager. Mintzberg (1975) criticizing functional approach looked at managerial per-formance from role and behavioral perspective. Mintzberg evaluated the roles of a managers in three categories which are interpersonal, information sharing and decision-making (Clement, 1992, p. 440). According to Mintzberg, leadership, figurehead and liaison role take place in the scope of interpersonal; observation, disseminator and spokesperson rest on information sharing roles; entrepreneurship, disturbance handler, resource allocator and nego-tiator take place in the roles related to decision-making (Hall, 2008, pp. 159-160; Stivers, Adams and Liu, 2007, pp. 78-80). Borman and Brush (1993) reviewed and categorized the studies about managerial performance and developed their classification on four mega-dimensions. These dimensions are specified as; (a) interpersonal relationships and com-munication, (b) leadership and supervision, (c) technical activities and management and (d) useful personal behaviors and skills (Borman and Brush, 1993, p. 10). Interpersonal relationships and communication dimension consists of effective communication, representing, maintaining good working relationships and persuading; leadership dimen-sion involves coordinating, directing and training subordinates; in the dimension of technical activities and manage-ment there exist planning, technical competence, administration, decision making, staffing, controlling, delegating, analyzing the data; in useful behaviors and skills dimension, being result oriented, handling crisis and organizational commitment exist (Borman and Brush, 1993, p. 10). While Hall (2008) researching managerial performance paid regard to (a) planning, (b) investigating, (c) coordinating, (d) evaluating, (e) leadership, (f) negotiating, (g) representing and (h) general performance as the criteria of success; Stiver et. al. (2007) discoursed the factors of (a) business knowledge, (b) communication, (c) team work, (d) work-place behaviors, (e) leadership, (f) ethical approach, and (g) creativity in measurement of managerial success (Hall, 2008, pp. 159-160; Stivers, Adams and Liu, 2007, pp. 78-80). When the studies on managerial performance were conceived, it was understood that the dimensions of communica-tion, business knowledge, leadership, management, problem solving, planning, coordinating, employee training and decision-making come into prominence. The main objective of the study is to find out that to what extent the decision-making competence of the managers and the results of managerial performance are related. Research question was tried to be answered by using Decision-Making Competence Scale developed by Bruin de Bruin et. al. (2007) and analyzing managers’ perceptions about managerial performance.
3. The Methodology and Model In the descriptive-analytical research, the responses that the participants gave to two conceptual structures were evaluated and the relationships between these structures were tried to be specified. For this purpose, two measure-
4 Ertuğrul Köse & Hüner Şencan
http://ijcf.ticaret.edu.tr
ment tools were used in order to reveal conceptual structures and the relationships between conceptual structures were tested with hypothesis testing.
3.1. Population, Sample and Research Application The research’s population consisted of 1623 managers working at Agricultural Cooperative Credit Center Associa-tion across Turkey. In every one of these cooperatives, one officier works as a manager. The theoretical population and the practical population of the study were not differentiated and all managers were accepted as practical popula-tion. For the selection of sample, “simple random sampling” method was applied. In simple random sampling method, the risk of bias disappears and sampling error can be predicted. The names of 1623 cooperatives were listed and among them 500 cooperatives were selected randomly. In order that managerial performance evaluations can be implemented within the scope of 360 degrees, 1 executive, 1 subordinate and 1 customer/farmer were selected from again cooperatives randomly to evaluate every manager. In data collection, questionnaire method was used and it was applied by receiving participants’ approvals. Question-naires were applied with three different methods. In the first method, the questionnaire was conducted by means of that the researcher in person met face to face with the participants. In this way, 102 questionnaires were obtained. In the second method, the questionnaire was distributed to participants via sales representatives working at Fertilizer Factory Trade Inc. District Office and a week time was given to the participants to fill in the questionnaires. 186 questionnaires were gathered with the second application. In the third method, questionnaire forms were sent to people in target group via e-mail and were asked to reply back. 182 questionnaire forms were obtained by the third method. At the end of the survey, 470 questionnaire forms were taken back and the ratio of return was %94. After questionnaire application was completed, 46 questionnaire forms were evaluated as invalid; therefore, the number of testable questionnaire forms reduced to 424.
3.2. Measurement In the research, a questionnaire including demographic variables and two attitude scales were used. Attitude scales were designed for “revealing the way of perception” of the managers and other evaluators. The first measurement tool was used for measuring decision-making competence. For this, “Decision-Making Competence” scale devel-oped by Bruine de Bruin et. al. (2007) was used. This scale was translated into Turkish by the researcher. This trans-lation was submitted for consideration of experts in their field. The necessary changes made in accordance with the opinions of experts. Items of the scale was adapted to the conditions of country. However, some of items were al-tered, and the number of items, which is 158 originally, was reduced to 78. There are six dimensions consisting of Resistance to Framing, Recognizing Social Norms, Self-Confidence, Applying Decision Rules, Consistency in Risk Perception and Resistance to Sunk Costs in Decision-Making Competence scale. In addition to these dimensions, a new dimension called “Thinking Right” was added to the scale and thereby Decision-Making Competence was con-sisted of seven sub-dimensions. In reliability analysis conducted, from the scales Recognizing Social Norms-I and Recognizing Social Norms-II, the first one was left out of assessment because of the low internal consistency and Omega values. Moreover, among the sub-dimensions measuring Decision-Making Competence’s conceptual struc-tures, Thinking Right, Applying Decision Rules and Resistance to Sunk Costs scales’ internal consistency and Omega values were low. For this reason, these scales were excluded from the analysis and Decision-Making Competence was measured with the dimensions of Resistance to Framing, Recognizing Social Norms-II, Self-Confidence and Con-sistency in Risk Perception. The second measurement instrument called “Managerial Performance” scale was formed as eight dimensions by the researcher in accordance with literature review. “The Profile of Ma-nagement Skills” scale by Sevy et. al. (1985), managerial performance classification by Borman and Brush (1993), “Managerial Success Factors” by Stiver et. al. (2007) and the studies by Hall (2008) and Bucur (2013) were taken into considiration while developing Managerial Performance scale. Different versions of Managerial Performance scale were generated, which allows the evaluations of executive, subordinate and customer. Accordingly, the other versions of managerial performance scale were (a)

The Effect of Decision – Making Competence on Managerial Performance 5
http://ijcf.ticaret.edu.tr
Self-evaluation scale, (b) Subordinate Evaluation scale, (c) Executive Evaluation scale and (d) Customer Evaluation scale. There existed 45 items in Self-evaluation scale, Subordinate Evaluation scale and Executive Evaluation scale. In Customer Evaluation scale, there were ten items related to managerial performance. Managerial Performance scale was designed in a form including Leadership, Business Knowledge, Management Success, Communication, Interper-sonal Relationships, Being Result Oriented, Taking Initiative and Training Subordinates. All items of the scales were designated on the basis of theoretical information from literature. Managerial performance was defined as a dependent variable in the research. The scales of Self-evaluation, Subordi-nate Evaluation, Executive Evaluation and Customer Evaluation were used in measurement of Managerial Perfor-mance. The number of items which was 45 for the first three scales was reduced to 20 after exploratory factor analy-sis; and the number of items for Customer scale was reduced to eight. Due to the low reliability, Customer scale was left out of the analysis and to calculate the scores of managers’ managerial performance, the average of self-evaluation, subordinate evaluation and executive evaluation scores were taken into consideration. Managerial Performance scales are measurement tools of Likert type; and labels used and the corresponding grades were specified as: (1) Strongly Disagree, (2) Partly Disagree, (3) Neutral, (4) Partly Agree, (5) Strongly Agree. The sub-scales of Decision-making competence were the independent variables of the research. The measurement tool of Decision-Making Competence is a mixed scale and consist of these dimensions: Resistance to Framing, Rec-ognizing Social Norms, Thinking Right, Self-confidence, Applying Decision Rules, Consistency in Risk Perception and Resistance to Sunk Costs. Recognizing Social Norms-I, Thinking Right, Applying Decision Rules and Resistance to Sunk Costs scales were left out of the analysis because of their low reliability scores. In calculating the scores of managers’ Decision-Making Competence, the scores from the scales of Resistance to Framing, Recognizing Social Norms-II, Self-confidence, Consistency in Risk Perception were averaged. After factor analysis, the number of items reduced to 5 in Resistance to Framing scale, 12 in Self-confidence scale, 5 in Recognizing Social Norms-II scale and 8 in Consistency in Risk Perception. Resistance to Framing scale’s labels were designed as: (1) Certainly option A should be chosen, (2) Option A should be chosen, (3) Option A can be chosen, (4) Option B can be chosen, (5) Option B should be chosen, (6) Certainly Option B should be chosen. Resistance to Sunk Costs scale’s labels were: (1) 1st option has very high probability to be chosen, (2) 1st option has high probability to be chosen, (3) 1st option can be chosen, (4) 2nd option can be chosen, (5) 2nd option has high probability to be chosen, (6) 2nd option has very high probability to be chosen. The scales of Recognizing Social Norms-I, Recognizing Social Norms-II, Applying Decision Rules and Consistency in Risk Perception were measurement tools that had two types of answers as “Yes-No or True-False”.
3.3. Hypothesis of The Research In the research, Decision-Making Competence was specified as the predictor variable and Managerial Performance was defined as the outcome variable. The hypothesis of the research determined that the managers having high scores of decision-making competence will have high scores of managerial performance. In scales of Decision-Making Competence and Managerial Performance, scale scores were obtained by calculating arithmetic means of related items.
4. Findings The findings of the research submitted as demographic findings related to participants, dimensionality, reliability, validity of scales and the results of hypothesis testing.

6 Ertuğrul Köse & Hüner Şencan
http://ijcf.ticaret.edu.tr
4.1. Descriptive Statistics The frequency distributions of demographic data regarding executives, managers, subordinates and customer partici-pants’ gender, age, educational status, work experience, period of management and period of recognition were calcu-lated. According to results 89.20% of executives participating the survey were males, 10.80% of them were females. Ages of 90.60% of executives were between 30 and 49. 93.60% of the executives, which was a great majority, had bachelor’s degree. Work experience of 50.20% of the executives was 21 years and more. Management period of 88% of the executives was between 0 and 16 years. 70.40% of the executives’ recognition period of managers was between 0 and 10 years. 84.90% of the managers participating the survey consisted of males; 15.10% of the managers were females. 81.60% of the managers were between 30 and 49 years old. 48.60% of the managers had bachelor’s degree; 34% of them were high-school graduates. Work experience of 59.20% of the managers was between 0 and 20 years. Management period of 74% of them was between 0 and 10 years. 72.60% of subordinates participating the survey were males and 27.40% of them were females. 76.20% of subordina-tes were between 30 and 49 years old. 54.60% of them had bachelor’s degree; 19.80% of them were high-school graduates. Work experience of 79.70% of subordinates was between 0 and 10 years. 91.50% of subordinates’ recog-nition period of managers was between 0 and 5 years. 98.30% of customers participating the survey were males, 1.70% of them were females. 79.90% of the customers were between 30 and 59 years old. 50.20% of the customers were primary school graduates; 27.40% of them were high-school graduates. 62% of the customers’ membership period was between 0 and 16 years. 96% of the custo-mers’ recognition period of managers was 0 and 10 years.
4.2. Analyses of Dimensionality, Reliability and Validity Factor analysis is used in order to classify variables that have common relational connections on multi-dimensional variable cluster and so to specify variables’ dimensions. In the research, explanatory factor analysis method was used for the items in “Decision-Making Competence” and “Managerial Performance” scales. For Explanatory factor analysis (EFA), “Factor 10.3.01” program was utilized. Within the scope of EFA, inter-items correlation values resul-ted in between 0.01 and 0.82 in sub-scales of Decision-Making Competence and between 0.04 and 0.79 in scales of Managerial Performance. The items which correlation coefficient with other variables was less than 0.20 were left out of the analysis by removing from the scales. Polychoric and tetrachoric correlation analysis was utilized in order to find factorial structure and to specify the number of factors. Horn’s parallel analysis method was used to determine the number of the factors. 0.40 value was defined as cut off line in determining individual factor loading. In result of explanatory factor analysis, it was observed that sub-scales of Decision-Making Competence and scales of Managerial Performance have a single factorial structure and because of this, inter-dimensional correlation coefficients were not calculated. After determining factorial structure, reliability analysis was conducted both for measurement tools and the data. Reliability analyses were examined under three main titles: Inter-items correlation coefficient values, split half met-hod and internal consistency. In literature it was suggested that inter-item correlation coefficients should be between 0.20 and 0.70; and that averages of correlations should be 0.20 and 0.40; and that items which has negative, low or too high correlation coefficient should be removed from the scale. In measurement tools, the items that had negative values and correlation coefficients were under 0.20 were left out of the analysis by removing them from the scales. As part of reliability analysis, split half method was conducted as a second technic. Because of the fact that one half of the scale’s reliability can be measured with split half method, Spearman-Brown formula was applied in order to obtain the reliability of the whole test. It was seen that Spearman-Brown reliability coefficient calculated by split half method was between 0.53 and 0.95 in the scales. According to this values, it was found out that there existed a linear relationship between both parts of the scales apart from Customer scale (R = 0.53). This results indicated that the scale reliability was at a good level. Another method conducted for reliability analysis was internal consistency. In order to assess internal consistency reliability, Cronbach alpha reliability is used mostly. Alpha value should be at

The Effect of Decision – Making Competence on Managerial Performance 7
http://ijcf.ticaret.edu.tr
least 0.70. However, it was seen in the explanatory-descriptive researches that values up to 0.60 were accepted. Gene-ral reliability coefficients relating to scales were calculated separately as alpha reliability coefficient, KR-20 and Ome-ga reliability coefficients; and then, the results were gathered in Table 1, Table 2 and Table 3.
Table 1. DMC Scales Internal Consistency Reliability Values
Number of items Cronbach alpha Omega values
Resistance to Framing (RtF) 5 0.64 0.70
Self-confidence (SC) 12 0.74 0.86
Resistance to Sunk Costs (RSC) 5 0.35 0.58
Table 2. DMC Scales Internal Consistency Reliability Values
Number of items KR-20 coefficient Omega values
Recognizing Social Norms-I (RSN1) 3 0.46 0.72
Recognizing Social Norms-II (RSN2) 5 0.67 0.84
Thinking Right (TR) 4 0.26 0.73
Applying Decision Rules (ADR) 3 0.35 0.58
Consistency in Risk Perception (CRP) 8 0.66 0.85
Reliability coefficient of the scale is evaluated as poor if it is > 0.50; as questionable if it is > 0.60; as acceptable if it is > 0.70; as good if it is > 0.80 and as highly reliable if it is > 0.90 (Gliem and Gliem, 2003, p. 87). It was seen that among the scales of Decision-Making Competence RtF, Self-confidence, RSN2 and Consistency in Risk Perception scales’ internal consistency reliability values were acceptable and that their Omega values were high. RSC, RSN1,TR and ADR scales’ internal consistency and Omega values were low. Because of the poor reliability, RSC, RSN1, TR and ADR scales droped and were left out of the analysis.
Table 3. Internal Consistency Reliability Values of MP Scales
Number of items Cronbach alpha Omega values
Managers-Self (MPS-MS) 20 0.83 0.96
Subordinates (MPS-S) 20 0.93 0.96
Customers (MPS-C) 8 0.56 0.86
Executives (MPS-E) 20 0.95 0.96
From among Managerial Performance scales, Managerial Performance Scale-Subordinates (MPS-S) and Managerial Performance Scale-Executives (MPS-E) were evaluated as highly reliable; Managerial Performance Scale-Managers-Self (MPS-MS) was evaluated as quite reliable and the reliability of Managerial Performance Scale-Customer (MPS-C) was evaluated as poor. It was resulted that the scales of MPS-S, MPS-E and MPS-MS were sufficiently reliable beca-use of the fact that their Omega values were above 0.80. After reliability analysis, validity analysis was done for mea-surement tools and the data.

8 Ertuğrul Köse & Hüner Şencan
http://ijcf.ticaret.edu.tr
Face validity assessment was carried out for the whole of the scale and on the basis of the items. It was concluded that scales had face validity because of the fact that the opinions of experts and participants were positive. Lawshe’s Content Validity Ratio (L-CVR) was utilized to specify content validity of the scales. CVR value of the items and scale scores should be equal to 1 to ensure content validity when the number of panel members are between five and eight (Ayre and Scally, 2014, p. 82). Because Decision-Making Competence and Managerial Performance scales’ L-CVR value was equal to 1, it was concluded that these scales had content validity. Construct validity analyses were examined as part of nomological network and confirmatory factor analysis. In order to provide evidence for a measurement tool measures the conceptual structure, nomological network should cover related structure. It was concluded that Decision-Making Competence and Managerial Performance scales that were used in the research had nomological validity as these scales were constructed on the basis of conceptual framework. Confirmatory Factor Analysis (CFA) is a frequently used method in search of construct validity. In this study, fit indices were used for construct validity analysis conducted with confirmatory factor analysis method. All fit index values of scales indicated good fit.
4.3. Hypothesis Testing Results The hypothesis of the research was tested with linear regression analysis. Before the analysis, it was examined whet-her the data met prior conditions of linear regression analysis or not. Prior conditions of linear regression analysis were examined in four basic titles as linearity, normality, independence of errors and homoscedasticity and it was seen that the assumptions were satisfied. As a result, it was evaluated that the results from regression analysis were “objective” and “fair” because of the fact that four prior conditions were fulfilled totally. Linear regression analysis was used in order to explore whether the markings of the participants in Decision-Making Competence scale provides the opportunity to estimate Managerial Performance significantly or not and it was seen that predictor variable explained 5.8% of the variance (R2 = 0.058; F = 25.942; p = 0.000) and it was understood that Decision-Making Competence factor provided the opportunity to explain Managerial Performance significantly (β =
0.149, p = 0.000). Therefore, alternative hypothesis was approved by succeeding in reject of null hypothesis.
When submitting the research results, in addition to p value, index values that indicate the strength of the relations-hip among variables or effect size should be included. Effect size is a statistical value that quantifies the degree to which sample results diverge from the expectations specified in H0 (Vacha-Haase and Thompson, 2004, p. 473). Effect size value which is an indicator of practical significance enables more reliable evaluation by removing misjudgment that can be resulted from sample size. Effect size can also be interpreted with “partial eta value” calcu-lated. That partial eta value is 0.01 refers to poor effect size, that it is 0.06 refers to reasonably low effect size, and that it is 0.14 refers to high effect size (Şencan, 2016, p. 88). Although the fact that p value resulted as statistically significant (that it is lower than 0.05) in result of calculation showed that there was an “effect” which was that Deci-sion-Making Competence variable affected Managerial Performance variable, this fact did not give an idea about the strength and level of this effect. In the calculation made via SPSS, partial eta value ensued as 0.176 and this indicated high effect size in the relationship between Decision-Making Competence and Managerial Performance.
5. Conclusion and Recommendation As a result of statistical analysis, it was seen that there was a significant relationship between managers’ decision-making competence and evaluators’ managerial performance perceptions. As there was not any study focusing di-rectly on decision-making competence and managerial performance in body of literature, discussions were approac-hed within the frame of related concepts. In their study, Peters et. al. (2006) explained competence as being acquainted with numbers and asserted that the individuals who were highly numerate were more successful than less numerate individuals. It was concluded that highly numerate individuals in comparison to less numerate individuals applied numerical principles, tended to draw affective meaning from numbers, were less susceptible to framing effect and they gave precise responce. Less nume-rate individuals were influenced by irrelevant information and drew poor precise meaning from relevant numbers.

The Effect of Decision – Making Competence on Managerial Performance 9
http://ijcf.ticaret.edu.tr
Analyses indicated that the effect of numeracy was not a result of general intelligence (Peters et. al., 2006, pp. 412-413). It was understood that being acquainted with the numbers contributed to decision-making competence by way of analytical skills. Another concept related to decision-making competence is critical thinking According to Bensley et. al. (2010), criti-cal thinking is to analyze the evidence comprehensively and totally in order to draw sound conslusions from evidence relavant to a claim (Bensley, Crowe, Bernhardt, Buckner and Allman, 2010, p. 91). It is seen that critical thinking is closely related to creative approach, problem solving and decision-making. Naktiyok and Çiçek (2014) found that there were positive and significant relationships between strategic insight and critical thinking (Naktiyok and Çiçek, 2014, p. 175). Resistance to framing and sunk cost fallacy are factors effecting decision-making competency. In the study conduc-ted by Carnevale et. al. (2011), it was seen that managers those high in need for cognition were less affected by resis-tance to framing and sunk costs than those low in need for cognition and these managers performed better than control group in the dimensions of resistance to framing, consistency in risk perceptions and resistance to sunk costs of decision-making competence (Carnevale, Inbar and Lerner, 2011, p. 277). This study shows that cognitive enhan-cement affects decision-making competence positively. Roth et. al. (2015) also stated that sunk costs effect is attenu-ated by time and older adults had a better performance in resistance to sunk costs than younger adults (Roth, Robbert and Straus, 2015, p. 123). Leadership style and decision-making are the influential factors in managers’ managerial performance. In Flood et. al.’s study, it was seen that while authoritarian, laissez faire and transactional leadership styles related negatively with shared decision-making and team effectiveness, transformational leadership style had statistically significant and positive effects with shared decision-making and team effectiveness (Flood, Hannan, Smith, Turner, West and Dawson, 2000, s. 414). Dries and Pepermans (2012) stated that analytical skills containing decision-making, problem solving, strategic insight and intellectual curiosity are best predictors of a future performance for a leader (Dries ve Pepermans, 2012, pp. 372-373). Studies supported that leadership and decision-making are interrelated concepts.
Self-confidence is an important factor of decision-making competence and our study it also supports that it is requi-red for a manager to be successful; however, overconfidence can lead to undesirable results. Shipman and Mumford (2011) found that confidence positively influenced leader performance interpersonally, overconfidence contributed to positive results and vision sharing, but that overconfidence had detrimental effects in cognitive activities like plan-ning (Shipman and Mumford, 2011, pp. 661-662). It was seen in the study of Doukas and Petmezas (2007) that over-confident managers contributed to their institutions less than rational managers did and self-attribution bias induced managerial overconfidence (Doukas and Petmezas, 2007, p. 574). Fabricius and Büttgen (2015) pointed it out that overconfidence reduced risk awareness of project managers and therefore overconfidence caused managers to assess risks in a more optimistic framework (Fabricius and Büttgen, 2015, p. 258). The relationship between decision-making competence and managerial performance in this study shows partial rele-vance with precident studies. The dimensions of the two components when taken into account shows lack of corra-boration with other researches. Partial relevance for the study abstructed from the key findings are far from associa-ting in the main level. Moreover, relevance in research findings is valid within the constraints of regression analysis. In the upcoming years, more precise results will be obtained with the researches in which interested researchers examine conceptual structures in different sectors and different managerial levels. For this, instead of multi-scale forms, integrated scales of competence and performance can come up with more efficient results.
10 Ertuğrul Köse & Hüner Şencan
http://ijcf.ticaret.edu.tr
References
Allan, P. (1981). Managers at Work: A Large Scale Study of the Managerial Job in New York City Government. Academy of Management Journal, 24(3), 613-619.
Appelt, K. C., Milch, K. F., Handgraaf, M. J., & Weber, E. U. (2011). The Decision Making Individual Differences Inventory and Guidelines for the Study of Individual Differences in Judgment and Decision-Making Research. Judgment and Decision Making, 6(3), 252-262.
Athanasou, J. A. (2012). Adult Language, Literacy, Numeracy and Problem-Solving Skills in the Workplace. Australian Journal of Adult Learning, 52(1), 173-182.
Ayre, C., & Scally, A. J. (2014). Critical Values for Lawshe’s Content Validity Ratio: Revisiting the Original Methods of Calculation. Measurement and Evaluation in Counseling and Development, 47(1), 79-86. http://dx.doi.org/10.1177/0748175613513808.
Bavolar, J. (2013). Validation of the Adult Decision-Making Competence in Slovak Students. Judgment and Decision Making, 8(3), 386-392.
Bensley, D. A., Crowe, D. S., Bernhardt, P., Buckner, C., & Allman, A. L. (2010). Teaching and Assessing Critical Thinking Skills for Argument Analysis in Psychology. Teaching of Psychology, 37, 91-96. http://dx.doi.org/10.1080/00986281003626656.
Borman, W. C., & Brush, D. H. (1993). More Progress Toward a Taxonomy of Managerial Performance Requirements. Human Performance, 6(1), 1-21.
Bruine de Bruin, W., Parker, A. M., & Fischhoff, B. (2007). Individual Differences in Adult Decision-Making Competence. Journal of Personality and Social Psychology, 92(5), 938-956. http://dx.doi.org/10.1037/0022-3514.92.5.938.
Carnevale, J. J., Inbar, Y., & Lerner, J. S. (2011). Individual Differences in Need for Cognition and Decision-Making Competence. Personality and Individual Differences, 51, 274-278. http://dx.doi.org/10.1016/j.paid.2010.07.002.
Clement, R. W. (1992). Functions, Roles and Behaviors: Teaching the Managerial Job. Journal of Managerial Issues, 4(3), 438-446.
Del Missier, F., Mantyla, T., & Bruine de Bruin, W. (2012). Decision‐Making Competence, Executive Functioning, and Genera Cognitive Abilities. Journal of Behavioral Decision Making, 25, 331-351. http://dx.doi.org/10.1002/bdm.731.
Del Missier, F., Mantyla, T., Hanssson, P., Bruine de Bruine, W., Parker, A. M., & Nilsson, L.-G. (2013). The Multifold Relationship Between Memory and Decision Making: An Individual-Differences Study. Journal of Experimental Psychology: Learning, Memory, and Cognition, 1-21. http://dx.doi.org/1037/a0032379.
Doukas, J. A., & Petmezas, D. (2007). Acquisitions, Overconfident Managers and Self-attribution Bias. European Financial Management, 13(3), 531-577. http://dx.doi.org/10.1111/j.1468-036X.2007.00371.x.
Dries, N., & Pepermans, R. (2012). How to Identify Leadership Potential: Develeopment and Testing of a Consensus Model. Human Resource Management, 51(3), 361-385. http://dx.doi.org/10.1002/hrm.21473.
Fabricius, G., & Büttgen, M. (2015). Project Managers’ Overconfidence: How is Risk Reflected in Anticipated Project Success? Business Research, 8, 239-263. http://dx.doi.org/10.1007/s40685-015-0022-3.
The Effect of Decision – Making Competence on Managerial Performance 11
http://ijcf.ticaret.edu.tr
Finucane, M. L., & Gullion, C. M. (2010). Developing a Tool for Measuring the Decision-Making Competence of Older Adults. Psychology and Aging, 25(2), 271-288. http://dx.doi.org/10.1037/a0019106.
Finucane, M. L., & Lees, N. B. (2005). Decision-Making Competence of Older Adults: Models and Methods. Hawaii: Center for Health Research, Hawai'i, Kaiser Permanente Hawaii.
Flood, P. C., Hannan, E., Smith, K. G., Turner, T., West, M. A., & Dawson, J. (2000). Chief Executive Leadership Style, Consensus Decision Making, and Top Management Team Effectiveness. European Journal of Work and Organizational Pyschology, 9(3), 401-420.
Gliem, J. A., & Gliem, R. R. (2003). Calculating, Interpreting, and Reporting Cronbach’s Alpha Reliability Coefficient for Likert-Type Scales. The Midwest Research-to-Practice Conference in Adult, Continuing, and Community Education (pp. 82-88). Columbus: The Ohio State University.
Hall, M. (2008). The Effect of Comprehensive Performance Measurement Systems on Role Clarity, Psychological Empowerment and Managerial Performance. Accounting, Organizations and Society, 33, 141-163. http://dx.doi.org/10.1016/j.aos.2007.02.004.
Katz, R. L. (1974). Skills of an Effective Administrator. Harvard Business Review, 52(5), 90-102.
Lau, C. M. (2015). The Effects of Nonfinancial Performance Measures on Role Clarity, Procedural Fairness and Managerial Performance. Pacific Accounting Review, 27(2), 142-165. http://dx.doi.org/10.1108/PAR-03-2013-0017.
Laud, R., Arevalo, J., & Johnson, M. (2015). The Changing Nature of Managerial Skills, Mindsets and Roles: Advancing Theory and Relevancy for Contemporary Managers. Journal of Management & Organization, 1-22. http://dx.doi.org/10.1017/jmo.2015.48.
Mintzberg, H. (1990). The Manager's Job: Folklore and Fact. Harvard Business Review, 163-176.
Naktiyok, A., & Çiçek, M. (2014). Critical Thinking as a Premise of Strategic Approach: A Study on Managers. Atatürk University Journal of Economics and Administrative Sciences, 28(2), 157-178.
Parker, A. M., & Fischhoff, B. (2005). Decision-Making Competence: External Validation Through an Individual-Differences Approach. Journal of Behavioral Decision Making, 18, 1-27. http://dx.doi.org/10.1002/bdm.481.
Parker, A. M., Bruine de Bruin, W., & Fischhoff, B. (2015). Negative Decision Outcomes are More Common Among People With Lower Decision-Making Competence: An Item-Level Analysis of the Decision Outcome Inventory (DOI). Frontiers of Psychology, 6, 1-7. http://dx.doi.org/10.3389/fpsyg.2015.00363.
Peters, E., Vastfjall, D., Slovic, P., Mertz, J. K., Mazzocco, K., & Dickert, S. (2006). Numeracy and Decision Making. Pyschological Science, 17(5), 407-413.
Robertson, I. T., & Sadri, G. (1993). Managerial Self-efficacy and Managerial Performance. British Journal of Management, 4, 37-45.
Roth, S., Robbert, T., & Straus, L. (2015). On the Sunk-Cost Effect in Economic Decision-Making: A Meta-Analytic Review. Business Research, 8, 99-138. http://dx.doi.org/ 10.1007/s40685-014-0014-8.
Shipman, A. S., & Mumford, M. D. (2011). When Confidence is Detrimental: Influence of Overconfidence on Leadership Effectiveness. The Leadership Quarterly, 22, 649-665. http://dx.doi.org/10.1016/j.leaqua.2011.05.006.

12 Ertuğrul Köse & Hüner Şencan
http://ijcf.ticaret.edu.tr
Stivers, B. P., Adams, J. S., & Liu, B. (2007). Managerial Success Factors: A Chinese Profile. Journal of Teaching in International Business, 18(4), 57-80. http://dx.doi.org/10.1300/J066v18n04_04.
Şencan, H. (2016). Clues for Thesis Writing. (2016, June 27) Retrieved from http://www.ders.es/.
Vacha-Haase, T., & Thompson, B. (2004). How to Estimate and Interpret Various Effect Sizes. Journal of Counseling Psychology, 51(4), 473-481. http://dx.doi.org/10.1037/0022-0167.51.4.473.
Weller, J. A., Ceschi, A., & Randolph, C. (2015). Decision-Making Competence Predicts Domain-Specific Risk Attitudes. Frontiers in Psychology, 6, 1-12. http://dx.doi.org/10.3389/fpsyg.2015.00540.

International Journal of Commerce and Finance, Vol. 2, Issue 2, 2016, 13-25
EXCHANGE RATES’ EFFECT ON SPOT AND FUTURES EQUITY INDEX MAR-KETS: A STUDY ON BORSA ISTANBUL1
Ayben Koy, (Ph. D.)
Istanbul Commerce University, Istanbul
İhsan Ersan, (Prof. Dr.)
Istanbul University, Istanbul
Abstract: This paper examines the linkages between the foreign exchange rates, spot equity index and equity index futures. The study aims to investigate whether there is difference between the spot and futures markets in the scope of relation with the foreign exchange rates’ returns and which leads the other. The relationships are examined by using the vector autoregression (VAR) model, impulse-response functions, variance decomposition and Granger Causality tests. The sample of the study consists of US dollar to Turkish Lira rate (USD/TRY), Euro to Turkish Lira rate (EUR/TRY), BIST 30 Index and BIST 30 Index Futures. The data of the study includes the period between January 2011 and December 2014 with daily data range. Our results have evidence that the foreign exchange rate markets in Turkey are driven by the equity market.
Keywords: Exchange Rates, Equity Index, Equity Index Futures, Causality
JEL Codes: G15 and G10
1. Introduction International financial markets have become increasingly linked, both as a result of rapid financial and technological innovation. The instruments of the international financial markets like equities, stock market indices, interest rates, exchange rates, futures prices and swaps are linked with each other. There have been many studies examining the relationship between these financial instruments and financial markets. foreign exchange rates and stock market. On the other hand there have been some studies examining the relationship between the same variables and futures markets. This study aims to show the differences between spot and futures markets in the scope of relation with the foreign exchange rates’ returns. Additionally, we analyzed the effects of foreign exchange rates on basis between spot and futures index. Theoretical-ly, the futures price is the sum of spot price and cost of carrying, where cost of carrying includes time value of mon-ey from the spot date to the futures date. There should be a difference between spot price and futures price in any date except the maturity. The actual basis is the difference between the futures price and the same day's spot price and it should be zero in the maturity.
2. Literature Review In the early studies, Franck and Young (1972) could not find a significant relation between stock prices and foreign exchange rate. Aggarwal (1981) finds a stronger positive relation in the short term than long term using the simple regression method. However, Soenen and Hennigar (1988) find a negative relation. Roll’s (1992) study show that there are three main factors effecting stock market returns. First, stock market indices vary widely in the number of constituent individual common stocks and in their diversification. Some indices are more diversified than others. Second, each country's industrial structure plays a major role in explaining stock price behavior. Third, for the major-ity of countries, a portion of national equity index behavior can be ascribed to foreign exchange rate behavior. Roll’s basic data are equity price indices for 24 countries. The foreign exchange rate variable is statistically significant for
1 This study is presented in The 23rd International Academic Conference in Venice, in 27 April 2016.
Inte
rnati
on
al
Jou
rnal
of
Co
mm
erc
e a
nd
Fin
an
ce

14 Ayben Koy & İhsan Ersan
http://ijcf.ticaret.edu.tr
most of the countries. Malaysia and Sweden are not significant and Norway is significant at only the 5% level. Some other studies show that stock prices have a significant effect on the exchange rate (Smith, 1992; Bahmani-Oskooee and Sohrabian, 1992; Morley 2007) and some studies (Hasan and Javed, 2009) cannot find. Gay (2008) investigates the relationship between foreign exchange rate and oil price among the equity markets Brazil, Russia, India, and China (BRIC) by employing Box-Jenkins ARIMA model and finds no evidence about existence of significant rela-tionship among variables.
One of the studies in Turkey is Kasman (2003) analyzed the relationship between the foreign exchange rate and BIST100, finance sector index, industry index and service index. The results show that causality relationship exists only from foreign exchange rate to the industry sector index. Kasman (2003) uses the daily returns, besides Ayvaz (2006), Savaş and Can (2011), Ceylan and Şahin (2015) used the montly returns. The results of Savaş and Can (2011) indicate that Euro-Dollar Parity and Real Effective Exchange Rate Index affect the BIST100 positively with 77,5%. In addition, according to Granger Causality Test results, a causality has been
found from BIST 100 to the Euro‐Dollar Parity and Real Effective Exchange Rate. The cointegration test results of Ayvaz (2006) reveal that there exists a long-term stable relationship between foreign exchange rate and BIST 100, foreign exchange rate and financial sector index, and foreign exchange rate and industry sector index. However, there is no relationship between foreign exchange rate and service sector index. Besides, the results indicate that there is a bi-directional causality among foreign exchange rate and stock price indices. Ceylan and Şahin (2015)’s findings ob-tain that; rate of foreign exchange and equity indices are stationary at the same level and cointegrated, there is a strong causal correlation from the rates of foreign exchange to the indices. There are some studies about the relationship between exchange rates and futures prices. In some studies (Klitgaard and Weir (2004), Tornell and Yuan (2012), Hossfeld and Röthig (2016)), the relationship between the spot and fu-tures markets of the exchange rates are investigated. These studies investigate two different markets of the same financial asset. One of the focus of the study is on the effect of the exchange rates on index futures prices. The relat-ed literature is bound with the futures prices except exchange rate futures. By using the Granger causality tests and impulse response functions of VAR, Li (2011) indicate that US exchange rate isn’t related with the energy futures prices. Moussa (2012) cannot find an effect of the exchange rates on the frozen concentrated orange juice futures return. Bernardina (2014) finds that US/Euro exchange rate is one of the drivers are relevant in explaining com-modity futures returns.
3. The Data and Methodology
The sample of the study consists of USD/TRY, EUR/TRY, BIST 30 Index and BIST 30 Index Futures with the nearest maturity. The data of the study includes the January 2011 and December 2014 with daily data range and obtained from Finnet. BIST 30 index, consists of 30 stocks selected among the stocks of companies traded on the National Market and the stocks of real estate investment trusts and venture capital investment trusts traded on the Collective Products Market. A the same time, the underlying security of BIST30 Futures is BIST30 price index. The settlement of the futures index is by cash. The contracts months are February, April, June, August, October and December (Contracts with three different expiration months nearest to the current month shall be traded concur-rently. If December is not one of those three months, an extra contract with an expiration month of December shall be launched.) The expiry date is the last business day of each contract month. In case domestic markets are closed for half day due to an official holiday, expiry date shall be the preceding business day. We also analyzed the basis. Basis is the difference between the spot index price and the futures index price with the nearest maturity. We used vector autoregression (VAR) model which is an econometric model used to capture the linear interdepend-encies among multiple time series. We chose this model, because in VAR, the researcher does not need to specify which variables are endogenous or exogenous all are endogenous (Brooks). Vector autoregression model (VAR) is used to discover the connection of the different time series without selecting any of them independent. The models are applied to binary series which are consist of an equity index/equity index futures/basis and foreign exchange. Six

Exchange Rates’ Effect On Spot And Futures Equity Index Mar-Kets: A Study On Borsa Istanbul 15
http://ijcf.ticaret.edu.tr
different models are studied. VAR is applied to the stable time series. We calculated the logarithmic differences and applied the unit root tests. It is found that all of the five time series have unit root and become stable in the first differences. Thus, we run the VAR lag order selections. By the lag order decisions, we run the VAR models. We didn’t clarify the VAR models in detail. Owing to the appointed VAR models, we tried to explain the short term and long term relationship between the variables. Impulse Response and Variance Decomposition tests are used to ex-tract the short term relationship, following Granger Causality Test is used to point the long term.
4. Results and Analysis The results of the unit root tests are shown in Table 1. The Augmented Dickey–Fuller (ADF) regression tests for the existence of unit root of the variable. The null hypothesis indicates that the variable is stationary, and the alterna-tive hypothesis tests the existence of the unit root. Phillips-Perron (PP) developed an alternative unit root test proce-dure that does not affect the asymptotic distribution of the test statistics while testing for a unit root and also robust to general forms of heteroscedasticity (Teker and Alp: 2014). The null hypothesis in PP indicates that the variable is stationary, and the alternative hypothesis tests the existence of the unit root. Kwiatkowski-Phillips–Schmidt–Shin (KPSS) tests are used for testing a null hypothesis that an observable time series is stationary around a deterministic trend. The null hypothesis in KPSS is different from the other tests and tests the existence of the unit root (Kwiat-kowski, Phillips, Schmidt and Shin, 1992). It is shown in Table 3 that both of the time series that calculate from logarithmic differences are stationary.
Table 1: Unit Root Tests
VAR lag order selection results of USD/TRY and BIST30 are shown in Table 2. The criteria that used in the VAR are LR (sequential modified LR test statistic (each test at 5% level)), FPE (Final prediction error), AIC (Akaike in-formation criterion), SC (Schwarz information criterion), HQ (Hannan-Quinn information criterion). The VAR lag order selection criteria for USD/TRY and BIST30 (log differences) are shown in Table 2. The results indicate that the model should be done by three lags.
ADF PhilipsPerron KPSS
Schwarz Akaike
Lag T-stat. Prob. Lag T-stat. Prob. T-stat. Prob. Prob.
BIST30 0 -33.1532 0.00 3 -15.7517 0.00 -33.1314 0.00 0.09532
BIST30FT 0 -33.6476 0.00 2 -17.3183 0.00 -33.6073 0.00 0.09746
Basis 4 -20.0057 0.00 14 -10.9729 0.00 -108.7631 0.00 0.05289
USD/TRY 0 -30.7750 0.00 0 -30.7750 0.00 -30.7684 0.00 0.05609
EUR/TRY 1 -23.0496 0.00 1 -23.0496 0.00 -26.9736 0.00 0.1152

16 Ayben Koy & İhsan Ersan
http://ijcf.ticaret.edu.tr
Table 2: VAR Lag Order Selection Criteria: USD/TRY - BIST30
Lag LogL LR FPE AIC SC HQ
0 6360.590 NA 0.000.1 -12.7555 -12.7456 -12.7517
1 6397.438 73.4728 0.0001 -12.8214 -12.7918 -12.8101
2 6436.060 76.8583 0.0001 -12.8908 -12.8416* -12.8721*
3 6441.984 11.7643* 0.0001* -12.8947* -12.8258 -12.8685
4 6445.917 7.7950 0.0001 -12.8945 -12.8060 -12.8609
5 6448.530 5.1684 0.0001 -12.8917 -12.7835 -12.8506
6 6452.565 7.9647 0.0001 -12.8918 -12.7639 -12.8432
7 6453.783 2.3989 0.0001 -12.8862 -12.7386 -12.8301
8 6454.231 0.8805 0.0001 -12.8791 -12.7118 -12.8155
The VAR lag order selection criteria for EUR/TRY and BIST30 (log differences) are shown in Table 3. The results indicate that the model should be done by two lags.
Table 3: VAR Lag Order Selection Criteria BIST30 –EUR/TRY
Lag LogL LR FPE AIC SC HQ
0 6378.959 NA 0.0001 -12.7923 -12.7825 -12.7886
1 6413.112 68.1007 0.0001 -12.8528 -12.8233 -12.8416
2 6435.276 44.1058 0.0001* -12.8892* -12.8400* -12.8705*
3 6437.622 4.65856 0.0001 -12.8859 -12.8170 -12.8597
4 6439.752 4.2215 0.0001 -12.8822 -12.7936 -12.8485
5 6445.023 10.4262* 0.0001 -12.8847 -12.7765 -12.8436
6 6445.963 1.8548 0.0001 -12.8786 -12.7507 -12.8299
7 6446.094 0.2581 0.0001 -12.8708 -12.7232 -12.8147
8 6446.624 1.0427 0.0001 -12.8638 -12.6966 -12.8003

Exchange Rates’ Effect On Spot And Futures Equity Index Mar-Kets: A Study On Borsa Istanbul 17
http://ijcf.ticaret.edu.tr
The coefficients of the VAR Models between BIST30 – USD/TRY and BIST30 – EUR/TRY are shown in Table 4.
Table 4: VAR Model - Substituted Coefficients
(BIST30- USD/TRY) (BIST30 – EUR/TRY)
USD/TRY(-1) USD/TRY(-2) USD/TRY(-3) BIST30 (-1) BIST30 (-2) BIST30 (-3) C
BIST30 0.0912 -0.1184 -0.0307 -0.0448 0.0579 0.0441 0.0002
USD/TRY -0.0817 -0.0538 -0.0218 -0.1016 -0.1021 0.0360 0.0005
EUR/TRY(-1) EUR/TRY (-2) BIST30 (-1) BIST30 (-2) C
BIST30 0.0648 0.1504 -0.0430 0.0524 0.0002
EUR/TRY 0.1294 0.1132 -0.0755 -0.0581 0.0003
Figure 1 shows the results of impulse response tests and variance decomposition of the VAR model which applied to BIST30 and USD/TRY with two lags. If one standard deviation’s shock is applied to BIST30, USD/TRY decreases 1.5 days, then it approaches to zero until 4 days. If one standard deviation’s shock is applied to USD/TRY, there is a small decrease in BIST30 in the first day, and it approaches to zero in the same day. The variance decomposition of the model shows that nearly 20% of the variance of USD/TRY can be explained by the variance of BIST30, besides the variance of BIST30 only can be explained by its own variance.
Figure 1: Impulse Response Tests and Variance Decomposition of BIST30-USD/TRY
-.004
-.002
.000
.002
.004
.006
1 2 3 4 5 6 7 8 9 10
Response of DLOGUSDTRY to DLOGUSDTRY
-.004
-.002
.000
.002
.004
.006
1 2 3 4 5 6 7 8 9 10
Response of DLOGUSDTRY to DLOGBIST30
-.005
.000
.005
.010
.015
.020
1 2 3 4 5 6 7 8 9 10
Response of DLOGBIST30 to DLOGUSDTRY
-.005
.000
.005
.010
.015
.020
1 2 3 4 5 6 7 8 9 10
Response of DLOGBIST30 to DLOGBIST30
Response to Cholesky One S.D. Innovations ± 2 S.E.
0
20
40
60
80
100
1 2 3 4 5 6 7 8 9 10
Percent DLOGUSDTRY variance due to DLOGUSDTRY
0
20
40
60
80
100
1 2 3 4 5 6 7 8 9 10
Percent DLOGUSDTRY variance due to DLOGBIST30
0
20
40
60
80
100
1 2 3 4 5 6 7 8 9 10
Percent DLOGBIST30 variance due to DLOGUSDTRY
0
20
40
60
80
100
1 2 3 4 5 6 7 8 9 10
Percent DLOGBIST30 variance due to DLOGBIST30
Variance Decomposition
Figure 2 shows the results of impulse response tests and variance decomposition of the VAR model which applied to BIST30 and EUR/TRY with two lags. If one standard deviation’s shock is applied to BIST30, EUR/TRY decreases 1.5 days, then it approaches to zero until 4 days. If one standard deviation’s shock is applied to EUR/TRY, there is a very small increase in BIST30, in the second day, and it approaches to zero in the same day. The variance decompo-

18 Ayben Koy & İhsan Ersan
http://ijcf.ticaret.edu.tr
sition of the model shows that nearly 10% of the variance of EUR/TRY can be explained by the variance of BIST30, besides the variance of BIST30 only can be explained by its own variance.
Figure 2: Impulse Response Tests and Variance Decomposition of BIST30-EUR/TRY
-.005
.000
.005
.010
.015
.020
1 2 3 4 5 6 7 8 9 10
Response of DLOGBIST30 to DLOGBIST30
-.005
.000
.005
.010
.015
.020
1 2 3 4 5 6 7 8 9 10
Response of DLOGBIST30 to DLOGEURTRY
-.002
.000
.002
.004
.006
1 2 3 4 5 6 7 8 9 10
Response of DLOGEURTRY to DLOGBIST30
-.002
.000
.002
.004
.006
1 2 3 4 5 6 7 8 9 10
Response of DLOGEURTRY to DLOGEURTRY
Response to Cholesky One S.D. Innovations ± 2 S.E.
0
20
40
60
80
100
1 2 3 4 5 6 7 8 9 10
Percent DLOGBIST30 variance due to DLOGBIST30
0
20
40
60
80
100
1 2 3 4 5 6 7 8 9 10
Percent DLOGBIST30 variance due to DLOGEURTRY
0
20
40
60
80
100
1 2 3 4 5 6 7 8 9 10
Percent DLOGEURTRY variance due to DLOGBIST30
0
20
40
60
80
100
1 2 3 4 5 6 7 8 9 10
Percent DLOGEURTRY variance due to DLOGEURTRY
Variance Decomposition
The VAR lag order selection criteria for USD/TRY and BIST30 Futures (log differences) are shown in Table 5. The results indicate that the model should be done by three lags.
Table 5: VAR Lag Order Selection Criteria: BIST30 Futures-USD/TRY
Lag LogL LR FPE AIC SC HQ
0 6332.066 NA 1.05e-08 -12.6982 -12.6884 -12.6945
1 6368.669 72.9869 9.81e-09 -12.7636 -12.7341 -12.7524
2 6406.024 74.3352 9.18e-09 -12.8305 -12.7814* -12.8118*
3 6412.990 13.8342* 9.13e-09* -12.8365* -12.7676 -12.8103
4 6415.068 4.11865 9.16e-09 -12.8326 -12.7441 -12.7990
5 6417.893 5.5870 9.18e-09 -12.8303 -12.7221 -12.7891
6 6422.389 8.8743 9.17e-09 -12.8313 -12.7034 -12.7827
7 6423.553 2.2922 9.23e-09 -12.8256 -12.6780 -12.7695
8 6424.195 1.2628 9.29e-09 -12.8189 -12.6516 -12.7553

Exchange Rates’ Effect On Spot And Futures Equity Index Mar-Kets: A Study On Borsa Istanbul 19
http://ijcf.ticaret.edu.tr
The VAR lag order selection criteria for EUR/TRY and BIST30 Futures (log differences) are shown in Table 6. The results indicate that the model should be done by two lags.
Table 6: VAR Lag Order Selection Criteria: BIST30 Futures-EUR/TRY
Lag LogL LR FPE AIC SC HQ
0 6350.153 NA 0.0001 -12.7345 -12.7247 -12.7308
1 6386.040 71.5579 0.0001 -12.7985 -12.7690 -12.7873
2 6407.716 43.1347* 0.0001* -12.8339* -12.7847* -12.8152*
3 6410.732 5.98895 0.0001 -12.8320 -12.7631 -12.8058
4 6411.453 1.42938 0.0001 -12.8254 -12.7368 -12.7917
5 6416.052 9.0966 0.0001 -12.8266 -12.7184 -12.7854
6 6416.676 1.2321 0.0001 -12.8198 -12.6919 -12.7712
7 6416.950 0.5394 0.0001 -12.8123 -12.6648 -12.7562
8 6417.443 0.9686 0.0001 -12.8053 -12.6380 -12.7417
The coefficients of the VAR Models between BIST30 Futures – USD/TRY and BIST30 Futures – EUR/TRY are shown in Table 7.
Table 7: VAR Models - Substituted Coefficients (BIST30 Futures- USD/TRY)
(BIST30 Futures– EUR/TRY)
USD/TRY (-1) USD/TRY (-2) USD/TRY (-3) BIST30FT (-1) BIST30 FT (-2) BIST30FT (-3) C
BIST30FT 0.0722 -0.1699 -0.0217 -0.0597 0.0249 0.0495 0.0003
USD/TRY -0.0788 -0.0535 -0.0263 -0.0993 -0.0976 -0.0381 0.0005
EUR/TRY (-1) EUR/TRY (-2) BIST30FT (-1) BIST30FT (-2) C
BIST30FT 0.0414 -0.1980 -0.0597 0.0196 0.0003
EUR/TRY 0.0133 -0.1119 -0.0759 -0.0543 0.0003
Figure 3 shows the results of impulse response tests and variance decomposition of the VAR model which applied to BIST30 Futures and USD/TRY with three lags. If one standard deviation’s shock is applied to BIST30 Futures, USD/TRY decreases 1.5 days, then it approaches to zero until 4 days. If one standard deviation’s shock is applied to USD/TRY, there is a small decrease in BIST30 Futures in the third day, and it approaches to zero in the next day. The variance decomposition of the model shows that nearly 20% of the variance of USD/TRY can be explained by the variance of BIST30 Futures, besides the variance of BIST30 Futures only can be explained by its own variance.

20 Ayben Koy & İhsan Ersan
http://ijcf.ticaret.edu.tr
Figure 3: Impulse Response Tests and Variance Decomposition of BIST30 Futures-USD/TRY
-.005
.000
.005
.010
.015
.020
1 2 3 4 5 6 7 8 9 10
Response of DLOGBIST30FT to DLOGBIST30FT
-.005
.000
.005
.010
.015
.020
1 2 3 4 5 6 7 8 9 10
Response of DLOGBIST30FT to DLOGUSDTRY
-.004
-.002
.000
.002
.004
.006
1 2 3 4 5 6 7 8 9 10
Response of DLOGUSDTRY to DLOGBIST30FT
-.004
-.002
.000
.002
.004
.006
1 2 3 4 5 6 7 8 9 10
Response of DLOGUSDTRY to DLOGUSDTRY
Response to Cholesky One S.D. Innovations ± 2 S.E.
0
20
40
60
80
100
1 2 3 4 5 6 7 8 9 10
Percent DLOGBIST30FT variance due to DLOGBIST30FT
0
20
40
60
80
100
1 2 3 4 5 6 7 8 9 10
Percent DLOGBIST30FT variance due to DLOGUSDTRY
0
20
40
60
80
100
1 2 3 4 5 6 7 8 9 10
Percent DLOGUSDTRY variance due to DLOGBIST30FT
0
20
40
60
80
100
1 2 3 4 5 6 7 8 9 10
Percent DLOGUSDTRY variance due to DLOGUSDTRY
Variance Decomposition
Figure 4 shows the results of impulse response tests and variance decomposition of the VAR model which applied to BIST30 Futures and EUR/TRY with two lags. If one standard deviation’s shock is applied to BIST30 Futures, EUR/TRY decreases 1.5 days, then it approaches to zero until 4 days. Although, if one standard deviation’s shock is applied to EUR/TRY, there is a very small decrease in BIST30 Futures in the third day, and it approaches to zero in the next day. The variance decomposition of the model shows that nearly 10% of the variance of EUR/TRY can be explained by the variance of BIST30 Futures, besides the variance of BIST30 Futures only can be explained by its own variance.
Figure 4: Impulse Response Tests and Variance Decomposition of BIST30 Futures-EUR/TRY
-.005
.000
.005
.010
.015
.020
1 2 3 4 5 6 7 8 9 10
Response of DLOGBIST30FT to DLOGBIST30FT
-.005
.000
.005
.010
.015
.020
1 2 3 4 5 6 7 8 9 10
Response of DLOGBIST30FT to DLOGEURTRY
-.002
.000
.002
.004
.006
1 2 3 4 5 6 7 8 9 10
Response of DLOGEURTRY to DLOGBIST30FT
-.002
.000
.002
.004
.006
1 2 3 4 5 6 7 8 9 10
Response of DLOGEURTRY to DLOGEURTRY
Response to Cholesky One S.D. Innovations ± 2 S.E.
0
20
40
60
80
100
1 2 3 4 5 6 7 8 9 10
Percent DLOGBIST30FT variance due to DLOGBIST30FT
0
20
40
60
80
100
1 2 3 4 5 6 7 8 9 10
Percent DLOGBIST30FT variance due to DLOGEURTRY
0
20
40
60
80
100
1 2 3 4 5 6 7 8 9 10
Percent DLOGEURTRY variance due to DLOGBIST30FT
0
20
40
60
80
100
1 2 3 4 5 6 7 8 9 10
Percent DLOGEURTRY variance due to DLOGEURTRY
Variance Decomposition

Exchange Rates’ Effect On Spot And Futures Equity Index Mar-Kets: A Study On Borsa Istanbul 21
http://ijcf.ticaret.edu.tr
The VAR lag order selection criteria for USD/TRY and Basis (log differences) are shown in Table 11. The results indicate that the model should be done by six lag.
Table 8: VAR Lag Order Selection Criteria: BASIS-USD/TRY
Lag LogL LR FPE AIC SC HQ
0 7738.244 NA 0.0001 -15.5190 -15.5092 -15.5153
1 7863.296 249.3520 0.0001 -15.7619 -15.7324 -15.7507
2 7895.524 64.1330 0.0001 -15.8185 -15.7693* -15.7998
3 7904.494 17.8146 0.0001 -15.8285 -15.7596 -15.8023*
4 7907.668 6.2903 0.0001 -15.8268 -15.7383 -15.7932
5 7916.652 17.7686 0.0001 -15.8368 -15.7286 -15.7957
6 7924.567 15.6245* 0.0001* -15.8447* -15.7168 -15.7961
7 7925.179 1.2055 0.0001 -15.8379 -15.6903 -15.7818
8 7928.551 6.6284 0.0001 -15.8366 -15.6694 -15.7730
The VAR lag order selection criterias for EUR/TRY and Basis (log differences) are shown in Table 9. The results indicate that the model should be done by six lag.
Table 9: VAR Lag Order Selection Criteria: BASIS-EUR/TRY
Lag LogL LR FPE AIC SC HQ
0 7759.177 NA 0.0001 -15.5610 -15.5512 -15.5573
1 7896.122 273.0660 0.0001 -15.8277 -15.7982 -15.8165
2 7933.541 74.4633 0.0001 -15.8948 -15.8456* -15.8761
3 7943.174 19.1297 0.0001 -15.9061 -15.8372 -15.8799*
4 7946.946 7.4760 0.0001 -15.9056 -15.8171 -15.8720
5 7954.588 15.1147 0.0001 -15.9129 -15.8047 -15.8718
6 7962.547 15.7118* 0.0001* -15.9209* -15.7930 -15.8722
7 7963.589 2.0528 0.0001 -15.9149 -15.7673 -15.8588
8 7965.837 4.4187 0.0001 -15.9114 -15.7441 -15.8478

22 Ayben Koy & İhsan Ersan
http://ijcf.ticaret.edu.tr
The coefficients of the VAR Models between Basis – USD/TRY and Basis – EUR/TRY are shown in Table 10.
Table 10: VAR Models: Basis and USD/TRY, Basis and EUR/TRY
Basis USD/TRY Basis EUR/TRY
USD/TRY (-1) 0.0136 -0.0204 EUR/TRY (-1) 0.0111 0.1769
USD/TRY (-2) -0.0448 0.0148 EUR/TRY (-2) -0.0435 -0.1235
USD/TRY (-3) -0.0167 0.0197 EUR/TRY (-3) -0.0192 0.0459
USD/TRY (-4) 0.01 0.0075 EUR/TRY (-4) 0.0031 -0.0237
USD/TRY (-5) 0.0022 -0.0271 EUR/TRY (-5) -0.0042 0.056
USD/TRY (-6) -0.0257 -0.1384 EUR/TRY (-6) -0.0304 -0.0224
Basis (-1) -0.6409 0.0305 Basis (-1) -0.6427 -0.0983
Basis (-2) -0.3649 -0.0159 Basis (-2) -0.3649 -0.0649
Basis (-3) -0.2309 0.0001 Basis (-3) -0.2333 -0.0977
Basis (-4) -0.1769 0.0008 Basis (-4) -0.1803 -0.1318
Basis (-5) -0.1621 0.0687 Basis (-5) -0.1644 -0.1233
Basis (-6) -0.799 0.0341 Basis (-6) -0.0805 -0.1289
C 0.0001 0.0004 C 0.001 0.0003
Figure 5 shows the results of impulse response tests and variance decomposition of the VAR model which applied to Basis and USD/TRY with six lags. If one standard deviation’s shock is applied to Basis, USD/TRY has a late and weak response in the seventh day. Besides if one standard deviation’s shock is applied to USD/TRY, there is a small decrease in Basis in the third day, and it approaches to zero in the same day. The variance decomposition of the model shows that Basis and USD/TRY only can be explained by their own variances.
Figure 5: Impulse Response Tests and Variance Decomposition of Basis-USD/TRY
0
20
40
60
80
100
1 2 3 4 5 6 7 8 9 10
Percent DLOGBASIS variance due to DLOGBASIS
0
20
40
60
80
100
1 2 3 4 5 6 7 8 9 10
Percent DLOGBASIS variance due to DLOGUSDTRY
0
20
40
60
80
100
1 2 3 4 5 6 7 8 9 10
Percent DLOGUSDTRY variance due to DLOGBASIS
0
20
40
60
80
100
1 2 3 4 5 6 7 8 9 10
Percent DLOGUSDTRY variance due to DLOGUSDTRY
Variance Decomposition
-.003
-.002
-.001
.000
.001
.002
.003
.004
1 2 3 4 5 6 7 8 9 10
Response of DLOGBASIS to DLOGBASIS
-.003
-.002
-.001
.000
.001
.002
.003
.004
1 2 3 4 5 6 7 8 9 10
Response of DLOGBASIS to DLOGUSDTRY
-.002
.000
.002
.004
.006
.008
1 2 3 4 5 6 7 8 9 10
Response of DLOGUSDTRY to DLOGBASIS
-.002
.000
.002
.004
.006
.008
1 2 3 4 5 6 7 8 9 10
Response of DLOGUSDTRY to DLOGUSDTRY
Response to Cholesky One S.D. Innovations ± 2 S.E.

Exchange Rates’ Effect On Spot And Futures Equity Index Mar-Kets: A Study On Borsa Istanbul 23
http://ijcf.ticaret.edu.tr
Figure 6 shows the results of impulse response tests and variance decomposition of the VAR model which applied to Basis and EUR/TRY with six lags. If one standard deviation’s shock is applied to Basis, EUR/TRY has a weak de-crease in the second day. Although, if one standard deviation’s shock is applied to EUR/TRY, there is a small de-crease in Basis in the third day, and it approaches to zero in the same day. The variance decomposition of the model shows that Basis and EUR/TRY only can be explained by their own variances.
Figure 6: Impulse Response Tests and Variance Decomposition of Basis-EUR/TRY
The results of the Granger Causality for all of the VAR Models are shown in Table 11. The Granger causality test is a statistical hypothesis test to determine whether one time series is an explaining variable for the other. The test identifies any causal relationship between the variables. Three types of Granger causality might be identified between two time series A and B. A might be the Granger cause of B, B might be the Granger cause of A or two of the series might be Granger cause of each other. As mentioned before, while the impulse-response tests and the variance de-composition tests explain the short run relationship, the Granger Causality Test explains the long run relationship. The results indicate that the logarithmic differences of BIST30 Index and BIST30 Index Futures are Granger Causal-ity of the logarithmic differences of the foreign exchange rates. Especially if an international investor decide to in-vest in Turkey in a long term maturity, following BIST30 Index and BIST30 Index Futures would be recommended. Changes in index prices would be an indicator for foreign exchanges. Conversely, USD/TRY or EUR/TRY is not a Granger cause for BIST30 Index, BIST30 Index Futures or the basis.
0
20
40
60
80
100
1 2 3 4 5 6 7 8 9 10
Percent DLOGEURTRY variance due to DLOGEURTRY
0
20
40
60
80
100
1 2 3 4 5 6 7 8 9 10
Percent DLOGEURTRY variance due to DLOGBASIS
0
20
40
60
80
100
1 2 3 4 5 6 7 8 9 10
Percent DLOGBASIS variance due to DLOGEURTRY
0
20
40
60
80
100
1 2 3 4 5 6 7 8 9 10
Percent DLOGBASIS variance due to DLOGBASIS
Variance Decomposition
-.002
.000
.002
.004
.006
.008
1 2 3 4 5 6 7 8 9 10
Response of DLOGEURTRY to DLOGEURTRY
-.002
.000
.002
.004
.006
.008
1 2 3 4 5 6 7 8 9 10
Response of DLOGEURTRY to DLOGBASIS
-.003
-.002
-.001
.000
.001
.002
.003
.004
1 2 3 4 5 6 7 8 9 10
Response of DLOGBASIS to DLOGEURTRY
-.003
-.002
-.001
.000
.001
.002
.003
.004
1 2 3 4 5 6 7 8 9 10
Response of DLOGBASIS to DLOGBASIS
Response to Cholesky One S.D. Innovations ± 2 S.E.

24 Ayben Koy & İhsan Ersan
http://ijcf.ticaret.edu.tr
Table:11 Granger Causality Tests
Dependent Variable Causality Variable Chi- sq Lags Probability
BIST30 USD/TRY 3.1014 3 0.3763
USD/TRY BIST30 161.8467 3 0.0000
BIST30 EUR/TRY 3.1508 2 0.2069
EUR/TRY BIST30 70.7317 2 0.0000
BIST30 FT USD /TRY 4.3318 3 0.2278
USD/TRY BIST30 FT 156.4857 3 0.0000
BIST30 FT EUR/TRY 4.8139 2 0.0901
EUR/TRY BIST30 FT 71.3616 2 0.0000
BASIS USD/TRY 9.8910 6 0.1293
USD/TRY BASIS 7.9607 6 0.2410
BASIS EUR/TRY 10.2830 6 0.1252
EUR/TRY BASIS 9.9876 6 0.1132
5. Conclusion: Both BIST30 and BIST30 Futures have the same effect on the foreign exchange rates. The impulse response tests indicates that if there is a shock in spot or futures index Borsa Istanbul, each of the two foreign exchange rates (USD/TRY and EUR/TRY) give the same response. They decrease in the first two days, and the response disap-pears in the fourth day. Besides, the variance decomposition tests show that nearly 10%-20% of the variance of foreign exchange rates can be explained by the variance of the spot or futures equity indices. However foreign ex-change rates’ variances don’t explain the variances of the equity indexes. In addition, basis between spot and futures indices do not have a prominent response to the changes in foreign exchange rates and foreign exchange rates do not have to the change in basis too. While the impulse-response tests and the variance decomposition tests explain the short run relationship, the Granger Causality Test explains the long run relationship. The results indicate that the logarithmic differences of BIST30 and BIST30 Futures are Granger Causality of the logarithmic differences of the foreign exchange rates. In literature, there are different results for the relationship between foreign exchange rates and Borsa Istanbul equity market. We found an evident result in the short run and also long run. Our results confirm Ayvaz (2006), Savaş and Can (2011) thus the foreign exchange rate markets in Turkey are driven by the equity market. One of the reasons might be the international investors who interest in those equities in BIST30. Therefor BIST30 is an important indi-cator for Turkey financial markets. In further studies we recommend searching the related literature and doing anal-yses between the variables in this study and portfolio invests.
References
Aggarwal, R. (2003) "Exchange rates and stock prices: A study of the US capital markets under floating exchange rates." , Akron Business and Economic Review, 12, 7-12.
Arshad H. and Javed, M. T. (2009) “An Empirical Investigation of the Causal Relationship among Monetary Varia-bles and Equity Market Returns”, The Lahore Journal of Economic, 14(1), 115-137.

Exchange Rates’ Effect On Spot And Futures Equity Index Mar-Kets: A Study On Borsa Istanbul 25
http://ijcf.ticaret.edu.tr
Ayvaz, Ö, (2006). “Döviz Kuru ve Hisse Senetleri Arasındaki Nedensellik İlişkisi”, Gazi Üniversitesi İİBF Dergisi, 8(2), 1-14.
Bahmani- Oskooee M. and Sohrabian A. (1992). “Stock Prices and The Effective Exchange Rate of The Dollar”, Applied Economics, 24, 459–64.
Bernardina, A. (2014), “The Influence of Biofuels, Economic and Financial Factors on Daily Returns of Commodity Futures Prices”, Energy Policy, 69, 227-247.
Brooks, C.. (2010), Introductory Econometrics for Finance, Cambridge University Press. Ceylan S. and Şahin B. Y. (2015). “Relationship between Stock Prices and Exchange Rate”, The Journal of Academic
Social Science Studies, (37), 399-408. Franck, P. and Young, A. (1972), “Stock Price Reaction of Multinational Firms to Exchange Realignments”, Financial
Management, (1), 66‐73. Gay R. D. (2008), “Effect Of Macroeconomic Variables On Stock Market Returns For Four Emerging Economies:
Brazil, Russia, India, And China”, International Business & Economics Research Journal, 7(3), 1-8. Hossfeld, O and Röthig A. (2016), “Do Speculative Traders Anticipate or Follow USD/EUR Exchange Rate
Movements? New Evidence on The Efficiency of The EUR Currency Futures Market”, Finance Research Letters, doi:10.1016/j.frl.2016.04.019.
Kasman, S. (2003), “The Relationship between Exchange Rates and Stock Prices: A Causality Analysis”, Dokuz Eylül Üniversitesi Sosyal Bilimler Enstitüsü Dergisi, 5(2), 70-79.
Klitgaard, T. and Weir L. (2004), “Exchange Rate Changes and Net Positions of Speculators in The Futures Mar-kets”, Federal Reserve Bank of New York Economic Policy Review, 10(1), 17-28.
Kwiatkowski D., Phillips P.C.B., Schmidt P. and Shin Y. (1992), “Testing the Null Hypothesis of Stationarity Against the Alternative of a Unit Root”, Journal of Econometrics, (54), 159-178.
Leblebici Teker, D. and Aykaç Alp E. (2014), “Granger Causality Relation Between Interest Rates and Stock Mar-kets: Evidence from Emerging Market”, European Journal of Business and Social Sciences, 2(10) ,63-73.
Li, Raymond (2011), “Energy Futures Prices and The US Dollar Exchange Rate”, Australian Economic Papers, 62-73, doi: 10.1111/j.1467-8454.2011.00411.x
Morley, B. (2007), “The monetary model of the exchange rate and equities: an ARDL bounds testing approach School of Management and Business”, Applied Financial Economics, (17), 391–397.
Roll, R. (1992), “Industrial Structure and the Comparative Behavior of International Stock Market Indices”, The Journal of Finance, 17(1), 3-41.
Moussa, F. K. (2012), “The Impact of Stock Prices Return, Energy Prices Return, and Exchange Rate Changes on Orange Juice Futures Price Return”, International Journal of Business, Accounting and Finance, 6(1), 124-131.
Savaş İ. ve Can İ. (2011), “Euro-Dolar Paritesi ve Reel Döviz Kuru’nun İMKB 100 Endeksi’ne Etkisi”, Eskişehir Osmangazi Üniversitesi İİBF Dergisi, 6(1), 323-339. Smith, C. (1992), “Equities and the UK exchange rate: a multi-country approach”, Applied Economics, (24), 327–35. Soenen, L. A. ve Hennigar, E. S. (1988), “An Analysis of Exchange Rates and Stock Prices: the U.S. Experience
between 1980 and 1986”, Akron Business and Economic Review, (19), 7-16. Tornell, A. and Yuan, C. (2012), “Speculation and Hedging in The Currency Futures Markets: Are They Informative
to The Spot Exchange Rates?”, Journal of Futures Markets, 32(2), 122-151. Finnet.

International Journal of Commerce and Finance, Vol. 2, Issue 2, 2016, 27-39
DETERMINATION OF ANGER EXPRESSION AND ANGER MANAGEMENT
STYLES AND AN APPLICATION ON OPERATING ROOM NURSES
Hülya Aslan, (Nurse Supervisor Assc.)
Yeditepe University Hospital, Istanbul
Nilay Gemlik, (Dr.)
Faculty of Health Sciences, Marmara University, İstanbul
Gülfer Bektaş, (Dr.)
Acibadem University, School of Healthcare Management, İstanbul
Abstract:
This research has been carried out in order to determine anger expression and anger management styles in operating room nurses. By applying an in-depth interview technique on operating room nurses working in a private hospital, a qualitative study has been performed in order to determine anger expression and anger management styles in operating room nurses. The interview consisted of ten questions such as demographic questions addressing the workers’ age, sex, education level and duration of employment in the organization they work, aiming to determine their anger expression and anger management styles. Since operating room environments contain various risk factors, and require active team work in a stressful dynamic setting under excessive workload, , it has been found that operating room nurses display their anger through loud speaking, fail to settle their anger positively, fail to control their anger in a behavioural pattern despite their cognitive awareness in anger management. Thus, it has been suggested that operating room nurses should be trained on anger management methods so that they can manage their anger in a stressful operating room environment.
Keywords: Anger, Anger Expression, Anger Management Methods, Operating Room Nurses
1. Introduction Like love and joy experienced in human life, anger is a - feeling observed in all living species in nature. Like other feelings, anger is a feeling that affects many systems cognitively and physiologically. Although anger is considered to be a negative emotion, it can be turned to a positive one if properly managed, and is universal. Expression of anger is an acquired behaviour. Majority of anger-related problems are caused by inappropriate expression of anger, and how critical it is to express the anger properly is still debated. One of the most important things to know about anger is that, emergence or experience of anger may not be avoided as anger is a natural emotion. Therefore, feeling anger is something that can never be ignored. For an individual to experience his anger, which is a natural emotion, without harming himself and the environment, the individual should first recognize and identify anger, and then express it in a positive way (Sülün, 2013:2). A very healthy and natural feeling when expressed appropriately, anger leads to significant problems in business life, personal relationships and overall quality of life when it becomes uncontrollable and destructive. In addition, failure
to express anger appropriately depletes the individual’s energy and makes it difficult for the individual to control his behaviours (Baran, 2009:1).
Inte
rnati
on
al
Jou
rnal
of
Co
mm
erc
e a
nd
Fin
an
ce

28 Hülya Aslan, Nilay Gemlik, Gülfer Bektaş
Due to intensive working conditions, higher number of patients, paucity of budget and economic resources and conflicts within the team, nursing profession is considered to be an occupational group frequently exposed to anger. This study has been conducted to identify how operating room nurses express and control their anger.
2. Overview 2.1. The concept of anger There are many definitions for the feeling of anger which we frequently experience in our daily and business life. Lexically, anger is defined as the aggressive reaction, annoyance, rage and fury in response to frustration, offence or threat (www.tdk.gov.tr Date of access: April 19, 2015). Anger is one of the five basic emotions of a person, others of which are happiness, sadness, fear and hate (Bilge and Ünal,2005:189-196). Anger is an important sign indicating that we are hurt, our rights are violated, our requirements or demands are not properly satisfied, or simply things go wrong (Lerner,2014:5-15). As an inborn sense developing early in life, anger is a quite natural, universal, aggression- and violence-free and life-enriching emotional reaction necessary to sustain in response to unsatisfied demands, undesired results and unmet expectations (Albayrak and Happy 2009: 57-69). Based on these definitions, we experience the feeling of anger as a result of unrealized expectations in daily and business life, dissatisfaction about the life, unhappiness, encountering various undesired situations, and reduced tolerance. When expressed quite naturally and properly like other feelings, anger is indeed constructive and can enhance communication between individuals. However, anger may also turn to an uncontrolled behavioural abnormality potentially culminating in aggressive and highly destructive reactions.
2.1.1. Functions of anger Although anger is commonly perceived as a negative emotion harming people, it is in fact a humane, normal and healthy emotion. It is necessary for the individual to safeguard his presence and establish it in his environment.
Despite commonly connoting negativity, anger is also known to have a set of functions that make one’s life easier. The functions of anger are summarized as follows;
Anger energizes,
Anger prevents disturbing internal reactive behaviours that further infuriate one’s emotions,
Anger facilitates the expression of negative feelings towards others,
Anger also makes a person bold in achieving his demands,
Anger warns a person that he is being irritated,
Anger builds a defence against the risk of damage to ego resulting from the orientation of the concern to external conflicts (Falcon, 2005: 1-22).
Expression of anger constructively fosters trust, intimacy and empathy in interpersonal relationships, and founds a basis for communication by giving a sense of self-control (Batıgün and Falcon, 2009: 1-193). While directly warning the individual for a problem and allowing him to protect himself, anger may, on the other hand, harm the individual and his environment if not controlled. Hence, it has both positive and negative functions (Soyka, 2000: 19-27).

29 Hülya Aslan, Nilay Gemlik, Gülfer Bektaş
Briefly, anger is an efficient, productive and motivating condition when not suppressed and denied. Yet, when denied and suppressed, anger turns into a condition that harms individuals as well as their environment. The resulting frustration deteriorates relationships between people and its suppression leads to mental and physical disorders. Furthermore, when intense feelings of anger are experienced, verbal and non-verbal aggression may occur.
2.1.2. Causes of anger Anger may develop both from internal and external causes. Anger may be directed at a specific person or a specific event, as well as being a result of general individual problems. Given the complex nature of anger, abundance of internal and external factors involved in evaluating anger is remarkable. Internal causes: Basic feelings underlying internal causes driving anger are jealousness, sadness, worry, loneliness, alienation, anxiety, frustration, injustice, not being understood and distress. Such primary feelings lead to anger when they accumulate, harden and solidify (Tatlıoğlu and Karaca, 2013:1102-1123). External causes: Injustice, physical harm and injury, getting harassed, attacked and threatened. While external causes of anger may be the physical environmental factors or individual disputes arising from disagreement, a variety of social and cultural factors introduced by the social life may also take place (Tatlıoğlu and Karaca, 2013: 1102-1123). Many people and events we encounter in our daily lives and at work may trigger anger. It may be our mother, a friend, a man on the street, traffic jam or a work-related problem. While our own personal delusions may be responsible for our anger, it may also be the memories of a past frustrating event that drive the anger. Frustration, rejection, unpleasant situations, disrespect for our personal rights as well as economic, cultural, social and biological factors we encounter at particular times in our lives constitute the stimuli that cause anger.
2.1.3. Types of anger In literature, anger is studied in two ways depending on its occurrence and expression.
2.1.3.1. Trait-destructive anger This refers to individual tendency to get angry. These individuals have higher levels of anger and get angry more often. Since anger is employed destructively, feelings of hatred, revenge, hostility, resentment, sadness, aggression and fear are experienced more intensely (İlhan, 2014:162-165). Destructive anger may cause problems in the work and family environment, interpersonal relationships, and/or the
person’s quality of life. Driving individuals to behave aggressively, anger is destructive and entails negative emotions (Kaplan, 2007:1).
2.1.3.2. Situational-constructive anger Situational anger is the form of anger that has accumulated in the individual over time and that erupt suddenly. Despite being apparently exhibited and called in the form of anger, situation anger is in fact underlain by the
individual’s sense of disappointment, injustice, suffering, frustration, offence and dissatisfaction of expectations (Ozmen, 2004: 30). In constructively expressing the anger, the angry person establishes a positive relationship with others. People exhibit direct and true, positive and healthy behaviours upon their feelings (Karslı, 2008:23).

30 Hülya Aslan, Nilay Gemlik, Gülfer Bektaş
2.1.4. Dimensions of anger There are dimensions that trigger, create and effect the expression of anger. Typically, these are physical and physiological dimensions, cognitive and emotional dimensions, and behavioural and reactive dimensions. Anger is addressed as an all-round structure composed of various variables including physiological (generally sympathetic stimulation, acceleration of heartbeat, increased blood pressure), cognitive (irrational beliefs), perceptual (subjective recognition of anger), and behavioural (mimics, verbal or behavioural expression) variables. In other words, the root causes of behavioural responses are not principally related to the events, but are rather associated with the meanings, interpretations and thoughts produced by the individual in his mind, as well as the beliefs underlying them. Such ways of thinking are formed by social experiences we are involved in since early childhood. Thus, anger and expression thereof may be said to be the collective outcome of biology and culture, our cognitive structures, and the body (Sülün, 2013:37). Anger is an emotion experienced in a broad spectrum of intensities ranging from very mild to intense. Like other emotions, physiological and biological changes are felt together. If the person is attentive, his body informs him that he is angry. There are also physical signs of anger. The stimuli mobilizes the emotion, stress and tension are initiated, and energy-driving adrenalin excretion starts followed by more frequent breathing, faster heart beating, increased
blood pressure, and the body and the mind get ready for the “Fight or escape” response (Kökdemir, 2004:7-10). Cognitive and emotional approach reveals how the person perceives and interprets the anger. Once anger is detected
and redirected by the central nervous system, the intensity of anger is determined by the person’s response to anger
and nature of this response, way of expressing the anger, person’s rational or irrational ways of thinking, beliefs, prejudices, past experiences and their association with events (Herdem, 2009:25). Depending on the type of stimulus and the individual cognitive structure, individuals display various reactions to the anger perceived. While some individuals tend to suppress or repress their anger under the effect of the community and the social system they are involved in, some attempt to exhibit their anger in different ways or express it (Peters, 2004:28).
2.1.5. Positive and negative aspects of anger Besides its positive aspects, anger has also negative ones particularly when it is not expressed properly and healthily. When anger harms interpersonal relationships, it transforms into an unhealthy state of feeling. Such mode of anger is destructive, harmful and includes aggressive behaviours. Persons that cannot control their anger commonly display certain behaviours including severe and sudden outbursts of anger, utilizing anger as an instrument to gain power, substance abuse to cope with the underlying causes of anger, overreacting to critics and rejection, and denying the responsibility for their own behaviours and blaming others.
Transformed mode of anger may be in the form of “finding a whipping boy”, namely deflection. Sometimes, it may be expressed in the opposite direction in the form of excessively polite reaction. And sometimes it may affect and impair mental health. It may lead to paralysis and tics. Anger is the underlying reason of some psychosomatic diseases such as headaches, ulcer, reflux, gastritis, high blood pressure and asthma.. Anger may be expressed in the
form of slander, gossip and conspiracy as well. Moreover, anger affects the individual’s cognitive abilities. Individual starts to consider and judge the events from that point of view. Since an angry person will judge events negatively, anger also represents a barrier to positive thinking. In this respect, sudden responses driven by anger constitute negative responses of anger. This feeling that cannot be exhibited in a positive way leads to negative results in interpersonal relationships (Genç, 2007:18).

31 Hülya Aslan, Nilay Gemlik, Gülfer Bektaş
In persons with high level of anger, regretting and drawing lessons from the negative experiences for which anger is expressed is less probable and interpersonal problems are more frequent (Dilekler et al., 2014:44-59). Anger is known as a negative emotion by almost everyone. In fact, anger dresses and protects the individual against tough and dangerous situations. By reminding that something has to change, anger helps to promote interpersonal relationships into a more productive and healthy form (İmamoğlu, 2003:35). When energy released by anger is employed constructively, anger is considered as a normal and positive feeling. By guiding the individual to react properly, it imparts to the individual strength, superiority and the ability to control events. When openly expressed, anger renders relationships meaningful, prevents interpersonal conflicts, and provides individual with the necessary motivation for change (Tambağ and Öz, 2005:11-22). On the other hand, unhealthy form of anger does not represent a tool for solving a problem, taking revenge, blaming and controlling others, and proving to be right. Unhealthy anger leads to problems in business life and overall life quality, and causes impairment of health. Anger is experienced healthily when it is expressed towards the appropriate person for appropriate reasons in a controlled manner. Anger is a reaction to a negative experience. By reminding us that something has to change, this feeling helps to transform relationships and situations into a more efficient and positive state.
2.2. Expression of anger 2.2.1. Anger expression patterns Expression of anger varies from person to person. These can be classified as inward anger, outward anger and controlled anger. While repression includes restraining and expressing anger, outward expression is manifested physically such as hitting, damaging objects, as well as verbally such as yelling, insulting and criticizing. Controlling anger means that the individual is patient and tolerant in his relationships with others, and maintains an attitude of controlling the anger. In environments based upon a good communication, the individual desires to express his feelings comfortably and
wants to be understood by others. In life, the milieu occasionally strives to control and guide the individual’s feelings and thoughts. People attempting to control and guide the feelings, thoughts and behaviours of others in life induce negative effects on people's psychological health. In this case, the primary response from the other person would be to deny and resist to the control directed to him. And this is manifested in the form of anger and exhibition of the angry behaviour. In other words, the individual harshly shows a furious reaction to the external control directed to him. The secondary response to be shown by the individual involved in such a communication may occur in the form of repressing the anger and resigning himself to the control of the external stimuli (Özmen, 2006:39-56). Whatever the sources of anger are, all people tend to get angry. However, how the anger is expressed or what induces the anger most varies by individual. Individuals displaying anger aggressively without considering the cause of their anger fail to control their reactions as they usually act without thinking. And due to such uncontrolled behaviours, they experience problems in communicating with the people around and lose their friendship. On the other hand, an individual who has attained the emotional maturity allowing him to control his feelings and behaviours first tends to temper the same excitement of anger and exhibit it without hurting others. Yet, individuals failing to exhibit their anger and constantly suppressing it may have some psychosomatic or depressive issues (Yılmaz, 2007:171-172).
2.2.2. Repressing the anger Some people have great difficulty in expressing their anger, and block the expression of anger due to the intrinsic rules and obstacles they have. Non-exhibited anger leads to physiological effects in the individual further culminating in physical health problems. It is important for such individuals to recognize their anger first.

32 Hülya Aslan, Nilay Gemlik, Gülfer Bektaş
Individuals with repressed anger have difficulty in accepting that they are angry. Reaction of these individuals to anger usually consists of passive responses. Such passive reactions to anger usually occur in the form of frowning, pout, sulk and resentment. These individuals hope that others recognize and read their thoughts. Eventually, this may end up with suffering, resentment or frowning. Individuals with repressed anger do not immediately exhibit an aggressive response when faced with an anger-triggering situation, but rather think for a long time over the severity of the situation and the reaction to give (Özmen, 2006:39-56). Finally, isolation from others and refusing to cooperate with them, silence, forgetfulness, psychosomatic disorders, depression and guilt, susceptibility to accidents, resistance to cooperation, addictive behaviours, excessive tolerance, unsociable behaviours, crying, hopes for violence and crime, intense discomfort and feeling of stress, unhappiness and tension, resentment and presence of mental suffering are the signs and symptoms of indirect expression of anger (Soykan, 2003:19-27).
2.2.3. Outward expression of anger Outward expression of anger and frequently expressing it verbally is the uncontrolled release of anger. Individuals outwardly expressing their anger need to learn how to express their anger in a more controlled and useful manner rather than releasing it in an uncontrolled way. Some individuals act despotically in a way to hurt and humiliate others. Even though such outward expression of
anger provides a temporary relief, it depletes individual’s energy, makes it difficult to control the behaviours, and render the individual aggressive and offensive. If these individuals keep releasing their senses of anger in an exposed and uncontrolled manner, they will most probably face difficulties in their interpersonal communications, be excluded from communities they are involved, and begin to have conflicts in the family, at work and in social relationships (Beyazaslan, 2012: 24). Anger may also be released through verbal forms including yelling and reprimanding, as well as non-verbal forms including glowering or hostile glances. And further, anger may be outwardly expressed in indirect forms including vilification, defamatory humour or gossip (Engin, 2004:9).
2.2.4. Controlling the anger Anger control means the acquirement of the ability to express anger properly. Anger control is one of the most
challenging emotions. It is important for the individual to understand what anger is and how to manage it. What’s critical in the control of anger is the positive rather than negative response to the situation arousing the anger. For individual happiness at home and workplace, psychological health and social cohesion, one of the important skills that an individual should have is the ability to control anger. In anger control, various skills such as using humour, maintaining a peaceful, flexible and accommodating attitude, relaxing, acknowledging, identifying and confronting the problem as well as focusing on and solving it, enhancing communication skills, sharing thoughts and feelings, changing the mindset, and being able to recognize the anger are effective ( Özkaya up and Buga, 2010:50-59). Anger and aggressive behaviours should never be perceived as a tool for problem solving, taking revenge, blaming others, justification for committing a crime, reason for violence, and a tool for advocacy and controlling others. What is healthier is to render personality as the protective instrument for the psychological and social health by constructively redefining this emotion, which initially appears negative, through appropriate trainings and methods (Tatlıoğlu and Karaca, 2013:1102-1123).

33 Hülya Aslan, Nilay Gemlik, Gülfer Bektaş
2.2.5. Methods for controlling anger There are many methods teaching anger management, yet, the accurate method depends on the individual. The
selection of the appropriate method should be based on the individual’s own personality and lifestyle. Methods for controlling anger contain cognitive, emotional, communicational and behavioural dimensions. In the cognitive method, confronting the situation inducing the anger, avoiding it, describing the event from different angles, and thinking in different perspectives may direct the individual towards more accurate responses. In
addition, individual should strive to control his anger through his own guiding sentences such as “Do not let the
anger seize you”, “Take a deep breath” etc. (Bilge and Ünal, 2005: 189-196). Next, in the emotional method, detecting the early signs of anger, being aware of the resulting feelings, discovering how the body reacts, reducing physical stimulation such as gritting teeth and fists, stomach cramps, difficulty in swallowing, biting lips, etc., and employing anger as a hint to change the thoughts and behaviours are effective (Kökdemir, 2004:7-10). Moreover, communication should be used properly to control anger. This means listening to the partner, calming down, correctly analysing the events, and criticizing positively instead of saying what immediately comes to mind during anger (Karadal, 2009:75). The purpose of the behavioural method is to prevent aggressive behaviours. It further means creating efficient, namely productive anger behaviour, avoiding and protecting from destructive and provocative behaviours, and reviewing and reassessing the root causes of and underlying the anger as well as their results. Hence, improper actions triggered by anger would be replaced by more favourable alternatives (www.aktuelpsikoloji.com). Date of access: May 16, 2015). Briefly, it is not always possible to change, fend off or move away from people that drive us angry. However, it is in our hands to learn how to control our reactions. Acknowledging anger as a normal feeling and being aware of our reactions at the time of anger are critical for controlling the anger.
2.3. An Overview On Hospitals, Operating Rooms And Nurses
2.3.1. The Hospital Environment Hospitals are among the most complex organizations, and therefore have a great potential for conflicts. Hospitals harbour various conflict inputs primarily including the involvement of many professionals from a broad range of disciplines, continuous service at full capacity, heavy workload, disputes among staff in the patient treatment process, complexity of roles, and uncertainty of tasks, leading to the frequent emergence of anger cycles. Hospitals typically represent non-profit service organizations where all varieties of health services are produced continuously and cost-effectively. Hospitals offer education, research and public health services, interact with the milieu in the healthcare industry, process various inputs into useful outputs, and display complex, expensive and specific various functions (Yılmaz, 1996:5). Furthermore, hospitals are organizations where different disciplines should collectively work across a common purpose. They offer vital services to people, race against time, employ distinct technologies, intensely interact with a big mass of people, and are hence exposed to conflicts and tension.
2.3.2. Operating Room Setting Operating rooms are typically the spaces where sophisticated technology, tools and equipment are used, various surgical techniques and methods are employed in the light of new and advanced information, and where teamwork is

34 Hülya Aslan, Nilay Gemlik, Gülfer Bektaş
critical to take and implement proper decisions rapidly. Since critical and high-risk procedures are conducted in operating rooms, their atmosphere frequently triggers anger. In addition, operating rooms are isolated sections of the hospital where required surgical treatment is conducted upon the diagnosis. An operating room can also be defined as a physical and functional space where surgical procedures are conducted. Physical components of this space are the architectural design, engineering, equipment and surgical tools. Functional components comprise systems used to apply the treatment safely, reliably and cost-effectively (Uludoğan, 2010:23). Due to the working atmosphere inside, operating rooms accommodate major issues that may be faced by operating room nurses potentially leading to anger most frequently, including anaesthesia gases leaking from the anaesthesia machine, stab wounds, non-ergonomic equipment positions and postures, solutions used for sterilization/disinfection, exposure to radioactive rays, communication issues within the team arising from the difficulty to handle a self-opinionated group, stress due to the necessity of showing utmost attention for the specific nature of the work, psychosocial problems induced by dark and lack of daylight, and disarrangement of working conditions, particularly resting and meals.
2.3.3. Operating room nurses While nurses working in an operating room provide an all-round dynamic nursing care demanding utmost attention and close observation in an isolated environment due to rapid circulation of patients, they are also supposed to use complex technological tools and equipment. Such working conditions affect operating room nurses, frequently entailing anger resulting from intense stress. Besides typical roles of getting acquainted with new knowledge and applications, new technological trends, implementing, organizing, inspecting, as well as evaluating the results, operating room nurses are also supposed to carry the skills of thinking straight, acting fast, being attentive, showing prudence, observing, being inclined to teamwork and developing good communication within the team (Gümüşkaya, 2010:9). Anger is also defined as an emotional response to frustration and intense stressors encountered at work. Negative factors impairing patient care, conditions associated with the physical work environment, heavy workload, poor social support, high mass of patients, standing for a long time, and working indoors are the compelling factors for operating room nurses. At this point, stressful working environment, absence of common goals, poor consultation within the organizational process, competition between teams, and poor communication within the team cause nurses to tend to get into conflicts and experience a rage (Bayrı, 2007:19). Operating room nurses are exposed to myriad of risks in their work environment. These are typically stress-related factors including long-term work, heavy workload, time pressure, difficult or complex tasks, insufficient rest intervals, monotony and physically poor work conditions (location, temperature and lighting). Besides, standing for long time depending on the service load, lack of sleep during on-call service, and eating disorders also add to the level of stress faced by nurses, culminating in physical, mental and social impacts (Tan et al., 2009:67-68). Operating room nursing has different characteristics from other nursing functions. Nurses are supposed to work in harmony with other members of the team within such a critical field characterized by rapid scientific and technological advancements, intensive teamwork, high level of patient dependency, and strict intolerance to unsatisfactory knowledge and skills. To maintain teamwork within the operating room is a very difficult task. There is a set of problems that the team faces. These are mainly differences in the educational background, ambiguity of roles entailing false expectations, authority, power struggle, hierarchic conflicts, and personal characteristics of team members, all frequently leading to tension within the team and inducing anger in operating room nurses (Uludoğan, 2010:25).

35 Hülya Aslan, Nilay Gemlik, Gülfer Bektaş
3. Material And Method The aim of this study is to identify how operating room nurses express and control their anger in the operating room. First, the researcher has attempted to identify the underlying causes of anger induced in nurses working in operating rooms that can be characterized as complex spaces harbouring myriad of risk factors strictly requiring a mistake-free teamwork, and further to figure out whether nurses are knowledgeable about anger management in such a complex environment. The research is a qualitative study where in-depth interviews were made through the semi-structured interview guide. This is because in a qualitative study, it is a quite strong tool as it better unveils the personal data, opinions, experiences and feelings of individuals, and is based on speech, which is the most common form of communication. Qualitative research is based on the principle of induction. Researcher is in an attempt to determine the key themes of the studied problem based on descriptive and detailed data gathered, and translate this data into a meaningful form, namely to develop a theory based on this data. Case-related factors (environment, individuals, events, processes, etc.) are explored in a holistic approach with emphasis in how they affect the case (Yıldırım and Şimşek, 2013:63). Upon the consent of participants, interview minutes and data were gathered through the semi-structured interview guide according to the convenience sampling and in-depth interview method. The in-depth interview method is a preferred method in comprehending, understanding and interpreting social reality. The interview form ensures the coverage of all dimensions and questions relating to the research problem. (Cevahir, 2013:123). In designing the questions, 2 academic researchers have been consulted with. The convenience sampling method was selected as the study method because the researcher was in the intent of involving into the study the individuals agreeing to meet at hospitals. Research was carried out through in-depth interviews as accompanied by eight operating room nurses. Each interview lasted for 15 to 20 minutes. Interview is composed of 10 questions. While creating the interview form, the emphasis was to include open-ended targeted questions that are clear and that suit the experiences of interviewees, allowing the individuals to provide more detailed answers. Also during the interview, directive reactions were avoided. Questions were structured in an order ranging from the private to common, with questions on sensitive issues being at the end of the form, and questions on knowledge and skills were logically associated with experiences (Yıldırım and Şimşek, 2013:156). Questions on the guide were aimed at identifying the demographics of employees such as date of birth, gender, educational background, term of employment in the organization, as well as their way of expressing anger and their knowledge on and experiences in anger management. To ensure the validity and reliability of the research, interviews with participants were held in the operating room, and clear, detailed and deep-focussed data were gathered during
the research through long-term interaction allowing researcher’s evaluation by the researcher, so that expert could review and the participant could assess the data gathered.
4. Results Anger may be found in majority of the employees regardless of their age, education and work experience. This study was conducted on operating room nurses at a private hospital through the in-depth interview method. Briefly, the following results have been derived from the research. Title: Operating room nurse Number of participants: 8 Gender: Female Year of birth: between 1975-1989

36 Hülya Aslan, Nilay Gemlik, Gülfer Bektaş
Educational background: Postgraduate Degree (1), Graduate Degree (1), Associate Degree (1), High School (5) Experience in the organization (years): 5 years and over in average The majority of the group defined anger as extreme tension and uncontrolled reactions resulting from injustice and dissatisfaction. Seven participants acknowledged that they are generally angry while only one stated occasional anger. The general statement of the group is that they frequently experience anger upon the mistakes of others, when they are frustrated, not understood, and in case of poor physical environment, cold, hunger, staying indoors, conflict within the team, failure and feeling worthless. Since causes of anger are common throughout the group, no association is built with their demographics. Only two of the nurses stated that they occasionally repress their anger while other nurses stated that they generally raise their voices, satirize and talk with third parties about the person making them angry. Four of the nurses stated that they experience frequent outbursts of anger while the remaining four stated rare outbursts. Four of the nurses described control of anger as the ability to manage tension at the time of anger while three described it as the ability to understand the other party, and one stated that she has no knowledge about anger management. While five of the nurses preferred to move off during anger, one stated that she tries to take a deep breath, and two stated that they are unable to control anger and have no knowledge about it. While five of the nurses stated that they go angry when they work indoors without daylight, three stated that they are used to this situation and do not experience any anger. Additionally, it was found that nurses with a term of employment of 5 years or above are stressed more when they work indoors. While eight of the nurses stated that they feel frustrated in the operating room, four stated that they get angry because of irresponsible, indifferent and insensitive behaviours of their colleagues, and the other four stated that heavy workload, long-time hunger, standing, and poorly limited resting drive them angry.
5. Discussion Majority of the operating room nurses frequently experience anger because of the risk factors in the operating room, long-time hunger and standing, poorly limited resting, staying indoors, mistakes within the team, heavy workload, and disinterested and irresponsible behaviours of colleagues in some cases. It has been found that the whole group frequently experiences anger commonly because of the mistakes of others, not being understood by others, poor physical environment, conflicts within the team, failure, and perfectionist attitudes of some. It has further been found that, at the time of anger, six of the nurses raise their voice, satirize and talk with third parties about persons making them angry, and outwardly express their anger, while two occasionally repress it. Five of the nurses exhibit verbal aggression rather than physical aggression at the time of anger, and sleep disorders entailed by their on-call service cause them feel angry. Eight of the nurses often display their angry outwardly through fury and shouting. Four of the nurses often experience outbursts of anger at home and work. The nurses generally describe the control of anger as the ability to manage tension and understand the other party at the time of anger. The nurses commonly state that they fail to control their anger, and rather prefer to leave the site.

37 Hülya Aslan, Nilay Gemlik, Gülfer Bektaş
Finally, it has been found that majority of the operating room nurses tend to confront the situation causing the
anger, avoid them, describe the events from different angles, and ask themselves the questions of “at the time of
anger, where am I?, who am I with?, what happens?, what do I expect?” in order to consider different points of view.
6. Conclusion Anger is an emotional response necessary to survive directed to unsatisfied requests, undesired outcomes and unmet expectations. The most important thing to know about anger is that the emergence or experience of anger is unavoidable. For an individual to develop the ability of experiencing anger without harming himself and his environment, he needs to first recognize and identify anger, and then express it in a positive way. Operating rooms are typically the spaces where sophisticated technology, tools and equipment are used, various surgical techniques and methods are employed in the light of new and advanced information, and teamwork is critical to take and implement proper decisions rapidly. While nurses working in an operating room provide an all-round dynamic nursing care demanding utmost attention and close observation in an isolated environment due to rapid circulation of patients, they are also supposed to use complex technological tools and equipment, and therefore such tough working conditions induce intensive stress and frequently cause anger in them. They often express anger by expressing it outwardly. Though they are cognitively aware of anger management, they fail to control anger at the behavioural side. In addition, the results of other researches provided below suggest that nurses fail to properly express and control their anger, and therefore experience various problems. In his study where the association between the way nurses express their anger and their overall health condition is explored, Bayrı (20007) has found that nurses have a high level of anger and suffer some health problems as they fail to express their anger properly. In his study where the influence of anger level on job satisfaction is explored for nurses, Baran (2009) has found that job satisfaction decreases as the scores of outward expression and repression of anger rise. In his study exploring for nurses the level of anger and way of expressing it in the working environment, İlhan (2014) has found that nurses fail to express their anger properly, leading to problems in their professional relationships. In his study exploring how nurses express their anger and communicate, Yılmaz (2009) has found that, as the level of assertiveness increases, their level of anger is reduced and they manage to control their anger. Surprisingly, there are already researches in the literature on the expression and control of anger in nurses, however there is no study specifically on operating room nurses. Though some of the operating room nurses have a high level of cognitive awareness, they fail to control anger at the behavioural side. And finally based on the foregoing facts and results, I recommend that a training support should be procured from expert professionals on the control of tension and anger in operating rooms that are highly exposed to stress.
References
Albayrak B, Kutlu Y., (2009), “Ergenlerde Öfke İfade Tarzı ve İlişkili Faktörler”, Maltepe University, Journal of Nursing Science and Art, 3, 57-69.
Balkaya F, Şahin H., N., (2003), “Journal of Turkish Psychiatry”,14,3,192-202. Baran M., (2009). Influence of Anger Level on Job Satisfaction for Nurses. Atatürk University, Institute of Health
Sciences, Master Thesis, Erzurum, (Supervisor: Asst. Assc. Dr. A. Okanlı).
Batıgün Durak A, Şahin Hisli N., (2009), “Interpersonal Style, Anger and Sense of Self: Common Elements in Psychopathology", Ankara University Scientific Research Project, 2009, Ankara, 1-193.

38 Hülya Aslan, Nilay Gemlik, Gülfer Bektaş
Bayrı F., (2007), Exploring the Association Between the Ways Nurses Express Their Anger and Their General Health. Cumhuriyet University, Institute of Health Sciences, Master Thesis, Sivas, (Supervisor: Asst. Assc. Dr. M. Kelleci).
Beyazaslan T., (2012), How Training on the Control of Anger Influences Anger and Emotional Control in Patients Diagnosed with Hypertension. Gaziantep University, Institute of Health Sciences, Master Thesis, Gaziantep, (Supervisor: Asst. Assc. Dr. D. Tanrıverdi).
Bilge A, Ünal G., (2005), “Anger, Anger Control and Approach to Nursing”, Ege University, Journal of the School of Nursing, 21,1,189-196.
Dilekler İ, Törenli Z, Selvi K., (2014), “Exploring Anger from Different Perspectives: The Anger Mechanism, Anger
and the Therapist’s Anger in Different Psychopathologies”, Ayna Clinical Psychology Journal, 13, 44-59. Engin E., (2004), Exploring the Relationship between the Anger Levels and Work Motivation in Nurses Working in
Psychiatry Clinics. Ege University, Institute of Health Sciences, PhD Thesis, Izmir (Supervisor: Assc. Dr. O. Çam).
Genç H., (2010), Exploring the Influence of Anger Management Training on the Trait Anger Levels of Grade 9 Students. Dokuz Eylül University, Institute of Educational Sciences, Master Thesis, 2010, Istanbul (Supervisor: Prof. Dr. G. Aksoy).
Gümüşkaya O., (2010), Need of Operating Room Nurses to Training. Haliç University, Institute of Health Sciences, Master Thesis, Istanbul (Supervisor: Prof. Dr. G. Aksoy).
Herdem T. E., (2009), Effectiveness of the Anger Control Program Designed for Store Employees. Hacettepe University, Institute of Social Sciences, Master Thesis, Ankara (Supervisor: Assc. Dr. F. Bilge).
İlhan K. H., (2014), Anger Levels and Ways of Expressing Anger in the Working Environment for Nurses. Haliç University, Institute of Health Sciences, Master Thesis, Istanbul (Supervisor: Asst. Assc. Dr. Ö. Işıl).
İmamoğlu S., (2003), Exploring the Relationship of the Anger and Anger Expression Styles of Preservice Teachers with their Attachment Styles. Marmara University, Institute of Educational Sciences, Master Thesis, Istanbul (Supervisor: Prof. Dr. B. Aydın).
Kaplan A., (2007), Exploring the Influence of the Program for Anger Management Skills on the Aggression Level and Sense of Self in Grade 5 Students in Primary Education. Dokuz Eylül University, Institute of Educational Sciences, Department of Educational Sciences, Master Thesis, Izmir (Supervisor: Asst. Assc. Dr. N.B. Serin).
Karadal F., (2009), Anger Management and a Research in the Niğde University. Nigde University, Institute of Social Sciences, Master Thesis, Niğde (Supervisor: Asst. Assc. Dr. İ. Yalçın).
Karslı E., (2008), Interpersonal Style, Self-Perception, Anger and Psychosomatic Disorders. Ankara University, Institute of Social Sciences, Master Thesis, Ankara (Supervisor: Assc. Dr. A. D. Batıgün).
Kökdemir H., (2004) “Anger and Anger Control”, Pivolka 3, 12, 7-10. Lerner H., (2014), The Dance of Anger, Istanbul, Varlık publications, issue: 1317.
Özkamalı E, Buğa A., (2010), “Influence of an Anger Management Training Program on the Trait Anger Levels of
University Students”, Mersin University, Journal of the Faculty of Education, 6, 2, 50-59. Özmen A., (2004), Influence of the Choice Theory- and Reality Therapy-Based Training Program for Coping With
Anger and the Interaction Group Practice on the Skills of University Students to Cope With Anger. Ankara University, Institute of Educational Sciences, Department of Educational Sciences, PhD Thesis, Ankara (Supervisor: Prof. Dr. U. Öner).
Özmen A., (2006), “Anger: Institutional Approaches and Factors Driving the Emergence of Anger in Individuals”, Ankara University, Journal of the Faculty of Educational Sciences, 39, 1, 39-56.
Soykan Ç., (2003), “Anger and Anger Management”, Kriz Journal, 11, 2, 19-27. Sülün Ö., (2013), Comparison of Anger and Anger Levels in Soccer Referees with their Levels of Empathic
Tendency. Karamanoğlu Mehmetbey University College of Social Sciences, Master's thesis, Karaman, (Supervisor: Assc. Dr. H. Şahan).
Şahin H., (2005), “Theoretical Foundations of Anger Control”, Süleyman Demirel University, Journal of the Burdur Faculty of Education 6, 10, 1-22.

39 Hülya Aslan, Nilay Gemlik, Gülfer Bektaş
Tan M, Polat H, Akgün Şahin Z., (2012), “Assessing the Perception of Nurses in their Working Environment”, Sağlıkta Performans ve Kalite Journal 2, 4, 67-78.
Tambağ H, Öz F., (2004), How Adolescents Living with Their Families and in Orphanages Express Anger. Hacettepe University, Institute of Health Sciences, Master Thesis, Ankara (Supervisor: Assc. Dr. F. Öz).
Tatlıoğlu K, Karaca M., (2013), “A Social, Psychological Assessment on the Phenomenon of Anger”, The Journal of Academic Social Science Studies. 6, 1102-1123.
Uludoğan S., (2010), Exploring the Administrative Problems with Operating Room Nurses. Marmara University, Institute of Health Sciences, Istanbul (Supervisor: Asst. Assc. Dr. N. Bahçecik).
Yıldırım A, Şimşek H., Methods of Qualitative Research in Social Sciences. 2013; 9th Edition, Ankara, Seçkin Publications.
Yılmaz A, (2007), Evaluating the Influence of the Forms of Expressing Anger in Organizations on the Quality of Institutional Communication, and a Case Study in the Mobile Force Department of Eskişehir. Anadolu University, Institute of Social Sciences, Master Thesis. Eskişehir (Supervisor: Assc. Dr. E. Eroğlu).
Yılmaz M., (1996), Management and Organizational Problems in Hospitals. Kırıkkale University, Institute of Social Sciences, Master Thesis, Kırıkkale (Supervisor: Prof. Dr. S. Buzlu).
www.tdk.gov.tr. [19.04.205] www.aktuelpsiloloji.com. [16.05.2016]

International Journal of Commerce and Finance, Vol. 2, Issue 2, 2016, 41-59
SELECTIVITY SKILLS OF MUTUAL FUND MANAGERS IN INDIA: AN ANALYSIS
Bilal Ahmad Pandow, (Senior Lecture)
Middle East College, Oman
Abstract: Stock selection is the nucleus in the investment management process. It involves identifying and selecting undervalued securities which among other things requires the successful forecasting of the company specific events or an ability to predict the general behavior of security prices in the future. If the fund manager is able to identify and select the undervalued securities for the portfolio, then it will be possible for the fund manager to increase the returns of the schemes and vice versa. In practice fund managers are expected to earn superior returns for unit holders consistently as being professionals therefore possess superior skills to collect and analyze the data with the purpose to select the right type of securities for the portfolio. The present work is based on the review of tens of studies both foreign and Indian studies relating to mutual funds. The mutual fund industry in India consists of public sector, private sector and foreign funds. All the three sectors were studied to compare the selectivity and timing performance on the basis of sponsorship of funds. However, from these only active funds belongings to Growth, Income, Balanced and Tax-Saving Schemes were selected for the study. In this paper stock selectivity skills of sample fund managers were tested by using Jensen’s Alpha and Fama’s net selectivity measure.
Keywords: Stock selection, Mutual Funds, Growth, Income, Balanced and Tax-Saving Schemes
1. Introduction The mutual fund industry in India consists of public sector, private sector and foreign funds. All the three sectors were studied to compare the selectivity and timing performance on the basis of sponsorship of funds. However, from these only active funds belongings to Growth, Income, Balanced and Tax-Saving Schemes were selected for the study. The period of study is five years from April 2007 to 31st March 2011. The rationale for selecting the study period of 5-years from 1st April 2007 to 31st March 2011 stems from two reasons. Firstly, during this period, the stock market experienced higher volatility, as such chosen to find-out whether the funds have succeeded in surpassing the market performance even under depressed market conditions. Secondly, the five years were long enough to capture different market phases and to draw meaningful conclusions. Since large number of schemes were in existence during the period of the study, as such due to time and other con-straints, it was not possible to study all the schemes. It is in view of this fact, an adequate and representative sample was drawn from the universe using convenience sampling method. Initially, the study viewed 76 schemes out of 587 schemes existing as on 1st April 2007, however, the availability of consistent data during the study period (April 2007 to March 2011) was available for 40 schemes only, as such the final sample size for the present study was reduced to 40 schemes, accounting for around 7 percent of the total schemes. These schemes belonged to 19 fund houses con-sisting of all the three sectors viz. public sector, private sector foreign funds, Of the total sample size of 40 schemes, 33 schemes belonged to the private sector and 7 to the public sector including UTI. Further, 37 schemes are open-ended and 3 schemes are close-ended in nature. Aim wise, the sample consisted of 28 Growth Schemes, 3 Income Schemes, 3 Balanced Funds and 6 Tax-Saving Schemes. Stock selectivity skills of sample fund managers were tested by using Jensen’s Alpha and Fama’s net selectivity meas-ure. Jensen (1968) developed an absolute measure based on Capital Asset Pricing Model (CAPM) to regress the excess returns of a portfolio on the market factor. Assuming that market beta or slope co-efficient is constant then the unconditional Alpha is a measure of average performance as in Jensen (1968). The absolute regression equation
Inte
rnati
on
al
Jou
rnal
of
Co
mm
erc
e a
nd
Fin
an
ce

42 Bilal Ahmad Pandow
http://ijcf.ticaret.edu.tr
is based on the assumption that the funds systematic risk is stationary over time. Owing to this assumption, Jensen’s measurement model attributes funds overall performance to manager’s selectivity performance exclusively. As such mutual funds are expected to perform better than the market, therefore calls for a continuous evaluation of the performance of funds. The assessment of fund manager’s performance is important for two reasons: one it ena-bles investors to allocate investible funds into different funds efficiently second it influences the compensation of fund managers. From an academic perspective, the goal of identifying superior fund managers is interesting because it challenges the efficient market hypothesis. The present study analyses stock selectivity skills of Mutual Fund Man-agers in India. The remainder of this article is organized as follows. In section 2, we form our hypotheses. We present our method-ology and the research model in section 3 and discuss the sample selection in section 4. We highlight the results in section 5 and document our conclusions in section 6.
2. Literature Review, objective, and hypotheses With the growing popularity of mutual funds, performance evaluation of fund managers has become a fundamental issue for both practitioners and academicians. Studies have been conducted world over to examine the investment performance of managed portfolio. From an academic perspective, the goal of identifying superior fund managers is interesting because it challenges the efficient market hypothesis. The ability of mutual fund managers to time the market, that is, to increase a fund’s exposure to the market index prior to market advances and to decrease exposure prior to market declines has remained the subject matter for researchers. The other important aspect which attracted the attention of researcher’s world-over is stock selection skills of fund managers. Numbers of studies have been conducted on these two skills of fund managers. A critical review of the studies on these two aspects of mutual funds has been undertaken which becomes essential to know what the existing literature has to say about the stock selectivity skills of fund managers. An extensive and systematic study was made by Friend, et al., (1962) of 152 mutual funds and found that mutual fund schemes earned an average annual return of 12.4 percent, while their composite benchmark earned a return of 12.6 percent. Their alpha was negative with 20 basis points. Overall results did not suggest widespread inefficiency in the industry. Further comparison of fund returns with turnover and expense categories did not reveal a strong rela-tionship. Irwin, Brown, FE (1965) analyzed issues relating to investment policy, portfolio turnover rate, performance of mutu-al funds and its impact on the stock markets. The study has revealed that mutual funds had a significant impact on the price movement in the stock market. Also concludes that, on an average, funds did not perform better than the composite markets and there was no persistent relationship between portfolio turnover and fund performance. The performance of 57 fund managers was evaluated by Treynor and Mazuy (1966) in terms of their market timing abilities and have found that fund managers had not successfully outguessed the market. The results suggested that, investors were completely dependent on fluctuations in the market. Further found that the improvement in the rates of return was due to the fund managers’ ability to identify under-priced industries and companies. The study adopted Treynor’s (1965) methodology for reviewing the performance of mutual funds. A composite portfolio evaluation technique concerning risk-adjusted returns was developed by Jensen (1968). He evaluated the ability of 115 fund managers in selecting securities during the period 1945-66. Analysis of net returns indicated that, 39 funds had above average returns, while 76 funds yielded abnormally poor returns. Using gross returns, 48 funds showed above average results and 67 funds below average results. On the basis of this study Jensen has concluded that, there was very little evidence that funds were able to perform significantly better than expected as fund managers were not able to forecast securities price movements.

Selectivity Skills of Mutual Fund Managers Iin India: An Analysis 43
http://ijcf.ticaret.edu.tr
The methods to distinguish observed return due to the ability to pick up the best securities at a given level of risk from that of predictions of price movements in the market was developed by Fama (1972). He introduced a multi-period model allowing evaluation on a period-by-period and on a cumulative basis. He branded that, return on a portfolio constitutes return for security selection and return for bearing risk. His contributions combined the con-cepts from modern theories of portfolio selection and capital market equilibrium with more traditional concepts of good portfolio management. The investment performance of 40 funds was analyzed by Klemosky (1973) based on quarterly returns during the period 1966-71. He acknowledged that, biases in Sharpe, Treynor, and Jensen’s measures, could be removed by using mean absolute deviation and semi-standard deviation as risk surrogates com-pared to the composite measures derived from the CAPM. Gupta Ramesh (1989) evaluated fund performance in India comparing the returns earned by schemes of similar risk and similar constraints. An explicit risk-return relationship was developed to make comparison across funds with different risk levels. His study decomposed total return into return from investors risk, return from managers’ risk and target risk. Mutual fund return due to selectivity was decomposed into return due to selection of securities and timing of investment in a particular class of securities. The present work is based on the review of tens of studies both foreign and Indian studies relating to mutual funds. The review of foreign studies ensures that, mutual funds have a significant impact on the price movement in the stock market, the average return from the schemes were below that of their benchmark, all the three models provid-ed identical results, good performance were associated with low expense ratio and not with the size. The aforementioned studies indicate that the evaluation of mutual funds has been a matter of concern in India for the researchers, academicians, fund managers and financial analysts to a greater extent after 1985. The reviews bring to light the importance of mutual funds in the Indian financial scenario; highlight the need for adequate investor protection, single regulatory authority, higher return for a given risk as per investors’ expectation, greater conven-ience and liquidity, and the expectations that mutual funds should act as a catalytic agent of economic growth and foster investors’ interest.
Objective of the study The study is aimed to achieve the following specific objectives:
To assess whether the Indian fund managers possess the stock selection ability.
To study the consistency in the selectivity of fund managers.
To examine whether the selectivity varies with the fund characteristics.
To find out whether there exists relationship between different evaluation criterions.
Hypotheses In line with the above stated objectives, the following hypotheses are laid in order to provide a direction to the study: H1: There is no positive selectivity performance among Indian Fund Managers across measurement criteria H2: There is short term persistence in the selectivity performance of fund managers across the various measurement criteria, but in the long run no such persistence exists across the two measurement criteria H3: There is no significant difference in the selectivity performance across different fund characteristics H4: There exists significant relationship between different selectivity evaluation criterions
3. The Methodology and Model To test the above hypothesis, the data set used is secondary in nature which was collected from the database of AM-FI for Net Asset Value (NAV), National Stock Exchange (NSE) for S&P CNX Nifty and RBI for risk free rate. Fund returns were calculated on the basis of daily NAVs rather than monthly NAVs for the reason that research has revealed that the high frequency data such as daily NAVs have more revealing power than less frequency data. Fur-ther, the daily returns so obtained were annualized using geometric averaging to obtain average annual fund return.

44 Bilal Ahmad Pandow
http://ijcf.ticaret.edu.tr
The yields on 91-day treasury bills issued by Reserve Bank of India (RBI) have been used as a proxy for risk-free return. Besides, S&P CNX Nifty is used as surrogate for the market portfolio/return as well as for bench-mark vari-ability. DATA ANALYSIS Initially we have assessed the overall performance of the sample funds by analyzing their excess return, (Rp-Rf), abnormal excess return, (Rp-Rm), and riskiness of funds viz. a viz. market portfolio. Then the poor or superior per-formance was decomposed by assessing whether the fund performance is due to the stock selectivity skills or market timing abilities of fund managers. The daily returns for each of the sample schemes and the market portfolio have been calculated after making proper adjustments for the dividend, if any, paid by the schemes, as follows: Fund Return (Rpt) = (NAV_t - NAV_(t-1))/NAV_(t-1)
Where:
Rpt = Return of a scheme at the end of day t
NAVt = Net assets value of the scheme at the end of day ‘t’
NAVt-1 = Net assets value of the scheme at the beginning of day ‘t’
Similarly the daily returns for the market Index i.e. for S&P CNX Nifty have been calculated using the following
formula:
Market Index Return (Rmt)= (MI_t - MI_(t-1))/〖S&P CNX Niftyt〗_(t-1)
Where:
Rmt = Return of the market Index for the day ‘t’
MIt = Market value of the market index i.e. S&P CNX Nifty at the end of day ‘t’
MIt-1= Market value of the Market Index i.e. S&P CNX Nifty in the beginning of day ’t’
The daily returns are then annualized to obtain mean annual daily returns of each sample scheme and the market
Index as follows:
Mean Annual Daily Portfolio Return (Rpt-a) = (Rp1+Rp2+Rp3+……….Rpn)/N
Mean Annual Daily Market Return (Rmt-a) = (Rm1+Rm2+ Rm3…….Rmn)/N
Selectivity Performance Measurement Models
Stock selectivity skills of sample fund managers were tested by using Jensen’s Alpha and Fama’s net selectivity meas-ure. Jensen (1968) developed an absolute measure based on Capital Asset Pricing Model (CAPM) to regress the excess returns of a portfolio on the market factor. Assuming that market beta or slope co-efficient is constant then the unconditional Alpha is a measure of average performance as in Jensen (1968). The absolute regression equation is based on the assumption that the funds systematic risk is stationary over time. Owing to this assumption, Jensen’s measurement model attributes funds overall performance to manager’s selectivity performance exclusively. This model is shown by the following regression specifications: Rpt-Rft= α + β (Rmt– Rft) +et
Where:
Rpt= The average return of the fund at time ‘t’
Rft= The risk-free return at time ‘t’

Selectivity Skills of Mutual Fund Managers Iin India: An Analysis 45
http://ijcf.ticaret.edu.tr
α = The Jensen performance co-efficient
β = The estimate co-efficient for the systematic risk level of the fund
Rmt = Average return on the market portfolio
et = An error term
Here, the intercept α in the above equation is the Jensen’s performance co-efficient indicating risk-adjusted selectivi-ty performance of the fund. A positive and significant Alpha (α) indicates average extra return yielded by a scheme over the benchmark market portfolio return after considering the level of systematic risk of the scheme, thus reflect-ing the superior performance of the scheme due to the fund manager’s selectivity abilities. Fama’s Decomposition Measure Eugene F. Fama (1972) developed another selectivity performance measurement criterion which decomposes the fund’s performance into three components viz: risk free return, compensation for systematic risk, and the return due to the stock selectivity performance of the fund manager as revealed by the Fama’s decomposition model. The mod-el further segregates the selectivity performance into two parts viz. compensation for diversification and net selectivi-ty. Greater the diversification of the fund less would be the compensation for inadequate diversification and vice versa. As such for a well-diversified portfolio, the compensation for inadequate diversification would be close to zero and will always take a non-negative value otherwise. Therefore, net selectivity which is the difference between the compensation for selectivity and compensation for inadequate diversification can always be less than or equal to that of selectivity Fama’s (1972) decomposition measure is expressed as: Rpt= Rft+ β (Rmt– Rft) + (Rmt– Rft) (σp/ σm- β) + (Rpt– Rft)-(σp/ σm) (Rmt– Rft)
Where
Rpt = The average return of the fund at time ‘t’
Rft = The risk free return at time ‘t’
β = The estimate co-efficient for the systematic risk level of the fund
Rmt = Average return on the market portfolio
β (Rmt– Rft) = Compensation for systematic risk
(Rmt– Rft) (σp/ σm- β) = Compensation for inadequate diversification
(Rpt– Rft) - (σp/ σm) (Rmt– Rft) = Net selectivity or excess return after adjusting for all risks.
Here, selectivity is equal to the net selectivity plus compensation for systematic risk and for compensation for inade-quate diversification. However, the selectivity performance is measured on the basis of net selectivity rather than the total selectivity. A positive net selectivity is indicates that the fund has been able to earn extra return even after taking into account the compensation required for inadequate diversification, thus better selectivity performance of the fund manager. Conversely, a negative net selectivity indicates that the fund has not been able to earn even a part of the compensation required for inadequate diversification, thus reflects poor selectivity on the part of fund managers. HYPOTHESES TESTING To provide a direction to the study, hypotheses were set which were tested by using relevant statistical tools. To test whether Jensen alpha (a), Fama’s net selectivity and Henrickson and Merton’s ‘γ’ co-efficient (Gamma) are statistical-ly significant for each of the sample individual funds, paired two-tailed t-test has been used. For the sample as a whole, whose size was 40 schemes, Z-test has been used to test the statistical significance of Jensen’s alpha, Fama’s net selectivity and HM’s ‘γ’ co-efficient to know whether the sample fund managers have superior selectivity and

46 Bilal Ahmad Pandow
http://ijcf.ticaret.edu.tr
timing performance. Besides, spearman’s rank co- relation co-efficient technique has been used to assess the associa-tion between two selectivity performance measurement models viz. Jensen alpha and Fama’s selectivity and between two selectivity and one timing models. To assess the riskiness of the sample funds and bench mark market index, standard deviation and Beta co-efficient has been used. Standard deviation has been used to assess the total risk while as Beta co-efficient has been used to determine the component of systematic risk.
4. Sample Selection and Descriptive Statistics Since large number of schemes were in existence during the period of the study, as such due to time and other con-straints, it was not possible to study all the schemes. It is in view of this fact, an adequate and representative sample was drawn from the universe using convenience sampling method. Initially, the study viewed 76 schemes out of 587 schemes existing as on 1st April 2007, however, the availability of consistent data during the study period (April 2007 to March 2011) was available for 40 schemes only, as such the final sample size for the present study was reduced to 40 schemes, accounting for around 70 percent of the total schemes. These schemes belonged to 19 fund houses consisting of all the three sectors viz. public sector, private sector foreign funds, of the total sample size of 40 schemes, 33 schemes belonged to the private sector and 7 to the public sector including UTI. Further, 37 schemes are open-ended and 3 schemes are close-ended in nature. Aim wise, the sample consisted of 28 Growth Schemes, 3 Income Schemes, 3 Balanced Funds and 6 Tax-Saving Schemes.
5. Results and Analysis
Stock selection is the nucleus in the investment management process. It involves identifying and selecting underval-ued securities which among other things requires the successful forecasting of the company specific events or an ability to predict the general behavior of security prices in the future. If the fund manager is able to identify and select the undervalued securities for the portfolio, then it will be possible for the fund manager to increase the re-turns of the schemes and vice versa. In practice fund managers are expected to earn superior returns for unit holders consistently as being professionals therefore possess superior skills to collect and analyze the data with the purpose to select the right type of securities for the portfolio. As already stated earlier that to measure stock selection performance of fund managers, Jensen (1968) and Fama (1972) criterion has been used. Jensen (1968) developed an absolute measure based on CAPM to find out the selec-tivity performance of fund managers by regressing excess fund returns with the excess market returns. The superior return earned due to the ability of superior stock selection is known from Jensen’s Alpha (α) which is an intercept of the equation it indicates a fund return when the return on the market portfolio is zero. Therefore, a positive and significant Alpha (α) value indicates average extra return earned over the bench mark return after considering the level of systematic risk assumed by the fund. Thus, reflects the superior selectivity performance of the fund manager. Conversely negative alpha (α) indicates to poor stock selectivity skills on the part of the fund manager. In order to comment on the stock selectivity performance of the fund managers of the sample schemes during the period under study (2007-2011). Alpha’s (α) using the Jensen’s measure have been calculated which have been pre-sented in Table 4.3. Besides, ranks were assigned to the sample funds on the basis of their alphas with the purpose to classify the funds into best and worst ranking funds. Alpha values of the sample funds so obtained were also tested for one percent significance level in order to know whether positive stock picking performance of the fund manager is statistically significant or not.

Selectivity Skills of Mutual Fund Managers Iin India: An Analysis 47
http://ijcf.ticaret.edu.tr
Table 4.3: Stock Selectivity Performance of Fund Managers using Jensen Model
Scheme Jensen Al-
pha (α)
SD T-Stat P-Value Ranking
ICICI Prudential Discovery Fund – Growth 0.3553 0.8314 0.9556 0.3934 1
HDFC Equity Fund 0.3023 0.6015 1.1238 0.324 2
ICICI Pru Tax Plan 0.2964 0.6828 0.9707 0.3867 3
Reliance Growth Fund 0.2928 0.6651 0.9844 0.3807 4
Franklin India Bluechip Fund 0.2813 0.5789 1.0866 0.3383 5
Baroda Pioneer Growth 0.2744 0.5978 1.0264 0.3627 6
Reliance Regular Savings Fund 0.2735 0.6043 1.012 0.3688 7
Birla Sun Life Frontline Equity 0.2663 0.5819 1.0233 0.364 8
HDFC Tax Saver Fund 0.2622 0.6086 0.9634 0.3899 9
Tata Pure Equity Fund 0.2451 0.5687 0.9637 0.3898 10
Tata Tax Advantage Fund 0.2441 0.5220 1.0456 0.3548 11
Principal Index Fund 0.2409 0.5409 0.9959 0.3757 12
Quantum Long-Term Equity Fund 0.2391 0.4931 1.0843 0.3392 13
Sundaram Growth Fund 0.2358 0.5519 0.9554 0.3935 14
UTI - Opportunities Fund 0.2354 0.5305 0.9922 0.3773 15
Fidelity Equity Fund 0.2326 0.5444 0.9554 0.3935 16
L&T Growth Fund 0.2324 0.5477 0.9488 0.3964 17
ING Core Equity Fund –Growth 0.2238 0.5381 0.93 0.405 18
Birla Sun Life Top 100 Fund – Growth 0.2110 0.5284 0.8929 0.4224 19
Sundaram Select Focus 0.2098 0.5332 0.8798 0.4286 20
Morgan Stanley Growth Fund 0.2063 0.5955 0.7746 0.4818 21
ING Tax Savings Fund 0.2048 0.6025 0.7601 0.4895 22
Baroda Pioneer ELSS 0.2033 0.5806 0.783 0.4774 23
UTI - Growth Retail 0.2016 0.5071 0.889 0.4243 24
HSBC Equity Fund 0.1924 0.4943 0.8704 0.4332 25
LIC Nomura Mf Equity Fund 0.1821 0.5388 0.7719 0.4832 26
Sahara Growth Fund 0.1674 0.5299 0.7064 0.5189 27
ING Balanced Fund (D) 0.1606 0.4803 0.7477 0.4962 28
LIC Nomura Mf India Vision Fund (D) 0.1502 0.4643 0.7234 0.5095 29
SBI Magnum NRI Investment Fund-Flexi Asset (D) Balanced 0.1406 0.4823 0.6519 0.5501 30
SBI One India Fund 0.1067 0.5275 0.4523 0.6745 31
Kotak 50 Growth 0.1009 0.6075 0.3714 0.7292 32
JM Balanced Fund - (D) 0.0529 0.4141 0.2857 0.7893 33
Principal Personal Tax Saver Fund 0.0118 0.6967 0.0379 0.9716 34

48 Bilal Ahmad Pandow
http://ijcf.ticaret.edu.tr
Quantum Liquid Fund – Growth -0.0012 0.3455 0.0078 0.9942 35
Kotak Equity Arbitrage Growth -0.0019 0.3394 0.0125 0.9906 36
Templeton India TMA -0.0034 0.3467 0.0219 0.9836 37
SBI Arbitrage Opportunities Fund -0.0036 0.3405 0.0236 0.9823 38
HSBC Cash Fund -0.0131 0.3451 0.0849 0.9364 39
Sahara Growth Fund – Div -0.0199 0.6382 0.0697 0.9478 40
Note: •SD: Standard Deviation Source: AMC reports, NSE historical data and RBI reports Table 4.3.a: Z-Value of Jensen Alpha
P value and statistical significance:
The two-tailed P value is less than 0.0001
By conventional criteria, this difference is considered to be extremely statistically significant.
Confidence interval:
The hypothetical mean is 0.000000
The actual mean is 0.179825
The difference between these two values is 0.179825
The 95 percent confidence interval of this difference:
From 0.146750 to 0.212900
Intermediate values used in calculations:
t = 10.9971
df = 39
standard error of difference = 0.016
Perusal of the data presented in Table 4.3 brings to fore that out of the total sample of 40 schemes, majority of the schemes i.e. 34 schemes accounting for 85 percent of the sample size have positive Alpha values, which indicates superior stock selectivity performance of their fund managers at their respective levels of systematic risk. On the other hand fund managers of six schemes namely Quantum Liquid Fund - Growth, Kotak Equity Arbitrage Growth, Templeton India TMA, SBI Arbitrage Opportunities Fund, HSBC Cash Fund, and Sahara Growth Fund – Div ac-counting for 15 percent of the sample size have demonstrated poor selectivity performance as these schemes are having negative alpha’s which means that their returns were negative when the returns on the market portfolio were zero. Compared to these schemes, the alpha’s of other funds reveals positive abnormal returns (Excess return over the market portfolio) ranging between 1.18 percent to 35.53 percent. It can also be seen from the table that from the sample schemes with positive alphas, only two schemes viz. JM Balanced Fund and Principal Personal Tax Saver Fund have recorded alphas less than 5 percent, whereas the alphas of all other schemes has ranged between 10.09 percent to 35.53 percent which is indicative of the fact that these funds have earned abnormal returns ranging be-tween 10.09 percent to 35.53 percent which is more than sufficient by all standards. But, it is difficult to infer whether this is due to random chance or superior stock selectivity skills of the sample fund managers. To resolve this, the statistical significance of the estimated performance measure (alpha) has been assessed using ‘t’ test and ‘z’ test, the details of which have been shown in the above referred table. A closer look into the t-values and their corresponding P values presented in Table 4.3.a reveals that although 34 funds or 85 percent of sample funds have positive alphas, but looking at their t-ratio and their corresponding P-values, it is found that the alphas of all the sample funds are not statistically significant even at 1 percent level. This is indicative of the poor

Selectivity Skills of Mutual Fund Managers Iin India: An Analysis 49
http://ijcf.ticaret.edu.tr
stock selection performance of sample fund managers. But when testing significance for all the funds taken together using Z-test, the two tailed P-value is found less than 0.0001 which by conventional criteria implies extremely statis-tically significant difference even at 5 percent level. This is in total contrast to the significance of Alpha when found on individual basis, this can be attributed to the significant difference in the standard deviations of two data sets. As such, it can be concluded that either the sample fund managers have contributed a very insignificant amount to the extra return of 8.356 percent or have failed to contribute to abnormal excess return (8.3566 percent) by their active selection exercise. Since the study reveals lack of stock selection skills among the sample fund managers as such the hypothesis laid down about selectivity/performance is accepted. This finding accords with that of Jensen (1968), Shah and Thomas (1994), Gupta and Gupta (2004), Tripathy (2004), Anand and Murugaiah (2006) and Abhijt Khundn (2009). Howev-er, there are other studies like Goggin et.al (1993), Debatal (2005), Barua and Verma (1991), Chander (2005), Sehgal and Jhanwar (2008) Anggrinblatt and Titman (1994) which have found superior or better selectivity performance of fund managers. The failure of the sample Indian fund Manager to use selectivity skills to earn superior returns per-haps can be attributed to the recession conditions in the capital market due to the global financial crisis which not only affected Indian equity market but to the equity markets world-over for quite some period particularly in the years 2008-2010. The markets also witnessed very high volatility which is reflected in the higher standard deviation of sample funds. In statistical terms, more the standard deviation less will be the t-ratio. The similar situation happened with the t-ratios of the funds under study while accessing the significance of alpha. Fama’s Decomposition Model Eugene F. Fama (1972) has developed another stock selectivity performance evaluation framework, which however, finer breakdown of the fund’s performance. It decomposes the total performance into risk-free return (Rf), premium for systematic risk and return due to stock selection ability of the fund manager at a given level of risk. Fama (1972) has further decomposed the stock selection ability of the fund managers into two parts, viz. Compensation for diver-sification and net selectivity. In fact, greater the diversification achieved by a fund, lesser would be the compensation for inadequate diversification and vice versa. As such, the compensation for inadequate diversification may be close to zero for a well-diversified fund and will always take a non-negative value otherwise. As such, net selectivity, which is the difference between the selectivity and the compensation for inadequate diversification can always be less than or equal to that of the selectivity. Therefore, a positive net selectivity represents superior return even after the extra return required for inadequate diversification. On the other hand, negative net selectivity denotes that the fund man-ager has failed to earn even a part of the return required for inadequate diversification thus implies poor net selectivi-ty performance.
Table 4.4: Fama’s Selectivity & Net Selectivity of Sample Funds
Schemes Compensation for systematic
riskβ (Rmt - Rft)
Portfolio SD (σp)
Market SD (σm)
Compensation For Inade-
quate Diversi-fication
(Rmt-Rft) (σp/σm-β)
Net Selectivity (Rp-Rf)-(σp/σm)
(Rmt-Rft)
Fams’s Selectivity
Baroda Pioneer ELSS -0.0124 0.0165 0.0202 0.0329 0.0800 0.1006
Baroda Pioneer Growth -0.0129 0.0172 0.0202 0.0343 0.1374 0.1588
Birla Sun Life Frontline Equity -0.0122 0.0162 0.0202 0.0324 0.1446 0.1648
Birla Sun Life Top 100 Fund – Growth -0.0119 0.0158 0.0202 0.0315 0.1046 0.1242
Fidelity Equity Fund -0.0113 0.0145 0.0202 0.0294 0.1191 0.1372
Franklin India Bluechip Fund -0.0119 0.0153 0.0202 0.0309 0.1524 0.1714
HDFC Equity Fund -0.0123 0.0156 0.0202 0.0318 0.2040 0.2235
HDFC Tax Saver Fund -0.0115 0.0141 0.0202 0.0291 0.1657 0.1833
HSBC Cash Fund 0.0000 0.0003 0.0202 0.0004 -0.0135 -0.0131
HSBC Equity Fund -0.0112 0.0147 0.0202 0.0296 0.0840 0.1023
ICICI Pru Tax Plan -0.0105 0.0142 0.0202 0.0281 0.1821 0.1997
ICICI Prudential Discovery Fund – -0.0099 0.0142 0.0202 0.0276 0.2507 0.2684

50 Bilal Ahmad Pandow
http://ijcf.ticaret.edu.tr
Growth
ING Balanced Fund (D) -0.0091 0.0119 0.0202 0.0238 0.0639 0.0787
ING Core Equity Fund –Growth -0.0126 0.0162 0.0202 0.0328 0.0841 0.1043
ING Tax Savings Fund -0.0114 0.0162 0.0202 0.0315 0.0794 0.0996
JM Balanced Fund - (D) -0.0099 0.0139 0.0202 0.0272 -0.0374 -0.0201
Kotak 50 Growth -0.0130 0.0154 0.0202 0.0321 0.0866 0.1057
Kotak Equity Arbitrage Growth 0.0003 0.0012 0.0202 0.0012 0.0005 0.0019
L&T Growth Fund -0.0135 0.0177 0.0202 0.0356 0.0935 0.1155
LIC Nomura Mf Equity Fund -0.0136 0.0183 0.0202 0.0364 0.0451 0.0678
LIC Nomura Mf India Vision Fund (D) -0.0125 0.0174 0.0202 0.0341 0.0260 0.0477
Morgan Stanley Growth Fund -0.0122 0.0164 0.0202 0.0326 0.0824 0.1028
Principal Index Fund -0.0139 0.0180 0.0202 0.0362 0.0925 0.1149
Principal Personal Tax Saver Fund -0.0124 0.0181 0.0202 0.0349 -0.0103 0.0122
Quantum Liquid Fund – Growth 0.0000 0.0002 0.0202 0.0002 -0.0013 -0.0011
Quantum Long-Term Equity Fund -0.0114 0.0144 0.0202 0.0293 0.1345 0.1524
Reliance Growth Fund -0.0110 0.0152 0.0202 0.0300 0.1943 0.2132
Reliance Regular Savings Fund -0.0090 0.0122 0.0202 0.0242 0.1804 0.1956
Sahara Growth Fund -0.0119 0.0187 0.0202 0.0352 0.0880 0.1113
Sahara Growth Fund – Div -0.0107 0.0354 0.0202 0.0548 -0.1231 -0.0790
SBI Arbitrage Opportunities Fund 0.0003 0.0011 0.0202 0.0010 -0.0015 -0.0002
SBI Magnum NRI Investment Fund-Flexi Asset (D) Balanced -0.0108 0.0134 0.0202 0.0275 0.0570 0.0737
SBI One India Fund -0.0124 0.0149 0.0202 0.0309 0.0123 0.0308
Sundaram Growth Fund -0.0133 0.0175 0.0202 0.0351 0.1255 0.1474
Sundaram Select Focus -0.0130 0.0173 0.0202 0.0345 0.1184 0.1400
Tata Pure Equity Fund -0.0116 0.0154 0.0202 0.0308 0.1423 0.1614
Tata Tax Advantage Fund -0.0103 0.0140 0.0202 0.0278 0.1511 0.1686
Templeton India TMA 0.0000 0.0002 0.0202 0.0002 -0.0036 -0.0034
UTI - Growth Retail -0.0100 0.0135 0.0202 0.0268 0.1135 0.1303
UTI - Opportunities Fund -0.0051 0.0154 0.0202 0.0243 0.2343 0.2534
Note:
• Rpt: Mean Daily Annual Fund Return • Rft : Risk Free Return • Rmt: Mean Daily Annual Market Return • σp: Standard Deviation Portfolio • σm: Standard Deviation Market • β: Portfolio Beta
Source: AMC reports, NSE historical data and RBI reports Results of Fama’s decomposition measure have been detailed out in Table 4.4 which among other things presents market risk premium, Compensation for inadequate diversification and net selectivity. It is evident from the table that out of 40 sample schemes, 35 schemes which account for 87.5 percent of the sample size have negative risk premium which implies that the systematic risk to which these schemes were exposed was less than the average market portfolio risk. The risk premium for other three sample schemes was zero and for the remaining two schemes very negligible, i.e. 0.0003. As such it becomes quite clear from the above that the sample schemes were having less than the market risk which is also evident from their beta values which for most of the schemes was either negative or very low. Negative are very insignificant market risk for the sample schemes implies that no por-tion of actual return will be eaten- up by the market risk premium. While looking at the compensation for inadequate diversification (Rm-Rf) (σp/σm-β), it become clear from the data presented in the above referred table that no sample scheme has been found to be well diversified as none of their schemes have scored zero value for compensation for inadequate diversification. However, compensation for inade-

Selectivity Skills of Mutual Fund Managers Iin India: An Analysis 51
http://ijcf.ticaret.edu.tr
quate diversification on five sample schemes is very low, ranging between 0.0002 to 0.0012 which implies that these schemes were almost well diversified. It can be also seen from the table that the average compensation for inade-quate diversification for all the sample schemes has been 2.77 percent which in no way is more given the mean re-turn of 18.39 percent for all the schemes during the reference period. As such it can be concluded that though the majority of the sample schemes were not well diversified yet their level of their inadequate diversification was not significant. Table 4.4 also presents the data on net selectivity. According to Fama, Selectivity as revealed by (alpha) also includes compensation for inadequate diversification. Therefore, to conclude about the stock selection skills of fund manag-ers, the need is to look into the selectivity net of compensation for inadequate diversification. Given this fact, the net selectivity co-efficient of the sample funds has been calculated using Fama’s metric and the details of which have been presented in the above referred table. Perusal of the data about net selectivity reveals that 33 schemes out of the total sample of 40 schemes i.e. 82.5 percent of the sample schemes have reported positive net selectivity there by indicating superior stock selection performance. However seven sample schemes i.e. 17.5 percent of the sample size have shown poor selectivity performance as these have reported negative values for net selectivity ranging between -0.0013 to -0.0374. It can also be observed from the above table that 16 sample schemes namely Baroda Pioneer Growth, Birla Sun Life Frontline Equity, Birla Sun Life Top 100 Fund–Growth, Fidelity Equity Fund, Franklin India Bluechip Fund, HDFC Equity Fund, HDFC Tax Saver Fund, ICICI PRU Tax Plan, ICICI Prudential Discovery Fund–Growth, Quantum Long-Term Equity Fund, Reliance Growth Fund, Reliance Regular Savings Fund, Sundaram Growth Fund, Sundaram Select Focus, Principal Index Fund and L&T Growth Fund have reported better selectivity performance than the average selectivity performance of the sample as a whole as these have scored more than the average value of 9.10 percent of all schemes. While looking at the ranking of different funds as shown in Table 4.4, it can be observed that among the funds which have reported positive selectivity performance, ICICI Prudential Discovery Fund is at the top followed by UTI-Opportunities Fund and HDFC Equity Fund. The schemes that rank at the bottom with positive selectivity performance includes Kotak Equity Arbitage Growth, SBI one Indian Fund, LIC Nomura MF, India vision fund, LIC Nomura MF Equity Fund and SBI Magnum NRI Invest Fund. It can also be observed that though Kotak Equity Arbitrage Growth, SBI One Indian Fund and LIC Nomura MF India Vision Fund have scored positive scores for net selectivity yet these scores are very low ranging between 0.0005 to 0.0256 only. Further to state that among the sample seven funds namely HSBC Cash Fund, JM Balanced Fund-(D), Principal Personal Tax Saver Fund, Quantum Liquid Fund–Growth, Sahara Growth Fund-Div, SBI Arbi-trage Opportunities Fund, and Templeton India TMA , which have reported negative selectivity performance, Sahara Growth Funds-Div. with -12.31 percent was the worst performing fund among all funds followed by J.M Balanced Fund, HSBC Cash Fund, Principal Personal Tax Saver Fund, Templeton India TMA, SBI Arbitrage Opportunities Fund And Quantum Liquid Fund-Growth. While comparing with the Jensen criterion, it can be observed from Table 4.4 and 4.3 that all those schemes which have reported positive selectivity performance under Jensen criterion have shown similar results except with respect to three schemes viz. JM Balanced Fund (D), Kotak Equity Arbitrage Growth and Principal Personal Tax Saver Fund. As such it can be inferred that the result as shown by the Fama’s net selectivity metric can be different from that of Jensen criterion. This in other words means that the selectivity performance as revealed by Jensen metric cannot be a final word on selectivity performance. Given the superiority of the Fama’s criterion, in order to conclude about the selectivity performance, it would be appropriate to use Fama’s net selectivity criterion, which decomposes selectivity into compensation for inadequate diversification and net selectivity. Table 4.5: Z Value for Fama’s Alpha
P value and statistical significance:
The two-tailed P value is less than 0.0001
By conventional criteria, this difference is considered to be extremely statistically significant.
Confidence interval:
The hypothetical mean is 0.000000

52 Bilal Ahmad Pandow
http://ijcf.ticaret.edu.tr
The actual mean is 0.108663
The difference between these two values is 0.108663
The 95 percent confidence interval of this difference:
From 0.082976 to 0.134349
Intermediate values used in calculations:
t = 8.5565
df = 39
standard error of difference =0.013
Presence of positive alpha or net selectivity only hints at better selectivity performance. But to conclude about the superior selectivity performance, there is a need to test the statistical significance of Fama’s net selectivity. For this purpose T-test has been used to test the significance of individual funds and Z-test for assessing the significance of all the funds taken together. The results of these two tests of significance have been presented in table 4.5 which reveals that Fama Alpha for none of the funds has been found statistically significant even at 5 percent level which becomes clear from their T-ratios and their corresponding P-values. This in other words means that the managers of the sample funds have failed to identify and pick-up under-valued stocks. So the excess abnormal return of the sam-ple funds cannot be attributed to the selectivity performance of sample fund managers but may be either due to timing performance or by chance. But when significance has been assessed for all the sample funds together using Z-test, Fama’s alpha (Net Selectivity) has been found statistically significant. As can be seen from Table 4.5 the two tailed P-value is found less than 0.0001 which by conventional criteria implies extremely statistically significant dif-ference even at 5 percent level. The difference in result is perhaps due to the difference in standard deviations of two data sets. Using Jensen Alpha & Fama’s net selectivity it has been found that the fund managers of sample schemes lack selec-tivity performance across the two measurement criterions, thus the null hypothesis laid down for selectivity skills of fund managers in India is accepted. This finding corresponds with the finding of Jensen (1968) chen, Lee, Rahman and Chan (1992), Coggin, Fabozzi and Rehman (1993), Lee and Rahman (1990), Irissapaneetal (2000), Sehgal and Jhanwar (2008), Barua and Verma(1991) Chander (2005), Sehgal and Jhanwar (2008), Abhijit Kundu(2009) and Zabiulla (2013), there are equal number of studies whose results are contrary to the findings of the present study. The important such studies includes; Grinblatt and Titman (1994) Shah and Thomas (1994), Jaydev (1996), Gupta (2004), Tripathy (2004), and Anand and Murugaiah (2006). Differences in the findings of various studies are bound to exist for the reasons that the studies differ on various parameters like sample size, period of study etc. It is also that the sample fund managers perhaps have shown no selectivity performance for the reason that during the 3 years of reference period i.e. 2008-2010, the equity market in India had witnessed deep recession due to global financial crisis. Under deep recession it is unlikely even for the best managers to perform well or outperform the market. The same is perhaps true about the fund managers of sample schemes studied in the present study. Stock Selection Performance across the Measurement Criteria In addition to the study of stock selection performance of Indian Fund Managers during the period under study (2007-11) using different measurement criterion, an effort has also been made to study the extent of relationship that exists between Jensen’s and Fama’s selectivity performance measurement criterions. For this purpose, Spearman’s Rank Correlation Coefficients between the ranks under each selectivity measurement criteria have been calculated, the details of which have been presented in Table 4.6.

Selectivity Skills of Mutual Fund Managers Iin India: An Analysis 53
http://ijcf.ticaret.edu.tr
Table 4.6: Spearman’s Rank Correlation between the Ranks under Selectivity Measurement Models
Jenson Alpha Fama Selectivity Net Selectivity
Sp
earm
an's
rh
o Jenson Alpha
Correlation Coefficient Sig. (2-tailed)
1.000 .939** .937**
. .000 .000
Fama Selectivity Correlation Coefficient Sig. (2-tailed)
1.000 .998**
.000
Net Selectivity
Correlation Coefficient Sig. (2-tailed)
1.000
Note: ** stands for Correlation is significant at the 0.01 level (2-tailed) Perusal of the data contained in the Table 4.6 reveals significant level of association between the rankings assigned under the two measurement criterion across all possible combinations viz. rs(1,3), rs(1,2) and rs(2,3) respectively. It can be observed that the correlation coefficients between the rankings under Jensen (1968) and Fama’s (1972) selec-tivity criterion [rs(1,2)], and between the rankings under Jensen (1968) and Fama’s (1972) net selectivity criterion [rs(1,3)] are 0.939 and 0.937 respectively which are high by all standards thus indicating significant correlation be-tween the results of the two criterions. Similarly under Fama’s (1972) Net selectivity criterion and Fama’s (1972) selectivity criterion [rs(2,3)] is 0.998 which again signifies higher degree of correlation between the two criterion. It can also be seen from the data contained in table that the degree of correlation between the rankings under the two measurement criterion is statistically significant even at 0.01 level of significance. It implies fund manager’s uniform stock selection performance across the measurement criteria. At the same time, highly significant correlation between the two criteria’s i.e. [rs(1,2)] and [rs(2,3)] denotes that the compensation for inadequate diversification has not im-pacted selectivity performance anyway. The presence of significant correlation between the ranks under each measurement criteria used the hypothesis that there is positive relationship between the two measurement criterions but statistically insignificant is rejected. This finding across with the findings of many other studies like: Odean (1999); Barber, Lee, Liu, and Odean (2009); and Markowitz (1952). PERSISTENCE IN SELECTIVITY PERFORMANCE To comment about the selectivity performance of fund managers using mean Jensen Alpha or mean Fama’s net selectivity for the study period as a whole is meaningful. But more important issue is the persistence in manager’s ability to select stocks and to time risk factors. A fund manager who comes out successful today, whether he/she will be able to repeat the same performance in future consistently, is a matter of concern to the fund investors and other stake holders. Rather to conclude about the stock picking ability of fund managers, one would be interested in know-ing whether there is consistency in selectivity performance or not. If a fund manager is able to deliver better perfor-mance consistently i.e. quarter-after-quarter or year-after-year, then his or her performance in selecting the right type of stocks for the portfolio would be considered satisfactory. Conversely if the fund manager’s performance varies significantly from period to period, then it would be an indication that there is something wrong with his/her stock selection skills or market timing ability. As per the standard practice, a fund manager is expected to perform better than the market and more importantly perform consistently. Hence it is imperative to analyze the persistence in the stock selection performance of fund managers.

54 Bilal Ahmad Pandow
http://ijcf.ticaret.edu.tr
Table 4.7: Persistence in Selectivity Performance of Sample Fund Managers
Jensen Model
Scheme 2007 2008 2009 2010 2011
ICICI Prudential Discovery Fund – Growth 0.0653 0.5510 1.8581 -0.5527 -0.1452
HDFC Equity Fund 0.2832 0.6752 1.2158 -0.4587 -0.2041
ICICI Pru Tax Plan 0.1790 0.6133 1.4186 -0.5690 -0.1600
Reliance Growth Fund 0.3920 0.5733 1.3139 -0.6307 -0.1846
Franklin India Bluechip Fund 0.2566 0.8182 1.0142 -0.5342 -0.1483
Baroda Pioneer Growth 0.4731 0.8285 0.9159 -0.5911 -0.2545
Reliance Regular Savings Fund 0.2963 0.7375 1.0888 -0.5985 -0.1567
Birla Sun Life Frontline Equity 0.2520 0.7401 1.0576 -0.5324 -0.1855
HDFC Tax Saver Fund 0.2202 0.6212 1.1964 -0.5451 -0.1816
Tata Pure Equity Fund 0.3556 0.6783 0.9619 -0.6182 -0.1522
Tata Tax Advantage Fund 0.3562 0.5946 0.9392 -0.5268 -0.1428
Principal Index Fund 0.3243 0.8755 0.7372 -0.5528 -0.1794
Quantum Long-Term Equity Fund 0.1459 0.4503 1.0377 -0.4478 0.0095
Sundaram Growth Fund 0.3984 0.6005 0.9542 -0.5768 -0.1970
UTI - Opportunities Fund 0.4719 0.1874 1.0678 -0.5344 -0.0160
Fidelity Equity Fund 0.1644 0.7111 0.9713 -0.4881 -0.1955
L&T Growth Fund 0.2107 0.7761 0.8958 -0.5355 -0.1850
ING Core Equity Fund –Growth 0.2148 0.7515 0.8770 -0.5294 -0.1947
Birla Sun Life Top 100 Fund – Growth 0.1131 0.6959 0.9134 -0.5134 -0.1540
Sundaram Select Focus 0.4836 0.6001 0.7937 -0.6077 -0.2206
Morgan Stanley Growth Fund 0.1657 0.7097 1.0100 -0.6142 -0.2399
ING Tax Savings Fund 0.0028 0.5740 1.1793 -0.5002 -0.2322
Baroda Pioneer ELSS 0.3099 0.6164 0.9686 -0.6539 -0.2245
UTI - Growth Retail 0.2348 0.5806 0.8917 -0.5186 -0.1805
HSBC Equity Fund 0.4195 0.6708 0.6449 -0.5682 -0.2050
LIC Nomura Mf Equity Fund 0.1117 0.8036 0.7742 -0.5572 -0.2220
Sahara Growth Fund 0.2827 0.6151 0.7923 -0.6433 -0.2101
ING Balanced Fund (D) 0.2667 0.6385 0.6575 -0.5827 -0.1773
LIC Nomura Mf India Vision Fund (D) 0.4904 0.5047 0.5528 -0.5890 -0.2078
SBI Magnum NRI Investment Fund-Flexi Asset (D) Balanced 0.2205 0.5622 0.7168 -0.5802 -0.2162
SBI One India Fund -0.0542 0.5556 0.8404 -0.6320 -0.1764
Kotak 50 Growth 0.3298 0.6074 0.7128 -0.9292 -0.2164
JM Balanced Fund - (D) 0.0896 0.4635 0.4940 -0.6130 -0.1695
Principal Personal Tax Saver Fund -0.1842 0.4525 1.0608 -0.9938 -0.2761
Quantum Liquid Fund – Growth 0.1687 0.4055 0.1604 -0.5981 -0.1425
Kotak Equity Arbitrage Growth 0.1867 0.3730 0.1698 -0.5934 -0.1454
Templeton India TMA 0.1712 0.4012 0.1586 -0.6040 -0.1440
SBI Arbitrage Opportunities Fund 0.1845 0.3694 0.1692 -0.6007 -0.1403

Selectivity Skills of Mutual Fund Managers Iin India: An Analysis 55
http://ijcf.ticaret.edu.tr
HSBC Cash Fund 0.1705 0.3893 0.1392 -0.6104 -0.1540
Sahara Growth Fund - Div -0.3704 0.6038 0.7926 -0.9336 -0.1917
Average 0.2213 0.5994 0.8529 -0.5965 -0.1780
Source: AMC reports, NSE historical data and RBI reports
Table 4.8: Persistence in Selectivity Performance of Sample Fund Managers
Fama Model
Scheme 2007 2008 2009 2010 2011
UTI - Opportunities Fund 0.5519 -0.507 1.5996 -0.1627 -0.2395
ICICI Prudential Discovery Fund – Growth 0.184 -0.6616 2.2403 -0.2033 -0.3746
Reliance Growth Fund 0.52 -0.6086 1.7914 -0.2323 -0.438
HDFC Equity Fund 0.4054 -0.6668 1.7858 -0.1051 -0.4684
Reliance Regular Savings Fund 0.3939 -0.3728 1.452 -0.2858 -0.3453
Tata Tax Advantage Fund 0.4765 -0.5346 1.4165 -0.1965 -0.3529
ICICI Pru Tax Plan 0.2923 -0.6847 1.8179 -0.2298 -0.3999
Sundaram Select Focus 0.6439 -0.6298 1.4416 -0.2 -0.4665
Tata Pure Equity Fund 0.4922 -0.6007 1.4748 -0.2313 -0.3654
HDFC Tax Saver Fund 0.3382 -0.6693 1.7004 -0.2233 -0.3942
Birla Sun Life Frontline Equity 0.3868 -0.6835 1.5855 -0.1603 -0.4347
Sundaram Growth Fund 0.557 -0.7981 1.5515 -0.1627 -0.456
Franklin India Bluechip Fund 0.383 -0.6495 1.4801 -0.193 -0.3852
Baroda Pioneer Growth 0.6088 -0.7254 1.4646 -0.1836 -0.5313
UTI - Growth Retail 0.3507 -0.5018 1.3163 -0.1547 -0.3961
Sahara Growth Fund 0.4919 -0.5262 1.3115 -0.2403 -0.4355
Fidelity Equity Fund 0.2846 -0.6111 1.4443 -0.1405 -0.4219
Birla Sun Life Top 100 Fund – Growth 0.2491 -0.5996 1.4276 -0.1267 -0.4018
Quantum Long-Term Equity Fund 0.2547 -0.9189 1.5115 -0.1203 -0.2351
HSBC Equity Fund 0.5447 -0.5864 1.0873 -0.1812 -0.4518
Kotak 50 Growth 0.4239 -0.6696 1.2299 -0.1888 -0.3934
Baroda Pioneer ELSS 0.4289 -0.8203 1.5164 -0.2193 -0.5126
Morgan Stanley Growth Fund 0.2967 -0.7946 1.5467 -0.2028 -0.4685
L&T Growth Fund 0.3625 -0.8747 1.4664 -0.1492 -0.4325
Principal Index Fund 0.4675 -0.8154 1.3121 -0.1351 -0.4645
ING Tax Savings Fund 0.1339 -0.9205 1.6704 -0.1207 -0.4468
ING Core Equity Fund -Growth 0.3523 -0.8214 1.3472 -0.1413 -0.4433
SBI Magnum NRI Investment Fund-Flexi Asset (D) Balanced 0.3281 -0.7255 1.2858 -0.2642 -0.3416
Sahara Growth Fund - Div 0.1003 -0.5236 1.3108 -0.2118 -0.4211
ING Balanced Fund (D) 0.3678 -0.4882 1.0184 -0.325 -0.351
LIC Nomura Mf Equity Fund 0.2766 -0.8012 1.3256 -0.1457 -0.4881
LIC Nomura Mf India Vision Fund (D) 0.6523 -0.8912 1.0179 -0.1696 -0.4951
SBI One India Fund 0.0598 -0.797 1.4278 -0.2464 -0.396
Equity Arbitrage Growth 0.1899 0.3506 0.184 -0.5557 -0.1608
SBI Arbitrage Opportunities Fund 0.1872 0.3505 0.1786 -0.5602 -0.1534

56 Bilal Ahmad Pandow
http://ijcf.ticaret.edu.tr
Quantum Liquid Fund – Growth 0.1694 0.3992 0.1625 -0.5928 -0.1449
Templeton India TMA 0.1719 0.3952 0.1607 -0.5988 -0.1465
Principal Personal Tax Saver Fund -0.0377 -0.794 1.4852 -0.2181 -0.4756
HSBC Cash Fund 0.1719 0.3778 0.1431 -0.5994 -0.158
JM Balanced Fund - (D) 0.1928 -0.7073 0.985 -0.2569 -0.3668
Average 0.34264 -0.55269 1.291875 -0.24088 -0.38137
Source: AMC reports, NSE historical data and RBI reports The issue of persistence in fund manager’s ability to select undervalued stocks has two dimensions. First, one can ask if some managers who did particularly well or poorly in the past quarter/year continues to do so in the next, that is, one can examine if there is persistence in general. The second question is if managers exhibit persistence in general, that is, no matter what the performance over the previous quarter/year was, it remains unchanged or is better in the next. In this study we check persistence by addressing both of these questions. To test for persistence in the stock selectivity performance of sample fund managers, across the two measurement criterion namely Jensen (1968) and Fama (1972), we have calculated yearly Alpha’s and also assigned ranks to each fund on the basis of the excess return (Alpha). The said data is presented in Table 4.7, the perusal of which reveals short term persistence (i.e. in the first three years) in terms of first question defined above i.e. whether the managers repeat the past performance with positive selectivity performance, in case of all the sample 40 funds except three funds namely: SBI One India, Principal Personal Tax Saver Fund and Sahara Growth Fund-Div. However, with respect to the long term persistence i.e. for all the five years, none of the sample funds have shown persistence in their performance as during the first three years most of the sample funds have reported positive alpha’s and in the last two years of the period under study i.e. for 2010 and 2011, all the sample funds have reported negative alpha’s. As such it can be inferred that fund managers have failed to perform well consistently in the long run. As already stated that the other way to look into the persistence in performance is that if managers exhibit persis-tence in performance in general i.e. no matter what the performance over the previous year was, it improves or re-mains unchanged in the next, In terms of this question, during the short run i.e. first 3- years of the period under study 30 sample funds i.e. 75 percent of the sample fund have exhibited persistence in general. But in the long run i.e. during the entire study period, none of the sample funds have exhibited persistence in general as in case of all the sample funds the alpha’s were positive in the first three years then negative in the last two years. What emerges from the above is that 75 percent of the sample funds have exhibited persistence in general in first three years of the time series but no such persistence for the entire time series. Table 4.8 presents year-wise Fama’s Net Selectivity along with the ranks occupied by each fund. It can be observed from the data contained in the above referred table that all the sample 40 funds except four funds namely: SBI Arbi-trage Opportunity Fund, HSBC Cash Fund, Templeton India TMA and Quantum Liquid Fund- Growth have re-ported neither short term (2007-09) nor long run i.e. for the entire study period persistence in stock selectivity per-formance based on Fama’s Net Selectivity. The above mentioned four sample funds have reported persistence only for the first three years of the study period (2006-2011). But when one looks into the entire period of study, these four funds have also exhibited either little or no persistence. With respect to the persistence in general terms; none of the funds have exhibited persistence in general terms (i.e. no matter what the performance over the previous year was, it remains unchanged in the next). It can also be seen from the above referred table that on the basis of Fama’s Net Selectivity, none of the sample funds have shown persistence in selectivity performance but during the last two years of time series, all the sample funds have consistently reported negative net selectivity performance. What emerges from the above discussion on persistence of selectivity performance is that on the basis of Jensen Alpha majority of the funds reported persistence in selectivity performance in the short run. But in the longer run i.e. for the entire time series (2006-2011) no such persistence in selectivity performance has been observed for the sam-ple funds. However, on the basis of Fama’s Net selectivity, no persistence neither in the short run nor in the long

Selectivity Skills of Mutual Fund Managers Iin India: An Analysis 57
http://ijcf.ticaret.edu.tr
run in the selectivity of performance of fund managers of sample funds has been observed. Lack of persistence is indicative of the fact that the fund managers have failed in picking up under -valued stocks consistently which in turn implies poor selectivity performance on the part of sample fund managers during the period under study. Short run persistence was observed on the basis of Jensen alpha but no such persistence has been found with respect to Fama’s Net Selectivity, as such the hypothesis set in this regard for the study is rejected. Besides, no relative per-sistence over the longer run has been observed across both the measurement criterion, therefore the hypothesis that there is no persistence in the selectivity performance of fund managers across both the criterion is accepted. The finding about the existence of short term persistence in selectivity performance based on Jensen alpha corre-sponds with the findings of Benjamini and Hochberg 1995; Benjamini and Yekutieli 2001; and Storey 2002 There seems to be more evidence for relative short term persistence in selectivity performance (Evangeloselal, 2009). A common conclusion in the literature, however, is that expect for the very best fund managers, persistence primarily exists among poor performers Grinber (1996); Carhart (1997), Bolhen and Busse (2004). The similar finding emerges from the present study i.e. poor performers namely HSBC Cash, Quantum Liquid fund-growth, SBI Arbitrage Op-portunity Fund and Templeton India. TNA which have performed poorly compared to other sample funds, have been found to report persistence in selectivity performance, however, in the short run only. With regard to the long run persistence, the finding of the absence of relative long term persistence in selectivity performance of the sample funds across both the measurement criterion is line with the findings of other studies like: Chander (2005), Joyti Dhar (2004) Berk and Green (2004), Elton et.al (1992), Treynor and Mazuy (1996), Hen-rikson (1984). This lack of persistence in the long run could potentially be attributed to several factors. One is the diminishing investment opportunities of well performing funds Evangelos (2009). Another possibility is that man-agement fee rise over- time so as to capitalize on a good performance record. Finally, the performing managers may simply wish to exploit their reputation and find a more lucrative job, perhaps in a hedge fund Evagelos (2009).
References
Abrevaya, J., Jiang, W., 2001. Pairwise-slopes statistics for testing curvature. Working paper, University of Chicago Graduate School of Business and Columbia Business School.
Angol, "Role of Self Regulatory Organisation in Mutual Fund Industry in India", Chartered Financial Analyst, Vol.7 (1), 1992, p11.
Ansari, "Mutual Funds in India: Emerging Trends", The Chartered Accountant, Vol. 42(2), (August 1993), pp.88-93.
Ansari, "Mutual Funds in India: Emerging Trends", The Chartered Accountant, Vol. 42(2), (August 1993), pp.88-93.
Arditti, "Another Look at Mutual Fund Performance", Journal of Financial and Quantitative Analysis, Vol. 3, (1971), pp. 909-912.
Bansal L K, "Challenges For Mutual Funds In India", Chartered Secretary, Vol. 21(10), (October 1991), pp. 825-26.
Batra and Bhatia, "Indian Mutual Funds: A study of Public sector" , paper presented, UTI Institute of Capital Mar-ket, Mumbai, (1992).
Baur, Sundaram and Smith, "Mutual Funds: The US Experience", Finance India, Vol. 9(4), (1995), pp.945-957.
Carlson, "Aggregate Performance Of Mutual Funds, 1948-1967", Journal of Financial and Quantitative Analysis, Vol. 5, (1970), pp.1-32.
Conrad S Ciccotello and C Terry Grant, "Information Pricing: The Evidence from Equity Mutual Funds", The Fi-nancial Review, Vol. 31(2), (1996), pp.365-380.
Dellva, Wilfred L.and Olson, Gerard T. "The Relationship Between Mutual Fund Fees And Expenses And Their Effects On Performance", The Financial Review, Vol. 33(1), (Feb 1998), pp.85-104.
Fama, "Components of Investment Performance", Journal of Finance, Vol. 27, (1972), pp.551-567
Fernando, Chitru S et.al., "Is Share Price Related To Marketability? Evidence from Mutual Fund Share Splits", Jour-nal of The Financial Management Association, Vol. 28(3), Autumn (1999) pp.54-67.

58 Bilal Ahmad Pandow
http://ijcf.ticaret.edu.tr
Friend et.al, "A Study of Mutual Funds" U.S. Securities and Exchange Commission, USA, (1962).
Friend, Blume, Crockett, Mutual Funds and Other Institutional Investors - A new perspective, Mc Graw Hill Book Company, New York, (1970).
Gangadhar V, "The Changing Pattern of Mutual Funds in India", The Management Accountant, Vol. 27 (12), (De-cember 1992), pp. 924-28.
Grubber, "The Persistence Of Risk-Adjusted Mutual Fund Performance", Journal of Business, Vol. 2, (1996), pp.133-157.
Gupta L C, Mutual Funds and Asset Preference, Society for Capital Market Research and Development, New Delhi, First Edition (1992).
Gupta, "The Mutual Fund Industry and Its Comparative Performance", Journal of Financial and Quantitative Analy-sis, Vol. 6, (1974), pp.894.
Irissappane, Aravazhi, (2000), 'Paradigm Shifts in the Performance of Indian Mutual Funds: An Analysis with Refer-ence to Close-Ended Funds of Selected Institutions', UTI Institute of Capital Markets, Mumbai
Irwin, Brown, FE, et al., "A Study of Mutual Funds: Investment Policy and Investment Company Performance" reprinted in Hsiu-kwangwer and Alan Jzakon (Ed.) Elements of Investments, New York: Holt, Renchart and Winston, (1965), pp.371-385.
Jensen Michael C, "The Performance Of Mutual Funds In The Period 1945-1964", Journal of Finance, Vol. 23, (1968), pp.389-416.
Jiang, W., 2001, A Non Parametric Test of Market Timing, Journal of Empirical Finance 10, 399-425.
Khorana, Ajay and Nelling, Edward "The Determinants And Predictive Ability Of Mutual Fund Ratings", Journal Of Investing, Vol. 7(3), Fall (1998), pp 61-66.
Klemosky, "How Consistently Do Managers Manage", Journal of Portfolio Management, Vol. 3, (1977), pp.11-15.
Maria Do Ceu Cortez & Florinda Silva, "Conditioning Information on Portfolio Performance Evaluation: A Reex-amination of Performance Persistence in the Portuguese Mutual Fund Market", Finance India, Vol. XVI (4), (December 2002), pp. 1393-1408.
McDonald and John, "Objectives And Performance Of Mutual Funds, 1960-69", Journal of Financial and Quantita-tive Analysis, Vol. 9, (1974), pp.311-333.
Meyer, "Further Applications of Stochastic Dominance to Mutual Fund Performance", Journal of Financial and Quantitative Analysis, Vol 12(1977) 917-924.
Rich Fortin, and Stuart Michelson, "Are load Mutual Funds Worth the Price?", Journal Of Investing, Vol. 4(3) , (Fall 1995), pp. 89-94.
Saha Asish and Rama Murthy Y Sree, "Managing Mutual Funds: Some Critical Issues", Journal of Social and Man-agement Science, Vol. XXII (1), (1993-94), pp.25-35.
Sahu R K and Panda J, "The Role And Future Of Mutual Funds In India", Management Accountant, (February 1993) pp. 91-3.
Sanjay Kant Khare, (2007), 'Mutual Funds: A Refuge for Small Investors', Southern Economist, Vol.45(18)
Sarkar A K, "Mutual Funds in India - Emerging Trends", The Management Accountant, Vol. 26 (3), (March 1991), pp.171-174.
Shah Ajay and Thomas Susan, "Performance Evaluation of Professional Portfolio Management In India", paper presented, CMIE, (10 April 1994).
Sharpe, William F "Mutual Fund Performance", The Journal of Business, Vol. 39(1), (1966), pp.119-138.
Shashikant Uma, (1995), Mutual Funds in India: Challenges, opportunities and ... Performance over time", Journal Of Investing, Spring, Vol. 4(1), pp.8-17
Shashikant, Uma "Accounting Policy and Practices of Mutual Funds: The Need for Standardization", Prajan, Vol. XXIV (2), (1993), pp. 91-102.

Selectivity Skills of Mutual Fund Managers Iin India: An Analysis 59
http://ijcf.ticaret.edu.tr
Shome, "A Study Of Performance Of Indian Mutual Funds", unpublished thesis, Jhansi University, (1994).
Shukla and Singh , "Are CFA Charter Holders Better Equity Fund Managers", Chartered Financial Analysts, Vol. 2, (1994), pp.68-74.
Smith and Tito, "Risk-Return Measures of Post-Portfolio Performance" Journal of Financial and Quantitative Analy-sis, Vol. 4, (1969), pp.449-471.
Statman, Meir "Socially Responsible Mutual Funds", Journal Of Financial Analysts Vol. 56 (3) (May / June 2000), pp. 30-38.
Treynor and Mazuy , "Can Mutual Funds Outguess The Markets" Harvard Business Review, Vol. 44, (1966), pp.131-136.
Treynor Jack L, "How to Rate Management of Investment Funds", Harvard Business Review, Vol. 43(1), (1965), pp. 63-75.
Vaid, Seema, "Mutual Fund Operations In India", Rishi Publications, Varnasi, (1994)
Vidhyashankar S, "Mutual Funds: Emerging Trends In India", Chartered Secretary, Vol. 20(8), (August 1990), pp.639-640.

International Journal of Commerce and Finance, Vol. 2, Issue 2, 2016, 61-70
BENEFITING FROM THE COLLECTIVE LABOR AGREEMENT IN TURKISH COLLECTIVE BARGAINING SYSTEM1
Mehmet Saim Aşçı, (Ph.D)
İstanbul Medipol University, Turkey
Abstract: Collective agreement system, which closely involves the content of social fabric and separation of powers in industrial society -some of the main problems constituting economic, political and judicial fabric of the society- and as the product of a historical development process, is applied in many countries as a dynamic process that is able to rapidly adapt to both changing economic and social conditions and changes in technological structure and plays the most effective role in determining employment conditions. A collective labor agreement is primarily formed for the purpose of improving working conditions of workers and to recover their material circumstances through other side benefits provided in goods and money in addition to salary increases. Naturally, aspiration of employees to benefit from collective labor agreement applied in the workplace they serve is for their self-interest. However, to be able to benefit from collective labor agreement, while only aspi-ring is not sufficient to utilize it; fulfilling a set of conditions is also necessary.
Keywords: Collective Bargaining, Labour Unions, Collective Labour Agreements, Employees.
1. Introduction Collective agreement system is the product of a historical development process (Zaim, 1977).
It is applied in many countries as a dynamic process that is able to rapidly adapt to both changing economic and social conditions and changes in technological structure and plays the most effective role in determining employment conditions (Ekin, 1979).
Whereas it can be observed that more than 150 thousand collective agreements are in force in the USA simultane-ously; the system adapts to not only political regimes but also rapidly changing character of industrial life with its democratic and dynamic quality.
According to Harold W. Davey, collective agreement always plays an effective role as a useful mechanism for en-suring balance, stability and alteration in labor relations all together (Dawey, 1963).
Collective agreements, in essence, include issues to be handled in determining working conditions in the workplace. Terms regarding wages and work hours are particularly foremost among these issues undoubtedly. Staff manage-ment, human relations and, more generally, many issues included in behavioral sciences started to be considered in labor agreement provisions in recent years.
Moreover, collective agreements perceive many other issues from physical working conditions to relations of work-ers with employers and their own organizations and from settlement of disputes to complaints mechanisms. In this respect, collective bargaining system should be considered as a main and indispensable institution of democratization of industrial relations (Ekin, 1979).
1 This article has been generated from the Doctoral dissertation of the author under the title of “A Research Investigating Out of Scope
Employee Application in Turkish Collective Agreement System and Attitudes of Workmen Regarding the Issue”.
Inte
rnati
on
al
Jou
rnal
of
Co
mm
erc
e a
nd
Fin
an
ce

62 Mehmet Saim Aşçı
http://ijcf.ticaret.edu.tr
Collective agreement system does not indicate relations of individuals trying to agree upon certain principles but rather relations of organized groups. In other words, collective agreement system is an institutionalized representa-tion process and an entity generated to enhance workers’ bargaining power through economic imperatives (Zaim, 1977).
In a broader scanning, collective agreement system involves one of the main problems constituting economic, politi-cal and judicial fabric of society. This is the content of social fabric and separation of powers in an industrializing society.
In other words, it refers to mutual interactions of industrialization and social structure, i.e. the issues of relations between ruling and ruled ones in industry and the balance of power between the groups. The ultimate aim of all these issues is to configure fabric of industrial society so as to maximize its social and economic welfare. In all coun-tries of contemporary world, economic and industrial structure in particular is closely connected to harmonious development of labor relations. The principal method in regulating these relations is collective bargaining system in democratic countries.
Collective agreement system contemporarily has three aims in general: 1. To determine the price of worker’s labor, i.e. wages, 2. To establish an industrial jurisprudence system about labor disputes, 3. To constitute a systematics to represent individual and collective interests of workers and employers.
In fact, collective bargaining is a difficult process requiring a careful preparation and high-level management skills. In spite of all difficulties, collective bargaining is a beneficial application for the protection of labor force-management autonomy in a free society. If the settlement of labor disputes is left to third parties, freedoms of labor force and management will be restricted. Therefore, while collective bargaining serves to interests of labor force and manage-ment, it also serves to interests of the free society in the long term as well (Davis,1988).
Collective bargaining is also a channel to “participation to the management” enabling share of management authority in determination of economic and non-economic rules regarding working conditions. In this sense, it is a tool con-tributing democratization of management in the workplace (Koray, 1992).
Collective bargaining is also a tool used for “remedy of the problems” to solve the conflict of interests between the parties of labor and employer which have separate interests (Koray, 1992).
Collective bargaining determines rights and responsibilities of parties, carries out its liability to maintain labor peace and concludes procedures to be applied in the case of disputes and hence it is a conciliator remedy in labor relations. Western societies have achieved to provide consensus and continuity in industrial relations systems due to they use collective bargaining for not only a bargaining relation gathering opposite interests but also an institution to solve this conflict (Barbash, 1980).
Collective agreement system has attracted the attention of various disciplines because of its such multifaceted charac-ter.
While it constitutes examination field of economics, law, political sciences disciplines on the one hand, it is included in research topics of sociology and psychology due to it is a form of group relations among people on the other.
Thus, psychological researches investigating dynamic process of group activities in the society deal with humane facade of collective agreement system. A business attracts sociologists attention as a community and a social system. As for collective agreement system, it draws attention with respect to its effects on relations between individuals and groups within the frame of a business or a branch of industry.

Benefiting From The Collective Labor Agreement In Turkish Collective Bargaining System 63
http://ijcf.ticaret.edu.tr
Collective agreement system is one of important power elements of a society with its economic, judicial, social, polit-ical and psycho-sociologic significance (Zaim, 1977).
Apart from terms of Law of Obligations with 1926 date on “General Contract”, the first law to regulate collective labor agreements was the law with 1963 date and 275 number in Turkey. After the acceptance of 1982 Constitution, 275 numbered law was replaced with “Law of Collective Bargaining Agreements, Strike and Lock-out” with 5th May 1983 date and 2822 number (Oğuzman, -).
Finally, 18th October 2012 dated and 6356 numbered “Law of Trade Unions and Collective Bargaining System” was published in 7th November 2012 Official Gazette for the purpose “to enact a long-running law moving Turkish industrial relations system forward, reflecting values of the age and providing radical solutions for the problems of Turkish working life as well” (6356 numbered Law of Trade Unions and Collective Bargaining System, General Preamble) and substituted for the laws of “Trade Unions” with 2821 number and “Collective Bargaining Agree-ments, Strike and Lock-out” with 2822 number.
In Article 33 and 35 of Law of Trade Unions and Collective Bargaining System, essential elements for the definition of the collective agreement have been given. In article 33 of the Law, following statements are included:
“(1) A collective labor agreement shall contain provisions on the conclusion, content and expiration of a contract of employment.
(2) Collective labor agreements may also contain other stipulations as to the mutual rights and obligations of the parties, application and supervision of the agreement and the means to be resorted for the settlement of disputes.
(3) A Framework agreement shall apply to members of workers’ and employers’ confederations which are parties to this agreement and may cover the arrangements concerning vocational training, health and safety at work, social responsibility and employment policies.
(4) Framework contract is placed for minimum one and maximum three years upon the invitation of one party and affirmative response of the other party.
(5) Collective labor agreements and framework agreements shall not include arrangements contrary to the Constitu-tion and the binding provisions of the laws.”.
In Article 35 of the Law, an imperative regulation was enacted and to place collective labor agreement in written was emphasized through the statement of “A collective labor agreement shall be done in written.” (Kılıçoğlu, 2013).
By considering such provisions of the law, collective labor agreement can be defined as:
Collective Labor Agreement is a written contract placed in order to regulate provisions on conclusion, content and expiration of the labor contract between labor union and employer’s union or employer that is not a member of employer’s union and it may also include mutual rights and obligations of the parties, application and supervision of the agreement and means to be resorted for settlement of disputes (Çelik, 2015).
On the basis of these definitions principal elements of collective labor agreement can be listed as follows (İnce, 1985):
1. Collective Labor Agreement is a sui generis private law contract. 2. On the parties of Collective Labor Agreement is necessarily labor union. The other party is the employer
or the employer’s union. According to definition in the law, if the employer is a member of an employer’s
64 Mehmet Saim Aşçı
http://ijcf.ticaret.edu.tr
union, then the party of the contract shall become the employer’s union. The contract concluded by labor communities not having labor union legibility will not be deemed as collective labor agreement.
3. Collective Labor Agreement regulates the issues about conclusion, content and expiration of labor con-tract in principle. In other words, issues constituting the content of labor contract such as working condi-tions, work hours, holidays and leaves, wages and payments of benefits are included in Collective Labor Agreement in addition to terms about conclusion and termination of the labor contract.
4. Collective Labor Agreement may include terms about rights and obligations of the parties and application and supervision in addition to regulation indicated above. In other words, issues such as assignment of the representatives, tasks of the representatives, notice board, complaint management, settlement of dis-putes may be included in collective labor agreements.
2. The Concept of Benefiting From The Collective Agreement Collective labor agreement is primarily formed for the purpose of improving working conditions of workers and to recover their material circumstances through other side benefits provided in goods and money in addition to salary increases as indicated above. Then, aspiration of workers to benefit from collective labor agreement applied in the workplace they serve is for their self-interest. However, to be able to benefit from collective labor agreement, while only aspiring is not sufficient to benefit from it; fulfilling a set of conditions is also necessary (Akı, 1975).
2.1. Beneficiaries of Collective Agreement In the Law of Trade Unions and Collective Labor Agreements with the number of 6356, the issue of benefiting from the collective labor agreement by members and non-members of a workers’ trade union which is one of the parties is included in Article 39.
It is possible to handle these matters in the following sub-titles (Çelik, 2015).
2.1.1. Members of A Workers’ Trade Union Which Is One of the Parties In the 6356 numbered Law, it is obviously indicated that members of a workers’ trade union which is one of the parties benefit from the Collective Labor Agreement. (a.39/1). In application of this provision, the scope and level of collective labor agreement do not matter. Collective Labor Agreement may have been concluded in the forms of workplace, workplaces or enterprise collective labor agreement. The important thing is whether the worker employed in the workplace included in the scope of a concluded collective labor agreement is the member of the signatory union. Now then, workers who are employed in a workplace included in the scope of a concluded collective labor agreement and members of signatory union can benefit from the contract as it is obviously indicated in Article 39. 6356 numbered Law regulates that the amount of the membership dues shall be fixed by the general board in ac-cordance with the procedures and principles identified in unions’ statutes (a.18/1).
The 6356 numbered Law clarifies on which date members of the trade union that is the party of a collective labor agreement can start to benefit from the contract. According to the Law, members of a trade union at the date of signing the collective labor agreement to which that trade union is a party shall benefit from that agreement as of the commencement date; workers who become members after the date of signature shall benefit from the agreement as of the date when the trade union communicates their membership to the employer (a.39/2).
2.1.2. Non-Members of A Workers’ Trade Union Which Is One of the Parties a) Benefiting from the Agreement through Payment of Solidarity Dues As it was in former 275 numbered and 2822 numbered Laws, a provision regarding benefiting from the agreement by non-members of the signatory union through payment of solidarity dues is included in 6356 numbered Law as well. In the Law, it is obviously indicated that the consent of the trade union shall not be required in benefiting from the collective labor agreement by paying solidarity contributions (a.39/4). In the law, the provision of that benefiting from the collective labor agreement by paying solidarity contributions shall do so starting from the date on which such request is made (a.39/4).
Benefiting From The Collective Labor Agreement In Turkish Collective Bargaining System 65
http://ijcf.ticaret.edu.tr
In the Law of Trade Unions and Collective Bargaining Agreements with 6356 number, the provision of that “the amount of the solidarity dues shall be determined with the trade union statute, provided that the amount is not above the amount of the membership dues” has been enacted (a.39/5).
The opportunity that the law provides for non-members of the signatory trade union to benefit from collective agreement by paying solidarity contributions is in compliance with the principles of optional affiliation to unions and prohibition of forcing someone for membership indicated in the Constitution and Trade Unions Law, due to it does not force the worker to become a member of the union basically. On the other hand, individuals other than those providing material and moral support for the union in its important and difficult activity to conclude Collective La-bor Agreement and hence eligible to benefit from it are also able to utilize it without bearing any cross and the Law found that inconvenient with respect to getting stronger and development of the unions and accepted that non-members of the signatory union may benefit from the activity in the exchange of an amount to be paid to the union.
While, differently from 2821 numbered Law in Article 18 of 6356 numbered Law, the fact that an upper limit has not been determined for union dues and it has been stipulated that the amount of the membership dues shall be fixed by the general board in accordance with the procedures and principles identified in their statutes and a restriction pro-portional to membership dues has been determined with respect to solidarity contribution has an importance in the sense of protecting autonomy in the operation of unions, there is also a necessity to protect existing balance in exe-cution. Herein, it should be taken into consideration that membership dues consist one of the important income sources with respect to continuity of the union on the one hand, and it should not be as much high as to make bene-fiting from the right of union association too difficult on the other. It also should be noted that the amount of soli-darity contribution should be determined in compliance with the point to protect the freedom of staying away from the union (Alpagut, 2012).
b) Application of the Agreement to the Non-members through Written Consent of the Union Law of Trade Unions and Collective Labor Agreement with 6356 number stipulated application of rights and inter-ests that workers’ and employers’ institutions provide to their members through their own activities to non-members and necessitated written consent of these institutions (Kılıçoğlu, 2013). According to the Law, “The extension of the rights and benefits that organization provides for its members through its activities to those who are not members shall be dependent upon its written approval, without prejudice to the provisions included from the part seven to the part twelve of this law (a.26/4). In pursuant to this article, through the written approval of a labor union, the people who are not a member of the relevant union can benefit from the Collective Labor Agreement and other activities that the union carries out. However, in applications to date, it has not been commonly observed that labor unions give a written approval to enable non-members to benefit from a Collective Labor Agreement. It was sometimes observed in the past that labor unions conclude some terms to be applied to all workers in some payments of benefit issues such as transportation and meal in collective labor agreements. However, conclusions ensuring application of terms of a collective labor agreement regarding monetary issues to all workers were almost never encountered. Un-doubtedly, it cannot be expected that trade unions(**) which does not want non-members to benefit from the con-tracts by paying solidarity contribution would pave the way to written approval option to enable non-members to benefit from the contract in which there is not any matter of contribution.
2.1.3. Extend of the Agreement through Cabinet Decree In 275 numbered Law, provisions regarding extension was included for the purpose of providing uniform conditions in labor market in the cases of some workers are not able to benefit from the contract due to uninvolved employers start to run after the conclusion of a collective labor agreement applying to majority of workers in a business line and prevention of unnecessary strikes and lock-outs (Interim Commission Report, TGNA, p.132). However, there was not any extension application in former periods. Therefore, 2822 numbered Law stipulated new principles in order
** In the negotiations of 6356 numbered Law of Trade Unions and Collective Labor Agreement during the discussion in TGNA, removal of benefiting from the Collective Labor Agreement through paying Solidarity Contribution in relevant workplace was demanded (Musa Çam, TGNA Reports)

66 Mehmet Saim Aşçı
http://ijcf.ticaret.edu.tr
to ease functionality of extension and reduce the numbers of workers not being able to benefit from collective labor agreements (Mis & Özsoy, 1983).
According to regulation made by 2822 numbered Law, Council of Ministers can extend a collective labor agreement completely, partly or after making necessary amendments which is concluded by the union having the greatest num-ber of members among the unions representing at least ten percent of the workers in a certain business line to the other workplaces or some of them in the same business line not having collective labor agreement upon the demand of labor and employer unions in the business line or relevant employers or Minister of Labor and after taking opin-ions of High Board of Arbitration (TSGLK a. 11/I).
In order to benefit from extended contract, workers do not need to pay even solidarity contribution. After the ter-mination of extended collective labor agreement, extension decision terminates as well (a. ll/III). However, when Council of Ministers finds it necessary, it can repeal the decree by explaining its preamble (a. 11/IV).
As it can be seen, extension is to ensure application of a collective labor agreement to the workplaces out of the scope of the agreement through an administrative action of Council of Ministers.
Indeed, extension is a way that eliminates unfair competition circumstances among employers arising from opting of some employers out of collective labor agreement in a certain business line and ensures application of the collective labor agreement in a broader sphere and rise level of living of workers as well as placement of uniform rules and prevention of unnecessary strikes and lock-outs and public interest is forefront in all these reasons (Oğuzman, -).
After entry into force of 2822 numbered Law, it can be observed that Council of Minister sometimes used its exten-sion authority (Reisoğlu, 1986).
Rules of extension of collective labor agreement have been regulated in Article 40 of Trade Unions and Collective Labor Agreement with 6356 number. In this new regulation, there are some partial differences from the regulation included in 2821 numbered Law (a.11). The law maker has obviously emphasized that extension cannot come into force retroactively. On the other hand, conclusion of a new collective labor agreement before the due date of ex-tended labor agreement has been allowed due to parties may agree and conclude a new collective labor agreement (TU and CLA. m.40). In that case, application of extended collective labor agreement will terminate automatically (Kılıçoğlu, 2013).
2.2. The Concept and Types of Out-of-Scope Staff as the exception of Benefiting from the Collective Agreement Workers falling out of the scope of a collective labor agreement should be examined in two parts. The first part is to fall out of the scope because of the law and the second one is to be excluded from the scope through the wills of the parties concluding the contract (Reisoğlu, 1986).
Collective labor agreement, which is a kind of private law contracts, is concluded in line with the wills of the parties in compliance with stipulations of constitution and laws. However, some workers are directly excluded from the execution scope of collective labor agreement through a legal regulation before their will due to their task and posi-tion.
Here, workers that serves to an employer under a service contract but excluded from the scope of collective labor agreement through a legal regulation and for various reasons are the matter (Reisoğlu, 1986).

Benefiting From The Collective Labor Agreement In Turkish Collective Bargaining System 67
http://ijcf.ticaret.edu.tr
In Article 21 of 2821 numbered Law, those forbidden from membership of a union were determined as follows;
1. “Military staff 2. Inspectors, controllers and directors working in administrations, organizations, institutions, banks and in-
surance companies indicated in the second clause of Article 40 and other managers equal and superior to those,
3. Teachers working in the schools subjected to Law of Private Education Institutions with 8th June 1965 date and 625 number cannot be a member of labor and employer unions and cannot establish unions.”
Here, workers that serves to an employer under a service contract but excluded from the scope of collective labor agreement for various reasons are the matter. In the same article, military staff is included in this prohibition to membership and founder of a union. Work relation of military staff is similar with civil servants. In this respect, it is not possible to consider them as labors. Moreover, there is not any definition in the law regarding these people. For this reason, benefiting from collective labor agreement by military staff, who is committed to statute law, cannot be thought (Eyrenci, 1984).
On the other hand, due to labor relation of some of those indicated in Article 21 of 2821 numbered Trade Unions Law is on the basis of service contract, whether they can benefit from the rights of freedom of association and col-lective labor agreement protected by the Constitution became a matter of discussion (Reisoğlu, 1986).
Individual freedom of association, which can be defined as being a member, not being a member or resignation from the membership of a union without any forceful action, is under Constitutional security (a.51). However, some pro-visions included in Article 21 of 2821 numbered trade unions law used to restrict such freedoms in places (Kutal, 1987).
In addition to that these restrictions are contradictory with individual freedom of association protected by Constitu-tional level, it also conflicts with the “workers and employers, without distinction whatsoever, shall have the right to establish and, subject only to the rules of the organization concerned, to join organizations of their own choosing without previous authorization” terms of Article 2 of ILO Convention regarding “Freedom of Association and Pro-tection of the Right to Organize” with 87 number and approved in 1993.
In Article 17 of 6356 numbered Law of Trade Unions and Collective Labor Agreement, acquisition of membership has been regulated for elimination of restrictions and conflicts limiting the freedoms. In the Article, all workers are entitled to become a mem-ber of a union through the statement of “any person who completes 15 years of age and who is considered as a worker in accordance with the provisions of this Law may join a workers’ trade union”.
Through 6356 numbered Trade Unions and Collective Labor Agreement Law, a liberal approach has been adopted in establishment of membership relations in compliance with international norms, liberty to become a member or not has been ensured. Workers serving to a second employer in different workplaces belonging to different employ-ers in the same business line are entitled to become a member of more than one union. Regulation aims to enable employees working with flexible hours to become members of more than one union in the case of concluding labor contracts with different employers in the same business line (Kılıçoğlu, 2013).
2.2.1. Out-of-Scope Employees for Being Deemed to Representative of Employer According to 2/1-e and 2/2 articles of 6356 numbered Law of Trade Unions and Collective Labor Agreement, “Employer’s representative refers to the persons authorized to manage an entire enterprise in the name of the em-ployer. The employer’s representatives shall be considered as employers for the purposes of the implementation of this Law.” Employer’s representatives are dependent to employer on the basis of service contract or statute law according to quality of workplace or enterprise whether it is private sector or public institution. As a rule, there exists a “Labor Contract Relationship” between employer and employer’s representative in all workplaces of private sector.

68 Mehmet Saim Aşçı
http://ijcf.ticaret.edu.tr
Therefore, such kind of employer’s representatives can benefit from protective provisions of 4857 numbered Labor Law.
According to Law of Trade Unions and Collective Labor Agreement, definition of employer’s representative has been regulated to prohibit entrance of these people to labor unions in essence. Naturally, it cannot be suggested that an individual representing employer and not a member of labor union can benefit from collective labor contract. Such individuals cannot make any claim to benefit from collective labor agreement by paying solidarity contribution as well, and their relationship with employer is only determined on the basis of labor contract (Reisoğlu, 1986).
Moreover, with respect to definition of employer’s representative concept, differences between Labor Law and Trade Unions Law should be taken for granted by considering aims of both regulations. In the definition of Labor Law, “management of the work and workplace” was taken as a basis and a broader definition was preferred with respect to scope for the purpose of operating management function. On the other hand, Law of Trade Unions and Collective Labor Agreements regulates union and collective labor agreement rights of workers as stipulated by Con-stitution (a.51-53) and prevents deprivation of workers that are deemed employer’s representative according to Labor Law and works under labor contract from this right through is narrower scope (Centel, 1992).
Moreover, lawmaker deems employees authorized to administration of whole enterprise as employer and entitle them to become a member of employer unions.
In this sense, individuals acting as a party in collective labor agreement or collective bargaining with a representative title out of those deemed as employer’s representative by Law Labor are considered as employer with respect to application of 6356 numbered Law of Trade Unions and Collective Labor Agreement (Tra Un and CLA a.39/7)
Indeed, being out-of-scope of such people should be taken for granted due to an individual acting on behalf of em-ployer in Agreement bargains with representative title and defending rights of employer cannot benefit from Collec-tive Labor Agreement (even though she/he pays solidarity contribution).
2.2.2. Workers not Participating or Withdrawing from Applied Strike According to Clause 1 of Article 64 of 6356 numbered Law of Trade Unions and Collective Labor Agreement, em-ployer is free to employ workers not participating or withdrawing from the strike. Workers who operated in the workplace with the except of those operated mandatorily according to Article 65(***) cannot benefit from the collec-tive labor agreement concluded at the end of the strike, unless there is a provision to decide on the contrary (Tra Un and CLA a. 39/8).
Here, falling out of scope of some workers is stipulated because of the law. While these workers may be members of signatory labor union, they may be non-union or member of another union as well. They cannot benefit from the agreement, unless there is a provision to decide on the contrary in the Collective Labor Agreement. These workers cannot benefit from the agreement even if they pay solidarity contribution (Oğuzman, -, Şahlanan, 1992, Kutal, 1983).
Whereas prevention of workers not participating or withdrawing from participating to strike from benefiting from a collective labor agreement concluded afterwards is evaluated as narrowing application sphere of the agreement like workers excluded from the scope of the agreement, these two applications are different from each other. While out-of-scope- staff application is a matter for workers operating certain tasks; the prohibition about benefiting from collective labor agreement regulated in clause 1 of article 64 in 6356 numbered Law of Trade Unions and Collective
*** Workers who have to operate in the workplace during a Strike and Lock-out application are those who ensure: -continuity of the works that there is a technical necessity about their continuity in the sense of quality, -workplace security and prevention of machinery and inventory stock, tools, raw materials, semi-finished and finished materials from decay, -protection of animals and plants.

Benefiting From The Collective Labor Agreement In Turkish Collective Bargaining System 69
http://ijcf.ticaret.edu.tr
Labor Agreement - unless otherwise decided- is valid for all workers not participating or withdrawing from partici-pating to a strike regardless of their tasks and positions. On the other hand, whereas change of task of a worker formerly excluded from the scope of the agreement enables the worker to benefit from collective labor agreement through eliminating out-of-scope quality; change of tasks of workers not participating and withdrawing from the participating to strike do not give a way to enable them to benefit from the agreement (Can, 1995).
According to Article 65 of 6356 numbered Law of Trade Unions and Collective Labor Agreement, while workers who have obligation to work during the strike and lock-out have to work, employer has to enable them to work as well. Likewise, operation of these works stipulated in this article is not only for the benefit of employer, it is also compulsory for the protection of national wealth and prevention of loss of jobs for workers (Yarsuvat, 1978).
2.2.3. Exclusion of Some Workers from the Scope by the Agreement of Parties of Collective Labor Agree-ment Exclusion of some workers such as directors, chiefs, engineers and even all office staff which are members or able to be a member of labor unions from the scope of the agreement is a commonly encountered case in application of Collective Labor Agreements, hence they are left to sphere of service contract (Çelik, 2015). This is regulated through scope articles included in Collective Labor Agreements.
Out-of-scope staff concept in industrial relation applications refers to people excluded from Collective Labor Agreement regime even though they are able to be member of a labor union, and even they are, as a result of con-sensus of the parties of Collective Labor Agreement, in other words those to whom Collective Labor Agreement is not applied.
Conclusion Collective bargaining refers to the process in which labor unions representing workers on the one hand and employ-ers or employers’ institutions on the other gather and come to the table in order to determine working rules and conditions of both parties and the process to conclude the collective agreement.
Through concluded collective agreements as a result of collective bargaining, parties present working conditions on which they made a consensus and they presume themselves to be bounded with these working provisions. As for collective agreement, it is “a contract concluded between one or more labor organization and one or more employers or employer organization in one or more workplaces or business line for regulation of individual and collective rela-tions between workers and employers and determination of rights and obligations between the parties of the con-tract”.
Aspiration of employees to benefit from collective labor agreement which is concluded for the purpose of improving working conditions of workers and to recover their material circumstances through other side benefits is for their self-interest. However, it is necessary to fulfill some kind of conditions to be able to benefit from collective labor agreement.
References Akı, E. (1975). Türk Hukukunda Toplu İş Sözleşmesinden Yararlanma. İzmir: Karaca Ofset Basımevi.
Alpagut, G. (2012). 6356 Sayılı Yasa'nın Toplu İş Sözleşmesi ve Toplu İş Uyuşmazlıklarına İlişkin Hükümlerinin Değerlendirilmesi- Uluslararası Normlara Uyum. Legal İş Hukuku ve Sosyal Güvenlik Dergisi, 9(35), 25-55.
Barbash, J. (1980). The Work Humanization Movement: US and European Experience Compared. Labor Relations in Advanced Industrial Societies, edited by Benjamin Martin and Everett M. Kassalow. Washington, DC: Carnegie Endowment for International Peace, 184-95.
Can, M. (1995, February). Toplu İş Sözleşmesi Düzeninde Kapsam Dışı Personelin Niteliği. TÜHİS İş Hukuku Ve İktisat Dergisi, 13(4), 5-49.
Centel, T. (1992). İş Hukuku. İstanbul: Kazancı Yayınları.

70 Mehmet Saim Aşçı
http://ijcf.ticaret.edu.tr
Cordova, E. (1982). Collective bargaining. In Comparative Labour Law and Industrial Relations (pp. 220-242). Springer Netherlands.
Çelik, N. (2015). İş Hukuku Dersleri (28.Baskı). İstanbul: Beta Yayınları.
Davis, K. (1988). İşletmede İnsan Davranışı. İstanbul: Yön Ajans.
Dawey, H. W. (1963). Contemporary Collective Bargaining. New Jersey: Prentice Hall.
Ekin, N. (1979). Endüstri İlişkileri. İstanbul: Elektronik Ofset.
Eyrenci, Ö. (1984). Sendikalar Hukuku. İstanbul: Banksis Yayını.
İnce, E. (1985). Toplu Pazarlık Hukuku (C. 3, Ser. 2). İstanbul: Kazancı Hukuk Yayınları.
Kılıçoğlu, M. (2013). 6356 Sayılı Sendikalar ve Toplu İş Sözleşmesi Kanunu Yorumu. Ankara: Bilge Yayınevi.
Koray, M. (1992). Endüstri İlişkileri. İzmir: Basisen Yayınları.
Kutal, M. (1987, Temmuz). Uluslararası Normlar Karşısında Türkiye'de Sendikacılık ve Toplu Pazarlık Hukuku. İktisat Ve Maliye, XXXIV(4), 148.
Oğuzman, K. (tarih yok). Hukuki Yönden İşçi-İşveren İlişkileri (4.Baskı, C. 1). İstanbul: Yön Ajans.
Reisoğlu, S. (1986). 2822 Sayılı Toplu İş Sözleşmesi Grev ve Lokavt Kanunu Şerhi. Ankara: Ayyıldız Matbaası.
Yarsuvat, D. (1978). Çalışma Ceza Hukuku Sendika Özgürlüğüne Karşı Suçlar Kanunsuz Grev ve Lokavt Suçları. İstanbul: İstanbul Üniversitesi Yayınları.
Zaim, S. (1977). Çalışma Ekonomisi. İstanbul: Elektronik Ofset.

International Journal of Commerce and Finance, Vol. 2, Issue 2, 2016, 71-83
DAY OF THE WEEK EFFECT IN CONVENTIONAL AND ISLAMIC STOCK INDEXES
Emin Avcı, (Assoc. Prof.)
Marmara University, Turkey
Abstract: In this study, existence of day of the week (DOW) effect is examined pre/post subprime crisis periods and in terms of conventional/Islamic of indexes. Canada, Indonesia, Japan, UK and USA markets are examined for a period of 2003-2014. The findings of the study showed significant DOW effect for all indexes, however such effect is not persistent. When DOW effect examined in terms of conventional and Islamic indexes of each market, there is not persistent conformity on the DOW effect for both indexes of the same markets.
Keywords: Day of the Week Effect, Subprime Crisis, Islamic Indexes
JEL Codes: G10, G14 and G15
1. Introduction By 2007, increasing number of defaults in subprime credits hit the housing market and mortgage based financial instruments in United States, and then by 2008 subprime crisis turned out to be a global financial crisis. Several financial institutions were collapsed and severe downturns realized in global stock markets. As a consequence, recent financial crisis had a great impact on every fields of global economy, financial institutions and behavior of economic agents.
Financial crises, not only the recent global financial crisis but even local crises, have an impact on trading behavior of market participants. Some studies presented that the individuals’ past experiences influence their risk taking and investment portfolio composition (Malmendier and Nagel, 2011); crisis periods changes future market risk and return expectations and hence change the risk taking behavior (Weber, et.al., 2013); crisis cause a temporary increase in expectations/uncertainty and long term increase in disagreement between market participants (Hudomiet, et.al., 2011); as a result of change in perceptions during crisis periods, trading and risk taking behavior are also subject to change (Hoffmann, et.al., 2013). Not only the individuals but also financial institutions effected from crises from different aspects such as banking regulations and risk taking (Calluzzoa and Dong, 2015), credit lines (Fratzscher, et.al., 2016), hedge funds trading (David, et.al., 2012).
Such impacts of financial crises on both individual and institutional investors may cause changes in their trading behavior and may cause some structural changes in financial markets; such that, one of the objectives of this study is to analyze the possible change in the market efficiency after subprime crisis. Although, there are several analysis or methods for measuring efficiency, the existence of the day of the week (hereafter, DOW) effect before, during and after the crisis period will be analyzed in this study.
The existence of day of the week effect have been reported in many studies from different aspects of developed markets, developing markets and different indexes. However, there is little for DOW effect anomaly for Islamic indexes. Hence, another objective of this study to analyze the existence of DOW effect for Islamic indexes and compare the findings with the conventional indexes for pre and post crisis periods.
In order to achieve the objectives mentioned above, indexes from 5 countries (United States of America, United Kingdom, Canada, Japan and Indonesia) were selected and both Islamic and conventional indexes of those markets
Inte
rnati
on
al
Jou
rnal
of
Co
mm
erc
e a
nd
Fin
an
ce

72 Emin Avcı
http://ijcf.ticaret.edu.tr
were analyzed in this study. The analyses are carried out for a period of 2003-2014. In order to investigate the possible effects of crisis, the data set divided in to three periods: 2003-2007, 2008-2009 and 2010-2014.
Remainder of this study is organized as follows; section two will present a summary of related literature on DOW effect; section three presents the data to be used in analyses and methodological details; section four will be the findings of the analyses, and hence last section is the conclusion.
2. Literature Review As it is well known, efficient market hypothesis states that all available information is reflected to asset prices (Fama, 1970 and 1965), that no one can continuously earn abnormal profits. Such proposition of the efficient capital market hypothesis has been one of the most debated topics in finance arena. One aspect of the debates is concentrated on stock price anomalies such as value, size and calendar anomalies, which contradicts the validity of the market efficiency.
Among these anomalies the calendar anomalies have been at the center of the interest for both practitioners and academicians. The calendar anomalies are basically seasonal or reoccurring patterns in stock returns, which might be used to earn abnormal profit by market timing investment strategies. Among different calendar anomalies (like January effect, turn of the month effect, sell in May, holiday effect) the DOW effect appeals great attention of researchers.
The existence of DOW effect, which is significant daily return differences among week days, have been extensively documented in many studies from different aspects of developed markets, developing markets and different indexes. In this part of the study, the previous literature dealing with the DOW effect will be summarized for the countries, which are the sample of the below empirical analysis.
Although, earlier evidences about could be found for US market (as Cross, 1973), DOW effect appeal great attention by 1980s. French (1980) reported significant negative Monday return for S&P composite portfolio. Similar result was reported by Gibbons and Hess (1981) for Dow Jones 30 securities. Keim and Stambaugh (1984) analyzed S&P composite index returns and reported persistent lower returns for Monday and higher returns for last trading day of the week (Friday or Saturday). By the use of 90year data for DJIA, Lakonishok and Smidt (1988) reported similar results.
Not only the USA markets presented DOW effect but also some evidences were documented for international markets (for international studies the results of the countries, which are the sample of the below empirical analysis, will be summarized). One of the earliest studies in international arena was documented by Jaffe and Westerfield (1985), who investigate 5 developed markets. Although, USA, UK, and Canada presented negative Monday, Japan had the lowest return on Tuesday. A similar finding was documented by Condoyanni, et.al. (1987), who analyzed 7 markets, while USA, UK and Canadian markets presented negative Monday returns, negative Tuesday was documented for Japan for whole period of analysis. When the existence of DOW effect was considered for sub-periods, all countries had a significant negative Monday in some periods, Canada and USA had no significant negative Tuesday returns. Moreover, Board and Sutcliff (1988) reported DOW effect for UK market, however significance of the effect declines over time.
Although, earlier studies revealed the existence of DOW effect for several markets, most of the studies published by the end of 1980s contradicts former evidences. For example, Connolly (1989) stated that estimation and testing methodology effects the strength of DOW effect. Likewise, Chang, et.al. (1993) analyzed the robustness of DOW effect in 23 markets and reported that DOW effect was not significant for most markets after sample size and error term adjustments. Although, some markets presented significant DOW effect after adjustments, those effects were not strong across calendar. Similar findings were also reported by Dubois and Louvet (1996). Moreover, Marquering (2006) argued that effect of an anomaly was subject to decrease in two years following its publication. On the other
Day Of The Week Effect in Conventional and Islamic Stock Indexes 73
http://ijcf.ticaret.edu.tr
hand, Brusa, et.al. (2000) presented the reverse weekend effect, where returns were positive Monday for large firms and negative for small firms in four of the US indexes (DJIA, CRSP, S&P500 and NYSE). However, it should also be added that such reverse DOW effect was not valid for international markets (Brusa, et.al., 2003).
By 2000s several studies documented the decreasing importance of DOW effect in developed countries. Among those, Kohers, et.al. (2004) reported that although DOW effect was valid for 1980s for most of the developed stock markets (negative Monday for UK, USA and Canada; negative Tuesday for Japan), however by 1990s almost all DOW effect faded except Japan, which showed negative Monday. In a similar study, Cho, et.al. (2007) explored the DOW effect for Dow Jones Industrial Average (DJIA), S&P 500, NASDAQ, Russell 2000, FTSE 100, Nikkei 222 and CRSP indexes. They stressed that although DOW effect reversed or weakened for DJA and S&P 500 indexes after 1987, it was strong in Nasdaq, Russell 2000 and CRSP. On the other hand, Boudreaux, et.al, (2010) found that DOW effect was valid for only bear market for DJIA, S&P500 and Nasdaq. Similarly, finding also reported by Urquhart and McGroarty (2014), and they added the time varying behavior of DOW effect. Another study on US markets. Similarly, Olson, et.al., (2015) explore the DOW effect for seven US market indexes for a period of 1973-2013. They stated that the DOW effect was significantly smaller after 1976 and Monday returns became similar to other weekday returns. In a cross country analysis, Cinko, et.al. (2015) studied the existence of DOW effect for 24 indexes in 16 developed countries for a period of 1999-2013. No significant DOW effect could be found for US stock indexes (Dow Jones Inds. Average, Nasdaq100 and S&P500). However, significant negative Wednesday for UK stock indexes (FTSE All-Share and FTSE100) and positive Friday for Canadian S&P/TSX Composite index were reported.
Some other studies in literature compared the existence of DOW effect between developed and developing countries. Following Asian crisis, Ndu (2005) examined 10 developed and developing East Asian markets for 1998-2003 period. While Indonesian Jakarta Stock Exchange (JSE) exhibited negative Monday and Wednesday returns, Japan Nikkei225 index presented negative mean returns for all days except Tuesday. When maximum and minimum of index returns are analyzed JSE had maximum on Thursday and minimum on Monday; whereas Nikkie225 index presented maximum on Tuesday and minimum on Thursday. On the other hand, Hui (2005) considered six stock market indices (S&P 500 Composite, Nikkei 225, Hang Seng Index, Korea SE Composite, SES All-Share Index and Taiwan SE Weighted). The DOW effect was found in Singapore with low returns on Monday-Tuesday and high returns on Wednesday-Friday.
The evidences for emerging markets also presents mixed evidences. Choudhry (2000) analyzed the DOW effect for 7 Asian emerging countries for 1990-1995 period by using GARCH methodology. While some markets presented significant DOW effect, Indonesian Jakarta Composite Index presented significant negative returns for Monday but no significant day of the week reported for remaining weekdays. Contrary, Basher and Sadorsky (2006) studied 21 emerging countries for December 1992-October 2003 period. They utilized 5 different models to test the existence of DOW effect and results were subject to change under different models. Although, majority of the markets did not present DOW effect, some markets had strong DOW effect. For Indonesia, Tuesday effect was detected under only one model. However, Cinko, et.al. (2014) examined DOW effect for 13 developing countries for 12year period. Significant DOW effects was documented for all countries. Indonesian Jacarta Composite Index presented negative Monday and positive Wednesday, Thursday, Friday returns.
Although, the existence of DOW effects have been reported in many studies from different aspects of developed markets, developing markets and different indexes, there is little evidence on the existence of DOW effect anomaly for Islamic indexes. Among these, Abdullah, et.al. (2011) studied the existence of DOW effect on 3 indexes of Malaysian market (Kuala Lumpur Shariah Index-KLSI-, FBM Emas Shariah and FBM Hijrah Emas Shariah). The findings of the study presented significant negative Monday and positive Friday for KLSI, and no DOW effect for

74 Emin Avcı
http://ijcf.ticaret.edu.tr
other indexes. In a similar study, Lean and Tan (2010) explored the DOW effect in FTSE Bursa Malaysia index family including Shariah indexes for 2006-2008 period (2007-2008 for some indexes). The DOW effect could not be found for all indexes except MESDAQ index. Moreover, Wenhui, et.al., (2009) studied for 1999-2007 for FTSE Bursa Malaysia Hijrah Shariah Index and reported significant positive Friday return.
3. Data and Methodology In order to explore the DOW effect per and post financial crisis and compare the differences in conventional and Islamic indexes, total of 10 indexes will be analyzed. The dataset of 10 indexes composed of 5 conventional and 5 Islamic indexes. As a result of data availability, the indexes from Canada, Japan, Indonesia, UK and USA stock markets are selected as samples. The indexes covered are given in Table 1.
Table 1 Indexes Data
Type Index Country Symbol
Conventional
FTSE 100 UK FTSE 100
Jakarta Composite Indonesia JKSE
Nikkei 225 Stock Average Japan Nikkei 225
S&P 500 Composite USA S&P 500
S&P/TSX Composite Canada S&P/TSX
Islamic
Dow Jones Islamic Market Canada Canada DJICN
Dow Jones Islamic Market Japan Japan DJIJP
Dow Jones Islamic Market U.S. USA DJIUS
Dow Jones Islamic Market U.K. UK DJIUK
Jakarta Islamic Index Indonesia JKII
In order to analyze possible effect of recent financial crisis the analyses are carried out for a period of 2003-2014. The data set divided in to three periods: 2003-2007, 2008-2009 and 2010-2014.
The daily closing prices of the indexes were used to calculate the returns of each index by the following formula:
𝑟𝑡,𝐼 = 𝑙𝑛 (𝐼𝑡,𝑖
𝐼𝑡−1,𝑖⁄ )
Where rt,I stands for the Ith index return at a specific time t; It, I and It-1, I are Ith index closing price for time t and t-1 respectively.
By following the previous literature, regression analyses conducted to explore possible DOW effect (French, 1980; Balaban, 1995). The regression model constructed with daily dummies and error term. The following equation presents the regression model utilized in the study:
𝑟𝑡,𝐼 = 𝛽1𝐷𝑀 + 𝛽2𝐷𝑇 + 𝛽3𝐷𝑊 + 𝛽4𝐷𝑇𝐻 + 𝛽5𝐷𝐹 + 𝑒𝐼

Day Of The Week Effect in Conventional and Islamic Stock Indexes 75
http://ijcf.ticaret.edu.tr
Where, rI,t stands for Ith index return at time t; eI is the random error term. Additionally, DM, DT, DW, DTH, DF are the dummy variables for Monday, Thursday, Wednesday, Thursday, and Friday, respectively.
The descriptive statistics of index returns for 10 indexes are given in Appendix I. For whole period of 2003-2014, while lowest standard deviation was realized in Canadian conventional index of S&P/TSX, the highest standards deviation is in Canadian Islamic index. Similar finding is valid for 2010-2014 period. For 2003-2007 period, Canadian S&P/TSX index has lowest and JKII (Indonesia Islamic) has highest standard deviation. For crisis period of 2007-2008, UK FTSE index has lowest and DJICN (Canadanian Islamic) has highest standard deviation. When standard deviations of conventional and Islamic indexes compared it is observed that conventional indexes have lower standard deviation than Islamıc counterparts for most of the sub-periods.
4. Empirical Findings The impact of recent financial crisis on market efficiency and differences in conventional and Islamic indexes have been analyzed for 10 indexes from 5 countries. Overall results (coefficients and p values) of the analyses are presented in Appendix II.
Table 2 Sign of the coefficients for all indexes
Period Return Monday Tuesday Wednesday Thursday Friday
2003-2007 Pozitive 7 9 7 10 9
Negative 3 1 3 0 1
2008-2009 Pozitive 2 6 4 3 4
Negative 8 4 6 7 6
2010-2014 Pozitive 3 9 7 6 7
Negative 7 1 3 4 3
2003-2014 Pozitive 0 7 3 10 6
Negative 10 3 7 0 4
Table 2 summaries the daily coefficient of all returns for whole period and sub-periods. For whole period of 2003-2014 all of the indexes present negative return on Mondays and positive returns on Thursdays. For sub-period of 2003-2007 again positive Thursdays are observed for all markets, and positive Tuesday and Friday for 9 indexes. For this period, dominance of positive returns for all indexes is obvious. For crisis period of 2008-2009, majority of the index present positive Tuesday but rest of the week days have negative returns. For post crisis period of 2010-2014, the dominance of positive returns can be observed for all indexes except Monday.
Table 3 presents the indexes, which have significant DOW effect with their significance level. Although, for whole period of 2003-2014, all indexes have negative Monday and positive Thursday returns (see Table 2), only 3 of Monday returns are significant. Moreover, there are some significant Wednesday returns. Both of the Indonesian conventional (JKSE) and Islamic (JKII) indexes present the same return patterns (negative Monday, positive Wednesday and Friday returns). Similar return pattern can also be observed in UK conventional (FTSE100) and Islamic (DJIUK) indexes with negative Wednesday. On the other hand, while Canadian Islamic (DJICN) index presents negative Monday and positive Friday returns, no DOW effect can be observed in conventional counterpart. No significant return pattern can be detected for Tuesday and Thursdays.

76 Emin Avcı
http://ijcf.ticaret.edu.tr
Table 3 Findings for period of 2003-2014
+ or – signs represent positive or negative returns. 1%, 5% and 10% are the significance levels.
Index Monday Tuesday Wednesday Thursday Friday
FTSE 100
-5%
JKSE -1%
+1%
+1%
DJICN -10%
+10%
DJIUK
-5%
JKII -5%
+1%
+1%
The findings for pre-crisis period of 2003-2007 is presented in Table 4. No significant Monday and Thursday returns are found for this period. Moreover, there is no significant negative return for this period. Both of the Japanese (conventional and Islamic) and USA conventional indexes have no DOW effect. On the other hand, 6 indexes presented positive Friday returns, which are the conventional and Islamic indexes of UK (FTSE and DJIUK), Indonesia (JKSE and JKII), Canada (S&P/TSX and DJICAN). While, positive Tuesday returns are observed in Indonesian indexes, positive Wednesday return is valid for both of the Indonesian index and US Islamic (DJIUS) index.
Table 4 Findings for period of 2003-2007
Index Monday Tuesday Wednesday Thursday Friday
FTSE 100
+5%
JKSE
+5% +1%
+1%
S&P/TSX
+5%
DJICAN
+1%
DJIUS
+ 10%
DJIUK
+5%
JKII
+5% +5%
+1%
When the findings for crisis period of 2008-2009 is analyzed, no DOW effect can be observed except Canadian conventional (S&P/TSX) index. This finding possibly due to the high volatility during the period and the short analysis period.
The findings for post crisis period of 2010-2014 is presented in Table 5. No DOW effect is valid for Thursday and Friday in any index. In 4 index, there is significant Monday returns. While both indexes (S&P500 and DJIUS) of US have positive Monday, Indonesian indexes (JKSE and JKII) have negative Monday returns. The conventional UK (FTSE) and Canadian (S&P/TSX) indexes presented positive Tuesday return. Hence, positive Wednesday returns are valid for Indonesian indexes (JKSE and JKII) and conventional Japanese (Nikkei 225) index.

Day Of The Week Effect in Conventional and Islamic Stock Indexes 77
http://ijcf.ticaret.edu.tr
Table 5
Findings for period of 2010-2014
Index Monday Tuesday Wednesday Thursday Friday
FTSE 100
+5%
JKSE -10%
+1%
Nikkei 225
+10%
S&P 500 +5%
S&P/TSX
+5%
DJICN -10%
DJIUS +5%
JKII -10%
+1%
The tables 3-4-5 presented the findings of the study, however such findings need interpretation in terms of effect of the recent global crisis and the different DOW effects explored in conventional and Islamic indexes. Table 6 summaries the significant findings of the study both in terms of type of the index (conventional and Islamic) on country bases and in terms of period of analysis.
Table 6 DOW Effect comparison with respect to index type and crisis period
M: Monday, T: Tuesday, W: Wednesday, F: Friday.
Country Index Type 2003-2007 2008-2009 2010-2014 2003-2014
Canada Conventional +F -M +T
Islamic +F
-M -M, +F
Indonesia Conventional +T, +W, +F
-M, +W -M, +W, +F
Islamic +T, +W, +F
-M, +W -M, +W, +F
Japan Conventional
+W
Islamic
UK Conventional +F +T -W
Islamic +F -W
USA Conventional
+M
Islamic +W
+M
Table 6 demonstrates divergence of weekdays with respect to sample period, while traditional DOW effect (negative Monday and positive Friday) can be observed for Canadian Islamic index and both of Indonesian indexes for full sample of 2003-2014, no DOW effect can be observed for Japan and USA. When sub-periods are examined, divergence in weekdays quite clear. For pre-crisis period, no significant Monday return is existing. However, positive

78 Emin Avcı
http://ijcf.ticaret.edu.tr
Friday is observed for Canada, Indonesia and UK markets When post-crisis period is examined, Friday effect disappears but mixed Monday effect is observed for 3 markets. No significant DOW effect is found for crisis period except Canada.
Such finding is consistent with the literate that documented the changing patterns in weekdays, like declining, reversal and disappearance (Olson, et.al., 2015; Urquhart and McGroarty, 2014; Boudreaux, et.al, 2010; Basher and Sadorsky, 2006; Kohers, et.al., 2004). The proposition by Doyle and Chen (2009), who stated that weekday effect is in state of flux and changes overtime, try to explain such changing pattern as “wandering weekday effect”. On the other hand, Olson, et.al. (2015) stated that such changing patterns in weekdays is a long-term adjustment of the market before disappearance of DOW effect.
When Table 6 is explored according to index type, Indonesian indexes presented the same DOW effect for each period under investigation. However, it should be noted that as an emerging market, such finding may be due to the limited market efficiency. For developed markets, results are not persistent. While Canada and UK indexes demonstrated positive Fridays for both type of indexes in pre-crisis period; both indexes of USA have positive Monday return for post-crisis period. For whole sample of 2003-2014, both UK indexes have negative Monday. For the remaining periods and markets, there is either no DOW effect or different effect is present. So, it is not possible assert that conditional and Islamic indexes of a market present similar DOW effect.
Although, it is not possible interpret such finding directly with analysis above, it should be noted that especially for the developed markets, Islamic indexes composed of relatively small companies with respect to conventional indexes. Kamara (1997) and Mehdian and Perry (2001) uncover the evidences on the differences of DOW effect for large and small companies.
5. Conclusion
Day of the week (DOW) effect is one of the most researched topic in finance. In this study, DOW effect is examined under two aspects: first, the existence of DOW effect pre and post crisis periods; second, the existence of DOW effect under conventional and Islamic of indexes. The analyses cover a period of 2003-2014 with three sub-periods. Conventional and Islamic indexes of Canada, Indonesia, Japan, UK and USA markets are examined.
The findings of the study showed significant DOW effects for each index, however such effect is not persistent. The divergence of DOW effect for different periods can be explained by “wandering weekend effect”. On the other hand, when DOW effect examined in terms of conventional and Islamic indexes, there is no conformity of the DOW effect for conventional and Islamic index of a market. While, some markets presented similar DOW effect in some periods, such similarity is subject to disappear in another period.
References
Abdullah, R.N.J.R., Baharuddin, N.S., Shamsudin, N., Mahmood, W.M.W., and Sahudin, Z. (2011), “The day of the week effect on Bursa (Bourse) Malaysia Shariah-compliant market” Interdisciplinary Journal of Research in Business, 1(4), 29-36.
Balaban, E. (1995) “Day of the week effects: new evidence from an emerging stock market” Applied Economics Letters, 2, 139-143.
Basher, S.A. and Sadorsky, P. (2006) “Day-of-the-week effects in emerging stock markets” Applied Economic Letters, 13(10), 621-628.
Board, J.L.G. and Sutcliff, C.M.S. (1988) The weekend effect in UK stock market returns” Journal of Business Finance & Accounting, 15(2), 199-213.

Day Of The Week Effect in Conventional and Islamic Stock Indexes 79
http://ijcf.ticaret.edu.tr
Boudreaux, D., Rao, S., & Fuller, P. (2010) “An investigation of the weekend effect during different market orientations” Journal of Economics and Finance, 34, 257-268.
Brusa, J. and Liu, P. and Schulman, C. (2000) “The weekend effect, `reverse' weekend effect, and firm size” Journal of Business Finance & Accounting, 27(5- 6), 555-574.
Brusa, J. and Liu, P. and Schulman, C. (2003) “The ‘‘reverse’’ weekend effect: The U.S. market versus international markets” International Review of Financial Analysis, 12, 267 – 286.
Calluzzoa, P. and Dong, G.N. (2015) “Has the financial system become safer after the crisis? The changing nature of financial institution risk” Journal of Banking & Finance, 53, 233-248.
Chang, E.C., Pinegar, J.M. and Ravichandran, R. (1993) “International evidence on the robustness of the day-of-the-week effect” Journal of Financial and Quantitative Analysis, 28(4), 497-513.
Cho, Y.H., Oliver Linton, O. and Whang, Y.J. (2007) “Are there Monday effects in stock returns: A stochastic dominance approach” Journal of Empirical Finance, 14(5), 736–755.
Choudhry, T. (2000) “Day of the week effect in emerging Asian stock markets: evidence from the GARCH model” Applied Financial Economics, 10, 235-242.
Cinko, M., Avcı, E., Aybars, A. and Öner, M. (2014) “Analyzing the existence of the day of the week effect in selected emerging country stock exchanges” International Journal of Corporate Finance and Accounting, 1(2), 33-43.
Cinko, M., Avcı, E., Aybars, A. and Öner, M. (2015) “Analyzing the existence of the day of the week effect in selected developed country stock exchanges” International Journal of Economics and Finance, 7(5), 96-108.
Connolly, R.A. (1989) “An examination of the robustness of the weekend effect” The Journal of Financial and Quantitative Analysis, 24(2), 133-169.
Condoyanni, L., O'hanlon, J. and Ward, C.W.R. (1987) “Day of the week effects on stock returns: international evidence” Journal of Business Finance & Accounting, 14(2), 159-174.
Cross, F. (1973) “The behavior of stock prices on fridays and Mondays” Financial Analysts Journal, 29(6), 67-69. David, I.B., Franzoni, F. and Moussawi, R. (2012) “Hedge fund stock trading in the financial crisis of 2007–2009”
The Review of Financial Studies, 25(1), 1-24. Doyle, J.R. and Chen, C.H. (2009) “The wandering weekday effect in major stock markets” Journal of Banking &
Finance, 33(8), 1388-1399. Dubois, M. and Louvet, P. (1996) “The day-of-the-week effect: the international evidence” Journal of Banking &
Finance, 20(9), 1463-1484. Fama, E. F. (1965) “The behavior of stock market prices” Journal of Business, 38, 34-105. Fama, E. F. (1970) “Efficient capital markets: a review of theory and empirical work” The Journal of Finance, 25(2),
383-417. Fratzscher, M., König, P.J. and Lambert, C. (2016) “Credit provision and banking stability after the Great Financial
Crisis: The role of bank regulation and the quality of governance” Journal of International Money and Finance, 66, 113–135.
French, K. R. (1980) “Stock returns and the weekend effect” Journal of Financial Economics, 8, 55-69. Gibbons, M. R.,and Hess, P. (1981) “Day of the week effects and asset returns” Journal of Business, 54(4), 579-596. Hoffmann, A.O.I, Post, T. and Pennings, J.M.E. (2013) “Individual investor perceptions and behavior during the
financial crisis” Journal of Banking & Finance, 37, 60-74. Hudomiet, P., Kezdi, K. and Willis, R.J. (2011) “Stock market crash and expectations of American households”
Journal of Applied Economics, 26, 393–415. Hui, T.K. (2005) “Day-of-the-week effects in US and Asia–Pacific stock markets during the Asian financial crisis: a
non-parametric approach” Omega, 33(3), 227-282. Jaffe, J., and Westerfield, R. (1985) “The week-end effect in common stock returns: the international evidence” The
Journal of Finance, 40(2), 433-454. Kamara, A. (1997) “New evidence on the monday seasonal in stock returns” The Journal of Business, 70(1), 63-84. Keim, D. B. and Stambaugh, R.F. (1984) “A further investigation of the weekend effect in stock returns” The Journal
of Finance, 39(3), 819-835.

80 Emin Avcı
http://ijcf.ticaret.edu.tr
Kohers, G., N. Kohers, Pandey, V. and Kohers, T. (2004) “The disappearing day-of-the-week effect in the world’s largest equity markets” Applied Economics Letters, 11, 167–171.
Lakonishok, J. and Smidt, S. (1988) “Are seasonal anomalies real? a ninety-year perspective” The Review of Financial Studies, 1(4), 403-425.
Lean, H.H. and Tan, V.K.M. (2010) “Existence of the day-of-the-week effect in FTSE Bursa Malaysia” Jurnal Pengurusan, 31, 3-11.
Malmendier, U. and Nagel, S. (2011) “Depression babies: do macroeconomic experiences affect risk taking?” The Quarterly Journal Of Economics, 126, 373–416.
Marquering, W., Nisser, J. and Valla, T. (2006) “Disappearing anomalies: a dynamic analysis of the persistence of anomalies” Applied Financial Economics, 16, 291–302.
Mehdian, S. and Perry, M.J. (2001) “The reversal of the monday effect: new evidence from US equity markets” Journal of Business Finance & Accounting, 28,1043-1065.
Ndu, C.C. (2005) “Day of the week effect and volatility in stock returns in the post crisis period: Evidence from Eat Asian financial markets” The International Journal of Finance, 17(2), 3525-3537.
Olson, D., Charles Mossman, C. and Chou, N.T. (2015) “The evolution of the weekend effect in US markets” The Quarterly Review of Economics and Finance, 58, 56-63.
Urquhart, A. and McGroarty, F. (2014) “Calendar effects, market conditions and the Adaptive Market Hypothesis: Evidence from long-run U.S. data” International Review of Financial Analysis, 35, 154–166.
Weber, M., Weber, E.U. and Nosic, A. (2013) “Who takes risks when and why: determinants of changes in investor risk taking” Review of Finance, 17, 847–883.
Wenhui, D., Yusof, Z. and Sieng, C.C. (2009) “Calender Effect in Shariah-Compliant Stocks Returns; Evidence front FTSE Bursa Malaysia Hijrah Shariah Index” Proceedings of 2009 International Conference on Economics, Business Management and Marketing, Singapore, 9-11 October, 270-274.
Appendixes Appendix 1: Summary Statistics
Period S&P500 JKSE FTSE 100 NIKKEI 225 S&P/TSX
2003-2014
Mean 0,000272 0,000802 0,000163 0,000227 0,000254
Std. Dev. 0,012113 0,013773 0,011607 0,014894 0,010995
Max -0,0947 -0,10954 -0,09266 -0,12111 -0,09788
Min 0,109572 0,076231 0,093843 0,132346 0,093703
DJIUS JKII DJIUK DJIJP DJICN
Mean 0,000322 0,000744 0,000191 0,000136 0,000298
Std. Dev. 0,011679 0,016101 0,014329 0,013405 0,017545
Max -0,09697 -0,13857 -0,09569 -0,09549 -0,13769
Min 0,117399 0,087555 0,116762 0,106579 0,118689
S&P500 JKSE FTSE 100 NIKKEI 225 S&P/TSX
2003-2007
Mean 0,000393 0,001432 0,000379 0,000444 0,000566
Std. Dev. 0,008188 0,012697 0,008862 0,011541 0,007342
Min -0,03587 -0,078 -0,04918 -0,0557 -0,0358
Max 0,034814 0,067338 0,059026 0,036031 0,023725
DJIUS JKII DJIUK DJIJP DJICN
Mean 0,00045 0,001528 0,000588 0,000352 0,001008

Day Of The Week Effect in Conventional and Islamic Stock Indexes 81
http://ijcf.ticaret.edu.tr
Std. Dev. 0,008425 0,015088 0,010245 0,011841 0,012818
Min -0,03593 -0,10038 -0,05083 -0,06167 -0,07913
Max 0,035474 0,075824 0,049083 0,046646 0,044106
S&P500 JKSE FTSE 100 NIKKEI 225 S&P/TSX
2008-2009
Mean -0,00053 -0,00015 -0,00034 -0,00071 -0,00031
Std. Dev. 0,021586 0,020046 0,019391 0,023369 0,02068
Min -0,0947 -0,10954 -0,09266 -0,12111 -0,09788
Max 0,109572 0,076231 0,093843 0,132346 0,093703
DJIUS JKII DJIUK DJIJP DJICN
Mean -0,00033 -0,00032 -0,00045 -0,00049 -0,00038
Std. Dev. 0,019815 0,0229 0,023693 0,020158 0,031333
Min -0,09697 -0,13857 -0,09569 -0,09549 -0,13769
Max 0,117399 0,078629 0,116762 0,106579 0,118689
Appendix 1: Summary Statistics (Cont.)
Period S&P500 JKSE FTSE 100 NIKKEI 225 S&P/TSX
2010-2014
Mean 0,00047 0,000555 0,000148 0,000386 0,000168
Std. Dev. 0,009917 0,011518 0,009709 0,013432 0,008055
Min -0,06896 -0,093 -0,04779 -0,11153 -0,04123
Max 0,046317 0,070136 0,050322 0,055223 0,03941
DJIUS JKII DJIUK DJIJP DJICN
Mean 0,000455 0,000387 5,34E-05 0,00017 -0,00014
Std. Dev. 0,009956 0,013558 0,012765 0,011331 0,013449
Min -0,06412 -0,09906 -0,07223 -0,06836 -0,07897
Max 0,045858 0,087555 0,058477 0,067542 0,05993
Appendix 2: Statistical Findings
S&P 500 2003-2007 2008-2009 2010-2014 2003-2014
Beta t Sig. Beta t Sig. Beta t Sig. Beta t Sig.
Monday .020 .725 .468 -.035 -.803 .422 .003 .095 .924 -.006 -.382 .703
Tuesday .028 1.021 .307 .036 .810 .418 .054 1.961 .050 .020 1.253 .210
Wednesday .043 1.548 .122 -.045 -1.037 .300 .008 .285 .776 -.004 -.241 .810
Thursday .011 .398 .691 -.001 -.015 .988 .023 .819 .413 .014 .897 .370
Friday .005 .179 .858 -.009 -.202 .840 .018 .667 .505 -.009 -.570 .568
DJIUS 2003-2007 2008-2009 2010-2014 2003-2014
Beta t Sig. Beta t Sig. Beta t Sig. Beta t Sig.

82 Emin Avcı
http://ijcf.ticaret.edu.tr
Monday .014 .504 .615 -.021 -.470 .639 .005 .179 .858 -.008 -.493 .622
Tuesday .032 1.159 .246 .032 .732 .465 .061 2.186 .029 .015 .965 .334
Wednesday .051 1.830 .068 -.046 -1.043 .298 .007 .236 .814 -.002 -.097 .923
Thursday .022 .812 .417 .004 .098 .922 .013 .476 .634 .017 1.092 .275
Friday .000 .007 .995 -.007 -.166 .868 .017 .610 .542 -.009 -.560 .575
JKSE 2003-2007 2008-2009 2010-2014 2003-2014
Beta t Sig. Beta t Sig. Beta t Sig. Beta t Sig.
Monday -.017 -.627 .531 -.034 -.768 .443 -.052 -1.896 .058 -.046 -2.848 .004
Tuesday .065 2.375 .018 -.031 -.718 .473 .029 1.052 .293 .023 1.434 .152
Wednesday .076 2.775 .006 .004 .082 .934 .121 4.403 .000 .058 3.557 .000
Thursday .037 1.336 .182 .003 .071 .944 -.004 -.142 .887 .015 .908 .364
Friday .090 3.266 .001 .041 .945 .345 .014 .498 .619 .051 3.132 .002
JKII 2003-2007 2008-2009 2010-2014 2003-2014
Beta t Sig. Beta t Sig. Beta t Sig. Beta t Sig.
Monday -.011 -.397 .692 -.019 -.423 .673 -.048 -1.749 .081 -.039 -2.392 .017
Tuesday .066 2.395 .017 -.029 -.654 .514 .020 .721 .471 .019 1.196 .232
Wednesday .067 2.448 .015 -.020 -.460 .646 .116 4.215 .000 .050 3.097 .002
Thursday .010 .349 .727 -.007 -.156 .876 -.021 -.755 .450 .003 .197 .844
Friday .094 3.401 .001 .043 .985 .325 -.003 -.115 .909 .043 2.668 .008
Appendix 2: Statistical Findings (Cont.)
FTSE100 2003-2007 2008-2009 2010-2014 2003-2014
Beta t Sig. Beta t Sig. Beta t Sig. Beta t Sig.
Monday .009 .332 .740 .025 .573 .567 -.011 -.412 .680 -.004 -.248 .804
Tuesday -.002 -.087 .931 .025 .568 .570 .060 2.169 .030 .014 .884 .377
Wednesday -.002 -.065 .948 -.037 -.837 .403 -.029 -1.048 .295 -.034 -2.099 .036
Thursday .025 .908 .364 -.047 -1.061 .289 .013 .477 .634 .005 .291 .771
Friday .065 2.364 .018 -.006 -.128 .898 .001 .048 .962 .016 1.014 .311
DJIUK 2003-2007 2008-2009 2010-2014 2003-2014
Beta t Sig. Beta t Sig. Beta t Sig. Beta t Sig.
Monday -.002 -.081 .936 .012 .274 .784 -.003 -.116 .907 -.009 -.579 .563
Tuesday .020 .717 .473 .031 .703 .482 .030 1.085 .278 .013 .844 .399
Wednesday .008 .288 .774 -.051 -1.158 .247 -.015 -.553 .580 -.033 -2.095 .036
Thursday .045 1.626 .104 -.026 -.603 .547 .003 .092 .927 .010 .632 .528
Friday .058 2.080 .038 -.008 -.190 .849 -.005 -.170 .865 .014 .866 .386
Nikkei225 2003-2007 2008-2009 2010-2014 2003-2014
Beta t Sig. Beta t Sig. Beta t Sig. Beta t Sig.
Monday .028 1.018 .309 -.016 -.372 .710 -.003 -.091 .927 -.008 -.514 .607
Tuesday .012 .451 .652 -.007 -.151 .880 -.012 -.436 .663 -.006 -.354 .723
Wednesday -.011 -.407 .684 .018 .400 .689 .048 1.723 .085 .006 .385 .700
Thursday .034 1.239 .215 -.017 -.398 .691 .018 .647 .518 .007 .442 .659
Friday .022 .804 .421 -.046 -1.037 .300 .013 .479 .632 -.002 -.150 .880
DJIJP 2003-2007 2008-2009 2010-2014 2003-2014
Beta t Sig. Beta t Sig. Beta t Sig. Beta t Sig.
Monday .025 .891 .373 -.015 -.338 .736 .010 .351 .725 -.012 -.720 .471
Tuesday .010 .371 .710 -.023 -.534 .593 .008 .271 .786 -.001 -.042 .967
Wednesday -.020 -.710 .478 .046 1.059 .290 .010 .346 .729 -.007 -.436 .663
Thursday .032 1.141 .254 -.011 -.251 .802 .010 .372 .710 .009 .538 .590
Friday .019 .702 .483 -.051 -1.170 .243 -.004 -.131 .896 -.009 -.590 .555
S&P/TSX 2003-2007 2008-2009 2010-2014 2003-2014

Day Of The Week Effect in Conventional and Islamic Stock Indexes 83
http://ijcf.ticaret.edu.tr
Beta t Sig. Beta t Sig. Beta t Sig. Beta t Sig.
Monday .040 1.437 .151 -.085 -1.932 .054 -.034 -1.238 .216 -.013 -.806 .420
Tuesday .022 .805 .421 .032 .737 .461 .060 2.158 .031 .013 .833 .405
Wednesday .028 1.026 .305 -.014 -.322 .748 .009 .323 .747 -.009 -.551 .582
Thursday .021 .745 .457 .009 .217 .828 .000 .011 .992 .014 .883 .377
Friday .061 2.206 .028 .023 .521 .602 .012 .437 .662 .022 1.367 .172
DJICAN 2003-2007 2008-2009 2010-2014 2003-2014
Beta t Sig. Beta t Sig. Beta t Sig. Beta t Sig.
Monday .003 .119 .905 -.060 -1.368 .172 -.050 -1.794 .073 -.028 -1.776 .076
Tuesday .009 .315 .753 .021 .478 .633 .029 1.037 .300 -.001 -.043 .966
Wednesday .040 1.433 .152 .004 .095 .924 -.004 -.141 .888 -.009 -.563 .573
Thursday .033 1.209 .227 -.004 -.101 .919 .000 .006 .995 .010 .624 .533
Friday .090 3.268 .001 .012 .273 .785 .002 .058 .954 .028 1.743 .081

International Journal of Commerce and Finance, Vol. 2, Issue 2, 2016, 85-95
INFLUENCING FACTORS OF CURRENCY RISK OF DEPOSIT BANKS IN TURKEY BY USING PROBIT METHOD
Serhat Yüksel (Asst. Prof.)
Konya Food and Agriculture University
Mustafa Özsarı (Res. Asst)
Konya Food and Agriculture University
İsmail Canöz (Res. Asst)
İstanbul Arel University
Abstract In this paper, we aimed to analyze the factors that affect currency risk of the banks. Within this scope, annual data of 23 deposit banks for the periods between 2005 and 2015 was evaluated. In addition to this situation, panel probit model was used in order to achieve this objective. Regarding the subject of the currency risk, this model was firstly used in this study. According to the results of the analysis, it was determined that 3 independent variables affect the currency risk of deposit banks in Turkey. Firstly, it was identified that there is a positive relationship between total assets and currency risk. This situation explains that when the size of the banks increases, they tend to take more currency risk. In addition to this variable, it was also defined that there is a direct relationship between economic growth and currency risk of the banks. This result refers that in case of an increment in the market stability; banks think that the market is safer and they increase their currency risk. Moreover, it was also concluded that there is a negative relationship between interest rate and currency risk of the banks. This aspect shows that when interest rate decreases, it will lower uncertainty in the market. Thus, banks would take higher currency risk in such markets.
Keywords: Turkish Banking Sector, Deposit Banks, Currency Risk, Panel Probit
JEL Codes: F31, G21, G32,
1. Introduction Banks are the institutes which collect money from the people who have savings (Mishkin, 2007). Owing to this issue, these people have a chance to earn interest income. On the other side, they give money as a loan to the companies. Therefore, these companies can reach the fund they need to invest and to fulfill their operational needs (Dinçer et. al., 2016). Because of this situation, it can be said that banks play a significant role for the economy. Hence, the banks should provide the performance stability for the economy to improve (Zengin and Yüksel, 2016). However, banks face different type of the risks in their operations (Hacıoğlu et. al., 2013), (Van Greuning and Brajovic-Bratanovic, 2009). The most significant risk of the banks is credit risk which means the possibility that customers cannot pay their debt to the banks (Altman and Saunders, 1998). On the other side, banks are also subject to the market risk in addition to the credit risk. The reason for this condition is that there is uncertainty in the market. In other words, some variables in the market, such as interest rate and currency risk can change very easily and it is too difficult to estimate the future value of these variables (Alexander, 2009). Because of this aspect, banks may have high amount of loss if they do not take necessary actions to hedge those risks. Currency risk is one of the important types of market risk banks have to manage. The main reason behind this situation is that banks stated to make a lot of operations in foreign currency especially with the effect of globalization. Currency risk refers to the risk that causes loss for the banks because of the volatility in exchange rate (Shapiro, 1985). As it can be understood from this definition banks are subject to currency risks when there is a difference between foreign exchange assets and liabilities. If these foreign exchange assets of the banks are higher
Inte
rnati
on
al
Jou
rnal
of
Co
mm
erc
e a
nd
Fin
an
ce

86 Serhat Yüksel, Mustafa Özsarı, İsmail Canöz
http://ijcf.ticaret.edu.tr
than the liabilities, banks will have loss when foreign currency depreciates. On the other hand, in case of higher foreign exchange liabilities than the assets, banks will get loss when there is a foreign currency appreciation. Owing to the expressions emphasized above, currency risk is essential for the banks. Because of this condition, this risk should be managed effectively by the banks. Within this context, first of all, currency risk should be measured appropriately (Dinçer and Hacıoğlu, 2015). There are mainly two different types of measurement models of the currency risk which are standard method and value at risk method. In addition to this situation, Banking Regulatory and Supervisory Agency (BRSA) gives very much importance to currency risk that it wants Turkish banks to calculate and report currency risk daily. As a result of this analysis, if banks have currency risk which is higher than expected level, BRSA can control this risk more effectively. While considering the issues emphasized above, it can be said that studies related to the risks of the banks are essential. Parallel to this aspect, in this study, we aim to identify the indicators of the currency risk for Turkish banks. Within this scope, we used the annual data for the period between 2005 and 2015. Additionally, panel probit model was used so as to achieve this objective. As a result of the analysis, it will be possible to understand the influencing factors of the currency risk in Turkish banking sector. Owing to this objective, this study will be useful to make necessary recommendation in order to minimize the currency risk. The paper is organized as follows: after introduction part, we give information about the similar studies in the literature. Moreover, the third part explains research and application to determine the important factors of currency risk in banking sector. In this part, we identify the data, methodology and details of panel probit analysis. Finally, the results of the analysis are given in the conclusion part.
2. Literature Review There are many studies in the literature that aimed to analyze the determinants of currency risk. Some of them were detailed on table 1.
Table 1. Studies Related to the Currency Risk
Authors Method Scope Result
Shapiro (1985) Regression US Inflation is the main indicator of the currency risk.
Levich and Thomas (1993)
Regression US Derivatives are useful products to decrease currency risk.
De Santis and Gerard (1998)
GARCH US Stock exchange index is an important indicator of currency risk.
Carlson and Osler (1999)
Survey US Interest rate affects the size of currency risk.
Günay (2001) GARCH Turkey It was analyzed that there is a relationship between interest rate and currency risk.
De Roon et. al. (2003)
Regression G5 Countries It was identified that futures and options are significant tools to hedge currency risk.
Yıldırım (2003) Augmented
Dickey Fuller Test
Turkey It showed that there is not any relationship between purchasing power parity and currency risk in the long run.
Lustig and Verdelhan (2005)
Regression US It was concluded that interest rate affects currency risk.
Ayvaz (2006) Granger Causality Analysis
Turkey It was defined that volatility in İstanbul Stock Exchange index causes currency risk.
Lustig and Verdelhan (2007)
Regression Japan They determined that large return volatility influences currency risk.
Çiçek and Öztürk MGARCH Turkey Change in international reserve amount is an indicator of
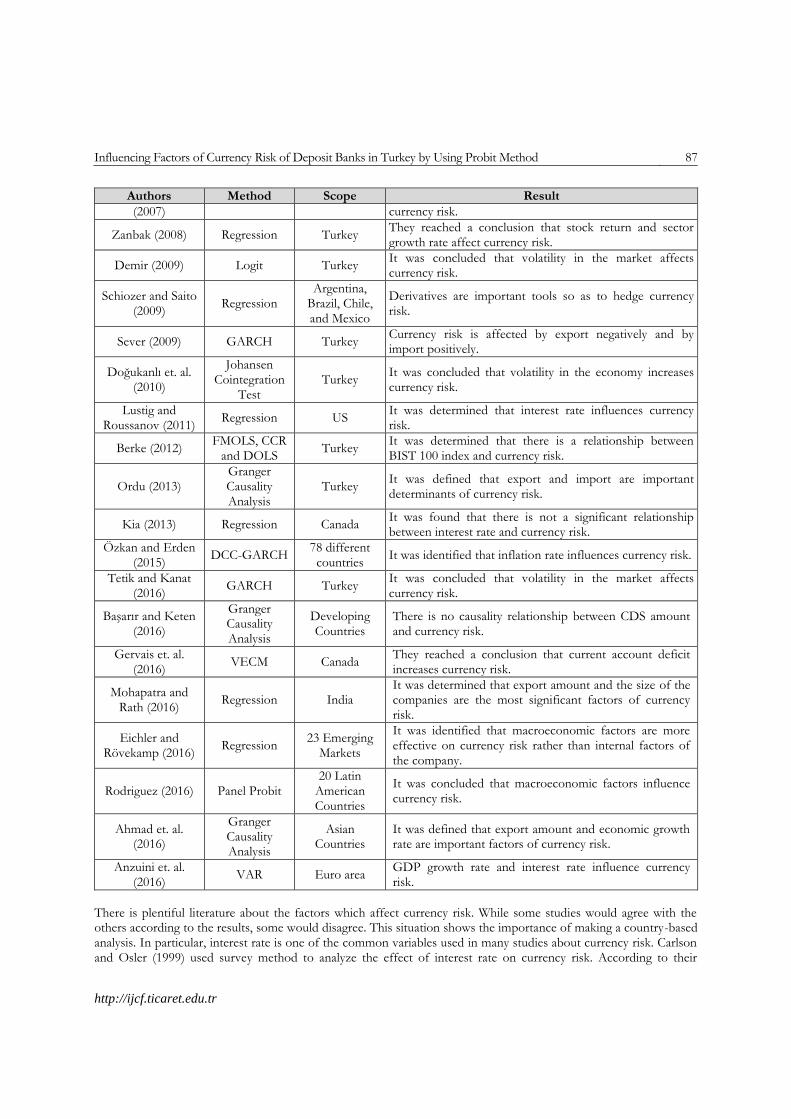
Influencing Factors of Currency Risk of Deposit Banks in Turkey by Using Probit Method 87
http://ijcf.ticaret.edu.tr
Authors Method Scope Result
(2007) currency risk.
Zanbak (2008) Regression Turkey They reached a conclusion that stock return and sector growth rate affect currency risk.
Demir (2009) Logit Turkey It was concluded that volatility in the market affects currency risk.
Schiozer and Saito (2009)
Regression Argentina,
Brazil, Chile, and Mexico
Derivatives are important tools so as to hedge currency risk.
Sever (2009) GARCH Turkey Currency risk is affected by export negatively and by import positively.
Doğukanlı et. al. (2010)
Johansen Cointegration
Test Turkey
It was concluded that volatility in the economy increases currency risk.
Lustig and Roussanov (2011)
Regression US It was determined that interest rate influences currency risk.
Berke (2012) FMOLS, CCR
and DOLS Turkey
It was determined that there is a relationship between BIST 100 index and currency risk.
Ordu (2013) Granger Causality Analysis
Turkey It was defined that export and import are important determinants of currency risk.
Kia (2013) Regression Canada It was found that there is not a significant relationship between interest rate and currency risk.
Özkan and Erden (2015)
DCC-GARCH 78 different countries
It was identified that inflation rate influences currency risk.
Tetik and Kanat (2016)
GARCH Turkey It was concluded that volatility in the market affects currency risk.
Başarır and Keten (2016)
Granger Causality Analysis
Developing Countries
There is no causality relationship between CDS amount and currency risk.
Gervais et. al. (2016)
VECM Canada They reached a conclusion that current account deficit increases currency risk.
Mohapatra and Rath (2016)
Regression India It was determined that export amount and the size of the companies are the most significant factors of currency risk.
Eichler and Rövekamp (2016)
Regression 23 Emerging
Markets
It was identified that macroeconomic factors are more effective on currency risk rather than internal factors of the company.
Rodriguez (2016) Panel Probit 20 Latin
American Countries
It was concluded that macroeconomic factors influence currency risk.
Ahmad et. al. (2016)
Granger Causality Analysis
Asian Countries
It was defined that export amount and economic growth rate are important factors of currency risk.
Anzuini et. al. (2016)
VAR Euro area GDP growth rate and interest rate influence currency risk.
There is plentiful literature about the factors which affect currency risk. While some studies would agree with the others according to the results, some would disagree. This situation shows the importance of making a country-based analysis. In particular, interest rate is one of the common variables used in many studies about currency risk. Carlson and Osler (1999) used survey method to analyze the effect of interest rate on currency risk. According to their

88 Serhat Yüksel, Mustafa Özsarı, İsmail Canöz
http://ijcf.ticaret.edu.tr
results, it was stated that interest rate determines the size of currency risk in United States. While Lustig and Verdelhan (2005) and Lustig and Roussanov (2011) agreed with the result that interest rate has an effect on currency risk through their US scoped regression analysis, Kia (2013) came up with another result suggesting that there is not a significant effect of interest rate on currency risk by using the same method for another country, Canada. In addition to these studies, Anzuini et. al. (2016) and Günay (2001) found a significant impact of interest rate on currency risk. Moreover, international trade represents a core variable which determines currency risk. Using GARCH method for Turkey, Sever (2009) showed that currency risk was affected by imports and exports. Similar to study, Ordu (2013) also indicated the importance of imports and exports in order to determine the currency risk by using Granger Causality Analysis for Turkey. Likewise, using regression analysis for India, Mohapatra and Rath (2016) found that export amounts and size of companies are significant determinants of currency risk. Ahmad et. al. (2016) supported these results for Asian Countries. They found that the amount of exports and growth rate are important factors determining currency risk. On the other hand, derivatives and stock exchange indexes are important factors that influence the currency risk. Levich and Thomas (1993) and Schiozer and Saito (2009) found that derivatives are important tools to reduce currency risk by using regression analysis. De Santis and Gerard (1998) and Berke (2012) found that stock exchange indexes have an important effect on currency risk. Additionally, Ayvaz (2006) stated that the volatility in BIST index causes currency risk. While De Roon et. al. (2003) represents the importance of using futures and options to reduce the currency risk, Zanbak (2008) found the impact of stock return and sector growth rate on currency risk. On the contrary, Başarır and Keten (2016) found that there is no significant relationship between CDS amount and currency risk. Last but not least, there are macroeconomic variables that affect the currency risk. Saphiro (1985) used regression analysis to measure the effect of inflation on currency risk in US. According to the results of this study, inflation is the main determinant of currency risk. However, Özkan and Erden (2015) found contradictory results. They found that inflation rate increases currency risk by using DCC-GARCH method for 78 different countries. Yıldırım (2003) used Augmented Dickey-Fuller test to analyze the possible effects of purchasing power parity on currency risk. Results showed that there is no effect of purchasing power parity on currency risk. Using MGARCH analysis, Çiçek and Öztürk (2007) concluded that variation of international reserve amount has an impact on currency risk in Turkey. Gervais et. al. (2016) found that current account deficit increases currency risk using VECM analysis for Canada. Rodriguez (2016) used panel probit method for 20 Latin American countries and stated that macroeconomic factors had impact on currency risk. Furthermore, Eichler and Rövekamp (2016) found that macroeconomic factors were more important variables to determine currency risk for companies than internal factors by using regression analysis for 23 emerging markets.
3. Research and Application 3.1. Data
In this study, we used annual data for the periods between 2005 and 2015. This data of internal variables was provided from Turkish Banking Association. On the other side, the data of external variables was obtained from the website of World Bank. In addition to that, we used EViews 8.0 and SPSS 22 programs to make the analysis. There are 27 deposit banks in Turkey. However, because Bank of Tokyo-Mitsubishi UFJ Turkey, Odea Bank and Rabobank have been newly established and Adabank is not an active deposit bank in Turkey due to the legal problems with its owners, we removed these banks from the analysis. Therefore, in this study, we used the data of 23 deposit banks. The details of these banks were given in table 2.
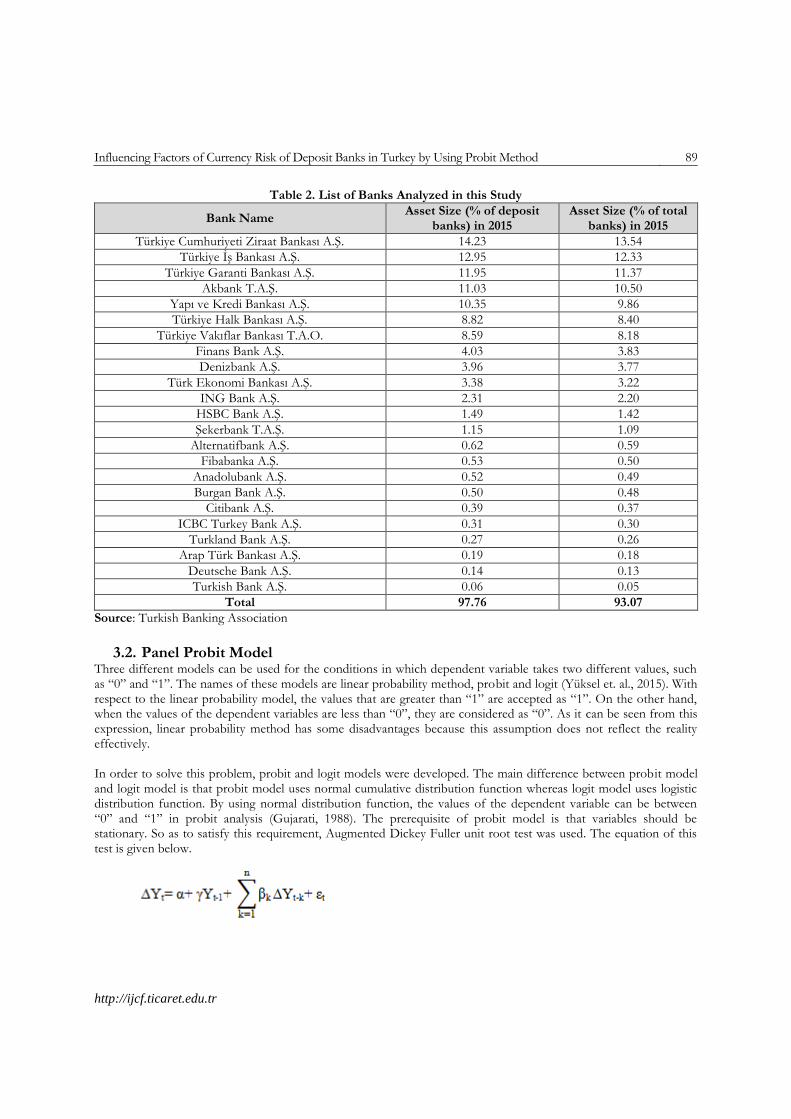
Influencing Factors of Currency Risk of Deposit Banks in Turkey by Using Probit Method 89
http://ijcf.ticaret.edu.tr
Table 2. List of Banks Analyzed in this Study
Bank Name Asset Size (% of deposit
banks) in 2015 Asset Size (% of total
banks) in 2015
Türkiye Cumhuriyeti Ziraat Bankası A.Ş. 14.23 13.54
Türkiye İş Bankası A.Ş. 12.95 12.33
Türkiye Garanti Bankası A.Ş. 11.95 11.37
Akbank T.A.Ş. 11.03 10.50
Yapı ve Kredi Bankası A.Ş. 10.35 9.86
Türkiye Halk Bankası A.Ş. 8.82 8.40
Türkiye Vakıflar Bankası T.A.O. 8.59 8.18
Finans Bank A.Ş. 4.03 3.83
Denizbank A.Ş. 3.96 3.77
Türk Ekonomi Bankası A.Ş. 3.38 3.22
ING Bank A.Ş. 2.31 2.20
HSBC Bank A.Ş. 1.49 1.42
Şekerbank T.A.Ş. 1.15 1.09
Alternatifbank A.Ş. 0.62 0.59
Fibabanka A.Ş. 0.53 0.50
Anadolubank A.Ş. 0.52 0.49
Burgan Bank A.Ş. 0.50 0.48
Citibank A.Ş. 0.39 0.37
ICBC Turkey Bank A.Ş. 0.31 0.30
Turkland Bank A.Ş. 0.27 0.26
Arap Türk Bankası A.Ş. 0.19 0.18
Deutsche Bank A.Ş. 0.14 0.13
Turkish Bank A.Ş. 0.06 0.05
Total 97.76 93.07
Source: Turkish Banking Association
3.2. Panel Probit Model
Three different models can be used for the conditions in which dependent variable takes two different values, such as “0” and “1”. The names of these models are linear probability method, probit and logit (Yüksel et. al., 2015). With respect to the linear probability model, the values that are greater than “1” are accepted as “1”. On the other hand, when the values of the dependent variables are less than “0”, they are considered as “0”. As it can be seen from this expression, linear probability method has some disadvantages because this assumption does not reflect the reality effectively. In order to solve this problem, probit and logit models were developed. The main difference between probit model and logit model is that probit model uses normal cumulative distribution function whereas logit model uses logistic distribution function. By using normal distribution function, the values of the dependent variable can be between “0” and “1” in probit analysis (Gujarati, 1988). The prerequisite of probit model is that variables should be stationary. So as to satisfy this requirement, Augmented Dickey Fuller unit root test was used. The equation of this test is given below.

90 Serhat Yüksel, Mustafa Özsarı, İsmail Canöz
http://ijcf.ticaret.edu.tr
In the equation above, "∆Yt" means the first difference of the series. In this analysis, the value of "γ" is significant. If this value is equal to “0”, this means that there is not a unit root in the equation which means that the variable is stationary (Granger, 1969). Esquivel and Larrain (1998) tried to determine the early warning signals of the financial crisis occurred in 30 different countries by using probit method. Additionally, Frankel and Rose (1996) made a similar study in 105 countries with the help of this method. Furthermore, Oktar and Dalyancı (2010) analyzed Turkish financial crises after 1990 and Oktar and Yüksel (2015) examined Russian crisis in 1998 by using probit model.
3.3. Variables Used in this Study
With respect to the currency risk, we used the ratio of “(net open FX position + net off-balance sheet position)/total capital”. So as to calculate the value of the dependent variable, firstly we compared the absolute value of each bank’s ratio with the absolute value of the sector average. If the bank’s ratio is greater than the sector average, then it will take the value of “1”, but in other cases, it will be “0”. In other words, the value of “1” refers to the situation of higher currency risk whereas dependent variable will be “0” when banks have lower currency risk. Additionally, in order to analyze the influencing factors of currency risk in Turkish banks, we decided to use 10 different independent variables. 4 of them are internal explanatory variables and 6 are external variables. The details of these variables were given in table 3.
Table 3. Independent Variables Used in the Study
Return on equity refers to the ratio of net profit to total equity amount. As it can be seen from the definition, it is a ratio that shows the probability performance of the banks (Arditti, 1967). Therefore, it is expected that the banks
1 (BIST), Borsa Istanbul, formerly known as Istanbul Stock Exchange Market.
Type of the Variables Independent
Variables References
Internal
ROE Demir (2009), Lustig and Verdelhan (2007)
Total Assets Demir (2009), Mohapatra and Rath (2016), Lustig and Verdelhan (2007)
Total Loans/Total Deposits
Demir (2009), Lustig and Verdelhan (2007)
Derivatives/Total Loans
Başarır and Keten (2016), Mohapatra and Rath (2016), Ahmad et. al. (2016), Schiozer and Saito (2009), Levich and Thomas (1993), De Roon et. al. (2003)
External
Economic Growth Demir (2009), Zanbak (2008), Kia (2013), Eichler and Rövekamp (2016), Rodriguez (2016), Ahmad et. al. (2016), Anzuini et. al. (2016)
Inflation Rate Özkan and Erden (2015), Eichler and Rövekamp (2016), Rodriguez (2016), Shapiro (1985)
Interest rate
Günay (2001), Kia (2013), Eichler and Rövekamp (2016), Rodriguez (2016), Anzuini et. al. (2016), Lustig and Roussanov (2011), Carlson and Osler (1999), Lustig and Verdelhan (2005)
BIST1 100 index
Ayvaz (2006), Berke (2012), Demir (2009), Zanbak (2008), Doğukanlı et. al. (2010), Çiçek and Öztürk (2007), De Santis and Gerard (1998), Lustig and Roussanov (2011)
Current Account Deficit/GDP
Ordu (2013), Gervais et. al. (2016), Başarır and Keten (2016), Kia (2013), Sever (2009), Eichler and Rövekamp (2016), Rodriguez (2016)
Reserves Çiçek and Öztürk (2007)

Influencing Factors of Currency Risk of Deposit Banks in Turkey by Using Probit Method 91
http://ijcf.ticaret.edu.tr
which have higher profit can take higher amount of currency risk. As a consequence of their competitive power, banks, which have higher performance, may take higher amount of currency risk. This situation is also valid for the total assets variable which shows the size of the banks. In addition to these variables, the ratio of total loans to total deposits shows the level of the risk banks take. Owing to this situation, there should be positive relationship between this ratio and currency risk. The last internal variable of this study is derivatives. These are the products that can be used in order to hedge currency risk. Thus, there should be a negative relationship between currency risk and the amount of derivatives. In addition to the internal variables, we used 6 external variables that may affect the currency risk of the banks. Economic growth is a significant indicator of economic stability in the country. As a result of this condition, it is expected to have positive relationship between economic growth and currency risk. Due to the same reason, current account deficit amount and inflation rate are expected to decrease currency risk. Moreover, because higher interest rate leads to increase the volatility in the market, there should be negative relationship between this variable and currency risk (Devereux, 1997). Finally, when international reserve amount of a country is high, banks in that country can take higher currency risk.
3.4. Results of the Model
In order to understand the indicators of currency risk, first of all, Augmented Dickey Fuller unit root test was performed. The details of this test were given on table 4.
Table 4. Unit Root Test Results
Variables Level Value (Probability) First Difference Value (Probability)
Return on Equity 0.0006 -
Total Assets 1.0000 0.0027
Total Loans / Total Deposits 0.9990 0.0106
Derivatives 0.8099 0.0010
Economic Growth 0.0002 -
Inflation Rate 0.0000 -
Interest Rate 1.0000 0.0002
BIST 100 Index 0.0000 -
Current Account Deficit 0.0285 -
Reserves 0.8613 0.0035
As it can be seen from table 4, 5 explanatory variables (Return on Equity, Economic Growth, Inflation Rate, BIST 100 Index, and Current Account Deficit) are stationary on their level values. On the other side, it was also identified that 5 independent variables (Total Assets, Total Loans / Total Deposits, Derivatives, Interest Rate and Reserves) are not stationary because their probability levels are more than 0.05. Therefore, we used the first difference of these variables on the analysis. After that, panel probit analysis was performed by using EViews 8 program. The results of this analysis were shown in table 5.
Table 5. Panel Probit Test Results
Variables Coefficient Probability
Return on Equity 0.007 0.471
Total Assets 0.001 0.075
Total Loans / Total Deposits -0.304 0.798
Derivatives -0.005 0.639
Economic Growth 0.124 0.001
Interest Rate -0.239 0.000
Reserves 0.001 0.891
Nagelkerke R-squared: 0.228

92 Serhat Yüksel, Mustafa Özsarı, İsmail Canöz
http://ijcf.ticaret.edu.tr
Table 5 shows the panel probit analysis result. Due to the multicollinearity problem, we had to eliminate the variables of “inflation rate”, “BIST 100 Index” and “Current Account Deficit” from the analysis. As it can be seen from table 5, the probability values of 3 explanatory variables are less than 0.1. This situation shows that these 3 variables are statistically significant. Because the coefficient of total assets is positive (0.001), it can be understood that there is a direct relationship between this variable and currency risk of the banks. That is to say, Turkish banks, which have higher size, take more currency risk in comparison with other banks. Another significant explanatory variable of this study is economic growth. Since its coefficient is positive (0.124), it was defined that there is a direct relationship between economic growth and currency risk of the banks. In other words, when economic growth goes up, currency risk amount of Turkish banks rises as well. The main reason behind this condition is that economic growth increases stability of the economy. Owing to this aspect, because banks think that the market is safe, so they increase their currency risk in order to make more profit. On the other hand, it was determined that there is an inverse relationship between interest rate and currency risk of the banks due to the negative coefficient of this variable (-0.239). This situation shows that lower interest rate leads banks to take higher currency risk. In other words, because decreasing interest rate shows the stability in the economy, uncertainty in the market goes down for the banks. As a result of this situation, banks can take higher currency risk.
4. Conclusion In this study, we tried to determine the influencing factors of currency risk of the deposit banks in Turkey. Within this context, we analyzed 23 deposit banks in Turkey. On the other side, Bank of Tokyo-Mitsubishi UFJ Turkey, Odea Bank, Rabobank and Adabank had to be eliminated since the data for these banks cannot be obtained. In addition to this situation, annual data for the periods between 2005 and 2015 was evaluated in this study. Furthermore, analysis was performed by using panel probit approach. In the first stage of the analysis, we made unit root test to the explanatory variables in order to understand whether they are stationary or not. In order to achieve this objective, Augmented Dickey Fuller unit root test was performed. As a result of this analysis, it was identified that 5 explanatory variables (Return on Equity, Economic Growth, Inflation Rate, BIST 100 Index, and Current Account Deficit) are stationary on their level values. On the contrary, it was also seen that 5 other independent variables (Total Assets, Total Loans / Total Deposits, Derivatives, Interest Rate and Reserves) are not stationary because their probability levels are more than 0.05. Because of this situation, the first differences of these variables were used in the analysis. After making unit root test, panel probit test was performed. According to the results of this analysis, it was determined that 3 independent variables influence the currency risk of Turkish deposit banks. First of all, it was concluded that there is a direct relationship between the amount of total assets and the currency risk of the banks because the coefficient of this variable is positive. This issue refers to the situation that when the size of the banks increases, they tend to have more currency risk in comparison with other banks. Another conclusion from this result of this analysis is that there is a positive relationship between economic growth and currency risk of the banks. In other words, it was defined that currency risk amount of Turkish banks goes up when there is an economic growth. This condition shows that when economy is growing, market will be assumed as safe by the banks. Hence, they can increase the currency risk so as to achieve their profitability. Furthermore, it was also identified that lower interest rate causes banks to take higher currency risk. The main reason behind this situation is that uncertainty in the market will be reduced when there is a decrease in interest rate. This study determined the influencing factors of the banks to take currency risk. These results may be directive for regulatory authority to control banks not to take higher currency risk. In other words, it was recommended that Banking Regulatory and Supervisory Agency should consider the banks, which have higher size, regarding currency risk because they tend to take more risk according to the results of this study. In addition to this aspect, the conditions in which there is high economic growth and lower interest rate should also be taken into the consideration since banks are willing to take higher currency risk when the market is stable. Furthermore, some additional researches can be performed by including lots of countries in order to much detailed results.

Influencing Factors of Currency Risk of Deposit Banks in Turkey by Using Probit Method 93
http://ijcf.ticaret.edu.tr
References
Ahmad, F., Draz, M. U., & Yang, S. C. (2016). Exchange Rate, Economic Growth and Foreign Direct
Investment in Emerging Asian Economies: Fresh Evidence from Long Run Estimation and Variance
Decomposition Approach.Economic Growth and Foreign Direct Investment in Emerging Asian Economies:
Fresh Evidence from Long Run Estimation and Variance Decomposition Approach (June 6, 2016).
Alexander, C. (2009). Market Risk Analysis, Value at Risk Models (Vol. 4). John Wiley & Sons.
Altman, E. I., & Saunders, A. (1998). Credit risk measurement: Developments over the last 20 years. Journal of
Banking and Finance, 21(11/12).
Anzuini, A., Cecioni, M., & Neri, S. (2016). Determinants of the movements in the euro-dollar exchange rate
during the sovereign debt crisis. Bank of Italy Occasional Paper, Available at SSRN: 305.
Arditti, F. D. (1967). Risk and the required return on equity. The Journal of Finance, 22(1), 19-36.
Ayvaz, Ö. (2006). Döviz Kuru ve Hisse Senetleri Fiyatları Arasındaki Nedensellik İlişkisi. İktisadi ve İdari
Bilimler Fakültesi Dergisi, 8(2), 1-14.
Başarır, Ç., & Keten, M. (2016). Gelişmekte Olan Ülkelerin Cds Primleri İle Hisse Senetleri Ve Döviz Kurları
Arasındaki Kointegrasyon İlişkisi A Coıntegratıon Analysis Between Cds Premiums, Stock Indexes And
Exchange Rates In Emerging Countries. Mehmet Akif Ersoy Üniversitesi Sosyal Bilimler Enstitüsü
Dergisi, 8(15), 369-380.
Berke, B. (2012). Döviz Kuru ve İMKB100 Endeksi İlişkisi: Yeni Bir Test. Maliye Dergisi, 163, 243-257.
Carlson, J. A., & Osler, C. L. (1999). Determinants of currency risk premiums.FRB of New York Staff Report,
(70).
Çiçek, M., & Öztürk, F. (2007). Yabancı Hisse Senedi Yatırımcıları Türkiye’de Döviz Kuru Volatilitesini
Şiddetlendiriyor Mu?. Ankara Üniversitesi SBF Dergisi, 62(04), 83-107.
Demir, S. (2009). Döviz Riskinden Korunma Yöntemleri ve Kullanılma Nedenleri: İMKB Örneği. Muhasebe ve
Finansman Dergisi, 41, 156-170.
De Roon, F. A., Nijman, T. E., & Werker, B. J. (2003). Currency hedging for international stock portfolios: The
usefulness of mean–variance analysis.Journal of Banking & Finance, 27(2), 327-349.
De Santis, G., & Gerard, B. (1998). How big is the premium for currency risk?.Journal of Financial
Economics, 49(3), 375-412.
Devereux, M. B. (1997). Real exchange rates and macroeconomics: evidence and theory. Canadian Journal of
Economics, 773-808.
Dincer, H., & Hacioglu, U. (2015). A Comparative Performance Evaluation on Bipolar Risks in Emerging
Capital Markets Using Fuzzy AHP-TOPSIS and VIKOR Approaches. Engineering Economics, 26(2), 118-
129.
Dincer, H., Hacioglu, U., & Yuksel, S. (2016). Balanced Scorecard-based Performance Assessment of Turkish
Banking Sector with Analytic Network Process. International Journal of Decision Sciences & Applications-
IJDSA, 1(1), 1-21.
Doğukanlı, H., Özmen, M., & Yücel, E. (2010). İMKB’de Sektörel Açıdan Döviz Kuru Duyarlılığının
incelenmesi. Çukurova Üniversitesi Sosyal Bilimler Enstitüsü Dergisi, 19(3), 63-86.
Eichler, S., & Rövekamp, I. (2016). A market-based indicator of currency risk: Evidence from American
Depositary Receipts. Available at SSRN 2738025.
Esquivel, G., & Larrain, F. (1998). Explaining currency crises. John F. Kennedy Faculty Research WP Series
R98-07.
Frankel, J. A., & Rose, A. K. (1996). Currency crashes in emerging markets: An empirical treatment. Journal of
international Economics, 41(3), 351-366.

94 Serhat Yüksel, Mustafa Özsarı, İsmail Canöz
http://ijcf.ticaret.edu.tr
Gervais, O., Schembri, L., & Suchanek, L. (2016). Current account dynamics, real exchange rate adjustment, and
the exchange rate regime in emerging-market economies. Journal of Development Economics, 119, 86-99.
Granger, C. W. (1969). Investigating causal relations by econometric models and cross-spectral
methods. Econometrica: Journal of the Econometric Society, 424-438.
Gujarati, D. (1988). Basic Econometrics. McGraw Hill International Edition.
Günay, A. (2001). Exchange rate risk and interest rate: a case study for Turkey (Doctoral dissertation, Bilkent
University).
Hacioglu, U., Dincer, H., & Celik, I. (2016). The Volatile Effect of Conflict Risk on Foreign Investment.
International Journal of Research in Business and Social Science (2147-4478), 2(1), 57-66.
Kia, A. (2013). Determinants of the real exchange rate in a small open economy: Evidence from Canada. Journal
of International Financial Markets, Institutions and Money, 23, 163-178.
Levich, R. M., & Thomas, L. R. (1993). The merits of active currency risk management: evidence from
international bond portfolios. Financial Analysts Journal, 49(5), 63-70.
Lustig, H., Roussanov, N., & Verdelhan, A. (2011). Common risk factors in currency markets. Review of
Financial Studies, 24(11), 3731-3777.
Lustig, H., & Verdelhan, A. (2005). The cross-section of currency risk premia and US consumption growth
risk (No. w11104). National Bureau of Economic Research
Lustig, H., & Verdelhan, A. (2007). The cross section of foreign currency risk premia and consumption growth
risk. The American economic review, 97(1), 89-117.
Mishkin, F. S. (2007). The economics of money, banking, and financial markets. Pearson education.
Mohapatra, S. M., & Rath, B. N. (2016). Exchange Rate Exposure and its Determinants: Evidence from Indian
Firms. The International Trade Journal, 1-15.
Oktar, S., & Dalyancı, L. (2010). Finansal Kriz Teorileri ve Türkiye Ekonomisinde 1990 Sonrası Finansal
Krizler. İktisadi ve İdari Bilimler Dergisi, 29(2), 1-22.
Oktar, S., & Yüksel, S. (2015). 1998 Yılında Rusya’da Yaşanan Bankacılık Krizi ve Öncü Göstergeleri. İktisadi
ve İdari Bilimler Dergisi, 37(2), 327-340.
Ordu, C. F. (2013). Döviz kuru dış ticaret ilişkisi: Türkiye örneği. Adnan Menderes Üniversitesi Sosyal Bilimler
Enstitüsü Yüksek Lisans Tezi.
Özkan, I., & Erden, L. (2015). Time-varying nature and macroeconomic determinants of exchange rate pass-
through. International Review of Economics & Finance, 38, 56-66.
Rodriguez, C. M. (2016). Economic and political determinants of exchange rate regimes: The case of Latin
America. International Economics, 147, 1-26.
Schiozer, R. F., & Saito, R. (2009). The determinants of currency risk management in Latin American
nonfinancial firms. Emerging Markets Finance and Trade, 45(1), 49-71
Sever, E. (2009). Reel Döviz Kuru Belirsizliğinin Ticaret Performansına Etkisi: Türkiye Uygulaması.
Girişimcilik ve Kalkınma Dergisi, 4(2), 77-97.
Shapiro, A. C. (1985). Currency risk and country risk in international banking.The Journal of Finance, 40(3),
881-891
Tetik, N., & Kanat, E. (2016). Döviz Kuru Riskinin Ölçülmesinde Garch Yönteminin Uygulanması. Sosyal ve
Beşeri Bilimler Araştırmaları Dergisi, 122.
Yıldırım, O. Döviz Kurları Çerçevesinde Satın Alma Gücü Paritesinin Zaman Serisi Analizi ve Türkiye
Ekonomisi Uygulaması, Bankacılar Dergisi, sayı 44, 2003.
Van Greuning, H., & Brajovic-Bratanovic, S. (2009). Analyzing banking risk: a framework for assessing
corporate governance and risk management. World Bank Publications.

Influencing Factors of Currency Risk of Deposit Banks in Turkey by Using Probit Method 95
http://ijcf.ticaret.edu.tr
Yüksel, S., Dincer, H., & Hacioglu, U. (2015). CAMELS-based Determinants for the Credit Rating of Turkish
Deposit Banks. International Journal of Finance & Banking Studies, 4(4), 1-17.
Zanbak, M. (2008). Döviz kuru riski analizi: Türkiye üzerine ampirik bir inceleme (Master Thesis, Akdeniz
University).
Zengin, S., & Yüksel, S. (2016). Likidite riskini etkileyen faktörler: Türk bankacılık sektörü üzerine bir
inceleme. İstanbul Ticaret Üniversitesi Sosyal Bilimler Dergisi, 15(29), 77-95.