Embed Size (px)
Citation preview

FLOW RESISTANCE IN BEDROCK RIVER CHANNELS 611
Copyright © 2004 John Wiley & Sons, Ltd. Earth Surf. Process. Landforms 29, 611–627 (2004)
Earth Surface Processes and Landforms
Earth Surf. Process. Landforms 29, 611–627 (2004)Published online in Wiley InterScience (www.interscience.wiley.com). DOI: 10.1002/esp.1057
THE FRICTIONAL RESISTANCE CHARACTERISTICS OF
A BEDROCK-INFLUENCED RIVER CHANNEL
G. L. HERITAGE,1* B. P. MOON,2 L. J. BROADHURST3 AND C. S. JAMES3
1 Department of Geography, Peel Building, University of Salford, Manchester, M5 4WT, UK2 Department of Geography, University of the Witwatersrand, 1 Jan Smuts Avenue, Johannesburg, South Africa
3 Centre for Water in the Environment, University of the Witwatersrand, 1 Jan Smuts Avenue, Johannesburg, South Africa
Received 25 July 2002; Revised 27 May 2003; Accepted 24 July 2003
ABSTRACT
Much of the published literature relating to reach-scale total flow resistance concentrates on alluvial rivers and little mentionis made of the more extreme resistance found in bedrock-influenced river systems. This paper presents the results of adetailed investigation of total flow resistance variation for five channel types on the Sabie River, South Africa (cohesivemixed anastomosed, uncohesive mixed anastomosed, mixed pool–rapid, alluvial braided and alluvial single thread) over arange of discharges. Manning’s ‘n’ and Darcy-Weisbach f resistance coefficients are calculated using Barnes’ methodology(H. H. Barnes, US Geological Survey Water Supply Paper 1849, 1967). These data are analysed at the scales of channel typeand morphologic unit and the resultant resistance values are compared with the literature. Generally the low-flow frictionvalues estimated for the bedrock-influenced channel types are higher than any reported. Flow resistance quantification of thealluvial channel type study sites on the Sabie River produced values slightly higher than earlier studies of similar morphologies.In situations where significant areas of irregular bedrock are exposed (cohesive mixed anastomosed and mixed pool–rapidchannel types) the high flow resistance coefficients at low discharges probably reflect energy dissipation due to hydraulicjumps and internal distortions; however, these values fall as discharge increases to values comparable to those recorded forstep–pool rivers. It is suggested that the slightly elevated resistance coefficients recorded in the alluvial channel types arethe result of the vegetation roughness component, operating when the macro-channel bar features are inundated. Copyright© 2004 John Wiley & Sons, Ltd.
KEY WORDS: flow resistance; channel friction; bedrock channels; Sabie River
INTRODUCTION
Despite considerable research much of the flow resistance literature published to date applies to alluvial rivers
(Chow, 1959; Barnes, 1967; Jarrett, 1984; Hicks and Mason, 1991). Little attention has been given to quantifying
flow resistance in bedrock-influenced river systems, despite the fact that such rivers are encountered across
the globe. This paper details a study of the bedrock-influenced Sabie River, Mpumalanga Province, South Africa,
that uses measured multiple cross-section and flow parameters to predict the total roughness coefficients
(Manning’s ‘n’ and Darcy-Weisbach f ) for a variety of bedrock-influenced channel types. Friction coefficients
are presented at a variety of morphological scales from channel type to morphologic unit and across a range of
discharges.
The channel type roughness–discharge functions presented in this paper have been successfully transferred
to similar channel types to generate stage–discharge values and associated hydraulic parameters where no
gauged information exists. To date they have been used by Birkhead et al. (2000) to route sediment through the
Sabie River system and by Heritage et al. (2003) to estimated the peak flood discharge values that occurred on
the Sabie and Letaba river systems following the February 2000 cyclones in Southern Africa. Validation of the
resultant discharge using velocity area peak flood discharge estimates from video footage at monumented cross-
sections indicates that the friction factor predictions are generally within 30–50 per cent of the extended gauge
station discharge estimates (Heritage et al., 2003).
* Correspondence to: G. L. Heritage, Department of Geography, Peel Building, University of Salford, Manchester, M5 4WT, UK.E-mail: [email protected]
612 G. L. HERITAGE ET AL.
Copyright © 2004 John Wiley & Sons, Ltd. Earth Surf. Process. Landforms 29, 611–627 (2004)
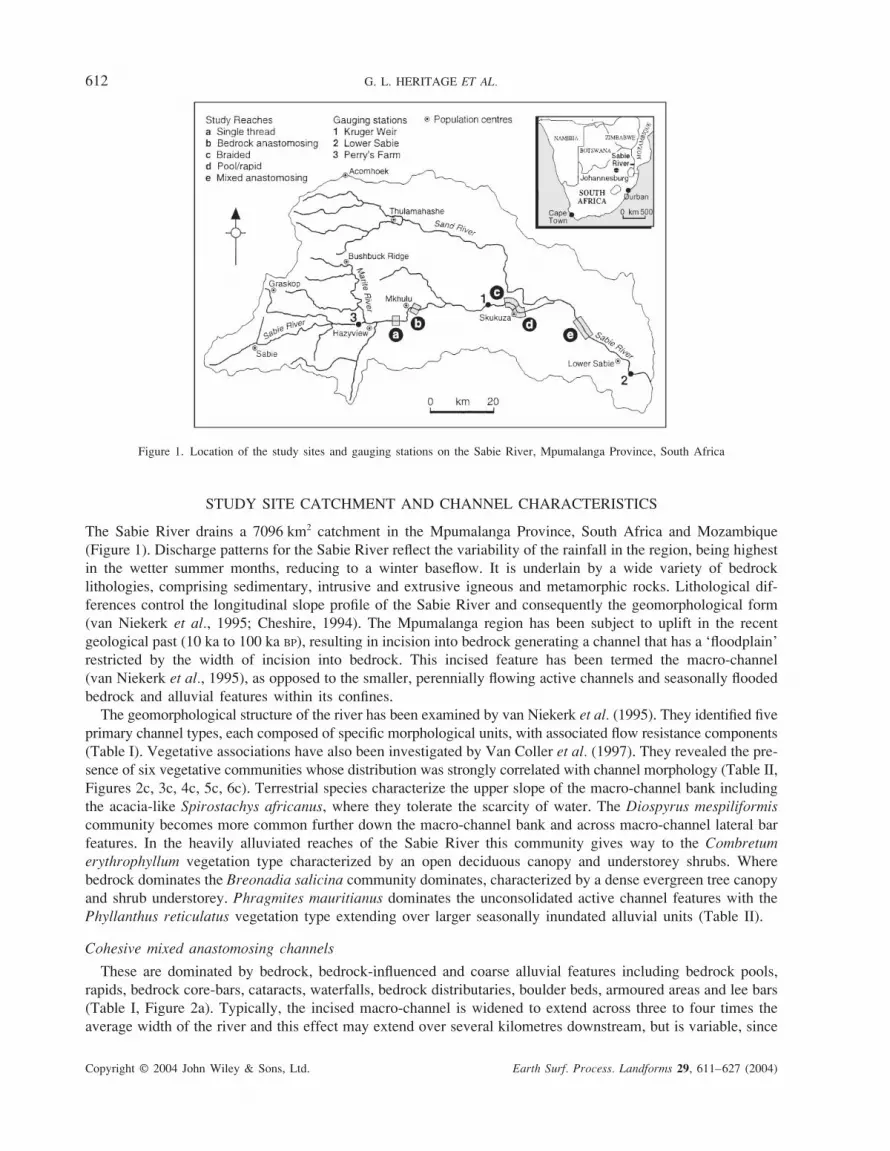
Figure 1. Location of the study sites and gauging stations on the Sabie River, Mpumalanga Province, South Africa
STUDY SITE CATCHMENT AND CHANNEL CHARACTERISTICS
The Sabie River drains a 7096 km2 catchment in the Mpumalanga Province, South Africa and Mozambique
(Figure 1). Discharge patterns for the Sabie River reflect the variability of the rainfall in the region, being highest
in the wetter summer months, reducing to a winter baseflow. It is underlain by a wide variety of bedrock
lithologies, comprising sedimentary, intrusive and extrusive igneous and metamorphic rocks. Lithological dif-
ferences control the longitudinal slope profile of the Sabie River and consequently the geomorphological form
(van Niekerk et al., 1995; Cheshire, 1994). The Mpumalanga region has been subject to uplift in the recent
geological past (10 ka to 100 ka BP), resulting in incision into bedrock generating a channel that has a ‘floodplain’
restricted by the width of incision into bedrock. This incised feature has been termed the macro-channel
(van Niekerk et al., 1995), as opposed to the smaller, perennially flowing active channels and seasonally flooded
bedrock and alluvial features within its confines.
The geomorphological structure of the river has been examined by van Niekerk et al. (1995). They identified five
primary channel types, each composed of specific morphological units, with associated flow resistance components
(Table I). Vegetative associations have also been investigated by Van Coller et al. (1997). They revealed the pre-
sence of six vegetative communities whose distribution was strongly correlated with channel morphology (Table II,
Figures 2c, 3c, 4c, 5c, 6c). Terrestrial species characterize the upper slope of the macro-channel bank including
the acacia-like Spirostachys africanus, where they tolerate the scarcity of water. The Diospyrus mespiliformis
community becomes more common further down the macro-channel bank and across macro-channel lateral bar
features. In the heavily alluviated reaches of the Sabie River this community gives way to the Combretum
erythrophyllum vegetation type characterized by an open deciduous canopy and understorey shrubs. Where
bedrock dominates the Breonadia salicina community dominates, characterized by a dense evergreen tree canopy
and shrub understorey. Phragmites mauritianus dominates the unconsolidated active channel features with the
Phyllanthus reticulatus vegetation type extending over larger seasonally inundated alluvial units (Table II).
Cohesive mixed anastomosing channels
These are dominated by bedrock, bedrock-influenced and coarse alluvial features including bedrock pools,
rapids, bedrock core-bars, cataracts, waterfalls, bedrock distributaries, boulder beds, armoured areas and lee bars
(Table I, Figure 2a). Typically, the incised macro-channel is widened to extend across three to four times the
average width of the river and this effect may extend over several kilometres downstream, but is variable, since
FLOW RESISTANCE IN BEDROCK RIVER CHANNELS 613
Copyright © 2004 John Wiley & Sons, Ltd. Earth Surf. Process. Landforms 29, 611–627 (2004)
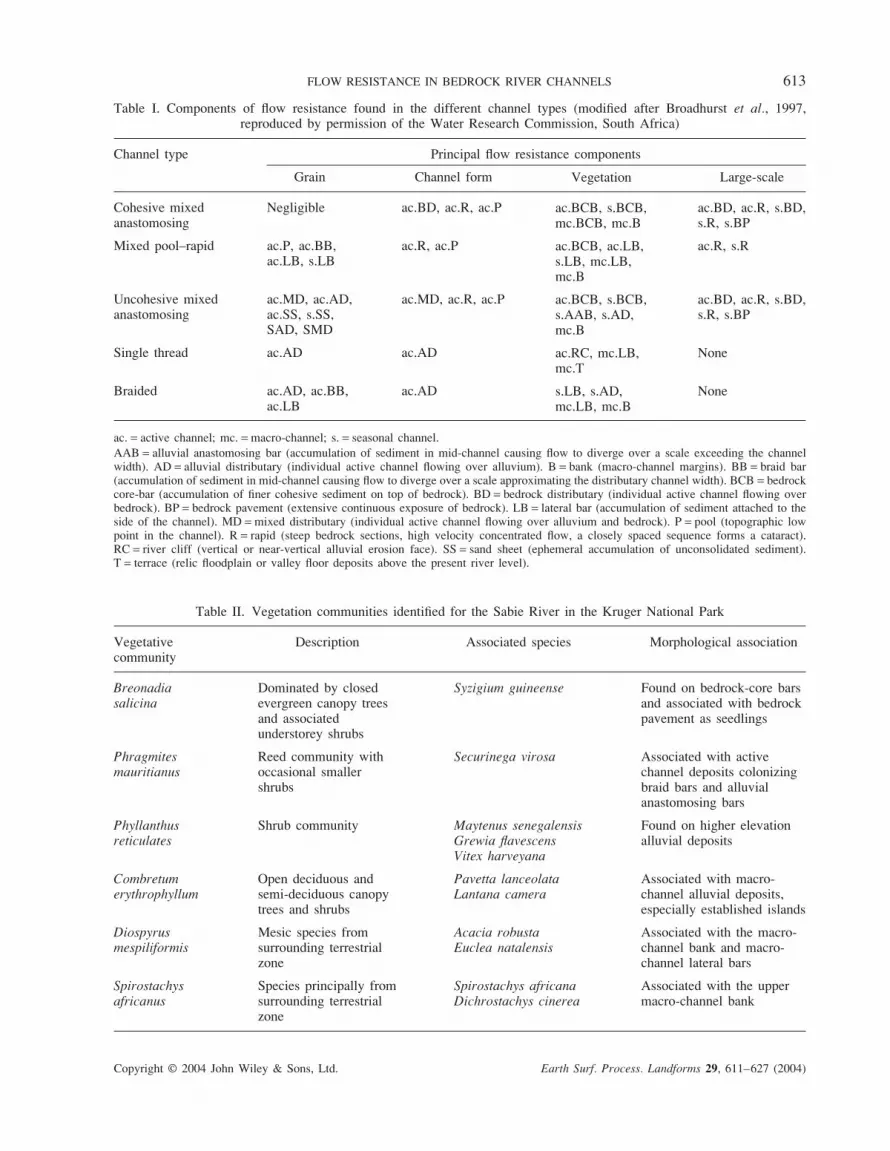
Table I. Components of flow resistance found in the different channel types (modified after Broadhurst et al., 1997,reproduced by permission of the Water Research Commission, South Africa)
Channel type Principal flow resistance components
Cohesive mixedanastomosing
Mixed pool–rapid
Uncohesive mixedanastomosing
Single thread
Braided
ac. = active channel; mc. = macro-channel; s. = seasonal channel.
AAB = alluvial anastomosing bar (accumulation of sediment in mid-channel causing flow to diverge over a scale exceeding the channelwidth). AD = alluvial distributary (individual active channel flowing over alluvium). B = bank (macro-channel margins). BB = braid bar(accumulation of sediment in mid-channel causing flow to diverge over a scale approximating the distributary channel width). BCB = bedrockcore-bar (accumulation of finer cohesive sediment on top of bedrock). BD = bedrock distributary (individual active channel flowing overbedrock). BP = bedrock pavement (extensive continuous exposure of bedrock). LB = lateral bar (accumulation of sediment attached to theside of the channel). MD = mixed distributary (individual active channel flowing over alluvium and bedrock). P = pool (topographic lowpoint in the channel). R = rapid (steep bedrock sections, high velocity concentrated flow, a closely spaced sequence forms a cataract).RC = river cliff (vertical or near-vertical alluvial erosion face). SS = sand sheet (ephemeral accumulation of unconsolidated sediment).T = terrace (relic floodplain or valley floor deposits above the present river level).
Large-scale
ac.BD, ac.R, s.BD,s.R, s.BP
ac.R, s.R
ac.BD, ac.R, s.BD,s.R, s.BP
None
None
Grain
Negligible
ac.P, ac.BB,ac.LB, s.LB
ac.MD, ac.AD,ac.SS, s.SS,SAD, SMD
ac.AD
ac.AD, ac.BB,ac.LB
Channel form
ac.BD, ac.R, ac.P
ac.R, ac.P
ac.MD, ac.R, ac.P
ac.AD
ac.AD
Vegetation
ac.BCB, s.BCB,mc.BCB, mc.B
ac.BCB, ac.LB,s.LB, mc.LB,mc.B
ac.BCB, s.BCB,s.AAB, s.AD,mc.B
ac.RC, mc.LB,mc.T
s.LB, s.AD,mc.LB, mc.B
Table II. Vegetation communities identified for the Sabie River in the Kruger National Park
Vegetativecommunity
Breonadiasalicina
Phragmitesmauritianus
Phyllanthusreticulates
Combretumerythrophyllum
Diospyrusmespiliformis
Spirostachysafricanus
Morphological association
Found on bedrock-core barsand associated with bedrockpavement as seedlings
Associated with activechannel deposits colonizingbraid bars and alluvialanastomosing bars
Found on higher elevationalluvial deposits
Associated with macro-channel alluvial deposits,especially established islands
Associated with the macro-channel bank and macro-channel lateral bars
Associated with the uppermacro-channel bank
Associated species
Syzigium guineense
Securinega virosa
Maytenus senegalensisGrewia flavescensVitex harveyana
Pavetta lanceolataLantana camera
Acacia robustaEuclea natalensis
Spirostachys africanaDichrostachys cinerea
Description
Dominated by closedevergreen canopy treesand associatedunderstorey shrubs
Reed community withoccasional smallershrubs
Shrub community
Open deciduous andsemi-deciduous canopytrees and shrubs
Mesic species fromsurrounding terrestrialzone
Species principally fromsurrounding terrestrialzone
614 G. L. HERITAGE ET AL.
Copyright © 2004 John Wiley & Sons, Ltd. Earth Surf. Process. Landforms 29, 611–627 (2004)
Figure 2. Characteristic geomorphology (a), long-section and cross-section locations (b) and vegetation types (c) of the cohesive mixedanastomosing channel type study site on the Sabie River (small-scale features not illustrated)
FLOW RESISTANCE IN BEDROCK RIVER CHANNELS 615
Copyright © 2004 John Wiley & Sons, Ltd. Earth Surf. Process. Landforms 29, 611–627 (2004)
the size of the feature is a function of the local geology. Numerous active channel bedrock distributaries exist
flowing over a steep gradient within the incised channel (Figure 2b), describing a tortuous route over the
resistant rock. Such channels have a fixed planform as defined by the weaker pathways through the resistant
outcrop (Cheshire, 1994). These distributaries display very few alluvial features. Bedrock features include pools,
rapids, cataracts and small waterfalls, with sediment accumulation being restricted to lee bar deposits down-
stream of bedrock obstructions, armoured areas and fine deposits in low energy areas of flow. Elevated bedrock
areas are common and may exist as exposed bedrock pavements and as areas of limited sediment build-up
termed bedrock core-bars (van Niekerk et al., 1995). Bedrock core-bars in the bottom of the macro-channel are
dominated by Breonadia salicina, a riparian tree that germinates in bedrock cracks (Table I), and associated
understorey shrubs. Reed growth (Phragmites mauritianus) is prevalent on unconsolidated deposits (Figure 2c).
Mixed pool–rapid channels
These are dominated by bedrock and bedrock-influenced features (Table I, Figure 3a), most notably
pool–rapid sequences within the active channel, the scale of which is dependent on local geological variability
(Figure 3b). Typically, the rapids are free of sediment apart from occasional boulders and small-scale bedrock
core-bars. The pool areas are more variable, ranging from sediment-free bedrock areas to sediment-lined
pools, incorporating a variety of bar types. The active pool–rapid channels typically occupy only a portion
of the macro-channel. Large-scale sedimentary features associated with infrequent high magnitude flows have
covered much of the bedrock across the rest of the incised channel and are colonized by a vegetation assemblage
dominated by Phylanthus reticulatus and Diospyrus mespilliformis (Figure 3c).
Uncohesive mixed anastomosing channels
These are reaches of the macro-channel displaying multiple bedrock and occasional alluvial distributary chan-
nels that divide and rejoin over a distance much greater than the width of individual distributaries (Figure 4a)
to create an assemblage of low gradient active channels that appear to be relatively stable (Figure 4b). This
stabilization is aided by extensive reed growth (Phragmites mauritanus) on alluvial anastomosing bars between
the active distributaries, which increases channel resistance during flows higher than the capacity of the distributary
channels (Table I) and promotes bar growth by the vertical accretion of sediment (Figure 4c).
Single-thread channels
These channel types have developed in fully alluvial sections of the Sabie River. Typically, these channel
types contain a considerable range of the features noted in temperate alluvial single-thread channels including
lateral bars, alluvial pools, river cliffs, apical pools, point bars, rip channels, riffles and terraces (Figure 5a).
Channel gradients are generally low for this channel type (Figure 5b) and the vegetation includes Combretum
erethryphyllum and Diospyrus mespilliformis on terrace features and Phragmites mauritianus on active channel
unconsolidated deposits (Figure 5c).
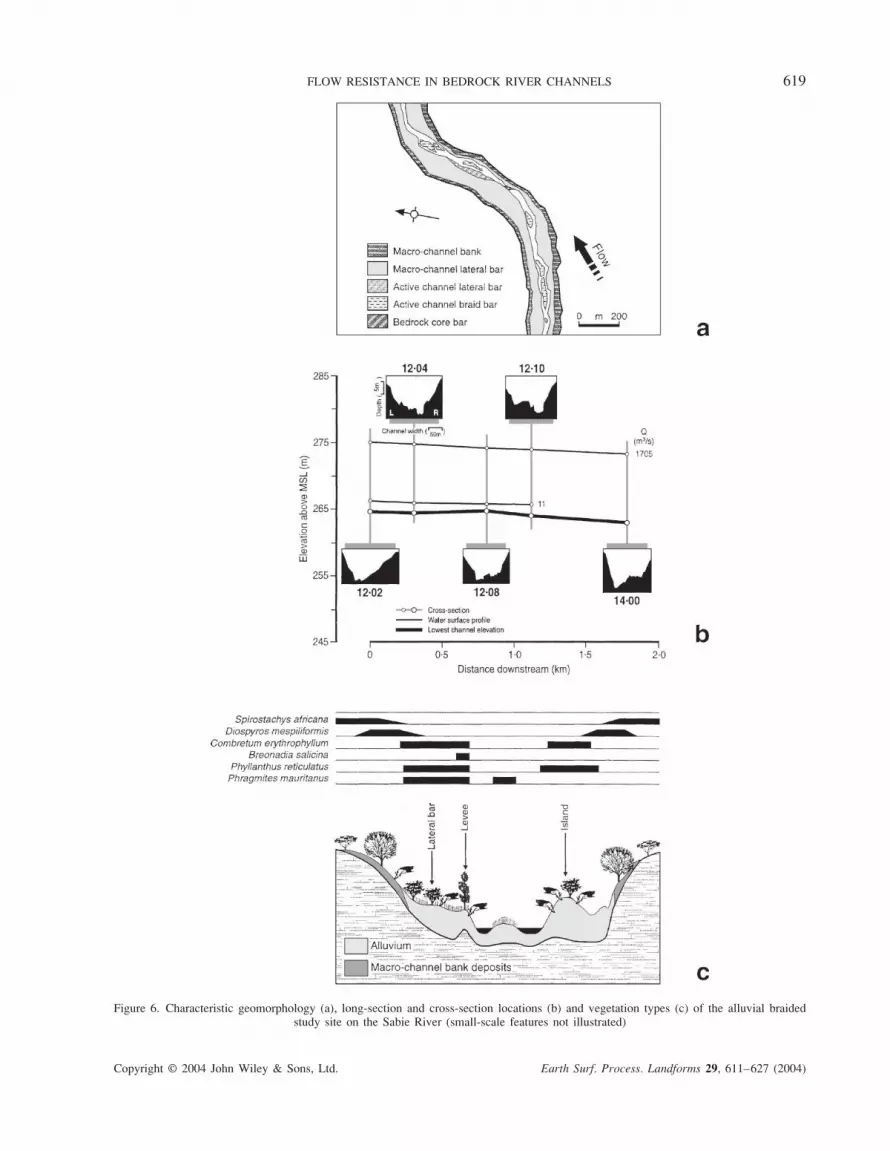
Braided channels
These moderate gradient channel types (Figure 6b) are characterized by ephemeral deposits of unconsolidated
sediment within the active channels. The degree of braiding in the Sabie River, as defined by the number of braid
channels, is low reflecting channel splitting around mid-channel bars within the active channel. Lateral bars are
also common (Figure 6a). Both of these feature types are often colonized by reeds (Phragmites mauritianus).
Beyond the active channels the banks are composed largely of cohesive macro-channel deposits well protected
by vegetative cover (Table I, Figure 6c).
METHODOLOGY
Collection of channel-type geometric and hydraulic data
Five representative reaches were chosen to characterize the variety of channel types found on the Sabie
River within the Kruger National Park. The locations for these reaches are shown on Figure 1. To identify

616 G. L. HERITAGE ET AL.
Copyright © 2004 John Wiley & Sons, Ltd. Earth Surf. Process. Landforms 29, 611–627 (2004)
Figure 3. Characteristic geomorphology (a), long-section and cross-section locations (b) and vegetation types (c) of the mixed pool–rapidstudy site on the Sabie River (small-scale features not illustrated)

FLOW RESISTANCE IN BEDROCK RIVER CHANNELS 617
Copyright © 2004 John Wiley & Sons, Ltd. Earth Surf. Process. Landforms 29, 611–627 (2004)
Figure 4. Characteristic geomorphology (a), long-section and cross-section locations (b) and vegetation types (c) of the uncohesive mixedanastomosing study site on the Sabie River (small-scale features not illustrated)

618 G. L. HERITAGE ET AL.
Copyright © 2004 John Wiley & Sons, Ltd. Earth Surf. Process. Landforms 29, 611–627 (2004)
Figure 5. Characteristic geomorphology (a), long-section and cross-section locations (b) and vegetation types (c) of the alluvial single-threadstudy site on the Sabie River (small-scale features not illustrated)
FLOW RESISTANCE IN BEDROCK RIVER CHANNELS 619
Copyright © 2004 John Wiley & Sons, Ltd. Earth Surf. Process. Landforms 29, 611–627 (2004)
Figure 6. Characteristic geomorphology (a), long-section and cross-section locations (b) and vegetation types (c) of the alluvial braidedstudy site on the Sabie River (small-scale features not illustrated)
620 G. L. HERITAGE ET AL.
Copyright © 2004 John Wiley & Sons, Ltd. Earth Surf. Process. Landforms 29, 611–627 (2004)
all the flow resistance components at each channel type and to correlate their occurrence to observed local
hydraulic conditions, eight to ten monumented cross-sections per channel type were surveyed using a total
station. These sections were then tied together through a long section total station survey of the benchmarks
(Figures 2b, 3b, 4b, 5b and 6b). The longitudinal spacing of the cross-sections was designed to incorporate
the presence of low-flow hydraulic ‘controls’ that cause energy loss, and thus to define accurately water
surface slope along a reach. These ‘controls’ included bedrock outcrops, major alluvial bars or tributary
confluences and major channel features, such as braid bars, meander apices or changes in the vegetation
community. In addition to the cross-sectional shape survey, vegetation, sedimentological and morphologic
unit data were collected for each cross-section (Broadhurst et al., 1997). Flow stage for a range of low and
medium discharges was recorded at the monumented cross-sections, so as to define the water surface slope
along the reach. Levelling survey from the cross-section benchmark captured low-flow water levels. Scaffold
poles painted with poster paint were used to record elevated flows. Peak flow levels left a mark on the
poles and this was surveyed in to the local benchmark and the poles repainted. Where preserved, local
strand line evidence was also measured to compare to the pole data. Stage–discharge relationships were
constructed for each cross-section utilizing gauge station data from Kruger Weir in the case of the cohesive
mixed anastomosed, single-thread, mixed pool–rapid and braided study sites and from Lower Sabie for
the uncohesive mixed anastomosing study site (Figure 1). This differentiation was deemed necessary due to the
inputs from the seasonal Sand River tributary. Time of survey was used to determine the appropriate discharge
at the gauge station for low-flow stage surveys and the peak flow between survey periods was used to determine
elevated flow magnitude. High magnitude flow levels were only recorded at one or two cross-sections per study
reach and at three out of the five reaches, low-flow stages were recorded for all cross-sections at several
discharges.
DATA ANALYSIS
Reach flow resistance quantification
The cross-section and hydraulic data collection surveyed per reach enables flow resistance to be quantified
over a range of physical spatial scales. This may be accomplished using the Barnes (1967) methodology, which
averages flow resistance for a multi-cross-section reach. The Manning’s ‘n’ and Darcy-Weisbach f flow resist-
ance equations (1 and 2) have been used by engineers to calculate discharge, Q, in a channel, using the premise
that it is proportional to a power of the friction slope, Sf (often approximated by the water surface slope), the
hydraulic radius, R, gravitational acceleration g, and the cross-sectional area, A.
Manning’s ‘n’:
Q
AR S
n
f =
2
3
1
2
(1)
Darcy-Weisbach:
Q AgRS
f
f =
8
1
2
(2)
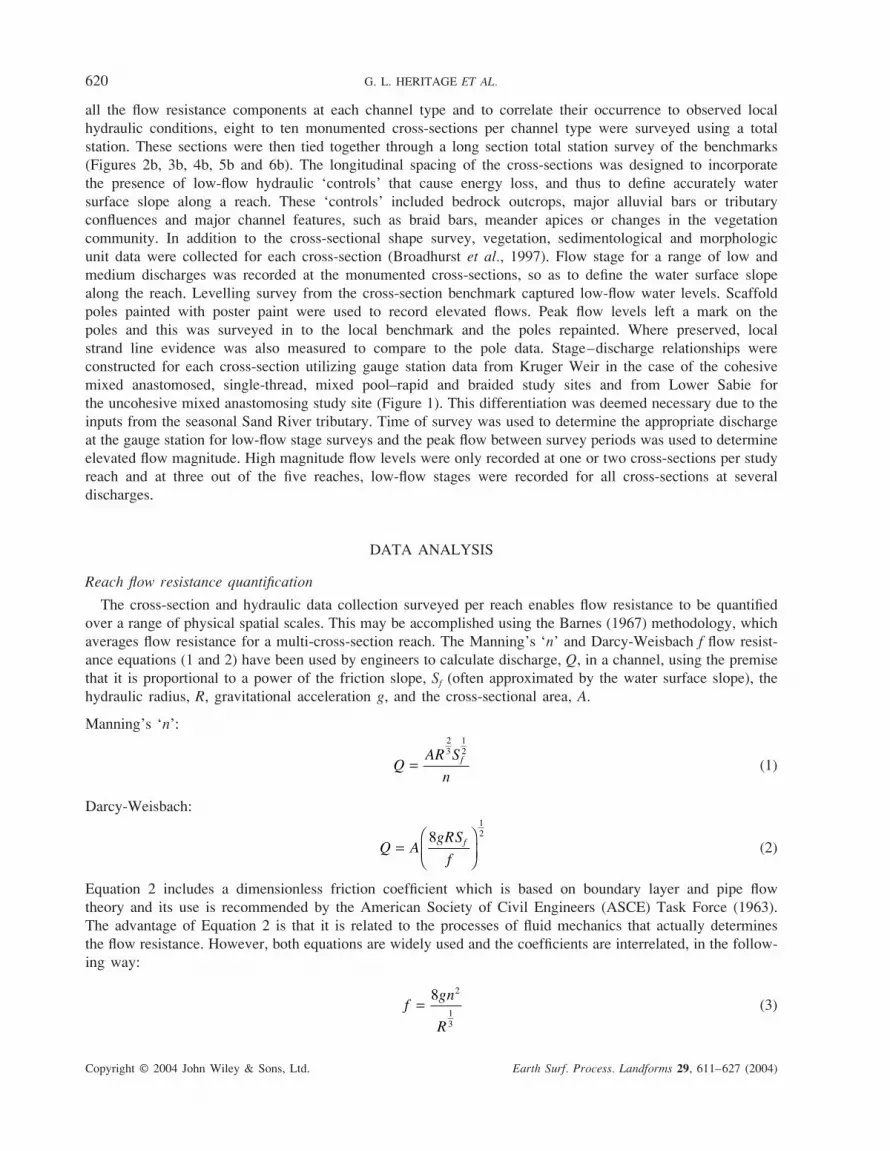
Equation 2 includes a dimensionless friction coefficient which is based on boundary layer and pipe flow
theory and its use is recommended by the American Society of Civil Engineers (ASCE) Task Force (1963).
The advantage of Equation 2 is that it is related to the processes of fluid mechanics that actually determines
the flow resistance. However, both equations are widely used and the coefficients are interrelated, in the follow-
ing way:
fgn
R
=8 2
1
3
(3)

FLOW RESISTANCE IN BEDROCK RIVER CHANNELS 621
Copyright © 2004 John Wiley & Sons, Ltd. Earth Surf. Process. Landforms 29, 611–627 (2004)
Figure 7. Definition of channel geometry and hydraulic parameters for use in calculating flow resistance in a multi-section reach (fromBroadhurst et al., 1997)
A value of the friction slope, Sf, to be used in the Manning’s ‘n’ or Darcy-Weisbach f total resistance equations
is only available between sections, as it is defined by:
S
h
L
h h k h
Lf
f v v
( )= =
+ −∆ ∆ ∆(4)
where hf is the friction head loss, L is reach length, ∆h is the change in elevation of the water surface between
the upstream and downstream cross-sections, ∆hv is the change in velocity head between the upstream and
downstream cross-sections and k(∆hv) approximates the energy loss due to acceleration or deceleration in a
contracting or expanding reach (Figure 7). Following convention, k is assumed to equal zero for contracting
reaches and 0·5 for expanding reaches (Chow, 1959). The velocity head, hv, at a cross-section is equal to αV2/
2g, where α is the velocity head coefficient, which indicates the degree of uniformity of velocity across the
section.
Velocity change between the sections under investigation is not known, therefore it has been assumed for the
purpose of this study that α equals 1. This follows a precedent set by Chow (1959) and followed by others
calculating flow resistance coefficients (Barnes, 1967; Jarrett, 1984; Hicks and Mason, 1991). However, several
studies have shown that values for α can exceed unity, with values greater than two attributed to expanding
sections displaying flow separation (Streeter, 1942).
A representative value of flow resistance for a multiple section reach at a given discharge can be obtained
by equating the friction head loss calculated from the friction slope (Equation 1 or 2) with the friction head loss
given by Equation 4. This uses the method adopted by Barnes (1967) and followed by Jarrett (1984) and Hicks
and Mason (1991). Therefore:
h h h hf f f f m m
. .. , , ( ),
= + +−1 2 2 3 1
(5)
622 G. L. HERITAGE ET AL.
Copyright © 2004 John Wiley & Sons, Ltd. Earth Surf. Process. Landforms 29, 611–627 (2004)
and from the Manning’s ‘n’ equation (Equation 1) and the continuity equation Q = AV:
h n QL
Z Z
L
Z Z
L
Z Zf
m m
m m m
. . . , , ( ),
( ),
= + +
−
−
2 2 1 2
1 2
2 3
2 3
1
1
(6)
where m is the number of cross-sections (with the mth cross-section being furthest upstream), (m−1),m represents
the difference in value of the parameter in question between cross-section m−1 and cross-section m, Z = AR2/3,
and a representative value of Z, following Barnes (1967) for the reach between two adjacent cross-sections, is
given by (Z1Z2)1/2.
From Equations 4 and 5:
h h h h h k h k h k hf m v v v v m m vm m m
( ) ( ) ( . . . ), , ( ),, , ( ),= − + − − + + − −1 1 2 2 3 11 1 2 2 3 1
∆ ∆ ∆ (7)
and therefore, from Equation 6:
nQ
h h h h k h k h k h
L
Z Z
L
Z Z
L
Z Z
m v v v v m m v
m m
m m
m m m
( ) ( ) ( . . . )
. . .
, , ( ),
, , ( ),
( )
, , ( ),=− + − − + +
+ +
−
−
−
−1 1 1 2 2 3 1
1 2
1 2
2 3
2 3
1
1
1 1 2 2 3 1∆ ∆ ∆
1
2
(8)
In a similar fashion an equivalent expression for Darcy-Weisbach friction factor may be derived:
fg
Q
h h h h k h k h k h
L
YY
L
Y Y
L
m v v v v m m v
m m
m m m
( ) ( ) ( . . . )
( )
( )
. . .
, , ( ),
, , ( ),
, , ( ),=− + − − + +
+ +
−
−
−82
1 1 2 2 3 1
1 2
1 2
1
2
2 3
2 3
1
2
1
1 1 2 2 3 1∆ ∆ ∆
(( )( )Y Ym m−
1
1
2
(9)
where Y = A2R.
Using Equations 8 and 9, the total flow resistance coefficients (‘n’ and f ) can be quantified over a variety of
scales, from a two-section ‘sub-reach’, which could encompass a morphological unit, to a numerous-section
channel type ‘reach’. Where only one estimate of high discharge stage was recorded within the study reach,
Equations 1 and 2 have been used to calculate flow resistance at a cross-section. In these cases, local water
surface slope was not available and energy slope was assumed to equal the regional bed slope (this assumes that
the flow is uniform at high discharges). Therefore, these high discharge flow resistance estimates are less reliable
than the multi-cross-section derived estimates of the low and medium discharges. Where two high discharge
stages were recorded within a study reach, local slope, and hence true energy slope, was available and the full
Barnes (1967) methodology was used to quantify flow resistance.
RESULTS AND DISCUSSION
Frictional estimates have been made at the channel type and morphologic unit scale for flows of between 1 and
100 m3 s−1. Additionally stage measurements for a flood of between 1600 and 2100 m3 s−1 allowed high-flow
estimates to be made. The cohesive mixed anastomosing channel type displays the highest flow resistance values
(Figure 8), but shows the same trend as all of the channel types, with a decrease in flow resistance from low
to medium discharges (1 m3 s−1 and 100 m3 s−1). A similar decreasing trend in flow resistance with discharge
occurs for all of the morphological units investigated. The alluvial channel types (braided and single thread) have
the lowest flow resistance coefficients, with uncohesive mixed anastomosing and pool–rapid reaches displaying

FLOW RESISTANCE IN BEDROCK RIVER CHANNELS 623
Copyright © 2004 John Wiley & Sons, Ltd. Earth Surf. Process. Landforms 29, 611–627 (2004)
Figure 8. Darcy-Weisbach friction factor f and Manning’s ‘n’ quantification for the five channel type study sites over a range of discharges
Figure 9. Darcy-Weisbach friction factor f and Manning’s ‘n’ quantification for bedrock and alluvial morphologic units over a range ofdischarges
intermediate values. The uncohesive mixed anastomosing and braided reach flow resistance are seen to increase
marginally from medium to high discharges. Bedrock-influenced rapids and cataracts display the highest flow
resistance values, while the alluvial braid bars and pools exhibit lower flow resistance (Figure 9). Direct measure-
ment of low-flow discharge in individual bedrock distributaries at the cohesive mixed anastomosing channel
type has enabled flow resistance to be quantified for this morphological unit (Figure 10). Flow resistance values
in distributaries 2–7 are similar to other bedrock morphologic units quantified on the Sabie River. Extreme
624 G. L. HERITAGE ET AL.
Copyright © 2004 John Wiley & Sons, Ltd. Earth Surf. Process. Landforms 29, 611–627 (2004)
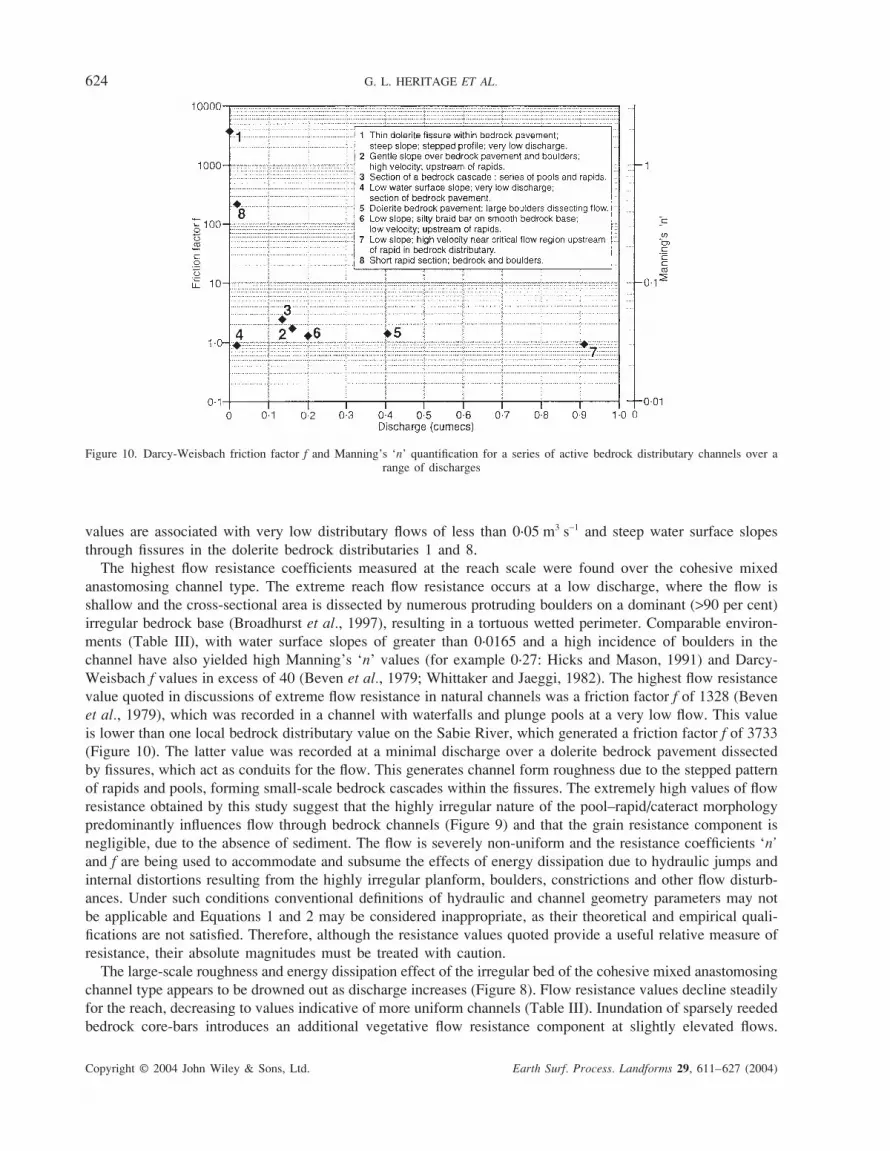
Figure 10. Darcy-Weisbach friction factor f and Manning’s ‘n’ quantification for a series of active bedrock distributary channels over arange of discharges
values are associated with very low distributary flows of less than 0·05 m3 s−1 and steep water surface slopes
through fissures in the dolerite bedrock distributaries 1 and 8.
The highest flow resistance coefficients measured at the reach scale were found over the cohesive mixed
anastomosing channel type. The extreme reach flow resistance occurs at a low discharge, where the flow is
shallow and the cross-sectional area is dissected by numerous protruding boulders on a dominant (>90 per cent)
irregular bedrock base (Broadhurst et al., 1997), resulting in a tortuous wetted perimeter. Comparable environ-
ments (Table III), with water surface slopes of greater than 0·0165 and a high incidence of boulders in the
channel have also yielded high Manning’s ‘n’ values (for example 0·27: Hicks and Mason, 1991) and Darcy-
Weisbach f values in excess of 40 (Beven et al., 1979; Whittaker and Jaeggi, 1982). The highest flow resistance
value quoted in discussions of extreme flow resistance in natural channels was a friction factor f of 1328 (Beven
et al., 1979), which was recorded in a channel with waterfalls and plunge pools at a very low flow. This value
is lower than one local bedrock distributary value on the Sabie River, which generated a friction factor f of 3733
(Figure 10). The latter value was recorded at a minimal discharge over a dolerite bedrock pavement dissected
by fissures, which act as conduits for the flow. This generates channel form roughness due to the stepped pattern
of rapids and pools, forming small-scale bedrock cascades within the fissures. The extremely high values of flow
resistance obtained by this study suggest that the highly irregular nature of the pool–rapid/cateract morphology
predominantly influences flow through bedrock channels (Figure 9) and that the grain resistance component is
negligible, due to the absence of sediment. The flow is severely non-uniform and the resistance coefficients ‘n’
and f are being used to accommodate and subsume the effects of energy dissipation due to hydraulic jumps and
internal distortions resulting from the highly irregular planform, boulders, constrictions and other flow disturb-
ances. Under such conditions conventional definitions of hydraulic and channel geometry parameters may not
be applicable and Equations 1 and 2 may be considered inappropriate, as their theoretical and empirical quali-
fications are not satisfied. Therefore, although the resistance values quoted provide a useful relative measure of
resistance, their absolute magnitudes must be treated with caution.
The large-scale roughness and energy dissipation effect of the irregular bed of the cohesive mixed anastomosing
channel type appears to be drowned out as discharge increases (Figure 8). Flow resistance values decline steadily
for the reach, decreasing to values indicative of more uniform channels (Table III). Inundation of sparsely reeded
bedrock core-bars introduces an additional vegetative flow resistance component at slightly elevated flows.

FLOW RESISTANCE IN BEDROCK RIVER CHANNELS 625
Copyright © 2004 John Wiley & Sons, Ltd. Earth Surf. Process. Landforms 29, 611–627 (2004)
Table III. Flow resistance coefficients for a variety of channel conditions
Reference
Chow (1959)
Barnes (1967)
Bathurst (1978)
Bathurst et al. (1981)
Richards (1982)
Thorne andZevenbergen (1985)
Bathurst (1985)
Hicks and Mason (1991)
Whittaker and Jaeggi (1982)
Beven et al. (1979)
Bridge and Gabel (1992)
Bakry et al. (1992)
Hall and Freeman (1994)
Friction factor f
–––
–
3·12 (max)
4·79 (max)
0·0720·40·196
1·55 (max)
0·655·46 (max)
––
44·9 (max)
1328 (max)48
0·070·13 (max)
–
–
Channel description
Vegetation infestedDense brush and willowsCobble bottom
Bedrock base with boulders.High slope, low depth
Mountain stream, low flow
Flume study, large-scale roughness
Clean natural channelWeedy natural channelMountain stream with boulders
Mountain stream, large boulders
Mountain river, high slope
Boulder bed, low flowLarge boulder and bedrock, high flow
Step–pool mountain streams
Waterfalls and plunge pools; low flowStraight, pools and cobbled riffles
Low sinuosity, braided
Vegetation-infested canals
Flume study, dense vegetation
Manning’s ‘n’
0·10·16 (max)0·05 (max)
0·075
–
–
0·030·070·05
0·11 (max)
–
0·270·2
–
––
–
0·050·074 (max)
0·270·7 (max)
Resistance to flow imparted by the Breonadia salicina riparian forest community growing on the bedrock core-
bars and the Diospyrus mespiliformis community present on the macro-channel bank (Figure 2c) may explain
the increased friction estimates for flood flows. The mixed pool–rapid channel type is characterized by rapid
morphological units, which occur repeatedly within the active distributaries. These units comprise more than
70 per cent irregular bedrock outcrops or large boulders (Broadhurst et al., 1997) and studies at the morphologic
unit scale (Figure 9) indicate that they generate considerable flow resistance, particularly at lower flows. It is
suggested that this large-scale roughness is contributing to the higher magnitude flow resistance estimated for
this channel type (Figure 8).
The magnitudes of flow resistance calculated for the uncohesive mixed anastomosing study site are lower
than for the cohesive mixed anastomosed study site as it flows over a shallower gradient (Figure 4b). The
flow resistance coefficients show an almost identical declining trend in value up to the mid-range discharge
to the braided reach and are similar in magnitude to those measured in mountain streams (Bathurst, 1978;
Thorne and Zevenbergen, 1985; Bathurst, 1985). The resistance may be linked to the presence of irregular
bedrock outcrops and boulders within this channel type and to the extensive cover of Phragmites mauritianus
reed and the Phylanthus reticulatus deciduous shrub community across the bottom of the macro-channel. A
slight increase in reach flow resistance is found over the uncohesive mixed anastomosing channel type at the
1000 m3 s−1 flood, compared to the intermediate discharge flow resistance values. Inspection of inundation
patterns has shown that flow remains generally confined to unvegetated active distributaries at most sections
at a discharge of 85 m3 s−1. Therefore, at discharges lower than 85 m3 s−1 the flow resistance is attributable to
626 G. L. HERITAGE ET AL.
Copyright © 2004 John Wiley & Sons, Ltd. Earth Surf. Process. Landforms 29, 611–627 (2004)
large-scale channel form or grain resistance. The seasonal alluvial anastomosing bars and lateral bars at
the uncohesive mixed anastomosing study sites are generally sparsely vegetated, although there are locally
dense areas of Phragmities mauritianus. These morphological units are inundated at the high discharge of
1000 m3 s−1; hence vegetation flow resistance will be introduced. At this high discharge, the flow depth is
such that the effect of grain roughness will be minimal, so the increase in flow resistance can be attributed to
the vegetation and inundation of larger scale morphologic units introducing form roughness. This is supported
by the fact that the flow resistance magnitude at discharge 1000 m3 s−1 falls within the range (Manning’s
‘n’ = 0·05–0·1) of vegetation flow resistance quoted by other authors (Chow, 1959; Richards, 1982; Bakry
et al., 1992).
The alluvial reaches, namely braided and single thread, have the lowest flow resistance values and tend, with
medium range discharges, to values similar to those reported for ‘clean natural channels’ (Richards, 1982). In
particular, the braided reach compares favourably to other alluvial ‘low sinuosity braided channels’ (Bridge and
Gabel, 1992). At low discharges (10 m3 s−1), the flow resistance values resemble the lower range of values
reported for cobble- and some boulder-bed channel environments (Chow, 1959; Barnes, 1967; Richards, 1982;
Thorne and Zevenbergen, 1985). The active channel sediments in the study reach were coarse sand (D50 = 1 mm);
however, isolated bedrock outcrops and boulders do disrupt the flow at low discharges. The percentage of the
wetted perimeter covered by bedrock or boulders is generally less than 5 per cent (Broadhurst et al., 1997), but
this is still likely to result in a higher flow resistance, if only at very low discharges and flow depths. High
discharge (650 m3 s−1) stage data were collected at the braided reach, enabling flow resistance calculation. The
flow resistance rises to a friction factor f of 0·103, which is higher than the intermediate discharge resistance
values. The corresponding stage inundates 75 per cent of the macro-channel width, covering heavily reeded
macro-channel and seasonal lateral bars (Figure 6c). It is clear from Figure 9 that the effect of channel form
flow resistance will be minimal, as the low relief braid bars become drowned out as flow levels rise. Therefore,
the increased channel friction can largely be attributed to vegetation resistance. Alongside the reeds the Combretum
erythrophyllum vegetation type, characterized by open canopy trees and shrubs (Table II), dominates the sea-
sonal and macro-channel deposits in this channel type and may explain the increase in resistance estimated for
elevated flows which would inundate this community. Calculation of flow resistance over the whole single-
thread reach initially showed an increase in flow resistance at 20 m3 s−1. This can partly be attributed to vegetation
resistance of the fringing river cliff reeds and shrubs (Table I).
CONCLUSIONS
It is clear from the discharge–flow resistance results presented that each channel type displays a different
relationship reflecting the complex spatial nature of the roughness elements present. Channel types exhibiting
a high degree of bedrock influence generate extreme flow resistance values. Channel form and vegetation flow
resistance components dominate over grain roughness elements in these environments. Flow resistance quanti-
fication of the alluvial channel type study sites on the Sabie River produced values comparable with earlier
studies of similar morphologies. Flow resistance quantification of the cohesive mixed anastomosing channel type
and of bedrock morphological units has produced extreme magnitudes of flow resistance, at low discharges.
Under these conditions the flow resistance coefficients are probably reflecting energy dissipations due to hydraulic
jumps and internal distortions. However, the large-scale roughness and energy dissipation effect of the irregular
bedrock channel base becomes drowned out as discharge increases and this is reflected in a decline in the
extreme flow resistance values. The influence of vegetation on the inundated seasonal and macro-channel
features generates a significant additional flow resistance component at high discharges for all the channel types
investigated.
ACKNOWLEDGEMENTS
The authors wish to thank the Water Research Commission of South Africa for financing the research. The
National Parks Board of South Africa provided logistical support. Mr G. Dobrzynski kindly prepared the maps
and diagrams.

FLOW RESISTANCE IN BEDROCK RIVER CHANNELS 627
Copyright © 2004 John Wiley & Sons, Ltd. Earth Surf. Process. Landforms 29, 611–627 (2004)
REFERENCES
ASCE Task Force 1963. Progress report of the Task Force on Friction Factors in Open Channels of the Committee of Hydromechanics,Hydraulics Division. Journal of Hydraulics Division, ASCE 89(HY2): 97–143.
Bakry MF, Gates TK, Khattab AF. 1992. Field measured hydraulic resistance characteristics in vegetation infested canals. Journal of
Irrigation and Drainage Engineers, ASCE 118(2): 256–274.Barnes HH. 1967. Roughness characteristics of natural channels. US Geological Survey Water Supply Paper 1849. USGS: Washington DC;
1–9.Bathurst JC. 1978. Flow resistance of large-scale roughness. Journal of Hydraulic Engineering, ASCE 104(HY12): 1587–1603.Bathurst JC. 1985. Flow resistance estimation in mountain rivers. Journal of Hydraulic Engineering, ASCE 111(4): 625–643.Bathurst JC, Li RM, Simons DB. 1981. Resistance equation for large-scale roughness. Journal of Hydraulic Engineering, ASCE 107(HY12):
1593–1613.Beven K, Gilman K, Newson M. 1979. Flow and flow routing in upland channel networks. International Association of Hydrological
Science, Hydrologic Science Bulletin 24(3): 303–325.Birkhead AL, Heritage GL, James CS, Rogers K, Quinn NW, van Niekerk AW. 2000. Geomorphological change models for the Sabie River
in the Kruger National Park. Water Research Commission Report No. 782/1/00, Pretoria, South Africa.Bridge JS, Gabel SL. 1992. Flow and sediment dynamics in a low sinuosity, braided river: Calamus River, Nebraska Sandhills. Sedimentology
39: 125–142.Broadhurst LJ, Heritage GH, van Niekerk AW, James CS, Rogers KH. 1997. Translating discharge into local hydraulic conditions on
the Sabie River: an assessment of channel flow resistance. Water Research Commission Report K5/474/0/1 Vol. 2. Water ResearchCommission: Pretoria, South Africa.
Cheshire P. 1994. Geology and geomorphology of the Sabie River, Kruger National Park, and its catchment area. Centre for Water in theEnvironment. Internal report 1/94. University of the Witwatersrand: Johannesburg.
Chow VT. 1959. Open Channel Hydraulics. McGraw Hill: Tokyo.Hall BR, Freeman GE. 1994. Study of hydraulic roughness in wetland vegetation. Bulletin of the Wetlands Research Programme 4: 1,
1–4.Heritage GL, Moon BP, Large ARG, Birkhead AL. 2003. The accuracy of representative reach based semi-arid bedrock-influenced channel
resistance information to estimate flood magnitude using the slope-area method. Geografiska Annaler 85(A): 1–11.Hicks DM, Mason PD. 1991. Roughness Characteristics of New Zealand Rivers. Water Resources Survey: DSIR.Jarrett RD. 1984. Hydraulics of high gradient streams. Journal of Hydraulic Engineering, ASCE 110(11): 1519–1539.Richards K. 1982. Rivers: Form and Process in Alluvial Channels. Methuen: London.Streeter VL. 1942. The kinetic energy and momentum correction factors for pipes and for open channels of great width. Civil Engineer
12(4): 212–213.Thorne CR, Zevenbergen LW. 1985. Estimating mean velocity in mountain rivers. Journal of Hydraulic Engineering, ASCE 111(4): 612–
624.Van Coller AL, Rogers KH, Heritage GL. 1997. Linking riparian vegetation types and fluvial geomorphology along the Sabie River within
the Kruger National Park, South Africa. African Journal of Ecology 35: 194–212.van Niekerk AW, Heritage GL, Moon BP. 1995. River classification for management: the geomorphology of the Sabie River in the E.
Transvaal. South African Geographical Journal 77(2): 68–76.Whittaker JG, Jaeggi MNR. 1982. Origin of step-pool systems in mountain streams. Journal of the Hydraulics Division, ASCE 108(HY6):
758–773.


