Embed Size (px)
Citation preview
Matrix Diffusion-Derived Plume Attenuation in Fractured Bedrock by David 5. Lipson', Bernard H. Kueper2, and Michael J. Gefel13
Abstract M, 'itiix .' diffusion can attenuate the rate of plume migration in fractured bedrock relative to the rate of ground
water tlow for both conservative and nonconservative solutes of interest. In a system of parallel, equally spaced con- stant aperture fractures sub.ject to steady-state ground water tlow and an infinite source width, the degree of plume attenuation increases with time and travel distance. eventually reaching an asymptotic level. The asymptotic degree of plume attenuation i n the absence of degradation can be predicted by a plume attenuation factor, p. which is read- ily estimated as K ' (cb,,Jb, ), where K' is the retardation factor in the matrix, is the matrix porosity, and +, is the fracture porosity. This dual-porosity relationship can also be thought of as the ratio of primary to secondary porosity. ,!3 reprewits the rate of ground water tlow in fractures relative to the rate of plume advance. For the conditions exan- ined in this study, ,!3 increases with greater matrix porosity, greater matrix fraction organic carbon, larger fracture spacing. and smaller fracture aperture. These concepts are illustrated using a case study where dense nonaqueous phase liqiiicl in fractured sandstone produced a dissolved-phase trichloroethylene (TCE) plume -300 m in length. Transport parameters such as matrix porosity, fracture porosity, hydraulic gradient, and the matrix retardation factor were charac te r id at the site through field investigations. In the fractured sandstone bedrock examined in this study, the asymptotic plume attenuation factors ( p values) for conservative and nonconservative solutes (i.e., chloride and TCE) were predicted to be -800 and 12,2 10, respectively. Quantitative analyses demonstrate that a porous media (sin- gle-porosity) solutc transport model is not appropriate for simulating contaminant transport in fractured sandstone where matrix dillusion occ~irs. Rather, simulations need t o be conducted with either a discrete fracture model that explicitly incorporates matrix diffusion, or a dual-continuum model that accounts for mass transfer between mobile and immobile /ones. Simulations also demonstrate that back diffusion from the matrix to fractures will likely be the time-limiting factor i n reaching ground water cleanup goals in some fractured bedrock environments.
Introduction CharacteriAng solute plume transport in fractured
bedrock is often an essential component of environmental investigations at sites contaminated by dense nonaqueous phase liquids (DNAPLs). Examples of DNAPLs frequently
encountered throughout North America and other industri- alized areas of the world include chlorinated solvents, poly- chlorinated biphenyl oils, creosote, and coal tar. At sites underlain by fractured bedrock, DNAPL can enter open fractures if the capillary pressure exceeds the fracture entry pressure (Kueper and McWhorter I99 1 ). Once having entered a fracture network, DNAPL will distribute itself in
'Department of Geology and Geological Engineering, Col- orado School o f Mines, Golden, CO 80401; (303) 231-9115; fax (303) 231-9571; [email protected]; also a t Blasland, Bouck & Lee Inc., Golden, Colorado
*Corresponding author: Department o f Civil Engineering, Queen's University, Kingston, Ontario, Canada; (613) 533-6834; fax (613) 533-2128; [email protected]
"Blasland, Bouck & Lee Inc., Syracuse, New York; (315) 446-2570, ext. 171; fax (315) 449-0025; [email protected]
Received May 2003, accepted March 2004. Copyright 0 2005 by the National Ground Water Association.
the form of disconnected blobs and ganglia of organic liq- uid referred to as residual, and in continuous distributions referred to as pools (Longino and Kueper 1999). Both residual and pooled DNAPL will dissolve into tlowing ground water, giving rise to aqueous phase plumes. These plumes are subject to advection, dispersion, matrix diffu- sion, sorption, and a variety of potential degradation processes.
Matrix diffusion refers to the transport process whereby solutes dissolved in ground water diffuse either
30 Vol. 43, No. 1 -GROUND WATER-January-February 2005 (paqes 30-391
from open fractures into the bedrock matrix, or from the matrix into open fractures (Pankow and Cherry 1996). The direction of diffusion depends on the direction of the con- centration gradient. For example, when solutes are initially introduced into fractures, a strong concentration gradient exists from the open fractures to the uncontaminated rock matrix, resulting in diffusion of solutes from the fractures into the matrix. This forward diffusion process continues until either the solute storage capacity of the matrix has been reached or the solute concentration in the fractures is equal to that in the matrix. Once the solute source is removed from the fractures, the concentration gradient reverses, resulting in back diffusion of solutes out of the matrix and into the fractures. The matrix diffusion process was first examined in a hydrogeology context by Foster (1975) and has since been discussed by a number of authors including Goodall and Quigley (1977), McKay et a]. (1993), Germain and Frind (1989), Sudicky and Frind (1982), and Reynolds and Kueper (2002).
One implication of matrix diffusion is that the major- ity of the solute in fractured bedrock may be located within the rock matrix, and not in the open fractures. While open fractures can be considered the primary pathways for ground water flow, the rock matrix can be considered the primary reservoir for solute storage in certain rock types.
A second implication of matrix diffusion is that the rate of dissolved plume migration in fractured bedrock may be significantly less than the rate of ground water flow. The bedrock matrix acts as a solute sink, continuously remov- ing solute from ground water flowing through fractures as the plume advances. This is a plume attenuation process that manifests itself in a manner similar to what would occur due to sorption to grain surfaces.
A third implication of matrix diffusion is that the time required to clean up aqueous phase contamination in frac- tured bedrock may be governed by the rate at which con- taminants can diffuse back out of the rock matrix. Even if clean ground water is flushed through open fractures, this ground water will become contaminated by solutes diffus- ing back out of the rock matrix and into the fractures. Back diffusion out of the rock matrix will continue as long as con- centrations in the matrix exceed those in the open fractures.
A fourth implication of matrix diffusion is that residual and pooled DNAPL present in rock fractures will dissolve directly into the rock matrix due to diffusion, as well as into ground water flowing through the fractures (Parker et al. 1994). In certain fractured bedrock environments, the lifes- pan of residual and pooled DNAPL is governed by the rate at which the DNAPL dissolves and diffuses directly into the rock matrix, not the rate at which it dissolves into flow- ing ground water within the fractures (Pankow and Cherry 1996).
The purpose of this work is to evaluate the influence of bedrock physical and chemical properties on the matrix dif- fusion process, with particular emphasis on plume attenua- tion at a former industrial site in the northeastern United States. Using this site as a case study, this paper describes methods to measure bedrock parameters that influence the matrix diffusion process. Many of these properties are read- ily measured using standard laboratory and field testing methods. We examine the degree of plume attenuation
attributable to matrix diffusion as a function of time and distance, using a mathematical model based on the work of Sudicky and Frind (1982). The model addresses solute transport through a set of parallel, equally spaced fractures. Model input parameters used in this study were obtained primarily from field investigations at the case study site.
Case Study The numerical simulations presented in thispaper are
based on fractured bedrock parameters measured at a for- mer industrial site in the northeastern United States. DNAPL rich in trichloroethylene (TCE) has been collected from bedrock piezometers and monitoring wells associated with the site monitoring network. Dissolved TCE concen- trations have been detected in bedrock ground water sam- ples at concentrations of up to 780 ppm. The bedrock has an average matrix porosity of -8%, suggesting matrix dif- fusion could influence TCE fate and transport in ground water.
Bedrock in the study area is mapped as the Triassic New Haven Arkose redbeds (Rogers 1985), which consist of red to reddish-brown to pink sedimentary rocks, includ- ing interbedded sandy to silty channel deposits and silty floodplain deposits that were laid down in a rift basin set- ting known as the Hartford Basin (Hubert et al. 1978). In outcrops of the New Haven Arkose near the study area, the silty strata (former overbank deposits) appear fissile, crumbly, and deeply weathered, and the interbedded sandy strata (former channel deposits) appear relatively compe- tent and resistant. The New Haven Arkose is cemented by carbonate and is subject to weathering by partial dissolu- tion. Localized, relict caliche deposits containing gypsum are also observed within the New Haven Arkose and are interpreted to be the result of temporary deposition of solu- ble evaporite minerals in an arid paleoclimatic setting (Hubert et al. 1978). The formation contains some rela- tively competent and resistant beds, however, which pro- duce topographic ridges parallel to the north-northeast strike of bedding. Later in the Triassic and early Jurassic periods, the continued east-west crustal extension and rift- ing disrupted the New Haven Arkose along a series of north-striking, generally west-dipping normal faults. The resulting bedrock structure is characterized by gently east- ward-dipping bedding (Hubert et al. 1978). Within the New Haven Arkose are isolated sills and dikes consisting of dia- base that were emplaced as igneous intrusions during the overall rifting process (Hubert et al. 1978). Faults have been mapped within 4 km (2.5 miles) of the study area, but no faults have been reported at the site. Bedrock core sam- ples from the site generally consist of medium- to coarse- grained, feldspathic sandstone; conglomerate; silty, fine sandstone; and siltstone. Fractures are predominantly paral- lel to the subhorizontal bedding of the arkose.
During the site investigation, bedrock data collection activities focused on measuring parameters that are expected to influence matrix diffusion. Bedrock matrix parameters were characterized by collecting and analyzing bedrock core samples. At four drilling locations, bedrock coring was performed using a 6.4 cm (2.5 in) diameter wire line rotary coring system starting at the top of bedrock and
31 D.S. Lipson et al. GROUND WATER 43, no. 1: 30-39
extending to depths of 3.4, 18.3, 26.5, and 26.8 m (1 1, 60, 87, and 88 ft) below the top of bedrock. A total of 18 bedrock matrix samples were obtained from various depths within these coreholes for laboratory analysis of fraction of organic carbon vo,) using the Lloyd Kahn method, and matrix porosity ( C # J ~ ) and bulk density (p,) using American Petroleum Institute RP-40 methods (API 1998). Matrix sorption (R' ) was calculated for TCE using the analytical lab results for these parameters and the principles described in the next section. A summary of the analytical data is pre- sented in Table 1.
Bedrock fracture characteristics were measured based on in situ borehole imaging data, visual observation of core samples, and hydraulic testing results. Bedrock fracture spacing (S) was observed directly, based on the distances between adjacent fractures along the borehole wall or in core samples. In situ images of the borehole wall were obtained at the two deepest core holes using a digital, opti- cal borehole image processing system (BIPS). BIPS log- ging was also performed at a former on-site water well with a 30.5 m (100 ft) long, open bedrock intake section. Frac- tures observed via BIPS were generally parallel to bedding with a mean dip angle of -22". At the two shallower core- holes, the spacing between fractures was measured by core sample inspection. An effort was made to distinguish in
situ, natural bedrock fractures from mechanical breaks. Fractures with staining or infilling by silty material or min- eral precipitates were interpreted as natural. Fracture spac- ing measurements were obtained for a total of 20 bedrock intervals corresponding to packer test intervals discussed later, most of which were 3 m (10 ft) in length. Interval- average fracture spacing measurements were obtained by dividing the length of each bedrock interval by the number, of fractures observed within that interval. Based on the BIPS and bedrock core sample data, a mean, interval-aver- age fracture spacing of 142.3 cm (4.7 ft) was calcuiated, with a standard deviation of 98.9 cm (3.2 ft).
Fracture aperture ( e ) values were calculated based on the number of fractures and hydraulic conductivity values within the aforementioned packer test intervals. Packer tests, also known as hydraulic tests or water pressure tests (Zeigler 1976; USBR 1977), were performed to develop a hydraulic conductivity profile for the bedrock at the four HQ coreholes. Packer test pumping rates, water pressures, and test section geometry provided a basis for estimating the bulk transmissivity (T,) within each test interval (Zei- gler 1976; USBR 1977). Average fracture transmissivity (Tf> values were calculated for each packer test interval by dividing T, by the number of fractures within the interval. Interval-average fracture apertures were then calculated
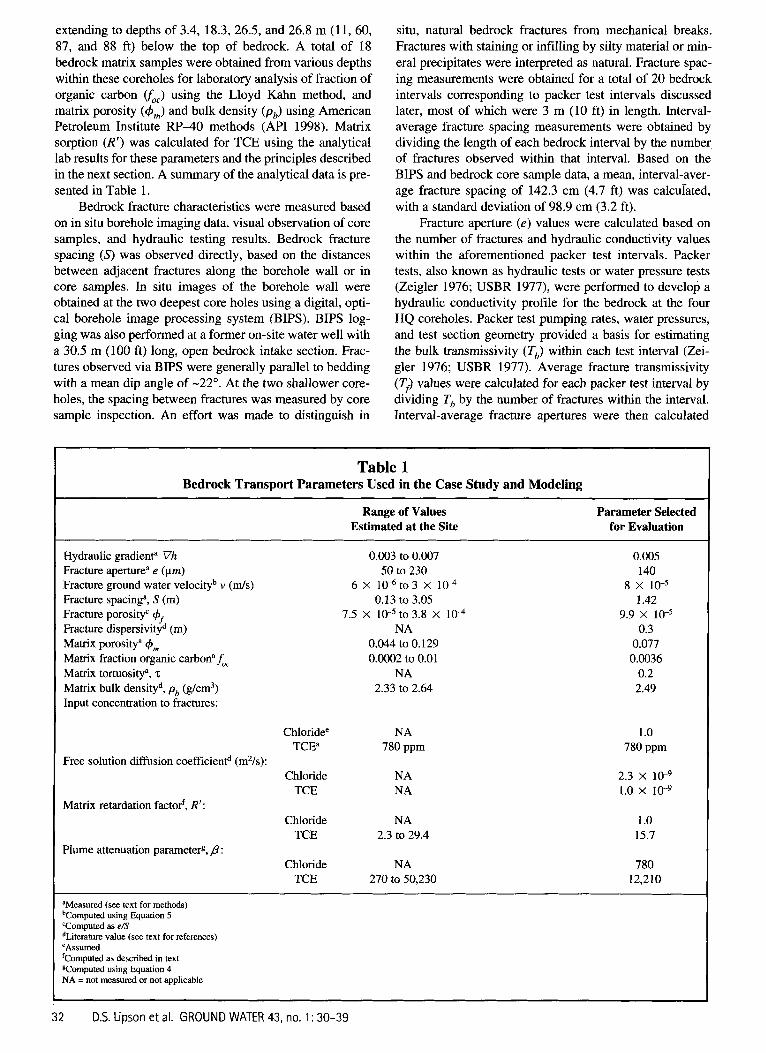
Table 1 Bedrock Transport Parameters Used in the Case Study and Modeling
~~
Range of Values Parameter Selected Estimated at the Site for Evaluation
Hydraulic gradient" Vh 0.003 to 0.007 0.005 Fracture aperture" e (pm) 50 to 230 140 Fracture ground water velocityb v ( d s ) Fracture spacinga, S (m) 0.13 to 3.05 1.42
Fracture dispersivityd (m) NA 0.3 Matrix porosity" +,,, 0.044 to 0.129 0.077 Matrix fraction organic carbonafoc 0.0002 to 0.01 0.0036
Matrix bulk densityd, pb (g/cm3) 2.33 to 2.64 2.49 Input concentration to fractures:
6 X 10⁻⁶to3 X lo4 8 X
Fracture porosity' +f 7.5 x 10⁻⁵ to 3.8 x 10⁻⁴ 9.9 x 10⁻⁵
Matrix tortuositya, z NA 0.2
Chloride" TCE"
Chloride TCE
Chloride TCE
Chloride TCE
Free solution diffusion coefficient" (m2/s):
Matrix retardation factor', R':
Plume attenuation parameterg, p:
NA 780 ppm
NA NA
NA 2.3 to 29.4
NA 270 to 50,230
1 .o 780 ppm
2.3 x 10⁻⁹
1.0 x 10⁻⁹
1 .o 15.7
780 12,210
aMeasured (see text for methods) bComputed using Equation 5 CComputed as e/S dLiterature value (see text for references) eAssumed fComputed as described in text Computed using Equation 4 NA = not measured or not applicable
32 D.S. Lipson et al. GROUND WATER 43, no. 1 : 30-39
based on a form of the cubic law, e = [ 12 Tfplp g]’”, where p is the ground water viscosity, p is the ground water den- sity, and g is the acceleration due to gravity (Zeigler 1976). The fracture aperture estimates are summarized in Table 1.
The component of the hydraulic gradient along bed- ding plane fractures (Vh) was estimated based on potentio- metric elevation data measured at observation wells and piezometers. The plume transport direction in bedrock is approximately parallel to the strike direction of the pre- dominant, bedding-plane fractures. The average ground water velocity within bedrock fractures (v) was calculated based on fracture aperture and hydraulic gradient using principles described in the next section.
Solute Transport Model We used the parallel-plate, discrete fracture solute
transport model (DFM) provided by Sudicky and Frind (1982) to evaluate TCE transport in site bedrock and sup- port refinement of the site conceptual model. The Sudicky and Frind (1982) model accounts for one-dimensional advective-dispersive solute transport in fractures subject to diffusion into the matrix, sorption to the fracture walls, sorption within the matrix, and first order decay of the solute. Unidirectional, steady-state ground water flow is assumed to be occurring through the set of parallel, equally spaced fractures, with no advective component of flow in the rock matrix.
The governing equation for contaminant transport in the fractures is given by (Sudicky and Frind 1982)
where c is the concentration of the solute in the fractures, t is time, v is the average linear ground water velocity in the fractures, D is the coefficient of hydrodynamic dispersion in the fractures, z is the distance of travel along the frac- tures, h is the solute decay constant, +,,, is the matrix poros- ity, e is the fracture aperture, D’ is the effective diffusion coefficient for the matrix, c’ is the concentration of solute in the matrix, and x is the distance into the matrix. The frac- ture retardation factor, R, which accounts for sorption to the fracture walls is represented by R = 1 + (2Kf/e), where Kf is the mass of solute per unit fracture wall area divided by the concentration of solute in solution assuming a linear sorption isotherm.
The effective diffusion coefficient, D’, is represented by D’ = zDo, where z is the matrix tortuosity, and Do is the free solution diffusion coefficient for the solute of interest. Diffusive contaminant transport in the matrix is represented by (Sudicky and Frind 1982)
act D’ d2c’ + hc’ = 0 - - -- at R’ ax2
where R’ is the retardation factor representing sorption of solute to grain surfaces within the matrix, calculated as R‘ = 1 + (pd+,)K,, where pb is the dry bulk density of the matrix, and K, is the distribution coefficient for the matrix. K,,, is calculated from K, = KO, foc where Koc is the organic carbon partition coefficient for the solute andfoc is the frac- tion of organic carbon in the matrix.
Equations 1 and 2 are coupled through the diffusive flux crossing the fracture/matrix interface, and through the fact that c = c’ at x = e/2. The closed-form analytical solu- tion representing the solution to the aforementioned set of governing partial differential equations is described further by Sudicky and Frind (1982). The model assumes an infi- nitely large planar source at a constant concentration at the inflow end of the set of parallel fractures (i.e., at z = 0). The model solves for the concentration distribution in both the open fractures and the rock matrix for any time and spatial location of interest.
Sudicky and Frind (1982) introduce a dimensionless quantity p describing the ratio of diffusive loss into the matrix to the amount of solute in the fractures as
24,, ( R ’ 0’) ‘I2
h‘I2eR P = tanh(ah’/2) (3 1
where u = G(S-e)/2 and G = (R’/D‘)ll2. Since the fracture spacing is generally much larger
than the fracture aperture (i.e., S >> e) in most fractured bedrock settings, (S-e) is reasonably approximated by S. When solute degradation is negligible, tanh(uh’”) is rea- sonably approximated by ( ~ 1 ~ ~ ~ . Assuming that sorption to fracture walls is negligible (i.e., R = l), which is reasonable for reasons explained later, these simplifications reduce Equation 3 to
where +f is the fracture porosity defined as e/S. For non- sorbing solutes such as chloride, R’ = 1 and /3 is approxi- mated simply as the ratio of matrix to fracture porosity (+,/c)~)- The quantity presented in Equation 4 is simply the ratio of contaminant storage capacity in the matrix to con- taminant storage capacity in the open fractures, and will be referred to here as the steady-state plume attenuation factor. Sudicky and Frind (1982) provide mathematical expres- sions for the ratio of ground water velocity to contaminant velocity for the case where solute degradation is not negli- gible.
The steady-state ground water velocity in the fractures (v) is calculated as (Bear et al. 1993)
( 5 )
where V h is the hydraulic gradient in the fracture. A Type-I boundary condition (constant concentration) is assumed at the fracture origin, and initial concentrations in the fractures and matrix are assumed to be zero.
D.S. Lipson et al. GROUND WATER 43, no. 1: 30-39 33
It is recognized that this DFM is an idealized represen- tation of bedrock fracture systems. Although fracture net- works typically exhibit more variability than can be incorporated in this study, the presented model is a useful tool to examine the relative influence of various parameters and processes on the rate of plume migration in fractured bedrock systems. Additional assumptions of this model are that (1) the solute decay coefficient is the same in the frac- tures as in the matrix, (2) sorption is uniform in the bedrock matrix, ( 3 ) the pore structure in the matrix exhibits uniform structure and distribution, and, (4) there is no advection in the matrix.
Site Modeling Although site bedrock contains a network of intercon-
nected fractures forming ground water flow pathways more complicated than those which can be incorporated into the DFM used in this study, the use of a system of parallel frac- tures captures the primary solute transport pathways (bed- ding plane fractures) in the New Haven Arkose. The use of equally spaced, parallel fractures likely leads to a minimum estimate of the time and distance scales required for con- taminants to diffuse from open fractures into the rock matrix and vice versa. The use of a more sophisticated model that incorporates fracture networks would likely lead to longer diffusion timescales than that calculated by a par- allel fracture model since optimal flow conditions would not be occurring in every fracture. The bedrock DNAPL zone at the site is relatively large, justifying the use of a one-dimensional solute-transport model for screening pur- poses.
Prior to using the model for predictive simulations, a calibration exercise was completed to develop a set of input parameters representative of site conditions. Calibration involved varying fracture aperture to match TCE concen- trations along the axis of the deep bedrock plume. The cal- ibration exercise consisted of varying the fracture aperture to obtain a TCE concentration of 5 ppb at a distance of 300 m from the source area. Site data indicate that it is rea- sonable to use an equivalent straight-line flow distance of -300 m between the source area and the hydraulically downgradient extent of the dissolved TCE plume, defined as the location where TCE concentrations in bedrock are on the order of 5 ppb. Considering the fact that DNAPL may have entered bedrock fractures as early as 1955, the model was run to a time of 40 yr during the calibration exercise. A constant source concentration of 780 ppm was assigned at z = 0 based on the measured water quality data.
Hydraulic gradient (0.005), matrix porosity (0.077), and the matrix retardation factor for TCE (R’ = 15.7) were held constant during calibration. These parameters assume uniform distribution of pore structure and fraction organic carbon throughout the bedrock matrix. The TCE matrix retardation factor employs an organic carbon partition coef- ficient of 126 mL/g for TCE (Cohen and Mercer 1993). Although a retardation factor of 15.7 for TCE may seem to be high, it is not unreasonable given the low porosity and high dry bulk density of the rock matrix (mean measured value of 2.49 g/cc). For the samef,, value, lower TCE retar- dation factors would be calculated in unconsolidated
deposits exhibiting higher porosity and lower dry bulk den- sity.
Fracture spacing was held constant at 1.42 m for cali- bration purposes, while fracture aperture was the only para- meter varied during calibration. The aperture of conductive fractures typically has a higher degree of uncertainty than fracture spacing and other parameters, justifying the varia- tion of this parameter to achieve calibration. Although it is not known at what point in time DNAPL first entered bedrock at this site, the calibration exercise showed that unreasonably large fracture apertures would be required to transport TCE 300 m in time periods significantly < 40 yr. In other words, the average site parameters measured at the site suggest that TCE could not have migrated 300 m through parallel fractures spaced 1.42 m apart over time periods significantly < 40 yr.
The final calibration simulation incorporated a fracture aperture of 140 ym, fracture dispersivity of 0.3 m, matrix tortuosity of 0.2, free-solution TCE diffusion coefficient of 1 x m2/s (Pankow and Cherry 1996), no sorption onto fracture walls, and no solute degradation. The calibrated aperture is greater than the average fracture aperture of 96 ym measured at the site, but well within the range of mea- sured values (Table l). A dispersivity of 0.3 m is consid- ered reasonable for individual, rough-walled fractures (Pankow and Cherry 1996). The fracture dispersivity influ- ences the degree of dispersion occurring in the open frac- tures, but does not exert a great influence on the rates of contaminant diffusion either into or out from the matrix. A matrix tortuosity of 0.2 is reasonable for a sandstone exhibiting a moderate to high matrix porosity (Pankow and Cherry 1996). Solute degradation was not incorporated due to the uncertainty regarding the degradation half-life of TCE in site ground water.
DFM output was evaluated by plotting concentration vs. distance profiles for various times of interest. To assess the amount of plume attenuation relative to the rate of ground water flow, a one-dimensional equivalent-porous- medium (EPM) model utilizing a constant concentration inlet boundary condition (Ogata and Banks 1961) was used to match the DFM concentration profiles. The EPM simu- lations used the identical ground water velocities as the DFM (Table l), but the EPM retardation factor (RE) and EPM dispersivity (aE) terms were adjusted until the leading edge of the EPM breakthrough curve (< 0.5 relative con- centration units) matched the leading edge of the DFM con- centration profile. This curve-matching procedure results in a unique solution because the EPM retardation factor is used to match the position of one-half the solute concentra- tion (0.5 relative concentration) while the EPM dispersivity value is used to match the slope of the resulting concentra- tion curve. Note that the only input parameters required for the EPM model are the ground water velocity, the solute retardation factor, and the porous medium dispersion coef- ficient (characterized by the dispersivity). Furthermore, the EPM model relies on using constant retardation and disper- sivity values that do not change with time or distance. The EPM retardation factor therefore represents the amount of plume attenuation attributable to the matrix diffusion process at a given point in time and space.
34 D.S. Lipson et al. GROUND WATER 43, no. 1 : 30-39
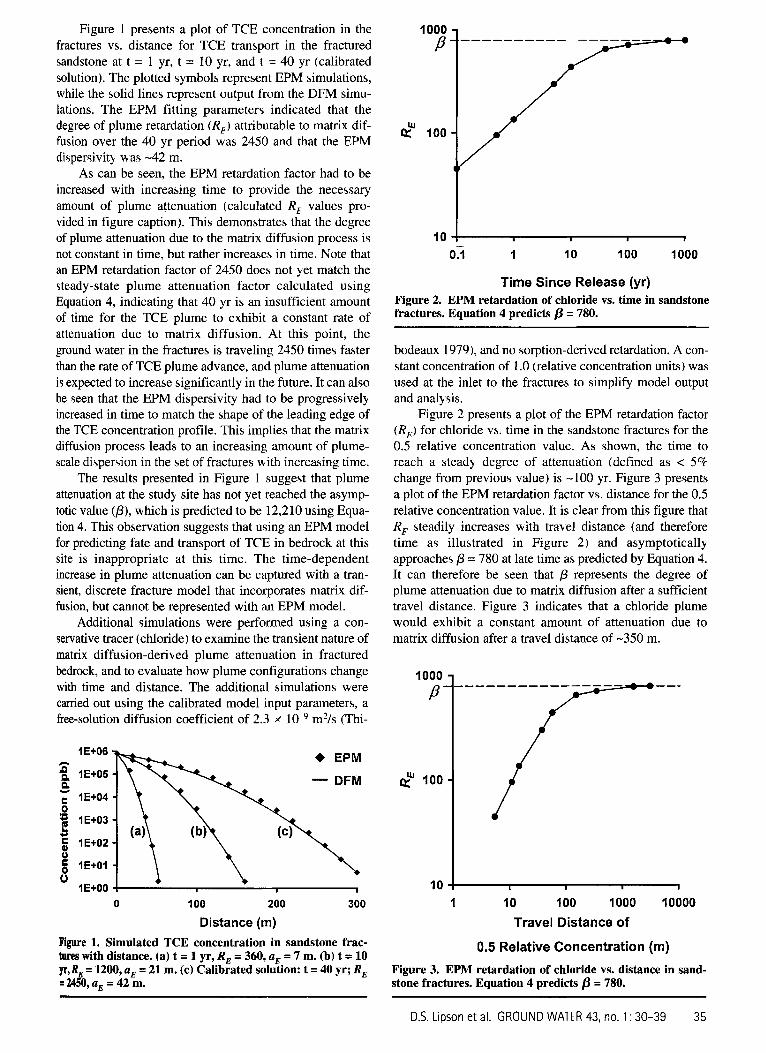
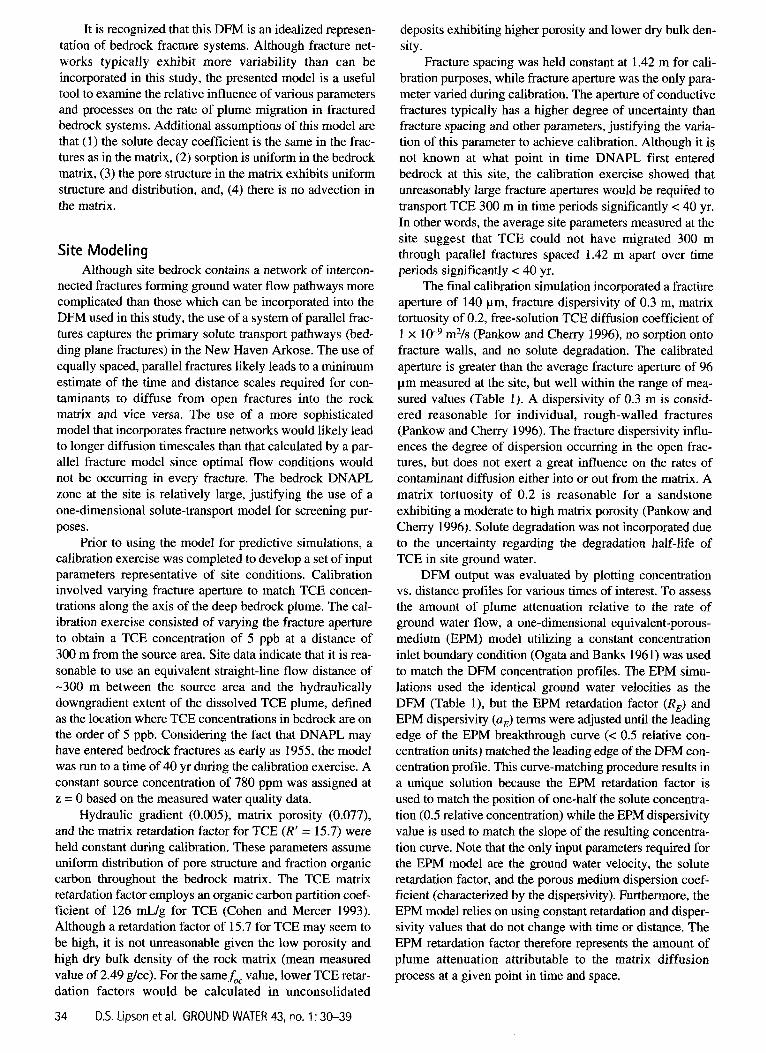
Figure 1 presents a plot of TCE concentration in the fractures vs. distance for TCE transport in the fractured sandstone at t = 1 yr, t = 10 yr, and t = 40 yr (calibrated solution). The plotted symbols represent EPM simulations, while the solid lines represent output from the DFM simu- lations. The EPM fitting parameters indicated that the degree of plume retardation ( R E ) attributable to matrix dif- fusion over the 40 yr period was 2450 and that the EPM dispersivitj ba \ -42 m.
As can be seen, the EPM retardation factor had to be increased with increasing time to provide the necessary amount of plume attenuation (calculated RE values pro- vided in figure caption). This demonstrates that the degree of plume attenuation due to the matrix diffusion process is not constant in time, but rather increases in time. Note that an EPM retardation factor of 2450 does not yet match the steady-state plume attenuation factor calculated using Equation 4, indicating that 40 yr is an insufficient amount of time for the TCE plume to exhibit a constant rate of attenuation due to matrix diffusion. At this point, the ground water in the fractures is traveling 2450 times faster than the rate of TCE plume advance, and plume attenuation is expected to increase significantly in the future. It can also be seen that the EPM dispersivity had to be progressively increased in time to match the shape of the leading edge of the TCE concentration profile. This implies that the matrix diffusion process leads to an increasing amount of plume- scale diqersion in the set of fractures with increasing time.
The results presented in Figure 1 suggest that plume attenuation at the study site has not yet reached the asymp- totic value (p), Rhich is predicted to be 12,210 using Equa- tion 4. This observation suggests that using an EPM model for predicting fate and transport of TCE in bedrock at this site is inappropriate at this time. The time-dependent increase in plume attenuation can be captured with a tran- sient, discrete fracture model that incorporates matrix dif- fusion, but cannot be represented with an EPM model.
Additional simulations were performed using a con- servative tracer (chloride) to examine the transient nature of matrix diffusion-derik ed plume attenuation in fractured bedrock, and to evaluate how plume configurations change with time and distance. The additional simulations were carried out using the calibrated model input parameters, a free-solution diffusion coefficient of 2.3 % 10 m2/s (Thi-
10
1 E+06
1E+05
1E+04 0 5 1E+03
lE+02 0 5 1E+01 0
1E+00
A
n
.- *
I I I I
4 EPM
- DFM
0 100 200 300
Distance (m) Figure 1. Simulated TCE concentration in sandstone frac- lures with distance. (a) t = 1 yr, RE = 360, up = 7 m. (b) t = 10 p,RE = 1200, uE = 21 m. (c) Calibrated solution: t = 40 yr; RE = 2450, uE = 42 m.
Time Since Release (yr) Figure 2. EPM retardation of chloride vs. time in sandstone fractures. Equation 4 predicts p = 780.
bodeaux 1979), and no sorption-derived retardation. A con- stant concentration of 1 .O (relative concentration units) was used at the inlet to the fractures to simplify model output and analy sis.
Figure 2 presents a plot of the EPM retardation factor (R,) for chloride vs. time in the sandstone fractures for the 0.5 relative concentration value. As shown, the time to reach a steady degree of attenuation (defined as < 5% change from previous value) is -100 yr. Figure 3 presents a plot of the EPM retardation factor v5. distance for the 0.5 relative concentration value. It is clear from this figure that RE. steadily increases with trakel distance (and therefore time as illustrated in Figure 2) and asymptotically approaches p = 780 at late time as predicted by Equation 4. It can therefore be seen that p represents the degree of plume attenuation due to matrix diffusion after a sufficient travel distance. Figure 3 indicates that a chloride plume would exhibit a constant amount of attenuation due to matrix diffusion after a travel distance of -350 m.
I 10 100 1000 10000
Travel Distance of
0.5 Relative Concentration (m) Figure 3. EPM retardation of chloride vs. distance in sand- stone fractures. Equation 4 predicts p = 780.
D.S. Lipson et al. GROUND WATER 43, no. 1 : 30-39 35
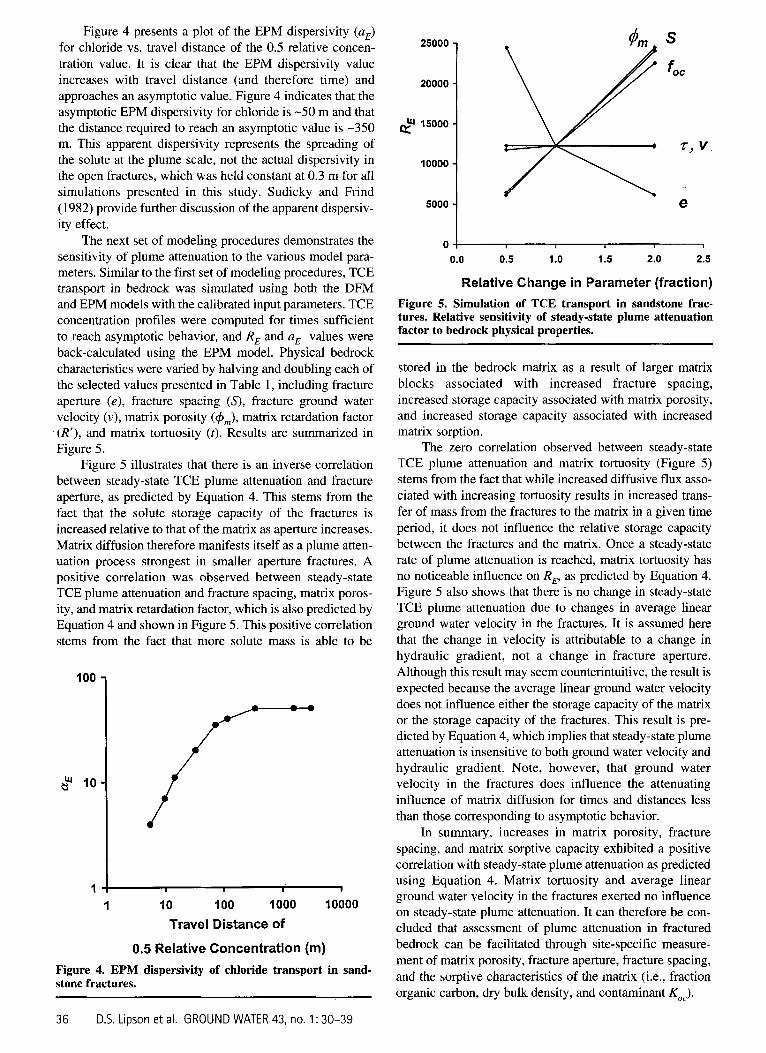
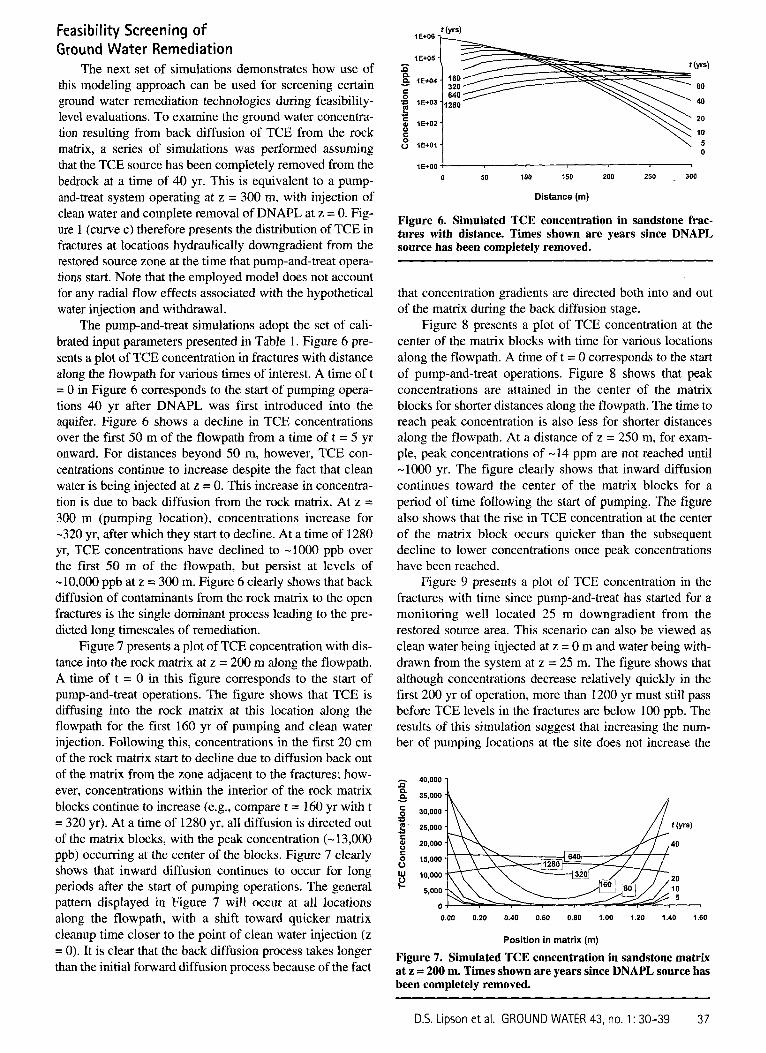
Figure 4 presents a plot of the EPM dispersivity (a,) for chloride vs. travel distance of the 0.5 relative concen- tration value. It is clear that the EPM dispersivity value increases with travel distance (and therefore time) and approaches an asymptotic value. Figure 4 indicates that the asymptotic EPM dispersivity for chloride is -50 m and that the distance required to reach an asymptotic value is -350 m. This apparent dispersivity represents the spreading of the solute at the plume scale, not the actual dispersivity in the open fractures, which was held constant at 0.3 m for all simulations presented in this study. Sudicky and Frind (1982) provide further discussion of the apparent dispersiv- ity effect.
The next set of modeling procedures demonstrates the sensitivity of plume attenuation to the various model para- meters. Similar to the first set of modeling procedures, TCE transport in bedrock was simulated using both the DFM and EPM models with the calibrated input parameters. TCE concentration profiles were computed for times sufficient to reach asymptotic behavior, and RE and a, values were back-calculated using the EPM model. Physical bedrock characteristics were varied by halving and doubling each of the selected values presented in Table 1, including fracture aperture (e), fracture spacing (S), fracture ground water velocity (v), matrix porosity (+J, matrix retardation factor (R’), and matrix tortuosity ( t ) . Results are summarized in Figure 5.
Figure 5 illustrates that there is an inverse correlation between steady-state TCE plume attenuation and fracture aperture, as predicted by Equation 4. This stems from the fact that the solute storage capacity of the fractures is increased relative to that of the matrix as aperture increases. Matrix diffusion therefore manifests itself as a plume atten- uation process strongest in smaller aperture fractures. A positive correlation was observed between steady-state TCE plume attenuation and fracture spacing, matrix poros- ity, and matrix retardation factor, which is also predicted by Equation 4 and shown in Figure 5. This positive correlation stems from the fact that more solute mass is able to be
$ 1 0 -
loo 1
1 1 10 100 I000 10000
Travel Distance of
0.5 Relative Concentration (m) Figure 4. EPM dispersivity of chloride transport in sand- stone fractures.
25000
20000
$J 15000
10000
5000
0 1 I I
0.0 0.5 1 .o 1.5 2.0 2.5
Relative Change in Parameter (fraction) Figure 5. Simulation of TCE transport in sandstone frac- tures. Relative sensitivity of steady-state plume attenuation factor to bedrock physical properties.
stored in the bedrock matrix as a result of larger matrix blocks associated with increased fracture spacing, increased storage capacity associated with matrix porosity, and increased storage capacity associated with increased matrix sorption.
The zero correlation observed between steady-state TCE plume attenuation and matrix tortuosity (Figure 5) stems from the fact that while increased diffusive flux asso- ciated with increasing tortuosity results in increased trans- fer of mass from the fractures to the matrix in a given time period, it does not influence the relative storage capacity between the fractures and the matrix. Once a steady-state rate of plume attenuation is reached, matrix tortuosity has no noticeable influence on RE, as predicted by Equation 4. Figure 5 also shows that there is no change in steady-state TCE plume attenuation due to changes in average linear ground water velocity in the fractures. It is assumed here that the change in velocity is attributable to a change in hydraulic gradient, not a change in fracture aperture. Although this result may seem counterintuitive, the result is expected because the average linear ground water velocity does not influence either the storage capacity of the matrix or the storage capacity of the fractures. This result is pre- dicted by Equation 4, which implies that steady-state plume attenuation is insensitive to both ground water velocity and hydraulic gradient. Note, however, that ground water velocity in the fractures does influence the attenuating influence of matrix diffusion for times and distances less than those corresponding to asymptotic behavior.
In summary, increases in matrix porosity, fracture spacing, and matrix sorptive capacity exhibited a positive correlation with steady-state plume attenuation as predicted using Equation 4. Matrix tortuosity and average linear ground water velocity in the fractures exerted no influence on steady-state plume attenuation. It can therefore be con- cluded that assessment of plume attenuation in fractured bedrock can be facilitated through site-specific measure- ment of matrix porosity, fracture aperture, fracture spacing, and the sorptive characteristics of the matrix (i.e., fraction organic carbon, dry bulk density, and contaminant &).
36 D.S. Lipson et al. GROUND WATER 43, no. 1 : 30-39
Feasibility Screening of Ground Water Remediation
The next set of simulations demonstrates how use of this modeling approach can be used for screening certain ground water remediation technologies during feasibility- level evaluations. To examine the ground water concentra- tion resulting from back diffusion of TCE from the rock matrix, a series of simulations was performed assuming that the TCE source has been completely removed from the bedrock at a time of 40 yr. This is equivalent to a pump- and-treat system operating at z = 300 m, with injection of clean water and complete removal of DNAPL at z = 0. Fig- ure 1 (curve c) therefore presents the distribution of TCE in fractures at locations hydraulically downgradient from the restored source zone at the time that pump-and-treat opera- tions start. Note that the employed model does not account for any radial flow effects associated with the hypothetical water injection and withdrawal.
The pump-and-treat simulations adopt the set of cali- brated input parameters presented in Table 1. Figure 6 pre- sents a plot of TCE concentration in fractures with distance along the flowpath for various times of interest. A time of t = 0 in Figure 6 corresponds to the start of pumping opera- tions 40 yr after DNAPL was first introduced into the aquifer. Figure 6 shows a decline in TCE concentrations over the first 50 m of the flowpath from a time o f t = 5 yr onward. For distances beyond 50 m, however, TCE con- centrations continue to increase despite the fact that clean water is being injected at z = 0. This increase in concentra- tion is due to back diffusion from the rock matrix. At z = 300 m (pumping location), concentrations increase for -320 yr, after which they start to decline. At a time of 1280 yr, TCE concentrations have declined to -1000 ppb over the first 50 m of the flowpath, but persist at levels of -10,000 ppb at z = 300 m. Figure 6 clearly shows that back diffusion of contaminants from the rock matrix to the open fractures is the single dominant process leading to the pre- dicted long timescales of remediation.
Figure 7 presents a plot of TCE concentration with dis- tance into the rock matrix at z = 200 m along the flowpath. A time of t = 0 in this figure corresponds to the start of pump-and-treat operations. The figure shows that TCE is diffusing into the rock matrix at this location along the flowpath for the first 160 yr of pumping and clean water injection. Following this, concentrations in the first 20 cm of the rock matrix start to decline due to diffusion back out of the matrix from the zone adjacent to the fractures; how- ever, concentrations within the interior of the rock matrix blocks continue to increase (e.g., compare t = 160 yr with t = 320 yr). At a time of 1280 yr, all diffusion is directed out of the matrix blocks, with the peak concentration (- 13,000 ppb) occurring at the center of the blocks. Figure 7 clearly shows that inward diffusion continues to occur for long periods after the start of pumping operations. The general pattern displayed in Figure 7 will occur at all locations along the flowpath, with a shift toward quicker matrix cleanup time closer to the point of clean water injection (z = 0). It is clear that the back diffusion process takes longer than the initial forward diffusion process because of the fact
1E+05 1 = ( Y W P
80 a 1E+04- I 6 O e 320
640 .= 1E+03 - 40 q280 m, 20 5 1E+O2-
c 10
- - 0" 1E+01 { \ 5
1E+00 0 50 100 150 200 250 300
Distance (m)
Figure 6. Simulated TCE concentration in sandstone frac- tures with distance. Times shown are years since DNAPL source has been completely removed.
that concentration gradients are directed both into and out of the matrix during the back diffusion stage.
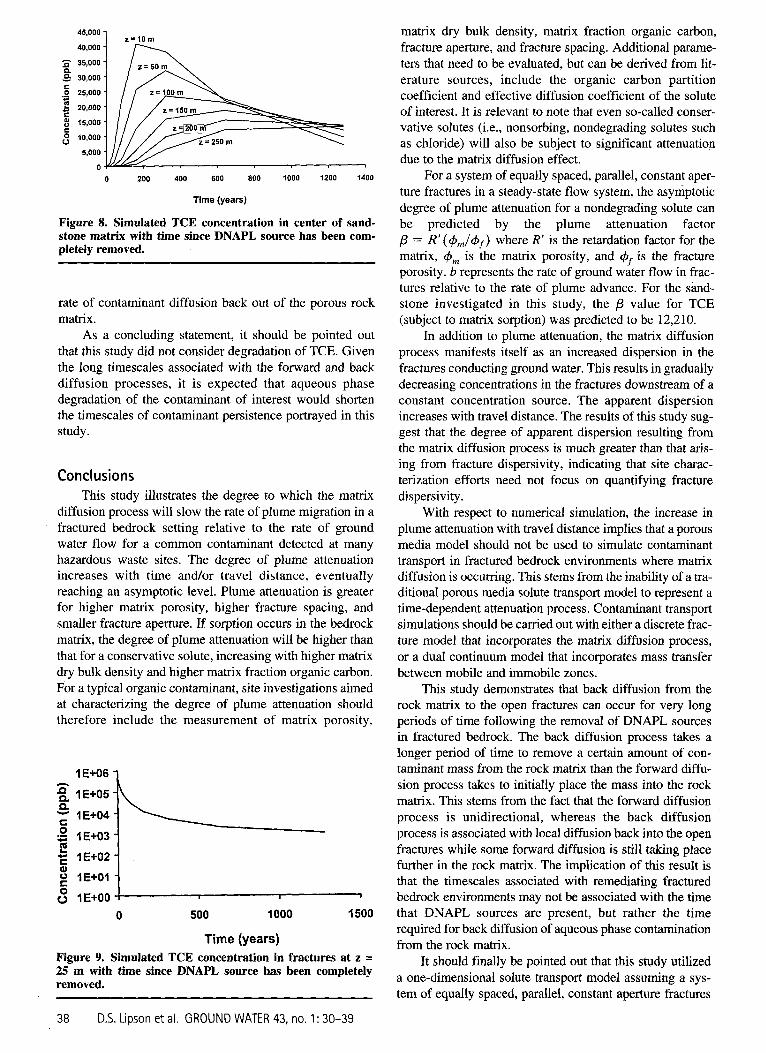
Figure 8 presents a plot of TCE concentration at the center of the matrix blocks with time for various locations along the flowpath. A time of t = 0 corresponds to the start of pump-and-treat operations. Figure 8 shows that peak concentrations are attained in the center of the matrix blocks for shorter distances along the flowpath. The time to reach peak concentration is also less for shorter distances along the flowpath. At a distance of z = 250 m, for exam- ple, peak concentrations of -14 ppm are not reached until -1000 yr. The figure clearly shows that inward diffusion continues toward the center of the matrix blocks for a period of time following the start of pumping. The figure also shows that the rise in TCE concentration at the center of the matrix block occurs quicker than the subsequent decline to lower concentrations once peak concentrations have been reached.
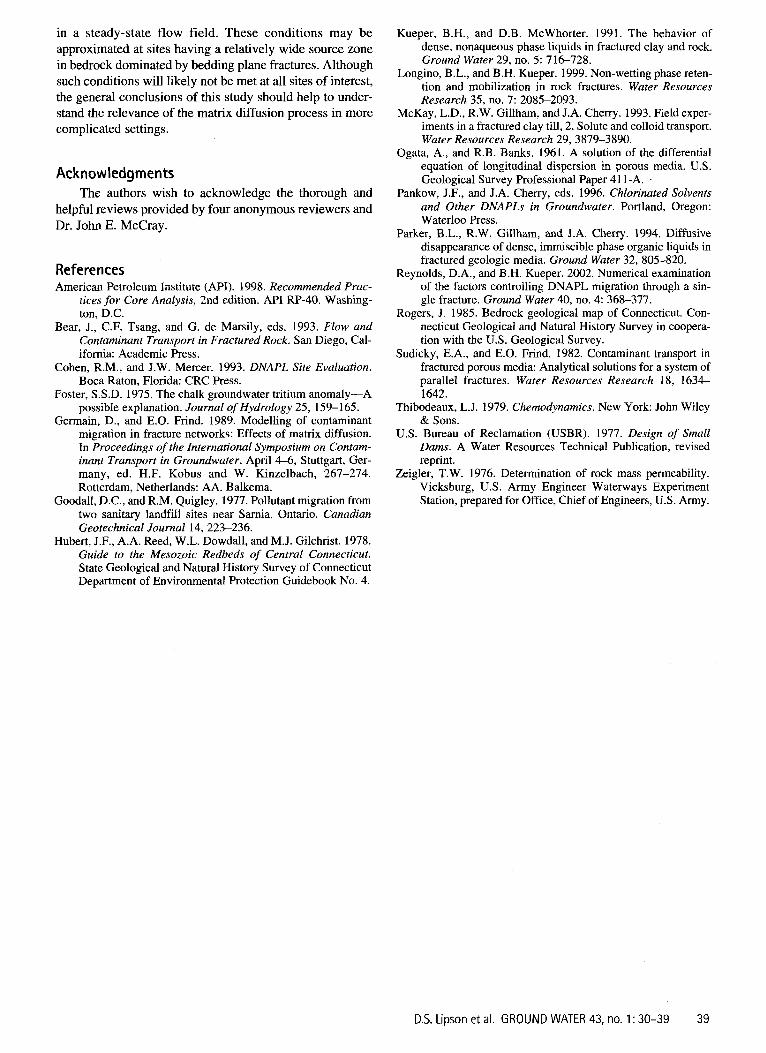
Figure 9 presents a plot of TCE concentration in the fractures with time since pump-and-treat has started for a monitoring well located 25 m downgradient from the restored source area. This scenario can also be viewed as clean water being injected at z = 0 m and water being with- drawn from the system at z = 25 m. The figure shows that although concentrations decrease relatively quickly in the first 200 yr of operation, more than 1200 yr must still pass before TCE levels in the fractures are below 100 ppb. The results of this simulation suggest that increasing the num- ber of pumping locations at the site does not increase the
40,000
8 35,000 - 5 30,000 xz !! 25,000 c
c 0 15,000 0 ' 5,000
0
Y
$ 20,000
w 10,000
0.00 0.20 0.40 0.60 0.80 1.00 1.20 1.40 1.60
Position in matrix (m)
Figure 7. Simulated TCE concentration in sandstone matrix at z = 200 m. Times shown are years since DNAPL source has been completely removed.
D.S. Lipson et al. GROUND WATER 43, no. 1: 30-39 37
4 5 3 0 0 0 ] '=% 40,000 = 35,000
P p 30,000 c 0 25,000 .= g 20,000
s 10,000
8 15,000 C
5,000
0
0 200 400 600 800 1000 1200 1400
Time (years)
Figure 8. Simulated TCE concentration in center of sand- stone matrix with time since DNAPL source has been com- pletely removed.
rate of contaminant diffusion back out of the porous rock matrix.
As a concluding statement, it should be pointed out that this study did not consider degradation of TCE. Given the long timescales associated with the forward and back diffusion processes, it is expected that aqueous phase degradation of the contaminant of interest would shorten the timescales of contaminant persistence portrayed in this study.
Conclusions This study illustrates the degree to which the matrix
diffusion process will slow the rate of plume migration in a fractured bedrock setting relative to the rate of ground water flow for a common contaminant detected at many hazardous waste sites. The degree of plume attenuation increases with time andlor travel distance, eventually reaching an asymptotic level. Plume attenuation is greater for higher matrix porosity, higher fracture spacing, and smaller fracture aperture. If sorption occurs in the bedrock matrix, the degree of plume attenuation will be higher than that for a conservative solute, increasing with higher matrix dry bulk density and higher matrix fraction organic carbon. For a typical organic contaminant, site investigations aimed at characterizing the degree of plume attenuation should therefore include the measurement of matrix porosity,
1E+06 1
1E+05
1E+04
1E+03 E 1E+02 0 1E+01
0 C 0
d)
b 0 1E+00 0 500 1000 1500
Time (years) Figure 9. Simulated TCE concentration in fractures at z = 25 m with time since DNAPL source has been completely removed.
matrix dry bulk density, matrix fraction organic carbon, fracture aperture, and fracture spacing. Additional parame- ters that need to be evaluated, but can be derived from lit- erature sources, include the organic carbon partition coefficient and effective diffusion coefficient of the solute of interest. It is relevant to note that even so-called conser- vative solutes (i.e., nonsorbing, nondegrading solutes such as chloride) will also be subject to significant attenuation due to the matrix diffusion effect.
For a system of equally spaced, parallel, constant aper- ture fractures in a steady-state flow system, the asymptotic degree of plume attenuation for a nondegrading solute can be predicted by the plume attenuation factor /3 = R' ( +,/qhf) where R' is the retardation factor for the matrix, +m is the matrix porosity, and +f is the fracture porosity. b represents the rate of ground water flow in frac- tures relative to the rate of plume advance. For the sand- stone investigated in this study, the p value for TCE (subject to matrix sorption) was predicted to be 12,210.
In addition to plume attenuation, the matrix diffusion process manifests itself as an increased dispersion in the fractures conducting ground water. This results in gradually decreasing concentrations in the fractures downstream of a constant concentration source. The apparent dispersion increases with travel distance. The results of this study sug- gest that the degree of apparent dispersion resulting from the matrix diffusion process is much greater than that aris- ing from fracture dispersivity, indicating that site charac- terization efforts need not focus on quantifying fracture dispersivity .
With respect to numerical simulation, the increase in plume attenuation with travel distance implies that a porous media model should not be used to simulate contaminant transport in fractured bedrock environments where matrix diffusion is occurring. This stems from the inability of a tra- ditional porous media solute transport model to represent a time-dependent attenuation process. Contaminant transport simulations should be carried out with either a discrete frac- ture model that incorporates the matrix diffusion process, or a dual continuum model that incorporates mass transfer between mobile and immobile zones.
This study demonstrates that back diffusion from the rock matrix to the open fractures can occur for very long periods of time following the removal of DNAPL sources in fractured bedrock. The back diffusion process takes a longer period of time to remove a certain amount of con- taminant mass from the rock matrix than the forward diffu- sion process takes to initially place the mass into the rock matrix. This stems from the fact that the forward diffusion process is unidirectional, whereas the back diffusion process is associated with local diffusion back into the open fractures while some forward diffusion is still taking place further in the rock matrix. The implication of this result is that the timescales associated with remediating fractured bedrock environments may not be associated with the time that DNAPL sources are present, but rather the time required for back diffusion of aqueous phase contamination from the rock matrix.
It should finally be pointed out that this study utilized a one-dimensional solute transport model assuming a sys- tem of equally spaced, parallel, constant aperture fractures
38 D.S. Lipson et al. GROUND WATER 43, no. 1 : 30-39
in a steady-state flow field. These conditions may be approximated at sites having a relatively wide source zone in bedrock dominated by bedding plane fractures. Although such conditions will likely not be met at all sites of interest, the general conclusions of this study should help to under- stand the relevance of the matrix diffusion process in more complicated settings.
Acknowledgments The authors wish to acknowledge the thorough and
helpful reviews provided by four anonymous reviewers and Dr. John E. McCray.
References American Petroleum Institute (API). 1998. Recommended Prac-
tices for Core Analysis, 2nd edition. API RP-40. Washing- ton, D.C.
Bear, J., C.F. Tsang, and G. de Marsily, eds. 1993. Flow and Contaminant Transport in Fractured Rock. San Diego, Cal- ifornia: Academic Press.
Cohen, R.M., and J.W. Mercer. 1993. DNAPL Site Evaluation. Boca Raton, Florida: CRC Press.
Foster, S.S.D. 1975. The chalk groundwater tritium anomaly-A possible explanation. Journal of Hydrology 25, 159-1 65.
Germain, D., and E.O. Frind. 1989. Modelling of contaminant migration in fracture networks: Effects of matrix diffusion. In Proceedings of the International Symposium on Contam- inant Transport in Groundwater, April 4-6, Stuttgart, Ger- many, ed. H.F. Kobus and W. Kinzelbach, 267-274. Rotterdam, Netherlands: AA. Balkema.
Goodall, D.C., and R.M. Quigley. 1977. Pollutant migration from two sanitary landfill sites near Sarnia, Ontario. Canadian Geotechnical Journal 14,223-236.
Hubert, J.F., A.A. Reed, W.L. Dowdall, and M.J. Gilchrist. 1978. Guide to the Mesozoic Redbeds of Central Connecticut. State Geological and Natural History Survey of Connecticut Department of Environmental Protection Guidebook No. 4.
Kueper, B.H., and D.B. McWhorter. 1991. The behavior of dense, nonaqueous phase liquids in fractured clay and rock. Ground Water 29, no. 5: 716-728.
Longino, B.L., and B.H. Kueper. 1999. Non-wetting phase reten- tion and mobilization in rock fractures. Water Resources Research 35, no. 7: 2085-2093.
McKay, L.D., R.W. Gillham, and J.A. Cherry. 1993. Field exper- iments in a fractured clay till, 2. Solute and colloid transport. Water Resources Research 29,3879-3890.
Ogata, A., and R.B. Banks. 1961. A solution of the differential equation of longitudinal dispersion in porous media. U.S. Geological Survey Professional Paper 41 1-A. -
Pankow, J.F., and J.A. Cherry, eds. 1996. Chlorinated Solvents and Other DNAPLs in Groundwater. Portland, Oregon: Waterloo Press.
Parker, B.L., R.W. Gillham, and J.A. Cherry. 1994. Diffusive disappearance of dense, immiscible phase organic liquids in fractured geologic media. Ground Water 32, 805-820.
Reynolds, D.A., and B.H. Kueper. 2002. Numerical examination of the factors controlling DNAPL migration through a sin- gle fracture. Ground Water 40, no. 4: 368-377.
Rogers, J. 1985. Bedrock geological map of Connecticut. Con- necticut Geological and Natural History Survey in coopera- tion with the U.S. Geological Survey.
Sudicky, E.A., and E.O. Frind. 1982. Contaminant transport in fractured porous media: Analytical solutions for a system of parallel fractures. Water Resources Research 18, 1634- 1642.
Thibodeaux, L.J. 1979. Chemodynamics. New York: John Wiley & Sons.
U.S. Bureau of Reclamation (USBR). 1977. Design of Small Dams. A Water Resources Technical Publication, revised reprint.
Zeigler, T.W. 1976. Determination of rock mass permeability. Vicksburg, U.S. Army Engineer Waterways Experiment Station, prepared for Office, Chief of Engineers, U.S. Army.
D.S. Lipson et al. GROUND WATER 43, no. 1: 30-39 39


