Embed Size (px)
Citation preview
Geophys. J. Int. (2000) 140, 251–266
Scattering characteristics in heterogeneously fractured reservoirsfrom waveform estimation
Feng Shen* and M. Nafi ToksozEarth Resources L aboratory, Department of Earth, Atmospheric, and Planetary Sciences, Massachusetts Institute of T echnology, MA, USA.
E-mail: [email protected]
Accepted 1999 May 24. Received 1999 April 23; in original form 1998 June 1
SUMMARYOffset-dependent characteristics of seismic scattering are useful for characterizingfractured reservoirs. We use two models that have different background mediumproperties and different azimuthal AVO responses to study elastic wave propagationand scattering in gas-saturated, heterogeneously fractured reservoirs. Heterogeneousfracture density distributions are built through stochastic modelling. Synthetic seismogramsare generated by 3-D finite difference modelling, and waveforms along crack-normal andstrike directions are considered in this paper. The multiple signal classification (MUSIC)frequency estimator is used in waveform estimation to provide frequency-domainattributes related to seismic wave scattering by fracture heterogeneity. Our resultsindicate that the strength of the scattering field is a function of the background medium.The strength also increases with increasing fracture scatterer density and with decreasingcorrelation length of spatial variations of fracture density. The scattering field is weakat the top of the fractured reservoir. The first-order results are dominated by velocityanisotropy of the mean fracture density field. However, the base of the fracturedreservoir corresponds to a strong scattering field on which fracture heterogeneity hasa larger effect and is characterized by the loss of coherence.
Key words: 3-D finite difference modelling, heterogeneously fractured reservoirs, offset,scattering characteristics, waveform estimation.
As pointed out by Sayers & Rickett (1997), an azimuthal1 INTRODUCTION
variation in AVO due to fractures in the overburden may beResearch in vertically aligned fractured media shows that the misinterpreted as being due to the presence of aligned fractureseffect of fractures is a function of both incident angle and in the reservoir. Therefore, other attributes correlated withazimuth. Using a physical model, Chang & Gardner (1993) fracture effects are helpful in constraining our interpretationfound that the magnitude of the reflection amplitude decreased and characterizing fractured reservoirs.with increasing offset and the rate of the decrease was greatest Seismic studies of fractured reservoirs indicate that fracturein the direction perpendicular to the features. Theoretical density variations can be present in reservoirs. By studyingstudies by Sayers & Rickett (1997) showed that for gas-filled P–S converted waves, Ata & Michelena (1995) generatedopen fractures in sandstone, the effect of fractures only became anisotropy maps (fracture orientation and density) of thenoticeable as the critical angle for the unfractured sandstone reservoirs and correlated their results with available well data.was approached. However, for reflections from the base of the Based on a 3-D AVO technique, Ramos & Davis (1997) alsofracture unit, the azimuthal AVO response was stronger and showed spatial variations of crack density in coal-bed methanemore visible at the conventional seismic offset. Additionally, reservoirs. With any seismic data analysis and interpretation,such azimuthal AVO responses in fractured media have been however, we must consider the fundamental question of hownoted and applied to fracture detection in seismic data sets. much detail can be interpreted reliably from the data. ThisLynn et al. (1995) and Perez & Gibson (1996) related azimuth- issue is particularly pertinent to fractured reservoirs, wheredependent P-wave AVO responses to open fracture orientation. geological control and other source information are scarce.
Previous studies have shown that the effects of heterogeneity
on scattering in isotropic media lead to the creation of coda*Now at: Department of Geology, Peking University, Beijing 100871,
China. E-mail: [email protected]. waves (incoherent energy), the damping of transmitted waves,
251© 2000 RAS
Dow
nloaded from https://academ
ic.oup.com/gji/article/140/2/251/781144 by guest on 23 July 2022
252 F. Shen and M. Nafi T oksoz
and variations in coherent waveforms (Aki 1969; Richards & to extract offset-dependent parameters from seismic waveforms
in the frequency domain. The term ‘multiple signal classi-Menke 1983; Gibson & Levander 1988; Toksoz & Charrette1990; Wu & Aki 1990; Levander et al. 1994). In studies of fication’ describes experimental and theoretical techniques
involved in determining the parameters of multiple wave frontswave scattering by heterogeneities in isotropic media, authors
have noted that coda waves result from the scattering of arriving at an antenna array. These parameters are based onmeasurements of signals received at the array elements. Theinhomogeneities and differ from coherent waves in frequency.
The characteristics of the resulting coda wave frequencies have introduction of the MUSIC algorithm (Schmidt 1979; Bienvenu
& Kopp 1980), which requires a 1-D search, was an attemptbeen investigated. Aki & Chouet (1975) found that whilstlow-frequency coda waves are dominated by surface waves, to exploit more fully the underlying data model. This method
improves the resolution of source bearing in passive sonar arrays,higher-frequency coda waves are composed primarily of body
waves that have been scattered at some depth. Coates & multiple emitter location and signal parameter estimation, andsensor array processing (Schmidt 1979, 1986; Johnson &Charrette (1993) and Charrette (1991) showed that coda waves
in impedance models have a lower frequency range, and coda DeGraaf 1982; Viberg & Ottersten 1991). This technique has
better resolution and better frequency estimation charac-waves in velocity models have a higher and wider frequencyrange. The numerical results of Richards & Menke (1983) teristics than spectral techniques such as autoregressive or
Prony. MUSIC has received much attention and can provideindicated that when scattering dominates over intrinsic friction,
the coda of a transmitted wave contains higher frequencies asymptotically unbiased estimations of signals. The asymptoticproperties of MUSIC are well documented in the literaturethan the initial pulse. Frankel & Clayton (1986) showed that
the presence of higher-frequency seismic coda waves is a major (e.g. Jeffries & Farrier 1985; Porat & Friedlander 1988; Clergeot
et al. 1989).constraint on the heterogeneity spectrum of the crust. Thesephenomena express the fact that a pulse loses coherence, and In this paper, we introduce the eigenvector-based estimation
technique, MUSIC, to the waveform estimation of syntheticthus incoherent coda energy with various frequencies is created.
Waveform variation, an important parameter in seismic seismograms in a frequency-offset domain. These seismogramsare generated by 3-D finite difference modelling and reflectedscattering studies, has been noted by several authors. Richards
& Menke (1983) observed similar numerical results from two from the tops and the bases of fractured reservoirs. Frequency-dependent signal signatures estimated by the frequency estimatordifferent types of velocity fluctuations. The resulting pulse can
be seen losing amplitude and broadening as transmitted waves are used to study properties of wave propagation through
3-D, gas-saturated, heterogeneously fractured reservoirs. Bypropagate; this feature increases with the propagation pathlength. Frankel & Clayton (1986) quantified waveform variation investigating the effects of fracture heterogeneity on reflected
P waves, we seek to explain and understand the characteristicsby determining the cross-correlation functions from finite
difference synthetic seismograms. As a wave passes through a of seismic scattering in fractured media. The object of this paperis to make clear which characteristics related to scattering byheterogeneous medium, its frequency and amplitude are affected
by the inhomogeneity. These studies show that the variation fractures can be extracted from reflected waves and can thus
be used in fracture characterization.of waveforms across seismic arrays is a useful observation thatprovides constraints on the heterogeneity.
However, as far as we know, the effects of heterogeneity2 SIGNAL PARAMETER ESTIMATIONand associated characteristics on wave scattering in hetero-FUNCTIONgeneous anisotropic (fractured) media remain, for the most part,
unstudied. In heterogeneous fractured reservoirs with the fractureThis method is based on an eigenanalysis of a correlation
density varying spatially, it is expected that fractures havedata matrix. It separates information in the correlation matrix
different effects on wave scattering at the reservoir top andinto two vector subspaces, one a signal space and the other
base due to different wave propagation paths and transmissiona noise space. Functions of the vector in either the signal or
processes. Groenenboom & Snieder (1995) have characterizednoise space can be used to create frequency estimators. The
heterogeneity parameters by determining the effects of hetero-estimated number of spectral peaks by the frequency estimator
geneity on the phases and amplitudes of coherent waves. Inrepresents the number of signals. The signal locations in the
this study, we also use coherent waves (reflected waves) tofrequency range indicate the signal frequencies. A detailed
quantify the effects of fracture heterogeneity. The scatteringdiscussion about the frequency estimator is in appendices A
characteristics can be extracted from waveforms in the fre-and B.
quency domain. These characteristics help us to understandThe frequency estimator function can be written as
the effects of the heterogeneous fracture density field on the
seismic response and to characterize fractured reservoirs withF( f )=
1
∑P
k=M+1ak|eH ( f )v
k|2
, (1)estimated seismic attributes.Because most seismic data sets come from reflected P waves,
a detailed understanding of the effects of fracture density hetero-geneity on P-wave seismic response is of primary importance where a is the weighting function, M is the number of signals,
v is an eigenvector and e is a complex sinusoid vector. Thefor fractured reservoir characterization. Amplitudes can be
obtained directly from seismic data or synthetic seismograms. superscript H denotes the Hermitian transpose operation. Asdiscussed in Appendix A, when e( f
i)=s
i, one of the sinusoidalHowever, higher-resolution signal estimation techniques are
needed both for investigating fracture effects on the frequency signal vectors, the estimate causes the function F( f ) to have
very sharp peaks at the signal frequency fi. Note that theof reflected waves and for understanding scattering charac-
teristics in fractured reservoirs in more detail. We apply a frequency estimator is a pseudo-spectrum estimator becausethe correlation sequence cannot be recovered by Fouriertechnique—the multiple signal classification method (MUSIC)—
© 2000 RAS, GJI 140, 251–266
Dow
nloaded from https://academ
ic.oup.com/gji/article/140/2/251/781144 by guest on 23 July 2022
Scattering characteristics in fractured reservoirs 253
transforming the frequency estimator. Setting a=1 for all k model 1 are taken from laboratory measurements (Teng &
Mavko 1996); model 2 parameters are taken from a class 1leads to the multiple signal classification algorithm (Schmidt1986), gas sand example (Rutherford & Williams 1989). Model 1 has
smaller elastic property contrasts in the background media
than model 2. The parameters of background rocks andF( f )=1
eH ( f )A ∑P
k=M+1vkvHkB eH( f )
. (2)fractures for both models are listed in Table 1.
In our modelling, an effective medium model (Schoenberg
& Sayers 1995) and Hudson’s crack models (Hudson 1981;Setting a=1/l
kfor all k yields the eigenvector algorithm
Hudson et al. 1996) have been used in the elastic tensorfrequency estimator (Johnson & Degraaf 1982):
inversion, which has been studied in detail (Liu et al. 1996;
Shen et al. 1997). For simplicity, the fractured reservoir isF( f )=
1
eH ( f )A ∑P
k=M+11
lkvkvHkB eH( f )
. (3) assumed to have the same shale above and below it.Seismograms along crack-normal and strike directions are
considered. There are 41 traces in each direction, the minimumoffset is 0°, and the maximum offset is approximated as a 34°
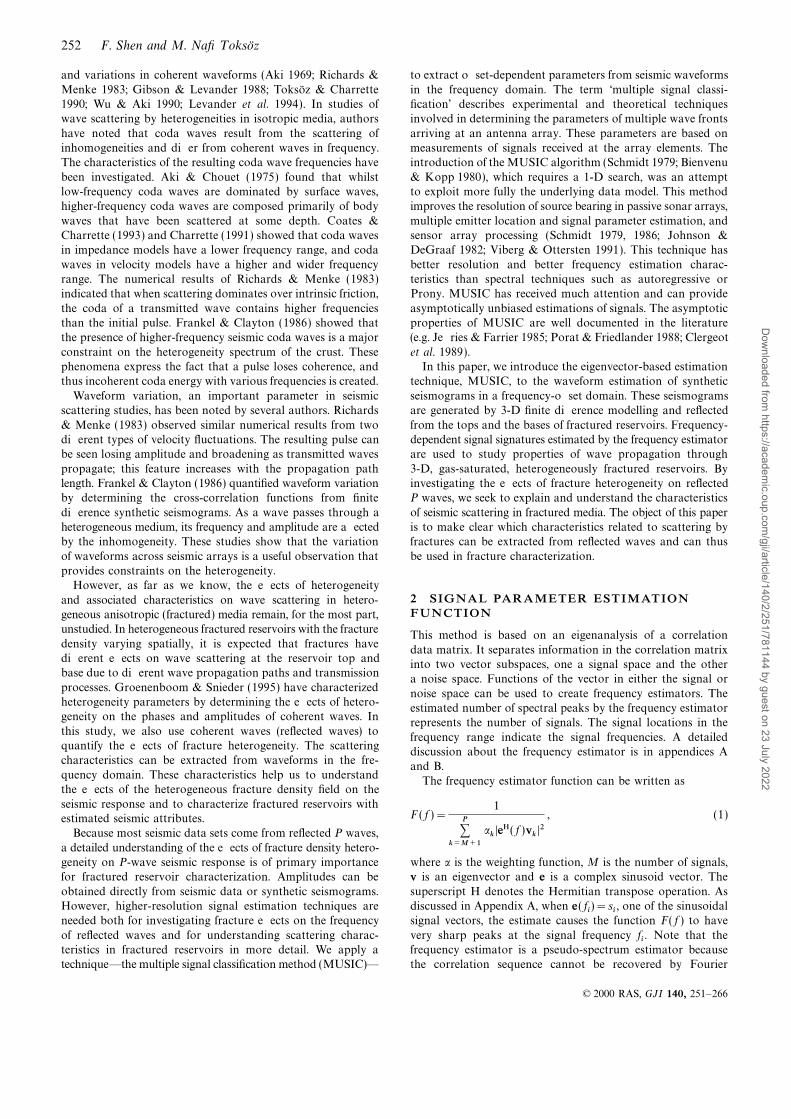
3 3-D FINITE DIFFERENCE APPLIED TO incident angle relative to the first reflected layer. An explosiveTWO FRACTURED RESERVOIR MODELS source is used, and the dominant frequency of the source
wavelet is 45 Hz. The physical model and source receiver con-Most theoretical studies of seismic scattering are based on the
figurations are shown in Fig. 1. All grid edges have absorbingfirst Born approximation and generalized Born approximation
boundary conditions to suppress artificial reflections.(Chernov 1960), which state that only single scattering occurs
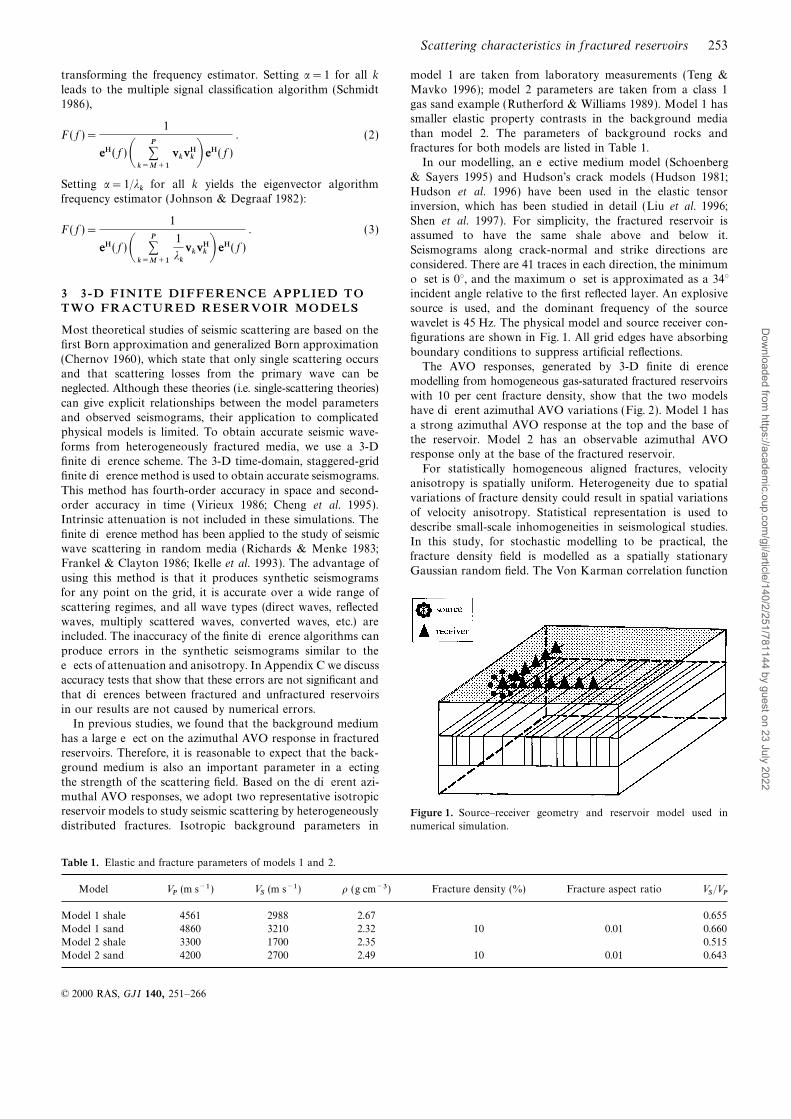
The AVO responses, generated by 3-D finite differenceand that scattering losses from the primary wave can be
modelling from homogeneous gas-saturated fractured reservoirsneglected. Although these theories (i.e. single-scattering theories)
with 10 per cent fracture density, show that the two modelscan give explicit relationships between the model parameters
have different azimuthal AVO variations (Fig. 2). Model 1 hasand observed seismograms, their application to complicated
a strong azimuthal AVO response at the top and the base ofphysical models is limited. To obtain accurate seismic wave-
the reservoir. Model 2 has an observable azimuthal AVOforms from heterogeneously fractured media, we use a 3-D
response only at the base of the fractured reservoir.finite difference scheme. The 3-D time-domain, staggered-grid
For statistically homogeneous aligned fractures, velocityfinite difference method is used to obtain accurate seismograms.
anisotropy is spatially uniform. Heterogeneity due to spatialThis method has fourth-order accuracy in space and second-
variations of fracture density could result in spatial variationsorder accuracy in time (Virieux 1986; Cheng et al. 1995).
of velocity anisotropy. Statistical representation is used toIntrinsic attenuation is not included in these simulations. The
describe small-scale inhomogeneities in seismological studies.finite difference method has been applied to the study of seismic
In this study, for stochastic modelling to be practical, thewave scattering in random media (Richards & Menke 1983;
fracture density field is modelled as a spatially stationaryFrankel & Clayton 1986; Ikelle et al. 1993). The advantage of
Gaussian random field. The Von Karman correlation functionusing this method is that it produces synthetic seismogramsfor any point on the grid, it is accurate over a wide range of
scattering regimes, and all wave types (direct waves, reflectedwaves, multiply scattered waves, converted waves, etc.) areincluded. The inaccuracy of the finite difference algorithms can
produce errors in the synthetic seismograms similar to theeffects of attenuation and anisotropy. In Appendix C we discussaccuracy tests that show that these errors are not significant and
that differences between fractured and unfractured reservoirsin our results are not caused by numerical errors.
In previous studies, we found that the background medium
has a large effect on the azimuthal AVO response in fracturedreservoirs. Therefore, it is reasonable to expect that the back-ground medium is also an important parameter in affecting
the strength of the scattering field. Based on the different azi-muthal AVO responses, we adopt two representative isotropicreservoir models to study seismic scattering by heterogeneously Figure 1. Source–receiver geometry and reservoir model used in
numerical simulation.distributed fractures. Isotropic background parameters in
Table 1. Elastic and fracture parameters of models 1 and 2.
Model VP
(m s−1 ) VS
(m s−1) r (g cm−3) Fracture density (%) Fracture aspect ratio VS/VP
Model 1 shale 4561 2988 2.67 0.655
Model 1 sand 4860 3210 2.32 10 0.01 0.660
Model 2 shale 3300 1700 2.35 0.515
Model 2 sand 4200 2700 2.49 10 0.01 0.643
© 2000 RAS, GJI 140, 251–266
Dow
nloaded from https://academ
ic.oup.com/gji/article/140/2/251/781144 by guest on 23 July 2022
254 F. Shen and M. Nafi T oksoz
Figure 2. Normalized AVO responses at the tops and bases of gas-saturated fractured reservoirs in crack-normal and strike directions. Fracture
density is 10 per cent. Normalized AVO responses in (a) model 1 and (b) model 2.
is used to model heterogeneity in the fracture density field,4 SCATTERING CHARACTERISTICS IN
which is specified by the function describing its amplitude,TWO FRACTURED RESERVOIR MODELS
orientation and characteristic wavenumbers and its roughnessnumber. The properties of the Von Karman correlation function In this section, frequency-dependent signal signatures, esti-
mated by the frequency estimator from synthetic waveformshave been described by Goff & Jordan (1988) in detail. Forour simulation to be simple and practical, we assume that in crack-normal and strike directions, are used to quantify the
scattering characteristics for models 1 and 2. Time-domainfracture density does not vary with depth. For each model, we
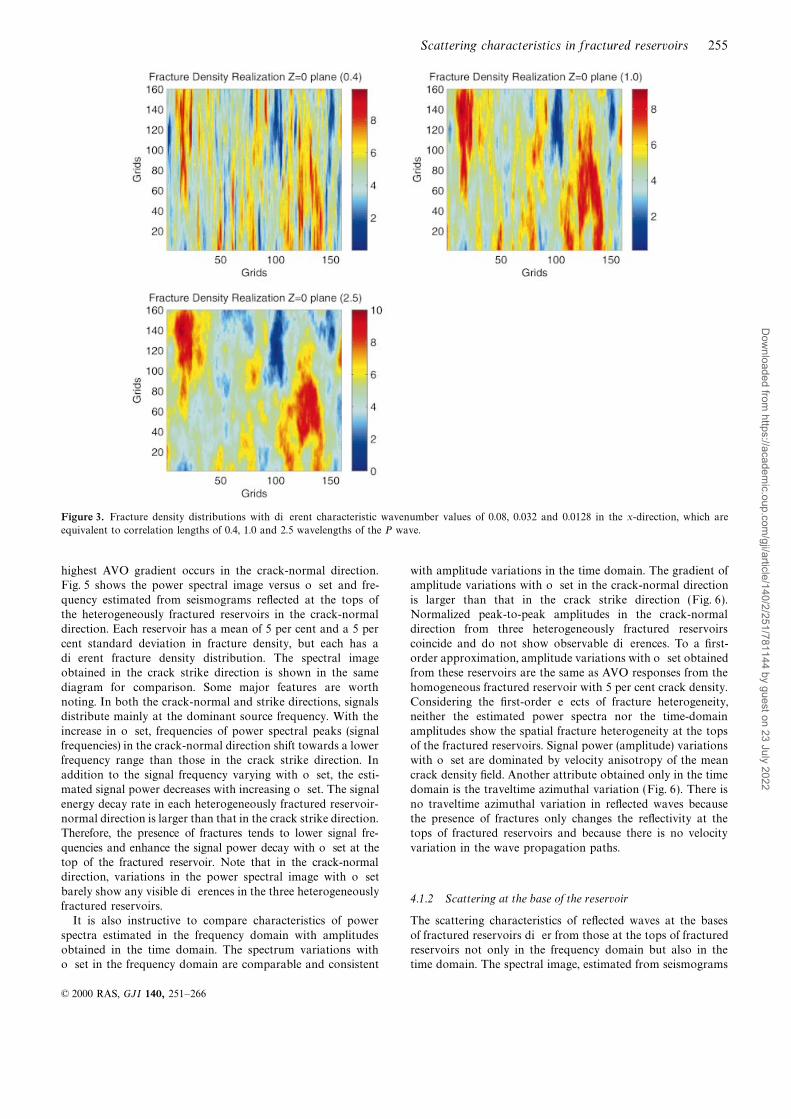
construct three heterogeneous fracture density distributions that attributes such as peak-to-peak amplitude and traveltime areobtained directly from synthetic seismograms. Traveltime ishave the same characteristic wavenumber value, 0.0032, in the
y-direction and different characteristic wavenumber values, determined by finding the time of the P-wave amplitude’s firstpeak on the synthetic seismogram. The traveltime is measured0.08, 0.032 and 0.0128, in the x-direction. The roughness
number is 0.8. Fig. 3 shows three fracture density distributions. to the same accuracy as the time step (Dt) in the finite difference
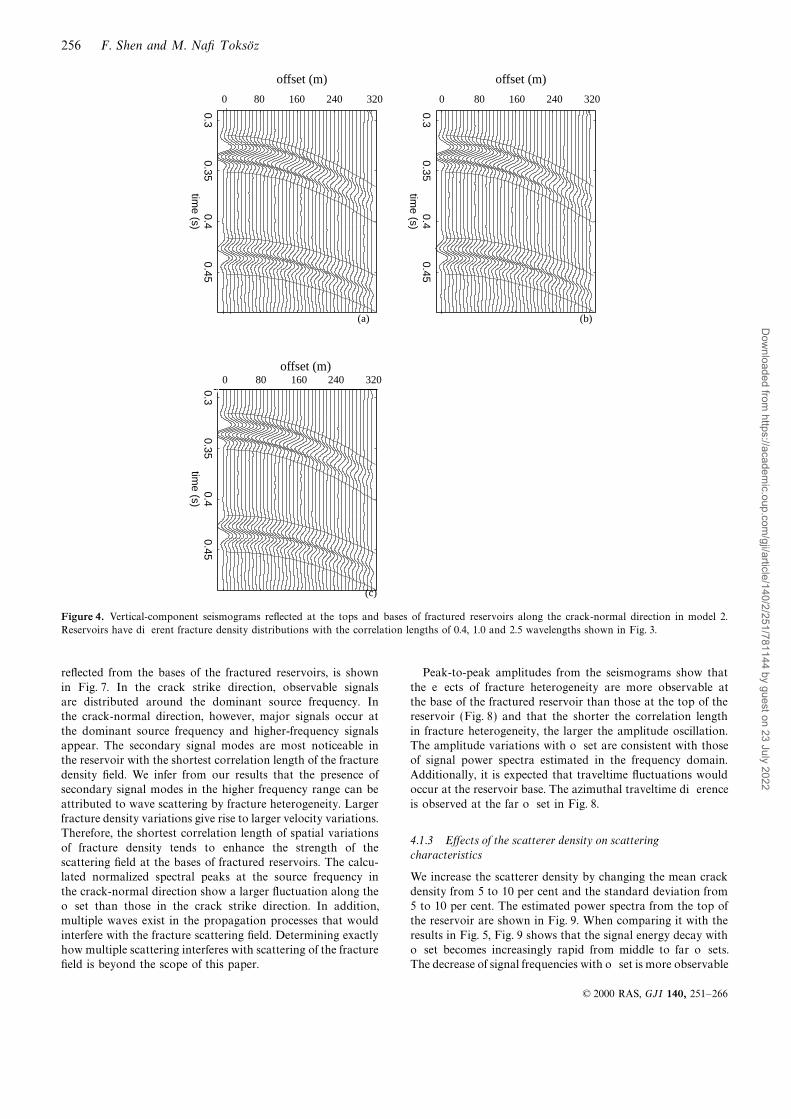
simulations.Finite difference simulations are used to generate syntheticseismograms in heterogeneously fractured reservoirs withdifferent fracture density distributions. Figs 4(a), (b) and (c)
4.1 Scattering characteristics in fractured reservoir model 1show examples of vertical-component synthetic seismogramsin model 2 in the crack-normal direction. The source coordi-
4.1.1 Scattering at the top of the reservoirnate in the x–y plane is located at gridpoint (50,50). Waveforms
within time windows are used in parameter estimations, which As shown in Fig. 2(a), the azimuthal AVO response in model 1at the top of the fractured reservoir is larger than that at theare reflected waves at the tops and the bases of fractured
reservoirs. reservoir base due to the difference in incident angles. The
© 2000 RAS, GJI 140, 251–266
Dow
nloaded from https://academ
ic.oup.com/gji/article/140/2/251/781144 by guest on 23 July 2022
Scattering characteristics in fractured reservoirs 255
Figure 3. Fracture density distributions with different characteristic wavenumber values of 0.08, 0.032 and 0.0128 in the x-direction, which are
equivalent to correlation lengths of 0.4, 1.0 and 2.5 wavelengths of the P wave.
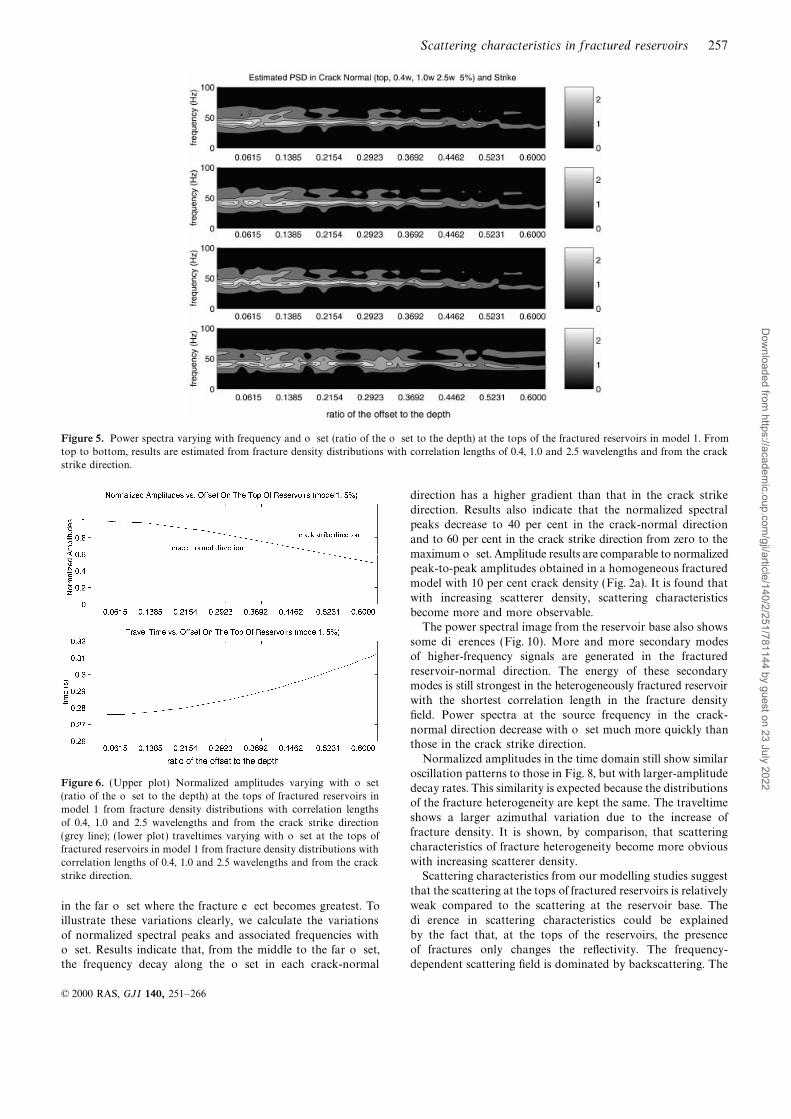
highest AVO gradient occurs in the crack-normal direction. with amplitude variations in the time domain. The gradient ofamplitude variations with offset in the crack-normal directionFig. 5 shows the power spectral image versus offset and fre-
quency estimated from seismograms reflected at the tops of is larger than that in the crack strike direction (Fig. 6).Normalized peak-to-peak amplitudes in the crack-normalthe heterogeneously fractured reservoirs in the crack-normal
direction. Each reservoir has a mean of 5 per cent and a 5 per direction from three heterogeneously fractured reservoirs
coincide and do not show observable differences. To a first-cent standard deviation in fracture density, but each has adifferent fracture density distribution. The spectral image order approximation, amplitude variations with offset obtained
from these reservoirs are the same as AVO responses from theobtained in the crack strike direction is shown in the same
diagram for comparison. Some major features are worth homogeneous fractured reservoir with 5 per cent crack density.Considering the first-order effects of fracture heterogeneity,noting. In both the crack-normal and strike directions, signals
distribute mainly at the dominant source frequency. With the neither the estimated power spectra nor the time-domain
amplitudes show the spatial fracture heterogeneity at the topsincrease in offset, frequencies of power spectral peaks (signalfrequencies) in the crack-normal direction shift towards a lower of the fractured reservoirs. Signal power (amplitude) variations
with offset are dominated by velocity anisotropy of the meanfrequency range than those in the crack strike direction. In
addition to the signal frequency varying with offset, the esti- crack density field. Another attribute obtained only in the timedomain is the traveltime azimuthal variation (Fig. 6). There ismated signal power decreases with increasing offset. The signal
energy decay rate in each heterogeneously fractured reservoir- no traveltime azimuthal variation in reflected waves becausethe presence of fractures only changes the reflectivity at thenormal direction is larger than that in the crack strike direction.
Therefore, the presence of fractures tends to lower signal fre- tops of fractured reservoirs and because there is no velocity
variation in the wave propagation paths.quencies and enhance the signal power decay with offset at thetop of the fractured reservoir. Note that in the crack-normaldirection, variations in the power spectral image with offset
barely show any visible differences in the three heterogeneously4.1.2 Scattering at the base of the reservoir
fractured reservoirs.It is also instructive to compare characteristics of power The scattering characteristics of reflected waves at the bases
of fractured reservoirs differ from those at the tops of fracturedspectra estimated in the frequency domain with amplitudesobtained in the time domain. The spectrum variations with reservoirs not only in the frequency domain but also in the
time domain. The spectral image, estimated from seismogramsoffset in the frequency domain are comparable and consistent
© 2000 RAS, GJI 140, 251–266
Dow
nloaded from https://academ
ic.oup.com/gji/article/140/2/251/781144 by guest on 23 July 2022
256 F. Shen and M. Nafi T oksoz
0.30.35
0.40.45
time (s)
0.30.35
0.40.45
time (s)
0.30.35
0.40.45
0 10 20 30 40
time (s)
Seismogram model2 (2.5) (VZ component)offset (m)0 80 160 240 320
(a) (b)
0 80 160 240 320 0 80 160 240 320
offset (m) offset (m)
(c)
Figure 4. Vertical-component seismograms reflected at the tops and bases of fractured reservoirs along the crack-normal direction in model 2.
Reservoirs have different fracture density distributions with the correlation lengths of 0.4, 1.0 and 2.5 wavelengths shown in Fig. 3.
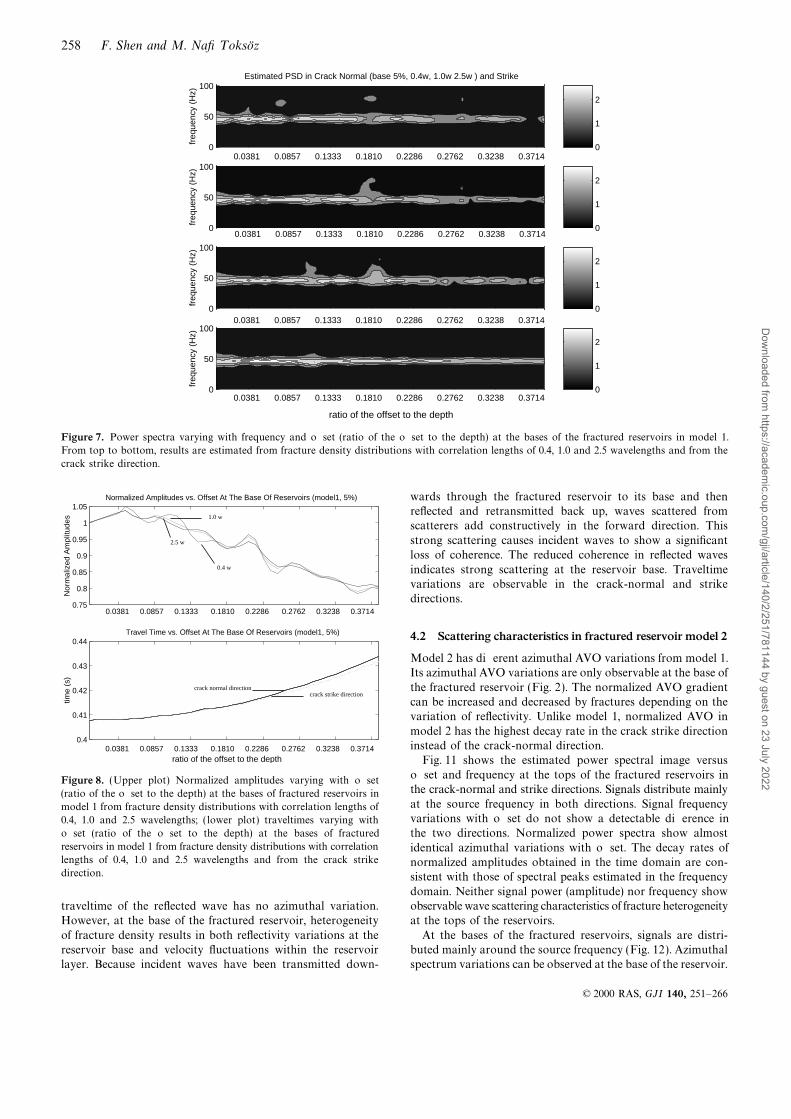
reflected from the bases of the fractured reservoirs, is shown Peak-to-peak amplitudes from the seismograms show that
the effects of fracture heterogeneity are more observable atin Fig. 7. In the crack strike direction, observable signalsare distributed around the dominant source frequency. In the base of the fractured reservoir than those at the top of the
reservoir (Fig. 8) and that the shorter the correlation lengththe crack-normal direction, however, major signals occur at
the dominant source frequency and higher-frequency signals in fracture heterogeneity, the larger the amplitude oscillation.The amplitude variations with offset are consistent with thoseappear. The secondary signal modes are most noticeable in
the reservoir with the shortest correlation length of the fracture of signal power spectra estimated in the frequency domain.
Additionally, it is expected that traveltime fluctuations woulddensity field. We infer from our results that the presence ofsecondary signal modes in the higher frequency range can be occur at the reservoir base. The azimuthal traveltime difference
is observed at the far offset in Fig. 8.attributed to wave scattering by fracture heterogeneity. Largerfracture density variations give rise to larger velocity variations.Therefore, the shortest correlation length of spatial variations
4.1.3 EVects of the scatterer density on scatteringof fracture density tends to enhance the strength of the
characteristicsscattering field at the bases of fractured reservoirs. The calcu-lated normalized spectral peaks at the source frequency in We increase the scatterer density by changing the mean crack
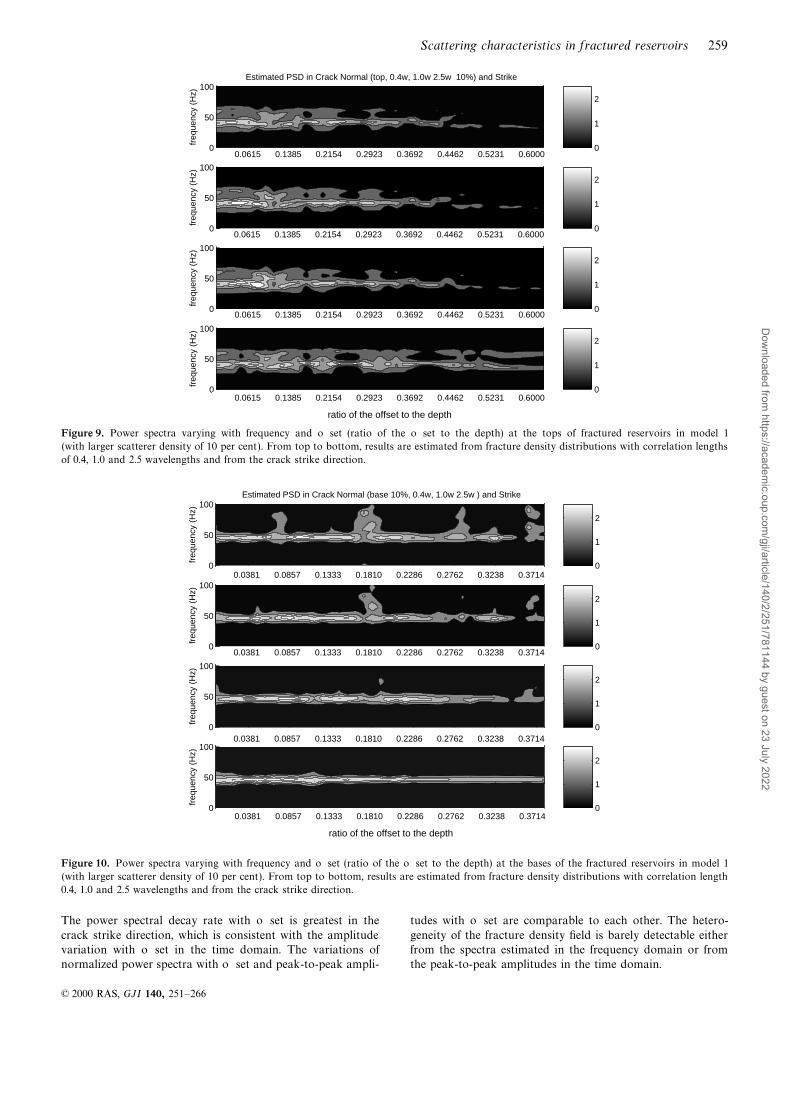
density from 5 to 10 per cent and the standard deviation fromthe crack-normal direction show a larger fluctuation along theoffset than those in the crack strike direction. In addition, 5 to 10 per cent. The estimated power spectra from the top of
the reservoir are shown in Fig. 9. When comparing it with themultiple waves exist in the propagation processes that would
interfere with the fracture scattering field. Determining exactly results in Fig. 5, Fig. 9 shows that the signal energy decay withoffset becomes increasingly rapid from middle to far offsets.how multiple scattering interferes with scattering of the fracture
field is beyond the scope of this paper. The decrease of signal frequencies with offset is more observable
© 2000 RAS, GJI 140, 251–266
Dow
nloaded from https://academ
ic.oup.com/gji/article/140/2/251/781144 by guest on 23 July 2022
Scattering characteristics in fractured reservoirs 257
Figure 5. Power spectra varying with frequency and offset (ratio of the offset to the depth) at the tops of the fractured reservoirs in model 1. From
top to bottom, results are estimated from fracture density distributions with correlation lengths of 0.4, 1.0 and 2.5 wavelengths and from the crack
strike direction.
direction has a higher gradient than that in the crack strike
direction. Results also indicate that the normalized spectral
peaks decrease to 40 per cent in the crack-normal direction
and to 60 per cent in the crack strike direction from zero to the
maximum offset. Amplitude results are comparable to normalizedpeak-to-peak amplitudes obtained in a homogeneous fractured
model with 10 per cent crack density (Fig. 2a). It is found that
with increasing scatterer density, scattering characteristics
become more and more observable.The power spectral image from the reservoir base also shows
some differences (Fig. 10). More and more secondary modes
of higher-frequency signals are generated in the fractured
reservoir-normal direction. The energy of these secondarymodes is still strongest in the heterogeneously fractured reservoir
with the shortest correlation length in the fracture density
field. Power spectra at the source frequency in the crack-
normal direction decrease with offset much more quickly thanthose in the crack strike direction.
Normalized amplitudes in the time domain still show similaroscillation patterns to those in Fig. 8, but with larger-amplitude
Figure 6. (Upper plot) Normalized amplitudes varying with offset decay rates. This similarity is expected because the distributions(ratio of the offset to the depth) at the tops of fractured reservoirs in
of the fracture heterogeneity are kept the same. The traveltimemodel 1 from fracture density distributions with correlation lengths
shows a larger azimuthal variation due to the increase ofof 0.4, 1.0 and 2.5 wavelengths and from the crack strike directionfracture density. It is shown, by comparison, that scattering(grey line); ( lower plot) traveltimes varying with offset at the tops ofcharacteristics of fracture heterogeneity become more obviousfractured reservoirs in model 1 from fracture density distributions withwith increasing scatterer density.correlation lengths of 0.4, 1.0 and 2.5 wavelengths and from the crack
strike direction. Scattering characteristics from our modelling studies suggest
that the scattering at the tops of fractured reservoirs is relatively
weak compared to the scattering at the reservoir base. Thein the far offset where the fracture effect becomes greatest. Todifference in scattering characteristics could be explainedillustrate these variations clearly, we calculate the variationsby the fact that, at the tops of the reservoirs, the presenceof normalized spectral peaks and associated frequencies withof fractures only changes the reflectivity. The frequency-offset. Results indicate that, from the middle to the far offset,
the frequency decay along the offset in each crack-normal dependent scattering field is dominated by backscattering. The
© 2000 RAS, GJI 140, 251–266
Dow
nloaded from https://academ
ic.oup.com/gji/article/140/2/251/781144 by guest on 23 July 2022
258 F. Shen and M. Nafi T oksoz
5 10 15 20 25 30 35 400
50
100
freq
uenc
y (H
z)
Estimated PSD in Crack Normal (base 5%, 0.4w, 1.0w 2.5w ) and Strike
0
1
2
5 10 15 20 25 30 35 400
50
100
freq
uenc
y (H
z)
0
1
2
5 10 15 20 25 30 35 400
50
100
freq
uenc
y (H
z)
0
1
2
5 10 15 20 25 30 35 400
50
100
traces
freq
uenc
y (H
z)
0
1
2
0.0381 0.0857 0.1333 0.1810 0.2286 0.2762 0.3238 0.3714
0.0381 0.0857 0.1333 0.1810 0.2286 0.2762 0.3238 0.3714
0.0381 0.0857 0.1333 0.1810 0.2286 0.2762 0.3238 0.3714
0.0381 0.0857 0.1333 0.1810 0.2286 0.2762 0.3238 0.3714
ratio of the offset to the depth
Figure 7. Power spectra varying with frequency and offset (ratio of the offset to the depth) at the bases of the fractured reservoirs in model 1.
From top to bottom, results are estimated from fracture density distributions with correlation lengths of 0.4, 1.0 and 2.5 wavelengths and from the
crack strike direction.
wards through the fractured reservoir to its base and thenreflected and retransmitted back up, waves scattered fromscatterers add constructively in the forward direction. This
strong scattering causes incident waves to show a significantloss of coherence. The reduced coherence in reflected waves
indicates strong scattering at the reservoir base. Traveltimevariations are observable in the crack-normal and strikedirections.
4.2 Scattering characteristics in fractured reservoir model 2
Model 2 has different azimuthal AVO variations from model 1.Its azimuthal AVO variations are only observable at the base of
the fractured reservoir (Fig. 2). The normalized AVO gradientcan be increased and decreased by fractures depending on thevariation of reflectivity. Unlike model 1, normalized AVO in
model 2 has the highest decay rate in the crack strike directioninstead of the crack-normal direction.
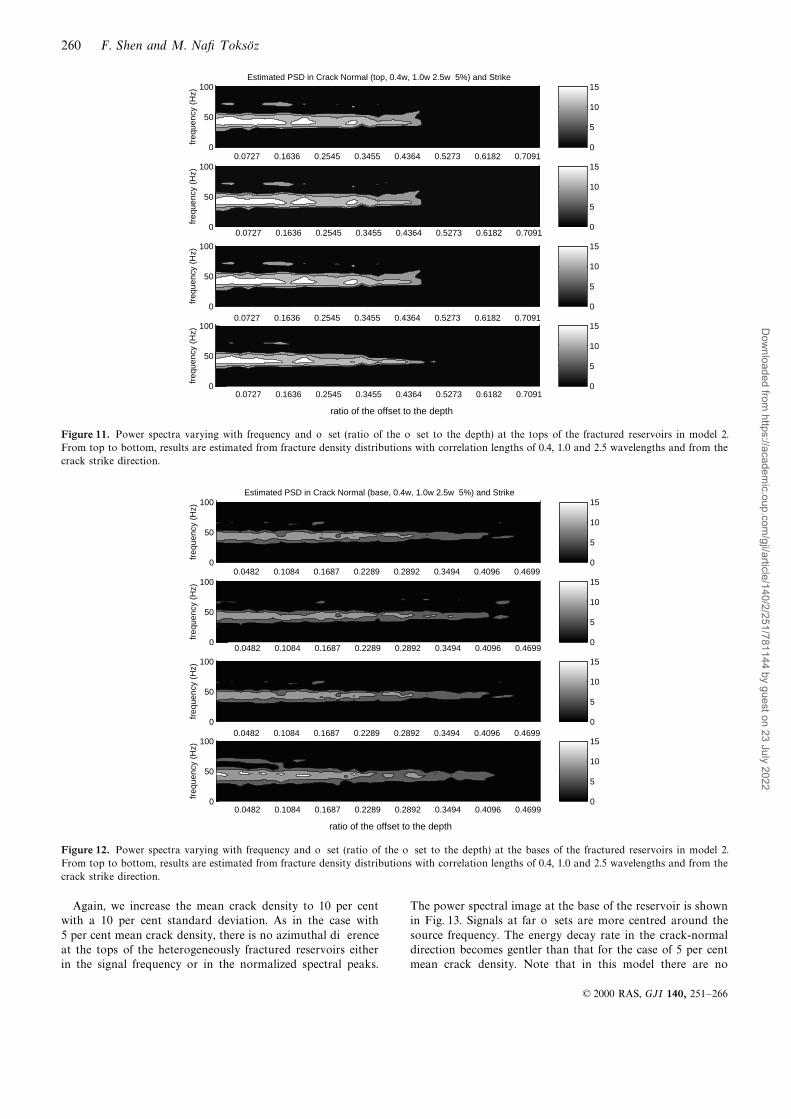
Fig. 11 shows the estimated power spectral image versus
5 10 15 20 25 30 35 400.75
0.8
0.85
0.9
0.95
1
1.05
Traces (red: 0.4w; green: 1.0; Blue: 2.5 yellow: 0% in crack density
Nor
mal
ized
Am
plitu
des
Normalized Amplitudes vs. Offset At The Base Of Reservoirs (model1, 5%)
5 10 15 20 25 30 35 400.4
0.41
0.42
0.43
0.44
Traces (red: 0.4w; green: 1.0; Blue: 2.5 yellow: 0% in crack density
time
(s)
Travel Time vs. Offset At The Base Of Reservoirs (model1, 5%)
0.0381 0.0857 0.1333 0.1810 0.2286 0.2762 0.3238 0.3714
0.0381 0.0857 0.1333 0.1810 0.2286 0.2762 0.3238 0.3714 ratio of the offset to the depth
0.4 w
2.5 w
1.0 w
crack strike direction crack normal direction
offset and frequency at the tops of the fractured reservoirs inFigure 8. (Upper plot) Normalized amplitudes varying with offsetthe crack-normal and strike directions. Signals distribute mainly(ratio of the offset to the depth) at the bases of fractured reservoirs inat the source frequency in both directions. Signal frequencymodel 1 from fracture density distributions with correlation lengths ofvariations with offset do not show a detectable difference in0.4, 1.0 and 2.5 wavelengths; ( lower plot) traveltimes varying with
offset (ratio of the offset to the depth) at the bases of fractured the two directions. Normalized power spectra show almostreservoirs in model 1 from fracture density distributions with correlation identical azimuthal variations with offset. The decay rates oflengths of 0.4, 1.0 and 2.5 wavelengths and from the crack strike normalized amplitudes obtained in the time domain are con-direction. sistent with those of spectral peaks estimated in the frequency
domain. Neither signal power (amplitude) nor frequency showobservable wave scattering characteristics of fracture heterogeneitytraveltime of the reflected wave has no azimuthal variation.
However, at the base of the fractured reservoir, heterogeneity at the tops of the reservoirs.
At the bases of the fractured reservoirs, signals are distri-of fracture density results in both reflectivity variations at thereservoir base and velocity fluctuations within the reservoir buted mainly around the source frequency (Fig. 12). Azimuthal
spectrum variations can be observed at the base of the reservoir.layer. Because incident waves have been transmitted down-
© 2000 RAS, GJI 140, 251–266
Dow
nloaded from https://academ
ic.oup.com/gji/article/140/2/251/781144 by guest on 23 July 2022
Scattering characteristics in fractured reservoirs 259
5 10 15 20 25 30 35 400
50
100
freq
uenc
y (H
z)
Estimated PSD in Crack Normal (top, 0.4w, 1.0w 2.5w 10%) and Strike
0
1
2
5 10 15 20 25 30 35 400
50
100
freq
uenc
y (H
z)
0
1
2
5 10 15 20 25 30 35 400
50
100
freq
uenc
y (H
z)
0
1
2
5 10 15 20 25 30 35 400
50
100
traces
freq
uenc
y (H
z)
0
1
2
0.0615 0.1385 0.2154 0.2923 0.3692 0.4462 0.5231 0.6000
0.0615 0.1385 0.2154 0.2923 0.3692 0.4462 0.5231 0.6000
0.0615 0.1385 0.2154 0.2923 0.3692 0.4462 0.5231 0.6000
0.0615 0.1385 0.2154 0.2923 0.3692 0.4462 0.5231 0.6000
ratio of the offset to the depth
Figure 9. Power spectra varying with frequency and offset (ratio of the offset to the depth) at the tops of fractured reservoirs in model 1
(with larger scatterer density of 10 per cent). From top to bottom, results are estimated from fracture density distributions with correlation lengths
of 0.4, 1.0 and 2.5 wavelengths and from the crack strike direction.
5 10 15 20 25 30 35 400
50
100
freq
uenc
y (H
z)
Estimated PSD in Crack Normal (base 10%, 0.4w, 1.0w 2.5w ) and Strike
0
1
2
5 10 15 20 25 30 35 400
50
100
freq
uenc
y (H
z)
0
1
2
5 10 15 20 25 30 35 400
50
100
freq
uenc
y (H
z)
0
1
2
5 10 15 20 25 30 35 400
50
100
traces
freq
uenc
y (H
z)
0
1
2
0.0381 0.0857 0.1333 0.1810 0.2286 0.2762 0.3238 0.3714
0.0381 0.0857 0.1333 0.1810 0.2286 0.2762 0.3238 0.3714
0.0381 0.0857 0.1333 0.1810 0.2286 0.2762 0.3238 0.3714
0.0381 0.0857 0.1333 0.1810 0.2286 0.2762 0.3238 0.3714
ratio of the offset to the depth
Figure 10. Power spectra varying with frequency and offset (ratio of the offset to the depth) at the bases of the fractured reservoirs in model 1
(with larger scatterer density of 10 per cent). From top to bottom, results are estimated from fracture density distributions with correlation length
0.4, 1.0 and 2.5 wavelengths and from the crack strike direction.
The power spectral decay rate with offset is greatest in the tudes with offset are comparable to each other. The hetero-
geneity of the fracture density field is barely detectable eithercrack strike direction, which is consistent with the amplitudevariation with offset in the time domain. The variations of from the spectra estimated in the frequency domain or from
the peak-to-peak amplitudes in the time domain.normalized power spectra with offset and peak-to-peak ampli-
© 2000 RAS, GJI 140, 251–266
Dow
nloaded from https://academ
ic.oup.com/gji/article/140/2/251/781144 by guest on 23 July 2022
260 F. Shen and M. Nafi T oksoz
5 10 15 20 25 30 35 400
50
100
freq
uenc
y (H
z)
Estimated PSD in Crack Normal (top, 0.4w, 1.0w 2.5w 5%) and Strike
0
5
10
15
5 10 15 20 25 30 35 400
50
100
freq
uenc
y (H
z)
0
5
10
15
5 10 15 20 25 30 35 400
50
100
freq
uenc
y (H
z)
0
5
10
15
5 10 15 20 25 30 35 400
50
100
traces
freq
uenc
y (H
z)
0
5
10
15
0.0727 0.1636 0.2545 0.3455 0.4364 0.5273 0.6182 0.7091
0.0727 0.1636 0.2545 0.3455 0.4364 0.5273 0.6182 0.7091
0.0727 0.1636 0.2545 0.3455 0.4364 0.5273 0.6182 0.7091
0.0727 0.1636 0.2545 0.3455 0.4364 0.5273 0.6182 0.7091
ratio of the offset to the depth
Figure 11. Power spectra varying with frequency and offset (ratio of the offset to the depth) at the tops of the fractured reservoirs in model 2.
From top to bottom, results are estimated from fracture density distributions with correlation lengths of 0.4, 1.0 and 2.5 wavelengths and from the
crack strike direction.
5 10 15 20 25 30 35 400
50
100
freq
uenc
y (H
z)
Estimated PSD in Crack Normal (base, 0.4w, 1.0w 2.5w 5%) and Strike
0
5
10
15
5 10 15 20 25 30 35 400
50
100
freq
uenc
y (H
z)
0
5
10
15
5 10 15 20 25 30 35 400
50
100
freq
uenc
y (H
z)
0
5
10
15
5 10 15 20 25 30 35 400
50
100
traces
freq
uenc
y (H
z)
0
5
10
15
0.0482 0.1084 0.1687 0.2289 0.2892 0.3494 0.4096 0.4699
0.0482 0.1084 0.1687 0.2289 0.2892 0.3494 0.4096 0.4699
0.0482 0.1084 0.1687 0.2289 0.2892 0.3494 0.4096 0.4699
0.0482 0.1084 0.1687 0.2289 0.2892 0.3494 0.4096 0.4699
ratio of the offset to the depth
Figure 12. Power spectra varying with frequency and offset (ratio of the offset to the depth) at the bases of the fractured reservoirs in model 2.
From top to bottom, results are estimated from fracture density distributions with correlation lengths of 0.4, 1.0 and 2.5 wavelengths and from the
crack strike direction.
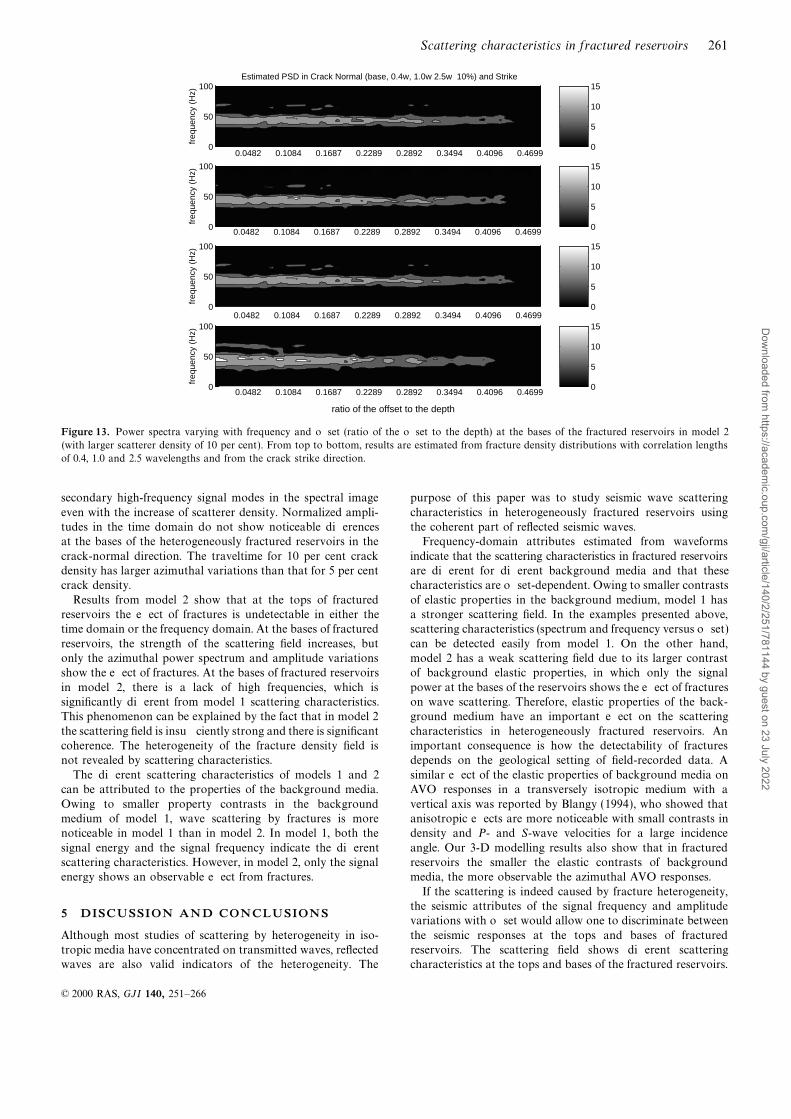
Again, we increase the mean crack density to 10 per cent The power spectral image at the base of the reservoir is shownin Fig. 13. Signals at far offsets are more centred around thewith a 10 per cent standard deviation. As in the case with
5 per cent mean crack density, there is no azimuthal difference source frequency. The energy decay rate in the crack-normaldirection becomes gentler than that for the case of 5 per centat the tops of the heterogeneously fractured reservoirs either
in the signal frequency or in the normalized spectral peaks. mean crack density. Note that in this model there are no
© 2000 RAS, GJI 140, 251–266
Dow
nloaded from https://academ
ic.oup.com/gji/article/140/2/251/781144 by guest on 23 July 2022
Scattering characteristics in fractured reservoirs 261
5 10 15 20 25 30 35 400
50
100
freq
uenc
y (H
z)
Estimated PSD in Crack Normal (base, 0.4w, 1.0w 2.5w 10%) and Strike
0
5
10
15
5 10 15 20 25 30 35 400
50
100
freq
uenc
y (H
z)
0
5
10
15
5 10 15 20 25 30 35 400
50
100
freq
uenc
y (H
z)
0
5
10
15
5 10 15 20 25 30 35 400
50
100
traces
freq
uenc
y (H
z)
0
5
10
15 0.0482 0.1084 0.1687 0.2289 0.2892 0.3494 0.4096 0.4699
0.0482 0.1084 0.1687 0.2289 0.2892 0.3494 0.4096 0.4699
ratio of the offset to the depth
0.0482 0.1084 0.1687 0.2289 0.2892 0.3494 0.4096 0.4699
0.0482 0.1084 0.1687 0.2289 0.2892 0.3494 0.4096 0.4699
0.0482 0.1084 0.1687 0.2289 0.2892 0.3494 0.4096 0.4699
Figure 13. Power spectra varying with frequency and offset (ratio of the offset to the depth) at the bases of the fractured reservoirs in model 2
(with larger scatterer density of 10 per cent). From top to bottom, results are estimated from fracture density distributions with correlation lengths
of 0.4, 1.0 and 2.5 wavelengths and from the crack strike direction.
secondary high-frequency signal modes in the spectral image purpose of this paper was to study seismic wave scattering
characteristics in heterogeneously fractured reservoirs usingeven with the increase of scatterer density. Normalized ampli-tudes in the time domain do not show noticeable differences the coherent part of reflected seismic waves.
Frequency-domain attributes estimated from waveformsat the bases of the heterogeneously fractured reservoirs in the
crack-normal direction. The traveltime for 10 per cent crack indicate that the scattering characteristics in fractured reservoirsare different for different background media and that thesedensity has larger azimuthal variations than that for 5 per cent
crack density. characteristics are offset-dependent. Owing to smaller contrasts
of elastic properties in the background medium, model 1 hasResults from model 2 show that at the tops of fracturedreservoirs the effect of fractures is undetectable in either the a stronger scattering field. In the examples presented above,
scattering characteristics (spectrum and frequency versus offset)time domain or the frequency domain. At the bases of fractured
reservoirs, the strength of the scattering field increases, but can be detected easily from model 1. On the other hand,model 2 has a weak scattering field due to its larger contrastonly the azimuthal power spectrum and amplitude variations
show the effect of fractures. At the bases of fractured reservoirs of background elastic properties, in which only the signal
power at the bases of the reservoirs shows the effect of fracturesin model 2, there is a lack of high frequencies, which issignificantly different from model 1 scattering characteristics. on wave scattering. Therefore, elastic properties of the back-
ground medium have an important effect on the scatteringThis phenomenon can be explained by the fact that in model 2
the scattering field is insufficiently strong and there is significant characteristics in heterogeneously fractured reservoirs. Animportant consequence is how the detectability of fracturescoherence. The heterogeneity of the fracture density field is
not revealed by scattering characteristics. depends on the geological setting of field-recorded data. A
similar effect of the elastic properties of background media onThe different scattering characteristics of models 1 and 2can be attributed to the properties of the background media. AVO responses in a transversely isotropic medium with a
vertical axis was reported by Blangy (1994), who showed thatOwing to smaller property contrasts in the backgroundmedium of model 1, wave scattering by fractures is more anisotropic effects are more noticeable with small contrasts in
density and P- and S-wave velocities for a large incidencenoticeable in model 1 than in model 2. In model 1, both the
signal energy and the signal frequency indicate the different angle. Our 3-D modelling results also show that in fracturedreservoirs the smaller the elastic contrasts of backgroundscattering characteristics. However, in model 2, only the signal
energy shows an observable effect from fractures. media, the more observable the azimuthal AVO responses.
If the scattering is indeed caused by fracture heterogeneity,the seismic attributes of the signal frequency and amplitude
5 DISCUSSION AND CONCLUSIONSvariations with offset would allow one to discriminate between
the seismic responses at the tops and bases of fracturedAlthough most studies of scattering by heterogeneity in iso-tropic media have concentrated on transmitted waves, reflected reservoirs. The scattering field shows different scattering
characteristics at the tops and bases of the fractured reservoirs.waves are also valid indicators of the heterogeneity. The
© 2000 RAS, GJI 140, 251–266
Dow
nloaded from https://academ
ic.oup.com/gji/article/140/2/251/781144 by guest on 23 July 2022
262 F. Shen and M. Nafi T oksoz
At the tops of fractured reservoirs, the presence of fractures strength of signals. The background incoherent noise and/or
coherent noise have their own effects on this eigenanalysis-tends to decrease the frequency and vary the amplitude ofbased frequency estimator. If the data has incoherent noise,reflected waves. Also, the signal frequency decays smoothlythe properties of the frequency estimator are not precise, butwith offset, which results in the phenomenon that the coherentthey tend to be approximately so. The reason is that the(reflected) wavefield becomes insensitive to the specific fractureprincipal singular values of the signal in a correlation matrixdistribution or the fracture heterogeneity. Scattering character-composed of noisy samples tend to be larger than the smallestistics are comparable with properties of homogeneous fracturedsingular values of the noise (which were exactly zero in thereservoirs with the same mean fracture density. Therefore,noiseless case). The signal eigenvectors corresponding to thethe first-order effect of fracture heterogeneity on the offset-signal principal eigenvalues have fewer noise contributions thandependent frequency decay and amplitude variation is con-the noise subspace eigenvectors corresponding to the smallesttrolled by the mean fracture density. Unlike the seismicsingular values. If the coherent noise were coloured noise ratherresponse at the tops of heterogeneously fractured reservoirs,than white noise, the performance of the estimator would beat the bases of fractured reservoirs high-frequency secondarydegraded. However, the fundamental limitation to the perform-signal modes are generated and coherent waves become lessance of the estimator in practice is how well the signal and noisecoherent. Our results show that fracture heterogeneity has aeigenvalues can be separated from the noise-only eigenvalues.larger effect on the scattering field at the reservoir base. The
presence of secondary, higher-frequency signals and the loss of
coherence in reflected waves can be used to indicate scatteringACKNOWLEDGMENTSby fracture heterogeneity and are characteristics of a strong
scattering field. We are grateful to Dan Burns at MIT for reviewing this paperThe spatial variation of heterogeneity is another factor and for his helpful comments. We thank Jesus Sierra and
affecting scattering characteristics. Frankel & Clayton (1986) Franklin Ruiz at MIT for their helpful discussions. We thankshowed that the coda amplitude decreases strongly for the John Queen from Conoco Inc. for his enthusiastic encourage-exponential medium (equivalent to the Von Karman function ment and valuable comments. We also thank two reviewerswith roughness parameter 0.5) as the correlating distance for their helpful comments and recommendations on an earlier
draft. The 3-D finite difference modelling code was modifiedincreases. Our results show that the strength of the scatteringfrom Ningya Cheng’s code. This research was supported byfield at the base of a fractured reservoir is inversely proportionalthe Borehole Acoustics and Logging/Reservoir Delineationto the correlation length of the fracture density field andConsortium at MIT and by Science Research Laboratoryproportional to the scatterer (fracture) density. The strongest(Department of Energy Prime) grant DE-82066–223II-1.scattering characteristics in model 1 occur in the reservoir that
has the shortest correlation length in the fracture density field.
In the time domain, at the top of the reservoir, fractures onlyREFERENCESchange the P-wave reflectivity; there are no visible azimuthal
traveltime variations. However, at the reservoir base, in Aki, K., 1969. Analysis of seismic coda of local earthquakes as scatteredaddition to P-wave reflectivity variations, velocity fluctuations waves, J. geophys. Res., 74, 615–631.
Aki, K. & Chouet, B., 1975. Origin of coda waves, source attenuation,exist in the wave transmission and reflection processes.and scattering effects, J. geophys. Res., 80, 3322–3342.Azimuthal traveltime variations are observable at the bases of
Ata, E. & Michelena, R.J., 1995. Mapping distribution of fractures infractured reservoirs. At both the tops and bases of fractureda reservoir with P-S converted waves, L eading Edge, 12, 664–676.reservoirs, azimuthal amplitude variations in the time domain
Bienvenu, G. & Kopp, L., 1980. Adaptivity to background noiseare comparable with those estimated in the frequency domain.
spectral coherence for high resolution passive methods, Proc. IEEEWhilst this paper has attempted to quantify the scatter-
ICASSP, (Denver, CO), 307–310.ing characteristics in gas-saturated, heterogeneously fractured Blangy, J.P., 1994. AVO in transversely isotropic media—An overview,reservoirs, field reservoirs are, undoubtedly, even more Geophysics, 59, 775–781.complex. First, the background medium could be vertically Chang, C.H. & Gardner, G.H.F., 1993. Effects of vertically aligned
fractures on reflection amplitudes: an amplitudes-versus-offset study,and/or laterally heterogeneous. Second, anelastic attenuation63rd Ann. Int. Mtng SEG, Expanded Abstracts, 769–771.is important in determining the strength of the scattered events
Charrette, E.E., 1991. Elastic wave scattering in random media, PhDin the field data. The relative roles of apparent and intrinsicthesis, MIT, Cambridge, MA.attenuation, however, are not well understood. Third, we must
Cheng, N., Cheng, C.H. & Toksoz, M.N., 1995. Borehole waveconsider that some noisy events may be caused by conversions
propagation in three-dimensions, J. acoust. Soc. Am., 97, 3483–3493.between P and S waves. Relatively simple models, however, Chernov, L.A., 1960. Wave Propagation in a Random Medium, McGraw-can provide insights into the nature of scattering characteristics Hill, New York.and effects of the fracture density heterogeneity on seismic Clergeot, H., Tressens, S. & Ouamri, A., 1989. Performance of high
resolution frequencies estimation methods compared to the Cramer-responses.Rao bounds, IEEE T rans. Acoustics, Speech Signal Processing,This paper set out to clarify which scattering characteristicsASSP-37, 1703–1720.of heterogeneously fractured reservoirs can be determined from
Coates, R.T. & Charrette, E.E., 1993. A comparison of signal scatteringP-wave data. To do so, the high-resolution estimation methodand finite difference synthetic seismograms in realizations of 2-D
was needed to extract robust attributes related to fractures.elastic random media, Geophys. J. Int., 113, 463–482.
Assuming a high signal-to-noise ratio, the multiple signal Frankel, A. & Clayton, R.W., 1986. Finite-difference simulations ofclassification method known as the frequency estimator can seismic scattering: implications for the propagation of short-periodbe applied to field seismic data analyses to estimate the number seismic waves in the crust and models of crustal heterogeneity,
J. Geophys. Res., 91, 6465–6489.of signals, the frequency location of signals and the relative
© 2000 RAS, GJI 140, 251–266
Dow
nloaded from https://academ
ic.oup.com/gji/article/140/2/251/781144 by guest on 23 July 2022
Scattering characteristics in fractured reservoirs 263
Gibson, B.S. & Levander, A.R., 1988. Modeling and processing of Virieux, J., 1986. P-SV wave propagation in heterogeneous media:
velocity-stress finite difference method, Geophysics, 51, 889–901.scattered waves in seismic reflection surveys, Geophysics, 53,Wax, M. & Kailath, T., 1985. Detection of signals by information466–478.
theoretic criteria, IEEE T rans. Acoustics, Speech and SignalGoff, J.A. & Jordan, T.H., 1988. Stochastic modeling of seafloor-Processing, ASSP-33, 387–392.morphology: inversion of sea beam data for second-order statistics,
Wax, M. & Ziskind, I., 1989. On unique localization of multipleJ. geophys. Res., 93, 13 589–13 608.sources by passive sensor arrays, IEEE T rans. Acoustics, Speech andGroenenboom, J. & Snieder, R., 1995. Attenuation, dispersion, andSignal Processing, ASSP-37, 996–1000.anisotropy by multiple scattering of transmitted waves through
Wu, R.S. & Aki, K., eds, 1990. Scattering and Attenuation of Seismicdistributions of scatters, J. acoust. Soc. Am., 98, 3482–3492.Waves, Birkhauser, Basel.Hudson, J.A., 1981. Wave speeds and attenuations of elastic waves in
material containing cracks, Geophys. J. R. astr. Soc., 64, 133–150.
Hudson, J.A., Liu, E. & Crampin, S., 1996. Transmission properties of APPENDIX A: FREQUENCY ESTIMATORSa plan fault, Geophys. J. Int., 125, 559–566.
Ikelle, L.T., Yung, S.K. & Daube, F., 1993. 2-D random media with Seismic signals can be described as the convolution of theellipsoidal autocorrelation functions, Geophysics, 58, 1359–1372. reflection sequence {a
i} with the wavelet W
i(t),
Jeffries, D.J. & Farrier, D.R., 1985. Asymptotic results for eigenvector
methods, Proc. Inst. Elec. Eng., F, 132, 589–594. Y (t)= ∑K−1i=0
aiWi(t−t
i) . (A1)
Johnson, D.H. & DeGraaf, S.R., 1982. Improving the resolution of
bearing in passive sonar arrays by eigenvalue analysis, IEEE T rans. Because our interest is in the frequency domain, consider theAcoustics, Speech Signal Processing, ASSP-30, 638–647.
Fourier transform of the seismic signals over time:Levander, A., England, R.W., Smith, S.K., Hobbs, R.W., Goff, J.A. &
Holliger, K., 1994. Stochastic characterization and seismic responseY ( f )= ∑
K−1i=0
aiexp(−j2p f t
i)W
i( f ) . (A2)
of upper and middle crustal rocks based on the Lewisian gneiss
complex, Scotland, Geophys. J. Int., 119, 243–259.Assuming we have equally sampled data, the delays t
iwill beLiu, E., MacBeth, C., Point, C. & Hudson, J.A., 1996. The effective
of the form iT , so Y ( f ) becomeselastic compliance of fractured rock, 66th Ann. Int., Mtg, Soc. Expl.
Geophys., Expanded Abstracts, 1842–1845.Y ( f , T )= ∑
K−1i=0
aiexp (−j2p f iT )W
i( f ) . (A3)Lynn, H.B., Bates, C.R., Simon, K.M. & van Dok, R., 1995. The effects
of azimuthal anisotropy in P-wave 3-D seismic, 65th Ann. Int. Mtg,
Soc. Expl. Geophys., Expanded Abstracts, 723–730. We assume that recorded seismic waveforms X( f , T ) consistPerez, M. & Gibson, R., 1996. Detection of fracture orientation of Y ( f , T ) and complex-valued noise N( f ):
using azimuthal variation of P-wave AVO responses: Barinas fieldX( f , T )=Y ( f , T )+N( f ) . (A4)(Venezuela), 66th Ann. Int. Mtg, Soc. Expl. Geophys., Expanded
Abstracts, 1353–1356. The eigenvectors of the pth-order correlation data matrix RpPorat, B. & Friedlander, B., 1988. Analysis of the asymptotic relative calculated from X are defined by the property
efficiency of the MUSIC algorithms in resolving plane waves in
RpVi=l
iVi, i=1, 2, … , p , (A5)noise, IEEE T rans. Acoustics, Speech Signal Processing, ASSP-36,
532–544.where l
iis the eigenvalue associated with the eigenvector V
i.
Ramos, A.C.B. & Davis, T.L., 1997. 3-D AVO analysis and modelingAssume that the output contains the signal and noise, whichapplied to fracture detection in coalbed methane reservoirs,are uncorrelated to each other. The data matrix R
pcan beGeophysics, 62, 1683–1695.
expressed as the sum of a signal correlation matrix and a noiseRichards, P.G. & Menke, W., 1983. The apparent attenuation of acorrelation matrix. If there are M independent signals in whitescattering medium, Bull. seism. Soc. Am., 73, 1005–1022.noise, the correlation matrix can be written asRutherford, S.R. & Williams, M.W., 1989. Amplitude-versus-offset
variations in gas sands, Geophysics, 54, 680–688.
Sayers, C.M. & Rickett, J., 1997. Azimuthal variation in AVO response Rp= ∑
M
i=1risisHi+s
wI , (A6)
for fractured gas sands, Geophys. Prospect., 45, 165–182.
Schmidt, R., 1979. Multiple emitter location and signal para- in which riis the power of the ith signal and s
wis the power
meter estimation, in Proc. RADC Spectral Estimation Workshop of the noise. I is a identity matrix equal to the dimension pxp(Rome, NY), 243–258. of the correlation matrix R
pand s
iis a signal vector of
Schmidt, R., 1986. Multiple emitter location and signal parameter dimensional p with the frequency informationestimation, IEEE T rans. Antennas Propagation, AP-34, 276–280.
Schoenberg, M. & Sayers, C.M., 1995. Seismic anisotropy of fractured
rock, Geophysics, 60, 204–211.
Shen, F., Zhu, X. & Toksoz, M.N., 1997. Anisotropy of alignedSi= K 1
exp ( j2p fiT )
…
exp ( j2p fi( p−1)T )
K . (A7)fractures and P-wave azimuthal AVO response, 67th Ann. Int. Mtg,
Soc. Expl. Geophys., Expanded Abstracts, 2001–2004.
Teng, L. & Mavko, G., 1996. Fracture signatures on P-wave AVOZ,
66th Ann. Int. Mtg, Soc. Expl. Geophys., Expanded Abstracts,The signal matrix will have eigendecomposition in which
1818–1821.the eigenvalues have been ordered in decreasing valueToksoz, M.N. & Charrette, E.E., 1990. Effects of random hetero-l1≥l2…≥l
pand the eigenvectors are orthonormal. It cangeneities on seismic waves: implications for determination of
be shown that a matrix of dimension P with rank M<P willreservoir heterogeneities, Soc. Expl. Geophys., Japan Int. Conferencehave P−M zero eigenvalues. The M largest eigenvectorson Geotomography, 425.correspond to the signal terms and the P−M smallest areViberg, M. & Ottersten, B., 1991. Sensor array processing based on
subspace fitting, IEEE T rans. Signal Processing, 39, 1110–1121. orthogonal to all of the signal direction vectors. Thus, the
© 2000 RAS, GJI 140, 251–266
Dow
nloaded from https://academ
ic.oup.com/gji/article/140/2/251/781144 by guest on 23 July 2022
264 F. Shen and M. Nafi T oksoz
signal autocorrelation matrix can be written asAPPENDIX C: 3-D FINITE DIFFERENCETESTS
Sp= ∑
M
i=1pisisHi= ∑
M
i=1liViV Hi
. (A8)The errors in finite difference methods can produce effects in
errors are not significant and that they are not contaminatingThe alternative expression of the identity matrix in terms ofour results.orthogonal eigenvectors is
The 3-D finite difference time-domain algorithm used here
is described by Cheng et al. (1995), who computed the finiteI= ∑P
i=1ViV Hi
. (A9)difference synthetics for borehole wave propagation in isotropicas well as anisotropic formations. Comparison of the finite
Rp
can be written in the formdifference results with analytic solutions of a point force sourcein a homogeneous transversely isotropic medium showed very
Rp= ∑
M
i=1liViV Hi+ ∑
P
i=1swViV Hi
, (A10)good agreement. The seismograms and the snapshot showed
the good performance of Higdon’s absorbing boundary con-dition in the anisotropic medium with properly chosenR
p= ∑
M
i=1(li+s
w)ViV Hi+ ∑
P
i=M+1swViV Hi
. (A11)velocities.
To prove that the anisotropic behaviour of reflectivity is dueThe eigenvectors VM+1 , … , V
Pspan the noise subspace of R
p,
to fractures rather than to the finite difference scheme we calcu-all with identical eigenvalues, sw. The principal eigenvectors
late reflected synthetic seismograms in the x- and y-directionsV1 , V 2 , … , VM
span the signal subspaces of both Rp
and Sp for unfractured (isotropic) and fractured (anisotropic) reservoirs.with eigenvalues (l
i+s
w). Note that the eigenvectors are
The seismic waves are generated by an explosive source, and theorthogonal and that the principal eigenvectors span thesource–receiver seismograms similar to those of attenuation,same subspace of the signal vectors. The signal vectors aredispersion and anisotropy. Therefore, it is necessary to ensureorthogonal to all the vectors in the noise subspace, i.e.that the geometry is the same as that shown in Fig. 1. The
elastic parameters of model 1 are used in our test (Table 1).sHi( f )A ∑
P
k=M+1akVkB=0 (1≤i≤M) . (A12)
This property forms the basis of the noise subspace frequencyestimators.
APPENDIX B: MODEL ORDER SELECTION
Because the best choice for the number of signals is not
generally known a priori, in practice it is usually necessary toestimate the model order M based on some theoretical criteria
to make M close to the actual value. Minimum descriptionlength (MDL) order selection criteria, expanded by Wax &Kailath (1985) and Wax & Ziskind (1989), are used to handle
the subspace separation problem. Assuming that l1>l2 , … , lp
are eigenvalues of the correlation matrix R, M<P, where Mis the number of signals (model order), and N is the number
of data samples,
MDL (M)=−lnA aP
i=M+1li
1
(P−M)
1
P−M∑P
i=M+1li B(P−M)N
+1
2M(2P−M) ln(N) . (B1)
The number of signals is determined as the value ofM3{0, 1, 2, … , P−1} for which MDL is minimized. Johnson
& DeGraaf (1982) studied the sensitivity of multiple signal
sample (0.0004s)
sample (0.0004s)
600650
700750
0 5 10 15 20 25 30 35 40
traces
600650
700750
0 5 10 15 20 25 30 35 40
traces
offset (m)
0 40 80 120 160 200 240 280 320
0 40 80 120 160 200 240 280 320
offset (m)
classification and the eigenvector algorithm through simu-Figure C1. (Upper plot) Vertical-component seismograms reflectedlations. Their results indicate that the eigenvector algorithmfrom the homogeneous unfractured reservoir. Dotted lines represent
estimator is less sensitive to the choice of M and producesseismograms in the y-direction and solid lines represent seismograms
fewer spurious peaks than multiple signal classification esti-in the x-direction. (Lower plot) Vertical-component seismograms
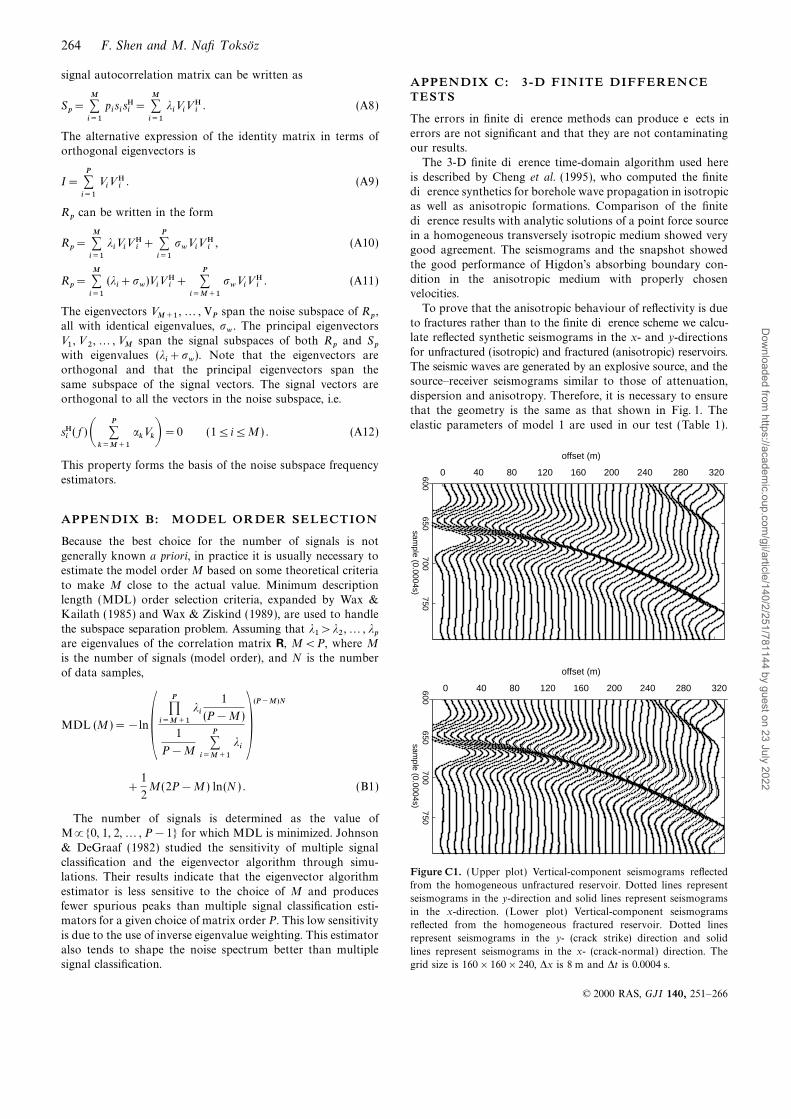
mators for a given choice of matrix order P. This low sensitivity reflected from the homogeneous fractured reservoir. Dotted linesis due to the use of inverse eigenvalue weighting. This estimator represent seismograms in the y- (crack strike) direction and solidalso tends to shape the noise spectrum better than multiple lines represent seismograms in the x- (crack-normal ) direction. The
grid size is 160×160×240, Dx is 8 m and Dt is 0.0004 s.signal classification.
© 2000 RAS, GJI 140, 251–266
Dow
nloaded from https://academ
ic.oup.com/gji/article/140/2/251/781144 by guest on 23 July 2022
Scattering characteristics in fractured reservoirs 265
0 100 200 300 4000
100
200
300
400
x (m)
y (m
)
Vz component (isotropic)
1.6
1.7
1.8
1.9
2
x 10−8
0 100 200 300 4000
100
200
300
400
x (m)
y (m
)
Vz component (Gas,5%)
1.6
1.7
1.8
1.9
2
2.1
x 10−8
0 100 200 300 4000
100
200
300
400
x (m)
y (m
)
Vz component (Gas,10%)
1.5
1.6
1.7
1.8
1.9
2
2.1
x 10−8
0 100 200 300 4000
100
200
300
400
x (m)
y (m
)
Vz component (Gas,15%)
1.5
1.6
1.7
1.8
1.9
2
2.1
x 10−8
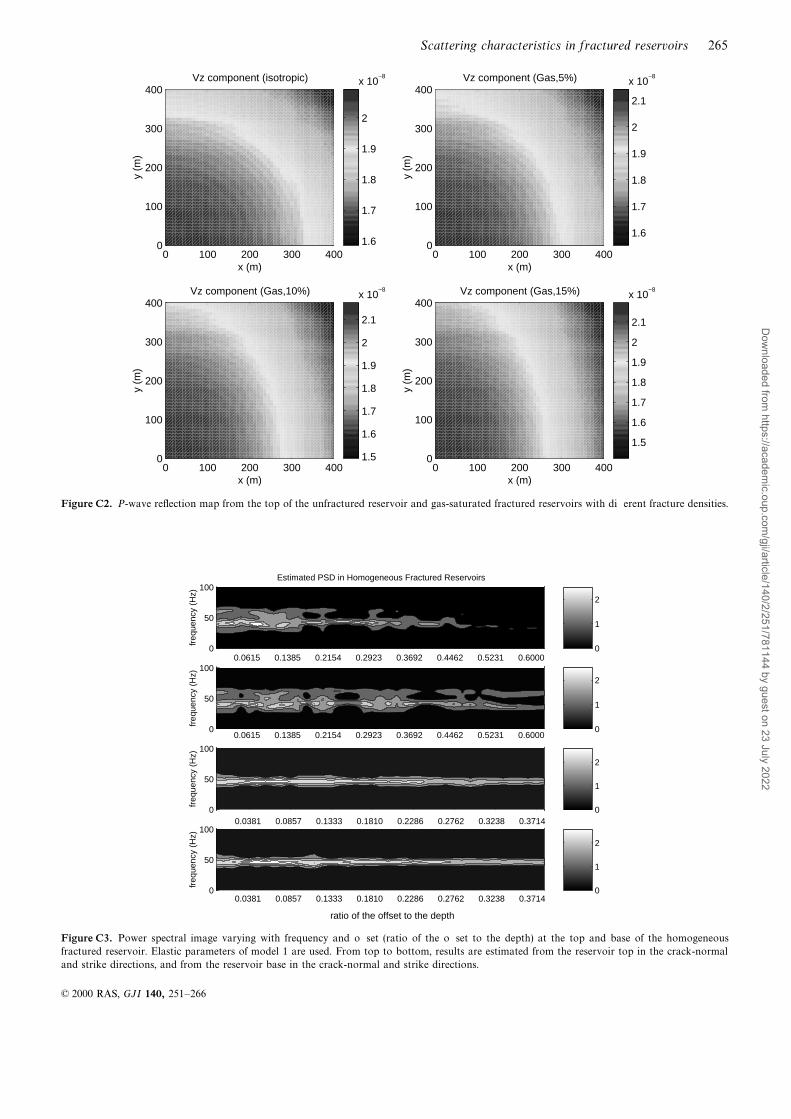
Figure C2. P-wave reflection map from the top of the unfractured reservoir and gas-saturated fractured reservoirs with different fracture densities.
5 10 15 20 25 30 35 400
50
100
freq
uenc
y (H
z)
Estimated PSD in Homogeneous Fractured Reservoirs
0
1
2
5 10 15 20 25 30 35 400
50
100
freq
uenc
y (H
z)
0
1
2
5 10 15 20 25 30 35 400
50
100
freq
uenc
y (H
z)
0
1
2
5 10 15 20 25 30 35 400
50
100
offset
freq
uenc
y (H
z)
0
1
2
0.0381 0.0857 0.1333 0.1810 0.2286 0.2762 0.3238 0.3714
0.0381 0.0857 0.1333 0.1810 0.2286 0.2762 0.3238 0.3714
0.0615 0.1385 0.2154 0.2923 0.3692 0.4462 0.5231 0.6000
0.0615 0.1385 0.2154 0.2923 0.3692 0.4462 0.5231 0.6000
ratio of the offset to the depth
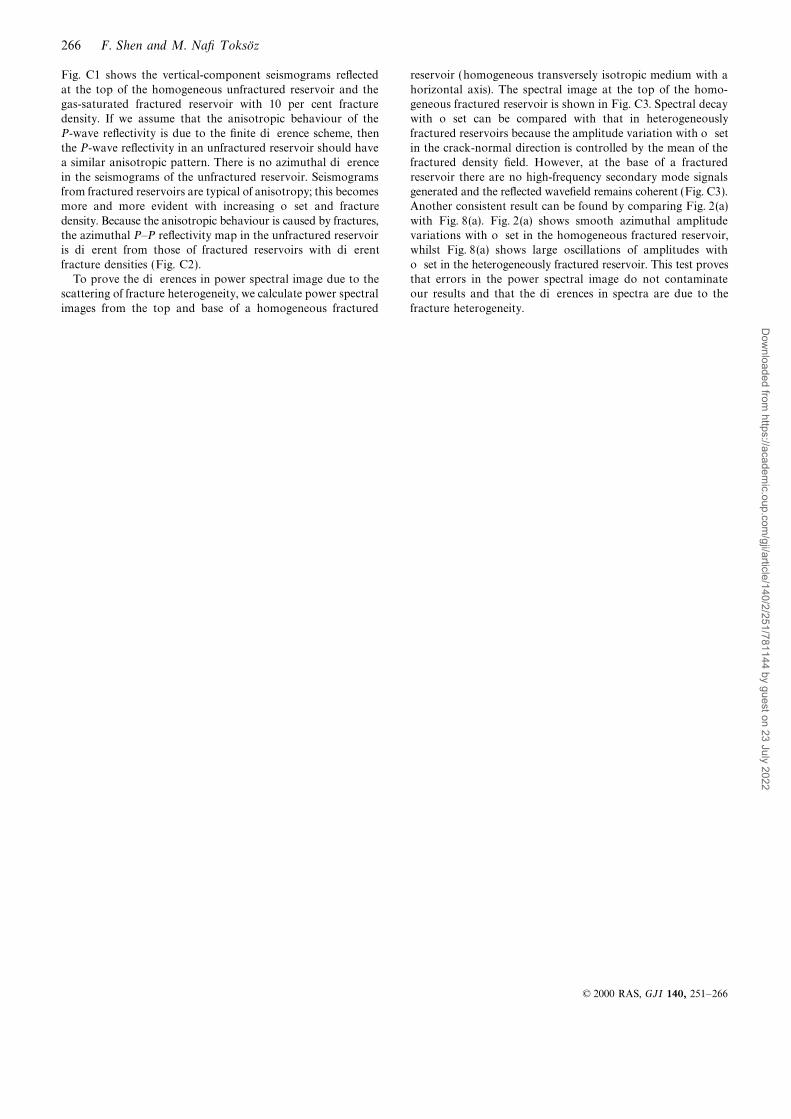
Figure C3. Power spectral image varying with frequency and offset (ratio of the offset to the depth) at the top and base of the homogeneous
fractured reservoir. Elastic parameters of model 1 are used. From top to bottom, results are estimated from the reservoir top in the crack-normal
and strike directions, and from the reservoir base in the crack-normal and strike directions.
© 2000 RAS, GJI 140, 251–266
Dow
nloaded from https://academ
ic.oup.com/gji/article/140/2/251/781144 by guest on 23 July 2022
266 F. Shen and M. Nafi T oksoz
Fig. C1 shows the vertical-component seismograms reflected reservoir (homogeneous transversely isotropic medium with a
horizontal axis). The spectral image at the top of the homo-at the top of the homogeneous unfractured reservoir and thegas-saturated fractured reservoir with 10 per cent fracture geneous fractured reservoir is shown in Fig. C3. Spectral decay
with offset can be compared with that in heterogeneouslydensity. If we assume that the anisotropic behaviour of the
P-wave reflectivity is due to the finite difference scheme, then fractured reservoirs because the amplitude variation with offsetin the crack-normal direction is controlled by the mean of thethe P-wave reflectivity in an unfractured reservoir should have
a similar anisotropic pattern. There is no azimuthal difference fractured density field. However, at the base of a fractured
reservoir there are no high-frequency secondary mode signalsin the seismograms of the unfractured reservoir. Seismogramsfrom fractured reservoirs are typical of anisotropy; this becomes generated and the reflected wavefield remains coherent (Fig. C3).
Another consistent result can be found by comparing Fig. 2(a)more and more evident with increasing offset and fracture
density. Because the anisotropic behaviour is caused by fractures, with Fig. 8(a). Fig. 2(a) shows smooth azimuthal amplitudevariations with offset in the homogeneous fractured reservoir,the azimuthal P–P reflectivity map in the unfractured reservoir
is different from those of fractured reservoirs with different whilst Fig. 8(a) shows large oscillations of amplitudes with
offset in the heterogeneously fractured reservoir. This test provesfracture densities (Fig. C2).To prove the differences in power spectral image due to the that errors in the power spectral image do not contaminate
our results and that the differences in spectra are due to thescattering of fracture heterogeneity, we calculate power spectral
images from the top and base of a homogeneous fractured fracture heterogeneity.
© 2000 RAS, GJI 140, 251–266
Dow
nloaded from https://academ
ic.oup.com/gji/article/140/2/251/781144 by guest on 23 July 2022


