Embed Size (px)
Citation preview

UNIVERSITY OF CALIFORNIA
Los Angeles
Fractured Politics: The Evolution of Oil and
Gas Well Stimulation Regulation in California
A dissertation submitted in partial satisfaction of the
requirements for the degree Doctor of Philosophy
in Urban Planning
by
Adam John Dorr
2017

© Copyright by
Adam John Dorr
2017

ii
ABSTRACT OF THE DISSERTATION
Fractured Politics: The Evolution of Oil and
Gas Well Stimulation Regulation in California
by
Adam John Dorr
Doctor of Philosophy in Urban Planning
University of California, Los Angeles, 2017
Professor Susanna B. Hecht, Chair
California has been an oil and gas state throughout its history. In the latter half of 19th
Century and first half of the 20th Century, hydrocarbon extraction helped define both Californian
prosperity and the early promise of the West. Many decades later, the Energy Act of 2005 helped
to revitalize domestic oil and gas production by exempting a suite of new “enhanced recovery
techniques” for well stimulation, commonly referred to as “fracking”, under major federal
environmental regulations. This dissertation research engages the subsoil political ecology of
California’s petroleum sector in order to explain how well stimulation regulation evolved in
California following the rapid deployment of fracking technology across the country that

iii
triggered a decade of “Shale Revolution” beginning in 2006. Well stimulation in California
represents a case study of the intensely politicized and contested evolution of extractive regimes
and their environmental governance at subnational scales in the wake of disruptive technological
change. The embedded single-case design employed in this research targets two units of analysis:
regulation and frames. Regulation is analyzed using Governance and Political Economy Analysis
to assess the structural, institutional, and stakeholder dynamics of California’s oil and gas sector,
while frames are analyzed using Frame Analysis of news media and semi-structured open-ended
interviews to examine how discourse coalitions construct narratives with which to advance their
agendas. This dissertation research contributes to the academic literatures relating to energy
systems and their sociotechnical transitions by situating the case of well stimulation regulation in
California within the substantive, theoretical, and philosophical debates surrounding the
environmental governance of extraction.

iv
The dissertation of Adam John Dorr is approved.
Paul M. Ong
Randall D. Crane
Franklin D. Gilliam, Jr.
Susanna B. Hecht, Committee Chair
University of California, Los Angeles
2017

v
For my grandparents and parents who led the way,
for my wife who travelled with me,
and for my children so they may follow.

vi
Table of Contents
List of Figures ................................................................................................................................. x
Acronyms ..................................................................................................................................... xiv
Chapter 1. Introduction ................................................................................................................... 1
Problem Statement ...................................................................................................................... 2
Research Questions ..................................................................................................................... 4
Dissertation Structure.................................................................................................................. 5
Chapter 2. Background ................................................................................................................... 7
The Shale Revolution .................................................................................................................. 7
Enhanced Recovery Techniques, Well Stimulation, and Fracking ........................................... 12
Perforating............................................................................................................................. 16
Waterflooding ....................................................................................................................... 24
Chemical Flooding ................................................................................................................ 26
Hydraulic Fracturing ............................................................................................................. 30
Acidizing ............................................................................................................................... 34
Thermal ................................................................................................................................. 35
Gas Injection ......................................................................................................................... 36
Directional Drilling ............................................................................................................... 36
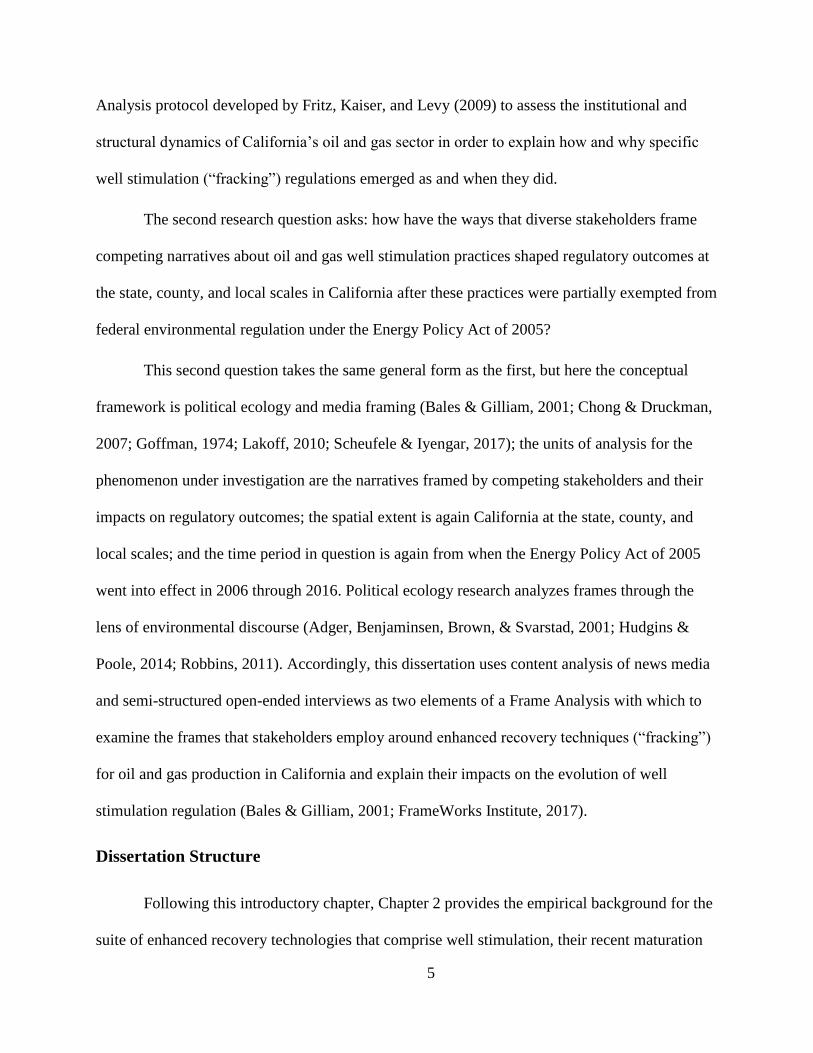
Well Completion and Flowback ............................................................................................... 40
Environmental Impact ............................................................................................................... 42
Geographic Footprint ............................................................................................................ 43
Air Pollution.......................................................................................................................... 45
Water Pollution, Soil Contamination, and Waste Management ........................................... 46
Noise Pollution...................................................................................................................... 50
Water and Resource Use ....................................................................................................... 52
Induced Seismicity ................................................................................................................ 54
Greenhouse Gas Emissions and Climate Change ................................................................. 56
Chapter 3. Literature Review ........................................................................................................ 59
Political Ecology ....................................................................................................................... 59
Political Ecology of the Subsurface ...................................................................................... 63
Political Ecology of Fracking ............................................................................................... 65
Adaptive Governance................................................................................................................ 69
Anticipatory Governance .......................................................................................................... 72

vii
Sociotechnical Transitions ........................................................................................................ 74
Media Framing .......................................................................................................................... 77
Framing Fracking .................................................................................................................. 80
Chapter 4: California Historical Context ...................................................................................... 82
Pre-History and Early Years of Oil and Gas in California ....................................................... 82
Drilling for Oil .......................................................................................................................... 87
The Standard Model .................................................................................................................. 91
Natural Gas ............................................................................................................................... 94
California Begins Producing Oil ............................................................................................. 100
New Petroleum Products for New Markets ............................................................................ 107
The Los Angeles City Oil Field .............................................................................................. 108
Oil Beyond the Los Angeles and Ventura Fields .................................................................... 112
The Monterey Shale Formation .............................................................................................. 122
Tidelands and Offshore Oil ..................................................................................................... 126
The Santa Barbara Oil Spill of 1969 ....................................................................................... 131
Natural Gas in California ........................................................................................................ 138
Enhanced Recovery Techniques in California ........................................................................ 139
Property Rights and Taxation ................................................................................................. 142
Chapter 5. Methodology ............................................................................................................. 146
Rationale ................................................................................................................................. 146
Case Context and Case Study ................................................................................................. 148
Unit of Analysis: Regulation .................................................................................................. 149
Unit of Analysis: Frames ........................................................................................................ 150
Data ......................................................................................................................................... 151
Chapter 6. Findings ..................................................................................................................... 153
Introduction ............................................................................................................................. 153
Scientists in Conflict ........................................................................................................... 153
History Rhymes in California ............................................................................................. 155
Research Questions ............................................................................................................. 158
GPE Analysis Findings Part 1: Structural Factors .................................................................. 159
Scale .................................................................................................................................... 160
Property Rights ................................................................................................................... 167
Federal Lands and Leases ................................................................................................... 168
State and Other Public Lands .............................................................................................. 171

viii
Geographies ........................................................................................................................ 172
Class Dynamics ................................................................................................................... 209
Markets and Cost Structures ............................................................................................... 215
Changing Energy Technologies .......................................................................................... 221
GPE Analysis Findings Part 2: Institutions ............................................................................ 228
Public Agencies .................................................................................................................. 231
Legislation........................................................................................................................... 235
Ballot Measures and Initiatives ........................................................................................... 244
Informal Institutions............................................................................................................ 245
GPE Analysis Findings Part 3: Stakeholders .......................................................................... 247
Industry Firms and Trade Associations .............................................................................. 247
Local Community Groups................................................................................................... 249
NGOs .................................................................................................................................. 250
Think Tanks ........................................................................................................................ 251
Elected Representatives ...................................................................................................... 252
Frame Analysis Findings ........................................................................................................ 252
Supporting Orientation........................................................................................................ 255
Opposing Orientation .......................................................................................................... 258
Discussion ............................................................................................................................... 261
Scientific Uncertainty ......................................................................................................... 262
The Prospect of Promise and Peril ...................................................................................... 266
Institutional Credibility and Legitimacy ............................................................................. 270
Politicization, Polarization, and Identity ............................................................................. 274
Technological Transition and Disruption ........................................................................... 279
Competing Narratives ......................................................................................................... 284
Legislative Outcomes: Arriving at SB 4 ............................................................................. 285
The Aftermath ..................................................................................................................... 291
Limitations .......................................................................................................................... 297
Chapter 7. Conclusion ................................................................................................................. 299
Situating Fracking in California within Substantive Debates ................................................. 300
Situating Fracking in California within Theoretical Debates ................................................. 302
Situating Fracking in California within Philosophical Debates .............................................. 303
Toward a Political Ecology of Sociotechnical Transition ...................................................... 306
Appendix A. Interview Questionnaire Instrument ...................................................................... 308

ix
Interviewee Recruitment Email Template .............................................................................. 315
Appendix B. GPE Analysis Questions........................................................................................ 316
Sectoral Factors ....................................................................................................................... 316
Institutions............................................................................................................................... 317
Appendix C. Annotated Legislative Timeline ............................................................................ 318
Appendix D: California NGOs and Groups Opposed to Fracking ............................................. 328
Bibliography ............................................................................................................................... 333

x
List of Figures
Figure 1: U.S. Oil and Natural Gas Production 1900-2016. ........................................................... 8 Figure 2: U.S. Oil and Natural Gas Prices 1900-2016. ................................................................. 10 Figure 3: U.S. Oil and Natural Gas Production from Hydraulically Fractured Wells, 2000-2015.
....................................................................................................................................................... 11
Figure 4: Chronology of Enhanced Oil Recovery Techniques. .................................................... 13 Figure 5: Conventional and Unconventional Hydrocarbon Deposits. .......................................... 15 Figure 6: Oil-Bearing Shale. ......................................................................................................... 16 Figure 7: Roberts Torpedo Memorial. .......................................................................................... 17 Figure 8: Roberts Torpedo Patent Drawing. ................................................................................. 18
Figure 9: Oilfield “Shooter” Preparing Nitroglycerin for a Pennsylvania Well, Circa 1870s. ..... 19 Figure 10: Project Gasbuggy 29 Kiloton Nuclear Warhead. ........................................................ 20
Figure 11: Project Gasbuggy Well Pad. ........................................................................................ 21 Figure 12: Perforating Gun Featured in Popular Science Monthly, 1938. ................................... 22
Figure 13: A Modern Perforating Gun.......................................................................................... 23 Figure 14: Illustration of a Modern Perforating Gun in Action. ................................................... 23 Figure 15: Long Beach Harbor Region High Tide Flooding from Land Subsidence, 1953. ........ 26
Figure 16: Popular Mechanics Magazine Article Describing Chemical Flooding. ...................... 28 Figure 17: Hydraulic Fracturing. .................................................................................................. 32
Figure 18: Cyclic Steam Injection. ............................................................................................... 35 Figure 19: Popular Science Monthly Article on Directional Drilling........................................... 37 Figure 20: Pad Drilling. ................................................................................................................ 40
Figure 21: A Well Pad with Multiple “Christmas Tree” Wellheads and On-Site Storage Tanks
after Well Completion................................................................................................................... 41 Figure 22: Lined Wastewater Storage Pit in Arkansas. ................................................................ 42 Figure 23: Vertical Wells in the South Belridge Oil Field in Kern County, California. .............. 44
Figure 24: Pad Drilling with Hydraulic Fracturing in Upper Green River Valley, Wyoming. .... 45 Figure 25: Illustration of Well Casing. ......................................................................................... 47
Figure 26: Spraying Wastewater Brine as a De-Icing Treatment in West Virginia. .................... 50
Figure 27: A Well Pad Sound Barrier in Kern County, California. .............................................. 51 Figure 28: Pattison Sand Co. Surface Mine in Clayton, Iowa. ..................................................... 53 Figure 29: Cumulative Number of Earthquakes in Eastern and Central United States of
Magnitude 3.0 and Greater 1970-2013. ........................................................................................ 55 Figure 30: Oklahoma Earthquakes of Magnitude 3.0 or Greater, 1978-2016. ............................. 56
Figure 31: Stylized Representation of Oil and Gas Resource Categorizations (not to scale). ...... 57
Figure 32: Attractor Basins in Social-Ecological System States. ................................................. 71
Figure 33: Multi-Level Perspective (MLP) Theory of Sociotechnical Transition. ...................... 76 Figure 34: 1913 Replica of a Chumash Tomol with Asphaltum Caulking................................... 83 Figure 35: Pit and Tunnel Mining for Asphaltum in McKittrick, California. .............................. 85 Figure 36: Asphaltum Excavation in McKittrick, Calfiornia. ...................................................... 86 Figure 37: Entrance to an Asphaltum Mine in McKittrick, California. ........................................ 86
Figure 38: Entrance to a Stanford Slanting Tunnel in Ventura County, California. .................... 87 Figure 39: Depiction of Salt Drilling in Sichuan Province, Song Dynasty (AD 940 to 1279). .... 88 Figure 40: “Colonel” Edwin Drake. .............................................................................................. 89

xi
Figure 41: Price of Oil per Barrel (CPI Inflation-Adjusted 2016 USD), 1860 to 2016. ............... 91
Figure 42: The Eternal Fire at Baba Gurgur in Northern Iraq. ..................................................... 95
Figure 43: The First Gas Street Lamp in America. ....................................................................... 97 Figure 44: Flaring Natural Gas in North Dakota. ......................................................................... 98 Figure 45: Satellite Imagery Showing Gas Flaring in North Dakota’s Bakken Oil Fields........... 99 Figure 46: Thomas Bard. ............................................................................................................ 101 Figure 47: Diagram of the Sulphur Mountain Oil Formation in Ventura County, California. ... 102
Figure 48: California Star Oil Works Pico No. 4 in Pico Canyon. ............................................. 103 Figure 49: 19th Century California Oil Production. ................................................................... 104 Figure 50: Point Alameda Oil Refinery in San Francisco Bay, Circa 1880. .............................. 105 Figure 51: The Great California Lakeview Gusher of 1909. ...................................................... 107 Figure 52: Court Street in the Los Angeles City Oil Field, Circa Late-1890s............................ 109
Figure 53: “Forest” of Derricks in the Los Angeles City Oil Field, 1908. ................................. 110
Figure 54: Los Angeles City Oil Field with Seven Wells Listed as Active in 2017. ................. 110 Figure 55: Emma Summer, the “Oil Queen” of California. ....................................................... 112
Figure 56: Aerial View of Signal Hill, Circa 1930. .................................................................... 113
Figure 57: “Tribute to Roughnecks” Sculpture by Cindy Jackson at Signal Hill. ...................... 114 Figure 58: Oil Derricks at Venice Beach, Circa 1952. ............................................................... 115 Figure 59: Huntington Beach in 1928 and 2015. ........................................................................ 116
Figure 60: Los Angeles County and Orange County Oil Fields. ................................................ 117 Figure 61: Teamsters Hauling Oil from Kern River into Bakersfield, Circa 1901. .................... 118
Figure 62: Kern River Oil Field, 2009. ....................................................................................... 119 Figure 63: Aerial View of Kern River Oil Field, 2012. .............................................................. 120 Figure 64: California Oil and Gas Fields. ................................................................................... 122
Figure 65: Monterey Shale Basins. ............................................................................................. 124 Figure 66: Folded Sedimentary Layers of a Surface Outcropping of the Monterey Formation. 125
Figure 67: Summerland Oil Field Drilling Derricks, 1902. ........................................................ 126 Figure 68: Summerland Oil Field Drilling Site, 2009. ............................................................... 127
Figure 69: Rincon Island in the Santa Barbara Channel. ............................................................ 130 Figure 70: THUMS Offshore Facility Grissom Island at Long Beach Harbor. .......................... 131
Figure 71: Map of 1969 Santa Barbara Oil Spill. ....................................................................... 132 Figure 72: Aerial View of the 1969 Santa Barbara Oil Spill. ..................................................... 133 Figure 73: State Forestry Conservation Crews on a Beach in Santa Barbara. ............................ 134
Figure 74: A Surfer at a Santa Barbara Beach, 1969. ................................................................. 134 Figure 75: Oil Seeps on the Ocean Floor. ................................................................................... 135 Figure 76: Western Region Natural Gas Pipeline Network. ....................................................... 139
Figure 77: Tidal Flooding from Land Subsidence at the Wilmington Oil Field, Circa 1950s. .. 140 Figure 78: Enhanced Recovery Techniques Commonly Used in California .............................. 142
Figure 79: Case Study Design..................................................................................................... 146 Figure 80: Members of the State Geological Survey of California, 1860. ................................. 154 Figure 81: Professor Benjamin Silliman Junior, 1865. ............................................................... 155 Figure 82: Monterey Shale Unproved Technically Recoverable Tight Oil Reserve Estimates. 157 Figure 83: Smog and Oil Industry Protest at Pasadena Civic Auditorium, October 1954. ........ 162
Figure 84: Smog Obscuring Los Angeles City Hall and the Hall of Justice, 1968. ................... 163 Figure 85: Bureau of Land Management Website Home Page. ................................................. 166 Figure 86: Federal Lands in California. ...................................................................................... 169

xii
Figure 87: A Well Pad in Los Padres National Forest, 2016. ..................................................... 171
Figure 88: Monterey Formation Shale Plays with Agriculture and Urban Development. ......... 174
Figure 89: Urban Oil Wells in the Greater Los Angeles Metropolitan Area. ............................. 175 Figure 90: Oil Pumpjacks in Baldwin Hills. ............................................................................... 176 Figure 91: Pumpjacks Near Signal Hill. ..................................................................................... 177 Figure 92: Pumpjacks Adjacent to Coastal Homes in Huntington Beach. ................................. 178 Figure 93: Permitted Location 1 for Well Stimulation Treatment, Placentia. ............................ 179
Figure 94: Permitted Location 2 for Well Stimulation Treatment, Placentia. ............................ 179 Figure 95: Permitted Location 3 for Well Stimulation Treatment, Placentia. ............................ 180 Figure 96: Permitted Locations for Well Stimulation Treatment, Placentia. ............................. 181 Figure 97: The Richfield Oil Field with Inset Well Stimulation Locations, Placentia. .............. 182 Figure 98: Los Angeles County and Orange County 2016 Presidential Election Map. ............. 184
Figure 99: Los Angeles Metropolitan Area Median Income (2012 USD) and Oil Wells. ......... 185
Figure 100: AllenCo Energy Site in University Park Neighborhood, Los Angeles. .................. 187 Figure 101: Los Angeles Metropolitan Area NATA Respiratory Hazard Index and Oil Wells. 188
Figure 102: Freeport-McMoRan Site in Jefferson Neighborhood, Los Angeles. ....................... 189
Figure 103: Jefferson Community Protests led by USC Students, Los Angeles. ....................... 190 Figure 104: San Joaquin Basin and Shale Play. .......................................................................... 191 Figure 105: Colocation of Agriculture and Oil Wells in California, Circa 1911. ...................... 192
Figure 106: Oil Wells in Agricultural Fields Near Kern River, California. ............................... 193 Figure 107: Colocation of Agriculture and Oil Wells in Kern County, California. ................... 194
Figure 108: Unlined Wastewater Storage Pit 1 in Kern County, California. ............................. 195 Figure 109: Unlined Wastewater Storage Pit 2 in Kern County, California. ............................. 196 Figure 110: Unlined Wastewater Storage Pits in Kern County, California. ............................... 197
Figure 111: Oil and Gas Wastewater Storage and Disposal Pits in Kern County, California. ... 198 Figure 112: Percent Area of California Land Under U.S. Drought Monitor Categories. ........... 200
Figure 113: Histogram of Water Use per Well stimulation Treatment in California. ................ 201 Figure 114: Summerland Oil Wells, Circa 1903. ....................................................................... 203
Figure 115: Federal and State Offshore Oil and Gas Fields in the Santa Maria-Ventura Basin. 204 Figure 116: Santa Barbara and Ventura Coastal Oil Wells (Active and Inactive). .................... 205
Figure 117: Federal Offshore Crude Oil Production in California, 1981 to 2017. ..................... 206 Figure 118: Refugio Oil Spill, 2015. .......................................................................................... 207 Figure 119: Marine Protected Areas Affected by the 2015 Refugio Oil Spill............................ 208
Figure 120: Breitburn Energy Drilling Site in Los Angeles, California. .................................... 211 Figure 121: Freeport-McMoRan Inc.’s Packard Well Drilling Site in Los Angeles, California. 212 Figure 122: An E&B Natural Resources Oil Well Located One Block from Wilmington Middle
School. ........................................................................................................................................ 213 Figure 123: California and Petroleum Industry Demographic Comparison, 2015. .................... 214
Figure 124: Petroleum Industry Employment by Educational Attainment. ............................... 215 Figure 125: U.S. Crude Oil California First Purchase Price, 2000 to 2016. ............................... 216 Figure 126: California Crude Oil and Natural Gas Production, 1981 to 2016. .......................... 218 Figure 127: U.S. Crude Oil Production, Imports, and Total Consumption, 1950 to 2016. ........ 219 Figure 128: Change in Global Oil Production, 2010 to 2017 (Indexed to January 2010). ......... 220
Figure 129: Crude Oil Supply to California Refineries, 1982 to 2016. ...................................... 221 Figure 130: U.S. Primary Energy Consumption by Source, 1950 to 2016. ................................ 222 Figure 131: Average Unconventional Well Drilling and Completion Costs, 2006 to 2015. ...... 223

xiii
Figure 132: Solar Photovoltaic Learning Curve. ........................................................................ 224
Figure 133: Installed Photovoltaic Solar Capacity by State, 2016. ............................................ 225
Figure 134: California Photovoltaic Solar Capacity and Generation, 2000 to 2016. ................. 226 Figure 135: California Wind Power Net Generation, 2001 to 2016. .......................................... 227 Figure 136: Institutional Map of California’s Oil and Gas Sector. ............................................. 230 Figure 137: Largest Oil Producers in California, 2016............................................................... 248 Figure 138: Number of Los Angeles Times Articles that Mention “Fracking”. ........................ 254
Figure 139: Igniting Methane Dissolved in Colorado Tapwater in the Film “Gasland”. ........... 262 Figure 140: California Rig Count, 1987 to 2017. ....................................................................... 269 Figure 141: Oil and Gas Industry Spending on Lobbying, 2006 to 2016. .................................. 273 Figure 142: California Crude Oil Production and Hubbert Curve. ............................................. 280 Figure 143: Infra-Red Image of Aliso Canyon Storage Facility Methane Leak, December 2015.
..................................................................................................................................................... 294
Figure 144: Aliso Canyon Storage Facility Blow Out Site, December 2015. ............................ 295

xiv
Acronyms
AB Assembly Bill
BLM Bureau of Land Management
BOEM Bureau of Ocean Energy Management
BSEE Bureau of Safety and Environmental Enforcement
CAA Clean Air Act
CalEPA California Environmental Protection Agency
CARB California Air Resources Board
CEQA California Environmental Quality Act
CFC Chlorofluorocarbons
CIPA California Independent Petroleum Association
CNRA California Natural Resources Act
CWA Clean Water Act
DDT Dichlorodiphenyltrichloroethane
DOE Department of Energy
DOGGR Division of Oil, Gas, and Geothermal Resources
EIR Environmental Impact Report
EOR Enhanced Oil Recovery
EPAA Emergency Petroleum Allocation Act
EPCA Energy Policy and Conservation Act
EPCRA Emergency Planning and Community Right-to-Know Act
EWG Environment Working Group
GOO Get Oil Out
GPE Governance and Political Economy
IPAA Independent Petroleum Association of America
IPCC Intergovernmental Panel on Climate Change
LA Los Angeles
MLP Multi-Level Perspective
MMS Minerals Management Service
MOU Memorandum of Understanding
NATA National Air Toxics Assessment
NEPA National Environmental Policy Act
NGO Non-Governmental Organization
NRDC Natural Resources Defense Council
ONRR Office of Natural Resources Revenue
OSHA Occupational Safety and Health Act
PNE Peaceful Nuclear Explosions
xv
RCRA Resources Conservation and Recovery Act
SB Senate Bill
SDWA Safe Drinking Water Act
SES Social-Ecological System
TRI Toxic Release Inventory
TSCA Toxic Substances Control Act
U.S. EIA United States Energy Information Administration
U.S. EPA United States Environmental Protection Agency
UIC Underground Injection Control
USGS United States Geological Survey
VOC Volatile Organic Compound
WSPA Western States Petroleum Association

xvi
ACKNOWLEDGEMENTS
I owe a great debt of gratitude to my dissertation committee members, my department,
and my family, without whose tireless support this research would not have been possible.
I wish to thank Professor Susanna B. Hecht, my committee chair, for giving me both the
guidance and the freedom necessary to pursue this challenging topic in a rigorous and open-
ended manner. I also wish to thank my committee members, Professor Paul M. Ong, Professor
Randall D. Crane, and Professor Franklin D. Gilliam, Jr., for their thoughtful and constructive
contributions to this project.
The department chairs during my time at UCLA, Professor Lois Takahashi and Professor
Evelyn Blumenberg, and Vinit Mukhija never failed to provide encouragement or to find the
means to support my studies, and I thank them for their kindness and compassion throughout my
time in the program. Robin McCallum, Alexis Oberlander, and Marsha Brown likewise provided
administrative support far beyond the call of duty, and to them I give my deepest thanks for their
patience and thoughtfulness. Without the generosity and forbearance of all of these invaluable
individuals who make up the Department of Urban Planning at UCLA, I could never have
managed to complete my program of study, nor could I have discovered my love of teaching in
the process.
To my grandfather, Bill Stegath, whose boundless curiosity, enthusiasm, and pride in my
achievements was a priceless inspiration. To my parents, your confidence and faith in my
potential has been an abiding source of strength throughout my entire life. To my wife,
Stephanie, I have no words for all you have given me these long years, and my love is matched
only by the pride and joy I have felt witnessing your own triumphs. You have ever been the light
that has shown the way. And to my daughter, Misora, you are my promise and purpose. I cannot
begin to thank you enough.

xvii
VITA
Adam John Dorr
EDUCATION
• University of Michigan, School of Natural Resources and Environment, Ann Arbor,
Michigan, Master of Science, 2010
• Arizona State University, School of Business, Bachelor of Science, 2000
• Institute for Economics and Political Studies, University of Cambridge, UK, Foreign
Study Program, 1997
PUBLICATIONS
Dorr, A. (2017). Common errors in reasoning about the future: Three informal fallacies.
Technological Forecasting and Social Change, 116, 322–330.
Dorr, A. (2016). Technological change and climate scenarios. Nature Climate Change, 6(7),
638–639. https://doi.org/10.1038/nclimate2981
Dorr, A. (2016). The impact pulse and restoration curves: Going beyond mitigation and
stabilization. Anthropocene, 16, 61–66. https://doi.org/10.1016/j.ancene.2016.08.002
https://doi.org/10.1016/j.techfore.2016.06.018
Dorr, A. (2016). Technology blindness and temporal imprecision: rethinking the long term in an
era of accelerating technological change. Foresight, 18(4), 391–413.
https://doi.org/10.1108/FS-11-2015-0049
Dorr, A. (2012). Letter to a Conservative Nation. CreateSpace, Los Angeles, California, ISBN:
978-1469988436.
Benson, S.M., and Dorr, A. (2008). “Traditional Dyeing: Indigo in Oman”. Pride: The Crafts of
the Sultanate of Oman. Al Roya Press & Publishing House, Muscat, Oman.
Dorr, A. and Benson, S.M. (2003). “The Omani Indigo Revitalization Project: An
Interdisciplinary Approach to the Management of Heritage as an Economic Resource and
its Leverage as a Platform for Cultural Tourism in the Sultanate of Oman”.
ForumUNESCO 2002, Amman, Jordan. Paper and poster presentation.
Dorr, A. and Ritchie, M.N. (2002). “Preserving and Perpetuating Traditional Craft Industries in
the Sultanate of Oman: The Role of Omani Heritage Gallery as a Private Sector Marketing
and Development Agency”. International Congress on Islamic Arts & Crafts, Isfahan, Iran.
RESEARCH
• “Climate Engineering Governance” with Professor Ted Parson, School of Law, UCLA 2017
• “Antelope Valley Community Survey” with Professor Todd Franke and Professor Jorja Leap,
Department of Social Welfare, UCLA 2017
• “Equity in Sustainability” with Professor Paul M. Ong in conjunction with the UCLA Luskin
Center for Innovation, UCLA 2014
• “Immigrant Inequality in Los Angeles” with Professor Paul M. Ong in conjunction with the
UCLA Center for the Study of Inequality, UCLA 2014
• “Managing Conflicting Institutional Logics in Sustainable Enterprises: Social Service versus
Market” with Professor Zeke Hasenfeld and Professor Eve Garrow, UCLA 2011

xviii
• “Statewide Sustainability Study of Evidence-Based Practices in Community Mental Health
Settings” with Professor Mary Ruffolo, University of Michigan 2010-2011
• National Botanical Gardens, Heritage Village, with WS Atkins International & Co., Sultanate
of Oman 2006
• Heritage Artifact Accession Registry, Oman Ministry of Tourism, Sultanate of Oman 2006
PRESENTATIONS & LECTURES
• Dorr, A. (2017). Fractured Politics: The Evolution of Fracking Regulation in California.
Michigan State University, Lansing, Michigan.
• Dorr, A. (2016-2017). Technology and Sustainability in the 21st Century. Los Angeles
Community College System lecture series, Los Angeles, California.
• Dorr, A. (2015). The Future of Nature: Technology and Environment in the 21st Century.
UCLA, Los Angeles, California.
• Dorr, A. (2005). The Craft Heritage of Oman. Smithsonian Institution Festival of Folk Life,
seminar and lecture series, Washington DC.
• Dorr, A. and Benson, S.M. (2003). The Omani Indigo Revitalization Project: An
Interdisciplinary Approach to the Management of Heritage as an Economic Resource and its
Leverage as a Platform for Cultural Tourism in the Sultanate of Oman. ForumUNESCO
2002, Amman, Jordan. Paper and poster presentation.
• Preservation, Sultanate of Oman 2001
TEACHING
• ENV105 Environment and Society, Washtenaw Community College 2017
• ENV132/UP165/GEOG115 Environmentalism: Past, Present, Future, UCLA 2011-2017
• M1C The Future of Nature: Environment and Technology in the 21st Century, UCLA 2015-
2016
• GEOG M128 Global Environment and Development: Problems and Issues, UCLA 2014
• M1A-B Environment and Sustainability Cluster Series, UCLA 2014-2016
• Environ M167 Environmental Justice, UCLA 2013
• UP 217B Masters Students Comprehensive Urban Agriculture Project, UCLA 2013
• Urban Planning Writing Teaching Assistant, UCLA 2011, 2012
• C160/260 Environmental Politics and Governance, UCLA 2010
• Env345/Soc380 Environmental Public Opinion Analysis, University of Michigan 2010
• Env550/Strategy566 Systems Thinking for Sustainable Enterprise, University of Michigan
2009
PROFESSIONAL EXPERIENCE
• RethinkX, consultant, London UK 2017
• The Nejd, co-founder and CEO, Sultanate of Oman 2004-2007
• Smithsonian Institution Festival of Folk Life, coordinator, Washington DC 2005
• Omani Heritage (NGO), sustainable development manager, Sultanate of Oman 2001-2004
• Omani Camel Bone Resource Revitalization Project, project manager, Sultanate of Oman
2002-2003
• Omani Indigo Revitalization Project, Project Manager, Sultanate of Oman 2001-2002
• Emergency-Birth-Control.org, co-founder, 2000-2016

1
Chapter 1. Introduction
California has been an oil and gas state throughout its history. In the latter half of 19th
Century and first half of the 20th Century, hydrocarbon extraction helped define both Californian
prosperity and the promise of the West. Los Angeles itself sits atop one of the country’s largest
single deposits of oil, and much of the city’s early economic growth was driven by its
extraordinary endowment of hydrocarbon wealth. Major arterial roads such as Wilshire
Boulevard were once forested with oil derricks, as were a number of the region’s famed beaches.
After more than a century of continuous production, a suite of new oil and gas production
methods referred to as “enhanced recovery techniques” or simply “fracking” emerged in the
early 2000s, of which a subset known as “well stimulation” treatments offered the tantalizing
prospect of breathing new life into the aging oil fields of Southern California’s Monterey Shale
Formation.
Since the 1960s California has also been the epicenter of the global environmental
movement, and so for the last five decades the state’s cultural, political, and economic identity
has been hammered and shaped by the dueling blows of the very heaviest of heavy industry and
the vanguard of the world’s environmental organizations. The story of oil and gas in California is
inevitably one of place-based conflict as well, where competing interests vie across disparate
geographies and localities, and where ideologies of progress and development clash with ideas of
preservation and conservation.
As the nation entered a new era of petroleum production in 2006 with the advent of cost-
effective enhanced recovery technologies, the Monterey Shale Formation – which harbors one of
the largest deposits of oil in the country – hung before the state as an almost irresistible prize.

2
But the specter of climate change, the surge of clean energy and transportation, the increasingly
desperate thirst for residential and agricultural water under historic drought conditions, and
California’s unique geology together complicated the relatively straightforward economic logics
that have normalized the use of enhance recovery techniques and their social and environmental
externalities in other states. California’s complex internal struggle to reconcile differing rights,
priorities, and needs among diverse groups of stakeholders with varied relationships to the
natural world and its resources has produced unique policy and regulatory outcomes for many
decades. Yet, given the state’s enormous cultural and economic influence both nationally and
worldwide, the general trajectories of California’s environmental governance outcomes
nevertheless blaze a trail that other states and nations follow.
Set against a backdrop of profound political tension and uncertainty at the national scale,
first with the election of President Barack Obama and later with the election of President Donald
Trump, California’s struggle to govern hydrocarbon extraction during a period when disruptive
new oil and gas production technologies have emerged represents a remarkable opportunity for
study.
Problem Statement
Enhanced recovery techniques for oil and gas production, commonly referred to as
“fracking”, are a paradoxical topic in California. If we take all competing claims about the
technology at face value, a morass of contradictions emerges. It is new, yet decades old. It is
extremely dangerous, yet perfectly safe. It causes earthquakes, yet has nothing to do with them.
It is a major threat to air and water quality, yet there are only a handful of documented instances
of contamination in California. Fracking has led to a “shale boom” of natural gas production
which is acting as a “bridge fuel” to a renewable energy future, yet its fugitive methane is worse

3
for climate change than coal. The oil reserves in the Monterey Shale will lead to an economic
boom, yet little or none of that oil is actually accessible and no new jobs will be created. It is
politically polarized, yet it is producing unusual alliances between hard-left liberal
environmentalists and hard-right conservative farmers. How are we to disentangle this
extraordinary web of confusion, given that there are discouragingly few reliable data available
about the engineering and production practices around fracking, the levels of production and
associated income that it actually yields, or its impacts on human and ecological health?
Complicating matters further is the fact that enhanced recovery techniques are not
substantively regulated at the federal level. Under the Energy Act of 2005, hydraulic fracturing is
specifically exempted from regulation under the Safe Drinking Water Act, and existing special
accommodations for oil and gas drilling and production are expanded under the Clean Water
Act, the Resources Conservation and Recovery Act, and the National Environmental Protection
Act. The onus has therefore fallen on state and local governments to regulate the new extractive
regimes that have emerged. In September of 2013, after two years of bitter contestation,
California Senate Bill No. 4 (SB 4) was signed into law by Governor Jerry Brown. The
legislation enacted a period of interim regulations on fracking pending the findings of a statewide
environmental impact report (EIR). The finalized EIR was published in July of 2015, and
permanent regulations went into effect in 2016. The decade-long journey from the start of the
Shale Revolution in 2006 in Washington DC to the permanent statewide regulations of SB 4 is
an instructive example of the long and winding road that environmental governance must
sometimes travel.
This dissertation engages the subsoil political ecology and political economy of Southern
California’s petroleum industry to analyze how environmental governance regimes at the state,

4
regional, and local levels evolved following the advent of disruptive new oil and gas production
technologies. The case study of California oil and gas well stimulation governance undertaken
here adds to the academic literature around extractive industries and their “transformations with
financial, technological, geographical, and institutional dimensions” on subnational scales and
advances understanding of the political ecology of sociotechnical transitions (Bebbington &
Bury, 2013, p. 66).
Research Questions
This dissertation asks two interrelated research questions at different levels of analysis
whose answers, when taken together, help to build an understanding of the evolution of oil and
gas well stimulation regulation in California.
The first research question asks: how does the political ecology of California’s energy
system explain the regulation of oil and gas well stimulation practices at the local, county, and
state level that has emerged after these practices were partially exempted from federal
environmental regulation under the Energy Policy Act of 2005?
This research question takes the general form: “how does conceptual framework A
explain phenomenon B in space C at time D?” The conceptual framework here is political
ecology, which comprises a broadly-defined political economy of the environment (Blaikie &
Brookfield, 1987; Robbins, 2011); the unit of analysis for the phenomenon under investigation is
oil and gas well stimulation regulation; the spatial extent is California at the state, county, and
local scales; and the time period in question is from when the Energy Policy Act of 2005 went
into effect in 2006 through 2016. Political ecology research analyzes the evolution of regulatory
regimes through the lens of political economy of the environment (Blaikie & Brookfield, 1987;
Robbins, 2011). Accordingly, this dissertation employs the Governance and Political Economy
5
Analysis protocol developed by Fritz, Kaiser, and Levy (2009) to assess the institutional and
structural dynamics of California’s oil and gas sector in order to explain how and why specific
well stimulation (“fracking”) regulations emerged as and when they did.
The second research question asks: how have the ways that diverse stakeholders frame
competing narratives about oil and gas well stimulation practices shaped regulatory outcomes at
the state, county, and local scales in California after these practices were partially exempted from
federal environmental regulation under the Energy Policy Act of 2005?
This second question takes the same general form as the first, but here the conceptual
framework is political ecology and media framing (Bales & Gilliam, 2001; Chong & Druckman,
2007; Goffman, 1974; Lakoff, 2010; Scheufele & Iyengar, 2017); the units of analysis for the
phenomenon under investigation are the narratives framed by competing stakeholders and their
impacts on regulatory outcomes; the spatial extent is again California at the state, county, and
local scales; and the time period in question is again from when the Energy Policy Act of 2005
went into effect in 2006 through 2016. Political ecology research analyzes frames through the
lens of environmental discourse (Adger, Benjaminsen, Brown, & Svarstad, 2001; Hudgins &
Poole, 2014; Robbins, 2011). Accordingly, this dissertation uses content analysis of news media
and semi-structured open-ended interviews as two elements of a Frame Analysis with which to
examine the frames that stakeholders employ around enhanced recovery techniques (“fracking”)
for oil and gas production in California and explain their impacts on the evolution of well
stimulation regulation (Bales & Gilliam, 2001; FrameWorks Institute, 2017).
Dissertation Structure
Following this introductory chapter, Chapter 2 provides the empirical background for the
suite of enhanced recovery technologies that comprise well stimulation, their recent maturation

6
and rapid widespread adoption across the United States over the last decade, and how they are
currently used by the oil and gas industry in California. Chapter 3 then surveys the key elements
within the academic literatures of political ecology, adaptive governance, anticipatory
governance, socio-technical transitions, and media framing. Taken together, these literatures
provide a conceptual framework for understanding the dynamics of environmental conflict
within California’s oil and gas sector as well as the regulatory regimes across different scales and
geographies that have emerged as a result. Chapter 4 details the historical context of oil and gas
production within California and its energy system, out of which contemporary debates in the
state over enhanced recovery techniques has emerged. Chapter 5 specifies the dissertation’s case-
study methodology, the analytical protocols employed to answer the two interrelated research
questions introduced above, and the primary and secondary data sources that inform the
analyses. Chapter 6 presents the findings produced by the Governance and Political Economy
Analysis protocol and the Frame Analysis protocol. Chapter 7 then concludes the dissertation
with a discussion of how this research contributes to substantive, theoretical, and philosophical
debates within political ecology and environmental governance discourses as we look to the
future of California’s energy system within the context of global environmental and
technological change, and suggests avenues that subsequent research might explore.

7
Chapter 2. Background
This chapter presents introduces key concepts and terminology relating to well
stimulation regulation in California, and situates current “fracking” production techniques within
the context of their historical development and their associated impacts upon the macroeconomy
of the petroleum industry over the last two decades. The chapter then goes on to relate specific
oil and gas technologies and their associated practices to concerns about both human health and
ecological impact, and thereby sets the stage for understanding the extent to which modern oil
and gas production methods have become a politicized and publicized focal point of
contemporary environmental discourse in California.
The Shale Revolution
After a century of growth, oil and gas production in the United States peaked in the early
1970s following the trajectory predicted by geologist M. King Hubbert (Hubbert & Willis,
1957). After reaching an initial peak on the Hubbert Curve and weathering the economic and
political energy crisis that followed, the United States shifted toward an aggressive regime of oil
and gas importation with attendant foreign policy aimed to secure and stabilize supplies overseas
(Yergin, 2011).

8
Figure 1: U.S. Oil and Natural Gas Production 1900-2016.
(Source Data: U.S. EIA, 2017a, 2017c).
The initial peaking of U.S. oil and gas production was the result of industry reaching the
extraction rate limits of the available technology. Production of oil and gas went into decline for
several decades as a result, and industry began to invest in more cost-effective opportunities
overseas in the meantime. But in the early 2000s a conflux of three structural changes within the
energy sector upended the post-peak status quo and triggered a boom in domestic petroleum
production.
The first of these structural changes was technological. Starting in 2005 with gas and then
in 2008 with oil, the industry began to rapidly adopt and deploy a suite of new technologies that
had been developed incrementally throughout the 1980s and 1990s. These included 3D
seismography and geological modeling, downhole telemetry and high-precision positioning,
directional drilling, fracturing fluid and proppant chemistry, and ultra-high-durability drill bits
0
500
1,000
1,500
2,000
2,500
3,000
3,500
4,000
0
5
10
15
20
25
30
35
Bar
rels
of
Oil
(mill
ion
s)
Cu
bic
Fee
t o
f N
atu
ral G
as (
trill
ion
s)
U.S. Crude Oil and Natural Gas Production 1900-2016
Natural Gas Crude Oil
Initial Oil and Gas Production Peak
Beginning of the “Shale Revolution”

9
(Glowka & Schafer, 1993; Groat & Grimshaw, 2012; MITEI, 2011; Montgomery & Smith,
2010; Trembath, Jenkins, Nordhaus, & Shellenberger, 2012). Working in conjunction, these
technologies substantially reduced the cost of producing oil and gas from a broad range of
varying geological deposits.
The second structural change was economic. After an extended period of relative stability
throughout the 1980s and 1990s, oil and gas prices rose by more than 500 percent between 2000
and 2007. There is disagreement in the relevant literatures about the causes of this dramatic
change, but commonly-cited considerations include: 1) increasing global demand (especially
from China, India, and Brazil); 2) destabilization of supply due to war (e.g. in Iraq), terrorism
(e.g. the September 11th attacks), and internal political strife (e.g. in Venezuela, Nigeria, and
Iran); 3) financial speculation; 4) global production peaking; and 5) interaction between oil and
gas markets (Brigida, 2014; Jadidzadeh & Serletis, 2017; Kilian, 2014; Kilian & Hicks, 2013;
Stern, 2013; Yergin, 2011). The resulting high prices of oil and gas changed the domestic
industry cost calculus such that enhanced recovery methods which had hitherto been
prohibitively expensive now became economically viable for the first time. This in turn created
an abundance of financial incentive for new investment in domestic petroleum exploration and
production.

10
Figure 2: U.S. Oil and Natural Gas Prices 1900-2016.
(Data Source: U.S. EIA, 2017b, 2017f).
The third structural change was institutional. The Energy Policy Act of 2005 exempted
hydraulic fracturing under the Safe Drinking Water Act (SDWA) and expanded existing special
accommodations for oil and gas industry practices under the Clean Air Act (CAA), the Clean
Water Act (CWA), the National Environmental Policy Act (NEPA), and the Resources and
Conservation Recovery Act (RCRA). This key piece of federal legislation, referred to in the
environmental discourse as the “Halliburton Loophole” because of then-Vice-President Dick
Cheney’s close association with the company as its former CEO, signaled to the petroleum
industry that it was free to deploy new production methods without fear of persecution under
federal law (Howarth, Ingraffea, & Engelder, 2011; Warner & Shapiro, 2013).
An American oil and gas renaissance known as the “Shale Revolution” has since
followed these structural shifts, with the United States surpassing both Russia and Saudi Arabia
to become the largest oil and gas producer in 2012, and imports are at their lowest levels since
1985 (U.S. EIA, 2016). Since 2003, tens of millions of acres of land have been leased for oil and
$-
$20
$40
$60
$80
$100
$120
$140
$-
$2
$4
$6
$8
$10
$12
$14
1975 1980 1985 1990 1995 2000 2005 2010 2015
Cru
de
Oil
Pri
ce (
$/b
bl)
Nat
ura
l Gas
Pri
ce (
$/t
cf)
U.S. Crude Oil and Natural Gas Prices (Nominal Unadjusted)
Natural Gas Crude Oil

11
gas production, hundreds of thousands of acres of land have been cleared for the 125,000 shale
oil and gas wells that have already been drilled nationwide, and tens of thousands more are
expected to be drilled by 2020 (FracFocus Chemical Disclosure Registry, 2017b; Halliburton,
2008; Johnson, 2010; U.S. EIA, 2012a). Fracking has been adopted much more rapidly in the
United States than in other countries, and over the last decade shale gas production in particular
has grown dramatically – from 2.5 billion to 35 billion cubic feet per day, rising from 3 percent
of total domestic natural gas production in 2005 to more than 50 percent in 2016 (U.S. EIA,
2017a). Tight oil production has also grown substantially, from less than 250,000 barrels per day
in 2005 to nearly 5 million barrels per day in 2016, and now exceeds 50 percent of total domestic
production (U.S. EIA, 2017a).
Figure 3: U.S. Oil and Natural Gas Production from Hydraulically Fractured Wells, 2000-2015.
(Source: EPA 2016, Figure 3-19).
A worldwide supply glut fueled by U.S. production has driven oil and gas prices to pre-
recession lows, and the renewed abundance of cheap energy is credited (albeit controversially)
with creating hundreds of thousands of jobs and buoying the domestic economy as a whole
(Feyrer, Mansur, & Sacerdote, 2015; Hausman & Kellogg, 2015; Mills, 2014).

12
Enhanced Recovery Techniques, Well Stimulation, and Fracking
The term “fracking” is a contraction of “hydraulic fracturing” and is used as shorthand by
both the industry and the public alike to refer to all “enhanced recovery techniques” that increase
the volume of oil or gas produced from a given well. But hydraulic fracturing is just one among
many different specific “treatments” that may be employed during the drilling of a well or after
its “completion” and extraction of oil or gas has begun. A chronology of the broad categories
into which these enhanced recovery techniques fall is diagramed in Figure 3 below. It is
important to emphasize, however, that these techniques are subject to several important
complicating factors.
The first of these factors is the question of whether the target of production is oil or gas.
Some enhanced recovery techniques, such as hydraulic fracturing, may be applied to both oil and
gas deposits, while others may not. In California, however, the vast majority of recovery
techniques are applied to the production of oil, not gas, and so the phrase “enhanced oil
recovery” (EOR) is the more widely used term within the state’s petroleum industry.

13
Figure 4: Chronology of Enhanced Oil Recovery Techniques.

14
(Figure 1 Sources: Alvarado & Manrique, 2010; Blackwell, Rayne, & Terry, 1959; Caudle &
Dyes, 1958; Fried, 1961; Gurgel, Moura, Dantas, Neto, & Neto, 2008; Hanzlik & Mims, 2003;
Kaufman, 2012; Muggeridge et al., 2014; Mungan, 1984; Muskat, 1949; Packer, 1933;
Sandiford, 1964; Sarathi, 1999; Sheng, 2010; Stewart, Hunt, Schneider, Geffen, & Berry, 1954;
Sustek & Traverse, 1981; Thomas, 2016; Turta, 2013; U.S. EPA, 2015a).
The second complicating factor is the geology of the target deposit, which may be
broadly categorized as either “conventional” or “unconventional” (see Figure 5 below). Oil
forms in sedimentary rocks two to four kilometers below the surface where pressures and
temperatures are sufficient to transform organic matter into liquid hydrocarbons via thermogenic
breakdown, or “cracking”. Natural gas forms under higher temperatures and pressures at greater
depths, between three and six kilometers. The oil and gas may then migrate through pores and
fractures in the “source” or “parent rock” until they become trapped and concentrated beneath a
dome of impermeable “cap” rock to form a conventional deposit. The typically much larger
quantity of oil and gas that remains diffused throughout the entire porous petroleum-bearing
layers of source rock are referred to as unconventional deposits (Hughes, 2013; Long, Feinstein,
Birkholzer, et al., 2015).

15
Figure 5: Conventional and Unconventional Hydrocarbon Deposits.
(Image Source: U.S. EPA, 2015a adapted from U.S. Geological Survey Fact Sheet 0113-01).
The terminology surrounding enhanced recovery techniques is inconsistent because there
are no agreed-upon international standards across the industry, but with that proviso
unconventional deposits are generally recognized as those which include coal bed methane, tight
oil and shale oil, tight gas, and shale gas. “Coal bed methane” – alternatively referred to as
“coalbed gas”, “coal seam gas”, or “coal mine methane” – is natural gas that is present within
coal, and which is extracted prior to the mining of the coal itself. “Tight oil” occurs in formations
of shale, sandstone, and carbonate rock such as limestone that contain light oil, but whose
permeability and porosity is too low to allow that oil to flow without stimulation. “Shale oil” is
therefore generally considered to be a form of tight oil (U.S. EIA, 2013).
Conceptually, the same relationship exists between “tight gas” and “shale gas”, but shale
gas is usually regarded as separate from other forms of tight gas by the industry itself (Shell Oil

16
Company, 2014). The distinction is rooted in history and practice: tight gas has long been
produced, whereas shale gas was an elusive prize prior to the emergence of cost-effective
enhanced recovery techniques.
Figure 6: Oil-Bearing Shale.
(Image Source: U.S. Department of the Interior, 2012).
Perforating
The idea of forcibly modifying geological formations in order to stimulate oil and gas
production is a venerable one. The earliest explosive or “perforating” enhanced recovery
techniques date to 1864 when Edward A.L. Roberts, a colonel in the union Army serving with
the Regiment of the Potomac, first conceived of using explosives to stimulate oil production after
witnessing their use during his civil war service (American Oil & Gas Historical Society, 2016;

17
Whiteshot, 1905). He successfully deployed the technology – an iron case packed with eight
pounds of gunpowder which he named the “Roberts Torpedo” – in 1865 at Ladies Well in
Titusville Pennsylvania, the site of the first oil rush, just six years after “Colonel” Edwin Drake
successfully drilled the world’s first oil well there (American Oil & Gas Historical Society,
2016; Yergin, 2008). Roberts obtained the first of many patents in 1865 and founded the Roberts
Petroleum Torpedo Company in that same year (Whiteshot, 1905). “Shooters”, as the oil hands
who deployed these devices were known (Lodge, 1938), began using nitroglycerin instead of
gunpowder in 1867 – notably, the same year that Alfred Nobel developed the stabilized form of
nitroglycerin known as dynamite (NobelPrize.org, 2016; Schück & Sohlman, 1929). This early
form of explosive fracturing could increase well production by a factor of 12 in some cases
(American Oil & Gas Historical Society, 2016).
Figure 7: Roberts Torpedo Memorial.
(Image Source: American Oil & Gas Historical Society).

18
Figure 8: Roberts Torpedo Patent Drawing.
(Image Source: American Oil & Gas Historical Society).

19
Figure 9: Oilfield “Shooter” Preparing Nitroglycerin for a Pennsylvania Well, Circa 1870s.
(Image: American Oil & Gas Historical Society).
Fracturing with explosives reached its zenith in 1967 with Project Gasbuggy, a nuclear
detonation of a 29 kiloton warhead by the Lawrence Radiation Laboratory and the El Paso
Natural Gas Company in northern new Mexico (Kaufman, 2012). This was part of the larger
Project Plowshare, a Cold War initiative to develop Peaceful Nuclear Explosions (PNE)
applications, primarily for mining and construction. Subsequent tests in 1969 and 1973
confirmed the initial findings that the gas resulting from nuclear fracturing was too radiologically
contaminated for commercial use, and the approach was abandoned as impracticable (Kaufman,
2012).

20
Figure 10: Project Gasbuggy 29 Kiloton Nuclear Warhead.
(Image Source: Los Alamos Laboratory, 1967).

21
Figure 11: Project Gasbuggy Well Pad.
(Image: Los Alamos Laboratory, 1967).
Today, geological formations are no longer fractured with a single large explosive, but
rather with “perforating guns” which fire multiple projectiles into the target rock in order to open
additional channels out of which oil and gas may flow (Schlumberger, 2014). The modern
process of perforation, or “perfing” as it is commonly termed, dates to the mid-1930s and is a
widely-used enhanced recovery technique in contemporary oil and gas production (Lodge, 1938;
Schlumberger, 2012).

22
Figure 12: Perforating Gun Featured in Popular Science Monthly, 1938.
(Image Source: Popular Science Monthly, 1938).

23
Figure 13: A Modern Perforating Gun.
(Image Source: Delphian Ballistics, 2015).
Figure 14: Illustration of a Modern Perforating Gun in Action.
(Image Source: Schlumberger, 2014).

24
Waterflooding
“Waterflooding” is an enhanced recovery technique that involves injecting water into one
or more wells in order to increase oil or gas production in other wells nearby. This process was
discovered by accident shortly after the first wells were drilled in Titusville, Pennsylvania, in
1865 (Satter, Iqbal, & Buchwalter, 2008), and by the 1890s knowledge and use of the process
was widespread enough to cause conflict among competing producers such that it was initially
outlawed and only later legalized in 1921 (Buckwalter, 1949; Fettke, 1938; Pennsylvania
Department of Environmental Protection, 2009). Waterflooding with high-pressure injection
therefore began in earnest in 1920s in the Bradford Oil Field in Pennsylvania, and went on to
become common practice by the 1930s (Craig, 1971; Rose, Buckwalter, & Woodhall, 1989;
Willhite, 1986).
The primary function of water injection is to maintain or increase reservoir pressure,
which typically declines as a result of the “voidage” caused by withdrawing oil or gas from
petroleum-bearing rock. However, a key secondary benefit of “voidage replacement” via water
injection is the mitigation of land subsidence (see Figure 15 below). This has been particularly
problematic in the coastal oil fields of the Los Angeles Basin, such as in the seaside operations at
the Wilmington Oil Field in Long Beach (Mayuga, 1970; Sabin, 2005). More recent research has
suggested that land subsidence associated with oil production may have induced earthquakes
between 1915 and 1933 in the Greater Los Angeles area, including the magnitude 6.4 Long
Beach Earthquake, prior to the introduction of voidage replacement which may have since
forestalled subsequent seismic inducement (Hough & Page, 2016).
An important application of deep water injection technology is the disposal of hazardous
waste fluids from a variety of sources, including those containing toxic and radiological

25
contaminants. Chief among these waste fluids is the fossil water hosted by and produced from
petroleum reservoirs themselves alongside oil and gas (Argonne National Laboratory, 2004).
Injection disposal is regulated under the U.S. EPA Underground Injection Control (UIC)
program and federal Safe Drinking Water Act (SDWA) provisions (U.S. EPA, 2013, 2015b,
2015c). The UIC categorizes injection wells under six classes, Class II being designated
specifically to oil and gas related activities such as the disposal of hydraulic fracturing fluids and
“produced” or “fossil” water (U.S. EPA, 2016c). Injection disposal practices and their regulation
have played an important role in shaping EOR, particularly in California where the ratio of
produced water to produced oil can exceed 15:1 (California Department of Conservation, 2017c;
Gans et al., 2015).

26
Figure 15: Long Beach Harbor Region High Tide Flooding from Land Subsidence, 1953.
(Image Source: Los Angeles Examiner Herald-Express Photographs Collection, 1951, HE Box
193).
Chemical Flooding
By the 1890s when knowledge of water flooding had become widespread, oil and gas
producers had begun to experiment with additives to improve the fluid’s capacity to enhance oil
recovery. Acids were among the first additives tried, followed over the next several decades by
solvents and surfactants, and then later in the 20th Century by foam, alkali, and polymer
additives, some or all of which may be used in combination (Fried, 1961; Mungan, 1984;
Sandiford, 1964; Sheng, 2010; Thomas, 2016). Prior to the rise of the modern environmental

27
movement, innovations in chemical flooding EOR were met with enthusiasm both within the
industry and the popular press (Figure 16).

28
Figure 16: Popular Mechanics Magazine Article Describing Chemical Flooding.

29
(Image Source: Packer, 1933).

30
Hydraulic Fracturing
Hydraulic fracturing emerged from earlier advancements in high-pressure water injection
technologies used for water flooding and chemical flooding EOR as well as for waste disposal
injection. Hydraulic fracturing involves the injection of fluids under pressures great enough to
fracture oil- and gas-bearing rock, which includes shales, non-shale “tight” formations, and
coalbeds (U.S. EPA, 2015a). Proposals for the method date to at least the 1930s, but the first
successful application of the technique was achieved in 1947 in Kansas by the Stanolind Oil and
Gas Company (Montgomery & Smith, 2010). Two years later the process was licensed and
performed commercially by the Halliburton Oil Well Cementing Company, and in its primitive
form has since been deployed in over one million oil and gas wells in the United States alone
(Montgomery & Smith, 2010; U.S. EPA, 2015a).
Hydraulic fracturing was a logical extension of synthesizing earlier fracturing methods
(i.e. perforating with explosives) with injection methods (i.e. waterflooding and chemical
flooding), and “frac jobs” quickly became a widespread practice: “treatments reached more than
3,000 wells a month for stretches during the mid-1950s” (Montgomery & Smith, 2010, p. 27).
However, as with other enhance recovery techniques, hydraulic fracturing had to wait for
significant advances in well-drilling technology before finding significant application in
unconventional oil or gas deposits.
Starting in the late 1970s, federal programs began funding industry research into
expanding shale gas enhanced recovery techniques (Eberhart, 2014; Shellenberger & Nordhaus,
2011; U.S. EPA, 2015a). The Federal Energy Regulatory Committee funded and provided
oversight for research undertaken by the an industry research consortium organized as the Gas
Research Institute, and additional fracturing and directional drilling technologies were developed

31
by the Department of Energy (then the Energy Research & Development Administration), the
National Energy Technology Laboratory (then the Morgantown Energy Research Center), and
the Bureau of Mines (Trembath et al., 2012). Demonstrations of “directional drilling” and
“massive” (or “high-volume”) hydraulic fracturing in unconventional shale formations were
made in 1976 and 1977 respectively, and the two technologies were successfully combined in
1986 in West Virginia (Kozik & Holditch, 1981; Trembath et al., 2012). Further advances
emerged throughout the late 1980s and early 1990s in the form of downhole telemetry, 3D
seismic imaging, precise GPS positioning, ultra-durable drill bit coatings, and fracturing fluid
chemistry during a period of prolonged natural gas price stability (Glowka & Schafer, 1993;
Groat & Grimshaw, 2012; MITEI, 2011; Montgomery & Smith, 2010; Norris, Bernsten, Myhre,
& Winters, 1996; Trembath et al., 2012; U.S. EIA, 2017g). In 2001 the Mitchell Energy
Company demonstrated unequivocal economic viability of hydraulic fracturing in a horizontally
drilled well in the Barnett Shale in Texas at then-prevailing market rates, and by 2005 the
technique had emerged as a the new industry standard for enhanced recovery of oil and natural
gas in low-permeability shale plays across the United States (U.S. EPA, 2015a; Yergin, 2011).
Hydraulic fracturing stimulates oil and gas output by “[increasing] the surface area of the
reservoir rock by creating fractures that are propped open, allowing the hydrocarbon to flow
from the rock through the fractures to the well and through the well up to the surface” (U.S.
EPA, 2015a, p. 2.2). To achieve this, fracking fluid generally consists of water, a “proppant”
(most commonly sand), and a variety of chemical additives to control the properties of the
fracturing fluid at different stages of the process (California Council on Science and Technology,
Lawrence Berkeley National Laboratory, & Pacific Institute, 2015; Halliburton, 2015; Hubbert &
Willis, 1957; Montgomery & Smith, 2010; Rickards, Brannon, Wood, & Stephenson, 2003;

32
Schein, 2005; Zimmermann, Blöcher, Reinicke, & Brandt, 2011). The proppant suspended in the
fluid props open the newly created fractures after the injection pressure is released. Oil and gas
are then able to flow through the fractures and up the production well to the surface (California
Department of Conservation, 2017a). Size, strength, and density of proppant particles are
important determinants of permeability to natural gas and oil, and are therefore carefully
controlled (Guimaraes, Valdes, Palomino, & Santamarina, 2007; Rickards et al., 2003).
Figure 17: Hydraulic Fracturing.
(Image Source: Nicole Fuller, Sayo-Art LLC).
Modern oil and gas wells may be up to 13,500 feet deep, with horizontal sections or
“cuts” of up to 5,000 feet, and because of their size the hydraulic fracturing process can require
more than 10 million gallons of water in extreme cases, although the number is generally

33
between 2 million and 5 million in the Barnett, Eagle Ford, Haynesville, Bakken, and Marcellus
Shale formations (Goodwin, Carlson, Douglas, & Knox, 2012; Nicot & Scanlon, 2012; U.S.
EPA, 2015a). However, because the geology of the Monterey Formation is more convoluted and
because the target of enhanced recovery is overwhelmingly oil rather than gas, long horizontal
cuts are less common and average per-well water use used in fracking treatments in California is
much less than in other states, with estimates averaging only 150,000 gallons per well (California
Council on Science and Technology et al., 2016).
Chemical additives typically constitute less than 1 percent of fracking fluid by volume,
but nevertheless play a crucial role in controlling its properties at various stages of well
stimulation (FracFocus Chemical Disclosure Registry, 2017a, 2017b). Key advances in
fracturing fluid chemistry were made during the 1990s, sometimes quite by accident
(Zuckerman, 2013). Most of these additives “are used to mitigate adverse chemical and
biological processes, and are the same as those used in [conventional] drilling”(California
Council on Science and Technology et al., 2016, p. 46). Friction reducers increase the rate of
flow and reduce the energy required to move the fluid into and out of the well; gelling agents and
surfactants help keep proppants in suspension by preventing them from settling before
penetrating fractures in the target rock; biocides and scale inhibitors prevent buildup of scale
deposits by killing scale-producing bacteria and controlling precipitation of minerals out of the
fluid; stabilizers prevent surrounding clays in the target rock from absorbing water from the fluid
and swelling or shifting as a result; winterizing agents inhibit corrosion of the piping and casing
within the wellbore; non-emulsifiers prevent emulsions from forming in the fluid that would
interfere with oil and gas flow; and breakers allow control of gels and the decrease of viscosity,
which is necessary following proppant placement in order for oil and gas to flow to the surface

34
(California Department of Conservation, 2017b; FracFocus Chemical Disclosure Registry,
2017b, 2017c; Halliburton, 2015; Schein, 2005). Beyond these functions, the key property of
concern for hydraulic fracturing fluid is its viscosity (Cipolla, Lolon, Erdle, & Rubin, 2010),
which must be tuned to the target rock in order to “create complex fractures with large fracture-
matrix area and narrow fracture apertures” (California Council on Science and Technology et al.,
2016, p. 47).
The specificity of the methods associated with hydraulic fracturing and its use in
combination with other enhanced recovery techniques, together with the highly-localized
demands of shale geology, is sufficiently complicated that no two industry firms are likely to
undertake the practice in exactly the same way. As a result, the specifics of hydraulic fracturing
methods are proprietary and protected as trade secrets by many firms that employ them (Craven,
2014).
Acidizing
An enhanced recovery technique closely associated and often used in conjunction with
hydraulic fracturing is “acidizing”, which involves injection of one or more acids (typically
hydrochloric or hydrofluoric, but also formic, acetic, chloroacetic, and sulfamic) into a wellbore
in order to “to restore or improve an oil or gas well’s productivity by dissolving material in the
productive formation that is restricting flow, or to dissolve formation rock itself to enhance
existing, or to create new flow paths to the wellbore” (American Petroleum Institute, 2014, p. 1).
“Matrix acidizing” is used when injection rates are below the pressure necessary to fracture the
target rock, while “fracture acidizing” (alternatively “acid fracturing” or more archaically
“pressure parting”) are treatments at above fracture pressure (Portier, Laurent, & Vuataz, 2007;

35
Settari, 1993). A third category of acidizing is “acid washing” whose purpose is to clean the
wellbore itself of build-up and debris (American Petroleum Institute, 2014).
Thermal
Beginning in the 1920s, oil and gas producers observed that the efficacy of waterflooding
could be improved by heating the water (Sheng, 2010; Willhite, 1986). Although “hot
waterflooding” continues to be a widely-used enhanced recovery technique, the subsequent
development of steam-based methods supplanted most hot waterflooding in California (Blevins,
1990; Sustek & Traverse, 1981). Given the nature of the Monterey Shale, the most prevalent of
these is “cyclic steam injection” (known colloquially within the industry as “huff and puff”)
wherein steam is injected periodically into an oil well (Sheng, 2010).
Figure 18: Cyclic Steam Injection.
(Image Source: National Energy Technology Laboratory, undated).

36
Gas Injection
Beginning in the 1930s, operators experimented with injection of various gases –
including hydrocarbons produced from wells themselves – to maintain reservoir pressure and
thereby enhanced recovery rates. One early example of this method was piloted in California’s
Canal Field near Bakersfield in Kern County in 1942 (Muskat, 1949). Natural gas contain few or
no liquefiable hydrocarbons, known as “lean hydrocarbon gas” or “dry gas”, was the preferred
option for a number of decades. More recent methods enabled by technological advances such as
ultra-high-pressure pumping capacities have allowed firms to undertake gas injection with
carbon dioxide (CO2) and nitrogen (N2) as well (Alvarado & Manrique, 2010; Sheng, 2010). The
prevailing gas injection pathway is via adjacent injection wells, but gas may also be injected into
the product well itself – a method referred to as “gas lift” (RigZone, 2017). Gas injection may be
used in combination with other enhanced recovery techniques, most notably waterflooding in
what are termed “water-alternating-gas” treatments (J. R. Christensen, Stenby, & Skauge, 1998).
Directional Drilling
Oil and gas firms began to experiment with drilling wells outside of vertical starting in
the 1930s (Figure 19 below). The capacity to steer a wellbore and achieve “directional drilling”
improved incrementally over the remainder of the century with innovations in materials and
mechanical engineering, telemetry and sensing, seismic modeling and mapping, and 3D
positioning, such that by the early 2000s operators could drill for up to two miles in any direction
– including horizontally – to an accuracy of within a few centimeters (U.S. EPA, 2016a).

37
Figure 19: Popular Science Monthly Article on Directional Drilling.

38
(Image Source: Gleason, 1934).

39
Directional drilling technology advanced incrementally from its origins in the 1930s until
1991 when the first commercially well to utilize horizontal drilling was completed by Mitchell
Energy following a successful ongoing collaboration between private and federally-funded
research (Eberhart, 2014; Shellenberger & Nordhaus, 2011; Trembath et al., 2012). Directional
drilling allows as many as 20 separate wells to be drilled from the same well pad – a technique
known as “pad drilling”, illustrated in Figure 20 below (U.S. EIA, 2012b). The impact on oil and
gas exploration and production has been significant: “drilling multiple wells from a single
surface site, played a lynchpin role in opening up capital-intensive tight formation oil plays over
the last four years as part of a broader revolution in drilling and completion techniques … [and]
enabled the industry to employ factory-like economies of scale to shorten cycle time and increase
rig productivity so that hydrocarbons are brought to market more quickly or, in the case of batch
completions, in greater volume” (Mason, 2015, p. 1). Pad drilling has allowed firms to reduce the
per-unit-production surface footprint of oil and gas operations.
40
Figure 20: Pad Drilling.
(Image Source: Statoil and U.S. EIA, 2015).
Well Completion and Flowback
Once the drilling and associated treatment processes have been completed for a given
well, the “well completion” stage commences. Upon completion, a permanent wellhead called a
“Christmas tree” (shown in Figure 21) is installed from which oil and gas may be withdrawn for
many years and either held in on-site storage tanks or distributed elsewhere. Productivity of
completed wells declines over time, typically following an exponential decay pattern, and so
completed wells may be periodically stimulated or “fracked” using one or more of the
aforementioned enhanced recovery techniques in order to maintain or restore their output
(Hughes, 2013; U.S. EIA, 2011).

41
Figure 21: A Well Pad with Multiple “Christmas Tree” Wellheads and On-Site Storage Tanks
after Well Completion.
(Image Source: Anadarko Petroleum Corp., 2014).
If injection of any kind occurred during the drilling of a well then some of those materials
may return to the surface as “flowback fluids” along with produced oil, gas, and water (DOE,
2009; FracFocus Chemical Disclosure Registry, 2015; U.S. EPA, 2016b). After the oil and gas
are captured, flowback fluids and produced water together comprise wastewater that is then
either held in on-site storage pits like the one shown in Figure 22 (variously referred to as
“holding ponds”, “frack ponds”, “drilling pools”, “evaporation pits”, “sumps”, and
“impoundments”), or transported via pipeline or truck to off-site pits (sometimes referred to as
“centralized impoundment dams”).

42
Figure 22: Lined Wastewater Storage Pit in Arkansas.
(Image Source: Bill Cunningham, USGS, 2016).
Environmental Impact
The Shale Revolution has brought greater attention to long-standing environmental
concerns around oil and gas production. The primary concern at the global level is anthropogenic
climate change driven by greenhouse gas emissions associated with the continued use of fossil
fuels (IPCC, 2013). At the local level, direct concerns include: air pollution from operations
machinery and off-gassing from produced or stored petroleum; pollution of surface and ground
water; soil contamination; hazardous waste management (including radioactive waste) and spills;
noise; habitat contamination, fragmentation, and destruction; water use; induced seismicity; and
the meta-concern about the environmental justice (i.e. the inequitable distribution) of these
impacts (see for example O’Rourke & Connolly, 2003). Oil and gas are also implicated
indirectly in concerns about the human and ecological impacts associated with the manufacture,
utilization, and disposal of petroleum-based products such as pesticides, fertilizers, and plastics
among many others (ATSDR, 2017; U.S. EPA, 2017). None of these concerns, however, are new
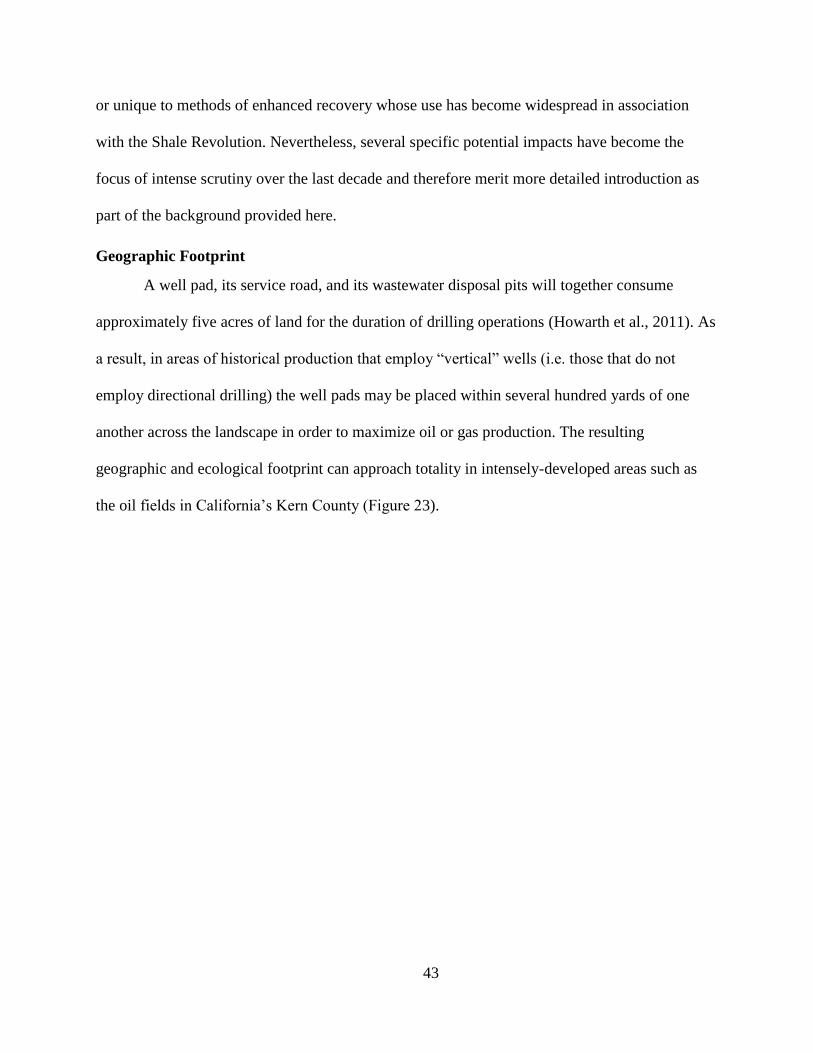
43
or unique to methods of enhanced recovery whose use has become widespread in association
with the Shale Revolution. Nevertheless, several specific potential impacts have become the
focus of intense scrutiny over the last decade and therefore merit more detailed introduction as
part of the background provided here.
Geographic Footprint
A well pad, its service road, and its wastewater disposal pits will together consume
approximately five acres of land for the duration of drilling operations (Howarth et al., 2011). As
a result, in areas of historical production that employ “vertical” wells (i.e. those that do not
employ directional drilling) the well pads may be placed within several hundred yards of one
another across the landscape in order to maximize oil or gas production. The resulting
geographic and ecological footprint can approach totality in intensely-developed areas such as
the oil fields in California’s Kern County (Figure 23).

44
Figure 23: Vertical Wells in the South Belridge Oil Field in Kern County, California.
(Image Source: The Center for Land Use Interpretation, 2010).
Pad drilling may reduce the footprint on a per-unit-production basis, but intensive
operations that maximize oil or gas production may nevertheless impose a substantial footprint
on the landscape (Figures 23-24). This footprint can in turn translate into habitat fragmentation
and destruction (for example Adams et al., 2011; Drohan et al., 2012; Kiviat, 2013; Northrup,
Anderson, & Wittemyer, 2015; Northrup & Wittemyer, 2013).

45
Figure 24: Pad Drilling with Hydraulic Fracturing in Upper Green River Valley, Wyoming.
(Image Source: Gordan/EcoFlight, 2009).
Air Pollution
The operation of heavy machinery together with the petroleum byproducts produced by a
well emit air pollutants that threaten both the local environment and the global atmospheric
commons (Colborn, Kwiatkowski, Schultz, & Bachran, 2011; Colborn, Schultz, Herrick, &
Kwiatkowski, 2014; Spellman, 2012; Vinciguerra et al., 2015). Specific contaminants of concern
include: polycyclic aromatic hydrocarbons such as methane, benzene, toluene, xylene; volatile
organic compounds such as formaldehyde and various alkenes and alkanes; diesel particulate
matter and carbon monoxide from trucks, generators, and other equipment; hydrogen sulfide and
methyl chloride; nitrous oxides; heavy metals; respirable silica from proppant sand processing;
and dust stirred up by vehicle traffic on unpaved roads (Adgate, Goldstein, & McKenzie, 2014;
Litovitz, Curtright, Abramzon, Burger, & Samaras, 2013; McKenzie, Witter, Newman, &

46
Adgate, 2012; Meng & Ashby, 2014; Roy, Adams, & Robinson, 2014; Srebotnjak & Rotkin-
Ellman, 2014; Weinhold, 2012).
The threat of illness or injury from air pollutants associated with oil and gas operations
scales with concentration, and therefore with proximity, so both industry workers and adjacent
communities are vulnerable (Macey et al., 2014; Rabinowitz et al., 2015). Exposure to air
pollutants from oil and gas operations where enhanced recovery techniques are employed may
affect the brain and nervous system, lungs, skin, eyes, nose, throat, heart, digestive system, and
liver (Breech, Cox, Crowe, Hendricks, & Larson, 2014; Srebotnjak & Rotkin-Ellman, 2014).
Acidizing treatments in particular have come under scrutiny for their potential air pollution
impacts (Abdullah, Malloy, Stenstrom, & Suffet, 2017; American Petroleum Institute, 2014;
Reddall, 2013), and at least one well in Los Angeles has been ordered closed following
community complaints and after EPA inspectors were sickened by fumes on site (Sahagun,
2013).
Water Pollution, Soil Contamination, and Waste Management
All petroleum operations pose a contamination risk to groundwater, surface water, and
soil. Contamination may occur via several pathways: 1) from the produced oil or gas themselves;
2) from other hazardous substances that are produced from the reservoir rock; or 3) from
hazardous substances that are utilized at the surface or downhole during the process (Osborn,
Vengosh, Warner, & Jackson, 2011; U.S. EPA, 2015a; Vengosh, Jackson, Warner, Darrah, &
Kondash, 2014).
Because oil and gas wells must typically be drilled through an overlying aquifer, there is
a risk that the engineering measures taken to prevent leakage through the well casing may fail
(Long, Feinstein, Bachmann, et al., 2015 Appendix 2.D). Casings (illustrated in Figure 25) are

47
comprised of multiple layers of tubing, steel, and cement and are designed “to withstand a
variety of forces, such as collapse, burst, and tensile failure, as well as chemically aggressive
brine” (Schlumberger, 2017).
Figure 25: Illustration of Well Casing.
(Image Source: Texas Oil and Gas Association, 2015).
48
Evaluations by industry technical firms have found failure rates for oil and gas well
casings can exceed 10 percent within several years, 60 percent within 30 years, and that most
wells are likely to fail eventually (Brufatto et al., 2003; Jackson, 2014; Wu, Doble, Turnadge, &
Mallants, 2016). It is not yet clear what percentage of well casing failures are likely to result in
groundwater contamination on any given timescale, but there is sufficient reason to suspect that
contamination will occur that concern is warranted (Ingraffea, Wells, Santoro, & Shonkoff,
2014; Jackson et al., 2013; Osborn et al., 2011). Ongoing research is also investigating the
potential for oil or gas from the underlying reservoir rock to contaminate overlying aquifers by
migrating upward outside of the wellbore in instances where the layers are disturbed through
hydraulic fracturing, perforating, or other enhanced recovery methods (Sherwood et al., 2016;
U.S. EPA, 2016a).
Once the target oil or gas has been acquired, the flowback fluids and solid waste
materials must be managed and disposed of safely or they may pose a risk to water resources.
Flowback fluids comprise both “produced water”, meaning water (typically brine) originating
from the reservoir rock that is withdrawn alongside the oil or gas, and the non-petroleum
additives used in the production process (Gregory, Vidic, & Dzombak, 2011; Vidic, Brantley,
Vandenbossche, Yoxtheimer, & Abad, 2013). If flowback fluids are held in unlined storage pits,
as is common practice in California, then they may leach into underlying soil and groundwater
(Cart, 2015a; Grinberg, 2014).
Hazardous wastewater is commonly disposed of in “injection wells” (California
Department of Conservation, 2017c; Pennsylvania Department of Environmental Protection,
2009; U.S. EPA, 2016c). The U.S. EPA regulates injection wells in six classes under the
Underground Injection Control (UIC) program and the SDWA, and the flowback fluid

49
wastewater associated with oil and gas production may be disposed of in either Class I or Class
II injection wells (U.S. EPA, 2013, 2015c). These injection wells utilize much the same casing
technology as oil and gas wells, and are therefore to subject to similar risks of contaminating the
aquifers they pass through. Moreover, permitting of injection wells is an imperfect process and
has repeatedly resulted in accidental contamination of protected aquifers that supply drinking
water in California (Cart, 2015b; Kiparsky & Hein, 2013; Knickmeyer, 2015).
Flowback fluids held above ground in storage pits or tanks may contaminate surface
waters as a result of poor waste management practices or accidental spills, resulting in the
discharge of effluent into streams, rivers, ponds, and lakes – with associated risk to human health
and ecological integrity (Burton et al., 2014; Kiparsky & Hein, 2013; Urbina, 2011; Weltman-
Fahs & Taylor, 2013). In addition, some states permit certain types of flowback fluids (usually
brines) to be disposed of via “beneficial use” which typically takes the form of spreading onto
roads for the purpose of either dust control or de-icing as shown in Figure 26(Brown, 2014;
Poole, 2013). These “surface disposal” uses have been criticized for the risks they may pose to
surface water because flowback wastewater is known to contain a wide variety of hazardous
substances, including radioisotopes of radium from uranium-bearing geologies such as
Pennsylvania’s Marcellus Shale (Lauer, Harkness, & Vengosh, 2016; Skalak et al., 2014).

50
Figure 26: Spraying Wastewater Brine as a De-Icing Treatment in West Virginia.
(Image Source: Caroline Snyder, 2016).
Direct soil contamination from oil and gas operations follows broadly similar pathways to
surface water contamination (Pichtel, 2016). However, one additional pathway to soil
contamination is the unwitting use of contaminated groundwater for irrigation. In California, for
example, a Kern County jury awarded plaintiff Fred Starrh $8.5 million in damages in a lawsuit
against Aera Energy which had allegedly contaminated local irrigation wells with flowback
wastewater leachate from unlined storage pits (Miller, 2010).
Noise Pollution
Although it is technologically feasible for the loud sounds of oil and gas operations to be
suppressed, as the example in Figure 27 shows, the structures represent an additional production
cost and so noise pollution remains a common impact in areas where firms are not under
sufficient pressure from stakeholders to capture these environmental externalities (Hays,
McCawley, & Shonkoff, 2017).

51
Figure 27: A Well Pad Sound Barrier in Kern County, California.
(Image Source: Casey Jenkins, 2016).
Industrial noise exposure is a biological stressor that has been linked to elevated cortisol
levels (Hammer, Swinburn, & Neitzel, 2014; Spreng, 2000), sleep disruption (Hume, Brink, &
Basner, 2012), hypertension (Dratva et al., 2012), endocrine disruption (Stansfeld & Matheson,
2003; Windle et al., 1997), cognitive impairment (Lercher, Evans, Meis, & Kofler, 2002),
cardiovascular disease (Babisch et al., 2013; Münzel, Gori, Babisch, & Basner, 2014), adiposity
(J. S. Christensen et al., 2016), diabetes (Sørensen et al., 2013), depression (Orban et al., 2016),
and pregnancy outcomes (Gehring, Tamburic, Sbihi, Davies, & Brauer, 2014). The extensive
medical literature around noise pollution is therefore a widely-cited environmental health
concern with respect to both conventional oil and gas production and the enhanced recovery
techniques that have become widespread following the Shale Revolution (Adgate et al., 2014).

52
Moreover, hydraulic fracturing in particular generates substantially more noise than conventional
oil and gas production on account of its intensive use of pumping machinery and truck-delivered
material inputs.
Water and Resource Use
Water flooding, chemical flooding, and hydraulic fracturing are enhanced recovery
techniques that have been employed for many decades, and so water has long been an input into
oil and gas production. However, it wasn’t until horizontal drilling technology matured that
“massive hydraulic fracturing” (or alternatively “high-volume hydraulic fracturing”) for natural
gas in unconventional shale deposits began to employ millions of gallons per treatment and
multiple treatments per well – amounts ranging from 10 to 50 times greater than those used in
traditional vertical oil and gas wells that target conventional deposits (Goodwin et al., 2012; K.
E. Murray, 2013; Nicot & Scanlon, 2012). Where suitable freshwater cannot be piped to a
drilling site or obtained from the local aquifer, it may be delivered by tanker trucks, which in
turn exacerbates several of the aforementioned environmental impacts (Berg, 2012). In water-
stressed regions such as California, the prospect of intense water use associated with new
enhanced recovery techniques has been a cause for concern among both the public and
stakeholders with competing water-use interests such as farmers (Kiparsky & Hein, 2013;
Sommer, 2014). It is important to note, however, that water use varies substantially according to
the geology of a given region and the depth or length of the wellbore (Gallegos, Varela, Haines,
& Engle, 2015; Jackson et al., 2015). In many areas, including throughout most of California,
water use in wells that target unconventional deposits via enhanced recovery techniques is not
significantly greater than in conventional wells (Kondash & Vengosh, 2015; Scanlon, Reedy, &
Nicot, 2014). Water use in California has risen in recent years, but less than states where high-
volume hydraulic fracturing for natural gas is now widespread (Tiedeman, Yeh, Scanlon, Teter,

53
& Mishra, 2016). Moreover, a substantial portion of the water used may in be produced water
that has been processed for reuse (California Council on Science and Technology et al., 2015;
Nair, Protasova, Bilstad, & Strand, 2016).
In addition to water, proppant sand may be used in volumes up to several thousand tons
per well. The desired properties of proppant sand are highly specific, and so sources of this
material input are now environmentally controversial and contested in locales such as Bagley,
Wisconsin, and Clayton, Iowa, that host large-scale surface mines (Henschel & Bowden, 2016;
Pearson, 2013).
Figure 28: Pattison Sand Co. Surface Mine in Clayton, Iowa.
(Image Source: Jim Kachel 2015).

54
Induced Seismicity
“Induced seismicity”, or anthropogenic earthquakes, are a potential environmental impact
of concern in geologically active regions such as California (Weingarten, Ge, Godt, Bekins, &
Rubinstein, 2015). Induced seismicity associated with oil and gas development has been
theorized for many decades (Hsieh & Bredehoeft, 1981; Segall, 1989; Sibson, 1981), but the
increase in volume and pressure of injected fluids associated with contemporary enhanced
recovery techniques together with increased public interest and scrutiny has renewed scientific
interest in the subject (Davies, Foulger, Bindley, & Styles, 2013; W. Ellsworth et al., 2015;
William L. Ellsworth, 2013; W.L. Ellsworth et al., 2011; van der Elst, Page, Weiser, Goebel, &
Hosseini, 2016). The central United States has seen a large increase in seismicity since the early
2000s coinciding with the Shale Revolution (Figure 29). The average of 24 earthquakes of
magnitude greater than 3.0 occurring per year between 1973 to 2008 rose to 193 between 2009
and 2014, with 688 occurring in 2014 alone (Frohlich, 2012; Frohlich et al., 2016; Gan &
Frohlich, 2013; Keranen, Weingarten, Abers, Bekins, & Ge, 2014; Rubinstein & Mahani, 2015).
The majority of these earthquakes are occurring in Oklahoma in proximity to hydraulic
fracturing operations (Figure 30).

55
Figure 29: Cumulative Number of Earthquakes in Eastern and Central United States of
Magnitude 3.0 and Greater 1970-2013.
(Source: USGS 2013, Ellsworth 2013).

56
Figure 30: Oklahoma Earthquakes of Magnitude 3.0 or Greater, 1978-2016.
(Source: USGS-NEIC ComCat and Oklahoma Geological Survey, 2016).
Analysis of historical data has suggested that past earthquakes in seismically active
regions such as Los Angeles may have been triggered by oil withdrawals between 1915 and 1932
prior to widespread practice of water injection to stabilize reservoir formations and prevent land
subsidence (Hough & Page, 2016). Los Angles communities that are host to intensive oil
production, such as Baldwin Hills, have repeatedly expressed concerns about induced seismicity
(Granda, 2015; Stuart, 2012).
Greenhouse Gas Emissions and Climate Change
The technological advances underlying contemporary enhanced recovery techniques have
dramatically increased the quantity of oil and gas reserves that may be categorized as
“economically recoverable resources” – by at least one order of magnitude – following the U.S.
Energy Information Administration’s classification schema (Figure 31). As a result, liquid fossil
fuels are unlikely to become scarce in the near term, meaning that ceteris paribus their price is

57
likely to remain low and their utilization is likely to continue for substantially longer than most
observers with concerns about peaking of global oil and gas production expected prior to the
Shale Revolution (Blackmon, 2013; Chapman, 2014; Kloor, 2013; J. W. Murray & Hansen,
2013; Verbruggen & Al Marchohi, 2010).
Figure 31: Stylized Representation of Oil and Gas Resource Categorizations (not to scale).
(Source: U.S. EIA, 2014).
The greatest global environmental implication of continued fossil fuel consumption
driven by the Shale Revolution is that anthropogenic climate change driven by emissions of
carbon dioxide, methane, and other greenhouse gasses are more likely to continue than they
otherwise would have if the supply of oil and gas had peaked and begun to fall as was widely
anticipated prior to the early 2000s. A plateaued or falling supply of fossil fuels would likely
have driven prices of oil and gas up, which in turn would likely have created incentive both to
economize consumption and to adopt alternative (i.e. renewable) sources of energy (Mann,
2013).
Even if all other concerns about local and regional environmental impacts from enhanced
recovery techniques could be successfully addressed through sound engineering, responsible

58
management practices, and appropriate regulation – as the industry has strived to assure the
public – the overarching concern that fossil fuels impose an unsustainable environmental impact
on the planet would persist. The environmental discourse surrounding the Shale Revolution has
therefore been framed from the start as, fundamentally, a question of sustainability.

59
Chapter 3. Literature Review
This chapter reviews key elements of the academic literature in the following fields: 1)
political ecology, 2) adaptive governance, 3) anticipatory governance, 4) sociotechnical
transitions, and 5) media framing. Political ecology lays the broad foundation for this dissertation
research and provides tools for understanding the structural dynamics of environmental conflict
through the lenses of political economy, property and capital accumulation, and power relations.
Adaptive governance elaborates upon that foundation by providing tools for understanding
environmental change at the institutional level through the lenses of systems dynamics and
resilience. Anticipatory governance provides further tools for foreseeing and managing
technological change at the institutional level. The sociotechnical transitions literature provides
additional tools for understanding the origins, impacts, and trajectories of specific technological
advancements. And media framing provides important tools for understanding how stakeholders
build knowledges, manage uncertainties, and construct narratives about environmental issues.
Taken together, these literatures create a conceptual framework for understanding both
the dynamics of environmental conflict within the California oil and gas sector, and the natural
resource regulatory regimes across different scales and geographies that have emerged as a
result. Over the course of this chapter’s review, the gaps in the relevant literatures are
highlighted, and the ways in which this dissertation research advances knowledge within the
aforementioned fields by contributing to those gaps are also discussed.
Political Ecology
Political ecology is an interdisciplinary field that has been defined a number of different
ways over the last four decades. Cockburn and Ridgeway initially used the term as a moniker

60
under which to describe urban and rural environmental degradation and the radical movements
arising around them “in the United States, in Western Europe and in other advanced industrial
countries” (1979, p. 3). The conception of political ecology as a mode of inquiry that “combines
the concerns of ecology and a broadly defined political economy” (Blaikie & Brookfield, 1987,
p. 17) has remained an enduring one, even as the topical focus shifted toward a “third world and
rural context” (Robbins, 2011, p. 6). By the 1990s, political ecology had evolved from its roots
as “a Marxist-influenced analysis of resource use and environmental conservation during the
1970s and early 1980s” into a set of approaches that “challenge[d] the ostensibly modernist and
Eurocentric character of development” and the new sustainable development paradigm in ways
that were “inspired … by peasant and agrarian societies in the throes of complex forms of
capitalist transition” (Peet & Watts, 1996, pp. 4–5). In particular, political ecology began to push
back against resurgent Malthusian narratives typified by the Club of Rome Limits to Growth
report (1972) of the “pressure-of-population-on-resources view, and the market distortion or
mismanagement explanation of degradation … [and in] their place affirmed the centrality of
poverty as a major cause of ecological deterioration” (Peet & Watts, 1996, p. 7). In the place of
“crude Malthusianism” which “poorly reflects the complexity of global ecology”, political
ecology came to stress the unequal distribution of resources among actors as central to building
an understanding of sustainability and resilience (Robbins, 2011, p. 9). An emphasis on space
and scale has been present from the field’s inception, but it has only been since 2003 that
scholars have returned their gaze once again to “First World” industrial and urban questions
(Biehler & Simon, 2011; Heynen, 2013; Swyngedouw & Heynen, 2003). Recent years have seen
research into the political ecologies of food (Galt, 2013), obesity (Guthman, 2011), human health

61
(Jackson & Neely, 2015; Perreault, Bridge, & McCarthy, 2015), and even turfgrass lawns
(Robbins, 2007) in the Global North.
Perreault et al. (2015) offer the following assessment of political ecology’s definitional
challenges:
“We hold that political ecology is best characterized not by research
topic (e.g. agrarian dynamics, resource conflict, deforestation,
conservation, resource governance), or scalar or socio-spatial focus
(landscape, community, household, rural versus urban, Third or First
World). Such boundary-making would ultimately prove fruitless, as
the restless nature of academics (and the demands of the academy)
would inevitably push these boundaries outward into new theoretical,
empirical, methodological, and spatial/scalar frontiers. Rather … the
field’s coherence derives from a set of commitments that are held in
common – in various ways and to varying degrees – in all political
ecological work.” (Perreault et al., 2015, p. 7).
Political ecology is therefore a field that resists simple definitions based on substantive
focus or disciplinary boundaries. Rather, it is organized around a common core of assumptions,
commitments, and theoretical bases.
Tim Forsyth identifies the following as political ecology’s foundational assumptions: 1)
that no ecology can be apolitical; 2) that the politicization environmental change must be
understood as a function of power relations and the attendant struggles that ensue; and 3) that the
causes of environmental conflict must be viewed through historical and distributional lenses
(Forsyth, 2003, p. 2). Forsyth also explains how elements of critical theory help inform political

62
ecology’s explanations of the causes of environmental degradation which “avoid the simplistic
separation of science and politics (or facts and norms), and the use of a priori notions of
ecological causality and meaning, and instead … adopt a more politically aware understanding of
the contexts in which environmental explanations emerge, and are seen to be relevant” (Forsyth,
2003, p. 21). So while political ecology is rooted in its own set of epistemological assumptions,
its critical stance simultaneously challenges the assumptions that more typically inform apolitical
approaches to understanding environmental degradation. This is important “because so much
environmental policy is based upon the belief that explanations and scientific accuracy have
already been established,” when in fact scientific uncertainty often abounds and explanations
based upon that uncertainty are often contested – as in the case at hand of oil and gas well
stimulation and its environmental impacts in California (Forsyth, 2003, p. 21).
Perreault et al. identify the foundational commitments of political ecology as: 1) a
theoretical commitment to critical social theory and a post-positivist understanding of nature and
the production of knowledge; 2) a methodological commitment to “in-depth direct observation
involving qualitative research of some sort, often in combination with quantitative methods
and/or document analysis”; and 3) an explicitly normative political commitment to justice and
structural change (2015, pp. 7–8).
Paul Robbins identifies three theoretical bases that underlie the above assumptions and
commitments, and which in turn characterize political ecology “as a distinct mode of research”
(Robbins, 2011, p. 67). The first is the explanation of land degradation as: a) “a regionalized
phenomenon conditioned by trans-regional patterns of accumulation”, and b) “mediated by the
adaptation of land managers and the variable reversibility and multiple equilibria of
environmental system states” (Robbins, 2011, p. 206). The second theoretical base is the

63
explanation of environmental conflicts as phenomena which: a) “result from environmental
development practices that are conditioned by classed, gendered, and raced imaginaries”; b) “fall
along extant faultlines of regional social stratification that determine differential environmental
access and responsibility”; and c) “embody classed and gendered struggles over highly malleable
property institutions” (Robbins, 2011, p. 207). The third theoretical base is the explanation of
environmental movements as a product of: a) “differential risk and ecological injustice that
developments from patterns of uneven development”; and b) “challenges to traditional ecological
economies” (Robbins, 2011, p. 207).
In their totality, political ecology’s foundational assumptions, commitments, and
theoretical bases outline the broad contours of a conceptual framework for understanding the
evolution of oil and gas well stimulation (collectively, “fracking”) regulation in California.
Political Ecology of the Subsurface
A growing body of literature in the fields of political ecology and human geography has
begun to focus on “subterranean struggles” and “the disparities with which conflicts surrounding
the environmental gains and losses produced by economic growth are distributed, and in
particular those produced by the mining and hydrocarbon sectors” (Bebbington & Bury, 2013, p.
13). This literature has started to “draw attention to the relative invisibility of minerals, oil and
gas in the canons of political ecology” (Bebbington, 2012, p. 1152).
Bebbington and Bury identify five themes within contemporary “subsoil” political
ecology: 1) engagement with other environmental disciplines in order to understand the full
depth and breadth of ecological impacts resulting from extractive industry; 2) adaptation to
environmental changes that are irreversible in the near-term for all practical purposes; 3) the
geographic territoriality of production; 4) the “centrality of the state” in understanding

64
“relationships between extraction, access, nation, sovereignty, and borders”; and 5) the
importance of understanding landscape transformation as a product of “enclosure,
commodification, and struggle” (2013, pp. 9–12). These struggles structure the “unequal
distribution of environmental gains and losses incurred during economic growth”, and have been
the focus of Joan Martinez-Alier’s work on the environmentalism of the poor, meaning the
efforts by which “both poor people and activists seek to prevent the transfer of the
socioeconomic costs of growth to those areas where poor people live” (Bebbington & Bury,
2013, p. 13; Juan Martinez-Alier, 2003).
The experiences that poor and marginalized communities throughout the global south
have had with the hydrocarbon extraction industries have been documented in the Peruvian
Amazon (Finer & Orta-Martínez, 2010; Viale & Monge, 2011), the Ecuadorian and Bolivian
Amazon (Finer, Jenkins, Pimm, Keane, & Ross, 2008; Perreault, 2013), and Nigeria (Watts,
2004), and this research can inform our understanding of the struggles that emerge around these
same industries in the Global North through a number of different interdisciplinary lenses. Joan
Martinez-Alier’s research on the environmentalism of the poor views these struggles through the
lens of political ecology coupled with ecological economics (2009; 2003). Gavin Bridge marries
political ecology with an understanding of global production networks in order to make sense of
regional and territorial dynamics (2004, 2008). Matthew Huber views the political economy of
oil and gas extraction from a Marxist perspective, analyzing capital accumulation within energy
systems in terms of historical materialism (Huber, 2009, 2011). And a number of authors have
brought a political economy of the environment perspective to understanding the “oil curse” in
the Global South (Appel, Mason, & Watts, 2015; Bebbington, Bornschlegl, & Johnson, 2013;
Burchardt & Dietz, 2014).

65
Each of these areas of the literature provide important lessons for understanding the
political ecology of oil and gas development in the Global North. Key among these are
communities’ efforts to: 1) “cope with extractive industry”; 2) “respond to and resist extraction”;
3) “maneuver among and make sense of shifting contours of identity politics”; 4) “demand new
ways of governing extraction”; and 5) navigate the terrain in which “the presence of political
parties and movements within [environmental] conflicts is often used by companies and
government in their efforts to delegitimize protests, on the grounds that the protests are
politically motivated rather than based on any justifiable cause for concern” (Bebbington &
Bury, 2013, pp. 18–19).
Political Ecology of Fracking
In March 2012, Michael Finewood and Laura Stroup published what was perhaps the first
paper in the political ecology literature to address fracking directly (Finewood & Stroup, 2012).
Their analysis centers upon the social, economic, and political “normalization” of environmental
impacts from hydraulic fracturing for natural gas in Pennsylvania via “neoliberal pro-fracking
arguments [that] are (re)defining the relationship among people, the environment, and
institutions” (Finewood & Stroup, 2012, p. 72). Although their analysis centers on water impacts,
its thrust can in principle extend to all environmental risks posed by well stimulation with which
“communities must make land use decisions based on incomplete and competing forms of
knowledge,” and in which “market approaches to environmental regulation become a more
accepted, and perhaps dominant part of governance” (2012, p. 77). The authors express concern
about the normalization and acceptance of “remote environmental exploitation and brutality
where the scalar issues make sacrifice zones almost invisible to the larger nation and world”
66
(2012, p. 77). These concerns have been widely echoed across the subsequent political ecology
literature around well stimulation.
In November later the same year, Anna Willow, Jeanne Simonelli, and Sara Wylie hosted
the “Energy, Environment, Engagement: Anthropological Encounters with Hydraulic Fracturing”
sessions at the Annual Meeting of the American Anthropological Association. This session
included some of the earliest explicit discussion of the political ecology of fracking (or,
alternatively, hydraulic fracturing or hydro-fracking) in the United States. Additional participants
included Anastasia Hudgins, Amanda Poole, and Kim de Rijke. In 2014, the “Journal of Political
Ecology” then published a Special Section on “Energy, environment, engagement: encounters
with hydraulic fracking”, which included papers by each of these scholars.
Willow and Wylie call for political ecology to engage fracking in the United States, and
argue that “multiple methodological approaches” and “new fieldwork trajectories based on
collaborative research philosophies” are needed to break down “the barriers that once existed
between scholarship and advocacy” (Willow & Wylie, 2014, p. 232). The authors point out that
fracking is deeply politicized and “must be approached not only as an environmental issue, but as
a cultural and political one as well,” and that “constructive ways of envisioning and enacting a
positive future” in response to technological change within extractive regimes are a serious
challenge – particularly when the industries involved are actively working to sequester
information and perpetuate ignorance among affected stakeholders (Willow & Wylie, 2014, pp.
224, 232).
In a separate paper in the same volume, Willow employs an environmental justice lens to
analyze how groups “contend with environmental challenges that they did not authorize, and do
no benefit from” by comparing the experiences of communities in Ohio where shale gas

67
development is taking place with the experiences of the Grassy Narrows First Nation community
in Ontario, Canada, as they dealt with the impacts from dams, mining, logging, and from paper
milling (Willow, 2014).
Simonelli’s paper in the same volume explores “the way community understanding of the
impact and infrastructure associated with hydraulic fracturing (fracking) has translated into
social action within the social, political, and ecological context of rural New York State”
(Simonelli, 2014, p. 258). She explores the role that scientific knowledge plays in shaping the
understandings that are emerging around fracking and its impacts, and how these knowledges are
in turn used to frame policymaking narratives. Simonelli observes that “critical information and
insight sometimes gets caught between urgency and validation,” meaning that governance
informed by scientific knowledge cannot always keep pace with changes on the ground, and that
therefore “the need to maintain systematic methodology, obtain testable and replicable results,
and submit to comprehensive critique and review is [both a] strength and weakness of the
process of scientific investigation” (Simonelli, 2014, p. 274).
Hudgins and Poole, in the same volume, analyze the discourse around fracking in western
Pennsylvania via policy ethnography in order to understand “expressions of political power” and
“attempts to manufacture consent” (2014, p. 303). The authors show how industry influences and
shapes public opinion to support extraction and capital accumulation, and how the state
apparatus participates in the process by both facilitating these accumulations and by organizing
and presenting knowledge about fracking “such that the balance of power shifts further out of
democratic reach” by “narrow[ing] the range of expertise included in important decision-making
processes such that critical perspectives are excluded” (Hudgins & Poole, 2014, pp. 303, 317).
Poole and Hudgins then published a subsequent paper later the same year in which they examine
68
some of the methodological challenges associated with conducting ethnographic research into
fracking in western Pennsylvania, and in particular the challenges of “opening up conversations
among different stakeholders who sometimes maintain oppositional relationships” (Poole &
Hudgins, 2014).
Early treatments of fracking began to appear elsewhere in the political ecology literature
beyond the “Journal of Political Ecology” at roughly the same time. In their 2014 paper, for
example, Eleanor Andrews and James McCarthy argue that fracking in the United States, like so
many other political ecologies of the subsurface in the Global South, “involves complex multi-
scalar relationships among actors with vastly different levels of power and forms of articulation
… in which patterns of access to and control over resources are (in some instances) being
reconfigured through both formal and informal means” (Andrews & McCarthy, 2013, p. 9). They
suggest that this presents an opportunity for interdisciplinary collaboration, and go on to
highlight the specific example of how synergy between political ecology and legal geography
approaches might be used to build a better understanding of how “laws and the authority of the
state more broadly have been changed, deployed, and invoked … to enable the extraction of the
gas in the shale and its circulation as a viable commodity” (Andrews & McCarthy, 2014, p. 7).
More recent research on the political ecology of fracking has begun to explore the
interactions between participatory-based and expert-driven approaches to understanding the
environmental risks and impacts of well stimulation methods (Demeritt, 2015), how these
methods are beginning to be perceived outside of the United States (Clifford, 2015; Garvie &
Shaw, 2016; Vesalon & Creţan, 2015), the coordination of collective action by local, national,
and international NGOs using digital technologies such as online social networks (Hopke, 2016),
the dynamics of fracking policy negotiation (Dodge & Lee, 2017), the political ecology of

69
hydrocarbons and energy systems more broadly (Sovacool, 2016), and the linkages between
energy systems and food systems (Huber, 2017). Most of this research, however, remains
focused on states where the targets of enhanced recovery techniques are primarily
unconventional deposits of natural gas. To date there has been no political ecology research that
explores well stimulation in California, where the target is almost entirely limited to
unconventional deposits of tight oil, and so this dissertation research therefore addresses a
notable gap in the political ecology literature.
Adaptive Governance
In order for this dissertation to answer its research about how oil and gas well stimulation
regulation in California evolved, its conceptual framework must be informed by an appropriate
body of environmental governance theory. Adaptive governance provides a set of theoretical
tools for understanding environmental change within the context of complex adaptive social-
ecological systems.
Chaffin, Gosnell and Cosens define adaptive governance as “as a range of interactions
between actors, networks, organizations, and institutions emerging in pursuit of a desired state
for social-ecological systems,” and that, as such, it is “an emergent form of environmental
governance that is increasingly called upon by scholars and practitioners to coordinate resource
management regimes in the face of the complexity and uncertainty associated with rapid
environmental change” (2014, p. 1).
Adaptive governance originally emerged as a literature starting in 2003 when the term
was introduced in a seminal paper by Thomas Dietz, Elinor Ostrom, and Paul Stern (Dietz,
Ostrom, & Stern, 2003). This early work helped lay the conceptual cornerstones of the field –
namely, that the governance of natural resource use under changing conditions requires that

70
environmental change be framed within the context of social-ecological systems (SES) theory,
with emphasis on the key ideas of complexity, vulnerability, resilience, and adaptive capacity
(Folke, 2006; Folke, Hahn, Olsson, & Norberg, 2005; Gunderson, 1999). A core premise of the
adaptive governance literature is therefore that environmental governance ought to conceive of
both society’s ongoing management of natural resources and its responses to abrupt ecological
changes from an SES perspective.
Although SESs may be temporarily stable, abrupt shifts from one “attractor basin” of
stability within the “state space” of a dynamic system to another are the rule rather than the
exception. The response of SESs to perturbation are understood in terms of “resilience” and
“adaptive capacity” (Gallopín, 2006). These concepts are interrelated and not formally
distinguished, but there is general agreement across the adaptive governance and SES literatures
that resilience and adaptive capacity together represent the magnitude of perturbation that a
complex dynamic system can withstand before experiencing an abrupt shift combined with the
ability of that system to reorganize after perturbation into a new configuration that retains
richness of function (Gallopín, 2006; Smit & Wandel, 2006). Figure 32 illustrates the concept of
attractor basins, using a non-specified two-dimensional system state space for clarity. In reality,
however, SESs may have any number of dimensions.

71
Figure 32: Attractor Basins in Social-Ecological System States.
Research in the field recognizes that top-down approaches to navigating environmental
change in complex dynamic SESs seldom successfully adapt to specific contexts (Cumming,
Cumming, & Redman, 2006; Lemos & Agrawal, 2006; Young, 2002) and “often [fall] short in
efforts to coordinate governance across large-scale ecosystems that cross multiple jurisdictional
boundaries” (Chaffin et al., 2014, p. 1). But bottom-up approaches may also fail across varied
geographies and scales, and “local governance is not always inclusive of all voices, especially
those of stakeholders who are marginalized by dominant power relations and deprived of rightful
access to resources” (Chaffin et al., 2014, p. 1). The field emerged, in part, in recognition of the
need for an approach to environmental governance that is “capable of confronting landscape-
scale problems in a manner both flexible enough to address highly contextualized SESs and
dynamic and responsive enough to adjust to complex, unpredictable feedbacks between social
and ecological system components” (Chaffin et al., 2014, p. 1). Adaptive governance therefore
provides theoretical tools for understanding the crucial roles that values, knowledges, and
practices embedded within local and regional networks (i.e. clusters of individuals, groups,
communities, organizations, and the formal and informal institutions with which they engage)
Attractor Basins
SYSTEM STATE SPACE
Perturbation

72
play in establishing the legitimacy of environmental governance (Brosius, Tsing, & Zerner,
2005; Brunner, Steelman, Coe-Juell, Cromley, & Edwards, 2005; Cosens, 2013).
Scholars from many disciplines have employed the field’s tools to understand a wide
variety of different types of environmental change, including natural hazards and disasters
(Andrew & Kendra, 2012; Djalante, 2012; Djalante, Holley, & Thomalla, 2011), deforestation
(Boyd, 2008), river basin management (Cosens & Williams, 2012), wetland protection and
restoration (Gunderson & Light, 2006), regional watershed management (Abers & Keck, 2013;
Bark, Garrick, Robinson, & Jackson, 2012; Cosens, Gunderson, Allen, & Benson, 2014; Kallis,
Kiparsky, & Norgaard, 2009), and climate change (Huntjens et al., 2012; Lynch & Brunner,
2010). Cases within this empirical literature span dozens of countries across both the Global
South and the Global North. The changes in land use and associated environmental impacts of oil
and gas well stimulation in various California localities are substantively consistent with the
above empirical case studies and others like them in the adaptive governance literature. No
adaptive governance research has yet been published about fracking in California, however, and
so this dissertation addresses a gap in the literature.
Anticipatory Governance
As discussed in the preceding chapters, modern oil and gas well stimulation capabilities
are the product of a number of convergent advances in technology. This dissertation’s conceptual
framework must therefore be informed by an appropriate body of theory for foreseeing and
managing institutional responses to technological change. One promising new interdisciplinary
literature that fulfills this requirement is adaptive governance.
David Guston, the field’s founding scholar, defines anticipatory governance as “a broad-
based capacity extended through society that can act on a variety of inputs to manage [emerging

73
technologies] while such management is still possible” (Guston, 2007, p. vi). The purpose of
anticipatory governance is to increase reflexivity within the scientific enterprise, meaning to
“learn in ways that expand the domain of, and inform the available choices in, decision making”
in order to expand society’s capacity to anticipate and govern amidst technological change
(Guston, 2007, p. vi). Keon Chi argues that anticipatory governance therefore represents a shift
from “short-term-oriented decision-making practices to longer-term policy making with vision
and foresight [which] allows legislative, management, and adjudication processes to be based
more on informed trends and fact and evidence-based decisions as well as preferred futures
designed together by state officials and citizens” (2008, p. 6).
Anticipatory governance offers approaches to decision-making under conditions of high
uncertainty (Quay, 2010). These approaches are distinguished from others in the broader
governance literature because they draw upon foresight methods for anticipating and planning
for possible, probable, and preferable futures (Guston, 2014; Karinen & Guston, 2009). Foresight
notably eschews the fine-grained specifics of prediction and forecasting, which tend to be
technologically deterministic, and instead favors more open-ended and reflexive anticipation
(Barben, Fisher, Selin, & Guston, 2008; Georghiou, 2009). Anticipatory governance also
intersects with scenario planning in the urban and regional planning literature. Ray Quay
explains that the three distinguishing functions of anticipatory governance in the context of
planning are “anticipation and futures analysis, creation of flexible adaptation strategies, and
monitoring and action” (2010, p. 498), and through an analysis of three case studies in major
U.S. cities (New York, Denver, and Phoenix) he shows that anticipatory governance “represents
a governance framework in which planning and decision making may be able to overcome [some
of the] obstacles to traditional physical planning” (2010, p. 506).

74
Nanotechnology was the primary substantive concentration of anticipatory governance at
the field’s inception in the mid-2000s, but more recent research has broadened the field’s focus
to include climate change and regional scenario planning (Quay, 2010), urban planning (Wiek,
Guston, Leeuw, Selin, & Shapira, 2013), social-ecological resilience (Boyd, Nykvist, Borgström,
& Stacewicz, 2015), water policy and management (Sampson, Quay, & White, 2016; Sampson,
Quay, White, Gober, & Kirkwood, 2013; D. D. White et al., 2013), global health and innovation
(Aujla & Wolbring, 2016), genomics and personalized medicine (Ozdemir, Husereau, Hyland,
Samper, & Salleh, 2009), synthetic biology (Michelson, 2016), and geoengineering (Bellamy,
Chilvers, Vaughan, & Lenton, 2013; Low, 2017). The topic of this dissertation – oil and gas well
stimulation in California – represents a reasonable addition to the above list, and helps to fill a
current gap in the literature.
Sociotechnical Transitions
This dissertation’s conceptual framework draws upon sociotechnical transition theory in
order to understand the origins, impacts, and trajectories of technological change. The
sociotechnical transition literature is an interdisciplinary body of research that emerged from key
threads in science and technology studies (STS), perhaps most notably Bruno Latour’s actor
network theory (ANT) which asserts that technologies and their material embodiments are
socially constructed, instituted, and perpetuated (Latour, 1987, 1990, 1993; Latour & Woolgar,
1979; Law & Callon, 1992). Latour’s pioneering work gave rise to a broadly conceived
technoscience in which “the social characterization … accompanies the technology, infuses it
with meaning, legislates its existence, and authorizes its materiality” (Selin, 2007, p. 199).
Sociotechnical transitions are a facet of this technoscience, and are understood to be “a process
of shifting assemblies of associations and substitutions, a reweaving of elements [where changes]

75
in one element in the network can trigger changes in other elements,” and they became a specific
research focus in part because there had been “relatively little attention in [STS] for long-term
and large-scale technological developments” (Geels, 2002, p. 1259).
The multi-level perspective (MLP) theory of sociotechnical transition developed by
Frank Geels offers a key tool for understanding technological change. Within MLP,
sociotechnical transitions are conceived as “non-linear processes that result from the interplay of
developments at three analytical levels: niches (the locus for radical innovations), sociotechnical
regimes (the locus of established practices and associated rules that stabilize existing systems),
and an exogenous sociotechnical landscape” (Geels, 2011, p. 26). This schema is illustrated in
Figure 33 below.

76
Figure 33: Multi-Level Perspective (MLP) Theory of Sociotechnical Transition.
(Source: Reproduced from Geels & Kemp, 2007 Fig. 2).
Geels explains that the “sociotechnical regime” level “forms the ‘deep structure’ that
accounts for the stability of an existing sociotechnical system … [and] refers to the semi-
coherent set of rules that orient and coordinate the activities of the social groups that reproduce
the various elements of sociotechnical systems” (Geels, 2011, p. 27). These regimes are stable
configurations of “locked in” institutions, practices, and technologies, and so “innovation” of
various kinds – technological, cultural, political, scientific, or industrial – occurs incrementally at
this level of analysis, such that trajectories of change are predictable in the short-term and serve
to reproduce existing sociotechnical and social-ecological systems (Geels, 2010).

77
“Niches” within the MLP schema “are ‘protected spaces’ such as R&D laboratories,
subsidised demonstration projects, or small markets” where actors “work on radical innovations
that deviate from existing regimes [in hopes] that their promising novelties are eventually used in
the regime or even replace it” (Geels, 2011, p. 27). At the niche level of analysis, the processes
of envisioning radical change, building social networks, and technical learning are key.
The “landscape” level within the MLP schema is the “wider context … [which provides]
not only the technical and material backdrop that sustains society, but also includes
demographical trends, political ideologies, societal values, and macro-economic patterns [that]
form an external context that actors at niche and regime levels cannot influence in the short run”
(Geels, 2011, p. 28).
This three-level schema allows MLP theory to characterize different sociotechnical
transition pathways (Geels & Kemp, 2007; Geels & Schot, 2007), different actors and their types
and degrees of agency (Geels, 2011; Genus & Coles, 2008; Smith, Voß, & Grin, 2010), different
ontologies of transition (Geels, 2010), and the relation between possible, probable, and preferred
transitions in the context of sustainability (Shackley & Green, 2007; Verbong & Geels, 2007).
The sociotechnical transition literature in general, and MLP theory in particular, can help to
inform this dissertation’s conceptual framework by providing tools to better understand the shifts
in California’s energy system that have resulted from technological innovation in oil and gas
well stimulation. This specific topic has not yet received the attention of sociotechnical transition
scholars, and so this dissertation also fills a gap in the current literature.
Media Framing
The majority of Americans obtain their information “through newsprint, television, and
the Internet,” and so the news media therefore wields “considerable influence over the public's

78
perception [which], in turn, affects how decision makers view and respond to risks” (Ford &
King, 2015, pp. 137–138). Scholars across a wide range of disciplines have for several decades
invoked various versions of the concept of the “frame” to convey the idea that “an issue can be
viewed from a variety of perspectives and be construed as having implications for multiple
values or considerations” (Chong & Druckman, 2007, p. 104). Erving Goffman offered the
earliest formal articulation of the concept in his book “Frame Analysis: An Essay on the
Organization of Experience” (1974), which collected and synthesized several decades of his
prior thought and research. Disparate theories of framing have since proliferated across the social
sciences (Scheufele & Iyengar, 2017), and frames are understood to be not just tools for
communication (Entman, 1993; Scheufele, 2013) and advocacy (Bales & Gilliam, 2001; Benford
& Snow, 2000) but also as a basic function of human cognition (Druckman, 2001; Goffman,
1974; Lakoff, 1987, 2002, 2009, 2010) and the social construction of how we collectively
perceive reality (Carter, 2013; Gamson, Croteau, Hoynes, & Sasson, 1992).
Chong and Druckman define framing as, “the process by which people develop a
particular conceptualization of an issue or reorient their thinking about an issue” (2007, p. 104).
Within this general context, a “media frame” may therefore be further defined as, “a written,
spoken, graphical, or visual message modality that a communicator, by means of a technological
channel, uses to contextualize a topic, such as a person, event, episode, or issue, within a text”
(D’Angelo, 2017, p. 634). But frames are not free-standing conceptual constructs. Bales and
Gilliam explain that framing can be regarded as “how messages are encoded with meaning so
that they can be efficiently interpreted in relationship to existing beliefs and ideas” (2001, p. 3).
In media framing theory, frames take two general forms: frames of emphasis and frames
of equivalency. Frames of emphasis, which are the primary focus of media framing research, are

79
those which highlight specific actors, intentions, stereotypes, values, principles, icons, events,
and information “in an effort to define the topic and purvey a set of judgments about it”
(D’Angelo, 2017, p. 635; Entman, 1993). Frames of equivalency, which are employed in
journalistic reporting that purports to be “objective” or “balanced”, are those which present a
topic in terms of available options, each of which comprises its own set of risks, benefits, and
detriments (D’Angelo, 2017). Researchers employ “a wide range of qualitative and quantitative
techniques that incorporate both inductive and deductive approaches in order to identify framing
devices” within media content (D’Angelo, 2017, pp. 634–635). The concept of “narratives” is
related to but distinct from frames. A narrative is a set of information framed as a story, and
therefore typically involves an account of both actors (who harbor intentions and goals) as they
stand in relation to events (whose outcomes those actors either influence or are influenced by),
and to which some valence is attached (Gamson & Modigliani, 1989; Jones & McBeth, 2010;
Paschen & Ison, 2014; Wozniak, Lück, & Wessler, 2015).
For any given environmental issue, the various stakeholders involved may employ
“framing strategies” as a deliberate advocacy effort in order to utilize news media as a conduit
through which to advance narratives that embody their own specific values and goals (Heikkila,
Pierce, et al., 2014). The selective emphasis of information has long been recognized as a key
tool of environmental advocacy within politicized and contested discourses (Fischer, 2003; Hajer
& Versteeg, 2005). Stakeholders in environmental discourse have strategically utilized frames of
emphasis that highlight the unjust distribution of environmental burdens (Čapek, 1993; Clayton,
Koehn, & Grover, 2013; Taylor, 2000) and a broad range of unsustainable systems and practices
(Barr, Gilg, & Shaw, 2011; Delshad, Raymond, Sawicki, & Wegener, 2010; Lejano, Ingram, &
Ingram, 2013; Wolsko, Ariceaga, & Seiden, 2016).

80
Framing Fracking
A small body of work has emerged in recent years that examines the framing of fracking
in environmental discourse and news media. Marita Wright’s ethnographic research (2013) has
traced the rise of the anti-fracking protest movement nationwide through the lens of collective
action frames and NGO-audience relationships. Matz and Renfrew (2015) examine efforts of the
industry public relations initiative “Energy in Depth” to frame of fracking nationwide in a pro-
economic and pro-nationalist light. Mazur (2016) explores the role that “Gasland”, an influential
documentary that frames fracking in terms of community health and safety impacts, played in
conjunction with the Deepwater Horizon oil spill disaster to raise public awareness and media
attention around the issue of fracking. In more regionally-focused research, Heikkila et al.
explore how fracking opponents have morally characterized policy actors to construct policy
narratives in New York (2014), and how the framing of core and secondary policy beliefs have
influenced fracking regulatory outcomes in Colorado (Heikkila, Pierce, et al., 2014). Eaton and
Kinchy (2016) investigate the ways in which frames shape individual and collective action
among local residents in rural Pennsylvania and Saskatchewan in response to fracking in their
communities. Hudgins and Poole undertake policy ethnographies in Pennsylvania to examine
how “the state uses its socially sanctioned authority to reframe water, land, air, community,
health, and self around a paradigm that interprets those as sources of profit” (2014, p. 303; 2014).
Beyond the United States, researchers have begun to explore the ways in which opponents and
proponents of fracking have framed the issue in anticipation of the technology’s implementation
in the United Kingdom (Bomberg, 2013, 2017b; Hilson, 2015; Macnaghten, Davies, & Kearnes,
2015; L. Williams, Macnaghten, Davies, & Curtis, 2017) and in Poland (Lis & Stankiewicz,

81
2017). No research yet exists that explores the framing of fracking in California, and so this
dissertation serves to fill a gap in the media framing literature.
82
Chapter 4: California Historical Context
California has been an oil and gas state throughout its history, and for half a century an
environmental bellwether for the nation. The state’s internal struggle to reconcile competing and
conflicting needs, rights, and priorities among diverse stakeholders cuts a political and legislative
course toward which the country as a whole has tended to steer over time. From the outset of the
Shale Revolution, conflicting narratives about economic benefits, environmental impacts, and
natural resource demands have cast long shadows of fear and doubt over the prospect of a
trillion-dollar prize lying in the untapped potential of the Monterey Shale Formation. Political
ecology research that analyzes the Californian carbon landscape and looks to its future must
therefore be informed by the state’s rich and complicated past. The brief history of oil and gas in
California presented here attempts to lay necessary groundwork for the analyses in the chapters
that follow.
Pre-History and Early Years of Oil and Gas in California
Prior to the Columbian Exchange, the indigenous inhabitants of what is now the state of
California had been using the petroleum from natural seeps for millennia (California Department
of Conservation, 1985). As in many other parts of the world, extremely heavy oil known as
asphaltum “was used to make baskets and jars, to fasten arrowpoints to shafts, and for
ornaments,” as well as for waterproofing and adhesives (Ritzius, 1993, p. 7). Archeological
evidence for the use of asphaltum dates to at least the second millennium BC, and possibly much
earlier (Heizer, 1972; Wallace, 1955). Later, Spanish explorers spotted oil slicks off the coast of
present-day California, and onshore the Portuguese explorer Juan Rodriguez Cabrillo “found
Indians gathering asphaltum … from natural seeps … for many purposes, including … making

83
wooden canoes, called ‘tomols’” such as the example shown in Figure 1 (Ritzius, 1993). The
Spanish explorers themselves, “used asphaltum to seal seams in their ships” (California
Department of Conservation, 2013b). Early European settlers emulated the indigenous practices
they encountered, and gathered or traded for asphaltum to use as sealant for their roofs. Settlers
and miners also used the lighter oil from seeps to lubricate the wheels and axles of wagons
(California Department of Conservation, 2013b).
Figure 34: 1913 Replica of a Chumash Tomol with Asphaltum Caulking.
(Image Source: Santa Barbara Natural History Museum, 2017).
In 1848, Mexico ceded California along with much of its northern territory to the United
States in the Treaty of Gaudelupe. The Gold Rush of 1849 followed, California was granted
statehood with unprecedented speed in 1850, and by 1865 the state’s population had grown by
375 percent as pioneers and prospectors flocked to the west to seek their fortunes. At the same
time, the foundations for the “rock oil” industry were being laid. Canadian geologist Dr.
Abraham Gesner invented the process by which kerosene is distilled from heavier oil in 1846
and received a U.S. patent for it in 1854 (Murray, 1993; Yergin, 2008). At the same time interest
was beginning to stir over the promise of rock oil now being gathered by hand in small quantities
from natural seeps in Pennsylvania. Also in 1854, the services of famed Yale professor Benjamin
Silliman, Jr., were retained by a determined and visionary polymath named George Bissell

84
together with his financial partner James Townsend (Tarbell, 1904). Silliman, a chemist, was
able to confirm Bissell’s belief in the potential of rock oil to be easily distilled into several
different “fractions” suitable for a variety of uses, including as a lighting fuel. With Silliman’s
authoritative vote of confidence, Bissell and Townsend were able to raise capital for a venture
that would go on to become the Pennsylvania Rock Oil Company (Yergin, 2008). Oil proved its
worth in short order, and thanks also to the invention of kerosene lamps by Ignacy Łukasiewicz
in Poland in 1853 and possibly independently by Michael Dietz in the late 1850s, kerosene
quickly came to replace whale oil as the lighting fuel of choice. Demand for this cheaper,
cleaner-burning, longer-lasting alternative helped drive the nascent oil boom in Pennsylvania
which then spread to California within months.
The first person to refine lamp oil in California was Andreas Pico, who “obtained oil
from seeps in Pico Canyon, near Newhall, and distilled the oil for use as an illuminant at the San
Fernando Mission” in 1850 (1993, p. 7). Although we cannot be certain how Pico’s lamp oil
differed from kerosene, it is clear that distilling hydrocarbons for illumination from rock oil was
an idea in the air at the time. By the 1850s oil was being collected from seeps at Sulphur
Mountain in Ventura County and distilled for private use, and petroleum products began to be
produced commercially in California in 1855, when oil from a Humboldt County seep was first
sold. In 1856 a San Francisco-based company also appears to have begun distilling oil from the
La Brea tar pits near Los Angeles, but the records of this activity are somewhat unclear. By the
end of the decade oil was being produced from active excavations around these natural seeps,
with operations centered at McKittrick in Kern County and Sargent Ranch in Santa Clara County
that ran until the late 1860s when excavation was superseded by drilling (Ritzius, 1993).

85
Figure 35: Pit and Tunnel Mining for Asphaltum in McKittrick, California.
(Image Source: Unknown, circa 1860).

86
Figure 36: Asphaltum Excavation in McKittrick, Calfiornia.
(Image Source: Unknown, circa 1860).
Figure 37: Entrance to an Asphaltum Mine in McKittrick, California.
(Image Source: Unknown, circa 1860).

87
At the same time, a mining engineer and entrepreneur named Josiah Stanford began to
excavate tunnels at Sulphur Mountain in Ventura County. Stanford’s team of Chinese laborers
dug some 30 upward slanting tunnels, the most productive of which reportedly yielded as much
as 20 barrels per day (Nelson, 2001). A California Department of Conservation report notes that,
“the oil flowing steadily from the tunnels made Stanford one of the top oil producers of the
1860s and the tunnels produced more oil in California than any other production method” at that
time, and that “in the early 1990s, a few tunnels were still producing oil, but by 1997 the last one
had been plugged and abandoned” (California Department of Conservation, 2013b, p. 2). In the
early 1860s kerosene was in high demand in Calfornia but supplies were scarce as a consequence
of the Civil War, and enterprising prospectors and investors turned their gaze to local sources
(Nelson, 2001).
Figure 38: Entrance to a Stanford Slanting Tunnel in Ventura County, California.
(Image Source: Unknown.)
Drilling for Oil
In 1856 the already determined and redoubtable George Bissell developed the crucial
notion of drilling for oil. On a hot summer day in New York, Bissell “took refuge from the

88
burning sun under the awning of a druggist’s shop on Broadway” and was inspired by an
advertisement in the shop window for rock oil derived medicine that showed drilling derricks in
the background (Yergin, 2008, p. 25). Nearly three decades prior, in 1830, Europeans had
imported a method for boring deep saltwater wells from the Chinese who had developed the
process more than 1,500 years earlier.
Figure 39: Depiction of Salt Drilling in Sichuan Province, Song Dynasty (AD 940 to 1279).
(Image Source: The Annals of Salt Law of Sichuan Province, 19th Century).
Small quantities of petroleum were a minor byproduct of European salt wells, hence the
drilling derricks in the background of the rock oil medicine advertisement. Bissell thereafter
envisioned a future in which oil was pumped like water out of drilled wells instead of dug-out
pits – a vision that was initially met with ridicule. Bissell had the further perspicacity to enlist the
services of an extraordinarily tenacious man by the name of Edwin Drake. Bissell and his fellow

89
investors in the Pennsylvania Rock Oil Company sent Drake to the backwoods town of
Titusville, Pennsylvania, in December 1857 (carrying the fictitious moniker “Colonel” to inspire
confidence and respect among the local townsfolk) to try to drill America’s first oil well (Yergin,
2008).
Figure 40: “Colonel” Edwin Drake.
(Image Source: Drake Well Museum, circa 1860).
Drake struggled for nearly two years to develop equipment and drill a well with the help
of a cooperative local blacksmith by the name of William A. Smith and his two sons. By August
1859, all of the original investors except James Townsend had given up on the venture.
Townsend had financed Drake out of his own pocket for a time, but eventually ran out of funds
and sent a letter to Drake with final payment and instructions to abandon the operation. In what
may well be an apocryphal embellishment of the tale, Townsend’s letter arrived in the post from
New Haven on the day Drake finally struck oil. At a depth of 69 feet, Drake’s well at last
fulfilled Bissell’s original vision of pumping liquid oil from the Earth (Yergin, 2008).
After news spread that the “Yankees struck oil”, Titusville was transformed almost
overnight into a bustling town where thousands flocked in hopes of “striking it rich”. It was

90
America’s first oil rush. A year after Drake’s initial success there were 75 wells in and around
Titusville and its neighboring valley of Oil Creek. Pennsylvania went from producing hundreds
of barrels per year to 450,000 barrels in 1860, and then to 3 million barrels in 1862. Supply
quickly outstripped demand, however, and prices fell from $10 per barrel (equivalent to $263
today) in January 1861 to just 50 cents per barrel ($13 today) six months later (Yergin, 2008).
Fortunes were made very quickly amidst the boom. Yergin writes that “one memorable well
generated $15,000 of profit for every dollar invested,” and that “one farm that had been virtually
worthless a few months earlier was sold for $1.3 million in July 1865, and then resold for $2
million in September”, the latter amount worth $28 million today (2008, pp. 30–31). But fortunes
were lost quickly in the bust as well – and as much or more on land speculation as on oil
production itself: “A parcel of land Pithole bought for $2 million in 1865 was auctioned for
$4.37 in 1878” (2008, p. 31).
The first two decades of oil production were centered first in Pennsylvania and later
Ohio, Indiana, and California, and these years were characterized by series of boom-and-bust
cycles, as reflected in the price of oil between 1860 and 1880 (Figure 8). Texas, the eventual
leader of oil production, would not become a significant producer until the late 1890s (Rundell,
1977; Warner, 1939). Similarly, Oklahoma’s oil boom did not begin until 1897 (Boyd, 2002).

91
Figure 41: Price of Oil per Barrel (CPI Inflation-Adjusted 2016 USD), 1860 to 2016.
(Source Data: U.S. EIA, 2017).
Despite initial vagaries in price, however, demand for oil grew exponentially – and
supply along with it – until the energy crises of the 1970s associated with the initial peak in
domestic production (see Chapter 2, Figure 1). Oil holds great value for the energy it embodies
as fuel for machinery and industry, for heating, for lighting, and for generating electricity, as
well as great value as a material input for products and processes too numerous to list. This
tremendous instrumental value has caused oil to play a uniquely powerful role in the global
economy and its geopolitics throughout modern history (Ross, 2012; Yergin, 2008, 2011).
The Standard Model
Any history of oil and gas must provide at least a brief summary of the industry’s iconic
firm, Standard Oil. Founded in Ohio in 1870 by John D. Rockefeller, his brother William
$-
$50
$100
$150
$200
$250
$300
1860 1870 1880 1890 1900 1910 1920 1930 1940 1950 1960 1970 1980 1990 2000 2010 2020
Oil
Pri
ce (
$/b
bl)
Ad
just
ed 2
01
6 U
SD
Historical Price of Oil from 1860 to 2016 (Adjusted 2016 USD)

92
Rockefeller, and their partners Samuel Andrews, Henry Flagler, Stephen Harkness, and Oliver
Burr Jennings, the company’s initial focus was on consolidating and improving the refinery
segment of the oil industry. Within two years, Standard Oil had either acquired or driven out of
business virtually all of its competitors in Cleveland, which at the time was the central
refinement hub for production in Pennsylvania, Ohio, and Indiana. John D. Rockefeller’s driving
vision was of an industry whose supply was carefully managed not only for optimal efficiency
and profitability, but to avoid the destructive price swings and boom and bust cycles driven by
the market vagaries of uncoordinated competition and speculative investment (Tarbell, 1904).
In the decade following its founding, Standard Oil leveraged its size and economies of
scale to commodify petroleum products and broker low-cost transportation deals, driving prices
down and holding them below levels that smaller firms were capable of sustaining. Kerosene
was the most important of these products, but naptha (gasoline), fuel oil, lubricating oils,
petroleum jelly (trademarked as Vaseline), and paraffin were similarly affected by Standard Oil’s
“Great Game” (Yergin, 2008). Then, in 1882, Standard Oil made innovative and secretive use of
the legal concept of the trust in order to circumvent state-level laws limiting the size of enterprise
and protect the business from ownership squabbles in the event of the death of any of its
founders. A board of trustees was established, and it was this trust that owned stock in all of the
various entities controlled by Standard Oil and managed all of its operations (Business History
Foundation, 1955; Tarbell, 1904; Yergin, 2008).
Standard Oil pioneered the modern form of the multinational corporation, as well as the
management and ownership regime known as “vertical integration” in which all of the
enterprises in a product’s supply chain are brought under common ownership. Over the next 30
years, the company would go on to own or directly control as much as 85 percent of the oil

93
production, processing and refinement, marketing, and distribution of petroleum products in the
United States, and in the process exert enormous influence over the industry and its markets
worldwide. Efforts to break up the company and end its monopolistic control over the oil
industry began as early as 1890 (in Ohio), and its dissolution was finally confirmed by the U.S.
Supreme Court in 1911 who ruled in favor of a lawsuit brought against the Standard Oil Trust by
the Department of Justice in 1909 by finding that the company had unlawfully abused its market
power in a variety of ways, including:
“Rebates, preferences and other discriminatory practices in favor of the combination by
railroad companies; restraint and monopolization by control of pipe lines, and unfair practices
against competing pipe lines; contracts with competitors in restraint of trade; unfair methods of
competition, such as local price cutting at the points where necessary to suppress competition;
espionage of the business of competitors, the operation of bogus independent companies, and
payment of rebates on oil, with the like intent; the division of the United States into districts and
the limiting of the operations of the various subsidiary corporations as to such districts so that
competition in the sale of petroleum products between such corporations had been entirely
eliminated and destroyed; and finally reference was made to what was alleged to be the
“enormous and unreasonable profits” earned by the Standard Oil Trust and the Standard Oil
Company as a result of the alleged monopoly” (Supreme Court Reporter, 1911, p. 509).
The Standard Oil Trust was broken into 33 companies, several of which have survived to
be major industry brands today, including ExxonMobil (originally Standard Oil Company of
New Jersey and Standard Oil Company of New York), Amoco (originally Standard Oil of
Indiana), and Chevron (originally Standard Oil of California). Rather notably for the purposes of
this dissertation, California is the one major oil-producing state that resisted Standard Oil’s

94
dominance. The leading producer in California at the time was Union Oil (later Unocal, now
Chevron), and that company along with others in the state “contrasted sharply with the attitude in
other parts of the country” in their amicable disposition toward the new profession of petroleum
geology (Yergin, 2008, p. 82). California was able to resist Standard Oil in part because the state
led the nation in oil production for the first decade of the 20th Century (and accounted for 22
percent of global production) thanks to scientific and technological innovation, and in part
because California served markets in Asia via ship rather than domestic markets the pipeline and
rail (Franks & Lambert, 1985; White, 1968).
Natural Gas
Like oil, knowledge of natural gas dates to antiquity, as seeps occasionally catch fire
naturally and can burn for long durations – years, decades, or even centuries. Perhaps the most
famous of these “eternal flames” is the Eternal Fire at Baba Gurgur, in what is today northern
Iraq (Figure 42). Baba Gurgur was described by Herodotus and Plutarch, and is suspected to be
the “fiery furnace” referred to the Old Testament’s Book of Daniel (Yergin, 2008). It burns to
this day, uninterrupted for at least 3,000 years, and possibly a great deal longer.

95
Figure 42: The Eternal Fire at Baba Gurgur in Northern Iraq.
(Image Source: Chad R. Hill, 2006).
Herodotus, along with Pausanias and Euripides, also mentions an eternal flame in the
Temple of Apollo at the Oracle at Delphi, and places its discovery by a goatherd at around 1,000
BCE. Pausanias (circa AD 110 to AD 180) records that the flame burned during the Roman
sacking of Delphi by General Sulla in 87 BCE. By around 400 BCE both natural gas and oil
were being utilized as byproduct of drilling salt wells in China (Temple & Needham, 2007).
During the Han Dynasty, circa 100 AD, systems of bamboo pipelines and storage tanks were
used capture and transport gas from “fire wells” primarily for use in boiling brine from adjacent
salt wells to produce salt (Manchester, 1918; Temple & Needham, 2007).
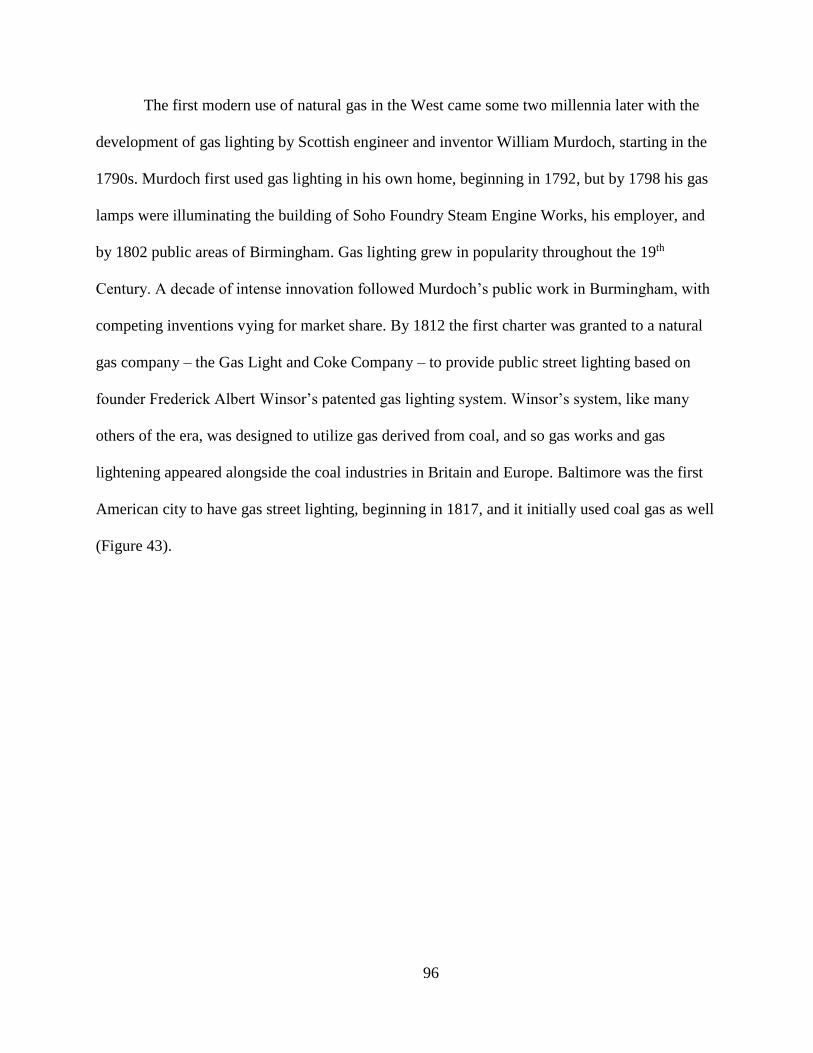
96
The first modern use of natural gas in the West came some two millennia later with the
development of gas lighting by Scottish engineer and inventor William Murdoch, starting in the
1790s. Murdoch first used gas lighting in his own home, beginning in 1792, but by 1798 his gas
lamps were illuminating the building of Soho Foundry Steam Engine Works, his employer, and
by 1802 public areas of Birmingham. Gas lighting grew in popularity throughout the 19th
Century. A decade of intense innovation followed Murdoch’s public work in Burmingham, with
competing inventions vying for market share. By 1812 the first charter was granted to a natural
gas company – the Gas Light and Coke Company – to provide public street lighting based on
founder Frederick Albert Winsor’s patented gas lighting system. Winsor’s system, like many
others of the era, was designed to utilize gas derived from coal, and so gas works and gas
lightening appeared alongside the coal industries in Britain and Europe. Baltimore was the first
American city to have gas street lighting, beginning in 1817, and it initially used coal gas as well
(Figure 43).
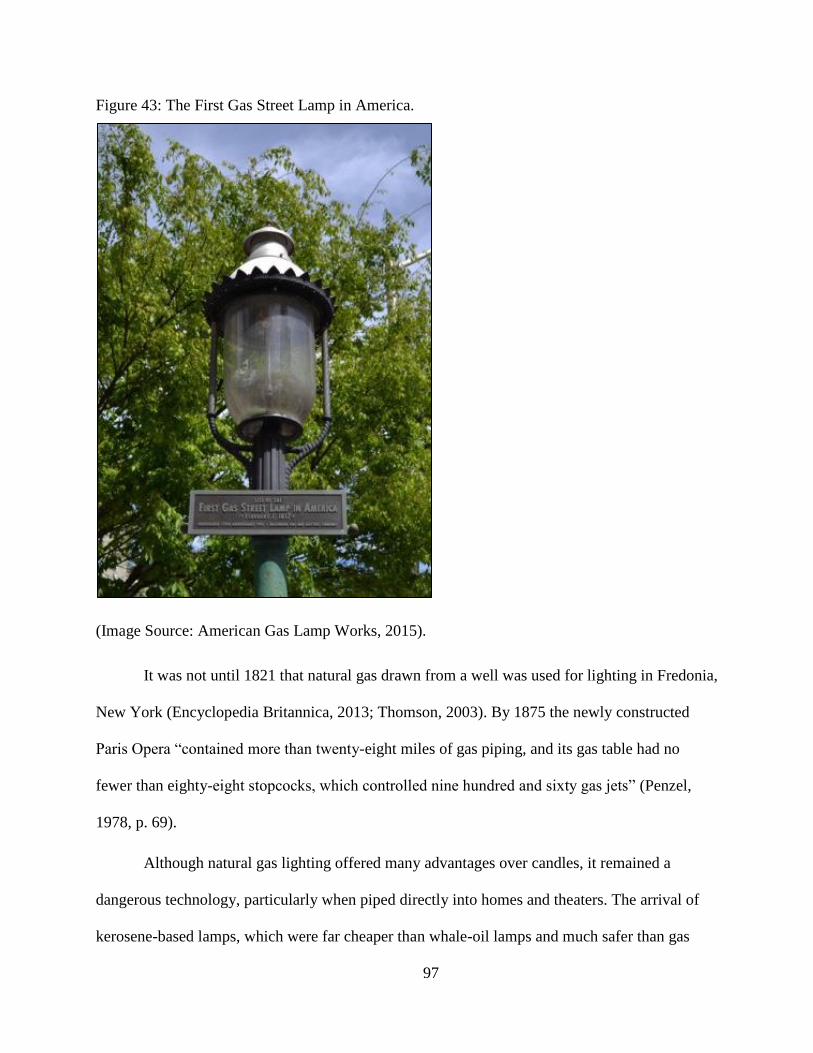
97
Figure 43: The First Gas Street Lamp in America.
(Image Source: American Gas Lamp Works, 2015).
It was not until 1821 that natural gas drawn from a well was used for lighting in Fredonia,
New York (Encyclopedia Britannica, 2013; Thomson, 2003). By 1875 the newly constructed
Paris Opera “contained more than twenty-eight miles of gas piping, and its gas table had no
fewer than eighty-eight stopcocks, which controlled nine hundred and sixty gas jets” (Penzel,
1978, p. 69).
Although natural gas lighting offered many advantages over candles, it remained a
dangerous technology, particularly when piped directly into homes and theaters. The arrival of
kerosene-based lamps, which were far cheaper than whale-oil lamps and much safer than gas

98
lamps, suppressed demand for natural gas as an in-home illuminant (though natural gas remained
popular for street lighting). But the advent of electric lighting at the turn of the 20th Century
resulted in the rapid subsequent demise of gas lighting, and the demand for natural gas stagnated
thereafter for several decades. Nonetheless, natural gas was produced in enormous quantities as a
byproduct of oil production, in much the way that carbon dioxide bubbles out of carbonated
beverages. Since natural gas is extremely flammable, it posed a serious explosion risk for oil
operations and was therefore burned off, or flared, both at wells and refineries.
Figure 44: Flaring Natural Gas in North Dakota.
(Image Source: Wilson and Krauss, 2011).
The practice of flaring continues today wherever it remains more cost-effective to simply
dispose of the gas by burning it than to store it for either on-site use (natural gas is sometimes
pumped back down into oil wells to maintain reservoir pressure) or sale. The scale of flaring
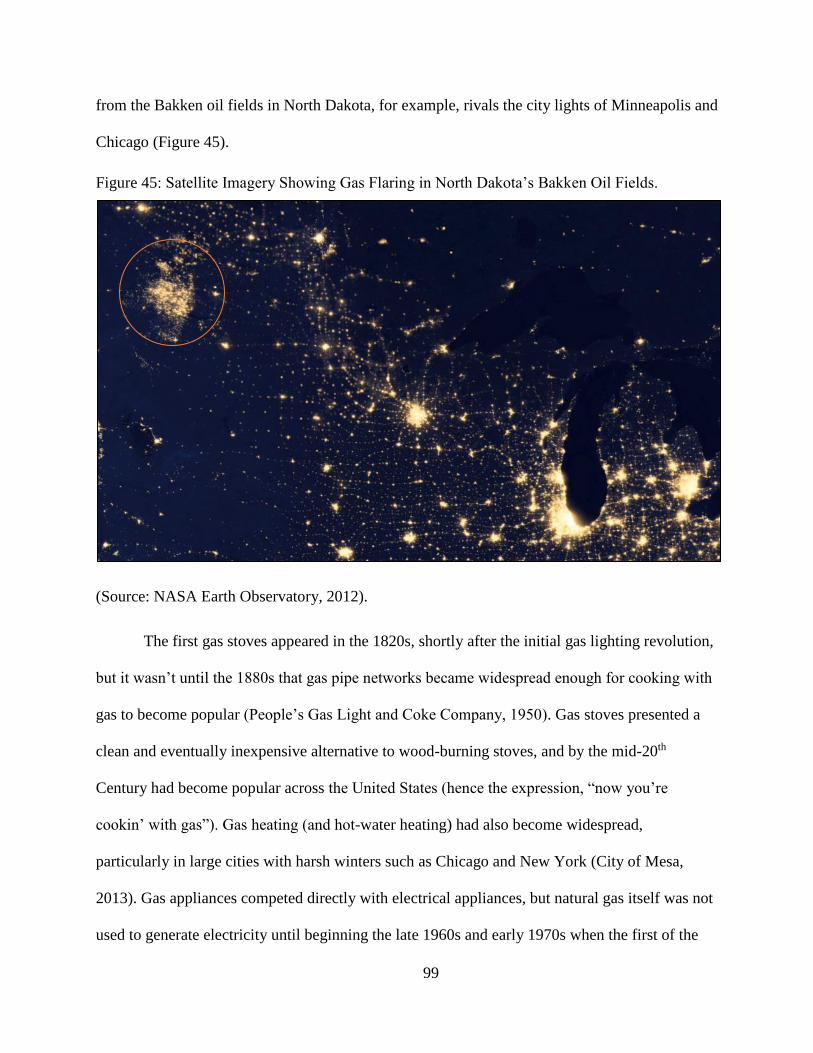
99
from the Bakken oil fields in North Dakota, for example, rivals the city lights of Minneapolis and
Chicago (Figure 45).
Figure 45: Satellite Imagery Showing Gas Flaring in North Dakota’s Bakken Oil Fields.
(Source: NASA Earth Observatory, 2012).
The first gas stoves appeared in the 1820s, shortly after the initial gas lighting revolution,
but it wasn’t until the 1880s that gas pipe networks became widespread enough for cooking with
gas to become popular (People’s Gas Light and Coke Company, 1950). Gas stoves presented a
clean and eventually inexpensive alternative to wood-burning stoves, and by the mid-20th
Century had become popular across the United States (hence the expression, “now you’re
cookin’ with gas”). Gas heating (and hot-water heating) had also become widespread,
particularly in large cities with harsh winters such as Chicago and New York (City of Mesa,
2013). Gas appliances competed directly with electrical appliances, but natural gas itself was not
used to generate electricity until beginning the late 1960s and early 1970s when the first of the

100
international oil shortages of that era together with pressure from the nascent environmental
movement to reduce coal-related air pollution and acid rain made gas turbines an attractive
economic and political option for energy production (Encyclopedia Britannica, 2013).
California Begins Producing Oil
There appears to be no clear answer to the question of where the first viable California oil
well was drilled. Several competing claims are made by a number of different early sources from
the 19th Century, but these appear to contain inconsistencies. For example, one claim is that
“California’s first productive oil well was drilled by the Union Matolle Company in California’s
Central Valley” (Schuiling, 2008, p. 4). The Union Matolle Company, however, operated in
Humboldt County which is several hundred miles from the Central Valley – an area that did not
see significant oil exploration during the 1860s. The company’s first oil well was allegedly
drilled in Humboldt County in 1861, though it proved unsuccessful (California Department of
Conservation, 1985; California State Mining Bureau, 1883). Also in 1861, G.S. Gilbert
established a refining operation near Ventura to process asphaltum collected from Ojai Ranch
seeps that produced 300 to 400 gallons per week. Over the next four years, drilling efforts
expanded markedly such that by 1865 “there were 65 companies drilling for oil in the state”
(Ritzius, 1993, p. 8). A number of sources claim that the Union Matolle Company first began to
sell oil in this same year, shipping out of the production town Petrolia, but it is unclear which
well or wells first began producing (Franks & Lambert, 1985; Ritzius, 1993). Among the most
successful of these early wells was “Ojai 6”, drilled to 550 feet between 1866 and 1867 by
Thomas R. Bard on Rancho Ojai in Ventura County, which produced 15 to 20 barrels of oil per
day (Nelson, 2001; White, 1968). On the basis of this success, Bard “became the first person to
establish sustained production of petroleum from a drilled well in the state” – at least according

101
to the account of Michael Nelson of the City of Santa Paula’s Union Oil Museum (Nelson, 2001,
p. 17).
Figure 46: Thomas Bard.
(Image Source: Unknown, circa 1860s).
Thomas Bard was acting on the instructions of his uncle, Thomas Scott, who had secured
the oil mineral rights for some 277,000 acres in California, including property at Ojai Valley
(Nelson, 2001). Scott had become wealthy by investing in Pennsylvania railroads a decade
earlier and was now convinced by the enthusiasm of Professor Benjamin Silliman’s declaration
that Sulphur Mountain in Ventura held “fabulous wealth in the best of oil” (Nelson, 2001, p. 16).
Undeterred by the early fits and starts of the oil industry in California, Bard would go on to a
storied career as an organizer of Ventura County, the President and founder of the Union Oil
company of California, the “Father of Port Hueneme”, Republican state senator, and a founding
board member of Occidental College (Hutchinson, 1965).

102
Figure 47: Diagram of the Sulphur Mountain Oil Formation in Ventura County, California.
(Image Source: Unknown, circa 1867).
California’s first oil boom, centered in Los Angeles and Ventura in the 1860s, was short-
lived. With the end of the Civil War in 1865, cross-continental supply lines were reopened
amidst the supply glut from the Pennsylvania boom and the prices of kerosene and oil dropped
precipitously. Kerosene fell from $2.50 per gallon in 1865 to $1.70 in 1866 and 54 cents in 1867,
while oil dropped from $6.50 per barrel to $2.50 (Nelson, 2001). It would be nearly a decade
before oil exploration and production in California began again in force. The initial fizzle had a
temporary chilling effect on oil prospects in the west that cost Professor Silliman his reputation,
and along with it his post at Yale. But within a decade he was redeemed when, according to
another common claim (one repeated in the company history of Chevron Corporation), “driller
Alex Mentry succeeded in striking oil in Pico No. 4, despite rattlesnakes, wasps, mud and
underbrush … the first successful oil well in California” (Chevron, 2013). This particular claim
seems to hinge upon the definition of “successful”, which here is taken to mean commercially
viable in the long term. California Star Works’ Pico No. 4 did indeed produce for over a century
(Chevron, 2013; Ritzius, 1993).

103
Figure 48: California Star Oil Works Pico No. 4 in Pico Canyon.
(Image Source: Carleton Watkins, 1877).
By the end of the 19th Century, California’s annual oil production exceeded 2 million
barrels (Figure 49). A decade later, in 1910, that number had grown exponentially to 73 million
barrels annually (Redpath, 1900; Yergin, 2008).

104
Figure 49: 19th Century California Oil Production.
(Source Data: Franks & Lambert, 1985; Redpath, 1900).
Oil wells alone, however, were not enough to create an industry. Oil must also be refined,
and although a number of small distilleries were created to refine oil alongside production
throughout the state, the first true oil refinery in California – and the first west of the Mississippi
– was the Pioneer Oil Refinery, constructed in Newhall in 1876 with a capacity of 20 barrels per
day (California Department of Conservation, 1985). Unfortunately, no verifiable source is cited
for this claim, although it appears to be corroborated by an 1899 statement from Professor W. L.
Watts of the State Mining Bureau (Redpath, 1900). Four years later, in 1880, Coast Oil built a
much larger refinery at Point Alameda in San Francisco Bay that was capable of processing 600
barrels per day (Figure 50). The company also constructed a pipeline that linked Pico Canyon
with the Southern Pacific train station at Elayon in Southern California. Train links proved
prohibitively expensive, however, and in 1888 “two wooden steamers equipped with steel tanks
0
500,000
1,000,000
1,500,000
2,000,000
2,500,000
3,000,000
3,500,000
4,000,000
4,500,000
5,000,000
Bar
rels
of
Oil
Oil Production in California - 19th Century

105
were constructed in San Francisco and were soon transporting oil from Ventura to San Francisco
at greatly reduced costs” (Ritzius, 1993, p. 9).
Figure 50: Point Alameda Oil Refinery in San Francisco Bay, Circa 1880.
(Image Source: Standard Oil Company of California, 1880).
In the 1880s, the oil industry entered a minor recession (visible in Figure 12) following
the invention of the electric light bulb by Thomas Edison, which diminished the demand for
kerosene-based lighting. Gas lighting and heating had existing in San Francisco since at least
1852, when the San Francisco Gas Company was founded by Peter and James Donahue, but
limited availability of the then coal-derived gas together with the expense and danger of gas

106
infrastructure meant that kerosene (having replaced whale oil) remained a competitive source of
illumination until the arrival of electricity nearly half a century later. The San Francisco Gas
Company, after many decades of mergers, eventually became Pacific Gas & Electric Company
which is today one of California’s largest utilities (Pacific Gas & Electric Company, 2013).
Meanwhile, in Southern California the Los Angeles Gas Company had installed 43 gas lamps
along Main Street by 1868 as part of the city’s effort to improve safety at night, that gas for
which was initially produced from asphaltum, then later from oil, and ultimately from natural gas
wells following the drilling of the first low-volume natural gas wells in California in 1885 in the
city of Stockton. In 1886, the Pacific Lighting company was founded in San Francisco, which
then acquired the Los Angeles Gas Company 1890 and ultimately went on to become the
Southern California Gas Company (SoCalGas, 2013).
California’s first gusher, the Hardison and Stewart Oil Company (later the Union Oil
Company) well No. 16, was drilled in January 1888 in Adams Canyon near Santa Paula in the
Ventura basin, and produced 500 barrels per day. In February 1892 the company’s well No. 28,
known as “Wild Bill”, blew out with an uncontrolled flow of 1,500 barrels per day, some 40,000
of which were lost down the Santa Clara River and to the sea before the flow was brought under
control. The largest gusher in the United was the Lakeview No. 1 well in the San Joaquin Valley
(one of several gushers there) which blew out in 1909 with an initial flow 20 feet in diameter and
200 feet high discharging 125,000 barrels per day. At 9 million barrels, Lakeview No. 1 remains
the largest oil spill in American history – twice the BP Deepwater Horizon oil spill of 2010 in the
Gulf of Mexico and some 20 times the Exxon Valdez disaster in Alaska’s Prince William Sound
(Harvey, 2010; Rintoul, 2000; United States Coast Guard, 2011).

107
Figure 51: The Great California Lakeview Gusher of 1909.
(Image Source: Pacific Oil World, circa 1909).
New Petroleum Products for New Markets
By the 1880s new technologies were beginning to emerge in response to the rapidly
expanding availability of fossil hydrocarbons, and their attendant products and services in turn
created market demand that accelerated the growth of the petroleum industries that spawned
them. For example, oil burners began to be incorporated into shipboard steam engines and steam
locomotives, Sir Charles Parsons invented the modern steam turbine in 1884 (which remains the
core technology of electricity generation today), and Karl Benz and Wilhelm Daimler introduced

108
the world’s first gasoline-powered automobile in 1885. These and other technologies utilized oil
and gas as cheap and abundant sources of energy – i.e. as fuels. By contrast, the price of sperm
whale oil (the lighting fuel of choice) at the industry’s peak in 1854 was $3.84 per gallon, or
$161 per barrel – the equivalent of over $4,440 in 2017 dollars (Eaton, 1866). By comparison,
the price of rock oil per barrel 12 years later in 1866 was just 9 cents per gallon, or $3.75 per
barrel – the equivalent of $55 in 2017 dollars (Williamson & Daum, 1959). The synergistic
combination of radically abundant energy with machines capable of utilizing that energy to do
physical work in place of manual labor has driven much of the sustained exponential growth of
economic productivity worldwide since the 1880s (Drexler, 2013; Yergin, 2008, 2011).
The Los Angeles City Oil Field
Although a man named Baker, about whom little is recorded, appears to have dug the
first well in Los Angeles city proper near the corner of Hoover Street and Wilshire Boulevard, it
was Edward L. Doheny who is credited with launch the city’s oil boom in 1892. Doheny and his
partner Charles A. Canfield launched the development of the Los Angeles City Oil Field starting
at the corner of Patton Street and West State Street (Redpath, 1900). Doheny rose to the status of
tycoon not only from producing oil in Los Angeles and selling it to local factories and railroads
(whom he encouraged to make the change from coal-powered to oil-burning locomotives), but
also from extensive investments in oil production in Mexico: he founded the Pan American
Petroleum Transport company, which would later become the state-owned Pemex following the
nationalization of the industry in 1938. His colorful life is punctuated with controversy (he was
charged but acquitted several times in the bribery case known as the Teapot Dome scandal) and
tragedy (his daughter died early, his first wife Carrie committed suicide, and his son was
murdered under mysterious circumstances). Doheny is reputed to be the inspiration for the

109
character J. Arnold Ross in Upton Sinclair’s celebrated novel “Oil!”, upon which the Academy-
Award-winning 2007 film “There Will Be Blood” is based (Schlosser, 2008).
Figure 52: Court Street in the Los Angeles City Oil Field, Circa Late-1890s.
(Image Source: Unknown, California State Library, Sacramento, California).

110
Figure 53: “Forest” of Derricks in the Los Angeles City Oil Field, 1908.
(Image Source: Graham, 1908).
Figure 54: Los Angeles City Oil Field with Seven Wells Listed as Active in 2017.
(Source: DOGGR, 2017).

111
By 1901, over 200 oil companies were active in the Los Angeles City Oil Field, and
seven of the more than 1,250 wells eventually drilled there were still listed as active in 2017
(DOGGR, 2010). Doheny wasn’t the only tycoon of the Los Angeles City Oil Field, however. In
1893 a brilliant and enterprising middle-aged piano teacher named Emma Summer entered the
oil business by investing $700 of her personal piano tutoring savings along with another $1800
of borrowed funds to drill a well near her home. With a combination of tenacity, good fortune,
and extraordinary business acumen she quickly began acquiring ailing competitors and
consolidating operations under the manteau of her own company. More importantly, Summer
locked up contracts with key local clients, including factories, hotels, rail and trolley firms, and
the Pacific Light and Power Company (Rasmussen, 1999). By 1900 Summer controlled half of
the Los Angeles City Oil Field, which was producing 50,000 barrels of oil per month, earning
her the title of California’s “Oil Queen” (American Oil & Gas Historical Society, 2016).
Although fields discovered later would produce in much larger quantities, and the Los Angeles
City Oil Field that once hosted a “forest” of over 500 oil derricks was redeveloped into suburban
neighborhoods during the 1960s, Emma Summer remains an iconic figure in the story of
California’s first major oil field (Rasmussen, 1999).

112
Figure 55: Emma Summer, the “Oil Queen” of California.
(Image Source: Sunset Magazine, 1901).
Oil Beyond the Los Angeles and Ventura Fields
Although its climate would likely have ensured that Los Angeles would become a major
metropolitan center in any case, it was the Black Gold Rush and the billions of barrels of oil
beneath the earth that turned it from a small town of 11,000 people in 1880 into a booming city
of 500,000 by 1920 that was producing a fifth of the world’s petroleum (The Center for Land
Use Interpretation, 2013; U.S. Census Bureau, 2013). Many areas in Los Angeles County and
neighboring Orange County remain culturally associated with past and present oil productivity –
Signal Hill, Baldwin Hills, Huntington Beach, and Long Beach being prominent examples.

113
Figure 56: Aerial View of Signal Hill, Circa 1930.
(Image Source: Spence courtesy of the Harold-Examiner Collection, circa 1930).

114
Figure 57: “Tribute to Roughnecks” Sculpture by Cindy Jackson at Signal Hill.
(Image Source: American Oil & Gas Historical Society, 2015).

115
Figure 58: Oil Derricks at Venice Beach, Circa 1952.
(Image Source: Los Angeles County Chamber of Commerce, circa 1952).

116
Figure 59: Huntington Beach in 1928 and 2015.
(Image Source: Orange County Archives, 2017).

117
Of the oil fields so far discovered in Los Angeles County and Orange County, the
Wilmington Field is by far the largest at nearly 40 square miles. It is the third-largest field in the
48 lower states and has yielded over 2.7 billion barrels since 1932, and although its technically
recoverable reserves are 90 percent depleted, over 1,300 of the field’s 6,150 wells remain active
and produce 13 million barrels per year (California Department of Conservation, 2012).
Figure 60: Los Angeles County and Orange County Oil Fields.
(Source: DOGGR, 2001).
New oil fields have been discovered in other areas of Southern California beyond the
original strikes in Los Angeles County and Ventura County, the largest concentration of which
lie in the southern half of the San Joaquin Valley in Kern County (Figure 23). The southern
portion of the San Joaquin Valley (or “Central Valley”) lies atop the Monterey Shale Formation
in what is today Kern County (see below). Two brothers named James and Jonathan Elwood
Wilmington Oil Field
Los Angeles City Oil Field

118
discovered oil at Kern River in 1899 after hand-digging a 75-foot hole, and within a year another
pair of brothers named Horace and Milton McWhorter then drilled the first successful well in the
county. These successful strike were publicized by a shrewd oilman named Angus Crites, and by
1901 there were over 200 companies actively drilling in the area (Brewer, 2001).
Figure 61: Teamsters Hauling Oil from Kern River into Bakersfield, Circa 1901.
(Image Source: Unknown, circa 1901).

119
Figure 62: Kern River Oil Field, 2009.
(Image Source: WikiMedia Commons, 2009).

120
Figure 63: Aerial View of Kern River Oil Field, 2012.
(Image Source: WikiMedia Commons, 2012).
Kern County is where the majority of the state’s oil production is undertaken today, and
also where the majority of wells that utilize enhanced recovery techniques have been drilled to
date (Long, Feinstein, Bachmann, et al., 2016; Long, Feinstein, Jordan, et al., 2016).
Modest deposits of “non-associated” natural gas – i.e. those not found in conjunction
with crude oil and defined by the U.S. EIA to produce more than 1,069 cubic meters of gas per
cubic meter of crude oil – exist in the Dobbins-Forbes and Winters-Domingine systems of the
Sacramento Basin (Figure 26) at the northern reach of California’s Central Valley (Magoon,
Castano, Lillis, Mackevett, & Naeser, 1994). But these deposits have migrated as far as 200

121
kilometers the porous structure of the basin from their source rock as a result of complex and still
poorly-understood geological processes that involve dozens of distinct rock strata whose history
of tectonic interactions spans over 60 million years (Jenden & Kaplan, 1989), and so “basin-
center gas accumulation” is not likely to exist in the Sacramento Basin and therefore “stimulation
techniques may improve natural gas production from low permeability reservoir rocks
sporadically, [but] widespread development of unconventional gas resources in California using
well stimulation appears unlikely” without major advances in both technology and our
understanding of the area’s geology (Long, Feinstein, Birkholzer, et al., 2016, p. 19).

122
Figure 64: California Oil and Gas Fields.
(Source: Adapted from California Geological Survey, 2011).
The Monterey Shale Formation
The Monterey Formation, a geologically recent 1,750-square-mile mass of marine
sedimentary rock layers deposited during the mid- to late-Miocene era 5 million to 6 million
years ago, has been known to be the source rock for the majority of California’s oil and gas
Natural Gas Field
Oil Field
Non-Associated Fields (Sacramento Basin)
Monterey Shale Fields (San Joaquin Basin, Santa Maria / Ventura Basin, Los Angeles Basin)

123
deposits since the early 20th Century (Bagg, 1905; Chaika & Williams, 2001; Hanna, 1928).
Geologist and Director of the Monterey And Related Sedimentary Rocks project Richard Behl
reports that “total organic carbon (TOC) in the Monterey can be as high as 23 percent (34
percent organic matter by weight), but averages between 2 percent and 5 percent” (1999, p. 306).
Shale is fine-grained clastic sedimentary rock rich in organic material, and in the rather unusual
case of California’s Monterey Formation these shales were deposited on the seafloor of a
subducting continental shelf in calm waters with substantial quantities of amorphous marine
algal debris that with time, heat, and pressure were transformed into petroleum (Behl, 1999;
Isaacs & Rullkötter, 2001). Figure 65 shows the major shale basins of interest in the Monterey
Formation which host the oil fields of Southern California.

124
Figure 65: Monterey Shale Basins.
(Source: ArcGIS California Shale Viewer, 2017).
Unlike other shale formations in the lower 48 states, the Monterey Shale formed at the
edge of the continent and is naturally fractured by ongoing tectonic activity in geological fault
zones (Isaacs & Rullkötter, 2001). So while the Bakken Formation in North Dakota, for example,
is only 22 feet think on average and nowhere thicker than 140 feet because it has not been

125
significantly folded, the thickness of the Monterey Formation averages almost 1,900 feet
(Garthwaite, 2013). The natural folding and fracturing of the Monterey Formation has allowed a
portion of the oil and gas present in that parent shale to migrate into reservoirs beneath cap
domes of impermeable overlying rock, and it is these reservoirs that are the target of
conventional oil and gas production (Hughes, 2013; Long, Feinstein, Jordan, et al., 2016; Phelan,
2013). This migrated portion, however, is thought to be only a small fraction of the total quantity
of petroleum stored in the Monterey Formation, and so the prospect of using new enhanced
recovery techniques to exploit that as-yet untapped hydrocarbon potential has been the center of
controversy among California’s diverse stakeholders.
Figure 66: Folded Sedimentary Layers of a Surface Outcropping of the Monterey Formation.
(Image Source: American Association of Petroleum Geologists, 2013).

126
Tidelands and Offshore Oil
The sedimentary basins and shale plays of the Monterey Formation extend into the
oceans off of California’s coast, where they intersect with the older underlying Rincon
Formation shales and younger overlying upper Miocene and Pliocene layers of the Sisquoc, Pico,
and Repetto formations (Isaacs & Rullkötter, 2001; Long, Feinstein, Birkholzer, et al., 2016).
Offshore oil was known from slicks and odors on the water for centuries prior to the industrial
development of petroleum, and concerted efforts to produce offshore began surprisingly early on
in the industry’s history. Offshore drilling processes were pioneered in California’s Summerland
Oil Field beginning in 1896 (National Commission on the BP Deepwater Horizon Oil Spill,
2010; Rintoul, 2000). Wooden peers, each hosting a number of drilling derricks, were built out
from the shoreline (Figure 67). These 412 initial wells were only a moderate success, and were
abandoned just a few years after production peaked in 1902. It would be nearly half a century,
however, before technological advances and economic forces converged to make offshore
drilling out of sight of land a viable proposition in the state.
Figure 67: Summerland Oil Field Drilling Derricks, 1902.
(Image Source: U.S. Geological Survey, 1902).

127
Figure 68: Summerland Oil Field Drilling Site, 2009.
(Image Source: WikiMedia Commons, 2009).
Coastal “tidelands” became an issue of contention between state and federal governments
during that period in the coastal states. Tidelands are the land area that lies between the high and
low water line, and in low-lying flats these can comprise substantial acreage. Some of the largest
oil fields in California, including much of the Wilmington Oil Field’s 1.5 billion barrels, lie
beneath the tidelands of Long Beach and Los Angeles harbors, and the “struggle over coastal oil
drilling in the 1920s and early 1930s underscored the increasingly uneasy relationship between
coastal extractive industry and the booming tourist, recreational, and residential economy”
(Sabin, 2005, p. 77). In the 1929 case Boone v. Kinsbury, the California Supreme Court ruled in
favor of oil and gas development on tidelands, to which local governments (lobbied in force by
coastal residents, property developers, and tourism business owners) from Santa Barbara to
Huntington Beach responded with moratoria on permitting followed by permanent bans on new
drilling. As a result, the court’s ruling “set off a coastal drilling spree” between 1929 and 1930
on leaseholds in Mendocino, Humbolt, Santa Barbara, Ventura, Los Angeles, and Orange
counties where drilling had been permitted prior (Sabin, 2005, p. 77). Farther from the shoreline,

128
ownership and drilling rights remained uncertain and undeveloped until the 1947 U.S. Supreme
Court decision in United States v. California that upheld President Harry Truman’s assertion of
“federal jurisdiction over the entire continental shelf” in the aftermath of World War II (National
Commission on the BP Deepwater Horizon Oil Spill, 2010, p. 2; Owen & Southwestern
Federation of Geological Societies, 1975). The first truly offshore well in the United States was
then drilled 10.5 miles off the Louisiana coast in 1947, though it lay in only 18 feet of water.
Barges hosting drilling derricks and other production equipment were towed out to sea and
anchored in place, and for a time the practice was known as “barge drilling” by Texaco and Shell
who pioneered the practice (National Commission on the BP Deepwater Horizon Oil Spill,
2010).
The 1947 Supreme Court ruling was met with resistance, however, and several years later
in 1953 under pressure from the Eisenhower Administration Congress passed the Submerged
Lands Act and the Outer Continental Shelf Act which together granted states title out to three
nautical miles (Owen & Southwestern Federation of Geological Societies, 1975). Following this
protracted post-war political contest over offshore jurisdiction, the first offshore platform in
California state waters went into operation in state waters in 1958 under the designation “Hazel”.
The first platform in federal waters, “Hogan”, began producing in 1967 (County of Santa
Barbara Planning and Development Energy Division, 2013a).
From 1963 to 1984 the U.S. Department of the Interior issued a total of 371 federal leases
off the California coast (County of Santa Barbara Planning and Development Energy Division,
2013b). Of these, 176 have been relinquished, 104 have expired, 12 were terminated, 36 never
produced, and 43 are currently producing via 23 platforms in federal waters (Bureau of Safety
and Environmental Enforcement, 2017; County of Santa Barbara Planning and Development

129
Energy Division, 2013b). Federal leases continued to be sold until 1984 when Congress
defunded the leasing program, after which President George H. W. Bush and President Bill
Clinton issued formal moratoria on new leases via Executive order. These moratoria remained in
effect from 1990 until 2008 when President George W. Bush rescinded his predecessor’s
Executive Order while at the same time an appropriations bill that for the first time in nearly 30
years did not contain the funding ban passed the House and the Senate (Simon, 2008). No new
federal leases were sold under the Bush Administration, but the Obama Administration
announced its intent to open new areas for offshore oil and development in late March of 2010 –
only to rescind that decision in November later the same year (Broder, 2010; Broder & Krauss,
2010). The oil spill in the Gulf of Mexico from the Deepwater Horizon blowout in 2010 made
offshore drilling a politically unpalatable for a time, and also forced the Minerals Management
Service (the federal agency then responsible for monitoring and enforcing regulation on offshore
drilling) to be reorganized into the Bureau of Ocean Energy Management and the Bureau of
Safety and Environmental Enforcement in order to reduce conflict of mission interests (Bureau
of Ocean Energy Management, 2010). In September of 2016 the Obama Administration
announced new federal leases for offshore drilling available by auction in 2017 and 2018
(Bureau of Ocean Energy Management, 2016).
Nine offshore facilities in California remain active in state and municipal waters today,
but five of these are near-shore artificial islands – one in the Santa Barbara Channel and four at
Long Beach Harbor. Rincon Island in Santa Barbara was the first of its kind, built in 1958 by the
Richfield Oil Company (now ARCO) to target the Rincon Oil Field in the Ventura Basin.

130
Figure 69: Rincon Island in the Santa Barbara Channel.
(Image Source: Antandrus, 2009).
The four artificial islands constructed in Long Beach Harbor are the THUMS islands
(named after the constituents of their owning consortium – Texaco, Humble Oil [Exxon], Union
Oil [Unocal], Mobil Oil, and Shell Oil), built in 1964 and 1965, and which have been owned and
operated by Occidental Petroleum since 2000 (Occidental Petroleum, 2013). Total annual
offshore production in state and municipal waters is roughly 3 million barrels of oil and 6 billion
cubic feet of natural gas. A further 23 platforms are currently active in federal waters, producing
approximately 25 million barrels of oil and 35 billion cubic feet of natural gas (California
Department of Conservation, 2013a). The THUMS islands were originally built to implement
“slant drilling” (i.e. drilling at an angle away from plumb vertical) for the purpose of targeting
the Wilmington Oil Field while still complying with regulatory restrictions on shorefront drilling
that were intended to protect beaches and residential property. Today these islands employ pad

131
drilling with directional/horizontal drilling such that several dozen independent well bores can be
drilled in all directions from the relatively small geographic footprint of the single well pad.
Figure 70: THUMS Offshore Facility Grissom Island at Long Beach Harbor.
(Image Source: John Robinson, 2015).
The Santa Barbara Oil Spill of 1969
Fears over the safety and reliability of offshore production were dramatically confirmed
with the blowout of the Union Oil Company’s Platform A on January 28, 1969 (Easton, 1972;
Spezio, 2011). The “Santa Barbara Oil Spill”, as the event soon became known, proved to be a
crucial turning point for both California’s petroleum industry and for the state’s identity as leader
on environmental governance (Clarke & Hemphill, 2002; Merchant, 1990).
Platform A on the Dos Cuadras Oil Field blew out in 1969 and discharged between
80,000 and 100,000 barrels of oil into the water of the Santa Barbara Channel, fouling 35 miles

132
of coastline for more than a year (County of Santa Barbara Planning and Development Energy
Division, 2013a).
Figure 71: Map of 1969 Santa Barbara Oil Spill.
(Image Source: Antandrus, 2009).

133
Figure 72: Aerial View of the 1969 Santa Barbara Oil Spill.
(Image Source: County of Santa Barbara, 1969).

134
Figure 73: State Forestry Conservation Crews on a Beach in Santa Barbara.
(Image Source: Wally Fong, 1969).
Figure 74: A Surfer at a Santa Barbara Beach, 1969.
(Image Source: Unknown, 1969).

135
The initial blowout was contained within two weeks, but several ruptures on the ocean
floor around the platform had also begun to exude oil and were still releasing between five and
10 barrels per day a year later (Easton, 1972). A small amount continues to leak around the
derelict platform site and its neighbors in the Santa Barbara Channel today (Figure 75), although
Chevron (formerly Union Oil and Unocal) insists these seeps are not anthropogenic (Steffen,
2010).
Figure 75: Oil Seeps on the Ocean Floor.
(Image Source: Donna Schroeder and U.S. Geological Survey, circa 2010).
Public response to the spill was extraordinarily animated. Nonprofit organizations
emerged immediately, including the well-known Get Oil Out (GOO) group (Frazier, 2009).
Moreover, opposition to the oil industry and advocacy on behalf of the environment, wildlife,
and human health was remarkably unified across political lines. The organization GOO

136
succeeded in gathering more than 250,000 signatures for a petition to stop oil production off the
Santa Barbara coast – a remarkable feat in the era before the Internet made such efforts relatively
easy (Frazier, 2009). News media outlets provided extensive coverage of the event and leveraged
the power of television to raise national awareness of an environmental crisis as never before.
The president of Union Oil, Fred Hartley, was called before a Senate subcommittee, where he
expressed genuine surprise at the public outcry over the spill, saying, “I am always tremendously
impressed … at the publicity that death of birds receives versus the loss of people ... Although it
has been referred to as a disaster, it is not a disaster to people” (Easton, 1972, p. 69). On
February 3, the day after oil first began washing ashore, while volunteer cleanup crews scoured
beaches and attempted to rescue befouled seabirds in the immediate aftermath of the spill,
Secretary of the Interior Walter Hickel announced a temporary cessation of offshore operations
that lasted only a few hours – just long enough for a closed-door meeting to be held between
Department of the Interior staff and industry executives. Local objections to the kid-glove
response – and also to being excluded from what they believed should be a public debate – were
amplified in the national news media to such an extent that three days later President Nixon
announced the cessation of all offshore drilling in federal waters pending a full review. The next
day, on February 7, a $1.3 billion dollar class action lawsuit was filed against the Union Oil
Company and its partners operating Platform A – an instance in which the plaintiffs were
eventually victorious in what has become an important case study in environmental law (Boyle,
1972; Easton, 1972). The Union Oil Company “also settled a lawsuit filed by the State of
California, County of Santa Barbara, and the Cities of Santa Barbara and Carpinteria in the
amount of $9.5 million for loss of property” (County of Santa Barbara Planning and
Development Energy Division, 2013a, p. 1). The California State Lands Commission responded

137
to the spill by immediately placing a moratorium on new offshore leases in state waters – a ban
codified 25 years later by the California Coastal Sanctuary Act of 1994. As of 2016, no new
leases had been issued for state waters in the five decades since the spill occurred and only three
offshore platforms were active in state waters as of April 2017 (California State Lands
Commission, 2017; Rogers, 2017).
Perhaps more important than its immediate implications for the oil and gas industry in
California were the legislative and social implications of the Santa Barbara oil spill for the
relationship between heavy industry and the environment. Less than six months after the spill, on
June 22 1969, the Cuyahoga River in Cleveland, Ohio, caught on fire for thirteenth time in 100
years (Adler, 2003; Time Magazine, 1969). The 1969 fire was not as severe as its predecessors,
nor was it the only polluted river in the nation polluted enough to be set ablaze, but its proximity
in time to the Santa Barbara Oil Spill thrust the event into the national spotlight. Together, these
environmental disasters are widely credited with pushing the nascent environmental movement
past its tipping point (Miller, 1999). The first Earth Day was celebrated the next year, on April
22 1970, and major elements of modern environmental governance – including key legislation
and agencies at the local, state, and federal levels – emerged in the early 1970s (Clarke &
Hemphill, 2002). Chief among these at the federal level were the National Environmental Policy
Act (NEPA) which President Nixon signed into law on January 1st 1970; the Clean Air Act
Extension of 1970 which greatly expanded the mandate of the previous 1963 law of the same
name; the creation of the U.S. Environmental Protection Agency in 1970 by President Nixon; the
Clean Water Act of 1972 which amended and expanded the Federal Water Pollution Control Act
of 1948; the Marine Protection Research and Sanctuary Act of 1972; the Marine Mammal
Protection Act of 1972; and the Endangered Species Act of 1973. In California, state-level

138
governance responses included the passing of the California Environmental Quality Act (CEQA)
in 1970 and the creation by ballot initiative of the California Coastal Commission in 1972.
Natural Gas in California
In California, natural gas production began in Stockton in 1885 but didn’t reach an
industrial scale until 1909 at the Buena Vista Oil Field, which contained not only oil but a large
associated reservoir of natural gas as well (California Department of Conservation, 2006). This
development was shortly followed by others in the Cymric Oil Field, Lost Hills Oil Field, South
Belridge Oil Field, and the Elk Hills Oil Field. The latter, Elk Hills, is the largest in California –
and is ten times larger than any other oil-associated natural gas field in the state (California
Department of Conservation, 2006). Exploration of the Sacramento Basin for non-associated gas
fields began in 1918, of which the Rio Vista Gas Field – discovered in 1936 – is the largest
(Jenden & Kaplan, 1989; Magoon et al., 1994). The Pacific Lighting company responded to
these discoveries by converting its systems to natural gas (as opposed to coal-derived gas) and
constructing a pipeline network to producers throughout the state. A number of other gas
companies in California acted similarly, and Pacific Lighting “acquired control of the gas
distribution systems of Southern Counties in 1925, Santa Maria Gas Company in 1928 and
Southern California Gas in 1929” (SoCalGas, 2013, p. 1). The holding company retained the
name Pacific Lighting until 1988 when it was changed to Pacific Enterprises, and more recently
to Sempra Energy after a series of mergers, but its core gas utility business has retained the name
of its 1929 acquisition: the Southern California Gas Company (SoCalGas, 2013).
As California’s economy grew throughout the 20th Century, the demand for natural gas
expanded more rapidly than state supplies could match, such that eventually 90 percent of
natural gas was being supplied to California through 30-inch pipelines from other states as well

139
as from Alberta, Canada (Figure 43). The first of these interstate pipelines, built in 1948, was
1,200 miles long and connected California with natural gas production in Texas (SoCalGas,
2013).
Figure 76: Western Region Natural Gas Pipeline Network.
(Image Source: U.S. EIA, 2017).
Enhanced Recovery Techniques in California
California’s tectonically-active geology has naturally folded and fractured the state’s oil-
bearing formations. As a consequence, only some of the industry’s enhanced recovery techniques
may be put to fruitful use in the state. Perforating, for example, is rarely if ever employed in
California. However, high-pressure injection technology developed in the 1920s and 1930s in
Texas is widely used for enhanced recovery in California. Water flooding was first deployed in
the Wilmington Field starting in the 1940s both to stimulate oil production and to control land

140
subsidence (Mayuga, 1970; The Center for Land Use Interpretation, 2013). According to the
Center for Land Use Interpretation:
“By the 1940s, after only a decade of oil production, the land level
was dropping to the extent the buildings and roads cracked, oil
well casings and pipelines sheared, and portions of the port
flooded. Subsidence reached its peak in the early 1950s, when the
ground dropped by four feet in just two years. At the lowest point,
the bottom of the subsidence bowl, the land was 29 feet lower than
it had been before oil production began.” (2013, p. 1).
Figure 77: Tidal Flooding from Land Subsidence at the Wilmington Oil Field, Circa 1950s.
(Image Source: Herald-Examiner Collection, circa 1950s).
As the pressures achievable with water injection technology grew, industry engineers
began to anticipate the possibility of utilizing hydraulic force to fracture reservoir rock. In 1947,
the first ultra-high-pressure injection techniques were used in Kansas to actively fracture rock
strata and thereby enhance oil and gas recovery – the process now known as hydraulic fracturing

141
(Montgomery & Smith, 2010). Hydraulic fracturing was first applied in conventional vertical
wells in California starting in 1953 and became widespread by the 1980s, but it wasn’t until
horizontal drilling, 3D seismography, downhole telemetry, and other enabling technologies
matured in the early 2000s that hydraulic fracturing began to be applied in unconventional shale
deposits as well (California Council on Science and Technology, Lawrence Berkeley National
Laboratory, & Pacific Institute, 2016).
In addition to “traditional” hydraulic fracturing used in combination with various kinds of
chemical flooding, the three most common enhanced recovery techniques used in California are
“steam drive” (or steam injection), cyclic steam injection (known as “huff and puff”), and CO2
injection methods described in Chapter 2 (Figure 78).

142
Figure 78: Enhanced Recovery Techniques Commonly Used in California
(Image Source: Adapted from The Wall Street Journal, 2013).
Property Rights and Taxation
In the United States, unlike most other nations, rights to subsurface resources such as
minerals and petroleum on privately-owned lands are naturally bundled with surface property
rights in a “fee simple” estate unless severed into a split estate via a legally-binding mineral title
opinion (Mee Jr., 1976). Land titles in California originally stem from the 1848 Treat of
Guadalupe Hildalgo which ended the war with Mexico and ceded all property rights to the
United States. Titles to real property, entailing both surface and subsurface rights, began properly
with California’s admission into the Union in 1850 (Mee Jr., 1976). As in many other states, oil
and gas development rights in California are typically leased rather than purchased because of

143
the inevitable uncertainties surrounding their value. Owners (and, by proxy, leasees) of
subsurface rights in California are granted reasonable use of the surface for oil and gas
production under California Civil Code. Severed mineral rights may be terminated and returned
to the surface property owner if they are left “dormant” (meaning unutilized and unasserted) for
more than 20 years (California Civil Code section 883.210-883.270).
Property rights conflicts over oil and gas development have arisen historically for several
reasons. First, rightsholders may disagree about constitutes reasonable use of the surface if there
are competing land uses (see for example Butcher v. Okmar Oil Co., 1977). Second, neighboring
rightsholders may oppose the externalities associated with certain types of land use, including the
possibility of air, water, soil, and noise pollution. Third, neighboring rightsholders may enter into
a race with one another to be the first to extract oil and gas beneath their land under “rule of
capture” (Hardwicke, 1935; Haupt & Rockwell, 2017; Kramer & Anderson, 2005). This legal
doctrine, whose origins lie in English Common Law, asserts that whoever is the first to utilize a
subsurface resource has priority claim to that resource. In the case of oil and gas, which are
mobile, withdrawing hydrocarbons from a reservoir beneath one parcel of land may result in
hydrocarbons from nearby parcels migrating in to fill the void. And fourth, “subsurface trespass”
is a possibility in situations where directional drilling allows one rightsholder to extract oil or gas
from beyond the vertical column boundaries of their own overlying surface property (Kramer &
Anderson, 2005). Precedent exists in California case law for subsurface trespasses relating to oil
and gas drilling date to the California Supreme Court Union Oil Co. v Reconstruction Oil Co.
decision in 1935, which upheld the plaintiffs claim of “crooked-hole drilling” upon their property
(Ragsdale, 1993). Nevertheless, subsurface trespasses are difficult to monitor and enforce and

144
surface spacing of well pads is typically arranged by rightsholders to deliberately avoid conflict,
so despite legal precedent they are seldom ever prosecuted (Bertrand & Berg, 2013).
In addition to being taxed on any income from the sale of oil or gas, petroleum
production in the United States is subject to several different types of “severance tax” liability
that varies a great deal among the 30 states that host the industry. Most states tax the value of the
oil or gas produced, which fluctuates with prevailing market prices, and explicitly identifies
these liabilities as a severance tax. Some states, such as California, instead levy a per-volume fee
that is most commonly referred to as a “conservation fee” or “production assessment” that scales
with production rather than price (Finnegan, 2015; Skelton, 2015). A number of states use a
combination of both mechanisms (Anderson et al., 2004; Brown, 2013; Lowe, 2014).
California’s production assessment fee in 2016 was $0.3243123 per barrel of oil or 10,000 cubic
feet of gas, up substantially from $0.1426683 per unit in 2013 (California Department of
Conservation, 2017). At the 2016-low of $26 the 2016 rate was the equivalent of 1.25 percent,
while at the 2016-high of $57 it was the equivalent of 0.57 percent, which is considerably lower
than the severance and/or conservation tax rates of other states such as North Dakota (5 percent),
Wyoming (6 percent), Oklahoma (7 percent), Texas (7.5 percent), and Alaska (35 percent)
(Council of State Governments, 2016).
At the local level, counties in California typically assess an “ad valorem” property tax on
oil and gas properties in California. The Petroleum Standards Advisory Committee of the
California Assessor’s Association determines the reference price for oil and gas, against which
local ad valorem taxes are levied. In 2016 that price was $41 per barrel of oil and $2.65 per
million-Btu-equivalent of natural gas, with minor regional adjustments based on the prevailing
quality of oil produced in that area (California Energy Commission, 2017). These oil and gas

145
property tax rates change over time and vary by county, but are typically less than 2 percent of
the assessed value (Cooper, Sedgwick, & Mitra, 2012).

146
Chapter 5. Methodology
This dissertation research employs qualitative analysis in an embedded single-case
design, following the designation of Robert Yin (2009). The case context for this research is
California’s energy system, the case itself is oil and gas well stimulation in the state, and within
the case are two embedded units of analysis: regulation and frames. Figure 79 below, adapted
from Yin (2009 Fig. 2.4), illustrates the conceptual structure of this research design.
Figure 79: Case Study Design.
(Source: Adapted from Yin (2009 Fig. 2.4) “Case Study Research Design and Methods”).
Rationale
Robert Yin defines a case study as “an empirical inquiry that investigates a contemporary
phenomenon in depth and within its real-life context, especially when the boundaries between
phenomenon and context are not clearly evident” (2009, p. 18). This stands in contrast to
Case: Oil & Gas Well Stimulation
Unit of Analysis: Regulation
Unit of Analysis:
Frames
Case Context: California’s Energy System

147
experimental research, for example, which “controls” empirical observations by “deliberately
divorces a phenomenon from its context, attending to only a few variables” (Yin, 2009, p. 18).
The case study approach “copes with the technically distinctive situation in which there will be
many more variables of interest than data points, and as one result relies on multiple sources of
evidence, with data needing to converge in a triangulating fashion, and as another result benefits
from the prior development of theoretical propositions to guide data collection and analysis”
(Yin, 2009, p. 18).
Case study research is appropriate for answering “how” and “why” questions where the
objective is to produce explanation rather than description of phenomena, or where “the
operational links [need] to be traced … rather than mere frequencies or incidence” (Yin, 2009, p.
9). Case study research is therefore “generalizable to theoretical propositions and not to
populations or universes,” and so “the goal will be to expand and generalize theories (analytic
generalization) and not to enumerate frequencies (statistical generalization)” (Yin, 2009, p. 15).
Construct validity is achieved by building chains of evidence from multiple sources, internal
validity is achieved by building rigorous explanations, external validity is achieved by
generalizing toward theoretical propositions rather than other phenomena, and reliability is
achieved by following systematic analytical protocols (Creswell, 2013; Yin, 2009).
Case study research may be recognized as one among a number of qualitative research
approaches (Creswell, 2012, 2013), but both qualitative and quantitative data may be gathered as
appropriate for any individual case. For this dissertation research, both qualitative data (from
primary and secondary sources) and quantitative data (from secondary sources) are used to
establish the case context within which the evolution of oil and gas well stimulation regulation
and its framing have occurred, and so it is appropriate to characterize this research as a mixed-

148
methods case study. In the case of oil and gas well stimulation, both in California and elsewhere,
there is a paucity of reliable quantitative data available, and this has two important implications
which are discussed at length in Chapter 6: first, timely policymaking and governance cannot
always depend on quantitative data under conditions of rapid socio-technical transition and
environmental change; and second, stakeholders leverage the uncertainty around unreliable
quantitative data to frame events and risks in ways that serve their particular interests.
An embedded single-case design is appropriate where a phenomenon represents a rare
circumstance that presents an unusual opportunity for study from which to generalize toward
theoretical explanations of future phenomena of a similar kind, and where several subunits of
analysis may be examined together to enhance the insights gleaned from the study (Creswell,
2012; Yin, 2009).
Case Context and Case Study
According to Robert Yin, “every type of [case study] design will include the desire to
analyze the contextual conditions in relation to the case,” but “the boundaries between the case
and the context are not likely to be sharp” (2009, p. 46). For this dissertation research, the case
context is California’s energy system and the case study itself is oil and gas well stimulation.
California’s energy system represents the appropriate context within which to analyze
well stimulation regulation and frames because oil and gas are integral to energy production and
consumption throughout the state. Policy and governance for oil and gas production is structured
primarily around the functional utility of the energy embodied within them as fuels, and only
secondarily as material inputs into industrial processes. As a result, oil and gas are governed
separately from other mined and extracted natural resources, and this governance is organized
within the California Department of Conservation foremost because these fossil fuels are

149
regarded as a precious non-renewable endowment to be used “wisely” and not wastefully
(DOGGR, 2017; McCarthy, 2002). For oil and gas consumption, major environmental impacts
are also associated primarily with their functional utility as fuels – namely, the contribution to
local air pollution and global climate change burning them to generate electricity and power
various modes of transportation. Moreover, within the literature that has begun to explore the
food-energy-water nexus, fossil fuels are typically analyzed as part of the energy component of
these coupled systems (Bazilian et al., 2011; Hussey & Pittock, 2012; Ringler, Bhaduri, &
Lawford, 2013; Romero-Lankao, McPhearson, & Davidson, 2017; Villarroel Walker, Beck,
Hall, Dawson, & Heidrich, 2014).
Unit of Analysis: Regulation
The first research question this dissertation asks is: how does the political ecology of
California’s energy system explain the regulation of oil and gas well stimulation practices at the
local, county, and state level that has emerged after these practices were partially exempted from
federal environmental regulation under the Energy Policy Act of 2005?
To answer this question, the Governance and Political Economy (GPE) analysis protocol
developed by Fritz, Kaiser, and Levy (2009) is employed to analyze the evolution of oil and gas
regulation in California through the lens of political economy of the environment. “Regulation”
here refers to specific pieces of legislation enacted particular levels of government – municipal,
county, state – that govern the permitting and practice of oil and gas well stimulation. The GPE
analysis protocol was originally developed for social science research in less-developed
countries funded by World Bank, and many case-studies have now been published around this
tool (Fritz, Levy, & Ort, 2014). Key strengths of the GPE analysis protocol are that it is designed
to be employed at different geospatial and organizational scales from the local to state/national

150
level, and that it highly-specified (Fritz et al., 2009 Annexes 1 & 2). The protocol requires that
structural elements of the governance system in question be detailed in depth, that stakeholders
and their interests be identified, and that the relationships between these elements be mapped in
terms of the flows of information, resources, and influence. Fully mapping the political economy
in question (in this case, California’s oil and gas sector) helps to explain the past evolution and
future trajectory of environmental governance – i.e. of the institutions (formal and informal),
policies, and regulations at play.
Unit of Analysis: Frames
The second research question this dissertation asks is: how have the ways that diverse
stakeholders frame competing narratives about oil and gas well stimulation practices shaped
regulatory outcomes at the state, county, and local levels in California after these practices were
partially exempted from federal environmental regulation under the Energy Policy Act of 2005?
To answer this question, content analysis of news media and semi-structured open-ended
interviews are used to identify the frames that stakeholders employ around oil and gas well
stimulation in California and explain their impacts on the evolution of well stimulation
regulation (Bales & Gilliam, 2001; FrameWorks Institute, 2017). “Frames” here refers to the
specific values, assumptions, and emphases that a given stakeholder uses to establish a context
for making and interpreting claims about oil and gas well stimulation. These frames vary widely
across different stakeholders, and so their resulting claims are often contradictory. Moreover,
stakeholders’ competing claims are often structured as narratives, such that different frames yield
different “stories” about intentions, struggles, and goals of various actors engaged with the issue
of oil and gas well stimulation in California.

151
The content analysis aims to “discern important thematic patterns in news reporting (in
terms of reporting style, content, allocation of news time, etc.) as well as to identify the leading
frames and narratives within that coverage” (FrameWorks Institute, 2017, p. 1). Semi-structured
open-ended interviews are also analyzed to “identify categories, patterns, themes and
connections” with which to infer and interpret frames and their invocation within narratives
(Cope, 2010, p. 451; Saldana, 2015). Together, this approach “[examines] the way people think
about a topic, the pattern of reasoning, the connections they make to other issues, and the devices
they use to resist new information” (FrameWorks Institute, 2017, p. 1). Although a number of
different approaches to content analysis are employed throughout the social sciences (Matthes &
Kohring, 2008), this dissertation research adopts a qualitative hermeneutic approach, which
extracts emergent frames and describes them in depth while at the same time taking care to
acknowledge and avoid threats to validity from selection and confirmation bias (Bos & Tarnai,
1999; David, Atun, Fille, & Monterola, 2011; Matthes & Kohring, 2008; Scheufele & Scheufele,
2010). This approach, in which “texts are examined and given interpretive accounts based on
their depictions of the broader cultural context within which the discourse occurs” (David et al.,
2011, p. 331) is appropriate for a single-case case-study research design where the sample
analyzed content is used to generalize toward theoretical explanation rather than the larger
population of content (Yin, 2009).
Data
The analyses conducted in this dissertation research draw upon both primary and
secondary data sources.
Primary data were gathered from semi-structured open-ended interviews. These
interviews ranged in duration from 30 to 45 minutes, and questions were organized thematically.

152
All interviewees were asked questions that were intended to probe their “awareness and
understanding” as well as their “valence and attitude” with regard to oil and gas well stimulation
in California. Interviewees whose occupation/profession directly or indirectly intersects with oil
and gas well stimulation in California were asked further thematic questions from one of five
stakeholder categories: “private-sector-specific”, “academy-specific”, “nonprofit-sector-
specific”, “regulatory-agency-specific”, or “elected-representative-specific”. Details of the
interview questionnaire instrument’s guiding language and logic may be found in Appendix A.
Interviewees were initially identified and recruited through purposive sampling in order to ensure
a meaningful representation of all relevant categories of stakeholders. These stakeholder
categories included: 1) residents in affected communities; 2) private-sector oil and gas firms; 3)
academic scientists and scholars; 4) nonprofit organizations (both opponents and proponents); 5)
regulatory agencies; and 6) elected representatives. Interviewees were subsequently recruited
through snowball sampling (i.e. through earlier interviewee recommendations) as well.
Secondary data that informed both the GPE analysis protocol (for analysis of regulation)
and the content analysis of news media (for the analysis of frames) were drawn from two major
sources: archival records and documentation. Archival records comprised: 1) public use data
files and archives maintained by the California Department of Conservation’s Division of Oil,
Gas, & Geothermal Resources (DOGGR), by the California Energy Commissions (CEC), and by
the U.S. Department of Energy’s Energy Information Administration (U.S. EIA); and 2)
geographic data files, maps, and charts maintained by DOGGR, CEC, and U.S. EIA.
Documentation comprised publications: 1) peer-reviewed studies; 2) news media articles; 3)
industry reports and press releases; 4) public agency reports and press releases; and 5)
legislation.

153
Chapter 6. Findings
“History doesn’t repeat itself, but it does rhyme.”
– attributed to Mark Twain
Introduction
Scientists in Conflict
In 1860, Governor John B. Weller called for a geographic survey of California, saying,
“the principle object should be to ascertain and make known, at home and abroad, the immense
wealth of our State in minerals and in agricultural resources with a view to their full
development” (Journal of the Senate of the State of California, 1860). But despite widespread
knowledge of surface petroleum seeps both onshore and offshore, it was not yet clear whether
California was home to substantial oil or gas deposits. The geological sciences at the time lacked
an accurate understanding of the origins of fossil fuels, and so rival scientists with differing
theories made competing and contradictory claims about California’s hydrocarbon wealth. Josiah
Whitney (center in Figure 1) was appointed State Geologist and head of the geological survey in
April 1860, and spent more than a decade criticizing all optimistic prospecting claims about
California’s potential oil wealth – none more venomously than those made by Professor
Benjamin Silliman (of Yale and Titusville fame, shown in Figure 2) whom he held in deep
disdain (White, 1968). Silliman had publicly announced, on the basis of his own more limited
survey of the state’s geology near known oil seeps, that California held “fabulous wealth in the
best of oil” (Nelson, 2001, p. 16). Whitney and his colleague William Brewer (far right in Figure
1) embarked on a long and bitter campaign to discredit Silliman.

154
Figure 80: Members of the State Geological Survey of California, 1860.
(Image Source: Unknown, circa 1860).
The failure of initial oil drilling efforts in the 1860s to replicate the bonanza that was
occurring in Pennsylvania appeared to confirm Whitney’s claims that Silliman was acting as
booster for California oil only to enrich himself by hoodwinking unwitting investors. Whitney’s
work with the state geological survey had the benefit of being both more academically and more
politically legitimate, and by the early 1870s Silliman had lost his post at Yale and much of his
scientific reputation. But his claims were spectacularly vindicated by the success of Star Works
Pico No. 4 in 1874 and other early wells in the Ventura basin, and later by the undeniably
fabulous wealth of oil in the San Joaquin and Los Angeles basins. Silliman died in 1885 and so
he didn’t live to see the latter confirmations of his claims, but Whitney did: California produced
over 80 million barrels of oil in the year of his passing in 1913 – nearly 40 percent of the total
national output (Redpath, 1900; White, 1968).

155
Figure 81: Professor Benjamin Silliman Junior, 1865.
(Image Source: William Warren, 1865).
History Rhymes in California
In July 2011, a century and a half after Silliman’s controversial estimate of California’s
oil endowment, the U.S. Department of Energy’s Energy Information Administration (U.S. EIA)
published a commissioned report produced by INTEK Inc. entitled “Review of Emerging
Resources: U.S. Shale Gas and Shale Oil Plays” which claimed that “the largest shale oil
formation [in the country] is the Monterey/Santos play in southern California, which is estimated
to hold 15.4 billion barrels or 64 percent of the total shale oil resources [in the lower 48 states]”
(U.S. EIA, 2011, p. 4). At then-prevailing prices of over $100 per barrel, these reserve estimates
represented more than one trillion dollars of oil wealth.
Enthusiasm among industry firms and policymakers at the prospect of developing this
tremendous economic prize was tempered by the concerns of scientists and communities that a
shale oil boom in California based on high-risk enhanced recovery techniques – collectively
referred to as “fracking” – could carry severe environmental implications. Fears were especially

156
acute in urban areas of Los Angeles County among communities that were already taking action
to address the environmental impacts of oil production in their neighborhoods (Rodriguez,
2011b). As it had several years earlier in other states, fracking quickly became California’s
highest-profile environmental issue (NRDC, 2012, 2013, 2014). Intense concerns about the
potential of fracking to contribute to air pollution, surface and groundwater pollution, soil
contamination, habitat destruction, water use, induced seismicity, and climate change stimulated
social mobilization and drove the legislative outcomes that followed, which culminated in the
passing of Senate Bill No. 4 (SB 4) in 2013 to regulate well stimulation treatments in California.
But the trillion-dollar California shale oil trove never materialized. In 2012 the U.S. EIA
reduced its original estimate of technically recoverable tight oil reserves from 15.4 billion barrels
to 13.7 billion barrels (U.S. EIA, 2012). Then in 2013 geologist David Hughes published an
analysis which showed that the methodology employed by the U.S. EIA and INTEK Inc. was
severely flawed (J. D. Hughes, 2013b, 2013c). The U.S. EIA responded by dramatically
downgrading its estimates, to 600 million barrels in 2014 and just 200 million barrels in 2016 –
less than 2 percent of the original figure (Sahagun, 2014; U.S. EIA, 2017a). The U.S. Geological
Survey (USGS) published still lower estimates in 2015 and 2016 for the San Joaquin and Los
Angeles basins of the Monterey Formation respectively for a total of 34 million barrels of
unconventional shale oil recoverable via intensive methods – a mere 0.25 percent of the original
U.S. EIA estimate (USGS, 2015, 2016). As Californian oilman Frank Barrett once noted: “The
true expert is the drill. You couldn’t say that a territory is known oil ground [until] you put a drill
in it.” (U.S. Circuit Courts of Appeals, 1919).

157
Figure 82: Monterey Shale Unproved Technically Recoverable Tight Oil Reserve Estimates.
(Source Data: U.S. EIA 2011-2017, USGS, 2015-2016).
Mark Twain is often credited with the quip that “history does not repeat itself, but it does
rhyme,” and the ways in which the unfolding of events leading up to the passage of SB 4 in 2013
validate that sentiment are striking. The patterns of conflict and contestation evident in
California’s recent battle over the regulation of well stimulation share marked similarities with
those that shaped the state’s petroleum legacy in earlier periods.
From its beginnings, California’s oil and gas industry has been a “terrain of struggle”,
and these struggles have by turns been scientific, economic, legislative, and political. In the
1860s, the authoritative geological experts of the day – Yale Professor Benjamin Silliman Junior
and Harvard Professor Josiah Whitney – were bitterly divided as to the extent of the state’s oil
wealth, leaving investors, lawmakers, and communities to construct competing narratives amidst
an atmosphere of scientific uncertainty. With the advent of the Shale Revolution 150 years later,
scientific uncertainty about the mixed promise and peril of petroleum production once again cast
stakeholders into political struggle for control over the governance of Californian carbon.
0 2 4 6 8 10 12 14 16
U.S. EIA2011
U.S. EIA2012
U.S. EIA2014
U.S. EIA2016
USGS 2016
Barrels of Oil (billions)
Monterey Shale Technically Recoverable Tight Oil Reserve Estimates

158
Research Questions
This chapter attempts to answer two research questions. First: how does the political
ecology of California’s energy system explain the regulation of oil and gas well stimulation
practices at the local, county, and state level that has emerged after these practices were partially
exempted from federal environmental regulation under the Energy Policy Act of 2005? This
dissertation uses the Governance and Political Economy (GPE) Analysis protocol developed by
Fritz et al. (2009; 2014) applied at the sectoral level to answer this question. Structural factors,
institutions, and stakeholders are the key elements of GPE analysis at the sectoral level (Fritz et
al., 2009, p. xiii). The image of a theater provides a useful metaphor: structural factors set the
stage for the analysis; institutions comprise both the furnishings on the stage with which
stakeholders interact as well as the rules and boundaries they must oblige; and the stakeholders
themselves are the actors upon the stage. In the presentation of findings that follows, each of
these elements are examined and analyzed in detail. It is important to note that the term
“governance” within the GPE analytical framework refers to the totality of policies, regulations,
and institutions (both formal and informal) that together comprise the machinery of California’s
political economy within which petroleum production is governed (A. Agrawal & Lemos, 2007;
Fritz et al., 2014; Lemos & Agrawal, 2006).
Second: how have the ways that diverse stakeholders frame competing narratives about
oil and gas well stimulation practices shaped regulatory outcomes at the state, county, and local
levels in California after these practices were partially exempted from federal environmental
regulation under the Energy Policy Act of 2005? This dissertation employs a Frame Analysis
derived from the Strategic Frame Analysis protocol developed by Bales and Gilliam (2001) in
conjunction with the FrameWorks Institute (2017). The content of news media, industry

159
publications and statements, public agency reports, and key informant interviews is analyzed to
extract emergent frames and describe them in depth in order to understand how different
stakeholders understand the subject of fracking, the patterns of reasoning they employ, and the
narratives they adopt and advance as a result (FrameWorks Institute, 2017).
GPE Analysis Findings Part 1: Structural Factors
Structures in GPE analysis are defined as the long-term contextual factors that lie beyond
the direct control of stakeholders and which change slowly over long periods of time (Fritz et al.,
2009; ODI, 2009). Structural factors include scales, geographies, ecologies, politics, class
dynamics, markets and their economies, and technologies. Fritz et al. note that these “historical
legacies often have profound effects on shaping current dynamics” and “capturing such longer
processes, and how societies continue to deal with them, provides depth and perspective to the
issue of ‘how things have become the way they are today’” (Fritz et al., 2009, p. xiii). Paul Sabin
provides a political economy analysis of the way in which structural factors have played a crucial
role in shaping California’s oil and gas industry through the first half of the 20th Century in
“Crude Politics: The California Oil Market 1900-1940” (2005), which he extends to the end of
the century in his more recent publications (Sabin, 2010, 2012). Regarding the structural factors
that continue to shape the oil and gas industry, Sabin notes that “our energy system embodies
political power and social values as much as the latest engineering and science” (2010, p. 76),
and that although market forces are important, “policy and politics [establish] the playing field
for market interactions among producers and consumers” (2010, p. 84). The preceding Chapters
2 and 4, respectively, chart the contours of America’s petroleum history and the non-market
structural factors specific to California that shaped the state’s unique hydrocarbon legacy up until
the advent of the Shale Revolution. The GPE analysis presented here therefore extends the

160
existing literature to examine the “shale decade” from 2006 to 2016, situating the California
“fracking story” upon the stage comprised of the state’s unique geographical, cultural,
environmental, and political structures.
Matthew Huber (2009, 2011) notes the “perhaps obvious, but nevertheless crucial point”
that the ongoing reproduction of many of these structural factors is wholly dependent upon cheap
and abundant supplies of fossil fuels in stable commodity markets (2013, p. 105). Paul Sabin
echoes this sentiment “the question we have rarely thought to as is, why is oil so cheap?” (Sabin,
2005, p. 2, emphasis in original), as do Anthony Bebbington and Jeffrey Bury who note that
petroleum markets hold a “special resonance for political ecology’s interest in social
movements” because they wield “immense power in and significance for the transformation of
social life” (A. Bebbington & Bury, 2013, pp. 3–4).
Scale
The concept of scale in political ecology and geography “has been interpreted and
operationalized in many competing, and sometimes conflicting, ways, resulting in a large, often
highly abstract, and sometimes contentious body of literature” (McCarthy, 2005, p. 733).
Because consensus has emerged in these literatures that “scale” is socially constructed,
McCarthy points out that “questions immediately arise: who produces scale, how, and for what
purposes?” (2005, p. 733). Scholars have noted that there can be mismatches between the spatial
and temporal scales of social and ecological systems, and these mismatches “arise through
changes in the relationships between the spatial, temporal, or functional scales at which the
environment varies, the scales at which human social organization occurs, and the demands of
people and other organisms for resources” (Cumming, Cumming, & Redman, 2006, p. 3). The
recent political ecology literature has emphasized the importance of paying “closer attention to

161
‘the environment’ – environmental politics, nonhuman actors, and biophysical processes”
(Neumann, 2009, p. 399; Rangan & Kull, 2008). McCarthy in particular has stressed the co-
production of nature and society in both urban and rural-agricultural settings, given that
ecological scales are no less constructed than social ones (2014; 2005). States play a key role in
scalar construction by virtue of their power and authority, and so the production of scale tends to
reflect the organizational levels of government both operatively and normatively (Brenner, 2001;
Marston, 2000).
American federalism has always given states a substantial role in both petroleum and
environmental governance, and states have in turn always shared some of that power with local
authorities. An “equilibrium in oil policy” had existed for nearly half a century following the
conclusion of the “Teapot Dome” scandal in which Secretary of the Interior, Albert Fall, was
convicted of accepting bribes in exchange for oil leases on federal lands in Wyoming (a scandal
in which infamous Los Angeles oil man Edward Doheny Jr. was implicated but not indicted)
(McCartney, 2008; Noggle, 1962; Wiltz, 1964). Prior to the energy crises of the 1970s, this
equilibrium had balanced domestic oil production against foreign imports, with ever-expanding
consumer demand unfettered by the need for either environmental or efficiency concerns acting
as the fulcrum between the two (Sabin, 2012). But major shifts in regulatory landscapes were
triggered by the initial peaks in domestic oil and gas production simultaneously coupled with
international supply constraints caused by the OPEC cartel and later by the Islamic Revolution in
Iran (Murphy & Hall, 2011; Witze, 2007), and these crises led to a rethinking of U.S.
dependency upon abundant fossil fuels for the material and energy inputs necessary to sustain
continuous economic growth (Yergin, 2006, 2011), out of which emerged conflicting federal
commitments to both “new pollution laws, offshore drilling restrictions, financial reforms, and

162
efficiency measures” on the one hand, and low fuel and energy prices on the other (Sabin, 2012,
p. 177).
The stage for environmental reform had already been set by the end of the 1960s, and so
the energy crises at least served as catalyzers of the environmental movement that exploded into
global consciousness starting in 1970, if not also as direct triggers, with the oil industry squarely
implicated as a chief driver of air pollution – most notably in Los Angeles (Figure 83).
Figure 83: Smog and Oil Industry Protest at Pasadena Civic Auditorium, October 1954.
(Image Source: LIFE Magazine, 1954).

163
Figure 84: Smog Obscuring Los Angeles City Hall and the Hall of Justice, 1968.
(Image Source: Herald-Examiner Collection, 1968).
Social mobilization in the 1960s around civil rights, opposition to the Vietnam War, and
the specter of nuclear conflict was preconditioned to crystalize around a new environmental
movement, and political pressure mounted in Washington for environmental protection beyond
the local and regional scale. In the preface of a 1965 report by the Environmental Pollution Panel
of the President’s Science Advisory Committee entitled “Restoring the Quality of Our
Environment”, President Lyndon Johnson noted the following:
“We are a nation of affluence. The technology that has permitted our
affluence spews out vast quantities of wastes and spent products that

164
pollute our air, poison our waters, and even impair our ability to feed
ourselves. At the same time, we have crowded together into dense
metropolitan areas where concentration of wastes intensifies the
problem. Pollution now is one of the most pervasive problems of our
society. With our numbers increasing, and with our increasing
urbanization and industrialization, the flow of pollutants to our air,
soils and waters is increasing. This increase is so rapid that our present
efforts in managing pollution are barely enough to stay even, surely
not enough to make the improvements that are needed.” (White House
Office of Science and Technology, 1965, p. v).
Significant federal environmental legislation emerged in the years immediately thereafter,
the specifics of which are discussed below (see: institutions). Yet for all its legislative progress
toward securing environmental protections following the rise of the modern environmental
movement, the structure and functioning of federal apparatus that govern oil and gas production
(in contrast to its utilization as fuels and industrial inputs) changed remarkably little in the
decades that followed. The key federal agencies directly engaged with monitoring and enforcing
regulations on the production and sale of oil and gas in the 1970s were the same ones in place in
2006: the U.S. Environmental Protection Agency (which regulates impacts); the U.S.
Department of the Interior (which regulates oil and gas leases of federal lands via its Mineral
Management Service); the Federal Energy Regulatory Commission (which regulates interstate
oil and gas transfers via pipelines, and disseminates industry data via its Energy Information
Administration); the U.S. Department of Commerce (which regulates importation and
exportation); and the U.S. Securities and Exchange Commission (which regulates industry

165
reporting guidelines). During the same period, the oil and gas industry achieved a notable degree
of “regulatory capture” by both securing numerous exceptions to key pieces of federal
environmental legislation (Environmental Working Group, 2009; Kosnik, 2007 – see Appendix
C; Pagel & Sumi, 2011), and by cooptation of specific agencies – perhaps most notably the
Mineral Management Service, whose culpability was highlighted as a result of the BP Deepwater
Horizon disaster of 2010 such that the agency was dissolved and reorganized in the aftermath
(Bratspies, 2011; Frank, 2009; Shapiro, 2011). Although there is no unambiguous consensus
among scholars as to the degree to which federal oil and gas governance apparatus had been
captured by industry interests (Carpenter & Moss, 2013), national policy was nevertheless
aligned squarely with industry interests and focused on maximizing petroleum output – with the
environmental toll of the sector a decidedly secondary consideration (see Figure 85, for
example).

166
Figure 85: Bureau of Land Management Website Home Page.
(Image Source: U.S. BLM, 2017).
At the state scale, by contrast, California’s regulation of the oil and gas industry and its
associated environmental impacts changed substantially during the thirty years between the
1970s energy crises and the start of the Shale Revolution, with new agencies such the California
Environmental Protection Agency arising and older agencies such as the Department of
Conservation’s Division of Oil and Gas being restructured and renamed (see: institutions). These
changes reflected an ongoing structural shift in state governance of the energy sector toward
protecting human health and ecological integrity at the expense of industry productivity
(Merchant, 1998; J. C. Williams, 1997).
At the local scale, regulatory control over oil and gas production in the period leading up
to the Shale Revolution remained limited. Instead, focus lay squarely on monitoring and
enforcing the industry’s environmental impacts. Local communities with significant wealth and

167
associated political power and voice met with some notable successes, as discussed below (see:
class dynamics), but these were by their nature the exception rather than the rule.
With the growth of interest in fracking, first at the advent of the Shale Revolution in 2006
and later with the publication of the U.S. EIA’s extraordinary reserve estimates for California in
2013, the existing trends in governance structure change accelerated but did not alter direction:
1) federal apparatus remained focused primarily economic growth (see Figure 6 below); 2) state
apparatus continued to place ever-greater emphasis on human health and ecological integrity
where those concerns were counterpoised against industry productivity; and 3) local apparatus
remained squarely focused on environmental impacts. The net result of the structural
convergence between the state and local concern around environmental impacts of oil and gas
production was a surge in new legislation to regulate oil and gas production starting in 2011 that
reached its pinnacle with the passing of SB 4 in 2013, discussed in detail below.
Property Rights
The basket of rights associated with property has a constitutional basis, and therefore
changes so slowly that property regimes merit treatment as structural factors rather than as
institutions for the purposes of GPE analysis. The property regime in the United States is unusual
by global standards in that private citizens may own both surface and subsurface rights, which in
California and other states allows landowners to sell or lease mineral rights to third parties in
exchange for monetary compensation. (Worldwide it is uncommon for subsurface rights to be
owned privately, and firms must therefore negotiate access and rent-seeking arrangements with
the state – see Bridge, 2008). Privately-controlled mineral rights in California may therefore be
separated from surface rights, with the notable consequence that the purchaser is automatically
granted an “easement”, meaning reasonable access to and use of the overlying land to extract the
minerals, even if the owner of that land is a third party. Most minerals, meanwhile, are

168
considered real property prior to extraction, upon which they become personal property. Oil and
gas, however, are treated differently than solid minerals. Because oil and gas are “fugitive
substances” which may migrate beneath neighboring lands, it is the first party to “capture” those
hydrocarbons that may claim ownership rights over them. Prior to capture, the law does not
consider these substances property. This “rule of capture” (discussed in Chapter 4) therefore
treats oil and gas in a manner similar to that of animals and groundwater (Hardwicke, 1935;
Haupt & Rockwell, 2017; Joy & Dimitroff, 2016; Kramer & Anderson, 2005).
The structure of property rights in the United States therefore incentivizes a race among
producers to be not only the first to purchase or lease the mineral rights for a petroleum rich area,
but to produce as much oil or gas as possible so that competing firms on neighboring lands don’t
“drink their milkshake” (a reference to the popular culture explanation of the concept in the film
“There Will Be Blood” based on Upton Sinclair’s novel “Oil!”). Key figures in positions of
natural resource and conservation leadership have long lamented the inefficiencies, cyclical
boom-and-bust market instabilities, and tragedies of the commons that tend to accompany such
extractive races for oil and gas – perhaps most notably President Theodore Roosevelt and USGS
director George Otis Smith – but there is little scope for intervention under the current property
regime given that the majority of petroleum-bearing lands are privately owned. (Offshore oil and
gas production, by contrast, occurs exclusively under public leases and so federal and state
policy are able to exercise substantial control over production in those fields – see: Tidelands and
Offshore Oil, Chapter 4).
Federal Lands and Leases
Roughly 46 percent of California is federal land (Vincent, Hanson, & Argueta, 2017), as
shown in Figure 86 below.

169
Figure 86: Federal Lands in California.
(Source Data: ESRI, 2017).
The majority of oil and gas leases on federal lands in the state are administered by the
Bureau of Land Management (BLM), and these roughly 600 active leases span 200,000 acres
and hosting nearly 8,000 wells. Over 95 percent of these wells are situated in “established fields”

170
(meaning areas where petroleum production has taken place for many decades) within the Kern
County area of the San Joaquin Valley Production on BLM lands together with offshore leases
amounts to about approximately 10 percent of total oil and natural gas production in the state
(U.S. BLM, 2017; U.S. EIA, 2015). A small number of individual oil and gas wells continue to
produce from leases on U.S. Fish and Wildlife Service, U.S. Forest Service, and U.S.
Department of Defense lands, but together these comprise less than one percent of total state
production. New federal leases were initially planned by the Forest Service in 2005 and the BLM
in 2007 that would have auctioned up to one million acres of land for oil and gas development,
perhaps most notably in Los Padres National Forest. However, a series of successful lawsuits
filed by the Center for Biological Diversity, Los Padres National Forest Watch, and Defenders of
Wildlife resulted in rulings against the agencies under the National Environmental Policy Act
and halted new leases after 2013 pending additional environmental review (Whetzel, 2017).

171
Figure 87: A Well Pad in Los Padres National Forest, 2016.
(Image Source: Los Padres Forest Watch, 2016).
State and Other Public Lands
According to the California State Lands Commission (2017) there are 55 oil and gas
leases on state lands in California, 27 onshore and 28 offshore. The onshore leases host 79 wells,
13 of which are active, and only one of which is an oil well. The active oil well is located on a
1981 lease in the Lindsey Slough field in Solano County, and produces roughly 175 barrels per
day. The offshore leases host 625 wells, 461 of which are still active. There are roughly the same
number of active offshore oil wells as gas wells at any given time. Total offshore oil production
from these state leases was 2.9 million barrels 2016. Only two offshore leases have been granted
in state waters since 1969: PRC-4736 NB/SB in 1973, and PRC-7911 in 1996. No wells have yet
been drilled in the latter 1996 lease.

172
Although California has followed the same general pattern as other petroleum-producing
states in that state-level policy has encouraged low and stable oil and gas prices, contests over
coastal lands atop oil fields were largely settled in the first half of the 20th Century in favor of
beach preservation and coastal property owners whose residences and businesses accrued more
value – and in ample quantities to translate into actionable political power – from recreation than
from oil and gas development. As a result, state land holdings of beaches and tidelands ceased to
be dedicated to petroleum development by the 1940s (Sabin, 2005), and have instead been areas
dedicated to recreation and tourism since that time (see: coastal, below).
Geographies
California’s unique hydrocarbon geography was a crucial structural determinant of how
the Shale Revolution unfolded in the state. Geography by its nature differs from place to place,
and the relevant literatures place due emphasis on the importance of understanding how these
structures shape social, economic, political, and environmental outcomes (see for example A.
Bebbington & Bury, 2013; Liverman, 2004; Perreault, Bridge, & McCarthy, 2015; Robbins,
2011). But key geographical features of oil and gas production in California – namely its geology
and the extent to which the industry is integrated within both urban and agricultural landscapes –
are both qualitatively and quantitatively extraordinary relative to their counterparts in the
country’s other shale plays.
Geology
As discussed in Chapter 4, California’s petroleum geology differs from that of other
states in that it formed much more recently (and is indeed still forming) where marine sediment
layers are subducted at an active plate tectonic boundary. Many of the new enhanced recovery
techniques that opened unconventional shales to profitable development in the Barnett, Eagle

173
Ford, Bakken, and Marcellus formations to the east cannot be implemented in California’s
Monterey Formation because the reservoir rock strata are already highly folded and fractured.
The early projections of technically recoverable reserves from the Monterey Formation such as
those published by the U.S. EIA in 2011 which later proved to be dramatically erroneous were
based on simple extrapolations from fracking deployments in other states that did not adequately
account for these geological differences.
California’s geology also differs from most other centers of fracking in that a sizable
portion of its oil-bearing deposits are located offshore (Figure 88). And while this is true of
Texas and Louisiana as well, no new offshore leases in California have been made available in
state waters since 1969 or in federal waters since 1982 and so the political feasibility of
exploiting that geology (whose technically recoverable reserves were included in the 2011 U.S.
EIA projections) remains limited.

174
Figure 88: Monterey Formation Shale Plays with Agriculture and Urban Development.
(Source: Carnegie Endowment for International Peace, 2014).
To a first approximation, the three major geologies of the Monterey Formation – namely,
the Los Angeles, San Joaquin, and Santa Maria-Ventura basins – are associated with urban, rural,
and coastal geographies respectively (Figures 65 and 88).

175
Urban
More than 30,000 oil and gas wells have been drilled in greater Los Angeles metropolitan
area that includes portions of Los Angeles, Orange, San Bernardino, and Riverside counties
(Figure 10). The region contains roughly 4,000 active oil wells which in 2015 produced 24
million barrels per year, or approximately 12 percent of total state (DOGGR, 2017a, 2017b). A
proportionately smaller amount of natural gas, amounting to less than 1 percent of California’s
total production, is produced in the basin (DOGGR, 2017a).
Figure 89: Urban Oil Wells in the Greater Los Angeles Metropolitan Area.
(Source Data: DOGGR, 2017).
The intensity with which urban land in the Los Angeles metropolitan area is developed,
combined with the density of the populations that inhabit them, invariably produces
disagreements among diverse stakeholders with incompatible priorities, values, needs, goals, and

176
conceptions of what constitutes just outcomes with respect to quality of life and environment.
And while Los Angeles is not as densely populated per unit land area as many urban polities
across the globe, the region is nonetheless host to stark conflicts over land uses whose
distribution of benefits and burdens is challenged morally, ethically, politically, and legally on
both procedural and distributional bases (Schlosberg, 2004, 2007).
Oil and gas production in Los Angeles, however, does not strictly conform to standard
patterns of environmental justice that have been so widely observed in other cases where the
externalities of industrial activity fall disproportionately on poorer and more disadvantaged
communities of color (Bryant, 1995; Mohai, Pellow, & Roberts, 2009; United Church of Christ,
1987, 2007). Rather, communities have responded in diverse ways to the threats to human and
ecological health that the industry poses (see: class dynamics). With some notable exceptions
(see: institutions), oil and gas production is deeply normalized within urban life in Los Angeles
(Figures 90-92).
Figure 90: Oil Pumpjacks in Baldwin Hills.
(Image Source: NRDC, 2011).

177
Figure 91: Pumpjacks Near Signal Hill.
(Image Source: Center for Land Use Interpretation, 2010).

178
Figure 92: Pumpjacks Adjacent to Coastal Homes in Huntington Beach.
(Image Source: Reed Saxon, 2011).
However, only a handful of locations in the Los Angeles basin have been permitted for
hydraulic fracturing or acidizing well stimulation treatments to date, and as of May 2017 only
three such locations are registered as active (DOGGR, 2017b). These three locations are operated
by Greka Oil & Gas Incorporated, and are clustered in close proximity to one another at the
southern portion of the Richfield oil field in the city of Placentia, Orange County (Figures 93-
97).

179
Figure 93: Permitted Location 1 for Well Stimulation Treatment, Placentia.
(Image Source: Google, 2017).
Figure 94: Permitted Location 2 for Well Stimulation Treatment, Placentia.
(Image Source: Google, 2017).

180
Figure 95: Permitted Location 3 for Well Stimulation Treatment, Placentia.
(Image Source: Google, 2017).

181
Figure 96: Permitted Locations for Well Stimulation Treatment, Placentia.
(Image Source: Google, 2017).

182
Figure 97: The Richfield Oil Field with Inset Well Stimulation Locations, Placentia.
(Source Data: Google, 2017).
The inset map in Figure 97 corresponds to Figure 96, which shows that the three
permitted locations where hydraulic fracturing and acidizing treatment permits have be filed lie
in close proximity to the residential neighborhoods that overlie the Richfield oil field, as well as
to Anaheim Lake, the Santa Ana River Lakes, and Huckleberry Kids’ Pond. (These water bodies
are public recreation areas stocked with fish for human consumption). Yet despite serious
concerns about the threats to surface and ground water posed by oil and gas operations from the
general public, Placentia is not a seat of strong opposition to fracking. The city and its neighbors
Brea and Yorba Linda are affluent “oil towns [that do] not really want to bite the hand that fed
them” (Orlowski, 2016 quoting Quam-Wickham).

183
Although the number of fracking permits issued to date is far too small to generalize
from, it is likely not a coincidence that these permits were sought and obtained within
communities that are long-standing bastions of political conservatism as well, given that fracking
has become an intensely politicized issue over the course of the Shale Revolution (see:
discussion). For older oil fields where production has gone on for many decades, however, there
is little correlation between the sites of wells and the political leanings of their host communities
(Figure 98).

184
Figure 98: Los Angeles County and Orange County 2016 Presidential Election Map.
(Source Data: Los Angeles Times, 2016).
Similarly, there is little correlation between the sites of wells and the economic status of
their host communities (Figure 99). Wealthy communities in Beverly Hills and West Los
Angeles, for example, have historically hosted oil production of approximately similar intensity
to lower-income communities in Inglewood and Long Beach. There is, however, a marked
difference in the level of investment that petroleum firms make to minimize the environmental
PLACE

185
impacts of their operations among communities according to their level of wealth (see: class
dynamics).
Figure 99: Los Angeles Metropolitan Area Median Income (2012 USD) and Oil Wells.
(Source Data: DOGGR 2017; ESRI, 2016).
Irrespective of their political or economic profiles, the primary environmental concerns
that urban communities of the Los Angeles basin have about fracking are air quality, noise, and
induced seismicity.
Air quality concerns stem from both general public awareness of known linkages
between fossil fuels and emissions, and from specific instances of localized industry impacts.
$82,000 or greater
$68,001 to $82,000
$53,001 to $68,000
$39,001 to $53,000
$24,001 to $39,000
$24,000 or less
No Households

186
One high-profile example of the latter was the AllenCo Energy production facility in the
University Park community of South Los Angeles, where residents had complained of noxious
fumes and respiratory ailments for several years (Figure 100). When U.S. EPA investigators
finally inspected the site three years after the community lodged the first of over 250 complaints,
they were immediately sickened by fumes, and an injunction halted operations shortly thereafter
(Sahagun, 2013a, 2013b). Stakeholders opposed to fracking tend to infer from individual high-
profile instances of acute point-source pollution such as the AllenCo Energy case that all new oil
and gas production poses unacceptable threats to air quality (Alexander, 2012; Reyes, 2016a;
Rodriguez, 2011b). Several communities in the Los Angeles metropolitan area have long-
standing complaints about the industry’s overall impact on local air quality as well – perhaps
most notably the port-adjacent community of Wilmington which is situated atop the eponymous
Wilmington oil field and hosts both petroleum production and refinery operations (Boxall &
Mozingo, 2016).

187
Figure 100: AllenCo Energy Site in University Park Neighborhood, Los Angeles.
(Image Source: Google, 2017).
Nevertheless, the correlation between overall air quality in the Los Angeles metropolitan
area is therefore not strongly associated with oil and gas well sites. Figure 101 maps the National
Air Toxics Assessment (NATA) Hazard Index, which is the “sum of hazard quotients for
substances” as an “approximation of the aggregate effect on the target organ” (i.e. lung disease)
as a result of exposure to criteria air pollutants such as particulate matter, diesel exhaust,
tropospheric ozone, carbon monoxide (CO), lead, nitric oxides (NOx), sulfuric oxides (SOx), as
well as volatile organic compounds (VOCs) such as formaldehyde, acetaldehyde, and methanol
(U.S. EPA, 2017).

188
Figure 101: Los Angeles Metropolitan Area NATA Respiratory Hazard Index and Oil Wells.
(Source Data: EPA 2017; ESRI, 2016).
The explanation for this finding, which may initially seem surprising, is that unlike other
urban industrial operations which can locate themselves wherever costs are lowest, the petroleum
industry must follow the dictates of geology. So although disadvantaged communities do indeed
arise in proximity to industrial centers, as in the case of Wilmington, the oil and gas industry is
less able to systematically target low-income areas to the extent that other polluting industries are
(Mohai et al., 2009).
Noise pollution is frequent complaint from urban communities adjacent to oil and gas
operations. Noise is seldom the isolated focus of concern, but instead often accompanies air
pollution as a secondary issue, as in the case of the Freeport-McMoRan site in the South Los
Angeles neighborhood of Jefferson (Figure 102). Although the deleterious impacts of noise are
Data not Available
Less than 70th Percentile
70th - 80th Percentile
80th - 90th Percentile
90th - 95th Percentile
95th - 100th Percentile

189
substantial and have been studied both separately from and in direct relation to fracking as
discussed in Chapter 2, complaints in the fracking discourse frame noise as a nuisance rather
than as a serious threat to public health (Liberty Hill Foundation, 2015).
Figure 102: Freeport-McMoRan Site in Jefferson Neighborhood, Los Angeles.
(Image Source: Google, 2017).
USC
Campus

190
Figure 103: Jefferson Community Protests led by USC Students, Los Angeles.
(Image Source: Genero Molina, 2013).
The perceived possibility that fracking may induce seismic activity – i.e. cause
earthquakes – in the Los Angeles region is frequently cited as a major concern by local
stakeholders (CAFrackFacts.org, 2017; Granda, 2015). The current body of evidence suggests
that the specific enhanced recovery techniques employed in the Los Angeles basin do contribute
significantly to the risk of a major seismic event beyond the extent to which conventional oil and
gas operations already do so (Hauksson, Goebel, Ampuero, & Cochran, 2015). Nevertheless,
recent research has suggested that petroleum production during the 20th Century may have
elevated the background level of seismicity as well as contributed to specific seismic events in
the past, and this research is frequently cited by local residents and fracking opposition groups as
reason for taking greater precautions, given the potential destruction that a major earthquake the
Los Angeles area could cause (Arbelaez, Wolf, & Grinberg, 2014).
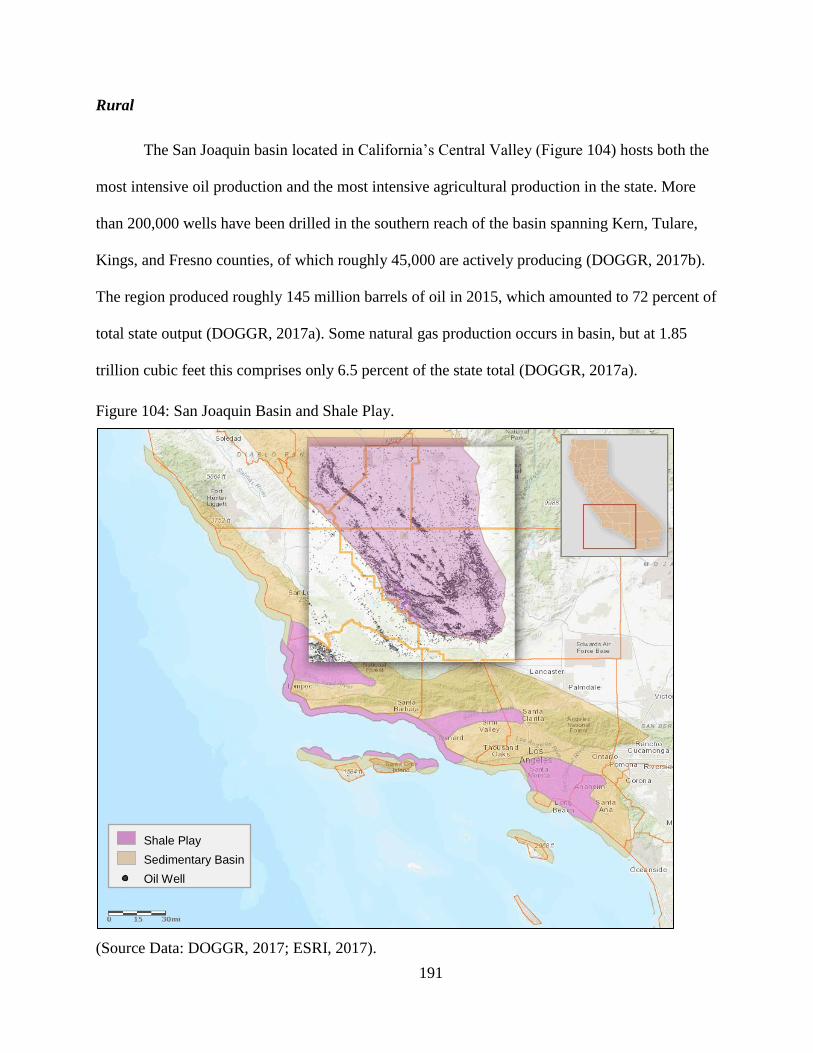
191
Rural
The San Joaquin basin located in California’s Central Valley (Figure 104) hosts both the
most intensive oil production and the most intensive agricultural production in the state. More
than 200,000 wells have been drilled in the southern reach of the basin spanning Kern, Tulare,
Kings, and Fresno counties, of which roughly 45,000 are actively producing (DOGGR, 2017b).
The region produced roughly 145 million barrels of oil in 2015, which amounted to 72 percent of
total state output (DOGGR, 2017a). Some natural gas production occurs in basin, but at 1.85
trillion cubic feet this comprises only 6.5 percent of the state total (DOGGR, 2017a).
Figure 104: San Joaquin Basin and Shale Play.
(Source Data: DOGGR, 2017; ESRI, 2017).
Shale Play
Sedimentary Basin
Oil Well

192
Oil and gas drilling, production, and distribution operations have coexisted for over a
century with agriculture in California (Figure 105).
Figure 105: Colocation of Agriculture and Oil Wells in California, Circa 1911.
(Image Source: Standard Oil of California, circa 1911).
Although the historical legacy of oil and agriculture integration continues to the present
day (Figures 106-107), the Shale Revolution raised public consciousness about the potential
impacts of modern enhanced recovery techniques and drew attention to a number of specific
practices in the San Joaquin basin that may pose an environmental threat to both human health
and agro-ecosystems.
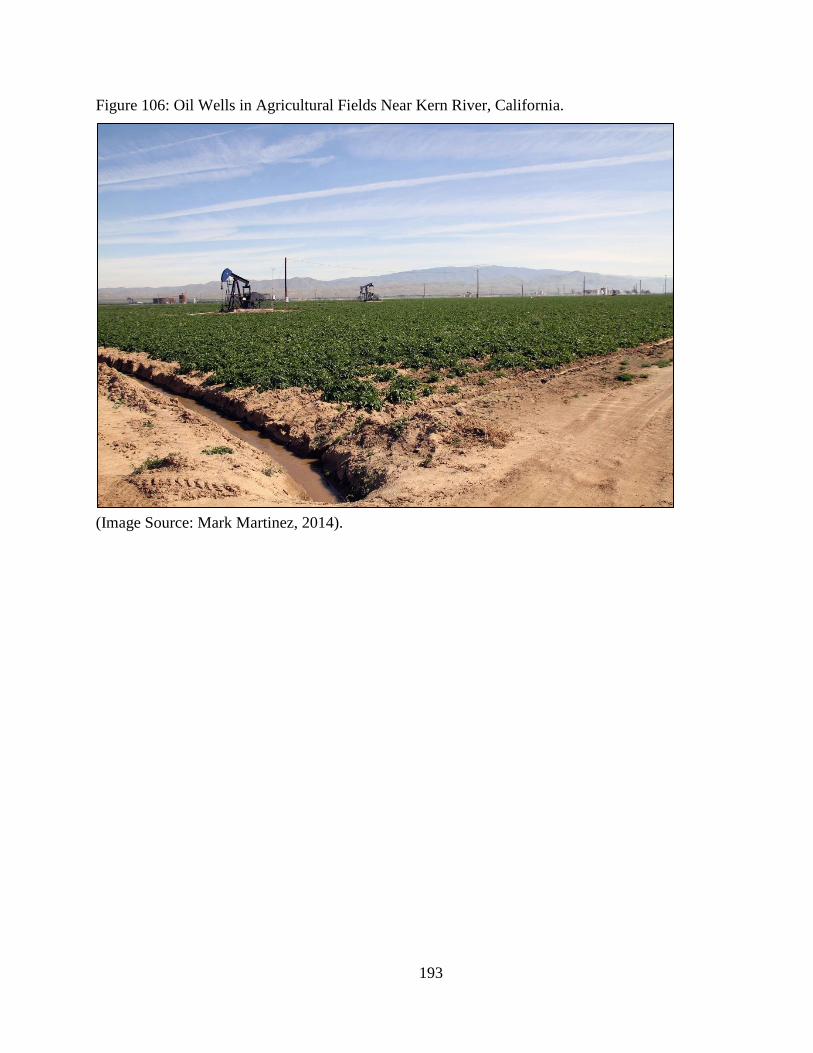
193
Figure 106: Oil Wells in Agricultural Fields Near Kern River, California.
(Image Source: Mark Martinez, 2014).

194
Figure 107: Colocation of Agriculture and Oil Wells in Kern County, California.
(Source Data: DOGGR, 2017; ESRI, 2017).
Concerns about fracking in the rural San Joaquin basin center largely on contamination of
surface water, groundwater, and soil. The use of enhanced recovery techniques generates
wastewater comprised of both flowback fluids and produced water (see: Chapter 2), and this
wastewater is either pumped into on-site storage tanks, discharged into storage pits, or injected
into disposal wells. Because oil production from the Monterey Shale yields as much as 16 barrels
of produced water for each barrel of oil (a very high ratio by industry standards), disposal of
wastewater in on-site storage pits is a long-standing practice in the San Joaquin region (Grinberg,
2014). Although regulations in some other states require storage pits to be lined with
impermeable material such as heavy-duty plastic sheeting to prevent leaching into the underlying
BAKER

195
soil and groundwater, this is not a statewide requirement in California (Grinberg, 2016; U.S.
EPA, 2016). Unlined wastewater storage pits (Figures 108-110) are therefore a primary target of
concern among opponents of fracking in the San Joaquin region.
Figure 108: Unlined Wastewater Storage Pit 1 in Kern County, California.
(Image Source: Grinberg, 2014).

196
Figure 109: Unlined Wastewater Storage Pit 2 in Kern County, California.
(Image Source: Grinberg, 2014).

197
Figure 110: Unlined Wastewater Storage Pits in Kern County, California.
(Image Source: Brian van der Brug, 2015).
Some of these unlined wastewater storage pits have been in continuous use for nearly 60
years, and the Central Valley Water Board has been slow to take regulatory enforcement action
despite confirmation of groundwater contamination plumes in the basin (Cart, 2015a, 2015e;
Grinberg, 2016). Moreover, 40 percent of region’s 1,113 pits are not formally permitted (shown
in red in Figure 111).

198
Figure 111: Oil and Gas Wastewater Storage and Disposal Pits in Kern County, California.
(Source Data: DOGGR, 2017; FrackTracker Alliance, 2017; ESRI, 2017).
“Kern County officials earlier this year discovered more than 300 previously unidentified
waste sites … the water board’s review found that more than one-third of the region’s active
disposal pits were operating without permission” (Cart, 2015f). Moreover, hundreds of class II
injection wells used for disposal of industry wastewater have been found to be in violation of
regulation and/or operated without proper permitting (Baker, 2015b; Cart, 2015b; U.S. EPA,
2015).
A number of farmers in the San Joaquin basin have filed lawsuits against oil and gas
firms, alleging that soil and groundwater contamination from storage pits has damaged their trees

199
and crops (Baker, 2015a, 2015b; Cart, 2015b). In 2013 a jury ordered Aera Energy LLC to pay
$8.6 million in compensatory damages and $9 million in punitive damages after 9 years of legal
proceedings and appeals (Cox, 2013). A lawsuit filed by environmental watchdog groups
Association of Irritated Residents, Clean Water Fund, and Center for Environmental Health
under the California Safe Drinking Water and Toxic Enforcement Act of 1986 against the oil
industry firm Valley Water Management was settled was settled in July 2016 for $200,000 in
penalties plus remediation costs (Clean Water Action, 2016). In an interview for this dissertation,
Chief Deputy Director of the State Water Resources Control Board Jonathan Bishop affirmed the
agency’s claims that no evidence of contamination of drinking water aquifers has been found to
date as a result of the unlawful injection disposals that have occurred, but that more
comprehensive testing and ongoing monitoring are necessary to rule out the possibility with
greater confidence.
Surface and groundwater contamination are of concern in the San Joaquin basin’s rural
farming communities primarily because agriculture is dependent upon accessible, reliable, and
affordable supplies of fresh water: “If we don’t have water, your property’s worth zero” (Baker,
2015a quoting Mike Hopkins of Palla Farms). A U.S. EPA report on the impacts of hydraulic
fracturing noted that “water withdrawals for hydraulic fracturing in times or areas of low water
availability, particularly in areas with limited or declining groundwater resources” are an
environmental impact of particular concern (2016).
Overarching concerns about water supply in general, and whether or not fracking by
petroleum industry firms would compete with agriculture for water use in the San Joaquin basin,
were exacerbated during the historic drought conditions from 2014 to 2016 (Figure 112) that
drove substantial increases in food prices (Food & Water Watch, 2014; Hoerling, 2014).

200
Figure 112: Percent Area of California Land Under U.S. Drought Monitor Categories.
(Source Data: U.S. Drought Monitor, 2017).
Hydraulic fracturing well stimulations are long-standing industry practice in California
and have not grown significantly in number since the advent of the Shale Revolution. Roughly
1,800 of these stimulations are currently undertaken each year in California, or about half of all
new onshore wells, and the average quantity of water used in per well stimulation in California is
approximately 140,000 gallons (California Council on Science and Technology, Lawrence
Berkeley National Laboratory, & Pacific Institute, 2015; Freyman, 2014; SCAQMD, 2014;
Tiedeman, Yeh, Scanlon, Teter, & Mishra, 2016; WSPA, 2014).
0
10
20
30
40
50
60
70
80
90
100
2006 2007 2008 2009 2010 2011 2012 2013 2014 2015 2016 2017
Per
cen
t A
rea
(%)
Percent Area of California Land - U.S. Drought Monitor Categories
Abnormally Dry Moderate Drought Severe Drought Extreme Drought Exceptional Drought

201
Figure 113: Histogram of Water Use per Well stimulation Treatment in California.
(Image Source: California Council on Science and Technology, Lawrence Berkeley National
Laboratory, & Pacific Institute, 2015, fig. S.2-5).
As one point of comparison, however, average household water consumption in
California is 132,000 gallons per year (DeOreo et al., 2011), so total water consumption by well
stimulation treatments is therefore the equivalent of approximately 2,000 households, or less than
0.015 percent of residential water use in California. As another point of comparison, roughly 40
percent of California’s total water supply is devoted to agriculture (overwhelmingly for
irrigation), which amounts to 10.5 trillion gallons each year – 42,000 times more than the 250
million gallons used for hydraulic fracturing (California Department of Water Resources, 2017).
Nevertheless, rural communities continue to express concerns over the oil and gas industry’s
water use: “They’re competing for the same water that we’re using for our farms … that’s taken
away from the farm fields” (quoting San Joaquin farmer Keith Gardiner, Sommer, 2014, 2017).
Coastal
During the first half of the 20th Century, the petroleum industry in California fought a
bitter battle for access to the state’s beaches and tidelands. These were state lands, but much of

202
the property adjacent to the beaches themselves was already privately owned by wealthy
communities, and ultimately the political influence of residents, state officials, and elected
representatives who argued for recreation-based development of these resources won out over
those for industrial development (Sabin, 2005). State legislators in committee hearings also noted
that “the attractive beaches and beach resorts throughout the state are a source of considerable
revenue in addition to being of inestimable pleasure and aesthetic value” (Sacramento Bee,
1935). Local moratoria preceded regional bans in 1930s on beach and tidelands drilling,
relegating beach and wharf derricks to the past (Figure 114), driving the industry inland, and
incentivizing the development of “slanted” drilling (an early precursor to horizontal and
directional drilling).

203
Figure 114: Summerland Oil Wells, Circa 1903.
(Image Source: C.C. Pierce & Co., 1903; USC Digital Library, 2017).
Two decades then passed before technological advances made offshore drilling possible,
but just 6 years after the first platform went into operation in 1963 the famed Santa Barbara oil
spill of 1969 halted new offshore leasing and severely curtailed development of known oil and
gas fields (Figure 115) in the Santa Maria-Ventura basin (see Chapter 4). Several hundred
coastal wells were ultimately drilled on beaches, tidelands, and in state and federal offshore
leases in the basin (Figure 116), but only a handful of these remain active today.

204
Figure 115: Federal and State Offshore Oil and Gas Fields in the Santa Maria-Ventura Basin.
(Source Data: DOGGR 2017; ESRI 2017).
V
entura
Santa
Barbara

205
Figure 116: Santa Barbara and Ventura Coastal Oil Wells (Active and Inactive).
(Source Data: DOGGR, 2017; ESRI, 2017).
So despite the presence of substantial technically recoverable reserves in the coastal and
offshore fields of in the Santa Maria-Ventura basin, Figure 117 shows that production has
declined from a peak of over six million barrels per month in 1995 to fewer than one million
barrels per month in 2017 (U.S. EIA, 2017b). Moreover, the Shale Revolution that began in 2006
has had no discernible impact on this decline, which helps affirm industry claims that the
enhanced recovery techniques used to target unconventional shale deposits elsewhere in the
country are not readily deployable in the Monterey Formation.
Shale Play
Sedimentary Basin
Oil Well

206
Figure 117: Federal Offshore Crude Oil Production in California, 1981 to 2017.
(Source Data: U.S. EIA, 2017b).
The primary environmental concerns about fracking in coastal communities are the
impacts of marine wastewater discharges on wildlife, the impacts of crude oil spills on beaches,
and induced seismicity (Segee & O’Dea, 2015). The Santa Barbara based NGO Environmental
Defense Center filed a federal lawsuit against the U.S. Department of the Interior’s Bureau of
Ocean Energy Management (BOEM) and Bureau of Safety and Environmental Enforcement
(BSEE) for “failure to provide for public or environmental review prior to approving 51 oil
drilling permits authorizing the use of acid well stimulation (“acidizing”) and hydraulic
fracturing (“fracking”) from offshore oil platforms located in the Santa Barbara Channel”
(Environmental Defense Center, 2014). The case was settled, and as part of the settlement the
U.S. Department of the Interior issued a “finding of no significant impact” from well stimulation
treatments on the Pacific Outer Continental Shelf (Nikolewski, 2016). An important factor that
lead the inquiry to this conclusion was the revelation that the Shale Revolution had not resulted
in new enhanced recovery practices at these offshore facilities, but rather that hydraulic
0
1
2
3
4
5
6
7
1981 1986 1991 1996 2001 2006 2011 2016
Mill
ion
s o
f B
arre
ls P
er M
on
th
Federal Offshore Production of Crude Oil in California 1981 to 2017
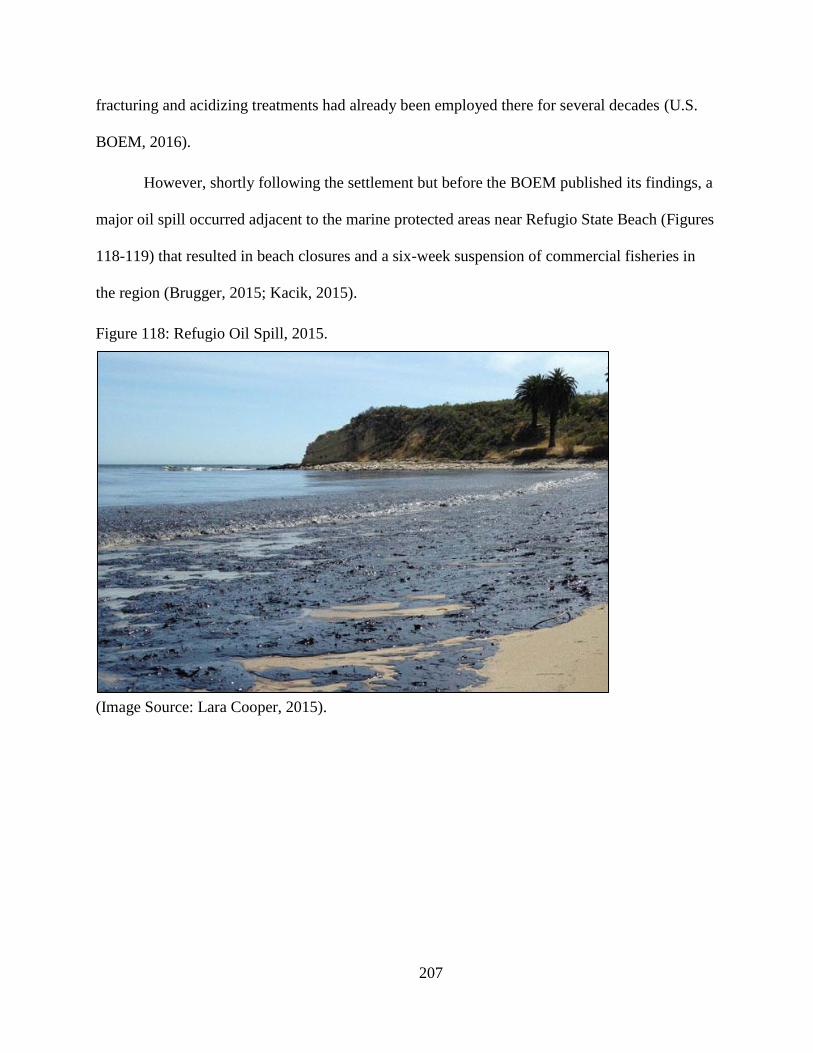
207
fracturing and acidizing treatments had already been employed there for several decades (U.S.
BOEM, 2016).
However, shortly following the settlement but before the BOEM published its findings, a
major oil spill occurred adjacent to the marine protected areas near Refugio State Beach (Figures
118-119) that resulted in beach closures and a six-week suspension of commercial fisheries in
the region (Brugger, 2015; Kacik, 2015).
Figure 118: Refugio Oil Spill, 2015.
(Image Source: Lara Cooper, 2015).

208
Figure 119: Marine Protected Areas Affected by the 2015 Refugio Oil Spill.
(Image Source: GreenInfo Network, 2015).
Given the timing of the Refugio oil spill relative to the U.S. Department of the Interior’s
finding of no significant impact, opponents of fracking did not accept the findings as valid.
Environmental Defense Center together with NGO Channelkeeper filed a second lawsuit in May
2016 against the BOEM and BSEE under the Endangered Species Act and the National
Environmental Policy Act in an attempt to compel the agencies to prepare a more comprehensive
environmental impact statement (Environmental Defense Center, 2016). Shortly afterward the
office of California Attorney General Kamala Harris filed a lawsuit as well, stating, “The U.S.
Department of Interior’s inadequate environmental assessment would open the door to practices
like fracking that may pose a threat to the health and well-being of California communities”
(Wyler, 2016).

209
A central objection to offshore well stimulation treatments is that unlike onshore
production where wastewater is stored in pits or tanks, offshore oil and gas operations discharge
wastewater directly into the marine environment (Long, Feinstein, Birkholzer, et al., 2015; Segee
& O’Dea, 2015). Because this wastewater comprises both produced water and fracturing fluids,
the latter of which contains additives that are known to be toxic, opponents argue that these
discharges pose a greater threat to marine environments than natural oil and gas seeps. The
petroleum industry disagrees with this assessment, and cites research to the contrary that
suggests offshore oil and gas production may actually have improved marine environmental
quality in recent decades by lowering reservoir pressures and thereby inhibiting flows of oil and
gas from natural seeps (Hornafius, Quigley, & Luyendyk, 1999; Quigley et al., 1999).
Given the long-standing historical precedent that prohibits oil and gas production in
coastal areas combined with both declining productivity and ongoing high-profile oil spills
despite assurances of minimal environmental impact, state and local moratoria on coastal drilling
have not changed as a result of the Shale Revolution and seem very unlikely to do so in the
future.
Class Dynamics
Throughout the global south, the petroleum industry is broadly comparable to other
extractive industries which have a well-documented history of exploiting and disenfranchising
vulnerable communities as well as damaging the ecologies upon which those communities
depend (Appel, Mason, & Watts, 2015; A. Bebbington & Bury, 2013; A. J. Bebbington & Bury,
2009; Blaikie & Brookfield, 1987; Bridge, 2008; Forsyth, 2003, 2008; Martinez-Alier, 2003;
Peet & Watts, 1996; Perreault et al., 2015; Robbins, 2011; Zimmerer & Bassett, 2003). However,
in California – as is the case in other affluent industrialized economies – oil and gas production
have not produced the same patterns of race/ethnicity-based environmental injustice that so often

210
arise around other polluting industries. Rather, petroleum-bearing geology may underlie rich and
poor communities alike, and so the class dynamics that arise tend to manifest themselves not
only in terms of accountability, but in terms of visibility as well.
As discussed earlier (see: urban geographies), wealthy communities that host oil and gas
production possess the political and financial resources necessary to both hold heavy industry to
account for any trespasses upon human and ecological health, whereas poorer communities do
not (Sahagun, 2013a, 2013b). Because of this, the petroleum industry tends to invest in measures
that lower the visibility of its activities (and thereby capture specific environmental externalities)
in communities that have the means to oppose their activities. As a result, oil and gas production
in wealthy communities in California is often hidden from view within visually disguised and
sound-proofed structures (Figures 120-122).

211
Figure 120: Breitburn Energy Drilling Site in Los Angeles, California.
(Image Source: Adam Dorr, 2017).

212
Figure 121: Freeport-McMoRan Inc.’s Packard Well Drilling Site in Los Angeles, California.
(Image Source: LA Weekly, 2015).
In communities that lack the power to confront the industry, those externalities remain
uncaptured (Figure 122).

213
Figure 122: An E&B Natural Resources Oil Well Located One Block from Wilmington Middle
School.
(Image Source: Aura Bodago, 2015).
Within the industry itself, relative to the demographic profile of California as a whole,
whites are somewhat overrepresented, Hispanics are somewhat underrepresented, and Asians,
blacks, and Native Americans are proportionately represented (Figure 123). The industry directly
employs 143,000 full-time workers who together earn a total of $19.9 billion annually in labor
income on a direct contribution of $111 billion in output of the state’s GDP (Sedgwick & Mitra,
2015). These figures represent approximately 0.8 percent of California’s workforce and GDP
respectively (U.S. Bureau of Labor Statistics, 2017a). The annual median wage in the industry
lies between $74,500 to $133,000, depending on which occupations are included in the
calculation, but in any case the industry average substantially exceeds the overall state average
wage in private industry of $56,800 (U.S. Bureau of Labor Statistics, 2017b).

214
Figure 123: California and Petroleum Industry Demographic Comparison, 2015.
(Source Data: WSPA, 2017; U.S. Census Bureau, 2017).
Less than one quarter of industry employees have a bachelor’s degree, and workers with
less than high school or high school education comprise nearly 40 percent of the workforce
(Figure 124).

215
Figure 124: Petroleum Industry Employment by Educational Attainment.
(Source Data: Sedgwick and Mitra, 2015).
The data above indicate that industry’s class dynamics are complicated. Like most mature
extractive industries, the oil and gas sector in California externalizes its environmental costs such
that they will tend to fall upon disproportionately on disadvantaged communities and exacerbate
any socioeconomic or political inequalities therein. And similarly, like most mature extractive
industries, the bulk of the benefits accrue to capital rather than to labor. At the same time,
however, the industry is a consistent source of high-paying jobs that offer the potential for
upward socioeconomic mobility to workers from all ethnic and educational backgrounds. The
orthogonality of the industry’s demographic profile relative to prevailing class dynamics served
to advance a political narrative of shared economic prosperity in which the trillion-dollar prize of
the Monterey Formation represented a rising tide that would lift all boats.
Markets and Cost Structures
Fracking for oil with current technology is only profitable in California when oil prices
reach about $80 per barrel in 2013 adjusted dollars (J. D. Hughes, 2013b and personal
0%
5%
10%
15%
20%
25%
30%
Less Than HighSchool
High School Some College Bachelor's orHigher
N/A
Petroleum Industry Employment by Educational Attainment
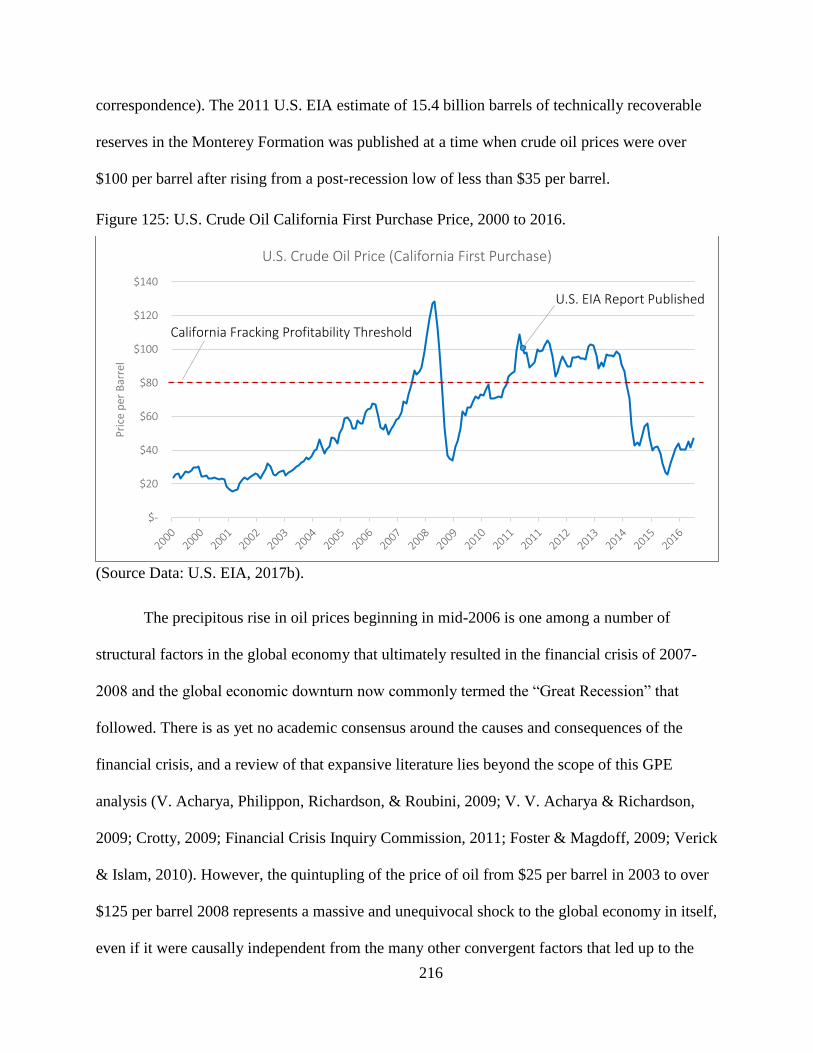
216
correspondence). The 2011 U.S. EIA estimate of 15.4 billion barrels of technically recoverable
reserves in the Monterey Formation was published at a time when crude oil prices were over
$100 per barrel after rising from a post-recession low of less than $35 per barrel.
Figure 125: U.S. Crude Oil California First Purchase Price, 2000 to 2016.
(Source Data: U.S. EIA, 2017b).
The precipitous rise in oil prices beginning in mid-2006 is one among a number of
structural factors in the global economy that ultimately resulted in the financial crisis of 2007-
2008 and the global economic downturn now commonly termed the “Great Recession” that
followed. There is as yet no academic consensus around the causes and consequences of the
financial crisis, and a review of that expansive literature lies beyond the scope of this GPE
analysis (V. Acharya, Philippon, Richardson, & Roubini, 2009; V. V. Acharya & Richardson,
2009; Crotty, 2009; Financial Crisis Inquiry Commission, 2011; Foster & Magdoff, 2009; Verick
& Islam, 2010). However, the quintupling of the price of oil from $25 per barrel in 2003 to over
$125 per barrel 2008 represents a massive and unequivocal shock to the global economy in itself,
even if it were causally independent from the many other convergent factors that led up to the
$-
$20
$40
$60
$80
$100
$120
$140
Pri
ce p
er B
arre
l
U.S. Crude Oil Price (California First Purchase)
U.S. EIA Report Published
California Fracking Profitability Threshold

217
crisis (J. D. Hamilton, 2009). A number of commentators warned that oil prices might be rising
as a result of speculation, and that an oil market bubble was emerging alongside the United
States housing market bubble (Chung, 2008). The bubble burst during the financial crisis and the
price of oil crashed from a momentary high of over $145 per barrel in July of 2008 to a low of
just $30 in December later that year (U.S. EIA, 2017f).
By 2011, oil prices had once again risen to over $80 per barrel – the level necessary for
widespread fracking in California to be economically viable – and remained relatively stable for
several years before tumbling once more in 2014 (Figure 125). The decline in oil prices since
2011 at least partly explains why the technically recoverable reserves (whatever they may be) are
not being exploited, and therefore why California oil production has declined overall since 2006
despite the advent of the Shale Revolution and the associated dramatic increase in shale oil
production elsewhere in the country, with only a very modest and temporary increase in
production between 2011 and 2014 (Figure 126).

218
Figure 126: California Crude Oil and Natural Gas Production, 1981 to 2016.
(Source Data: U.S. EIA, 2017b).
A number of factors are likely to have contributed to the fall of oil prices in 2014,
including a dramatic increase in U.S. shale oil output and an associated effort by Saudi Arabia to
suppress prices and maintaining production volumes – possibly to discourage U.S. investment in
shale oil (Horsey, 2015; Krauss, 2014). Saudi Arabia and OPEC subsequently agreed to limit
production in order to maintain higher oil prices despite ongoing growth in North American oil
output (Conca, 2015; Inman, 2016). The pronounced increase in U.S. domestic oil production
and corresponding decrease in oil imports starting in 2010 as the Shale Revolution began to
mature is shown in Figure 127. (Note also that total oil consumption began to rise once again in
2010 as the United States started to recover from the Great Recession and returned once more to
pre-recession levels of economic growth).
-
50
100
150
200
250
300
350
400
450
-
100
200
300
400
500
600
700
Bar
rels
(m
illio
ns)
Cu
bic
Fee
t (b
illio
ns)
California Crude Oil and Natural Gas Production, 1981 to 2016
Natural Gas Crude Oil

219
Figure 127: U.S. Crude Oil Production, Imports, and Total Consumption, 1950 to 2016.
(Source Data: U.S. EIA, 2017b).
The net result of increased output worldwide was a supply glut, and in turn a decline in
oil prices whose volatility was exacerbated by commodity market speculation (Gold, 2014,
2015). It should be noted, however, that even modest changes in global supply have dramatic
direct impacts on oil prices, as well as substantial indirect impacts on many other sectors of the
global economy, such that the “glut” in question represented at most a 5 percent year-on-year
increase during the most volatile period from October 2013 to October 2014 (shaded area in
Figure 128).
-
1,000
2,000
3,000
4,000
5,000
6,000
7,000
1950 1955 1960 1965 1970 1975 1980 1985 1990 1995 2000 2005 2010 2015 2020
Mill
ion
s o
f B
arre
ls
Annual Crude Oil Production, Imports, and Total Consumption
Imports Domestic Production Total Consumption

220
Figure 128: Change in Global Oil Production, 2010 to 2017 (Indexed to January 2010).
(Source Data: U.S. EIA, 2017e).
Despite being a significant domestic producer, California has been a net-importer of oil
and gas for many decades, and since the late 1990s has also imported the majority of
unprocessed crude oil to its refineries from others states and foreign countries (Figures 127, 129).
The increase in U.S. domestic oil production from the Shale Revolution has therefore not
significantly altered California’s dependence on foreign oil. Of the international sources of
imports, Saudi Arabia comprises roughly one third, Ecuador and Columbia together comprise
another third, and the remaining third is sourced from more than a dozen other countries
(California Energy Commission, 2017c). Where local actors in the sector may exert more control
is over the secondary market for gasoline because four firms control 78 percent of refinery
capacity in the state. In November of 2016, for example, the average markup of retail gasoline
over wholesale prices was 104 percent in Los Angeles, compared with 62 percent in Chicago and
75 percent in New York. Not surprisingly, the industry itself denies collusion to manipulate
prices, but Santa Monica-based group Consumer Watchdog alleges that this disparity is not
explained by differences in taxes, costs, or other market factors (Penn, 2016).
-5%
0%
5%
10%
15%
2010 2011 2012 2013 2014 2015 2016 2017
Change in Global Oil Production (Indexed to January 2010)

221
Figure 129: Crude Oil Supply to California Refineries, 1982 to 2016.
(Source Data: California Energy Commission, 2017d).
Changing Energy Technologies
During the decade of the Shale Revolution from 2006 to 2016, two dramatic
technological changes have impacted the national energy sector in general and California’s
energy sector in particular. The first of these is fracking, meaning the advent of low-cost
enhanced recovery techniques for producing oil and gas from unconventional shale deposits. The
second is the continued decrease in the cost of renewable energy. Both of these impacts are
clearly evident in U.S. primary energy consumption (Figure 130), with use of oil, gas, and
renewables growing to displace use of coal.
-
100,000
200,000
300,000
400,000
500,000
600,000
700,000
800,000
1982 1984 1986 1988 1990 1992 1994 1996 1998 2000 2002 2004 2006 2008 2010 2012 2014 2016
Tho
usa
nd
s o
f B
arre
ls
Crude Oil Supply Sources to California Refineries
California Alaska Foreign

222
Figure 130: U.S. Primary Energy Consumption by Source, 1950 to 2016.
(Source Data: U.S. EIA, 2017).
The technological advances related to enhanced recovery techniques which led to the
Shale were recounted in detail in Chapter 1. Changes in average cost per well over time (Figure
131) are the net result of these improvements in technological efficiency (which lower costs) in
conjunction with a progressive decline in the average quality of reservoir rock targeted by
operators (which raises costs).
0
0.005
0.01
0.015
0.02
0.025
0.03
0.035
0.04
0.045
1950 1955 1960 1965 1970 1975 1980 1985 1990 1995 2000 2005 2010 2015
Qu
adri
llio
n B
TUs
U.S. Primary Energy Consumption by Source
Oil Natural Gas Coal Nuclear Hydroelectric Other Renewables

223
Figure 131: Average Unconventional Well Drilling and Completion Costs, 2006 to 2015.
(Source: U.S. EIA, 2016, Figure 3).
Firms rapidly exploited high-quality deposits first – the “low hanging fruit” – and as a
result costs per well began to rise in 2009 as a reflection of declines in the average quality of
reservoir rock in new wells. But as the Shale Revolution progressed, competition and experience
drove improvements in technological efficiency, resulting in a general decline in costs starting in
2012 (Rapier, 2016; Reuters, 2015; U.S. EIA, 2016). However, these cost declines are relatively
modest and are likely to slow and eventually reverse as incremental technology improvements
yield diminishing returns and target rock quality declines (J. D. Hughes, 2016b, 2016a).
At the same time that the Shale Revolution was occurring between 2006 and 2016,
California was expanding its renewable energy portfolio through precipitous growth in the
installed capacity of photovoltaic solar power and wind power. In purely technological terms,
advances in photovoltaic solar power have driven costs down with such consistency for the past
four decades that the trend is referred to “Swanson’s Law”. This is illustrated in Figure 132
below, which plots the relationship between cumulative installed capacity and average module
price. Note that the plot is logarithmic, and so the linear trajectory on the chart represents an
Co
st (m
illio
ns)

224
exponential trend in absolute terms. This trend is expected to continue at least into the mid-
2020s, such that the levelized cost of energy for photovoltaic solar installations in 2025 is
projected to be 60 percent lower than in 2015 (IRENA, 2016).
Figure 132: Solar Photovoltaic Learning Curve.
(Source Data: ITRPV, 2017).
Cost improvements in photovoltaic solar power to date have been achieved through a
combination of advances in the underlying technology together with economies of scale in
manufacturing and deployment. In recent years, both of these factors have been amplified by
large demand-side investments from the Chinese government (Forsythe, 2017; Zhang & He,
2013). Figure 133 shows that California leads the nation in photovoltaic power deployment by a
wide margin, with nearly as much installed capacity than all other states combined (U.S. EIA,
2017c).
$0
$1
$10
$100
0.001 0.01 0.1 1 10 100 1000
Ave
rage
Mo
du
le P
rice
(2
01
2 U
SD)
Cumulative Installed Photovoltaic Capacity (gigawatts)
Solar Photovoltaic Learning Curve - "Swanson's Law"
2012
2015
2016
2017
1976
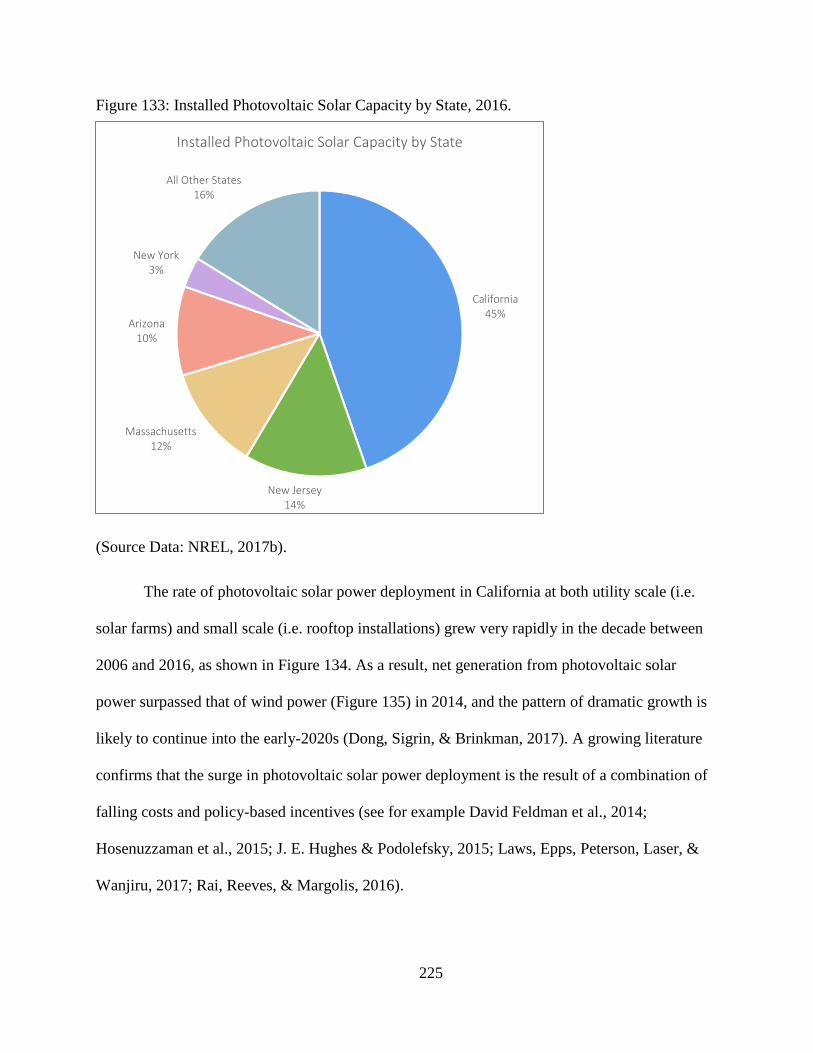
225
Figure 133: Installed Photovoltaic Solar Capacity by State, 2016.
(Source Data: NREL, 2017b).
The rate of photovoltaic solar power deployment in California at both utility scale (i.e.
solar farms) and small scale (i.e. rooftop installations) grew very rapidly in the decade between
2006 and 2016, as shown in Figure 134. As a result, net generation from photovoltaic solar
power surpassed that of wind power (Figure 135) in 2014, and the pattern of dramatic growth is
likely to continue into the early-2020s (Dong, Sigrin, & Brinkman, 2017). A growing literature
confirms that the surge in photovoltaic solar power deployment is the result of a combination of
falling costs and policy-based incentives (see for example David Feldman et al., 2014;
Hosenuzzaman et al., 2015; J. E. Hughes & Podolefsky, 2015; Laws, Epps, Peterson, Laser, &
Wanjiru, 2017; Rai, Reeves, & Margolis, 2016).
California45%
New Jersey14%
Massachusetts12%
Arizona10%
New York3%
All Other States16%
Installed Photovoltaic Solar Capacity by State

226
Figure 134: California Photovoltaic Solar Capacity and Generation, 2000 to 2016.
(California Energy Commission, 2017b; Source Data: California Solar Initiative, 2017; U.S.
EIA, 2017d).
The cost of wind power has declined in the last decade as well, but the overarching trend
is neither as dramatic nor as consistent as has been the case for photovoltaic solar power (Lantz,
Wiser, & Hand, 2012; NREL, 2017a). This is likely because underlying technology for wind
0
5,000
10,000
15,000
20,000
25,000
30,000
Meg
awat
ts (
MW
)
California Installed PV Solar Capacity (MW)
Utility- Scale PV Solar Small-Scale Solar PV
0
100
200
300
400
500
600
700
-
2,000
4,000
6,000
8,000
10,000
12,000
14,000
16,000
18,000
20,000
Nu
mb
er o
f In
stal
lati
on
s
Gen
erat
ion
(G
Wh
)
California Utility-Scale PV Generation (GWh) and Number of Installations
Number of Installations Utility-Scale PV Solar

227
power is no longer improving significantly. Net generation from window power in California
grew substantially from 4,900 megawatts in 2006 to 13,700 megawatts in 2016, but only a
relatively modest amount of new wind capacity has been installed since 2013 (Figure 135)
compared to the explosive growth of solar capacity.
Figure 135: California Wind Power Net Generation, 2001 to 2016.
(Source Data: U.S. EIA, 2017d).
A number of technological advances indirectly related to energy production also helped
set the stage for the Shale Revolution. Extraordinary changes in information technology and
telecommunications have been collectively driven by accelerating growth in the price-
performance of computing in the decade from 2006 to 2016 (Brynjolfsson & McAfee, 2012;
Dorr, 2016). Less radical but nonetheless substantial advancements in energy storage were made
in the same period – namely in lithium-ion batteries, whose improved performance has both
driven and been driven by the growing popularity of portable electronic devices and electric
vehicles (Deng, 2015). These synergistic advancements have had direct implications for the
-
2,000
4,000
6,000
8,000
10,000
12,000
14,000
16,000
Meg
awat
ts (
MW
)
California Wind Power Net Generation (MW)
Wind Power Net Generation

228
continued decline in photovoltaic solar panel costs and their associated rise in popularity, with
California acting as the epicenter of solar power deployment, and they have therefore played an
important (and largely unrecognized) role in setting the structural context of the Shale
Revolution in the state.
GPE Analysis Findings Part 2: Institutions
Any understanding of the political ecology of the Shale Revolution in California must
include an assessment of the relevant institutions involved: the flows of information and forms of
knowledge they produce and disseminate; the pathways by which they support or oppose
political and regulatory action; and the manner in which these dynamics unfold across
landscapes that are constructed by interactions between humans and non-human nature (Hecht,
Morrison, & Padoch, 2014). To this end, a key output of GPE analysis is an “institutional
mapping” (Figure 136) which enables researchers to develop an understanding of: 1) the setting
in which stakeholders and their state counterparts operate; 2) how their interests and incentives
both shape and are shaped by the institutions which comprise that setting; and 3) the key “levers
of change” in the system (Fritz et al., 2009 Annex 1). Institutional mapping attempts to identify
both formal and informal institutions. “Formal institutions are codified – e.g. as laws and
regulations – and usually have formal sanctioning mechanisms to make them effective …
Informal institutions are norms and social practices rooted in history and culture [but can] also
emerge as the result of the weakness, erosion or collapse of formal institutions,” and the
interaction between the two “often shapes outcomes such as policy decisions or the
implementation of policies” (Fritz et al., 2009, p. 45).
Figure 136 maps the formal relationships of authority (blue arrows) and informal
relationships of political influence (red arrows), financial support (green arrows), and

229
information (gray arrows) that characterize the political economy of California’s oil and gas
sector. For the purposes of this GPE analysis here, public agencies are treated as formal
institutions – unlike the other actors shown in Figure 136, which are treated as stakeholders.

230
Figure 136: Institutional Map of California’s Oil and Gas Sector.

231
Public Agencies
A plethora of public agencies at the federal, state, and local level possess authority to
monitor, regulate, control, incentivize, and penalize private activities that ultimately affect the oil
and gas sector in California. However, the majority of these relations are so indirect that they are
better considered in aggregate as part of the structural factors described in the preceding section.
At the federal level, the agency with the most extensive regulatory control over the oil
and gas sector is the United States Environmental Protection Agency (U.S. EPA). The U.S. EPA
is charged with monitoring and enforcing federal regulation enacted across over a dozen major
pieces of legislation (see: legislation). Wherever oil and gas industry activity falls within the
purview of federal environmental law that governs air quality, surface water and ground water
quality, drinking water supplies, soil integrity and land revitalization, endangered and invasive
species, hazardous substances and waste, fuel economy, and energy efficiency in California it
does so through a network of direct and delegated channels of authority in collaboration with
state agencies (U.S. EPA, 2017). The Bureau of Land Management (BLM) is the federal agency
that oversees and maintains authority over federal lands in California, including offshore
territory beyond three nautical miles. Like the U.S. EPA, the BLM coordinates with other
agencies to govern oil and gas exploration and production within its jurisdiction. In both federal
and state waters, the BLM coordinated with the Minerals Management Service (MMS) agency of
the United States Department of the Interior to monitor and enforce offshore oil, gas, and mining
operations up until 2010. But the MMS was disbanded and restructured following the BP
Deepwater Horizon disaster in the Gulf of Mexico that year which revealed evidence of gross
negligence and regulatory capture (Banerjee, 2011; Broder, 2011). The agency’s three broad
categories of duties – revenue collection, leasing, and environmental protection – were deemed

232
to be compromised by mutual conflict of interest, and so the restructuring in 2011 yielded three
new agencies emerged to assume these duties respectively: the Office of Natural Resources
Revenue (ONRR), the Bureau of Safety and Environmental Enforcement (BSEE), and the
Bureau of Ocean Energy Management (BOEM). Of these, only the BSEE is actively engaged
with monitoring and enforcing environmental regulations as they pertain to offshore oil and gas
industry operations.
At the state level, the two agencies that exercise regulatory control over the oil and gas
sector are the California Natural Resources Agency (CNRA) and the California Environmental
Protection Agency (CalEPA). Within CNRA are the Department of Conservation and the
Department of Water Resources. The Division of Oil, Gas, and Geothermal Resources
(DOGGR) is housed within the Department of Conservation, and it is the single institution that
wields the most extensive oversight and regulatory authority over the oil and gas industry in
California. The key regulatory responsibilities of DOGGR are: 1) monitoring of the roughly
90,000 active wells in the state; 2) supervision of drilling, production and maintenance, and
plugging and abandonment oil and gas wells, both onshore and offshore; 3) permitting and
testing; 5) oversight of wastewater injection disposal; 6) operational safety and health
inspections; 7) inspection of oilfield leases; 8) inspection of oilfield infrastructure such as storage
tanks, pits, and pipelines; and 9) monitoring for land subsidence. CalEPA houses the California
Air Resources Board, the Air Quality Management Districts, the State Water Resources Control
Board (and its Regional Water Quality Control Boards), and the Department of Resources,
Recycling, and Recovery. In addition to CNRA and CalEPA, the Executive Branch of
California’s state government also comprises five directly appointed commissions whose
jurisdictions intersect with the oil and gas sector: the California Energy Commission, California

233
Water Commission, California Coastal Commission, California State Lands Commission, and
California Public Utilities Commission. With respect to oil and gas governance, CNRA
collaborates closely with and effectively exercises authority over the California Coastal
Commission and California Energy Commission. The other commissions operate more
independently, such that their relationship with CNRA is largely advisory.
The unwieldy complexity of the state’s environmental regulatory apparatus was already
evident to environmental NGOs and policymakers at the start of the Shale Revolution in 2006. In
2007, for example, the California Water Quality Monitoring Council was created under mandate
by California Senate Bill 1070 in order to formalize coordination between CNRA and CalEPA in
order to integrate their water quality and related ecosystem monitoring, assessment, and
reporting (CWQMC, 2017). Beginning in 2011, state representatives began proposing Assembly
and Senate bills to regulate well stimulation in California (see: legislation and Appendix C),
which culminated in the passing of Senate Bill No. 4 (SB 4) on September 20th, 2013. SB 4 §
3160(c)1 requires the following of DOGGR:
“the division shall collaboratively identify and delineate the existing
statutory authority and regulatory responsibility relating to well
stimulation treatments and well stimulation treatment-related activities
of the Department of Toxic Substances Control, the State Air
Resources Board, any local air districts, the State Water Resources
Control Board, the Department of Resources Recycling and Recovery,
any regional water quality control board, and other public entities, as
applicable. This shall specify how the respective authority,
responsibility, and notification and reporting requirements associated

234
with well stimulation treatments and well stimulation treatment-related
activities are divided among each public entity.”
By 2016, DOGGR had adopted a memorandum of understanding (MOU) with more than
two dozen different state and federal agencies (DOGGR, 2017e). These MOUs and the scope
they establish for oil and gas industry governance are summarized in Table 1 below.
Table 1: DOGGR Inter-Agency Memoranda of Understanding for Environmental Governance of
California’s Oil and Gas Industry.
Agency MOU Scope
California Coastal Commission Well stimulation treatments and related activities in coastal zones.
California Air Resources Board; San Joaquin Valley Air Pollution Control District
Air quality impacts of well stimulation treatments and related activities.
California Department of Resources Recycling and Recovery
Disposal of waste in landfills associated with well stimulation treatments and related activities.
California Department of Toxic Substances Control
Disposal of waste in landfills associated with well stimulation treatments and related activities.
State Water Resources Control Board; Regional Water Quality Control Boards
Well stimulation treatments and related activities.
U.S. Department of the Interior Bureau of Safety and Environmental Enforcement; U.S. Department of Transportation Office of Pipeline Safety, Research and Special Program Administration; California State Lands Commission; California State Fire Marshal
Implements the Offshore California Pipeline Inspection Survey Plan to assess the current conditions and evaluate future pipeline inspection needs.
California Public Utilities Commission Clarifies responsibilities for managing gas-storage pipelines.
Department of Forestry and Fire Protection; State Fire Marshal's Office of Pipeline Safety
Closes jurisdictional gaps between the two agencies.
Department of Fish and Game Coordinates activities related to the Coastal Sage Scrub Natural Community Conservation Planning process.
Department of Fish and Game; State Water and Resources Control Board
Clarifies procedures for modifying notification requirements for onshore drilling and production oil spills.
Department of Fish and Game; Regional Water Quality Control Boards; California Coastal Commission; San Luis Obispo County
Creates a Joint Coordination Committee for assessing and responding to environmental impacts of Guadalupe Oil Field diluent releases.
Department of Fish and Game Office of Oil Spill Prevention and Response
Coordinates monthly marine aircraft patrol flights to monitor and report on offshore oil and gas operations.
Department of Fish and Game Office of Oil Spill Prevention and Response; State Lands
Establishes a Review Subcommittee to assess regulations, guidelines, and amendments to the state oil spill contingency plan.

235
Agency MOU Scope
Commission; California Coastal Commission; State Water Resources Control Board
Santa Barbara County Delineates administrative procedures for modifying field boundaries for oil and gas fields within Santa Barbara County.
California State Water Resources Control Board
Establishes procedures for reporting proposed oil, gas, and geothermal field discharges and for prescribing permit requirements.
South Coast Air Quality Management District
Delineates responsibilities for the inspection of oilfield valves and flanges.
U.S. Fish and Wildlife Service; Bureau of Land Management; Department of Fish and Game; California Energy Commission; Kern County
Define relationships among agencies with permit or regulatory authority over Species of Concern. Develops a Kern County Endangered Species Program to ensure that private parties comply with applicable laws and regulations.
Bureau of Land Management Delineates procedures for regulating oilfield operations to minimize duplication.
(Source Data: DOGGR, 2017e, 2017d).
At the local level of counties and cities there are few agencies that are specifically
organized with a mandate to govern oil and gas industry activity. (Local governments instead
tend to exercise control over permitting in their jurisdictions – see: legislation). Two specific
exceptions are notable, however. First, the city of Los Angeles created a full-time “petroleum
administrator” position within the Mayor’s Office to oversee oil and gas operations within its
jurisdiction (Reyes, 2016b, 2016c). Second, the Los Angeles County Board of Supervisors
convened an oil and gas “strike team” to investigate and monitor the county’s oil fields and to
update local zoning codes and procedures in order to ensure that future facilities undergo more
rigorous review prior to being permitted (Sewell, 2016).
Legislation
Enhanced recovery techniques employed by the oil and gas industry fall under the
regulatory purview of several federal laws. Well construction and the acquisition of water for
injection are regulated under the National Environmental Policy Act (NEPA) of 1969, the Clean
Air Act (CAA) of 1963, the Occupational Safety and Health Act (OSHA) of 1970, and the Clean

236
Water Act (CWA) of 1972. The injection of fluids for fracturing, acidizing, chemical flooding,
and steam flooding are regulated under the Comprehensive Environmental Response,
Compensation, and Liability Act (CERCLA, also known as the “Superfund Act”) of 1980 and
the Emergency Planning and Community Right-to-Know Act (EPCRA) of 1986, in addition to
OSHA and CWA. Disposal of wastewater and solid wastes along with the closure and
abandonment of wells are further regulated under the Safe Drinking Water Act (SDWA) of 1974,
the Resources Conservation and Recovery Act (RCRA) of 1976, and the Toxic Substances
Control Act (TSCA) of 1976, in addition to all of the aforementioned laws.
Most of the major federal environmental statutes emerged during the 1970s as a political
response to the combination of lobbying the by the nascent environmental movement. At the
same time, the energy crises of the 1970s drove a policy shift toward oil and gas resource
conservation which resulted in the 1973 Emergency Petroleum Allocation Act (EPAA), the 1975
Energy Policy and Conservation Act (EPCA) which established the U.S. Strategic Petroleum
Reserve, the 1978 Natural Gas Policy Act, and the 1980 Crude Oil Windfall Profits Tax Act.
These statutes were aimed not just at conserving the natural environment, but also at conserving
petroleum as a nonrenewable resource of vital economic and strategic importance.
At the outset of the Shale Revolution in 2006, a number of oil and gas industry activities
were exempted under the federal environmental statutes mentioned above (Environmental
Working Group, 2009; Pagel & Sumi, 2011). The Energy Policy Act of 2005 expanded a number
of these exemptions for enhanced recovery techniques in general, and for hydraulic fracturing in
particular.
Under NEPA, oil and gas drilling operations are exempted from environmental impact
statement requirements so long as total surfaces disturbances are less than 150 acres, or as long

237
as drilling in the area was a reasonably foreseeable activity within the next five years. Under
CAA, emissions from individual well pads are exempt from being considered in aggregate, with
the result that areas containing a large number of wells can still become heavily polluted. Under
CWA, oil and gas facilities smaller than five acres have been exempted from stormwater runoff
standards since 1992, and this exemption was expanded to include industry-related construction
facilities by the Energy Policy Act of 2005. Under CERCLA, the law excludes oil and gas
companies from the definition of “Potentially Responsible Parties”, and thereby exempts the
industry from being held fully accountable for remediation of sites contaminated by hazardous
waste. Under EPCRA, the oil and gas industry is exempted from the requirement to report
releases of toxic substances to the Toxic Release Inventory (TRI) maintained by the U.S. EPA.
Under SDWA, hydraulic fracturing has been exempt from regulation since 1997 (Leaf v. EPA
1997), and these exemptions were explicitly clarified under the Energy Policy Act of 2005 to
include the federal Underground Injection Control (UIC) program such that only fracture
treatments performed with diesel fuel as the working fluid (an extremely uncommon practice)
would be regulated under the statute. Finally, under RCRA the oil and gas industry has been
exempt from disclosure and safety requirements for hazardous substances since 1988 (EWG,
2009; Tiemann & Vann, 2015; Vann, Murrill, & Tiemann, 2013). Many of these exemptions
have been granted on the basis of firms’ needs to protect their trade secrets.
The Shale Revolution has quickly become a textbook case of federalism (Rosenbaum,
2013). The states within the American federalist system offer opportunities to test different
policies under different social, economic, political, environmental, and geographic conditions as
“laboratories for national policy” (Donahue, 1997, p. 45). The regulatory vacuum at the federal
level created by decades of concerted lobbying by the petroleum industry, which was greatly

238
expanded by the Energy Policy Act of 2005, pushed the obligations of governance to the states.
In the case of California, it wasn’t until 2011 and the publication of the U.S. EIA report of the
state’s enormous (and, in retrospect, greatly inflated) technically recoverable oil reserves that
state and local policymakers came under sufficient political pressure to begin advancing a
legislative agenda to regulate the oil and gas industry’s use of enhanced recovery techniques in
California (Warner & Shapiro, 2013).
At the state level, regulations that affect the oil and gas industry in California were
instituted during the 1980s and 1990s that go beyond federal protections, including the California
Safe Drinking Water and Toxic Enforcement Act of 1986, the California Clean Air Act of 1988,
and the creation of the California Environmental Protection Agency (Cal EPA) by Governor
Wilson’s Executive Order W-5-91 in 1991. California was granted ongoing waivers under
Section 209 of the federal CAA to enact stricter vehicle emissions standards that those mandated
by federal law, and a number of other states exercised their right to adopt California’s standards
in favor of federal ones as per Section 177 of that same statute. Throughout the 1990s and early
2000s the state enacted a substantial body of legislation to protect air and water quality by
regulating a broad range of pollutants and polluting activities. By 2006, California had firmly
established its environmental leadership, and in that same year Governor Arnold
Schwarzenegger (a Republican but nevertheless long-standing environmental advocate) signed
Assembly Bill No. 32 (AB 32), the California Global Warming Solutions Act, into law.
Governor Schwarzenegger had already signed Executive Order S-3-05 in 2005 that established
greenhouse gas emissions targets for the state, and AB 32 granted legislative authority to the
California Air Resources Board (CARB) to coordinate the actions of other state agencies and
implement the necessary measures with which to achieve those targets. The bill was authored by

239
Democratic assembly members Fran Pavley, and Fabian Nunez. (Pavley would go on as state
senator would to become a key voice in the California fracking discourse and the author of SB
4).
The drilling of oil and gas well in California must be undertaken in accordance with
guidelines and requirements under California Public Resources Code sections 3106, 3203, 3211,
3220, 3222, 3224, and 3255, as well as Title 14 of the California Code of Regulations, sections
1722.2, 1722.3, and 1722.4 (DOGGR, 2017c). Nevertheless, the state-level regulations place at
the beginning of the Shale Revolution in 2006 did little to govern enhanced recovery techniques
such as hydraulic fracturing. The dearth of effective regulation and associated lack of adequate
monitoring and enforcement did not come to the attention of the public until 2011, when the U.S.
EIA published its projection of 15.4 billion barrels of technically recoverable oil in the Monterey
Formation. The prospect of a shale oil boom in California therefore triggered a wave of bill
proposals in the state legislature to regulate the oil and gas industry (Table 2 below).
Table 2: Bills Related to Oil and Gas Regulation Proposed in California State Legislature.
Bill Scope
AB 1759: Introduced by Assemblymember Rob Bonta (D). 2016.
Would require refineries to notify communities within 3.5 miles of any use of hydrogen fluoride, hydrofluoric acid, or modified hydrofluoric acid.
AB 1882: Introduced by Assemblymember as Williams (D). 2016.
Would require DOGGR to collaborate with State Water Resources Control Boards on review of Class II injection well projects.
AB 1902: Introduced by Assemblymember Scott Wilk (R). 2016.
Would place a statute of limitations on lawsuits from the Aliso Canyon gas leak.
AB 1903: Introduced by Assemblymember Scott Wilk (R). 2016.
Would require the Public Utility Commission and Department of Public Health to study the effects of the Aliso Canyon gas leak.
AB 1904: Introduced by Assemblymember Scott Wilk (R). 2016.
Would require the Office of Environmental Health Hazard Assessment to assess health risks associated with gas odorants.
AB 1905: Introduced by Assemblymember Scott Wilk (R). 2016.
Would require an independent scientific study of natural gas storage facilities and related practices.
AB 2206: Introduced by Assemblymember Das Williams (D). 2016.
Would require an independent scientific study of the use of biomethane in gas transmission pipelines.

240
Table 2: Bills Related to Oil and Gas Regulation Proposed in California State Legislature.
Bill Scope
AB 2313: Introduced by Assemblymember Das Williams (D). 2016.
Would require the State Air Resources Board to assess the potential for renewable natural gas produced in the state.
AB 2729: Introduced by Assemblymember Das Williams (D). 2016.
Would alter the definitions of “active observation well”, “idle well”, and “long-term idle well”, and would authorize a property owner to claim rights to and declare a well abandoned and plug the well.
AB 2748: Introduced by Assemblymember Mike Gatto (D). 2016.
Would expedite lawsuits related to the Aliso Canyon gas leak.
AB 2756: Introduced by Assemblymember Tony Thurmond (D). 2016.
Would reform civil penalties for oil and gas industry violations.
AB 2788: Introduced by Assemblymember Mike Gatto (D). 2016.
Would modify emergency regulations of natural gas storage facilities.
AB 2874: Introduced by Assemblymember Beth Gaines (R). 2016.
Would incentivize in-state natural gas production.
SB 13 [passed and chaptered in 2015]: Introduced by Senator Fran Pavley (D).
Would authorize State Water Resources Control Boards to designate probationary basins to expand groundwater protections. Signed into law on September 3rd, 2015.
SB 32: Introduced by Senator Fran Pavley (D). 2015.
Would set state greenhouse gas emissions targets to 80 percent below 1990 levels by 2050.
SB 248: Introduced by Senator Fran Pavley (D). 2015.
Would require comprehensive documentation of well operations, and criminalize failure to do so.
SB 545: Introduced by Senator Hannah-Beth Jackson (D). 2015.
Would change the duties of the State Oil and Gas Supervisor, and would reform industry reporting requirements to limit confidentiality water protections.
SB 248: Introduced by Senator Fran Pavley (D). 2015.
Would greatly expand regulations of enhanced recovery techniques, broadly defined, following the template established by SB 4 on well stimulation treatments.
SB 380: Introduced by Senator Fran Pavley (D). 2015.
Would limit gas storage operations near the Aliso Canyon storage facility and in any facilities built before 1954 pending comprehensive review by the Public Utilities Commission.
SB 788: Introduced by Senator McGuire (D). 2015.
Would ban future offshore drilling in state waters.
SB 886: Introduced by Senator Fran Pavley (D). 2015.
Would limit gas storage operations near the Aliso Canyon storage facility and in any facilities built before 1954 pending comprehensive review by the Public Utilities Commission. (Similar to SB 380).
SB 887: Introduced by Senator Fran Pavley (D). 2015.
Would require all existing gas storage wells to be brought into compliance with new regulations.
SB 888: Introduced by Senator Ben Allen (D). 2015.
Would make the Office of Emergency Services responsible for natural gas storage facility emergencies.
SB 900: Introduced by Senator Hannah-Beth Jackson (D). 2015.
Would authorize the State Lands Commission to declare abandonment status for any wells that come into state possession as a result of gifts, bequests, or donations of land to the state.

241
Table 2: Bills Related to Oil and Gas Regulation Proposed in California State Legislature.
Bill Scope
SB 1147: Introduced by Senator Galgiani (D). 2015.
Would modify the definitions of “aboveground storage tank” for the purposes of both storage and transportation of oil and gas.
SB 1441: Introduced by Senator Leno (D). 2015.
Would categorize vented and fugitive natural gas emissions as counting against compliance obligations under the State Air Resources Control Boards’ market-based compliance mechanisms.
AB 356: Introduced by Assemblymember Das Williams (D). 2015.
Would expand groundwater monitoring requirements by oil and gas operators.
AB 815: Introduced by Assemblymember Sebastian Ridley-Thomas (D). 2015.
Would modify levy an oil spill prevention administration fee from oil and gas operators and refineries.
AB 1490: Introduced by Assemblymember Anthony Rendon (D). 2015.
AB 1501: Introduced by Assemblymember Anthony Rendon (D). 2015.
Would require methane emissions standards for well stimulation treatments to be established and monitored by Air Quality Management Districts.
SB 1017: Introduced by Senator Noreen Evans (D). 2014.
Would impose a 9.5 percent severance tax upon oil and gas firms, with all revenues to go to the California Higher Education Fund.
SB 1132: Introduced by Senator Holly Mitchell (D) and Senator Mark Leno (D). 2014.
Would “impose a moratorium on fracking, acidizing and other well stimulation techniques” pending the outcome of the statewide independent study of the environmental impacts of fracking mandated by SB 4.
SB 1156: Introduced by Senator Steinberg (D). 2014.
Would impose a carbon tax on fossil fuel suppliers, with all revenues to be deposited Special Fund.
SB 1281: Introduced by Senator Fran Pavley (D). 2014.
Would require the disclosures of information related water use for oil and gas production.
SB 1319: Introduced by Senator Fran Pavley (D). 2014.
Would expand the Lempert-Keene-Seastrand Oil Spill Prevention and Response Act, and require additional procedures for the handling and transport of oil.
SB 1389: Introduced by Senator Jerry Hill (D). 2014.
Would impose rules for maximum operation pressures in gas transmission pipelines under the Public Utilities Act.
AB 1937 [passed and chaptered in 2014]: Introduced by Assemblymember Richard Gordon (D).
Would amend the Natural Gas Pipeline Safety Act to require special school and hospital notifications. Signed into law on August 25th, 2014.
AB 2420: Introduced by Assemblymember Adrin Nazarian (D). 2014.
Would allow cities to prohibit well stimulation treatments and avoid preemption under state law.
AB 2678: Introduced by Assemblymember Sebastian Ridley-Thomas (D). 2014.
Would modify requirements for the Oil Spill Technical Advisory Committee and levy an oil spill prevention administration fee from oil and gas operators.
SB 4 [passed and chaptered in 2013]: Introduced by Senator Fran Pavley (D).
Establishes a framework for regulation of hydraulic fracturing, requires an independent scientific study of the environmental impacts of fracking in California, and mandates that DOGGR coordinate with other state agencies to consolidate and

242
Table 2: Bills Related to Oil and Gas Regulation Proposed in California State Legislature.
Bill Scope
coordinate the monitoring and enforcement of regulations pertaining to well stimulation and related activities. Signed into law on September 20th, 2013.
SB 395: Introduced by Senator Hannah-Beth Jackson (D). 2013.
Would “classify hydraulic fracturing wastewater as hazardous waste and require that it be regulated as a hazardous substance”.
SB 665 [passed and chaptered in 2013]: Introduced by Senator Lois Wolk (D).
Would “change bonding requirements for operators of oil or natural gas wells and shift the financial burden of responding to abandoned wells or other violations from taxpayers to oil and gas drillers. This bill was signed into law by the Governor on September 20th, 2013.
AB 7: Introduced by Assemblymember Bob Wieckowski (D). 2013.
Would “mandate disclosure of details about hydraulic fracturing operations including the chemicals used, while allowing proprietary information to be kept confidential”.
AB 288: Introduced by Assemblymember Marc Levine (D). 2013.
Would “extend to 30 days from 10 the amount of time that DOGGR has to approve a permit for a new drilling operation. It would delete a provision that has applications automatically approved if DOGGR fails to act within the time limit”.
AB 649: Introduced by Assemblymember Adrin Nazarian (D). 2013.
Would establish “a moratorium on hydraulic fracturing near an aquifer until a determination that drilling would not endanger health.”
AB 669: Introduced by Assemblymember Mark Stone (D). 2013.
Would “require oil companies to produce wastewater plans, which must be approved by regional water quality control boards.”
AB 982: Introduced by Assemblymember Das Williams (D). 2013.
Would “require groundwater monitoring before and after any hydraulic fracturing operation.”
AB 1301: Introduced by Assemblymember Richard Bloom (D). 2013.
Would define hydraulic fracturing and impose a moratorium on the practice until the California legislature enacts further legislation to regulate the practice.
AB 1323: Introduced by Assemblymember Holly Mitchell (D). 2013.
Would “put a ban in place until a study is completed”.
SB 1054: Introduced by Senator Fran Pavley (D). 2012.
Would require firms to notify residents and land owners prior to commencing any fracking operations.
AB 972: Introduced by Assemblymember Betsy Butler (D). 2011.
Would “bar the supervisor from issuing a permit for an oil and gas well that will be hydraulically fractured until regulations governing its practice are adopted.”
AB 591: Introduced by Assemblymember Bob Wieckowski (D). 2011.
Would “require firms to disclose the location of their fracking operations, the chemicals used in fracking fluids (irrespective of “trade secrets”), and the quantity of fresh water used during production.”

243
(Source Data: LA Times Editorial Board, 2011; Lifsher & McGreevy, 2013; Mulkern, 2013;
Official California Legislative Information, 2012a, 2012a, 2012b; State of California Legislative
Counsel, 2013; Stoel Rives, 2017).
Legislating efforts that began in 2011 eventually culminated with the passing of SB 4,
proposed by Democratic Senator Fran Pavley, on September 20th 2013. In broad terms, the bill
has the following regulatory effects: 1) it defines “well stimulation” as hydraulic fracturing and
matrix acidizing only; 2) and requires DOGGR to formally coordinate with other state and
federal agencies to delineate regulatory authority and responsibility; 3) it requires DOGGR to
administer a more stringent permitting and notification program for well stimulation activities; 4)
it requires DOGGR to implement a groundwater monitoring and reporting program; 5) it requires
public disclosure of chemicals used in well stimulation treatments, with a reversal of the
presumption of trade secrets; and 6) it mandated an independent scientific study of the potential
health and environmental impacts of well stimulation treatments in California. Interim
regulations developed by DOGGR in December of 2013 went into effect for beginning January
1st, 2014, and were made permanent with minimal amendment following the publication of the
mandated independent scientific study in July of 2015.
In three years that followed the passing of SB 4, legislators – including Senator Pavley –
attempted without success to advance bills such as SB 248 to expand the relatively narrow scope
of the original regulation beyond hydraulic fracturing and acidizing treatments to encompass all
enhanced recovery techniques. Efforts are ongoing, but findings of minimal impact from the
mandated independent scientific study together with the dramatic collapse of estimated
technically recoverable reserves has removed much of the issue’s political urgency (see:
discussion).

244
At the local level, a number of cities and counties have imposed moratoria on fracking in
their jurisdictions. California is a home rule state, meaning that under the state Constitution local
governments enforce their own zoning and permitting laws, thereby allowing them to determine
which activities are allowed within their jurisdictions. The first locality in California to issue a
temporary 45-day moratorium was Carson City, which halted all oil and gas drilling on March
19th, 2014. The city council voted not to extend the moratoria when it expired (Mai-Duc, 2014a,
2014b; Mazza, 2014). The city of Compton followed on April 22nd, 2014, but rescinded the
moratorium after facing a lawsuit from the Western States Petroleum Association (see:
discussion). Beverly Hills instituted the first permanent ban on May 7th by prohibiting all
hydraulic fracturing and acidizing treatments (Dana Feldman, 2014; O’Connor, 2014). The cities
of Los Angeles and San Francisco passed motions to consider moratoria on fracking in 2014, but
those moratoria were never implemented (Reyes, 2014). Santa Cruz was the first county to ban
fracking, on May 20th of 2014, and was followed later than year by San Benito, Butte,
Mendocino, and Alameda counties (Carroll, 2014; Cart, 2014). These are symbolic moratoria
because the petroleum industry is not active in those territories. However, a ballot measure to
phase out hydraulic fracturing and acidizing treatments in Monterey County passed on
November 9th of 2016 – the first to do so in a county with significant oil and gas production
(Rogers, 2016).
Ballot Measures and Initiatives
The processes by which policy and law is crafted by the legislature and signed by the
Governor in California are unexceptional and do not require explication here. However,
California is one of 24 states that allow ballot initiatives, which are a direct democracy
mechanism that allows the public to bypass the legislature and vote directly upon a “ballot

245
measure” (as they are termed at the local level) or a “ballot proposition” (at the state level) to
enact law, or upon a “petition referendum” to veto an existing law adopted by the state
legislature (California Secretary of State, 2017b). This formal institution is important to the
specific issue of oil and gas regulation because it means that a straight “up or down” vote by the
electorate at a single election can result in a permanent ban of specific enhanced recovery
techniques. Indeed, such a vote took place in Monterey County in the November 2016 election
and the electorate passed Measure Z, which established a timeline over which hydraulic
fracturing and acidizing practices will be phases out and eventually banned (Monterey County
Elections Office, 2016). As of 2016, no ballot proposition had yet reached a vote in the state’s
general election.
Informal Institutions
The institutions that govern the use of enhanced recovery techniques in California are on
the whole highly formalized, and what few informal institutions exist function in ways that are
“complementary” to formal ones (as opposed to accommodating, substituting, or subverting
(Fritz et al., 2009). Nevertheless, it is useful to consider the roles that political influence,
financial support, and information play in shaping the relationships among the oil and gas
sector’s various actors. These relationships are indicated as directional flows in Figure 57 above.
Political influence (red arrows, Figure 57) represents the lobbying efforts that
communities, NGOs, and industry firms undertake to influence policymakers and thereby steer
the legislative agenda toward their interests. Official lobbying in California is regulated under the
Political Reform Act of 1974, with recent amendments establishing limits on the financial value
of gifts and adding rigor to the lobbyist registration process. But the vast majority of lobbying
efforts are unofficial, and take place in the public discourse rather than the state capitol.

246
Individual residents and community groups, for example, have undertaken petition and letter-
writing campaigns with assistance from environmental NGOs to influence their elected
representatives and place initiatives on election ballots. Industry firms, both independently and
through representative associations, have in turn undertaken projects of their own to steer public
opinion, influence policymakers, and either promote or oppose ballot initiatives.
Financial support (green arrows, Figure 57) represent another channel of influence among
the oil and gas sector’s various actors. Contributions to political campaigns and individual
politicians are formally governed by California Government Code Section 85200 to 85201, and
so informal networks arise separately from the financial support of NGOs (including political
action committees) and think tanks by monied interests. Informal rules emerge within these
networks such that their members coalesce around specific values and their associated frames
and narratives (Lejano, Ingram, & Ingram, 2013). Conditions of financial dependence may arise
here, in which case monied interests become “rule makers” for the NGOs and think tanks they
support (Fritz, Kaiser, & Levy, 2009).
Information (gray arrows, Figure 57) represents a final channel of influence among the
oil and gas sector’s various actors. Although universities and the news media remain relatively
independent informational content creators and therefore free from relationships that result in
informal rule making, NGOs, think tanks, and industry firms are selective in their acquisition,
amplification, and use of information from these sources. As a result, the information flows
between community groups, NGOs, think tanks, and industry firms tend to be ruled informally
by filters of bias which select for specific content that reinforces the values and advances the
goals of the actors within their respective networks (Latour, 2007; Lejano et al., 2013).
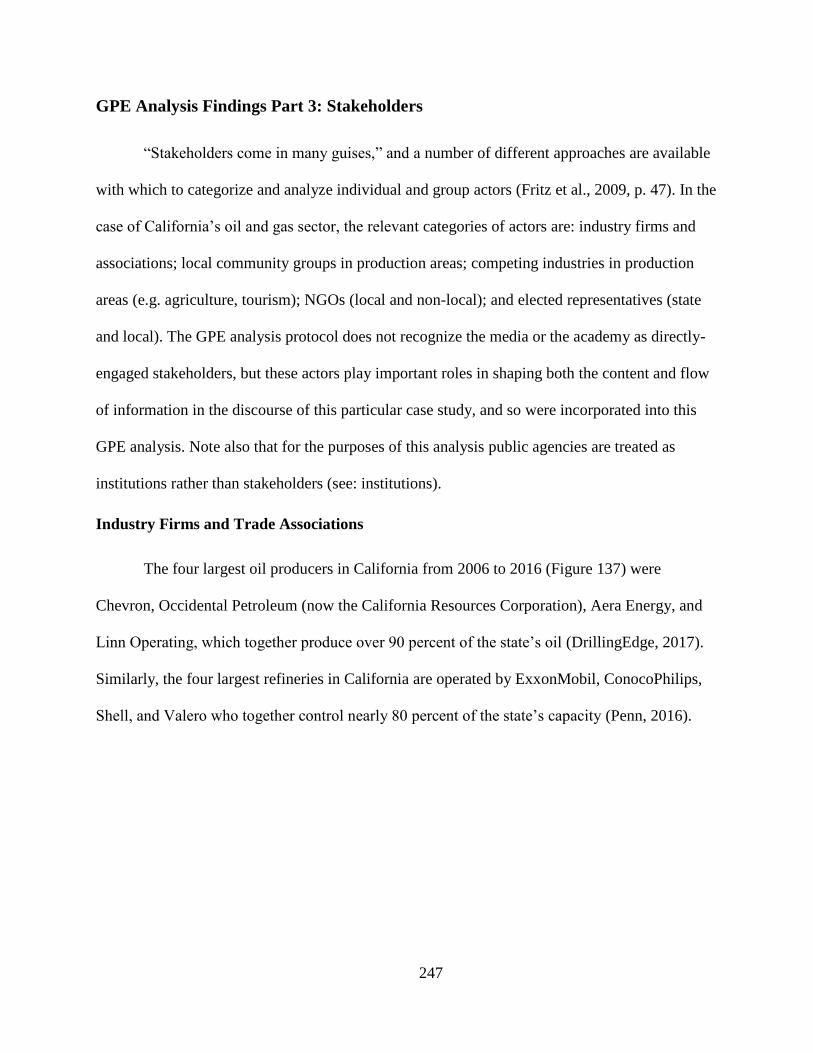
247
GPE Analysis Findings Part 3: Stakeholders
“Stakeholders come in many guises,” and a number of different approaches are available
with which to categorize and analyze individual and group actors (Fritz et al., 2009, p. 47). In the
case of California’s oil and gas sector, the relevant categories of actors are: industry firms and
associations; local community groups in production areas; competing industries in production
areas (e.g. agriculture, tourism); NGOs (local and non-local); and elected representatives (state
and local). The GPE analysis protocol does not recognize the media or the academy as directly-
engaged stakeholders, but these actors play important roles in shaping both the content and flow
of information in the discourse of this particular case study, and so were incorporated into this
GPE analysis. Note also that for the purposes of this analysis public agencies are treated as
institutions rather than stakeholders (see: institutions).
Industry Firms and Trade Associations
The four largest oil producers in California from 2006 to 2016 (Figure 137) were
Chevron, Occidental Petroleum (now the California Resources Corporation), Aera Energy, and
Linn Operating, which together produce over 90 percent of the state’s oil (DrillingEdge, 2017).
Similarly, the four largest refineries in California are operated by ExxonMobil, ConocoPhilips,
Shell, and Valero who together control nearly 80 percent of the state’s capacity (Penn, 2016).

248
Figure 137: Largest Oil Producers in California, 2016.
(Source Data: DrillingEdge, 2017).
Although the sector is dominated by a small number of very large firms, there are
nonetheless dozens of smaller independent producers as well as hundreds of companies that
provide specialty products and services in support of exploration, drilling, production,
maintenance, abandonment, refinery, and distribution operations. As a result, the industry has
three major trade associations through which it advances its policy agenda: the Independent
Petroleum Association of America (California chapter), the Western States Petroleum
Association, and the California Independent Oil Marketers Association. (There are natural gas
trade associations as well, but virtually no fracking for natural gas is undertaken in California
and so these organizations are not active in the state’s fracking discourse). The primary functions
of these trade associations are to fund local and national industry NGOs and think tanks, and to
lobby (and financially support) state and local representatives. The political ideology of the
Chevron34%
Aera Energy28%
California Resources
Corporation25%
Linn Operating5%
Others8%
Largest Oil Producers in California in 2016

249
NGOs, think tanks, and representatives that industry firms and their trade associations target is
almost exclusively conservative, and so their alignment is with the Republican Party (see: elected
representatives).
Local Community Groups
Local residents throughout California formed community groups to organize opposition
to fracking in their communities following the projection of 15.4 billion barrels of technically
recoverable reserves by the U.S. EIA in 2011. Prominent examples include Citizens Coalition for
a Safe Community (in Los Angeles), Californians Against Fracking (in San Francisco), Baldwin
Hills Oil Watch (in Baldwin Hills), Frack Free Culver City (in Culver City), and Stop Fracking
Brea (in Brea). These groups have coordinated their efforts with the support of local NGOs to
form coalitions both with other local community groups opposed to fracking and with other
environmental groups and NGOs more broadly (Californians Against Fracking, 2017).
Local community groups act at the grassroots level to organize and mobilize political and
legal opposition to fracking and related activities in their neighborhoods. They are both informed
by NGOs and think tanks and also function as sources of on-the-ground information for those
organizations. These organizations lobby their local and state elected representatives, and have
used a variety of means and fora for messaging such as staging protests, organizing petitions and
letter-writing campaigns, and attending town council meetings and other public events. All local
community groups are opposed to fracking; no comparable local groups have formed in support
of fracking within communities in California. The political ideology of local community groups
is almost exclusively liberal, but alignments are divided between the Democratic Party and the
Green Party.

250
NGOs
Local California-based NGOs that oppose fracking are, like other environmental NGOs,
differentiated according to their strategic focus. Environment California is an example of an
advocacy-focused NGO that concentrates on social and political mobilization. This NGO
provides organizational resources to local community groups and individual residents, and works
in coalitions with other NGOs and local community groups to lobby local and state elected
representatives. Clean Energy California and Consumer Watchdog are two examples of
awareness-focused NGOs that concentrate on educating the public about the potential risks to
human and ecological health posed by fracking. The Center for Biological Diversity is an
example of a litigation-based NGO that concentrates on holding industry firms and public
agencies accountable by filing lawsuits against them under state and federal environmental law.
National NGOs that maintain active offices in California tend to fall broadly into the same focal
categories of advocacy, awareness, and litigation as well, with Food & Water Watch,
FrackTracker Alliance, and the Natural Resources Defense Council (NRDC) being examples of
those categories respectively. As with other stakeholders, NGOs that oppose fracking almost
exclusively espouse a liberal political ideology and are aligned with either the Democratic Party
or the Green Party.
Local California-based NGOs that support fracking are different than their oppositional
counterparts in that few of them have individual members or community partners. Instead, these
NGOs are almost entirely “astroturfing” entities established by oil and gas firms or their trade
associations for the purpose of public relations and counter-messaging. Examples include
Californians for Energy Independence, Californians for Affordable & Reliable Energy,
Californians Against Higher Taxes, and Fueling California. These organizations appear to do

251
little or no active advocacy (i.e. social mobilization) or litigating, but rather focus almost entirely
on awareness and information dissemination. These NGOs appear to lobby elected
representatives at the state level only, and not at the local level. National NGOs that maintain
active offices in California such as Energy in Depth, FracFocus, Energy Citizens, and Consumer
Energy Alliance follow the same pattern. Like the firms and trade associations that support them,
pro-fracking NGOs in California are politically conservative and aligned with the Republican
Party.
Think Tanks
Think tanks are distinct from other NGOs because they have occupied a crucial position
in California’s fracking discourse as politically-motivated knowledge producers. This knowledge
had an outsized effect on public opinion in the early years of the Shale Revolution because of the
paucity of independent peer-reviewed scientific research available on the subject and the marked
scientific uncertainty surrounding the work had been done to date (see: discussion). Liberal think
tanks such as the Post-Carbon Institute and the Clean Water Fund opposed to fracking publish
reports that emphasize threats to human and ecological health while downplaying economic
benefits (Grinberg, 2014; J. D. Hughes, 2013a), while conservative think tanks such as IHS
Insight and the Los Angeles County Economic Development Corporation published reports that
do the opposite (IHS Global Insight, 2012; Sedgwick, Mitra, & Cooper, 2014). These reports
were important sources of information to other stakeholders prior to the publication of more
authoritative research from non-partisan sources – namely, universities and public agencies –
starting in 2015 (California Council on Science and Technology et al., 2015).

252
Elected Representatives
Although elected representatives have played a crucial role in shaping the evolution of
well stimulation regulation in California, particularly in the later years of the Shale Revolution
from 2011 onward, they have tended to do so as political blocs rather than as individuals.
Notable individual exceptions include State Assemblymember Bob Wieckowski who proposed
the first bill to regulate fracking, State Assemblymember Das Williams who proposed multiple
bills to regulate fracking, and Senator Fran Pavley who also proposed multiple bills both before
and after her bill SB 4 passed. As an Assemblymember in the preceding term before being
elected to the state Senate, Senator Pavley authored AB 32, the Global Warming Solutions Act
of 2006, which created California’s greenhouse gas “cap and trade” system as well as its first
statutory emissions and renewable portfolio targets, is heralded as a watershed achievement in
American climate change governance. Governor Arnold Schwarzenegger, who held office from
2003 through 2010 and signed AB 32 into law, was an outspoken environmental advocate whose
Executive Order S-3-05 in 2005 helped set the stage for AB 32. Governor Schwarzenegger’s
consistently pro-environment stance stood at odds with his Republican Party platform, but he left
office prior to fracking becoming of an issue of concern in California. His successor, Governor
Jerry Brown, signed SB 4 into law but like the Democratic Party platform as a whole has
otherwise held a moderate position on fracking and other oil and gas concerns which has drawn
criticism from both ends of the political spectrum (Hertsgaard, 2015; Megerian, 2015a, 2015b;
Megerian & Mason, 2015).
Frame Analysis Findings
Between January 2010 and December 2016, the Los Angeles Times published 390
articles that mentioned the term “fracking” (Figure 138). The anti-fracking watchdog group

253
California Frack Facts (CAFrackFacts.org) began providing a press clip service to its readership
in May of 2013, and by December 2016 had posted over 800 news media articles relating to oil
and gas production in the state (which included many of the 390 Los Angeles Times articles) –
along with more than 3,000 additional news media articles about fracking and the petroleum
industry nationwide. A number of these news media articles cite studies conducted or funded by
anti-fracking environmental NGOs such as the Pacific Institute, Post Carbon Institute, and
Natural Resources Defense Council (NRDC). The pro-fracking “public relations campaign” and
website known as Energy in Depth (EnergyInDepth.org) was “created by the Independent
Petroleum Association of America (IPAA) in 2009, specifically oriented around the issue of
hydraulic fracturing” (Matz & Renfrew, 2015, p. 289). The website began publishing California-
based content in July 2012, and through December 2016 posted 132 blog posts and editorials.
Many of these commentaries are critical of the studies and reports produced by environmental
NGOs, and point instead to other publications (which are smaller in number) that emphasize the
benefits of fracking and the feasibility of undertaking the practice safely.
The findings reported here reflect a content analysis based upon a purposive sample of
100 representative news media articles, studies, reports, press releases, public statements, blog
posts, and interviews whose focal topic was specifically fracking in California and whose authors
and voices reflect the full range of stakeholders engaged on the issue in the state.
[Note that the findings of this dissertation research, like all qualitative studies, inevitably
reflect the biases of their author (Clifford, Cope, Gillespie, & French, 2016; Creswell, 2012;
Hay, 2016), and that the analysis presented here therefore draws not only the reading of the
purposive sample texts but – unavoidably – the reading of thousands of other topically relevant
publications as well.]

254
Figure 138: Number of Los Angeles Times Articles that Mention “Fracking”.
(Source Data: Los Angeles Time 2017; ProQuest 2017).
All stakeholders engage in framing, whether consciously or unconsciously, in the
processes of sense-making and constructing meaning (Lakoff, 2009, 2010; see also D. A.
Scheufele & Iyengar, 2017). In the case of an issue such as fracking that is the subject of public
debate, different stakeholders not only build their own worldview through frames, but
communicate – i.e. convey information – about their perceptions, values, and goals through those
frames as well (Chong & Druckman, 2007; D’Angelo, 2017; Entman, 1993; D. Scheufele, 1999).
The findings of this dissertation research (summarized in Table 3 below) agree with and confirm
those of other peer-reviewed studies about the framing of fracking in the United States
(Bomberg, 2013, 2017a; Dodge, 2015; Dodge & Lee, 2017a; Matz & Renfrew, 2015; Nyberg,
Wright, & Kirk, 2017; Willow & Wylie, 2014; Wright, 2013), and are broadly congruent with
international findings as well (Bomberg, 2017b; L. Williams et al., 2017).
0
20
40
60
80
100
120
2010 2011 2012 2013 2014 2015 2016
Nu
mb
er o
f A
rtic
les
Number of Los Angeles Times Articles that Mention "Fracking"

255
Table 3: Frames in the California Fracking Discourse.
Issue Orientation Master Frame Organizing Narrative Specific Frames
Supports Fracking Utility-Maximizing Fracking is an Opportunity Economic Benefit;
Job Creation;
Technological Innovation;
Old and Safe Technology;
Energy Security;
Manageable Risk
Opposes Fracking Moralizing Fracking is Dangerous Environmental Harm;
Irresponsibility;
Greed;
Inequity and Injustice;
David versus Goliath;
Regulatory Capture;
Energy Technology Lock-In
Both stakeholder orientations toward the issue of fracking – supporting or opposing –
evince a master frame, an organizing narrative, and multiple specific frames (Benford, 2013;
Fisher, 1997; Snow, 2004).
Supporting Orientation
Supporters of fracking overwhelmingly invoke the benefits of utilizing the practice as the
internal logic that justifies their support. Within this master frame of utility-maximization,
supporters argue that fracking presents an opportunity (or set of opportunities) that ought to be
seized. The organizing narrative of their advocacy is therefore a story in which a clear-thinking
and determined group is struggling to be enterprising and industrious in the face of ignorant,
fearful, and backward-looking opposition, and that out of this industriousness will emerge not
only profit for the intrepid trailblazers but overall social and economic prosperity resulting from
a “rising tide that lifts all boats”. Within this narrative, supporters invoke a number of specific
frames.

256
Foremost is the frame of economic benefit, in which a range of claimed macroscopic
benefits are emphasized, including increases in private profits, expansion of public revenues, and
overall gains in California’s productivity and global competitiveness. Typical examples of this
frame are superlative claims that the industry is, “a massive driver of our state’s economy and
contributor to its coffers,” and that it produces “more than the total economic activity of 15 state
economies, accounting for 3.6 percent of California’s total output”. Interviewees noted that “our
companies pay more than $21 billion in state and local taxes that provide vital local services,”
and commentators argue that “Californians rely on the state’s oil industry to maintain
California’s position of energy leadership”. On this view, fracking represents an “economic
renaissance [that] benefits all Americans” and an opportunity for the “the development of our
abundant resources and the much-needed economic growth [that] comes with it”.
Job creation is a closely related frame, but is distinguished by its focus on the
opportunities that fracking presents to individual Californians. One interviewee stated:
“The average salary in our industry is $81,000, and you can make
more than that with just a high school degree. There’s no other
industry in California that I’m aware of that provides that kind of
opportunity to someone with little higher education. Sure, we have
people with PhDs, geologists, scientists, engineers, but we also
provide an amazing path to the middle class.”
Supporters of the petroleum industry emphasize both the scale of job creation (“we
provide almost a half million jobs, and $38 billion in labor income”) as well as the diversity of
the workforce (“27 percent of our workforce is Hispanic, 13 percent is Asian, and almost 6
percent is African-American – and the Hispanic numbers are higher than the percentage in the

257
high-tech industry and also in environmental groups”). Interestingly, the opportunity for
redemption is an integral part of the job creation frame: “the industry gave him a chance even
though he had previously spent time in prison,” and “I made poor choices as a young adult and
so when an employer does a background check on me they may be a little leery of hiring me, but
this oil company has employed me for the last 10 years”.
Supporters frame fracking as an example of technological innovation, and present it as an
example of how economic, social, and environmental problems can be addressed with
innovation. Within this frame, fracking is presented as a “disruptive” and “revolutionary”
breakthrough that has not only “[contributed] more than $100 billion annually to the U.S.
economy” and “created millions of new high-paying jobs” across the country, but it “has allowed
the U.S. power sector to move away from coal, which has in turn reduced U.S. carbon emissions
by more than 10 percent between 2005 and 2013”.
At the same time, and standing in clear contradiction with the technological innovation
frame, supporters frame fracking in California as a decades-old practice with a proven track
record of safety. Claims such as, “techniques like acid maintenance, matrix acidizing and acid
fracturing (along with hydraulic fracturing) have been safe and routine parts of energy
development in California for decades if not a century due to both industry best practices,” and
“hydraulic fracturing has been safely conducted in California for decades,” typify this frame.
Energy security is framed as an additional benefit of fracking in California, as it is to the
Shale Revolution across the country more generally. Within this frame, fracking represents an
opportunity to make “progress toward making the United States energy independent, thereby
increasing our national security”. As a major importer of oil and gas (see Chapter 4), California

258
is particularly dependent upon foreign sources of petroleum, and so fracking is framed as an
opportunity “to reverse California’s growing dependence on foreign oil”.
Within the organizing narrative of opportunity, supporters frame the potential impacts of
fracking as a matter of risk management. Claims such as, “fracking technology is fundamentally
safe and has manageable risks,” and “studies have shown repeatedly that fracking is
fundamentally safe,” and “the facts clearly show that this technology can be used safely while
regulatory updates are made” typify this frame.
Opposing Orientation
Opponents of fracking invoke a moralizing master frame, and argue that fracking
presents is inherently dangerous. The organizing narrative of their opposition is therefore a story
in which a powerful and already profitable industry is greedily seeking to further advance its
own financial interests with willfully reckless, irresponsible, and callous – i.e. immoral –
disregard for the harms caused to both human and ecological health. Within this narrative,
supporters invoke a number of specific frames.
Chief among these frames is environmental harm, which comprises threats to both human
and ecological health as a result of air pollution, surface water and groundwater pollution, soil
contamination, greenhouse gas emissions, habitat fragmentation and destruction, and induced
seismicity. Within this frame, opponents of fracking use language with strong moral valence.
Terms such as “poison”, “toxic chemicals”, “contaminates”, “disrupts”, “sickens”, and “kills
[wildlife]” are commonly employed. Phrases such as, “it poisons our water, contaminates our air
and emits massive greenhouse gas pollution,” and “hydraulic fracturing, acidization, and other
forms of well stimulation [exacerbate] environmental threats, particularly climate disruption,
local air and water pollution, and resource consumption,” and “fracking is an inherently

259
dangerous practice, and the only way to protect ourselves is to halt use of this toxic technique”
typify this frame.
Supporters frame fracking in California as irresponsible. On this view, use of the practice
is inherently dangerous and cannot be undertaken safely with respect to either local
environmental harms or contributions to global climate change. Phrases such as, “[fracking is]
reckless [and] puts our special places and the communities that rely on them for drinking water
and recreation at risk,” and “Fracking is a major threat to the health of San Francisco Bay and the
Delta watershed, and needs to be outlawed in our state,” and “if the fracking boom continues, oil
and gas companies will light the fuse on a carbon bomb that will shatter efforts to avert climate
chaos” typify this frame.
Greed is framed as the motivation behind the petroleum industry’s perceived willingness
to act irresponsibly. Phrases such as, “residents [are] no strangers to oil and gas industry greed
and haste,” and “they profit from dirty energy, they don’t want California to build a clean energy
future, they don’t care about our kids and our communities, just their own profits,” and “greed
has destroyed the ability of the fossil fuel industry to think logically,” typify this frame.
A closely related opposition frame is that of inequity and injustice, which connects
irresponsibility and greed to unjust outcomes for vulnerable groups. Rhetoric such as, “Do oil
companies really care about vulnerable populations like low income people and communities of
color? Could it be that they are using these families as a smokescreen for killing environmental
protections and protecting their profits?” and statements such as, “Fracking often is done very
close to vulnerable people – infants, school children, the elderly and those with weakened
immune systems – even though communities typically seek to keep industrial activities far away

260
from facilities serving these populations, such as schools, hospitals, nursing homes and day care
centers” typify this frame.
Opponents of fracking frame the issue as a David versus Goliath conflict, where local
communities struggle against “Big Oil”. Communities and environmental NGOs are depicted as
underdogs in this frame: “in a testament to the power of organized and tenacious people,
residents of Carson, California, claimed victory over an oil giant’s big money bullying”, and
“Don’t let Big Oil write climate rules… it’s time to take on Big Oil” typify this frame.
Opponents also frame fracking as an issue of regulatory capture, in which Big Oil has
coopted the public agencies responsible for governing the industry. Within this frame, opponents
make statements such as, “my experience with our state government agencies has been really
disappointing … I don’t feel like they’re representing me, I don’t even feel like they care,” and
“if not for the complicity of the state agencies this disaster would not have ever happened,” and
“[we] demand that all of our elected officials stop taking money from Big Oil and start
prioritizing public health over industry profits”. Claims that “Big Oil and WSPA have captured
California politics,” and “Big Oil also gets its buddies in key positions in regulatory agencies,”
and “so egregious are DOGGR’s failures that even the EPA, not known for its willingness to rein
in Big Oil & Gas, has chastised its lax approach to regulation … that a regulatory agency could
be so negligent ought to be unimaginable” typify this frame.
A final prominent opposition frame is that of energy technology lock-in, meaning that
fracking threatens to derail the progress California has made toward decarbonizing its energy
system. Opponents claim that “fracking is undoing California’s climate gains,” and “our studies
show that damage from fracking in California in 2014 alone was equivalent to taking all our
solar panels off our roofs and all our electric cars off our roads”. Statements such as, “the oil

261
industry will focus all its resources on killing cap-and-trade,” and “a last-ditch effort [is] now
underway by some oil companies and their political allies in Sacramento to derail the most
comprehensive clean fuel policies in the country,” and “[fracking is] attempting to rain on
California’s clean parade” typify this frame.
Discussion
Awareness of fracking exploded into public consciousness when the 2010 documentary
film “Gasland” by Josh Fox brought attention to the issue nationwide. The film focused
primarily on the boom in shale gas production going on in Pennsylvania, West Virginia, and
Ohio where since 2006 there had been a frenzied race among shale gas firms and speculators to
acquire, flip, and drill leases as quickly as possible under the “rule of capture” (see: Chapter 4) in
order to win priority claim over subsurface resources as far as two horizontal miles from their
parent drill pads (Grow, 2012; Grow, Schneyer, & Driver, 2012). Perhaps the most striking
imagery from the film is of a homeowner in Weld County, Colorado, who lights the methane
dissolved in his tap water on fire (Figure 139). The surge in awareness and concern about
fracking brought enhanced recovery techniques under intense scrutiny across the country in the
months that followed, including in California.
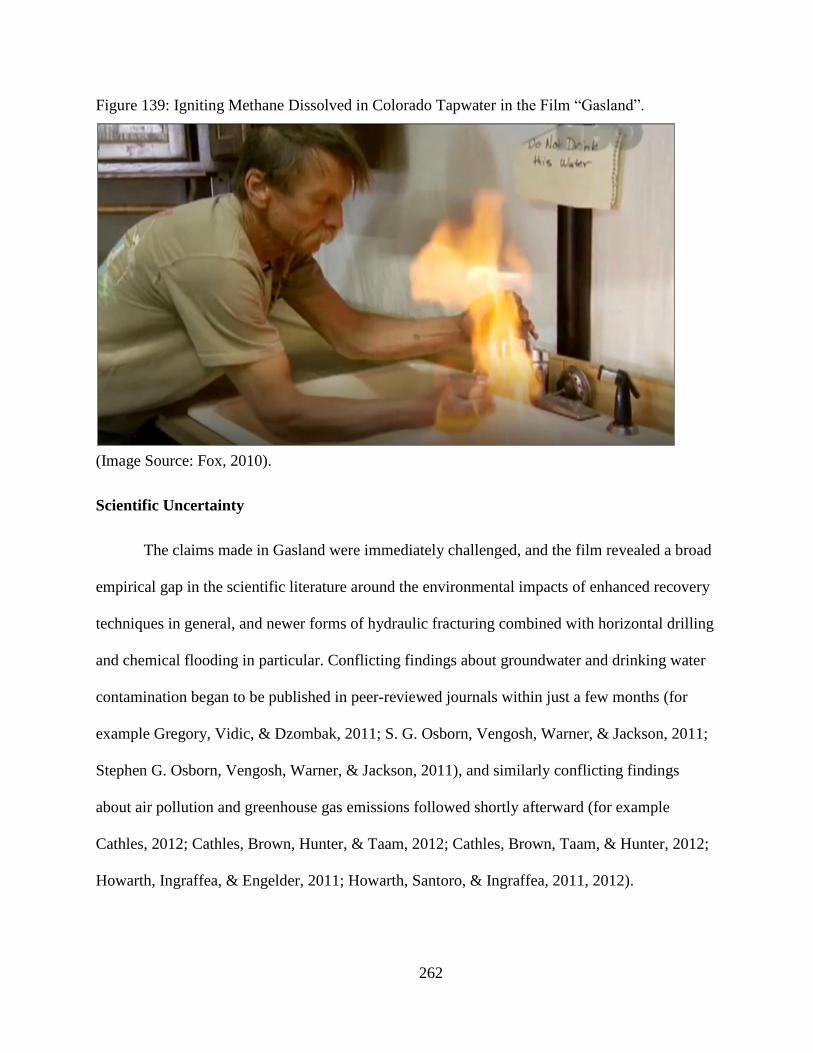
262
Figure 139: Igniting Methane Dissolved in Colorado Tapwater in the Film “Gasland”.
(Image Source: Fox, 2010).
Scientific Uncertainty
The claims made in Gasland were immediately challenged, and the film revealed a broad
empirical gap in the scientific literature around the environmental impacts of enhanced recovery
techniques in general, and newer forms of hydraulic fracturing combined with horizontal drilling
and chemical flooding in particular. Conflicting findings about groundwater and drinking water
contamination began to be published in peer-reviewed journals within just a few months (for
example Gregory, Vidic, & Dzombak, 2011; S. G. Osborn, Vengosh, Warner, & Jackson, 2011;
Stephen G. Osborn, Vengosh, Warner, & Jackson, 2011), and similarly conflicting findings
about air pollution and greenhouse gas emissions followed shortly afterward (for example
Cathles, 2012; Cathles, Brown, Hunter, & Taam, 2012; Cathles, Brown, Taam, & Hunter, 2012;
Howarth, Ingraffea, & Engelder, 2011; Howarth, Santoro, & Ingraffea, 2011, 2012).

263
Had there been greater scientific consensus around the risks and benefits of fracking, then
in all likelihood the issue of fracking would have been subsumed within the normal policy debate
over how to balance the economic benefits of fossil fuels against their known environmental
harms. But the uncertainties around both the promise and peril of fracking created a void into
which hyperbolic narratives could be projected unchecked. With the mainstream media spotlight
shone on the issue and the new power of social media attenuating the public’s response, fracking
became the center of a political debate sufficiently intense to stimulate social mobilization.
Community groups formed, NGOs were created, protests were organized, industry associations
formed action committees – and in the absence of actionable scientific knowledge from
traditional independent sources at universities and public agencies, all of these actors turned to
partisan think tanks for “facts” to support their competing claims. At the same, the definitions
and meanings of fracking in the discourse were themselves contradictory and confusing.
Fracking is an industry term of art that refers to all enhanced recovery techniques, the newer
forms of which became increasingly widespread from 2006 onward, but the practice of hydraulic
fracturing from which the term is derived was pioneered in 1947. The specific techniques
employed vary depending on whether the target of fracking is oil or gas, as well as the geology
of the parent rock (see: Chapter 2), and so their potential economic benefits and environmental
harms vary in kind. In 2010 these subtleties were not well known or understood among the
public, policymakers, or even scientists themselves.
From this abundance of confusion and uncertainty emerged a morass of paradoxical
claims: the technology is new, yet decades old; it is terribly dangerous, yet perfectly safe; it is a
grave threat to air and water quality, yet it produces natural gas which is the cleanest of the fossil
fuels; it is a green “bridge fuel” to a renewable energy future, yet fugitive methane is worse for

264
climate change than coal; and the massive reserves in California’s Monterey Shale will lead to an
economic and employment boom, yet little or none of that oil is accessible. The result was what
Carl Sagan might have called a “demon-haunted” discourse: one plagued by ignorance,
misinformation, and impassioned convictions rooted in ideology rather than fact (Sagan, 1995).
In November of 2013, 20 of the nation’s most accomplished environmental and
geophysical scientists wrote an open letter to Governor Jerry Brown recommending that
California follow the example of other states and “immediately place a moratorium on shale tight
oil and gas development until it is determined by independent scientific studies whether and
under which conditions these forms of fossil fuel development can be deployed in a manner that
protects public health and safety, the conservation of the State's natural resources, and helps to
achieve the climate goals set out by [the California Global Warming Solutions Act] AB 32”
(Caldiera et al., 2013, p. 1). In their letter, these scientists listed the following major concerns
about fracking in California:
1. Increase in fossil fuel production at a time when California is transitioning to low-carbon
renewable energy technologies.
2. Carbon intensification of California oil production.
3. Increase in fossil fuel consumption that elevates atmospheric carbon dioxide emissions.
4. Fugitive methane leakage, which comprises up to 17 percent of all methane produced in
the LA Basin, will exacerbate climate change in the near term because methane possesses
up to 86 times the global warming potential of carbon dioxide.
5. Air pollution from fracking operations in the form of particulate emissions, dust
emissions, and ground-level ozone production.

265
6. Water pollution from the toxic and carcinogenic chemicals used in fracking process,
which may contaminate soils and surface water as well as aquifers and drinking water,
and the loss of both wildlife and domestic animals.
7. Large scale water use at a time of severe water scarcity.
8. Increase in frequency of earthquakes as a result of underground injection wells.
9. Habitat loss from the large spatial footprint of fracking infrastructure.
One month later, a different group of 21 eminent scientists led by Stephen Holditch –
primarily professors of geology and engineering – wrote another open letter to Governor Jerry
Brown in response (Boland, 2013). This second letter underscored the economic benefits of
fracking, and reiterated claims that the technology can be used safely, saying, “we have found
nothing to suggest that shale development poses risks that are unknown or cannot be managed
and mitigated with available technologies, best practices and smart regulation” (Holditch et al.,
2013). These scientists suggest that fracking offers the following benefits to California at
acceptable levels of environmental and human health risk:
1. Lower energy prices for American consumers.
2. Creation of jobs.
3. Buoying of the California economy at large.
4. Revitalization of an industry that has traditionally been important in California.
5. Increased tax revenues.
As the vignette that introduced this chapter points out, history sometimes rhymes, and the
fracking debate was not the first disagreement among scientists about oil in California. In the
19th Century, Benjamin Silliman Jr. and Josiah Whitney bitterly disputed the magnitude of the
state’s fossil fuel endowment (White, 1968). In the 1950s, scientists (some with petroleum

266
industry funding) debated the causes and impacts of air pollution in Los Angeles (Jacobs &
Kelly, 2008; Jenkins, 1954). And in the wake of the Santa Barbara spill in 1969, scientists
disagreed about the impact of oil on marine ecosystem (Easton, 1972; Lovelock, 2004; Spezio,
2011; U.S. House of Representatives, 1970). In each of these instances, the public – normally
dependent upon universities and government agencies for definitive scientific claims – became
the target audience for interest groups’ competing interpretations of what little empirical
evidence was available at the time. In the case of fracking, think tanks were well-positioned –
and indeed actively positioned themselves – to fill the knowledge gap, and they remained
influential sources of information for other stakeholders until 2015 when the first authoritative
independent scientific evaluations of the environmental impacts of fracking in California were
published as mandated under SB 4 (California Council on Science and Technology et al., 2015;
Long, Feinstein, Bachmann, et al., 2015; Long, Feinstein, Birkholzer, et al., 2015; Long,
Feinstein, Jordan, et al., 2015). Competing lines of narrative then emerged based upon these
limited empirical data, which were framed and analyzed by those same think tanks according to
their organizing ideologies.
The Prospect of Promise and Peril
Public awareness and associated enthusiasm and concern about fracking in California
were limited prior to 2011 because there had hitherto been no evidence that the national boom,
which by then was entering its fifth year in Pennsylvania and Texas, would affect the Golden
State. But stakeholder attitudes changed rapidly after the U.S. EIA reported estimates of 15.4
billion barrels of technically recoverable reserves in the Monterey Shale Formation.
One of the first responses was by a coalition of local and national NGOs to protest BLM
permitting of fracking on federal lands and in Los Padres National Forest without environmental

267
review (Center for Biological Diversity, Sierra Club, & Los Padres ForestWatch, 2011). This
was followed several months later by the first of several formal lawsuits against federal and state
agencies filed by local community groups and NGOs for injunctions against the use of fracking
prior on California lands “without analyzing the full environmental effects of doing so”
(Cummings, Hobstetter, & Matthews, 2014, p. 1). Reports from NGOs and think tanks opposed
to fracking started to emerge in 2012, such as “California, Here They Come: Now is the Time to
Ban Fracking” published by Food & Water Watch (2012a). At the same time, reports about the
potential economic benefits of fracking such as “America’s New Energy Future: The
Unconventional Oil and Gas Revolution and the U.S. Economy” published by IHS Global
Insight began to appear as well (2012). In general these reports were bullish about the economic
prospects of fracking in California insomuch as they took the assumptions of the 2011 U.S. EIA
report as granted (for example Avalos & Vera, 2013).
The most influential second-order analysis of fracking in California was published by the
University of Southern California (USC) Global Energy Network at the Price School of Public
Policy (2013), which took the U.S. EIA estimates for the Monterey Formation as granted and
projected benefits to the state economy in five-year increments to 2030. The study, which was
funded largely by the Western States Petroleum Association, projected direct above-baseline
benefits to California of: 1) $11,000 in additional per-capita GDP; 2) 2.8 million new jobs; 3)
$223 billion in annual personal income; and 4) $24.6 billion in annual tax revenues. These (quite
literally) incredible figures projected that within 10 years fracking for oil would grow to become
roughly 10 percent of the total economy of California, and as such would represent a “rising
tide” to lift all boats (USC Global Energy Network, 2013).

268
It is clear that many stakeholders took the promise and peril of fracking in California
seriously. What is less clear is how oil and gas industry experts regarded these implications at the
time. Given that some industry scientists and engineers must have understood the stark
geological differences between the Monterey Formation and other shale formations, and given
that as of 2013 there was still no evidence of a fracking boom taking off in California, it seems
likely that at least some industry experts knew that the U.S. EIA estimates were unrealistic and
that the USC projections were therefore inflated. But no voices of reason emerged from the
industry to temper expectations (J. D. Hughes, 2013b, 2013c).
Did California oil and gas firms genuinely believe the fracking hype, as industry and
public agency interviewees for this dissertation research have claimed? Or did it cynically allow
the public and policymakers to labor under the illusion than an economic bonanza lay just over
the horizon in an effort to secure less stringent regulation going forward, as local community
group and NGO interviewees for this research have claimed? A definitive answer may never be
forthcoming. Nonetheless, there exists a striking piece of evidence that the California petroleum
industry as a whole did earnestly anticipate a fracking boom for oil as early as June 2009: the
number of oil rigs began to grow dramatically (Figure 140).

269
Figure 140: California Rig Count, 1987 to 2017.
(Data Source: Baker Hughes, 2017).
Oil rig count is a key indicator of drilling activity because it signifies new wells going
into production. California’s oil rig count was nearing historic lows in 2009, at under 200, but by
March 2011 it had rebounded to over 800 rigs – the highest number since 1987 – and grew
steadily through August 2012 to over 1,400 rigs. Growth then stalled for about one year before
resuming and reaching a record high of 1,609 in October 2014.
What these data suggest is that the industry trusted the authority of the U.S. EIA’s
projections, while at the same time it presumed oil prices would remain at profitable levels – i.e.
above $80 barrel. Following Upton Sinclair’s notorious observation that “It is difficult to get a
man to understand something, when his salary depends upon his not understanding it!” (1935, p.
109), it seems that oil firms in California listened to the news they wanted to hear, and expanded
new drilling operations accordingly. But then that speculative bubble burst when oil prices fell
and fracking failed to fulfill its initial promise, which forced the U.S. EIA to revise its estimates
downward by over 99 percent (J. D. Hughes, 2013a, 2013b).
0
200
400
600
800
1,000
1,200
1,400
1,600
1,800
Nu
mb
r o
f R
igs
California Rig Count, 1987 to 2017
Oil Gas

270
Oil rig count subsequently crashed during the first several months of 2015 to below 600,
and finally fell to under 300 in mid-2016. Meanwhile, gas rig count began to rise along with oil
rig count in mid-2009, but then peaked in mid-2010 before the 2011 U.S. EIA report was
published, and thereafter declined steadily through 2016 (Baker Hughes, 2017). Had the oil
industry not genuinely believed the California fracking hype alongside the public and
policymakers, then we would expect to have seen oil rig count fall along with gas rig count as a
reflection of steadily-declining levels of production (see: Figure 47).
Institutional Credibility and Legitimacy
When the prospect of a California shale boom first arose with the 2011 U.S. EIR report,
stakeholders opposed to fracking immediately cast a critical gaze upon the state’s oil and gas
regulatory apparatus. After pressuring the local governments to gather information about
industry practices and their potential environmental impacts, these stakeholders quickly learned
that hydraulic fracturing had been employed in California for decades (see for example Cardno
ENTRIX, 2012). The industry argued that this long track record of hydraulic fracturing
demonstrated its safety, issuing statements such as, “after producing oil [in California] for more
than 100 years, oil companies have a tremendous amount of skill and expertise at safely
handling, using and disposing of [wastewater]” (WSPA, 2014, p. 2). But stakeholders opposed to
fracking interpreted the revelation as an admission of guilt and evidence that DOGGR and other
public agencies were either captive to industry or asleep at the wheel in the face of a looming
environmental crisis (Vives, 2012b).
Under the scrutiny that ensued, stakeholders’ fears were confirmed: “DOGGR has
admitted that it does not know where or how often hydraulic fracturing occurs in California, how
much water is required, or what chemicals are injected underground in fracking fluids, and has

271
admitted that it does not have any information regarding the safety, efficacy, or necessity of the
practice,” (Pardee, Hobstetter, Rhoades Siegel, & Cummings, 2013). Subsequent investigations
of wastewater disposal practices in Kern County revealed that oversight errors and antiquated
data systems had caused DOGGR to accidentally permit illegal wastewater injection wells
(Baker, 2015a, 2015b; Cart, 2015c).
DOGGR was not the only agency subject to criticism for failures to adequately monitor
and regulate oil and gas industry practices. Residents in University Park complained to the South
Coast Air Quality Management District 251 times between 2009 and 2012 years about foul
odors, respiratory ailments, and nosebleeds near a well operated by Allenco Energy. The agency
claimed that air sampling had shown the odors to be harmless and that the problem “boils down
to incompatible zoning decisions”, but UCLA toxicology professor James Dahlgreen disagreed
with that assessment, saying, “If you can smell it, it’s not safe, these people are experiencing
symptoms”, and signage within the well site itself warns of poisonous gas (Sahagun, 2013a).
Community lobbying efforts eventually reached U.S. Senator Barbara Boxer, who asked that
federal officials from the U.S. EPA inspect the site. Upon arrival these inspectors were
immediately sickened by toxic emissions from the site, including U.S. Environmental Protection
Agency regional administrator for the Pacific Southwest Jared Blumenfeld, who said, “I've been
to oil and gas production facilities throughout the region, but I’ve never had an experience like
that before – we suffered sore throats, coughing and severe headaches that lingered for hours”
(Sahagun, 2013b). The California Department of Water and the State and Regional Water Boards
failed to address fracking in the 2013 California Water Plan, which runs to over 3,000 pages,
mentioning the issue just twice: once in a single paragraph in Chapter 3 that notes the U.S.
Bureau of Land Management (BLM) proposed rule for regulating fracking on public and Native

272
American land, and one other short sentence that is repeated verbatim in each of the 12 regional
reports which refers readers to the CalEPA Groundwater Ambient Monitoring & Assessment
(GAMA) program for general information about fracking (California Department of Water
Resources, 2013).
Andrew Grinberg, a project manager for the NGO Clean Water Action, epitomized the
response of fracking opponents: “Californians have lost all confidence in our regulators,
allowing oil companies to inject toxic chemicals into sources of drinking water, while we suffer
from extreme drought, is a clear sign that DOGGR needs urgent reform” (Cart, 2015d).
Opponents of fracking like Grinberg point to lobbying funding and campaign spending as a
corrupting influence on state regulatory efficacy. Between 2006 and 2016 the petroleum industry
has consistently been one of the largest spenders on lobbying and political campaigns in
California. Figure 141 shows that direct lobbying expenditures by the industry in California
peaked in 2015 at over $22 million. Over the ten-year period of the national shale boom, the
industry spent $138 million on lobbying and over $150 million on political campaigns in the
state (Bacher, 2015a, 2015b; California Secretary of State, 2017a; U.S. Senate Office of Public
Records, 2017). One important pattern note is that between 2011 and 2015 lobbying spending in
California grew while spending at the federal level declined, which – along with oil rig count –
may suggest that the petroleum industry genuinely believed in the prospect of a California shale
boom, and that this belief manifested itself as “investment” in lobbying efforts to steer policy and
legislation to its favor (Atkin, 2014).

273
Figure 141: Oil and Gas Industry Spending on Lobbying, 2006 to 2016.
(Source Data: California Secretary of State, 2017a; U.S. Senate Office of Public Records, 2017).
Democratic state Senator Hannah-Beth Jackson, a vocal critic of fracking, called the
failings of public agencies “endemic” and said that “there has been a serious imbalance between
the role of regulating the oil and gas industry and the role of protecting the public” (Cart, 2015b).
Media commentary accused DOGGR of “handing out permits for drilling in the Central Valley
without records, oversight or enforcement of 21st Century environmental laws” and serving as an
industry “lapdog” instead of “watchdog” (Hayden, 2015). Peer-reviewed analyses have
suggested that failures of governance by DOGGR are comparable other instances of oil and gas
regulatory capture that have occurred historically across the country (McBeath, 2016).
The perceived crisis of legitimacy among state agencies that opponents of fracking claim
to be the result of inaction, ineptitude, and the corrosive influence of industry lobbying helped to
$-
$20
$40
$60
$80
$100
$120
$140
$160
$180
$200
2006 2007 2008 2009 2010 2011 2012 2013 2014 2015 2016
$-
$5
$10
$15
$20
$25
Fed
eral
Lo
bb
yin
g ($
mill
ion
)
Cal
ifo
rnia
Lo
bb
yin
g ($
mill
ion
)
Oil and Gas Industry Spending on Lobbying
California Federal
274
set in motion a sustained effort beginning in 2011 to reform California’s oil and gas regulatory
apparatus at both the state and local levels.
Politicization, Polarization, and Identity
Among the American public, commitment to environmental issues “can be somewhat
fickle, moving in cycles that visibly advance and retreat over time,” and that often coincide with
economic conditions (Guber, 2003, p. 177). Nevertheless, a clear pattern of political polarization
has emerged over the past two decades around environmental issues (R. E. Dunlap, Xiao, &
McCright, 2001; Riley E. Dunlap, 2013; Jacques, Dunlap, & Freeman, 2008; Rosenbaum, 2013).
In 1996, when asked whether “the country should do whatever it takes to protect the
environment”, 70 percent of right-leaning/Republican respondents agreed compared to 86
percent of left-leaning/Democrat respondents. But that gap had widened considerably by 2016,
when 52 percent of right-leaning/Republican respondents agreed compared to 90 percent of left-
leaning/Democrat respondents (Pew Research Center, 2017a). Similarly, when asked in 1996
whether “stricter environmental laws and regulations cost too many jobs and hurt the economy,”
39 percent of right-leaning/Republican respondents agreed compared to 29 percent of left-
leaning/Democrat respondents. By 2016, 65 percent of right-leaning/Republican respondents
agreed compared to just 13 percent of left-leaning/Democrat respondents (Pew Research Center,
2016, 2017a).
McCright and Dunlap note that “significant ideological and partisan polarization has
occurred on the issue of climate change” in particular, and therefore around the use of fossil fuels
which are its primary cause (2011, p. 691). A survey in early 2017 found a substantial partisan
divide when it asked whether “protecting the environment from the effects of energy
development/use” was a “top priority”: only 32 percent of right-leaning/Republican respondents

275
agreed with the statement, compared to 68 percent of left-leaning/Democrat respondents (Pew
Research Center, 2017b). When specifically asked about fossil fuels in 2016, 51 percent of right-
leaning/Republican respondents stated they favor “emphasizing alternative energy” compared to
89 percent of left-leaning/Democrat respondents (Gallup, 2016).
This political division around the environmental issues associated with extractive
industries is not unique to the United States. The tendency of struggles over extraction to become
politicized is well-documented in the political ecology literature (Andrews & McCarthy, 2014;
A. Bebbington, 2012; Guha & Martinez-Alier, 1997; Martinez-Alier, 2003; Perreault et al., 2015;
Willow & Wylie, 2014), and conflicts over extraction “also serve as vehicles for other struggles
… [which presents] an analytical challenge at the point of trying to understand the struggles over
extraction and simultaneously understanding the ways in which extraction is bundled up with
other dimensions of the political economy” (A. Bebbington & Bury, 2013, p. 19). This is because
“struggles over extraction frequently become overdetermined: they serve as lightning rods for
other struggles that have gone latent for a while but are then reactivated through the tensions and
passions aroused by extraction” (A. Bebbington & Bury, 2013, p. 19). Fracking appears to have
served as precisely the sort of “lightning rod” issue to which Bebbington and Bury refer.
At the national level, the issue of fossil fuel development became a common refrain
during the 2008 Presidential election campaign with the phrase, “Drill, baby, drill!” Republicans
ostensibly invoked the phrase to call for increased domestic petroleum production as a path to
energy independence (Carnevale, 2008), but it also served as an example of “dog-whistle
politics” that signaled conservative affiliation via an explicitly callous disregard for
environmental concerns (López, 2015; Safire, 2008). The subsequent divisions between
Republicans and Democrats about fracking in particular have been substantial, with 73 percent of

276
Republicans supporting the practice in 2012 compared to 33 percent of Democrats (Pew
Research Center, 2012). These divisions have remained wide even as overall support for fracking
has declined among all Americans, such that by 2016 support among Republicans had fallen to
58 percent compared to 28 percent among Democrats (Pew Research Center, 2016a, 2016b). At
no time since 2013, however, have the majority of Americans been in favor of the practice, and
by late 2016 support among all Americans had fallen to roughly 40 percent (Gallup Inc., 2015,
2016; Pew Research Center, 2012). Moreover, support for fracking among Democrats has never
been greater than 33 percent.
Nevertheless, there has been consistent bipartisan support among elected officials for
fracking at both the federal level (Z. Carpenter, 2016; Jordan, 2016; McCauley, 2016) and the
state level California (Hertsgaard, 2015; Wildermuth, 2017) since the beginning of the Shale
Revolution. In the three years following the 2008 presidential election, the Obama
Administration together with the Democratic Party as a whole remained consistently supportive
of fracking, leaving oppositional politics to play out at the state and local levels (Davenport,
2016; Helman, 2013). A remarkable gap therefore exists between policymakers and the public on
the issue of fracking, and this division has helped to catalyze social mobilization in opposition to
both the specific practice of fracking and to the petroleum industry and its outsized influence on
American politics and policy writ large (McKibben, 2016).
In California, the case of fracking became emblematic of the state’s overarching struggle
to divest itself from fossil fuels in order to achieve the combined goals of reducing energy
independence, limiting air pollution, and minimizing climate change impact. As such, fracking
was readily incorporated into state-level liberal and environmental identities and their associated
politics. In the urban and coastal communities of the Los Angeles and Santa Maria-Ventura shale

277
basins respectively, this served only to further entrench existing identities and divisions. In the
rural and overwhelmingly conservative communities of the San Joaquin basin, however, farmers
have forged unusual alliances with liberal environmentalists to resist extraction – or, more
specifically, the environmental externalities associated with petroleum production – that impact
their health and livelihoods (Onishi, 2013a, 2013b, 2014a). Record drought in California
between 2011 and 2015 only served to exacerbate concerns about the potential impacts of a
fracking boom on both the availability and quality of water for agricultural use (Onishi, 2014b).
As a result, farmers in the rural Central Valley began to file lawsuits with the help of
environmental NGOs in 2013 against oil and gas firms – including one RICO lawsuit alleging
racketeering (Aiello, 2013a, 2013b; Cox, 2014; Grossi, 2013; Mundy, 2015). These political
alliances defy and transcend stereotypical liberal/conservative, urban/rural, rich/poor, and
white/non-white binaries around which environmental identities have tended to align in the
United States. Fracking in rural California is therefore an instance of communities’ “struggles to
cope with extractive industry, to respond to and resist extraction, to maneuver among and make
sense of shifting contours of identity politics, and to demand new ways of governing extraction”
that is consistent with other political ecology case studies documented across the globe (A.
Bebbington & Bury, 2013, p. 18). And as in so many other cases, the “hidden costs of
extraction” have been marked by changes in daily life such as alterations in travel patterns,
timing of activities, cropping choices, purchases of filtration and other pollution-management
equipment, and decline in property values (A. Bebbington & Bury, 2013, p. 18).
The petroleum industry has not been blind to the political dimensions of fracking in
California. Bebbington and Bury observe that “the presence of political parties and movements
within [extraction] conflicts is often used by companies and government in their efforts to

278
delegitimize protests, on the grounds that the protests are politically motivated rather than based
on any justifiable cause of concern,” (2013, p. 19) and this phenomenon has been evident in the
discourse as well. The California Independent Petroleum Association (CIPA) has been
particularly vocal in depicting opponents of fracking as activists with a radical agenda rather than
as rational actors seeking redress for the industry’s environmental and human health impacts that
they witness in their communities (CIPA, 2016). Claims such as, “once again, anti-oil activists
are using politics and twisting the facts in their quest to threaten our nation’s energy
independence” (Nemec, 2017, p. 1) and “activists oppose common-sense solutions… things like
facts and trade-offs are not typically important to ideologues” (Quast, 2013, p. 1) are typical of
the tone and content that characterize industry responses to fracking opposition. Efforts to
discredit, marginalize, and politically pigeonhole their opponents are therefore an integral part of
the industry’s framing strategy (see: Chapter 7).
The federal government’s ceding of “legal, physical, discursive, and bureaucratic power”
with the passing of the Energy Policy Act of 2005 cast fracking into the arena of state and local
policy conflict (A. Bebbington & Bury, 2013, p. 282). As in so many other cases, stakeholders
then turned to politics in an effort to steer state power to their own ends. The net result of the
politicization of fracking in California over the course of the Shale Revolution has been complex
and varied according to the specific geographies in question. In coastal and urban communities
in the Santa Maria-Ventura and Los Angeles areas respectively, opponents challenge the
petroleum industry’s right to exist and operate at all with calls for moratoria and bans on fracking
from the local to state level, and so here the issue has served to further entrench and polarize
existing identities. In the rural communities of the San Joaquin Valley, however, opponents have
not objected to the industry’s right to extract at large, but rather to specific instances of negligent

279
or unlawful practices that run into conflict with agriculture, and here the issue has served to
dissolve and transform conventional political identities. Fracking in the San Joaquin shale basin
of California’s Central Valley is therefore an example of the type of phenomenon to which the
discipline of political ecology (at least in part) emerged in the 1990s as a response: one that
demands we “rethink modern urban/rural and nature/culture binaries” and “formally
[problematize] Western analytical conceptualizations of ideal nature as located outside the city
and wholly separable from human culture” (Rademacher, 2015, p. 142).
Technological Transition and Disruption
Despite the petroleum industry’s arguments that fracking is a decades-old technology (for
example Manfreda, 2015), the cluster of technical advancements that converged in the early
2000s to facilitate cost-effect exploitation of unconventional shale deposits of oil and gas
deposits clearly constitutes a categorically new functional capacity rather than mere “sustaining
innovations” (after Christensen, 1992, 1997, 2006). California’s oil production (Figure 142), like
U.S. domestic oil production as a whole (Figure 1 in Chapter 2), shows a compelling fit with the
Hubbert model of longitudinal extractive output up until the start of the Shale Revolution in 2006
(Hubbert, 1956). Hubbert curves, from which the concept of “peak oil” is derived, presume fixed
technological capacity over time, and are therefore subject to disruption. Such a disruption in
total U.S. domestic oil production is clearly evident beginning in 2006, but no corresponding
disruption occurred in California.

280
Figure 142: California Crude Oil Production and Hubbert Curve.
(Source Data: U.S. EIA, 2017b; American Petroleum Institute, 1999)
Hubbert curves presume technological determinism, which is to say that they assert
production is overwhelmingly a function of technological capacity and that any deviations from
the model over time caused by social, political, and economic factors will tend to be minor and
temporary. There is perhaps too much historical deviation in the case of California oil production
to make a strong claim for technological determinism, but the closeness of fit to the Hubbert
curve does suggest that its trajectory is narrowly bounded by available technology, and this is
consistent with the conclusions reached by other researchers such as Paul Sabin who notes:
“Regulation of oil production and the political allocation of petroleum resources [in California
has been] heavily shaped by the characteristics of petroleum underground and the technological
advances that facilitated its extraction” (2005, p. 5).
The emergence of fracking as a suite of advances that together yielded new functional
capacity seemed poised to disrupt long-standing technological boundaries on the trajectory of oil
production in California, as elsewhere across the country, thereby leading to a sharp deviation
0
100
200
300
400
1850 1870 1890 1910 1930 1950 1970 1990 2010 2030
Oil
Pro
du
ctio
n (
Mill
ion
s o
f B
arre
ls)
California Crude Oil Production and Hubbert Curve
Hubbert Curve Crude Oil Production

281
from the fait accompli of the older technology’s Hubbert curve: the Shale Revolution. Observers
expected that petroleum extraction would continue in a radical new form: “King Oil is dead, long
live King Oil!” (Klare, 2014; McCammon, 2017; Sanders, 2015). But the Shale Revolution was
stymied in California by the unusual geology of the Monterey Shale Formation, and the state’s
oil production trajectory has been consigned to remain on the Hubbert curve of prior technology
– at least for now.
The case of fracking in California is therefore an illustrative example of how dependent
the deployment of a new technological capacity is upon local circumstances, no matter how
disruptive it might have proven elsewhere, and serves as a cautionary tale for industry, NGOs,
the state, the academy, and the public alike to be wary of generalizing claims about energy
technology deployment from one locality to another. Much of the technology transition (Geels,
2002) and disruptive innovation (Christensen, 1997) literatures – including those pertaining
specifically to energy – fail to fully recognize the power of local conditions to constrain
technological deployment. As a result, these literatures do not adequately situate energy
transitions and disruptions within their specific social, political, economic, ecological, and
geographical contexts (see for example Shackley & Green, 2007; Smith, Voß, & Grin, 2010;
Verbong & Geels, 2007). This failure may, in part, result from the literature’s focus on industry
rather than locality as the unit of analysis at the micro-scale (i.e. “technological niches”) from
which innovations emanate and drive either incremental or abrupt change at the meso-scale of
“socio-technical regimes” or the macro-scale of “socio-technical landscapes” (Geels, 2005;
Geels & Kemp, 2007; Genus & Coles, 2008). Although it is perhaps rare, fracking is not the only
instance in which an energy technology has failed to take off as expected because of local
circumstances. Other notable examples in the United States are wind and geothermal power in

282
Hawaii, which despite great geographic potential were each long forestalled by local ecological,
cultural, and political factors (Edelstein & A. Kleese, 1995; Leonard, 2012).
The energy landscape in California is a “system of objects” that for many decades has
comprised “firms, communities, and people [who] are chained together in such a way that they
tyrannize one another” (Robbins, 2007, p. 14). In other words, mutual dependencies result in a
configuration – an “attractor basin” – of the energy system that is durable over years or decades.
These dependencies are fostered by the widespread use of oil and gas not just as fuels but also as
industrial inputs. However, as the long-anticipated prospect of technological alternatives in both
energy production (via cost-competitive renewables, most notably PV solar) and consumption
(via vehicle electrification) finally approaches reality, pressure has begun to mount from
progressive stakeholders who advocate for a transition to renewables based on their potential to
be more sustainable, healthy, and equitable than fossil fuels. Conservative stakeholders, in turn,
advocate for maintaining the petroleum status quo based on claims (whether legitimate or not)
that a transition to renewables would threaten jobs and economic prosperity. At the time of this
writing it remains to be seen whether the energy landscape in California will shift to renewables
incrementally or abruptly depending upon social, political, legal, economic, ecological, and
geographic factors at the state and local levels. It should be noted, however, that the levelized
cost of energy (LCOE) for PV solar plus storage – meaning the price of electricity when
overnight battery storage is included in the cost – is already nearing parity with electricity
produced by natural gas turbines, which in turn are now cheaper and cleaner than their coal-
burning successors. Solar power deployment has accelerated in the run up to grid parity, and
fossil fuel power plants in California are already beginning to idle during periods of high
insolation as a result of surplus output from renewables (Penn & Menezes, 2017). With the cost

283
of both PV solar panels and battery storage likely to continue falling throughout the 2020s, there
may come a point at which the value proposition of this renewable energy technology is
irresistible – economically and otherwise. Whether passing the grid parity threshold will result in
a gradual energy transition (Monstadt & Wolff, 2015) or an abrupt “clean disruption” (Seba,
2014) in California is not yet clear, and may itself depend upon the aforementioned contextual
factors. But while the preponderance of evidence strongly suggests the latter scenario is more
likely to occur, we should take some pause from the lessons of history in which earlier energy
technologies proved neither as clean nor as disruptive as anticipated. Lewis Mumford, for
example, predicted that hydropower would “liberate workers, purify polluted industrial cities,
and foster independence, decentralization, and democracy” (Sabin, 2010, p. 87), but the
electricity and water they made available helped give rise to industrial agriculture operations at
the expense of river ecosystems without always benefiting communities and workers – especially
immigrants. Nuclear fission originally promised electricity “too cheap to meter” (Strauss, 1954),
but the costs of construction, operation, and waste disposal ultimately proved too great for most
localities to bear (Union of Concerned Scientists, 2017). Advocates of biofuels laud their carbon
neutrality, but when produced instead of food or in place of forest conservation and preservation
biofuels may by many measures do more harm than good (Hunsberger, German, & Goetz, 2017;
Neville & Dauvergne, 2016). And solar, wind, and geothermal power installations have
footprints upon the landscape, albeit of a different character than that of fossil fuels, that bear
local concerns and complexities of their own.
Beyond California, fracking for natural gas has been widely hailed as a “bridge fuel” to a
low-carbon future (MITEI, 2011). But opponents of the technology such as Bill McKibben argue
that “far from being a bridge, the big investments in natural gas may actually be a breakwater

284
that keeps this new wave of truly clean energy from washing onto our shores,” and that “thanks
to methane leaks, [natural] gas won’t work as a ‘bridge fuel’” (2014, p. 1). In terms of energy
production within the state itself, California extracts very little of its own natural gas and is
therefore poised to “leapfrog” over fracking directly to next generation of renewable energy
technologies – most especially PV solar plus storage. Moreover, if renewables energy were to
become sufficiently inexpensive and abundant over the course of this century, then hydrocarbons
consumed as industrial inputs may one day come not from fossil sources but from carbon-neutral
synthetic ones instead (van der Giesen, Kleijn, & Kramer, 2014). Indeed, this pathway toward a
renewables-based energy future that is either carbon-neutral or carbon-negative is the explicit
long-term aim of the state’s current energy policy (California Energy Commission, 2017a).
Apprehension is still warranted, however, because while some future technological
advancements may well unleash the potential of renewables, others might yet unlock the billions
of barrels of fossil oil that still lie in wait within the Monterey Shale (Dorr, 2017; Mann, 2013).
Competing Narratives
Two competing narratives – one supporting fracking and the other opposing – emerged
almost immediately after the U.S. EIA 2011 report estimated 15.4 billion barrels of recoverable
reserves in the Monterey Shale. Where the supporting narrative promised trillion-dollar
economic bonanza, millions of new jobs, and a new era of cheap oil and security without
dependence upon foreign imports, the opposing narrative warned of a cataclysm of unavoidable
environmental harms that threatened human and ecological health alike. But try as they might,
the proponents of fracking gained little traction among the public with their utility-maximizing
master frame and the story of opportunity it told. The opponents of fracking, comprised largely
of community groups and environmental NGOs, avoided frames of cost-benefit analysis and risk
285
management, and instead focused squarely on the moral valence of the issue: fracking was
wrong because it was inherently dangerous, it was motivated by greed, and it represented a step
backward into the dirty energy era of the past instead of a step forward into the clean energy era
of the future.
The moralizing master frame of the opposition was key. Although the petroleum industry
mounted a well-organized and well-funded campaign to discredit its opponents for “fear-
mongering” and “peddling debunked claims” and for disseminating “myths versus facts” through
“ridiculous stunts”, its attempts at “fact checking” and “mythbusting” failed to convince the
public. It appears that opponents of fracking convinced the public that the oil and gas industry
could not be trusted, that its intentions were selfish, that its actions were irresponsible, and that it
had a known track record of both lying to and willfully harming the public. Moreover, every
effort the industry made to advance its own narrative paradoxically served to advance the
narrative of its opponents (Matz & Renfrew, 2015).
From 2011 onward, support for fracking continued to decline nationwide and in
California, as each new image of flaming tapwater or illegally-dumped wastewater published in
the news or spread across social media reinforced the opposition narrative that Big Oil and their
supporters were villains: greedy, irresponsible, selfish, and above all dishonest.
Legislative Outcomes: Arriving at SB 4
In the abstract, shifts in governance tend to reflect contests over “entanglement”, meaning
the “overlapping administrative jurisdictions layered upon ambiguous functional divisions of
labor [that] produce competition for, confusion about, over even gaps in political authority”
(Abers & Keck, 2013, p. 21). The practical result of responses to entanglement is “institution-
building”, which is “a relational process that occurs through human action and involves such

286
disparate activities as creating and disseminating ideas, struggling over legal designs,
experimenting with new solutions for problems, accumulating organizational and technical
capabilities, and building networks of support for the implementation of those ideas and laws”
(Abers & Keck, 2013, p. 3).
In the specific case of California’s oil and gas sector amidst the Shale Revolution,
entanglement and institution-building have been shaped by political disputes as in so many other
examples elsewhere (Martinez-Alier, 2003), but – importantly – not by the territorial disputes
that often accompany political conflict in the global south (Abers & Keck, 2013; Peet & Watts,
1996; Watts, 2004). Conflict over oil and gas tends to center more upon the mineral rights below
ground, and less upon the property rights at the surface – hence the title of Antony Bebbington
and Jeffrey Bury’s book “Subterranean Struggles” (2013). Within this political economy
framework, the state occupies an ambiguous role as both institution and stakeholder: “the state
emerges, therefore, as both a directly interested party (it controls rights in the subsoil) and also as
a clear terrain of struggle” (A. Bebbington & Bury, 2013, p. 282).
The case of fracking in California initially presented itself as a crisis, the first direct
legislative impact of which was Assemblyman Bob Wieckowski’s proposal of AB 591 in June
2011, just weeks before the U.S. EIA report’s release (Table 2). This bill was an “attempt to get
in front of the issue” that would have required “[disclosure of] the chemicals being used” along
with disclosure of where firms were undertaking fracking and how much fresh water was they
were consuming in the process (Rodriguez, 2011a). Subsequent state Assembly and Senate bills
proposed in 2011 and 2012 either reiterated and elaborated on these requirements, or called for a
statewide moratorium on the practice prior to completion of an independent scientific study of
the risks posed by the practice. At the time, communities were already engaged in a lawsuit in
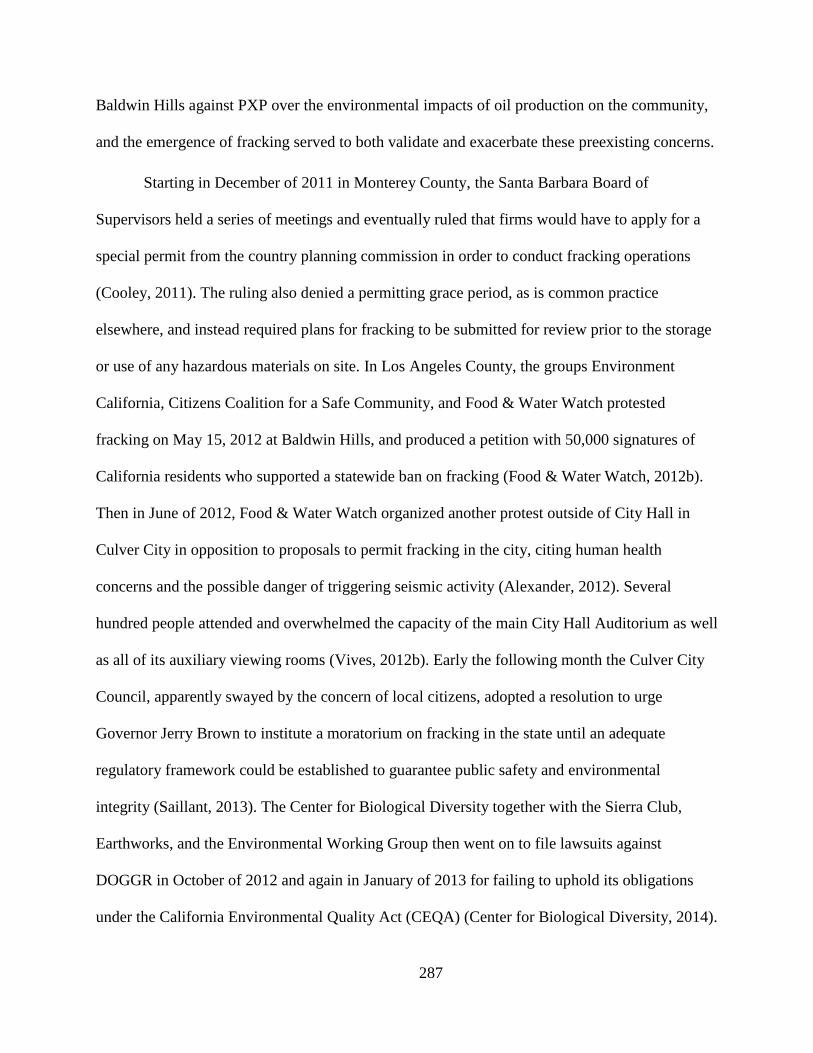
287
Baldwin Hills against PXP over the environmental impacts of oil production on the community,
and the emergence of fracking served to both validate and exacerbate these preexisting concerns.
Starting in December of 2011 in Monterey County, the Santa Barbara Board of
Supervisors held a series of meetings and eventually ruled that firms would have to apply for a
special permit from the country planning commission in order to conduct fracking operations
(Cooley, 2011). The ruling also denied a permitting grace period, as is common practice
elsewhere, and instead required plans for fracking to be submitted for review prior to the storage
or use of any hazardous materials on site. In Los Angeles County, the groups Environment
California, Citizens Coalition for a Safe Community, and Food & Water Watch protested
fracking on May 15, 2012 at Baldwin Hills, and produced a petition with 50,000 signatures of
California residents who supported a statewide ban on fracking (Food & Water Watch, 2012b).
Then in June of 2012, Food & Water Watch organized another protest outside of City Hall in
Culver City in opposition to proposals to permit fracking in the city, citing human health
concerns and the possible danger of triggering seismic activity (Alexander, 2012). Several
hundred people attended and overwhelmed the capacity of the main City Hall Auditorium as well
as all of its auxiliary viewing rooms (Vives, 2012b). Early the following month the Culver City
Council, apparently swayed by the concern of local citizens, adopted a resolution to urge
Governor Jerry Brown to institute a moratorium on fracking in the state until an adequate
regulatory framework could be established to guarantee public safety and environmental
integrity (Saillant, 2013). The Center for Biological Diversity together with the Sierra Club,
Earthworks, and the Environmental Working Group then went on to file lawsuits against
DOGGR in October of 2012 and again in January of 2013 for failing to uphold its obligations
under the California Environmental Quality Act (CEQA) (Center for Biological Diversity, 2014).

288
Meanwhile, anti-fracking protests continued to occur in on a regular basis in major cities across
the state (Banerjee, 2013; Campbell, 2014; Vives, 2012a, 2012c).
From 2011 to 2013, as California’s stakeholders grappled with the perceived crisis of
fracking and the mix of promise and peril it presented, new forms of governance were imagined
and debated in anticipation of a technological disruption of the state’s petroleum industry and
associated energy and transportation sectors. Scrutiny and critique were key elements at the core
of California’s fracking discourse during this period, and the response of state apparatus to
apparent failures of institutional credibility and legitimacy was four-fold: 1) it aimed to reduce
scientific uncertainty by mandating the production of knowledge by independent scientific
authorities; 2) it replaced leadership who were either negligent or corrupt; 3) it adopted new rules
and regulations; and 4) it restructured the apparatus to better fulfill its monitoring and
enforcement duties. These responses were achieved via the passage of SB 4 in September 2013.
The rationale behind SB 4 is stated explicitly in the Section 1 of the bill’s text:
“The Legislature finds and declares all of the following:
(a) The hydraulic fracturing of oil and gas wells in combination with
technological advances in oil and gas well drilling are spurring oil
and gas extraction and exploration in California. Other well
stimulation treatments, in addition to hydraulic fracturing, are also
critical to boosting oil and gas production.
(b) Insufficient information is available to fully assess the science of
the practice of hydraulic fracturing and other well stimulation
treatment technologies in California, including environmental,
occupational, and public health hazards and risks.

289
(c) Providing transparency and accountability to the public regarding
well stimulation treatments, including, but not limited to, hydraulic
fracturing, associated emissions to the environment, and the handling,
processing, and disposal of well stimulation and related wastes,
including from hydraulic fracturing, is of paramount concern.
(d) The public disclosure of chemical information required by this act
ensures that potential public exposure to, and dose received from,
well stimulation treatment fluid chemicals can be reasonably
discerned.
(e) The Legislature encourages the use or reuse of treated or untreated
water and produced water for well stimulation treatments and well
stimulation treatment-related activities.”
Democratic legislators supported SB 4 largely because of intense, persistent, and well-
organized pressure from their constituencies. But Republicans had an additional reason for
supporting the bill: it was preferable to the available alternatives, most especially a ballot
proposition. Had SB 4 not passed, it is very likely that a proposition to ban fracking statewide
would have met with enough support to appear on the ballot, thereby threatening an up-or-down
public vote. The outlawing of well stimulation treatments (defined, for example, as hydraulic
fracturing, matrix acidizing, and acid fracturing) would have been a far worse outcome for the
industry than the mere regulatory strictures imposed by SB 4, and it is quite likely that such a
proposition would have passed. Industry opposition to SB 4 was therefore limited, carrying just
enough force via the expenditure of political and financial capital to massage some of the finer
details of the legislation (such as limiting its scope to only a narrow definition of which practices

290
constitute well stimulation) and to legitimize the narrative that the bill was an onerous imposition
on firms, but not so much as to defeat the bill outright. Environmental NGOs criticized the bill
on this basis, condemning it for unwittingly playing to industry interests and not doing enough to
protect human or ecological health (Stock, 2013).
Scholars such as David Spence have argued that it is useful to view legislative and
governance outcomes like California’s SB 4 as the product of Coasian bargaining over rights to
utilize property in ways that generate environmental externalities. Spence observes that “[s]hale
oil and gas production holds out the prospect of great benefits and great costs, particularly for
locals … [it] offers an example of an age-old political problem that the law is called upon to
solve: the conflict between an intensely held minority viewpoint and a less intense, contrary view
held by the majority” (2014, p. 413). But while Coasian logic suggests that “giving local
governments the power to veto proposals to frack will lead to more bargaining, and thus more
efficient outcomes, than state-level decision making,” the well-known limitations of the logic
challenge both scholars and policymakers alike to identify governance responses to fracking that
more fully account for the information asymmetries among stakeholders and “more closely
consider the transaction costs that local governments and producers face in bargaining”
(Wiseman, 2015, pp. 1–3). Other scholars view the governance challenges posed by fracking
through institutional lenses, and analyze subterranean struggles as tragedies of the commons to
be solved with adaptive approaches that task local and regional authorities to engage in the
messy processes of rule-making and institution-building in order to resolve entitlement conflicts
around extraction (A. J. Bebbington & Bury, 2009; Hudgins & Poole, 2014; Powers, 2010).
Viewed as a common-pool resource problem from an institutional perspective, SB 4 represents a
stage-setting legislative outcome upon which contests and conflicts will play out at the regional

291
and local levels (Abers & Keck, 2013; Dietz, Ostrom, & Stern, 2003; Ostrom, 1990). A third
contingent of scholars regards legislative and governance outcomes such as SB 4 through the
lens of power relations, and therefore understands regulations and the public apparatuses for
monitoring and enforcing them to be mechanisms by which capital (from a Marxian perspective)
and the state (from a Foucauldian perspective) reproduce both themselves and their subjects (see
for example Blaikie & Brookfield, 1987; Foucault, 1982; Harvey, 1973; Peet & Watts, 1996;
Powers, 2010; Watts, 2004; Willow, 2014). Through the lens of power, SB 4 represents an
embodiment of the “tensions between neoliberalism, capitalist production and consumption, on
the one hand, and the stated ideals of community empowerment, on the other” (Cornea, Véron,
& Zimmer, 2017, p. 2). When viewed through the lens of power, technologies like fracking and
the people and organizations that utilize them constitute linkages within networks of actors, and
together comprise integral elements of the “stable assemblages” that make society “durable”
(Latour, 1990). Formal institutions such as laws and regulations, on this view, are mechanisms
by which the social and power relations embedded within society are “stabilized”, or sustained,
via the continued use and dependence upon a specific technology or “artifact”. The emergence of
legislation such as SB 4, which constrains rather than outlaws the continued use of given
technology (in this case fracking), is therefore predictable precisely because the stability and
indeed survival of the existing sociotechnical system depends upon it (Latour, 1993, 2007).
The Aftermath
After four years of heated political contestation following the 2011 U.S. EIA report about
the 15.4-billion-barrel trove of oil in the Monterey Shale, the dust at last began to settle in the
summer of 2015. In June, the U.S. EPA released the long-awaited first draft of its national study:

292
“EPA found scientific evidence that hydraulic fracturing activities
can impact drinking water resources under some circumstances [and]
identifies certain conditions under which impacts from hydraulic
fracturing activities can be more frequent or severe,” including the
following:
• Water withdrawals for hydraulic fracturing in times or areas of
low water availability, particularly in areas with limited or
declining groundwater resources;
• Spills during the handling of hydraulic fracturing fluids and
chemicals or produced water that result in large volumes or high
concentrations of chemicals reaching groundwater resources;
• Injection of hydraulic fracturing fluids into wells with inadequate
mechanical integrity, allowing gases or liquids to move to
groundwater resources;
• Injection of hydraulic fracturing fluids directly into groundwater
resources;
• Discharge of inadequately treated hydraulic fracturing wastewater
to surface water; and
• Disposal or storage of hydraulic fracturing wastewater in unlined
pits, resulting in contamination of groundwater resources.”
Several weeks later, in July, the independent scientific study of fracking impacts in
California published its own findings that direct environmental impacts are limited primarily to

293
soil, surface water, and groundwater contamination as a result of irresponsible wastewater
disposal practices (California Council on Science and Technology et al., 2015). The researchers
found no evidence of aquifer contamination as a direct result of the drilling and production of
stimulated wells in particular, nor did they find evidence that fracking wells impose a greater
land footprint than oil development in general. The study also confirmed industry claims that
because horizontal wells are uncommon and because so much fossil water is produced alongside
oil in the Monterey Shale on account of its unique geology, fracking in California does not
consume large quantities of fresh water. The researchers did, however, find that well stimulation
practices tend to produce slightly more air pollutants than conventional operations on account of
their use of toxic additives in fracturing and acidizing fluids, but they note that these are “mostly
a small part of total emissions in oil producing regions” (California Council on Science and
Technology et al., 2015, p. 2).
At the end of the summer, in September 2015, the U.S. Geological Survey published its
assessment of oil and gas resources in the Monterey Shale that further downgraded the initial
2011 U.S. EIA estimate to just 21 million barrels of recoverable tight oil – less than 1/700th of
the original figure (USGS, 2015). The fracking boom in California was a bust. Four years of
intense political struggle in which triumphant economic visions clashed with apocalyptic
environmental ones ended with a fizzle, and the concerns that motivated the pursuit of local
moratoria and bans on well stimulation practices in most petroleum-producing localities
diminished such that fracking was no longer a significant part of the environmental legislative
agenda.
Less than a month later, however, petroleum in California returned to the national
headlines with the Aliso Canyon natural gas storage facility leak – the largest methane leak in the

294
country’s history (Conley et al., 2016; Khan, 2016). Over the 110 days between its discovery on
October 23 and containment on February 11, the blowout is estimated to have discharged more
than 100,000 tons of methane and 8,000 tons of ethane into the atmosphere (Figures 143 and
144).
Figure 143: Infra-Red Image of Aliso Canyon Storage Facility Methane Leak, December 2015.
(Image Source: Environmental Defense Fund, 2015).

295
Figure 144: Aliso Canyon Storage Facility Blow Out Site, December 2015.
(Image Source: Earthworks, 2015).
Oil was discovered at Aliso Canyon in 1938 and developed through the early 1970s by
the Tidewater Associated Oil Company, owned by renowned Los Angeles oil man J. Paul Getty.
Upon depletion in 1972, the wells in the Aliso Canyon field were repurposed for natural gas
storage and comprise the second largest facility of this kind in the nation. Prior to the 2015
disaster, the facility was used primarily for back-up power generation when draw on the grid is
highest in the summer heat. The blowout was attributed to the Southern California Gas
Company’s failure to adequately maintain the facility’s antiquated and aging infrastructure –
most of which was over 50 years old (Siders, 2016).
The Aliso Canyon disaster was notable not only for the scale of the natural gas leak, but
also because it affected the wealthy and predominantly white neighborhood of Porter Ranch.
More than 8,000 families were evacuated after thousands of complaints and reports of respiratory
ailments, nosebleeds, and other health problems were reported by residents (Page, 2016; Walton,

296
2016). At its peak, the cost of housing displaced families exceeded $1.8 million per day.
Although the footprint of the oil and gas industry in Los Angeles tends not to follow the patterns
of environmental injustice that are typical of other heavy industries on account of the need to
abide geological rather than socioeconomic contours, the fact that a community with substantial
power and voice suffered the greatest impacts from the disaster likely triggered more intense
regulatory and judicial responses from local and state authorities. In the wake of the disaster,
evidence emerged that both utility executives at the Southern California Gas Company as well as
public officials were warned in direct testimony by Phillip E. Baker, Director of Storage for the
company, in November 2014 that the decades-old storage facility was a proverbial “time bomb”
waiting to go off (California Public Utilities Commission, 2014). More than 130 civil lawsuits
were filed by affected residents, and Los Angeles County filed criminal charges against the
utility for its negligence (M. Hamilton, 2016; St. John & Walton, 2016; Walton, 2016).
In March of 2016 the Los Angeles County Board of Supervisors formed a “Strike Team”
charged with spot-checking well sites for compliance with permitting and operating regulations
that might have been overlooked by DOGGR (Mazza, 2014; Sewell, 2016). A year later, the
Southern California Gas Company sued Los Angeles County “because of the County of Los
Angeles and Cal/OSHA’s unlawful and improper attempts to regulate SoCalGas’ natural gas
pipeline and underground storage facilities,” and claimed that these “improper actions are
preempted by federal and state law” under the purview of the Pipeline and Harzardous Materials
Administration with the U.S. Department of Transportation (McNary, 2017, p. 1). The next
week, Los Angeles County filed a countersuit over the reopening of the Aliso gas storage facility
(N. Agrawal, 2017).

297
Environmental NGOs that had previously been focused specifically on fracking in
California used the Aliso Canyon disaster as a justification to pivot toward opposition of oil and
gas development at large. Interviewees at several local and state NGOs confirmed claims made
by industry interviewees that “fracking was just an excuse to go after the entire oil and gas
industry”. The prominent local anti-fracking group California Frack Facts (CAFrackFacts.org),
for example, altered the title of its popular newsfeed from “Fracking Press Clips” to “Oil & Gas
Press Clips”. This pivot reflects a change in posture with respect to the petroleum industry and
its associated energy infrastructure from one that is critical of specific high-risk practices such as
fracking toward a one that condemns the entire fossil energy system as inherently dangerous.
Limitations
While GPE and frame analysis are both appropriate case-study approaches for answering
this dissertation’s respective research questions, they nevertheless each have limitations.
A key limitation of the GPE analysis conducted in this dissertation research is the
unavoidable fact that information about private-sector shareholders (in this case, petroleum firms
and their industry associations) and the flows of resources, information, and influence between
them and other categories of shareholders (namely, policymakers and public agencies) are highly
opaque. Because the existence and magnitude of these flows can seldom be observed directly (to
gather primary data) or obtained from other sources (as secondary data), they must therefore be
inferred from indirect evidence. Another limitation of the GPE analysis is that the unit of
analysis in question – the industrial practice of fracking as an object of regulation – is inherently
part of an open system, and so the decisions about what constitutes the relevant boundaries of the
“political economy” for the purposes of this analysis remain open to challenge. Constraints of
time and resources prevented this dissertation research from fully including public utilities and

298
transportation as part of the analysis, for example, yet connections clearly exist between the
petroleum industry and these other sectors of the California economy.
A major limitation of the frame analysis conducted in this dissertation research is the
possibility that constraints on time and resources prevented the discovery of all salient frames
that are operative within the fracking discourse in California. Although perhaps unlikely, it is not
impossible that conducting additional interviews or reviewing a larger body of publications
might have revealed frames that would alter the findings and conclusions of this dissertation
research. A related limitation of the frame analysis is that the private thoughts and conversations
remain inaccessible, and so with few exceptions (such as leaked secret surveillance recordings,
for example) only content that stakeholders are willing to share in either interviews or
publications are available for examination.
Future research could address these limitations through a combination of additional
financial and labor resources, triangulation with other methodological approaches, and – ideally
– leveraging social resources (such as personal or business connections) to obtain better access to
key informants within the petroleum industry.

299
Chapter 7. Conclusion
The rise of modern environmentalism brought international attention to both long-
standing and new debates over humanity’s relationship with nature. This case study of how well
stimulation techniques (or “fracking”, to which the collection practices is more commonly
referred) have been framed, understood, and ultimately governed in California during the
unfolding of the domestic Shale Revolution unfolded challenges apolitical conceptions of
communities, ecologies, economies, and technologies (i.e. “sociotechnical” systems. In doing so,
this dissertation research interrogates the widespread assumptions that the environmental impacts
of energy systems are either structurally-determined or technologically-determined fait accompli
upon which institutions and stakeholders exert only superficial influence (Robbins, 2007; Sabin,
2005). The analyses undertaken here explore the interdependencies among state apparatus, firms,
and communities which for many decades have consistently produced what we might term the
“carbon citizens” whose identities shape and are shape by the energy system, and “whose [lives
are] disciplined by the material demands of the landscapes they inherit, create, and maintain”
(Robbins, 2007, p. xviii). The findings of these analyses affirm the deeply politicized nature of
the state’s energy system and the polarized identities within its polity, and show that California
continues to offer “a case history for the impact of oil on individual states and a microcosm of its
penetration of the United States as a whole” (Sabin, 2005, p. 1).
This dissertation research contributes to the academic literature surrounding energy
systems and their sociotechnical transitions by helping to elucidate how the evolution of
California’s unique fracking discourse and governance has shaped national and global

300
environmental debates at three distinct levels of abstraction: substantive, theoretical, and
philosophical.
Situating Fracking in California within Substantive Debates
Substantive environmental debates tend to center upon specific historical events,
ecological practices, and cultural phenomena. Specific historical events such as California’s
Lakeview Gusher of 1909, the Dust Bowl from 1934 to 1939, the Santa Barbara oil spill and
Cuyahoga River fire in 1969, the Love Canal disaster in 1978, the disaster at Three Mile Island
in 1979, the Bhopal disaster in 1984, the Chernobyl nuclear disaster in 1986, the Exxon Valdez
oil spill in 1989, the BP Deepwater Horizon oil spill in 2010, and the Fukushima Daiichi nuclear
disaster in 2011 each served to galvanize public interest and environmental concern to such a
degree that they provoked direct and sustained political responses at all levels of government
(Andrews, 2006; Pepper, 1984). Events of this kind contribute to our culture’s overall ecological
zeitgeist, and thereby drive the broader theoretical and philosophical debates of their time as
well. Fracking in California has not (yet) produced a singular environmental disaster directly, but
it has indirectly supported the state’s lock-in to fossil fuels and the aging infrastructure
associated with them – and the Aliso Canyon blowout and natural gas leak disaster in 2015 is
precisely such an event. And opponents of fracking, such as environmental NGOs, have been a
concerted effort to link the two within the public consciousness.
Similarly, specific ecological practices such as clear cutting of old growth redwood
forests in the 19th and early 20th Century, water diversion and the aggressive damming of rivers
beginning in early 20th Century, and air and water pollution resulting from modern agriculture
and industry have contributed to environmental concerns among the public that drive wider
debates. Much to the chagrin of the petroleum industry whose firms and associations have tried
301
repeatedly to highlight the distinctions among the various enhanced recovery techniques they
employ, fracking is understood by the California public to be a dangerous practice that is
inherently harmful to both human and ecological health.
So too do specific policies shape environmental discourse and debates, including both
those that are explicitly environmental such as smog legislation that first began with the Air
Pollution Control Act of 1955, as well as those that have indirect environmental consequences
such as the protracted series of legislation that funded California’s early highway infrastructure
and paved the way (quite literally) for the automobile to become the dominant mode of personal
transportation (Sabin, 2005). The emergence of SB 4 as the state’s flagship legislation to regulate
well stimulation practices (defined narrowly as only hydraulic fracturing, matrix acidizing, and
fracture acidizing) now represents the centerpiece of the California’s fracking governance
institutions. Local policy and regulation remains relevant, but is nonetheless secondary to SB 4
with respect to its impacts upon substantive
Finally, specific cultural phenomena such as the publication of Rachel Carlson’s Silent
Spring that warned of the dangers posed by DDT, Paul Ehrlich’s The Population Bomb that
predicted resource shortages, the inaugural Earth Day in 1970, and Al Gore’s 2006 film An
Inconvenient Truth also play an important role in establishing and steering substantive
environmental debate (Grove, 1990; Sabin, 2013). Here California has played an outsized role in
shaping substantive debates around fracking because of the extraordinary power to influence
public opinion that the state’s native film and television industries possess. Josh Fox’s 2010 film
Gasland is in large part responsible for initially raising fracking to public consciousness
nationwide, and subsequent documentary and fiction films further grappled with the issue. A
number of Hollywood celebrities lent their voices to the opposition of fracking in California, and

302
have remained vocal as the target of that opposition pivoted toward fossil fuels and
decarbonizing the state’s energy system at large starting in 2015 (Daunt, 2016).
Situating Fracking in California within Theoretical Debates
Theoretical debates among scientists over how environmental problems ought to be
constructed, how the relevant data should be gathered and analyzed, and what conclusions may
be drawn from those data both inform and are informed by the aforementioned substantive
debates that center upon events, practices, policies, and cultural phenomena. For example,
substantive debate over the Santa Barbara oil spill in 1969 between industry, federal agencies,
and local communities sparked an intense theoretical debate among scientists which ultimately
led researchers to wholly redefine marine ecosystem degradation and to revolutionize how water
pollution is detected and measured (Spezio, 2011). In the opposite direction, theoretical debate
among academic and industry scientists over the toxicity of tetraethyl lead in gasoline throughout
the 1960s and 1970s eventually evolved into a substantive public controversy thanks in great
measure to the outspoken advocacy of Cal Tech geochemist Clair Patterson beginning in 1962
(Tilton, 1998). Other examples of past theoretical debates include the safety of fluoridated water,
the risk of nuclear power plant failures, the role of chlorofluorocarbons (CFCs) in the loss of
stratospheric ozone, and the dangers to ecosystems posed by DDT, among many others.
Like other examples of case study research, the goal of this dissertation research is “to
expand and generalize theories (analytic generalization) and not to enumerate frequencies
(statistical generalization),” and so the findings presented here are “generalizable to theoretical
propositions and not to populations or universes” (Yin, 2009, p. 15). The theoretical explanations
for how and why environmental governance and discourse evolved as it did around fracking in
California that were developed through this research may therefore contribute to the political

303
ecology literature by aiding future theoretical efforts to explain the evolution of environmental
governance and discourse around other instances of extraction and sociotechnical transition
(Bebbington & Bury, 2013; Robbins, 2011). The case of fracking in California may also
therefore contribute to the framing literature by aiding future theoretical efforts to explain how
stakeholders in competing “discourse coalitions” (i.e. blocs of stakeholders that either support or
oppose a new practice or policy) leverage scientific uncertainty as part of their efforts to frame
and narrate the issue to their advantage (Bomberg, 2017; Dodge & Lee, 2017; Metze & Dodge,
2016). Potential examples of future extractive struggles include those over lithium and cobalt
(for batteries) and rare earth elements such as neodymium and praseodymium (for magnets and
electronics). Potential examples of sociotechnical transitions include the ongoing genetic
modification of organisms, the advent of lab-cultured and synthetic meats, the adoption of
autonomous vehicles, and the deployment of solar radiation management (SRM) climate
engineering.
Situating Fracking in California within Philosophical Debates
Substantive and theoretical debates play out beneath the larger arc of philosophical
debates, as societies perpetually redefine, reconstruct, and reinterpret the meanings of the terms
“nature” and “environment”. “Nature, like us, has a history,” Peter Coates writes in his
eponymous book Nature, and “the layers have never ceased to accumulate … the strata of
meaning are now bewilderingly dense and convoluted” (Coates, 2005, pp. 1–2). The idea of
“nature” is a floating signifier, and therefore a hybrid of our sociopolitical perceptions and
physical experiences (Latour, 1993). In the process of constructing nature, we also establish the
conditions of our relationship to it (White, 1967) or, indeed, whether humanity ought to be held
as conceptually distinct from nature at all (Leopold, 1953). For example, philosophical debate

304
over whether other living things have inalienable rights or whether they are merely resources
with which to meet human needs continues to pit the philosophies of preservation (which aims to
protect nature from human use) and conservation (which aims to protect nature for human use)
against one another more than a century after John Muir and Gifford Pinchot first fully
articulated these conflicting visions in the environmental discourse (Andrews, 2006; Balogh,
2002; Meyer, 1997). Philosophical debate over how to weigh the peril of ecological and public
health risks against the promise of economic benefits across a range of timescales with differing
degrees of inclusion has been central to many previous environmental issues (Robbins, Hintz, &
Moore, 2013). Deforestation in the 19th Centuries, the damming of rivers in the early 20th
Century, the application of fertilizers and pesticides top crops starting in the mid-20th Century,
the deployment of nuclear power in the latter half of the 20th Century, and the use of genetic
engineering starting in the early 21st Century are all examples of contested practices whose
underlying technologies carry some non-trivial risk of causing environmental damage. These and
a plethora of others are now joined by fracking as examples of how differing ethics produce
incommensurate modes of environmental valuation (see for example Costanza, 2001; Farber,
Costanza, & Wilson, 2002; Martinez-Alier, Munda, & O’Neill, 1998).
Philosophical debates of this sort are inherently political (Callicott, 1990; Callicott &
Nelson, 1998; Robbins, 2011; Robbins, Hintz, & Moore, 2013). Sabin (2013) argues that the
competing visions proffered by Jimmy Carter and Ronald Reagan during the 1980 presidential
election represent an important historical turning point in environmental discourse: where
Carter’s vision prioritized restraint and frugality on the basis of ecological limits and
environmental risks, Reagan’s vision emphasized expansion and growth drawing from a faith in

305
human ingenuity, market-based solutions, and divine providence. Sabin traces the roots of
today’s environmental partisanship in the United States to this particular philosophical debate.
The philosophical debates surrounding fracking in California are framed by stakeholders
in dichotomous terms: economy versus environment, safe versus dangerous, responsible versus
reckless, urban versus rural, rich versus poor, conservative versus liberal, freedom versus
tyranny, David versus Goliath, progress versus regress. The binary character of these debates
lends them to zero-sum outcomes as well as intense political polarization (see for example
Lakoff, 2002, 2009, 2010). This in turn has important implications for how disagreement among
scientists is leveraged by different groups to construct competing fracking narratives in order to
advance their specific interests (Hudgins & Poole, 2014; Pielke Jr., 2004). As ever, science “is a
remarkably potent catalyst for political dispute” (Sarewitz, 2004, p. 397). The lack of scientific
consensus and associated proliferation of narratives in the California fracking discourse serves to
reiterate an “old chestnut” of political ecology, which is the importance of recognizing that
different stakeholders harbor diverse conceptions of “the good” that originate from their widely
divergent experiences, values, and goals (Bebbington & Bury, 2013).
The case of fracking in California is particularly instructive because stakeholder
perceptions of an impending explosion of shale oil production (representing either a crisis or an
opportunity) lent an extraordinary urgency to the normally slow-moving environmental
discourse. This dissertation research therefore contributes to the environmental ethics literature
by illustrating the unusual dynamics of philosophical debate within environmental discourse –
and most especially the power of moralizing frames – that may come to surround sociotechnical
transitions when the stakes are high and time is short.

306
Toward a Political Ecology of Sociotechnical Transition
Neither the economic promise nor the environmental peril of fracking in California came
to pass. And yet legislation was enacted as if both the opportunity and the crisis were real. This
case study of fracking in California therefore reveals that the ongoing reproduction of our current
petroleum-based sociotechnical system requires not just industrial inputs of capital and labor, but
also a large interdependent web of consumer behaviors, socioeconomic structures, formal and
informal institutions of governance, political climate, and a normative tolerance of
environmental risks to human and ecological health that together rationalize extraction (Robbins,
2011). The complexity of this sociotechnical system, however, contains internal contradictions
that have defied simple market logics since the earliest days of oil in California beginning in the
1870s (Sabin, 2005, 2012). The emergence of SB 4 as the centerpiece of the state’s fracking
governance is, on this view, the outcome of a deeply-entrenched political economy struggling to
sustain itself. The GPE analysis presented here therefore answers this dissertation’s first research
question: how does the political ecology of California’s energy system explain the regulation of
oil and gas well stimulation practices at the local, county, and state level that has emerged after
these practices were partially exempted from federal environmental regulation under the Energy
Policy Act of 2005? It does so by identifying the relevant structural factors, institutions, and
stakeholders that engage fracking in California, and explaining the dynamics of their
interrelations unfolded over the course of the Shale Revolution from 2006 to 2016. The frame
analysis presented here in turn answers this dissertation’s second research question: how have
the ways that diverse stakeholders frame competing narratives about oil and gas well stimulation
practices shaped regulatory outcomes at the state, county, and local levels in California after
these practices were partially exempted from federal environmental regulation under the Energy

307
Policy Act of 2005? It shows that by invoking a moralizing master frame and an organizing
narrative of danger, opponents of fracking were able to portray the petroleum industry and its
supporters as villains, and thereby turn their own master frame of utility-maximization against
them by citing it as evidence of greed and recklessness. Opponents of fracking were then able to
leverage this framing of themselves as heroic underdogs engaged in a righteous quest in their
efforts to steer public opinion and influence policymakers, such that aggressive state-level
legislation in the form of SB 4 was proposed and passed despite broad bipartisan support for
fracking among elected officials both within California and across the country as a whole.
The case of fracking in California is in many ways a deeply familiar political ecology
story: it is one of entangled institutions and industries, of struggles over extraction, of the
evolution of state and local environmental governance under federalism, and of the reproduction
of the existing (carbon) regime (Abers & Keck, 2013; Bebbington & Bury, 2013; Robbins,
2011). But it is also an extraordinary story of technological change triggering social
mobilization, of perceptions mattering more than reality, of activism overturning orthodoxy, and
of moral valence superseding structural and technical logics. By offering specific explanations
for these processes through the use of GPE and Frame analyses, this dissertation research helps
us move toward a better understanding of the political ecology of sociotechnical transitions.
Future research in political ecology and related disciplines could therefore build upon this
understanding to investigate the dynamics of subsequent sociotechnical transitions in energy
systems, food systems, water systems, transportation systems, and housing triggered by
technological advances in renewable energy, battery storage, synthetic and indoor agriculture,
atomically precise manufacturing, machine intelligence, and automation – among many others –
in both the United States and abroad.

308
Appendix A. Interview Questionnaire Instrument
“Fractured Politics” Semi-Structured Open-Ended Interview Questionnaire
Primary Data Instrument for Adam Dorr PhD Dissertation Research IRB#16-001591
Opening Statement:
“Thank you very much for agreeing to be interviewed. As the Research Information Sheet you
have reviewed states, the purpose of this interview is to gather data for my PhD dissertation
research at UCLA, which aims to build an understanding of the history and evolution of oil and
gas well stimulation practices (collectively known as fracking) and their regulation in California.
If you have any questions or concerns at any time during the interview, please don’t hesitate to
voice them. And if you wish to stop the interview at any time for any reason, you are free to do
so. I’m going to begin recording now. Are you ready?”
QUESTIONNAIRE
Category Question Logic
1. Awareness and
understanding
What do respondents know, or perceive
themselves to know, about fracking, its
regulation, and its politicization? And
how have they acquired this knowledge?
1.1 Can you describe how you
first became aware of
fracking?
This question is intended to contextualize
the respondent’s knowledge within the
history of fracking.
1.2 Where do you get most of
your information about
fracking?
This question is intended to identify the
respondent’s sources of information, and
whether or not they perceive those sources
to be legitimate and/or comprehensive.
1.3 Fracking is often portrayed
as a political issue in the
mainstream news media.
Why do you think this is
the case?
This question is intended to probe the
respondent’s political understanding of
fracking, and gauge their awareness of
how various interest groups perceive the
issue differently.

309
1.4 What is your view of the
current state of scientific
knowledge around
fracking?
This question is intended to gauge the
respondent’s awareness of the scientific
uncertainty surrounding fracking.
1.5 Are there any specific
aspects of fracking that you
think need greater study
before policies and
regulations should be put
in place?
This question is intended to probe the
respondent’s perceptions and beliefs about
the relationship between scientific
understanding and policymaking.
2. Valence and
attitude
Why is fracking an issue that respondents
care about? What values (positive or
negative) do they ascribe to the issue?
What are their concerns about the issue?
What are their hopes for the direction that
the issue will take?
2.1 Is fracking an important
issue to you, and if so
why?
This question is intended to give
respondents an open-ended opportunity to
identify explain the reasons why fracking
is a significant issue to them (e.g.
personally, professionally, etc.). This will
provide an indication of the moral and
political valence that the issue holds for
different groups, how they frame their
knowledge within the context of their
values, and why and how narratives are
constructed accordingly.
2.2 What is your own view on
how the benefits and
drawbacks of fracking
should be weighed against
each other?
This question is intended to ascertain how
the respondent evaluates the potential
risks of fracking to human and ecological
health relative to its potential
socioeconomic benefits.
2.3 Do you think fracking
could be done safely if all
of the best available
practices were always
followed?
This question is intended to identify
whether respondents believe the risks
posed by fracking are inherent in the
technology itself or a function of
imperfect implementation, which shapes
how fracking should be regulated.
2.4 What are your thoughts on
how the benefits and
drawbacks of fracking are
distributed across different
social groups?
This question is intended to probe whether
respondents believe fracking is a social
and environmental justice issue, and its
associated political and moral valence.

310
2.5 Can you describe any ways
in which your views of
fracking have changed over
time?
This question is intended to identify any
specific factors that have influenced the
respondent’s attitude toward fracking
2.6 Why do you think fracking
is so controversial?
This question is intended to identify how
respondents frame the issue of fracking,
and how/why their own framing conflicts
with competing frames and their
associated narratives.
2.7 What do you think are the
greatest barriers to
addressing the issue of
fracking in better ways?
This question is intended to identify both
the direction in which respondents think
fracking policy and regulation should
move, and the parties/interests who are
opposed to that movement. In doing so,
this question is intended to identify
whether respondents view the obstacles to
their own interests as structural (i.e. a
function of unthinking systemic forces,
such as impersonal market pressures) or
political (i.e. a function of deliberate
actions by vested interests).
3. Private-sector-
specific
[To be asked only
of respondents who
work in the private
sector]
What do private-sector-specific
respondents know (or perceive themselves
to know) about fracking as practiced in
California? And how do they compare
their own knowledge in this regard to the
level of knowledge exhibited within the
public fracking discourse?
3.1 In your experience, what
percentages of new well
jobs involve hydraulic
fracturing, acidizing, and
perforating respectively?
This question is intended to explore how
private-sector-specific respondents
perceive the role that fracking plays
within the oil and gas industry in
California.
3.2 Is there anything about
well stimulation in
California that you think
the public or policymakers
misunderstand?
This question is intended to explore
whether or not private-sector-specific
respondents perceive a substantial gap
between their own “insider”
understanding of fracking and the
(mis)understandings that others are
operating with.
3.3 Why do you think some
individuals and groups are
so opposed to fracking?
This question is intended to explore how
private-sector-specific respondents
perceive the values, assumptions,

311
(mis)understandings, and motivations of
opponents to fracking.
3.4 What do you think are the
greatest challenges in
complying with fracking
regulation?
This question is intended to explore how
private-sector-specific respondents
perceive the local, state, and federal
regulatory frameworks that govern
fracking.
4. Academy-
Specific
[To be asked only
of respondents who
work in academia]
What do scientists who are engaged in
research related to oil, gas, and energy
(and their regulation) know (or perceive
themselves to know) about the current
state of scientific understanding around
fracking and its consequences (both
positive and negative)?
4.1 Which aspects, impacts, or
benefits of fracking in
California do you think are
the least well understood,
scientifically?
This question is intended to identify
where scientists perceive scientific
uncertainty about fracking to be greatest.
4.2 Which aspects, impacts, or
benefits of fracking in
California do you think are
the least well understood
by the public and
policymakers?
This question is intended to gauge
scientists’ perception of how the public
and policymakers understand (or
misunderstand) fracking and its
consequences.
4.3 Where do you think
research around fracking is
most urgently needed?
This question is intended to ascertain
precisely where and why scientific
knowledge about fracking is currently
limited.
4.4 What, if any, do you think
are the greatest barriers to
improving our scientific
understanding of fracking?
This question is intended to identify what
scientists perceive to be the barriers
and/or limits to research (i.e. whether
these are endogenous factors inherent to
fracking technology itself, or whether
these are exogenous factors relating to
social, political, or economic interests).
5. Nonprofit-
sector-specific
[To be asked only
of respondents who
work in the
What do activists (either proponents or
opponents of fracking) perceive to be the
values, motivations, and perceptions of
those they disagree with?

312
nonprofit sector or
are activists]
5.1 What is the purpose of
your NGO and can you tell
me about its specific goals?
This question is intended to identify the
purpose and goals of the NGO.
5.2 Is there anything about
well stimulation in
California that you think
the public or policymakers
misunderstand?
This question is intended to explore
whether or not NGO-specific respondents
perceive a substantial gap between their
own understanding of fracking and the
(mis)understandings that others are
operating with.
5.3 Why do you think some
individuals and groups [do
or don’t] support fracking?
This question is intended to explore how
NGO-specific respondents perceive the
values, assumptions, (mis)understandings,
and motivations of fracking supporters.
5.4 What action would you
like to see from
policymakers and
regulatory agencies
regarding fracking?
This question is intended to ascertain what
NGO-specific respondents perceive to be
the policymaking and regulatory
outcomes that would be needed in order
for their organization to achieve its goals.
6. Regulatory-
agency-specific
[To be asked only
of respondents who
work for public
sector agencies]
What do regulatory-agency-specific
respondents view as the major challenges
around fracking regulation, and what is
their perception of the relationship
between the public, private, and nonprofit
sectors around fracking?
6.1 What do you think have
been, and are, the most
substantial barriers to
implementing effective
fracking regulation?
This question is intended to identify
barriers to effective fracking regulation, as
perceived by regulatory-agency-specific
respondents.
6.2 What are your thoughts on
the relationship between
local, state, and federal
agencies with regard to
fracking regulation?
This question is intended to explore
regulatory-agency-specific respondents’
perceptions of the cross-scale regulatory
dynamics of fracking.
6.3 What sources of
information about fracking
does your agency draw
upon to support its
This question is intended to identify
which sources of data agencies utilize to
inform fracking regulation, monitoring,

313
regulating, monitoring,
and/or enforcement
efforts? And what (if any)
are the challenges
associated with working
from those sources?
and enforcement, and what the limitations
of those data are.
6.4 What, if anything, is
different about regulating
fracking compared to
regulating other oil, gas,
and energy technologies in
the past?
This question is intended to gather
insights into whether and how the
regulation of fracking differs from
previous energy technologies.
7. Elected-
representative-
specific
[To be asked only
of respondents who
are elected
representatives]
What do elected representatives view as
the major challenges around fracking
regulation? And what sources of
information do they draw upon to develop
the understanding upon which they
engage in fracking policymaking?
7.1 What do you think have
been, and are, the most
substantial barriers to
implementing effective
fracking regulation?
This question is intended to identify
barriers to effective fracking regulation, as
perceived by elected-representative-
specific respondents.
7.2 What are your thoughts on
the relationship between
local, state, and federal
agencies with regard to
fracking regulation?
This question is intended to explore
elected-representative-specific
respondents’ perceptions of the cross-
scale regulatory dynamics of fracking.
7.3 What sources of
information about fracking
does your agency draw
upon to support its
regulating, monitoring,
and/or enforcement
efforts? And what (if any)
are the challenges
associated with working
from those sources?
This question is intended to identify
which sources of data agencies utilize to
inform fracking regulation, monitoring,
and enforcement, and what the limitations
of those data are.
7.4 Does the issue of fracking
pose any unusual or unique
policymaking challenges
This question is intended to explore
elected-representative-specific
respondents’ perceptions of fracking as an

314
compared to other
environmental issues in
general, and to energy
technology regulation in
particular?
environmental issue, and to ascertain any
features of the issue that are unusual or
unique.
8. Conclusion
8.1 Are there any changes on
the horizon – social,
economic, political,
technology – that you think
are likely to significantly
affect fracking in
California?
This closing question is intended to allow
respondents to share their visions for the
future of fracking in California, and
identify which factors of change they
perceive to be most significant in shaping
that future.
Closing Statement:
Thank you again for agreeing to participate in this interview. If you have any other questions or
concerns that were not addressed on the Research Information Sheet, please feel free to contact
me.

315
Interviewee Recruitment Email Template
Subject: Interview Request from UCLA PhD Student Dissertation about Fracking in California
Dear [Interviewee],
My name is Adam Dorr and I am an Urban Planning PhD student at UCLA. I am getting in touch to ask if
I could interview you for my doctoral dissertation research on the topic of “oil and gas well stimulation”,
more commonly known as “fracking”, in California. The issue of fracking in California affects different
groups of people in different ways, and I would like to learn about your perspective on the issue.
If this is something you would be willing to do, then the interview would take place either in person or by
phone for about 30 minutes. The interview would be at a time and location of your choosing, and would
be completely confidential and anonymous. The purpose of the interview would be for me to gain an
understanding of your perspective on fracking in California, how you have developed your knowledge
about the issue, and whether or not you think it is important and why.
Thank you very much for your time and consideration. Please find my contact information below, and I
hope to hear from you at your convenience.
Best regards,
Adam Dorr
Telephone: (808) 640-5588
Email: [email protected]
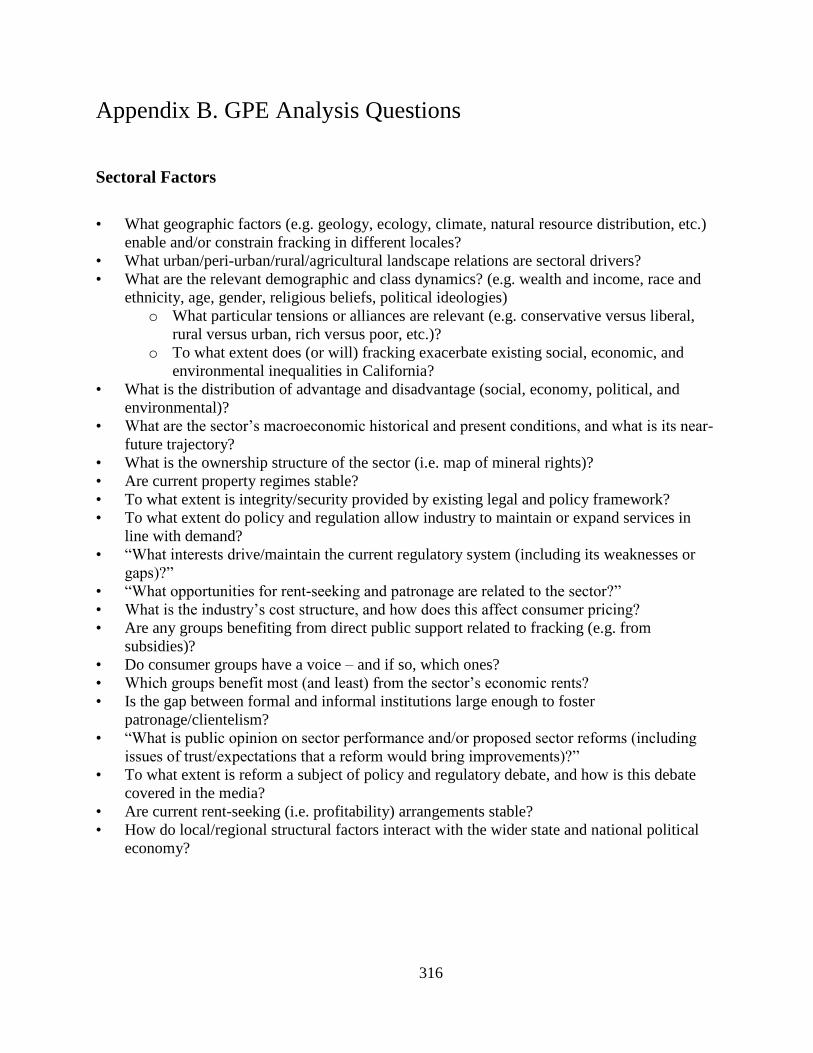
316
Appendix B. GPE Analysis Questions
Sectoral Factors
• What geographic factors (e.g. geology, ecology, climate, natural resource distribution, etc.)
enable and/or constrain fracking in different locales?
• What urban/peri-urban/rural/agricultural landscape relations are sectoral drivers?
• What are the relevant demographic and class dynamics? (e.g. wealth and income, race and
ethnicity, age, gender, religious beliefs, political ideologies)
o What particular tensions or alliances are relevant (e.g. conservative versus liberal,
rural versus urban, rich versus poor, etc.)?
o To what extent does (or will) fracking exacerbate existing social, economic, and
environmental inequalities in California?
• What is the distribution of advantage and disadvantage (social, economy, political, and
environmental)?
• What are the sector’s macroeconomic historical and present conditions, and what is its near-
future trajectory?
• What is the ownership structure of the sector (i.e. map of mineral rights)?
• Are current property regimes stable?
• To what extent is integrity/security provided by existing legal and policy framework?
• To what extent do policy and regulation allow industry to maintain or expand services in
line with demand?
• “What interests drive/maintain the current regulatory system (including its weaknesses or
gaps)?”
• “What opportunities for rent-seeking and patronage are related to the sector?”
• What is the industry’s cost structure, and how does this affect consumer pricing?
• Are any groups benefiting from direct public support related to fracking (e.g. from
subsidies)?
• Do consumer groups have a voice – and if so, which ones?
• Which groups benefit most (and least) from the sector’s economic rents?
• Is the gap between formal and informal institutions large enough to foster
patronage/clientelism?
• “What is public opinion on sector performance and/or proposed sector reforms (including
issues of trust/expectations that a reform would bring improvements)?”
• To what extent is reform a subject of policy and regulatory debate, and how is this debate
covered in the media?
• Are current rent-seeking (i.e. profitability) arrangements stable?
• How do local/regional structural factors interact with the wider state and national political
economy?

317
Institutions
• Which institutions (and their corresponding stakeholders) are rule-takers and which are rule-
makers?
• What is the organization of government authority (i.e. agencies, commissions, and their
roles and responsibilities)?
o What is the credibility and legitimacy of government?
o What capacities do these formal institutions have?
o What governance strategies (e.g. permitting, monitoring, enforcement) do they
adopt?
o What mechanisms of accountability are in place?
o To what extent are corruption and regulatory capture a significant problem?
• What is the formal legal framework at the federal, state, and local levels?
o How are property rights assigned?
o What are the relevant major policies, laws/statutes, regulations, standards, and legal
rulings?
o What are the budgeting, planning, and contract-tendering/procurement processes?
o What distinctions exist between de jur rules and de facto practices?
• What are the relevant electoral rules and dynamics, and how do these shape political
processes?
o How are electoral promises made and accounted for?
o How substantive is the policy debate component of the electoral process?
o How informed are voters, and how do they obtain their information?
o What shapes voter preferences?
o Have California ballot initiatives played an unusual role in these processes?
• What market mechanisms are relevant?
• What norms and expectations apply?
o How do norms and expectations bound the available problem and solution spaces?

318
Appendix C. Annotated Legislative Timeline
What follows are singular pieces of federal and state legislation as well as precipitous
events that have exerted marked influence upon the oil and gas industry in California. It is
important to note that ongoing incremental legislative efforts also exert a strong influence on the
industry, particularly the work done by CARB. But because the latter typically includes a
number of minor developments each year there is insufficient space here to present them in their
entirety. For a detailed timeline of Cal/EPA and CARB regulatory activity, see Cal/EPA (2012).
For a detailed chronology of DOGGR regulatory activity, see California Department of
Conservation (2013).
Year Title Jurisdiction Summary and Annotation
1899 Los Angeles Oil Exchange established Local The exchange allowed the trading of securities (i.e. oil futures) by oil companies in Southern California.
1906-1911
Standard Oil Co. of New Jersey v. United States, 221 U.S. 1
Federal The Standard Oil Trust was found guilty of monopolization in the oil and gas industry. The Trust was broken up into a number of smaller regional companies, the successors of which survive today (e.g. Chevron, Exxon Mobil, Amoco).
1910 Lakeview No. 1 gusher is the largest oil spill in Californian – and American – history
State 5.4 million barrels – 227 million gallons – spilled in Kern County.
1915 Regulating the Drilling of Petroleum and Gas Wells
State The California State Mining Bureau (which later became the California State Mining Bureau, then the Division of Mines and Mining, the Division of Mines, and finally – today – the California Geological Survey) created the Department of Petroleum and Gas (which later became the Division of Oil and Gas, and then the Division of Oil, Gas, and Geothermal Resources).
1920 Federal Water Power Act Federal Created the Federal Power Commission (FPC), which is granted authority to regulate electric power, hydroelectric projects, and also the natural gas industry.
1924 Oil Pollution Act Federal Following findings of the Army Corps of Engineers beginning in 1921 that oil threatened

319
waterways and fisheries, this act prohibited the intentional release
1932 Revenue Act of 1932 Federal Established the first federal tax on gasoline. Extended and amended many times under subsequent Revenue Acts. As of 2013, federal gasoline tax stands at 18.4 cents per gallon.
California has the nation’s highest combined federal and state gasoline tax, at 71.9 cents per gallon (and a 74.9 cents per gallon tax on diesel, which includes a 24.4 cent per gallon federal tax).
1938 Natural Gas Act of 1932 Federal The earliest federal regulation of the natural gas industry. Aimed primarily at controlling prices charged by interstate gas pipeline transport companies in instances where state and local price regulation was not working.
1942 Wartime gasoline rationing instituted Federal Gasoline rationed starting in 1942. Rationing ended in 1945.
1945 Emissions of dense smoke banned in Los Angeles
Local (Los Angeles)
In response to a dark smoke cloud forming over Los Angeles in on July 26, 1943, that apparently originated at the Southern California Gas Company’s plant on Aliso Street, and several similar events that followed, the city created a Smoke and Fumes Commission to study the problem. Two years later, Los Angeles County’s Air Pollution Control Director banned emissions of dense smoke, including from backyard trash burning.
1947 Air Pollution Control Act State Authorized the establishment of Air Pollution Control Districts (APCDs) or Air Quality Management Districts (AQMDs) for every county in the state. There are 23 APCDs and 12 AQMDs.
1949 Street Car Conspiracy convictions State GM, Firestone Tire, Mack Trucks, Standard Oil of California, and Phillips Petroleum were convicted of conspiracy to monopolize urban transit in California.
Although the oil and car industries were convicted of conspiracy, historians now dismiss allegations of a grand design to undermine electric vehicles and mass transit in favor of the simpler explanation that the oil automotive industries were simply acting in their own rational self-interest to advance gasoline and diesel powered buses over electric streetcars and tramways.
1953 Submerged Lands Act of 1953 and Outer Continental Shelf Lands Act of 1953
Federal Together established that marine areas more than 3 miles offshore fall under federal jurisdiction with respect to the location and duration of permitted drilling activities.

320
1954 Bureau of Air Sanitation State Established within California’s State Department of Public Health. Merged with Motor Vehicle Pollution Control Board in 1967 to become CARB.
1955 California Bay Area Pollution Control Act
Local (Bay Area)
Established the multi-county Bay Area Air Pollution Control District.
1956 Highway Revenue Act of 1956 Federal Established the federal Highway Trust Fund to finance the interstate highway system. Paid for in part by gasoline taxes imposed under the Revenue Act.
1960 Motor Vehicle Pollution Control Board State The Board had the authority to determine pollution standards, approve emissions-control devices, and issue pollution exemptions. Merged with Bureau of Air Sanitation in 1967 to become CARB.
1963 Clean Air Act
(amendments in 1967, 1970, 1977, and 1990)
Federal California is permitted to have a state-level regulatory agency for air quality under the federal Clean Air Act because it was the only state to have agencies in place prior to the federal legislation. The CAA also includes funding for research into new technologies for removing sulfur from oil and coal (primarily targeting urban power plants). The technology is fully realized in 1979, leading to a marked reduction in acid rain beginning in the 1980s.
1964 Wilderness Act of 1964 Federal Created a federal definition of wilderness:
“A wilderness, in contrast with those areas where man and his own works dominate the landscape, is hereby recognized as an area where the earth and its community of life are untrammeled by man, where man himself is a visitor who does not remain.”
Initially protected 9.1 million acres of federal land from development via the creation of the National Wilderness Preservation System (NWPS).
Today the NWPS designates 757 areas as wilderness, totaling 109.5 million acres (including portions of the areas administered by the National Park Service, the U.S. Forest Service, the U.S. Fish and Wildlife Service, and the Bureau of Land Management). Of these 757 areas, 149 are in California.
1967 California Mulford-Carrell Air Resources Act
(established CARB)
State Combined the Bureau of Air Sanitation and the Motor Vehicle Pollution Control Board to create the California Air Resources Board (CARB), or just ARB as it is sometimes called. CARB conducts air quality planning and science, performs
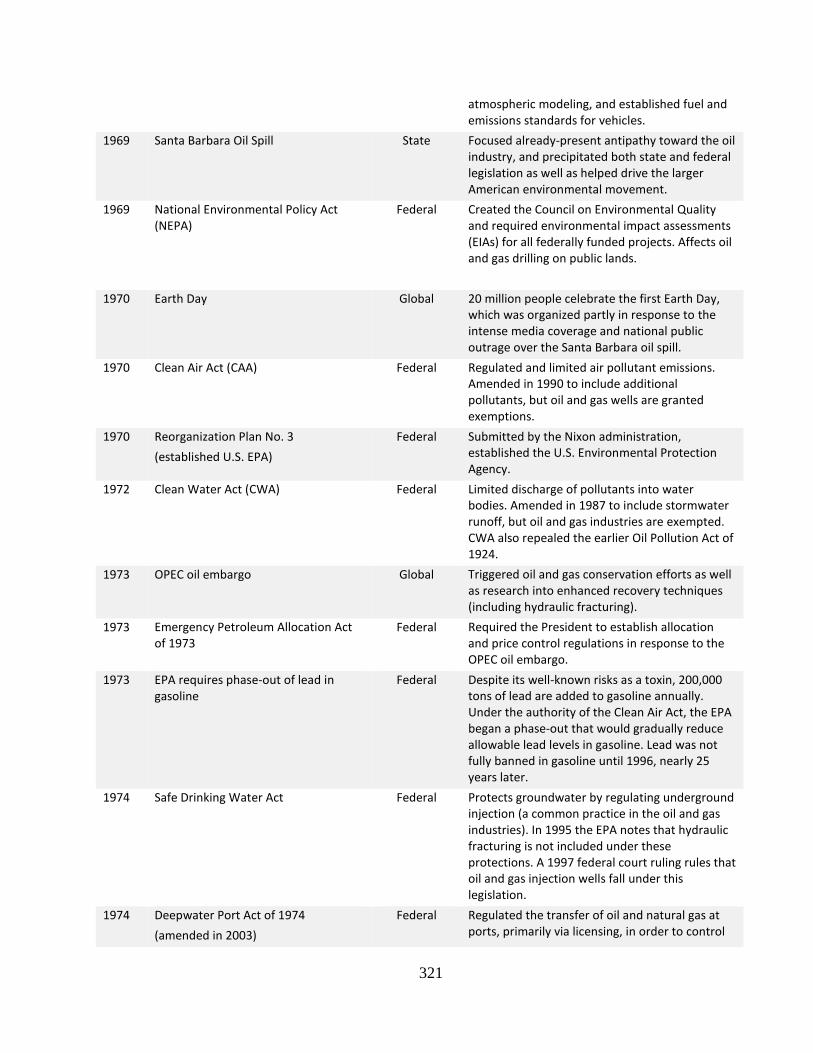
321
atmospheric modeling, and established fuel and emissions standards for vehicles.
1969 Santa Barbara Oil Spill State Focused already-present antipathy toward the oil industry, and precipitated both state and federal legislation as well as helped drive the larger American environmental movement.
1969 National Environmental Policy Act (NEPA)
Federal Created the Council on Environmental Quality and required environmental impact assessments (EIAs) for all federally funded projects. Affects oil and gas drilling on public lands.
1970 Earth Day Global 20 million people celebrate the first Earth Day, which was organized partly in response to the intense media coverage and national public outrage over the Santa Barbara oil spill.
1970 Clean Air Act (CAA) Federal Regulated and limited air pollutant emissions. Amended in 1990 to include additional pollutants, but oil and gas wells are granted exemptions.
1970 Reorganization Plan No. 3
(established U.S. EPA)
Federal Submitted by the Nixon administration, established the U.S. Environmental Protection Agency.
1972 Clean Water Act (CWA) Federal Limited discharge of pollutants into water bodies. Amended in 1987 to include stormwater runoff, but oil and gas industries are exempted. CWA also repealed the earlier Oil Pollution Act of 1924.
1973 OPEC oil embargo Global Triggered oil and gas conservation efforts as well as research into enhanced recovery techniques (including hydraulic fracturing).
1973 Emergency Petroleum Allocation Act of 1973
Federal Required the President to establish allocation and price control regulations in response to the OPEC oil embargo.
1973 EPA requires phase-out of lead in gasoline
Federal Despite its well-known risks as a toxin, 200,000 tons of lead are added to gasoline annually. Under the authority of the Clean Air Act, the EPA began a phase-out that would gradually reduce allowable lead levels in gasoline. Lead was not fully banned in gasoline until 1996, nearly 25 years later.
1974 Safe Drinking Water Act Federal Protects groundwater by regulating underground injection (a common practice in the oil and gas industries). In 1995 the EPA notes that hydraulic fracturing is not included under these protections. A 1997 federal court ruling rules that oil and gas injection wells fall under this legislation.
1974 Deepwater Port Act of 1974
(amended in 2003)
Federal Regulated the transfer of oil and natural gas at ports, primarily via licensing, in order to control

322
spills, leakage, and dumping associated with oil and gas tanker ships.
1975 Energy Policy and Conservation Act of 1975 (EPCA)
Federal Designed to increase supply and decrease demand of energy – especially fossil fuels. Established the Strategic Petroleum Reserve in response to the 1973-1974 oil embargo by OPEC plus Egypt, Syria, and Tunisia. Established Corporate Average Fuel Economy (CAFE) standards. Incentivized increased domestic oil production.
1976 Resource Conservation and Recovery Act
Federal Establishes standards for hazardous wastes. In 1980 the EPA begins to study oil and gas exemptions, and in 1988 (over the objections of EPA officials and whistleblowers) determines that parts of the legislation do not apply to the oil and gas industries.
1976 Toxic Substances Control Act Federal Aimed at curtailing environmental and public health impacts from synthetic and organic chemicals – particularly petrochemicals.
1977 The Federal Power Commission (FPC) is dissolved.
Federal Authority to regulate natural gas, oil, hydroelectric power generation, and electricity transmission is transferred to the Federal Energy Regulatory Commission (FERC).
1978 Natural Gas Policy Act Intended to create a single national natural gas market in order to stabilize supply, demand, and therefore prices. Gave the Federal Energy Regulatory Commission (FERC) jurisdiction over natural gas production, which included the introduction of complex production-based pricing controls.
1980 Comprehensive Environmental Response, Compensation, and Liability Act of 1980 (CERCLA), commonly referred to as the Superfund Act
Federal A belated response to the environmental public health disaster at Love Canal. Requires the identification and cleanup of sites contaminated with toxic pollutants, and provides funding mechanisms for these efforts. Petroleum (i.e. oil and natural gas) are notably not included as “hazardous” toxins under the law.
1980 Crude Oil Windfall Profits Tax Act Federal Following the deregulation of oil prices during the 1970s, oil producers (once again) began to net enormous profits. This Act created three tiers under which oil industry income was taxed:
• Tier 1: all domestically produced oil
• Tier 2: oil from marginal (aka “stripper”) wells nearing the end of productive life
• Tier 3: oil discovered after 1978, heavy oil, and incremental tertiary oil
Repealed in 1988 by the Omnibus Trade and Competitiveness Act.

323
1981 Executive Order 12287 Federal Removed price and allocations controls on crude oil (i.e. those established by the Emergency Petroleum Allocation Act of 1973).
1986 California Proposition 65 - The Safe Drinking Water and Toxic Enforcement Act of 1986
State Recognized the rights of the people of California to be informed and to protect themselves from exposure to known carcinogens. Required the Governor’s office to update and publish a list of known carcinogens. Required products sold in California that contain carcinogens (which includes all, or nearly all, petroleum products) to carry the label, “This product contains chemicals known to the State of California to cause cancer and birth defects or other reproductive harm.”
1988 California Clean Air Act State Formed the basis of what was later adopted by U.S. Congress in amendments to the federal CWA in 1990.
1989 Exxon Valdez disaster Federal Vivid imagery and extensive media coverage rekindled public fear of the potential for oil spills to devastate coastlines.
1989 EPA requires phased-in reformulation of gasoline to reduce volatility
Federal Between 1989 and 1994 the EPA established new standards requiring gasoline to be formulated so that volatility (i.e. evaporation rates measured by Reid Vapor Pressure) was minimized, in order to prevent air pollution – particularly during the warm summer months.
1990 Amendment to the Clean Air Act Federal Among much else, required the reformulation of fuels to be cleaner-burning. This lead to the adoption of Methyl tertiary butyl ether (MTBE) as a gasoline additive.
1990 Oil Pollution Act of 1990 Federal In response to the Exxon Valdez oil spill, this bill requires oil companies to have a spill prevention and cleanup plans in place. It also forbids any vessel that has spilled more than 1 million gallons of oil from operating in Prince William Sound. The bill also capped civil liability for spills as $75 million. Following the 2010 Deepwater Horizon spill, attempts to raise the liability limit to $10 billion failed in the Senate.
1991 California Environmental Protection Agency (Cal/EPA) formed
State Cal/EPA created by Governor Pete Wilson in Executive Order W-5-91. CARB is reorganized as a department under Cal/EPA.
1994 Unocal diluent spill is discovered State Unocal admits spilling 8.5 million gallons of diluent (a diluting liquid used to reduce the viscosity of crude oil), making this the second largest spill in California’s history.
1995 EPA announces “first comprehensive control of toxic air pollution from petroleum refineries” under the authority of the Clean Air Act
Federal Imposed stricter emissions standards on refineries, reducing VOC air toxics such as benzene by 60 percent. Aimed at reducing smog and improving public health for 4.5 million living “near” the nation’s 192 refineries.
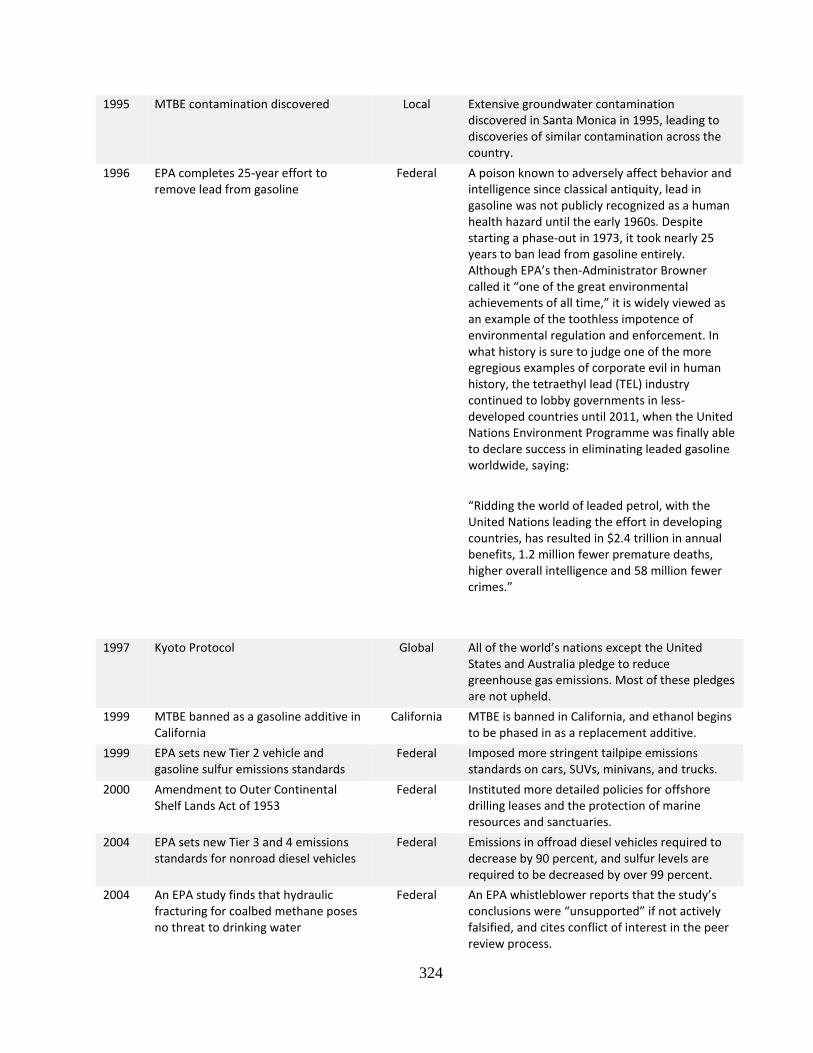
324
1995 MTBE contamination discovered Local Extensive groundwater contamination discovered in Santa Monica in 1995, leading to discoveries of similar contamination across the country.
1996 EPA completes 25-year effort to remove lead from gasoline
Federal A poison known to adversely affect behavior and intelligence since classical antiquity, lead in gasoline was not publicly recognized as a human health hazard until the early 1960s. Despite starting a phase-out in 1973, it took nearly 25 years to ban lead from gasoline entirely. Although EPA’s then-Administrator Browner called it “one of the great environmental achievements of all time,” it is widely viewed as an example of the toothless impotence of environmental regulation and enforcement. In what history is sure to judge one of the more egregious examples of corporate evil in human history, the tetraethyl lead (TEL) industry continued to lobby governments in less-developed countries until 2011, when the United Nations Environment Programme was finally able to declare success in eliminating leaded gasoline worldwide, saying:
“Ridding the world of leaded petrol, with the United Nations leading the effort in developing countries, has resulted in $2.4 trillion in annual benefits, 1.2 million fewer premature deaths, higher overall intelligence and 58 million fewer crimes.”
1997 Kyoto Protocol Global All of the world’s nations except the United States and Australia pledge to reduce greenhouse gas emissions. Most of these pledges are not upheld.
1999 MTBE banned as a gasoline additive in California
California MTBE is banned in California, and ethanol begins to be phased in as a replacement additive.
1999 EPA sets new Tier 2 vehicle and gasoline sulfur emissions standards
Federal Imposed more stringent tailpipe emissions standards on cars, SUVs, minivans, and trucks.
2000 Amendment to Outer Continental Shelf Lands Act of 1953
Federal Instituted more detailed policies for offshore drilling leases and the protection of marine resources and sanctuaries.
2004 EPA sets new Tier 3 and 4 emissions standards for nonroad diesel vehicles
Federal Emissions in offroad diesel vehicles required to decrease by 90 percent, and sulfur levels are required to be decreased by over 99 percent.
2004 An EPA study finds that hydraulic fracturing for coalbed methane poses no threat to drinking water
Federal An EPA whistleblower reports that the study’s conclusions were “unsupported” if not actively falsified, and cites conflict of interest in the peer review process.

325
2005 Energy Policy Act of 2005 Federal Exempts drilling and injection wells from regulation under most prior environmental legislation (NEPA, CAA, CWA, SDWA etc.) in Section 322, commonly known as the “Halliburton Loophole”. The Act also gave additional responsibilities to the FERC:
• Regulates the transmission and sale of natural gas for resale in interstate commerce.
• Approves the siting of and abandonment of interstate natural gas facilities, including pipelines, storage and liquefied natural gas.
• Uses civil penalties and other means against energy organizations and individuals who violate FERC rules in the energy markets.
• Oversees environmental matters related to natural gas and hydroelectricity projects and major electricity policy initiatives.
• Administers accounting and financial reporting regulations and conduct of regulated companies.
2006-2013
California oil severance tax bills proposed
State California is one of the only oil producing areas in the world where a severance tax is not levied for severing natural resources from the land on which they are found. A number of Assembly and Senate bills have been proposed over the last decade to establish a severance tax on the oil industry in California. The most recent effort, SB-241 and AB-1326 would have imposed a 9.5 percent and 12.5 percent severance tax respectively on oil, based on prevailing marketing prices. (SB-241 would also have levied a 3.5 percent severance tax on natural gas).
2006 EPA Clean Diesel Program Federal Refiners and importers are required to reduce sulfur content in diesel by 97 percent.
2006 Bureau of Land Management (BLM) grants natural gas wells exemptions to NEPA
Federal Exemptions granted to roughly one quarter of all wells on its public lands in the western states.
2006 AB32 Global Warming Solutions Act State Requires a state-level plan for identifying, categorizing, and measuring state sources of greenhouse gases. Requires a state-level plan for greenhouse gas reduction by 2020. Establishes emissions limits, recommends emissions-mitigation technology, and creates an emissions-trading system with a regressive schedule of emissions limits through 2020.
2008 For the first time in nearly 30 years, Congress does not extend the defacto
Federal A political response to the “drill baby drill” campaign issue of the 2008 Presidential election.

326
moratorium on new federal offshore drilling leases
The Obama Administration continues to ostensibly support new drilling in existing leases, but no new leases have been granted in any case. Moreover, after the BP Deepwater Horizon disaster in 2010 public support for offshore drilling has declined dramatically.
2009 EPA “gives California permission to set its own auto emissions standards beginning with 2009 models”
State California originally requested a waiver for special authority to enact stricter air pollution standards than those under the Clean Air Act in order to deal with its severe air pollution problems in 2005, but the first request was denied by the Bush Administration. A second waiver request was approved in 2009 by the Obama Administration.
2010 DP Deepwater Horizon oil spill Gulf of Mexico
The largest marine oil spill to date, spilled nearly 5 million barrels of oil into the Gulf of Mexico. Cleanup, investigation, and a large number of criminal and civil suits are ongoing. Fines payable to the Department of Justice total $4.525 billion so far. Criminal and civil settlements to date have reportedly already cost BP $42 billion. EPA temporarily banned BP from acquiring new U.S. government contracts.
2010 Minerals Management Service (MMS) is scandalized by the BP Deepwater Horizon disaster, and is reorganized
Federal In the wake of the BP Deepwater Horizon disaster and the scandal of monitoring and oversight failure by the Minerals Management Service (MMS), the MMS is dissolved and replaced by the Bureau of Ocean Energy Management, Regulation and Enforcement within the Office of Natural Resource Revenue (ONRR). BOEMRE is further divided into the Bureau of Ocean Energy Management (BOEM) and the Bureau of Safety and Environmental Enforcement (BSEE), to separate energy management and environmental enforcement functions and (ostensibly) reduce the inherent conflict of interest therein.
2012 EPA issues 54.5 mpg average fuel economy standard by 2025
Federal Required that the U.S. auto fleet achieve an average of 54.5 mpg fuel economy by 2025. If this standard is met, it will be a achieved by a combination of smaller and lighter vehicles, electric and hybrid drivetrains, and next-generation diesel engines.
2013 SB 4 signed by Governor Jerry Brown, California releases proposed fracking regulations
State After a series of competing bills to regulate fracking are winnowed down to a sole survivor, SB 4, introduced by Senator Fran Pavley and signed by Governor Jerry Brown. The law goes into effect January 1, 2014, and will start a one-year process so that regulations are finalized by January 1, 2015.

327
SB 4 has been heavily criticized by environmental groups that oppose fracking, since it establishes regulation rather than a moratorium on the practice.
SB 4 has several key functions:
1. Allows fracking to continue in California under state law (assures the industry that no moratorium will be imposed at the state level). 2. Starting January 1, 2014, fracking activity will require permitting by the Division of Oil, Gas and Geothermal Resources (DOGGR). 3. Requires independent study of the safety of fracking to be overseen by the California Department of Natural Resources (DNR). 4. Requires that landowners within 500 yards of any permitted well be notified 30 days prior to the start of drilling. Landowners can require drilling companies to pay for water testing.
Local governments, such as the County of Santa Cruz, have responded by imposing temporary moratoria on fracking in their jurisdictions.

328
Appendix D: California NGOs and Groups Opposed to Fracking
• 350.org (and local chapters)
• AFSCME Council 57
• Alameda County Against Fracking
• Alameda Creek Alliance
• Alliance for Democracy
• Association of Irritated Residents
• Baldwin Hills Oil Watch
• Ballona Creek Renaissance
• Ballona Network
• Bay Localize
• Bees and Beyond Inc.
• Benecians for a Safe and Healthy Community
• Big Bend Hot Springs Project
• BikeSD
• Breast Cancer Action
• Burbank Green Alliance
• Butte Environmental Council
• CA League of United Latin American Citizens
• CAFrackFacts.org
• Cal Poly Biomimicry Club
• Cal Poly Surfrider Club
• California Coastkeeper Alliance
• California Environmental Justice Alliance
• California League of Conservation Voters
• California League of United Latin American Citizens
• California Nurses Association
• California Public Interest Research Group (CALPIRG)
• California State Grange
• California Student Sustainability Coalition
• California Water Impact Network
• Californians for Western Wilderness
• Californians Who Drink Water
• CALPIRG
• CALPIRG UCSD
• Camp Nast Associates (CNA)
• Carpinteria Valley Association
• Carson Citizen Cultural Arts Foundation
• Carson Coalition
• Carson Connected
• Center for Biological Diversity

329
• Center on Race, Poverty & the Environment
• Central California Environmental Justice Network
• Central Coast Rising
• Central Valley Safe Environment Network
• Citizen Engagement Lab
• Citizens Against Pollution
• Citizens Coalition for a Safe Community
• Citizens For Responsible Oil & Gas
• Clark Strategic Partners
• Clean Water Action
• Cleveland National Forest Foundation (CNFF)
• Climate Action Group
• Coalition for Grassroots Progress
• Coastal Environmental Rights Foundation
• CoFED
• Comite Civico del Valle, Inc.
• Communities for a Better Environment
• Communities for Sustainable Monterey County
• Community Rights Network of Mendocino County
• Community Rights Organization of Willits
• Courage Campaign
• CREDO
• Crocket-Rodeo United to Defend the Environment
• Decide Locally Carpinteria
• Democracy for America
• Earth Day Los Angeles
• Earth Passages
• Earthworks
• Ebbetts Pass Forest Watch
• Ecological Farming Association
• Elder Creek Center For The Land
• Environment and Human Rights Advisory
• Environment California
• Environmental Action
• Environmental Action Committee of West Marin
• Environmental Priorities Network
• Environmental Protection Information Center
• Environmental Voices
• Environmental Working Group
• Family Farm Defenders
• Food & Water Watch
• Food Empowerment Project
• Fossil Fuel UC
• Frack Free Culver City

330
• Frack-Free Butte County
• Frac-watch
• Frank Consulting Group
• Fresnans Against Fracking
• Friends of the Earth
• Friends of the Pogonip
• Gage and Gage Productions
• Garaventa Consulting
• Gase-FREE Planet
• Global Alliance for Incinerator Alternatives – GAIA
• Global Community Monitor
• Global Exchange
• Grassroots Coalition
• Gray Panthers of the East Bay
• Grayson Neighborhood Council
• Green Party (local chapters)
• Green Retirement Plans, Inc.
• Greenaction for Health and Environmental Justice
• Greenpeace
• Humanist Association of the Monterey Bay
• I AM Jerusalem
• Justified Cause in Native
• Klamath Forest Allaince
• Klamath Siskiyou Wildlands Center
• KyotoUSA
• Label GMOs.org
• Laytonville Grange
• League of Latin American Citizens (LULAC)-District 17
• Local Clean Energy Alliance
• Los Padres ForestWatch
• Mainstreet Moms
• Making Culver City Safe
• Marin Water Coalition
• Martin Luther King Coalition of Greater Los Angeles
• Martinez Environmental Group
• Medicine Lake Citizens for Quality Environment
• Mercedians Against Fracking
• Mill Valley Seniors for Peace
• MNP Farmers' Markets
• Model Neighborhood Program
• MOMS Advocating Sustainability
• Monterey County Against Fracking
• Mothers of East Los Angeles
• Mount Shasta Bioregional Ecology Center

331
• Movement Generation
• MoveOn.org
• Mt. Diablo Peace and Justice Center
• Neighborhood Farmers’ Model Markets
• Northcoast Environmental Center
• NRDC (Natural Resources Defense Council, local chapters)
• Oil Change International
• Orange County Interfaith Coalition for the Environment
• Organic Consumers Association
• People’s Environmental Network of Sonora
• Physicians for Social Responsibility SF
• Planet Cruz Comedy with Richard Stockton
• Planting Justice
• Preserve Wild Santee
• Progressive Democrats of the Santa Monica Mountains
• Protect Mustangs
• Protect Our Water
• Prunedale Preservation Alliance
• Public Citizen
• Radical Art For These Times (RAFTT)
• Rainforest Action Network
• Reconnect Nature
• Residents Organized for a Safe Environment
• Restore the Delta
• Rising Tide Monterey Bay
• Russian Riverkeeper
• S.A.F.E. Students Against Fracking the Environment
• San Benito Rising
• San Francisco Tomorrow
• San Joaquin Raptor/Wildlife Rescue Center
• San Joaquin Valley Conservancy
• San Joaquin Valley Latino Environmental Advancement Project
• San Luis Obispo Clean Water Action
• San Luis Obispo Coastkeeper
• San Luis Obispo Mothers for Peace
• Santa Barbara County Water Guardians
• Santa Barbara Frack Back to Save The Central Coast
• Santa Monica Greens
• Sarah4Hope
• Save Our Forests and Ranchlands (SOFAR)
• SaveWithSunlight, Inc.
• Sierra Club California (and local chapters)
• SLO Clean Water Action
• Small Planet Institute

332
• SoCal Against Tar Sands
• Solar One
• South Monterey County Citizen Planning Alliance
• Southern Monterey County Rural Coalition
• Stewards of the Earth
• Stop Fracking Brea
• Students Against Fracking at U.C. Berkeley
• Sunflower Alliance
• Sungevity
• Surfrider Foundation
• Sustainable Carmel Valley
• Sustainable Fairfax
• Tar Sands Action SoCal
• Team Zissou Environmental Organization
• Teens Turning Green
• The Action Hub
• The California State Grange
• The Ecology Center
• The Orange County Interfaith Coalition for the Environment
• The River Project
• The Student Food Collective at UCLA
• Topanga Peace Alliance
• Transition (local chapters)
• Trinity County Progressives
• Turtle Island Restoration Network
• Union de Vecinos
• United Native Americans
• Urban and Environmental Policy Institute, Occidental College
• Valley Improvement Projects
• Valley Land Alliance
• Ventura County Democratic Central Committee
• Wellstone Democratic Renewal Club
• Wetlands Defense Fund
• Whittier Hills Oil Watch
• Wholly H2O
• WHOW – Whittier Hills Oil Watch
• Wild Equity Institute
• Wild Heritage Planners
• Wild Nature Institute
• Wilder Utopia
• WiserEarth
• Women Occupy San Diego
• Women's International League for Peace and Freedom

333
Bibliography
Abdullah, K., Malloy, T., Stenstrom, M. K., & Suffet, I. H. (Mel). (2017). Toxicity of acidization
fluids used in California oil exploration. Toxicological & Environmental Chemistry,
99(1), 78–94. https://doi.org/10.1080/02772248.2016.1160285
Abers, R. N., & Keck, M. E. (2013). Practical Authority: Agency and Institutional Change in
Brazilian Water Politics. OUP USA.
Acharya, V., Philippon, T., Richardson, M., & Roubini, N. (2009). The Financial Crisis of 2007-
2009: Causes and Remedies. Financial Markets, Institutions & Instruments, 18(2), 89–
137. https://doi.org/10.1111/j.1468-0416.2009.00147_2.x
Acharya, V. V., & Richardson, M. (2009). Causes of the Financial Crisis. Critical Review, 21(2–
3), 195–210. https://doi.org/10.1080/08913810902952903
Adams, M. B., Edwards, P. J., Ford, W. M., Johnson, J. B., Schuler, T. M., Gundy, M. T.-V., &
Wood, F. (2011). Effects of development of a natural gas well and associated pipeline on
the natural and scientific resources of the Fernow Experimental Forest.
https://doi.org/10.2737/NRS-GTR-76
Adgate, J. L., Goldstein, B. D., & McKenzie, L. M. (2014). Potential Public Health Hazards,
Exposures and Health Effects from Unconventional Natural Gas Development.
Environmental Science & Technology, 48(15), 8307–8320.
https://doi.org/10.1021/es404621d
Adger, W. N., Benjaminsen, T. A., Brown, K., & Svarstad, H. (2001). Advancing a Political
Ecology of Global Environmental Discourses. Development and Change, 32(4), 681–
715. https://doi.org/10.1111/1467-7660.00222
334
Adler, J. H. (2003). Fables of the Cuyahoga: Reconstructing a History of Environmental
Protection. Fordham Environmental Law Journal, 14, 89–146.
Agrawal, A., & Lemos, M. C. (2007). A Greener Revolution in the Making?: Environmental
Governance in the 21st Century. Environment: Science and Policy for Sustainable
Development, 49(5), 36–45. https://doi.org/10.3200/ENVT.49.5.36-45
Agrawal, N. (2017, July 21). L.A. County sues over reopening of Aliso Canyon. Los Angeles
Times. Retrieved from http://www.latimes.com/local/lanow/la-me-ln-aliso-canyon-suit-
20170721-story.html
Aiello, D. (2013a, February 6). California Farmers Alarmed as Energy Companies Outbid Ag
Water Districts for Resource. Retrieved November 1, 2013, from
http://www.californiaprogressreport.com/site/california-farmers-alarmed-energy-
companies-outbid-ag-water-districts-resource
Aiello, D. (2013b, May 21). California Farmer Warns: “Don’t Trust Oil Industry, State or
Courts” to Protect Water. Retrieved November 1, 2013, from
http://www.californiaprogressreport.com/site/california-farmer-warns-dont-trust-oil-
industry-state-or-courts-protect-water
Alexander, C. (2012, June 11). Culver City Moms (and Dads) Unite Against Fracking. Retrieved
January 1, 2014, from http://culvercity.patch.com/groups/politics-and-elections/p/culver-
city-moms-and-dads-unite-against-fracking
Alvarado, V., & Manrique, E. (2010). Enhanced Oil Recovery: An Update Review. Energies,
3(9), 1529–1575. https://doi.org/10.3390/en3091529
American Oil & Gas Historical Society. (2016a). Shooters - A “Fracking” History. Retrieved
January 7, 2016, from http://aoghs.org/technology/hydraulic-fracturing/

335
American Oil & Gas Historical Society. (2016b, November 21). Oil Queen of California.
Retrieved May 1, 2017, from http://aoghs.org/petroleum-pioneers/emma-summers-oil-
queen/
American Petroleum Institute. (2014). Acidizing Briefing Paper - Treatment in Oil and Gas
Operators (No. DM2014-113). American Petroleum Institute & American Natural Gas
Alliance. Retrieved from http://www.api.org/~/media/Files/Oil-and-Natural-
Gas/Hydraulic-Fracturing/Acidizing-oil-natural-gas-briefing-paper-v2.pdf
Anderson, O. L., Dzienkowski, J. S., Lowe, J. S., Peroni, R. J., Pierce, D. E., & Smith, E. E.
(2004). Hemingway Oil and Gas Law and Taxation (4 edition). St. Paul, MN: West
Academic Publishing.
Andrew, S. A., & Kendra, J. M. (2012). An adaptive governance approach to disaster-related
behavioural health services. Disasters, 36(3), 514–532. https://doi.org/10.1111/j.1467-
7717.2011.01262.x
Andrews, E., & McCarthy, J. (2013). Scale, shale, and the state: political ecologies and legal
geographies of shale gas development in Pennsylvania. Journal of Environmental Studies
and Sciences, 1–10. https://doi.org/10.1007/s13412-013-0146-8
Andrews, E., & McCarthy, J. (2014). Scale, shale, and the state: political ecologies and legal
geographies of shale gas development in Pennsylvania. Journal of Environmental Studies
and Sciences, 4(1), 7–16. https://doi.org/10.1007/s13412-013-0146-8
Andrews, R. N. L. (2006). Managing the Environment, Managing Ourselves: A History of
American Environmental Policy (2nd ed.). New Haven: Yale University Press.
Appel, H., Mason, A., & Watts, M. (Eds.). (2015). Subterranean Estates: Life Worlds of Oil and
Gas. Ithaca, NY: Cornell University Press.

336
Arbelaez, J., Wolf, S., & Grinberg, A. (2014). On Shaky Ground: Fracking, Acidizing, and
Increased Earthquake Risk in California. Berkeley, CA: Earthworks, CEnter for
Biological Diversty, and Clean Water Action. Retrieved from
http://www.shakyground.org/wp-content/uploads/2014/02/ShakyGround-FINAL1.pdf
Argonne National Laboratory. (2004). A White paper Describing Produced Water from
Production of Crude Oil, Natural Gas, and Coal Bed Methane (White Paper No. W-31-
109-Eng-38). Washington, D.C.: U.S. Department of Energy National Energy
Technology Laboratory. Retrieved from
http://109.4iranian.com/uploads/prodwaterpaper_1270.pdf
Atkin, E. (2014, May 30). Oil Lobby Overpowers Voters To Kill Statewide Fracking Ban In
California. Retrieved from https://thinkprogress.org/oil-lobby-overpowers-voters-to-kill-
statewide-fracking-ban-in-california-98498d1b82e9/
ATSDR. (2017). ATSDR Toxic Substances Portal. Retrieved May 17, 2017, from
https://www.atsdr.cdc.gov/substances/index.asp
Aujla, S., & Wolbring, G. (2016). Anticipatory governance of technological innovation in global
health as seen in Canadian newspapers. Annals of Global Health, 82(3), 333.
https://doi.org/10.1016/j.aogh.2016.04.017
Avalos, A., & Vera, D. (2013). The Petroleum Industry and the Monterey Shale: Current
Economic Impact and the Economic Future of the San Joaquin Valley (p. 38). Fresno,
CA: University Business Center, Craig School of Business, California State University,
Fresno. Retrieved from
http://www.wspa.org/sites/default/files/uploads/The%20Petroleum%20Industry%20and%
20the%20Monterey%20Shale%20-%20Fresno%20State%20Study.pdf

337
Babisch, W., Pershagen, G., Selander, J., Houthuijs, D., Breugelmans, O., Cadum, E., …
Hansell, A. L. (2013). Noise annoyance — A modifier of the association between noise
level and cardiovascular health? Science of The Total Environment, 452–453, 50–57.
https://doi.org/10.1016/j.scitotenv.2013.02.034
Bacher, D. (2015a, February 6). Big Oil Group Spent $8.9 Million Last Year Lobbying Jerry
Brown and California Officials. East Bay Express. Retrieved from
https://www.eastbayexpress.com/SevenDays/archives/2015/02/06/big-oil-group-spent-
89-million-last-year-lobbing-jerry-brown-and-california-officials
Bacher, D. (2015b, July 29). California’s Biggest ‘Secret’ — Oil Industry Capture of the
Regulatory Apparatus. East Bay Express. Retrieved from
https://www.eastbayexpress.com/SevenDays/archives/2015/07/29/californias-biggest-
secret-oil-industry-capture-of-the-regulatory-apparatus
Bagg, R. M. (1905). Miocene Foraminifera From the Monterey Shale of California Few Species
from the Tejon Formation (Bulletin No. 268) (p. 89). Washington, D.C: United States
Geological Survey. Retrieved from http://pubs.usgs.gov/bul/0268/report.pdf
Baker, D. R. (2015a, January 31). State let oil companies taint drinkable water in Central Valley.
San Francisco Chronicle. Retrieved from
http://www.sfchronicle.com/business/article/State-let-oil-companies-taint-drinkable-
water-in-6054242.php
Baker, D. R. (2015b, October 16). State shuts 33 wells injecting oil wastewater into aquifers. San
Francisco Gate. Retrieved from http://www.sfgate.com/business/article/State-shuts-33-
wells-injecting-oil-wastewater-6574845.php

338
Baker Hughes. (2017, January). Retrieved January 15, 2017, from http://phx.corporate-
ir.net/phoenix.zhtml?c=79687&p=irol-reportsother
Bales, S., & Gilliam, F. D. (2001). Strategic Frame Analysis (Social Policy Report No. Volume
XV Number 3) (p. 19). Los Angeles, CA: UCLA Center for Communications and
Community. Retrieved from http://escholarship.org/uc/item/5sk7r6gk
Balogh, B. (2002). Scientific Forestry and the Roots of the Modern American State: Gifford
Pinchot’s Path to Progressive Reform. Environmental History, 7(2), 198–225.
https://doi.org/10.2307/envhis/7.2.198
Banerjee, N. (2011, September 30). Agency overseeing oil, gas exploration gets shakeup. LA
Times. Retrieved from http://latimesblogs.latimes.com/greenspace/2011/09/offshore-oil-
gas-exploration.html
Banerjee, N. (2013, July 28). Message is mixed on fracking. Los Angeles Times. Retrieved from
http://www.latimes.com/nation/nationnow/la-na-epa-dimock-20130728-m-story.html
Barben, D., Fisher, E., Selin, C., & Guston, D. (2008). Anticipatory Governance of
Nanotechnology: Foresight, Engagement, and Integration. In E. J. Hackett (Ed.), The
Handbook of Science and Technology Studies (3rd ed., pp. 979–1000). MIT Press.
Bark, R. H., Garrick, D. E., Robinson, C. J., & Jackson, S. (2012). Adaptive basin governance
and the prospects for meeting Indigenous water claims. Environmental Science & Policy,
19–20, 169–177. https://doi.org/10.1016/j.envsci.2012.03.005
Barr, S., Gilg, A., & Shaw, G. (2011). Citizens, consumers and sustainability: (Re)Framing
environmental practice in an age of climate change. Global Environmental Change,
21(4), 1224–1233. https://doi.org/10.1016/j.gloenvcha.2011.07.009

339
Bazilian, M., Rogner, H., Howells, M., Hermann, S., Arent, D., Gielen, D., … Yumkella, K. K.
(2011). Considering the energy, water and food nexus: Towards an integrated modelling
approach. Energy Policy, 39(12), 7896–7906. https://doi.org/10.1016/j.enpol.2011.09.039
Bebbington, A. (2012). Underground political ecologies: The second Annual Lecture of the
Cultural and Political Ecology Specialty Group of the Association of American
Geographers. Geoforum, 43(6), 1152–1162.
https://doi.org/10.1016/j.geoforum.2012.05.011
Bebbington, A., Bornschlegl, T., & Johnson, A. (2013). Political Economies of Extractive
Industry: From Documenting Complexity to Informing Current Debates. Development
and Change, n/a-n/a. https://doi.org/10.1111/dech.12057
Bebbington, A., & Bury, J. (2013). Subterranean Struggles: New Dynamics of Mining, Oil, and
Gas in Latin America. University of Texas Press.
Bebbington, A. J., & Bury, J. T. (2009). Institutional challenges for mining and sustainability in
Peru. Proceedings of the National Academy of Sciences, 106(41), 17296–17301.
https://doi.org/10.1073/pnas.0906057106
Behl, R. J. (1999). Since Bramlette (1946): The Miocene Monterey Formation of California
revisited. Geological Society of America Special Papers, 338, 301–313.
https://doi.org/10.1130/0-8137-2338-8.301
Bellamy, R., Chilvers, J., Vaughan, N. E., & Lenton, T. M. (2013). ‘Opening up’ geoengineering
appraisal: Multi-Criteria Mapping of options for tackling climate change. Global
Environmental Change, 23(5), 926–937. https://doi.org/10.1016/j.gloenvcha.2013.07.011

340
Benford, R. D. (2013). Master Frame. In The Wiley-Blackwell Encyclopedia of Social and
Political Movements. Blackwell Publishing Ltd.
https://doi.org/10.1002/9780470674871.wbespm126
Benford, R. D., & Snow, D. A. (2000). Framing Processes and Social Movements: An Overview
and Assessment. Annual Review of Sociology, 26(1), 611–639.
https://doi.org/10.1146/annurev.soc.26.1.611
Berg, T. (2012, October). Trucking “Fracking” Water. Retrieved May 1, 2017, from
http://www.truckinginfo.com/channel/equipment/article/story/2012/11/trucking-fracking-
water.aspx
Bertrand, J. L., & Berg, L. N. (2013). MCLE Self-Study Article: Fracking: Expected Lawsuits.
Environmental Law News, 22(2).
Biehler, D. D., & Simon, G. L. (2011). The Great Indoors: Research frontiers on indoor
environments as active political-ecological spaces. Progress in Human Geography, 35(2),
172–192. https://doi.org/10.1177/0309132510376851
Blackmon, D. (2013, July 16). As Fracking Rises, Peak Oil Theory Slowly Dies. Retrieved May
1, 2017, from http://www.forbes.com/sites/davidblackmon/2013/07/16/as-fracking-rises-
peak-oil-theory-slowly-dies/
Blackwell, R. J., Rayne, J. R., & Terry, W. M. (1959). Factors Influencing the Efficiency of
Miscible Displacement. Retrieved from https://www.onepetro.org/general/SPE-1131-G
Blaikie, P., & Brookfield, H. (1987). Land Degradation and Society. Routledge Kegan & Paul.
Blevins, T. R. (1990). Steamflooding in the U.S.: A Status Report. Journal of Petroleum
Technology, 42(05), 548–554. https://doi.org/10.2118/20401-PA

341
Boland, B. (2013, August 20). 21 Top Scientists Praise Gov. Jerry Brown’s New Fracking Rules.
Retrieved January 28, 2014, from http://cnsnews.com/news/article/barbara-boland/21-
top-scientists-praise-gov-jerry-brown-s-new-fracking-rules
Bomberg, E. (2013). The Comparative Politics of Fracking: Networks and Framing in the US
and Europe (SSRN Scholarly Paper No. ID 2301196). Rochester, NY: Social Science
Research Network. Retrieved from https://papers.ssrn.com/abstract=2301196
Bomberg, E. (2017a). Fracking and framing in transatlantic perspective: a comparison of shale
politics in the US and European Union. Journal of Transatlantic Studies, 15(2), 101–120.
https://doi.org/10.1080/14794012.2016.1268789
Bomberg, E. (2017b). Shale We Drill? Discourse Dynamics in UK Fracking Debates. Journal of
Environmental Policy & Planning, 19(1), 72–88.
https://doi.org/10.1080/1523908X.2015.1053111
Bos, W., & Tarnai, C. (1999). Content analysis in empirical social research. International
Journal of Educational Research, 31(8), 659–671. https://doi.org/10.1016/S0883-
0355(99)00032-4
Boxall, B., & Mozingo, J. (2016, February 20). After 10 years, neighbors of a Wilmington oil
drilling operation still complain of health, environmental issues. Los Angeles Times.
Retrieved from http://www.latimes.com/science/la-me-next-door-20160221-story.html
Boyd, D. T. (2002). Oklahoma Oil: Past, Present, and Future. Oklahoma Geology Notes, 62(3),
97–106.
Boyd, E. (2008). Navigating Amazonia under uncertainty: past, present and future environmental
governance. Philosophical Transactions of the Royal Society of London B: Biological
Sciences, 363(1498), 1911–1916. https://doi.org/10.1098/rstb.2007.0023

342
Boyd, E., Nykvist, B., Borgström, S., & Stacewicz, I. A. (2015). Anticipatory governance for
social-ecological resilience. AMBIO, 44(1), 149–161. https://doi.org/10.1007/s13280-
014-0604-x
Boyle, D. F. (1972). Mass Accident Class Actions. California Law Review, 60(6), 1615–1640.
Bratspies, R. M. (2011). A Regulatory Wake-up Call: Lessons from BP’s Deepwater Horizon
Disaster. Golden Gate University Environmental Law Journal, 5, 7.
Breech, R., Cox, C., Crowe, E., Hendricks, J., & Larson, D. (2014). Warning Signs: Toxic Air
Pollution Identified at Oil and Gas Development Sites. Brattleboro, VT: Coming Clean
and Global Community Monitor.
Brenner, N. (2001). The limits to scale? Methodological reflections on scalar structuration.
Progress in Human Geography, 25(4), 591–614.
https://doi.org/10.1191/030913201682688959
Brewer, C. (2001). Historic Kern County: An Illustrated History of Bakersfield and Kern
County. HPN Books.
Bridge, G. (2004). Gas, and how to get it. Geoforum, 35(4), 395–397.
Bridge, G. (2008). Global production networks and the extractive sector: governing resource-
based development. Journal of Economic Geography, 8(3), 389–419.
https://doi.org/10.1093/jeg/lbn009
Brigida, M. (2014). The switching relationship between natural gas and crude oil prices. Energy
Economics, 43, 48–55. https://doi.org/10.1016/j.eneco.2014.01.014
Broder, J. M. (2010, March 31). Obama to Open Offshore Areas to Oil Drilling for First Time -
NYTimes.com. New York Times. Retrieved from
http://www.nytimes.com/2010/03/31/science/earth/31energy.html

343
Broder, J. M. (2011, September 13). Farewell to an Acronym. New York Times. Retrieved from
https://green.blogs.nytimes.com/2011/09/13/farewell-to-an-acronym/
Broder, J. M., & Krauss, C. (2010, December 1). U.S. Drops Bid to Explore Oil in Eastern Gulf.
The New York Times. Retrieved from
https://www.nytimes.com/2010/12/02/us/02drill.html
Brosius, J. P., Tsing, A. L., & Zerner, C. (2005). Communities and Conservation: Histories and
Politics of Community-based Natural Resource Management. Rowman Altamira.
Brown, C. (2013). State Revenues and the Natural Gas Boom: An Assessment of State Oil and
Gas Production Taxes (No. 978-1-58024-695–8). Washington, D.C.: National
Conference of State Legislatures. Retrieved from
http://www.ncsl.org/documents/energy/pdf_version_final.pdf
Brown, V. J. (2014). Radionuclides in fracking wastewater: managing a toxic blend.
Environmental Health Perspectives, 122(2), A50-55. https://doi.org/10.1289/ehp.122-
A50
Brufatto, C., Cochran, J., Conn, L., El-Zeghaty, S., Fraboulet, B., Griffin, T., … Rishmani, L.
(2003). From Mud to Cement - Building Gas Wells. Oilfield Review, (Autumn), 62–77.
Brugger, K. (2015, May 28). Refugio Oil Spill: Timeline of Events. Santa Barbara Independent.
Retrieved from http://www.independent.com/news/2015/may/28/refugio-oil-spill-
timeline-events/
Brunner, R., Steelman, T. A., Coe-Juell, L., Cromley, C., & Edwards, C. (2005). Adaptive
Governance: Integrating Science, Policy, and Decision Making. Columbia University
Press.

344
Bryant, B. I. (1995). Environmental Justice: Issues, Policies, and Solutions. Washington, D.C:
Island Press.
Brynjolfsson, E., & McAfee, A. (2012). Race Against the Machine: How the Digital Revolution
is Accelerating Innovation, Driving Productivity, and Irreversibly Transforming
Employment and the Economy. Lexington, Mass: Digital Frontier Press.
Buckwalter, J. F. (1949). Water Flooding the Bradford Field - 1949. Appalachian Geological
Society, 1. Retrieved from
http://archives.datapages.com/data/appalachian/bulletinv1_49/buckwalter.htm
Burchardt, H.-J., & Dietz, K. (2014). (Neo-)extractivism – a new challenge for development
theory from Latin America. Third World Quarterly, 35(3), 468–486.
https://doi.org/10.1080/01436597.2014.893488
Bureau of Ocean Energy Management. (2016, September 16). March Lease Sale to Offer All
Available Acreage in the Central Gulf of Mexico | BOEM. Retrieved June 4, 2017, from
https://www.boem.gov/note09142016/
Bureau of Safety and Environmental Enforcement. (2017). Pacific OCS Platforms. Retrieved
May 1, 2017, from https://www.bsee.gov/stats-facts/ocs-regions/pacific/pacific-ocs-
platforms
Burton, G. A., Basu, N., Ellis, B. R., Kapo, K. E., Entrekin, S., & Nadelhoffer, K. (2014).
Hydraulic “Fracking”: Are surface water impacts an ecological concern? Environmental
Toxicology and Chemistry, 33(8), 1679–1689. https://doi.org/10.1002/etc.2619
Business History Foundation. (1955). History of Standard Oil Company (New Jersey). New
York: Harper.

345
CAFrackFacts.org. (2017). Earthquakes and Fracking | CAFrackFacts. Retrieved May 1, 2017,
from http://www.cafrackfacts.org/impacts/seismology/
Caldiera, K., Ehrlich, A., Ehrlich, P., Gautier, C., Hansen, J., Harte, J., … Woodwell, G. (2013,
November 13). Letter to The Honorable Governor Jerry Brown. Retrieved from
http://thinkprogress.org/wp-content/uploads/2013/11/FINAL-Letter-From-Scientists-to-
Jerry-Brown_2013-11-13.pdf
Cal/EPA. (2012, February 6). Key Events in the History of Air Quality in California. Retrieved
November 1, 2013, from http://www.arb.ca.gov/html/brochure/history.htm
California Council on Science and Technology, Lawrence Berkeley National Laboratory, &
Pacific Institute. (2015). Advanced Well Stimulation Technologies in California: An
Independent Review of Scientific and Technical Information (No. 978-1-930117-93–8).
Sacramento, CA: California Council on Science and Technology, Lawrence Berkeley
National Laboratory, & Pacific Institute. Retrieved from
http://ccst.us/publications/2014/160708-blm-report.pdf
California Department of Conservation. (1985). Early Oil and Gas Production in California
DVD2 [DVD]. Retrieved from http://www.youtube.com/watch?v=aMbL49KBYe0
California Department of Conservation. (2006). Oil and Gas Statistics. Retrieved October 1,
2013, from ftp://ftp.consrv.ca.gov/pub/oil/annual_reports/2006/0102stats_06.pdf
California Department of Conservation. (2012). 2012 Preliminary Report of California Oil and
Gas Production Statistics (Report of California Oil and Gas Production Statistics No.
PR03) (p. 24). Sacramento, CA: California Department of Conservation Division of Oil,
Gas, and Geothermal Resources. Retrieved from
ftp://ftp.consrv.ca.gov/pub/oil/annual_reports/2012/PR03_PreAnnual_2012.pdf

346
California Department of Conservation. (2013a). DOGGR Oil, Gas & Geothermal- Publications-
Laws and Regulations. Retrieved October 1, 2013, from
http://www.conservation.ca.gov/dog/pubs_stats/Pages/law_regulations.aspx
California Department of Conservation. (2013b). Oil and Gas Facts. Retrieved October 1, 2013,
from http://www.consrv.ca.gov/dog/Pages/statistics.aspx
California Department of Conservation. (2013c). Oil and Gas Production History in California
(p. 8). Sacramento, CA: California Department of Conservation. Retrieved from
ftp://ftp.consrv.ca.gov/pub/oil/history/History_of_Calif.pdf
California Department of Conservation. (2017a). DOGGR Old News. Retrieved May 1, 2017,
from http://www.conservation.ca.gov/dog/Pages/DOGGROldNews.aspx
California Department of Conservation. (2017b). Hydraulic Fracturing in California. Retrieved
May 1, 2017, from
http://www.conservation.ca.gov/dog/general_information/Pages/HydraulicFracturing.asp
x
California Department of Conservation. (2017c). Oil, Gas & Geothermal - Frequently Asked
Questions. Retrieved May 1, 2017, from
http://www.conservation.ca.gov/dog/faqs/Pages/Index.aspx#wst
California Department of Conservation. (2017d). Oil, Gas & Geothermal- Injection Wells.
Retrieved May 1, 2017, from
http://www.conservation.ca.gov/dog/general_information/Pages/class_injection_wells.as
px

347
California Department of Water Resources. (2013). California Water Plan Update 2013
(California Water Plan) (p. 3095). Sacramento, CA: California Department of Water
Resources. Retrieved from http://www.waterplan.water.ca.gov/cwpu2013/prd/index.cfm
California Department of Water Resources. (2017). California State Water Project-Water
Supply. Retrieved May 1, 2017, from http://www.water.ca.gov/swp/watersupply.cfm
California Energy Commission. (2017a). 2017 Integrated Energy Policy Report. Retrieved June
1, 2017, from http://www.energy.ca.gov/2017_energypolicy/index.html
California Energy Commission. (2017b). California Solar Energy Statistics & Data. Retrieved
June 1, 2017, from http://www.energy.ca.gov/almanac/renewables_data/solar/index.php
California Energy Commission. (2017c). Foreign Sources of Crude Oil Imports to California
2016. Retrieved May 1, 2017, from
http://www.energy.ca.gov/almanac/petroleum_data/statistics/2016_foreign_crude_source
s.html
California Energy Commission. (2017d). Oil Supply Sources To California Refineries. Retrieved
May 1, 2017, from
http://www.energy.ca.gov/almanac/petroleum_data/statistics/crude_oil_receipts.html
California Energy Commission. (2017e). Petroleum Market Advisory Committee. Retrieved May
1, 2017, from http://www.energy.ca.gov/assessments/petroleum_market/#12162014
California Public Utilities Commission. (2014). SoCalGas Direct Testimony of Phillip E. Baker
Underground Storage (2016 General Rate Case No. A. 14-11-XXX). Los Angeles, CA.
Retrieved from https://www.socalgas.com/regulatory/documents/a-14-11-004/SCG-
06_P__Baker_Testimony.pdf

348
California Secretary of State. (2017a). California Secretary of State - CalAccess. Retrieved June
1, 2017, from http://cal-access.sos.ca.gov/
California Secretary of State. (2017b). Statewide Initiative Guide. Retrieved May 1, 2017, from
http://www.sos.ca.gov/elections/ballot-measures/how-qualify-initiative/initiative-guide/
California Solar Initiative. (2017). California Distributed Generation Statistics. Retrieved June 1,
2017, from http://californiadgstats.ca.gov/
California State Lands Commission. (2017a). Offshore Oil and Gas Leases. Retrieved May 1,
2017, from http://www.slc.ca.gov/Info/Oil_Gas.html
California State Lands Commission. (2017b). Public Record Act Request, Calendar Year 2016
State Oil and Gas Leases and Production Data. California State Lands Commission.
California State Mining Bureau. (1883). Third Annual Report of the State Minerologist (No. 3).
Sacramento, CA: California State Mining Bureau.
Californians Against Fracking. (2017). Members. Retrieved May 1, 2017, from
http://californiansagainstfracking.org/member-organizations/
Callicott, J. B. (1990). Whither Conservation Ethics? Conservation Biology, 4(1), 15–20.
https://doi.org/10.1111/j.1523-1739.1990.tb00261.x
Callicott, J. B., & Nelson, M. P. (1998). The Great New Wilderness Debate. University of
Georgia Press.
Campbell, J. (2014, January 23). Anti-fracking activists to protest Cuomo’s Los Angeles
fundraiser. Retrieved from
http://www.democratandchronicle.com/story/VoteUp/2014/01/23/anti-fracking-activists-
to-protest-cuomos-hollywood-fundraiser/4791703/

349
Čapek, S. M. (1993). The “Environmental Justice” Frame: A Conceptual Discussion and an
Application. Social Problems, 40(1), 5–24. https://doi.org/10.2307/3097023
Cardno ENTRIX. (2012). Hydraulic Fracturing Study PXP Inglewood Oil Field (p. 206). Los
Angeles, CA: Cardno ENTRIX. Retrieved from
http://www.inglewoodoilfield.com/res/docs/102012study/Hydraulic%20Fracturing%20St
udy%20Inglewood%20Field10102012.pdf
Carnevale, M. L. (2008, September 3). Steele Gives GOP Delegates New Cheer: ‘Drill, Baby,
Drill!’ Retrieved March 30, 2014, from http://blogs.wsj.com/washwire/2008/09/03/steele-
gives-gop-delegates-new-cheer-drill-baby-drill/tab/article/
Carpenter, D., & Moss, D. A. (2013). Preventing Regulatory Capture: Special Interest Influence
and How to Limit it. Cambridge University Press.
Carroll, R. (2014, May 21). Santa Cruz becomes first California county to ban fracking. Reuters.
Retrieved from https://www.reuters.com/article/california-fracking-
idUSL1N0O700J20140521
Cart, J. (2014, November 29). Election win puts rural San Benito County on anti-fracking map.
Los Angeles Times. Retrieved from http://www.latimes.com/local/california/la-me-san-
benito-fracking-20141129-story.html
Cart, J. (2015a, February 26). Hundreds of illicit oil wastewater pits found in Kern County. Los
Angeles Times. Retrieved from http://www.latimes.com/local/lanow/la-me-ln-pits-oil-
wastewater-20150226-story.html
Cart, J. (2015b, March 10). Agencies admit failing to protect water sources from fuel pollution.
Los Angeles Times. Retrieved from http://www.latimes.com/local/california/la-me-
fracking-water-20150311-story.html

350
Cart, J. (2015c, March 10). Lawmakers grill state oil regulators on oversight failures. Los
Angeles Times. Retrieved from http://www.latimes.com/local/lanow/la-me-lawmakers-
grill-oil-regulators-20150310-story.html
Cart, J. (2015d, March 26). State lawmakers slam oil regulators after embarrassing lapses. Los
Angeles Times. Retrieved from http://www.latimes.com/local/california/la-me-
lawmakers-intent-on-overhaul-20150325-story.html
Cart, J. (2015e, July 30). Central Valley board allows wastewater disposal to continue despite
contamination. Los Angeles Times. Retrieved from
http://www.latimes.com/local/california/la-me-oil-waste-pits-20150731-story.html
Cart, J. (2015f, July 30). Kern County to consider cracking down on oil field waste water pits.
Los Angeles Times. Retrieved from http://www.latimes.com/local/lanow/la-lan-oil-water-
pits-20150730-story.html
Carter, M. J. (2013). The Hermeneutics of Frames and Framing: An Examination of the Media’s
Construction of Reality. SAGE Open, 3(2), 2158244013487915.
https://doi.org/10.1177/2158244013487915
Cathles, L. M. (2012). Assessing the greenhouse impact of natural gas. Geochemistry
Geophysics Geosystems, 13.
Cathles, L. M., Brown, L., Hunter, A., & Taam, M. (2012, February 29). Response to Howarth et
al’s Reply (February 29, 2012). Press Release, Ithica, NY.
Cathles, L. M., Brown, L., Taam, M., & Hunter, A. (2012). A commentary on “The greenhouse-
gas footprint of natural gas in shale formations” by RW Howarth, R. Santoro, and
Anthony Ingraffea. Climatic Change, 113(2), 525–535.

351
Caudle, B. H., & Dyes, A. B. (1958). Improving Miscible Displacement by Gas-Water Injection.
Retrieved from https://www.onepetro.org/general/SPE-911-G
Center for Biological Diversity. (2014). Our Campaign. Retrieved January 1, 2014, from
http://www.biologicaldiversity.org/campaigns/california_fracking/our_campaign.html
Center for Biological Diversity, Sierra Club, & Los Padres ForestWatch. (2011, July 18). Protest
Filed to Save California Watersheds From Dangerous Fracking. Center for Biological
Diversity. Retrieved from
http://www.biologicaldiversity.org/news/press_releases/2011/monterey-lease-07-18-
2011.html
Chaffin, B., Gosnell, H., & Cosens, B. (2014). A decade of adaptive governance scholarship:
synthesis and future directions. Ecology and Society, 19(3). https://doi.org/10.5751/ES-
06824-190356
Chaika, C., & Williams, L. A. (2001). Density and Mineralogy Variations as a Function of
Porosity in Miocene Monterey Formation Oil and Gas Reservoirs in California. AAPG
Bulletin, 85(1), 149–167. https://doi.org/10.1306/8626C785-173B-11D7-
8645000102C1865D
Chapman, I. (2014). The end of Peak Oil? Why this topic is still relevant despite recent denials.
Energy Policy, 64, 93–101. https://doi.org/10.1016/j.enpol.2013.05.010
Chevron. (2013, August). Leading the Way 1876-1911. Retrieved August 27, 2013, from
http://www.chevron.com/about/history/1876/
Chi, K. (2008). Four Strategies to Transform State Governance (Organizational Transformation
Series). IBM Center for the Business of Government.

352
Chong, D., & Druckman, J. N. (2007). Framing Theory. Annual Review of Political Science,
10(1), 103–126. https://doi.org/10.1146/annurev.polisci.10.072805.103054
Christensen, C. M. (1992). Exploring the Limits of the Technology S-Curve. Part I: Component
Technologies. Production and Operations Management, 1(4), 334–357.
https://doi.org/10.1111/j.1937-5956.1992.tb00001.x
Christensen, C. M. (1997). The Innovator’s Dilemma: When New Technologies Cause Great
Firms to Fail. Retrieved from http://www.hbs.edu/faculty/Pages/item.aspx?num=46
Christensen, C. M. (2006). The Ongoing Process of Building a Theory of Disruption. Journal of
Product Innovation Management, 23(1), 39–55. https://doi.org/10.1111/j.1540-
5885.2005.00180.x
Christensen, J. R., Stenby, E. H., & Skauge, A. (1998). Review of WAG Field Experience.
Presented at the International Petroleum Conference and Exhibition of Mexico, Society
of Petroleum Engineers. https://doi.org/10.2118/39883-MS
Christensen, J. S., Raaschou-Nielsen, O., Tjønneland, A., Overvad, K., Nordsborg, R. B., Ketzel,
M., … Sørensen, M. (2016). Road Traffic and Railway Noise Exposures and Adiposity in
Adults: A Cross-Sectional Analysis of the Danish Diet, Cancer, and Health Cohort.
Environmental Health Perspectives, 124(3), 329–335.
https://doi.org/10.1289/ehp.1409052
Chung, J. (2008, June 3). Soros sounds alarm on oil ‘bubble.’ Financial Times. Retrieved from
https://www.ft.com/content/5dbd0ffe-30ef-11dd-bc93-000077b07658
CIPA. (2016, September 26). Court Strikes Down Frivolous Activist Lawsuit. Retrieved from
https://www.cipa.org/files/RLS%20CBD%203%20Lawsuit%2009-26-16%20FINAL.pdf

353
Cipolla, C. L., Lolon, E. P., Erdle, J. C., & Rubin, B. (2010). Reservoir Modeling in Shale-Gas
Reservoirs. SPE Reservoir Evaluation & Engineering, 13(04), 638–653.
https://doi.org/10.2118/125530-PA
City of Mesa. (2013). History of Natural Gas Industry. Retrieved October 1, 2013, from
http://www.mesaaz.gov/energy/nghistory.aspx
Clarke, K., & Hemphill, J. (2002). The Santa Barbara Oil Spill: A Retrospective. Yearbook of the
Association of Pacific Coast Geographers, 64, 157–162.
Clayton, S., Koehn, A., & Grover, E. (2013). Making Sense of the Senseless: Identity, Justice,
and the Framing of Environmental Crises. Social Justice Research, 26(3), 301–319.
https://doi.org/10.1007/s11211-013-0185-z
Clean Water Action. (2016, July 28). Watchdog Groups Settle First-Ever Prop 65 Lawsuit to
Clean Up Polluting Oil and Gas Wastewater Pits. Retrieved May 1, 2017, from
http://www.cleanwateraction.org/releases/watchdog-groups-settle-first-ever-prop-65-
lawsuit-clean-polluting-oil-and-gas-wastewater
Clifford, J. (2015). Frontiers of Fracking : Underground Political Ecology and Unconventional
Energy in the Contested Landscapes of North West England. Retrieved from
http://www.diva-portal.org/smash/record.jsf?pid=diva2:951145
Clifford, N., Cope, M., Gillespie, T. W., & French, S. (Eds.). (2016). Key Methods in Geography
(3 edition). London: SAGE Publications Ltd.
Coates, P. A. (2005). Nature: western attitudes since ancient times. Berkeley: University of
California Press.
Cockburn, A., & Ridgeway, J. (1979). Political Ecology. Times Books.

354
Colborn, T., Kwiatkowski, C., Schultz, K., & Bachran, M. (2011). Natural Gas Operations from
a Public Health Perspective. Human and Ecological Risk Assessment: An International
Journal, 17(5), 1039–1056. https://doi.org/10.1080/10807039.2011.605662
Colborn, T., Schultz, K., Herrick, L., & Kwiatkowski, C. (2014). An Exploratory Study of Air
Quality Near Natural Gas Operations. Human and Ecological Risk Assessment: An
International Journal, 20(1), 86–105. https://doi.org/10.1080/10807039.2012.749447
Conca, J. (2015, July 22). U.S. Winning Oil War Against Saudi Arabia. Forbes. Retrieved from
https://www.forbes.com/sites/jamesconca/2015/07/22/u-s-winning-oil-war-against-saudi-
arabia/
Conley, S., Franco, G., Faloona, I., Blake, D. R., Peischl, J., & Ryerson, T. B. (2016). Methane
emissions from the 2015 Aliso Canyon blowout in Los Angeles, CA. Science, aaf2348.
https://doi.org/10.1126/science.aaf2348
Cooley, M. (2011, December 7). County-level ‘fracking’ rules get board OK. Retrieved January
1, 2014, from http://santamariatimes.com/news/local/govt-and-politics/county-level-
fracking-rules-get-board-ok/article_c4a7c704-20a6-11e1-9902-0019bb2963f4.html
Cope, M. (2010). Coding Transcripts and Diaries. In N. Clifford, S. French, & G. Valentine
(Eds.), Key Methods in Geography. London, UK: SAGE Publications Ltd.
Cornea, N. L., Véron, R., & Zimmer, A. (2017). Everyday governance and urban environments:
Towards a more interdisciplinary urban political ecology. Geography Compass, 11(4),
n/a-n/a. https://doi.org/10.1111/gec3.12310
Cosens, B. (2013). Legitimacy, Adaptation, and Resilience in Ecosystem Management. Ecology
and Society, 18(1). https://doi.org/10.5751/ES-05093-180103

355
Cosens, B., Gunderson, L., Allen, C., & Benson, M. H. (2014). Identifying Legal, Ecological and
Governance Obstacles, and Opportunities for Adapting to Climate Change.
Sustainability, 6(4), 2338–2356. https://doi.org/10.3390/su6042338
Cosens, B., & Williams, M. (2012). Resilience and Water Governance: Adaptive Governance in
the Columbia River Basin. Ecology and Society, 17(4). https://doi.org/10.5751/ES-
04986-170403
Costanza, R. (2001). Visions, Values, Valuation, and the Need for an Ecological Economics.
Bioscience, 51(6), 459–468.
Council of State Governments. (2016). The Book of the States 2016 (2016th ed.). Council Of
State Governments. Retrieved from http://knowledgecenter.csg.org/kc/category/content-
type/bos-2016
County of Santa Barbara Planning and Development Energy Division. (2013a). Blowout at
Union Oil’s Platform A [County of Santa Barbara Planning and Development Energy
Division]. Retrieved October 1, 2013, from
http://www.sbcountyplanning.org/energy/information/1969blowout.asp
County of Santa Barbara Planning and Development Energy Division. (2013b). Historic
Overview of OCS Oil & Gas Leasing Offshore California. Retrieved from
http://www.sbcountyplanning.org/energy/information/fedHistoric.asp
Cox, J. (2013, March 8). Aera-Starrh lawsuit goes to jury. Retrieved May 1, 2017, from
http://www.bakersfield.com/archives/aera-starrh-lawsuit-goes-to-jury/article_1eaa1e37-
1444-57d6-82c6-e53c5c4214a4.html
Cox, J. (2014, September 16). Farmer lawsuit blames crop loss on oil companies’ waste
injections. The Bakersfield Californian. Retrieved from

356
http://www.bakersfield.com/news/farmer-lawsuit-blames-crop-loss-on-oil-companies-
waste-injections/article_7da0569f-9dbf-5c9e-abdb-e1e29c3c2174.html
Craig, F. F. (1971). The Reservoir Engineering Aspects of Waterflooding. New York: H.L.
Doherty Memorial Fund of AIME.
Craven, J. (2014). Fracking Secrets: The Limitations of Trade Secret Protection in Hydraulic
Fracturing. Vanderbilt Journal of Entertainment & Technology Law, 16(2), 395–424.
Creswell, J. W. (2012). Qualitative Inquiry and Research Design: Choosing Among Five
Approaches (Third Edition). Sage Publications, Inc.
Creswell, J. W. (2013). Research Design: Qualitative, Quantitative, and Mixed Methods
Approaches. Thousand Oaks: SAGE Publications : SAGE Publications, Inc.
Crotty, J. (2009). Structural causes of the global financial crisis: a critical assessment of the ‘new
financial architecture.’ Cambridge Journal of Economics, 33(4), 563–580.
https://doi.org/10.1093/cje/bep023
Cumming, G., Cumming, D. H. M., & Redman, C. (2006). Scale Mismatches in Social-
Ecological Systems: Causes, Consequences, and Solutions. Ecology and Society, 11(1).
https://doi.org/10.5751/ES-01569-110114
Cummings, B., Hobstetter, D. R., & Matthews, N. Center for Biological Diversityu and Sierra
Club v. The Bureau of Land Management and Ken Salazar (United States District Court
for the Northern District of California San Jose Division 2014). Retrieved from
http://www.biologicaldiversity.org/programs/public_lands/energy/dirty_energy_develop
ment/oil_and_gas/pdfs/California_Oil_and_Gas_Complaint_12-08-2011.pdf
CWQMC. (2017). California Water Quality Monitoring Council (SB 1070). Retrieved May 1,
2017, from http://www.mywaterquality.ca.gov/monitoring_council/index2.html

357
D’Angelo, P. (2017). Framing: Media Frames. In The International Encyclopedia of Media
Effects. John Wiley & Sons, Inc. https://doi.org/10.1002/9781118783764.wbieme0048
Daunt, T. (2016, March 1). Here’s Why Mark Ruffalo Led Leonardo DiCaprio and Others on a
Tour Through Parts of LA. GOOD Magazine. Retrieved from
https://www.good.is/articles/ruffalo-lear-dicaprio-los-angeles-urban-oil-wells-fracking
Davenport, C. (2016, June 22). Obama Fracking Rule Is Struck Down by Court. The New York
Times. Retrieved from https://www.nytimes.com/2016/06/23/us/politics/hydraulic-
fracturing-interior-department-regulations.html
David, C. C., Atun, J. M., Fille, E., & Monterola, C. (2011). Finding Frames: Comparing Two
Methods of Frame Analysis. Communication Methods and Measures, 5(4), 329–351.
https://doi.org/10.1080/19312458.2011.624873
Davies, R., Foulger, G., Bindley, A., & Styles, P. (2013). Induced seismicity and hydraulic
fracturing for the recovery of hydrocarbons. Marine and Petroleum Geology, 45, 171–
185. https://doi.org/10.1016/j.marpetgeo.2013.03.016
Delphian Ballistics. (2015). Delphian Ballistics. Retrieved November 30, 2015, from
http://www.delphianballistics.com/
Delshad, A. B., Raymond, L., Sawicki, V., & Wegener, D. T. (2010). Public attitudes toward
political and technological options for biofuels. Energy Policy, 38(7), 3414–3425.
https://doi.org/10.1016/j.enpol.2010.02.015
Demeritt, D. (2015). The Promises of Participation in Science and Political Ecology. In T.
Perreault, G. Bridge, & J. McCarthy (Eds.), The Routledge Handbook of Political
Ecology. Routledge.

358
Deng, D. (2015). Li-ion batteries: basics, progress, and challenges. Energy Science &
Engineering, 3(5), 385–418. https://doi.org/10.1002/ese3.95
DeOreo, W. B., Mayer, P. W., Martien, L., Hayden, M., Funk, A., Kramer-Duffield, M., &
Davis, R. (2011). California Single Family Water Use Efficiency Study (p. 388).
Sacramento, CA: California Department of Water Resources. Retrieved from
http://www.irwd.com/images/pdf/save-
water/CaSingleFamilyWaterUseEfficiencyStudyJune2011.pdf
Dietz, T., Ostrom, E., & Stern, P. C. (2003). The Struggle to Govern the Commons. Science,
302(5652), 1907–1912. https://doi.org/10.1126/science.1091015
Djalante, R. (2012). Review Article: “Adaptive governance and resilience: the role of multi-
stakeholder platforms in disaster risk reduction.” Nat. Hazards Earth Syst. Sci., 12(9),
2923–2942. https://doi.org/10.5194/nhess-12-2923-2012
Djalante, R., Holley, C., & Thomalla, F. (2011). Adaptive governance and managing resilience
to natural hazards. International Journal of Disaster Risk Science, 2(4), 1–14.
https://doi.org/10.1007/s13753-011-0015-6
Dodge, J. (2015). The deliberative potential of civil society organizations: framing hydraulic
fracturing in New York. Policy Studies, 36(3), 249–266.
https://doi.org/10.1080/01442872.2015.1065967
Dodge, J., & Lee, J. (2017a). Framing Dynamics and Political Gridlock: The Curious Case of
Hydraulic Fracturing in New York. Journal of Environmental Policy & Planning, 19(1),
14–34. https://doi.org/10.1080/1523908X.2015.1116378
359
Dodge, J., & Lee, J. (2017b). Framing Dynamics and Political Gridlock: The Curious Case of
Hydraulic Fracturing in New York. Journal of Environmental Policy & Planning.
Retrieved from http://agris.fao.org/agris-search/search.do?recordID=US201700081507
DOE, U. S. (2009). Modern Shale Gas Development in the United States: A Primer (No. DE-
FG26-04NT15455) (p. 116). U.S. Department of Energy Office of Fossil Technology and
National Energy Laboratory.
DOGGR. (2010). 2009 Annual Report of the State Oil & Gas Supervisor (Annual Report No.
PR06) (p. 274). Sacramento, CA: California Department of Conservation Division of Oil,
Gas, and Geothermal Resources. Retrieved from
ftp://ftp.consrv.ca.gov/pub/oil/annual_reports/2009/PR06_Annual_2009.pdf
DOGGR. (2017a). California Department of Conservation - DOGGR Official Website.
Retrieved from http://www.conservation.ca.gov/dog/Pages/aboutUs.aspx
DOGGR. (2017b). Divison of Oil, Gas & Geothermal Resources Well Finder. Retrieved May 1,
2017, from https://maps.conservation.ca.gov/doggr/wellfinder
DOGGR. (2017c). General Information Hydraulic Fracturing in California. Retrieved May 1,
2017, from
http://www.conservation.ca.gov/dog/general_information/Pages/HydraulicFracturing.asp
x
DOGGR. (2017d). Inter-Agency Collaboration for Well Stimulation Treatment. Retrieved May
1, 2017, from http://www.conservation.ca.gov/dog/Pages/WSTOtherAgencies.aspx
DOGGR. (2017e). Memoranda of Understanding/Agreement. Retrieved May 1, 2017, from
http://www.conservation.ca.gov/dog/for_operators/Pages/mou_moa.aspx

360
Donahue, J. D. (1997). Disunited States: What’s At Stake As Washington Fades And The States
Take The Lead. New York, NY: Basic Books.
Dong, C., Sigrin, B., & Brinkman, G. (2017). Forecasting residential solar photovoltaic
deployment in California. Technological Forecasting and Social Change, 117, 251–265.
https://doi.org/10.1016/j.techfore.2016.11.021
Dorr, A. (2016). Technology Blindness and Temporal Imprecision: Rethinking the Long Term in
an Era of Accelerating Technological Change. Foresight.
Dorr, A. (2017). Common errors in reasoning about the future: Three informal fallacies.
Technological Forecasting and Social Change, 116, 322–330.
https://doi.org/10.1016/j.techfore.2016.06.018
Dratva, J., Phuleria, H. C., Foraster, M., Gaspoz, J.-M., Keidel, D., Künzli, N., … Schindler, C.
(2012). Transportation noise and blood pressure in a population-based sample of adults.
Environmental Health Perspectives, 120(1), 50–55. https://doi.org/10.1289/ehp.1103448
Drexler, K. E. (2013). Radical Abundance: How a Revolution in Nanotechnology will Change
Civilization. New York: BBS PublicAffairs.
DrillingEdge. (2017). California Permits, Production, Wells & Operators. Retrieved June 1,
2017, from http://www.drillingedge.com/california
Drohan, P. J., Finley, J. C., Roth, P., Schuler, T. M., Stout, S. L., Brittingham, M. C., & Johnson,
N. C. (2012). Oil and gas impacts on forest ecosystems: findings gleaned from the 2012
Goddard Forum at Penn State University. https://doi.org/10.10170S1466046612000300
Druckman, J. N. (2001). The Implications of Framing Effects for Citizen Competence. Political
Behavior, 23(3), 225–256. https://doi.org/10.1023/A:1015006907312

361
Dunlap, R. E. (2013). Climate Change Skepticism and Denial An Introduction. American
Behavioral Scientist, 57(6), 691–698. https://doi.org/10.1177/0002764213477097
Dunlap, R. E., Xiao, C., & McCright, A. M. (2001). Politics and Environment in America:
Partisan and Ideological Cleavages in Public Support for Environmentalism.
Environmental Politics, 10(4), 23–48. https://doi.org/10.1080/714000580
Easton, R. O. (1972). Black Tide: The Santa Barbara Oil Spill and its Consequences. Delacorte
Press.
Eaton, E., & Kinchy, A. (2016). Quiet voices in the fracking debate: Ambivalence,
nonmobilization, and individual action in two extractive communities (Saskatchewan and
Pennsylvania). Energy Research & Social Science, 20, 22–30.
https://doi.org/10.1016/j.erss.2016.05.005
Eaton, S. J. M. (1866). Petroleum: a history of the oil region of Venango County, Pennsylvania.
Its resources, mode of development, and value: embracing a discussion of ancient oil
operations. Philadelphia: J. P. Skelly.
Eberhart, D. (2014, June 24). The US Shale Revolution: Who Really Deserves the Credit?
Retrieved May 1, 2017, from http://canaryusa.com/credit-for-us-shale-revolution/
Edelstein, M., & A. Kleese, D. (1995). Cultural relativity of impact assessment: Native Hawaiian
opposition to geothermal energy development. Society & Natural Resources - SOC
NATUR RESOUR, 8, 19–31. https://doi.org/10.1080/08941929509380896
Ellsworth, W. L. (2013). Injection-Induced Earthquakes. Science, 341(6142), 1225942.
https://doi.org/10.1126/science.1225942
Ellsworth, W. L., Hickman, S. H., Lleons, A. L., McGarr, A., Michael, A. J., & Rubinstein, J. L.
(2011, April 18). Are Seismicity Rate Changes in the Midcontinent Natural or Manmade?
362
Seismological Society of America. Retrieved from http://www2.seismosoc.org/FMPro?-
db=Abstract_Submission_12&-sortfield=PresDay&-sortorder=ascending&-
sortfield=Special+Session+Name+Calc&-sortorder=ascending&-
sortfield=PresTimeSort&-sortorder=ascending&-op=gt&PresStatus=0&-lop=and&-
token.1=ShowSession&-token.2=ShowHeading&-recid=224&-
format=/meetings/2012/abstracts/sessionabstractdetail.html&-lay=MtgList&-find
Ellsworth, W., Llenos, A., McGarr, A., Michael, A., Rubinstein, J., Mueller, C., … Calais, E.
(2015). Increasing seismicity in the U. S. midcontinent: Implications for earthquake
hazard. The Leading Edge, 34(6), 618–626. https://doi.org/10.1190/tle34060618.1
Encyclopedia Britannica. (2013). Natural Gas - History of Use. Retrieved November 3, 2013,
from http://www.britannica.com/EBchecked/topic/406163/natural-gas/50586/History-of-
use
Entman, R. M. (1993). Framing: Toward Clarification of a Fractured Paradigm. Journal of
Communication, 43(4), 51–58. https://doi.org/10.1111/j.1460-2466.1993.tb01304.x
Environmental Defense Center. (2014, December 3). Lawsuit Demands Public Transparency,
Environmental Analysis for Offshore Acidizing and Fracking Drilling Permits. Retrieved
from https://www.environmentaldefensecenter.org/wp-content/uploads/2015/04/14-12-
3.pdf
Environmental Defense Center. (2016, November 11). Groups File Lawsuit Challenging Federal
Approval of Offshore Fracking and Acidizing. Retrieved May 1, 2017, from
https://www.environmentaldefensecenter.org/programs_press_type/parent-room/groups-
file-lawsuit-challenging-federal-approval-of-offshore-fracking-and-acidizing/

363
Environmental Working Group. (2009). Oil and Gas Industry Exemptions. Retrieved May 1,
2017, from http://www.ewg.org/research/free-pass-oil-and-gas/oil-and-gas-industry-
exemptions
EWG. (2009, March 26). Oil and Gas Industry Exemptions. Retrieved from
http://www.ewg.org/research/free-pass-oil-and-gas/oil-and-gas-industry-exemptions
Farber, S. C., Costanza, R., & Wilson, M. A. (2002). Economic and ecological concepts for
valuing ecosystem services. Ecological Economics, 41(3), 375–392.
Feldman, D. (2014, May 7). Beverly Hills becomes first in California to ban fracking. Reuters.
Retrieved from https://www.reuters.com/article/us-usa-fracking-california-
idUSBREA4603O20140507
Feldman, D., Barbose, G., Margolis, R., James, T., Weaver, S., Darghouth, N., … Wiser, R.
(2014). Photovoltaic System Pricing Trends: Historical, Recent, and Near-Term
Projections 2014 Edition (Photovoltaic System Pricing Trends No. NREL/PR-6A20-
62558). Washington, D.C.: U.S. Department of Energy NREL. Retrieved from
http://www.nrel.gov/docs/fy14osti/62558.pdf
Fettke, C. R. (1938). The Bradford oil field, Pennsylvania and New York. Department of Internal
Affairs, Topographic and Geologic Survey.
Feyrer, J., Mansur, E. T., & Sacerdote, B. (2015). Geographic Dispersion of Economic Shocks:
Evidence from the Fracking Revolution (Working Paper No. 21624). National Bureau of
Economic Research. https://doi.org/10.3386/w21624
Financial Crisis Inquiry Commission. (2011). The Financial Crisis Inquiry Report: Final Report
of the National Commission on the Causes of the Financial and Economic Crisis in the
United States (Authorized Edition). PublicAffairs.

364
Finer, M., Jenkins, C. N., Pimm, S. L., Keane, B., & Ross, C. (2008). Oil and Gas Projects in the
Western Amazon: Threats to Wilderness, Biodiversity, and Indigenous Peoples. PLOS
ONE, 3(8), e2932. https://doi.org/10.1371/journal.pone.0002932
Finer, M., & Orta-Martínez, M. (2010). A second hydrocarbon boom threatens the Peruvian
Amazon: trends, projections, and policy implications. Environmental Research Letters,
5(1), 014012. https://doi.org/10.1088/1748-9326/5/1/014012
Finewood, M. H., & Stroup, L. J. (2012). Fracking and the Neoliberalization of the Hydro-Social
Cycle in Pennsylvania’s Marcellus Shale. Journal of Contemporary Water Research &
Education, 147(1), 72–79. https://doi.org/10.1111/j.1936-704X.2012.03104.x
Finnegan, M. (2015, May 15). Tom Steyer eyes new oil tax and gas-price transparency. LA
Times. Retrieved from http://www.latimes.com/local/political/la-me-pc-steyer-oil-tax-
gas-prices-20150515-story.html
Fischer, F. (2003). Reframing Public Policy: Discursive Politics and Deliberative Practices.
OUP Oxford.
Fisher, K. (1997). Locating Frames in the Discursive Universe. Sociological Research Online,
2(3), 1–24. https://doi.org/10.5153/sro.78
Folke, C. (2006). Resilience: The emergence of a perspective for social–ecological systems
analyses. Global Environmental Change, 16(3), 253–267.
https://doi.org/10.1016/j.gloenvcha.2006.04.002
Folke, C., Hahn, T., Olsson, P., & Norberg, J. (2005). Adaptive Governance of Social-Ecological
Systems. Annual Review of Environment and Resources, 30(1), 441–473.
https://doi.org/10.1146/annurev.energy.30.050504.144511

365
Food & Water Watch. (2012a). California, Here They Come: Now is the Time to Ban Fracking.
San Francisco, CA: Food & Water Watch. Retrieved from
https://www.foodandwaterwatch.org/sites/default/files/California%20Ban%20Fracking%
20IB%20May%202012.pdf
Food & Water Watch. (2012b, May 15). Citizens, Groups Calling for a Ban on Fracking in
California. Retrieved January 1, 2014, from
http://www.foodandwaterwatch.org/pressreleases/citizens-groups-calling-for-a-ban-on-
fracking-in-california/
Food & Water Watch. (2014, February 27). California Farmers Demand Fracking Moratorium.
Retrieved March 21, 2014, from http://ecowatch.com/2014/02/27/california-farmers-
demand-fracking-moratorium/
Ford, J. D., & King, D. (2015). Coverage and framing of climate change adaptation in the media:
A review of influential North American newspapers during 1993–2013. Environmental
Science & Policy, 48, 137–146. https://doi.org/10.1016/j.envsci.2014.12.003
Forsyth, T. (2003). Critical Political Ecology: The Politics of Environmental Science (1st ed.).
Routledge.
Forsyth, T. (2008). Political Ecology and the Epistemology of Social Justice. Geoforum, 39(2),
756–764. https://doi.org/10.1016/j.geoforum.2006.12.005
Forsythe, M. (2017, January 5). China Aims to Spend at Least $360 Billion on Renewable
Energy by 2020. The New York Times. Retrieved from
https://www.nytimes.com/2017/01/05/world/asia/china-renewable-energy-
investment.html

366
Foster, J. B., & Magdoff, F. (2009). The Great Financial Crisis: Causes and Consequences.
NYU Press.
Foucault, M. (1982). The Subject and Power. Critical Inquiry, 8(4), 777–795.
https://doi.org/10.1086/448181
Fox, J. (2010). Gasland. HBO Documentary Films. Retrieved from
http://www.gaslandthemovie.com/
FracFocus Chemical Disclosure Registry. (2015). Fracturing Fluid Management. Retrieved
January 15, 2016, from https://fracfocus.org/hydraulic-fracturing-how-it-works/drilling-
risks-safeguards
FracFocus Chemical Disclosure Registry. (2017a). Water Protection. Retrieved May 1, 2017,
from https://fracfocus.org/water-protection/drilling-usage
FracFocus Chemical Disclosure Registry. (2017b). What Chemicals Are Used. Retrieved May 1,
2017, from http://fracfocus.org/chemical-use/what-chemicals-are-used
FracFocus Chemical Disclosure Registry. (2017c). Why Chemicals Are Used. Retrieved May 1,
2017, from https://fracfocus.org/chemical-use/why-chemicals-are-used
FrameWorks Institute. (2017). Research Methods. Retrieved January 1, 2017, from
http://frameworksinstitute.org/sfa-methods.html
Frank, T. (2009, June 24). Obama and “Regulatory Capture.” Wall Street Journal. Retrieved
from http://www.wsj.com/articles/SB124580461065744913
Franks, K. A., & Lambert, P. F. (1985). Early California oil: a photographic history, 1865-1940.
Texas A&M University Press.

367
Frazier, C. (2009, January 28). Daily Sound — Locals remember oil spill like it was yesterday
[Daily Sound]. Retrieved October 1, 2013, from
http://web.archive.org/web/20100805082025/http://www.thedailysound.com/012809Oil
Freyman. (2014). Hydraulic Fracturing & Water Stress: Water Demand by the Numbers (p. 85).
Boston, MA: Ceres. Retrieved from http://www.ceres.org/resources/reports/hydraulic-
fracturing-water-stress-water-demand-by-the-numbers/at_download/file
Fried, A. N. (1961). The Foam-Drive Process for Increasing the Recovery of Oil. Bureau of
Mines.
Fritz, V., Kaiser, K., & Levy, B. (2009). Problem-Driven Governance and Political Economy
Analysis: Good Practice Framework (p. 84). Washington, D.C.: The World Bank.
Retrieved from
http://siteresources.worldbank.org/EXTGOVANTICORR/Resources/3035863-
1286395629347/PGPE-GoodPracticeFramework12-2009.pdf
Fritz, V., Levy, B., & Ort, R. (Eds.). (2014). Problem-Driven Political Economy Analysis: The
World Bank’s Experience. Washington, D.C.: The World Bank.
Frohlich, C. (2012). Two-year survey comparing earthquake activity and injection-well locations
in the Barnett Shale, Texas. Proceedings of the National Academy of Sciences.
https://doi.org/10.1073/pnas.1207728109
Frohlich, C., DeShon, H., Stump, B., Hayward, C., Hornbach, M., & Walter, J. I. (2016). A
Historical Review of Induced Earthquakes in Texas. Seismological Research Letters,
87(4), 1022–1038. https://doi.org/10.1785/0220160016
368
Gallegos, T. J., Varela, B. A., Haines, S. S., & Engle, M. A. (2015). Hydraulic fracturing water
use variability in the United States and potential environmental implications. Water
Resources Research, 51(7), 5839–5845. https://doi.org/10.1002/2015WR017278
Gallopín, G. C. (2006). Linkages between vulnerability, resilience, and adaptive capacity. Global
Environmental Change, 16(3), 293–303. https://doi.org/10.1016/j.gloenvcha.2006.02.004
Gallup. (2016). In U.S., 73% Now Prioritize Alternative Energy Over Oil, Gas. Retrieved from
http://www.gallup.com/poll/190268/prioritize-alternative-energy-oil-gas.aspx
Galt, R. E. (2013). Placing Food Systems in First World Political Ecology: A Review and
Research Agenda. Geography Compass, 7(9), 637–658.
https://doi.org/10.1111/gec3.12070
Gamson, W. A., Croteau, D., Hoynes, W., & Sasson, T. (1992). Media Images and the Social
Construction of Reality. Annual Review of Sociology, 18(1), 373–393.
https://doi.org/10.1146/annurev.so.18.080192.002105
Gamson, W. A., & Modigliani, A. (1989). Media Discourse and Public Opinion on Nuclear
Power: A Constructionist Approach. American Journal of Sociology, 95(1), 1–37.
Gan, W., & Frohlich, C. (2013). Gas injection may have triggered earthquakes in the Cogdell oil
field, Texas. Proceedings of the National Academy of Sciences, 201311316.
https://doi.org/10.1073/pnas.1311316110
Gans, K., Blondes, M., Kharaka, Y., Reidy, M., Conaway, C., Thordsen, J., … Engle, M. (2015).
Management of Reclaimed Produced Water in California Enhanced with the Expanded
US Geological Survey Produced Waters Geochemical Database. In AGU Fall Meeting
Abstracts. American Geophysical Union. Retrieved from
http://adsabs.harvard.edu/abs/2015AGUFM.H21B1374G

369
Garthwaite, J. (2013, May 27). Monterey Shale Shakes Up California’s Energy Future. Retrieved
October 1, 2013, from http://news.nationalgeographic.com/news/energy/2013/05/130528-
monterey-shale-california-fracking/
Garvie, K. H., & Shaw, K. (2016). Shale gas development and community response: perspectives
from Treaty 8 territory, British Columbia. Local Environment, 21(8), 1009–1028.
https://doi.org/10.1080/13549839.2015.1063043
Geels, F. W. (2002). Technological transitions as evolutionary reconfiguration processes: a
multi-level perspective and a case-study. Research Policy, 31(8–9), 1257–1274.
https://doi.org/10.1016/S0048-7333(02)00062-8
Geels, F. W. (2005). Technological Transitions and System Innovations: A Co-evolutionary and
Socio-technical Analysis. Edward Elgar Publishing.
Geels, F. W. (2010). Ontologies, socio-technical transitions (to sustainability), and the multi-
level perspective. Research Policy, 39(4), 495–510.
https://doi.org/10.1016/j.respol.2010.01.022
Geels, F. W. (2011). The multi-level perspective on sustainability transitions: Responses to seven
criticisms. Environmental Innovation and Societal Transitions, 1(1), 24–40.
https://doi.org/10.1016/j.eist.2011.02.002
Geels, F. W., & Kemp, R. (2007). Dynamics in socio-technical systems: Typology of change
processes and contrasting case studies. Technology in Society, 29(4), 441–455.
https://doi.org/10.1016/j.techsoc.2007.08.009
Geels, F. W., & Schot, J. (2007). Typology of sociotechnical transition pathways. Research
Policy, 36(3), 399–417. https://doi.org/10.1016/j.respol.2007.01.003

370
Gehring, U., Tamburic, L., Sbihi, H., Davies, H. W., & Brauer, M. (2014). Impact of noise and
air pollution on pregnancy outcomes. Epidemiology (Cambridge, Mass.), 25(3), 351–358.
https://doi.org/10.1097/EDE.0000000000000073
Genus, A., & Coles, A.-M. (2008). Rethinking the multi-level perspective of technological
transitions. Research Policy, 37(9), 1436–1445.
https://doi.org/10.1016/j.respol.2008.05.006
Georghiou, L. (Ed.). (2009). The Handbook of Technology Foresight: Concepts and Practice.
Edward Elgar Publishing.
Gleason, S. (1934, May). Slanted Oil Wells Work New Marvels. Popular Science Monthly.
Glowka, D. A., & Schafer, D. M. (1993). Program plan for the development of advanced
synthetic-diamond drill bits for hard-rock drilling (p. Medium: P; Size: 42 p.). Retrieved
from http://www.osti.gov/energycitations/servlets/purl/10104670-LtOYCH/native/
Goffman, E. (1974). Frame Analysis: An Essay on the Organization of Experience. Harvard
University Press.
Gold, R. (2014, October 15). Global Oil Glut Sends Prices Plunging. Wall Street Journal.
Retrieved from http://www.wsj.com/articles/global-oil-glut-sends-prices-plunging-
1413334648
Gold, R. (2015, August 21). No End in Sight for Oil Glut. Wall Street Journal. Retrieved from
http://www.wsj.com/articles/no-end-in-sight-for-oil-glut-1440113703
Goodwin, S., Carlson, K., Douglas, C., & Knox, K. (2012). Life cycle analysis of water use and
intensity of oil and gas recovery in Wattenberg field, Colo. Oil & Gas Journal, (May 7
2012), 48–59.

371
Granda, C. (2015, May 5). Baldwin Hills resident concerned fracking may be causing
earthquakes. Retrieved May 1, 2017, from http://abc7.com/696402/
Gregory, K. B., Vidic, R. D., & Dzombak, D. A. (2011). Water Management Challenges
Associated with the Production of Shale Gas by Hydraulic Fracturing. Elements, 7(3),
181–186.
Grinberg, A. (2014a). In the Pits - Oil and Gas Wastewater Disposal into Open Unlined Pits and
the Threat to California’s Water and Air (p. 31). Oakland, CA: Clean Water Action /
Clean Water Fund.
Grinberg, A. (2014b). In the Pits: Oil and Gas Wastewater Disposal into Open Unlined Pits and
the Threat to California’s Water and Air. Oakland, CA: Clean Water Action and Clean
Waster Fund. Retrieved from
http://www.cleanwateraction.org/sites/default/files/docs/publications/In%20the%20Pits.p
df
Grinberg, A. (2016). Still in the Pits: Update on Oil and Gas Wastewater Disposal in California.
Oakland, CA: Clean Water Action and Clean Waster Fund. Retrieved from
http://www.cleanwateraction.org/sites/default/files/docs/publications/Still%20In%20the
%20Pits%20-%20March%202016.pdf
Groat, C. G., & Grimshaw, T. W. (2012). Fact-Based Regulation for Environmental Protection
in Shale Gas Development Summary of Findings. (E. Institute, Trans.) (p. 59). Austin,
TX: The University of Texas at Austin.
Grossi, M. (2013, December 28). Shafter farmer helps bring focus to Valley environmental
issues. The Fresno Bee. Retrieved from http://www.fresnobee.com/news/special-
reports/article19518198.html

372
Grove, R. (1990). The origins of environmentalism. Nature, 345(6270), 11–14.
https://doi.org/10.1038/345011a0
Grow, B. (2012, October 2). Energy firm uses “land grabs” to secure fracking rights from
reluctant landowners. Retrieved June 18, 2013, from
http://openchannel.nbcnews.com/_news/2012/10/02/14183177-energy-firm-uses-land-
grabs-to-secure-fracking-rights-from-reluctant-landowners
Grow, B., Schneyer, J., & Driver, A. (2012, October 2). Special Report: The casualties of
Chesapeake’s land grab across America. Reuters. Retrieved from
http://www.reuters.com/article/2012/10/02/us-chesapeake-landgrab-substory-
idUSBRE8910E920121002
Guber, D. L. (2003). The Grassroots of a Green Revolution: Polling America on the
Environment. MIT Press.
Guha, R., & Martinez-Alier, J. (1997). Varieties of environmentalism: essays North and South.
Earthscan Publications.
Guimaraes, M. S., Valdes, J. R., Palomino, A. M., & Santamarina, J. C. (2007). Aggregate
production: Fines generation during rock crushing. International Journal of Mineral
Processing, 81(4), 237–247. https://doi.org/10.1016/j.minpro.2006.08.004
Gunderson, L. (1999). Resilience, Flexibility and Adaptive Management - - Antidotes for
Spurious Certitude? Conservation Ecology, 3(1). https://doi.org/10.5751/ES-00089-
030107
Gunderson, L., & Light, S. S. (2006). Adaptive management and adaptive governance in the
everglades ecosystem. Policy Sciences, 39(4), 323–334. https://doi.org/10.1007/s11077-
006-9027-2

373
Gurgel, A., Moura, M. C. P. A., Dantas, T. N. C., Neto, E. L. B., & Neto, A. A. D. (2008). A
Review on Chemical Flooding Methods Applied in Enhanced Oil Recovery. Brazilian
Journal of Petroleum and Gas, 2(2). Retrieved from
http://www.portalabpg.org.br/bjpg/index.php/bjpg/article/view/53
Guston, D. H. (2007). Preface. In N. M. de S. C. P. D. D. P. R. A. Dean & M. E. M. P. D. D. S.
F. Fellow (Eds.), Yearbook of Nanotechnology in Society: Presenting Futures (pp. 377–
392). John Wiley & Sons, Inc. https://doi.org/10.1002/9780470165874.ch21
Guston, D. H. (2014). Understanding ‘anticipatory governance.’ Social Studies of Science, 44(2),
218–242. https://doi.org/10.1177/0306312713508669
Guthman, J. (2011). Weighing In: Obesity, Food Justice, and the Limits of Capitalism. Berkeley:
University of California Press.
Hajer, M., & Versteeg, W. (2005). A decade of discourse analysis of environmental politics:
Achievements, challenges, perspectives. Journal of Environmental Policy & Planning,
7(3), 175–184. https://doi.org/10.1080/15239080500339646
Halliburton. (2008). U.S. Shale Gas: An Unconventional Resource. Unconventional Challenges.
(White paper No. H06377 07/08) (p. 8). Houston, TX: Halliburton. Retrieved from
http://www.halliburton.com/public/solutions/contents/Shale/related_docs/H063771.pdf
Halliburton. (2015). Breakers. Retrieved November 30, 2015, from
http://www.halliburton.com/en-US/ps/stimulation/fracturing/fracturing-fluid-
additives/breakers.page
Hamilton, J. D. (2009). Causes and Consequences of the Oil Shock of 2007-08. Presented at the
Brookings Papers on Economic Activity 2009, Washington, D.C. Retrieved from
http://econweb.ucsd.edu/~jhamilton/Hamilton_oil_shock_08.pdf

374
Hamilton, M. (2016, January 26). Negligence by Southern California Gas Co. led to massive
Porter Ranch-area gas leak, AQMD says. Los Angeles Times. Retrieved from
http://www.latimes.com/local/lanow/la-me-ln-socal-gas-lawsuit-porter-ranch-gas-leak-
20160126-story.html
Hammer, M. S., Swinburn, T. K., & Neitzel, R. L. (2014). Environmental Noise Pollution in the
United States: Developing an Effective Public Health Response. Environmental Health
Perspectives (Online); Research Triangle Park, 122(2), 115.
https://doi.org/http://dx.doi.org/10.1289/ehp.1307272
Hanna, G. D. (1928). The Monterey Shale of California at Its Type Locality with a Summary of
Its Fauna and Flora. AAPG Bulletin, 12(10), 969–983.
Hanzlik, E. J., & Mims, D. S. (2003). Forty Years of Steam Injection in California - The
Evolution of Heat Management. Presented at the SPE International Improved Oil
Recovery Conference in Asia Pacific, Society of Petroleum Engineers.
https://doi.org/10.2118/84848-MS
Hardwicke, R. E. (1935). The Rule of Capture and Its Implications as Applied to Oil and Gas.
American Bar Association. Section of Mineral and Natural Resources Law. Proceedings,
1935, 1.
Harvey, D. (1973). Social Justice and the City. London: Edward Arnold.
Harvey, S. (2010, June 13). California’s legendary oil spill. Los Angeles Times. Retrieved from
http://articles.latimes.com/2010/jun/13/local/la-me-then-20100613
Hauksson, E., Goebel, T., Ampuero, J.-P., & Cochran, E. S. (2015). A century of oilfield
operations and earthquakes in the greater Los Angeles Basin, southern California. The
Leading Edge, 34, 650656. https://doi.org/10.1190/tle34060650.1

375
Haupt, K. J., & Rockwell, D. L. (2017). Principles of California Real Estate. Rockwell
Publishing Company.
Hausman, C., & Kellogg, R. (2015). Welfare and Distributional Implications of Shale Gas. In
Brookings Papers on Economic Activity. Brookings Institution.
Hay, I. (Ed.). (2016). Qualitative Research Methods in Human Geography (4 edition). Don
Mills, Ontario: Oxford University Press.
Hayden, T. (2015, April 24). Watchdog or lapdog of Big Oil? San Francisco Chronicle.
Retrieved from http://www.sfchronicle.com/opinion/article/Dogging-DOGGR-s-
misdeeds-in-Kern-6220757.php
Hays, J., McCawley, M., & Shonkoff, S. B. C. (2017). Public health implications of
environmental noise associated with unconventional oil and gas development. Science of
The Total Environment, 580, 448–456. https://doi.org/10.1016/j.scitotenv.2016.11.118
Hecht, S. B., Morrison, K. D., & Padoch, C. (Eds.). (2014). The Social Lives of Forests: Past,
Present, and Future of Woodland Resurgence. University of Chicago Press.
Heikkila, T., Pierce, J. J., Gallaher, S., Kagan, J., Crow, D. A., & Weible, C. M. (2014).
Understanding a Period of Policy Change: The Case of Hydraulic Fracturing Disclosure
Policy in Colorado. Review of Policy Research, 31(2), 65–87.
https://doi.org/10.1111/ropr.12058
Heikkila, T., Weible, C. M., & Pierce, J. J. (2014). Exploring the Policy Narratives and Politics
of Hydraulic Fracturing in New York. In M. D. Jones, E. A. Shanahan, & M. K. McBeth
(Eds.), The Science of Stories (pp. 185–205). Palgrave Macmillan US.
https://doi.org/10.1057/9781137485861_9

376
Heizer, R. F. (1972). Mines and Quarries of the Indians of California. Ramona, Calif: Ballena
Press.
Helman, C. (2013, February 12). President Obama Gets It: Fracking Is Awesome. Forbes.
Retrieved from https://www.forbes.com/sites/christopherhelman/2013/02/12/president-
obama-gets-it-fracking-is-awesome/
Henschel, H., & Bowden, B. (2016, May 5). Controversy on Wisconsin-Iowa border as frac sand
mine, No. 1 in violations, seeks to expand. Retrieved May 1, 2017, from
http://wisconsinwatch.org/2016/05/controversy-on-wisconsin-iowa-border-as-frac-sand-
mine-no-1-in-violations-seeks-to-expand/
Hertsgaard, M. (2015, February 5). Gov. Jerry Brown’s fracking problem. Los Angeles Times.
Retrieved from http://www.latimes.com/opinion/op-ed/la-oe-hertsgaard-jerry-brown-
fracking-20150206-story.html
Heynen, N. (2013). Urban political ecology I: The urban century. Progress in Human
Geography, 0309132513500443. https://doi.org/10.1177/0309132513500443
Hilson, C. (2015). Framing Fracking: Which Frames Are Heard in English Planning and
Environmental Policy and Practice? Journal of Environmental Law, 27(2), 177–202.
https://doi.org/10.1093/jel/equ036
Hoerling, M. P. (2014, March 8). Global Warming? Not Always. The New York Times. Retrieved
from http://www.nytimes.com/2014/03/09/opinion/sunday/global-warming-not-
always.html
Holditch, S., Muller, R., Frederick, J., Smith, J., Conrad, J., Kerzmann, T., … Hanson, G. (2013,
December 18). Letter to Governor Jerry Brown. Retrieved from

377
http://energyindepth.org/wp-content/uploads/2013/12/Letter-to-Governor-Brown-Dec-
18.pdf
Hopke, J. E. (2016). Translocal anti-fracking activism: an exploration of network structure and
tie content. Environmental Communication, 10(3), 380–394.
https://doi.org/10.1080/17524032.2016.1147474
Hornafius, J. S., Quigley, D., & Luyendyk, B. P. (1999). The world’s most spectacular marine
hydrocarbon seeps (Coal Oil Point, Santa Barbara Channel, California): Quantification of
emissions. Journal of Geophysical Research: Oceans, 104(C9), 20703–20711.
https://doi.org/10.1029/1999JC900148
Horsey, D. (2015, January 16). Saudis’ price war on U.S. oil is giving us cheap gas. Los Angeles
Times. Retrieved from http://www.latimes.com/opinion/topoftheticket/la-na-tt-saudis-
price-war-20150115-story.html
Hosenuzzaman, M., Rahim, N. A., Selvaraj, J., Hasanuzzaman, M., Malek, A. B. M. A., &
Nahar, A. (2015). Global prospects, progress, policies, and environmental impact of solar
photovoltaic power generation. Renewable and Sustainable Energy Reviews, 41, 284–
297. https://doi.org/10.1016/j.rser.2014.08.046
Hough, S. E., & Page, M. (2016). Potentially Induced Earthquakes during the Early Twentieth
Century in the Los Angeles Basin. Bulletin of the Seismological Society of America.
https://doi.org/10.1785/0120160157
Howarth, R. W., Ingraffea, A., & Engelder, T. (2011). Natural gas: Should fracking stop?
Nature, 477(7364), 271–275. https://doi.org/10.1038/477271a

378
Howarth, R. W., Santoro, R., & Ingraffea, A. (2011). Methane and the greenhouse-gas footprint
of natural gas from shale formations. Climatic Change, 106(4), 679–690.
https://doi.org/10.1007/s10584-011-0061-5
Howarth, R. W., Santoro, R., & Ingraffea, A. (2012). Venting and leaking of methane from shale
gas development: response to Cathles et al. Climatic Change, 113(2), 537–549.
https://doi.org/10.1007/s10584-012-0401-0
Hsieh, P. A., & Bredehoeft, J. D. (1981). A reservoir analysis of the Denver earthquakes: A case
of induced seismicity. Journal of Geophysical Research: Solid Earth, 86(B2), 903–920.
https://doi.org/10.1029/JB086iB02p00903
Hubbert, M. K. (1956). Nuclear Energy and the Fossil Fuel. In Spring Meeting of the Southern
District (p. 40). San Antonio, Texas: American Petroleum Institute, Division of
Production.
Hubbert, M. K., & Willis, D. G. (1957). Mechanics of hydraulic fracturing. Transactions of the
American Institute of Mining, Metallurgical and Petroleum Engineers, 9(2), 153–166.
Huber, M. T. (2009). Energizing historical materialism: Fossil fuels, space and the capitalist
mode of production. Geoforum, 40(1), 105–115.
https://doi.org/10.1016/j.geoforum.2008.08.004
Huber, M. T. (2011). Oil, Life, and the Fetishism of Geopolitics. Capitalism Nature Socialism,
22(3), 32–48. https://doi.org/10.1080/10455752.2011.593883
Huber, M. T. (2013). Lifeblood: Oil, Freedom, and the Forces of Capital. University of
Minnesota Press. Retrieved from http://www.jstor.org/stable/10.5749/j.ctt46npkm
Huber, M. T. (2017). Reinvigorating Class in Political Ecology: Nitrogen Capital and the Means
of Degradation. Geoforum, 81, (in press). https://doi.org/10.1016/j.geoforum.2017.01.010

379
Hudgins, A., & Poole, A. (2014). Framing fracking: private property, common resources, and
regimes of governance. Journal of Political Ecology, 21, 303–319.
Hughes, J. D. (2013a). Drill, Baby, Drill: Can Unconventional Fuels Usher in a New Era of
Energy Abundance? (p. 178). Santa Rosa, CA: Post Carbon Institute. Retrieved from
http://www.postcarbon.org/reports/DBD-report-FINAL.pdf
Hughes, J. D. (2013b). Drilling California: A Reality Check on the Monterey Shale. Santa Rosa,
CA: Post Carbon Institute. Retrieved from http://www.postcarbon.org/reports/Drilling-
California_FINAL.pdf
Hughes, J. D. (2013c). Energy: A reality check on the shale revolution. Nature, 494(7437), 307–
308. https://doi.org/10.1038/494307a
Hughes, J. D. (2016a). 2016 Shale Gas Reality Check: Revisiting the U.S. Department of Energy
Play-by-Play Forecasts through 2040 from Annual Energy Outlook 2016. Santa Rosa,
CA: Post Carbon Institute. Retrieved from http://www.postcarbon.org/publications/2016-
shale-gas-reality-check/
Hughes, J. D. (2016b). 2016 Tight Oil Reality Check: Revisiting the U.S. Department of Energy
Play-by-Play Forecasts through 2040 from Annual Energy Outlook 2016. Santa Rosa,
CA: Post Carbon Institute. Retrieved from http://www.postcarbon.org/publications/2016-
tight-oil-reality-check/
Hughes, J. E., & Podolefsky, M. (2015). Getting Green with Solar Subsidies: Evidence from the
California Solar Initiative. Journal of the Association of Environmental and Resource
Economists, 2(2), 235–275. https://doi.org/10.1086/681131
Hume, K. I., Brink, M., & Basner, M. (2012). Effects of environmental noise on sleep. Noise &
Health, 14(61), 297–302. https://doi.org/10.4103/1463-1741.104897

380
Hunsberger, C., German, L., & Goetz, A. (2017). “Unbundling” the biofuel promise: Querying
the ability of liquid biofuels to deliver on socio-economic policy expectations. Energy
Policy, 108(Supplement C), 791–805. https://doi.org/10.1016/j.enpol.2017.04.017
Huntjens, P., Lebel, L., Pahl-Wostl, C., Camkin, J., Schulze, R., & Kranz, N. (2012).
Institutional design propositions for the governance of adaptation to climate change in the
water sector. Global Environmental Change, 22(1), 67–81.
https://doi.org/10.1016/j.gloenvcha.2011.09.015
Hussey, K., & Pittock, J. (2012). The Energy–Water Nexus: Managing the Links between
Energy and Water for a Sustainable Future. Ecology and Society, 17(1).
https://doi.org/10.5751/ES-04641-170131
Hutchinson, W. H. (1965). Oil, Land, and Politics: the California Career of Thomas Robert
Bard. University of Oklahoma Press.
IHS Global Insight. (2012). America’s New Energy Future: The Unconventional Oil and Gas
Revolution and the US Economy (p. 184). Washington, D.C.: IHS Global Insight.
Retrieved from
http://www.energyxxi.org/sites/default/files/pdf/americas_new_energy_future-
highlights.pdf
Ingraffea, A. R., Wells, M. T., Santoro, R. L., & Shonkoff, S. B. C. (2014). Assessment and risk
analysis of casing and cement impairment in oil and gas wells in Pennsylvania, 2000–
2012. Proceedings of the National Academy of Sciences, 111(30), 10955–10960.
https://doi.org/10.1073/pnas.1323422111

381
Inman, P. (2016, December 4). Opec doesn’t hold all the cards, even after its oil price agreement.
The Observer. Retrieved from http://www.theguardian.com/business/2016/dec/03/opec-
oil-price-deal-doesnt-hold-cards-fracking
IPCC. (2013). Climate Change 2013 – The Physical Science Basis (IPCC Assessment). Geneva,
Switzerland: Intergovernmental Panel on Climate Change.
IRENA. (2016). The Power to Change: Solar and Wind Cost Reduction Potential to 2025. Abu
Dhabi: International Renewable Energy Agency. Retrieved from
http://www.irena.org/DocumentDownloads/Publications/IRENA_Power_to_Change_201
6.pdf
Isaacs, C. M., & Rullkötter, J. (2001). The Monterey Formation: From Rocks to Molecules.
Columbia University Press.
ITRPV. (2017). International Technology Roadmap for Photovoltaic (ITRPV Roadmap).
ITRPV. Retrieved from
file:///F:/DISS%20FUCK/Misc%20tech%20papers/ITRPV%20Eighth%20Edition%2020
17.pdf
Jackson, P., & Neely, A. H. (2015). Triangulating health Toward a practice of a political ecology
of health. Progress in Human Geography, 39(1), 47–64.
https://doi.org/10.1177/0309132513518832
Jackson, R. B. (2014). The integrity of oil and gas wells. Proceedings of the National Academy
of Sciences of the United States of America, 111(30), 10902–10903.
https://doi.org/10.1073/pnas.1410786111
Jackson, R. B., Gorody, A., Mayer, B., Roy, J., Ryan, M., & Van Stempvoort, D. (2013).
Groundwater Protection and Unconventional Gas Extraction: The Critical Need for Field-

382
Based Hydrogeological Research. Groundwater, 51(4), 488–510.
https://doi.org/10.1111/gwat.12074
Jackson, R. B., Lowry, E. R., Pickle, A., Kang, M., DiGiulio, D., & Zhao, K. (2015). The Depths
of Hydraulic Fracturing and Accompanying Water Use Across the United States.
Environmental Science & Technology, 49(15), 8969–8976.
https://doi.org/10.1021/acs.est.5b01228
Jacobs, C., & Kelly, W. J. (2008). Smogtown: The Lung-burning History of Pollution in Los
Angeles. Overlook Press.
Jacques, P. J., Dunlap, R. E., & Freeman, M. (2008). The organisation of denial: Conservative
think tanks and environmental scepticism. Environmental Politics, 17(3), 349–385.
https://doi.org/10.1080/09644010802055576
Jadidzadeh, A., & Serletis, A. (2017). How does the U.S. natural gas market react to demand and
supply shocks in the crude oil market? Energy Economics, 63, 66–74.
https://doi.org/10.1016/j.eneco.2017.01.007
Jenden, P. D., & Kaplan, I. R. (1989). Origin of Natural Gas in Sacramento Basin, California.
AAPG Bulletin, 73(4), 431–453.
Jenkins, V. N. (1954). The Petroleum Industry Sponsors Air Pollution Research. Air Repair,
3(3), 144–149. https://doi.org/10.1080/00966665.1954.10467615
Johnson, N. (2010). Report 1: Marcellus Shale Natural Gas and Wind (Pennsylvania Energy
Impacts Assessment) (p. 47). The Nature Conservancy. Retrieved from
www.nature.org/media/pa/pa_energy_assessment_report.pdf

383
Jones, M. D., & McBeth, M. K. (2010). A Narrative Policy Framework: Clear Enough to Be
Wrong? Policy Studies Journal, 38(2), 329–353. https://doi.org/10.1111/j.1541-
0072.2010.00364.x
Journal of the Senate of the State of California, C. L. (1860). Journal of the Senate of the State of
California (11th Session). Sacramento, CA.
Joy, M. P., & Dimitroff, S. D. (2016, June). Oil and gas regulation in the United States:
overview. Retrieved May 1, 2017, from
https://content.next.westlaw.com/Document/I466099551c9011e38578f7ccc38dcbee/Vie
w/FullText.html?contextData=(sc.Default)&transitionType=Default&firstPage=true&bhc
p=1
Kacik, A. (2015, August 14). 3 months after oil spill, Santa Barbara region recovering. Pacific
Coast Business Times. Retrieved from https://www.pacbiztimes.com/2015/08/14/3-
months-after-oil-spill-santa-barbara-region-recovering/
Kallis, G., Kiparsky, M., & Norgaard, R. (2009). Collaborative governance and adaptive
management: Lessons from California’s CALFED Water Program. Environmental
Science & Policy, 12(6), 631–643. https://doi.org/10.1016/j.envsci.2009.07.002
Karinen, R., & Guston, D. H. (2009). Toward Anticipatory Governance: The Experience with
Nanotechnology. In M. Kaiser, M. Kurath, S. Maasen, & C. Rehmann-Sutter (Eds.),
Governing Future Technologies (pp. 217–232). Springer Netherlands.
https://doi.org/10.1007/978-90-481-2834-1_12
Kaufman, S. (2012). Project Plowshare: The Peaceful Use of Nuclear Explosives in Cold War
America. Cornell University Press.

384
Keranen, K. M., Weingarten, M., Abers, G. A., Bekins, B. A., & Ge, S. (2014). Sharp increase in
central Oklahoma seismicity since 2008 induced by massive wastewater injection.
Science, 345(6195), 448–451. https://doi.org/10.1126/science.1255802
Khan, A. (2016, February 25). Porter Ranch leak declared largest methane leak in U.S. history.
Los Angeles Times. Retrieved from http://www.latimes.com/science/sciencenow/la-sci-
sn-porter-ranch-methane-20160225-story.html
Kilian, L. (2014). Oil Price Shocks: Causes and Consequences. Annual Review of Resource
Economics, 6(1), 133–154. https://doi.org/10.1146/annurev-resource-083013-114701
Kilian, L., & Hicks, B. (2013). Did Unexpectedly Strong Economic Growth Cause the Oil Price
Shock of 2003–2008? Journal of Forecasting, 32(5), 385–394.
https://doi.org/10.1002/for.2243
Kiparsky, M., & Hein, J. F. (2013). Regulation of Hydraulic Fracturing in California: A Waste
Water and Water Quality Perspective (p. 61). Berkeley, CA: UC Berkeley, Wheeler
Institute for Water Law & Policy, and Center for Law, Energy and the Environment.
Retrieved from
http://www.law.berkeley.edu/files/ccelp/Wheeler_HydraulicFracturing_April2013(1).pdf
Kiviat, E. (2013). Risks to biodiversity from hydraulic fracturing for natural gas in the Marcellus
and Utica shales. Annals of the New York Academy of Sciences, 1286(1), 1–14.
https://doi.org/10.1111/nyas.12146
Klare, M. T. (2014, January 9). Peak Oil Is Dead. Long Live Peak Oil! The Nation. Retrieved
from https://www.thenation.com/article/peak-oil-dead-long-live-peak-oil/
Kloor, K. (2013, July 18). Is Peak Oil Dead or Just Postponed? Retrieved May 1, 2017, from
http://blogs.discovermagazine.com/collideascape/2013/07/18/the-end-of-peak-oil/

385
Knickmeyer, E. (2015, February 6). California permitted oil-field discharge in protected water.
Retrieved May 1, 2017, from http://www.dailynews.com/environment-and-
nature/20150206/california-permitted-oil-field-discharge-in-protected-water
Kondash, A., & Vengosh, A. (2015). Water Footprint of Hydraulic Fracturing. Environmental
Science & Technology Letters, 2(10), 276–280.
https://doi.org/10.1021/acs.estlett.5b00211
Kosnik, R. L. (2007). The Oil and Gas Industry’s Exclusions and Exemptions to Major
Environmental Statutes. Washington, D.C.: Earthworks. Retrieved from
https://www.earthworksaction.org/files/publications/PetroleumExemptions1c.pdf
Kozik, H. G., & Holditch, S. A. (1981). A Case History for Massive Hydraulic Fracturing the
Cotton Valley Lime Matrix, Fallon and Personville Fields. Journal of Petroleum
Technology, 33(2). Retrieved from https://www.onepetro.org/journal-paper/SPE-7911-
PA
Kramer, B. M., & Anderson, O. L. (2005). The Rule of Capture - An Oil and Gas Perspective.
Environmental Law, 35, 899.
Krauss, C. (2011, September 26). In North Dakota, Wasted Natural Gas Flickers Against the
Sky. The New York Times. Retrieved from
https://www.nytimes.com/2011/09/27/business/energy-environment/in-north-dakota-
wasted-natural-gas-flickers-against-the-sky.html
Krauss, C. (2014, November 3). U.S. Oil Prices Fall Below $80 a Barrel. The New York Times.
Retrieved from https://www.nytimes.com/2014/11/04/business/energy-environment/us-
oil-prices-fall-below-80-a-barrel.html

386
LA Times Editorial Board. (2011, May 9). Something in the water. Los Angeles Times. Retrieved
from http://articles.latimes.com/2011/may/09/opinion/la-ed-fracking-20110509
Lakoff, G. (1987). Women, Fire, and Dangerous Things. University of Chicago Press.
Lakoff, G. (2002). Moral Politics : How Liberals and Conservatives Think (Second Edition
edition). Chicago: University Of Chicago Press.
Lakoff, G. (2009). The Political Mind: A Cognitive Scientist’s Guide to Your Brain and Its
Politics (Reprint edition). New York: Penguin Books.
Lakoff, G. (2010). Why it Matters How We Frame the Environment. Environmental
Communication: A Journal of Nature and Culture, 4(1), 70–81.
https://doi.org/10.1080/17524030903529749
Lantz, E., Wiser, R., & Hand, M. (2012). The Past and Future Cost of Wind Energy. Golden,
CO: International Energy Agency, National Renewable Energy Laboratory, and
Lawrence Berkeley National Laboratory. Retrieved from
https://www.ieawind.org/index_page_postings/WP2_task26.pdf
Latour, B. (1987). Science in Action: How to Follow Scientists and Engineers Through Society.
Harvard University Press.
Latour, B. (1990). Technology is society made durable. The Sociological Review, 38(S1), 103–
131. https://doi.org/10.1111/j.1467-954X.1990.tb03350.x
Latour, B. (1993). We Have Never Been Modern. Cambridge, Mass: Harvard University Press.
Latour, B. (2007). Reassembling the Social: An Introduction to Actor-Network-Theory (1st
edition). Oxford: Oxford University Press.
Latour, B., & Woolgar, S. (1979). Laboratory Life: The Construction of Scientific Facts.
Princeton University Press.

387
Lauer, N. E., Harkness, J. S., & Vengosh, A. (2016). Brine Spills Associated with
Unconventional Oil Development in North Dakota. Environmental Science &
Technology, 50(10), 5389–5397. https://doi.org/10.1021/acs.est.5b06349
Law, J., & Callon, M. (1992). The Life and Death of an Aircraft: A Network Analysis of
Technical Change. In J. Law & W. E. Bijker (Eds.), Shaping Technology/building
Society: Studies in Sociotechnical Change (pp. 21–52). MIT Press.
Laws, N. D., Epps, B. P., Peterson, S. O., Laser, M. S., & Wanjiru, G. K. (2017). On the utility
death spiral and the impact of utility rate structures on the adoption of residential solar
photovoltaics and energy storage. Applied Energy, 185, 627–641.
https://doi.org/10.1016/j.apenergy.2016.10.123
Lejano, R. P., Ingram, M., & Ingram, H. M. (2013). The power of narrative in environmental
networks. Cambridge, Massachusetts: The MIT Press.
Lemos, M. C., & Agrawal, A. (2006a). Environmental Governance. Annual Review of
Environment and Resources, 31(1), 297–325.
https://doi.org/10.1146/annurev.energy.31.042605.135621
Lemos, M. C., & Agrawal, A. (2006b). Environmental Governance. Annual Review of
Environment and Resources, 31(1), 297–325.
https://doi.org/10.1146/annurev.energy.31.042605.135621
Leonard, T. (2012, March 19). Broken promises: The rusting wind turbines of Hawaii. Daily
Mail. Retrieved from
http://www.hawaiifreepress.com/ArticlesMain/tabid/56/ID/6350/Broken-promises-The-
rusting-wind-turbines-of-Hawaii.aspx

388
Leopold, A. (1953). Round River: From the Journals of Aldo Leopold. (L. B. Leopold, Ed.).
Oxford University Press.
Lercher, P., Evans, G., Meis, M., & Kofler, W. (2002). Ambient neighbourhood noise and
children’s mental health. Occupational and Environmental Medicine, 59(6), 380–386.
https://doi.org/10.1136/oem.59.6.380
Liberty Hill Foundation. (2015). Drilling Down: The Community Consequences of Expanded
Oil Development in Los Angeles. Los Angeles, CA. Retrieved from
https://www.libertyhill.org/sites/libertyhillfoundation/files/Drilling%20Down%20Report
_1.pdf
LIFE Magazine, T. (1954, November 1). Smog in Los Angeles. LIFE Magazine, 37(18).
Lifsher, M., & McGreevy, P. (2013, September 20). Brown signs bill on fracking, upsetting both
sides of oil issue. Los Angeles Times. Retrieved from
http://articles.latimes.com/2013/sep/20/local/la-me-brown-bills-fracking-20130921
Lis, A., & Stankiewicz, P. (2017). Framing Shale Gas for Policy-Making in Poland. Journal of
Environmental Policy & Planning, 19(1), 53–71.
https://doi.org/10.1080/1523908X.2016.1143355
Litovitz, A., Curtright, A., Abramzon, S., Burger, N., & Samaras, C. (2013). Estimation of
regional air-quality damages from Marcellus Shale natural gas extraction in
Pennsylvania. Environmental Research Letters, 8(1), 014017.
https://doi.org/10.1088/1748-9326/8/1/014017
Liverman, D. (2004). Who Governs, at What Scale and at What Price? Geography,
Environmental Governance, and the Commodification of Nature. Annals of the

389
Association of American Geographers, 94(4), 734–738. https://doi.org/10.1111/j.1467-
8306.2004.00428.x
Lodge, J. E. (1938). New Oil Sources Forecast by World’s Deepest Well. Popular Science
Monthly, (August), 21–23.
Long, J. C. S., Feinstein, L. C., Bachmann, C. E., Birkholzer, J. T., Camarillo, M. K., Domen, J.
K., … Phillips, S. E. (2015). An Independent Scientific Assessment of Well Stimulation in
California Volume II: Potential Environmental Impacts of Hydraulic Fracturing and
Acid Stimulations (No. 978-1-930117-75–4). Sacramento, CA. Retrieved from
http://ccst.us/publications/2015/160708-sb4-vol-II.pdf
Long, J. C. S., Feinstein, L. C., Birkholzer, J., Jordan, P., Houseworth, J., Dobson, P. F., …
Gautier, D. L. (2015). An Independent Scientific Assessment of Well Stimulation in
California Volume I: Well Stimulation Technologies and their Past, Present, and
Potential Future Use in California (No. 978-1-930117-97–6). Sacramento, CA:
California Council on Science and Technology. Retrieved from
http://ccst.us/publications/2015/160708-sb4-vol-I.pdf
Long, J. C. S., Feinstein, L. C., Jordan, P. D., Birkholzer, J. T., Maddalena, R. L., Foxall, W., …
Shonkoff, S. B. C. (2015). An Independent Scientific Assessment of Well Stimulation in
California Volume III: Case Studies of Hydraulic Fracturing and Acid Stimulations in
Select Regions: Offshore, Monterey Formation, Los Angeles Basin, and San Joaquin
Basin (No. 978-1-930117-70–9). Sacramento, CA: California Council on Science and
Technology. Retrieved from http://ccst.us/publications/2015/160708-sb4-vol-III.pdf
López, I. H. (2015). Dog Whistle Politics: How Coded Racial Appeals Have Reinvented Racism
and Wrecked the Middle Class (Reprint edition). Oxford: Oxford University Press.

390
Los Angeles Examiner Herald-Express Photographs Collection. (1951). Los Angeles Examiner
Photographs Collection, 1920-1961. USC Digital Library. Retrieved from
http://digitallibrary.usc.edu/cdm/landingpage/collection/p15799coll44
Lovelock, J. (2004). Archer John Porter Martin CBE. 1 March 1910 — 28 July 2002 Elected
F.R.S. 1950. Biographical Memoirs of Fellows of the Royal Society, 50, 157–170.
https://doi.org/10.1098/rsbm.2004.0012
Low, S. (2017). Engineering imaginaries: Anticipatory foresight for solar radiation management
governance. Science of The Total Environment, 580, 90–104.
https://doi.org/10.1016/j.scitotenv.2016.07.200
Lowe, J. (2014). Oil and Gas Law in a Nutshell (6 edition). St. Paul, MN: West Academic
Publishing.
Lynch, A. H., & Brunner, R. D. (2010). Learning from Climate Variability: Adaptive
Governance and the Pacific ENSO Applications Center. Weather, Climate, and Society,
2(4), 311–319. https://doi.org/10.1175/2010WCAS1049.1
Macey, G. P., Breech, R., Chernaik, M., Cox, C., Larson, D., Thomas, D., & Carpenter, D. O.
(2014). Air concentrations of volatile compounds near oil and gas production: a
community-based exploratory study. Environmental Health, 13, 82.
https://doi.org/10.1186/1476-069X-13-82
Macnaghten, P., Davies, S. R., & Kearnes, M. (2015). Understanding Public Responses to
Emerging Technologies: A Narrative Approach. Journal of Environmental Policy &
Planning, 0(0), 1–19. https://doi.org/10.1080/1523908X.2015.1053110

391
Magoon, L., Castano, J., Lillis, P., Mackevett, N., & Naeser, N. (1994). Two petroleum systems
in the Sacramento Basin, California-A basis for new discoveries. AAPG Bulletin
(American Association of Petroleum Geologists);(United States), 78(CONF-9404149–).
Mai-Duc, C. (2014a, March 19). Carson imposes moratorium on oil drilling over fear of
fracking. Los Angeles Times. Retrieved from
http://articles.latimes.com/2014/mar/19/local/la-me-0320-carson-drilling-20140320
Mai-Duc, C. (2014b, April 30). Fracking-inspired moratorium on oil drilling to expire in Carson.
Los Angeles Times. Retrieved from http://www.latimes.com/local/lanow/la-me-ln-
moratorium-oil-drilling-carson-fracking-20140430,0,7557119.story#axzz30QbqhCfX
Manchester, H. H. (1918). Historical Notes on the Evolution of Water Heating. In The Gas Age
(Vol. 41, pp. 453–454). New York, NY: Progressive Age Publishing.
Manfreda, J. (2015, April 13). The Real History Of Fracking. Retrieved June 1, 2017, from
http://oilprice.com/Energy/Crude-Oil/The-Real-History-Of-Fracking.html
Mann, C. C. (2013, May). What If We Never Run Out of Oil? The Atlantic. Retrieved from
http://www.theatlantic.com/magazine/archive/2013/05/what-if-we-never-run-out-of-
oil/309294/?single_page=true
Marston, S. A. (2000). The social construction of scale. Progress in Human Geography, 24(2),
219–242. https://doi.org/10.1191/030913200674086272
Martinez-Alier, J. (2003). The Environmentalism of the Poor: A Study of Ecological Conflicts
and Valuation. Cheltenham, UK: Edward Elgar Publishing.
Martinez-Alier, J. (2009). Social Metabolism, Ecological Distribution Conflicts, and Languages
of Valuation. Capitalism Nature Socialism, 20(1), 58–87.
https://doi.org/10.1080/10455750902727378

392
Martinez-Alier, J., Munda, G., & O’Neill, J. (1998). Weak comparability of values as a
foundation for ecological economics. Ecological Economics, 26(3), 277–286.
Mason, R. (2015, February 5). The Next Evolutionary Step in Pad Drilling. Retrieved January
19, 2016, from http://info.drillinginfo.com/pad-drilling-2-point-0/
Matthes, J., & Kohring, M. (2008). The Content Analysis of Media Frames: Toward Improving
Reliability and Validity. Journal of Communication, 58(2), 258–279.
https://doi.org/10.1111/j.1460-2466.2008.00384.x
Matz, J., & Renfrew, D. (2015). Selling “Fracking”: Energy in Depth and the Marcellus Shale.
Environmental Communication, 9(3), 288–306.
https://doi.org/10.1080/17524032.2014.929157
Mayuga, M. N. (1970). Geology and Development of California’s Giant-Wilmington Oil field.
In Geology of Giant Petroleum Fields (pp. 158–184). Tulsa, OK: American Association
of Petroleum Geologists.
Mazur, A. (2016). How did the fracking controversy emerge in the period 2010-2012? Public
Understanding of Science, 25(2), 207–222. https://doi.org/10.1177/0963662514545311
Mazza, S. (2014, April 30). Carson officials lift moratorium on Occidental oil drilling project.
Retrieved May 1, 2014, from http://www.dailybreeze.com/business/20140430/carson-
officials-lift-moratorium-on-occidental-oil-drilling-project
McBeath, J. A. (2016). Big Oil in the United States: Industry Influence on Institutions, Policy,
and Politics: Industry Influence on Institutions, Policy, and Politics. ABC-CLIO.
McCammon, D. (2017, March 21). King Oil Is Dead; Long Live The King. Retrieved June 1,
2017, from https://seekingalpha.com/article/4056925-king-oil-dead-long-live-king
393
McCarthy, J. (2002). First World political ecology: lessons from the Wise Use movement.
Environment and Planning A, 34(7), 1281–1302.
McCarthy, J. (2005). Scale, Sovereignty, and Strategy in Environmental Governance. Antipode,
37(4), 731–753. https://doi.org/10.1111/j.0066-4812.2005.00523.x
McCartney, L. (2008). The Teapot Dome Scandal: How Big Oil Bought the Harding White
House and Tried to Steal the Country. Random House.
McCright, A. M., & Dunlap, R. E. (2011). The Politicization of Climate Change and Polarization
in the American Public’s Views of Global Warming, 2001–2010. Sociological Quarterly,
52(2), 155–194. https://doi.org/10.1111/j.1533-8525.2011.01198.x
McKenzie, L. M., Witter, R. Z., Newman, L. S., & Adgate, J. L. (2012). Human health risk
assessment of air emissions from development of unconventional natural gas resources.
The Science of the Total Environment, 424, 79–87.
https://doi.org/10.1016/j.scitotenv.2012.02.018
McKibben, B. (2014, September 8). Fracking may be worse than burning coal. So why is Obama
still betting his climate legacy on it? Mother Jones. Retrieved from
http://www.motherjones.com/environment/2014/09/methane-fracking-obama-climate-
change-bill-mckibben/
McNary, S. (2017, July 14). SoCal Gas pushes back on new gas safety demands. Southern
California Public Radio. Retrieved from
http://www.scpr.org/news/2017/07/14/73805/socal-gas-pushes-back-on-l-a-county-and-
cal-osha-s/
Meadows, D. H., & Club of Rome. (1972). The Limits to growth; a report for the Club of Rome’s
project on the predicament of mankind. New York: Universe Books.

394
Mee Jr., J. H. (1976). Leasing Land for Oil and Gas Development in California (No. PR09).
California Department of Conservation DOGGR.
Megerian, C. (2015a, August 24). Gov. Jerry Brown takes aim at oil companies over “highly
destructive” product. Los Angeles Times. Retrieved from
http://www.latimes.com/local/political/la-me-pc-jerry-brown-oil-companies-climate-
change-20150824-story.html
Megerian, C. (2015b, November 12). Protesters to Gov. Jerry Brown: Prove your green
credentials by banning fracking. Los Angeles Times. Retrieved from
http://www.latimes.com/politics/la-pol-sac-fracking-protest-jerry-brown-20151112-
story.html
Megerian, C., & Mason, M. (2015, September 13). The inside story of how power struggles
doomed Jerry Brown’s top priority. Los Angeles Times. Retrieved from
http://www.latimes.com/local/politics/la-me-pol-sac-brown-legislature-20150913-
story.html
Meng, Q., & Ashby, S. (2014). Distance: A critical aspect for environmental impact assessment
of hydraulic fracking. The Extractive Industries and Society, 1(2), 124–126.
https://doi.org/10.1016/j.exis.2014.07.004
Merchant, C. (1990). Environmental Ethics and Political Conflict: A View from California.
Environmental Ethics, 12(1), 45–68. https://doi.org/10.5840/enviroethics19901217
Merchant, C. (1998). Green Versus Gold: Sources In California’s Environmental History. Island
Press.

395
Metze, T., & Dodge, J. (2016). Dynamic Discourse Coalitions on hydro-fracking in Europe and
the United States. Environmental Communication, 10(3), 365–379.
https://doi.org/10.1080/17524032.2015.1133437
Meyer, J. M. (1997). Gifford Pinchot, John Muir, and the Boundaries of Politics in American
Thought. Polity, 30(2), 267–284. https://doi.org/10.2307/3235219
Michelson, E. S. (2016). Assessing the Societal Implications of Emerging Technologies:
Anticipatory Governance in Practice. Routledge.
Miller, J. (2010, December 15). Oil and Water Don’t Mix with California Agriculture. High
Country News. Retrieved from http://www.hcn.org/issues/42.21/oil-and-water-dont-mix-
with-california-agriculture
Miller, M. (1999, November 30). The Oil Spill That Sparked the Green Revolution - latimes. Los
Angeles Times. Retrieved from http://articles.latimes.com/1999/nov/30/local/me-38862
Mills, M. P. (2014). Where the Jobs Are: Small businesses Unleash America’s Energy
Employment Boom (Manhattan Institute’s Power & Growth Initiative No. No. 4).
Manhattan Institute. Retrieved from https://www.manhattan-
institute.org/sites/default/files/R-MM-0214.pdf
MITEI. (2011). The Future of Natural Gas: An Interdisciplinary MIT Study (p. 178). Cambridge,
MA: MIT. Retrieved from http://energy.mit.edu/wp-content/uploads/2011/06/MITEI-
The-Future-of-Natural-Gas.pdf
Mohai, P., Pellow, D., & Roberts, J. T. (2009). Environmental Justice. Annual Review of
Environment and Resources, 34(1), 405–430. https://doi.org/10.1146/annurev-environ-
082508-094348

396
Monstadt, J., & Wolff, A. (2015). Energy transition or incremental change? Green policy
agendas and the adaptability of the urban energy regime in Los Angeles. Energy Policy,
78(C), 213–224.
Monterey County Elections Office. (2016). Ballot Measure Full Text of Measure Z. Retrieved
May 1, 2017, from
http://www.montereycountyelections.us/a_measures_NOVEMBER_2016_EN_MZ.html
Montgomery, C. T., & Smith, M. B. (2010). Hydraulic Fracturing: History of an Enduring
Technology. Jounral of Petroleum Technology, 62(12).
Muggeridge, A., Cockin, A., Webb, K., Frampton, H., Collins, I., Moulds, T., & Salino, P.
(2014). Recovery rates, enhanced oil recovery and technological limits. Phil. Trans. R.
Soc. A, 372(2006), 20120320. https://doi.org/10.1098/rsta.2012.0320
Mulkern, A. C. (2013, April 23). Calif. advancing measures to stop or limit fracking. Retrieved
January 1, 2014, from http://www.eenews.net/energywire/stories/1059979927/print
Mundy, J. (2015, June 6). Attorney Discusses RICO Lawsuit Involving Governor and Oil
Companies: California’s “Water-Gate.” Retrieved June 1, 2017, from
https://www.lawyersandsettlements.com/articles/hydraulic-fracturing-water-
contamination-epa-fracking-hydrofracking/interview-hydraulic-fracturing-water-
contamination-11-20692.html
Mungan, N. (1984). Alkaline Flooding. In E. Okandan (Ed.), Heavy Crude Oil Recovery (pp.
317–352). Springer Netherlands. https://doi.org/10.1007/978-94-009-6140-1_9
Münzel, T., Gori, T., Babisch, W., & Basner, M. (2014). Cardiovascular effects of environmental
noise exposure. European Heart Journal, 35(13), 829–836.
https://doi.org/10.1093/eurheartj/ehu030

397
Murphy, D. J., & Hall, C. A. S. (2011). Energy return on investment, peak oil, and the end of
economic growth. Annals of the New York Academy of Sciences, 1219(1), 52–72.
https://doi.org/10.1111/j.1749-6632.2010.05940.x
Murray, J. W., & Hansen, J. (2013). Peak Oil and Energy Independence: Myth and Reality. Eos,
Transactions American Geophysical Union, 94(28), 245–246.
https://doi.org/10.1002/2013EO280001
Murray, K. E. (2013). State-Scale Perspective on Water Use and Production Associated with Oil
and Gas Operations, Oklahoma, U.S. Environmental Science & Technology, 47(9), 4918–
4925. https://doi.org/10.1021/es4000593
Murray, T. J. (1993). Dr Abraham Gesner: the father of the petroleum industry. Journal of the
Royal Society of Medicine, 86(1), 43–44.
Muskat, M. (1949). Physical principles of oil production. McGraw-Hill Book Co.
Nair, R. R., Protasova, E., Bilstad, T., & Strand, S. (2016). Reuse of Produced Water by
Membranes for Enhanced Oil Recovery. Presented at the SPE Annual Technical
Conference and Exhibition, Society of Petroleum Engineers.
https://doi.org/10.2118/181588-MS
National Commission on the BP Deepwater Horizon Oil Spill. (2010). Staff Working Paper No.
1 - A Brief History of Offshore Oil Drilling (p. 18). Washington, D.C: National
Commission on the BP Deepwater Horizon Oil Spill and Offshore Drilling. Retrieved
from
http://permanent.access.gpo.gov/gpo182/A%20Brief%20History%20of%20Offshore%20
Drilling%20Working%20Paper%208%2023%2010.pdf

398
Nelson, M. (2001). Thomas Bard, Josiah Stanford, and the 1860’s Hunt for California Crude.
Pacific Petroleum Geologist Newsletter, 2, 16–17.
Nemec, R. (2017, March 16). EDF Targeting California Oilfield Pollution. Retrieved June 1,
2017, from http://www.naturalgasintel.com/articles/109782-edf-targeting-california-
oilfield-pollution
Neumann, R. P. (2009). Political ecology: theorizing scale. Progress in Human Geography,
33(3), 398–406. https://doi.org/10.1177/0309132508096353
Neville, K. J., & Dauvergne, P. (2016). The Problematic of Biofuels for Development. In The
Palgrave Handbook of International Development (pp. 649–668). Palgrave Macmillan,
London. https://doi.org/10.1057/978-1-137-42724-3_36
Nicot, J.-P., & Scanlon, B. R. (2012). Water Use for Shale-Gas Production in Texas, U.S.
Environmental Science & Technology, 46(6), 3580–3586.
https://doi.org/10.1021/es204602t
Nikolewski, R. (2016, May 31). Feds OK fracking off the California coast. Los Angeles Times.
Retrieved from http://www.latimes.com/business/la-fi-fracking-california-20160531-
snap-story.html
NobelPrize.org. (2016). Alfred Nobel - His Life and Work. Retrieved January 7, 2016, from
http://www.nobelprize.org/alfred_nobel/biographical/articles/life-work/
Noggle, B. (1962). Teapot Dome: oil and politics in the 1920’s. Louisiana State University
Press.
Norris, M. R., Bernsten, B. A., Myhre, P., & Winters, W. J. (1996). Multiple Proppant Fracturing
of a Horizontal Wellbore: an integration of two technologies (Vol. 186). Presented at the

399
European Petroleum Conference, Society of Petroleum Engineers.
https://doi.org/http://dx.doi.org/10.2118/36899-MS
Northrup, J. M., Anderson, C. R., & Wittemyer, G. (2015). Quantifying spatial habitat loss from
hydrocarbon development through assessing habitat selection patterns of mule deer.
Global Change Biology, 21(11), 3961–3970. https://doi.org/10.1111/gcb.13037
Northrup, J. M., & Wittemyer, G. (2013). Characterising the impacts of emerging energy
development on wildlife, with an eye towards mitigation. Ecology Letters, 16(1), 112–
125. https://doi.org/10.1111/ele.12009
NRDC. (2012). Protecting Americans from the Risks of Fracking (Fact Sheet) (p. 4).
Washington, DC: Natural Resources Defense Council. Retrieved from
www.nrdc.org/energy/files/frackingrisks.pdf
NRDC. (2013). Spreading Like Wildfire: Oil and gas leases mean that fracking could occur on
tens of millions of acres of U.S. lands (Fact Sheet No. FS:13-02-c) (p. 1). Washington,
DC: National Resources Defense Council. Retrieved from
http://www.nrdc.org/land/drilling/files/fracking-land-leases-FS.pdf
NRDC. (2014). Drilling in California: Who’s at risk? (NRDC Report No. R:14-09-a).
Washington, D.C.: Natural Resources Defense Council. Retrieved from
https://www.nrdc.org/sites/default/files/california-fracking-risks-report.pdf
NREL. (2017a). 2015 Cost of Wind Energy Review (No. DE-AC36-08GO28308). Washington,
D.C.: U.S. Department of Energy, National Renewable Energy Laboratory. Retrieved
from
https://emp.lbl.gov/sites/default/files/2015_nrel_cost_of_wind_energy_review_lbnl.pdf

400
NREL. (2017b). The Open PV Project - State Rankings. Retrieved June 1, 2017, from
https://openpv.nrel.gov/rankings
Nyberg, D., Wright, C., & Kirk, J. (2017). Fracking the Future: Temporality, Framing and the
Politics of Unconventional Fossil Fuels. Academy of Management Proceedings, 2017(1),
10744. https://doi.org/10.5465/AMBPP.2017.104
Occidental Petroleum. (2013). THUMS Long Beach Company. Retrieved October 1, 2013, from
http://www.oxy.com/OurBusinesses/OilAndGas/UnitedStates/Pages/LongBeach.aspx
O’Connor, L. (2014, April 24). California City Becomes First To Vote To Ban Fracking.
Retrieved May 1, 2014, from http://www.huffingtonpost.com/2014/04/24/beverly-hills-
fracking-ban_n_5208377.html
ODI. (2009). Political Economy Analysis How To Note (DFID Practice Paper). London, UK:
U.K. Department for International Development and Overseas Development Institute.
Retrieved from https://www.odi.org/sites/odi.org.uk/files/odi-assets/events-
documents/3797.pdf
Official California Legislative Information. (2012a, February 9). SB-1054 Oil and gas: well
operation: notice. Retrieved January 1, 2014, from
http://leginfo.legislature.ca.gov/faces/billTextClient.xhtml;jsessionid=cbe067daea0ff4440
cce3cf74fe2?bill_id=201120120SB1054
Official California Legislative Information. (2012b, June 13). Bill Analysis AB 972. Retrieved
January 1, 2014, from http://www.leginfo.ca.gov/pub/11-12/bill/asm/ab_0951-
1000/ab_972_cfa_20120622_173651_sen_comm.html

401
Onishi, N. (2013a, June 1). California ‘Oil and Ag’ Face Rift on Fracking. The New York Times.
Retrieved from https://www.nytimes.com/2013/06/02/us/california-oil-and-ag-face-rift-
on-fracking.html
Onishi, N. (2013b, June 1). Fracking Tests Ties Between California ‘Oil and Ag’ Interests. The
New York Times. Retrieved from http://www.nytimes.com/2013/06/02/us/california-oil-
and-ag-face-rift-on-fracking.html
Onishi, N. (2014a, May 14). California’s Thirst Shapes Debate Over Fracking. The New York
Times. Retrieved from http://www.nytimes.com/2014/05/15/us/californias-thirst-shapes-
debate-over-fracking.html
Onishi, N. (2014b, July 7). A California Oil Field Yields Another Prized Commodity. The New
York Times. Retrieved from https://www.nytimes.com/2014/07/08/us/california-drought-
chevron-oil-field-water-irrigation.html
Orban, E., McDonald, K., Sutcliffe, R., Hoffmann, B., Fuks, K. B., Dragano, N., … Moebus, S.
(2016). Residential Road Traffic Noise and High Depressive Symptoms after Five Years
of Follow-up: Results from the Heinz Nixdorf Recall Study. Environmental Health
Perspectives, 124(5), 578–585. https://doi.org/10.1289/ehp.1409400
Orlowski, A. (2016, April 5). Housing vs. oil wells: In Orange County, it’s increasingly leading
to tension. Retrieved May 1, 2017, from http://www.ocregister.com/2016/04/05/housing-
vs-oil-wells-in-orange-county-its-increasingly-leading-to-tension/
O’Rourke, D., & Connolly, S. (2003). Just Oil? The Distribution of Environmental and Social
Impacts of Oil Production and Consumption. Annual Review of Environment and
Resources, 28(1), 587–617. https://doi.org/10.1146/annurev.energy.28.050302.105617

402
Osborn, S. G., Vengosh, A., Warner, N. R., & Jackson, R. B. (2011). Methane contamination of
drinking water accompanying gas-well drilling and hydraulic fracturing. Proceedings of
the National Academy of Sciences, 108(20), 8172–8176.
https://doi.org/10.1073/pnas.1100682108
Osborn, S. G., Vengosh, A., Warner, N. R., & Jackson, R. B. (2011). Reply to Saba and
Orzechowski and Schon: Methane contamination of drinking water accompanying gas-
well drilling and hydraulic fracturing. Proceedings of the National Academy of Sciences
of the United States of America, 108(37), E665–E666.
Ostrom, E. (1990). Governing the Commons: The Evolution of Institutions for Collective Action.
Cambridge ; New York: Cambridge University Press.
Owen, E. W., & Southwestern Federation of Geological Societies. (1975). Trek of the Oil
Finders: A History of Exploration for Petroleum. Tulsa, Okla: American Association of
Petroleum Geologists.
Ozdemir, V., Husereau, D., Hyland, S., Samper, S., & Salleh, M. Z. (2009). Personalized
Medicine Beyond Genomics: New Technologies, Global Health Diplomacy and
Anticipatory Governance. Current Pharmacogenomics and Personalized Medicine, 7(4),
225–230.
Pacific Gas & Electric Company. (2013). PG&E History. Retrieved October 1, 2013, from
http://www.pge.com/about/company/profile/history/
Packer, C. E. (1933). New Billions from Oil! Popular Mechanics Magazine, (March), 337–338.
Page, S. (2016, January 7). After At Least 2,300 Home Evacuations, Big Methane Leak Causes
State Of Emergency. Retrieved June 1, 2017, from https://thinkprogress.org/after-at-least-
2-300-home-evacuations-big-methane-leak-causes-state-of-emergency-9e02b0668473/

403
Pagel, L., & Sumi, L. (2011). Loopholes for Polluters – The oil and gas industry’s exemptions to
major environmental laws (Fact Sheet). Washington, D.C.: Earthworks. Retrieved from
https://www.earthworksaction.org/files/publications/FS_LoopholesForPollutersNEW.pdf
Pardee, V. P., Hobstetter, D. R., Rhoades Siegel, K., & Cummings, B. Center for Biological
Diversity v. California Department of Conservation, No. RG13664543 (Superior Court
for the State of California for the City and County of Alameda January 24, 2013).
Retrieved from http://blogs2.law.columbia.edu/climate-change-litigation/wp-
content/uploads/sites/16/case-documents/2013/20130124_docket-
RG13664534_complaint.pdf
Paschen, J.-A., & Ison, R. (2014). Narrative research in climate change adaptation—Exploring a
complementary paradigm for research and governance. Research Policy, 43(6), 1083–
1092. https://doi.org/10.1016/j.respol.2013.12.006
Pearson, T. W. (2013). Frac Sand Mining in Wisconsin: Understanding Emerging Conflicts and
Community Organizing. Culture, Agriculture, Food and Environment, 35(1), 30–40.
https://doi.org/10.1111/cuag.12003
Peet, R., & Watts, M. (Eds.). (1996). Liberation Ecologies: Environment, Development, Social
Movements. London ; New York: Routledge.
Penn, I. (2016, November 29). Consumer group alleges that California refiners are manipulating
gasoline prices. Los Angeles Times. Retrieved from http://www.latimes.com/business/la-
fi-gasoline-prices-20161129-story.html
Penn, I., & Menezes, R. (2017, February 5). Californians are paying billions for power they don’t
need. LA Times. Retrieved from http://www.latimes.com/projects/la-fi-electricity-
capacity/

404
Pennsylvania Department of Environmental Protection. (2009). Injection Wells for Disposal and
Enhanced Recovery (Fact Sheet No. 5500–FS–DEP2250 Rev. 4/2009). Harrisburg, PA:
Pennsylvania Department of Environmental Protection. Retrieved from
http://energy.wilkes.edu/PDFFiles/Issues/Injection%20Wells%20for%20Disposal%20an
d%20Enhanced%20Recovery.pdf
Penzel, F. (1978). Theatre lighting before electricity (1st ed). Middletown, Conn: Wesleyan
University Press.
People’s Gas Light and Coke Company. (1950). 100 years of gas service in Chicago, 1850-1950.
Chicago. Retrieved from http://archive.org/details/100yearsofgasser00peop
Pepper, D. (1984). The roots of modern environmentalism. London ; Dover, N.H: Croom Helm.
Perreault, T. (2013). Nature and Nation: Hydrocarbons, Governance, and the Territorial Logics
of “Resource Nationalism” in Bolivia. In A. Bebbington & J. Bury (Eds.), Subterranean
Struggles: New Dynamics of Mining, Oil, and Gas in Latin America. University of Texas
Press.
Perreault, T., Bridge, G., & McCarthy, J. (2015). The Routledge Handbook of Political Ecology.
Routledge.
Pew Research Center. (2016, December 8). Partisan, ideological divide on environmental
regulations. Retrieved from http://www.people-press.org/2016/12/08/3-political-values-
government-regulation-environment-immigration-race-views-of-islam/3_2-8/
Pew Research Center. (2017a, April 20). For Earth Day, here’s how Americans view
environmental issues. Retrieved from http://www.pewresearch.org/fact-
tank/2017/04/20/for-earth-day-heres-how-americans-view-environmental-issues/

405
Pew Research Center. (2017b, May 16). Partisans agree on the importance of energy sector jobs,
divided on prioritizing environmental effects of energy sources. Retrieved from
http://www.pewinternet.org/2017/05/16/public-divides-over-environmental-regulation-
and-energy-policy/ps_2017-05-16_energy-priorities_0-02/
Phelan, S. (2013, September 2). Monterey Shale geology is relatively young and seismically
active. Retrieved October 22, 2013, from http://baynature.org/articles/how-the-monterey-
shale-came-to-be/
Pichtel, J. (2016). Oil and Gas Production Wastewater: Soil Contamination and Pollution
Prevention. Applied and Environmental Soil Science, 2016, e2707989.
https://doi.org/10.1155/2016/2707989
Pielke Jr., R. A. (2004). When scientists politicize science: making sense of controversy over
The Skeptical Environmentalist. Environmental Science & Policy, 7(5), 405–417.
https://doi.org/10.1016/j.envsci.2004.06.004
Poole, A., & Hudgins, A. (2014). “I care more about this place, because I fought for it”:
exploring the political ecology of fracking in an ethnographic field school. Journal of
Environmental Studies and Sciences, 4(1), 37–46. https://doi.org/10.1007/s13412-013-
0148-6
Poole, H. (2013). State Policies on use of Hydraulic Fracturing Waste as a Road De-Icer (LOR
Research Report). Connecticut General Assembly Office of Legislative Research.
Retrieved from https://www.cga.ct.gov/2013/rpt/2013-R-0469.htm
Portier, S., Laurent, A., & Vuataz, F.-D. (2007). Review on chemical stimulation techniques in
oil industry and applications to geothermal systems (Technical Report No. Work Package
4) (p. 34). Deep Heat Mining Association.

406
Powers, E. C. (2010). Fracking and Federalism: Support for an Adaptive Approach That Avoids
the Tragedy of the Regulatory Commons Notes and Comments. Journal of Law and
Policy, 19, 913–972.
Quast, D. (2013, May 6). At Regulatory Hearings, Activists Oppose Common-Sense Solutions.
Retrieved June 1, 2017, from https://energyindepth.org/california/at-regulatory-hearings-
activists-oppose-common-sense-solutions/
Quay, R. (2010). Anticipatory Governance. Journal of the American Planning Association,
76(4), 496–511. https://doi.org/10.1080/01944363.2010.508428
Quigley, D. C., Hornafius, J. S., Luyendyk, B. P., Francis, R. D., Clark, J., & Washburn, L.
(1999). Decrease in natural marine hydrocarbon seepage near Coal Oil Point, California,
associated with offshore oil production. Geology, 27(11), 1047–1050.
https://doi.org/10.1130/0091-7613(1999)027<1047:DINMHS>2.3.CO;2
Rabinowitz, P. M., Slizovskiy, I. B., Lamers, V., Trufan, S. J., Holford, T. R., Dziura, J. D., …
Stowe, M. H. (2015). Proximity to natural gas wells and reported health status.
Environmental Health Perspectives, 123(1), 21–26. https://doi.org/10.1289/ehp.1307732
Rademacher, A. (2015). Urban Political Ecology. Annual Review of Anthropology, 44(1), 137–
152. https://doi.org/10.1146/annurev-anthro-102214-014208
Ragsdale, T. D. (1993). Hydraulic Fracturing: The Stealthy Subsurface Trespass. Tulsa Law
Review, 28(3).
Rai, V., Reeves, D. C., & Margolis, R. (2016). Overcoming barriers and uncertainties in the
adoption of residential solar PV. Renewable Energy, 89, 498–505.
https://doi.org/10.1016/j.renene.2015.11.080

407
Rangan, H., & Kull, C. (2008). What makes ecology “political”?: rethinking “scale” in political
ecology. Progress in Human Geography. https://doi.org/10.1177/0309132508090215
Rapier, R. (2016, February 29). The Break Even Cost For Shale Oil. Forbes. Retrieved from
https://www.forbes.com/sites/rrapier/2016/02/29/the-break-even-cost-for-shale-oil/
Rasmussen, C. (1999, July 11). The Gush of Oil Was Music to “Queen’s” Ears. Los Angeles
Times. Retrieved from http://articles.latimes.com/1999/jul/11/local/me-54981
Reddall, B. (2013, June 19). California senators want more information on oil well “acid jobs.”
Reuters. Retrieved from http://www.reuters.com/article/california-oil-acidjobs-
idUSL2N0EU1U320130619
Redpath, L. V. (1900). Petroleum in California: a concise and reliable history of the oil industry
of the state. L. V. Redpath.
Reuters. (2015, April 22). U.S. fracking costs falling fast, may keep fields in play. Reuters.
Retrieved from http://www.reuters.com/article/ceraweek-fracking-costs-
idUSL1N0XJ1BU20150422
Reyes, E. A. (2014, February 28). L.A. City Council moves toward fracking ban. Los Angeles
Times. Retrieved from http://articles.latimes.com/2014/feb/28/local/la-me-ln-fracking-
ban-vote-20140228
Reyes, E. A. (2016a, January 25). South L.A. residents want city to act on Jefferson Boulevard
oil drilling site. Los Angeles Times. Retrieved from
http://www.latimes.com/local/california/la-me-oil-drilling-jefferson-20160125-story.html
Reyes, E. A. (2016b, February 2). L.A. leaders want someone overseeing oil operations in the
city full time. Los Angeles Times. Retrieved from http://www.latimes.com/local/lanow/la-
me-ln-petroleum-chief-20160202-story.html

408
Reyes, E. A. (2016c, September 19). L.A. taps Long Beach engineer as petroleum czar. Los
Angeles Times. Retrieved from http://www.latimes.com/local/lanow/la-me-ln-petroleum-
administrator-20160918-snap-story.html
Rickards, A. R., Brannon, H. D., Wood, W. D., & Stephenson, C. J. (2003). High Strength,
Ultra-Lightweight Proppant Lends New Dimensions to Hydraulic Fracturing
Applications. Presented at the SPE Annual Technical Conference and Exhibition,
Denver, CO: Society of Petroleum Engineers. https://doi.org/10.2118/84308-MS
RigZone. (2017). How Does Artificial Lift Work? Retrieved May 12, 2017, from
http://www.rigzone.com/training/insight.asp?insight_id=315&c_id=4
Ringler, C., Bhaduri, A., & Lawford, R. (2013). The nexus across water, energy, land and food
(WELF): potential for improved resource use efficiency? Current Opinion in
Environmental Sustainability, 5(6), 617–624.
https://doi.org/10.1016/j.cosust.2013.11.002
Rintoul, W. (2000). Drilling Through Time: 75 Years with California’s Division of Oil and Gas.
DIANE Publishing Company.
Ritzius, D. E. (1993). California Oil, Gas, and Geothermal Resources An Introduction (No.
TR03) (p. 81). Sacramento, CA: California Department of Conservation.
Robbins, P. (2007a). Lawn People: How Grasses, Weeds, and Chemicals Make Us Who We Are.
Temple University Press.
Robbins, P. (2007b). Lawn People: How Grasses, Weeds, and Chemicals Make Us Who We Are.
Philadelphia: Temple University Press.
Robbins, P. (2011). Political Ecology: A Critical Introduction (2nd ed.). Wiley-Blackwell.

409
Robbins, P., Hintz, J., & Moore, S. A. (2013). Environment and Society: A Critical Introduction.
John Wiley & Sons.
Rodriguez, A. (2011a, June 22). California bill would reveal chemicals used in “fracking”
process. Retrieved from http://latimesblogs.latimes.com/greenspace/2011/06/fracking-
hyraulic-fracturing-california-oil-natural-gas-shale-wieckowski.html
Rodriguez, A. (2011b, July 7). Culver City residents settle suit with oil company, L.A. County.
Los Angeles Times. Retrieved from http://articles.latimes.com/2011/jul/07/local/la-me-
oil-deal-20110707
Rogers, P. (2016, November 9). Fracking ban: Environmentalists declare victory on Monterey
Measure Z. The Mercury News. Retrieved from
http://www.mercurynews.com/2016/11/09/fracking-ban-environmentalists-declare-
victory-on-monterey-measure-z/
Rogers, P. (2017, April 17). First California offshore oil platform in 20 years to be removed. The
Mercury News. Retrieved from http://www.mercurynews.com/2017/04/17/first-
california-offshore-oil-platform-to-be-removed-in-20-years/
Romero-Lankao, P., McPhearson, T., & Davidson, D. J. (2017). The food-energy-water nexus
and urban complexity. Nature Climate Change, 7(4), 233–235.
https://doi.org/10.1038/nclimate3260
Rose, S. C., Buckwalter, J. F., & Woodhall, R. J. (1989). The Design Engineering Aspects of
Waterflooding. Richardson, TX: Society of Petroleum Engineers.
Rosenbaum, W. A. (2013). Environmental Politics and Policy, 9th Edition (9 edition).
Washington, DC: CQ Press.

410
Ross, M. (2012). The Oil Curse: How Petroleum Wealth Shapes the Development of Nations.
Princeton, NJ: Princeton University Press.
Roy, A. A., Adams, P. J., & Robinson, A. L. (2014). Air pollutant emissions from the
development, production, and processing of Marcellus Shale natural gas. Journal of the
Air & Waste Management Association (1995), 64(1), 19–37.
Rubinstein, J. L., & Mahani, A. B. (2015). Myths and Facts on Wastewater Injection, Hydraulic
Fracturing, Enhanced Oil Recovery, and Induced Seismicity. Seismological Research
Letters. https://doi.org/10.1785/0220150067
Rundell, W. (1977). Early Texas Oil: A Photographic History, 1866-1936. Texas A & M
University Press.
Sabin, P. (2005). Crude Politics: The California Oil Market, 1900-1940. Berkeley, Calif.:
University of California Press.
Sabin, P. (2010). “The Ultimate Environmental Dilemma”: Making a Place for Historians in the
Climate Change and Energy Debates. Environmental History, 15(1), 76–93.
https://doi.org/10.1093/envhis/emq019
Sabin, P. (2012). Crisis and Continuity in U.S. Oil Politics, 1965–1980. Journal of American
History, 99(1), 177–186. https://doi.org/10.1093/jahist/jas086
Sabin, P. (2013). The Bet: Paul Ehrlich, Julian Simon, and our Gamble Over Earth’s Future.
Sacramento Bee. (1935, May 7). Oil Committee Hits Drilling on State’s Beaches. The
Sacramento Bee.
Safire, W. (2008). Safire’s Political Dictionary. Oxford University Press.
Sagan, C. (1995). The Demon-Haunted World: Science as a Candle in the Dark (1st ed). New
York: Random House.

411
Sahagun, L. (2013a, September 21). Chemical odor, kids’ nosebleeds, few answers in South L.A.
neighborhood. Los Angeles Times. Retrieved from http://www.latimes.com/local/la-me-
0922-oil-20130922-story.html
Sahagun, L. (2013b, November 8). EPA officers sickened by fumes at South L.A. oil field. Los
Angeles Times. Retrieved from http://www.latimes.com/local/la-me-1109-fumes-
20131109-story.html
Sahagun, L. (2014, May 20). U.S. officials cut estimate of recoverable Monterey Shale oil by
96%. Los Angeles Times. Retrieved from http://www.latimes.com/business/la-fi-oil-
20140521-story.html#
Saillant, C. (2013, September 4). 2 L.A. City Council members propose ban on fracking for oil.
Los Angeles Times. Retrieved from http://articles.latimes.com/2013/sep/04/local/la-me-
council-fracking-20130905
Saldana, J. (2015). The Coding Manual for Qualitative Researchers. SAGE.
Sampson, D. A., Quay, R., & White, D. D. (2016). Anticipatory modeling for water supply
sustainability in Phoenix, Arizona. Environmental Science & Policy, 55, Part 1, 36–46.
https://doi.org/10.1016/j.envsci.2015.08.014
Sampson, D. A., Quay, R., White, D. D., Gober, P., & Kirkwood, C. (2013). Anticipatory Water
Management in Phoenix using Advanced Scenario Planning and Analyses: WaterSim 5.
AGU Fall Meeting Abstracts, 31. Retrieved from
http://adsabs.harvard.edu/abs/2013AGUFM.H31C1185S
Sanders, D. (2015, April 1). King Oil is dead...long live King Oil! Retrieved June 1, 2017, from
https://www.linkedin.com/pulse/king-oil-deadlong-live-don-sanders/

412
Sandiford, B. B. (1964). Laboratory and Field Studies of Water Floods Using Polymer Solutions
to Increase Oil Recoveries. Journal of Petroleum Technology, 16(08), 917–922.
https://doi.org/10.2118/844-PA
Sarathi, P. S. (1999). In-situ Combustion Handbook: Principles and Practices. National
Technology Information Service.
Sarewitz, D. (2004). How science makes environmental controversies worse. Environmental
Science & Policy, 7(5), 385–403. https://doi.org/10.1016/j.envsci.2004.06.001
Satter, A., Iqbal, G. M., & Buchwalter, J. L. (2008). Practical Enhanced Reservoir Engineering:
Assisted with Simulation Software. PennWell Books.
Scanlon, B. R., Reedy, R. C., & Nicot, J.-P. (2014). Comparison of Water Use for Hydraulic
Fracturing for Unconventional Oil and Gas versus Conventional Oil. Environmental
Science & Technology, 48(20), 12386–12393. https://doi.org/10.1021/es502506v
SCAQMD. (2014). Update on Implementation of Rule 1148.2. South Coast Air Quality
Management District. Retrieved from http://www.aqmd.gov/docs/default-
source/compliance/rule-1148.2-reports/r1148-2-june-2014-op-09-19-14-
final.pdf?sfvrsn=4
Schein, G. (2005). The Application and Technology of Slickwater Fracturing. Retrieved from
https://www.onepetro.org/general/SPE-108807-DL
Scheufele, B. T., & Scheufele, D. A. (2010). Of Spreading Activation, Applicability, and
Schemas: Conceptual Distinctions and Their Operational Implications for Measuring
Frames and Framing Effects. In P. D’Angelo & J. A. Kuypers (Eds.), Doing News
Framing Analysis: Empirical and Theoretical Perspectives (pp. 84–109). New York ;
London: Routledge.

413
Scheufele, D. (1999). Framing as a theory of media effects. Journal of Communication, 49(1),
103–122. https://doi.org/10.1111/j.1460-2466.1999.tb02784.x
Scheufele, D. A. (2013). Communicating science in social settings. Proceedings of the National
Academy of Sciences, 110(Supplement 3), 14040–14047.
https://doi.org/10.1073/pnas.1213275110
Scheufele, D. A., & Iyengar, S. (2017). The State of Framing Research: A Call for New
Directions. In K. Kenski & K. H. Jamieson (Eds.), The Oxford Handbook of Political
Communication. Oxford University Press, Incorporated.
Schlosberg, D. (2004). Reconceiving Environmental Justice: Global Movements And Political
Theories. Environmental Politics, 13(3), 517–540.
https://doi.org/10.1080/0964401042000229025
Schlosberg, D. (2007). Defining Environmental Justice: Theories, Movements, and Nature.
Oxford University Press, USA.
Schlosser, E. (2008, February 22). ‘Oil!’ and the History of Southern California. The New York
Times. Retrieved from
https://www.nytimes.com/2008/02/22/timestopics/topics_uptonsinclair_oil.html
Schlumberger. (2012). Defining Perforating - Detonation for Delivery. (T. Smithson, Ed.).
Schlumberger. Retrieved from
http://www.slb.com/news/inside_news/2013/~/media/Files/resources/oilfield_review/ors1
2/spr12/defining_perforating.ashx
Schlumberger. (2014). Perforating Innovations - Shooting Holes in Performance Models. Oilfield
Review, 26(3), 14–31.

414
Schlumberger. (2017). Casing - Schlumberger Oilfield Glossary. Retrieved May 1, 2017, from
http://www.glossary.oilfield.slb.com/en/Terms/c/casing.aspx
Schück, H., & Sohlman, R. (1929). The Life of Alfred Nobel. William Heinemann.
Schuiling, T. (2008). What’s with Oil – the Probable Status of the Resource. Redlands
Fortnightly, 37.
Seba, T. (2014). Clean Disruption of Energy and Transportation: How Silicon Valley Will Make
Oil, Nuclear, Natural Gas, Coal, Electric Utilities and Conventional Cars Obsolete by
2030.
Sedgwick, S. M., & Mitra, S. (2015). Oil and Gas in California: The Industry and Its Economic
Contribution and user Industries at Risk in 2015. Los Angeles, CA: Los Angeles County
Economic Development Corporation Economic and Policy Analysis Group. Retrieved
from http://laedc.org/download/31930/
Sedgwick, S. M., Mitra, S., & Cooper, C. (2014). Oil and Gas in California: The Industry and Its
Economic Contribution in 2012. Los Angeles, CA: Los Angeles County Economic
Development Corporation Economic and Policy Analysis Group. Retrieved from
http://laedc.org/download/31930/
Segall, P. (1989). Earthquakes triggered by fluid extraction. Geology, 17(10), 942–946.
https://doi.org/10.1130/0091-7613(1989)017<0942:ETBFE>2.3.CO;2
Segee, B., & O’Dea, E. (2015). Dirty Water: Offshore Fracking in California. Santa Barbara,
CA: Environmental Defense Center. Retrieved from
https://www.environmentaldefensecenter.org/wp-
content/uploads/2015/03/DirtyWater.pdf

415
Selin, C. (2007). Expectations and the Emergence of Nanotechnology. Science, Technology, &
Human Values, 32(2), 196–220. https://doi.org/10.1177/0162243906296918
Settari, A. (1993). Modeling of acid-fracturing treatments. SPE Production & Facilities, 8(01),
30–38.
Sewell, A. (2016, March 29). L.A. County to set up strike team to look at oil and gas wells. Los
Angeles Times. Retrieved from http://www.latimes.com/local/lanow/la-me-ln-county-gas-
strike-team-20160329-story.html
Shackley, S., & Green, K. (2007). A conceptual framework for exploring transitions to
decarbonised energy systems in the United Kingdom. Energy, 32(3), 221–236.
https://doi.org/10.1016/j.energy.2006.04.010
Shapiro, S. A. (2011). The Complexity of Regulatory Capture: Diagnosis, Causality and
Remediation (SSRN Scholarly Paper No. ID 2004521). Rochester, NY: Social Science
Research Network. Retrieved from https://papers.ssrn.com/abstract=2004521
Shell Oil Company. (2014). Understanding Tight and Shale Gas. Retrieved April 8, 2014, from
http://www.shell.us/aboutshell/shell-businesses/onshore/shale-tight.html
Shellenberger, M., & Nordhaus, T. (2011, December 7). A boom in shale gas? Credit the feds.
The Washington Post. Retrieved from https://www.washingtonpost.com/opinions/a-
boom-in-shale-gas-credit-the-feds/2011/12/07/gIQAecFIzO_story.html
Sheng, J. (2010). Modern Chemical Enhanced Oil Recovery: Theory and Practice. Gulf
Professional Publishing.
Sherwood, O. A., Rogers, J. D., Lackey, G., Burke, T. L., Osborn, S. G., & Ryan, J. N. (2016).
Groundwater methane in relation to oil and gas development and shallow coal seams in
the Denver-Julesburg Basin of Colorado. Proceedings of the National Academy of

416
Sciences of the United States of America, 113(30), 8391–8396.
https://doi.org/10.1073/pnas.1523267113
Sibson, R. H. (1981). Fluid Flow Accompanying Faulting: Field Evidence and Models. In D. W.
Simpson & P. G. Richards (Eds.), Earthquake Prediction (pp. 593–603). American
Geophysical Union. https://doi.org/10.1029/ME004p0593
Siders, D. (2016, January 6). Jerry Brown declares emergency around Southern California gas
leak. The Sacramento Bee. Retrieved from http://www.sacbee.com/news/politics-
government/capitol-alert/article53353615.html
Simon, R. (2008, September 24). Era of oil drilling ban draws to close. Los Angeles Times.
Retrieved from http://articles.latimes.com/2008/sep/24/nation/na-drilling24
Simonelli, J. (2014). Home rule and natural gas development in New York: civil fracking rights.
Journal of Political Ecology, 21, 258–278.
Sinclair, U. (1935). I, Candidate for Governor: And How I Got Licked. University of California
Press.
Skalak, K. J., Engle, M. A., Rowan, E. L., Jolly, G. D., Conko, K. M., Benthem, A. J., &
Kraemer, T. F. (2014). Surface disposal of produced waters in western and southwestern
Pennsylvania: Potential for accumulation of alkali-earth elements in sediments.
International Journal of Coal Geology, 126, 162–170.
https://doi.org/10.1016/j.coal.2013.12.001
Skelton, G. (2015, September 16). The time is ripe for a tax on oil extraction to pay for
California road repairs. LA Times. Retrieved from
http://www.latimes.com/local/california/la-me-cap-20150917-column.html

417
Smit, B., & Wandel, J. (2006). Adaptation, adaptive capacity and vulnerability. Global
Environmental Change, 16(3), 282–292. https://doi.org/10.1016/j.gloenvcha.2006.03.008
Smith, A., Voß, J.-P., & Grin, J. (2010). Innovation studies and sustainability transitions: The
allure of the multi-level perspective and its challenges. Research Policy, 39(4), 435–448.
https://doi.org/10.1016/j.respol.2010.01.023
Snow, D. A. (2004). Framing Processes, Ideology, and Discursive Fields. In D. A. Snow, S. A.
Soule, & H. Kriesi (Eds.), The Blackwell Companion to Social Movements (pp. 380–412).
Blackwell Publishing Ltd. https://doi.org/10.1002/9780470999103.ch17
SoCalGas. (2013). History of SoCalGas. Retrieved August 30, 2013, from
http://www.socalgas.com/news-room/company-history.shtml
Sommer, L. (2014, October 10). With Drought, New Scrutiny Over Fracking’s Water Use.
Retrieved May 1, 2017, from
https://endpointb3649865.chios.panth.io/science/2014/10/10/with-drought-new-scrutiny-
over-frackings-water-use/
Sommer, L. (2017, January 17). California Says Oil Companies Can Keep Dumping Wastewater
During State Review. Retrieved May 11, 2017, from
https://ww2.kqed.org/science/2017/01/17/california-says-oil-companies-can-keep-
dumping-wastewater-during-state-review/
Sørensen, M., Andersen, Z. J., Nordsborg, R. B., Becker, T., Tjønneland, A., Overvad, K., &
Raaschou-Nielsen, O. (2013). Long-Term Exposure to Road Traffic Noise and Incident
Diabetes: A Cohort Study. Environmental Health Perspectives, 121(2), 217–222.
https://doi.org/10.1289/ehp.1205503

418
Sovacool, B. (2016). The Political Ecology and Justice of Energy. In The Palgrave Handbook of
the International Political Economy of Energy (pp. 529–558). Palgrave Macmillan.
Spellman, F. R. (2012). Environmental Impacts of Hydraulic Fracturing. CRC Press.
Spence, D. B. (2014). The Political Economy of Local Vetoes. Texas Law Review, 93, 351–413.
Spezio, T. S. (2011). Rising Tide: The Santa Barbara Oil Spill and its Aftermath (Doctoral
Dissertation). University of California Davis, Davis, CA.
Spreng, M. (2000). Possible health effects of noise induced cortisol increase. Noise & Health,
2(7), 59–64.
Srebotnjak, T., & Rotkin-Ellman, M. (2014). Fracking Fumes: Air Pollution from Hydraulic
Fracturing Threatens Public Health and Communities (Issue Brief No. ip:14-10-a).
Washington, D.C.: NRDC. Retrieved from
https://www.nrdc.org/sites/default/files/fracking-air-pollution-IB.pdf
St. John, P., & Walton, A. (2016, February 2). L.A. County files criminal charges over Porter
Ranch gas leak. Los Angeles Times. Retrieved from
http://www.latimes.com/local/lanow/la-me-attorney-general-lawsuit-aliso-canyon-leak-
20160202-story.html
Stansfeld, S. A., & Matheson, M. P. (2003). Noise pollution: non-auditory effects on health.
British Medical Bulletin, 68(1), 243–257. https://doi.org/10.1093/bmb/ldg033
State of California Legislative Counsel. (2013). AB-1326. Retrieved November 25, 2013, from
http://www.leginfo.ca.gov/pub/11-12/bill/asm/ab_1301-
1350/ab_1326_bill_20110510_amended_asm_v96.pdf
419
Steffen, D. (2010). How regulation came to be: Santa Barbara [Daily Kos]. Retrieved October
24, 2013, from http://www.dailykos.com/story/2010/01/24/827938/-How-regulation-
came-to-be-Santa-Barbara
Stern, J. (2013). The Pricing of Internationally Traded Gas (1 edition). Oxford ; New York:
Oxford Institute for Energy Studies.
Stewart, C. R., Hunt, E. B. J., Schneider, F. N., Geffen, T. M., & Berry, V. J. J. (1954). The Role
of Bubble Formation in Oil Recovery by Solution Gas Drives in Limestones. Journal of
Petroleum Technology, 5(12), 21–28. https://doi.org/10.2118/410-G
Stock, S. (2013, September 12). California Fracking Law Has Huge Holes, Critics Argue.
Retrieved June 1, 2017, from http://www.nbcbayarea.com/news/california/California-
Fracking-Law-Has-Huge-Holes-Critics-Argue-223556411.html
Stoel Rives. (2017). Legislative Update: Oil & Gas Related Bills. Retrieved from
http://www.californiaenvironmentallawblog.com/oil-and-gas/legislative-update-oil-gas-
related-bills-introduced-in-the-2017-2018-legislative-session/
Stuart, T. (2012, May 17). Could Fracking in Los Angeles Cause an Earthquake? Retrieved May
26, 2017, from http://www.laweekly.com/news/could-fracking-in-los-angeles-cause-an-
earthquake-2174957
Supreme Court Reporter. (1911). Supreme Court Reporter: U.S. Reports. Cases Argued and
Determined in the Supreme Court of the United States. Supreme Court Reporter, 31,
502–534.
Sustek, A. J., & Traverse, E. F. (1981). San Ardo Field – Case History of a Successful Steam
Flood, 535–548.

420
Swyngedouw, E., & Heynen, N. C. (2003). Urban Political Ecology, Justice and the Politics of
Scale. Antipode, 35(5), 898–918. https://doi.org/10.1111/j.1467-8330.2003.00364.x
Tarbell, I. M. (1904). The History of the Standard Oil Company. New York: McClure, Phillips &
Co.
Taylor, D. E. (2000). The Rise of the Environmental Justice Paradigm Injustice Framing and the
Social Construction of Environmental Discourses. American Behavioral Scientist, 43(4),
508–580. https://doi.org/10.1177/0002764200043004003
Temple, R. K. G., & Needham, J. (2007). The Genius of China: 3,000 Years of Science,
Discovery, & Invention. Rochester, Vt.: Inner Traditions.
The Center for Land Use Interpretation. (2013). Urban Crude: The Oil Fields of the Los Angeles
Basin. Retrieved October 1, 2013, from
http://www.clui.org/ondisplay/urbancrude/online/regions.html
Thomas, A. (2016). Polymer Flooding. https://doi.org/10.5772/64623
Thomson, J. (2003). Scot Who Lit the World: The Story of William Murdoch, Inventor of Gas
Lighting. Janet Thomson.
Tiedeman, K., Yeh, S., Scanlon, B. R., Teter, J., & Mishra, G. S. (2016). Recent Trends in Water
Use and Production for California Oil Production. Environmental Science & Technology,
50(14), 7904–7912. https://doi.org/10.1021/acs.est.6b01240
Tiemann, M., & Vann, A. (2015). Hydraulic Fracturing and Safe Drinking Water Act
Regulatory Issues (No. R41760). Washington, DC: Congressional Research Service.
Tilton, G. R. (1998). Clair Cameron Patterson 122-1995: A Biographical Memoir by George R.
Tilton. National Academy of Sciences. Retrieved from

421
http://www.nasonline.org/publications/biographical-memoirs/memoir-pdfs/patterson-
clair-c.pdf
Time Magazine. (1969, August 1). America’s Sewage System and the Price of Optimism. Time.
Retrieved from http://content.time.com/time/magazine/article/0,9171,901182,00.html
Trembath, A., Jenkins, J., Nordhaus, T., & Shellenberger, M. (2012). Where the Shale Gas
Revolution Came From: Government’s Role in the Development of Hydraulic Fracturing
in Shale (p. 13). Breakthrough Institute. Retrieved from
http://thebreakthrough.org/index.php/programs/energy-and-climate/where-the-shale-gas-
revolution-came-from/
Turta, A. (2013). Enhanced Oil Recovery Field Case Studies: Chapter 18. In Situ Combustion.
Elsevier Inc. Chapters.
Union of Concerned Scientists. (2017). The Cost of Nuclear Power. Retrieved June 1, 2017,
from http://www.ucsusa.org/nuclear-power/cost-nuclear-power
United Church of Christ. (1987). Toxic Waste and Race In The United States: A National Report
on the Racial and Socio-Economic Characteristics of Communities with Hazardous
Waste Sites (p. 86). United Church of Christ. Retrieved from
www.ucc.org/justice/pdfs/toxic20.pdf
United Church of Christ. (2007). Toxic Wastes and Race at Twenty 1987—2007: A Report
Prepared for the United Church of Christ Justice & Witness Ministries (p. 175). United
Church of Christ. Retrieved from www.ucc.org/justice/pdfs/toxic20.pdf
United States Coast Guard. (2011). On scene coordinator report Deepwater Horizon oil spill.
Washington, D.C. : U.S. Dept. of Homeland Security, U.S. Coast Guard. Retrieved from
http://purl.fdlp.gov/GPO/gpo15255

422
Urbina, I. (2011, February 26). Regulation Lax as Gas Wells’ Tainted Water Hits Rivers. The
New York Times. Retrieved from http://www.nytimes.com/2011/02/27/us/27gas.html
U.S. BLM. (2017). Bureau of Land Management. Retrieved May 1, 2017, from
https://www.blm.gov/
U.S. BOEM. (2010). The Reorganization of the Former MMS. Retrieved May 1, 2017, from
https://www.boem.gov/Reorganization/
U.S. BOEM. (2016, May 27). BSEE and BOEM Publish Joint Environmental Assessment on
Use of Well Stimulation Treatments in Federal Waters off California | BOEM. Retrieved
May 1, 2017, from https://www.boem.gov/press05272016/
U.S. Bureau of Labor Statistics. (2017a). California Economy at a Glance. Retrieved from
https://www.bls.gov/eag/eag.ca.htm
U.S. Bureau of Labor Statistics. (2017b). May 2016 State Occupational Employment and Wage
Estimates California. Retrieved from https://www.bls.gov/oes/current/oes_ca.htm#00-
0000
U.S. Census Bureau. (2013). Los Angeles County, California. Retrieved October 1, 2013, from
http://quickfacts.census.gov/qfd/states/06/06037.html
U.S. Circuit Courts of Appeals. (1919). United States Circuit Courts of Appeals Reports: With
Key-number Annotations ... V. 1-171 [1891-1919].
U.S. Department of the Interior. (2012). Oil Shale and Tar Sands Programmatic Environmental
Impact Statement. Retrieved November 30, 2015, from
http://ostseis.anl.gov/images/photos/oil_shale-600.jpg

423
U.S. EIA. (2011). Review of Emerging Resources: U.S. Shale Gas and Shale Oil Plays (p. 105).
Washington, D.C: U.S. Energy Information Administration. Retrieved from
http://www.eia.gov/analysis/studies/usshalegas/pdf/usshaleplays.pdf
U.S. EIA. (2012a). Annual Energy Outlook 2012 with Projections to 2035 (Annual Energy
Outlook No. DOE/EIA-0383(2012) (p. 252). Washington, DC: U.S. Department of
Energy, Energy Information Administration. Retrieved from
http://www.eia.gov/forecasts/aeo/pdf/0383(2012).pdf
U.S. EIA. (2012b). Annual Energy Outlook 2013 Early Release Overview (Annual Energy
Outlook) (p. 16). Washington, DC: U.S. Department of Energy, Energy Information
Administration. Retrieved from http://www.eia.gov/forecasts/aeo/er/index.cfm
U.S. EIA. (2012c, September 11). Pad drilling and rig mobility lead to more efficient drilling.
Retrieved May 1, 2017, from https://www.eia.gov/todayinenergy/detail.php?id=7910
U.S. EIA. (2013). Technically Recoverable Shale Oil and Shale Gas Resources: An Assessment
of 137 Shale Formations in 41 Countries Outside the United States (p. 730). Washington,
DC: U.S. Department of Energy, Energy Information Administration. Retrieved from
http://www.eia.gov/analysis/studies/worldshalegas/pdf/fullreport.pdf
U.S. EIA. (2015). Sales of Fossil Fuels Produced from Federal and Indian Lands, FY 2003
through FY 2014. Washington, DC: U.S. Energy Information Administration. Retrieved
from https://www.eia.gov/analysis/requests/federallands/pdf/eia-federallandsales.pdf
U.S. EIA. (2016a). Trends in U.S. Oil and Natural Gas Upstream Costs. Washington, D.C.: U.S.
Energy Information Administration. Retrieved from
https://www.eia.gov/analysis/studies/drilling/pdf/upstream.pdf

424
U.S. EIA. (2016b, May 23). United States remains largest producer of petroleum and natural gas
hydrocarbons. Retrieved from http://www.eia.gov/todayinenergy/detail.php?id=26352#
U.S. EIA. (2017a). Annual Energy Outlook 2017 (Annual Energy Outlook No. #AEO2017).
Washington, D.C: U.S. Department of Energy, Energy Information Administration.
Retrieved from https://www.eia.gov/outlooks/aeo/pdf/0383(2017).pdf
U.S. EIA. (2017b). Crude Oil Production. Retrieved May 1, 2017, from
https://www.eia.gov/dnav/pet/pet_crd_crpdn_adc_mbbl_a.htm
U.S. EIA. (2017c). Electric Power Monthly (Electric Power Monthly). Washington, D.C.: U.S.
Energy Information Administration. Retrieved from
https://www.eia.gov/electricity/monthly/pdf/epm.pdf
U.S. EIA. (2017d). Electricity Data Browser. Retrieved June 1, 2017, from
https://www.eia.gov/electricity/data/browser/#/topic/0?agg=1,0,2&fuel=008&geo=00000
0000004&sec=o3g&linechart=ELEC.GEN.WND-CA-
99.A&columnchart=ELEC.GEN.WND-CA-99.A&map=ELEC.GEN.WND-CA-
99.A&freq=A&ctype=linechart<ype=pin&rtype=s&maptype=0&rse=0&pin=
U.S. EIA. (2017e). Short-Term Energy Outlook Data Browser. Retrieved June 1, 2017, from
https://www.eia.gov/outlooks/steo/data/browser/
U.S. EIA. (2017f, May). Crude Oil Prices. U.S. Department of Energy, Energy Information
Administration. Retrieved from
https://www.eia.gov/dnav/pet/hist/LeafHandler.ashx?n=PET&s=F000000__3&f=M
U.S. EIA. (2017g, May). Natural Gas Prices. U.S. Department of Energy, Energy Information
Administration. Retrieved from
http://www.eia.gov/dnav/ng/ng_pri_sum_dcu_nus_m.htm
425
U.S. EPA. (2013). Water: Underground Injection Control. Retrieved October 1, 2013, from
http://water.epa.gov/type/groundwater/uic/history.cfm
U.S. EPA. (2015a). Assessment of the Potential Impacts of Hydraulic Fracturing for Oil and Gas
on Drinking Water Resources (No. EPA/600/R-15/047a) (p. 998). Washington, D.C.:
U.S. Environmental Protection Agency. Retrieved from
http://ofmpub.epa.gov/eims/eimscomm.getfile?p_download_id=523539
U.S. EPA. (2015b). Class I Industrial and Municipal Waste Disposal Wells. Retrieved January 1,
2016, from http://www.epa.gov/uic/class-i-industrial-and-municipal-waste-disposal-wells
U.S. EPA. (2015c). Underground Injection Control Regulations and Safe Drinking Water Act
Provisions. Retrieved January 1, 2016, from http://www.epa.gov/uic/underground-
injection-control-regulations-and-safe-drinking-water-act-provisions
U.S. EPA. (2015d, June 11). Underground Injection Control Well Classes [Overviews and
Factsheets]. Retrieved May 1, 2017, from https://www.epa.gov/uic/underground-
injection-control-well-classes
U.S. EPA. (2016a). Hydraulic Fracturing for Oil and Gas: Impacts from the Hydraulic
Fracturing Water Cycle on Drinking Water Resources in the United States (No. EPA-
600-R-16-236Fa). Washington, D.C.: U.S. Environmental Protection Agency. Retrieved
from http://ofmpub.epa.gov/eims/eimscomm.getfile?p_download_id=530159
U.S. EPA. (2016b). The Hydraulic Fracturing Water Cycle [Data and Tools]. Retrieved January
19, 2016, from http://www.epa.gov/hfstudy/hydraulic-fracturing-water-cycle
U.S. EPA. (2016c). Underground Injection Control Well Classes [Overviews and Factsheets].
Retrieved January 19, 2016, from http://www.epa.gov/uic/underground-injection-control-
well-classes

426
U.S. EPA. (2017a). Chemicals and Toxics Topics [Collections and Lists]. Retrieved May 17,
2017, from https://www.epa.gov/environmental-topics/chemicals-and-toxics-topics
U.S. EPA. (2017b). Environmental Topics. Retrieved June 1, 2017, from
https://www.epa.gov/environmental-topics
U.S. EPA. (2017c). NATA: Glossary of Terms. Retrieved from https://www.epa.gov/national-
air-toxics-assessment/nata-glossary-terms
US House of Representatives. Hearings before a Subcommittee of the Committee on
Government Operations, § Committee on Government Operations (1970). Washington,
D.C.
U.S. Senate Office of Public Records. (2017). Query the Lobbying Contributions Database.
Retrieved June 1, 2017, from
https://soprweb.senate.gov/index.cfm?event=lobbyistselectfields
USC Global Energy Network. (2013). Powering California: The Monterey Shale & California’s
Economic Future (p. 4). Los Angeles, CA: USC Price School of Public Policy & Viterbi
School of Engineering. Retrieved from http://gen.usc.edu/assets/001/84787.pdf
USGS. (2015). Assessment of undiscovered continuous oil and gas resources in the Monterey
Formation, San Joaquin Basin Province, California, 2015 (National and Global
Petroleum Assessment No. Fact Sheet 2015-3058). Washington, D.C.: U.S. Geological
Survey. Retrieved from https://pubs.usgs.gov/fs/2016/3036/fs20163036.pdf
USGS. (2016). Assessment of Undiscovered Continuous Oil and Gas Resources in the Monterey
Formation, Los Angeles Basin Province, California, 2015 (National and Global
Petroleum Assessment No. Fact Sheet 2016–3036). Washington, D.C.: U.S. Geological
Survey. Retrieved from https://pubs.usgs.gov/fs/2016/3036/fs20163036.pdf

427
van der Elst, N. J., Page, M. T., Weiser, D. A., Goebel, T. H. W., & Hosseini, S. M. (2016).
Induced earthquake magnitudes are as large as (statistically) expected. Journal of
Geophysical Research: Solid Earth, 121(6), 2016JB012818.
https://doi.org/10.1002/2016JB012818
van der Giesen, C., Kleijn, R., & Kramer, G. J. (2014). Energy and Climate Impacts of
Producing Synthetic Hydrocarbon Fuels from CO2. Environmental Science &
Technology, 48(12), 7111–7121. https://doi.org/10.1021/es500191g
Vann, A., Murrill, B. J., & Tiemann, M. (2013). Hydraulic Fracturing: Selected Legal Issues
(No. R43152). Washington, DC: Congressional Research Service.
Vengosh, A., Jackson, R. B., Warner, N., Darrah, T. H., & Kondash, A. (2014). A Critical
Review of the Risks to Water Resources from Unconventional Shale Gas Development
and Hydraulic Fracturing in the United States. Environmental Science & Technology,
48(15), 8334–8348. https://doi.org/10.1021/es405118y
Verbong, G., & Geels, F. (2007). The ongoing energy transition: Lessons from a socio-technical,
multi-level analysis of the Dutch electricity system (1960–2004). Energy Policy, 35(2),
1025–1037. https://doi.org/10.1016/j.enpol.2006.02.010
Verbruggen, A., & Al Marchohi, M. (2010). Views on peak oil and its relation to climate change
policy. Energy Policy, 38(10), 5572–5581. https://doi.org/10.1016/j.enpol.2010.05.002
Verick, S., & Islam, I. (2010). The Great Recession of 2008-2009: Causes, Consequences and
Policy Responses (SSRN Scholarly Paper No. ID 1631069). Rochester, NY: Social
Science Research Network. Retrieved from https://papers.ssrn.com/abstract=1631069
Vesalon, L., & Creţan, R. (2015). ‘We are not the Wild West’: anti-fracking protests in Romania.
Environmental Politics, 24(2), 288–307. https://doi.org/10.1080/09644016.2014.1000639

428
Viale, C., & Monge, C. (2011). Extractive Industries and their Imprint. In J. Crabtree (Ed.),
Fractured Politics: Peruvian Democracy Past and Present. London, UK: School of
Advanced Study.
Vidic, R. D., Brantley, S. L., Vandenbossche, J. M., Yoxtheimer, D., & Abad, J. D. (2013).
Impact of Shale Gas Development on Regional Water Quality. Science, 340(6134).
https://doi.org/10.1126/science.1235009
Villarroel Walker, R., Beck, M. B., Hall, J. W., Dawson, R. J., & Heidrich, O. (2014). The
energy-water-food nexus: Strategic analysis of technologies for transforming the urban
metabolism. Journal of Environmental Management, 141, 104–115.
https://doi.org/10.1016/j.jenvman.2014.01.054
Vincent, C. H., Hanson, L. A., & Argueta, C. N. (2017). Federal Land Ownership: Overview
and Data. Washington, DC: Congressional Research Service. Retrieved from
https://fas.org/sgp/crs/misc/R42346.pdf
Vinciguerra, T., Yao, S., Dadzie, J., Chittams, A., Deskins, T., Ehrman, S., & Dickerson, R. R.
(2015). Regional air quality impacts of hydraulic fracturing and shale natural gas activity:
Evidence from ambient VOC observations. Atmospheric Environment, 110, 144–150.
https://doi.org/10.1016/j.atmosenv.2015.03.056
Vives, R. (2012a, June 12). Protesters head to Culver City meeting to decry fracking. LA Times
Blogs - L.A. NOW. Retrieved from
http://latimesblogs.latimes.com/lanow/2012/06/protesters-take-to-culver-city-streets-to-
decry-fracking-.html

429
Vives, R. (2012b, June 23). Inglewood Oil Field’s neighbors want answers about land shift. Los
Angeles Times. Retrieved from http://articles.latimes.com/2012/jun/23/local/la-me-
inglewood-fracking-20120624
Vives, R. (2012c, October 16). Amid protests, report finds no harm from fracking. Los Angeles
Times. Retrieved from http://articles.latimes.com/2012/oct/16/local/la-me-fracking-
baldwin-hills-20121016
Wallace, W. J. (1955). A Suggested Chronology for Southern California Coastal Archaeology.
Southwestern Journal of Anthropology, 11(3), 214–230. https://doi.org/10.2307/3629021
Walton, A. (2016, April 27). 80 attorneys in one courtroom help Porter Ranch residents defeat
gas company in one battle. Los Angeles Times. Retrieved from
http://www.latimes.com/local/california/la-me-porter-ranch-20160428-story.html
Warner, B., & Shapiro, J. (2013). Fractured, Fragmented Federalism: A Study in Fracking
Regulatory Policy. Publius: The Journal of Federalism, 43(3), 474–496.
https://doi.org/10.1093/publius/pjt014
Warner, C. A. (1939). Texas Oil & Gas Since 1543. Copano Bay Press.
Watts, M. (2004). Resource curse? governmentality, oil and power in the Niger Delta, Nigeria.
Geopolitics, 9(1), 50–80. https://doi.org/10.1080/14650040412331307832
Weingarten, M., Ge, S., Godt, J. W., Bekins, B. A., & Rubinstein, J. L. (2015). High-rate
injection is associated with the increase in U.S. mid-continent seismicity. Science,
348(6241), 1336–1340. https://doi.org/10.1126/science.aab1345
Weinhold, B. (2012). The Future of Fracking: New Rules Target Air Emissions for Cleaner
Natural Gas Production. Environmental Health Perspectives; Research Triangle Park,
120(7), a272-9.

430
Weltman-Fahs, M., & Taylor, J. M. (2013). Hydraulic Fracturing and Brook Trout Habitat in the
Marcellus Shale Region: Potential Impacts and Research Needs. Fisheries, 38(1), 4–15.
https://doi.org/10.1080/03632415.2013.750112
Whetzel, C. (2017, May 7). Sale of Oil Leases on California Public Lands on Hold. Retrieved
June 1, 2017, from https://www.bna.com/sale-oil-leases-n73014450568/
White, D. D., Quay, R., Ferguson, D. B., Buizer, J. L., Guido, Z., & Chhetri, N. (2013). Linking
Climate Change Science and Adaptation Policy at the Community Scale through
Anticipatory Governance: A Review of Concepts with Application to Arizona
Communities (Invited). AGU Fall Meeting Abstracts, 43. Retrieved from
http://adsabs.harvard.edu/abs/2013AGUFMNH43D..02W
White, G. T. (1968). Scientists in Conflict: The Beginnings of the Oil Industry in California
(First Edition edition). San Marino, CA: Huntington Library.
White House Office of Science and Technology. (1965). Restoring the Quality of Our
Environment. Washington, DC: White House Office of Science and Technology,
Environmental Pollution Panel, President’s Science Advisory Committee.
White, L. (1967). Historical Roots of Our Ecologic Crisis. Science, 155(3767), 1203-.
https://doi.org/10.1126/science.155.3767.1203
Whiteshot, C. A. (1905). The Oil-well Driller: A History of the World’s Greatest Enterprise, the
Oil Industry. C. A. Whiteshot.
Wiek, A., Guston, D., Leeuw, S. van der, Selin, C., & Shapira, P. (2013). Nanotechnology in the
City: Sustainability Challenges and Anticipatory Governance. Journal of Urban
Technology, 20(2), 45–62. https://doi.org/10.1080/10630732.2012.735415

431
Willhite, G. P. (1986). Waterflooding. Richardson, TX: Society of Petroleum Engineers.
Retrieved from http://site.ebrary.com/id/10619570
Williams, J. C. (1997). Energy and the making of modern California. University of Akron Press.
Williams, L., Macnaghten, P., Davies, R., & Curtis, S. (2017). Framing ‘fracking’: Exploring
public perceptions of hydraulic fracturing in the United Kingdom. Public Understanding
of Science, 26(1), 89–104. https://doi.org/10.1177/0963662515595159
Williamson, H. F., & Daum, A. (1959). The American Petroleum Industry; the Age of
Illumination, 1859-1899. Evanston [Ill.]: Northwestern University Press.
Willow, A. J. (2014). The new politics of environmental degradation: un/expected landscapes of
disempowerment and vulnerability. Journal of Political Ecology, 21, 303–319.
Willow, A. J., & Wylie, S. (2014). Politics, ecology, and the new anthropology of energy:
exploring the emerging frontiers of hydraulic fracking. Journal of Political Ecology, 21,
222–236.
Wiltz, J. E. (1964). The Origins of Teapot Dome: Progressives, Parties, and Petroleum, 1909-
1921 by J. Leonard Bates. Indiana Magazine of History. Retrieved from
https://scholarworks.iu.edu/journals/index.php/imh/article/view/9062
Windle, R. J., Wood, S., Shanks, N., Perks, P., Conde, G. L., Da Costa, A. P. C., … Lightman, S.
L. (1997). Endocrine and Behavioural Responses to Noise Stress:Comparison of Virgin
and Lactating Female Ratsduring Non-Disrupted Maternal Activity. Journal of
Neuroendocrinology, 9(6), 407–414. https://doi.org/10.1046/j.1365-2826.1997.00587.x
Wiseman, H. J. (2015). Governing Fracking from the Ground Up. Texas Law Review, 93, 19–46.
Witze, A. (2007). Energy: That’s oil, folks... Nature, 445(7123), 14–17.
https://doi.org/10.1038/445014a

432
Wolsko, C., Ariceaga, H., & Seiden, J. (2016). Red, white, and blue enough to be green: Effects
of moral framing on climate change attitudes and conservation behaviors. Journal of
Experimental Social Psychology, 65, 7–19. https://doi.org/10.1016/j.jesp.2016.02.005
Wozniak, A., Lück, J., & Wessler, H. (2015). Frames, Stories, and Images: The Advantages of a
Multimodal Approach in Comparative Media Content Research on Climate Change.
Environmental Communication, 9(4), 469–490.
https://doi.org/10.1080/17524032.2014.981559
Wright, M. (2013). Making it Personal: How Anti-Fracking Organizations Frame Their
Messages. The Journal of Politics and Society, 24(2), 107–125.
WSPA. (2014). Setting the Record Straight: Water and Hydraulic Fracturing in California.
Western States Petroleum Association. Retrieved from
https://www.wspa.org/sites/default/files/uploads/Setting_Record_Straight_Water.pdf
Wu, B., Doble, R., Turnadge, C., & Mallants, D. (2016). Well Failure Mechanisms and
Conceptualisation of Reservoir-Aquifer Failure Pathways. Presented at the SPE Asia
Pacific Oil & Gas Conference and Exhibition, Society of Petroleum Engineers.
https://doi.org/10.2118/182460-MS
Wyler, G. (2016, December 20). California sues to block offshore oil fracking. Orange County
Register. Retrieved from http://www.ocregister.com/2016/12/20/california-sues-to-block-
offshore-oil-fracking/
Yergin, D. (2006). Ensuring Energy Security. Foreign Affairs, 85(2), 69–82.
https://doi.org/10.2307/20031912
Yergin, D. (2008). The Prize: the Epic Quest for Oil, Money, and Power. New York: Free Press.

433
Yergin, D. (2011). The Quest: Energy, Security and the Remaking of the Modern World. New
York: Penguin Press.
Yin, R. K. (2009). Case Study Research: Design and Methods. SAGE.
Young, O. R. (2002). The Institutional Dimensions of Environmental Change: Fit, Interplay, and
Scale. MIT Press.
Zhang, S., & He, Y. (2013). Analysis on the development and policy of solar PV power in China.
Renewable and Sustainable Energy Reviews, 21, 393–401.
https://doi.org/10.1016/j.rser.2013.01.002
Zimmerer, K. S., & Bassett, T. J. (Eds.). (2003). Political Ecology: An Integrative Approach to
Geography and Environment-Development Studies. New York: The Guilford Press.
Zimmermann, G., Blöcher, G., Reinicke, A., & Brandt, W. (2011). Rock specific hydraulic
fracturing and matrix acidizing to enhance a geothermal system — Concepts and field
results. Tectonophysics, 503(1–2), 146–154. https://doi.org/10.1016/j.tecto.2010.09.026
Zuckerman, G. (2013, November 6). Breakthrough: The Accidental Discovery That
Revolutionized American Energy. The Atlantic. Retrieved from
https://www.theatlantic.com/business/archive/2013/11/breakthrough-the-accidental-
discovery-that-revolutionized-american-energy/281193/


