Embed Size (px)
Citation preview
Genome-Wide Selection Signaturesand Human-Mediated IntrogressionEvents in Bos taurus indicus-influenced Composite Beef CattleSeyed Milad Vahedi1, Siavash Salek Ardestani 2, Kian Pahlevan Afshari 3,Seyed Mohammad Ghoreishifar4, Sima Moghaddaszadeh-Ahrabi 5*,Mohammad Hossein Banabazi 6† and Luiz Fernando Brito7
1Department of Animal Science and Aquaculture, Dalhousie University, Truro, NS, Canada, 2Department of Animal Science,Science and Research Branch, Islamic Azad University, Tehran, Iran, 3Department of Animal Sciences, Islamic Azad University,Varamin-Pishva Branch, Varamin, Iran, 4Department of Animal Science, University College of Agriculture and Natural Resources,University of Tehran, Karaj, Iran, 5Department of Animal Science, Faculty of Agriculture and Natural Resources, Islamic AzadUniversity, Tabriz Branch, Tabriz, Iran, 6Department of Animal Breeding and Genetics (HGEN), Centre for Veterinary Medicine andAnimal Science (VHC), Swedish University of Agricultural Sciences (SLU), Uppsala, Sweden, 7Department of Animal Sciences,Purdue University, West Lafayette, IN, United States
Genetic introgression from interbreeding hybridization of European Bos taurus taurus(EBT) and Indian Bos taurus indicus (IBI) cattle breeds have been widely used to combinethe climatic resilience of the IBI cattle and the higher productivity of EBT when forming newcomposite beef cattle (CB) populations. The subsequent breeding strategies have shiftedtheir initial genomic compositions. To uncover population structure, signatures ofselection, and potential introgression events in CB populations, high-density genotypes[containing 492,954 single nucleotide polymorphisms (SNPs) after the quality control] of486 individuals from 15 cattle breeds, including EBT, IBI, and CB populations, along withtwo Bos grunniens genotypes as outgroup were used in this study. Then, in-depthpopulation genetics analyses were performed for three CB breeds of Beefmaster,Brangus, and Santa Gertrudis. Neighbor-joining, principal components, and admixtureanalyses confirmed the historical introgression of EBT and IBI haplotypes into CB breeds.The fdM statistics revealed that only 12.9% of CB populations’ genetic components are ofIBI origin. The results of signatures of selection analysis indicated different patterns ofselection signals in the three CB breeds with primary pressure on pathways involved inprotein processing and stress response in Beefmaster, cell proliferation regulation andimmune response in Brangus, and amino acids and glucose metabolisms in SantaGertrudis. An average of >90% of genomic regions underlying selection signatureswere of EBT origin in the studied CB populations. Investigating the CB breeds’genome allows the estimation of EBT and IBI ancestral proportions and the locations
Edited by:Li Ma,
University of Maryland, United States
Reviewed by:Wai Yee Low,
University of Adelaide, AustraliaHussain Mahdi Bahbahani,Kuwait University, Kuwait
*Correspondence:Sima [email protected]
†Present address:Mohammad Hossein Banabazi,
Department of Biotechnology, AnimalScience Research Institute of Iran,Agricultural Research, Education &Extension Organization, Karaj, Iran
Specialty section:This article was submitted to
Livestock Genomics,a section of the journalFrontiers in Genetics
Received: 28 December 2021Accepted: 09 February 2022
Published: 30 May 2022
Citation:Vahedi SM, Salek Ardestani S,
Pahlevan Afshari K, Ghoreishifar SM,Moghaddaszadeh-Ahrabi S,
Banabazi MH and Brito LF (2022)Genome-Wide Selection Signaturesand Human-Mediated Introgression
Events in Bos taurus indicus-influenced Composite Beef Cattle.
Front. Genet. 13:844653.doi: 10.3389/fgene.2022.844653
Abbreviations: BMA, beefmaster; BRM, brahman; BRG, brangus; CHL, charolais; CB, composite beef cattle; DCMS, de-correlated composite of multiple signals; EBT, european Bos taurus taurus; EHH, extended haplotype homozygosity; FDR, falsediscovery rate; GOBP, gene ontology biological process; GYR, gyr; HFD, hereford; IBI, indian Bos taurus indicus; iHH12,integrated haplotype homozygosity pooled; iHS, integrated haplotype score; KEGG, kyoto encyclopedia of genes and genomes;NEL, nellore; OUT, outgroup (yak); PMT, piedmontese; PPI, protein-protein interaction; SGT, santa gertrudis; SNP, singlenucleotide polymorphism; Z(D), Z-transformed D; Z(fdM), Z-transformed fdM.
Frontiers in Genetics | www.frontiersin.org May 2022 | Volume 13 | Article 8446531
ORIGINAL RESEARCHpublished: 30 May 2022
doi: 10.3389/fgene.2022.844653
within the genome where either taurine or indicine origin alleles are under selectivepressure. Such findings highlight various opportunities to control the selection processmore efficiently and explore complementarity at the genomic level in CB populations.
Keywords: indicine, taurine, composite beef cattle, population genetics, introgression, recent selection signatures
INTRODUCTION
Various cattle breeds with particular phenotypes and geneticbackgrounds have been artificially selected worldwide mainlyfor agricultural purposes, such as milk yield, meat production,and climatic resilience (Bélanger and Pilling, 2019; Freitas et al.,2021). Two main types of modern cattle breeds of Bos taurustaurus (humpless taurine) and Bos taurus indicus (humpedindicine) are the result of two domestication processes in theFertile Crescent and the Indus Valley, respectively (Hiendlederet al., 2008; Bickhart et al., 2016). Population genetic studies basedon genomic single-nucleotide polymorphism (SNP) dataidentified three major groups of cattle, comprising of Asianindicine, Eurasian taurine, and African taurine (BovineHapMap Consortium, 2009; McTavish et al., 2013). However,a prominent whole-genome sequencing analysis of domesticcattle populations demonstrated that the worldwide cattlepopulation could be classified into five continental groupsbased on Y-chromosome haplotypes and autosomal variants:European taurine, Eurasian taurine, East Asian taurine,Chinese indicine, and Indian indicine (Chen et al., 2018). Incontrast, composite cattle breeds have been developed by human-mediated crossing of two or more breeds, in specific proportions,to combine their desirable and complementary traits into onebreed (Gregory and Cundiff, 1980; Gregory et al., 1994). Once thecomposite breed is formed, intensive selection programs, mainlyfor traits valued by breeders, are applied to improve the rates ofgenetic gain and animal productive efficiency (Heaton et al., 2002;Grigoletto et al., 2020).
Over the last half-century, some Bos taurus indicus-influencedcomposite beef cattle (CB) breeds, such as Beefmaster, Brangus,and Santa Gertrudis, have been developed in the US to combinethe climatic resilience of the Indian Bos taurus indicus cattle (IBI)and the higher productivity of European Bos taurus taurus (EBT)(Buzanskas et al., 2017; Gregory and Cundiff, 1980). Beefmaster isthe first American composite breed which was developed throughcrossing between Brahman, Shorthorn, and Hereford on theLasater Ranch in Falfurrias, Texas in 1908. The pedigree-estimated breed composition in Beefmaster is expected to be½ Brahman, ¼ Hereford, and ¼ Shorthorn (Warwick, 1958).Brangus cattle was derived from crosses between Angus andBrahman cattle in Oklahoma, Mississippi, Texas, and Louisianain the 1930s and the breed’s genome content of ⅜ Brahman and⅝ Angus is expected (International Brangus BreedersAssociation; https://gobrangus.com/). Santa Gertrudis cattlewas developed on the King Ranch in Kingsville, Texas, byexperimental crossbreeding between Shorthorn and Brahmancattle between 1910 and 1920. This breed is expected to havea genetic composition of ⅜ Brahman and ⅝ Shorthorn (Rhoad,1949; Warwick, 1958).
One of the primary sources of genetic variability, particularlyin composite breeds, is adaptive variation transmitted to thebreed by introgression, a phenomenon referred to as “adaptiveintrogression” (Hedrick, 2013). Therefore, almost all the variantspresent in the populations of CB breeds will have been ofintrogressed origin from IBI and EBT breeds. The availabilityof whole-genome DNA information on a large number ofindividuals enables assigning ancestry along a chromosomeand identify ancestry genomic regions introgressed into hybridbreeds using high-throughput genomic data (Malinsky et al.,2021). Introgression analysis of CB cattle breeds represents anappealing model for understanding the genomic consequences ofcrossbreeding with the goal of improving traits of interest.
The processes of domestication, breed formation, andsubsequent selection have left detectable footprints within thegenome of CB cattle breeds (Paim et al., 2020; Singh et al., 2020).Some of these footprints of selection (also known as selectionsignatures) reflect the historical selection during cattledomestication, whereas some represent selection within thepast few generations for economically important traits,including meat production or environmental adaptation(Decker et al., 2014). Regarding the recent crossbreedingevents in CB breeds, attention must be given to the morerecent systematic, organized selection following the breedformation than old selective sweeps. Meanwhile, severalextended haplotype homozygosity (EHH)-related statisticshave been developed to detect more recent selection events(Sabeti et al., 2002). Moreover, the results of multiple EHH-based tests can be integrated into different composite measures ofselection (Lotterhos et al., 2017). One of the well-knowncomposite measures is the de-correlated composite of multiplesignals (DCMS), proposing higher resolution and power ofdetecting selection signals compared to most single statistics(Ma et al., 2015) and composite measures of selectionfootprints (Lotterhos et al., 2017).
This study uses genomic data generated from the IlluminaBovineHD SNP Beadchip (San Diego, CA, United States) to tracethe ancestry components and understand the introgressionprocesses that formed the currently observed diversity of CBbreeds. Moreover, we applied the DCMS method to explorerecent selection signatures in the autosomal genome of CBbreeds to investigate the possible determinants of adaptationand production.
MATERIALS AND METHODS
Data Collection and Quality ControlGenotype data of 15 cattle breeds (N = 486), including nineEBT, three IBI, and three CB breeds, along with two Bos
Frontiers in Genetics | www.frontiersin.org May 2022 | Volume 13 | Article 8446532
Vahedi et al. Selection Signatures and Introgression in Cattle
grunniens samples as outgroup was obtained from the WIDDEdatabase (Sempéré et al., 2015). Only breeds genotyped withthe Illumina Bovine HD Genotyping BeadChip (www.illumina.com; San Diego, CA, United States) and that hadat least 10 individuals were included in this study. Table 1presents the cattle breeds, their abbreviations, and number ofindividuals included in this study. Quality control of 732,993SNP was performed using the VCFtools 0.1.16 (Danecek et al.,2011) for all genotypes. Markers with minor allelic frequency<0.01, SNP calling rate <0.90, extreme departure from Hardy-Weinberg equilibrium p-value < 10–7, and SNPs located onnon-autosomal chromosomes were removed. Furthermore,samples with a genotype call rate of less than 90% werediscarded from downstream analyses. After the qualitycontrol, 492,954 SNPs from 488 animals remained forfurther analyses.
Population Structure and Phylogenetic TreePrincipal component analysis (PCA) was used to estimategenetic relationships and population structure. PCA wasconducted using the PLINK 2.0 software (Purcell et al.,2007). Subsequently, a 3D plot of principal components wasconstructed using a custom-made Python 3.8 (http://www.python.org) script (https://github.com/Siavash-cloud/3D-PCA-plot). The phylogenetic analysis was performed usingthe neighbor-joining approach in VCF-kit 0.2.9 (Cook &Andersen, 2017). Visualization of the phylogenetic analysiswas based on rooting of the outgroup in FigTree 1.4.3(http://tree.bio.ed.ac.uk/software/figtree). Maximum likelihoodanalysis of population structure of the studied cattle breeds wasconducted using Admixture 1.3 (Alexander et al., 2009) for K valuesranging from 2 to 20 with 10 iterations per K value. The Admixturesoftware (Alexander et al., 2009) uses a cross-validation procedure toestimate the most likely number of ancestral populations (K). Thecross-validation error estimates were plotted using the ggplot2package (Villanueva and Chen, 2019) in the R 4.0.5 software (RCore Team, 2020) to compare the K values.
Genomic Introgression AnalysesPatterson’s D (Green et al., 2010) and the related estimate ofadmixture fraction f, referred to as f4-ratio (Patterson et al., 2012)were estimated using the Dtrios program implemented in theDsuite package (Malinsky et al., 2021) to assess the evidence forgene flow from EBT and IBI breeds into CB populations. Thesetwo statistics are applied to assess correlations of allelefrequencies across populations (Patterson et al., 2012). Thesemethods can be successfully used for learning about hybridizationand introgression events within groups of closely relatedpopulations (Patterson et al., 2012; Pease and Hahn, 2015). Inthe Patterson’s D and f4-ratio statistics, a simple explicitphylogenetic tree model is fitted to a quartet of populations,and a formal test for a history of admixture is performed in thatcontext (Patterson et al., 2012). The D and f4-ratio statistics wereapplied to biallelic SNPs across four populations: P1, P2, P3, andOUT, related by the rooted tree [(P1,P2), P3, OUT], where yak(Bos grunniens) was used as the outgroup (OUT) to test if the P1(EBT cattle) and P2 (IBI cattle) shared more alleles at the SNPlevel with a candidate introgressor—P3, including the three CBbreeds. The site patterns were ordered as follows: BBAArepresents P1 and P2 sharing the derived allele, ABBAreferred to P2 and P3 sharing the derived allele, and BABA toP1 and P3 sharing the derived allele. Under the null hypothesis,which assumes no gene flow, the ABBA and BABA patterns areexpected to occur due to incomplete lineage sorting with equalfrequencies, and a significant deviation from that expectation isconsistent with introgression between P3 and either P1 or P2. Formore details, see Patterson et al. (2012) and Durand et al. (2011).Therefore, for all n biallelic sites, nABBA, nBABA, and nBBAAwere calculated as follows (Patterson et al., 2012):
nABBA � ∑n
i�1(1 − p̂i1)p̂i2p̂i3(1 − p̂iO) + p̂i1(1 − p̂i2)(1 − p̂i3)p̂iO
nBABA � ∑n
i�1p̂i1(1 − p̂i2)p̂i3(1 − p̂iO) + (1 − p̂i1)p̂i2(1 − p̂i3)p̂iO
nBBAA � ∑n
i�1p̂i1p̂i2(1 − p̂i3)(1 − p̂iO) + (1 − p̂i1)(1 − p̂i2)p̂i3p̂iO
where p̂i1, p̂i2, p̂i3, and p̂iO are the derived allele frequencyestimate at site i in P1, P2, P3, and OUT, respectively. Basedon Patterson et al. (2012)’s definition, the Dsuit package appliesOUT as the fourth population, not necessarily an outgroup; formore details, see Malinsky et al. (2021). Therefore, the implicitassumption that the outgroup population is fixed for the ancestralallele and is necessarily used in that case is no longer applicable(Malinsky et al., 2021). Patterson’s D statistics was calculated by
D � ∑n
i�1(p̂i2−p̂i1)(p̂i3−p̂iO)∑n
i�0(p̂i2+p̂i1−2p̂i2p̂i1)(p̂i3+p̂iO−2p̂i3p̂iO)(Patterson et al., 2012). To
calculate the f4-ratio, P3 was split into two subsets, P3a and P3b,and Dsuite randomly sampled from P3 alleles at each SNP. Then,
f4-ratio was calculated using f4-ratio � ∑n
i�1(p̂i3a−p̂iO)(p̂i2−p̂i1)∑n
i�1(p̂i3a−p̂iO)(p̂i3b−p̂i1)(Patterson et al., 2012).
TABLE 1 | Descriptive statistics for the studied cattle breeds.
Type Breed Abbreviation N Total
European Bos taurus (EBT) Angus ANG 42 315Brown Swiss BSW 22Charolais CHL 37Guernsey GNS 21Herford HFD 28Holstein HOL 60Jersey JER 34Limousin LMS 50Piedmontese PMT 21
Indian Bos taurus indicus (IBI) Brahman BRM 46 104Gyr GYR 27Nellore NEL 31
Composite beef cattle (CB) Beefmaster BMA 23 67Brangus BRG 12Santa Gertrudis SGT 32
Bos grunniens Yak OUT 2 2
Frontiers in Genetics | www.frontiersin.org May 2022 | Volume 13 | Article 8446533
Vahedi et al. Selection Signatures and Introgression in Cattle
To localize the introgressed loci from the breeds with thehighest Z-transformed D (Z(D)) and f4-ratio values, theDinvestigate software of the Dsuite package (Malinsky et al.,2021) and fdM statistics were applied. fdM is a conservativeversion of the f statistic that is particularly appropriate foranalysis of small genomic windows (Malinsky et al., 2018).The fdM statistics (Malinsky et al., 2015) was estimated using asliding window size of 10 SNPs and a step size of two SNPs (Wanget al., 2020) as follows:
fdM � S(P1, P2, P3, OUT)−S(Pd, P2, Pd, OUT)
Where S(P1, P2, P3, OUT) stands for the numerator of Patterson’sD, and −S(Pd, P2, Pd,OUT) is equivalent to the fdM numeratorwhen Pd � P1 and Pd � P3, depending on which of P1 or P2
populations has the higher frequency of the derived allele. Underthe null hypothesis, i.e., no introgression, the fdM value issymmetrically distributed around zero, and it can equallyquantify shared variation between P3 and P2 (positive values)or between P3 and P1 (negative values) (Malinsky et al., 2021).
Analysis of Recent Signatures of SelectionTo detect recent signatures of selection in each CB breed, threeEHH-related within-population signatures of selection tests,including integrated haplotype score (iHS; Voight et al., 2006),integrated haplotype homozygosity pooled (iHH12; Torres et al.,2018), and nSL (Ferrer-Admetlla et al., 2014) were applied usingselscan 2.0.0 software (Szpiech and Hernandez, 2014). Prior toanalyses, missing genotypes were removed using VCFtools 0.1.16(genotype call rate = 100%) since selscan cannot handle missinggenotypes. Genotype imputation was not performed becausethere were not enough genotyped individuals to accuratelyperform imputation, especially when considering that the CBpopulations have high genetic diversity. The nSL procedurecalculates the SL statistic that measures the length of a segmentof haplotype homozygosity in terms of segregating sites (Ferrer-Admetlla et al., 2014). Then, the three statistics of iHS, iHH12, andnSL were combined into a single DCMS framework. The approachof combining multiple selection signals in the DCMS frameworkhas been previously performed in several studies (e.g., Yurchenkoet al., 2018; Ghoreishifar et al., 2020). DCMS combines p-valuesproduced by multiple statistics for each locus into a single measureconsidering the correlation between the statistics (Lotterhos et al.,2017). The DCMS statistic is calculated at the position l as follows(Ma et al., 2015):
DCMSl � ∑n
t�1
log[1−pltplt]
∑ni�1|rit|
where plt shows the p-value at position l for statistic t; rit refersto the correlation between the test statistic of the i th and t thmethods, and n is the total number of test statistics combined inthe DCMS. The expression 1∑n
i�1 |rit|is called weight factor, which
ranges from 1n to 1.
Therefore, within a given CB breed, for each statistic of iHS,iHH12, and nSL, genome-wide p-values were calculated based on
fractional ranks using the stat_to_pvalue function of the RMINOTAUR package (Verity et al., 2017). Fractional rankp-values were estimated using a right-tailed test for allstatistics (two.tailed = FALSE, right. tailed = TRUE); then,DCMS statistics were calculated using the DCMS function ofthe R MINOTAUR package (Verity et al., 2017). DCMS valueswere then fitted to a normal distribution using the robust linearmodel (rlm function) of theMASS R package (Venables & Ripley,2013) and model = rlm (dcms ~ 1), where the dcms object is avector containing the raw DCMS values. The outputs of the fittedmodel, including mean and standard deviation, were used by thepnorm R function to calculate the p-values of the DCMS statistics(lower.tail = FALSE, log. p = FALSE). Finally, to control formultiple testing false discovery rate (FDR) among rejected nullhypotheses, the DCMS p-values were transformed to thecorresponding q-values using the qvalue R function and theBenjamini and Hochberg method (Benjamini and Hochberg,1995).
We extracted the fdM value of genomic regions harboring SNPswith significant selection signals (q-value < 0.05). The average fdMvalues of regions harboring each significant SNP under selectionwere used to identify the ancestry. To show the overlaps betweensignatures of selection and introgression analyses, graphicalvisualization of bovine chromosomes was applied using thechromoMap 0.3.1 package (Anand and Lopez, 2022) in the Rsoftware (R Core Team, 2020).
Gene AnnotationAfter z-transforming the fdM values (Z(fdM)), genomic regionsranked the highest and lowest 95 percentile of Z(fdM) values wereconsidered as putative introgressed genomic regions into CBbreeds. This threshold was set since significant Patterson’s Dvalues indicated that on average 6.39% of bovine genome wasintrogressed into the CB breeds. A similar threshold level andapproach have been previously applied by Barbato et al. (2020)and Morales-Cruz et al. (2021). To locate the putative regionsunder selection, chromosome intervals harboring SNPs with aq-value < 0.05 were considered as statistically significant intervals,and boundaries of each interval were defined by the locations ofthe first flanking SNPs exhibiting a q-value > 0.10. The advantageof this approach is that fewer candidate genes are obtained for theselection peaks (Yurchenko et al., 2018). Then, protein-codinggenes were extracted from the significant regions based on theUMD 3.1 bovine reference genome assembly (Zimin et al., 2009).Manhattan plots of the results were created using the R packageCMplot 3.6.2 (Yin et al., 2021).
Protein-Protein Interaction NetworkConstruction and Functional EnrichmentAnalysisThe genes identified for each CB breeds were separately appliedfor functional enrichment and protein-protein interaction (PPI)network analyses. Prior to the analyses, duplicated genes wereremoved from the genes list of each breed. Functional profiling (g:GOSt) of gProfiler software (Raudvere et al., 2019) was used todetermine terms of Gene Ontology (GO) biological processes
Frontiers in Genetics | www.frontiersin.org May 2022 | Volume 13 | Article 8446534
Vahedi et al. Selection Signatures and Introgression in Cattle
(GO:BP) or biological pathways in the Kyoto Encyclopedia of Genesand Genomes (KEGG), WikiPathways, and Reactome databases inwhich the candidate genes identified in the introgression study werestatistically overrepresented. The functional enrichment analysis wasconducted based on the reference gene list of Bos taurus. Regardingcandidate genes found in selection signature analyses, PPI networkand functional enrichment analyses were conducted using theCytoscape 3.8.2 software (Shannon et al., 2003) and the referencegene list of Bos taurus. The stringApp (Doncheva et al., 2018) ofCytoscape was used to import and augment networks from theSTRING protein database (https://string-db.org/). Physicalinteractions with the confidence cutoff ratio of 0.4 (defaultsetting) and a maximum of 20 additional interactions weretested. The stringApp predicts interactions based on co-expressionanalysis, evolutionary signals across the cattle genome, automatictext-mining, and orthology-based evidence transfer acrossorganisms. To identify biological pathways enriched in thecandidate gene lists, gene enrichment analysis was performed for
GO:BP, KEGG,WikiPathways, and Reactome terms. The FDR value< 0.05 was considered as the threshold for identifying theoverrepresented terms in all functional enrichment analyses.
RESULTS
A total of 488 cattle from a publicly-available database wereincluded in this study (Table 1). After quality control, 492,954SNPs from all animals remained for further analyses. Theaverage ± standard deviation of inter-marker distance of thedifferent breeds was 4.9 ± 8.0 Kb, and the minimum andmaximum distance between SNPs were 0.1 and 36.6 Kb,respectively.
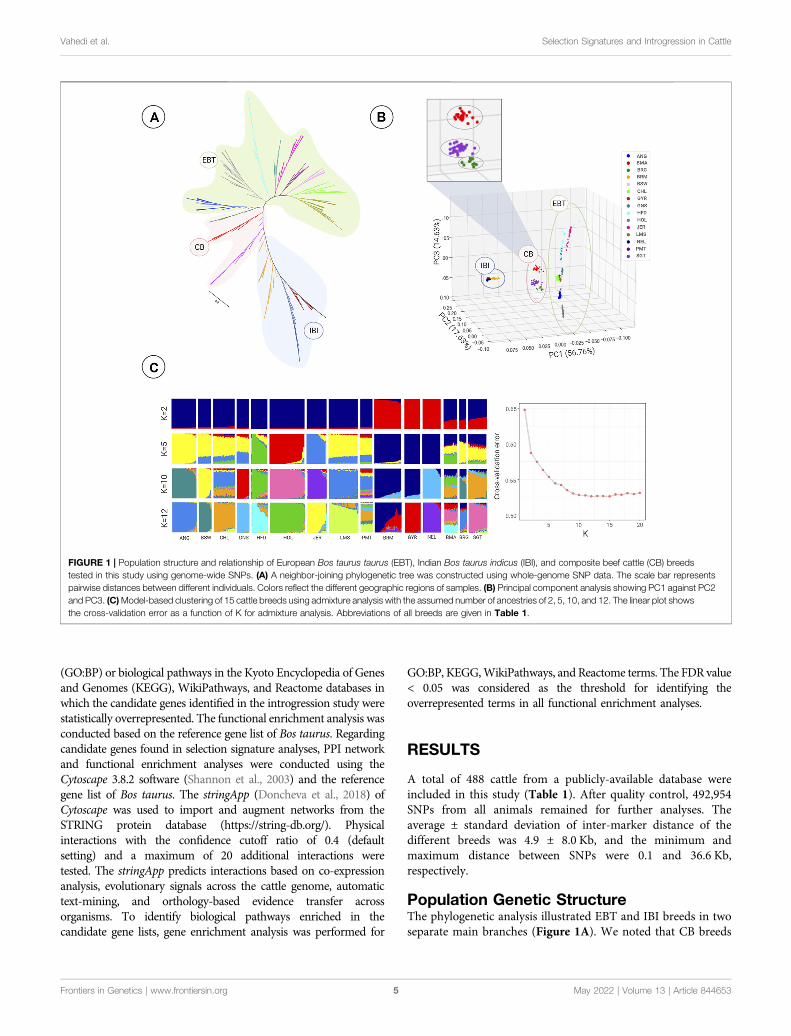
Population Genetic StructureThe phylogenetic analysis illustrated EBT and IBI breeds in twoseparate main branches (Figure 1A). We noted that CB breeds
FIGURE 1 | Population structure and relationship of European Bos taurus taurus (EBT), Indian Bos taurus indicus (IBI), and composite beef cattle (CB) breedstested in this study using genome-wide SNPs. (A) A neighbor-joining phylogenetic tree was constructed using whole-genome SNP data. The scale bar representspairwise distances between different individuals. Colors reflect the different geographic regions of samples. (B) Principal component analysis showing PC1 against PC2and PC3. (C)Model-based clustering of 15 cattle breeds using admixture analysis with the assumed number of ancestries of 2, 5, 10, and 12. The linear plot showsthe cross-validation error as a function of K for admixture analysis. Abbreviations of all breeds are given in Table 1.
Frontiers in Genetics | www.frontiersin.org May 2022 | Volume 13 | Article 8446535
Vahedi et al. Selection Signatures and Introgression in Cattle
were located at intermediate positions between these two majorclades, as expected. The CB breeds gathered in a paraphyleticpattern, most likely due to the gene flow between IBI and CB. TheBrangus was clustered in one clade with the Angus breed,suggesting a closer genetic relationship with EBT cattle,particularly Angus, compared to other populations(Figure 1A). In contrast, Santa Gertrudis demonstrated moreintimate genetic relationships with the Brahman breed from theIBI group. The Beefmaster breed was also located between SantaGertrudis and Brangus clades, with a slight affinity to the EBTclades.
Similar population affinities were obtained based on the PCAresults, in which a clear genetic structure with samples from eachgeographical region clustering together was observed(Figure 1B). The first component (PC1 = 56.76%) was drivenby the difference between three large clusters of EBT, IBI, and CB.However, within the CB cluster, a separation was found betweenBeefmaster, Brangus, and Santa Gertrudis breeds along thesecond (PC2 = 17.63%) and third (PC3 = 14.63%) principalcomponents.
The ancestral lineage compositions of 15 cattle breeds fromglobal populations are shown in Figure 1C. The K value,representing the number of ancestral populations, indicatedthat the lowest cross-validation error is K = 12. However, withregards to the history of the different populations and thepractice of crossbreeding, we chose to plot the admixtureresults from two assumed ancestries (K = 2) to optimal K of12 (Figure 1C). In K = 2, the samples were split into twogroups: 1) pure EBT or IBI animals and 2) crossbred CB breeds(combination of the two ancestral populations). Resultsrevealed the presence of EBT and IBI breeds admixture inall three CB breeds populations, confirming the principalcomponent analysis plot. On average, Beefmaster showed0.71 ± 0.04 and 0.29 ± 0.04 of EBT and IBI ancestry. Incontrast, the average EBT and IBI ancestral contribution inBrangus was estimated at 0.69 ± 5 and 0.31 ± 0.05, respectively.In Santa Gertrudis, we estimated an average of 0.64 ± 0.03 and0.36 ± 0.03 of EBT and IBI ancestry, respectively. Among theIBI breeds, Gyr had the highest percentage of IBI ancestry inthe Beefmaster genome (0.21 ± 0.04, K = 12), whereasBrahman was the most introgressed IBI breed to Brangusgenome (0.18 ± 0.05, K = 12). Furthermore, Nelloreachieved the highest level of admixture in Santa Gertrudisamong IBI breeds (0.07 ± 0.04, K = 12). Among EBT breeds,Hereford (0.28 ± 0.06, K = 8) and Angus (0.59 ± 0.05, K = 12)had the highest genomic contribution in Beefmaster andBrangus, respectively. Moreover, Hereford (0.16 ± 0.06, K =12) gained the most significant introgression among EBTbreeds in the Santa Gertrudis genome.
Detection of IntrogressionAmong 455 possible breed trios, we found 306 trios withsignificant Z(D) values (p < 0.05). Among them, 38, 44, and 56trios revealed the significant admixture in Beefmaster,Brangus, and Santa Gertrudis breeds. We also estimated230 trios with f4-ratio > 0.1%, among which 37, 36, and 51trios demonstrated the gene flow from EBT and IBI
populations to Beefmaster, Brangus, and Santa Gertrudisbreeds, respectively.
BeefmasterAmong 29 significant Z(D) values indicating introgression eventswith EBT breeds, the highest value belonged to the Herefordbreed while the Piedmontese was considered as P1((((PMT,BMA),HFD),OUT); D = 0.100; Z(D) = 30.020). Thisresult was confirmed by f4-ratio as the highest f 4-ratio valuebelonged to Hereford ((((((((ANG,HFD),BMA),OUT); f4-ratio =8.450). In contrast, the most significant Z(D) value representingintrogression events with IBI breeds was obtained from the trio of(((HFD,BMA),GYR),OUT); D = 0.015; Z(D) = 9.433). In parallel,the Gyr population possessed the highest f 4-ratio value((((HFD,BMA),GYR),OUT); f 4-ratio = 0.154) among thoseshowing IBI introgression. Our results indicated clear evidenceof genome-wide level introgression from Hereford and Gyr breedsto the Beefmaster population, which is consistent with the results ofPCA and admixture analyses.
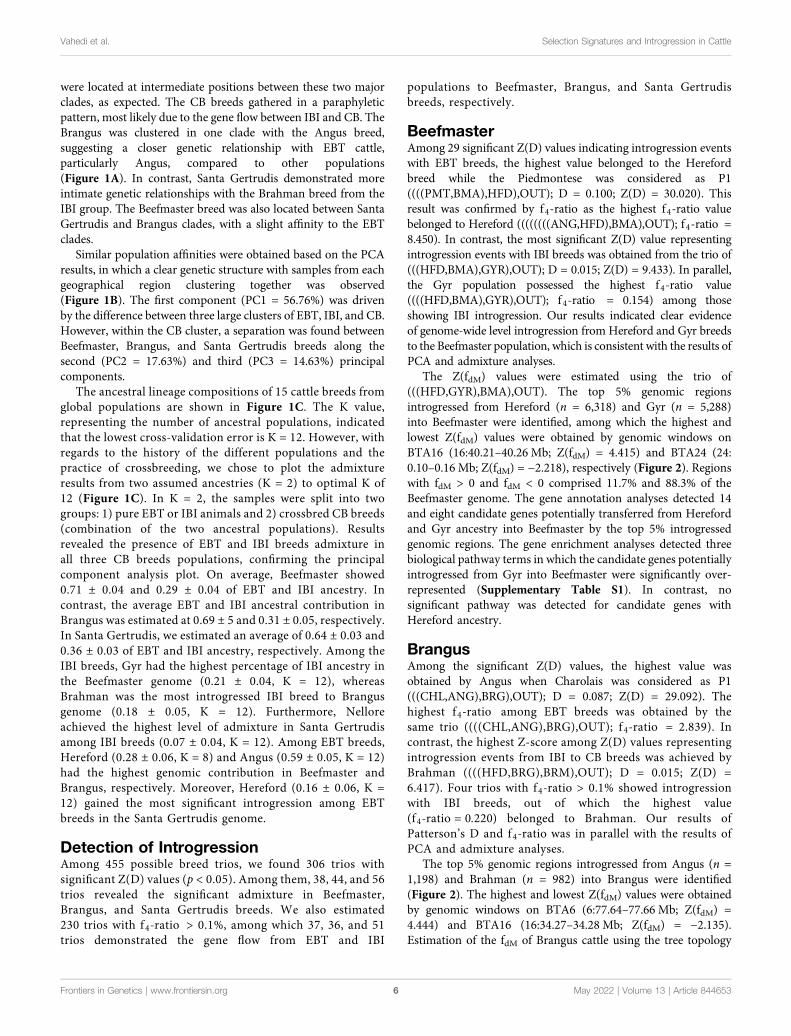
The Z(fdM) values were estimated using the trio of(((HFD,GYR),BMA),OUT). The top 5% genomic regionsintrogressed from Hereford (n = 6,318) and Gyr (n = 5,288)into Beefmaster were identified, among which the highest andlowest Z(fdM) values were obtained by genomic windows onBTA16 (16:40.21–40.26 Mb; Z(fdM) = 4.415) and BTA24 (24:0.10–0.16 Mb; Z(fdM) = −2.218), respectively (Figure 2). Regionswith fdM > 0 and fdM < 0 comprised 11.7% and 88.3% of theBeefmaster genome. The gene annotation analyses detected 14and eight candidate genes potentially transferred from Herefordand Gyr ancestry into Beefmaster by the top 5% introgressedgenomic regions. The gene enrichment analyses detected threebiological pathway terms in which the candidate genes potentiallyintrogressed from Gyr into Beefmaster were significantly over-represented (Supplementary Table S1). In contrast, nosignificant pathway was detected for candidate genes withHereford ancestry.
BrangusAmong the significant Z(D) values, the highest value wasobtained by Angus when Charolais was considered as P1(((CHL,ANG),BRG),OUT); D = 0.087; Z(D) = 29.092). Thehighest f4-ratio among EBT breeds was obtained by thesame trio ((((CHL,ANG),BRG),OUT); f 4-ratio = 2.839). Incontrast, the highest Z-score among Z(D) values representingintrogression events from IBI to CB breeds was achieved byBrahman ((((HFD,BRG),BRM),OUT); D = 0.015; Z(D) =6.417). Four trios with f4-ratio > 0.1% showed introgressionwith IBI breeds, out of which the highest value(f 4-ratio � 0.220) belonged to Brahman. Our results ofPatterson’s D and f4-ratio was in parallel with the results ofPCA and admixture analyses.
The top 5% genomic regions introgressed from Angus (n =1,198) and Brahman (n = 982) into Brangus were identified(Figure 2). The highest and lowest Z(fdM) values were obtainedby genomic windows on BTA6 (6:77.64–77.66 Mb; Z(fdM) =4.444) and BTA16 (16:34.27–34.28 Mb; Z(fdM) = −2.135).Estimation of the fdM of Brangus cattle using the tree topology
Frontiers in Genetics | www.frontiersin.org May 2022 | Volume 13 | Article 8446536
Vahedi et al. Selection Signatures and Introgression in Cattle
(((ANG,BRM),BRG),OUT) revealed that the introgressed regionswith fdM > 0 and fdM < 0 formed 11.8% and 88.2% of the Brangusgenome, respectively. The gene annotation analyses revealed that581 and 10 candidate genes were potentially transferred by thetop 5% introgressed genomic regions from Angus and Brahmaninto Brangus. Based on the gene enrichment analysis, we found 13and two biological processes and pathway terms in which thecandidate genes introgressed from Angus and Brahman wereoverrepresented (Supplementary Table S1).
Santa GertrudisAmong the significant Z(D) values, the highest value belonged tothe Hereford breed (((BRG,HFD), GT),OUT); D = 0.104; Z(D) =26.542). This result was further confirmed by f4-ratio test(((CHL,HFD),SGT),OUT); f 4-ratio = 10.280). On the contrary,10 significant Z(D) values were estimated for IBI breeds, amongwhich the Nellore breed obtained the highest Z-score
((((HFD,SGT),NEL),OUT); D = 0.016; Z(D) = 9.830). Inagreement with this result, Nellore had the highest value off 4-ratio among those representing IBI introgression (f 4-ratio =0.146). Therefore, in agreement to the admixture results, theintrogression assessment of Patterson’s D and f4-ratio clearlydepicted the higher levels of genome-wide introgression fromHereford and Nellore into the Santa Gertrudis breed.
The top 5% genomic regions introgressed from Hereford (n =1,237) and Nellore (n = 1,085) were determined (Figure 2). Thehighest and lowest Z(fdM) values were obtained by genomicwindows on BTA8 (8:8:33.30–33.32 Mb; Z(fdM) = 4.264) andBTA14 (14:14:64.37–64.42 Mb; Z(fdM) = −2.421). The estimationof the fdM values using the trio of (((HFD,NEL),SGT),OUT)showed that the introgressed regions with fdM > 0 and fdM < 0contributed to 15.3% and 84.7% of the Santa Gertrudis genome,respectively. The gene annotation analyses revealed that 42 and15 candidate genes were potentially transferred by the top 5%
FIGURE 2 |Manhattan plot of the Z-transformed fdM (Z(fdM)) at the significance threshold of 5% in Beefmaster (A), Brangus (B), and Santa Gertrudis (C). The fdM> 0 representsregions with Indian Bos taurus indicus (IBI) ancestry, while fdM < 0 represents regions with European Bos taurus (EBT) origin. Abbreviations of all breeds are given in Table 1.
Frontiers in Genetics | www.frontiersin.org May 2022 | Volume 13 | Article 8446537
Vahedi et al. Selection Signatures and Introgression in Cattle
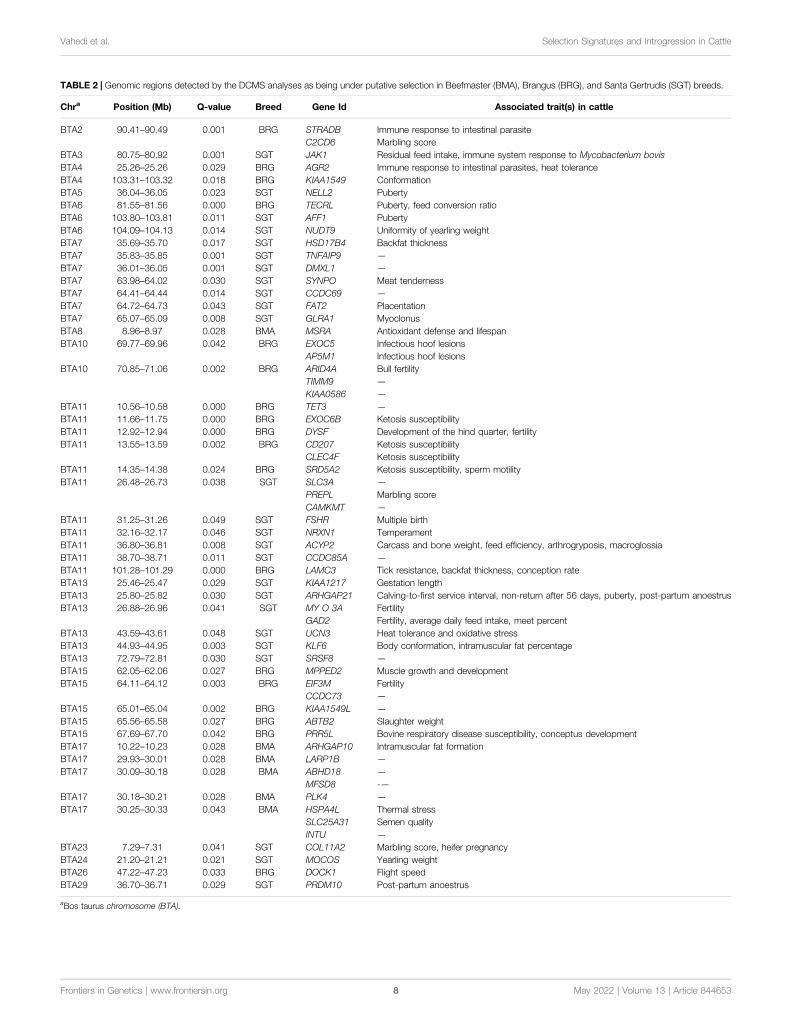
TABLE 2 | Genomic regions detected by the DCMS analyses as being under putative selection in Beefmaster (BMA), Brangus (BRG), and Santa Gertrudis (SGT) breeds.
Chra Position (Mb) Q-value Breed Gene Id Associated trait(s) in cattle
BTA2 90.41–90.49 0.001 BRG STRADB Immune response to intestinal parasiteC2CD6 Marbling score
BTA3 80.75–80.92 0.001 SGT JAK1 Residual feed intake, immune system response to Mycobacterium bovisBTA4 25.26–25.26 0.029 BRG AGR2 Immune response to intestinal parasites, heat toleranceBTA4 103.31–103.32 0.018 BRG KIAA1549 ConformationBTA5 36.04–36.05 0.023 SGT NELL2 PubertyBTA6 81.55–81.56 0.000 BRG TECRL Puberty, feed conversion ratioBTA6 103.80–103.81 0.011 SGT AFF1 PubertyBTA6 104.09–104.13 0.014 SGT NUDT9 Uniformity of yearling weightBTA7 35.69–35.70 0.017 SGT HSD17B4 Backfat thicknessBTA7 35.83–35.85 0.001 SGT TNFAIP9 —
BTA7 36.01–36.05 0.001 SGT DMXL1 —
BTA7 63.98–64.02 0.030 SGT SYNPO Meat tendernessBTA7 64.41–64.44 0.014 SGT CCDC69 —
BTA7 64.72–64.73 0.043 SGT FAT2 PlacentationBTA7 65.07–65.09 0.008 SGT GLRA1 MyoclonusBTA8 8.96–8.97 0.028 BMA MSRA Antioxidant defense and lifespanBTA10 69.77–69.96 0.042 BRG EXOC5 Infectious hoof lesions
AP5M1 Infectious hoof lesionsBTA10 70.85–71.06 0.002 BRG ARID4A Bull fertility
TIMM9 —
KIAA0586 —
BTA11 10.56–10.58 0.000 BRG TET3 —
BTA11 11.66–11.75 0.000 BRG EXOC6B Ketosis susceptibilityBTA11 12.92–12.94 0.000 BRG DYSF Development of the hind quarter, fertilityBTA11 13.55–13.59 0.002 BRG CD207 Ketosis susceptibility
CLEC4F Ketosis susceptibilityBTA11 14.35–14.38 0.024 BRG SRD5A2 Ketosis susceptibility, sperm motilityBTA11 26.48–26.73 0.038 SGT SLC3A —
PREPL Marbling scoreCAMKMT —
BTA11 31.25–31.26 0.049 SGT FSHR Multiple birthBTA11 32.16–32.17 0.046 SGT NRXN1 TemperamentBTA11 36.80–36.81 0.008 SGT ACYP2 Carcass and bone weight, feed efficiency, arthrogryposis, macroglossiaBTA11 38.70–38.71 0.011 SGT CCDC85A —
BTA11 101.28–101.29 0.000 BRG LAMC3 Tick resistance, backfat thickness, conception rateBTA13 25.46–25.47 0.029 SGT KIAA1217 Gestation lengthBTA13 25.80–25.82 0.030 SGT ARHGAP21 Calving-to-first service interval, non-return after 56 days, puberty, post-partum anoestrusBTA13 26.88–26.96 0.041 SGT MY O 3A Fertility
GAD2 Fertility, average daily feed intake, meet percentBTA13 43.59–43.61 0.048 SGT UCN3 Heat tolerance and oxidative stressBTA13 44.93–44.95 0.003 SGT KLF6 Body conformation, intramuscular fat percentageBTA13 72.79–72.81 0.030 SGT SRSF8 —
BTA15 62.05–62.06 0.027 BRG MPPED2 Muscle growth and developmentBTA15 64.11–64.12 0.003 BRG EIF3M Fertility
CCDC73 —
BTA15 65.01–65.04 0.002 BRG KIAA1549L —
BTA15 65.56–65.58 0.027 BRG ABTB2 Slaughter weightBTA15 67.69–67.70 0.042 BRG PRR5L Bovine respiratory disease susceptibility, conceptus developmentBTA17 10.22–10.23 0.028 BMA ARHGAP10 Intramuscular fat formationBTA17 29.93–30.01 0.028 BMA LARP1B —
BTA17 30.09–30.18 0.028 BMA ABHD18 —
MFSD8 -—BTA17 30.18–30.21 0.028 BMA PLK4 —
BTA17 30.25–30.33 0.043 BMA HSPA4L Thermal stressSLC25A31 Semen qualityINTU —
BTA23 7.29–7.31 0.041 SGT COL11A2 Marbling score, heifer pregnancyBTA24 21.20–21.21 0.021 SGT MOCOS Yearling weightBTA26 47.22–47.23 0.033 BRG DOCK1 Flight speedBTA29 36.70–36.71 0.029 SGT PRDM10 Post-partum anoestrus
aBos taurus chromosome (BTA).
Frontiers in Genetics | www.frontiersin.org May 2022 | Volume 13 | Article 8446538
Vahedi et al. Selection Signatures and Introgression in Cattle
introgressed genomic regions from Hereford and Nellore intoSanta Gertrudis. In total, we identified 12 terms in which theintrogressed genes from Nellore to Santa Gertrudis weresignificantly overrepresented (Supplementary Table S1). Oneterm was also found significant overrepresented by introgressedgenes from Hereford to Santa Gertrudis (SupplementaryTable S1).
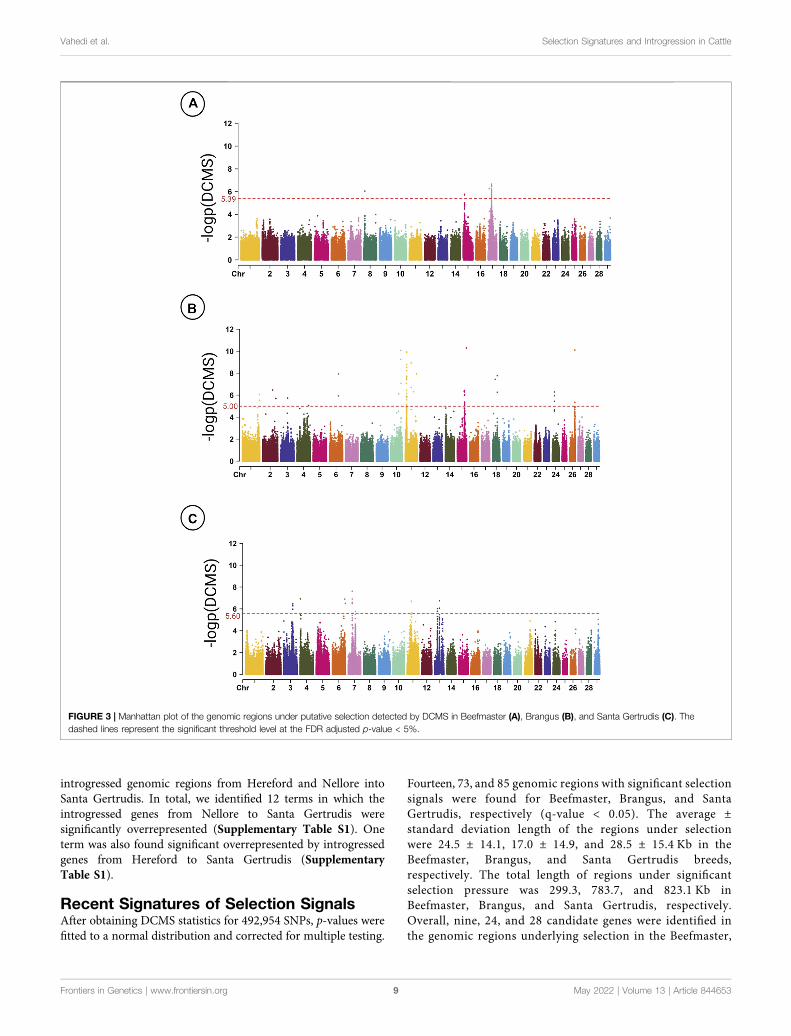
Recent Signatures of Selection SignalsAfter obtaining DCMS statistics for 492,954 SNPs, p-values werefitted to a normal distribution and corrected for multiple testing.
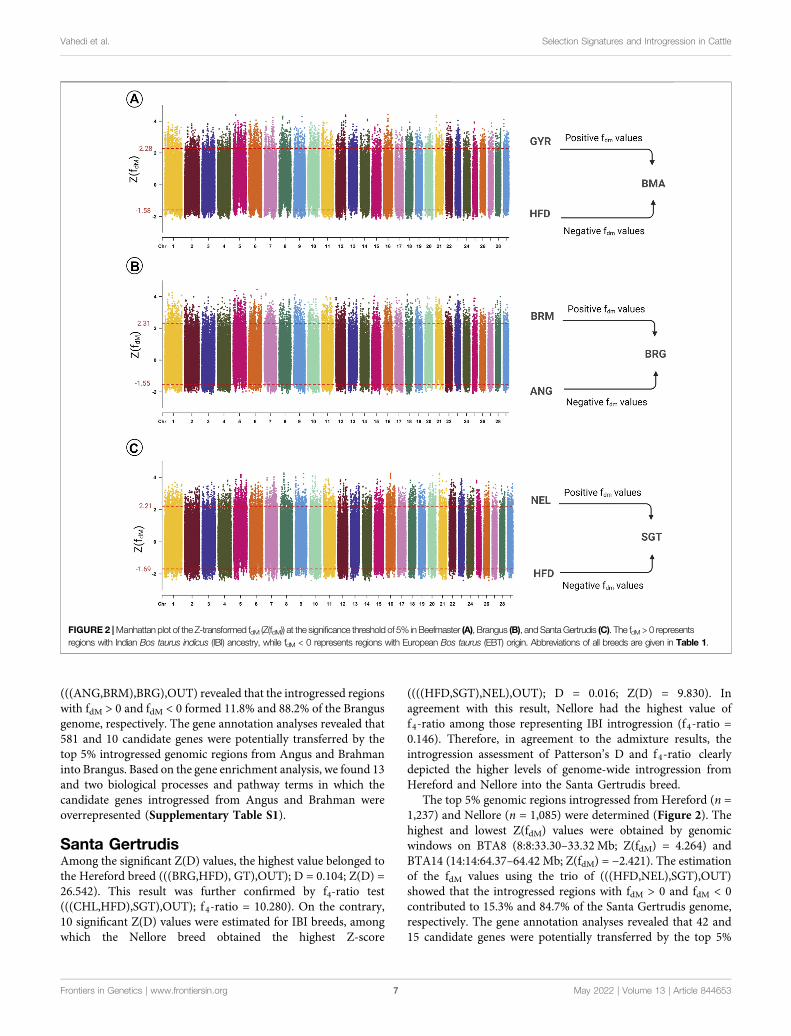
Fourteen, 73, and 85 genomic regions with significant selectionsignals were found for Beefmaster, Brangus, and SantaGertrudis, respectively (q-value < 0.05). The average ±standard deviation length of the regions under selectionwere 24.5 ± 14.1, 17.0 ± 14.9, and 28.5 ± 15.4 Kb in theBeefmaster, Brangus, and Santa Gertrudis breeds,respectively. The total length of regions under significantselection pressure was 299.3, 783.7, and 823.1 Kb inBeefmaster, Brangus, and Santa Gertrudis, respectively.Overall, nine, 24, and 28 candidate genes were identified inthe genomic regions underlying selection in the Beefmaster,
FIGURE 3 | Manhattan plot of the genomic regions under putative selection detected by DCMS in Beefmaster (A), Brangus (B), and Santa Gertrudis (C). Thedashed lines represent the significant threshold level at the FDR adjusted p-value < 5%.
Frontiers in Genetics | www.frontiersin.org May 2022 | Volume 13 | Article 8446539
Vahedi et al. Selection Signatures and Introgression in Cattle
Brangus, and Santa Gertrudis breeds (Table 2). None of thecandidate genes were detected in more than one breed.
The distribution of regions under selection across the genome ofCB breeds is depicted in Figure 3. The most significant genomicregion in Brangus was detected on BTA11 (11:12.91–12.93Mb;q-value = 0.00002), whereas in Beefmaster, one region on BTA8and four regions on BTA17 were found with the lowest q-value of0.028. In Santa Gertrudis, the most significant region is located onBTA7 (7:35.82–35.84Mb) with q-value = 0.00055.
Gene annotation analysis of the regions underlying selectionrevealed various previously-reported and novel candidate genesthat are associated with a diverse range of traits, includingreproduction, susceptibility to infectious diseases, meat quality,thermotolerance, susceptibility to metabolic diseases, geneticdiseases, puberty, feed efficiency, carcass quality, sexdetermination, and temperament (Table 2). In the PPInetwork analysis, nine, 24, and 26 identifiers were uploadedfrom the STRING database for Beefmaster, Brangus, and SantaGertrudis. PPI networks including 28, 33, and 40 genes withsignificant interactions were constructed for Beefmaster, Brangus,and Santa Gertrudis (Supplementary Figure S1). Geneenrichment analysis revealed that in the Beefmaster breed, thediscovered candidate genes were significantly overrepresented inchaperon-mediated protein folding term (GO:0061077), alongwith three terms related to heat stress response (BTA-2262752,BTA-3371453, bta04141). Regarding the Brangus breed, wefound multiple significant pathways associated with immunesystem function (bta04666, bta04664, bta04662, bta04650),metabolism (BTA-194840, bta04024, GO:0007265),intracellular signaling (bta04014, bta04310, bta04015), andmuscle development (bta04810). In the Santa Gertrudis breed,we detected significant metabolic pathways, including lysin(bta00310), beta-alanine (bta00410), pyruvate (bta00620), andarginine and proline (bta00330).
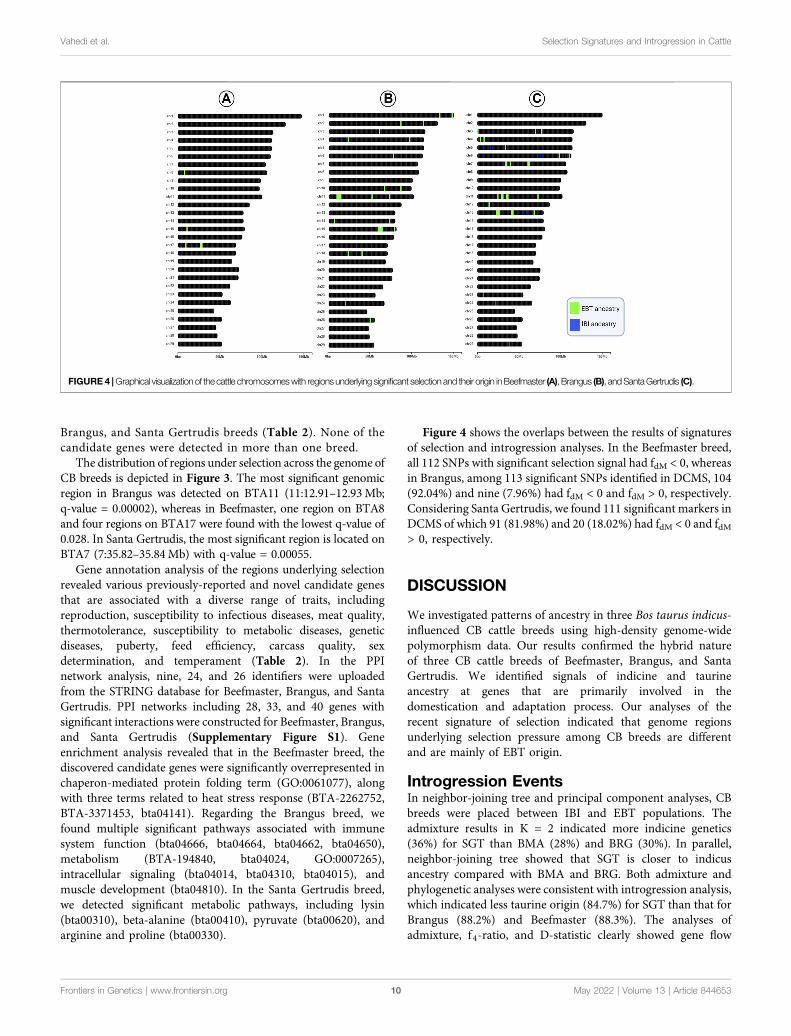
Figure 4 shows the overlaps between the results of signaturesof selection and introgression analyses. In the Beefmaster breed,all 112 SNPs with significant selection signal had fdM < 0, whereasin Brangus, among 113 significant SNPs identified in DCMS, 104(92.04%) and nine (7.96%) had fdM < 0 and fdM > 0, respectively.Considering Santa Gertrudis, we found 111 significant markers inDCMS of which 91 (81.98%) and 20 (18.02%) had fdM < 0 and fdM> 0, respectively.
DISCUSSION
We investigated patterns of ancestry in three Bos taurus indicus-influenced CB cattle breeds using high-density genome-widepolymorphism data. Our results confirmed the hybrid natureof three CB cattle breeds of Beefmaster, Brangus, and SantaGertrudis. We identified signals of indicine and taurineancestry at genes that are primarily involved in thedomestication and adaptation process. Our analyses of therecent signature of selection indicated that genome regionsunderlying selection pressure among CB breeds are differentand are mainly of EBT origin.
Introgression EventsIn neighbor-joining tree and principal component analyses, CBbreeds were placed between IBI and EBT populations. Theadmixture results in K = 2 indicated more indicine genetics(36%) for SGT than BMA (28%) and BRG (30%). In parallel,neighbor-joining tree showed that SGT is closer to indicusancestry compared with BMA and BRG. Both admixture andphylogenetic analyses were consistent with introgression analysis,which indicated less taurine origin (84.7%) for SGT than that forBrangus (88.2%) and Beefmaster (88.3%). The analyses ofadmixture, f 4-ratio, and D-statistic clearly showed gene flow
FIGURE 4 |Graphical visualizationof the cattle chromosomeswith regionsunderlying significant selection and their origin inBeefmaster (A), Brangus (B), andSantaGertrudis (C).
Frontiers in Genetics | www.frontiersin.org May 2022 | Volume 13 | Article 84465310
Vahedi et al. Selection Signatures and Introgression in Cattle
from different IBI and EBT breeds to CB populations. Our resultswere consistent with historical pedigree information of theintrogression history of the hybrid cattle breeds (Ritchie,2009). Using D, f 4-ratio, and fdM statistics, we observed that,on average, only 12.9% of the studied CB breeds’ genome wasintrogressed from indicine origin, which is in agreement with theresults reported by McTavish et al. (2013), who indicated thatonly 11% of recently formed hybrid breeds’ genome is of indicineancestry. Moreover, Barbato et al. (2020) reported thatapproximately 11–13% of indicine ancestry were recorded inthree Central Italian breeds of Marchigiana, Romagnola, andChianina. Our admixture results showed a higher level of IBIintrogression (average of 32.0%) in the studied CB population.The explanation for this discordance might be that a historicalmodel is not fitted in admixture analysis, and it is unrealisticallyassumed that all populations have derived from a single ancestralgroup (Alexander et al., 2009). On the contrary, D, f 4-ratio, andfdM statistics include fitting a simple phylogenetic tree model to agroup of populations, and they provide a formal test for a historyof admixture in that context (Patterson et al., 2012). Therefore, amore accurate estimation of introgression would be feasible(Malinsky et al., 2021).
Using the fdM statistics we inferred genomic local ancestry inCB breeds. In all chromosomes, some segments ranked thehighest 95 percentile or the lowest 95 percentile. Barbato et al.(2020) identified multiple introgressed genomic regions in threeItalian breeds in all chromosomes except in BTA17 and BTA 28.However, they only searched for indicine-driven introgressedregions. Five genes were common among the candidate geneswith EBT ancestry (Supplementary Figure S2). Among them,Neurexin 3 (NRXN3) is involved in the genetic architecture ofcattle temperament (Paredes-Sánchez et al., 2020). NRXN3 is amember of the Neurexins family that are cell adhesion moleculesin the nervous system to specify and stabilize excitatory andinhibitory synapses (Aoto et al., 2013). Another gene from thisfamily, Neurexin 1 (NRXN1), was shared between candidategenes with EBT ancestry in Brangus and Santa Gertrudis. Thisgene has been proposed as a candidate gene for a moderatetemperament of cattle (Qanbari et al., 2014). The Bos taurusindicus crosses, particularly Brahman crosses, have been reportedto be more temperamental than EBT breeds but less aggressive/fearful than IBI breeds (Hoppe et al., 2010). Therefore, theinheritance of alleles with EBT ancestry may contribute to lessfearful or excitable animal’s response to handling or forcedmovement by humans. Another candidate gene, TSC22Domain Family Member 1 (TSC22D1), encodes a member ofthe TSC22 domain family of leucine zipper transcription factorsand belongs to the large family of early response genes, which areactivated rapidly in response to a wide range of cellular stimuli(Kester et al., 1999). This gene has been found to be associatedwith maternal lipomatous myopathy (Peletto et al., 2017) andcalving difficulty (Purfield et al., 2020) in cattle. It has beengenerally assumed that IBI cattle have less calving difficulty thanEBT breeds due to their pelvic structure. However, the greateremphasis on growth rate has increased the risk of calvingdifficulties in CB breeds (Morrison et al., 1989). Twocandidate genes of CASP2 and RIPK1 Domain Containing
Adaptor with Death Domain (CRADD) and Sodium/Potassium Transporting ATPase Interacting 2 (NAKIN2) wereshared among candidate genes with IBI ancestry. CRADDencodes a death domain-containing protein that can inducecell apoptosis (Ahmad et al., 1997). This gene is involved incattle embryonic development, a process in which apoptosis playsa critical role in adapting myometrial cells during pregnancy(Rehman et al., 2003). In contrast, the function of NAKIN2 incattle is not comprehensively understood yet.
In all CB populations, gene enrichment study of genes with IBIancestry showed the detected candidate genes were significantlyinvolved in biological processes associated with apoptosisregulation by tumor suppressor TP53 (Supplementary TableS1). TP53 is upregulated in response to several stimuli, includingactivation of oncogenes, DNA damage, or nutrient deprivation(Aubrey et al., 2018). Subsequently, apoptosis will be inducedthrough intrinsic or extrinsic pathways (Aubrey et al., 2018). TheTP53 gene and its pathways are associated with some traits incattle, such as heifer fertility (Neupane et al., 2017) and carcassweight (Carvalho et al., 2019). Carcass weight and quality areusually higher in EBT breeds than IBI’s (Highfill et al., 2012).Indeed, cattle with IBI influence tend to have lower meattenderness and growth rate than EBT (Wheeler et al., 2010;Elzo et al., 2012). Therefore, increases in the proportion ofalleles with EBT origin in the crossbred progeny could resultin higher meat quality and yield. Santa Gertrudis and Beefmastergenes with IBI ancestry are significantly involved in the Class C/3(Metabotropic glutamate/pheromone receptors) pathway. Cattlepheromones are crucial in reproduction and social behaviors, e.g.,sexual attraction, mother-young interactions, estrus indication,puberty acceleration, reducing the post-partum anestrus,hormonal stimulation, and erection (Mucignat-Caretta, 2014).Therefore, they could be critical factors in animals’ fitness andreproductive success.
Santa Gertrudis candidate genes with EBT ancestry weresignificantly overrepresented in the neural crest differentiationprocess (Supplementary Table S1). Neural crest cells have thepotential to differentiate into several different cell types of thevertebrate body. They are the origin of most parts of theperipheral nervous system, endocrine cells in the adrenalmedulla and thyroid, the frontal part of the head, and parts ofthe cardiovascular system (for a review, please see Dupin et al.,2006). It has been hypothesized that a reduction in neural crestcell proliferation and migration is an essential genetic mechanismof early domestication (Wilkins et al., 2014). Moreover, furtherchanges to the neural crest may potentiate the later evolution ofother domestication traits (Wright et al., 2020). Oxidation bycytochrome P450 was the most significant pathway in whichBrangus candidate genes with EBT ancestry wereoverrepresented. Overall, five genes were overrepresented inthe Oxidation by cytochrome P450 WikiPathway term whichincludes 39 genes in cow. Drugs, toxins, and many foreignhydrophobic compounds are removed from the body bycytochrome P450 enzyme system, particularly in the liver(Moubarak & Rosenkrans, 2000). Moreover, the critical role ofP450 genes in oxidative stress, inflammatory-based diseases, andsynthesis and metabolism of sterols, steroid hormones, and lipid
Frontiers in Genetics | www.frontiersin.org May 2022 | Volume 13 | Article 84465311
Vahedi et al. Selection Signatures and Introgression in Cattle

biofactors such as eicosanoids, vitaminD3, and retinoids inmammalsis well-documented (Omura, 1999; Kuhn et al., 2020). Therefore,understanding the inheritance of cytochrome P450 oxidationfunctional elements from EBT breeds might be essential inveterinary practice, nutrition, and metabolic priorities of CB breeds.
Recent Signatures of SelectionTo the best of our knowledge, this study is the first report ofsignatures of selection in the Beefmaster breed. In this breed,DCMS found three locations on the bovine genome with themost significant peaks (q-value = 0.02809), including twolocations on BTA17 (17:10.22–10.23Mb and 17:29.93–30.18Mb)and one on BTA8 (8:8.97–8.97Mb) (Figure 3). We found sixcandidate genes in these regions, including Methionine SulfoxideReductase A (MSRA), Rho GTPase Activating Protein 10(ARHGAP10), Polo Like Kinase 4 (PLK4), La-related protein 1(LARP1B), Abhydrolase Domain Containing 18 (ABHD18), andMajor Facilitator Superfamily Domain Containing 8 (MFSD8), ofwhich the function of the last three genes in CB breeds are notcomprehensively known. Oxidation of proteins by reactive oxygenspecies can occur in oxidative stress, such as heat stress and severaldiseases. Free and protein-boundmethionine residues are susceptibleto oxidation to methionine sulfoxide derivatives (Moskovitz et al.,2001). However,MSRA can repair this modification by catalyzing thethioredoxin-dependent reduction of free and protein-bound Met(O)to methionine (Moskovitz et al., 2001). Therefore,MSRA plays a vitalrole in stress response in mammals. ARHGAP10 is also a member ofthe Rho-GTPase activating protein (Rho-GAP) family, regulatingRho-GTPase signaling pathways, and these pathways are involved inactin cytoskeleton dynamics, cell proliferation, and differentiation(Bassères et al., 2002). A recent study on Japanese black cattleindicated that this gene might be involved in intramuscular fatformation (Ueda et al., 2021). The PPI network analysis ofBeefmaster candidate genes indicated the critical role of HeatShock Protein Family A Member 4 Like (HSPA4L) withcontribution into three biological pathways (SupplementaryFigure S1). HSPA4L is a member of the HSP70 gene family, thelargest and the most conserved protein family throughout evolution(Daugaard et al., 2007). HSP70 genes function in heat tolerance,protection of cells against apoptosis, and reactive oxygen species(Feder & Hofmann, 1999). A recent transcriptome study in cattlerevealed that the expression of HSPA4L is upregulated in the milksomatic cells during heat challenge (Garner et al., 2020). Geneenrichment analysis revealed that Beefmaster candidate genes weresignificantly overrepresented in pathways related to post-translationprotein modifications and stress response (Supplementary FigureS1). It is noteworthy that Beefmaster has been widely used not onlyfor their heat tolerance and adaptability but excellent growth andcarcass quality (Cartwright, 1970; Wheeler et al., 2010).
Regarding the Brangus breed, we identified 73 genomic windowsunderlying selection, of which the most significant signal was foundon BTA11 (11:12.92–12.94Mb; q-value = 1.02E-06) (Figure 3). Thewell-known candidate gene of Dysferlin (DYSF) is located in thisregion. Dysferlin, known as dystrophy-associated fer-1-like protein,is encoded by the DYSF gene (Blandin et al., 2012). This calcium-dependent transmembrane protein is mainly expressed in skeletaland cardiac muscles to enhance calcium-mediatedmembrane fusion
and sarcolemmal repair (Blandin et al., 2012). Mutations in this genecause multiple different phenotypes of muscular dystrophies inhumans (Vilchez et al., 2005). In contrast, studies in cattledemonstrated its strong association with the development ofcattle muscularity (Doyle et al., 2020), sire conception rate(Rezende et al., 2018), and female reproductive performance(Fonseca et al., 2020). A recent study conducted by Zhang et al.(2020) indicated that this gene might be under strong positiveselection for high altitudes adaptation in Chinese indigenouscattle. We could not find any overlapping genomic regionsbetween our results and a recently-conducted signatures ofselection study in the Brangus breed by Paim et al. (2020). Thereason could be that we investigated recent signatures of selection,i.e., those regions underlying selection following the breed formation,using multiple EHH-based methods. While runs of homozygosity,which is an indicator of genomic autozygosity, may arise due toseveral population phenomena like inbreeding, genetic drift,consanguineous mating, population bottleneck, as well as naturaland artificial selection (Falconer and Mackay, 1996; Curik et al.,2014).
PPI network analysis of Brangus candidate genes revealedsignificant interactions with the Rac subfamily of the Rho familyof GTPases, particularly RAC1, RAC2, and RAC3. Moreover, in PPInetwork analysis, we found multiple pathways which are connectedto these genes, including Ras signaling pathway, regulation of actincytoskeleton, Rho GTPase cycle, Rap1 signaling pathway, cAMPsignaling pathway, and Ras protein signal transduction. Ras signalingis a critical intracellular signaling pathway that plays a vital role incellular proliferation and differentiation, survival, and geneexpression (Vojtek and Der, 1998). Rho GTPases of the Rassuperfamily and Rap1 protein act as molecular switches tocontrol a wide range of essential biochemical pathways inresponse to environmental stimuli through intracellular signaltransduction pathways (Bar-Sagi and Hall, 2000). It is noteworthythat Rap1 activation is mediated by several second messengers, suchas cAMP (Zwartkruis and Bos, 1999). Studies on cattle have shownthe importance of Ras signaling pathway in meat quality (Li et al.,2020) and subcutaneous fat deposition (Taniguchi et al., 2008), Rap1signaling pathway in muscle development (Zhan et al., 2018), andcAMP signaling pathway in lipidmetabolism (Junjvlieke et al., 2020).
To the best of our knowledge, signatures of selection analysis havenot been previously conducted on Santa Gertrudis. We identified 85genomic regions with significant selection signals in this breed(Figure 3). The most significant region was located on BTA7 (7:35.83–35.85Mb; q-value = 0.00055). We found a candidate gene ofTumorNecrosis Factor-Alpha Inducible Protein 9 (TNFAIP9) in thisregion. TNFAIP9 is a member of the STEAP (six transmembraneepithelial antigen of prostate) family vital for cellular iron uptake andhomeostasis (Han et al., 2018). Studies in humans suggested thatTNFAIP9 might be involved in adipocyte development andmetabolism (Gui et al., 2016). However, its function in cattle hasnot been comprehensively understood yet. We also detected severalgenomic regions with significant selection signals on BTA11 (11:31.25–38.71Mb) and BTA13 (13:25.80–44.95Mb). In geneannotation study of these regions, several candidate genes havebeen found related to reproductive system function in cattle,including Follicle Stimulating Hormone Receptor (FSHR)
Frontiers in Genetics | www.frontiersin.org May 2022 | Volume 13 | Article 84465312
Vahedi et al. Selection Signatures and Introgression in Cattle
(Widmer et al., 2021), KIAA1217 (Mohammadi et al., 2020), RhoGTPase Activating Protein 21 (ARHGAP21) (Wolf et al., 2021),Myosin IIIA (MY O 3A) (Mohammadi et al., 2020), and GlutamateDecarboxylase 2 (GAD2) (Mohammadi et al., 2020). Fertility is anessential element in beef cattle production because it directly relatesto producing the offspring necessary to offset costs in productionsystems (Thundathil et al., 2016). This trait has been improved in CBbreeds during the last decades through assisted reproductivetechnologies of artificial insemination and genetic selection(Cammack et al., 2009). We also detected a significant signal onBTA 3 (3: 80.75–80.92Mb). A larger overlapped region has beenpreviously detected to be under significant selection in the Shekobreed (3:80.10–80.93Mb) (Bahbahani et al., 2018). We detected thecandidate gene of Janus Kinase 1 (JAK1) in this region which isinvolved in cattle residual feed intake (Xi et al., 2015) and immuneresponse to Mycobacterium bovis (Imai et al., 2003).
The PPI network analysis revealed the central role of twomembers of the aldehyde dehydrogenase (ALDH) genesuperfamily, including Aldehyde Dehydrogenase 3 FamilyMember A2 (ALDH3A2) and Aldehyde Dehydrogenase 7 FamilyMember A1 (ALDH7A1). Recent studies have indicated the role ofALDH7A1 in feed efficiency (De Oliveira et al., 2014) and growthrate (Buzanskas et al., 2014), but less information is available aboutthe ALDH3A2 role. Gene enrichment analysis indicated thatBeefmaster candidate genes were significantly overrepresented inseveral metabolic pathways, particularly of amino acids metabolism(Supplementary Figure S1). Amino acids are the principal nutritioncomponent for protein synthesis andmeat, and rapid rates of muscleprotein deposition is positively correlated with growth and efficientbeef production. Lysin is a limiting amino acid for optimizing thegrowth of certain animals such as pigs and poultry, and it is one ofthe first three limiting amino acids (methionine, lysine, andthreonine) in growing cattle diet (Richardson and Hatfield, 1978).Moreover, lean growth rate in cattle is positively associated withoverall feed efficiency in growing and finishing animals (Archer et al.,1997). Therefore, the lysin metabolismmight play an important rolein selection of feed efficient animals with high growth rate.
Integration of Recent Signatures ofSelection and Introgression EventsThe overlap between the results of signatures of selection andintrogression analyses deciphered that the selected regions instudied CB breeds were predominantly EBT in origin (Figure 4).However, the proportion of EBT ancestry in selected regions ishigher in Beefmaster (100%) than Brangus (92.04%) and SantaGertrudis (81.98%). Our results complement the previous studyof Paim et al. (2020) that showed that homozygous regions inBrangus are mainly of Angus ancestry. Our results show how thecombination of selection and complementary can shift the geneticarchitecture of CB populations following the breed formation.
Although a reasonable number of genotyped animals wereavailable for this study, the sample size is still a limiting factor.Therefore, larger datasets could enable accurate genotype imputationanalyses and therefore, the inclusion of a larger number of SNPmarkers in the analyses. In addition, it would be recommended toadd other breeds that might have contributed to the formation of the
three CB analyzed as well as other composite populations such as theMontana tropical Composite (Grigoletto et al., 2020).
CONCLUSION
Our study revealed human-mediated introgression events andgenomic regions underlying selection in three CB breeds. Weconfirmed the low contribution of alleles with IBI origin in theCB cattle genome. The majority of selected genomic regions in CBcattle breeds came from EBT that can be in conjunction with thetraits of interest for genetic improvement and selection. Our resultsdemonstrate how complementarity and selection collaborate inshaping the genetic architecture of the CB breeds population. Weshowed that the overlaps between these two events were breed-specific, suggesting that differences in breeding objectives andselection intensities exist between CB breeds. Investigating the CBbreeds’ genomic architecture allows the estimation of genome-wideindicine and taurine genome proportions and demonstrates thelocations within the genome where alleles with either taurine orindicine origin provide a selective advantage. Such findings providethe opportunity to control the breeding programs more efficiently.
DATA AVAILABILITY STATEMENT
Publicly available datasets were analyzed in this study. This datacan be found here: http://widde.toulouse.inra.fr/widde/widde/main.do?module=cattle.
AUTHOR CONTRIBUTIONS
SV conceived the study. SV carried out the analyses and draftedthe manuscript. SS helped to carry out the analyses and write themanuscript. LB, SG, and MB critically edited and reviewed themanuscript. LB, SV, SM, and KP contributed to the final approvalof the version to be published. All authors contributed to thearticle and approved the submitted version. All authors have readand agreed to the published version of the manuscript.
ACKNOWLEDGMENTS
We would like to thank Guilhem Sempéré, Laurence Flori, and theircolleagues for developing the freely accessible WIDDE database. Apart of the statistical analyses was conducted in Canada usingCompute Canada resources (www.computecanada.ca). The accessto Compute Canada resources was provided by a sponsor atDalhousie University.
SUPPLEMENTARY MATERIAL
The SupplementaryMaterial for this article can be found online at:https://www.frontiersin.org/articles/10.3389/fgene.2022.844653/full#supplementary-material
Frontiers in Genetics | www.frontiersin.org May 2022 | Volume 13 | Article 84465313
Vahedi et al. Selection Signatures and Introgression in Cattle
REFERENCES
Ahmad, M., Srinivasula, S. M., Wang, L., Talanian, R. V., Litwack, G., Fernandes-Alnemri, T., et al. (1997). CRADD, a Novel Human Apoptotic AdaptorMolecule for Caspase-2, and FasL/tumor Necrosis Factor Receptor-Interacting Protein RIP. Cancer Res. 57 (4), 615–619.
Alexander, D. H., Novembre, J., and Lange, K. (2009). Fast Model-BasedEstimation of Ancestry in Unrelated Individuals. Genome Res. 19 (9),1655–1664. doi:10.1101/gr.094052.109
Anand, L., and Lopez, C. M. R. (2022). ChromoMap: an R Package for InteractiveVisualization of Multi-omics Data and Annotation of Chromosomes. BMCBioinform. 23 (1), 1–9. doi:10.1186/s12859-021-04556-z
Aoto, J., Martinelli, D. C., Malenka, R. C., Tabuchi, K., and Südhof, T. C. (2013).Presynaptic Neurexin-3 Alternative Splicing Trans-synaptically ControlsPostsynaptic AMPA Receptor Trafficking. Cell 154 (1), 75–88. doi:10.1016/j.cell.2013.05.060
Archer, J. A., Arthur, P. F., Herd, R. M., Parnell, P. F., and Pitchford, W. S. (1997).Optimum Postweaning Test for Measurement of Growth Rate, Feed Intake, andFeed Efficiency in British Breed Cattle. J. Anim. Sci. 75 (8), 2024–2032. doi:10.2527/1997.7582024x
Aubrey, B. J., Kelly, G. L., Janic, A., Herold, M. J., and Strasser, A. (2018). HowDoesP53 Induce Apoptosis and How Does This Relate to P53-Mediated TumourSuppression? Cell Death Differ 25 (1), 104–113. doi:10.1038/cdd.2017.169
Bahbahani, H., Afana, A., and Wragg, D. (2018). Genomic Signatures of AdaptiveIntrogression and Environmental Adaptation in the Sheko Cattle of SouthwestEthiopia. PLoS One 13 (8), e0202479. doi:10.1371/journal.pone.0202479
Bar-Sagi, D., and Hall, A. (2000). Ras and Rho GTPases. Cell 103 (2), 227–238.doi:10.1016/s0092-8674(00)00115-x
Barbato, M., Hailer, F., Upadhyay, M., Del Corvo, M., Colli, L., Negrini, R., et al.(2020). Adaptive Introgression from Indicine Cattle into white Cattle Breeds fromCentral Italy. Sci. Rep. 10 (1), 1–11. doi:10.1038/s41598-020-57880-4
Bassères, D. S., Tizzei, E. V., Duarte, A. A., Costa, F. F., and Saad, S. T. (2002).ARHGAP10, a Novel Human Gene Coding for a Potentially Cytoskeletal Rho-GTPase Activating Protein. Biochem. Biophys. Res. Commun. 294 (3), 579–585.doi:10.1016/S0006-291X(02)00514-4
Bélanger, J., and Pilling, D. (2019). The State of the World’s Biodiversity for Foodand Agriculture. (Rome: Food and Agriculture Organization of the UnitedNations FAO).
Benjamini, Y., and Hochberg, Y. (1995). Controlling the False Discovery Rate: APractical and Powerful Approach to Multiple Testing. J. R. Stat. Soc. Ser. B(Methodological) 57 (1), 289–300. doi:10.1111/j.2517-6161.1995.tb02031.x
Bickhart, D. M., Xu, L., Hutchison, J. L., Cole, J. B., Null, D. J., Schroeder, S. G., et al.(2016). Diversity and Population-Genetic Properties of Copy NumberVariations and Multicopy Genes in Cattle. DNA Res. 23 (3), 253–262.doi:10.1093/dnares/dsw013
Blandin, G., Beroud, C., Labelle, V., Nguyen, K., Wein, N., Hamroun, D., et al.(2012). UMD-DYSF, a Novel Locus Specific Database for the Compilation andInteractive Analysis of Mutations in the Dysferlin Gene. Hum. Mutat. 33 (3),E2317–E2331. doi:10.1002/humu.22015
Bovine HapMap Consortium (2009). Genome-wide Survey of SNP VariationUncovers the Genetic Structure of Cattle Breeds. Science 324 (5926),528–532. doi:10.1126/science.1167936
Buzanskas, M. E., Grossi, D. A., Ventura, R. V., Schenkel, F. S., Sargolzaei, M., Meirelles,S. L., et al. (2014). Genome-wide Association for Growth Traits in Canchim BeefCattle. PLoS One 9 (4), e94802. doi:10.1371/journal.pone.0094802
Buzanskas, M. E., Ventura, R. V., Seleguim Chud, T. C., Bernardes, P. A., Santos, D.J. de. A., Regitano, L. C. de. A., et al. (2017). Study on the Introgression of BeefBreeds in Canchim Cattle Using Single Nucleotide Polymorphism Markers.PLoS One 12 (2), e0171660. doi:10.1371/journal.pone.0171660
Cammack, K., Thomas, M., and Enns, R. (2009). Reproductive Traits and TheirHeritabilities in Beef Cattle. The Prof. Anim. Scientist 25 (5), 517–528. doi:10.15232/s1080-7446(15)30753-1
Cartwright, T. (1970). Selection Criteria for Beef Cattle for the Future. J. Anim. Sci.30 (5), 706–711. doi:10.2527/jas1970.305706x
Carvalho, M., Baldi, F., Alexandre, P., Santana, M., Ventura, R., Bueno, R., et al.(2019). Genomic Regions and Genes Associated with Carcass Quality in NeloreCattle. Genet. Mol. Res. 18 (1), 1–15. doi:10.4238/gmr18226
Chen, N., Cai, Y., Chen, Q., Li, R., Wang, K., Huang, Y., et al. (2018). Whole-genome Resequencing Reveals World-wide Ancestry and AdaptiveIntrogression Events of Domesticated Cattle in East Asia. Nat. Commun. 9(1), 1–13. doi:10.1038/s41467-018-04737-0
Cook, D. E., and Andersen, E. C. (2017). VCF-kit: Assorted Utilities for the VariantCall Format. Bioinformatics 33 (10), 1581–1582. doi:10.1093/bioinformatics/btx011
Curik, I., Ferenčaković, M., and Sölkner, J. (2014). Inbreeding and Runs ofHomozygosity: A Possible Solution to an Old Problem. Livestock Sci. 166,26–34. doi:10.1016/j.livsci.2014.05.034
Danecek, P., Auton, A., Abecasis, G., Albers, C. A., Banks, E., DePristo, M. A., et al.(2011). The Variant Call Format and VCFtools. Bioinformatics 27 (15),2156–2158. doi:10.1093/bioinformatics/btr330
Daugaard, M., Rohde, M., and Jäättelä, M. (2007). The Heat Shock Protein 70Family: Highly Homologous Proteins with Overlapping and Distinct Functions.FEBS Lett. 581 (19), 3702–3710. doi:10.1016/j.febslet.2007.05.039
De Oliveira, P. S., Cesar, A. S., do Nascimento, M. L., Chaves, A. S., Tizioto, P. C.,Tullio, R. R., et al. (2014). Identification of Genomic Regions Associated withFeed Efficiency in Nelore Cattle. BMC Genet. 15 (1), 1–10. doi:10.1186/s12863-014-0100-0
Decker, J. E., McKay, S. D., Rolf, M.M., Kim, J., Molina Alcalá, A., Sonstegard, T. S.,et al. (2014). Worldwide Patterns of Ancestry, Divergence, and Admixture inDomesticated Cattle. PLoS Genet. 10 (3), e1004254. doi:10.1371/journal.pgen.1004254
Doncheva, N. T., Morris, J. H., Gorodkin, J., and Jensen, L. J. (2018). CytoscapeStringApp: Network Analysis and Visualization of Proteomics Data.J. Proteome Res. 18 (2), 623–632. doi:10.1021/acs.jproteome.8b00702
Doyle, J. L., Berry, D. P., Veerkamp, R. F., Carthy, T. R., Evans, R. D., Walsh, S. W.,et al. (2020). Genomic Regions Associated with Muscularity in Beef CattleDiffer in Five Contrasting Cattle Breeds. Genet. Selection Evol. 52 (1), 1–18.doi:10.1186/s12711-020-0523-1
Dupin, E., Creuzet, S., and Le Douarin, N. M. (2006). The Contribution of theNeural Crest to the Vertebrate Body. Neural Crest Induction Differ. 589,96–119. doi:10.1007/978-0-387-46954-6_6
Durand, E. Y., Patterson, N., Reich, D., and Slatkin, M. (2011). Testing for AncientAdmixture between Closely Related Populations. Mol. Biol. Evol. 28 (8),2239–2252. doi:10.1093/molbev/msr048
Elzo, M., Johnson, D., Wasdin, J., and Driver, J. (2012). Carcass and MeatPalatability Breed Differences and Heterosis Effects in an Angus–BrahmanMultibreed Population. Meat Sci. 90 (1), 87–92. doi:10.1016/j.meatsci.2011.06.010
Falconer, D., and Mackay, T. (1996). Introduction to Quantitative Genetics.Harlow, UK): Addison Wesley Longman.
Feder, M. E., and Hofmann, G. E. (1999). Heat-shock Proteins, MolecularChaperones, and the Stress Response: Evolutionary and Ecological Physiology.Annu. Rev. Physiol. 61 (1), 243–282. doi:10.1146/annurev.physiol.61.1.243
Ferrer-Admetlla, A., Liang, M., Korneliussen, T., and Nielsen, R. (2014). OnDetecting Incomplete Soft or Hard Selective Sweeps Using HaplotypeStructure. Mol. Biol. Evol. 31 (5), 1275–1291. doi:10.1093/molbev/msu077
Fonseca, P. A., Suárez-Vega, A., and Cánovas, A. (2020). Weighted GeneCorrelation Network Meta-Analysis Reveals Functional Candidate GenesAssociated with High-And Sub-fertile Reproductive Performance in BeefCattle. Genes 11 (5), 543. doi:10.3390/genes11050543
Freitas, P. H., Wang, Y., Yan, P., Oliveira, H. R., Schenkel, F. S., Zhang, Y., et al.(2021). Genetic Diversity and Signatures of Selection for thermal Stress in Cattleand Other Two Bos Species Adapted to Divergent Climatic Conditions. Front.Genet. 12, 102. doi:10.3389/fgene.2021.604823
Garner, J., Chamberlain, A., Vander Jagt, C., Nguyen, T., Mason, B., Marett, L.,et al. (2020). Gene Expression of the Heat Stress Response in Bovine Peripheralwhite Blood Cells and Milk Somatic Cells In Vivo. Scientific Rep. 10 (1), 1–12.doi:10.1038/s41598-020-75438-2
Ghoreishifar, S. M., Eriksson, S., Johansson, A. M., Khansefid, M., Moghaddaszadeh-Ahrabi, S., Parna, N., et al. (2020). Signatures of Selection Reveal Candidate GenesInvolved in Economic Traits and Cold Acclimation in Five Swedish Cattle Breeds.Genet. Selection Evol. 52 (1), 1–15. doi:10.1186/s12711-020-00571-5
Green, R. E., Krause, J., Briggs, A. W., Maricic, T., Stenzel, U., Kircher, M., et al.(2010). A Draft Sequence of the Neandertal Genome. Science 328 (5979), 710.doi:10.1126/science.1188021
Frontiers in Genetics | www.frontiersin.org May 2022 | Volume 13 | Article 84465314
Vahedi et al. Selection Signatures and Introgression in Cattle
Gregory, K., and Cundiff, L. (1980). Crossbreeding in Beef Cattle: Evaluation ofSystems. J. Anim. Sci. 51 (5), 1224–1242. doi:10.2527/jas1980.5151224x
Gregory, K., Cundiff, L., Koch, R., Dikeman, M., and Koohmaraie, M. (1994). BreedEffects, Retained Heterosis, and Estimates of Genetic and PhenotypicParameters for Carcass and Meat Traits of Beef Cattle. J. Anim. Sci. 72 (5),1174–1183. doi:10.2527/1994.7251174x
Grigoletto, L., Ferraz, J., Oliveira, H. R., Eler, J. P., Bussiman, F. O., Abreu Silva, B.C., et al. (2020). Genetic Architecture of Carcass and Meat Quality Traits inMontana Tropical® Composite Beef Cattle. Front. Genet. 11, 123. doi:10.3389/fgene.2020.00123
Gui, L., Hu, Y., Hou, Z., and Wang, P. (2016). Expression and Clinical Significanceof the Obesity-Related Gene TNFAIP9 in Obese Children. Genet. Mol. Res. 15(3). doi:10.4238/gmr.15037995
Han, M., Xu, R., Wang, S., Yang, N., Ni, S., Zhang, Q., et al. (2018). Six-transmembrane Epithelial Antigen of Prostate 3 Predicts Poor Prognosisand Promotes Glioblastoma Growth and Invasion. Neoplasia 20 (6),543–554. doi:10.1016/j.neo.2018.04.002
Heaton, M. P., Harhay, G. P., Bennett, G. L., Stone, R. T., Grosse, W. M., Casas, E.,et al. (2002). Selection and Use of SNP Markers for Animal Identification andPaternity Analysis in US Beef Cattle. Mamm. Genome 13 (5), 272–281. doi:10.1007/s00335-001-2146-3
Hedrick, P. W. (2013). Adaptive Introgression in Animals: Examples andComparison to New Mutation and Standing Variation as Sources ofAdaptive Variation. Mol. Ecol. 22 (18), 4606–4618. doi:10.1111/mec.12415
Hiendleder, S., Lewalski, H., and Janke, A. (2008). Complete MitochondrialGenomes of Bos taurus and Bos indicus Provide New Insights into Intra-species Variation, Taxonomy and Domestication. Cytogenet. Genome Res. 120(1–2), 150–156. doi:10.1159/000118756
Highfill, C., Esquivel-Font, O., Dikeman, M., and Kropf, D. (2012). TendernessProfiles of Ten Muscles from F1 Bos indicus X Bos taurus and Bos taurus CattleCooked as Steaks and Roasts. Meat Sci. 90 (4), 881–886. doi:10.1016/j.meatsci.2011.11.022
Hoppe, S., Brandt, H. R., König, S., Erhardt, G., and Gauly, M. (2010).Temperament Traits of Beef Calves Measured under Field Conditions andTheir Relationships to Performance. J. Anim. Sci. 88 (6), 1982–1989. doi:10.2527/jas.2008-1557
Imai, K., Kurita-Ochiai, T., and Ochiai, K. (2003). Mycobacterium Bovis bacillusCalmette-Gueérin Infection Promotes SOCS Induction and Inhibits IFN-γ-Stimulated JAK/STAT Signaling in J774 Macrophages. FEMS Immunol. Med.Microbiol. 39 (2), 173–180. doi:10.1016/s0928-8244(03)00231-1
Junjvlieke, Z., Khan, R., Mei, C., Cheng, G., Wang, S., Raza, S. H. A., et al. (2020).Effect of ELOVL6 on the LipidMetabolism of Bovine Adipocytes.Genomics 112(3), 2282–2290. doi:10.1016/j.ygeno.2019.12.024
Kester, H. A., Blanchetot, C., den Hertog, J., van der Saag, P. T., and van der Burg,B. (1999). Transforming Growth Factor-β-Stimulated Clone-22 Is a Member ofa Family of Leucine Zipper Proteins that Can Homo-And Heterodimerize andHas Transcriptional Repressor Activity. J. Biol. Chem. 274 (39), 27439–27447.doi:10.1074/jbc.274.39.27439
Kuhn, M., Mavangira, V., and Sordillo, L. (2020). Invited Review: CytochromeP450 Enzyme Involvement in Health and Inflammatory-Based Diseases ofDairy Cattle. J. Dairy Sci. 104 (2), 1276–1290. doi:10.3168/jds.2020-18997
Li, N., Yu, Q.-L., Yan, X.-M., Li, H.-B., and Zhang, Y. (2020). Sequencing andCharacterization of miRNAs and mRNAs from the Longissimus Dorsi ofXinjiang Brown Cattle and Kazakh Cattle. Gene 741, 144537. doi:10.1016/j.gene.2020.144537
Lotterhos, K. E., Card, D. C., Schaal, S. M., Wang, L., Collins, C., and Verity, B.(2017). Composite Measures of Selection Can Improve the Signal-to-noiseRatio in Genome Scans. Methods Ecol. Evol. 8 (6), 717–727. doi:10.1111/2041-210x.12774
Ma, Y., Ding, X., Qanbari, S., Weigend, S., Zhang, Q., and Simianer, H. (2015).Properties of Different Selection Signature Statistics and a New Strategy forCombining Them. Heredity 115 (5), 426–436. doi:10.1038/hdy.2015.42
Malinsky, M., Challis, R. J., Tyers, A. M., Schiffels, S., Terai, Y., Ngatunga, B. P.,et al. (2015). Genomic Islands of Speciation Separate Cichlid Ecomorphs in anEast African Crater lake. Science 350 (6267), 1493. doi:10.1126/science.aac9927
Malinsky, M., Matschiner, M., and Svardal, H. (2021). Dsuite-Fast D-statistics andRelated Admixture Evidence from VCF Files. Mol. Ecol. Resour. 21 (2),584–595. doi:10.1111/1755-0998.13265
Malinsky, M., Svardal, H., Tyers, A. M., Miska, E. A., Genner, M. J., Turner, G. F.,et al. (2018). Whole-genome Sequences of Malawi Cichlids Reveal MultipleRadiations Interconnected by Gene Flow. Nat. Ecol. Evol. 2 (12), 1940–1955.doi:10.1038/s41559-018-0717-x
McTavish, E. J., Decker, J. E., Schnabel, R. D., Taylor, J. F., and Hillis, D. M. (2013).New World Cattle Show Ancestry from Multiple Independent DomesticationEvents. Proc. Natl. Acad. Sci. 110 (15), E1398–E1406. doi:10.1073/pnas.1303367110
Mohammadi, A., Alijani, S., Rafat, S. A., and Abdollahi-Arpanahi, R. (2020).Genome-wide Association Study and Pathway Analysis for Female FertilityTraits in Iranian Holstein Cattle. Ann. Anim. Sci. 20 (3), 825–851. doi:10.2478/aoas-2020-0031
Morales-Cruz, A., Aguirre-Liguori, J. A., Zhou, Y., Minio, A., Riaz, S., Walker, A.M., et al. (2021). Introgression Among North American Wild Grapes (Vitis)Fuels Biotic and Abiotic Adaptation. Genome Biol. 22 (1), 1–27. doi:10.1186/s13059-021-02467-z
Morrison, D., Humes, P., and Koonce, K. (1989). Comparisons of Brahman andContinental European Crossbred Cows for Calving Ease in a SubtropicalEnvironment. J. Anim. Sci. 67 (7), 1722–1731. doi:10.2527/jas1989.6771722x
Moskovitz, J., Bar-Noy, S., Williams, W. M., Requena, J., Berlett, B. S., andStadtman, E. R. (2001). Methionine Sulfoxide Reductase (MsrA) Is aRegulator of Antioxidant Defense and Lifespan in Mammals. Proc. Natl.Acad. Sci. 98 (23), 12920–12925. doi:10.1073/pnas.231472998
Moubarak, A., and Rosenkrans, C., Jr (2000). Hepatic Metabolism of ErgotAlkaloids in Beef Cattle by Cytochrome P450. Biochem. Biophysical Res.Commun. 274 (3), 746–749. doi:10.1006/bbrc.2000.3210
Mucignat-Caretta, C. (2014). Neurobiology of Chemical Communication.Neupane, M., Geary, T. W., Kiser, J. N., Burns, G. W., Hansen, P. J., Spencer, T. E.,
et al. (2017). Loci and Pathways Associated with Uterine Capacity forPregnancy and Fertility in Beef Cattle. PLoS One 12 (12), e0188997. doi:10.1371/journal.pone.0188997
Omura, T. (1999). Forty Years of Cytochrome P450. Biochem. Biophysical Res.Commun. 266 (3), 690–698. doi:10.1006/bbrc.1999.1887
Paim, T. do. P., Hay, E. H. A., Wilson, C., Thomas, M. G., Kuehn, L. A., Paiva, S. R.,et al. (2020). Genomic Breed Composition of Selection Signatures in BrangusBeef Cattle. Front. Genet. 11, 710. doi:10.3389/fgene.2020.00710
Paredes-Sánchez, F. A., Sifuentes-Rincón, A. M., Casas, E., Arellano-Vera, W.,Parra-Bracamonte, G. M., Riley, D. G., et al. (2020). Novel Genes Involved inthe Genetic Architecture of Temperament in Brahman Cattle. PLoS One 15 (8),e0237825.
Patterson, N., Moorjani, P., Luo, Y., Mallick, S., Rohland, N., Zhan, Y., et al. (2012).Ancient Admixture in Human History. Genetics 192 (3), 1065–1093. doi:10.1534/genetics.112.145037
Pease, J. B., andHahn,M.W. (2015). Detection and Polarization of Introgression ina Five-Taxon Phylogeny. Syst. Biol. 64 (4), 651–662. doi:10.1093/sysbio/syv023
Peletto, S., Strillacci, M., Capucchio, M., Biasibetti, E., Modesto, P., Acutis, P., et al.(2017). Genetic Basis of Lipomatous Myopathy in Piedmontese Beef Cattle.Livestock Sci. 206, 9–16. doi:10.1016/j.livsci.2017.09.027
Purcell, S., Neale, B., Todd-Brown, K., Thomas, L., Ferreira, M. A., Bender, D., et al.(2007). PLINK: a Tool Set for Whole-Genome Association and Population-Based Linkage Analyses. Am. J. Hum. Genet. 81 (3), 559–575. doi:10.1086/519795
Purfield, D. C., Evans, R. D., and Berry, D. P. (2020). Breed-and Trait-specificAssociations Define the Genetic Architecture of Calving Performance Traits inCattle. J. Anim. Sci. 98 (5), skaa151. doi:10.1093/jas/skaa151
Qanbari, S., Pausch, H., Jansen, S., Somel, M., Strom, T. M., Fries, R., et al. (2014).Classic Selective Sweeps Revealed by Massive Sequencing in Cattle. PLoS Genet.10 (2), e1004148. doi:10.1371/journal.pgen.1004148
R Core Team (2020). R: A Language and Environment for Statistical Computing.Vienna, Austria: R Foundation for Statistical Computing. Available at: https://www.R-project.org/.
Raudvere, U., Kolberg, L., Kuzmin, I., Arak, T., Adler, P., Peterson, H., et al. (2019).G: Profiler: AWeb Server for Functional Enrichment Analysis and Conversionsof Gene Lists (2019 Update). Nucleic Acids Res. 47 (W1), W191–W198. doi:10.1093/nar/gkz369
Rehman, K. S., Yin, S., Mayhew, B. A., Word, R. A., and Rainey, W. E. (2003).Human Myometrial Adaptation to Pregnancy: CDNA Microarray GeneExpression Profiling of Myometrium from Non-pregnant and Pregnant
Frontiers in Genetics | www.frontiersin.org May 2022 | Volume 13 | Article 84465315
Vahedi et al. Selection Signatures and Introgression in Cattle
Women. MHR: Basic Sci. Reprod. Med. 9 (11), 681–700. doi:10.1093/molehr/gag078
Rezende, F., Dietsch, G., and Peñagaricano, F. (2018). Genetic Dissection of BullFertility in US Jersey Dairy Cattle. Anim. Genet. 49 (5), 393–402. doi:10.1111/age.12710
Rhoad, A. O. (1949). The Santa Gertrudis Breed: The Genesis and the Genetics of aNew Breed of Beef Cattle. J. Hered. 40 (5), 115–126. doi:10.1093/oxfordjournals.jhered.a106008
Richardson, C., and Hatfield, E. (1978). The Limiting Amino Acids in GrowingCattle. J. Anim. Sci. 46 (3), 740–745. doi:10.2527/jas1978.463740x
Ritchie, H. (2009). Breeds of Beef and Multi-Purpose Cattle: Acknowledgements.Sabeti, P. C., Reich, D. E., Higgins, J. M., Levine, H. Z., Richter, D. J., Schaffner, S. F.,
et al. (2002). Detecting Recent Positive Selection in the Human Genome fromHaplotype Structure. Nature 419 (6909), 832–837. doi:10.1038/nature01140
Sempéré, G., Moazami-Goudarzi, K., Eggen, A., Laloë, D., Gautier, M., and Flori, L.(2015). WIDDE: a Web-Interfaced Next Generation Database for GeneticDiversity Exploration, with a First Application in Cattle. BMC Genomics 16(1), 1–8.
Shannon, P., Markiel, A., Ozier, O., Baliga, N. S., Wang, J. T., Ramage, D., et al.(2003). Cytoscape: A Software Environment for Integrated Models ofBiomolecular Interaction Networks. Genome Res. 13 (11), 2498–2504.doi:10.1101/gr.1239303
Singh, A., Mehrotra, A., Gondro, C., da Silva Romero, A. R., Pandey, A. K.,Karthikeyan, A., et al. (2020). Signatures of Selection in Composite VrindavaniCattle of India. Front. Genet. 11. doi:10.3389/fgene.2020.589496
Szpiech, Z. A., and Hernandez, R. D. (2014). Selscan: An Efficient MultithreadedProgram to Perform EHH-Based Scans for Positive Selection.Mol. Biol. Evol. 31(10), 2824–2827. doi:10.1093/molbev/msu211
Taniguchi, M., Basarab, J. A., Dodson, M. V., and Moore, S. S. (2008). ComparativeAnalysis on Gene Expression Profiles in Cattle Subcutaneous Fat Tissues.Comp. Biochem. Physiol. D: Genomics Proteomics 3 (4), 251–256. doi:10.1016/j.cbd.2008.06.002
Thundathil, J. C., Dance, A. L., and Kastelic, J. P. (2016). Fertility Management ofBulls to Improve Beef Cattle Productivity. Theriogenology 86 (1), 397–405.doi:10.1016/j.theriogenology.2016.04.054
Torres, R., Szpiech, Z. A., and Hernandez, R. D. (2018). Human DemographicHistory Has Amplified the Effects of Background Selection across the Genome.PLoS Genet. 14 (6), e1007387. doi:10.1371/journal.pgen.1007387
Ueda, S., Hosoda, M., Yoshino, K., Yamanoue, M., and Shirai, Y. (2021). GeneExpression Analysis Provides New Insights into the Mechanism ofIntramuscular Fat Formation in Japanese Black Cattle. Genes 12 (8), 1107.doi:10.3390/genes12081107
Venables, W. N., and Ripley, B. D. (2013). Modern Applied Statistics with S-PLUS.Springer Science & Business Media.
Verity, R., Collins, C., Card, D. C., Schaal, S. M., Wang, L., and Lotterhos, K. E.(2017). Minotaur: A Platform for the Analysis and Visualization of MultivariateResults from Genome Scans with R Shiny. Mol. Ecol. Resour. 17 (1), 33–43.doi:10.1111/1755-0998.12579
Vilchez, J. J., Gallano, P., Gallardo, E., Lasa, A., Rojas-García, R., Freixas, A., et al.(2005). Identification of a Novel Founder Mutation in the DYSF Gene CausingClinical Variability in the Spanish Population. Arch. Neurol. 62 (8), 1256–1259.doi:10.1001/archneur.62.8.1256
Villanueva, R. A. M., and Chen, Z. J. (2019). ggplot2: Elegant Graphics for DataAnalysis.
Voight, B. F., Kudaravalli, S., Wen, X., and Pritchard, J. K. (2006). A Map of RecentPositive Selection in the Human Genome. PLoS Biol. 4 (3), e72. doi:10.1371/journal.pbio.0040072
Vojtek, A. B., and Der, C. J. (1998). Increasing Complexity of the Ras SignalingPathway. J. Biol. Chem. 273 (32), 19925–19928. doi:10.1074/jbc.273.32.19925
Wang, J., Liu, C., Chen, J., Bai, Y., Wang, K., Wang, Y., et al. (2020). Genome-WideAnalysis Reveals Human-Mediated Introgression from Western Pigs toIndigenous Chinese Breeds. Genes 11 (3), 275. doi:10.3390/genes11030275
Warwick, E. J. (1958). Fifty Years of Progress in Breeding Beef Cattle. J. Anim. Sci.17 (4), 922–943. doi:10.2527/jas1958.174922x
Wheeler, T., Cundiff, L., Shackelford, S., and Koohmaraie, M. (2010).Characterization of Biological Types of Cattle (Cycle VIII): Carcass, Yield,and Longissimus Palatability Traits. J. Anim. Sci. 88 (9), 3070–3083. doi:10.2527/jas.2009-2497
Widmer, S., Seefried, F. R., von Rohr, P., Häfliger, I. M., Spengeler, M., andDrögemüller, C. (2021). A Major QTL at the LHCGR/FSHR Locus for MultipleBirth in Holstein Cattle. Genet. Selection Evol. 53 (1), 1–15. doi:10.1186/s12711-021-00650-1
Wilkins, A. S., Wrangham, R. W., and Fitch, W. T. (2014). The “DomesticationSyndrome” in Mammals: A Unified Explanation Based on Neural Crest CellBehavior and Genetics. Genetics 197 (3), 795–808. doi:10.1534/genetics.114.165423
Wolf, M. J., Yin, T., Neumann, G. B., Korkuć, P., Brockmann, G. A., König, S., et al.(2021). Genome-Wide Association Study Using Whole-Genome SequenceData for Fertility, Health Indicator, and Endoparasite Infection Traits inGerman Black Pied Cattle. Genes 12 (8), 1163. doi:10.3390/genes12081163
Wright, D., Henriksen, R., and Johnsson, M. (2020). Trends in Ecology & Evolution,S0169–S5347. doi:10.1016/j.tree.2020.08.009Defining the domesticationsyndrome: Comment on Lord et al. 2020
Xi, Y., Yang, Z., Wu, F., Han, Z., andWang, G. (2015). Gene Expression Profiling ofHormonal Regulation Related to the Residual Feed Intake of Holstein Cattle.Biochem. Biophysical Res. Commun. 465 (1), 19–25. doi:10.1016/j.bbrc.2015.07.092
Yin, L., Zhang, H., Tang, Z., Xu, J., Yin, D., Zhang, Z., et al. (2021). Rmvp: AMemory-Efficient, Visualization-Enhanced, and Parallel-Accelerated Tool forGenome-wide Association Study. Genomics, Proteomics & BioinformaticsS1672-0229 (21), 00050–00054. doi:10.1016/j.gpb.2020.10.007
Yurchenko, A. A., Daetwyler, H. D., Yudin, N., Schnabel, R. D., Vander Jagt, C. J.,Soloshenko, V., et al. (2018). Scans for Signatures of Selection in Russian CattleBreed Genomes Reveal New Candidate Genes for Environmental Adaptationand Acclimation. Scientific Rep. 8 (1), 1–16. doi:10.1038/s41598-018-31304-w
Zhan, S., Zhao, W., Song, T., Dong, Y., Guo, J., Cao, J., et al. (2018). DynamicTranscriptomic Analysis in Hircine Longissimus Dorsi Muscle from Fetal toNeonatal Development Stages. Funct. Integr. Genomics 18 (1), 43–54. doi:10.1007/s10142-017-0573-9
Zhang, Y., Hu, Y., Wang, X., Jiang, Q., Zhao, H., Wang, J., et al. (2020). PopulationStructure, and Selection Signatures Underlying High-Altitude AdaptationInferred from Genome-wide Copy Number Variations in ChineseIndigenous Cattle. Front. Genet. 10, 1404. doi:10.3389/fgene.2019.01404
Zimin, A. V., Delcher, A. L., Florea, L., Kelley, D. R., Schatz, M. C., Puiu, D., et al.(2009). A Whole-Genome Assembly of the Domestic Cow, Bos taurus. GenomeBiol. 10 (4), 1–10. doi:10.1186/gb-2009-10-4-r42
Zwartkruis, F. J., and Bos, J. L. (1999). Ras and Rap1: Two Highly Related SmallGTPases with Distinct Function. Exp. Cel Res. 253 (1), 157–165. doi:10.1006/excr.1999.4695
Conflict of Interest: The authors declare that the research was conducted in theabsence of any commercial or financial relationships that could be construed as apotential conflict of interest.
Publisher’s Note: All claims expressed in this article are solely those of the authorsand do not necessarily represent those of their affiliated organizations, or those ofthe publisher, the editors and the reviewers. Any product that may be evaluated inthis article, or claim that may be made by its manufacturer, is not guaranteed orendorsed by the publisher.
Copyright © 2022 Vahedi, Salek Ardestani, Pahlevan Afshari, Ghoreishifar,Moghaddaszadeh-Ahrabi, Banabazi and Brito. This is an open-access articledistributed under the terms of the Creative Commons Attribution License (CCBY). The use, distribution or reproduction in other forums is permitted, provided theoriginal author(s) and the copyright owner(s) are credited and that the originalpublication in this journal is cited, in accordance with accepted academic practice.No use, distribution or reproduction is permitted which does not comply withthese terms.
Frontiers in Genetics | www.frontiersin.org May 2022 | Volume 13 | Article 84465316
Vahedi et al. Selection Signatures and Introgression in Cattle


