Embed Size (px)
Citation preview
MAHARSHI DAYANAND UNIVERSITY, ROHTAK (A State University established under Haryana Act No. XXV of 1975) 'A' Grade University Accredited by NAAC.
A REPORT ON
T&D Losses in Indian States
Reasons and Recommendation
By
Aashutosh Kumar Soni Roll No.-2
Nov, 2014
1
Executive Summary
India GDP with 4.7% increase in year 2013 and population increased by 1.3% increases the
demand of electricity. Indian power sector having installed capacity of 253 GW and power
demand of only about 140 GW looks easy to provide whole India with zero cut electricity.
However, India faced a peak power deficit of 7.4% or about 9.5GW of excess demand than
supply. Power shortages have adverse effect in Indian economy. It not only affects the livelihood
but also affects on GDP as loss, influencing multiple industries like agriculture, manufacturing
etc.
It is very much essential to improve this sector for economic growth and enhancement of
standard of living of livelihood. As per the 12th
five-year plan, the future expansion in power
generation capacity in India is planned around 88GW. In order to meet this capacity, investment
in the transmission sector needs to be increased. Overall, an addition of 90,000 ckm of 765-220
kV lines, 154,000 MVA of substation capacity and 27,350 MW of national grid capacity is
required in order to meet the 12th Five Year Plan. The requirement for electricity distribution has
been pegged at Rs 3.06 lakh crore.
The technical losses that are transmission and distribution losses are calculated to be around 21%
of total output generated electricity. Different states have different loss amount and percentage of
output due to specific reasons. So about 50 GW power is lost in the process of transmitting the
power and distributing it to the consumers. Different major aspects of technical losses and their
remedial measures that are being implemented and need to be planned have been recommended
in this report.
2
Contents
Executive Summary ................................................................................................................................. 1
Introduction ............................................................................................................................................ 3
Transmission and Distribution Losses ...................................................................................................... 4
Global Scenario ....................................................................................................................................... 6
Reasons behind T&D Losses..................................................................................................................... 7
Measures for reducing Transmission and Distribution Losses................................................................... 9
Recommendations and Conclusion ........................................................................................................ 12
Bibliography .......................................................................................................................................... 13
Glossary ................................................................................................................................................ 14
3
Introduction
The power sector constitutes the backbone of the national economy of any country. Adequate
electrical power with a high degree of reliability and quality is also the key to Indian economic
growth. India is the third largest power producer in the world with the total power capacity of
more than 253 GW. Despite growth in power generation capacity over the last 5-Year Plans,
India is facing huge power deficit with peak power deficit of about 7% to 16%. Keeping in view
the central position of the power sector for good quality of life and sustainable economic
development, the Government of India has adopted the policy of providing “access to
uninterrupted quality power supply at affordable costs to all. The responsibility of translating this
vision into reality vests with the power sector and particularly the power distribution sector
functionaries”.
In last 20 years, the Indian power sector has witnessed tremendous growth both in size and in
capacity. In India, the current power installed capacity of power generation aims to increase it to
315 GW to 335 GW by the year 2017. However, in spite of such massive expansion, the power
sector in India has not been able to match the rapidly growing demand for reliable and cost
effective supply. Demand for power has continued to grow at a compound annual rate of 3% to
8% and has completely outstripped the supply leading to an ever-widening gap. The power
sector faces many challenges today in its march towards meeting its goal of “Power to All”.
In the overall Power Development scenario in India, the transmission and distribution system
constitutes the essential link between the power generating sources and the ultimate consumption
of that. The optimum utilization of the generated power is not possible without the help of an
adequate and efficient transmission and distribution system. In India, though the expansion of
transmission systems has been carried out in a planed way based on detailed technical studies,
however, the distribution system has grown in an unplanned and haphazard manner to meet the
immediate objective of meeting growing demands of consumers on an urgent basis. This
approach, over the years, has created an inefficient distribution system contributing to very high
Aggregate Technical and Commercial losses (AT & C losses) and poor quality with low
reliability of power supply to consumers. Unfortunately, it has led to tremendous consumer
dissatisfaction. It has also affected the financial performance of utilities. Thus, in the ongoing
power sector reforms, the focus has rightly shifted to upgrading this Sub-transmission and
distribution (ST & D) system and improving its efficiency to reduce AT & C losses.
4
Transmission and Distribution Losses
In India, the fact is that not all energy supplied to a distribution utility reaches the end
consumers. A substantial amount of energy is lost in the distribution system by way of technical
losses. These inherent losses in transmission and distribution of electrical energy from the
generating stations to the ultimate consumers should be reduced by eliminating or minimizing
the causes of losses. T & D loss is the difference between units injected into the system and the
units billed to the ultimate consumers, which is generally expressed as percentage of units
injected. It is generally calculated for a period of one financial year:
Hence,
𝑇&𝐷 𝑙𝑜𝑠𝑠𝑒𝑠 % =[ 𝐸𝑛𝑒𝑟𝑔𝑦 𝐼𝑛𝑝𝑢𝑡 − 𝐸𝑛𝑒𝑟𝑔𝑦 𝐵𝑖𝑙𝑙𝑒𝑑 × 100]
𝐸𝑛𝑒𝑟𝑔𝑦 𝐼𝑛𝑝𝑢𝑡
{For a Financial Year}
The transmission and distribution (T & D) losses in our country, which were around 15% up to
1966-67, increased gradually to 23.28% by 1989-90. After a brief spell of reduction in T & D
losses to 21.13% (1994-95), there has been an upswing and the losses reached a level of 33.98%
during 2001-02. Since then, a reducing trend has been observed as T & D losses have come
down to 32.54% during 2002-03, 32.53% during 2003-04 and 31.25% during 2004-05.
The Transmission and Distribution losses in advanced countries of the world have been ranging
between 6 to 11%. Even in many developing countries, T & D losses are less than the level
obtaining in India. However, T & D losses in India are not comparable with advanced countries
as the system operating conditions there are different from those obtainable in India. As per the T
& D losses issued by CEA, taking into consideration the Indian conditions, it would be
reasonable to aim for containing T & D losses within 10-to15percentage in different States
(Table 1):
5
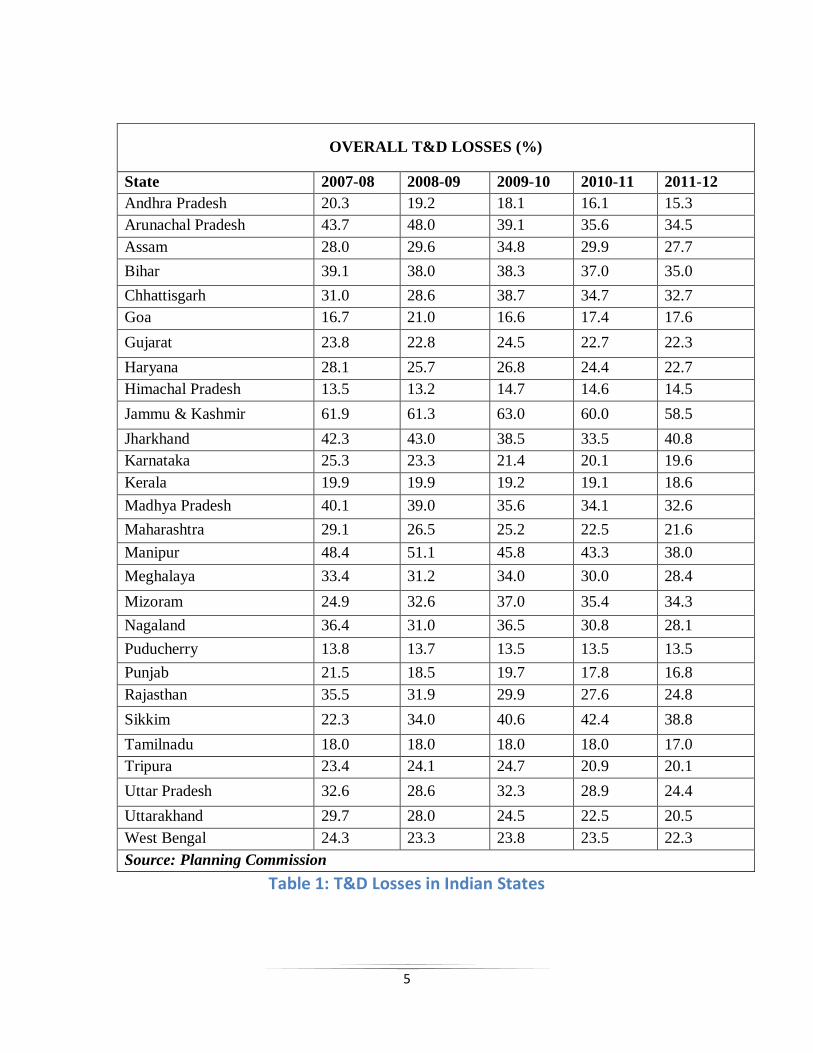
Table 1: T&D Losses in Indian States
OVERALL T&D LOSSES (%)
State 2007-08 2008-09 2009-10 2010-11 2011-12
Andhra Pradesh 20.3 19.2 18.1 16.1 15.3
Arunachal Pradesh 43.7 48.0 39.1 35.6 34.5
Assam 28.0 29.6 34.8 29.9 27.7
Bihar 39.1 38.0 38.3 37.0 35.0
Chhattisgarh 31.0 28.6 38.7 34.7 32.7
Goa 16.7 21.0 16.6 17.4 17.6
Gujarat 23.8 22.8 24.5 22.7 22.3
Haryana 28.1 25.7 26.8 24.4 22.7
Himachal Pradesh 13.5 13.2 14.7 14.6 14.5
Jammu & Kashmir 61.9 61.3 63.0 60.0 58.5
Jharkhand 42.3 43.0 38.5 33.5 40.8
Karnataka 25.3 23.3 21.4 20.1 19.6
Kerala 19.9 19.9 19.2 19.1 18.6
Madhya Pradesh 40.1 39.0 35.6 34.1 32.6
Maharashtra 29.1 26.5 25.2 22.5 21.6
Manipur 48.4 51.1 45.8 43.3 38.0
Meghalaya 33.4 31.2 34.0 30.0 28.4
Mizoram 24.9 32.6 37.0 35.4 34.3
Nagaland 36.4 31.0 36.5 30.8 28.1
Puducherry 13.8 13.7 13.5 13.5 13.5
Punjab 21.5 18.5 19.7 17.8 16.8
Rajasthan 35.5 31.9 29.9 27.6 24.8
Sikkim 22.3 34.0 40.6 42.4 38.8
Tamilnadu 18.0 18.0 18.0 18.0 17.0
Tripura 23.4 24.1 24.7 20.9 20.1
Uttar Pradesh 32.6 28.6 32.3 28.9 24.4
Uttarakhand 29.7 28.0 24.5 22.5 20.5
West Bengal 24.3 23.3 23.8 23.5 22.3
Source: Planning Commission
6
Global Scenario
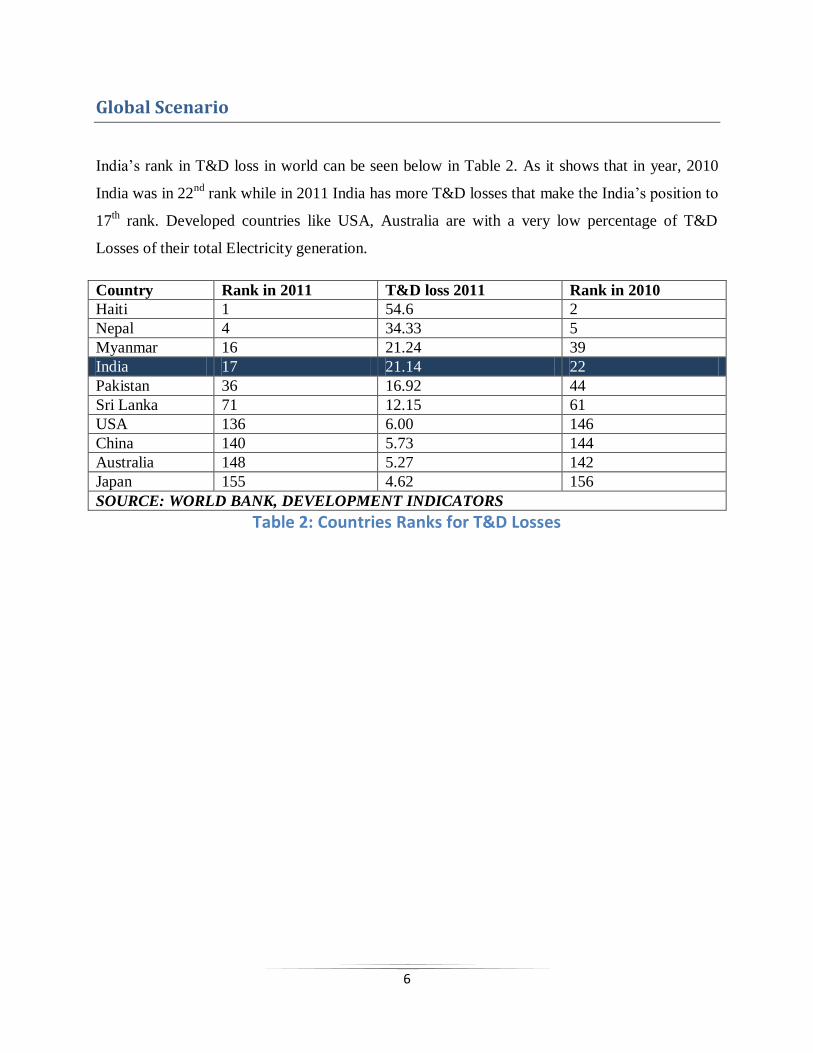
India’s rank in T&D loss in world can be seen below in Table 2. As it shows that in year, 2010
India was in 22nd
rank while in 2011 India has more T&D losses that make the India’s position to
17th rank. Developed countries like USA, Australia are with a very low percentage of T&D
Losses of their total Electricity generation.
Country Rank in 2011 T&D loss 2011
(% of output)
Rank in 2010
Haiti 1 54.6 2
Nepal 4 34.33 5
Myanmar 16 21.24 39
India 17 21.14 22
Pakistan 36 16.92 44
Sri Lanka 71 12.15 61
USA 136 6.00 146
China 140 5.73 144
Australia 148 5.27 142
Japan 155 4.62 156
SOURCE: WORLD BANK, DEVELOPMENT INDICATORS
Table 2: Countries Ranks for T&D Losses
7
Reasons behind T&D Losses
Technical loss is inherent in electrical systems, as all electrical devices have some resistance and
the flow of current causes a power loss (I2R loss). Integration of this power loss over time, i.e.,
I2R.dt is the energy loss.
Different types of losses and their reasons:
1. Line loss:
a. Loss in conductors/cables, where lower size conductors are used. This causes sags
and temperature rise in conductors, which further aggravate the loss.
b. Loss in higher loaded phase wires due to unbalanced loading.
c. Losses due to current in neutral for cases of unbalanced where neutral wires of
lower size are used (like 3 ½ core cables, and neutral wires of size lower than
phase wires).
d. Loosening of strands (in multi-strand conductors like ACSR, AAC, AAAC, etc.).
2. Losses in mid-span joints at terminations:
a. Contacts of joints due to improper installation and looseness.
b. Contacts of joints due to inadequate surface area of contact.
3. Losses in Transformers:
a. Loose connections at brushings.
b. Bend in jumpers at connectors where the strands are not tightly held.
c. High no-load loss depending on type of core used.
d. High no-load loss in repaired transformers, where the core has not been properly
tightened.
e. No-load loss in case a large number of lightly loaded DTs.
f. High copper loss for transformers operating at sub-optimal loading which is not
commensurate with the designed optimal loading.
4. Losses in service cables and connections:
a. Under sized service cables.
b. Loss in joints of service cables at the poles or junction boxes.
8
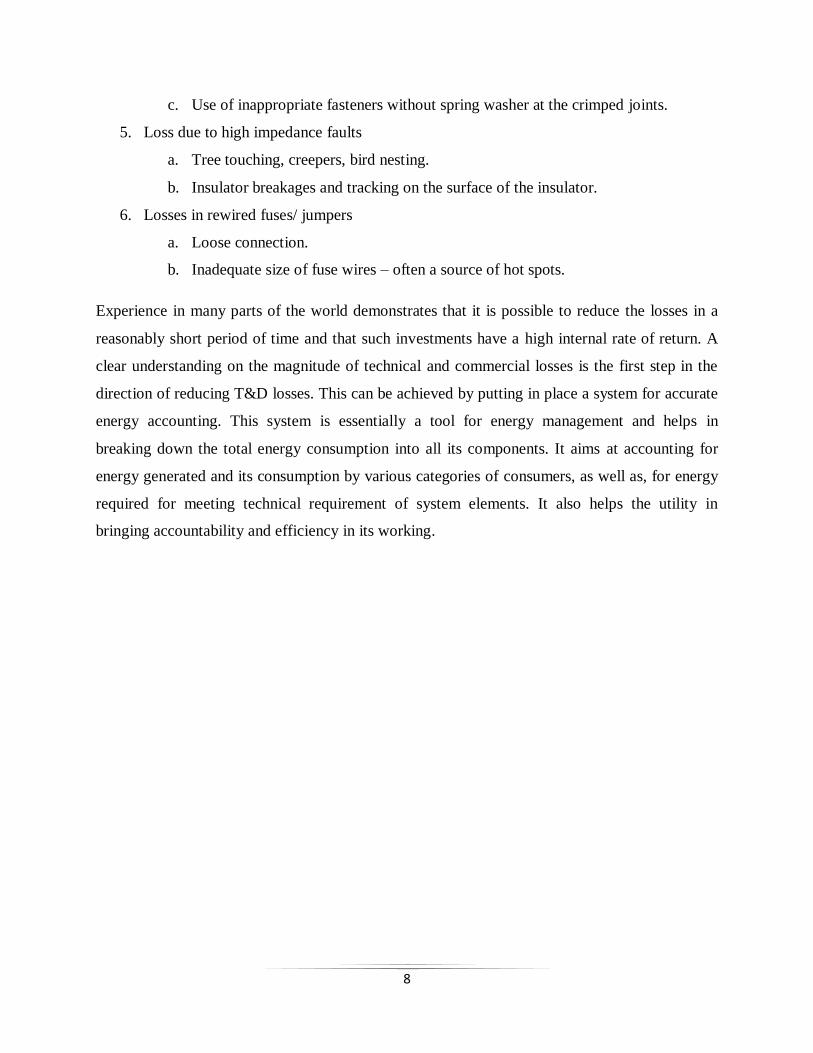
c. Use of inappropriate fasteners without spring washer at the crimped joints.
5. Loss due to high impedance faults
a. Tree touching, creepers, bird nesting.
b. Insulator breakages and tracking on the surface of the insulator.
6. Losses in rewired fuses/ jumpers
a. Loose connection.
b. Inadequate size of fuse wires – often a source of hot spots.
Experience in many parts of the world demonstrates that it is possible to reduce the losses in a
reasonably short period of time and that such investments have a high internal rate of return. A
clear understanding on the magnitude of technical and commercial losses is the first step in the
direction of reducing T&D losses. This can be achieved by putting in place a system for accurate
energy accounting. This system is essentially a tool for energy management and helps in
breaking down the total energy consumption into all its components. It aims at accounting for
energy generated and its consumption by various categories of consumers, as well as, for energy
required for meeting technical requirement of system elements. It also helps the utility in
bringing accountability and efficiency in its working.
9
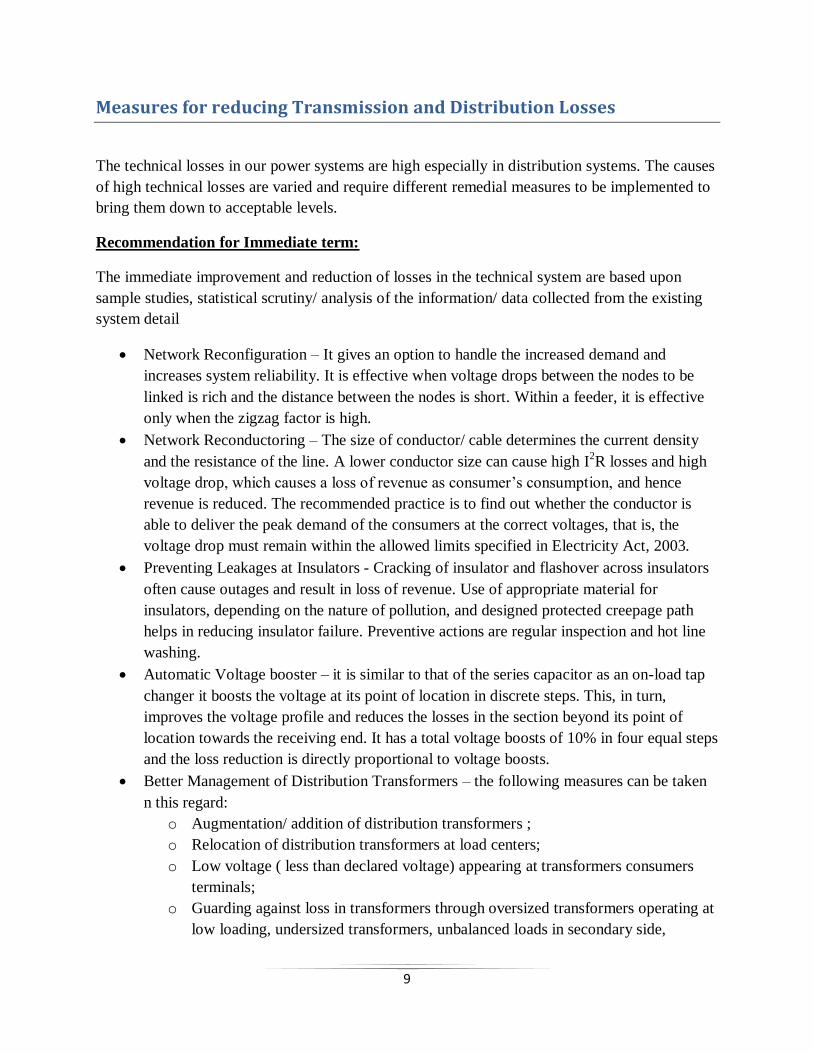
Measures for reducing Transmission and Distribution Losses
The technical losses in our power systems are high especially in distribution systems. The causes
of high technical losses are varied and require different remedial measures to be implemented to
bring them down to acceptable levels.
Recommendation for Immediate term:
The immediate improvement and reduction of losses in the technical system are based upon
sample studies, statistical scrutiny/ analysis of the information/ data collected from the existing
system detail
Network Reconfiguration – It gives an option to handle the increased demand and
increases system reliability. It is effective when voltage drops between the nodes to be
linked is rich and the distance between the nodes is short. Within a feeder, it is effective
only when the zigzag factor is high.
Network Reconductoring – The size of conductor/ cable determines the current density
and the resistance of the line. A lower conductor size can cause high I2R losses and high
voltage drop, which causes a loss of revenue as consumer’s consumption, and hence
revenue is reduced. The recommended practice is to find out whether the conductor is
able to deliver the peak demand of the consumers at the correct voltages, that is, the
voltage drop must remain within the allowed limits specified in Electricity Act, 2003.
Preventing Leakages at Insulators - Cracking of insulator and flashover across insulators
often cause outages and result in loss of revenue. Use of appropriate material for
insulators, depending on the nature of pollution, and designed protected creepage path
helps in reducing insulator failure. Preventive actions are regular inspection and hot line
washing.
Automatic Voltage booster – it is similar to that of the series capacitor as an on-load tap
changer it boosts the voltage at its point of location in discrete steps. This, in turn,
improves the voltage profile and reduces the losses in the section beyond its point of
location towards the receiving end. It has a total voltage boosts of 10% in four equal steps
and the loss reduction is directly proportional to voltage boosts.
Better Management of Distribution Transformers – the following measures can be taken
n this regard:
o Augmentation/ addition of distribution transformers ;
o Relocation of distribution transformers at load centers;
o Low voltage ( less than declared voltage) appearing at transformers consumers
terminals;
o Guarding against loss in transformers through oversized transformers operating at
low loading, undersized transformers, unbalanced loads in secondary side,
10
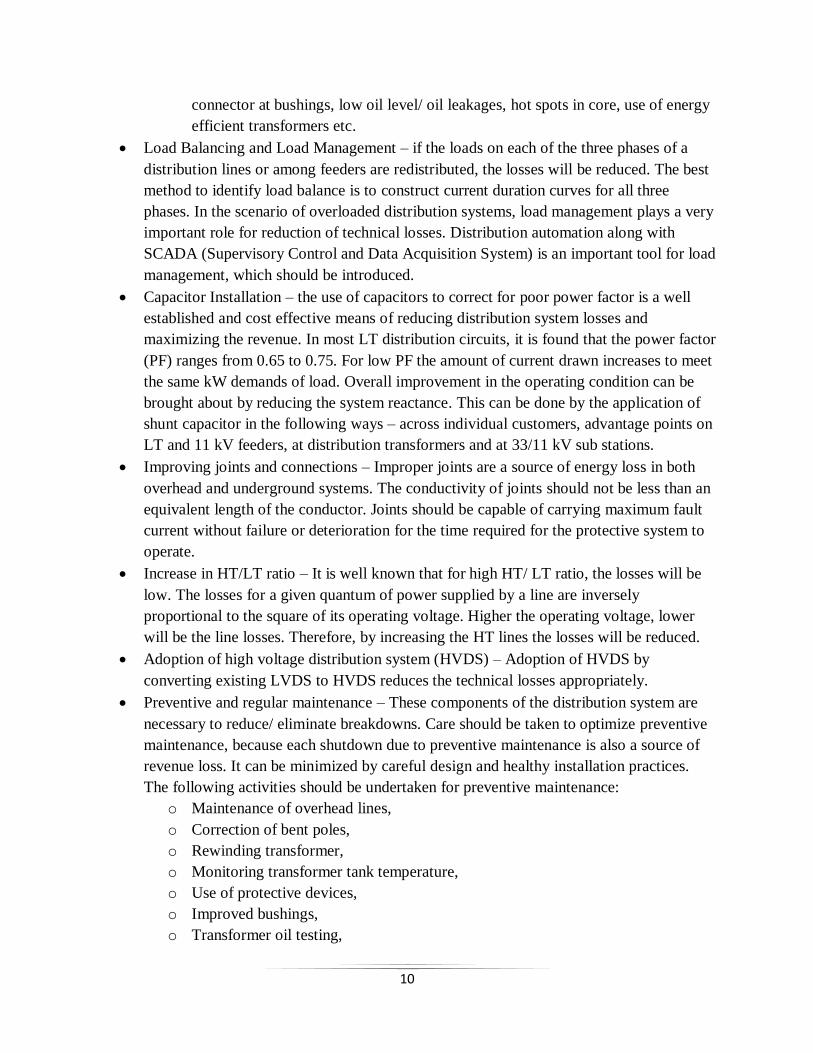
connector at bushings, low oil level/ oil leakages, hot spots in core, use of energy
efficient transformers etc.
Load Balancing and Load Management – if the loads on each of the three phases of a
distribution lines or among feeders are redistributed, the losses will be reduced. The best
method to identify load balance is to construct current duration curves for all three
phases. In the scenario of overloaded distribution systems, load management plays a very
important role for reduction of technical losses. Distribution automation along with
SCADA (Supervisory Control and Data Acquisition System) is an important tool for load
management, which should be introduced.
Capacitor Installation – the use of capacitors to correct for poor power factor is a well
established and cost effective means of reducing distribution system losses and
maximizing the revenue. In most LT distribution circuits, it is found that the power factor
(PF) ranges from 0.65 to 0.75. For low PF the amount of current drawn increases to meet
the same kW demands of load. Overall improvement in the operating condition can be
brought about by reducing the system reactance. This can be done by the application of
shunt capacitor in the following ways – across individual customers, advantage points on
LT and 11 kV feeders, at distribution transformers and at 33/11 kV sub stations.
Improving joints and connections – Improper joints are a source of energy loss in both
overhead and underground systems. The conductivity of joints should not be less than an
equivalent length of the conductor. Joints should be capable of carrying maximum fault
current without failure or deterioration for the time required for the protective system to
operate.
Increase in HT/LT ratio – It is well known that for high HT/ LT ratio, the losses will be
low. The losses for a given quantum of power supplied by a line are inversely
proportional to the square of its operating voltage. Higher the operating voltage, lower
will be the line losses. Therefore, by increasing the HT lines the losses will be reduced.
Adoption of high voltage distribution system (HVDS) – Adoption of HVDS by
converting existing LVDS to HVDS reduces the technical losses appropriately.
Preventive and regular maintenance – These components of the distribution system are
necessary to reduce/ eliminate breakdowns. Care should be taken to optimize preventive
maintenance, because each shutdown due to preventive maintenance is also a source of
revenue loss. It can be minimized by careful design and healthy installation practices.
The following activities should be undertaken for preventive maintenance:
o Maintenance of overhead lines,
o Correction of bent poles,
o Rewinding transformer,
o Monitoring transformer tank temperature,
o Use of protective devices,
o Improved bushings,
o Transformer oil testing,
11
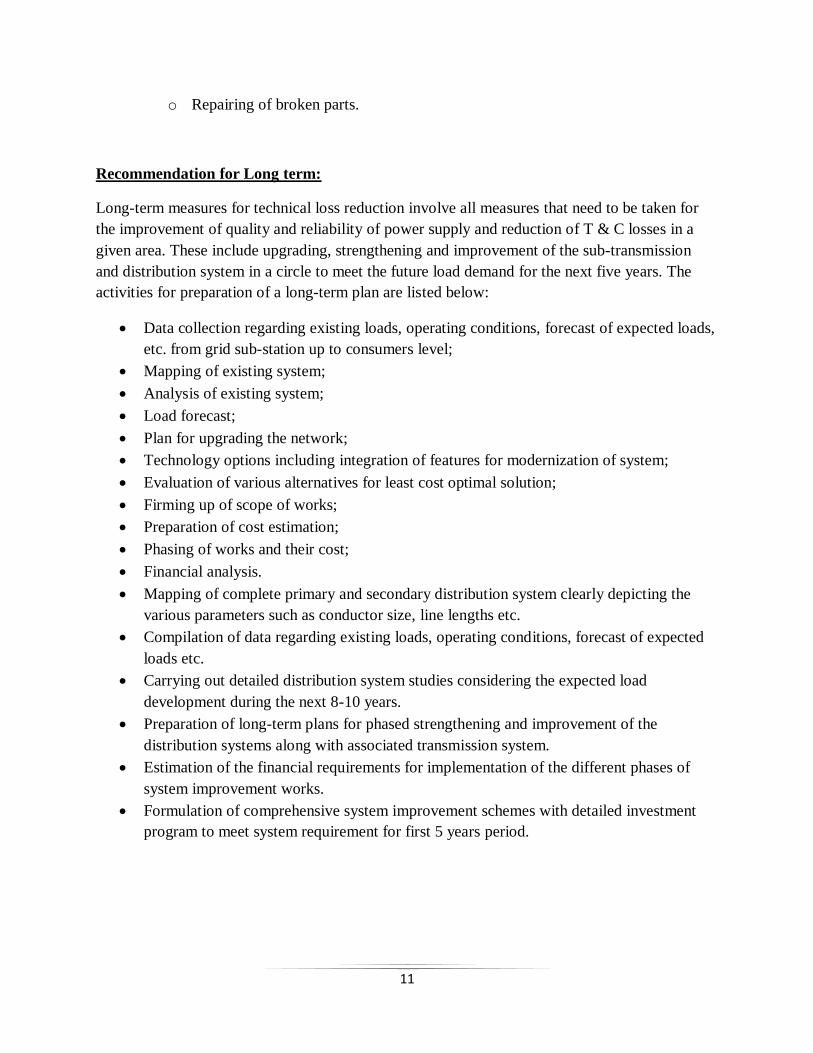
o Repairing of broken parts.
Recommendation for Long term:
Long-term measures for technical loss reduction involve all measures that need to be taken for
the improvement of quality and reliability of power supply and reduction of T & C losses in a
given area. These include upgrading, strengthening and improvement of the sub-transmission
and distribution system in a circle to meet the future load demand for the next five years. The
activities for preparation of a long-term plan are listed below:
Data collection regarding existing loads, operating conditions, forecast of expected loads,
etc. from grid sub-station up to consumers level;
Mapping of existing system;
Analysis of existing system;
Load forecast;
Plan for upgrading the network;
Technology options including integration of features for modernization of system;
Evaluation of various alternatives for least cost optimal solution;
Firming up of scope of works;
Preparation of cost estimation;
Phasing of works and their cost;
Financial analysis.
Mapping of complete primary and secondary distribution system clearly depicting the
various parameters such as conductor size, line lengths etc.
Compilation of data regarding existing loads, operating conditions, forecast of expected
loads etc.
Carrying out detailed distribution system studies considering the expected load
development during the next 8-10 years.
Preparation of long-term plans for phased strengthening and improvement of the
distribution systems along with associated transmission system.
Estimation of the financial requirements for implementation of the different phases of
system improvement works.
Formulation of comprehensive system improvement schemes with detailed investment
program to meet system requirement for first 5 years period.
12
Recommendations and Conclusion
Keeping the above in view, it is very essential that immediate steps be initiated to have an
assessment of the realistic T &D losses in each of the states and that immediate steps are taken to
reduce the same in a systematic manner by all the players in the field.
The central or the state governments should draw plans to provide financial support to the
utilities for installations of meters on at least all the distribution transformers in a phased
manner.
It should be made obligatory for all the big industries as well as the utilities to carry out
energy audit of their system to identify high loss areas and take remedial measures to
reduce the same.
Schemes for incentive awards to utilities those are able to reduce T&D losses beyond a
certain pre-fixed limit.
The financial institutions should be encouraged to provide easy loans to utilities for
taking remedial measures to reduce the T&D losses.
Publicity campaigns should be carried out to make the consumer aware of the high
penalties on the unauthorized use of electricity.
Utilities should prepare realistic power Master Plans for their systems to develop a
strategy to meet the growing electricity demands of the different sectors of the state’s
economy over the next 15 years.

13
Bibliography
i. Power Transmission- Real Bottleneck, FICCI, Sep. 2013
ii. Annual Reports, CEA, 2008 To 2012
iii. World Development Indicators, World Bank
iv. Energy Reports, Planning Commission
14
Glossary
GDP- Gross Domestic Product
Ckm- Circuit Kilometer
T&D- Transmission and Distribution
CEA- Central Electricity Authority
ACSR- Aluminium Conductor Steel Reinforced
AAC- All Aluminium Conductor
AAAC- All Aluminium Alloy Conductor
DTs- Distribution Transformer