Embed Size (px)
Citation preview
Rep
rodu
ced
from
Soi
l Sci
ence
Soc
iety
of A
mer
ica
Jour
nal.
Pub
lishe
d by
Soi
l Sci
ence
Soc
iety
of A
mer
ica.
All
copy
right
s re
serv
ed.
Hydraulic Properties in a Silt Loam Soil under Natural Prairie,Conventional Till, and No-Till
Juan P. Fuentes, Markus Flury,* and David F. Bezdicek
ABSTRACT undergo this dramatic cyclic change in soil structure;although seasonal variations in hydraulic conductivitiesTillage in the Palouse region of Washington State over the pastoccur through root development, earthworm activity,100 yr has influenced the soil physical and biological properties. In
particular, hydraulic properties are significantly affected by soil culti- and other natural processes such as freezing and thaw-vation. The objectives of this study were to assess the temporal pat- ing, or shrinking and swelling.terns of soil hydraulic properties under three management systems, Soil compaction can also alter hydraulic conductivity.natural prairie (NP), conventional till (CT), and no-till (NT), and to Soil compaction, mostly caused by wheel traffic, de-compare hydraulic properties between these three systems. Saturated stroys large pores, thereby reduces saturated and near-and near-saturated hydraulic conductivities (up to �15 cm-H2O hy- saturated hydraulic conductivities (Ankeny et al., 1990;draulic head), and soil water retention curves were determined using
Heddadj and Gascuel-Odoux, 1999). The effects of soilintact soil cores taken from the top 10 cm of soil. Soils were sampledcompaction vary with soil type and management. Underat six different times during a period of 1.5 yr from a NP, a long-no-till systems, wheel traffic may cause compaction ofterm (�100 yr) CT, and a 27-yr-old NT system. The NP representedthe soil matrix and results in reduction of saturated andthe original soil and natural vegetation of the area. Significant tempo-
ral variation in hydraulic conductivity was found. Temporal variation near-saturated hydraulic conductivities, but biologicalwas most evident in the NP soil, where organic matter content was effects, such as root channels and earthworm burrowstwice as large as under the CT and NT soils. Hydraulic conductivities may counteract the compaction-induced reduction ofin the NP were about one order of magnitude larger than in the the conductivities (Gantzer and Blake, 1978; Ankenycultivated soils. In NT, saturated hydraulic conductivities in the top et al., 1990).5 cm of soils were significantly larger than in CT. No-till and CT soils Because of the many factors affecting the hydraulichad similar near-saturated hydraulic conductivities, indicating that
conductivity, a temporal pattern may be difficult to ob-even 27 yr of continuous NT could not restore the original hydraulicserve (Logsdon, 1993). Sometimes, certain factors areproperties of the soil. Restoration of original hydraulic properties inmore dominant than others, allowing us to discern tem-cultivated former prairie soils may take considerably longer.poral patterns. For instance, saturated and near-satu-rated hydraulic conductivities can increase from a wetto dry season due to the formation of cracks, particularlyHydraulic conductivity depends on soil structure,in soils that shrink and swell (Jabro, 1996; Azevedo etwhich varies in both space and time. Temporalal., 1998). Decreases of saturated and near-saturatedvariation of hydraulic conductivity is caused by growthhydraulic conductivities occur when soil particles recon-and decay of plant roots (Meek et al., 1992), activity ofsolidate, especially after tillage operations, when rain-soil organisms (Beven and Germann, 1982; Willoughbydrop impact causes sealing of the soil surface, and whenet al., 1996), precipitation that forms surface crustsroot growth clogs pre-existing pores (Messing and Jar-(Messing and Jarvis, 1993), shrinking and swellingvis, 1993; Angulo-Jaramillo et al., 1997; Suwardji and(Messing and Jarvis, 1990; Bagarello et al., 1999), freez-Eberbach, 1998). The effect of roots on saturated anding and thawing (Scott et al., 1994), and agriculturalnear-saturated hydraulic conductivities is closely relatedactivities, such as tillage and wheel-traffic compactionto the physiological stage of the root system. Living(Ankeny et al., 1990; Logsdon and Jaynes, 1996).roots can create new pores, but also use pre-existing rootTillage operations affect hydraulic conductivities inor earthworm channels for growth, thereby reducingcontrasting ways. Tillage, especially plowing, createshydraulic conductivities. When roots decay, they leavemacropores that cause saturated and near-saturated hy-behind empty pores through which water can flow rap-draulic conductivities to increase considerably, but alsoidly (Murphy et al., 1993). Wetting and drying cyclesdisrupts pore continuities that reduce hydraulic conduc-near to the root systems can also create new pores andtivities between plow layers and subsoils (Bouma, 1991).cracks (Rasse et al., 2000). The activity and type ofShortly after tillage, saturated and near-saturated hy-root systems can play a pronounced role in temporaldraulic conductivities in the topsoil are usually largevariation of hydraulic conductivities. Increases in infil-and decrease with time due to reconsolidation of soiltration rates from spring to late summer in an irrigatedparticles (Cassel and Nelson, 1985; Messing and Jarvis,montmorillonitic soil have been linked to decaying roots1993). No-till systems and nonagricultural soils do notof perennial plants, which can create more stable poresas compared with annual plants (Mitchell et al., 1995).J.P. Fuentes, M. Flury, and D.F. Bezdicek, Dep. of Crop and Soil
Most of the studies conducted in cultivated soils haveSciences, Center for Multiphase Environmental Research, Washing-associated the changes in hydraulic conductivities withton State Univ., Pullman, WA 99164. Received 22 Sept. 2003. *Corre-
sponding author ([email protected]). variations in soil structure due to tillage. Few studieshave assessed the long-term effect of farming on hydrau-Published in Soil Sci. Soc. Am. J. 68:1679–1688 (2004).lic conductivities. The prairie in eastern Washington, Soil Science Society of America
677 S. Segoe Rd., Madison, WI 53711 USA which has been cultivated since the late 1870s (Michal-
1679
Rep
rodu
ced
from
Soi
l Sci
ence
Soc
iety
of A
mer
ica
Jour
nal.
Pub
lishe
d by
Soi
l Sci
ence
Soc
iety
of A
mer
ica.
All
copy
right
s re
serv
ed.
1680 SOIL SCI. SOC. AM. J., VOL. 68, SEPTEMBER–OCTOBER 2004
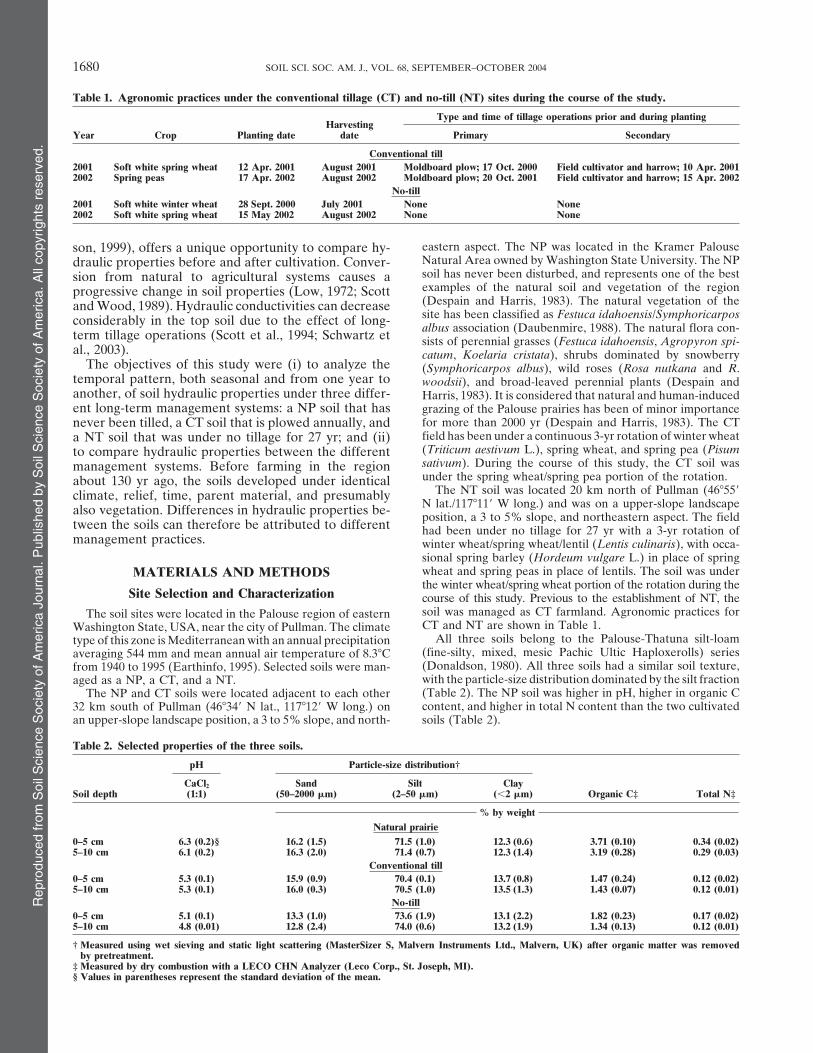
Table 1. Agronomic practices under the conventional tillage (CT) and no-till (NT) sites during the course of the study.
Type and time of tillage operations prior and during plantingHarvesting
Year Crop Planting date date Primary Secondary
Conventional till2001 Soft white spring wheat 12 Apr. 2001 August 2001 Moldboard plow; 17 Oct. 2000 Field cultivator and harrow; 10 Apr. 20012002 Spring peas 17 Apr. 2002 August 2002 Moldboard plow; 20 Oct. 2001 Field cultivator and harrow; 15 Apr. 2002
No-till2001 Soft white winter wheat 28 Sept. 2000 July 2001 None None2002 Soft white spring wheat 15 May 2002 August 2002 None None
eastern aspect. The NP was located in the Kramer Palouseson, 1999), offers a unique opportunity to compare hy-Natural Area owned by Washington State University. The NPdraulic properties before and after cultivation. Conver-soil has never been disturbed, and represents one of the bestsion from natural to agricultural systems causes aexamples of the natural soil and vegetation of the regionprogressive change in soil properties (Low, 1972; Scott(Despain and Harris, 1983). The natural vegetation of theand Wood, 1989). Hydraulic conductivities can decreasesite has been classified as Festuca idahoensis/Symphoricarposconsiderably in the top soil due to the effect of long-albus association (Daubenmire, 1988). The natural flora con-term tillage operations (Scott et al., 1994; Schwartz et sists of perennial grasses (Festuca idahoensis, Agropyron spi-
al., 2003). catum, Koelaria cristata), shrubs dominated by snowberryThe objectives of this study were (i) to analyze the (Symphoricarpos albus), wild roses (Rosa nutkana and R.
temporal pattern, both seasonal and from one year to woodsii), and broad-leaved perennial plants (Despain andanother, of soil hydraulic properties under three differ- Harris, 1983). It is considered that natural and human-inducedent long-term management systems: a NP soil that has grazing of the Palouse prairies has been of minor importance
for more than 2000 yr (Despain and Harris, 1983). The CTnever been tilled, a CT soil that is plowed annually, andfield has been under a continuous 3-yr rotation of winter wheata NT soil that was under no tillage for 27 yr; and (ii)(Triticum aestivum L.), spring wheat, and spring pea (Pisumto compare hydraulic properties between the differentsativum). During the course of this study, the CT soil wasmanagement systems. Before farming in the regionunder the spring wheat/spring pea portion of the rotation.about 130 yr ago, the soils developed under identical
The NT soil was located 20 km north of Pullman (46�55�climate, relief, time, parent material, and presumablyN lat./117�11� W long.) and was on a upper-slope landscapealso vegetation. Differences in hydraulic properties be- position, a 3 to 5% slope, and northeastern aspect. The field
tween the soils can therefore be attributed to different had been under no tillage for 27 yr with a 3-yr rotation ofmanagement practices. winter wheat/spring wheat/lentil (Lentis culinaris), with occa-
sional spring barley (Hordeum vulgare L.) in place of springwheat and spring peas in place of lentils. The soil was underMATERIALS AND METHODSthe winter wheat/spring wheat portion of the rotation during the
Site Selection and Characterization course of this study. Previous to the establishment of NT, thesoil was managed as CT farmland. Agronomic practices forThe soil sites were located in the Palouse region of easternCT and NT are shown in Table 1.Washington State, USA, near the city of Pullman. The climate
All three soils belong to the Palouse-Thatuna silt-loamtype of this zone is Mediterranean with an annual precipitation(fine-silty, mixed, mesic Pachic Ultic Haploxerolls) seriesaveraging 544 mm and mean annual air temperature of 8.3�C(Donaldson, 1980). All three soils had a similar soil texture,from 1940 to 1995 (Earthinfo, 1995). Selected soils were man-with the particle-size distribution dominated by the silt fractionaged as a NP, a CT, and a NT.(Table 2). The NP soil was higher in pH, higher in organic CThe NP and CT soils were located adjacent to each othercontent, and higher in total N content than the two cultivated32 km south of Pullman (46�34� N lat., 117�12� W long.) on
an upper-slope landscape position, a 3 to 5% slope, and north- soils (Table 2).
Table 2. Selected properties of the three soils.
pH Particle-size distribution†
CaCl2 Sand Silt ClaySoil depth (1:1) (50–2000 �m) (2–50 �m) (�2 �m) Organic C‡ Total N‡
% by weightNatural prairie
0–5 cm 6.3 (0.2)§ 16.2 (1.5) 71.5 (1.0) 12.3 (0.6) 3.71 (0.10) 0.34 (0.02)5–10 cm 6.1 (0.2) 16.3 (2.0) 71.4 (0.7) 12.3 (1.4) 3.19 (0.28) 0.29 (0.03)
Conventional till0–5 cm 5.3 (0.1) 15.9 (0.9) 70.4 (0.1) 13.7 (0.8) 1.47 (0.24) 0.12 (0.02)5–10 cm 5.3 (0.1) 16.0 (0.3) 70.5 (1.0) 13.5 (1.3) 1.43 (0.07) 0.12 (0.01)
No-till0–5 cm 5.1 (0.1) 13.3 (1.0) 73.6 (1.9) 13.1 (2.2) 1.82 (0.23) 0.17 (0.02)5–10 cm 4.8 (0.01) 12.8 (2.4) 74.0 (0.6) 13.2 (1.9) 1.34 (0.13) 0.12 (0.01)
† Measured using wet sieving and static light scattering (MasterSizer S, Malvern Instruments Ltd., Malvern, UK) after organic matter was removedby pretreatment.
‡ Measured by dry combustion with a LECO CHN Analyzer (Leco Corp., St. Joseph, MI).§ Values in parentheses represent the standard deviation of the mean.
Rep
rodu
ced
from
Soi
l Sci
ence
Soc
iety
of A
mer
ica
Jour
nal.
Pub
lishe
d by
Soi
l Sci
ence
Soc
iety
of A
mer
ica.
All
copy
right
s re
serv
ed.
FUENTES ET AL.: HYDRAULIC PROPERTIES IN A SILT LOAM SOIL 1681
�1019 cm H2O). Before analysis, nylon membranes (NylonSoil SamplingMesh No 400, Gilson Company, Inc., Lewis Center, OH) were
Soil samples were taken in 2001 on May 16 to 17, and attached at the bottom of each core with rubber bands. CoresNovember 30, and in 2002 on April 22 to 25, June 26 to 27, were saturated from the bottom with a degased 5 mM CaSO4September 18 to 20, and December 7 to 11 from 20 by 20 m solution for 48 h. Some swelling was observed in the NPplots. At each sampling date, eight intact soil cores of 9-cm soils during saturation, however, the volume change duringdiam. and 10-cm depth were taken for hydraulic conductivity saturation was at most 3%, and considered part of the experi-analysis, and five cores of 5.4-cm diam. and 9-cm depth were mental error.taken for soil water retention analysis. Crop and plant residues For water potentials ranging from 0 to �4.2 kPa, the mea-on the soil surface were removed before sampling. The cores surements were made with the hanging water column methodwere taken with a manual hammer-driven core sampler from (Townend et al., 2000) using a Buchner funnel with a frittedrandom locations, which were determined using a random disk (Pyrex, fritted disk No 36060, ASTM 40-60, Corning Inc.,number generator. If the random location fell on a crop row Acton, MA). For water potentials ranging from �10 to �100or on a wheel track, then a new random location was chosen. kPa, a pressure plate extractor (Soilmoisture EquipmentBecause of dry soil conditions in September 2002, the soil was Corp., Goleta, CA) with 1-bar ceramic plates was used. Atwetted 1 d before sampling by infiltrating about 60 mm of each pressure, soil cores were equilibrated for 96 h, weighed,well water at the sampling locations. The 10-cm deep soil cores and returned to the plate extractor for the next pressure step.were dissected in two depths (0–5 and 5–10 cm) and the 9-cm At the end, soil cores were oven-dried at 105�C for 48 h todeep cores were dissected in three depths (0–3, 3–6, and determine the porosity. The volumetric water contents deter-6–9 cm), and stored at 4�C. mined at each pressure step were averaged over the five repli-
cated soil cores.Measurement of Hydraulic Properties
Data AnalysisHydraulic ConductivitySoil water characteristics were analyzed using the van Gen-Saturated hydraulic conductivities (Ks) were measured with
uchten relationship (van Genuchten, 1980)the constant-head method (Klute and Dirksen, 1986). BeforeKs determination, soil cores were saturated from the bottom � � �r � (�s � �r)[1 � (h)n](1/n�1) [1]by placing the cores in a tray with about 2-cm deep, degased5 mM CaSO4 solution for 48 h. where � is the volumetric water content and h, the hydraulic
Near-saturated hydraulic conductivities at low hydraulic head. The parameters (inverse of the air entry potential),heads (�1, �6, and �15 cm-H2O) were measured with a steady n (associated with the pore-size distribution), �s (saturatedstate method using a tension-infiltrometer (Klute and Dirksen, water content), and �r (residual water content) were fitted to1986). The water level in the infiltrometer was monitored the experimental data using the RETC program (van Genuch-with a pressure transducer (PX 170, Omega Engineering Inc., ten et al., 1991).Stamford, CT). The tension-infiltrometer was equipped with Analysis of variance (ANOVA) was used to test for differ-a nylon membrane of 30 cm-H2O bubbling pressure (Nylon ences in hydraulic conductivity between management systemsMesh No 400, Gilson Company, Inc., Lewis Center, OH). A (MS) and sampling time (TIME). The analysis made here islayer of glass beads (Glass Oxide C.A.S. No 65997-17-3, Potter similar to the one employed by Scott et al. (1994). The ANOVAIndustries Inc., Canby, OR), �1 mm thick, was used between model considered a complete randomized design with two-waythe nylon membrane and the soil samples to ensure good treatment structure (MS, TIME) with repeated measurementshydraulic contact (Reynolds and Zebchuk, 1996). A water (DEPTH). Significant differences between MS, TIME, and themanometer was used to check the hydraulic head inside the interaction between MS and TIME were tested using the repli-infiltrometer disk. The bottom boundary condition of the soil cations within MS and TIME as the error term. Significantcore was controlled by a suction table of fine sand, which was differences in depth (DEPTH) and the interactions DEPTH hydraulically connected to a hanging water column. The air- MS, DEPTH TIME, DEPTH MS TIME were testedentry potential of the fine sand was �15.5 cm-H2O, that is, the with the total error of the model. Log-transformed (log K)sand remains water saturated for potentials hydraulic heads data were used for the statistical analysis. Normality of thebetween 0 and �15.5 cm-H2O. Steady-state flow conditions transformed distributions was examined by the Shapiro–Wilkwere established by adjusting top and bottom boundary condi- test. We used the general linear model (GLM) to carry outtions to the same matric potential, so that the total potential the ANOVA using SAS 8.0 (SAS Institute, Cary, NC). Ifdifference between top and bottom of the column was only significant differences (P � 0.05) were found, we further ana-due to the gravitational potential difference. This results in a lyzed the means with the least significant differences (LSD)unit gradient condition (Hillel, 1998). Hydraulic conductivities procedure. The means of the logarithmically transformed vari-were calculated using Darcy’s law after constant flow rate ables are, if not noted otherwise, reported as geometric means,was achieved. Measurements were made in hydraulic head and the errors of the mean as 95% confidence intervals com-sequences of �1, �6, and �15 cm-H2O. puted from the logarithmically transformed data (Sokal and
Assuming cylindrical pores and applying the Young-Laplace Rohlf, 1995).equation using a 0� solid-liquid contact angle, the pore diam-eters excluded from water flow at the different hydraulic heads
RESULTS AND DISCUSSIONare 3 mm at �1 cm-H2O, 0.5 mm at �6 cm-H2O, and 0.2 mmat �15 cm-H2O. All these pores are usually considered mac- Temporal Variation of Hydraulic Propertiesropores in soils, and we therefore denote the correspondinghydraulic conductivities as near-saturated. The measurements of the hydraulic conductivities are
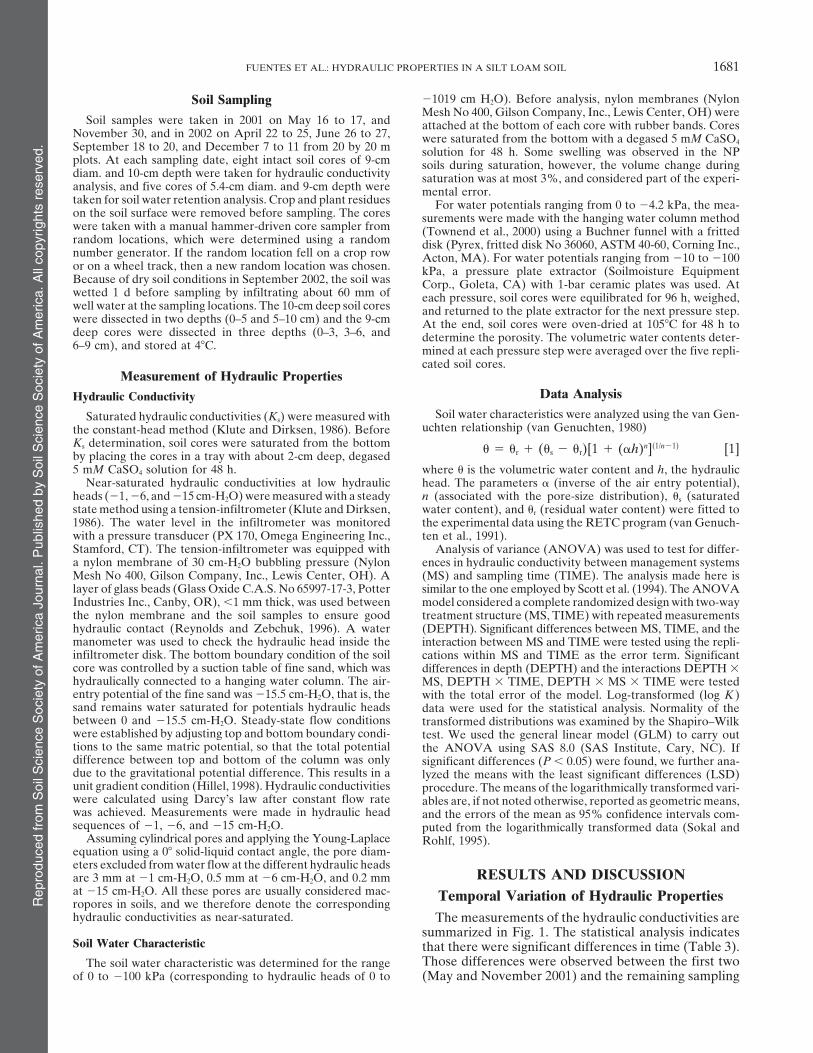
summarized in Fig. 1. The statistical analysis indicatesSoil Water Characteristic that there were significant differences in time (Table 3).
Those differences were observed between the first twoThe soil water characteristic was determined for the rangeof 0 to �100 kPa (corresponding to hydraulic heads of 0 to (May and November 2001) and the remaining sampling
Rep
rodu
ced
from
Soi
l Sci
ence
Soc
iety
of A
mer
ica
Jour
nal.
Pub
lishe
d by
Soi
l Sci
ence
Soc
iety
of A
mer
ica.
All
copy
right
s re
serv
ed.
1682 SOIL SCI. SOC. AM. J., VOL. 68, SEPTEMBER–OCTOBER 2004
Fig. 1. Temporal variation of hydraulic conductivity for sampling depths 0 to 5 cm (left panels) and 5 to 10 cm (right panels). Symbols representthe geometric mean and the bars are 95% confidence intervals (n � 8).
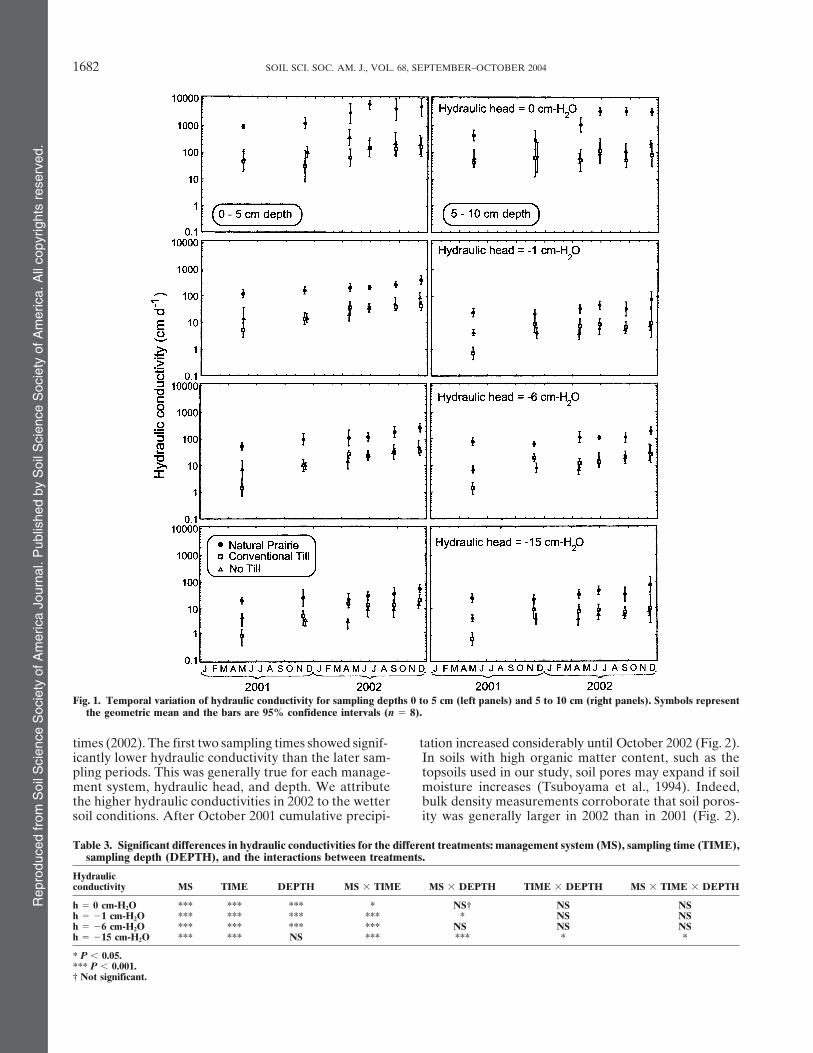
times (2002). The first two sampling times showed signif- tation increased considerably until October 2002 (Fig. 2).In soils with high organic matter content, such as theicantly lower hydraulic conductivity than the later sam-
pling periods. This was generally true for each manage- topsoils used in our study, soil pores may expand if soilmoisture increases (Tsuboyama et al., 1994). Indeed,ment system, hydraulic head, and depth. We attribute
the higher hydraulic conductivities in 2002 to the wetter bulk density measurements corroborate that soil poros-ity was generally larger in 2002 than in 2001 (Fig. 2).soil conditions. After October 2001 cumulative precipi-
Table 3. Significant differences in hydraulic conductivities for the different treatments: management system (MS), sampling time (TIME),sampling depth (DEPTH), and the interactions between treatments.
Hydraulicconductivity MS TIME DEPTH MS TIME MS DEPTH TIME DEPTH MS TIME DEPTH
h � 0 cm-H2O *** *** *** * NS† NS NSh � �1 cm-H2O *** *** *** *** * NS NSh � �6 cm-H2O *** *** *** *** NS NS NSh � �15 cm-H2O *** *** NS *** *** * *
* P � 0.05.*** P � 0.001.† Not significant.
Rep
rodu
ced
from
Soi
l Sci
ence
Soc
iety
of A
mer
ica
Jour
nal.
Pub
lishe
d by
Soi
l Sci
ence
Soc
iety
of A
mer
ica.
All
copy
right
s re
serv
ed.
FUENTES ET AL.: HYDRAULIC PROPERTIES IN A SILT LOAM SOIL 1683
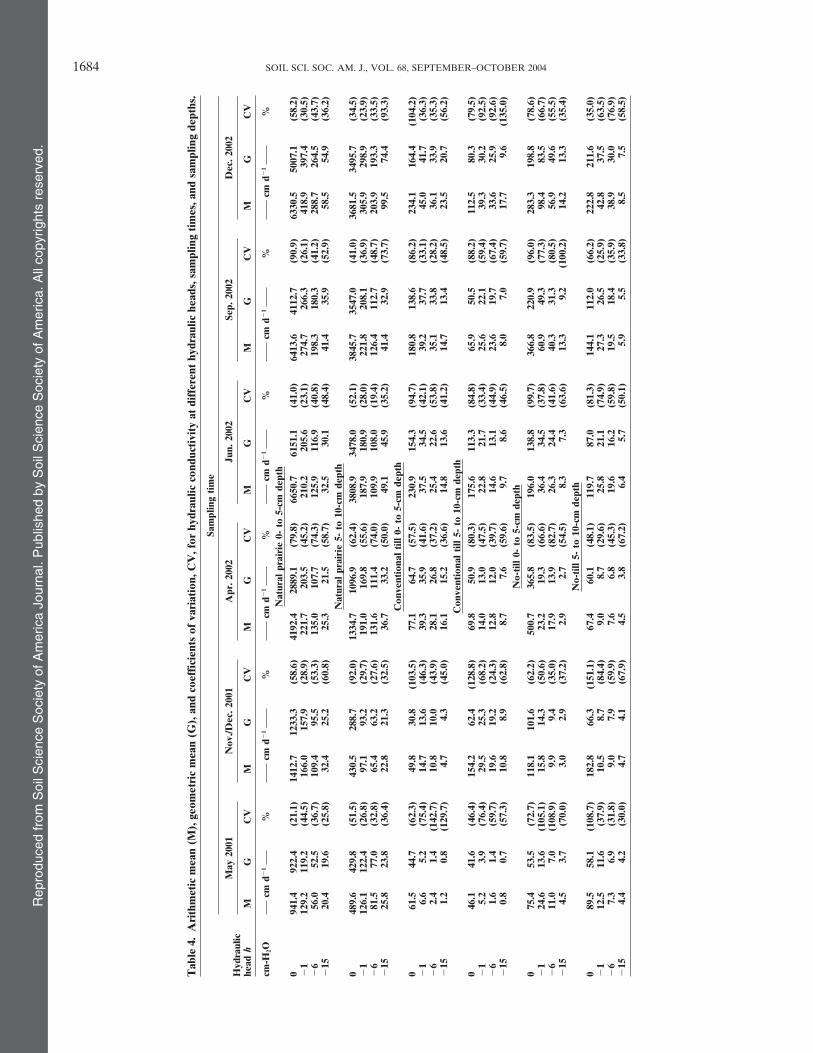
are commonly found for saturated conditions than un-der unsaturated conditions (e.g., Nielsen et al., 1973;Azevedo et al., 1998). The saturated hydraulic conduc-tivity often varied over more than one order of magni-tude between replicates. Spatial variations of this extentare common (Nielsen et al., 1973; Jury et al., 1987; Russoet al., 1997).
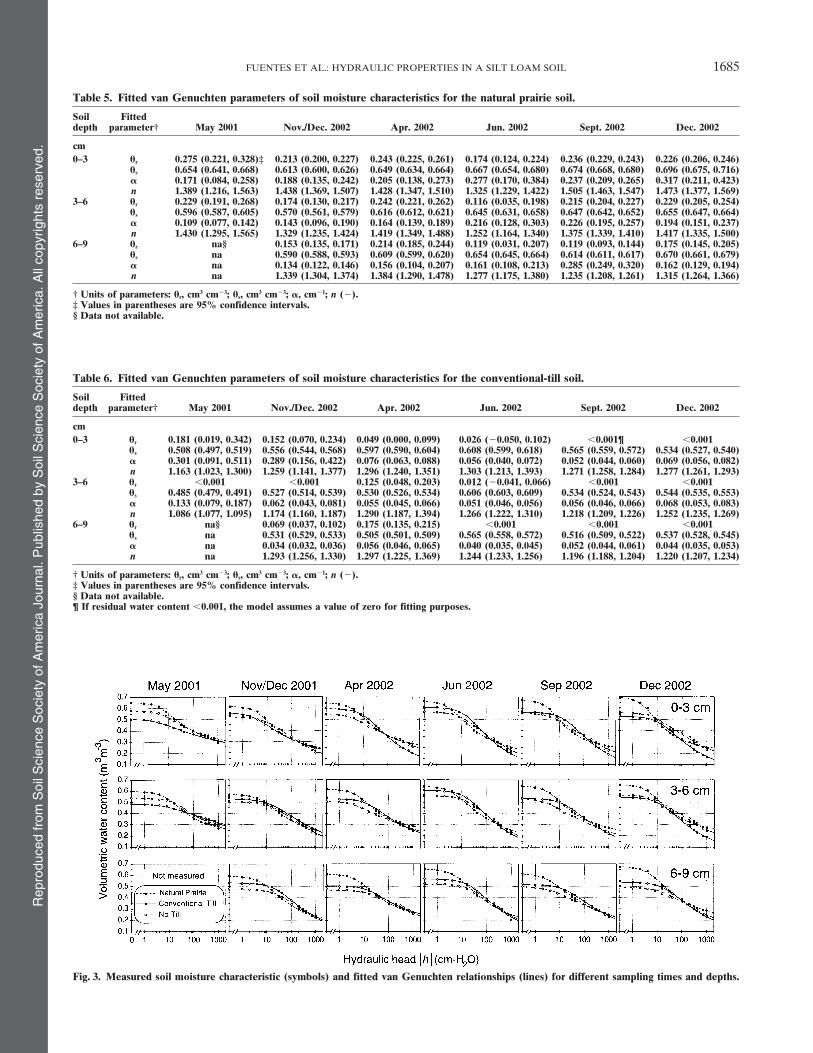
The soil water characteristics were well described withthe van Genuchten relationship (Fig. 3). The fitted vanGenuchten parameters are listed in Tables 5 through 7.The NP and the NT system did not show much temporalvariation in the shape of the water characteristics; how-ever, the CT system showed some temporal variation.From November 2001 to September 2002, the CT systemshowed an increase in porosity between equivalentheads of 0 and �33 cm H2O and a decrease in porositybetween equivalent heads less than �300 cm H2O(Fig. 3). The increase in porosity was associated withan increase in saturated hydraulic conductivity (Fig. 1).The increase in porosity between 0 and �33 cm H2O isattributed to tillage and cultivation operations, whichwere performed in October 2001 and April 2002. Theseobservations are consistent with findings of others(Mapa et al., 1986; Ahuja et al., 1998). The temporalvariation in moisture characteristics decreased with in-creasing sampling depth, corroborating the observationsmade with the hydraulic conductivities.
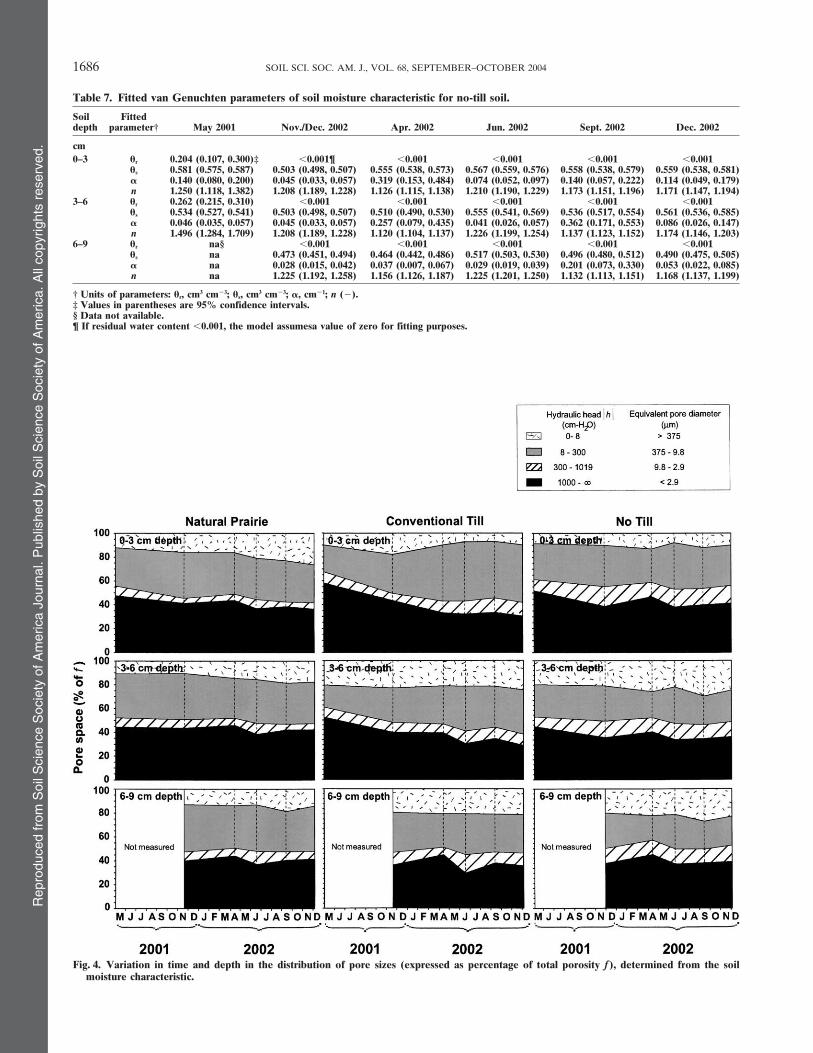
The distribution of pore sizes in NT was fairly con-stant in time, however, some variation was discerned inNP and CT (Fig. 4). In the NP, the fraction of poreslarger than 375 �m increased over time, whereas in CTthe opposite trend was observed. The CT system showedthe largest temporal variation in pore-size distributions,likely caused by tillage. The magnitude of the variationinduced by tillage decreased with depth.
Fig. 2. Monthly precipitation and temporal variation of bulk densityfor sampling depths 0 to 3, 3 to 6, and 6 to 9 cm. Symbols representthe mean and the bars are one standard error (n � 5). Precipitation Effect of Soil Managementdata courtesy of Pullman NOAA Weather Station, WA (Jeff Smith, on Hydraulic PropertiesUSDA-ARS, Pullman, WA, personal communication, 2003).
Overall, there were significant differences in hydraulicconductivities between management systems (Table 3).The increase in hydraulic conductivities, particularly theThe NP had significantly larger hydraulic conductivitiessaturated hydraulic conductivity, in Year 2002 was mostthan CT and NT for all hydraulic heads, depths, andpronounced in the NP, which has the highest amountsampling times, except for the saturated hydraulic con-of organic matter.ductivity for the 5- to 10-cm depth in November 2001The interaction between MS and TIME was significantand the unsaturated conductivity at �15 cm-H2O for thefor the conductivities at all hydraulic heads (Table 3).0- to 5-cm depth in April 2002, where no statisticalThis shows that the temporal change in hydraulic con-differences were detected (Table 3, Fig. 1).ductivity depended on the management system. The NP
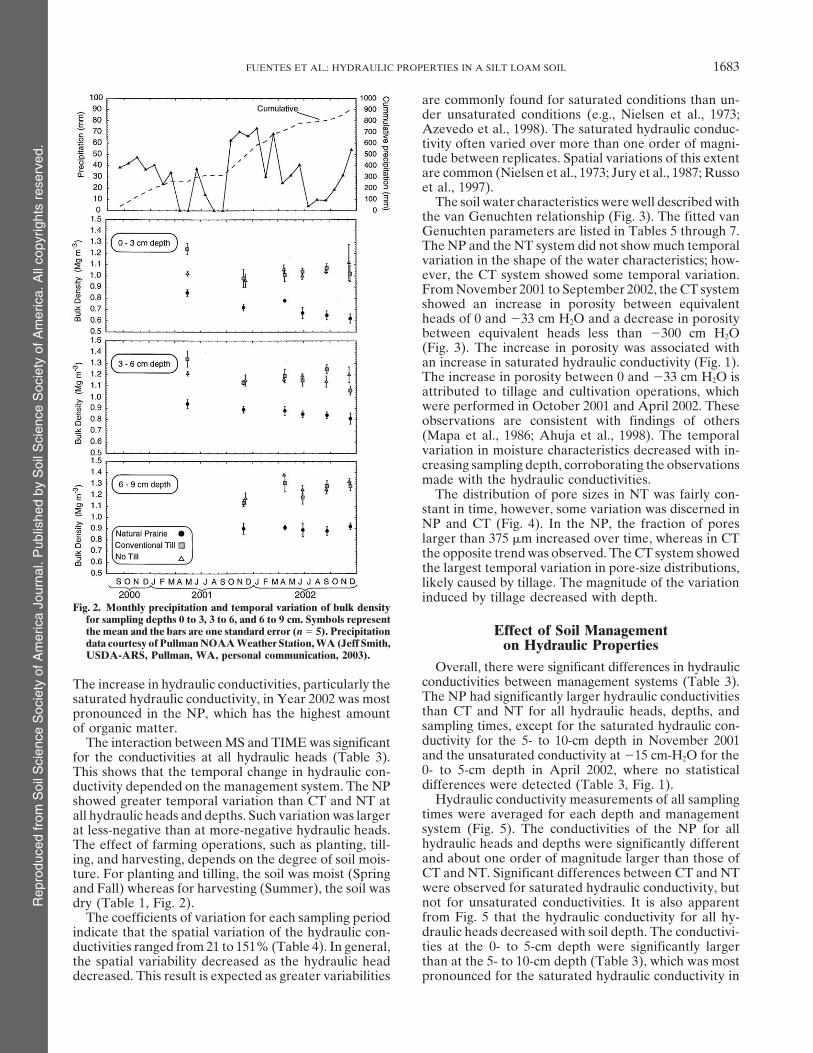
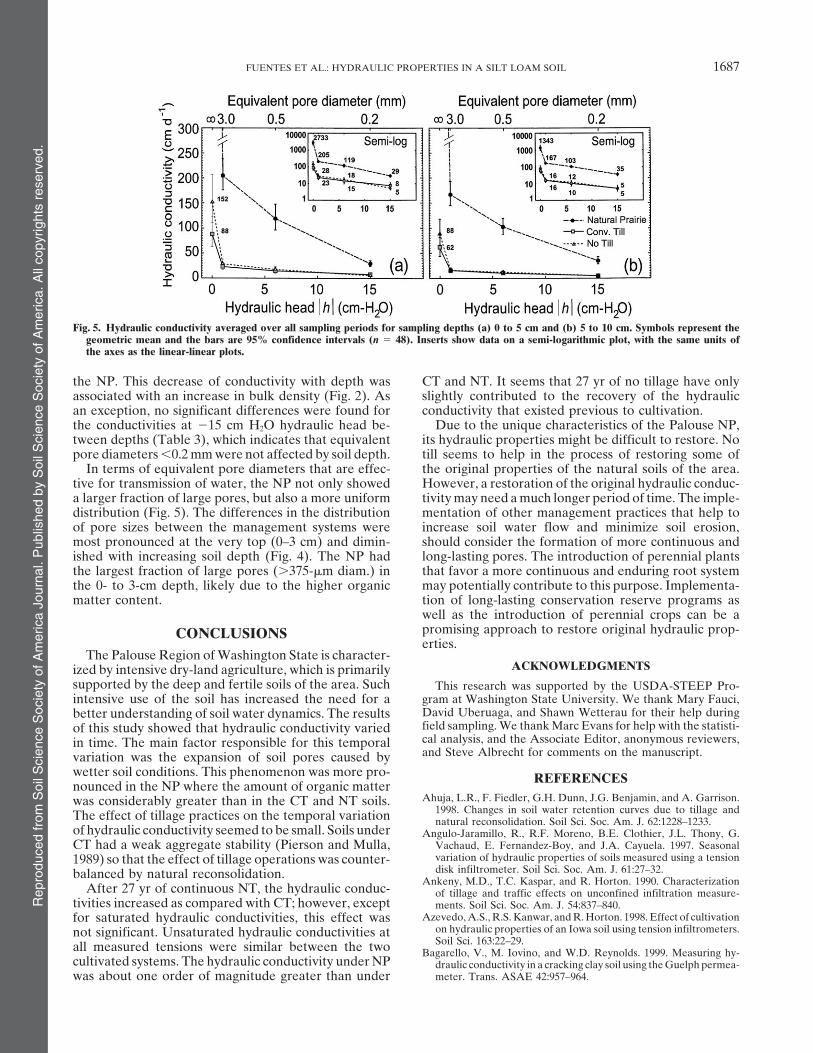
Hydraulic conductivity measurements of all samplingshowed greater temporal variation than CT and NT attimes were averaged for each depth and managementall hydraulic heads and depths. Such variation was largersystem (Fig. 5). The conductivities of the NP for allat less-negative than at more-negative hydraulic heads.hydraulic heads and depths were significantly differentThe effect of farming operations, such as planting, till-and about one order of magnitude larger than those ofing, and harvesting, depends on the degree of soil mois-CT and NT. Significant differences between CT and NTture. For planting and tilling, the soil was moist (Springwere observed for saturated hydraulic conductivity, butand Fall) whereas for harvesting (Summer), the soil wasnot for unsaturated conductivities. It is also apparentdry (Table 1, Fig. 2).from Fig. 5 that the hydraulic conductivity for all hy-The coefficients of variation for each sampling perioddraulic heads decreased with soil depth. The conductivi-indicate that the spatial variation of the hydraulic con-ties at the 0- to 5-cm depth were significantly largerductivities ranged from 21 to 151% (Table 4). In general,than at the 5- to 10-cm depth (Table 3), which was mostthe spatial variability decreased as the hydraulic head
decreased. This result is expected as greater variabilities pronounced for the saturated hydraulic conductivity in
Rep
rodu
ced
from
Soi
l Sci
ence
Soc
iety
of A
mer
ica
Jour
nal.
Pub
lishe
d by
Soi
l Sci
ence
Soc
iety
of A
mer
ica.
All
copy
right
s re
serv
ed.
1684 SOIL SCI. SOC. AM. J., VOL. 68, SEPTEMBER–OCTOBER 2004
Tab
le4.
Ari
thm
etic
mea
n(M
),ge
omet
ric
mea
n(G
),an
dco
effi
cien
tsof
vari
atio
n,C
V,f
orhy
drau
licco
nduc
tivi
tyat
diff
eren
thy
drau
liche
ads,
sam
plin
gti
mes
,and
sam
plin
gde
pths
.
Sam
plin
gti
me
May
2001
Nov
./Dec
.200
1A
pr.2
002
Jun.
2002
Sep.
2002
Dec
.200
2H
ydra
ulic
head
hM
GC
VM
GC
VM
GC
VM
GC
VM
GC
VM
GC
V
cm-H
2Ocm
d�1
%cm
d�1
%cm
d�1
%cm
d�1
%cm
d�1
%cm
d�1
%N
atur
alpr
airi
e0-
to5-
cmde
pth
094
1.4
922.
4(2
1.1)
1412
.712
33.3
(58.
6)41
92.4
2889
.1(7
9.8)
6650
.761
51.1
(41.
0)64
13.6
4112
.7(9
0.9)
6330
.550
07.1
(58.
2)�
112
9.2
119.
2(4
4.5)
166.
015
7.9
(28.
9)22
1.7
203.
5(4
5.2)
210.
220
5.6
(23.
1)27
4.7
266.
3(2
6.1)
418.
939
7.4
(30.
5)�
656
.052
.5(3
6.7)
109.
495
.5(5
3.3)
135.
010
7.7
(74.
3)12
5.9
116.
9(4
0.8)
198.
318
0.3
(41.
2)28
8.7
264.
5(4
3.7)
�15
20.4
19.6
(25.
8)32
.425
.2(6
0.8)
25.3
21.5
(58.
7)32
.530
.1(4
8.4)
41.4
35.9
(52.
9)58
.554
.9(3
6.2)
Nat
ural
prai
rie
5-to
10-c
mde
pth
048
9.6
429.
8(5
1.5)
430.
528
8.7
(92.
0)13
34.7
1096
.9(6
2.4)
3808
.934
78.0
(52.
1)38
45.7
3547
.0(4
1.0)
3681
.534
95.7
(34.
5)�
112
6.1
122.
4(2
6.8)
97.1
93.2
(29.
7)19
1.0
169.
8(5
5.6)
187.
918
0.9
(28.
0)22
1.8
208.
1(3
6.9)
305.
929
8.9
(23.
9)�
681
.577
.0(3
2.8)
65.4
63.2
(27.
6)13
1.6
111.
4(7
4.0)
109.
910
8.0
(19.
4)12
6.4
112.
7(4
8.7)
203.
919
3.3
(33.
5)�
1525
.823
.8(3
6.4)
22.8
21.3
(32.
5)36
.733
.2(5
0.0)
49.1
45.9
(35.
2)41
.432
.9(7
3.7)
99.5
74.4
(93.
3)C
onve
ntio
nal
till
0-to
5-cm
dept
h0
61.5
44.7
(62.
3)49
.830
.8(1
03.5
)77
.164
.7(5
7.5)
230.
915
4.3
(94.
7)18
0.8
138.
6(8
6.2)
234.
116
4.4
(104
.2)
�1
6.6
5.2
(75.
4)14
.713
.6(4
6.3)
39.3
35.9
(41.
6)37
.534
.5(4
2.1)
39.2
37.7
(33.
1)45
.041
.7(3
6.3)
�6
2.4
1.4
(142
.7)
10.8
10.0
(43.
9)28
.126
.8(3
7.2)
25.4
22.6
(53.
8)35
.133
.8(2
8.2)
36.1
33.9
(35.
3)�
151.
20.
8(1
29.7
)4.
74.
3(4
5.0)
16.1
15.2
(36.
6)14
.813
.6(4
1.2)
14.7
13.4
(48.
5)23
.520
.7(5
6.2)
Con
vent
iona
lti
ll5-
to10
-cm
dept
h0
46.1
41.6
(46.
4)15
4.2
62.4
(128
.8)
69.8
50.9
(80.
3)17
5.6
113.
3(8
4.8)
65.9
50.5
(88.
2)11
2.5
80.3
(79.
5)�
15.
23.
9(7
6.4)
29.5
25.3
(68.
2)14
.013
.0(4
7.5)
22.8
21.7
(33.
4)25
.622
.1(5
9.4)
39.3
30.2
(92.
5)�
61.
61.
4(5
9.7)
19.6
19.2
(24.
3)12
.812
.0(3
9.7)
14.6
13.1
(44.
9)23
.619
.7(6
7.4)
33.6
25.9
(92.
6)�
150.
80.
7(5
7.3)
10.8
8.9
(62.
8)8.
77.
6(5
9.6)
9.7
8.6
(46.
5)8.
07.
0(5
9.7)
17.7
9.6
(135
.0)
No-
till
0-to
5-cm
dept
h0
75.4
53.5
(72.
7)11
8.1
101.
6(6
2.2)
500.
736
5.8
(83.
5)19
6.0
138.
8(9
9.7)
366.
822
0.9
(96.
0)28
3.3
198.
8(7
8.6)
�1
24.6
13.6
(105
.1)
15.8
14.3
(50.
6)23
.219
.3(6
6.6)
36.4
34.5
(37.
8)60
.949
.3(7
7.3)
98.4
83.5
(66.
7)�
611
.07.
0(1
08.9
)9.
99.
4(3
5.0)
17.9
13.9
(82.
7)26
.324
.4(4
1.6)
40.3
31.3
(80.
5)56
.949
.6(5
5.5)
�15
4.5
3.7
(70.
0)3.
02.
9(3
7.2)
2.9
2.7
(54.
5)8.
37.
3(6
3.6)
13.3
9.2
(100
.2)
14.2
13.3
(35.
4)N
o-ti
ll5-
to10
-cm
dept
h0
89.5
58.1
(108
.7)
182.
866
.3(1
51.1
)67
.460
.1(4
8.1)
119.
787
.0(8
1.3)
144.
111
2.0
(66.
2)22
2.8
211.
6(3
5.0)
�1
12.5
11.6
(37.
9)10
.58.
7(8
4.4)
9.0
8.7
(29.
6)25
.821
.1(7
4.9)
27.3
26.5
(25.
9)42
.837
.5(6
3.5)
�6
7.3
6.9
(31.
8)9.
07.
9(5
9.9)
7.6
6.8
(45.
3)19
.616
.2(5
9.8)
19.5
18.4
(35.
9)38
.930
.0(7
6.9)
�15
4.4
4.2
(30.
0)4.
74.
1(6
7.9)
4.5
3.8
(67.
2)6.
45.
7(5
0.1)
5.9
5.5
(33.
8)8.
57.
5(5
8.5)
Rep
rodu
ced
from
Soi
l Sci
ence
Soc
iety
of A
mer
ica
Jour
nal.
Pub
lishe
d by
Soi
l Sci
ence
Soc
iety
of A
mer
ica.
All
copy
right
s re
serv
ed.
FUENTES ET AL.: HYDRAULIC PROPERTIES IN A SILT LOAM SOIL 1685
Table 5. Fitted van Genuchten parameters of soil moisture characteristics for the natural prairie soil.
Soil Fitteddepth parameter† May 2001 Nov./Dec. 2002 Apr. 2002 Jun. 2002 Sept. 2002 Dec. 2002
cm0–3 �r 0.275 (0.221, 0.328)‡ 0.213 (0.200, 0.227) 0.243 (0.225, 0.261) 0.174 (0.124, 0.224) 0.236 (0.229, 0.243) 0.226 (0.206, 0.246)
�s 0.654 (0.641, 0.668) 0.613 (0.600, 0.626) 0.649 (0.634, 0.664) 0.667 (0.654, 0.680) 0.674 (0.668, 0.680) 0.696 (0.675, 0.716)� 0.171 (0.084, 0.258) 0.188 (0.135, 0.242) 0.205 (0.138, 0.273) 0.277 (0.170, 0.384) 0.237 (0.209, 0.265) 0.317 (0.211, 0.423)n 1.389 (1.216, 1.563) 1.438 (1.369, 1.507) 1.428 (1.347, 1.510) 1.325 (1.229, 1.422) 1.505 (1.463, 1.547) 1.473 (1.377, 1.569)
3–6 �r 0.229 (0.191, 0.268) 0.174 (0.130, 0.217) 0.242 (0.221, 0.262) 0.116 (0.035, 0.198) 0.215 (0.204, 0.227) 0.229 (0.205, 0.254)�s 0.596 (0.587, 0.605) 0.570 (0.561, 0.579) 0.616 (0.612, 0.621) 0.645 (0.631, 0.658) 0.647 (0.642, 0.652) 0.655 (0.647, 0.664)� 0.109 (0.077, 0.142) 0.143 (0.096, 0.190) 0.164 (0.139, 0.189) 0.216 (0.128, 0.303) 0.226 (0.195, 0.257) 0.194 (0.151, 0.237)n 1.430 (1.295, 1.565) 1.329 (1.235, 1.424) 1.419 (1.349, 1.488) 1.252 (1.164, 1.340) 1.375 (1.339, 1.410) 1.417 (1.335, 1.500)
6–9 �r na§ 0.153 (0.135, 0.171) 0.214 (0.185, 0.244) 0.119 (0.031, 0.207) 0.119 (0.093, 0.144) 0.175 (0.145, 0.205)�s na 0.590 (0.588, 0.593) 0.609 (0.599, 0.620) 0.654 (0.645, 0.664) 0.614 (0.611, 0.617) 0.670 (0.661, 0.679)� na 0.134 (0.122, 0.146) 0.156 (0.104, 0.207) 0.161 (0.108, 0.213) 0.285 (0.249, 0.320) 0.162 (0.129, 0.194)n na 1.339 (1.304, 1.374) 1.384 (1.290, 1.478) 1.277 (1.175, 1.380) 1.235 (1.208, 1.261) 1.315 (1.264, 1.366)
† Units of parameters: �r, cm3 cm�3; �s, cm3 cm�3; �, cm�1; n (�).‡ Values in parentheses are 95% confidence intervals.§ Data not available.
Table 6. Fitted van Genuchten parameters of soil moisture characteristics for the conventional-till soil.
Soil Fitteddepth parameter† May 2001 Nov./Dec. 2002 Apr. 2002 Jun. 2002 Sept. 2002 Dec. 2002
cm0–3 �r 0.181 (0.019, 0.342) 0.152 (0.070, 0.234) 0.049 (0.000, 0.099) 0.026 (�0.050, 0.102) �0.001¶ �0.001
�s 0.508 (0.497, 0.519) 0.556 (0.544, 0.568) 0.597 (0.590, 0.604) 0.608 (0.599, 0.618) 0.565 (0.559, 0.572) 0.534 (0.527, 0.540)� 0.301 (0.091, 0.511) 0.289 (0.156, 0.422) 0.076 (0.063, 0.088) 0.056 (0.040, 0.072) 0.052 (0.044, 0.060) 0.069 (0.056, 0.082)n 1.163 (1.023, 1.300) 1.259 (1.141, 1.377) 1.296 (1.240, 1.351) 1.303 (1.213, 1.393) 1.271 (1.258, 1.284) 1.277 (1.261, 1.293)
3–6 �r �0.001 �0.001 0.125 (0.048, 0.203) 0.012 (�0.041, 0.066) �0.001 �0.001�s 0.485 (0.479, 0.491) 0.527 (0.514, 0.539) 0.530 (0.526, 0.534) 0.606 (0.603, 0.609) 0.534 (0.524, 0.543) 0.544 (0.535, 0.553)� 0.133 (0.079, 0.187) 0.062 (0.043, 0.081) 0.055 (0.045, 0.066) 0.051 (0.046, 0.056) 0.056 (0.046, 0.066) 0.068 (0.053, 0.083)n 1.086 (1.077, 1.095) 1.174 (1.160, 1.187) 1.290 (1.187, 1.394) 1.266 (1.222, 1.310) 1.218 (1.209, 1.226) 1.252 (1.235, 1.269)
6–9 �r na§ 0.069 (0.037, 0.102) 0.175 (0.135, 0.215) �0.001 �0.001 �0.001�s na 0.531 (0.529, 0.533) 0.505 (0.501, 0.509) 0.565 (0.558, 0.572) 0.516 (0.509, 0.522) 0.537 (0.528, 0.545)� na 0.034 (0.032, 0.036) 0.056 (0.046, 0.065) 0.040 (0.035, 0.045) 0.052 (0.044, 0.061) 0.044 (0.035, 0.053)n na 1.293 (1.256, 1.330) 1.297 (1.225, 1.369) 1.244 (1.233, 1.256) 1.196 (1.188, 1.204) 1.220 (1.207, 1.234)
† Units of parameters: �r, cm3 cm�3; �s, cm3 cm�3; �, cm�1; n (�).‡ Values in parentheses are 95% confidence intervals.§ Data not available.¶ If residual water content �0.001, the model assumes a value of zero for fitting purposes.
Fig. 3. Measured soil moisture characteristic (symbols) and fitted van Genuchten relationships (lines) for different sampling times and depths.
Rep
rodu
ced
from
Soi
l Sci
ence
Soc
iety
of A
mer
ica
Jour
nal.
Pub
lishe
d by
Soi
l Sci
ence
Soc
iety
of A
mer
ica.
All
copy
right
s re
serv
ed.
1686 SOIL SCI. SOC. AM. J., VOL. 68, SEPTEMBER–OCTOBER 2004
Table 7. Fitted van Genuchten parameters of soil moisture characteristic for no-till soil.
Soil Fitteddepth parameter† May 2001 Nov./Dec. 2002 Apr. 2002 Jun. 2002 Sept. 2002 Dec. 2002
cm0–3 �r 0.204 (0.107, 0.300)‡ �0.001¶ �0.001 �0.001 �0.001 �0.001
�s 0.581 (0.575, 0.587) 0.503 (0.498, 0.507) 0.555 (0.538, 0.573) 0.567 (0.559, 0.576) 0.558 (0.538, 0.579) 0.559 (0.538, 0.581)� 0.140 (0.080, 0.200) 0.045 (0.033, 0.057) 0.319 (0.153, 0.484) 0.074 (0.052, 0.097) 0.140 (0.057, 0.222) 0.114 (0.049, 0.179)n 1.250 (1.118, 1.382) 1.208 (1.189, 1.228) 1.126 (1.115, 1.138) 1.210 (1.190, 1.229) 1.173 (1.151, 1.196) 1.171 (1.147, 1.194)
3–6 �r 0.262 (0.215, 0.310) �0.001 �0.001 �0.001 �0.001 �0.001�s 0.534 (0.527, 0.541) 0.503 (0.498, 0.507) 0.510 (0.490, 0.530) 0.555 (0.541, 0.569) 0.536 (0.517, 0.554) 0.561 (0.536, 0.585)� 0.046 (0.035, 0.057) 0.045 (0.033, 0.057) 0.257 (0.079, 0.435) 0.041 (0.026, 0.057) 0.362 (0.171, 0.553) 0.086 (0.026, 0.147)n 1.496 (1.284, 1.709) 1.208 (1.189, 1.228) 1.120 (1.104, 1.137) 1.226 (1.199, 1.254) 1.137 (1.123, 1.152) 1.174 (1.146, 1.203)
6–9 �r na§ �0.001 �0.001 �0.001 �0.001 �0.001�s na 0.473 (0.451, 0.494) 0.464 (0.442, 0.486) 0.517 (0.503, 0.530) 0.496 (0.480, 0.512) 0.490 (0.475, 0.505)� na 0.028 (0.015, 0.042) 0.037 (0.007, 0.067) 0.029 (0.019, 0.039) 0.201 (0.073, 0.330) 0.053 (0.022, 0.085)n na 1.225 (1.192, 1.258) 1.156 (1.126, 1.187) 1.225 (1.201, 1.250) 1.132 (1.113, 1.151) 1.168 (1.137, 1.199)
† Units of parameters: �r, cm3 cm�3; �s, cm3 cm�3; �, cm�1; n (�).‡ Values in parentheses are 95% confidence intervals.§ Data not available.¶ If residual water content �0.001, the model assumesa value of zero for fitting purposes.
Fig. 4. Variation in time and depth in the distribution of pore sizes (expressed as percentage of total porosity f ), determined from the soilmoisture characteristic.
Rep
rodu
ced
from
Soi
l Sci
ence
Soc
iety
of A
mer
ica
Jour
nal.
Pub
lishe
d by
Soi
l Sci
ence
Soc
iety
of A
mer
ica.
All
copy
right
s re
serv
ed.
FUENTES ET AL.: HYDRAULIC PROPERTIES IN A SILT LOAM SOIL 1687
Fig. 5. Hydraulic conductivity averaged over all sampling periods for sampling depths (a) 0 to 5 cm and (b) 5 to 10 cm. Symbols represent thegeometric mean and the bars are 95% confidence intervals (n � 48). Inserts show data on a semi-logarithmic plot, with the same units ofthe axes as the linear-linear plots.
the NP. This decrease of conductivity with depth was CT and NT. It seems that 27 yr of no tillage have onlyslightly contributed to the recovery of the hydraulicassociated with an increase in bulk density (Fig. 2). As
an exception, no significant differences were found for conductivity that existed previous to cultivation.Due to the unique characteristics of the Palouse NP,the conductivities at �15 cm H2O hydraulic head be-
tween depths (Table 3), which indicates that equivalent its hydraulic properties might be difficult to restore. Notill seems to help in the process of restoring some ofpore diameters �0.2 mm were not affected by soil depth.
In terms of equivalent pore diameters that are effec- the original properties of the natural soils of the area.However, a restoration of the original hydraulic conduc-tive for transmission of water, the NP not only showed
a larger fraction of large pores, but also a more uniform tivity may need a much longer period of time. The imple-mentation of other management practices that help todistribution (Fig. 5). The differences in the distribution
of pore sizes between the management systems were increase soil water flow and minimize soil erosion,should consider the formation of more continuous andmost pronounced at the very top (0–3 cm) and dimin-
ished with increasing soil depth (Fig. 4). The NP had long-lasting pores. The introduction of perennial plantsthat favor a more continuous and enduring root systemthe largest fraction of large pores (�375-�m diam.) in
the 0- to 3-cm depth, likely due to the higher organic may potentially contribute to this purpose. Implementa-tion of long-lasting conservation reserve programs asmatter content.well as the introduction of perennial crops can be apromising approach to restore original hydraulic prop-CONCLUSIONSerties.
The Palouse Region of Washington State is character-ACKNOWLEDGMENTSized by intensive dry-land agriculture, which is primarily
supported by the deep and fertile soils of the area. Such This research was supported by the USDA-STEEP Pro-gram at Washington State University. We thank Mary Fauci,intensive use of the soil has increased the need for aDavid Uberuaga, and Shawn Wetterau for their help duringbetter understanding of soil water dynamics. The resultsfield sampling. We thank Marc Evans for help with the statisti-of this study showed that hydraulic conductivity variedcal analysis, and the Associate Editor, anonymous reviewers,in time. The main factor responsible for this temporaland Steve Albrecht for comments on the manuscript.variation was the expansion of soil pores caused by
wetter soil conditions. This phenomenon was more pro- REFERENCESnounced in the NP where the amount of organic matter
Ahuja, L.R., F. Fiedler, G.H. Dunn, J.G. Benjamin, and A. Garrison.was considerably greater than in the CT and NT soils.1998. Changes in soil water retention curves due to tillage andThe effect of tillage practices on the temporal variation natural reconsolidation. Soil Sci. Soc. Am. J. 62:1228–1233.
of hydraulic conductivity seemed to be small. Soils under Angulo-Jaramillo, R., R.F. Moreno, B.E. Clothier, J.L. Thony, G.Vachaud, E. Fernandez-Boy, and J.A. Cayuela. 1997. SeasonalCT had a weak aggregate stability (Pierson and Mulla,variation of hydraulic properties of soils measured using a tension1989) so that the effect of tillage operations was counter-disk infiltrometer. Soil Sci. Soc. Am. J. 61:27–32.balanced by natural reconsolidation.
Ankeny, M.D., T.C. Kaspar, and R. Horton. 1990. CharacterizationAfter 27 yr of continuous NT, the hydraulic conduc- of tillage and traffic effects on unconfined infiltration measure-
tivities increased as compared with CT; however, except ments. Soil Sci. Soc. Am. J. 54:837–840.Azevedo, A.S., R.S. Kanwar, and R. Horton. 1998. Effect of cultivationfor saturated hydraulic conductivities, this effect was
on hydraulic properties of an Iowa soil using tension infiltrometers.not significant. Unsaturated hydraulic conductivities atSoil Sci. 163:22–29.all measured tensions were similar between the two Bagarello, V., M. Iovino, and W.D. Reynolds. 1999. Measuring hy-
cultivated systems. The hydraulic conductivity under NP draulic conductivity in a cracking clay soil using the Guelph permea-meter. Trans. ASAE 42:957–964.was about one order of magnitude greater than under
Rep
rodu
ced
from
Soi
l Sci
ence
Soc
iety
of A
mer
ica
Jour
nal.
Pub
lishe
d by
Soi
l Sci
ence
Soc
iety
of A
mer
ica.
All
copy
right
s re
serv
ed.
1688 SOIL SCI. SOC. AM. J., VOL. 68, SEPTEMBER–OCTOBER 2004
Beven, K., and P. Germann. 1982. Macropores and water flow in Michalson, E.L. 1999. A history of conservation research in the PacificNorthwest. p. 1–10. In E.L. Michalson et al. (ed.) Conservationsoils. Water Resour. Res. 18:1311–1325.
Bouma, J. 1991. Influence of soil macroporosity on environmental farming in the United States. The methods and accomplishmentsof the STEEP Program. CRC Press, Boca Raton, FL.quality. Adv. Agron. 46:1–37.
Cassel, D.K., and L.A. Nelson. 1985. Spatial and temporal variability Mitchell, A.R., T.R. Ellsworth, and B.D. Meek. 1995. Effect of rootsystems on preferential flow in swelling soil. Commun. Soil Sci.of soil physical properties of Norfolk loamy sand as affected by
tillage. Soil Tillage Res. 5:5–17. Plant Anal. 26:2655–2666.Murphy, B.W., T.B. Koen, B.A. Jones, and L.M. Huxedurp. 1993.Daubenmire, R.F. 1988. Steppe vegetation of Washington. Tech. Rep.
Washington State Coop. Extension and USDA Tech. Bull. EB1446, Temporal variation of hydraulic properties for some soils withfragile structure. Aust. J. Soil Res. 31:179–197.Pullman, WA.
Nielsen, D.R., J.W. Biggar, and K.T. Erh. 1973. Spatial variability ofDespain, D.W., and G.A. Harris. 1983. Kramer Palouse Natural Area.field-measured soil-water properties. Hilgardia 42:215–259.Great Basin Nat. 43:421–424.
Pierson, F.B., and D.J. Mulla. 1989. An improved method for measur-Donaldson, N.C. 1980. Soil survey of Whitman County, Washington.ing aggregate stability of a weakly aggregated loessial soil. Soil Sci.USDA-SCS, Washington State University, Pullman, WA.Soc. Am. J. 53:1825–1831.Earthinfo 1995. NCDC summary of the day. Earthinfo, Inc., Boul-
Rasse, D.P., A.J.M. Smucker, and D. Santos. 2000. Alfalfa root shootder, CO.mulching effects on soil hydraulic properties and aggregation. SoilGantzer, C.J., and G.R. Blake. 1978. Physical characteristics of LeSci. Soc. Am. J. 64:725–731.Sueur clay loam following no-till and conventional tillage. Agron.
Reynolds, W.D., and W.D. Zebchuk. 1996. Use of contact materialJ. 70:853–857.in tension infiltrometer measurements. Soil Technol. 9:141–159.Heddadj, D., and C. Gascuel-Odoux. 1999. Topographic and seasonal
Russo, D., I. Russo, and A. Laufer. 1997. On the spatial variabilityvariations of unsaturated hydraulic conductivity as measured byof parameters of the unsaturated hydraulic conductivity. Watertension disc infiltrometers at the field scale. Eur. J. Soil Sci. 50:Resour. Res. 33:947–956.275–283.
Schwartz, R.C., S.R. Evett, and P.W. Unger. 2003. Soil hydraulicHillel, D. 1998. Environmental soil physics. Academic Press, Sanproperties of cropland compared with reestablished and nativeDiego.grassland. Geoderma 116:47–60.Jabro, J.D. 1996. Variability of field-saturated hydraulic conductivity
Scott, H.D., A. Mauromoustakos, I.P. Handayani, and D.M. Miller.in a Hagerstown soil as affected by initial water content. Soil1994. Temporal variability of selected properties of loessial soil asSci. 161:735–739.affected by cropping. Soil Sci. Soc. Am. J. 58:1531–1538.Jury, W.A., D. Russo, G. Sposito, and H. Elabd. 1987. The spatial
Scott, H.D., and L.S. Wood. 1989. Impact of crop production on thevariability of water and solute transport properties in unsaturatedphysical status of a typic Albaqualf. Soil Sci. Soc. Am. J. 53:soil. I. Analysis of property variation and spatial structure with1819–1825.statistical models. Hilgardia 55:1–32. Sokal, R.R., and F.J. Rohlf. 1995. Biometry. 3rd ed. Freeman andKlute, A., and C. Dirksen. 1986. Hydraulic conductivity and diffusivity: Co., New York.Laboratory methods. p. 687–734. In A. Klute (ed.) Methods of soil Suwardji, P., and P.L. Eberbach. 1998. Seasonal changes of physical
analysis. Part 1. 2nd ed. ASA, Madison, WI. properties of an Oxic Paleustalf (Red Kandosol) after 16 years ofLogsdon, S.D. 1993. Negative head hydraulic properties of the soil direct drilling or conventional cultivation. Soil Tillage Res. 49:
surface at different times. Soil Sci. 56:373–379. 65–77.Logsdon, S.D., and D.B. Jaynes. 1996. Spatial variability of hydraulic Townend, J., M.J. Reeve, and A. Carter. 2000. Water Release Charac-
conductivity in a cultivated field at different times. Soil Sci. Soc. teristic. p. 95–140. In K.A. Smith and C.E. Mullins (ed.) Soil envi-Am. J. 60:703–709. ronmental analysis. Physical methods. 2nd ed. Marcel Dekker,
Low, A. 1972. The effect of cultivation on the structure and other New York.physical characteristics of grassland and arable soils (1945–1970). Tsuboyama, Y., R.C. Sidle, S. Noguchi, and I. Hosoda. 1994. FlowJ. Soil Sci. 23:363–380. and solute transport through the soil matrix and macropores of a
Mapa, R.B., R.E. Green, and L. Santo. 1986. Temporal variability of hillslope segment. Water Resour. Res. 30:879–890.soil hydraulic properties with wetting and drying subsequent to van Genuchten, M.Th. 1980. A closed-form equation for predictingtillage. Soil Sci. Soc. Am. J. 50:1133–1138. the hydraulic conductivity of unsaturated soils. Soil Sci. Soc. Am.
Meek, B.D., E.R. Rechel, L.M. Carter, W.R. DeTar, and A.L. Urie. J. 44:892–898.1992. Infiltration rate of a sandy loam soil: Effects of traffic, tillage, van Genuchten, M.Th., F.J. Leij, and S.R. Yates. 1991. The RETCand plant roots. Soil Sci. Soc. Am. J. 56:908–913. Code for Quantifying the Hydraulic Functions of Unsaturated
Messing, I., and N.J. Jarvis. 1990. Seasonal variation in field-saturated Soils. U.S. Environmental Protection Agency, EPA/600/2–91/065,hydraulic conductivity in two swelling clay soils in Sweden. J. Soil Washington, DC.Sci. 41:229–237. Willoughby, G.L., E.J. Kladivko, and M.R. Savabi. 1996. Seasonal
Messing, I., and N.J. Jarvis. 1993. Temporal variation in the hydraulic variations in infiltration rate under no-till and conventional (disk)conductivity of a tilled clay soil as measured by tension infiltromet- tillage systems as affected by Lumbricus terrestris activity. Soil Biol.
Biochem. 29:481–484.ers. J. Soil Sci. 44:11–24.