Embed Size (px)
Citation preview
SKILLED LABOUR: GAINS AND LOSSES
Bob Birrell, Ian R Dobson, Virginia Rapson and T. Fred Smith
Centre for Population and Urban ResearchMonash University
July 2001
Commonwealth of Australia 2001
ISBN 0 642 26063 X
This work is copyright. Apart from any use as permitted under the Copyright Act 1968, nopart may be reproduced by any process without prior written permission from theCommonwealth available from Info Products. Requests and inquiries concerningreproduction and rights should be addressed to:
The ManagerLegislative ServicesInfo ProductsDepartment of Finance and AdministrationGPO Box 1920CANBERRA ACT 2601
The views expressed in this report are those of the authors and do not necessarily representthose of the Department of Immigration and Multicultural Affairs.
Skilled Labour: Gains and Losses - page 3
SKILLED LABOUR: GAINS AND LOSSES
Table of Contents
Page
Executive Summary 5
Introduction 7
Data Sources 8
Aggregate Movements 10
How significant is Australia’s ‘brain gain’? 13
The magnitude of net losses of skilled residents 16
Testing ideas about resident losses 20
Analysis of selected occupations 25
The movement of skilled migrants to Australia 31
Conclusion 35
References 36
Appendix 37
Skilled Labour: Gains and Losses - page 4
The Authors
Bob Birrell is Reader in Sociology and Director, Centre for Population and Urban Research,Monash University.
Ian R Dobson is Director of Institutional Research and Associate to the DeputyVice-Chancellor at Monash University.
Virginia Rapson is Research Manager, Centre for Population and Urban Research, MonashUniversity.
T. Fred Smith is Deputy Vice-Chancellor (Research) at La Trobe University.
Acknowledgements
We would like to acknowledge the financial support for this project by the Department ofImmigration and Multicultural Affairs; the Department of Employment, Workplace Relationsand Small Business; the Department of Education, Training and Youth Affairs; theDepartment of Industry, Science and Resources; The National Office for the InformationEconomy; and AXISS Australia.
Skilled Labour: Gains and Losses - page 5
Executive Summary
This Report examines the movement of skilled workers to and from Australia over the fiveyear period 1995-96 to 1999-2000. The main objective was to establish the extent of anylosses or gains of such workers by occupation over this period. The Report also incorporates aqualitative component which explores the factors shaping the international movement ofskilled workers.
The data utilised covered all persons arriving in or leaving Australia on a permanent or long-term basis, including New Zealand citizens. Long-term arrivals refer to persons who state anintention of staying in Australia for a year or more. Long-term departures refer, in the case ofAustralian residents, to persons who state that they are leaving Australia for a year or more,and in the case of visitors, to those who state that they are leaving Australia after a visit of ayear or more. The data originate primarily from passenger cards filled in by people arriving,or leaving Australia. Because of this, the information provided is sometimes inadequate forprecise identification of their occupation. The data base also lacks qualitative information onthe occupational characteristics of movers, such as level of education and job experience. It istherefore not possible to address concerns such as those related to the loss of senior researchscientists.
The Report classifies the movement data into three streams. The first is settlers, that is, thosewho say that their stay in Australia is permanent (including New Zealand citizens). Thesecond is residents, who are defined as all those who are permanent residents of Australia,whether Australia-born or former settlers. The third stream is visitors who hold rights to workand who state an intention of staying long-term in Australia. Australia’s gain or loss of skilledworkers is thus the sum of the movement of settlers and the net flows of Australian residentsand visitors.
The main finding is that over the five years in question Australia registered a ‘brain gain’.There was a net loss of skilled residents, but this was more than offset for almost everyoccupation by gains from settler movement and a net inflow of visitors.
Detailed analysis of skilled worker movements over the three years 1997-98 to 1999-2000showed that the overall skilled worker gain was modest relative to the total Australianemployed workforce as of May 2000. The ‘brain gain’ over this three year period forprofessionals was equivalent to 2 per cent of the stock of employed professional workers and3.6 per cent for managers and administrators relative to the managerial and administrativeworkforce in employment. Gains of this order were found for all the occupations underconsideration including 3.2 per cent for computing professionals, 2.1 per cent for accountantsand 0.6 per cent for nursing professionals.
A major focus of the Report is the extent of net resident losses of skilled workers. In the caseof professionals this loss was 35,927 over the three years 1997-98 to 1999-2000. This losshas increased during the 1990s. Nevertheless, when compared to the stock of Australia’semployed workforce as of May 2000, it is small. The loss of residents was equivalent to 2.2per cent for all professionals. There was no tendency for high losses in occupations whereinternational demand was strong during the period. The net resident loss relative to theemployed stock of workers was 2.1 per cent for computing professionals, 2.9 per cent foraccountants and 1.4 per cent for nurses.
Skilled Labour: Gains and Losses - page 6
Further analysis of the movements of resident professionals showed that by far the chiefdestination for those leaving on a permanent or long-term basis was the United Kingdom,followed by the USA and Singapore. Return rates from these destinations were 70 per centfrom the United Kingdom, 58 per cent from the United States and 44 per cent from Singapore.
The predominance of the United Kingdom as a destination, the relatively high return rate andthe youthful age of Australian residents departing for the United Kingdom, suggest that muchof this movement was akin to the traditional Australian ‘boomerang’ trip overseas. TheUnited Kingdom remains the main destination for such trips, in part because a substantialminority of Australian residents hold work rights in Britain. Young Australians also haveaccess to Working Holiday visa rights to the United Kingdom (but not to the United States).
While the study did not support the widespread view that Australia is experiencing a ‘braindrain’, the lack of qualitative data on movers leaves open the possibility that Australia islosing high quality residents and replacing them with lower quality settlers and visitors.Analysis of past patterns of immigration indicates that there was some basis for this concernin the late 1980s, but that the recent tightening of the immigration program has led to a bettertargeted and higher quality flow of migrants.
The final qualitative phase of the Report explores the issue of why, given that there are morelucrative opportunities for some professionals overseas, Australia is losing so few of itsskilled workers, even in high demand fields like computing. The same question applies to thecontinued inflow of settlers and visitors in these fields. The conclusion drawn from casestudies of particular occupations was that where demand for the skill in question in Australiawas strong there is a relatively limited outflow of residents. The implication is thatemployment in Australia offers attractions other than high salaries. The analysis of this issuesuggests that the main attraction is lifestyle.
Skilled Labour: Gains and Losses - page 7
SKILLED LABOUR: GAINS AND LOSSES
Introduction
There is widespread concern about Australia losing skilled workers to other nations. The fearof an alleged ‘brain drain’ is largely based on anecdotal accounts of high level scientists,computing professionals and others being attracted to the United States or some other firstworld country. There is a reciprocal concern that Australia will not be able to attract highlyskilled migrants because of the competitive advantage of locations like the United States,given Australia’s weak dollar and relatively low salaries. According to Professor LauchlanChipman, Chair of the Australian Vice-Chancellors’ Committee’s Standing Committee onInformation Policy, even if Australia tries to fill the allegedly wide gaps in the Australian ITworkforce with developing country migrants ‘it is not going to happen. The bidding war forgraduates from developing nations would have been intense in any circumstances but with aweak dollar Australia is simply not in the hunt.'1
Despite the anecdotal nature of these concerns, they are plausible given that there are lucrativeopportunities available to some categories of skilled Australian workers in some locations.The recent decline in the value of the Australian dollar has added fuel to such concerns. Thereis also evidence of new opportunities for international migration. Only a few developedcountries operate formal migration programs, including the United States, Canada, NewZealand and Australia. But there are new opportunities for the movement of skilled workers,mainly directed at persons moving for temporary employment, but usually also ultimatelyoffering permanent residence. The United States, in particular, has sharply increased itsannual quota of temporary resident work visas (H-1B visas) from 65,000 in the late 1990s to195,000 in 2001. The nations of Western Europe, which have hitherto run highly restrictivemigration regimes are also becoming more open to skilled migration. Great Britain, which isby far the largest destination of skilled Australian residents moving overseas, has recently(late 2000) made employment based work visas more accessible. These reforms includeallowing recent foreign born graduates of British universities in skill shortage areas to beeligible for work permits where they are sponsored by a British employer, even though theyhave no work experience.2 Partly as a result, net migration into Britain has increased sharplyin recent years, not just from the subcontinent of India and other former British colonies inAsia, Africa and elsewhere, but also from ‘Old’ Commonwealth countries like New Zealand,Australia and Canada. 3
There has been little systematic analysis of migration movements in the many academicworks which have explored the social and economic implications of the new ‘globalising’environment. Nevertheless, the impression given in these works is that a two tiered pattern isemerging in which the knowledge- and capital-rich experience minimal constraints oninternational mobility at the same time as barriers are increasingly being laid against themovement of others. As one text puts it ‘for the inhabitants of the first world – theincreasingly cosmopolitan, extraterritorial world of global businessmen, global culturemanagers or global academics, state borders are leveled down, as they are dismantled for theworld’s commodities, capital and finances’.4 Another argues that ‘people with scarce skillscan go anywhere in response to attractive combinations of income levels and lifestyles. This isone of the factors contributing to the concentration of innovation and control in "world cities"which dominate the global economy.’5
Skilled Labour: Gains and Losses - page 8
Given this setting it is not surprising that many Australian commentators fear that Australiacould be subject to a ‘brain drain’. Australia, as an outlier in the global economy, may appearto be vulnerable in a context where there is an international scramble for skilled labour. Justas both Tasmania and New Zealand are losing significant components of their ‘best andbrightest’ to the Australian mainland,6 so perhaps Australia may find itself being drained ofsuch people to the international corporate heartlands of Europe and North America.
This study explores these concerns by examining the international movement of skilledpersons to and from Australia in the second half of the 1990s. Data are provided on themovements of people in selected occupations to and from Australia over the period 1995-96to 1999-2000. The occupations chosen include those such as computing professionals andaccountants where supply shortages were evident in Australia during the second half of the1990s. In these occupations there has been some concern that these shortages have beenexacerbated by a ‘brain drain’ from Australia. The other occupations studied were selectedbecause of their particular interest to the Commonwealth Departments which contributed tothe support for the study. These include scientists and engineers. In the case of scientists, theconcern has not so much been a lack of domestic supply but fears that allegedly inadequatepublic and private support for research and development in Australia has prompted an exodusof Australian scientists to overseas locations.
Data Sources
The Australian Government holds one of the most comprehensive sets of records ofinternational movers in the world. Occupational detail (down to the four-digit AustralianStandard Classification of Occupations (ASCO) level) is recorded and stored electronicallyfor the following categories of movers:Arrivals• Persons entering Australia on a permanent basis (that is, they hold permanent residence
visas – sometimes referred to as settlers) who say they are part of the workforce.• New Zealand citizens who say they are part of the workforce and intend to settle here
permanently or who enter on a long-term basis (defined as arriving in Australia with thestated intention of staying a year or more).
• All others who do not hold permanent residence visas but who intend to visit Australia fora year or more and who are in the workforce.
• Australian residents (that is, persons born in Australia or persons who hold permanentresidence visas, including New Zealand citizens who normally live in Australia) who arereturning from a long-term stay overseas (defined as a year or more).
Departures• Residents leaving Australia who declare that they are leaving permanently.• Residents who indicate that their departure is for a long-term visit overseas (defined as a
year or more in duration).• Visitors (persons not holding permanent residence status) who are leaving Australia after
a long-term stay of a year or more.
For each of the persons moving in and out of Australia in the above categories, apart fromoccupation (if in the workforce), information is available on birthplace, citizenship, age, sex,place of origin for arrivals and place of destination for departures, and visa category. No dataare available for education level.
Skilled Labour: Gains and Losses - page 9
Limitations of the data
While the information described is of great value for the purposes of this study, it haslimitations. First, no occupation data are recorded for persons who arrive for short-term visits(defined as less than a year’s duration) or, in the case of Australian residents, those who arereturning from a short-term visit overseas. This means that the data tend to understate thecontribution of skilled visitors to the Australian workforce. This is particularly so in the caseof arrivals holding long-stay business visas (visa category 457) who may stay for up to fouryears but often indicate that their visit is to be short term (that is, less than one year’sduration). These 457 visa category visitors would normally undertake skilled work inAustralia.
Second, the veracity of the occupation data depends on the traveller filling out his or herpassenger card accurately. (One exception is those entering Australia as permanent residentsin the skilled categories or on long-stay business visas whose occupational data are takenfrom electronic data sources entered by the Department of Immigration and MulticulturalAffairs (DIMA) officers at the overseas issuing post). Passengers often do not fill in the fulldetail of their occupation. Thus instead of saying that they are an electrical or mechanicalengineer, they simply write ‘engineer’. Or instead of indicating their occupation is primary orsecondary teacher they write ‘teacher’. Teachers are not shown here by category for thisreason. In the case of natural and physical science professionals, detail for each componentoccupation is provided along with a total for the category. However, the detail for thecomponent occupations must be treated with caution. It is likely to be accurate for the settlergroup because it is taken from on-line sources (rather than from the passenger card) derivingfrom the original application process. But for other movement categories the informationcomes from the less reliable passenger card. Thus the ‘other natural and physical science’ sub-category tends to be artificially increased because those coding the passenger cards often donot have enough information to be precise about which occupation within the natural andphysical sciences the person occupies.
Third, there is the possibility of people incorrectly filling in the time period of their visit orstay overseas. In the case of visitor arrivals, it is common for the same person to indicate thathe or she is entering Australia for a long-term stay more than once in a particular year. Forexample, a long-stay business visa holder may enter Australia intending to work for morethan a year, but go home for Christmas. When returning to Australia after Christmas he or shemay quite correctly say (again) that a long-term stay is intended. The data set utilised in theanalysis here includes an indicator for each long-term arrival as to whether the entry is thefirst or a subsequent entry. Analysis of these data has shown that about a third of visitorentries recorded as long-term are second or subsequent entries. Thus published information ofthe movements of long-term visitors (including that reported in Australian Bureau of Statistics(ABS) publications) may exaggerate the number of people entering Australia for such visits.For this study we have not taken account of duplicate entries because there is no parallelindicator for ‘first’ and subsequent departure for visitors leaving Australia after a long-termstay. To some extent the ‘excess’ of long-term visitor arrivals will be counteracted byduplicates in the departure data as well.
Skilled Labour: Gains and Losses - page 10
Fourth, there is the problem of ‘category jumping’. Both residents and visitors may not leaveor stay for the period they state on their passenger card. This could lead to over orunderestimates of movers by occupation. Though the ABS calculates 'category jumping'estimates for the overall flows of residents and visitors, no adjustments are made byoccupation. For example, if an Australian resident leaves saying the departure is for a short-term but in fact leaves for a long-term stay or permanently, the statistics will undercount theloss of residents. There is no doubt that this occurs, particularly in the case of some overseas-born residents. For example, the ABS has consistently estimated that a high level of HongKong-born Australian residents who say they are leaving for a short-term stay in fact leave fora longer period.7 There is no way of identifying the occupation of such persons. ‘Categoryjumping’ also occurs in the other direction, especially where persons enter Australia as short-term visitors such as students and thus do not have an occupation recorded. Where suchpersons subsequently change their status in Australia to that of permanent resident (such aswhen a former overseas student is sponsored for permanent residence by an employer) theythen become ‘category jumpers’. Currently over half of all long stay Temporary Businessvisas are issued to applicants already in Australia, usually to persons who arrived on short-term visitor visas. Many of these persons will subsequently work in Australia on a long-termbasis, but will not have been counted amongst the long-term visitor arrivals in the movementsdata base.
Finally it is difficult to assess the ‘quality’ of movers. As noted, there are no data oneducational level in the movements data base. It is obvious that the value to Australianemployers of movers such as doctors, university lecturers, engineers and so on will varysharply according to the qualifications and experience these persons bring with them. Thoseselected under the Government’s Independent program are far more likely to be able toproductively enter the Australian labour market than those entering under the family reunionor humanitarian programs. In these latter categories there is no consideration of qualificationsor English language skills in the selection process. This ‘quality’ issue will be exploredfurther below.
These caveats indicate that the apparent precision shown in the tables can be misleading. Theinformation presented should be regarded as indicative of the impact of internationalmovement on Australia’s skilled workforce. Nevertheless, the Australian data provide a richsource of information on the origin and destination of arrivals and departures by occupationfor most of those with work rights in Australia, as well as some characteristics of the mover,including birthplace and citizenship.
Aggregate movements
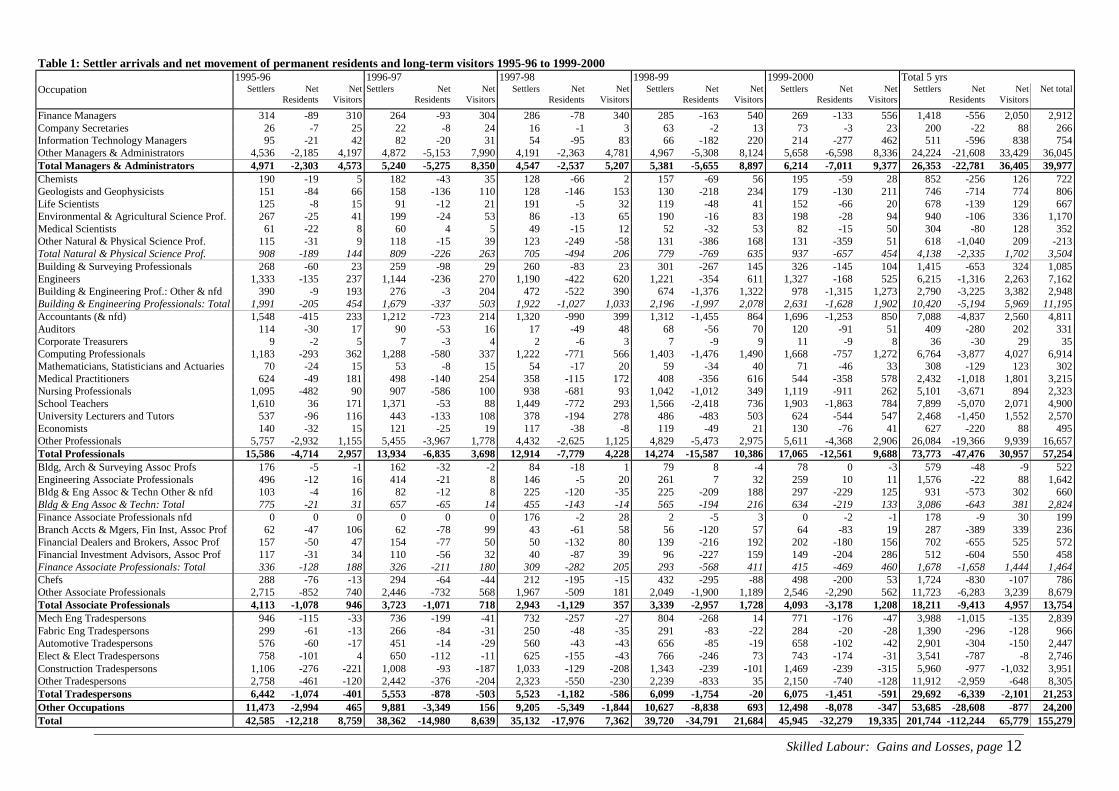
We begin with the overall pattern. Table 1 shows the annual net flows of persons with anoccupation over the years 1995-96 to 1999-2000, by selected occupations and totalmovements for all persons indicating an occupation. For the years 1995-96 and 1996-97 theoccupational data were adjusted to the Second Edition ASCO occupational definitionsintroduced in 1996 through the use of a concordance prepared by the ABS. DIMA did notswitch to the Second Edition ASCO definitions until the year 1997-98.
Three broad categories of movers are distinguished as; those arriving as permanent residentsor settlers, net residents and net visitors. This classification is used throughout the Report.Settlers or permanent residents include all those who initially arrive in Australia holding
Skilled Labour: Gains and Losses - page 11
permanent resident visas. They also include New Zealanders where such persons indicate thattheir stay in Australia is permanent. Once in Australia, however, settlers are regarded for thepurposes of this study as part of the overall stock of residents. It is generally assumed (orhoped) that settlers, as well as Australia-born residents, are here to stay. Table 1 shows thatthe settler inflow has been substantial throughout the 1995-96 to 1999-2000 period, and that ithas increased significantly since 1997-98.
Central to this study is the extent to which any part of the stock of permanent residents(whether Australia-born or settlers) is departing and not returning. Fears about a ‘brain drain’refer to possible losses amongst both Australia-born and overseas-born residents. Like theAustralia-born residents, settlers have the right to leave and, if they fulfil certain residentialrequirements, can return to Australia when and if they please. Thus the second category, netresidents, refers to the difference between the number of permanent residents leavingAustralia who say that their departure is permanent or long-term and the number who returnafter a long-term stay overseas. We do not differentiate between those indicating that theirstay overseas is permanent or long-term, largely because decisions on this matter are oftenfluid. However, for the record, in 1999-2000 a third of residents departing Australia on apermanent or long-term basis said that they were leaving Australia permanently. Table 1shows that there has been a net loss of skilled residents throughout the period in question andthat this loss has increased sharply, particularly since 1998-99. The components of this netloss are probed later. Nevertheless, it is notable that the net resident loss is less than the gainsfrom settler arrivals for all persons recording an occupation through the period 1995-96 to1999-2000. However, there are some occupations amongst the professional and managerialgroup where the net resident loss exceeds the settler intake, especially in 1998-99 and 1999-2000.
The third component identified in Table 1 and elsewhere in this study is net visitors. Thisrefers to the difference between the number of those who arrive in Australia with a visaallowing them to work who indicate that their stay is to be for a year or more and those wholeave Australia after a long-term stay of a year or more. Table 1 shows that there is asignificant and growing number of net visitors over the second half of the 1990s.
When these three streams are combined, it is plain that Australia is not experiencing anaggregate ‘brain drain’. Over the five years to 30 June 2000 there was a net gain of155,279 persons who hold an occupation. There was a gain in every occupation identified(apart from Other Natural and Physical Science Professionals, but this possibly derivesfrom the coding problems mentioned above).
Skilled Labour: Gains and Losses, page 12
Table 1: Settler arrivals and net movement of permanent residents and long-term visitors 1995-96 to 1999-20001995-96 1996-97 1997-98 1998-99 1999-2000 Total 5 yrs
Occupation Settlers NetResidents
NetVisitors
Settlers NetResidents
NetVisitors
Settlers NetResidents
NetVisitors
Settlers NetResidents
NetVisitors
Settlers NetResidents
NetVisitors
Settlers NetResidents
NetVisitors
Net total
Finance Managers 314 -89 310 264 -93 304 286 -78 340 285 -163 540 269 -133 556 1,418 -556 2,050 2,912Company Secretaries 26 -7 25 22 -8 24 16 -1 3 63 -2 13 73 -3 23 200 -22 88 266Information Technology Managers 95 -21 42 82 -20 31 54 -95 83 66 -182 220 214 -277 462 511 -596 838 754Other Managers & Administrators 4,536 -2,185 4,197 4,872 -5,153 7,990 4,191 -2,363 4,781 4,967 -5,308 8,124 5,658 -6,598 8,336 24,224 -21,608 33,429 36,045Total Managers & Administrators 4,971 -2,303 4,573 5,240 -5,275 8,350 4,547 -2,537 5,207 5,381 -5,655 8,897 6,214 -7,011 9,377 26,353 -22,781 36,405 39,977Chemists 190 -19 5 182 -43 35 128 -66 2 157 -69 56 195 -59 28 852 -256 126 722Geologists and Geophysicists 151 -84 66 158 -136 110 128 -146 153 130 -218 234 179 -130 211 746 -714 774 806Life Scientists 125 -8 15 91 -12 21 191 -5 32 119 -48 41 152 -66 20 678 -139 129 667Environmental & Agricultural Science Prof. 267 -25 41 199 -24 53 86 -13 65 190 -16 83 198 -28 94 940 -106 336 1,170Medical Scientists 61 -22 8 60 4 5 49 -15 12 52 -32 53 82 -15 50 304 -80 128 352Other Natural & Physical Science Prof. 115 -31 9 118 -15 39 123 -249 -58 131 -386 168 131 -359 51 618 -1,040 209 -213Total Natural & Physical Science Prof. 908 -189 144 809 -226 263 705 -494 206 779 -769 635 937 -657 454 4,138 -2,335 1,702 3,504Building & Surveying Professionals 268 -60 23 259 -98 29 260 -83 23 301 -267 145 326 -145 104 1,415 -653 324 1,085Engineers 1,333 -135 237 1,144 -236 270 1,190 -422 620 1,221 -354 611 1,327 -168 525 6,215 -1,316 2,263 7,162Building & Engineering Prof.: Other & nfd 390 -9 193 276 -3 204 472 -522 390 674 -1,376 1,322 978 -1,315 1,273 2,790 -3,225 3,382 2,948Building & Engineering Professionals: Total 1,991 -205 454 1,679 -337 503 1,922 -1,027 1,033 2,196 -1,997 2,078 2,631 -1,628 1,902 10,420 -5,194 5,969 11,195Accountants (& nfd) 1,548 -415 233 1,212 -723 214 1,320 -990 399 1,312 -1,455 864 1,696 -1,253 850 7,088 -4,837 2,560 4,811Auditors 114 -30 17 90 -53 16 17 -49 48 68 -56 70 120 -91 51 409 -280 202 331Corporate Treasurers 9 -2 5 7 -3 4 2 -6 3 7 -9 9 11 -9 8 36 -30 29 35Computing Professionals 1,183 -293 362 1,288 -580 337 1,222 -771 566 1,403 -1,476 1,490 1,668 -757 1,272 6,764 -3,877 4,027 6,914Mathematicians, Statisticians and Actuaries 70 -24 15 53 -8 15 54 -17 20 59 -34 40 71 -46 33 308 -129 123 302Medical Practitioners 624 -49 181 498 -140 254 358 -115 172 408 -356 616 544 -358 578 2,432 -1,018 1,801 3,215Nursing Professionals 1,095 -482 90 907 -586 100 938 -681 93 1,042 -1,012 349 1,119 -911 262 5,101 -3,671 894 2,323School Teachers 1,610 36 171 1,371 -53 88 1,449 -772 293 1,566 -2,418 736 1,903 -1,863 784 7,899 -5,070 2,071 4,900University Lecturers and Tutors 537 -96 116 443 -133 108 378 -194 278 486 -483 503 624 -544 547 2,468 -1,450 1,552 2,570Economists 140 -32 15 121 -25 19 117 -38 -8 119 -49 21 130 -76 41 627 -220 88 495Other Professionals 5,757 -2,932 1,155 5,455 -3,967 1,778 4,432 -2,625 1,125 4,829 -5,473 2,975 5,611 -4,368 2,906 26,084 -19,366 9,939 16,657Total Professionals 15,586 -4,714 2,957 13,934 -6,835 3,698 12,914 -7,779 4,228 14,274 -15,587 10,386 17,065 -12,561 9,688 73,773 -47,476 30,957 57,254Bldg, Arch & Surveying Assoc Profs 176 -5 -1 162 -32 -2 84 -18 1 79 8 -4 78 0 -3 579 -48 -9 522Engineering Associate Professionals 496 -12 16 414 -21 8 146 -5 20 261 7 32 259 10 11 1,576 -22 88 1,642Bldg & Eng Assoc & Techn Other & nfd 103 -4 16 82 -12 8 225 -120 -35 225 -209 188 297 -229 125 931 -573 302 660Bldg & Eng Assoc & Techn: Total 775 -21 31 657 -65 14 455 -143 -14 565 -194 216 634 -219 133 3,086 -643 381 2,824Finance Associate Professionals nfd 0 0 0 0 0 0 176 -2 28 2 -5 3 0 -2 -1 178 -9 30 199Branch Accts & Mgers, Fin Inst, Assoc Prof 62 -47 106 62 -78 99 43 -61 58 56 -120 57 64 -83 19 287 -389 339 236Financial Dealers and Brokers, Assoc Prof 157 -50 47 154 -77 50 50 -132 80 139 -216 192 202 -180 156 702 -655 525 572Financial Investment Advisors, Assoc Prof 117 -31 34 110 -56 32 40 -87 39 96 -227 159 149 -204 286 512 -604 550 458Finance Associate Professionals: Total 336 -128 188 326 -211 180 309 -282 205 293 -568 411 415 -469 460 1,678 -1,658 1,444 1,464Chefs 288 -76 -13 294 -64 -44 212 -195 -15 432 -295 -88 498 -200 53 1,724 -830 -107 786Other Associate Professionals 2,715 -852 740 2,446 -732 568 1,967 -509 181 2,049 -1,900 1,189 2,546 -2,290 562 11,723 -6,283 3,239 8,679Total Associate Professionals 4,113 -1,078 946 3,723 -1,071 718 2,943 -1,129 357 3,339 -2,957 1,728 4,093 -3,178 1,208 18,211 -9,413 4,957 13,754Mech Eng Tradespersons 946 -115 -33 736 -199 -41 732 -257 -27 804 -268 14 771 -176 -47 3,988 -1,015 -135 2,839Fabric Eng Tradespersons 299 -61 -13 266 -84 -31 250 -48 -35 291 -83 -22 284 -20 -28 1,390 -296 -128 966Automotive Tradespersons 576 -60 -17 451 -14 -29 560 -43 -43 656 -85 -19 658 -102 -42 2,901 -304 -150 2,447Elect & Elect Tradespersons 758 -101 4 650 -112 -11 625 -155 -43 766 -246 73 743 -174 -31 3,541 -787 -8 2,746Construction Tradespersons 1,106 -276 -221 1,008 -93 -187 1,033 -129 -208 1,343 -239 -101 1,469 -239 -315 5,960 -977 -1,032 3,951Other Tradespersons 2,758 -461 -120 2,442 -376 -204 2,323 -550 -230 2,239 -833 35 2,150 -740 -128 11,912 -2,959 -648 8,305Total Tradespersons 6,442 -1,074 -401 5,553 -878 -503 5,523 -1,182 -586 6,099 -1,754 -20 6,075 -1,451 -591 29,692 -6,339 -2,101 21,253Other Occupations 11,473 -2,994 465 9,881 -3,349 156 9,205 -5,349 -1,844 10,627 -8,838 693 12,498 -8,078 -347 53,685 -28,608 -877 24,200Total 42,585 -12,218 8,759 38,362 -14,980 8,639 35,132 -17,976 7,362 39,720 -34,791 21,684 45,945 -32,279 19,335 201,744 -112,244 65,779 155,279

Skilled Labour: Gains and Losses, page 13
How significant is Australia’s ‘brain gain’?
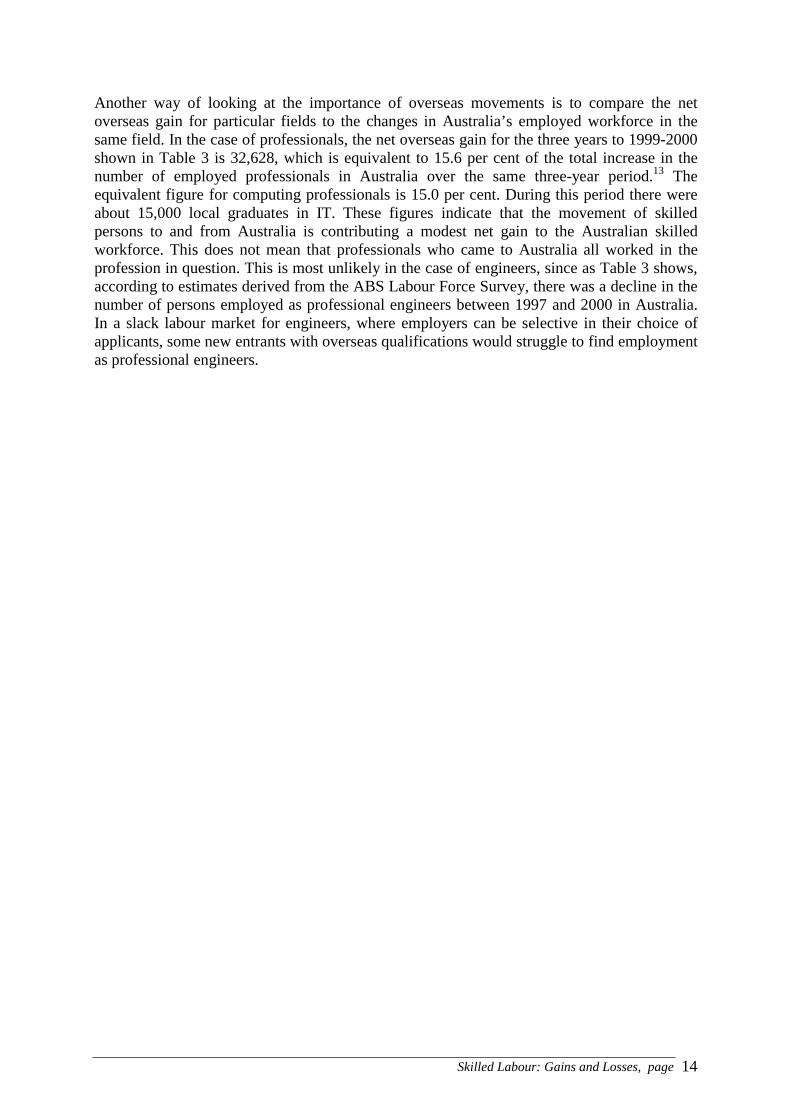
In order to assess the significance of this ‘gain’, the net gain from overseasmovements for the three years 1997-98 to 1999-2000 in each occupation has beenexpressed as a percentage of the stock of persons employed in that occupation inAustralia as of May 2000. The analysis is limited to movements over these three yearsbecause of the difficulties of providing concorded data for 1995-96 and 1996-97 whenvariables like destination/origin or birthplace are examined.
These net gain ratios, expressed as percentages, are shown in Table 2. On thismeasure, Australia has achieved a modest ‘brain gain’ in the professional fields,including computing professionals, accountants and mathematicians, statisticians andactuaries (all fields where concerns about a ‘brain drain’ have been expressed). Thenet flow from international movements over the three years to mid-2000 amongstprofessionals was equivalent to 2 per cent of the numbers employed in the professionsas of May 2000. The rate of net gain was larger in the Manager and Administratorfields and smaller for the Associate Professional and Tradespersons fields. Therelatively high net gain for building and engineering professionals (which includesengineers, architects and other building professionals) is largely a consequence of ahigh rate of settler intake in these fields in the late 1990s.
Those who have followed the ‘brain drain’ literature since the late 1980s will not besurprised at these findings. In the case of engineers, successive research reports haveindicated that Australia has experienced a net gain in its engineering workforcethrough international movements since the 1980s (and before). In 1988, Pure showedthat notwithstanding some concerns about a ‘brain drain’ at the time, Australia wasreceiving a substantial net gain of scientists and engineers from internationalmovement.8 T.F. Smith elaborated on this finding in his studies of the internationalmovement of engineers published in 19939 and 1994.10 In a subsequent study byBirrell and Hawthorne, which was based on the 1991 Census, it was shown that 44.2per cent of all persons holding degree level qualifications in engineering who wereresident in Australia in 1991 were overseas born.11 Most recently, the Department ofIndustry, Science and Resources (DISR) has reported that Australia made a net gainof scientists and engineers from international movement throughout the 1990s.12 Thereport in question shows that there was a net gain from migration of scientists andengineers over the period 1987-88 to 1998-99 of 55,000 of which 27,000 wereengineers.
Throughout the period since the late 1980s, most of the engineers arriving as settlerscame from Asia and Eastern Europe. Australia has attracted large numbers ofengineers from these locations in part because graduate numbers are large relative tothe professional opportunities in these regions. As a consequence many engineers areeager to take up any opportunities available in a first world country by immigratingthere. Table 1 shows that there were 3,728 settlers arriving in Australia over theperiod 1997-98 to 1999-2000 who indicated that they were engineers. The Appendixto this Report shows that 1,578 came from Asia, including 551 from China and 207from India. The most important Eastern Europe source countries were the formerUSSR with 143 and Romania with 93.
Skilled Labour: Gains and Losses, page 14
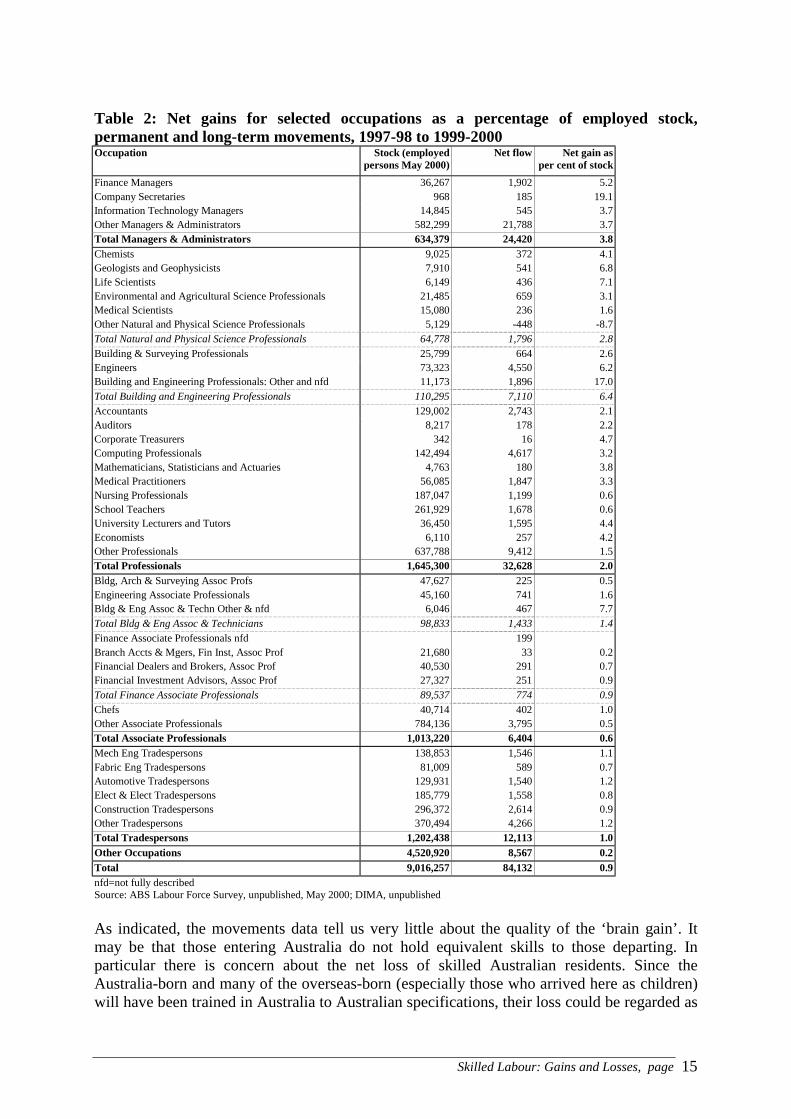
Another way of looking at the importance of overseas movements is to compare the netoverseas gain for particular fields to the changes in Australia’s employed workforce in thesame field. In the case of professionals, the net overseas gain for the three years to 1999-2000shown in Table 3 is 32,628, which is equivalent to 15.6 per cent of the total increase in thenumber of employed professionals in Australia over the same three-year period.13 Theequivalent figure for computing professionals is 15.0 per cent. During this period there wereabout 15,000 local graduates in IT. These figures indicate that the movement of skilledpersons to and from Australia is contributing a modest net gain to the Australian skilledworkforce. This does not mean that professionals who came to Australia all worked in theprofession in question. This is most unlikely in the case of engineers, since as Table 3 shows,according to estimates derived from the ABS Labour Force Survey, there was a decline in thenumber of persons employed as professional engineers between 1997 and 2000 in Australia.In a slack labour market for engineers, where employers can be selective in their choice ofapplicants, some new entrants with overseas qualifications would struggle to find employmentas professional engineers.
Skilled Labour: Gains and Losses, page 15
Table 2: Net gains for selected occupations as a percentage of employed stock,permanent and long-term movements, 1997-98 to 1999-2000Occupation Stock (employed
persons May 2000)Net flow Net gain as
per cent of stock
Finance Managers 36,267 1,902 5.2Company Secretaries 968 185 19.1Information Technology Managers 14,845 545 3.7Other Managers & Administrators 582,299 21,788 3.7Total Managers & Administrators 634,379 24,420 3.8
Chemists 9,025 372 4.1Geologists and Geophysicists 7,910 541 6.8Life Scientists 6,149 436 7.1Environmental and Agricultural Science Professionals 21,485 659 3.1Medical Scientists 15,080 236 1.6Other Natural and Physical Science Professionals 5,129 -448 -8.7
Total Natural and Physical Science Professionals 64,778 1,796 2.8
Building & Surveying Professionals 25,799 664 2.6Engineers 73,323 4,550 6.2Building and Engineering Professionals: Other and nfd 11,173 1,896 17.0
Total Building and Engineering Professionals 110,295 7,110 6.4
Accountants 129,002 2,743 2.1Auditors 8,217 178 2.2Corporate Treasurers 342 16 4.7Computing Professionals 142,494 4,617 3.2Mathematicians, Statisticians and Actuaries 4,763 180 3.8Medical Practitioners 56,085 1,847 3.3Nursing Professionals 187,047 1,199 0.6School Teachers 261,929 1,678 0.6University Lecturers and Tutors 36,450 1,595 4.4Economists 6,110 257 4.2Other Professionals 637,788 9,412 1.5Total Professionals 1,645,300 32,628 2.0
Bldg, Arch & Surveying Assoc Profs 47,627 225 0.5Engineering Associate Professionals 45,160 741 1.6Bldg & Eng Assoc & Techn Other & nfd 6,046 467 7.7
Total Bldg & Eng Assoc & Technicians 98,833 1,433 1.4
Finance Associate Professionals nfd 199Branch Accts & Mgers, Fin Inst, Assoc Prof 21,680 33 0.2Financial Dealers and Brokers, Assoc Prof 40,530 291 0.7Financial Investment Advisors, Assoc Prof 27,327 251 0.9
Total Finance Associate Professionals 89,537 774 0.9
Chefs 40,714 402 1.0Other Associate Professionals 784,136 3,795 0.5Total Associate Professionals 1,013,220 6,404 0.6
Mech Eng Tradespersons 138,853 1,546 1.1Fabric Eng Tradespersons 81,009 589 0.7Automotive Tradespersons 129,931 1,540 1.2Elect & Elect Tradespersons 185,779 1,558 0.8Construction Tradespersons 296,372 2,614 0.9Other Tradespersons 370,494 4,266 1.2Total Tradespersons 1,202,438 12,113 1.0
Other Occupations 4,520,920 8,567 0.2
Total 9,016,257 84,132 0.9
nfd=not fully describedSource: ABS Labour Force Survey, unpublished, May 2000; DIMA, unpublished
As indicated, the movements data tell us very little about the quality of the ‘brain gain’. Itmay be that those entering Australia do not hold equivalent skills to those departing. Inparticular there is concern about the net loss of skilled Australian residents. Since theAustralia-born and many of the overseas-born (especially those who arrived here as children)will have been trained in Australia to Australian specifications, their loss could be regarded as
Skilled Labour: Gains and Losses, page 16
potentially serious. Much depends on whether such persons return to Australia and the scaleof these losses relative to the total stock of persons by occupation.
Table 3: Ratio of Net International Movements to Growth in Employment 1997-2000,by Selected Occupations
Employment Net Overseas Overseas
Occupation Change Movement Movement as aPercentage of
1997 - 2000 1997 - 2000 Employment Change
Accountants 39362 2713 6.9%
Computing Professionals 30783 4617 15.0%
Nurses 12134 1199 9.9%
Natural & Physical Science Professionals 14396 1796 12.5%
Engineers -10129 4550 N/A
Other Professionals 122326 17753 14.5%
Total Professionals 208,872 32,628 15.6%
Source: Employment Change, ABS Labor Force Estimates by Occupation, May 1997 and May 2000
The magnitude of net losses of skilled residents
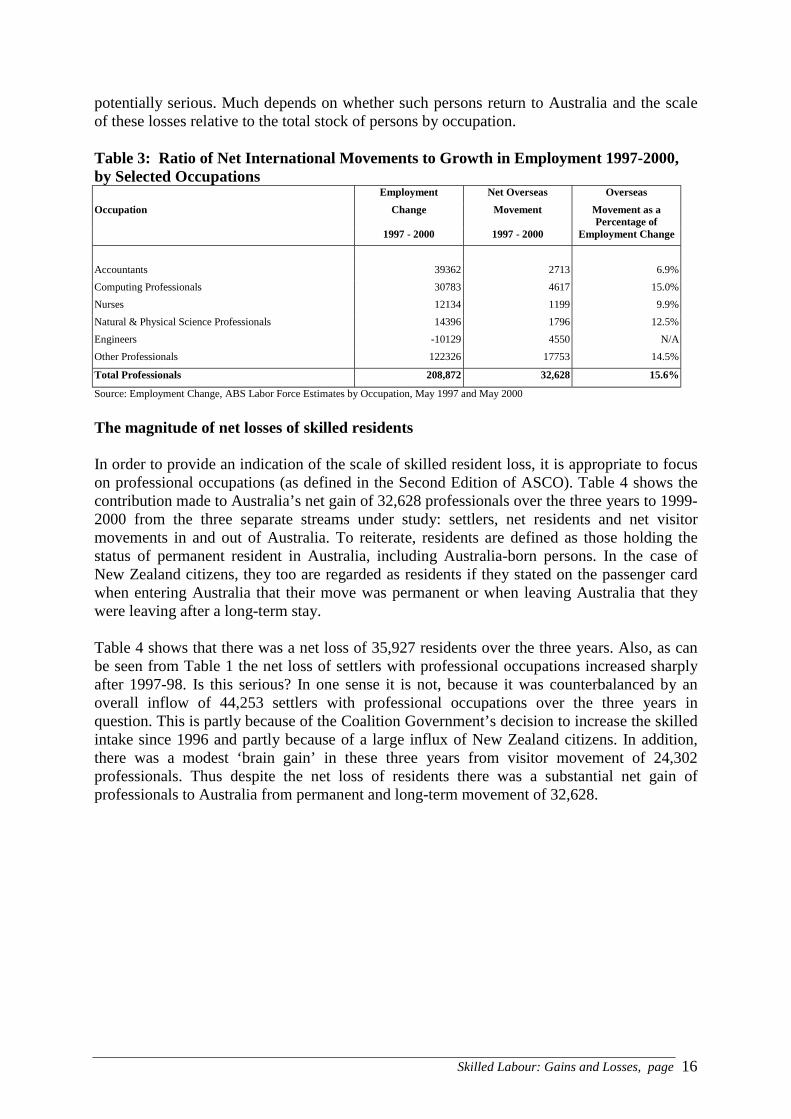
In order to provide an indication of the scale of skilled resident loss, it is appropriate to focuson professional occupations (as defined in the Second Edition of ASCO). Table 4 shows thecontribution made to Australia’s net gain of 32,628 professionals over the three years to 1999-2000 from the three separate streams under study: settlers, net residents and net visitormovements in and out of Australia. To reiterate, residents are defined as those holding thestatus of permanent resident in Australia, including Australia-born persons. In the case ofNew Zealand citizens, they too are regarded as residents if they stated on the passenger cardwhen entering Australia that their move was permanent or when leaving Australia that theywere leaving after a long-term stay.
Table 4 shows that there was a net loss of 35,927 residents over the three years. Also, as canbe seen from Table 1 the net loss of settlers with professional occupations increased sharplyafter 1997-98. Is this serious? In one sense it is not, because it was counterbalanced by anoverall inflow of 44,253 settlers with professional occupations over the three years inquestion. This is partly because of the Coalition Government’s decision to increase the skilledintake since 1996 and partly because of a large influx of New Zealand citizens. In addition,there was a modest ‘brain gain’ in these three years from visitor movement of 24,302professionals. Thus despite the net loss of residents there was a substantial net gain ofprofessionals to Australia from permanent and long-term movement of 32,628.
Skilled Labour: Gains and Losses, page 17
Table 4: Net gain and components of net gain of permanent and long-term (PLT)movers with professional occupations by country of movement, 1997-98 to 1999-2000,(per cent)
Per cent of net PLT movement (negative = loss)
Components of net gainNext / Last residence Net Gain Residents Visitors Settlers
New Zealand 22.6 -11.9 9.4 21.2Sth Africa 14.9 0.2 5.1 8.0China 11.7 -1.9 1.5 9.4UK & Nthn Ireland 9.0 -28.7 31.5 12.6India 7.8 -0.2 2.1 4.8Ireland Rep 4.0 -1.4 5.1 1.3Canada 3.1 -1.6 3.6 1.6Hong Kong 2.9 -5.7 0.6 6.4Philippines 2.9 -0.3 -0.1 2.4German F.D.R. 2.6 -1.0 2.9 1.1Malaysia 2.3 -1.0 0.6 2.2Indonesia 1.3 -1.7 2.6 0.9USA 0.6 -15.1 16.9 3.4Japan -1.0 -3.3 1.4 1.2Singapore -2.3 -7.1 3.6 2.1Papua New Guinea -3.3 -4.0 0.9 0.3Subtotal 79.1 -84.8 87.9 78.9Remainder 20.9 -15.2 12.1 21.1
Total 100.0 -100.0 100.0 100.0
Number 32,628 -35,927 24,302 44,253
Note: Shaded cells are the top ten net losses/gains. Source: DIMA unpublishedTotal net numbers vary slightly from other tables because there is no information on the next residence of some departures.
For those concerned about losses of Australian residents (perhaps because of their Australiantraining) Table 5 provides some perspective on the scale of these losses. The Table indicatesthe net loss of Australian residents both for the professional occupations and otheroccupations under study over the years 1996-97 to 1999-2000 relative to the stock of personsemployed in the same occupation in Australia as of May 2000.
Skilled Labour: Gains and Losses, page 18
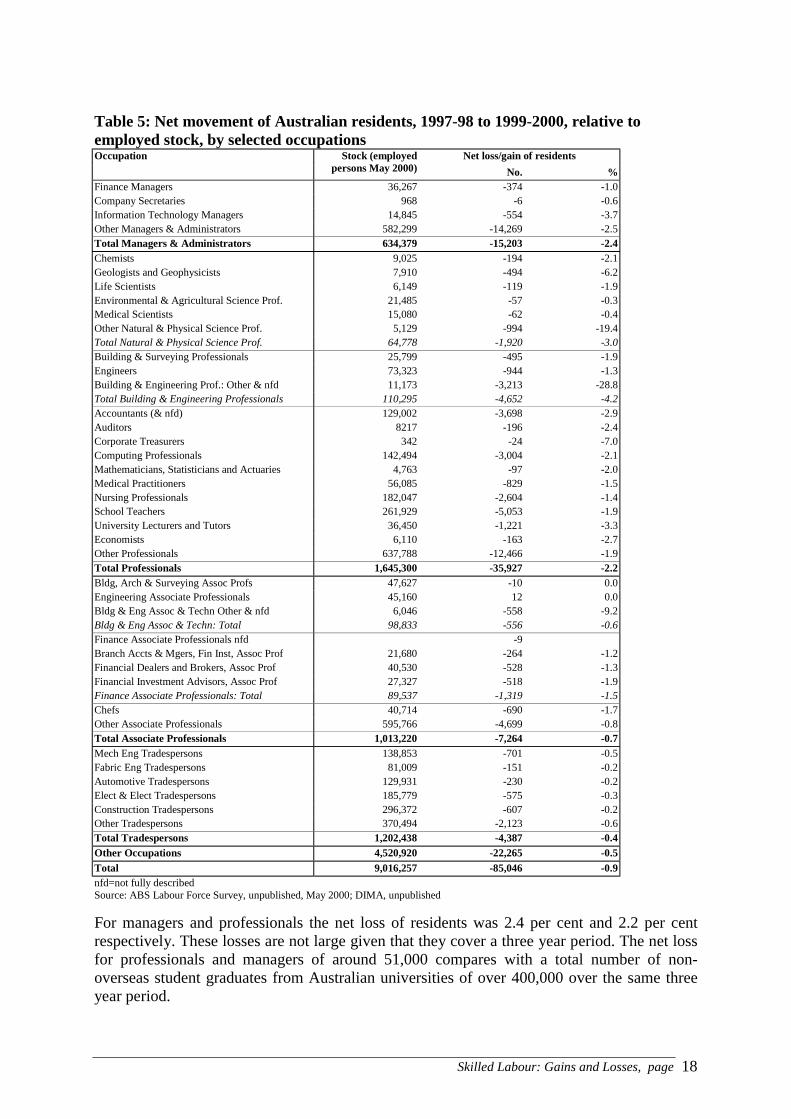
Table 5: Net movement of Australian residents, 1997-98 to 1999-2000, relative toemployed stock, by selected occupations
Net loss/gain of residentsOccupation Stock (employedpersons May 2000) No. %
Finance Managers 36,267 -374 -1.0Company Secretaries 968 -6 -0.6Information Technology Managers 14,845 -554 -3.7Other Managers & Administrators 582,299 -14,269 -2.5Total Managers & Administrators 634,379 -15,203 -2.4
Chemists 9,025 -194 -2.1Geologists and Geophysicists 7,910 -494 -6.2Life Scientists 6,149 -119 -1.9Environmental & Agricultural Science Prof. 21,485 -57 -0.3Medical Scientists 15,080 -62 -0.4Other Natural & Physical Science Prof. 5,129 -994 -19.4Total Natural & Physical Science Prof. 64,778 -1,920 -3.0Building & Surveying Professionals 25,799 -495 -1.9Engineers 73,323 -944 -1.3Building & Engineering Prof.: Other & nfd 11,173 -3,213 -28.8Total Building & Engineering Professionals 110,295 -4,652 -4.2Accountants (& nfd) 129,002 -3,698 -2.9Auditors 8217 -196 -2.4Corporate Treasurers 342 -24 -7.0Computing Professionals 142,494 -3,004 -2.1Mathematicians, Statisticians and Actuaries 4,763 -97 -2.0Medical Practitioners 56,085 -829 -1.5Nursing Professionals 182,047 -2,604 -1.4School Teachers 261,929 -5,053 -1.9University Lecturers and Tutors 36,450 -1,221 -3.3Economists 6,110 -163 -2.7Other Professionals 637,788 -12,466 -1.9Total Professionals 1,645,300 -35,927 -2.2
Bldg, Arch & Surveying Assoc Profs 47,627 -10 0.0Engineering Associate Professionals 45,160 12 0.0Bldg & Eng Assoc & Techn Other & nfd 6,046 -558 -9.2Bldg & Eng Assoc & Techn: Total 98,833 -556 -0.6Finance Associate Professionals nfd -9Branch Accts & Mgers, Fin Inst, Assoc Prof 21,680 -264 -1.2Financial Dealers and Brokers, Assoc Prof 40,530 -528 -1.3Financial Investment Advisors, Assoc Prof 27,327 -518 -1.9Finance Associate Professionals: Total 89,537 -1,319 -1.5Chefs 40,714 -690 -1.7Other Associate Professionals 595,766 -4,699 -0.8Total Associate Professionals 1,013,220 -7,264 -0.7
Mech Eng Tradespersons 138,853 -701 -0.5Fabric Eng Tradespersons 81,009 -151 -0.2Automotive Tradespersons 129,931 -230 -0.2Elect & Elect Tradespersons 185,779 -575 -0.3Construction Tradespersons 296,372 -607 -0.2Other Tradespersons 370,494 -2,123 -0.6Total Tradespersons 1,202,438 -4,387 -0.4
Other Occupations 4,520,920 -22,265 -0.5
Total 9,016,257 -85,046 -0.9nfd=not fully describedSource: ABS Labour Force Survey, unpublished, May 2000; DIMA, unpublished
For managers and professionals the net loss of residents was 2.4 per cent and 2.2 per centrespectively. These losses are not large given that they cover a three year period. The net lossfor professionals and managers of around 51,000 compares with a total number of non-overseas student graduates from Australian universities of over 400,000 over the same threeyear period.
Skilled Labour: Gains and Losses, page 19
In some of the fields where the loss is highest, the distinctive feature of the labour market inquestion is that demand in Australia is low. For example, there has been a high net loss ofgeologists which is probably related to the recent downturn in mineral exploration. The highnet loss of residents of 19.4 per cent for Other Natural and Physical Science Professionals,could be affected by Australia’s relatively poor record in providing research opportunities inthese fields.14 However, this high net loss is partly a consequence of the tendency for suchresidual occupational categories to be artificially inflated.
The net loss of residents for Building and Engineering professionals, at 4.2 per cent for allthose included in this category, was also comparatively high. Unfortunately, it proveddifficult to analyse the composition of this loss because most of it occurred in the ‘other andnfd’ component of the category. For this group there was insufficient evidence to identify theprecise occupation of the movers. However, it was possible to analyse the subset of engineersidentified in Table 5. The net loss of resident engineers shown in the Table was 944. Analysisof the birthplaces of resident engineers arriving and departing Australia over the period 1997-98 to 1999-2000 (not shown in the Table) revealed that 611 or 65 per cent of the total net lossof resident engineers over this period was Australia-born. It was shown earlier that nearly halfof Australia’s resident degree qualified engineering workforce was foreign-born by 1991.Their low share of the net loss of Australia’s resident engineers indicates that they have a lowpropensity to leave Australia. Given that there was a surplus of engineers in Australia relativeto the job opportunities in the profession during the 1990s it might have been expected thatmore overseas-born engineers would have sought opportunities abroad. That they did not isprobably partly due to the fact that many of the overseas-born engineers arriving in the secondhalf of the 1980s and early 1990s were unable to find positions in their field in Australia andthus were not well placed to compete for engineering jobs overseas.
On the other hand, there are several fields, including those in the financial sector (accountants,financial dealers and investment brokers) and in the computing field (information technologymanagers and computing professionals) where there is an undoubted pull from overseas butconcurrently strong demand in Australia. In all of these fields the net loss of residents, exceptfor the information technology managers, is about the same or below that for all professionals.
These outcomes suggest the hypothesis that where demand in Australia is strong for particularskills, the attractions of working in Australia, such as lifestyle and low cost of living, aresufficient to prevent any major drain of resident Australian professionals. These advantagesappear to compensate for the financial gains which might be made by moving overseas. Thishypothesis is explored further below in the course of more detailed examination of particularoccupations.
Current concern in Australia about the loss of skilled residents seems to be unnecessarilyalarmist. Because Australia runs a relatively vigorous immigration program it is inevitablethat it will lose some residents. Immigrants often move on an experimental basis. If the movedoes not work out economically or socially some migrants may decide to leave. In the 1970sthere was an alarm about Australia’s ability to retain the large settler flow of the 1960s.Studies at the time showed that of the immigrant cohort arriving in 1966, 24 per cent had leftAustralia permanently by 1971, with even higher losses for those with skilled occupations.15
It is not possible to replicate this study because the movements data base does not permit anymatching of those coming and going (as was the case for the study cited).
Skilled Labour: Gains and Losses, page 20
Since some resident loss will occur, the issue should be one of the scale of the loss. Thefindings detailed above indicate that currently, it is not large relative to Australia’s skilledworkforce. But one view prominent in the current public debate on the issue is that Australiais entering a new phase in which global demand for skilled workers will see Australianresident workers (whether overseas- or Australia-born) becoming the subject of recruitmentfrom other affluent societies. In other words we become the prey rather than the predator inthe international pursuit of skilled workers. Our neighbour, New Zealand, seems to be in thissituation. As can be seen from Table 4, some 22.6 per cent of Australia’s net gain of 32,628professionals over the three years 1997-98 to 1999-2000 derived from the net movement ofpeople between Australia and New Zealand and moving from Australia to New Zealand. Thisis equivalent to a loss of 7,374 professionals by New Zealand. At the time of the 1996 NewZealand Census there were 191,597 persons employed as professionals in New Zealand. Thethree year net loss to Australia represents nearly a 4 per cent loss of the professional stock atthe time of the Census. There have also been comparable net losses elsewhere in the world.16
These losses do constitute a serious ‘brain drain’.
However, Australia is losing residents on a much lower scale than is New Zealand. Pessimistsmay argue that with the recent action on the part of the United States and European nations tomake it easier for firms to recruit skilled workers, the present relatively moderate loss ofAustralian skilled residents could escalate. With new immigration opportunities, Australiansmight decide to move because salaries are considerably higher in Europe and North Americathan Australia. This view gains some credibility from our analysis because it is true that boththe outflow and net loss of skilled residents has increased in the last couple of years. Analternative view is that the increased net loss of skilled Australian residents in recent yearscould be put down to a lag effect. Though Australian residents have been drawn overseas inincreased numbers it may be that most will return. If so, the recent higher net resident losswill not be sustained.
Testing ideas about resident losses
Our initial working hypothesis was that to the extent Australia was losing skilled residentsthey would most likely be drawn from those who were overseas born and overseas trained. Itwas expected that such persons would be less likely to be anchored in Australia by ties offamily or emotion (sense of place and identity) and more likely to have connections to jobopportunities abroad.
Table 4 provides some information relevant to these issues. The pattern of net losses ofresidents is consistent with the idea that Australia is losing skilled residents to technologicallyadvanced countries. Some 29 per cent of the net losses of Australian residents withprofessional occupations came from those moving to and from the UK (including NorthernIreland). The next largest destinations for these losses were the United States, New Zealandand Singapore. For New Zealand, the loss is mainly from New Zealand-born personsreturning to New Zealand. This latter flow illustrates the argument that where a particularcountry is a major source of settlers it is likely to generate a high downstream return flow.
The UK, United States and Singapore are all ‘hot spots’ in the international ‘knowledgeeconomy’. The availability of lucrative and challenging work opportunities is likely to be afactor in these movements. Yet, why the dominance of the UK? Its economy has flourishedin recent years, but since the UK does not match the United States when it comes to the level
Skilled Labour: Gains and Losses, page 21
of demand for professionals or longstanding interest in the recruitment of immigrants to fillskill gaps, why should the net loss to the United States be so much lower than to the UK?
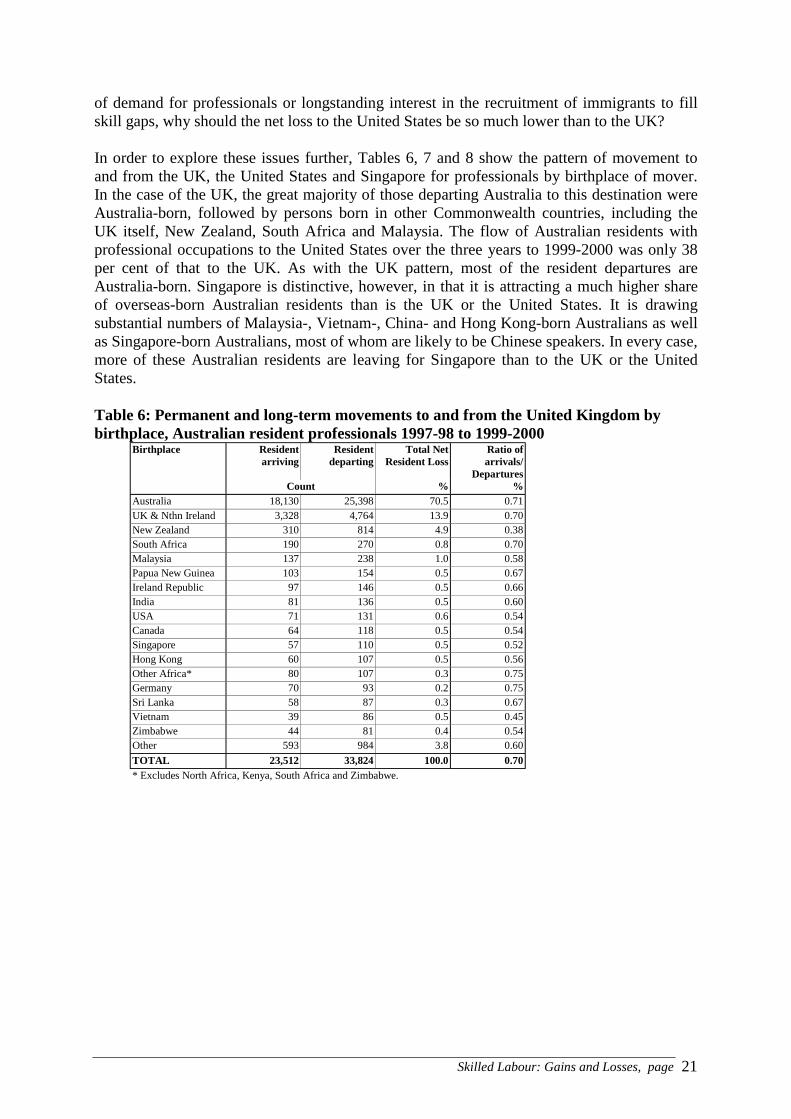
In order to explore these issues further, Tables 6, 7 and 8 show the pattern of movement toand from the UK, the United States and Singapore for professionals by birthplace of mover.In the case of the UK, the great majority of those departing Australia to this destination wereAustralia-born, followed by persons born in other Commonwealth countries, including theUK itself, New Zealand, South Africa and Malaysia. The flow of Australian residents withprofessional occupations to the United States over the three years to 1999-2000 was only 38per cent of that to the UK. As with the UK pattern, most of the resident departures areAustralia-born. Singapore is distinctive, however, in that it is attracting a much higher shareof overseas-born Australian residents than is the UK or the United States. It is drawingsubstantial numbers of Malaysia-, Vietnam-, China- and Hong Kong-born Australians as wellas Singapore-born Australians, most of whom are likely to be Chinese speakers. In every case,more of these Australian residents are leaving for Singapore than to the UK or the UnitedStates.
Table 6: Permanent and long-term movements to and from the United Kingdom bybirthplace, Australian resident professionals 1997-98 to 1999-2000
Birthplace Residentarriving
Residentdeparting
Total NetResident Loss
Ratio ofarrivals/
DeparturesCount % %
Australia 18,130 25,398 70.5 0.71UK & Nthn Ireland 3,328 4,764 13.9 0.70New Zealand 310 814 4.9 0.38South Africa 190 270 0.8 0.70Malaysia 137 238 1.0 0.58Papua New Guinea 103 154 0.5 0.67Ireland Republic 97 146 0.5 0.66India 81 136 0.5 0.60USA 71 131 0.6 0.54Canada 64 118 0.5 0.54Singapore 57 110 0.5 0.52Hong Kong 60 107 0.5 0.56Other Africa* 80 107 0.3 0.75Germany 70 93 0.2 0.75Sri Lanka 58 87 0.3 0.67Vietnam 39 86 0.5 0.45Zimbabwe 44 81 0.4 0.54Other 593 984 3.8 0.60
TOTAL 23,512 33,824 100.0 0.70
* Excludes North Africa, Kenya, South Africa and Zimbabwe.
Skilled Labour: Gains and Losses, page 22
Table 7: Permanent and long-term movements to and from the USA by birthplace,Australian resident professionals 1997-98 to 1999-2000
Birthplace Residentarriving
Residentdeparting
Total NetResident Loss
Ratio ofarrivals/
departuresCount % %
Australia 5,339 8,787 67.5 0.61USA 429 776 6.0 0.55UK & Nthn Ireland 414 721 5.5 0.57India 129 367 2.8 0.35New Zealand 121 272 2.1 0.44China 63 205 1.6 0.31Philippines 96 165 1.3 0.58Malaysia 80 143 1.1 0.56Vietnam 48 124 1.0 0.39Sri Lanka 47 108 0.8 0.44Sth Africa 60 90 0.7 0.67Canada 47 80 0.6 0.59Hong Kong 49 75 0.6 0.65USSR & Baltic States 31 65 0.5 0.48Germ F.D.R. 44 61 0.5 0.72Singapore 35 60 0.5 0.58Other Africa* 34 60 0.5 0.57Other 515 855 6.6 0.60
TOTAL 7,581 13,014 100.0 0.58
* Excludes North Africa, Kenya, South Africa and Zimbabwe.
Table 8: Permanent and long-term movements to and from Singapore by birthplace,Australian resident professionals 1997-98 to 1999-2000
Birthplace Residentarriving
Residentdeparting
Total NetResident Loss
Ratio ofarrivals/
DeparturesCount % %
Australia 602 2,247 49.1 0.27Malaysia 355 583 12.7 0.61Singapore 292 361 7.9 0.81UK & Nthn Ireland 113 299 6.5 0.38Vietnam 84 136 3.0 0.62China 84 133 2.9 0.63Hong Kong 82 128 2.8 0.64Indonesia 56 79 1.7 0.71India 35 79 1.7 0.44New Zealand 15 64 1.4 0.23Sri Lanka 52 63 1.4 0.83USA 12 27 0.6 0.44Canada 9 24 0.5 0.38Fiji 3 23 0.5 0.13Germany 8 23 0.5 0.35Sth Africa 11 23 0.5 0.48Taiwan 22 22 0.5 1.00Other 179 266 5.8 0.67
TOTAL 2,014 4,580 100.0 0.44
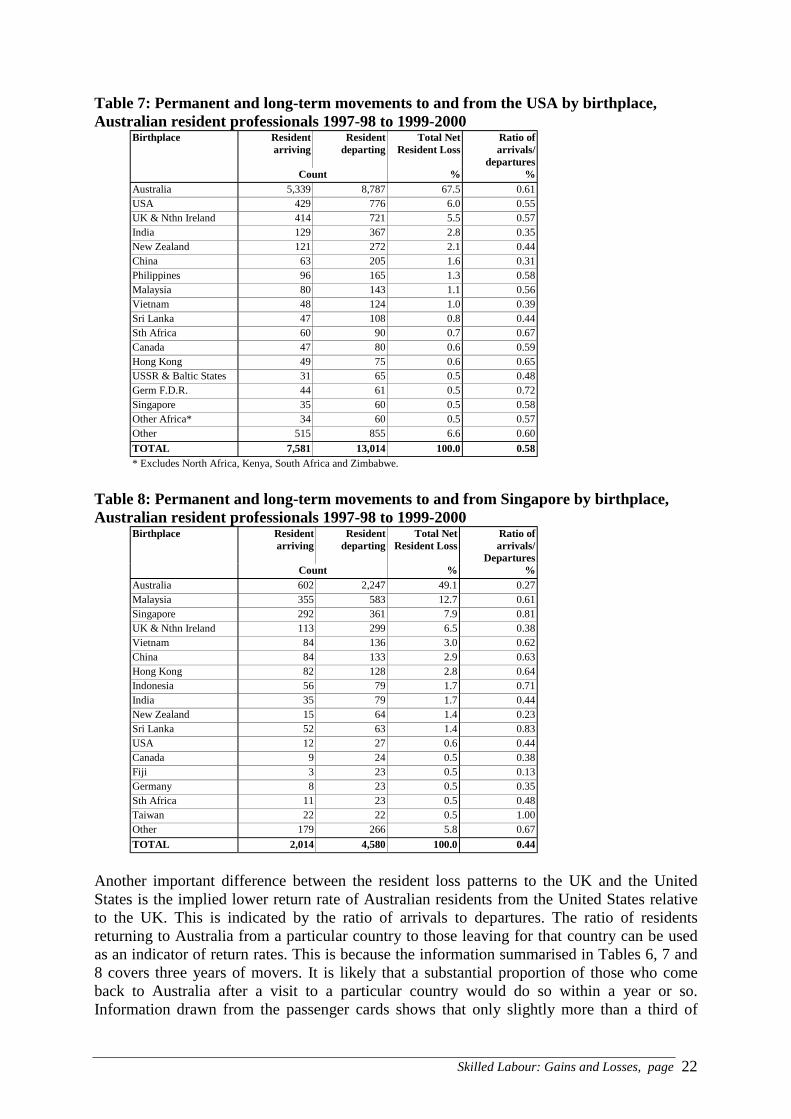
Another important difference between the resident loss patterns to the UK and the UnitedStates is the implied lower return rate of Australian residents from the United States relativeto the UK. This is indicated by the ratio of arrivals to departures. The ratio of residentsreturning to Australia from a particular country to those leaving for that country can be usedas an indicator of return rates. This is because the information summarised in Tables 6, 7 and8 covers three years of movers. It is likely that a substantial proportion of those who comeback to Australia after a visit to a particular country would do so within a year or so.Information drawn from the passenger cards shows that only slightly more than a third of
Skilled Labour: Gains and Losses, page 23
residents who returned to Australia over the three years to 1999-2000 stayed overseas formore than two years. Those who stay longer might build up their connections to the place inquestion and as a consequence perhaps stay permanently. Thus the overall return rates for thethree countries (70 per cent for the UK, 58 per cent for the United States, and 44 per cent forSingapore) should give a reasonable indication of likely resident loss levels. The onlyqualification is that in a period like the late 1990s when the international labour market wascoming to the boil, there is likely to be a lag effect if those leaving in boom yearssubsequently return to Australia.
The return rates from the United States are especially low for India-born and China-bornAustralian residents relative both to Australia-born and most other overseas-born Australianresidents. Another point to note is that the number of Australian residents with professionaloccupations and born in these two countries who moved to the United States was much largerthan the number leaving for the UK.
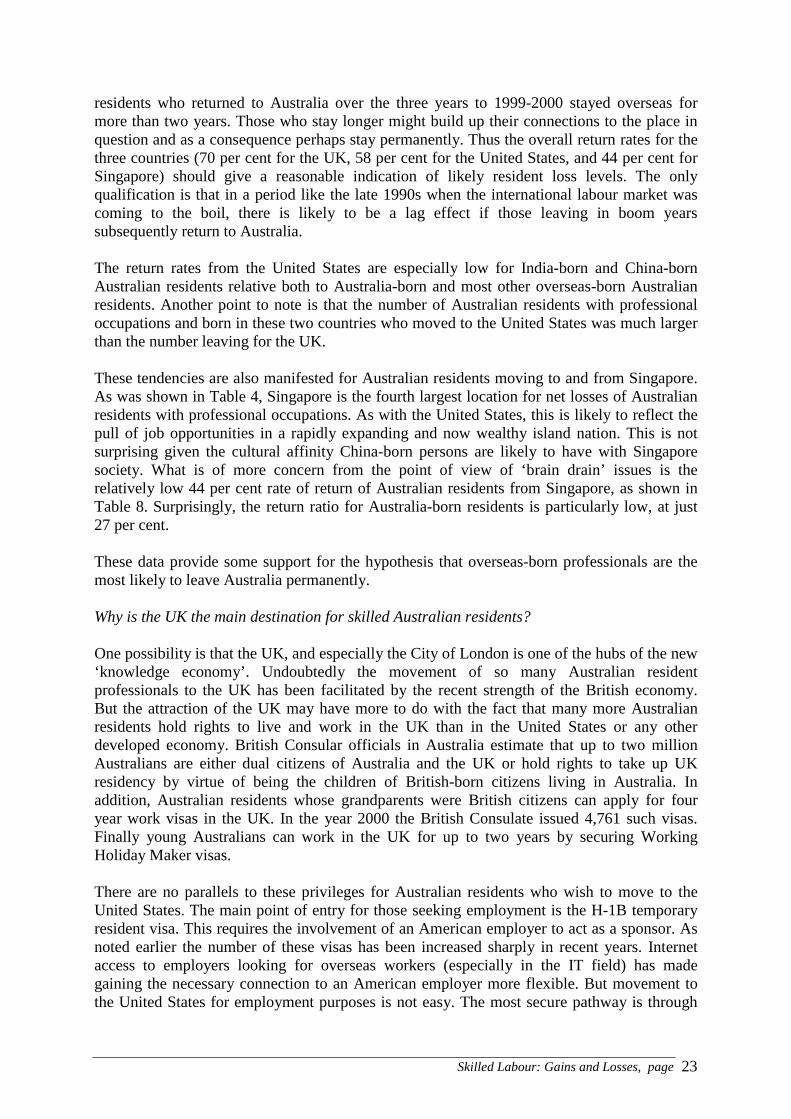
These tendencies are also manifested for Australian residents moving to and from Singapore.As was shown in Table 4, Singapore is the fourth largest location for net losses of Australianresidents with professional occupations. As with the United States, this is likely to reflect thepull of job opportunities in a rapidly expanding and now wealthy island nation. This is notsurprising given the cultural affinity China-born persons are likely to have with Singaporesociety. What is of more concern from the point of view of ‘brain drain’ issues is therelatively low 44 per cent rate of return of Australian residents from Singapore, as shown inTable 8. Surprisingly, the return ratio for Australia-born residents is particularly low, at just27 per cent.
These data provide some support for the hypothesis that overseas-born professionals are themost likely to leave Australia permanently.
Why is the UK the main destination for skilled Australian residents?
One possibility is that the UK, and especially the City of London is one of the hubs of the new‘knowledge economy’. Undoubtedly the movement of so many Australian residentprofessionals to the UK has been facilitated by the recent strength of the British economy.But the attraction of the UK may have more to do with the fact that many more Australianresidents hold rights to live and work in the UK than in the United States or any otherdeveloped economy. British Consular officials in Australia estimate that up to two millionAustralians are either dual citizens of Australia and the UK or hold rights to take up UKresidency by virtue of being the children of British-born citizens living in Australia. Inaddition, Australian residents whose grandparents were British citizens can apply for fouryear work visas in the UK. In the year 2000 the British Consulate issued 4,761 such visas.Finally young Australians can work in the UK for up to two years by securing WorkingHoliday Maker visas.
There are no parallels to these privileges for Australian residents who wish to move to theUnited States. The main point of entry for those seeking employment is the H-1B temporaryresident visa. This requires the involvement of an American employer to act as a sponsor. Asnoted earlier the number of these visas has been increased sharply in recent years. Internetaccess to employers looking for overseas workers (especially in the IT field) has madegaining the necessary connection to an American employer more flexible. But movement tothe United States for employment purposes is not easy. The most secure pathway is through
Skilled Labour: Gains and Losses, page 24
completion of an American postgraduate degree (which very few Australian residentsundertake) followed by employer sponsorship on an H-1B. The procurement of permanentresidence status or a ‘green card’, even for persons who hold H-1B visas is a long andtortuous process. It is far easier for overseas-born professionals to gain permanent residencein Australia than the United States.
The numbers of H-1B visas issued to Australians has increased in recent years but from avery low base. In 1991 there were 1,102 visas issued to Australians, rising to 1,651 in 1999.(The major occupation for which H-1B visas are issued is computing).17 This number wasdwarfed by other countries of origin, particularly India, to whose residents 55,047 H-1B visaswere issued in 1999. The movement of Australian residents to the United States via this visais potentially a loss to Australia. But at this stage the numbers are small, and as shown inTable 7 most do return to Australia.
The much larger movement to the UK is more likely to be a combination of work and travel,harking back to the long tradition of Australians taking an overseas spin before settling downto career and family in Australia. The return rate is high. As mentioned earlier in this Report,very few Australian residents are being recruited via the UK work permit system. IfAustralians were being heavily caught up in corporate recruiting or inter-company transfersone would expect these numbers to be significant (since most Australians do not have workrights in Britain). However in the year 2000 the British Consulate in Australia issued just 27work permits to Australian residents.
Age and the propensity to move
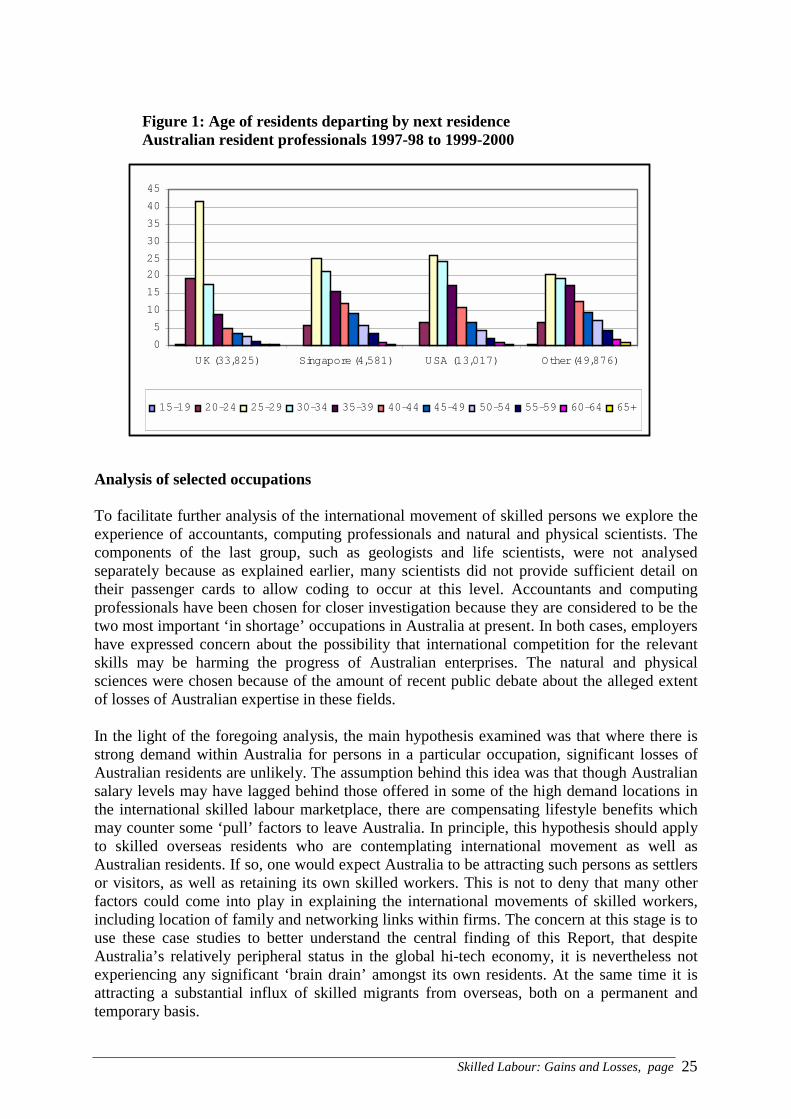
One way of testing the hypothesis that the movement of Australian residents to the UK can beregarded as part of a traditional boomerang trip abroad is to examine the age distribution ofresident departures. This is shown in Figure 1 for residents who indicated that they heldprofessional occupations and who departed Australia over the three years 1997-98 to 1999-2000 for the UK, the United States, Singapore and all other destinations.
The dominance of persons in the younger age groups (20-24 years and particularly 25-29years) is clear for visitors to the UK. The Australian residents departing for the United Statesand Singapore are relatively older. Older persons are much more likely to be moving topursue professional careers than is the case for the younger visitors to Britain. Thus the agedistribution data offers a partial confirmation of the earlier argument that the large outflow ofAustralian residents to the UK is probably best interpreted as a continuation of the past patternof young people exploring the world rather than as part of long-term career moves.
Skilled Labour: Gains and Losses, page 25
Figure 1: Age of residents departing by next residenceAustralian resident professionals 1997-98 to 1999-2000
Analysis of selected occupations
To facilitate further analysis of the international movement of skilled persons we explore theexperience of accountants, computing professionals and natural and physical scientists. Thecomponents of the last group, such as geologists and life scientists, were not analysedseparately because as explained earlier, many scientists did not provide sufficient detail ontheir passenger cards to allow coding to occur at this level. Accountants and computingprofessionals have been chosen for closer investigation because they are considered to be thetwo most important ‘in shortage’ occupations in Australia at present. In both cases, employershave expressed concern about the possibility that international competition for the relevantskills may be harming the progress of Australian enterprises. The natural and physicalsciences were chosen because of the amount of recent public debate about the alleged extentof losses of Australian expertise in these fields.
In the light of the foregoing analysis, the main hypothesis examined was that where there isstrong demand within Australia for persons in a particular occupation, significant losses ofAustralian residents are unlikely. The assumption behind this idea was that though Australiansalary levels may have lagged behind those offered in some of the high demand locations inthe international skilled labour marketplace, there are compensating lifestyle benefits whichmay counter some ‘pull’ factors to leave Australia. In principle, this hypothesis should applyto skilled overseas residents who are contemplating international movement as well asAustralian residents. If so, one would expect Australia to be attracting such persons as settlersor visitors, as well as retaining its own skilled workers. This is not to deny that many otherfactors could come into play in explaining the international movements of skilled workers,including location of family and networking links within firms. The concern at this stage is touse these case studies to better understand the central finding of this Report, that despiteAustralia’s relatively peripheral status in the global hi-tech economy, it is nevertheless notexperiencing any significant ‘brain drain’ amongst its own residents. At the same time it isattracting a substantial influx of skilled migrants from overseas, both on a permanent andtemporary basis.
0
5
10
15
20
25
30
35
40
45
UK (33,825) Singapore (4,581) USA (13,017) Other (49,876)
15-19 20-24 25-29 30-34 35-39 40-44 45-49 50-54 55-59 60-64 65+
Skilled Labour: Gains and Losses, page 26
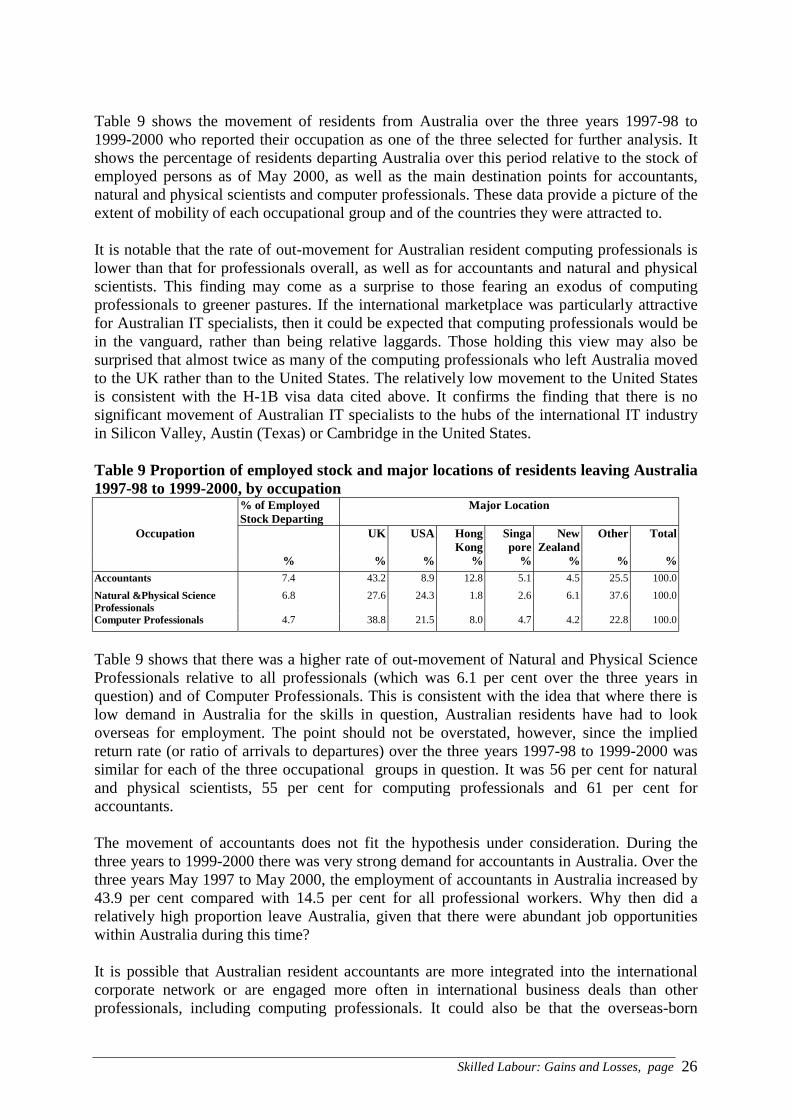
Table 9 shows the movement of residents from Australia over the three years 1997-98 to1999-2000 who reported their occupation as one of the three selected for further analysis. Itshows the percentage of residents departing Australia over this period relative to the stock ofemployed persons as of May 2000, as well as the main destination points for accountants,natural and physical scientists and computer professionals. These data provide a picture of theextent of mobility of each occupational group and of the countries they were attracted to.
It is notable that the rate of out-movement for Australian resident computing professionals islower than that for professionals overall, as well as for accountants and natural and physicalscientists. This finding may come as a surprise to those fearing an exodus of computingprofessionals to greener pastures. If the international marketplace was particularly attractivefor Australian IT specialists, then it could be expected that computing professionals would bein the vanguard, rather than being relative laggards. Those holding this view may also besurprised that almost twice as many of the computing professionals who left Australia movedto the UK rather than to the United States. The relatively low movement to the United Statesis consistent with the H-1B visa data cited above. It confirms the finding that there is nosignificant movement of Australian IT specialists to the hubs of the international IT industryin Silicon Valley, Austin (Texas) or Cambridge in the United States.
Table 9 Proportion of employed stock and major locations of residents leaving Australia1997-98 to 1999-2000, by occupation
% of EmployedStock Departing
Major Location
Occupation UK USA HongKong
Singapore
NewZealand
Other Total
% % % % % % % %
Accountants 7.4 43.2 8.9 12.8 5.1 4.5 25.5 100.0
Natural &Physical ScienceProfessionals
6.8 27.6 24.3 1.8 2.6 6.1 37.6 100.0
Computer Professionals 4.7 38.8 21.5 8.0 4.7 4.2 22.8 100.0
Table 9 shows that there was a higher rate of out-movement of Natural and Physical ScienceProfessionals relative to all professionals (which was 6.1 per cent over the three years inquestion) and of Computer Professionals. This is consistent with the idea that where there islow demand in Australia for the skills in question, Australian residents have had to lookoverseas for employment. The point should not be overstated, however, since the impliedreturn rate (or ratio of arrivals to departures) over the three years 1997-98 to 1999-2000 wassimilar for each of the three occupational groups in question. It was 56 per cent for naturaland physical scientists, 55 per cent for computing professionals and 61 per cent foraccountants.
The movement of accountants does not fit the hypothesis under consideration. During thethree years to 1999-2000 there was very strong demand for accountants in Australia. Over thethree years May 1997 to May 2000, the employment of accountants in Australia increased by43.9 per cent compared with 14.5 per cent for all professional workers. Why then did arelatively high proportion leave Australia, given that there were abundant job opportunitieswithin Australia during this time?
It is possible that Australian resident accountants are more integrated into the internationalcorporate network or are engaged more often in international business deals than otherprofessionals, including computing professionals. It could also be that the overseas-born
Skilled Labour: Gains and Losses, page 27
component of Australia’s accounting workforce has a high degree of mobility. Theexamination of movement patterns of Australian resident accountants by birthplace,conducted below, supports this idea.
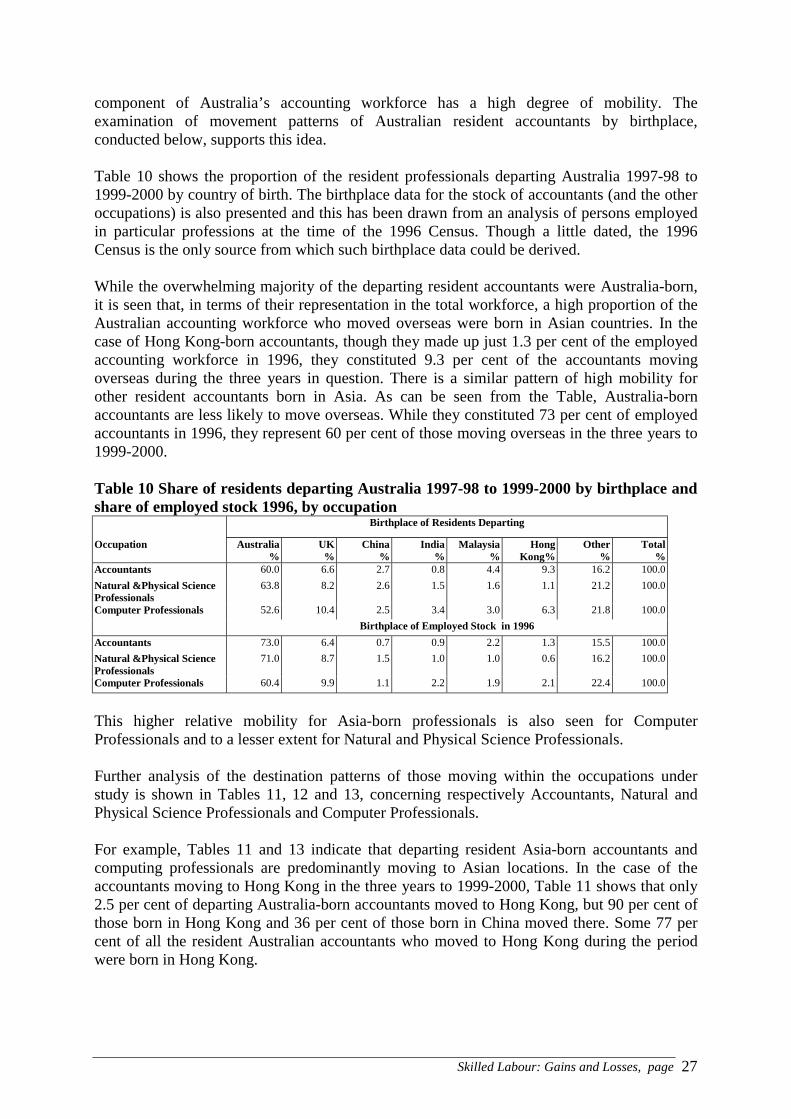
Table 10 shows the proportion of the resident professionals departing Australia 1997-98 to1999-2000 by country of birth. The birthplace data for the stock of accountants (and the otheroccupations) is also presented and this has been drawn from an analysis of persons employedin particular professions at the time of the 1996 Census. Though a little dated, the 1996Census is the only source from which such birthplace data could be derived.
While the overwhelming majority of the departing resident accountants were Australia-born,it is seen that, in terms of their representation in the total workforce, a high proportion of theAustralian accounting workforce who moved overseas were born in Asian countries. In thecase of Hong Kong-born accountants, though they made up just 1.3 per cent of the employedaccounting workforce in 1996, they constituted 9.3 per cent of the accountants movingoverseas during the three years in question. There is a similar pattern of high mobility forother resident accountants born in Asia. As can be seen from the Table, Australia-bornaccountants are less likely to move overseas. While they constituted 73 per cent of employedaccountants in 1996, they represent 60 per cent of those moving overseas in the three years to1999-2000.
Table 10 Share of residents departing Australia 1997-98 to 1999-2000 by birthplace andshare of employed stock 1996, by occupation
Birthplace of Residents Departing
Occupation Australia%
UK%
China%
India%
Malaysia%
HongKong%
Other%
Total%
Accountants 60.0 6.6 2.7 0.8 4.4 9.3 16.2 100.0
Natural &Physical ScienceProfessionals
63.8 8.2 2.6 1.5 1.6 1.1 21.2 100.0
Computer Professionals 52.6 10.4 2.5 3.4 3.0 6.3 21.8 100.0
Birthplace of Employed Stock in 1996
Accountants 73.0 6.4 0.7 0.9 2.2 1.3 15.5 100.0
Natural &Physical ScienceProfessionals
71.0 8.7 1.5 1.0 1.0 0.6 16.2 100.0
Computer Professionals 60.4 9.9 1.1 2.2 1.9 2.1 22.4 100.0
This higher relative mobility for Asia-born professionals is also seen for ComputerProfessionals and to a lesser extent for Natural and Physical Science Professionals.
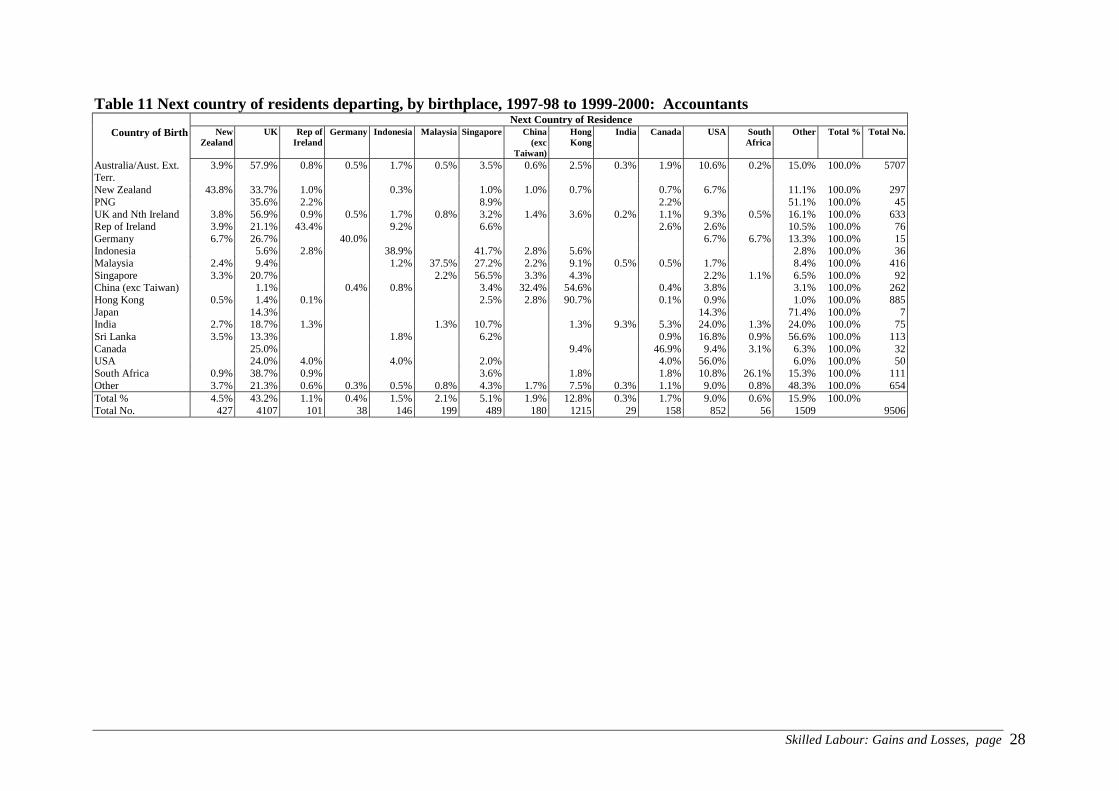
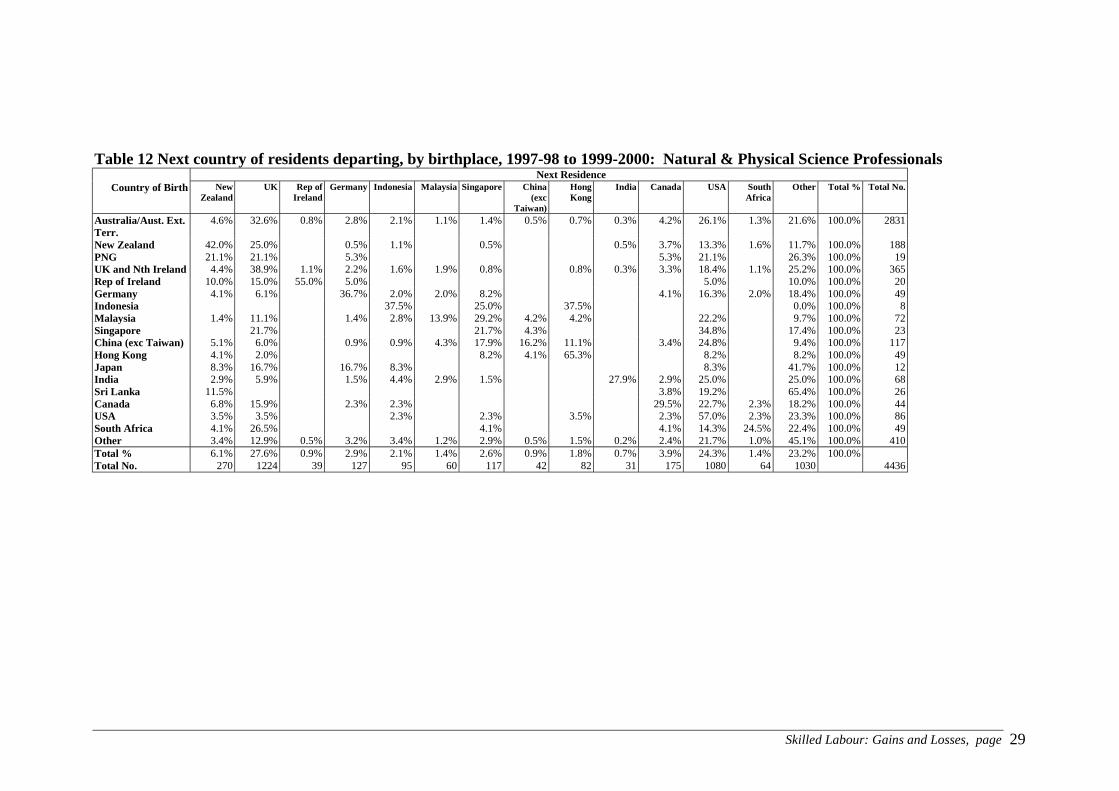
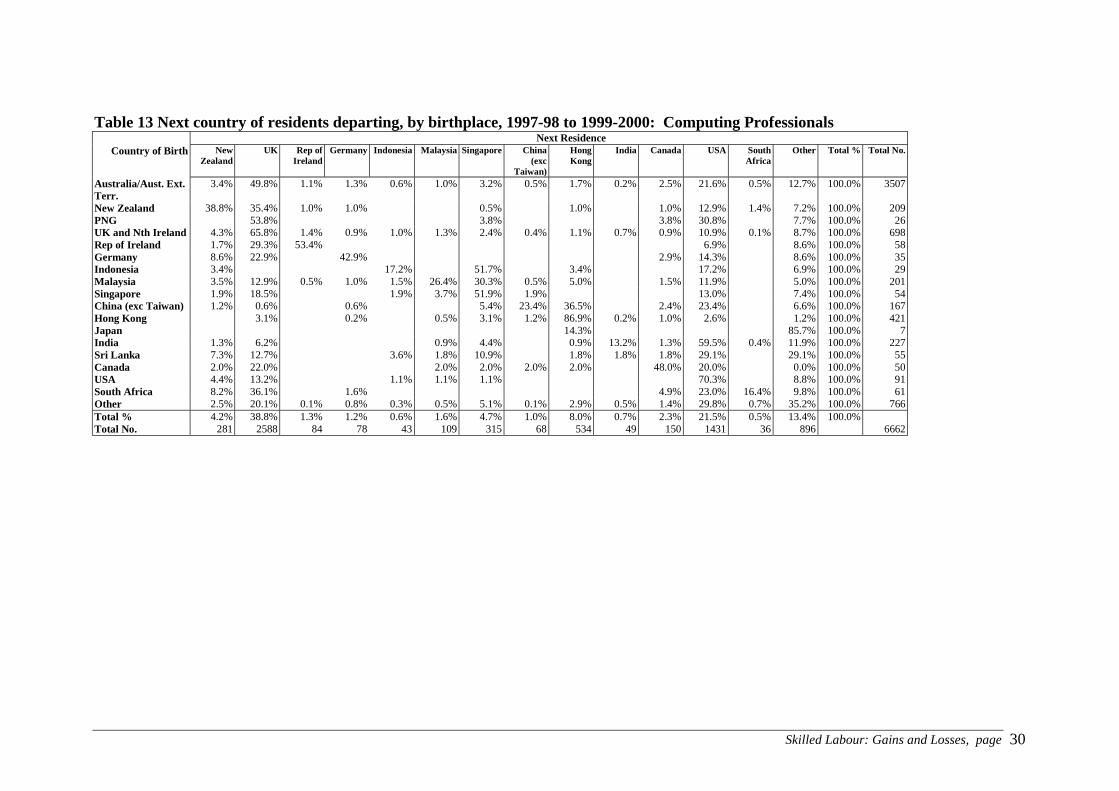
Further analysis of the destination patterns of those moving within the occupations understudy is shown in Tables 11, 12 and 13, concerning respectively Accountants, Natural andPhysical Science Professionals and Computer Professionals.
For example, Tables 11 and 13 indicate that departing resident Asia-born accountants andcomputing professionals are predominantly moving to Asian locations. In the case of theaccountants moving to Hong Kong in the three years to 1999-2000, Table 11 shows that only2.5 per cent of departing Australia-born accountants moved to Hong Kong, but 90 per cent ofthose born in Hong Kong and 36 per cent of those born in China moved there. Some 77 percent of all the resident Australian accountants who moved to Hong Kong during the periodwere born in Hong Kong.
Skilled Labour: Gains and Losses, page 28
Table 11 Next country of residents departing, by birthplace, 1997-98 to 1999-2000: AccountantsNext Country of Residence
Country of Birth NewZealand
UK Rep ofIreland
Germany Indonesia Malaysia Singapore China(exc
Taiwan)
HongKong
India Canada USA SouthAfrica
Other Total % Total No.
Australia/Aust. Ext.Terr.
3.9% 57.9% 0.8% 0.5% 1.7% 0.5% 3.5% 0.6% 2.5% 0.3% 1.9% 10.6% 0.2% 15.0% 100.0% 5707
New Zealand 43.8% 33.7% 1.0% 0.3% 1.0% 1.0% 0.7% 0.7% 6.7% 11.1% 100.0% 297PNG 35.6% 2.2% 8.9% 2.2% 51.1% 100.0% 45UK and Nth Ireland 3.8% 56.9% 0.9% 0.5% 1.7% 0.8% 3.2% 1.4% 3.6% 0.2% 1.1% 9.3% 0.5% 16.1% 100.0% 633Rep of Ireland 3.9% 21.1% 43.4% 9.2% 6.6% 2.6% 2.6% 10.5% 100.0% 76Germany 6.7% 26.7% 40.0% 6.7% 6.7% 13.3% 100.0% 15Indonesia 5.6% 2.8% 38.9% 41.7% 2.8% 5.6% 2.8% 100.0% 36Malaysia 2.4% 9.4% 1.2% 37.5% 27.2% 2.2% 9.1% 0.5% 0.5% 1.7% 8.4% 100.0% 416Singapore 3.3% 20.7% 2.2% 56.5% 3.3% 4.3% 2.2% 1.1% 6.5% 100.0% 92China (exc Taiwan) 1.1% 0.4% 0.8% 3.4% 32.4% 54.6% 0.4% 3.8% 3.1% 100.0% 262Hong Kong 0.5% 1.4% 0.1% 2.5% 2.8% 90.7% 0.1% 0.9% 1.0% 100.0% 885Japan 14.3% 14.3% 71.4% 100.0% 7India 2.7% 18.7% 1.3% 1.3% 10.7% 1.3% 9.3% 5.3% 24.0% 1.3% 24.0% 100.0% 75Sri Lanka 3.5% 13.3% 1.8% 6.2% 0.9% 16.8% 0.9% 56.6% 100.0% 113Canada 25.0% 9.4% 46.9% 9.4% 3.1% 6.3% 100.0% 32USA 24.0% 4.0% 4.0% 2.0% 4.0% 56.0% 6.0% 100.0% 50South Africa 0.9% 38.7% 0.9% 3.6% 1.8% 1.8% 10.8% 26.1% 15.3% 100.0% 111Other 3.7% 21.3% 0.6% 0.3% 0.5% 0.8% 4.3% 1.7% 7.5% 0.3% 1.1% 9.0% 0.8% 48.3% 100.0% 654Total % 4.5% 43.2% 1.1% 0.4% 1.5% 2.1% 5.1% 1.9% 12.8% 0.3% 1.7% 9.0% 0.6% 15.9% 100.0%Total No. 427 4107 101 38 146 199 489 180 1215 29 158 852 56 1509 9506
Skilled Labour: Gains and Losses, page 29
Table 12 Next country of residents departing, by birthplace, 1997-98 to 1999-2000: Natural & Physical Science ProfessionalsNext Residence
Country of Birth NewZealand
UK Rep ofIreland
Germany Indonesia Malaysia Singapore China(exc
Taiwan)
HongKong
India Canada USA SouthAfrica
Other Total % Total No.
Australia/Aust. Ext.Terr.
4.6% 32.6% 0.8% 2.8% 2.1% 1.1% 1.4% 0.5% 0.7% 0.3% 4.2% 26.1% 1.3% 21.6% 100.0% 2831
New Zealand 42.0% 25.0% 0.5% 1.1% 0.5% 0.5% 3.7% 13.3% 1.6% 11.7% 100.0% 188PNG 21.1% 21.1% 5.3% 5.3% 21.1% 26.3% 100.0% 19UK and Nth Ireland 4.4% 38.9% 1.1% 2.2% 1.6% 1.9% 0.8% 0.8% 0.3% 3.3% 18.4% 1.1% 25.2% 100.0% 365Rep of Ireland 10.0% 15.0% 55.0% 5.0% 5.0% 10.0% 100.0% 20Germany 4.1% 6.1% 36.7% 2.0% 2.0% 8.2% 4.1% 16.3% 2.0% 18.4% 100.0% 49Indonesia 37.5% 25.0% 37.5% 0.0% 100.0% 8Malaysia 1.4% 11.1% 1.4% 2.8% 13.9% 29.2% 4.2% 4.2% 22.2% 9.7% 100.0% 72Singapore 21.7% 21.7% 4.3% 34.8% 17.4% 100.0% 23China (exc Taiwan) 5.1% 6.0% 0.9% 0.9% 4.3% 17.9% 16.2% 11.1% 3.4% 24.8% 9.4% 100.0% 117Hong Kong 4.1% 2.0% 8.2% 4.1% 65.3% 8.2% 8.2% 100.0% 49Japan 8.3% 16.7% 16.7% 8.3% 8.3% 41.7% 100.0% 12India 2.9% 5.9% 1.5% 4.4% 2.9% 1.5% 27.9% 2.9% 25.0% 25.0% 100.0% 68Sri Lanka 11.5% 3.8% 19.2% 65.4% 100.0% 26Canada 6.8% 15.9% 2.3% 2.3% 29.5% 22.7% 2.3% 18.2% 100.0% 44USA 3.5% 3.5% 2.3% 2.3% 3.5% 2.3% 57.0% 2.3% 23.3% 100.0% 86South Africa 4.1% 26.5% 4.1% 4.1% 14.3% 24.5% 22.4% 100.0% 49Other 3.4% 12.9% 0.5% 3.2% 3.4% 1.2% 2.9% 0.5% 1.5% 0.2% 2.4% 21.7% 1.0% 45.1% 100.0% 410Total % 6.1% 27.6% 0.9% 2.9% 2.1% 1.4% 2.6% 0.9% 1.8% 0.7% 3.9% 24.3% 1.4% 23.2% 100.0%Total No. 270 1224 39 127 95 60 117 42 82 31 175 1080 64 1030 4436
Skilled Labour: Gains and Losses, page 30
Table 13 Next country of residents departing, by birthplace, 1997-98 to 1999-2000: Computing ProfessionalsNext Residence
Country of Birth NewZealand
UK Rep ofIreland
Germany Indonesia Malaysia Singapore China(exc
Taiwan)
HongKong
India Canada USA SouthAfrica
Other Total % Total No.
Australia/Aust. Ext.Terr.
3.4% 49.8% 1.1% 1.3% 0.6% 1.0% 3.2% 0.5% 1.7% 0.2% 2.5% 21.6% 0.5% 12.7% 100.0% 3507
New Zealand 38.8% 35.4% 1.0% 1.0% 0.5% 1.0% 1.0% 12.9% 1.4% 7.2% 100.0% 209PNG 53.8% 3.8% 3.8% 30.8% 7.7% 100.0% 26UK and Nth Ireland 4.3% 65.8% 1.4% 0.9% 1.0% 1.3% 2.4% 0.4% 1.1% 0.7% 0.9% 10.9% 0.1% 8.7% 100.0% 698Rep of Ireland 1.7% 29.3% 53.4% 6.9% 8.6% 100.0% 58Germany 8.6% 22.9% 42.9% 2.9% 14.3% 8.6% 100.0% 35Indonesia 3.4% 17.2% 51.7% 3.4% 17.2% 6.9% 100.0% 29Malaysia 3.5% 12.9% 0.5% 1.0% 1.5% 26.4% 30.3% 0.5% 5.0% 1.5% 11.9% 5.0% 100.0% 201Singapore 1.9% 18.5% 1.9% 3.7% 51.9% 1.9% 13.0% 7.4% 100.0% 54China (exc Taiwan) 1.2% 0.6% 0.6% 5.4% 23.4% 36.5% 2.4% 23.4% 6.6% 100.0% 167Hong Kong 3.1% 0.2% 0.5% 3.1% 1.2% 86.9% 0.2% 1.0% 2.6% 1.2% 100.0% 421Japan 14.3% 85.7% 100.0% 7India 1.3% 6.2% 0.9% 4.4% 0.9% 13.2% 1.3% 59.5% 0.4% 11.9% 100.0% 227Sri Lanka 7.3% 12.7% 3.6% 1.8% 10.9% 1.8% 1.8% 1.8% 29.1% 29.1% 100.0% 55Canada 2.0% 22.0% 2.0% 2.0% 2.0% 2.0% 48.0% 20.0% 0.0% 100.0% 50USA 4.4% 13.2% 1.1% 1.1% 1.1% 70.3% 8.8% 100.0% 91South Africa 8.2% 36.1% 1.6% 4.9% 23.0% 16.4% 9.8% 100.0% 61Other 2.5% 20.1% 0.1% 0.8% 0.3% 0.5% 5.1% 0.1% 2.9% 0.5% 1.4% 29.8% 0.7% 35.2% 100.0% 766Total % 4.2% 38.8% 1.3% 1.2% 0.6% 1.6% 4.7% 1.0% 8.0% 0.7% 2.3% 21.5% 0.5% 13.4% 100.0%Total No. 281 2588 84 78 43 109 315 68 534 49 150 1431 36 896 6662
Skilled Labour: Gains and Losses, page 31
These findings have some interesting implications for reflections about the extent ofAustralian engagement in Asia. It is clear that Australia-born professionals are showing littleinterest in moving to Asian locations. This is despite the economic dynamism of parts of theregion and the relatively high salary packages available, especially in Singapore and HongKong.18
The movement of a significant proportion of the Asia-born component of the skilled residentworkforce may be of concern, especially in the context of the Australian Government’sdecision to expand the immigration program to accommodate several thousand additionalformer full fee-paying IT graduates per annum.19 However further analysis of the Asia-bornaccountants and computing professionals who are leaving Australia (not shown in the Tables)indicates that most are returning.
In the case of the Hong Kong-born resident accountants, although 1,215 left Australia on apermanent or long-term basis over the three years to 1999-2000, 1,083 returned to Australiaafter a long-term stay overseas during the same period. The only significant exception to thispattern was found with India-born computing professionals. Some 227 left Australia (mainlyfor the United States) but only 84 returned.
The movement of skilled migrants to Australia
If Australia was ‘not in the hunt’ in the international marketplace for skilled personnel, asProfessor Chipman20 asserts, it would be hard to attract skilled persons from overseas, letalone hold the bulk of Australian residents in the fields where overseas demand was strongest.These expectations are not supported by the data presented here. As noted earlier, for almostevery occupation examined, the net losses of Australian residents are more than covered bysettler arrivals (including New Zealand citizens) and a net inflow of visitors.
While Australia is undoubtedly attracting considerable inflows of professionals, there is someconcern as to whether these migrants match the skills of the Australian residents who areleaving.
In the case of mathematicians, the Federation of Australian Scientific and TechnologicalSciences (FASTS) recently published a report entitled Mathematical Sciences in Australia:Looking for a Future.21 This is specifically directed at an examination of the health ofmathematics in Australia and covers the decline in the number of students undertakingadvanced mathematical courses in schools and universities, the lack of suitably trainedteachers as well as the loss of highly qualified academic staff from universities. The latter datawere drawn from an e-mail survey of all university mathematics departments and cover themovement of mathematicians post 1995. The lists show 62 experienced mathematicsresearchers and 45 new researchers leaving Australian universities for positions overseas. Italso lists nine Australia-born and 14 overseas-born new mathematics researchers enteringAustralia. Thus, the total outflow is 107, over half of which are experienced researchers,which is offset by an influx of 23, all relatively inexperienced researchers.
The movements data for mathematicians, statisticians and actuaries reported in Table 1indicates a net outflow of residents for the five year period 1995-2000 of 129. However, therewas an inflow of 308 settlers and 123 net visitors, resulting in a net gain of 302. However, asacknowledged earlier, the movements data base provides no information about the relative
Skilled Labour: Gains and Losses, page 32
educational level, experience, English language capacity or other relevant skills of movers. Inthis case it may well be that the apparent 'brain gain' may be somewhat illusory.
Australia’s experience with the large influx of skilled migrants who entered Australia in thelate 1980s provides further support for the above concerns. Only 38 per cent of the migrantsarriving in Australia between 1986 and 1991 who held degree level qualifications had beenable to find employment at the professional or managerial level as of 1991.22 Subsequentanalysis of the 1996 Census showed that the situation of these 1986-91 arrivals had notimproved. For those holding credentials gained overseas, the proportion employed at theprofessional or managerial level was just over 40 per cent by 1996, indicating that they hadmade little occupational progress during the intervening five years.23
This outcome was partly attributable to the onset of the recession in the early 1990s. Inaddition, many of the migrants in question had entered under the family or humanitarianprograms and thus had not been subject to any assessment of their credentials. The selectioncriteria in place at the time for those who were selected as skilled migrants were also deficientin that they took no account of whether the skills the migrant offered were in demand inAustralia. Further, it was only in the early 1990s that DIMA required most skilled migrants topass a formal test of their English language capacity. These studies, however, did show thatcomputing professionals were doing reasonably well in Australia, even when they came fromNon-English-Speaking countries.24 This outcome reflects the high demand for such skills andthe relative ease of transference of professionals trained in international programminglanguages.
The experience of the late 1980s should not be generalised to the circumstances at the end ofthe 1990s. By this time the family migration program had been reduced and the selectionregime affecting the settlers entering Australia under the Skilled programs was better attunedto the needs of Australian employers. To gain selection in the main skilled program anapplicant had to possess at least vocational English skills and had to have his or hercredentials accepted by the relevant professional or trade authority in Australia. Since mid-1999, when the system was reformed again, an element of occupational targeting has beenincluded, which favours skills in demand (including computing, accounting and nursing) andgives priority to applicants with Australian qualifications. From mid-2001, applicants who areformer full fee-paying overseas students will not have to leave Australia to apply forpermanent residency.
Selection of skilled migrants is based on a points system, which measures factors includingskill, age, English language ability, (Australian) qualifications and level of demand forparticular occupations. The current ‘pass mark’ is 110 points. As part of the recent reforms,occupations eligible for selection are classified into 40, 50 and 60 point categories. The 60point group includes professional fields such as computing, engineering, nursing and sometrades. The 50 point group includes occupations where specific university or trade training isnot central to employment in the field, for example in various managerial occupations inpersonnel or public relations work. A number of the scientific occupations such as physicistsand mathematicians are also included in this second category. The 40 point category includesvarious sub-professional fields. Several of the financial sector occupations, such as futurestraders and financial investment advisors are classified within this group. Most applicants willstruggle to achieve the required pass mark if they do not possess a 60 point occupation unlessthey are sponsored by relatives in Australia. Most clerical and blue collar occupations are notlisted at all and thus are not eligible to apply. Other occupations not listed include doctors and
Skilled Labour: Gains and Losses, page 33
university lecturers, the former because the Australian Government had been anxious toreduce the inflow of doctors because of an alleged oversupply of doctors in Australia and thelatter because the opportunities for unsponsored academics are somewhat limited - academicsneed to be sponsored by their employers under the Employer Nomination Scheme.
As a result of these reforms, the quality and occupational relevance of immigrants selectedunder the skilled categories has improved sharply. The latest information (for the first sevenmonths of 2000-2001) concerning the outcomes of those applying under the new Skilled-Independent program (visa category 136) indicates that 29 per cent of all the principalapplicants selected were computing professionals and 19 per cent were accountants. The sharefor these two occupations is well above what it was under the pre-1999 selection system.Also, just over half of the computing professionals and accountants selected so far during2000-2001 held Australian qualifications. Most of these would have completed thesequalifications as full fee-paying overseas students in Australia.
Applicants who hold Australian qualifications in computing and accounting are likely to be indemand elsewhere in the world. Moreover most of the successful applicants are of Asianorigin. They are taking up the migration option to Australia at a time when there is a seriousshortage of IT professionals in parts of Asia, including, as noted above, in Hong Kong andSingapore. Australia, therefore, is attracting these people despite the vigorous competitionelsewhere.
Australia’s attractions
The strong demand for professionals in computing and some other fields in Australia in recentyears is fundamental to Australia’s ability to retain most of its own resident professionals withthe skills in question and to attract overseas trained persons in the same fields. This isparticularly evident in relation to New Zealand citizens. New Zealand commentatorsemphasise that it is not so much any shortfall of jobs in New Zealand which explains theexodus to Australia but the potential career gains and higher salaries available in Australia.Lifestyle is a secondary matter in this case. But if this is so, what factors can explain whyAustralia (in its turn) is not losing a greater proportion of its residents to locations which offerbetter salaries and perhaps better career prospects? And why is Australia attracting asubstantial flow of skilled migrants to Australia (other than from New Zealand)?
One hypothesis is that ‘lifestyle’ is a key factor. This term covers a multitude of dimensions,including political security, a crime and pollution free urban setting (relative to parts of Asiaand the United States), a low cost of living, good quality (and at least at the university level)low cost education for children, good housing and other urban amenities and nice weather.Another important factor, especially for residents or prospective immigrants of Asian origin isthe existence of substantial co-ethnic communities in Sydney and Melbourne.
It is not easy to arrive at any definitive conclusions about the weight of these factors. There isvery little in depth analysis in the literature of the factors shaping international movement toand from Australia. Most of the discussion to date has been anecdotal in nature. However thisliterature, plus our interviews with experts involved in the recruitment of professional staffdid support the hypothesis about the importance of lifestyle attractions in Australia’ssituation. Nevertheless, the comments that follow should be regarded as preliminary. They areintended to contribute to further debate and it is hoped, will prompt more systematic researchon the issue.
Skilled Labour: Gains and Losses, page 34
Typical of accounts concerning IT personnel is one reported by Financial Times journalistFiona Curruthers. After citing the princely salaries on offer to some IT specialists in HongKong and Singapore and Australia’s relatively tough tax regime, Curruthers is left with thepuzzle as to why Australia (according to the IT recruiters in Asia she spoke to) neverthelessdoes well in the competition for such staff. The answer is personalised via the case of aBritish IT specialist, who, it is claimed, could earn a fortune in Europe or Asia, but hasinstead based himself in Sydney for the past decade. This person is quoted as saying that‘Australia will always attract the best people from overseas because, at the end of the day,lifestyle is the number one reason a European would make the transition’. Curruthers herselfconcludes that Australia, ‘wins hands down in the region for lifestyle, low cost of living, lesspollution and reliable public health and education systems’.25
The IT recruiters we talked to emphatically agreed with this judgement about the importanceof lifestyle. Nevertheless, they acknowledge that the high level of contracting in the IT fieldmeans that Australian residents have to be sensitive to opportunities in overseas markets,especially when demand for their services declines, as it has in recent months. They do look atjob opportunities overseas and are willing to move out if necessary. But the intention is to doso for a short stint ‘to restore the bank balance’. The recruiters also emphasise that animportant factor inhibiting such movement (apart from the lifestyle advantages Australiaoffers) is the high cost of living abroad. Their advice to Australian residents contemplatingmoving to the United States is that as a 'rule of thumb', the buying power of the Australiandollar in Australia is roughly equivalent to the buying power of the American dollar inAmerica.
The recruiters also note that in their experience, it has not been difficult to attract migrantshere, whether on a temporary or permanent basis. They regard South Africa as a valued andreadily accessible source because professionals from South Africa can fit readily into theAustralian corporate setting. India too, is increasingly seen as a ready source of IT skills,which is likely to expand in the future as employers overcome some initial uncertainties aboutskills and concerns about whether the cultural ‘style’ fits with an Australian workplace. Therehas been some criticism from employer representatives in Australia about the allegedstrictness of Australian immigration regulations. However, recruiters who actually use thesystem to bring in computing professionals on temporary work permits acknowledge that theycan do so readily. This is also our view. The Australian skilled temporary resident regulationswere deregulated in 1996. They are currently less stringent than the H-1B rules operating inthe United States.26
The evidence presented earlier showed that there has been an increase in the net flow ofvisitors with work permits to Australia. By far the largest single occupation in this visitor flowis computing professionals. Over the three years to 1999-2000 tables in the Appendix showthat there was an inflow of 5,561 visitors with computing occupations and an outflow ofvisitors with the same occupation of 2,233, thus producing a net intake of 3,328. Most of thisnet inflow came from the United Kingdom and from the United States. The net inflow fromIndia was somewhat smaller, but India does now rank as the third largest source country.
Skilled Labour: Gains and Losses, page 35
Conclusion
This Report presents a more positive picture of Australia’s attractions for skilled persons thanwould have been expected given the widespread concern that Australia has been experiencinga ‘brain drain’.
This ‘brain drain’ image has emerged in a knowledge vacuum, since there has previously beenlittle empirical work conducted which could counter such false impressions. Concerns aboutskill losses seem mainly to have arisen in the context of departures of senior researchpersonnel. However another source of worry has been the emergence of shortages of skilledworkers in fields such as IT and accounting. Such concerns have been accompanied bypersistent anecdotal reports about the attraction of Australian experts to overseas locations. Inthis context employers and press commentators have been tempted to conclude that a ‘braindrain’ is contributing to the shortage situation.
A shortage of highly skilled workers is a problem in some fields. There is a variety of reasonsfor this situation. It is to be hoped that this Report will direct attention to more substantivecauses than the alleged ‘brain drain’. These include the level of training opportunitiesavailable for Australian residents, particularly in the computing field.
Skilled Labour: Gains and Losses, page 36
References
1 Lauchlan Chipman, Paper presented to the Higher Education Information Technology Forum, ‘Universities in aDynamic Australian Information Economy’, Sydney, April 10, 2001, p. 42 Stephen Glover et al, Migration: an Economic and Social Analysis, Research, Development and StatisticsDirectorate, Home Office, London, 2001, p. 203 Ibid, p. 94 Zygmunt Bauman, Globalisation, the Human Consequences, Polity Press, Cambridge, 1998, p. 895 Stephen Castles and Mark Miller, The Age of Migration, Second Edition, 1998, Basingstoke, England,Macmillan, p. 926 For the Tasmanian experience, see Natalie Jackson and Rebecca Kippen, ‘Whither Tasmania? A note onTasmania’s population problem’, People and Place, vol. 9, no. 1, March 2001, pp 27-37, Monash UniversityVictoria. The New Zealand situation is spelled out below and in more detail in Bob Birrell and Virginia Rapson,‘New Zealanders in Australia: the end of an era?’ People and Place, vol. 9, no. 1, March 2001, MonashUniversity Victoria, pp. 61-74.7 Australian Bureau of Statistics (ABS), Migration, 1996-97, 1998, Table no. 37, Canberra8 G. Pure, Search, vol.19, no.2, 1988, Sydney, pp 85-899 T. Fred. Smith, ‘Is there a brain drain? The case of engineers’, People and Place, vol. 1, no. 3, September 1993,Monash University Victoria, pp, 43-4610 T. Fred. Smith, ‘The movement of engineers in and out of Australia’, People and Place, vol. 2, No. 1, March1994, Monash University Victoria, pp. 25-2911 Bob Birrell and Lesleyanne Hawthorne, Immigrants and the Professions in Australia, Centre for Populationand Urban Research, Monash University Victoria, 1997, Table 412 Department of Industry, Science and Resources, Australian Science and Technology at a Glance, 2000,Canberra, p. 1213 ABS, The Labour Force, May 1997 and May 2000, unpublished tables, Canberra14 The Chance to Change, Discussion Paper by the Chief Scientist, Canberra, August 2000, pp. 12-1615 Immigration Advisory Council, Inquiry into the Departure of Settlers from Australia, Final Report, AustralianGovernment Publishing Service, Canberra, 1973, pp. 28-2916 See Birrell and Rapson, op cit, p. 6617 Lindsay Lowell, ‘The demand and new legislation for skilled temporary workers (H-1Bs) in the UnitedStates’, People and Place, December 2000, Monash University Victoria, p.3318 Nayan Chanda, ‘The Tug of War for Asia’s Best Brains’, Far Eastern Economic Review, November 9, 2000,Hong Kong, pp. 38-4419 Office of Philip Ruddock MP. Immigration Initiatives to attract IT experts January 29, 200120 Lauchlan Chipman, op cit.21 FASTS Occasional Paper Series, Number 3, October 200022 Bob Birrell and Lesleyanne Hawthorne, Op. Cit., p. 1423 Bob Birrell and Lesleyanne Hawthorne, ‘Skilled migration outcomes as of 1996’, in Review of theIndependent and Skilled-Australian Linked Categories, Report’, DIMA, February 1999, Canberra, pp 10-11.24 Ibid, Table 325 Fiona Curruthers, ‘Barriers are falling in the IT recruitment war’, The Financial Times, December 6, 2000,London, p. 926 Bob Birrell, ‘Information Technology and Australia’s immigration program: is Australia doing enough?'People and Place, June 2000, Monash University Victoria, pp. 78-82