Embed Size (px)
Citation preview
NUTRIENTS LOSSES EVALUATION IN DRAINAGE WATER OF
MARDAN SCARP
BY
HAMID GUL
DOCTOR OF PHILOSOPHY (Ph.D) IN AGRICULTURE
(SOIL & ENVIRONMENTAL SCIENCES)
DEPARTMENT OF SOIL & ENVIRONMENTAL SCIENCES FACULTY OF CROP PRODUCTION SCIENCES
KPK AGRICULTURAL UNIVERSITY PESHAWAR, PAKISTAN
OCTOBER, 2010

ii
NUTRIENTS LOSSES EVALUATION IN DRAINAGE WATER OF
MARDAN SCARP
BY HAMID GUL
A thesis submitted to the NWFP Agricultural University, Peshawar in partial fulfillment of the requirements for the degree of
DOCTOR OF PHILOSOPHY (Ph.D) IN AGRICULTURE (SOIL AND ENVIRONMENTAL SCIENCES)
Approved by:
_________________________ Chairman Supervisory Committee Dr. Riaz A. Khattak (FRSC) Meritorious Professor Dept. of Soil and Environ. Sciences
_________________________ Member Prof. Dr. Muhammad Jamal Khan Dept. of Soil and Environ. Sciences
_________________________ Member Prof. Dr. Muhammad Sharif Dept. of Soil and Environ. Sciences
_________________________ Member Prof. Dr. Muhammad Jamal Khan Dept. of Water Management
_________________________ Chairperson/ Convener Board of Prof. Dr. Sajida Perveen studies Dept. of Soil and Environ. Sciences _________________________ Dean, Faculty of Crop Production Prof. Dr. Zahoor A. Swati Sciences ________________________ Director Advanced Studies and Prof. Dr. Farhatullah Research
DEPARTMENT OF SOIL & ENVIRONMENTAL SCIENCES FACULTY OF CROP PRODUCTION SCIENCES
KPK AGRICULTURAL UNIVERSITY PESHAWAR, PAKISTAN
October, 2010

iii
Wxw|vtàxw àÉ Åç UxÄÉäxw f|áàxÜa|tét`xxÇt;Ätàx<?
j|yx tÇw V{|ÄwÜxÇA

iv
Table of Contents
No. Title Page #
i. List of Tables ................................................................................................... iii
ii. List of Figures .................................................................................................. viii
iii. Acknowledgements .......................................................................................... ix
iv. Abstract ............................................................................................................ x
1. INTRODUCTION ................................................................................................... 1
2. REVIEW OF LITERATURE ................................................................................... 6
2.1 Nutrient losses from subsurface drainage system ...................................................... 9
2.2 Impact of drainage on environment ............................................................................ 15
2.3 Controlling losses from subsurface drainage system .................................................. 17
2.4 Reuse of drainage waters ............................................................................................ 21
2.5 Physico-chemical characteristics of the soils of SCARP Area and KPK ................... 23
3. MATERIALS AND METHODS ............................................................................. 27
3.1 Field Survey and Site Selection ................................................................................. 27
3.2 General Description of the Area ................................................................................. 28
3.2.1 District Charsadda ............................................................................................... 28
3.2.2 District Mardan .................................................................................................... 29
3.2.3 The Climate of the Project Area ........................................................................... 29
3.2.4 Topography and Drainage .................................................................................... 30
3.2.5 The Soils of the Project Area ............................................................................... 30
3.3 Soil Samples Collections ............................................................................................ 31
3.4 Collection of Drainage Waters Samples ..................................................................... 32
3.5 Collection of Irrigation waters Samples ..................................................................... 33
3.6 Crop Yield and Nutrient Balance ................................................................................ 33
3.6.1 Farmer’s Fields ................................................................................................................ 33
3.6.2 Experimental Fields ......................................................................................................... 34
3.7 Laboratory Analysis .......................................................................................... 34
3.7.1 Soil pH ............................................................................................................................ 34
3.7.2 Electrical conductivity .................................................................................................... 35
3.7.3 Calcium and Mg by Atomic Absorption Spectrophotometer ........................................ 35
3.7.4 Sodium and K by flame photometer ............................................................................... 35
3.7.5. Sodium adsorption ratio .................................................................................................. 35
3.7.6 Lime content ................................................................................................................... 35
3.7.7 Soil texture ...................................................................................................................... 36
3.7.8 Organic matter ................................................................................................................ 36
3.7.9 Mineral nitrogen in soil or water samples ...................................................................... 37

v
3.7.10 AB-DTPA extractable P, K, Cu, Zn, Fe, and Mn .......................................................... 38
3.6.11 Analysis of plant samples .......................................................................................................... 38
3.7.12 Leaching fraction ............................................................................................................. 39
3.7.13 Hydraulic Conductivity .................................................................................................. 39
3.7.14 Soil Permeability .............................................................................................................. 40
3.8 Statistical Analyses ..................................................................................................... 40
4. RESULTS AND DISCUSSION ............................................................................. 41
4.1 Field Survey and Site Selection for the Study ............................................................ 41
4.2 Chemical Composition of Irrigation Waters Applied to Site-1, Fazliabad, Mardan and Site-2, Manga Dargai Charsadda ............................................................ 45
4.2.1 pH, EC, Ca, Mg, Na and SAR of irrigation waters ........................................................ 45
4.2.2 Macronutrients [NH4-N, NO3-N, P and K]iw in irrigation waters ................................... 46
4.2.3 Micronutrients [Cu, Fe, Mn and Zn]iw in irrigation waters ............................................. 46
4.2.4 Salts, cations and nutrients added in irrigation waters per Season ................................. 50
4.3 Soil Chemical Composition ........................................................................................ 54
4.3.1 Soil pH, EC, Cations, SAR and lime ............................................................................... 54
4.3.2 Soil Organic Matter, NH4-N, NO3-N and AB-DTPA Extractable P and K ................... 63
4.3.3 Concentrations of AB-DTPA Extractable Cu, Fe, Mn and Zn in Soil Samples ........... 71
4.3.4 Soil particle size distribution, permeability, leaching fraction and hydraulic conductivity ..................................................................................................................... 78
4.4 Concentrations and Losses of Nutrients Through Tile Drainage Waters Measured at Site-1, Fazliabad and Site-2, Manga Dargai, Mardan SCARP ............... 87
4.4.1 Drainage Waters’ pH ...................................................................................................... 87
4.4.2 Drainage Water Electrical Conductivity (ECdw) ............................................................. 91
4.3.3 Cations [Na, Ca and Mg] concentrations in Drainage Waters ........................................ 94
4.3.4 Macronutrients [N, P and K] in Drainage Waters ........................................................... 102
4.3.4 Micronutrients [Cu, Fe, Mn and Zn] in Drainage Waters ............................................... 115
4.5 Discharge of Water Drained (L min-1) From Site-1, Fazliabad and Site-2, Manga Dargai, Mardan SCARP ................................................................................ 129
4.6 Rate and Quantity of Salts and Nutrients Leached in Drainage Waters From Site-1, Fazliabad and Site-2, Manga Dargai, Mardan SCARP ................................... 131
4.7 Nutrient Balances in Soil-Crop-Drainage System ..................................................... 135
4.7.1 Farmers Fields .................................................................................................................. 135
4.7.2 Field Study ....................................................................................................................... 138
5. SUMMARY ...................................................................................................... 143
6. CONCLUSIONS............................................................................................... 149
7. RECOMMENDATIONS .................................................................................. 151
8. LITERATURE CITED ..................................................................................... 152
APPENDICES ................................................................................................. 164

vi
List of Tables
No. Title Page #
1 Enhancement in average crop yields of wheat, maize, sugarcane and tobacco with SCARP in district Mardan and Charsadda as revealed by Survey ..................................... 42
2 Fertilizer application before and after SCARP .................................................................... 42
3 pH, EC, cations and nutrients concentrations of irrigation waters applied to wheat during 2003-04 at site-1, Fazliabad and site-2, Manga Dargai ........................................... 47
4 pH, EC, cations and nutrients concentrations of irrigation waters applied to maize crop during 2004 at site-1, Fazliabad and site-2, Manga Dargai ........................................ 48
5 pH, EC, cations and nutrients concentrations of irrigation waters applied to what crop during 2004-05 at site-1, Fazliabad and site-2, Manga Dargai ................................... 49
6 Seasonal addition of salts, cations and macro and micronutrients (kg ha-1) through irrigation waters in different growing season during 2003-05 at site-1, Fazliabad and site-2, Manga Dargai ..................................................................................................... 51
7 Seasonal addition of salts, cations and macro and micronutrients (kg ha-1) through irrigation waters in different growing season during 2003-05 at site-1, Fazliabad and site-2, Manga Dargai .................................................................................................... 52
8 ANOVA showing Mean Square (MS) values for soil pH, EC, Na, Ca, Mg, SAR and lime content of soil samples collected from ten different fields at six depths from site-1, Fazliabad and site-2, Manga Dargai at three sampling times during 2003-05 ............................................................................................................................... 55
9 Changes in soil pH with sampling time and soil depths at site-1, Fazliabad and site-2, Manga Dargai during 2003-05 under sub-surface tile drainage system ( n = 10) ........... 56
10 Changes in soil EC with sampling time and soil depths at site-1, Fazliabad and site-2, Manga Dargai during 2003-05 under sub-surface tile drainage system ( n = 10) ....................................................................................................................................... 57
11 Changes in water saturated soil Na concentrations (mg L-1) with sampling time and soil depths at site-1, Fazliabad and site-2, Manga Dargai during 2003-05 under sub-surface tile drainage system ( n = 10) .......................................................................... 58
12 Changes in water saturated soil Ca concentrations (mg L-1) with sampling time and soil depths at site-1, Fazliabad and site-2, Manga Dargai during 2003-05 under sub-surface tile drainage system ( n = 10) .......................................................................... 59
13 Changes in water saturated soil Mg concentrations (mg L-1) with sampling time and soil depths at site-1, Fazliabad and site-2, Manga Dargai during 2003-05 under sub-surface tile drainage system ( n = 10) .......................................................................... 60
14 Changes in soil SAR with sampling time and soil depths at site-1, Fazliabad and site-2, Manga Dargai during 2003-05 under sub-surface tile drainage system ( n = 10) ....................................................................................................................................... 61
15 Changes in soil lime contents (g 100 g-1 soil) with sampling time and soil depths at site-1, Fazliabad and site-2, Manga Dargai during 2003-05 under sub-surface tile drainage system ( n = 10) .................................................................................................... 62

vii
16 ANOVA showing Mean Square (MS) values for soil organic matter (SOM), NH4-N, NO3-N, P and K in soil samples collected from ten different fields at six depths from site-1, Fazliabad and site-2, Manga Dargai at three sampling times during 2003-05 ............................................................................................................................... 64
17 Changes in soil organic matter content (%) with sampling time and soil depths at site-1, Fazliabad and site-2, Manga Dargai during 2003-05 under sub-surface tile drainage system ( n = 10) .................................................................................................... 65
18 Changes in KCl extractable soil NO3-N (mg kg-1) with sampling time and soil depths at site-1, Fazliabad and site-2, Manga Dargai during 2003-05 under sub-surface tile drainage system ( n = 10) ................................................................................. 66
19 Changes in KCl extractable soil NH4-N (mg kg-1) with sampling time and soil depths at site-1, Fazliabad and site-2, Manga Dargai during 2003-05 under sub-surface tile drainage system ( n = 10) ................................................................................. 67
20 Changes in AB-DTPA extractable P (mg kg-1 soil) with sampling time and soil depths at site-1, Fazliabad and site-2, Manga Dargai during 2003-05 under sub-surface tile drainage system ( n = 10) ................................................................................. 69
21 Changes in AB-DTPA extractable K (mg kg-1 soil) with sampling time and soil depths at site-1, Fazliabad and site-2, Manga Dargai during 2003-05 under sub-surface tile drainage system ( n = 10) ................................................................................. 70
22 ANOVA showing Mean Square (MS) values for AB-DTPA extractable Cu, Fe, Mn and Zn of soil samples collected from 10 different fields at 6 depths from Fazliabad (Mardan) and Manga Dargai (Charsadda) at three sampling times during 2003-05 ............................................................................................................................... 72
23 Changes in AB-DTPA extractable Cu (mg kg-1) with sampling time and soil depths at site-1, Fazliabad and site-2, Manga Dargai during 2003-05 under sub-surface tile drainage system ( n = 10) .................................................................................................... 73
24 Changes in AB-DTPA extractable Fe (mg kg-1) with sampling time and soil depths at site-1, Fazliabad and site-2, Manga Dargai during 2003-05 under sub-surface tile drainage system ( n = 10) .................................................................................................... 75
25 Changes in AB-DTPA extractable Mn (mg kg-1) with sampling time and soil depths at site-1, Fazliabad and site-2, Manga Dargai during 2003-05 under sub-surface tile drainage system ( n = 10) ................................................................................. 76
26 Changes in AB-DTPA extractable Zn (mg kg-1) with sampling time and soil depths at site-1, Fazliabad and site-2, Manga Dargai during 2003-05 under sub-surface tile drainage system ( n = 10) .................................................................................................... 77
27 ANOVA showing Mean Square (MS) values for sand, silt, clay, soil permeability, leaching fraction and hydraulic conductivity of soil samples collected from 10 different fields at 6 depths from Fazliabad (Mardan) and Manga Dargai (Charsadda) at three sampling times during 2003-05 .......................................................... 79
28 Changes in soil sand fraction (%) with sampling time and soil depths at site-1, Fazliabad and site-2, Manga Dargai during 2003-05 under sub-surface tile drainage system ( n = 10) .................................................................................................................. 80
29 Changes in soil silt fraction (%) with sampling time and soil depths at site-1, Fazliabad and site-2, Manga Dargai during 2003-05 under sub-surface tile drainage system ( n = 10) .................................................................................................................. 81

viii
30 Changes in soil clay fraction (%) with sampling time and soil depths at site-1, Fazliabad and site-2, Manga Dargai during 2003-05 under sub-surface tile drainage system ( n = 10) .................................................................................................................. 82
31 Changes in soil permeability (mm d-1) with sampling time and soil depths at site-1, Fazliabad and site-2, Manga Dargai during 2003-05 under sub-surface tile drainage system ( n = 10) .................................................................................................................. 84
32 Changes in soil leaching fraction (mm d-1) with sampling time and soil depths at site-1, Fazliabad and site-2, Manga Dargai during 2003-05 under sub-surface tile drainage system ( n = 10) .................................................................................................... 85
33 Changes in soil hydraulic conductivity (mm d-1) with sampling time and soil depths at site-1, Fazliabad and site-2, Manga Dargai during 2003-05 under sub-surface tile drainage system ( n = 10) ................................................................................. 86
34 ANOVA showing MS values for pHdw, ECdw, [Na]dw, [Ca]dw and [Mg]dw measured at six different post irrigation timings after each irrigation at two sites (Fazliabad and Mange Dargai) during three season from 2003 to 2005. .............................................. 88
35 Drainage water pH observed at given irrigation numbers and post irrigation timings in site-1, Fazliabad and site-2, Manga Dargai under subsurface tile drainage system during 2003-05 ......................................................................................... 89
36 Changes in drainage water pH with irrigation number, post irrigation time and different cropping seasons at site-1, Fazliabad and site-2, Manga Dargai under subsurface tile drainage system during 2003-05 .................................................................. 90
37 Drainage water [EC]dw observed at given irrigation numbers and post irrigation timings in site-1, Fazliabad and site-2, Manga Dargai under subsurface tile drainage system during 2003-05 ......................................................................................... 92
38 Changes in [EC]dw with irrigation number, post irrigation time and different cropping seasons at site-1, Fazliabad and site-2, Manga Dargai under subsurface tile drainage system during 2003-05 .................................................................................... 93
39 Drainage water [Na]dw observed at given irrigation numbers and post irrigation timings in site-1, Fazliabad and site-2, Manga Dargai under subsurface tile drainage system during 2003-05 ......................................................................................... 95
40 Changes in [Na]dw with irrigation number, post irrigation time and different cropping seasons at site-1, Fazliabad and site-2 , Manga Dargai under subsurface tile drainage system during 2003-05 .................................................................................... 96
41 Drainage water [Ca]dw observed at given irrigation numbers and post irrigation timings in site-1, Fazliabad and site-2, Manga Dargai under subsurface tile drainage system during 2003-05 ......................................................................................... 98
42 Changes in [Ca]dw with irrigation number, post irrigation time and different cropping seasons at site-1, Fazliabad and site-2 , Manga Dargai under subsurface tile drainage system during 2003-05 .................................................................................... 99
43 Drainage water [Mg]dw observed at given irrigation numbers and post irrigation timings in site-1, Fazliabad and site-2, Manga Dargai under subsurface tile drainage system during 2003-05 ......................................................................................... 100
44 Changes in [Mg]dw with irrigation number, post irrigation time and different cropping seasons at site-1, Fazliabad and site-2 , Manga Dargai under subsurface tile drainage system during 2003-05 .................................................................................... 101

ix
45 ANOVA showing MS values for [NH4-N]dw, [NO3-N]dw, [P]dw and [K]dw measured at six different post irrigation timings after each irrigation at two sites (Fazliabad and Manga Dargai) during three season from 2003 to 2005. .............................................. 103
46 Drainage water [NH4-N]dw observed at given irrigation numbers and post irrigation timings in site-1, Fazliabad and site-2, Manga Dargai under subsurface tile drainage system during 2003-05 .......................................................................................... 104
47 Changes in [NH4-N]dw with irrigation number, post irrigation time and different cropping seasons at site-1, Fazliabad and site-2 , Manga Dargai under subsurface tile drainage system during 2003-05 .................................................................................... 105
48 Drainage water [NO3-N]dw observed at given irrigation numbers and post irrigation timings in site-1, Fazliabad and site-2, Manga Dargai under subsurface tile drainage system during 2003-05 .......................................................................................... 107
49 Changes in [NO3-N]dw with irrigation number, post irrigation time and different cropping seasons at site-1, Fazliabad and site-2 , Manga Dargai under subsurface tile drainage system during 2003-05 .................................................................................... 108
50 Drainage water [P]dw observed at given irrigation numbers and post irrigation timings in site-1, Fazliabad and site-2, Manga Dargai under subsurface tile drainage system during 2003-05 .......................................................................................... 110
51 Changes in [P]dw with irrigation number, post irrigation time and different cropping seasons at site-1, Fazliabad and site-2 , Manga Dargai under subsurface tile drainage system during 2003-05 .......................................................................................... 111
52 Drainage water [K]dw observed at given irrigation numbers and post irrigation timings in site-1, Fazliabad and site-2, Manga Dargai under subsurface tile drainage system during 2003-05 .......................................................................................... 113
53 Changes in [K]dw with irrigation number, post irrigation time and different cropping seasons at site-1, Fazliabad and site-2, Manga Dargai under subsurface tile drainage system during 2003-05 .................................................................................... 114
54 ANOVA showing MS values for [Cu]dw, [Fe]dw, [Mn]dw and [Zn]dw measured at six different post irrigation timings after each irrigation at two sites (Fazliabad and Manga Dargai) during three season from 2003 to 2005. .................................................... 116
55 Drainage water [Cu]dw observed at given irrigation numbers and post irrigation timings in site-1, Fazliabad and site-2, Manga Dargai under subsurface tile drainage system during 2003-05 .......................................................................................... 117
56 Changes in [Cu]dw with irrigation number, post irrigation time and different cropping seasons at site-1, Fazliabad and site-2 , Manga Dargai under subsurface tile drainage system during 2003-05 .................................................................................... 118
57 Drainage water [Fe]dw observed at given irrigation numbers and post irrigation timings in site-1, Fazliabad and site-2, Manga Dargai under subsurface tile drainage system during 2003-05 .......................................................................................... 120
58 Changes in [Fe]dw with irrigation number, post irrigation time and different cropping seasons at site-1, Fazliabad and site-2 , Manga Dargai under subsurface tile drainage system during 2003-05 .................................................................................... 121
59 Drainage water [Mn]dw observed at given irrigation numbers and post irrigation timings in site-1, Fazliabad and site-2, Manga Dargai under subsurface tile drainage system during 2003-05 .......................................................................................... 123

x
60 Changes in [Mn]dw with irrigation number, post irrigation time and different cropping seasons at site-1, Fazliabad and site-2 , Manga Dargai under subsurface tile drainage system during 2003-05 .................................................................................... 124
61 Drainage water [Zn]dw observed at given irrigation numbers and post irrigation timings in site-1, Fazliabad and site-2, Manga Dargai under subsurface tile drainage system during 2003-05 .......................................................................................... 126
62 Changes in [Zn]dw with irrigation number, post irrigation time and different cropping seasons at site-1, Fazliabad and site-2 , Manga Dargai under subsurface tile drainage system during 2003-05 .................................................................................... 127
64 Rate of volume of water [co-efficient of drainage] (L min-1) drained from site-1, Fazliabad and site-2, Manga Dargai as influenced by irrigation number and post irrigation timing , under subsurface tile drainage system during 2003-05 .......................... 128
65 Nutrients and salts removed with drainage water from site-1, Fazliabad and site-2, Manga Dargai in six months with various irrigations during 2003-05 (values are averages across post irrigation times) .................................................................................. 130
66 Estimated loss of nutrients and salts (six monthly) based on soil hydraulic conductivity (0.3mm d-1) with drainage water from site-1, Fazliabad and site-1, Manga Dargai during 2003-05 ............................................................................................ 132
67 Addition and removal of NPK in different selected fields at Fazliabad (Mardan) and Manga Dargai (Charsadda) during rabi 2003-04 .......................................................... 134
68 Addition and removal of Cu, Fe, Mn and Zn in different selected fields at Fazliabad (Mardan) and Manga Dargai (Charsadda) during rabi 2003-04 .......................... 136
69 Addition and removal of N,P and K in different fertilized fields at Fazliabad (Mardan) and Manga Dargai (Charsadda) during Kharif 2004 ........................................... 137
70 Addition and removal of N, P and K in different fertilized fields at Fazliabad (Mardan) and Manga Dargai (Charsadda) during rabi 2004-05 .......................................... 139
71 Post harvest soil pHe, ECe, KCl extractable NH4-N and NO3-N and AB-DTPA extractable P and K as influenced by the given NPK level to maize crop during 2004 at site-1, Fazliabad and site-2, Manga Dargai under subsurface drainage system ................................................................................................................................. 141
72 Post harvest soil pHe, ECe, KCl extractable NH4-N and NO3-N and AB-DTPA extractable P and K as influenced by the given NPK level to wheat crop during 2004-05 at site-1, Fazliabad and site-2, Manga Dargai under subsurface drainage system ................................................................................................................................. 142

xi
List of Figures
No. Title Page #
1 Changes in drainage water [pH]dw at site-1, Fazliabad and site-2 Manga Dargai
during 2003-05 .................................................................................................................... 90
2 Changes in drainage water [EC]dw at site-1, Fazliabad and site-2 Manga Dargai
during 2003-05 .................................................................................................................... 93
3 Changes in drainage water [Na]dw at site-1, Fazliabad and site-2 Manga Dargai
during 2003-05 .................................................................................................................... 96
4 Changes in drainage water [Ca]dw at site-1, Fazliabad and site-2 Manga Dargai
during 2003-05 .................................................................................................................... 99
5 Changes in drainage water [Mg]dw at site-1, Fazliabad and site-2 Manga Dargai
during 2003-05 .................................................................................................................... 101
6 Changes in drainage water [NH4-N]dw at site-1, Fazliabad and site-2 Manga Dargai
during 2003-05 .................................................................................................................... 105
7 Changes in drainage water [NO3-N]dw at site-1, Fazliabad and site-2 Manga Dargai
during 2003-05 .................................................................................................................... 108
8 Changes in drainage water [P]dw at site-1, Fazliabad and site-2 Manga Dargai
during 2003-05 .................................................................................................................... 111
9 Changes in drainage water [P]dw at site-1, Fazliabad and site-2 Manga Dargai
during 2003-05 .................................................................................................................... 114
10 Changes in drainage water [Cu]dw at site-1, Fazliabad and site-2 Manga Dargai
during 2003-05 .................................................................................................................... 118
11 Changes in drainage water [Fe]dw at site-1, Fazliabad and site-2 Manga Dargai
during 2003-05 .................................................................................................................... 121
12 Changes in drainage water [Mn]dw at site-1, Fazliabad and site-2 Manga Dargai
during 2003-05 .................................................................................................................... 124
13 Changes in drainage water [Zn]dw at site-1, Fazliabad and site-2 Manga Dargai
during 2003-05 .................................................................................................................... 127

xii
ACKNOWLEDGEMENTS
All glory be to Allah, the Beneficent, the Merciful Whose blessings enabled me to complete
this piece of research work. I offer my humble gratitude from the core of my heart to Holy
Prophet Muhammad (PBUH) who is forever a torch of guidance and knowledge for
humanity.
I feel delighted to express my gratitude to my supervisor Dr. Riaz A. Khattak (FRSC),
Meritorious Professor, Dept. Soil and Environmental Sciences, KPK Agricultural University
whose creative ideas, guidance and keen interest made this dissertation possible. I gratefully
acknowledge his help and cooperation and timely review of the manuscript for a couple of
times. I cordially appreciate the help and guidance of Prof. Dr. Muhammad Jamal Khan, and
Prof. Dr. Mohammad Sharif, Dept. of Soil and Environmental Sciences, and Prof. Dr.
Muhammad Jamal Khan, Dept. of Water Management.
I am extremely thankful to Prof. Dr. Zahoor A. Swati, Dean Faculty of Crop Production
Sciences, and Prof. Dr. Sajida Perveen, Chairperson Dept. Soil and Environmental Sciences
for providing facilities to conduct this research. Sincere thanks are extended to all faculty
members of Soil and Environmental Sciences, who are all my teachers, for their guidance,
kind cooperation and good wishes. Special reference is made to acknowledge the help of Dr.
Dost Muhammad, Lecturer/JRS, Dept. of Soil and Environmental Sciences during data
analysis and thesis write up.
I am extremely thankful to all the laboratory staff and those who assisted me in field work
especially Mr. Sartaj (Late), Mr. Aurangzeb, Mr. Zahidullah, Mr. Hussain Muhammad, Mr.
Muhammad Ali, Madam Shaheen, and to my colleagues, Dr. Haroon, Dr. Zahid Hussain, and
Mr. Manzoor Ahmad (Ph.D Scholar) whose help and continuous support made this
manuscript possible.
The help, facility and guidance provided to me during my research and thesis write up by Mr.
Major (Retd.) Sahibzada Muhammad Khalid, Chairman Pakistan Tobacco Board and other
colleagues of my department are highly acknowledged. I think it would have been impossible
without their generous help and cooperation.
I am deeply indebted to my affectionate wife, children especially Maria,Bushra, Sofia and
Malaika for their love, encouragement and patience throughout my Ph.D studies. I will never
be able to repay them back.
Hamid Gul

xiii
Nutrients Losses Evaluation in Drainage Water of Mardan SCARP
Hamid Gul and Riaz A. Khattak
Department of Soil and Environmental Sciences,
KPK Agricultural University, Peshawar
Abstract
This study was conducted to assess the nutrients losses from parts representative of Mardan and Charsadda soils through subsurface tile drainage system installed under Salinity Control and Reclamation Project (SCARP). The subsurface drainage system was executed during 1979-1992 whereby 150 m long lateral porous pipes were installed at a depth to 2.0 to 3.0 m with 90 m spacing. The lateral pipes were connected to a 1200 m long main collector pipe opening into main open drain. To achieve this objective, samples of irrigation waters, drainage waters and soils samples (to a depth of 270 cm with 45 cm increment from surface) were periodically collected for three cropping seasons during 2003-05. Drainage water samples were collected for the post irrigation timings of 24, 30, 36, 48, 72 and 96 h for each irrigation applied to the two sites, Fazliabad, Mardan and Manga Dargai Charsadda selected on the basis of a field survey of the area. Samples of irrigation waters (iw), drainage water (dw) and soils were analyzed for pH, EC, Na, Ca, Mg, SAR, N, P, K, Cu, Fe, Mn and Zn. The total input and removal of salts and nutrients were estimated using the concentration of a nutrient multiplied by volume of water and yield of a crop in a given season.
The field survey indicated that after SCARP execution the cropping intensity and crop yields increased three to four fold. Poplar (Populus alba) plantation disturbed the tiles and resulted in blockage and breakage of drainage pipes in parts of the area. The banks of irrigation waters revealed the soil erosion and subsidence to weak matrix associated with leaching of Ca and Mg. Nutrients requirements have gone up and need to be supplied proportionately to get higher yield of the crops. The values of pH and EC of irrigation water showed limited variation with time and seasons. The pHiw and ECiw of site-2 applied were higher compared to site-1.The values of EC, Ca, Mg, Na and SAR were in the range permissible for irrigation in both sites. Mean seasonal values of pH, EC, [Ca] and [Mg] were higher for irrigation waters applied to maize during 2004 as compared to water applied during 2003-04 and 2004-05 applied to wheat crop, while [Na] in both successive seasons of 2004 and 2004-05 were lower than the mean values recorded for the season 2003-04. Although the values of NH4-N, NO3-N, P, and K and micronutrients in irrigation waters appeared low but their total input over the cropping season in six irrigations may be important for crop growth. For instance the seasonal addition of readily bio- available NH4-N, NO3-N, P and K ranged between 1.24 to 3.36, 1.85 to 4.24, 0.56 to 2.88 and 6.86 to 12.3 kg ha-1, respectively in irrigation water.
Statistical analysis using factorial model (sampling time x 6 locations over time x 2 replications over locations x 6 sampling depth) revealed that all these factors

xiv
significantly (P<0.001) influenced soil pH, EC, Na, Ca, Mg, SAR, organic matter, NH4-N,(except location/time), NO3-N, (except sampling time and location over time), P (except replication/location), K, Cu, Fe, Mn and Zn (except replication/location). Soils were silt loam, alkaline, strongly calcarious non saline, low in organic matter, low in Ca, Mg in relation to Na, low in N, P and adequate in K. Soils were permeable and that the leaching fraction determined in disturbed surface soil (0-45 cm) samples varied between 0.1 to 0.28 in site-1 and 0.16 to 0.24 in site-2 during 1st year. Leaching of salts and migration of clay was suggested by increasing levels to lower depths. The concentrations of nutrients showed significant variations with depth, time and sites.
Based on statistical factorial analysis [2 sites x 3 seasons x 6 irrigation x 6 post irrigations sampling timing], sites, cropping season and number of irrigation induced significant variations in the values of pH, EC, Ca, NH4-N, P, and K concentrations in drainage waters, collected after each irrigation at the given timings. Sites showed non-significant difference in Mg, NO3-N while P varied non-significantly with number of irrigation and Mg with cropping season. The post irrigation sampling had significant effect on [Na]dw only. The [Cu]dw and [Zn]dw varied significantly (p < 0.05) only with seasons while [Mn]dw showed significant (p < 0.05) differences in sites and seasons.
When averaged across other factors, site-2 maintained higher mean values of pH, EC, Ca, NH4-N, P, Fe, and lower values of K while concentrations of Mg, NO3, Cu and Mn were statistically similar in both sites. Higher values of these ions in site-2 could be associated with its higher concentrations in irrigation water which had its source from a large drain collecting canal seepage while stie-1 was irrigated directly with canal waters. When averaged across other factors, mean values of EC, Na, NO3 and Fe were higher in drainage waters collected during 2003-04, pH, Ca, Mg and Mn were higher during 2004 and those of NH4, P, K and Zn were higher in 2004-05 than other years, respectively.
The mean values of [Na]dw were several folds greater than [Ca]dw and [Mg]dw. [NO3-N]dw were 2.5 times greater than [NH4-N] and [P]dw which were four to ten times lower than K. Similarly mean values of [Cu]dw were four times greater than [Zn]dw. This trend was consisted with concentrations observed in irrigation water, notwithstanding the variations from year to year and site to site. All these nutrients concentrations were invariably higher in dw than iw.
The observed seasonal losses with drainage waters ranged from 1.6 to 8.2 (NH4-N), 0.7 to 22.9 (NO3-N), 0.32 to 7.0 (P), 18.5 to 53.4 (K) in site-1 and 1.2 to 7.5, 1.2 to 13.7, 1.4 to 6.5 and 14.9 to 35.5 kg ha-1 for the given nutrients in site-2, respectively in 2003-04. More or less similar losses were observed with some variations in the subsequent years. Nutrient balance suggested the losses through drainage and removal by crops generated negative balance in fields where no or lower doses of N, P and K were added. It is concluded that adequate fertilizers addition is imperative for maintaining soil fertility and to obtain optimum yields under the given irrigation-crop-drainage system.
1
1. INTRODUCTION
Salinization and waterlogging are the major problems in the low lying and poorly drained
soils of all over the world. In such soils the water moves down through the soil to a less
permeable layer where it builds up water table or flows down a slope and raises the level of
water table in the lower areas. Along with the injurious impacts of excessive waters on crop
production coupled with a series of bio-chemical changes in soil properties, the excess
waters can also lead to the development of salinity problem in the area (Hoffman and
Dunrnford, 1999). When the water table builds up, water can move to the surface by
capillary action which also carries dissolved salts to root-zone and surface soil. At the
surface, the water evaporates and the dissolved salts accumulate and thus lead to salinity
problem in the soil. Furthermore, as the roots draw water from the soil, more water carrying
salts moves up, thus increases the salts concentrations in the root-zone. Ghassemi et al.
(1995) reviewed various estimates of the global extent of salinization of land and water
resources and concluded that of the total 230 m ha of irrigated land around the world, some
45 m ha suffer from severe irrigation induced salinity problems. Ghafoor et al. (2004)
reported that due to lack of skill in applying water and shortfalls in infrastructure of the
irrigation system, nearly 30‐50% of the irrigated lands in the arid and semi‐arid regions
across the world have some degree of soil salinization problems. .
Saline and saline-sodic soils contain excessive concentrations of either soluble salts or
exchangeable sodium (Na) or both. These soluble and exchangeable salts cause harmful
effects to plants by increasing the salts concentration of the soil solution and promote
exchangeable Na concentrations on soil exchange complexes (Richard, 1954; Sposito, 1989;
Bohn et al., 2001). These salts impair the soil productivity through upsetting the water and
nutritional balance of plants (Mengel and Kirkby, 1987; Garg and Gupta, 1997; Mer et al.,
2000; Qadir et al., 2007). Increase in salinity causes delay and reduction in seed
germination and dehydration of plant cells which collectively result in drastic reduction of
plant growth or even complete abolishment of the crop in severe conditions (Bernstein,
1961; Donahue et al., 1983; Ramoliya and Pandey, 2003). The salinity-sodicity also

2
deteriorates many soil chemical, physical and biological properties (Läuchli and Epstein,
1990; Gupta and Gupta, 1997; Sumner 1993; Al-Nabulsi, 2001; Qadir et al., 2006) and
thus it is rightly believed that salinization is the first indicator towards desertification and
other environmental consequences.
Reclamation of salt affected soils can provide a unique opportunity for improving farmer’s
living standard and life style through increased crop yields. It also helps to alleviate the
pressure on current natural resources through bringing more soils under cultivation and
increasing fertilizers use efficiency on sustainable basis. To reclaim a waterlogged and
saline soil, basic steps like lowering the water table, removing the excess salts through
leaching or runoff and replacing the Na on exchange complexes with the application of
appropriate amendments are imperative. Depending on the soil phyico-chemical conditions
these steps are taken separately or in an integrated manner for more fruitful results.
Whatever the case may be, but it is certain that the excess water must be removed from the
soil to enable sustained agricultural activities in the area.
Subsurface drainage drains out excess waters from low-lying waterlogged areas. In such
system, a web of porous tile pipes interlinked with each other and to the main drainage pipes
are buried in the soil at some appropriate distances which collect excess water from the soil
into the main drainage pipe which then opens in the drainage canals. The depth and slope of
the porous pipes depends on soil physicochemical properties like texture, topography,
hydraulic conductivity, CEC, and the degree and extent of reclamation of soil. The
subsurface drainage system certainly lowers the water table and may correct the salinity
problem if good quality water is available for effective irrigations. However, along with
water and salts leaching and afterward flushing out from the soil many dissolved ions
including the essential nutrients also accompany with the moving water. The loss of
nutrients and ions in such system are much more than the otherwise similar soil and thus
needs proper monitoring to get sustainable production without deteriorating the soil fertility
conditions. The addition of nutrients and ions through fertilizers, mineralization and
irrigations waters and losses through drainage and crop removal must be properly monitored
(Ochs, 1987) to get economically viable and sustainable output without deteriorating the soil

3
fertility and other soil characteristics. Other side effects of excessive water drainage include
loss of wet land, change of habitat, lowering of water table and leaching of various
agrochemicals into water bodies which may cause environmental problems (Ochs, 1987’
Schnagl and Lee, 1987; Madramootoo et al., 1996) . Assessments of drainage waters from
such system may be regularly conducted to take timely measure to protect soil resources and
avoid any environmental consequences associated with discharge of agrochemicals and
nutrients in the outgoing waters (Ochs, 1987; Schnagl and Lee, 1987).
Like other parts of the country, inappropriate irrigation system leading to extensive seepage
from canals coupled with non-judicial and lavish use of irrigation waters and plain
topography of the area, parts of districts Mardan, Charsadda and Swabi of Khyber
Paktunkhwa (formerly, NWFP) developed the problems of waterlogging and salinity.
Because of the intensity of the problem, a huge multi-lateral aid project known as Mardan
Salinity Control and Reclamation Project (SCARP) located in North West Frontier Province
(NWFP) now known as Khyber Pakhtunkhwa (KPK), Pakistan was established. It was
started within the administrative districts of Mardan and Charsadda. The project was jointly
executed by International Development Agency (IDA), Canadian International
Development Agency (CIDA), Government of Pakistan and Government of KPK through
Water and Power Development Authority (WAPDA). The main objectives of the project
were to prevent or reduce waterlogging, control salinity and make more land available for
agriculture through subsurface porous tiled drainage system in the area. The project known
as Mardan SCARP encompassed 50040 ha of the Culturable Command Area (CCA) of the
total 54453 ha total Gross Command Area (GCA) of the lower Swat irrigation canal, which
emanates from the Swat River via the Munda Head works. The overall project consisted of
an extensive program of civil works including; construction of surface and subsurface
drains, irrigation canal remodeling, road improvement, land leveling, reclamation and
agricultural extension developments program. About 33401 ha of the total GCA) or 29555
ha of CCA having high water tables were recommended to be provided with horizontal
subsurface drains. The 29555 ha area was divided into two sub areas. Sub-area-I having
5870 ha area comprised of land which was abandoned for crop production due to high water

4
tables and/or salinity buildup before inception of the project activities while sub-area-II with
23684 ha area consisted of land which was under cultivation but had lower yields due to
salinity/ and waterlogging problems. The remaining area, consisting of small patches
scattered within the waterlogged area, was not recommended for subsurface drainage due to
the presence of soils having very low hydraulic conductivity or the presence of shallow
impermeable fragipan layers. The project began as a legal entity in 1979 and terminated in
1992. The project’s original schedule of completion in 6 years was prolonged to 13 years
(Freedman and Lodhi, 2001) which enhanced the cost of reclamation from Rs. 26000 to Rs.
63600 ha-1.
The tile drainage system installed during 1979-92, no doubt, lowered the water table and
enhanced the water allowance and improved drainage co-efficient (Khan and Awan, 1997).
The grain yields of maize (Zea mays L.) wheat (Triticum aestivum L.), sugarcane
(Saccharum spontanium, L ) and tobacco (Nicotiana Tabacum, L) increased by 3 to 4 folds
with introduction of subsurface drainage system. However, due to increased availability of
irrigation water and rapid drainage, it was apprehended that there would be substantial
amount of leaching of valuable nutrients beyond the root zone that would eventually retard
soil fertility and productivity, if not properly replenished. Along with soil fertility
degradation, the enriched drained water with nutrients and many other agro-chemicals can
pose many environmental hazards to downstream lands and aquatic system.
So far no attention has been given by any agency to investigate and quantify the losses of
nutrients from the SCARP area, which is subjected to intensive cropping and substantial
amounts of costly fertilizers are being annually applied. Having this in mind it was decided
to conduct study for proper quantification of the nutrient losses from this system. This study,
on evaluating the nutrients losses in Mardan SCARP under subsurface drainage system, is
first of its nature. It aimed at measuring the losses of fertilizers nutrients caused by irrigation
drainage waters in Mardan SCARP areas and to suggest measures for enhancing fertilizers
use efficiency and crop productivity on sustainable basis.

5
In view of the cost of fertilizers it was imperative to conduct a detailed investigation
regarding the amount of fertilizer applied and amount lost through irrigation drainage
waters. The study was conducted on two sites i.e. Fazliabad, district Mardan (site-1) and
Manga Dargai, district Charsadda (site-2), KPK province with the following objectives.
Objectives:
The major objectives of the proposed research were to evaluate the degree and extent of
nutrient losses from the selected sites in the Mardan SCARP area. The specific objectives of
this research project include:
i. Investigate the changes in salts and nutrients with irrigation timings, number and
season.
ii. Quantification of nutrients added and lost from the system in the drainage
waters.
iii. Evaluate the quality of drainage waters for crop production.
iv. Develop recommendations to minimize nutrients losses on sustainable basis for
maximizing agricultural production and to keep the nutrients out of streams,
rivers and lakes to save the fish and other aquatic animals.

6
2. REVIEW OF LITERATURE
The availability of water to crops, no doubt, is the most limiting factor in arid and
semiarid conditions whereby the timely application of irrigation water with appropriate
amounts can boost up the crop yields several times more than any other agricultural
input. However, in either case whether the irrigation water comes from underground or
surface water sources, the ultimate increases in crop yields and changes in soil properties
depend on water quality and quantity, time and intensity of water application and other
management practices like method of irrigation and on the type and efficiency of
drainage system.
The non-judicial use of irrigation waters in a canal irrigation system mainly associated
with lack of proper training and education of farming community lead to substantial
seepage and result in waterlogging especially in poorly drained areas (Hoffman and
Durnford, 1999). This condition is further aggravated in low land areas having almost
plain or concave topography which exists in the Peshawar Valley and some other parts of
the country (Soil Survey of Pakistan, 2007). Bresler et al. (1982) and Kielen (1996)
reported that irrigation water is the main source of waterlogging and salinity in low land
areas where the water table is shallow. Nearly 30-50% of the irrigated lands in the arid
and semiarid regions across the world have some degree of soil salinization problems due
to lack of skill in applying water and shortfalls in the infrastructure of the irrigation
system (Ghafoor et al., 2004). In Pakistan about 5.4 m ha soils are classified as
waterlogged (Agric. Stat. of Pak., 2009). Waterlogging is usually followed by the salinity
problem in hot arid climatic conditions whereby the higher evaporation of water leads to
upward movement of salts through capillary rise (Isabelo and Jack, 1993). Continued
evaporation processes over longer time concentrate salts in the root zone to excessive
levels. Due to lack of proper managerial practices and strategies, waterlogging is
expanding and globally 1.5 mha of irrigated land per annum is lost to salinity and
waterlogging (Brundtland and Khalid, 1987).

7
Like other areas of the world, wide spread irrigation system in Pakistan have resulted in
waterlogging and salinity in some parts of the country. Birch et al. (1990) blamed the
Sukkur Barrage Project which was completed in 1932 for development of widespread
problems of waterlogging and salinity in the irrigation command area. Similar is the case
in the Peshawar Valley where the lower Swat Canal Irrigation System increased the water
supply in the command area but due to plain topography, shallow water table and
unattended drainage system, the salinity and waterlogging problem increased with time.
Various agencies had adopted different criteria for classification of waterlogged soil
depending on soil properties, climatic conditions, crop yield and the specific objective of
the agency. For example, the National Commission of Agriculture India (1976) classified
the area as waterlogged if water table is less than 1.5 m while Ministry of Water
Resources of the same country (1991) extended the water table range up to 2 m and also
stated that the area having water table between 2-3 m may be potentialy waterlogged
(IDNP, 2002). In the same manner Water and Power Department Authority (WAPDA)
Pakistan (1979) reported the area having water table less than 3 m depth should be
considered potentially waterlogged. The area having the water table at 1.5 m deep from
soil surface is classified as disaster waterlogged area (WAPDA, 1979) and the water table
at Mardan before Salinity Control and Reclamation Project (SCARP) was 0.3 to 1.2 m
with an average value of 0.79 m (Canadian Team, 1984).
Subsurface drainage system can actively remove the excess waters from the waterlogged
and poorly drained soils. It is more effective than digging tube wells in lowering the
water table and soil reclamation (Woltere et al., 1996). The subsurface tile drainage
system is usually constructed with the three main objectives (1) to prevent or reduce
waterlogging, (2) control salinity, and (3) make new land available for agriculture
(Ritzema, 1994). The subsurface drainage system improve growing conditions by
promoting aeration of the root zone, increasing percolation and leaching of salts and
lowering the water table (Richard et al., 1989). These desirable effects were observed in
Mardan SCARP when the soil conditions and crop yields before and after the completion
of the project in 1992 were compared through personal survey (Table 1, section 4.1) and

8
also given in the final reports of Mardan SCARP (Canadian Drainage Team, 1984). It
was noted that wheat, maize and cane yields increased by 3 to 4 times with the SCARP
project. Kazmi (1999) and Khan (1999) reported a marked decrease in water table and
increase in various crops with introduction of Swabi SCARP in the Peshawar Valley.
According to Ramazan (1999) salinity reduced, cropping intensities and crop yields
increased and the gross income and socio-economic conditions of the farmers improved
with introduction of SCARP and subsurface drainage system in Indus Basin of the
country. Ahmad (2004) studied the effect of Mardan SCARP on soil salinity reduction by
comparing the soils in 2003 to that of 1977 (before the project installation). Sixty soil
samples were collected from various parts of the project area, and it was reported that
average EC in the upper layer (0-30 cm) decreased from 1.27 dS m-1 in 1977 to 0.69 dS
m-1 in 2003 due to installation of tile drains.
However, besides these desirable effects, the subsurface drainage system can pose the
following three environmental effects i.e. (1) disturbance and/or pollution of the
environment, (2) depletion and/or over-exploitation of the natural resources and (3)
destruction and/or impairment of the natural ecosystem. Along with these impacts other
side effects of drainage include leaching of nutrients and other agrochemical, erosion and
sedimentations, seepage, salinization and acidification in other areas, loss of wetland and
change of habitat (Weinberg et al., 1991; Ritzema, 1994). The downstream side-effects
include the effects of the disposal of drainage effluent, excess surface waters, and
seepage from drainage canals.
The negative and positive effects of surface drainage system have been envisaged by
many researchers across the world. For example in Romania, Ionitoaia and Zarma (1996)
summarized that the main positive features of subsurface drainage system include
drainage of swampy areas, improvement in the runoff regime, stabilization of phreatic
level fluctuations and improvement of hydrophysical and chemical soil properties. While
the negative features associated with excessive drainage include negative influences on
the soil hydrosaline regime as well as on some specific flora species zones. In Egypt
where subsurface drainage system has been installed on 1.8 m ha area, El-Guindy and

9
Amer (1996) reported that along with many beneficial effects, the system also resulted in
pollution of downstream waters with salts, nutrients and many agrochemicals.
The impacts of subsurface drainage system on nutrient leaching and potential threat to
environment are briefly reviewed in the following section.
2.1 Nutrient losses from subsurface drainage system
Nutrient loss in an agricultural system where chemical fertilizers are applied is a common
problem but losses in drainage water per se have received little attention. Richard et al.
(1989) reported that along with many beneficial effects, the subsurface drainage system
also tends to increase the leaching of nutrients, particularly nitrate-nitrogen. These losses
decrease the fertilizer use efficiency and increase the cost the production. The recently
conducted survey in China by Ma et al. (2010) revealed awfully low efficiency of N (the
ratio of N output in the main product and the total N input) with only 26, 11 and 9% for
crop production, animal production and whole food chain, respectively while the
efficiency in same order for P was only 36, 6 and 7 % which suggested huge amount of
losses of N and P from the system. It was reported that N is either lost to atmosphere in
form of gases or in water soluble forms through drainage waters. It was estimated that
about 23 T g applied N was lost to atmosphere as ammonia (57%), N2O (2%), N2 (33%)
and NO2 (8%) while about 20 T g was lost through ground and surface water as NH4 and
NO3-N. This situation usually prevails in all agricultural systems. The study on drainage
system in the lower Fraser Valley of British Columbia on flat lowlands with humid
climatic conditions suggested a pronounced transient leaching of nutrients that were
associated with increasingly percolating waters. In Netherland, Molenar et al. (1990)
concluded that increased drainage system and lack of fertilizers application led to a
decline in soil fertility during the present century. Such condition may prevail across the
world and require much more attention where the soil fertility is already pitiable and
farmers are compelled to apply costly fertilizers.
Analysis and proper monitoring of drainage waters could give better estimate of nutrient
losses with sub surface drainage system. Schils (1994) reported that 20 and 24 kg N ha-1

10
was lost through drainage waters in Netherlands from grass paddocks and grass white
clover paddocks in three consecutive winters. The rate of losses varied from year to year
as well as with organic matter, cutting ratio, nitrogen rate, clover/grass ratio and
percentage of annual meadow grass.
A high rate of fertilizer with frequent irrigation can result in poor efficiency in terms of
nutrient uptake, as well as high nutrient losses in drainage water (Lian et al., 1997).
Similarly, the type and time of fertilizer application will also influence the loss of
nutrients from the soil. Tartola and Demppainen (1998) studied losses of N and P from
perennial grass ley on a fine sand soil with five treatments: (1) no fertilizer, (2) cow
slurry applied in autumn, (3) in winter, (4) in spring, and (5) mineral fertilizer applied in
spring. The amount of N applied was 0, 772, 807, 805 and 510 kg ha-1 while that of P was
0, 141, 119, 143 and 107 kg ha-1, respectively during (1992-96). “In the first year
(establishment of the ley, 1992-93), N losses (drainage + surface runoff) were slightly
higher after application of slurry in autumn (with immediate ploughing, treatment 2) than
in treatments 1, 4 and 5 (21 kg ha-1 vs. 17 kg ha-1), but the respective P losses (0.7-0.9 kg
ha-1) were not affected. During the ley years (1993-96) the N and P losses were increased
by surface application of fertilizers and by abundance of surface runoff (83-100% of the
total runoff). Nutrient losses were extremely high after slurry application in autumn and
winter, accounting for 11% and 33% of the applied N and 17% and 59% of applied P,
respectively. The N losses during the ley years from treatments 1-5 were 13, 62, 191, 23
and 24 kg ha-1, where the proportion of NH4-N was 21, 49, 56, 33 and 39%. The
respective P losses were 0.73, 1.6, 5.4, 4.2 and 4.0 kg ha-1, where the proportion of PO4-P
was 52, 85, 77, 68 and 64%”.
Cucci et al. (1994) also reported higher nutrients losses at higher fertilizer levels. They
studied the effects of application of 150 or 300 kg N, 100 or 200 kg P2O5 and 75 or 150
kg K2O on soil leaching and P flow from lysimeters filled with silty clay soil on a layer of
fissured limestone and planted with artichokes. It was observed that about 50% of the
water lost by leaching occurred in Jan. and Feb. in the 1st year, Nov. in the 2nd year and
Feb. in the 3rd year of the trial. Losses of nitrate and K differed between years and

11
months and were higher at the higher fertilizer rates. Nutrient losses were usually highest
in Nov. and Feb. P losses and movements in the soil were negligible.
The differential losses of nutrient from organic and inorganic sources were studied by
Randall et al. (2000) whereby the effects of dairy manure and urea applied at equivalent
rates were investigated. The effect of these fertilizers on [NO3-N], [total P],[ortho-P],
[NH4-N], [Escherichia coli] in subsurface tile drainage water, maize (Zea mays)
production and changes in soil P and K were recorded. Both fertilizers were applied
through broadcast containing 154 to 224 kg N ha-1 yr-1 each fall during 1993-96. The
soil of the experimental site was poorly drained (fine loamy, mixed, superactive, Typic
Endoaquoll). Though the N and P concentrations did not vary in drainage waters for the
two sources, still the the number of samples having at least higher concentrations than the
minimum detectable limit was significantly higher for manure treated plot. This effect
was also reflected in maize yield whereby 0.7 Mg ha-1 greater yield was recorded for the
urea treatment compared with dairy manure. Soil P and K in the top 20 cm were
increased by 1 mg kg-1 for every 12 kg P ha-1 and 10 kg K ha-1 applied as manure that
suggested additional benefit of manure over alone urea.
In a similar study Oskarsen et al. (1996) evaluated nutrient losses after different
treatments with slurry and commercial fertilizer, combined with autumn or spring
ploughing, in a four-year period on a silty clay loam soil in central Norway. It was
observed that approximately 75% of the water came through the drainage pipes, and 25%
as surface runoff. Surface runoff mainly occurred in periods with melting snow or heavy
rain on frozen soil. Most of the eroded material was found as suspended in the water from
the drainage pipes, and there was very little surface erosion in the experimental period.
Greatest losses of N and P were found when pig slurry was applied before ploughing in
autumn, and the highest losses were found in the winter months. Autumn ploughing
caused significantly higher losses of N and P than spring ploughing. There were also
significantly higher losses of N and P from treatments receiving NPK fertilizer compared
to treatments receiving only pig slurry.

12
The effect of increase in fertilizer N level on concentration and amounts of NO3 and other
nutrients losses in drainage waters was investigated by Monaghan et al. (2000) during a
four years study. Four levels of urea as 0, 100, 200 or 400 kg N ha-1 yr-1 were applied to
intensively grazed cattle pastures in the tile area of New Zealand. Increasing the levels of
N, mean annual losses of NO3-N in drainage linearly increased from 30, 34, 46 and 56 kg
N ha-1 with 0, 100, 200 and 400 kg N ha-1 yr-1, respectively. Corresponding [NO3-N] in
drainage waters were 8.3, 9.2, 12.5 and 15.4 mg L-1, respectively. However, it was
suggested that the increased NO3 losses at higher rates of N fertilizer addition were
instead associated to the indirect effect of increasing returns of urine and dung N to
pasture. In Years 2 and 3, leaching losses of Ca, Mg, K, Na and SO4-S averaged 61, 9,
11, 28 and 17 kg ha-1 yr-1, respectively, in treatment receiving no N. Increasing fertilizer
N inputs significantly increased Ca and, to a lesser extent, K leaching losses but had no
effect on losses of other plant nutrients. The surface runoff losses of Total-P, NO3-N and
NH4-N were less than 0.5 kg ha-1 yr-1. The results suggested that the extent of nutrients
losses is enhanced pronouncedly beyond certain levels of added fertilizers. The increase
in Ca and K losses with increasing N rates could be associated with formation of soluble
complexes of Ca(NO3)2, KNO3 (Sposito, 1989, Khattak and Jarrell, 1988; 1989) which
promoted their mobility.
Yusron and Phillips (1997) reported that N leaching mostly (85-90%) occurred as NO3-,
however, small amounts of NH4+ (10-15%) were also leached. Leaching was an
important component of N losses under un-cropped conditions and N leaching was
reduced as a result of growing cotton. Reduction in N leaching with crop may be
associated with removal of N by crop and as well as to structural stability because of
plant roots.
Type of the crop, growth rate and the growth stage of the specific crop determine the
extent of nutrient losses from the tile drainage system. Field trials showing the impact of
crop rotation and fertilizer application rate on nutrient leaching were conducted by
Sileika (2000). Depending on land use and fertilizer application the NO3-N loss-
coefficient changed from year to year. The highest losses of NO3-N were recorded from

13
sowing crop after crop and from intensively fertilized sugarbeet fields as 26.9 and 23.6 kg
ha-1 yr-1 while the lowest were from pasture and non-fertilized ley as 5.5 and 11.7 kg ha-1
yr-1, respectively. The nitrate load decreased when non-fertilized ley was included in the
crop rotation as well as perennial grass protective zone at a drinking water well. During
the first 5 mo after ploughing, an average of 23.9 kg NO3 ha-1 was transported within
drainage runoff from non-ploughed pasture, while 59.6 kg ha-1 was lost from ploughed.
Average yearly NO3 losses-coefficient derived from 2.5 yr of observation for ploughed
pasture was 94.2 kg ha-1, while for non-ploughed it was 12.8 kg ha-1. Proper manure
storage was an effective measure for preventing nutrient leaching from farms. The total N
concentration in drainage waters from 400 cow barns was up to 201 mg L-1 while
permitted limit for drainage water from barns is 12 mg L-1. The highest concentration of
total P during the first five mo of observation was 15 mg L-1 where the permissible limit
is 1.5 mg L-1. Very high P and NH4 concentrations in the drainage water, up to 850 and
106 mg L-1, respectively, confirmed that sewage from the barn was directed to the
drainage system.
In another study Borowiec et al. (1989) observed the highest mean annual NO3
concentrations (12 to 15 mg L-1) from sugar beet or maize plots and the fields kept bare
during autumn/winter while the lower values (4 to 7 mg L-1) were found with lucerne,
winter rape or winter cereals. The N,P and K concentrations in drainage waters were
monitored by Madramootoo et al. (1992) installed on two soils, 5 ha each, grown with
potato (Solanum tuberosum) for two growing seasons (April to November) in Quebec.
The N concentration ranged from 1.70 to 40.02 mg L-1 while P ranged from 0.002 to
0.052 mg L-1. On one field, K concentrations were always <10 mg L-1, while, on the other
field, K concentrations were mostly >10 mg L-1. At the end of the growing season, in the
final year of the project, the total amounts of N which were removed by the subsurface
drainage systems of the two fields were 14 kg ha-1 and 70 kg ha-1.
The soil management such as tillage operation with different devices can affect the
moving of nutrients with percolating waters. Randall (1990) collected samples from two
long-term tillage treated soil at 0-30, 30-60, 60-90, 90-120 and 120-150 cm depth.

14
Nitrate-N accumulation in the 0 to 30 cm profile in late July was reduced by 75% (no
tillage) to 38% (chisel plough) compared with the conventional mouldboard tillage
system at the 8th year. Accumulation of NO3-N in kg ha-1 in the 0 to 150 cm profile after
harvest was 878 (mouldbord), 639 (Chisel), 403 (disc plough), and 232 (no tillage
system). The temperature and the degree of waterlogging or aeration also affected the rate
and total amounts of N drained from the peat soils. (Heathwaite, 1990). This could be
associated with the process of organic matter decomposition, mainly mineralization
accentuated by high temperature, proper aeration and vise versa.
The mobility and dynamic of the specific nutrient, an ion or a chemical specie determines
their retention time in soil and rate of leaching from the system. It is just like
chromatographic principles where the soil acts as stationary phase or nutrients in solution
as mobile phase. Fujiyama and Nagai (1989) applied two concentrations (C1 and C2)
with two rates (10 and 15 mm d-1) through drip irrigation to plants grown in pots of dune
sand. The concentrations of nutrient ions in the basic solution, C1 was as follows: 1
NH4+, 6 NO-
3, 2 K+, 1 H2PO-4, 4 Ca2+ and 4 Mg2+ mmol(+) L
-1 whereby the concentration
of the other solution, C2, was twice as high. The composition of the drainage water was
different from that of the nutrient solution (in both C1 and C2) with Mg concentration
increasing whereas that of other cations decreased. The effect of the solution
concentration and application rate on plant nutrient uptake was greatest for P, followed
by N, K, Ca and Mg; this suggested that the mobility of the nutrients in the dune sand
influenced their availability. The recovery rate of the nutrients (expressed as the % in the
shoots in relation to the amount applied) decreased in the order, K, N, P, Mg and Ca; it
decreased as the concentration and application rate increased.
Steenhuis and Geohring (1990) compared the conditions under which preferential flow of
soil water results in significant movement of agricultural chemicals underlying tile drains.
It was argued that the assumption of homogenous porous media was valid when
predicting nutrient and salt loads, but not for the early arrival of pesticides. The
preferential flow for various pesticides was also inferred by Czapar et al. (1991).

15
The spacing and slope of drains will no doubt play their role on water removal and rate of
leaching of nutrients and other chemicals. The steeper the slope and the decrease in
distance between the two drains will enhance the leaching rate. In three years field study
on subsurface tile drains with 5, 10, and 20 m distances installed at two locations on low
organic matter and poorly structured silt loam soil, Kladivko et al. (1991) observed that
total amount of pesticides, nutrients, sediment, and water removed by subsurface drains
was greatest for the 5 m spacing and least for the 20 m spacing. Annual nitrate-N losses
to subsurface drain flow ranged from 18 to 70 with an average of 41.7 kg ha-1. Annual
average ammonium-N, soluble P, and K losses were 0.5, 0.04, and 2.6 kg ha-1,
respectively.
It is important to note that the nutrient and salt leaching is usually high in recently
installed drainage system which decreases with time as the salts and nutrient
concentrations in soil decreases. Similarly, with each growing season, after preparation of
the field it is expected that the nutrient losses in drainage water would be more as
compared to the later stages of the crop toward crop harvest. It seems that soil nutrient
leaching comes to steady state with passage of time. Althoff and Kleveston (1996)
reported that the amount of suspended solids and nutrients (P, K, Ca, Mg) in drainage
waters were higher in initially collected samples at 0, 12, 24 h after soil preparation for
rice than 48, 72 and 96 h. Similarly, the nutrients lost from Humic Gleysol (site-1) were
predominantly greater than Cambisol (site-2) in early 0, 12 and 24 h which were almost
similar for the two sites after 48, 72 and 96 h post soil preparation timing. It was
concluded from the study that eventually the rate of nutrient losses in drainage waters
reach to steady state in both the soils. The steady state flow after certain time and the
difference between the soils were also reported by Bohm (1996) after conducting
lysimeter study on three soils: a deep Calcic Chernozem, a shallow Calcic Chernozem
and a Gleyic Chernozem. The chemical analysis of the very first collected seepage water
showed higher concentrations of NO-3 and PO4
2- that exceeded the Austrian allowable
concentrations. However, with time the leaching of these nutrients declined and reached
to steady state.

16
2.2 Impact of drainage on environment
The sediments and nutrients lost from land could pollute the ground and downstream
waters. Weinberg (1990) reported that agricultural chemical runoff is the most common
cause of nonpoint-source pollution in lakes and streams in the USA. The environmental
problems of irrigation and drainage include surface and ground water contamination,
deterioration of fish and waterfowl habitat, public health problems, degradation of soil
and land resources, and ground water overdraft (Weinberg et al., 1991). Major pollutants
in drainage water are salt, nitrate, phosphorus, sediment, heavy metals, trace elements,
bacteria and pesticide (Madramootoo et al., 1996). These pollutants destroy aquatic
ecosystems, and impair downstream water quality. While stating the problems of
pollution through drainage waters, Ochs (1987) called for effective monitoring projects to
avoid further degradation of the system in future. Elevated levels of many trace elements
including Se were reported by Deason (1987) in downstream waters as a result of
drainage waters in a reconnaisance studies at 9 locations in 7 western US states. Schnagl
and Lee (1987) reported that in the early 1980s, pesticides from the rice fields were the
cause of fish kills in agricultural drains and contamination problems in municipal water
supplies.
Rummenie and Noble (1996) collected water samples and stream biota to asses ‘stream
health’ in Australia. Besides, its physical degradation, sediments also transported
absorbed pesticides and nutrients into down waters system. However, its concentrations
in percolating water vary with season of the year along with many other dominant factors
like soil characteristics, crop type and nutrient concentration in the soil solution. Marques
et al. (1997) evaluated the nutrient fluxes in a chronosequence of Douglas fir
[Pseudotsuga menziesii] stands (20, 40 and 60 yr old) in the Beaujolais Mounts. Annual
and seasonal variations occurred during the 3 yr of investigation (1992-95) whereby the
fluxes were generally highest in autumn-winter, while nutrient leaching from soils were
higher at time of vegetation dormancy period.

17
Borowiec and Zablocki (1988) presented data on the effect of agricultural non-point
sources pollution on the quality of surface waters of North-Western Poland. In small
unsettled watersheds with similar conditions the mean and maximum concentrations of
NO3-N in stream waters draining State Farm fields were nearly twice as high as
concentrations in drainage from private farm fields. The mean concentrations of other
compounds were similar but the maximum concentrations were lower. Nutrient
concentrations of drainage waters from soils with high fertilizer application rates were
strongly dependent on the plant cover in the drainage area, especially during the autumn-
winter season and to a lesser extent on differences in precipitation amounts.
2.3 Controlling losses from subsurface drainage system
Many approaches as recommended by Weinberg (1990) can be adopted to reduce the
losses of nutrients and pollution in the downstream from drainage system. These
approaches include implementation of soil and water conservation practices, integrated
nutrient management, and pest management. Reduction in fertilizer and pesticide input,
modifying methods of animal wastes, irrigation scheduling and conservation tillage can
reduce the loss of nutrients and other chemicals to downstream waters.
Madramootoo et al. (1996) emphasized on modifying the existing irrigation and drainage
practices, as well as the cropping and biological systems, to reduce the level of pollutants
in drainage effluent. Water table management, intercropping and strip cropping with
water-absorbing crops, constructed flow-through wetlands, and saline agriculture-forestry
are some practices which hold promise. The pesticide concentrations from rice field in
California's Sacramento Valley remarkably decreased with the modifications of irrigation
and drain water management (Schnagl and Lee, 1987).
Along with the lining of irrigation channel to reduce the seepage, as stated earlier, the
application method of irrigation waters strongly influence the volume and nutrients
concentration in the drainage waters. Efforts should be made to apply the minimum water
required to support the plant. Instead of heavy irrigation, frequent but light irrigation
would be more fruitful in controlling the nutrient leaching. Moll and Christen (1996)
18
compared two irrigation management options, each with two sets of constraints aimed to
reduce the salt load leaving farms in sub-surface drainage water in Australia. The options
considered were drip or flood irrigation, and the constraints were holding drainage water
on farm in an evaporation basin or discharging it to the surface drainage system (at a cost
to the farmer). Over a 15-year period, drip irrigation was the most financially attractive
method of drainage management when discharge of saline drainage water incurs a
charge, and also under an on-farm retention constraint. This was subject to the size of the
basin being at least 6.5% for the drip system and 10% for the flood system. Drip
irrigation was relatively expensive to install, but its running costs, including labour and
water costs, were considerably lower. On-farm storage is a more costly option than
paying for discharge. All options become more profitable as vineyard area increases.
Compared to fallow land, the crop cover can reduce the leaching of nutrients and other
agro-chemicals. Similarly the type of the crop will also affect the drainage water quality
(Pondel et al., 1991). The grass cover strongly reduced the losses compared with soil with
a catch crop and bare soil (Ulean, 1995). The cultivation of leguminous crop could have
advantage over the non-leguminous crops mainly because of their characteristic root
system and difference in nutrient requirements. Owens (1990) conducted experiments on
the effects of legumes on ground water quality and NO3-N concentrations in drainage
waters. Three Coshocton monolith lysimeters (Y-102A, B, and C) containing a well-
drained silt loam soil on a 13% slope, and four lysimeters (Y103A, B, C, and D)
containing a moderately well-drained silt loam soil on a 6% slope were used to study the
effects of a legume-grass mixture on ground water quality. These lysimeters were grown
with maize, a lucerne-orchard grass mix (70% Medicago sativa L. + 30% Dactylis
glomerata L.). The maize, some of which received high rates of N fertilizers, produced
NO3-N concentrations in percolate ranging from 15 to 40 mg L-1. Under lucerne NO3-N
concentrations in leachate often were less than 5 mg L-1 especially on the moderately
well-drained lysimeters. The highest NO3-N percolate concentration under all treaments
occurred during the winter/early spring months. The higher N in drainage waters from
maize grown lysimeter was mainly associated with higher application of N fertilizer as

19
compared to others. The higher concentration of a nutrient in soil solution will eventually
result in higher losses with drainage waters. Cecon et al. (1993) analyzed the outflows
from 2 pipe-drained plots in north-eastern Italy for 6 and 3 years to determine the levels
of soluble nutrients (NO3, P and K) and to calculate mass nutrient losses by drainage. The
plots had different cropping systems: (1) conversion from fertilized arable crops and
meadow (1981-1983) to unfertilized meadow (1984-1986); (2) rotation of fertilized
arable crops (1984-1986). Annual mean losses of nitrate were 32.4 and 28. 6 kg ha-1 in
the conventionally cultivated plots, decreasing to 20.5 kg ha-1 in the unfertilized meadow.
Cultivation practices did not significantly affect P and K losses (0.2 and 1-1.5 kg ha-1 per
year, respectively). The K losses were greater under arable crops than under permanent
meadow. Nutrient losses mainly occurred during the winter and spring months. There
was an approximate balance between input and output in the fertilized plots.
Eltun et al. (1996) investigated the environmental side-effects and productivity of six
cropping systems, involving conventional, integrated, and ecological arable and forage
systems. The systems differed with regard to crop rotation, fertilization, soil tillage, and
plant protection, and they were established on model farms equipped with field
lysimeters for measuring drainage and surface runoff. The drainage and surface losses of
soil particles, P, K, Mg, Ca, and SO4-S over the first four-year cropping period were 28,
0.32, 7, 12, 159 and 30 kg ha-1, respectively. The results showed that arable cropping
systems with autumn ploughing had higher erosion risks than arable systems with spring
tillage or forage crop systems. Results showed that losses of most nutrients were less
affected by the cropping systems than was N. However, crop management factors like
time of soil tillage, time of manure application, and type of plant cover in the autumn,
affected the loss of P. Plant residues were important sources for loss of P and K, while
the loss of Mg, Ca, and S were primarily affected by fertilization. Because of variation in
weather factors, there was a great annual variation in nutrient losses, which showed that
long term observations were needed in order to obtain reliable data concerning nutrient
losses from the various cropping systems.

20
Shtikans and Kazhotsin (1994) carried out a study from 1982-90 on an experimental
drainage installation on a reclaimed dernopodzolic gleyed medium loam in Latvia. Lime
(Ca) was applied at rates of 0, 0.5, 1.0 and 2.0 of hydrolytic activity and four levels of
fertilizer application, where F0 = no fertilizer, F1 = 45: 30 45 kg N:PK ha-1, F2 = 2 X F1,
and F3 = 3 X F1. Fertilizers were applied annually in the form of ammonium nitrate,
simple granulated superphosphate and potassium chloride. The field crop rotation
included winter rye, barley, perennial grasses, potatoes and oats. It was concluded that:
(1) drainage of excessively wet dernopodzolic soils promoted the leaching of Ca, Mg and
other plant nutrients; (2) with an annual drainage runoff of 118 mm and the addition of
lime and fertilizer, Ca and Mg leached were 69 and 21 kg ha-1 without fertilizer; 95-132
and 26-33 kg ha-1 with annual applications of F1; and 30-42 kg ha-1 with annual
applications of F3; (3) fertilizer application which gave grain yields of 3-4 t ha-1 did not
cause excessive concentrations of nutrients in the drainage water but fertilizer
applications which gave grain yields of 5-6 t ha-1 increased the concentrations of these
elements in the drainage water substantially; and (4) losses of Ca and Mg measured in the
field were similar to lysimeter studies but values of the leaching of N, P, K were
markedly lower.
The effects of lime and fertilizer application on plant nutrient discharge in drain water
have been investigated in a long-term fourteen-year (1981-1994) field experiment in
Latvia (Stikans et al., 1996). It was estimated that fertilizer application caused leaching
losses of most nutrients. However, fertilizer application for crop yields reaching 3.0-4.0 t
ha-1 of grain did not result in plant nutrient inputs to drain water exceeding
environmentally permissible limits.
The water-use efficiencies on irrigation systems need to be improved substantially so that
further adverse impacts on the environment such as waterlogging, salinity/alkalinity, and
nutrient depletion of soils can be avoided (Mauderli et al., 1996). Participatory
organization of water users, as well as the improvement of on-field water management
practices can contribute to substantial improvements. With almost negligible investment

21
it was possible to double water-use efficiency in parts of Pakistans' Sindh-Province that
were strongly affected by salt. Resulting in increases in cotton yields are expected to be
of the order of 70-130%, mainly from basin- to furrow-irrigation, as well as the
improvement of the social organization of water users. Issues affecting water users do not
get sufficient attention in the context of rehabilitation of large irrigation schemes.
Therefore relevant policies, addressing best economic return and environmental impact
are urgently needed.
2.4 Reuse of drainage waters
The reuse of drainage waters can certainly improve the water availability at farm gates.
However, before its use for this purpose it should be properly monitored for salts and
toxic elements, pathogens or any other agrochemicals to avoid their build up in the long
run. The waters that can pose any potential threat to the health of soil or crop production
should never be applied without proper management practices. For example application
of chemical amendments and selection of proper tolerant crop with advanced crop
husbandry practices are required wherever highly saline drained waters are to be used for
crop productions. The actual influence of drainage waters should be studied per se in the
field before recommending the drainage waters of the area for continuous crop
production.
Hassan et al. (1996) reported that water samples collected from the River Nile, Egypt,
and agricultural drains showed correlations between (i) salinity and total dissolved solids;
(ii) permeability and electrical conductivity; (iii) toxicity and SAR with chloride ion
concentrations. However, there was no evidence of detrimental impact of reused drainage
water. The pH and EC of drainage waters from Swabi SCARP were 8.34 and 1.59 dS m-1
meaning that it was of marginal quality but can be reused with management practices. In
another study conducted by Ahmad (2004) it was reported that about 35% of drainage
waters in Mardan SCARP were of marginal quality because of higher RSC (0.44 to 4.7
mmol(-) L-1).

22
In spite of the risk of salinity or any other elemental toxicity development, these drainage
waters are good sources of many essential nutrients that can reduce the input cost of
fertilizers. The drainage waters in Mardan SCARP contained 0.012 to 2.00 mg NO3-N L-1
(Abdullah et al., 2002) and application of such waters in six irrigation will add up to 12
kg N ha-1 in any growing season. The same is true for other macro and micronutrients.
The concentrations of NO3-N ranged from 0.01 to 4.0 mg L-1 in drainage effluent samples
and in the augor hole analysed water samples in Mardan SCARP area. If the drainage
water has higher EC or other toxic element, it should be treated with amendments or
more easily blended with other fresh water to reduce the risk of salinity or toxicity
development. Such experiment was conducted by Sharma et al. (1990) at field level
during 1986-88 whereby the effect of irrigation with drainage water of 4 salinity levels on
build-up of soil salinity (ECe) and growth and yield of wheat was evaluated. The
drainage water initialy had a mean EC of 27 dSm-1 and which was diluted with canal
water to obtain ECiw of 6, 9 and 12 dS m-1. Pre-sowing irrigation with canal water,
followed by 3 irrigations with drainage water of different salinity levels even up to 27
dSm-1, had no significant effect on growth and yield of wheat in 1986-87 because of good
winter rain (10.2 cm). But 4 post-sowing irrigations of 6, 9, 12 and 27 dSm-1 salinity
waters in 1987-88 decreased the shoot and root growth and resulted in 6, 15, 25 and 38%
reduction in grain yield, respectively, compared with canal water irrigation. Application
of drainage water with increasing levels of salinity increased the soil salinity at all levels
sampled to a depth of 90 cm. The maximum ECe build-up in the root-zone during 1987-
88 was 9.80 dSm-1 in 0-15 cm layer and 14.91 dSm-1 during 1987-88 in 30-45 cm layer.
Salts accumulated in the preceding crop season were leached out to safe levels by the
monsoon rains before the next wheat season.
Another study conducted by Sharma et al. (1991) in 1986-89 on a sandy loam soil to
evaluate the effects of irrigation with drainage water of different salinity levels on soil
salinity build-up, growth and yield of wheat cv. HD 2009. It was reported that though the
blended waters decreased the growth and yield in 2nd and 3rd year, whereas in the 1st year
winter rains (102 mm) during the early growth period nullified the treatment effects. On

23
the average use of 6, 9, 12 and 18-27 dSm-1 salinity water for 3 years resulted in 4.4, 9.2,
15.9 and 21.3% reduction in grain yield, respectively, compared with yields with canal
water irrigation. Grain protein content was not inferior even when saline drainage water
was used without dilution. No problem of soil degradation was observed. Most of the
salts accumulated in the preceding crop season were leached out to safe levels by
monsoon rains before the next wheat season. On the contrary, Belanger et al. (1989)
stated that since the 1970s, nutrient-enriched agricultural drainage water has been
pumped into the Everglades Water Conservation Areas, has been markedly changing
plant communities and oxygen regimes. The sawgrass plains and diverse aquatic sloughs
that once dominated the area are gradually being replaced by more heterotrophic cattail
stands. An oxygen budget study in Water Conservation Area-2A revealed that diurnal
oxygen levels, and variations were greatest in slough and sawgrass areas and minimal at
the nutrient-enriched cattail site. Sediment oxygen demand was the major oxygen sink at
all sites, while reaeration (sawgrass and cattail sites) and benthic algal production (slough
site) were the major sources of oxygen. The slough algal mat areas represent important
sites for marsh primary production and detrital processes. These areas function as feeding
areas for fishes, invertebrates, waterfowl, as well as important oxygen sources for
adjacent sawgrass areas as well. Their elimination, therefore, could have serious
ecological consequences.
In a study on the use of drainage water for agriculture in Egypt, an experimental area of
2.5 feddans was established in Fayoum Governorate where drainage water, mixed and
fresh water have been used for irrigation of common crops in the Fayoum area (El-
Guindy et al., 1989). Data on soils and crops were collected frequently and analysed.
Results showed that irrigation with saline water decreased soil salinity as long as the salt
concentration in the water was less than that of the soil. Tile drainage and gypsum at 2 t
feddan-1 reduced ESP by 30%. Wheat could tolerate salinity in irrigation water up to 700
mg L-1 where soil salinity was greater than 4 dS m-1 without appreciable decrease in
yield, but was affected by ESP higher than 13. Maize was very sensitive to soil salinity
values higher than 2.4 dSm-1, but the effect of water salinity could not be observed.

24
2.5 Physico-chemical characteristics of the soils of SCARP Area and KPK
Khattak and Perveen (1987) after analyzing soils samples collected from Peshawar and
Charsadda reported that these soils are low in organic matter, having no severe salinity
problems in most of the areas but alkaline in soil reaction due to calcareous nature. The
lime, organic matter, pH, EC, Fe, Zn, Cu and Mn contents in these soils ranged from 0.13
to 15.24%, 0.17 to 2.24%, 7.2 to 8.6, 0.14 to 1.10 dS m-1, 1.30 to 6.08, 0.50 to 2.24, and
2.21 to 5.85 mg kg-1, respectively. Soil samples of Mardan district contained lime (5.50
to 15.87%), organic matter (0.16 to 2.21%), pH, (7.05 to 9.10), EC (0.18 to 2.8 dS m-1),
Fe (5.39 to 32.01), Zn (0.63 to 1.99), Cu (1.56 to 4.90) and Mn (14.08 to 44.90 mg kg-1).
The texture of the soil samples of Mardan district ranged from sandy loam to clay and
that of Peshawar and Charsadda ranged from sandy loam to silty clay loam. Ihsan (1986)
studied micronutrients status of Mardan soils and reported that DTPA extractable Zn, Cu,
Fe and Mn ranged from 0.63 to 1.99, 1.56 to 4.90, 5.39 to 32.01 and 14.08 to 44.90 µg g-1
respectively. The micronutrient concentrations in Mardan and Charsadda were almost
similar to other parts of the country. Nadeem et al. (2004) gave ABDTPA extractable
micronutrients ranges in soils: Zn (0.06 to 4.69), Cu (0.24 to 6.14), Fe (0.55 to 24.07),
and Mn (0.25 to 8.93) µg g-1 while conducting survey of Sargodha, Punjab plains.
Haq et al. (1992) collected samples of soil and sugarbeet leaves from the farmer’s fields
of Charsadda and Mardan areas. The organic matter ranged from 0.40 to 1.58 with an
average of 0.96%, lime from 1.75 to 21.75 and average of 7.22%, AB-DTPA extractable
P from 1.90 to 13.30 with average of 5.69 mg kg-1 and K ranged from 55 to 451 with a
mean value of 186 mg kg-1. The Cu ranged from 0.80 to 6.35 µg g-1 with average of 2.27,
Fe from 2.43 to 20.08 with a mean of 8.55, Mn from 4.80 to 34.94 µg g-1 with an average
of 15.70 µg g-1 and Zn from 0.35 to 9.91 µg g-1 with a mean value of 4.38 µg g-1. While
surveying most areas of the KPK province (formerly called NWFP), Bhatti (1997)
reported that soil samples of KPK contained an average lime content of 13.0%, organic
matter of 0.53%, available K of 133.0 mg kg-1, mineral N of 18 mg kg-1, sand of 21.0%
and an average pH of 7.71. Iqbal et al. (1987) reported that the concentration of Zn, Cu,
Fe and Mn were 0.22 to 0.66, 3.37 to 6.01, 14.8 to 27.9 and 1.12 to 9.72 mg kg-1
respectively in the soil samples of Charsadda area. In another report Khan and Bhatti

25
(2000) reported that soils in Thana Malkand Agency, KPK province contained mean
mineral N as 23 mg kg-1, AB-DTPA extractable P, K, Zn, Cu, Fe, and Mn as 5.03, 131.0,
1.16, 0.72, 7.79 and 3.31 mg kg-1in the soil samples while organic matter was 0.87%.
This brief review reveals that soils of the area are low in organic matter, deficient in N
and P, having no salinity problem but alkaline in nature associated with high lime
contents. Micronutrient, especially Zn is deficient in some areas.
However, in the area under study (Mardan SCARP), the Canadian Drainage Team (1984)
reported pH of 7.9 to 10.1, EC of 0.6 to 14.50 dS m-1, SAR values of 1.5 to 207.5, Na
content of 2.2 to 207.5 mmol(c) L-1 and soil permeability of 0.15 to 2.13 m d-1 with an
average of 1.01 m yr-1 before the installation of the project. However, after completion of
the project, the salinity and waterlogging problems have been corrected and EC has been
reduced to safe levels. Mukhtar et al. (2000) reported 0.24 and 0.20 dSm-1 of EC in
Mardan and Charsadda soils.
The EC and soil nutrients reduce with soil depths. Sohail et al. (1997) conducted an
experiment of nitrate leaching in soil and found that NO3 concentration decreased with
increase in the depth, but perusal of the data indicated that the concentration of NO3-N
was inconsistently distributed in different depths of the soil after maize harvesting. The
total N contents were 0.05, 0.04, 0.03, and 0.02% in 0-30, 30-60, 60-90, 90-120, 120-150
cm depths, respectively, showing a decreasing trend but total N is mostly associated with
organic matter contents which decreased with depth. Samreen et al. (2003) reported that
NO3-N contents were 8.25 , 7.11 and 6.07 µg g-1 in the soil samples collected from 0-30,
30-60 and 60-90 cm depths respectively while conducting research on soybean. Rashid et
al. (1987) reported Na concentration of 16.9 to 299.5 mg kg-1 in surface horizon and 22.5
to 882.3 mg kg-1 in the whole profile suggesting Na leaching. Heavy buildup of P in the
upper soil layer and movement of P to sub-soil depths in plots receiving super-phosphate
was noticed (Anilkumar and Wahid, 1989). Organic matter decreased with depth while
lime content increased with depth (Khan et al., 2004). Ibrahim et al. (2002) reported that
NO3 was higher in lower depths of the soil than the upper depths. Jarwar et al. (2002)
reported 0.65% organic matter and 26.0 mg kg-1 of mineral N contents in the surface soil,
and that N uptake increased continuously up to the highest N rate. Memon et al. (2002)

26
reported that distribution of NO3-N in soil was 10.2, 10.5, 11.31, and 7.9 mg kg-1 for 0-
15, 15-30, 30-60, and 60-90 cm depths respectively. These values are typical of soil
profile developed in arid regions with low organic matter ( Wasi Ullah et al 2005 and
Rashid 2008).
Ramazan (1996) reported that the SAR in different soil depths varied significantly and
minimum SAR was observed in 15-30 cm soil depth and maximum in the lower depth
(60-90 cm) following the pattern of Na salt distributions in the soil profile. The irrigation
application at 40% depletion of available soil moisture was more effective in controlling
soil salinity and sodicity in normal non gypsiferous soil up to the depth of 90 cm under
wheat sorghum crop rotation. The difference between the amount of salts brought in by
irrigation water and the amount of salt leached from the soil profile indicated that salt
leaching from the deeper parts of the clay layer was still continuing, suggesting slower
rate. More salts accumulated in the lower soil depths because of flushing down of these
salts with excess water i.e. application of higher quantity of water dissolved soil natural
lime and releasing Ca2+, helped in leaching down the Na and the high delta water also
restricted upward movement of salts including Na with capillary water.
Similarly, if parent material contains more lime stone, more CaCO3 is expected in soil
which leaches down to C-horizon, the reason why the C-horizons of all the series showed
more lime content as compared to AP-horizon (Khattak, 1996 and Muhammad 2009).
This brief review signifies that subsurface drainage water system should be regularly
monitored for the quality of drainage water to maintain soil fertility for sustainable crop
production and prevent the downstream pollution. This will enable the farming
community and policy makers to adopt strategies to reduce leaching of nutrients and
other agro-chemicals through sub-surface drainage system. This will also be highly
helpful for the researchers, extension workers and stack holders to do further research and
develop guidelines for farming community in this regards. The present research was
initiated with these prime objectives to monitor the losses of nutrients from system,
potential reuse of drainage waters, nutrient balancing and make proper recommendations
for fertilizers application for the farming community of the area.

27
3. MATERIALS AND METHODS
The following scientific approach was adopted to evaluate the degree and extent of
nutrients and salts removal through drainage waters in a subsurface tile drainage system
from the selected sites in Mardan SCARP area during cropping seasons covering the period
from 2003 to 2005.
3.1 Field Survey and Site Selection
Field survey was conducted through a well designed questionnaire (Appendix 1). The
questionnaire covered the collection of information regarding the amount of fertilizers
added, water applied, volume of drainage waters, crop yield and quality of crop, cost of
production and any other information/problem observed before and after SCARP
implementation. Thirty five farmers were interviewed personally in district Mardan and
29 in district Charsadda both located in KPK province, Pakistan.
After the completion of field survey of the Mardan and Charsadda districts, the following
two sites were selected based on the suitability and differences in irrigation water
sources. Each site had an optimum area of 24 ha, intensively used for cultivation of
different crops.
Site 1: Fazliabad, Mardan, having silt loam textured soil, irrigated with lower
Swat canal water [distributary No. 7]. It was located in village Kalushah
(Fazliabad) in district Mardan.
Site 2: Manga Dargai, Charsadda also having silt-loam texture but had relatively
less clay and silt and was irrigated with drainage waters supplied through Hisara
Drain. This open surface deep drain collects waters from canal seepage and from
small open field drainage system. The site was selected on main Mardan
Charsadda road at Manga Dargai in district Charsadda.

28
3.2 General Description of the Area
The background of the project area, climatic condition and common vegetations are given in
this section. The Mardan SCARP project was installed in the administrative areas of
Mardan and Charsadda districts, located in the extreme north western part of the country and
almost central areas of the NWFP (North West Frontier Province) now name as Khyber
Pakhtunkwa (KPK). The Project area lies between latitudes 33o40`and and33o35` N and
between longitudes of 71o15` and 72o50` E with an average altitude of about 274 m above
the sea level. Soils of the valley are composed of alluvium formed under the combined
influence of either a sub-humid or a semi arid-subtropical hot continental climate, a scarce
vegetation and relatively rich biotic activity from alluvial (mainly piedmont) and aeolian
(mainly loess) parent material in nearly level to gently sloping positions (Soil Survey of
Pakistan, 2007). The alluvial parent materials in the valley are comprised mainly of
piedmont alluvium with some basin and river alluvium. The texture varies from sandy to
clayey types in case of piedmont alluvium, while it is mainly clayey type in case of basin
alluvium (Mardan Basin) and predominantly sandy type with some clayey spots (Indus
Basin) in case of river alluvium. The aeolian parent materials are predominant by loess
having silty texture.
3.2.1 District Charsadda
The parent materials are from schists, gneisses and reef limestone. The annual rainfall is
about 400 to 600 mm. The soil series are deeply developed, moderately drained, moderately
fine textured soils (Soil Survey of Pakistan, 2007). The soils are slightly to strongly
calcareous and usually contain few fine kanker which increase in size with depth. The A
horizon ranges in color from dark grayish to brown when moist and the texture is silt loam
or silty clay loam. The thickness of the A horizon ranges from 12 to 25 cm. The underlying
B horizon ranges in color from brown to dark brown when moist. The depth of the bottom
of the B horizon ranges from 50 to 120 cm. The C horizon has the same ranges in color. The
horizon boundaries are gradual, clear and smooth. The soils occur in nearly level plains. The
parent materials are outwashes from the adjacent loess plains. The soils are cultivated and

29
the natural vegetation has been cleared. Most of these soils are irrigated from canals. They
have moderate to high intensity of cropping. The main crops of the area are sugarcane
(Saccharum spontanium), maize (Zea mays-L), wheat (Triticum aestivum-L), Tobacco
(Nicotiana Tabacum), and Berseem (Trifolium alexandrium).
3.2.2 District Mardan
The plain consists of fine alluvial deposit, the composition and depth of which is spatially
variable (Soil Survey of Pakistan, 2007). The Mardan basin has been filled by subrecent
sediments derived from soils in the loess plains. The area has a hot subtropical
continental climate. The region is 270 m above sea level. The soil series occurs in the
northern half of Peshawar valley and usually these soils occupy the centre of elongated
interfluves between gullies.
The Mardan series are deeply developed fine textured soils in basin alluvia. They are
moderately well and seasonally imperfectly drained. They have well developed structural
B horizon. The soils are slightly to moderately calcareous. Horizon boundaries are clear
and smooth, with A horizon dark grayish brown moist and grayish brown dry, silty clay
loam and week fine granular structure, sticky, plastic and very hard dry. The thickness of
A horizon varies from 10 to 15 cm. The underlying B horizon ranges in colour from dark
grey to dark brown when moist. The depth of the bottom of this horizon ranges from 90
to 150 cm. The C horizon varies in colour from dark brown to light olive brown when
moist.
The area is extensively cultivated and consequently the vegetation is no longer natural.
The whole area is used for irrigated agriculture with moderate to high cropping intensity.
Sugarcane, sugar beet, wheat, maize, and tobacco are the main crops of the area.
3.2.3 The Climate of the Project Area
The climate of the project area is typical of the interior of the Indo-Pakistan
Subcontinent. The rainfall does not follow the normal monsoon pattern experienced in
the region further south. Instead, it is characterized by long seasonal fluctuations in

30
temperature and rainfall. The hottest month is June, when the average daily maximum
temperature reaches 39oC. January is the coldest month with a recorded night temperature
of 0oC.
The annual precipitation over the project area varies from 658.30 mm at Utmanzai to
944.32 mm at Mardan, indicating a general increase in precipitation when moving from
west to east (Soil survey of Pakistan, 2007). The winter rainfalls are influenced by cold
fronts moving in from the Hindu Kush Mountain Range, which flanks the area on the
northwestern side, while the summer rains result from warm fronts from the Indian
Ocean.
3.2.4 Topography and Drainage
The project area is characterized by slightly rolling to almost flat topography. The slope
of the land ranges from 0 to 4% with an average slope of about 0.2%, mostly towards the
south-east. Portions of the flatter southern area, having slopes of 0.1% or less, are
waterlogged and salt-affected.
The project area is presently drained by a number of surface drains which, under the
project, have been remodeled to meet surface and subsurface drainage requirements. The
outlets of the collector pipes of the subsurface drainage systems are discharged into the
deep surface drains.
3.2.5 The Soils of the Project Area
The soils of the Mardan SCARP area are almost entirely loess and reworked loess (i.e.
eroded and re-deposited by water action). The net effect of the water action has been to
produce or approach an isotropic soil structure.
In general, the soils are genetically undeveloped. This is especially true along drainage
channels, where fresh materials are still being seasonally deposited. There is evidence,
however, of feeble structural development in isolated areas. The relatively well drained
soils on level and gently sloping areas exhibit varying degrees of soil structure

31
development. The poorly-drained soils in the basin plain show mottled horizons and
fossil calcium carbonate kankar. They have developed saline-alkali conditions in some
places, especially on slightly raised lands that are poorly leached.
Historically, the area has sustained a scarce to moderate cover, consisting mainly of
grasses with some bushes and trees. Vegetation has not contributed greatly to soil
formation because of overgrazing, clearing of vegetation for irrigated farming and
because of the prevailing high summer temperatures which causes rapid decomposition
of organic materials. Even though the parent material is generally calcareous, some areas,
especially the depressions, are non-calcareous. Natural flora is limited and little calcium
has been transferred from the deeper soil layers to the upper horizon containing the
organic matter. Consequently, a calcium balance has not been maintained in the soil
profile.
Most soils have a medium to moderately fine texture for the top 1.22 m, changing to silt
loam and fine silty sand textures to a depth of 3.05 m. They are yellowish brown to dark
brown in colour and are mostly calcareous. The lime content varies from 2 to 14% with a
zone of lime accumulation often occurring at a depth of about 0.91m.
Nearly levels soils and calcareous soils do not exhibit this shallow lime accumulation
zone. The sloping silt loam and silty clay loam soils have fossil kankar zones at various
depths depending on the amount of original soil which has been eroded.
Organic matter content is generally low, being less than 1% in virtually all soil.
3.3 Soil Samples Collections
To assess the soil for various physico-chemical characteristics as influenced by location,
depth and timing of the soil sampling, ten fields in each of the two sites were selected
randomly, which were grown with the same crop i.e. wheat in Rabi season (November to
May) and maize in Kharif season (July to October) during the study period. After
dividing the area into 10 different sampling units, 3 pits with 1 x 2 m2 up to a depth of

32
270 cm were dug in each sampling unit for composite sampling at 0-45, 45-90, 90-135,
135-180, 180-225 and 225-270 cm depths of soil. As such a total of 60 samples from 10
locations with 6 depths in each site were collected during a given sampling time. The soil
samples from the same sampling units at both sites were collected three times i.e. before
fertilizer application during wheat crop sowing (October 2003), after wheat crop harvest
(May, 2004) and after maize crop (September-October 2004). The samples were
collected in properly labeled plastic bags and were transferred to laboratory for further
processing and drying up. These soil samples were analyzed for water saturated soil pH,
EC, Ca, Mg, Na, SAR, mineral N and AB-DTPA extractable P, K, Fe, Cu, Mn, Zn, and
lime, O.M., soil permeability, hydraulic conductivity, leaching fraction and soil texture
using standard analytical procedure explained in section 3.7.
3.4 Collection of Drainage Waters Samples
Each site had a web of porous lateral pipes of 150 m long buried at 2.0 to 3.0 m with 90
m distance between the two lateral pipes. The lateral pipes then open into main horizontal
pipe of 1200 m with a gentle slope buried at the same depth as of lateral pipes. The main
horizontal slope flows into the open drain canal from where the drainage waters were
collected at different post irrigation timings. Whenever the irrigation was applied to the
selected fields, drainage water samples from the main drainage pipe flowing into the
drainage canal were collected at intervals of 24, 30, 36, 48, 60, 72 and 96 h post irrigation
timings. A total of six irrigations were applied in each of the cropping season from Rabi
2003-04 to Rabi 2004-05 in both sites.
The drainage waters were collected in properly labeled 250 mL plastic bottles and were
analyzed for EC and pH immediately. These bottles were then added with few drop of
toluene to avoid biological activity and then they were analyzed for Ca, Mg, Na and SAR
and macro- and micronutrients following the standard procedures.

33
3.5 Collection of Irrigation waters Samples
During each irrigation applied to the selected fields, a sample of 250 mL of irrigation
water was collected in plastics bottles and were analyzed for pH, EC, cations, macro- and
micronutrients to assess addition of salts and nutrients with application of irrigation
waters. It was noted that each time about 10 cm of water depth was applied as flood
irrigation to the selected field. This figure of 10 cm water depths was used for calculating
the amount of salts and nutrients based on their concentration in the given irrigation
multiplied by the volume of irrigation waters.
The site-1, Fazliabad was irrigated through Lower Swat Canal [disributary No. 7]
emanated from Munda Head Works installed at Swat River. The site-2, Manga Dargai
was irrigated through Hisara drained canal, with mixture of subsurface drainage waters
and irrigation canal water of Lower Swart Canal system.
3.6 Crop Yield and Nutrient Balances
The net nutrient balance in the system was estimated from the amount of a nutrient added
through fertilizers and irrigation waters minus lost through drainage waters and removal
by crop. The following two approaches were adopted to assess and compare the nutrient
balance in the subsurface drainage crop system.
3.6.1 Farmer’s Fields
The farmers’ fields at both sites, already selected for soil sampling and were grown with
wheat crop during 2003-04, were used for this purpose. All the fields were grown by
farmers, according to their own traditional practices whereby some farmers added organic
plus chemical fertilizers or alone chemical fertilizer of N and P as urea, diammonium
phosphate, triple super phosphate but no one applied K to their crops as chemical
fertilizers. The nutrients added to the system minus removed from the system were
calculated from the addition of the nutrient through fertilizers and irrigation waters and
were removed through drainage waters by crop in ten fields independently at each site.

34
3.6.2 Experimental Fields
Three fields of about 500 m2 each in both site-1 and site-2 were applied with 0-0-0
(control), 90-60-30, and 120-90-60 kg N:P2O5:K2O ha-1 to the maize (during 2004) and
wheat (2004-05) to measure the nutrients balance in the system. The main objective was
to estimate profitable yields without deteriorating the soil fertility based on the properly
applied amounts of nutrients.
After the soil preparation for sowing at field capacity, the plots were added with pre-
assigned amounts of N, P and K as urea, diammonium phosphate (DAP) and sulfate of
potash (SOP) through broadcast as done by most of the farmers in the area. The fertilizers
were then thoroughly mixed with soil and then all the plots were sown with seed rate of
30 kg maize c.v. Sarhad White during Kharif 2004 and 120 kg wheat c.v. Tatatara during
Rabi 2004-05. Biomass and grain yields data of both the crops were recorded by
harvesting of randomly selected three spot of 2 m2 each in respective treatment plots.
Composite soil samples at 6 depths i.e. 0-45, 45-90, 90-135, 135-180, 180-225 and 225-
270 cm through digging up of 3 pits (1x 2 x 2.7 m3) at each treatment plots were
collected to see if there is any effect of fertilizer application on soil fertility after crop
harvest under the given sub-surface tiled drainage system.
3.7 Laboratory Analysis
3.7.1 Soil pH (Thomas, 1996)
The pH in soil saturation extract, irrigation or drainage waters was determined by
Thomas (1996) with the help of pH meter (InoLab, WTW, Germany). The pH meter was
calibrated with standard buffer solutions before taking readings of samples. Electrode of
the pH meter was rinsed with distilled water each time before inserting in the new
sample.

35
3.7.2 Electrical conductivity (Rhoades, 1996)
The EC in irrigation or drainage waters or saturation extract was determined as described
by Rhoades (1996) using EC meter (WTW, Germany). Before analyzing samples, the EC
meter was calibrated against 0.1 M and 0.01 M KCl solutions.
3.7.3 Calcium and Mg by Atomic Absorption Spectrophotometer
The [Ca] and [Mg] in saturated soil extract, irrigation water or drainage water were
determined using atomic absorption spectrophotometer (PerkinElmer 2380). The machine
was calibrated with respective standard solution before analyzing the samples.
3.7.4 Sodium and K by flame photometer
The Na and K in soil saturation extracts, irrigation or drainage waters were analyzed by
flame photometry (Jenway PFP-7). The machine was calibrated with respective standards
of Na and K before running the samples.
3.7.5. Sodium adsorption ratio (Richard, 1954)
Once the concentrations of Na and Ca + Mg in soil saturation extracts, irrigation water or
drainage waters were known, SAR of the soils and waters was calculated using the
formula.
3.7.6 Lime content (Richard, 1954)
The lime in soil was determined by acid-neutralization method. Five grams soil was
transferred into 150 mL flask and mixed with 50 mL of 0.5M HCl. The suspension was
heated for five minutes followed by filtering through Whatman No. 42 after cooling. The
SAR =
[Na], [Ca], and [Mg]
are in mmol L‐1
[Na+]
[Ca2+ + Mg2+]
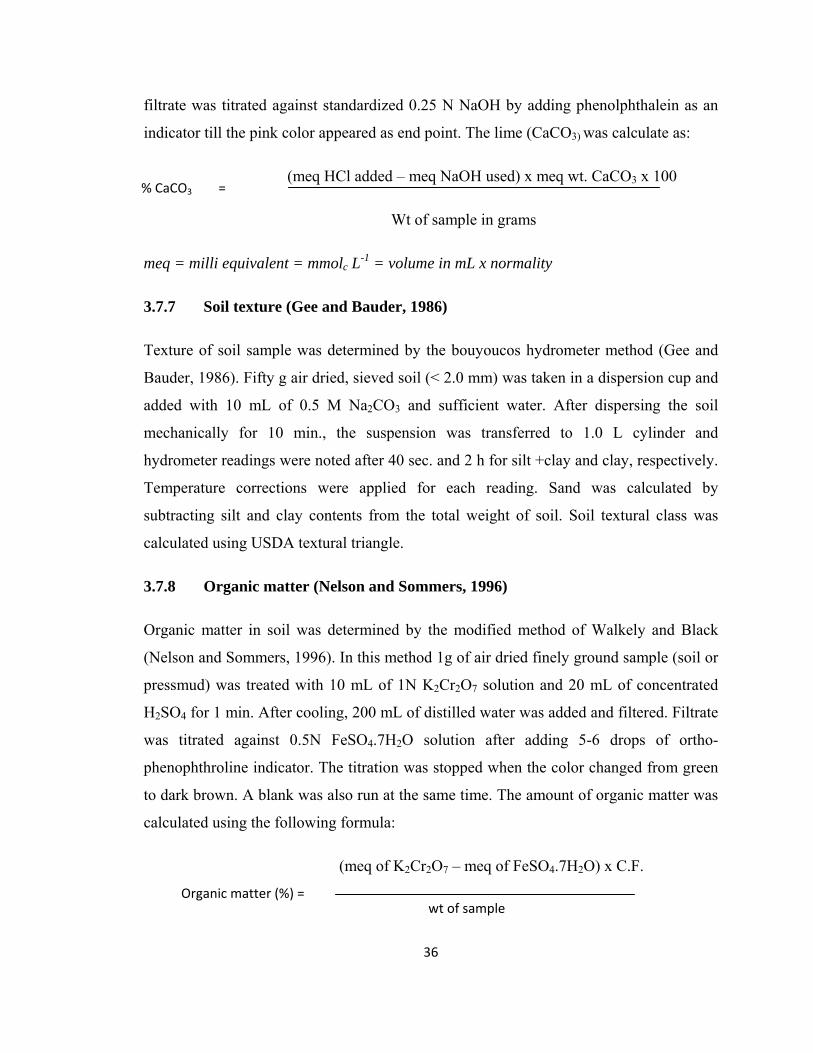
36
filtrate was titrated against standardized 0.25 N NaOH by adding phenolphthalein as an
indicator till the pink color appeared as end point. The lime (CaCO3) was calculate as:
(meq HCl added – meq NaOH used) x meq wt. CaCO3 x 100
Wt of sample in grams
meq = milli equivalent = mmolc L-1 = volume in mL x normality
3.7.7 Soil texture (Gee and Bauder, 1986)
Texture of soil sample was determined by the bouyoucos hydrometer method (Gee and
Bauder, 1986). Fifty g air dried, sieved soil (< 2.0 mm) was taken in a dispersion cup and
added with 10 mL of 0.5 M Na2CO3 and sufficient water. After dispersing the soil
mechanically for 10 min., the suspension was transferred to 1.0 L cylinder and
hydrometer readings were noted after 40 sec. and 2 h for silt +clay and clay, respectively.
Temperature corrections were applied for each reading. Sand was calculated by
subtracting silt and clay contents from the total weight of soil. Soil textural class was
calculated using USDA textural triangle.
3.7.8 Organic matter (Nelson and Sommers, 1996)
Organic matter in soil was determined by the modified method of Walkely and Black
(Nelson and Sommers, 1996). In this method 1g of air dried finely ground sample (soil or
pressmud) was treated with 10 mL of 1N K2Cr2O7 solution and 20 mL of concentrated
H2SO4 for 1 min. After cooling, 200 mL of distilled water was added and filtered. Filtrate
was titrated against 0.5N FeSO4.7H2O solution after adding 5-6 drops of ortho-
phenophthroline indicator. The titration was stopped when the color changed from green
to dark brown. A blank was also run at the same time. The amount of organic matter was
calculated using the following formula:
(meq of K2Cr2O7 – meq of FeSO4.7H2O) x C.F.
% CaCO3 =
Organic matter (%) = wt of sample

37
C.F. = 0.69 which comes from the assumptions that (1) about 75% oxidation takes
place in this process (ii) soil organic matter contains 58%C (iii) meq. wt of carbon
is 0.003 and (iv) percent conversion
meq = milli equivalent =m molc L-1 = volume in mL x normality
3.7.9 Mineral nitrogen in soil or water samples (Mulvaney, 1996)
To determine mineral N concentration, 20 g soil sample was shaken with 100 mL of 1 M
KCl for 1 h on end-to-end shaker. After filtration, 20 mL of extract was distilled with
MgO for determining NH4-N and another 20 mL with MgO plus Devarda’s alloy (DA) to
recover NH4+ + NO3
- concentration. The distillate was collected each time in 5 mL boric
acid mixed indicator solution followed by titration against 0.005 M HCl. Blank was run
simultaneously using either MgO or MgO+Devarda’s alloy.
NH4-N (mg kg-1) = (sample –blank) x 0.005x 0.014 x 100x 106
NH4-N+NO3-N (mg kg-1) = (sample –blank) x 0.005x 0.014 x 100x 106
Wherein: Sample = HCl titration readings for sample
Blank = HCl titration readings for blank
0.005 = N of HCl, Normality of HCl
0.014 = meq of N, milli-equivalent of nitrogen
100 = mL vol., volume made
20 = mL volume distilled
1000000 = conversion into mg kg-1 (106 mg kg-1)
g. weight of soil x 20 Wherein only
MgO was used
weight of soil x 20 Wherein MgO
+DA were used

38
Mineral N in irrigation or drainage waters was determined by distilling 20 ml of sample
in presence of MgO for NH4-N and and MgO+Devarda’s alloy for NH4-N+NO3-N. The
distillate was collected in 5 mL boric acid mixed indicator and titrated against 0.005 M
HCl. Mineral N was calculated as as given above.
3.7.10 AB-DTPA extractable P, K, Cu, Zn, Fe, and Mn
AB-DTPA extractable P, K, Cu, Zn, Fe, and Mn were determined in soil as described by
Soltonpour and Schawab (1977). AB-DTPA solution was prepared by dissolving 2 g
DTPA (0.005 M) in 500 mL water having 4 mL of (1:1) ammonia solution to facilitate
dissolution and prevent effervescing. In another flask 134 g NaHCO3 was dissolved in
1200 mL of water. The two solutions were mixed and pH adjusted to 7.6 by adding
ammonia or HCl and volume was made up to 2.0 L.
A 40 mL AB-DTPA solution was added to a 20 g soil sample taken in flask, which
shaken gently on reciprocating shaker for 15 min. while flasks were kept opened.
Suspension was filtered through Whatmann 42 and stored for analysis.
Phosphorus was determined by ammonium molybdate color complex measuring
absorption on 880 nm wavelength using Spectrophotometer (Perkin Elmer, Lamda 35).
The K was determined by flame photometry while Cu, Fe, Zn and Mn were determined
by atomic absorption spectrophotometer (PerkinElmer 2380).
In irrigation or drainage waters, the sample was treated as for soil without addition of
AB-DTPA solution.
3.6.11 Analysis of plant samples
Plant samples, collected at the time of crop harvest, were washed with distilled water and
dried in oven at 60-70 0C for 48 h. These samples were then grinded and stored in glass
bottles. These samples were then analyzed for Na, Ca, Mg, N, P, K and micronutrients
Zn, Cu, Fe, Mn after wet digestion (Benton et al., 1991). In this method 0.5 g sample was

39
added with 10 mL HNO3 and kept overnight. Next day 4 mL conc. HClO4 was added to
the solution and heated/boiled on block digester until the color of sample became clear.
The given nutrients were determined as described for waters.
3.7.12 Leaching fraction
Leaching fraction (LF) was determined from the amount of irrigation and drainage
waters using the formula:
appliedwaterofDepth
zonerootbelowedWaterleachLF
3.7.13 Hydraulic Conductivity (Ritzema, 1994)
Soil hydraulic conductivity was determined in undisturbed soils by the following formula
described by (Ritzema, 1994). In this procedure a hole was bored into the soil with an
augar to a certain depth (D) below the water table and the radius (r) of the hole was
measured. A float was attached to a light-weight steel tape which was then fixed to a
standard rod. Standard rod was then pressed into the soil at the edge of hole up to the
mark on the standard rod. So that the water level readings can be taken at fixed height
above the ground surface. When the water in the hole reached at equilibrium, it depth
from the reference point above the ground surface was measured and denoted as D1. A
part of water was then removed with the help of bailer and steel tap with float was then
lowered in the hole as quickly as possible, the depth of water table at that point was
measure as H0. The ground water then begins to seep into the hole and the rate at which
it raised was measured and recorded in the proforma with a given interval of time (t).
Measurements were continued and point (Hn) was noted where measurement was
stopped. Recovery of water in the hole equaled to 25% of the depth of water initially
bailed out was measured after the procedure and the point was denoted as Ht and
hydraulic conductivity was measured with following formula:

40
Where
K = Hydraulic conductivity (m d-1)
C = a geometric factor of the soil
t = time elapsed since the 1st readings of the level of the rising water in the hole (sec)
Ho = Ht when t is equal to zero
Ht = depth of water level in the hole below the reference level as time t (cm)
3.7.14 Soil Permeability (Richard, 1954)
The soil permeability was determined in disturbed soil (< 2 mm particle size) packed in a
special apparatus as described by Richard, 1954. The water was inserted into the soil
through a filter paper placed on soil surface and hydraulic gradient of 2.0 was maintained
as suggested in the procedure. The water temperature, the time at which the water was
admitted to the soil container and the time at which the water first percolated through the
sample was noted. The percolated volume of water in the specified time was measured
and the soil permeability was calculated with the given formula.
38 Statistical Analyses
All the data were subjected to the analysis of variance (ANOVA) technique (Steel and
Torrie, 1980) using either simple factorial RCB design based on the number of variables
in the particular study. Details of ANOVA and variable factors are given for each study
in results and discussion sections. The statistical analyses were performed by using
MSTATC, SAS and Statistix computer programs. The Least Significant Difference
(LSD) test was used to differentiate the effects of various variable factors.
K =
Ho – Ht
C t

41
4. RESULTS AND DISCUSSION
The study to evaluate the degree and extent of nutrient losses in a subsurface tile drainage
system from Mardan SCARP included the general survey for site collection, periodical
analyses of soil, irrigation and drainage waters and calculation of nutrient balancing in
the system based on difference between the nutrients inputs through fertilizers and
irrigation waters and lost though crop removal and drainage waters. The results of these
basic components of the study are presented and briefly discussed in the following
sections.
4.1 Field Survey and Site Selection for the Study
Thirty five farmers in district Mardan and 29 in district Charsadda representing Mardan
SCARP area were interviewed before the site selection for the study through a well
designed pre-tested questionnaire (Appendix I). The survey revealed improvements in
soil properties, crop yields and intensities and socio-economic conditions of the farming
community in the area.
Most of the farmers (> 95%) were of the opinion that soils have improved and became
more productive after execution of SCARP in the area. Cropping intensity in the project
area has increased. Yield has increased and previously barren lands have become
productive, and in places where production was zero, had now returned to better
production capacity. Before SCARP biomass yield was more and economic yield was
nominal, while after SCARP the economic yield has increased. The yield of wheat,
maize, sugarcane and tobacco has increased by 3 to 4 folds with completion of the
SCARP project (Table 1). Such increases in yields have improved the socio-economic
conditions of the farming community in the area. Along with increases in yields, the
cropping intensity and cropping husbandry like application of fertilizer, selection of
better seeds, timely cultivation and preparation of land with modern tools have been
started by the farmers after SCARP.

42
Table 1 Enhancement in average crop yields of wheat, maize, sugarcane and tobacco
with SCARP in district Mardan and Charsadda as revealed by Survey
Crops Before SCARP After SCARP
---------------------------------Kg ha-1------------------------
Wheat 1000-1520 4000-5000
Maize 0-1000 3000-4000
Sugarcane 10000-15000 30000-40000
Tobacco 0-1520 2000-3000
Before SCARP susbenia (eculantus) was the only produce from these soils. Maize and
tobacco production was not possible in the project area and the gur was to be taken in
teens containers in bulk and was just like charcoal in color. But after SCARP quality of
crop produce has been improved. However along with increases in crop yields and
quality the fertilizers requirements have also been increased that might be associated with
higher yields and leaching of nutrients with drainage waters. As evident from Table 2,
fertilizers application has increased almost over 100% after SCARP.
Table 2 Fertilizer application before and after SCARP
Crop Before SCARP After SCARP Increase
Urea TSP Urea TSP Urea TSP
----------------------------(kg ha-1)--------------------------- --------- % ------
Maize 60.5 32.1 134.4 80.3 122.1 150.0
Wheat 80.5 43.0 134.4 80.3 66.9 86.8
Sugar cane 107.4 53.6 161.3 80.5 50.1 50.2

43
The water applied for seven days fulfilled the requirements only for 3-4 days due to rapid
percolation. Additional water supply is needed as the drainage tiles evacuated water from
the fields without a coordinated increase in water delivery. According to the farmers the
soils have become well drained and easy to work. Some farmers stated that the drainage
waters applied for irrigation was not so good and fertile as canal water. Roots of trees
grown on borders of the field, disturbed the tiles and resulted in blockage and breakage of
the drainage pipes. Soils of Dosehra, Charsadda area are hard to work and are becoming
waterlogged again due to the silting up of the main drain which causes blockage of
outlets of tile drains that need cleaning. The yield of the crops in this area is low as
compared to other areas of the SCARP region because of this problem. Urea, DAP and
nitrate fertilizers are being used for all crops and no potash is used except in tobacco,
where NPK complex fertilizer is used.
On the basis of the field survey problems after SCARP are summarized below.
1. Soils are drying rapidly and water requirement in the area has increased.
2. Inequity in water distribution has occurred after SCARP.
The canal irrigation system has been disturbed after SCARP because of
installation of water-ways (Nakka) on higher level, due to which uniform
water delivery is not possible. In the previous system the water supply was
adjusted in such a way that whenever the water went down in canal because of
water shortage, water delivery was automatically lowered ensuring uniform
water delivery up to the fields located at the tail ends.
3. Soil erosion occurs near and on the sides of open drains, which results in
reducing the capacity of the open drains.
4. White ants/termites problems has become common and all crops are suffering
except tobacco and sugar beet.
5. There is no institutional infrastructure to monitor and maintain the drainage
system.

44
6. The open drains are not being cleaned regularly, which create problems of
blockage.
7. Nutrients requirements have increased, which need to be supplemented
proportionately for higher yield of the crops either through chemical
fertilizers, which is expensive and or through organic manures.
8. Poplar cultivation was banned by the authorities, but not implemented, which
created problems of blockage.
Based on the problems as revealed by the questionnaire two sites i.e. site- 1, Fazliabad,
Mardan and site -2, Manga Dargai, Charsadda were selected for the study of nutrient
dynamic in the system. For this purpose the addition of nutrients through fertilizers and
irrigation waters and losses though tile drainage waters and crop removal were
periodically monitored for three consecutive cropping season to evaluate the nutrient
balance in the system and to formulate fertilizers recommendations.
The following sections cover the data on analysis of irrigation waters (Table 3 to 7), soil
analysis (Table 8 to 33) and drainage waters (Table 34 to 62) and a balance sheet of
nutrients as nutrients added and nutrients removed (Table 63 to 67). Given the volume of
the data, efforts were being made to present and discuss each section in a precisely and
succinctly manner without compromising on the essentiality of information.

45
4.2 Chemical Composition of Irrigation Waters Applied to Site-1, Fazliabad,
Mardan and Site-2, Manga Dargai Charsadda
Table 3 represents data pertaining to irrigation waters applied to wheat crop during 2003-
04, and Table 4 shows data for the same variables for the year 2004, summer crop maize,
while Table 5 contains data for irrigation waters used for wheat crop during 2004-05.
Table 6 and 7 show data for the total inputs of salts, cations, macro and micronutrients
through irrigation waters.
4.2.1 pH, EC, Ca, Mg, Na and SAR of irrigation waters
The pH values of irrigation waters (pHiw) measured in site-1 varied between 6.99 to 7.46
with mean values of 7.28±0.17, indicated limited variability within six irrigations (Table
3). The electrical conductivity of irrigation waters (ECiw) had low values in the 5th and 6th
irrigation as compared to first four irrigations. The ECiw values were more variable (0.13
to 0.73 with mean value of 0.42±0.28 dS m-1) compared to pHiw. In site 2, pHiw was
higher than site-1 while ECiw showed less variability (0.32 to 0.64 dS m-1) with mean
values of 0.43±0.11 dS m-1. The ECiw values remained within the permissible limits for
irrigation as per criteria of Ayers and Westcot (1985).
The concentrations of Ca, Mg, Na and hence SAR values were in the range for normal
waters in both sites. The variability between irrigation waters followed the pattern of
ECiw. The irrigation waters of 5th and 6th irrigation having low ECiw also contained lower
cations and SAR (Table 3). Similarly 1st, 2nd and 4th irrigations with higher ECiw showed
higher cations and SAR. The concentrations of Na, although in permissible limits were
invariably higher than Ca and Mg. Irrigation waters applied to site-2 contained lower Ca,
Mg but higher Na than site-1 that may be associated to the fact that water at this site
consisted both canal and drainage waters supplied by the Hisara drain while the water at
site 1 consisted solely of River Swat canal waters. The values of pHiw and ECiw in the
irrigation waters applied to subsequent maize (Table 4) and wheat (Table 5) followed
almost similar pattern. However, mean seasonal values of pHiw, ECiw, [Ca], and [Mg]
were higher for irrigation waters applied to maize during 2004 as compared to water
applied during 2003-04 and 2004-05 to wheat crops, while Na in both the successive
46
years of 2004 and 2004-05 were lower than the mean values observed for the first season
of 2003-04.
4.2.2 Macronutrients [NH4-N, NO3-N, P and K]iw in irrigation waters
The values of NH4-N, NO3-N, P and K in the irrigation waters showed apparently smaller
values with reasonable stability between the irrigations numbers in both sites (Table 3-5).
However, given the volume of waters applied per each number of irrigation, these
nutrients concentrations could be significant with respect to immediate supply to crops
and as well as in terms of leaching in the existing well drained system. The [K]iw were
much greater than N and P while [P]iw were the lowest (Tables 3-5). Site-2 had
comparable [N]iw during 2003-04 but had slightly higher [P]iw and [K]iw (Table 3). In the
subsequent irrigation waters the concentrations of NH4-N, NO3-N and P and K were
relatively higher in site 2 than site 1 (Table 4 and 5). It is important to recognize that the
mean values of [NO3)iw were much greater than [NH4]iw (Table 3-5) and values as high as
1.12 mg L-1 were observed in 1st irrigation in 2004-05 at site-1. The [NH4]iw during the
three season were 0.24±0.05, 0.26±0.08 and 0.38±0.26 mg L-1 in site-1 and 0.21±0.04,
0.44±0.15 and 0.56±0.17 mg L-1 in site-2, respectively (Table 3-5). Changes in NH4-N
and NO3-N in irrigation waters with season could be associated with the variability in the
chemistry of river waters emanating from Swat Valley due to natural chemical processes
(oxidation-reduction, hydrolysis) in rocks and minerals. The anthropogenic activities
along the sides of river/canal could also influence and cause seasonal variability in the
waters through direct deposition of wastes and through runoff (Cresser et al., 2004; Clark
et al., 2004) and may explain for relatively higher values observed during 2004 and 2005.
The higher values observed in site-2 could be due to the input of drainage waters mixed
with canal waters used for irrigation in this site.
4.2.3 Micronutrients [Cu, Fe, Mn and Zn]iw in irrigation waters
The micronutrients concentrations were quite low as expected in both sites showing some
variations within the irrigation applied from time to time (Table 3). In the subsequent
irrigation applied to maize (Table 4) and wheat (Table 5), levels of micronutrients
remained more or less similar to those observed initially (Table 3). Such concentrations
of micronutrients ranging from traces to < 1.0 mg L-1 in canal waters at Charsadda were
reported by Iqbal et al. (1987).

47
Table 3 pH, EC, cations and nutrients concentrations of irrigation waters applied to wheat during 2003-04 at site-1, Fazliabad and site-2, Manga Dargai
Irrigation# and
date
pH EC Ca Mg Na SAR NH4 NO3 P K Cu Zn Fe Mn
- dS m-1 ----------------------------------------------------------- mg L-1------------------------------------------------------
------------------------------------------------------------------------Site 1, Fazliabad) -------------------------------------------------------------------------
1st (20-11-03) 7.41 0.59 26.06 20.75 47.74 1.69 0.20 0.40 0.15 1.15 0.05 0.03 0.04 0.03
2nd (28-12-03) 7.48 0.73 31.70 26.70 50.48 1.59 0.20 0.30 0.04 1.30 0.08 0.10 0.00 0.04
3rd (03-02-04) 7.31 0.22 5.75 0.93 7.58 0.77 0.21 0.40 0.13 1.20 0.03 0.03 0.16 0.04
4th (29-03-04) 6.99 0.67 9.54 1.93 41.55 3.20 0.30 0.20 0.13 1.42 0.06 0.00 0.03 0.06
5th (20-04-04) 7.20 0.13 4.50 1.00 17.07 1.89 0.20 0.40 0.04 0.67 0.02 0.00 0.00 0.07
6th (2-05-04) 7.27 0.15 4.58 0.80 15.33 1.73 0.30 0.20 0.07 1.13 0.01 0.00 0.00 0.08
Mean 7.28 0.42 13.69 8.69 29.96 1.81 0.24 0.32 0.09 1.15 0.04 0.02 0.04 0.05
S.D 0.17 0.28 12.04 11.81 18.72 0.79 0.05 0.10 0.05 0.26 0.03 0.03 0.06 0.02
------------------------------------------------------------------------Site 2, Manga Dargai----------------------------------------------------------------------
1st (02-12-03) 7.74 0.47 15.67 17.95 43.52 1.77 0.15 0.35 0.18 1.18 0.14 0.01 0.05 0.02
2nd (31-12-03) 7.24 0.38 7.47 4.15 47.25 3.43 0.20 0.20 0.13 1.25 0.04 0.01 0.02 0.07
3rd (05-02-04) 7.40 0.52 4.56 2.63 52.65 4.84 0.25 0.35 0.13 1.24 0.14 0.03 0.06 0.02
4th (27-03-04) 7.08 0.37 2.85 3.40 47.94 4.52 0.20 0.35 0.14 1.24 0.14 0.01 0.03 0.01
5th (22-04-04) 7.37 0.64 3.53 2.45 50.00 4.98 0.20 0.20 0.14 1.30 0.05 0.04 0.02 0.09
6th (05-05-04) 8.24 0.32 2.81 2.98 18.24 1.80 0.24 0.40 0.13 1.30 0.01 0.00 0.00 0.00
Mean 7.51 0.45 6.15 5.59 43.27 3.56 0.21 0.31 0.14 1.25 0.09 0.02 0.03 0.04
S.D 0.42 0.12 4.98 6.08 12.63 1.48 0.04 0.09 0.02 0.04 0.06 0.02 0.02 0.04
* SD represents standard deviation from mean values

48
Table 4 pH, EC, cations and nutrients concentrations of irrigation waters applied to maize crop during 2004 at site-1, Fazliabad and site-2, Manga Dargai
Irrigation# and date
pH EC Ca Mg Na SAR NH4 NO3 P K Cu Zn Fe Mn
- dS m-1 -------------------------------------------------- mg L-1-------------------------------------------------
------------------------------------------------------------------------Site 1, Fazliabad) ------------------------------------------------------------------------
1st (10-07-04) 7.30 0.49 11.03 2.00 18.34 1.33 0.18 0.30 0.23 1.15 0.12 0.01 0.02 0.14
2nd (23-07-04) 7.40 0.42 5.96 20.00 13.41 0.59 0.32 0.60 0.37 1.00 0.12 0.01 0.01 0.14
3rd (10-08-04) 7.24 0.57 33.19 3.08 9.82 0.44 0.22 0.25 0.24 1.19 0.09 0.02 0.01 0.05
4th (25-08-04) 7.34 0.41 6.36 25.00 20.25 0.80 0.20 0.42 0.34 1.14 0.16 0.01 0.01 0.09
5th (05-09-04) 7.32 0.44 13.19 2.35 15.95 1.06 0.40 0.80 0.25 1.35 0.13 0.01 0.03 0.04
6th (20-09-04) 7.39 0.45 35.70 3.80 17.10 0.73 0.25 0.40 0.30 1.19 0.15 0.01 0.01 0.05
Mean 7.33 0.46 17.57 9.37 15.81 0.83 0.26 0.46 0.29 1.17 0.13 0.01 0.02 0.09
S.D 0.06 0.06 13.38 10.31 3.73 0.32 0.08 0.20 0.06 0.11 0.02 0.00 0.01 0.05
-----------------------------------------------------------------------Site 2, Manga Dargai---------------------------------------------------------------------
1st ((05-07-04) 7.80 0.54 9.44 4.94 31.81 2.08 0.53 0.60 0.52 1.32 0.09 0.01 0.02 0.13
2nd (25-07-04) 7.42 0.41 18.21 0.89 11.28 0.70 0.37 0.70 0.34 1.70 0.30 0.01 0.03 0.15
3rd (17-08-04) 7.60 0.50 37.25 22.91 37.60 1.19 0.25 0.30 0.45 1.18 0.42 0.01 0.04 0.14
4th (30-08-04) 7.74 0.42 32.69 18.40 30.45 1.05 0.39 0.60 0.41 1.81 0.39 0.02 0.03 0.13
5th (10-09-04) 7.47 0.49 30.22 8.84 9.80 0.40 0.68 1.20 0.60 1.23 0.37 0.03 0.03 0.13
6th (28-09-04) 7.28 0.41 9.95 3.40 22.74 1.58 0.43 0.60 0.56 1.24 0.41 0.01 0.03 0.11
Mean 7.55 0.46 22.96 9.90 23.95 1.17 0.44 0.67 0.48 1.41 0.33 0.02 0.03 0.13
S.D 0.20 0.06 12.05 8.84 11.42 0.60 0.15 0.29 0.10 0.27 0.13 0.01 0.01 0.01
* SD represents standard deviation from mean values

49
Table 5 pH, EC, cations and nutrients concentrations of irrigation waters applied to wheat crop during 2004-05 at site-1, Fazliabad and site-2, Manga Dargai
Irrigation# and
date
pH EC Ca Mg Na SAR NH4 NO3 P K Cu Zn Fe Mn
- dS m-1 -------------------------------------------------- mg L-1-------------------------------------------------
-----------------------------------------------------------------------Site 1, Fazliabad) -------------------------------------------------------------------------
1st (09-12-04) 7.30 0.28 6.00 9.10 17.00 6.19 0.28 1.12 0.39 2.40 0.16 0.01 0.01 0.09
2nd (14-02-05) 7.51 0.47 15.16 3.97 12.40 4.01 0.16 0.64 0.44 1.90 0.32 0.02 0.02 0.04
3rd (03-03-05) 7.48 0.17 30.80 10.00 10.00 2.21 0.80 0.88 0.33 2.20 0.22 0.01 0.01 0.04
4th (28-03-05) 7.00 0.10 12.80 3.28 20.95 7.39 0.24 0.90 0.15 1.90 0.15 0.01 0.01 0.14
5th (18-04-05) 7.28 0.60 30.90 4.30 17.20 4.10 0.60 0.45 0.28 2.40 0.27 0.01 0.01 0.04
6th (01-05-05) 7.32 0.13 11.70 20.25 18.30 4.58 0.20 0.25 0.30 2.00 0.25 0.01 0.01 0.04
Mean 7.32 0.29 17.89 8.48 15.98 4.75 0.38 0.71 0.32 2.13 0.23 0.01 0.01 0.07
S.D 0.18 0.20 10.48 6.42 4.03 1.82 0.26 0.32 0.10 0.23 0.07 0.00 0.00 0.04
---------------------------------------------------------------------Site 2, Manga Dargai----------------------------------------------------------------------
1st (25-12-04) 7.51 0.50 5.90 1.20 42.00 22.29 0.62 0.48 0.30 2.00 0.33 0.04 0.03 0.04
2nd (12-02-05) 7.70 0.63 4.60 5.38 20.94 9.37 0.80 1.25 0.37 2.48 0.40 0.01 0.04 0.04
3rd (50-03-05) 7.72 0.27 16.00 4.91 43.00 13.30 0.60 1.20 0.44 2.00 0.39 0.01 0.05 0.01
4th (30-03-05) 8.20 0.34 8.40 2.00 50.30 22.06 0.34 0.40 0.38 1.90 0.37 0.01 0.03 0.01
5th (20-04-05) 7.10 0.30 5.45 3.30 30.90 14.77 0.60 0.40 0.23 1.98 0.11 0.04 0.06 0.08
6th (03-05-05) 7.50 0.39 3.00 4.20 52.60 27.72 0.40 0.40 0.35 2.00 0.40 0.04 0.01 0.08
Mean 7.62 0.41 7.23 3.50 39.96 18.25 0.56 0.69 0.35 2.06 0.33 0.03 0.04 0.04
S.D 0.36 0.14 4.65 1.65 12.03 6.87 0.17 0.42 0.07 0.21 0.11 0.02 0.02 0.03
* SD represents standard deviation from mean values
50
4.2.4 Salts, cations and nutrients added in irrigation waters per Season
Table 6 indicates data regarding the quantity of salts, cations and nutrients added to soil
through irrigation waters. These values are estimated on the basis of concentrations
observed in a given irrigation waters applied multiplied by the volume of water whereby
a depth of 10 cm-ha for each irrigation and that a total of six irrigations were taken into
account in a single growing season (Table 6). The quantity of salts, cations and nutrients
(N, P, K, Cu, Fe, Mn and Zn) added through irrigation waters showed well pronounced
variations within the seasons. Salts added to site-1, Fazliabad and site-2, Manga Dargai
amounted to 1.594 and 1.667 Mg ha-1 in 2003-04, 1.734 and 1.8872 in 2004 and 1.128
and 1.494 Mg ha-1 in 2004-05, respectively. The quantity of Ca, Mg, and Na also showed
similar variations with some exceptions. For example, the quantity of Ca added to site-2,
Manga Dargai in 2004 was three times higher than what was added during 2003-04 and
2004-05. On the contrary the amount of Na was lower in 2004 as compared to 2003-04
and 2004-05 (Table 6).
The total addition over the three seasons indicated higher input of the major nutrients
(NH4-N, NO3-N, K) and micronutrients during 2004 and 2005 compared to 2003-04
(Table 6 and 7). To appreciate the variability in the amounts of salts, cations and nutrients
mean values (averaged across individual irrigation numbers) along with standard
deviations are provided in Table 6. Given the SD, seasonal variations can be seen for
salts in both sites. Except Ca and Mg, which were higher in site-1 and lower in site-2, all
other nutrients input through irrigation waters into site-2 was higher than site-1. As
compared to the sole sources of canal irrigations at site-1, Fazliabad, the concentrations
of nutrients at site-2, Manga Dargai were higher during all cropping season because of
the irrigation waters that were a mixture of both canal and drainage waters. Hence the
total input of nutrients increased in this site, Manga Dargai. The total input of NH4-N,
NO3-N, P and K increased with season as evident from values of 1.41, 1.57 and 2.28 kg
NH4 ha-1 season-1 and 1.90, 2.77 and 4.24 kg NO3 ha-1 season-1 added during 2003-04,

51
Table 6 Seasonal addition of salts, cations and macro and micronutrients (kg ha-1)
through irrigation waters in different growing season during 2003-05 at
site-1, Fazliabad and site-2, Manga Dargai
Salts/Nut. ----------------------- Growing seasons and locations---------------------- ---------Total-------
-------2003-04------ -----------2004------- --------2004-05------- ------2003-05---------
Fazliabad Dargai Fazliabad Dargai Fazliabad Dargai Fazliabad Dargai
Salts 1594 1728 1779 1790 1120 1555 4493 5073
Na 179.7 259.6 94.9 143.6 95.8 239.7 370.4 642.9
Ca 82.1 36.9 105.4 137.7 107.3 43.3 294.8 217.9
Mg 52.1 33.6 56.2 59.4 50.9 20.9 159.2 113.9
NH4-N 1.41 1.24 1.57 2.65 2.28 3.36 5.26 7.25
NO3-N 1.90 1.85 2.77 4.00 4.24 4.13 8.91 9.98
P 0.56 0.85 1.73 2.88 1.89 2.07 4.18 5.8
K 6.86 7.50 7.02 8.48 12.80 12.36 26.68 28.34
Cu 0.25 0.52 0.78 1.97 1.37 2.00 2.4 4.49
Fe 0.24 0.18 0.07 0.18 0.07 0.21 0.38 0.57
Zn 0.17 0.10 0.09 0.10 0.06 0.15 0.32 0.35
Mn 0.32 0.22 0.51 0.80 0.40 0.25 1.23 1.27
Note: calculation based on 10 cm (4 inch) water depth per irrigation and that total 6 irrigations were applied in each growing season. Total amount of salts were calculated from the assumption that 1 dS m-1 EC contains 640 mg salts L-1.

52
Table 7 Seasonal addition of salts, cations and macro and micronutrients (kg ha-1) through irrigation waters in different growing season during 2003-05 at site-1, Fazliabad and site-2, Manga Dargai
Site Salts Ca Mg Na NH4 NO3 P K Cu Zn Fe Mn
-------------------------------------------------- Kg ha-1 season-1--------------------------------------------------------------
--------------------------------------------------------- Rabi 2003-04----------------------------------------------------------------------
Site-1 Total 1594 82.1 52.1 179.8 1.41 1.90 0.56 6.86 0.25 0.17 0.24 0.32
Mean 266 13.7 8.6 29.9 0.24 0.32 0.09 1.14 0.04 0.03 0.04 0.05
S.D 177 12.0 11.8 18.7 0.05 0.10 0.05 0.26 0.03 0.04 0.06 0.02
Site-2 Total 1728 36.8 33.5 259.6 1.24 1.85 0.85 7.50 0.52 0.10 0.18 0.22
Mean 288 6.1 5.5 43.2 0.21 0.31 0.14 1.25 0.09 0.02 0.03 0.04
S.D 75.5 4.9 6.0 12.6 0.04 0.09 0.02 0.04 0.06 0.02 0.02 0.04
----------------------------------------------------------------- Kharif 2004 ----------------------------------------------------------------
Site-1 Total 1779 105.4 56.2 94.8 1.57 2.77 1.73 7.02 0.78 0.07 0.09 0.51
Mean 296 17.5 9.3 15.8 0.26 0.46 0.29 1.17 0.13 0.01 0.02 0.09
S.D 38 13.3 10.3 3.7 0.08 0.20 0.06 0.11 0.02 0.00 0.01 0.05
Site-2 Total 1790 137.7 59.3 143.6 2.65 4.00 2.88 8.48 1.97 0.10 0.18 0.80
Mean 295.4 22.9 9.9 23.9 0.44 0.67 0.48 1.41 0.33 0.02 0.03 0.13
S.D 35.6 12.0 8.84 11.4 0.15 0.29 0.10 0.27 0.12 0.01 0.01 0.01
--------------------------------------------------------------- Rabi 2004-05----------------------------------------------------------------
Site-1 Total 1120 107.3 50.9 95.8 2.28 4.24 1.89 12.8 1.37 0.06 0.07 0.40
Mean 187 17.8 8.4 15.9 0.38 0.71 0.32 2.13 0.23 0.01 0.01 0.07
S.D 129 10.4 6.4 4.0 0.26 0.32 0.10 0.23 0.07 0.00 0.00 0.04
Site-2 Total 1555 43.3 20.9 239.7 3.36 4.13 2.07 12.3 2.00 0.15 0.21 0.25
Mean 259 7.2 3.5 39.9 0.56 0.69 0.35 2.06 0.33 0.02 0.04 0.04
S.D 87 4.6 1.6 12.0 0.17 0.42 0.07 0.21 0.11 0.02 0.02 0.03
Note: calculation based on 10 cm (4 inch) water depth per irrigation and that total 6 irrigations were applied in each growing season. Total amount of salts were calculated from the assumption that 1 dS m-1 EC contains 640 mg salts L-1.

53
2004 and 2004-05 in site-1, respectively (Table 7). The increases in P input with season
could be appreciated from the values of 0.56, 1.73 and 1.89 in site-1 and 0.85, 2.88 and
2.07 kg P ha-1 for the respective years (Table 7).
As explained earlier variations in the concentrations and composition of surface irrigation
waters having its origin in remotely located rocks and minerals and passing through
heavily populated areas is understandable in terms of natural processes of weathering and
as well as man induced activities. Swat Canal is lifted from river Swat which is coming
from far flung mountains and also subjected to receive the pollution from the adjoining
towns either through direct deposition/or through runoff. These processes have increased
by many folds with passage of time due to increase in population which resulted in
enhanced automobiles, hoteling and deforestation.

54
4.3 Soil Chemical Composition
4.3.1 Soil pH, EC, Cations, SAR and lime
Summary of analysis of variance (ANOVA) showing the effect of sampling time,
location, soil depth and their interaction on soil pH, ECe and water extracted Na, Ca, Mg,
SAR and lime at the given level of probability is provided in Table 8. Table 9 shows the
values of soil pH for both sites before wheat, after wheat (before maize) and after maize
at the given sampling depths. The mean pH values generally remained stable (Table 9)
however sampling time (season) and location x time of sampling had significant effect on
soil pH (Table 8).
The EC values of saturation extract (ECe) were invariably below 1.0 dS m-1 and showed
significant variations with depth of sampling, time of sampling and sites (Table 10). The
concentrations of Na, Ca, Mg and values of SAR and lime indicated significant variations
with sampling time, depths while interactive effects of locations over time of sampling
was non-significant on Na but significant on Ca, Mg, SAR and lime (Table 8). The
concentrations of cations and lime tended to increase with sampling depths when
averaged across sampling time and locations (Table 11 to 15). The [Na] were higher in all
samples than [Mg] by several folds which were also lower than [Ca]. The [Ca] in
saturation extracts ranged from 5.58 in surface soil samples to 64.24 mg L-1 in the lowest
layer (225-270 cm) in site-1 during 2003-04 and showed higher mean values in the
subsurface sampling (Table 12). When averaged across sampling times and locations the
mean values showed significant increases with sampling depth. This trend was less
consistent in case of Mg (Table 13) but well pronounced in case of Na (Table 11) The
soils having mean values of lime between > 9.0 and < 14.0 g 100 g-1 were strongly
calcareous (SSSA, 1996). The values of pH, EC, SAR and lime were in close proximity
with values for general soils of KPK (Khattak and Perveen, 1987, Soil Survey of
Pakistan, 2007), for some selected areas in Peshawar valley (Ahmad et al., 2008), for

55
Table 8 ANOVA showing Mean Square (MS) values for soil pH, EC, Na, Ca, Mg, SAR and lime content of soil samples collected from ten different fields at six depths from site-1, Fazliabad and site-2, Manga Dargai at three sampling times during 2003-05
SOV D.F pH EC Na Ca Mg SAR Lime
Sampling time 2 0.07* 0.006*** 108.58* 1631.5*** 756.4*** 7.57*** 16.01***
Location(Time) 3 0.58*** 0.003*** 20.82ns 2431.6*** 14638*** 47.95*** 8.49***
Rep.(Location) 18 0.02ns 0.003*** 121.40*** 87.87*** 28.04* 2.36*** 1.16***
Soil Depth 5 0.03ns 0.002*** 5566.8*** 5802.1*** 157.0*** 31.89*** 85.80***
Depth x Time 10 0.02ns 0.001*** 51.67* 49.02* 81.18*** 3.00*** 6.67***
L X D x Time 15 0.01ns 0.001** 59.00** 113.49*** 107.4*** 0.56Ns 0.32Ns
Error 306 0.02 <0.001 27.67 24.15 16.46 0.92 0.33
Total 359 9.66 0.356 40169.1 50734.4 14657.3 683.3 680.0
C.V. % 1.84 13.74 13.94 16.17 34.89 16.23 4.97
Ns, *, **, and *** represent not significant at 0.05, significant at 0.05, 0.01 and 0.001, respectively

56
Table 9 Changes in soil pH with sampling time and soil depths at site-1, Fazliabad and site-2, Manga Dargai during 2003-05 under sub-surface tile drainage system ( n = 10)
Sampling depth
------------------------------------------ Time of sampling -------------------------------------------------- Grand Mean
Before wheat After wheat After maize
----------------------------------------------------------Site-1, Fazliabad ------------------------------------------------------------------
(cm) Min Max Mean S.D. Min Max Mean S.D. Min Max Mean S.D.
0-45 7.80 8.30 8.03 0.17 7.88 8.42 8.13 0.19 7.90 8.30 8.03 0.13 8.06
45-90 7.85 8.24 8.04 0.15 7.78 8.35 8.07 0.20 7.80 8.38 8.07 0.19 8.06
90-135 7.78 8.28 8.09 0.17 7.98 8.40 8.20 0.13 7.80 8.30 8.01 0.15 8.10
135-180 7.88 8.40 8.10 0.15 7.84 8.50 8.18 0.22 7.78 8.25 8.02 0.14 8.10
180-225 7.86 8.30 8.09 0.17 7.89 8.44 8.15 0.18 7.89 8.40 8.09 0.18 8.11
225-270 7.80 8.30 8.09 0.08 7.70 8.44 8.16 0.22 8.00 8.40 8.18 0.13 8.14
Mean 7.83 8.30 8.07 0.15 7.85 8.43 8.15 0.19 7.86 8.34 8.07 0.15 8.10
------------------------------------------------------Site-2, Manga Dargai ----------------------------------------------------------------
0-45 7.76 8.20 7.99 0.14 7.70 8.23 7.99 0.14 7.78 8.20 7.94 0.12 7.97
45-90 7.82 8.22 7.99 0.11 7.83 8.10 7.95 0.10 7.88 8.20 8.01 0.10 7.98
90-135 7.77 8.20 7.93 0.12 7.67 8.20 7.97 0.17 7.70 8.10 7.89 0.12 7.93
135-180 7.79 8.00 7.91 0.07 7.79 8.38 7.93 0.18 7.75 8.10 7.87 0.11 7.90
180-225 7.90 8.20 8.02 0.10 7.81 8.10 7.98 0.10 7.70 8.10 7.96 0.15 7.98
225-270 7.84 8.12 7.99 0.08 7.79 8.20 7.96 0.11 7.90 8.20 8.02 0.12 7.99
Mean 7.81 8.16 7.97 0.10 7.77 8.20 7.96 0.13 7.79 8.15 7.95 0.12 7.96
------------------------------------Averaged across depths and locations (RxDxL, n = 120)---------------------------------------
Before wheat 7.76 8.40 8.02 ba 0.14
After wheat 7.67 8.50 8.06 a 0.19
After maize 7.70 8.40 8.01 b 0.16
LSD (p< .05) - - 0.03
--------------------------------Average across sampling times and locations (RxTxL, n = 60)------------------------------------
0-45 7.70 8.42 8.02 ba 0.15
45-90 7.78 8.38 8.02 ba 0.15
90-135 7.67 8.4 8.01 ba 0.15
135-180 7.75 8.5 8.00 b 0.14
180-225 7.70 8.44 8.05 ba 0.15
225-270 7.70 8.44 8.07 a 0.15
LSD (p< .05) - - 0.05
* Values with same letter(s) do not differ significantly at p < 0.05

57
Table 10 Changes in soil EC with sampling time and soil depths at site-1, Fazliabad and site-2, Manga Dargai during 2003-05 under sub-surface tile drainage system ( n = 10)
Sampling depth
------------------------------------------- Time of sampling ------------------------------------------------ Grand Mean Before wheat After wheat After maize
---------------------------------------------------------Site-1, Fazliabad --------------------------------------------------------------------
(cm) Min Max Mean S.D. Min Max Mean S.D. Min Max Mean S.D.
0-45 0.13 0.20 0.17 0.03 0.14 0.23 0.19 0.03 0.14 0.22 0.19 0.02 0.18
45-90 0.12 0.21 0.17 0.03 0.16 0.24 0.20 0.03 0.15 0.25 0.20 0.03 0.19
90-135 0.15 0.20 0.18 0.02 0.16 0.25 0.20 0.03 0.16 0.24 0.20 0.03 0.19
135-180 0.15 0.24 0.18 0.02 0.18 0.27 0.20 0.03 0.17 0.22 0.19 0.02 0.19
180-225 0.17 0.20 0.18 0.01 0.20 0.25 0.22 0.02 0.17 0.25 0.21 0.02 0.21
225-270 0.15 0.27 0.20 0.03 0.16 0.26 0.20 0.03 0.16 0.27 0.21 0.03 0.20
Mean 0.15 0.22 0.18 0.02 0.17 0.25 0.20 0.03 0.16 0.24 0.20 0.03 0.19
--------------------------------------------------Site-2, Manga Dargai -------------------------------------------------------------------
0-45 0.13 0.21 0.17 0.03 0.12 0.27 0.21 0.05 0.13 0.21 0.17 0.02 0.18
45-90 0.14 0.25 0.19 0.04 0.14 0.27 0.18 0.04 0.12 0.24 0.19 0.03 0.18
90-135 0.15 0.25 0.20 0.04 0.14 0.20 0.18 0.02 0.16 0.25 0.20 0.03 0.19
135-180 0.15 0.25 0.20 0.03 0.13 0.24 0.18 0.04 0.16 0.22 0.20 0.02 0.19
180-225 0.15 0.22 0.18 0.03 0.14 0.28 0.21 0.05 0.14 0.24 0.19 0.03 0.19
225-270 0.13 0.22 0.17 0.03 0.14 0.20 0.16 0.02 0.18 0.25 0.22 0.02 0.18
Mean 0.14 0.23 0.18 0.03 0.14 0.24 0.18 0.04 0.15 0.24 0.19 0.03 0.19
---------------------------------Averaged across depths and locations (RxDxL, n = 120)--------------------------------------
Before wheat 0.12 0.27 0.182 b 0.03
After wheat 0.12 0.28 0.192 a 0.04
After maize 0.12 0.27 0.197 a 0.03
LSD (p< .05) - - 0.007
-------------------------------------Average across sampling times and locations (RxTxL, n = 60)---------------------------
0-45 0.12 0.27 0.182 c 0.03
45-90 0.12 0.27 0.185 bc 0.03
90-135 0.14 0.25 0.192 ba 0.03
135-180 0.13 0.27 0.190 bc 0.03
180-225 0.14 0.28 0.200 a 0.03
225-270 0.13 0.27 0.194 ba 0.03
LSD (p< .05) - - 0.009
* Values with same letter(s) do not differ significantly at p < 0.05

58
Table 11 Changes in water saturated soil Na concentrations (mg L-1) with sampling time and soil depths at site-1, Fazliabad and site-2, Manga Dargai during 2003-05 under sub-surface tile drainage system ( n = 10)
Sampling depth
---------------------------------------------------- Time of sampling -------------------------------------------------------- Grand
Mean Before wheat After wheat After maize
----------------------------------------------------------Site-1, Fazliabad --------------------------------------------------------------------------
(cm) Min Max Mean S.D. Min Max Mean S.D. Min Max Mean S.D.
0-45 19.76 31.81 24.19 3.50 18.22 31.33 24.14 4.54 19.90 29.20 24.63 3.17 24.32
45-90 18.89 38.56 29.38 5.48 19.95 48.49 29.78 8.16 27.53 37.00 32.17 3.11 30.44
90-135 25.74 48.59 37.26 6.41 19.95 48.39 33.84 8.04 23.95 40.46 34.01 6.26 35.04
135-180 30.46 52.83 43.29 7.42 29.79 47.14 38.32 5.53 31.70 47.66 39.44 6.23 40.35
180-225 42.71 54.47 47.15 3.88 34.51 58.23 46.24 7.32 37.46 50.40 45.23 4.43 46.21
225-270 38.56 60.35 52.96 12.53 46.27 57.36 51.56 4.11 43.60 54.76 50.74 3.51 51.75
Mean 29.35 47.77 39.04 6.54 28.12 48.49 37.31 6.28 30.69 43.25 37.70 4.45 38.02
------------------------------------------------------Site-2, Manga Dargai ------------------------------------------------------------------------
0-45 19.86 35.67 27.02 4.60 18.12 28.34 23.69 3.45 18.90 24.00 21.60 1.79 24.10
45-90 26.12 41.26 33.73 5.39 21.21 38.95 30.00 4.54 23.60 30.20 27.74 1.90 30.49
90-135 29.31 45.69 37.58 5.87 25.84 42.42 35.91 5.60 29.90 36.44 33.51 2.10 35.66
135-180 27.86 52.44 43.30 7.14 25.84 48.10 37.62 7.35 28.84 45.00 39.45 4.48 40.13
180-225 33.74 58.03 47.80 8.51 39.04 54.27 47.52 4.84 37.60 51.30 45.03 4.66 46.78
225-270 19.67 52.35 41.95 12.53 41.84 59.48 49.32 6.22 44.58 57.60 50.72 3.52 47.33
Mean 26.09 47.57 38.56 7.34 28.65 45.26 37.34 5.33 30.57 40.76 36.34 3.07 37.42
------------------------------------Averaged across depths and locations (RxDxL, n = 120)--------------------------------------------
Before wheat 18.89 60.35 38.80 a 10.74
After wheat 18.12 59.48 37.33 b 10.87
After maize 18.90 57.60 37.02 b 10.11
LSD (p< .05) - - 1.33
----------------------------------Average across sampling times and locations (RxTxL, n = 60)---------------------------------------
0-45 18.12 35.67 24.21 f 3.83
45-90 18.89 48.49 30.47 e 3.58
90-135 19.95 48.59 35.35 d 3.67
135-180 25.84 52.83 40.24 c 3.72
180-225 33.74 58.23 46.50 b 3.17
225-270 19.67 60.35 49.54 a 3.23
LSD (p< .05) - - 1.89
* Values with same letter(s) do not differ significantly at p < 0.05

59
Table 12 Changes in water saturated soil Ca concentrations (mg L-1) with sampling time and soil depths at site-1, Fazliabad and site-2, Manga Dargai during 2003-05 under sub-surface tile drainage system ( n = 10)
Sampling depth
------------------------------------------- Time of sampling ---------------------------------------------------- Grand Mean
Before wheat After wheat After maize
----------------------------------------------------------Site-1, Fazliabad ------------------------------------------------------------------
Depth (cm) Min Max Mean S.D. Min Max Mean S.D. Min Max Mean S.D.
0-45 5.58 20.35 13.48 4.12 15.18 21.32 18.31 1.93 6.70 12.80 9.55 1.68 13.78
45-90 15.85 24.49 18.69 2.51 20.74 32.35 24.87 3.04 8.77 18.25 14.57 2.77 19.37
90-135 19.72 29.82 22.26 3.07 18.07 35.44 24.83 4.87 10.78 22.33 17.43 3.64 21.51
135-180 19.37 37.70 25.13 5.37 24.32 40.38 31.21 4.57 10.60 33.10 24.10 7.58 26.81
180-225 30.95 44.20 36.00 4.11 27.95 42.64 35.22 4.54 11.25 48.50 32.28 12.02 34.50
225-270 37.92 64.24 46.29 3.96 33.78 48.59 43.16 4.91 11.35 51.00 35.87 12.20 41.77
Mean 21.57 36.80 26.97 3.86 23.34 36.79 29.60 3.98 9.91 31.00 22.30 6.65 26.29
------------------------------------------------------Site-2, Manga Dargai ----------------------------------------------------------------
0-45 15.78 30.50 22.81 5.17 13.83 24.59 18.49 3.60 12.40 29.45 16.53 4.85 19.28
45-90 31.33 40.90 37.36 3.43 21.50 33.45 25.73 3.71 18.43 33.50 23.16 4.49 28.75
90-135 38.52 45.00 42.20 2.06 18.44 34.48 27.89 4.86 20.40 40.45 27.35 5.27 32.48
135-180 33.85 52.90 44.31 6.03 35.26 45.40 39.98 3.36 23.90 38.72 33.28 4.52 39.19
180-225 38.25 48.22 44.03 2.99 34.57 47.80 41.63 5.07 28.20 46.90 39.81 4.61 41.83
225-270 40.70 54.51 48.51 3.96 38.28 50.42 45.91 3.54 20.36 48.52 41.42 8.20 45.28
Mean 33.07 45.34 39.87 3.94 26.98 39.36 33.27 4.02 20.62 39.59 30.26 5.32 34.47
---------------------------------Averaged across depths and locations (RxDxL, n = 120)--------------------------------------
Before wheat 5.58 64.24 33.42 a 12.50
After wheat 13.83 50.42 31.43 b 10.01
After maize 6.70 51.00 26.28 c 11.93
LSD (p< .05) - - 1.24
--------------------------------Average across sampling times and locations (RxTxL, n = 60)------------------------------------
0-45 5.58 30.5 16.53 f 5.56
45-90 8.77 40.9 24.06 e 5.78
90-135 10.78 45.0 26.99 d 5.53
135-180 10.60 52.9 33.00 c 5.23
180-225 11.25 48.5 38.16 b 4.95
225-270 11.35 64.24 43.52 a 5.22
LSD (p< .05) - - 1.76
* Values with same letter(s) do not differ significantly at p < 0.05

60
Table 13 Changes in water saturated soil Mg concentrations (mg L-1) with sampling time and soil depths at site-1, Fazliabad and site-2, Manga Dargai during 2003-05 under sub-surface tile drainage system ( n = 10)
Sampling depth
-------------------------------------------- Time of sampling -------------------------------------------------- Grand Mean Before wheat After wheat After maize
----------------------------------------------------------Site-1, Fazliabad ------------------------------------------------------------------
Depth (cm) Min Max Mean S.D. Min Max Mean S.D. Min Max Mean S.D.
0-45 1.92 6.62 4.19 1.65 7.47 10.90 9.12 1.06 6.60 11.10 8.71 1.41 7.34
45-90 2.38 10.34 5.28 2.33 6.17 9.20 6.81 0.87 7.80 11.27 10.01 1.29 7.37
90-135 7.66 12.07 9.23 1.21 7.85 11.66 10.25 1.07 8.30 11.40 10.00 0.93 9.83
135-180 1.51 7.96 4.33 1.92 7.26 9.13 8.27 0.55 8.69 10.73 9.74 0.60 7.45
180-225 1.88 6.62 4.29 1.51 6.16 8.73 7.71 0.99 7.90 11.35 10.04 1.21 7.35
225-270 10.99 15.63 13.57 2.28 6.77 10.10 7.94 1.19 7.90 11.20 9.59 1.11 10.36
Mean 4.39 9.87 6.81 1.82 6.95 9.95 8.35 0.96 7.87 11.18 9.68 1.09 8.28
------------------------------------------------------Site-2, Manga Dargai ----------------------------------------------------------------
0-45 6.95 79.93 16.15 22.48 10.43 16.08 14.15 1.79 10.60 14.82 12.89 1.39 14.39
45-90 7.15 15.36 11.43 2.78 7.56 11.27 10.07 1.09 7.90 17.42 12.83 2.87 11.44
90-135 6.45 11.74 8.07 1.58 13.87 17.56 15.50 1.13 14.00 17.50 15.62 1.30 13.06
135-180 3.96 8.74 7.13 1.76 17.05 21.69 19.45 1.52 16.43 20.20 18.70 1.27 15.09
180-225 8.90 11.87 10.08 0.84 14.46 26.11 22.23 3.89 13.54 24.46 21.51 3.05 17.94
225-270 7.36 15.26 11.63 2.28 17.33 22.09 19.64 1.79 19.00 28.60 22.55 3.22 17.94
Mean 6.80 23.82 10.74 5.29 13.45 19.13 16.84 1.87 13.58 20.50 17.35 2.18 14.98
---------------------------------Averaged across depths and locations (RxDxL, n = 120)--------------------------------------
Before wheat 1.51 79.93 8.78 b 7.44
After wheat 6.16 26.11 12.59 a 5.43
After maize 6.60 28.60 13.51 a 5.05
LSD (p< .05) - - 1.03
--------------------------------Average across sampling times and locations (RxTxL, n = 60)------------------------------------
0-45 1.92 79.93 10.87 c 9.74
45-90 2.38 17.42 9.40 d 3.50
90-135 6.45 17.56 11.4 bc 3.53
135-180 1.51 21.69 11.2 bc 3.48
180-225 1.88 26.11 12.64 b 3.40
225-270 6.77 28.6 14.15 a 3.26
LSD (p< .05) - - 1.46
* Values with same letter(s) do not differ significantly at p < 0.05

61
Table 14 Changes in soil SAR with sampling time and soil depths at site-1, Fazliabad and site-2, Manga Dargai during 2003-05 under sub-surface tile drainage system ( n = 10)
Sampling depth
---------------------------------------------- Time of sampling -------------------------------------------- Grand Mean
Before wheat After wheat After maize
----------------------------------------------------------Site-1, Fazliabad ------------------------------------------------------------------
Depth (cm) Min Max Mean S.D. Min Max Mean S.D. Min Max Mean S.D.
0-45 2.59 2.21 2.08 0.52 1.35 1.94 1.62 0.92 1.84 2.03 1.95 0.61 1.85
45-90 1.65 2.32 2.18 0.84 1.39 2.73 1.92 1.50 2.29 2.36 2.24 0.55 2.10
90-135 1.76 2.67 2.36 1.11 1.39 2.54 2.03 1.21 1.88 2.45 2.26 1.07 2.21
135-180 2.53 2.88 2.96 0.99 1.92 2.46 2.22 0.92 2.46 2.60 2.42 0.83 2.51
180-225 2.84 2.85 2.79 0.59 2.17 2.99 2.59 1.14 2.95 2.39 2.51 0.46 2.63
225-270 2.00 2.47 2.48 1.75 2.68 2.76 2.67 0.61 3.42 2.55 2.74 0.36 2.62
Mean 2.12 2.55 2.45 0.97 1.85 2.58 2.20 1.03 2.49 2.39 2.36 0.59 2.34
------------------------------------------------------Site-2, Manga Dargai ----------------------------------------------------------------
0-45 1.48 1.08 1.49 0.27 1.26 1.54 1.42 0.52 1.34 1.27 1.36 0.26 1.42
45-90 1.54 1.97 1.75 0.74 1.41 2.10 1.79 0.75 1.63 1.49 1.62 0.24 1.71
90-135 1.62 2.21 1.96 1.05 1.56 2.07 1.91 0.84 1.76 1.70 1.78 0.30 1.88
135-180 1.70 2.48 2.25 0.93 1.26 2.07 1.72 1.18 1.57 2.06 1.91 0.68 1.95
180-225 1.80 2.74 2.38 1.58 1.98 2.21 2.08 0.55 2.05 2.13 2.01 0.58 2.15
225-270 1.05 2.28 1.98 1.75 1.99 2.48 2.16 0.95 2.40 2.28 2.22 0.37 2.12
Mean 1.52 2.01 1.97 0.80 1.59 2.09 1.85 0.78 1.81 1.85 1.84 0.40 1.89
---------------------------------Averaged across depths and locations (RxDxL, n = 120)--------------------------------------
Before wheat 1.67 2.58 2.18 0.84
After wheat 1.44 2.39 2.01 0.97
After maize 1.75 2.26 2.06 0.87
LSD (p< .05) - - 0.30 -
--------------------------------Average across sampling times and locations (RxTxL, n = 60)------------------------------------
0-45 2.38 1.08 1.60e 0.32
45-90 2.06 2.25 1.88d 0.41
90-135 1.67 2.19 2.03c 0.42
135-180 2.77 2.18 2.17b 0.44
180-225 3.46 2.36 2.35a 0.38
225-270 1.61 2.22 2.35a 0.38
LSD (p< .05) 0.36
* Values with same letter(s) do not differ significantly at p < 0.05

62
Table 15 Changes in soil lime contents (g 100g-1 soil) with sampling time and soil depths at site-1, Fazliabad and site-2, Manga Dargai during 2003-05 under sub-surface tile drainage system ( n = 10)
Sampling depth
------------------------------------------------ Time of sampling ------------------------------------------------ Grand Mean Before wheat After wheat After maize
----------------------------------------------------------Site-1, Fazliabad ------------------------------------------------------------------
Depth (cm) Min Max Mean S.D. Min Max Mean S.D. Min Max Mean S.D.
0-45 8.80 10.47 9.54 0.63 8.96 10.90 9.93 0.66 8.43 9.80 9.05 0.48 9.51
45-90 9.87 11.28 10.49 0.55 9.88 11.50 10.78 0.54 9.00 11.20 10.17 0.73 10.48
90-135 9.94 11.70 11.11 0.64 10.88 12.15 11.43 0.48 9.90 12.70 11.24 0.91 11.26
135-180 10.98 12.00 11.62 0.36 10.78 12.00 11.53 0.46 10.72 13.36 11.95 0.83 11.70
180-225 10.90 13.00 11.89 0.70 11.10 13.10 12.05 0.57 11.37 14.84 12.86 1.09 12.27
225-270 11.73 13.79 12.31 0.38 11.92 13.00 12.37 0.34 13.00 15.23 13.79 0.81 12.82
Mean 10.37 12.04 11.16 0.54 10.59 12.11 11.35 0.51 10.40 12.86 11.51 0.81 11.34
------------------------------------------------------Site-2, Manga Dargai ----------------------------------------------------------------
0-45 8.50 11.10 10.14 0.69 9.33 11.25 10.30 0.52 8.90 10.00 9.37 0.45 9.94
45-90 9.80 12.00 10.70 0.58 10.35 11.65 11.07 0.43 9.63 11.70 10.93 0.68 10.90
90-135 9.90 12.00 11.21 0.56 10.88 12.49 11.46 0.53 11.00 13.38 12.22 0.88 11.63
135-180 11.00 13.00 11.80 0.57 11.00 12.80 11.84 0.57 12.40 14.40 13.24 0.72 12.29
180-225 11.33 12.44 11.95 0.32 11.00 13.00 12.03 0.57 13.20 14.75 13.94 0.56 12.64
225-270 11.56 12.90 12.18 0.38 11.99 13.32 12.56 0.47 14.00 15.30 14.67 0.44 13.14
Mean 10.35 12.24 11.33 0.52 10.76 12.42 11.54 0.51 11.52 13.26 12.40 0.62 11.76
---------------------------------Averaged across depths and locations (RxDxL, n = 120)--------------------------------------
Before wheat 8.50 13.79 11.24 c 0.99
After wheat 8.96 13.32 11.45 b 0.92
After maize 8.43 15.30 11.95 a 1.90
LSD (p< .05) - - 0.14
--------------------------------Average across sampling times and locations (RxTxL, n = 60)------------------------------------
0-45 8.43 11.25 9.72 f 0.71
45-90 9.00 12 10.69 e 0.72
90-135 9.90 13.38 11.44 d 0.71
135-180 10.72 14.4 12.00 c 0.70
180-225 10.90 14.84 12.45 b 0.72
225-270 11.56 15.3 12.98 a 0.73
LSD (p< .05) - - 0.20
* Values with same letter(s) do not differ significantly at p < 0.05

63
sugar beet fields in Mardan and Charsadda (Haq et al., 1992) and for general soils in
Mardan SCARP area (Mukhtar et al., 2000). However, these values of EC, SAR and Ca,
Mg and Na were much less than the values reported by Canadian Drainage Team (1984)
for the given soils before SCARP inception and by others for agricultural soils which
shows that the SCARP has substantially reduced the concentrations of bases in the soil.
The increases in pH, EC, cations, lime and SAR indicated downward movements of salts
with percolating waters (Ramazan, 1996; Khattak, 1996; Muhammad, 2009). Increases in
lime content with depth are caused by movement of Ca and HCO3 to lower layers where
it is precipitated as CaCO3 (Sposito, 1989, Bohn et al., 2001).
4.3.2 Soil Organic Matter, NH4-N, NO3-N and AB-DTPA Extractable P and K
The soil organic matter (SOM) and K were significantly affected by sampling time,
location over time, replication over locations and soil depths and interaction (depths x
time, location x depth x time) had no effect on SOM (Table 16). The concentrations of
NH4-N and NO3-N were non significantly affected by location over time of sampling and
by other interactions while the effect of sampling time, replications over locations and
sampling depths were significant on NH4-N, whereas P values were non-significant for
replications over location and other interactions but were significantly affected by time of
sampling, location over time and depths of sampling at the given levels of probability
(Table 16).
The values of SOM although were invariably low (≤ 1.0 g 100 g-1) in soil but showed a
consistent trend with depths of sampling and time of sampling with little variations
between the two sites (Table 17). The concentrations of NO3-N and NH4-N were higher
in the top 0-45 and 45-90 cm depths and substantially decreased in the lower depths in
both sites (Tables 18 and 19). The concentrations of NO3-N did not change with sampling
time (Table 18) but those of NH4-N were lower in samples collected after maize in both
sites (Table 19). Site-2, Manga Dargai maintained relatively higher concentrations of
NH4-N compared to site-1, Fazliabad. The higher values of N in the surface soil could be
associated with decomposition of SOM and addition of nitrogenous fertilizers as
suggested by field survey(Table 2) while maize being an exhaustive crop lowered the
mineral N compared to wheat.

64
Table 16 ANOVA showing Mean Square (MS) values for soil organic matter (SOM), NH4-N, NO3-N, P and K in soil samples collected from ten different fields at six depths from site-1, Fazliabad and site-2, Manga Dargai at three sampling times during 2003-05
SOV D.F OM NH4-N NO3-N P K
Sampling time 2 0.141*** 47.96* 92.7 Ns 2.20* 8070.92***
Location(Time) 3 0.036*** 16.88Ns 15.8 Ns 192.13** 20485.49***
Rep.(Location) 18 0.063*** 25.80** 112.5 *** 0.872 Ns 2435.01***
Soil Depth 5 0.862*** 601.68*** 242.3 *** 5.73*** 3296.59***
Depth x Time 10 0.009Ns 16.35Ns 41.5 Ns 1.09ns 563.99Ns
L x D x Time 15 0.005Ns 14.75Ns 42.8 Ns 1.02ns 477.59Ns
Error 306 0.005 11.04 31.86 0.71 642.50
Total 359 7.58 7384.70 14245.53 2.42 347321.26
C.V. % 12.17 22.44 42.76 23.27 15.33
Ns, *, **, and *** represent not significant at 0.05, significant at 0.05, 0.01 and 0.001, respectively

65
Table 17 Changes in soil organic matter content (%) with sampling time and soil depths at site-1, Fazliabad and site-2, Manga Dargai during 2003-05 under sub-surface tile drainage system ( n = 10)
Sampling depth
---------------------------------------------- Time of sampling ----------------------------------------- Grand Mean Before wheat After wheat After maize
----------------------------------------------------------Site-1, Fazliabad ------------------------------------------------------------------
Depth (cm) Min Max Mean S.D. Min Max Mean S.D. Min Max Mean S.D.
0-45 0.59 1.00 0.76 0.15 0.62 0.96 0.74 0.12 0.60 0.85 0.73 0.09 0.74
45-90 0.54 0.80 0.66 0.11 0.56 0.84 0.67 0.10 0.50 0.79 0.65 0.10 0.66
90-135 0.49 0.70 0.58 0.09 0.47 0.98 0.64 0.15 0.48 0.70 0.60 0.07 0.61
135-180 0.47 0.80 0.59 0.11 0.43 0.82 0.57 0.12 0.45 0.65 0.53 0.07 0.56
180-225 0.39 0.60 0.50 0.07 0.38 0.68 0.49 0.10 0.37 0.55 0.46 0.06 0.48
225-270 0.37 0.58 0.46 0.09 0.37 0.56 0.44 0.06 0.30 0.50 0.38 0.07 0.43
Mean 0.48 0.75 0.59 0.10 0.47 0.81 0.59 0.11 0.45 0.67 0.56 0.07 0.58
------------------------------------------------------Site-2, Manga Dargai ----------------------------------------------------------------
0-45 0.65 1.00 0.82 0.12 0.66 0.82 0.71 0.05 0.61 0.90 0.76 0.09 0.76
45-90 0.58 0.86 0.74 0.10 0.58 0.75 0.66 0.05 0.54 0.81 0.65 0.09 0.68
90-135 0.52 0.89 0.70 0.12 0.53 0.70 0.61 0.05 0.46 0.73 0.57 0.09 0.63
135-180 0.48 0.83 0.63 0.12 0.46 0.62 0.56 0.04 0.37 0.65 0.50 0.09 0.56
180-225 0.40 0.70 0.54 0.10 0.44 0.61 0.53 0.05 0.30 0.58 0.42 0.09 0.50
225-270 0.36 0.62 0.46 0.09 0.37 0.52 0.47 0.04 0.25 0.50 0.35 0.08 0.43
Mean 0.50 0.82 0.65 0.11 0.51 0.67 0.59 0.05 0.42 0.70 0.54 0.09 0.59
---------------------------------Averaged across depths and locations (RxDxL, n = 120)--------------------------------------
Before wheat 0.36 1.00 0.62 a 0.15
After wheat 0.37 0.98 0.59 b 0.12
After maize 0.25 0.90 0.55 c 0.15
LSD (p < .05) - - 0.02
--------------------------------Average across sampling times and locations (RxTxL, n = 60)------------------------------------
0-45 0.59 1 0.75 a 0.11
45-90 0.50 0.86 0.67 b 0.11
90-135 0.46 0.98 0.62 c 0.11
135-180 0.37 0.83 0.56 d 0.11
180-225 0.30 0.7 0.49 e 0.11
225-270 0.25 0.62 0.43 f 0.11
LSD (p < .05) - - 0.03
* Values with same letter(s) do not differ significantly at p < 0.05

66
Table 18 Changes in KCl extractable soil NO3-N (mg kg-1) with sampling time and soil depths at site-1, Fazliabad and site-2, Manga Dargai during 2003-05 under sub-surface tile drainage system ( n = 10)
Sampling depth
--------------------------------------------- Time of sampling ------------------------------------------------ Grand Mean
Before wheat After wheat After maize
----------------------------------------------------------Site-1, Fazliabad ------------------------------------------------------------------
Depth (cm) Min Max Mean S.D. Min Max Mean S.D. Min Max Mean S.D.
0-45 7.00 30.62 14.18 7.04 8.75 22.75 16.45 4.44 9.80 21.25 16.84 4.24 15.82
45-90 5.25 21.88 12.87 6.68 4.38 26.25 14.53 6.94 5.75 19.30 14.80 4.79 14.06
90-135 4.37 23.63 12.72 6.81 7.88 23.88 16.74 5.67 5.57 21.85 14.82 4.91 14.76
135-180 5.25 23.63 9.59 5.75 4.37 15.75 11.52 4.24 10.92 19.62 14.61 3.02 11.91
180-225 0.87 23.63 10.48 6.52 5.25 14.00 9.68 3.37 7.38 19.15 12.46 3.65 10.87
225-270 7.00 21.88 11.03 9.62 4.73 12.25 8.16 2.69 7.65 22.20 11.88 4.86 10.35
Mean 4.96 24.21 11.81 7.07 5.89 19.15 12.84 4.56 7.85 20.56 14.23 4.25 12.96
------------------------------------------------------Site-2, Manga Dargai ----------------------------------------------------------------
0-45 2.63 27.13 16.98 8.43 2.62 33.25 19.60 9.80 5.40 21.63 14.85 4.78 17.14
45-90 0.88 21.88 9.80 7.54 0.00 25.37 15.40 8.98 10.37 22.88 16.72 4.09 13.97
90-135 6.13 25.38 14.45 5.87 0.87 19.25 9.74 6.94 11.32 17.10 13.85 2.05 12.68
135-180 4.37 27.13 13.19 7.29 3.50 23.62 12.19 7.28 8.40 17.45 13.21 2.98 12.86
180-225 4.38 21.00 11.01 5.77 0.00 29.75 15.31 10.25 7.70 17.20 11.61 2.96 12.64
225-270 0.88 31.50 11.73 9.62 0.00 14.87 8.71 4.37 7.00 22.75 13.43 4.61 11.29
Mean 3.21 25.67 12.86 7.42 1.17 24.35 13.49 7.94 8.37 19.84 13.94 3.58 13.43
---------------------------------Averaged across depths and locations (RxDxL, n = 120)--------------------------------------
Before wheat 0.87 31.50 12.33c 6.93
After wheat 0.00 33.25 13.17b 7.30
After maize 5.40 22.88 14.09a 4.16
LSD (p < .05) - - 0.02
--------------------------------Average across sampling times and locations (RxTxL, n = 60)------------------------------------
0-45 2.62 33.25 16.48 a 6.74
45-90 0.00 26.25 14.02 b 6.92
90-135 0.87 25.38 13.72 c 6.82
135-180 3.50 27.13 12.37 d 6.69
180-225 0.00 29.75 11.76 e 6.25
225-270 0.00 31.5 10.82 f 5.72
LSD (p < .05) - - 0.03
* Values with same letter(s) do not differ significantly at p < 0.05

67
Table 19 Changes in KCl extractable soil NH4-N (mg kg-1) with sampling time and soil depths at site-1, Fazliabad and site-2, Manga Dargai during 2003-05 under sub-surface tile drainage system ( n = 10)
Sampling depth
----------------------------------------------- Time of sampling ------------------------------------------------- Grand Mean Before wheat After wheat After maize
----------------------------------------------------------Site-1, Fazliabad -----------------------------------------------------------------
Depth (cm) Min Max Mean S.D. Min Max Mean S.D. Min Max Mean S.D.
0-45 9.63 26.25 16.59 5.54 13.13 27.65 20.70 4.12 10.00 19.75 15.92 3.14 17.74
45-90 10.50 26.25 18.38 4.68 15.75 22.75 18.73 2.86 11.96 21.00 17.05 3.44 18.05
90-135 11.38 22.75 16.42 4.18 11.38 19.25 16.31 2.89 8.90 20.40 15.39 3.69 16.04
135-180 10.50 19.25 14.44 2.62 11.38 19.25 15.00 2.47 8.65 20.82 12.99 3.67 14.14
180-225 7.00 15.75 12.17 2.35 8.75 14.00 11.99 1.98 9.78 14.65 12.02 1.28 12.06
225-270 7.00 22.75 11.64 2.81 7.00 12.25 9.89 2.24 6.88 11.54 9.33 1.60 10.28
Mean 9.34 22.17 14.94 3.70 11.23 19.19 15.44 2.76 9.36 18.03 13.78 2.80 14.72
------------------------------------------------------Site-2, Manga Dargai ----------------------------------------------------------------
0-45 14.00 26.25 21.88 4.68 11.38 25.38 17.56 4.63 6.20 22.90 16.04 4.62 18.49
45-90 14.00 28.00 19.16 4.03 12.25 27.13 18.90 3.90 11.37 21.00 16.93 3.53 18.33
90-135 13.65 21.00 17.20 2.66 11.38 21.88 15.98 3.42 9.00 16.54 14.29 2.47 15.83
135-180 10.50 16.63 13.74 2.15 7.88 18.38 13.01 3.43 10.60 19.00 14.44 2.94 13.73
180-225 7.00 14.88 11.20 2.64 9.63 18.38 12.25 2.83 9.80 19.00 13.75 3.66 12.40
225-270 7.00 15.75 10.94 2.81 6.13 15.75 9.80 3.16 7.90 15.90 11.04 2.86 10.59
Mean 11.03 20.42 15.69 3.16 9.78 21.15 14.58 3.56 9.15 19.06 14.41 3.35 14.90
---------------------------------Averaged across depths and locations (RxDxL, n = 120)--------------------------------------
Before wheat 7.00 28.00 15.31 a 4.99
After wheat 6.13 27.65 15.01 a 4.66
After maize 6.20 22.90 14.10 b 3.83
LSD (p< .05) - - 0.84
--------------------------------Average across sampling times and locations (RxTxL, n = 60)-----------------------------------
0-45 6.20 27.65 18.11 a 4.92
45-90 10.50 28.00 18.19 a 4.87
90-135 8.90 22.75 15.93b 5.06
135-180 7.88 20.82 13.93c 5.06
180-225 7.00 19.00 12.23 d 4.79
225-270 6.13 22.75 10.44 e 5.05
LSD (p< .05) - - 1.19
* Values with same letter(s) do not differ significantly at p < 0.05

68
The concentrations of AB-DTPA extractable P were in the medium range (> 4.0 to < 6.0
mg kg-1) in site-1 and low (< 3.0 mg kg-1) in site-2 and were significantly higher in the 0-
45 cm depth and statistically similar in the lower depths (Table 20). On the contrary to
NH4-N which decreased in samples collected after maize, P concentrations were
significantly higher after maize compared to those collected before wheat which were at
par with after wheat. The higher [P] in soil could be associated with addition of more
phosphatic fertilizers to maize and the accelerated process of nitrification in summer as
compared to winter, converted NH4-N to NO3-N more rapidly that reduced [NH4-N]
(Alexander, 1971; Stevenson, 1985). However, a closure look at the data for N and P
showed greater variability for NO3-N as shown by SD (standard deviation) in the values
obtained from ten different fields for the given depth and sampling time as compared to
NH4-N and P. This observation seems related to differences in the mobility, adsorption
and uptake rate of these ions in such a dynamic system which is subjected to excessive
leaching because of drainage (Crowe et al., 2004). Phosphate and NH4 are strongly
adsorbed on soil surfaces while NO3 is freely leached, as such a differential in retention
time and uptake by crop is produced.
The AB-DTPA extractable [K] was adequate in most of the samples where in site-2
maintained higher [K] than site-1. The irrigation waters applied to this site contained
higher K than the waters applied to site-1. All variables except their interactions
significantly influenced [K] (Table 16). Soil samples collected before wheat in both sites
showed significant (p < 0.05) variability with depth of sampling, time (season) of
sampling and were lower than the subsequent sampling after wheat but increased in
samples collected after maize or any summer crop (Table 16 and 21). Every field was
irrigated with similar quantity of irrigation waters in a given site but the input of nutrients
through irrigation, fertilizers and removal by crop may not necessarily be uniform over
the ten fields in a site used for the study under report as other agronomic practices applied
by the farmers may be variable: Pooling the data over the ten different fields could
generate certain level of seasonal and spatial variability with respect to soil chemical
characteristics (Calver et al., 2004).

69
Table 20 Changes in AB-DTPA extractable P (mg kg-1 soil) with sampling time and soil depths at site-1, Fazliabad and site-2, Manga Dargai during 2003-05 under sub-surface tile drainage system ( n = 10)
Sampling depth
----------------------------------------- Time of sampling ------------------------------------------------ Grand Mean Before wheat After wheat After maize
----------------------------------------------------------Site-1, Fazliabad ------------------------------------------------------------------
Depth (cm) Min Max Mean S.D. Min Max Mean S.D. Min Max Mean S.D.
0-45 4.25 7.09 5.44 1.09 3.37 7.80 5.88 1.36 4.90 7.00 5.92 0.87 5.75
45-90 3.19 6.38 4.79 1.11 3.37 6.56 4.89 1.15 3.90 7.09 5.32 1.16 5.00
90-135 3.54 6.56 4.47 1.02 2.86 6.73 4.79 1.16 3.60 6.91 5.28 0.99 4.84
135-180 3.37 6.02 4.57 0.85 3.19 6.56 4.16 1.21 3.20 6.40 4.60 0.96 4.45
180-225 3.19 6.91 5.05 1.33 3.01 7.09 4.82 1.40 3.18 6.05 4.38 0.87 4.75
225-270 3.19 5.49 4.20 0.41 3.01 6.02 4.71 1.14 3.40 7.00 4.56 1.28 4.49
Mean 3.46 6.41 4.75 0.97 3.14 6.79 4.88 1.24 3.70 6.74 5.01 1.02 4.88
------------------------------------------------------Site-2, Manga Dargai ----------------------------------------------------------------
0-45 1.77 2.84 2.32 0.31 1.77 3.37 2.41 0.53 2.35 4.00 3.25 0.52 2.66
45-90 1.42 2.66 2.14 0.39 1.42 3.01 2.23 0.47 1.63 3.39 2.62 0.60 2.33
90-135 1.59 2.84 2.11 0.35 1.42 3.54 2.25 0.57 2.20 3.01 2.59 0.33 2.32
135-180 1.59 3.01 2.23 0.52 1.42 2.84 2.25 0.42 1.67 3.02 2.53 0.47 2.34
180-225 1.77 3.19 2.22 0.54 0.71 2.84 2.09 0.58 1.70 2.60 2.14 0.31 2.15
225-270 2.13 3.54 2.64 0.41 1.77 2.66 2.23 0.27 1.45 2.44 2.03 0.38 2.30
Mean 1.71 3.01 2.28 0.42 1.42 3.04 2.24 0.47 1.83 3.08 2.53 0.43 2.35
---------------------------------Averaged across depths and locations (RxDxL, n = 120)--------------------------------------
Before wheat 1.42 7.09 3.51 b 1.49
After wheat 0.71 7.80 3.56 ba 1.64
After maize 1.45 7.09 3.77 a 1.53
LSD (p < .05) - - 0.21
--------------------------------Average across sampling times and locations (RxTxL, n = 60)------------------------------------
0-45 1.77 7.8 4.21 a 1.79
45-90 1.42 7.09 3.67 b 1.79
90-135 1.42 6.91 3.58 b 1.82
135-180 1.42 6.56 3.39 b 1.84
180-225 0.71 7.09 3.45 b 1.87
225-270 1.45 7 3.40 b 1.81
LSD (p < .05) - - 0.30
* Values with same letter(s) do not differ significantly at p < 0.05
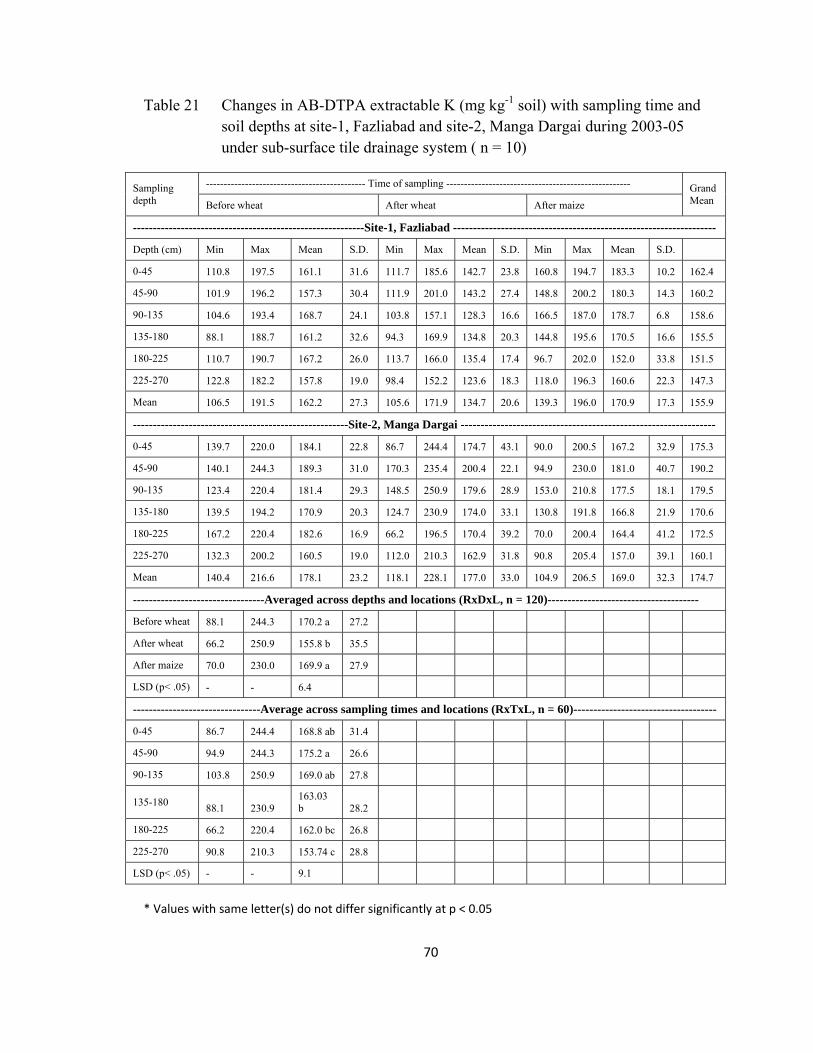
70
Table 21 Changes in AB-DTPA extractable K (mg kg-1 soil) with sampling time and soil depths at site-1, Fazliabad and site-2, Manga Dargai during 2003-05 under sub-surface tile drainage system ( n = 10)
Sampling depth
--------------------------------------------- Time of sampling ---------------------------------------------------- Grand Mean Before wheat After wheat After maize
----------------------------------------------------------Site-1, Fazliabad ------------------------------------------------------------------
Depth (cm) Min Max Mean S.D. Min Max Mean S.D. Min Max Mean S.D.
0-45 110.8 197.5 161.1 31.6 111.7 185.6 142.7 23.8 160.8 194.7 183.3 10.2 162.4
45-90 101.9 196.2 157.3 30.4 111.9 201.0 143.2 27.4 148.8 200.2 180.3 14.3 160.2
90-135 104.6 193.4 168.7 24.1 103.8 157.1 128.3 16.6 166.5 187.0 178.7 6.8 158.6
135-180 88.1 188.7 161.2 32.6 94.3 169.9 134.8 20.3 144.8 195.6 170.5 16.6 155.5
180-225 110.7 190.7 167.2 26.0 113.7 166.0 135.4 17.4 96.7 202.0 152.0 33.8 151.5
225-270 122.8 182.2 157.8 19.0 98.4 152.2 123.6 18.3 118.0 196.3 160.6 22.3 147.3
Mean 106.5 191.5 162.2 27.3 105.6 171.9 134.7 20.6 139.3 196.0 170.9 17.3 155.9
------------------------------------------------------Site-2, Manga Dargai ----------------------------------------------------------------
0-45 139.7 220.0 184.1 22.8 86.7 244.4 174.7 43.1 90.0 200.5 167.2 32.9 175.3
45-90 140.1 244.3 189.3 31.0 170.3 235.4 200.4 22.1 94.9 230.0 181.0 40.7 190.2
90-135 123.4 220.4 181.4 29.3 148.5 250.9 179.6 28.9 153.0 210.8 177.5 18.1 179.5
135-180 139.5 194.2 170.9 20.3 124.7 230.9 174.0 33.1 130.8 191.8 166.8 21.9 170.6
180-225 167.2 220.4 182.6 16.9 66.2 196.5 170.4 39.2 70.0 200.4 164.4 41.2 172.5
225-270 132.3 200.2 160.5 19.0 112.0 210.3 162.9 31.8 90.8 205.4 157.0 39.1 160.1
Mean 140.4 216.6 178.1 23.2 118.1 228.1 177.0 33.0 104.9 206.5 169.0 32.3 174.7
---------------------------------Averaged across depths and locations (RxDxL, n = 120)--------------------------------------
Before wheat 88.1 244.3 170.2 a 27.2
After wheat 66.2 250.9 155.8 b 35.5
After maize 70.0 230.0 169.9 a 27.9
LSD (p< .05) - - 6.4
--------------------------------Average across sampling times and locations (RxTxL, n = 60)------------------------------------
0-45 86.7 244.4 168.8 ab 31.4
45-90 94.9 244.3 175.2 a 26.6
90-135 103.8 250.9 169.0 ab 27.8
135-180 88.1 230.9
163.03 b 28.2
180-225 66.2 220.4 162.0 bc 26.8
225-270 90.8 210.3 153.74 c 28.8
LSD (p< .05) - - 9.1
* Values with same letter(s) do not differ significantly at p < 0.05

71
Generally the soil solutions in the field contained similar trend i.e. low [P] and higher [N]
and [K] (Rashid, 1996; Mengel and Kirkby, 1987; Dost and Khattak, 2009). The values
of soil organic matter, N, P and K were closely similar to the values given by Haq et al.
(1992), Bhatti (1997), Nizami and Salim (1997), Sohail et al. (1997), Mushtaq and Safeer
(2000), Ajmal et al. (2004) and Ahmad et al. (2008) for the soils of Peshawar valley and
other areas of the country who reported that soils were deficient in organic matter
(usually < 1.0%), N and P but mostly sufficient in K contents with values usually higher
than 120 mg K kg-1 soil. The values of NH4-N and NO3-N observed in these well drained
soils are typical of agricultural soils low in organic matter. The low organic matter in
these soils is mainly because of little application of organic fertilizer, lack of proper crop
residue incorporation and hot climatic conditions conducive for rapid mineralization. The
decrease in organic matter and other macronutrient concentration with increasing soil
depth were reported by Memon et al. (2002), Samreen et al. (2003) and Khan et al.
(2004).
4.3.3 Concentrations of AB-DTPA Extractable Cu, Fe, Mn and Zn in Soil Samples
The summary of ANOVA showing degree of freedom and mean square values (MS) for
these micronutrients as influenced by the sampling time, depth, location over time and
ten fields referred to as replications per site is provided in Table 22.
As can be seen the concentrations of Fe and Mn showed significant variability with
sampling time, depth and location, depth x time, replication x depth x time while Cu and
Zn were non significantly affected at replication over location and sampling time,
respectively (Table 22).
Variability in the [Cu] within the fields with sampling time for a given depth and with
depth of sampling in the two sites can be seen in Table 23. The [Cu] in surface soil (0-45
cm) soil samples was the highest for all three sampling timings in site-1 but in site-2 this
trend was lacking. Lowest values of 0.28-0.32 mg Cu kg-1 soil were observed in 90-135
cm in site-1 during pre-wheat sampling but in the subsequent periods it ranged between
1.94 to 4.0 and 0.90 to 3.43 mg kg-1 for the same depth. The variability with depth was
less pronounced but a decreasing trend in samples collected during subsequent cropping
was observed. With respect to crop requirement, [Cu] in these fields were adequate as per
criteria of Soltanpour (1985).

72
Table 22 ANOVA showing Mean Square (MS) values for AB-DTPA extractable Cu, Fe, Mn and Zn of soil samples collected from 10 different fields at 6 depths from Fazliabad (Mardan) and Manga Dargai (Charsadda) at three sampling times during 2003-05
SOV Cu Fe Mn Zn
Sampling time 2 1.16*** 259.17*** 12.62*** 0.06Ns
Location(Time) 3 21.11*** 710.18*** 204.23*** 18.01***
Rep.(Location) 18 0.20Ns 4.84*** 2.60*** 0.06Ns
Soil Depth 5 4.67*** 118.09*** 114.18*** 2.58***
Depth x Time 10 1.91*** 16.27*** 94.85*** 2.05***
L x D x Time 15 5.09*** 32.88*** 61.14*** 1.24***
Error 306 49.05 1.75 1.04 0.04
Total 359 237.45 4518.80 3441.86 120.16
C.V. 19.60 8.99 13.33 26.13
Ns, *, **, and *** represent not significant at 0.05, significant at 0.05, 0.01 and 0.001, respectively

73
Table 23 Changes in AB-DTPA extractable Cu (mg kg-1) with sampling time and soil depths at site-1, Fazliabad and site-2, Manga Dargai during 2003-05 under sub-surface tile drainage system ( n = 10)
Sampling depth
------------------------------------------ Time of sampling -------------------------------------------- Grand Mean
Before wheat After wheat After maize
----------------------------------------------------------Site-1, Fazliabad --------------------------------------------------------------
Depth (cm) Min Max Mean S.D. Min Max Mean S.D. Min Max Mean S.D.
0-45 3.18 4.20 3.54 0.36 1.97 4.64 3.19 1.02 2.27 3.33 2.71 0.35 3.15
45-90 1.96 2.42 2.28 0.13 2.26 2.76 2.48 0.14 1.75 2.60 2.35 0.24 2.37
90-135 0.28 0.32 0.30 0.01 1.94 4.00 2.42 0.60 0.90 3.43 2.18 0.74 1.63
135-180 0.77 1.00 0.86 0.07 2.24 4.18 2.89 0.51 2.00 2.98 2.40 0.35 2.05
180-225 1.98 2.42 2.17 0.12 2.23 4.28 3.26 0.67 1.92 2.87 2.34 0.34 2.59
225-270 2.39 2.62 2.49 0.43 1.55 2.26 1.97 0.27 2.00 3.41 2.39 0.43 2.28
Mean 1.76 2.16 1.94 0.19 2.03 3.69 2.70 0.54 1.81 3.10 2.39 0.41 2.35
------------------------------------------------------Site-2, Manga Dargai ------------------------------------------------------------
0-45 0.40 2.43 2.03 0.72 0.92 1.21 1.06 0.10 0.90 1.60 1.07 0.20 1.38
45-90 1.98 2.38 2.19 0.11 1.78 2.45 2.13 0.22 1.70 2.30 1.98 0.20 2.10
90-135 1.17 4.21 2.67 0.87 1.85 2.23 2.04 0.14 1.78 2.00 1.95 0.07 2.22
135-180 1.79 2.62 2.13 0.23 0.92 1.07 1.02 0.05 0.90 1.00 0.98 0.04 1.38
180-225 1.97 4.22 2.45 0.65 1.62 2.41 2.04 0.24 1.57 2.28 1.91 0.18 2.13
225-270 0.92 2.46 1.42 0.43 0.96 1.85 1.20 0.25 0.90 1.80 1.08 0.27 1.23
Mean 1.37 3.05 2.15 0.50 1.34 1.87 1.58 0.17 1.29 1.83 1.49 0.16 1.74
---------------------------------Averaged across depths and locations (RxDxL, n = 120)--------------------------------------
Before wheat 0.28 4.22 2.04 ba 0.91
After wheat 0.92 4.64 2.14 a 0.85
After maize 0.90 3.43 1.94 b 0.65
LSD (p< .05) - - 0.10
--------------------------------Average across sampling times and locations (RxTxL, n = 60)--------------------------------
0-45 0.40 4.64 2.27 a 1.11
45-90 1.70 2.76 2.23 a 1.15
90-135 0.28 4.21 1.93 b 1.16
135-180 0.77 4.18 1.71 c 1.18
180-225 1.57 4.28 2.36 a 1.18
225-270 0.90 3.41 1.76c 1.18
LSD (p< .05) - - 0.14
* Values with same letter(s) do not differ significantly at p < 0.05

74
The variability in [Fe] in fields for the given depth was higher than [Cu]. Site-2 had
higher [Fe] than site-1 and with few exceptions, it tended to increase with depth when
averaged across time of sampling, fields over locations and fields over time (Table 24).
When averaged across depths and locations, the [Fe] increased with season of samplings.
The increase in [Fe] with depth might be associated with the process of biochemical
reduction of Fe at lower depths (Lindsay, 1979; Dikko et al., 1997) or with downward
movement caused by percolating waters containing Fe and Mn, although in low
concentrations. This observation is also corroborated by increase in [Mn] with soil depth
when values were averaged across sampling years and locations.
The [Mn] were similar to [Fe] in behavior with respect to depth of sampling, sampling
time and differences within the sites (Table 24). The mean values averaged across depths
increased with subsequent sampling in site-1 and decreased in site-2. Higher values at
lower depths suggested leaching of both Fe and Mn, as pointed out earlier.
As compared to Cu, Fe and Mn, the [Zn] were much lower in these soils. Site-1 had
values mostly below 2.0 mg kg-1 while values in site-2 did not exceed 1.0 mg kg-1 and
hence can be considered as deficient for crop growth. As compared to other
micronutrients, variability in [Zn] was non-significant with sampling time and replication
over sites (Table 22 and 26). But the effect of depth and depth x sampling time
interaction showed significant effect on [Zn]. Values higher in surface and lower in
subsurface soil in site-1 and 2 could be seen in the samples collected before wheat but
this trend diminished in the subsequent samplings probably due to removal by crop or
leaching to subsurface soil.
The overall values of micronutrients concentrations in the selected soils of study were in
the ranges reported by Iqbal et al. (1987), Khattak and Perveen (1987), Ihsan (1986),
Nadeem et al. (2004) for Peshawar and Mardan soils and other parts of the country. The
deficiency of Zn in these soils has been commonly reported in these studies.

75
Table 24 Changes in AB-DTPA extractable Fe (mg kg-1) with sampling time and soil depths at site-1, Fazliabad and site-2, Manga Dargai during 2003-05 under sub-surface tile drainage system ( n = 10)
Sampling depth
---------------------------------------------- Time of sampling ------------------------------------------------ Grand Mean
Before wheat After wheat After maize
----------------------------------------------------------Site-1, Fazliabad ------------------------------------------------------------------
Depth (cm) Min Max Mean S.D. Min Max Mean S.D. Min Max Mean S.D.
0-45 6.36 7.23 6.80 0.29 11.68 16.24 14.05 1.51 13.00 14.70 13.97 0.57 11.60
45-90 6.59 8.24 7.82 0.49 13.54 17.18 15.79 1.14 12.90 17.00 15.54 1.12 13.05
90-135 9.87 11.31 10.61 0.52 11.94 17.90 15.64 1.61 14.00 20.00 18.07 1.81 14.77
135-180 8.80 10.10 9.18 0.39 13.86 18.86 16.40 1.76 15.00 19.00 17.90 1.34 14.49
180-225 7.98 9.00 8.43 0.32 10.82 15.08 12.91 1.51 12.50 19.25 15.53 2.05 12.29
225-270 9.92 11.41 10.58 1.09 11.54 14.52 12.84 0.99 11.40 20.00 16.23 3.43 13.22
Mean 8.25 9.55 8.90 0.52 12.23 16.63 14.60 1.42 13.13 18.33 16.21 1.72 13.24
------------------------------------------------------Site-2, Manga Dargai ----------------------------------------------------------------
0-45 13.48 20.16 17.96 2.14 9.96 13.70 11.72 1.06 10.20 14.00 11.67 1.16 13.78
45-90 11.70 16.32 13.67 1.43 13.64 15.48 14.45 0.63 12.30 14.40 13.83 0.60 13.99
90-135 15.94 20.16 18.07 1.26 15.48 16.58 16.02 0.38 14.80 16.00 15.35 0.48 16.48
135-180 15.94 22.56 19.15 1.87 15.84 19.08 16.93 0.95 15.00 17.46 16.31 0.70 17.46
180-225 13.36 17.54 14.94 1.22 13.84 20.22 17.77 1.79 14.00 19.00 16.79 1.35 16.50
225-270 17.48 20.96 19.28 1.09 12.44 22.44 18.87 2.60 15.96 20.48 18.50 1.38 18.88
Mean 14.65 19.62 17.18 1.50 13.53 17.92 15.96 1.23 13.71 16.89 15.41 0.94 16.18
---------------------------------Averaged across depths and locations (RxDxL, n = 120)--------------------------------------
Before wheat 6.36 22.56 13.04 a 4.66
After wheat 9.96 22.44 15.28 b 2.48
After maize 10.20 20.48 15.81c 2.41
LSD (p< .05) - - 0.33
--------------------------------Average across sampling times and locations (RxTxL, n = 60)------------------------------------
0-45 6.36 20.16 12.69 d 3.61
45-90 6.59 17.18 13.52 c 3.57
90-135 9.87 20.16 15.63 a 3.58
135-180 8.80 22.56 15.98a 3.57
180-225 7.98 20.22 14.39 b 3.55
225-270 9.92 22.44 16.05 a 3.66
LSD (p< .05) - - 0.48
* Values with same letter(s) do not differ significantly at p < 0.05

76
Table 25 Changes in AB-DTPA extractable Mn (mg kg-1) with sampling time and soil depths at site-1, Fazliabad and site-2, Manga Dargai during 2003-05 under sub-surface tile drainage system ( n = 10)
Sampling depth
----------------------------------------------- Time of sampling ------------------------------------------- Grand Mean Before wheat After wheat After maize
----------------------------------------------------------Site-1, Fazliabad ---------------------------------------------------------------
Depth (cm) Min Max Mean S.D. Min Max Mean S.D. Min Max Mean S.D.
0-45 6.01 10.16 7.77 1.27 4.69 8.25 6.01 1.14 5.00 7.00 5.80 0.78 6.53
45-90 5.92 8.20 7.35 0.69 5.60 6.28 6.02 0.23 5.69 6.51 6.10 0.24 6.49
90-135 1.18 6.20 3.19 1.96 4.73 8.26 6.22 0.88 5.00 8.00 6.42 1.06 5.28
135-180 1.57 4.38 2.58 1.04 6.33 8.28 7.65 0.61 6.45 9.47 7.68 0.84 5.97
180-225 3.93 7.50 4.99 1.26 7.88 15.21 12.53 2.30 7.69 10.47 9.09 0.88 8.87
225-270 5.20 8.71 6.38 0.92 5.54 8.23 6.90 0.74 6.00 9.00 7.30 0.79 6.86
Mean 3.97 7.53 5.38 1.19 5.80 9.09 7.55 0.98 5.97 8.41 7.06 0.77 6.66
------------------------------------------------------Site-2, Manga Dargai -------------------------------------------------------------
0-45 8.09 12.36 10.54 1.36 3.75 6.00 4.50 0.60 3.90 4.60 4.12 0.24 6.39
45-90 11.65 15.41 13.30 1.40 5.67 8.86 7.91 0.86 5.50 9.00 7.53 1.10 9.58
90-135 15.15 18.22 16.35 1.06 9.58 14.33 11.89 1.65 7.70 11.60 10.11 1.10 12.78
135-180 1.92 6.25 4.15 1.05 7.90 11.43 9.45 1.06 7.65 9.98 8.97 0.81 7.52
180-225 7.78 10.22 9.24 0.87 9.02 12.45 11.00 1.20 8.75 11.87 10.09 1.02 10.11
225-270 3.96 6.27 4.81 0.92 5.71 8.20 6.44 0.68 5.59 6.28 5.92 0.22 5.72
Mean 8.09 11.46 9.73 1.11 6.94 10.21 8.53 1.01 6.52 8.89 7.79 0.75 8.68
---------------------------------Averaged across depths and locations (RxDxL, n = 120)--------------------------------------
Before wheat 1.18 18.22 7.55 b 4.19
After wheat 3.75 15.21 8.04 a 2.71
After maize 3.90 11.87 7.43 b 1.95
LSD (p< .05) - - 0.26
--------------------------------Average across sampling times and locations (RxTxL, n = 60)--------------------------------
0-45 3.75 12.36 6.46 de 2.38
45-90 5.50 15.41 8.03 c 2.39
90-135 1.18 18.22 9.03 b 2.45
135-180 1.57 11.43 6.75 d 2.49
180-225 3.93 15.21 9.49 a 2.57
225-270 3.96 9.00 6.29 e 2.49
LSD (p< .05) - - 0.37
* Values with same letter(s) do not differ significantly at p < 0.05

77
Table 26 Changes in AB-DTPA extractable Zn (mg kg-1) with sampling time and soil depths at site-1, Fazliabad and site-2, Manga Dargai during 2003-05 under sub-surface tile drainage system ( n = 10)
Sampling depth
----------------------------------------------------- Time of sampling -------------------------------------------------------- Grand Mean Before wheat After wheat After maize
----------------------------------------------------------Site-1, Fazliabad ------------------------------------------------------------------
Depth (cm) Min Max Mean S.D. Min Max Mean S.D. Min Max Mean S.D.
0-45 0.28 2.26 1.62 0.69 0.64 0.89 0.70 0.08 0.63 0.93 0.74 0.08 1.02
45-90 0.30 1.90 1.56 0.46 1.38 2.03 1.78 0.22 1.45 2.10 1.84 0.20 1.73
90-135 0.33 2.21 0.62 0.57 1.16 1.66 1.48 0.16 1.43 1.93 1.65 0.15 1.25
135-180 0.38 0.85 0.50 0.14 1.53 1.86 1.72 0.10 1.47 2.00 1.78 0.21 1.33
180-225 1.01 1.97 1.37 0.28 0.57 0.89 0.70 0.10 0.62 1.00 0.75 0.12 0.94
225-270 0.38 1.58 1.23 0.07 0.36 0.65 0.45 0.08 0.42 0.61 0.51 0.06 0.73
Mean 0.45 1.80 1.15 0.37 0.94 1.33 1.14 0.12 1.00 1.43 1.21 0.14 1.17
------------------------------------------------------Site-2, Manga Dargai ----------------------------------------------------------------
0-45 0.44 0.64 0.56 0.06 0.07 0.24 0.14 0.07 0.07 0.33 0.16 0.08 0.29
45-90 0.18 0.41 0.24 0.08 0.37 0.65 0.49 0.08 0.28 0.60 0.41 0.10 0.38
90-135 0.08 0.40 0.18 0.09 0.44 0.63 0.55 0.06 0.40 0.60 0.47 0.06 0.40
135-180 0.37 0.62 0.48 0.09 0.55 0.65 0.61 0.03 0.47 0.61 0.53 0.05 0.54
180-225 0.43 0.58 0.51 0.05 0.52 0.66 0.60 0.05 0.45 0.70 0.54 0.07 0.55
225-270 0.10 0.35 0.17 0.07 0.20 0.42 0.25 0.06 0.15 0.34 0.21 0.05 0.21
Mean 0.27 0.50 0.36 0.07 0.36 0.54 0.44 0.06 0.30 0.53 0.38 0.07 0.39
---------------------------------Averaged across depths and locations (RxDxL, n = 120)--------------------------------------
Before wheat 0.08 2.26 0.75 a 0.60
After wheat 0.07 2.03 0.79 a 0.54
After maize 0.07 2.10 0.80 a 0.59
LSD (p< .05) - - 0.05
--------------------------------Average across sampling times and locations (RxTxL, n = 60)------------------------------------
0-45 0.07 2.26 0.65 e 0.57
45-90 0.18 2.1 1.05 a 0.57
90-135 0.08 2.21 0.82 c 0.54
135-180 0.37 2 0.94 b 0.54
180-225 0.43 1.97 0.74 d 0.54
225-270 0.10 1.58 0.47 f 0.53
LSD (p< .05) - - 0.07
* Values with same letter(s) do not differ significantly at p < 0.05

78
4.3.4 Soil particle size distribution, permeability, leaching fraction and hydraulic conductivity
The particle size distribution showing the ranges, mean values±SD for ten fields for the
given depth and sampling time is provided in Table 28-30. Data on soil permeability and
leaching fraction (LF), hydraulic conductivity (HC) are presented in Table 31, 32 and 33,
respectively. The ANOVA (Table 27) indicated no significant changes in sand fraction
but showed significant changes in silt, clay, permeability and leaching fraction (L.F).
Changes in all these parameters were significant with location over time, replications
over location and soil depth, variations with location over time and replications over
locations (Table 27).
The sand fraction ranged between 10 to 20 g 100 g-1 soil with mean values of 13.28±1.59
g 100 g-1 in site-1 in first sampling and yielded mean values of 12.89±1.32 and
12.75±0.65 g 100g-1 in the 2nd and 3rd sampling. Given the standard deviations for the
mean of fields, depth and location, the observed variations may not seem large, however,
a difference of few percent in sand, silt and clay can affect permeability and leaching of
nutrients. Textural class of a given soil normally does not change with time but spatial
variability within field and with depth in a given profile is well recognized and is not
uncommon (Wasiullah and Bhatti, 2005: Rashid et al. 2008).
Looking at the particle size distribution of silt, these soils were predominantly silty
having mean values of 70.07±2.69, 71.89±3.21 and 68.50±1.08 g 100 g-1 soil in the site 1
as determined in the three sampling period, while site-2 contained mean values of
67.08±1.5, 67.09±1.92 and 68.51±1.10 g 100 g-1 soil, for the corresponding periods
(Table 29). Site-2 contained relatively (2 to 3 %) less silt as compared to site-1. Because
of the large sampling size (n = 20), the level of significance with sampling time when
averaged across all other variables, cannot be taken for rigorous interpretations. Small
changes in silt over a given field with time could be associated with uneven distribution
of silt particles added through canal irrigation waters which contain appreciable amount
of silt or added through seasonal runoff in monsoon. Table 30 indicates that site-1 had
higher clay size particles compared to site-2 on the basis of ranges for the given location
and mean values for field and depth of samples.

79
Table 27 ANOVA showing Mean Square (MS) values for sand, silt, clay, soil permeability, leaching fraction and hydraulic conductivity of soil samples collected from 10 different fields at 6 depths from Fazliabad (Mardan) and Dargai (Charsadda) at three sampling times during 2003-05
SOV D.F Sand Silt Clay Permea-bility
LF H. C
Sampling time 2 1.9Ns 35.90*** 41.16*** 0.032*** 0.009*** 0.095**
Location(Time) 3 915.6*** 319.51*** 411.23*** 0.012*** 0.002Ns 0.077**
Rep.(Location) 18 10.3*** 23.26*** 19.03*** 0.003*** 0.001Ns 0.018 *
Soil Depth 5 82.5*** 2.81Ns 135.48*** 0.072*** 0.018*** -
Depth x Time 10 2.6Ns 4.56Ns 2.13Ns 0.015*** 0.002Ns -
L x D x Time 15 1.6Ns 2.44Ns 0.90Ns 0.003*** 0.003*** -
Error 306 2.18 4.77 2.31 0.001* 0.001 0.008
C.V. % 9.39 3.17 7.26 16.70 7.14
Ns, *, **, and *** represent not significant at 0.05, significant at 0.05, 0.01 and 0.001, respectively

80
Table 28 Changes in soil sand fraction (%) with sampling time and soil depths at site-1, Fazliabad and site-2, Manga Dargai during 2003-05 under sub-surface tile drainage system ( n = 10)
Sampling depth
------------------------------------------ Time of sampling ----------------------------------------------------- Grand Mean Before wheat After wheat After maize
----------------------------------------------------------Site-1, Fazliabad -----------------------------------------------------------------
Depth (cm) Min Max Mean S.D. Min Max Mean S.D. Min Max Mean S.D.
0-45 12.00 15.00 14.20 0.88 13.00 17.00 14.28 1.06 13.95 15.30 14.49 0.47 14.32
45-90 12.00 16.00 13.96 1.11 12.00 14.00 13.43 0.66 13.50 14.50 14.01 0.31 13.80
90-135 11.90 17.00 13.56 1.56 11.00 15.20 13.00 1.13 12.30 15.00 13.26 0.84 13.27
135-180 11.00 18.00 13.09 2.02 10.00 15.00 12.66 1.30 11.00 14.37 12.43 1.06 12.73
180-225 11.28 20.00 12.94 2.64 9.72 17.00 12.22 1.88 10.78 13.00 11.67 0.72 12.28
225-270 10.00 19.00 11.92 1.30 10.00 16.40 11.62 1.86 10.00 11.22 10.63 0.50 11.39
Mean 11.36 17.50 13.28 1.59 10.95 15.77 12.87 1.32 11.92 13.90 12.75 0.65 12.97
------------------------------------------------------Site-2, Manga Dargai ---------------------------------------------------------------
0-45 18.00 21.40 20.37 1.02 17.00 22.00 19.69 1.86 19.00 21.40 20.41 0.80 20.16
45-90 2.00 21.00 17.88 5.66 16.40 21.40 19.54 1.65 19.00 20.00 19.52 0.44 18.98
90-135 16.00 21.00 19.34 1.32 18.00 20.75 19.18 0.99 18.23 20.26 19.12 0.61 19.21
135-180 16.00 20.00 18.64 1.11 16.00 21.00 18.62 1.65 16.00 19.42 18.26 0.98 18.50
180-225 15.00 19.12 17.71 1.33 15.60 20.00 17.92 1.40 15.64 18.70 17.14 1.02 17.59
225-270 15.00 18.64 16.66 1.30 14.00 19.33 16.45 1.69 15.00 18.00 16.27 0.83 16.46
Mean 13.67 20.19 18.43 1.96 16.17 20.75 18.57 1.54 17.15 19.63 18.45 0.78 18.48
---------------------------------Averaged across depths and locations (RxDxL, n = 120)--------------------------------------
Before wheat 2.00 21.40 15.85 a 3.52
After wheat 9.72 22.00 15.72 a 3.34
After maize 10.00 21.40 15.60 a 3.26
LSD (p< .05) - - 0.55
--------------------------------Average across sampling times and locations (RxTxL, n = 60)-----------------------------------
0-45 12.00 22 17.24 a 3.13
45-90 2.00 21.4 16.39 b 3.12
90-135 11.00 21 16.24 b 3.19
135-180 10.00 21 15.62 c 3.31
180-225 9.72 20 14.94 d 3.27
225-270 10.00 19.33 13.92 e 3.33
LSD (p< .05) - - 0.53
* Values with same letter(s) do not differ significantly at p < 0.05

81
Table 29 Changes in soil silt fraction (%) with sampling time and soil depths at site-1, Fazliabad and site-2, Manga Dargai during 2003-05 under sub-surface tile drainage system ( n = 10)
Sampling depth
---------------------------------------------- Time of sampling ------------------------------------------------- Grand Mean Before wheat After wheat After maize
----------------------------------------------------------Site-1, Fazliabad -------------------------------------------------------------
Depth (cm) Min Max Mean S.D. Min Max Mean S.D. Min Max Mean S.D.
0-45 67.44 72.00 70.08 1.27 67.00 78.00 72.10 3.34 66.59 70.05 68.78 1.08 70.32
45-90 67.56 72.00 70.52 1.38 69.00 78.00 72.71 2.87 66.88 70.40 68.52 1.06 70.58
90-135 66.66 71.10 69.92 1.32 69.00 78.00 72.63 3.48 66.70 70.00 68.29 1.06 70.28
135-180 67.89 72.00 69.90 1.25 68.00 78.00 71.88 3.17 65.86 70.20 68.15 1.34 69.98
180-225 65.00 96.70 71.19 9.08 68.00 77.00 71.10 3.45 67.00 70.22 68.39 1.02 70.23
225-270 64.00 71.35 68.80 1.87 68.00 76.00 70.90 2.94 67.58 70.00 68.86 0.94 69.52
Mean 66.43 75.86 70.07 2.69 68.17 77.50 71.89 3.21 66.77 70.15 68.50 1.08 70.15
------------------------------------------------------Site-2, Manga Dargai ------------------------------------------------------------
0-45 64.67 70.00 67.69 1.65 65.00 71.00 67.50 1.72 65.90 70.00 68.36 1.21 67.85
45-90 66.00 69.00 67.35 1.20 65.00 68.00 66.88 1.08 67.02 70.03 68.47 0.99 67.57
90-135 65.94 68.14 67.28 0.68 64.00 70.00 67.50 1.84 67.20 69.17 68.23 0.67 67.67
135-180 64.00 69.00 67.33 1.57 61.00 70.00 66.83 2.62 67.00 71.02 68.13 1.22 67.43
180-225 62.00 68.76 66.52 2.06 59.00 68.00 66.34 2.65 67.00 70.96 68.81 1.38 67.22
225-270 63.00 68.00 66.32 1.87 64.00 70.00 67.47 1.64 67.90 71.00 69.09 1.11 67.62
Mean 64.27 68.82 67.08 1.50 63.00 69.50 67.09 1.92 67.00 70.36 68.51 1.10 67.56
---------------------------------Averaged across depths and locations (RxDxL, n = 120)--------------------------------------
Before wheat 62.00 96.70 68.57 b 3.29
After wheat 59.00 78.00 69.49 a 3.56
After maize 65.86 71.02 68.51 b 1.09
LSD (p< .05) - - 0.55
--------------------------------Average across sampling times and locations (RxTxL, n = 60)-------------------------------
0-45 64.67 78 69.09 a 2.40
45-90 65.00 78 69.08 a 2.47
90-135 64.00 78 68.97 a 2.59
135-180 61.00 78 68.70 a 2.69
180-225 59.00 96.7 68.73 a 2.83
225-270 63.00 76 68.57 a 2.99
LSD (p< .05) - - 0.79
* Values with same letter(s) do not differ significantly at p < 0.05

82
Table 30 Changes in soil clay fraction (%) with sampling time and soil depths at site-1, Fazliabad and site-2, Manga Dargai during 2003-05 under sub-surface tile drainage system ( n = 10)
Sampling depth
----------------------------------------- Time of sampling ------------------------------------------------------ Grand Mean Before wheat After wheat After maize
----------------------------------------------------------Site-1, Fazliabad ------------------------------------------------------------------
Depth (cm) Min Max Mean S.D. Min Max Mean S.D. Min Max Mean S.D.
0-45 14.00 18.00 15.73 1.07 9.00 16.00 13.62 2.86 15.81 18.11 16.73 0.71 15.36
45-90 13.00 18.44 15.52 1.67 10.00 17.00 13.86 2.77 16.00 18.72 17.47 0.85 15.62
90-135 14.00 19.00 16.52 1.47 9.00 18.00 14.37 3.31 17.30 19.13 18.46 0.63 16.45
135-180 13.00 19.00 17.02 1.94 10.40 20.00 15.46 2.89 18.80 20.20 19.39 0.48 17.29
180-225 15.00 20.00 18.54 1.73 11.00 21.00 16.68 3.52 18.87 20.98 19.83 0.66 18.35
225-270 16.00 22.00 19.28 1.46 12.24 21.00 17.43 3.22 20.00 21.52 20.71 0.56 19.14
Mean 14.17 19.41 17.10 1.56 10.27 18.83 15.24 3.10 17.80 19.78 18.76 0.65 17.03
------------------------------------------------------Site-2, Manga Dargai ----------------------------------------------------------------
0-45 10.00 14.00 11.94 1.17 10.00 15.00 12.81 1.34 10.00 13.00 11.43 0.95 12.06
45-90 10.00 14.00 12.97 1.42 10.60 15.60 13.58 1.46 10.00 13.30 12.11 1.09 12.89
90-135 12.00 16.00 13.38 1.32 10.00 16.00 13.33 1.70 11.83 14.00 12.65 0.71 13.12
135-180 11.40 16.00 14.03 1.47 11.00 19.00 14.55 2.01 12.80 14.70 13.61 0.68 14.06
180-225 13.06 20.00 16.17 2.34 13.00 22.00 15.94 2.55 12.70 15.00 14.05 0.93 15.39
225-270 15.22 20.00 17.02 1.46 13.00 20.00 16.08 1.75 13.00 16.00 14.64 0.99 15.92
Mean 11.95 16.67 14.25 1.53 11.27 17.93 14.38 1.80 11.72 14.33 13.08 0.89 13.91
---------------------------------Averaged across depths and locations (RxDxL, n = 120)--------------------------------------
Before wheat 10.00 22.00 15.68 a 2.64
After wheat 9.00 22.00 14.81b 2.82
After maize 10.00 21.52 15.92 a 3.21
LSD (p< .05) - - 0.38
--------------------------------Average across sampling times and locations (RxTxL, n = 60)------------------------------------
0-45 9.00 18.11 13.71 e 2.43
45-90 10.00 18.72 14.25 ed 2.50
90-135 9.00 19.13 14.78 d 2.56
135-180 10.40 20.2 15.68 c 2.51
180-225 11.00 22 16.87 b 2.51
225-270 12.24 22 17.53 a 2.53
LSD (p< .05) - - 0.55
* Values with same letter(s) do not differ significantly at p < 0.05

83
As pointed out earlier, small changes with time could be associated with impact of
irrigation waters containing more silt size particles which induced changes in the clay
distribution in a given field. Increases in the clay with depth suggest downward
movement of clay particles with drainage waters in the high coefficient tile drainage
system exerting internal downward pressure.
Soil permeability data revealed relatively higher values for site-1 as compared to site-2.
This observation corresponds to the clay content, which is higher in site-1 and lower in
site-2. The permeability of these soils could be considered as low to medium, with values
mostly ranging from 0.42 to 0.67 mm d-1 in site-1 and from 0.46 to 0.67 mm d-1 in site-2
with grand mean of 0.55 and 0.57 mm d-1, respectively. It is important to note that the
soil permeability tended to be uniform throughout the soil depths, although when
averaged across replications x depth x location, it increased with depth with 0.01 mm d-1
increments (Table 31).
Table 32 shows data pertaining to L.F. determined in the disturbed soil samples packed in
a column representing the given sampling depth from the respective fields in each site. It
can be seen that it covers a range from 0.15 to 0.30, 0.17 to 0.32 and 0.18 to 0.33 in site-1
for three sampling periods with mean values of 0.23±0.04, 0.25±0.04 and 0.24±0.04,
respectively. In site-2 it varied between 0.13 to 0.32, 0.15 to 0.31 and 0.18 to 0.32, with
mean values of 0.22±0.04, 0.23±0.03 and 0.24±0.04 for the given sampling period (Table
32). Data suggested improvement in L.F. with cropping. The observed values of L.F. are
considered ideal for avoiding salt build up in soil (Sposito, 1989)
Hydraulic conductivity determined in the surface soils ranged from 0.96 to 1.30, 0.91 to
1.28 and 0.93 to 1.34 with mean values of 1.18±0.13, 1.07±0.13 and 1.22±0.12 mm d-1 in
site 1 for the three consecutive soil sampling (Table 33). The ranges and mean values for
site-2 were larger with mean values of 1.35±0.09, 1.20±0.05 and 1.26±0.10 mm d-1 for
the corresponding period. The higher HC values in site-2 might be due to lower clay
content than site-1 in the given surface soil (Table 33).

84
Table 31 Changes in soil permeability (mm d-1) with sampling time and soil depths at site-1, Fazliabad and site-2, Manga Dargai during 2003-05 under sub-surface tile drainage system ( n = 10)
Sampling depth
---------------------------------------- Time of sampling ----------------------------------------------- Grand Mean Before wheat After wheat After maize
----------------------------------------------------------Site-1, Fazliabad ----------------------------------------------------------------
Depth (cm) Min Max Mean S.D. Min Max Mean S.D. Min Max Mean S.D.
0-45 0.42 0.63 0.52 0.06 0.43 0.50 0.47 0.02 0.42 0.52 0.47 0.04 0.49
45-90 0.46 0.58 0.54 0.05 0.46 0.60 0.51 0.04 0.47 0.54 0.51 0.02 0.52
90-135 0.45 0.67 0.55 0.07 0.46 0.60 0.54 0.04 0.50 0.60 0.56 0.04 0.55
135-180 0.43 0.63 0.54 0.06 0.48 0.62 0.58 0.04 0.57 0.64 0.60 0.03 0.57
180-225 0.47 0.67 0.55 0.07 0.43 0.66 0.60 0.07 0.62 0.64 0.63 0.01 0.59
225-270 0.48 0.60 0.52 0.04 0.49 0.65 0.61 0.05 0.54 0.67 0.63 0.04 0.59
Mean 0.45 0.63 0.54 0.06 0.46 0.61 0.55 0.04 0.52 0.60 0.57 0.03 0.55
------------------------------------------------------Site-2, Manga Dargai --------------------------------------------------------------
0-45 0.48 0.61 0.55 0.05 0.48 0.56 0.52 0.03 0.48 0.55 0.52 0.02 0.53
45-90 0.47 0.62 0.53 0.05 0.52 0.60 0.56 0.03 0.52 0.61 0.57 0.03 0.55
90-135 0.46 0.64 0.55 0.06 0.50 0.60 0.56 0.03 0.50 0.60 0.56 0.03 0.56
135-180 0.48 0.63 0.57 0.04 0.54 0.61 0.58 0.03 0.56 0.63 0.59 0.03 0.58
180-225 0.48 0.60 0.54 0.04 0.55 0.67 0.63 0.04 0.57 0.67 0.62 0.03 0.60
225-270 0.50 0.60 0.56 0.04 0.58 0.66 0.63 0.03 0.60 0.66 0.64 0.02 0.61
Mean 0.48 0.62 0.55 0.05 0.53 0.62 0.58 0.03 0.54 0.62 0.58 0.03 0.57
---------------------------------Averaged across depths and locations (RxDxL, n = 120)--------------------------------------
Before wheat 0.42 0.67 0.54 c 0.05
After wheat 0.43 0.67 0.56 b 0.06
After maize 0.42 0.67 0.58 a 0.06
LSD (p< .05) - - 0.01
--------------------------------Average across sampling times and locations (RxTxL, n = 60)----------------------------------
0-45 0.42 0.63 0.51 e 0.05
45-90 0.46 0.62 0.54 d 0.05
90-135 0.45 0.67 0.55 c 0.05
135-180 0.43 0.64 0.58 b 0.04
180-225 0.43 0.67 0.59 a 0.05
225-270 0.48 0.67 0.60 a 0.04
LSD (p< .05) - - 0.01
* Values with same letter(s) do not differ significantly at p < 0.05

85
Table 32 Changes in soil leaching fraction (mm d-1) with sampling time and soil depths at site-1, Fazliabad and site-2, Manga Dargai during 2003-05 under sub-surface tile drainage system ( n = 10)
Sampling depth
------------------------------------- Time of sampling ---------------------------------------------------- Grand Mean
Before wheat After wheat After maize
----------------------------------------------------------Site-1, Fazliabad -------------------------------------------------------------
Depth (cm) Min Max Mean S.D. Min Max Mean S.D. Min Max Mean S.D.
0-45 0.16 0.28 0.22 0.03 0.18 0.32 0.22 0.05 0.18 0.22 0.20 0.01 0.21
45-90 0.17 0.30 0.23 0.04 0.19 0.31 0.27 0.05 0.20 0.29 0.26 0.03 0.25
90-135 0.20 0.32 0.28 0.03 0.17 0.32 0.23 0.04 0.19 0.37 0.25 0.06 0.25
135-180 0.16 0.30 0.21 0.05 0.17 0.29 0.23 0.04 0.18 0.33 0.25 0.05 0.23
180-225 0.15 0.28 0.23 0.04 0.21 0.30 0.25 0.03 0.19 0.30 0.22 0.04 0.23
225-270 0.16 0.25 0.20 0.03 0.22 0.32 0.28 0.04 0.18 0.31 0.25 0.05 0.24
Mean 0.17 0.29 0.23 0.04 0.19 0.31 0.25 0.04 0.19 0.30 0.24 0.04 0.24
------------------------------------------------------Site-2, Manga Dargai -----------------------------------------------------------
0-45 0.16` 0.24 0.19 0.02 0.15 0.22 0.20 0.02 0.18 0.28 0.21 0.03 0.20
45-90 0.18 0.32 0.27 0.04 0.23 0.31 0.27 0.03 0.19 0.32 0.25 0.04 0.26
90-135 0.13 0.30 0.23 0.05 0.21 0.30 0.25 0.03 0.18 0.30 0.25 0.04 0.24
135-180 0.18 0.29 0.21 0.04 0.18 0.30 0.24 0.04 0.18 0.30 0.25 0.04 0.23
180-225 0.16 0.30 0.21 0.04 0.19 0.27 0.22 0.03 0.19 0.30 0.26 0.04 0.23
225-270 0.16 0.27 0.22 0.03 0.19 0.30 0.22 0.03 0.18 0.32 0.23 0.06 0.22
Mean 0.16 0.29 0.22 0.04 0.19 0.28 0.23 0.03 0.18 0.30 0.24 0.04 0.23
---------------------------------Averaged across depths and locations (RxDxL, n = 120)-------------------------------------
Before wheat 0.13 0.32 0.22 b 0.04
After wheat 0.15 0.32 0.24 a 0.04
After maize 0.18 0.37 0.24 a 0.05
LSD (p< .05) - - 0.01
-------------------------------Average across sampling times and locations (RxTxL, n = 60)--------------------------------
0-45 0.15 0.32 0.21 c 0.03
45-90 0.17 0.32 0.26 a 0.03
90-135 0.13 0.37 0.25 a 0.03
135-180 0.16 0.33 0.23 b 0.04
180-225 0.15 0.3 0.23 b 0.04
225-270 0.16 0.32 0.23 b 0.03
LSD (p< .05) - - 0.01
* Values with same letter(s) do not differ significantly at p < 0.05

86
Table 33 Changes in soil hydraulic conductivity (mm d-1) with sampling time and soil depths at site-1, Fazliabad and site-2, Manga Dargai during 2003-05 under sub-surface tile drainage system ( n = 10)
Sampling depth ------------------------------------------ Time of sampling ----------------------------------------------- Grand
Mean Before wheat After wheat After maize
----------------------------------------------------------Site-1, Fazliabad ------------------------------------------------------------------
Depth (cm) Min Max Mean S.D. Min Max Mean S.D. Min Max Mean S.D.
0-45 0.96 1.30 1.18 0.13 0.91 1.28 1.07 0.13 0.93 1.34 1.22 0.12 1.16
------------------------------------------------------Site-2, Manga Dargai ----------------------------------------------------------------
0-45 1.16 1.46 1.35 0.09 1.13 1.27 1.20 0.05 1.11 1.40 1.26 0.10 1.27
---------------------------------Averaged across locations (RxL)------------------------------------------------------
Before wheat 0.96 1.46 1.26 a 0.14
After wheat 0.91 1.28 1.13 b 0.11
After maize 0.93 1.40 1.23 a 0.12
LSD (p < .05) - - 0.06
--------------------------------Average across sampling times and locations (RxTxL, )---------------------------------------------
0-45 0.91 1.46 1.21 0.13
* Values with same letter(s) do not differ significantly at p < 0.05

87
4.4 Concentrations and Losses of Nutrients Through Tile Drainage Waters Measured at Site-1, Fazliabad and Site-2, Manga Dargai, Mardan SCARP
Samples of drainage waters (dw) were collected from tile drainage system after each
irrigations at intervals varying from 24 to 96 h during three crops seasons i.e. Rabi 2003-
04, Kharif 2004 and Rabi 2004-05. The samples were analyzed for pH, ECdw, cations and
macro- and micronutrients concentrations. The drainage coefficient and volume of waters
drained were measured to quantify the total salts and nutrients lost from the soil-drainage
system. The data are given in Table 34 to 66. Salient features are briefly discussed in this
section.
4.4.1 Drainage Waters’ pH
The summary of ANOVA showing degree of freedom (df) and mean square (MS) for
pHdw, ECdw and cations [Na, Ca, Mg]dw are provided in Table 34. The values of the pH in
drariange waters (pHdw) determined at given intervals for a given irrigation number and
year of sampling are provided in Table 35 for both sites while Table 36 shows mean
values for pHdw averaged across sites x years (S x Y) for each irrigation, and mean values
for each site and year of sampling as averaged across irrigation number x site (I x S) and
irrigation number x years (I x Y).
The pHdw values showed non-significant variations with post irrigation timings but varied
significantly (p < 0.05) with number of irrigation applied, with sites and with year of
sampling (Table 34). During kharif 2004, pH values were significantly higher at both
sites with mean values of 7.76 (site-1) and 7.84 (site-2) than the rabi 2003-04 and rabi-
2004-05 (Fig. 1). When averaged across years x irrigations, site-2 showed higher pHdw
than site-1 while when averaged across sites and irrigation number, the pHdw for the year
2004 were significantly greater than 2003-04 and 2004-05 (Table 36). When averaged
across years and post irrigation timings (Fig. 1) the two sites showed statistically
equivalent pH values with each other.

88
Table 34 ANOVA performed in a factorial model [2 sites x 3 yr x 6 irrigation x 6 timings] showing MS values for pHdw, ECdw, [Na]dw, [Ca]dw and [Mg]dw measured at six different post irrigation timings after each irrigation at two sites (Fazliabad and Manga Dargai) during three season from 2003 to 2005.
SOV D.F. pH EC Na Ca Mg
Site (S) 1 0.29* 0.12* 76NS 570** 60NS
Year (Y) 2 1.59** 0.06* 1430** 5891** 138NS
Irrigation# (I) 5 0.18* 0.08** 326* 272** 368**
Post irri.time (T) 5 0.04NS 0.01NS 328* 43 NS 56NS
S x Y 2 <0.01NS 0.02NS 242NS 601** 55NS
S x I 5 0.13 NS 0.02NS 461** 121NS 74NS
S x T 5 0.10 NS 0.01NS 51NS 22 NS 36NS
Y x I 10 0.09 NS 0.03NS 186NS 516** 176**
Y x T 10 0.05 NS 0.01NS 148NS 130NS 67NS
I x T 25 0.08 NS 0.01NS 160NS 140* 62NS
S x Y x I 10 0.09 NS 0.03* 96NS 657** 52NS
S x Y x T 10 0.05 NS 0.01NS 104NS 60 NS 41NS
S x I x T 25 0.05 NS 0.00NS 144NS 85 NS 71NS
Y x I x T 50 0.05 NS 0.01NS 164NS 126* 36NS
Error 50 0.06 0.01 108 68 49
% C.V. 3.34 20.26 21.48 37.83 58.14

89
Table 35 Drainage water pH observed at given irrigation numbers and post irrigation timings in site-1, Fazliabad and site-2, Manga Dargai under subsurface tile drainage system during 2003-05
Irrigation number
--------------------------------Site-1-------------------------- ---------------------------Site-2--------------------------
---------------------------------------------------- Post Irrigation Time (h) --------------------------------------------------
24 30 36 48 72 96 Mean
24 30 36 48 72 96 Mean
------------------------------------------------------------------------ 2003-04-----------------------------------------------------------------
1st 7.32 7.31 7.34 7.37 7.42 7.89 7.44 8.16 7.23 7.09 7.64 7.81 7.71 7.61
2nd 7.58 7.40 7.47 7.45 7.32 7.09 7.39 7.18 7.31 7.41 7.18 7.58 6.37 7.17
3rd 7.29 7.76 7.30 7.41 7.53 7.06 7.39 7.30 7.60 7.15 7.60 7.35 7.82 7.47
4th 7.80 7.30 7.48 7.40 7.50 7.44 7.49 7.76 8.00 7.90 8.18 7.74 8.00 7.93
5th 7.47 7.58 7.90 7.48 7.60 7.72 7.63 7.66 7.72 7.54 7.62 7.00 7.38 7.49
6th 7.10 7.70 7.68 7.30 7.40 7.52 7.45 7.65 7.34 7.56 8.00 7.78 7.51 7.64
Mean 7.43 7.51 7.53 7.40 7.46 7.45 7.46 7.62 7.53 7.44 7.70 7.54 7.47 7.55
----------------------------------------------------------------------- 2004---------------------------------------------------------------------
1st 7.52 7.70 7.50 7.85 7.60 7.92 7.68 8.00 7.92 8.10 8.00 7.94 7.83 7.97
2nd 7.54 7.33 7.48 7.80 7.92 7.69 7.63 7.92 8.00 7.77 7.52 7.80 7.75 7.79
3rd 7.83 8.10 7.70 7.67 7.86 8.03 7.87 8.00 8.10 7.51 7.47 7.60 7.90 7.76
4th 7.44 7.90 7.37 7.52 8.00 7.72 7.66 8.00 7.69 7.83 7.80 7.94 8.03 7.88
5th 7.75 7.94 7.90 7.70 8.10 7.75 7.86 7.90 7.64 7.70 7.63 7.80 8.00 7.78
6th 7.79 8.10 7.52 7.77 7.80 8.20 7.86 7.47 7.64 8.10 7.92 7.82 8.03 7.83
Mean 7.65 7.85 7.58 7.72 7.88 7.89 7.76 7.88 7.83 7.84 7.72 7.82 7.92 7.84
----------------------------------------------------------------------- 2004-05-----------------------------------------------------------------
1st 7.56 7.28 7.50 7.68 7.85 7.59 7.58 7.89 7.24 7.92 7.17 7.75 7.40 7.56
2nd 7.58 8.06 7.60 7.54 7.70 7.60 7.68 8.00 7.44 7.30 7.60 8.10 6.90 7.56
3rd 7.79 7.10 7.20 7.30 7.41 7.32 7.35 7.65 7.28 7.70 7.67 7.20 7.43 7.49
4th 7.48 8.10 7.30 7.68 7.43 7.50 7.58 8.20 7.77 7.48 7.22 7.87 8.00 7.76
5th 7.40 8.00 7.30 7.42 7.20 7.80 7.52 7.52 7.80 7.70 8.30 7.66 7.50 7.75
6th 7.28 7.47 7.67 8.10 8.00 7.50 7.67 7.70 7.20 7.47 7.60 8.00 7.68 7.61
Mean 7.52 7.67 7.43 7.62 7.60 7.55 7.56 7.83 7.46 7.60 7.59 7.76 7.49 7.62
G Mean 7.53 7.67 7.51 7.58 7.65 7.63 7.60 7.78 7.61 7.62 7.67 7.71 7.62 7.67

90
Table 36 Changes in drainage water pH with irrigation number, post irrigation time and different cropping seasons at site-1, Fazliabad and site-2, Manga Dargai under subsurface tile drainage system during 2003-05
SOV ------------------------ Post Irrigation Time (h) ------------------------------------------ Mean
Irrig. # 24 30 36 48 72 96
--------------------------------- Averages across sites and year of sampling (S x Y)-----------------------------------------
1st 7.74 7.45 7.58 7.62 7.73 7.72 7.64 abc
2nd 7.63 7.59 7.51 7.52 7.74 7.23 7.54 c
3rd 7.64 7.66 7.43 7.52 7.49 7.59 7.56 bc
4th 7.78 7.79 7.56 7.63 7.75 7.78 7.72 a
5th 7.62 7.78 7.67 7.69 7.56 7.69 7.67 ab
6th 7.50 7.58 7.67 7.78 7.80 7.74 7.68 a
Mean 7.65 a 7.64 a 7.57 a 7.63 a 7.68 a 7.63a
-------------------------Averages across irrigation number and year of sampling (I x Y)---------------------------------
Site-1 7.53 7.67 7.51 7.58 7.65 7.63 7.60 b
Site-2 7.78 7.61 7.62 7.67 7.71 7.62 7.67 a
--------------------------------- Averages across irrigation number and sites (I x S)------------------------------------------
2003-04 7.52 7.52 7.49 7.55 7.50 7.46 7.51 b
2004 7.76 7.84 7.71 7.72 7.85 7.90 7.80 a
2004-05 7.67 7.56 7.51 7.61 7.68 7.52 7.59 b
c
bc
a a
bc b
LSD0.05 = 0.12
Fig. 1 Changes in drainage water [pH]dw at site‐1, Fazliabad and site‐2 Manga Dargai
during 2003‐05

91
4.4.2 Drainage Water Electrical Conductivity (ECdw)
The ECdw was also not sensitive to post irrigation timings and showed non-significant
variations while year of samplings, sites and number of irrigations had significant effect
on ECdw whereas all interactions had non-significant effect on ECdw (Table 34).
Table 37 shows data pertaining to ECdw measured after each irrigation for the 24 to 96 h
post irrigation timings for each of the sampling at the two sites. Table 38 shows mean
values of ECdw when averaged across years of samplings and sites (Y x S), irrigation
number and year of sampling (I x Y) and irrigation number and sites (I x S). With few
exceptions, values of ECdw remained below 1.0 dS m-1 and mean values of post
irrigations timings for given irrigations and for a given time of sampling for each
irrigation invariably remained within the permissible limit for agricultural use (Ayers and
Westcot, 1985) in both sites and during all years (Table 37 and 38).
The mean values across post irrigation timings in year x site interactions (Y x S), the
initial irrigation numbers tended to yield higher values of ECdw (Tables 37 and 38).
Comparison of the sites, when averaged across irrigation numbers and years of sampling
(I x Y), although with small difference, the ECdw (0.70 dS m-1) for site-2 was
significantly higher than site-1 (0.67 dS m-1). Values of ECdw for the years 2004-05 were
greater than 2004 and similar to 2003-04. Fig.2 further substantiate the variability and
differences in the values of ECdw in the two sites during the three years of samplings. The
values of ECdw for site-2 were invariably higher than site-1 during all the three years but
they were statistically significant only during the last year (2004-05) with a mean values
of 0.75 dS m-1 for site-2 and 0.67 dS m-1 for site-1 (Fig. 2). The relatively higher values
of EC observed in site-2 could be attributed to the reason that this site received irrigation
waters from Hisara drain which collects mixture of canal seepage and drainage waters,
from the surrounding agricultural fields.

92
Table 37 Drainage water [EC]dw (dS m-1)observed at given irrigation numbers and post irrigation timings in site-1, Fazliabad and site-2, Manga Dargai under subsurface tile drainage system during 2003-05
Irrigation number
---------------------------Site-1------------------------- ---------------------------Site-2--------------------------
---------------------------------------------------- Post Irrigation Time (h) -----------------------------------------------------
24 30 36 48 72 96 Mean 24 30 36 48 72 96 Mean
------------------------------------------------------------------- 2003-04----------------------------------------------------------------
1st 0.67 0.67 0.67 0.67 0.67 0.67 0.67 0.75 0.72 0.74 1.26 0.75 1.30 0.92
2nd 0.69 0.70 0.72 0.66 0.68 0.72 0.70 0.77 0.75 0.72 0.73 0.73 0.79 0.75
3rd 0.65 0.64 0.65 0.66 0.58 0.64 0.64 0.70 0.73 0.37 0.70 1.25 0.80 0.76
4th 0.65 0.70 0.65 0.67 0.67 0.65 0.67 0.48 0.52 0.40 0.47 0.55 0.48 0.48
5th 0.72 0.60 0.44 0.63 0.69 0.74 0.64 0.70 0.68 0.49 0.39 0.51 0.72 0.58
6th 0.55 0.68 0.53 0.51 0.57 0.61 0.58 0.80 0.67 0.38 0.60 0.79 0.49 0.62
Mean 0.66 0.67 0.61 0.63 0.64 0.67 0.65 0.70 0.68 0.52 0.69 0.76 0.76 0.69
------------------------------------------------------------------ 2004---------------------------------------------------------------------
1st 0.83 0.77 0.69 0.73 0.74 0.70 0.74 0.80 0.51 0.60 0.40 0.63 0.87 0.64
2nd 0.66 0.80 0.78 0.52 0.86 0.59 0.70 0.66 0.73 0.81 0.76 0.65 0.81 0.74
3rd 0.81 0.73 0.76 0.57 0.81 0.65 0.72 0.72 0.83 0.70 0.78 0.37 0.76 0.69
4th 0.41 0.53 0.80 0.75 0.60 0.80 0.65 0.39 0.82 0.77 0.73 0.48 0.64 0.64
5th 0.50 0.72 0.50 0.60 0.48 0.73 0.59 0.53 0.70 0.46 0.68 0.80 0.67 0.64
6th 0.57 0.38 0.62 0.41 0.53 0.31 0.47 0.63 0.48 0.72 0.67 0.52 0.77 0.63
Mean 0.63 0.66 0.69 0.60 0.67 0.63 0.65 0.62 0.68 0.68 0.67 0.58 0.75 0.66
----------------------------------------------------------------- 2004-05-----------------------------------------------------------------
1st 0.66 0.66 0.67 0.66 0.73 0.67 0.68 0.63 1.00 0.81 0.74 0.65 0.77 0.77
2nd 0.66 0.73 0.68 0.72 0.70 0.58 0.68 0.68 0.78 0.84 0.73 0.97 0.70 0.78
3rd 0.64 0.70 0.27 0.67 0.65 0.70 0.61 0.62 0.67 0.89 0.90 0.58 0.89 0.76
4th 0.68 0.48 0.73 0.70 0.72 0.70 0.67 0.79 0.76 0.70 0.82 0.60 0.57 0.71
5th 0.69 0.67 0.60 0.66 0.70 0.71 0.67 0.64 0.75 0.87 0.79 0.76 1.10 0.82
6th 0.70 0.75 0.60 0.73 0.78 0.65 0.70 0.68 0.73 0.66 0.82 0.59 0.67 0.69
Mean 0.67 0.67 0.59 0.69 0.71 0.67 0.67 0.67 0.78 0.80 0.80 0.69 0.78 0.75
G. Mean 0.65 0.66 0.63 0.64 0.68 0.66 0.65 0.67 0.71 0.66 0.72 0.68 0.77 0.70

93
Table 38 Changes in [EC]dw (dS m-1)with irrigation number, post irrigation time and different cropping seasons at site-1, Fazliabad and site-2, Manga Dargai under subsurface tile drainage system during 2003-05
SOV ------------------------- Post Irrigation Time (h) --------------------------------------- Mean
Irrig. # 24 30 36 48 72 96
------------------------------ Averages across sites and year of sampling (S x Y)-----------------------------------------
1st 0.72 0.72 0.70 0.74 0.70 0.83 0.74 a
2nd 0.69 0.75 0.76 0.69 0.77 0.70 0.72 a
3rd 0.69 0.72 0.61 0.71 0.71 0.74 0.70 ab
4th 0.57 0.64 0.68 0.69 0.60 0.64 0.64 bc
5th 0.63 0.69 0.56 0.63 0.66 0.78 0.66 bc
6th 0.66 0.62 0.59 0.62 0.63 0.58 0.62 c
Mean 0.66 a 0.69 a 0.65 a 0.68 a 0.68 a 0.71 a 0.68
-----------------------Averages across irrigation number and year of sampling (I x Y)------------------------------
Site-1 0.65 0.66 0.63 0.64 0.68 0.66 0.65 b
Site-2 0.67 0.71 0.66 0.72 0.68 0.77 0.70 a
------------------------------ Averages across irrigation number and sites (I x S)----------------------------------------
2003-04 0.68 0.67 0.56 0.66 0.70 0.72 0.67 ab
2004 0.63 0.67 0.68 0.63 0.62 0.69 0.65 b
2004-05 0.67 0.72 0.69 0.75 0.70 0.73 0.71 a
LSD at p < 0.05 for irrigation and post irrigation time = 0.06, for year = 0.05 and for sites = 0.04
b
b
b b b
aLSD0.05 = 0.065
Fig. 2 Changes in drainage water [EC]dw at site‐1, Fazliabad and site‐2 Manga Dargai
during 2003‐05

94
The values of pHdw and ECdw were relatively higher than the values of pHiw and ECiw.
The mean values of pHiw were 7.28 and 7.55 for site-1 and site-2 while pHdw were 7.60
and 7.65, respectively. The mean values of ECiw were 0.42 and 0.43, compared to 0.65
and 0.70 dS m-1 of ECdw for site-1 and site-2, respectively.
The pH of the irrigation waters is controlled by the quality and source of irrigation while
pH of drainage waters is also influenced by the chemistry of soil solution the irrigation
waters percolate through. The pHdw is in alkaline range so it will cause minimum losses
of micronutrients (Lindsay, 1979).
Both the soils are calcareous, site-1 is irrigated with canal waters while site-2 receives
both canal seepage plus drainage waters from agricultural fields. The cultural practices
particularly types of crops and type and quantity of fertilizers added will have some effect
on soil pH of soils and drainage waters when used over a longer period of time.
4.3.3 Cations [Na, Ca and Mg] Concentrations in Drainage Waters
The [Na]dw was non-significantly affected by all sources of variations except interactions
(Table-34). Timing of post irrigations samplings had non-significant effect on all cations
and even on pHdw and ECdw but showed significant impact on [Na]dw. Table 39 suggests
little variability between the individual observations recorded after the given timings of
sampling for each irrigation and year of sampling for each site. When data were averaged
across years and sites, variability due to irrigations number and timings was evident
(Table 39 and 40). Site-2 yielded similar [Na]dw to site-1 when averaged across all other
variables (Table 40). When averaged across sites and post irrigation timings, differences
due to year could be seen in Table 40 and Fig. 3. The differences in [Na]dw due to sites
were significant only during 2003-04. The observed values of [Na]dw in almost all
instances were in the range considered safe for irrigation (Ayers and Westcot, 1985).

95
Table 39 Drainage water [Na]dw (mg L-1) observed at given irrigation numbers and post irrigation timings in site-1, Fazliabad and site-2, Manga Dargai under subsurface tile drainage system during 2003-05
Irrigation number
------------------------------Site-1--------------------------- ---------------------------Site-2--------------------------
------------------------------------------------- Post Irrigation Time (h) -----------------------------------------------------
24 30.0 36.0 48.0 72.0 96.0 Mean 24.0 30.0 36.0 48.0 72.0 96.0 Mean
----------------------------------------------------------------------- 2003-04-----------------------------------------------------------------
1st 44.2 45.5 44.4 44.6 45.4 45.7 45.0 68.0 56.1 56.3 48.4 66.1 52.6 57.9
2nd 47.2 46.7 45.3 47.1 59.0 47.3 48.8 70.6 65.7 66.0 70.5 61.4 53.6 64.6
3rd 66.4 63.0 58.6 51.9 51.9 55.9 57.9 61.4 53.8 60.8 52.4 67.9 70.1 61.1
4th 46.4 57.9 17.6 35.4 36.1 47.5 40.2 44.3 51.6 48.5 41.9 53.5 58.6 49.7
5th 39.6 56.9 74.9 44.2 61.1 49.4 54.4 45.3 43.1 54.8 48.5 22.0 60.4 45.7
6th 37.2 51.8 68.5 33.1 58.8 70.7 53.3 41.5 62.0 64.4 33.6 47.4 68.5 52.9
Mean 46.8 53.7 51.5 42.7 52.0 52.8 49.9 55.2 55.4 58.5 49.2 53.0 60.6 55.3
----------------------------------------------------------------------- 2004---------------------------------------------------------------------
1st 17.2 37.1 45.3 36.4 42.3 33.7 35.3 40.9 42.3 33.7 40.2 75.2 37.6 45.0
2nd 36.6 54.2 41.2 45.8 44.0 14.1 39.3 56.0 42.7 66.1 31.8 63.7 38.0 49.7
3rd 36.7 54.6 48.2 40.9 46.5 61.5 48.1 45.4 43.4 13.8 56.3 37.1 47.6 40.6
4th 50.8 64.5 36.4 51.2 40.8 17.2 43.5 22.0 53.3 48.4 68.6 75.9 25.9 49.0
5th 36.5 48.5 50.5 63.9 61.8 58.8 53.3 23.0 30.5 42.7 35.7 43.7 36.4 35.3
6th 47.6 36.5 47.2 38.4 49.4 48.4 44.6 31.5 51.6 49.7 24.0 42.7 49.6 41.5
Mean 37.6 49.2 44.8 46.1 47.5 38.9 44.0 36.5 44.0 42.4 42.8 56.4 39.2 43.5
----------------------------------------------------------------------- 2004-05-----------------------------------------------------------------
1st 32.6 47.7 45.4 44.4 45.4 60.1 46.0 50.7 40.1 50.4 48.4 36.5 42.0 44.7
2nd 50.3 35.0 52.3 50.7 60.6 63.0 52.0 40.3 60.5 63.9 53.0 52.3 47.5 52.9
3rd 42.1 58.0 64.2 52.8 60.8 70.4 58.0 60.1 44.5 60.3 57.9 60.4 33.5 52.8
4th 74.7 54.0 44.2 36.3 63.2 56.3 54.8 60.7 71.0 53.7 35.5 50.6 43.8 52.5
5th 42.4 64.0 45.4 36.8 60.2 32.0 46.8 36.8 33.5 27.6 45.8 50.5 63.4 42.9
6th 14.2 63.4 41.2 45.7 44.0 39.6 41.4 20.6 52.6 63.7 70.7 27.4 35.1 45.0
Mean 42.7 53.7 48.8 44.5 55.7 53.6 49.8 44.9 50.4 53.3 51.9 46.3 44.2 48.5
G Total 42.4 52.2 48.4 44.4 51.7 48.4 47.9 45.5 49.9 51.4 47.9 51.9 48.0 49.1

96
Table 40 Changes in [Na]dw (mg L-1) with irrigation number, post irrigation time and different cropping seasons at site-1, Fazliabad and site-2 , Manga Dargai under subsurface tile drainage system during 2003-05
SOV ------------------------- Post Irrigation Time (h) ------------------------------------- Mean
Irrig. # 24 30 36 48 72 96
-------------------------- Averages across sites and year of sampling (S x Y)------------------------------------------
1st 42.24 44.80 45.90 43.72 51.83 45.28 45.63 c
2nd 50.18 50.79 55.78 49.82 56.82 43.93 51.22 ab
3rd 52.02 52.88 50.97 52.01 54.09 56.51 53.08 a
4th 49.81 58.72 41.46 44.82 53.33 41.54 48.28 abc
5th 37.26 46.08 49.32 45.81 49.89 50.06 46.40 bc
6th 32.09 52.97 55.79 40.90 44.94 51.98 46.44 bc
Mean 43.93 c 51.04 ab 49.87 ab 46.18 bc 51.82 a
48.22 abc 48.51
----------------------Averages across irrigation number and year of sampling (I x Y)------------------------------
Site-1 42.36 52.19 48.36 44.42 51.74 48.42 47.91 a
Site-2 45.50 49.89 51.37 47.94 51.90 48.01 49.10 a
---------------------------- Averages across irrigation number and sites (I x S)-----------------------------------------
2003-04 51.01 54.51 55.00 45.96 52.54 56.70 52.62 a
2004 37.02 46.60 43.59 44.42 51.93 39.06 43.77 b
2004-05 43.78 52.01 51.01 48.16 50.98 48.89 49.14 a
LSD at p < 0.05 for irrigation and post irrigation time = 4.93, for year = 3.49 and for site = 2.84
b a
cd db bc
LSD0.05 = 4.93
Fig. 3 Changes in drainage water [Na]dw at site‐1, Fazliabad and site‐2 Manga Dargai
during 2003‐05

97
The [Ca]dw and [Mg]dw showed non-significant ( p < 0.05) fluctuation with time of post
irrigation and significant variations within sites and number of irrigation (Table 34). The
values of [Ca]dw and [Mg]dw were lower than [Na]dw by a factor of 2 or 3. The [Ca]dw and
[Mg]dw were significantly higher in site-2 than site-1 and also significantly higher in 2004
compared to 2003-04 and 2004-2005 sampling period (Table 42, Fig. 4; Table 44, Fig. 5).
Initial irrigations (1st and 2nd) generally produced higher values of cations in drainage
waters than the subsequent irrigation, which is understandable in terms of the possibility
that the system of soil-irrigation waters might have come to steady state with drainage
waters with passage of time. The [Ca]iw, [Mg]iw and [Na]iw in the 1st and 2nd irrigation
were greater than their concentrations in drainage waters while their concentrations in the
subsequent post irrigation drainage waters were higher than irrigation waters. The inverse
pattern of Na versus Ca and Mg can be seen with respect to their response to timings of
post irrigation, years of sampling and even in case of sites. The [Na]dw showed significant
changes with timings and was higher in samples collected during 2003-04 as compared to
other years while [Ca, Mg]dw showed non-significant variations with timings and were
lower in 2003-04 compared to 2004 and 2004-05.
Several researchers (El-Guindy and Amer, 1996; Richard et al., 1989, Schils, 1994;
Sherma et al., 1991) have expressed concern over the pollution of downstream waters
with salts, nutrients and agrochemicals because of subsurface drainage waters. The rate of
nutrients and salts losses varied from year to year (Schils, 1994) which reduces nutrients
efficiency. Monsoon rains cause leaching of salts in a given drainage system (Sharma et
al., 1991) which affects, rather help crop growth due to reduction in root zone salinity
(Khattak and Muhammad, 2008, Muhammad and Khattak, 2009). Since all the
concentrations of cations and ECdw values remained within the permissible limits,
therefore, these observations should not be of any concern regarding the reuse of drainage
waters.

98
Table 41 Drainage water [Ca]dw (mg L-1) observed at given irrigation numbers and post irrigation timings in site-1, Fazliabad and site-2, Manga Dargai under subsurface tile drainage system during 2003-05
Irrigation number
-----------------------------Site-1---------------------------- ---------------------------Site-2--------------------------
------------------------------------------------ Post Irrigation Time (h) -----------------------------------------------------
24 30.0 36.0 48.0 72.0 96.0 Mean 24.0 30.0 36.0 48.0 72.0 96.0 Mean
----------------------------------------------------------------------- 2003-04-----------------------------------------------------------------
1st 34.3 22.8 31.1 30.2 32.0 29.3 30.0 30.2 33.7 31.5 22.7 27.5 32.2 29.6
2nd 10.0 4.6 2.5 2.6 7.7 20.9 8.1 47.7 4.6 5.2 2.5 33.2 34.1 21.2
3rd 16.7 30.2 17.7 13.6 17.1 9.0 17.4 18.4 15.6 13.4 30.2 8.5 9.5 16.0
4th 20.4 19.2 5.4 6.1 5.3 2.6 9.8 5.3 6.3 5.8 9.5 9.0 7.3 7.2
5th 27.8 11.3 9.9 2.4 2.7 22.8 12.8 4.3 12.1 4.1 6.2 5.9 8.6 6.9
6th 2.7 16.7 28.9 8.5 12.2 2.3 11.9 9.8 12.4 8.7 8.1 5.5 9.3 9.0
Mean 18.7 17.5 15.9 10.6 12.8 14.5 15.0 19.3 14.1 11.5 13.2 14.9 16.8 15.0
----------------------------------------------------------------------- 2004---------------------------------------------------------------------
1st 6.2 6.4 6.3 6.6 6.4 41.9 12.3 43.9 32.4 48.8 44.8 39.6 42.2 41.9
2nd 6.1 4.8 43.2 39.8 6.2 7.9 18.0 37.2 42.2 49.4 39.3 32.2 31.3 38.6
3rd 40.6 47.1 38.2 44.1 40.4 38.9 41.5 35.4 44.1 43.7 46.3 39.6 10.9 36.7
4th 41.8 32.3 30.0 31.7 49.8 38.2 37.3 40.2 9.8 8.7 38.4 41.5 8.5 24.5
5th 33.1 43.7 10.0 34.6 33.1 35.4 31.6 30.0 34.7 43.1 42.8 33.6 44.4 38.1
6th 9.6 4.7 34.7 37.7 36.4 10.4 22.2 37.3 40.3 48.7 42.3 46.6 41.2 42.7
Mean 22.9 23.2 27.0 32.4 28.7 28.8 27.2 37.3 33.9 40.4 42.3 38.9 29.7 37.1
----------------------------------------------------------------------- 2004-05-----------------------------------------------------------------
1st 21.0 8.0 30.2 14.6 9.0 12.5 15.9 4.1 9.9 34.0 12.0 9.1 5.5 12.4
2nd 17.7 20.3 19.2 34.3 30.1 32.2 25.6 8.7 8.4 4.3 4.0 6.3 6.0 6.3
3rd 5.0 7.7 10.1 20.2 30.3 14.6 14.6 5.9 30.3 13.7 30.4 47.6 22.0 25.0
4th 11.9 2.7 20.0 4.6 15.4 9.0 10.6 32.5 20.1 2.6 5.6 33.0 20.4 19.0
5th 22.3 17.7 3.6 9.0 12.7 7.7 12.2 22.6 32.2 19.0 27.5 27.5 19.3 24.7
6th 33.0 40.6 7.8 39.2 35.0 41.9 32.9 5.0 30.3 22.7 30.4 22.6 30.2 23.5
Mean 18.5 16.2 15.2 20.3 22.1 19.7 18.6 13.1 21.9 16.1 18.3 24.4 17.2 18.5
G Total 20.0 18.9 19.4 21.1 21.2 21.0 20.3 23.2 23.3 22.6 24.6 26.0 21.3 23.5

99
Table 42 Changes in [Ca]dw (mg L-1) with irrigation number, post irrigation time and different cropping seasons at site-1, Fazliabad and site-2 , Manga Dargai under subsurface tile drainage system during 2003-05
SOV ------------------------ Post Irrigation Time (h) --------------------------------- Mean
Irrig. # 24 30 36 48 72 96
---------------------------- Averages across sites and year of sampling (S x Y)---------------------------------------
1st 23.29 18.85 30.30 21.82 20.60 27.26 23.69 ab
2nd 21.23 14.16 20.64 20.41 19.30 22.07 19.63 c
3rd 20.34 29.17 22.79 30.79 30.58 17.49 25.19 a
4th 25.33 15.07 12.06 15.98 25.67 14.31 18.07 c
5th 23.33 25.28 14.93 20.43 19.23 23.02 21.04 bc
6th 16.23 24.16 25.24 27.69 26.38 22.56 23.71 ab
Mean 21.62 a 21.12 a 20.99 a 22.85 a 23.63 a 21.12 a 21.89
-----------------------Averages across irrigation number and year of sampling (I x Y)------------------------------
Site-1 20.01 18.93 19.36 21.09 21.21 20.97 20.26 b
Site-2 23.24 23.30 22.63 24.61 26.04 21.27 23.51 a
---------------------------- Averages across irrigation number and sites (I x S)-----------------------------------------
2003-04 18.96 15.80 13.68 11.88 13.87 15.66 14.97 c
2004 30.10 28.52 33.71 37.37 33.79 29.26 32.13 a
2004-05 15.81 19.02 15.60 19.31 23.22 18.44 18.57 b
LSD at p < 0.05 for irrigation and post irrigation time = 3.92, for year = 2.77 and for site = 2.26
c c
b
a
c c
LSD0.05 = 3.920
Fig. 4 Changes in drainage water [Ca]dw at site‐1, Fazliabad and site‐2 Manga Dargai
during 2003‐05

100
Table 43 Drainage water [Mg]dw (mg L-1) observed at given irrigation numbers and post irrigation timings in site-1, Fazliabad and site-2, Manga Dargai under subsurface tile drainage system during 2003-05
Irrigation number
-----------------------------Site-1---------------------------- ---------------------------Site-2--------------------------
-------------------------------------------------- Post Irrigation Time (h) -----------------------------------------------------
24 30.0 36.0 48.0 72.0 96.0 Mean 24.0 30.0 36.0 48.0 72.0 96.0 Mean
----------------------------------------------------------------------- 2003-04-----------------------------------------------------------------
1st 23.4 22.5 22.5 22.3 22.3 22.7 22.6 19.3 24.6 26.5 26.4 19.0 27.5 23.9
2nd 4.4 2.8 2.8 2.8 4.9 5.1 3.8 4.1 3.5 3.0 4.2 4.9 4.9 4.1
3rd 14.3 8.2 12.7 10.7 11.2 14.3 11.9 5.0 4.9 18.0 20.5 5.9 22.3 12.8
4th 4.9 11.8 3.7 4.6 5.0 3.6 5.6 6.9 20.5 14.5 6.4 9.6 6.5 10.7
5th 2.8 2.4 4.3 24.5 27.9 3.0 10.8 21.7 19.9 4.5 6.7 4.8 1.7 9.9
6th 22.4 2.6 27.3 8.4 3.0 3.1 11.1 9.3 7.1 22.7 21.0 26.3 5.6 15.3
Mean 12.0 8.4 12.2 12.2 12.4 8.6 11.0 11.1 13.4 14.9 14.2 11.7 11.4 12.8
----------------------------------------------------------------------- 2004---------------------------------------------------------------------
1st 14.1 34.9 12.3 23.2 10.1 18.2 18.8 9.1 13.1 11.7 8.9 6.8 9.6 9.9
2nd 5.1 6.8 1.2 12.4 7.9 10.0 7.3 8.0 34.9 15.2 11.9 17.9 13.2 16.9
3rd 1.0 22.9 11.2 13.2 4.3 8.9 10.2 18.1 14.0 12.7 1.0 9.8 41.2 16.1
4th 0.9 12.1 10.3 11.1 8.0 9.8 8.7 23.0 30.2 9.8 16.0 9.4 7.0 15.9
5th 20.1 10.2 9.0 12.9 10.1 17.8 13.3 12.3 11.1 10.7 13.5 20.4 11.0 13.2
6th 12.3 31.1 10.1 13.5 18.9 10.8 16.1 18.1 5.9 7.9 31.1 8.9 26.8 16.5
Mean 8.9 19.7 9.0 14.4 9.9 12.6 12.4 14.8 18.2 11.3 13.7 12.2 18.1 14.7
----------------------------------------------------------------------- 2004-05-----------------------------------------------------------------
1st 6.0 10.0 8.2 10.7 16.0 14.3 10.9 20.6 5.7 7.0 12.0 5.7 20.0 11.8
2nd 4.1 5.4 11.3 4.9 2.7 3.3 5.3 9.4 3.9 7.7 4.0 6.7 4.7 6.1
3rd 2.8 23.0 14.3 22.3 10.7 20.6 15.6 16.3 1.9 9.0 7.1 19.3 27.0 13.4
4th 4.9 22.6 13.0 4.7 11.0 23.4 13.3 5.6 27.5 19.6 3.5 20.4 20.5 16.2
5th 11.8 4.7 10.8 11.0 5.4 4.4 8.0 6.5 4.3 4.8 3.5 4.2 4.5 4.6
6th 4.1 35.2 20.0 6.8 12.3 10.0 14.7 11.8 7.5 5.6 16.5 12.9 5.5 10.0
Mean 5.6 16.8 12.9 10.1 9.7 12.7 11.3 11.7 8.5 9.0 7.8 11.5 13.7 10.4
G. Mean 8.9 15.0 11.4 12.2 10.7 11.3 11.6 12.5 13.4 11.7 11.9 11.8 14.4 12.6

101
Table 44 Changes in [Mg]dw (mg L-1) with irrigation number, post irrigation time and different cropping seasons at site-1, Fazliabad and site-2 , Manga Dargai under subsurface tile drainage system during 2003-05
SOV ----------------------------- Post Irrigation Time (h) ----------------------------- Mean
Irrig. # 24 30 36 48 72 96
----------------------------- Averages across sites and year of sampling (S x Y)-----------------------------------------
1st 15.41 18.45 14.68 17.24 13.32 18.71 16.30 a
2nd 5.86 9.55 6.87 6.70 7.49 6.86 7.22 d
3rd 9.59 12.46 12.98 12.48 10.21 22.38 13.35 ab
4th 7.70 20.79 11.82 7.70 10.57 11.80 11.73 bc
5th 12.51 8.77 7.35 12.01 12.10 7.07 9.97 cd
6th 13.00 14.90 15.60 16.22 13.72 10.28 13.95 ab
Mean 10.68 b 14.15 a 11.55 ab 12.06 ab 11.24 ab 12.85 ab 12.09
----------------------Averages across irrigation number and year of sampling (I x Y)---------------------------------
Site-1 8.85 14.95 11.39 12.22 10.65 11.28 11.56 a
Site-2 12.51 13.36 11.71 11.90 11.82 14.41 12.62 a
--------------------------- Averages across irrigation number and sites (I x S)--------------------------------------------
2003-04 11.54 10.88 13.53 13.20 12.05 10.01 11.87 ab
2004 11.84 18.94 10.17 14.06 11.05 15.35 13.57 a
2004-05 8.65 12.64 10.94 8.91 10.60 13.18 10.82 b
LSD at p < 0.05 for irrigation and post irrigation time = 3.33, for year = 2.35 and for site = 1.92
b ab ab
a
b b
Fig. 5 Changes in drainage water [Mg]dw at site‐1, Fazliabad and site‐2 Manga Dargai
during 2003‐05
LSD0.05 = 3.327

102
4.3.4 Macronutrients [N, P and K] in Drainage Waters
The concentrations of mineral N determined as [NH4-N and NO3-N]dw, [P]dw and [K]dw in
the drainage waters samples from each irrigation after 24 to 96 h application and mean
values as averaged across years x sites (Y x S), irrigation number and years (I x Y) and
irrigation number x sites (I x S) for each post irrigation timings are provided in Table 45
to 51.
Statistical analysis revealed that no significant changes in the [NH4-N]dw and [NO3-N]dw,
[P]dw and [K]dw were observed with post irrigation timings while years of sampling had
significant effect on the concentrations of these major nutrients in the drainage waters
whereas NO3-N showed non-significant response to sites. The NH4-N and P were non-
significantly affected by number of irrigation and years (Tables 45). Variations due to
sites and year indicated higher values for site-2 and for year 2004-05 when averaged over
number of irrigations and years (Table 47 to 51).
The [NH4]dw with few exceptions where relatively higher values (1.0 to 1.20 mg L-1)
were noted, mostly remained below 0.60 mg L-1 in both sites during the three years of
samplings (Table 46). The values in Table-46 indicate variability in the concentrations of
[NH4-N]dw from irrigation to irrigation at a given timings of post irrigation samplings but
when data were averaged across timings, the mean values showed non-significant
differences with irrigation (Table 47). When averaged across irrigation numbers and
years, site-2 produced higher [NH4]dw than site-1 while in case of years (I x S), the year
2004-05 followed by 2003-04 and 2004 showed significantly different mean values of
0.55, 0.46 and 0.34 mg L-1, respectively.

103
Table 45 ANOVA performed in a factorial model [2 sites x 3 yr x 6 irrigations x 6 timings]showing MS values for [NH4-N]dw, [NO3-N]dw, [P]dw and [K]dw measured at six different post irrigation timings after each irrigation at two sites (Fazliabad and Manga Dargai) during three season from 2003 to 2005.
SOV D.F. NH4-N NO3-N P K
Site (S) 1 0.40* 0.27NS 1.44** 20.81**
Year (Y) 2 0.81** 0.96** 0.75** 9.39**
Irrigation# (I) 5 0.04NS 0.55* 0.06NS 5.91**
Post irri.time (T) 5 0.06NS 0.01NS 0.01NS 0.79NS
S x Y 2 0.05NS 0.12NS 0.78** 11.43**
S x I 5 0.05NS 0.17NS 0.04NS 5.25*
S x T 5 0.02NS 0.15NS <0.01NS 1.23NS
Y x I 10 0.10NS 0.11NS 0.02NS 3.07NS
Y x T 10 0.01NS 0.07NS 0.02NS 2.54NS
I x T 25 0.06NS 0.18NS 0.02NS 2.50NS
S x Y x I 10 0.14* 0.25NS 0.05NS 2.36NS
S x Y x T 10 0.03NS 0.30NS 0.02NS 1.51NS
S x I x T 25 0.08NS 0.12NS 0.02NS 0.89NS
Y x I x T 50 0.05NS 0.21NS 0.03NS 1.43NS
Error 50 0.06 0.16 0.02 1.55
% C.V. 57.41 49.75 29.70 29.03

104
Table 46 Drainage water [NH4-N]dw (mg L-1) observed at given irrigation numbers and post irrigation timings in site-1, Fazliabad and site-2, Manga Dargai under subsurface tile drainage system during 2003-05
Irrigation number
------------------------Site-1---------------------------- -----------------------Site-2--------------------------
--------------------------------------------- Post Irrigation Time (h) -----------------------------------------------------
24 30 36 48 72 96 Mean 24 30 36 48 72 96 Mean
------------------------------------------------------------------- 2003-04-----------------------------------------------------------------
1st 0.20 0.20 0.24 0.36 0.8 0.24 0.34 1.20 0.40 0.32 0.20 0.20 0.24 0.43
2nd 0.32 0.24 0.20 0.20 0.20 0.20 0.23 0.20 0.80 0.20 1.00 0.80 1.20 0.70
3rd 0.24 0.32 0.60 0.20 0.32 0.24 0.32 0.30 0.60 0.80 0.65 0.40 0.40 0.53
4th 0.80 0.60 1.00 0.20 0.20 0.68 0.58 0.85 1.08 0.95 1.00 0.24 0.60 0.79
5th 0.20 0.40 0.60 0.60 0.32 0.20 0.39 0.24 0.80 0.20 0.20 0.40 0.60 0.41
6th 0.80 0.60 0.40 0.80 0.36 0.20 0.53 0.32 0.28 0.20 0.40 0.24 0.20 0.27
Mean 0.43 0.39 0.51 0.39 0.37 0.29 0.40 0.52 0.66 0.45 0.58 0.38 0.54 0.52
-------------------------------------------------------------------- 2004----------------------------------------------------------------
1s 0.23 0.51 0.26 0.13 0.43 0.21 0.30 0.42 0.22 0.14 0.32 0.30 0.20 0.27
2nd 0.68 0.37 0.22 0.40 0.16 0.29 0.35 0.26 0.40 0.14 0.24 0.18 0.20 0.24
3rd 0.15 0.27 0.44 0.32 0.14 0.20 0.25 0.60 1.00 0.49 0.37 0.20 0.44 0.52
4th 0.13 0.24 0.79 0.32 0.18 0.12 0.30 0.80 0.30 0.62 0.32 0.60 0.48 0.52
5th 1.00 0.39 0.19 0.26 0.46 0.12 0.40 0.12 0.10 0.20 0.35 0.24 0.17 0.20
6th 0.15 0.20 0.58 0.45 0.34 0.28 0.33 0.40 0.33 0.47 0.60 0.20 0.10 0.35
Mean 0.39 0.33 0.41 0.31 0.29 0.20 0.32 0.43 0.39 0.34 0.37 0.29 0.27 0.35
------------------------------------------------------------------- 2004-05-----------------------------------------------------------------
1st 0.24 0.84 0.80 0.24 0.20 0.96 0.55 0.95 0.60 0.25 0.80 0.80 0.38 0.63
2nd 0.80 0.28 0.40 0.72 0.36 0.80 0.56 0.25 0.80 1.00 0.80 0.45 0.80 0.68
3rd 0.40 0.60 0.20 0.24 0.20 1.00 0.44 0.30 0.70 0.42 0.40 1.00 0.40 0.54
4th 0.20 0.28 0.80 1.00 0.60 0.20 0.51 0.60 0.40 0.20 0.34 0.30 0.50 0.39
5th 0.80 0.60 0.32 0.72 0.20 0.40 0.51 0.60 0.80 1.20 0.90 0.44 0.40 0.72
6th 0.65 0.22 0.40 0.20 0.63 0.14 0.37 1.00 0.28 0.50 0.78 0.80 0.56 0.65
Mean 0.52 0.47 0.49 0.52 0.37 0.58 0.49 0.62 0.60 0.60 0.67 0.63 0.51 0.60
G. Mean 0.44 0.40 0.47 0.41 0.34 0.36 0.40 0.52 0.55 0.46 0.54 0.43 0.44 0.49

105
Table 47 Changes in [NH4-N]dw (mg L-1) with irrigation number, post irrigation time and different cropping seasons at site-1, Fazliabad and site-2 , Manga Dargai under subsurface tile drainage system during 2003-05
SOV ------------------------ Post Irrigation Time (h) ---------------------------------- Mean
Irrig. # 24 30 36 48 72 96
-------------------------- Averages across sites and year of sampling (S x Y)--------------------------------------
1st 0.54 0.46 0.34 0.34 0.46 0.37 0.42 a
2nd 0.42 0.48 0.36 0.56 0.36 0.58 0.46 a
3rd 0.33 0.58 0.49 0.36 0.38 0.45 0.43 a
4th 0.56 0.48 0.73 0.53 0.35 0.43 0.51 a
5th 0.49 0.52 0.45 0.51 0.34 0.32 0.44 a
6th 0.55 0.32 0.43 0.54 0.43 0.25 0.42 a
Mean 0.48 a 0.47 a 0.47 a 0.47 a 0.39 a 0.40 a 0.45
--------------------Averages across irrigation number and year of sampling (I x Y)----------------------------
Site-1 0.44 0.40 0.47 0.41 0.34 0.36 0.40 b
Site-2 0.52 0.55 0.46 0.54 0.43 0.44 0.49 a
-------------------- Averages across irrigation number and sites (I x S)--------------------------------------------
2003-04 0.47 0.53 0.48 0.48 0.37 0.42 0.46 b
2004 0.41 0.36 0.38 0.34 0.29 0.23 0.34 c
2004-05 0.57 0.53 0.54 0.60 0.50 0.55 0.55 a
LSD at p < 0.05 for irrigation post irrigation time = 0.12, for years = 0.09 and for site = 0.07
bc
a
c c
ab
a LSD0.05 = 0.121
Fig. 6 Changes in drainage water [NH4‐N]dw at site‐1, Fazliabad and site‐2 Manga Dargai
during 2003‐05

106
Unlike NH4-N, [NO3]dw were non-significantly affected by sites but strongly and
significantly affected by year of sampling and irrigation numbers (Table 45). As expected
the [NO3]dw yielded much higher values (Table 48) than [NH4]dw (Table 47). The mean
values for given timings of post irrigations, and for a given irrigation in a year of
samplings exhibited a wide range of values. Values as high as 2.80 mg L-1 and 2.0 mg L-1
were recorded during 2nd irrigation at 24 and 48 h during 2003-04 in stie-1 and similar
values were observed at 36 h (2.08 mg L-1) and 24 h (2.00 mg L-1) in 1st and 2nd irrigation
respectively, in site-2 (Table 48). Values above 1.0 mg L-1 of NO3-N could be seen
during the subsequent years of samplings in both years.
When data were averaged across years and sites, the mean values for post irrigation
timings were similar while 1st irrigation had significantly higher mean value of 1.07 mg
L-1 than the remaining irrigations (Table 49). Higher leaching of NO3-N with the initial
irrigations is understandable as it is not adsorbed on soil surfaces and is known to form
very little complexes with cations (Sposito, 1989) to restrict its rate of movement with
percolating waters down the soil depth (Page et al., 1987).
The grand mean of [NO3-N]dw for sites as averaged across irrigations x years (I x Y) were
similar while those for years as averaged across irrigation x sites (I x S) were statistically
different whereby the year 2003-04 produced the highest value of 0.96 followed by
similar values of 0.75 and 0.77 mg L-1 (Table 49 and Fig. 7). Seasonal variations in
nutrients losses were reported by Marques et al. (1997) while Schils (1994) reported
variations in nutrients losses from year to year with N ranging from 20-24 kg ha-1 in
subsurface drainage system. Madramootoo et al. (1992) observed N concentrations of 1.7
to 40.02 mg L-1 in drainage waters. According to Richard et al. (1989) NO3-N losses
increase with subsurface drainage. Application of manures and slurry enhanced N and P
losses (Tartola and Demppainen, 1998).

107
Table 48 Drainage water [NO3-N]dw observed at given irrigation numbers and post irrigation timings in site-1, Fazliabad and site-2, Manga Dargai under subsurface tile drainage system during 2003-05
Irrigation number
------------------------Site-1---------------------------- -----------------------Site-2--------------------------
---------------------------------------------------- Post Irrigation Time (h) ----------------------------------------------------
24 30 36 48 72 96 Mean 24 30 36 48 72 96 Mean
----------------------------------------------------------------------- 2003-04-----------------------------------------------------------------
1st 0.44 0.76 1.60 2.20 2.40 0.32 1.29 1.60 0.80 2.08 0.80 0.92 0.96 1.19
2nd 2.00 0.60 0.80 2.80 0.44 0.56 1.20 2.00 0.20 1.20 0.80 0.80 0.52 0.92
3rd 0.08 1.28 0.12 0.60 1.68 0.36 0.69 0.86 0.65 1.00 0.75 0.80 0.60 0.78
4th 1.40 1.20 0.60 0.80 0.60 1.00 0.93 0.45 1.12 1.15 0.90 0.96 1.40 1.00
5th 0.80 0.80 1.20 0.80 0.68 0.56 0.81 1.76 1.60 1.00 0.40 0.40 1.00 1.03
6th 0.12 2.00 0.60 0.40 1.64 0.80 0.93 0.48 0.84 0.60 0.20 0.96 1.60 0.78
Mean 0.81 1.11 0.82 1.27 1.24 0.60 0.97 1.19 0.87 1.17 0.64 0.81 1.01 0.95
----------------------------------------------------------------------- 2004---------------------------------------------------------------------
1st 0.68 0.65 1.14 0.48 0.53 0.82 0.72 1.00 0.84 1.12 0.90 0.54 1.22 0.94
2nd 0.36 1.00 0.66 0.56 0.70 0.82 0.68 0.60 0.58 0.86 1.18 0.65 0.88 0.79
3rd 0.78 0.55 1.00 0.20 0.56 0.70 0.63 1.00 0.50 0.59 0.90 1.00 0.70 0.78
4th 0.90 0.49 0.57 0.41 1.00 0.88 0.71 0.39 0.92 1.00 0.80 0.42 0.66 0.70
5th 0.72 0.52 0.48 0.92 0.54 0.75 0.66 0.90 1.32 0.50 0.65 1.00 0.58 0.83
6th 0.56 1.00 0.24 0.61 1.11 0.79 0.72 0.74 0.70 1.00 0.90 0.76 0.95 0.84
Mean 0.67 0.70 0.68 0.53 0.74 0.79 0.69 0.77 0.81 0.85 0.89 0.73 0.83 0.81
----------------------------------------------------------------------- 2004-05-----------------------------------------------------------------
1st 1.44 0.96 0.24 0.56 0.44 0.80 0.74 1.00 1.20 1.80 1.90 1.40 1.84 1.52
2nd 0.72 0.92 0.80 0.08 0.36 0.80 0.61 0.70 0.80 0.52 1.00 0.70 1.00 0.79
3rd 0.20 1.40 0.60 1.04 0.60 0.20 0.67 0.50 0.65 0.80 0.52 1.10 0.56 0.69
4th 0.44 0.52 0.80 0.80 1.80 1.60 0.99 1.00 0.32 0.40 0.40 0.70 0.60 0.57
5th 0.80 0.20 1.08 0.80 0.52 1.20 0.77 0.20 0.30 0.50 1.00 0.52 0.63 0.53
6th 0.40 0.60 0.50 0.70 0.40 0.54 0.52 0.93 0.68 0.70 1.00 1.20 0.80 0.89
Mean 0.67 0.77 0.67 0.66 0.69 0.86 0.72 0.72 0.66 0.79 0.97 0.94 0.91 0.83
G Mean 0.71 0.86 0.72 0.82 0.89 0.75 0.79 0.90 0.78 0.93 0.83 0.82 0.92 0.86

108
Table 49 Changes in [NO3-N]dw (mg L-1) with irrigation number, post irrigation time and different cropping seasons at site-1, Fazliabad and site-2 , Manga Dargai under subsurface tile drainage system during 2003-05
SOV ---------------------- Post Irrigation Time (h) ----------------------------------- Mean
Irrig. # 24 30 36 48 72 96
----------------------- Averages across sites and year of sampling (S x Y)-----------------------------------------
1st 1.03 0.87 1.33 1.14 1.04 0.99 1.07 a
2nd 1.06 0.68 0.81 1.07 0.61 0.76 0.83 b
3rd 0.57 0.84 0.69 0.67 0.96 0.52 0.71 b
4th 0.76 0.76 0.75 0.69 0.91 1.02 0.82 b
5th 0.86 0.79 0.79 0.76 0.61 0.79 0.77 b
6th 0.54 0.97 0.61 0.64 1.01 0.91 0.78 b
Mean 0.80 a 0.82 a 0.83 a 0.83 a 0.86 a 0.83 a 0.83
---------------------Averages across irrigation number and year of sampling (I x Y)----------------------------
Site-1 0.71 0.86 0.72 0.82 0.89 0.75 0.79 a
Site-2 0.90 0.78 0.93 0.83 0.82 0.92 0.86 a
---------------------- Averages across irrigation number and sites (I x S)-------------------------------------------
2003-04 1.00 0.99 1.00 0.95 1.02 0.81 0.96 a
2004 0.72 0.76 0.76 0.71 0.73 0.81 0.75 b
2004-05 0.69 0.71 0.73 0.82 0.81 0.88 0.77 b
LSD at p < 0.05 for irrigation and post irrigation time = 0.20, for year = 0.14 and for site = 0.11
a a
b ab
b ab
LSD0.05 = 0.195
Fig. 7 Changes in drainage water [NH4‐N]dw at site‐1, Fazliabad and site‐2 Manga Dargai
during 2003‐05

109
The concentrations of [P]dw showed significant (p < 0.05) variations with sites and years
of samplings and non-significant variations due to timings of post irrigations and number
of irrigation waters applied during each crop growing season (Table 45). All interactions
were also non-significant.
Table 50 indicates values of [P]dw for individual observations for all variables in both
sites recorded during the three cropping seasons designated as year 2003-04, 2004 and
2004-05. When averaged across sites x years, post irrigation timings exhibited similar
mean values while 4th irrigation produced significantly (p < 0.05) higher mean value of
0.64 mg L-1 compared to 1st irrigation but similar to other irrigations (Table 51). When
averaged across irrigation x years (I x Y) site-2 showed significantly higher grand mean
values than site-1. The differences due to years of samplings were significantly higher for
year 2005 (Table 51, Fig. 8). During the years 2003-04 and 2004, both sites produced
significantly smaller [P]dw while during 2005, site 2 yielded significantly higher [P]dw
than site-1 (Fig. 8). The [P]dw were comparable to [NH4]dw and lower than [NO3]dw. The
[P]iw ranged between 0.04 to 0.18 mg L-1 while [P]dw was four to five times higher
ranging from 0.40 to 0.94 mg L-1. The NH4-N in drainage waters was 2-3 times greater
than irrigation waters while NO3-N was 4-5 times higher in drainage waters. This suggest
that water soluble, readily bio-available nutrients are being lost from the soils in the
subsurface drainage system.
Although P being less soluble in the given pH of irrigation waters, soil solution and
drainage waters (Lindsay, 1979) and is known to be strongly adsorbed on soil surfaces
(Sposito, 1989; Spark, 1995), its concentrations in the drainage waters are reasonably
higher when compared with the reported values in soil solutions (Mengel and Kirkby,
1987: Bohn et al., 2001) and with those (0.002 to 0.52 mg L-1) observed by Madramootoo
et al. (1998) in drainage waters. The mean values above 0.40 to 1.0 mg L-1 in the
drainage waters could be important in terms of crop bioavailability and as well as offer
reasonable potential for its reuse in irrigation waters. However, its collection in ponds or
lakes over a longer period of time may cause eutrophication (Brady and Weil., 1999).

110
Table 50 Drainage water [P]dw (mg L-1) observed at given irrigation numbers and post irrigation timings in site-1, Fazliabad and site-2, Manga Dargai under subsurface tile drainage system during 2003-05
Irrig. number
------------------------Site-1---------------------------- -----------------------Site-2--------------------------
------------------------------------------------ Post Irrigation Time (h) --------------------------------------------------
24 30 36 48 72 96 Mean 24 30 36 48 72 96 Mean
--------------------------------------------------------------------- 2003-04--------------------------------------------------------------
1st 0.50 0.33 0.33 0.04 0.43 0.76 0.40 0.54 0.50 0.43 0.43 0.42 0.45 0.46
2nd 0.65 0.65 0.04 0.43 0.47 0.41 0.44 0.47 0.45 0.53 0.44 0.35 0.52 0.46
3rd 0.54 0.77 0.63 0.63 0.44 0.35 0.56 0.37 0.40 0.27 0.46 0.41 0.49 0.40
4th 0.36 0.76 0.40 0.34 0.41 0.82 0.52 0.49 0.64 0.71 0.45 0.52 0.67 0.58
5th 0.75 0.56 0.34 0.37 0.30 0.41 0.46 0.49 0.22 0.82 0.45 0.67 0.45 0.52
6th 0.56 0.37 0.52 0.47 0.75 0.45 0.52 1.05 0.67 0.30 0.82 0.45 0.56 0.64
Mean 0.56 0.57 0.38 0.38 0.47 0.53 0.48 0.57 0.48 0.51 0.51 0.47 0.52 0.51
---------------------------------------------------------------------- 2004------------------------------------------------------------------
1st 0.60 0.37 0.49 0.34 0.41 0.37 0.43 0.75 0.41 0.37 0.82 0.71 0.34 0.57
2nd 0.45 0.52 0.49 0.30 0.64 0.37 0.46 0.60 0.45 0.86 0.60 0.64 0.56 0.62
3rd 0.45 0.34 0.75 0.67 0.45 0.71 0.56 0.49 0.37 0.41 0.80 0.45 0.67 0.53
4th 0.41 0.86 0.78 0.64 0.82 0.56 0.68 0.52 0.78 0.37 0.35 0.75 0.41 0.53
5th 0.64 0.45 0.41 0.67 0.37 0.45 0.50 0.71 0.44 0.67 0.70 0.52 0.78 0.64
6th 0.49 0.41 0.37 0.75 0.30 0.34 0.44 0.41 0.75 0.52 0.70 0.35 0.50 0.54
Mean 0.51 0.49 0.55 0.56 0.50 0.47 0.51 0.58 0.53 0.53 0.66 0.57 0.54 0.57
--------------------------------------------------------------------- 2004-05---------------------------------------------------------------
1st 0.54 0.38 0.63 0.76 0.58 0.36 0.54 0.79 0.66 0.74 0.53 0.61 0.74 0.68
2nd 0.56 0.35 0.53 0.78 0.49 0.43 0.52 0.96 0.83 0.88 0.57 1.23 0.83 0.88
3rd 0.73 0.50 0.65 0.42 0.33 0.71 0.56 0.88 1.27 0.79 1.09 0.88 0.74 0.94
4th 0.37 0.52 0.64 0.40 0.57 0.44 0.49 1.40 1.05 0.96 1.23 0.70 0.96 1.05
5th 0.28 0.64 0.35 0.41 0.31 0.44 0.41 0.88 1.31 1.23 0.79 0.83 0.74 0.96
6th 0.41 0.45 0.38 0.42 0.34 0.50 0.42 0.79 0.88 0.74 0.83 0.96 0.88 0.85
Mean 0.48 0.47 0.53 0.53 0.44 0.48 0.49 0.95 1.00 0.89 0.84 0.87 0.82 0.89
G Mean 0.52 0.51 0.49 0.49 0.47 0.49 0.49 0.70 0.67 0.64 0.67 0.64 0.63 0.66

111
Table 51 Changes in [P]dw (mg L-1) with irrigation number, post irrigation time and different cropping seasons at site-1, Fazliabad and site-2 , Manga Dargai under subsurface tile drainage system during 2003-05
SOV --------------------------- Post Irrigation Time (h) ---------------------------- Mean
Irrig. # 24 30 36 48 72 96
---------------------- Averages across sites and year of sampling (S x Y)----------------------------------------
1st 0.62 0.44 0.50 0.49 0.53 0.50 0.51 b
2nd 0.62 0.54 0.56 0.52 0.64 0.52 0.56 ab
3rd 0.58 0.61 0.58 0.68 0.49 0.61 0.59 ab
4th 0.59 0.77 0.64 0.57 0.63 0.64 0.64 a
5th 0.63 0.60 0.64 0.57 0.50 0.55 0.58 ab
6th 0.62 0.59 0.47 0.67 0.53 0.54 0.57 ab
Mean 0.61 a 0.59 a 0.56 a 0.58 a 0.55 a 0.56 a 0.58
----------------Averages across irrigation number and year of sampling (I x Y)------------------------------
Site-1 0.52 0.51 0.49 0.49 0.47 0.49 0.49 b
Site-2 0.70 0.67 0.64 0.67 0.64 0.63 0.66 a
--------------------Averages across irrigation number and sites (I x S)--------------------------------------
2003-04 0.56 0.53 0.44 0.44 0.47 0.53 0.50 b
2004 0.54 0.51 0.54 0.61 0.53 0.51 0.54 b
2004-05 0.72 0.74 0.71 0.69 0.65 0.65 0.69 a
LSD for irrigation and post irrigation time = 0.08, for year = 0.06 and for site = 0.05
c bc bc b c
a LSD0.05 = 0.081
Fig. 8 Changes in drainage water [P]dw at site‐1, Fazliabad and site‐2 Manga Dargai
during 2003‐05

112
The sites, years of sampling and number of irrigation water applied induced significant (p
< 0.05) variability in the [K]dw while post irrigation timings had no significant influence
on [K]dw (Table 45). The interactions of sites and years (S x Y) and sites x number of
irrigation (S x I) also showed significant effect while all other interactions were non-
significant at P < 0.05.
To appreciate the overall magnitude of variability and as well as extent of K losses in
drainage waters, data pertaining to individual observations at given post irrigation
timings, number of irrigations for each cropping season i.e. Rabi 2003-04, Kharif 2004
and Rabi 2004-05 for both sites are provided in Table 52. It indicates that the [K]dw
values recorded during the three cropping seasons at each irrigation water applied and
post irrigation timings are quite sizable reaching up to 10.3 mg L-1 with grand mean value
of 4.35 mg L-1 which are several fold greater than the N [NH4-N + NO3-N]dw and [P]dw
(Tables 46, 48 and 50). Similar (10 mg L-1) K concentrations were reported by
Madramootoo et al. (1992) in drainage waters from potato field. This observation
suggested higher magnitude of K removal from the soil and could be critical with respect
to crop requirement if not adequately replenished in the form of chemical fertilizers on
regular basis.
Data in Table 53 present mean values across sites x years, irrigation number x years and
irrigation number x sites to appreciate the impact of irrigation number, site and year,
respectively at the given time of sampling. It can be seen that mean values were more or
less closer to each other but losses due to 2nd and 3rd irrigations were significantly higher
than 1st and 5th and 6th irrigations, which were statistically similar to each other (Table
53).
Seasonal differences in [K]dw at given post irrigation timings and irrigation number
between the sites were observed (Table 52). When data were averaged across irrigation
timings x sites, Rabi 2004-05 produced significantly higher [K] dw than the preceding
years which were statistically identical with each other (Table 53). This observation is
further substantiated by comparing the effect of sites at each year (Fig. 9). Site-1 out

113
Table 52 Drainage water [K]dw (mg L-1) observed at given irrigation numbers and post irrigation timings in site-1, Fazliabad and site-2, Manga Dargai under subsurface tile drainage system during 2003-05
Irrigation number
------------------------Site-1---------------------------- -----------------------Site-2--------------------------
--------------------------------------------------- Post Irrigation Time (h) -----------------------------------------------------
24 30 36 48 72 96 Mean 24 30 36 48 72 96 Mean
----------------------------------------------------------------------- 2003-04-----------------------------------------------------------------
1st 8.16 2.81 2.57 2.69 2.59 2.42 3.54 4.70 2.82 5.40 3.87 3.41 3.90 4.02
2nd 4.25 8.97 7.76 2.26 3.43 3.57 7.04 3.25 4.62 2.76 3.38 3.60 3.21 3.47
3rd 5.69 6.30 2.96 4.90 4.27 3.70 4.64 2.64 3.88 4.54 5.00 4.60 3.45 4.02
4th 6.42 4.90 5.30 4.70 4.00 4.30 4.94 4.90 4.20 3.70 4.30 3.50 4.00 4.10
5th 4.90 4.50 4.40 4.20 3.80 3.50 4.22 5.00 3.90 4.70 2.40 5.20 2.60 3.97
6th 4.30 3.80 4.10 4.30 4.70 4.00 4.20 4.30 4.50 3.70 4.00 2.50 4.90 3.98
Mean 5.62 5.55 6.18 3.84 3.80 3.58 4.76 4.13 3.99 4.13 3.83 3.80 3.68 3.93
----------------------------------------------------------------------- 2004---------------------------------------------------------------------
1st 5.24 3.52 2.85 2.59 3.99 4.24 3.74 6.57 3.81 2.51 2.95 3.28 4.28 3.90
2nd 4.94 4.46 5.36 3.77 6.71 5.40 5.11 2.99 5.16 3.45 4.05 8.56 7.20 5.24
3rd 3.28 3.80 5.30 6.49 4.69 4.24 4.63 4.93 6.77 3.65 4.85 7.19 3.38 5.13
4th 4.09 3.50 3.57 2.90 4.05 3.42 3.59 4.14 2.00 3.68 2.92 3.01 2.90 3.11
5th 2.69 3.33 3.45 2.57 3.15 2.73 2.99 2.79 3.93 2.58 2.73 3.52 2.95 3.08
6th 3.24 4.05 2.18 4.64 4.28 3.27 3.61 3.90 3.76 3.37 4.51 3.87 3.81 3.87
Mean 3.91 3.78 3.79 3.83 4.48 3.88 3.94 4.22 4.24 3.21 3.67 4.91 4.09 4.05
----------------------------------------------------------------------- 2004-05-----------------------------------------------------------------
1st 2.90 2.44 5.38 4.70 4.00 5.30 4.12 5.30 4.65 4.15 4.00 3.75 4.78 4.44
2nd 2.48 4.72 4.80 5.20 10.3 5.45 5.50 5.00 3.70 3.90 4.41 4.80 4.15 4.33
3rd 4.18 2.98 7.42 6.90 4.72 6.30 5.42 3.74 2.70 4.85 4.53 5.30 4.67 4.30
4th 5.70 9.65 10.9 8.20 4.90 6.30 7.61 3.72 2.89 2.80 2.90 3.40 4.10 3.30
5th 5.80 8.20 4.28 3.50 4.30 6.40 5.41 2.50 3.40 2.00 3.43 4.00 3.20 3.09
6th 4.80 4.00 5.20 3.95 4.40 4.80 4.53 5.00 4.60 3.40 3.72 5.00 4.10 4.30
Mean 4.31 5.33 6.33 5.41 5.44 5.76 5.43 4.21 3.66 3.52 3.83 4.38 4.17 3.96
G Mean 4.61 4.89 5.43 4.36 4.57 4.41 4.71 4.19 3.96 3.62 3.78 4.36 3.98 3.98

114
Table 53 Changes in [K]dw with irrigation number, post irrigation time and different cropping seasons at site-1, Fazliabad and site-2, Manga Dargai under subsurface tile drainage system during 2003-05
SOV --------------------------- Post Irrigation Time (h) ----------------------------------- Mean
Irrig. # 24 30 36 48 72 96
------------------------ Averages across sites and year of sampling (S x Y)-----------------------------------------
1st 5.48 3.34 3.81 3.47 3.50 4.15 3.96 bc
2nd 3.82 5.27 4.67 3.85 6.24 4.83 4.78 a
3rd 4.08 4.41 4.79 5.45 5.13 4.29 4.69 a
4th 4.83 4.52 4.99 4.32 3.81 4.17 4.44 ab
5th 3.95 4.54 3.57 3.14 4.00 3.56 3.79 c
6th 4.26 4.12 3.66 4.19 4.13 4.15 4.08 bc
Mean 4.40 a 4.37 a 4.25 a 4.07 a 4.47 a 4.19 a 4.35
-------------------Averages across irrigation number and year of sampling (I x Y)-------------------------------
Site-1 4.61 4.77 4.88 4.36 4.57 4.41 4.60 a
Site-2 4.19 3.96 3.62 3.78 4.36 3.98 3.98 b
--------------------- Averages across irrigation number and sites (I x S)--------------------------------------------
2003-04 4.88 4.60 4.32 3.83 3.80 3.63 4.17 b
2004 4.07 4.01 3.50 3.75 4.69 3.99 4.00 b
2004-05 4.26 4.49 4.92 4.62 4.91 4.96 4.69 a
LSD at p < 0.05 for irrigation post irrigation time = 0.59, for year = 0.42 and for site = 0.34
b b b b
a
b
LSD0.05 = 0.590
Fig. 9 Changes in drainage water [P]dw at site‐1, Fazliabad and site‐2 Manga Dargai
during 2003‐05

115
yielded site-2 during 2004-05 only while in the other two years both sites behaved
similarly (Fig. 9). Such seasonal variations, depending on soil characteristics, crop type,
and nutrients concentrations in the soil solution, were reported by Rummenie and Noble
(1996) in the percolating waters.
4.3.4 Micronutrients [Cu, Fe, Mn and Zn] in Drainage Waters
The concentrations of micronutrients in drainage waters, [Cu, Fe, Mn and Zn]dw, were
determined after application of each irrigation water at the time intervals of 24, 30, 36,
48, 72 and 96 h. Data for a total of six irrigations for all timings of post irrigation for the
three cropping seasons at both sites are provided in Tables 54 to 66. While the summary
of ANOVA performed on factorial design [2 sites x 3 years x 6 irrigations x 6 timings] is
provided in Table 54.
The [Cu]dw responded significantly to number of irrigations and non-significantly to sites,
years of sampling and to timings of post irrigations (Table 55). As can be seen,
variations due to post irrigation samplings were small and values of [Cu]dw ranged
between minimum of 0.17 observed in 4th irrigation at 48 h to maximum of 0.44 mg L-1
in site-1 and from 0.16 to 0.70 in site-2 during 2003-04 (Table 55). During the
subsequent years, similar values were observed while yearwise differences in the site
were seen in alternate fashion. The mean values averaged across the timings for a given
irrigation number exhibited variability where 3rd irrigation produced significantly higher
[Cu]dw compared to all others which showed non-significant differences in mean values
(Table 55 and 56).
When data were averaged across irrigations and years of samplings, site-1 and site-2
showed similar [Cu]dw (Table 56). In the same fashion, years of sampling did not exert
any significant differences when averaged across irrigation number and site (I x S).
However, when the mean values were presented for every year separating the two sites
(Fig. 10), both sites exhibited significantly different response for the given year as

116
Table 54 ANOVA performed in a factorial model [2 sites x 3 yr x 6 irrigation x 6 timings]showing MS values for [Cu]dw, [Fe]dw, [Mn]dw and [Zn]dw measured at six different post irrigation timings after each irrigation at two sites (Fazliabad and Manga Dargai) during three seasons from 2003 to 2005.
SOV D.F. Cu Fe Mn Zn
Site (S) 1 0.02NS 0.07** 0.08* 0.003NS
Year (Y) 2 <0.01NS 0.19** 2.52** 0.004*
Irrigation# (I) 5 0.06* <0.01NS 0.03NS <0.001NS
Post irri.time (T) 5 <0.01NS 0.02* 0.02NS 0.001NS
S x Y 2 0.53** 0.06** <0.01NS 0.001NS
S x I 5 0.03NS <0.01NS 0.01NS 0.001NS
S x T 5 0.01NS <0.01NS 0.01NS <0.001NS
Y x I 10 0.04NS <0.01NS 0.02NS 0.001NS
Y x T 10 0.00NS 0.02NS 0.03NS 0.001NS
I x T 25 0.01NS <0.01NS 0.01NS <0.001NS
S x Y x I 10 0.03NS 0.01NS 0.02NS <0.001NS
S x Y x T 10 0.01NS <0.01NS 0.01BS <0.001NS
S x I x T 25 <0.01NS 0.01NS 0.03NS <0.001NS
Y x I x T 50 0.01NS <0.01NS 0.02NS 0.001NS
Error 50 0.02 <0.01 0.02 0.001
% C.V. 36.94 82.17 52.47 65.86

117
Table 55 Drainage water [Cu]dw (mg L-1) observed at given irrigation numbers and post irrigation timings in site-1, Fazliabad and site-2, Manga Dargai under subsurface tile drainage system during 2003-05
Irrigation number
------------------------Site-1---------------------------- -----------------------Site-2--------------------------
------------------------------------------------- Post Irrigation Time (h) -------------------------------------------------
24 30 36 48 72 96 Mean 24 30 36 48 72 96 Mean
----------------------------------------------------------------------- 2003-04------------------------------------------------------------
1st 0.38 0.35 0.37 0.38 0.35 0.38 0.37 0.45 0.20 0.82 0.75 0.76 0.49 0.58
2nd 0.41 0.34 0.36 0.35 0.39 0.44 0.38 0.61 0.58 0.30 0.60 0.24 0.22 0.43
3rd 0.43 0.42 0.31 0.41 0.35 0.32 0.37 0.64 0.51 0.43 0.37 0.67 0.70 0.55
4th 0.37 0.35 0.23 0.17 0.10 0.41 0.27 0.37 0.40 0.43 0.16 0.41 0.43 0.37
5th 0.39 0.21 0.31 0.34 0.15 0.09 0.25 0.39 0.45 0.35 0.44 0.45 0.38 0.41
6th 0.25 0.37 0.24 0.30 0.35 0.21 0.29 0.50 0.47 0.43 0.49 0.35 0.41 0.44
Mean 0.37 0.34 0.30 0.33 0.28 0.31 0.32 0.49 0.44 0.46 0.47 0.48 0.44 0.46
-------------------------------------------------------------------- 2004------------------------------------------------------------------
1st 0.55 0.47 0.47 0.42 0.45 0.40 0.46 0.45 0.44 0.48 0.42 0.23 0.33 0.39
2nd 0.44 0.55 0.44 0.08 0.58 0.44 0.42 0.34 0.22 0.44 0.24 0.40 0.40 0.34
3rd 0.53 0.41 0.40 0.46 0.78 0.52 0.51 0.05 0.41 0.39 0.28 0.40 0.07 0.27
4th 0.43 0.67 0.55 0.68 0.47 0.77 0.60 0.32 0.07 0.09 0.49 0.45 0.09 0.25
5th 0.68 0.38 0.38 0.36 0.55 0.45 0.47 0.22 0.34 0.44 0.24 0.33 0.15 0.29
6th 0.49 0.55 0.46 0.56 0.47 0.59 0.52 0.40 0.41 0.46 0.56 0.08 0.39 0.38
Mean 0.52 0.50 0.45 0.43 0.55 0.53 0.50 0.30 0.32 0.38 0.37 0.32 0.24 0.32
-------------------------------------------------------------------- 2004-05--------------------------------------------------------------
1st 0.44 0.25 0.38 0.34 0.40 0.30 0.35 0.40 0.67 0.30 0.27 0.21 0.63 0.41
2nd 0.37 0.30 0.35 0.28 0.30 0.29 0.32 0.51 0.64 0.71 0.30 0.76 0.67 0.60
3rd 0.40 0.31 0.35 0.45 0.43 0.36 0.38 0.75 0.50 0.90 0.61 0.64 0.44 0.64
4th 0.43 0.27 0.41 0.32 0.40 0.26 0.35 0.40 0.40 0.67 0.44 0.16 0.43 0.42
5th 0.37 0.32 0.35 0.30 0.42 0.32 0.35 0.17 0.20 0.20 0.50 0.30 0.20 0.26
6th 0.24 0.43 0.20 0.42 0.15 0.25 0.28 0.49 0.29 0.18 0.20 0.35 0.31 0.30
Mean 0.38 0.31 0.34 0.35 0.35 0.30 0.34 0.45 0.45 0.49 0.39 0.40 0.45 0.44
G Mean 0.42 0.39 0.36 0.37 0.39 0.38 0.39 0.41 0.40 0.45 0.41 0.40 0.37 0.41

118
Table 56 Changes in [Cu]dw (mg L-1) with irrigation number, post irrigation time and different cropping seasons at site-1, Fazliabad and site-2 , Manga Dargai under subsurface tile drainage system during 2003-05
SOV ---------------------------- Post Irrigation Time (h) ------------------------------ Mean
Irrig. # 24 30 36 48 72 96
------------------------- Averages across sites and year of sampling (S x Y)--------------------------------------
1st 0.45 0.40 0.47 0.43 0.40 0.42 0.43 ab
2nd 0.45 0.44 0.43 0.31 0.45 0.41 0.41 ab
3rd 0.47 0.43 0.46 0.43 0.54 0.40 0.45 a
4th 0.39 0.36 0.40 0.38 0.33 0.40 0.38 bc
5th 0.37 0.32 0.34 0.36 0.37 0.27 0.34 c
6th 0.39 0.42 0.33 0.42 0.29 0.36 0.37 bc
Mean 0.42 a 0.39 a 0.41 a 0.39 a 0.40 a 0.38 a 0.40
-------------------Averages across irrigation number and year of sampling (I x Y)---------------------------
Site-1 0.42 0.39 0.36 0.37 0.39 0.38 0.39 a
Site-2 0.41 0.40 0.45 0.41 0.40 0.37 0.41 a
------------------------ Averages across irrigation number and sites (I x S)---------------------------------------
2003-04 0.43 0.39 0.38 0.40 0.38 0.37 0.39 a
2004 0.41 0.41 0.42 0.40 0.43 0.38 0.41 a
2004-05 0.41 0.38 0.42 0.37 0.38 0.37 0.39 a
LSD at p < 0.05 for irrigation and post irrigation time = 0.07, for year = 0.05 and for site = 0.04
b
a a
b b
a
LSD0.05 = 0.069
Fig. 10 Changes in drainage water [Cu]dw at site‐1, Fazliabad and site‐2 Manga Dargai
during 2003‐05

119
pointed out earlier. During the rabi seasons 2003-04 and 2004-05, the [Cu]dw in site-2
were significantly greater than site-1 while for the year 2004 (Kharif season), the site-1
out yielded site 2 (Fig. 10). Similar seasonal variations were also reported by Cucci et al.
(1994) and Rummenie and Nobel (1996) for nutrients leaching in drainage waters.
Although Cu is strongly adsorbed on soil constituents (Sposito, 1989 and Khattak and
Page, 1992), the mean values (Table 56) or even individual values of [Cu]dw (Table 55)
suggest that an appreciable amount of Cu is lost from the system through drainage waters
and without replenishment on regular basis crop growth may suffer due to low [Cu] in
soil solution (Lian et al., 1997).
The [Fe]dw responded significantly to sites (p < 0.05), year of sampling (p < 0.01) and
post irrigation timings (p < 0.05) and non-significantly to number of irrigation (Table
53). This behavior of Fe in drainage waters was in total contrast to [Cu]dw which was
only significantly affected by irrigation number and non-significantly varied with other
three variables (Table 54).
Timings of samplings after irrigation generally induced little dispersion in data for other
nutrients (P, N, Cu, Mn and Zn) but in case of [Fe]dw statistically significant variability
can be noticed mainly after 48 h samplings time both in site-1 and site-2 (Table 57 and
58). The remaining timings showed statistically similar mean values when averaged
across irrigation numbers in site x year interaction. In the interaction of irrigation x
year, site-2 produced significantly higher [Fe]dw than site-1, while in the irrigation x site
interaction ( I x S), the grain mean of [Fe]dw during 2003-04 was the highest followed by
2004-05 and lowest in 2004 with significant differences within the years of samplings
(Table 58). However, when the data were averaged across timings and numbers of
irrigations for year x sites interactions, it was noted that site-2 produced significantly
higher [Fe]dw value of 0.21 mg L-1 than site-1 during 2003-04 while during the other
cropping seasons, site-1 and site-2 behaved similar to each other, whereas the values
observed in the year 2004-05 were statistically greater than 2004 and lower than 2003-
04 (Fig. 11). In comparison to [Cu]dw the values of [Fe]dw were much lower.

120
Table 57 Drainage water [Fe]dw (mg L-1) observed at given irrigation numbers and post irrigation timings in site-1, Fazliabad and site-2, Manga Dargai under subsurface tile drainage system during 2003-05
Irrig. number
------------------------Site-1---------------------------- -----------------------Site-2--------------------------
------------------------------------------------ Post Irrigation Time (h) -----------------------------------------------------
24 30 36 48 72 96 Mean 24 30 36 48 72 96 Mean
----------------------------------------------------------------------- 2003-04-----------------------------------------------------------------
1st 0.07 0.04 0.16 0.07 0.05 0.00 0.07 0.12 0.10 0.09 0.68 0.11 0.06 0.19
2nd 0.06 0.05 0.09 0.06 0.09 0.31 0.11 0.30 0.17 0.35 0.09 0.06 0.09 0.18
3rd 0.06 0.17 0.05 0.35 0.11 0.07 0.14 0.20 0.13 0.17 0.30 0.12 0.18 0.18
4th 0.19 0.07 0.07 0.13 0.01 0.04 0.09 0.13 0.08 0.13 0.74 0.08 0.08 0.21
5th 0.01 0.08 0.08 0.31 0.04 0.06 0.10 0.06 0.37 0.10 0.66 0.79 0.00 0.33
6th 0.09 0.12 0.10 0.14 0.05 0.14 0.11 0.04 0.09 0.14 0.26 0.08 0.31 0.15
Mean 0.08 0.09 0.09 0.18 0.06 0.10 0.10 0.14 0.16 0.16 0.46 0.21 0.12 0.21
----------------------------------------------------------------------- 2004---------------------------------------------------------------------
1st 0.04 0.03 0.07 0.04 0.07 0.05 0.05 0.05 0.04 0.07 0.05 0.03 0.04 0.05
2nd 0.09 0.07 0.05 0.04 0.07 0.08 0.07 0.05 0.07 0.08 0.04 0.06 0.08 0.06
3rd 0.05 0.08 0.04 0.09 0.06 0.02 0.05 0.04 0.02 0.07 0.06 0.03 0.07 0.05
4th 0.06 0.04 0.07 0.04 0.08 0.09 0.06 0.05 0.04 0.06 0.03 0.03 0.04 0.04
5th 0.03 0.05 0.03 0.07 0.06 0.04 0.05 0.05 0.03 0.04 0.02 0.06 0.04 0.04
6th 0.07 0.06 0.05 0.07 0.05 0.07 0.06 0.04 0.07 0.05 0.04 0.04 0.07 0.05
Mean 0.06 0.05 0.05 0.06 0.06 0.06 0.06 0.05 0.05 0.06 0.04 0.04 0.06 0.05
----------------------------------------------------------------------- 2004-05-----------------------------------------------------------------
1st 0.15 0.07 0.17 0.09 0.32 0.06 0.14 0.05 0.18 0.35 0.13 0.09 0.08 0.15
2nd 0.16 0.04 0.04 0.37 0.14 0.18 0.16 0.06 0.30 0.09 0.06 0.04 0.06 0.10
3rd 0.10 0.19 0.05 0.20 0.03 0.13 0.12 0.10 0.09 0.02 0.04 0.06 0.10 0.07
4th 0.04 0.10 0.07 0.04 0.05 0.10 0.07 0.11 0.05 0.17 0.06 0.27 0.12 0.13
5th 0.04 0.09 0.30 0.15 0.10 0.16 0.14 0.13 0.09 0.09 0.12 0.06 0.20 0.12
6th 0.09 0.17 0.05 0.04 0.06 0.09 0.08 0.16 0.18 0.25 0.05 0.29 0.31 0.21
Mean 0.10 0.11 0.11 0.15 0.12 0.12 0.12 0.10 0.15 0.16 0.08 0.14 0.15 0.13
G Mean 0.08 0.08 0.09 0.13 0.08 0.09 0.09 0.10 0.12 0.13 0.19 0.13 0.11 0.13

121
Table 58 Changes in [Fe]dw (mg L-1) with irrigation number, post irrigation time and different cropping seasons at site-1, Fazliabad and site-2 , Manga Dargai under subsurface tile drainage system during 2003-05
SOV --------------------------- Post Irrigation Time (h) ----------------------------------- Mean
Irrig. # 24 30 36 48 72 96
------------------------ Averages across sites and year of sampling (S x Y)------------------------------------------
1st 0.08 0.08 0.15 0.18 0.11 0.05 0.11 a
2nd 0.12 0.12 0.12 0.11 0.08 0.13 0.11 a
3rd 0.09 0.11 0.07 0.17 0.07 0.10 0.10 a
4th 0.10 0.06 0.09 0.17 0.09 0.08 0.10 a
5th 0.05 0.12 0.11 0.22 0.19 0.08 0.13 a
6th 0.08 0.11 0.11 0.10 0.10 0.16 0.11 a
Mean 0.09 b 0.10 b 0.11 b 0.16 a 0.10 b 0.10 b 0.11
-------------------------Averages across irrigation number and year of sampling (I x Y)----------------------------
Site-1 0.08 0.08 0.09 0.13 0.08 0.09 0.09 b
Site-2 0.10 0.12 0.13 0.19 0.13 0.11 0.13 a
-------------------------------- Averages across irrigation number and sites (I x S)-------------------------------------
2003-04 0.11 0.12 0.13 0.32 0.13 0.11 0.15 a
2004 0.05 0.05 0.06 0.05 0.05 0.06 0.05 c
2004-05 0.10 0.13 0.14 0.11 0.13 0.13 0.12 b
LSD at p < 0.05 for irrigation and post irrigation time = 0.04, for year = 0.03 and for site = 0.02
b
a
c c
bb
LSD0.05 = 0.043
Fig. 11 Changes in drainage water [Fe]dw at site‐1, Fazliabad and site‐2 Manga Dargai
during 2003‐05

122
Although both Cu and Fe are sensitive to high pH, however, Cu is known to be more
stable than Fe in terrestrial and aquatic system (Adriano, 1992). The comparison of
irrigation water data support this observation whereby [Cu]iw in irrigation waters were
much higher than [Fe]iw. As such input of Cu in irrigation waters ranged from 0.25 to
1.37 in site-1 and from 0.52 to 2.00 kg ha-1 in site-2 while that of Fe ranged from 0.07 to
0.24 in site-1 and from 0.18 to 0.21 kg ha-1 in site-2 during 2003-05 (Table 6). It means
that higher input in irrigation waters resulted in elevated levels of [Cu]dw which left
behind lower AB-DTPA extractable [Cu] in soil (Table 23) as compared to Fe (Table 24).
The sites and years of samplings exhibited significant differences in [Mn]dw and number
and post irrigation timings exerted non-significant variations (Table 55). The co-efficient
of variations (52.47%) in [Mn]dw was greater than [Cu]dw but lower than [Fe]dw (82.17%)
and [Zn]dw (65.86%).
The individual values of [Mn]dw were lower than [Cu]dw but slightly higher than [Fe]dw
and about ten folds greater than [Zn]dw. In the interactions of year x site, post irrigation
timings (averaged across irrigations) and irrigation number (averaged across post
irrigation timings) showed inconsistent trend in [Mn]dw (Table 60). The [Mn]dw after 24 h
and 72 h were statistically similar to each other and to 36 and 96 h but significantly
greater than those observed after 30 and 48 h of irrigations which were similar to each
otehr. When the same data were averaged across timings, the 3rd irrigation produced
significantly highest value of 0.32 mg L-1 and 4th and 6th irrigation produced the lowest
values of o.23 and 0.25 mg L-1 [Mn]dw (Table 60). These differences were of smaller
magnitude and statistically similar in both the sites in irrigation x year interactions [I x Y]
and irrigation x site interactions [I x S] where the [Mn]dw were similar for 2003-04 and
2004-05 but significantly higher for the year 2004 (Table 60, Fig. 12). The Fig. 12 also
indicates similarities between sites for a given year but yearwise comparison indicated
higher values of [Mn]dw during 2004 for site-1 and site-2 when averaged across irrigation
number and sites. This was in sharp contrast to the behavior of [Fe]dw which was the
lowest in 2004 in the given interaction.

123
Table 59 Drainage water [Mn]dw (mg L-1) observed at given irrigation numbers and post irrigation timings in site-1, Fazliabad and site-2, Manga Dargai under subsurface tile drainage system during 2003-05
Irrig. number
------------------------Site-1---------------------------- -----------------------Site-2--------------------------
--------------------------------------------- Post Irrigation Time (h) ----------------------------------------------
24 30 36 48 72 96 Mean 24 30 36 48 72 96 Mean
----------------------------------------------------------------- 2003-04-----------------------------------------------------------------
1st 0.01 0.01 0.14 0.17 0.20 0.15 0.11 0.10 0.70 0.24 0.29 0.14 0.09 0.26
2nd 0.05 0.06 0.04 0.18 0.22 0.09 0.11 0.22 0.04 0.05 0.35 0.12 0.08 0.14
3rd 0.05 0.06 0.17 0.23 0.05 0.42 0.16 0.18 0.12 0.08 0.17 0.23 0.14 0.15
4th 0.13 0.09 0.15 0.07 0.13 0.14 0.12 0.08 0.08 0.12 0.02 0.07 0.02 0.07
5th 0.07 0.06 0.22 0.18 0.17 0.29 0.17 0.81 0.01 0.02 0.09 0.09 0.60 0.27
6th 0.23 0.11 0.11 0.02 0.21 0.10 0.13 0.09 0.11 0.07 0.13 0.08 0.08 0.09
Mean 0.09 0.07 0.14 0.14 0.16 0.20 0.13 0.25 0.18 0.10 0.18 0.12 0.17 0.16
-------------------------------------------------------------------- 2004--------------------------------------------------------------------
1st 0.54 0.39 0.47 0.09 0.51 0.44 0.41 0.66 0.42 0.33 0.59 0.73 0.08 0.47
2nd 0.60 0.52 0.67 0.49 0.55 0.42 0.54 0.54 0.68 0.64 0.41 0.49 0.55 0.55
3rd 0.58 0.73 0.51 0.50 0.33 0.54 0.53 0.72 0.44 0.62 0.31 0.59 0.48 0.53
4th 0.43 0.54 0.47 0.33 0.73 0.52 0.51 0.32 0.77 0.45 0.36 0.45 0.44 0.46
5th 0.43 0.59 0.73 0.31 0.48 0.39 0.49 0.64 0.43 0.52 0.54 0.33 0.69 0.53
6th 0.44 0.50 0.32 0.09 0.33 0.43 0.35 0.69 0.38 0.44 0.34 0.66 0.46 0.49
Mean 0.50 0.55 0.53 0.30 0.49 0.46 0.47 0.60 0.52 0.50 0.42 0.54 0.45 0.50
------------------------------------------------------------------- 2004-05-----------------------------------------------------------------
1st 0.18 0.20 0.30 0.09 0.15 0.02 0.16 0.09 0.06 0.12 0.22 0.08 0.34 0.15
2nd 0.30 0.05 0.20 0.05 0.40 0.15 0.19 0.04 0.30 0.17 0.14 0.23 0.08 0.16
3rd 0.03 0.18 0.09 0.14 0.27 0.20 0.15 0.90 0.02 0.34 0.08 0.90 0.18 0.40
4th 0.04 0.01 0.19 0.25 0.03 0.06 0.10 0.07 0.17 0.08 0.17 0.08 0.24 0.14
5th 0.28 0.03 0.13 0.44 0.05 0.14 0.18 0.13 0.10 0.14 0.03 0.22 0.12 0.12
6th 0.29 0.09 0.22 0.18 0.07 0.13 0.16 0.14 0.19 0.16 0.34 0.49 0.27 0.27
Mean 0.19 0.09 0.19 0.19 0.16 0.12 0.16 0.23 0.14 0.17 0.16 0.34 0.21 0.21
G Mean 0.26 0.23 0.29 0.21 0.27 0.26 0.25 0.36 0.28 0.26 0.25 0.33 0.27 0.29

124
Table 60 Changes in [Mn]dw (mg L-1) with irrigation number, post irrigation time and different cropping seasons at site-1, Fazliabad and site-2 , Manga Dargai under subsurface tile drainage system during 2003-05
SOV ---------------------------- Post Irrigation Time (h) -------------------------------- Mean
Irrig. # 24 30 36 48 72 96
------------------------ Averages across sites and year of sampling (S x Y)-----------------------------------------
1st 0.26 0.30 0.27 0.24 0.30 0.19 0.26 ab
2nd 0.29 0.28 0.30 0.27 0.33 0.23 0.28 ab
3rd 0.41 0.26 0.30 0.24 0.39 0.33 0.32 a
4th 0.18 0.28 0.24 0.20 0.25 0.24 0.23 b
5th 0.39 0.20 0.29 0.26 0.22 0.37 0.29 ab
6th 0.31 0.23 0.22 0.18 0.31 0.25 0.25 b
Mean 0.31 a 0.26 b 0.27 ab 0.23b 0.30 a 0.27 ab 0.27
-------------------averages across irrigation number and year of sampling (I x Y) -------------------------------
Site-1 0.26 0.23 0.29 0.21 0.27 0.26 0.25 a
Site-2 0.36 0.28 0.26 0.25 0.33 0.27 0.29 a
------------------------------ Averages across irrigation number and sites (I x S)------------------------------------
2003-04 0.17 0.12 0.12 0.16 0.14 0.18 0.15 b
2004 0.55 0.53 0.51 0.36 0.51 0.45 0.49 a
2004-05 0.21 0.12 0.18 0.18 0.25 0.16 0.18 b
LSD at p < 0.05 for irrigation and post irrigation time = 0.07, for year = 0.05 and for site = 0.04
c bc
a a
bc b
LSD0.05 = 0.068
Fig. 12 Changes in drainage water [Mn]dw at site‐1, Fazliabad and site‐2 Manga Dargai
during 2003‐05

125
The [Fe]dw was much higher in site-2 than in site-1 during 2003-04 but similar in these
sites during the subsequent years of sampling. The [Mn]dw showed no differences
between the two sites regarding years of sampling but the mean [Mn]dw observed in 2004
in both sites were much greater than the 1st and 3rd cropping season (Fig. 12). The higher
[Mn]dw in 2004 were induced by relatively higher [Mn]iw for this year (Table 4)
compared to 2003-04 (Table 3) and 2005 (Table 5) sampling periods. It once again
reiterates the point that along with other factors related to soil and crop, nutrient
concentrations in irrigation waters largely determine the concentration of nutrients in
drainage waters.
The variations in [Zn]dw were only significantly affected by years of sampling while sites,
irrigation number and post irrigation sampling timings had non-significant effect on it
(Table 55). Values of [Zn]dw were much lower than Cu, Fe and Mn and in some cases the
concentrations were not detectable (Table 60). The [Zn]iw (Zn concentrations in irrigation
waters) were also very low (0 to 0.04 mg L-1, Tables 3-5)which might accounted for the
observed lowest values of [Zn]dw.
The interaction between sites x years, irrigation x years and irrigation x sites for the given
timings at each irrigation , each site and years, respectively showed differences only in
the mean values for the year of samplings when averaged across sites and timing (Table
62). When sites were separated in each year (Fig. 13), although significant but the net
differences in the mean values are very small (0.01 mg L-1) and its implication on field
scale are difficult to be predicted.
Like other nutrients, lower concentrations of Zn in irrigation waters resulted in lower
[Zn]dw and as well as in soil AB-DTPA extractable [Zn] (Table 26). Therefore, Zn
addition to these soils will certainly promote crop growth.

126
Table 61 Drainage water [Zn]dw (mg L-1) observed at given irrigation numbers and
post irrigation timings in site-1, Fazliabad and site-2, Manga Dargai under
subsurface tile drainage system during 2003-05
Irrig. number
------------------------Site-1---------------------------- -----------------------Site-2--------------------------
---------------------------------------------------- Post Irrigation Time (h) ---------------------------------------------
24 30 36 48 72 96 Mean 24 30 36 48 72 96 Mean
----------------------------------------------------------------------- 2003-04------------------------------------------------------------
1st 0.15 0.04 0.00 0.04 0.10 0.05 0.06 0.07 0.07 0.09 0.03 0.12 0.07 0.08
2nd 0.15 0.04 0.07 0.08 0.03 0.01 0.06 0.08 0.01 0.04 0.03 0.03 0.05 0.04
3rd 0.03 0.02 0.04 0.06 0.01 0.00 0.03 0.11 0.06 0.12 0.03 0.06 0.08 0.08
4th 0.06 0.08 0.03 0.01 0.01 0.01 0.03 0.01 0.08 0.02 0.07 0.11 0.01 0.05
5th 0.04 0.02 0.01 0.02 0.09 0.04 0.04 0.08 0.09 0.07 0.08 0.07 0.03 0.07
6th 0.02 0.04 0.01 0.04 0.04 0.08 0.04 0.03 0.08 0.02 0.07 0.02 0.05 0.05
Mean 0.08 0.04 0.03 0.04 0.05 0.03 0.04 0.06 0.07 0.06 0.05 0.07 0.05 0.06
----------------------------------------------------------------------- 2004----------------------------------------------------------------
1st 0.02 0.04 0.01 0.07 0.05 0.05 0.04 0.08 0.04 0.04 0.02 0.01 0.02 0.04
2nd 0.07 0.01 0.05 0.06 0.05 0.01 0.04 0.02 0.01 0.02 0.05 0.07 0.04 0.04
3rd 0.06 0.08 0.01 0.02 0.03 0.06 0.04 0.05 0.03 0.06 0.04 0.11 0.04 0.05
4th 0.01 0.04 0.06 0.03 0.08 0.05 0.04 0.08 0.01 0.06 0.01 0.05 0.04 0.04
5th 0.04 0.01 0.01 0.08 0.04 0.08 0.04 0.01 0.01 0.05 0.08 0.08 0.07 0.05
6th 0.06 0.07 0.06 0.06 0.04 0.07 0.06 0.03 0.01 0.05 0.04 0.04 0.03 0.03
Mean 0.04 0.04 0.03 0.05 0.05 0.05 0.05 0.04 0.02 0.05 0.04 0.06 0.04 0.04
----------------------------------------------------------------------- 2004-05------------------------------------------------------------
1st 0.03 0.06 0.08 0.01 0.06 0.07 0.05 0.10 0.02 0.04 0.03 0.10 0.01 0.05
2nd 0.09 0.01 0.04 0.10 0.03 0.17 0.07 0.06 0.12 0.09 0.08 0.01 0.11 0.08
3rd 0.01 0.04 0.01 0.08 0.09 0.04 0.05 0.06 0.01 0.04 0.08 0.09 0.12 0.07
4th 0.03 0.02 0.04 0.10 0.04 0.06 0.05 0.09 0.04 0.10 0.02 0.07 0.10 0.07
5th 0.10 0.05 0.10 0.07 0.03 0.05 0.07 0.06 0.06 0.12 0.07 0.03 0.10 0.07
6th 0.00 0.05 0.01 0.02 0.05 0.08 0.04 0.07 0.01 0.06 0.09 0.02 0.06 0.05
Mean 0.04 0.04 0.05 0.06 0.05 0.08 0.05 0.07 0.04 0.08 0.06 0.05 0.08 0.06
G Mean 0.05 0.04 0.04 0.05 0.05 0.05 0.05 0.06 0.04 0.06 0.05 0.06 0.06 0.06

127
Table 62 Changes in [Zn]dw (mg L-1) with irrigation number, post irrigation time and different cropping seasons at site-1, Fazliabad and site-2 , Manga Dargai under subsurface tile drainage system during 2003-05
SOV --------------------------- Post Irrigation Time (h) -------------------------------- Mean
Irrig. # 24 30 36 48 72 96
----------------------------- Averages across sites and year of sampling (S x Y)--------------------------------------
1st 0.08 0.04 0.04 0.03 0.07 0.05 0.05 a
2nd 0.08 0.03 0.05 0.07 0.04 0.06 0.05 a
3rd 0.05 0.04 0.05 0.05 0.07 0.06 0.05 a
4th 0.05 0.04 0.05 0.04 0.06 0.04 0.05 a
5th 0.06 0.04 0.06 0.07 0.06 0.06 0.06 a
6th 0.03 0.04 0.04 0.05 0.03 0.06 0.04 a
Mean 0.06 a 0.04 b 0.05 ab 0.05 ab 0.05 ab 0.06 a 0.05 a
-----------------------Averages across irrigation number and year of sampling (I x Y)----------------------------
Site-1 0.05 0.04 0.04 0.05 0.05 0.05 0.05 a
Site-2 0.06 0.04 0.06 0.05 0.06 0.06 0.06 a
---------------------------- Averages across irrigation number and sites (I x S)--------------------------------------
2003-04 0.07 0.05 0.04 0.05 0.06 0.04 0.05 ab
2004 0.04 0.03 0.04 0.05 0.05 0.05 0.04 b
2004-05 0.06 0.04 0.06 0.06 0.05 0.08 0.06 a
LSD at p < 0.05 for irrigation post irrigation time = 0.02, for year = 0.01 and for site = 0.01
bc
ab
bc c abc
a LSD0.05 = 0.016
Fig. 13 Changes in drainage water [Zn]dw at site‐1, Fazliabad and site‐2 Manga Dargai
during 2003‐05

128
Table 63 Summary of the drainage water EC and cations and nutrients concentrations at site-1, Fazliabad and site-2, Manga Dargai during 2003-05
Sites Range EC Na Ca Mg NH4 NO3 P K Fe Cu Mn Zn
dS m-1 ------------------------------------------ mg L-1--------------------------------------------------------
---------------------------------------------Rabi 2003-04 --------------------------------------------------------
Site-1 Min 0.44 17.60 2.34 2.43 0.20 0.08 0.04 2.26 0.01 0.05 0.01 0.01
Max 0.79 74.88 43.80 28.03 1.00 2.80 0.87 7.76 0.35 0.78 0.42 0.15
Mean 0.65 51.65 16.51 12.85 0.41 1.03 0.49 4.69 0.10 0.44 0.13 0.04
S.D 0.06 11.43 11.23 9.11 0.24 0.64 0.17 2.39 0.07 0.15 0.09 0.02
Site-2 Min 0.37 22.02 2.48 0.63 0.20 0.04 0.22 2.00 0.01 0.16 0.01 0.01
Max 1.30 75.65 47.67 31.47 1.20 2.20 2.92 5.50 5.60 0.92 0.98 0.12
Mean 0.69 56.11 16.60 12.93 0.51 0.93 0.54 3.80 0.33 0.49 0.19 0.06
S.D 0.22 11.39 11.89 8.90 0.30 0.49 0.37 0.89 0.78 0.17 0.22 0.03
------------------------------------------- Kharif 2004 -----------------------------------------------------------
Site-1 Min 0.31 14.13 4.69 0.91 0.12 0.20 0.30 2.07 0.02 0.05 0.07 0.01
Max 0.89 64.53 49.80 35.22 1.00 1.22 0.86 6.71 0.09 0.78 0.73 0.08
Mean 0.64 43.08 25.68 12.60 0.34 0.69 0.52 3.78 0.06 0.44 0.40 0.04
S.D 0.14 12.26 15.30 8.13 0.21 0.24 0.16 1.03 0.02 0.15 0.17 0.03
Site-2 Min 0.35 13.76 5.84 0.80 0.10 0.39 0.25 2.00 0.02 0.05 0.08 0.01
Max 0.87 78.50 49.41 41.17 1.14 1.40 0.86 8.56 0.08 0.71 0.81 0.11
Mean 0.64 47.15 32.82 14.07 0.39 0.81 0.53 3.99 0.05 0.37 0.48 0.04
S.D 0.14 14.81 13.19 9.01 0.23 0.23 0.15 1.30 0.02 0.14 0.15 0.02
-------------------------------------------- Rabi 2004 -05---------------------------------------------------------
Site-1 Min 0.27 14.20 2.50 1.00 0.13 0.08 0.18 2.44 0.01 0.15 0.01 0.01
Max 0.88 74.66 47.16 35.20 1.00 1.80 0.78 12.27 0.37 0.45 0.44 0.17
Mean 0.68 46.34 19.59 10.81 0.43 0.69 0.47 5.51 0.12 0.34 0.15 0.05
S.D 0.09 12.30 13.44 7.10 0.26 0.33 0.14 2.25 0.09 0.06 0.11 0.04
Site-2 Min 0.48 17.80 2.50 1.90 0.16 0.08 0.53 1.80 0.01 0.12 0.02 0.01
Max 1.10 72.60 47.16 27.50 1.20 1.90 1.40 5.45 0.47 0.90 0.90 0.12
Mean 0.74 49.54 19.59 9.97 0.53 0.67 0.86 3.64 0.12 0.42 0.20 0.06
S.D 0.13 12.77 13.44 6.58 0.24 0.38 0.19 0.96 0.10 0.19 0.16 0.04
Min, Max, Mean and S.D values are based on the whole data irrespective of post irrigation time or irrigation number

129
4.5 Discharge of Water Drained (L min-1) From Site-1, Fazliabad and Site-2,
Manga Dargai, Mardan SCARP
Table 64 shows the water drained per minute, drainage co-efficient (L min-1) from each
site at the given timings of post irrigation for the given number of irrigations. The first
section of the Table 64 contains the mean values averaged across sites and year of
sampling. One can see that the volume of water drained from site-2 was substantially
higher than site-1while variations within the sampling timings in both sites were not large
but enough to account for the variability in the nutrient concentrations and total amount
of leachates (Table 64). Site-2, Manga Dargai, having less clay percent allowed more
water to drain per unit time and that is why the concentrations of cations, macronutrients
and micronutrients in the drainage waters were generally higher from this site compared
to site-1, Fazliabad with higher clay contents.
When values were averaged across the sampling timings, non-significant (p < 0.05)
variations amongst irrigations were observed. When averaged over the irrigation number
and sites, cropping seasons (years) showed significant differences in the drainage co-
efficient. The values of drainage co-efficient during first two years were statistically
similar to each other and significantly higher than year 2005. The volume of waters can
increase or decrease the concentrations of nutrients in drainage waters depending upon
other factors such as the degree and strength of a nutrient adsorption, pH of irrigation
waters, pH of soil, biogeochemical and biological activities, rate of decompositions of
organic materials and redox potential (West, 1990; Lindsay, 1979; Bohn et al., 2001).
The values of drainage co-efficient provided in Table 64, enabled us to work out the
quantity of salts and nutrients leached and moved through the subsurface drainage
system.

130
Table 64 Rate of volume of water [co-efficient of drainage] (L min-1) drained from site-1, Fazliabad and site-2, Manga Dargai as influenced by irrigation number and post irrigation timing , under subsurface tile drainage system during 2003-05
SOV ---------------------------- Post Irrigation Time (h) -------------------------- Mean
Irrig. # 24 30 36 48 72 96
-------------------------- Averages across sites and year of sampling (S x Y)----------------------------------
1st 807 827 872 838 848 879 845 a
2nd 852 820 823 848 837 825 834 a
3rd 813 843 842 868 855 832 842 a
4th 850 841 851 814 837 803 833 a
5th 817 833 845 825 850 845 836 a
6th 843 860 847 842 835 843 845 a
Mean 830 a 837 a 847 a 839 a 844 a 838 a 839 a
-------------------Averages across irrigation number and year of sampling (I x Y)------------------------
Site-1 773 786 793 782 774 794 784 b
Site-2 887 889 901 896 913 882 895 a
------------------------- Averages across irrigation number and sites (I x S)-----------------------------------
2003-04 831 822 845 822 821 819 827 b
2004 820 830 820 815 820 830 823 b
2004-05 840 860 875 880 890 865 868 c
LSD at p < 0.05 for irrigation post irrigation time = 21.31, for year = 15.07 and for site = 12.31

131
4.6 Rate and Quantity of Salts and Nutrients Leached in Drainage Waters From
Site-1, Fazliabad and Site-2, Manga Dargai, Mardan SCARP
The rate of salts and nutrients removed per unit area per unit time (kg or g ha-1 h-1) were
calculated using nutrients concentrations in the respective irrigation at a given time of
sampling. These values are provided in Appendices 2 to 14. This exercise was performed
to get estimate of the degree and extent of losses of nutrients from the system and to
assess the rate of undermining of soils with time so that appropriate fertilizers
recommendations can be formulated for the farming community to ensure optimum yield.
The Appendix 3 indicates hourly losses of salts from the soil calculated on the basis of
ECdw. The data suggest that the soil-drainage system has almost reached to steady state in
terms of salt leached in a given irrigation over the given time. Site-2 generally released
more salts with mean values of 1.00 kg salts ha-1 h-1 than site-1 (0.82 kg salts ha-1 h-1).
Table 65 shows the losses of salts and nutrients where the hourly losses (Appendices 3 –
14) were converted to seasonal losses with average of six months per season. The amount
of salts ranged between 2.251 to 3.981 with mean value of 3.385±0.355 Mg ha-1 in site 1
and from 1.95 to 6.103 with mean value of 3.965±1.328 Mg ha-1 in site-2 during cropping
season 2003-04. The subsequent years also showed relatively higher mean values of
4.058±0.844 and 4.693±0.815 Mg ha-1 for 2004 and 2004-05, respectively in site-2. This
suggest that under the existing irrigation drainage system, whereby amounts of salts
added in irrigation waters is less than the salts removed in drainage waters, the chances
for salts build up in the soil are minimum.
The hourly losses of cations, N (NH4-N, NO3-N), P and K and micronutrients provided in
appendices 4 – 14, apparently seemed to be small but to appreciate its magnitude it is
important to consider the seasonal losses (Table 65). Large amount (kg ha-1) of Na (144
to 584), Ca (19 to 278) and Mg (19 to 239) was lost from site 1 which was similar to site-
2 (Table 65). The major nutrients (N, P and K) removed through drainage waters could
be substantial if considered on annual bases. For instance the observed losses of NH4-N,
NO3-N, P and K ranged between 1.6 to 8.2, 0.7 to 22.9, 0.32 to 7.0 and 18.5 to 53.4 kg
ha-1 season-1 in site-1 (Table 65) would double per year touching the maximum of 16.2,
45.8, 14.0 and 106.8 kg NH4, NO3, P and K ha-1 yr-1, respectively.

132
Table 65 Nutrients and salts removed with drainage water from site-1, Fazliabad and site-2, Manga Dargai in six months with various irrigations during 2003-05 (values are averages across post irrigation times)
Sites Salts Na Ca Mg NH4 NO3 P K Cu Fe Zn Mn
----------------------------------------- kg ha-1------------------------------ -------------- g ha-1 ------------
------------------------------------------------------ 2003-04--------------------------------------------------------
Site1 Min 2251 144 19 19 1.6 0.7 0.3 18.5 729 79 77 81
Max 3981 599 278 239 8.2 22.9 7.0 53.4 3810 2835 1315 3447
Mean 3385 409 124 90 3.2 8.0 3.9 39.0 2642 824 362 1080
SD 355 99 88 72 1.9 5.6 1.5 23.5 787 670 303 701
Site2 Min 2225 143 16 11 1.2 1.2 1.4 14.9 929 62 60 64
Max 8317 444 290 174 7.5 13.7 6.5 35.5 5384 5133 758 5039
Mean 4249 342 93 80 3.2 5.9 3.2 24.3 2871 1290 368 1028
SD 1430 69 73 56 2.0 2.9 1.0 5.2 1006 1284 197 1167
---------------------------------------------------------- 2004--------------------------------------------------------
site1 Min 1543 119 40 8 1.0 1.8 2.1 18.4 665 148 39 723
Max 4637 585 400 271 7.1 9.6 7.8 58.9 6495 816 726 6166
Mean 3375 359 221 101 2.6 5.6 4.2 32.3 4042 466 371 3855
SD 777 101 131 60 1.6 1.9 1.3 9.6 1035 170 204 1213
site2 Min 2426 143 72 10 1.0 3.8 3.3 19.4 445 154 68 807
Max 5412 836 480 427 9.1 13.7 8.3 77.7 5108 757 1140 7455
Mean 4058 419 356 142 3.3 7.8 5.5 38.8 3067 470 394 4845
SD 844 150 109 88 1.9 2.3 1.6 14.1 1371 164 246 1488
------------------------------------------------------ 2004-05--------------------------------------------------------
site1 Min 1568 129 26 22 1.4 0.8 2.4 20.9 1361 272 78 97
Max 4666 677 407 342 9.3 15.2 7.6 105.9 4374 3596 1432 3992
Mean 3856 451 170 103 4.4 6.4 4.4 49.4 3053 1069 487 1409
SD 559 120 109 71 2.5 3.5 1.2 19.8 693 774 318 983
site2 Min 3309 187 25 20 1.9 1.9 5.5 20.7 1555 175 93 207
Max 6843 687 494 249 12.4 19.7 14.5 55.0 8748 3402 1244 9352
Mean 4693 471 181 100 5.9 8.1 8.7 38.5 4269 1238 625 2026
SD 815 123 118 68 2.6 4.3 2.2 8.4 1995 847 334 2017

133
Actually all these nutrients are water soluble and easily bio-available and their removal
could be therefore critical in terms of crop requirements if not adequately replenished
through fertilizers.
The micronutrient losses ranging between < 1.0 and 4.0 kg ha-1 appear to be of limited
magnitude, but in terms of their crop requirement these amounts could make the
difference and may render the soil deficient and the crop yield may suffer if not added to
soil.
Table 66 show the quantity of salts and nutrients leached in drainage waters based on the
drainage co-efficient of 0.30 cm d-1 used during the initial design at the time of laying the
tile drainage system in the area. The values of salts, cations, macro and micronutrients are
comparable to some extent but underestimate the quantity in general when compared to
the amounts calculated from actual measured discharges provided in Table 65. The mean
values provided in Table 66 estimated using the drainage co-efficient are lower than
those in Table 65 calculated from the experimental values of drainage of waters from the
drainage system.
The loss of Ca and Mg through drainage waters from these soils weaken the matrix of the
soil and make it liable to stress exerted through agricultural machinery. During the field
survey it was observed that banks of the fields were eroded and could not withstand
physical pressure and were prone to subsiding.

134
Table 66 Estimated loss of nutrients and salts (six monthly) based on soil hydraulic conductivity (0.3mm d-1) with drainage water from site-1, Fazliabad and site-2, Manga Dargai during 2003-05
Sites Salts Na Ca Mg NH4 NO3 P K Fe Cu Mn Zn
-------------------------------------- kg ha-1------------------------------ --------------- g ha-1 ---------------
--------------------------------------------Rabi 2003-04 ------------------------------------------------------------
Site-1 Min 1217 76 10 10 0.9 0.3 0.2 9.8 43 199 43 43
Max 2184 323 189 121 4.3 12.1 3.8 25.7 1512 3370 1814 648
Mean 1795 223 71 56 1.8 4.5 2.1 20.3 435 1894 566 170
S.D 167 49 49 39 1.0 2.8 0.7 10.3 318 666 378 95
Site-2 Min 1023 95 11 3 0.9 0.2 1.0 8.6 43 691 43 43
Max 3594 327 206 136 5.2 9.5 12.6 23.8 24192 3974 4234 518
Mean 1910 242 72 56 2.2 4.0 2.4 16.4 1443 2104 829 274
S.D 600 49 51 38 1.3 2.1 1.6 3.8 3356 751 940 139
----------------------------------------------- Kharif 2004 ----------------------------------------------------------
Site-1 Min 857 61 20 4 0.5 0.9 1.3 8.9 73 199 298 22
Max 2461 279 215 152 4.3 5.3 3.7 29.0 389 3370 3167 359
Mean 1769 186 111 54 1.5 3.0 2.3 16.3 242 1894 1745 180
S.D 399 53 66 35 0.9 1.0 0.7 4.4 82 666 748 109
Site-2 Min 968 59 25 3 0.4 1.7 1.1 8.6 73 212 359 30
Max 2405 339 213 178 4.9 6.0 3.7 37.0 346 3067 3512 475
Mean 1762 204 142 61 1.7 3.5 2.3 17.2 207 1578 2088 159
S.D 390 64 57 39 1.0 1.0 0.7 5.6 71 611 659 101
-------------------------------------------------- Rabi 2004 -05------------------------------------------------------------
Site-1 Min 746 61 11 4 0.6 0.3 0.8 10.5 35 648 43 35
Max 2433 323 204 152 4.3 7.8 3.4 53.0 1598 1944 1901 734
Mean 1873 200 85 47 1.8 3.0 2.1 23.8 536 1489 630 231
S.D 255 53 58 31 1.1 1.4 0.6 9.7 371 265 461 156
Site-2 Min 1327 77 11 8 0.7 0.3 2.3 7.8 39 536 86 22
Max 3041 314 204 119 5.2 8.2 6.0 23.5 2017 3888 3897 527
Mean 2051 214 85 43 2.3 2.9 3.7 15.7 518 1809 875 270
S.D 351 55 58 28 1.0 1.7 0.8 4.1 424 818 696 157
Note: Values are based on the whole data irrespective of post irrigation time or irrigation number

135
4.7 Nutrient Balances in Soil-Crop-Drainage System
Ten farmers’ fields were selected to estimate the nutrients balance in soil-crop-drainage
system. The following approach was adopted to estimate the nutrient balance in the
system; Balance [nutrients added (organic + inorganic) fertilizers + nutrients added in
irrigation waters] – [nutrients removed by the crop + nutrients leached in drainage water].
To achieve this objective, nutrient balance was estimated for farmers’ fields as well as for
field experiments conducted which are presented here:
4.7.1 Farmers Fields
An effort was made to quantify the nutrients added both as chemical and organic
fertilizers, in irrigation waters and removed by crop and drainage waters. For this purpose
fertilizers and crop yield data were recorded from the ten farmers at each site.
Table 67 shows the balance of NP and K and Table 68 shows balance of micronutrients.
It can be seen that removal of N exceeded amount of N added in all fields in site 1 and six
field in site-2. Negative values ranged from -12.9 to -107.3 kg ha-1 in site-1 and from -7.8
to -89.2 kg ha-1 in site-2. The amount of P was negative in six and four fields in site-1 and
2, respectively. The amount of K was largely and invariably left in negative.
These data suggest rather confirm that nutrients replenishment is necessary and
particularly K, which leached in drainage waters in much higher quantity must be
included in the fertilizers program for optimum crop yield. The variability in the field
was mainly due to the variable amount of nutrients added by the farmers, and to the
variation in yield of crop obtained in addition to variations in irrigation and drainage
waters nutrient concentrations.
The balances of micronutrients (Cu, Fe, Mn and Zn) were invariably in minus (Table 68)
mainly because they are added in small amounts in irrigation waters and also subject to
regular loss through drainage waters. Also, farmers generally do not practice the addition
of micronutrients.

136
Table 67 Addition and removal of NPK in different selected fields at Fazliabad (Mardan) and Manga Dargai (Charsadda) during rabi 2003-04
Farmer’s Name
--------Nitrogen----------- --------Phosphorus------- --------Potassium--------
Add. Rem. Bal Add. Rem. Bal Add.
Rem. Bal
---------------------------------------- kg ha-1 --------------------------------------------- -----------------------------------------------------Site-1, Fazliabad--------------------------------------------- 1 Nawab Khan 112.0 139.4 -27.5 37.2 28.6 8.7 52.3 131.7 -79.4
2 Akbar Khan 52.7 160.0 -107.3 30.3 32.7 -2.3 6.9 149.5 -142.6
3 Azeem Khan 46.5 186.1 -139.5 14.4 37.3 -22.9 12.5 162.1 -149.6
4 Amanullah 62.6 156.4 -93.8 56.1 31.8 24.3 29.6 142.7 -113.1
5 Mahmood 139.2 152.0 -12.9 25.4 30.9 -5.5 6.9 139.1 -132.3
6 Salim 126.8 151.8 -25.0 75.0 30.8 44.2 6.9 137.9 -131.0
7 Said Badshah 167.6 186.0 -18.5 25.4 37.0 -11.6 6.9 156.0 -149.1
8 Farman 68.8 142.2 -73.4 31.3 29.1 2.2 29.6 133.2 -103.6
9 Sharif Gul 73.3 142.0 -68.7 29.3 29.0 0.3 22.0 132.6 -110.6
10 Sultan 61.3 138.2 -76.8 28.3 28.5 -0.2 18.2 133.9 -115.7 -------------------------------------------------------- Site-2, Manga Dargai ---------------------------------------
1 Feroz Shah 116.3 146.0 -29.6 50.6 30.0 20.6 8.7 137.4 -128.7
2 Owaiz 161.8 154.9 6.9 34.7 31.3 3.4 42.8 135.0 -92.2
3 Waqas 161.8 144.4 17.4 50.6 29.4 21.2 8.7 129.4 -120.7
4 Amin 139.6 167.9 -28.4 25.8 33.7 -7.9 8.7 142.6 -133.9
5 Akbar Shah 105.0 176.8 -71.8 50.6 35.4 15.1 8.7 150.8 -142.1
6 Israr 154.4 150.6 3.8 31.7 30.6 1.1 31.4 134.7 -103.3
7 Idris 139.6 149.1 -9.5 25.8 30.5 -4.7 8.7 137.0 -128.3
8 Anwar Shah 154.4 162.2 -7.8 31.7 32.7 -1.0 31.4 140.5 -109.1
9 Ashfaq 122.3 141.3 -19.0 38.2 28.8 9.3 8.7 127.8 -119.1
10 Feroz Khan 66.3 153.5 -87.2 21.4 31.1 -9.7 23.8 135.9 -112.1
The balances of NPK were based on the differences between nutrient supplied through fertilizers (chemical + FYM) and irrigation waters and removed by crop (grain + straw) and drained with sub-surface tile drains.
Total seasonal (6 irrigations) addition of N in irrigation waters in Fazliabad and Manga Dargai were 3.3 and 3.7 kg ha-1 and removal in drainage waters was 11.68 and 8.74 kg ha-1
Total seasonal (6 irrigations) addition of P in irrigation waters in Fazliabad and Manga Dargai were 0.6 and 1.0 kg ha-1 and removal in drainage waters was 4.05 and 3.36 kg ha-1
Total seasonal (6 irrigations) addition of K in irrigation waters in Fazliabad and Manga Dargai were 6.9 and 8.7 kg ha-1 and removal in drainage waters was 38.35 and 23.55 kg ha-1

137
Table 68 Addition and removal of Cu, Fe, Mn and Zn in different selected fields at Fazliabad (Mardan) and Manga Dargai (Charsadda) during rabi 2003-04
Field#
------------Cu----------- ------------Fe------------ ------------Mn----------- ------------Zn------------
Add. Rem.
Bal Add. Rem. Bal Add. Rem.
Bal Add. Rem. Bal
------------------------------------------------------ kg ha-1 -------------------------------------------------------- -------------------------------------------------------Site-1, Fazliabad--------------------------------------------------- 1 0.35 2.73 -2.38 2.12 2.27 -0.15 1.67 1.76 -0.08 1.06 0.55 0.51
2 0.25 2.74 -2.49 0.24 2.54 -2.30 0.51 1.89 -1.38 0.17 0.58 -0.41
3 0.26 2.75 -2.49 0.47 2.74 -2.26 0.66 1.98 -1.33 0.28 0.61 -0.33
4 0.30 2.74 -2.44 1.18 2.44 -1.26 1.09 1.84 -0.75 0.61 0.57 0.04
5 0.25 2.74 -2.49 0.24 2.38 -2.14 0.51 1.81 -1.30 0.17 0.56 -0.39
6 0.25 2.74 -2.49 0.24 2.36 -2.12 0.51 1.80 -1.29 0.17 0.56 -0.39
7 0.25 2.75 -2.50 0.24 2.64 -2.40 0.51 1.94 -1.43 0.17 0.61 -0.44
8 0.30 2.73 -2.43 1.18 2.29 -1.11 1.09 1.77 -0.68 0.61 0.55 0.06
9 0.28 2.73 -2.45 0.87 2.28 -1.41 0.90 1.76 -0.87 0.47 0.55 -0.08
10 0.27 2.73 -2.46 0.71 2.30 -1.59 0.80 1.77 -0.97 0.39 0.55 -0.16 ----------------------------------------------------------Site-2, Manga Dargai----------------------------------------------
1 0.62 3.10 -2.48 0.19 3.95 -3.76 0.26 2.03 -1.77 0.10 0.64 -0.54
2 0.69 3.10 -2.41 1.60 3.93 -2.33 1.13 2.02 -0.89 0.77 0.65 0.12
3 0.62 3.09 -2.47 0.19 3.86 -3.67 0.26 1.98 -1.72 0.10 0.63 -0.53
4 0.62 3.11 -2.49 0.19 4.02 -3.83 0.26 2.07 -1.81 0.10 0.67 -0.57
5 0.62 3.11 -2.49 0.19 4.12 -3.93 0.26 2.12 -1.86 0.10 0.69 -0.59
6 0.67 3.10 -2.43 1.13 3.92 -2.79 0.84 2.01 -1.17 0.54 0.64 -0.10
7 0.62 3.10 -2.48 0.19 3.94 -3.75 0.26 2.03 -1.77 0.10 0.64 -0.54
8 0.67 3.10 -2.43 1.13 3.99 -2.86 0.84 2.05 -1.21 0.54 0.66 -0.12
9 0.62 3.09 -2.47 0.19 3.84 -3.65 0.26 1.97 -1.71 0.10 0.63 -0.53
10 0.65 3.10 -2.45 0.82 3.94 -3.12 0.65 2.02 -1.38 0.40 0.65 -0.25
The balances of Cu, Fe, Zn and Mn were based on the differences between nutrient supplied
through fertilizers (chemical + FYM) and irrigation waters and removed by crop (grain +
straw) and drained with sub-surface tile drains.
Total seasonal (6 irrigations) addition of Cu in irrigation waters in Fazliabad and Manga
Dargai were 0.25 and 0.62 kg ha-1 and removal in drainage waters was 2.66 and 3.02 kg ha-1
Total seasonal (6 irrigations) addition of Fe in irrigation waters in Fazliabad and Manga
Dargai were 0.24 and 0.19 kg ha-1 and removal in drainage waters was 0.83 and 2.59 kg ha-1
Total seasonal (6 irrigations) addition of Mn in irrigation waters in Fazliabad and Manga
Dargai were 0.51 and 0.26 kg ha-1 and removal in drainage waters was 1.07 and 1.28 kg ha-1
Total seasonal (6 irrigations) addition of Zn in irrigation waters in Fazliabad and Manga
Dargai were 0.17 and 0.10 kg ha-1 and removal in drainage waters was 0.36 and 0.40 kg ha-1

138
4.7.2 Field Study
Field experiments were also conducted to evaluate the losses of N, P and K. Three levels
of NP and K were added to maize (Table 69) and wheat crops (Table 70). This
experiment allowed us to obtain more authentic data as compared to farmers field data.
Table 69 shows that as rates of N, P and K increased, yield of maize increased in both
sites. Although due to higher biomass, N removal also increased, but because of proper
fertilizers doses negative balance was highest in control (No NPK added) and lowest in
the highest treatments of N. The P was surplus in P treatments while K remained in
negative. The second year (2004-05) data also showed similar results (Table 70).
The field results confirmed that nutrients replenishment is imperative for sustainable crop
production in the SCARP, Mardan.
The post harvest soil analyses are provided in Tables 71 and 72. Soil pH showed
variations with depth with values ranging from 7.90 to 8.30. The ECe values remained
within the non-saline limits covering a range of 0.16 to 0.28 in site-1 and 0.28 to 0.60 dS
m-1 in site-2. An increasing trend in ECe with depth can be seen at given level fertilizer
but when data were averaged over depth, the ECe values were similar at the applied
levels of NPK (Table 71). Slightly higher values of N, P and K in soil could be seen in
surface soil samples when NPK was added but leaching to lower depths was also
observed. When averaged across sampling depth, all nutrients increased with increasing
rates of N, P and K (Table 71 and 72).

139
Table 69 Addition and removal of N,P and K by maize grown under the given levels of fertilizers at site-1, Fazliabad and site-2, Manga Dargai during Kharif 2004
Fertilizer Maize yield ---------Nitrogen----- ------Phosphorus------ ------Potassium--------
N-P2O5-K2O Grain Straw *Add. Rem. Bal Add. Rem. Bal Add. Rem. Bal
----------------------------------------------------------- Kg ha-1 ---------------------------------------------------------------
--------------------------------------------------- Site-1, Fazliabad -----------------------------------------------------------
0-0-0 820 2214 5.4 32.74 -27.3 1.5 9.26 -7.8 7.1 63.99 -56.9
90-60-30 1735 4684 95.4 65.4 30.0 27.7 16.61 11.1 32.1 129.34 -97.3
120-90-60 3200 8768 125.4 128.12 -2.7 40.8 29.53 11.3 57.1 235.27 -178.2
--------------------------------------------------- Stie-2, Manga Dargai -----------------------------------------------------------
0-0-0 840 2276 5.9 35.307 -29.4 2.5 9.34 -6.9 8.6 74.68 -66.1
90-60-30 1680 4452 95.9 65.31 30.6 28.7 15.57 13.1 34.8 128.96 -94.2
120-90-60 3000 7860 125.9 113.12 12.8 41.8 28.83 12.9 47.9 210.90 -163.0
Addition of nutrients included additions through chemical fertilizers (urea, DAP and SOP)
while removal included crop uptake (grain + straws) and losses through drainage water
Total seasonal (6 irrigations) addition of N in irrigation waters in Fazliabad and Manga
Dargai were 5.4 and 5.9 kg ha-1 and removal in drainage waters was 8.35 and 11.56 kg ha-1
Total seasonal (6 irrigations) addition of P in irrigation waters in Fazliabad and Manga
Dargai were 1.5 and 2.5 kg ha-1 and removal in drainage waters was 4.24 and 5.09 kg ha-1
Total seasonal (6 irrigations) addition of K in irrigation waters in Fazliabad and Manga
Dargai were 7.1 and 8.6 kg ha-1 and removal in drainage waters was 30.82 and 38.13 kg ha-1

140
Table 70 Addition and removal of N,P and K by wheat grown under the given levels of fertilizers at site-1, Fazliabad and site-2, Manga Dargai during rabi 2004-2005
Fertilizer Wheat yield ---------Nitrogen----- ------Phosphorus------ ------Potassium--------
N-P2O5-K2O Grain Straw Add Rem Bal Add Rem Bal Add Rem Bal
----------------------------------------------------------- Kg ha-1 ---------------------------------------------------------------
-------------------------------------------------- Fazliabad (Mardan) -----------------------------------------------------------
0-0-0 1000 2250 6.0 33.1 -27.0 1.6 9.44 -7.8 12.5 85.69 -73.2
90-60-30 4430 7640 96.0 122.3 -26.3 27.8 33.37 -5.6 37.5 190.36 -152.8
120-90-60 5110 8110 126.0 155.3 -29.3 40.9 46.07 -5.2 57.1 201.75 -144.7
--------------------------------------------------- Dargai (Charsadda) ---------------------------------------------------------
0-0-0 1200 2000 7.2 35.6 -28.4 1.9 13.52 -11.6 12.8 69.56 -56.8
90-60-30 4070 8170 97.2 120.4 -23.2 28.1 33.22 -5.1 39.0 176.05 -137.0
120-90-60 5050 8070 127.2 149.4 -22.2 41.2 46.43 -5.2 52.1 190.29 -138.2
Addition of nutrients included additions through chemical fertilizers (urea, DAP and SOP)
while removal included crop uptake (grain + straw) and losses through drainage water
Total seasonal (6 irrigations) addition of N in irrigation waters in Fazliabad and Manga
Dargai were 6.02 and 7.2 kg ha-1 and removal in drainage waters was 10.02 and 11.62 kg ha-1
Total seasonal (6 irrigations) addition of P in irrigation waters in Fazliabad and Manga
Dargai were 1.6 and 1.9 kg ha-1 and removal in drainage waters was 4.26 and 8.36 kg ha-1
Total seasonal (6 irrigations) addition of K in irrigation waters in Fazliabad and Manga
Dargai were 12.5 and 12.8 kg ha-1 and removal in drainage waters was 49.86 and 35.20 kgha-1

141
Table 71 Post harvest soil pHe, ECe, KCl extractable NH4-N and NO3-N and AB-DTPA extractable P and K as influenced by the given NPK level to maize crop during 2004 at site-1, Fazliabad and site-2, Manga Dargai under subsurface drainage system
Soil depth
--------------------Site-1, Fazliabad Site-2, Manga Dargai
pH EC NH4 NO3 P K pH EC NH4 NO3 P K
cm dS m-1 ------------- mg kg-1------------ dS m-1 ------------- mg kg-1------------
-------------------------------------------- 0:0:0 kg N:P2O5:K2O ha-1--------------------------------------------------------
0-45 8.20 0.17 13.9 19.4 3.0 100.0 7.80 0.36 14.3 12.0 2.5 200.0
45-90 8.00 0.20 12.6 17.9 3.4 182.9 7.89 0.43 14.0 12.7 2.4 180.0
90-135 8.30 0.23 11.9 12.2 2.5 190.7 8.30 0.48 13.0 11.7 2.0 172.0
135-180 7.97 0.22 13.0 10.9 2.7 200.0 8.00 0.55 13.1 13.0 2.2 160.0
180-225 8.10 0.20 10.4 8.0 2.0 165.8 8.10 0.51 11.9 12.3 1.7 110.0
225-270 8.00 0.25 12.0 8.8 2.2 128.0 8.00 0.60 11.2 13.0 1.0 73.0
--------------------------------------------90:60:30 kg N:P2O5:K2O ha-1--------------------------------------------------------
0-45 8.15 0.17 14.0 20.1 4.9 172.3 7.90 0.29 20.5 12.3 2.6 218.9
45-90 7.90 0.19 13.1 15.7 4.6 160.9 7.83 0.32 12.1 16.1 2.4 210.2
90-135 8.00 0.22 12.3 12.0 5.0 188.0 8.00 0.30 13.4 17.4 2.1 202.7
135-180 8.28 0.21 13.7 13.5 4.0 200.7 7.98 0.40 12.0 12.6 1.8 190.8
180-225 7.98 0.18 11.4 8.8 4.7 170.5 8.10 0.47 12.5 12.9 2.2 171.5
225-270 8.10 0.26 11.9 9.6 4.1 120.7 8.00 0.64 8.3 12.5 1.8 160.4
-------------------------------------------- 120:90:60 kg N:P2O5:K2O ha-1--------------------------------------------------------
0-45 7.90 0.16 16.5 23.3 5.4 215.0 8.00 0.28 21.4 17.8 4.1 230.0
45-90 8.00 0.21 14.5 19.4 4.9 221.0 7.92 0.33 16.9 15.4 3.8 200.4
90-135 8.20 0.19 15.0 21.5 5.4 197.3 8.10 0.42 14.6 16.2 2.7 187.9
135-180 8.10 0.23 13.3 14.8 4.5 223.6 7.90 0.39 13.0 14.4 3.3 193.5
180-225 8.30 0.21 12.0 15.7 5.0 156.7 8.00 0.45 14.1 14.0 3.0 188.0
225-270 8.10 0.28 12.2 17.5 4.5 145.7 7.87 0.53 11.4 14.6 3.2 175.7
---------------------------------------------Averaged across soil depths and locations-----------------------------------------------
0-0-0 8.10 0.21 12.3 12.9 2.6 161.2 8.02 0.49 12.9 12.4 2.0 149.2
90-60-30 8.07 0.20 12.7 13.3 4.6 168.8 7.97 0.40 13.1 14.0 2.2 192.4
120-90-60 8.10 0.21 13.9 18.7 4.9 193.2 8.0 0.40 15.2 15.4 3.3 195.9

142
Table 72 Post harvest soil pHe, ECe, KCl extractable NH4-N and NO3-N and AB-DTPA extractable P and K as influenced by the given NPK level to wheat crop during 2004-05 at site-1, Fazliabad and site-2, Manga Dargai under subsurface drainage system
Soil depth
--------------------Site-1, Fazliabad---------------------- -------------Site-2, Manga Dargai----------------------
pH EC NH4 NO3 P K pH EC NH4 NO3 P K
cm dS m-1 ------------- mg kg-1------------ dS m-1 ------------- mg kg-1------------
---------------------------------------- 0:0:0 kg N:P2O5:K2O ha-1--------------------------------------------------------
0-45 7.98 0.18 14.0 18.9 3.8 140.0 7.9 0.30 13.9 12.5 2.0 190.0
45-90 8.10 0.21 12.7 15.9 3.5 195.8 8.0 0.39 14.8 13.0 2.1 180.0
90-135 8.28 0.23 11.8 12.1 2.7 100.9 7.9 0.41 12.8 12.0 2.6 156.0
135-180 8.00 0.20 14.2 14.0 2.8 210.0 8.1 0.50 13.0 12.8 1.8 160.0
180-225 8.22 0.23 11.5 10.3 3.0 175.0 8.3 0.54 12.1 12.0 1.6 150.0
225-270 8.20 0.26 12.0 19.0 2.3 135.0 8.1 0.60 12.4 13.7 1.0 100.0
8.13 0.22 12.7 15.0 3.0 159.5 8.1 0.46 13.2 12.7 1.8 156.0
------------------------------------- 120:90:60 kg N:P2O5:K2O ha-1-----------------------------------------------------
0-45 8.00 0.17 20.3 18.0 5.1 160.7 8.0 0.31 20.4 12.0 2.8 210.0
45-90 8.20 0.20 14.0 17.2 4.8 210.0 8.2 0.35 13.0 16.0 2.5 200.0
90-135 8.00 0.23 13.2 12.9 4.9 130.0 8.0 0.32 12.6 16.4 2.4 170.0
135-180 7.95 0.20 12.0 14.6 4.0 210.9 8.0 0.41 12.0 13.0 2.0 165.0
180-225 8.20 0.20 14.0 13.0 5.0 180.7 7.9 0.50 10.8 12.6 2.1 148.0
225-270 8.00 0.28 12.3 20.5 4.3 145.0 8.1 0.58 10.0 15.5 1.5 90.0
8.06 0.21 14.3 16.0 4.7 172.9 8.0 0.41 13.1 14.2 2.2 163.8
----------------------------------------- 120:90:60 kg N:P2O5:K2O ha-1-------------------------------------------------
0-45 8.10 0.18 20.5 19.5 5.6 180.0 7.9 0.27 18.5 20.0 5.0 225.0
45-90 8.30 0.22 14.7 17.6 5.0 220.0 8.0 0.32 18.0 18.7 4.3 200.0
90-135 7.97 0.20 14.0 13.0 5.2 140.0 8.2 0.39 15.6 18.0 4.0 180.0
135-180 8.20 0.22 13.2 14.9 5.0 210.0 8.0 0.40 15.0 17.6 4.1 190.0
180-225 8.00 0.25 14.1 13.7 5.1 200.7 8.2 0.44 15.0 15.0 3.8 200.0
225-270 8.10 0.27 12.5 20.3 4.7 170.0 8.1 0.50 13.3 15.2 3.0 178.0
------------------------------------------------Averaged across soil depths and locations -----------------------------------------------
0-0-0 8.13 0.22 12.70 15.03 3.0 159.4 8.05 0.46 13.17 12.66 1.84 156.00
90-60-30 8.06 0.21 14.30 16.03 4.6 172.8 8.02 0.41 13.14 14.23 2.21 163.83
120-90-60 8.11 0.22 14.84 16.49 5.1 186.7 8.07 0.39 15.89 17.43 4.03 195.50

143
5. SUMMARY
The twin problems of water logging and salinity are widespread in the irrigated land all
over the world. Annually 1.5 m ha of irrigated land is lost due to salinity and water
lagging globally. These two issues were major factors in the decline of farm productivity
in Mardan and Charsadda districts of Khyber Pakhtunkhwa (KPK) Province, Pakistan.
Water table had risen, accompanied by increasing salinization of agricultural lands. The
negative impacts of excessive water on crop production were coupled with a series of
bio-chemical changes in soil properties. To overcome the problem of water logging and
salinity, Salinity Control and Reclamation Project (SCARP) was initiated in 1979 and
completed in 1992 in the area of Districts Mardan and Charsadda.
The subsurface tile drainage system was executed, whereby 150 m long lateral porous
pipes were installed at a depth to 2.0 to 3.0 m with 90 m spacing. The lateral pipes were
connected to a 1200 m long main collector pipe opening into main open drain. This study
was undertaken to evaluate the nutrients losses occurring in the project area through a
comprehensive subsurface tile drainage system. To achieve this objective two sites for
assessing nutrients dynamics, site-1 located at Fazliabad, Mardan and site-2 located at
Manga Dargai Charsadda, were selected. For the selection of these sites a well designed
questionnaire was constructed and field survey was conducted and was personally
completed for collection of the relevant information regarding crops, fertilizers
application and drainage system in the area. After site selection, ten farmer’s fields per
site were specified for recording data on irrigation water, soils, crops and drainage
waters. Samples of irrigation, drainage waters and soils were collected for three cropping
seasons, Rabi wheat (2003-04), Kharif maize (2004) and Rabi wheat (2004-05). A total
of six irrigation waters were applied for each crop. After every irrigation, samples of
subsurface drainage waters were collected over post irrigation timings of 24, 30, 36, 48,
72 and 96 h. Drainage coefficient or discharge of water from main horizontal drainage
pipe was recorded. Soil samples were collected up to a depth of 270 cm at an increment
of 45 cm from the surface at both sites before and after cropping. Soil, irrigations waters
(iw), and drainage water (dw) were analyzed for pH, EC, Ca, Mg, Na, N, P, K, Cu, Fe,

144
Mn and Zn in addition to soil organic matter, lime contents, particle size distribution,
leaching fraction, permeability and hydraulic conductivity.
Statistical analysis was performed using factorial models for post irrigation drainage
water sampling and soil properties to assess the effect of contributing factors on
irrigation, drainage waters and soil samples with time and location.
The field survey indicated improvements in soil properties (EC and SAR), crop yields
intensities and hence in the socio-economic conditions of farmers in the SCARP areas.
Besides the above advantages of subsurface drainage system, it was observed that the
Poplar (Populus alba) plantation disturbed the tiles and resulted in blockage and breakage
of drainage pipes in parts of the area. The banks of irrigation waters revealed soil erosion
and subsidence due to weak soil matrix associated with leaching of Ca and Mg. Nutrients
requirements have gone up and need to be supplied proportionately to get higher yield of
the crops.
The irrigation water analysis showed that pH values of irrigation water varied between
6.99 and 7.46 with mean value of 7.28 ±0.17. The values of EC and pH at site-2 were
higher than site-1. The ECiw was more variable (0.13 to 0.73) with mean value of
0.42±0.18 dS m-1 but remained within permissible limits for irrigation (ranging between
0.29 to 0.46 in site-1 and 0.41 to 0.46 in site 2). The concentration of Ca, Mg, Na and
hence SAR values were also in the permissible range in both sites. Irrigation waters
applied to site-2 contained lower Ca, Mg but higher Na than site-1. The higher EC and
Na at site-2 was attributed to the mixed drainage and canal water supplied through Hisara
drain as compared to the direct canal water application at site-1.
The concentrations of macro- and micronutrients in irrigation waters were smaller,
however considering the given volume of water applied per each number of irrigation,
and total irrigation per crop, then these nutrients concentrations would be significant with
respect to the immediate supply to crops as well as in terms of leaching in the drainage
system. For instance the seasonal addition of readily bio-available NH4-N, NO3-N, P and

145
K ranged between 1.24 to 3.36, 1.85 to 4.24, 0.56 to 2.88 and 6.86 to 12.3 kg ha-1,
respectively in irrigation water. Like EC and Na, the nutrients inputs through irrigation
water at site-2 were higher than site-1.
Statistical analysis using factorial model (sampling time x 6 locations over time x 2
replications over locations x 6 sampling depths) showed variable changes in soil
parameters. The soil pH significantly varied with location x time of sampling. The ECe
values were invariably below 1.0 dS m-1 and showed significant variations with depths of
sampling, time of sampling and sites. The concentrations of cations and lime tended to
increase with sampling depths when averaged across sampling time and locations.
The values of SOM were low ≤ 1.0 g 100 g-1 soil, but showed a consistent trend with
depths of sampling and time of sampling, with little variations between the two sites. The
concentrations of NH4 –N and NO3 –N were higher in the top depths and substantially
decreased in lower depths for both sites. The concentrations of AB-DTPA extractable [P]
were in the medium range (>4.0 to < 6.0 mg kg-1) in site-1 and low (< 3.0 mg kg-1) in
site-2 and were significantly higher in upper depth. AB-DTPA extractable [K] were
adequate and site-2 maintained higher [K] than site-1 and varied significantly with all
variables except their interaction.
The concentration of [Fe] and [Mn] showed significant variability with sampling time,
depth and location while [Cu] and [Zn] were not significantly affected at replication over
location and sampling time, respectively. The [Cu] in surface soil samples was the
highest for all three timings in site-1 but in site-2 this trend was lacking. Variability in
[Fe] in fields for the given depth was higher, site-2 had higher [Fe] than site-1. When
averaged across depths and locations, the [Fe] increased with depths. The mean values of
[Mn] averaged across depths increased with subsequent sampling in site-1 and decreased
in site-2. Higher values at lower depths suggested leaching of Fe and Mn. The [Zn]
showed significant variations in respect of soil depth and depth x sampling times and
non-significant with sampling time and replication over sites.
The silt, clay, soil permeability and leaching fraction significantly varied with depth. The
site-2 contained relatively less silt as compared to site-1. Soil permeability data revealed

146
higher values for site-1 as compared to site-2, with values mostly ranging from 0.42 to
0.67 mm d- 1 in site-1 and from 0.46 to 0.67 mm d-1 in site-2 with grand mean of 0.55 and
0.57 mm d-1, respectively. The mean values for L.F for three sampling periods were
0.23± 0.04, 0.25±0.04 and 0.24±0.04 for site-1 and 0.22±0.04, 0.23±0.03 and 0.24±0.04
in site-2, for the given sampling periods in disturbed soil samples. The hydraulic
conductivity of the soil with mean values of 1.18±0.13, 1.07±0.13 and 1.22±0.12 mm d-1
in site-1 for the the three soil samplings periods, while in site-2 these values were
1.35±0.09, 1.20±0.05 and 1.26±0.10 mm d-1 for the corresponding period.
Based on statistical factorial analysis [2 sites x 3 seasons x 6 irrigations x 6 post
irrigations sampling timings], sites, cropping season and number of irrigation induced
significant variations in the values of pH, EC, Ca, NH4-N, P, and K concentrations in
drainage waters, collected after each irrigation at the given timings. The drainage water
pH was higher at site 2 (7.84) than site-1 (7.76) when averaged across all other factors.
With few exceptions, the values of ECdw remained below 1.0 dS m-1 and mean values of
post irrigations timings for given irrigations and for a given time of sampling for each
irrigation invariably remained within the permissible limit for agricultural use in both
sites and during all years. The values of ECdw for site-2 were invariably higher than site-1
during all the three years. The [Na]dw was non-significantly affected by all sources of
variations except interactions. The observed values of [Na]dw in almost all instances were
in the range considered safe for irrigation. The values of [Ca]dw and [Mg]dw were lower
than [Na]dw by a factor of 2 or 3. The [Ca]dw and [Mg]dw were significantly higher in
site-2 than site-1.
The changes in [NH4-N]dw, [NO3-N]dw, [P]dw and [K]dw were non-significant with post
irrigation timings while years of sampling had significant effect on the concentrations of
these major nutrients in the drainage water. The [NH4-N]dw with few exceptions were
mostly below 0.60 mg L-1 in both sites during the three years of samplings. The [NO3-
N]dw were significantly affected by sites, year of sampling and irrigation numbers and its
values varied from 0.69 to 0.97 mg L-1. The concentrations of [P]dw showed significant
variations with sites and years of samplings and non significant variations with post

147
irrigation sampling and number of irrigation water applied during each growing season. It
ranged from 0.40 to 0.94 mg P L-1 when averaged across sites and seasons. The [K]dw
values recorded during the three cropping seasons at each irrigation water applied and
post irrigation timings were quite sizable reaching up to 10.3 mg L-1 with grand mean
values of 4.35 mg L-1. This observation suggested K replenishment in the form of
fertilizers on regular basis. The [K]dw was significantly higher in site-1 than site-2.
The concentrations of micronutrients [Cu, Fe, Mn and Zn]dw though seemed of minor
magnitude but because of their requirements and availability in minute amounts can play
a significant role in terms of crop production. The [Cu]dw responded significantly to
number of irrigations and non significantly to sites, year of sampling and to timings of
post irrigation. When averaged across irrigation and years of sampling, site-1 and site-2
showed statistically similar [Cu]dw. The [Fe]dw responded significantly to sites, year of
sampling and post irrigation timings and non significantly to number of irrigation. When
the data were averaged across timings and numbers of irrigations for year x sites
interactions, it was noted that site-2 produced significantly higher [Fe]dw with value of
0.21 mg L-1 than site-1 during 2003-04. Changes in the [Mn]dw values were significant
for sites and year of sampling and number and post irrigation timings exerted non-
significant variations. The variations in [Zn]dw were significantly affected by year of
sampling while sites, irrigation number and timing after application had no significant
effect on [Zn]dw. The [Zn]dw were lower than all other micronutrients studied, while
[Cu]dw were several fold higher than Fe,Mn and Zn.
The volume of water drained (drainage co-efficient) from each site at the given timings of
samplings and that water drained from site-2 was substantially higher than site-1.The rate
of salts and nutrients removed per unit area per unit time (kg or g ha-1 h-1) were calculated
using nutrient concentrations in the irrigations at a given time of sampling. The data
suggested that the soil drainage system had almost reached to steady state in term of salt
leaching in a given irrigation over the given time. Site-2 generally released more salts
than site-1. The observed seasonal losses in drainage waters ranged from 1.6 to 8.2 (NH4-
N), 0.7 to 22.9 (NO3-N), 0.32 to 7.0 (P), 18.5 to 53.4 (K) kg ha-1 in site-1 and 1.2 to 7.5,

148
1.2 to 13.7, 1.4 to 6.5 and 14.9 to 35.5 for these nutrients, respectively in 2003-04. More
or less similar losses were observed with some variations in the subsequent years.
Two set of experiments, one under farmer’s conventional practice (farmers’ field) for
wheat crop and the other with addition of specified doses of NPK as 0:0:0, 90:60:30 and
120:90:60 kg ha-1 were conducted on maize and wheat for the two consecutive seasons to
evaluate the nutrient balance in irrigation-soil-crop-drainage system. The results revealed
that removal of N exceeded the amount of N added in farmers’ fields. Similarly, the net
balance of P was negative in six fields in site-1 and four fields in site-2. The K values
largely and invariably left in negative in all field at both sites. The negative values of N,
P and K data suggested nutrients replenishment for optimum yield and soil fertility on
sustainable basis. In the same fashion, the net balances of Cu, Zn, Fe and Mn were
invariably in minus because they were added in small amounts in irrigation waters only
and concomitantly subjected to regular losses through drainage waters.
The 2nd set of experiments, which were conducted to evaluate the net balances of N, P
and K under their various doses, revealed that with increasing rates N, P and K, yield of
maize (272 and 81%) and wheat (366 and 19 %) increased over control and conventional
NPK levels, respectively, when averaged across the two sites. Negative balances of N, P
and K were in the control and lowest in the highest treatments of N. The P was surplus in
treatments while K remained in negative. These results confirmed that nutrients
replenishment is imperative for sustainable crop production in the Mardan SCARP area.

149
6. CONCLUSIONS
The irrigation waters at both sites were of good quality having no potential threat
of developing salinity problems
These waters contained substantial amounts of water soluble and readily bio-
available macro- and micronutrients; N (5.23), P (1.66), K (9.17), Cu (1.15), Fe
(0.16), Zn (0.11), Mn (0.42) kg ha-1 season-1, when averaged across seasons and
locations.
The nutrients addition in six irrigation per season for site-2 were relatively higher
than site-1 that could be due to the combined sources of canal and drainage waters
used for irrigation at site-2 through Hisara drain while site-1 received canal
water.
The soils in both sites were slightly alkaline, strongly calcareous and had no sign
of salinity.
The site-1 had relatively higher pH, EC and Na as compared to site-2 while the
reverse were true for Ca and Mg that could be related to irrigation waters and soil
texture whereby site-2 had comparatively coarser texture as also indicated by
higher permeability, leaching fraction and hydraulic conductivity at site-2 as
compared to site-1,
The site-2 had relatively higher organic matter, mineral N, AB-DTPA extractable
K, Fe, and Mn but lower P, Cu, and Zn as compared to site-1. However, it was
observed that except K, Cu, and Zn which were adequate to high, the other
nutrients and OM were low at both sites.
The soil pH, [Na], [Ca], OM, and [NH4-N] in soil significantly decreased with
cropping seasons while EC, [Mg], LF, PM, lime, [NO3-N], [P] and [Fe]
significantly increased with cropping season when the values were averaged
across the fields, sites and depth of soil samples.
The soil pH, EC, Na, Ca, Mg, sand, L.F, OM, N, P, K, Cu, and Zn significantly

150
decreased with the increase in soil depth. While the Clay contents, lime, Fe and
Mn increased with increasing soil depths when values were averaged across field,
sites and season of samplings.
The drainage waters analyzed at each irrigation for six post irrigation timings
revealed no significant differences with post irrigation timings.
The seasonal loss of salts and macro and micronutrients in drainage waters were :
3936 (salts) 408 (Na), 190 (Ca), 102 (Mg), 3.7 (NH4-N), 6.9 (NO3-N), 4.9 (P),
37.0 (K), 3.3 (Cu), 0.9 (Fe), 0.4 (Zn), and 0.3 (Mn) kg ha-1 when averaged across
sites, irrigation number, post irrigation timings and year of samplings, which
could deplete soil fertility and result in yield reduction of crops if not replenished
on regular basis.
This was supported by field experiments whereby substantial increase in wheat
and maize were observed with increasing rates of N, P and K as fertilizers.

151
7. RECOMMENDATIONS
In overall, the drainage waters were of good quality and contained substantial
amounts of nutrients. Their use for irrigation purpose would enhance the soil
fertility without causing any potential threat to salinity development under the
existing drainage system.
To overcome the nutrient depletion due to crop removal and losses through
drainage waters, N, P, and K should be added at the rate of 120:90:60 kg ha-1
instead of conventional rates applied by farmers.
The K, highly leachable under the existing system must be applied through
fertilizers to recover the gap produced by the losses through drainage.
The net losses of micronutrients though were of small magnitude but their
requirements in small amounts necessitate their proper monitoring to ensure
profitable crop yields.
Such practices that enhance the retention of soil nutrients and waters, like the
addition of organic matter and crop residue management should be adopted to
reduce the loss of nutrients with drainage waters from the system.
Proper dosage, split application of fertilizers and avoiding the use of nitrate in
the project area would reduce the ultimate losses of nutrients from the system.
Crop rotation especially the inclusion of leguminous crops would improve the
soil characteristics and enhance the soil fertility status.
In view of the excessive losses of bases, particularly Ca and Mg, application
of pressmud and gypsum will be advisable to maintain good soil physical
conditions and reduce nutrient losses.

152
8. LITERATURE CITED
Abdullah, M., M.A. Tahir, and A.D. Khan. 2002. Investigation on nitrate nitrogen (NO3-N) in ground water of Mardan SCARP area, NWFP. Abstracts of 9th Int. Congr. of Soil Sci., (2002), p.p. 14-15.
Adriano, D.C. 1986. Trace Elements in the Terrestrial Environment. Springer-Verlag. New York, Berlin, Heidelberg, Tokoyo
Agric. Stat. of Pak. 2009. Agricultural Statistics of Pakistan (2008-2009). Min. of Food and Agriculture, Economic Wing, Government of Pakistan, Islamabad
Ahmad, M., R.A. Khattak, and D. Muhammad. 2008. Soil evaluation of Kafoor Dheri farm for crop production. Soil and Environ. 27(1):43-51
Ahmad, T. 2004. Impact of Mardan SCARP on soil salinity and waterlogging. M.Sc (Hons) Thesis. Department of Soil and Environ. Sci. KPK Agric. Univ. Peshawar. Pak.
Ajmal, K., M. Ahmad, M. A. Avais, S. Kanwal, and S. Ghill. 2004. Relationships of soil texture and organic matter with available potassium and saturation percentage of soils. Pak. J. Soil. Sci. 23(1-2): 67-74.
Alexander, M. 1971. The Nitrogen Cycle. p. 225-305. In Introduction to Soil Microbioligy. 2nd Ed. John Willey & Sons, Inc. New York.
Al-Nabulsi, Y.A. 2001. Saline drainage water, irrigation frequency and crop species effects on some physical properties of soils. J. Agron. Crop Sci. 186:15-20.
Althoff, D.A., and R.l. Kleveston. 1996. Suspended solids and nutrients losses during soil preparation for irrigated rice. Agropecuaria Catarinense. 9(2):44-46.
Anilkumar, K.S., and P.A. Wahid. 1989. Impact of long term inorganic fertilization on soil nutrients availability and nutrition of coconut palm. Radiotracer Lab. Kerala. Agric. Univ. Vellanikkara, Trichur, 680654, Kerala, India. Oleagineus Paris. 44: 281-284.
Ayers, R.S., and D. W. Westcot. 1985. Water quality for agriculture. FAO Irrigation and Drainage Paper 29, Rev. 1. FAO, Rome. 63 pp.
Belanger, T. V., T.D.J. Scheid, and J.R. Platko II. 1989. Lake and reservoir management. 5 (1): 101-111.
Benton, J. Jr., B. Wolf, and H.A. Mills. 1991. Plant analysis hand book. A Practical Sampling, Preparation, Analysis and Interpretation Guide. Micro-Macro Publishing Inc., USA.

153
Bernstein, L. 1961. Osmotic adjustment of plants to saline media: I. Steady state. Am. J. Botany. 48:909-918.
Bhatti, A.U. 1997. Irrigated soils of NWFP, Water Management in NWFP. Edited by D. Hamm and Murray Rust, Edward J. Vander V., and Habib-ur-rehman. NWFP Agric. Univ. Peshawar, Dept. of Irrigation and soil and water conservation wageningen Agric. Univ. The Netherland. p.p. 96-111.
Birch, R.P., J.J. Van-Wonderen, and J.J. Van-Wonderen. Exploitation of fresh water lenses in Sindh province, Pakistan. Proc. 14th Int. Congr. Irrigation and Drainage, Rio de janeiro, Brazil. No. 1-B: 445-460.
Bohm, K. 1996. Hirschstetten lysimert network: initial results of drainage water analyses. Bericht uber die 6. Lysimetertagung “Lysimter im dienste des Grundwassserschutzes” am 16. Und 17. April 1996. 47-53.
Bohn, H.L., B.L. McNeal, and G.A. O’Gonnor. 2001. Soil Chemistry. 3rd Ed. John Wiley and Sons, Inc. New York
Borowiec, S., and Z. Zablock. 1988. Agricultural pollution sources of stream and drainage waters of North-Western Poland. Zeszyty-Naukowe. Akademii. Rolniezej-w-szyzecinie, Rolanictwo. No. 45: 27-57.
Borowiec, S., K. Zablocki, E. Welte, L. Szaboles. 1989. The effect of cultivated plants on nitrate-nitrogen concentrations in drainage water. Protection of water quality from harmful emissions with special regard to nitrate and heavy metals. Proceedings of the 5th Int. Symposium of CIEC, p.p. 259 – 262.
Brady, N.C. and R.R. Weil. 1999. The nature and Properties of Soils. 12th ed. Maxwell-Macmillan Publishing Company, New York, USA.
Bresler, E., B.L. McNeal, and D.L. Carter. 1982. Saline and sodic soils: Principles-dynamics-modeling. Springer-Verlag, NY, USA.
Brundtland, G.M., and M. Khalid. 1987. Our Common Future: Report of the World Commission on the Environment. UNEP Governing Council, Oxford University Press, Oxford.
Calver, L., R. Smart, C. McClean, M.S. Cresser. 2004. Modeling the spatial distribution of soil chemical characteristics and associated drainage waters: A case study in the Lake Distric, Proc. GIS Research UK, 12th Annual Conf., UEA, Norwich, 18th -30th April. p. 389-392.
Canadian Drainage Team. 1984. Mardan SCARP subsurface drainage design analysis. Pakistan WAPDA.

154
Cecon, P., M. Borin, and C. Giupponi. 1993. Nutrients removed by pipe drains in two cropping system. European J. Agron. 2(3): 223-230.
Clark, M.J., M.S. Cresser, R. Smart, P.J. Chapman, and A.C. Edwards. 2004. Extent, causes and modeling of seasonal changes in N-species concentrations in upland rivers of Northern Scotland. Biochem. 68(1): 1-19.
Cresser, M.S., R.P. Smart, M. Clark, A. Crowe, D. Holden, P.J. Chapman, and A.C. Edwards. 2004. Controls on N species leaching in upland moorland catchments. Water, air and Soil Pollution, Focus. 4(6): 85-95.
Crowe, A.M., A. Sakata, C. McClean, and M.S. Cresser. 2004. What factors control soil profile nitrogen storage?. Water, Air & Soil Pollution, Focus. 4(6): 75-84.
Cucci, G, A. Caro, M. Borin(ed), and M. Sattin. 1994. Lysimeter trial on leaching water quality and phosphorus flow in the soil. Proc. of the 3rd Congr. the European Society for Agronomy, Paduva University, Abano Poduva, Italy. p.p.782-783 (September 18-22, 1994).
Czapar, G.F., R.S. Kanwar, T.J. Gish(ed.), A. Shirmohammadi. 1991. Field measurement of preferential flow using sub surface drainage tiles. Preferential flow: Proc. of the Natl. Symposium, Chicago, Illinois, USA, 122-128.
Deason, J. P. 1987. Westwide investigations of potential irrigation induced water quality problems, preliminary results. Toxic substances in Agricultural Water Supply and Drainage. ICID Natl. Meeting Papers. P.P. 37-48.
Dikko, A.U., R. Smart., A.Wade, and M.S. Cresser. 1997. Possible effects of losses in drainage water on the copper and zinc status of Scottish upland soils and their sustainability. ITC Journal: Special Congr. Issue: Geo-Information for Sustainable Land Management, ¾ on CD ROM.
Donahue, R.L, R.W. Miller, and J.C. Shickluna. 1983. Soils: An Introduction to Soil and Plant Growth. Englewood Cliffs, New Jersey: Prentice-Hall, Inc. pp. 667.
El-Guindy, S., and M.H. Amer. 1996. Environmental impact of drainage projects in Egypt. Proc. 6th drainage workshop on drainage and the environment, Ljubljana, Slovenia. p. 455-463.
El-Guindy, S., G. Abd El-Nasser, A. Abu-Bakr, and L. El-Sissi. 1989. The effect of irrigation with drainage water on some chemical soil properties and the yield of different field crops. Reuse of low quality water for irrigation in Mediterranean countries. Proc. the Cairo Aswan Seminar. P.147-155.

155
Eltun, R., O. Fugleberg, and O. Nordheim. 1996. The apelsvoll cropping system experiment. VII Runoff losses of soil particles, phosphorus, potassium, magnesium, calcium and sulphur. Norwegian Journal of agric. Sci. 10 (4): 371-384.
Fujiyama, H., and T. Nagai. 1989. Studies on responses of plants grown on sand dune soil on a nutrient solution applied by drip irrigation. Soil Sci. Plant Nutrition 35 (1): 55-61.
Gangbazo, G., A.R. Pesant, D. Cote, G.M. Barnett, and D. Cluis. 1997. Spring runoff and drainage N and P losses from hg-manured corn. Journal of the American Water Resour. Assoc. 33(2): 405-411.
Garg B.K., and I.C. Gupta. 1997. Saline Wastelands Environment and Plant Growth. Jodhpur, India: Scientific Publishers. 283 pp.
Gee, G.W., and J.W. Bauder. 1986. Particle size analysis. In. A. Klute (ed.) Method of Soil Analysis. Part 1. 2nd Ed. Agron. 9: 383-411.
Ghafoor, A., M. Qadir, and G. Murtaza. 2004. Salt-Affected Soil: Principle and Management. Allied Book Centre, 34-Urdu Bazar, Lahore, Pakistan.
Ghassemi, F., A. J. Jakeman, and H. A. Nix. 1995. Salinisation of Land and Water Resources: Human Causes, Extent, Management and Case Studies. p. 517. CABI Publishing, Wallingford, UK.
Gupta, S.K., and I.C. Gupta. 1997. Management of Saline Soils and Waters. Revised Ed. Scientific Publishers, Jodphur, India.
Haq, I., A.R. Khan, and H. Rehman. 1992. Nutritional status of the soils and leaves of sugar beet crop grown on the farmer’s fields in Peshawar Valley. Pakistan J. Soil Sci. 7 (1-2): 29-38.
Hassan, S. K., M. El Mouttassem, and A. Perrier. 1996. Environmental Impact of the reuse of drainage water in irrigation along the River Nile. Transactions of the 16th Int. Congr. on Irrigation and Drainage, Cairo, Egypt: 131-144.
Hoffman, G.J., and D.S. Durnford. 1999. Draiange design for salinity control. In: R.W. Skaggs and J. Van Schilfaarde (Ed.) Agricultural Drainage. Agronomy No. 38. Amer. Soc. Agron. 579-614.
IDNP, Indo-Dutch Network Project. 2002. Methodology for Identification of waterlogging and Soil Salinity Conditions Using Remote Sensing. CSSRI, Karnal, India and Alterra-ILRI, Wageningen, The Netherland

156
Ihsan, U. 1986. To study the micronutrient status of the soils of Mardan district. M.Sc. Thesis, Dept. Soil Sci. NWFP Agric. Univ. Peshawar, Pakistan.
Ionitoaia, H., and R. Zarma. 1996. On the environmental impact of drainage works in Romania. Proc. 6th drainage workshop on drainage and the environment, Ljubljana, Slovenia. p.p. 64-71.
Iqbal, M.M., S.M. Shah, and W. Muhammad. 1987. Micronutrient status of some soils, sugar cane plants and irrigation waters of Charsadda. Proc. Natl. Seminar on Micronutrients in soils and crops in Pakistan, NWFP, Agric. Univ. Peshawar, Pakistan. p.p. 149-155.
Isabelo S.A., and E.R. Jack. 1993. Phosphogypsum in agriculture. Adv. Agron.49: 55-118.
Jarwar, A. K., K.S. Memon, and Z. H. Shah. 2002. Influence of the source and rate of nitrogenous fertilizer and irrigation depth on fertilizer N-recovery and grain yield of wheat. Abstracts of 9th Int. Congr. soil science, 2002. p. 17.
Kazmi, S.I. 1999. Performance evaluation of composite pipe drainage system at Kalpani Pilot Project area of Swabi SCARP. M.Sc (Hons) Thesis. Department of Water Management, KPK Agric. Univ. Peshawar. Pak.
Khan, F.U., and A.U. Bhatti. 2000. Soil and nutrients losses through sediment under wheat mono cropping and barley legume inter cropping from up land sloping soil. Pak. J. soil Sci. 18(1-4): 45-50.
Khan, F.U., W. Ahmad, A.U. Bhatti, R.A. Khattak and M. Shafiq. 2004. Effect of soil erosion on chemical properties of some soil series in NWFP Pakistan. Jour. of Sci. Tech. and Development. 23(4): 31-35.
Khattak, J.K., and S. Perveen. 1987. Micronutrients status of NWFP soils. Proc. Natl. seminar on micronutrients in soils and crops in NWFP Agric. Univ. Peshawar, Pakistan. p.p. 62-74.
Khattak, R.A. 1996. Chemical properties of soil in : Soil Sciences. E. Bashir and R. Bantal (ed). National Book Foundation, Islamabad. p.p. 167-199.
Khattak, R.A., and A.L. Page. 1992. Mechanism of manganese adsorption on soil constituents. P 383-400. In: D.C. Adriano (ed.). Bio-geochemistry of Trace Metals. Bacon, Raton, Ann Arbor, London, Tokoyo. Lewis Publishers
Khattak, R.A., and D. Muhammad. 2008. Increasing crop production through humic acid in rainfed and salt-affected soils in Kohat Division. Final technical progress

157
Report, ALP-PARC Islamabad, Project. Dept. Soil and Environ. Sci. NWFP Agric. Univ. Peshawar.
Khattak, R.A., and W.M. Jarrell. 1988. Salt-induced manganese solubilization in California soils. Soil Sci. Soc. Am. J. 52: 1606-1611. (USA) (IF 1.834)
Khattak, R.A., and W.M. Jarrell. 1989. Effect of saline irrigation on soil Mn leaching and bioavailability to sugar beet. Soil Sci. Soc. Am. J. 53:142-146.
Kielen, N.C., 1996. Farmers Perception on Salinity and Sodicity. IIMI, Lahore, 65 p.
Kladivko, E.J., G.E. Van Scoyoc., E.J. Monke, K.M. Oates, W. Pask, and G.E. Van. Scoyoc. 1991. Pesticide and nutrient movement in to subsurface Tile drains on a silt loam soil in Indiana. Journal of environmental quality. 20(1): 264-270.
Läuchli, A., and E. Epstein. 1990. Plant responses to saline conditions. p. 113-137. In K.K. Tanji (ed.) Agricultural Salinity Assessment and Management. Amer. Soc. Civil Engg. NY USA. Mann. Rep. Eng. Pract. 71: 113–137.
Lian, S., C.H. Wang, and Y.C. Lee. 1997. Analysis of fertilizer response and efficiency in vegetable production in the Hsilo area, Taiwan. Extension Bulletin ASPAC, Food and Fert. Tech. Cent. No. 443, p. 12.
Lieten, F. 2000. Recycling of nutrient solution in substrate cultures. Fruit. Belge. 68(487): 170-172.
Lindsay, W.L. 1979. Chemical Equilibria in Soils. A Wiley-Interscience Publication. John Willey and Sons, New York.
Ma, L., W.Q. Ma., G.L. Velthof, F.G. Wang, W. Qin, F.s. Zhang, and O. Oenime. 2010. Modeling nutrient flows in the food chain of China. J. Envron. Qual. 39: 1279-1289.
Madramootoo, C.A., K.A. Wiyo, and P. Enright. 1992. Nutrient losses through tile drains from two potato fields. Appl. Eng. in Agric. 8(5): 639-646.
Madramootoo, C.A., Maticic (ed), B. Hacek. 1996. Drainage Practices and biological systems for environmental protection. Proc. 6th ICID drainage workshop, Ljubljana, Slovenia, (22-24 April 1996): 50-59.
Mall, J. and E. Christen. 1996. Financial evaluation of options for managing tile drainage water to meet environmental constraints. Technical Memorandum Division of Water Resoruces; Inst. Natural Resour. and Environ., CSIRO. 96(20): 18.
Marques, R., J. Ranger, S. Villette, and A. Grainier. 1997. Nutrients dynamics in a chronosequence of Douglas-fir (Psedudotsuga menziesii,(Mirb) Franco) stands on

158
the Beaujolais Mounts (France). 2. Quantitative approach. Forest Ecol. And Mangt. 92(1-3): 167-197.
Mauderli, A.F., C.A. Madramootoo, and G.T. Dodds. 1996. Water use efficiency, enhanced farmers participation, means for controlling environmental impacts in irrigation drainage. Proc. of Workshop at the 16th ICID Congr., Cairo, Egypt. p. 13-26.
Memon, K. S., K. Nenwani, A. H. Soomro, and J. Shah. 2002. Profile distribution of nitrate nitrogen in relation to fertilizer management in Banona. Abstracts of 9th Int. congr. Soil Sci., 2002. p.p. 19-20.
Mengel, K, and E.A. Kirkby. 1987. Principles of plant nutrition. 4th Ed. Worblaufen-Bern, Switzerland: Int. potash inst.
Mer, R.K, P.K. Prajith, D.H. Pandya, and A.N. Pandey. 2000. Effect of salts on germination of seeds and growth of young plants of Hordeum vulgare, Triticum aestivum, Cicer arietinum and Brassica juncea. J. Agro. Crop Sci. 185: 209-217.
Molenar, J.D., J.D. De Molenar, and S.R. Gliessman (ed). 1990. The impact of agrohydrological management on water, nutrients, and fertilizers in the environment of the Netherlands. Agroecology., Researching the ecological basis for sustainable agriculture. Review. P.p. 275-304.
Monaghan, R.M., R.J. Paton, L.C. Smith, and C. Binet. 2000. Nutrient losses in drainage and surface runoff from a cattle grazed pasture in southland. Proc. of the New Zealand Grassland Assoc. 62nd conf., Invercargill, New Zealand, 31 Octo-2, November 2000. 62: 99-104.
Muhammad, D. 2009. Evaluating effectiveness of pressmud, gypsum, sulfuric acid and farmyard manure in reclamation of saline-sodic soils, nutrient dynamics and crop growth. Ph.D Thesis. Department of Soil and Environmental Sciences, KPK AUP, Peshawar.
Muhammad, D., and R.A. Khattak. 2009. Growth and nutrient concentrations of maize in pressmud treated saline-sodic soils. Soil and Environ. 28(2): 145-155.
Mukhtiar, A., M.S. Sarir, M.U. Shirazi, S.M. Alam and R. Ansari. 2000. Phosphorus mineralization in some soil series of Peshawar valley. Pak. J. of Soil Sci. 18(1-4): 13-18.
Mulvaney, R.L. 1996. Nitrogen-Inorganic forms. In D.L. Sparks (ed.) Method of Soil Analysis. Part 3. Amer. Soc. Agron. 38: 1123-1184.

159
Mushtaq, A. C. and M. Safeer. 2000. Effect of wheat-soybean relay cropping on soil moisture content and crop yield under rainfed conditions. Pak. J. Soil Sci. 18(1-4): 51-54.
Nelson, D.W., and L.E. Sommer. 1996. Total C, organic C and organic matter. In: D.L. Spark (ed.) Method of Soil Analysis. Part 3. Am. Soc. Agron. 34: 961-1010.
Nizami, M.M.I., and M. Salim. 1997. Studies on crop stand and grain yield of maize as influenced by soil crusting in different soil series. Pak. J. of Soil Sci. 13 (1-4): 62-65.
Ochs, W. J. 1987. Toxics in agricultural water supplies- an international perspective. Toxic substances in Agricultural Water Supply and Drainage. ICID Natl. Meeting papers. p.p. 81-86.
Oskarsen, H., T.K. Haraldsen, A.H. Aastveit, and K. Myhr. 1996. The Kvithamar field lysimeter. II. Pipe drainage, surface runoff and nutrient leaching. Norwegian Journal of Agric. Sci. 10 (2) 211-228.
Owens, L.B. 1990. Nitrate-nitrogen concentrations in percolate from lysimeters planted to a legume grass mixture. Journal of Environmental Quality. 19(1): 131-135.
Page, A. L., M. M. El Amamy, and R. A. Khattak. 1987. Effects of on-site Disposal of Residues from coal combustion, Blow down water, and other waste streams on groundwater quality. A case study at the Mohave generating station. Program excellence in energy research, university of California, Riverside. Final Report. Pages: 1-122. Submitted to: Southern California Edison Company.
Pondel, H., S. Sykut, M. R. Kowska, and H. Terelak. 1991. Leaching of fertilizer nutrients from cultivated soils based on researches carried out by the Institute of Soil Science and cultivation of plants. Roezniki Gleboznaweze. 42(3): 97-107.
Qadir, M., A.D. Noble, S. Schubert, R.J. Thomas, and A. Arslan. 2006. Salinity induced land degradation and its sustainable management: problems and prospects. Land degrade. Develop. 17: 661-676.
Qadir, M., S. Schubert, D. Badia, B.R. Sharma, A.S. Qureshi and G. Murtaza. 2007. Ameliorating and nutrient management strategies for sodic and alkali soils. CAB Reviews: Perspective in Agriculture, Veterinary Sciences, Nutrition and Natural Resources: http://www.cababstractsplus.org/cabreview.
Ramazan, C. M. 1996. Salt distribution in soil profile with high water table under low and high irrigation regimes. IWASRI Publication No. 162. 13 West Wood Colony, Thoker Niaz Baig, Lahore, Pakistan. 1-48.

160
Ramazan, C. M. 1999. Impact of conjunctive use of water on soil and crops under farmer’s management. Irrigation under conditions of water scarcity. 17th ICID Int. Congr. on Irrigation and Drainage, Granda, Spain. 1: 95-105.
Ramoliya, P J, and A. N. Pandey. 2003. Effect of salinisation of soil on emergence, growth and survival of seedlings of Cordia rothii. Forest Ecology and Management 176:185-194.
Randall, G.W. 1990. Nitrate-N in the soil profile and tile drainage water as influenced by tillage. American Journal of Industrial Medicine. 18(4): 457-460.
Randall, G.W., T.K. Iragavarapu, and M.A. Schmitt. 2000. Nutrient losses in subsurface drainage water from dairy manure and urea applied for corn. J. Environ. Quality. 29(4): 1244-1252.
Rashid, A. 1996. Soils: basic concepts and principles in : Soil Sciences. E. Bashir and R. Bantal (ed). National Book Foundation, Islamabad. p.p. 3-23.
Rashid, A., Hussain H., and G. Ahmed. 1987. Micronutrients distribution in selected soil profiles of Potohar region. Proc. Natl. seminar on micronutrient in soils and crops in Pakistan. Edited by J.K. Khattak, S. Perveen and Farmanullah, NWFP Agric. Univ. Peshawar. p.p. 30-46.
Rashid, M., A.U. Bhatti, F. U. Khan and Wasiullah. 2008. Physico-chemical properties and fertility status of soils of district Peshawar and Charsadda. Soil and Environment. 27(2): 228-235.
Rhoades J. D. 1996. Salinity: Electrical Conductivity and total dissolved solids. In: D. L. Sparks (ed.). Method of Soil Analysis. Part. 3. Am. Soc. Agron. Inc. Madison WI USA. 14: 417-436
Richard, L.A. 1954. Diagnosis and Improvement of Saline and Alkali Soils. USDA Handbook 60. US Department of Agriculture, Washington DC.
Richard, P., S.T. Chieng, and N.K. Nagpal. 1989. Water and nutrient movement in an agricultural soil under drained and undrained conditions. Toxic substances in agricultural water supply and drainage, 2nd Pan-American ICID Regional Conf. p.p. 281-292.
Ritzema, H.P. 1994. Drainage Principles and application. ILRI, Publication No. 16. Int. Inst. for Land Reclamation and Improvement. Wageningen, the Netherland
Ritzema, H.P., and H.M.H Braun. 1994. Environmental Drainage Principles and applications. ED. 2: 1041-1065; IRLI Publication 16.

161
Rummenie, S., and B. Nobel. 1996. Drainage and tail water recycling reduces nutrient, sediment movement. Aust. Cotton Grower. 17(6): 30-32.
Samreen, S., Safdar A., and S. Sohail Ijaz. 2003. Role of Phosphorus and inoculation in nitrogen fixation by Sybean selection NARC-6. Pak. J.S.S. 22(1): 87-91.
SChils, R. 1994. Nitrate losses from grazed grass and grass/clover pasture on clay soil. Meststoffen. No.1994. 78-84.
Schnagl, R. J., and J.M. Lee. 1987. Control of pesticides discharges from rice growing regions of the sacramento valley, California.
Sharma, D. P., N.K. Sing, K.V.G.K. Rao, and Kumbhare. 1990. Response of wheat to re-use of saline drainage water in a sandy loam soil. Ind. J. of Agric. Sci. 60 (7): 448-452.
Sharma, D. P., N.K. Sing, K.V.G.K. Rao, and Kumbhare. 1991. Irrigation of wheat with saline drainage water on a sandy loam soil. Agric. Water Management. 19(3): 223-233.
Sileika, A.S. 2000. Nutrients losses from agriculture in Lithuania. Landbauforschung Volkenrode. 50(1-2): 15-23.
Sohail, A.C., I.A. Zamurad, Ch. A. Muhammad, and M. Shah. 1997. Effect of source and time of N application on yield and uptake in maize crop. Pak. J. of Soil Sci. 13(1-4): 46-50.
Soil Survey of Pakistan. 2007. Land Resources Inventory and Agricultural Land Use Plan of Charsadda District. National Agric. Land Use Plan. Lahore, Pakistan.
Soltanpour, P.N. 1985. Use of ammonium bicarbonate-DTPA soil test to evaluate elemental availability and toxicity. Comm. Soil Sci. Plant Anal; 16:322-38.
Soltonpour, P.N., and A.P. Schawab. 1977. A new soil test for simultaneous extraction of soil macro and micronutrients. Comm. Soil Sci. Plant Anal. 8: 195-207
Spark, D.L. (1995). Environmental Soil Chemistry. Academic Press, New York
Sposito, G. 1989. The Chemistry of Soils. Oxford University Press, New York
SSSA. 1996. Soil Science Society of America. Glossary of Soil Science Terms, Soil Science Society of America, Madison, WI. NY
Steel, R.G.D., and J.H. Torrie. 1980. Principles and Procedures of Statistics. 2nd ed. McGraw Hill Book Co., New York, USA

162
Steenhuis, T., L.D. Geohring. 1990. Importance of preferential flow as mechanism for solute loss in agricultural tile lines. Proc. symposium on land drainage of salinity in Arid and Semi-arid regions, Cairo. 3:163-174.
Stevenson, J.M. 1985. The Nitrogen Cycles in Soil: Global and Ecological Aspects. P. 106-153. In Cycles of Soils. A Wiley Interscience Publication, New York
Stikans, J., V. Kazocins, and I. Lipenite. 1996. Impact of fertilizers on nutrient losses through tile drains in Latvia. Proc. of the Latvian Academy of Sciences, Section B. Natural Sciences. 50(2): 85-89.
Sumner, M.E. 1993. Sodic soils: New perspectives. Aust. J. Soil Res. 31: 683 -750.
Tartola, E., and E. Demppainen. 1998. Nitrogen and phosphorus losses in surface runoff and drainage water after application of slurry and mineral fertilizer to perennial grsss ley. Agric. Food Sci. Finland. 7(5-6): 569-581.
Ulean, B. 1995. Episodic precipitation and discharge events and their influence on losses of phosphorus and nitrogen from the drained arable fields. Swedish Journal of Agricultural Research. 25(1): 25-31.
WAPDA,. 1979. Water and Power Development Authority; Soil salinity and water table survey. Project-wise data of the Indus basin, 21 million acres. Lahore. Survey and Research Organization, Master Planning and Review Division, Govt. of Pakistan.
Wasiullah, and A.U. Bhatti. 2005. Mapping of soil properties and nutrients using spatial variability and geo-statistical techniques. Soil and Environment. 24(2): 88-97.
Weinberg, A. C. 1990. Low input agriculture reduces a nonpoint source pollution. Journal of soil and water conservation. 45(1): 48-51, BLDSC.
Weinberg. M., Z. Willey, A. Dinar (ed), and D. Zilberman. 1991. Creating economic solutions to the environmental problems of irrigation and drainage. The Economics and Management of Water and Drainage in Agric.: 531-556.
West, D.W. 1990. Land reclamation, crop production and irrigation water quality standards. Intl. Waterlogging and Salinity Res. Inst. (IWASRI). Pub. No. 15. IWASRI, Lahore, Pakistan.
Woltere, W., M. Ittefaq, M.N. Bhutta, C.A. Madramootoo, and G.T. Dodds. 1996. Drainage discharge and quality for drainage options in Pakistan. Sustainability of irrigated agric: managing environmental changes due to irrigation and drainage. Proc. Workshop at the 16th ICID Congr., Egypt. 45-55.

163
Yusron, M., and Phillips, I.R. 1997. Nitrogen leaching from urea and ammonium sulphate fertilizers under uncropped and cotton cropped conditions. Indonesian J. of Crop Sci. 12(1-2): 23-29.

164
APPENDICES

165
Appendix 1. Questionnaire for field survey in the Mardan SCARP Area
1. Name of farmer/agency number
2. Address/location/site
3. Crop grown and area (kg ha-1 and ha)
4. Previous crop
5. Nutrients added
Organic Inorganic
Total Element Total Element
-------------------------- kg ha-1-----------------------
N
P
K
Cu
Fe
Zn
Mn
6. Type of fertilizers (inorganic)
Name 1st application 2nd application Total
Kg ha-1
------------------- kg ha-1 --------------------
Urea
SSP

166
TSP
DAP
MOP
SOP
Any other
7. Crop history (previous ----------------------------------, Present -----------------------
8. Amount of water applied
9. Amount of drainage waters
10. Crop yield ( kg ha-1)
a. Economic yield
b. Biological yield
11. Difference in yield before and after SCARP
a. No difference -----------, improved ------------------, reduced -----------
12. Quality of the product before and after SCARP
a. No difference -----------, better ------------------, deteriorated ------------
13. Cost of production before and after the SCARP
a. No difference --------------, increased -----------------, decreased -----------
14. Any other information/problem observed before and after the SCARP
14.1 ----------------------------------------------------------------------------------------------
14.2 ---------------------------------------------------------------------------------------------
14.3 -----------------------------------------------------------------------------------------------
14.4 -----------------------------------------------------------------------------------------------

167
Appendix. 2. ANOVA showing MS values for rate of volume of water and removal of salts, Na, Ca and Mg, NH4-N and NO3-N in drainage waters measured at six different post irrigation timings after each irrigation at two sites (Fazliabad and Manga Dargai) during three season from 2003 to 2005.
SOV D.F. Volume Salts Na Ca Mg NH4-N NO3-N
Site (S) 1 663781** 1.84** 49NS 4274** 238NS 1.41* 1.13NS
Year (Y) 2 46325** 0.33** 8148** 32089** 1296** 5.46** 0.31NS
Irrigation# (I) 5 1133NS 0.16** 1183NS 1244** 1254** 0.09NS 2.34*
Post irri.time (T) 5 1136NS 0.03NS 1522* 224NS 265NS 0.22NS 0.15NS
S x Y 2 30666** <0.01NS 4053** 7221** 733* 0.53NS 5.40**
S x I 5 1637NS 0.05NS 1460* 324NS 346NS 0.13NS 0.93NS
S x T 5 2508NS 0.02NS 330NS 213NS 183NS 0.10NS 0.48NS
Y x I 10 2126NS 0.07NS 806NS 1700** 612** 0.35NS 0.52NS
Y x T 10 2085NS 0.03NS 593NS 532NS 294NS 0.06NS 0.31NS
I x T 25 2067NS 0.02NS 730NS 665* 240NS 0.23NS 0.62NS
S x Y x I 10 2964NS 0.08* 325NS 2623** 196NS 0.52* 1.14NS
S x Y x T 10 1387NS 0.03NS 561NS 252NS 18NS 0.14NS 0.93NS
S x I x T 25 2060NS 0.01NS 560NS 346NS 315NS 0.31NS 0.43NS
Y x I x T 50 1959NS 0.03NS 789NS 505* 159NS 0.20NS 0.75NS
Error 50 2027 0.04 539 311 203 0.25 0.70
% C.V. 5.37 21.48 24.56 39.94 60.04 57.51 52.20
NS, *, ** represent not significant, significant at P < 0.05 and p < 0.01, respectively.

168
Appindix. 3. ANOVA showing MS values for rate of removal of N, P and K, Cu, Fe, Mn and Zn in drainage waters measured at six different post irrigation timings after each irrigation at two sites (Fazliabad and Manga Dargai) during three season from 2003 to 2005.
SOV D.F. P K Cu Fe Mn Zn
Site (S) 1 7.38** 119.1** 71495NS 130861* 777060** 9062NS
Year (Y) 2 8.80** 151.9** 942977** 531482** 1.17x10⁷** 43076**
Irrigation# (I) 5 0.24NS 37.7** 276134* 13664NS 158814NS 3038NS
Post irri. time (T) 5 0.04NS 4.4NS 27029NS 54920NS 129722NS 6298NS
S x Y 2 6.28** 123.3** 1160796** 52954NS 268807* 4956NS
S x I 5 0.15NS 28.9* 113192NS 30155NS 70408NS 5916NS
S x T 5 0.03NS 16.1Ns 42298NS 5515NS 73960NS 3991NS
Y x I 10 0.08NS 12.6NS 175037NS 23805NS 118006NS 4552NS
Y x T 10 0.08NS 15.6NS 11626NS 68620** 135491NS 5691NS
I x T 25 0.09NS 11.8NS 56483NS 24065NS 58692NS 3485NS
S x Y x I 10 0.21NS 18.5NS 180927* 39743NS 109314NS 1577NS
S x Y x T 10 0.10NS 6.5NS 58396NS 36232NS 69158NS 2821NS
S x I x T 25 0.12NS 7.4NS 39250NS 40008NS 141976NS 3365NS
Y x I x T 50 0.14NS 10.3NS 72894NS 29577NS 82872NS 4294NS
Error 50 0.13 10.4 87349 24394 83734 4118
% C.V. 31.73 37.71 38.41 75.57 52.66 63.82
NS, *, ** represent not significant, significant at P < 0.05 and p < 0.01, respectively.
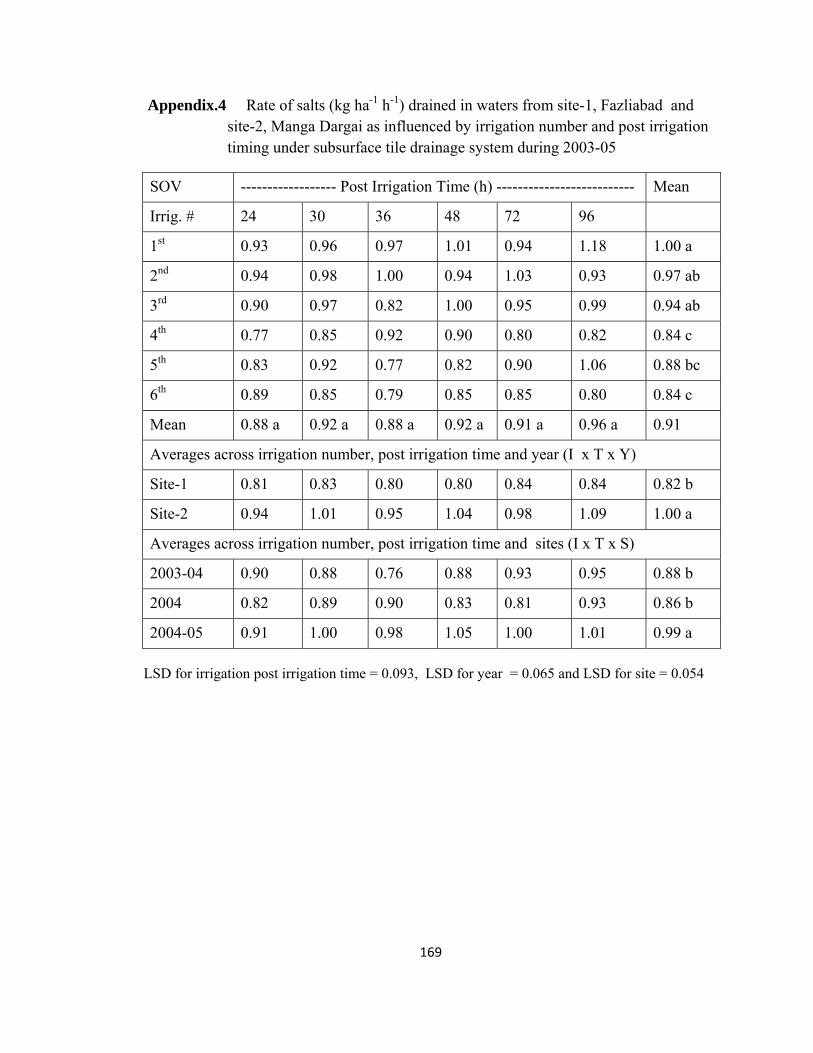
169
Appendix.4 Rate of salts (kg ha-1 h-1) drained in waters from site-1, Fazliabad and site-2, Manga Dargai as influenced by irrigation number and post irrigation timing under subsurface tile drainage system during 2003-05
SOV ------------------ Post Irrigation Time (h) -------------------------- Mean
Irrig. # 24 30 36 48 72 96
1st 0.93 0.96 0.97 1.01 0.94 1.18 1.00 a
2nd 0.94 0.98 1.00 0.94 1.03 0.93 0.97 ab
3rd 0.90 0.97 0.82 1.00 0.95 0.99 0.94 ab
4th 0.77 0.85 0.92 0.90 0.80 0.82 0.84 c
5th 0.83 0.92 0.77 0.82 0.90 1.06 0.88 bc
6th 0.89 0.85 0.79 0.85 0.85 0.80 0.84 c
Mean 0.88 a 0.92 a 0.88 a 0.92 a 0.91 a 0.96 a 0.91
Averages across irrigation number, post irrigation time and year (I x T x Y)
Site-1 0.81 0.83 0.80 0.80 0.84 0.84 0.82 b
Site-2 0.94 1.01 0.95 1.04 0.98 1.09 1.00 a
Averages across irrigation number, post irrigation time and sites (I x T x S)
2003-04 0.90 0.88 0.76 0.88 0.93 0.95 0.88 b
2004 0.82 0.89 0.90 0.83 0.81 0.93 0.86 b
2004-05 0.91 1.00 0.98 1.05 1.00 1.01 0.99 a
LSD for irrigation post irrigation time = 0.093, LSD for year = 0.065 and LSD for site = 0.054

170
Appendix. 5 Rate of Na (g ha-1 h-1) drained in waters from site-1, Fazliabad and site-2, Manga Dargai as influenced by irrigation number and post irrigation timing under subsurface tile drainage system during 2003-05
SOV --------------------- Post Irrigation Time (h) ------------------------- Mean
Irrig. # 24 30 36 48 72 96
1st 78.08 85.38 92.30 85.38 101.92 92.50 89.26 b
2nd 97.83 95.90 107.07 96.85 111.13 84.00 98.80 ab
3rd 99.05 103.98 97.70 106.55 106.86 107.83 103.66 a
4th 99.95 116.60 83.48 86.17 107.37 76.67 95.04 ab
5th 69.63 88.50 94.51 87.16 100.96 98.22 89.83 b
6th 62.05 106.30 109.79 82.21 85.57 99.84 90.96 b
Mean 84.43 c
99.44 ab
97.48 ab 90.72 bc 102.30 a
93.18 abc 94.59
Averages across irrigation number, post irrigation time and year (I x T x Y)
Site-1 82.43 103.15 95.88 86.80 100.41 96.01 94.11 a
Site-2 86.43 95.74 99.07 94.64 104.20 90.34 95.07 a
Averages across irrigation number, post irrigation time and sites (I x T x S)
2003-04 84.72 90.01 92.81 75.21 86.41 92.50 86.94 b
2004 76.03 96.52 88.34 90.57 107.64 81.47 90.10 b
2004-05 92.55 111.81 111.28 106.38 112.86 105.57 106.74 a
LSD for irrigation post irrigation time = 10.99, LSD for year = 7.77 and LSD for site = 6.34

171
Appendix. 6. Rate of Ca (g ha-1 h-1) drained in waters from site-1, Fazliabad and site-2, Manga Dargai as influenced by irrigation number and post irrigation
timing under subsurface tile drainage system during 2003-05
SOV ------------------------- Post Irrigation Time (h) ------------------ Mean
Irrig. # 24 30 36 48 72 96
1st 43.54 34.78 62.73 43.11 40.26 54.48 46.48 abc
2nd 39.68 30.39 40.57 42.46 36.25 40.95 38.38 cd
3rd 38.29 59.52 46.31 64.09 65.17 33.89 51.21 a
4th 53.40 30.17 24.49 30.83 53.67 27.88 36.74 d
5th 45.86 50.81 32.05 41.08 39.71 47.03 42.76 bcd
6th 33.82 51.55 51.36 56.88 53.88 48.82 49.38 ab
Mean 42.43 a 42.87 a 42.92 a 46.41 a 48.16 a 42.18 a 44.16
Averages across irrigation number, post irrigation time and year (I x T x Y)
Site-1 38.33 37.52 38.20 41.58 40.58 42.05 39.71 b
Site-2 46.53 48.21 47.63 51.23 55.74 42.30 48.61 a
Averages across irrigation number, post irrigation time and sites (I x T x S)
2003-04 31.61 27.12 24.11 19.16 22.64 25.72 25.06 c
2004 62.09 60.08 69.96 77.49 69.98 61.35 66.83 a
2004-05 33.59 41.40 34.68 42.57 51.85 39.46 40.59 b
LSD for irrigation post irrigation time = 8.35, LSD for year =5.911 and LSD for site = 4.82

172
Appendix. 7. Rate of Mg (g ha-1 h-1) drained in waters from site-1, Fazliabad and site-2, Manga Dargai as influenced by irrigation number and post irrigation timing under subsurface tile drainage system during 2003-05
SOV ------------------------ Post Irrigation Time (h) ------------------------ Mean
Irrig. # 24 30 36 48 72 96
1st 28.56 33.75 28.27 31.92 25.22 37.20 30.82 a
2nd 12.11 20.90 14.00 13.44 15.08 13.48 14.84 d
3rd 19.62 24.53 25.01 24.11 21.74 45.49 26.75 ab
4th 16.01 41.82 23.78 14.82 21.38 23.39 23.54 bc
5th 22.47 16.26 14.83 23.01 23.62 14.66 19.14 cd
6th 25.79 30.90 29.72 31.70 25.31 21.89 27.55 ab
Mean 20.76 b 28.03 a 22.60 ab 23.16 ab 22.06 ab 26.02 ab 23.77
Averages across irrigation number, post irrigation time and year (I x T x Y)
Site-1 16.83 29.80 22.79 23.70 20.42 22.78 22.72 a
Site-2 24.69 26.26 22.41 22.63 23.69 29.25 24.82 a
Averages across irrigation number, post irrigation time and sites (I x T x S)
2003-04 19.41 17.64 23.04 21.63 20.07 16.26 19.68 b
2004 24.49 39.32 21.13 28.22 22.50 33.23 28.15 a
2004-05 18.37 27.13 23.63 19.65 23.60 28.56 23.49 ab
LSD for irrigation post irrigation time = 6.76, LSD for year = 4.77 and LSD for site = 3.90

173
Appendix. 8. Rate of NH4-N (g ha-1 h-1) drained in waters from site-1, Fazliabad and site-2, Manga Dargai as influenced by irrigation number and post irrigation
timing under subsurface tile drainage system during 2003-05
SOV ------------------- Post Irrigation Time (h) ---------------------- Mean
Irrig. # 24 30 36 48 72 96
1st 0.98 0.91 0.69 0.72 0.92 0.79 0.84 a
2nd 0.84 0.91 0.72 1.09 0.66 1.07 0.88 a
3rd 0.64 1.16 0.93 0.71 0.79 0.89 0.86 a
4th 1.10 0.86 1.40 0.97 0.73 0.78 0.98 a
5th 0.93 0.96 0.96 1.03 0.67 0.60 0.86 a
6th 1.10 0.63 0.86 1.07 0.88 0.48 0.84 a
Mean 0.93 a 0.91 a 0.93 a 0.93 a 0.78 a 0.77 a 0.87
Averages across irrigation number, post irrigation time and year (I x T x Y)
Site-1 0.85 0.78 0.94 0.81 0.66 0.72 0.79 b
Site-2 1.01 1.03 0.92 1.05 0.90 0.82 0.95 a
Averages across irrigation number, post irrigation time and sites (I x T x S)
2003-04 0.78 0.83 0.80 0.78 0.61 0.65 0.74 b
2004 0.84 0.74 0.78 0.70 0.59 0.48 0.69 b
2004-05 1.18 1.14 1.20 1.32 1.12 1.17 1.19 a
LSD for irrigation post irrigation time = 0.238, LSD for year = 0.168 and LSD for site = 0.137

174
Appendix. 9. Rate of NO3-N (g ha-1 h-1) drained in waters from site-1, Fazliabad and site-2, Manga Dargai as influenced by irrigation number and post irrigation
timing under subsurface tile drainage system during 2003-05
SOV ------------------- Post Irrigation Time (h) ------------------- Mean
Irrig. # 24 30 36 48 72 96
1st 1.90 1.70 2.62 2.28 2.03 2.12 2.11 a
2nd 1.99 1.35 1.52 2.08 1.18 1.51 1.61 b
3rd 1.06 1.67 1.32 1.37 1.95 1.01 1.40 b
4th 1.53 1.43 1.47 1.29 1.73 1.89 1.56 b
5th 1.55 1.49 1.52 1.41 1.48 1.26 1.45 b
6th 1.16 1.87 1.28 1.21 2.00 1.71 1.54 b
Mean 1.53 a 1.59 a 1.62 a 1.61 a 1.73 a 1.58 a 1.61
Averages across irrigation number, post irrigation time and year (I x T x Y)
Site-1 1.40 1.66 1.45 1.51 1.80 1.39 1.54 a
Site-2 1.66 1.51 1.78 1.70 1.66 1.77 1.68 a
Averages across irrigation number, post irrigation time and sites (I x T x S)
2003-04 1.64 1.67 1.66 1.63 1.74 1.28 1.60 a
2004 1.47 1.58 1.57 1.47 1.49 1.70 1.55 a
2004-05 1.49 1.50 1.63 1.72 1.95 1.78 1.68 a
LSD for irrigation post irrigation time = 0.398, LSD for year = 0.281 and LSD for site = 0.230

175
Appendix. 10. Rate of P (g ha-1 h-1) drained in waters from site-1, Fazliabad and site-2, Manga Dargai as influenced by irrigation number and post irrigation timing
under subsurface tile drainage system during 2003-05
SOV ------------------- Post Irrigation Time (h) --------------------- Mean
Irrig. # 24 30 36 48 72 96
1st 1.18 0.86 1.03 0.99 1.07 1.04 1.03 b
2nd 1.25 1.04 1.08 1.06 1.32 1.02 1.13 ab
3rd 1.13 1.27 1.17 1.42 1.02 1.21 1.20 a
4th 1.24 1.53 1.28 1.11 1.26 1.20 1.27 a
5th 1.22 1.22 1.29 1.11 1.00 1.10 1.16 ab
6th 1.17 1.19 0.96 1.30 1.06 1.07 1.12 ab
Mean 1.20 a 1.19 a 1.14 a 1.17 a 1.12 a 1.11 a 1.15
Averages across irrigation number, post irrigation time and year (I x T x Y)
Site-1 0.99 1.01 0.96 0.97 0.90 0.97 0.97 b
Site-2 1.41 1.36 1.31 1.36 1.34 1.24 1.34 a
Averages across irrigation number, post irrigation time and sites (I x T x S)
2003-04 0.95 0.88 0.73 0.72 0.77 0.87 0.82 c
2004 1.11 1.08 1.10 1.26 1.11 1.05 1.12 b
2004-05 1.54 1.60 1.57 1.52 1.48 1.40 1.52 a
LSD for irrigation post irrigation time = 0.173, LSD for year = 0.123 and LSD for site = 0.100

176
Appendix. 11. Rate of K (g ha-1 h-1) drained in waters from site-1, Fazliabad and site-2, Manga Dargai as influenced by irrigation number and post irrigation timing
under subsurface tile drainage system during 2003-05
SOV ------------------ Post Irrigation Time (h) ------------------------ Mean
Irrig. # 24 30 36 48 72 96
1st 10.36 6.50 7.67 6.80 6.98 8.70 7.83 c
2nd 7.73 10.57 12.44 7.78 12.60 9.51 10.11 a
3rd 7.91 8.75 9.46 11.18 10.52 8.44 9.37 ab
4th 9.51 9.02 10.21 8.27 7.39 7.89 8.71 abc
5th 7.36 8.94 6.80 6.13 7.86 7.15 7.37 c
6th 8.38 8.26 7.19 8.22 8.22 8.15 8.07 bc
Mean 8.54 a 8.67 a 8.96 a 8.06 a 8.93 a 8.31 a 8.58
Averages across irrigation number, post irrigation time and year (I x T x Y)
Site-1 8.95 9.63 10.91 8.69 8.92 8.83 9.32 a
Site-2 8.14 7.72 7.01 7.43 8.93 7.79 7.84 b
Averages across irrigation number, post irrigation time and sites (I x T x S)
2003-04 8.35 7.98 9.08 6.33 6.28 5.96 7.33 b
2004 8.35 8.34 7.08 7.72 9.64 8.27 8.23 b
2004-05 8.94 9.70 10.72 10.13 10.87 10.69 10.17 a
SD for irrigation post irrigation time = 1.53, LSD for year = 1.08 and LSD for site = 0.88

177
Appendix. 12. Rate of Cu (mg ha-1 h-1) drained in waters from site-1, Fazliabad and site-2, Manga Dargai as influenced by irrigation number and post irrigation
timing under subsurface tile drainage system during 2003-05
SOV ------------------ Post Irrigation Time (h) --------------------- Mean
Irrig. # 24 30 36 48 72 96
1st 835 783 921 808 744 866 826 b
2nd 872 819 850 582 915 822 810 ab
3rd 875 841 933 881 1068 724 887 a
4th 772 698 789 735 650 741 731 bc
5th 672 603 662 695 721 517 645 c
6th 773 836 635 820 542 700 718 bc
Mean 800 a 763 a 798 a 753 a 774 a 728 a 769
Averages across irrigation number, post irrigation time and year (I x T x Y)
Site-1 811 759 722 715 757 743 751 a
Site-2 788 768 874 792 790 714 788 a
Averages across irrigation number, post irrigation time and sites (I x T x S)
2003-04 711 629 633 645 609 600 638 b
2004 815 833 849 802 864 773 823 a
2004-05 873 827 913 814 847 811 847 a
SD for irrigation post irrigation time = 139.92, LSD for year = 98.94 and LSD for site = 80.78

178
Appendix. 13. Rate of Fe (mg ha-1 h-1) drained in waters from site-1, Fazliabad and site-2, Manga Dargai as influenced by irrigation number and post irrigation
timing under subsurface tile drainage system during 2003-05
SOV ------------------- Post Irrigation Time (h) --------------------- Mean
Irrig. # 24 30 36 48 72 96
1st 147 152 320 306 222 107 209 a
2nd 215 225 201 231 147 256 213 a
3rd 164 218 120 321 128 178 188 a
4th 184 119 186 266 173 152 180 a
5th 106 204 217 380 311 182 233 a
6th 165 235 214 177 202 308 217 a
Mean 164 b 192 b 210 ab 280 a 197 b 197 b 207 a
Averages across irrigation number, post irrigation time and year (I x T x Y)
Site-1 151 168 173 254 158 188 182 b
Site-2 176 216 247 306 237 206 231 a
Averages across irrigation number, post irrigation time and sites (I x T x S)
2003-04 177 198 208 491 207 186 245 a
2004 107 102 117 100 103 120 108 b
2004-05 207 277 304 248 282 285 267 a
SD for irrigation post irrigation time = 73.94, LSD for year = 52.28 and LSD for site = 42.69

179
Appendix. 14. Rate of Mn (mg ha-1 h-1) drained in waters from site-1, Fazliabad and site-2, Manga Dargai as influenced by irrigation number and post irrigation
timing under subsurface tile drainage system during 2003-05
SOV ------------------- Post Irrigation Time (h) ------------------- Mean
Irrig. # 24 30 36 48 72 96
1st 511 528 540 491 620 397 515 b
2nd 594 589 581 514 679 455 569 ab
3rd 832 506 634 492 858 655 663 a
4th 364 587 496 402 508 463 470 b
5th 713 415 589 524 443 705 565 ab
6th 657 469 445 376 643 506 516 b
Mean 612 a 516 ab 547 ab 467 b 625 a 530 ab 549
Averages across irrigation number, post irrigation time and year (I x T x Y)
Site-1 501 455 550 414 514 502 490 b
Site-2 723 576 545 519 736 558 609 a
Averages across irrigation number, post irrigation time and sites (I x T x S)
2003-04 262 192 204 260 239 307 244 c
2004 1133 1107 1048 752 1066 935 1007 a
2004-05 441 247 390 388 570 349 398 b
SD for irrigation post irrigation time = 136.99, LSD for year = 96.87 and LSD for site = 79.09

180
Appendix. 15. Rate of Zn (mg ha-1 h-1) drained in waters from site-1, Fazliabad and site-2, Manga Dargai as influenced by irrigation number and post irrigation
timing under subsurface tile drainage system during 2003-05
SOV ---------------- Post Irrigation Time (h) ------------------- Mean
Irrig. # 24 30 36 48 72 96
1st 143 83 91 65 137 91 102 a
2nd 152 65 102 135 71 128 109 a
3rd 97 72 85 108 139 112 102 a
4th 102 80 110 72 110 90 94 a
5th 102 71 124 129 111 127 111 a
6th 71 84 72 101 68 121 86 a
Mean 111 a 76 b 98 ab 102 ab 106 ab 111 a 101
Averages across irrigation number, post irrigation time and year (I x T x Y)
Site-1 106 78 73 105 93 110 94 a
Site-2 116 74 122 98 119 113 107 a
Averages across irrigation number, post irrigation time and sites (I x T x S)
2003-04 118 84 71 76 92 66 84 b
2004 89 58 86 92 111 96 88 b
2004-05 126 86 135 137 115 173 129 a
SD for irrigation post irrigation time = 33.29, LSD for year = 26.38 and LSD for site = 19.20