Embed Size (px)
Citation preview
Sakura Sogo REIT Presentation Material for FP4 (Four months ended 30 June 2018)
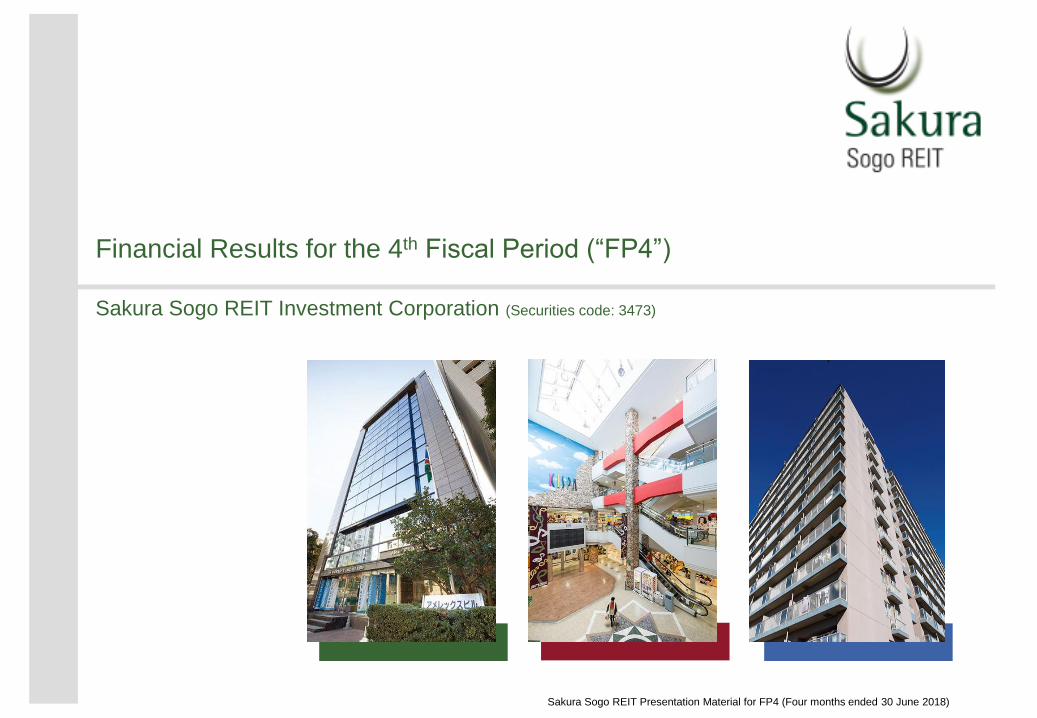
Financial Results for the 4th Fiscal Period (“FP4”)
Sakura Sogo REIT Investment Corporation (Securities code: 3473)
Sakura Sogo REIT Presentation Material for FP4 (Four months ended 30 June 2018) 2
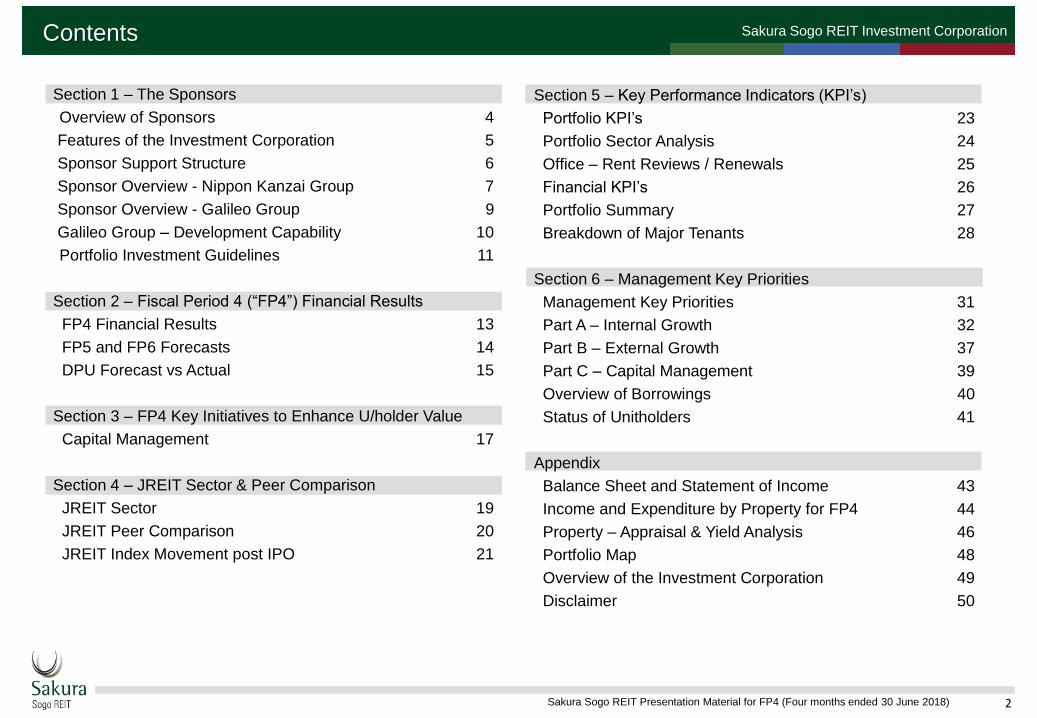
Sakura Sogo REIT Investment CorporationContents
Section 1 – The Sponsors
Overview of Sponsors 4
Features of the Investment Corporation 5
Sponsor Support Structure 6
Sponsor Overview - Nippon Kanzai Group 7
Sponsor Overview - Galileo Group 9
Galileo Group – Development Capability 10
Portfolio Investment Guidelines 11
Section 2 – Fiscal Period 4 (“FP4”) Financial Results
FP4 Financial Results 13
FP5 and FP6 Forecasts 14
DPU Forecast vs Actual 15
Section 3 – FP4 Key Initiatives to Enhance U/holder Value
Capital Management 17
Section 4 – JREIT Sector & Peer Comparison
JREIT Sector 19
JREIT Peer Comparison 20
JREIT Index Movement post IPO 21
Section 5 – Key Performance Indicators (KPI’s)
Portfolio KPI’s 23
Portfolio Sector Analysis 24
Office – Rent Reviews / Renewals 25
Financial KPI’s 26
Portfolio Summary 27
Breakdown of Major Tenants 28
Section 6 – Management Key Priorities
Management Key Priorities 31
Part A – Internal Growth 32
Part B – External Growth 37
Part C – Capital Management 39
Overview of Borrowings 40
Status of Unitholders 41
Appendix
Balance Sheet and Statement of Income 43
Income and Expenditure by Property for FP4 44
Property – Appraisal & Yield Analysis 46
Portfolio Map 48
Overview of the Investment Corporation 49
Disclaimer 50
Sakura Sogo REIT Investment Corporation
3Sakura Sogo REIT Presentation Material for FP3 (Six months ended 28 February 2018)
Section 1 – The Sponsors
Sakura Sogo REIT Presentation Material for FP4 (Four months ended 30 June 2018) 4
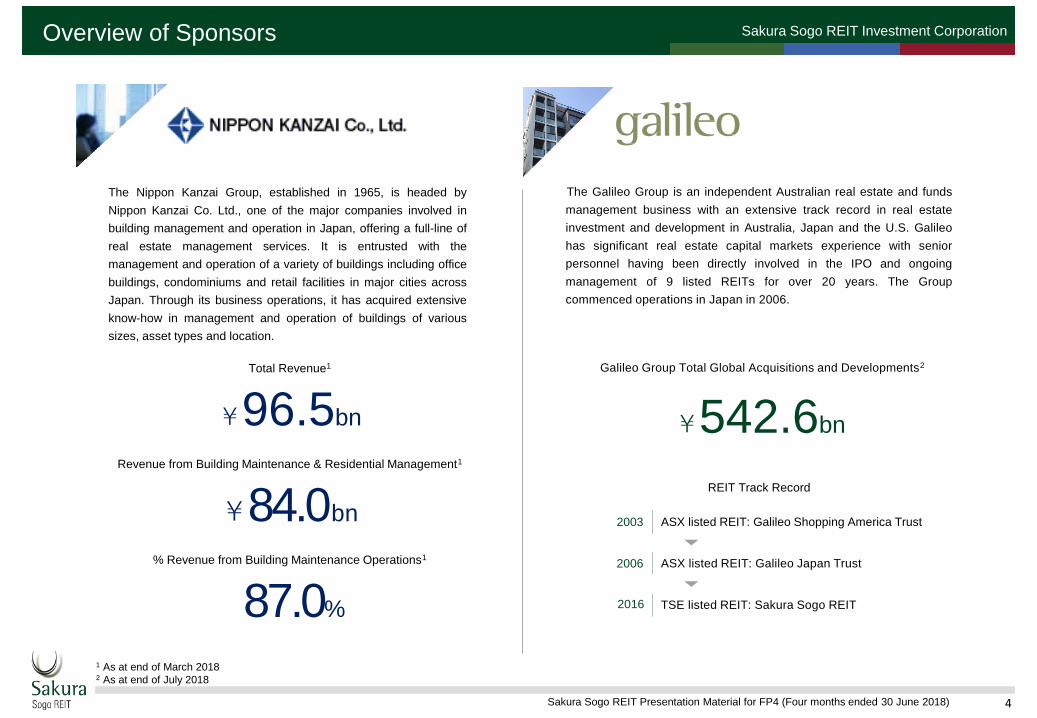
Sakura Sogo REIT Investment CorporationOverview of Sponsors
The Nippon Kanzai Group, established in 1965, is headed by
Nippon Kanzai Co. Ltd., one of the major companies involved in
building management and operation in Japan, offering a full-line of
real estate management services. It is entrusted with the
management and operation of a variety of buildings including office
buildings, condominiums and retail facilities in major cities across
Japan. Through its business operations, it has acquired extensive
know-how in management and operation of buildings of various
sizes, asset types and location.
Galileo Group Total Global Acquisitions and Developments2
¥542.6bn
2003 ASX listed REIT: Galileo Shopping America Trust
2006 ASX listed REIT: Galileo Japan Trust
2016 TSE listed REIT: Sakura Sogo REIT
Galileo Group
1 As at end of March 20182 As at end of July 2018
Total Revenue1
¥96.5bn
Revenue from Building Maintenance & Residential Management1
¥84.0bn
% Revenue from Building Maintenance Operations1
87.0%
The Galileo Group is an independent Australian real estate and funds
management business with an extensive track record in real estate
investment and development in Australia, Japan and the U.S. Galileo
has significant real estate capital markets experience with senior
personnel having been directly involved in the IPO and ongoing
management of 9 listed REITs for over 20 years. The Group
commenced operations in Japan in 2006.
REIT Track Record
Sakura Sogo REIT Presentation Material for FP4 (Four months ended 30 June 2018) 5
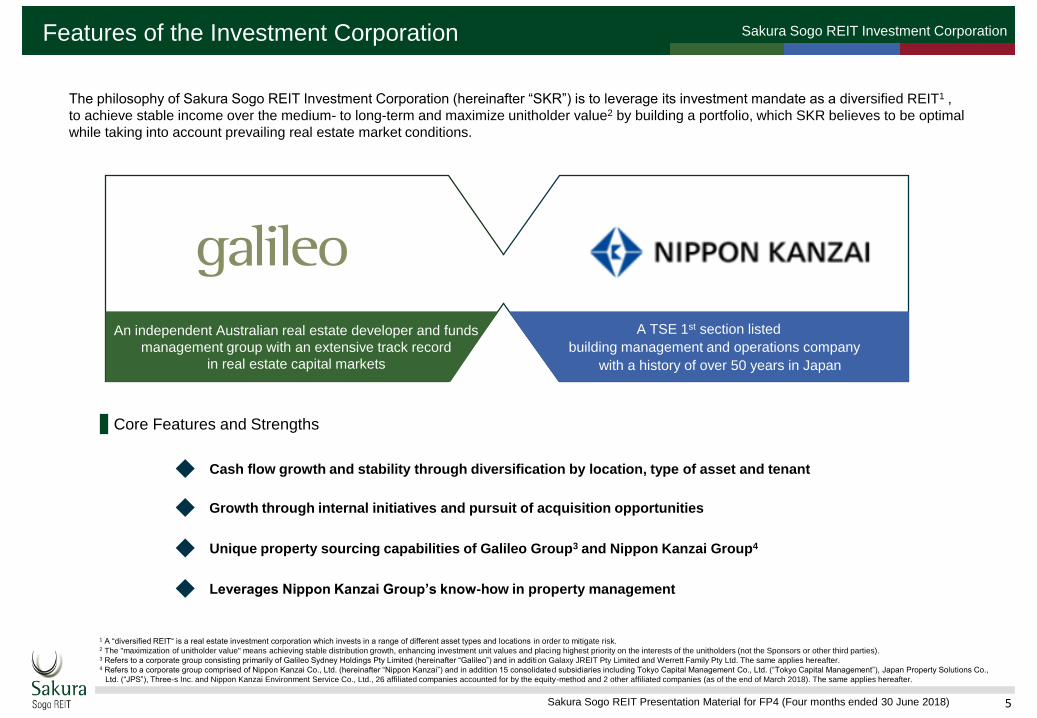
Sakura Sogo REIT Investment CorporationFeatures of the Investment Corporation
Core Features and Strengths
An independent Australian real estate developer and funds
management group with an extensive track record
in real estate capital markets
A TSE 1st section listed
building management and operations company
with a history of over 50 years in Japan
Cash flow growth and stability through diversification by location, type of asset and tenant
Growth through internal initiatives and pursuit of acquisition opportunities
Unique property sourcing capabilities of Galileo Group3 and Nippon Kanzai Group4
Leverages Nippon Kanzai Group’s know-how in property management
The philosophy of Sakura Sogo REIT Investment Corporation (hereinafter “SKR”) is to leverage its investment mandate as a diversified REIT1 ,
to achieve stable income over the medium- to long-term and maximize unitholder value2 by building a portfolio, which SKR believes to be optimal
while taking into account prevailing real estate market conditions.
1 A “diversified REIT“ is a real estate investment corporation which invests in a range of different asset types and locations in order to mitigate risk.2 The "maximization of unitholder value" means achieving stable distribution growth, enhancing investment unit values and placing highest priority on the interests of the unitholders (not the Sponsors or other third parties).3 Refers to a corporate group consisting primarily of Galileo Sydney Holdings Pty Limited (hereinafter “Galileo”) and in addition Galaxy JREIT Pty Limited and Werrett Family Pty Ltd. The same applies hereafter.4 Refers to a corporate group comprised of Nippon Kanzai Co., Ltd. (hereinafter “Nippon Kanzai”) and in addition 15 consolidated subsidiaries including Tokyo Capital Management Co., Ltd. (“Tokyo Capital Management”), Japan Property Solutions Co.,
Ltd. (“JPS”), Three-s Inc. and Nippon Kanzai Environment Service Co., Ltd., 26 affiliated companies accounted for by the equity-method and 2 other affiliated companies (as of the end of March 2018). The same applies hereafter.
Sakura Sogo REIT Presentation Material for FP4 (Four months ended 30 June 2018) 6
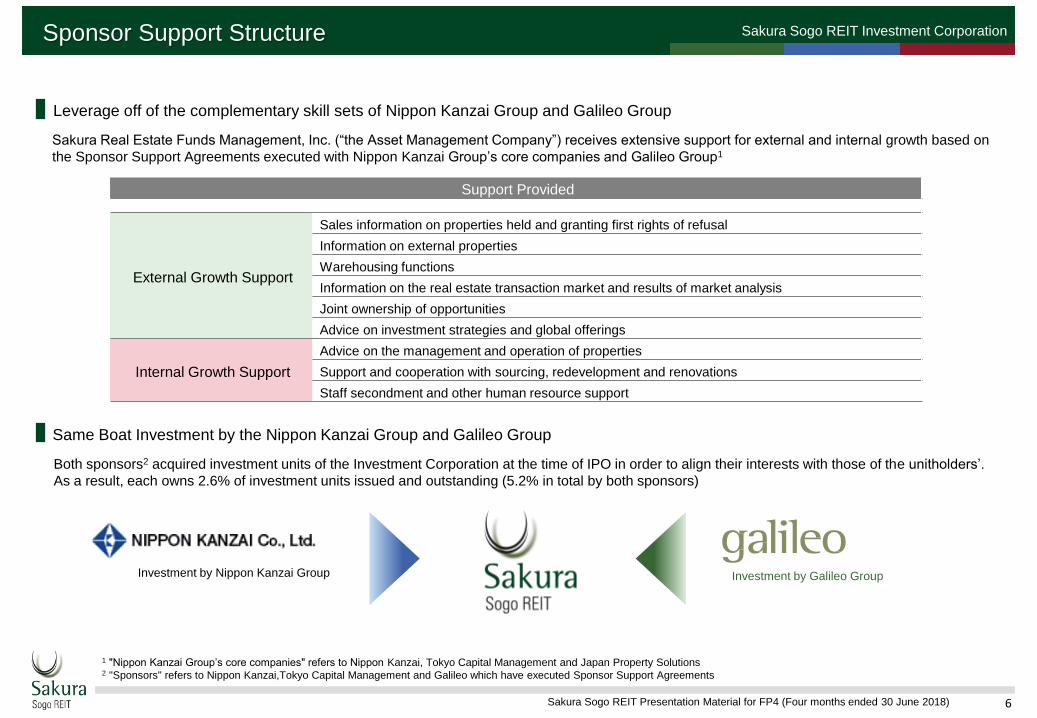
Sakura Sogo REIT Investment CorporationSponsor Support Structure
Sakura Real Estate Funds Management, Inc. (“the Asset Management Company”) receives extensive support for external and internal growth based on
the Sponsor Support Agreements executed with Nippon Kanzai Group’s core companies and Galileo Group1
1 "Nippon Kanzai Group’s core companies" refers to Nippon Kanzai, Tokyo Capital Management and Japan Property Solutions2 "Sponsors" refers to Nippon Kanzai,Tokyo Capital Management and Galileo which have executed Sponsor Support Agreements
Both sponsors2 acquired investment units of the Investment Corporation at the time of IPO in order to align their interests with those of the unitholders’.
As a result, each owns 2.6% of investment units issued and outstanding (5.2% in total by both sponsors)
Support Provided
External Growth Support
Sales information on properties held and granting first rights of refusal
Information on external properties
Warehousing functions
Information on the real estate transaction market and results of market analysis
Joint ownership of opportunities
Advice on investment strategies and global offerings
Internal Growth Support
Advice on the management and operation of properties
Support and cooperation with sourcing, redevelopment and renovations
Staff secondment and other human resource support
Same Boat Investment by the Nippon Kanzai Group and Galileo Group
Leverage off of the complementary skill sets of Nippon Kanzai Group and Galileo Group
Investment by Galileo GroupInvestment by Nippon Kanzai Group
Sakura Sogo REIT Presentation Material for FP4 (Four months ended 30 June 2018) 7
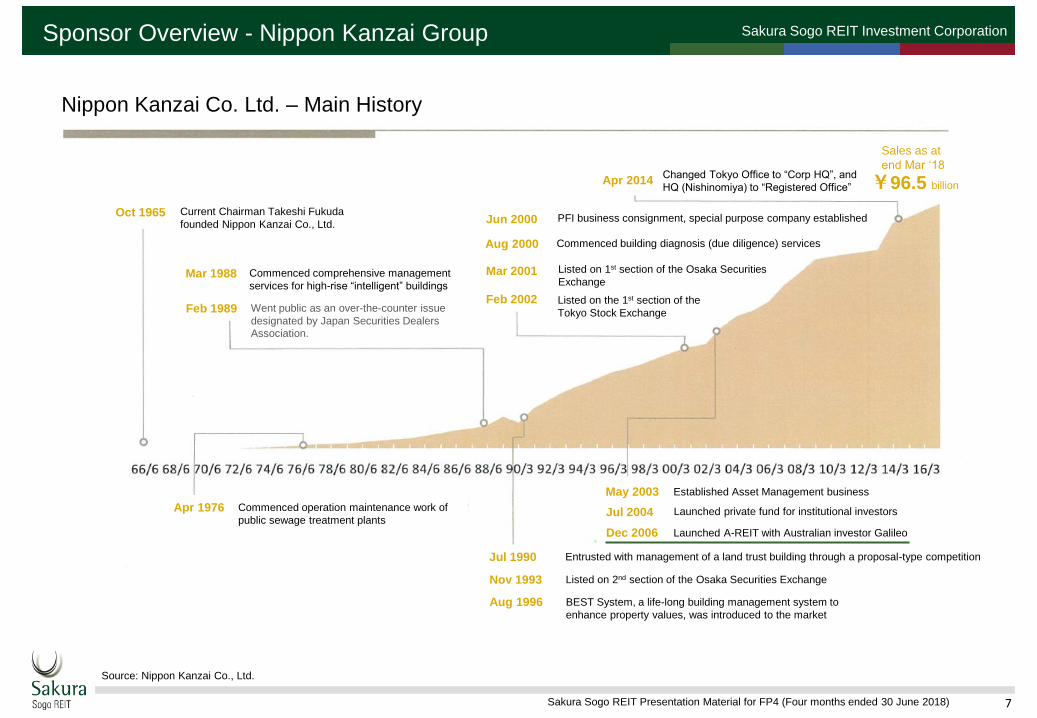
Sakura Sogo REIT Investment CorporationSponsor Overview - Nippon Kanzai Group
Source: Nippon Kanzai Co., Ltd.
Galileo GroupNippon Kanzai Co. Ltd. – Main History
Oct 1965 Current Chairman Takeshi Fukuda
founded Nippon Kanzai Co., Ltd.
Aug 2000
Mar 1988
Apr 2014
Feb 1989
Apr 1976
Jun 2000
Aug 1996
Mar 2001
May 2003
Nov 1993
Dec 2006
Jul 2004
Jul 1990
Changed Tokyo Office to “Corp HQ”, and
HQ (Nishinomiya) to “Registered Office”
Went public as an over-the-counter issue
designated by Japan Securities Dealers Association.
Sales as at
end Mar ‘18
¥96.5 billion
Commenced comprehensive management
services for high-rise “intelligent” buildings
Entrusted with management of a land trust building through a proposal-type competition
BEST System, a life-long building management system to
enhance property values, was introduced to the market
Commenced building diagnosis (due diligence) services
Listed on 1st section of the Osaka Securities
Exchange
Feb 2002 Listed on the 1st section of the
Tokyo Stock Exchange
Established Asset Management business
Launched A-REIT with Australian investor Galileo
Commenced operation maintenance work of
public sewage treatment plantsLaunched private fund for institutional investors
Listed on 2nd section of the Osaka Securities Exchange
PFI business consignment, special purpose company established
Sakura Sogo REIT Presentation Material for FP4 (Four months ended 30 June 2018) 8
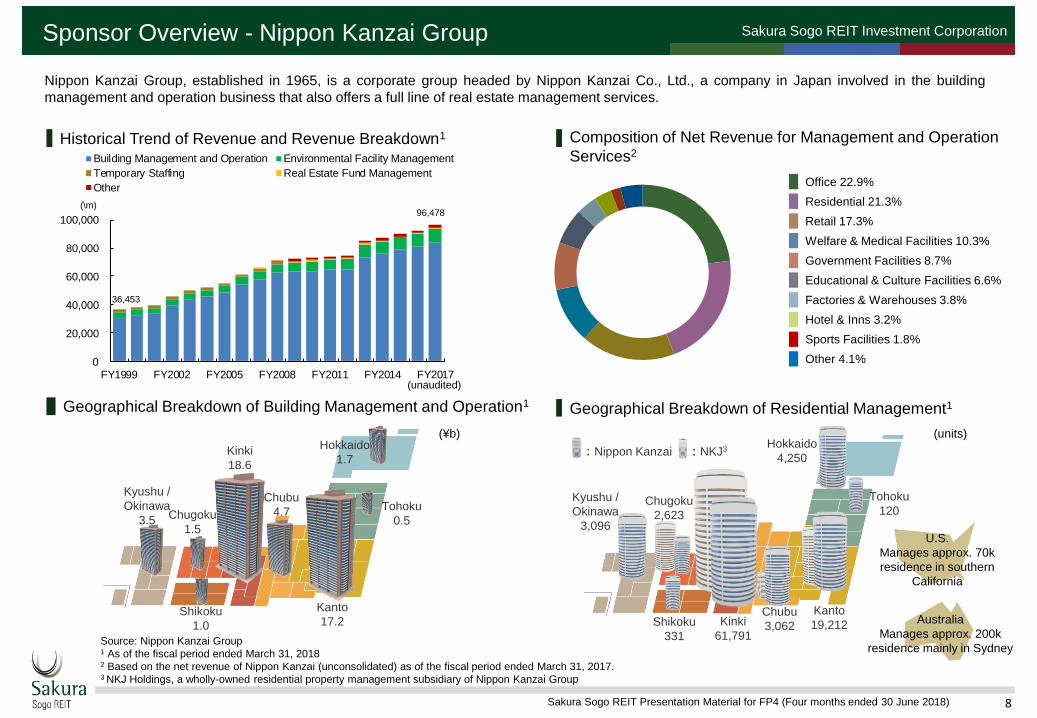
Sakura Sogo REIT Investment CorporationSponsor Overview - Nippon Kanzai Group
Nippon Kanzai Group, established in 1965, is a corporate group headed by Nippon Kanzai Co., Ltd., a company in Japan involved in the building
management and operation business that also offers a full line of real estate management services.
Source: Nippon Kanzai Group1 As of the fiscal period ended March 31, 20182 Based on the net revenue of Nippon Kanzai (unconsolidated) as of the fiscal period ended March 31, 2017.3 NKJ Holdings, a wholly-owned residential property management subsidiary of Nippon Kanzai Group
Historical Trend of Revenue and Revenue Breakdown1 Composition of Net Revenue for Management and Operation
Services2
Geographical Breakdown of Building Management and Operation1 Geographical Breakdown of Residential Management1
Residential 21.3%
36,453
96,478
:Nippon Kanzai :NKJ3
Kinki
61,791
Kanto
19,212Chubu
3,062
Hokkaido
4,250
Tohoku
120
Shikoku
331
Chugoku
2,623
Kyushu /
Okinawa
3,096
Australia
Manages approx. 200k
residence mainly in Sydney
U.S.
Manages approx. 70k
residence in southern
California
Office 22.9%
Retail 17.3%
Welfare & Medical Facilities 10.3%
Government Facilities 8.7%
Educational & Culture Facilities 6.6%
Factories & Warehouses 3.8%
Hotel & Inns 3.2%
Sports Facilities 1.8%
Other 4.1%
(units)
(\m)
0
20,000
40,000
60,000
80,000
100,000
FY1999 FY2002 FY2005 FY2008 FY2011 FY2014 FY2017
Building Management and Operation Environmental Facility Management
Temporary Staffing Real Estate Fund Management
Other
Kinki
18.6
Kanto
17.2
Chubu
4.7
Hokkaido
1.7
Tohoku
0.5
Shikoku
1.0
Chugoku
1.5
Kyushu /
Okinawa
3.5
(¥b)
(unaudited)
Sakura Sogo REIT Presentation Material for FP4 (Four months ended 30 June 2018) 9
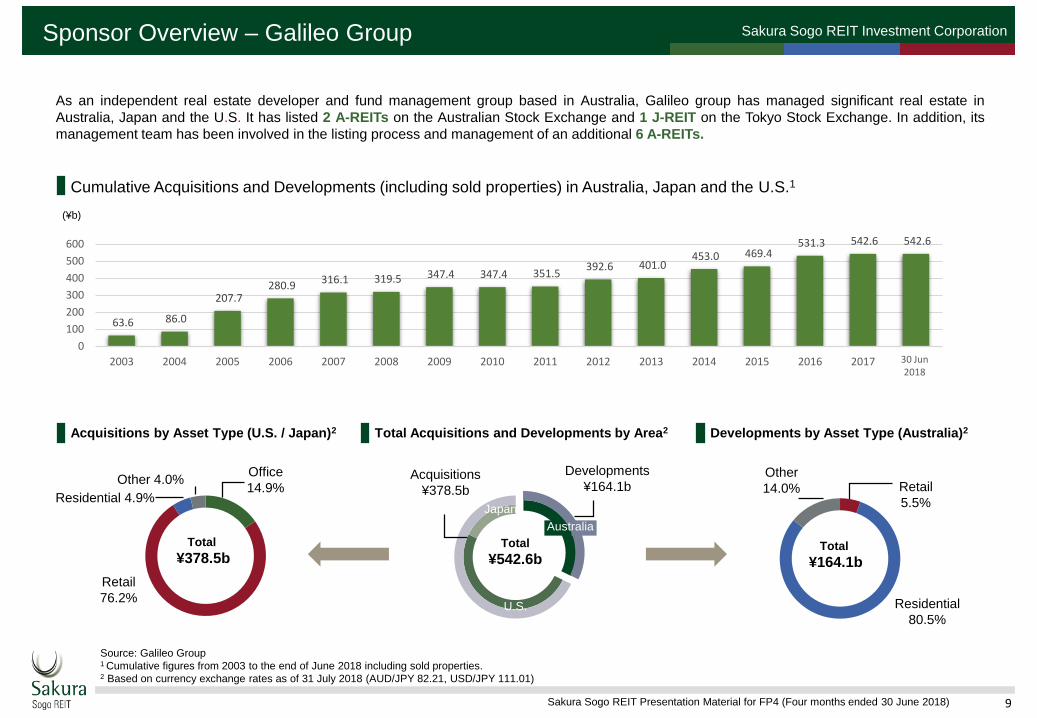
Sakura Sogo REIT Investment CorporationSponsor Overview – Galileo Group
Cumulative Acquisitions and Developments (including sold properties) in Australia, Japan and the U.S.1
As an independent real estate developer and fund management group based in Australia, Galileo group has managed significant real estate in
Australia, Japan and the U.S. It has listed 2 A-REITs on the Australian Stock Exchange and 1 J-REIT on the Tokyo Stock Exchange. In addition, its
management team has been involved in the listing process and management of an additional 6 A-REITs.
Office
14.9%
Retail
76.2%
Residential 4.9%
Other 4.0%
Total
¥378.5b
Developments
¥164.1bAcquisitions
¥378.5b
Japan
U.S.
Australia
Total
¥542.6bTotal
¥164.1b
Retail
5.5%
Other
14.0%
Residential
80.5%
(¥b)
Source: Galileo Group1 Cumulative figures from 2003 to the end of June 2018 including sold properties. 2 Based on currency exchange rates as of 31 July 2018 (AUD/JPY 82.21, USD/JPY 111.01)
Acquisitions by Asset Type (U.S. / Japan)2 Total Acquisitions and Developments by Area2 Developments by Asset Type (Australia)2
63.6 86.0
207.7 280.9
316.1 319.5 347.4 347.4 351.5 392.6 401.0
453.0 469.4 531.3 542.6 542.6
0
100
200
300
400
500
600
2003 2004 2005 2006 2007 2008 2009 2010 2011 2012 2013 2014 2015 2016 2017 201830 Jun2018
Sakura Sogo REIT Presentation Material for FP4 (Four months ended 30 June 2018) 10
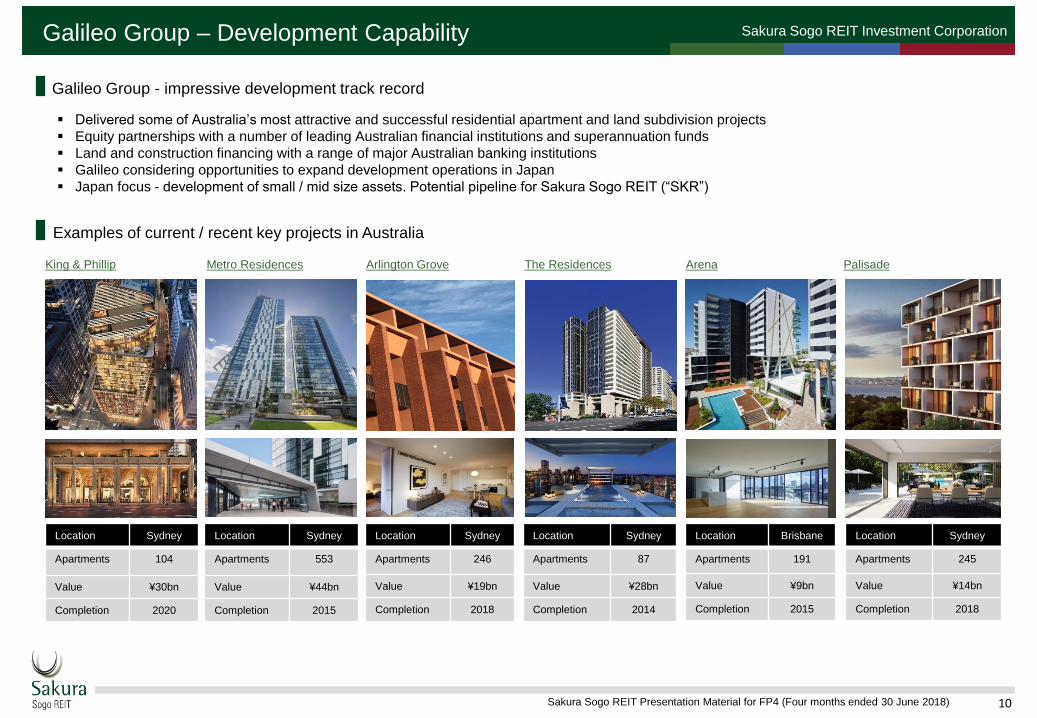
Sakura Sogo REIT Investment CorporationGalileo Group – Development Capability
Galileo Group - impressive development track record
▪ Delivered some of Australia’s most attractive and successful residential apartment and land subdivision projects
▪ Equity partnerships with a number of leading Australian financial institutions and superannuation funds
▪ Land and construction financing with a range of major Australian banking institutions
▪ Galileo considering opportunities to expand development operations in Japan
▪ Japan focus - development of small / mid size assets. Potential pipeline for Sakura Sogo REIT (“SKR”)
Examples of current / recent key projects in Australia
Location Sydney
Apartments 104
Value ¥30bn
Completion 2020
Location Sydney
Apartments 553
Value ¥44bn
Completion 2015
King & Phillip Metro Residences
Location Sydney
Apartments 246
Value ¥19bn
Completion 2018
Arlington Grove
Location Brisbane
Apartments 191
Value ¥9bn
Completion 2015
Arena
Location Sydney
Apartments 245
Value ¥14bn
Completion 2018
Palisade
Location Sydney
Apartments 87
Value ¥28bn
Completion 2014
The Residences
Sakura Sogo REIT Presentation Material for FP4 (Four months ended 30 June 2018) 11
Sakura Sogo REIT Investment Corporation
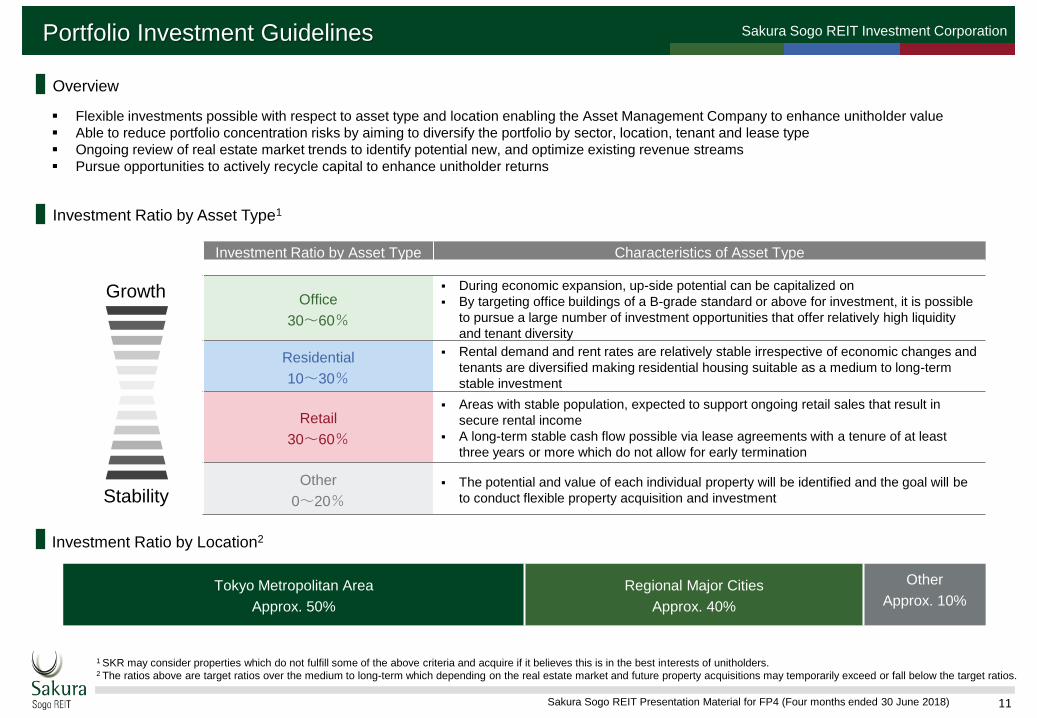
Investment Ratio by Asset Type Characteristics of Asset Type
Office
30~60%
▪ During economic expansion, up-side potential can be capitalized on
▪ By targeting office buildings of a B-grade standard or above for investment, it is possible
to pursue a large number of investment opportunities that offer relatively high liquidity
and tenant diversity
Residential
10~30%
▪ Rental demand and rent rates are relatively stable irrespective of economic changes and
tenants are diversified making residential housing suitable as a medium to long-term
stable investment
Retail
30~60%
▪ Areas with stable population, expected to support ongoing retail sales that result in
secure rental income
▪ A long-term stable cash flow possible via lease agreements with a tenure of at least
three years or more which do not allow for early termination
Other
0~20%
▪ The potential and value of each individual property will be identified and the goal will be
to conduct flexible property acquisition and investment
Investment Ratio by Asset Type1
Portfolio Investment Guidelines
▪ Flexible investments possible with respect to asset type and location enabling the Asset Management Company to enhance unitholder value
▪ Able to reduce portfolio concentration risks by aiming to diversify the portfolio by sector, location, tenant and lease type
▪ Ongoing review of real estate market trends to identify potential new, and optimize existing revenue streams
▪ Pursue opportunities to actively recycle capital to enhance unitholder returns
1 SKR may consider properties which do not fulfill some of the above criteria and acquire if it believes this is in the best interests of unitholders.2 The ratios above are target ratios over the medium to long-term which depending on the real estate market and future property acquisitions may temporarily exceed or fall below the target ratios.
Tokyo Metropolitan Area
Approx. 50%
Regional Major Cities
Approx. 40%
Other
Approx. 10%
Investment Ratio by Location2
Stability
Growth
Overview

Sakura Sogo REIT Investment Corporation
12Sakura Sogo REIT Presentation Material for FP3 (Six months ended 28 February 2018)
Section 2 – FP4 Financial Results
Sakura Sogo REIT Presentation Material for FP4 (Four months ended 30 June 2018) 13
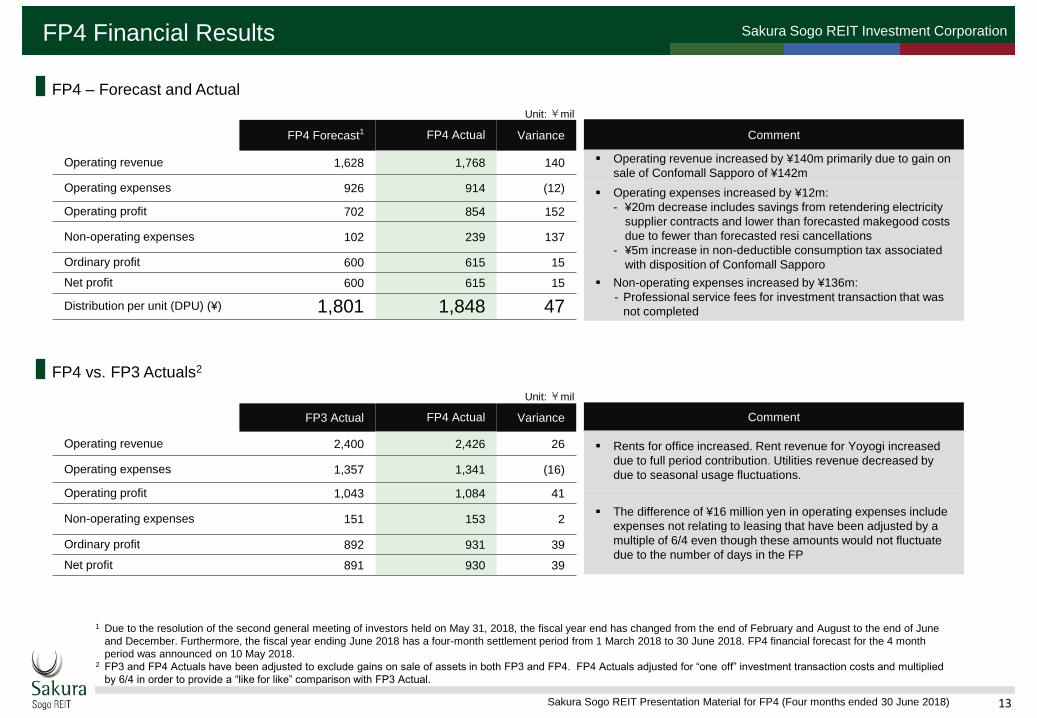
Sakura Sogo REIT Investment CorporationFP4 Financial Results
FP4 Forecast1 FP4 Actual Variance
Operating revenue 1,628 1,768 140
Operating expenses 926 914 (12)
Operating profit 702 854 152
Non-operating expenses 102 239 137
Ordinary profit 600 615 15
Net profit 600 615 15
Distribution per unit (DPU) (¥) 1,801 1,848 47
Unit: ¥mil
FP4 – Forecast and Actual
1 Due to the resolution of the second general meeting of investors held on May 31, 2018, the fiscal year end has changed from the end of February and August to the end of June
and December. Furthermore, the fiscal year ending June 2018 has a four-month settlement period from 1 March 2018 to 30 June 2018. FP4 financial forecast for the 4 month
period was announced on 10 May 2018.2 FP3 and FP4 Actuals have been adjusted to exclude gains on sale of assets in both FP3 and FP4. FP4 Actuals adjusted for “one off” investment transaction costs and multiplied
by 6/4 in order to provide a “like for like” comparison with FP3 Actual.
Comment
▪ Operating revenue increased by ¥140m primarily due to gain on
sale of Confomall Sapporo of ¥142m
▪ Operating expenses increased by ¥12m:
- ¥20m decrease includes savings from retendering electricity
supplier contracts and lower than forecasted makegood costs
due to fewer than forecasted resi cancellations
- ¥5m increase in non-deductible consumption tax associated
with disposition of Confomall Sapporo
▪ Non-operating expenses increased by ¥136m:
- Professional service fees for investment transaction that was
not completed
FP3 Actual FP4 Actual Variance
Operating revenue 2,400 2,426 26
Operating expenses 1,357 1,341 (16)
Operating profit 1,043 1,084 41
Non-operating expenses 151 153 2
Ordinary profit 892 931 39
Net profit 891 930 39
Unit: ¥mil
FP4 vs. FP3 Actuals2
Comment
▪ Rents for office increased. Rent revenue for Yoyogi increased
due to full period contribution. Utilities revenue decreased by
due to seasonal usage fluctuations.
▪ The difference of ¥16 million yen in operating expenses include
expenses not relating to leasing that have been adjusted by a
multiple of 6/4 even though these amounts would not fluctuate
due to the number of days in the FP
Sakura Sogo REIT Presentation Material for FP4 (Four months ended 30 June 2018) 14
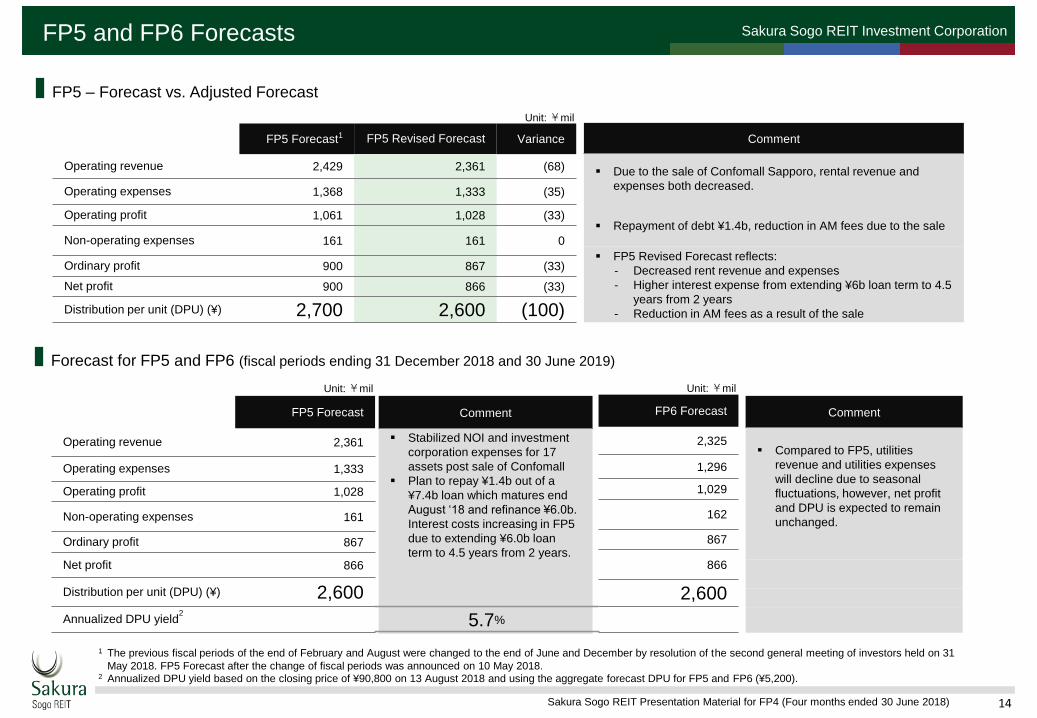
Sakura Sogo REIT Investment CorporationFP5 and FP6 Forecasts
FP5 – Forecast vs. Adjusted Forecast
1 The previous fiscal periods of the end of February and August were changed to the end of June and December by resolution of the second general meeting of investors held on 31
May 2018. FP5 Forecast after the change of fiscal periods was announced on 10 May 2018.2 Annualized DPU yield based on the closing price of ¥90,800 on 13 August 2018 and using the aggregate forecast DPU for FP5 and FP6 (¥5,200).
Unit: ¥mil
Forecast for FP5 and FP6 (fiscal periods ending 31 December 2018 and 30 June 2019)
Comment
▪ Stabilized NOI and investment
corporation expenses for 17
assets post sale of Confomall
▪ Plan to repay ¥1.4b out of a
¥7.4b loan which matures end
August ‘18 and refinance ¥6.0b.
Interest costs increasing in FP5
due to extending ¥6.0b loan
term to 4.5 years from 2 years.
FP5 Forecast
Operating revenue 2,361
Operating expenses 1,333
Operating profit 1,028
Non-operating expenses 161
Ordinary profit 867
Net profit 866
Distribution per unit (DPU) (¥) 2,600
Annualized DPU yield2
FP6 Forecast
2,325
1,296
1,029
162
867
866
2,600
Unit: ¥mil
Comment
▪ Compared to FP5, utilities
revenue and utilities expenses
will decline due to seasonal
fluctuations, however, net profit
and DPU is expected to remain
unchanged.
5.7%
FP5 Forecast1 FP5 Revised Forecast Variance
Operating revenue 2,429 2,361 (68)
Operating expenses 1,368 1,333 (35)
Operating profit 1,061 1,028 (33)
Non-operating expenses 161 161 0
Ordinary profit 900 867 (33)
Net profit 900 866 (33)
Distribution per unit (DPU) (¥) 2,700 2,600 (100)
Unit: ¥mil
Comment
▪ Due to the sale of Confomall Sapporo, rental revenue and
expenses both decreased.
▪ Repayment of debt ¥1.4b, reduction in AM fees due to the sale
▪ FP5 Revised Forecast reflects:
- Decreased rent revenue and expenses
- Higher interest expense from extending ¥6b loan term to 4.5
years from 2 years
- Reduction in AM fees as a result of the sale
Sakura Sogo REIT Presentation Material for FP4 (Four months ended 30 June 2018) 15
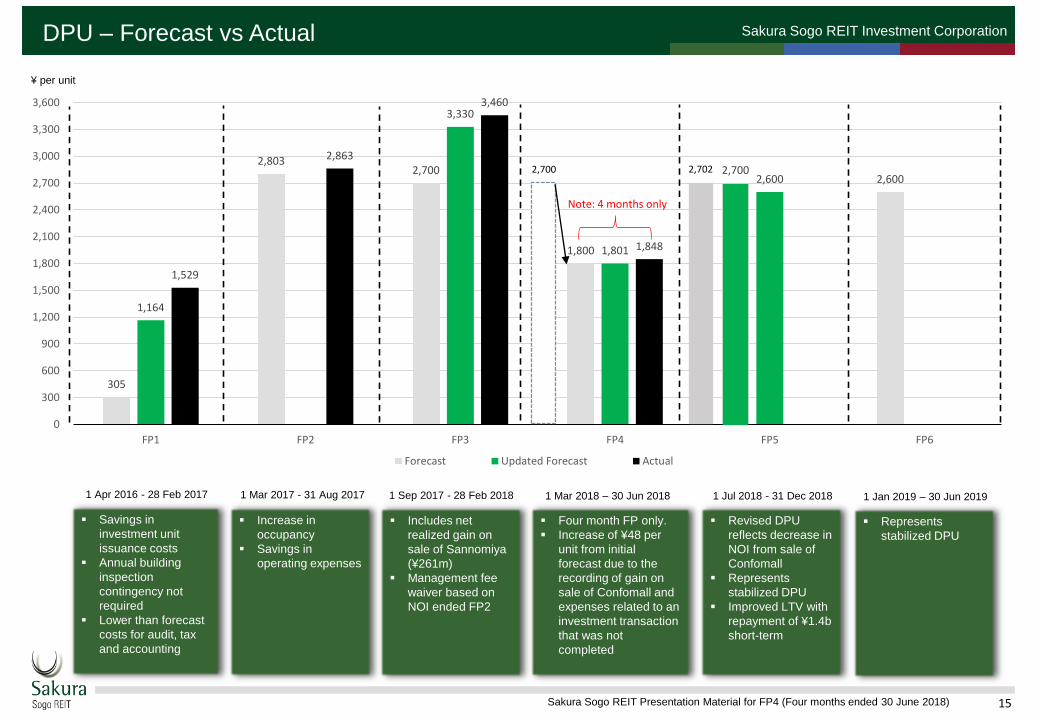
Sakura Sogo REIT Investment CorporationDPU – Forecast vs Actual
305
2,803 2,700
1,800
2,700 2,600
1,164
3,330
1,801
2,600
1,529
2,863
3,460
1,848
0
300
600
900
1,200
1,500
1,800
2,100
2,400
2,700
3,000
3,300
3,600
FP1 FP2 FP3 FP4 FP5 FP6
Forecast Updated Forecast Actual
2,700
▪ Savings in
investment unit
issuance costs
▪ Annual building
inspection
contingency not
required
▪ Lower than forecast
costs for audit, tax
and accounting
1 Apr 2016 - 28 Feb 2017 1 Mar 2017 - 31 Aug 2017
▪ Increase in
occupancy
▪ Savings in
operating expenses
▪ Includes net
realized gain on
sale of Sannomiya
(¥261m)
▪ Management fee
waiver based on
NOI ended FP2
▪ Four month FP only.
▪ Increase of ¥48 per
unit from initial
forecast due to the
recording of gain on
sale of Confomall and
expenses related to an
investment transaction
that was not
completed
1 Sep 2017 - 28 Feb 2018 1 Mar 2018 – 30 Jun 2018 1 Jul 2018 - 31 Dec 2018
▪ Revised DPU
reflects decrease in
NOI from sale of
Confomall
▪ Represents
stabilized DPU
▪ Improved LTV with
repayment of ¥1.4b
short-term
▪ Represents
stabilized DPU
1 Jan 2019 – 30 Jun 2019
¥ per unit
Note: 4 months only
2,702
Sakura Sogo REIT Investment Corporation
16Sakura Sogo REIT Presentation Material for FP3 (Six months ended 28 February 2018)
Section 3 – FP4 Key Initiatives to Enhance Unitholder Value
Sakura Sogo REIT Presentation Material for FP4 (Four months ended 30 June 2018) 17
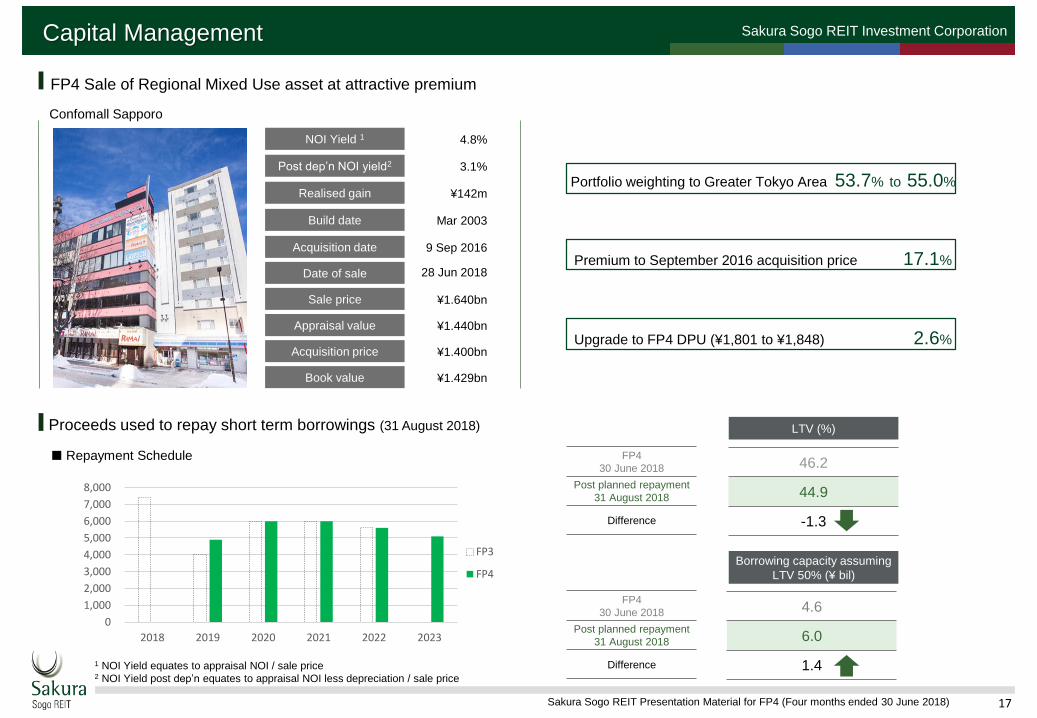
Sakura Sogo REIT Investment CorporationCapital Management
FP4 Sale of Regional Mixed Use asset at attractive premium
1 NOI Yield equates to appraisal NOI / sale price2 NOI Yield post dep’n equates to appraisal NOI less depreciation / sale price
Confomall Sapporo
NOI Yield 1 4.8%
Sale price ¥1.640bn
Appraisal value ¥1.440bn
Acquisition price ¥1.400bn
Book value ¥1.429bn
Realised gain ¥142m
Post dep’n NOI yield2 3.1%
Acquisition date 9 Sep 2016
Date of sale 28 Jun 2018
Build date Mar 2003
Portfolio weighting to Greater Tokyo Area 53.7% to 55.0%
Upgrade to FP4 DPU (¥1,801 to ¥1,848) 2.6%
Premium to September 2016 acquisition price 17.1%
Proceeds used to repay short term borrowings (31 August 2018)
46.2
44.9
-1.3
FP4
30 June 2018
Post planned repayment
31 August 2018
Difference
LTV (%)
4.6
6.0
1.4
Borrowing capacity assuming
LTV 50% (¥ bil)
FP4
30 June 2018
Post planned repayment
31 August 2018
Difference
■ Repayment Schedule
0
1,000
2,000
3,000
4,000
5,000
6,000
7,000
8,000
2018 2019 2020 2021 2022 2023
FP3
FP4
Sakura Sogo REIT Investment Corporation
18Sakura Sogo REIT Presentation Material for FP3 (Six months ended 28 February 2018)
Section 4 – JREIT Sector & Peer Comparison
Sakura Sogo REIT Presentation Material for FP4 (Four months ended 30 June 2018) 19
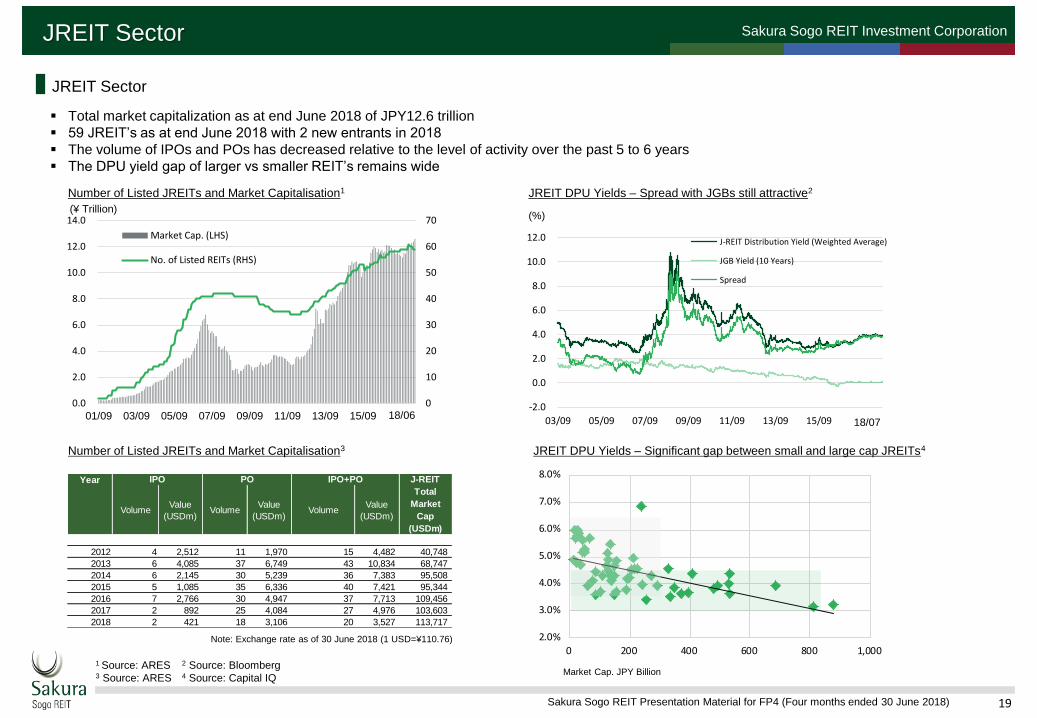
Sakura Sogo REIT Investment CorporationJREIT Sector
1 Source: ARES3 Source: ARES
JREIT Sector
▪ Total market capitalization as at end June 2018 of JPY12.6 trillion
▪ 59 JREIT’s as at end June 2018 with 2 new entrants in 2018
▪ The volume of IPOs and POs has decreased relative to the level of activity over the past 5 to 6 years
▪ The DPU yield gap of larger vs smaller REIT’s remains wide
(¥ Trillion)
Number of Listed JREITs and Market Capitalisation1
Number of Listed JREITs and Market Capitalisation3 JREIT DPU Yields – Significant gap between small and large cap JREITs4
JREIT DPU Yields – Spread with JGBs still attractive2
(%)
Market Cap. JPY Billion2 Source: Bloomberg4 Source: Capital IQ
Note: Exchange rate as of 30 June 2018 (1 USD=¥110.76)
18/03
0
10
20
30
40
50
60
70
0.0
2.0
4.0
6.0
8.0
10.0
12.0
14.0
01/09 03/09 05/09 07/09 09/09 11/09 13/09 15/09 17/09
Market Cap. (LHS)
No. of Listed REITs (RHS)
18/06-2.0
0.0
2.0
4.0
6.0
8.0
10.0
12.0
03/09 05/09 07/09 09/09 11/09 13/09 15/09 17/09
J-REIT Distribution Yield (Weighted Average)
JGB Yield (10 Years)
Spread
18/07
IPO PO IPO+PO
VolumeValue
(USDm)Volume
Value
(USDm)Volume
Value
(USDm)
2012 4 2,512 11 1,970 15 4,482 40,748
2013 6 4,085 37 6,749 43 10,834 68,747
2014 6 2,145 30 5,239 36 7,383 95,508
2015 5 1,085 35 6,336 40 7,421 95,344
2016 7 2,766 30 4,947 37 7,713 109,456
2017 2 892 25 4,084 27 4,976 103,603
2018 2 421 18 3,106 20 3,527 113,717
J-REIT
Total
Market
Cap
(USDm)
Year
2.0%
3.0%
4.0%
5.0%
6.0%
7.0%
8.0%
0 200 400 600 800 1,000
Sakura Sogo REIT Presentation Material for FP4 (Four months ended 30 June 2018) 20
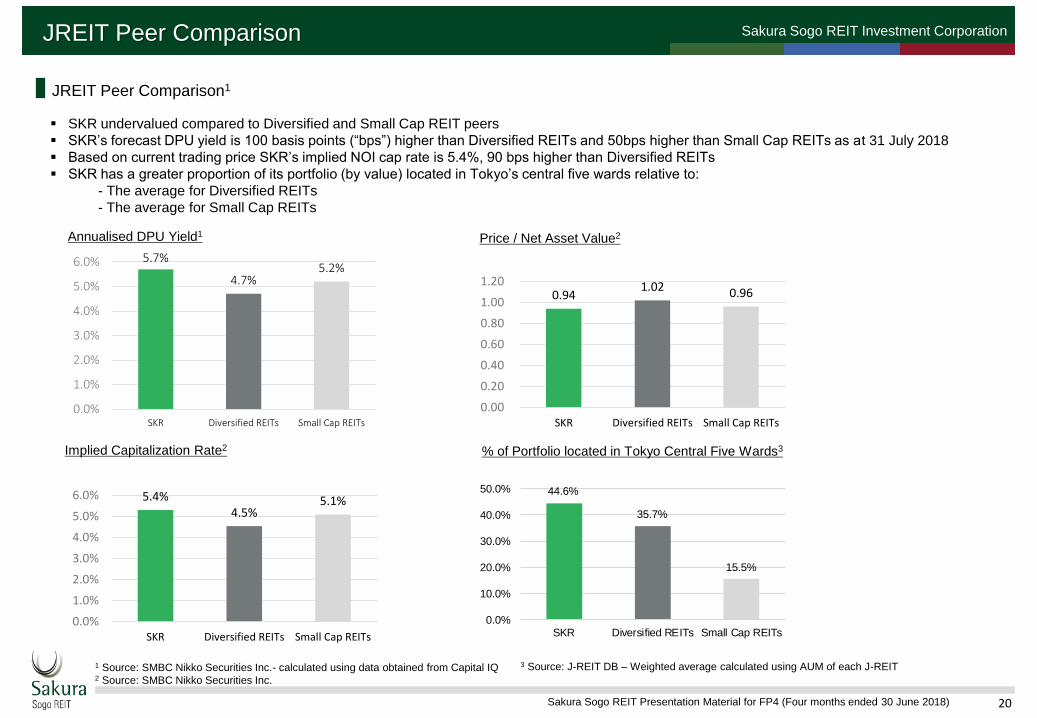
Sakura Sogo REIT Investment CorporationJREIT Peer Comparison
JREIT Peer Comparison1
1 Source: SMBC Nikko Securities Inc.- calculated using data obtained from Capital IQ2 Source: SMBC Nikko Securities Inc.
▪ SKR undervalued compared to Diversified and Small Cap REIT peers
▪ SKR’s forecast DPU yield is 100 basis points (“bps”) higher than Diversified REITs and 50bps higher than Small Cap REITs as at 31 July 2018
▪ Based on current trading price SKR’s implied NOI cap rate is 5.4%, 90 bps higher than Diversified REITs
▪ SKR has a greater proportion of its portfolio (by value) located in Tokyo’s central five wards relative to:
- The average for Diversified REITs
- The average for Small Cap REITs
Implied Capitalization Rate2 % of Portfolio located in Tokyo Central Five Wards3
Annualised DPU Yield1
3 Source: J-REIT DB – Weighted average calculated using AUM of each J-REIT
Price / Net Asset Value2
44.6%
35.7%
15.5%
0.0%
10.0%
20.0%
30.0%
40.0%
50.0%
SKR Diversified REITs Small Cap REITs
5.4%4.5%
5.1%
0.0%
1.0%
2.0%
3.0%
4.0%
5.0%
6.0%
SKR Diversified REITs Small Cap REITs
5.7%
4.7%5.2%
0.0%
1.0%
2.0%
3.0%
4.0%
5.0%
6.0%
SKR Diversified REITs Small Cap REITs
0.94 1.02 0.96
0.00
0.20
0.40
0.60
0.80
1.00
1.20
SKR Diversified REITs Small Cap REITs
Sakura Sogo REIT Presentation Material for FP4 (Four months ended 30 June 2018) 21
Sakura Sogo REIT Investment Corporation
0
5,000
10,000
15,000
20,000
25,000
30,000
35,000
74,000
79,000
84,000
89,000
94,000
99,000
104,000
2016/9/7 2016/12/2 2017/2/27 2017/5/24 2017/8/19 2017/11/13 2018/2/8 2018/5/5 2018/7/31
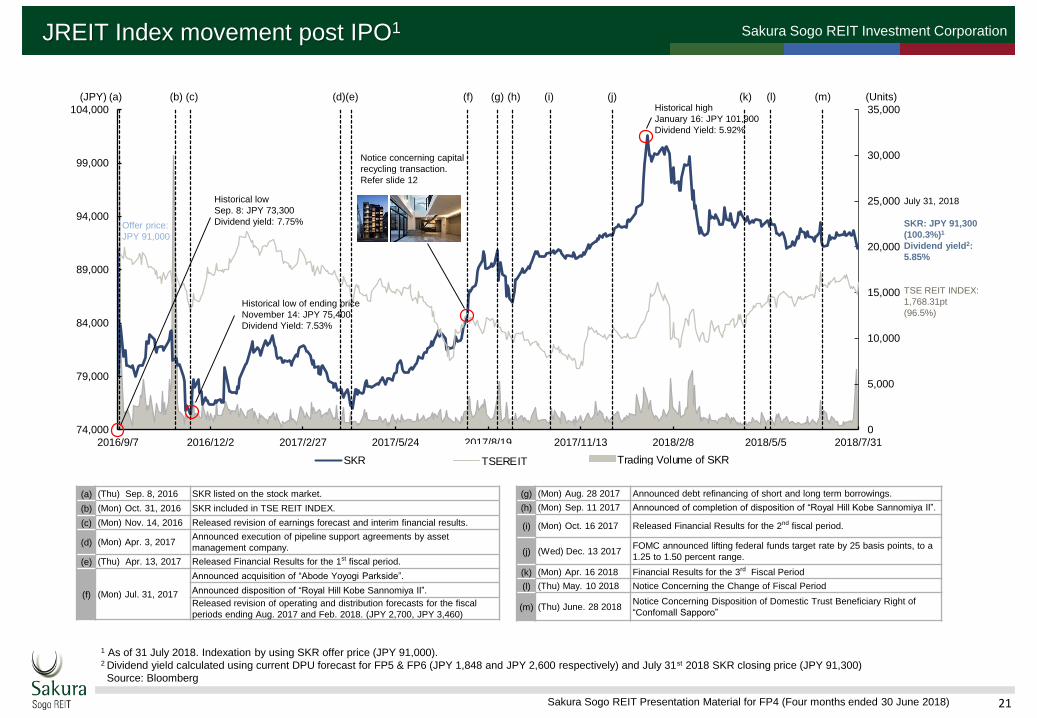
1 As of 31 July 2018. Indexation by using SKR offer price (JPY 91,000).2 Dividend yield calculated using current DPU forecast for FP5 & FP6 (JPY 1,848 and JPY 2,600 respectively) and July 31st 2018 SKR closing price (JPY 91,300)
Source: Bloomberg
0
5,000
10,000
15,000
20,000
25,000
30,000
35,000
74,000
79,000
84,000
89,000
94,000
99,000
104,000
2016/9/8 2016/11/18 2017/1/28 2017/4/9 2017/6/19 2017/8/29 2017/11/8 2018/1/18 2018/3/30
Trading Volume of SKR SKR TSEREIT
0
5,000
10,000
15,000
20,000
25,000
30,000
35,000
74,000
79,000
84,000
89,000
94,000
99,000
104,000
2016/9/8 2016/11/18 2017/1/28 2017/4/9 2017/6/19 2017/8/29 2017/11/8 2018/1/18 2018/3/30
Trading Volume of SKR SKR TSEREIT
0
5,000
10,000
15,000
20,000
25,000
30,000
35,000
74,000
79,000
84,000
89,000
94,000
99,000
104,000
2016/9/8 2016/11/18 2017/1/28 2017/4/9 2017/6/19 2017/8/29 2017/11/8 2018/1/18 2018/3/30
Trading Volume of SKR SKR TSEREIT
JREIT Index movement post IPO1
(a) (Thu) Sep. 8, 2016 SKR listed on the stock market.
(b) (Mon) Oct. 31, 2016 SKR included in TSE REIT INDEX.
(c) (Mon) Nov. 14, 2016 Released revision of earnings forecast and interim financial results.
(d) (Mon) Apr. 3, 2017Announced execution of pipeline support agreements by asset
management company.
(e) (Thu) Apr. 13, 2017 Released Financial Results for the 1st fiscal period.
(f) (Mon) Jul. 31, 2017
Announced acquisition of “Abode Yoyogi Parkside”.
Announced disposition of “Royal Hill Kobe Sannomiya II”.
Released revision of operating and distribution forecasts for the fiscal
periods ending Aug. 2017 and Feb. 2018. (JPY 2,700, JPY 3,460)
(g) (Mon) Aug. 28 2017 Announced debt refinancing of short and long term borrowings.
(h) (Mon) Sep. 11 2017 Announced of completion of disposition of “Royal Hill Kobe Sannomiya II”.
(i) (Mon) Oct. 16 2017 Released Financial Results for the 2nd fiscal period.
(j) (Wed) Dec. 13 2017FOMC announced lifting federal funds target rate by 25 basis points, to a
1.25 to 1.50 percent range.
(k) (Mon) Apr. 16 2018 Financial Results for the 3rd Fiscal Period
(l) (Thu) May. 10 2018 Notice Concerning the Change of Fiscal Period
(m) (Thu) June. 28 2018Notice Concerning Disposition of Domestic Trust Beneficiary Right of
“Confomall Sapporo”
Historical low of ending price
November 14: JPY 75,400
Dividend Yield: 7.53%
Notice concerning capital
recycling transaction.
Refer slide 12
Historical high
January 16: JPY 101,900
Dividend Yield: 5.92%
Historical low
Sep. 8: JPY 73,300
Dividend yield: 7.75%Offer price:
JPY 91,000
July 31, 2018
SKR: JPY 91,300
(100.3%)1
Dividend yield2:
5.85%
TSE REIT INDEX:
1,768.31pt
(96.5%)
(a) (b) (c) (d)(e) (f) (g) (h) (i) (j) (k) (l) (m) (Units)(JPY)

Sakura Sogo REIT Investment Corporation
22Sakura Sogo REIT Presentation Material for FP3 (Six months ended 28 February 2018)
Section 5 - Key Performance Indicators
Sakura Sogo REIT Presentation Material for FP4 (Four months ended 30 June 2018) 23
Sakura Sogo REIT Investment Corporation
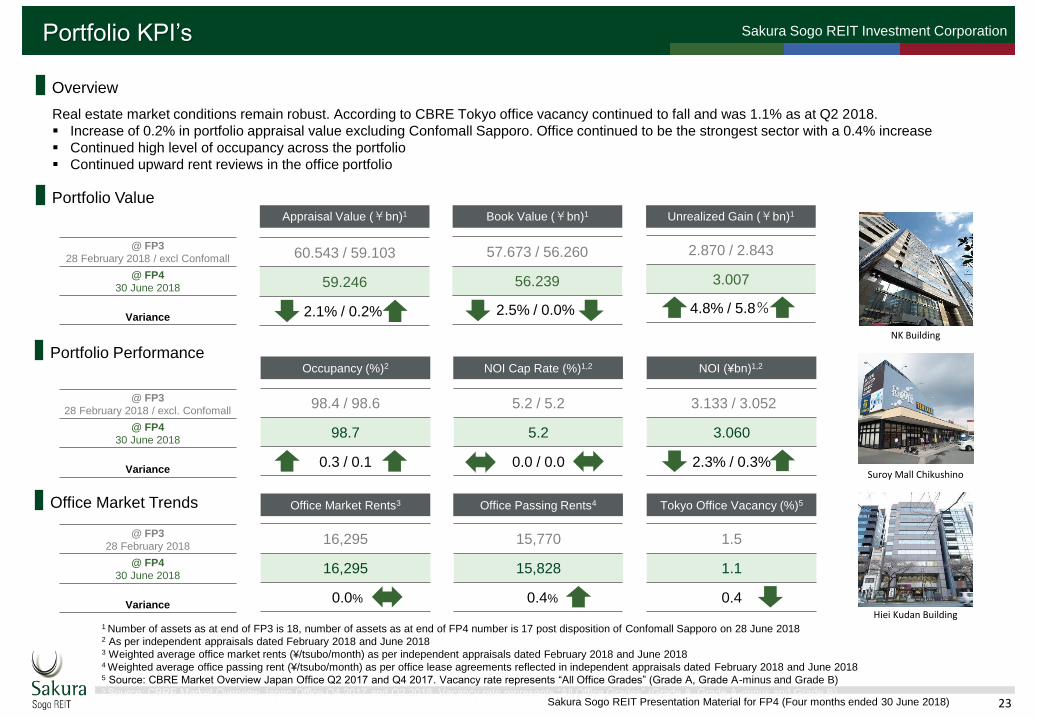
Real estate market conditions remain robust. According to CBRE Tokyo office vacancy continued to fall and was 1.1% as at Q2 2018.
▪ Increase of 0.2% in portfolio appraisal value excluding Confomall Sapporo. Office continued to be the strongest sector with a 0.4% increase
▪ Continued high level of occupancy across the portfolio
▪ Continued upward rent reviews in the office portfolio
Portfolio KPI’s
Overview
Book Value (¥bn)1Appraisal Value (¥bn)1
NOI (¥bn)1,2 NOI Cap Rate (%)1,2
Office Market Rents3
Occupancy (%)2
Tokyo Office Vacancy (%)5Office Passing Rents4
16,295
16,295
0.0%
15,770
15,828
0.4%
3.133 / 3.052
3.060
2.3% / 0.3%
5.2 / 5.2
5.2
0.0 / 0.0
98.4 / 98.6
98.7
0.3 / 0.1
1.5
1.1
0.4
1 Number of assets as at end of FP3 is 18, number of assets as at end of FP4 number is 17 post disposition of Confomall Sapporo on 28 June 2018 2 As per independent appraisals dated February 2018 and June 20183 Weighted average office market rents (¥/tsubo/month) as per independent appraisals dated February 2018 and June 20184 Weighted average office passing rent (¥/tsubo/month) as per office lease agreements reflected in independent appraisals dated February 2018 and June 20185 Source: CBRE Market Overview Japan Office Q2 2017 and Q4 2017. Vacancy rate represents “All Office Grades” (Grade A, Grade A-minus and Grade B)5 Source: CBRE Market Overview Japan Office Q4 2017 and Q2 2018. Vacancy rate represents “All Office Grades” (Grade A, Grade A-minus and Grade B)
Unrealized Gain (¥bn)1
@ FP3
28 February 2018 / excl Confomall
@ FP4
30 June 2018
Variance
NK Building
Suroy Mall Chikushino
Hiei Kudan Building
Portfolio Value
Portfolio Performance
Office Market Trends
@ FP3
28 February 2018 / excl. Confomall
@ FP4
30 June 2018
Variance
@ FP3
28 February 2018
@ FP4
30 June 2018
Variance
60.543 / 59.103
59.246
2.1% / 0.2%
57.673 / 56.260
56.239
2.5% / 0.0%
2.870 / 2.843
3.007
4.8% / 5.8%
Sakura Sogo REIT Presentation Material for FP4 (Four months ended 30 June 2018) 24
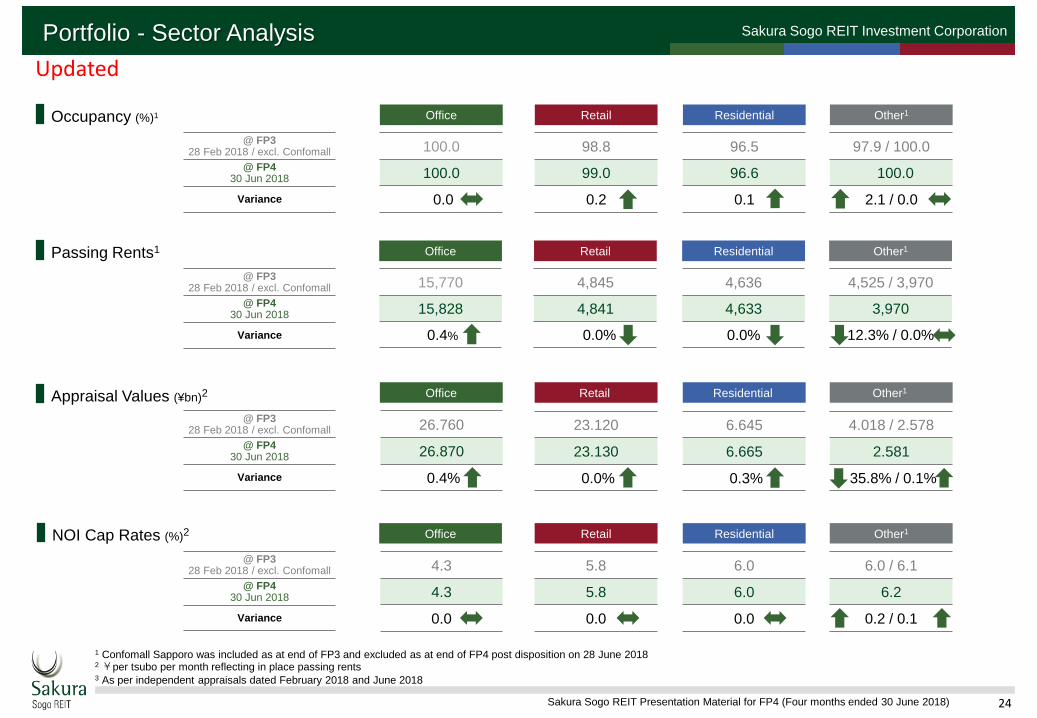
Sakura Sogo REIT Investment CorporationPortfolio - Sector Analysis
1 Confomall Sapporo was included as at end of FP3 and excluded as at end of FP4 post disposition on 28 June 2018 2 ¥per tsubo per month reflecting in place passing rents3 As per independent appraisals dated February 2018 and June 2018
Office
Retail Office
Retail Office
15,770
15,828
0.4%
4.3
4.3
0.0
23.120
23.130
0.0%
26.760
26.870
0.4%
5.8
5.8
0.0
Retail
4,845
4,841
0.0%
Passing Rents1
Appraisal Values (¥bn)2
NOI Cap Rates (%)2
Office
100.0
100.0
0.0
Retail
98.8
99.0
0.2
@ FP3 28 Feb 2018 / excl. Confomall
@ FP430 Jun 2018
Variance
Occupancy (%)1
Residential
Residential
6.645
6.665
0.3%
6.0
6.0
0.0
Residential
4,636
4,633
0.0%
Residential
96.5
96.6
0.1
Other1
Other1
4.018 / 2.578
2.581
35.8% / 0.1%
6.0 / 6.1
6.2
0.2 / 0.1
Other1
4,525 / 3,970
3,970
12.3% / 0.0%
Other1
97.9 / 100.0
100.0
2.1 / 0.0
@ FP3 28 Feb 2018 / excl. Confomall
@ FP430 Jun 2018
Variance
@ FP3 28 Feb 2018 / excl. Confomall
@ FP430 Jun 2018
Variance
@ FP3 28 Feb 2018 / excl. Confomall
@ FP430 Jun 2018
Variance
Updated
Sakura Sogo REIT Presentation Material for FP4 (Four months ended 30 June 2018) 25
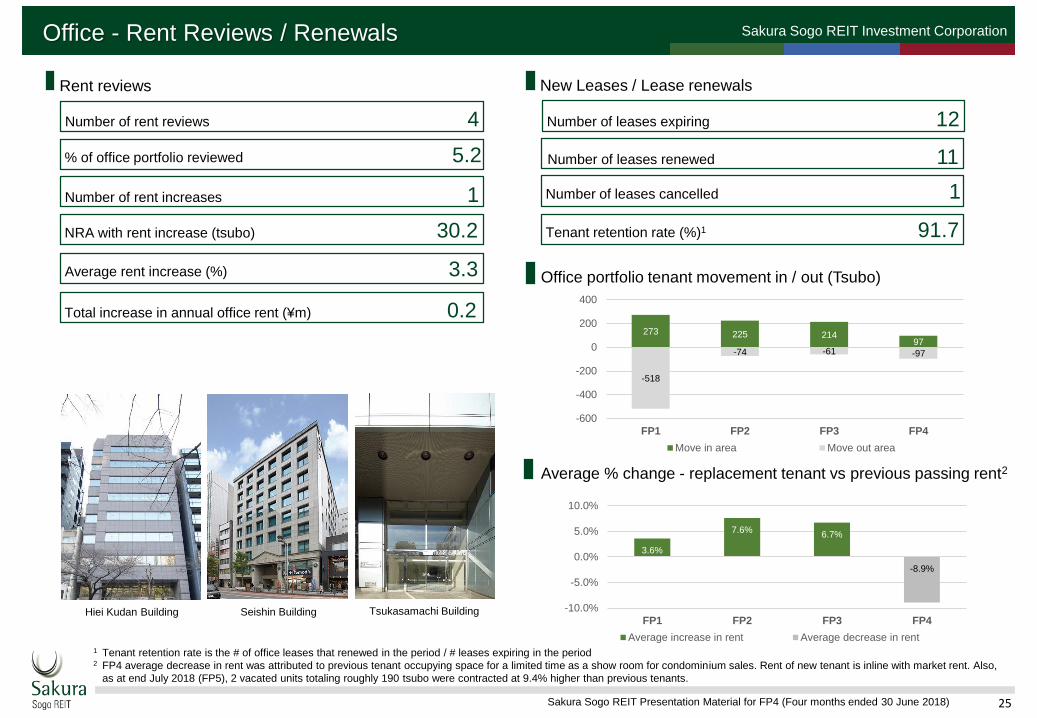
Sakura Sogo REIT Investment CorporationOffice - Rent Reviews / Renewals
Rent reviews
NRA with rent increase (tsubo) 30.2
Total increase in annual office rent (¥m) 0.2
Average rent increase (%) 3.3
New Leases / Lease renewals
Seishin Building Tsukasamachi Building
% of office portfolio reviewed 5.2
Number of rent reviews 4
Number of leases cancelled 1
Number of leases expiring 12
Number of rent increases 1
Number of leases renewed 11
Tenant retention rate (%)1 91.7
Hiei Kudan Building
Office portfolio tenant movement in / out (Tsubo)
Average % change - replacement tenant vs previous passing rent2
3.6%
7.6%6.7%
-8.9%
-10.0%
-5.0%
0.0%
5.0%
10.0%
FP1 FP2 FP3 FP4
Average increase in rent Average decrease in rent1 Tenant retention rate is the # of office leases that renewed in the period / # leases expiring in the period2 FP4 average decrease in rent was attributed to previous tenant occupying space for a limited time as a show room for condominium sales. Rent of new tenant is inline with market rent. Also,
as at end July 2018 (FP5), 2 vacated units totaling roughly 190 tsubo were contracted at 9.4% higher than previous tenants.
273 225 21497
-518
-74 -61 -97
-600
-400
-200
0
200
400
FP1 FP2 FP3 FP4
Move in area Move out area
Sakura Sogo REIT Presentation Material for FP4 (Four months ended 30 June 2018) 26
Sakura Sogo REIT Investment CorporationFinancial KPI’s
Overview
LTV (%)
Total Assets (¥bn)
Annualized DPU yield (%)
NAV (¥per unit) Net Equity (¥bn)
Unit Price (¥ per unit) P/NAV
Total Liabilities (¥bn)
63.19
62.75
0.7%
29.25
29.25
0.0%
5.71
5.72
0.0%
96,470
96,880
0.4%
94,5001
90,800
3.9%
0.98
0.94
4.1%
Ave. loan maturity (years)
Seishin Building
Urban Plaza Imazato
Suroy Mall Nagamine
@ FP3
28 February 2018
@ FP4
30 June 2018
Variance
1 Annualized DPU yield based on unit price of ¥94,500 as at 12 April 2018 and the aggregate of FP4 and FP5 DPU Forecasts announced on 16 April 2018 2 Annualized DPU yield based on aggregate of current FP4 and FP5 DPU Forecasts and closing price on 13 August 2018 of ¥90,800
▪ LTV increased by 0.3% at the end of FP4 due to the sale of Confomall Sapporo. However, the LTV after debt repayment at the end of August will
decrease to 44.9%, 1.0% lower than the LTV as at end FP3
▪ Average loan duration post refinance at the end of August is expected to be 2.91 years, an increase from 2.12 years as at the end of FP3
▪ Net asset value per unit unit increased by 0.4% due to rise in appraisal values
▪ Estimated stabilized DPU is maintained at 5.7%
Balance Sheet
Investment Units
@ FP3
28 February 2018
@ FP4
30 June 2018
Variance
@ FP3
28 February 2018
@ FP4
30 June 2018
Variance
45.9
46.2
0.3
2.45
2.12
0.33
32.7
32.8
0.3%
Sakura Sogo REIT Presentation Material for FP4 (Four months ended 30 June 2018) 27
Sakura Sogo REIT Investment CorporationPortfolio Summary
Tokyo Metropolitan
Area55.0%Major
Regional Cities37.6%
Other7.4%
Office44.0%
Retail40.0%
Residential11.7%
Other4.3%
No. of properties 17
Total book value ¥m 56,239
Total appraised value ¥m 59,246 Average NOI yield %1 5.2
Average occupancy % 98.6 Average NOI yield post depreciation %1 4.3
Portfolio Diversification
At 30 June 2018 (post disposition of Confomall Sapporo)
■ Investment Ratio by Location■ Investment Ratio by Asset Type
Lease type (by income)
1 Calculated based on 30 June 2018 independent appraisals. 2 Includes leases that can be cancelled by paying cancellation penalties3 Weighted average lease term to expiry
WALE3 of non-cancellable leases (years) 7.4
Standard Japanese leases % 55.7
Non-cancellable leases %2 44.3
Sakura Sogo REIT Presentation Material for FP4 (Four months ended 30 June 2018) 28
Sakura Sogo REIT Investment CorporationBreakdown of Major Tenants
1 Indicates the ratio of leased area (including storage, but excluding car park( with respect to the total leaseable area.2 Indicates the ratio of all-in rent revenue (including storage) from each tenant with respect to total portfolio rent revenue excluding residential portfolio.
Wholesale & Retail61.3%
Manufacturing11.4%
Service9.7%
Other6.9%
Medical, Welfare, Fitness5.4%
Information & Communications5.4%
170 tenants
145,514㎡
At 30 June 2018 (excluding Residential portfolio)
Wholesale & Retail42.9%
Manufacturing13.7%
Service12.9%
Other12.4%
Manufacturing10.6%
Information & Communications7.5%
170 tenants
¥3.5 bn/p.a.
■ By leaseable area1 ■ By rent per annum2
Industry Rent (¥mil p.a.)
Wholesale & Retail 1,502
Information & Communications 481
Service 453
Other 435
Manufacturing 374
Medical, Welfare, Fitness 266
Total 3,511
Industry Leased area (m2)
Wholesale & Retail 89,148
Manufacturing 16,601
Service 14,095
Other 9,974
Medical, Welfare, Fitness 7,883
Information & Communications 7,812
Total 145,514
Sakura Sogo REIT Presentation Material for FP4 (Four months ended 30 June 2018) 29
Sakura Sogo REIT Investment CorporationBreakdown of Major Tenants
At 30 June 2018 (excluding residential portfolio)
1 Indicates the leased area (including storage, but excluding car park) indicated in each lease agreement pertaining to each tenant as at 30 June 2018.2 Indicates the ratio of leased area with respect to the total leaseable area.3 Indicates the ratio of all-in rent revenue (including storage) from each tenant with respect to total portfolio rent revenue excluding residential portfolio. 4 Tenant would not allow disclosure
■ By rent revenue
■ By leaseable area
Tenant Property Leased area
(m2)1
% of total portfolio
leaseable area
(%)2
Lease expiry date Type of lease
Seiyu GK Seiyu Minakuchi 23,814.90 16.4 Non-disclosure4
Standard
Nagasakiya Co., Ltd. La Park Kishiwada 15,249.10 10.6 18-Oct-34 Standard
Non-disclosure4
Funabashi Hi Tech Park I Non-disclosure4
Non-disclosure4
Non-disclosure4
Non-disclosure4
Mr. Max Suroy Mall Chikushino 7,997.10 5.5 03-Jul-27 Fixed term
Sakoda Co., Ltd. Suroy Mall Chikushino Non-disclosure4
Non-disclosure4
Non-disclosure4
Fixed term
Nobuta Enterprises La Park Kishiwada 7,555.90 5.2 19-Jul-27 Fixed term
Edion Corporation Suroy Mall Chikushino 4,955.70 3.4 03-Jul-27 Fixed term
Sanki Co., Ltd. La Park Kishiwada 4,281.60 2.9 22-Jul-23 Fixed term
Non-disclosure4
Funabashi Hi Tech Park II Non-disclosure4
Non-disclosure4
Non-disclosure4
Non-disclosure4
Vinxus Corporation NK Building 2,927.37 2.0 Non-disclosure4
Non-disclosure4
Tenant Property Asset Type % of total portfolio
rent revenue
(%)3
Lease expiry date Type of lease
Nagasakiya Co., Ltd. La Park Kishiwada Retail Non-disclosure4
18-Oct-34 Standard
Non-disclosure4
Seiyu Minakuchi Retail Non-disclosure4
Non-disclosure4
Standard
Vinxus Corporation NK Building Office Non-disclosure4
Non-disclosure4
Non-disclosure4
Nobuta Enterprises La Park Kishiwada Retail Non-disclosure4
19-Jul-27 Fixed term
Non-disclosure4
Suroy Mall Chikushino Retail Non-disclosure4
Non-disclosure4
Fixed term
Mr. Max Co., Ltd. Suroy Mall Chikushino Retail Non-disclosure4
03-Jul-27 Fixed term
Non-disclosure4
Funabashi Hi Tech Park I Other Non-disclosure4
Non-disclosure4
Non-disclosure4
Spectris Co., Ltd. Tsukasamachi Building Office 2.5 30-Sep-18 Standard
Jorudan Co., Ltd. Seishin Building Office 2.4 31-Jan-20 Standard
Edion Corporation Suroy Mall Chikushino Retail Non-disclosure4
03-Jul-27 Fixed term
Sakura Sogo REIT Investment Corporation
30Sakura Sogo REIT Presentation Material for FP3 (Six months ended 28 February 2018)
Section 6 - Management Key Priorities
Sakura Sogo REIT Presentation Material for FP4 (Four months ended 30 June 2018) 31
Sakura Sogo REIT Investment Corporation
Internal Growth
▪ Utilize the expertise of Nippon
Kanzai to ensure buildings are well
maintained while minimizing costs
▪ Strategic capital expenditure initiatives
to:
- Maintain high occupancy
- Minimize downtime on vacant space
- Enhance revenue through current and
future rent reviews
▪ Actively pursue growth
- Upward rent reviews particularly
in office
- Creating new revenue streams;
e.g. contracting rooftop
telecommunications antenna
▪ Explore opportunities to recycle
assets which can:
- Increase distributions
- Enhance portfolio characteristics
▪ Carefully manage borrowings to
mitigate maturity risk and minimize
ongoing cost of debt
▪ Cumulative investment scheme for
the Asset Management Company
directors and employees to further
align interest with unitholders
Capital Management
Management Key Priorities
Enhance Unitholder
Value
▪ Identifying off market investment
opportunities leveraging off sponsor
relationships
▪ Add to existing pipeline support
network
▪ Foster relationships with mid-scale
developers
External Growth

Sakura Sogo REIT Investment Corporation
32Sakura Sogo REIT Presentation Material for FP3 (Six months ended 28 February 2018)
Part A - Internal Growth Initiatives
Sakura Sogo REIT Presentation Material for FP4 (Four months ended 30 June 2018) 33
Sakura Sogo REIT Investment CorporationInternal Growth
Office
1 Average passing rent vs. assessed market rent based on net rentable area from independent appraisals dated 30 June 2018
21.0%
54.2%
10.1%
14.7%
79.0%
Rent Gap1
> 10% < 20%
between 0% - 10%
less than 0%
9 tenants
714 tsubo
40 tenants
3,825 tsubo
19 tenants
1,478 tsubo
Will continue to pursue rent increases for tenants in this category
Monitor / consider upward rent revisions for tenants with a rent gap of
less than 10%
Maintain sound relationships and ensure building services meet tenant
expectations
Focus on high level of tenant retention – target > 80%
> 20% 13 tenants
1,035 tsubo
▪ Successful track record of achieving rent increases in office assets
▪ Uplift of 3.3% for a rent review, ¥0.2 mil p.a.
▪ Based on independent appraisals, over 75% of office floor space is at or below assessed market rent
3.3 0.2
Number of
Increases
1
4th Fiscal Period
Amount p.a.
(¥ mil)
14.7
Average
increase (%)
11.0
Number of
increases
1
3rd Fiscal Period
Amount p.a.
(¥ mil)
14.4
Average
increase (%)
9.2
Number of
increases
6
2nd Fiscal Period
Amount p.a.
(¥ mil)Average
increase (%)Amount p.a.
(¥ mil)
11.6
Average
increase (%)
8.2
Number of
increases
7
1st Fiscal Period
Sakura Sogo REIT Presentation Material for FP4 (Four months ended 30 June 2018) 34
Sakura Sogo REIT Investment CorporationInternal Growth
Office Residential
Matsuya Residence Sekime Achieving higher rental rates for new tenants
La Park Kishiwada Effective utilization of common area space
Retail
Converted portion of idle common area space into rentable storage for an
existing tenant. Increase in revenue is approx. ¥1 million p.a.
La Park Kishiwada Increased vending machine revenue
Tsukasamachi Bldg EV enhancement
Before After
Differentiated subject property from neighboring properties by reducing tenant
initial costs (no longer requiring TSD and key money as lease conditions)
while revisiting and further promoting the strengths of subject property; e.g.
good natural sunlight, well known primary school right across the street and
onsite carpark facilities. Also, currently undertaking large-scale refurbishment
works on the external walls which will approve the appearance and level of
safety of the property while making it more competitive from a leasing
standpoint.
• Market rent within this area and assessed rent by independent appraiser is
between ¥5,100 and ¥5,300 per tsubo/mth
• During the period 7-units were retenanted at rents roughly 5% higher than
previous tenants; ¥5,600 and ¥6,400 per tsubo/mth
Renegotiated terms with vending machine operators while adding one new
vending machine and changing one other. Forecast annual increase in
revenue is approx. ¥340k based on May and June 2018 actuals
Before After
Undertook major EV renewal works which will further contribute to tenant
satisfaction and enhance asset value
Before After
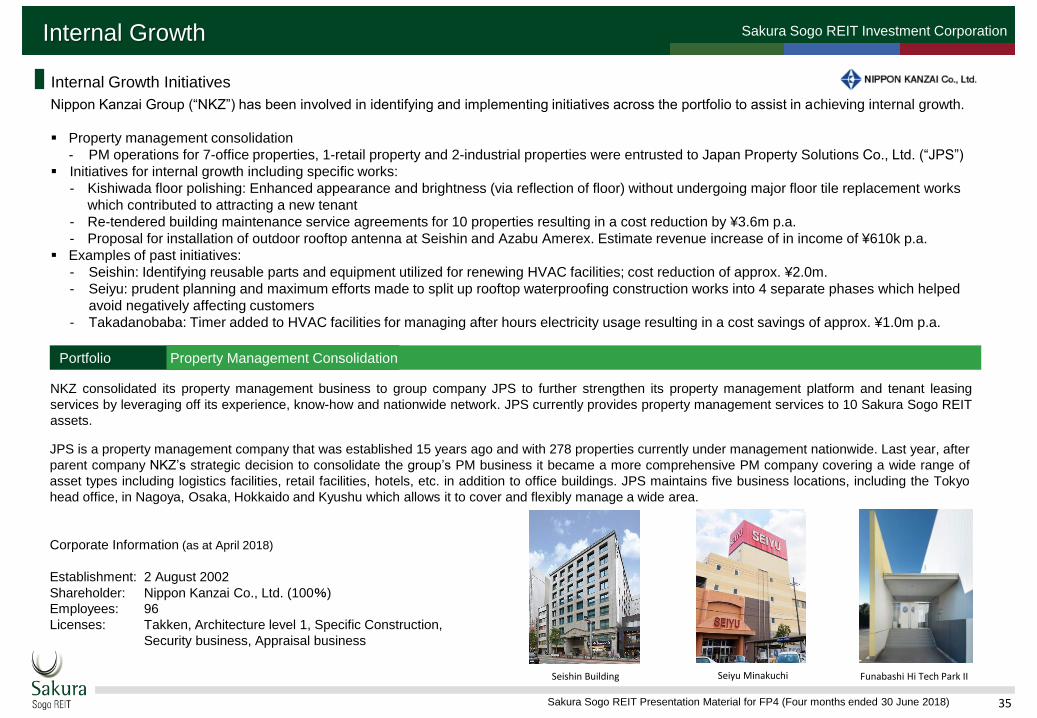
Sakura Sogo REIT Presentation Material for FP4 (Four months ended 30 June 2018) 35
Sakura Sogo REIT Investment CorporationInternal Growth
NKZ consolidated its property management business to group company JPS to further strengthen its property management platform and tenant leasing
services by leveraging off its experience, know-how and nationwide network. JPS currently provides property management services to 10 Sakura Sogo REIT
assets.
Portfolio Property Management Consolidation
Internal Growth Initiatives
Nippon Kanzai Group (“NKZ”) has been involved in identifying and implementing initiatives across the portfolio to assist in achieving internal growth.
▪ Property management consolidation
- PM operations for 7-office properties, 1-retail property and 2-industrial properties were entrusted to Japan Property Solutions Co., Ltd. (“JPS”)
▪ Initiatives for internal growth including specific works:
- Kishiwada floor polishing: Enhanced appearance and brightness (via reflection of floor) without undergoing major floor tile replacement works
which contributed to attracting a new tenant
- Re-tendered building maintenance service agreements for 10 properties resulting in a cost reduction by ¥3.6m p.a.
- Proposal for installation of outdoor rooftop antenna at Seishin and Azabu Amerex. Estimate revenue increase of in income of ¥610k p.a.
▪ Examples of past initiatives:
- Seishin: Identifying reusable parts and equipment utilized for renewing HVAC facilities; cost reduction of approx. ¥2.0m.
- Seiyu: prudent planning and maximum efforts made to split up rooftop waterproofing construction works into 4 separate phases which helped
avoid negatively affecting customers
- Takadanobaba: Timer added to HVAC facilities for managing after hours electricity usage resulting in a cost savings of approx. ¥1.0m p.a.
Funabashi Hi Tech Park IISeishin Building Seiyu Minakuchi
JPS is a property management company that was established 15 years ago and with 278 properties currently under management nationwide. Last year, after
parent company NKZ’s strategic decision to consolidate the group’s PM business it became a more comprehensive PM company covering a wide range of
asset types including logistics facilities, retail facilities, hotels, etc. in addition to office buildings. JPS maintains five business locations, including the Tokyo
head office, in Nagoya, Osaka, Hokkaido and Kyushu which allows it to cover and flexibly manage a wide area.
Corporate Information (as at April 2018)
Establishment: 2 August 2002
Shareholder: Nippon Kanzai Co., Ltd. (100%)
Employees: 96
Licenses: Takken, Architecture level 1, Specific Construction,
Security business, Appraisal business
Sakura Sogo REIT Presentation Material for FP4 (Four months ended 30 June 2018) 36
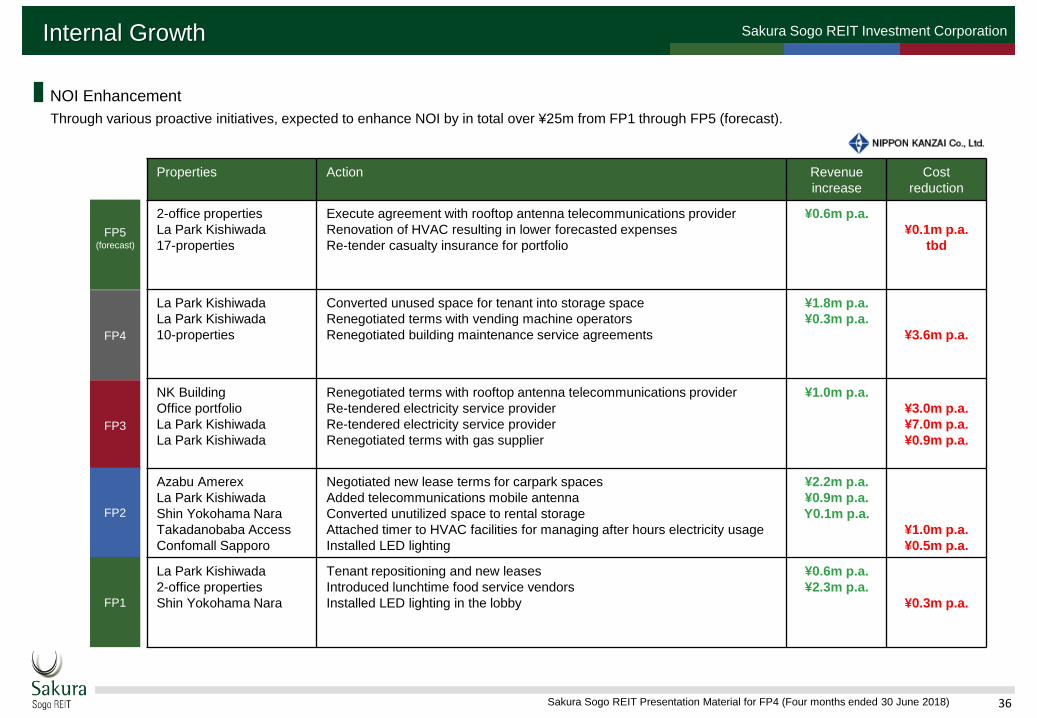
Sakura Sogo REIT Investment CorporationInternal Growth
NOI Enhancement
Through various proactive initiatives, expected to enhance NOI by in total over ¥25m from FP1 through FP5 (forecast).
Properties Action Revenue
increase
Cost
reduction
2-office properties
La Park Kishiwada
17-properties
Execute agreement with rooftop antenna telecommunications provider
Renovation of HVAC resulting in lower forecasted expenses
Re-tender casualty insurance for portfolio
¥0.6m p.a.
¥0.1m p.a.
tbd
La Park Kishiwada
La Park Kishiwada
10-properties
Converted unused space for tenant into storage space
Renegotiated terms with vending machine operators
Renegotiated building maintenance service agreements
¥1.8m p.a.
¥0.3m p.a.
¥3.6m p.a.
NK Building
Office portfolio
La Park Kishiwada
La Park Kishiwada
Renegotiated terms with rooftop antenna telecommunications provider
Re-tendered electricity service provider
Re-tendered electricity service provider
Renegotiated terms with gas supplier
¥1.0m p.a.
¥3.0m p.a.
¥7.0m p.a.
¥0.9m p.a.
Azabu Amerex
La Park Kishiwada
Shin Yokohama Nara
Takadanobaba Access
Confomall Sapporo
Negotiated new lease terms for carpark spaces
Added telecommunications mobile antenna
Converted unutilized space to rental storage
Attached timer to HVAC facilities for managing after hours electricity usage
Installed LED lighting
¥2.2m p.a.
¥0.9m p.a.
Y0.1m p.a.
¥1.0m p.a.
¥0.5m p.a.
La Park Kishiwada
2-office properties
Shin Yokohama Nara
Tenant repositioning and new leases
Introduced lunchtime food service vendors
Installed LED lighting in the lobby
¥0.6m p.a.
¥2.3m p.a.
¥0.3m p.a.
FP4
FP3
FP2
FP1
FP5(forecast)

Sakura Sogo REIT Investment Corporation
37Sakura Sogo REIT Presentation Material for FP3 (Six months ended 28 February 2018)
Part B - External Growth Initiatives
Sakura Sogo REIT Presentation Material for FP4 (Four months ended 30 June 2018) 38
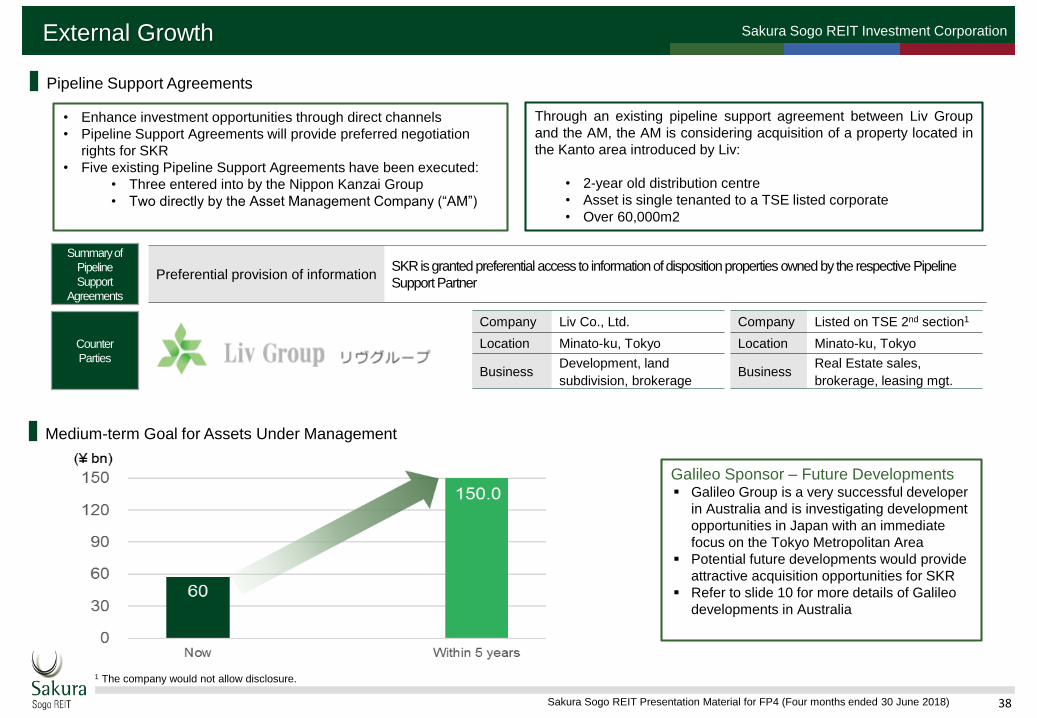
Sakura Sogo REIT Investment CorporationExternal Growth
• Enhance investment opportunities through direct channels
• Pipeline Support Agreements will provide preferred negotiation
rights for SKR
• Five existing Pipeline Support Agreements have been executed:
• Three entered into by the Nippon Kanzai Group
• Two directly by the Asset Management Company (“AM”)
Galileo Sponsor – Future Developments▪ Galileo Group is a very successful developer
in Australia and is investigating development
opportunities in Japan with an immediate
focus on the Tokyo Metropolitan Area
▪ Potential future developments would provide
attractive acquisition opportunities for SKR
▪ Refer to slide 10 for more details of Galileo
developments in Australia
Through an existing pipeline support agreement between Liv Group
and the AM, the AM is considering acquisition of a property located in
the Kanto area introduced by Liv:
• 2-year old distribution centre
• Asset is single tenanted to a TSE listed corporate
• Over 60,000m2
Preferential provision of informationSKR is granted preferential access to information of disposition properties owned by the respective Pipeline
Support Partner
Summary of
Pipeline
Support
Agreements
Counter
Parties
Pipeline Support Agreements
Medium-term Goal for Assets Under Management
1 The company would not allow disclosure.
Company Liv Co., Ltd.
Location Minato-ku, Tokyo
BusinessDevelopment, land
subdivision, brokerage
Company Listed on TSE 2nd section1
Location Minato-ku, Tokyo
BusinessReal Estate sales,
brokerage, leasing mgt.
Sakura Sogo REIT Investment Corporation
39Sakura Sogo REIT Presentation Material for FP3 (Six months ended 28 February 2018)
Part C - Capital Management
Sakura Sogo REIT Presentation Material for FP4 (Four months ended 30 June 2018) 40
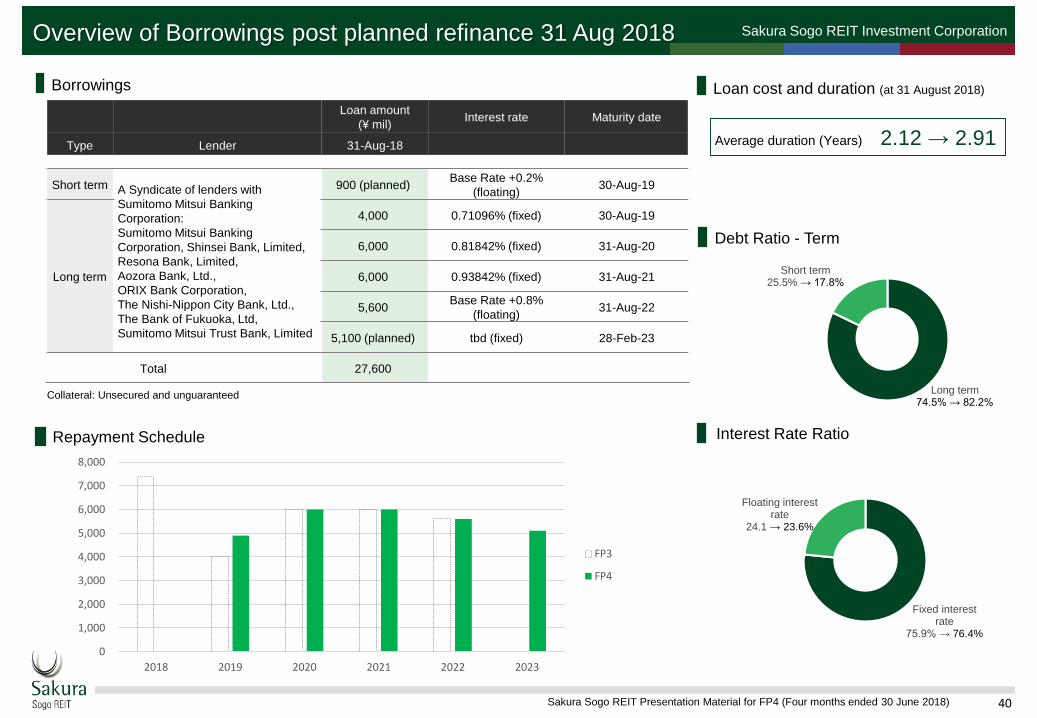
Sakura Sogo REIT Investment CorporationOverview of Borrowings post planned refinance 31 Aug 2018
Borrowings
Collateral: Unsecured and unguaranteed
Loan cost and duration (at 31 August 2018)
Average duration (Years) 2.12 → 2.91
Debt Ratio - Term
Interest Rate RatioRepayment Schedule
Loan amount
(¥ mil)Interest rate Maturity date
Type Lender 31-Aug-18
Short term A Syndicate of lenders with
Sumitomo Mitsui Banking
Corporation:
Sumitomo Mitsui Banking
Corporation, Shinsei Bank, Limited,
Resona Bank, Limited,
Aozora Bank, Ltd.,
ORIX Bank Corporation,
The Nishi-Nippon City Bank, Ltd.,
The Bank of Fukuoka, Ltd,
Sumitomo Mitsui Trust Bank, Limited
900 (planned)Base Rate +0.2%
(floating)30-Aug-19
Long term
4,000 0.71096% (fixed) 30-Aug-19
6,000 0.81842% (fixed) 31-Aug-20
6,000 0.93842% (fixed) 31-Aug-21
5,600Base Rate +0.8%
(floating)31-Aug-22
5,100 (planned) tbd (fixed) 28-Feb-23
Total 27,600
Long term74.5% → 82.2%
Short term25.5% → 17.8%
Fixed interest rate
75.9% → 76.4%
Floating interest rate
24.1 → 23.6%
0
1,000
2,000
3,000
4,000
5,000
6,000
7,000
8,000
2018 2019 2020 2021 2022 2023
FP3
FP4
Sakura Sogo REIT Presentation Material for FP4 (Four months ended 30 June 2018) 41
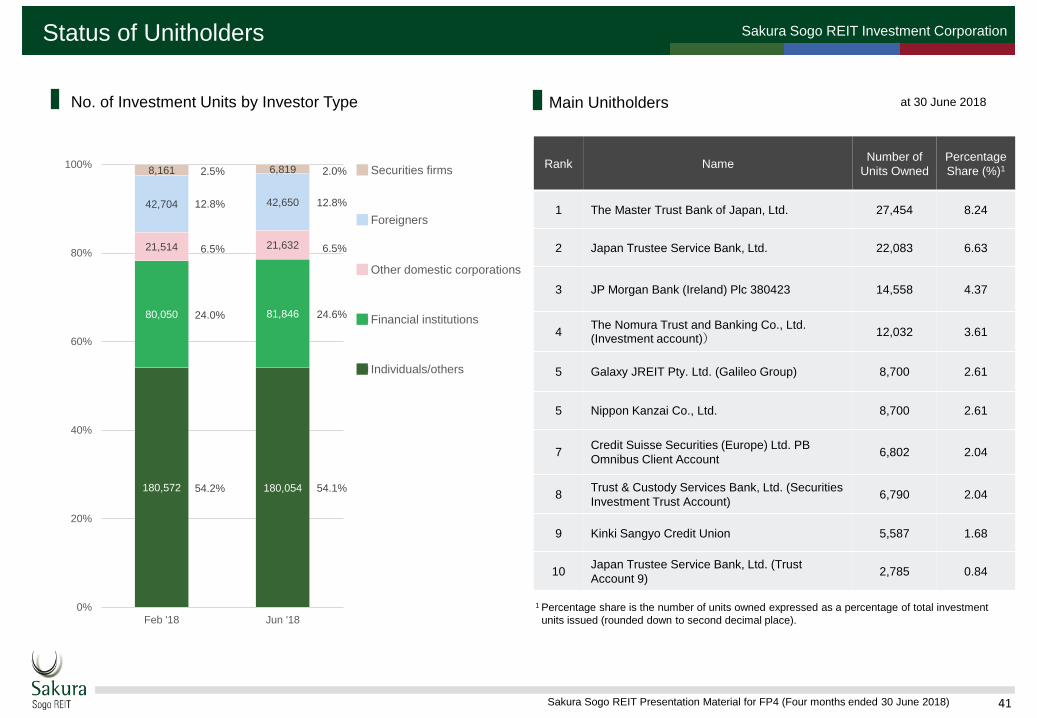
Sakura Sogo REIT Investment CorporationStatus of Unitholders
Rank NameNumber of
Units Owned
Percentage
Share (%)1
1 The Master Trust Bank of Japan, Ltd. 27,454 8.24
2 Japan Trustee Service Bank, Ltd. 22,083 6.63
3 JP Morgan Bank (Ireland) Plc 380423 14,558 4.37
4The Nomura Trust and Banking Co., Ltd. (Investment account))
12,032 3.61
5 Galaxy JREIT Pty. Ltd. (Galileo Group) 8,700 2.61
5 Nippon Kanzai Co., Ltd. 8,700 2.61
7Credit Suisse Securities (Europe) Ltd. PB
Omnibus Client Account6,802 2.04
8Trust & Custody Services Bank, Ltd. (Securities
Investment Trust Account)6,790 2.04
9 Kinki Sangyo Credit Union 5,587 1.68
10Japan Trustee Service Bank, Ltd. (Trust
Account 9)2,785 0.84
1 Percentage share is the number of units owned expressed as a percentage of total investment
units issued (rounded down to second decimal place).
Main Unitholders at 30 June 2018
180,572 180,054
80,050 81,846
21,514 21,632
42,704 42,650
8,161 6,819
0%
20%
40%
60%
80%
100%
Feb '18 Jun '18
Securities firms
Foreigners
Other domestic corporations
Financial institutions
Individuals/others
No. of Investment Units by Investor Type
54.1%
24.6%
6.5%
12.8%
2.0%
54.2%
24.0%
6.5%
12.8%
2.5%
Sakura Sogo REIT Investment Corporation
42Sakura Sogo REIT Presentation Material for FP3 (Six months ended 28 February 2018)
Appendix
Sakura Sogo REIT Presentation Material for FP4 (Four months ended 30 June 2018) 43
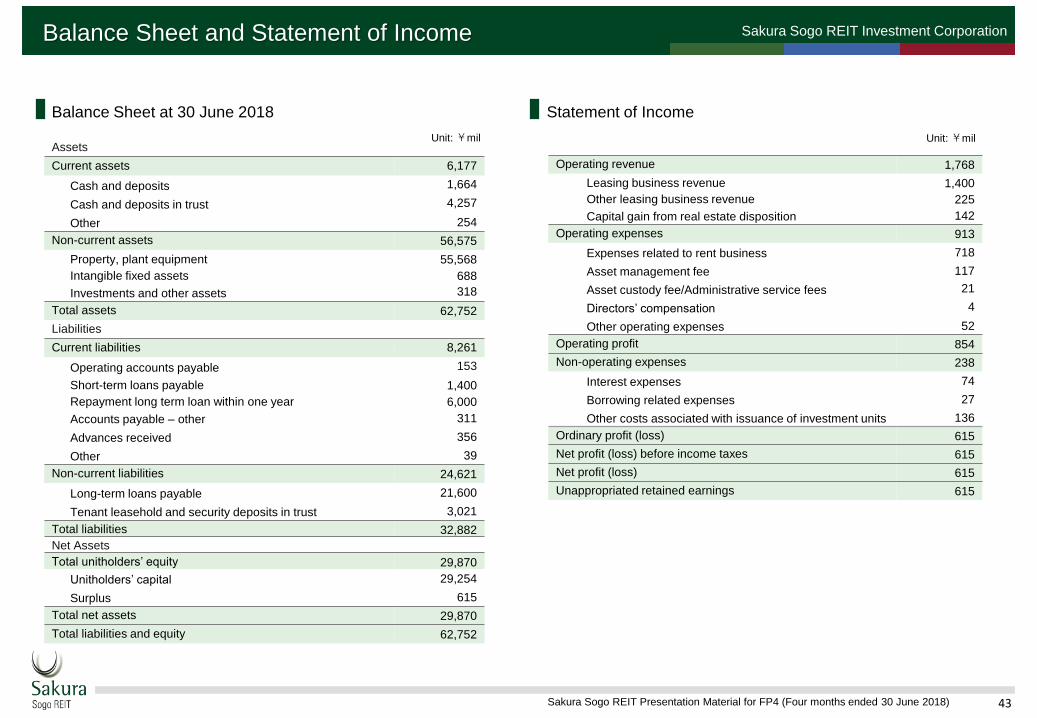
Sakura Sogo REIT Investment CorporationBalance Sheet and Statement of Income
Unit: ¥mil Unit: ¥mil
Statement of IncomeBalance Sheet at 30 June 2018
Assets
Current assets 6,177
Cash and deposits 1,664
Cash and deposits in trust 4,257
Other 254
Non-current assets 56,575
Property, plant equipment 55,568
Intangible fixed assets 688
Investments and other assets 318
Total assets 62,752
Liabilities
Current liabilities 8,261
Operating accounts payable 153
Short-term loans payable 1,400
Repayment long term loan within one year 6,000
Accounts payable – other 311
Advances received 356
Other 39
Non-current liabilities 24,621
Long-term loans payable 21,600
Tenant leasehold and security deposits in trust 3,021
Total liabilities 32,882
Net Assets
Total unitholders’ equity 29,870
Unitholders’ capital 29,254
Surplus 615
Total net assets 29,870
Total liabilities and equity 62,752
Operating revenue 1,768
Leasing business revenue 1,400
Other leasing business revenue 225
Capital gain from real estate disposition 142
Operating expenses 913
Expenses related to rent business 718
Asset management fee 117
Asset custody fee/Administrative service fees 21
Directors’ compensation 4
Other operating expenses 52
Operating profit 854
Non-operating expenses 238
Interest expenses 74
Borrowing related expenses 27
Other costs associated with issuance of investment units 136
Ordinary profit (loss) 615
Net profit (loss) before income taxes 615
Net profit (loss) 615
Unappropriated retained earnings 615
Sakura Sogo REIT Presentation Material for FP4 (Four months ended 30 June 2018) 44
Sakura Sogo REIT Investment CorporationIncome and Expenditure by Property for FP4(122 operating days)
Unit: ¥’000
OF-01 OF-02 OF-03 OF-04 OF-05 OF-06 OF-07 RT-01 RT-02
Seishin
Building
NK
Building
Tsukasamachi
BuildingTakadanobaba
Access
Azabu Amerex
Building
Hiei Kudan
Building
Shin Yokohama
Nara Building
La Park
Kishiwada
Suroy Mall
Chikushino
Operating revenue from
real estate leasing159,985 81,668 74,456 68,841 46,180 45,003 54,540 333,817 200,489
Leasing business
revenue145,022 72,744 66,722 58,141 42,590 43,293 45,089 256,831 196,016
Other Leasing business
revenue14,962 8,924 7,734 10,699 3,589 1,710 9,451 76,985 4,473
Operating expenses from
real estate leasing32,847 22,439 16,534 23,055 13,403 12,427 16,945 185,471 50,351
Management fees 8,391 8,503 6,538 10,181 5,191 7,028 6,151 86,714 27,010
Utilities expenses 9,221 5,815 3,924 5,114 2,256 14 4,481 63,925 2,546
Insurance premium 161 106 98 119 61 89 111 844 457
Repair & Maintenance 308 204 413 704 462 276 356 610 325
Trust Fees 600 600 500 500 250 500 600 1,233 500
Property Tax 13,836 7,051 4,918 6,014 5,076 4,449 5,146 29,652 13,117
Other expenses 328 158 141 420 104 68 99 2,490 6,3941
Leasing NOI 127,137 59,229 57,922 45,785 32,776 32,575 37,594 148,346 150,137
Depreciation 9,428 4,646 5,505 6,198 1,615 1,800 6,569 27,517 24,832
Operating income (loss)
from real estate leasing117,708 54,582 52,417 39,586 31,161 30,775 31,025 120,828 125,305
1 includes leasehold rent
Sakura Sogo REIT Presentation Material for FP4 (Four months ended 30 June 2018) 45
Sakura Sogo REIT Investment CorporationIncome and Expenditure by Property for FP4 (122 operating days)
Unit: ¥’000
1 Confomall Sapporo disposed on 28 June 20182 Capex expenditure only3 Includes leasehold rent
RT-03 RT-04 RS-01 RS-02 RS-04 RS-05 OT-01 OT-02 OT-03
Seiyu
Minakuchi
Suroy Mall
Nagamine
Shiroi
Logiman
Matsuya
Residence
Sekime
Urban Plaza
Imazato
Abode Yoyogi
Parkside
Funabashi Hi-
Tech ParkⅠFunabashi Hi-
Tech Park ⅡConfomall
Sapporo1
Operating revenue from
real estate leasingNon-disclosure 122,263 91,789 59,544 26,434 46,573 Non-disclosure Non-disclosure 46,415
Leasing business
revenueNon-disclosure 101,407 85,248 52,623 24,852 28,473 Non-disclosure Non-disclosure 38,384
Other Leasing business
revenueNon-disclosure 20,856 6,541 6,920 1,582 18,099 Non-disclosure Non-disclosure 8,030
Operating expenses from
leasing business23,964 38,808 41,848 19,391 9,641 3,676 4,411 3,634 22,551
Management fees 4,026 10,631 17,334 9,060 4,418 1,749 660 660 4,642
Utilities expenses 0 17,257 6 1,877 341 134 0 0 7,139
Insurance premium 358 178 430 171 82 26 82 52 184
Repair & Maintenance 02
938 12,731 4,340 2,149 76 0 0 748
Trust Fees 500 500 839 250 250 333 600 600 490
Property Tax 7,883 8,737 9,325 3,499 2,156 1,234 3,057 2,175 8,888
Other expenses 11,1963
564 1,180 192 243 121 11 147 457
Leasing NOI Non-disclosure 83,455 49,940 40,152 16,792 42,896 Non-disclosure Non-disclosure 23,863
Depreciation 30,400 12,211 13,036 7,804 4,016 3,080 6,557 2,221 9,464
Operating income (loss)
from real estate leasingNon-disclosure 71,243 36,903 32,347 12,775 39,816 Non-disclosure Non-disclosure 14,399
Sakura Sogo REIT Presentation Material for FP4 (Four months ended 30 June 2018) 46
Sakura Sogo REIT Investment Corporation
Asset Type Office Retail
No. OF-01 OF-02 OF-03 OF-04 OF-05 OF-06 OF-07 RT-01 RT-02
Property NameSeishin
Building
NK
Building
Tsukasamachi
Building
Takadanobaba
Access
Azabu Amerex
Building
Hiei Kudan
Building
Shin Yokohama
Nara Building
La Park
Kishiwada
Suroy Mall
Chikushino
AddressShinjuku-ward,
Tokyo
Chiyoda-ward,
Tokyo
Chiyoda-ward,
Tokyo
Shinjuku-ward,
TokyoMinato-ward, Tokyo
Chiyoda-ward,
Tokyo
Kohoku-ward,
Yokohama
Kishiwada city,
OsakaChikushino, Kyushu
Appraisal @ FP3
(¥bn)8,850 3,980 4,040 3,510 2,270 2,090 2,020 6,640 7,790
Appraisal @ FP4
(¥bn)8,860 4,000 4,050 3,540 2,290 2,110 2,020 6,640 7,790
NOI Yield @
FP3 (%)3.9 4.4 4.5 4.6 4.2 4.6 5.3 6.0 5.6
NOI Yield @
FP4 (%) 3.9 4.4 4.4 4.6 4.2 4.6 5.4 6.0 5.6
NOI Yield @ FP3
post depr (%)3.6 4.1 4.1 4.1 4.0 4.4 4.5 4.7 4.7
NOI Yield @ FP4
post depr (%)3.6 4.0 4.0 4.0 4.0 4.4 4.4 4.7 4.7
Property – Appraisal & Yield Analysis
at 30 June 2018
Sakura Sogo REIT Presentation Material for FP4 (Four months ended 30 June 2018) 47
Sakura Sogo REIT Investment Corporation
Asset Type Retail Residential Other
Total
(17 properties)
No. RT-03 RT-04 RS-01 RS-02 RS-04 RS-05 OT-01 OT-02
Property NameSeiyu
Minakuchi
Suroy Mall
Nagamine
Shiroi
Logiman
Matsuya Residence
Sekime
Urban Plaza
Imazato
Abode Yoyogi
Parkside
Funabashi Hi-Tech
ParkⅠFunabashi Hi-Tech
Park Ⅱ
AddressMinakuchi,
ShigaKumamoto city,
Kumamoto
Shiroi city,
Chiba
Osaka city,
Osaka
Osaka city,
Osaka
Shibuya-ward,
Tokyo
Funabashi city,
Chiba
Funabashi city,
Chiba
Appraisal @ FP3
(¥bn)4,220 4,470 2,160 1,930 945 1,610 1,800 778 59,103
Appraisal @ FP4
(¥bn)4,230 4,470 2,160 1,930 945 1,630 1,800 781 59,246
NOI Yield @ FP3
(%)6.0 5.6 6.9 6.4 5.9 4.2 6.1 6.2 5.2
NOI Yield @ FP4
(%) 6.0 5.6 6.9 6.4 5.9 4.2 6.1 6.2 5.2
NOI Yield @ FP3
post depr (%)4.0 4.8 5.2 5.2 4.7 3.6 5.1 5.5 4.3
NOI Yield @ FP4
post depr (%)3.8 4.8 5.1 5.1 4.7 3.7 5.0 5.4 4.3
Property – Appraisal & Yield Analysis
at 30 June 2018
Sakura Sogo REIT Presentation Material for FP4 (Four months ended 30 June 2018) 48
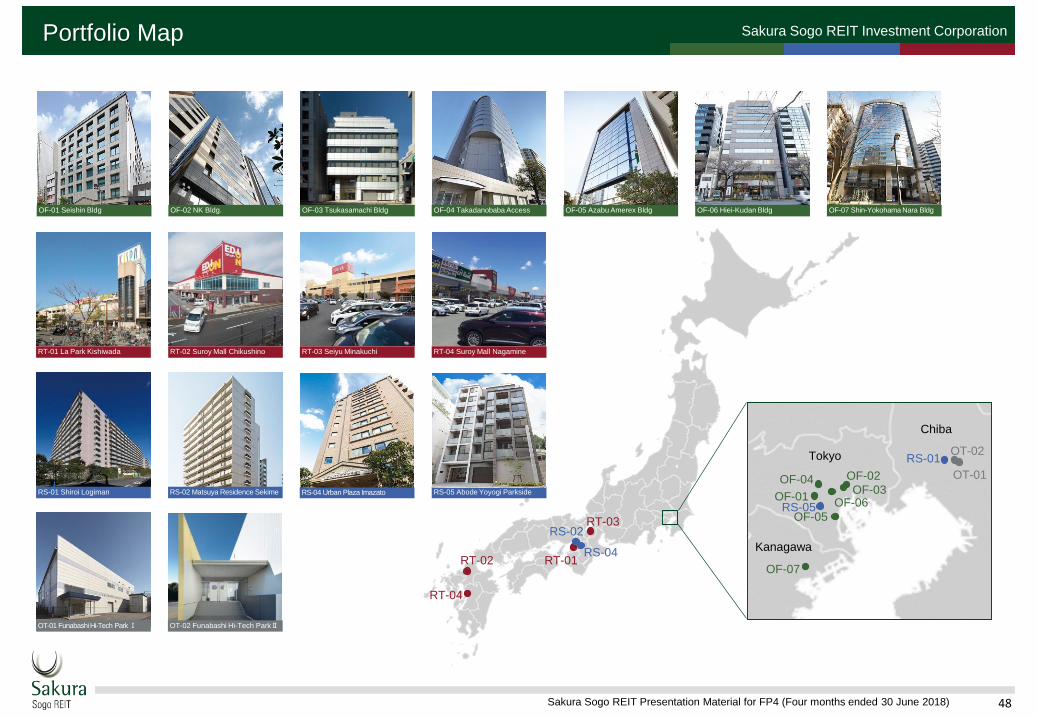
Sakura Sogo REIT Investment CorporationPortfolio Map
OF-01 Seishin Bldg OF-02 NK Bldg. OF-03 Tsukasamachi Bldg OF-04 Takadanobaba Access OF-05 Azabu Amerex Bldg OF-06 Hiei-Kudan Bldg OF-07 Shin-Yokohama Nara Bldg
RT-01 La Park Kishiwada RT-02 Suroy Mall Chikushino RT-03 Seiyu Minakuchi RT-04 Suroy Mall Nagamine
RS-01 Shiroi Logiman RS-02 Matsuya Residence Sekime
OT-01 Funabashi Hi-Tech Park Ⅰ OT-02 Funabashi Hi-Tech ParkⅡ
RS-05 Abode Yoyogi Parkside
RT-01RT-02
RT-03
RT-04
RS-02
RS-04
OF-02OF-03
OF-01
OF-04
OF-05
OF-06
OF-07
RS-01
OT-01
OT-02
Chiba
Tokyo
Kanagawa
RS-05
Coming soon
RS-04 Urban Plaza Imazato
Sakura Sogo REIT Presentation Material for FP4 (Four months ended 30 June 2018) 49
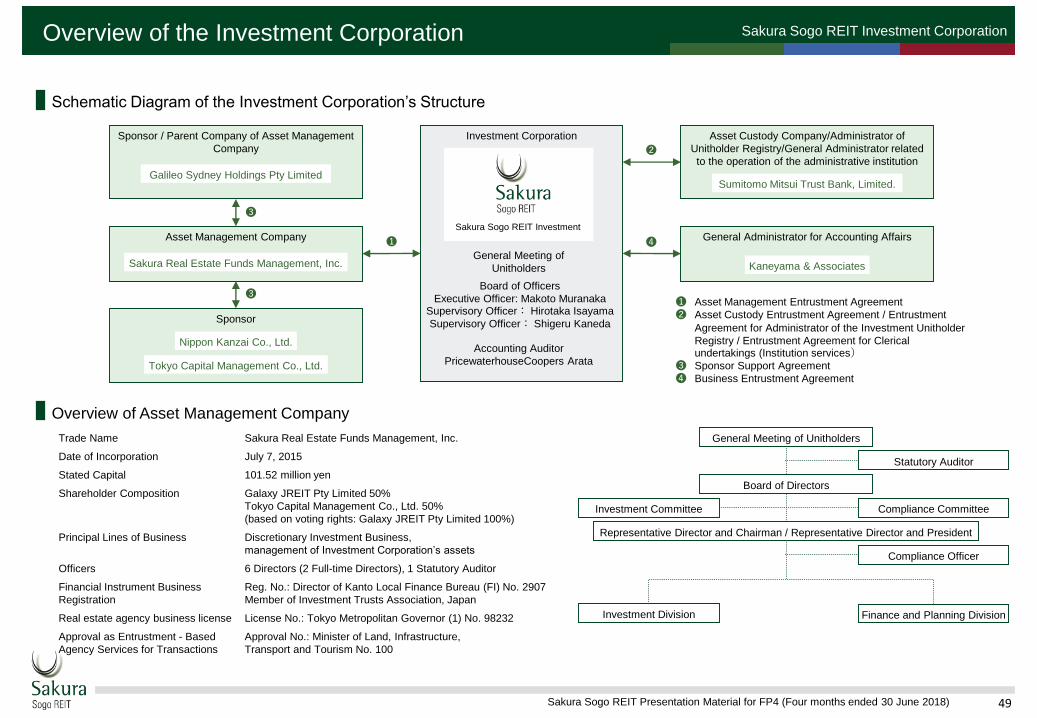
Sakura Sogo REIT Investment CorporationOverview of the Investment Corporation
Investment Corporation
❶ Asset Management Entrustment Agreement
❷ Asset Custody Entrustment Agreement / Entrustment
Agreement for Administrator of the Investment Unitholder
Registry / Entrustment Agreement for Clerical undertakings (Institution services)
❸ Sponsor Support Agreement
❹ Business Entrustment Agreement
Sponsor
Nippon Kanzai Co., Ltd.
Tokyo Capital Management Co., Ltd.
Asset Management Company
Sakura Real Estate Funds Management, Inc.
Sponsor / Parent Company of Asset Management
Company
Galileo Sydney Holdings Pty Limited
Board of Officers
Executive Officer: Makoto MuranakaSupervisory Officer: Hirotaka Isayama
Supervisory Officer: Shigeru Kaneda
Accounting Auditor
PricewaterhouseCoopers Arata
General Meeting of
Unitholders
General Administrator for Accounting Affairs
Kaneyama & Associates
Asset Custody Company/Administrator of
Unitholder Registry/General Administrator related
to the operation of the administrative institution
Sumitomo Mitsui Trust Bank, Limited.
❶
❷
❸
❹
❸
General Meeting of Unitholders
Board of Directors
Representative Director and Chairman / Representative Director and President
Statutory Auditor
Compliance Committee
Finance and Planning DivisionInvestment Division
Investment Committee
Compliance Officer
Overview of Asset Management Company
Schematic Diagram of the Investment Corporation’s Structure
Sakura Sogo REIT Investment
Trade Name Sakura Real Estate Funds Management, Inc.
Date of Incorporation July 7, 2015
Stated Capital 101.52 million yen
Shareholder Composition Galaxy JREIT Pty Limited 50%
Tokyo Capital Management Co., Ltd. 50%
(based on voting rights: Galaxy JREIT Pty Limited 100%)
Principal Lines of Business Discretionary Investment Business,
management of Investment Corporation’s assets
Officers 6 Directors (2 Full-time Directors), 1 Statutory Auditor
Financial Instrument Business
Registration
Reg. No.: Director of Kanto Local Finance Bureau (FI) No. 2907
Member of Investment Trusts Association, Japan
Real estate agency business license License No.: Tokyo Metropolitan Governor (1) No. 98232
Approval as Entrustment - Based
Agency Services for Transactions
Approval No.: Minister of Land, Infrastructure,
Transport and Tourism No. 100
Sakura Sogo REIT Presentation Material for FP4 (Four months ended 30 June 2018) 50
Sakura Sogo REIT Investment CorporationDisclaimer
This presentation material has been prepared solely for the purpose of providing information, and not for soliciting investments in certain products.
The presentation material includes, in addition to a description of Sakura Sogo REIT Investment Corporation (hereinafter the “Investment Corporation”), charts, data, etc.
prepared by Sakura Real Estate Funds Management, Inc. (hereinafter the “Asset Management Company”) based on data and indices published by third parties.
Furthermore, it includes present analysis, judgements and other opinions of the Asset Management Company regarding such information.
The contents of the presentation material have not been audited, and their accuracy nor integrity is guaranteed. The analysis and judgement by the Asset Management
Company are its current opinions and the contents may be modified or repealed without any advance notice.
The Investment Corporation or the Asset Management Company bear no responsibility with regard to the accuracy of the data or indices published by third parties
(including data based on real estate appraisal reports).
The content of this presentation material include statements on forecast and future operating results. Such statements are based on the information available at the time
of preparation of this presentation material and certain assumptions for unforeseeable factors, and thus do not guarantee future operating results of the Investment
Corporation and may differ from actual operating results.