Embed Size (px)
Citation preview

I N V E S T O RP R E S E NTATION
N Y S E : CIO
M A Y 2 0 1 6
Forward-Looking StatementsThis presentation contains certain “forward-looking statements” within the meaning of the Private Securities Litigation Reform Act of 1995, Section 27Aof the Securities Act of 1933, as amended, and Section 21E of the Securities Exchange Act of 1934, as amended. Certain statements contained in thispresentation, including those that express a belief, expectation or intention, as well as those that are not statements of historical fact, are forward-looking statements within the meaning of the federal securities laws and as such are based upon City Office REIT, Inc. (“CIO” or the “Company”) andits current beliefs as to the outcome and timing of future events. There can be no assurance that actual forward-looking statements, includingprojected capital resources, projected profitability and portfolio performance, estimates or developments affecting the Company will be thoseanticipated by the Company. Examples of forward-looking statements include those pertaining to expectations regarding our financial performance,including under metrics such as FFO, market rental rates, national or local economic growth, estimated replacement costs of our properties, projectedcapital improvements, expected sources of financing, expectations as to the timing of closing of acquisitions, dispositions, or other transactions, theexpected operating performance of anticipated near-term acquisitions and descriptions relating to these expectations, including, without limitation, theanticipated net operating income yield and cap rates. Forward-looking statements presented in this presentation are based on management’s beliefsand assumptions made by, and information currently available to, management.
Forward-looking statements are generally identifiable by use of forward-looking terminology such as “may,” “will,” “should,” “potential,” “intend,”“expect,” “seek,” “anticipate,” “estimate,” “believe,” “could,” “project,” “predict,” “hypothetical,” “continue,” “future” or other similar words or expressions.All forward-looking statements included in this presentation are based upon information available to the Company on the date hereof and theCompany is under no duty to update any of the forward-looking statements after the date of this presentation to conform these statements to actualresults. The forward-looking statements involve a number of significant risks and uncertainties. Factors that could have a material adverse effect onthe Company’s operations and future prospects are set forth in the Company’s Annual Report on Form 10-K for the fiscal year ended December 31,2015 and Quarterly Report on Form 10-Q for the three months ended March 31, 2016, including the sections entitled “Risk Factors” contained therein.The factors set forth in the Risk Factors section and otherwise described in the Company’s filings with SEC could cause the Company’s actual resultsto differ significantly from those contained in any forward-looking statement contained in this presentation. The Company does not guarantee that theassumptions underlying such forward-looking statements are free from errors. Unless otherwise stated, historical financial information and per shareand other data is as of March 31, 2016.
Should one or more of these risks or uncertainties occur, or should underlying assumptions prove incorrect, the Company’s business, financialcondition, liquidity, cash flows and results could differ materially from those expressed in any forward-looking statement. While forward-lookingstatements reflect our good faith beliefs, they are not guarantees of future performance. Any forward-looking statement speaks only as of the date onwhich it is made. New risks and uncertainties arise over time, and it is not possible for us to predict the occurrence of those matters or the manner inwhich they may affect us. We disclaim any obligation to publicly update or revise any forward-looking statement to reflect changes in underlyingassumptions or factors, of new information, data or methods, future events or other changes. Use caution in relying on past forward-lookingstatements, which were based on results and trends at the time they were made, to anticipate future results or trends.
2
3
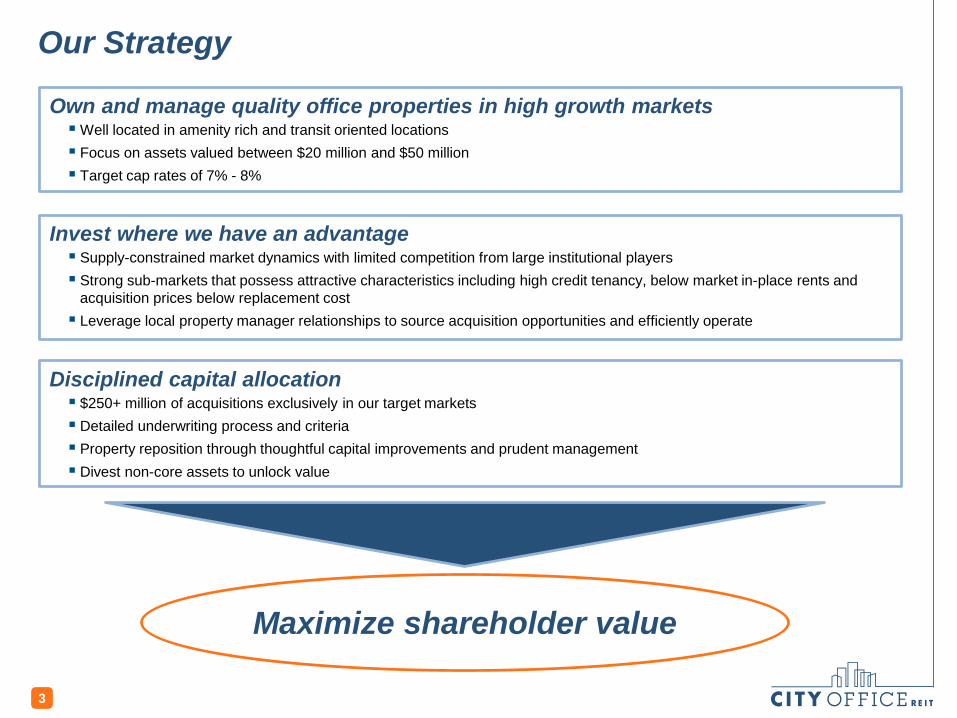
Our Strategy
Own and manage quality office properties in high growth marketsWell located in amenity rich and transit oriented locations Focus on assets valued between $20 million and $50 million Target cap rates of 7% - 8%
Invest where we have an advantage Supply-constrained market dynamics with limited competition from large institutional players Strong sub-markets that possess attractive characteristics including high credit tenancy, below market in-place rents and
acquisition prices below replacement cost Leverage local property manager relationships to source acquisition opportunities and efficiently operate
Disciplined capital allocation $250+ million of acquisitions exclusively in our target markets Detailed underwriting process and criteria Property reposition through thoughtful capital improvements and prudent management Divest non-core assets to unlock value
Maximize shareholder value
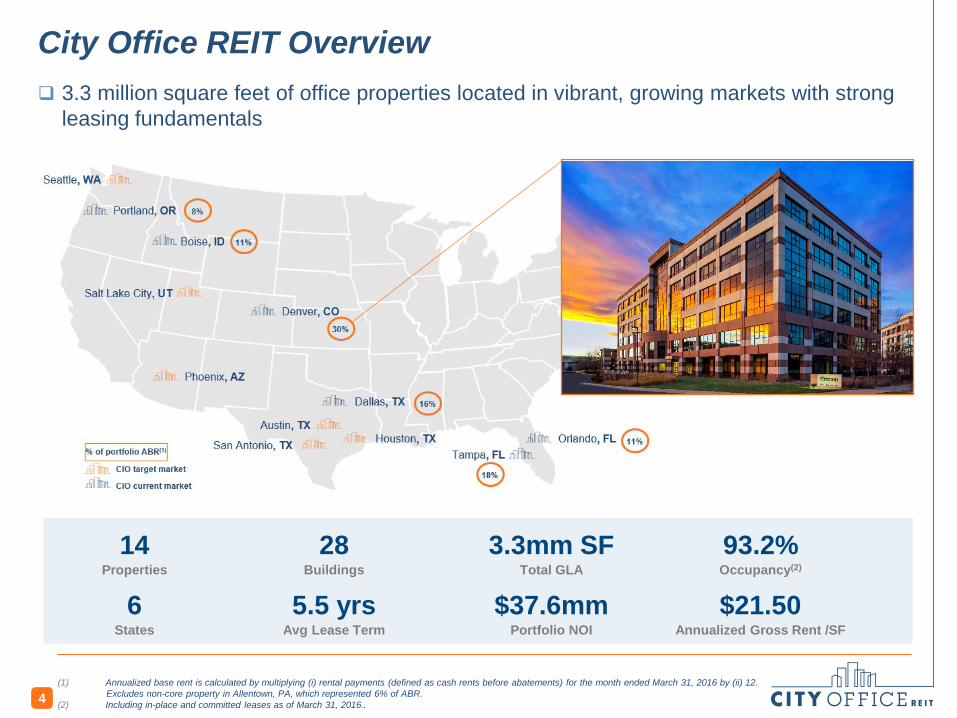
City Office REIT Overview
4(1) Annualized base rent is calculated by multiplying (i) rental payments (defined as cash rents before abatements) for the month ended March 31, 2016 by (ii) 12. E Excludes non-core property in Allentown, PA, which represented 6% of ABR.(2) Including in-place and committed leases as of March 31, 2016..
3.3 million square feet of office properties located in vibrant, growing markets with strong leasing fundamentals
14Properties
6States
28Buildings
5.5 yrsAvg Lease Term
3.3mm SFTotal GLA
$37.6mmPortfolio NOI
93.2%Occupancy(2)
$21.50Annualized Gross Rent /SF
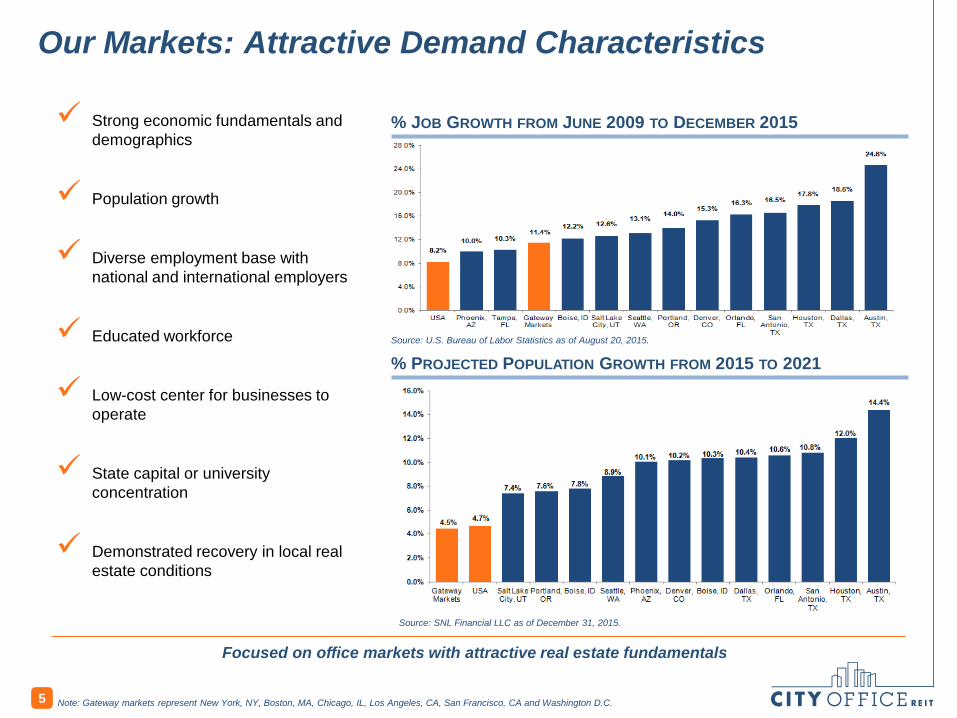
Our Markets: Attractive Demand Characteristics
Strong economic fundamentals and demographics
Population growth
Diverse employment base with national and international employers
Educated workforce
Low-cost center for businesses to operate
State capital or university concentration
Demonstrated recovery in local real estate conditions
Note: Gateway markets represent New York, NY, Boston, MA, Chicago, IL, Los Angeles, CA, San Francisco, CA and Washington D.C.
% JOB GROWTH FROM JUNE 2009 TO DECEMBER 2015
% PROJECTED POPULATION GROWTH FROM 2015 TO 2021
5
Source: U.S. Bureau of Labor Statistics as of August 20, 2015.
Source: SNL Financial LLC as of December 31, 2015.
Focused on office markets with attractive real estate fundamentals
Operational Priorities
6
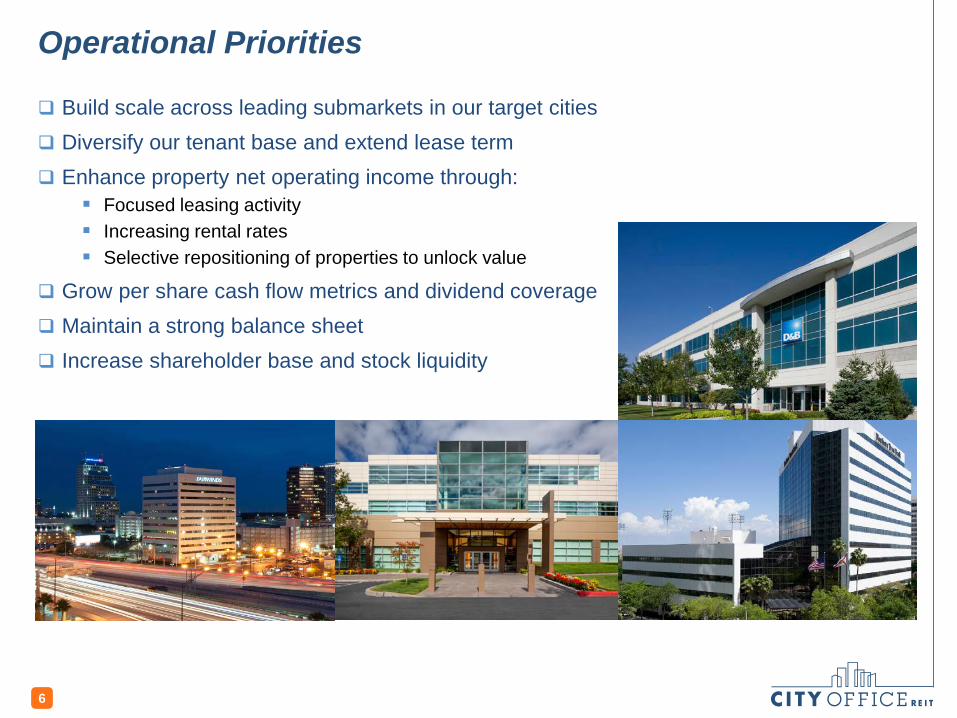
Build scale across leading submarkets in our target cities Diversify our tenant base and extend lease term Enhance property net operating income through:
Focused leasing activity Increasing rental rates Selective repositioning of properties to unlock value
Grow per share cash flow metrics and dividend coverage Maintain a strong balance sheet Increase shareholder base and stock liquidity
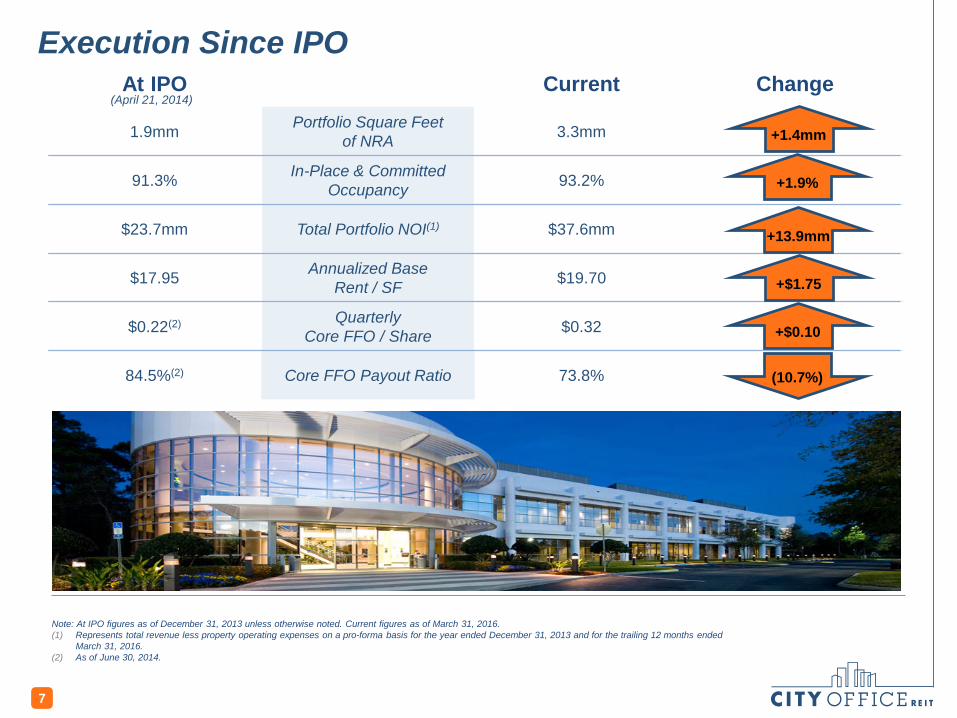
At IPO Current Change
1.9mm Portfolio Square Feet of NRA 3.3mm
91.3% In-Place & Committed Occupancy 93.2%
$23.7mm Total Portfolio NOI(1) $37.6mm
$17.95 Annualized Base Rent / SF $19.70
$0.22(2) QuarterlyCore FFO / Share $0.32
84.5%(2) Core FFO Payout Ratio 73.8%
Execution Since IPO
7
Note: At IPO figures as of December 31, 2013 unless otherwise noted. Current figures as of March 31, 2016.(1) Represents total revenue less property operating expenses on a pro-forma basis for the year ended December 31, 2013 and for the trailing 12 months ended
March 31, 2016.(2) As of June 30, 2014.
(April 21, 2014)
+13.9mm
+1.9%
+1.4mm
+$1.75
+$0.10
(10.7%)
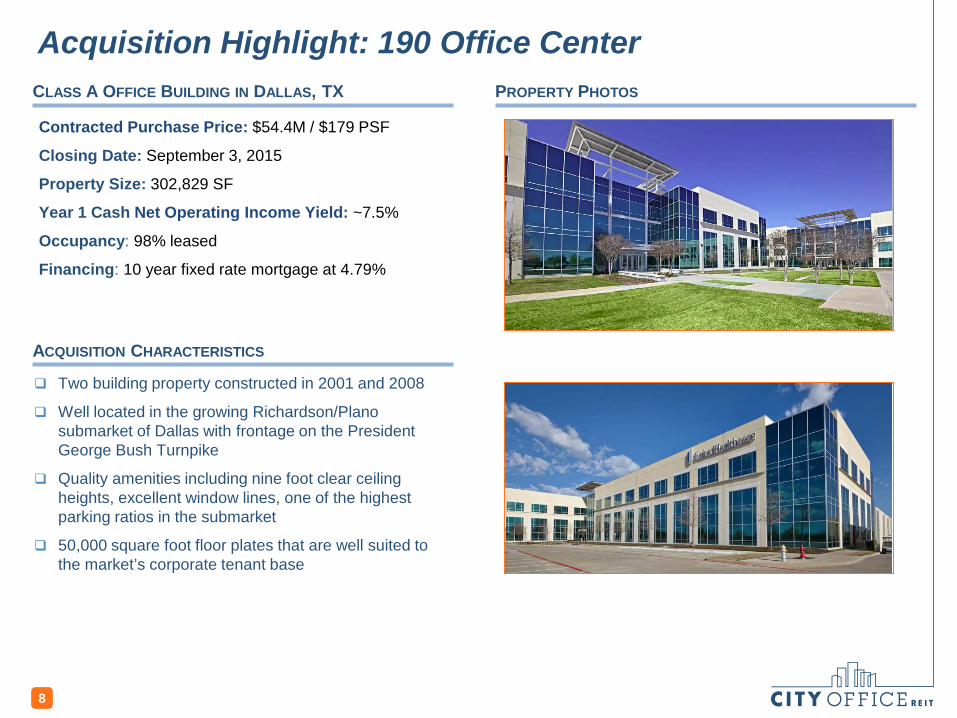
Acquisition Highlight: 190 Office Center
Contracted Purchase Price: $54.4M / $179 PSF
Closing Date: September 3, 2015
Property Size: 302,829 SF
Year 1 Cash Net Operating Income Yield: ~7.5%
Occupancy: 98% leased
Financing: 10 year fixed rate mortgage at 4.79%
CLASS A OFFICE BUILDING IN DALLAS, TX PROPERTY PHOTOS
Two building property constructed in 2001 and 2008
Well located in the growing Richardson/Plano submarket of Dallas with frontage on the President George Bush Turnpike
Quality amenities including nine foot clear ceiling heights, excellent window lines, one of the highest parking ratios in the submarket
50,000 square foot floor plates that are well suited to the market’s corporate tenant base
8
ACQUISITION CHARACTERISTICS
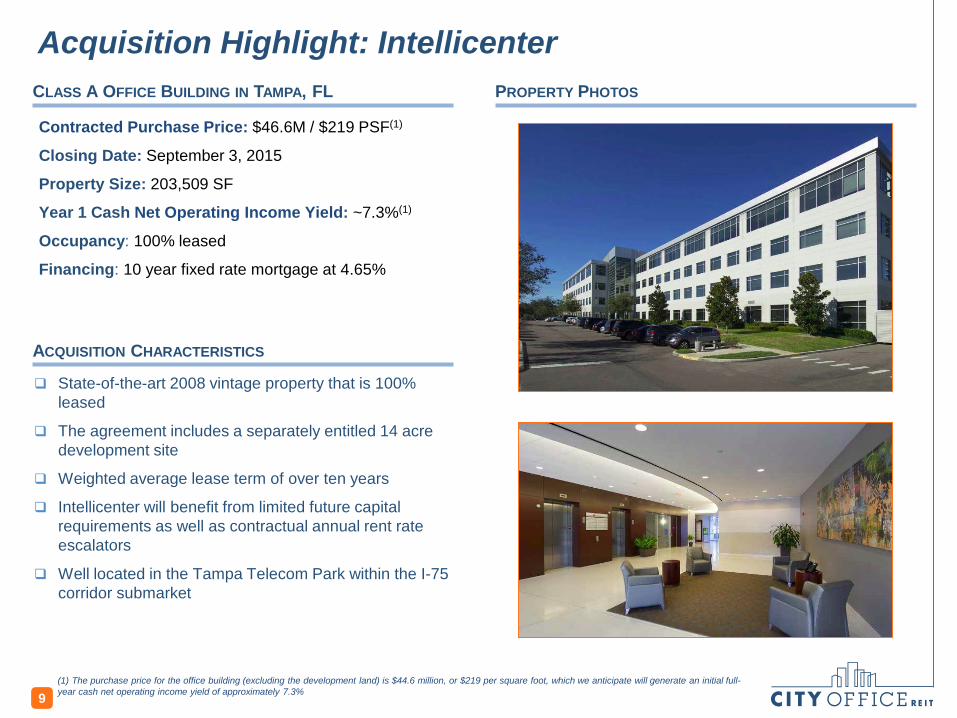
Acquisition Highlight: Intellicenter
Contracted Purchase Price: $46.6M / $219 PSF(1)
Closing Date: September 3, 2015
Property Size: 203,509 SF
Year 1 Cash Net Operating Income Yield: ~7.3%(1)
Occupancy: 100% leased
Financing: 10 year fixed rate mortgage at 4.65%
CLASS A OFFICE BUILDING IN TAMPA, FL PROPERTY PHOTOS
State-of-the-art 2008 vintage property that is 100% leased
The agreement includes a separately entitled 14 acre development site
Weighted average lease term of over ten years
Intellicenter will benefit from limited future capital requirements as well as contractual annual rent rate escalators
Well located in the Tampa Telecom Park within the I-75 corridor submarket
9(1) The purchase price for the office building (excluding the development land) is $44.6 million, or $219 per square foot, which we anticipate will generate an initial full-year cash net operating income yield of approximately 7.3%
ACQUISITION CHARACTERISTICS
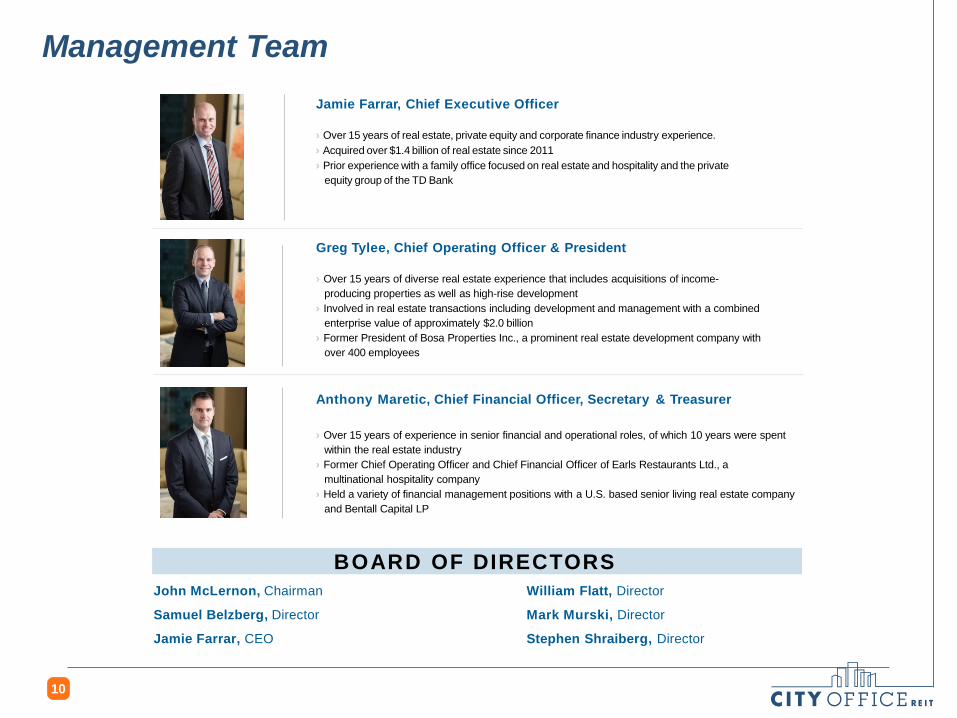
Jamie Farrar, Chief Executive Officer
› Over 15 years of real estate, private equity and corporate finance industry experience.› Acquired over $1.4 billion of real estate since 2011› Prior experience with a family office focused on real estate and hospitality and the private
equity group of the TD Bank
Greg Tylee, Chief Operating Officer & President
› Over 15 years of diverse real estate experience that includes acquisitions of income-producing properties as well as high-rise development
› Involved in real estate transactions including development and management with a combinedenterprise value of approximately $2.0 billion
› Former President of Bosa Properties Inc., a prominent real estate development company withover 400 employees
Anthony Maretic, Chief Financial Officer, Secretary & Treasurer
› Over 15 years of experience in senior financial and operational roles, of which 10 years were spentwithin the real estate industry
› Former Chief Operating Officer and Chief Financial Officer of Earls Restaurants Ltd., amultinational hospitality company
› Held a variety of financial management positions with a U.S. based senior living real estate company and Bentall Capital LP
John McLernon, Chairman
Samuel Belzberg, Director
Jamie Farrar, CEO
William Flatt, Director
Mark Murski, Director
Stephen Shraiberg, Director
BOARD OF DIRECTORS
10
Management Team
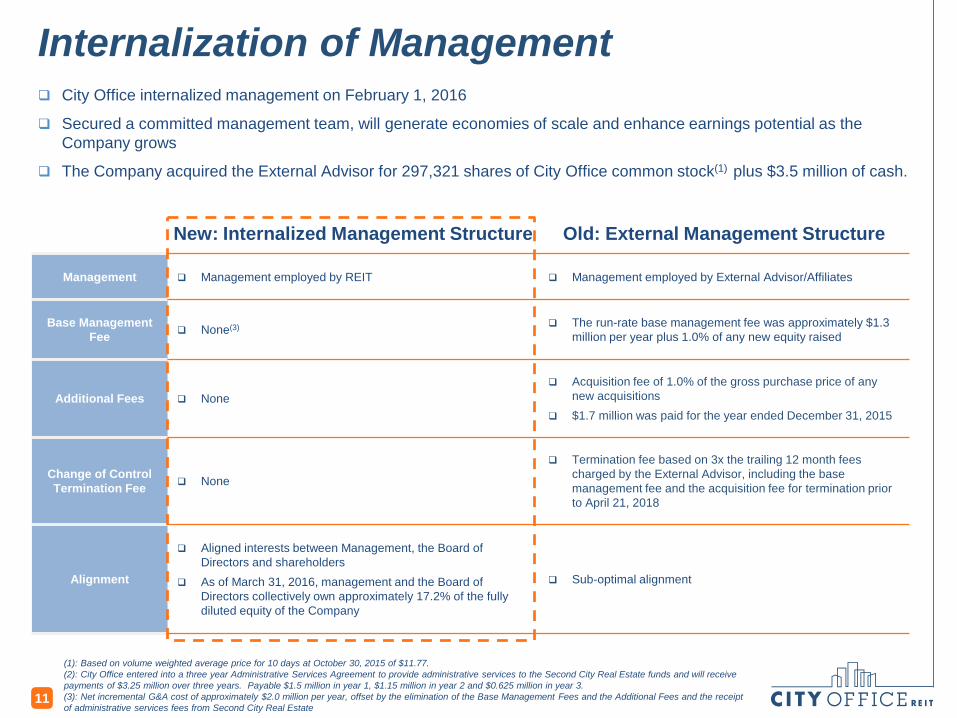
(1): Based on volume weighted average price for 10 days at October 30, 2015 of $11.77.(2): City Office entered into a three year Administrative Services Agreement to provide administrative services to the Second City Real Estate funds and will receive payments of $3.25 million over three years. Payable $1.5 million in year 1, $1.15 million in year 2 and $0.625 million in year 3.(3): Net incremental G&A cost of approximately $2.0 million per year, offset by the elimination of the Base Management Fees and the Additional Fees and the receipt of administrative services fees from Second City Real Estate
New: Internalized Management Structure Old: External Management Structure
Management Management employed by REIT Management employed by External Advisor/Affiliates
Base Management Fee None(3) The run-rate base management fee was approximately $1.3
million per year plus 1.0% of any new equity raised
Additional Fees None Acquisition fee of 1.0% of the gross purchase price of any
new acquisitions $1.7 million was paid for the year ended December 31, 2015
Change of Control Termination Fee None
Termination fee based on 3x the trailing 12 month fees charged by the External Advisor, including the base management fee and the acquisition fee for termination prior to April 21, 2018
Alignment
Aligned interests between Management, the Board of Directors and shareholders
As of March 31, 2016, management and the Board of Directors collectively own approximately 17.2% of the fully diluted equity of the Company
Sub-optimal alignment
11
Internalization of Management City Office internalized management on February 1, 2016
Secured a committed management team, will generate economies of scale and enhance earnings potential as the Company grows
The Company acquired the External Advisor for 297,321 shares of City Office common stock(1) plus $3.5 million of cash.
Portfolio Overview
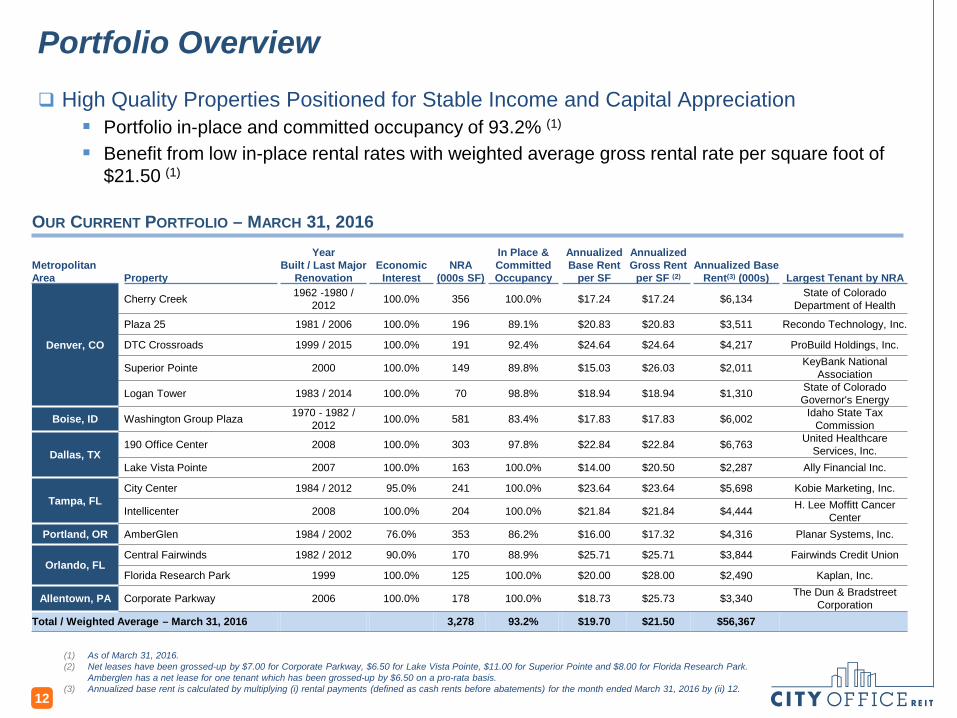
(1) As of March 31, 2016.(2) Net leases have been grossed-up by $7.00 for Corporate Parkway, $6.50 for Lake Vista Pointe, $11.00 for Superior Pointe and $8.00 for Florida Research Park.
Amberglen has a net lease for one tenant which has been grossed-up by $6.50 on a pro-rata basis. (3) Annualized base rent is calculated by multiplying (i) rental payments (defined as cash rents before abatements) for the month ended March 31, 2016 by (ii) 12.
12
OUR CURRENT PORTFOLIO – MARCH 31, 2016
MetropolitanArea Property
YearBuilt / Last Major
RenovationEconomic
Interest NRA
(000s SF)
In Place & CommittedOccupancy
Annualized Base Rent
per SF
Annualized Gross Rent
per SF (2)Annualized Base
Rent(3) (000s) Largest Tenant by NRA
Denver, CO
Cherry Creek 1962 -1980 / 2012 100.0% 356 100.0% $17.24 $17.24 $6,134 State of Colorado
Department of Health
Plaza 25 1981 / 2006 100.0% 196 89.1% $20.83 $20.83 $3,511 Recondo Technology, Inc.
DTC Crossroads 1999 / 2015 100.0% 191 92.4% $24.64 $24.64 $4,217 ProBuild Holdings, Inc.
Superior Pointe 2000 100.0% 149 89.8% $15.03 $26.03 $2,011 KeyBank National Association
Logan Tower 1983 / 2014 100.0% 70 98.8% $18.94 $18.94 $1,310 State of Colorado Governor's Energy
Boise, ID Washington Group Plaza 1970 - 1982 / 2012 100.0% 581 83.4% $17.83 $17.83 $6,002 Idaho State Tax
Commission
Dallas, TX190 Office Center 2008 100.0% 303 97.8% $22.84 $22.84 $6,763 United Healthcare
Services, Inc.Lake Vista Pointe 2007 100.0% 163 100.0% $14.00 $20.50 $2,287 Ally Financial Inc.
Tampa, FLCity Center 1984 / 2012 95.0% 241 100.0% $23.64 $23.64 $5,698 Kobie Marketing, Inc.
Intellicenter 2008 100.0% 204 100.0% $21.84 $21.84 $4,444 H. Lee Moffitt Cancer Center
Portland, OR AmberGlen 1984 / 2002 76.0% 353 86.2% $16.00 $17.32 $4,316 Planar Systems, Inc.
Orlando, FLCentral Fairwinds 1982 / 2012 90.0% 170 88.9% $25.71 $25.71 $3,844 Fairwinds Credit Union
Florida Research Park 1999 100.0% 125 100.0% $20.00 $28.00 $2,490 Kaplan, Inc.
Allentown, PA Corporate Parkway 2006 100.0% 178 100.0% $18.73 $25.73 $3,340 The Dun & Bradstreet Corporation
Total / Weighted Average – March 31, 2016 3,278 93.2% $19.70 $21.50 $56,367
High Quality Properties Positioned for Stable Income and Capital Appreciation Portfolio in-place and committed occupancy of 93.2% (1)
Benefit from low in-place rental rates with weighted average gross rental rate per square foot of $21.50 (1)
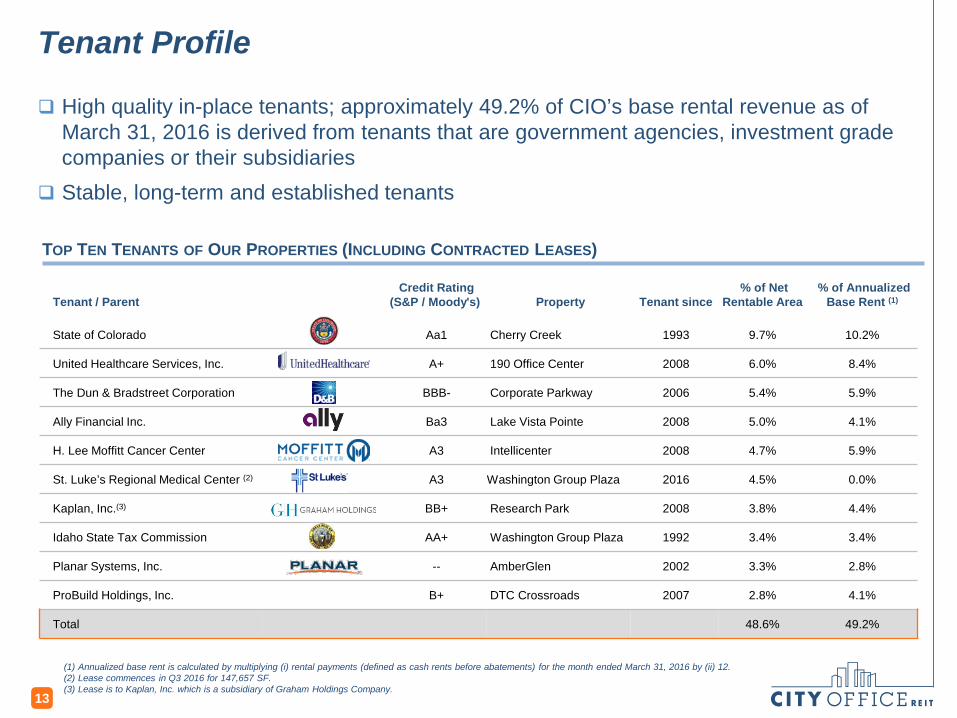
High quality in-place tenants; approximately 49.2% of CIO’s base rental revenue as of March 31, 2016 is derived from tenants that are government agencies, investment grade companies or their subsidiaries
Stable, long-term and established tenants
Tenant / Parent Credit Rating
(S&P / Moody's) Property Tenant since % of Net
Rentable Area % of Annualized
Base Rent (1)
State of Colorado Aa1 Cherry Creek 1993 9.7% 10.2%
United Healthcare Services, Inc. A+ 190 Office Center 2008 6.0% 8.4%
The Dun & Bradstreet Corporation BBB- Corporate Parkway 2006 5.4% 5.9%
Ally Financial Inc. Ba3 Lake Vista Pointe 2008 5.0% 4.1%
H. Lee Moffitt Cancer Center A3 Intellicenter 2008 4.7% 5.9%
St. Luke’s Regional Medical Center (2) A3 Washington Group Plaza 2016 4.5% 0.0%
Kaplan, Inc.(3) BB+ Research Park 2008 3.8% 4.4%
Idaho State Tax Commission AA+ Washington Group Plaza 1992 3.4% 3.4%
Planar Systems, Inc. -- AmberGlen 2002 3.3% 2.8%
ProBuild Holdings, Inc. B+ DTC Crossroads 2007 2.8% 4.1%
Total 48.6% 49.2%
TOP TEN TENANTS OF OUR PROPERTIES (INCLUDING CONTRACTED LEASES)
Tenant Profile
(1) Annualized base rent is calculated by multiplying (i) rental payments (defined as cash rents before abatements) for the month ended March 31, 2016 by (ii) 12.(2) Lease commences in Q3 2016 for 147,657 SF.(3) Lease is to Kaplan, Inc. which is a subsidiary of Graham Holdings Company.
13
7.2%
4.4%
12.9% 12.2% 9.8%
2.6%
10.9%5.0%
6.1%
2.5%0.8%
19.9%
5.5%
5.5%
0.0%
5.0%
10.0%
15.0%
20.0%
25.0%
30.0%
Vacant &Contracted
2016 2017 2018 2019 2020 2021 2022 2023 2024 2025 Thereafter
St. Lukes & Kaiser % of NRA
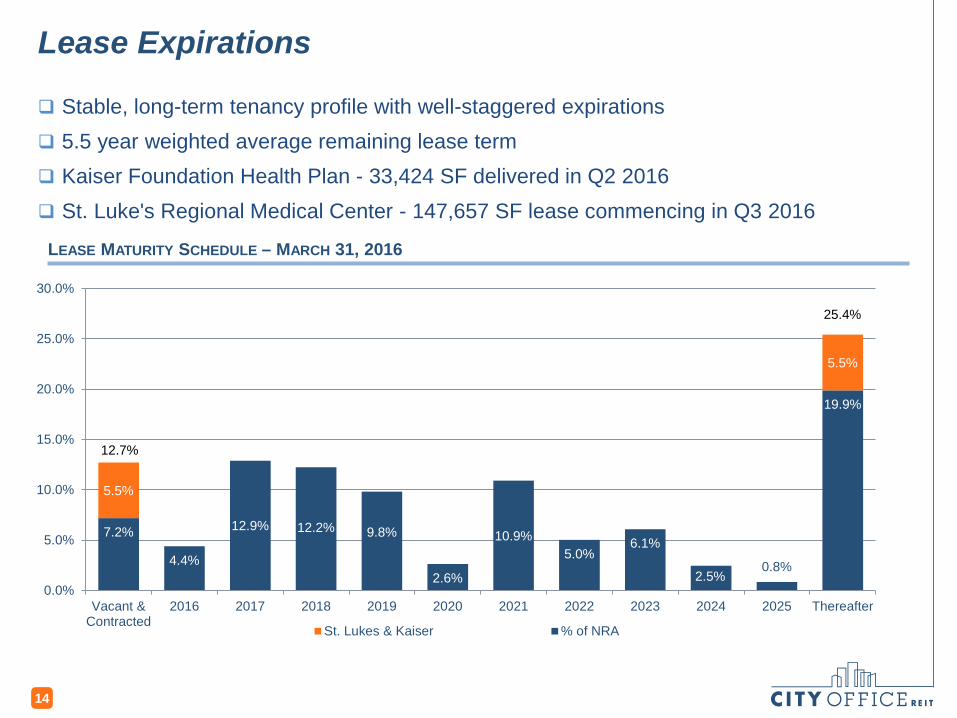
Lease Expirations
Stable, long-term tenancy profile with well-staggered expirations 5.5 year weighted average remaining lease term Kaiser Foundation Health Plan - 33,424 SF delivered in Q2 2016 St. Luke's Regional Medical Center - 147,657 SF lease commencing in Q3 2016
LEASE MATURITY SCHEDULE – MARCH 31, 2016
14
25.4%
12.7%
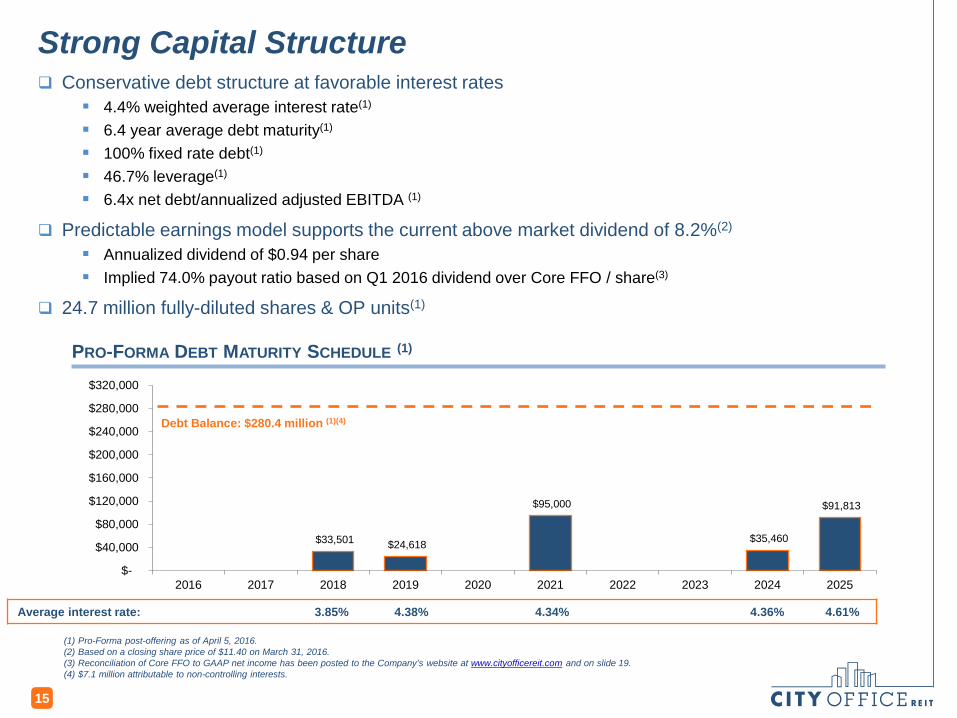
Strong Capital Structure Conservative debt structure at favorable interest rates
4.4% weighted average interest rate(1)
6.4 year average debt maturity(1)
100% fixed rate debt(1)
46.7% leverage(1)
6.4x net debt/annualized adjusted EBITDA (1)
Predictable earnings model supports the current above market dividend of 8.2%(2)
Annualized dividend of $0.94 per share Implied 74.0% payout ratio based on Q1 2016 dividend over Core FFO / share(3)
24.7 million fully-diluted shares & OP units(1)
(1) Pro-Forma post-offering as of April 5, 2016.(2) Based on a closing share price of $11.40 on March 31, 2016.(3) Reconciliation of Core FFO to GAAP net income has been posted to the Company’s website at www.cityofficereit.com and on slide 19.(4) $7.1 million attributable to non-controlling interests.
PRO-FORMA DEBT MATURITY SCHEDULE (1)
Debt Balance: $280.4 million (1)(4)
15
Average interest rate: 3.85% 4.38% 4.34% 4.36% 4.61%
$33,501 $24,618
$95,000
$35,460
$91,813
$-
$40,000
$80,000
$120,000
$160,000
$200,000
$240,000
$280,000
$320,000
2016 2017 2018 2019 2020 2021 2022 2023 2024 2025
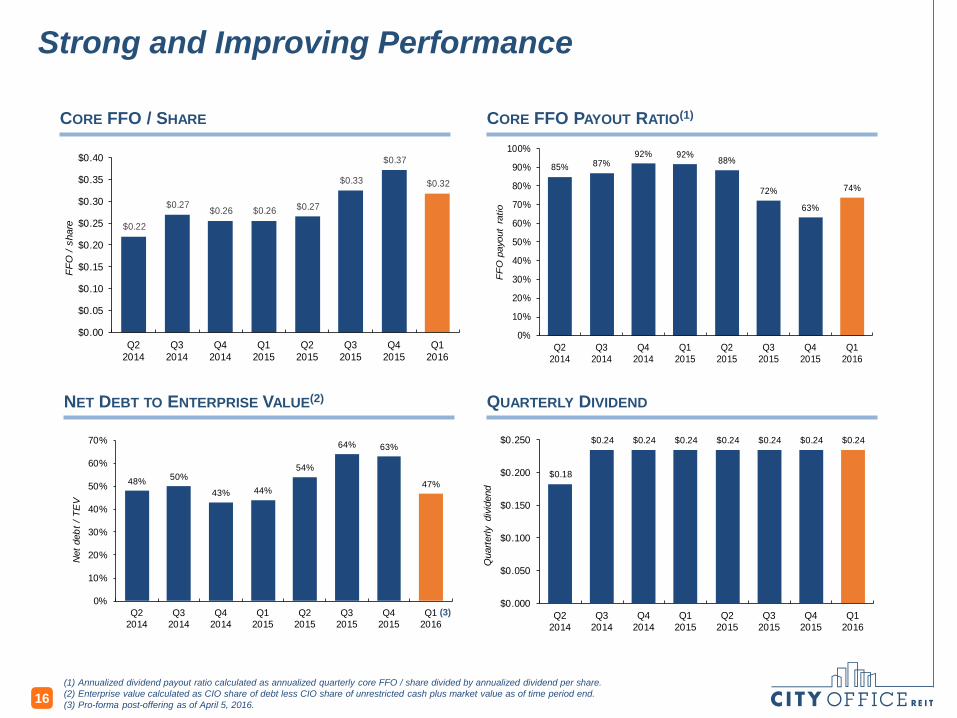
Strong and Improving Performance
16
CORE FFO / SHARE
NET DEBT TO ENTERPRISE VALUE(2)
(1) Annualized dividend payout ratio calculated as annualized quarterly core FFO / share divided by annualized dividend per share.(2) Enterprise value calculated as CIO share of debt less CIO share of unrestricted cash plus market value as of time period end. (3) Pro-forma post-offering as of April 5, 2016.
CORE FFO PAYOUT RATIO(1)
QUARTERLY DIVIDEND
(3)
48% 50%
43% 44%
54%
64% 63%
47%
0%
10%
20%
30%
40%
50%
60%
70%
Q22014
Q32014
Q42014
Q12015
Q22015
Q32015
Q42015
Q12016
Net
deb
t / T
EV
$0.22
$0.27 $0.26 $0.26 $0.27
$0.33
$0.37
$0.32
$0.00
$0.05
$0.10
$0.15
$0.20
$0.25
$0.30
$0.35
$0.40
Q22014
Q32014
Q42014
Q12015
Q22015
Q32015
Q42015
Q12016
FFO
/ sh
are
85% 87%92% 92% 88%
72%
63%
74%
0%
10%
20%
30%
40%
50%
60%
70%
80%
90%
100%
Q22014
Q32014
Q42014
Q12015
Q22015
Q32015
Q42015
Q12016
FF
O p
ayou
t ra
tio
$0.18
$0.24 $0.24 $0.24 $0.24 $0.24 $0.24 $0.24
$0.000
$0.050
$0.100
$0.150
$0.200
$0.250
Q22014
Q32014
Q42014
Q12015
Q22015
Q32015
Q42015
Q12016
Qua
rterly
div
iden
d
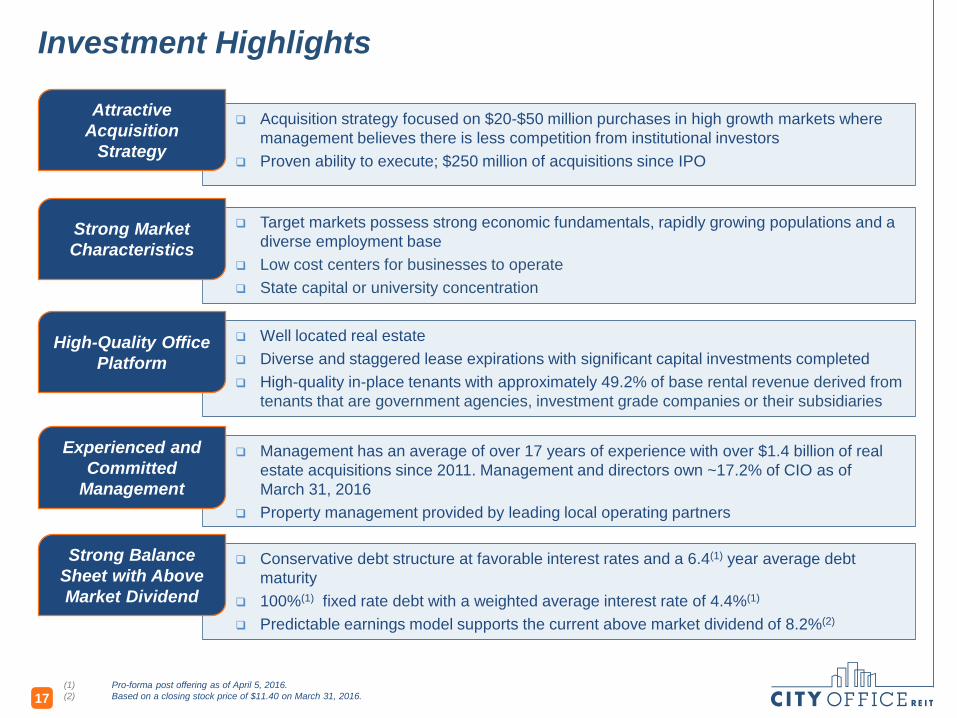
Investment Highlights
(1) Pro-forma post offering as of April 5, 2016.(2) Based on a closing stock price of $11.40 on March 31, 2016.17
Management has an average of over 17 years of experience with over $1.4 billion of real estate acquisitions since 2011. Management and directors own ~17.2% of CIO as of March 31, 2016
Property management provided by leading local operating partners
Acquisition strategy focused on $20-$50 million purchases in high growth markets where management believes there is less competition from institutional investors
Proven ability to execute; $250 million of acquisitions since IPO
Target markets possess strong economic fundamentals, rapidly growing populations and a diverse employment base
Low cost centers for businesses to operate State capital or university concentration
Well located real estate Diverse and staggered lease expirations with significant capital investments completed High-quality in-place tenants with approximately 49.2% of base rental revenue derived from
tenants that are government agencies, investment grade companies or their subsidiaries
Conservative debt structure at favorable interest rates and a 6.4(1) year average debt maturity
100%(1) fixed rate debt with a weighted average interest rate of 4.4%(1)
Predictable earnings model supports the current above market dividend of 8.2%(2)
Attractive Acquisition
Strategy
Strong Balance Sheet with Above Market Dividend
High-Quality Office Platform
Strong Market Characteristics
Experienced and Committed
Management
Appendix: Net Operating Income Reconciliation
18
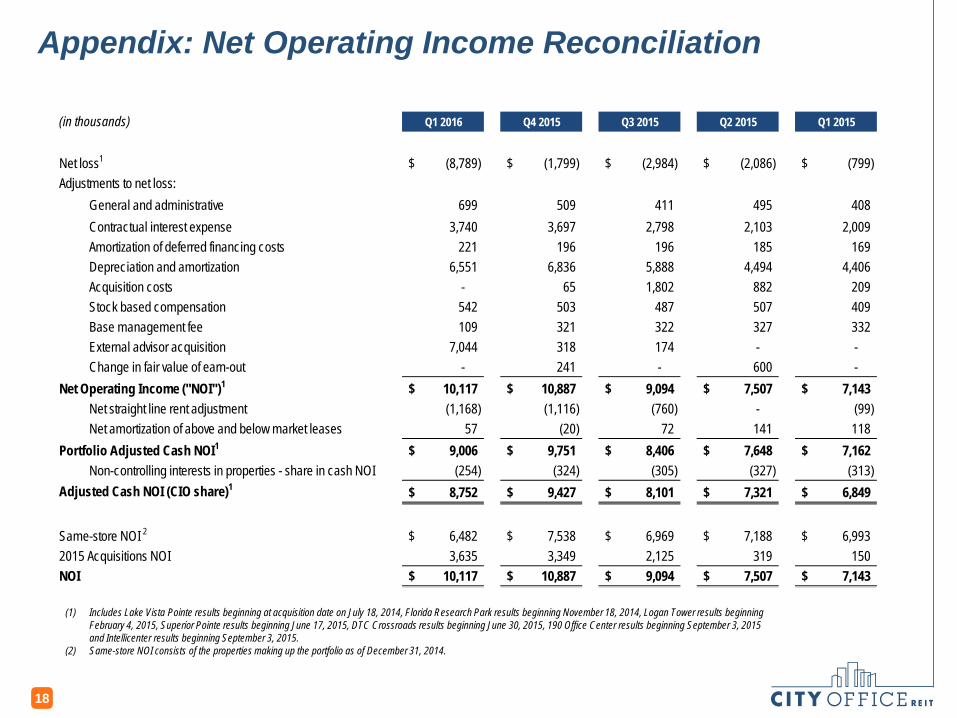
(1) Includes Lake Vista Pointe results beginning at acquisition date on July 18, 2014, Florida Research Park results beginning November 18, 2014, Logan Tower results beginning February 4, 2015, Superior Pointe results beginning June 17, 2015, DTC Crossroads results beginning June 30, 2015, 190 Office Center results beginning September 3, 2015 and Intellicenter results beginning September 3, 2015.
(2) Same-store NOI consists of the properties making up the portfolio as of December 31, 2014.
(in thousands) Q1 2016 Q4 2015 Q3 2015 Q2 2015 Q1 2015
Net loss1 (8,789)$ (1,799)$ (2,984)$ (2,086)$ (799)$ Adjustments to net loss:
General and administrative 699 509 411 495 408 Contractual interest expense 3,740 3,697 2,798 2,103 2,009 Amortization of deferred financing costs 221 196 196 185 169 Depreciation and amortization 6,551 6,836 5,888 4,494 4,406 Acquisition costs - 65 1,802 882 209 Stock based compensation 542 503 487 507 409 Base management fee 109 321 322 327 332 External advisor acquisition 7,044 318 174 - - Change in fair value of earn-out - 241 - 600 -
Net Operating Income ("NOI")1 10,117$ 10,887$ 9,094$ 7,507$ 7,143$ Net straight line rent adjustment (1,168) (1,116) (760) - (99) Net amortization of above and below market leases 57 (20) 72 141 118
Portfolio Adjusted Cash NOI1 9,006$ 9,751$ 8,406$ 7,648$ 7,162$ Non-controlling interests in properties - share in cash NOI (254) (324) (305) (327) (313)
Adjusted Cash NOI (CIO share)1 8,752$ 9,427$ 8,101$ 7,321$ 6,849$
Same-store NOI 2 6,482$ 7,538$ 6,969$ 7,188$ 6,993$ 2015 Acquisitions NOI 3,635 3,349 2,125 319 150 NOI 10,117$ 10,887$ 9,094$ 7,507$ 7,143$
Appendix: FFO and AFFO Reconciliation
19
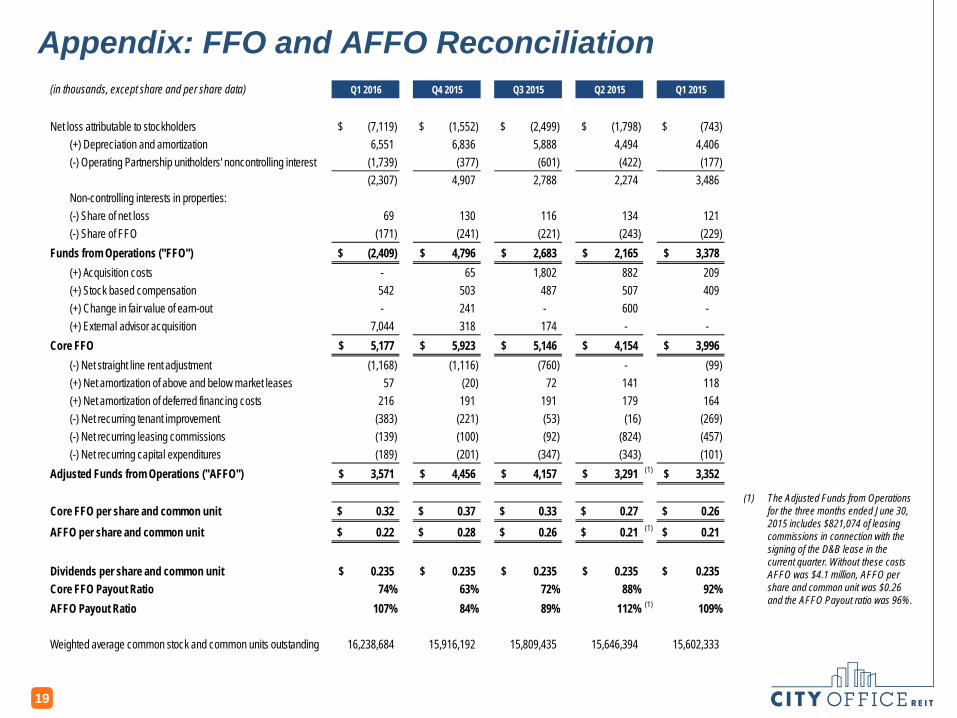
(1) The Adjusted Funds from Operations for the three months ended June 30, 2015 includes $821,074 of leasing commissions in connection with the signing of the D&B lease in the current quarter. Without these costs AFFO was $4.1 million, AFFO per share and common unit was $0.26 and the AFFO Payout ratio was 96%.
(in thousands, except share and per share data) Q1 2016 Q4 2015 Q3 2015 Q2 2015 Q1 2015
Net loss attributable to stockholders (7,119)$ (1,552)$ (2,499)$ (1,798)$ (743)$ (+) Depreciation and amortization 6,551 6,836 5,888 4,494 4,406 (-) Operating Partnership unitholders' noncontrolling interest (1,739) (377) (601) (422) (177)
(2,307) 4,907 2,788 2,274 3,486 Non-controlling interests in properties:(-) Share of net loss 69 130 116 134 121 (-) Share of FFO (171) (241) (221) (243) (229)
Funds from Operations ("FFO") (2,409)$ 4,796$ 2,683$ 2,165$ 3,378$ (+) Acquisition costs - 65 1,802 882 209 (+) Stock based compensation 542 503 487 507 409 (+) Change in fair value of earn-out - 241 - 600 - (+) External advisor acquisition 7,044 318 174 - -
Core FFO 5,177$ 5,923$ 5,146$ 4,154$ 3,996$ (-) Net straight line rent adjustment (1,168) (1,116) (760) - (99) (+) Net amortization of above and below market leases 57 (20) 72 141 118 (+) Net amortization of deferred financing costs 216 191 191 179 164 (-) Net recurring tenant improvement (383) (221) (53) (16) (269) (-) Net recurring leasing commissions (139) (100) (92) (824) (457) (-) Net recurring capital expenditures (189) (201) (347) (343) (101)
Adjusted Funds from Operations ("AFFO") 3,571$ 4,456$ 4,157$ 3,291$ (1) 3,352$
Core FFO per share and common unit 0.32$ 0.37$ 0.33$ 0.27$ 0.26$ AFFO per share and common unit 0.22$ 0.28$ 0.26$ 0.21$ (1) 0.21$
Dividends per share and common unit 0.235$ 0.235$ 0.235$ 0.235$ 0.235$ Core FFO Payout Ratio 74% 63% 72% 88% 92%AFFO Payout Ratio 107% 84% 89% 112% (1) 109%
Weighted average common stock and common units outstanding 16,238,684 15,916,192 15,809,435 15,646,394 15,602,333
Appendix: Financial Highlights
20
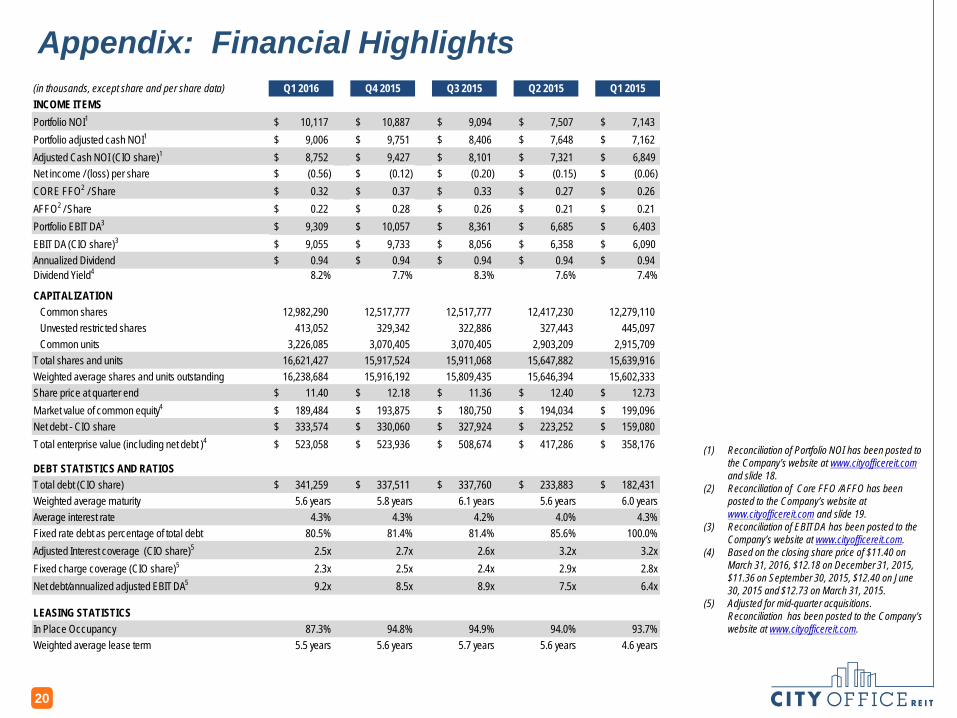
(1) Reconciliation of Portfolio NOI has been posted to the Company’s website at www.cityofficereit.comand slide 18.
(2) Reconciliation of Core FFO /AFFO has been posted to the Company’s website at www.cityofficereit.com and slide 19.
(3) Reconciliation of EBITDA has been posted to the Company’s website at www.cityofficereit.com.
(4) Based on the closing share price of $11.40 on March 31, 2016, $12.18 on December 31, 2015, $11.36 on September 30, 2015, $12.40 on June 30, 2015 and $12.73 on March 31, 2015.
(5) Adjusted for mid-quarter acquisitions. Reconciliation has been posted to the Company’s website at www.cityofficereit.com.
(in thousands, except share and per share data) Q1 2016 Q4 2015 Q3 2015 Q2 2015 Q1 2015INCOME ITEMSPortfolio NOI1 10,117$ 10,887$ 9,094$ 7,507$ 7,143$ Portfolio adjusted cash NOI1 9,006$ 9,751$ 8,406$ 7,648$ 7,162$ Adjusted Cash NOI (CIO share)1 8,752$ 9,427$ 8,101$ 7,321$ 6,849$ Net income / (loss) per share (0.56)$ (0.12)$ (0.20)$ (0.15)$ (0.06)$ CORE FFO2 / Share 0.32$ 0.37$ 0.33$ 0.27$ 0.26$ AFFO2 / Share 0.22$ 0.28$ 0.26$ 0.21$ 0.21$ Portfolio EBITDA3 9,309$ 10,057$ 8,361$ 6,685$ 6,403$ EBITDA (CIO share)3 9,055$ 9,733$ 8,056$ 6,358$ 6,090$ Annualized Dividend 0.94$ 0.94$ 0.94$ 0.94$ 0.94$ Dividend Yield4 8.2% 7.7% 8.3% 7.6% 7.4%
CAPITALIZATIONCommon shares 12,982,290 12,517,777 12,517,777 12,417,230 12,279,110 Unvested restricted shares 413,052 329,342 322,886 327,443 445,097 Common units 3,226,085 3,070,405 3,070,405 2,903,209 2,915,709
Total shares and units 16,621,427 15,917,524 15,911,068 15,647,882 15,639,916 Weighted average shares and units outstanding 16,238,684 15,916,192 15,809,435 15,646,394 15,602,333 Share price at quarter end 11.40$ 12.18$ 11.36$ 12.40$ 12.73$ Market value of common equity4 189,484$ 193,875$ 180,750$ 194,034$ 199,096$ Net debt - CIO share 333,574$ 330,060$ 327,924$ 223,252$ 159,080$ Total enterprise value (including net debt )4 523,058$ 523,936$ 508,674$ 417,286$ 358,176$
DEBT STATISTICS AND RATIOS Total debt (CIO share) 341,259$ 337,511$ 337,760$ 233,883$ 182,431$ Weighted average maturity 5.6 years 5.8 years 6.1 years 5.6 years 6.0 yearsAverage interest rate 4.3% 4.3% 4.2% 4.0% 4.3%Fixed rate debt as percentage of total debt 80.5% 81.4% 81.4% 85.6% 100.0%Adjusted Interest coverage (CIO share)5 2.5x 2.7x 2.6x 3.2x 3.2xFixed charge coverage (CIO share)5 2.3x 2.5x 2.4x 2.9x 2.8xNet debt/annualized adjusted EBITDA5 9.2x 8.5x 8.9x 7.5x 6.4x
LEASING STATISTICSIn Place Occupancy 87.3% 94.8% 94.9% 94.0% 93.7%Weighted average lease term 5.5 years 5.6 years 5.7 years 5.6 years 4.6 years

C I T Y O F F I C E REIT, I N C .E: [email protected] | T: 604 806 3366
Suite 2010,1075 West Georgia StVancouver, BC V6E 3C9
Suite 1255,8150 North Central ExpresswayDallas, TX 75206


