Embed Size (px)
Citation preview

STRENGTHINROOTED
AnnualReport
2018
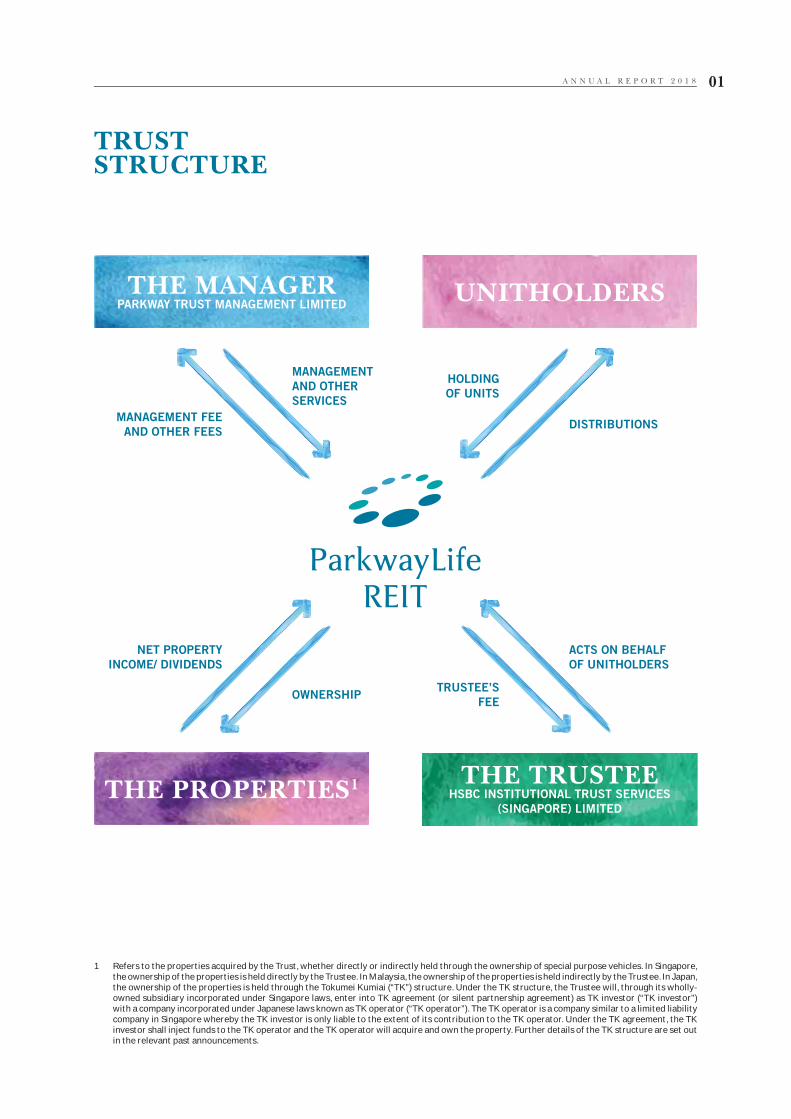
TRUSTSTRUCTURE
ACTS ON BEHALF
OF UNITHOLDERS
DISTRIBUTIONS
NET PROPERTY
INCOME/ DIVIDENDS
MANAGEMENT FEE
AND OTHER FEES
TRUSTEE’S
FEE
HOLDING
OF UNITS
OWNERSHIP
MANAGEMENT
AND OTHER
SERVICES
1 Refers to the properties acquired by the Trust, whether directly or indirectly held through the ownership of special purpose vehicles. In Singapore, the ownership of the properties is held directly by the Trustee. In Malaysia, the ownership of the properties is held indirectly by the Trustee. In Japan, the ownership of the properties is held through the Tokumei Kumiai (“TK”) structure. Under the TK structure, the Trustee will, through its wholly-owned subsidiary incorporated under Singapore laws, enter into TK agreement (or silent partnership agreement) as TK investor (“TK investor”) with a company incorporated under Japanese laws known as TK operator (“TK operator”). The TK operator is a company similar to a limited liability company in Singapore whereby the TK investor is only liable to the extent of its contribution to the TK operator. Under the TK agreement, the TK investor shall inject funds to the TK operator and the TK operator will acquire and own the property. Further details of the TK structure are set out in the relevant past announcements.
THE MANAGERPARKWAY TRUST MANAGEMENT LIMITED
THE PROPERTIES1
UNITHOLDERS
THE TRUSTEEHSBC INSTITUTIONAL TRUST SERVICES
(SINGAPORE) LIMITED
A N N U A L R E P O R T 2 0 1 8 01
Building on Effective Growth
Engines to Create Long-Term
Value for Unitholders
THE
OF STRENGTH
STRATEGY
PLife REIT is fi rmly guided by its principle of staying
prudent and focused on its growth strategy, with the
aim of delivering regular, stable distributions to its
Unitholders. Through a multi-pronged strategy of
dynamic capital and fi nancial management, targeted
investments, proactive asset management and effective
asset recycling and development, PLife REIT has once
again successfully delivered another year of sustained
growth and value to its Unitholders.

TOTAL
NUMBER OF
PROPERTIES:
50
TOTALPORTFOLIO
VALUE:
S$1.86billion
1 In relation to the divestment of four Japan properties in December 2016 as announced on 22 December 2016. Divestment gains (after tax) of S$5,390,000 was equally distributed over four quarters in FY2017.
Sawayaka Obatake Nibankan
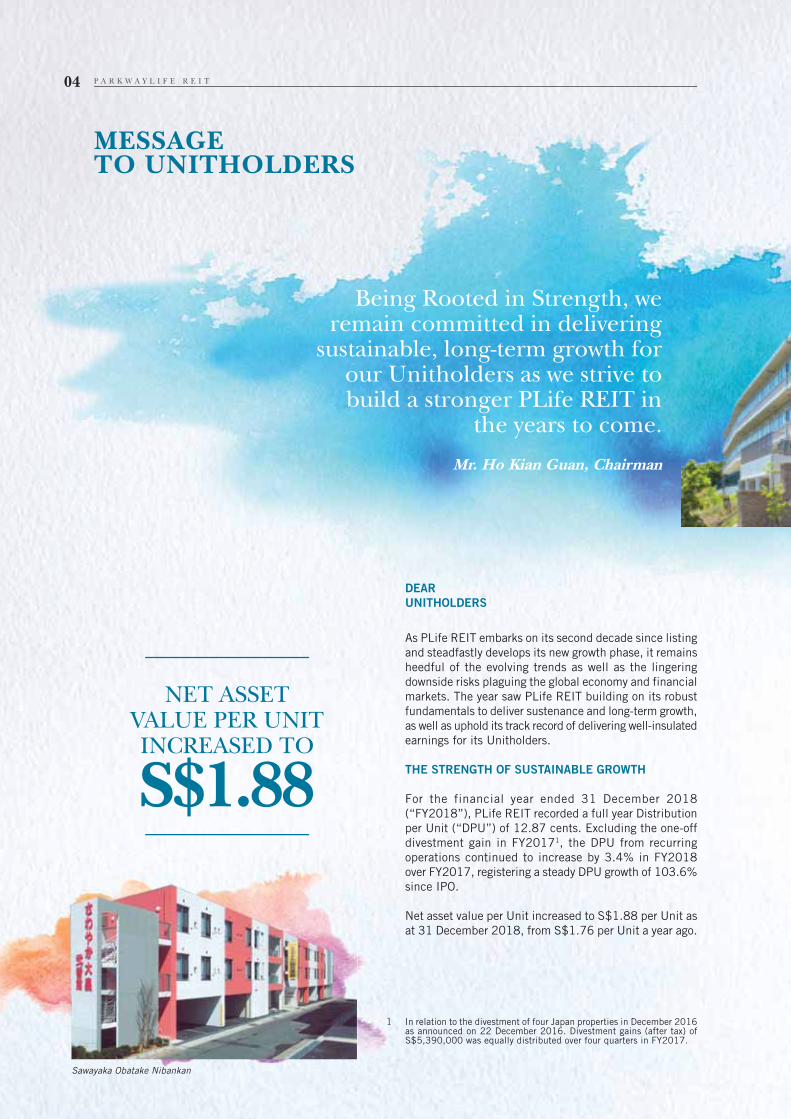
Being Rooted in Strength, we remain committed in delivering
sustainable, long-term growth for our Unitholders as we strive to build a stronger PLife REIT in
the years to come.
Mr. Ho Kian Guan, Chairman
DEAR
UNITHOLDERS
As PLife REIT embarks on its second decade since listing
and steadfastly develops its new growth phase, it remains
heedful of the evolving trends as well as the lingering
downside risks plaguing the global economy and financial
markets. The year saw PLife REIT building on its robust
fundamentals to deliver sustenance and long-term growth,
as well as uphold its track record of delivering well-insulated
earnings for its Unitholders.
THE STRENGTH OF SUSTAINABLE GROWTH
For the financial year ended 31 December 2018
(“FY2018”), PLife REIT recorded a full year Distribution
per Unit (“DPU”) of 12.87 cents. Excluding the one-off
divestment gain in FY20171, the DPU from recurring
operations continued to increase by 3.4% in FY2018
over FY2017, registering a steady DPU growth of 103.6%
since IPO.
Net asset value per Unit increased to S$1.88 per Unit as
at 31 December 2018, from S$1.76 per Unit a year ago.
MESSAGETO UNITHOLDERS
NET ASSET VALUE PER UNIT INCREASED TO
S$1.88
P A R K W A Y L I F E R E I T04
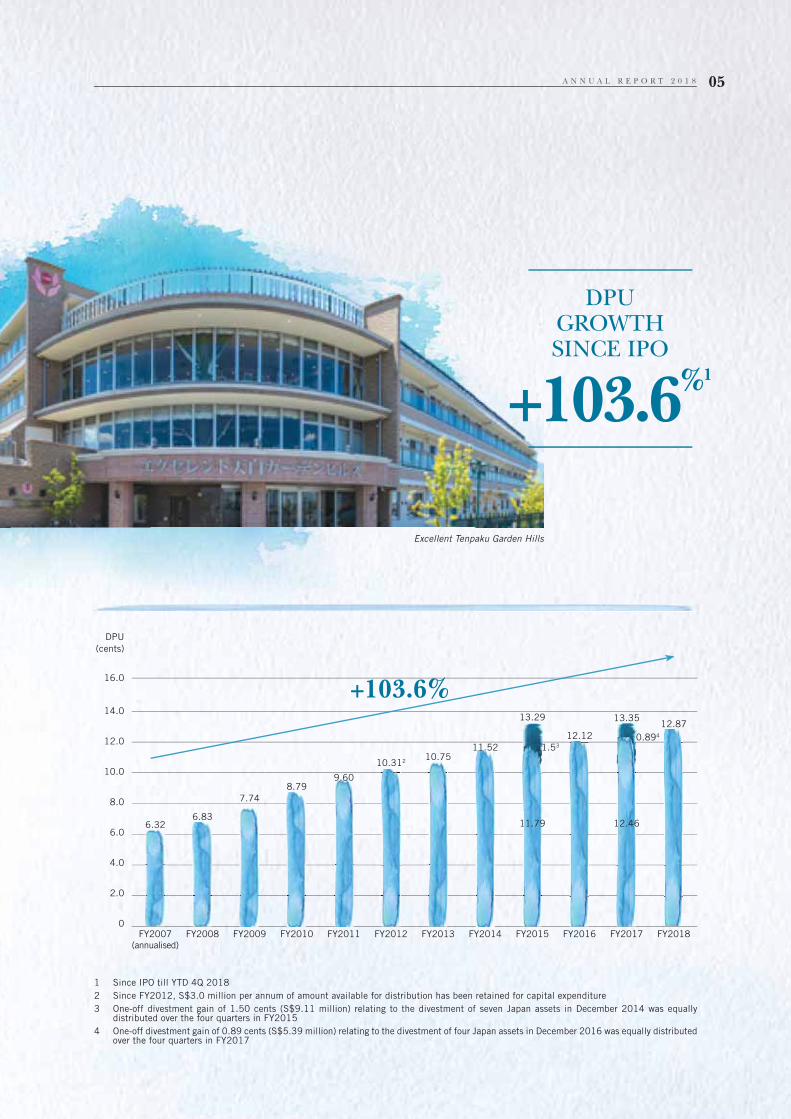
Excellent Tenpaku Garden Hills
1 Since IPO till YTD 4Q 2018
2 Since FY2012, S$3.0 million per annum of amount available for distribution has been retained for capital expenditure
3 One-off divestment gain of 1.50 cents (S$9.11 million) relating to the divestment of seven Japan assets in December 2014 was equally distributed over the four quarters in FY2015
4 One-off divestment gain of 0.89 cents (S$5.39 million) relating to the divestment of four Japan assets in December 2016 was equally distributed over the four quarters in FY2017
DPUGROWTHSINCE IPO
+103.6%1
+103.6%
FY2007
(annualised)
FY2008 FY2009 FY2010 FY2011 FY2012 FY2013 FY2014 FY2015 FY2016 FY2017 FY2018
DPU
(cents)
16.0
14.0
12.0
10.0
8.0
6.0
4.0
2.0
0
6.32
8.79
10.751.53
6.83
9.60
11.520.894
12.46
13.35
11.79
13.29
7.74
10.312
12.12
12.87
A N N U A L R E P O R T 2 0 1 8 05
MESSAGE TO UNITHOLDERS
THE STRENGTH OF STRATEGIES
As with past years, PLife REIT
intricately worked on balancing
its strategic priorities as it looked
to deliver continual value and
growth to its Unitholders in 2018.
Amid an environment of continual
uncertainties, the strategic pillar
of “Dynamic Capital and Financial
Management” took centre stage as
PLife REIT embarked on various key
finance initiatives to strengthen its
capital structure and provide better
assurance in dealing with its interest
rate and foreign exchange exposures.
In 1Q 2018, PLife REIT capitalised
on the opportunity to tap the capital
markets to term out the bulk of its
maturing loans due in 2019. With the
issuance of the JPY3.5 billion 6-year
senior unsecured fixed rate notes (the
“Notes Issue”) under the S$500
million Multicurrency Debt Issuance
Programme, the Group’s funding
sources were further diversified and
its debt maturity profile extended to
2024. The successful Notes Issue
at an attractive fixed rate pricing of
0.65% per annum, garnered strong
support from Japanese institutional
investors, affirming the continual
belief in PLife REIT’s growth strategy
in Japan. In 3Q 2018, PLife REIT
followed through with further pre-
emptive refinancing initiative to term
out the remaining loans due in 2019.
Recognising the Group’s exposure to
the Japan market, with 39.8%1 of
its revenue coming from that region,
PLife REIT had consistently been
adopting a natural hedge strategy for
its Japanese investments to maintain
a stable net asset value. In 2018,
PLife REIT also further extended its
JPY net income hedge acting as an
effective shield against JPY currency
volatility till 1Q 2023. Through the
concerted efforts of the various capital
and risk management initiatives, PLife
REIT ended the year with a stronger
financial position. With diversified
funding sources at low effective all-
in-cost of debt of 0.97% per annum,
PLife REIT will have no near term
refinancing risk till 2020. Coupled
with a well spread out debt maturity
profile with weighted average term to
maturity at 2.9 years, no more than
30% of debts will be due in a single
year. As at 31 December 2018, PLife
REIT’s interest cover stood healthy
at 13.7 times with its interest rate
exposure largely hedged. Gearing
remained optimal at 36.1%.
During the year, PLife REIT faithfully
engaged in “Proactive Asset
Management” of its portfolio, with
continual emphasis on nurturing strong
landlord-lessee relationships for this
specialised asset class. In the belief
that PLife REIT can drive value for its
Unitholders as it helps its operators to
grow through property enhancement
works tailored to address operators’
varying needs, two more collaborative
asset enhancement initiatives (“AEI”)
were carried out at its Japan property,
Ocean View Shonan Arasaki property
in 2018. To-date, PLife REIT has
successfully rolled out a total of
14 AEIs for its Japan portfolio and
1 AEI for its Malaysia portfolio.
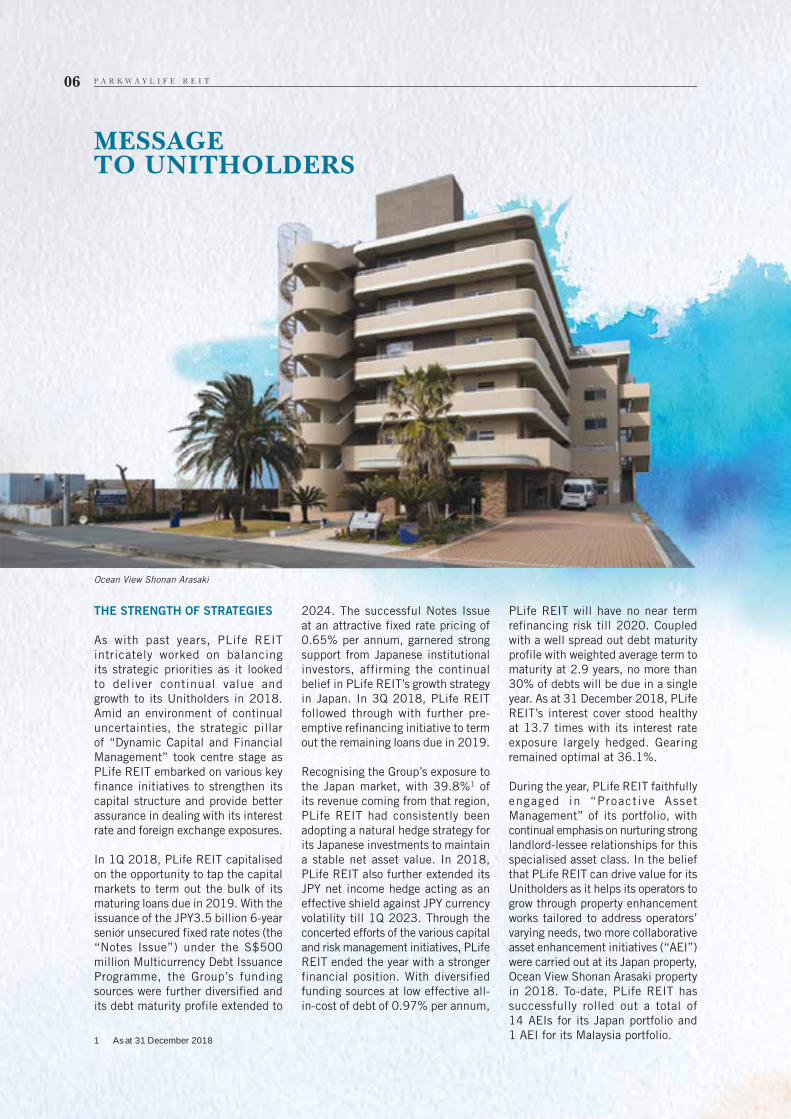
Ocean View Shonan Arasaki
TO UUNITHOLDERS
1 As at 31 December 2018
P A R K W A Y L I F E R E I T06
With the view to bolster long
term sustainable growth, PLife
REIT continued on its “Targeted
Investment” approach in 2018
with the selective acquisition of a
nursing rehabilitation facility in Japan,
Konosu Nursing Home Kyoseien, for
JPY1,500 million (approximately
S$17.8 million). Strategically located
in Saitama Prefecture, the acquisition
which was secured on a fresh 20-year
master lease arrangement signified
a new partnership with another
experienced operator in Japan, further
strengthening the Japan portfolio
attributes. With the growing ageing
population and shrinking family
sizes continuing to contribute to the
increase in demand for aged care
facilities in Japan, the newly acquired
asset enjoys a stable operational
occupancy of approximately 100%.
THE STRENGTH OF RESILIENCE
Building on the strong foundation
laid since listing in 2007, PLife
REIT remains as one of Asia’s largest
healthcare REITs. With an enlarged
portfolio of 50 properties worth
approximately S$1.86 billion, PLife
REIT continues to be well poised to
benefit from the resilient growth of
the healthcare industry in the Asia
Pacific region. With 95% of its
Singapore and Japan portfolios having
downside revenue protection and 61%
of its total portfolio pegged to CPI-
linked revision formula, PLife REIT’s
favourable lease structures continue
to provide steady rental growth whilst
protecting revenue stability amid
uncertain market conditions. As at
31 December 2018, the weighted
average lease to expiry stands at 7.11
years and coupled with the prudent
financial risk management initiatives
put in place during the year, PLife
REIT continues to offer one of the
strongest earnings visibility profiles
among S-REITs.
OUTLOOK
The long-term outlook of the healthcare
industry continues to be driven by an
ageing population regionally, demand
for better quality healthcare as well as
aged care services. Nonetheless, with
global growth expected to slow down
and macroeconomic, geopolitical
uncertainties as well as volatility
within the financial markets likely to
persist in 2019, PLife REIT will remain
cautious and vigilant as it continues
to pursue strategic opportunities to
drive value for Unitholders.
ACKNOWLEDGEMENTS
We would like to extend our sincere
appreciation to our Board members
for their invaluable guidance and
contributions. Special thanks as well
to the Management team and staff
for their efforts and dedication in
delivering consistent value and growth
of PLife REIT.
Lastly we wish to express our deepest
gratitude to our Unitholders, business
partners and lessees for their
continued support and trust.
Being Rooted in Strength, we remain
committed in delivering sustainable,
long-term growth for our Unitholders
as we strive to build a stronger PLife
REIT in the years to come.
HO KIAN GUANChairman
YONG YEAN CHAUChief Executive Offi cer and Executive
Director
A N N U A L R E P O R T 2 0 1 8 07
In 2018, aside from the uncertainty
arising from protectionist trade
policies and geopolitical tensions,
monetary policy normalization led to
tightening global financial conditions
across several major markets. In the
face of ongoing unpredictability in
the global economy and financial
markets, PLife REIT stayed committed
in driving resilient growth and value
for its Unitholders as it strategically
executed its key growth strategies
during the year to remain “Rooted
in Strength”.
TARGETED INVESTMENT
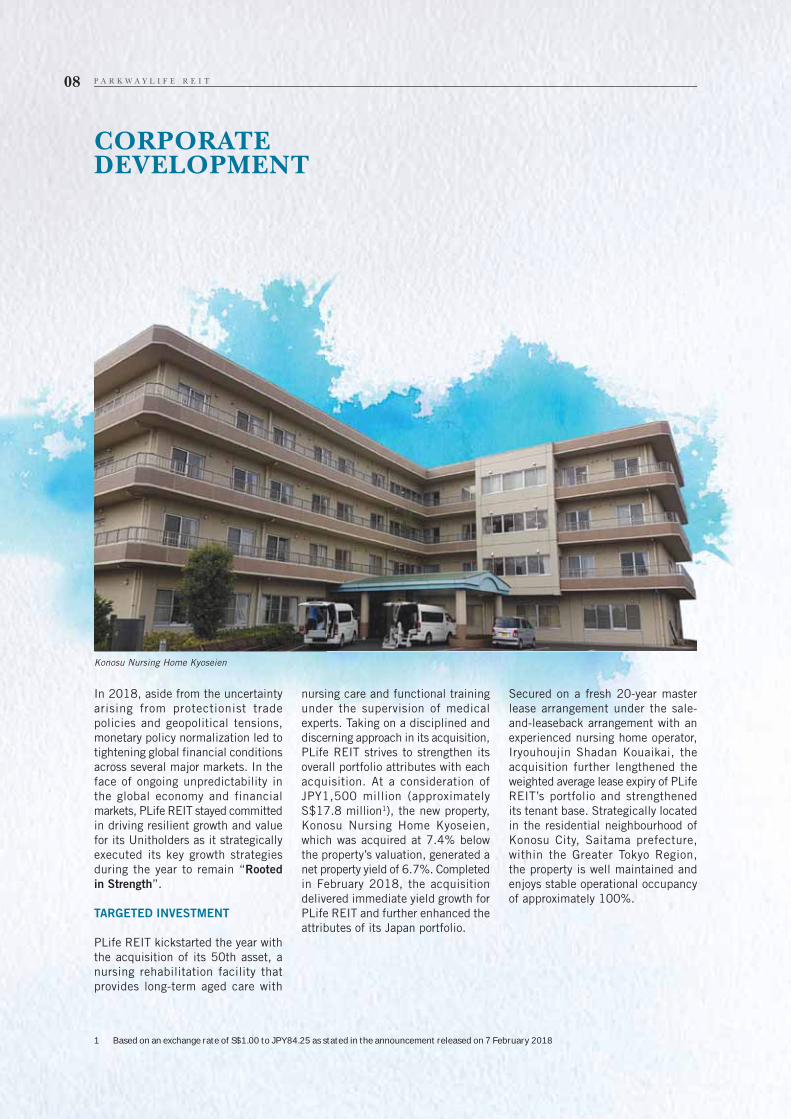
PLife REIT kickstarted the year with
the acquisition of its 50th asset, a
nursing rehabilitation facility that
provides long-term aged care with
nursing care and functional training
under the supervision of medical
experts. Taking on a disciplined and
discerning approach in its acquisition,
PLife REIT strives to strengthen its
overall portfolio attributes with each
acquisition. At a consideration of
JPY1,500 million (approximately
S$17.8 million1), the new property,
Konosu Nursing Home Kyoseien,
which was acquired at 7.4% below
the property’s valuation, generated a
net property yield of 6.7%. Completed
in February 2018, the acquisition
delivered immediate yield growth for
PLife REIT and further enhanced the
attributes of its Japan portfolio.
Secured on a fresh 20-year master
lease arrangement under the sale-
and-leaseback arrangement with an
experienced nursing home operator,
Iryouhoujin Shadan Kouaikai, the
acquisition further lengthened the
weighted average lease expiry of PLife
REIT’s portfolio and strengthened
its tenant base. Strategically located
in the residential neighbourhood of
Konosu City, Saitama prefecture,
within the Greater Tokyo Region,
the property is well maintained and
enjoys stable operational occupancy
of approximately 100%.
CORPORATE DEVELOPMENT
1 Based on an exchange rate of S$1.00 to JPY84.25 as stated in the announcement released on 7 February 2018
Konosu Nursing Home Kyoseien
P A R K W A Y L I F E R E I T08
PROACTIVE ASSET MANAGEMENT
Over the years as the portfolio grew
in size, PLife REIT conscientiously
managed and reviewed its properties
and portfolio mix with the view of
building an optimal portfolio that
sustains organic growth and value.
Given the specialised nature of
healthcare assets, PLife REIT
recognises the value of having
credible, experienced operators for
its portfolio and is keenly aware of
the importance of fostering strong
and effective relationships with its
lessees. Since the implementation
of its maiden collaborative Asset
Enhancement Initiative (“AEI”) in
2009, PLife REIT continues to work
cohesively with its lessees to tailor
property enhancement works suited for
their respective operational needs. In
February 2018, PLife REIT completed
two other AEIs at the Ocean View
Shonan Arasaki property in Japan. In
conjunction with its efforts to drive
sustainability, the recent AEIs involved
the conversion of an existing lighting
system to a full energy efficient LED
system and the replacement of an
existing air conditioning system to
energy efficient multi-split packaged
air conditioning units. Following the
completion of the AEI works, the
rent for Ocean View Shonan Arasaki
property increased by 1.6% for the
unexpired lease term of approximately
16.86 years effective 1 March 2018.
To-date, PLife REIT has successfully
rolled out a total of 14 AEIs for its
Japan portfolio and 1 AEI for its
Malaysia portfolio.
DYNAMIC CAPITAL AND
FINANCIAL MANAGEMENT
PLife REIT’s proven financial and
risk management strategy has
underpinned its sustainable returns
over the years. Recognising the
importance of staying well prepared
in an environment of uncertainty and
volatility in the financial markets,
PLife REIT embarked on various
key finance initiatives in 2018
to enhance the defensiveness of
its balance sheet and safeguard
the stability and resiliency of its
distributions to Unitholders.
In February 2018, PLife REIT tapped
the capital markets to further diversify
its funding sources. Through its
wholly-owned subsidiary, Parkway
Life MTN Pte Ltd, a 6-year JPY3.5
billion senior unsecured fixed rate
notes (the “Notes Issue”) under the
S$500 million Multicurrency Debt
Issuance Programme was issued at
a fixed rate of 0.65% per annum.
Denominated in JPY, the Notes Issue
serves as a natural hedge for PLife
REIT’s Japanese assets, eliminating
its exposure to foreign exchange risk.
With the Notes Issue, over 50% of
PLife REIT’s loans due in 2019 had
been termed out with its debt maturity
profile extended to year 2024. The
Notes issued at attractive pricing
reflected the continued strong support
of the Japanese institutional investors
and vote of confidence in PLife REIT’s
growth strategy in Japan.
In 1Q 2018, PLife REIT refinanced
and termed out the remaining
Japanese Yen loan due in 2019
using the proceeds from the Notes
Issue as well as the drawdown of
a 6-year JPY4.4 billion term loan
facility. Committed in strengthening
its financial position, PLife REIT
further refinanced an existing S$50
million loan due in 2019 and termed
out the SGD short term loans via a
3-year S$75 million revolving credit
facility in 3Q 2018. Following the
slew of refinancing initiatives, PLife
REIT had eliminated its near term
debt refinancing risk.
A N N U A L R E P O R T 2 0 1 8 09

CORPORATE DEVELOPMENT
Cognisant of its foreign currency
exposure, PLife REIT continues to
prudently manage its exposure against
foreign currency risks. During the year,
it further extended its JPY net income
hedge till 1Q 2023 to bolster the
long-term stability of its distributions
to Unitholders.
As at 31 December 2018, PLife
REIT’s gearing remained optimal
at 36.1% with a low effective all-in
cost of debt of 0.97% per annum.
With no near term refinancing risk
till 2020, its weighted average term
to maturity stood at 2.9 years, with
no more than 30% of debt due in a
single year. Maintaining a prudent
stance in managing its interest rate
risks as well, PLife REIT’s interest rate
exposure remained largely hedged with
an interest cover at 13.7 times. With
the resilient performance and healthy
liquidity position, Moody’s maintained
its investment grade rating of ‘Baa2’
with stable outlook for PLife REIT.
Sawayaka Mekari Nibankan
P A R K W A Y L I F E R E I T10

MARKET REVIEW AND OUTLOOK
1 IMF (January 2019). World Economic Outlook
2 Global tension is hampering our ability to fight climate change, Davos survey warns (2019, January 16), CNBC
MARKET CHALLENGES PERSIST
2018 saw a turbulent year of financial
market volatility, as equities started
the year with fervour - the S&P 500
reached a record high in September
- only to give way to reduced
optimism by December. While the
global economic growth that started
since 2016 continued in 2018, the
expansion has since weakened and
become less synchronized across
economies. Downside risks to global
growth have risen, tied particularly
to tightening global financial
conditions as monetary policy
normalizes, rising trade tensions and
political dysfunction1. Despite rising
macroeconomic and geopolitical
uncertainties, PLife REIT remained
resilient, performing in line with
forecasts and strengthening its
portfolio while maintaining a strong
balance sheet.
For 2018, the IMF maintained its
global growth projections at 3.7
percent. Looking ahead to 2019,
the pace of economic expansion is
expected to ease as global growth
is projected at 3.5 percent, 0.2
percentage point below last October’s
projections1.
Meanwhile, in the United States,
momentum is still strong as fiscal
stimulus continues to take its
effect, but the forecast is projected
to moderate from 2.9 percent in
2018 to 2.5 percent in 2019 due to
escalating trade tensions, including
the tariffs imposed on US imports
from China and trading partners
undertaking or promising retaliatory
and other protective measures1.
In Asia, China is projected to further
moderate its economic growth in
2019. Despite accommodative
macroeconomic st imulus and
resilient domestic demand likely
providing some cushion to growth,
China’s economy will slow on account
of a more restrained credit growth
and increased trade barriers.
On the geopolitical front, the lack of
clarity from Brexit weeks before the
U.K’s departure from the European
Union, German Chancellor Angela
Merkel’s announcement that she is
to retire from politics, the ongoing
“Yellow Vest” protests in France2
and the longest-ever government
shutdown in Washington, continue to
cast a shadow on financial markets.
As one of the biggest healthcare
REITs in Asia, PLife REIT continues
to provide an attractive investment
proposition in an increasingly
i nde te rmina te env i r onment ,
maintaining its growth momentum
while achieving another year of
sustainable, stable and resilient
distributions.
A N N U A L R E P O R T 2 0 1 8 11
MARKET REVIEW AND OUTLOOK
STRONG, SUPPORTIVE
FUNDAMENTALS IN JAPAN
The rare bright spot in the uncertain
global environment is Japan,
where 2019 projections have been
revised upwards by 0.2 percentage
point to 1.1% due to an expected
fiscal support to the economy from
measures to mitigate the effects of
the planned consumption tax rate
increase in October 20191. Japan’s
slowing population growth and ageing
population has inevitably impacted
the country’s labour force and put a
strain on their ability to care for the
elderly. In December 2018, lawmakers
in Japan passed a bill to overhaul the
immigration control law, adopting
changes designed to bring hundreds
of thousands into short-handed
sectors. The government estimates
up to 60,000 people will use the
new visa to find nursing care jobs in
Japan in the first five years, making
it the biggest job category in terms of
the number of foreign workers3. With
40% of the Japanese population set
to be aged 65 and above by 20504,
this legislation change is expected to
provide relief to the aged care sector,
which could see nursing care operators
ramping up their expansion.
With its portfolio of 45 high quality
nursing home and care facility
properties across the country, PLife
REIT is well positioned to benefit
from the government initiatives and
continued demographic developments
in this sector.
SINGAPORE STRENGTHENS
POSITION AS GLOBAL
HEALTHCARE HUB
With an estimated spending average of
one-third less than the OECD average5,
healthcare spending across Asia is set
to rise. Frost & Sullivan estimated that
the Asia-Pacific healthcare industry
accounted for 28% of the US$2
trillion global market, expanding at
11.1% in 20186. This represents one
of the fastest growing regions in the
world, even as the global healthcare
economy averaged a 4.8% annual
growth rate.
During Singapore’s 2018 Budget last
year, Finance Minister Heng Swee
Keat explained that the government
would put aside some S$10.2 billion
for healthcare expenditure, adding
that he expects Singapore’s average
annual healthcare spending to rise
from 2.2% of gross domestic product
(GDP) today to almost 3% of GDP over
the next decade, driven by an ageing
population and increase in the number
of citizens with chronic conditions.
This represents an increase of nearly
0.8-percentage point of GDP, or about
S$3.6 billion in today’s dollars7.
Beyond rising domestic demand,
driven by an ageing population,
rising affluence as well as increasing
awareness of healthcare standards,
Singapore is also an attractive hub
for medical tourism. According to
data from a medical tourism index,
Singapore was also ranked the most
attractive out of seven Asian countries
in 2017 for patient experience8.
The country’s well-developed
healthcare regulatory landscape also
makes it the top choice in the region
for patients who need world-class care
for complex conditions.
With strong government support and
growing private sector interest in the
healthcare assets, this industry is
poised to undergo a period of stronger
growth. PLife REIT is well-placed to
ride on this uptrend with its three
strategically-located world-class
private hospitals in its Singapore
portfolio.
GROWTH OF MEDICAL TOURISM
IN MALAYSIA
Malaysia’s market for medical
tourism has been identified as a key
economic area, with the Ministry of
Health Malaysia and its subsidiary,
Malaysia Healthcare Travel Council,
taking practical steps to grow this
sector further in 2018, with specific
allocations being made for Malaysia
Healthcare in developing the medical
tourism industry9.
3 Japan approves 126 measures to attract more foreign workers (2018, December 25), Nikkei Asian Review
4 World Population Review (2018). Japan Population
5 Healthcare Sector’s Growth Prospects Draw Fund Flows (2019, January 9), Singapore Exchange
6 Frost & Sullivan: Double digit growth rates will propel APAC to form 28% of US$2 trillion global healthcare market in 2018 (2019, January 19), Frost & Sullivan
7 Budget round-up speech by Minister Heng Swee Keat for Finance, (2018) Ministry of Communications and Information
8 Singapore tops for medical tourism, but rivals catching up quickly (2017, June 6), The Straits Times
9 Top Medical Tourism Destination has even bigger plans (2018) International Medical Travel Journal
P A R K W A Y L I F E R E I T12

Having been named “Destination of
the Year” by the International Medical
Tourism Journal for three consecutive
years10, Malaysia’s hospitals offer
world-class quality healthcare to
patients from around the world, with
the benefit of affordability and high
accessibility.
Supported by strong fundamentals
and demographic trends in Asia,
PLife REIT is well-poised to tap into
the growing demand in the regional
healthcare sector and to explore
further opportunities to grow its
portfolio by selectively seeking out
value-generating acquisitions that add
to the defensiveness and stability of
its overall portfolio.
S-REITS AN ATTRACTIVE
YIELD PLAY
Macro uncertainties amid global
trade tensions is likely to weigh on
investors’ minds in 2019, pushing
them to seek protection in yield plays
like S-REITs11. PLife REIT, being one
of SGX’s only three listed healthcare
REITs and trusts, stands in good
stead to continue offering investors
stability with its long average lease
expiry profile and downside-protected
rent structure for its portfolio.
As one of the largest l isted
healthcare REITs in Asia with robust
fundamentals, PLife REIT remains
strategically positioned to benefit from
this growing healthcare industry and
leverage on its core expertise as it
seeks out opportunities to meet the
growing demand.
10 The IMTJ Medical Travel Award Winners in 2018 (2018), International Medical Travel Journal
11 Singapore Reits start the year well ‘likely to continue to shine’. (2019, January 4), The Business Times
A N N U A L R E P O R T 2 0 1 8 13
THE
OF STRENGTH
SUSTAINABLE
Sustaining Stable GrowthThrough the Years
PLife REIT remains steadfast in building on its
fundamentals to ensure sustainable earnings
even amidst challenging market conditions. Over
the years, these unique core values successfully
navigated the REIT from market volatilities, as it
grew from strength to strength.
GROWTH

GROWTH IN PORTFOLIO VALUE
SINCE IPO:
140.2%
GROWTHIN MARKET
CAPITALISATION SINCE IPO:
106.7%

DR. JENNIFER
LEE GEK CHOOIndependent Director and
Chairman of the Nominating and
Remuneration Committee
Mr. Ho is the Executive Chairman of Keck Seng (Malaysia) Berhad since 1970 and
also of Keck Seng Investments (Hong Kong) Limited since 1979. He is also a Non-
Executive Director of Shangri-la Asia Limited since 1993 and is a member of the
Shangri-la Audit Committee. He was previously the Director of Parkway Holdings
Limited/Parkway Pantai Limited from 1985 to 2013 and was the Chairman of the
Tender Committee.
Mr. Ho graduated with a Bachelor’s degree in Business Administration and Commerce
from Nanyang University, Singapore in 1965.
Dr. Jennifer Lee serves on the boards of Parkway Trust Management Limited and The
Esplanade Company Ltd.
Dr. Lee was the Chief Executive Officer of KK Women’s and Children’s Hospital from
1991 to 2004. Before joining KK Hospital, Dr. Lee was the Chief Operating Officer of
Singapore General Hospital from 1988 to 1991 during the period of its corporatisation,
and prior to that had served in the Ministry of Health in various portfolios. Her most
recent work has been in development of the ageing sector, as Senior Consultant with
the Ministry of Health’s Ageing Planning Office from 2007 to 2015, and Chairperson
of the Agency for Integrated Care from 2009 to 2018.
Dr. Lee graduated with a medical degree in 1976 from the University of Singapore,
and obtained her Masters in Business Administration from the National University of
Singapore in 1986.
MR. HO KIAN GUANIndependent Director and
Chairman of the Board of Directors
BOARDOF DIRECTORS
P A R K W A Y L I F E R E I T16

Ms. Cheah is currently Operating Partner at Wavemaker Partners, a tech-focused
venture capital fund dual headquartered in Singapore and Los Angeles. She is
responsible for helping portfolio companies with business development, capital raising
and eventual exits.
Ms. Cheah previously spent more than 20 years in the investment banking industry.
She started her career with Merrill Lynch New York, followed by stints in Singapore
and London. Subsequently she became Executive Director of Investment Banking at
JP Morgan Singapore and later served as Co-head of Corporate Finance SEA at BNP
Paribas.
Ms. Cheah holds a B.A. in Economics and French from Wellesley College.
DR. TAN SEE LENGNon-Executive Director
Dr. Tan See Leng is the Managing Director and Chief Executive Officer of IHH
Healthcare Berhad (IHH). He provides strategic direction and leadership for overall
operations within IHH and its largest operating subsidiary, Parkway Pantai. Under his
stewardship, IHH has grown its footprint to more than 50 hospitals in 10 countries
worldwide.
He has over 27 years of experience in the healthcare industry. As a young entrepreneur,
he founded a private primary health group at 27 and subsequently developed it to the
second largest primary healthcare group in Singapore before selling the stake to one
of the leading global health-plan providers.
A passionate supporter of improving healthcare provision through innovations and
private-public collaboration, Dr. Tan has guest lectured at the Harvard Business
School’s healthcare management seminar series. He also provided advisory inputs
to Singapore Ministry of Health on the Medishield Life Review Committee and other
government agencies such as Department of Health, National Health Services (United
Kingdom).
Dr. Tan maintains active involvement in academia through board memberships and
appointments such as Adjunct Assistant Professor of Duke-NUS Graduate Medical
School Singapore, Office of Education and Advisory Board of Lee Kong Chian School
of Business at Singapore Management University.
MS. CHEAH SUI LINGIndependent Director and
Chairman of the Audit Committee
A N N U A L R E P O R T 2 0 1 8 17

BOARDOF DIRECTORS
DR. LIM SUET WUNNon-Executive Director
Dr. Lim is the Group Chief Operating Officer of IHH Healthcare Berhad.
Dr. Lim has more than 30 years of experience in healthcare management. Before
joining Parkway in 2011, he was the CEO of the National Healthcare Group and
Tan Tock Seng Hospital (TTSH). In this role, he was substantively involved with the
Nanyang Technological University (NTU) and Imperial College (London) collaboration,
to form the NTU Lee Kong Chian School of Medicine. Dr. Lim led the TTSH team
through the SARS crisis, when it was designated as the SARS hospital for the whole of
Singapore. For his leadership, he was awarded the Public Service Star by the President
of Singapore. Before this, Dr. Lim held the positions of CEO of the National University
of Hospital and COO of KK Women’s Hospital.
Dr. Lim was past Chairman to the Board of Joint Commission International (JCI), the
world’s leading international healthcare accreditation organization. Dr. Lim was also
previous Chairman of Johns Hopkins International Medical Center (Singapore), and
served on the Boards of the Ministry of Health Holdings Pte Ltd, National University
Health System Pte Ltd and Singapore’s Nursing Board. He headed several Ministry of
Health committees including the review of the country’s Medishield Insurance scheme
in 2005.
Dr. Lim is currently a Honorary Secretary in the Council of the Singapore National
Employers Federation.
A doctor by training, Dr. Lim also has Masters in Business Administration and Masters
in Public Health from the University of California, Los Angeles (UCLA).
MS. ROSSANA ANNIZAH
BINTI AHMAD RASHIDNon-Executive Director
Ms. Rossana was appointed as Non-Executive Director of Parkway Trust Management
Limited, an indirect wholly-owned subsidiary of IHH Healthcare Berhad. Parkway Trust
Management Limited manages Parkway Life Real Estate Investment Trust which is
listed on the Singapore Exchange Securities Trading Limited. She also serves on the
Board and Board Committee of Acibadem Saglik Yatirimlari Holding A.S., an indirect
subsidiary of IHH Healthcare Berhad.
Ms. Rossana concurrently serves as a member of the Investment Panel and the
Investment Panel Risk Committee of Malaysia’s Employees Provident Fund. In 2016,
she was appointed Country Chairman of the Jardine Matheson Group of Companies in
Malaysia. Subsequently she joined the Board of Cycle & Carriage Bintang Berhad, a
member of the Jardine Matheson Group, as Non-Independent Non-Executive Director.
She was also appointed as an Independent Non-Executive Director of edotco Group
Sdn Bhd in May 2016 and Independent Non-Executive Director of Celcom Axiata
Berhad in May 2017, both are subsidiaries of Axiata Group Berhad.
Prior to her current roles, Ms. Rossana was a career professional holding leadership
positions in the telecommunication and banking sectors. She previously served in
various senior management roles with TIME dotcom Berhad, Maxis Berhad and
RHB Bank Berhad, after beginning her banking career with Citibank Malaysia. With
a combined 30 years of experience, Ms Rossana has broad experience in business
strategy, identifying sustainable monetisation models, understanding customers and
competition, as well as the need for reviewing monetization models focusing on both
revenue management and cost management.
Ms. Rossana graduated in Bachelor of Arts in Banking and Finance from Canberra
College of Advanced Education, Australia (now known as University of Canberra).
P A R K W A Y L I F E R E I T18
MR. YONG YEAN CHAUChief Executive Offi cer and
Executive Director
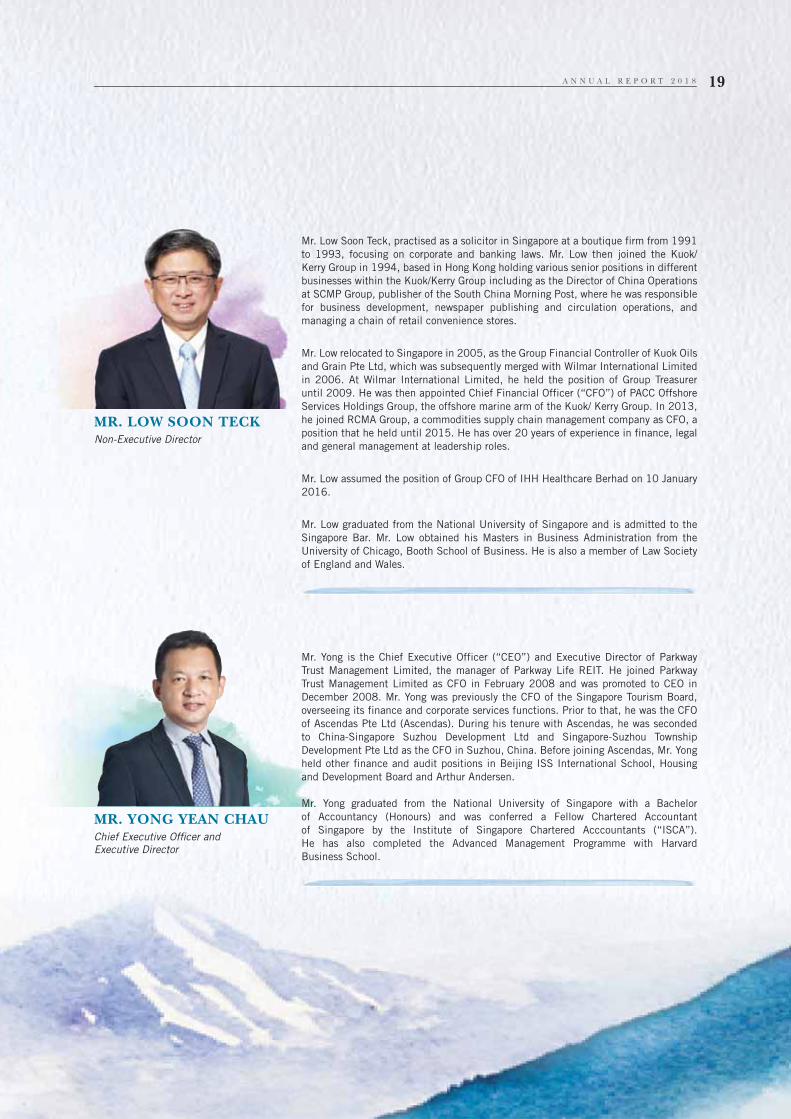
Mr. Low Soon Teck, practised as a solicitor in Singapore at a boutique firm from 1991
to 1993, focusing on corporate and banking laws. Mr. Low then joined the Kuok/
Kerry Group in 1994, based in Hong Kong holding various senior positions in different
businesses within the Kuok/Kerry Group including as the Director of China Operations
at SCMP Group, publisher of the South China Morning Post, where he was responsible
for business development, newspaper publishing and circulation operations, and
managing a chain of retail convenience stores.
Mr. Low relocated to Singapore in 2005, as the Group Financial Controller of Kuok Oils
and Grain Pte Ltd, which was subsequently merged with Wilmar International Limited
in 2006. At Wilmar International Limited, he held the position of Group Treasurer
until 2009. He was then appointed Chief Financial Officer (“CFO”) of PACC Offshore
Services Holdings Group, the offshore marine arm of the Kuok/ Kerry Group. In 2013,
he joined RCMA Group, a commodities supply chain management company as CFO, a
position that he held until 2015. He has over 20 years of experience in finance, legal
and general management at leadership roles.
Mr. Low assumed the position of Group CFO of IHH Healthcare Berhad on 10 January
2016.
Mr. Low graduated from the National University of Singapore and is admitted to the
Singapore Bar. Mr. Low obtained his Masters in Business Administration from the
University of Chicago, Booth School of Business. He is also a member of Law Society
of England and Wales.
MR. LOW SOON TECKNon-Executive Director
Mr. Yong is the Chief Executive Officer (“CEO”) and Executive Director of Parkway
Trust Management Limited, the manager of Parkway Life REIT. He joined Parkway
Trust Management Limited as CFO in February 2008 and was promoted to CEO in
December 2008. Mr. Yong was previously the CFO of the Singapore Tourism Board,
overseeing its finance and corporate services functions. Prior to that, he was the CFO
of Ascendas Pte Ltd (Ascendas). During his tenure with Ascendas, he was seconded
to China-Singapore Suzhou Development Ltd and Singapore-Suzhou Township
Development Pte Ltd as the CFO in Suzhou, China. Before joining Ascendas, Mr. Yong
held other finance and audit positions in Beijing ISS International School, Housing
and Development Board and Arthur Andersen.
Mr. Yong graduated from the National University of Singapore with a Bachelor
of Accountancy (Honours) and was conferred a Fellow Chartered Accountant
of Singapore by the Institute of Singapore Chartered Acccountants (“ISCA”).
He has also completed the Advanced Management Programme with Harvard
Business School.
A N N U A L R E P O R T 2 0 1 8 19
BOARD OF DIRECTORS SUMMARY
Name of Director Function(s)Academic and professional qualifi cations
Directorship or chairmanship both present and those held over the preceding three years in other listed companies and other major appointments
HO KIAN GUANAge: 73
Appointed on:21/10/2016
Non-Executive/ Independent Director, Chairman of the Board of Directors and Member of the Audit Committee
Business Administration and Commerce
Executive Chairman of Keck Seng Investments (Hong Kong) LimitedExecutive Chairman of Keck Seng (Malaysia) BerhadNon-Executive Director of Shangri-la Asia Limited
DR. JENNIFER LEE GEK CHOOAge: 66
Appointed on:30/06/2016
Non-Executive/IndependentDirector,Chairman ofNominating andRemunerationCommitteeand Member ofAudit Committee
MBBS, National University of Singapore
MBA, National University of Singapore
Director of The Esplanade Company Ltd Director of Ministry of Health Holdings(Stepped down on 31 August 2018)Chairman of Agency for Integrated Care Pte Ltd (Stepped down on 31 August 2018)Director of The Gentle Warriors Trust Ltd(resigned on 31 December 2017)Director of Bumrungrad International Ltd (dissolved on 28 December 2017)
CHEAH SUI LINGAge: 47
Appointed on:24/04/2017
Non-Executive/IndependentDirector, Chairmanof Audit Committeeand Member ofNominating andRemunerationCommittee
BA, Economics and French, Wellesley College, Massachusetts, USA
Operating Partner of Wavemaker PartnersIndependent Non-Executive Director of M&C REITManagement LimitedIndependent Non-Executive Director of M&C Business Trust Management LimitedNon-Executive Director of Leap201
DR. TAN SEE LENG Age: 54
Appointed on:21/06/2011
Non-Executive Director, Member of Nominating and Remuneration Committee
MBBS, MMed,FCFPS, MBA (ChicagoBooth), Fellow of Academy of Medicine, Singapore
Managing Director and Chief Executive Officer of IHH Healthcare BerhadGroup Chief Executive Officer and Managing Director of Parkway Pantai LimitedExecutive Director of Parkway Holdings LimitedNon-Executive and Non-Independent DirectorOf Fortis Healthcare LimitedMember of the Advisory Board of Lee Kong Chian School of Business,Singapore Management UniversityAdjunct Assistant Professor, Duke-NUS Medical School
DR. LIM SUET WUNAge: 59
Appointed on:26/02/2014
Non-Executive Director
MBBS, National University of Singapore MPH, UCLA MBA, UCLA
Group Chief Operating Officer of IHH Healthcare BerhadDirector of Parkway Pantai Limited (Resigned on 1 March 2018)Honorary Secretary in the Council of the Singapore National Employers Federation
ROSSANA ANNIZAH BINTI AHMAD RASHIDAge: 53
Appointed on:16/11/2015
Non-Executive Director
Bachelor of Arts in Banking and Finance, University of Canberra Australia
Independent Non-Executive Director of IHH Healthcare BerhadDirector of Parkway Pantai Limited (resigned on 1 March 2018)Member of Investment Panel of the Malaysia Employees Provident Fund (EPF)Member of Investment Panel Risk Committee of EPFDirector and Group Country Chairman of Jardine Matheson (Malaysia) Sdn BhdAlternate Director of Asas Klasik Sdn BhdNon-Independent, Non-Executive Director, Deputy Chairman of Cycle & Carriage Bintang BerhadIndependent Non-Executive Director of edotco Group Sdn BhdDirector of Jardine Lloyd Thompson Sdn BhdDirector of Acibadem Saglik Yatirimlari Holding A.S.Independent Non-Executive Director of Celcom Axiata Berhad
LOW SOON TECKAge: 54
Appointed on:28/02/2017
Non-Executive Director
MBA, University of Chicago, Booth School of BusinessBachelor of Laws, Honors (2nd Upper), National University of Singapore
Group Chief Financial Officer of IHH Healthcare BerhadNon-Executive and Non-Independent Director of Fortis Healthcare Limited
YONG YEAN CHAUAge: 53
Appointed on:29/01/2009
Executive Director/ Chief Executive Officer
B.ACC (Hons), Fellow Chartered Accountant of Singapore
Director of Hiap Tong Corporation Ltd(Retired on 27 July 2016)
P A R K W A Y L I F E R E I T20
MANAGEMENT TEAM
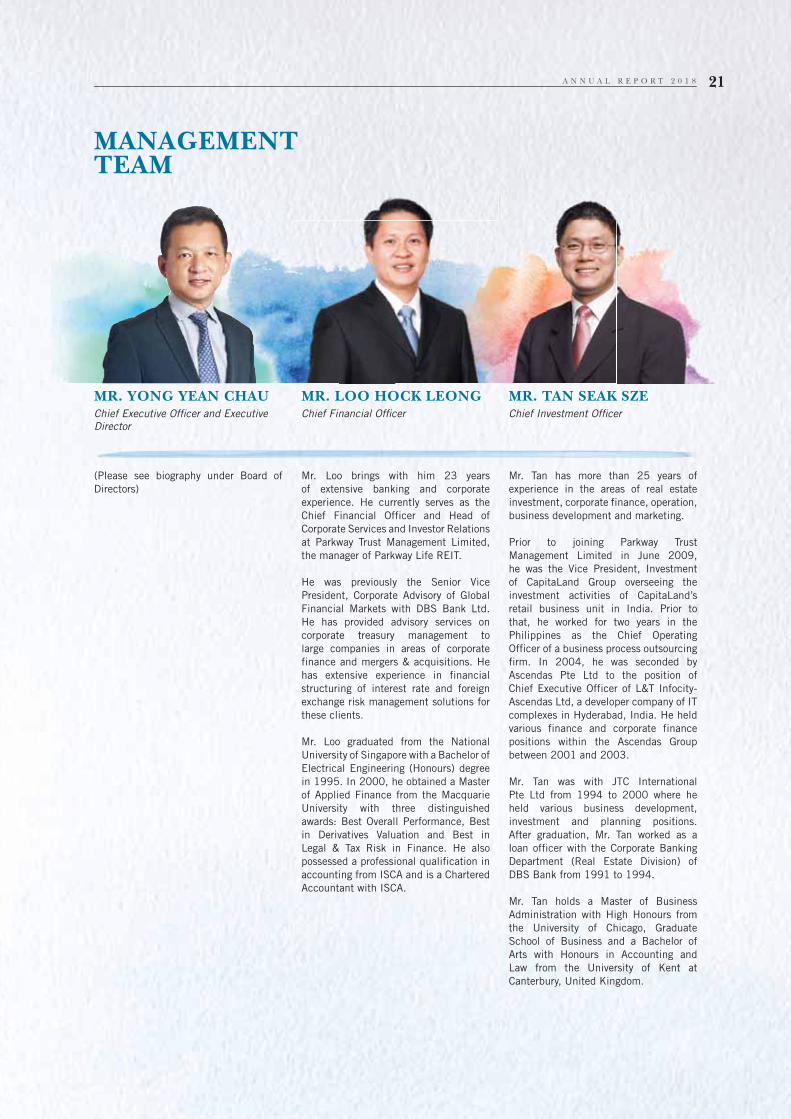
MR. YONG YEAN CHAUChief Executive Offi cer and Executive
Director
MR. LOO HOCK LEONGChief Financial Offi cer
MR. TAN SEAK SZEChief Investment Offi cer
(Please see biography under Board of
Directors)
Mr. Loo brings with him 23 years
of extensive banking and corporate
experience. He currently serves as the
Chief Financial Officer and Head of
Corporate Services and Investor Relations
at Parkway Trust Management Limited,
the manager of Parkway Life REIT.
He was previously the Senior Vice
President, Corporate Advisory of Global
Financial Markets with DBS Bank Ltd.
He has provided advisory services on
corporate treasury management to
large companies in areas of corporate
finance and mergers & acquisitions. He
has extensive experience in financial
structuring of interest rate and foreign
exchange risk management solutions for
these clients.
Mr. Loo graduated from the National
University of Singapore with a Bachelor of
Electrical Engineering (Honours) degree
in 1995. In 2000, he obtained a Master
of Applied Finance from the Macquarie
University with three distinguished
awards: Best Overall Performance, Best
in Derivatives Valuation and Best in
Legal & Tax Risk in Finance. He also
possessed a professional qualification in
accounting from ISCA and is a Chartered
Accountant with ISCA.
Mr. Tan has more than 25 years of
experience in the areas of real estate
investment, corporate finance, operation,
business development and marketing.
Prior to joining Parkway Trust
Management Limited in June 2009,
he was the Vice President, Investment
of CapitaLand Group overseeing the
investment activities of CapitaLand’s
retail business unit in India. Prior to
that, he worked for two years in the
Philippines as the Chief Operating
Officer of a business process outsourcing
firm. In 2004, he was seconded by
Ascendas Pte Ltd to the position of
Chief Executive Officer of L&T Infocity-
Ascendas Ltd, a developer company of IT
complexes in Hyderabad, India. He held
various finance and corporate finance
positions within the Ascendas Group
between 2001 and 2003.
Mr. Tan was with JTC International
Pte Ltd from 1994 to 2000 where he
held various business development,
investment and planning positions.
After graduation, Mr. Tan worked as a
loan officer with the Corporate Banking
Department (Real Estate Division) of
DBS Bank from 1991 to 1994.
Mr. Tan holds a Master of Business
Administration with High Honours from
the University of Chicago, Graduate
School of Business and a Bachelor of
Arts with Honours in Accounting and
Law from the University of Kent at
Canterbury, United Kingdom.
A N N U A L R E P O R T 2 0 1 8 21
MANAGEMENT TEAM
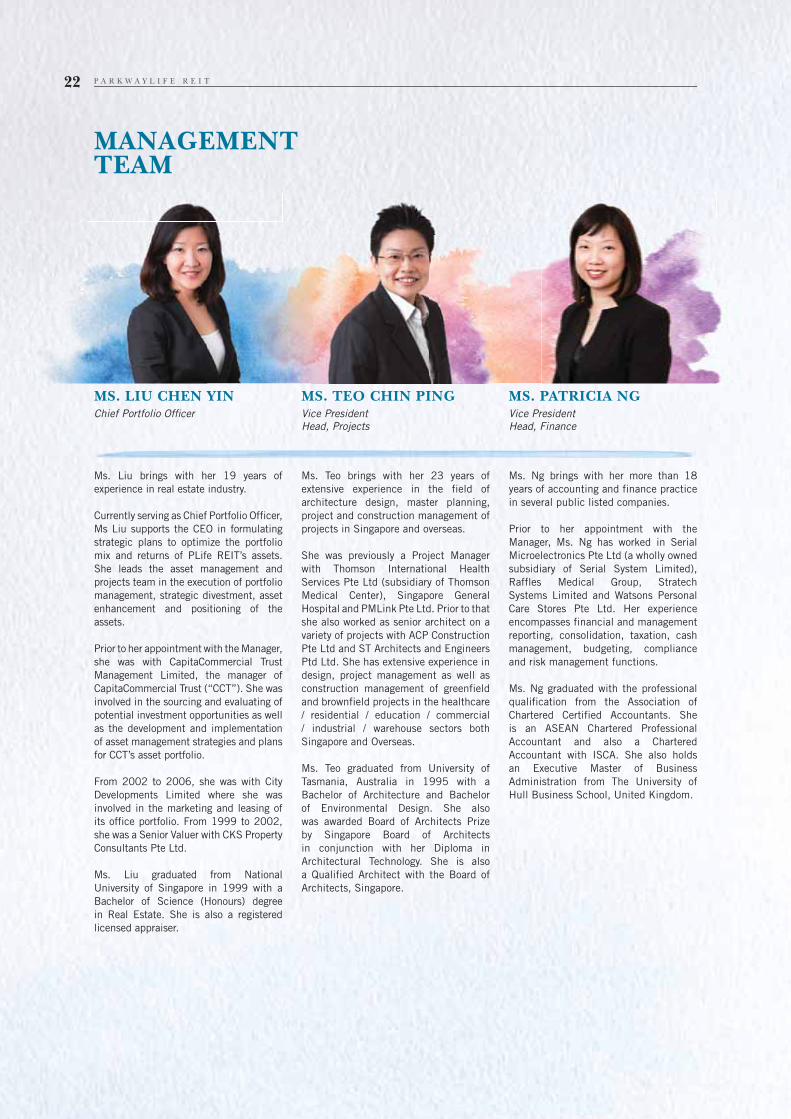
MS. LIU CHEN YIN Chief Portfolio Offi cer
MS. TEO CHIN PING Vice President
Head, Projects
MS. PATRICIA NG Vice President
Head, Finance
Ms. Liu brings with her 19 years of
experience in real estate industry.
Currently serving as Chief Portfolio Officer,
Ms Liu supports the CEO in formulating
strategic plans to optimize the portfolio
mix and returns of PLife REIT’s assets.
She leads the asset management and
projects team in the execution of portfolio
management, strategic divestment, asset
enhancement and positioning of the
assets.
Prior to her appointment with the Manager,
she was with CapitaCommercial Trust
Management Limited, the manager of
CapitaCommercial Trust (“CCT”). She was
involved in the sourcing and evaluating of
potential investment opportunities as well
as the development and implementation
of asset management strategies and plans
for CCT’s asset portfolio.
From 2002 to 2006, she was with City
Developments Limited where she was
involved in the marketing and leasing of
its office portfolio. From 1999 to 2002,
she was a Senior Valuer with CKS Property
Consultants Pte Ltd.
Ms. Liu graduated from National
University of Singapore in 1999 with a
Bachelor of Science (Honours) degree
in Real Estate. She is also a registered
licensed appraiser.
Ms. Teo brings with her 23 years of
extensive experience in the field of
architecture design, master planning,
project and construction management of
projects in Singapore and overseas.
She was previously a Project Manager
with Thomson International Health
Services Pte Ltd (subsidiary of Thomson
Medical Center), Singapore General
Hospital and PMLink Pte Ltd. Prior to that
she also worked as senior architect on a
variety of projects with ACP Construction
Pte Ltd and ST Architects and Engineers
Ptd Ltd. She has extensive experience in
design, project management as well as
construction management of greenfield
and brownfield projects in the healthcare
/ residential / education / commercial
/ industrial / warehouse sectors both
Singapore and Overseas.
Ms. Teo graduated from University of
Tasmania, Australia in 1995 with a
Bachelor of Architecture and Bachelor
of Environmental Design. She also
was awarded Board of Architects Prize
by Singapore Board of Architects
in conjunction with her Diploma in
Architectural Technology. She is also
a Qualified Architect with the Board of
Architects, Singapore.
Ms. Ng brings with her more than 18
years of accounting and finance practice
in several public listed companies.
Prior to her appointment with the
Manager, Ms. Ng has worked in Serial
Microelectronics Pte Ltd (a wholly owned
subsidiary of Serial System Limited),
Raffles Medical Group, Stratech
Systems Limited and Watsons Personal
Care Stores Pte Ltd. Her experience
encompasses financial and management
reporting, consolidation, taxation, cash
management, budgeting, compliance
and risk management functions.
Ms. Ng graduated with the professional
qualification from the Association of
Chartered Certified Accountants. She
is an ASEAN Chartered Professional
Accountant and also a Chartered
Accountant with ISCA. She also holds
an Executive Master of Business
Administration from The University of
Hull Business School, United Kingdom.
P A R K W A Y L I F E R E I T22

MR. SHAWN YAP Vice President
Head, Asset Management
MR. WAYNE LEE Assistant Vice President
Head, Investment & Special Project
MS. ANNIE CHEN Assistant Vice President
Corporate Finance
Mr. Yap brings with him 16 years of
experience in the real estate sector,
mainly in the areas of real estate asset
management, marketing and leasing.
Prior to his appointment at Parkway
Trust Management Limited, he was the
manager of CapitaLand Commercial
Limited. His responsibilities included
managing commercial and industrial
assets, monitoring and evaluating
financial performance of assets,
developing and implementing of asset
management strategies as well as
conducting studies to maximise asset
yields. He was also involved in the
divestment of CapitaLand’s commercial
assets, mainly Temasek Tower, Hitachi
Tower and Chevron House.
From 2002 to 2004, he was with
Singapore Land Authority where he
gained considerable experience in
marketing, managing and leasing of
State properties. He was also involved in
the formulation of policy papers.
Mr. Yap graduated from National
University of Singapore in 2001 with
a Bachelor of Business Administration
(Honours) degree, majoring in Finance.
Mr. Lee brings with him 16 years
of experience in the real estate and
REIT sectors, mainly in areas of
business development, valuation, fund
management, investment and asset
management.
Prior to his appointment with the
Manager, he was with Ascendas Property
Fund Trustee, the trustee-manager of
Ascendas India Trust. His responsibilities
in the investment and asset management
team included portfolio management,
financial modelling, feasibility and due
diligence assessment of investment
opportunities. He was also involved in the
acquisition of aVance Business Hub in
Hyderabad and the asset refurbishment
of Tech Park Mall in Bangalore.
From 2002 to 2007, he was a Business
Development Executive and Senior
Valuer with Wing Tai Holdings Limited
and Chesterton International Property
Consultants Pte Ltd respectively.
Mr. Lee holds a Master of Science (Real
Estate) from National University of
Singapore and a Bachelor in Business
majoring in Property from University of
South Australia. He is also a registered
licensed appraiser and member of the
Singapore Institute of Surveyor and
Valuer.
Ms. Chen brings with her more than
14 years of accounting experience,
with about 10 years in corporate
finance and treasury. She oversees
the corporate finance function and is
instrumental in securing the necessary
banks and capital market financing
to support the growth of the REIT.
She also drives the financial risk
management and treasury strategies,
in ensuring that the REIT maintains a
strong financial position.
Prior to joining the Manager, she was
with the Singapore Tourism Board’s
Finance and Information Technology
(IT) departments.
Ms. Chen graduated with a professional
qualification from the Association of
Chartered Certified Accountants and
is a Chartered Accountant with ISCA.
She also holds a Bachelor of Science
(Applied Accounting) from Oxford
Brookes University of United Kingdom
as well as a Bachelor of Commerce (IT)
from Curtin University of Technology of
Australia.
A N N U A L R E P O R T 2 0 1 8 23

THE
OF STRENGTH
RESILIENCE
Being the Defensive amongthe Defensives
Even with an enlarged portfolio, PLife REIT remains
grounded on the need to proactively and consistently
manage the risks associated with its portfolio.
Amidst the current market environment, PLife REIT
stands out as a resilient and defensive safe haven for
investors due to its strong record of stable earnings
as well as robust interest rate and foreign exchange
hedges in place.
g gg
as wwell ass robust intet reest rratate anand d foforeiggn n exexchccc anngeg
hedges in place.

WEIGHTEDAVERAGE LEASETERM TO EXPIRY
(by Gross Revenue):
7.11YEARS
DOWNSIDE PROTECTION
(by Gross Revenue):
94.8%
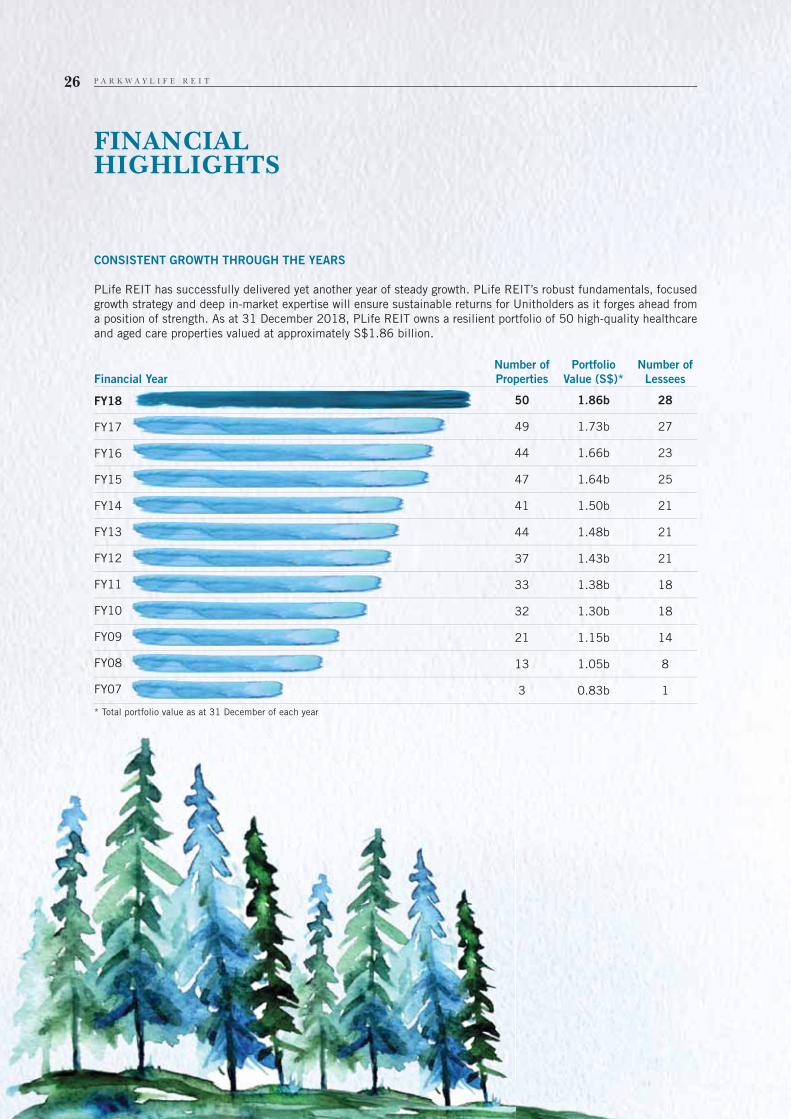
CONSISTENT GROWTH THROUGH THE YEARS
PLife REIT has successfully delivered yet another year of steady growth. PLife REIT’s robust fundamentals, focused
growth strategy and deep in-market expertise will ensure sustainable returns for Unitholders as it forges ahead from
a position of strength. As at 31 December 2018, PLife REIT owns a resilient portfolio of 50 high-quality healthcare
and aged care properties valued at approximately S$1.86 billion.
FINANCIALHIGHLIGHTS
Financial Year
Number of
Properties
Portfolio
Value (S$)*
Number of
Lessees
50 1.86b 28
49 1.73b 27
44 1.66b 23
47 1.64b 25
41 1.50b 21
44 1.48b 21
37 1.43b 21
33 1.38b 18
32 1.30b 18
21 1.15b 14
13 1.05b 8
3 0.83b 1
* Total portfolio value as at 31 December of each year
FY18
FY17
FY16
FY15
FY14
FY13
FY12
FY11
FY10
FY09
FY08
FY07
P A R K W A Y L I F E R E I T26
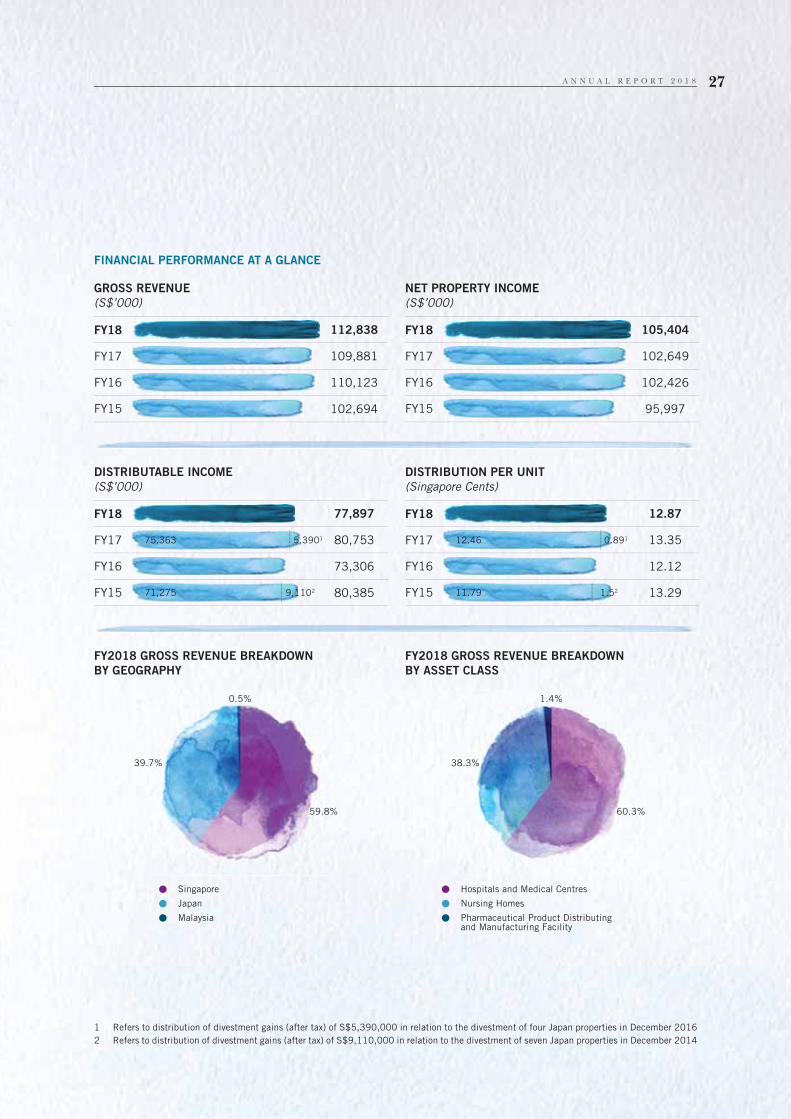
12.87
13.35
12.12
13.29
105,404
102,649
102,426
95,997
FINANCIAL PERFORMANCE AT A GLANCE
GROSS REVENUE
(S$’000)
FY2018 GROSS REVENUE BREAKDOWN
BY GEOGRAPHY
DISTRIBUTABLE INCOME
(S$’000)
NET PROPERTY INCOME
(S$’000)
FY2018 GROSS REVENUE BREAKDOWN
BY ASSET CLASS
DISTRIBUTION PER UNIT
(Singapore Cents)
Hospitals and Medical Centres
Nursing Homes
Pharmaceutical Product Distributing and Manufacturing Facility
Singapore
Japan
Malaysia
112,838
109,881
110,123
102,694
77,897
80,753
73,306
80,385
FY18
FY17
FY16
FY15
FY18
FY17
FY16
FY15
FY18
FY17
FY16
FY15
FY18
FY17
FY16
FY15
75,363 12.46
71,275
39.7% 38.3%
59.8% 60.3%
0.5% 1.4%
11.79
5,3901 0.891
9,1102 1.52
1 Refers to distribution of divestment gains (after tax) of S$5,390,000 in relation to the divestment of four Japan properties in December 2016
2 Refers to distribution of divestment gains (after tax) of S$9,110,000 in relation to the divestment of seven Japan properties in December 2014
A N N U A L R E P O R T 2 0 1 8 27
FINANCIALHIGHLIGHTS
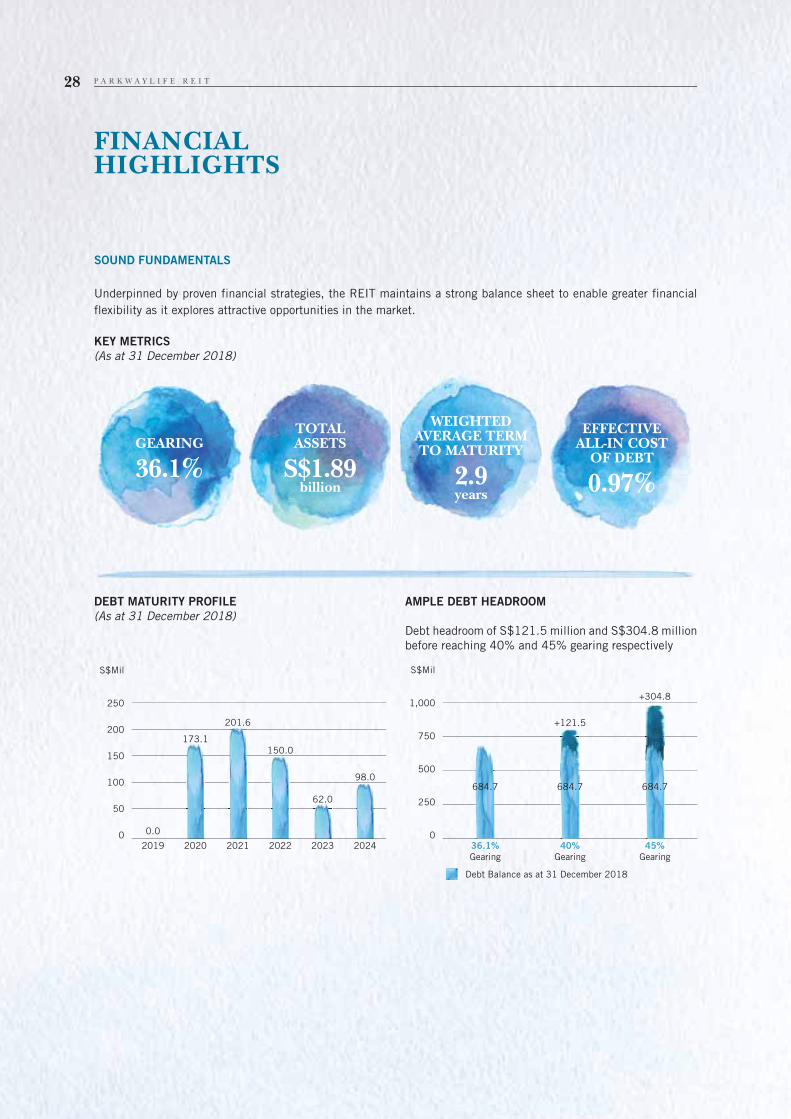
SOUND FUNDAMENTALS
Underpinned by proven financial strategies, the REIT maintains a strong balance sheet to enable greater financial
flexibility as it explores attractive opportunities in the market.
KEY METRICS
(As at 31 December 2018)
DEBT MATURITY PROFILE
(As at 31 December 2018)
AMPLE DEBT HEADROOM
Debt headroom of S$121.5 million and S$304.8 million
before reaching 40% and 45% gearing respectively
2019 2020 2021 2022 2023 2024
S$Mil
250
200
150
100
50
0
98.0
150.0
0.0
173.1
62.0
201.6
36.1%
Gearing
40%
Gearing
45%
Gearing
S$Mil
1,000
750
500
250
0
684.7 684.7
+121.5
684.7
+304.8
GEARING
36.1%
WEIGHTED AVERAGE TERM TO MATURITY
2.9years
TOTALASSETS
S$1.89billion
EFFECTIVE ALL-IN COST
OF DEBT
0.97%
Debt Balance as at 31 December 2018
P A R K W A Y L I F E R E I T28
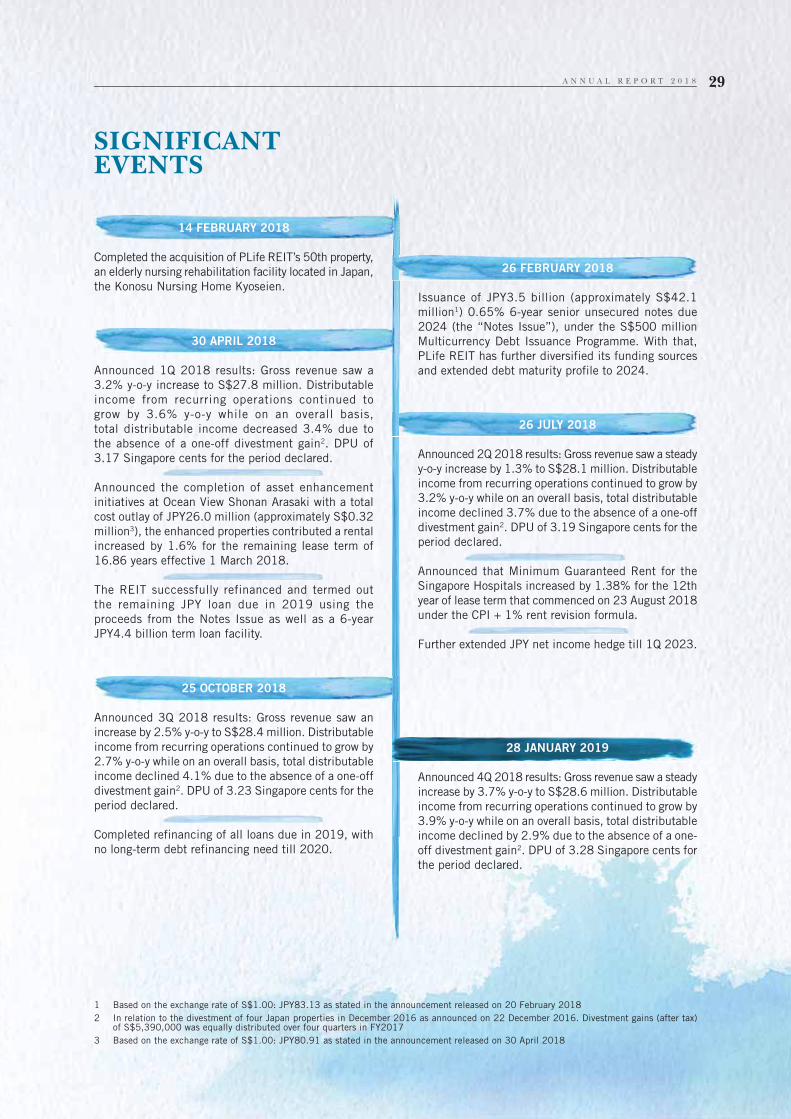
26 JULY 2018
Announced 2Q 2018 results: Gross revenue saw a steady
y-o-y increase by 1.3% to S$28.1 million. Distributable
income from recurring operations continued to grow by
3.2% y-o-y while on an overall basis, total distributable
income declined 3.7% due to the absence of a one-off
divestment gain2. DPU of 3.19 Singapore cents for the
period declared.
Announced that Minimum Guaranteed Rent for the
Singapore Hospitals increased by 1.38% for the 12th
year of lease term that commenced on 23 August 2018
under the CPI + 1% rent revision formula.
Further extended JPY net income hedge till 1Q 2023.
SIGNIFICANTEVENTS
1 Based on the exchange rate of S$1.00: JPY83.13 as stated in the announcement released on 20 February 2018
2 In relation to the divestment of four Japan properties in December 2016 as announced on 22 December 2016. Divestment gains (after tax) of S$5,390,000 was equally distributed over four quarters in FY2017
3 Based on the exchange rate of S$1.00: JPY80.91 as stated in the announcement released on 30 April 2018
14 FEBRUARY 2018
Completed the acquisition of PLife REIT’s 50th property,
an elderly nursing rehabilitation facility located in Japan,
the Konosu Nursing Home Kyoseien.
30 APRIL 2018
Announced 1Q 2018 results: Gross revenue saw a
3.2% y-o-y increase to S$27.8 million. Distributable
income from recurring operations continued to
grow by 3.6% y-o-y while on an overall basis,
total distributable income decreased 3.4% due to
the absence of a one-off divestment gain2. DPU of
3.17 Singapore cents for the period declared.
Announced the completion of asset enhancement
initiatives at Ocean View Shonan Arasaki with a total
cost outlay of JPY26.0 million (approximately S$0.32
million3), the enhanced properties contributed a rental
increased by 1.6% for the remaining lease term of
16.86 years effective 1 March 2018.
The REIT successfully refinanced and termed out
the remaining JPY loan due in 2019 using the
proceeds from the Notes Issue as well as a 6-year
JPY4.4 billion term loan facility.
25 OCTOBER 2018
Announced 3Q 2018 results: Gross revenue saw an
increase by 2.5% y-o-y to S$28.4 million. Distributable
income from recurring operations continued to grow by
2.7% y-o-y while on an overall basis, total distributable
income declined 4.1% due to the absence of a one-off
divestment gain2. DPU of 3.23 Singapore cents for the
period declared.
Completed refinancing of all loans due in 2019, with
no long-term debt refinancing need till 2020.
26 FEBRUARY 2018
Issuance of JPY3.5 billion (approximately S$42.1
million1) 0.65% 6-year senior unsecured notes due
2024 (the “Notes Issue”), under the S$500 million
Multicurrency Debt Issuance Programme. With that,
PLife REIT has further diversified its funding sources
and extended debt maturity profile to 2024.
28 JANUARY 2019
Announced 4Q 2018 results: Gross revenue saw a steady
increase by 3.7% y-o-y to S$28.6 million. Distributable
income from recurring operations continued to grow by
3.9% y-o-y while on an overall basis, total distributable
income declined by 2.9% due to the absence of a one-
off divestment gain2. DPU of 3.28 Singapore cents for
the period declared.
A N N U A L R E P O R T 2 0 1 8 29
PORTFOLIOHIGHLIGHTS
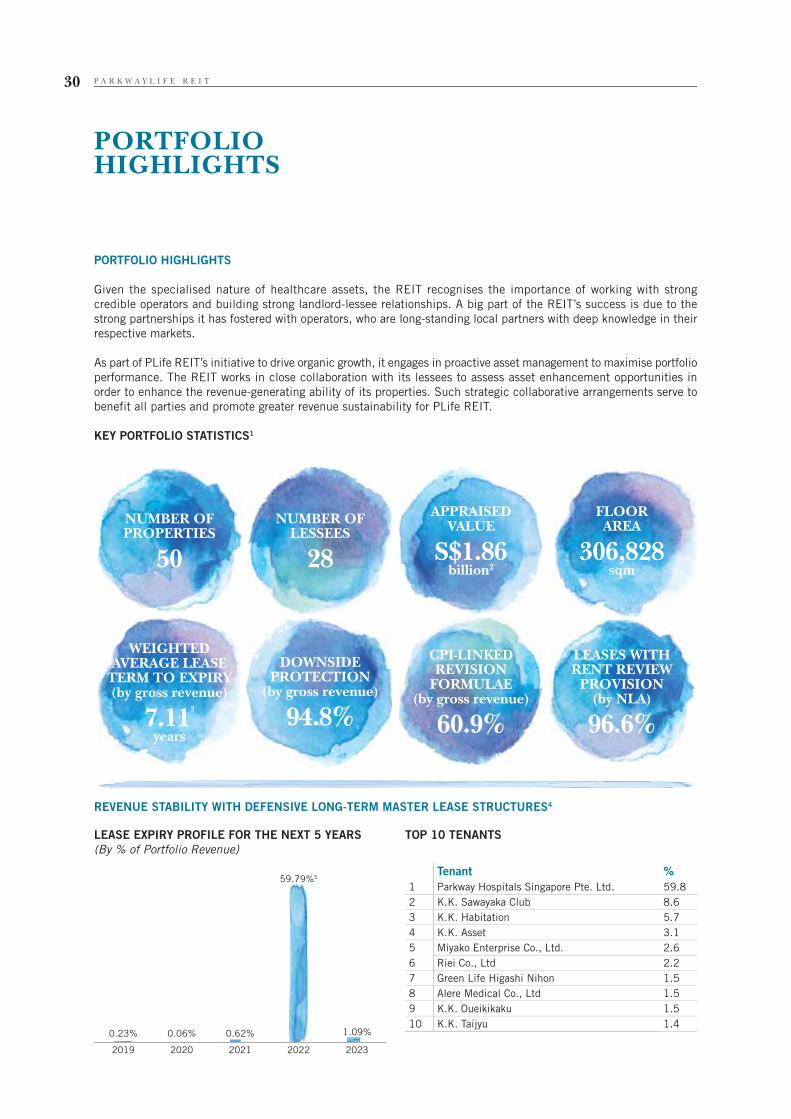
PORTFOLIO HIGHLIGHTS
Given the specialised nature of healthcare assets, the REIT recognises the importance of working with strong
credible operators and building strong landlord-lessee relationships. A big part of the REIT’s success is due to the
strong partnerships it has fostered with operators, who are long-standing local partners with deep knowledge in their
respective markets.
As part of PLife REIT’s initiative to drive organic growth, it engages in proactive asset management to maximise portfolio
performance. The REIT works in close collaboration with its lessees to assess asset enhancement opportunities in
order to enhance the revenue-generating ability of its properties. Such strategic collaborative arrangements serve to
benefit all parties and promote greater revenue sustainability for PLife REIT.
KEY PORTFOLIO STATISTICS1
REVENUE STABILITY WITH DEFENSIVE LONG-TERM MASTER LEASE STRUCTURES4
TOP 10 TENANTSLEASE EXPIRY PROFILE FOR THE NEXT 5 YEARS
(By % of Portfolio Revenue)
NUMBER OF PROPERTIES
50
WEIGHTED AVERAGE LEASE
TERM TO EXPIRY(by gross revenue)
7.113
years
APPRAISEDVALUE
S$1.86billion2
CPI-LINKED REVISION
FORMULAE(by gross revenue)
60.9%
NUMBER OF LESSEES
28
DOWNSIDE PROTECTION
(by gross revenue)
94.8%
FLOORAREA
306,828sqm
LEASES WITH RENT REVIEW
PROVISION(by NLA)
96.6%
Tenant %
1 Parkway Hospitals Singapore Pte. Ltd. 59.8
2 K.K. Sawayaka Club 8.6
3 K.K. Habitation 5.7
4 K.K. Asset 3.1
5 Miyako Enterprise Co., Ltd. 2.6
6 Riei Co., Ltd 2.2
7 Green Life Higashi Nihon 1.5
8 Alere Medical Co., Ltd 1.5
9 K.K. Oueikikaku 1.5
10 K.K. Taijyu 1.4
2019 2020 2021 2022 2023
1.09%0.62%0.23%
59.79%5
0.06%
P A R K W A Y L I F E R E I T30
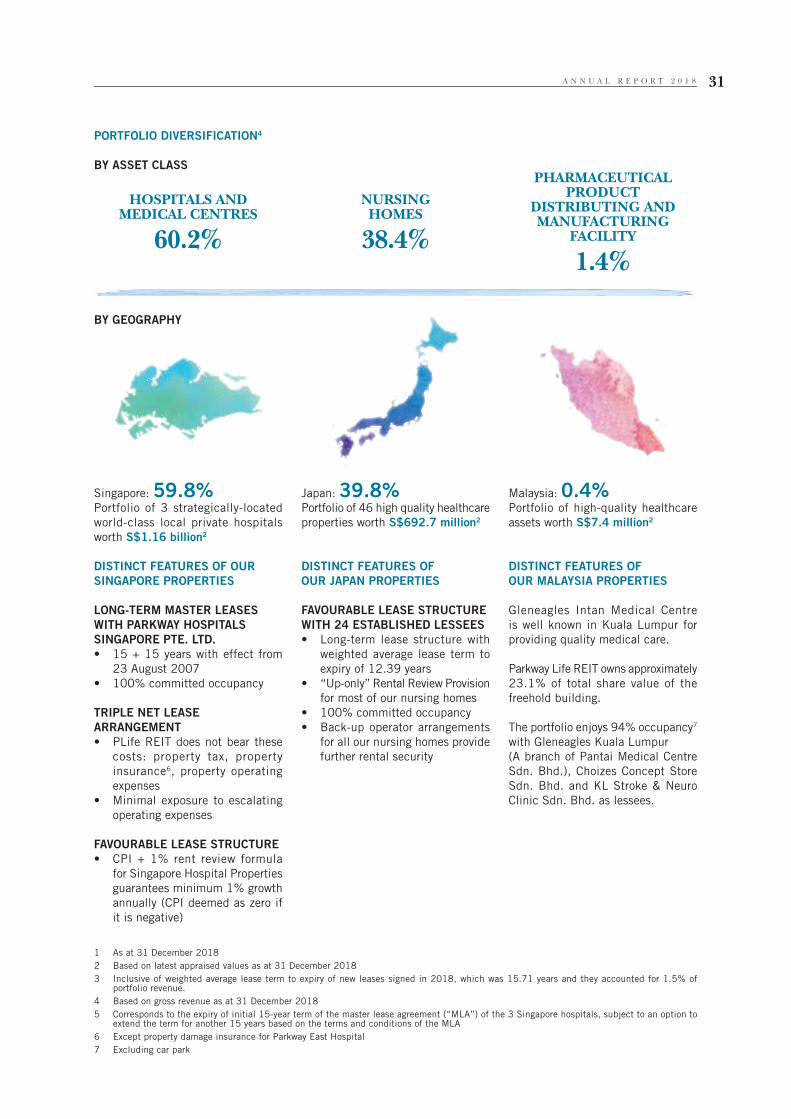
PORTFOLIO DIVERSIFICATION4
BY ASSET CLASS
BY GEOGRAPHY
1 As at 31 December 2018
2 Based on latest appraised values as at 31 December 2018
3 Inclusive of weighted average lease term to expiry of new leases signed in 2018, which was 15.71 years and they accounted for 1.5% of portfolio revenue.
4 Based on gross revenue as at 31 December 2018
5 Corresponds to the expiry of initial 15-year term of the master lease agreement (“MLA”) of the 3 Singapore hospitals, subject to an option to extend the term for another 15 years based on the terms and conditions of the MLA
6 Except property damage insurance for Parkway East Hospital
7 Excluding car park
HOSPITALS ANDMEDICAL CENTRES
60.2%
NURSINGHOMES
38.4%
PHARMACEUTICAL PRODUCT
DISTRIBUTING AND MANUFACTURING
FACILITY
1.4%
Singapore: 59.8%
Portfolio of 3 strategically-located
world-class local private hospitals
worth S$1.16 billion2
DISTINCT FEATURES OF OUR
SINGAPORE PROPERTIES
LONG-TERM MASTER LEASES
WITH PARKWAY HOSPITALS
SINGAPORE PTE. LTD.
• 15 + 15 years with effect from
23 August 2007
• 100% committed occupancy
TRIPLE NET LEASE
ARRANGEMENT
• PLife REIT does not bear these
costs: property tax, property
insurance6, property operating
expenses
• Minimal exposure to escalating
operating expenses
FAVOURABLE LEASE STRUCTURE
• CPI + 1% rent review formula
for Singapore Hospital Properties
guarantees minimum 1% growth
annually (CPI deemed as zero if
it is negative)
Japan: 39.8%Portfolio of 46 high quality healthcare
properties worth S$692.7 million2
DISTINCT FEATURES OF
OUR JAPAN PROPERTIES
FAVOURABLE LEASE STRUCTURE
WITH 24 ESTABLISHED LESSEES
• Long-term lease structure with
weighted average lease term to
expiry of 12.39 years
• “Up-only” Rental Review Provision
for most of our nursing homes
• 100% committed occupancy
• Back-up operator arrangements
for all our nursing homes provide
further rental security
Malaysia: 0.4%
Portfolio of high-quality healthcare
assets worth S$7.4 million2
DISTINCT FEATURES OF
OUR MALAYSIA PROPERTIES
Gleneagles Intan Medical Centre
is well known in Kuala Lumpur for
providing quality medical care.
Parkway Life REIT owns approximately
23.1% of total share value of the
freehold building.
The portfolio enjoys 94% occupancy7
with Gleneagles Kuala Lumpur
(A branch of Pantai Medical Centre
Sdn. Bhd.), Choizes Concept Store
Sdn. Bhd. and KL Stroke & Neuro
Clinic Sdn. Bhd. as lessees.
A N N U A L R E P O R T 2 0 1 8 31
FINANCIALREVIEW
RESILIENT GROWTH IN REVENUE
AND NET PROPERTY INCOME
Equity markets underperformed in
FY2018, with benchmark indexes
such as the STI and S-REIT Index
experiencing price declines. PLife
REIT was no exception, with its Unit
price moving in tandem with the wider
market as investors maintained a
cautious stance amid wide-ranging
uncertainties. Nonetheless, the Group
continued to deliver strong growth
and earnings in FY2018. Distribution
per Unit (“DPU”) from recurring
operations, excluding the one-off
distribution of divestment gains1,
rose 3.4% year-on-year (“y-o-y”) to
12.87 Singapore cents, extending its
track record of uninterrupted recurring
DPU growth since its listing in 2007.
PLife REIT’s gross revenue increased
2.7% y-o-y to S$112.8 million in
FY2018, an increase of $2.9 million
from FY2017. The growth was largely
attributed to revenue contribution
from the Japan nursing rehabilitation
facility acquired in February 2018,
higher yielding properties acquired
from the asset recycling initiative
completed in February 2017
and higher rent from the existing
properties, offset by the depreciation
of the Japanese Yen (“JPY”).
After deducting property expenses of
S$7.4 million, the Group recorded
a net property income of S$105.4
million in FY2018, which was 2.7%
or S$2.8 million higher than FY2017.
As a result of the Manager’s proactive
capital and financial management
efforts, PLife REIT was able to further
lower its finance costs for the year
under review. Despite the growth of
the portfolio, which stood at S$1.86
billion as at 31 December 2018,
finance costs2 decreased by 15.3%
in FY2018 largely due to cost savings
arising from refinancing initiatives in
4Q FY2017 and FY2018, as well as
the depreciation of the JPY.
With a sizeable Japan portfolio of 46
assets contributing close to 40% of
the Group revenue, it is important for
the Manager to manage the Group’s
exposure to foreign currency risks. As
such, the JPY net income has been
fully hedged till 1Q 2023, serving as
an effective shield against currency
fluctuations. During the year, the
Group registered a realised foreign
exchange gain amounting to S$0.7
million from the delivery of JPY
net income hedges. Furthermore,
PLife REIT also manages its foreign
currency risk by adopting a natural
hedge strategy.
Total operating expenses3 for the
year were S$28.8 million, which
represented 2.5% of PLife REIT’s
net asset value as at the end of the
financial year. Tax incurred for the
year was S$8.8 million.
On an overall basis, total distributable
income to Unitholders for FY2018
declined by 3.5% y-o-y to S$77.9
million, due to the absence of one-
off distribution of divestment gain1.
Excluding the one-off gain, total
distributable income to Unitholders
from recurring operations increased by
3.4% in FY2018. This translated to a
DPU for the year of 12.87 Singapore
cents which grew steadily by 103.6%
since IPO.
STRONG BALANCE SHEET
Through prudent and pre-emptive
capital management measures, PLife
REIT continued to maintain its robust
financial position in FY2018.
LEVERAGE AND BORROWINGS
As part of its continuous efforts to
strengthen the Group’s debt profile
and enhance the resiliency of the
balance sheet, PLife REIT had pre-
emptively termed out all existing long
term debts maturing in FY2019 during
the year under review, resulting in
no immediate refinancing need till
FY2020.
In 1Q 2018, the REIT further expanded
its funding source by tapping the
capital markets with the issuance of its
third series of JPY denominated fixed
rate notes amounted to JPY3.5 billion
(approximately S$43.4 million4) (the
“Notes Issue”). As at 31 December
2018, there were three series of
outstanding fixed rate notes issued
under the Debt Issuance Programme
which amounted to JPY11.8 billion
(approximately S$146.3 million),
representing about 20% of the
total borrowings of the Group. The
successful Notes Issue bore testament
to PLife REIT’s ability to raise funds
at favourable rates from alternative
sources.
1 In relation to the divestment of four Japan properties in December 2016 as announced on 22 December 2016. Divestment gains (after tax) of S$5,390,000 (S$0.89 cents) was equally distributed over four quarters in FY2017.
2 Finance costs largely consist of interest expense on loans, settlement on interest rate swaps that provide fixed rate funding on loans and amortisation of transaction costs of establishing debt facilities.
3 Made up of property expenses, management fees, trust expenses and finance costs.
4 Based on exchange rate of S$1.240 per JPY100 as at 31 December 2018. Unless otherwise stated, all conversions of JPY amounts into S$ in the Financial Review will be based on this exchange rate.
P A R K W A Y L I F E R E I T32
The proceeds of the Notes Issue and
the drawdown of a 6-year JPY4.4
billion (approximately S$54.6 million)
term loan facility were used to term
out the remaining JPY loan due in
2019. In 3Q 2018, PLife REIT has
further refinanced the existing SGD
loan due in 2019 and termed out
the SGD short term loans for another
3 years. With that, the Group has a
well-spread out debt maturity profile
with no long-term debt refinancing
needs till FY2020. The proactive
refinancing efforts have helped to
maintain PLife REIT’s weighted
average term to maturity at 2.9 years
as at 31 December 2018 compared
with 3.1 years a year ago.
For FY2018, the Group achieved a low
effective all-in cost of debt of 0.97%
per annum and an improved interest
cover from 11.3 times to 13.7 times
as compared to FY2017. Interest rate
exposure remained largely hedged for
the next few years.
Gearing remained at an optimal level
of 36.1% as at 31 December 2018,
within the 45% limit stipulated by
the Monetary Authority of Singapore’s
Property Funds Appendix. This leaves
the Group with a debt headroom of
S$304.8 million before reaching
the 45% gearing limit. With an
optimal gearing level and sufficient
debt headroom, PLife REIT has
the flexibility to capitalise on any
compelling investment opportunities
for growth.
CASH FLOWS AND LIQUIDITY
PLife REIT wrapped up the year in
a net cash position with cash and
cash equivalents5 standing at S$21.8
million, compared to S$25.5 million
in FY2017. The decrease in cash
and cash equivalents was mainly due
to the deployment of funds for the
acquisition of the Japan property in
1Q 2018.
Cash inflow from operating activities
for FY2018 grew to S$88.4 million
from S$80.7 million in FY2017,
attributed to the additional operating
cash flows from the Japan property
acquired in FY2018 and the absence
of one-off payment of Japanese
withholding tax on the divestment
gains in FY2018. The net cash
outflow of S$27.8 million for investing
activities was mainly due to acquisition
of a Japanese nursing rehabilitation
facility in 1Q 2018 and payment
of capital expenditure on existing
properties. Cash used in financing
activities was mainly due to payment
of distributions to Unitholders offset
by the drawdown of long term loan to
finance the acquisition in 1Q 2018.
ASSETS UNDER MANAGEMENT
Following the addition of a yield-
accretive nursing rehabilitation
facility in FY2018, the Group has
an enlarged portfolio of 50 quality
healthcare and healthcare-related
properties in Singapore, Japan and
Malaysia valued approximately at
S$1.86 billion as at 31 December
2018, up by S$129.5 million
from previous year. The increase in
investment properties was mainly
due to the property acquisition in
Japan, capital expenditure of existing
assets and appreciation of the JPY.
In addition, an annual independent
valuation performed for all properties
brought about a portfolio revaluation
gain of S$77.9 million, an increase
of 4.4% in the total portfolio value.
NET ASSET VALUE
Net asset value as at 31 December
2018 was S$1.88 per Unit, an
increase from S$1.76 in 2017.
5 Cash and cash equivalents at the respective year end exclude a cash deposit of JPY21.7 million (approximately S$0.3 million) placed with the Group by a vendor, for the purpose of Rental Income Guarantee.
A N N U A L R E P O R T 2 0 1 8 33

PORTFOLIOOUR PROPERTIES
Malaysia
4 Gleneagles Intan Medical Centre
Kuala Lumpur
Singapore
1 Mount Elizabeth Hospital
2 Gleneagles Hospital
3 Parkway East Hospital
12
4
3
P A R K W A Y L I F E R E I T34
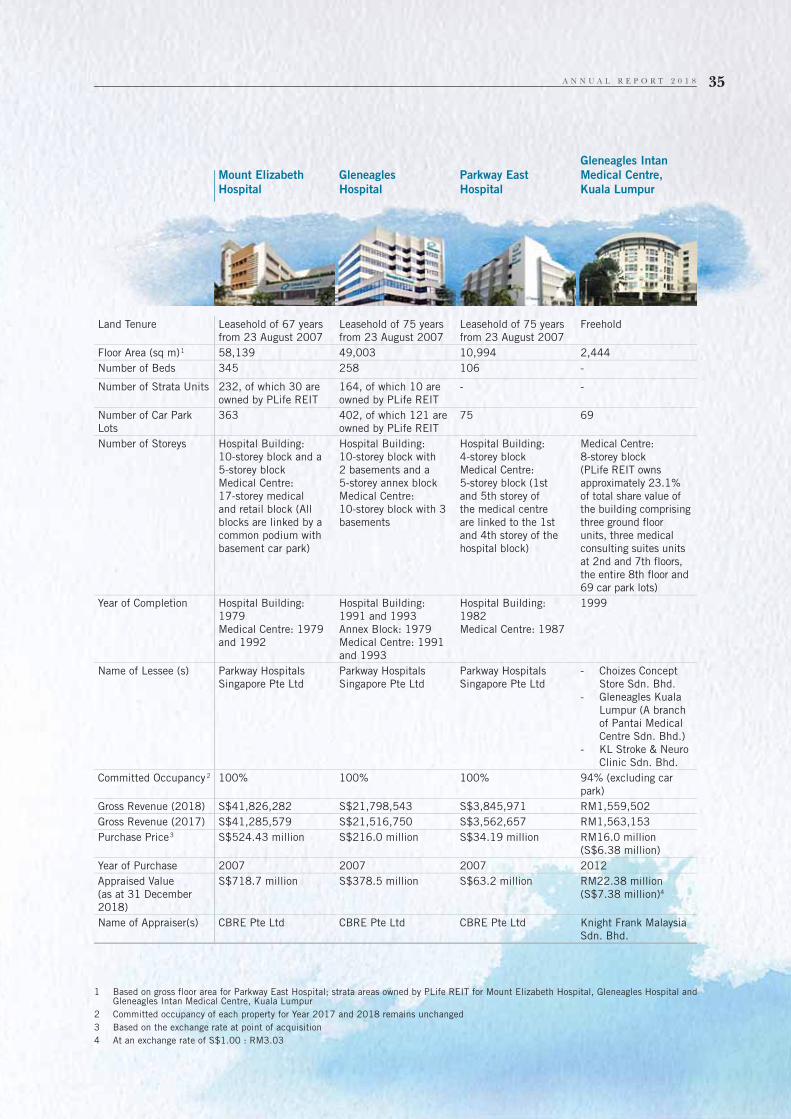
Land Tenure Leasehold of 67 years
from 23 August 2007
Leasehold of 75 years
from 23 August 2007
Leasehold of 75 years
from 23 August 2007
Freehold
Floor Area (sq m)1 58,139 49,003 10,994 2,444
Number of Beds 345 258 106 -
Number of Strata Units 232, of which 30 are
owned by PLife REIT
164, of which 10 are
owned by PLife REIT
- -
Number of Car Park
Lots
363 402, of which 121 are
owned by PLife REIT
75 69
Number of Storeys Hospital Building:
10-storey block and a
5-storey block
Medical Centre:
17-storey medical
and retail block (All
blocks are linked by a
common podium with
basement car park)
Hospital Building:
10-storey block with
2 basements and a
5-storey annex block
Medical Centre:
10-storey block with 3
basements
Hospital Building:
4-storey block
Medical Centre:
5-storey block (1st
and 5th storey of
the medical centre
are linked to the 1st
and 4th storey of the
hospital block)
Medical Centre:
8-storey block
(PLife REIT owns
approximately 23.1%
of total share value of
the building comprising
three ground floor
units, three medical
consulting suites units
at 2nd and 7th floors,
the entire 8th floor and
69 car park lots)
Year of Completion Hospital Building:
1979
Medical Centre: 1979
and 1992
Hospital Building:
1991 and 1993
Annex Block: 1979
Medical Centre: 1991
and 1993
Hospital Building:
1982
Medical Centre: 1987
1999
Name of Lessee (s) Parkway Hospitals
Singapore Pte Ltd
Parkway Hospitals
Singapore Pte Ltd
Parkway Hospitals
Singapore Pte Ltd
- Choizes Concept
Store Sdn. Bhd.
- Gleneagles Kuala
Lumpur (A branch
of Pantai Medical
Centre Sdn. Bhd.)
- KL Stroke & Neuro
Clinic Sdn. Bhd.
Committed Occupancy2 100% 100% 100% 94% (excluding car
park)
Gross Revenue (2018) S$41,826,282 S$21,798,543 S$3,845,971 RM1,559,502
Gross Revenue (2017) S$41,285,579 S$21,516,750 S$3,562,657 RM1,563,153
Purchase Price3 S$524.43 million S$216.0 million S$34.19 million RM16.0 million
(S$6.38 million)
Year of Purchase 2007 2007 2007 2012
Appraised Value
(as at 31 December
2018)
S$718.7 million S$378.5 million S$63.2 million RM22.38 million
(S$7.38 million)4
Name of Appraiser(s) CBRE Pte Ltd CBRE Pte Ltd CBRE Pte Ltd Knight Frank Malaysia
Sdn. Bhd.
1 Based on gross floor area for Parkway East Hospital; strata areas owned by PLife REIT for Mount Elizabeth Hospital, Gleneagles Hospital and Gleneagles Intan Medical Centre, Kuala Lumpur
2 Committed occupancy of each property for Year 2017 and 2018 remains unchanged
3 Based on the exchange rate at point of acquisition
4 At an exchange rate of S$1.00 : RM3.03
Mount Elizabeth
Hospital
Gleneagles
Hospital
Parkway East
Hospital
Gleneagles Intan
Medical Centre,
Kuala Lumpur
A N N U A L R E P O R T 2 0 1 8 35
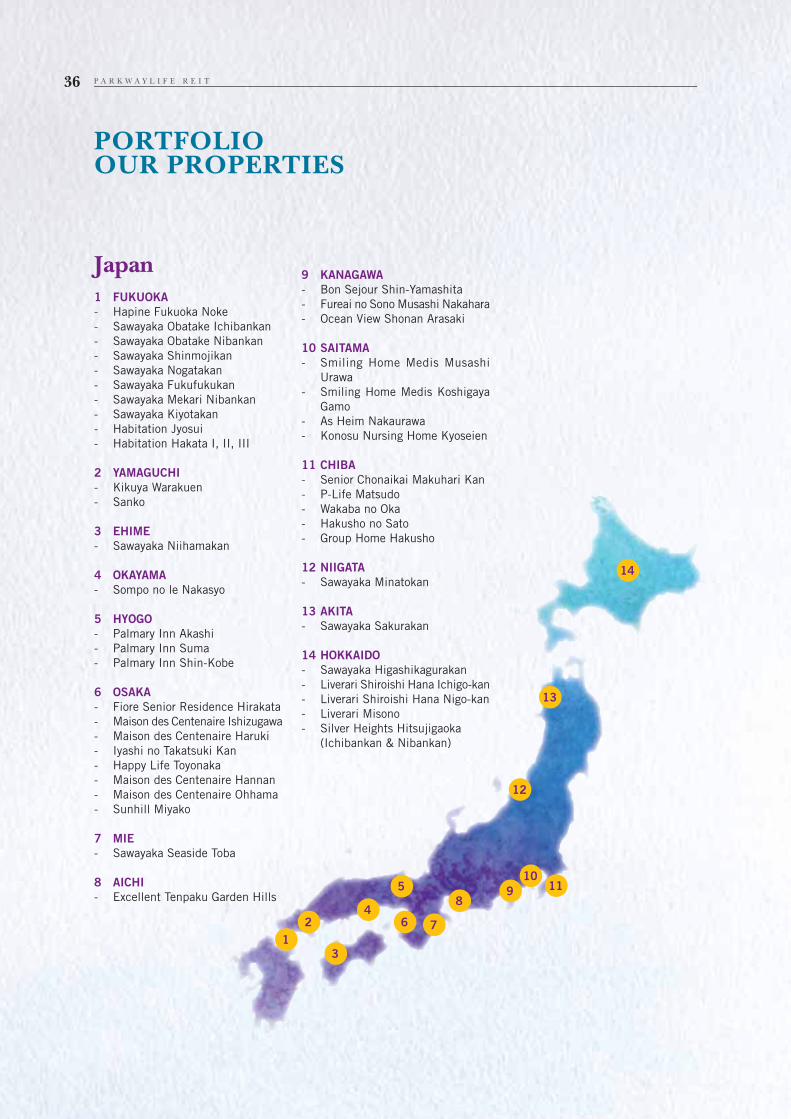
PORTFOLIOOUR PROPERTIES
Japan
1 FUKUOKA
- Hapine Fukuoka Noke
- Sawayaka Obatake Ichibankan
- Sawayaka Obatake Nibankan
- Sawayaka Shinmojikan
- Sawayaka Nogatakan
- Sawayaka Fukufukukan
- Sawayaka Mekari Nibankan
- Sawayaka Kiyotakan
- Habitation Jyosui
- Habitation Hakata I, II, III
2 YAMAGUCHI
- Kikuya Warakuen
- Sanko
3 EHIME
- Sawayaka Niihamakan
4 OKAYAMA
- Sompo no le Nakasyo
5 HYOGO
- Palmary Inn Akashi
- Palmary Inn Suma
- Palmary Inn Shin-Kobe
6 OSAKA
- Fiore Senior Residence Hirakata
- Maison des Centenaire Ishizugawa
- Maison des Centenaire Haruki
- Iyashi no Takatsuki Kan
- Happy Life Toyonaka
- Maison des Centenaire Hannan
- Maison des Centenaire Ohhama
- Sunhill Miyako
7 MIE
- Sawayaka Seaside Toba
8 AICHI
- Excellent Tenpaku Garden Hills
9 KANAGAWA
- Bon Sejour Shin-Yamashita
- Fureai no Sono Musashi Nakahara
- Ocean View Shonan Arasaki
10 SAITAMA
- Smiling Home Medis Musashi
Urawa
- Smiling Home Medis Koshigaya
Gamo
- As Heim Nakaurawa
- Konosu Nursing Home Kyoseien
11 CHIBA
- Senior Chonaikai Makuhari Kan
- P-Life Matsudo
- Wakaba no Oka
- Hakusho no Sato
- Group Home Hakusho
12 NIIGATA
- Sawayaka Minatokan
13 AKITA
- Sawayaka Sakurakan
14 HOKKAIDO
- Sawayaka Higashikagurakan
- Liverari Shiroishi Hana Ichigo-kan
- Liverari Shiroishi Hana Nigo-kan
- Liverari Misono
- Silver Heights Hitsujigaoka
(Ichibankan & Nibankan)
1
2
3
4
5
6 7
89
1011
12
13
14
P A R K W A Y L I F E R E I T36
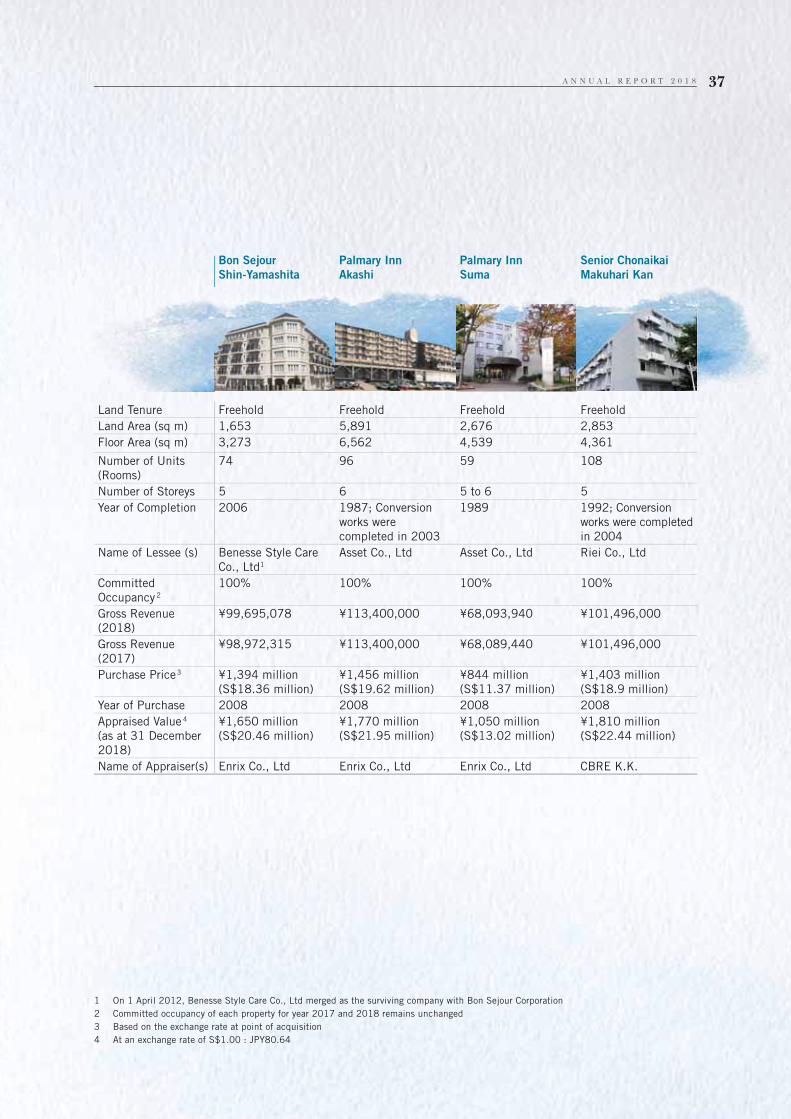
Land Tenure Freehold Freehold Freehold Freehold
Land Area (sq m) 1,653 5,891 2,676 2,853
Floor Area (sq m) 3,273 6,562 4,539 4,361
Number of Units
(Rooms)
74 96 59 108
Number of Storeys 5 6 5 to 6 5
Year of Completion 2006 1987; Conversion
works were
completed in 2003
1989 1992; Conversion
works were completed
in 2004
Name of Lessee (s) Benesse Style Care
Co., Ltd1
Asset Co., Ltd Asset Co., Ltd Riei Co., Ltd
Committed
Occupancy2
100% 100% 100% 100%
Gross Revenue
(2018)
¥99,695,078 ¥113,400,000 ¥68,093,940 ¥101,496,000
Gross Revenue
(2017)
¥98,972,315 ¥113,400,000 ¥68,089,440 ¥101,496,000
Purchase Price3 ¥1,394 million
(S$18.36 million)
¥1,456 million
(S$19.62 million)
¥844 million
(S$11.37 million)
¥1,403 million
(S$18.9 million)
Year of Purchase 2008 2008 2008 2008
Appraised Value4
(as at 31 December
2018)
¥1,650 million
(S$20.46 million)
¥1,770 million
(S$21.95 million)
¥1,050 million
(S$13.02 million)
¥1,810 million
(S$22.44 million)
Name of Appraiser(s) Enrix Co., Ltd Enrix Co., Ltd Enrix Co., Ltd CBRE K.K.
1 On 1 April 2012, Benesse Style Care Co., Ltd merged as the surviving company with Bon Sejour Corporation
2 Committed occupancy of each property for year 2017 and 2018 remains unchanged
3 Based on the exchange rate at point of acquisition
4 At an exchange rate of S$1.00 : JPY80.64
Bon Sejour
Shin-Yamashita
Palmary Inn
Akashi
Palmary Inn
Suma
Senior Chonaikai
Makuhari Kan
A N N U A L R E P O R T 2 0 1 8 37
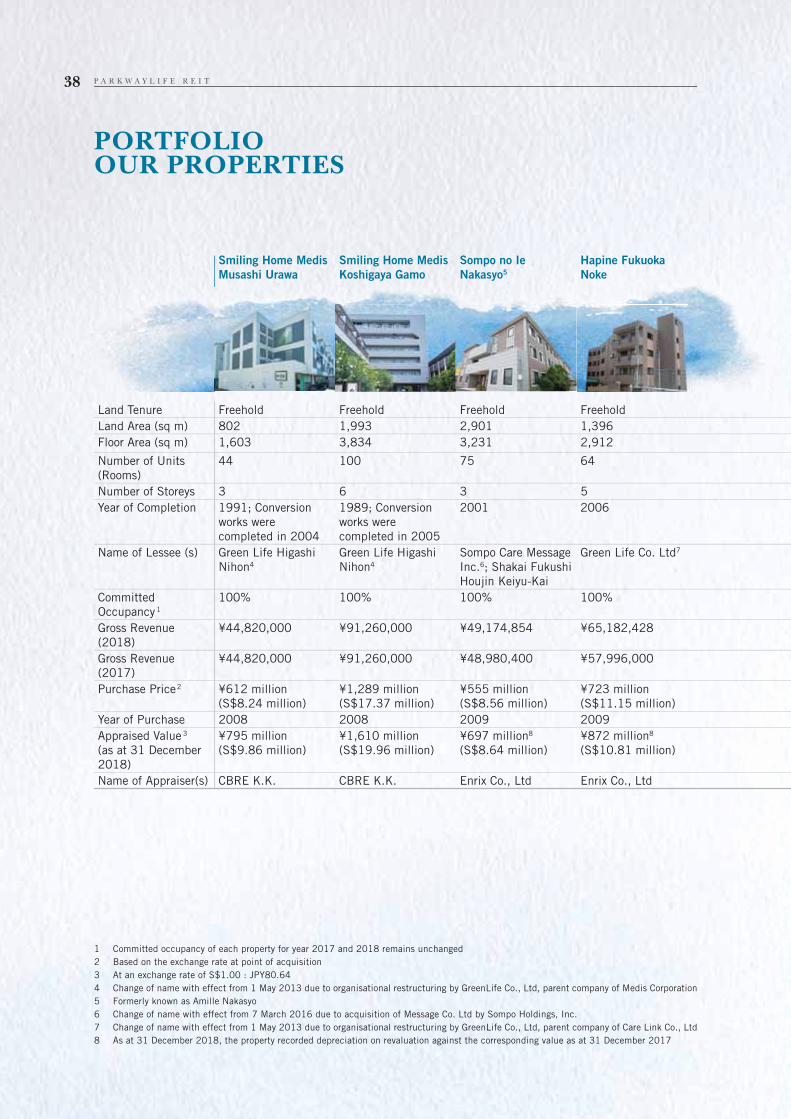
PORTFOLIOOUR PROPERTIES
1 Committed occupancy of each property for year 2017 and 2018 remains unchanged
2 Based on the exchange rate at point of acquisition
3 At an exchange rate of S$1.00 : JPY80.64
4 Change of name with effect from 1 May 2013 due to organisational restructuring by GreenLife Co., Ltd, parent company of Medis Corporation
5 Formerly known as Amille Nakasyo
6 Change of name with effect from 7 March 2016 due to acquisition of Message Co. Ltd by Sompo Holdings, Inc.
7 Change of name with effect from 1 May 2013 due to organisational restructuring by GreenLife Co., Ltd, parent company of Care Link Co., Ltd
8 As at 31 December 2018, the property recorded depreciation on revaluation against the corresponding value as at 31 December 2017
Smiling Home Medis
Musashi Urawa
Smiling Home Medis
Koshigaya Gamo
Sompo no Ie
Nakasyo5
Hapine Fukuoka
Noke
Land Tenure Freehold Freehold Freehold Freehold
Land Area (sq m) 802 1,993 2,901 1,396
Floor Area (sq m) 1,603 3,834 3,231 2,912
Number of Units
(Rooms)
44 100 75 64
Number of Storeys 3 6 3 5
Year of Completion 1991; Conversion
works were
completed in 2004
1989; Conversion
works were
completed in 2005
2001 2006
Name of Lessee (s) Green Life Higashi
Nihon4
Green Life Higashi
Nihon4
Sompo Care Message
Inc.6; Shakai Fukushi
Houjin Keiyu-Kai
Green Life Co. Ltd7
Committed
Occupancy1
100% 100% 100% 100%
Gross Revenue
(2018)
¥44,820,000 ¥91,260,000 ¥49,174,854 ¥65,182,428
Gross Revenue
(2017)
¥44,820,000 ¥91,260,000 ¥48,980,400 ¥57,996,000
Purchase Price2 ¥612 million
(S$8.24 million)
¥1,289 million
(S$17.37 million)
¥555 million
(S$8.56 million)
¥723 million
(S$11.15 million)
Year of Purchase 2008 2008 2009 2009
Appraised Value3
(as at 31 December
2018)
¥795 million
(S$9.86 million)
¥1,610 million
(S$19.96 million)
¥697 million8
(S$8.64 million)
¥872 million8
(S$10.81 million)
Name of Appraiser(s) CBRE K.K. CBRE K.K. Enrix Co., Ltd Enrix Co., Ltd
P A R K W A Y L I F E R E I T38
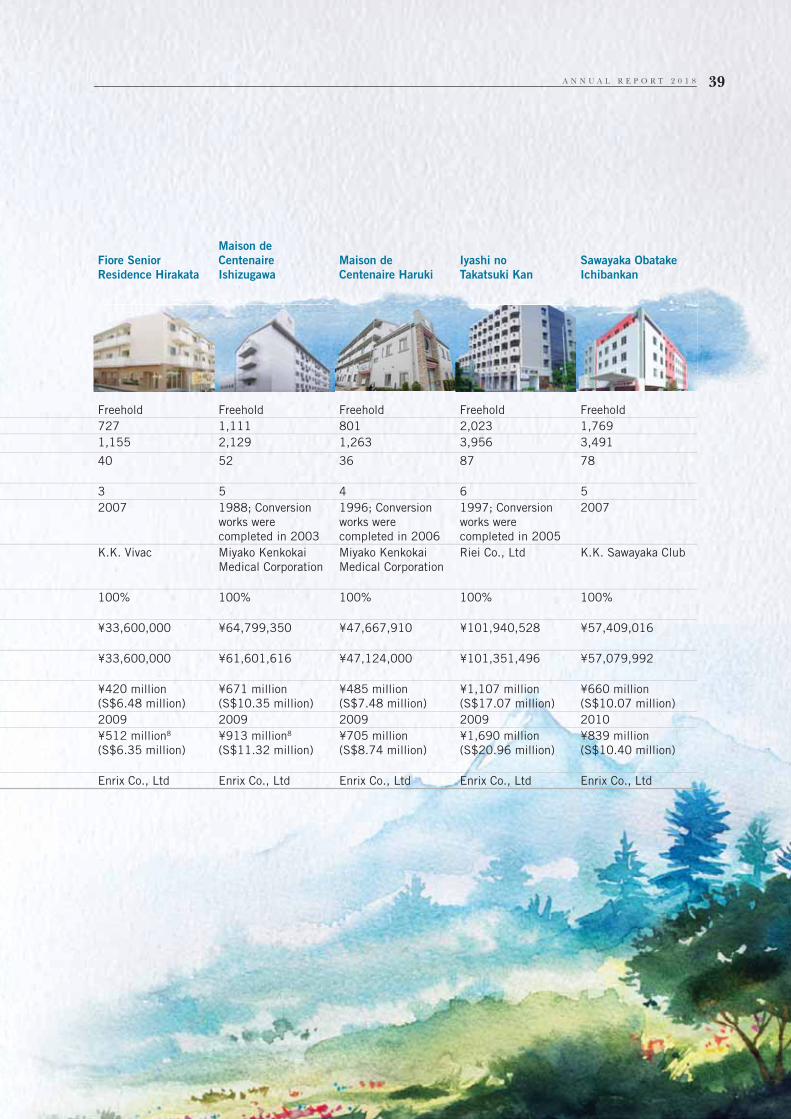
Maison de
Centenaire
Ishizugawa
Fiore Senior
Residence Hirakata
Maison de
Centenaire Haruki
Iyashi no
Takatsuki Kan
Sawayaka Obatake
Ichibankan
Freehold Freehold Freehold Freehold Freehold
727 1,111 801 2,023 1,769
1,155 2,129 1,263 3,956 3,491
40 52 36 87 78
3 5 4 6 5
2007 1988; Conversion
works were
completed in 2003
1996; Conversion
works were
completed in 2006
1997; Conversion
works were
completed in 2005
2007
K.K. Vivac Miyako Kenkokai
Medical Corporation
Miyako Kenkokai
Medical Corporation
Riei Co., Ltd K.K. Sawayaka Club
100% 100% 100% 100% 100%
¥33,600,000 ¥64,799,350 ¥47,667,910 ¥101,940,528 ¥57,409,016
¥33,600,000 ¥61,601,616 ¥47,124,000 ¥101,351,496 ¥57,079,992
¥420 million
(S$6.48 million)
¥671 million
(S$10.35 million)
¥485 million
(S$7.48 million)
¥1,107 million
(S$17.07 million)
¥660 million
(S$10.07 million)
2009 2009 2009 2009 2010
¥512 million8
(S$6.35 million)
¥913 million8
(S$11.32 million)
¥705 million
(S$8.74 million)
¥1,690 million
(S$20.96 million)
¥839 million
(S$10.40 million)
Enrix Co., Ltd Enrix Co., Ltd Enrix Co., Ltd Enrix Co., Ltd Enrix Co., Ltd
A N N U A L R E P O R T 2 0 1 8 39
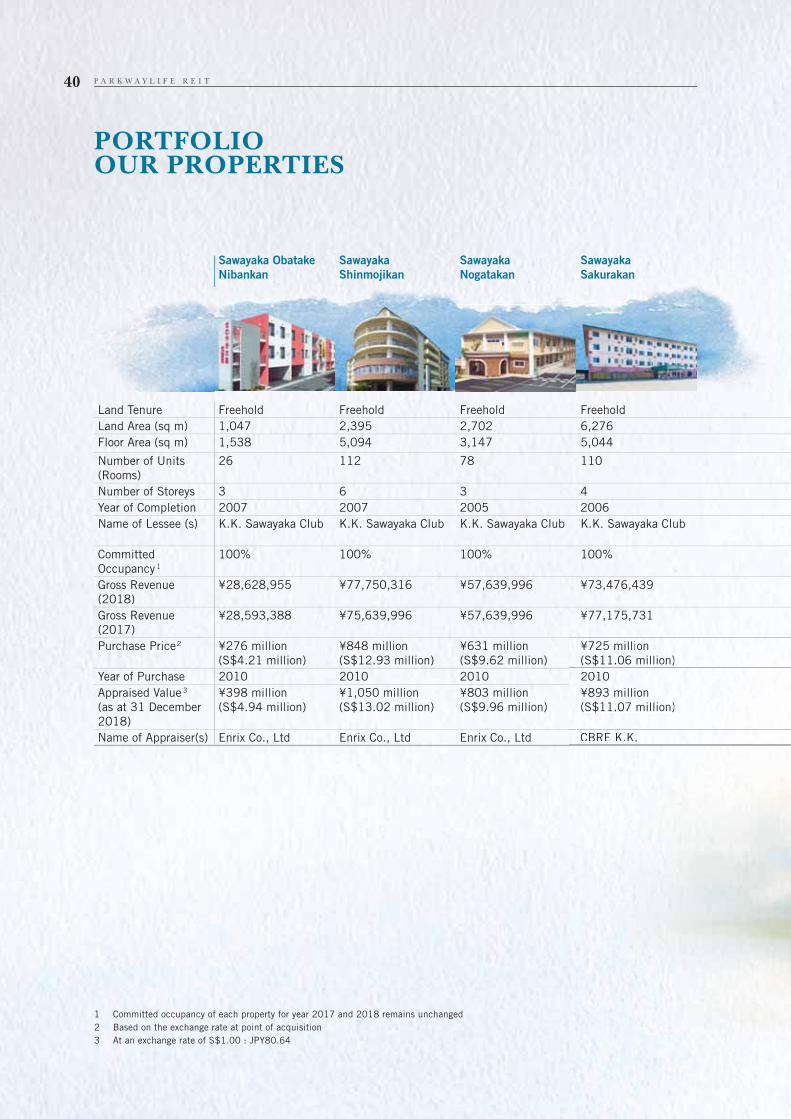
PORTFOLIOOUR PROPERTIES
Land Tenure Freehold Freehold Freehold Freehold
Land Area (sq m) 1,047 2,395 2,702 6,276
Floor Area (sq m) 1,538 5,094 3,147 5,044
Number of Units
(Rooms)
26 112 78 110
Number of Storeys 3 6 3 4
Year of Completion 2007 2007 2005 2006
Name of Lessee (s) K.K. Sawayaka Club K.K. Sawayaka Club K.K. Sawayaka Club K.K. Sawayaka Club
Committed
Occupancy1
100% 100% 100% 100%
Gross Revenue
(2018)
¥28,628,955 ¥77,750,316 ¥57,639,996 ¥73,476,439
Gross Revenue
(2017)
¥28,593,388 ¥75,639,996 ¥57,639,996 ¥77,175,731
Purchase Price2 ¥276 million
(S$4.21 million)
¥848 million
(S$12.93 million)
¥631 million
(S$9.62 million)
¥725 million
(S$11.06 million)
Year of Purchase 2010 2010 2010 2010
Appraised Value3
(as at 31 December
2018)
¥398 million
(S$4.94 million)
¥1,050 million
(S$13.02 million)
¥803 million
(S$9.96 million)
¥893 million
(S$11.07 million)
Name of Appraiser(s) Enrix Co., Ltd Enrix Co., Ltd Enrix Co., Ltd CBRE K.K.
1 Committed occupancy of each property for year 2017 and 2018 remains unchanged
2 Based on the exchange rate at point of acquisition
3 At an exchange rate of S$1.00 : JPY80.64
Sawayaka Obatake
Nibankan
Sawayaka
Shinmojikan
Sawayaka
Nogatakan
Sawayaka
Sakurakan
¥7255 mmillil onn
(SS$1$1$ 1.06 mmili lil on)
20010101
¥8893939 million
(SS$11.077 millionon)
CBBRE K.K.
P A R K W A Y L I F E R E I T40

Freehold Freehold Freehold Freehold Freehold
1,762 935 1,842 4,813 628
2,712 1,847 3,074 5,467 1,254
64 46 72 110 42
4 + 1 (basement) 4 4 + 1 (basement) 4 4
2006 2006 2008 2010 2007
As Partners Co., Ltd Y.K. Shonan Fureai
no Sono
K.K. Sawayaka Club K.K. Sawayaka Club K.K. Nihon Kaigo
Iryo Center
100% 100% 100% 100% 100%
¥67,200,000 ¥52,800,000 ¥50,449,794 ¥81,210,396 ¥35,280,000
¥67,200,000 ¥52,800,000 ¥50,240,004 ¥81,210,396 ¥35,280,000
¥812 million
(S$12.72 million)
¥628 million
(S$9.83 million)
¥564 million
(S$8.74 million)
¥866 million
(S$13.36 million)
¥445 million
(S$5.67 million)
2010 2010 2011 2012 2013
¥1,170 million
(S$14.51 million)
¥908 million
(S$11.26 million)
¥741 million
(S$9.19 million)
¥1,040 million
(S$12.90 million)
¥535 million
(S$6.63 million)
Enrix Co., Ltd Enrix Co., Ltd Enrix Co., Ltd CBRE K.K. Enrix Co., Ltd
Fureai no Sono
Musashi Nakahara
As Heim
Nakaurawa
Sawayaka
Fukufukukan
Sawayaka
Higashikagurakan
Happy Life
Toyonaka
¥8¥812 mmillllionon
(SS$12.7272 millionn)
¥6¥6282828 mmmililliliononn
(S(S$9$9$ .8.8333 mimim llllioioon)n)
¥5¥5¥ 6464 mmmilliii lilionon
(S(S( $8$8$88.7.7744 mimm llllioioon)n)
¥8¥86666 mmililllionon
(S(SSS$1$13.3.3 36363 mmilillilionon))
¥4¥¥44¥ 454 mmmilillilionon
(S(S$5$5$5$ .667 7 77 mimim llllioioon)n)
200101 20200101010 20200111111 2020201212121 202001313
¥1,11707 millil ono
(S$14.4 51 mmmillionno )
¥9¥90808080 mmmmmilllliiiiononoo
(S(S$1$$ 1.11.1.26266 mmili liilionnn))
¥7¥7¥7¥7¥ 41414141 mmmmililliliiiononoo
(S(S(S$9$9$99.1.199 mimm lllllion)n))
¥1¥1,0,0,0, 404040 mmmmililili liliononon
(S(S(SS(S$1$11$ 2.2.2.2 9090900 mmmmililili lililil ononon))
¥5¥55353535 mmmililillilionono
(S(S(S(S$6$6$6.6.6.663 3 3 mimmilll ioioon)n)n)
EnEnrix x Coo., Ltd EnEnrix xxx CoCoCoCo.,, LLLtdtdtdtd EnEnEnEnnEnEnEnriririrrr xxx x x x CoCoCoCoCoCo.,.,.,.,, LLLLLLLLtdtdtdtdtdttd CBCBCBCBCBCBBREREREREREREER KKKKKK.K.KKK.K.K.K..... EnEnEnEEnrirrirr xx x CoCoCoCCCCCoCC .,., LLLLLLLLLtdtdtdtdtdtdtdtdttt
A N N U A L R E P O R T 2 0 1 8 41
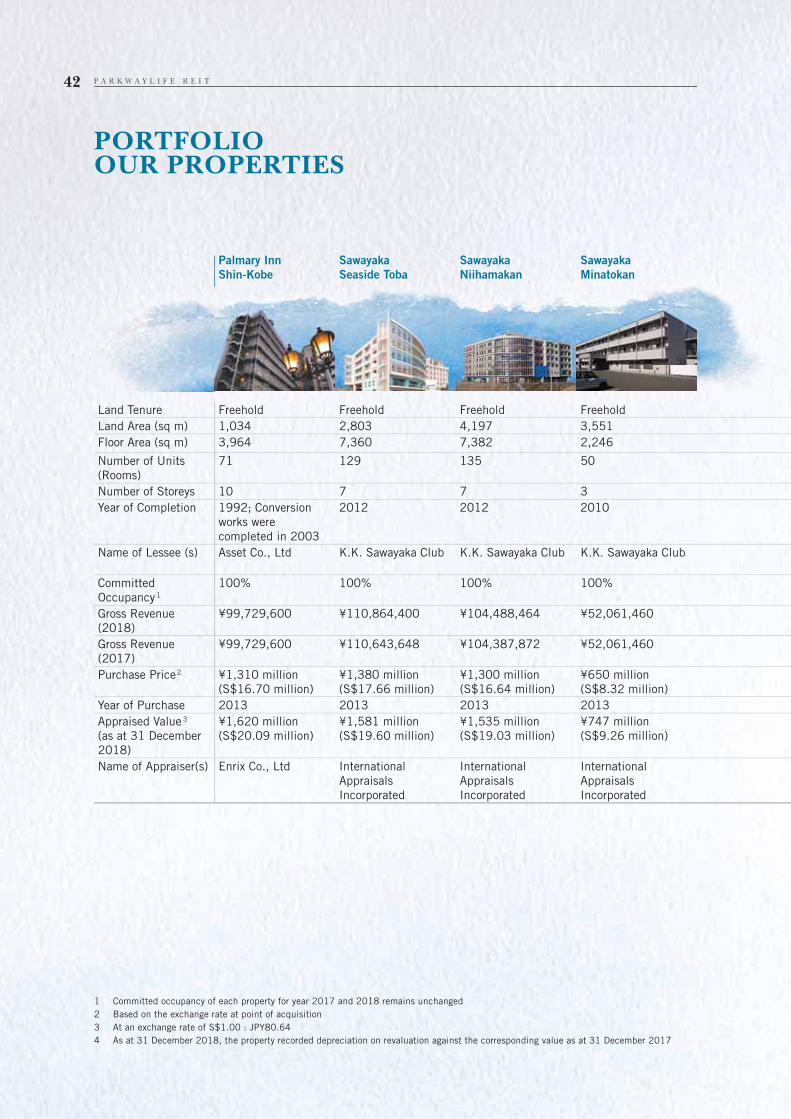
PORTFOLIOOUR PROPERTIES
Land Tenure Freehold Freehold Freehold Freehold
Land Area (sq m) 1,034 2,803 4,197 3,551
Floor Area (sq m) 3,964 7,360 7,382 2,246
Number of Units
(Rooms)
71 129 135 50
Number of Storeys 10 7 7 3
Year of Completion 1992; Conversion
works were
completed in 2003
2012 2012 2010
Name of Lessee (s) Asset Co., Ltd K.K. Sawayaka Club K.K. Sawayaka Club K.K. Sawayaka Club
Committed
Occupancy1
100% 100% 100% 100%
Gross Revenue
(2018)
¥99,729,600 ¥110,864,400 ¥104,488,464 ¥52,061,460
Gross Revenue
(2017)
¥99,729,600 ¥110,643,648 ¥104,387,872 ¥52,061,460
Purchase Price2 ¥1,310 million
(S$16.70 million)
¥1,380 million
(S$17.66 million)
¥1,300 million
(S$16.64 million)
¥650 million
(S$8.32 million)
Year of Purchase 2013 2013 2013 2013
Appraised Value3
(as at 31 December
2018)
¥1,620 million
(S$20.09 million)
¥1,581 million
(S$19.60 million)
¥1,535 million
(S$19.03 million)
¥747 million
(S$9.26 million)
Name of Appraiser(s) Enrix Co., Ltd International
Appraisals
Incorporated
International
Appraisals
Incorporated
International
Appraisals
Incorporated
Palmary Inn
Shin-Kobe
Sawayaka
Seaside Toba
Sawayaka
Niihamakan
Sawayaka
Minatokan
1 Committed occupancy of each property for year 2017 and 2018 remains unchanged
2 Based on the exchange rate at point of acquisition
3 At an exchange rate of S$1.00 : JPY80.64
4 As at 31 December 2018, the property recorded depreciation on revaluation against the corresponding value as at 31 December 2017
P A R K W A Y L I F E R E I T42
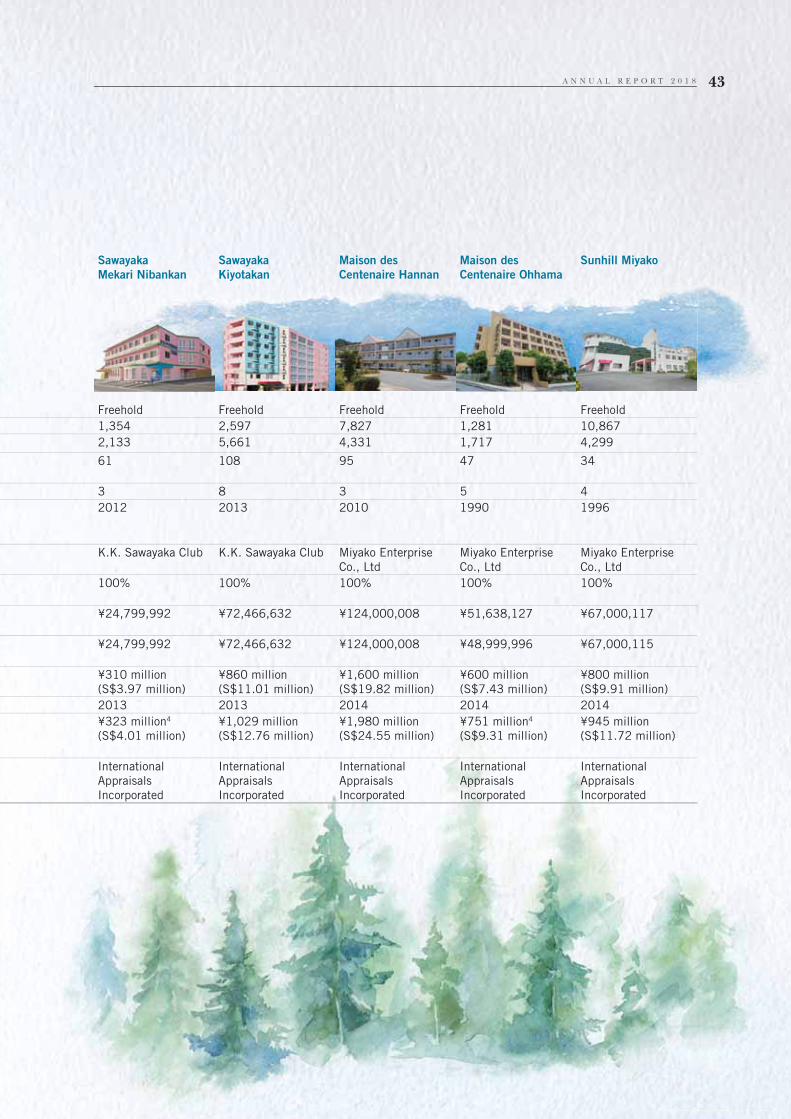
Freehold Freehold Freehold Freehold Freehold
1,354 2,597 7,827 1,281 10,867
2,133 5,661 4,331 1,717 4,299
61 108 95 47 34
3 8 3 5 4
2012 2013 2010 1990 1996
K.K. Sawayaka Club K.K. Sawayaka Club Miyako Enterprise
Co., Ltd
Miyako Enterprise
Co., Ltd
Miyako Enterprise
Co., Ltd
100% 100% 100% 100% 100%
¥24,799,992 ¥72,466,632 ¥124,000,008 ¥51,638,127 ¥67,000,117
¥24,799,992 ¥72,466,632 ¥124,000,008 ¥48,999,996 ¥67,000,115
¥310 million
(S$3.97 million)
¥860 million
(S$11.01 million)
¥1,600 million
(S$19.82 million)
¥600 million
(S$7.43 million)
¥800 million
(S$9.91 million)
2013 2013 2014 2014 2014
¥323 million4
(S$4.01 million)
¥1,029 million
(S$12.76 million)
¥1,980 million
(S$24.55 million)
¥751 million4
(S$9.31 million)
¥945 million
(S$11.72 million)
International
Appraisals
Incorporated
International
Appraisals
Incorporated
International
Appraisals
Incorporated
International
Appraisals
Incorporated
International
Appraisals
Incorporated
Sawayaka
Kiyotakan
Sawayaka
Mekari Nibankan
Maison des
Centenaire Hannan
Maison des
Centenaire Ohhama
Sunhill Miyako
A N N U A L R E P O R T 2 0 1 8 43
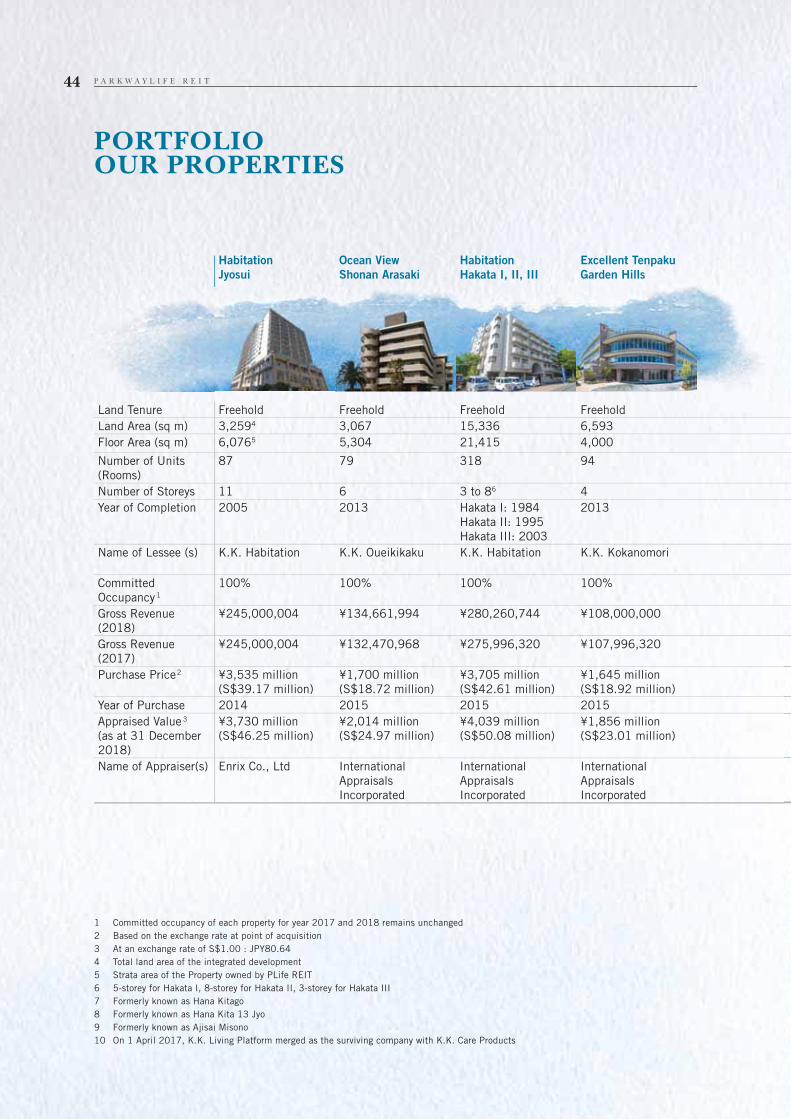
PORTFOLIOOUR PROPERTIES
Land Tenure Freehold Freehold Freehold Freehold
Land Area (sq m) 3,2594 3,067 15,336 6,593
Floor Area (sq m) 6,0765 5,304 21,415 4,000
Number of Units
(Rooms)
87 79 318 94
Number of Storeys 11 6 3 to 86 4
Year of Completion 2005 2013 Hakata I: 1984
Hakata II: 1995
Hakata III: 2003
2013
Name of Lessee (s) K.K. Habitation K.K. Oueikikaku K.K. Habitation K.K. Kokanomori
Committed
Occupancy1
100% 100% 100% 100%
Gross Revenue
(2018)
¥245,000,004 ¥134,661,994 ¥280,260,744 ¥108,000,000
Gross Revenue
(2017)
¥245,000,004 ¥132,470,968 ¥275,996,320 ¥107,996,320
Purchase Price2 ¥3,535 million
(S$39.17 million)
¥1,700 million
(S$18.72 million)
¥3,705 million
(S$42.61 million)
¥1,645 million
(S$18.92 million)
Year of Purchase 2014 2015 2015 2015
Appraised Value3
(as at 31 December
2018)
¥3,730 million
(S$46.25 million)
¥2,014 million
(S$24.97 million)
¥4,039 million
(S$50.08 million)
¥1,856 million
(S$23.01 million)
Name of Appraiser(s) Enrix Co., Ltd International
Appraisals
Incorporated
International
Appraisals
Incorporated
International
Appraisals
Incorporated
Habitation
Jyosui
Ocean View
Shonan Arasaki
Habitation
Hakata I, II, III
Excellent Tenpaku
Garden Hills
1 Committed occupancy of each property for year 2017 and 2018 remains unchanged
2 Based on the exchange rate at point of acquisition
3 At an exchange rate of S$1.00 : JPY80.64
4 Total land area of the integrated development
5 Strata area of the Property owned by PLife REIT
6 5-storey for Hakata I, 8-storey for Hakata II, 3-storey for Hakata III
7 Formerly known as Hana Kitago
8 Formerly known as Hana Kita 13 Jyo
9 Formerly known as Ajisai Misono
10 On 1 April 2017, K.K. Living Platform merged as the surviving company with K.K. Care Products
P A R K W A Y L I F E R E I T44

Freehold Freehold Freehold Freehold Freehold
628 436 429 5,694 6,574
1,051 747 724 9,013 5,431
48 24 18 123 135
3 3 3 5 to 6 3
2011 1990 1993 Ichibankan: 1987
Nibankan: 1991
1993
Living Platform, Ltd. Living Platform, Ltd. Living Platform,
Ltd.10
K.K. Silver Heights
Sapporo
K.K. Taijyu
100% 100% 100% 100% 100%
¥24,000,000 ¥12,815,498 ¥14,400,000 ¥88,770,000 ¥129,660,000
¥23,996,320 ¥12,255,520 ¥14,597,920 ¥88,770,000 ¥110,021,487
¥298 million
(S$3.43 million)
¥152 million
(S$1.75 million)
¥177 million
(S$2.04 million)
¥1,100 million
(S$13.23 million)
¥1,766 million
(S$22.06 million)
2015 2015 2015 2016 2017
¥363 million
(S$4.50 million)
¥176 million
(S$2.18 million)
¥202 million
(S$2.50 million)
¥1,180 million
(S$14.63 million)
¥2,130 million
(S$26.41 million)
International
Appraisals
Incorporated
International
Appraisals
Incorporated
International
Appraisals
Incorporated
CBRE K.K. CBRE K.K.
Liverari Shiroishi
Hana Nigo-kan8
Liverari Shiroishi
Hana Ichigo-kan7
Liverari
Misono9
Silver Heights
Hitsujigaoka
(Ichibankan &
Nibankan)
Wakaba no Oka
¥22989 milliono
(S$33.4. 3 million)n)
¥1¥15252 milliionon
(S$1 7.75 55 mim llion)n)
¥1¥17777 mmili llion
(SS$2.044 mim lll ion)n)
¥1,110000 mmili lil onn
(S( $1$13.2323 mmillil ono )
¥1¥ ,776666 mmilillil ono
(SS$2$$ 2.2 0606 mmili liiono )
20155 2015 202 155 202 16 2017
¥363 million
(S$4.50 0 million)
¥176 mmillion
(SS$22.18 millioon)
¥2¥ 02 milllion
(SS$2$ .50 miilllion)n)
¥1¥ ,1808 millil on
(S$14.63 mmillion)
¥22,11300 millil onon
(S( $2$26.41 mmillil on)
Internattionaal
Appraisals
Incorporatedd
Innteternational
Appraisals
Inncorpr oratted
Innternata ioonal
ApA prraisas ls
InI coorprporata ede
CBREE K.K. CBCBCCCCCCCCCCC REREEERERRE K.KKKKKKKKKKKKKKKKKKKKKKKKK........
A N N U A L R E P O R T 2 0 1 8 45
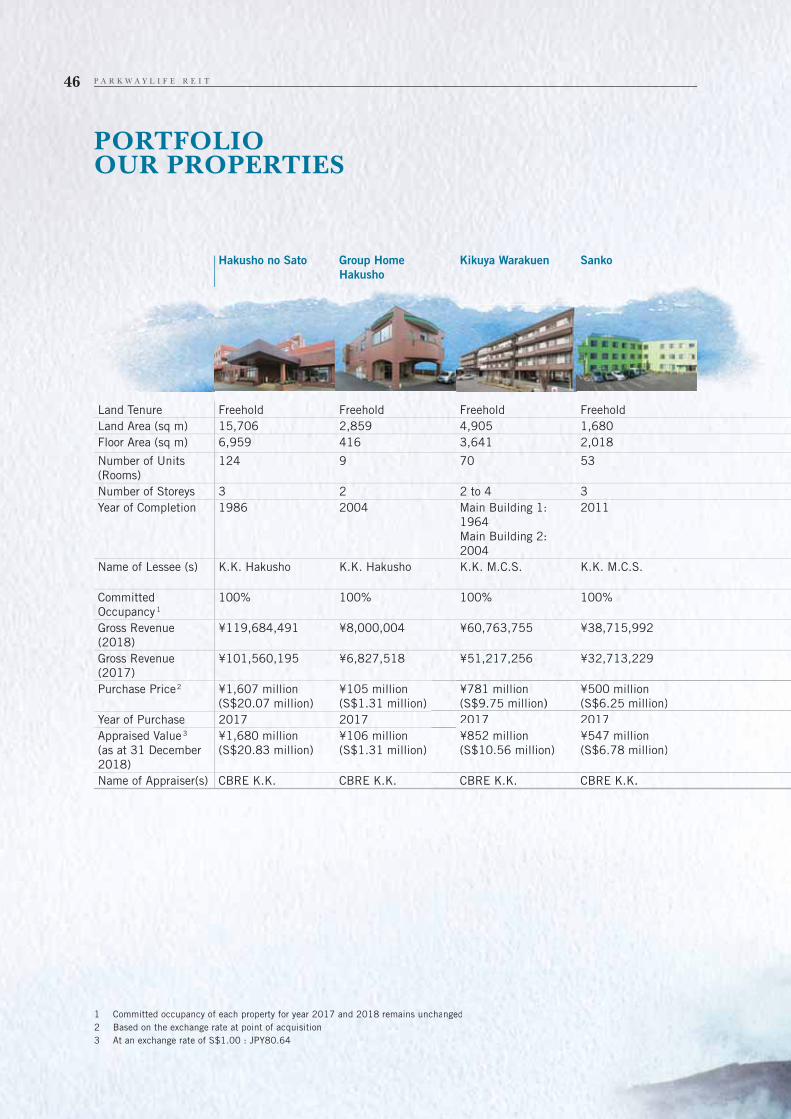
PORTFOLIOOUR PROPERTIES
Land Tenure Freehold Freehold Freehold Freehold
Land Area (sq m) 15,706 2,859 4,905 1,680
Floor Area (sq m) 6,959 416 3,641 2,018
Number of Units
(Rooms)
124 9 70 53
Number of Storeys 3 2 2 to 4 3
Year of Completion 1986 2004 Main Building 1:
1964
Main Building 2:
2004
2011
Name of Lessee (s) K.K. Hakusho K.K. Hakusho K.K. M.C.S. K.K. M.C.S.
Committed
Occupancy1
100% 100% 100% 100%
Gross Revenue
(2018)
¥119,684,491 ¥8,000,004 ¥60,763,755 ¥38,715,992
Gross Revenue
(2017)
¥101,560,195 ¥6,827,518 ¥51,217,256 ¥32,713,229
Purchase Price2 ¥1,607 million
(S$20.07 million)
¥105 million
(S$1.31 million)
¥781 million
(S$9.75 million)
¥500 million
(S$6.25 million)
Year of Purchase 2017 2017 2017 2017
Appraised Value3
(as at 31 December
2018)
¥1,680 million
(S$20.83 million)
¥106 million
(S$1.31 million)
¥852 million
(S$10.56 million)
¥547 million
(S$6.78 million)
Name of Appraiser(s) CBRE K.K. CBRE K.K. CBRE K.K. CBRE K.K.
Hakusho no Sato Group Home
Hakusho
Kikuya Warakuen Sanko
1 Committed occupancy of each property for year 2017 and 2018 remains unchanged
2 Based on the exchange rate at point of acquisition
3 At an exchange rate of S$1.00 : JPY80.64
¥5¥511,212 77,25256 ¥332,,713,229
¥7¥78181 millionon
(S$9$ 7.75 5 millioon)
¥5500000 million
(SS$6.25 mimilliooi n))
20177 200171
¥852 mmillion
(S(S$1$ 0.566 million))
¥5547 mmillionn
(S$6.78 millioon)
CBREE K.K. CBRE K.KK.
chachangengeeddd
P A R K W A Y L I F E R E I T46

Freehold Freehold
8,715 8,450
5,634 3,240
120 NA
5 2
2015 2005; Additional
works were
completed in 2007
Iryouhoujin Shadan
Kouaikai
Alere Medical Co.,
Ltd
100% 100%
¥100,453,756 ¥133,176,024
NA ¥133,174,053
¥1,500 million
(S$17.80 million)
¥2,590 million
(S$34.19 million)
2018 2008
¥1,660 million
(S$20.58 million)
¥2,370 million
(S$29.39 million)
Enrix Co., Ltd CBRE K.K.
P-Life Matsudo Konosu Nursing
Home Kyoseien
NA ¥1333,1,1744,,0, 535
¥1,55000 million
(S$17.7 8088888 millionn)
¥2,59090 mmili lion
(S(S$34.1919 milliion)
20188 20008
¥1,6600 mmillionon
(SS$2$20.0.5858 mmilillilionon))
¥2¥2,337070 mmilillilionon
(S(S$2$29.9.3939 mmililllionon))
EnEnrir x x CoCo.,, LLtdtd CBCBRER KKK.KK..
A N N U A L R E P O R T 2 0 1 8 47

CORPORATEWEBSITE
PLife REIT’s corporate website (www.plifereit.
com) allows for easy access to comprehensive
up-to-date information on the REIT. Information
like stock data, SGXnet announcements, financial
statements, press releases, presentation slides,
annual reports and other corporate development
is regularly updated to keep Unitholders
and the general public abreast of the REIT’s
performance. Beyond providing insights into its
growth strategy and latest developments, the
Manager also actively encourages Unitholders to
provide feedback or submit their enquiries via the
corporate website.
ANNUAL GENERAL MEETING
Each year, PLife REIT holds its Annual General
Meeting (“AGM”) in April in Singapore.
Extraordinary General Meetings (“EGM”) may
also be held, when relevant, to discuss specific
issues. AGMs and EGMs serve as platforms for
all Unitholders to interact with the Board of
Directors and management of the REIT Manager,
as well as to decide on proposed resolutions.
These meetings also allow the Manager to share
with the Unitholders the strategic direction of
the REIT and for the Board of Directors and
management to address Unitholders’ questions or
concerns.
CORPORATELITERATURE
All new announcements, such as corporate
developments, financial statements, press
releases and presentation slides are posted on
the corporate website immediately following its
release to SGX to ensure prompt dissemination
of information to Unitholders. PLife REIT
regularly publishes updates on its financials and
operations in a clear, concise and factual manner.
INVESTOR OUTREACH PROGRAMME
The Manager is committed to engaging investors
and analysts on a regular basis as part of its
outreach programme with the investment
community. Through media platforms, the REIT
also seeks to inform and articulate its strategies
and plans to the general public. Periodically, the
Manager may arrange site visits to the REIT’s
key properties to help investors, analysts and the
media better understand its portfolio.
INVESTORRELATIONS
ACTIVE DIALOGUE WITH THE
INVESTMENT COMMUNITY
Parkway Trus t Management
Limited, as the Manager of PLife
REIT (“Manager”), is committed
to upholding high standards in
accountability and disclosure. This is
critical to the long-term sustainability
of our business and value creation
for all stakeholders. We seek to go
above and beyond to ensure that all
necessary information is provided in
a clear, concise and accurate manner,
for investors to make well-informed
decisions.
This includes fostering strong
relationships with all Unitholders
as well as the wider financial and
investment communities by engaging
them in regular and transparent
communications. Throughout the
financial year, the Manager has
proactively reached out to existing
and potential investors, analysts,
media and Unitholders through
various communications channels
and programmes such as the corporate
website, corporate announcements,
general meetings and outreach
activities.
P A R K W A Y L I F E R E I T48
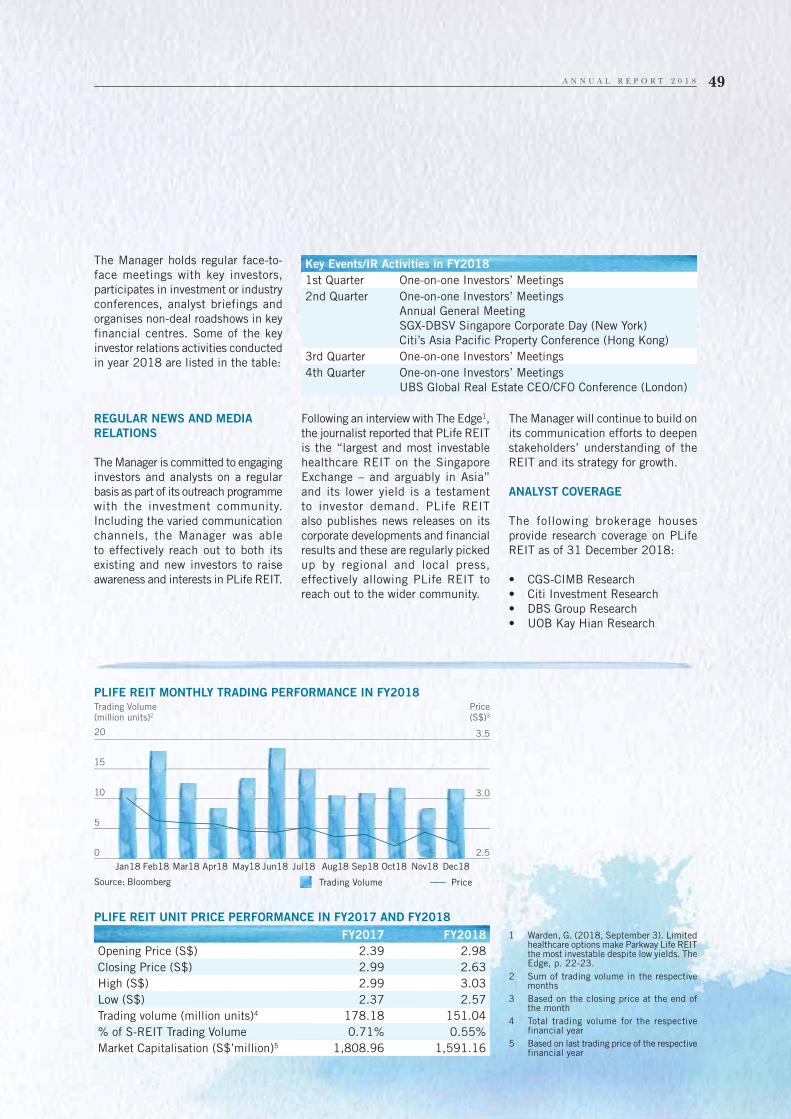
PLIFE REIT UNIT PRICE PERFORMANCE IN FY2017 AND FY2018
FY2017 FY2018
Opening Price (S$) 2.39 2.98
Closing Price (S$) 2.99 2.63
High (S$) 2.99 3.03
Low (S$) 2.37 2.57
Trading volume (million units)4 178.18 151.04
% of S-REIT Trading Volume 0.71% 0.55%
Market Capitalisation (S$’million)5 1,808.96 1,591.16
REGULAR NEWS AND MEDIA
RELATIONS
The Manager is committed to engaging
investors and analysts on a regular
basis as part of its outreach programme
with the investment community.
Including the varied communication
channels, the Manager was able
to effectively reach out to both its
existing and new investors to raise
awareness and interests in PLife REIT.
Following an interview with The Edge1,
the journalist reported that PLife REIT
is the “largest and most investable
healthcare REIT on the Singapore
Exchange – and arguably in Asia”
and its lower yield is a testament
to investor demand. PLife REIT
also publishes news releases on its
corporate developments and financial
results and these are regularly picked
up by regional and local press,
effectively allowing PLife REIT to
reach out to the wider community.
The Manager will continue to build on
its communication efforts to deepen
stakeholders’ understanding of the
REIT and its strategy for growth.
ANALYST COVERAGE
The following brokerage houses
provide research coverage on PLife
REIT as of 31 December 2018:
• CGS-CIMB Research
• Citi Investment Research
• DBS Group Research
• UOB Kay Hian Research
1 Warden, G. (2018, September 3). Limited healthcare options make Parkway Life REIT the most investable despite low yields. The Edge, p. 22-23.
2 Sum of trading volume in the respective months
3 Based on the closing price at the end of the month
4 Total trading volume for the respective financial year
5 Based on last trading price of the respective financial year
The Manager holds regular face-to-
face meetings with key investors,
participates in investment or industry
conferences, analyst briefings and
organises non-deal roadshows in key
financial centres. Some of the key
investor relations activities conducted
in year 2018 are listed in the table:
Key Events/IR Activities in FY2018
1st Quarter One-on-one Investors’ Meetings
2nd Quarter One-on-one Investors’ Meetings
Annual General Meeting
SGX-DBSV Singapore Corporate Day (New York)
Citi’s Asia Pacific Property Conference (Hong Kong)
3rd Quarter One-on-one Investors’ Meetings
4th Quarter One-on-one Investors’ Meetings
UBS Global Real Estate CEO/CFO Conference (London)
Trading Volume(million units)2
20
15
10
5
0
Jan18 Feb18 Mar18 Apr18 May18 Jun18 Jul18 Aug18 Sep18 Oct18 Nov18 Dec18
3.5
3.0
2.5
Price(S$)3
PLIFE REIT MONTHLY TRADING PERFORMANCE IN FY2018
Source: Bloomberg Trading Volume Price
A N N U A L R E P O R T 2 0 1 8 49
SUSTAINABILITYREPORT
BOARD STATEMENT
The Board of Directors (“the Board”)
of Parkway Trust Management Limited,
the Manager of Parkway Life Real
Estate Investment Trust (“PLife REIT”
or “the REIT”), is pleased to present
its annual Sustainability Report.
Sustainability plays an integral role
in PLife REIT’s operations. The Board
and management of the Manager
are committed to sustainability
and believe that incorporating
sustainability considerations and
practices across our portfolio will not
only enhance the performance of the
REIT but also create value for our
stakeholders and the society in the
long run. For this reason, we aim to
continually monitor and manage any
potential risks or opportunities in the
areas of Environmental, Social and
Governance (“ESG”) as we progress
on our sustainability journey.
The Manager holds itself to high
standards when managing the
activities of the REIT and its
employees. We are charged with the
responsibility management of our
investments, our own people’s well-
being and compliance with regulation.
The Board continues to oversee the
development of the sustainability
report. This includes selection of the
material ESG factors and setting of
performance measures and targets.
The sustainability report is aligned
to the Singapore Exchange (SGX);
SGX-ST Listing Rules 711A and 711B
and references the Global Reporting
Initiative Standards (2016).
SUSTAINABILITY AND PARKWAY
LIFE REIT
PLife REIT is one of Asia’s largest listed
healthcare REITs by asset size. PLife
REIT invests in income-producing real
estate and real estate-related assets
that are used primarily for healthcare
and healthcare-related purposes.
As the Manager of the REIT, we
consciously ensure that sustainability
is taken into consideration when
charting our business strategies
and operations. Consistent with our
prudent risk management procedures,
we also strive to identify and manage
ESG risks in order to build a resilient
portfolio with sustainable future.
The REIT’s Singapore hospitals are
leased out on master lease arrangement
to the subsidiary of IHH Healthcare
Berhad (“IHH”), wherein IHH is the
ultimate holding company of the
Manager; and properties in Japan
are leased out to various registered
care home operators. To achieve
sustainability at the property level,
we work closely with the operators
to support them in improving and
contributing to an elevated level of
sustainability performance.
As an externally managed REIT, the
skills and experience possessed by the
workforce of the Manager are critical
aspects to PLife REIT’s operations.
We view human capital as a key
contributing factor towards sustainable
growth of the REIT. Accordingly, time
and effort are dedicated to foster
relationships with the employees,
ensuring attention to well-being and
appreciation of the value employees
create as part of the Manager’s team.
This year, we have performed review of
the material ESG factors identified last
year and determined that these factors
remain our most relevant ESG focus
areas. In our maiden sustainability
report last year, we have identified
areas to improve in our management
processes and have proactively
incorporated initiatives into our
business operations such as assessing
operators’ sustainability needs in
our annual capital expenditure
planning and assessment. We have
also continued to uphold ethical
and thoughtful operating practices
and measure our performance in our
selected focus areas.
P A R K W A Y L I F E R E I T50
ABOUT THIS REPORT
The publication of sustainability report
is a testament to our commitment
to transparency. The sustainability
report details PLife REIT’s approach
to sustainability and how we practise
sustainability both within the Manager
and through our various partners at
the assets. We report on sustainability
once every year, covering the period
from 1 January to 31 December.
This report is based on the financial
year ended 31 December 2018 and is
in compliance with the requirements
of SGX-ST Listing Rules 711A and
711B. The report is with reference to
the Global Reporting Initiative (“GRI”)
Standards (2016), one of the most
commonly-used practice guides for
sustainability reporting. This report
references the following topic-specific
disclosures:
• Disclosure 401-1 from GRI 401:
Employment 2016
• Disclosure 404-1 and 404-3 from
GRI 404: Training and Education
2016
• Disclosure 414-1 from GRI 414:
New operators that were screened
using social criteria
• Disclosure 419-1 from GRI 419:
Socioeconomic Compliance 2016
• Disclosure FS10 from the
G4 Financial Services Sector
disclosures - Percentage and
number of companies held in the
institution’s portfolio with which
the reporting organization has
interacted on environmental or
social issues
REPORTING SCOPE
This report covers PLife REIT’s well-
diversified portfolio of 50 properties
as at 31 December 2018, located in
Singapore, Japan and Malaysia. In
Singapore, it owns the largest portfolio
of strategically-located private
hospitals comprising Mount Elizabeth
Hospital, Gleneagles Hospital and
Parkway East Hospital. In Japan, it
has 45 high quality nursing home
and care facility properties in various
prefectures of Japan as well as one
pharmaceutical product distributing
and manufacturing facility in Chiba
Prefecture. It also owns strata-titled
units/lots at Gleneagles Intan Medical
Centre, Kuala Lumpur in Malaysia.
The sustainability report focuses
primarily on the activities of PLife
REIT and the Manager. As PLife REIT
is not a property operator, the focus
is on creating a positive influence for
operators in the areas of ESG rather
than the operations at the properties
themselves.
FEEDBACK
We welcome your feedback to assist us
in the continual improvement in our
sustainability journey. Please direct
any enquiries, comments or feedback
on both our sustainability performance
and sustainability report to contact@
plifereit.com.
SUSTAINBILITY GOVERNANCE
In 2017, the Manager has established
a Sustainability Steering Committee
(“SSC”), which is responsible for
guiding the sustainability approach
and activities on the REIT and
Manager. This team includes the senior
management of the Manager in order
to set the tone of sustainability from
the top and integrate sustainability
into management decisions. The
SSC supports the Board and is in
turn supported by the Sustainability
Task Force (“STF”) which includes
representatives from Investment,
Asset Management, Compliance and
Legal, and Finance. During the year,
the SSC and STF have met regularly
to discharge their responsibilities.
The role of the SSC and STF are set
out below:
• SSC provides an oversight in terms
of the direction and management
of sustainability within the
REIT. It is also responsible for
communicating the performance
directly to the Board.
• STF is responsible for developing,
implementing and maintaining
sustainability related practices
and initiatives and monitoring the
REIT’s sustainability performance.
pp
oon’n s portfolio wiw th which tio
ortting ororgaganin zazatit onon hhasas epop
eded oon enenvivv roronmnmenenntatalll oror ctt
sssueuesis
A N N U A L R E P O R T 2 0 1 8 51
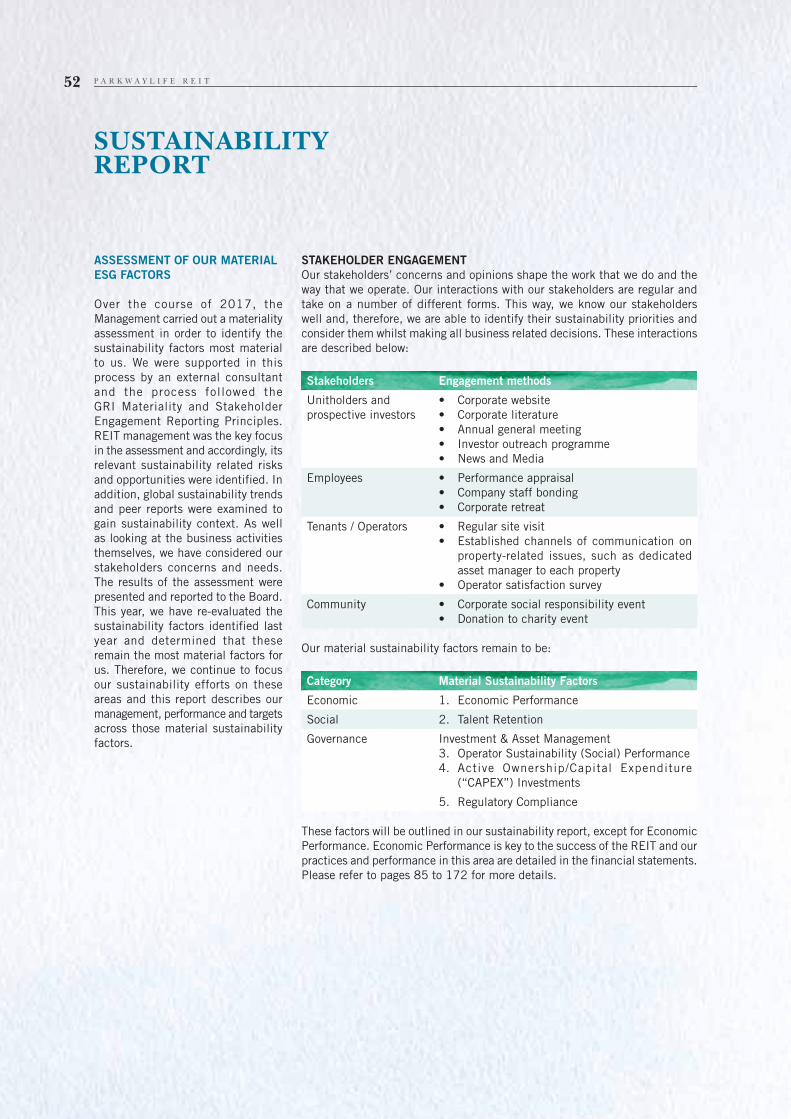
SUSTAINABILITYREPORT
ASSESSMENT OF OUR MATERIAL
ESG FACTORS
Over the course of 2017, the
Management carried out a materiality
assessment in order to identify the
sustainability factors most material
to us. We were supported in this
process by an external consultant
and the process followed the
GRI Materiality and Stakeholder
Engagement Reporting Principles.
REIT management was the key focus
in the assessment and accordingly, its
relevant sustainability related risks
and opportunities were identified. In
addition, global sustainability trends
and peer reports were examined to
gain sustainability context. As well
as looking at the business activities
themselves, we have considered our
stakeholders concerns and needs.
The results of the assessment were
presented and reported to the Board.
This year, we have re-evaluated the
sustainability factors identified last
year and determined that these
remain the most material factors for
us. Therefore, we continue to focus
our sustainability efforts on these
areas and this report describes our
management, performance and targets
across those material sustainability
factors.
STAKEHOLDER ENGAGEMENT
Our stakeholders’ concerns and opinions shape the work that we do and the
way that we operate. Our interactions with our stakeholders are regular and
take on a number of different forms. This way, we know our stakeholders
well and, therefore, we are able to identify their sustainability priorities and
consider them whilst making all business related decisions. These interactions
are described below:
Stakeholders Engagement methods
Unitholders and
prospective investors
• Corporate website
• Corporate literature
• Annual general meeting
• Investor outreach programme
• News and Media
Employees • Performance appraisal
• Company staff bonding
• Corporate retreat
Tenants / Operators • Regular site visit
• Established channels of communication on
property-related issues, such as dedicated
asset manager to each property
• Operator satisfaction survey
Community • Corporate social responsibility event
• Donation to charity event
Our material sustainability factors remain to be:
Category Material Sustainability Factors
Economic 1. Economic Performance
Social 2. Talent Retention
Governance Investment & Asset Management
3. Operator Sustainability (Social) Performance
4. Active Ownership/Capital Expenditure
(“CAPEX”) Investments
5. Regulatory Compliance
These factors will be outlined in our sustainability report, except for Economic
Performance. Economic Performance is key to the success of the REIT and our
practices and performance in this area are detailed in the financial statements.
Please refer to pages 85 to 172 for more details.
P A R K W A Y L I F E R E I T52
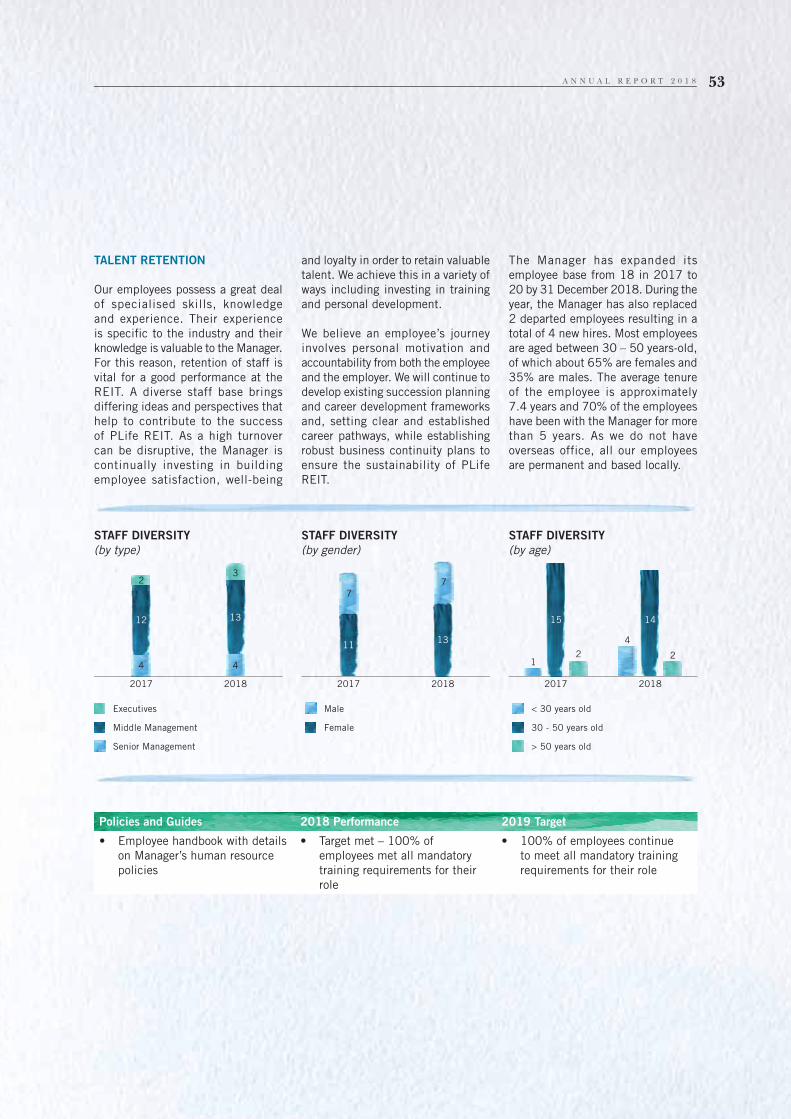
TALENT RETENTION
Our employees possess a great deal
of specialised skills, knowledge
and experience. Their experience
is specific to the industry and their
knowledge is valuable to the Manager.
For this reason, retention of staff is
vital for a good performance at the
REIT. A diverse staff base brings
differing ideas and perspectives that
help to contribute to the success
of PLife REIT. As a high turnover
can be disruptive, the Manager is
continually investing in building
employee satisfaction, well-being
and loyalty in order to retain valuable
talent. We achieve this in a variety of
ways including investing in training
and personal development.
We believe an employee’s journey
involves personal motivation and
accountability from both the employee
and the employer. We will continue to
develop existing succession planning
and career development frameworks
and, setting clear and established
career pathways, while establishing
robust business continuity plans to
ensure the sustainability of PLife
REIT.
The Manager has expanded its
employee base from 18 in 2017 to
20 by 31 December 2018. During the
year, the Manager has also replaced
2 departed employees resulting in a
total of 4 new hires. Most employees
are aged between 30 – 50 years-old,
of which about 65% are females and
35% are males. The average tenure
of the employee is approximately
7.4 years and 70% of the employees
have been with the Manager for more
than 5 years. As we do not have
overseas office, all our employees
are permanent and based locally.
STAFF DIVERSITY
(by type)
2017 2018
2
4 4
12 13
3
STAFF DIVERSITY
(by gender)
2017 2018
Male
Female
7
7
1113
< 30 years old
30 - 50 years old
> 50 years old
STAFF DIVERSITY
(by age)
2017 2018
15
1
4
2 2
14
Executives
Middle Management
Senior Management
Policies and Guides 2018 Performance 2019 Target
• Employee handbook with details
on Manager’s human resource
policies
• Target met – 100% of
employees met all mandatory
training requirements for their
role
• 100% of employees continue
to meet all mandatory training
requirements for their role
A N N U A L R E P O R T 2 0 1 8 53
SUSTAINABILITYREPORT
EMPLOYEE WELL-BEING
Employee well-being is another area
in which the Manager focuses in order
to provide a working environment that
attracts and retains the right talent.
The PLifeCARES Committee is tasked
to organise quarterly employee bonding
activities including educational
talks, sports activities and festive
celebrations. To encourage further
employees’ interaction outside office
environment, the Manager organises
corporate retreats for employees to
relax and recharge.
The Manager conducts a benchmarking
exercise from time to time to ensure
that employees are paid-to-market and
we also have a long-term incentive
plan for retention of key personnel
in place. We ensure that salary
adjustments are based on performance
and we actively promote a conducive
family-like working environment.
We believe that transparency is
essential for expectation alignment
and a more content workforce.
Therefore, the employee handbook
clearly states what is required of
employees through various policies
and practices such as the Code of
Conduct, Collective Agreements and
Grievance procedures. It also details
employees’ welfare entitlements,
including leave, health benefits,
insurance and etc.
COMMUNITY OUTREACH
The Manager endeavours to contribute
positively to the local community in
need. To this end, the Corporate Social
Responsibility (“CSR”) Committee
was set up and it is tasked to plan
and execute community events on a
regular basis.
As part of the CSR initiative this
year, we have partnered with Care
Community Services Society to be
one of the corporate sponsors for
their inaugural charity movie event
at Golden Village Great World City. The
proceeds from the charity event will be
used to fund programmes and services
that support over 1,300 beneficiaries
that includes vulnerable children,
youth-at-risk, low-income elderly and
ex-offenders and their families.
LEARNING AND DEVELOPMENT
We aim to build a strong and competent
professional team to drive the goal
toward the success of the REIT. To
invest in our human capital, the
Manager sets aside sufficient training
budget and encourages employees to
attend training to keep abreast of the
latest changes in the industry and
acquire new skills and knowledge
relevant to REIT management.
New employees are required to
attend the New Employee Orientation
which inculcates them with the
organisation’s mission, vision and
values. An overview of the Hospital/
Corporate Structure, Employee Self-
Service System and Human Resource
(“HR”) processes are introduced by
the respective HR Business Partners.
As part of the orientation, employees
are also introduced to the Employee
Handbook that details the various
learning and development policies,
procedures and entitlements for each
employee.
All permanent employees undergo
an annual performance review.
Performance appraisals are two-way
and employees are encouraged to
provide feedback to management. This
review is important for employees to
understand how they are performing in
order to improve in the areas needed,
as well as to discuss training and
development needs.
There are also mandatory trainings
needed for employees of the Manager
who are appointed representatives
in pursuant to the Capital Markets
Services (“CMS”) Licence issued by
the Monetary Authority of Singapore.
Employees must keep updated on
developments in the industry and,
therefore, we have developed a policy
on training requirements for appointed
CMS representatives. We also maintain
a training register to keep track of the
trainings and seminars attended by
all employees. In 2018, the average
training hours per employee was
approximately 19 hours.
P A R K W A Y L I F E R E I T54

INVESTMENT & ASSET
MANAGEMENT
The investment and asset management
decisions and activities will be crucial
in driving the growth of the REIT.
Therefore formulating and executing
the investment and asset management
strategic plans will be important
to deliver long term sustainable
returns for PLife REIT. There are
several policies and practices put
in place to ensure the acquisitions,
divestments and asset management
activities are carried out in accordance
with our strategic direction and with
the proper level of due diligence. For
the evaluation of new investments,
we will ensure the acquisitions
fulfil the REIT’s investment criteria
and considerations. The evaluation
procedure and process will be
governed by the internal investment
guideline and the Manager’s Operating
Policy – Investment / Divestment
(“Operating Policy”). The Operating
Policy ensures the acquisition /
divestment is in compliance with
the relevant regulatory requirements
and in line with the investment /
divestment objectives of the REIT.
In 2018, PLife REIT has completed
the acquisition of an elderly nursing
rehabilitation facility in Japan, which
is in compliance with the Operating
Policy. We continue to actively
assess our assets and operators post-
acquisition.
Material Factor Policies and Guides 2018 Performance 2019 Target
• Operator sustainability
(social) performance
• Operating Policy
• Building Lease
Agreement
• Target met – 100% of
our new acquisitions
in the last 12 months
were screened
following the Operating
Policy
• 100% of our new
acquisitions to be
screened following the
Operating Policy
Material Factor Policies and Guides 2018 Performance 2019 Target
• Active ownership/
capital expenditure
(“CAPEX”)
investments
• Operating Policy on
Asset Management
• Target met – 100% of
our assets have a
10-year CAPEX
projection in place
• Target met – 100%
of our assets
were checked
for enhancement
opportunities in the
last year
• 100% of our assets to
have a 10-year CAPEX
projection
• 100% of our assets to
be regularly checked
for enhancement
opportunities
A N N U A L R E P O R T 2 0 1 8 55
SUSTAINABILITYREPORT
OPERATOR SUSTAINABILITY
(SOCIAL) PERFORMANCE
As part of the evaluation and due
diligence process of the acquisition
of new aged care properties,
background research and assessment
of the operator will be important to
establish the better knowledge and
understanding of the party the REIT
will be working with for the next 10 to
20 years. On top of the independent
credit and financial evaluation of
the business operation of the aged
care operators, due diligence checks
are carried out to ensure all the
relevant licenses are in place, up
to date and in compliance with the
local regulatory requirements. The
operator’s operational history and
management background and the
credit and financial assessment of
the operator’s business profitability
are further clarified and checked via
information provided by the local asset
managers, consultants and vendors
in the assessment of their financial,
regulatory and social performance.
After acquis i t ions, constant
communication with the operators and
asset managers via regular site visits
and periodic reporting (occupancy
and financial performance) allow the
Manager to ensure good maintenance
and management of the properties.
All operators must abide by the
agreements in their lease, which
includes a non-anti-social clause
preventing operators from engaging
in anti-social activities. In addition,
the Manager also conducts annual
credit assessment as well as tenant/
operator satisfaction surveys which
serves to minimise any unexpected
operational, financial or social issues.
ACTIVE OWNERSHIP/CAPITAL
EXPENDITURE (“CAPEX”)
INVESTMENTS
Although we work closely with our
operators, the day-to-day running of
the assets is within their control. We
can further support them through asset
enhancement initiatives. Real estate
assets need regular maintenance as
well as updates to sustain the use
and value of the property in the long
run. These maintenance and update
plans are stated in a 10-year CAPEX
projection which is completed for
each and every one of our assets. Our
CAPEX plans are developed based on
the needs of the properties and the
operators in them and, as of 2018,
we now include an assessment of
the environmental, social and
governance needs. Operators are
consulted and recommendations are
made throughout this process. Ad-
hoc asset enhancement also occurs
as and when it is needed and these
enhancements may be driven by a
sustainability need. Some recent
asset enhancement initiatives (“AEI”)
include installation of energy efficient
equipment at our properties.
We also looked into CAPEX investments
to enhance the safety, reliability
and environmental sustainability of
properties, such as:
• New energy efficient chiller
installed at Mount Elizabeth
Hospital
• Discussion with hospital operator
to consider using bio-degradable
oil for transformers
• Explore Green Mark initiatives with
hospital operator
Some recent asset enhancement
initiatives include installation of energy
efficient equipment and refurbishing
older properties to enhance the image
and performance of the assets.
OCEAN VIEW SHONAN ARASAKI AEI (2018)
Replacement of existing air conditioning system to energy
efficient multi split packaged air conditioning units and
conversion of existing lighting system to full energy efficient
LED system. As a Green and Sustainable initiative, the LED
system together with the new air conditioning system will
reduce the long run maintenance costs resulting in overall
cost savings with reduced energy consumption.
P A R K W A Y L I F E R E I T56
REGULATORY COMPLIANCE
As a REIT and REIT Manager, we
are subject to numerous laws and
regulations. Compliance with these
is essential and breaches could lead
to loss of our operating licence.
In addition, a breach could cause
reputational damage and will lead to
a loss of trust in the Manager from
stakeholders such as the Board of
Directors, Unitholders, regulators and
employees.
Being in the healthcare industry,
there are also regulations that affect
the operations at our properties. Any
failures in this area in health and
safety issues will call into question
the integrity of the Manager and their
ability to operate in an ethical way.
The Manager has a strong commitment
to good corporate governance and
regulatory. Compliance for PLife REIT
generally covers the following areas:
• Compliance with Capital Markets
License for Real Estate Investment
Trust Management, administered
under the Securities and Futures
Act
• Compliance with Anti-corruption
and Anti-Money Laundering
regulation
• Compliance with Data Protection
• Compliance with health and safety
regulations of our properties
CORPORATE POLICIES
A number of policies help to avoid any incidents of non-compliance. These
include:
2018 Performance 2019 Target
• Target met – Zero incident of
significant1 fines and non-
monetary sanctions against
PLife REIT and the Manager
• Zero incident of significant1
fines and non-monetary
sanctions against PLife REIT
and the Manager
Corporate Policies Objective of policy
Conflict of Interest
policy
To establish guidelines on avoidance and prohibition
of relationship of vested interest between chief
executive officer, executive director or employees
and the concerned party where conflict of interest
may arise.
Regulatory and
Compliance Breach
policy
To provide guidance to all employees of the Manager
with regard to the policies and procedures in relation
to management and reporting of regulatory and
compliance breaches.
Compliance Manual
and Policies
for appointed
representatives of the
Manager
To provide summary of legal and regulatory
obligations applicable to the Manager.
Gift & Entertainment
policy
To provide guidelines to employees on the proper
manner and procedure to process, approve or
reject offers of gifts (including sponsorship and
entertainment) from external parties, so as to
safeguard the interests of employees and the
Manager. To provide guidance to employees to
address any conflict and to act in the Unitholder’s
best interests.
PDPA Policy The Manager is required to comply with the Personal
Data Protection Act 2012 (“PDPA”). The objective
of this policy is to provide guidance to the employees
of the Manager on the application of the PDPA.
Fraud & Whistle
blowing policy
To provide a channel for stakeholders to report
concerns on improprieties in financial reporting,
professional misconduct, irregularities or non-
compliance with laws and regulations applicable
to the Manager.
Policy on Dealing in
Securities
To provide guidance on dealings in PLife REIT units
by directors, officers and employees of the Manager.
1 Significant shall mean more than 1% of the Profit Before Tax of PLife REIT and the Manager respectively
A N N U A L R E P O R T 2 0 1 8 57
SUSTAINABILITYREPORT
Policies are one method for
sa fegua rd ing ou r co rpo ra te
compliance, but it is important
that the Manager’s employees are
educated on and understand the
regulatory environment. A combination
of briefings and self-declarations
keep them updated on changes
and developments. These involve
a briefing on the internal policies
they must adhere to which is part
of the new employee orientation.
Training on Anti-Money Laundering
is provided to the employees once
every two years and Regulatory
Compliance Training is provided to
the appointed representatives of the
Manager once a year. The Manager
also ensures compliance with the laws
and regulations applicable to the REIT
management, which includes the Code
on Collective Investment Schemes
issued by Monetary Authority of
Singapore (“MAS”), the listing manual
of the SGX-ST, the CMS licence
issued by MAS, the tax ruling issued
by the Inland Revenue Authority of
Singapore on taxation of the REIT and
its Unitholders, and the Singapore
Code of Corporate Governance (please
see page 59 for more details on the
Manager’s Corporate Governance
Statement).
The Manager fosters a working
environment where employees can
act appropriately, without fear of
retaliation in order to further commit
to the values of integrity and ethical
behaviour.
AT OUR PROPERTIES
PLife REIT places strong emphasis on
the safety features of its properties.
There is regular maintenance and
repairs of facilities and equipment,
for which PLife REIT (as Lessor) is
responsible for. In addition, initial
and regular confirmation of the
validity of operators’ licenses and
JCI accreditation for hospitals as
well as the submission of property
reports by care home operators to
ensure that regular maintenance and
inspections as required by regulatory
agencies are being carried out by the
tenants/ operators for their respective
properties. These include fire safety,
health & safety and lift and building
safety.
P A R K W A Y L I F E R E I T58
CORPORATEGOVERNANCE
Parkway Trust Management Limited, in its capacity as the Manager of PLife REIT recognises that an effective corporate
governance culture is critical to the performance of the Manager and consequently, the success of PLife REIT. The
Manager is firmly committed to good corporate governance and has adopted a comprehensive corporate governance
framework that meets best practice principles. In particular, the Manager has an obligation to act with due care and
diligence, and in the best interests of Unitholders.
The following sections describe the Manager’s main corporate governance policies and practices with reference to
the Code of Corporate Governance 2012 (“CG Code”). They encompass proactive measures for avoiding situations of
conflict and potential conflicts of interest and ensuring that applicable laws and regulations such as the Securities
and Futures Act, Chapter 289 of Singapore (“SFA”), the listing manual (“Listing Manual”) of the Singapore Exchange
Securities Trading Limited (“SGX-ST”), the Code on Collective Investment Schemes (“CIS Code”) issued by the Monetary
Authority of Singapore (“MAS”) including the Property Funds Appendix in Appendix 6 of the CIS Code (the “Property
Funds Appendix”), the CMS Licence (as defined below), the tax ruling issued by the Inland Revenue Authority of
Singapore on the taxation of PLife REIT and its Unitholders are complied with, and that the Manager’s obligations
under PLife REIT’s Trust Deed (as defined below) are properly and efficiently carried out. The Manager confirms that
it has adhered to the principles and guidelines as set out in the CG Code where applicable. Any deviations from the
CG Code are explained in this section.
THE MANAGER OF PLIFE REIT
The Manager has general powers of management over the assets of PLife REIT. The Manager’s main responsibility is
to manage PLife REIT’s assets and liabilities for the benefit of Unitholders.
The Manager sets the strategic direction of PLife REIT and makes recommendations to the Trustee on the acquisition,
divestment and enhancement of assets of PLife REIT in accordance with its stated investment strategy.
Other main functions and responsibilities of the Manager are as follows:
1. Using its best endeavours to carry on and conduct its business in a proper and efficient manner, to ensure that
the business of PLife REIT is carried on and conducted in a proper and efficient manner and to conduct all
transactions with or on behalf of PLife REIT at arm’s length and on normal commercial terms;
2. Preparing property plans on an annual basis for review by the directors of the Manager, which may contain proposals
and forecasts on net income, capital expenditure, sales and valuations, explanations of major variances to previous
forecasts, written commentary on key issues and underlying assumptions on inflation, annual turnover, rental rates,
occupancy costs and any other relevant assumptions. The purpose of these plans is to explain the performance
of PLife REIT’s assets;
3. Ensuring compliance with the applicable provisions of the SFA and all other relevant laws and regulations, the
Listing Manual, the CIS Code (including the Property Funds Appendix), the CMS Licence, the Trust Deed, the tax
ruling issued by the Inland Revenue Authority of Singapore on the taxation of PLife REIT and its Unitholders and
all relevant contracts;
4. Attending to all regular communications with Unitholders; and
5. Provision of project management services including co-ordination of pre-qualification and tender exercises as
well as project meetings, recommendation of project budget and appointment of project consultants as well as
monitoring and supervising any third parties engaged to provide such services.
PLife REIT, constituted as a trust, is externally managed by the Manager and accordingly, has no personnel of its own.
The Manager appoints experienced and well-qualified management personnel to handle its day-to-day operations. All
directors and employees of the Manager are remunerated by the Manager, and not PLife REIT.
A N N U A L R E P O R T 2 0 1 8 59

CORPORATEGOVERNANCE
Parkway Trust Management Limited has been appointed as the Manager of PLife REIT in accordance with the terms of
the trust deed constituting PLife REIT dated 12 July 2007 (as amended, the “Trust Deed”). The Trust Deed outlines
certain circumstances under which the Manager can be retired in favour of a corporation approved by the Trustee or
be removed by notice given in writing from the Trustee upon the occurrence of certain events.
On 1 August 2008, a licensing regime for managers of real estate investment trusts (“REITs”) was implemented under
the SFA. A person conducting REIT management activities is required to hold a capital markets services licence (“CMS
Licence”) pursuant to the SFA. On 11 August 2009, the Manager obtained a CMS Licence from MAS to conduct REIT
management. As a holder of a CMS Licence, the Manager is required to comply with various laws and regulations
applicable to CMS Licence holders which include, among others, the SFA, the Securities and Futures (Licensing and
Conduct of Business) Regulations, the Securities and Futures (Financial and Margin Requirements for Holders of
Capital Markets Services Licences) Regulations and the Securities and Futures (Disclosures of Interests) Regulations.
BOARD MATTERS
THE BOARD’S CONDUCT OF AFFAIRS
Principle 1: Every company should be headed by an effective Board to lead and control the company. The Board is
collectively responsible for the long-term success of the company. The Board works with management
to achieve this objective and management remains accountable to the Board.
The board of directors of the Manager (“Board’’) is responsible for the overall management and corporate governance
of the Manager including establishing strategic objectives, providing entrepreneurial leadership, establishing goals
for management and monitoring the achievement of these goals. All Board members participate in matters relating
to corporate governance, business operations and risks, financial performance and the nomination and review of
directors. The Board has established a framework for the management of the Manager including a system of internal
controls and a business risk management process which enables risks to be assessed and managed.
The Board meets regularly, at least once every quarter, to deliberate the strategic objectives and policies of PLife
REIT. Matters requiring the Board’s decision and approval include matters relating to investments, acquisitions and
disposals, leasing, assets enhancement initiatives, operating/capital expenditure, loan or debt financing or refinancing
taking into consideration PLife REIT’s commitment in terms of capital and other resources, the annual budget, the
release of the quarterly and full year results, the appointment of directors and other material transactions. The Board
also reviews the financial performance of PLife REIT against a previously approved budget, assesses the risks to the
assets of PLife REIT, examines liability management, and acts upon any comments from the auditors of PLife REIT.
Where necessary, additional Board meetings are held to address significant transactions or issues.
In the discharge of its functions, the Board is supported by an Audit Committee (“AC”) that provides independent
oversight of the Manager. The Board is also supported by a Nominating and Remuneration Committee (“NRC”) which
oversees the remuneration matters of the directors and key management personnel of the Manager, nomination of
directors and the effectiveness of the Board. Each of these Board committees operates under delegated authority of
the Board and is governed by its respective terms of reference which have been approved by the Board.
The Board has adopted a set of internal controls which it believes is adequate in safeguarding Unitholders’ interests
and PLife REIT’s assets. Appropriate delegation of authority has been provided to management to facilitate operational
efficiency.
P A R K W A Y L I F E R E I T60
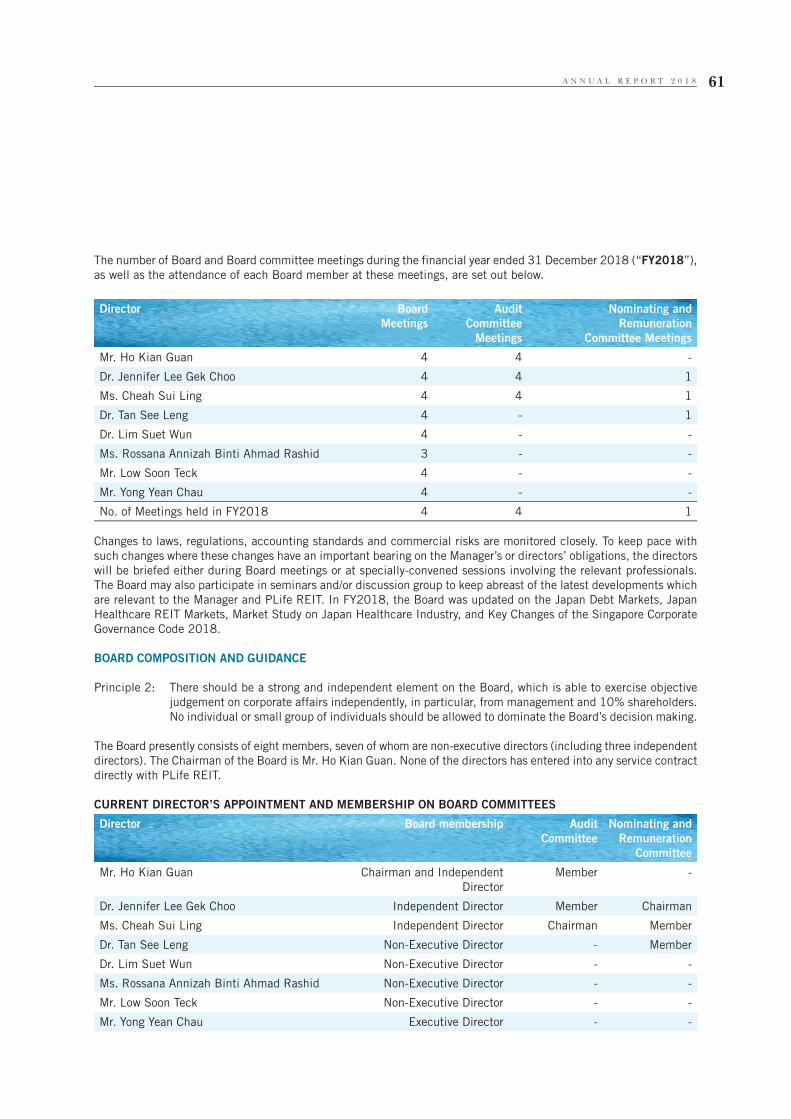
The number of Board and Board committee meetings during the financial year ended 31 December 2018 (“FY2018”),
as well as the attendance of each Board member at these meetings, are set out below.
Director Board
Meetings
Audit
Committee
Meetings
Nominating and
Remuneration
Committee Meetings
Mr. Ho Kian Guan 4 4 -
Dr. Jennifer Lee Gek Choo 4 4 1
Ms. Cheah Sui Ling 4 4 1
Dr. Tan See Leng 4 - 1
Dr. Lim Suet Wun 4 - -
Ms. Rossana Annizah Binti Ahmad Rashid 3 - -
Mr. Low Soon Teck 4 - -
Mr. Yong Yean Chau 4 - -
No. of Meetings held in FY2018 4 4 1
Changes to laws, regulations, accounting standards and commercial risks are monitored closely. To keep pace with
such changes where these changes have an important bearing on the Manager’s or directors’ obligations, the directors
will be briefed either during Board meetings or at specially-convened sessions involving the relevant professionals.
The Board may also participate in seminars and/or discussion group to keep abreast of the latest developments which
are relevant to the Manager and PLife REIT. In FY2018, the Board was updated on the Japan Debt Markets, Japan
Healthcare REIT Markets, Market Study on Japan Healthcare Industry, and Key Changes of the Singapore Corporate
Governance Code 2018.
BOARD COMPOSITION AND GUIDANCE
Principle 2: There should be a strong and independent element on the Board, which is able to exercise objective
judgement on corporate affairs independently, in particular, from management and 10% shareholders.
No individual or small group of individuals should be allowed to dominate the Board’s decision making.
The Board presently consists of eight members, seven of whom are non-executive directors (including three independent
directors). The Chairman of the Board is Mr. Ho Kian Guan. None of the directors has entered into any service contract
directly with PLife REIT.
CURRENT DIRECTOR’S APPOINTMENT AND MEMBERSHIP ON BOARD COMMITTEES
Director Board membership Audit
Committee
Nominating and
Remuneration
Committee
Mr. Ho Kian Guan Chairman and Independent
Director
Member -
Dr. Jennifer Lee Gek Choo Independent Director Member Chairman
Ms. Cheah Sui Ling Independent Director Chairman Member
Dr. Tan See Leng Non-Executive Director - Member
Dr. Lim Suet Wun Non-Executive Director - -
Ms. Rossana Annizah Binti Ahmad Rashid Non-Executive Director - -
Mr. Low Soon Teck Non-Executive Director - -
Mr. Yong Yean Chau Executive Director - -
A N N U A L R E P O R T 2 0 1 8 61
CORPORATEGOVERNANCE
The composition of the Board is determined using the following principles:
1. the Chairman of the Board and Chief Executive Officer (“CEO”) should in principle be separate persons;
2. the Board should comprise directors with a broad range of expertise and commercial experience (including expertise
in funds management and the property industry), and knowledge of PLife REIT; and
3. at least one-third of the Board should comprise independent directors.
INDEPENDENT DIRECTORS
The Board has three independent directors, namely Mr. Ho Kian Guan, Dr. Jennifer Lee Gek Choo and Ms. Cheah Sui
Ling. None of the independent directors has served beyond nine years on the Board.
The criterion of independence is based on the definition given in the CG Code. The Board considers an “independent”
director is one who has no relationship with the Manager, its related corporations, its 10% shareholders or its officers
or Unitholders of PLife REIT who have an interest of 10% or more in the Units of PLife REIT that could interfere, or
be reasonably perceived to interfere, with the exercise of the director’s independent business judgment with a view to
the best interest of the Manager and PLife REIT. Further, additional independence requirements were imposed under
regulations 13D to 13H of the Securities and Futures (Licensing and Conduct of Business) Regulations effective since
8 October 2018 (“SFLCB Regulations”). Under the SFLCB Regulations, a director is considered to be independent
if the director (i) is independent from the management of the Manager and PLife REIT; (ii) is independent from any
business relationship with the Manager and PLife REIT; (iii) is independent from every substantial shareholder of
the Manager and every substantial Unitholder of PLife REIT; (iv) is not a substantial shareholder of the Manager or a
substantial Unitholder of PLife REIT; and (v) has not served as a director on the Board for a continuous period of 9
years or longer. The Chairman of the Board also cannot be an executive director or a person who is a member of the
immediate family of the CEO.
The NRC has conducted an annual review of the directors’ independence taking into consideration the independence
criterion given in the CG Code and the SFLCB Regulations. The NRC considered and confirmed that Mr. Ho Kian Guan,
Dr. Jennifer Lee Gek Choo and Ms. Cheah Sui Ling are independent as they have each demonstrated independence
of view and conduct at both Board meetings and Board committee meetings and has been exercising independent
judgment in the best interests of PLife REIT. Based on the review and recommendation of the NRC, the Board concurred
that Mr. Ho, Dr. Lee and Ms. Cheah are considered independent.
The Board has not appointed a lead independent director in view that the CG Code requirement to appoint one
arises where (a) the Chairman and the CEO is the same person; (b) the Chairman and the CEO are immediate family
members; (c) the Chairman is part of the management team; or (d) the Chairman is not an independent director. The
Chairman and the CEO of the Manager are separately held by two persons, who are not immediate family members,
and the Chairman is an independent director who is not part of the management team, as described under section
of “Chairman and CEO” below. In light of the foregoing, the Board is not required to have independent directors to
make up at least half of the Board as guided under the CG Code.
NON-EXECUTIVE DIRECTORS
Non-executive directors exercise no management functions in the Manager or PLife REIT or any of its subsidiaries.
Although all the directors have equal responsibility for the performance of the Manager and PLife REIT, the role of
the non-executive directors is particularly important in ensuring that the performance of management in meeting
agreed goals and objectives is reviewed and the reporting of performance is monitored; and the strategies proposed
by management are fully discussed, rigorously examined and developed, taking into account the long-term interests
of PLife REIT’s assets and the Unitholders. The non-executive directors meet regularly without the presence of the
management.
P A R K W A Y L I F E R E I T62
The Board has reviewed its composition and is satisfied that the existing size and composition is appropriate, taking
into account the scope and nature of operations of the Manager and PLife REIT, the requirements of the business and
the need to avoid undue disruptions from changes to the composition of the Board and its committees. The majority
of the directors are non-executive and/or independent of the management. This enables the management to benefit
from their external, diverse and objective perspective on issues that are brought before the Board. It would also enable
the Board to interact and work with the management through a robust exchange of ideas and views to help shape the
strategic process. This, together with a clear separation of roles of the Chairman and CEO described below, provides
a healthy professional relationship between the Board and the management, with clarity of roles and robust oversight
as they deliberate the business activities of the Manager. The composition will be reviewed regularly to ensure that
the Board has the appropriate mix of expertise and experience and is of the appropriate size.
The profiles of the directors are set out on pages 16 to 20 of this Annual Report.
CHAIRMAN AND CHIEF EXECUTIVE OFFICER
Principle 3: There should be a clear division of responsibilities between the leadership of the Board and the executives
responsible for managing the company’s business. No one individual should represent a considerable
concentration of power.
The positions of Chairman and CEO are separately held by two persons in order to maintain an effective check and
balance and ensure increased accountability and greater capacity for the Board for independent decision making.
The Chairman of the Board, Mr. Ho Kian Guan is an independent director. The CEO is Mr. Yong Yean Chau who is
also an executive director of the Manager. The Chairman and the CEO are not immediate family members and are
not related to each other.
There is a clear separation of the roles and responsibilities between the Chairman and the CEO. The Chairman is
responsible for the overall management of the Board as well as ensuring that the directors and the management
work together with integrity and competency, and that the Board engages the management in constructive debate on
strategy, business operations, enterprise risk and other plans. The Chairman also ensures effective communication
with the Unitholders and takes a leading role in promoting high standards of corporate governance with support of
the Board and the management.
The CEO has full executive responsibilities over the business directions and operational decisions in the day to day
management of the Manager and PLife REIT.
BOARD MEMBERSHIP
Principle 4: There should be a formal and transparent process for the appointment and reappointment of directors
to the Board.
The appointment of director is a matter reserved for Board approval. The search for candidates is conducted through
contacts and recommendations. The NRC will evaluate and assess the candidate based on the directors’ criteria
approved by the Board, candidate’s academic and professional qualifications, expertise, commercial experience and
knowledge, taking into account the scope and nature of operations of the Manager and PLife REIT. Suitable candidates
are recommended by the NRC to the Board for approval. The Board will deliberate and review the proposed appointment
of a new director taking into account the recommendation by the NRC. Such appointment is subject to the approval
of MAS. A formal letter setting out the director’s duties and responsibilities will be given to the new director upon
his/her appointment to the Board. No new director was appointed to the Board during FY2018.
As the Manager is not a listed company, directors of the Manager are not subject to periodic retirement by rotation.
Pursuant to an undertaking given by Parkway Holdings Limited to the Trustee on 16 March 2017 (“Undertaking”),
Unitholders are given the right to endorse the appointment of the directors of the Manager by way of ordinary resolution
at the annual general meetings (“AGM”) of Unitholders. Accordingly, one-third of the directors of the Manager were
put forth for Unitholders’ endorsement of appointment during PLife REIT’s AGM since 2017.
A N N U A L R E P O R T 2 0 1 8 63
CORPORATEGOVERNANCE
The composition of the Board is reviewed regularly to ensure that the Board has the appropriate mix of expertise and
experience and is of the appropriate size. In carrying out this review, the Board looks to achieve a balance in matters
such as skill representation, experience, diversity (including gender diversity) and knowledge of the company. The
Board has appointed three female directors, each in year 2015, 2016 and 2017, which has since improved the
gender diversity of the Board to more than one-third.
The Board has set a general policy that a director should not have more than six listed company board representations
to take into account the market practices and the level of commitment required. This helps to ensure that the Board
is effective as a whole and that each director is capable of contributing time and attention to the affairs of PLife REIT
and the Manager, including attending and contributing at Board meetings. The Board assessed the effectiveness and
performance of the Board and its Board Committees on an annual basis.
BOARD PERFORMANCE
Principle 5: There should be a formal annual assessment of the effectiveness of the Board as a whole and its board
committees and the contribution by each director to the effectiveness of the Board.
A review of the Board’s performance is conducted annually to assess the effectiveness of the Board and the Board
committees. The review of the Board’s performance includes the Board composition, directors’ contribution and
commitment at board meetings, access to information, procedures, accountability and standards of conduct, skills and
any specific areas where improvement may be made by an individual director and the Board collectively. Attendance
at meetings as well as the contributions of each director to the Board are also considered. The Board has not engaged
any external facilitator to facilitate the assessment. Each of the directors are required to complete a questionnaire
evaluating the Board and the Board committees for the financial year under review. A summary of the feedbacks and
recommendations from the directors was prepared and presented to the NRC and the Board respectively. The NRC
has reviewed the summary and put forward its comments and recommendations, if any, to the Board for approval.
The Board is satisfied with the effectiveness of the Board and that all directors have demonstrated commitment to
their roles and contributed effectively to the Board.
ACCESS TO INFORMATION
Principle 6: In order to fulfill their responsibilities, directors should be provided with complete, adequate and timely
information prior to board meetings and on an ongoing basis so as to enable them to make informed
decisions to discharge their duties and responsibilities.
The management provides the Board with complete and adequate information on the business and the operations of
PLife REIT and the Manager, on a regular and quarterly basis, at Board meetings.
The annual calendar of the Board meeting is scheduled in advance. Board papers are dispatched to directors about a
week before the scheduled meetings so that directors have sufficient time to review and consider matters being tabled
and discussed at the meetings. The senior executives are also requested to attend the Board meetings to provide
insights into matters being discussed and to respond to any queries from the directors.
The Board has separate and independent access to management and the company secretary at all times. The Board is
entitled to request from management and is provided with such additional information in a timely manner as needed
to make informed decisions. The company secretary attends to corporate secretarial administration, ensures that
Board procedures are followed and that applicable rules and regulations are complied with. The company secretary
also attends all Board meetings. The appointment and removal of the company secretary is a Board reserved matter.
The Board also has access to independent professional advice where appropriate, at the Manager’s expense.
P A R K W A Y L I F E R E I T64

REMUNERATION MATTERS
Principle 7: There should be a formal and transparent procedure for developing policy on executive remuneration
and for fixing remuneration packages of individual directors. No director should be involved in deciding
his own remuneration.
Principle 8: The level and structure of remuneration should be aligned with the long-term interest and risk policies
of the company, and should be appropriate to attract, retain and motivate (a) the directors to provide
good stewardship of the company, and (b) key management personnel to successfully manage the
company. However, companies should avoid paying more than is necessary for this purpose.
Principle 9: Every company should provide clear disclosure of its remuneration policies, level and mix of remuneration,
and the procedure for setting remuneration, in the company’s Annual Report. It should provide disclosure
in relation to its remuneration policies to enable investors to understand the link between remuneration
paid to directors and key management personnel, and performance.
The directors’ fees and remuneration of staff of the Manager are paid in its own capacity using its own funds and fees
received from PLife REIT and not from the funds of PLife REIT.
The Manager advocates a performance based remuneration system for the CEO/executive director and key management
personnel. The NRC, which has an independent majority, helps to ensure that there is an effective and formal process to
establish the remuneration system. The remuneration of the CEO/executive director and the key management personnel
is reviewed by the NRC on an annual basis based on the financial and non-financial key performance indicators
(“KPIs”) linked to the performance of PLife REIT for the financial year under review, and individual performance of
each of the CEO/executive director and key management personnel in contribution to the long-term strategic goals
of PLife REIT and the Manager.
The remuneration for the CEO/executive director and key management personnel comprises fixed pay and short-term
and long-term incentives. The fixed pay component includes fixed salary and allowances. The short-term and long-
term incentives are tied to the individual performance and the performance of PLife REIT which include financial
and non-financial KPIs such as distributable income of PLife REIT, analyst coverage, tenant satisfaction, retention of
key staffs and regulatory compliance (“Performance Criteria”). The Performance Criteria and its target were approved
by the Board prior to each financial year. Under the long-term incentive plan (“LTI Plan”), the eligible employee will
be awarded with the PLife REIT’s units owned by the Manager based on the achievement of the Performance Criteria
for the financial year under review.
The LTI Plan is designed to enhance executive performance, encourage talent retention and provide eligible employees
with a personal direct interest in PLife REIT, so as to create better alignment of the interest between management
and the interest of Unitholders of PLife REIT. The LTI Plan will also serve to motivate eligible employees to achieve
the performance targets of PLife REIT. The Manager believes that the LTI Plan will make the Manager’s remuneration
package sufficiently competitive to recruit, reward, retain and motivate outstanding employees which are paramount
to the Manager’s long-term objective of achieving sustainable returns for Unitholders of PLife REIT.
The fees received by non-executive directors are at fixed rates and determined by the shareholder of the Manager on an
annual basis. In addition to their basic fee, the non-executive directors who hold the position of chairman in the Board
and any Board committee will be paid an additional fee. For the avoidance of doubt, the CEO/executive director does
not receive any director’s fee. None of the directors was involved in any decisions concerning their own remuneration.
A N N U A L R E P O R T 2 0 1 8 65
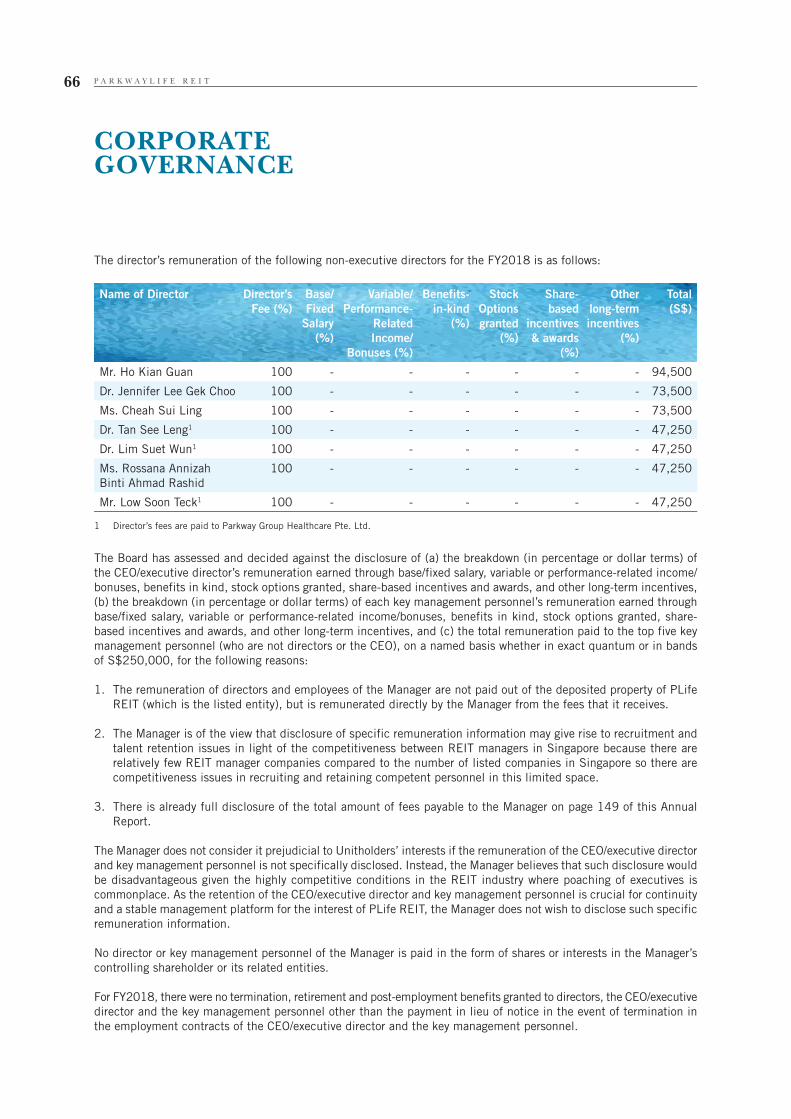
CORPORATEGOVERNANCE
The director’s remuneration of the following non-executive directors for the FY2018 is as follows:
Name of Director Director’s
Fee (%)
Base/
Fixed
Salary
(%)
Variable/
Performance-
Related
Income/
Bonuses (%)
Benefits-
in-kind
(%)
Stock
Options
granted
(%)
Share-
based
incentives
& awards
(%)
Other
long-term
incentives
(%)
Total
(S$)
Mr. Ho Kian Guan 100 - - - - - - 94,500
Dr. Jennifer Lee Gek Choo 100 - - - - - - 73,500
Ms. Cheah Sui Ling 100 - - - - - - 73,500
Dr. Tan See Leng1 100 - - - - - - 47,250
Dr. Lim Suet Wun1 100 - - - - - - 47,250
Ms. Rossana Annizah
Binti Ahmad Rashid
100 - - - - - - 47,250
Mr. Low Soon Teck1 100 - - - - - - 47,250
1 Director’s fees are paid to Parkway Group Healthcare Pte. Ltd.
The Board has assessed and decided against the disclosure of (a) the breakdown (in percentage or dollar terms) of
the CEO/executive director’s remuneration earned through base/fixed salary, variable or performance-related income/
bonuses, benefits in kind, stock options granted, share-based incentives and awards, and other long-term incentives,
(b) the breakdown (in percentage or dollar terms) of each key management personnel’s remuneration earned through
base/fixed salary, variable or performance-related income/bonuses, benefits in kind, stock options granted, share-
based incentives and awards, and other long-term incentives, and (c) the total remuneration paid to the top five key
management personnel (who are not directors or the CEO), on a named basis whether in exact quantum or in bands
of S$250,000, for the following reasons:
1. The remuneration of directors and employees of the Manager are not paid out of the deposited property of PLife
REIT (which is the listed entity), but is remunerated directly by the Manager from the fees that it receives.
2. The Manager is of the view that disclosure of specific remuneration information may give rise to recruitment and
talent retention issues in light of the competitiveness between REIT managers in Singapore because there are
relatively few REIT manager companies compared to the number of listed companies in Singapore so there are
competitiveness issues in recruiting and retaining competent personnel in this limited space.
3. There is already full disclosure of the total amount of fees payable to the Manager on page 149 of this Annual
Report.
The Manager does not consider it prejudicial to Unitholders’ interests if the remuneration of the CEO/executive director
and key management personnel is not specifically disclosed. Instead, the Manager believes that such disclosure would
be disadvantageous given the highly competitive conditions in the REIT industry where poaching of executives is
commonplace. As the retention of the CEO/executive director and key management personnel is crucial for continuity
and a stable management platform for the interest of PLife REIT, the Manager does not wish to disclose such specific
remuneration information.
No director or key management personnel of the Manager is paid in the form of shares or interests in the Manager’s
controlling shareholder or its related entities.
For FY2018, there were no termination, retirement and post-employment benefits granted to directors, the CEO/executive
director and the key management personnel other than the payment in lieu of notice in the event of termination in
the employment contracts of the CEO/executive director and the key management personnel.
P A R K W A Y L I F E R E I T66
No employee of the Manager was an immediate family member of a director and CEO/executive director and whose
remuneration exceeded S$50,000 during the FY2018. “Immediate family member” means the spouse, child, adopted
child, step-child, sibling and parent.
NOMINATING AND REMUNERATION COMMITTEE
The NRC of the Manager currently comprises Dr. Jennifer Lee Gek Choo (Chairman of the NRC) and Ms. Cheah Sui
Ling, both of whom are non-executive and independent directors, and Dr. Tan See Leng, a non-executive director. The
NRC members meet, at least once every year to deliberate the remuneration matters and matters relating to Board
members’ appointment and succession, Board performance evaluation and directors’ independence.
The NRC has a set of terms of reference defining its scope of responsibility and authority, which includes the following:
(a) recommending to the Board a framework of remuneration for key management personnel, and to determine
specific remuneration packages for the Board and key management personnel covering all aspects of remuneration
including but not limited to director’s fees, salaries, allowances, bonuses, options, unit-based incentives, awards
and benefits in kind;
(b) reviewing the appropriateness of remuneration awarded to attract, retain and motivate the executive director and
key management personnel needed to run the Manager and PLife REIT successfully;
(c) reviewing the pay and employment conditions within the industry and those of the peer companies to ensure that
the executive director and key management personnel are adequately remunerated;
(d) reviewing the adequacy and form of remuneration to the directors and key management personnel to ensure that
the remuneration realistically commensurate with the responsibilities and risks involved in being an effective
member, as well as corporate and individual performance;
(e) considering the eligibility of the executive director and key management personnel for benefits under long-term
incentive schemes and the administration thereof;
(f) reviewing the use of long-term incentives, including share schemes, for the executive director and key management
personnel;
(g) proposing candidates to the Board and Board committees of the Manager;
(h) overseeing the succession planning for the Board;
(i) assessing the performance and effectiveness of the Board as a whole and the Board committees and assessing
the contribution of each director to the effectiveness of the Board;
(j) recommending the training and professional development programs for the Board; and
(k) assessing independence of each director on an annual basis.
The members of the NRC do not participate in any decisions concerning their own remuneration.
The NRC ensures that non-executive directors are not over-compensated to the extent that their independence may
be compromised. Further, the NRC shall have the authority to consult experts (inside and/or outside the Manager) on
the remuneration of all directors, if it considers necessary.
A N N U A L R E P O R T 2 0 1 8 67
CORPORATEGOVERNANCE
ACCOUNTABILITY AND AUDIT
ACCOUNTABILITY
Principle 10: The Board should present a balanced and understandable assessment of the company’s performance,
position and prospects.
The Board continually strives to present a clear, balanced and understandable assessment of PLife REIT’s financial
position, performance and prospects primarily through the audited financial statements, annual report and quarterly
announcements of results to the Unitholders through announcements via SGXNet, press releases, the PLife REIT’s
website and media and analyst briefings.
The management also provides the Board with complete and adequate information in a timely manner and on an on-
going basis through regular updates on financial results, market trends and business developments.
RISK MANAGEMENT AND INTERNAL CONTROLS
Principle 11: The Board is responsible for the governance of risk. The Board should ensure that management maintains
a sound system of risk management and internal controls to safeguard shareholders’ interests and the
company’s assets, and should determine the nature and extent of the significant risks which the Board
is willing to take in achieving its strategic objectives.
The Board acknowledges that it is responsible for the overall internal control framework and the maintenance of a
sound system of internal controls. The system includes, inter alia, enterprise risk management and internal auditing.
However, the Board recognises that no cost effective internal control system and risk management will preclude all
errors and irregularities, as a system is designed to manage rather than eliminate the risk of failure to achieve business
objectives, and can provide only reasonable and not absolute assurance against material misstatement or loss.
To ensure a robust risk management system is maintained, the Manager, with concurrence of the AC, has put in
place an Enterprise Risk Management (“ERM”) framework and policies and ERM Committee which comprises senior
management personnel of the Manager from the operational, financial and technical areas, to identifying and managing
the risks that could arise in the course of managing PLife REIT. The responsibilities of the ERM Committee include
the oversight of matters relating to the management of risks. The Manager has engaged an external risk consultant
to facilitate the ERM process and to validate the sufficiency and adequacy of the internal controls put in place. Any
material non-compliance and internal control weakness, together with the recommendations to address them, the
mitigating controls or gaps (if any) are also presented to the AC and the Board accordingly.
The system of risk management is embedded in the internal control system of the Manager to address on-going
changes and challenges and to reduce uncertainties to PLife REIT. The ERM Committee, assisted by the external
risk consultant, will ensure the adequacy and efficiency of the internal controls. As such, the internal control system
will also assist the Board and the AC in compliance with the CG Code and the Listing Manual. The AC and the Board
review the adequacy and efficiency of the risk management system and internal controls on an annual basis.
The internal control and risk management functions conducted by the auditors and the external risk consultant
respectively are evaluated by the Manager’s ERM Committee and executive director, and are reported to the AC for
review. Based on the up-to-date evaluation of the controls by the auditors and the external risk consultant, the CEO
and the Chief Financial Officer of the Manager have provided an assurance to the Board that the financial records of
PLife REIT have been properly maintained and the financial statements give a true and fair view of the operations and
finances of PLife REIT, and the Manager’s internal controls and risk management systems are effective and adequate
for the year under review.
P A R K W A Y L I F E R E I T68
Nonetheless, the AC will:
(a) satisfy itself, by such means as it shall consider appropriate, that adequate counter measures (i.e. mechanisms
and processes, such as sound internal control systems) are in place to identify and mitigate any material business
risks associated with the Manager and PLife REIT;
(b) ensure that a review of the effectiveness and adequacy of the Manager’s internal controls, including financial,
operational, compliance and information technology controls, and risk management policies and systems, is
conducted at least annually. Such review can be carried out by internal auditors, external auditors and/or the ERM
Committee;
(c) ensure that the internal control recommendations made by internal auditors, external auditors and/or the ERM
Committee have been implemented by the Manager; and
(d) ensure that the Board is in a position to comment on the adequacy of the internal controls of the Manager.
Taking into account the abovementioned evaluation of the controls by the auditors and the external risk consultant,
the review by the Manager’s ERM Committee and executive director, and the assurance received from the CEO and
the Chief Financial Officer of the Manager, the Board in concurrence with the view of the AC, is of the opinion that
taking into account the nature, scale and complexity of the Manager’s operations, PLife REIT’s financial, operational,
compliance and information technology controls, and risk management systems were adequate and effective as at
31 December 2018.
AUDIT COMMITTEE
Principle 12: The Board should establish an AC with written terms of reference which clearly set out its authority
and duties.
The AC comprises Ms. Cheah Sui Ling (Chairman of the AC), Dr. Jennifer Lee Gek Choo and Mr. Ho Kian Guan, all of
whom are independent non-executive directors. The members of the AC collectively have recent and relevant expertise
or experience in financial management and are appropriately qualified to discharge their responsibilities.
The role of the AC is to monitor and evaluate the adequacy of the Manager’s internal controls and the effectiveness
of the Manager’s internal audit function. The AC also reviews the fairness and accuracy of information prepared for
inclusion in the financial reports and statements, and is responsible for the nomination of external auditors and
reviewing the adequacy of external audits in respect of cost, scope and performance. The AC members meet, at least
once every quarter to deliberate matters under its responsibility.
The AC has a set of terms of reference defining its scope of responsibility and authority, which includes the following:
(a) monitoring the procedures established to regulate related party transactions, including ensuring compliance with
the provisions of the Listing Manual relating to “interested person transactions” and the provisions of the Property
Funds Appendix relating to “interested party transactions”;
(b) reviewing arrangements by which employees of the Manager may, in confidence, raise concerns about possible
improprieties in matters of financial reporting or other matters and ensuring that arrangements are in place for
such concerns to be raised, independently investigated, and for appropriate follow-up action to be taken;
(c) reviewing external and internal audit reports to ensure that where deficiencies in internal controls have been
identified, appropriate and prompt remedial action is taken by the management;
(d) reviewing internal audit reports at least twice a year to ascertain that the guidelines and procedures established
to monitor related party transactions have been complied with;
A N N U A L R E P O R T 2 0 1 8 69
CORPORATEGOVERNANCE
(e) reviewing, on an annual basis, the internal audit function to ensure that is adequately resourced, is independent
of the activities it audits, has appropriate standing within the Manager, is staffed with persons with the relevant
qualifications and experience and has unfettered access to all documents, records, properties and personnel,
including access to the AC;
(f) monitoring the procedures in place to ensure compliance with applicable legislation, the Listing Manual and the
CIS Code including the Property Funds Appendix;
(g) reviewing the nature and extent of non-audit services performed by external auditors;
(h) reviewing the scope and results of the external audit and the independence and objectivity of the external auditors;
(i) meeting with external and internal auditors, without the presence of the executive director and key management
personnel at least annually;
(j) examining the effectiveness of financial, operational, compliance and information technology controls at least
annually;
(k) reviewing the significant financial reporting issues and judgements so as to ensure the integrity of the financial
statements of PLife REIT and any formal announcements relating to PLife REIT’s financial performance;
(l) investigating any matters within the AC’s terms of reference, whenever it deems necessary;
(m) reporting to the Board on material matters, findings and recommendations; and
(n) making recommendations to the Board on the appointment, re-appointment and removal of the external auditors.
The AC has authority to investigate any matter within its terms of reference. It also has full access to and co-operation
by management and full discretion to invite any director or executive officer to attend its meetings.
During the year under review, the AC has reviewed:
• the financial statements of PLife REIT before the announcement of quarterly and full-year results of PLife REIT;
• the reports on audit findings reported by the internal and external auditors;
• the reports on material business risk of PLife REIT reported by the external risk consultant;
• the compliance work plan and updates reported by the compliance officer;
• the related party transactions of PLife REIT.
In addition, the AC has conducted a review of all non-audit services provided by the external auditors and is satisfied
that the nature and extent of such services will not prejudice the independence and objectivity of the external auditors.
For FY2018, the aggregate amount of fees paid and payable by PLife REIT to the external auditors was S$348,000,
comprising non-audit service fees of S$87,000 and audit service fees of S$261,000. In appointing the audit firms for
the Group, the AC is satisfied that PLife REIT has complied with the Listing Rules 712 and 715 of the Listing Manual.
The AC meets with the external auditors, without the presence of management, at least once a year.
The AC is briefed regularly on the impact of the new accounting standards on PLife REIT’s financial statements by
the external auditors.
None of the members of the AC are former partners or directors of the Manager’s and PLife REIT’s external auditors.
P A R K W A Y L I F E R E I T70
INTERNAL AUDIT
Principle 13: The company should establish an effective internal audit function that is adequately resourced and
independent of the activities it audits.
The Manager has put in place a system of internal controls of procedures, including financial, operational, compliance
and information technology controls, and risk management systems to safeguard PLife REIT’s assets, Unitholders’
interests as well as to manage risk.
The internal audit function of the Manager is outsourced to an independent assurance service provider and the AC
reviews the adequacy and effectiveness of the internal auditor at least once a year. The AC is satisfied that the internal
auditor has the relevant qualifications and experience and has met the standards established by internationally
recognised professional bodies including the Standards for the Professional Practice of Internal Auditing set by The
Institute of Internal Auditors. The internal auditor reports directly to the AC on audit matters and the AC approves
the hiring, removal, evaluation and fees of the internal auditor. The AC also reviews and approves the annual internal
audit plan and reviews the internal audit reports and activities. The AC meets with the internal auditor, without the
presence of management, at least once a year. The AC is of the view that the internal auditor has adequate resources
to perform its functions and has to the best of its ability, maintained its independence from the activities that it audits.
UNITHOLDER RIGHTS AND RESPONSIBILITIES
Principle 14: Companies should treat all shareholders fairly and equitably, and should recognise, protect and facilitate
the exercise of shareholders’ rights, and continually review and update such governance arrangement.
Principle 15: Companies should actively engage their shareholders and put in place an investor relations policy to
promote regular, effective and fair communication with shareholders.
Principle 16: Companies should encourage greater shareholder participation at general meetings of shareholder,
and allow shareholders the opportunity to communicate their views on various matters affecting the
company.
COMMUNICATION WITH UNITHOLDERS
The Listing Manual of the SGX-ST requires that a listed entity discloses to the market, among others, matters that
would likely have a material effect on the price or value of the entity’s securities. The Manager upholds a strong
culture of continuous disclosure and transparent communication with Unitholders and the investing community, and
has put in place an investor relations policy which sets out the policies and practices which the Manager adopted.
The investor relations function is headed by the CEO and the Chief Financial Officer of the Manager. The Manager adopts
a proactive approach in reaching out to the Unitholders, existing and potential investors, analyst and media through
various communication channels and programmes such as the corporate website, corporate literature, annual general
meeting and investor outreach programmes, throughout the year. In line with the Manager’s objective of transparent
communication, timely and full disclosure of all material information relating to PLife REIT are disclosed by way of
public releases or announcements through the SGX-ST via SGXNET at first instance and then including the release
on PLife REIT’s website at www.plifereit.com. The Manager ensures that unpublished price sensitive information are
not disclosed selectively, and in the event of any inadvertent disclosure of such information, the Manager shall make
necessary disclosure to the public via SGXNET and release on PLife REIT’s website promptly.
It is the aim of the Board to provide the Unitholders with a balanced and comprehensive assessment of PLife REIT’s
performance, position and prospects. The Unitholders are encouraged to attend the annual general meeting (“AGM”)
of PLife REIT to ensure a high level of accountability and to stay informed of the strategies and goals of PLife REIT.
The chairpersons of the AC and/or the NRC and external auditors should, where possible, also be present to assist
the directors in addressing any relevant queries by Unitholders.
A N N U A L R E P O R T 2 0 1 8 71
CORPORATEGOVERNANCE
The notice of AGM is dispatched to the Unitholders in the manner set out in the Listing Manual. The Board welcomes
questions from the Unitholders who have an opportunity to raise issues either informally or formally before or at the AGM.
Each item of special business included in the notice of AGM is accompanied, where appropriate, by an explanation
for the proposed resolution and a proxy form with instructions on the appointment of proxies. Separate resolutions
are prepared for substantially separate issues at the AGM. The resolutions approved in the AGM will be announced
on or after the day AGM is held. Minutes of general meetings are also made available to Unitholders upon request.
As encouraged by SGX-ST and in support of the greater transparency of voting in AGM and good corporate governance,
the Manager has employed electronic polling since the AGM held in 2012 whereby all resolutions are voted by poll and
detailed results showing the number of votes cast for and against each resolution and the respective percentage are
published at the meeting. Prior to voting at the AGM, the voting procedures will be made known to the Unitholders.
The votes cast by each Unitholder are in direct proportion to their respective unitholdings in PLife REIT.
Please refer to page 132 of this Annual Report on the distribution policy and “Distribution Statements” on page 93
of this Annual Report for more details.
DEALINGS IN PLIFE REIT’S UNITS
The Trust Deed requires each director to give notice to the Manager of his acquisition of units or of changes in the
number of units which he holds or in which he has an interest, within two business days after such acquisition or the
occurrence of the event giving rise to changes in the number of units which he holds or in which he has an interest.
This is in line with the requirements of the Section 137Y of the SFA (relating to notification of unitholdings by directors
and CEO of the Manager). The CEO of the Manager is also required to give similar notice under the new section.
All dealings in units by the directors and the CEO will be announced via SGXNET, with the announcement to be posted
on the SGX-ST website at http://www.sgx.com.
The directors and employees of the Manager are encouraged, as a matter of internal policy, to hold units but are
prohibited from dealing in the units:
(a) in the period commencing one month before the public announcement of PLife REIT’s annual results and (where
applicable) property valuations and two weeks before the public announcement of PLife REIT’s quarterly results,
and ending on the date of announcement of the relevant results or as the case may be, property valuations; and
(b) at any time while in possession of unpublished price sensitive information.
The directors and employees of the Manager have been directed to refrain from dealing in units on short-term
considerations.
In addition, the Manager has undertaken that it will not deal in the units during the period commencing one month
before the public announcement of PLife REIT’s annual results and (where applicable) property valuations and two
weeks before the public announcement of PLife REIT’s quarterly results, and ending on the date of announcement
of the relevant results or as the case may be, property valuations.
Further, the Section 137ZC of the SFA (relating to notification of unitholdings by responsible persons) requires the
Manager to, inter alia, announce via SGXNET the particulars of any acquisition or disposal of interest in PLife REIT’s
units by the Manager no later than the end of the business day following the day on which the Manager became aware
of the acquisition or disposal.
P A R K W A Y L I F E R E I T72

RISK ASSESSMENT AND MANAGEMENT OF BUSINESS RISK
Effective risk management is a fundamental part of PLife REIT’s business operations. Recognising and managing
risk is central to the business and protecting Unitholders’ interests and value. PLife REIT operates within overall
guidelines and specific parameters set by the Board. Each transaction is comprehensively analysed to understand
the risk involved. Responsibility for managing risk lies initially with the business unit concerned, working within the
overall strategy outlined by the Board.
The Board meets quarterly (or more often, if necessary) and will review the financial performance of the Manager and
PLife REIT against a previously approved budget. The Board will also review the business risks of PLife REIT, examine
liability management and will act upon any comments from the auditors of PLife REIT.
The Manager has appointed experienced and well-qualified management personnel to handle the day-to-day operations
of the Manager and PLife REIT. In assessing business risks, the Board will consider the economic environment and risks
relevant to the property and healthcare industry. It reviews management reports and feasibility studies on investment
risks prior to approving all investment decisions. The management meets regularly to review the operations of the
Manager and discuss any disclosure issues.
WHISTLE-BLOWER PROTECTION POLICY
The Manager has established a whistle-blower policy which reflects the Manager’s commitment to conduct its business
within a framework that fosters the highest ethical and legal standards. In line with this commitment and PLife
REIT’s commitment to open communications, the whistle-blower policy aims to provide an avenue for employees
to raise concerns and reassurance that they will be protected from reprisals or victimisation for whistle-blowing in
good faith. The AC reviewed the whistle-blower policy which provides for mechanisms by which employees may, in
confidence, raise their concerns about possible improprieties in financial reporting or other matters and was satisfied
that arrangements are in place for the independent investigation of such matters and for appropriate follow-up action.
The Chairman of the AC is the first contact for issues raised under this policy.
DEALINGS WITH CONFLICTS OF INTEREST
The Manager has instituted the following procedures to deal with potential conflicts of interest issues:
(a) The Manager will be a dedicated manager to PLife REIT and will not manage any other REIT which invests in the
same type of properties as PLife REIT.
(b) All resolutions in writing of the Board in relation to matters concerning PLife REIT must be approved by a majority
of the directors, including at least one independent director.
(c) At least one-third of the Board shall comprise independent directors.
(d) All related party transactions are reviewed by the AC. Where a related party transaction is subject to approval by
AC, majority approval of AC is required. If a member of the AC has an interest in a transaction, he or she will
abstain from voting.
(e) In respect of matters in which Parkway Holdings Limited, the sponsor of PLife REIT (“Sponsor”) and/or its subsidiaries
have an interest, direct or indirect, any nominees appointed by the Sponsor and/or its subsidiaries to the Board
to represent its/their interest will abstain from voting. In such matters, the quorum must comprise a majority of
the independent directors and must exclude the nominee directors of the Sponsor and/or its subsidiaries.
(f) In respect of matters in which a director or his associates have an interest, direct or indirect, such interested
director will abstain from voting. In such matters, the quorum must comprise a majority of the Board and must
exclude such interested director.
A N N U A L R E P O R T 2 0 1 8 73
CORPORATEGOVERNANCE
(g) Under the Trust Deed, the Manager and its associates are prohibited from being counted in a quorum for or voting
at any meeting of Unitholders convened to approve any matter in which the Manager or any of its associates has a
material interest. For so long as Parkway Trust Management Limited is the manager of PLife REIT, the controlling
shareholders (as defined in the Listing Manual) of the Manager and their respective associates are prohibited from
being counted in the quorum for or voting at any meeting of Unitholders convened to consider a matter in respect
of which the relevant controlling shareholders of Parkway Trust Management Limited and/or their associates have
a material interest.
(h) It is also provided in the Trust Deed that if the Manager is required to decide whether or not to take any action
against any person in relation to any breach of any agreement entered into by the Trustee for and on behalf of
PLife REIT with a related party of the Manager, the Manager shall be obliged to consult with a reputable law firm
(acceptable to the Trustee) which shall provide legal advice on the matter. If the said law firm is of the opinion
that the Trustee, on behalf of PLife REIT, has a prima facie case against the party allegedly in breach under such
agreement, the Manager shall be obliged to take appropriate action in relation to such agreement. The Board
(including its independent directors) will have a duty to ensure that the Manager so complies. Notwithstanding
the foregoing, the Manager shall inform the Trustee as soon as it becomes aware of any breach of any agreement
entered into by the Trustee for and on behalf of PLife REIT with a related party of the Manager and the Trustee
may take such action as it deems necessary to protect the rights of Unitholders and/or which is in the interests
of Unitholders. Any decision by the Manager not to take action against a related party of the Manager shall not
constitute a waiver of the Trustee’s right to take such action as it deems fit against such related party.
PLife REIT’s properties are located in Singapore, Japan and Malaysia and its strategy is to invest primarily in income-
producing real estate and/or real estate-related assets in the Asia-Pacific region (including Singapore) that are used
primarily for healthcare and/or healthcare-related purposes (including, but not limited to, hospitals, healthcare facilities
and real estate and/or real estate assets used in connection with healthcare research, education, and the manufacture
or storage of drugs, medicine and other healthcare goods and devices), whether wholly or partially owned, and whether
directly or indirectly held through the ownership of special purpose vehicles whose primary purpose is to own such
real estate. The Sponsor has interests in several healthcare and/or healthcare-related properties in the Asia-Pacific
region such as those located in Malaysia. Potential conflicts of interest between the Sponsor and PLife REIT may
arise in respect of acquisition and ownership of healthcare and/or healthcare-related assets in the Asia-Pacific region,
including Singapore where PLife REIT’s initial properties are located, and where PLife REIT’s investment strategy is
to invest in healthcare and/or healthcare-related properties located therein.
In order to mitigate any conflict of interest between the Sponsor and PLife REIT in the Asia-Pacific region, the AC
will, during the course of its review of transactions to be entered into by PLife REIT in the future, take into account
the expiry of the right of first refusal granted by the Sponsor, together with any other relevant factors that may arise
during the assessment process and arrive at its view based on all relevant factors. The existing internal control
systems on dealings with conflict of interest will be reviewed periodically to ascertain its effectiveness and suitability
and further measures will be considered and implemented to fine-tune the internal control procedures to deal with
potential conflicts of interest issues.
In addition, the nominee directors appointed by the Sponsor to the Board are committed not to disclose to the Sponsor
information concerning offers to PLife REIT in respect of potential acquisition of new properties as well as offers
made by PLife REIT in respect of the potential acquisition of new properties, save for properties which the nominee
directors are in a position to confirm that the Sponsor has no intention of acquiring.
The Manager has also established a conflict of interest policy for its employees to ensure that any conflict of interest
or potential conflicts of interest are disclosed and approvals are sought where required.
P A R K W A Y L I F E R E I T74
RELATED PARTY TRANSACTIONS
THE MANAGER’S INTERNAL CONTROL SYSTEM
The Manager has established an internal control system to ensure that all future related party transactions (which term
includes an “interested person transaction” as defined under the Listing Manual and an “interested party transaction”
under the Property Funds Appendix) will be undertaken on normal commercial terms and will not be prejudicial to
the interests of PLife REIT or the Unitholders. As a general rule, the Manager must demonstrate to the AC that such
transactions satisfy the foregoing criteria, which may entail obtaining (where practicable) quotations from parties
unrelated to the Manager, or obtaining one or more valuations from independent professionals valuers (in accordance
with the Property Funds Appendix).
The Manager maintains a register to record all related party transactions which are entered into by PLife REIT and the
bases, including any quotations from unrelated parties and independent valuations obtained to support such bases,
on which they are entered. The Manager also incorporates into its internal audit plan a review of all related party
transactions entered into by PLife REIT. The AC reviews the internal audit reports at least twice a year to ascertain
that the guidelines and procedures established to monitor related party transactions have been complied with. In
addition, the Trustee will also have the right to review such audit report to ascertain that the Property Funds Appendix
have been complied with.
Further, the following procedures will be undertaken:
- transactions (either individually or as part of a series or if aggregated with other transactions involving the same
related party during the same financial year) below 3.0% of the value of PLife REIT’s net tangible assets will be
subject to review by the AC at regular intervals;
- transactions (either individually or as part of a series or if aggregated with other transactions involving the same
related party during the same financial year) equal to or exceeding 3.0% but below 5.0% of the value of PLife
REIT’s net tangible assets will be subject to the review and prior approval of the AC. Such approval shall only be
given if the transactions are on normal commercial terms and are consistent with similar types of transactions
made by the Trustee with third parties which are unrelated to the Manager; and
- transactions (either individually or as part of a series or if aggregated with other transactions involving the same
related party during the same financial year) equal to or exceeding 5.0% of the value of PLife REIT’s net tangible
assets will be reviewed and approved prior to such transactions being entered into, on the basis described in the
preceding paragraph, by the AC which may, as it deems fit, request advice on the transaction from independent
sources or advisers, including the obtaining of valuations from independent professional valuers. Further, under the
Listing Manual and the Property Funds Appendix, such transactions would have to be approved by the Unitholders
at a meeting of Unitholders.
Where matters concerning PLife REIT relate to transactions entered into or to be entered into by the Trustee for and on
behalf of PLife REIT with a related party of the Manager or PLife REIT, the Trustee is required to consider the terms
of such transactions to satisfy itself that such transactions are conducted on an arm’s length basis and on normal
commercial terms, are not prejudicial to the interests of PLife REIT or the Unitholders, and in accordance with all
applicable requirements under the Property Funds Appendix and/or the Listing Manual relating to the transaction
in question. Further, the Trustee has the ultimate discretion under the Trust Deed to decide whether or not to enter
into a transaction involving a related party of the Manager or PLife REIT. If the Trustee is to sign any contract with
a related party of the Manager or PLife REIT, the Trustee will review the contract to ensure that it complies with the
requirements relating to interested party transactions in the Property Funds Appendix (as may be amended from time
to time) and the provisions of the Listing Manual relating to interested person transactions (as may be amended from
time to time) as well as such other guidelines as may from time to time be prescribed by the MAS and the SGX-ST
to apply to REITs.
A N N U A L R E P O R T 2 0 1 8 75

CORPORATEGOVERNANCE
PLife REIT will, in compliance with Rule 905 of the Listing Manual, announce any interested person transaction if
such transaction, by itself or when aggregated with other interested person transactions entered into with the same
interested person during the same financial year, is 3.0% or more of PLife REIT’s latest audited net tangible assets.
The Manager also discloses in the Annual Report the aggregate value of the related party transactions entered during
the relevant financial year as required under the Listing Manual and the Property Funds Appendix. See page 173 of
this Annual Report for the disclosure.
ROLE OF THE AUDIT COMMITTEE FOR RELATED PARTY TRANSACTIONS
All related party transactions must be reviewed by the AC and where applicable, approved by a majority of the AC to
ensure compliance with the Manager’s internal control system and with the relevant provisions of the Listing Manual
as well as the Property Funds Appendix. The review will include the examination of the nature of the transactions and
its supporting documents or such other data deemed necessary to the AC.
CORPORATE GOVERNANCE REPORT
DISCLOSURE GUIDE
Guideline Questions How has the Company complied?
General (a) Has the Company complied with all the
principles and guidelines of the Code? If
not, please state the specific deviations
and the alternative corporate governance
practices adopted by the Company in lieu
of the recommendations in the Code.
(a) Please refer to the disclosures in this table
for specific deviations from the Code.
(b) In what respect do these alternative corporate
governance practices achieve the objectives of
the principles and conform to the guidelines
in the Code?
(b) As Parkway Life Real Estate Investment
Trust (“PLife REIT”) is externally managed
by the Manager which is not a listed entity,
alternative corporate governance practices
is adopted to the extent applicable to the
Manager.
Board Responsibility
Guideline 1.5 What are the types of material transactions which
require approval from the Board?
Yes, please refer to the disclosure on page 60
of the Corporate Governance Statement (“CG
Statement”).
Members of the Board
Guideline 2.6 (a) What is the Board’s policy with regard to
diversity in identifying director nominees?
(a) Yes, please refer to the disclosure on page
62 of the CG Statement.
(b) Please state whether the current composition
of the Board provides diversity on each of the
following – skills, experience, gender and
knowledge of the Company, and elaborate
with numerical data where appropriate.
(b) Yes, please refer to the disclosure on page
63 of the CG Statement.
(c) What steps has the Board taken to achieve the
balance and diversity necessary to maximize
its effectiveness?
(c) Yes, please refer to the disclosure on page
63 of the CG Statement.
P A R K W A Y L I F E R E I T76
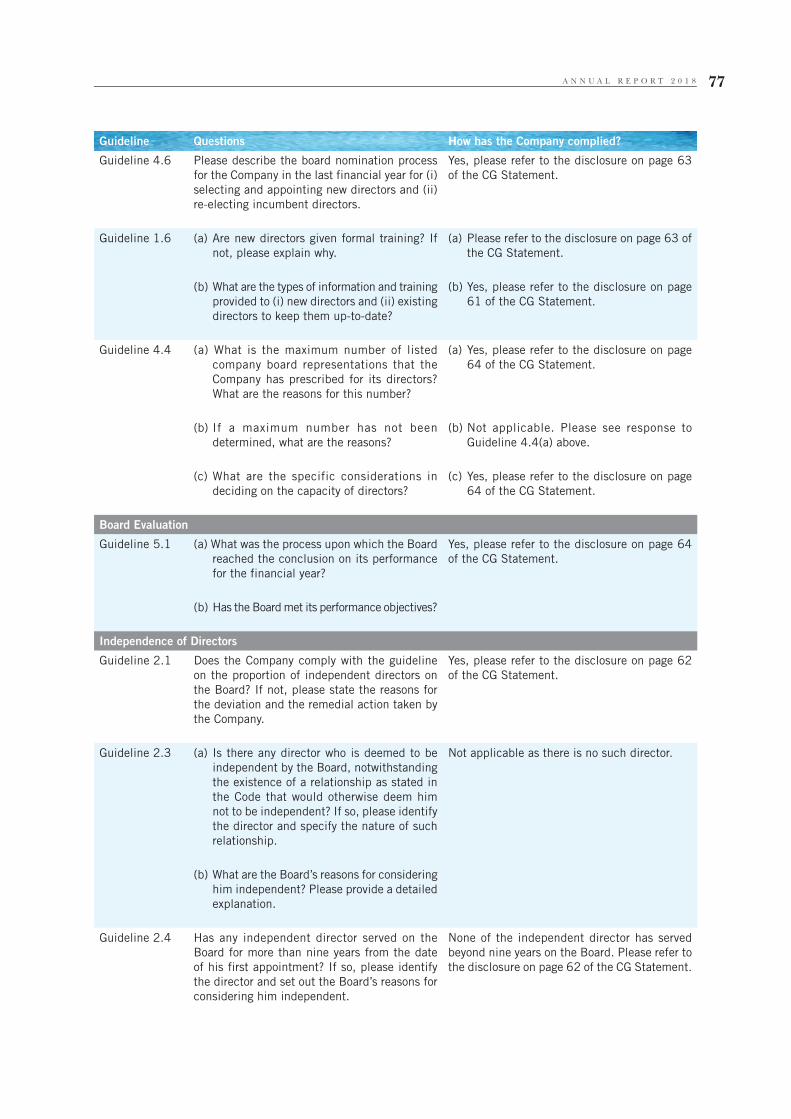
Guideline Questions How has the Company complied?
Guideline 4.6 Please describe the board nomination process
for the Company in the last financial year for (i)
selecting and appointing new directors and (ii)
re-electing incumbent directors.
Yes, please refer to the disclosure on page 63
of the CG Statement.
Guideline 1.6 (a) Are new directors given formal training? If
not, please explain why.
(a) Please refer to the disclosure on page 63 of
the CG Statement.
(b) What are the types of information and training
provided to (i) new directors and (ii) existing
directors to keep them up-to-date?
(b) Yes, please refer to the disclosure on page
61 of the CG Statement.
Guideline 4.4 (a) What is the maximum number of listed
company board representations that the
Company has prescribed for its directors?
What are the reasons for this number?
(a) Yes, please refer to the disclosure on page
64 of the CG Statement.
(b) If a maximum number has not been
determined, what are the reasons?
(b) Not applicable. Please see response to
Guideline 4.4(a) above.
(c) What are the specific considerations in
deciding on the capacity of directors?
(c) Yes, please refer to the disclosure on page
64 of the CG Statement.
Board Evaluation
Guideline 5.1 (a) What was the process upon which the Board
reached the conclusion on its performance
for the financial year?
Yes, please refer to the disclosure on page 64
of the CG Statement.
(b) Has the Board met its performance objectives?
Independence of Directors
Guideline 2.1 Does the Company comply with the guideline
on the proportion of independent directors on
the Board? If not, please state the reasons for
the deviation and the remedial action taken by
the Company.
Yes, please refer to the disclosure on page 62
of the CG Statement.
Guideline 2.3 (a) Is there any director who is deemed to be
independent by the Board, notwithstanding
the existence of a relationship as stated in
the Code that would otherwise deem him
not to be independent? If so, please identify
the director and specify the nature of such
relationship.
Not applicable as there is no such director.
(b) What are the Board’s reasons for considering
him independent? Please provide a detailed
explanation.
Guideline 2.4 Has any independent director served on the
Board for more than nine years from the date
of his first appointment? If so, please identify
the director and set out the Board’s reasons for
considering him independent.
None of the independent director has served
beyond nine years on the Board. Please refer to
the disclosure on page 62 of the CG Statement.
A N N U A L R E P O R T 2 0 1 8 77
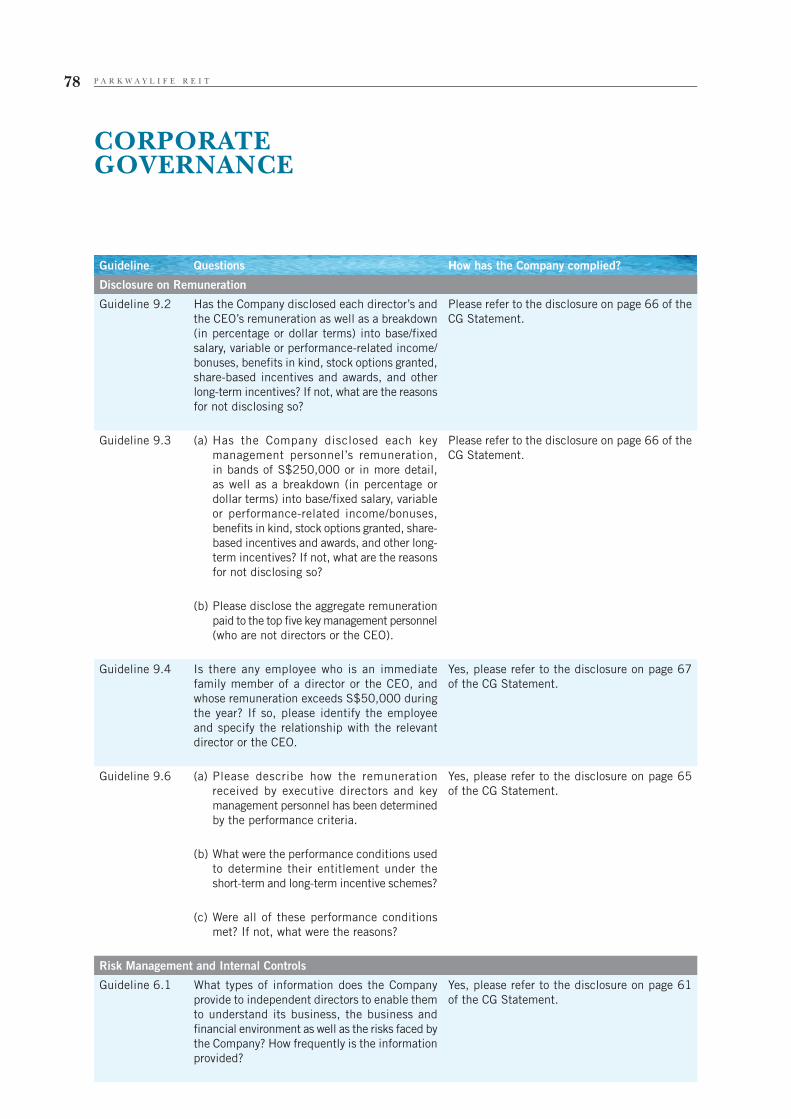
CORPORATEGOVERNANCE
Guideline Questions How has the Company complied?
Disclosure on Remuneration
Guideline 9.2 Has the Company disclosed each director’s and
the CEO’s remuneration as well as a breakdown
(in percentage or dollar terms) into base/fixed
salary, variable or performance-related income/
bonuses, benefits in kind, stock options granted,
share-based incentives and awards, and other
long-term incentives? If not, what are the reasons
for not disclosing so?
Please refer to the disclosure on page 66 of the
CG Statement.
Guideline 9.3 (a) Has the Company disclosed each key
management personnel’s remuneration,
in bands of S$250,000 or in more detail,
as well as a breakdown (in percentage or
dollar terms) into base/fixed salary, variable
or performance-related income/bonuses,
benefits in kind, stock options granted, share-
based incentives and awards, and other long-
term incentives? If not, what are the reasons
for not disclosing so?
Please refer to the disclosure on page 66 of the
CG Statement.
(b) Please disclose the aggregate remuneration
paid to the top five key management personnel
(who are not directors or the CEO).
Guideline 9.4 Is there any employee who is an immediate
family member of a director or the CEO, and
whose remuneration exceeds S$50,000 during
the year? If so, please identify the employee
and specify the relationship with the relevant
director or the CEO.
Yes, please refer to the disclosure on page 67
of the CG Statement.
Guideline 9.6 (a) Please describe how the remuneration
received by executive directors and key
management personnel has been determined
by the performance criteria.
Yes, please refer to the disclosure on page 65
of the CG Statement.
(b) What were the performance conditions used
to determine their entitlement under the
short-term and long-term incentive schemes?
(c) Were all of these performance conditions
met? If not, what were the reasons?
Risk Management and Internal Controls
Guideline 6.1 What types of information does the Company
provide to independent directors to enable them
to understand its business, the business and
financial environment as well as the risks faced by
the Company? How frequently is the information
provided?
Yes, please refer to the disclosure on page 61
of the CG Statement.
P A R K W A Y L I F E R E I T78
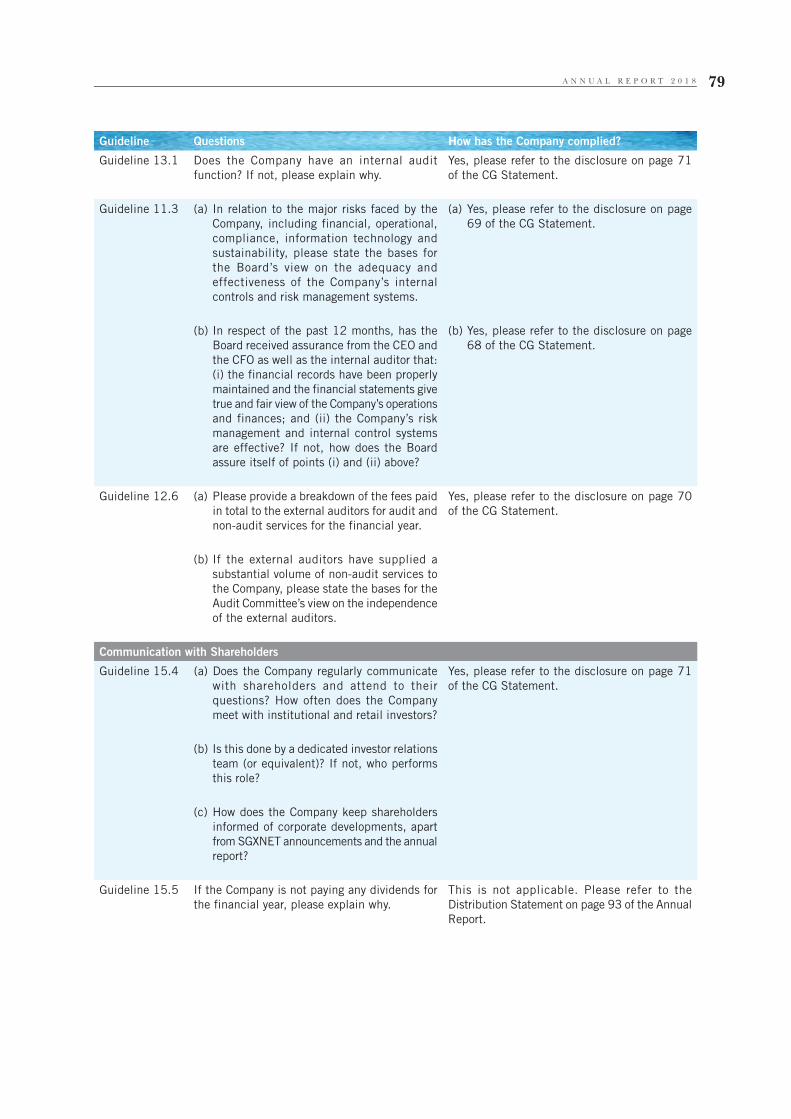
Guideline Questions How has the Company complied?
Guideline 13.1 Does the Company have an internal audit
function? If not, please explain why.
Yes, please refer to the disclosure on page 71
of the CG Statement.
Guideline 11.3 (a) In relation to the major risks faced by the
Company, including financial, operational,
compliance, information technology and
sustainability, please state the bases for
the Board’s view on the adequacy and
effectiveness of the Company’s internal
controls and risk management systems.
(a) Yes, please refer to the disclosure on page
69 of the CG Statement.
(b) In respect of the past 12 months, has the
Board received assurance from the CEO and
the CFO as well as the internal auditor that:
(i) the financial records have been properly
maintained and the financial statements give
true and fair view of the Company’s operations
and finances; and (ii) the Company’s risk
management and internal control systems
are effective? If not, how does the Board
assure itself of points (i) and (ii) above?
(b) Yes, please refer to the disclosure on page
68 of the CG Statement.
Guideline 12.6 (a) Please provide a breakdown of the fees paid
in total to the external auditors for audit and
non-audit services for the financial year.
Yes, please refer to the disclosure on page 70
of the CG Statement.
(b) If the external auditors have supplied a
substantial volume of non-audit services to
the Company, please state the bases for the
Audit Committee’s view on the independence
of the external auditors.
Communication with Shareholders
Guideline 15.4 (a) Does the Company regularly communicate
with shareholders and attend to their
questions? How often does the Company
meet with institutional and retail investors?
Yes, please refer to the disclosure on page 71
of the CG Statement.
(b) Is this done by a dedicated investor relations
team (or equivalent)? If not, who performs
this role?
(c) How does the Company keep shareholders
informed of corporate developments, apart
from SGXNET announcements and the annual
report?
Guideline 15.5 If the Company is not paying any dividends for
the financial year, please explain why.
This is not applicable. Please refer to the
Distribution Statement on page 93 of the Annual
Report.
A N N U A L R E P O R T 2 0 1 8 79
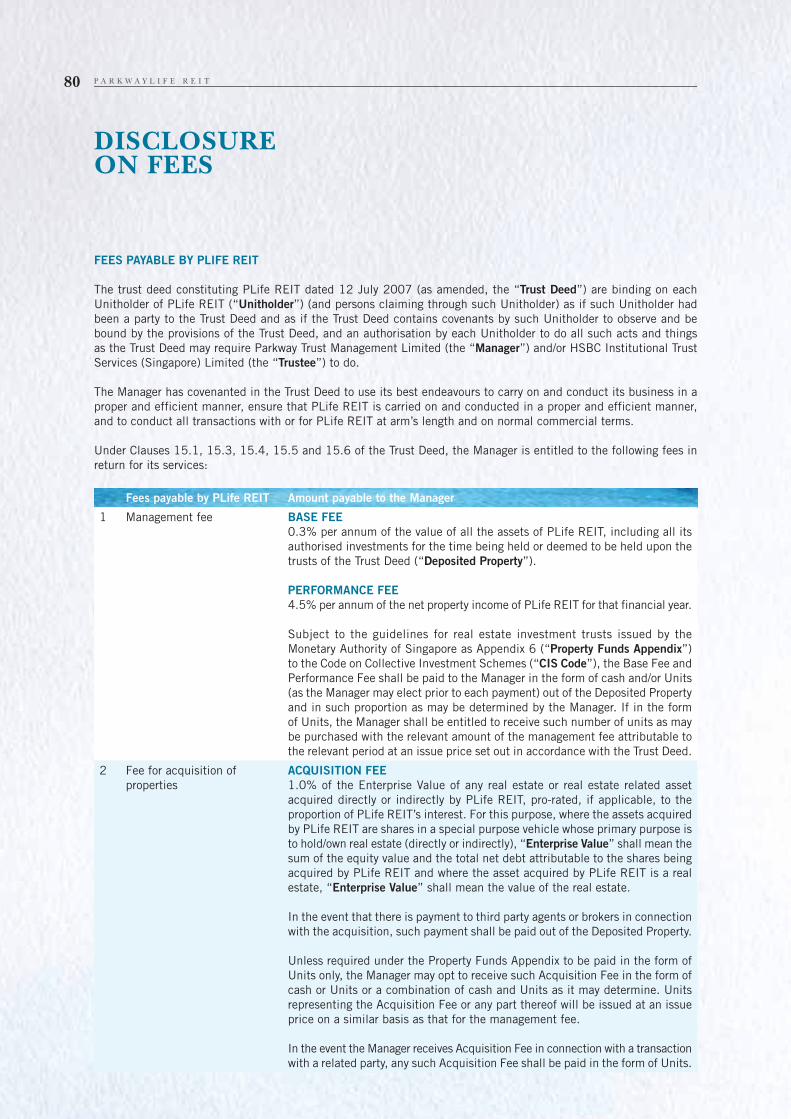
DISCLOSUREON FEES
FEES PAYABLE BY PLIFE REIT
The trust deed constituting PLife REIT dated 12 July 2007 (as amended, the “Trust Deed”) are binding on each
Unitholder of PLife REIT (“Unitholder”) (and persons claiming through such Unitholder) as if such Unitholder had
been a party to the Trust Deed and as if the Trust Deed contains covenants by such Unitholder to observe and be
bound by the provisions of the Trust Deed, and an authorisation by each Unitholder to do all such acts and things
as the Trust Deed may require Parkway Trust Management Limited (the “Manager”) and/or HSBC Institutional Trust
Services (Singapore) Limited (the “Trustee”) to do.
The Manager has covenanted in the Trust Deed to use its best endeavours to carry on and conduct its business in a
proper and efficient manner, ensure that PLife REIT is carried on and conducted in a proper and efficient manner,
and to conduct all transactions with or for PLife REIT at arm’s length and on normal commercial terms.
Under Clauses 15.1, 15.3, 15.4, 15.5 and 15.6 of the Trust Deed, the Manager is entitled to the following fees in
return for its services:
Fees payable by PLife REIT Amount payable to the Manager
1 Management fee BASE FEE
0.3% per annum of the value of all the assets of PLife REIT, including all its
authorised investments for the time being held or deemed to be held upon the
trusts of the Trust Deed (“Deposited Property”).
PERFORMANCE FEE
4.5% per annum of the net property income of PLife REIT for that financial year.
Subject to the guidelines for real estate investment trusts issued by the
Monetary Authority of Singapore as Appendix 6 (“Property Funds Appendix”)
to the Code on Collective Investment Schemes (“CIS Code”), the Base Fee and
Performance Fee shall be paid to the Manager in the form of cash and/or Units
(as the Manager may elect prior to each payment) out of the Deposited Property
and in such proportion as may be determined by the Manager. If in the form
of Units, the Manager shall be entitled to receive such number of units as may
be purchased with the relevant amount of the management fee attributable to
the relevant period at an issue price set out in accordance with the Trust Deed.
2 Fee for acquisition of
properties
ACQUISITION FEE
1.0% of the Enterprise Value of any real estate or real estate related asset
acquired directly or indirectly by PLife REIT, pro-rated, if applicable, to the
proportion of PLife REIT’s interest. For this purpose, where the assets acquired
by PLife REIT are shares in a special purpose vehicle whose primary purpose is
to hold/own real estate (directly or indirectly), “Enterprise Value” shall mean the
sum of the equity value and the total net debt attributable to the shares being
acquired by PLife REIT and where the asset acquired by PLife REIT is a real
estate, “Enterprise Value” shall mean the value of the real estate.
In the event that there is payment to third party agents or brokers in connection
with the acquisition, such payment shall be paid out of the Deposited Property.
Unless required under the Property Funds Appendix to be paid in the form of
Units only, the Manager may opt to receive such Acquisition Fee in the form of
cash or Units or a combination of cash and Units as it may determine. Units
representing the Acquisition Fee or any part thereof will be issued at an issue
price on a similar basis as that for the management fee.
In the event the Manager receives Acquisition Fee in connection with a transaction
with a related party, any such Acquisition Fee shall be paid in the form of Units.
P A R K W A Y L I F E R E I T80
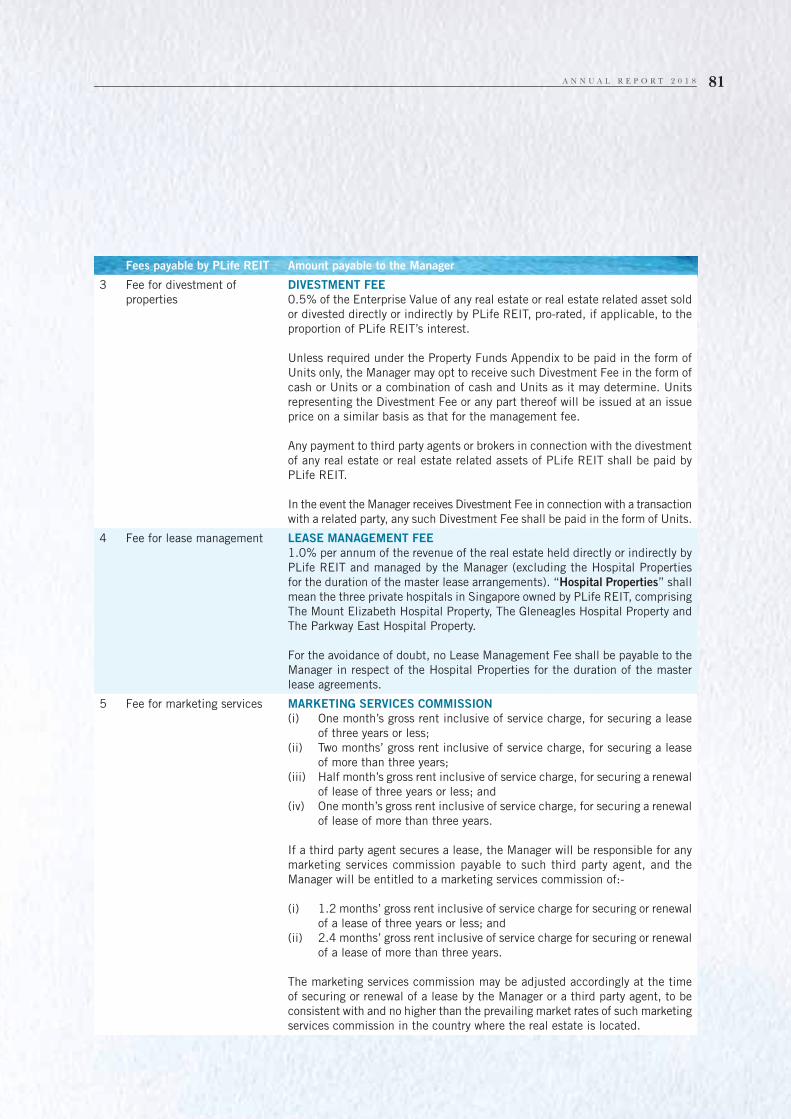
Fees payable by PLife REIT Amount payable to the Manager
3 Fee for divestment of
properties
DIVESTMENT FEE
0.5% of the Enterprise Value of any real estate or real estate related asset sold
or divested directly or indirectly by PLife REIT, pro-rated, if applicable, to the
proportion of PLife REIT’s interest.
Unless required under the Property Funds Appendix to be paid in the form of
Units only, the Manager may opt to receive such Divestment Fee in the form of
cash or Units or a combination of cash and Units as it may determine. Units
representing the Divestment Fee or any part thereof will be issued at an issue
price on a similar basis as that for the management fee.
Any payment to third party agents or brokers in connection with the divestment
of any real estate or real estate related assets of PLife REIT shall be paid by
PLife REIT.
In the event the Manager receives Divestment Fee in connection with a transaction
with a related party, any such Divestment Fee shall be paid in the form of Units.
4 Fee for lease management LEASE MANAGEMENT FEE
1.0% per annum of the revenue of the real estate held directly or indirectly by
PLife REIT and managed by the Manager (excluding the Hospital Properties
for the duration of the master lease arrangements). “Hospital Properties” shall
mean the three private hospitals in Singapore owned by PLife REIT, comprising
The Mount Elizabeth Hospital Property, The Gleneagles Hospital Property and
The Parkway East Hospital Property.
For the avoidance of doubt, no Lease Management Fee shall be payable to the
Manager in respect of the Hospital Properties for the duration of the master
lease agreements.
5 Fee for marketing services MARKETING SERVICES COMMISSION
(i) One month’s gross rent inclusive of service charge, for securing a lease
of three years or less;
(ii) Two months’ gross rent inclusive of service charge, for securing a lease
of more than three years;
(iii) Half month’s gross rent inclusive of service charge, for securing a renewal
of lease of three years or less; and
(iv) One month’s gross rent inclusive of service charge, for securing a renewal
of lease of more than three years.
If a third party agent secures a lease, the Manager will be responsible for any
marketing services commission payable to such third party agent, and the
Manager will be entitled to a marketing services commission of:-
(i) 1.2 months’ gross rent inclusive of service charge for securing or renewal
of a lease of three years or less; and
(ii) 2.4 months’ gross rent inclusive of service charge for securing or renewal
of a lease of more than three years.
The marketing services commission may be adjusted accordingly at the time
of securing or renewal of a lease by the Manager or a third party agent, to be
consistent with and no higher than the prevailing market rates of such marketing
services commission in the country where the real estate is located.
A N N U A L R E P O R T 2 0 1 8 81

DISCLOSUREON FEES
The Manager is of the view that the fee structure of PLife REIT promotes alignment of interests between the Manager
and the long-term interests of Unitholders. The rationale for each fee component is elaborated upon below:
BASE FEE
As an external manager, the Manager manages the assets and liabilities of PLife REIT for the benefit of its Unitholders
and should be fairly compensated for conducting the overall management of PLife REIT’s various affairs, which includes,
among others, formulation of business plans, execution of PLife REIT’s strategies, performing data analytics, monitoring
operating costs, evaluating asset enhancement initiatives and investment opportunities. Another key responsibility
is ensuring that PLife REIT complies with the applicable provisions of the Securities and Futures Act, Chapter 289
of Singapore (“SFA”) and all other relevant laws and regulations, such as the listing manual of Singapore Exchange
Securities Trading Limited (“Listing Manual”), the CIS Code (including the Property Funds Appendix), the Trust Deed,
the tax ruling issued by Inland Revenue Authority of Singapore on the taxation of PLife REIT and its Unitholders and
all relevant contracts entered on behalf of PLife REIT. The Base Fee compensates the Manager for establishing a core
team of representatives who are appointed in accordance with the SFA to execute its responsibilities as manager of
a real estate investment trust.
The Base Fee is linked to the value of all the assets of PLife REIT as the complexity and scope of work is commensurate
to the size of PLife REIT’s portfolio. In the event that the portfolio of PLife REIT grows, the degree and complexity
of the Manager’s responsibilities will correspondingly increase and the Manager has to be amply remunerated. This
ensures that the Manager is able to dedicate its efforts to the growth of PLife REIT.
PERFORMANCE FEE
With effect from 1 January 2016, the Performance Fee in respect of every calendar year shall be paid in arrears, no
more frequent than once a year. The Performance Fee structure of PLife REIT will incentivise the Manager to seek
continuous growth opportunities and encourage the Manager to act in the interests of Unitholders by increasing the
rental income generated from the real estate held directly or indirectly by PLife REIT (the “Properties of PLife REIT”)
while reducing property level expenses. Accordingly, the Performance Fee incentivises the Manager to take a holistic
and double-pronged approach towards the management of PLife REIT to improve the operating performance of PLife
REIT so that the Manager may, together with Unitholders, enjoy a higher net property income.
Fees payable by PLife REIT Amount payable to the Manager
6 Fee for property
management
PROPERTY MANAGEMENT FEE
2.0% per annum of the revenue of the real estate held directly or indirectly by
PLife REIT and managed by the Manager (excluding the Hospital Properties
for the duration of the master lease agreements).
For the avoidance of doubt, no Property Management Fee shall be payable to
the Manager in respect of the Hospital Properties for the duration of the master
lease agreements.
P A R K W A Y L I F E R E I T82
ACQUISITION FEE AND DIVESTMENT FEE
The Acquisition Fee and Divestment Fee are structured in order to incentivise the Manager to source for inorganic growth,
as well as to realise mature assets where suitable in the interests of Unitholders, in accordance with the acquisition
growth and active asset management strategies of PLife REIT. Bearing in mind that the Manager has to undertake
an extensive scope of work over and above the overall management of PLife REIT when undertaking acquisition or
divestment opportunities (including but not limited to compliance with the applicable laws, rules and regulations
relating to the acquisition or divestment, exploring shortlisting and monitoring investment opportunities, conduct of
due diligence, evaluation and in depth assessment of the acquisition or divestment opportunity, negotiations with
counterparties, conduct of board meetings and as the case may be, preparation of circulars and announcements), the
Manager should be compensated fairly to reflect the effort expended and the costs incurred during such undertakings.
It should be noted that the Acquisition Fee and Divestment Fee are only payable where the acquisition or divestment
has been successfully completed.
LEASE MANAGEMENT FEE
The Manager is entitled to lease management fee for provision of lease management services to the Properties of PLife
REIT (excluding the Hospital Properties for the duration of the master lease agreements) which includes coordinating
tenant’s fitting-out requirements, administration of rental collection, management of rental arrears and administration
of all property tax matters. In consideration for the provision of such lease management services, the Manager should
be entitled to fair remuneration. For avoidance of doubt, the Manager does not earn any lease management fee for the
Properties of PLife REIT located in Japan whereby the related services are carried out by the Japan asset managers
under the Tokumei Kumiai (“TK”) structure. The Manager has also excluded the Hospital Properties for the duration
of the master lease agreements to avoid any double counting of fees.
MARKETING SERVICES COMMISSION
The Marketing Services Commission is structured to incentivise the Manager to secure longer term leases which in
turn provides stability in the income stream of PLife REIT. Accordingly, the Manager is entitled to a higher commission
where the term of the lease is longer than three years. Higher commissions are payable for securing leases with new
tenants as compared to renewals of existing leases due to the increased effort which has to be expended by the Manager
to market, source for, attract and negotiate with new tenants. The Marketing Services Commission payable to the
Manager if a third party agent secures a lease is higher to take into account the Manager’s expenses as the Manager is
responsible for paying such third party agent. The Manager has to liaise, instruct and oversee the marketing activities
of such third party agent and should be fairly compensated for its efforts. The Marketing Services Commission will
serve to ensure that the Manager secures leases in the interests of PLife REIT and Unitholders.
PROPERTY MANAGEMENT FEE
The Manager is entitled to the property management fee for provision of property management services to the Properties
of PLife REIT (excluding the Hospital Properties for the duration of the master lease agreements). Generally, when
providing property management services, the Manager has to ensure compliance with the local regulations, manage
relations with many counterparties, and constantly review and assess the Properties of PLife REIT to ensure that there
is minimal disruption to existing operations. The Manager has to co-ordinate and plan to manage the Properties of
PLife REIT and also ensure that Properties of PLife REIT are well-managed so as to maximise returns for Unitholders.
In return for providing property management services which are beyond the ordinary scope of the Manager’s overall
management services, the Manager should be compensated fairly for its expertise. In addition, the Property Management
Fee has been structured so that the Manager is incentivised to improve the performance of the Properties of PLife REIT
managed by the Manager as these fees are pegged to the gross revenue of the real estate. For avoidance of doubt, the
Manager does not earn any property management fee for the Properties of PLife REIT located in Japan whereby the
related services are carried out by the Japan asset managers under the TK structure. The Manager has also excluded
the Hospital Properties for the duration of the master lease agreements to avoid any double counting of fees.
A N N U A L R E P O R T 2 0 1 8 83

CONTENTS
85 Report of the Trustee86 Statement by the Manager87 Independent Auditors’ Report91 Statements of Financial Position92 Statements of Total Return93 Distribution Statements95 Statements of Movements in
Unitholders’ Funds
96 Portfolio Statements108 Consolidated Statement of Cash
Flows110 Notes to the Financial Statements173 Additional Information174 Statistics of Unitholdings177 Notice of Annual General Meeting Proxy Form
A N N U A L R E P O R T 2 0 1 8 85
HSBC Institutional Trust Services (Singapore) Limited (the “Trustee”) is under a duty to take into custody and hold the assets of Parkway Life Real Estate Investment Trust (the “Trust”) and its subsidiaries (the “Group”) in trust for the holders (“Unitholders”) of units in the Trust (the “Units”). In accordance with the Securities and Futures Act (Cap. 289) of Singapore, its subsidiary legislation and the Code on Collective Investment Scheme, the Trustee shall monitor the activities of Parkway Trust Management Limited (the “Manager”) for compliance with the limitations imposed on the investment and borrowing powers as set out in the trust deed dated 12 July 2007 (as amended by the First Supplemental Deed dated 12 November 2009, the Second Supplemental Deed dated 30 March 2010 and the Third Supplemental Deed dated 31 March 2016) (the “Trust Deed”), between the Trustee and the Manager in each annual accounting period and report thereon to Unitholders in an annual report.
To the best knowledge of the Trustee, the Manager has, in all material respects, managed the Trust during the year covered by these financial statements, set out on pages 91 to 172, in accordance with the limitations imposed on the investment and borrowing powers set out in the Trust Deed.
For and on behalf of the Trustee,HSBC Institutional Trust Services (Singapore) Limited
Authorised Signatory
20 March 2019
REPORT OF THE TRUSTEE
P A R K W A Y L I F E R E I T86
In the opinion of the directors of Parkway Trust Management Limited, the accompanying financial statements set out on pages 91 to 172 comprising the statements of financial position, statements of total return, distribution statements, statements of movements in Unitholders’ funds and portfolio statements of the Group and of the Trust, cash flow statement of the Group and a summary of significant accounting policies and other explanatory notes, are drawn up so as to present fairly, in all material respects, the financial position and the portfolio of Parkway Life Real Estate Investment Trust (the “Trust”) and its subsidiaries (the “Group”) and of the Trust as at 31 December 2018, the total returns, distributable income, movements in Unitholders’ funds of the Group and the Trust and cash flows of the Group for the year then ended in accordance with the recommendations of Statement of Recommended Accounting Practice 7 “Reporting Framework for Unit Trusts” (RAP 7) issued by the Institute of Singapore Chartered Accountants and the provisions of the Trust Deed. At the date of this statement, there are reasonable grounds to believe that the Group and the Trust will be able to meet their financial obligations as and when they materialise.
For and on behalf of the Manager,Parkway Trust Management Limited
Yong Yean ChauDirector
20 March 2019
STATEMENT BY THE MANAGER
A N N U A L R E P O R T 2 0 1 8 87
UnitholdersParkway Life Real Estate Investment Trust
Constituted in the Republic of Singapore pursuant to the trust deed dated 12 July 2007 (as amended by the First Supplemental Deed dated 12 November 2009, the Second Supplemental Deed dated 30 March 2010 and the Third Supplemental Deed dated 31 March 2016)
Report on the audit of the financial statements
Opinion
We have audited the financial statements of Parkway Life Real Estate Investment Trust (the Trust) and its subsidiaries (the Group), which comprise the consolidated statement of financial position and consolidated portfolio statement of the Group and the statement of financial position and portfolio statement of the Trust as at 31 December 2018, the consolidated statement of total return, consolidated distribution statement, consolidated statement of movements in Unitholders’ funds and consolidated statement of cash flows of the Group and the statement of total return, distribution statement and statement of movements in Unitholders’ funds of the Trust for the year then ended, and notes to the financial statements, including a summary of significant accounting policies as set out on pages 91 to 172.
In our opinion, the accompanying consolidated financial statements of the Group and the statement of financial position, portfolio statement, statement of total return, distribution statement and statement of movements in Unitholders’ funds of the Trust present fairly, in all material respects, the consolidated financial position and the consolidated portfolio holdings of the Group and the financial position and the portfolio holdings of the Trust as at 31 December 2018 and the consolidated total return, consolidated distributable income, consolidated movements in Unitholders’ funds and consolidated cash flows of the Group and the total return, distributable income and movements in Unitholders’ funds of the Trust for the year then ended on that date in accordance with the recommendations of Statement of Recommended Accounting Practice 7 Reporting Framework for Unit Trusts (RAP 7) issued by the Institute of Singapore Chartered Accountants (ISCA).
Basis for opinion
We conducted our audit in accordance with Singapore Standards on Auditing (SSAs). Our responsibilities under those standards are further described in the ‘Auditors’ responsibilities for the audit of the financial statements’ section of our report. We are independent of the Group in accordance with the Accounting and Corporate Regulatory Authority Code of Professional Conduct and Ethics for Public Accountants and Accounting Entities (ACRA Code) together with the ethical requirements that are relevant to our audit of the financial statements in Singapore, and we have fulfilled our other ethical responsibilities in accordance with these requirements and the ACRA Code. We believe that the audit evidence we have obtained is sufficient and appropriate to provide a basis for our opinion.
Key audit matters
Key audit matters are those matters that, in our professional judgement, were of most significance in our audit of the financial statements of the current period. These matters were addressed in the context of our audit of the financial statements as a whole, and in forming our opinion thereon, and we do not provide a separate opinion on these matters.
INDEPENDENT AUDITORS’ REPORT

P A R K W A Y L I F E R E I T88
Valuation of investment properties (Refer to Portfolio Statements and Note 4 to the financial statements)
Risk
As at 31 December 2018, the Group has 50 properties (collectively “investment properties”). These investment properties are stated at their fair values, which amounted to $1.86 billion.
These investment properties are stated at their fair values based on independent external valuations.
The valuation of investment properties requires significant judgement in the determination of the appropriate valuation methodology and in deciding on the assumptions to be applied in the valuation. The valuations are sensitive to the key assumptions applied and a change in the assumptions could have a significant impact to the valuation.
Our response
We evaluated the capabilities, objectivity and competency of the valuers and held discussions with the valuers to understand their valuation methodologies and assumptions used.
We considered the valuation methodologies used against those applied by other valuers for similar property type. We challenged the key assumptions used in the valuation by comparing them against historical rates, market comparable and industry data, taking into consideration comparability and market factors.
Our findings
The valuers are members of recognised professional bodies for valuers and have considered their own independence in carrying out their work. The valuation methodologies used are in line with generally accepted market practices and the key assumptions applied are within the range of market data.
Other information
Parkway Trust Management Limited, the manager of the Trust (the Manager) is responsible for the other information contained in the annual report. Other information is defined as all information in the annual report other than the financial statements and our auditors’ report thereon.
We have obtained all other information prior to the date of this auditors’ report.
Our opinion on the financial statements does not cover the other information and we do not express any form of assurance conclusion thereon.
In connection with our audit of the financial statements, our responsibility is to read the other information identified above and, in doing so, consider whether the other information is materially inconsistent with the financial statements or our knowledge obtained in the audit, or otherwise appears to be materially misstated. If, based on the work we have performed, we conclude that there is a material misstatement of this other information, we are required to report that fact. We have nothing to report in this regard.
INDEPENDENT AUDITORS’ REPORT
A N N U A L R E P O R T 2 0 1 8 89
Responsibilities of the Manager for the financial statements
The Manager is responsible for the preparation and fair presentation of these financial statements in accordance with the recommendations of RAP 7 issued by the ISCA, and for such internal control as the Manager determines is necessary to enable the preparation of financial statements that are free from material misstatement, whether due to fraud or error.
In preparing the financial statements, the Manager is responsible for assessing the Group’s ability to continue as a going concern, disclosing, as applicable, matters related to going concern and using the going concern basis of accounting unless the Manager either intends to terminate the Group or to cease operations of the Group, or has no realistic alternative but to do so.
The Manager’s responsibilities include overseeing the Group’s financial reporting process.
Auditors’ responsibilities for the audit of the financial statements
Our objectives are to obtain reasonable assurance about whether the financial statements as a whole are free from material misstatement, whether due to fraud or error, and to issue an auditors’ report that includes our opinion. Reasonable assurance is a high level of assurance, but is not a guarantee that an audit conducted in accordance with SSAs will always detect a material misstatement when it exists. Misstatements can arise from fraud or error and are considered material if, individually or in the aggregate, they could reasonably be expected to influence the economic decisions of users taken on the basis of these financial statements.
As part of an audit in accordance with SSAs, we exercise professional judgement and maintain professional scepticism throughout the audit. We also:
• Identify andassess the risks ofmaterialmisstatement of the financial statements,whetherdue to fraudor error, design and perform audit procedures responsive to those risks, and obtain audit evidence that is sufficient and appropriate to provide a basis for our opinion. The risk of not detecting a material misstatement resulting from fraud is higher than for one resulting from error, as fraud may involve collusion, forgery, intentional omissions, misrepresentations, or the override of internal control.
• Obtainanunderstandingofinternalcontrolrelevanttotheauditinordertodesignauditproceduresthatareappropriate in the circumstances, but not for the purpose of expressing an opinion on the effectiveness of the Group’s internal control.
• Evaluatetheappropriatenessofaccountingpoliciesusedandthereasonablenessofaccountingestimatesandrelated disclosures made by the Manager.
• ConcludeontheappropriatenessoftheManager’suseofthegoingconcernbasisofaccountingand,basedon the audit evidence obtained, whether a material uncertainty exists related to events or conditions that may cast significant doubt on the Group’s ability to continue as a going concern. If we conclude that a material uncertainty exists, we are required to draw attention in our auditors’ report to the related disclosures in the financial statements or, if such disclosures are inadequate, to modify our opinion. Our conclusions are based on the audit evidence obtained up to the date of our auditors’ report. However, future events or conditions may cause the Group to cease to continue as a going concern.
INDEPENDENT AUDITORS’ REPORT
P A R K W A Y L I F E R E I T90
• Evaluatetheoverallpresentation,structureandcontentofthefinancialstatements,includingthedisclosures,and whether the financial statements represent the underlying transactions and events in a manner that achieves fair presentation.
• Obtainsufficientappropriateauditevidenceregardingthefinancialinformationoftheentitiesorbusinessactivities within the Group to express an opinion on the consolidated financial statements. We are responsible for the direction, supervision and performance of the group audit. We remain solely responsible for our audit opinion.
We communicate with the Manager regarding, among other matters, the planned scope and timing of the audit and significant audit findings, including any significant deficiencies in internal control that we identify during our audit.
We also provide the Manager with a statement that we have complied with relevant ethical requirements regarding independence, and to communicate with them all relationships and other matters that may reasonably be thought to bear on our independence, and where applicable, related safeguards.
From the matters communicated with the Manager, we determine those matters that were of most significance in the audit of the financial statements of the current period and are therefore the key audit matters. We describe these matters in our auditors’ report unless law or regulation precludes public disclosure about the matter or when, in extremely rare circumstances, we determine that a matter should not be communicated in our report because the adverse consequences of doing so would reasonably be expected to outweigh the public interest benefits of such communication.
The engagement partner on the audit resulting in this independent auditors’ report is Yap Wee Kee.
KPMG LLPPublic Accountants andChartered Accountants
Singapore20 March 2019
INDEPENDENT AUDITORS’ REPORT
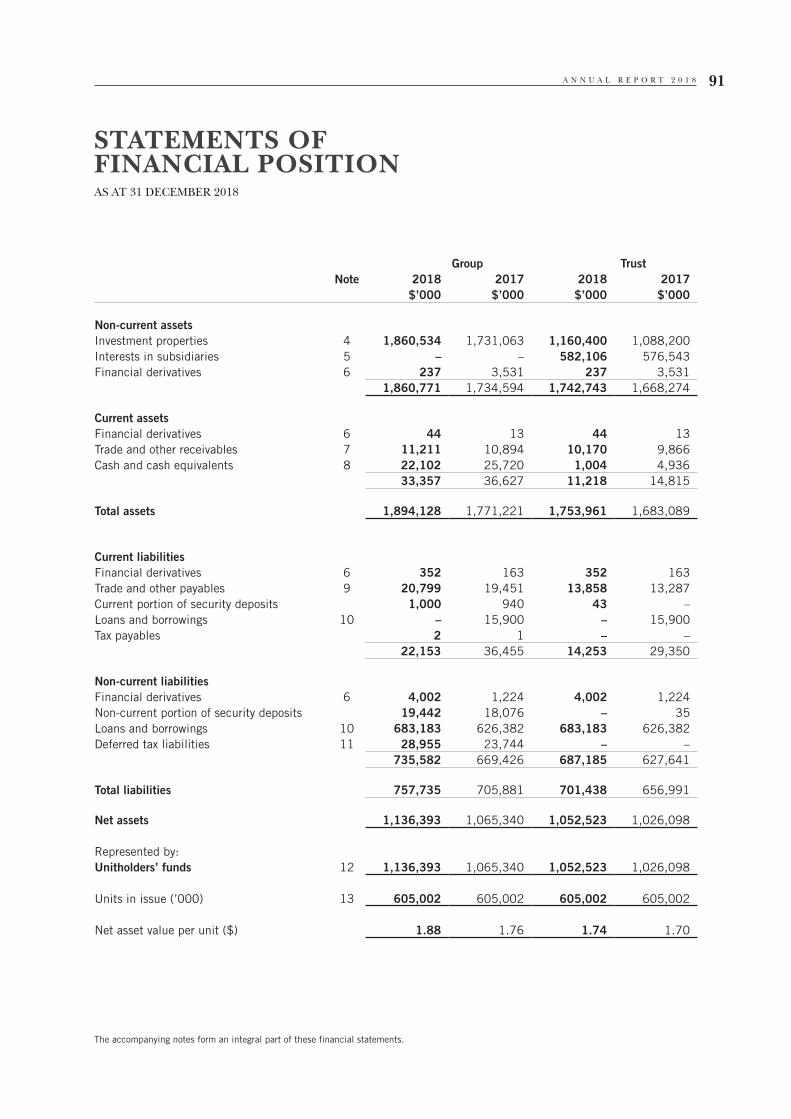
A N N U A L R E P O R T 2 0 1 8 91
Group TrustNote 2018 2017 2018 2017
$’000 $’000 $’000 $’000
Non-current assetsInvestment properties 4 1,860,534 1,731,063 1,160,400 1,088,200Interests in subsidiaries 5 – – 582,106 576,543Financial derivatives 6 237 3,531 237 3,531
1,860,771 1,734,594 1,742,743 1,668,274
Current assetsFinancial derivatives 6 44 13 44 13Trade and other receivables 7 11,211 10,894 10,170 9,866Cash and cash equivalents 8 22,102 25,720 1,004 4,936
33,357 36,627 11,218 14,815
Total assets 1,894,128 1,771,221 1,753,961 1,683,089
Current liabilitiesFinancial derivatives 6 352 163 352 163Trade and other payables 9 20,799 19,451 13,858 13,287Current portion of security deposits 1,000 940 43 –Loans and borrowings 10 – 15,900 – 15,900Tax payables 2 1 – –
22,153 36,455 14,253 29,350
Non-current liabilitiesFinancial derivatives 6 4,002 1,224 4,002 1,224Non-current portion of security deposits 19,442 18,076 – 35Loans and borrowings 10 683,183 626,382 683,183 626,382Deferred tax liabilities 11 28,955 23,744 – –
735,582 669,426 687,185 627,641
Total liabilities 757,735 705,881 701,438 656,991
Net assets 1,136,393 1,065,340 1,052,523 1,026,098
Represented by:Unitholders’ funds 12 1,136,393 1,065,340 1,052,523 1,026,098
Units in issue (’000) 13 605,002 605,002 605,002 605,002
Net asset value per unit ($) 1.88 1.76 1.74 1.70
STATEMENTS OF FINANCIAL POSITION AS AT 31 DECEMBER 2018
The accompanying notes form an integral part of these financial statements.

P A R K W A Y L I F E R E I T92
Group TrustNote 2018 2017 2018 2017
$’000 $’000 $’000 $’000
Gross revenue 14 112,838 109,881 85,298 91,199Property expenses 15 (7,434) (7,232) (3,118) (3,118)Net property income 105,404 102,649 82,180 88,081
Management fees 16 (11,402) (11,151) (10,186) (9,904)Trust expenses 17 (3,184) (3,086) (2,044) (2,212)Interest income 6 – – –Finance costs 18 (6,734) (7,952) (6,734) (7,952)Foreign exchange gain/(loss), net 991 1,583 (19,432) 20,979
(20,323) (20,606) (38,396) 911Total return before changes in fair value
of financial derivatives and investment properties 85,081 82,043 43,784 88,992
Net change in fair value of financial derivatives (2,256) 1,954 (7,653) 8,940
Net change in fair value of investment properties 4 77,888 25,970 67,339 26,789
Total return before income tax 160,713 109,967 103,470 124,721Income tax expense 19 (8,781) (8,503) – –Total return for the year 151,932 101,464 103,470 124,721
Earnings per unit (cents)
Basic and diluted 20 25.11 16.77 17.10 20.61
The accompanying notes form an integral part of these financial statements.
STATEMENTS OFTOTAL RETURNYEAR ENDED 31 DECEMBER 2018
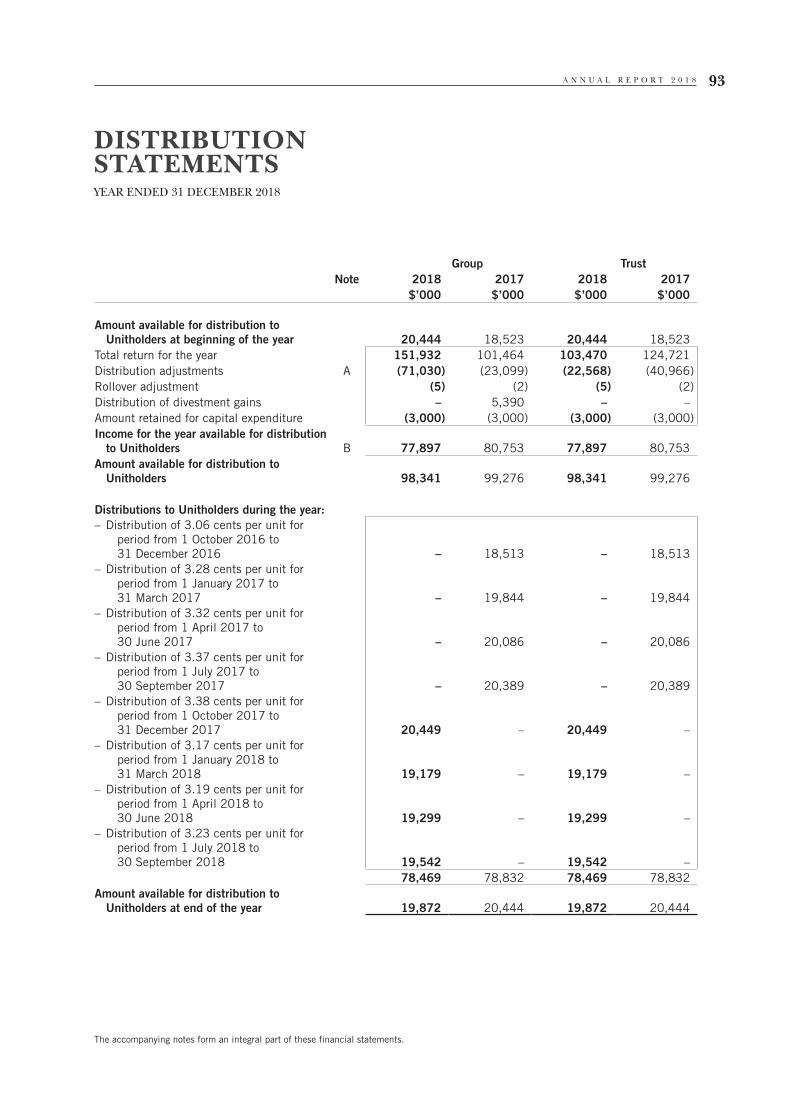
A N N U A L R E P O R T 2 0 1 8 93
Group TrustNote 2018 2017 2018 2017
$’000 $’000 $’000 $’000
Amount available for distribution to Unitholders at beginning of the year 20,444 18,523 20,444 18,523
Total return for the year 151,932 101,464 103,470 124,721Distribution adjustments A (71,030) (23,099) (22,568) (40,966)Rollover adjustment (5) (2) (5) (2)Distribution of divestment gains – 5,390 – –Amount retained for capital expenditure (3,000) (3,000) (3,000) (3,000)Income for the year available for distribution
to Unitholders B 77,897 80,753 77,897 80,753Amount available for distribution to
Unitholders 98,341 99,276 98,341 99,276
Distributions to Unitholders during the year:– Distribution of 3.06 cents per unit for
period from 1 October 2016 to 31 December 2016 – 18,513 – 18,513
– Distribution of 3.28 cents per unit for period from 1 January 2017 to 31 March 2017 – 19,844 – 19,844
– Distribution of 3.32 cents per unit for period from 1 April 2017 to 30 June 2017 – 20,086 – 20,086
– Distribution of 3.37 cents per unit for period from 1 July 2017 to 30 September 2017 – 20,389 – 20,389
– Distribution of 3.38 cents per unit for period from 1 October 2017 to 31 December 2017 20,449 – 20,449 –
– Distribution of 3.17 cents per unit for period from 1 January 2018 to 31 March 2018 19,179 – 19,179 –
– Distribution of 3.19 cents per unit for period from 1 April 2018 to 30 June 2018 19,299 – 19,299 –
– Distribution of 3.23 cents per unit for period from 1 July 2018 to 30 September 2018 19,542 – 19,542 –
78,469 78,832 78,469 78,832Amount available for distribution to
Unitholders at end of the year 19,872 20,444 19,872 20,444
The accompanying notes form an integral part of these financial statements.
DISTRIBUTION STATEMENTSYEAR ENDED 31 DECEMBER 2018
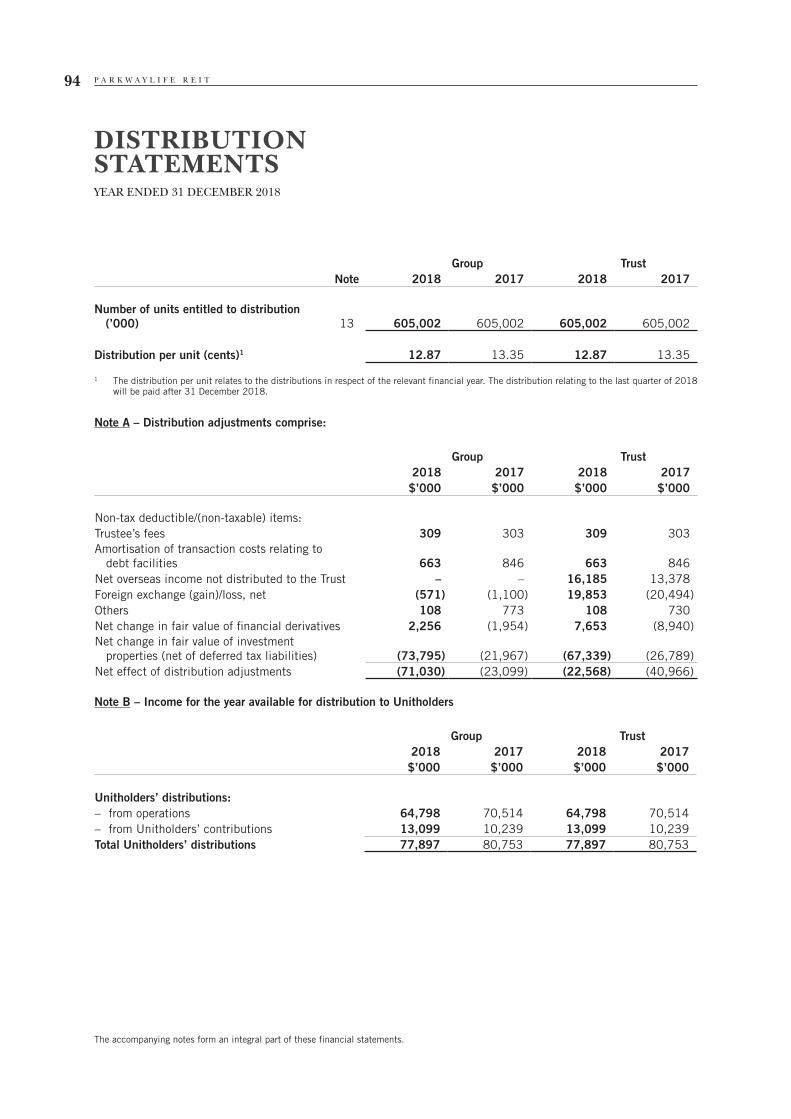
P A R K W A Y L I F E R E I T94
Group TrustNote 2018 2017 2018 2017
Number of units entitled to distribution (’000) 13 605,002 605,002 605,002 605,002
Distribution per unit (cents)1 12.87 13.35 12.87 13.35
1 The distribution per unit relates to the distributions in respect of the relevant financial year. The distribution relating to the last quarter of 2018 will be paid after 31 December 2018.
Note A – Distribution adjustments comprise:
Group Trust2018 2017 2018 2017$’000 $’000 $’000 $’000
Non-tax deductible/(non-taxable) items:Trustee’s fees 309 303 309 303Amortisation of transaction costs relating to
debt facilities 663 846 663 846Net overseas income not distributed to the Trust – – 16,185 13,378Foreign exchange (gain)/loss, net (571) (1,100) 19,853 (20,494)Others 108 773 108 730Net change in fair value of financial derivatives 2,256 (1,954) 7,653 (8,940)Net change in fair value of investment
properties (net of deferred tax liabilities) (73,795) (21,967) (67,339) (26,789)Net effect of distribution adjustments (71,030) (23,099) (22,568) (40,966)
Note B – Income for the year available for distribution to Unitholders
Group Trust2018 2017 2018 2017$’000 $’000 $’000 $’000
Unitholders’ distributions:– from operations 64,798 70,514 64,798 70,514– from Unitholders’ contributions 13,099 10,239 13,099 10,239Total Unitholders’ distributions 77,897 80,753 77,897 80,753
The accompanying notes form an integral part of these financial statements.
DISTRIBUTION STATEMENTSYEAR ENDED 31 DECEMBER 2018
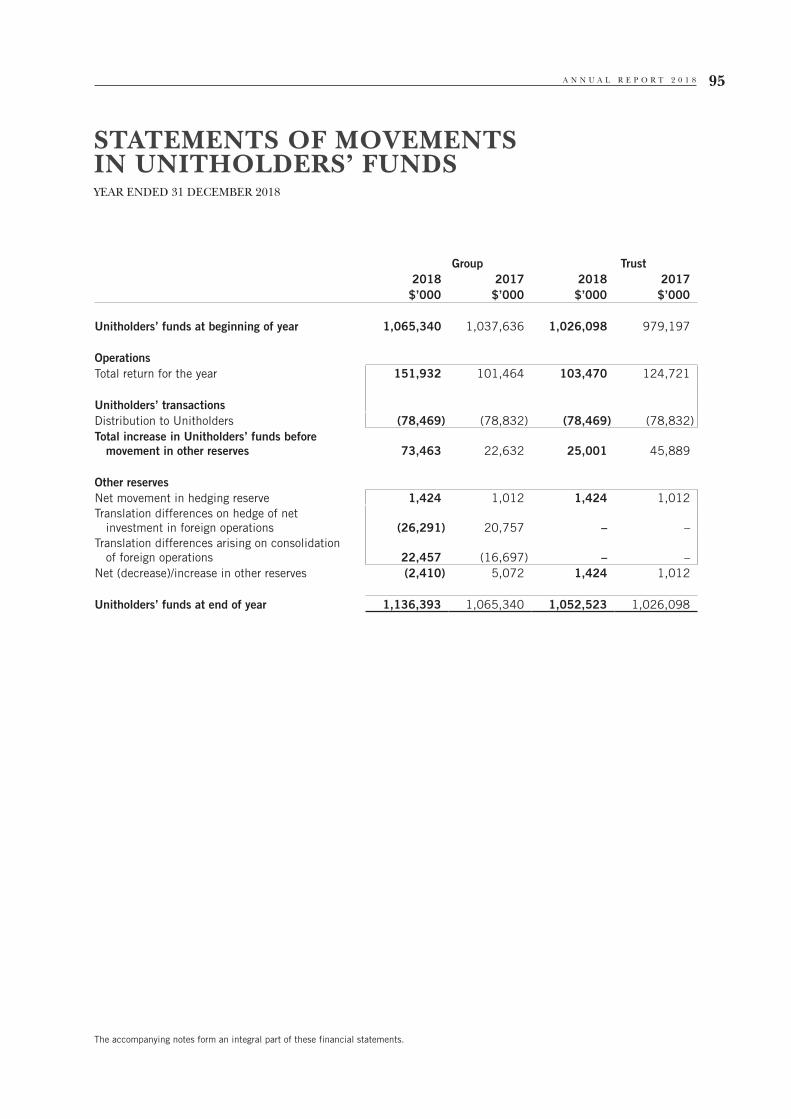
A N N U A L R E P O R T 2 0 1 8 95
Group Trust2018 2017 2018 2017$’000 $’000 $’000 $’000
Unitholders’ funds at beginning of year 1,065,340 1,037,636 1,026,098 979,197
OperationsTotal return for the year 151,932 101,464 103,470 124,721
Unitholders’ transactionsDistribution to Unitholders (78,469) (78,832) (78,469) (78,832)Total increase in Unitholders’ funds before
movement in other reserves 73,463 22,632 25,001 45,889
Other reservesNet movement in hedging reserve 1,424 1,012 1,424 1,012Translation differences on hedge of net
investment in foreign operations (26,291) 20,757 – –Translation differences arising on consolidation
of foreign operations 22,457 (16,697) – –Net (decrease)/increase in other reserves (2,410) 5,072 1,424 1,012
Unitholders’ funds at end of year 1,136,393 1,065,340 1,052,523 1,026,098
The accompanying notes form an integral part of these financial statements.
STATEMENTS OF MOVEMENTSIN UNITHOLDERS’ FUNDSYEAR ENDED 31 DECEMBER 2018
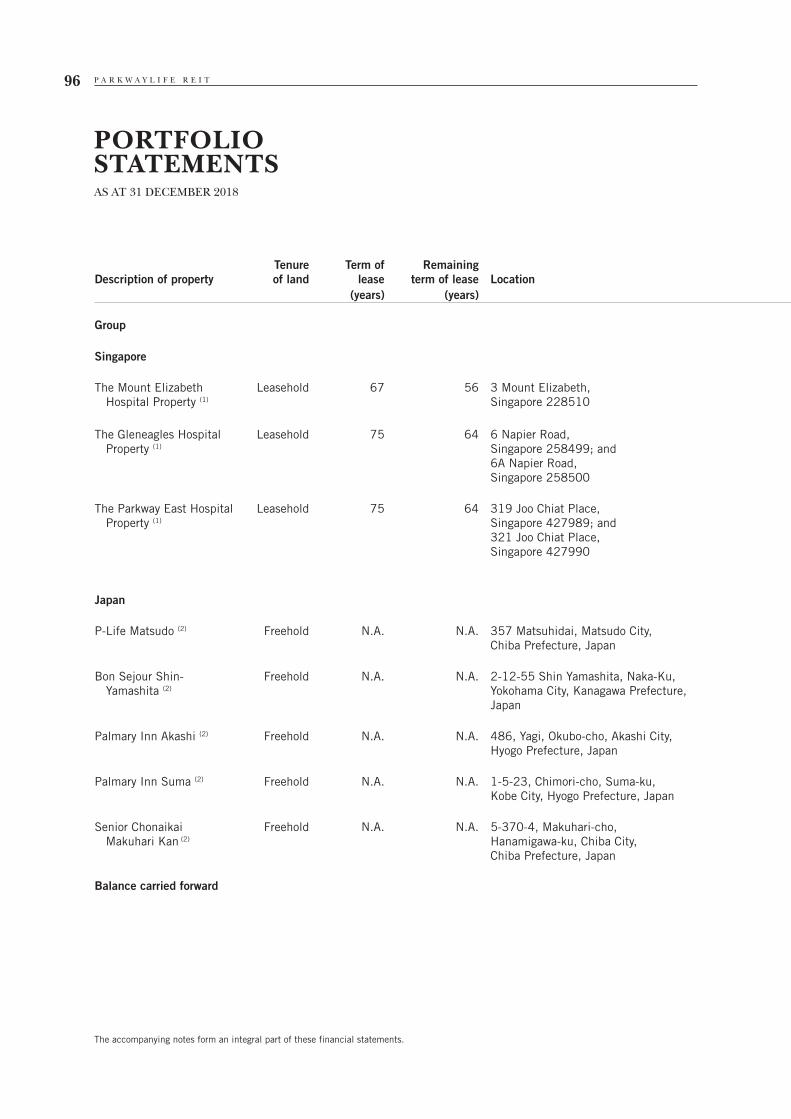
P A R K W A Y L I F E R E I T96
The accompanying notes form an integral part of these financial statements.
PORTFOLIO STATEMENTSAS AT 31 DECEMBER 2018
Description of propertyTenureof land
Term of lease
Remaining term of lease Location Existing use
At Valuation Percentage of Net Assets2018 2017 2018 2017
(years) (years) $’000 $’000 % %
Group
Singapore
The Mount Elizabeth Hospital Property (1)
Leasehold 67 56 3 Mount Elizabeth, Singapore 228510
Hospital and medical centre 718,700 675,500 63.2 63.4
The Gleneagles Hospital Property (1)
Leasehold 75 64 6 Napier Road, Singapore 258499; and 6A Napier Road,Singapore 258500
Hospital and medical centre 378,500 355,800 33.3 33.4
The Parkway East Hospital Property (1)
Leasehold 75 64 319 Joo Chiat Place, Singapore 427989; and 321 Joo Chiat Place, Singapore 427990
Hospital and medical centre 63,200 56,900 5.6 5.3
1,160,400 1,088,200 102.1 102.1
Japan
P-Life Matsudo (2) Freehold N.A. N.A. 357 Matsuhidai, Matsudo City, Chiba Prefecture, Japan
Pharmaceutical product distributing and manufacturing facility
29,388 27,776 2.6 2.6
Bon Sejour Shin-Yamashita (2)
Freehold N.A. N.A. 2-12-55 Shin Yamashita, Naka-Ku, Yokohama City, Kanagawa Prefecture, Japan
Nursing home with care service 20,460 18,873 1.8 1.8
Palmary Inn Akashi (2) Freehold N.A. N.A. 486, Yagi, Okubo-cho, Akashi City, Hyogo Prefecture, Japan
Nursing home with care service 21,948 20,654 1.9 1.9
Palmary Inn Suma (2) Freehold N.A. N.A. 1-5-23, Chimori-cho, Suma-ku, Kobe City, Hyogo Prefecture, Japan
Nursing home with care service 13,020 12,226 1.1 1.1
Senior Chonaikai Makuhari Kan (2)
Freehold N.A. N.A. 5-370-4, Makuhari-cho, Hanamigawa-ku, Chiba City, Chiba Prefecture, Japan
Nursing home with care service 22,444 21,247 2.0 2.0
Balance carried forward 107,260 100,776 9.4 9.4
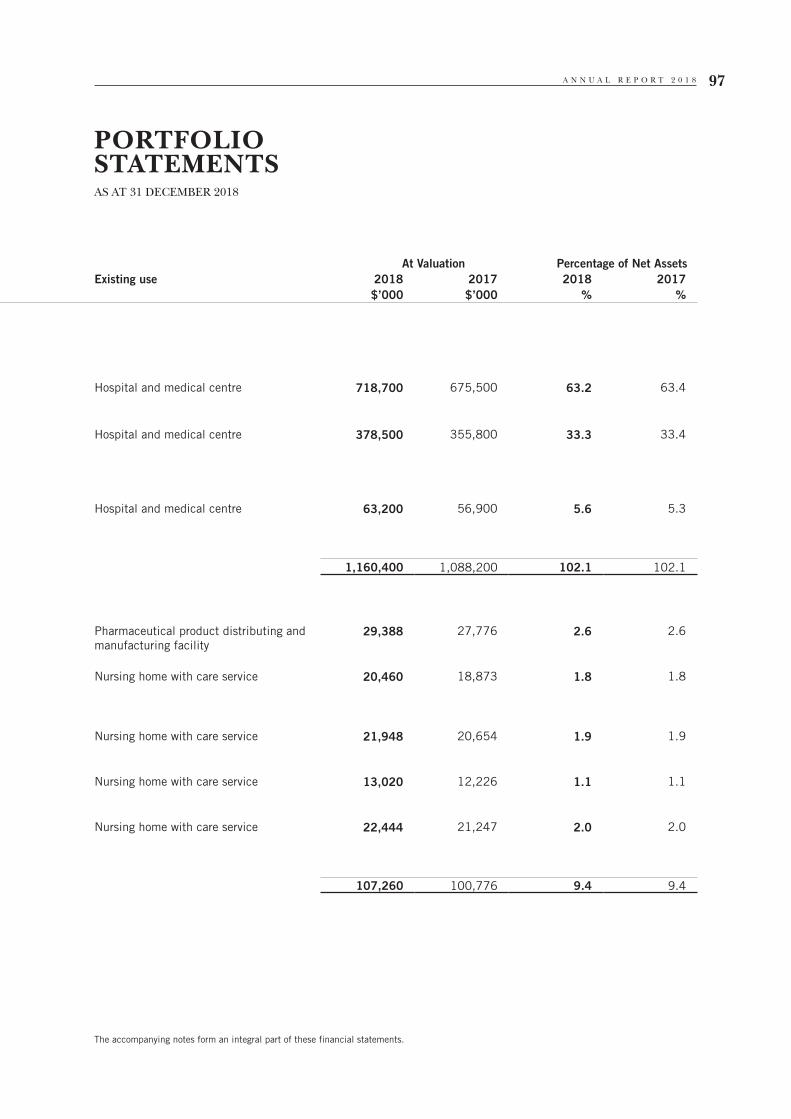
A N N U A L R E P O R T 2 0 1 8 97
The accompanying notes form an integral part of these financial statements.
PORTFOLIO STATEMENTSAS AT 31 DECEMBER 2018
Description of propertyTenureof land
Term of lease
Remaining term of lease Location Existing use
At Valuation Percentage of Net Assets2018 2017 2018 2017
(years) (years) $’000 $’000 % %
Group
Singapore
The Mount Elizabeth Hospital Property (1)
Leasehold 67 56 3 Mount Elizabeth, Singapore 228510
Hospital and medical centre 718,700 675,500 63.2 63.4
The Gleneagles Hospital Property (1)
Leasehold 75 64 6 Napier Road, Singapore 258499; and 6A Napier Road,Singapore 258500
Hospital and medical centre 378,500 355,800 33.3 33.4
The Parkway East Hospital Property (1)
Leasehold 75 64 319 Joo Chiat Place, Singapore 427989; and 321 Joo Chiat Place, Singapore 427990
Hospital and medical centre 63,200 56,900 5.6 5.3
1,160,400 1,088,200 102.1 102.1
Japan
P-Life Matsudo (2) Freehold N.A. N.A. 357 Matsuhidai, Matsudo City, Chiba Prefecture, Japan
Pharmaceutical product distributing and manufacturing facility
29,388 27,776 2.6 2.6
Bon Sejour Shin-Yamashita (2)
Freehold N.A. N.A. 2-12-55 Shin Yamashita, Naka-Ku, Yokohama City, Kanagawa Prefecture, Japan
Nursing home with care service 20,460 18,873 1.8 1.8
Palmary Inn Akashi (2) Freehold N.A. N.A. 486, Yagi, Okubo-cho, Akashi City, Hyogo Prefecture, Japan
Nursing home with care service 21,948 20,654 1.9 1.9
Palmary Inn Suma (2) Freehold N.A. N.A. 1-5-23, Chimori-cho, Suma-ku, Kobe City, Hyogo Prefecture, Japan
Nursing home with care service 13,020 12,226 1.1 1.1
Senior Chonaikai Makuhari Kan (2)
Freehold N.A. N.A. 5-370-4, Makuhari-cho, Hanamigawa-ku, Chiba City, Chiba Prefecture, Japan
Nursing home with care service 22,444 21,247 2.0 2.0
Balance carried forward 107,260 100,776 9.4 9.4
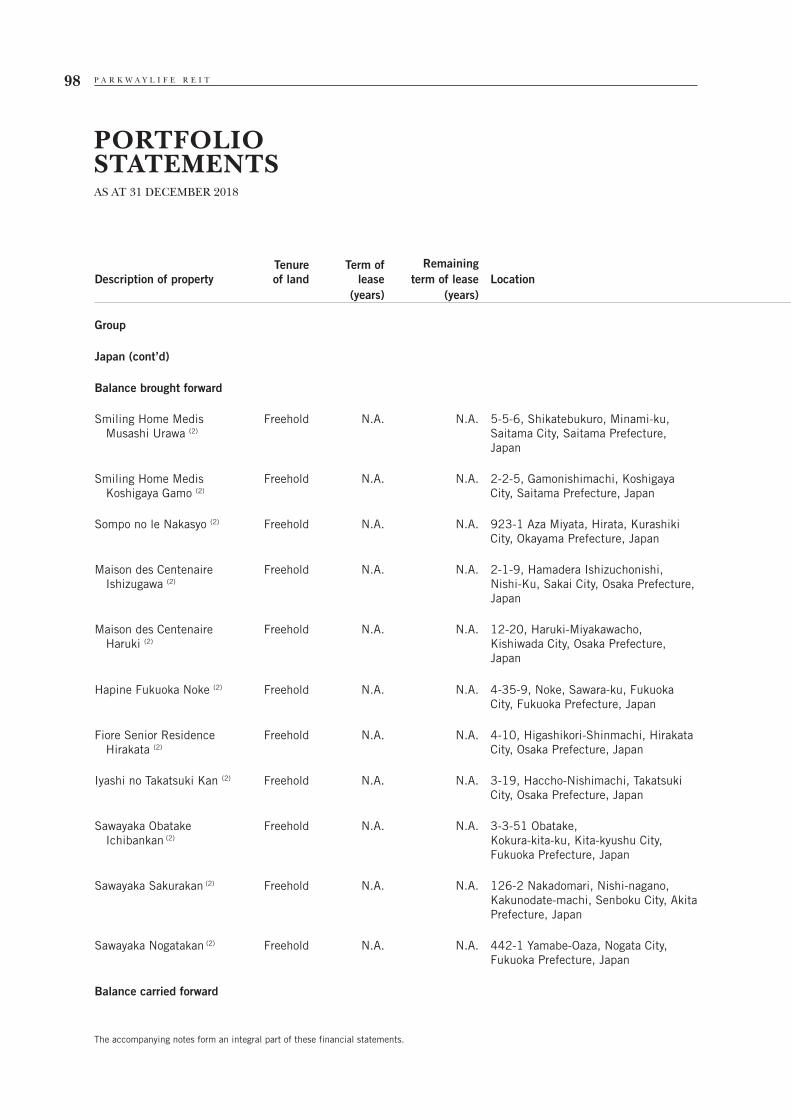
P A R K W A Y L I F E R E I T98
The accompanying notes form an integral part of these financial statements.
PORTFOLIO STATEMENTSAS AT 31 DECEMBER 2018
Tenureof land
Term of lease
RemainingExisting use
At Valuation Percentage of Net AssetsDescription of property term of lease Location 2018 2017 2018 2017
(years) (years) $’000 $’000 % %
Group
Japan (cont’d)
Balance brought forward 107,260 100,776 9.4 9.4
Smiling Home Medis Musashi Urawa (2)
Freehold N.A. N.A. 5-5-6, Shikatebukuro, Minami-ku, Saitama City, Saitama Prefecture, Japan
Nursing home with care service 9,858 9,342 0.9 0.9
Smiling Home Medis Koshigaya Gamo (2)
Freehold N.A. N.A. 2-2-5, Gamonishimachi, Koshigaya City, Saitama Prefecture, Japan
Nursing home with care service 19,964 19,111 1.8 1.8
Sompo no le Nakasyo (2) Freehold N.A. N.A. 923-1 Aza Miyata, Hirata, Kurashiki City, Okayama Prefecture, Japan
Nursing home with care service 8,643 8,487 0.8 0.8
Maison des Centenaire Ishizugawa (2)
Freehold N.A. N.A. 2-1-9, Hamadera Ishizuchonishi, Nishi-Ku, Sakai City, Osaka Prefecture, Japan
Nursing home with care service 11,321 11,122 1.0 1.0
Maison des Centenaire Haruki (2)
Freehold N.A. N.A. 12-20, Haruki-Miyakawacho, Kishiwada City, Osaka Prefecture, Japan
Nursing home with care service 8,742 8,368 0.8 0.8
Hapine Fukuoka Noke (2) Freehold N.A. N.A. 4-35-9, Noke, Sawara-ku, Fukuoka City, Fukuoka Prefecture, Japan
Nursing home with care service 10,813 10,837 1.0 1.0
Fiore Senior Residence Hirakata (2)
Freehold N.A. N.A. 4-10, Higashikori-Shinmachi, Hirakata City, Osaka Prefecture, Japan
Nursing home with care service 6,349 6,422 0.6 0.6
Iyashi no Takatsuki Kan (2) Freehold N.A. N.A. 3-19, Haccho-Nishimachi, Takatsuki City, Osaka Prefecture, Japan
Nursing home with care service 20,956 19,942 1.8 1.9
Sawayaka Obatake Ichibankan (2)
Freehold N.A. N.A. 3-3-51 Obatake,Kokura-kita-ku, Kita-kyushu City, Fukuoka Prefecture, Japan
Nursing home with care service 10,404 9,769 0.9 0.9
Sawayaka Sakurakan (2) Freehold N.A. N.A. 126-2 Nakadomari, Nishi-nagano, Kakunodate-machi, Senboku City, Akita Prefecture, Japan
Nursing home with care service 11,073 10,529 1.0 1.0
Sawayaka Nogatakan (2) Freehold N.A. N.A. 442-1 Yamabe-Oaza, Nogata City, Fukuoka Prefecture, Japan
Nursing home with care service 9,957 9,247 0.9 0.9
Balance carried forward 235,340 223,952 20.9 21.0
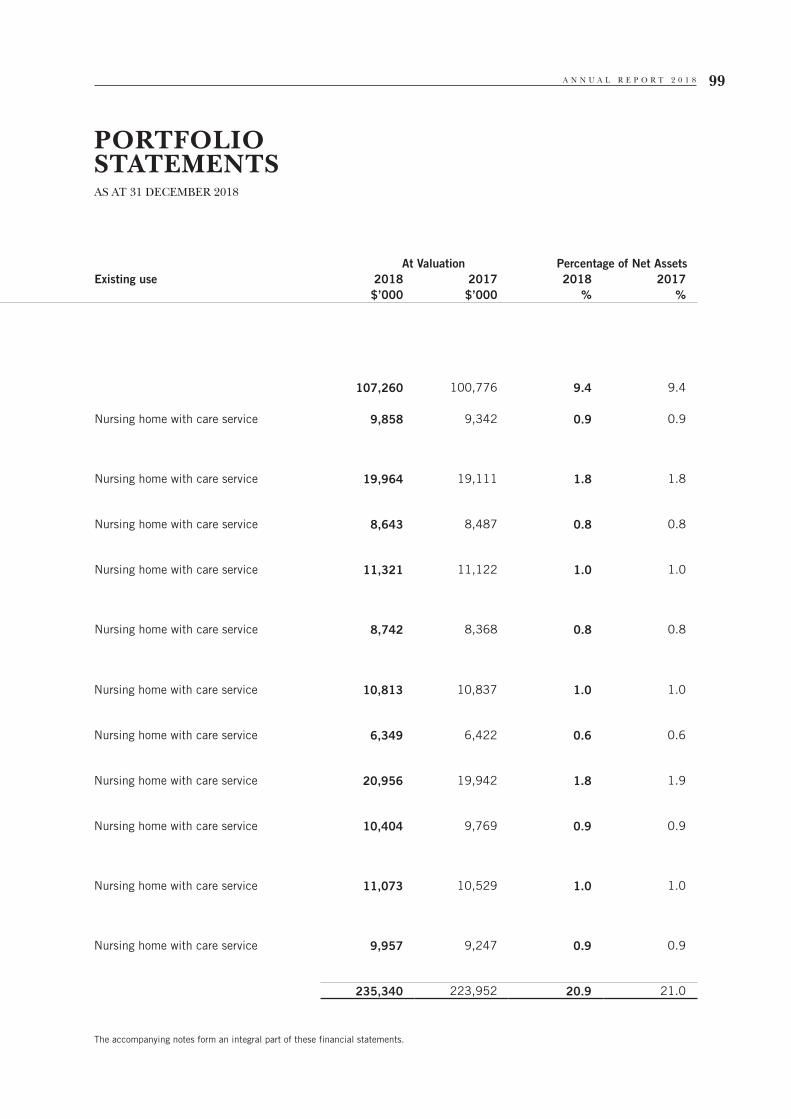
A N N U A L R E P O R T 2 0 1 8 99
The accompanying notes form an integral part of these financial statements.
PORTFOLIO STATEMENTSAS AT 31 DECEMBER 2018
Tenureof land
Term of lease
RemainingExisting use
At Valuation Percentage of Net AssetsDescription of property term of lease Location 2018 2017 2018 2017
(years) (years) $’000 $’000 % %
Group
Japan (cont’d)
Balance brought forward 107,260 100,776 9.4 9.4
Smiling Home Medis Musashi Urawa (2)
Freehold N.A. N.A. 5-5-6, Shikatebukuro, Minami-ku, Saitama City, Saitama Prefecture, Japan
Nursing home with care service 9,858 9,342 0.9 0.9
Smiling Home Medis Koshigaya Gamo (2)
Freehold N.A. N.A. 2-2-5, Gamonishimachi, Koshigaya City, Saitama Prefecture, Japan
Nursing home with care service 19,964 19,111 1.8 1.8
Sompo no le Nakasyo (2) Freehold N.A. N.A. 923-1 Aza Miyata, Hirata, Kurashiki City, Okayama Prefecture, Japan
Nursing home with care service 8,643 8,487 0.8 0.8
Maison des Centenaire Ishizugawa (2)
Freehold N.A. N.A. 2-1-9, Hamadera Ishizuchonishi, Nishi-Ku, Sakai City, Osaka Prefecture, Japan
Nursing home with care service 11,321 11,122 1.0 1.0
Maison des Centenaire Haruki (2)
Freehold N.A. N.A. 12-20, Haruki-Miyakawacho, Kishiwada City, Osaka Prefecture, Japan
Nursing home with care service 8,742 8,368 0.8 0.8
Hapine Fukuoka Noke (2) Freehold N.A. N.A. 4-35-9, Noke, Sawara-ku, Fukuoka City, Fukuoka Prefecture, Japan
Nursing home with care service 10,813 10,837 1.0 1.0
Fiore Senior Residence Hirakata (2)
Freehold N.A. N.A. 4-10, Higashikori-Shinmachi, Hirakata City, Osaka Prefecture, Japan
Nursing home with care service 6,349 6,422 0.6 0.6
Iyashi no Takatsuki Kan (2) Freehold N.A. N.A. 3-19, Haccho-Nishimachi, Takatsuki City, Osaka Prefecture, Japan
Nursing home with care service 20,956 19,942 1.8 1.9
Sawayaka Obatake Ichibankan (2)
Freehold N.A. N.A. 3-3-51 Obatake,Kokura-kita-ku, Kita-kyushu City, Fukuoka Prefecture, Japan
Nursing home with care service 10,404 9,769 0.9 0.9
Sawayaka Sakurakan (2) Freehold N.A. N.A. 126-2 Nakadomari, Nishi-nagano, Kakunodate-machi, Senboku City, Akita Prefecture, Japan
Nursing home with care service 11,073 10,529 1.0 1.0
Sawayaka Nogatakan (2) Freehold N.A. N.A. 442-1 Yamabe-Oaza, Nogata City, Fukuoka Prefecture, Japan
Nursing home with care service 9,957 9,247 0.9 0.9
Balance carried forward 235,340 223,952 20.9 21.0
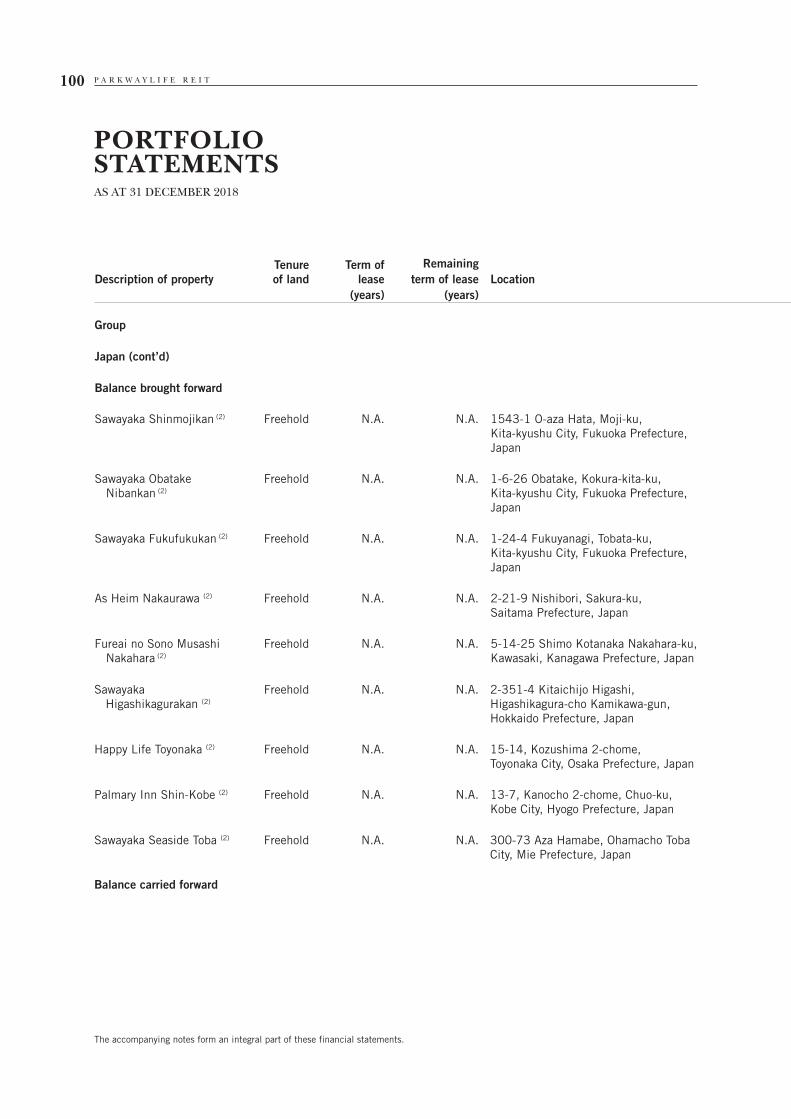
P A R K W A Y L I F E R E I T100
The accompanying notes form an integral part of these financial statements.
PORTFOLIO STATEMENTSAS AT 31 DECEMBER 2018
Tenureof land
Term of lease
RemainingExisting use
At Valuation Percentage of Net AssetsDescription of property term of lease Location 2018 2017 2018 2017
(years) (years) $’000 $’000 % %
Group
Japan (cont’d)
Balance brought forward 235,340 223,952 20.9 21.0
Sawayaka Shinmojikan (2) Freehold N.A. N.A. 1543-1 O-aza Hata, Moji-ku, Kita-kyushu City, Fukuoka Prefecture, Japan
Nursing home with care service 13,020 12,297 1.1 1.2
Sawayaka Obatake Nibankan (2)
Freehold N.A. N.A. 1-6-26 Obatake, Kokura-kita-ku, Kita-kyushu City, Fukuoka Prefecture, Japan
Short stay/Day care home 4,935 4,629 0.4 0.4
Sawayaka Fukufukukan (2) Freehold N.A. N.A. 1-24-4 Fukuyanagi, Tobata-ku, Kita-kyushu City, Fukuoka Prefecture, Japan
Nursing home with care service 9,188 8,772 0.8 0.8
As Heim Nakaurawa (2) Freehold N.A. N.A. 2-21-9 Nishibori, Sakura-ku, Saitama Prefecture, Japan
Nursing home with care service 14,508 13,769 1.3 1.3
Fureai no Sono Musashi Nakahara (2)
Freehold N.A. N.A. 5-14-25 Shimo Kotanaka Nakahara-ku, Kawasaki, Kanagawa Prefecture, Japan
Nursing home with care service 11,259 10,683 1.0 1.0
Sawayaka Higashikagurakan (2)
Freehold N.A. N.A. 2-351-4 Kitaichijo Higashi, Higashikagura-cho Kamikawa-gun, Hokkaido Prefecture, Japan
Nursing home with care service 12,896 12,274 1.1 1.2
Happy Life Toyonaka (2) Freehold N.A. N.A. 15-14, Kozushima 2-chome, Toyonaka City, Osaka Prefecture, Japan
Nursing home with care service 6,634 6,339 0.6 0.6
Palmary Inn Shin-Kobe (2) Freehold N.A. N.A. 13-7, Kanocho 2-chome, Chuo-ku, Kobe City, Hyogo Prefecture, Japan
Nursing home with care service 20,088 18,873 1.8 1.8
Sawayaka Seaside Toba (2) Freehold N.A. N.A. 300-73 Aza Hamabe, Ohamacho Toba City, Mie Prefecture, Japan
Nursing home with care service 19,604 18,470 1.7 1.7
Balance carried forward 347,472 330,058 30.7 31.0
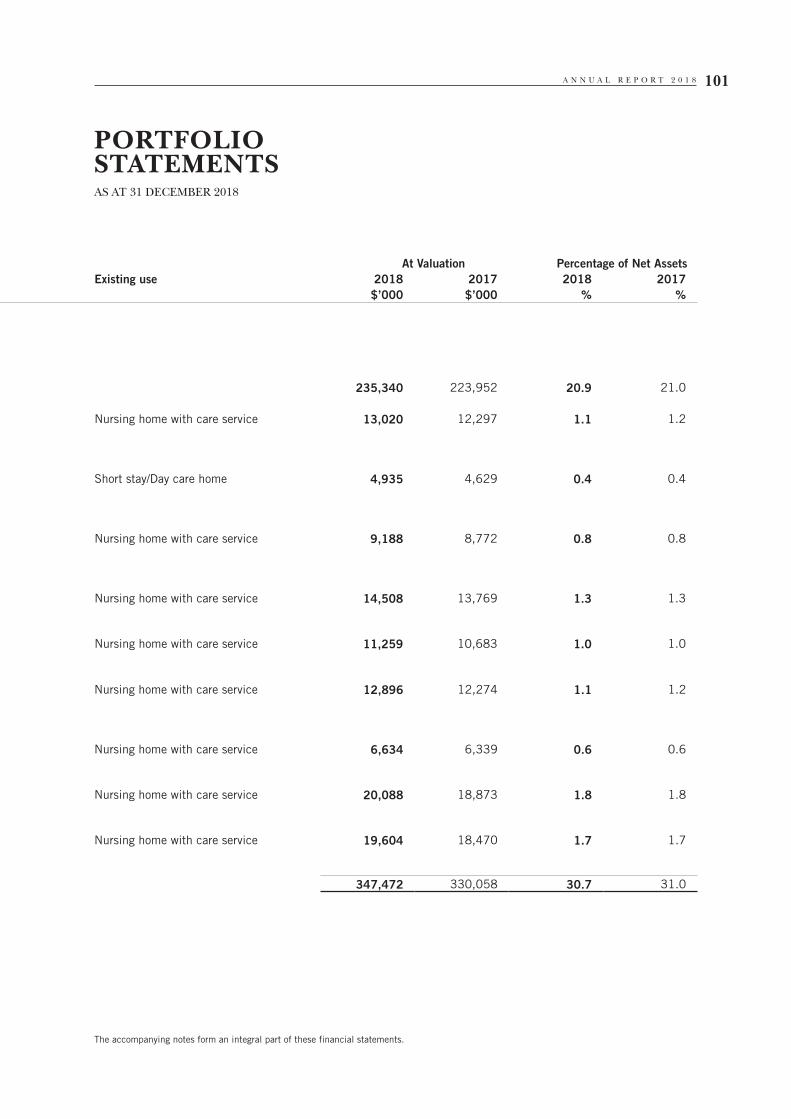
A N N U A L R E P O R T 2 0 1 8 101
The accompanying notes form an integral part of these financial statements.
PORTFOLIO STATEMENTSAS AT 31 DECEMBER 2018
Tenureof land
Term of lease
RemainingExisting use
At Valuation Percentage of Net AssetsDescription of property term of lease Location 2018 2017 2018 2017
(years) (years) $’000 $’000 % %
Group
Japan (cont’d)
Balance brought forward 235,340 223,952 20.9 21.0
Sawayaka Shinmojikan (2) Freehold N.A. N.A. 1543-1 O-aza Hata, Moji-ku, Kita-kyushu City, Fukuoka Prefecture, Japan
Nursing home with care service 13,020 12,297 1.1 1.2
Sawayaka Obatake Nibankan (2)
Freehold N.A. N.A. 1-6-26 Obatake, Kokura-kita-ku, Kita-kyushu City, Fukuoka Prefecture, Japan
Short stay/Day care home 4,935 4,629 0.4 0.4
Sawayaka Fukufukukan (2) Freehold N.A. N.A. 1-24-4 Fukuyanagi, Tobata-ku, Kita-kyushu City, Fukuoka Prefecture, Japan
Nursing home with care service 9,188 8,772 0.8 0.8
As Heim Nakaurawa (2) Freehold N.A. N.A. 2-21-9 Nishibori, Sakura-ku, Saitama Prefecture, Japan
Nursing home with care service 14,508 13,769 1.3 1.3
Fureai no Sono Musashi Nakahara (2)
Freehold N.A. N.A. 5-14-25 Shimo Kotanaka Nakahara-ku, Kawasaki, Kanagawa Prefecture, Japan
Nursing home with care service 11,259 10,683 1.0 1.0
Sawayaka Higashikagurakan (2)
Freehold N.A. N.A. 2-351-4 Kitaichijo Higashi, Higashikagura-cho Kamikawa-gun, Hokkaido Prefecture, Japan
Nursing home with care service 12,896 12,274 1.1 1.2
Happy Life Toyonaka (2) Freehold N.A. N.A. 15-14, Kozushima 2-chome, Toyonaka City, Osaka Prefecture, Japan
Nursing home with care service 6,634 6,339 0.6 0.6
Palmary Inn Shin-Kobe (2) Freehold N.A. N.A. 13-7, Kanocho 2-chome, Chuo-ku, Kobe City, Hyogo Prefecture, Japan
Nursing home with care service 20,088 18,873 1.8 1.8
Sawayaka Seaside Toba (2) Freehold N.A. N.A. 300-73 Aza Hamabe, Ohamacho Toba City, Mie Prefecture, Japan
Nursing home with care service 19,604 18,470 1.7 1.7
Balance carried forward 347,472 330,058 30.7 31.0

P A R K W A Y L I F E R E I T102
The accompanying notes form an integral part of these financial statements.
PORTFOLIO STATEMENTSAS AT 31 DECEMBER 2018
Tenureof land
Term of lease
RemainingExisting use
At Valuation Percentage of Net AssetsDescription of property term of lease Location 2018 2017 2018 2017
(years) (years) $’000 $’000 % %
Group
Japan (cont’d)
Balance brought forward 347,472 330,058 30.7 31.0
Sawayaka Niihamakan (2) Freehold N.A. N.A. Otsu 11-77, Higashida 3-chome, Niihama City, Ehime Prefecture, Japan
Nursing home with care service 19,034 17,912 1.7 1.7
Sawayaka Mekari Nibankan (2)
Freehold N.A. N.A. 2720-2, Okubo 1-chome, Mojiku, Kitakyushushi City, Fukuoka Prefecture, Japan
Nursing home with care service 4,005 4,178 0.4 0.4
Sawayaka Kiyotakan (2) Freehold N.A. N.A. 16-7, Kiyota 3-chome, Yahatahigashi-ku, Kitakyushushi, Fukuoka Prefecture, Japan
Nursing home with care service 12,760 11,822 1.1 1.1
Sawayaka Minatokan (2) Freehold N.A. N.A. 5155-3 Jyusanbancho,Furumachidori, Chuo-ku, Niigata City, Niigata Prefecture, Japan
Nursing home with care service 9,263 8,748 0.8 0.8
Maison des Centenaire Hannan (2)
Freehold N.A. N.A. 8-423-29 Momonokidai, Hannan City, Osaka Prefecture, Japan
Nursing home with care service 24,552 22,553 2.2 2.1
Maison des Centenaire Ohhama (2)
Freehold N.A. N.A. 3-11-18 Ohhama KitamachiSakai-Ku, Sakai City, Osaka Prefecture, Japan
Nursing home with care service 9,312 8,986 0.8 0.8
Sunhill Miyako (2) Freehold N.A. N.A. 8-423-30 Momonokidai, Hannan City, Osaka Prefecture, Japan
Extended stay lodging facility 11,718 11,146 1.0 1.1
Habitation Jyosui (2) Freehold N.A. N.A. 4-1-26 Yakuin, Chuo-ku Fukuoka City, Fukuoka Prefecture, Japan
Nursing home with care service 46,252 43,883 4.1 4.1
Ocean View Shonan Arasaki (2)
Freehold N.A. N.A. 5-25-1 Nagai, Yokosuka City, Kanagawa Prefecture, Japan
Nursing home with care service 24,974 23,681 2.2 2.2
Habitation Hakata I, II and III (2)
Freehold N.A. N.A. 23-10 Kanenokuma 3-chome Hakata-ku, Fukuoka City, Fukuoka Prefecture, Japan
Nursing home with care service 50,084 46,293 4.4 4.4
Excellent Tenpaku Garden Hills (2)
Freehold N.A. N.A. 141-3 Tsuchihara 2-chome, Tenpaku-ku, Nagoya City, Aichi Prefecture, Japan
Nursing home with care service 23,014 21,805 2.0 2.1
Balance carried forward 582,440 551,065 51.4 51.8

A N N U A L R E P O R T 2 0 1 8 103
The accompanying notes form an integral part of these financial statements.
PORTFOLIO STATEMENTSAS AT 31 DECEMBER 2018
Tenureof land
Term of lease
RemainingExisting use
At Valuation Percentage of Net AssetsDescription of property term of lease Location 2018 2017 2018 2017
(years) (years) $’000 $’000 % %
Group
Japan (cont’d)
Balance brought forward 347,472 330,058 30.7 31.0
Sawayaka Niihamakan (2) Freehold N.A. N.A. Otsu 11-77, Higashida 3-chome, Niihama City, Ehime Prefecture, Japan
Nursing home with care service 19,034 17,912 1.7 1.7
Sawayaka Mekari Nibankan (2)
Freehold N.A. N.A. 2720-2, Okubo 1-chome, Mojiku, Kitakyushushi City, Fukuoka Prefecture, Japan
Nursing home with care service 4,005 4,178 0.4 0.4
Sawayaka Kiyotakan (2) Freehold N.A. N.A. 16-7, Kiyota 3-chome, Yahatahigashi-ku, Kitakyushushi, Fukuoka Prefecture, Japan
Nursing home with care service 12,760 11,822 1.1 1.1
Sawayaka Minatokan (2) Freehold N.A. N.A. 5155-3 Jyusanbancho,Furumachidori, Chuo-ku, Niigata City, Niigata Prefecture, Japan
Nursing home with care service 9,263 8,748 0.8 0.8
Maison des Centenaire Hannan (2)
Freehold N.A. N.A. 8-423-29 Momonokidai, Hannan City, Osaka Prefecture, Japan
Nursing home with care service 24,552 22,553 2.2 2.1
Maison des Centenaire Ohhama (2)
Freehold N.A. N.A. 3-11-18 Ohhama KitamachiSakai-Ku, Sakai City, Osaka Prefecture, Japan
Nursing home with care service 9,312 8,986 0.8 0.8
Sunhill Miyako (2) Freehold N.A. N.A. 8-423-30 Momonokidai, Hannan City, Osaka Prefecture, Japan
Extended stay lodging facility 11,718 11,146 1.0 1.1
Habitation Jyosui (2) Freehold N.A. N.A. 4-1-26 Yakuin, Chuo-ku Fukuoka City, Fukuoka Prefecture, Japan
Nursing home with care service 46,252 43,883 4.1 4.1
Ocean View Shonan Arasaki (2)
Freehold N.A. N.A. 5-25-1 Nagai, Yokosuka City, Kanagawa Prefecture, Japan
Nursing home with care service 24,974 23,681 2.2 2.2
Habitation Hakata I, II and III (2)
Freehold N.A. N.A. 23-10 Kanenokuma 3-chome Hakata-ku, Fukuoka City, Fukuoka Prefecture, Japan
Nursing home with care service 50,084 46,293 4.4 4.4
Excellent Tenpaku Garden Hills (2)
Freehold N.A. N.A. 141-3 Tsuchihara 2-chome, Tenpaku-ku, Nagoya City, Aichi Prefecture, Japan
Nursing home with care service 23,014 21,805 2.0 2.1
Balance carried forward 582,440 551,065 51.4 51.8

P A R K W A Y L I F E R E I T104
The accompanying notes form an integral part of these financial statements.
PORTFOLIO STATEMENTSAS AT 31 DECEMBER 2018
Tenureof land
Term of lease
RemainingExisting use
At Valuation Percentage of Net AssetsDescription of property term of lease Location 2018 2017 2018 2017
(years) (years) $’000 $’000 % %
Group
Japan (cont’d)
Balance brought forward 582,440 551,065 51.4 51.8
Liverari Shiroishi Hana Ichigo-kan (2)
Freehold N.A. N.A. 1-18 Kitago 3jyo, Shiraishi-ku, Sapporo City, Hokkaido Prefecture, Japan
Nursing home with care service 4,501 4,143 0.4 0.4
Liverari Shiroishi Hana Nigo-kan (2)
Freehold N.A. N.A. 5-10 Kitago 2jyo 5-chome, Shiraishi-ku, Sapporo City, Hokkaido Prefecture, Japan
Nursing home with care service 2,183 2,006 0.2 0.2
Liverari Misono (2) Freehold N.A. N.A. 4-24 Misono 7jyo 3-chome, Toyohira-ku, Sapporo City, Hokkaido Prefecture, Japan
Group home with care service 2,505 2,303 0.2 0.2
Silver Heights Hitsujigaoka (Ichibankan and Nibankan) (2)
Freehold N.A. N.A. 6-1 Fukuzumi, 3jyo 3-chome, Toyohira-ku, Sapporo City, Hokkaido Prefecture, Japan
Nursing home with care service 14,632 13,769 1.3 1.3
Wakaba no Oka (2) Freehold N.A. N.A. 1763-12 Oguramachi Wakabaku, Chiba City, Chiba Prefecture, Japan
Nursing home with care service 26,412 24,808 2.3 2.3
Hakusho no Sato (2) Freehold N.A. N.A. 301 Hijikai, Yachimata City, Chiba Prefecture, Japan
Nursing home with care service 20,832 19,704 1.8 1.9
Group Home Hakusho (2) Freehold N.A. N.A. 1345-16 Toyoma, Yachimata City, Chiba Prefecture, Japan
Group home with care service 1,314 1,258 0.1 0.1
Kikuya Warakuen (2) Freehold N.A. N.A. 1404-10 Nishitoyoi, Oaza, Kudamatsu City, Yamaguchi Prefecture, Japan
Nursing home with care service 10,565 10,078 0.9 0.9
Sanko (2) Freehold N.A. N.A. 4-16-16 Mizuhomachi, Kudamatsu City, Yamaguchi Prefecture, Japan
Nursing home with care service 6,783 6,422 0.6 0.6
Konosu Nursing Home Kyoseien (3)
Freehold N.A. N.A. 3409-1 Shimoya, Konosu, Saitama Prefecture, Japan
Nursing rehabilitation facility 20,584 – 1.8 –
692,751 635,556 61.0 59.7

A N N U A L R E P O R T 2 0 1 8 105
The accompanying notes form an integral part of these financial statements.
PORTFOLIO STATEMENTSAS AT 31 DECEMBER 2018
Tenureof land
Term of lease
RemainingExisting use
At Valuation Percentage of Net AssetsDescription of property term of lease Location 2018 2017 2018 2017
(years) (years) $’000 $’000 % %
Group
Japan (cont’d)
Balance brought forward 582,440 551,065 51.4 51.8
Liverari Shiroishi Hana Ichigo-kan (2)
Freehold N.A. N.A. 1-18 Kitago 3jyo, Shiraishi-ku, Sapporo City, Hokkaido Prefecture, Japan
Nursing home with care service 4,501 4,143 0.4 0.4
Liverari Shiroishi Hana Nigo-kan (2)
Freehold N.A. N.A. 5-10 Kitago 2jyo 5-chome, Shiraishi-ku, Sapporo City, Hokkaido Prefecture, Japan
Nursing home with care service 2,183 2,006 0.2 0.2
Liverari Misono (2) Freehold N.A. N.A. 4-24 Misono 7jyo 3-chome, Toyohira-ku, Sapporo City, Hokkaido Prefecture, Japan
Group home with care service 2,505 2,303 0.2 0.2
Silver Heights Hitsujigaoka (Ichibankan and Nibankan) (2)
Freehold N.A. N.A. 6-1 Fukuzumi, 3jyo 3-chome, Toyohira-ku, Sapporo City, Hokkaido Prefecture, Japan
Nursing home with care service 14,632 13,769 1.3 1.3
Wakaba no Oka (2) Freehold N.A. N.A. 1763-12 Oguramachi Wakabaku, Chiba City, Chiba Prefecture, Japan
Nursing home with care service 26,412 24,808 2.3 2.3
Hakusho no Sato (2) Freehold N.A. N.A. 301 Hijikai, Yachimata City, Chiba Prefecture, Japan
Nursing home with care service 20,832 19,704 1.8 1.9
Group Home Hakusho (2) Freehold N.A. N.A. 1345-16 Toyoma, Yachimata City, Chiba Prefecture, Japan
Group home with care service 1,314 1,258 0.1 0.1
Kikuya Warakuen (2) Freehold N.A. N.A. 1404-10 Nishitoyoi, Oaza, Kudamatsu City, Yamaguchi Prefecture, Japan
Nursing home with care service 10,565 10,078 0.9 0.9
Sanko (2) Freehold N.A. N.A. 4-16-16 Mizuhomachi, Kudamatsu City, Yamaguchi Prefecture, Japan
Nursing home with care service 6,783 6,422 0.6 0.6
Konosu Nursing Home Kyoseien (3)
Freehold N.A. N.A. 3409-1 Shimoya, Konosu, Saitama Prefecture, Japan
Nursing rehabilitation facility 20,584 – 1.8 –
692,751 635,556 61.0 59.7
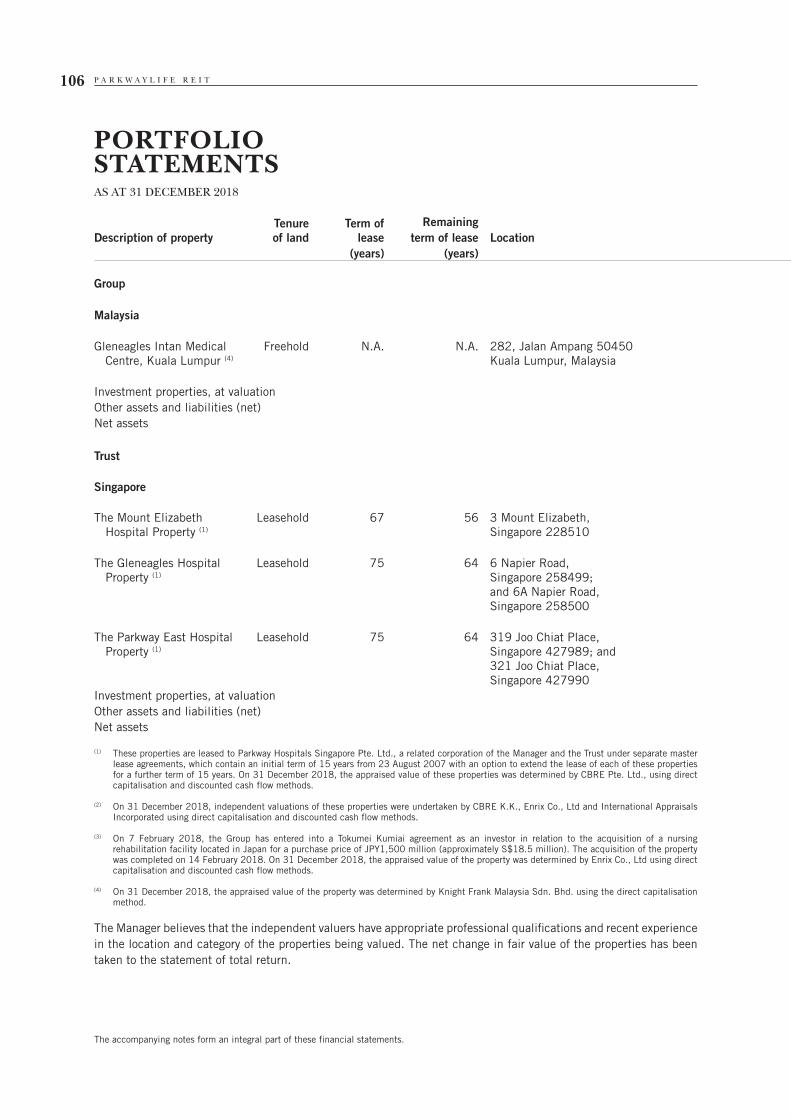
P A R K W A Y L I F E R E I T106
The accompanying notes form an integral part of these financial statements.
PORTFOLIO STATEMENTSAS AT 31 DECEMBER 2018
Tenureof land
Term of lease
RemainingExisting use
At Valuation Percentage of Net AssetsDescription of property term of lease Location 2018 2017 2018 2017
(years) (years) $’000 $’000 % %
Group
Malaysia
Gleneagles Intan Medical Centre, Kuala Lumpur (4)
Freehold N.A. N.A. 282, Jalan Ampang 50450 Kuala Lumpur, Malaysia
Medical Centre 7,383 7,307 0.6 0.7
Investment properties, at valuation 1,860,534 1,731,063 163.7 162.5Other assets and liabilities (net) (724,141) (665,723) (63.7) (62.5)Net assets 1,136,393 1,065,340 100.0 100.0
Trust
Singapore
The Mount Elizabeth Hospital Property (1)
Leasehold 67 56 3 Mount Elizabeth, Singapore 228510
Hospital and medical centre 718,700 675,500 68.3 65.8
The Gleneagles Hospital Property (1)
Leasehold 75 64 6 Napier Road, Singapore 258499; and 6A Napier Road, Singapore 258500
Hospital and medical centre 378,500 355,800 35.9 34.7
The Parkway East Hospital Property (1)
Leasehold 75 64 319 Joo Chiat Place, Singapore 427989; and 321 Joo Chiat Place, Singapore 427990
Hospital and medical centre 63,200 56,900 6.0 5.5
Investment properties, at valuation 1,160,400 1,088,200 110.2 106.0Other assets and liabilities (net) (107,877) (62,102) (10.2) (6.0)Net assets 1,052,523 1,026,098 100.0 100.0
(1) These properties are leased to Parkway Hospitals Singapore Pte. Ltd., a related corporation of the Manager and the Trust under separate master lease agreements, which contain an initial term of 15 years from 23 August 2007 with an option to extend the lease of each of these properties for a further term of 15 years. On 31 December 2018, the appraised value of these properties was determined by CBRE Pte. Ltd., using direct capitalisation and discounted cash flow methods.
(2) On 31 December 2018, independent valuations of these properties were undertaken by CBRE K.K., Enrix Co., Ltd and International Appraisals Incorporated using direct capitalisation and discounted cash flow methods.
(3) On 7 February 2018, the Group has entered into a Tokumei Kumiai agreement as an investor in relation to the acquisition of a nursing rehabilitation facility located in Japan for a purchase price of JPY1,500 million (approximately S$18.5 million). The acquisition of the property was completed on 14 February 2018. On 31 December 2018, the appraised value of the property was determined by Enrix Co., Ltd using direct capitalisation and discounted cash flow methods.
(4) On 31 December 2018, the appraised value of the property was determined by Knight Frank Malaysia Sdn. Bhd. using the direct capitalisation method.
The Manager believes that the independent valuers have appropriate professional qualifications and recent experience in the location and category of the properties being valued. The net change in fair value of the properties has been taken to the statement of total return.

A N N U A L R E P O R T 2 0 1 8 107
The accompanying notes form an integral part of these financial statements.
PORTFOLIO STATEMENTSAS AT 31 DECEMBER 2018
Tenureof land
Term of lease
RemainingExisting use
At Valuation Percentage of Net AssetsDescription of property term of lease Location 2018 2017 2018 2017
(years) (years) $’000 $’000 % %
Group
Malaysia
Gleneagles Intan Medical Centre, Kuala Lumpur (4)
Freehold N.A. N.A. 282, Jalan Ampang 50450 Kuala Lumpur, Malaysia
Medical Centre 7,383 7,307 0.6 0.7
Investment properties, at valuation 1,860,534 1,731,063 163.7 162.5Other assets and liabilities (net) (724,141) (665,723) (63.7) (62.5)Net assets 1,136,393 1,065,340 100.0 100.0
Trust
Singapore
The Mount Elizabeth Hospital Property (1)
Leasehold 67 56 3 Mount Elizabeth, Singapore 228510
Hospital and medical centre 718,700 675,500 68.3 65.8
The Gleneagles Hospital Property (1)
Leasehold 75 64 6 Napier Road, Singapore 258499; and 6A Napier Road, Singapore 258500
Hospital and medical centre 378,500 355,800 35.9 34.7
The Parkway East Hospital Property (1)
Leasehold 75 64 319 Joo Chiat Place, Singapore 427989; and 321 Joo Chiat Place, Singapore 427990
Hospital and medical centre 63,200 56,900 6.0 5.5
Investment properties, at valuation 1,160,400 1,088,200 110.2 106.0Other assets and liabilities (net) (107,877) (62,102) (10.2) (6.0)Net assets 1,052,523 1,026,098 100.0 100.0
(1) These properties are leased to Parkway Hospitals Singapore Pte. Ltd., a related corporation of the Manager and the Trust under separate master lease agreements, which contain an initial term of 15 years from 23 August 2007 with an option to extend the lease of each of these properties for a further term of 15 years. On 31 December 2018, the appraised value of these properties was determined by CBRE Pte. Ltd., using direct capitalisation and discounted cash flow methods.
(2) On 31 December 2018, independent valuations of these properties were undertaken by CBRE K.K., Enrix Co., Ltd and International Appraisals Incorporated using direct capitalisation and discounted cash flow methods.
(3) On 7 February 2018, the Group has entered into a Tokumei Kumiai agreement as an investor in relation to the acquisition of a nursing rehabilitation facility located in Japan for a purchase price of JPY1,500 million (approximately S$18.5 million). The acquisition of the property was completed on 14 February 2018. On 31 December 2018, the appraised value of the property was determined by Enrix Co., Ltd using direct capitalisation and discounted cash flow methods.
(4) On 31 December 2018, the appraised value of the property was determined by Knight Frank Malaysia Sdn. Bhd. using the direct capitalisation method.
The Manager believes that the independent valuers have appropriate professional qualifications and recent experience in the location and category of the properties being valued. The net change in fair value of the properties has been taken to the statement of total return.

P A R K W A Y L I F E R E I T108
GroupNote 2018 2017
$’000 $’000
Operating activitiesTotal return before income tax 160,713 109,967Adjustments for:Interest income (6) –Finance costs 6,734 7,952Net change in fair value of financial derivatives 2,256 (1,954)Net change in fair value of investment properties 4 (77,888) (25,970)Operating income before working capital changes 91,809 89,995
Changes in working capital:Trade and other receivables (264) (447)Trade and other payables 821 (1,876)Security deposits 583 1,109Cash generated from operations 92,949 88,781Income tax paid (4,599) (8,035)Cash flows generated from operating activities 88,350 80,746
Investing activitiesInterest received 6 –Capital expenditure on investment properties (6,629) (5,261)Cash outflow on purchase of investment properties
(including acquisition related costs) (Note A) (21,153) (65,189)Divestment related cost paid – (720)Cash flows used in investing activities (27,776) (71,170)
Financing activitiesBorrowing costs paid (616) (50)Interest paid (6,133) (7,256)Distributions to Unitholders (78,469) (78,832)Proceeds from issue of medium term notes 43,190 59,300Proceeds from loans and borrowings 217,211 210,971Repayment of loans and borrowings (239,892) (237,009)Cash flows used in financing activities (64,709) (52,876)
Net decrease in cash and cash equivalents (4,135) (43,300)Cash and cash equivalents at beginning of year 25,462 69,184Effects of exchange differences on cash balances 505 (422)Cash and cash equivalents at end of year (1) 8 21,832 25,462
(1) Excludes deposits amounting to JPY21.7 million (approximately $0.3 million) (2017: JPY21.7 million (approximately $0.3 million)) that are held as collaterals (Note 8).
The accompanying notes form an integral part of these financial statements.
CONSOLIDATED STATEMENT OF CASH FLOWSYEAR ENDED 31 DECEMBER 2018
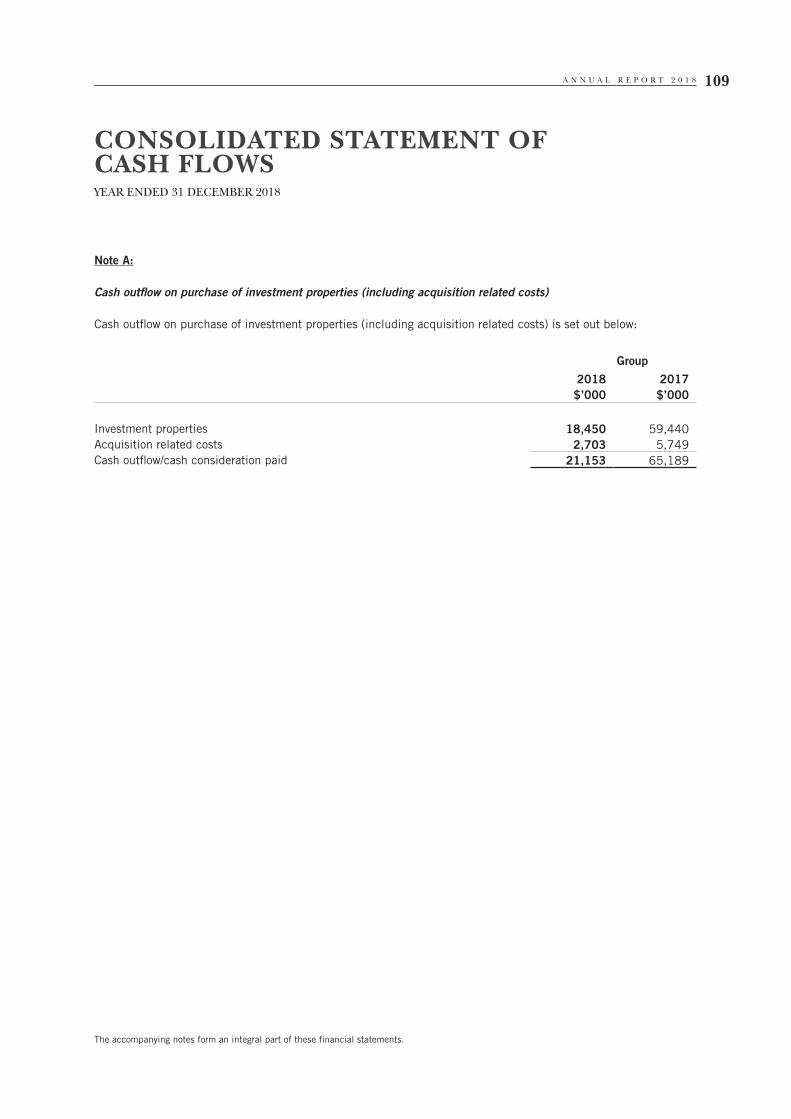
A N N U A L R E P O R T 2 0 1 8 109
Note A:
Cash outflow on purchase of investment properties (including acquisition related costs)
Cash outflow on purchase of investment properties (including acquisition related costs) is set out below:
Group
2018 2017$’000 $’000
Investment properties 18,450 59,440Acquisition related costs 2,703 5,749Cash outflow/cash consideration paid 21,153 65,189
The accompanying notes form an integral part of these financial statements.
CONSOLIDATED STATEMENT OF CASH FLOWSYEAR ENDED 31 DECEMBER 2018

P A R K W A Y L I F E R E I T110
NOTES TO THEFINANCIAL STATEMENTSYEAR ENDED 31 DECEMBER 2018
These notes form an integral part of the financial statements.
The financial statements were authorised for issue by the Manager and the Trustee on 20 March 2019.
1 GENERAL
Parkway Life Real Estate Investment Trust (the “Trust”) is a Singapore-domiciled unit trust constituted pursuant to the trust deed dated 12 July 2007 (as amended by the First Supplemental Deed dated 12 November 2009, Second Supplemental Deed dated 30 March 2010 and the Third Supplemental Deed dated 31 March 2016) (the “Trust Deed”) between Parkway Trust Management Limited (the “Manager”) and HSBC Institutional Trust Services (Singapore) Limited (the “Trustee”), governed by the laws of the Republic of Singapore. On 12 July 2007, the Trust was declared as an authorised unit trust scheme under the Trustees Act, Chapter 337. The Trustee is under a duty to take into custody and hold the assets of the Trust and its subsidiaries (the “Group”) in trust for the holders (“Unitholders”) of units in the Trust (the “Units”).
On 23 August 2007 (“Listing Date”), the Trust was admitted to the Official List of the Singapore Exchange Securities Trading Limited (“SGX-ST”) and was included under the Central Provident Fund (“CPF”) Investment Scheme on the same date.
At Listing Date, the Trust had invested in and owned an initial portfolio of three private hospitals in Singapore comprising The Mount Elizabeth Hospital Property, The Gleneagles Hospital Property, and The Parkway East Hospital Property (collectively, the “Hospital Properties”). The Hospital Properties are leased to a related corporation of the Manager and the Trust, Parkway Hospitals Singapore Pte. Ltd., pursuant to three separate master lease agreements.
The principal activity of the Trust is to invest primarily in income-producing real estate and/or real estate-related assets in the Asia-Pacific region (including Singapore) that are used primarily for healthcare and/or healthcare-related purposes (including but not limited to, hospitals, healthcare facilities and real estate and/or real estate assets used in connection with healthcare research, education, and the manufacture or storage of drugs, medicine and other healthcare goods and devices), whether wholly or partially owned, and whether directly or indirectly held through the ownership of special purpose vehicles whose primary purpose is to own such real estate. The principal activities of the subsidiaries are set out in Note 5.
For financial reporting purposes, the Group is regarded as a subsidiary of Parkway Investments Pte. Ltd., a company incorporated in the Republic of Singapore. Accordingly, the ultimate holding company is IHH Healthcare Berhad, a company incorporated in Malaysia.
The Trust has entered into several service agreements in relation to the management of the Trust and its property operations. The fee structures of these services are as follows:
(A) Trustee’s fee
Pursuant to the Trust Deed, the Trustee’s fee shall not exceed 0.03% per annum of the value of the gross assets of the Group (“Deposited Property”), subject to a minimum of $10,000 per month or such higher percentage as may be fixed by an Extraordinary Resolution at a meeting of Unitholders of the Trust. The Trustee’s fee is payable out of the Deposited Property on a monthly basis, in arrears. The Trustee is also entitled to seek reimbursement of expenses incurred in the performance of its duties under the Trust Deed.
Based on the current agreement between the Manager and the Trustee, the Trustee’s fee is charged on a scaled basis of up to 0.03% per annum of the value of the Group’s Deposited Property.

A N N U A L R E P O R T 2 0 1 8 111
NOTES TO THEFINANCIAL STATEMENTSYEAR ENDED 31 DECEMBER 2018
1 GENERAL (CONT’D)
(B) Manager’s management fees
Pursuant to the Trust Deed, the Manager is entitled to receive management fees comprising the base fee and performance fee as follows:
(i) A base fee of 0.3% per annum of the value of the Deposited Property; and
(ii) A performance fee of 4.5% per annum of the net property income of the Group.
The base fee and performance fee is payable to the Manager in the form of cash and/or units (as the Manager may elect prior to each payment) and in such proportion as may be determined by the Manager.
Where the management fees are payable in the form of units, such payment shall be made out quarterly in arrears and the Manager shall be entitled to receive such number of units as may be purchased with the relevant amount of the management fee attributable to the relevant period at an issue price set out in accordance with the Trust Deed. Where the management fees are payable in the form of cash, the portion of the base fee and performance fee payable in cash shall be payable monthly and quarterly in arrears, respectively. With effect from 1 January 2016, the performance fee is paid annually in arrears, regardless of whether it is paid in the form of cash and/or units.
Since the Listing Date, the Manager has elected to receive 20% of the base and performance fees in the form of units and 80% in the form of cash. With effect from the financial year ended 31 December 2011, the Manager has elected to receive 100% of the base and performance fees in the form of cash.
Any increase in the maximum permitted amount or any change in the structure of the Manager’s management fees must be approved by an Extraordinary Resolution at a meeting of Unitholders of the Trust duly convened and held in accordance with the provisions of the Trust Deed.
In addition to the management fees, the Manager is entitled to the following fees (excluding the Hospital Properties for the duration of the master lease agreements):
(i) A fee of 2.0% per annum of the revenue of the real estate held directly or indirectly by the Trust and managed by the Manager, for property management services provided by the Manager;
(ii) A fee of 1.0% per annum of the revenue of the real estate held directly or indirectly by the Trust and managed by the Manager, for lease management services provided by the Manager;
(iii) Commissions as set out below for securing new leases or renewal of leases for those real estate which are not leased to a master lessee under a master lease agreement, pursuant to marketing services provided by the Manager:
(a) Two months’ gross rent inclusive of service charge, for securing a lease of more than three years;
(b) One month’s gross rent inclusive of service charge, for securing a lease of three years or less;
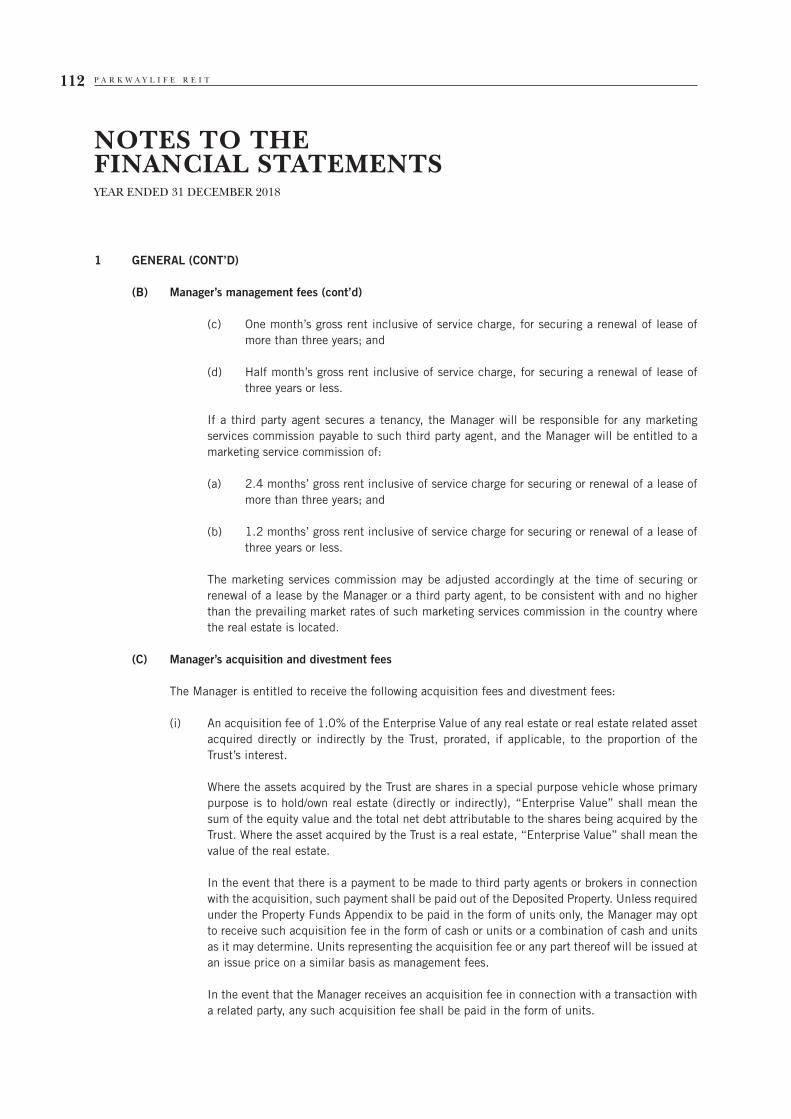
P A R K W A Y L I F E R E I T112
NOTES TO THEFINANCIAL STATEMENTSYEAR ENDED 31 DECEMBER 2018
1 GENERAL (CONT’D)
(B) Manager’s management fees (cont’d)
(c) One month’s gross rent inclusive of service charge, for securing a renewal of lease of more than three years; and
(d) Half month’s gross rent inclusive of service charge, for securing a renewal of lease of three years or less.
If a third party agent secures a tenancy, the Manager will be responsible for any marketing services commission payable to such third party agent, and the Manager will be entitled to a marketing service commission of:
(a) 2.4 months’ gross rent inclusive of service charge for securing or renewal of a lease of more than three years; and
(b) 1.2 months’ gross rent inclusive of service charge for securing or renewal of a lease of three years or less.
The marketing services commission may be adjusted accordingly at the time of securing or renewal of a lease by the Manager or a third party agent, to be consistent with and no higher than the prevailing market rates of such marketing services commission in the country where the real estate is located.
(C) Manager’s acquisition and divestment fees
The Manager is entitled to receive the following acquisition fees and divestment fees:
(i) An acquisition fee of 1.0% of the Enterprise Value of any real estate or real estate related asset acquired directly or indirectly by the Trust, prorated, if applicable, to the proportion of the Trust’s interest.
Where the assets acquired by the Trust are shares in a special purpose vehicle whose primary purpose is to hold/own real estate (directly or indirectly), “Enterprise Value” shall mean the sum of the equity value and the total net debt attributable to the shares being acquired by the Trust. Where the asset acquired by the Trust is a real estate, “Enterprise Value” shall mean the value of the real estate.
In the event that there is a payment to be made to third party agents or brokers in connection with the acquisition, such payment shall be paid out of the Deposited Property. Unless required under the Property Funds Appendix to be paid in the form of units only, the Manager may opt to receive such acquisition fee in the form of cash or units or a combination of cash and units as it may determine. Units representing the acquisition fee or any part thereof will be issued at an issue price on a similar basis as management fees.
In the event that the Manager receives an acquisition fee in connection with a transaction with a related party, any such acquisition fee shall be paid in the form of units.
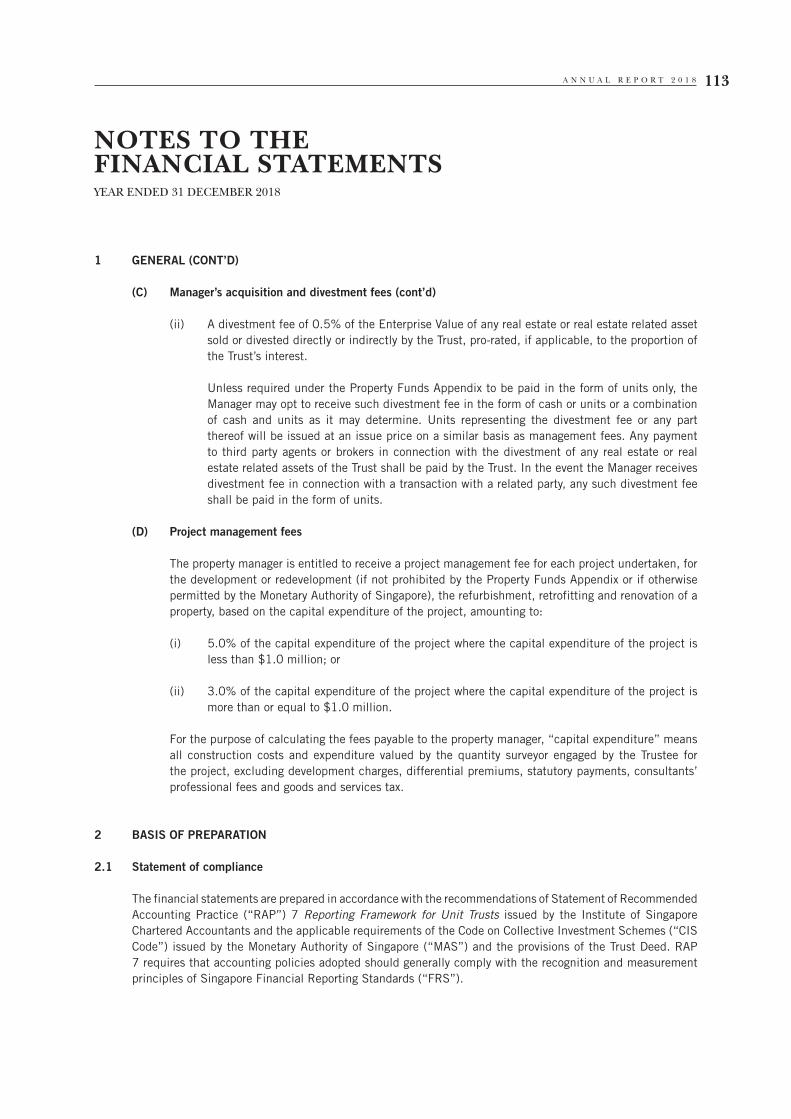
A N N U A L R E P O R T 2 0 1 8 113
NOTES TO THEFINANCIAL STATEMENTSYEAR ENDED 31 DECEMBER 2018
1 GENERAL (CONT’D)
(C) Manager’s acquisition and divestment fees (cont’d)
(ii) A divestment fee of 0.5% of the Enterprise Value of any real estate or real estate related asset sold or divested directly or indirectly by the Trust, pro-rated, if applicable, to the proportion of the Trust’s interest.
Unless required under the Property Funds Appendix to be paid in the form of units only, the Manager may opt to receive such divestment fee in the form of cash or units or a combination of cash and units as it may determine. Units representing the divestment fee or any part thereof will be issued at an issue price on a similar basis as management fees. Any payment to third party agents or brokers in connection with the divestment of any real estate or real estate related assets of the Trust shall be paid by the Trust. In the event the Manager receives divestment fee in connection with a transaction with a related party, any such divestment fee shall be paid in the form of units.
(D) Project management fees
The property manager is entitled to receive a project management fee for each project undertaken, for the development or redevelopment (if not prohibited by the Property Funds Appendix or if otherwise permitted by the Monetary Authority of Singapore), the refurbishment, retrofitting and renovation of a property, based on the capital expenditure of the project, amounting to:
(i) 5.0% of the capital expenditure of the project where the capital expenditure of the project is less than $1.0 million; or
(ii) 3.0% of the capital expenditure of the project where the capital expenditure of the project is more than or equal to $1.0 million.
For the purpose of calculating the fees payable to the property manager, “capital expenditure” means all construction costs and expenditure valued by the quantity surveyor engaged by the Trustee for the project, excluding development charges, differential premiums, statutory payments, consultants’ professional fees and goods and services tax.
2 BASIS OF PREPARATION
2.1 Statement of compliance
The financial statements are prepared in accordance with the recommendations of Statement of Recommended Accounting Practice (“RAP”) 7 Reporting Framework for Unit Trusts issued by the Institute of Singapore Chartered Accountants and the applicable requirements of the Code on Collective Investment Schemes (“CIS Code”) issued by the Monetary Authority of Singapore (“MAS”) and the provisions of the Trust Deed. RAP 7 requires that accounting policies adopted should generally comply with the recognition and measurement principles of Singapore Financial Reporting Standards (“FRS”).

P A R K W A Y L I F E R E I T114
NOTES TO THEFINANCIAL STATEMENTSYEAR ENDED 31 DECEMBER 2018
2 BASIS OF PREPARATION (CONT’D)
2.2 Basis of measurement
The financial statements have been prepared on the historical cost basis except for the following items:
– derivative financial instruments are measured at fair value; and
– investment properties are measured at fair value.
2.3 Functional and presentation currency
The financial statements of the Group and the Trust are presented in Singapore dollars, which is the Trust’s functional currency. All financial information presented in Singapore dollars have been rounded to the nearest thousand, unless otherwise stated.
2.4 Use of estimates and judgements
The preparation of financial statements in conformity with RAP 7 requires the Manager to make judgements, estimates and assumptions that affect the application of policies and the reported amounts of assets, liabilities, income and expenses. Actual results may differ from these estimates.
Estimates and underlying assumptions are reviewed on an ongoing basis. Revisions to accounting estimates are recognised in the period in which the estimates are revised and in any future periods affected.
In particular, information about assumptions and estimation uncertainties that have a significant risk of resulting in a material adjustment to the carrying amounts of assets and liabilities within the next financial year are included in the following notes:
• Note4 – fairvaluedeterminationofinvestmentproperties;and
• Note23 – valuationoffinancialinstruments.
Measurement of fair values
A number of the Group’s accounting policies and disclosures require the measurement of fair values, for both financial and non-financial assets and liabilities.
When measuring the fair value of an asset or a liability, the Group uses market observable data as far as possible. Fair values are categorised into different levels in a fair value hierarchy based on the inputs used in the valuation techniques as follows:
• Level1: Quoted prices (unadjusted) in active markets for identical assets or liabilities;
• Level2: Inputs other than quoted prices included in Level 1 that are observable for the asset or liability, either directly (i.e. as prices) or indirectly (i.e. derived from prices); and
• Level3: Inputs for the asset or liability that are not based on observable market data (unobservable inputs).
A N N U A L R E P O R T 2 0 1 8 115
NOTES TO THEFINANCIAL STATEMENTSYEAR ENDED 31 DECEMBER 2018
2 BASIS OF PREPARATION (CONT’D)
2.4 Use of estimates and judgements (cont’d)
If the inputs used to measure the fair value of an asset or a liability fall into different levels of the fair value hierarchy, then the fair value measurement is categorised in its entirety in the same level of the fair value hierarchy as the lowest level input that is significant to the entire measurement (with Level 3 being the lowest).
The Group recognises transfers between levels of the fair value hierarchy as of the end of the reporting period during which the change has occurred.
Further information about the assumptions made in measuring fair values is included in the following notes:
• Note4 – fairvaluedeterminationofinvestmentproperties;and
• Note23 – valuationoffinancialinstruments.
2.5 Changes in accounting policies
The Group has applied the principles relating to the recognition and measurement of the following FRSs for the first time for the annual period beginning on 1 January 2018:
• FRS115Revenue from Contracts with Customers;
• FRS109Financial Instruments.
FRS 115 Revenue from Contracts with Customers
FRS 115 establishes a comprehensive framework for determining whether, how much and when revenue is recognised. It replaced FRS 18 Revenue, FRS 11 Construction Contracts and related interpretations. Under FRS 115, revenue is recognised when a customer obtains control of the goods or services. Determining the timing of the transfer of control – at a point in time or over time – requires judgement.
The adoption of the recognition and measurement principles of FRS 115 did not have a material effect on the financial statements.
FRS 109 Financial Instruments
Classification and measurement of financial assets and financial liabilities
An explanation of how the Group classifies and measures financial assets and related gains and losses under the principles of FRS 109 is set out in Note 3.4.
The adoption of these principles did not have a material effect on the financial statements and the Group’s accounting policies for financial liabilities.
The following table and the accompanying notes below explain the original measurement categories under the principles of FRS 39 and the new measurement categories under the principles of FRS 109 for each class of the Group’s and the Trust’s financial assets and financial liabilities as at 1 January 2018.
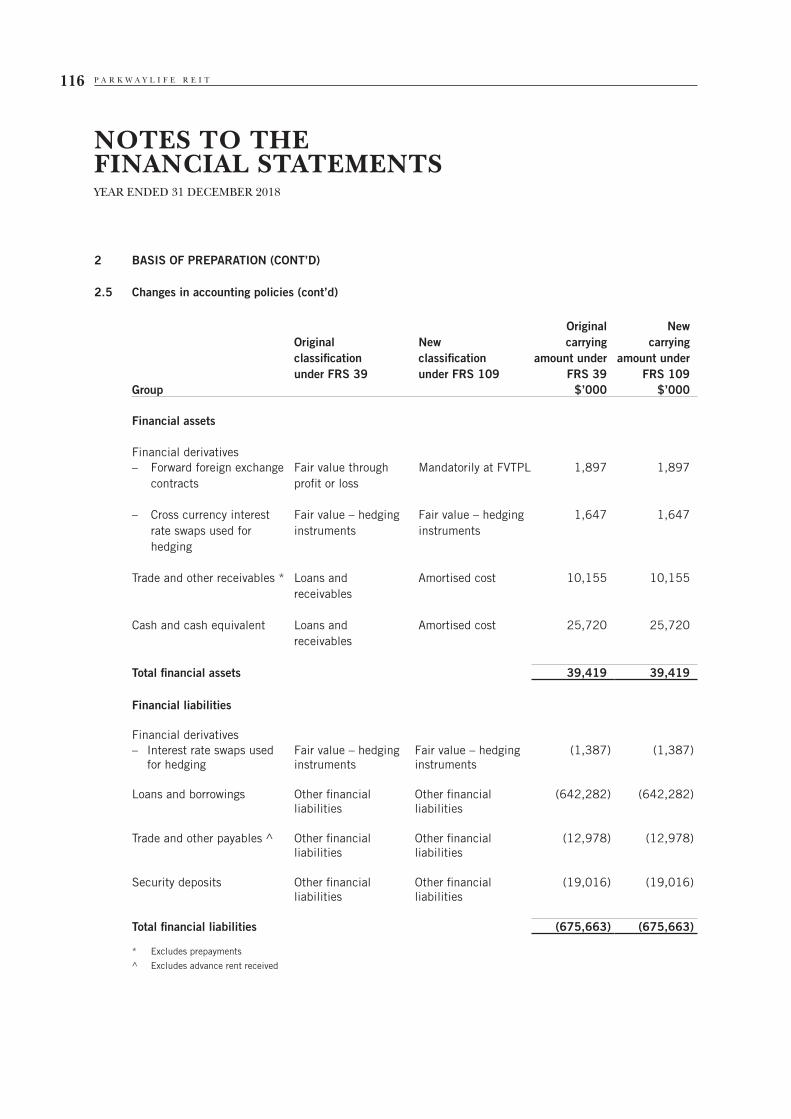
P A R K W A Y L I F E R E I T116
NOTES TO THEFINANCIAL STATEMENTSYEAR ENDED 31 DECEMBER 2018
2 BASIS OF PREPARATION (CONT’D)
2.5 Changes in accounting policies (cont’d)
Original classification under FRS 39
New classification under FRS 109
Original carrying
amount under FRS 39
New carrying
amount under FRS 109
Group $’000 $’000
Financial assets
Financial derivatives– Forward foreign exchange
contractsFair value through profit or loss
Mandatorily at FVTPL 1,897 1,897
– Cross currency interest rate swaps used for hedging
Fair value – hedging instruments
Fair value – hedging instruments
1,647 1,647
Trade and other receivables * Loans and receivables
Amortised cost 10,155 10,155
Cash and cash equivalent Loans and receivables
Amortised cost 25,720 25,720
Total financial assets 39,419 39,419
Financial liabilities
Financial derivatives– Interest rate swaps used
for hedgingFair value – hedging instruments
Fair value – hedging instruments
(1,387) (1,387)
Loans and borrowings Other financial liabilities
Other financial liabilities
(642,282) (642,282)
Trade and other payables ^ Other financial liabilities
Other financial liabilities
(12,978) (12,978)
Security deposits Other financial liabilities
Other financial liabilities
(19,016) (19,016)
Total financial liabilities (675,663) (675,663)
* Excludes prepayments
^ Excludes advance rent received
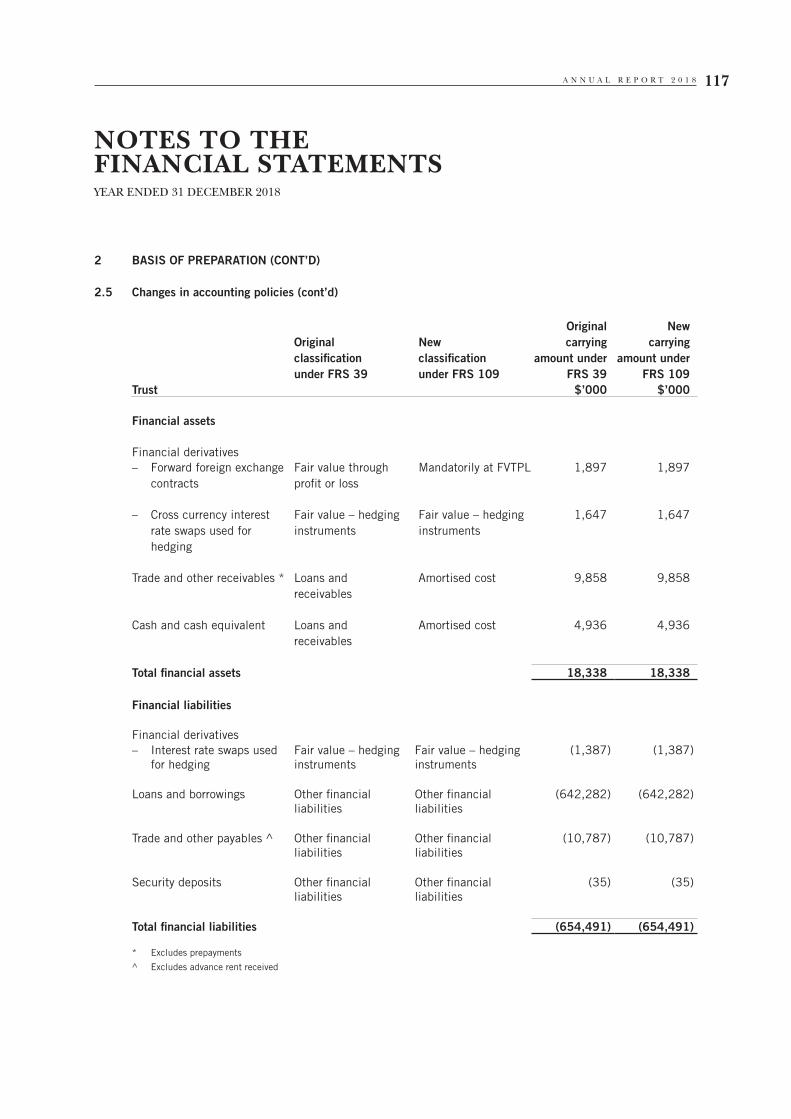
A N N U A L R E P O R T 2 0 1 8 117
NOTES TO THEFINANCIAL STATEMENTSYEAR ENDED 31 DECEMBER 2018
2 BASIS OF PREPARATION (CONT’D)
2.5 Changes in accounting policies (cont’d)
Original classification under FRS 39
New classification under FRS 109
Original carrying
amount under FRS 39
New carrying
amount under FRS 109
Trust $’000 $’000
Financial assets
Financial derivatives– Forward foreign exchange
contractsFair value through profit or loss
Mandatorily at FVTPL 1,897 1,897
– Cross currency interest rate swaps used for hedging
Fair value – hedging instruments
Fair value – hedging instruments
1,647 1,647
Trade and other receivables * Loans and receivables
Amortised cost 9,858 9,858
Cash and cash equivalent Loans and receivables
Amortised cost 4,936 4,936
Total financial assets 18,338 18,338
Financial liabilities
Financial derivatives– Interest rate swaps used
for hedgingFair value – hedging instruments
Fair value – hedging instruments
(1,387) (1,387)
Loans and borrowings Other financial liabilities
Other financial liabilities
(642,282) (642,282)
Trade and other payables ^ Other financial liabilities
Other financial liabilities
(10,787) (10,787)
Security deposits Other financial liabilities
Other financial liabilities
(35) (35)
Total financial liabilities (654,491) (654,491)
* Excludes prepayments
^ Excludes advance rent received
P A R K W A Y L I F E R E I T118
NOTES TO THEFINANCIAL STATEMENTSYEAR ENDED 31 DECEMBER 2018
3 SIGNIFICANT ACCOUNTING POLICIES
The accounting policies set out below have been applied consistently to all periods presented in the financial statements and have been applied consistently by the Group, except as explained in Note 2.5, which addressed changes in accounting policies.
3.1 Basis of consolidation
Business combinations
The Group accounts for business combinations using the acquisition method when control is transferred to the Group.
Business combinations and property acquisitions
Where a property is acquired, the Manager considers the substance of the assets and activities of the acquired entity in determining whether the acquisition represents the acquisition of a business.
The Group accounts for an acquisition as business combination where an integrated set of activities is acquired in addition to the property. More specifically, consideration is made of the extent to which significant processes are acquired.
When acquisition of an asset or a group of assets does not constitute a business combination, it is treated as property acquisition. In such cases, the individual identifiable assets acquired and liabilities assumed are recognised. The acquisition cost shall be allocated to the individual identifiable assets and liabilities on the basis of their relative fair values at the date of acquisition. Such a transaction does not give rise to goodwill.
Subsidiaries
Subsidiaries are entities controlled by the Group. The Group controls an entity when it is exposed to, or has rights to, variable returns from its involvement with the entity and has the ability to affect those returns through its power over the entity. The financial statements of subsidiaries are included in the consolidated financial statements from the date that control commences until the date that control ceases.
The accounting policies of subsidiaries have been changed where necessary to align them with the policies adopted by the Group.
Transactions eliminated on consolidation
Intra-group balances and transactions, and any unrealised income or expenses arising from intra-group transactions, are eliminated in preparing the consolidated financial statements.
Accounting for subsidiaries by the Trust
Investments in subsidiaries are stated in the Trust’s statement of financial position at cost less accumulated impairment losses.
A N N U A L R E P O R T 2 0 1 8 119
NOTES TO THEFINANCIAL STATEMENTSYEAR ENDED 31 DECEMBER 2018
3 SIGNIFICANT ACCOUNTING POLICIES (CONT’D)
3.2 Foreign currency
Foreign currency transactions
Transactions in foreign currencies are translated to the respective functional currencies of the Group entities at the exchange rates at the dates of the transactions. Monetary assets and liabilities denominated in foreign currencies at the reporting date are translated to the functional currency at the exchange rate at that date. The foreign currency gain or loss on monetary items is the difference between amortised cost in the functional currency at the beginning of the year, adjusted for effective interest and payments during the year, and the amortised cost in foreign currency translated at the exchange rate at the end of the reporting year.
Non-monetary assets and liabilities denominated in foreign currencies that are measured at fair value are translated to the functional currency at the exchange rate at the date that the fair value was determined. Non-monetary items in a foreign currency that are measured in terms of historical cost are translated using the exchange rate at the date of the transaction.
Foreign currency differences arising on translation are recognised in the statement of total return, except for differences arising on the translation of monetary items that in substance form part of the Group’s net investment in foreign operations, and financial liabilities designated as hedges of the net investment in foreign operations, which are recognised in the Unitholders’ funds.
Foreign operations
The assets and liabilities of foreign operations, including goodwill and fair value adjustments arising on acquisition, are translated to Singapore dollars at exchange rates at the reporting date. The income and expenses of foreign operations are translated to Singapore dollars at exchange rates at the dates of the transactions.
Foreign currency differences are recognised in the foreign currency translation reserve. When a foreign operation is disposed of such that control is lost, the cumulative amount in the foreign currency translation reserve related to that foreign operation is transferred to the statement of total return as part of the gain or loss on disposal. When the Group disposes of only part of its interest in a subsidiary that includes a foreign operation while retaining control, the relevant proportion of the cumulative amount is reattributed to non-controlling interests.

P A R K W A Y L I F E R E I T120
NOTES TO THEFINANCIAL STATEMENTSYEAR ENDED 31 DECEMBER 2018
3 SIGNIFICANT ACCOUNTING POLICIES (CONT’D)
3.3 Investment properties
Investment properties are properties held either to earn rental income or for capital appreciation or for both, but not for sale in the ordinary course of business. Investment properties are accounted for as non-current assets and are initially recognised at cost and at fair value thereafter. The cost of a purchased property comprises its purchase price and any directly attributable expenditure. Fair value of investment properties are determined in accordance with the Trust Deed, which requires the investment properties to be valued by independent registered valuers in the following manner:
(i) in such manner and frequency required under the CIS code issued by MAS; and
(ii) at least once a year, on the 31st December of each year.
Any increase or decrease on revaluation is credited or charged directly to the statement of total return as a net change in fair value of investment properties.
Subsequent expenditure relating to investment properties that has already been recognised is added to the carrying amount of the asset when it is probable that future economic benefits, in excess of originally assessed standard of performance of the existing asset, will flow to the Group. All other subsequent expenditure is recognised as an expense in the period in which it is incurred.
When an investment property is disposed of, the resulting gain or loss recognised in the statement of total return is the difference between net disposal proceeds and the carrying amount of the property.
Investment properties are not depreciated. The properties are subject to continued maintenance and regularly revalued on the basis set out above.
3.4 Financial instruments
Recognition and initial measurement
Non-derivative financial assets and financial liabilities
Trade receivables are initially recognised when they are originated. All other financial assets and financial liabilities are initially recognised when the Group becomes a party to the contractual provisions of the instrument.
A financial asset (unless it is a trade receivable without a significant financing component) or financial liability is initially measured at fair value plus, for an item not at fair value through profit or loss (FVTPL), transaction costs that are directly attributable to its acquisition or issue. A trade receivable without a significant financing component is initially measured at the transaction price.
A N N U A L R E P O R T 2 0 1 8 121
NOTES TO THEFINANCIAL STATEMENTSYEAR ENDED 31 DECEMBER 2018
3 SIGNIFICANT ACCOUNTING POLICIES (CONT’D)
3.4 Financial instruments (cont’d)
Classification and subsequent measurement
Non-derivative financial assets – Policy applicable from 1 January 2018
On initial recognition, a financial asset is classified as measured at amortised cost.
Financial assets are not reclassified subsequent to their initial recognition unless the Group changes its business model for managing financial assets, in which case all affected financial assets are reclassified on the first day of the first reporting period following the change in the business model.
Financial assets at amortised cost
A financial asset is measured at amortised cost if it meets both of the following conditions and is not designated as at FVTPL:
• itisheldwithinabusinessmodelwhoseobjectiveistoholdassetstocollectcontractualcashflows;and
• itscontractualtermsgiveriseonspecifieddatestocashflowsthataresolelypaymentsofprincipaland interest on the principal amount outstanding.
Financial assets: Business model assessment – Policy applicable from 1 January 2018
The Group makes an assessment of the objective of the business model in which a financial asset is held at a portfolio level because this best reflects the way the business is managed and information is provided to the Manager. The information considered includes:
• howtheperformanceoftheportfolioisevaluatedandreportedtotheManager;and
• therisksthataffecttheperformanceofthebusinessmodel(andthefinancialassetsheldwithinthatbusiness model) and how those risks are managed.
Transfers of financial assets to third parties in transactions that do not qualify for derecognition are not considered sales for this purpose, consistent with the Group’s continuing recognition of the assets.
P A R K W A Y L I F E R E I T122
NOTES TO THEFINANCIAL STATEMENTSYEAR ENDED 31 DECEMBER 2018
3 SIGNIFICANT ACCOUNTING POLICIES (CONT’D)
3.4 Financial instruments (cont’d)
Non-derivative financial assets: Assessment whether contractual cash flows are solely payments of principal and interest – Policy applicable from 1 January 2018
For the purposes of this assessment, ‘principal’ is defined as the fair value of the financial asset on initial recognition. ‘Interest’ is defined as consideration for the time value of money and for the credit risk associated with the principal amount outstanding during a particular period of time and for other basic lending risks and costs (e.g. liquidity risk and administrative costs), as well as a profit margin.
In assessing whether the contractual cash flows are solely payments of principal and interest, the Group considers the contractual terms of the instrument. This includes assessing whether the financial asset contains a contractual term that could change the timing or amount of contractual cash flows such that it would not meet this condition. In making this assessment, the Group considers:
• contingenteventsthatwouldchangetheamountortimingofcashflows;
• termsthatmayadjustthecontractualcouponrate,includingvariableratefeatures;
• prepaymentandextensionfeatures;and
• termsthatlimittheGroup’sclaimtocashflowsfromspecifiedassets(e.g.non-recoursefeatures).
A prepayment feature is consistent with the solely payments of principal and interest criterion if the prepayment amount substantially represents unpaid amounts of principal and interest on the principal amount outstanding, which may include reasonable additional compensation for early termination of the contract. Additionally, for a financial asset acquired at a significant discount or premium to its contractual par amount, a feature that permits or requires prepayment at an amount that substantially represents the contractual par amount plus accrued (but unpaid) contractual interest (which may also include reasonable additional compensation for early termination) is treated as consistent with this criterion if the fair value of the prepayment feature is insignificant at initial recognition.
Non-derivative financial assets: Subsequent measurement and gains and losses – Policy applicable from 1 January 2018
Financial assets at amortised cost
These assets are subsequently measured at amortised cost using the effective interest method. The amortised cost is reduced by impairment losses. Interest income, foreign exchange gains and losses and impairment are recognised in statement of total return. Any gain or loss on derecognition is recognised in statement of total return.
Non-derivative financial assets – Policy applicable before 1 January 2018
The Group classifies non-derivative financial assets into loans and receivables category.
A N N U A L R E P O R T 2 0 1 8 123
NOTES TO THEFINANCIAL STATEMENTSYEAR ENDED 31 DECEMBER 2018
3 SIGNIFICANT ACCOUNTING POLICIES (CONT’D)
3.4 Financial instruments (cont’d)
Non-derivative financial assets: Subsequent measurement and gains and losses – Policy applicable before 1 January 2018
Loans and receivables
Loans and receivables were financial assets with fixed or determinable payments that were not quoted in an active market. Such assets are initially measured at fair value plus any directly attributable transaction costs. Subsequent to initial recognition, loans and receivables were measured at amortised cost using the effective interest method, less any impairment losses.
Loans and receivables comprised cash and cash equivalents, and trade and other receivables.
Non-derivative financial liabilities: Classification, subsequent measurement and gains and losses
Financial liabilities are classified as other financial liabilities and are initially measured at fair value less directly attributable transaction costs. They are subsequently measured at amortised cost using the effective interest method. Interest expense and foreign exchange gains and losses are recognised in statement of total return. These financial liabilities comprised loans and borrowings, trade and other payables and security deposits.
Derecognition
Financial assets
The Group derecognises a financial asset when the contractual rights to the cash flows from the financial asset expire, or it transfers the rights to receive the contractual cash flows in a transaction in which substantially all of the risks and rewards of ownership of the financial asset are transferred or in which the Group neither transfers nor retains substantially all of the risks and rewards of ownership and it does not retain control of the financial asset.
The Group enters into transactions whereby it transfers assets recognised in its statement of financial position, but retains either all or substantially all of the risks and rewards of the transferred assets. In these cases, the transferred assets are not derecognised.
Financial liabilities
The Group derecognises a financial liability when its contractual obligations are discharged or cancelled, or expire. The Group also derecognises a financial liability when its terms are modified and the cash flows of the modified liability are substantially different, in which case a new financial liability based on the modified terms is recognised at fair value.
On derecognition of a financial liability, the difference between the carrying amount extinguished and the consideration paid (including any non-cash assets transferred or liabilities assumed) is recognised in statement of total return.

P A R K W A Y L I F E R E I T124
NOTES TO THEFINANCIAL STATEMENTSYEAR ENDED 31 DECEMBER 2018
3 SIGNIFICANT ACCOUNTING POLICIES (CONT’D)
3.4 Financial instruments (cont’d)
Offsetting
Financial assets and financial liabilities are offset and the net amount presented in the statement of financial position when, and only when, the Group currently has a legally enforceable right to set off the amounts and it intends either to settle them on a net basis or to realise the asset and settle the liability simultaneously.
Cash and cash equivalents
Cash and cash equivalents comprise cash balances and short-term deposits with maturities of three months or less from the date of acquisition that are subject to an insignificant risk of changes in their fair value, and are used by the Group in the management of its short-term commitments. For the purpose of the statement of cash flows, cash collateral received is excluded.
Derivative financial instruments and hedge accounting
Derivative financial instruments and hedge accounting – Policy applicable from 1 January 2018
The Group holds derivative financial instruments to hedge its foreign currency and interest rate risk exposures.
Derivatives are initially measured at fair value and any directly attributable transaction costs are recognised in statement of total return as incurred. Subsequent to initial recognition, derivatives are measured at fair value, and changes therein are generally recognised in statement of total return, unless it is designated in a hedge relationship that qualifies for hedge accounting.
The Group designates certain derivatives and non-derivative financial instruments as hedging instruments in qualifying hedging relationships. At inception of designated hedging relationships, the Group documents the risk management objective and strategy for undertaking the hedge. The Group also documents the economic relationship between the hedged item and the hedging instrument, including whether the changes in cash flows of the hedged item and hedging instrument are expected to offset each other.
Hedging relationships designated under FRS 39 that were still existing as at 31 December 2017 are treated as continuing hedges and hedge documentations were aligned accordingly to the requirements of FRS 109.
Cash flow hedges
The Group designates certain derivatives as hedging instruments to hedge the variability in cash flows associated with highly probable forecast transactions arising from changes in foreign exchange rates and interest rates.
When a derivative is designated as a cash flow hedging instrument, the effective portion of changes in the fair value of the derivative is recognised in Unitholders’ funds and accumulated in the hedging reserve. The effective portion of changes in the fair value of the derivative that is recognised in Unitholders’ funds is limited to the cumulative change in fair value of the hedged item, determined on a present value basis, from inception of the hedge. Any ineffective portion of changes in the fair value of the derivative is recognised immediately in statement of total return.
A N N U A L R E P O R T 2 0 1 8 125
NOTES TO THEFINANCIAL STATEMENTSYEAR ENDED 31 DECEMBER 2018
3 SIGNIFICANT ACCOUNTING POLICIES (CONT’D)
3.4 Financial instruments (cont’d)
For all hedge transactions, the amount accumulated in the hedging reserve is reclassified to the statement of total return in the same period or periods during which the hedged expected future cash flows affect the statement of total return.
If the hedge no longer meets the criteria for hedge accounting or the hedging instrument is sold, expires, is terminated or is exercised, then hedge accounting is discontinued prospectively. When hedge accounting for cash flow hedges is discontinued, the amount that has been accumulated in the hedging reserve and the cost of hedging reserve remains in Unitholders’ funds until, for a hedge of a transaction resulting in recognition of a non-financial item, it is included in the non-financial item’s cost on its initial recognition or, for other cash flow hedges, it is reclassified to statement of total return in the same period or periods as the hedged expected future cash flows affect total return.
If the hedged future cash flows are no longer expected to occur, then the amounts that have been accumulated in the hedging reserve and the cost of hedging reserve are immediately reclassified to statement of total return.
Net investment hedges
The Group designates certain derivatives and non-derivative financial liabilities as hedges of foreign exchange risk on a net investment in a foreign operation.
When a derivative instrument or a non-derivative financial liability is designated as the hedging instrument in a hedge of a net investment in a foreign operation, the effective portion of, for a derivative, changes in the fair value of the hedging instrument or, for a non-derivative, foreign exchange gains and losses is recognised in Unitholders’ funds and presented in the translation reserve within Unitholders’ funds. Any ineffective portion of the changes in the fair value of the derivative or foreign exchange gains and losses on the non-derivative is recognised immediately in statement of total return. The amount recognised in Unitholders’ funds is reclassified to statement of total return as a reclassification adjustment on disposal of the foreign operation.
Derivative financial instruments and hedge accounting – Policy applicable before 1 January 2018
The policy applied in the comparative information presented for 2017 is similar to that applied for 2018. For all cash flow hedges, including hedges of transactions resulting in the recognition of non-financial items, the amounts accumulated in the cash flow hedge reserve were reclassified to statement of total return in the same period or periods during which the hedged expected future cash flows affected statement of total return.
Other non-trading derivatives
When a derivative financial instrument is not designated in a hedge relationship that qualifies for hedge accounting, all changes in its fair value are recognised immediately in the statement of total return.
P A R K W A Y L I F E R E I T126
NOTES TO THEFINANCIAL STATEMENTSYEAR ENDED 31 DECEMBER 2018
3 SIGNIFICANT ACCOUNTING POLICIES (CONT’D)
3.5 Impairment
Non-derivative financial assets
Policy applicable from 1 January 2018
The Group recognises loss allowances for expected credit loss (“ECL”) on financial assets measured at amortised cost.
Loss allowances of the Group are measured on either of the following bases:
• 12-monthECLs:theseareECLsthatresultfromdefaulteventsthatarepossiblewithinthe12monthsafter the reporting date (or for a shorter period if the expected life of the instrument is less than 12 months); or
• LifetimeECLs:theseareECLsthatresultfromallpossibledefaulteventsovertheexpectedlifeofafinancial instrument.
Simplified approach
The Group applies the simplified approach to provide for ECLs for all trade receivables. The simplified approach requires the loss allowance to be measured at an amount equal to lifetime ECL.
General approach
The Group applies the general approach to provide for ECLs on all other financial instruments. Under the general approach, the loss allowance is measured at an amount equal to 12-month ECLs at initial recognition.
At each reporting date, the Group assesses whether the credit risk of a financial instrument has increased significantly since initial recognition. When credit risk has increased significantly since initial recognition, loss allowance is measured at an amount equal to lifetime ECLs.
When determining whether the credit risk of a financial asset has increased significantly since initial recognition and when estimating ECLs, the Group considers reasonable and supportable information that is relevant and available without undue cost or effort. This includes both quantitative and qualitative information and analysis, based on the Group’s historical experience and informed credit assessment and includes forward-looking information.
If credit risk has not increased significantly since initial recognition or if the credit quality of the financial instruments improves such that there is no longer a significant increase in credit risk since initial recognition, loss allowance is measured at an amount equal to 12-month ECLs.
The Group considers a financial asset to be in default when:
• theborrowerisunlikelytopayitscreditobligationstotheGroupinfull,withoutrecoursebytheGroupto actions such as realising security (if any is held); or
• thefinancialassetismorethan90dayspastdue.
A N N U A L R E P O R T 2 0 1 8 127
NOTES TO THEFINANCIAL STATEMENTSYEAR ENDED 31 DECEMBER 2018
3 SIGNIFICANT ACCOUNTING POLICIES (CONT’D)
3.5 Impairment (cont’d)
The maximum period considered when estimating ECLs is the maximum contractual period over which the Group is exposed to credit risk.
Measurement of ECLs
ECLs are probability-weighted estimates of credit losses. Credit losses are measured at the present value of all cash shortfalls (i.e. the difference between the cash flows due to the entity in accordance with the contract and the cash flows that the Group expects to receive). ECLs are discounted at the effective interest rate of the financial asset.
Credit-impaired financial assets
At each reporting date, the Group assesses whether financial assets carried at amortised cost are credit-impaired. A financial asset is ‘credit-impaired’ when one or more events that have a detrimental impact on the estimated future cash flows of the financial asset have occurred.
Evidence that a financial asset is credit-impaired includes the following observable data:
• significantfinancialdifficultyoftheborrowerorissuer;
• abreachofcontractsuchasadefaultorbeingmorethan90dayspastdue;
• the restructuring of a loan or advance by theGroup on terms that theGroupwould not considerotherwise;
• itisprobablethattheborrowerwillenterbankruptcyorotherfinancialreorganisation;or
• thedisappearanceofanactivemarketforasecuritybecauseoffinancialdifficulties.
Presentation of allowance for ECLs in the statement of financial position
Loss allowances for financial assets measured at amortised cost are deducted from the gross carrying amount of these assets.
Write-off
The gross carrying amount of a financial asset is written off (either partially or in full) to the extent that there is no realistic prospect of recovery. This is generally the case when the Group determines that the debtor does not have assets or sources of income that could generate sufficient cash flows to repay the amounts subject to the write-off. However, financial assets that are written off could still be subject to enforcement activities in order to comply with the Group’s procedures for recovery of amounts due.
P A R K W A Y L I F E R E I T128
NOTES TO THEFINANCIAL STATEMENTSYEAR ENDED 31 DECEMBER 2018
3 SIGNIFICANT ACCOUNTING POLICIES (CONT’D)
3.5 Impairment (cont’d)
Policy applicable before 1 January 2018
A financial asset not carried at FVTPL was assessed at the end of each reporting period to determine whether there was objective evidence that it was impaired. A financial asset was impaired if objective evidence indicated that a loss event(s) had occurred after the initial recognition of the asset, and that the loss event(s) had an impact on the estimated future cash flows of that asset that could be estimated reliably.
Objective evidence that financial assets were impaired included default or delinquency by a debtor, restructuring of an amount due to the Group on terms that the Group would not consider otherwise, indications that a debtor or issuer would enter bankruptcy, adverse changes in the payment status of borrowers or issuers, economic conditions that correlate with defaults or the disappearance of an active market for a security.
Loans and receivables
The Group considered evidence of impairment for loans and receivables at both an individual asset and collective level. All individually significant assets were individually assessed for impairment. Those found not to be impaired were then collectively assessed for any impairment that had been incurred but not yet identified. Assets that were not individually significant were collectively assessed for impairment. Collective assessment was carried out by grouping together assets with similar risk characteristics.
In assessing collective impairment, the Group used historical information on the timing of recoveries and the amount of loss incurred, and made an adjustment if current economic and credit conditions were such that the actual losses were likely to be greater or lesser than suggested by historical trends.
An impairment loss was calculated as the difference between the asset’s carrying amount and the present value of the estimated future cash flows, discounted at the asset’s original effective interest rate. Losses were recognised in statement of total return and reflected in an allowance account. When the Group considered that there were no realistic prospects of recovery of the asset, the relevant amounts were written off. If the amount of impairment loss subsequently decreased and the decrease was related objectively to an event occurring after the impairment was recognised, then the previously recognised impairment loss was reversed through statement of total return.
Non-financial assets
The carrying amounts of the Group’s non-financial assets, other than investment property, are reviewed at each reporting date to determine whether there is any indication of impairment. If any such indication exists, then the asset’s recoverable amount is estimated.
The recoverable amount of an asset or cash-generating unit is the greater of its value in use and its fair value less costs to sell. In assessing value in use, the estimated future cash flows are discounted to their present value using a pre-tax discount rate that reflects current market assessments of the time value of money and the risks specific to the asset or cash-generating unit. For the purpose of impairment testing, assets that cannot be tested individually are grouped together into the smallest group of assets that generates cash inflows from continuing use that are largely independent of the cash inflows of other assets or groups of assets (the “cash-generating unit, or CGU”).
A N N U A L R E P O R T 2 0 1 8 129
NOTES TO THEFINANCIAL STATEMENTSYEAR ENDED 31 DECEMBER 2018
3 SIGNIFICANT ACCOUNTING POLICIES (CONT’D)
3.5 Impairment (cont’d)
An impairment loss is recognised if the carrying amount of an asset or its CGU exceeds its estimated recoverable amount. Impairment losses are recognised in the statement of total return. Impairment losses recognised in respect of CGUs are allocated first to reduce the carrying amount of any goodwill allocated to the units, and then to reduce the carrying amounts of the other assets in the unit (group of units) on a pro rata basis.
Impairment losses recognised in prior periods are assessed at each reporting date for any indications that the loss has decreased or no longer exists. An impairment loss is reversed if there has been a change in the estimates used to determine the recoverable amount. An impairment loss is reversed only to the extent that the asset’s carrying amount does not exceed the carrying amount that would have been determined, net of depreciation or amortisation, if no impairment loss had been recognised.
3.6 Revenue recognition
(i) Rental income from operating leases
Rental income receivable under operating leases is recognised in the statement of total return on a straight-line basis over the term of the lease, except where an alternative basis is more representative of the pattern of benefits to be derived from the leased assets. Lease incentives granted are recognised as an integral part of the total rental to be received over the term of the lease. Contingent rentals, which include gross turnover rental, are recognised as income in the accounting period on a receipt basis.
(ii) Interest income
Interest income is recognised on an accrual basis, using the effective interest method.
(iii) Dividend income
Dividend income is recognised in the statement of total return on the date the Trust’s right to receive payment is established.
3.7 Expenses
(i) Property expenses
Property expenses are recognised on an accrual basis. Where the Group has the use of assets under operating leases, payments made under the leases are recognised in the statement of total return on a straight-line basis over the term of leases.

P A R K W A Y L I F E R E I T130
NOTES TO THEFINANCIAL STATEMENTSYEAR ENDED 31 DECEMBER 2018
3 SIGNIFICANT ACCOUNTING POLICIES (CONT’D)
3.7 Expenses (cont’d)
(ii) Management fees
Management fees comprise the Manager’s base fees, performance fees and asset management fees payable to the asset managers of the Japan properties.
Manager’s base fees and performance fees are recognised on an accrual basis based on the applicable formula stipulated in Note 1(B). Where applicable, Manager’s base fee and performance fee paid and payable in units are recognised as an expense in the statement of total return with a corresponding increase in Unitholders’ funds.
(iii) Trust expenses
Trust expenses are recognised on an accrual basis. Included in trust expenses is the trustee’s fees which are based on the applicable formula stipulated in Note 1(A).
(iv) Finance costs
Finance costs comprise interest expense on borrowings, amortisation of borrowings related transactions costs and settlement on financial derivatives.
Interest expense and similar charges are recognised in the statement of total return, using the effective interest rate method over the period of borrowings. Expenses incurred in connection with the arrangement of borrowings are recognised in the statement of total return using the effective interest method over the period for which the borrowings are granted.
3.8 Income tax expense
Income tax expense comprises current and deferred tax. Income tax is recognised in the statement of total return except to the extent that it relates to items directly related to Unitholders’ funds, in which case it is recognised in the Unitholders’ funds.
Current tax is the expected tax payable or receivable on the taxable income or loss for the year, using tax rates enacted or substantively enacted at the reporting date, and any adjustment to tax payable in respect of previous years. The amount of current tax payable or receivable is the best estimate of the tax amount expected to be paid or received that reflects uncertainty related to income taxes, if any.
Deferred tax is recognised in respect of temporary differences between the carrying amounts of assets and liabilities for financial reporting purposes and the amounts used for taxation purposes. Deferred tax is not recognised for the following temporary differences: the initial recognition of assets or liabilities in a transaction that is not a business combination and that affects neither accounting nor taxable profit or loss, and differences relating to investments in subsidiaries to the extent that the Group is able to control the timing of the reversal of the temporary difference and it is probable that they will not reverse in the foreseeable future. In addition, deferred tax is not recognised for taxable temporary differences arising on the initial recognition of goodwill.
A N N U A L R E P O R T 2 0 1 8 131
NOTES TO THEFINANCIAL STATEMENTSYEAR ENDED 31 DECEMBER 2018
3 SIGNIFICANT ACCOUNTING POLICIES (CONT’D)
3.8 Income tax expense (cont’d)
The measurement of deferred tax reflects the tax consequences that would follow the manner in which the Group expects, at the end of the reporting period, to recover or settle the carrying amount of its assets and liabilities. For investment property that is measured at fair value, the presumption that the carrying amount of the investment will be recovered through sale has not been rebutted. Deferred tax is measured at the tax rates that are expected to be applied to temporary differences when they reverse, based on the laws that have been enacted or substantively enacted by the reporting date.
Deferred tax assets and liabilities are offset if there is a legally enforceable right to offset current tax liabilities and assets, and they relate to income taxes levied by the same tax authority on the same taxable entity, or on different tax entities, but they intend to settle current tax liabilities and assets on a net basis or their tax assets and liabilities will be realised simultaneously.
A deferred tax asset is recognised for unused tax losses, tax credits and deductible temporary differences, to the extent that it is probable that future taxable profits will be available against which they can be utilised. Deferred tax assets are reviewed at each reporting date and are reduced to the extent that it is no longer probable that the related tax benefit will be realised.
In determining the amount of current and deferred tax, the Group takes into account the impact of uncertain tax positions and whether additional taxes and interest may be due. The Group believes that its accruals for tax liabilities are adequate for all open tax years based on its assessment of many factors, including interpretations of tax laws and prior experience. This assessment relies on estimates and assumptions and may involve a series of judgements about future events. New information may become available that causes the Group to change its judgement regarding the adequacy of existing tax liabilities; such changes to tax liabilities will impact tax expense in the period that such a determination is made.
The Inland Revenue Authority of Singapore (the “IRAS”) has issued a tax ruling on the income tax treatment of the Trust. Subject to meeting the terms and conditions of the tax ruling which includes a distribution of at least 90.0% of the taxable income of the Trust, the Trustee is not subject to tax on the taxable income of the Trust. Instead, the distributions made by the Trust out of such taxable income are subject to tax in the hands of Unitholders, unless they are exempt from tax on the Trust’s distributions. This treatment is known as the tax transparency treatment.
Qualifying Unitholders are entitled to gross distributions from the Trust. For distributions made to foreign non-individual Unitholders during the period from 18 February 2010 to 31 December 2025, the Trustee is required to withhold tax at the reduced rate of 10.0% on distributions made. For other types of Unitholders, the Trustee is required to withhold tax at the prevailing corporate tax rate on the distributions made by the Trust. Such other types of Unitholders are subject to tax on the regrossed amounts of the distributions received but may claim a credit for the tax deducted at source at the prevailing corporate tax rate by the Trustee.
P A R K W A Y L I F E R E I T132
NOTES TO THEFINANCIAL STATEMENTSYEAR ENDED 31 DECEMBER 2018
3 SIGNIFICANT ACCOUNTING POLICIES (CONT’D)
3.8 Income tax expense (cont’d)
A Qualifying Unitholder refers to a Unitholder who is:
• Anindividual;
• AcompanyincorporatedandtaxresidentinSingapore;
• ASingaporebranchofacompanyincorporatedoutsideSingapore;
• Abodyofpersons incorporatedor registered inSingapore includingacharity registeredunder theCharities Act (Cap. 37) or established by any written law, a town council, a statutory board, a co-operative society registered under the Co-operative Societies Act (Cap. 62) or a trade union registered under the Trade Unions Act (Cap. 333);
• Aninternationalorganisationthatisexemptfromtaxonsuchdistributionsbyreasonofanordermadeunder the International Organisations (Immunities and Privileges) Act (Cap. 145);
• Arealestateinvestmenttrustexchange-tradedfundwhichhasbeenaccordedthetaxtransparencytreatment.
A foreign non-individual Unitholder refers to a Unitholder who is not a resident of Singapore for income tax purpose and:
• whodoesnothaveanypermanentestablishmentinSingapore;or
• whocarriesonanyoperationthroughapermanentestablishmentinSingapore,wherethefundsusedto acquire the units in that REIT are not obtained from that operation.
The above tax transparency treatment does not apply to gains from disposal of any properties such as real estate properties, shares, etc that are determined by the IRAS to be revenue gains chargeable to tax. Tax on such gains or profits will be subject to tax, in accordance to Section 10(1)(a) of the Income Tax Act (Cap. 134) and collected from the Trustee. Where the gains are capital gains, they will not be subject to tax and the Trustee and the Manager may distribute the capital gains without tax being deducted at source.
3.9 Distribution policy
The Trust has a distribution policy to distribute at least 90.0% of its taxable income, other than gains from the sale of real estate properties that are determined by IRAS to be trading gains, and net overseas income, with the actual level of distribution to be determined at the Manager’s discretion. For the taxable income that is not distributed, referred to as retained taxable income, tax will be assessed on the Trustee. Where such retained taxable income is subsequently distributed, the Trustee need not deduct tax at source.
Net overseas income refers to the net profits (excluding any gains from the sale of property or shares, as the case may be) after applicable taxes and adjustment for non-cash items such as depreciation derived by the Trust from its properties, if any.

A N N U A L R E P O R T 2 0 1 8 133
NOTES TO THEFINANCIAL STATEMENTSYEAR ENDED 31 DECEMBER 2018
3 SIGNIFICANT ACCOUNTING POLICIES (CONT’D)
3.9 Distribution policy (cont’d)
Distributions to Unitholders are made on a quarterly basis, with the amount calculated as at 31 March, 30 June, 30 September and 31 December each year for the three-month period ending on each of the said dates. In accordance with the provisions of the Trust Deed, the Manager is required to pay distributions within 75 days after the end of the first three distribution periods of a financial year and within 90 days from the end of a financial year. Distributions, when paid, will be in Singapore dollars.
3.10 Earnings per unit
The Group presents basic and diluted earnings per unit (“EPU”) data for its units. Basic EPU is calculated by dividing the total return for the period after tax by the weighted average number of units outstanding during the period, adjusted for own units held. Diluted EPU is determined by adjusting the total return for the period after tax and the weighted average number of units outstanding, adjusted for own units held, for the effects of all dilutive potential units.
3.11 Segment reporting
An operating segment is a component of the Group that engages in business activities from which it may earn revenues and incur expenses, including revenues and expenses that relate to transactions with any of the Group’s other components. All operating segments’ operating results are reviewed regularly by the Manager’s CEO to make decisions about resources to be allocated to the segment and assess its performance, and for which discrete financial information is available.
Segment results include items directly attributable to a segment as well as those that can be allocated on a reasonable basis. Unallocated items comprise mainly corporate assets and expenses, and tax assets and liabilities.
Segment capital expenditure is the total cost incurred during the year on additions to investment properties that are expected to be used for more than one year.
3.12 New standards and interpretations not yet adopted
A number of new standards and amendments to standards are effective for annual periods beginning after 1 January 2019 and earlier application is permitted; however, the Group has not early applied the following new or amended standards in preparing these statements.
P A R K W A Y L I F E R E I T134
NOTES TO THEFINANCIAL STATEMENTSYEAR ENDED 31 DECEMBER 2018
3 SIGNIFICANT ACCOUNTING POLICIES (CONT’D)
3.12 New standards and interpretations not yet adopted (cont’d)
Applicable to 2019 financial statements
FRS 116 Leases
FRS 116 introduces a single, on-balance sheet lease accounting model for lessees. A lessee recognises a right-of-use (ROU) asset representing its right to use the underlying asset and a lease liability representing its obligation to make lease payments. There are recognition exemptions for short-term leases and leases of low-value items. Lessor accounting remains similar to the current standard – i.e. lessors continue to classify leases as finance or operating leases. FRS 116 replaces existing lease accounting guidance, including FRS 17 Leases, INT FRS 104 Determining whether an Arrangement contains a Lease, INT FRS 15 Operating Leases – Incentives and INT FRS 27 Evaluating the Substance of Transactions Involving the Legal Form of a Lease. The standard is effective for annual periods beginning on or after 1 January 2019, with early adoption permitted.
The Group plans to apply FRS 116 initially on 1 January 2019, using the modified retrospective approach. Therefore, the cumulative effect of adopting FRS 116 will be recognised as an adjustment to the opening balance of Unitholders’ funds at 1 January 2019, with no restatement of comparative information. The Group plans to apply the practical expedient to grandfather the definition of a lease on transition. This means that it will apply FRS 116 to all contracts entered into before 1 January 2019 and identified as leases in accordance with FRS 17 and INT FRS 104.
The Group as lessee
The Group expects to measure lease liabilities by applying a single discount rate to its portfolio. Furthermore, the Group is likely to apply the practical expedient to recognise amounts of ROU assets equal to their lease liabilities at 1 January 2019. For lease contracts that contain the option to renew, the Group is expected to use hindsight in determining the lease term.
The Group expects their existing operating lease arrangements to be recognised as ROU assets with corresponding lease liabilities under FRS 116. The nature of expenses related to those leases will change as FRS 116 replaces the straight-line operating lease expense with depreciation charge for ROU assets and interest expense on lease liabilities.
No significant impact is expected for leases in which the Group is a lessee.
The Group as lessor
FRS 116 substantially carries forward the current existing lessor accounting requirements. Accordingly, the Group continues to classify its leases as operating leases or finance leases, and to account for these two types of leases using the existing operating lease and finance lease accounting models respectively.
No significant impact is expected for leases in which the Group is a lessor.
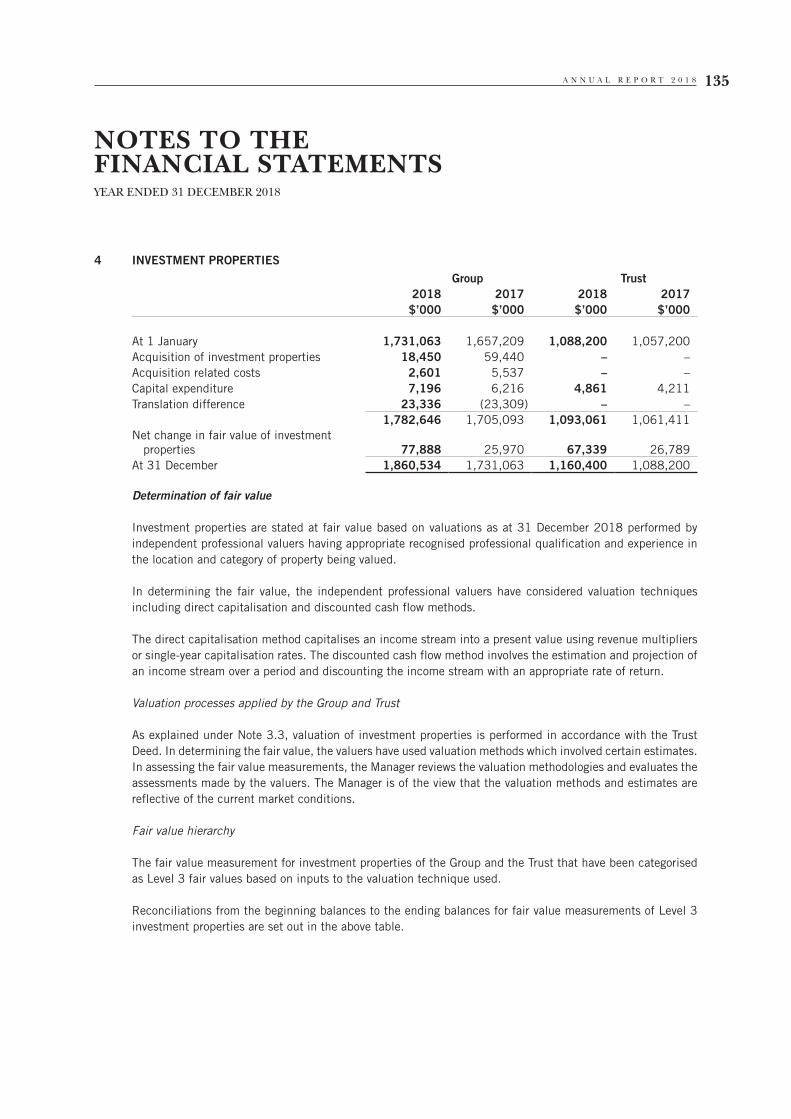
A N N U A L R E P O R T 2 0 1 8 135
NOTES TO THEFINANCIAL STATEMENTSYEAR ENDED 31 DECEMBER 2018
4 INVESTMENT PROPERTIESGroup Trust
2018 2017 2018 2017$’000 $’000 $’000 $’000
At 1 January 1,731,063 1,657,209 1,088,200 1,057,200Acquisition of investment properties 18,450 59,440 – –Acquisition related costs 2,601 5,537 – –Capital expenditure 7,196 6,216 4,861 4,211Translation difference 23,336 (23,309) – –
1,782,646 1,705,093 1,093,061 1,061,411Net change in fair value of investment
properties 77,888 25,970 67,339 26,789At 31 December 1,860,534 1,731,063 1,160,400 1,088,200
Determination of fair value
Investment properties are stated at fair value based on valuations as at 31 December 2018 performed by independent professional valuers having appropriate recognised professional qualification and experience in the location and category of property being valued.
In determining the fair value, the independent professional valuers have considered valuation techniques including direct capitalisation and discounted cash flow methods.
The direct capitalisation method capitalises an income stream into a present value using revenue multipliers or single-year capitalisation rates. The discounted cash flow method involves the estimation and projection of an income stream over a period and discounting the income stream with an appropriate rate of return.
Valuation processes applied by the Group and Trust
As explained under Note 3.3, valuation of investment properties is performed in accordance with the Trust Deed. In determining the fair value, the valuers have used valuation methods which involved certain estimates. In assessing the fair value measurements, the Manager reviews the valuation methodologies and evaluates the assessments made by the valuers. The Manager is of the view that the valuation methods and estimates are reflective of the current market conditions.
Fair value hierarchy
The fair value measurement for investment properties of the Group and the Trust that have been categorised as Level 3 fair values based on inputs to the valuation technique used.
Reconciliations from the beginning balances to the ending balances for fair value measurements of Level 3 investment properties are set out in the above table.
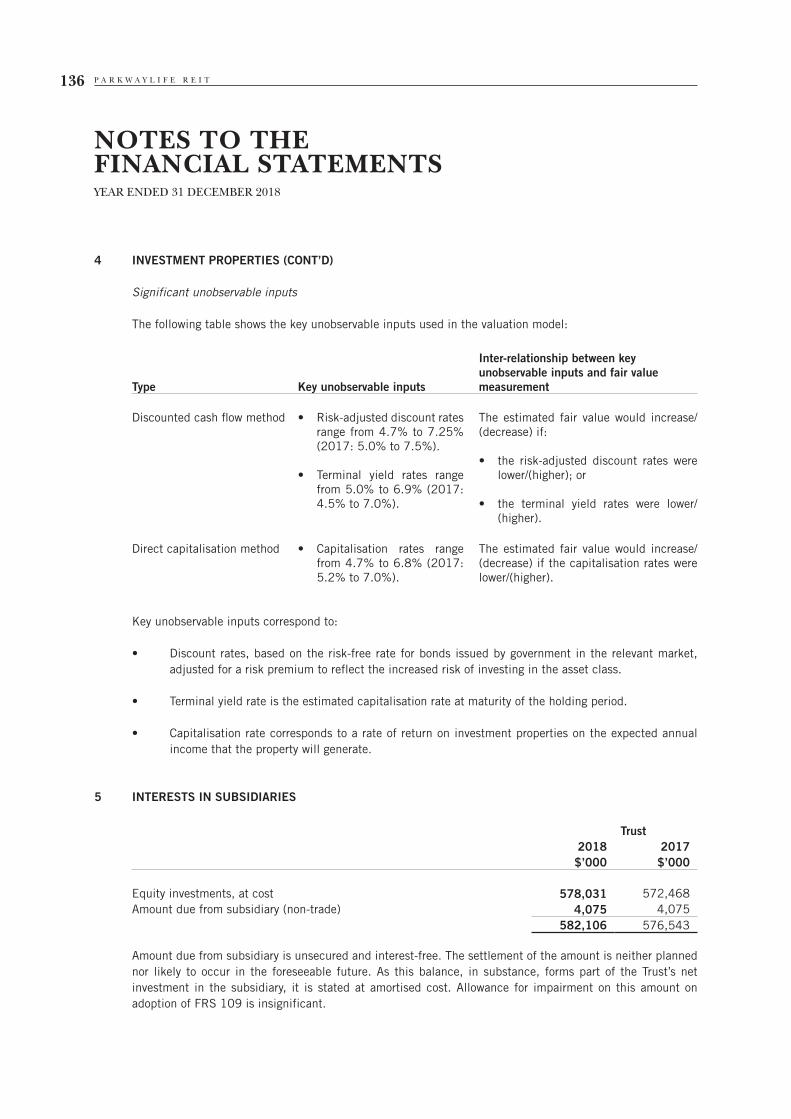
P A R K W A Y L I F E R E I T136
NOTES TO THEFINANCIAL STATEMENTSYEAR ENDED 31 DECEMBER 2018
4 INVESTMENT PROPERTIES (CONT’D)
Significant unobservable inputs
The following table shows the key unobservable inputs used in the valuation model:
Type Key unobservable inputs
Inter-relationship between key unobservable inputs and fair value measurement
Discounted cash flow method • Risk-adjusteddiscountratesrange from 4.7% to 7.25% (2017: 5.0% to 7.5%).
• Terminal yield rates rangefrom 5.0% to 6.9% (2017: 4.5% to 7.0%).
The estimated fair value would increase/(decrease) if:
• the risk-adjusted discount rates werelower/(higher); or
• the terminal yield rates were lower/(higher).
Direct capitalisation method • Capitalisation rates rangefrom 4.7% to 6.8% (2017: 5.2% to 7.0%).
The estimated fair value would increase/(decrease) if the capitalisation rates were lower/(higher).
Key unobservable inputs correspond to:
• Discountrates,basedontherisk-freerateforbondsissuedbygovernmentintherelevantmarket,adjusted for a risk premium to reflect the increased risk of investing in the asset class.
• Terminalyieldrateistheestimatedcapitalisationrateatmaturityoftheholdingperiod.
• Capitalisationratecorrespondstoarateofreturnoninvestmentpropertiesontheexpectedannualincome that the property will generate.
5 INTERESTS IN SUBSIDIARIES
Trust2018 2017$’000 $’000
Equity investments, at cost 578,031 572,468Amount due from subsidiary (non-trade) 4,075 4,075
582,106 576,543
Amount due from subsidiary is unsecured and interest-free. The settlement of the amount is neither planned nor likely to occur in the foreseeable future. As this balance, in substance, forms part of the Trust’s net investment in the subsidiary, it is stated at amortised cost. Allowance for impairment on this amount on adoption of FRS 109 is insignificant.
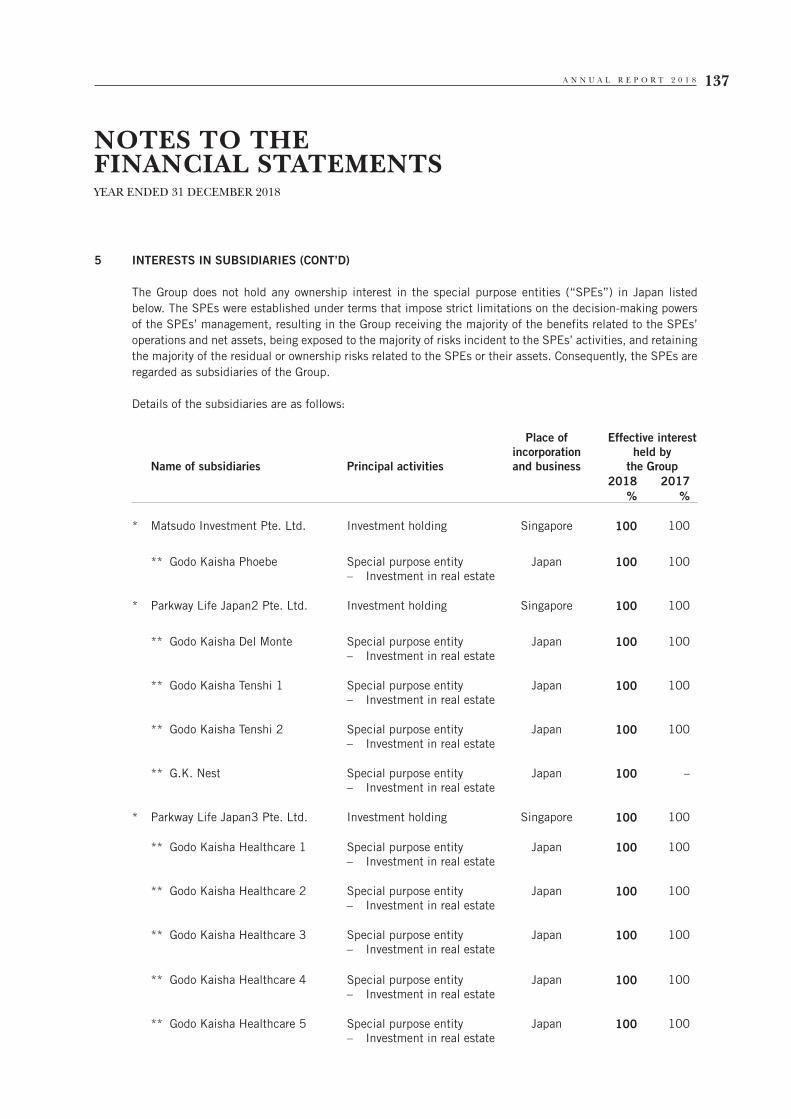
A N N U A L R E P O R T 2 0 1 8 137
NOTES TO THEFINANCIAL STATEMENTSYEAR ENDED 31 DECEMBER 2018
5 INTERESTS IN SUBSIDIARIES (CONT’D)
The Group does not hold any ownership interest in the special purpose entities (“SPEs”) in Japan listed below. The SPEs were established under terms that impose strict limitations on the decision-making powers of the SPEs’ management, resulting in the Group receiving the majority of the benefits related to the SPEs’ operations and net assets, being exposed to the majority of risks incident to the SPEs’ activities, and retaining the majority of the residual or ownership risks related to the SPEs or their assets. Consequently, the SPEs are regarded as subsidiaries of the Group.
Details of the subsidiaries are as follows:
Name of subsidiaries Principal activities
Place of incorporation and business
Effective interest held by
the Group2018 2017
% %
* Matsudo Investment Pte. Ltd. Investment holding Singapore 100 100
** Godo Kaisha Phoebe Special purpose entity– Investment in real estate
Japan 100 100
* Parkway Life Japan2 Pte. Ltd. Investment holding Singapore 100 100
** Godo Kaisha Del Monte Special purpose entity– Investment in real estate
Japan 100 100
** Godo Kaisha Tenshi 1 Special purpose entity– Investment in real estate
Japan 100 100
** Godo Kaisha Tenshi 2 Special purpose entity– Investment in real estate
Japan 100 100
** G.K. Nest Special purpose entity– Investment in real estate
Japan 100 –
* Parkway Life Japan3 Pte. Ltd. Investment holding Singapore 100 100
** Godo Kaisha Healthcare 1 Special purpose entity– Investment in real estate
Japan 100 100
** Godo Kaisha Healthcare 2 Special purpose entity– Investment in real estate
Japan 100 100
** Godo Kaisha Healthcare 3 Special purpose entity– Investment in real estate
Japan 100 100
** Godo Kaisha Healthcare 4 Special purpose entity– Investment in real estate
Japan 100 100
** Godo Kaisha Healthcare 5 Special purpose entity– Investment in real estate
Japan 100 100
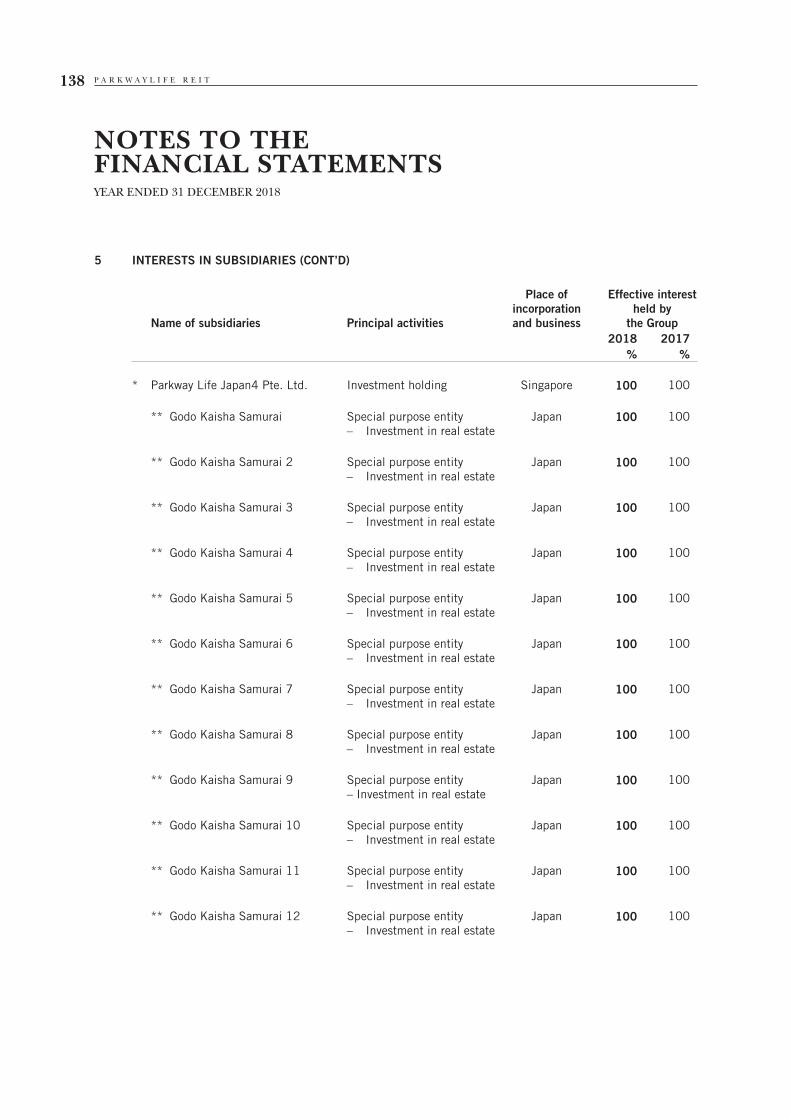
P A R K W A Y L I F E R E I T138
NOTES TO THEFINANCIAL STATEMENTSYEAR ENDED 31 DECEMBER 2018
5 INTERESTS IN SUBSIDIARIES (CONT’D)
Name of subsidiaries Principal activities
Place of incorporation and business
Effective interest held by
the Group2018 2017
% %
* Parkway Life Japan4 Pte. Ltd. Investment holding Singapore 100 100
** Godo Kaisha Samurai Special purpose entity– Investment in real estate
Japan 100 100
** Godo Kaisha Samurai 2 Special purpose entity– Investment in real estate
Japan 100 100
** Godo Kaisha Samurai 3 Special purpose entity– Investment in real estate
Japan 100 100
** Godo Kaisha Samurai 4 Special purpose entity– Investment in real estate
Japan 100 100
** Godo Kaisha Samurai 5 Special purpose entity– Investment in real estate
Japan 100 100
** Godo Kaisha Samurai 6 Special purpose entity– Investment in real estate
Japan 100 100
** Godo Kaisha Samurai 7 Special purpose entity– Investment in real estate
Japan 100 100
** Godo Kaisha Samurai 8 Special purpose entity– Investment in real estate
Japan 100 100
** Godo Kaisha Samurai 9 Special purpose entity– Investment in real estate
Japan 100 100
** Godo Kaisha Samurai 10 Special purpose entity– Investment in real estate
Japan 100 100
** Godo Kaisha Samurai 11 Special purpose entity– Investment in real estate
Japan 100 100
** Godo Kaisha Samurai 12 Special purpose entity– Investment in real estate
Japan 100 100
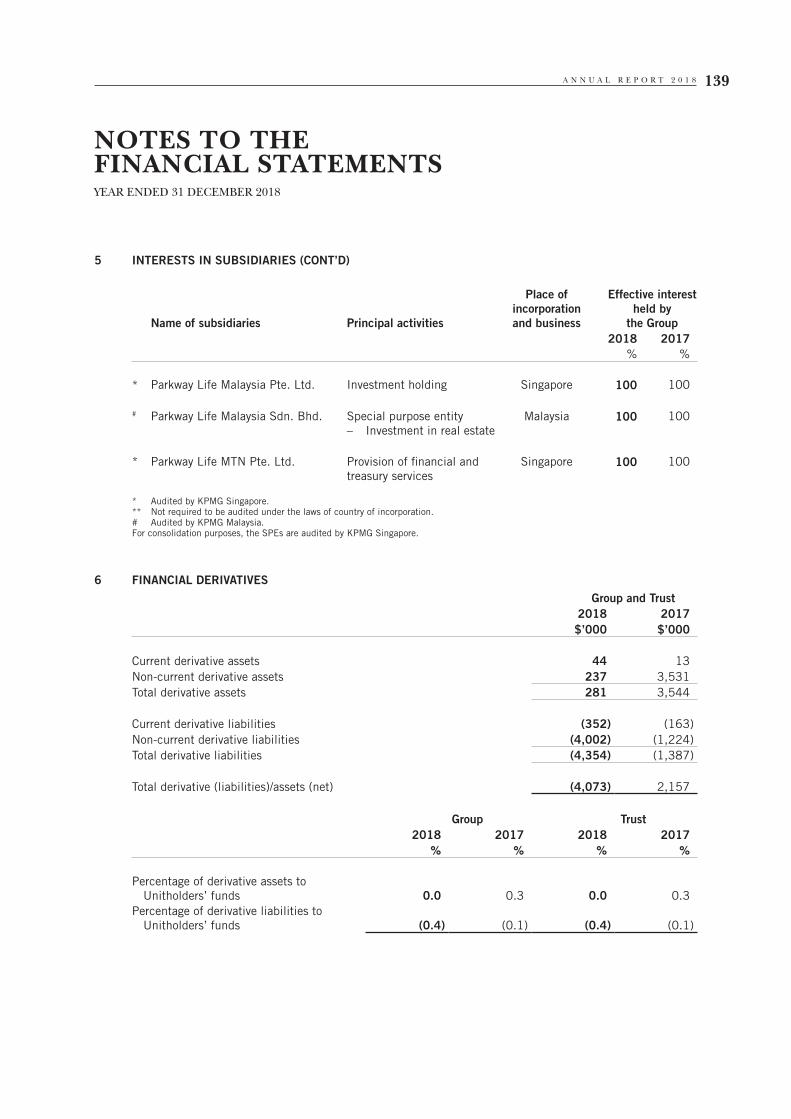
A N N U A L R E P O R T 2 0 1 8 139
NOTES TO THEFINANCIAL STATEMENTSYEAR ENDED 31 DECEMBER 2018
5 INTERESTS IN SUBSIDIARIES (CONT’D)
Name of subsidiaries Principal activities
Place of incorporation and business
Effective interest held by
the Group2018 2017
% %
* Parkway Life Malaysia Pte. Ltd. Investment holding Singapore 100 100
# Parkway Life Malaysia Sdn. Bhd. Special purpose entity– Investment in real estate
Malaysia 100 100
* Parkway Life MTN Pte. Ltd. Provision of financial and treasury services
Singapore 100 100
* Audited by KPMG Singapore.** Not required to be audited under the laws of country of incorporation.# Audited by KPMG Malaysia.For consolidation purposes, the SPEs are audited by KPMG Singapore.
6 FINANCIAL DERIVATIVES Group and Trust
2018 2017$’000 $’000
Current derivative assets 44 13Non-current derivative assets 237 3,531Total derivative assets 281 3,544
Current derivative liabilities (352) (163)Non-current derivative liabilities (4,002) (1,224)Total derivative liabilities (4,354) (1,387)
Total derivative (liabilities)/assets (net) (4,073) 2,157
Group Trust2018 2017 2018 2017
% % % %
Percentage of derivative assets to Unitholders’ funds 0.0 0.3 0.0 0.3
Percentage of derivative liabilities to Unitholders’ funds (0.4) (0.1) (0.4) (0.1)
P A R K W A Y L I F E R E I T140
NOTES TO THEFINANCIAL STATEMENTSYEAR ENDED 31 DECEMBER 2018
6 FINANCIAL DERIVATIVES (CONT’D)
Interest rate swaps
The Group manages its exposure to interest rate movements on its floating rate loans and borrowings by entering into interest rate swaps. As at the reporting date, the Group has interest rate swaps with a total notional principal of $342.2 million (2017: $334.9 million) to provide fixed rate funding up to 2024 (2017: up to 2020) at a weighted average effective interest rate of 0.25% (2017: 0.34%) per annum.
As at 31 December 2018, where the interest rate swaps are designated as the hedging instruments in qualifying cash flow hedges, the effective portion of the changes in fair value of the interest rate swaps amounting to $0.1 million gain (2017: $1.1 million gain) was recognised in the hedging reserve. During the financial year, the changes in fair value of interest rate swaps, where hedge accounting was discontinued or not practised, amounted to $0.2 million gain (2017: $0.5 million gain) was credited to the statement of total return. At the same time, an amount of $0.6 million loss (2017: $0.8 million loss) was reclassified from hedging reserve to the statement of total return.
Forward foreign exchange contracts
The Group manages its exposure to foreign currency movements on its net income denominated in Japanese Yen from its investments in Japan by using forward foreign exchange contracts to provide a hedge to the distribution of income from its investment in Japan, net of Japanese Yen financing costs.
At the reporting date, the Group has outstanding forward foreign exchange contracts with aggregate notional amounts of approximately $60.9 million (2017: $68.8 million). The change in fair value of $1.9 million loss (2017: $2.2 million gain) was charged to the statement of total return.
Cross currency interest rate swap
At the reporting date, the Group has cross currency interest rate swaps (“CCIRS”) with notional principal of $125.2 million (2017: $125.2 million) to manage its foreign currency risk and interest rate risk arising from the financing of Japan properties using Singapore dollar facilities. To maintain a natural hedge, the Group utilised CCIRS to realign the Singapore dollar denominated loans back into effective Japanese Yen denominated loans to match its underlying Japanese Yen denominated assets.
The Group had in-substance bifurcated the CCIRS and applied hedge accounting for net investment hedge and cash flow hedge, where the changes in fair value of the CCIRS of $5.4 million loss (2017: $7.0 million gain) and $0.7 million gain (2017: $0.9 million loss) were recognised in the foreign currency translation reserve and hedging reserve, respectively.
Offsetting financial assets and financial liabilities
The Group’s derivative transactions are entered into under International Swaps and Derivatives Association (“ISDA”) master netting agreements. In general, under such agreements, the amounts owed by each counterparty in respect of the same transactions outstanding in the same currency under the agreement are aggregated into a single net amount that is payable by one party to the other. In certain circumstances, for example when a credit event such as a default occurs, all outstanding transactions under the agreement are terminated, the termination value is assessed and only a single net amount is due or payable in settlement of all outstanding transactions.
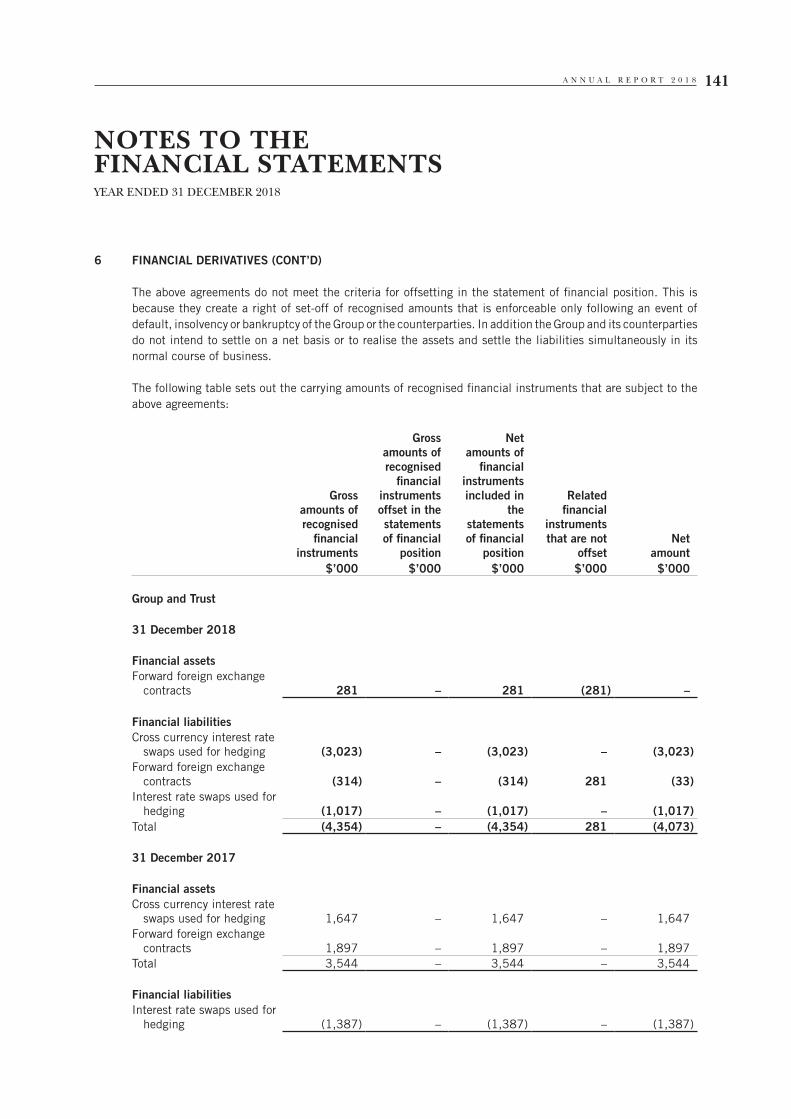
A N N U A L R E P O R T 2 0 1 8 141
NOTES TO THEFINANCIAL STATEMENTSYEAR ENDED 31 DECEMBER 2018
6 FINANCIAL DERIVATIVES (CONT’D)
The above agreements do not meet the criteria for offsetting in the statement of financial position. This is because they create a right of set-off of recognised amounts that is enforceable only following an event of default, insolvency or bankruptcy of the Group or the counterparties. In addition the Group and its counterparties do not intend to settle on a net basis or to realise the assets and settle the liabilities simultaneously in its normal course of business.
The following table sets out the carrying amounts of recognised financial instruments that are subject to the above agreements:
Grossamounts ofrecognised
financialinstruments
Grossamounts ofrecognised
financialinstrumentsoffset in the statementsof financial
position
Netamounts of
financialinstrumentsincluded in
the statementsof financial
position
Relatedfinancial
instruments that are not
offsetNet
amount$’000 $’000 $’000 $’000 $’000
Group and Trust
31 December 2018
Financial assetsForward foreign exchange
contracts 281 – 281 (281) –
Financial liabilitiesCross currency interest rate
swaps used for hedging (3,023) – (3,023) – (3,023)Forward foreign exchange
contracts (314) – (314) 281 (33)Interest rate swaps used for
hedging (1,017) – (1,017) – (1,017)Total (4,354) – (4,354) 281 (4,073)
31 December 2017
Financial assetsCross currency interest rate
swaps used for hedging 1,647 – 1,647 – 1,647Forward foreign exchange
contracts 1,897 – 1,897 – 1,897Total 3,544 – 3,544 – 3,544
Financial liabilitiesInterest rate swaps used for
hedging (1,387) – (1,387) – (1,387)
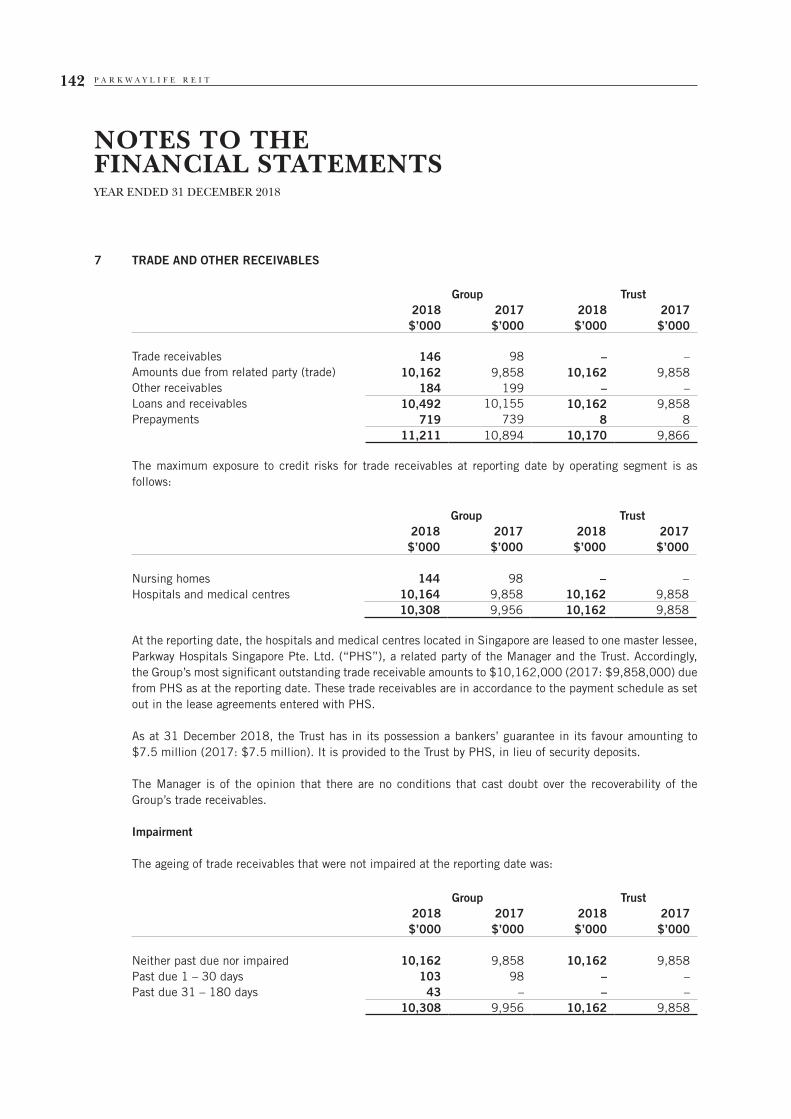
P A R K W A Y L I F E R E I T142
NOTES TO THEFINANCIAL STATEMENTSYEAR ENDED 31 DECEMBER 2018
7 TRADE AND OTHER RECEIVABLES
Group Trust2018 2017 2018 2017$’000 $’000 $’000 $’000
Trade receivables 146 98 – –Amounts due from related party (trade) 10,162 9,858 10,162 9,858Other receivables 184 199 – –Loans and receivables 10,492 10,155 10,162 9,858Prepayments 719 739 8 8
11,211 10,894 10,170 9,866
The maximum exposure to credit risks for trade receivables at reporting date by operating segment is as follows:
Group Trust2018 2017 2018 2017$’000 $’000 $’000 $’000
Nursing homes 144 98 – –Hospitals and medical centres 10,164 9,858 10,162 9,858
10,308 9,956 10,162 9,858
At the reporting date, the hospitals and medical centres located in Singapore are leased to one master lessee, Parkway Hospitals Singapore Pte. Ltd. (“PHS”), a related party of the Manager and the Trust. Accordingly, the Group’s most significant outstanding trade receivable amounts to $10,162,000 (2017: $9,858,000) due from PHS as at the reporting date. These trade receivables are in accordance to the payment schedule as set out in the lease agreements entered with PHS.
As at 31 December 2018, the Trust has in its possession a bankers’ guarantee in its favour amounting to $7.5 million (2017: $7.5 million). It is provided to the Trust by PHS, in lieu of security deposits.
The Manager is of the opinion that there are no conditions that cast doubt over the recoverability of the Group’s trade receivables.
Impairment
The ageing of trade receivables that were not impaired at the reporting date was:
Group Trust2018 2017 2018 2017$’000 $’000 $’000 $’000
Neither past due nor impaired 10,162 9,858 10,162 9,858Past due 1 – 30 days 103 98 – –Past due 31 – 180 days 43 – – –
10,308 9,956 10,162 9,858
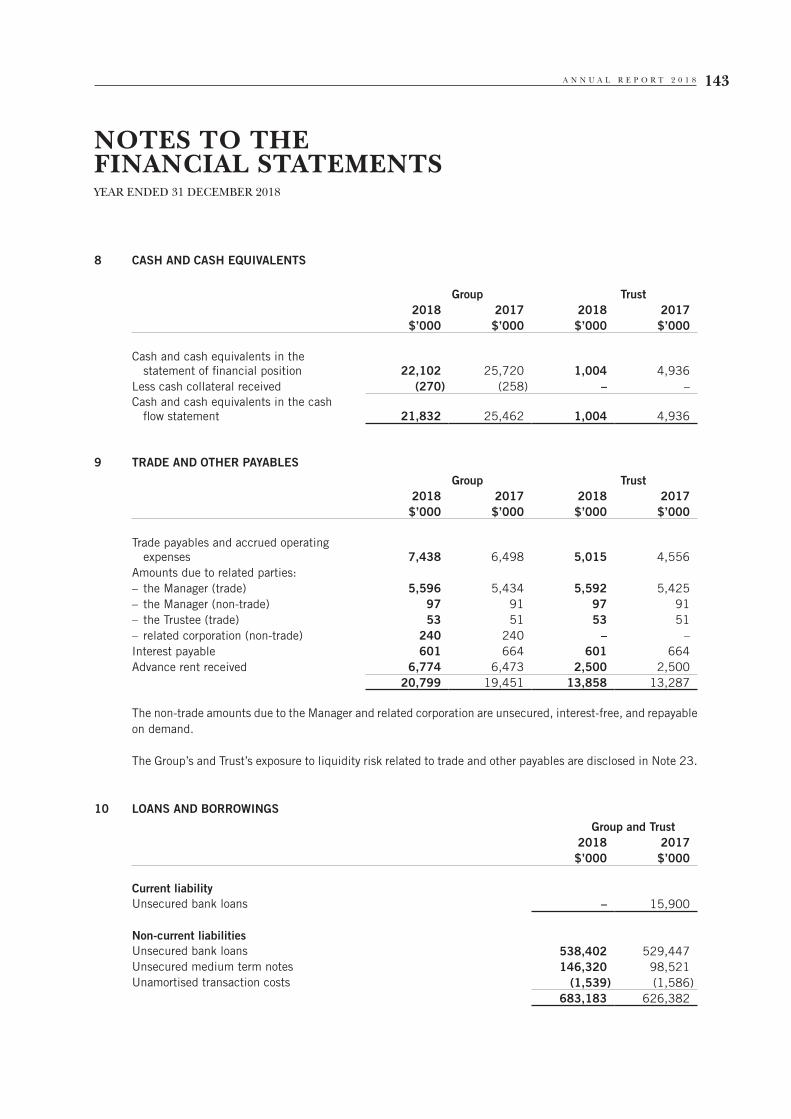
A N N U A L R E P O R T 2 0 1 8 143
NOTES TO THEFINANCIAL STATEMENTSYEAR ENDED 31 DECEMBER 2018
8 CASH AND CASH EQUIVALENTS
Group Trust2018 2017 2018 2017$’000 $’000 $’000 $’000
Cash and cash equivalents in the statement of financial position 22,102 25,720 1,004 4,936
Less cash collateral received (270) (258) – –Cash and cash equivalents in the cash
flow statement 21,832 25,462 1,004 4,936
9 TRADE AND OTHER PAYABLESGroup Trust
2018 2017 2018 2017$’000 $’000 $’000 $’000
Trade payables and accrued operating expenses 7,438 6,498 5,015 4,556
Amounts due to related parties:– the Manager (trade) 5,596 5,434 5,592 5,425– the Manager (non-trade) 97 91 97 91– the Trustee (trade) 53 51 53 51– related corporation (non-trade) 240 240 – –Interest payable 601 664 601 664Advance rent received 6,774 6,473 2,500 2,500
20,799 19,451 13,858 13,287
The non-trade amounts due to the Manager and related corporation are unsecured, interest-free, and repayable on demand.
The Group’s and Trust’s exposure to liquidity risk related to trade and other payables are disclosed in Note 23.
10 LOANS AND BORROWINGSGroup and Trust
2018 2017$’000 $’000
Current liabilityUnsecured bank loans – 15,900
Non-current liabilitiesUnsecured bank loans 538,402 529,447Unsecured medium term notes 146,320 98,521Unamortised transaction costs (1,539) (1,586)
683,183 626,382
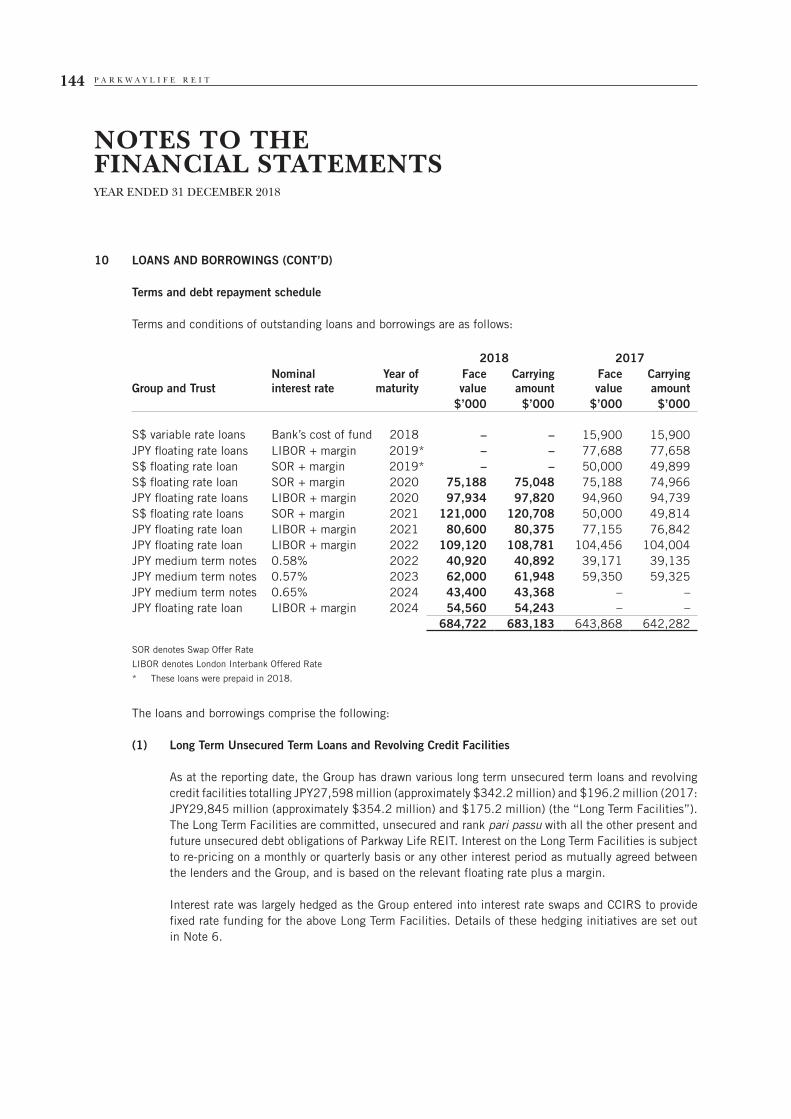
P A R K W A Y L I F E R E I T144
NOTES TO THEFINANCIAL STATEMENTSYEAR ENDED 31 DECEMBER 2018
10 LOANS AND BORROWINGS (CONT’D)
Terms and debt repayment schedule
Terms and conditions of outstanding loans and borrowings are as follows:
2018 2017
Group and TrustNominal interest rate
Year of maturity
Face value
Carrying amount
Face value
Carrying amount
$’000 $’000 $’000 $’000
S$ variable rate loans Bank’s cost of fund 2018 – – 15,900 15,900JPY floating rate loans LIBOR + margin 2019* – – 77,688 77,658S$ floating rate loan SOR + margin 2019* – – 50,000 49,899S$ floating rate loan SOR + margin 2020 75,188 75,048 75,188 74,966JPY floating rate loans LIBOR + margin 2020 97,934 97,820 94,960 94,739S$ floating rate loans SOR + margin 2021 121,000 120,708 50,000 49,814JPY floating rate loan LIBOR + margin 2021 80,600 80,375 77,155 76,842JPY floating rate loan LIBOR + margin 2022 109,120 108,781 104,456 104,004JPY medium term notes 0.58% 2022 40,920 40,892 39,171 39,135JPY medium term notes 0.57% 2023 62,000 61,948 59,350 59,325JPY medium term notes 0.65% 2024 43,400 43,368 – –JPY floating rate loan LIBOR + margin 2024 54,560 54,243 – –
684,722 683,183 643,868 642,282
SOR denotes Swap Offer Rate
LIBOR denotes London Interbank Offered Rate
* These loans were prepaid in 2018.
The loans and borrowings comprise the following:
(1) Long Term Unsecured Term Loans and Revolving Credit Facilities
As at the reporting date, the Group has drawn various long term unsecured term loans and revolving credit facilities totalling JPY27,598 million (approximately $342.2 million) and $196.2 million (2017: JPY29,845 million (approximately $354.2 million) and $175.2 million) (the “Long Term Facilities”). The Long Term Facilities are committed, unsecured and rank pari passu with all the other present and future unsecured debt obligations of Parkway Life REIT. Interest on the Long Term Facilities is subject to re-pricing on a monthly or quarterly basis or any other interest period as mutually agreed between the lenders and the Group, and is based on the relevant floating rate plus a margin.
Interest rate was largely hedged as the Group entered into interest rate swaps and CCIRS to provide fixed rate funding for the above Long Term Facilities. Details of these hedging initiatives are set out in Note 6.
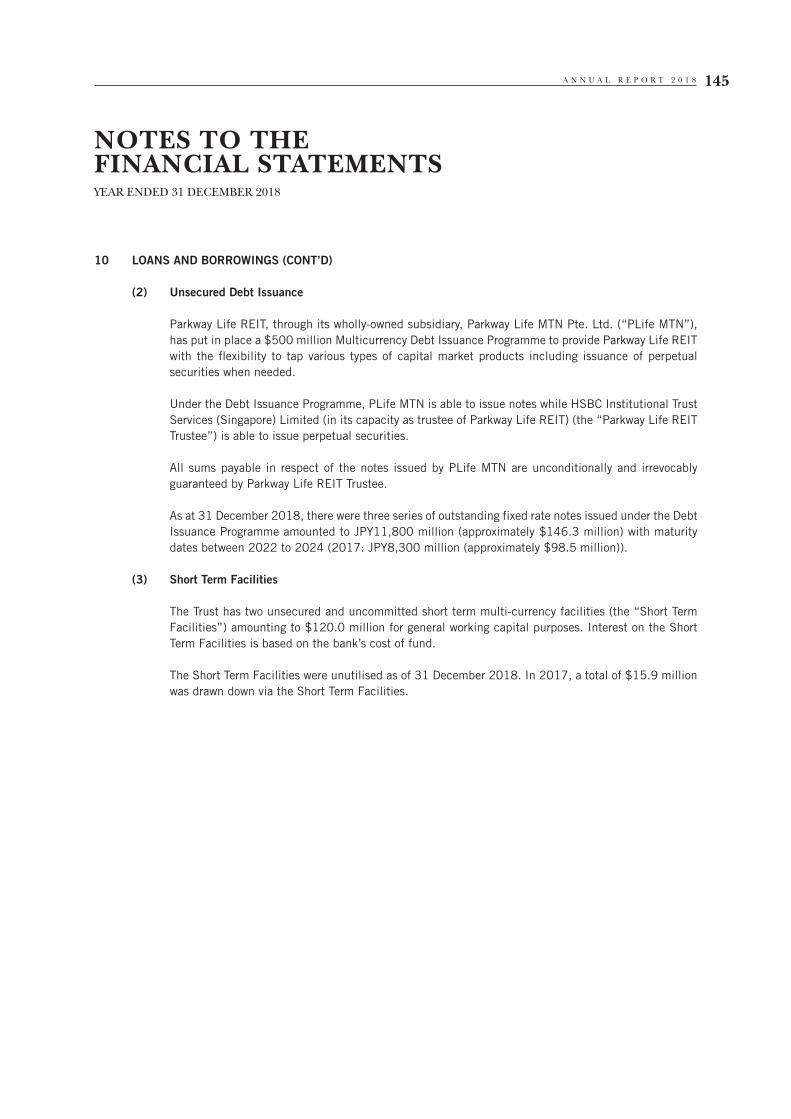
A N N U A L R E P O R T 2 0 1 8 145
NOTES TO THEFINANCIAL STATEMENTSYEAR ENDED 31 DECEMBER 2018
10 LOANS AND BORROWINGS (CONT’D)
(2) Unsecured Debt Issuance
Parkway Life REIT, through its wholly-owned subsidiary, Parkway Life MTN Pte. Ltd. (“PLife MTN”), has put in place a $500 million Multicurrency Debt Issuance Programme to provide Parkway Life REIT with the flexibility to tap various types of capital market products including issuance of perpetual securities when needed.
Under the Debt Issuance Programme, PLife MTN is able to issue notes while HSBC Institutional Trust Services (Singapore) Limited (in its capacity as trustee of Parkway Life REIT) (the “Parkway Life REIT Trustee”) is able to issue perpetual securities.
All sums payable in respect of the notes issued by PLife MTN are unconditionally and irrevocably guaranteed by Parkway Life REIT Trustee.
As at 31 December 2018, there were three series of outstanding fixed rate notes issued under the Debt Issuance Programme amounted to JPY11,800 million (approximately $146.3 million) with maturity dates between 2022 to 2024 (2017: JPY8,300 million (approximately $98.5 million)).
(3) Short Term Facilities
The Trust has two unsecured and uncommitted short term multi-currency facilities (the “Short Term Facilities”) amounting to $120.0 million for general working capital purposes. Interest on the Short Term Facilities is based on the bank’s cost of fund.
The Short Term Facilities were unutilised as of 31 December 2018. In 2017, a total of $15.9 million was drawn down via the Short Term Facilities.

P A R K W A Y L I F E R E I T146
NOTES TO THEFINANCIAL STATEMENTSYEAR ENDED 31 DECEMBER 2018
10 LOANS AND BORROWINGS (CONT’D)
Reconciliation of liabilities arising from financing activities
Non-cash changes
1 January 2018
Financing cash flows
Foreign exchange
movementInterest expense
Transaction costs relatedto loans and
borrowingsOther
changes
31 December
2018 $’000 $’000 $’000 $’000 $’000 $’000 $’000
Loans and borrowings 642,282 19,8931 20,345 – 663 – 683,183Interest payable 664 (6,133) – 6,070 – – 601Cross currency
interest rate swaps used for hedging – (assets)/ liabilities (1,647) – – – – 4,670 3,023
Interest rate swaps used for hedging – liabilities 1,387 – – – – (370) 1,017
Forward foreign exchange contracts – liabilities – – – – – 314 314
Non-cash changes
1 January 2017
Financing cash flows
Foreign exchange
movementInterest expense
Transaction costs related to loans and
borrowingsOther
changes
31 December
2017$’000 $’000 $’000 $’000 $’000 $’000 $’000
Loans and borrowings 628,785 33,2121 (20,561) – 846 – 642,282Interest payable 814 (7,256) – 7,106 – – 664Cross currency
interest rate swaps used for hedging – liabilities/ (assets) 4,437 – – – – (6,084) (1,647)
Interest rate swaps used for hedging – liabilities 3,039 – – – – (1,652) 1,387
1 Net proceeds from loans and borrowings, repayment of loans and borrowings, and payment of transaction costs related to loans and borrowings.
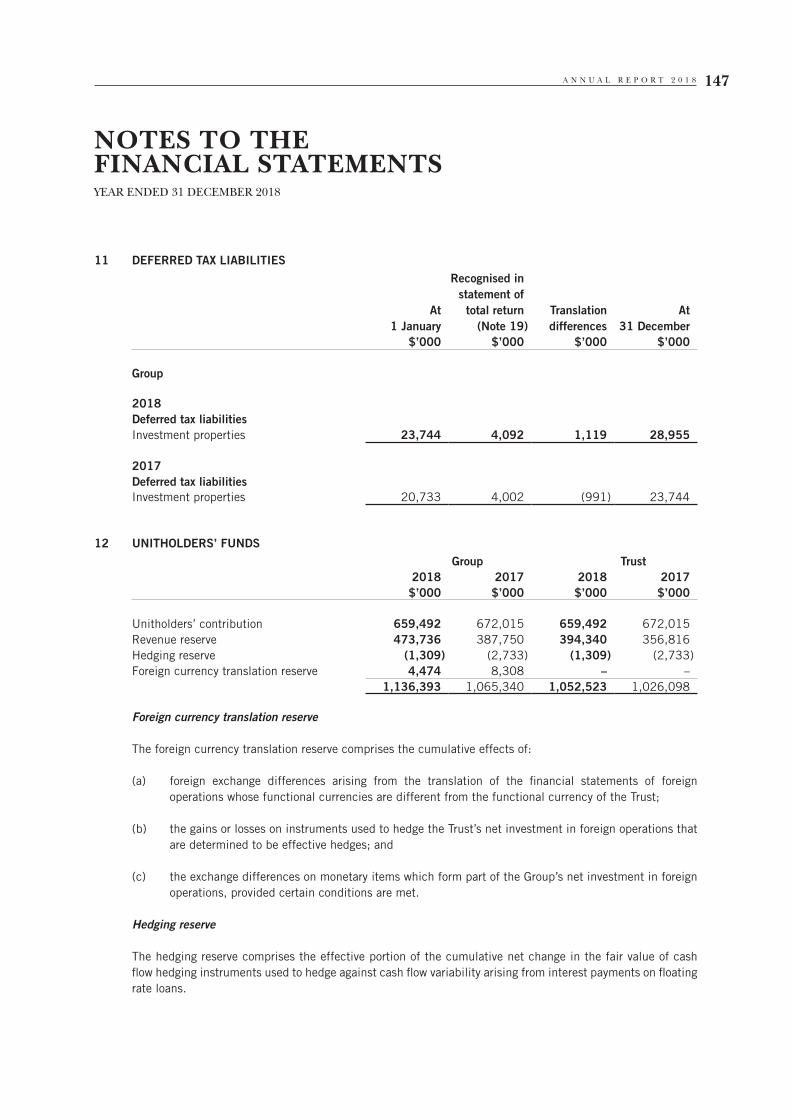
A N N U A L R E P O R T 2 0 1 8 147
NOTES TO THEFINANCIAL STATEMENTSYEAR ENDED 31 DECEMBER 2018
11 DEFERRED TAX LIABILITIES
At1 January
Recognised in statement of total return
(Note 19)Translation differences
At31 December
$’000 $’000 $’000 $’000
Group
2018Deferred tax liabilitiesInvestment properties 23,744 4,092 1,119 28,955
2017Deferred tax liabilitiesInvestment properties 20,733 4,002 (991) 23,744
12 UNITHOLDERS’ FUNDSGroup Trust
2018 2017 2018 2017$’000 $’000 $’000 $’000
Unitholders’ contribution 659,492 672,015 659,492 672,015Revenue reserve 473,736 387,750 394,340 356,816Hedging reserve (1,309) (2,733) (1,309) (2,733)Foreign currency translation reserve 4,474 8,308 – –
1,136,393 1,065,340 1,052,523 1,026,098
Foreign currency translation reserve
The foreign currency translation reserve comprises the cumulative effects of:
(a) foreign exchange differences arising from the translation of the financial statements of foreign operations whose functional currencies are different from the functional currency of the Trust;
(b) the gains or losses on instruments used to hedge the Trust’s net investment in foreign operations that are determined to be effective hedges; and
(c) the exchange differences on monetary items which form part of the Group’s net investment in foreign operations, provided certain conditions are met.
Hedging reserve
The hedging reserve comprises the effective portion of the cumulative net change in the fair value of cash flow hedging instruments used to hedge against cash flow variability arising from interest payments on floating rate loans.
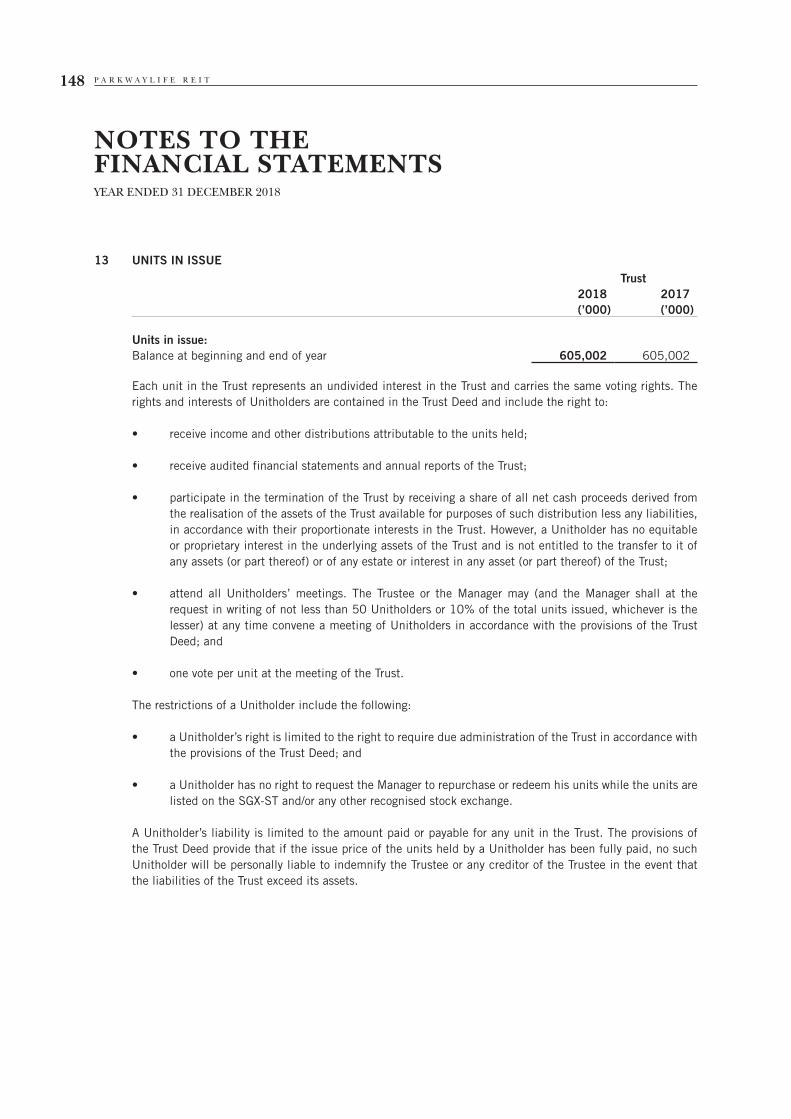
P A R K W A Y L I F E R E I T148
NOTES TO THEFINANCIAL STATEMENTSYEAR ENDED 31 DECEMBER 2018
13 UNITS IN ISSUETrust
2018 2017(’000) (’000)
Units in issue:Balance at beginning and end of year 605,002 605,002
Each unit in the Trust represents an undivided interest in the Trust and carries the same voting rights. The rights and interests of Unitholders are contained in the Trust Deed and include the right to:
• receiveincomeandotherdistributionsattributabletotheunitsheld;
• receiveauditedfinancialstatementsandannualreportsoftheTrust;
• participateintheterminationoftheTrustbyreceivingashareofallnetcashproceedsderivedfromthe realisation of the assets of the Trust available for purposes of such distribution less any liabilities, in accordance with their proportionate interests in the Trust. However, a Unitholder has no equitable or proprietary interest in the underlying assets of the Trust and is not entitled to the transfer to it of any assets (or part thereof) or of any estate or interest in any asset (or part thereof) of the Trust;
• attend all Unitholders’ meetings. The Trustee or the Manager may (and the Manager shall at therequest in writing of not less than 50 Unitholders or 10% of the total units issued, whichever is the lesser) at any time convene a meeting of Unitholders in accordance with the provisions of the Trust Deed; and
• onevoteperunitatthemeetingoftheTrust.
The restrictions of a Unitholder include the following:
• aUnitholder’srightislimitedtotherighttorequiredueadministrationoftheTrustinaccordancewiththe provisions of the Trust Deed; and
• aUnitholderhasnorighttorequesttheManagertorepurchaseorredeemhisunitswhiletheunitsarelisted on the SGX-ST and/or any other recognised stock exchange.
A Unitholder’s liability is limited to the amount paid or payable for any unit in the Trust. The provisions of the Trust Deed provide that if the issue price of the units held by a Unitholder has been fully paid, no such Unitholder will be personally liable to indemnify the Trustee or any creditor of the Trustee in the event that the liabilities of the Trust exceed its assets.
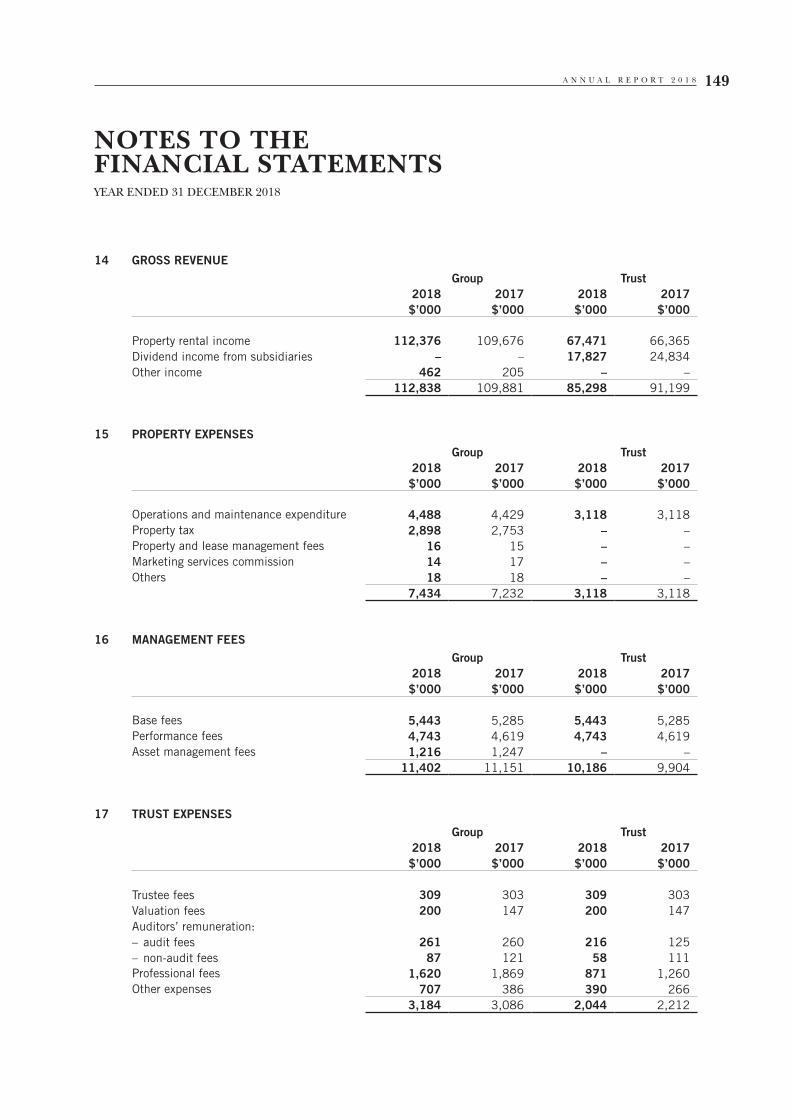
A N N U A L R E P O R T 2 0 1 8 149
NOTES TO THEFINANCIAL STATEMENTSYEAR ENDED 31 DECEMBER 2018
14 GROSS REVENUEGroup Trust
2018 2017 2018 2017$’000 $’000 $’000 $’000
Property rental income 112,376 109,676 67,471 66,365Dividend income from subsidiaries – – 17,827 24,834Other income 462 205 – –
112,838 109,881 85,298 91,199
15 PROPERTY EXPENSESGroup Trust
2018 2017 2018 2017$’000 $’000 $’000 $’000
Operations and maintenance expenditure 4,488 4,429 3,118 3,118Property tax 2,898 2,753 – –Property and lease management fees 16 15 – –Marketing services commission 14 17 – –Others 18 18 – –
7,434 7,232 3,118 3,118
16 MANAGEMENT FEESGroup Trust
2018 2017 2018 2017$’000 $’000 $’000 $’000
Base fees 5,443 5,285 5,443 5,285Performance fees 4,743 4,619 4,743 4,619Asset management fees 1,216 1,247 – –
11,402 11,151 10,186 9,904
17 TRUST EXPENSESGroup Trust
2018 2017 2018 2017$’000 $’000 $’000 $’000
Trustee fees 309 303 309 303Valuation fees 200 147 200 147Auditors’ remuneration:– audit fees 261 260 216 125– non-audit fees 87 121 58 111Professional fees 1,620 1,869 871 1,260Other expenses 707 386 390 266
3,184 3,086 2,044 2,212
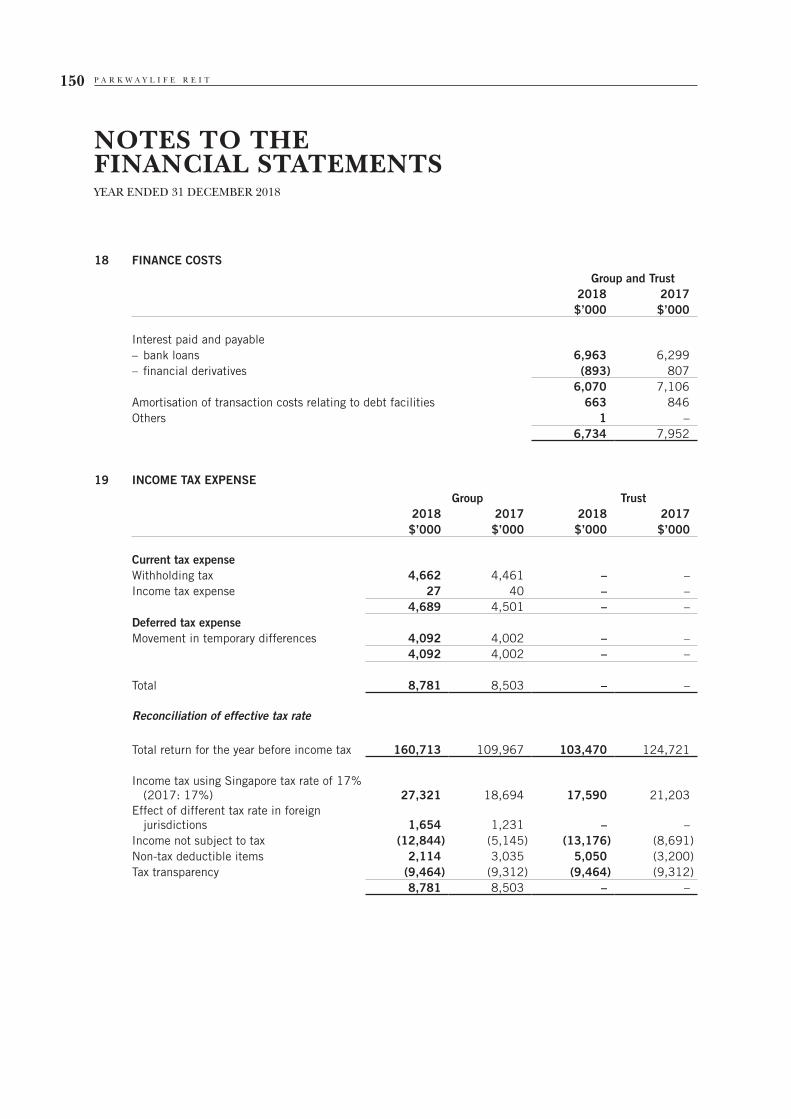
P A R K W A Y L I F E R E I T150
NOTES TO THEFINANCIAL STATEMENTSYEAR ENDED 31 DECEMBER 2018
18 FINANCE COSTSGroup and Trust
2018 2017$’000 $’000
Interest paid and payable– bank loans 6,963 6,299– financial derivatives (893) 807
6,070 7,106Amortisation of transaction costs relating to debt facilities 663 846Others 1 –
6,734 7,952
19 INCOME TAX EXPENSEGroup Trust
2018 2017 2018 2017$’000 $’000 $’000 $’000
Current tax expenseWithholding tax 4,662 4,461 – –Income tax expense 27 40 – –
4,689 4,501 – –Deferred tax expenseMovement in temporary differences 4,092 4,002 – –
4,092 4,002 – –
Total 8,781 8,503 – –
Reconciliation of effective tax rate
Total return for the year before income tax 160,713 109,967 103,470 124,721
Income tax using Singapore tax rate of 17% (2017: 17%) 27,321 18,694 17,590 21,203
Effect of different tax rate in foreign jurisdictions 1,654 1,231 – –
Income not subject to tax (12,844) (5,145) (13,176) (8,691)Non-tax deductible items 2,114 3,035 5,050 (3,200)Tax transparency (9,464) (9,312) (9,464) (9,312)
8,781 8,503 – –

A N N U A L R E P O R T 2 0 1 8 151
NOTES TO THEFINANCIAL STATEMENTSYEAR ENDED 31 DECEMBER 2018
20 EARNINGS PER UNIT
The calculation of basic earnings per unit is based on the weighted average number of units in issue during the year and the total return after income tax.
Group Trust2018 2017 2018 2017$’000 $’000 $’000 $’000
Total return before income tax and distribution 160,713 109,967 103,470 124,721
Less: Income tax expense (8,781) (8,503) – –Total return after income tax, before
distribution 151,932 101,464 103,470 124,721
Group and Trust2018 2017
Number of Units
Number of Units
(’000) (’000)
Weighted average number of units in issue 605,002 605,002
Group Trust2018 2017 2018 2017
Basic earnings per unit (cents) 25.11 16.77 17.10 20.61
Diluted earnings per unit is the same as the basic earnings per unit as there were no dilutive instruments in issue during the financial year.
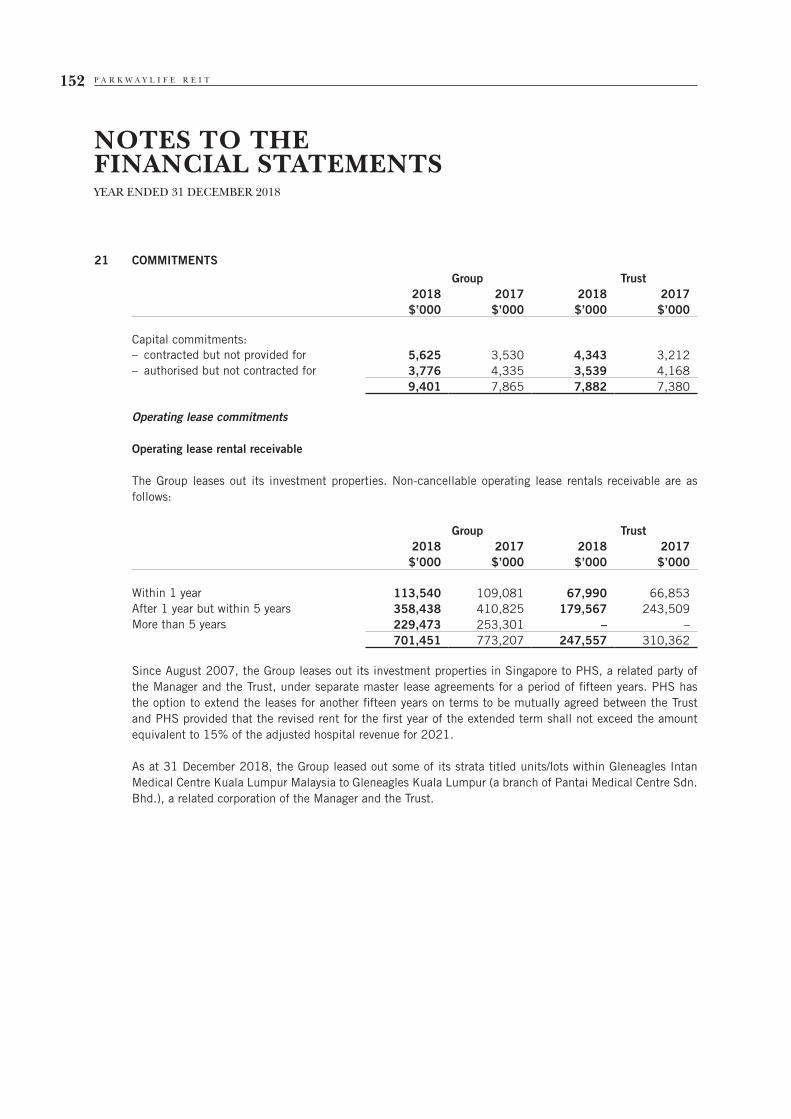
P A R K W A Y L I F E R E I T152
NOTES TO THEFINANCIAL STATEMENTSYEAR ENDED 31 DECEMBER 2018
21 COMMITMENTSGroup Trust
2018 2017 2018 2017$’000 $’000 $’000 $’000
Capital commitments:– contracted but not provided for 5,625 3,530 4,343 3,212– authorised but not contracted for 3,776 4,335 3,539 4,168
9,401 7,865 7,882 7,380
Operating lease commitments
Operating lease rental receivable
The Group leases out its investment properties. Non-cancellable operating lease rentals receivable are as follows:
Group Trust2018 2017 2018 2017$’000 $’000 $’000 $’000
Within 1 year 113,540 109,081 67,990 66,853After 1 year but within 5 years 358,438 410,825 179,567 243,509More than 5 years 229,473 253,301 – –
701,451 773,207 247,557 310,362
Since August 2007, the Group leases out its investment properties in Singapore to PHS, a related party of the Manager and the Trust, under separate master lease agreements for a period of fifteen years. PHS has the option to extend the leases for another fifteen years on terms to be mutually agreed between the Trust and PHS provided that the revised rent for the first year of the extended term shall not exceed the amount equivalent to 15% of the adjusted hospital revenue for 2021.
As at 31 December 2018, the Group leased out some of its strata titled units/lots within Gleneagles Intan Medical Centre Kuala Lumpur Malaysia to Gleneagles Kuala Lumpur (a branch of Pantai Medical Centre Sdn. Bhd.), a related corporation of the Manager and the Trust.
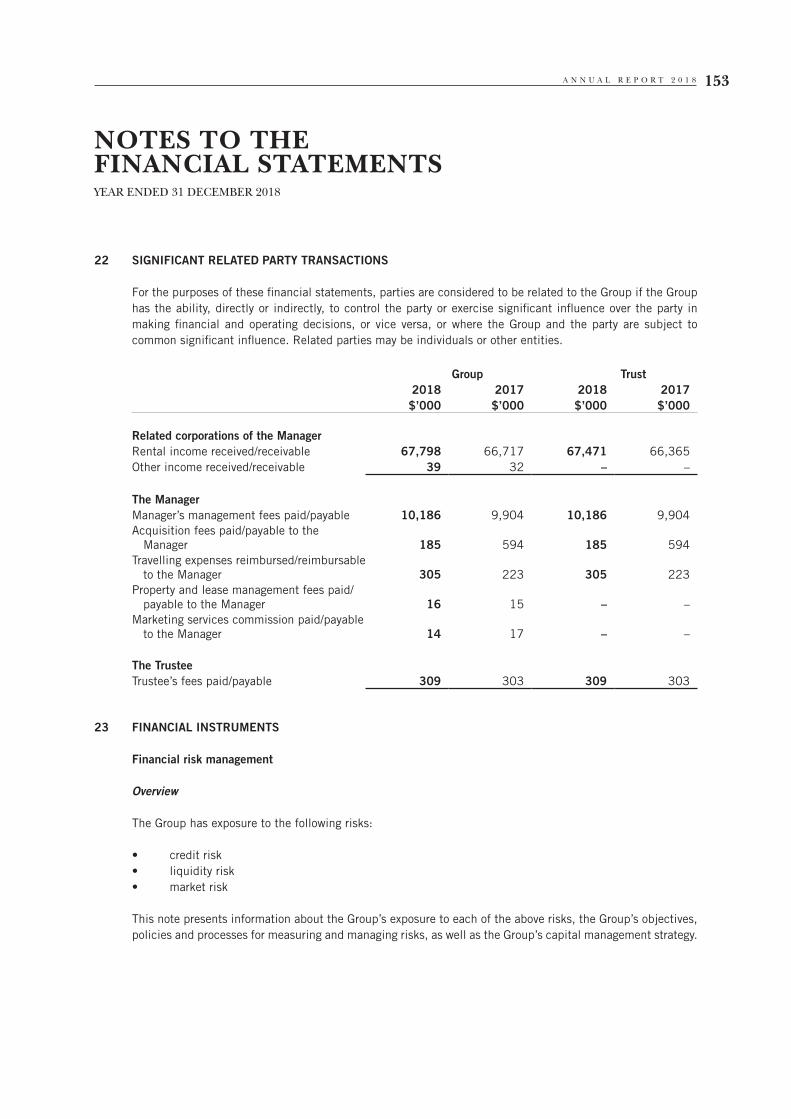
A N N U A L R E P O R T 2 0 1 8 153
NOTES TO THEFINANCIAL STATEMENTSYEAR ENDED 31 DECEMBER 2018
22 SIGNIFICANT RELATED PARTY TRANSACTIONS
For the purposes of these financial statements, parties are considered to be related to the Group if the Group has the ability, directly or indirectly, to control the party or exercise significant influence over the party in making financial and operating decisions, or vice versa, or where the Group and the party are subject to common significant influence. Related parties may be individuals or other entities.
Group Trust2018 2017 2018 2017$’000 $’000 $’000 $’000
Related corporations of the ManagerRental income received/receivable 67,798 66,717 67,471 66,365Other income received/receivable 39 32 – –
The ManagerManager’s management fees paid/payable 10,186 9,904 10,186 9,904Acquisition fees paid/payable to the
Manager 185 594 185 594Travelling expenses reimbursed/reimbursable
to the Manager 305 223 305 223Property and lease management fees paid/
payable to the Manager 16 15 – –Marketing services commission paid/payable
to the Manager 14 17 – –
The TrusteeTrustee’s fees paid/payable 309 303 309 303
23 FINANCIAL INSTRUMENTS
Financial risk management
Overview
The Group has exposure to the following risks:
• creditrisk• liquidityrisk• marketrisk
This note presents information about the Group’s exposure to each of the above risks, the Group’s objectives, policies and processes for measuring and managing risks, as well as the Group’s capital management strategy.
P A R K W A Y L I F E R E I T154
NOTES TO THEFINANCIAL STATEMENTSYEAR ENDED 31 DECEMBER 2018
23 FINANCIAL INSTRUMENTS (CONT’D)
Risk management framework
The Manager has overall responsibility for the establishment and oversight of the Group’s risk management framework. The Group has a system of controls in place to create an acceptable balance between the cost of risks occurring and the cost of managing the risks. The Manager continually monitors the Group’s risk management processes to ensure an appropriate balance between risks and controls is achieved. Risk management policies and systems are reviewed regularly to reflect changes in market conditions and the Group’s activities.
Credit risk
Credit risk is the risk of financial loss to the Group if a lessee or deposit taking financial institution fails to meet its contractual obligations, and arises principally from the Group’s receivables from lessees and cash and cash equivalents placed with these financial institutions.
Trade and other receivables
The investment properties in Singapore are leased to one master lessee, PHS, a related corporation of the Manager and the Trust. The investment properties in Japan are leased to several nursing home operators and a lessee in respect to the pharmaceutical product distributing and manufacturing facility. The Manager is of the opinion that there were no conditions that cast doubt over the recoverability of the Group’s trade receivables. The maximum exposure to credit risk is represented by the carrying value of these receivables on the statement of financial position.
Expected credit loss assessment as at 1 January and 31 December 2018
The Group uses an allowance matrix to measure the ECLs of trade receivables from individual customers. Loss rates are calculated using a ‘roll rate’ method based on the probability of a receivable progressing through successive stages of delinquency to write-off and are based on actual credit loss over the past three years. The Manager believes that no allowance of impairment is necessary in respect of the trade receivable as these receivables relate mainly to lessees that have a good record with the Group or have sufficient security deposits as collateral, and hence ECL is not material.
A N N U A L R E P O R T 2 0 1 8 155
NOTES TO THEFINANCIAL STATEMENTSYEAR ENDED 31 DECEMBER 2018
23 FINANCIAL INSTRUMENTS (CONT’D)
Cash and cash equivalents
Cash and fixed deposits are placed with financial institutions which are regulated.
At the reporting date, except as disclosed in Note 7, there were no significant concentration of credit risk. The maximum exposure to credit risk is represented by the carrying value on the statement of financial position.
Impairment on cash and cash equivalents has been measured on the 12-month expected loss basis and reflects the short maturities of the exposures. The Group considers that its cash and cash equivalents have low credit risk based on the external credit ratings of the counterparties. The amount of the allowance on cash and cash equivalents was negligible.
Derivatives
The derivatives are entered only with bank counterparties that are regulated. The maximum exposure to credit risk is represented by the carrying value on the statement of financial position.
Liquidity risk
Liquidity risk is the risk that the Group will encounter difficulty in meeting the obligations associated with its financial liabilities that are settled by delivering cash or another financial asset. The Group’s approach to managing liquidity is to ensure, as far as possible, that it will always have sufficient liquidity to meet its liabilities when due, under both normal and stressed conditions, without incurring unacceptable losses or risking damage to the Group’s reputation.
The Manager monitors and maintains a level of cash and cash equivalents deemed adequate to finance the Group’s operations and to cater for the fluctuations in cash flow requirements. Typically, the Group ensures that it has sufficient cash on demand to meet expected operational expenses for a reasonable period of time, including the servicing of financial obligations; this excludes the potential impact of extreme circumstances that cannot reasonably be predicted, such as natural disasters. In addition, the Manager also monitors and observes the CIS Code issued by the MAS concerning limits on total borrowings.
As at 31 December 2018, the Group has uncommitted short term credit facilities of $120.0 million (2017: $134.1 million) that can be drawn down to meet short term financing needs. Furthermore, the Group has put in place a $500 million Debt Issuance Programme.
As at 31 December 2018, the outstanding notes issued under the Debt Issuance Programme was JPY11,800 million (approximately $146.3 million) (2017: JPY8,300 million (approximately $98.5 million)).
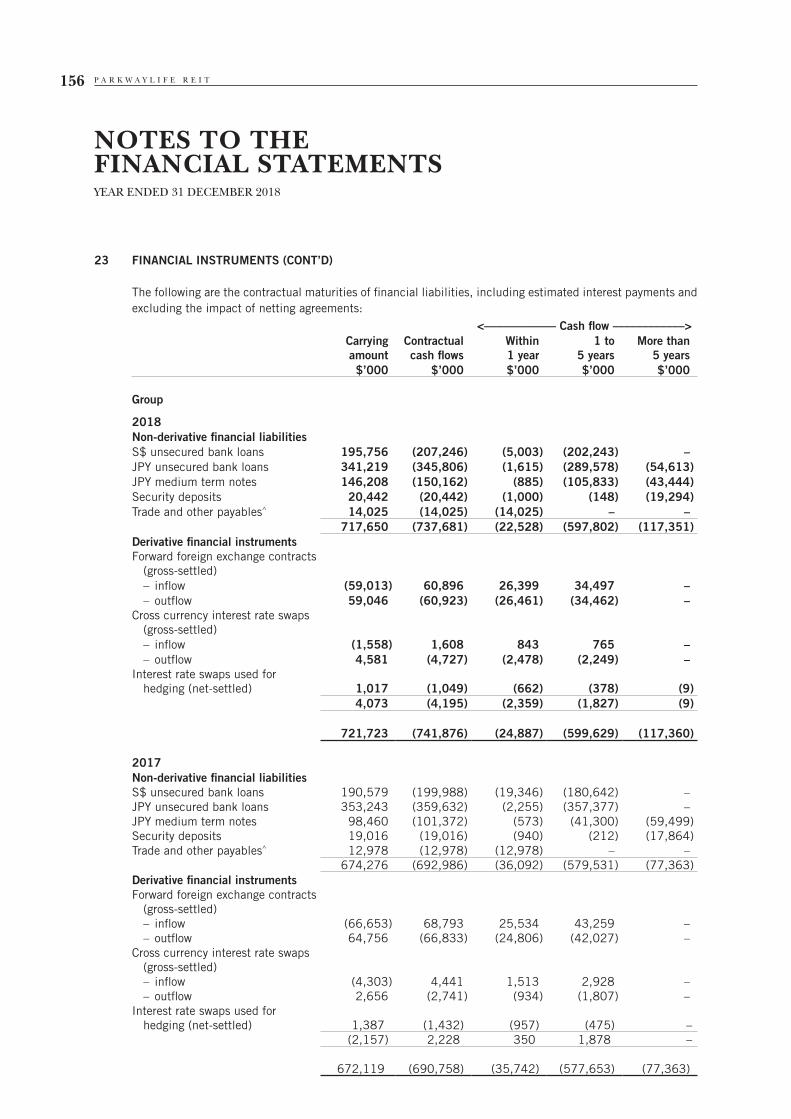
P A R K W A Y L I F E R E I T156
NOTES TO THEFINANCIAL STATEMENTSYEAR ENDED 31 DECEMBER 2018
23 FINANCIAL INSTRUMENTS (CONT’D)
The following are the contractual maturities of financial liabilities, including estimated interest payments and excluding the impact of netting agreements:
<–––––––––––– Cash flow ––––––––––––>Carrying amount
Contractual cash flows
Within1 year
1 to 5 years
More than5 years
$’000 $’000 $’000 $’000 $’000
Group
2018Non-derivative financial liabilitiesS$ unsecured bank loans 195,756 (207,246) (5,003) (202,243) –JPY unsecured bank loans 341,219 (345,806) (1,615) (289,578) (54,613)JPY medium term notes 146,208 (150,162) (885) (105,833) (43,444)Security deposits 20,442 (20,442) (1,000) (148) (19,294)Trade and other payables^ 14,025 (14,025) (14,025) – –
717,650 (737,681) (22,528) (597,802) (117,351)Derivative financial instrumentsForward foreign exchange contracts
(gross-settled) – inflow (59,013) 60,896 26,399 34,497 – – outflow 59,046 (60,923) (26,461) (34,462) –Cross currency interest rate swaps
(gross-settled) – inflow (1,558) 1,608 843 765 – – outflow 4,581 (4,727) (2,478) (2,249) –Interest rate swaps used for
hedging (net-settled) 1,017 (1,049) (662) (378) (9)4,073 (4,195) (2,359) (1,827) (9)
721,723 (741,876) (24,887) (599,629) (117,360)
2017Non-derivative financial liabilitiesS$ unsecured bank loans 190,579 (199,988) (19,346) (180,642) –JPY unsecured bank loans 353,243 (359,632) (2,255) (357,377) –JPY medium term notes 98,460 (101,372) (573) (41,300) (59,499)Security deposits 19,016 (19,016) (940) (212) (17,864)Trade and other payables^ 12,978 (12,978) (12,978) – –
674,276 (692,986) (36,092) (579,531) (77,363)Derivative financial instrumentsForward foreign exchange contracts
(gross-settled) – inflow (66,653) 68,793 25,534 43,259 – – outflow 64,756 (66,833) (24,806) (42,027) –Cross currency interest rate swaps
(gross-settled) – inflow (4,303) 4,441 1,513 2,928 – – outflow 2,656 (2,741) (934) (1,807) –Interest rate swaps used for
hedging (net-settled) 1,387 (1,432) (957) (475) –(2,157) 2,228 350 1,878 –
672,119 (690,758) (35,742) (577,653) (77,363)
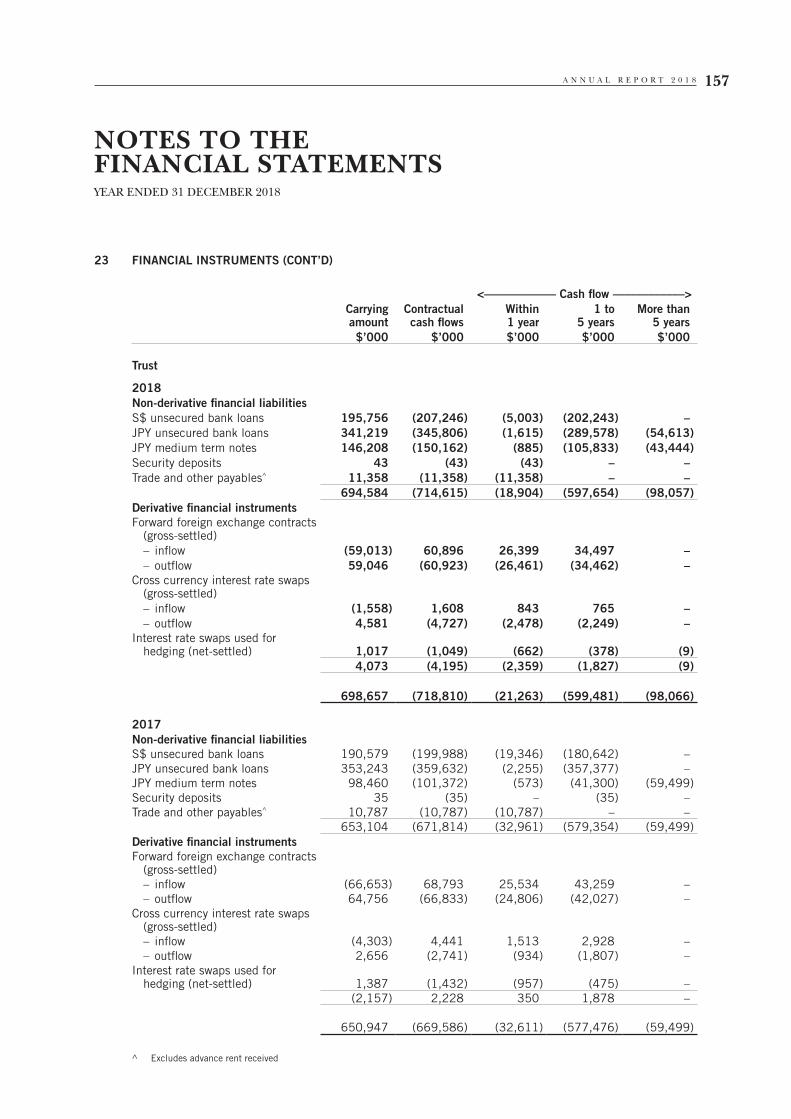
A N N U A L R E P O R T 2 0 1 8 157
NOTES TO THEFINANCIAL STATEMENTSYEAR ENDED 31 DECEMBER 2018
23 FINANCIAL INSTRUMENTS (CONT’D)
<–––––––––––– Cash flow ––––––––––––>Carrying amount
Contractual cash flows
Within 1 year
1 to 5 years
More than 5 years
$’000 $’000 $’000 $’000 $’000
Trust
2018Non-derivative financial liabilitiesS$ unsecured bank loans 195,756 (207,246) (5,003) (202,243) –JPY unsecured bank loans 341,219 (345,806) (1,615) (289,578) (54,613)JPY medium term notes 146,208 (150,162) (885) (105,833) (43,444)Security deposits 43 (43) (43) – –Trade and other payables^ 11,358 (11,358) (11,358) – –
694,584 (714,615) (18,904) (597,654) (98,057)Derivative financial instrumentsForward foreign exchange contracts
(gross-settled) – inflow (59,013) 60,896 26,399 34,497 – – outflow 59,046 (60,923) (26,461) (34,462) –Cross currency interest rate swaps
(gross-settled) – inflow (1,558) 1,608 843 765 – – outflow 4,581 (4,727) (2,478) (2,249) –Interest rate swaps used for
hedging (net-settled) 1,017 (1,049) (662) (378) (9)4,073 (4,195) (2,359) (1,827) (9)
698,657 (718,810) (21,263) (599,481) (98,066)
2017Non-derivative financial liabilitiesS$ unsecured bank loans 190,579 (199,988) (19,346) (180,642) –JPY unsecured bank loans 353,243 (359,632) (2,255) (357,377) –JPY medium term notes 98,460 (101,372) (573) (41,300) (59,499)Security deposits 35 (35) – (35) –Trade and other payables^ 10,787 (10,787) (10,787) – –
653,104 (671,814) (32,961) (579,354) (59,499)Derivative financial instrumentsForward foreign exchange contracts
(gross-settled) – inflow (66,653) 68,793 25,534 43,259 – – outflow 64,756 (66,833) (24,806) (42,027) –Cross currency interest rate swaps
(gross-settled) – inflow (4,303) 4,441 1,513 2,928 – – outflow 2,656 (2,741) (934) (1,807) –Interest rate swaps used for
hedging (net-settled) 1,387 (1,432) (957) (475) –(2,157) 2,228 350 1,878 –
650,947 (669,586) (32,611) (577,476) (59,499)
^ Excludes advance rent received
P A R K W A Y L I F E R E I T158
NOTES TO THEFINANCIAL STATEMENTSYEAR ENDED 31 DECEMBER 2018
23 FINANCIAL INSTRUMENTS (CONT’D)
Market risk
Market risk is the risk that changes in market prices, such as foreign exchange rates and interest rates will affect the Group’s income or the value of its holdings of financial instruments. The objective of market risk management is to manage and control market risk exposures within acceptable parameters, while optimising the return on risk.
Exposure to foreign currency risk
The Manager’s investment mandate covers the Asia-Pacific region. In order to manage the currency risk involved in investing in assets outside of Singapore, the Manager may, as appropriate, adopt currency risk management strategies including:
• theuseofforeigncurrencydenominatedborrowingstomatchthecurrencyoftheassetinvestmentasa natural currency hedge;
• theuseofderivativeorotherhedginginstrumentstohedgeagainstfluctuationsintheexchangeratesof foreign currency income received from offshore assets against Singapore dollars; and
• theuseofcrosscurrencyswapstohedgeagainstthefluctuationsintheexchangeratesofanyforeigncurrency denominated net assets of the Group against Singapore dollars.
The Group is exposed to foreign currency risk arising from its investments in Japan and Malaysia. The income generated from these investments and net assets are denominated in foreign currencies, mainly Japanese Yen (“JPY”) and Malaysia Ringgit (“MYR”).
The Group’s exposure to foreign currency risk mainly arises from the distribution of net income denominated in JPY from its investment properties located in Japan and its net investment in foreign operations denominated in JPY. The Manager limits the Group’s exposure to adverse movements in foreign currency exchange rates by using forward foreign exchange contracts to hedge the distribution of net income from its investments in Japan. In addition, the Group borrows loans denominated in JPY and utilised CCIRS to realign the Singapore dollar denominated loans back into effective JPY denominated loans to create a natural hedge for its JPY denominated investments and that are designated as net investment hedge.
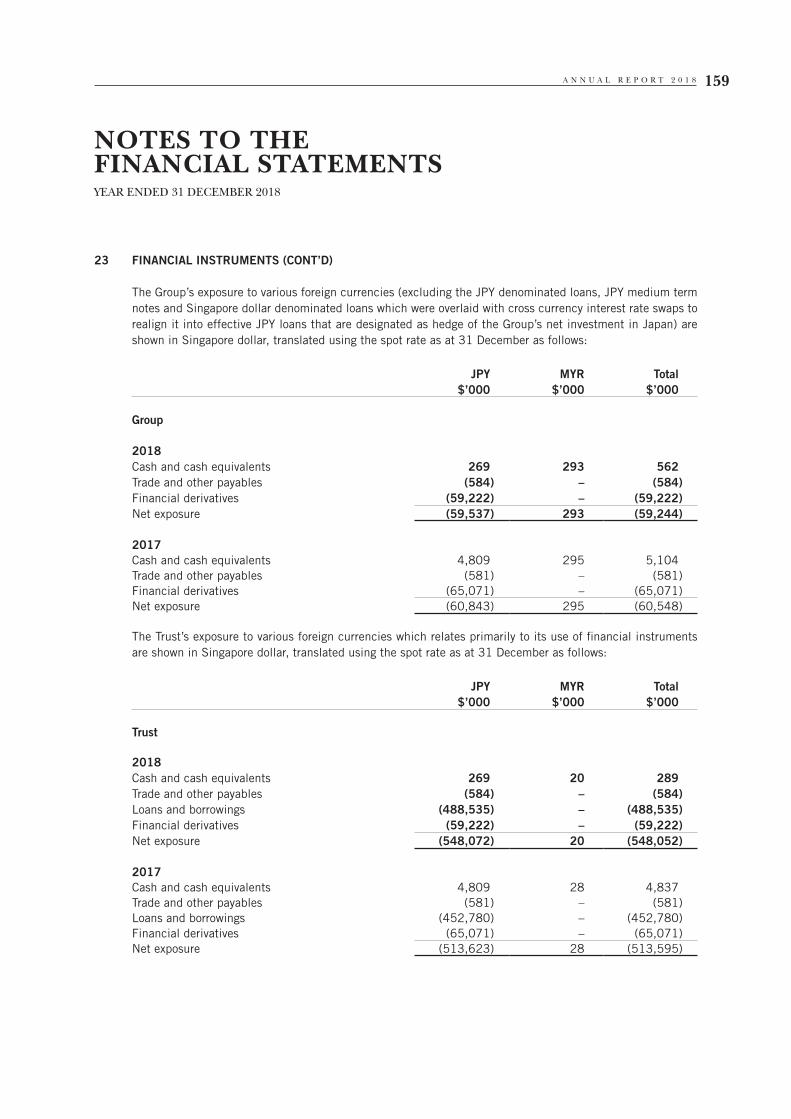
A N N U A L R E P O R T 2 0 1 8 159
NOTES TO THEFINANCIAL STATEMENTSYEAR ENDED 31 DECEMBER 2018
23 FINANCIAL INSTRUMENTS (CONT’D)
The Group’s exposure to various foreign currencies (excluding the JPY denominated loans, JPY medium term notes and Singapore dollar denominated loans which were overlaid with cross currency interest rate swaps to realign it into effective JPY loans that are designated as hedge of the Group’s net investment in Japan) are shown in Singapore dollar, translated using the spot rate as at 31 December as follows:
JPY MYR Total$’000 $’000 $’000
Group
2018Cash and cash equivalents 269 293 562Trade and other payables (584) – (584)Financial derivatives (59,222) – (59,222)Net exposure (59,537) 293 (59,244)
2017Cash and cash equivalents 4,809 295 5,104Trade and other payables (581) – (581)Financial derivatives (65,071) – (65,071)Net exposure (60,843) 295 (60,548)
The Trust’s exposure to various foreign currencies which relates primarily to its use of financial instruments are shown in Singapore dollar, translated using the spot rate as at 31 December as follows:
JPY MYR Total$’000 $’000 $’000
Trust
2018Cash and cash equivalents 269 20 289Trade and other payables (584) – (584)Loans and borrowings (488,535) – (488,535)Financial derivatives (59,222) – (59,222)Net exposure (548,072) 20 (548,052)
2017Cash and cash equivalents 4,809 28 4,837Trade and other payables (581) – (581)Loans and borrowings (452,780) – (452,780)Financial derivatives (65,071) – (65,071)Net exposure (513,623) 28 (513,595)
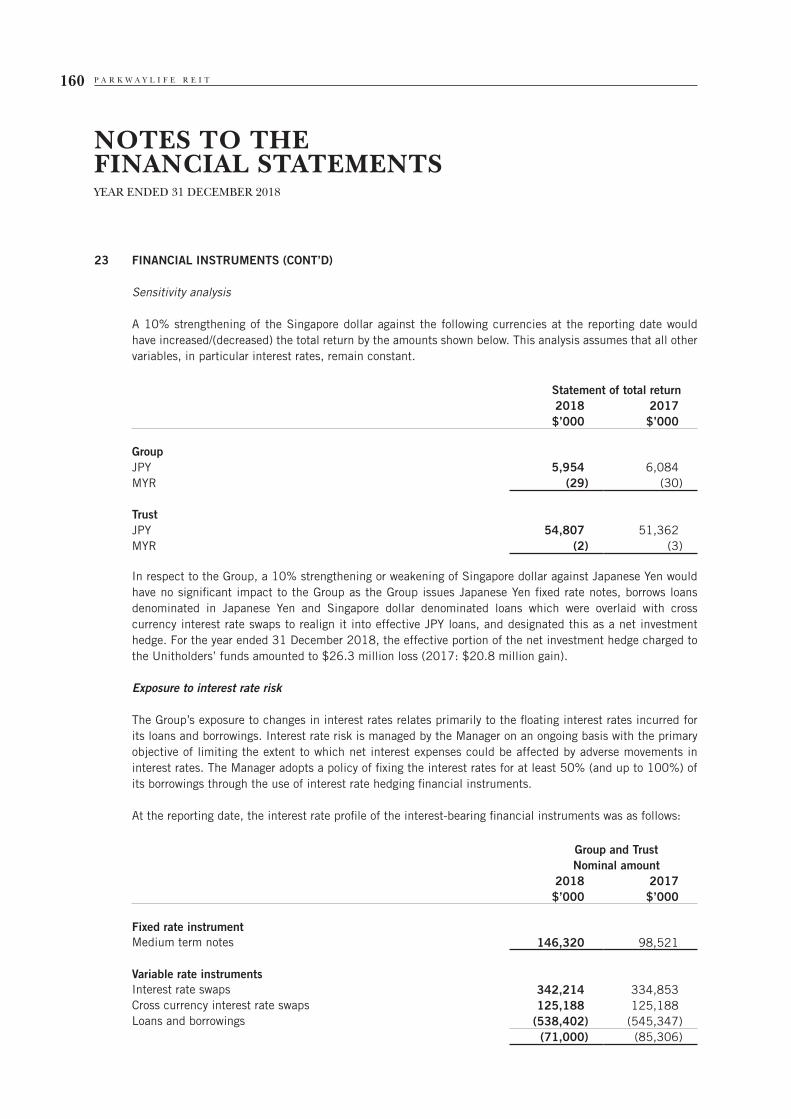
P A R K W A Y L I F E R E I T160
NOTES TO THEFINANCIAL STATEMENTSYEAR ENDED 31 DECEMBER 2018
23 FINANCIAL INSTRUMENTS (CONT’D)
Sensitivity analysis
A 10% strengthening of the Singapore dollar against the following currencies at the reporting date would have increased/(decreased) the total return by the amounts shown below. This analysis assumes that all other variables, in particular interest rates, remain constant.
Statement of total return2018 2017$’000 $’000
GroupJPY 5,954 6,084MYR (29) (30)
TrustJPY 54,807 51,362MYR (2) (3)
In respect to the Group, a 10% strengthening or weakening of Singapore dollar against Japanese Yen would have no significant impact to the Group as the Group issues Japanese Yen fixed rate notes, borrows loans denominated in Japanese Yen and Singapore dollar denominated loans which were overlaid with cross currency interest rate swaps to realign it into effective JPY loans, and designated this as a net investment hedge. For the year ended 31 December 2018, the effective portion of the net investment hedge charged to the Unitholders’ funds amounted to $26.3 million loss (2017: $20.8 million gain).
Exposure to interest rate risk
The Group’s exposure to changes in interest rates relates primarily to the floating interest rates incurred for its loans and borrowings. Interest rate risk is managed by the Manager on an ongoing basis with the primary objective of limiting the extent to which net interest expenses could be affected by adverse movements in interest rates. The Manager adopts a policy of fixing the interest rates for at least 50% (and up to 100%) of its borrowings through the use of interest rate hedging financial instruments.
At the reporting date, the interest rate profile of the interest-bearing financial instruments was as follows:
Group and TrustNominal amount
2018 2017$’000 $’000
Fixed rate instrumentMedium term notes 146,320 98,521
Variable rate instrumentsInterest rate swaps 342,214 334,853Cross currency interest rate swaps 125,188 125,188Loans and borrowings (538,402) (545,347)
(71,000) (85,306)

A N N U A L R E P O R T 2 0 1 8 161
NOTES TO THEFINANCIAL STATEMENTSYEAR ENDED 31 DECEMBER 2018
23 FINANCIAL INSTRUMENTS (CONT’D)
Fair value sensitivity analysis for fixed rate instruments
The Group does not account for any fixed rate financial assets at fair value through profit or loss. Therefore a change in interest rates at the reporting date would not affect statement of total return and Unitholders’ funds.
Cash flow sensitivity analysis for variable rate instruments
A change of 100 basis points in interest rates at the reporting date would have increased/(decreased) the total return and Unitholders’ funds by the amounts shown below. This analysis assumes that all other variables, in particular foreign currency rates, remain constant.
Statement of total return Unitholders’ funds100 bp
increase100 bp
decrease100 bp
increase100 bp
decrease$’000 $’000 $’000 $’000
Group and Trust
31 December 2018Loans and borrowings (5,384) 5,384 – –Interest rate swaps 3,422 (3,422) 5,036 (2,792)Cross currency interest rate swaps 1,252 (1,252) 2,583 (2,645)Cash flow sensitivity (net) (710) 710 7,619 (5,437)
31 December 2017Loans and borrowings (5,454) 5,454 – –Interest rate swaps 3,349 (3,349) 4,089 (5,092)Cross currency interest rate swaps 1,252 (1,252) 3,637 (3,717)Cash flow sensitivity (net) (853) 853 7,726 (8,809)
Hedge accounting
Cash flow hedges
At 31 December 2018, the Group held the following instruments to hedge exposures to changes in foreign currency and interest rates.
MaturityWithin 1 year
More than 1 year
Interest rate riskCross currency interest rate swapsNet exposure ($’000) – 125,188Average fixed interest rate – 0.75%
Interest rate swapsNet exposure ($’000) 145,452 196,762Average fixed interest rate 0.31% 0.2%
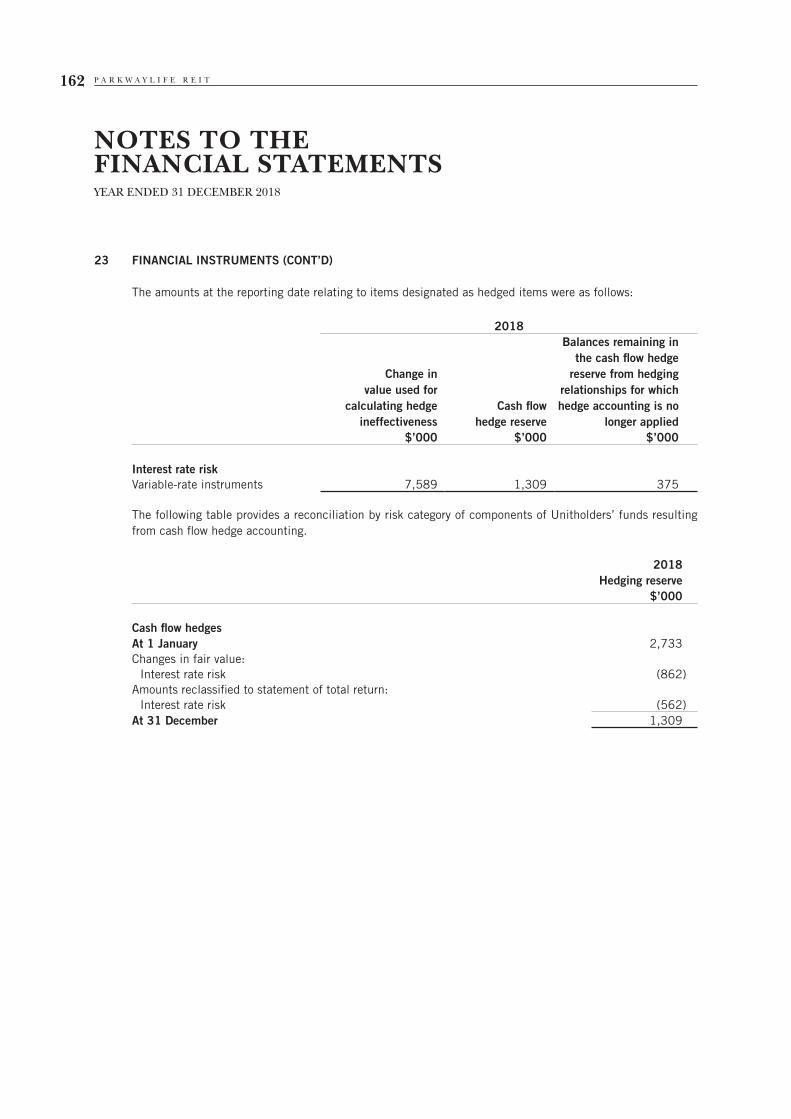
P A R K W A Y L I F E R E I T162
NOTES TO THEFINANCIAL STATEMENTSYEAR ENDED 31 DECEMBER 2018
23 FINANCIAL INSTRUMENTS (CONT’D)
The amounts at the reporting date relating to items designated as hedged items were as follows:
2018
Change in value used for
calculating hedge ineffectiveness
Cash flow hedge reserve
Balances remaining in the cash flow hedge
reserve from hedging relationships for which hedge accounting is no
longer applied$’000 $’000 $’000
Interest rate riskVariable-rate instruments 7,589 1,309 375
The following table provides a reconciliation by risk category of components of Unitholders’ funds resulting from cash flow hedge accounting.
2018 Hedging reserve
$’000
Cash flow hedgesAt 1 January 2,733Changes in fair value:
Interest rate risk (862)Amounts reclassified to statement of total return:
Interest rate risk (562)At 31 December 1,309
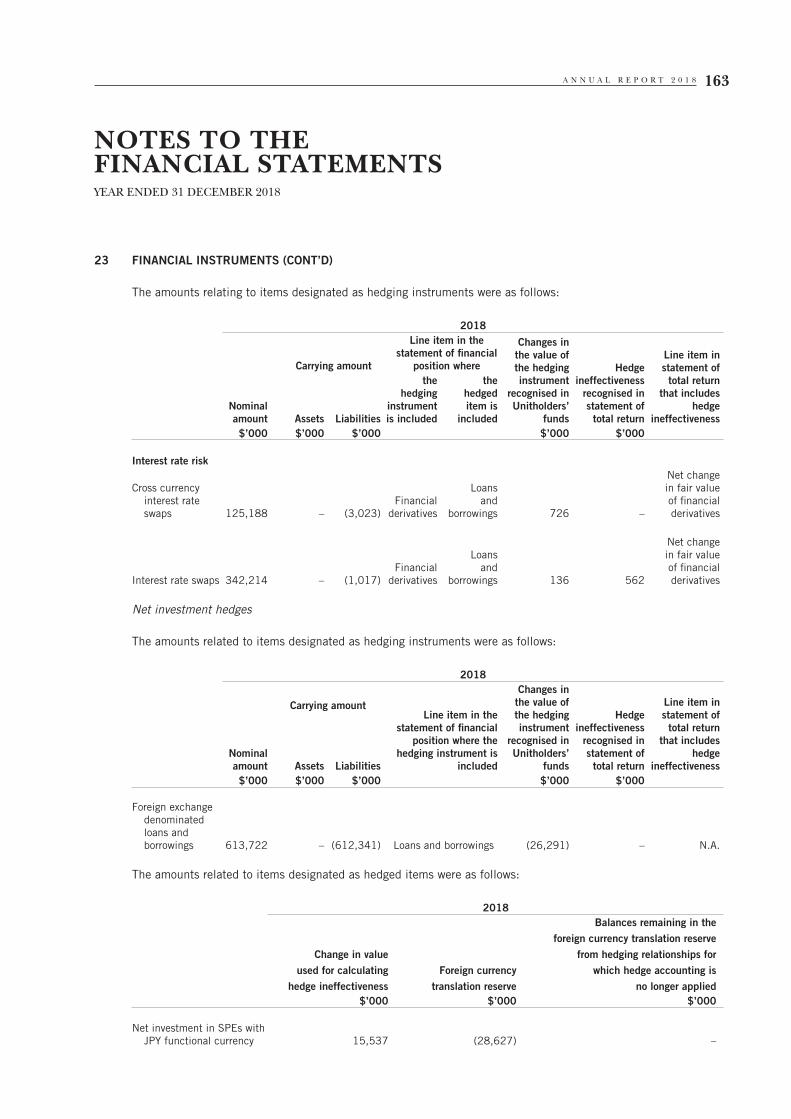
A N N U A L R E P O R T 2 0 1 8 163
NOTES TO THEFINANCIAL STATEMENTSYEAR ENDED 31 DECEMBER 2018
23 FINANCIAL INSTRUMENTS (CONT’D)
The amounts relating to items designated as hedging instruments were as follows:
2018
Nominal amount
Carrying amount
Line item in the statement of financial
position where
Changes in the value of the hedging instrument
recognised in Unitholders’
funds
Hedge ineffectiveness
recognised in statement of total return
Line item in statement of total return
that includes hedge
ineffectivenessAssets Liabilities
the hedging
instrument is included
the hedged item is
included$’000 $’000 $’000 $’000 $’000
Interest rate risk
Cross currency interest rate swaps 125,188 – (3,023)
Financialderivatives
Loansand
borrowings 726 –
Net change in fair value of financial derivatives
Interest rate swaps 342,214 – (1,017)Financial
derivatives
Loansand
borrowings 136 562
Net change in fair value of financial derivatives
Net investment hedges
The amounts related to items designated as hedging instruments were as follows:
2018
Nominal amount
Carrying amountLine item in the
statement of financial position where the
hedging instrument is included
Changes in the value of the hedging instrument
recognised in Unitholders’
funds
Hedge ineffectiveness
recognised in statement of total return
Line item in statement of total return
that includes hedge
ineffectivenessAssets Liabilities$’000 $’000 $’000 $’000 $’000
Foreign exchange denominated loans and borrowings 613,722 – (612,341) Loans and borrowings (26,291) – N.A.
The amounts related to items designated as hedged items were as follows:
2018
Change in value used for calculating
hedge ineffectivenessForeign currency
translation reserve
Balances remaining in the foreign currency translation reserve
from hedging relationships for which hedge accounting is
no longer applied$’000 $’000 $’000
Net investment in SPEs with JPY functional currency 15,537 (28,627) –
P A R K W A Y L I F E R E I T164
NOTES TO THEFINANCIAL STATEMENTSYEAR ENDED 31 DECEMBER 2018
23 FINANCIAL INSTRUMENTS (CONT’D)
Capital management
The Manager reviews the Group’s and the Trust’s capital structure regularly and uses a combination of debt and equity to fund acquisitions and asset enhancement projects.
The objectives of the Manager are to:
(a) maintain a strong financial position by adopting and maintaining an optimal gearing ratio;
(b) secure diversified funding sources from financial institutions and/or capital markets; and
(c) adopt a proactive financial risk management strategy to manage financial risks related to interest rate and foreign currency fluctuations.
The Manager seeks to maintain an optimal combination of debt and equity in order to minimise the cost of capital and maximise returns to Unitholders. The Manager also monitors the externally imposed capital requirements closely and ensures the capital structure adopted comply with these requirements.
The Group is subjected to the Aggregate Leverage limit as defined in the Property Funds Appendix of the CIS Code. The CIS Code stipulates that the total borrowings and deferred payments (the “Aggregate Leverage”) of a property fund should not exceed 45% of the fund’s Deposited Property.
During the financial year, the Group maintained a credit rating of Baa2 from Moody’s. The Aggregate Leverage of the Group as at 31 December 2018 was 36.1% (2017: 36.4%) of the Group’s Deposited Property. This complied with the stipulated Aggregate Leverage limit.
There were no changes in the Group’s approach to capital management during the year.
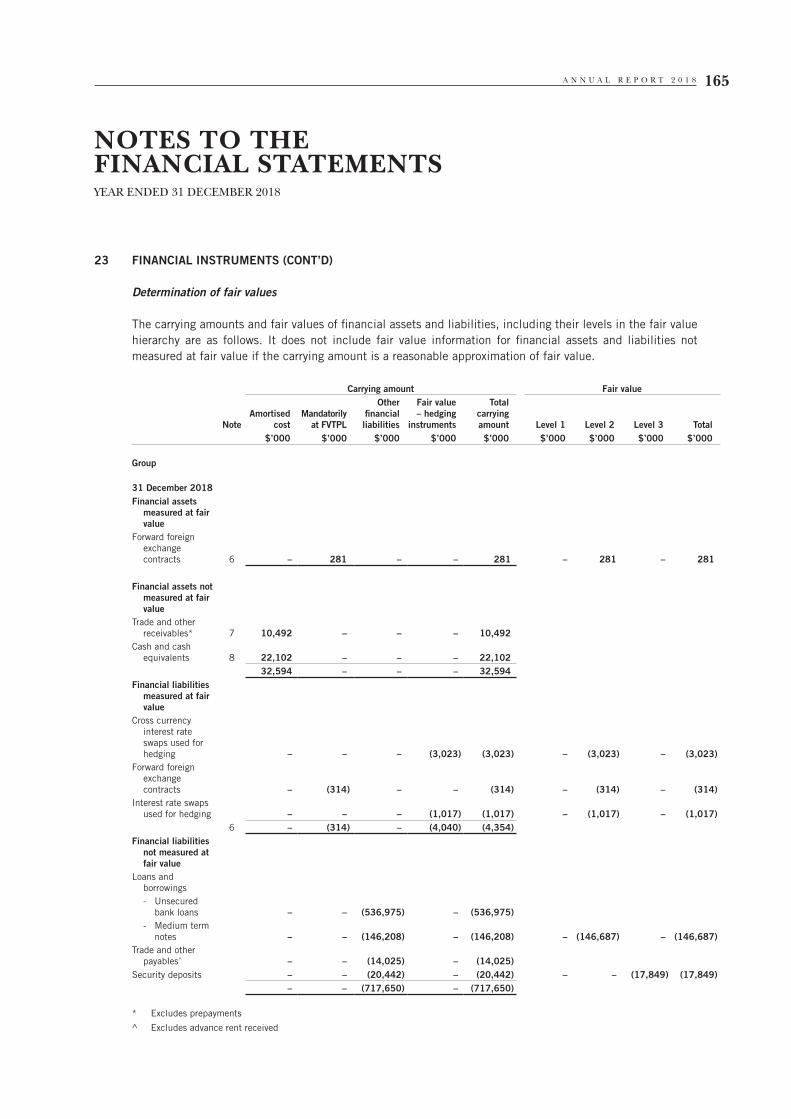
A N N U A L R E P O R T 2 0 1 8 165
NOTES TO THEFINANCIAL STATEMENTSYEAR ENDED 31 DECEMBER 2018
23 FINANCIAL INSTRUMENTS (CONT’D)
Determination of fair values
The carrying amounts and fair values of financial assets and liabilities, including their levels in the fair value hierarchy are as follows. It does not include fair value information for financial assets and liabilities not measured at fair value if the carrying amount is a reasonable approximation of fair value.
Carrying amount Fair value
NoteAmortised
costMandatorily
at FVTPL
Other financial liabilities
Fair value – hedging
instruments
Total carrying amount Level 1 Level 2 Level 3 Total
$’000 $’000 $’000 $’000 $’000 $’000 $’000 $’000 $’000
Group
31 December 2018Financial assets
measured at fair value
Forward foreign exchange contracts 6 – 281 – – 281 – 281 – 281
Financial assets not measured at fair value
Trade and other receivables* 7 10,492 – – – 10,492
Cash and cash equivalents 8 22,102 – – – 22,102
32,594 – – – 32,594Financial liabilities
measured at fair value
Cross currency interest rate swaps used for hedging – – – (3,023) (3,023) – (3,023) – (3,023)
Forward foreign exchange contracts – (314) – – (314) – (314) – (314)
Interest rate swaps used for hedging – – – (1,017) (1,017) – (1,017) – (1,017)
6 – (314) – (4,040) (4,354)Financial liabilities
not measured at fair value
Loans and borrowings- Unsecured
bank loans – – (536,975) – (536,975)- Medium term
notes – – (146,208) – (146,208) – (146,687) – (146,687)Trade and other
payables^ – – (14,025) – (14,025)Security deposits – – (20,442) – (20,442) – – (17,849) (17,849)
– – (717,650) – (717,650)
* Excludes prepayments
^ Excludes advance rent received

P A R K W A Y L I F E R E I T166
NOTES TO THEFINANCIAL STATEMENTSYEAR ENDED 31 DECEMBER 2018
23 FINANCIAL INSTRUMENTS (CONT’D)
Carrying amount Fair value
NoteLoans and
receivables
Designated at fair value#
Other financial liabilities
Fair value – hedging
instruments
Total carrying amount Level 1 Level 2 Level 3 Total
$’000 $’000 $’000 $’000 $’000 $’000 $’000 $’000 $’000
Group
31 December 2017Financial assets
measured at fair value
Forward foreign exchange contracts – 1,897 – – 1,897 – 1,897 – 1,897
Cross currency interest rate swaps used for hedging – – – 1,647 1,647 – 1,647 – 1,647
6 – 1,897 – 1,647 3,544Financial assets not
measured at fair value
Trade and other receivables* 7 10,155 – – – 10,155
Cash and cash equivalents 8 25,720 – – – 25,720
35,875 – – – 35,875Financial liabilities
measured at fair value
Interest rate swaps used for hedging 6 – – – (1,387) (1,387) – (1,387) – (1,387)
Financial liabilities not measured at fair value
Loans and borrowings- Unsecured
bank loans – – (543,822) – (543,822)- Medium term
notes – – (98,460) – (98,460) – (98,542) – (98,542)Trade and other
payables^ – – (12,978) – (12,978)Security deposits – – (19,016) – (19,016) – – (16,264) (16,264)
– – (674,276) – (674,276)
* Excludes prepayments
^ Excludes advance rent received
# Designated at fair value through profit or loss
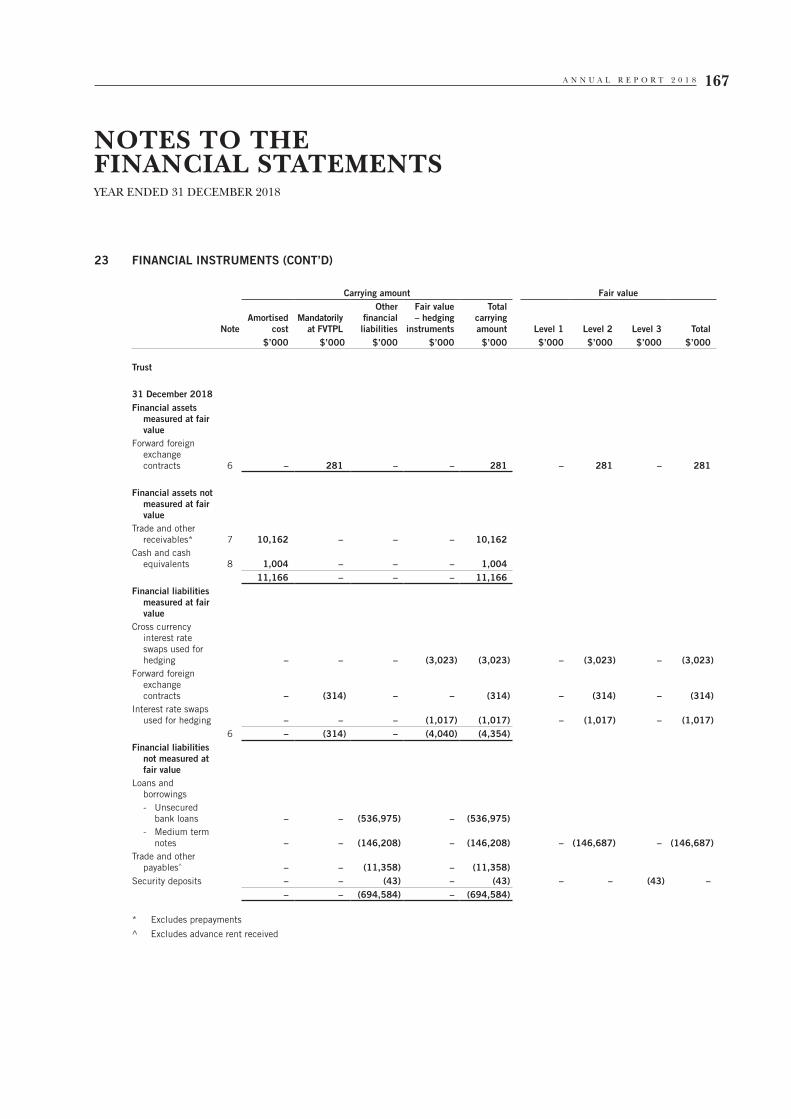
A N N U A L R E P O R T 2 0 1 8 167
NOTES TO THEFINANCIAL STATEMENTSYEAR ENDED 31 DECEMBER 2018
23 FINANCIAL INSTRUMENTS (CONT’D)
Carrying amount Fair value
NoteAmortised
costMandatorily
at FVTPL
Other financial liabilities
Fair value – hedging
instruments
Total carrying amount Level 1 Level 2 Level 3 Total
$’000 $’000 $’000 $’000 $’000 $’000 $’000 $’000 $’000
Trust
31 December 2018Financial assets
measured at fair value
Forward foreign exchange contracts 6 – 281 – – 281 – 281 – 281
Financial assets not measured at fair value
Trade and other receivables* 7 10,162 – – – 10,162
Cash and cash equivalents 8 1,004 – – – 1,004
11,166 – – – 11,166Financial liabilities
measured at fair value
Cross currency interest rate swaps used for hedging – – – (3,023) (3,023) – (3,023) – (3,023)
Forward foreign exchange contracts – (314) – – (314) – (314) – (314)
Interest rate swaps used for hedging – – – (1,017) (1,017) – (1,017) – (1,017)
6 – (314) – (4,040) (4,354)Financial liabilities
not measured at fair value
Loans and borrowings- Unsecured
bank loans – – (536,975) – (536,975)- Medium term
notes – – (146,208) – (146,208) – (146,687) – (146,687)Trade and other
payables^ – – (11,358) – (11,358)Security deposits – – (43) – (43) – – (43) –
– – (694,584) – (694,584)
* Excludes prepayments
^ Excludes advance rent received
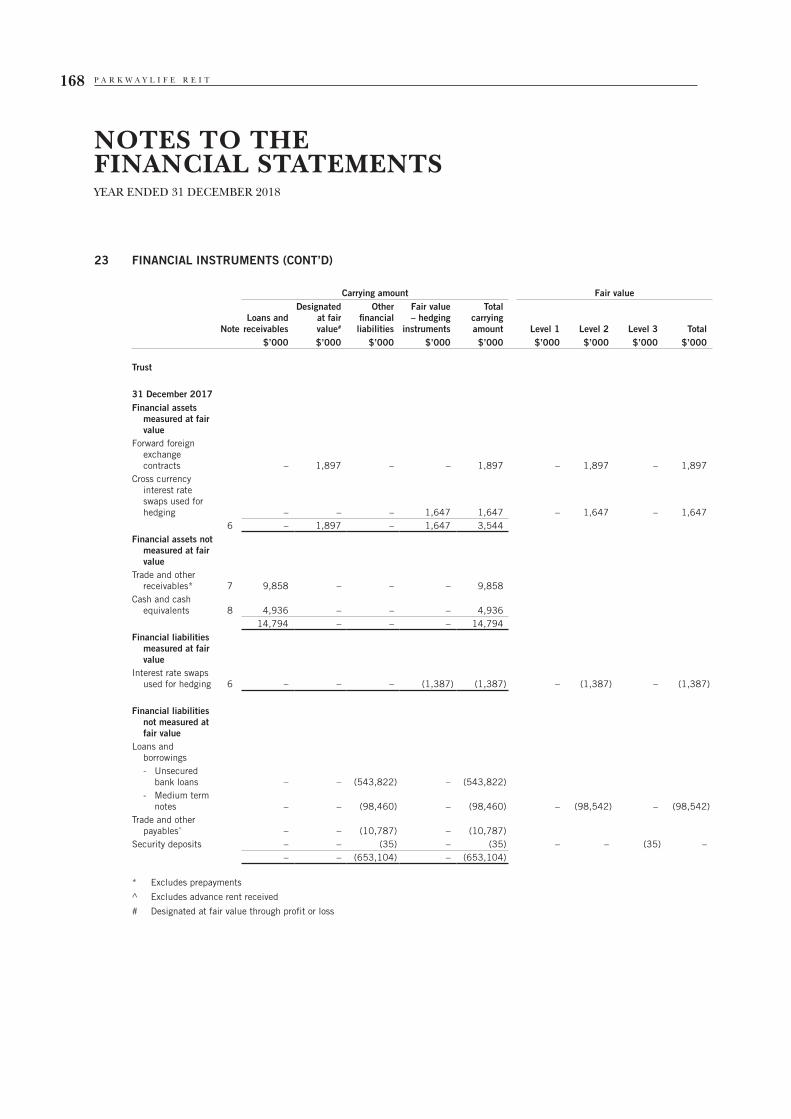
P A R K W A Y L I F E R E I T168
NOTES TO THEFINANCIAL STATEMENTSYEAR ENDED 31 DECEMBER 2018
23 FINANCIAL INSTRUMENTS (CONT’D)
Carrying amount Fair value
NoteLoans and
receivables
Designated at fair value#
Other financial liabilities
Fair value – hedging
instruments
Total carrying amount Level 1 Level 2 Level 3 Total
$’000 $’000 $’000 $’000 $’000 $’000 $’000 $’000 $’000
Trust
31 December 2017Financial assets
measured at fair value
Forward foreign exchange contracts – 1,897 – – 1,897 – 1,897 – 1,897
Cross currency interest rate swaps used for hedging – – – 1,647 1,647 – 1,647 – 1,647
6 – 1,897 – 1,647 3,544Financial assets not
measured at fair value
Trade and other receivables* 7 9,858 – – – 9,858
Cash and cash equivalents 8 4,936 – – – 4,936
14,794 – – – 14,794Financial liabilities
measured at fair value
Interest rate swaps used for hedging 6 – – – (1,387) (1,387) – (1,387) – (1,387)
Financial liabilities not measured at fair value
Loans and borrowings- Unsecured
bank loans – – (543,822) – (543,822)- Medium term
notes – – (98,460) – (98,460) – (98,542) – (98,542)Trade and other
payables^ – – (10,787) – (10,787)Security deposits – – (35) – (35) – – (35) –
– – (653,104) – (653,104)
* Excludes prepayments
^ Excludes advance rent received
# Designated at fair value through profit or loss

A N N U A L R E P O R T 2 0 1 8 169
NOTES TO THEFINANCIAL STATEMENTSYEAR ENDED 31 DECEMBER 2018
23 FINANCIAL INSTRUMENTS (CONT’D)
Measurement of fair values
(i) Valuation techniques and significant unobservable inputs
The following tables show the valuation techniques used in measuring Level 2 and Level 3 fair values, as well as the significant unobservable inputs used.
Financial instruments measured at fair value
Type Valuation technique
Group and Trust
Derivatives: interest rate swaps, forward foreign currency contracts and cross currency interest rate swaps
Market comparison technique: The fair values are based on valuations provided by the financial institutions that are the counterparties to the transactions. These quotes are tested for reasonableness by discounting estimated future cash flows based on the terms and maturity of each contract and using market interest rates for a similar instrument at the reporting date.
Financial instruments not measured at fair value
Type Valuation technique Key unobservable inputs
Group and Trust
Security deposits Discounted cash flows Discount rate –1.01% (2017: 1.06%)
Medium term notes The fair value is estimated considering recent quoted price in markets that are not active
Not applicable
Other financial assets and liabilities
The carrying amounts of financial assets and liabilities with a maturity of less than one year (including trade and other receivables, cash and cash equivalents, trade and other payables and interest-bearing borrowings which reprice within three months) are assumed to approximate their fair values because of the short period to maturity or repricing.
(ii) Transfer between Level 1 and Level 2
During the financial year ended 31 December 2018, there were no transfers between Level 1 and Level 2.
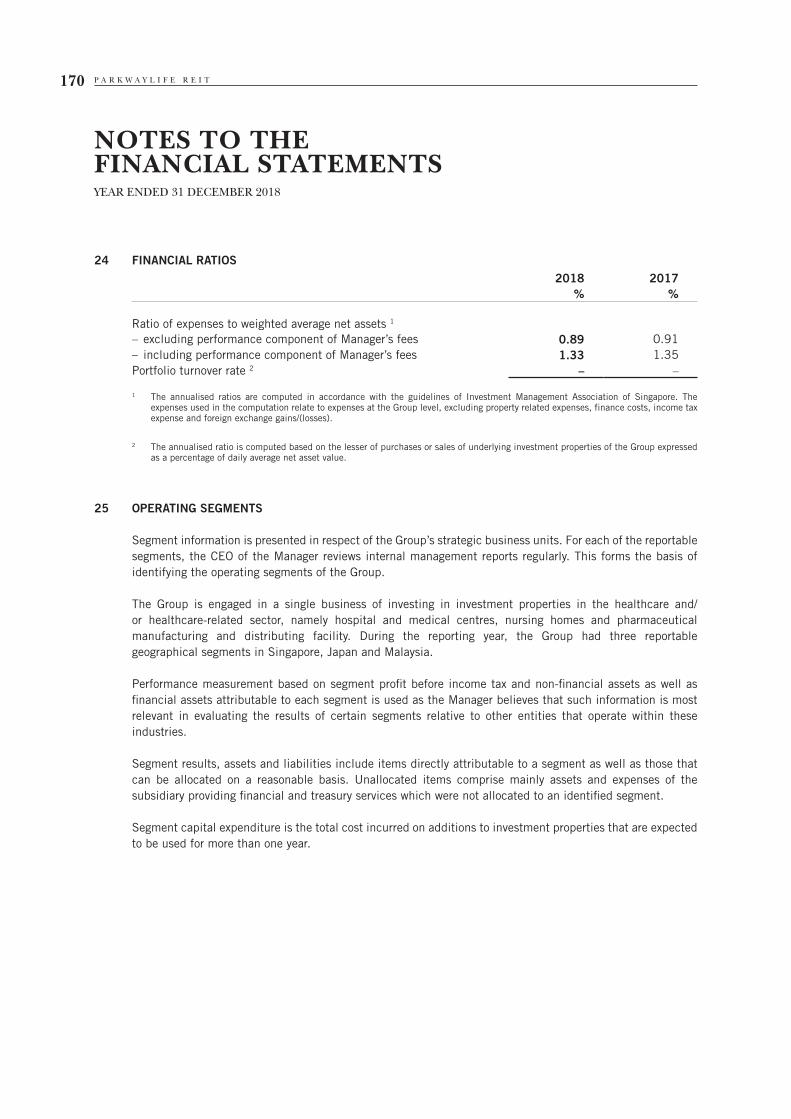
P A R K W A Y L I F E R E I T170
NOTES TO THEFINANCIAL STATEMENTSYEAR ENDED 31 DECEMBER 2018
24 FINANCIAL RATIOS2018 2017
% %
Ratio of expenses to weighted average net assets 1
– excluding performance component of Manager’s fees 0.89 0.91– including performance component of Manager’s fees 1.33 1.35Portfolio turnover rate 2 – –
1 The annualised ratios are computed in accordance with the guidelines of Investment Management Association of Singapore. The expenses used in the computation relate to expenses at the Group level, excluding property related expenses, finance costs, income tax expense and foreign exchange gains/(losses).
2 The annualised ratio is computed based on the lesser of purchases or sales of underlying investment properties of the Group expressed as a percentage of daily average net asset value.
25 OPERATING SEGMENTS
Segment information is presented in respect of the Group’s strategic business units. For each of the reportable segments, the CEO of the Manager reviews internal management reports regularly. This forms the basis of identifying the operating segments of the Group.
The Group is engaged in a single business of investing in investment properties in the healthcare and/or healthcare-related sector, namely hospital and medical centres, nursing homes and pharmaceutical manufacturing and distributing facility. During the reporting year, the Group had three reportable geographical segments in Singapore, Japan and Malaysia.
Performance measurement based on segment profit before income tax and non-financial assets as well as financial assets attributable to each segment is used as the Manager believes that such information is most relevant in evaluating the results of certain segments relative to other entities that operate within these industries.
Segment results, assets and liabilities include items directly attributable to a segment as well as those that can be allocated on a reasonable basis. Unallocated items comprise mainly assets and expenses of the subsidiary providing financial and treasury services which were not allocated to an identified segment.
Segment capital expenditure is the total cost incurred on additions to investment properties that are expected to be used for more than one year.
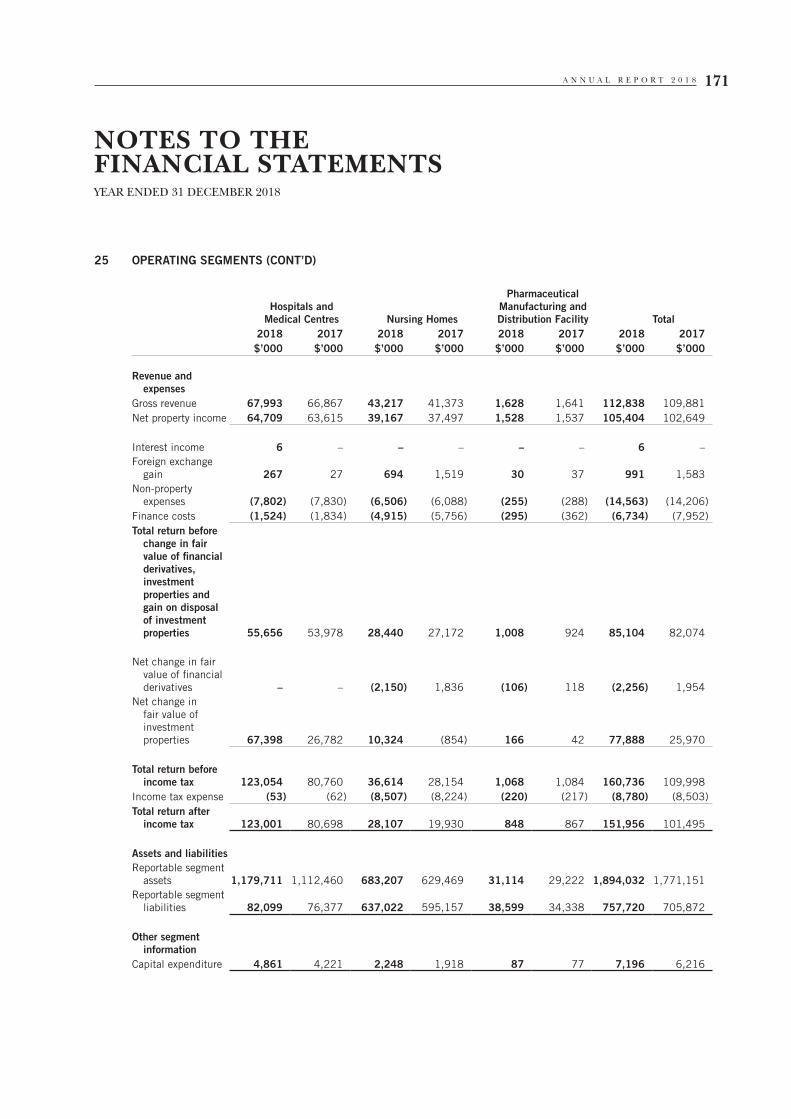
A N N U A L R E P O R T 2 0 1 8 171
NOTES TO THEFINANCIAL STATEMENTSYEAR ENDED 31 DECEMBER 2018
25 OPERATING SEGMENTS (CONT’D)
Hospitals and Medical Centres Nursing Homes
Pharmaceutical Manufacturing and Distribution Facility Total
2018 2017 2018 2017 2018 2017 2018 2017$’000 $’000 $’000 $’000 $’000 $’000 $’000 $’000
Revenue and expenses
Gross revenue 67,993 66,867 43,217 41,373 1,628 1,641 112,838 109,881Net property income 64,709 63,615 39,167 37,497 1,528 1,537 105,404 102,649
Interest income 6 – – – – – 6 –Foreign exchange
gain 267 27 694 1,519 30 37 991 1,583Non-property
expenses (7,802) (7,830) (6,506) (6,088) (255) (288) (14,563) (14,206)Finance costs (1,524) (1,834) (4,915) (5,756) (295) (362) (6,734) (7,952)Total return before
change in fair value of financial derivatives, investment properties and gain on disposal of investment properties 55,656 53,978 28,440 27,172 1,008 924 85,104 82,074
Net change in fair value of financial derivatives – – (2,150) 1,836 (106) 118 (2,256) 1,954
Net change in fair value of investment properties 67,398 26,782 10,324 (854) 166 42 77,888 25,970
Total return before income tax 123,054 80,760 36,614 28,154 1,068 1,084 160,736 109,998
Income tax expense (53) (62) (8,507) (8,224) (220) (217) (8,780) (8,503)Total return after
income tax 123,001 80,698 28,107 19,930 848 867 151,956 101,495
Assets and liabilitiesReportable segment
assets 1,179,711 1,112,460 683,207 629,469 31,114 29,222 1,894,032 1,771,151Reportable segment
liabilities 82,099 76,377 637,022 595,157 38,599 34,338 757,720 705,872
Other segment information
Capital expenditure 4,861 4,221 2,248 1,918 87 77 7,196 6,216
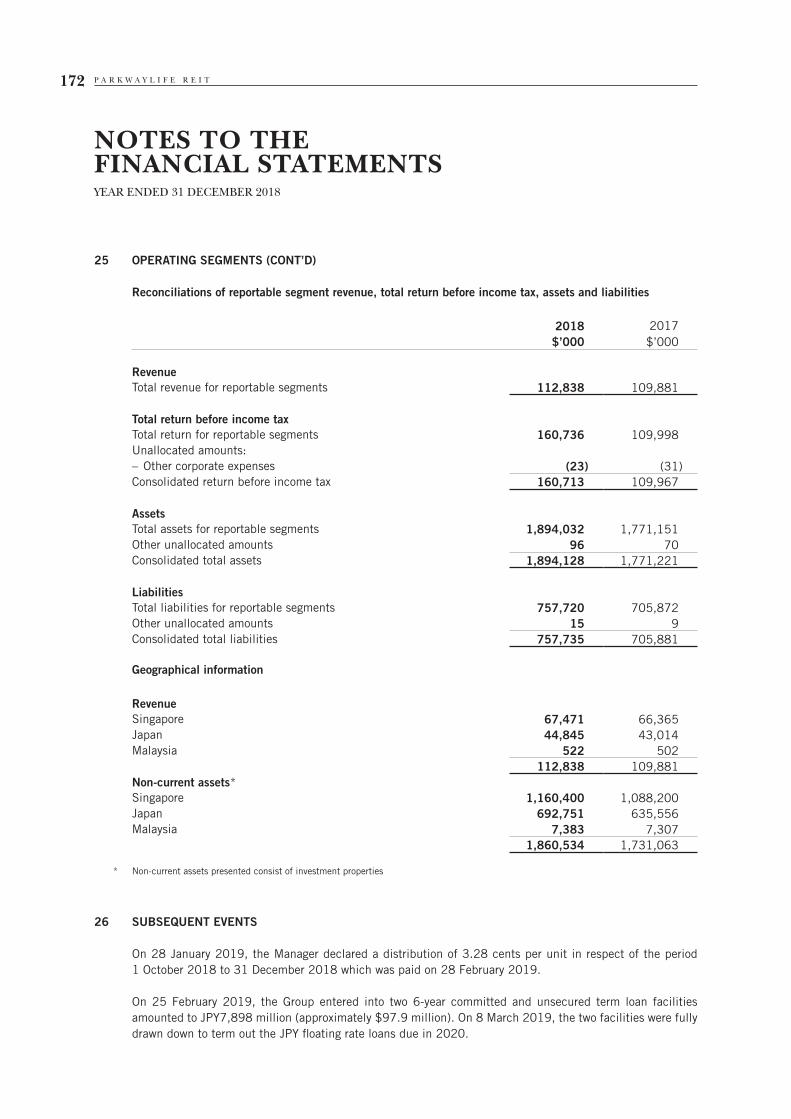
P A R K W A Y L I F E R E I T172
NOTES TO THEFINANCIAL STATEMENTSYEAR ENDED 31 DECEMBER 2018
25 OPERATING SEGMENTS (CONT’D)
Reconciliations of reportable segment revenue, total return before income tax, assets and liabilities
2018 2017$’000 $’000
RevenueTotal revenue for reportable segments 112,838 109,881
Total return before income taxTotal return for reportable segments 160,736 109,998Unallocated amounts:– Other corporate expenses (23) (31)Consolidated return before income tax 160,713 109,967
AssetsTotal assets for reportable segments 1,894,032 1,771,151Other unallocated amounts 96 70Consolidated total assets 1,894,128 1,771,221
LiabilitiesTotal liabilities for reportable segments 757,720 705,872Other unallocated amounts 15 9Consolidated total liabilities 757,735 705,881
Geographical information
RevenueSingapore 67,471 66,365Japan 44,845 43,014Malaysia 522 502
112,838 109,881Non-current assets*Singapore 1,160,400 1,088,200Japan 692,751 635,556Malaysia 7,383 7,307
1,860,534 1,731,063
* Non-current assets presented consist of investment properties
26 SUBSEQUENT EVENTS
On 28 January 2019, the Manager declared a distribution of 3.28 cents per unit in respect of the period 1 October 2018 to 31 December 2018 which was paid on 28 February 2019.
On 25 February 2019, the Group entered into two 6-year committed and unsecured term loan facilities amounted to JPY7,898 million (approximately $97.9 million). On 8 March 2019, the two facilities were fully drawn down to term out the JPY floating rate loans due in 2020.
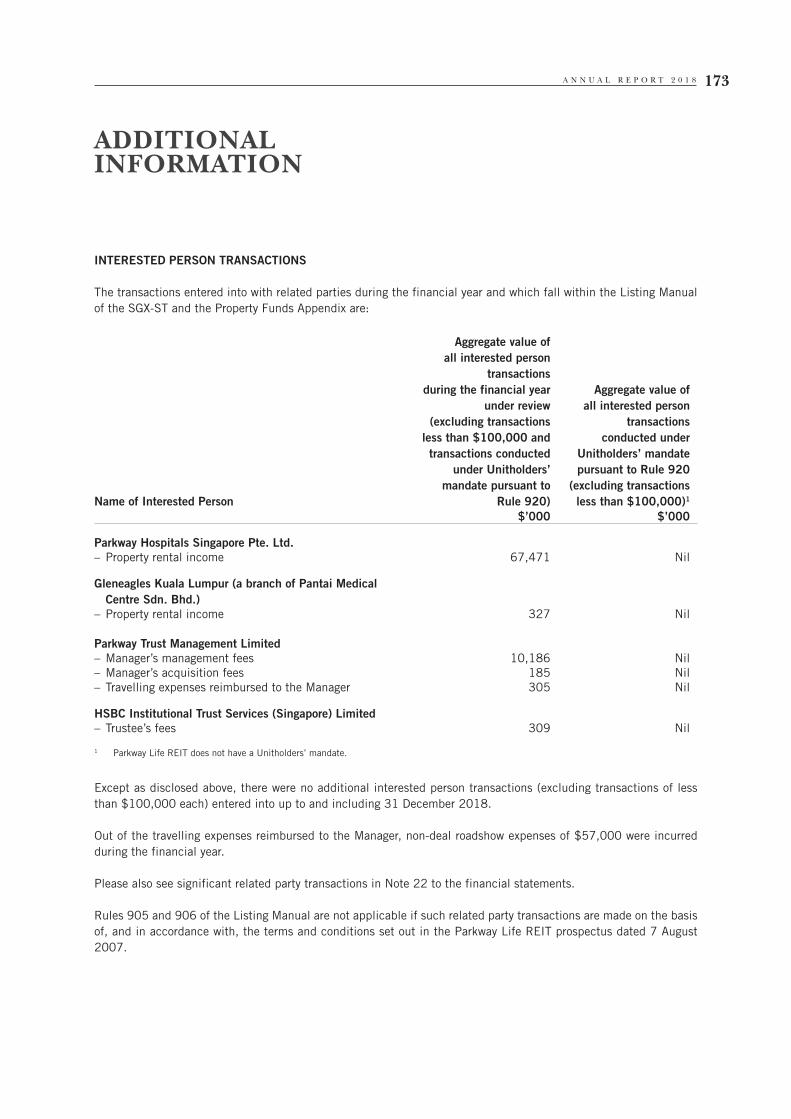
A N N U A L R E P O R T 2 0 1 8 173
INTERESTED PERSON TRANSACTIONS
The transactions entered into with related parties during the financial year and which fall within the Listing Manual of the SGX-ST and the Property Funds Appendix are:
Name of Interested Person
Aggregate value of all interested person
transactionsduring the financial year
under review(excluding transactions
less than $100,000 and transactions conducted
under Unitholders’ mandate pursuant to
Rule 920)
Aggregate value of all interested person
transactionsconducted under
Unitholders’ mandate pursuant to Rule 920
(excluding transactions less than $100,000)1
$’000 $’000
Parkway Hospitals Singapore Pte. Ltd.– Property rental income 67,471 Nil
Gleneagles Kuala Lumpur (a branch of Pantai Medical Centre Sdn. Bhd.)
– Property rental income 327 Nil
Parkway Trust Management Limited– Manager’s management fees 10,186 Nil– Manager’s acquisition fees 185 Nil– Travelling expenses reimbursed to the Manager 305 Nil
HSBC Institutional Trust Services (Singapore) Limited– Trustee’s fees 309 Nil
1 Parkway Life REIT does not have a Unitholders’ mandate.
Except as disclosed above, there were no additional interested person transactions (excluding transactions of less than $100,000 each) entered into up to and including 31 December 2018.
Out of the travelling expenses reimbursed to the Manager, non-deal roadshow expenses of $57,000 were incurred during the fi nancial year.
Please also see significant related party transactions in Note 22 to the financial statements.
Rules 905 and 906 of the Listing Manual are not applicable if such related party transactions are made on the basis of, and in accordance with, the terms and conditions set out in the Parkway Life REIT prospectus dated 7 August 2007.
ADDITIONALINFORMATION
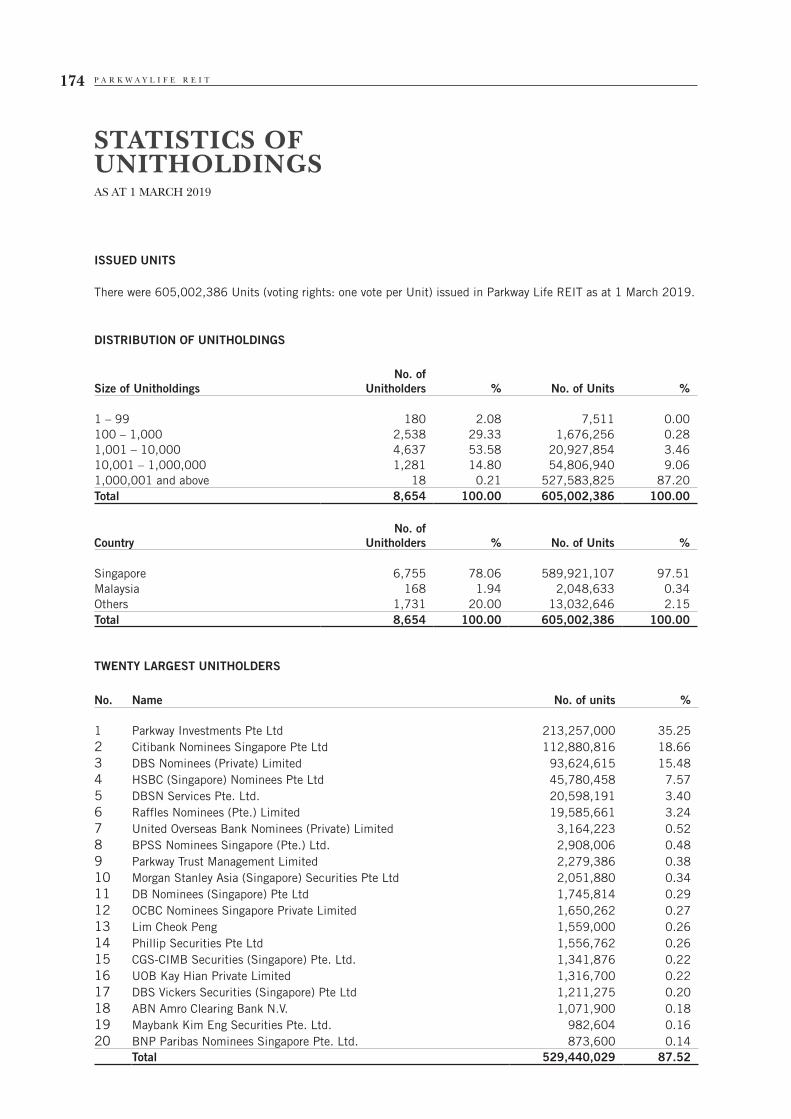
P A R K W A Y L I F E R E I T174
STATISTICS OFUNITHOLDINGSAS AT 1 MARCH 2019
ISSUED UNITS
There were 605,002,386 Units (voting rights: one vote per Unit) issued in Parkway Life REIT as at 1 March 2019.
DISTRIBUTION OF UNITHOLDINGS
Size of UnitholdingsNo. of
Unitholders % No. of Units %
1 – 99 180 2.08 7,511 0.00100 – 1,000 2,538 29.33 1,676,256 0.281,001 – 10,000 4,637 53.58 20,927,854 3.4610,001 – 1,000,000 1,281 14.80 54,806,940 9.061,000,001 and above 18 0.21 527,583,825 87.20Total 8,654 100.00 605,002,386 100.00
CountryNo. of
Unitholders % No. of Units %
Singapore 6,755 78.06 589,921,107 97.51Malaysia 168 1.94 2,048,633 0.34Others 1,731 20.00 13,032,646 2.15Total 8,654 100.00 605,002,386 100.00
TWENTY LARGEST UNITHOLDERS
No. Name No. of units %
1 Parkway Investments Pte Ltd 213,257,000 35.252 Citibank Nominees Singapore Pte Ltd 112,880,816 18.663 DBS Nominees (Private) Limited 93,624,615 15.484 HSBC (Singapore) Nominees Pte Ltd 45,780,458 7.575 DBSN Services Pte. Ltd. 20,598,191 3.406 Raffles Nominees (Pte.) Limited 19,585,661 3.247 United Overseas Bank Nominees (Private) Limited 3,164,223 0.528 BPSS Nominees Singapore (Pte.) Ltd. 2,908,006 0.489 Parkway Trust Management Limited 2,279,386 0.3810 Morgan Stanley Asia (Singapore) Securities Pte Ltd 2,051,880 0.3411 DB Nominees (Singapore) Pte Ltd 1,745,814 0.2912 OCBC Nominees Singapore Private Limited 1,650,262 0.2713 Lim Cheok Peng 1,559,000 0.2614 Phillip Securities Pte Ltd 1,556,762 0.2615 CGS-CIMB Securities (Singapore) Pte. Ltd. 1,341,876 0.2216 UOB Kay Hian Private Limited 1,316,700 0.2217 DBS Vickers Securities (Singapore) Pte Ltd 1,211,275 0.2018 ABN Amro Clearing Bank N.V. 1,071,900 0.1819 Maybank Kim Eng Securities Pte. Ltd. 982,604 0.1620 BNP Paribas Nominees Singapore Pte. Ltd. 873,600 0.14
Total 529,440,029 87.52
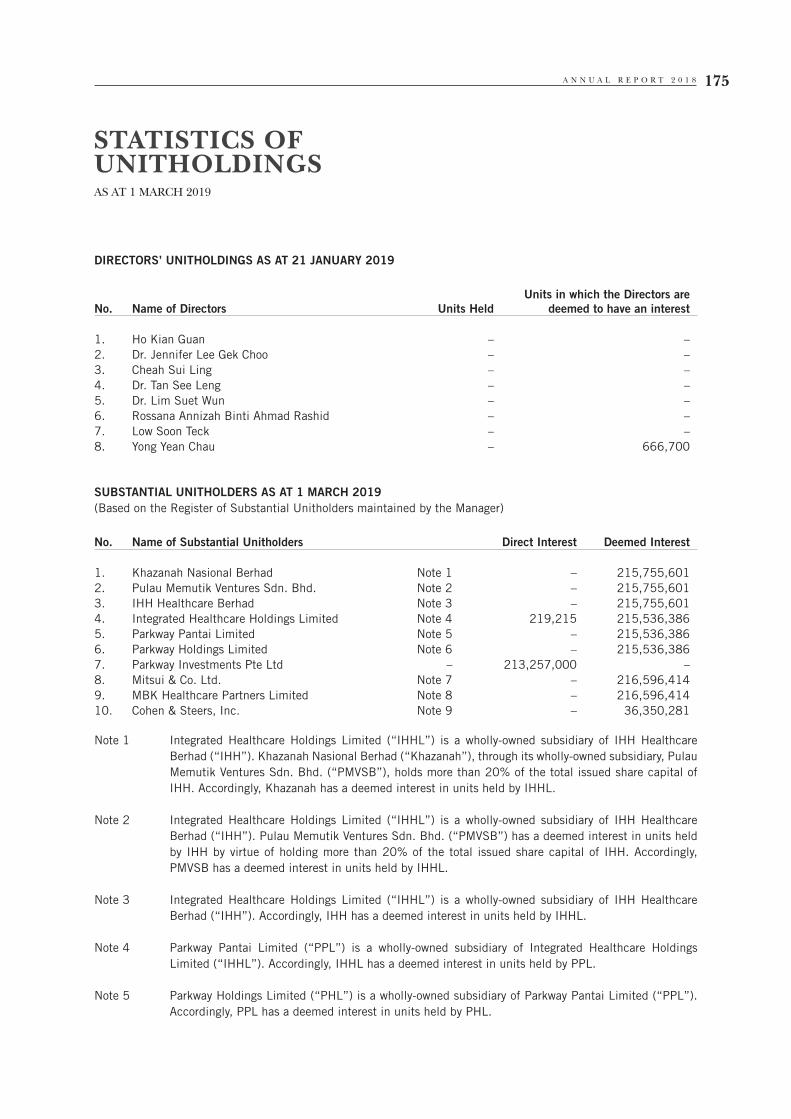
A N N U A L R E P O R T 2 0 1 8 175
STATISTICS OFUNITHOLDINGSAS AT 1 MARCH 2019
DIRECTORS’ UNITHOLDINGS AS AT 21 JANUARY 2019
No. Name of Directors Units HeldUnits in which the Directors are
deemed to have an interest
1. Ho Kian Guan – –2. Dr. Jennifer Lee Gek Choo – –3. Cheah Sui Ling – –4. Dr. Tan See Leng – –5. Dr. Lim Suet Wun – –6. Rossana Annizah Binti Ahmad Rashid – –7. Low Soon Teck – –8. Yong Yean Chau – 666,700
SUBSTANTIAL UNITHOLDERS AS AT 1 MARCH 2019(Based on the Register of Substantial Unitholders maintained by the Manager)
No. Name of Substantial Unitholders Direct Interest Deemed Interest
1. Khazanah Nasional Berhad Note 1 – 215,755,6012. Pulau Memutik Ventures Sdn. Bhd. Note 2 – 215,755,6013. IHH Healthcare Berhad Note 3 – 215,755,6014. Integrated Healthcare Holdings Limited Note 4 219,215 215,536,3865. Parkway Pantai Limited Note 5 – 215,536,3866. Parkway Holdings Limited Note 6 – 215,536,3867. Parkway Investments Pte Ltd – 213,257,000 –8. Mitsui & Co. Ltd. Note 7 – 216,596,4149. MBK Healthcare Partners Limited Note 8 – 216,596,41410. Cohen & Steers, Inc. Note 9 – 36,350,281
Note 1 Integrated Healthcare Holdings Limited (“IHHL”) is a wholly-owned subsidiary of IHH Healthcare Berhad (“IHH”). Khazanah Nasional Berhad (“Khazanah”), through its wholly-owned subsidiary, Pulau Memutik Ventures Sdn. Bhd. (“PMVSB”), holds more than 20% of the total issued share capital of IHH. Accordingly, Khazanah has a deemed interest in units held by IHHL.
Note 2 Integrated Healthcare Holdings Limited (“IHHL”) is a wholly-owned subsidiary of IHH Healthcare Berhad (“IHH”). Pulau Memutik Ventures Sdn. Bhd. (“PMVSB”) has a deemed interest in units held by IHH by virtue of holding more than 20% of the total issued share capital of IHH. Accordingly, PMVSB has a deemed interest in units held by IHHL.
Note 3 Integrated Healthcare Holdings Limited (“IHHL”) is a wholly-owned subsidiary of IHH Healthcare Berhad (“IHH”). Accordingly, IHH has a deemed interest in units held by IHHL.
Note 4 Parkway Pantai Limited (“PPL”) is a wholly-owned subsidiary of Integrated Healthcare Holdings Limited (“IHHL”). Accordingly, IHHL has a deemed interest in units held by PPL.
Note 5 Parkway Holdings Limited (“PHL”) is a wholly-owned subsidiary of Parkway Pantai Limited (“PPL”). Accordingly, PPL has a deemed interest in units held by PHL.

P A R K W A Y L I F E R E I T176
STATISTICS OFUNITHOLDINGSAS AT 1 MARCH 2019
Note 6 (1) Deemed interest in Parkway Investments Pte Ltd and Parkway Trust Management Limited, both wholly-owned subsidiaries of Parkway Holdings Limited.
(2) Parkway Investments Pte Ltd and Parkway Trust Management Limited are registered holders of 213,257,000 units and 2,279,386 units respectively.
Note 7 Integrated Healthcare Holdings Limited (“IHHL”) is a wholly-owned subsidiary of IHH Healthcare Berhad (“IHH”). MBK Healthcare Partners Limited (“MBKHPL”), a wholly-owned subsidiary of Mitsui & Co., Ltd. (“Mitsui”), has deemed interest in the units held by IHHL by virtue of MBKHPL holding more than 20 per cent of the total issued share capital of IHH. Accordingly, Mitsui has a deemed interest in units held by IHHL.
Note 8 Integrated Healthcare Holdings Limited (“IHHL”) is a wholly-owned subsidiary of IHH Healthcare Berhad (“IHH”). MBK Healthcare Partners Limited (“MBKHPL”) has deemed interest in the units held by IHHL by virtue of MBKHPL holding more than 20 per cent of the total issued share capital of IHH.
Note 9 Cohen & Steers, Inc. is deemed interested in the shares held by its wholly-owned subsidiary, Cohen & Steers Capital Management, Inc.
PUBLIC FLOAT
Under Rule 723 of the Listing Manual of the SGX-ST, a listed issuer must ensure that at least 10% of its listed securities are at all times held by the public. Based on the information made to the Manager as at 1 March 2019, approximately 64.23% of Parkway Life REIT’s Units were held in the hands of the public. Accordingly, Rule 723 of the Listing Manual of the SGX-ST has been complied with.
Parkway Life REIT did not hold any treasury units as at 1 March 2019.

A N N U A L R E P O R T 2 0 1 8 177
NOTICE IS HEREBY GIVEN that the Annual General Meeting of the holders of units of Parkway Life Real Estate Investment Trust (“Parkway Life REIT”, and the holders of units of Parkway Life REIT, “Unitholders”) will be held at Gleneagles Hospital, Lecture Theatre, Level 3, 6A Napier Road, Singapore 258500 on Friday, 26 April 2019 at 9.00 a.m., to transact the following business:
AS ORDINARY BUSINESS
1. To receive and adopt the Report of HSBC Institutional Trust Services (Singapore) Limited, as trustee of Parkway Life REIT (the “Trustee”), the Statement by Parkway Trust Management Limited, as manager of Parkway Life REIT (the “Manager”) and the Audited Financial Statements of Parkway Life REIT for the financial year ended 31 December 2018 together with the Auditors’ Report thereon. (Ordinary Resolution 1)
2. To re-appoint KPMG LLP as the Independent Auditor of Parkway Life REIT and to hold office until the conclusion of the next Annual General Meeting of Parkway Life REIT and to authorise the Manager to fix their remuneration. (Ordinary Resolution 2)
3. To endorse the appointments of the following directors of the Manager (the “Directors”), pursuant to the undertaking dated 16 March 2017 provided by Parkway Holdings Limited to the Trustee:
(a) Mr. Ho Kian Guan (Ordinary Resolution 3); and
(b) Mr. Low Soon Teck (Ordinary Resolution 4).
(Please see Explanatory Notes).
AS SPECIAL BUSINESS
4. That:
(a) approval be and is hereby given to amend the trust deed constituting Parkway Life REIT (as amended and restated) (the “Trust Deed”) to include provisions regarding electronic communications of notices and documents to Unitholders in the manner set out in Annex A of the appendix to the Notice of Annual General Meeting (the “Appendix”) dated 29 March 2019 (the “Proposed Electronic Communications Trust Deed Supplement”); and
(b) the Manager and the Trustee be and are hereby severally authorised to complete and do all such acts and things (including executing all such documents as may be required) as the Manager or, as the case may be, the Trustee, may consider expedient or necessary or in the interests of Parkway Life REIT to give effect to the Proposed Electronic Communications Trust Deed Supplement.
(Extraordinary Resolution 5) (Please see Explanatory Notes).
BY ORDER OF THE BOARDPARKWAY TRUST MANAGEMENT LIMITED(Company Registration no. 200706697Z)As manager of Parkway Life Real Estate Investment Trust
Chan Wan MeiCompany Secretary
Singapore29 March 2019
NOTICE OFANNUAL GENERAL MEETING
P A R K W A Y L I F E R E I T178
NOTES:
1. A Unitholder who is not a Relevant Intermediary entitled to attend and vote at the Annual General Meeting of the Unitholders of Parkway Life REIT (the “Meeting”) is entitled to appoint not more than two proxies to attend and vote in his stead. A proxy need not be a Unitholder. Where a Unitholder appoints more than one proxy, the appointments shall be invalid unless the Unitholder specifies the proportion of the Unitholder’s unitholdings (expressed as a percentage of the whole) to be represented by each proxy.
2. A Unitholder who is a Relevant Intermediary entitled to attend and vote at the Meeting is entitled to appoint more than one proxy to attend and vote instead of the Unitholder, but each proxy must be appointed to exercise the rights attached to a different Unit or Units held by such Unitholder. Where such Unitholder appoints more than one proxy, the appointments shall be invalid unless the Unitholder specifies the number of Units in relation to which each proxy has been appointed.
“Relevant Intermediary” means:
(a) a banking corporation licensed under the Banking Act, Chapter 19 of Singapore or a wholly-owned subsidiary of such a banking corporation, whose business includes the provision of nominee services and who holds Units in that capacity;
(b) a person holding a capital markets services licence to provide custodial services for securities under the Securities and Futures Act, Chapter 289 of Singapore and who holds Units in that capacity; or
(c) the Central Provident Fund Board (“CPF Board”) established by the Central Provident Fund Act, Chapter 36 of Singapore, in respect of Units purchased under the subsidiary legislation made under that Act providing for the making of investments from the contributions and interest standing to the credit of members of the Central Provident Fund, if the CPF Board holds those Units in the capacity of an intermediary pursuant to or in accordance with that subsidiary legislation.
3. The instrument appointing a proxy or proxies (the “Proxy Form”) must be deposited at the registered office of the Manager at 80 Robinson Road #02-00 Singapore 068898, not later than 9.00 a.m. on 23 April 2019, being 72 hours before the time fixed for the Meeting.
Personal Data Privacy
4. By submitting an instrument appointing a proxy(ies) and/or representative(s) to attend, speak and vote at the Meeting and/or any adjournment thereof, a Unitholder (i) consents to the collection, use and disclosure of the Unitholder’s personal data by the Manager and the Trustee (or their agents) for the purpose of the processing and administration by the Manager and the Trustee (or their agents) of proxies and representatives appointed for the Meeting (including any adjournment thereof) and the preparation and compilation of the attendance lists, minutes and other documents relating to the Meeting (including any adjournment thereof), and in order for the Manager and the Trustee (or their agents) to comply with any applicable laws, listing rules, regulations and/or guidelines (collectively, the “Purposes”), (ii) warrants that where the Unitholder discloses the personal data of the Unitholder’s proxy(ies) and/or representative(s) to the Manager and the Trustee (or their agents), the Unitholder has obtained the prior consent of such proxy(ies) and/or representative(s) for the collection, use and disclosure by the Manager and the Trustee (or their agents) of the personal data of such proxy(ies) and/or representative(s) for the Purposes, and (iii) agrees that the Unitholder will indemnify the Manager and the Trustee in respect of any penalties, liabilities, claims, demands, losses and damages as a result of the Unitholder’s breach of warranty.
NOTICE OFANNUAL GENERAL MEETING

A N N U A L R E P O R T 2 0 1 8 179
EXPLANATORY NOTES
Ordinary Resolutions 3 and 4
(1) Parkway Holdings Limited has on 16 March 2017 provided an undertaking (the “Undertaking”) to the Trustee that:
• for so long as the board of directors of the Manager (the “Board”) does not comprise at least half independent Directors, it will procure the Manager to include in the agenda for each annual general meeting of Parkway Life REIT (commencing from the annual general meeting held in 2017), the resolutions to endorse the appointment of at least one-third of the Directors for the time being (or, if their number is not three or a multiple of three, then the number nearest one-third);
• for so long as the Board does not comprise at least half independent Directors, it will:
– procure the Manager to seek Unitholder’s re-endorsement for the appointment of each Director no later than every third annual general meeting of Parkway Life REIT after the relevant general meeting at which such Director’s appointment was last endorsed or re-endorsed, as the case may be;
– (where a person is appointed as Director, either to fill a vacancy or as an addition to the existing Directors, at any time) procure the Manager to seek Unitholders’ endorsement for his/her appointment as a Director at the next annual general meeting of Parkway Life REIT immediately following his/her appointment;
– procure any person whose appointment as a Director has not been endorsed or re-endorsed (as the case may be) by the Unitholders at the relevant general meeting of Parkway Life REIT where the endorsement or re-endorsement (as the case may be) for his/her appointment was sought, to resign or otherwise be removed from the Board either (i) within 21 days from the date of the relevant general meeting or (ii) in the event that the Board determines that a replacement Director has to be appointed, no later than the date when such replacement Director is appointed, and the regulatory approval for such appointment (if any) has been obtained,
the performance of which shall in each case be subject to and in accordance with applicable laws and regulations.
(2) The endorsement or re-endorsement from Unitholders of any appointment of any person as a Director shall be by way of an ordinary resolution passed at the relevant general meeting.
(3) Subject to paragraph (1) above, the Undertaking shall not restrict Parkway Holdings Limited or the Manager from appointing any Director from time to time in accordance with the applicable laws and regulations (including any applicable rule of Singapore Exchange Securities Trading Limited) and the Constitution of the Manager.
NOTICE OFANNUAL GENERAL MEETING

P A R K W A Y L I F E R E I T180
(4) The Undertaking shall remain in force for so long as:
• Parkway Holdings Limited remains as the holding company (as defined in the Companies Act, Chapter 50 of Singapore) of the Manager; and
• Parkway Trust Management Limited remains as the manager of Parkway Life REIT.
(5) Detailed information on the Directors (including their current directorships in other listed companies and details of other principal commitments) can be found in “Board of Directors” section of Parkway Life REIT’s Annual Report 2018.
(6) Upon endorsement, each of Mr. Ho Kian Guan and Mr. Low Soon Teck will continue to serve as a Director on the Board. Mr. Ho Kian Guan will continue to serve as an Independent Director. Mr. Low Soon Teck will continue to serve as a Non-Executive Director.
Extraordinary Resolution 5
In connection with the amendments to the Companies Act, Chapter 50 of Singapore (the “Companies Act”), companies are allowed to send notices and documents electronically to their shareholders with the express, deemed or implied consent (the “Deemed Consent Regime” and the “Implied Consent Regime”, respectively) of the shareholders if the constitution of the company provides for it and the specified modes of electronic communications are set out in the constitution of the company (the “Companies Act Electronic Communications Amendments”). The SGX-ST has recently amended the listing rules of the SGX-ST (the “Listing Rules”) to align the Listing Rules with the Companies Act Electronic Communications Amendments, with issuers allowed to transmit certain types of notices and documents to shareholders (or Unitholders, in the case of a listed real estate investment trust (“REIT”) such as Parkway Life REIT) electronically with the express, deemed or implied consent of shareholders.
Although Parkway Life REIT is not bound by the Companies Act, it is nonetheless bound by the Listing Rules as a listed REIT. Accordingly, the Manager proposes to amend the Trust Deed to adopt certain provisions of the Listing Rules to implement the Implied Consent Regime and the Deemed Consent Regime and allow for such electronic transmission of notices and documents in relation to Parkway Life REIT.
(See the Appendix in relation to the Proposed Electronic Communications Trust Deed Supplement for further details.)
NOTICE OFANNUAL GENERAL MEETING
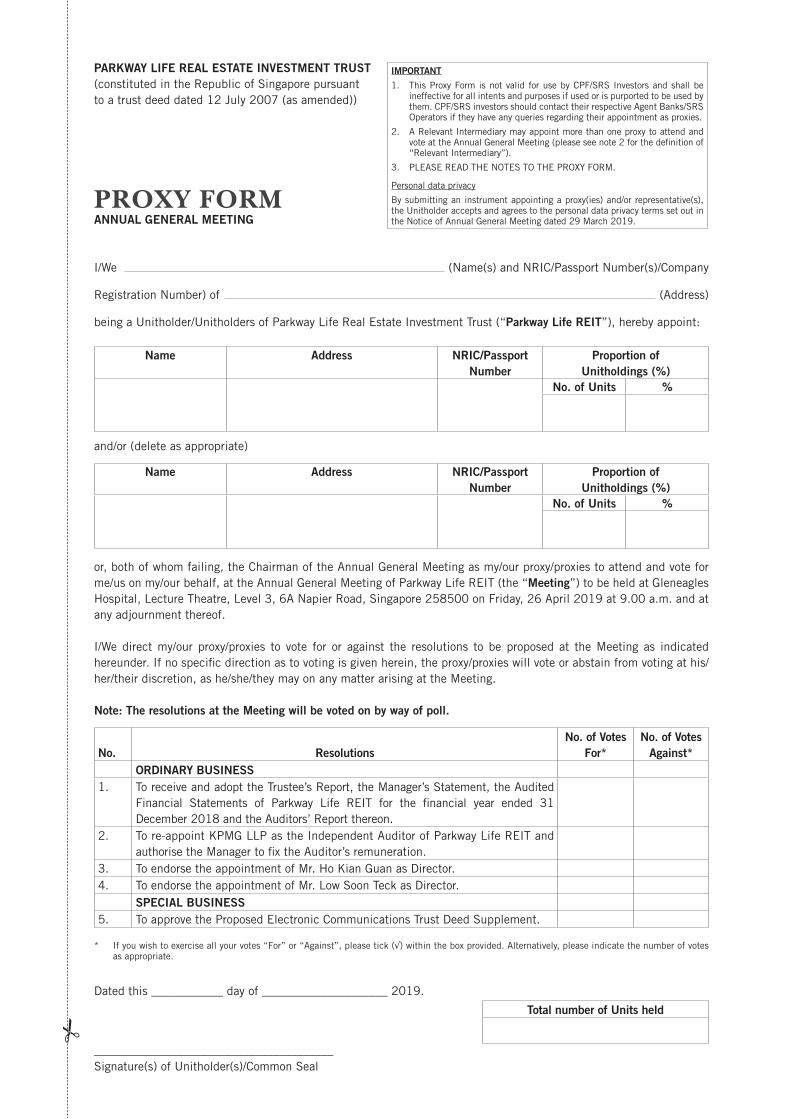
PARKWAY LIFE REAL ESTATE INVESTMENT TRUST(constituted in the Republic of Singapore pursuant to a trust deed dated 12 July 2007 (as amended))
PROXY FORMANNUAL GENERAL MEETING
I/We (Name(s) and NRIC/Passport Number(s)/Company
Registration Number) of (Address)
being a Unitholder/Unitholders of Parkway Life Real Estate Investment Trust (“Parkway Life REIT”), hereby appoint:
Name Address NRIC/Passport Number
Proportion ofUnitholdings (%)
No. of Units %
and/or (delete as appropriate)
Name Address NRIC/Passport Number
Proportion ofUnitholdings (%)
No. of Units %
or, both of whom failing, the Chairman of the Annual General Meeting as my/our proxy/proxies to attend and vote for me/us on my/our behalf, at the Annual General Meeting of Parkway Life REIT (the “Meeting”) to be held at Gleneagles Hospital, Lecture Theatre, Level 3, 6A Napier Road, Singapore 258500 on Friday, 26 April 2019 at 9.00 a.m. and at any adjournment thereof.
I/We direct my/our proxy/proxies to vote for or against the resolutions to be proposed at the Meeting as indicated hereunder. If no specific direction as to voting is given herein, the proxy/proxies will vote or abstain from voting at his/her/their discretion, as he/she/they may on any matter arising at the Meeting.
Note: The resolutions at the Meeting will be voted on by way of poll.
No. Resolutions No. of Votes
For*No. of Votes
Against*ORDINARY BUSINESS
1. To receive and adopt the Trustee’s Report, the Manager’s Statement, the Audited Financial Statements of Parkway Life REIT for the financial year ended 31 December 2018 and the Auditors’ Report thereon.
2. To re-appoint KPMG LLP as the Independent Auditor of Parkway Life REIT and authorise the Manager to fix the Auditor’s remuneration.
3. To endorse the appointment of Mr. Ho Kian Guan as Director.4. To endorse the appointment of Mr. Low Soon Teck as Director.
SPECIAL BUSINESS5. To approve the Proposed Electronic Communications Trust Deed Supplement.
* If you wish to exercise all your votes “For” or “Against”, please tick (√) within the box provided. Alternatively, please indicate the number of votes as appropriate.
Dated this ____________ day of _____________________ 2019.
Total number of Units held
________________________________________Signature(s) of Unitholder(s)/Common Seal
IMPORTANT
1. This Proxy Form is not valid for use by CPF/SRS Investors and shall be ineffective for all intents and purposes if used or is purported to be used by them. CPF/SRS investors should contact their respective Agent Banks/SRS Operators if they have any queries regarding their appointment as proxies.
2. A Relevant Intermediary may appoint more than one proxy to attend and vote at the Annual General Meeting (please see note 2 for the definition of “Relevant Intermediary”).
3. PLEASE READ THE NOTES TO THE PROXY FORM.
Personal data privacy
By submitting an instrument appointing a proxy(ies) and/or representative(s), the Unitholder accepts and agrees to the personal data privacy terms set out in the Notice of Annual General Meeting dated 29 March 2019.
IMPORTANT: PLEASE READ THE NOTES TO PROXY FORM BELOW
Notes to Proxy Form: 1. A Unitholder of Parkway Life REIT (“Unitholder”) who is not a Relevant Intermediary entitled to attend and
vote at the Meeting is entitled to appoint one or two proxies to attend and vote in his stead. Where a Unitholder appoints more than one proxy, the appointments shall be invalid unless the Unitholder specifies the proportion of the Unitholder’s unitholdings (expressed as a percentage of the whole) to be represented by each proxy.
2. A Unitholder who is a Relevant Intermediary entitled to attend and vote at the meeting is entitled to appoint more than one proxy to attend and vote instead of the Unitholder, but each proxy must be appointed to exercise the rights attached to a different Unit or Units held by such Unitholder. Where such Unitholder appoints more than one proxy, the appointments shall be invalid unless the Unitholder specifies the number of Units in relation to which each proxy has been appointed.
“Relevant Intermediary” means:
(a) a banking corporation licensed under the Banking Act, Chapter 19 of Singapore or a wholly-owned subsidiary of such a banking corporation, whose business includes the provision of nominee services and who holds Units in that capacity;
(b) a person holding a capital markets services licence to provide custodial services for securities under the Securities and Futures Act, Chapter 289 of Singapore and who holds Units in that capacity; or
(c) the Central Provident Fund Board (“CPF Board”) established by the Central Provident Fund Act, Chapter 36 of Singapore, in respect of Units purchased under the subsidiary legislation made under that Act providing for the making of investments from the contributions and interest standing to the credit of members of the Central Provident Fund, if the CPF Board holds those Units in the capacity of an intermediary pursuant to or in accordance with that subsidiary legislation.
3. A proxy need not be a Unitholder. The instrument appointing a proxy and power of attorney or other authority (if any) under which it is signed or a notarially certified copy of such power or authority must be deposited with the company secretary of Parkway Trust Management Limited (the “Manager”) at its registered office at 80 Robinson Road #02-00 Singapore 068898, not later than 9.00 a.m. on 23 April 2019, being 72 hours before the time fixed for the Meeting, and in default of which the instrument of proxy shall not be treated as valid.
4. Completion and return of this instrument appointing a proxy or proxies (“Proxy Form”) shall not preclude a Unitholder from attending and voting at the Meeting. Any appointment of a proxy or proxies shall be deemed to be revoked if a Unitholder attends the Meeting in person, and in such event, the Manager reserves the right to refuse to admit any person or persons appointed under the Proxy Form to the Meeting.
5. A Unitholder should insert the total number of units in Parkway Life REIT (“Units”) held. If the Unitholder has
Units entered against his name in the Depository Register (as defined in Section 81SF of the Securities and Futures Act, Chapter 289 of Singapore) maintained by The Central Depository (Pte) Limited (“CDP”), he should insert that number of Units. If the Unitholder has Units registered in his name in the Register of Unitholders of Parkway Life REIT, he should insert that number of Units. If the Unitholder has Units entered against his name in the said Depository Register and registered in his name in the Register of Unitholders, he should insert the aggregate number of Units. If no number is inserted, this form of proxy will be deemed to relate to all the Units held by the Unitholder.
6. The Proxy Form must be under the hand of the appointor or of his attorney duly authorised in writing. Where the Proxy Form is executed by a corporation, it must be executed either under its common seal or under the hand of its attorney or a duly authorised officer.
7. Where the Proxy Form is signed on behalf of the appointor by an attorney, the power of attorney or a duly certified copy thereof must (failing previous registration with the Manager) be lodged with the Proxy Form, failing which the Proxy Form may be treated as invalid.
8. The Manager shall be entitled to reject a Proxy Form which is incomplete, improperly completed or illegible or where the true intentions of the appointor are not ascertainable from the instructions of the appointor specified on and/or attached to the Proxy Form.
9. In addition, in the case of Units entered in the Depository Register, the Manager may reject a Proxy Form if the Unitholder, being the appointor, is not shown to have Units entered against his name in the Depository Register as at 72 hours before the time appointed for holding the Meeting, as certified by CDP to the Manager.
10. Resolutions at the Meeting will be voted on by way of poll. All Unitholders will be bound by the outcome of the Meeting regardless of whether they have attended or voted at the Meeting.
11. On a poll, every Unitholder who is present in person or by proxy shall have one vote for every Unit of which he is the Unitholder. A person entitled to more than one vote need not use all his votes or cast them the same way.

This page has been intentionally left blank.

This page has been intentionally left blank.

THE MANAGERParkway Trust Management LimitedCompany registration number: 200706697Z
REGISTERED ADDRESS80 Robinson Road #02-00 Singapore 068898Phone: (65) 6236 3333Fax: (65) 6236 4399
COMPANY SECRETARIESMs. Chan Wan Mei, ACISMs. Chan Lai Yin, ACIS
BOARD OF DIRECTORSMr. Ho Kian GuanIndependent Director, Chairman of the Board of Directors and Member of the Audit Committee
Dr. Jennifer Lee Gek ChooIndependent Director, Chairman of the Nominating and Remuneration Committee and Member of the Audit Committee
Ms. Cheah Sui LingIndependent Director, Chairman of the Audit Committee and Member of the Nominating and Remuneration Committee
Dr. Tan See LengNon-Executive Director, Member of the Nominating and Remuneration Committee
Dr. Lim Suet WunNon-Executive Director
Ms. Rossana Annizah Binti Ahmad RashidNon-Executive Director
Mr. Low Soon TeckNon-Executive Director
Mr. Yong Yean ChauChief Executive Officer and Executive Director
AUDIT COMMITTEEMs. Cheah Sui LingChairman
Mr. Ho Kian GuanMember
Dr. Jennifer Lee Gek ChooMember
NOMINATING AND REMUNERATION COMMITTEEDr. Jennifer Lee Gek ChooChairman
Ms. Cheah Sui LingMember
Dr. Tan See LengMember
TRUSTEE’S REGISTERED ADDRESSHSBC Institutional Trust Services (Singapore) Limited 21 Collyer QuayHSBC Building, #13-02Singapore 049320
TRUSTEE’S CORRESPONDENCE ADDRESSHSBC Institutional Trust Services (Singapore) Limited 21 Collyer QuayHSBC Building, #03-01Singapore 049320Phone: (65) 6658 6667
AUDITORSKPMG LLPPublic Accountants and Chartered Accountants16 Raffles Quay#22-00 Hong Leong BuildingSingapore 048581Phone: (65) 6213 3388Fax: (65) 6225 0984
Partner-in-charge:Yap Wee Kee(Appointed since financial year ended 31 December 2018)
UNIT REGISTRARBoardroom Corporate & AdvisoryServices Pte. Ltd.50 Raffles Place#32-01 Singapore Land TowerSingapore 048623Phone: (65) 6536 5355Fax: (65) 6536 1360
SGX CODEParkwayLife REIT
CORPORATEINFORMATION
PARKWAY TRUST MANAGEMENT LIMITED
101 Thomson Road#28-03 United Square
Singapore 307591Tel: (65) 6507 0650Fax: (65) 6507 0651
www.plifereit.com


