Embed Size (px)
Citation preview
THE MALAYSIAN REIT DEVELOPMENT ANDTHEIR ROLE IN A PORTFOLIO
By
ATASYA OSMADI
A thesis submitted in fulfilment of the requirements for the Degree ofDoctor of Philosophy at the University of Western Sydney
March 2010

ii
UNIVERSITY OF WESTERN SYDNEY
This thesis has been produced by a student of this University to satisfy learning
requirements of a postgraduate course.
While University staff may have offered supervision and advice to the author, the
University is unable to accept responsibility for any advice, recommendations,
suggestions or conclusions contained in this piece of work.
The University gratefully acknowledges the co-operation given to the student author
since studies such as these permit students to examine real world issues in a context
which provides an opportunity for meaningful research to be conducted and reported.

iii
DECLARATION
This thesis has been prepared by me to meet the requirements of a Doctor of
Philosophy degree at the University of Western Sydney.
I declare that this thesis represents my own work, except where due acknowledgement
is made, and that it has not been previously included in a thesis, dissertation or report
submitted to this University or to any other institution for a degree, diploma or other
qualification.
All possible care has been taken in the preparation of the information in this thesis;
however, I expressly disclaim any liability for the accuracy and sufficiency of the
information and under no circumstances shall either be liable in negligence or
otherwise in and arising out of the preparation or supply of the information in this
thesis.
Signed
Atasya Osmadi

iv
ACKNOWLEDGMENTS
This thesis was made possible with the assistance of the following people. Professor
Graeme Newell, my principal supervisor, has been very supportive and constructive
throughout my candidature. I would like to take this opportunity to express my
utmost gratitude for his guidance, encouragement and continuous support throughout
my research. Numerous property scholars and practitioners have also provided
constructive input to this thesis and I sincerely thank them. I would also like to
express my gratitude to my sponsors from the Public Service Department of Malaysia,
Ministry of Higher Education (Malaysia) and University Sains Malaysia for giving
me the privilege to do my PhD with Professor Graeme Newell in University of
Western Sydney.
I also gratefully acknowledge anonymous professionals and respondents to my
surveys who have been of assistance and supplied me with information important to
this thesis which have helped me to accomplish my PhD. Last, but not least, I
sincerely thank my family and friends especially my parents for their continuous
support throughout this period.
v
Table of Contents
Declaration iii
Acknowledgments iv
Table of Contents v
List of Tables x
List of Figures xvi
List of Abbreviations xvii
Executive Summary xix
Chapter 1: Introduction
1.1 Overall Context 1
1.1.1 Significance of Direct Property 8
1.1.2 Significance of Indirect Property 9
1.2 General Significance of the Malaysian Economy and Commercial Property
Markets 11
1.2.1 Significance of REITs in Malaysia 15
1.3 Objectives of the Study 17
1.4 Literature Review 19
1.4.1 Property in a Portfolio 19
1.4.2 REITs 22
1.4.2.1 REITs in US 22
1.4.2.2 A-REITs in Australia 23
1.4.3 REITs in Asia 24
1.4.4 M-REITs in Malaysia 25
1.5 Organisation of the Thesis 33
Chapter 2: Global Real Estate Investment Trusts and
Property Trust Vehicles
2.1 Global Status of REITs and Property Trust Vehicles 36
2.2 Malaysia REITs 52
vi
2.3 Global Property Securities Funds 55
2.3.1 Significance of Asia REITs 57
Chapter 3: Significance of Malaysian Commercial Property Markets
3.1 Significance of Malaysia: Social, Economic Activity and Demographics 58
3.2 Commercial Property Market Universe 60
3.2.1 Global Property Investor Interest 64
3.3 Malaysian Commercial Property: Asia Context 67
3.4 Property Ownership Structures 70
3.4.1 Property Companies 70
3.4.2 REITs 70
3.4.3 PTFs 72
3.4.4 REITs 74
3.4.5 Comparison Between PTFs and REITs 75
3.4.6 Comparison Between Conventional REITs and Islamic REITs 76
3.4.6.1 Characteristics of Islamic Finance 76
3.4.6.2 Characteristics of Islamic REITs 84
3.5 Market Size – Liquidity Issues 88
3.6 Future Opportunities 89
Chapter 4: Methodology
4.1 M-REIT Index Development 90
4.2 M-REIT Performance Analysis and Other Asset Classes 95
4.3 M-REIT Surveys 98
Chapter 5: Malaysian REIT Performance Analysis
5.1 Introduction 100
5.2 Property Trust Fund Analysis (1989-2005) 102
5.2.1: Risk-adjusted Returns: PTF 105
5.2.2 Portfolio diversification benefits: PTFs 106
5.3 Overall M-REIT Analysis (2005-2008) 107
5.3.1 Risk-adjusted Returns: M-REITs 111
5.3.2 Portfolio Diversification Benefits: M-REITs 112
vii
5.4 Conventional M-REIT Analysis (2005-2008) 113
5.4.1 Risk-adjusted Returns: M-REITs 114
5.4.2 Portfolio Diversification Benefits: Conventional M-REITs 115
5.5 Islamic M-REIT Analysis (2006-2008) 116
5.5.1 Risk-adjusted Returns: Islamic M-REITs 117
5.5.2 Portfolio Diversification Benefits: Islamic REITs 118
5.6 Significance of the Global Financial Crisis Via Sub-period
Performance Analysis for M-REITs 118
5.6.1 Risk-adjusted Returns 119
5.6.2 Portfolio Diversification Benefits 121
5.7 Significance of Global Financial Crisis Via Sub-period
Performance Analysis for Islamic M-REITs 122
5.7.1 Risk-adjusted Returns 122
5.7.2 Portfolio Diversification Benefits 125
5.8 Mixed-asset Portfolios for M-REITs 127
5.8.1 Mixed-asset Portfolios for Overall M-REITs 128
5.8.2 Mixed-asset Portfolios for Islamic M-REITs 132
5.8.3 Importance of Global Financial Crisis on Overall M-REITs and
Islamic M-REITs 138
5.8.3.1 Overall M-REITs 138
5.8.3.2 Islamic M-REITs 147
5.9 Efficient Frontier and Diagrams 158
5.9.1 Impact of Global Financial Crisis 160
5.10 M-REITs Panel Regression 165
5.11 Conclusion 168
Chapter 6: M-REIT Surveys
6.1 Introduction 180
6.2 Importance of Factors Regarding the Current Performance of M-REITs 181
6.2.1 Overall 181
6.2.2 REIT Managers 184
6.2.3 Property Advisors 187
6.2.4 Fund Managers 189
viii
6.2.5 Comparison of the Groups of Participants 191
6.2.6 Factor Analysis Regarding Current Performance Factors 195
6.3 Importance of Factors Regarding the Ongoing Success of M-REITs 196
6.3.1 Overall 196
6.3.2 REIT Managers 200
6.3.3 Property Advisors 202
6.3.4 Fund Managers 204
6.3.5 Comparison of the Three Groups of Participants 206
6.3.6 Factor Analysis Regarding Ongoing Success Factors for M-REITs 209
6.4 Comments From Respondents 210
6.4.1 M-REIT Fund Managers 211
6.4.2 Property Advisors 213
6.4.3 Fund Managers 214
6.5 Conclusion 216
Chapter 7: Summary
7.1 Summary of Contributions of the Research 217
7.2 Summary of Limitations 217
7.3 Suggestions 218
7.4 Summary of Future Research 220
References 224
Appendices 237
Appendix I The Survey Questionnaire for REIT Managers 238
Appendix II The Survey Questionnaire for Property Managers 239
Appendix III The Survey Questionnaire for Fund Managers 240
Appendix IV Global REITs 241
Appendix V M-REIT Case Studies 242
Appendix VI Paper Published for Journal of Property Research 243
Appendix VII Paper Published for PRPRJ 244
ix
List of Tables
Table 1.1: Countries with Existing and Considering REIT-like Structures 3
Table 1.2: Global REIT Comparison 5
Table 1.3: List of Advantages and Disadvantages of Direct Property 8
Table 1.4: Advantages and Disadvantages of Indirect Property 10
Table 1.5: Private/Unlisted Property 10
Table 1.6: Listed Securities in a REIT Structure 11
Table 1.7: Economic and Financial Profile of Malaysia: 2008 12
Table 1.8: Global Competitiveness of Malaysia 13
Table 1.9: Commercial Property Transactions in Asia: 2008 14
Table 1.10: Breakdown of Malaysia’s Commercial Property Sales by Market:
2008
14
Table 1.11: Asia Office Market Performance: 2008 16
Table 1.12: Asia Retail Market Performance: 2008 16
Table 1.13: Asia Industrial Market Performance: 2008 16
Table 2.1: Growth of REITs 37
Table 2.2 Global Real Estate Universe: 2009 38
Table 2.3: Property Performance as at December 2008 40
Table 2.3: Property Performance as at December 2008 (cont.) 41
Table 2.4: Significance of Listed Property Securities Markets in Asia:Dec.2008 43
Table 2.5: Global REIT Market: December 2008 45
Table 2.6: Top 50 Largest REITs Globally: December 2008 47
Table 2.6: Top 50 Largest REITs Globally: December 2008 (cont.) 48
Table 2.7: Global REIT Market Performance to December 2008 50
Table 2.8: Property Profile of Malaysian REITs*: December 2008 54
Table 2.9: Global Properties Securities Funds in 2007 56
Table 3.1: Social, Economic and Financial Profile of Malaysia: 2008 59
Table 3.2: Economic Growth Forecasts for Asia markets: 2009-2010 60
x
Table 3.3: Composition of RCA Commercial Property Transaction Database:
2007-2008 61
Table 3.4: Transparency of Property Markets: 2008 63
Table 3.5: Global Competitiveness Among Countries: 2008 63
Table 3.6: Corruption Perception of Countries: 2008 64
Table 3.7: Regulation for Asian REITs in the Region 66
Table 3.8: Commercial Property Transactions in Asia: 2007 68
Table 3.9: Property Profile of Malaysia: 2008 69
Table 3.10: Characteristics of Malaysian REITs 71
Table 3.11: List of Malaysian REITs by December 2008 74
Table 3.12: Comparison Between PTFs and REITs 75
Table 3.13: Major Islamic Financial Institutions 77
Table 3.14: Islamic Finance and Islamic Property Investment Institutions/Funds 78
Table 3.15: Major Islamic Property Funds 79
Table 3.16: Comparison Between Islamic and Conventional Financial Systems 80
Table 3.17: Financial Needs with Islamic Contracts Applied 82
Table 3.18: Comparison Between Islamic and Conventional REITs 87
Table 4.1: Investment Performance Index Applications 91
Table 4.2: Components of PTF and Various M-REIT Indices 92
Table 5.1: PTFs Performance Since IPO (as of 29 July 2005) 103
Table 5.2: Property Trust Fund (PTF) Performance: Dec. 1989 – July 2005 106
Table 5.3: Property Trust Fund (PTF) Correlation: Dec. 1989 – July 2005 107
Table 5.4: M-REIT Performance Since IPO (as of 31 December 2008) 108
Table 5.5: M-REITs: Gearing Details (as 31 December 2008) 109
Table 5.6: M-REITs: Latest Dividend Distribution Ratio 110
Table 5.7: Overall M-REIT Risk Adjusted Return Analysis:
8 August 2005 – 29 December 2008 112
Table 5.8: Overall M-REIT Correlation Analysis:
8 August 2005 – 29 December 2008 113
Table 5.9: Conventional M-REIT Risk-Adjusted Return Analysis:
8 August 2005 – 29 December 2008 115
xi
Table 5.10: Conventional M-REIT Correlation Analysis:
8 August 2005 – 29 December 2008 116
Table 5.11: Islamic M-REIT Risk-Adjusted Return Analysis:
21 August 2006 – 29 December 2008 117
Table 5.12: Islamic M-REIT Correlation Analysis:
21 August 2006 – 29 December 2008 118
Table 5.13: Overall M-REIT Pre-Global Financial Crisis Analysis:
8 August 2005 – 27 August 2007 119
Table 5.14: Overall M-REIT Post-Global Financial Crisis Analysis:
3 September 2007 – 29 December 2008 120
Table 5.15: Overall M-REIT Pre-Global Financial Crisis Analysis:
8 August 2005 – 27 August 2007 121
Table 5.16: Overall M-REIT Post-Global Financial Crisis Analysis:
3 September 2007 – 29 December 2008 122
Table 5.17: Islamic M-REIT Pre-Global Financial Crisis Analysis:
21 August 2006 – 27 August 2007 123
Table 5.18: Islamic M-REIT Post-Global Financial Crisis Analysis:
3 September 2007 – 29 December 2008 124
Table 5.19: Islamic M-REIT Pre-Global Financial Crisis Analysis:
21 August 2006 – 27 August 2007 126
Table 5.20: Islamic M-REIT Post-Global Financial Crisis Analysis: 3 September
2007 – 29 December 2008 127
Table 5.21: Scenario 1: Overall M-REIT vs KLCI Performance:
8 August 2005 – 29 December 2008 129
Table 5.22: Scenario 2: Overall M-REIT vs KLSE Property Sector Performance:
8 August 2005 – 29 December 2008 130
Table 5.23: Scenario 3: Overall M-REIT vs KLSE Plantation Sector
Performance: 8 August 2005 – 29 December 2008 131
Table 5.24: Scenario 4: Overall M-REIT vs KLSE Finance Sector Performance:
8 August 2005 – 29 December 2008 132
Table 5.25: Scenario 5: Islamic M-REIT vs. Conventional M-REIT
Performance: 21 August 2006 – 29 December 2008 133
xii
Table 5.26: Scenario 6: Islamic M-REIT vs KLCI Performance:
21 August 2006 – 29 December 2008 134
Table 5.27: Scenario 7: Islamic M-REIT vs KLSE Property Sector Performance:
21 August 2006 – 29 December 2008 135
Table 5.28: Scenario 8: Islamic M-REIT vs KLSE Plantation Sector
Performance: 21 August 2006 – 29 December 2008 136
Table 5.29: Scenario 9: Islamic M-REIT vs KLSE Finance Sector Performance:
21 August 2006 – 29 December 2008 137
Table 5.30: Scenario 10: Overall M-REIT vs KLCI Pre-Global Financial Crisis
Performance: 8 August 2005 – 27 August 2007 139
Table 5.31: Scenario 11: Overall M-REIT vs KLSE Property Sector Pre-Global
Financial Crisis Performance: 8 August 2005 – 27 August 2007 140
Table 5.32: Scenario 12: Overall M-REIT vs KLSE Plantation Sector Pre-
Global Financial Crisis Performance: 8 August 2005 –
27 August 2007 141
Table 5.33: Scenario 13: Overall M-REIT vs KLSE Finance Sector Pre-Global
Financial Crisis Performance: 8 August 2005 – 27 August 2007 142
Table 5.34: Scenario 14: Overall M-REIT vs KLCI Post-Global
Financial Crisis Performance: 3 September 2007 – 29 Dec. 2008 143
Table 5.35: Scenario 15: Overall M-REIT vs KLSE Property Post-Global
Financial Crisis Performance: 3 September 2007 – 29 Dec. 2008 144
Table 5.36: Scenario 16: Overall M-REIT vs KLSE Plantation Post-Global
Financial Crisis Performance: 3 September 2007 – 29 Dec. 2008 145
Table 5.37: Scenario 17: Overall M-REIT vs KLSE Finance Post-Global
Financial Crisis Performance: 3 September 2007 – 29 Dec. 2008 146
Table 5.38: Scenario 18: Islamic M-REIT vs Conventional M-REIT Pre-Global
Financial Crisis Performance: 21 August 2006 – 27 August 2007 148
Table 5.39: Scenario 19: Islamic M-REIT vs KLCI Pre-Global
Financial Crisis Performance: 21 August 2006 – 27 August 2007 149
Table 5.40: Scenario 20: Islamic M-REIT vs KLSE Property Sector Pre-Global
Financial Crisis Performance: 21 August 2006 – 27 August 2007 150
Table 5.41: Scenario 21: Islamic M-REIT vs KLSE Plantation Sector Pre-Global
Financial Crisis Performance: 21 August 2006 – 27 August 2007 151
xiii
Table 5.42: Scenario 22: Islamic M-REIT vs KLSE Finance Sector Pre-Global
Financial Crisis Performance: 21 August 2006 – 27 August 2007 152
Table 5.43: Scenario 23: Islamic M-REIT vs Conventional M-REIT Post-Global
Financial Crisis Performance: 3 September 2007 – 29 Dec. 2008 153
Table 5.44: Scenario 24: Islamic M-REIT vs KLCI Post-Global
Financial Crisis Performance: 3 September 2007 – 29 Dec. 2008 154
Table 5.45: Scenario 25: Islamic M-REIT vs KLSE Property Post-Global
Financial Crisis Performance: 3 September 2007 – 29 Dec. 2008 155
Table 5.46: Scenario 26: Islamic M-REIT vs KLSE Plantation Post-Global
Financial Crisis Performance: 3 September 2007 – 29 Dec. 2008 156
Table 5.47: Scenario 27: Islamic M-REIT vs KLSE Finance Post-Global
Financial Crisis Performance: 3 September 2007 – 29 Dec. 2008 157
Table 5.48: M-REIT Financial and Management Performance From 2007- 2009 166
Table 5.49: Dependent Variable: Return on Equity (ROE) 170
Table 5.50: Dependent Variable: Gross Margin 171
Table 5.51: Dependent Variable: Nett Asset Backing per Share 172
Table 5.52: Dependent Variable: Free Cashflow to Capital 173
Table 5.53: Dependent Variable: Liquid Asset per Share 174
Table 5.54: Dependent Variable: Asset Turnover 175
Table 5.55: Dependent Variable: Altman’s Z-Score 176
Table 5.56: Dependent Variable: Debt per Equity Ratio 177
Table 5.57: Overall M-REIT and Performance Report Card:
8 August 2005 – 28 December 2008 179
Table 5.58: Islamic M-REIT Performance Report Card:
21 August 2006 – 28 December 2008 179
Table 6.1: Importance of Factors Regarding the Current Performance of
M-REITs 182
Table 6.2: Importance of Factors Regarding the Current Performance of
M- REITs: REIT Managers 186
Table 6.3: Importance of Factors Regarding the Current Performance of
M-REITs: Property Advisors 188
Table 6.4: Importance of Factors Regarding the Current Performance of
M-REITs: Fund Managers 190
xiv
Table 6.5: Rank Correlation Between Groups on Importance of Factors
Regarding the Current Performance of M-REITs 191
Table 6.6: Importance of Factors Regarding the Current Performance of
M-REITs: ANOVA 193
Table 6.7: Importance of Factors Regarding the Ongoing Success of M-REITs 197
Table 6.8: Importance of Factors Regarding the Ongoing success of M-REITs:
REIT Managers 201
Table 6.9: Importance of Factors Regarding the Ongoing Success of M-REITs:
Property Advisors 203
Table 6.10: Importance of Factors Regarding the Ongoing Success of M-REITs:
Fund Managers 205
Table 6.11: Rank Correlation Between Groups on the Importance of Factors
Regarding the Ongoing Success of M-REITs 206
Table 6.12: Importance of Factors Regarding the Ongoing Success of M-REITs:
ANOVA 207
xv
List of Figures
Figure 1.1: Risk-return Spectrum of Commercial Property Investment
Opportunities 6
Figure 1.2: Profile of Commercial Property Investment Opportunities 7
Figure 2.1: Macquarie Eclipse REITs Development 57
Figure 4.1: Property Trust Fund Timeline 93
Figure 4.2: Overall M-REIT Timeline 93
Figure 4.3: Conventional M-REIT Timeline 94
Figure 4.4: Islamic M-REIT Timeline 94
Figure 5.1: Growth in Market Capitalisation of Overall M-REIT Index and
Conventional M-REIT Index Market 101
Figure 5.2: Growth in Market Capitalisation of Islamic M-REIT Index 102
Figure 5.3: Property Trust Fund Index Against the KLCI 104
Figure 5.4: Overall M-REIT Index in Comparison to KLCI 111
Figure 5.5: Conventional M-REIT Index Against KLCI 114
Figure 5.6: Islamic M-REIT Index Against KLCI 116
Figure 5.7: M-REIT Efficient Frontier: August 2006 – December 2008 158
Figure 5.8: M-REIT Asset Allocation Diagram: August 2006 – December 2008 160
Figure 5.9: M-REIT Efficient Frontier: pre-GFC 161
Figure 5.10: M-REIT Asset Allocation Diagram: pre-GFC 162
Figure 5.11: M-REIT Efficient Frontier: GFC 163
Figure 5.12: M-REIT Asset Allocation Diagram: GFC 164
Figure 5.13: Calculation Using EVIEWS 169
xvi
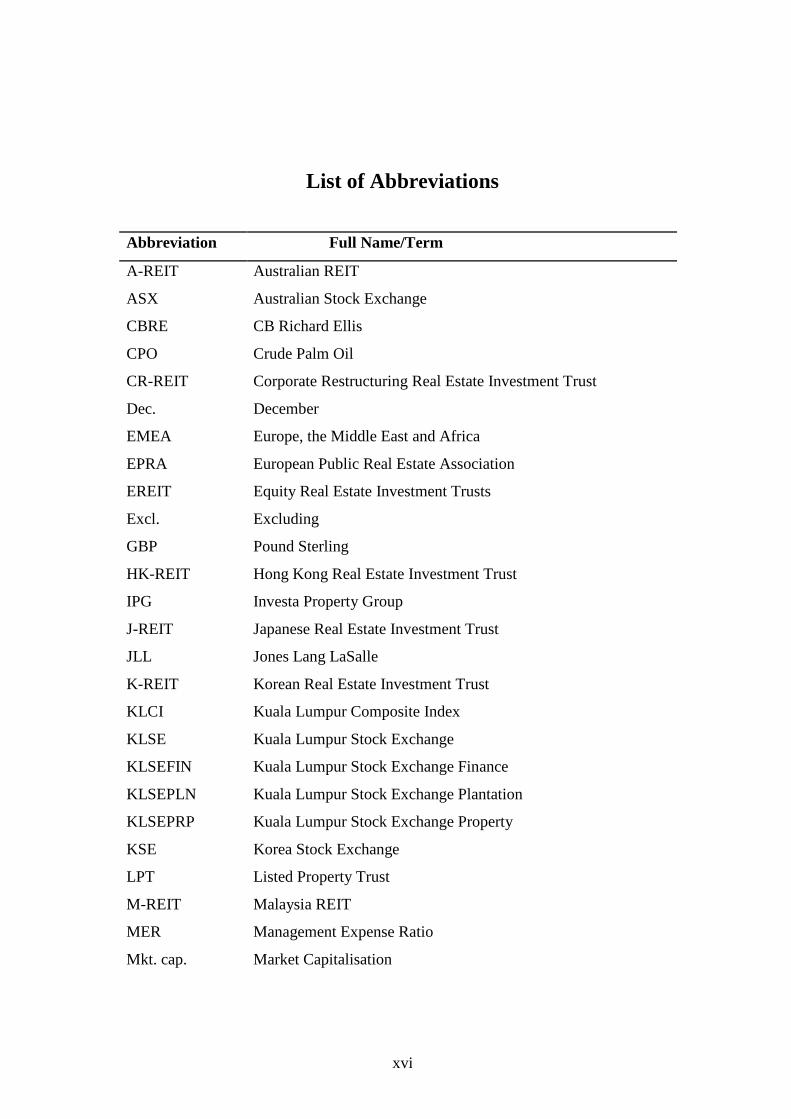
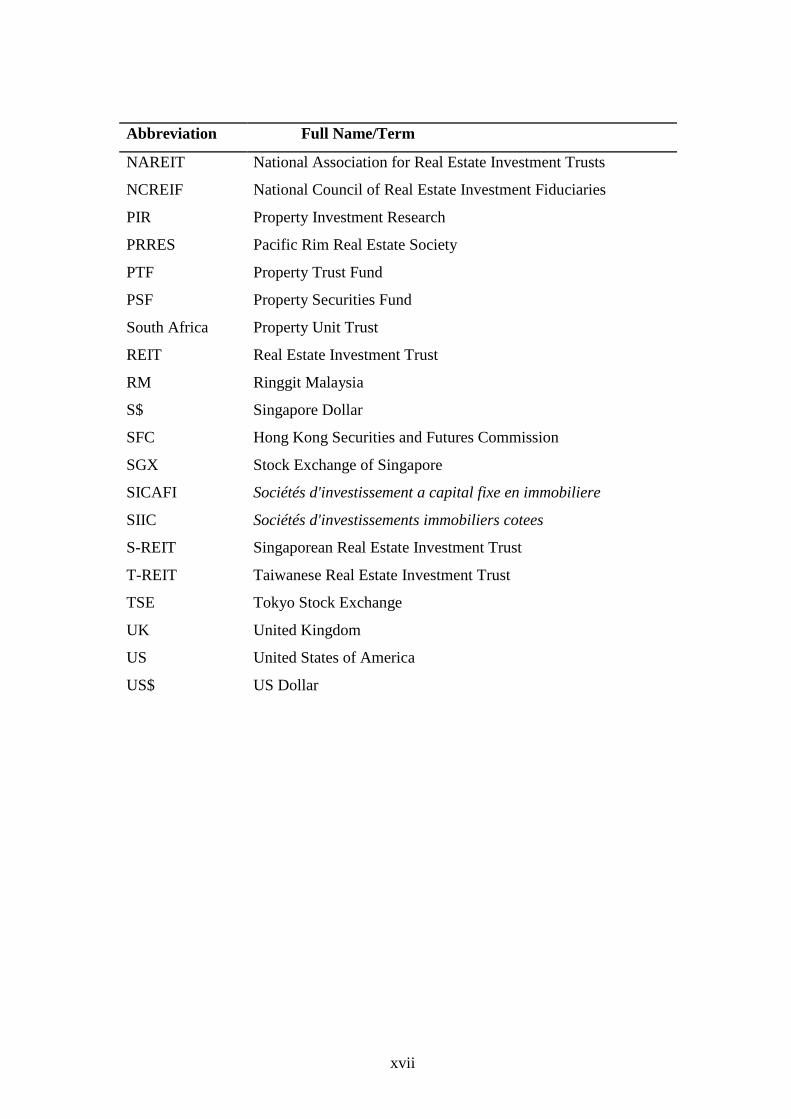
List of Abbreviations
Abbreviation Full Name/Term
A-REIT Australian REIT
ASX Australian Stock Exchange
CBRE CB Richard Ellis
CPO Crude Palm Oil
CR-REIT Corporate Restructuring Real Estate Investment Trust
Dec. December
EMEA Europe, the Middle East and Africa
EPRA European Public Real Estate Association
EREIT Equity Real Estate Investment Trusts
Excl. Excluding
GBP Pound Sterling
HK-REIT Hong Kong Real Estate Investment Trust
IPG Investa Property Group
J-REIT Japanese Real Estate Investment Trust
JLL Jones Lang LaSalle
K-REIT Korean Real Estate Investment Trust
KLCI Kuala Lumpur Composite Index
KLSE Kuala Lumpur Stock Exchange
KLSEFIN Kuala Lumpur Stock Exchange Finance
KLSEPLN Kuala Lumpur Stock Exchange Plantation
KLSEPRP Kuala Lumpur Stock Exchange Property
KSE Korea Stock Exchange
LPT Listed Property Trust
M-REIT Malaysia REIT
MER Management Expense Ratio
Mkt. cap. Market Capitalisation
xvii
Abbreviation Full Name/Term
NAREIT National Association for Real Estate Investment Trusts
NCREIF National Council of Real Estate Investment Fiduciaries
PIR Property Investment Research
PRRES Pacific Rim Real Estate Society
PTF Property Trust Fund
PSF Property Securities Fund
South Africa Property Unit Trust
REIT Real Estate Investment Trust
RM Ringgit Malaysia
S$ Singapore Dollar
SFC Hong Kong Securities and Futures Commission
SGX Stock Exchange of Singapore
SICAFI Sociétés d'investissement a capital fixe en immobiliere
SIIC Sociétés d'investissements immobiliers cotees
S-REIT Singaporean Real Estate Investment Trust
T-REIT Taiwanese Real Estate Investment Trust
TSE Tokyo Stock Exchange
UK United Kingdom
US United States of America
US$ US Dollar
xviii
Executive Summary
This PhD research will examine the development, performance and impact of
Malaysian REITs in the local, Asian and global REIT investment market; particularly
focusing on Islamic REITs in Malaysia. This issue is important as REITs have
emerged as a topic of considerable interest to the academic community, international
investors, policy makers and the public at large; particularly with the recent
significant development of REITs in Asia in recent years.
The objectives for this research are:
1. To compare the structure and regulation of Malaysian REITs with other
countries; both in Asia and internationally and differentiate the structure
between Malaysian conventional M-REITs and Islamic M-REITs
2. To develop an Malaysian REIT performance index and a sub-sector Islamic
M-REIT performance index and identify the impact of the Global Financial
Crisis on Malaysian REIT performance by analysing the risk-adjusted returns
performance for Malaysian REITs and Islamic M-REITs and analysing the
portfolio diversification benefits of Malaysian REITs and Islamic M-REITs in
a mixed-asset portfolio
3. To conduct an investment industry survey to identify the problems, challenges
and the possible solutions relating to a successful Malaysian REIT market
4. To identify Malaysian REIT prospects by determining the strategy for its
further strategic development and investor acceptance.
In terms of portfolio diversification for the whole period of 8 August 2005 till
December 2008, the overall M-REIT and Islamic M-REIT sector delivered strong
portfolio diversification benefit. However, one should be cautious before concluding
that Islamic M-REITs and conventional M-REITs have a smaller role in the mixed-
asset portfolio. Factors such as small sample bias as well as short study period (2½
years) should be taken into consideration.
xix
The survey results have revealed the key elements on the importance of the factors
regarding the current performance and the ongoing success of M-REITs. For all three
groups (property managers, fund managers and property advisors), the key points in
which they have equal agreement on the importance of factors regarding the current
performance of M-REITs are dividend growth and acquisition of new assets, while
the significant risk factors regarding M-REITs is the level of borrowings. In terms of
factors for the ongoing success, growth strategy is considered to be a significant
factor, which includes professional management, acquisition of new assets, dividend
growth and transparency in every aspect; especially in terms of regulation and
finance.
Overall, further research is clearly needed to further expand the understanding of
REITs in Malaysia, their investment dynamics and investor appeal. With the expected
future growth of M-REITs after the global financial crisis, this research will provide
increased understanding of M-REITs in an investment portfolio. In particular, this
understanding will also be relevant to the development of Islamic REITs, with the
expected future growth in Islamic property investment products and opportunities
globally.
1
CHAPTER 1
INTRODUCTION
1.1 Overall Context
Real estate investment trusts (REITs) are a form of property securitisation which has
proven to be a successful property investment vehicle in Australia, as well as in the
US. REITs provide investors with exposure to quality commercial property portfolios
via being listed on the stock market; serving as a hybrid investment vehicle. Recent
years have seen an increase of interest in real estate investment trusts (REITs) at a
global level; particularly amongst global property securities funds and international
investors. However, with this growing REIT awareness from international property
investors, there is a need for the further development of more innovative performance
analysis, products and opportunities to identify enhanced property portfolio
diversification benefits.
REITs have developed rapidly in recent years, with the number of REITs growing
significantly. This has seen REITs established (or legislated) in over 21 countries.
There has been substantial growth particularly in Asia (Japan, Singapore, Hong Kong,
Malaysia, Korea) and Europe (France, UK). Table 1.1 shows the status of global
REITs and the size of REIT markets in the various countries. However, the global
REIT market has been severely affected by the global financial market crisis in 2008,
with the total market capitalisation of listed REITs having declined significantly (eg:
November 2008: US$325bn, October: US$363.6bn, September: US$467.6bn, August:
US$484.9bn).
2
By December 2008, the number of REITs had grown to 509, with a market
capitalisation of US$375.6 billion. In Asia, there were 101 REITs with US$47.1
billion in market capitalisation, representing 12.5% of the global REIT market, with
REITs only being established in Asia in 2001, with the launching of the first Japanese
REIT (Whiting, 2007). Malaysia has 13 REITs and represents 0.3% of the global
REIT market. Within Asia, Malaysia accounts for 2.5% of the Asian REIT market.
One unique development in this REIT area has been the establishment of the world’s
first Islamic REIT in Malaysia in 2006, which include the principles of Shariah - the
body of Islamic law. Importantly, this development is significant, as it is another form
of ethical investment and will increase liquidity and transparency to the international
REIT market; particularly via increased acceptance from Islamic investors globally.
By the end of 2008, there were only three Islamic REITs in the world, with all three in
Malaysia; namely Al-‘Aqar KPJ REIT (hospital properties), Al-Hadharah Boustead
REIT (plantation properties) and Axis REIT (office/industrial properties). Axis REIT,
which was the first Malaysian REIT, has reclassified itself to being an Islamic REIT
in December 2008. By end of December 2008, the total market capitalisation of these
Islamic REITs was US$354.7 million (RM1228.9 million), representing 30% of
Malaysian REIT market capitalisation (APREA, 2009).
The US has the largest percentage of the global REIT market with 52%, followed by
Europe (21%), Asia (13%) and Australia (11%). The top 10 global REIT markets are:
#1: US #2: France #3: Australia #4: Japan #5: UK
#6: Canada #7: Singapore #8: Netherlands #9: Hong Kong
#10: Belgium
Japan dominates the Asian REIT market with US$29.5 billion in market
capitalisation, accounting for 7.8 % of the global REIT market and 62.6% of the
Asian REIT market.
3
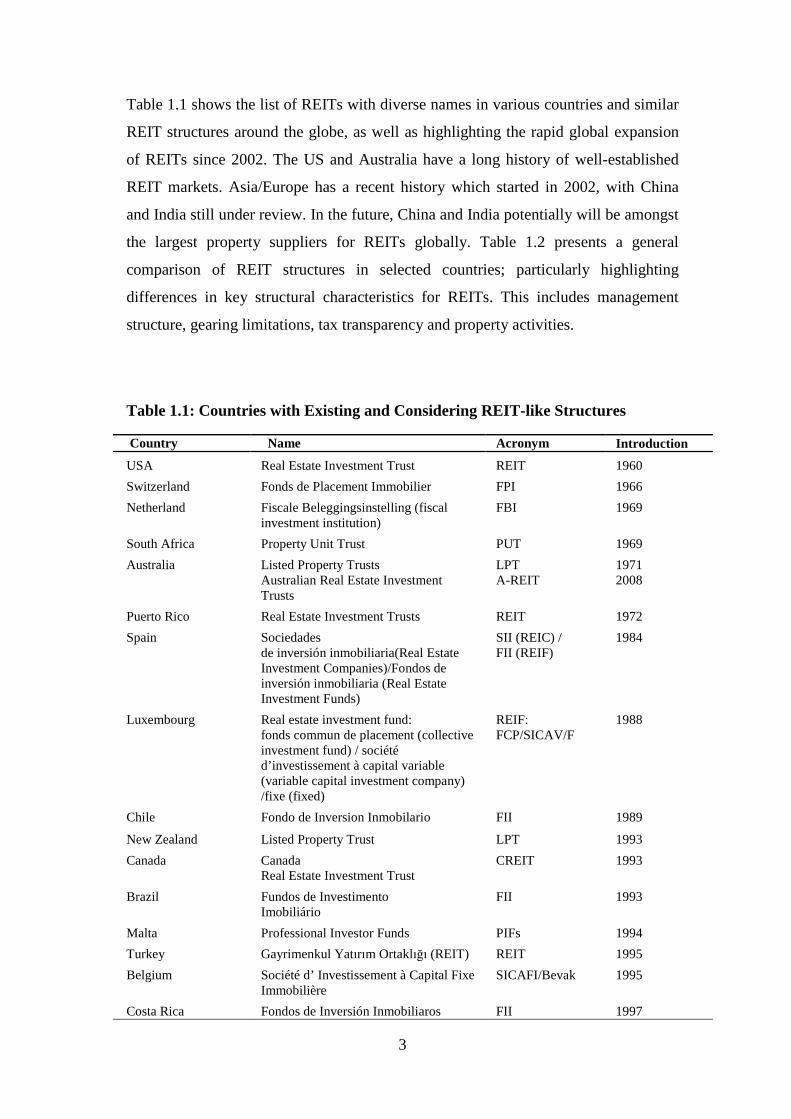
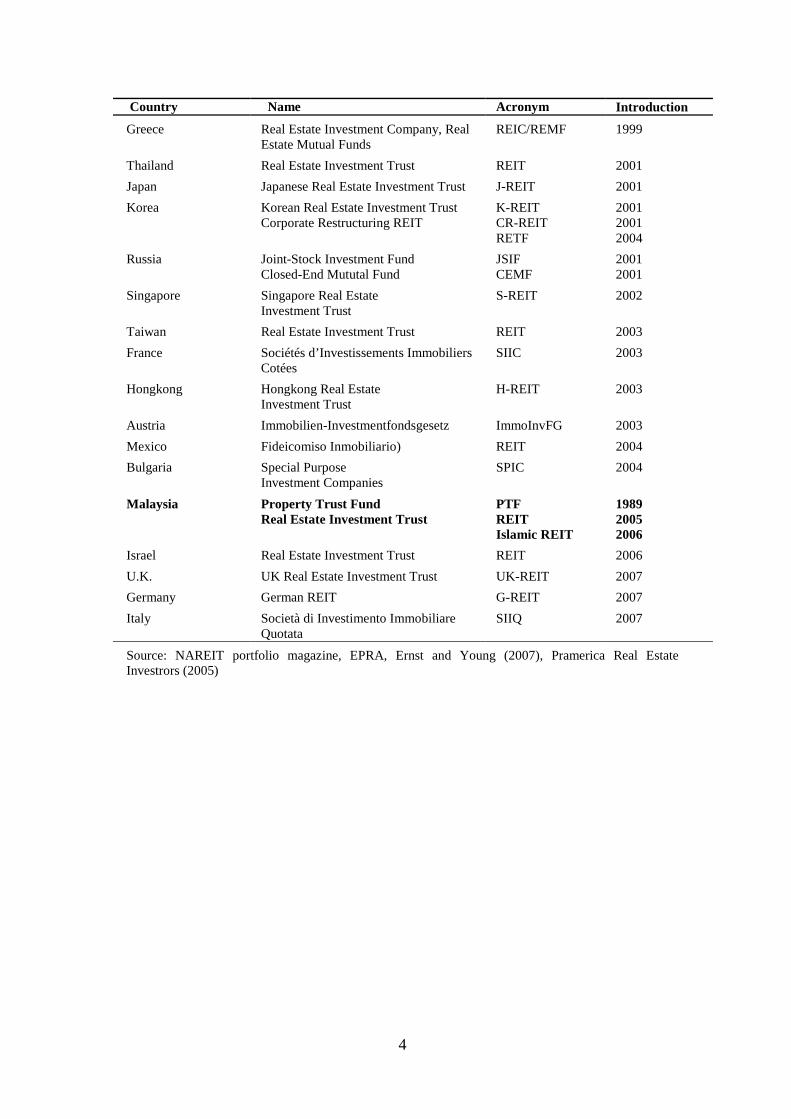
Table 1.1 shows the list of REITs with diverse names in various countries and similar
REIT structures around the globe, as well as highlighting the rapid global expansion
of REITs since 2002. The US and Australia have a long history of well-established
REIT markets. Asia/Europe has a recent history which started in 2002, with China
and India still under review. In the future, China and India potentially will be amongst
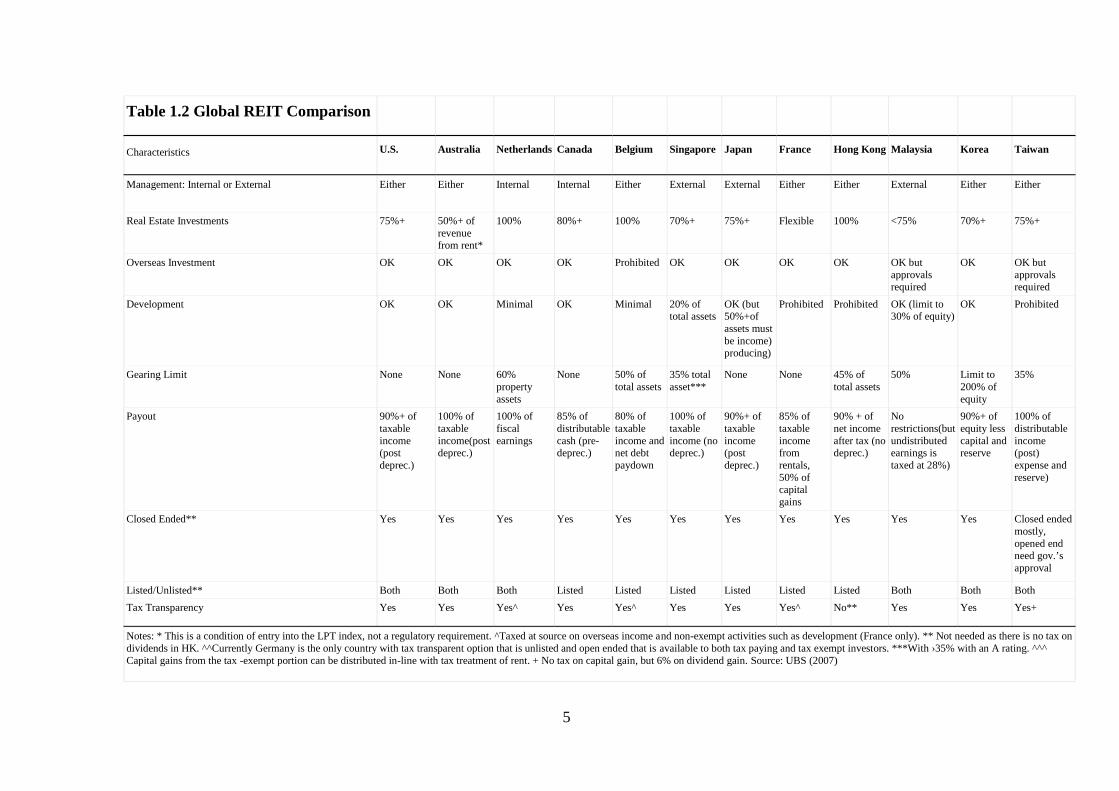
the largest property suppliers for REITs globally. Table 1.2 presents a general
comparison of REIT structures in selected countries; particularly highlighting
differences in key structural characteristics for REITs. This includes management
structure, gearing limitations, tax transparency and property activities.
Table 1.1: Countries with Existing and Considering REIT-like Structures
Country Name Acronym Introduction
USA Real Estate Investment Trust REIT 1960
Switzerland Fonds de Placement Immobilier FPI 1966
Netherland Fiscale Beleggingsinstelling (fiscalinvestment institution)
FBI 1969
South Africa Property Unit Trust PUT 1969
Australia Listed Property TrustsAustralian Real Estate InvestmentTrusts
LPTA-REIT
19712008
Puerto Rico Real Estate Investment Trusts REIT 1972
Spain Sociedadesde inversión inmobiliaria(Real EstateInvestment Companies)/Fondos deinversión inmobiliaria (Real EstateInvestment Funds)
SII (REIC) /FII (REIF)
1984
Luxembourg Real estate investment fund:fonds commun de placement (collectiveinvestment fund) / sociétéd’investissement à capital variable(variable capital investment company)/fixe (fixed)
REIF:FCP/SICAV/F
1988
Chile Fondo de Inversion Inmobilario FII 1989
New Zealand Listed Property Trust LPT 1993
Canada CanadaReal Estate Investment Trust
CREIT 1993
Brazil Fundos de InvestimentoImobiliário
FII 1993
Malta Professional Investor Funds PIFs 1994
Turkey Gayrimenkul Yatırım Ortaklığı (REIT) REIT 1995
Belgium Société d’ Investissement à Capital FixeImmobilière
SICAFI/Bevak 1995
Costa Rica Fondos de Inversión Inmobiliaros FII 1997
4
Country Name Acronym Introduction
Greece Real Estate Investment Company, RealEstate Mutual Funds
REIC/REMF 1999
Thailand Real Estate Investment Trust REIT 2001
Japan Japanese Real Estate Investment Trust J-REIT 2001
Korea Korean Real Estate Investment TrustCorporate Restructuring REIT
K-REITCR-REITRETF
200120012004
Russia Joint-Stock Investment FundClosed-End Mututal Fund
JSIFCEMF
20012001
Singapore Singapore Real EstateInvestment Trust
S-REIT 2002
Taiwan Real Estate Investment Trust REIT 2003
France Sociétés d’Investissements ImmobiliersCotées
SIIC 2003
Hongkong Hongkong Real EstateInvestment Trust
H-REIT 2003
Austria Immobilien-Investmentfondsgesetz ImmoInvFG 2003
Mexico Fideicomiso Inmobiliario) REIT 2004
Bulgaria Special PurposeInvestment Companies
SPIC 2004
Malaysia Property Trust FundReal Estate Investment Trust
PTFREITIslamic REIT
198920052006
Israel Real Estate Investment Trust REIT 2006
U.K. UK Real Estate Investment Trust UK-REIT 2007
Germany German REIT G-REIT 2007
Italy Società di Investimento ImmobiliareQuotata
SIIQ 2007
Source: NAREIT portfolio magazine, EPRA, Ernst and Young (2007), Pramerica Real EstateInvestrors (2005)
5
Table 1.2 Global REIT Comparison
Characteristics U.S. Australia Netherlands Canada Belgium Singapore Japan France Hong Kong Malaysia Korea Taiwan
Management: Internal or External Either Either Internal Internal Either External External Either Either External Either Either
Real Estate Investments 75%+ 50%+ ofrevenuefrom rent*
100% 80%+ 100% 70%+ 75%+ Flexible 100% <75% 70%+ 75%+
Overseas Investment OK OK OK OK Prohibited OK OK OK OK OK butapprovalsrequired
OK OK butapprovalsrequired
Development OK OK Minimal OK Minimal 20% oftotal assets
OK (but50%+ofassets mustbe income)producing)
Prohibited Prohibited OK (limit to30% of equity)
OK Prohibited
Gearing Limit None None 60%propertyassets
None 50% oftotal assets
35% totalasset***
None None 45% oftotal assets
50% Limit to200% ofequity
35%
Payout 90%+ oftaxableincome(postdeprec.)
100% oftaxableincome(postdeprec.)
100% offiscalearnings
85% ofdistributablecash (pre-deprec.)
80% oftaxableincome andnet debtpaydown
100% oftaxableincome (nodeprec.)
90%+ oftaxableincome(postdeprec.)
85% oftaxableincomefromrentals,50% ofcapitalgains
90% + ofnet incomeafter tax (nodeprec.)
Norestrictions(butundistributedearnings istaxed at 28%)
90%+ ofequity lesscapital andreserve
100% ofdistributableincome(post)expense andreserve)
Closed Ended** Yes Yes Yes Yes Yes Yes Yes Yes Yes Yes Yes Closed endedmostly,opened endneed gov.’sapproval
Listed/Unlisted** Both Both Both Listed Listed Listed Listed Listed Listed Both Both Both
Tax Transparency Yes Yes Yes^ Yes Yes^ Yes Yes Yes^ No** Yes Yes Yes+
Notes: * This is a condition of entry into the LPT index, not a regulatory requirement. ^Taxed at source on overseas income and non-exempt activities such as development (France only). ** Not needed as there is no tax ondividends in HK. ^^Currently Germany is the only country with tax transparent option that is unlisted and open ended that is available to both tax paying and tax exempt investors. ***With ›35% with an A rating. ^^^Capital gains from the tax -exempt portion can be distributed in-line with tax treatment of rent. + No tax on capital gain, but 6% on dividend gain. Source: UBS (2007)
6
Given the increasing significance of REITs in Asia and specifically in Malaysia, this
thesis focuses on the significance and performance of REITs in Malaysia from August
2005 to December 2008; particularly focusing on the development, risk-adjusted
performance and portfolio diversification benefits of Islamic REITs in Malaysia, as
well as their investor acceptance.
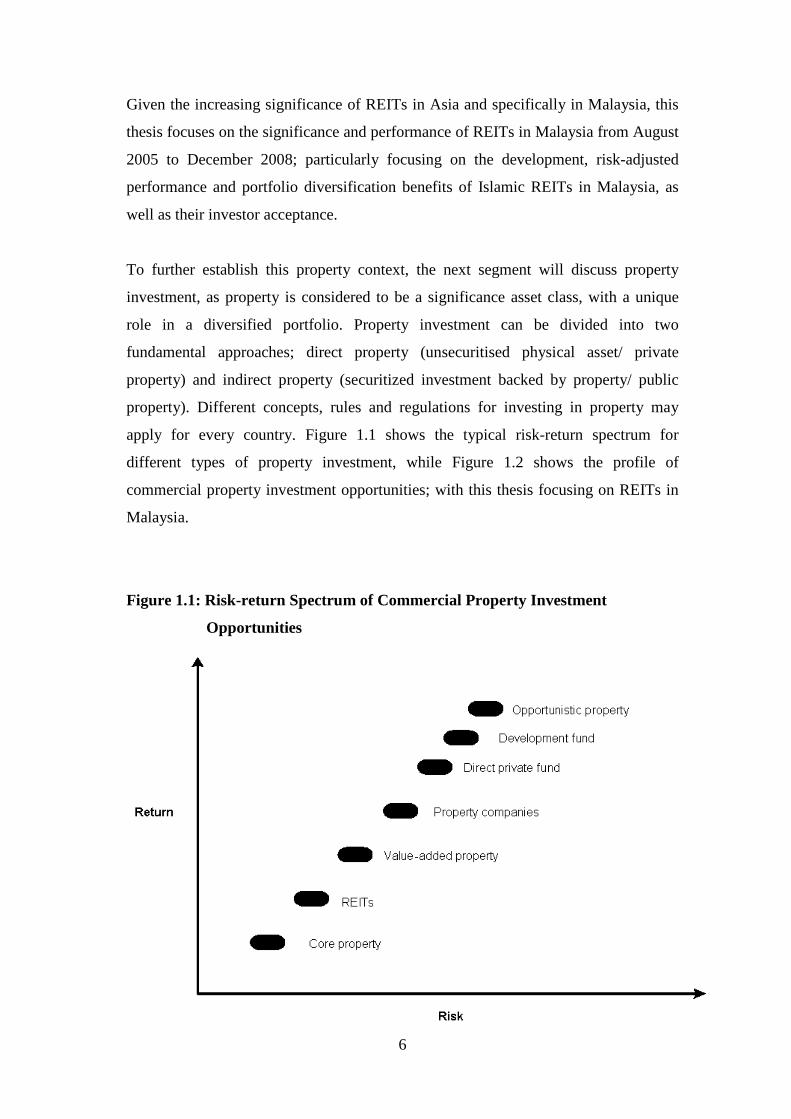
To further establish this property context, the next segment will discuss property
investment, as property is considered to be a significance asset class, with a unique
role in a diversified portfolio. Property investment can be divided into two
fundamental approaches; direct property (unsecuritised physical asset/ private
property) and indirect property (securitized investment backed by property/ public
property). Different concepts, rules and regulations for investing in property may
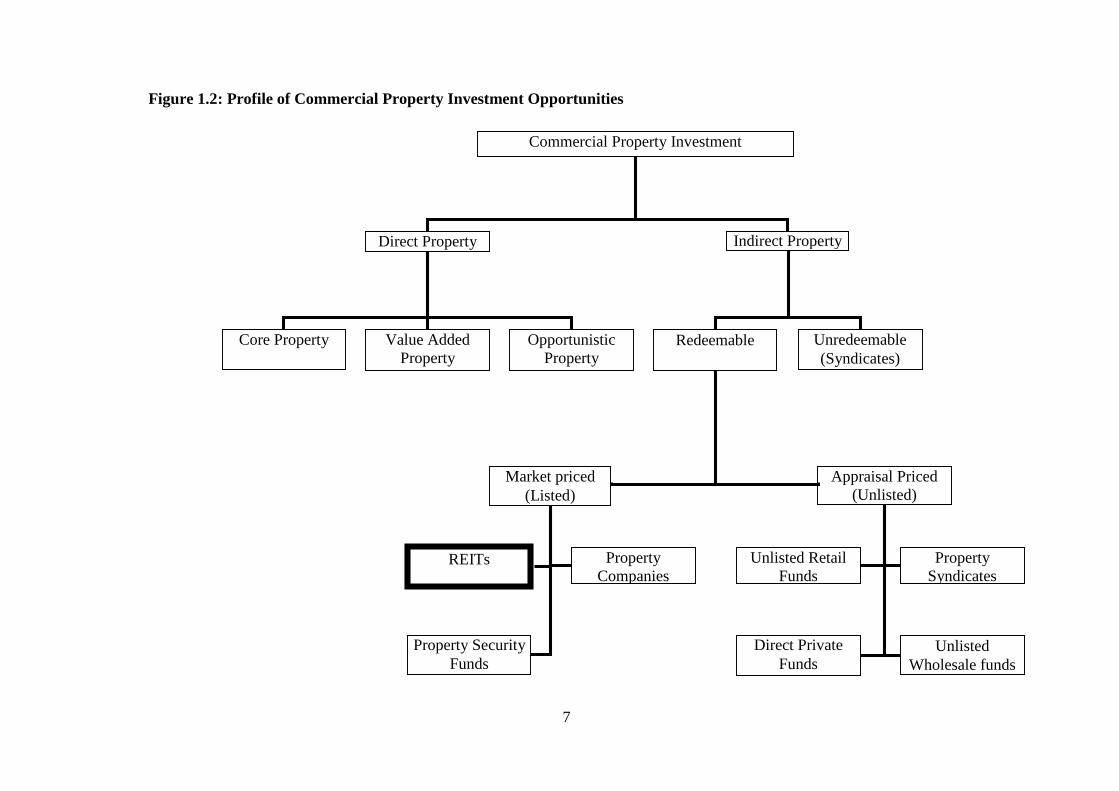
apply for every country. Figure 1.1 shows the typical risk-return spectrum for
different types of property investment, while Figure 1.2 shows the profile of
commercial property investment opportunities; with this thesis focusing on REITs in
Malaysia.
Figure 1.1: Risk-return Spectrum of Commercial Property Investment
Opportunities
7
Figure 1.2: Profile of Commercial Property Investment Opportunities
Commercial Property Investment
Direct Property
Core Property
Indirect Property
Redeemable Unredeemable(Syndicates)
Market priced(Listed)
Appraisal Priced(Unlisted)
OpportunisticProperty
Value AddedProperty
REITs PropertyCompanies
Property SecurityFunds
Unlisted RetailFunds
PropertySyndicates
Direct PrivateFunds
UnlistedWholesale funds
8
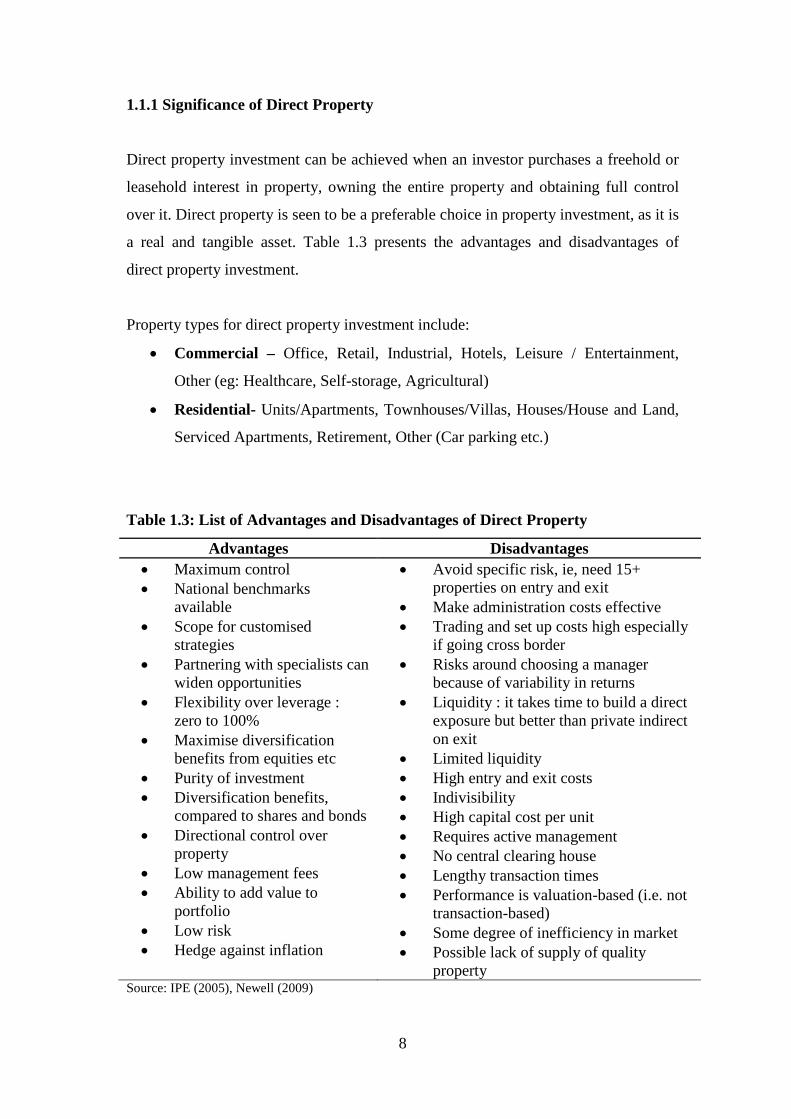
1.1.1 Significance of Direct Property
Direct property investment can be achieved when an investor purchases a freehold or
leasehold interest in property, owning the entire property and obtaining full control
over it. Direct property is seen to be a preferable choice in property investment, as it is
a real and tangible asset. Table 1.3 presents the advantages and disadvantages of
direct property investment.
Property types for direct property investment include:
Commercial – Office, Retail, Industrial, Hotels, Leisure / Entertainment,
Other (eg: Healthcare, Self-storage, Agricultural)
Residential- Units/Apartments, Townhouses/Villas, Houses/House and Land,
Serviced Apartments, Retirement, Other (Car parking etc.)
Table 1.3: List of Advantages and Disadvantages of Direct Property
Advantages Disadvantages
Maximum control National benchmarks
available Scope for customised
strategies Partnering with specialists can
widen opportunities Flexibility over leverage :
zero to 100% Maximise diversification
benefits from equities etc Purity of investment Diversification benefits,
compared to shares and bonds Directional control over
property Low management fees Ability to add value to
portfolio Low risk Hedge against inflation
Avoid specific risk, ie, need 15+properties on entry and exit
Make administration costs effective Trading and set up costs high especially
if going cross border Risks around choosing a manager
because of variability in returns Liquidity : it takes time to build a direct
exposure but better than private indirecton exit
Limited liquidity High entry and exit costs Indivisibility High capital cost per unit Requires active management No central clearing house Lengthy transaction times Performance is valuation-based (i.e. not
transaction-based) Some degree of inefficiency in market Possible lack of supply of quality
propertySource: IPE (2005), Newell (2009)

9
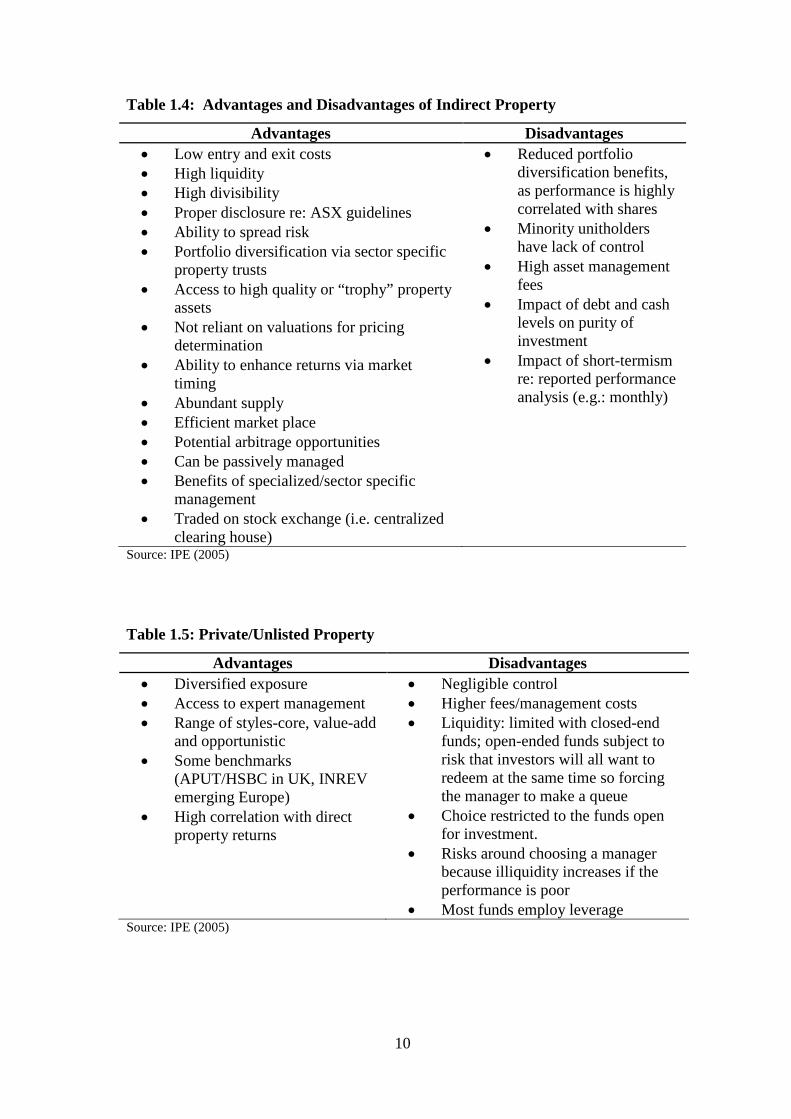
1.1.2 Significance of Indirect Property
Indirect property is generally considered to be a financial asset. Indirect property
investment can be achieved when an investor purchases units in a pooled investment;
thus gaining partial ownership of the property (i.e. shares in property company, REIT,
property trust or any company specialising in property dealings). Investors do not
have full control over this ownership, although they will obtain liquidity aspects of a
property asset. Investors will receive financial returns without having to use
substantial capital on purchasing. Tables 1.4, 1.5 and 1.6 show the advantages and
disadvantages of indirect property investment for these various property investment
vehicles.
Types of indirect property investment include:
Real Estate Investment Trust/Property Securities Funds – Real Estate
Investment Trust or Company (REIT)
Unlisted Property Trusts - Unlisted Wholesale Fund, Unlisted Retail Fund
Other Unlisted Entities- eg: Direct Private Fund
Mortgage Securities/Mezzanine Funds & Debentures -Mortgage Scheme
Debentures, Mortgage Fund Pooled, Mortgage Scheme Select
Property Investment Schemes Syndicates-Property Investment Schemes,
Strata Title Scheme, Direct Property Syndicates
10
Table 1.4: Advantages and Disadvantages of Indirect Property
Advantages Disadvantages
Low entry and exit costs High liquidity High divisibility Proper disclosure re: ASX guidelines Ability to spread risk Portfolio diversification via sector specific
property trusts Access to high quality or “trophy” property
assets Not reliant on valuations for pricing
determination Ability to enhance returns via market
timing Abundant supply Efficient market place Potential arbitrage opportunities Can be passively managed Benefits of specialized/sector specific
management Traded on stock exchange (i.e. centralized
clearing house)
Reduced portfoliodiversification benefits,as performance is highlycorrelated with shares
Minority unitholdershave lack of control
High asset managementfees
Impact of debt and cashlevels on purity ofinvestment
Impact of short-termismre: reported performanceanalysis (e.g.: monthly)
Source: IPE (2005)
Table 1.5: Private/Unlisted Property
Advantages Disadvantages
Diversified exposure Access to expert management Range of styles-core, value-add
and opportunistic Some benchmarks
(APUT/HSBC in UK, INREVemerging Europe)
High correlation with directproperty returns
Negligible control Higher fees/management costs Liquidity: limited with closed-end
funds; open-ended funds subject torisk that investors will all want toredeem at the same time so forcingthe manager to make a queue
Choice restricted to the funds openfor investment.
Risks around choosing a managerbecause illiquidity increases if theperformance is poor
Most funds employ leverageSource: IPE (2005)
11
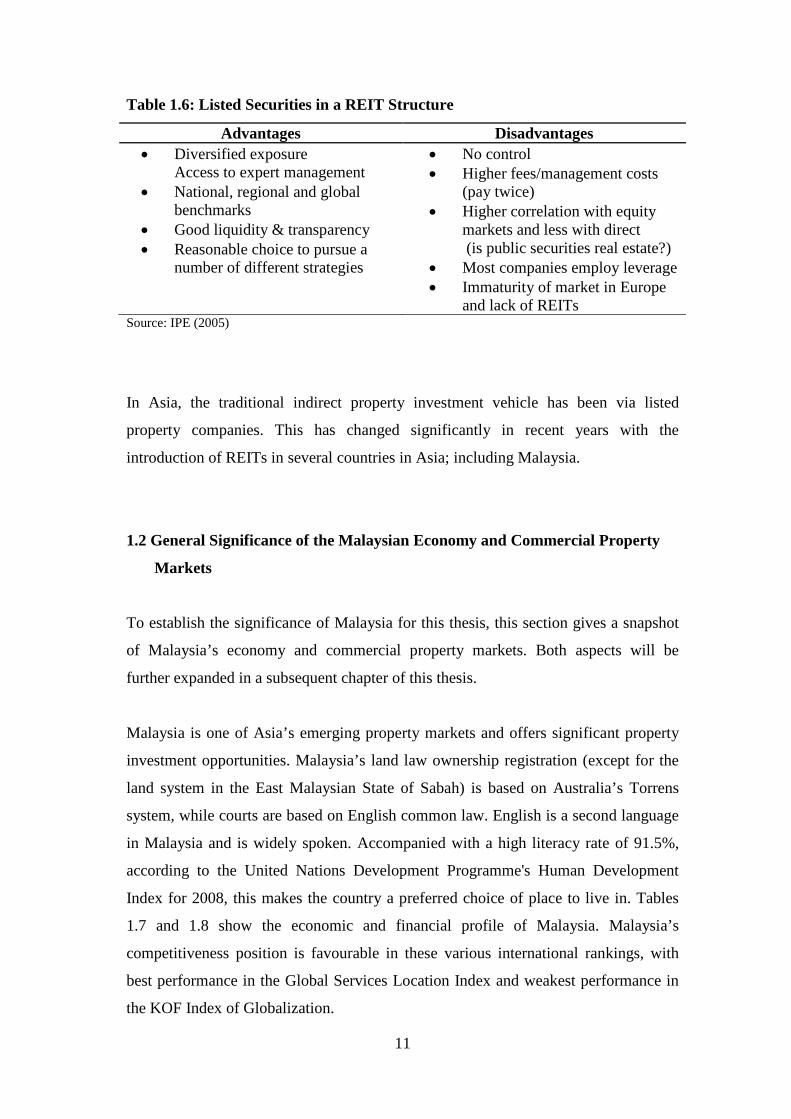
Table 1.6: Listed Securities in a REIT Structure
Advantages Disadvantages
Diversified exposureAccess to expert management
National, regional and globalbenchmarks
Good liquidity & transparency Reasonable choice to pursue a
number of different strategies
No control Higher fees/management costs
(pay twice) Higher correlation with equity
markets and less with direct(is public securities real estate?)
Most companies employ leverage Immaturity of market in Europe
and lack of REITsSource: IPE (2005)
In Asia, the traditional indirect property investment vehicle has been via listed
property companies. This has changed significantly in recent years with the
introduction of REITs in several countries in Asia; including Malaysia.
1.2 General Significance of the Malaysian Economy and Commercial Property
Markets
To establish the significance of Malaysia for this thesis, this section gives a snapshot
of Malaysia’s economy and commercial property markets. Both aspects will be
further expanded in a subsequent chapter of this thesis.
Malaysia is one of Asia’s emerging property markets and offers significant property
investment opportunities. Malaysia’s land law ownership registration (except for the
land system in the East Malaysian State of Sabah) is based on Australia’s Torrens
system, while courts are based on English common law. English is a second language
in Malaysia and is widely spoken. Accompanied with a high literacy rate of 91.5%,
according to the United Nations Development Programme's Human Development
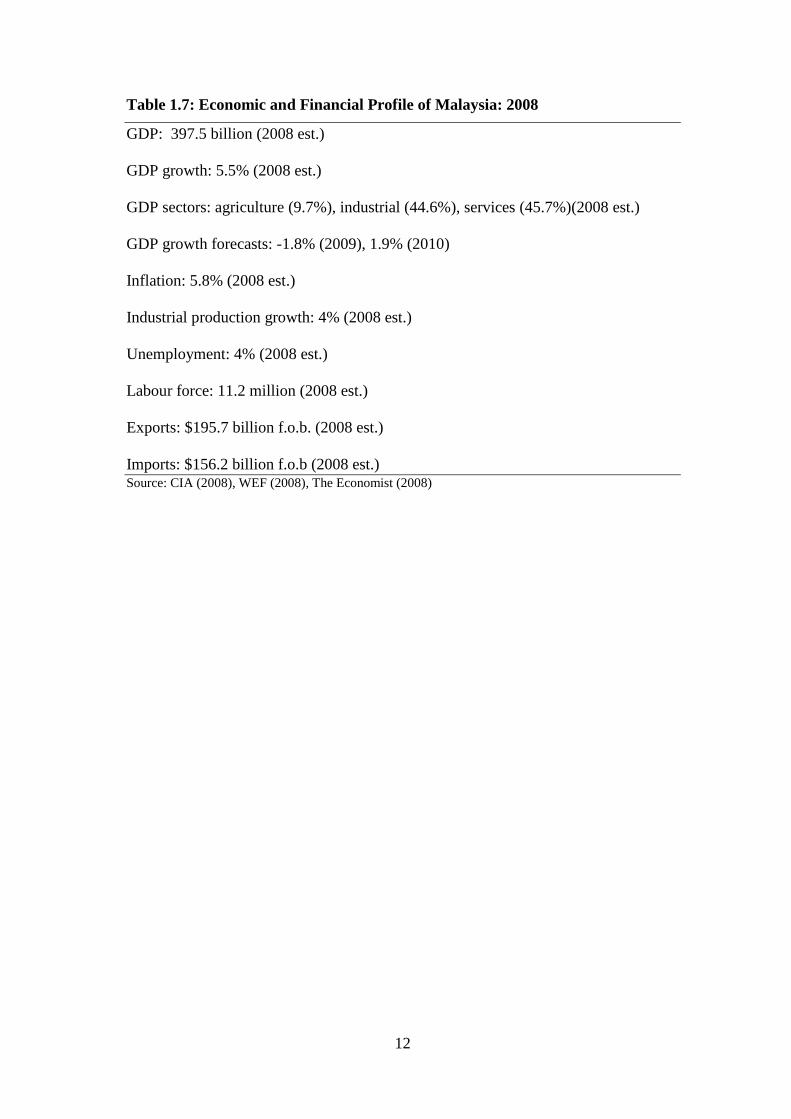
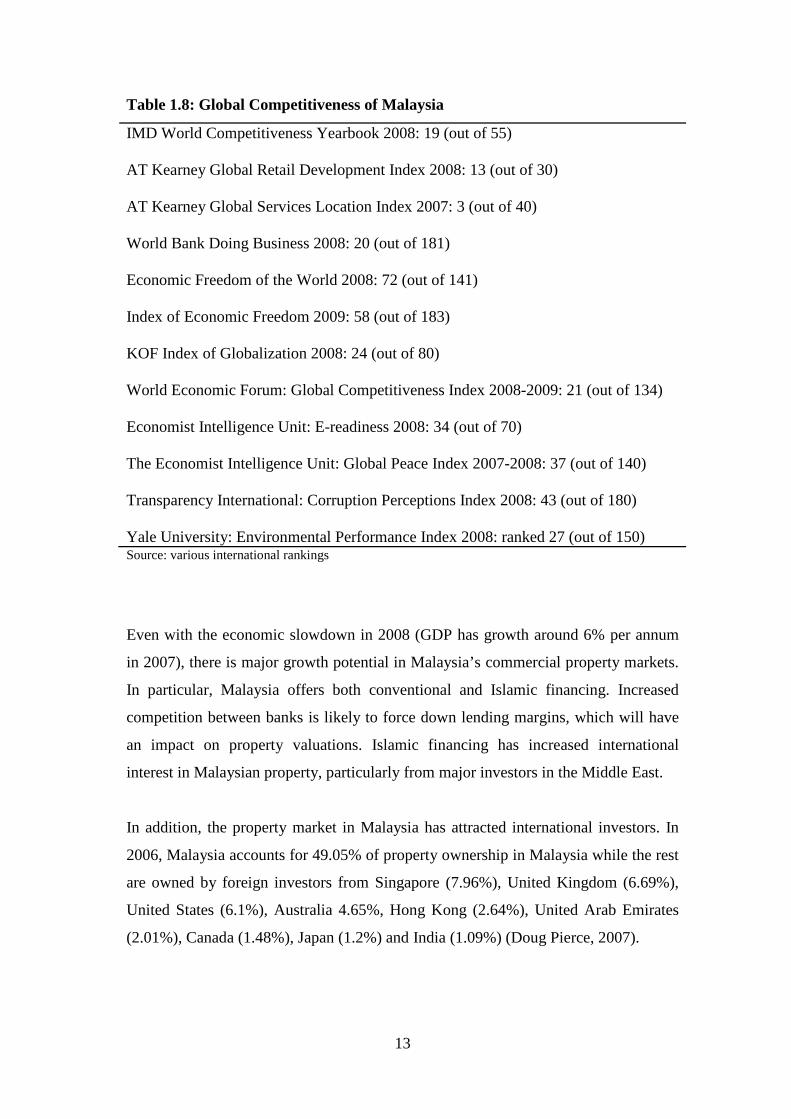
Index for 2008, this makes the country a preferred choice of place to live in. Tables
1.7 and 1.8 show the economic and financial profile of Malaysia. Malaysia’s
competitiveness position is favourable in these various international rankings, with
best performance in the Global Services Location Index and weakest performance in
the KOF Index of Globalization.
12
Table 1.7: Economic and Financial Profile of Malaysia: 2008
GDP: 397.5 billion (2008 est.)
GDP growth: 5.5% (2008 est.)
GDP sectors: agriculture (9.7%), industrial (44.6%), services (45.7%)(2008 est.)
GDP growth forecasts: -1.8% (2009), 1.9% (2010)
Inflation: 5.8% (2008 est.)
Industrial production growth: 4% (2008 est.)
Unemployment: 4% (2008 est.)
Labour force: 11.2 million (2008 est.)
Exports: $195.7 billion f.o.b. (2008 est.)
Imports: $156.2 billion f.o.b (2008 est.)Source: CIA (2008), WEF (2008), The Economist (2008)
13
Table 1.8: Global Competitiveness of Malaysia
IMD World Competitiveness Yearbook 2008: 19 (out of 55)
AT Kearney Global Retail Development Index 2008: 13 (out of 30)
AT Kearney Global Services Location Index 2007: 3 (out of 40)
World Bank Doing Business 2008: 20 (out of 181)
Economic Freedom of the World 2008: 72 (out of 141)
Index of Economic Freedom 2009: 58 (out of 183)
KOF Index of Globalization 2008: 24 (out of 80)
World Economic Forum: Global Competitiveness Index 2008-2009: 21 (out of 134)
Economist Intelligence Unit: E-readiness 2008: 34 (out of 70)
The Economist Intelligence Unit: Global Peace Index 2007-2008: 37 (out of 140)
Transparency International: Corruption Perceptions Index 2008: 43 (out of 180)
Yale University: Environmental Performance Index 2008: ranked 27 (out of 150)Source: various international rankings
Even with the economic slowdown in 2008 (GDP has growth around 6% per annum
in 2007), there is major growth potential in Malaysia’s commercial property markets.
In particular, Malaysia offers both conventional and Islamic financing. Increased
competition between banks is likely to force down lending margins, which will have
an impact on property valuations. Islamic financing has increased international
interest in Malaysian property, particularly from major investors in the Middle East.
In addition, the property market in Malaysia has attracted international investors. In
2006, Malaysia accounts for 49.05% of property ownership in Malaysia while the rest
are owned by foreign investors from Singapore (7.96%), United Kingdom (6.69%),
United States (6.1%), Australia 4.65%, Hong Kong (2.64%), United Arab Emirates
(2.01%), Canada (1.48%), Japan (1.2%) and India (1.09%) (Doug Pierce, 2007).
14
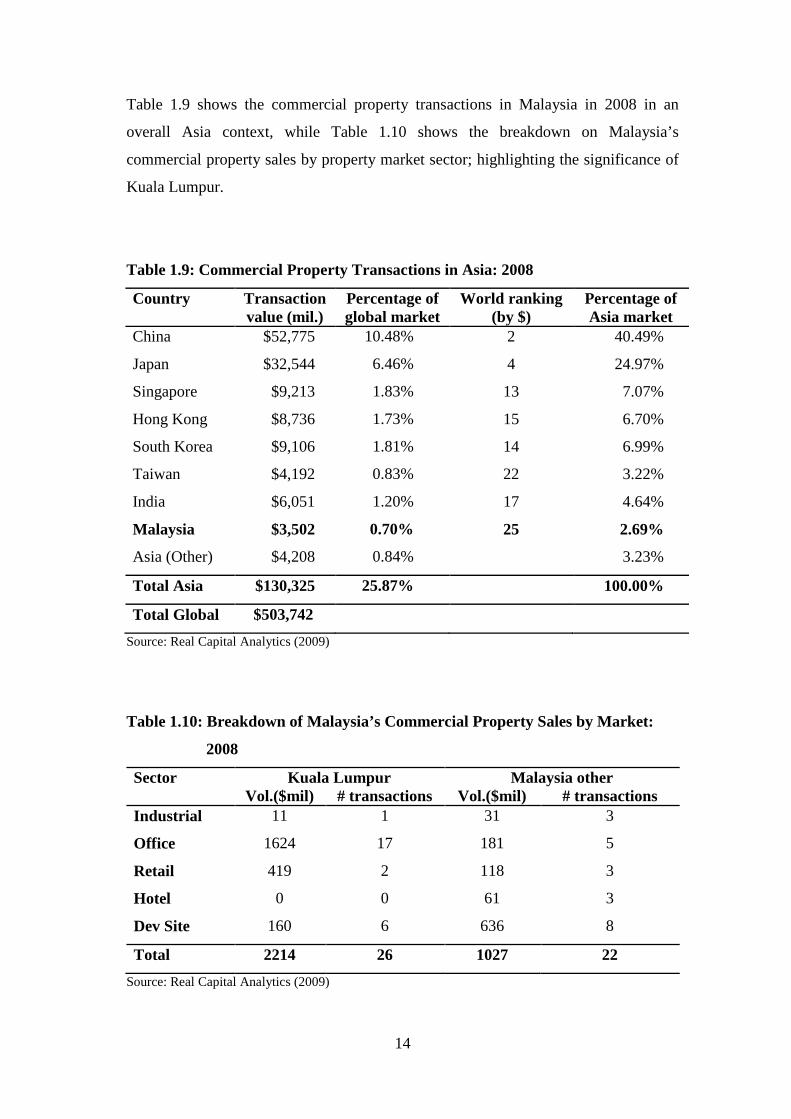
Table 1.9 shows the commercial property transactions in Malaysia in 2008 in an
overall Asia context, while Table 1.10 shows the breakdown on Malaysia’s
commercial property sales by property market sector; highlighting the significance of
Kuala Lumpur.
Table 1.9: Commercial Property Transactions in Asia: 2008
Country Transactionvalue (mil.)
Percentage ofglobal market
World ranking(by $)
Percentage ofAsia market
China $52,775 10.48% 2 40.49%
Japan $32,544 6.46% 4 24.97%
Singapore $9,213 1.83% 13 7.07%
Hong Kong $8,736 1.73% 15 6.70%
South Korea $9,106 1.81% 14 6.99%
Taiwan $4,192 0.83% 22 3.22%
India $6,051 1.20% 17 4.64%
Malaysia $3,502 0.70% 25 2.69%
Asia (Other) $4,208 0.84% 3.23%
Total Asia $130,325 25.87% 100.00%
Total Global $503,742
Source: Real Capital Analytics (2009)
Table 1.10: Breakdown of Malaysia’s Commercial Property Sales by Market:
2008
Sector Kuala Lumpur Malaysia otherVol.($mil) # transactions Vol.($mil) # transactions
Industrial 11 1 31 3
Office 1624 17 181 5
Retail 419 2 118 3
Hotel 0 0 61 3
Dev Site 160 6 636 8
Total 2214 26 1027 22
Source: Real Capital Analytics (2009)
15
1.2.1 Significance of REITs in Malaysia
Since the new issuance of REIT guidelines in 2005 and coupled with tax incentives,
REITs in Malaysia are seen to have a positive outlook following their wider
acceptance and increasing attention from institutional investors. Revised guidelines
have allowed more flexibility in terms of management, acquisition and borrowing
limits, while the inclusion of Islamic REITs in 2006 has encouraged participation of
international investors.
To further strengthen the M-REIT context, this is under-pinned by a strong local
commercial property market in Malaysia. Despite the global financial crisis, office
and retail markets managed to attain a post-stage (low but increasing vacancy rates)
position in 2008, with an increase in rent momentum. Meanwhile, the industrial
market is at growth stage (low and declining vacancy rates stage) with a stable rent
momentum (RREEF Research, 2009).
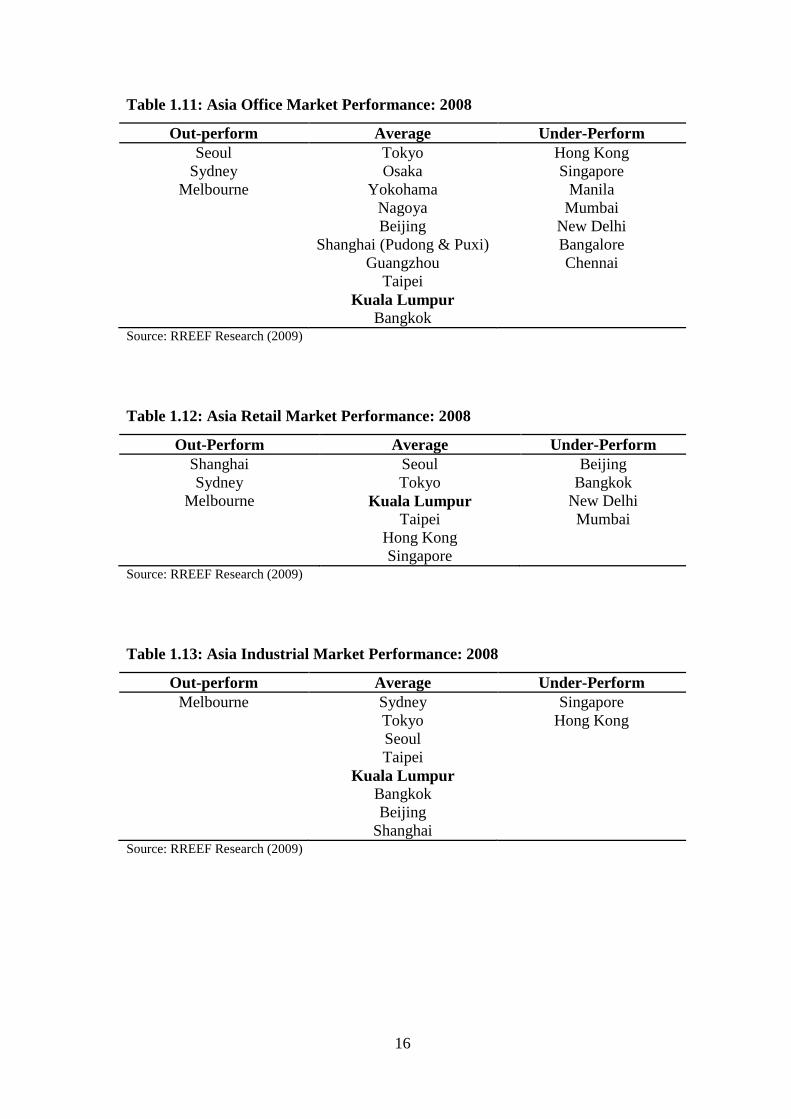
The office sector in Malaysia still has the capability to attain lower vacancy rates,
which decreased from 8.5% to 7.1% in 4Q:2008 in the Golden Triangle and CBD,
Kuala Lumpur (JLL, 2009) accompanied with an average rising rental rate of RM
7.10 psf. (US$2.05 psf.) per month, an increase of 9.2% (q-o-q) and 19.3% (y-o-y)
(CBRE, 2008). Although, Grade A vacancy rate fell by 80 bps to 6.9%, net absorption
was a positive 919,000 sf. for the fourth quarter of 2008. Unfortunately, retail rent
dropped, as the Consumer Sentiment Index fell from 88.9 points to 71.4 points in the
fourth quarter of 2008. It is also projected for the office and retail sectors to be under
contraction with a decrease in rent momentum until 2010. However, the industrial
sector will be in post-growth condition, with a stable rent momentum until 2010. This
indicates that industrial REITs could still generate a good return for investment.
Tables 1.11, 1.12 and 1.13 shows the strong performance of the office, retail and
industrial property markets in Malaysia in an Asia context.
16
Table 1.11: Asia Office Market Performance: 2008
Out-perform Average Under-PerformSeoul
SydneyMelbourne
TokyoOsaka
YokohamaNagoyaBeijing
Shanghai (Pudong & Puxi)Guangzhou
TaipeiKuala Lumpur
Bangkok
Hong KongSingapore
ManilaMumbai
New DelhiBangaloreChennai
Source: RREEF Research (2009)
Table 1.12: Asia Retail Market Performance: 2008
Out-Perform Average Under-PerformShanghaiSydney
Melbourne
SeoulTokyo
Kuala LumpurTaipei
Hong KongSingapore
BeijingBangkok
New DelhiMumbai
Source: RREEF Research (2009)
Table 1.13: Asia Industrial Market Performance: 2008
Out-perform Average Under-PerformMelbourne Sydney
TokyoSeoulTaipei
Kuala LumpurBangkokBeijing
Shanghai
SingaporeHong Kong
Source: RREEF Research (2009)
17
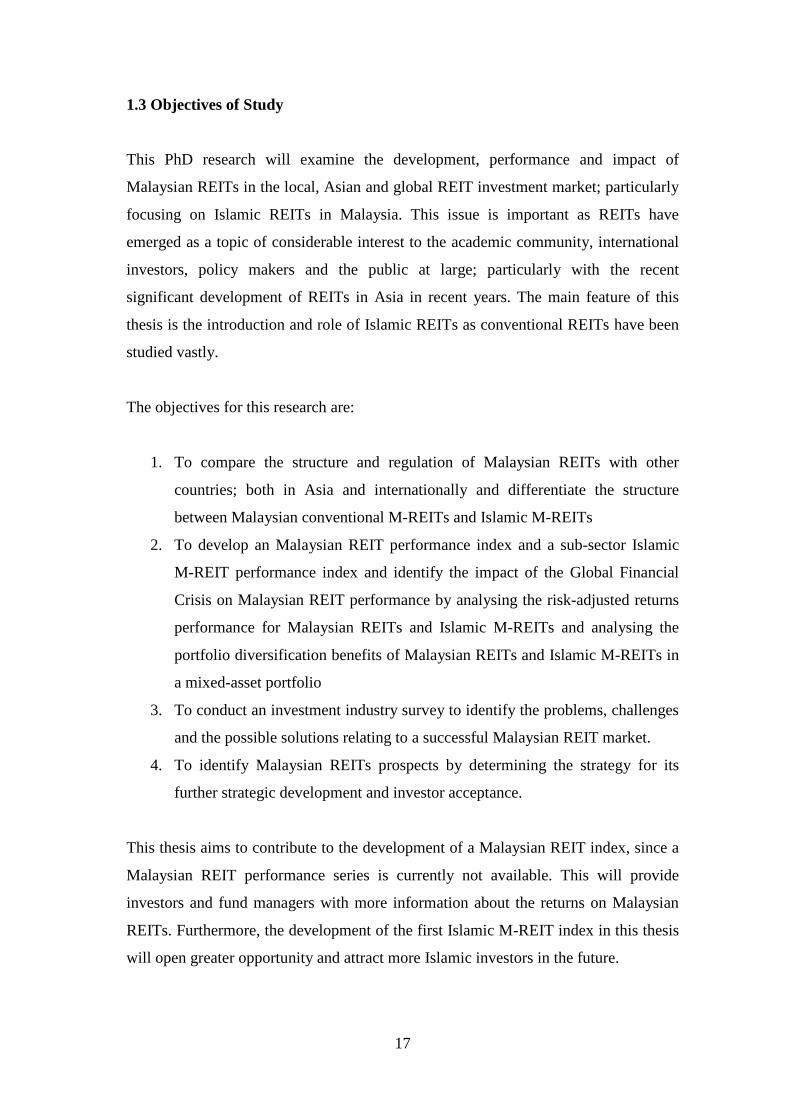
1.3 Objectives of Study
This PhD research will examine the development, performance and impact of
Malaysian REITs in the local, Asian and global REIT investment market; particularly
focusing on Islamic REITs in Malaysia. This issue is important as REITs have
emerged as a topic of considerable interest to the academic community, international
investors, policy makers and the public at large; particularly with the recent
significant development of REITs in Asia in recent years. The main feature of this
thesis is the introduction and role of Islamic REITs as conventional REITs have been
studied vastly.
The objectives for this research are:
1. To compare the structure and regulation of Malaysian REITs with other
countries; both in Asia and internationally and differentiate the structure
between Malaysian conventional M-REITs and Islamic M-REITs
2. To develop an Malaysian REIT performance index and a sub-sector Islamic
M-REIT performance index and identify the impact of the Global Financial
Crisis on Malaysian REIT performance by analysing the risk-adjusted returns
performance for Malaysian REITs and Islamic M-REITs and analysing the
portfolio diversification benefits of Malaysian REITs and Islamic M-REITs in
a mixed-asset portfolio
3. To conduct an investment industry survey to identify the problems, challenges
and the possible solutions relating to a successful Malaysian REIT market.
4. To identify Malaysian REITs prospects by determining the strategy for its
further strategic development and investor acceptance.
This thesis aims to contribute to the development of a Malaysian REIT index, since a
Malaysian REIT performance series is currently not available. This will provide
investors and fund managers with more information about the returns on Malaysian
REITs. Furthermore, the development of the first Islamic M-REIT index in this thesis
will open greater opportunity and attract more Islamic investors in the future.
18
There are limitations in this research due to the short time series of Malaysian REIT
data. Even though Malaysian Property Trust Funds (PTF) data has existed since 1989,
REITs in Malaysia were only listed in August 2005, while an Islamic REIT in
Malaysia was only listed in August 2006. This research acknowledges that there is not
the equivalent extensive time series of performance data for Malaysian REITs that
typically can be used for empirical analyses for the traditional REIT markets of
Australia and US. This shorter time series is clearly evident for all research involving
REITs in Asia, given they have only been established since 2002. Whilst the
performance data may not cover a full investment or property cycle, this limitation is
recognized, and should not be considered to be an impediment to a rigorous and
insightful PhD research study seeking to enhance our understanding on the strategic
contribution of M-REITs in a global REIT context.
The key issue in this thesis is to develop Malaysian REIT performance indicators and
to do the analyses over August 2005- December 2008 for Malaysian REITs to provide
the basis for future research regarding the risk-adjusted performance, portfolio
diversification benefits and strategic development of Malaysian REITs as a successful
REIT product in Asia. The associated investors’ survey will see a much richer and
informed analysis than that just provided by the empirical performance analysis. This
research aims to contribute to and expand on the existing research on REITs;
particularly concerning the significance of Malaysian REITs and Islamic REITs.
Appropriate research questions and methodology used for analysis will be discussed
further in the next section on literature review. Literature review is the critical
component to see the understanding of relevant literature. The next section will
summarize the body of knowledge in this field including the major research questions,
techniques employed as well as their limitations. This will motivate the proposed
study by how it hopes to contribute to this body of knowledge.
19
1.4 Literature Review
1.4.1 Property in a Portfolio
This chapter will discuss the literature on international property research and REITs.
The major focus will be on the Asia property research; specifically Malaysian REITs.
Direct and indirect commercial property have been a major component of the global
investment universe (PREI, 2005) and property is seen to be an alternative asset due
to its inherent characteristics and relative immaturity in some developing markets
(RREEF, 2007). Direct property has consistently been found to be an effective hedge
against inflation in the US (Fama and Schwert, 1977; Hartzell et al, 1987; Gyourko
and Linneman, 1988; Rubens et al, 1989; Wurtzebach et al, 1991; Liu et al, 1997),
U.K. (Limmack and Ward, 1988; Matysiak et al, 1996; Liu et al, 1997), Australia
(Newell, 1996), New Zealand (Newell and Boyd, 1995), Canada (Newell, 1995),
Hong Kong (Ganesan and Chiang, 1998) and Singapore (Sing and Low, 2000). An
empirical study of the inflation-hedging characteristics of the four Chinese major
cities found the contrary, where direct property in these cities was not an effective
hedge against inflation (Chu and Sing, 2004). The widely accepted finding of
Wurtzebach et al (1991) concludes that direct property is a good hedge against
inflation when the vacancy rate is low, and failed as an inflation hedge when the
vacancy rate is high.
The role of direct property in mixed-asset portfolios is well documented. In one of the
earliest studies on direct property as a separate asset class in a mixed-asset portfolio,
Webb et al (1988) found that not only should property be included in a mixed-asset
portfolio, but also approximately two-thirds of the investment wealth should be
allocated to property. Subsequent studies by Ennis and Burik (1991), Hamelink and
Hoesli (1996), Ziobrowski and Ziobrowski (1997), Byrne and Lee (1997) also
confirmed mixed-asset portfolios containing direct property and financial assets
always dominated the financial assets portfolio and the allocation of property in a
mixed-asset portfolio is 15% to 30%. However, when the property data were
desmoothed to factor in appraisal bias, the portfolio diversification gain was reduced.
Despite the favourable findings of numerous studies, the actual allocation for property
in institutional investors’ portfolios is substantially lower than the suggested level
20
(Geltner and Miller, 2001). When the market imperfections of direct property such as
indivisibility and no short sales are taken into consideration (Kallberg et al, 1996) and
the allocation to property is evaluated in the framework of asset-liability (Craft,
2001), the lower allocation of property in institutional investors’ portfolios is justified.
Meanwhile, indirect property have been found to be a poor hedge against inflation in
the US (Gyourko and Linneman, 1988; Liu and Mei, 1992; Liu et al, 1997), U.K.
(Hoesli et al, 1997; Liu et al, 1997), Australia (Newell, 1996), Hong Kong (Ganesan
and Chiang, 1998) and Singapore (Sing and Low, 2000).
The indirect property market was found to lead the direct property market, indicating
indirect (securitised) property reflects information on prices quicker than direct
property appraisal values (Barkham and Geltner, 1995, 1996). As such, Stevenson
(2001) suggested that property trust vehicles might be used as a short-term market-
timing device. This is perhaps the greatest potential benefit for a property fund
manager considering REITs and other property trust vehicles as portfolio assets. The
higher volatility found in the REIT sector is always going to mean that risk-adjusted
asset allocation results are going to be biased towards direct property; however, such
tests will not accurately pick up the short-term market timing benefits that investors
could obtain. In such a case, a portfolio manager could use individual funds both to
switch the property exposure of the portfolio and to use REIT vehicles to gain access
to markets where there are limited property investment opportunities
Liang and McIntosh (1998) and Newell and Tan (2003) have provided evidence for
the diversification benefits of including REITs/LPTs in a mixed-asset portfolio. By
investigating the style and exposure of REITs, Liang and McIntosh (1998) concluded
that REITs have become more “unique” and consequently REITs should be included
in a mixed-asset portfolio to achieve a better risk-return trade-off, despite the styles of
REITs changing over time. However, Glascock et al (2000) found REITs were
cointegrated with direct property and argue that there was no role for REITs in
portfolio risk reduction. Despite the contrary evidence of Glascock et al (2000), it is
widely accepted that both REITs/LPTs (indirect property) and direct property warrant
an allocation in mixed-asset portfolios.
21
Studies reveal the improvements of portfolio diversification benefits by including
international property in a mixed-asset portfolio (eg: Bardhan et al, 2008; Hoesli et al,
2004; Bond et al, 2003; Ling and Naranjo, 2002; Conover et al, 2002; Steinert and
Crowe, 2001; Wilson and Okunev, 1996; Wilson and Zurbruegg, 2003; Worzala and
Sirmans, 2003), while Asian property markets have been proven to be more effective
than European property markets in international diversification (Bond et al, 2003).
Studies have shown international diversification benefits by investing into the Asian
property markets (eg: Bond et al, 2003; Garvey et al, 2001; Liow and Adair, 2009),
with property companies in Asia showing long-term diversification benefits (Garvey
et al, 2001). Property performance has also been specifically examined in selected
Asian countries; namely Singapore (eg: Liow, 2000, 2001a, 2001b; Ong, 1994, 1995;
Sing and Low, 2000), Hong Kong (eg: Newell and Chau, 1996; Schwann and Chau,
2005), India (eg: Newell and Kamineni, 2007). Major factors also contributing to this
increased international property exposure have included the need for portfolio
diversification, potential for higher returns, lower cost of capital and favourable
exchange rates (Worzala and Newell, 1997).
Recent research have examined various aspects of property performance in Asia (eg:
Bond et al, 2003; Jin et al, 2007; Liow, 2007, 2008; Liow and Adair, 2009; Liow and
Sim, 2006; Ooi and Liow, 2004; Wilson et al, 2007; Wilson and Zurbruegg, 2004)
Numerous papers have assessed the significance of Asian property companies,
including Liow (2000, 2001, 2008), Liow and Adair (2008), Liow and Sim (2006),
Newell and Chau (1996).
In terms of financial performance, Liang and McIntosh (1998) concludes direct
property should be classified as a different asset class with indirect property. Other
studies (Gyourko and Linneman, 1988; Liu et al, 1990) indicates that direct property
is uncorrelated with indirect property, while other studies found that they are linked to
one another by common property factors (Giliberto, 1990; Liu and Mei, 1992;
Gyourko and Keim, 1992).
22
1.4.2 REITs
1.4.2.1 REITs in US
Previous research on REITs has been extensive. The significant research in US REITs
has been reviewed (Corgel, Mcintosh and Ott, 1995; Zietz, Sirmans and Friday 2003).
It has been divided into 4 distinct categories and several subcategories; 1) REITs as
real estate and common stocks, 2) REIT asset acquisitions and dispositions, 3)
restructuring of REITs and 4) asset market information and REIT prices.
Research have shown that US REITs are viewed as hybrid securities (eg: Liu and
Mei, 1992), and REITs are integrated with the stock market (Li and Wang, 1995; Ling
and Naranjo, 1999). After 1992, Clayton and Mackinnon (2003) found equity REITs
behave more like real estate, although Lee, Lee and Chiang (2005) do not support this
finding. In terms of inflation hedging characteristics, Gyourko and Linneman (1988),
Park, Mullineux and Chew (1990), Chan, Hendershott and Sanders (1990), Liu and
Mei (1992) and Liu, Hartzell and Hoesli (1997) perceived REITs as having poor
ability against inflation. There is an indication of inflation-hedging capabilities in
other countries (Liu, Hartzell and Hoesli, 1997) and in the long-term (Goebel and
Kim, 1989). REITs are also seen as ideal for reducing portfolio risk (Goldstein and
Nelling, 1999).
Researchers such as Smith and Shulman (1976), Titman and Warga (1986), and
Goebel and Kim (1989) also suggested that the performance of REITs was worse
than, or comparable to, the market portfolio. Others such as Burns and Epley (1982),
Kuhle (1987), and Sagalyn (1990) found that REITs outperformed the stock market
portfolio. According to Smith and Shulman (1976), 16 REITs in the period of 1963-
1973 and 102 REITs in the period of 1977-1984 (Kuhle and Walther, 1986)
outperformed the S&P index although in 1974, both research conducted suggested
REITs underperformed the S&P index during the recession period. Mixed results
were also reported by Chan, Hendershott and Sanders (1990), and Howe and Shilling
(1990), while Liu, Hartzell, Grissom and Wylie (1990) investigated the sensitivity of
performance measures to the choice of market portfolios. Subsequently, Han and
Liang (1995) in assessment of the long-term performance of US-REITs from 1970 to
23
1993 found that the performance of survivors-only samples may not be a good
representation of the performance of the overall REIT industry.
Newell and Fife (1995) report that based on the REITs analysed for the period of
1980 to 1995, the success of US REITs was contributed to by the improved
management structures and benefits of the Tax Reform Act 1986 which allows REIT
owners to own and manage properties. In corporate restructuring, mergers provide
significant wealth increases for the acquiring REIT shareholders especially with
similar portfolio of assets (Allen and Sirmans, 1987). In term of dividends, REITs pay
out high dividends than mortgage REITs (Chan, Erickson and Wang, 2003) and other
regular REITs and firms with fluctuating dividends will be penalised (Kallberg, Liu
and Srinivasan, 2003).
1.4.2.2 A-REITs in Australia
LPTs was the previous name for REITs in Australia, which were rebadged as A-
REITs in 2008. Research has shown that LPTs have been a successful indirect
vehicle; largely because of its tax transparency and investor acceptance. LPTs account
for 40% of institutional property exposure compared to 20% in mid to late 1980s.
Newell (2005) observed and documented these past studies and used a variance
decomposition procedure to assess the proportion of LPT volatility that is attributable
to stock, bond and property factors over 1985-2004. The dynamics of this LPT
performance is also assessed. Property is seen to only make a small contribution to
LPT variability, with the contribution of property only marginally increasing in recent
years with the increased maturity of the LPT sector. The importance of stocks in LPT
performance has decreased significantly, with bonds being the most dominant
component in LPT performance in recent years.
The success of A-REITs has also been examined in specific research on performance
analysis issues (Lee et al, 2007, 2008; Newell, 2006; Newell and Peng, 2006; Newell
and Tan, 2003, 2004; Peng, 2004; Tan, 2004a, 2004b; Ratcliffe and Dimovski, 2007),
as well as IPO or financing issues (Chikolwa, 2007, 2008; Dimovski and Brooks,
2006a, 2006b, 2007) and investor acceptance (Newell, 2007a, 2007b, 2008). In terms
24
of fund manager decision making (Newell and McIntosh, 2007; Newell and Peng,
2008; Tan, 2004c, 2004d). According to Ratcliffe and Dimovski (2007), there is an
increase in the market risk profile of LPTs, suggesting an erosion of the defensive
benefits of LPTs against stockmarket volatilities. The study also finds that the degree
of financial leverage has a positive and significant impact on the level of market and
interest rate risk for LPTs. There is also some evidence that the level of diversification
across different property types reduces market risk.
1.4.3 REITs in Asia
Recent years have seen improvement in maturity and transparency in many
international commercial property markets in Asia (Chin and Dent , 2006; Chin et al,
2006; JLL, 2008) which have led to the introduction of Asian REITs in recent years
(Chin et al, 2006; JLL, 2008; Ooi et al, 2006; Lin, 2007). Although research on Asian
property companies has been extensive, research on Asia REITs is limited. Given the
recent establishment of REITs in Asia, only limited research has been conducted in
this increasingly important area; this includes Chiang et al (2008), Kutsuna et al.
(2008), Lin (2007), Ooi et al. (2006), and Quek and Ong (2008); largely concentrating
on developmental and IPO aspects of REITs in the larger REIT markets in Asia;
namely Japan, Singapore and Hong Kong. Ooi and Newell (2005) examined the
different background of Asian REIT markets, while Kutsuna, Dimovski and Brooks
(2008) have assessed the success of the J-REIT IPO market, which have influenced
the legislation and listing of other Asian REIT markets. From 2001 to 2006, the J-
REIT market reported a 0.5% average underpricing, which was not a statistically
different to zero underpricing. Chua and Kitamura (2004) showed that the
development of Japan REITs was supported by the improved transparency of the
property market and the development of non-recourse loans and a low interest rate
which is close to zero. Meanwhile, in Singapore and Korea, higher entrance
thresholds and restrictions on borrowing have constrained their REIT development.
Carr, Dimovski, Newell, Ooi and Yap (2009) assessed the REIT IPO underpricing in
3 Asian countries; Singapore, Hong Kong and Malaysia. The study reveals the mean
25
underpricing for 34 REIT IPOs from 2000-2007 is 5.77%, which is the highest
amongst the published Singapore and Malaysia REIT literature to date.
1.4.4 M-REITs in Malaysia
Earlier research on Malaysian property markets was on property companies, largely
concerning the role of Malaysian property companies in a pan-Asia context (Liow,
2008; Liow & Adair, 2009; Liow & Sim, 2006; Newell, Liow, Ooi & Haihong, 2005),
board composition issues (Shakir, 2008a, 2008b, 2009), capital structure (Ameer,
2007; Mahmood & Zakaria, 2007), sustainability issues (Newell & Manaf, 2008) and
corporate real estate (Ting, Nassir, Newell and Hassan, 2006). Published evidence on
the performance of listed property trusts in Malaysia is very limited. REITs/LPTs
were established in Malaysia in 1990 as property trust funds (PTFs), but were not
successful due to restrictive LPT market conditions and the restrictive Guidelines on
Property Trust Funds (Ting, 2002; Foong, 2005). Kok and Khoo (1995) examined the
performance and the systematic risk of three PTFs, namely Arab Malaysian First
Property Trust, First Malaysia Property Trust and Amanah Harta Tanah PNB, over the
January 1991-April 1995 period. The PTFs did not give consistent performance over
time. The systematic risks of the listed property trusts were low before the period of
over-speculation. However, after the period of over-speculation, the systematic risks
were higher than those of the market. They also discovered that the systematic risk
rankings of the listed property trusts were not consistent over time.
Newell, Ting and Acheampong (2002) analysed the performance of four Malaysian
property trusts, over the 1991-2000 period. Based on a coefficient of variation
measure, they concluded that PTFs in Malaysia underperformed other competing
investment vehicles such as shares. Other factors contributing to this lesser
performance include a low level of institutional investors’ participation (Ting, 2000),
thin volume of trading, too small market capitalisation of LPTs in Malaysia, slow
capital appreciation, poor historical returns of LPTs, low dividend yield compared to
other investment options, low fluctuation in returns, lack of portfolio management
expertise in LPTs and non-performing of the property sector (Lee, Hishamuddin and
Lee, 2005). This has seen the Malaysian government revive their REIT regulations in
26
2005 to stimulate the REIT market in Malaysia, resulting in a surge in the
establishment of REITs since 2005.
An online survey was conducted by Latham Consulting between 20th November 2007
and 16th December 2007. Their survey was distributed to senior, very experienced
and well respected property professionals, ranging from Fund Managers (31%),
Property Professionals (28%), Lawyers/Tax/Accounting professionals (22%) and
Merchant Bankers/Property owners (18%) from 49 companies in 6 key countries. The
sample quality of respondents are exceptional, with 98% having spent their time
residing or working in Asia, while 60% worked with international companies.
According to the report prepared by Trust, the objectives of the survey were to
understand the perceptions and attitudes of key stakeholders in the region of the
relevant REIT markets. They have presented the results from all respondent for their
survey by converting the five-point ratings scale to an index where 100 equals the
average score. From 11 countries, Malaysia has improved its rank from 8 to 7 (5%
increase in index) for ‘Overall Potential’ and from 6 to 5 for ‘Regulatory Support’
(+7%), while maintaining the same rank for ‘Property Market Growth’ (+1%) and
‘REIT Opportunity’ (+7%).
Several factors may have affected the performance and development of REITs in
Malaysia such as market size, advisor type, tax rate, interest rate, inflation rate and
institutional investor participation. In Malaysia, M-REITs have a low level of
institutional investor participation. In particular, the average annual unit holdings of
institutional possession for the sample period of 1989 to 1997 were 3.43% (Ting,
2000). A study conducted by Lee, Hishamuddin and Lee (2005) inspected the lack of
interests from institutional investors to REITs. The study surveyed 21 of 57 senior
fund managers which 10% are from insurance companies, 24% from asset
management and 66% from unit trusts. Results from the study suggest that
institutional investors have poor perception of LPTs in Malaysia. In Malaysia, trading
volume was found as the most important factor for lack of interest in M-REITs
followed by small market size of LPTs, slow capital appreciation, poor historical
returns of LPTs, low dividend yield compared to other investment types, low
fluctuation in returns, lack of management expertise and property sector not
performing well. Yaakop Yahaya Al-Haj and Hashim (2007) support the findings by
27
Lee, Hishamuddin and Lee (2005) which found that trading volume is the most
important factor that attracts institutional investors to invest in REITs.
On the other hand, an analysis by Ting (2000) of the annual stock turnover ratio
demonstrated that the transactional activities of REITs are low. The mean annual
stock turnover ratio of 0.33 for the 1990 to 1997 period contrasts poorly against the
ratio of other sectors of Bursa Malaysia. This shows poor demand and interest from
Malaysian investors on REIT stock. The unstable dividends declared by LPTs may
also have an affect on investor’s lack of interest on LPTs (Ting, 2007). This research
aims to examine the Malaysian REIT market and investors participation which will be
discuss in detail in the next chapters.
The only research specifically on M-REITs assessed the development of Islamic M-
REITs (Osmadi, 2006), and the risk-adjusted performance and portfolio
diversification benefits of Islamic M-REITs in a portfolio over 2006-2008;
particularly contrasting the performance of Islamic M-REITs and conventional M-
REITs over this period and during the global financial crisis (Newell and Osmadi,
2009). Overall, Islamic M-REITs were seen to be a differentiating property
investment product from conventional M-REITs, as well as displaying the defensive
characteristics of low risk levels and portfolio diversification benefits. The robustness
of these characteristics were further enhanced during the GFC (Newell and Osmadi,
2009). Ibrahim and Ong (2008) have assessed Islamic REITs by establishing synthetic
Shariah-compliant US REIT portfolios to assess their risk-adjusted performance
against the broader US REIT sectors and the 'cost' of Shariah-compliance. An
assessment by establishing synthetic Shariah-compliant A-REIT portfolios to assess
their risk-adjusted performance against the broader A-REIT sectors and the 'cost' of
Shariah-compliance is yet to be discovered. In order to understand how well the M-
REIT company performs, an analysis which provide the financial and management
strength statistics and ratios will be conducted as financial strength is one of the most
critical measures of the worth of an investment (the other two are stability and
growth) and buying companies with high management quality (Dynaquest). Greater
detail on these statistics will be analysed further in the following chapters.
28
A survey to assess the importance of factors influencing the future development of M-
REITs was conducted over October – December 2007. The survey addressed a range
of factors influencing the future development of M-REITs. These factors were
identified by a literature review of the development of REITs in Asia (eg: Ooi et al.,
2006) and an assessment of previous REIT surveys conducted by one of the authors.
These factors comprehensively covered the areas of M-REIT structure, tax, regulatory
environment, industry structure, investor acceptance, property market environment,
property performance and individual property-specific issues.
Previous empirical research has generally found no significant differences between
the risk-adjusted performances of Islamic stocks versus non-Islamic stocks. This has
included studies concerning the US (e.g. Girard & Hassan, 2008; Hakim & Rashidian,
2002; Hussein, 2004; Hussein & Omran, 2005), UK (Kok, Giorgioni & Lewis, 2009)
and Malaysia (e.g. Abdullah, Hassan & Mohamad, 2007; Ahmad & Ibrahim, 2002;
Albaity & Ahmad, 2008; Sadeghi, 2008; Yusof & Majid, 2006, 2007). The results of
these Islamic stock studies are consistent with similar studies involving the more
general aspects of the performance of ethical portfolios (e.g. Sauer, 1997) and socially
responsible investing (e.g. Guerard, 1997; Kreander, Gray, Power & Sinclair, 2005).
There was also some evidence of Islamic stocks out-performing conventional stocks
(e.g. Abdullah et al., 2007; Hussein & Omran, 2005); particularly in a bear market.
While specialist stock sub-sectors are often expected to under-perform the overall
market, as they represent a smaller investment universe and have less potential
diversification (Albaity & Ahmad, 2008), these empirical studies showing no
evidence of under-performance by Islamic stocks have major investment implications.
In particular, they highlight the inclusion of shariah investment principles in
investment portfolios as delivering comparable risk-adjusted performance to
conventional investment portfolios. This performance is further reinforced as Islamic
stock portfolios require debt screening to achieve debt levels not exceeding 33%.
29
Research in this area is important as a number of the major global property fund
managers now have significant Asia property portfolios in their global property
mandates. This includes ING, RREEF, UBS, LaSalle and Pramerica, accounting for
over €33 billion in total in property assets under management in Asia (Gray, 2009).
Additionally, the development of REITs have proven to benefit investors in mature
markets (diversification benefits, property development, higher yield and total return),
banks (new IPO business, advisory on acquisitions and new lending opportunities),
property fund managers (expanded range products), other professionals real estate
agents, valuers, accountants (new business opportunities).
In June 2006, Gordon Brown Chancellor of the Exchequer for the UK government
would want to see London become the global centre for Islamic finance by offering
regulatory and tax regime measures to support the creation of products that comply
with Shariah law. The money from Muslim countries is estimated to be somewhere in
the region of 300-400 billion annually, growing at a rate around 15% per year. Angus
McIntosh, Head of research at King Sturge says one of the first REITs in UK may be
a Shariah compliant REIT (Property Australia, December 2006/January 2007). The
increased appetite for property investment by Middle East sovereign wealth funds
(e.g. Abu Dhabi Investment Authority, Kuwait Investment Authority, Qatar
Investment Authority) is expected to be a significant source of capital for Islamic
property funds (Deutsche Bank, 2007; DTZ, 2008; RREEF, 2008).
30
Shariah-compliant property investment in Asia has been identified as having high
potential, with Malaysia clearly seen as the most favoured market due to its political,
institutional and legal frameworks being conducive to Shariah-compliant property
investment (Ibrahim et al., 2009). Cross-border investing is also higher in Malaysia
(49% of 2008 transactions) than for Asia (27%) and globally (31%), with major
global property investors having significant Malaysian commercial properties in their
pan-Asia portfolios (e.g. ING). This sees Malaysia accounting for 0.8% of global
property companies and 1.6% of property companies in Asia (Macquarie Securities,
2009). Malaysia was not as adversely affected by the global financial crisis as most
other Asian markets (Newell and Razali, 2009), as well as Malaysia being one of the
most transparent property markets in Asia, only exceeded by Hong Kong and
Singapore (JLL, 2008). M-REITs is seen to be less impacted from GFC and gave a
total return of -18% in 2008, compared with REITs in Japan (-37%), Singapore
(-56%), US (-38%), Australia (-65%) and UK (-59%) (Macquarie Securities, 2009;
S&P, 2009).
SC have revised guidelines to encourage the growth of M-REITs, enhance their
attractiveness, attract foreign investors and encourage foreign REITs to list in
Malaysia (Securities Commission of Malaysia, 2008). These measures included
increased maximum gearing levels, improved tax arrangements (eg: reduced
withholding tax), improved foreign ownership conditions (eg: 100% of foreign
ownership of funds management), reduced Bumiputra ownership conditions, more
flexibility in property acquisitions, and improved reporting and disclosure (Trust,
2009). Overall, these new guidelines have been seen to be a stimulus to the M-REIT
market; particularly concerning increased foreign involvement (CB Richard Ellis,
2009). This has seen M-REITs rated as the #2 REIT market in Asia for future REIT
opportunity and the #3 REIT market in Asia for overall potential (Trust, 2009).
31
With Malaysia at the centre of Islamic financial services in Asia, Islamic M-REITs
have been shown to be well-suited as an Islamic financial product to achieve listed
property exposure with a number of local players expected to set up M-REITs in the
near future (e.g. Sunway, YTL). The Malaysian government has also refined the M-
REIT model and recently liberalised foreign investment restrictions to increase
overseas investor interest amongst REIT fund managers and those seeking to list as an
M-REIT. CapitaLand (Singapore) and Ezden (Qatar) have already expressed interest
as international players in setting up an M-REIT with improved market conditions in
the future.
In particular, Islamic M-REITs are a part of the Malaysian government's 10-year
Capital Markets Masterplan to enhance the international competitiveness of the
Malaysian capital markets (Trust, 2008). This has already seen Middle East investor
participation in M-REITs (e.g. Kuwait Global Investment House acquired a 4% stake
in Amanahraya REIT) (CBRE, 2009), with increased overseas Islamic bank activity
in M-REITs expected. At a local level, the major Malaysian pension fund (Employees
Provident Fund) currently has over RM7 billion managed by Islamic fund managers,
with this EPF fund now potentially able to effectively access the Shariah-compliant
Islamic M-REIT market. This demand is further reinforced by Islamic banking being
expected to account for 50-60% of the total savings of the world's 1.2 billion Muslims
by 2015 (RICS, 2006), as well as the continued active property investment role by
many of the Middle East sovereign wealth funds. This capital availability is also
expected to see strong demand for Islamic property investment opportunities in
countries with significant Muslim populations in Asia (e.g. Indonesia, India) and
Europe (e.g. Turkey) (RREEF, 2008).
32
This research should also open an opportunity for the the development of Waqaf
REIT as an ethical investment. Waqaf is a form of islamic charity that has been going
around globally in Muslim countries i.e Singapore and Indonesia. An example of
Waqaf in Malaysia is when recently JohorCorp donated shares from its land
development for their Waqaf Corporate. Since land is a scarce resource, it is best to
make full use of unused land to gain profit for further use in other charities.
Islamic REIT as one method of ethical investing (other than Green Buildings etc) may
open the opportunity to the development of Waqaf REIT as another form of ethical
investing. REIT allows investors to own a portion of a property without the issue of
managing the properties themselves. Islamic REITs have a similar structure but also
allow muslim investors to own a portion of 'halal' income producing properties as
stated through the Islamic REIT guidelines. Although a Waqaf REIT has not yet been
developed, Waqaf REIT is possibly an act where a person donates their land to be
developed and managed by a REIT company for the benefit of mankind. The land
donated for waqaf to can be used to build facilities for health, religious and
educational purposes to develop the economy and improve the welfare of society.
33
1.5 Organisation of the Thesis
The organization of this thesis is as follows:
Chapter 1: Introduction
In chapter 1, the general introduction focusing on the objectives and organisation of
the thesis framework will be made. This also includes a brief discussion on the overall
context on the significance of direct property and indirect property and a general
overview on the significance of Malaysian commercial property markets and M-
REITs. This chapter will also provide the literature review on general property
portfolio issues and REITs. Whilst a global context is provided, it will focus more on
the literature concerning REITs in Asia and specifically in Malaysia.
Chapter 2: Global Real Estate Investment Trusts and Property Trust
Vehicles
Chapter 2 will provide details of the global REIT status and details of the
development of specific REIT markets. Particular focus will be on the Asian REIT
market.
Chapter 3: Significance of Malaysian Commercial Property Markets
Chapter 3 will focus on the Malaysian commercial property market and Malaysian
REIT market. This will outline the Malaysian property market universe (size, property
ownership structure, direct property, indirect property, global investor interest),
economic activity and population. Malaysian commercial property in an Asia context
will also be discussed. An extended discussion on property ownership structures will
be presented. The subject matter includes reviewing Malaysian property companies,
listed property companies, Malaysian Property Trust Funds and Malaysian Real
Estate Investment Trusts (structure, characteristics, comparison, performance, issues
and future opportunities). Case studies of all 13 M-REITs (AHP, AHP2, Axis REIT,
Starhill REIT, UOA REIT, Tower REIT, Hektar REIT, AmFirst REIT, Quill Capita
Trust, Amanahraya REIT, Atrium REIT, Al-‘Aqar KPJ REIT, Al-Hadharah Boustead
REIT), which include overall M-REIT portfolio diversification by type and region,
operating platform and financial analysis will also be detailed in Appendix VII. A
34
section on the introduction to Islamic finance and Islamic REITs will also be included
in this chapter. This is essential for the understanding of the background and
framework of Islamic law in finance and it’s growing market and the establishment of
Islamic M-REITs.
Chapter 4: Methodology
Chapter 4 will focus on details of the methodology being used in the thesis and on the
methodology used for the M-REIT index development. This will comprise both the
conventional M-REIT index and Islamic M-REIT index. The second section of this
chapter will explain the methods used to analyse the performance of M-REITs and the
other asset classes, while the third section will discuss the methods in analysing the
M-REIT survey conducted. Data limitations will also be highlighted.
Chapter 5: M-REIT Performance Analysis
Chapter 5 will examine the M-REIT performance analysis which includes risk-
adjusted returns and portfolio diversification benefits for overall and conventional M-
REIT analysis from August 2005 to December 2008 and for Islamic M-REIT analysis
from August 2006 to December 2008. The significance of M-REITs and Islamic M-
REITs in a mixed-asset portfolio will also be discussed.
Chapter 6: M-REIT Surveys
Chapter 6 will focus on the survey results that have been generated from interviews
and distribution of questionnaires to Malaysian REIT managers, property advisors and
fund managers in Malaysia. Comparison between the survey results of these three
designated property groupings will be analysed and the investor implications will be
highlighted.

35
Chapter 7: Summary
Chapter 7 will state conclusions and summarize the contributions of this research, as
well as identifying the limitations of this research and future research opportunities
regarding M-REITs.
36
CHAPTER 2
GLOBAL REAL ESTATE INVESTMENT TRUSTS AND
PROPERTY TRUST VEHICLES
2.1 Global Status of REITs and Property Trust Vehicles
A REIT is a listed company which largely manage income-producing real estate and
allows investors to have a partial interest in the property via this listed entity. US-
REITs and A-REITs are the most developed REIT markets globally. Although
property companies have been significant in the Asian stock market, REITs are
gaining popularity in Asia with increased growth of Asian REITs and increased
attractiveness in tax structure among individual and institutional investors. As such,
this chapter will provide details of the global REIT status and details of the
development of specific REIT markets. Particular focus will be on the Asian REIT
market. The impact of the Global Financial Crisis may have dampened the growth and
performances of the global REIT sector (see Table 2.1) but a total of 78 cities around
the globe recorded $1 billion or more commercial property sales in 2008. Malaysia
emerged as one of the countries in Southeast Asia with a $1 billion market (Real
Capital Analytics, Feb 2009). Although the Global Financial Crisis sees a decreasing
growth of REITs for the first half of 2008 in several countries, several countries in
Asia including Malaysia have increased its number of REITs from 11 in 2006 to 13 in
2008.
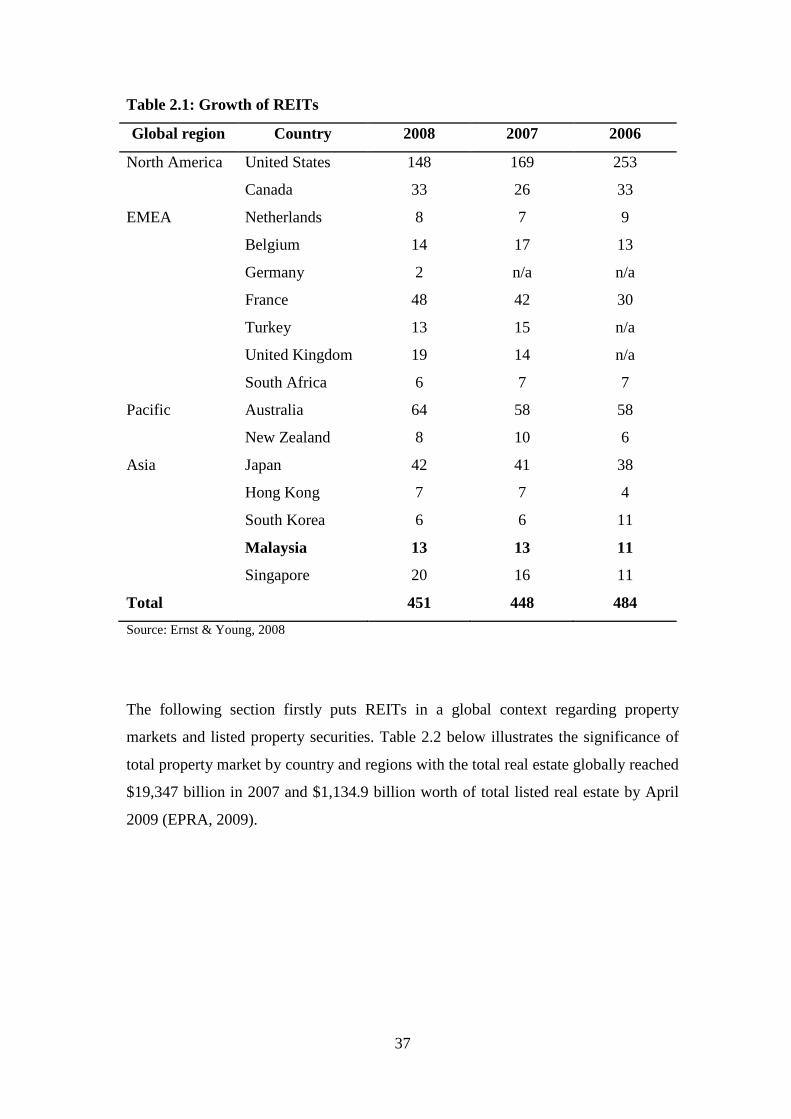
37
Table 2.1: Growth of REITs
Global region Country 2008 2007 2006
North America United States 148 169 253
Canada 33 26 33
EMEA Netherlands 8 7 9
Belgium 14 17 13
Germany 2 n/a n/a
France 48 42 30
Turkey 13 15 n/a
United Kingdom 19 14 n/a
South Africa 6 7 7
Pacific Australia 64 58 58
New Zealand 8 10 6
Asia Japan 42 41 38
Hong Kong 7 7 4
South Korea 6 6 11
Malaysia 13 13 11
Singapore 20 16 11
Total 451 448 484
Source: Ernst & Young, 2008
The following section firstly puts REITs in a global context regarding property
markets and listed property securities. Table 2.2 below illustrates the significance of
total property market by country and regions with the total real estate globally reached
$19,347 billion in 2007 and $1,134.9 billion worth of total listed real estate by April
2009 (EPRA, 2009).
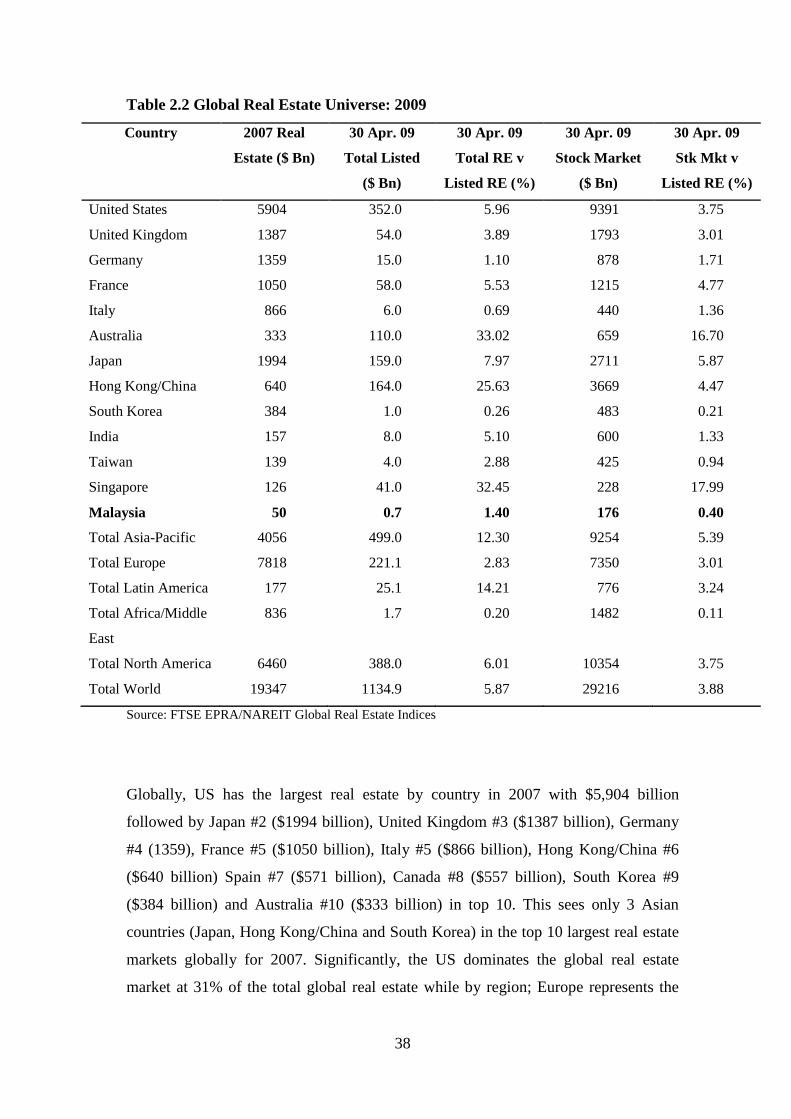
38
Table 2.2 Global Real Estate Universe: 2009
Country 2007 Real
Estate ($ Bn)
30 Apr. 09
Total Listed
($ Bn)
30 Apr. 09
Total RE v
Listed RE (%)
30 Apr. 09
Stock Market
($ Bn)
30 Apr. 09
Stk Mkt v
Listed RE (%)
United States 5904 352.0 5.96 9391 3.75
United Kingdom 1387 54.0 3.89 1793 3.01
Germany 1359 15.0 1.10 878 1.71
France 1050 58.0 5.53 1215 4.77
Italy 866 6.0 0.69 440 1.36
Australia 333 110.0 33.02 659 16.70
Japan 1994 159.0 7.97 2711 5.87
Hong Kong/China 640 164.0 25.63 3669 4.47
South Korea 384 1.0 0.26 483 0.21
India 157 8.0 5.10 600 1.33
Taiwan 139 4.0 2.88 425 0.94
Singapore 126 41.0 32.45 228 17.99
Malaysia 50 0.7 1.40 176 0.40
Total Asia-Pacific 4056 499.0 12.30 9254 5.39
Total Europe 7818 221.1 2.83 7350 3.01
Total Latin America 177 25.1 14.21 776 3.24
Total Africa/Middle
East
836 1.7 0.20 1482 0.11
Total North America 6460 388.0 6.01 10354 3.75
Total World 19347 1134.9 5.87 29216 3.88
Source: FTSE EPRA/NAREIT Global Real Estate Indices
Globally, US has the largest real estate by country in 2007 with $5,904 billion
followed by Japan #2 ($1994 billion), United Kingdom #3 ($1387 billion), Germany
#4 (1359), France #5 ($1050 billion), Italy #5 ($866 billion), Hong Kong/China #6
($640 billion) Spain #7 ($571 billion), Canada #8 ($557 billion), South Korea #9
($384 billion) and Australia #10 ($333 billion) in top 10. This sees only 3 Asian
countries (Japan, Hong Kong/China and South Korea) in the top 10 largest real estate
markets globally for 2007. Significantly, the US dominates the global real estate
market at 31% of the total global real estate while by region; Europe represents the
39
largest real estate market globally with 40%. Within Europe, the four largest markets,
Germany, UK, France and Italy represents 29% of the total global real estate market.
In the top 10 largest real estate among Asian countries, Japan has the largest real
estate in 2007 with $1994 billion followed by Hong Kong/China #2 ($640 billion),
South Korea #3 ($384 billion), India #4 ($157 billion), Taiwan #5 ($139 billion),
Singapore #6 ($126 billion), Indonesia #7 ($70 billion), Thailand #8 ($52 billion),
Malaysia #9 ($50 billion) and Philippines #10 ($23 billion). Asia Pacific represents
30% of the global real estate market with Asia Developed excluding Australia
represents 14.3% of the global real estate market. Malaysia represents 0.3% of the
global real estate market.
Table 2.3 shows the annualised returns for listed property companies by country as of
December 2008. Overall, the REIT market generates negative return for 2008. For the
2008 returns, the global REIT market generates a negative return of -49% with
Norway (-92%) having the worst performed property market among developed
countries. Focusing in Asia, Thailand generates -57% return followed by
Taiwan (-41%), Malaysia (-41%), Hong Kong (-54%), Japan (-34%) and Singapore
having the lowest return of -57%.
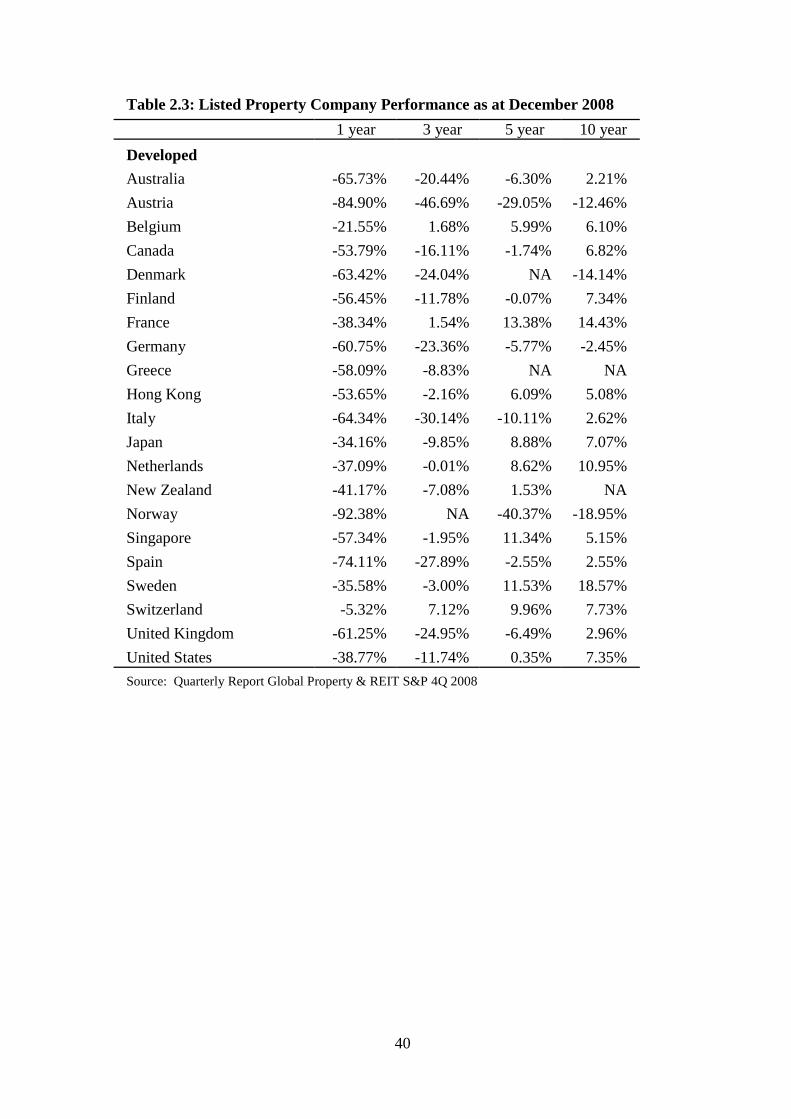
40
Table 2.3: Listed Property Company Performance as at December 2008
1 year 3 year 5 year 10 year
Developed
Australia -65.73% -20.44% -6.30% 2.21%
Austria -84.90% -46.69% -29.05% -12.46%
Belgium -21.55% 1.68% 5.99% 6.10%
Canada -53.79% -16.11% -1.74% 6.82%
Denmark -63.42% -24.04% NA -14.14%
Finland -56.45% -11.78% -0.07% 7.34%
France -38.34% 1.54% 13.38% 14.43%
Germany -60.75% -23.36% -5.77% -2.45%
Greece -58.09% -8.83% NA NA
Hong Kong -53.65% -2.16% 6.09% 5.08%
Italy -64.34% -30.14% -10.11% 2.62%
Japan -34.16% -9.85% 8.88% 7.07%
Netherlands -37.09% -0.01% 8.62% 10.95%
New Zealand -41.17% -7.08% 1.53% NA
Norway -92.38% NA -40.37% -18.95%
Singapore -57.34% -1.95% 11.34% 5.15%
Spain -74.11% -27.89% -2.55% 2.55%
Sweden -35.58% -3.00% 11.53% 18.57%
Switzerland -5.32% 7.12% 9.96% 7.73%
United Kingdom -61.25% -24.95% -6.49% 2.96%
United States -38.77% -11.74% 0.35% 7.35%
Source: Quarterly Report Global Property & REIT S&P 4Q 2008
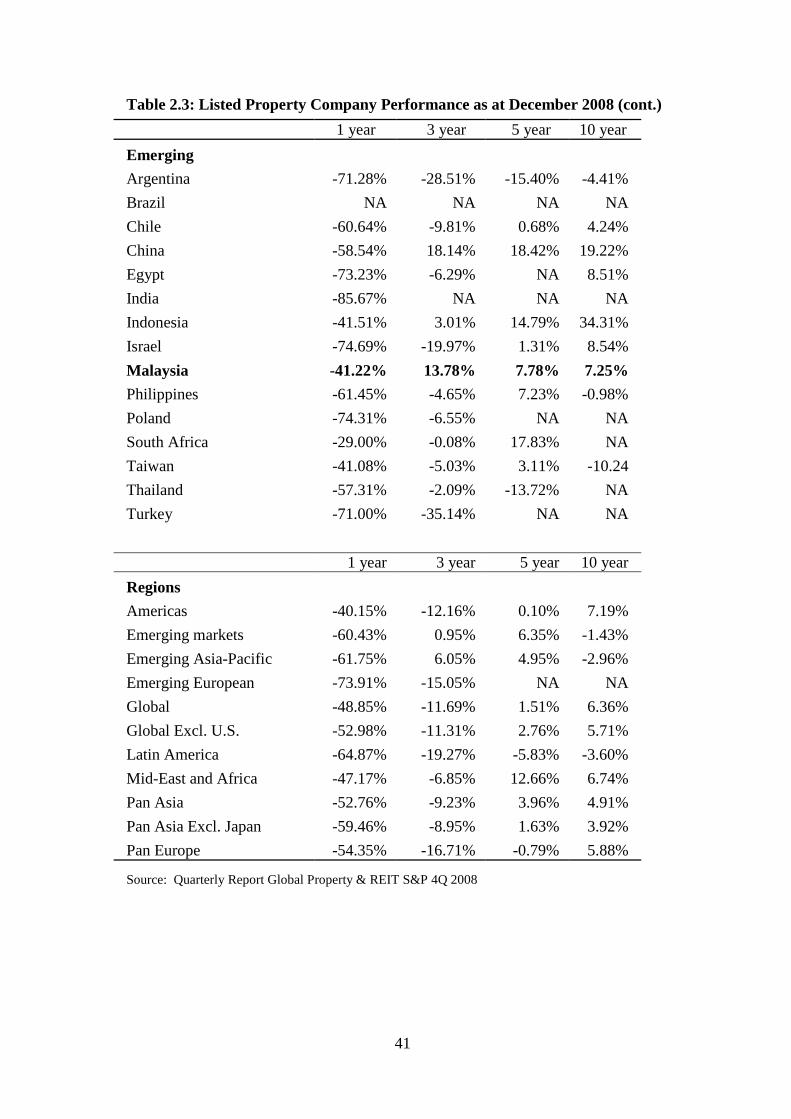
41
Table 2.3: Listed Property Company Performance as at December 2008 (cont.)
Source: Quarterly Report Global Property & REIT S&P 4Q 2008
1 year 3 year 5 year 10 year
Emerging
Argentina -71.28% -28.51% -15.40% -4.41%
Brazil NA NA NA NA
Chile -60.64% -9.81% 0.68% 4.24%
China -58.54% 18.14% 18.42% 19.22%
Egypt -73.23% -6.29% NA 8.51%
India -85.67% NA NA NA
Indonesia -41.51% 3.01% 14.79% 34.31%
Israel -74.69% -19.97% 1.31% 8.54%
Malaysia -41.22% 13.78% 7.78% 7.25%
Philippines -61.45% -4.65% 7.23% -0.98%
Poland -74.31% -6.55% NA NA
South Africa -29.00% -0.08% 17.83% NA
Taiwan -41.08% -5.03% 3.11% -10.24
Thailand -57.31% -2.09% -13.72% NA
Turkey -71.00% -35.14% NA NA
1 year 3 year 5 year 10 year
Regions
Americas -40.15% -12.16% 0.10% 7.19%
Emerging markets -60.43% 0.95% 6.35% -1.43%
Emerging Asia-Pacific -61.75% 6.05% 4.95% -2.96%
Emerging European -73.91% -15.05% NA NA
Global -48.85% -11.69% 1.51% 6.36%
Global Excl. U.S. -52.98% -11.31% 2.76% 5.71%
Latin America -64.87% -19.27% -5.83% -3.60%
Mid-East and Africa -47.17% -6.85% 12.66% 6.74%
Pan Asia -52.76% -9.23% 3.96% 4.91%
Pan Asia Excl. Japan -59.46% -8.95% 1.63% 3.92%
Pan Europe -54.35% -16.71% -0.79% 5.88%
42
For the top 10 global listed real estate markets by country in April 2009, US has the
largest listed real estate market with $352 billion followed by Hong Kong/China #2
($164 billion), Japan #3 ($159 billion), Australia #4 ($110 billion), France #5 ($58
billion), United Kingdom #6 ($54 billion), Singapore #7 ($41 billion), Canada #8
($36 billion), Spain #9 ($18 billion) and Germany #10 ($15 billion). Significantly, the
US dominates the global listed real estate market at 31%.
In the top 10 largest real estate markets listed among Asian countries in April 2009,
Hong Kong/China has the largest real estate listed with $164 billion followed by
Japan #2 ($159 billion), Singapore #3 ($41 billion), India #4 ($8 billion) while
Taiwan, Thailand and Philippines at #5 with $4 billion followed by South Korea
($1 billion), Malaysia ($0.7 billion) and Indonesia ($0.1 billion). By region; Asia
Pacific represents the largest listed real estate market globally with 44% with Asia
Developed excluding Australia represents 32% of the global listed real estate market.
Malaysia represents 0.06% of the global listed real estate market.
Table 2.4 shows the significance of listed property securities markets in Asia. By
December 2008, the global property securitisation had a market capitalisation of £653
billion comprising of 2068 companies in 66 countries. The global status of property
securities are dominated by Asia developed (£221.5 billion), followed by Americas
developed (£166.3 billion), Europe developed (£101.4 billion), Asia emerging (£70.4
billion), Middle East & Africa emerging (£46.6 billion), Oceania developed (£31.4
billion), Americas emerging (£10.0 billion) and Europe emerging (£5.8 billion).
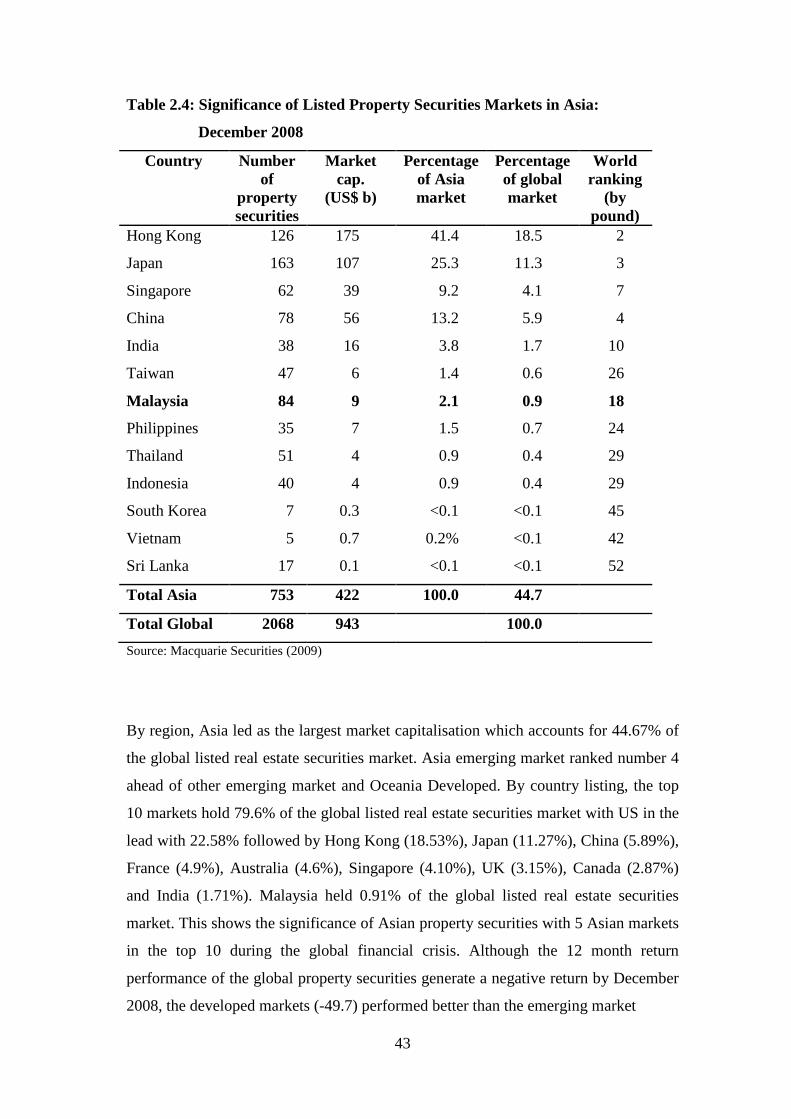
43
Table 2.4: Significance of Listed Property Securities Markets in Asia:
December 2008
Country Numberof
propertysecurities
Marketcap.
(US$ b)
Percentageof Asiamarket
Percentageof globalmarket
Worldranking
(bypound)
Hong Kong 126 175 41.4 18.5 2
Japan 163 107 25.3 11.3 3
Singapore 62 39 9.2 4.1 7
China 78 56 13.2 5.9 4
India 38 16 3.8 1.7 10
Taiwan 47 6 1.4 0.6 26
Malaysia 84 9 2.1 0.9 18
Philippines 35 7 1.5 0.7 24
Thailand 51 4 0.9 0.4 29
Indonesia 40 4 0.9 0.4 29
South Korea 7 0.3 <0.1 <0.1 45
Vietnam 5 0.7 0.2% <0.1 42
Sri Lanka 17 0.1 <0.1 <0.1 52
Total Asia 753 422 100.0 44.7
Total Global 2068 943 100.0
Source: Macquarie Securities (2009)
By region, Asia led as the largest market capitalisation which accounts for 44.67% of
the global listed real estate securities market. Asia emerging market ranked number 4
ahead of other emerging market and Oceania Developed. By country listing, the top
10 markets hold 79.6% of the global listed real estate securities market with US in the
lead with 22.58% followed by Hong Kong (18.53%), Japan (11.27%), China (5.89%),
France (4.9%), Australia (4.6%), Singapore (4.10%), UK (3.15%), Canada (2.87%)
and India (1.71%). Malaysia held 0.91% of the global listed real estate securities
market. This shows the significance of Asian property securities with 5 Asian markets
in the top 10 during the global financial crisis. Although the 12 month return
performance of the global property securities generate a negative return by December
2008, the developed markets (-49.7) performed better than the emerging market
44
(-65.2%), with Asia Developed (-54.8) performed better than Oceania Developed
(-55.3%) and Asia Emerging (-66.8%) performed better than Europe Emerging
(-82.6%).
By December 2008, the market capitalisation for REITs globally have reached £260
billion with 509 REITs in 21 countries with the largest region Americas (54.6%)
followed by Europe (21.2%), Asia (12.5%), Oceania (11.1%) and Middle East and
Africa (0.7%). In comparison to regions, Asia has seen increased maturity and has
seen as a large component which accounts for US$47.1 billion above; Australia
(US$40 billion). Table 2.5 shows the global REIT market by end of December 2008.
Amongst the global REIT markets, US have the largest REIT market in the world
with Hong Kong, Japan, Singapore and being the only Asian REIT markets in top 10.
The US has the largest percentage of the global REIT market with 52%, followed by
Europe (21%), Asia (13%) and Australia (11%). The top 10 global REIT markets are:
#1: US #2: France #3: Australia #4: Japan #5: UK
#6: Canada #7: Singapore #8: Netherlands #9: Hong Kong
#10: Belgium
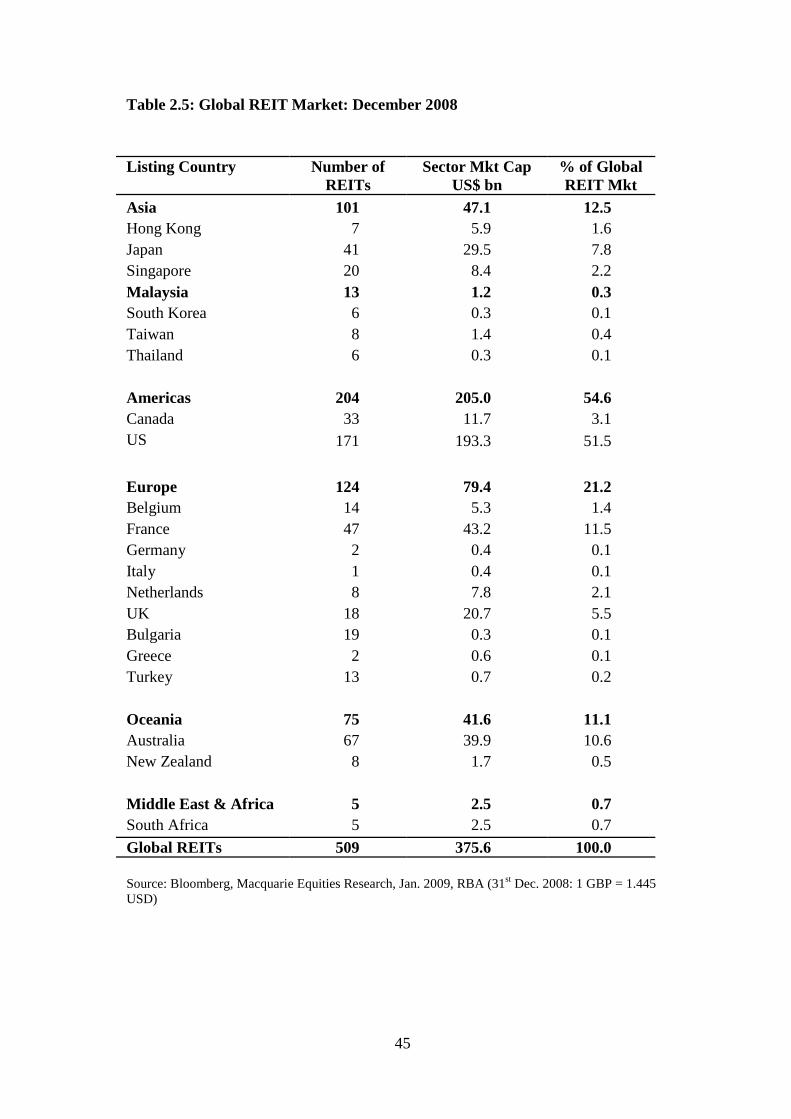
45
Table 2.5: Global REIT Market: December 2008
Source: Bloomberg, Macquarie Equities Research, Jan. 2009, RBA (31st Dec. 2008: 1 GBP = 1.445USD)
Listing Country Number ofREITs
Sector Mkt CapUS$ bn
% of GlobalREIT Mkt
Asia 101 47.1 12.5
Hong Kong 7 5.9 1.6
Japan 41 29.5 7.8
Singapore 20 8.4 2.2
Malaysia 13 1.2 0.3
South Korea 6 0.3 0.1
Taiwan 8 1.4 0.4
Thailand 6 0.3 0.1
Americas 204 205.0 54.6
Canada 33 11.7 3.1
US 171 193.3 51.5
Europe 124 79.4 21.2
Belgium 14 5.3 1.4
France 47 43.2 11.5
Germany 2 0.4 0.1
Italy 1 0.4 0.1
Netherlands 8 7.8 2.1
UK 18 20.7 5.5
Bulgaria 19 0.3 0.1
Greece 2 0.6 0.1
Turkey 13 0.7 0.2
Oceania 75 41.6 11.1
Australia 67 39.9 10.6
New Zealand 8 1.7 0.5
Middle East & Africa 5 2.5 0.7
South Africa 5 2.5 0.7
Global REITs 509 375.6 100.0
46
Table 2.6 shows the top 50 largest REITs globally. At December 2008, Westfield
Group from Australia has the largest REIT globally, although by country, the US
dominates the top 10 of the largest REITs globally with seven US-REITs. The other
three REITs which made it in the top 10 are Unibail-Rodamco from France (#3) and
Land Securities Group PLC from UK (#10). Overall, there are 27 US-REITs in the
top 50 of the largest REITs globally with a market cap of US$127,943 million which
accounts for 56% of the largest REITs globally in the top 50.
There were only five A-REITs in the top 50 of the largest REITs globally at
December 2008, namely Westfield (#1), Stockland (#16), CFS Retail (#28), GPT
(#31) and Dexus (#44). The total market capitalisation for all A-REITs in the top 50
of the largest REITs globally is US$17,123 million which accounts for 7.5% of the
largest REITs globally in the top 50.
In Europe, only REITs from UK, France and Netherlands made it in the top 50 of the
largest REITs globally at December 2008. There were only four UK-REITs in the top
50 of the largest REITs globally at December 2008, namely Land Securities Group
PLC from UK (#10), British Land Co PLC (#19), Liberty International PLC (#33),
Hammerson Plc (#40). The total market capitalisation for all UK-REITs in the top 50
of the largest REITs globally is US$15,012 million which accounts for 6.6% of the
largest REITs globally in the top 50. Meanwhile, there were only seven REITs from
France in the top 50 of the largest REITs globally at December 2008, namely Unibail-
Rodamco (#3), Gecina SA (#18), ICADE (#20), Klepierre (#21), Fonciere Des
Regions (#32), Mercialys (#38) and Altarea (#47). The total market capitalisation for
all REITs from France in the top 50 of the largest REITs globally is US$31,429
million which accounts for 13.7% of the largest REITs globally in the top 50. There
were only 2 REITs from Netherlands in the top 50 of the largest REITs globally at
December 2008, namely Corio NV (#30) and Wereldhave NV (#50). The total market
capitalisation for all REITs from Netherlands in the top 50 of the largest REITs
globally is US$4,868 million which accounts for 2.1% of the largest REIT globally in
the top 50.
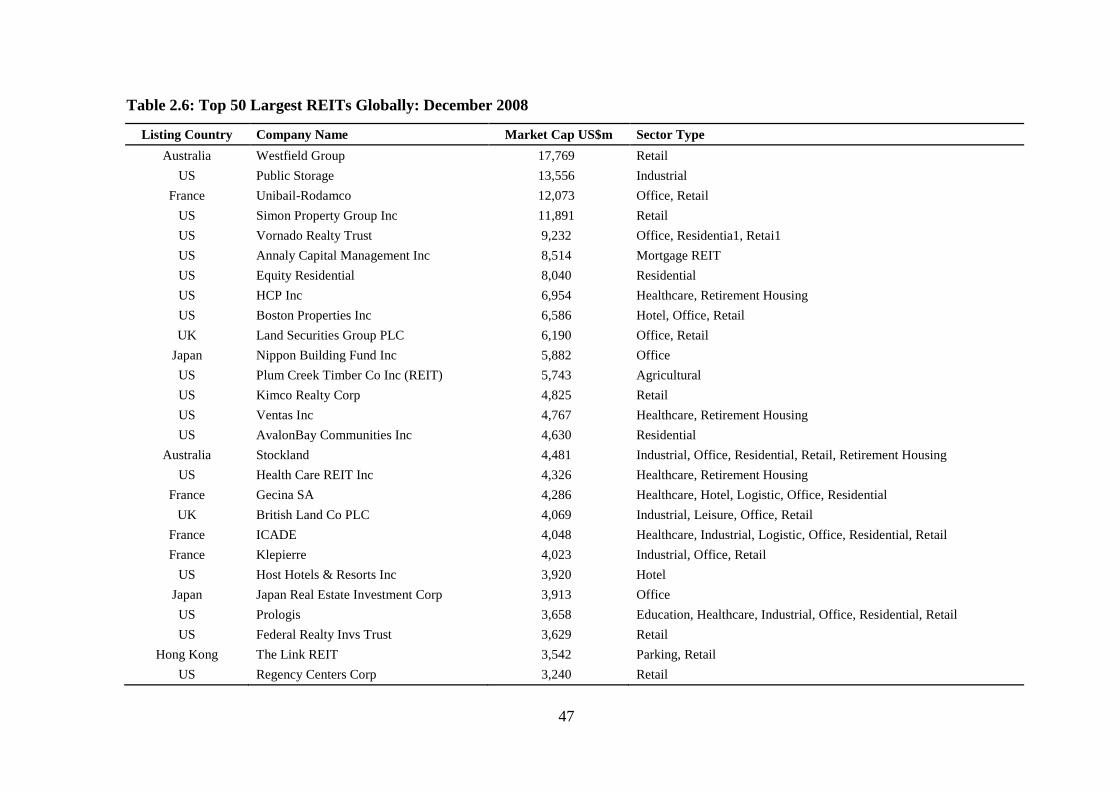
47
Table 2.6: Top 50 Largest REITs Globally: December 2008
Listing Country Company Name Market Cap US$m Sector Type
Australia Westfield Group 17,769 Retail
US Public Storage 13,556 Industrial
France Unibail-Rodamco 12,073 Office, Retail
US Simon Property Group Inc 11,891 Retail
US Vornado Realty Trust 9,232 Office, Residentia1, Retai1
US Annaly Capital Management Inc 8,514 Mortgage REIT
US Equity Residential 8,040 Residential
US HCP Inc 6,954 Healthcare, Retirement Housing
US Boston Properties Inc 6,586 Hotel, Office, Retail
UK Land Securities Group PLC 6,190 Office, Retail
Japan Nippon Building Fund Inc 5,882 Office
US Plum Creek Timber Co Inc (REIT) 5,743 Agricultural
US Kimco Realty Corp 4,825 Retail
US Ventas Inc 4,767 Healthcare, Retirement Housing
US AvalonBay Communities Inc 4,630 Residential
Australia Stockland 4,481 Industrial, Office, Residential, Retail, Retirement Housing
US Health Care REIT Inc 4,326 Healthcare, Retirement Housing
France Gecina SA 4,286 Healthcare, Hotel, Logistic, Office, Residential
UK British Land Co PLC 4,069 Industrial, Leisure, Office, Retail
France ICADE 4,048 Healthcare, Industrial, Logistic, Office, Residential, Retail
France Klepierre 4,023 Industrial, Office, Retail
US Host Hotels & Resorts Inc 3,920 Hotel
Japan Japan Real Estate Investment Corp 3,913 Office
US Prologis 3,658 Education, Healthcare, Industrial, Office, Residential, Retail
US Federal Realty Invs Trust 3,629 Retail
Hong Kong The Link REIT 3,542 Parking, Retail
US Regency Centers Corp 3,240 Retail
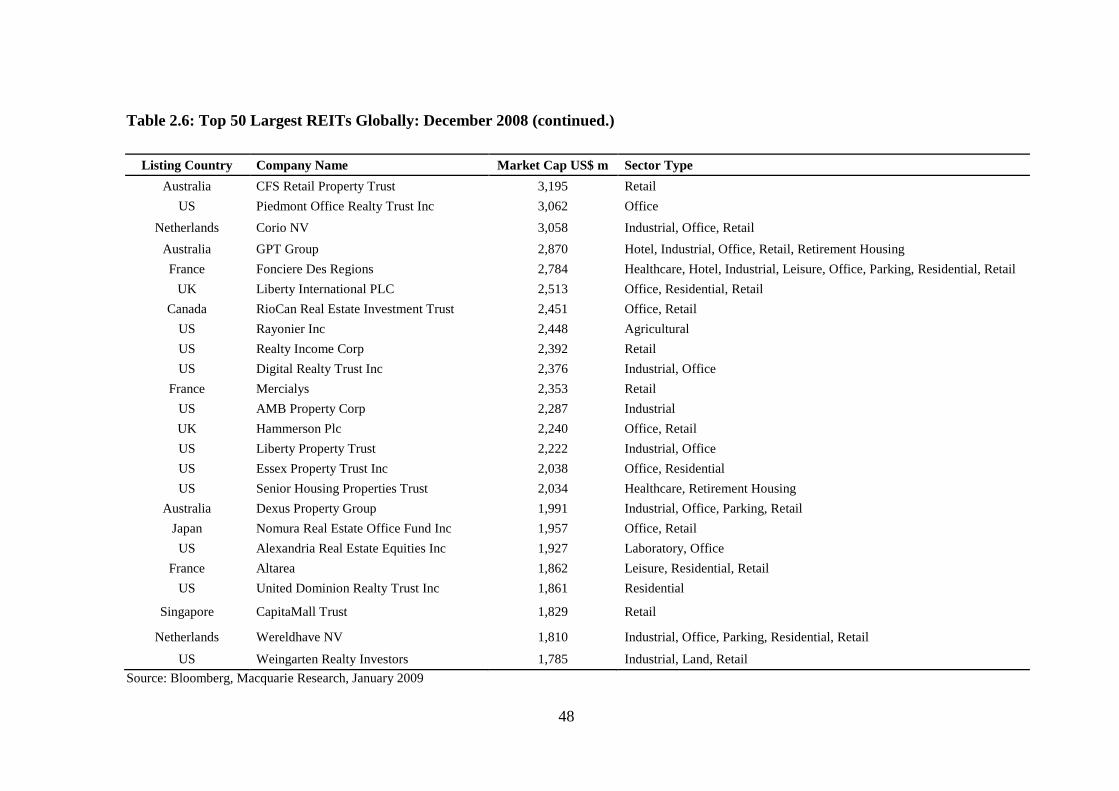
48
Table 2.6: Top 50 Largest REITs Globally: December 2008 (continued.)
Listing Country Company Name Market Cap US$ m Sector Type
Australia CFS Retail Property Trust 3,195 Retail
US Piedmont Office Realty Trust Inc 3,062 Office
Netherlands Corio NV 3,058 Industrial, Office, Retail
Australia GPT Group 2,870 Hotel, Industrial, Office, Retail, Retirement Housing
France Fonciere Des Regions 2,784 Healthcare, Hotel, Industrial, Leisure, Office, Parking, Residential, Retail
UK Liberty International PLC 2,513 Office, Residential, Retail
Canada RioCan Real Estate Investment Trust 2,451 Office, Retail
US Rayonier Inc 2,448 Agricultural
US Realty Income Corp 2,392 Retail
US Digital Realty Trust Inc 2,376 Industrial, Office
France Mercialys 2,353 Retail
US AMB Property Corp 2,287 Industrial
UK Hammerson Plc 2,240 Office, Retail
US Liberty Property Trust 2,222 Industrial, Office
US Essex Property Trust Inc 2,038 Office, Residential
US Senior Housing Properties Trust 2,034 Healthcare, Retirement Housing
Australia Dexus Property Group 1,991 Industrial, Office, Parking, Retail
Japan Nomura Real Estate Office Fund Inc 1,957 Office, Retail
US Alexandria Real Estate Equities Inc 1,927 Laboratory, Office
France Altarea 1,862 Leisure, Residential, Retail
US United Dominion Realty Trust Inc 1,861 Residential
Singapore CapitaMall Trust 1,829 Retail
Netherlands Wereldhave NV 1,810 Industrial, Office, Parking, Residential, Retail
US Weingarten Realty Investors 1,785 Industrial, Land, Retail
Source: Bloomberg, Macquarie Research, January 2009
49
In Asia, only REITs from Japan, Hong Kong and Singapore made it in the top 50 of
the largest REITs globally at December 2008. There were only three J-REITs in the
top 50 of the largest REITs globally at December 2008, namely Nippon Building
Fund Inc (#11), Japan Real Estate Investment Corp (#23) and Nomura Real Estate
Office Fund Inc (#45). The total market capitalisation for all J-REITs in the top 50 of
the largest REITs globally is US$11,752 million which accounts for 5.1% of the
largest REITs globally in the top 50.
The Link REIT (#26) is the only HK-REIT in the top 50 of the largest REITs globally
at December 2008, with a total market capitalisation of US$3,542 million which
accounts for 1.5% of the largest REITs globally in the top 50 while CapitaMall Trust
(#49) is the only S-REIT in the top 50 of the largest REITs globally at December
2008, with a total market capitalisation of US$1,829 million which accounts for 0.8%
of the largest REIT globally in the top 50. There are no M-REITs in the global top 50
REITs.
Table 2.7 shows the impact of the Global Financial Crisis in 2008 REIT returns by
country. The performance metrics are expressed in total returns and for the 1-, 3-, 5-
and 10–year performance, are all expressed in annual return. Overall, the REIT
market generates negative returns for 2008. For the 2008 returns, the global REIT
market generated a negative return of -45%, with Australia having the lowest return of
-65% followed by UK (-59%), Canada (-49%), US (-38%), France (-37%) and
Netherlands (-35%). Focusing on Asia, Thailand generated 0% return followed by
Taiwan (-9%), Malaysia (-18%), Hong Kong (-29%), South Korea (-36%), Japan
(-37%) and Singapore having the lowest return of -56%.
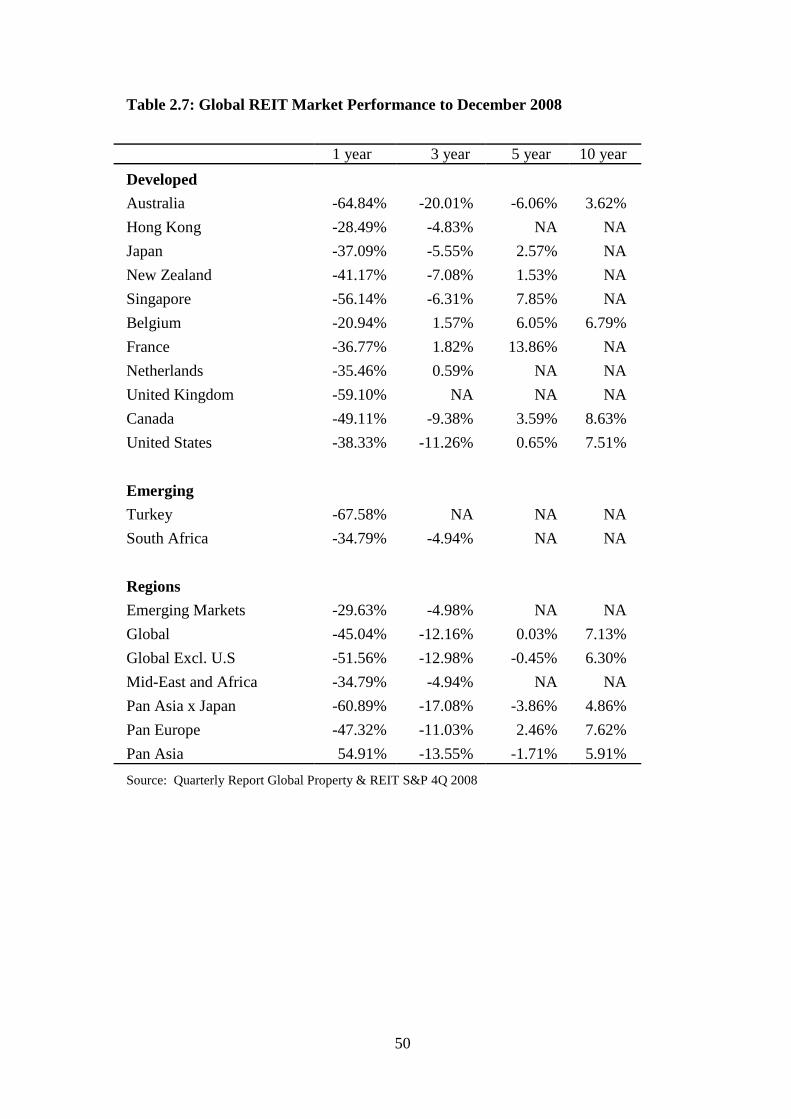
50
Table 2.7: Global REIT Market Performance to December 2008
Source: Quarterly Report Global Property & REIT S&P 4Q 2008
1 year 3 year 5 year 10 year
Developed
Australia -64.84% -20.01% -6.06% 3.62%
Hong Kong -28.49% -4.83% NA NA
Japan -37.09% -5.55% 2.57% NA
New Zealand -41.17% -7.08% 1.53% NA
Singapore -56.14% -6.31% 7.85% NA
Belgium -20.94% 1.57% 6.05% 6.79%
France -36.77% 1.82% 13.86% NA
Netherlands -35.46% 0.59% NA NA
United Kingdom -59.10% NA NA NA
Canada -49.11% -9.38% 3.59% 8.63%
United States -38.33% -11.26% 0.65% 7.51%
Emerging
Turkey -67.58% NA NA NA
South Africa -34.79% -4.94% NA NA
Regions
Emerging Markets -29.63% -4.98% NA NA
Global -45.04% -12.16% 0.03% 7.13%
Global Excl. U.S -51.56% -12.98% -0.45% 6.30%
Mid-East and Africa -34.79% -4.94% NA NA
Pan Asia x Japan -60.89% -17.08% -3.86% 4.86%
Pan Europe -47.32% -11.03% 2.46% 7.62%
Pan Asia 54.91% -13.55% -1.71% 5.91%
51
Table 2.8 shows list of Asian REITs ranked by market capitalisation with Nippon
Building Fund Inc. from Japan having the highest market capitalisation US$5.772
billion and UOB Apartment Property I having the lowest market capitalisation of
US$0.01 billion. By December 2008, the total number of Asian REITs increased to
115 with a market capitalisation of US$48 billion which accounts for 12.5% of the
global REIT. Only 5 Asian REITs made it in the top 50 of the largest REIT globally;
namely Nippon Building Fund Inc (#11), Japan Real Estate Investment Corporation
(#23), Link Reit (#26), Nomura Real Estate Office Fund (#45) and Capitamall Trust
(#49). By region, the Asia Developed REITs dominate the Asian REIT market with
US$44 billion in market capitalisation, accounting for 11.6% of the global REIT
market and 93% of the Asian REIT market, while Asia Emerging REITs are a lesser
components of the Asian REIT market with US$4 billion in market capitalisation,
accounting for 0.9% of the global REIT market and 7% of the Asian REIT market.
Japan dominates the Asian REIT market with US$29 billion in market capitalisation,
accounting for 7.8% of the global REIT market and 62.6% of the Asian REIT market,
while Singapore comes in second with US$9 billion in market capitalisation,
accounting for 2.2% of the global REIT market and 17.8% of the Asian REIT market.
Starhill Real Estate Investment Trust (#45) is the only Malaysian REIT in the top 50
of Asian REIT ranked by market capitalisation at US$0.2483 billion.
The following sections will discuss briefly the different REIT markets around the
world, starting with the largest REIT markets followed by other regions. More focus
will be given to the Asian REIT market to compare the Malaysia REIT market with
its neighbouring countries. Appendix VI details other REIT markets beside Malaysia.
52
2.2 Malaysia REITs
Malaysia was the first Asian country to develop a REIT market. It was previously
known as PTFs in 1986. Malaysia used the Australian LPT model to set up the
regulatory framework, although there are some different aspects to the structure. This
is mainly because of the ‘bumiputra’ rules which restrict foreign ownership in favour
of indigenous people of Malaysia. The first regulatory framework was approved by
Bank Negara Malaysia (the Central Bank of Malaysia), with the regulatory principles
governing their establishment and operation being the Companies Act 1965 and the
Securities Industry Act 1983 (Rozali and Hamzah, 2006). Later, the Securities
Commission (SC) became the regulator when it was formed. Specific Guidelines on
PTFs were introduced by the SC in 1991 and later revised in 1995 and 2002.
Unfortunately, from 1989 to 2005, the PTF industry performed poorly (Ting, 1999;
Newell, Ting and Acheampong, 2002; Osmadi, 2007). The regulatory structure was
still restrictive. During these periods, only subsidiary companies of financial
institutions were permitted to set up and manage such funds. Before the inception of
M-REITs in August 2005, only 3 PTFs were listed in the Kuala Lumpur Stock
Exchange (KLSE); namely AmFirst Property Trust (AMFPT), Amanah Harta Tanah
PNB (AHP) and Amanah Harta Tanah PNB 2 (AHP2). Other factors which have
contributed to the poor performance of PTFs were the lack of prime properties and
quality assets in their property portfolios. Even with the availability of these
properties, the borrowing limits and the long acquisition period have depleted the
interest to the parties involved (i.e. investors and property owners).
The poor performance of Malaysian PTFs, together with the successful development
of REIT-like structures in other countries (e.g. Australia and US), encouraged
government and regulators to enhance the existing PTF framework. In the 2005
budget, the Malaysian Government introduced further improvements to its REIT-like
structure which included a more tax transparent structure. However, the tax
transparency in Malaysia is not as attractive as being offered by other countries in the
region (eg: Singapore).
53
Among the new requirements include directing REIT managers to appoint a
designated person responsible for compliance. It also allows a portion of a REIT
portfolio to consist of real estate that it does not wholly-own or have a majority
ownership. REITs would not be allowed to acquire non-income generating real estate
such as vacant land, and may only acquire property that was under construction or
uncompleted real estate up to 10 per cent of its total asset value. REIT managers are
allowed to seek a general mandate from unit holders for issuance of units up to 20 per
cent of its fund size. The SC's prior approval on the real estate valuation is now only
required where acquisition of real estate is financed, or re-financed within one year,
through the issuance of new units.
By end of December 2008, more initiatives from the government have given a boost
to the M-REIT market. Foreign ownership of fund management companies and REIT
management companies has been given up to 70 percent with minimum Bumiputra
ownership remaining at 30 percent. This is an increase from 49 percent since 2005.
Islamic fund management companies have also been allowed to be wholly owned by
foreigners and invest all assets abroad. A RM7 billion fund has been channeled by
EPF (Employee Provident Fund) to be managed by Islamic fund management
companies. This has seen as a good approach, especially as Malaysia now has three
Islamic REITs; namely Al-Aqar KPJ REIT, Al-Hadharah Boustead REIT and Axis
REIT converted to an Islamic REIT in December 2008.
Key regulation and legislation on M-REITs include:
the Securities Commission Act 1993;
the Securities Industry Act 1983;
the Finance Act 2004;
the Guidelines on Real Estate Investment Trusts issued 3 January 2005;
the Guidelines for Islamic REITs issued 21 November 2005;
the Guidelines on Compliance Function for Fund Managers issued 15 March
2005;
the Listing Requirements of Bursa Malaysia Securities Berhad (if the REIT is
listed); and Guidance Notes 1 to 7 for Real Estate Investment Trusts issued by
the Securities Commission.
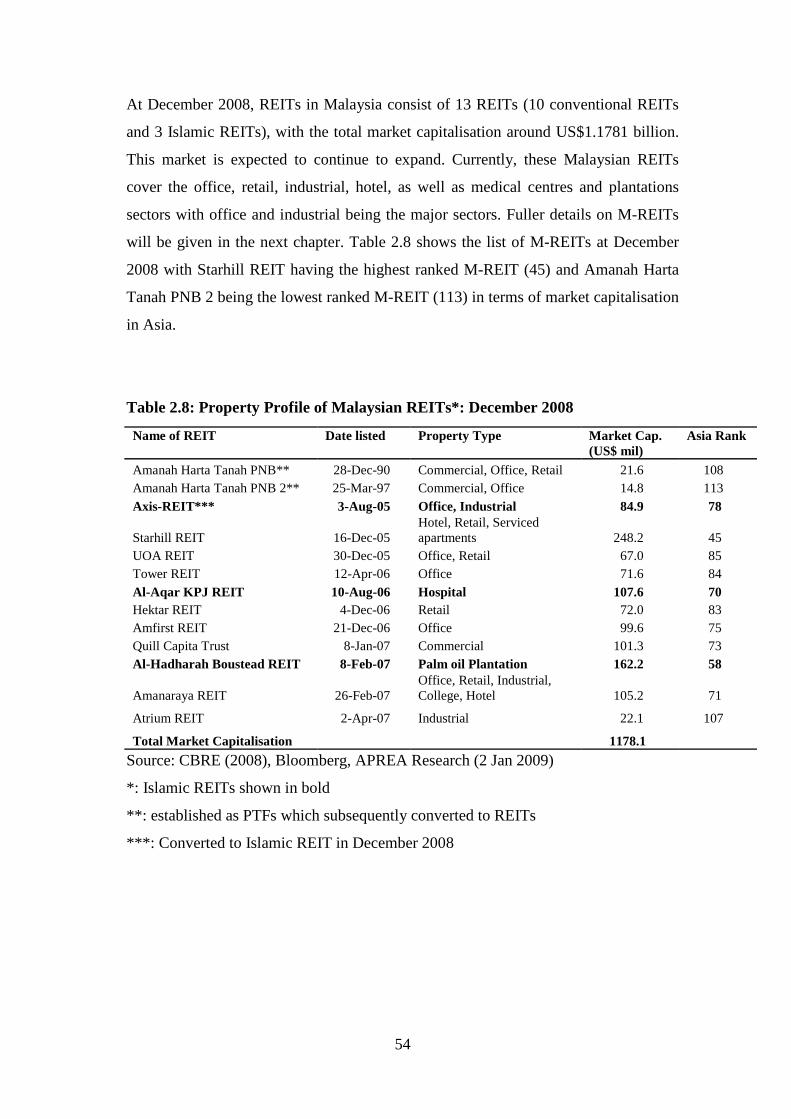
54
At December 2008, REITs in Malaysia consist of 13 REITs (10 conventional REITs
and 3 Islamic REITs), with the total market capitalisation around US$1.1781 billion.
This market is expected to continue to expand. Currently, these Malaysian REITs
cover the office, retail, industrial, hotel, as well as medical centres and plantations
sectors with office and industrial being the major sectors. Fuller details on M-REITs
will be given in the next chapter. Table 2.8 shows the list of M-REITs at December
2008 with Starhill REIT having the highest ranked M-REIT (45) and Amanah Harta
Tanah PNB 2 being the lowest ranked M-REIT (113) in terms of market capitalisation
in Asia.
Table 2.8: Property Profile of Malaysian REITs*: December 2008
Name of REIT Date listed Property Type Market Cap.(US$ mil)
Asia Rank
Amanah Harta Tanah PNB** 28-Dec-90 Commercial, Office, Retail 21.6 108
Amanah Harta Tanah PNB 2** 25-Mar-97 Commercial, Office 14.8 113
Axis-REIT*** 3-Aug-05 Office, Industrial 84.9 78
Starhill REIT 16-Dec-05Hotel, Retail, Servicedapartments 248.2 45
UOA REIT 30-Dec-05 Office, Retail 67.0 85
Tower REIT 12-Apr-06 Office 71.6 84
Al-Aqar KPJ REIT 10-Aug-06 Hospital 107.6 70
Hektar REIT 4-Dec-06 Retail 72.0 83
Amfirst REIT 21-Dec-06 Office 99.6 75
Quill Capita Trust 8-Jan-07 Commercial 101.3 73
Al-Hadharah Boustead REIT 8-Feb-07 Palm oil Plantation 162.2 58
Amanaraya REIT 26-Feb-07Office, Retail, Industrial,College, Hotel 105.2 71
Atrium REIT 2-Apr-07 Industrial 22.1 107
Total Market Capitalisation 1178.1
Source: CBRE (2008), Bloomberg, APREA Research (2 Jan 2009)
*: Islamic REITs shown in bold
**: established as PTFs which subsequently converted to REITs
***: Converted to Islamic REIT in December 2008
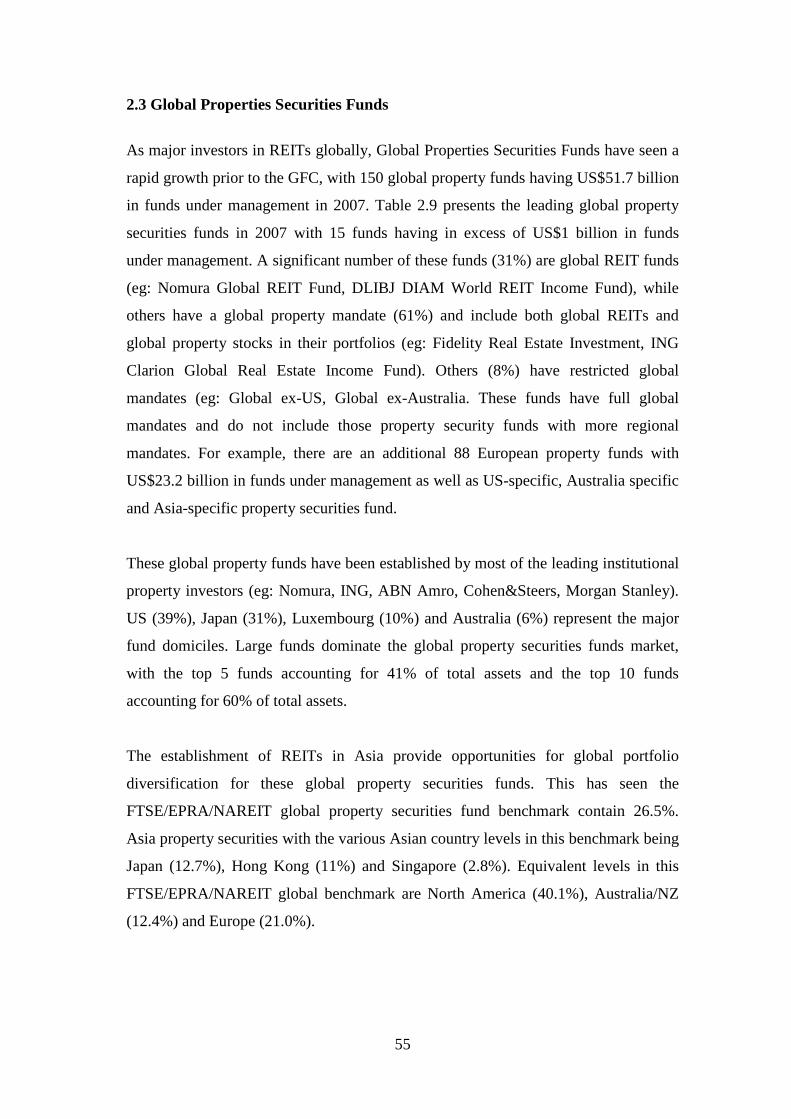
55
2.3 Global Properties Securities Funds
As major investors in REITs globally, Global Properties Securities Funds have seen a
rapid growth prior to the GFC, with 150 global property funds having US$51.7 billion
in funds under management in 2007. Table 2.9 presents the leading global property
securities funds in 2007 with 15 funds having in excess of US$1 billion in funds
under management. A significant number of these funds (31%) are global REIT funds
(eg: Nomura Global REIT Fund, DLIBJ DIAM World REIT Income Fund), while
others have a global property mandate (61%) and include both global REITs and
global property stocks in their portfolios (eg: Fidelity Real Estate Investment, ING
Clarion Global Real Estate Income Fund). Others (8%) have restricted global
mandates (eg: Global ex-US, Global ex-Australia. These funds have full global
mandates and do not include those property security funds with more regional
mandates. For example, there are an additional 88 European property funds with
US$23.2 billion in funds under management as well as US-specific, Australia specific
and Asia-specific property securities fund.
These global property funds have been established by most of the leading institutional
property investors (eg: Nomura, ING, ABN Amro, Cohen&Steers, Morgan Stanley).
US (39%), Japan (31%), Luxembourg (10%) and Australia (6%) represent the major
fund domiciles. Large funds dominate the global property securities funds market,
with the top 5 funds accounting for 41% of total assets and the top 10 funds
accounting for 60% of total assets.
The establishment of REITs in Asia provide opportunities for global portfolio
diversification for these global property securities funds. This has seen the
FTSE/EPRA/NAREIT global property securities fund benchmark contain 26.5%.
Asia property securities with the various Asian country levels in this benchmark being
Japan (12.7%), Hong Kong (11%) and Singapore (2.8%). Equivalent levels in this
FTSE/EPRA/NAREIT global benchmark are North America (40.1%), Australia/NZ
(12.4%) and Europe (21.0%).
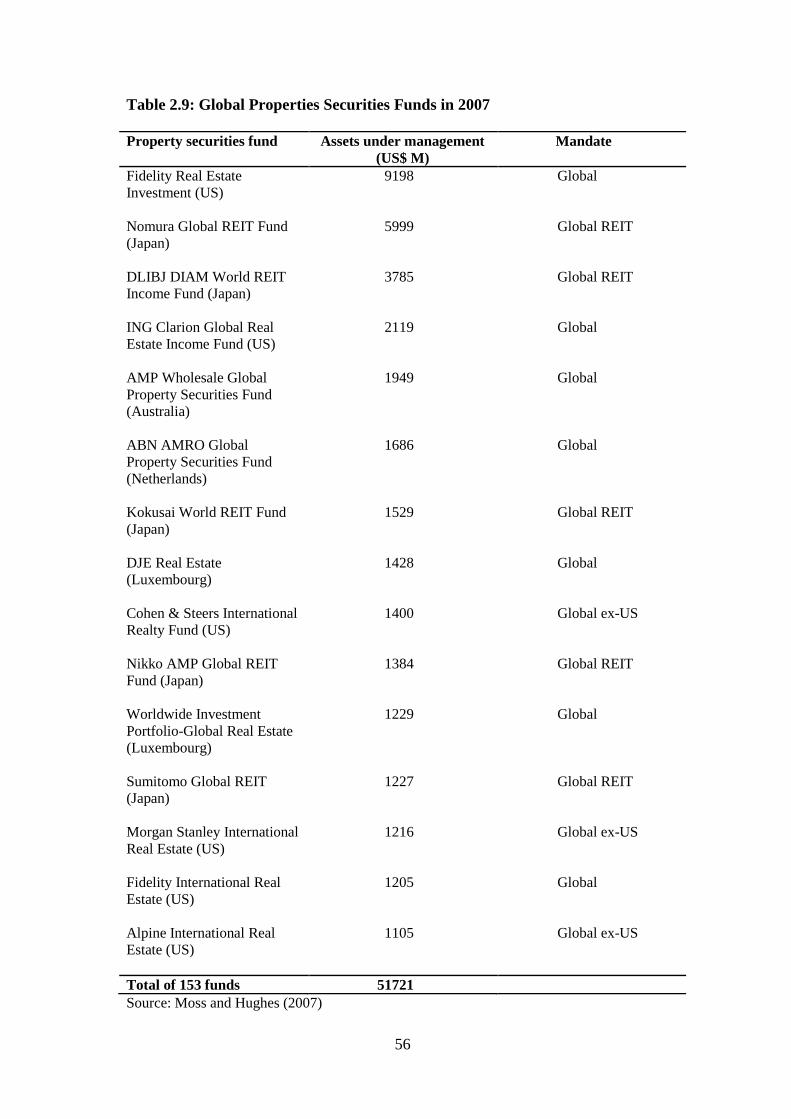
56
Table 2.9: Global Properties Securities Funds in 2007
Source: Moss and Hughes (2007)
Property securities fund Assets under management(US$ M)
Mandate
Fidelity Real EstateInvestment (US)
9198 Global
Nomura Global REIT Fund(Japan)
5999 Global REIT
DLIBJ DIAM World REITIncome Fund (Japan)
3785 Global REIT
ING Clarion Global RealEstate Income Fund (US)
2119 Global
AMP Wholesale GlobalProperty Securities Fund(Australia)
1949 Global
ABN AMRO GlobalProperty Securities Fund(Netherlands)
1686 Global
Kokusai World REIT Fund(Japan)
1529 Global REIT
DJE Real Estate(Luxembourg)
1428 Global
Cohen & Steers InternationalRealty Fund (US)
1400 Global ex-US
Nikko AMP Global REITFund (Japan)
1384 Global REIT
Worldwide InvestmentPortfolio-Global Real Estate(Luxembourg)
1229 Global
Sumitomo Global REIT(Japan)
1227 Global REIT
Morgan Stanley InternationalReal Estate (US)
1216 Global ex-US
Fidelity International RealEstate (US)
1205 Global
Alpine International RealEstate (US)
1105 Global ex-US
Total of 153 funds 51721
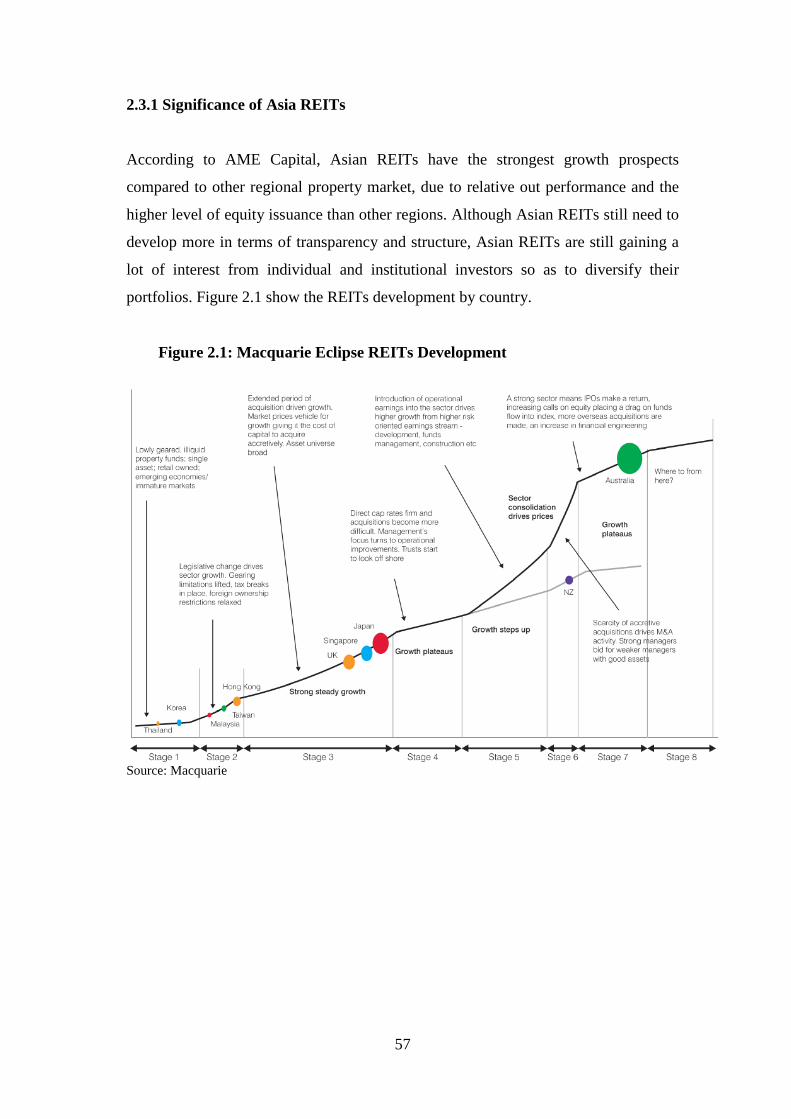
57
2.3.1 Significance of Asia REITs
According to AME Capital, Asian REITs have the strongest growth prospects
compared to other regional property market, due to relative out performance and the
higher level of equity issuance than other regions. Although Asian REITs still need to
develop more in terms of transparency and structure, Asian REITs are still gaining a
lot of interest from individual and institutional investors so as to diversify their
portfolios. Figure 2.1 show the REITs development by country.
Figure 2.1: Macquarie Eclipse REITs Development
Source: Macquarie
58
CHAPTER 3
SIGNIFICANCE OF MALAYSIAN COMMERCIAL
PROPERTY MARKETS
3.1 Significance of Malaysia: Social, Economic Activity and Demographics
Malaysia is a multicultural country, consisting of three majority groups: Malay,
Chinese and Indian. Malaysia has a robust state of economy and finance with a good
and competitive mix of conventional and Islamic finance sector that is well accepted
worldwide. The Malaysian financial system practices the dual banking system;
whereby the Islamic and conventional systems work together. Developments in the
country have progressed extensively with the significant increase of interest by
institutional investors locally and internationally. In property development, property
maintenance is still an issue that needs to be addressed. During the Asian Financial
Crisis, Malaysia is the first country in Asia to recover from the turmoil. Malaysia is
now faced with the global financial crisis and is still recovering from the epidemic
that have resulted in increasing unemployment rate; thus affecting the property sector
as borrowing became too expensive. The increase in unemployment rate to 3.7% has
resulted to decrease in domestic consumption in certain commodities. These have also
resulted in the decrease in property prices and property owners reducing rents for
retailers. Although there is no real property gains tax (which have been reverted in
late 2009), owners still have the opportunity to sell their houses higher than the
original purchase price although they are unable to gain the actual profit. Table 3.1
shows the social, economic and financial profile of Malaysia in 2008.
High commodity prices, stable employment and supportive financing environment
sustained the strong growth in private consumption in the first half-year. Although
private consumption declined in the second half of 2008, growth was still mainly
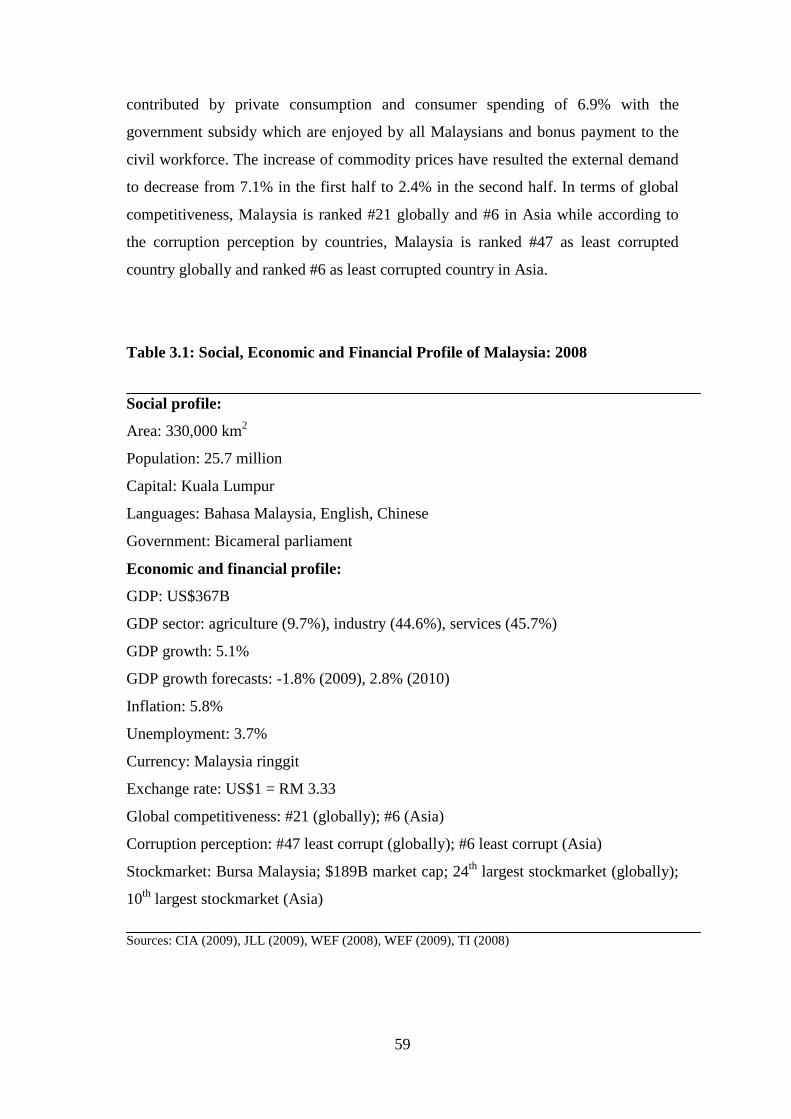
59
contributed by private consumption and consumer spending of 6.9% with the
government subsidy which are enjoyed by all Malaysians and bonus payment to the
civil workforce. The increase of commodity prices have resulted the external demand
to decrease from 7.1% in the first half to 2.4% in the second half. In terms of global
competitiveness, Malaysia is ranked #21 globally and #6 in Asia while according to
the corruption perception by countries, Malaysia is ranked #47 as least corrupted
country globally and ranked #6 as least corrupted country in Asia.
Table 3.1: Social, Economic and Financial Profile of Malaysia: 2008
Social profile:
Area: 330,000 km2
Population: 25.7 million
Capital: Kuala Lumpur
Languages: Bahasa Malaysia, English, Chinese
Government: Bicameral parliament
Economic and financial profile:
GDP: US$367B
GDP sector: agriculture (9.7%), industry (44.6%), services (45.7%)
GDP growth: 5.1%
GDP growth forecasts: -1.8% (2009), 2.8% (2010)
Inflation: 5.8%
Unemployment: 3.7%
Currency: Malaysia ringgit
Exchange rate: US$1 = RM 3.33
Global competitiveness: #21 (globally); #6 (Asia)
Corruption perception: #47 least corrupt (globally); #6 least corrupt (Asia)
Stockmarket: Bursa Malaysia; $189B market cap; 24th largest stockmarket (globally);
10th largest stockmarket (Asia)
Sources: CIA (2009), JLL (2009), WEF (2008), WEF (2009), TI (2008)
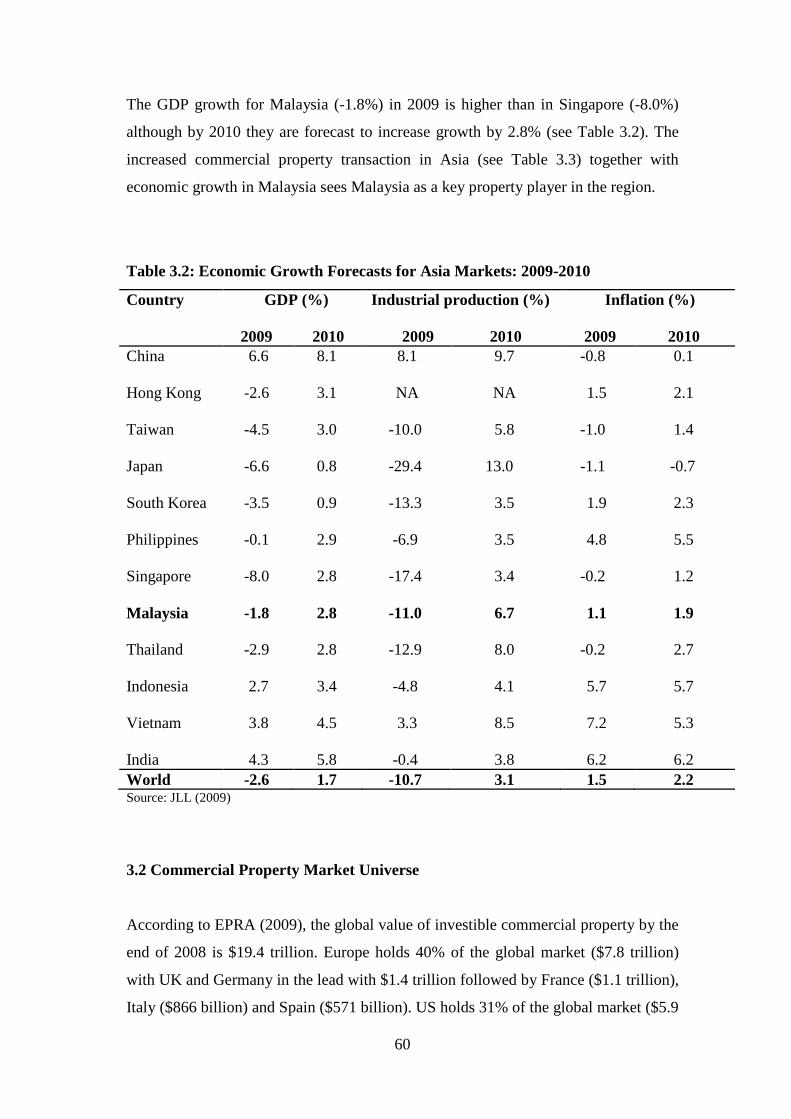
60
The GDP growth for Malaysia (-1.8%) in 2009 is higher than in Singapore (-8.0%)
although by 2010 they are forecast to increase growth by 2.8% (see Table 3.2). The
increased commercial property transaction in Asia (see Table 3.3) together with
economic growth in Malaysia sees Malaysia as a key property player in the region.
Table 3.2: Economic Growth Forecasts for Asia Markets: 2009-2010
Country GDP (%)
2009 2010
Industrial production (%)
2009 2010
Inflation (%)
2009 2010China 6.6 8.1 8.1 9.7 -0.8 0.1
Hong Kong -2.6 3.1 NA NA 1.5 2.1
Taiwan -4.5 3.0 -10.0 5.8 -1.0 1.4
Japan -6.6 0.8 -29.4 13.0 -1.1 -0.7
South Korea -3.5 0.9 -13.3 3.5 1.9 2.3
Philippines -0.1 2.9 -6.9 3.5 4.8 5.5
Singapore -8.0 2.8 -17.4 3.4 -0.2 1.2
Malaysia -1.8 2.8 -11.0 6.7 1.1 1.9
Thailand -2.9 2.8 -12.9 8.0 -0.2 2.7
Indonesia 2.7 3.4 -4.8 4.1 5.7 5.7
Vietnam 3.8 4.5 3.3 8.5 7.2 5.3
India 4.3 5.8 -0.4 3.8 6.2 6.2
World -2.6 1.7 -10.7 3.1 1.5 2.2Source: JLL (2009)
3.2 Commercial Property Market Universe
According to EPRA (2009), the global value of investible commercial property by the
end of 2008 is $19.4 trillion. Europe holds 40% of the global market ($7.8 trillion)
with UK and Germany in the lead with $1.4 trillion followed by France ($1.1 trillion),
Italy ($866 billion) and Spain ($571 billion). US holds 31% of the global market ($5.9
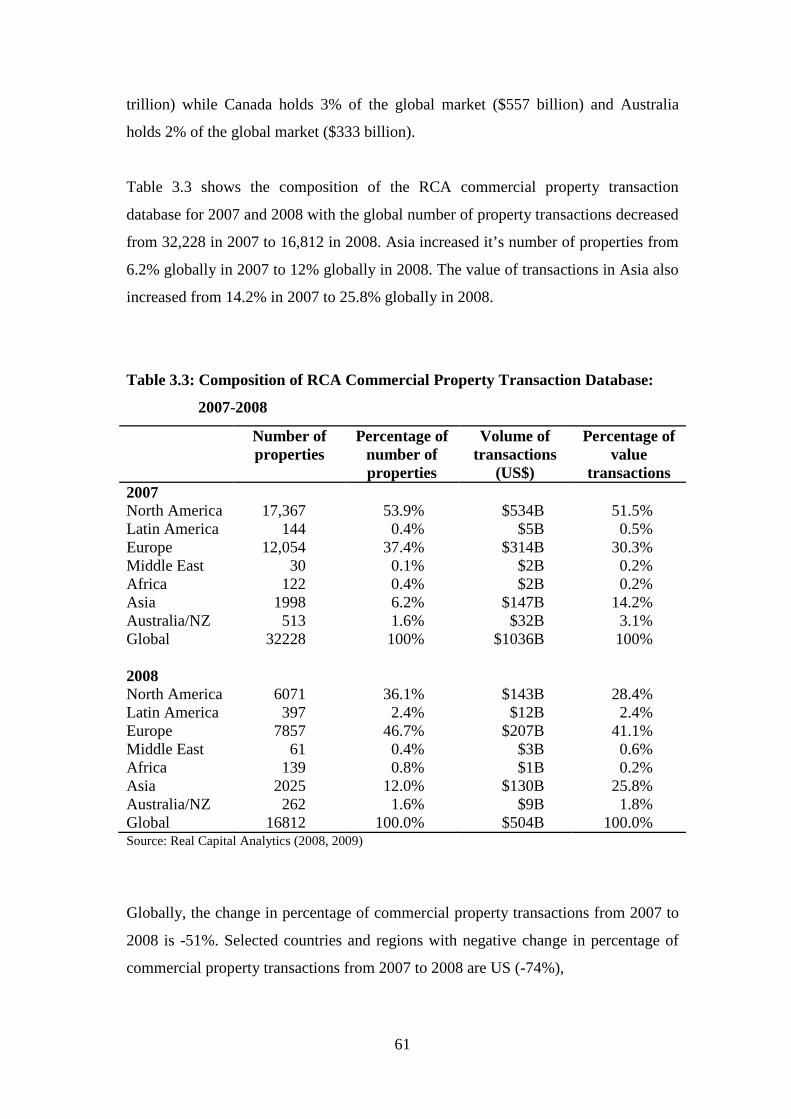
61
trillion) while Canada holds 3% of the global market ($557 billion) and Australia
holds 2% of the global market ($333 billion).
Table 3.3 shows the composition of the RCA commercial property transaction
database for 2007 and 2008 with the global number of property transactions decreased
from 32,228 in 2007 to 16,812 in 2008. Asia increased it’s number of properties from
6.2% globally in 2007 to 12% globally in 2008. The value of transactions in Asia also
increased from 14.2% in 2007 to 25.8% globally in 2008.
Table 3.3: Composition of RCA Commercial Property Transaction Database:
2007-2008
Number ofproperties
Percentage ofnumber ofproperties
Volume oftransactions
(US$)
Percentage ofvalue
transactions2007North America 17,367 53.9% $534B 51.5%Latin America 144 0.4% $5B 0.5%Europe 12,054 37.4% $314B 30.3%Middle East 30 0.1% $2B 0.2%Africa 122 0.4% $2B 0.2%Asia 1998 6.2% $147B 14.2%Australia/NZ 513 1.6% $32B 3.1%Global 32228 100% $1036B 100%
2008North America 6071 36.1% $143B 28.4%Latin America 397 2.4% $12B 2.4%Europe 7857 46.7% $207B 41.1%Middle East 61 0.4% $3B 0.6%Africa 139 0.8% $1B 0.2%Asia 2025 12.0% $130B 25.8%Australia/NZ 262 1.6% $9B 1.8%Global 16812 100.0% $504B 100.0%Source: Real Capital Analytics (2008, 2009)
Globally, the change in percentage of commercial property transactions from 2007 to
2008 is -51%. Selected countries and regions with negative change in percentage of
commercial property transactions from 2007 to 2008 are US (-74%),
62
Australia (-73%), UK (-55%), France (-53%), Germany (-49%), Canada (-43%) and
Europe (-34%). However several country delivered positive change in the percentage
of commercial property transactions from 2007 to 2008; eg: Netherlands (15%) and
Sweden (5%).
The Global Financial Crisis has affected the commercial property transactions which
have reduced the investment of the top 25 cities from a minimum of $8 billion in 2007
to a minimum of $3 billion in 2008. Although by regions, US have reduced its
investment from 56% in 2007 to 40% in 2008, Europe and Asia have increased its
investment from 20% in 2007 to 24% and 36% in 2008 respectively. Major cities
which make the top 25 cities in 2007 are New York (#1), London (#2), Los Angeles
(#3), Tokyo (#6), Singapore (#9), Paris (#10), Hong Kong (#14), Shanghai (#20),
Beijing (#21). 2008 sees a lot of participation from Asia, with New York leading the
cities followed by London (#2), Tokyo (#3), Beijing (#4), Paris (#6), Singapore (#7),
Hong Kong (#8), Shanghai (#11), Seoul (#15), Tianjin (#17), Hangzhou (#21), Osaka
(#24). In terms of the significance of $1 billion transaction markets in 2007, the
number of cities exceeding $1 billion was 114 cities, with Asia accounting for 18%
while in the lead is Americas (46%), followed by Europe (32%) and Australia (4%).
The number of cities exceeding $1 billion in 2008 decreased to 75 cities, with Asia
having an increased importance of 27%. Americas are still leading although in a
decreased percentage of 41% followed by Europe (27%) and Australia (5%).
Jones Lang LaSalle has assessed 82 countries for property market transparency for
2008. Significantly, Canada is the world’s most transparent property market as shown
in Table 3.4 ; being seen as more transparent than the other mature markets of the US,
UK, Australia and New Zealand. In Asia, only Hong Kong and Singapore have been
considered to be highly transparent together with Canada, Australia, US, UK, France.
Table 3.4 shows the transparency of property markets in 2008 in Asia with selected
countries as international benchmarks. In terms of global competitiveness, 134
countries have been assessed by WEF for 2008. Table 3.5 shows global
competitiveness in 2008 among countries in Asia with selected countries as
international benchmarks. Singapore is the only country in Asia which have made the
top 10 most competitive and least corrupt countries. Table 3.6 shows the corruption
perception of countries in Asia with selected countries as international benchmarks by
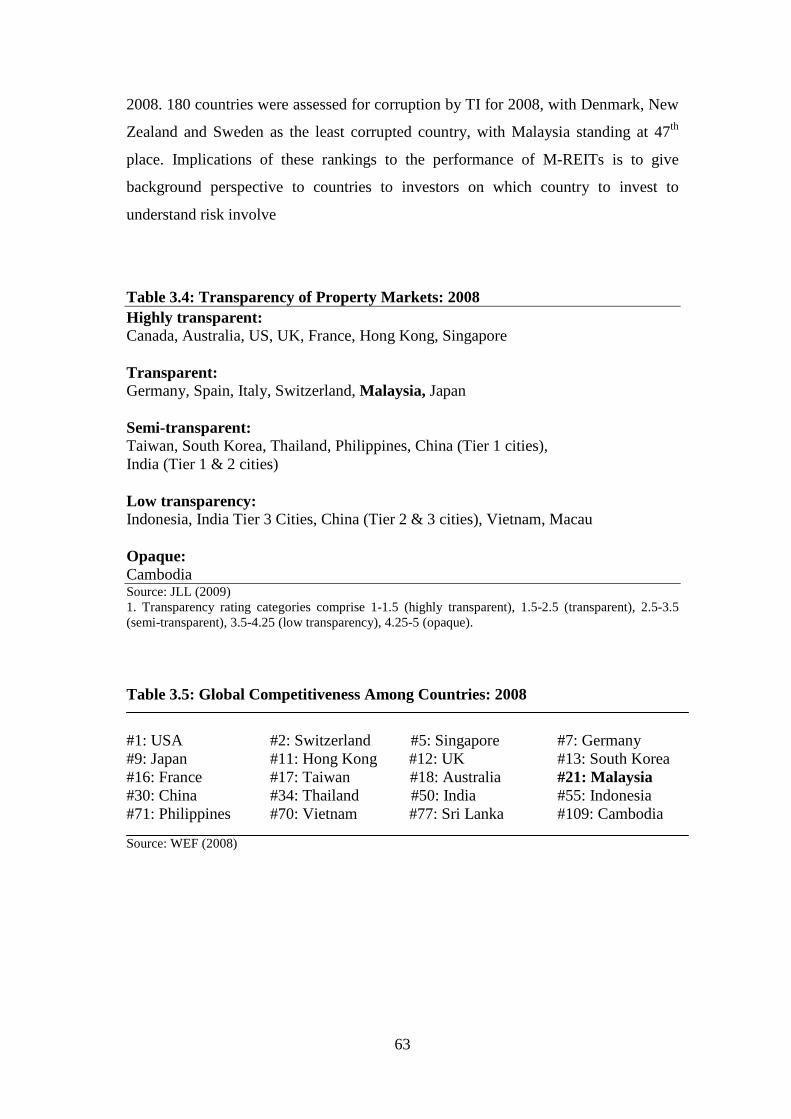
63
2008. 180 countries were assessed for corruption by TI for 2008, with Denmark, New
Zealand and Sweden as the least corrupted country, with Malaysia standing at 47th
place. Implications of these rankings to the performance of M-REITs is to give
background perspective to countries to investors on which country to invest to
understand risk involve
Table 3.4: Transparency of Property Markets: 2008
Highly transparent:Canada, Australia, US, UK, France, Hong Kong, Singapore
Transparent:Germany, Spain, Italy, Switzerland, Malaysia, Japan
Semi-transparent:Taiwan, South Korea, Thailand, Philippines, China (Tier 1 cities),India (Tier 1 & 2 cities)
Low transparency:Indonesia, India Tier 3 Cities, China (Tier 2 & 3 cities), Vietnam, Macau
Opaque:CambodiaSource: JLL (2009)1. Transparency rating categories comprise 1-1.5 (highly transparent), 1.5-2.5 (transparent), 2.5-3.5(semi-transparent), 3.5-4.25 (low transparency), 4.25-5 (opaque).
Table 3.5: Global Competitiveness Among Countries: 2008
#1: USA #2: Switzerland #5: Singapore #7: Germany#9: Japan #11: Hong Kong #12: UK #13: South Korea#16: France #17: Taiwan #18: Australia #21: Malaysia#30: China #34: Thailand #50: India #55: Indonesia#71: Philippines #70: Vietnam #77: Sri Lanka #109: Cambodia
Source: WEF (2008)
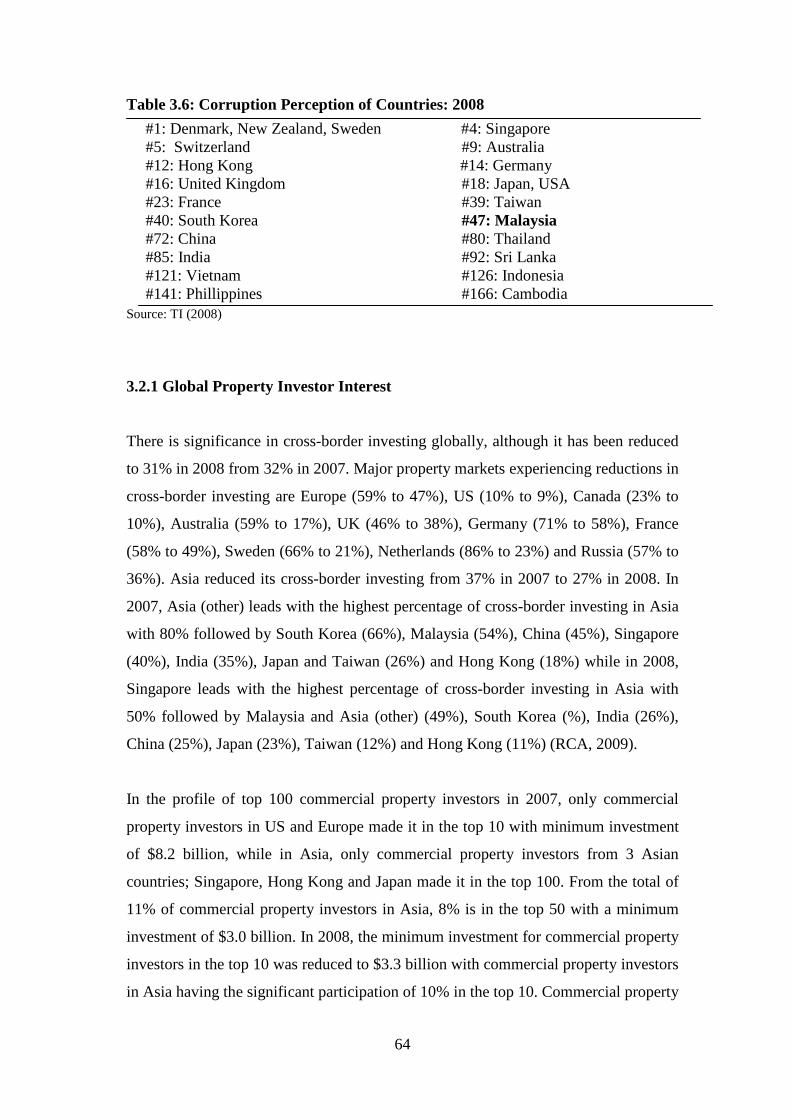
64
Table 3.6: Corruption Perception of Countries: 2008
#1: Denmark, New Zealand, Sweden #4: Singapore#5: Switzerland #9: Australia#12: Hong Kong #14: Germany#16: United Kingdom #18: Japan, USA#23: France #39: Taiwan#40: South Korea #47: Malaysia#72: China #80: Thailand#85: India #92: Sri Lanka#121: Vietnam #126: Indonesia#141: Phillippines #166: Cambodia
Source: TI (2008)
3.2.1 Global Property Investor Interest
There is significance in cross-border investing globally, although it has been reduced
to 31% in 2008 from 32% in 2007. Major property markets experiencing reductions in
cross-border investing are Europe (59% to 47%), US (10% to 9%), Canada (23% to
10%), Australia (59% to 17%), UK (46% to 38%), Germany (71% to 58%), France
(58% to 49%), Sweden (66% to 21%), Netherlands (86% to 23%) and Russia (57% to
36%). Asia reduced its cross-border investing from 37% in 2007 to 27% in 2008. In
2007, Asia (other) leads with the highest percentage of cross-border investing in Asia
with 80% followed by South Korea (66%), Malaysia (54%), China (45%), Singapore
(40%), India (35%), Japan and Taiwan (26%) and Hong Kong (18%) while in 2008,
Singapore leads with the highest percentage of cross-border investing in Asia with
50% followed by Malaysia and Asia (other) (49%), South Korea (%), India (26%),
China (25%), Japan (23%), Taiwan (12%) and Hong Kong (11%) (RCA, 2009).
In the profile of top 100 commercial property investors in 2007, only commercial
property investors in US and Europe made it in the top 10 with minimum investment
of $8.2 billion, while in Asia, only commercial property investors from 3 Asian
countries; Singapore, Hong Kong and Japan made it in the top 100. From the total of
11% of commercial property investors in Asia, 8% is in the top 50 with a minimum
investment of $3.0 billion. In 2008, the minimum investment for commercial property
investors in the top 10 was reduced to $3.3 billion with commercial property investors
in Asia having the significant participation of 10% in the top 10. Commercial property
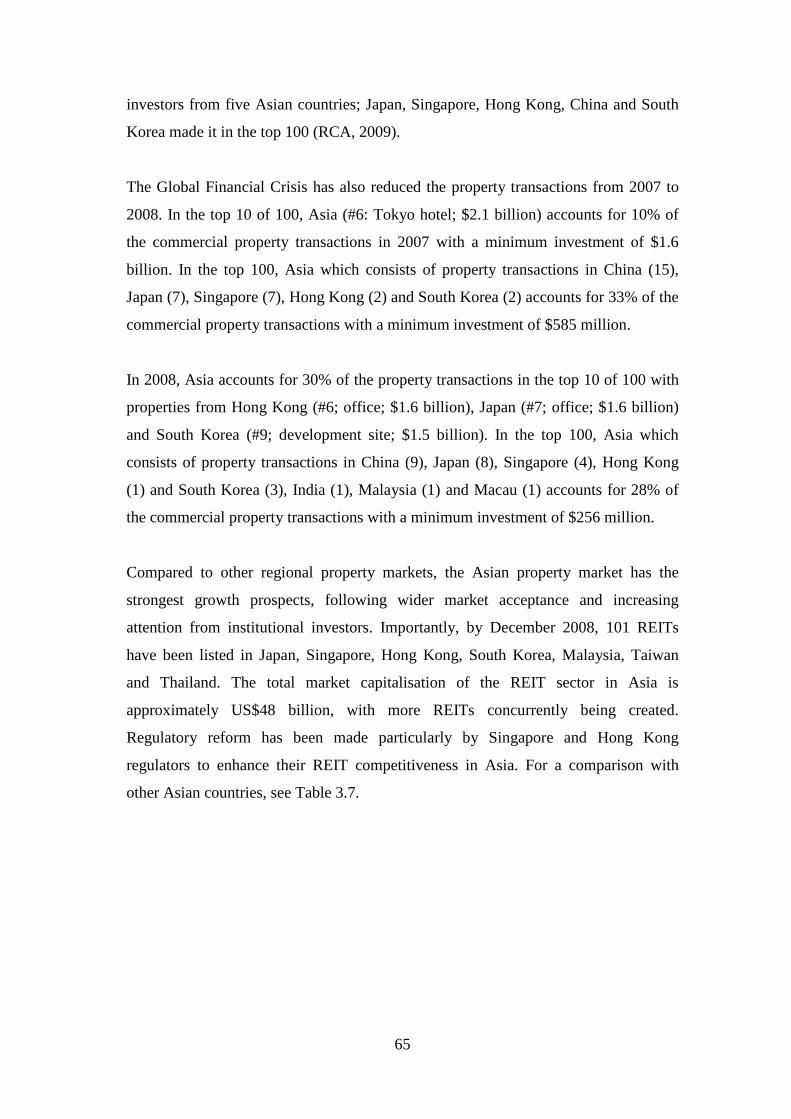
65
investors from five Asian countries; Japan, Singapore, Hong Kong, China and South
Korea made it in the top 100 (RCA, 2009).
The Global Financial Crisis has also reduced the property transactions from 2007 to
2008. In the top 10 of 100, Asia (#6: Tokyo hotel; $2.1 billion) accounts for 10% of
the commercial property transactions in 2007 with a minimum investment of $1.6
billion. In the top 100, Asia which consists of property transactions in China (15),
Japan (7), Singapore (7), Hong Kong (2) and South Korea (2) accounts for 33% of the
commercial property transactions with a minimum investment of $585 million.
In 2008, Asia accounts for 30% of the property transactions in the top 10 of 100 with
properties from Hong Kong (#6; office; $1.6 billion), Japan (#7; office; $1.6 billion)
and South Korea (#9; development site; $1.5 billion). In the top 100, Asia which
consists of property transactions in China (9), Japan (8), Singapore (4), Hong Kong
(1) and South Korea (3), India (1), Malaysia (1) and Macau (1) accounts for 28% of
the commercial property transactions with a minimum investment of $256 million.
Compared to other regional property markets, the Asian property market has the
strongest growth prospects, following wider market acceptance and increasing
attention from institutional investors. Importantly, by December 2008, 101 REITs
have been listed in Japan, Singapore, Hong Kong, South Korea, Malaysia, Taiwan
and Thailand. The total market capitalisation of the REIT sector in Asia is
approximately US$48 billion, with more REITs concurrently being created.
Regulatory reform has been made particularly by Singapore and Hong Kong
regulators to enhance their REIT competitiveness in Asia. For a comparison with
other Asian countries, see Table 3.7.
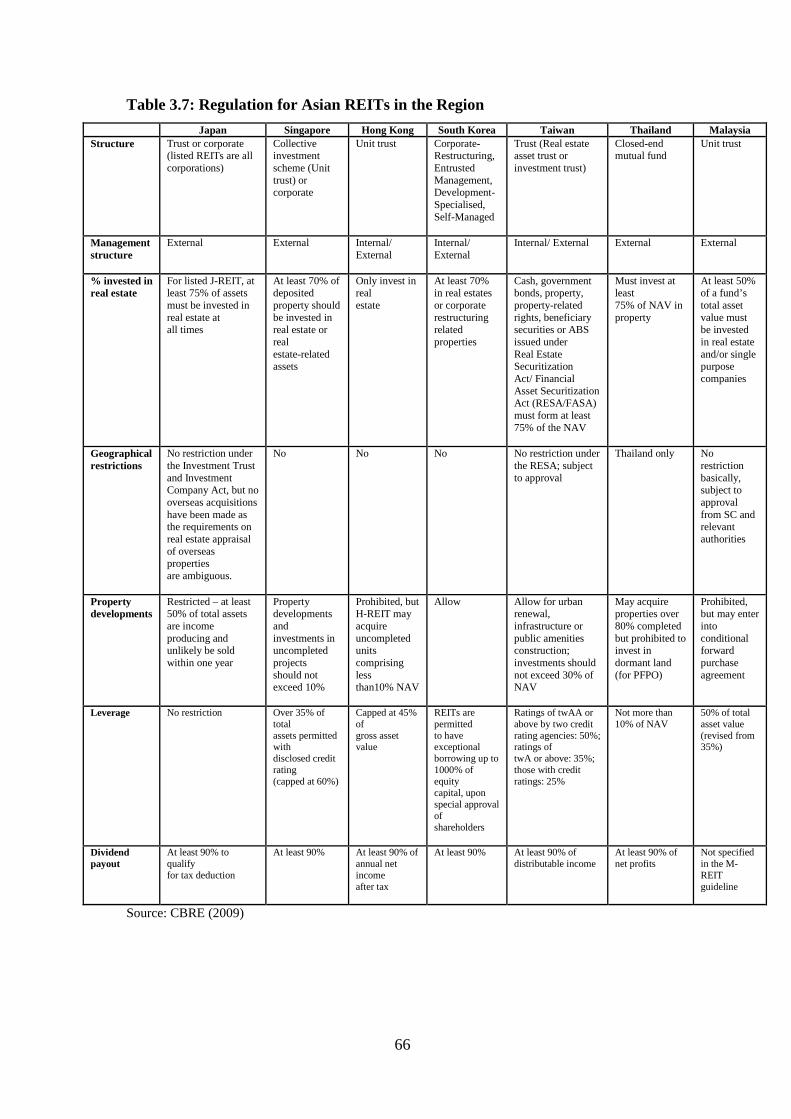
66
Table 3.7: Regulation for Asian REITs in the Region
Japan Singapore Hong Kong South Korea Taiwan Thailand Malaysia
Structure Trust or corporate(listed REITs are allcorporations)
Collectiveinvestmentscheme (Unittrust) orcorporate
Unit trust Corporate-Restructuring,EntrustedManagement,Development-Specialised,Self-Managed
Trust (Real estateasset trust orinvestment trust)
Closed-endmutual fund
Unit trust
Managementstructure
External External Internal/External
Internal/External
Internal/ External External External
% invested inreal estate
For listed J-REIT, atleast 75% of assetsmust be invested inreal estate atall times
At least 70% ofdepositedproperty shouldbe invested inreal estate orrealestate-relatedassets
Only invest inrealestate
At least 70%in real estatesor corporaterestructuringrelatedproperties
Cash, governmentbonds, property,property-relatedrights, beneficiarysecurities or ABSissued underReal EstateSecuritizationAct/ FinancialAsset SecuritizationAct (RESA/FASA)must form at least75% of the NAV
Must invest atleast75% of NAV inproperty
At least 50%of a fund’stotal assetvalue mustbe investedin real estateand/or singlepurposecompanies
Geographicalrestrictions
No restriction underthe Investment Trustand InvestmentCompany Act, but nooverseas acquisitionshave been made asthe requirements onreal estate appraisalof overseaspropertiesare ambiguous.
No No No No restriction underthe RESA; subjectto approval
Thailand only Norestrictionbasically,subject toapprovalfrom SC andrelevantauthorities
Propertydevelopments
Restricted – at least50% of total assetsare incomeproducing andunlikely be soldwithin one year
Propertydevelopmentsandinvestments inuncompletedprojectsshould notexceed 10%
Prohibited, butH-REIT mayacquireuncompletedunitscomprisinglessthan10% NAV
Allow Allow for urbanrenewal,infrastructure orpublic amenitiesconstruction;investments shouldnot exceed 30% ofNAV
May acquireproperties over80% completedbut prohibited toinvest indormant land(for PFPO)
Prohibited,but may enterintoconditionalforwardpurchaseagreement
Leverage No restriction Over 35% oftotalassets permittedwithdisclosed creditrating(capped at 60%)
Capped at 45%ofgross assetvalue
REITs arepermittedto haveexceptionalborrowing up to1000% ofequitycapital, uponspecial approvalofshareholders
Ratings of twAA orabove by two creditrating agencies: 50%;ratings oftwA or above: 35%;those with creditratings: 25%
Not more than10% of NAV
50% of totalasset value(revised from35%)
Dividendpayout
At least 90% toqualifyfor tax deduction
At least 90% At least 90% ofannual netincomeafter tax
At least 90% At least 90% ofdistributable income
At least 90% ofnet profits
Not specifiedin the M-REITguideline
Source: CBRE (2009)
67
The growth of international property investment and the maturity of real estate as an
asset class have seen an increased allocation of real estate by institutional investors. It
is proven that Real Estate Investment Trust delivers a better return compared to other
asset classes over time (RREEF Research, 2007). With the inclusion of Islamic REITs
in the market, REITs are becoming more significant in the pursuit to diversify
investor’s wealth in a portfolio. By 2020, the worldwide Muslim population will rise
to 2.5 billion from the current 1.5 billion. According to the Islamic Funds and
Investment report by Ernst and Young 2007, Shariah factors are important in 60% of
Islamic wealth markets. Islamic banks are expected to manage 40-50% of total
savings of the Muslim population within the next 10 years. Strong economic growth,
rising oil revenues and healthy current account surpluses in many Muslim countries
are among the factors supporting the growing potential of Shariah-compliant
investment. There could be more than US$1 trillion of capital allocated to Shariah-
compliant products. With the fast growing wealth of the Islamic population and
interest in ethical investment, it is essential to produce products to cater for their need.
3.3 Malaysian Commercial Property: Asia Context
By end of 2008, the value of investible commercial property in Asia is $3.7 trillion
(19% of global market), with Japan ($2.0 trillion) having the highest value of
investible commercial property in Asia followed by Hong Kong/China ($640 billion)
South Korea ($384 billion), India ($157 billion), Taiwan ($139 billion), Singapore
($126 billion), Indonesia ($70 billion), Thailand ($52 billion), Malaysia ($50 billion),
Philippines ($23 billlion) and Vietnam ($9 billion). (Newel and Razali, 2009)
Countries with a positive change in percentage from 2007 to 2008 in commercial
property transaction is lead by India (91%) followed by South Korea (86%), Asia
(other) (77%), Malaysia (75%). Asia (other) comprises Macau, Vietnam, Philippines,
Thailand, Indonesia, Kazakhstan, Cambodia and Sri Lanka. Meanwhile, countries
with negative change in percentage from 2007 to 2008 in commercial property
transactions is led by Singapore (-51%) followed by Japan (-15%) and China (-11%).
In total, Asia produced a negative change in commercial property transactions (-12%).
Table 3.8 shows commercial property transactions in Asia in 2007.
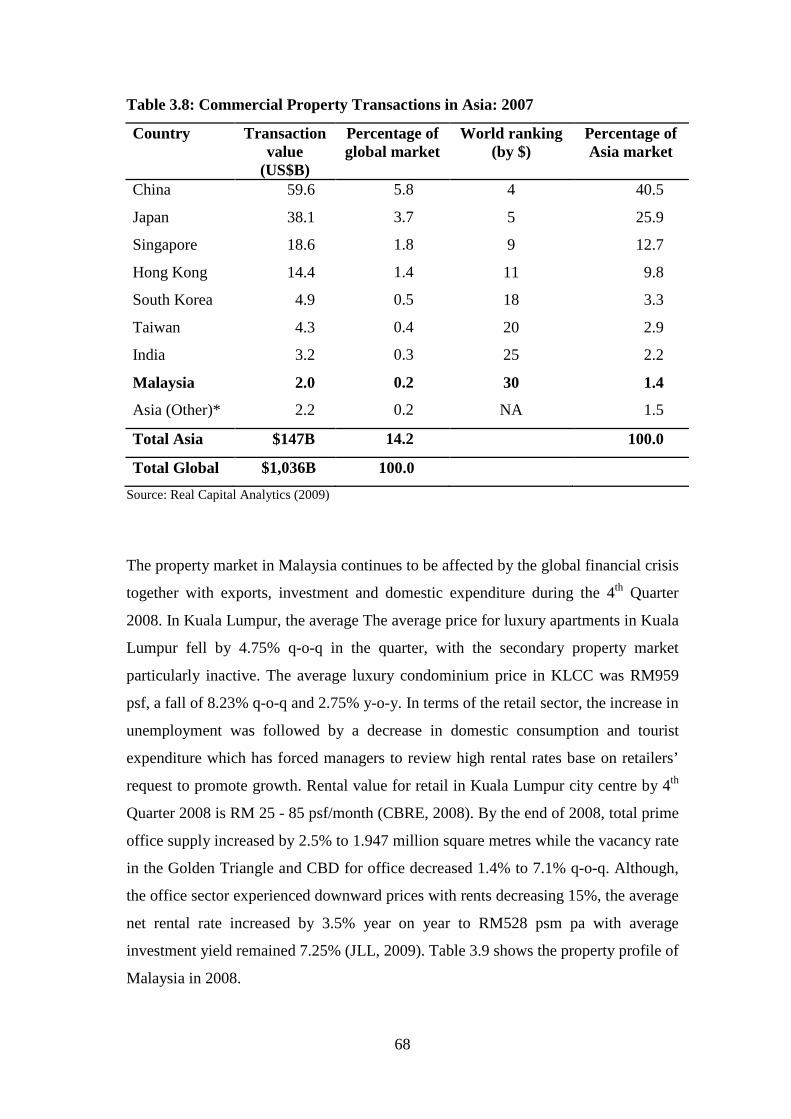
68
Table 3.8: Commercial Property Transactions in Asia: 2007
Country Transactionvalue
(US$B)
Percentage ofglobal market
World ranking(by $)
Percentage ofAsia market
China 59.6 5.8 4 40.5
Japan 38.1 3.7 5 25.9
Singapore 18.6 1.8 9 12.7
Hong Kong 14.4 1.4 11 9.8
South Korea 4.9 0.5 18 3.3
Taiwan 4.3 0.4 20 2.9
India 3.2 0.3 25 2.2
Malaysia 2.0 0.2 30 1.4
Asia (Other)* 2.2 0.2 NA 1.5
Total Asia $147B 14.2 100.0
Total Global $1,036B 100.0
Source: Real Capital Analytics (2009)
The property market in Malaysia continues to be affected by the global financial crisis
together with exports, investment and domestic expenditure during the 4th Quarter
2008. In Kuala Lumpur, the average The average price for luxury apartments in Kuala
Lumpur fell by 4.75% q-o-q in the quarter, with the secondary property market
particularly inactive. The average luxury condominium price in KLCC was RM959
psf, a fall of 8.23% q-o-q and 2.75% y-o-y. In terms of the retail sector, the increase in
unemployment was followed by a decrease in domestic consumption and tourist
expenditure which has forced managers to review high rental rates base on retailers’
request to promote growth. Rental value for retail in Kuala Lumpur city centre by 4th
Quarter 2008 is RM 25 - 85 psf/month (CBRE, 2008). By the end of 2008, total prime
office supply increased by 2.5% to 1.947 million square metres while the vacancy rate
in the Golden Triangle and CBD for office decreased 1.4% to 7.1% q-o-q. Although,
the office sector experienced downward prices with rents decreasing 15%, the average
net rental rate increased by 3.5% year on year to RM528 psm pa with average
investment yield remained 7.25% (JLL, 2009). Table 3.9 shows the property profile of
Malaysia in 2008.
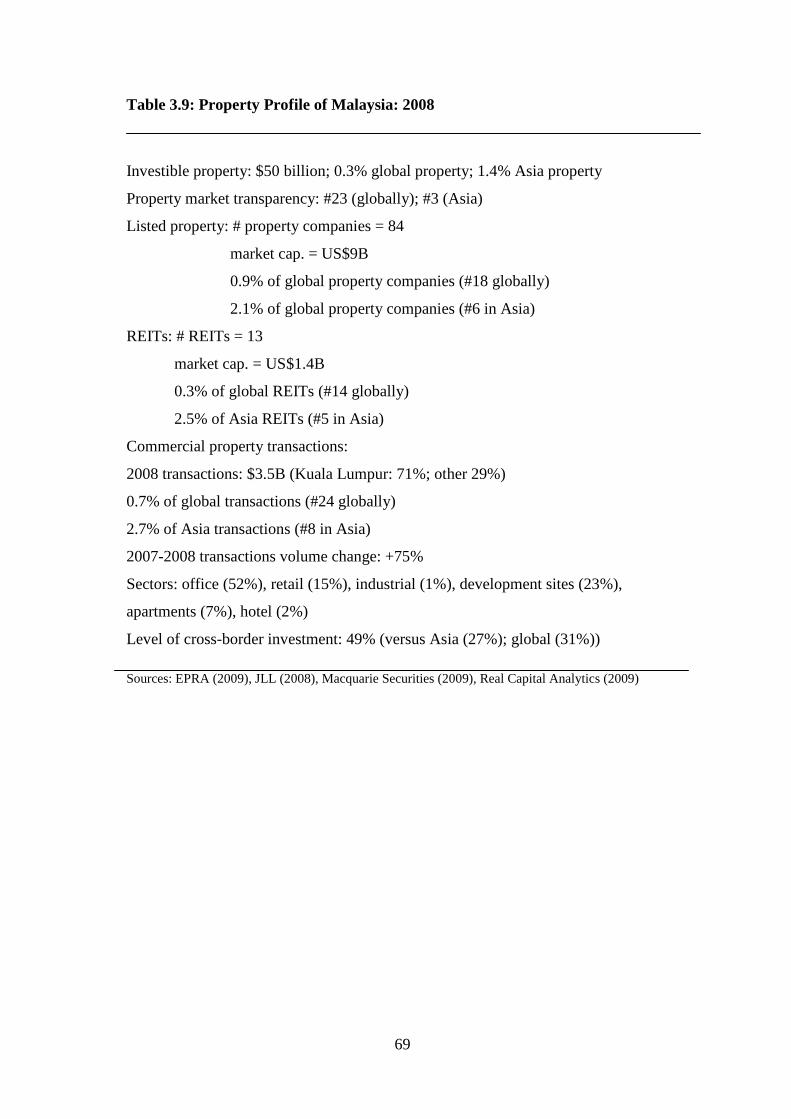
69
Table 3.9: Property Profile of Malaysia: 2008
Investible property: $50 billion; 0.3% global property; 1.4% Asia property
Property market transparency: #23 (globally); #3 (Asia)
Listed property: # property companies = 84
market cap. = US$9B
0.9% of global property companies (#18 globally)
2.1% of global property companies (#6 in Asia)
REITs: # REITs = 13
market cap. = US$1.4B
0.3% of global REITs (#14 globally)
2.5% of Asia REITs (#5 in Asia)
Commercial property transactions:
2008 transactions: $3.5B (Kuala Lumpur: 71%; other 29%)
0.7% of global transactions (#24 globally)
2.7% of Asia transactions (#8 in Asia)
2007-2008 transactions volume change: +75%
Sectors: office (52%), retail (15%), industrial (1%), development sites (23%),
apartments (7%), hotel (2%)
Level of cross-border investment: 49% (versus Asia (27%); global (31%))
Sources: EPRA (2009), JLL (2008), Macquarie Securities (2009), Real Capital Analytics (2009)
70
3.4 Property Ownership Structures
Property ownership structure in Malaysia can be both in direct and indirect property.
The next segments will discuss the profile of listed property companies and REITs in
Malaysia.
3.4.1 Property Companies
By December 2008, the number of listed property companies in Malaysia is 84 with a
market capitalisation of US$9B, which accounts for 0.9% of global property
companies (#18 globally) and 2.1% of Asia property companies (#6 in Asia).
3.4.2 REITs
By December 2008, the number of REITs in Malaysia is 13 with a market
capitalisation of US$1.4B which accounts for 0.3% of global REITs (#14 globally)
and 2.5% of Asia REITs (#5 in Asia). Table 3.10 show the characteristics of
Malaysian REITs.
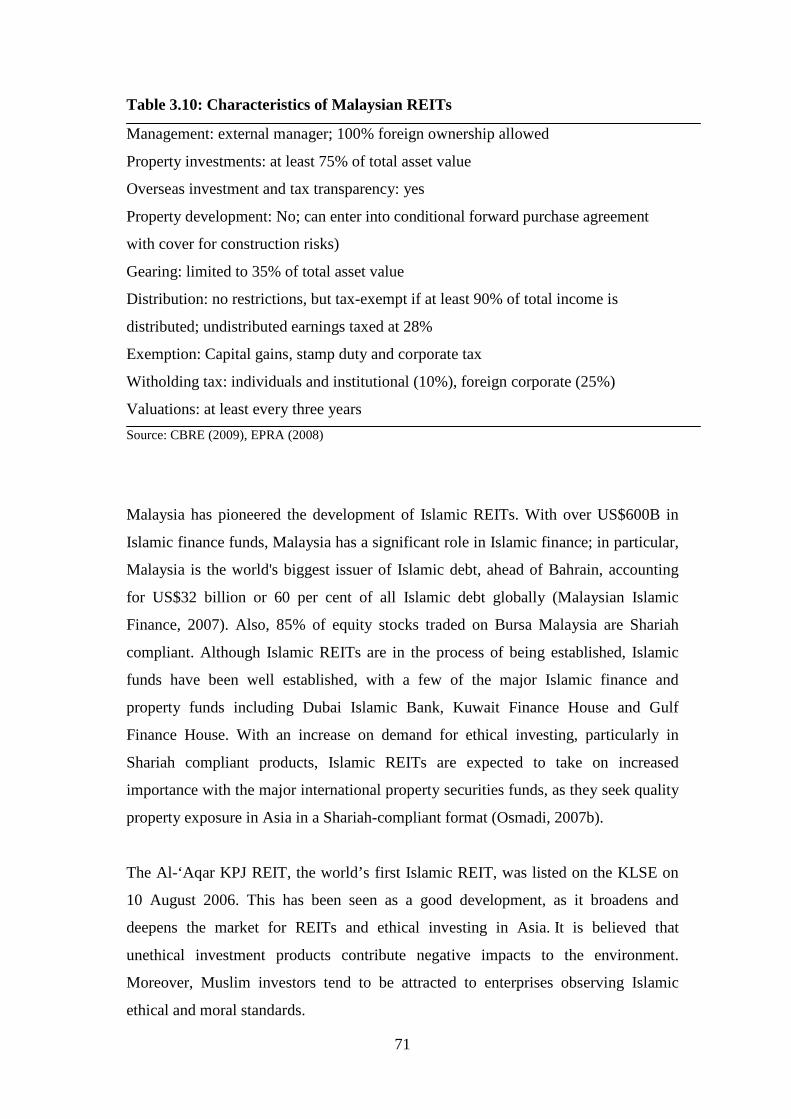
71
Table 3.10: Characteristics of Malaysian REITs
Management: external manager; 100% foreign ownership allowed
Property investments: at least 75% of total asset value
Overseas investment and tax transparency: yes
Property development: No; can enter into conditional forward purchase agreement
with cover for construction risks)
Gearing: limited to 35% of total asset value
Distribution: no restrictions, but tax-exempt if at least 90% of total income is
distributed; undistributed earnings taxed at 28%
Exemption: Capital gains, stamp duty and corporate tax
Witholding tax: individuals and institutional (10%), foreign corporate (25%)
Valuations: at least every three years
Source: CBRE (2009), EPRA (2008)
Malaysia has pioneered the development of Islamic REITs. With over US$600B in
Islamic finance funds, Malaysia has a significant role in Islamic finance; in particular,
Malaysia is the world's biggest issuer of Islamic debt, ahead of Bahrain, accounting
for US$32 billion or 60 per cent of all Islamic debt globally (Malaysian Islamic
Finance, 2007). Also, 85% of equity stocks traded on Bursa Malaysia are Shariah
compliant. Although Islamic REITs are in the process of being established, Islamic
funds have been well established, with a few of the major Islamic finance and
property funds including Dubai Islamic Bank, Kuwait Finance House and Gulf
Finance House. With an increase on demand for ethical investing, particularly in
Shariah compliant products, Islamic REITs are expected to take on increased
importance with the major international property securities funds, as they seek quality
property exposure in Asia in a Shariah-compliant format (Osmadi, 2007b).
The Al-‘Aqar KPJ REIT, the world’s first Islamic REIT, was listed on the KLSE on
10 August 2006. This has been seen as a good development, as it broadens and
deepens the market for REITs and ethical investing in Asia. It is believed that
unethical investment products contribute negative impacts to the environment.
Moreover, Muslim investors tend to be attracted to enterprises observing Islamic
ethical and moral standards.
72
Islamic investment products are likely to see significant future growth in many
countries. With the introduction of Islamic REITs, it is likely that the Islamic
compliant property market is poised to become significant within the global financial
markets. Today, Islamic financial institutions are advancing and improving their
products to attract more diversified investors, with Islamic REITs expected to play an
important role. The next section will discuss the history of the initial Property Trust
Fund (PTF) in Malaysia.
3.4.3 PTFs
Malaysia is the first Asian country to develop a REIT market. It was better known as
PTFs in 1986. Malaysia used the Australian LPT model to set up the regulatory
framework, although there are some different aspects to the structure. This is mainly
because of the ‘bumiputra’ rules which restrict foreign ownership in favour of
indigenous Malays. The first regulatory framework was approved by Bank Negara
Malaysia (the Central Bank of Malaysia) with the legislation governing their
establishment and operation being the Companies Act 1965 and the Securities
Industry Act 1983 (Rozali and Hamzah, 2006). Later, the Securities Commission (SC)
became the regulator once it was formed. Specific guidelines on PTFs were
introduced by the SC in 1991 and later revised in 1995 and 2002.
Unfortunately, since 1989 until 2004, the regulatory structure was still restrictive.
During these periods, only subsidiary companies of financial institutions were
permitted to set up and manage such funds. In 2004, only 3 PTFs were listed in the
Kuala Lumpur Stock Exchange (KLSE); namely AmFirst Property Trust (AMFPT),
Amanah Harta Tanah PNB (AHP) and Amanah Harta Tanah PNB 2 (AHP2). Other
factors which have contributed to the poor performance of PTFs were the lack of
prime properties and quality assets in their property portfolios. Even with the
availability of these properties, the borrowing limits and the long acquisition periods
have reduced the interest to the parties involved (i.e. investors and property owners).
73
Since its first listing, the price for AMFPT performed better in comparison with other
PTFs. Even during the Asian financial crisis in 1998, the trust was able to sustain,
with the lowest price of 50 sen which is higher than other PTFs in the same period.
The source of this steady income was mainly generated from both of their highly
occupied buildings in Kuala Lumpur, AmBank Group Building and AmBank Group
Leadership Centre.
Meanwhile, difficulties in acquiring prime properties have resulted in the AHP Trust
to expand their property portfolios with non-prime or small properties; e.g. shop
offices, shop houses and secondary buildings. In 1994, the stock market witnessed a
record-breaking bull run with AHP having the highest share price of RM5.75 in 1994.
However, the share price performance has been subdued as a result of the lack of
quality assets, which is then associated with investor’s lack in interest.
These factors have also hindered the performance trust of AHP2. The highest share
price for AHP2 was during its first day of listing, which then appears to fall much
further during the Asian Financial crisis. Until the first half of 2006, the trust
managers were still having difficulties to improve the occupancy level of their
property in Ipoh which is 29.69%. As at August 2006, the share price is the lowest
since it was listed which recorded only 38 sen.
The poor performances of Malaysian PTFs together with the successful development
of REIT-like structures in other countries (e.g. Australia and US) have encouraged the
government and regulators to enhance the existing PTF framework. In the 2005
budget, the Malaysian Government introduced further improvements to its REIT-like
structure which included a more tax transparent structure. However, the tax
transparency in Malaysia is not as attractive as been offered by other countries in the
region. This next section will highlight the development of Malaysian REITs which
include Islamic REITs in Malaysia, and their unique features as investment vehicles.
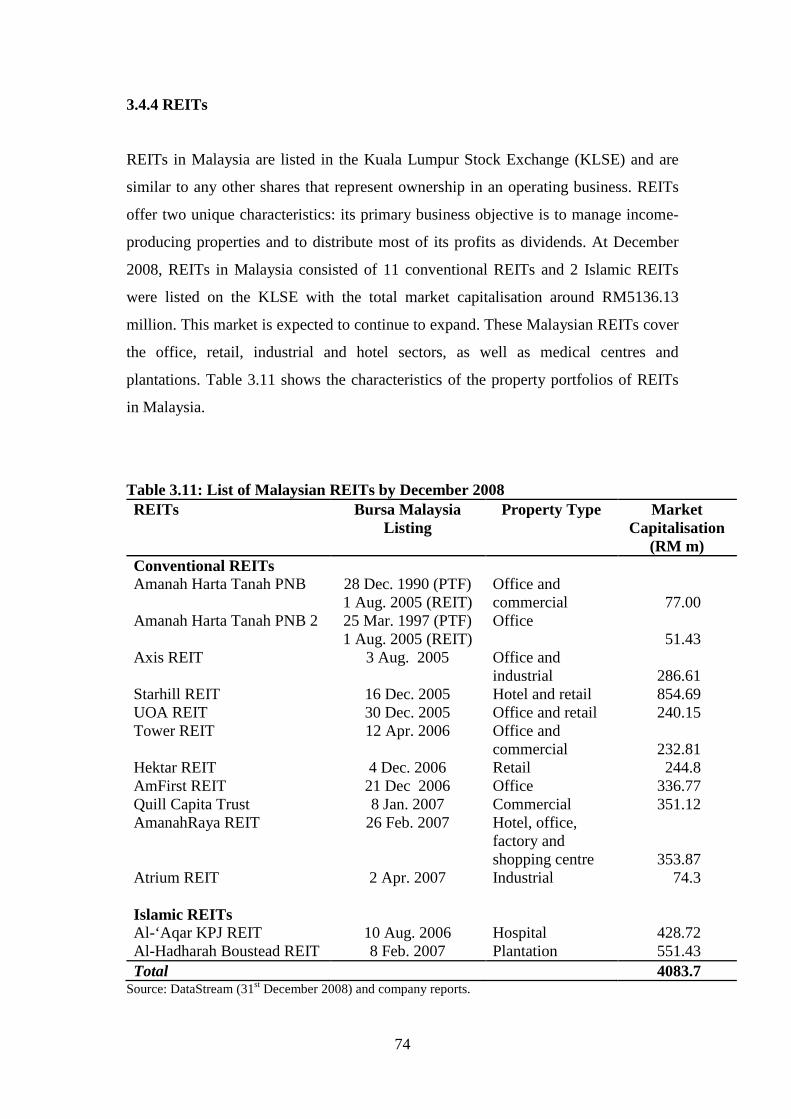
74
3.4.4 REITs
REITs in Malaysia are listed in the Kuala Lumpur Stock Exchange (KLSE) and are
similar to any other shares that represent ownership in an operating business. REITs
offer two unique characteristics: its primary business objective is to manage income-
producing properties and to distribute most of its profits as dividends. At December
2008, REITs in Malaysia consisted of 11 conventional REITs and 2 Islamic REITs
were listed on the KLSE with the total market capitalisation around RM5136.13
million. This market is expected to continue to expand. These Malaysian REITs cover
the office, retail, industrial and hotel sectors, as well as medical centres and
plantations. Table 3.11 shows the characteristics of the property portfolios of REITs
in Malaysia.
Table 3.11: List of Malaysian REITs by December 2008REITs Bursa Malaysia
ListingProperty Type Market
Capitalisation(RM m)
Conventional REITsAmanah Harta Tanah PNB 28 Dec. 1990 (PTF)
1 Aug. 2005 (REIT)Office andcommercial 77.00
Amanah Harta Tanah PNB 2 25 Mar. 1997 (PTF)1 Aug. 2005 (REIT)
Office51.43
Axis REIT 3 Aug. 2005 Office andindustrial 286.61
Starhill REIT 16 Dec. 2005 Hotel and retail 854.69UOA REIT 30 Dec. 2005 Office and retail 240.15Tower REIT 12 Apr. 2006 Office and
commercial 232.81Hektar REIT 4 Dec. 2006 Retail 244.8AmFirst REIT 21 Dec 2006 Office 336.77Quill Capita Trust 8 Jan. 2007 Commercial 351.12AmanahRaya REIT 26 Feb. 2007 Hotel, office,
factory andshopping centre 353.87
Atrium REIT 2 Apr. 2007 Industrial 74.3
Islamic REITsAl-‘Aqar KPJ REIT 10 Aug. 2006 Hospital 428.72Al-Hadharah Boustead REIT 8 Feb. 2007 Plantation 551.43
Total 4083.7Source: DataStream (31st December 2008) and company reports.
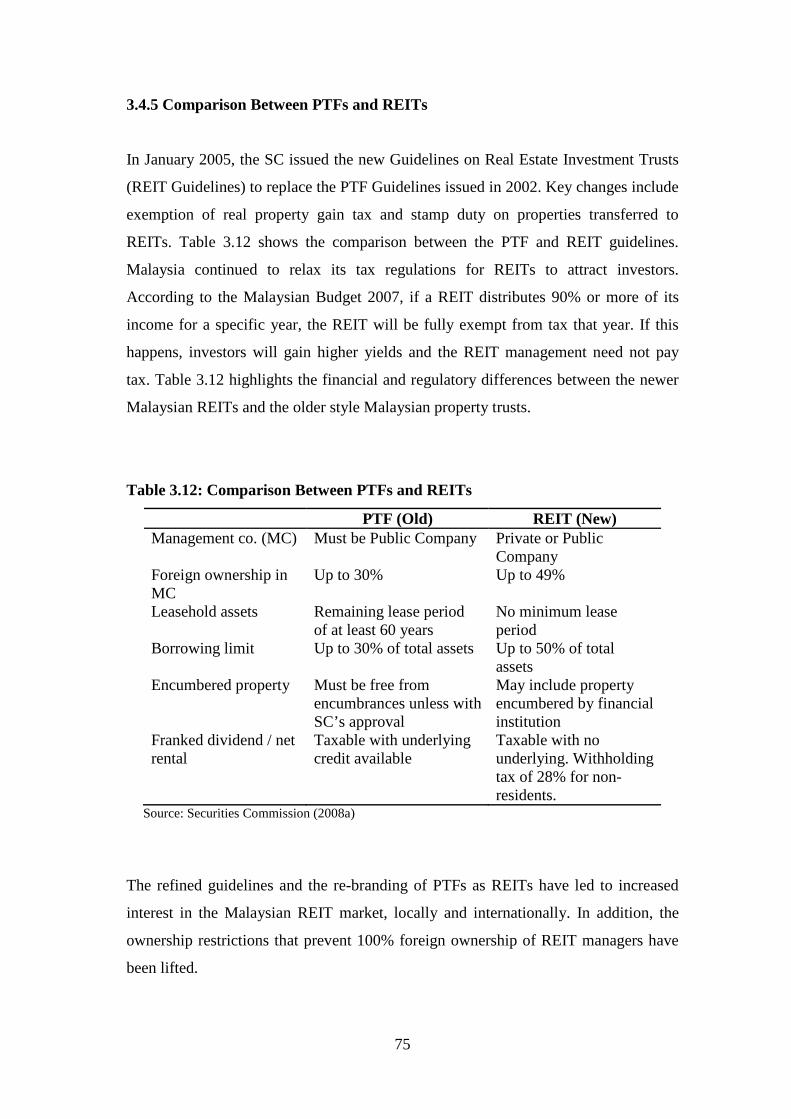
75
3.4.5 Comparison Between PTFs and REITs
In January 2005, the SC issued the new Guidelines on Real Estate Investment Trusts
(REIT Guidelines) to replace the PTF Guidelines issued in 2002. Key changes include
exemption of real property gain tax and stamp duty on properties transferred to
REITs. Table 3.12 shows the comparison between the PTF and REIT guidelines.
Malaysia continued to relax its tax regulations for REITs to attract investors.
According to the Malaysian Budget 2007, if a REIT distributes 90% or more of its
income for a specific year, the REIT will be fully exempt from tax that year. If this
happens, investors will gain higher yields and the REIT management need not pay
tax. Table 3.12 highlights the financial and regulatory differences between the newer
Malaysian REITs and the older style Malaysian property trusts.
Table 3.12: Comparison Between PTFs and REITs
PTF (Old) REIT (New)Management co. (MC) Must be Public Company Private or Public
CompanyForeign ownership inMC
Up to 30% Up to 49%
Leasehold assets Remaining lease periodof at least 60 years
No minimum leaseperiod
Borrowing limit Up to 30% of total assets Up to 50% of totalassets
Encumbered property Must be free fromencumbrances unless withSC’s approval
May include propertyencumbered by financialinstitution
Franked dividend / netrental
Taxable with underlyingcredit available
Taxable with nounderlying. Withholdingtax of 28% for non-residents.
Source: Securities Commission (2008a)
The refined guidelines and the re-branding of PTFs as REITs have led to increased
interest in the Malaysian REIT market, locally and internationally. In addition, the
ownership restrictions that prevent 100% foreign ownership of REIT managers have
been lifted.
76
3.4.6 Comparison Between Conventional REITs and Islamic REITs
The next section will discuss the characteristics of Islamic Finance and thus
comparing it to the conventional system. This will be followed with the comparison
between Conventional REITs and Islamic REITs.
3.4.6.1 Characteristics of Islamic Finance
The demand for Islamic finance has increased in many markets. There are several
reasons behind this recent growth. One is the strong demand from a large number of
immigrant and non-immigrant Muslims for Islamic financial services and
transactions. Second is the growing oil wealth, with demand for suitable investments
soaring in the Gulf region and third is the competitiveness of many of the products,
attracting both Muslim and non-Muslim investors. Today, the number of Islamic
financial institutions worldwide has risen to more than 300 in over 75 countries (see
Table 3.13). They are concentrated in the Middle East and Southeast Asia (with
Bahrain and Malaysia being the biggest hubs), and are also emerging in Europe and
the United States. The rapid growth of the Islamic banking and finance market is
estimated to be worth between US$200 billion to US$500 billion worldwide (UK
Financial Services Authority, 2006).
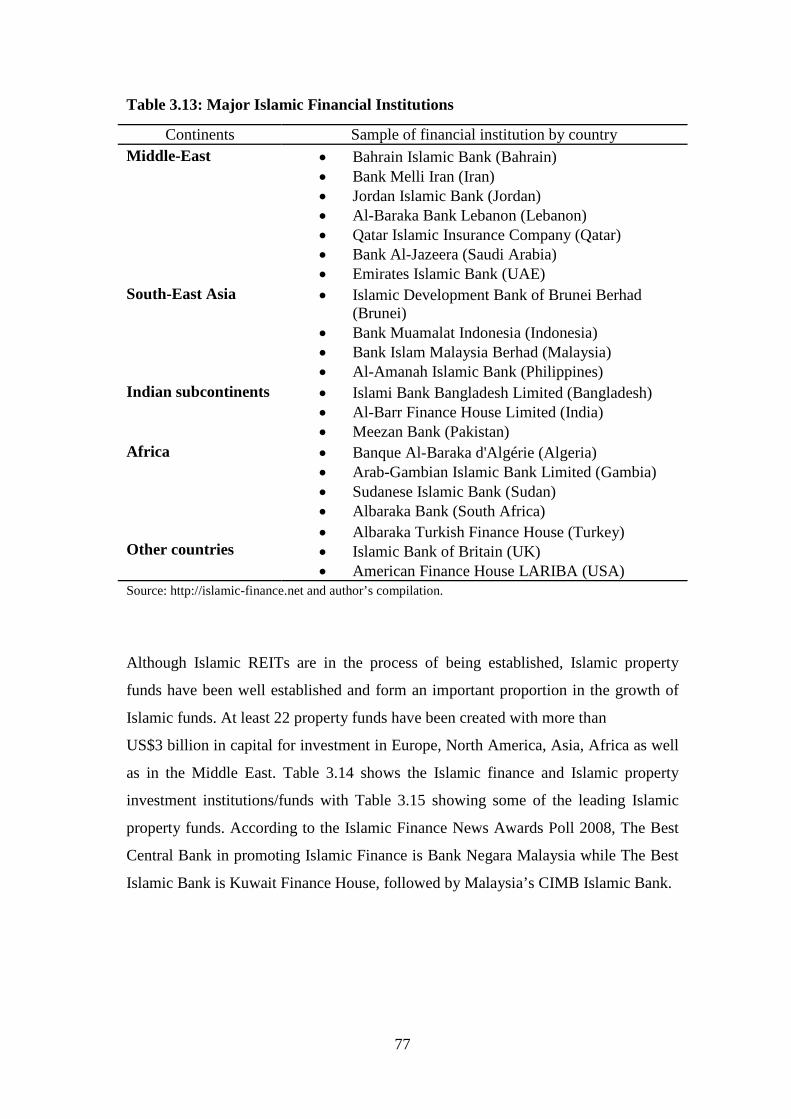
77
Table 3.13: Major Islamic Financial Institutions
Continents Sample of financial institution by country
Middle-East Bahrain Islamic Bank (Bahrain) Bank Melli Iran (Iran) Jordan Islamic Bank (Jordan) Al-Baraka Bank Lebanon (Lebanon) Qatar Islamic Insurance Company (Qatar) Bank Al-Jazeera (Saudi Arabia) Emirates Islamic Bank (UAE)
South-East Asia Islamic Development Bank of Brunei Berhad(Brunei)
Bank Muamalat Indonesia (Indonesia) Bank Islam Malaysia Berhad (Malaysia) Al-Amanah Islamic Bank (Philippines)
Indian subcontinents Islami Bank Bangladesh Limited (Bangladesh) Al-Barr Finance House Limited (India) Meezan Bank (Pakistan)
Africa Banque Al-Baraka d'Algérie (Algeria) Arab-Gambian Islamic Bank Limited (Gambia) Sudanese Islamic Bank (Sudan) Albaraka Bank (South Africa)
Other countries Albaraka Turkish Finance House (Turkey) Islamic Bank of Britain (UK) American Finance House LARIBA (USA)
Source: http://islamic-finance.net and author’s compilation.
Although Islamic REITs are in the process of being established, Islamic property
funds have been well established and form an important proportion in the growth of
Islamic funds. At least 22 property funds have been created with more than
US$3 billion in capital for investment in Europe, North America, Asia, Africa as well
as in the Middle East. Table 3.14 shows the Islamic finance and Islamic property
investment institutions/funds with Table 3.15 showing some of the leading Islamic
property funds. According to the Islamic Finance News Awards Poll 2008, The Best
Central Bank in promoting Islamic Finance is Bank Negara Malaysia while The Best
Islamic Bank is Kuwait Finance House, followed by Malaysia’s CIMB Islamic Bank.
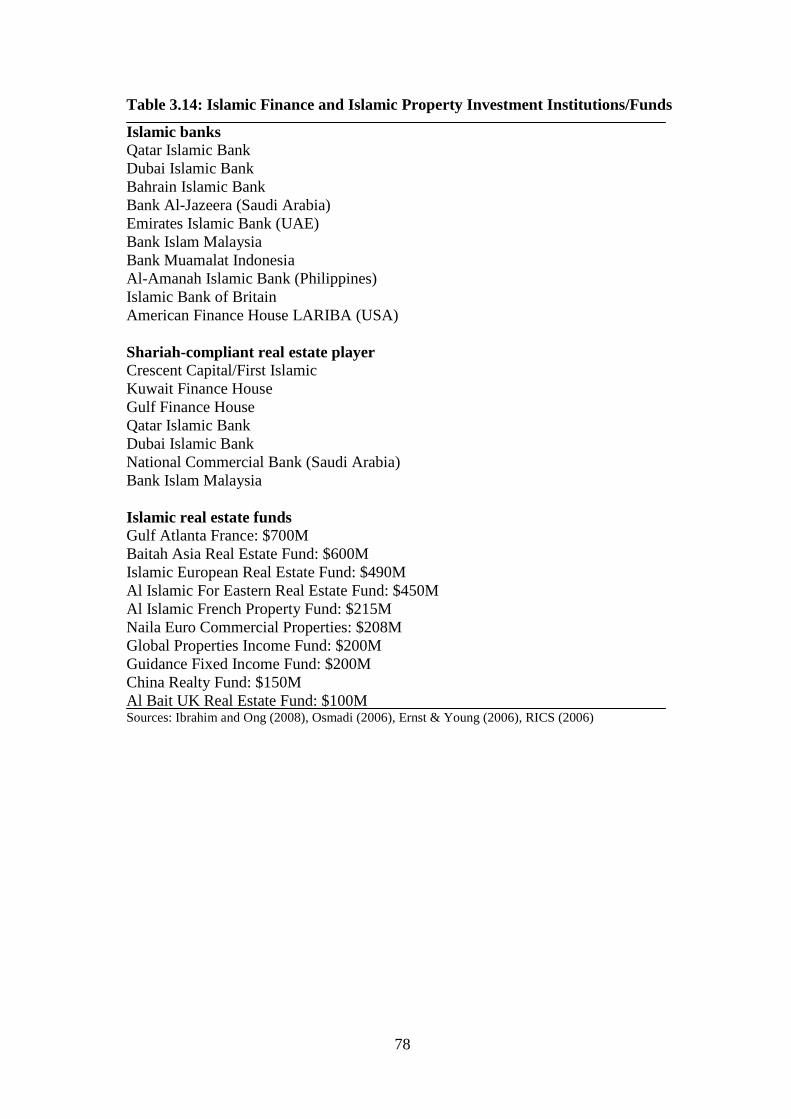
78
Table 3.14: Islamic Finance and Islamic Property Investment Institutions/Funds
Islamic banksQatar Islamic BankDubai Islamic BankBahrain Islamic BankBank Al-Jazeera (Saudi Arabia)Emirates Islamic Bank (UAE)Bank Islam MalaysiaBank Muamalat IndonesiaAl-Amanah Islamic Bank (Philippines)Islamic Bank of BritainAmerican Finance House LARIBA (USA)
Shariah-compliant real estate playerCrescent Capital/First IslamicKuwait Finance HouseGulf Finance HouseQatar Islamic BankDubai Islamic BankNational Commercial Bank (Saudi Arabia)Bank Islam Malaysia
Islamic real estate fundsGulf Atlanta France: $700MBaitah Asia Real Estate Fund: $600MIslamic European Real Estate Fund: $490MAl Islamic For Eastern Real Estate Fund: $450MAl Islamic French Property Fund: $215MNaila Euro Commercial Properties: $208MGlobal Properties Income Fund: $200MGuidance Fixed Income Fund: $200MChina Realty Fund: $150MAl Bait UK Real Estate Fund: $100MSources: Ibrahim and Ong (2008), Osmadi (2006), Ernst & Young (2006), RICS (2006)
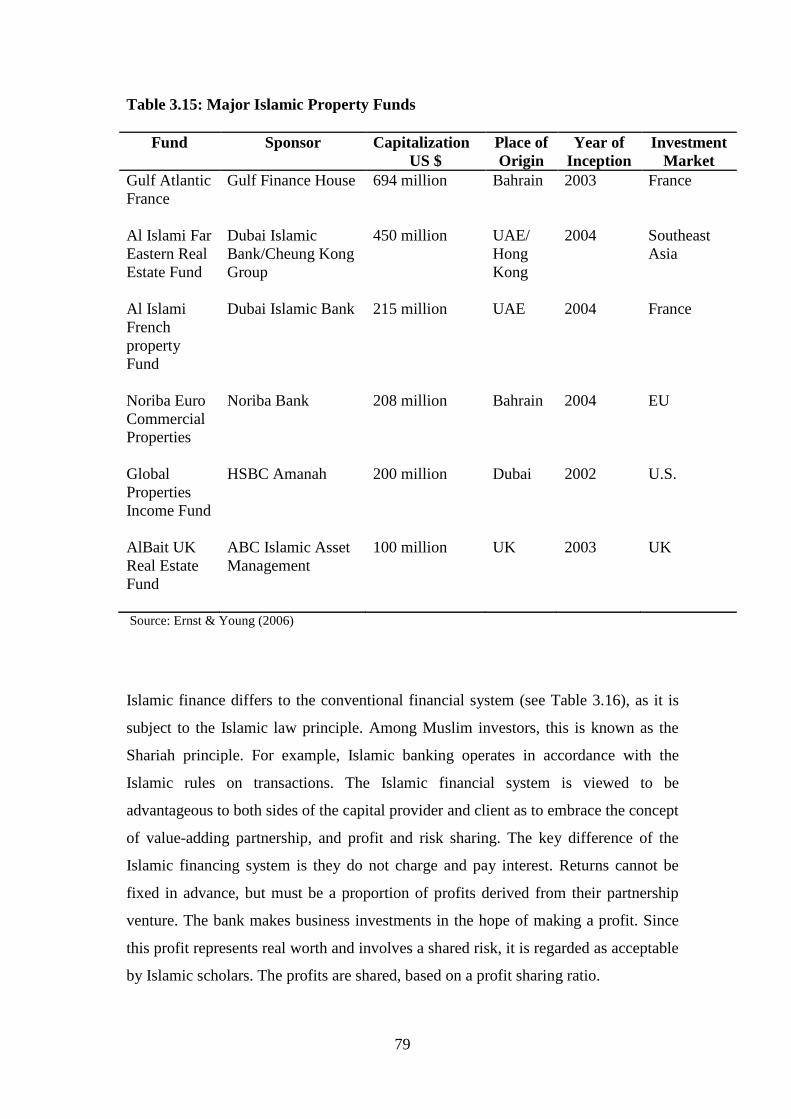
79
Table 3.15: Major Islamic Property Funds
Fund Sponsor CapitalizationUS $
Place ofOrigin
Year ofInception
InvestmentMarket
Gulf AtlanticFrance
Gulf Finance House 694 million Bahrain 2003 France
Al Islami FarEastern RealEstate Fund
Dubai IslamicBank/Cheung KongGroup
450 million UAE/HongKong
2004 SoutheastAsia
Al IslamiFrenchpropertyFund
Dubai Islamic Bank 215 million UAE 2004 France
Noriba EuroCommercialProperties
Noriba Bank 208 million Bahrain 2004 EU
GlobalPropertiesIncome Fund
HSBC Amanah 200 million Dubai 2002 U.S.
AlBait UKReal EstateFund
ABC Islamic AssetManagement
100 million UK 2003 UK
Source: Ernst & Young (2006)
Islamic finance differs to the conventional financial system (see Table 3.16), as it is
subject to the Islamic law principle. Among Muslim investors, this is known as the
Shariah principle. For example, Islamic banking operates in accordance with the
Islamic rules on transactions. The Islamic financial system is viewed to be
advantageous to both sides of the capital provider and client as to embrace the concept
of value-adding partnership, and profit and risk sharing. The key difference of the
Islamic financing system is they do not charge and pay interest. Returns cannot be
fixed in advance, but must be a proportion of profits derived from their partnership
venture. The bank makes business investments in the hope of making a profit. Since
this profit represents real worth and involves a shared risk, it is regarded as acceptable
by Islamic scholars. The profits are shared, based on a profit sharing ratio.
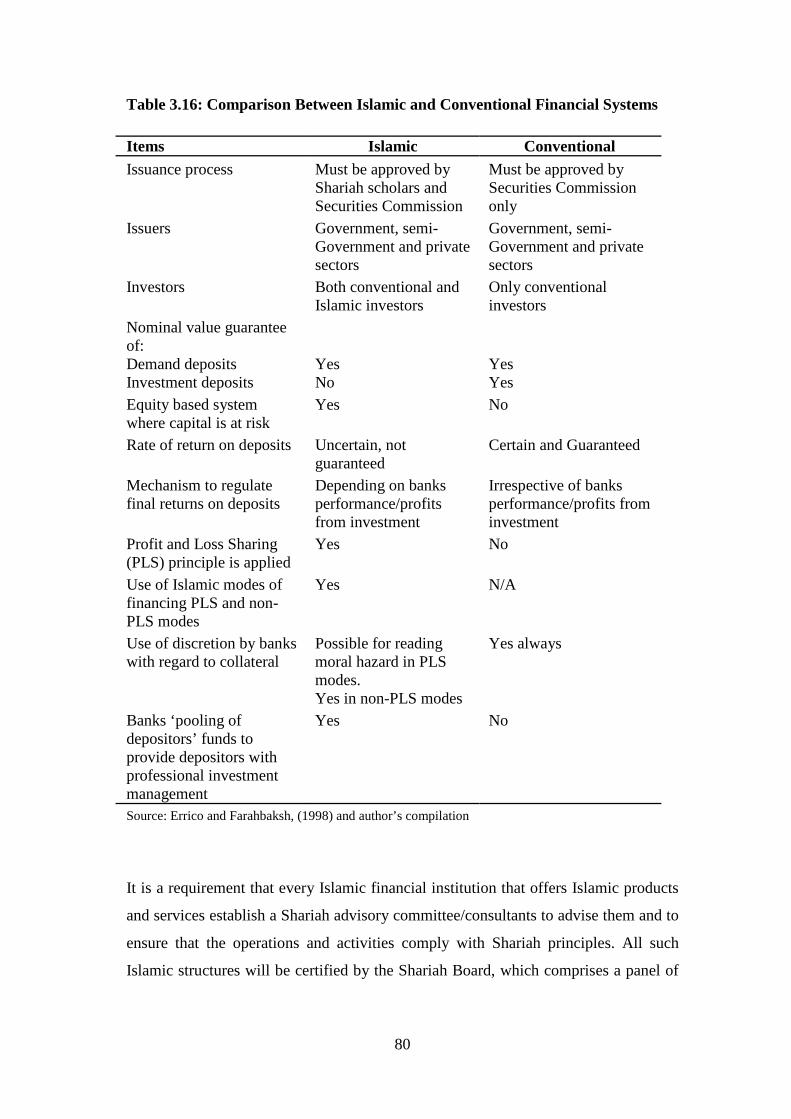
80
Table 3.16: Comparison Between Islamic and Conventional Financial Systems
Items Islamic Conventional
Issuance process Must be approved byShariah scholars andSecurities Commission
Must be approved bySecurities Commissiononly
Issuers Government, semi-Government and privatesectors
Government, semi-Government and privatesectors
Investors Both conventional andIslamic investors
Only conventionalinvestors
Nominal value guaranteeof:Demand depositsInvestment deposits
YesNo
YesYes
Equity based systemwhere capital is at risk
Yes No
Rate of return on deposits Uncertain, notguaranteed
Certain and Guaranteed
Mechanism to regulatefinal returns on deposits
Depending on banksperformance/profitsfrom investment
Irrespective of banksperformance/profits frominvestment
Profit and Loss Sharing(PLS) principle is applied
Yes No
Use of Islamic modes offinancing PLS and non-PLS modes
Yes N/A
Use of discretion by bankswith regard to collateral
Possible for readingmoral hazard in PLSmodes.Yes in non-PLS modes
Yes always
Banks ‘pooling ofdepositors’ funds toprovide depositors withprofessional investmentmanagement
Yes No
Source: Errico and Farahbaksh, (1998) and author’s compilation
It is a requirement that every Islamic financial institution that offers Islamic products
and services establish a Shariah advisory committee/consultants to advise them and to
ensure that the operations and activities comply with Shariah principles. All such
Islamic structures will be certified by the Shariah Board, which comprises a panel of

81
experts who are drawn from respected Shariah scholars with the expertise in Islamic
law.
Generally, Islamic law prohibits engaging with haram (religiously non-permissible)
activities which involves either products or services, but allows halal (religiously
permissible) activities. For various reasons, an activity is labelled haram as it is
considered to be harmful and destructive. Among the haram activities are:
1) Economic activities involving oppression, speculation and gambling.
2) Manufacturing and production of goods and services which is
against Islamic values.
3) Interest base transactions.
The following are some Islamic finance terms: (RICS, 2006)
Riba
Under the Shariah concept, riba or usury refers to the extra payment that must be paid
without any consideration that is acceptable under Islamic jurisdictions. It is
considered exploitive where one may earn without working in the expense of others.
In this context, riba comes in the form of interest, unlawful gain or unjustified
rewards. Muslim jurists have classified riba into two types:
Riba Al-Fadl
This term refers to unjust exchange in business transactions. Example of riba al-fadl:
Example 1: A sells $100 with a value of $110 to B without Shariah base
consideration. The extra payment of $10 will be riba and unacceptable.
Riba Al-Nasi’ah
This term refers to the charging of interest on loans from the lender in return for his
waiting period. Examples of riba al-nasi’ah:
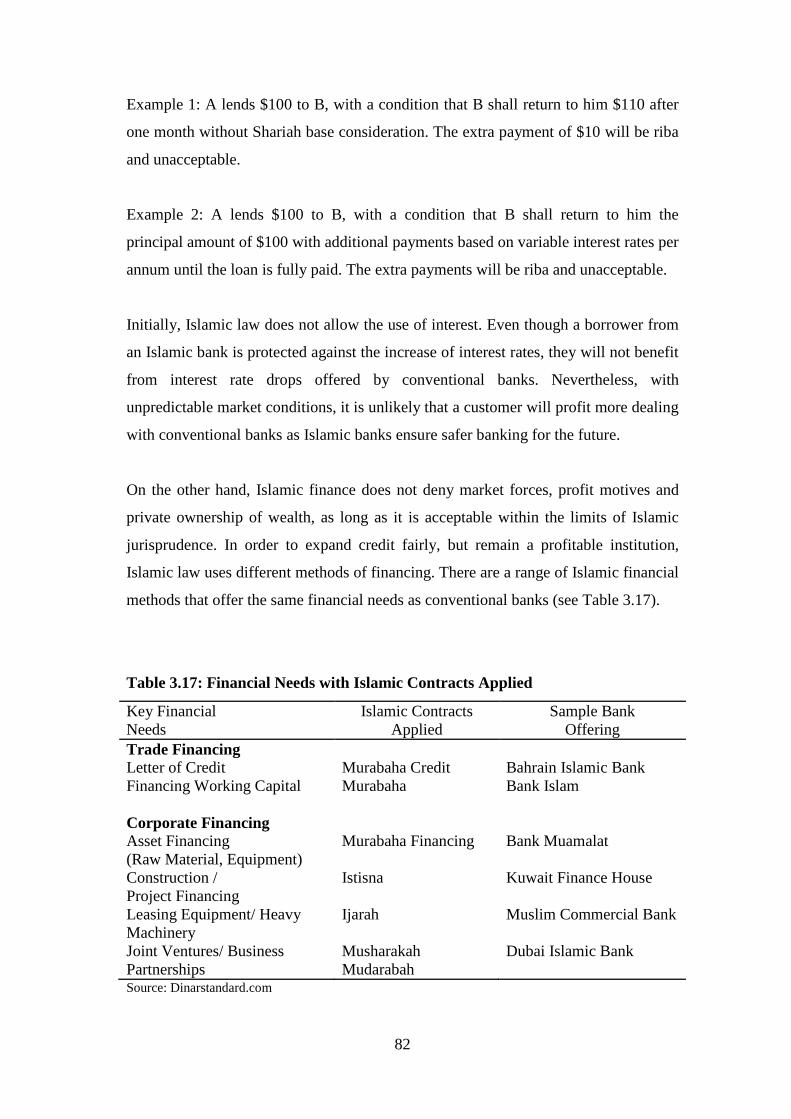
82
Example 1: A lends $100 to B, with a condition that B shall return to him $110 after
one month without Shariah base consideration. The extra payment of $10 will be riba
and unacceptable.
Example 2: A lends $100 to B, with a condition that B shall return to him the
principal amount of $100 with additional payments based on variable interest rates per
annum until the loan is fully paid. The extra payments will be riba and unacceptable.
Initially, Islamic law does not allow the use of interest. Even though a borrower from
an Islamic bank is protected against the increase of interest rates, they will not benefit
from interest rate drops offered by conventional banks. Nevertheless, with
unpredictable market conditions, it is unlikely that a customer will profit more dealing
with conventional banks as Islamic banks ensure safer banking for the future.
On the other hand, Islamic finance does not deny market forces, profit motives and
private ownership of wealth, as long as it is acceptable within the limits of Islamic
jurisprudence. In order to expand credit fairly, but remain a profitable institution,
Islamic law uses different methods of financing. There are a range of Islamic financial
methods that offer the same financial needs as conventional banks (see Table 3.17).
Table 3.17: Financial Needs with Islamic Contracts Applied
Key FinancialNeeds
Islamic ContractsApplied
Sample BankOffering
Trade FinancingLetter of Credit Murabaha Credit Bahrain Islamic BankFinancing Working Capital Murabaha Bank Islam
Corporate FinancingAsset Financing(Raw Material, Equipment)
Murabaha Financing Bank Muamalat
Construction /Project Financing
Istisna Kuwait Finance House
Leasing Equipment/ HeavyMachinery
Ijarah Muslim Commercial Bank
Joint Ventures/ BusinessPartnerships
MusharakahMudarabah
Dubai Islamic Bank
Source: Dinarstandard.com
83
Below are the descriptions of common Islamic concepts used in finance:
Debt instruments
Murabaha (cost-plus profit): a contract of sales between the capital provider and its
client. The capital provider purchases the client’s desired goods from a third party.
Then, the capital provider sells it to the client at an agreed mark-up price. With this,
the client has effectively obtained credit without paying interest. Repayment is usually
in instalments. Such a contract is valid on the condition that the price, other costs and
the profit margin of the seller are stated at the time of the agreement on the sale.
Istisna (manufacturing): a contract of sales and purchase of assets by specification or
order where the price is paid in advance, but the assets are manufactured or produced
and delivered at a later date.
Qard al-Hasan (benevolent loan): an interest-free loan for either welfare purposes or
for fulfilling short-term funding requirements. The borrower is only required to pay
back the amount borrowed.
Quasi-debt instruments
Ijara (leasing): a leasing contract whereby the capital provider purchases a piece of
equipment selected by the client and then leases it back to him for a specified rent and
term. Instead of lending money and earning interest, ijara allows the capital provider
to earn profits by charging rentals on the asset leased to the client.
Ijara wa iqtina (hire and purchase): a hire and purchase agreement. The transaction
resembles ijara, except that the client is committed to purchase the equipment at the
end of the rental period.
Sukuk (Islamic bond): similar characteristics to that of a conventional bond with the
difference being that they are asset backed; a sukuk representing proportionate
beneficial ownership in the underlying asset. The asset will be leased to the client to
yield the return on the investment.
84
Profit-and-loss-sharing instruments
Musharaka (joint venture): an equity participation contract under which the capital
provider and its client contribute jointly to finance a project. All parties share profits
on a pre-agreed ratio while losses are shared according to each party’s equity
participation. The reason is because in Islam, one cannot loose what they did not
contribute. Management of the venture is carried out by all, some, or just one party
member.
Mudaraba (investment partnership): a contract of investment partnership between the
capital provider for the project and the entrepreneur who will manage the project to
pursue partnership goal. The profit is shared according to the pre-agreed ratios. Aside
from the case of misconduct or violation of the conditions agreed upon by the capital
provider, any losses accruing are borne by the capital provider while the entrepreneur
loses its time, effort and share of the expected income. This arrangement reflects the
Islamic view that all those who participate in the same contract should bear the risk of
failure.
According to a survey conducted by RICS, the most preferred Islamic method of
financing is ijarah, followed by murabahah, sukuk, musharakah and mudarabah
respectively.
3.4.6.2 Characteristics of Islamic REITs
At present, Malaysia is the Islamic financial hub for the South Asian region.
According to credit-ratings agency Moody's Investors Service, Malaysia's Islamic
bond market is the largest in the world, accounting to US$30 billion of the US$41
billion in Islamic bonds issued since 1996. The Islamic finance system in Malaysia
has been long established since 1983 and is widely acceptable by Muslims and non-
Muslims locally and internationally. It has gained investor confidence for a promising
investment return. With increasing awareness and growth of oil wealth, particularly in
terms of attracting significant capital flows from other Islamic countries (eg: Middle
East), there has been a strong demand for more innovative and competitive products
from the Islamic financial industry.
85
Revised financial property regulations have recently improved the Malaysian REIT
environment. These include the implementation of a tax transparent structure and the
exemption from real property gains tax and stamp duty on properties that form a
REIT. Malaysia was the first Asian country to develop property trust funds (PTF) in
1986 and later REITs in 2005. Malaysia has introduced the Islamic REIT guidelines
in 2005, the first in the world to diversify their investment products.
An Islamic REIT is a form of ethical investment which is subject to the Shariah
principle. It differs to the conventional REIT system, as its framework is subject to the
Islamic law principle. Among Muslim investors, this is known as the Shariah
principle. The Islamic law principle prohibits engaging with haram (religiously non-
permissible) activities which involve either products or services, but allows halal
(religiously permissible) activities. For various reasons, an activity is labelled haram
as it is considered to be harmful and destructive.
In November 2005, the Syariah Advisory Council (SAC) of the Securities
Commission (SC) published the guidelines for Islamic REITs in Malaysia. The
Syariah Advisory Council (SAC) operates as the Shariah board in Malaysia. It is a
requirement that every Islamic financial institution that offers Islamic products and
services establish a Shariah advisory committee/consultants to advise them and to
ensure that the operations and activities comply with Shariah principles. All such
Islamic structures will be certified by the Shariah Board, which comprises a panel of
experts who are drawn from respected Shariah scholars with the expertise in Islamic
law. In the Malaysian Islamic REIT context, every single property transaction will
have to be scrutinized by the SAC to ensure full compliance with Islamic principles.
Therefore, all properties and tenants and subleasing details have to be screened and
approved by the SAC. The development of Islamic REIT guidelines compliments the
SC’s guidelines on REITs in Malaysia that were issued on January 2005. According
to these guidelines, if an Islamic REIT would be introduced, it should be structured to
comply with the conventional and Islamic REIT guidelines.
According to the guidelines, an Islamic REIT is permitted to own or purchase
property in which the tenants operate mixed activities that are halal and haram, but

86
with restrictions. In a situation where the property has tenants operating haram
activities, the fund manager needs to perform some additional compliance
assessments before acquiring the property for an Islamic REIT. They need to ensure
that the total rental ratio from haram activities to the total turnover of the Islamic
REIT in the current financial year should not exceed 20 percent. Rental activities that
are classified as haram as decided by the SAC are:
Manufacturing or sale of haram products (i.e pork products, tobacco, alcoholic
liquor, arms and ammunitions).
Entertainment activities- cinema, pornography and any other obscene
materials, hotels and resorts.
Gambling.
Conventional insurance companies.
Stockbroking or share trading in non-Shariah compliant securities.
Banks and Financial Institutions with riba (interest) base services.
If it does exceed 20 percent, the SAC will advise against investing in such a property.
The fund manager needs to be well-versed in differentiating halal and haram
activities. In addition, the manager of an Islamic REIT has to ensure that all forms of
investment, deposit and financing instruments comply with the Shariah principles.
Besides that, it has to use Islamic insurance to insure its property. However,
conventional insurance is acceptable if Islamic insurance is unavailable. An Islamic
REIT is also not permitted to own a property in which all the tenants operate only
haram activities. It cannot be put into an Islamic REIT, even if the total rental
complies with the 20% benchmark. In the case of accepting new tenants, tenants who
operate fully haram activities will not be allowed. Table 3.18 shows the comparison
between Islamic and Conventional REITs.
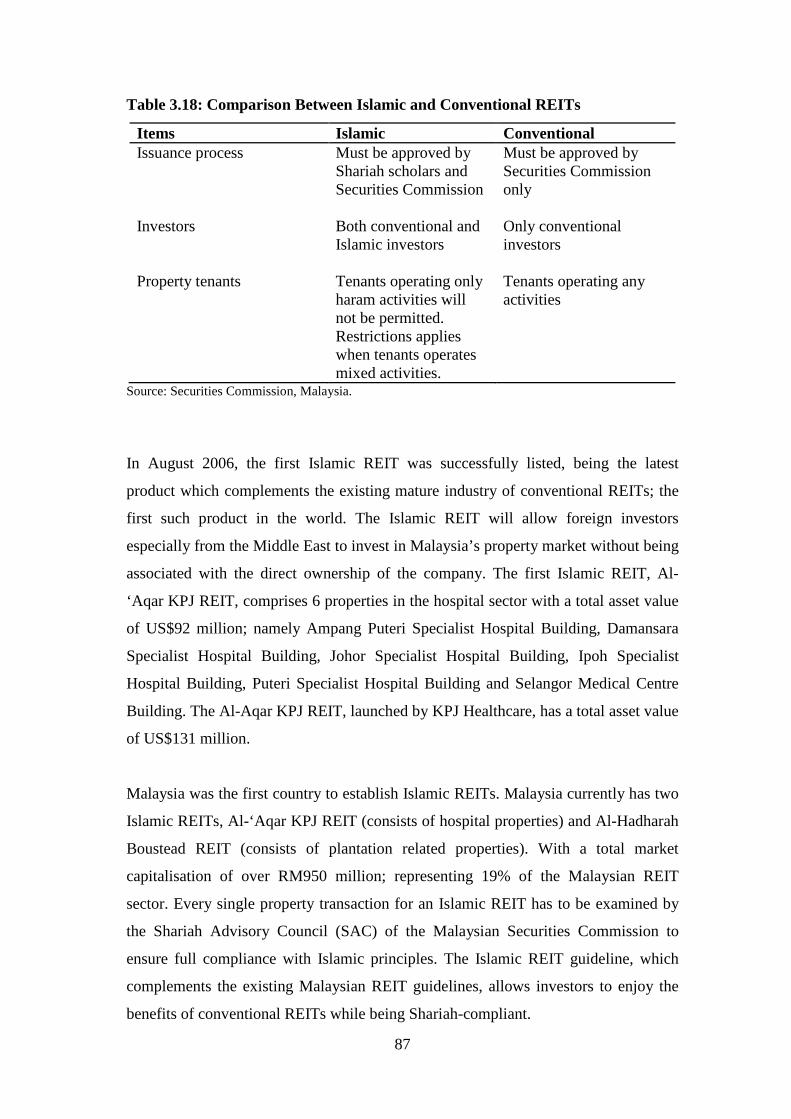
87
Table 3.18: Comparison Between Islamic and Conventional REITs
Items Islamic ConventionalIssuance process Must be approved by
Shariah scholars andSecurities Commission
Must be approved bySecurities Commissiononly
Investors Both conventional andIslamic investors
Only conventionalinvestors
Property tenants Tenants operating onlyharam activities willnot be permitted.Restrictions applieswhen tenants operatesmixed activities.
Tenants operating anyactivities
Source: Securities Commission, Malaysia.
In August 2006, the first Islamic REIT was successfully listed, being the latest
product which complements the existing mature industry of conventional REITs; the
first such product in the world. The Islamic REIT will allow foreign investors
especially from the Middle East to invest in Malaysia’s property market without being
associated with the direct ownership of the company. The first Islamic REIT, Al-
‘Aqar KPJ REIT, comprises 6 properties in the hospital sector with a total asset value
of US$92 million; namely Ampang Puteri Specialist Hospital Building, Damansara
Specialist Hospital Building, Johor Specialist Hospital Building, Ipoh Specialist
Hospital Building, Puteri Specialist Hospital Building and Selangor Medical Centre
Building. The Al-Aqar KPJ REIT, launched by KPJ Healthcare, has a total asset value
of US$131 million.
Malaysia was the first country to establish Islamic REITs. Malaysia currently has two
Islamic REITs, Al-‘Aqar KPJ REIT (consists of hospital properties) and Al-Hadharah
Boustead REIT (consists of plantation related properties). With a total market
capitalisation of over RM950 million; representing 19% of the Malaysian REIT
sector. Every single property transaction for an Islamic REIT has to be examined by
the Shariah Advisory Council (SAC) of the Malaysian Securities Commission to
ensure full compliance with Islamic principles. The Islamic REIT guideline, which
complements the existing Malaysian REIT guidelines, allows investors to enjoy the
benefits of conventional REITs while being Shariah-compliant.
88
The manager of an Islamic REIT needs to ensure that all forms of investment, deposit
and financing instruments comply with the Shariah principles. In addition, an Islamic
REIT has to use Islamic insurance to insure its property. However, conventional
insurance is acceptable if Islamic insurance is unavailable. An Islamic REIT is also
encouraged to participate in forward sales or purchases of currency with Islamic
financial institutions. However, if the Islamic REIT deals with conventional financial
institutions, it is permitted to participate in the conventional forward sales or
purchases of currency (Securities Commission, 2005b).
The Islamic financial system is viewed to be advantageous to both sides of the capital
provider and client as to embrace the concept of a value-adding partnership, and profit
and risk sharing. A few of the general Islamic finance laws that need to be followed
includes the debt and cash money should not form more than 50% of the existing
assets, and the debt to equity ratio of the company should not be more than 30:70%.
By following the Malaysian guidelines for Islamic REITs, it is seem to be
advantageous, as it encourages production of lawful commodities and services and
thus promotes ethical business and ethical investing. The only difference between the
conventional REITs and Islamic REITs is that Islamic REITs need to follow the
Shariah guidelines (Osmadi, 2006). Appendix I will discuss the establishment of 11
conventional M-REITs and 2 Islamic M-REITs in Malaysia.
3.5 Market Size – Liquidity Issues
The REIT market size is still small in Malaysia in comparison to their counterparts.
Transparency is still a big issue. This will be discussed in Chapter 7.
89
3.6. Future Opportunities
Islamic financial services have reached $729 billion at end-2007, 37% up from $531
billion in 2006 (IFSL, 2007). Meanwhile, the Islamic banking industry is valued at
several hundred billion dollars. According to McKinsey (2006), the Islamic Banking
Sector is worth between US$180 billion and US$250 billion while according to
estimates from Dubai International Financial Centre (DIFC), the global market of
Islamic financial products is worth more than US$200 billion and consists of 300
financial institutions in and outside the Muslim world. Shariah compliant products
(include banking assets and asset management) were valued at around US$450 billion
(ex-Iran) in 2006. With growth of 23.5% p.a. over the past five years, Shariah
compliant products are expected to grow at 17% p.a. to exceed US$1 trillion in value
by 2010 (ex-Iran) (McKinsey, 2006). The sector outside Iran has reached $US400-
500 billion and is on track to exceed US1 trillion by 2010.
There are a growing number of infrastructure projects requiring Islamic-compliant
finance, and this has created a considerable demand for professional services and
products within the Middle East region. However, Shariah-compliant real estate and
infrastructure investment are still relatively under-developed and fragmented.
According to Ernst and Young, US$8.6 billion was raised in the region for real estate
investment, demonstrating the strong appetite for real estate investment. For example,
Saudi Arabia’s General Organization for Social Insurance pension fund allocation has
planned to increase its real estate allocation to 1% to 5% over the next five years.
Moreover, of the US$3.7 billion invested by Middle East and North Africa private
equity firms in 2006, the largest share went to real estate (40%), followed by financial
services (17%) and travel and services (15%).
90
CHAPTER 4
METHODOLOGY
4.1 M-REIT Index Development
A PTF, overall M-REIT, conventional M-REIT and Islamic M-REIT index will be
developed to assist further empirical analyses in this thesis. In this context, the
construction of the Property Trust Fund index is significant to show the historical
performance of previous listed property trusts in Malaysia. The PTF index will start
from December 1989 until July 2005. For the purpose of this thesis, the PTF index
will end at July 2005 before the inception/rebranding of PTFs to M-REITs in August
2005. Meanwhile, the overall M-REIT and conventional M-REIT indices will start
from August 2005 until the end of December 2008, whilst the Islamic M-REIT index
will start from August 2006 until the end of December 2008. This covers the period
since the full introduction of both M-REITs and Islamic M-REITs. All total return
indices are constructed on a weekly basis to ensure sufficient data points over this
time period in constructing these M-REIT indices, with the market capitalisation-
weighted scheme applied due to the consistency with the other existing KLSE indices.
As such, the M-REIT indices will be benchmarked against the overall Malaysian
stock market performance indicators, including the Kuala Lumpur Composite Index
(KLCI). All indices have been rebased at base date = 100. The index is constructed
using the following equation:
MnRn + 1 base value t-1
Mn
where Mn represents the market capitalisation for M-REIT, Rn is the total return for
M-REIT, n is number of M-REIT available and t is the corresponding week and the
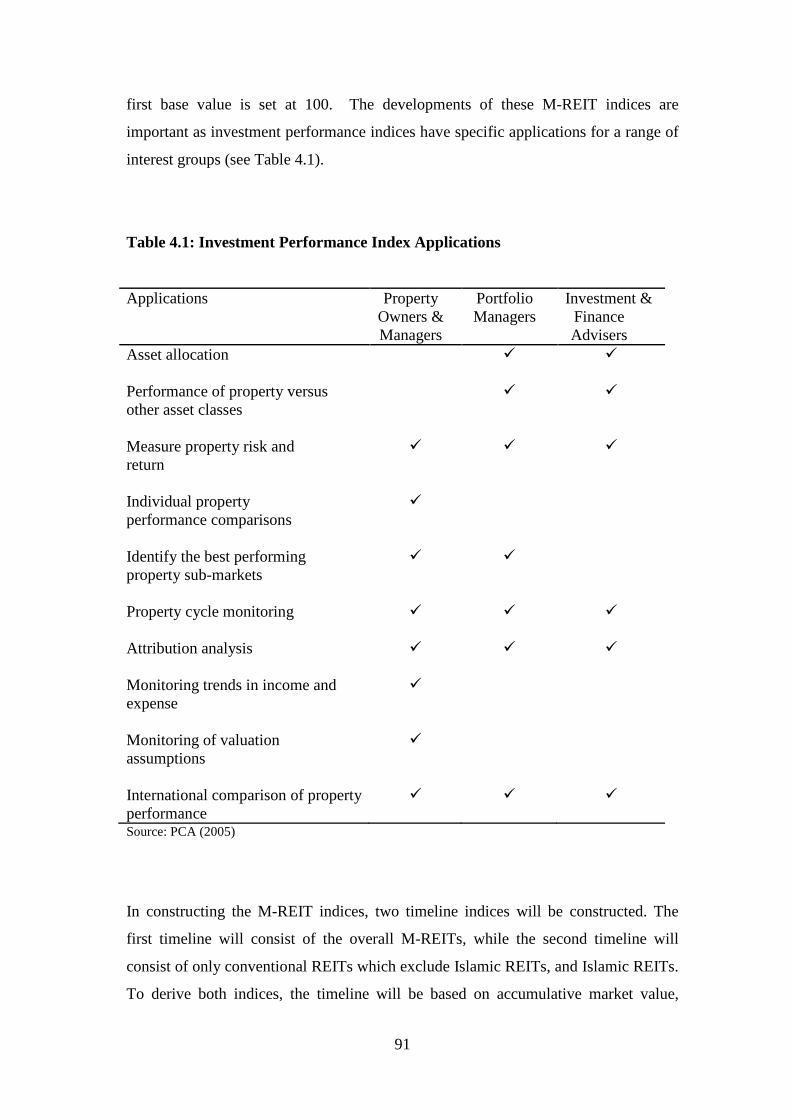
91
first base value is set at 100. The developments of these M-REIT indices are
important as investment performance indices have specific applications for a range of
interest groups (see Table 4.1).
Table 4.1: Investment Performance Index Applications
Applications PropertyOwners &Managers
PortfolioManagers
Investment &FinanceAdvisers
Asset allocation
Performance of property versusother asset classes
Measure property risk andreturn
Individual propertyperformance comparisons
Identify the best performingproperty sub-markets
Property cycle monitoring
Attribution analysis
Monitoring trends in income andexpense
Monitoring of valuationassumptions
International comparison of propertyperformance
Source: PCA (2005)
In constructing the M-REIT indices, two timeline indices will be constructed. The
first timeline will consist of the overall M-REITs, while the second timeline will
consist of only conventional REITs which exclude Islamic REITs, and Islamic REITs.
To derive both indices, the timeline will be based on accumulative market value,
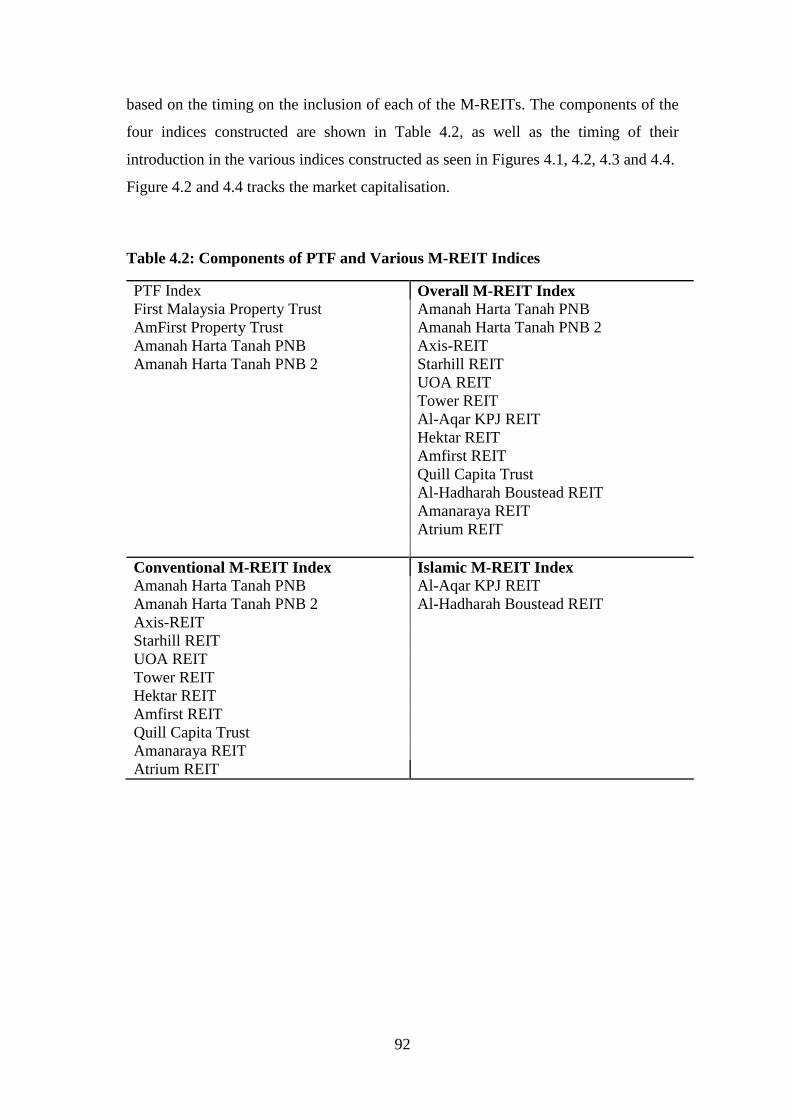
92
based on the timing on the inclusion of each of the M-REITs. The components of the
four indices constructed are shown in Table 4.2, as well as the timing of their
introduction in the various indices constructed as seen in Figures 4.1, 4.2, 4.3 and 4.4.
Figure 4.2 and 4.4 tracks the market capitalisation.
Table 4.2: Components of PTF and Various M-REIT Indices
PTF Index Overall M-REIT IndexFirst Malaysia Property Trust Amanah Harta Tanah PNBAmFirst Property Trust Amanah Harta Tanah PNB 2Amanah Harta Tanah PNB Axis-REITAmanah Harta Tanah PNB 2 Starhill REIT
UOA REITTower REITAl-Aqar KPJ REITHektar REITAmfirst REITQuill Capita TrustAl-Hadharah Boustead REITAmanaraya REITAtrium REIT
Conventional M-REIT Index Islamic M-REIT IndexAmanah Harta Tanah PNB Al-Aqar KPJ REITAmanah Harta Tanah PNB 2 Al-Hadharah Boustead REITAxis-REITStarhill REITUOA REITTower REITHektar REITAmfirst REITQuill Capita TrustAmanaraya REITAtrium REIT
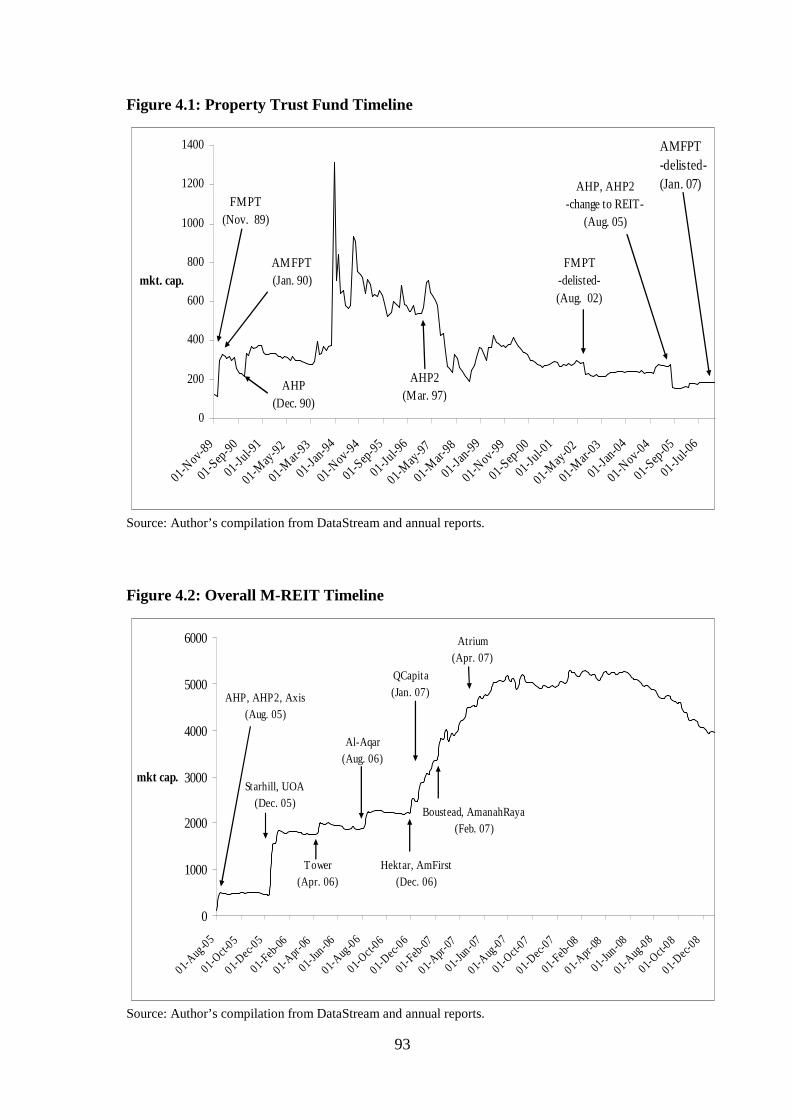
93
Figure 4.1: Property Trust Fund Timeline
0
200
400
600
800
1000
1200
1400
01-Nov-8
9
01-Sep
-90
01-Jul-9
1
01-May
-92
01-Mar-
93
01-Jan-9
4
01-Nov-9
4
01-Sep
-95
01-Jul-9
6
01-May
-97
01-Mar-
98
01-Jan-9
9
01-Nov-9
9
01-Sep
-00
01-Jul-0
1
01-May
-02
01-Mar-
03
01-Jan-0
4
01-Nov-0
4
01-Sep
-05
01-Jul-0
6
mkt. cap.
FMPT
(Nov. 89)
AMFPT
(Jan. 90)
AHP
(Dec. 90)
AHP2
(Mar. 97)
FMPT
-delisted-
(Aug. 02)
AHP, AHP2
-change to REIT-
(Aug. 05)
AMFPT
-delisted-
(Jan. 07)
Source: Author’s compilation from DataStream and annual reports.
Figure 4.2: Overall M-REIT Timeline
0
1000
2000
3000
4000
5000
6000
01-Aug
-05
01-Oct-
05
01-Dec
-05
01-Feb
-06
01-Apr
-06
01-Ju
n-06
01-Aug
-06
01-Oct-
06
01-Dec
-06
01-Feb
-07
01-Apr
-07
01-Ju
n-07
01-Aug
-07
01-Oct-
07
01-Dec
-07
01-Feb
-08
01-Apr
-08
01-Ju
n-08
01-Aug
-08
01-Oct-
08
01-Dec
-08
mkt cap.
AHP, AHP2, Axis
(Aug. 05)
Starhill, UOA
(Dec. 05)
Tower
(Apr. 06)
Al-Aqar
(Aug. 06)
Hektar, AmFirst
(Dec. 06)
QCapita
(Jan. 07)
Boustead, AmanahRaya
(Feb. 07)
Atrium
(Apr. 07)
Source: Author’s compilation from DataStream and annual reports.
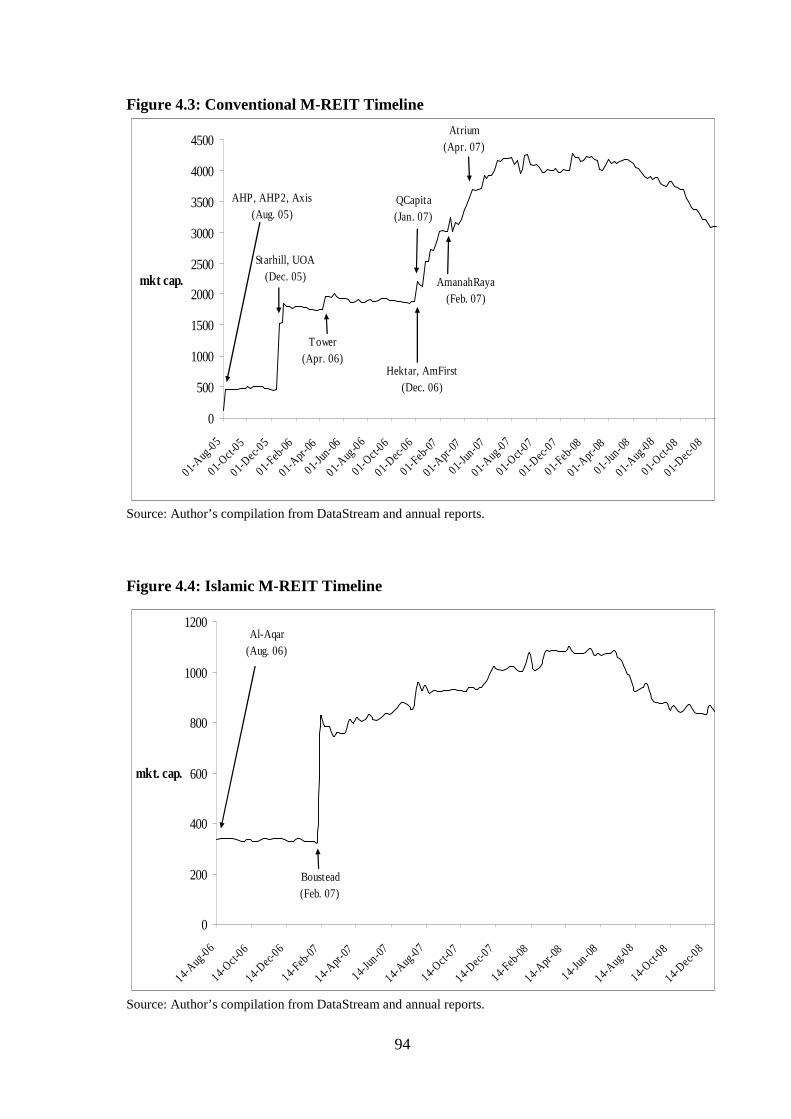
94
Figure 4.3: Conventional M-REIT Timeline
0
500
1000
1500
2000
2500
3000
3500
4000
4500
01-Aug
-05
01-Oct-
05
01-Dec
-05
01-Feb
-06
01-Apr
-06
01-Ju
n-06
01-Aug
-06
01-Oct-
06
01-Dec
-06
01-Feb
-07
01-Apr
-07
01-Ju
n-07
01-Aug
-07
01-Oct-
07
01-Dec
-07
01-Feb
-08
01-Apr
-08
01-Ju
n-08
01-Aug
-08
01-Oct-
08
01-Dec
-08
mkt cap.
AHP, AHP2, Axis
(Aug. 05)
Starhill, UOA
(Dec. 05)
Tower
(Apr. 06)Hektar, AmFirst
(Dec. 06)
QCapita
(Jan. 07)
AmanahRaya
(Feb. 07)
Atrium
(Apr. 07)
Source: Author’s compilation from DataStream and annual reports.
Figure 4.4: Islamic M-REIT Timeline
0
200
400
600
800
1000
1200
14-Aug
-06
14-Oct-
06
14-Dec
-06
14-Feb
-07
14-Apr
-07
14-Ju
n-07
14-Aug
-07
14-Oct-
07
14-Dec
-07
14-Feb
-08
14-Apr
-08
14-Ju
n-08
14-Aug
-08
14-Oct-
08
14-Dec
-08
mkt. cap.
Al-Aqar
(Aug. 06)
Boustead
(Feb. 07)
Source: Author’s compilation from DataStream and annual reports.
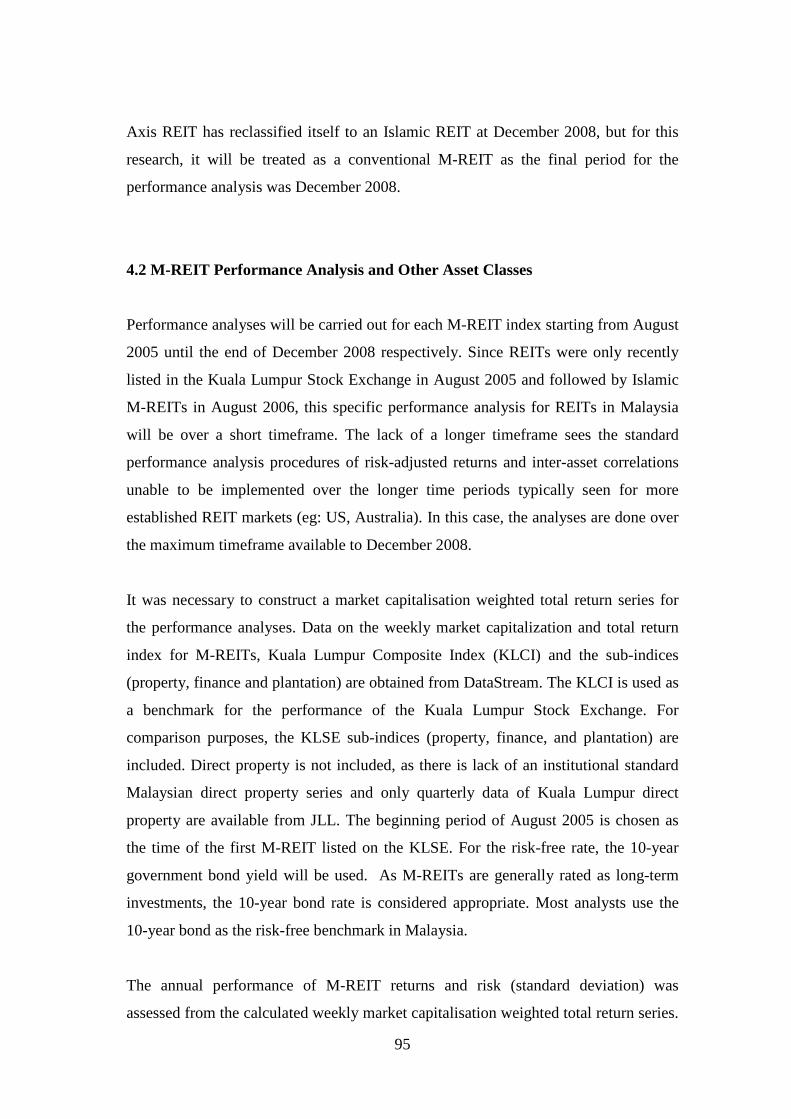
95
Axis REIT has reclassified itself to an Islamic REIT at December 2008, but for this
research, it will be treated as a conventional M-REIT as the final period for the
performance analysis was December 2008.
4.2 M-REIT Performance Analysis and Other Asset Classes
Performance analyses will be carried out for each M-REIT index starting from August
2005 until the end of December 2008 respectively. Since REITs were only recently
listed in the Kuala Lumpur Stock Exchange in August 2005 and followed by Islamic
M-REITs in August 2006, this specific performance analysis for REITs in Malaysia
will be over a short timeframe. The lack of a longer timeframe sees the standard
performance analysis procedures of risk-adjusted returns and inter-asset correlations
unable to be implemented over the longer time periods typically seen for more
established REIT markets (eg: US, Australia). In this case, the analyses are done over
the maximum timeframe available to December 2008.
It was necessary to construct a market capitalisation weighted total return series for
the performance analyses. Data on the weekly market capitalization and total return
index for M-REITs, Kuala Lumpur Composite Index (KLCI) and the sub-indices
(property, finance and plantation) are obtained from DataStream. The KLCI is used as
a benchmark for the performance of the Kuala Lumpur Stock Exchange. For
comparison purposes, the KLSE sub-indices (property, finance, and plantation) are
included. Direct property is not included, as there is lack of an institutional standard
Malaysian direct property series and only quarterly data of Kuala Lumpur direct
property are available from JLL. The beginning period of August 2005 is chosen as
the time of the first M-REIT listed on the KLSE. For the risk-free rate, the 10-year
government bond yield will be used. As M-REITs are generally rated as long-term
investments, the 10-year bond rate is considered appropriate. Most analysts use the
10-year bond as the risk-free benchmark in Malaysia.
The annual performance of M-REIT returns and risk (standard deviation) was
assessed from the calculated weekly market capitalisation weighted total return series.
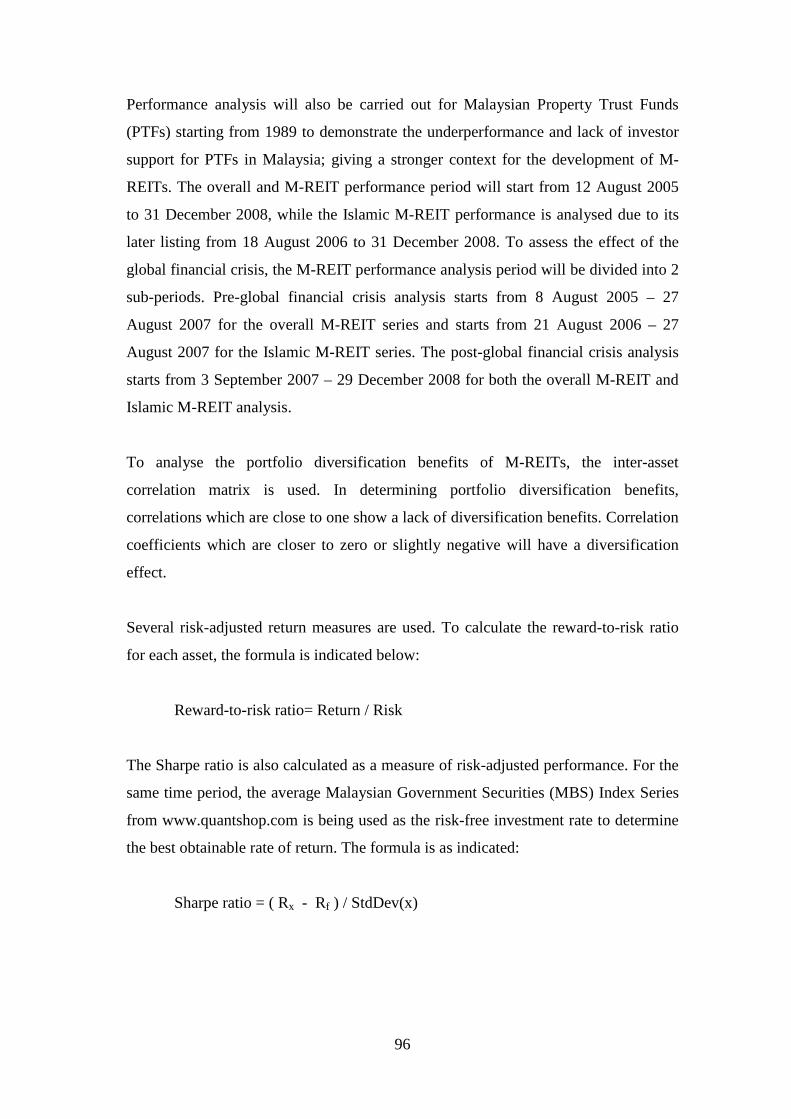
96
Performance analysis will also be carried out for Malaysian Property Trust Funds
(PTFs) starting from 1989 to demonstrate the underperformance and lack of investor
support for PTFs in Malaysia; giving a stronger context for the development of M-
REITs. The overall and M-REIT performance period will start from 12 August 2005
to 31 December 2008, while the Islamic M-REIT performance is analysed due to its
later listing from 18 August 2006 to 31 December 2008. To assess the effect of the
global financial crisis, the M-REIT performance analysis period will be divided into 2
sub-periods. Pre-global financial crisis analysis starts from 8 August 2005 – 27
August 2007 for the overall M-REIT series and starts from 21 August 2006 – 27
August 2007 for the Islamic M-REIT series. The post-global financial crisis analysis
starts from 3 September 2007 – 29 December 2008 for both the overall M-REIT and
Islamic M-REIT analysis.
To analyse the portfolio diversification benefits of M-REITs, the inter-asset
correlation matrix is used. In determining portfolio diversification benefits,
correlations which are close to one show a lack of diversification benefits. Correlation
coefficients which are closer to zero or slightly negative will have a diversification
effect.
Several risk-adjusted return measures are used. To calculate the reward-to-risk ratio
for each asset, the formula is indicated below:
Reward-to-risk ratio= Return / Risk
The Sharpe ratio is also calculated as a measure of risk-adjusted performance. For the
same time period, the average Malaysian Government Securities (MBS) Index Series
from www.quantshop.com is being used as the risk-free investment rate to determine
the best obtainable rate of return. The formula is as indicated:
Sharpe ratio = ( Rx - Rf ) / StdDev(x)

97
where:
Rx is the average annual rate of return of asset x
Rf is the best obtainable rate of return of a "risk-free" security (i.e. 10-year
bond)
StdDev(x) is the standard deviation of Rx
To calculate the various mixed-asset portfolios, the general formula for expected
return and standard deviation is indicated below:
Expected Return = 1
( )n
P i ii
E r w E r
where:
1
n
ii
w = 1.0;
n = the sample size;
iw = the weight of the funds invested in security i;
,i Pr r = the return on ith security and portfolio p; and
E = the expectation of the variable in the bracket.
Standard Deviation =1
)( 2
n
xxi
where:
n = the sample size;
xi = represents each data value from i=1 to i=N
x = the sample mean
In addition to the previous analysis, a panel regression on M-REITs performance
using firm’s characteristics (such as debt, ROA) as dependent variables will be use.
Panel regressions would be able to partially overcome the limited data faced in this
study to check the robustness of the findings.

98
4.3 M-REIT Surveys
A survey of the factors affecting the development of Malaysian REITs was also
conducted. Three similar questionnaires have been developed and personal interviews
conducted for three distinct groups of participants; REIT managers, fund managers
and property advisors. A copy of each survey and covering letter is given in Appendix
I, II and III. The common questions in the questionnaire included:
31 specific factors on the ongoing success of Malaysian REITs
31 specific factors on the current performance of Malaysian REITs
Qualitative questions regarding Malaysian REITs.
This survey approach was considered beneficial to obtain more insight into the views
and decision-making processes for these three groups concerning M-REITs and
Islamic M-REITs. Participants were asked to assess how important each factor was to
the development of REITs in Malaysia. All questions were scored on a 5-point rating
scale, ranging from 1 = not available to 5 = essential. Results are presented overall
and for each of these three groups of survey participants.
This survey was distributed over October - December 2007 to senior participants in
the Malaysian property industry. Contact information was obtained from published
resources (i.e. fund’s website, prospectus and/or annual report), with the PhD
candidate returning to Malaysia to conduct these personal interviews. Opinions from
these three distinct participants are very important and will benefit the future
development of Malaysian REITs. The outcomes from this survey will only be
presented at the aggregate level to ensure the confidentiality of the survey
respondents.
As this survey was focused on the impact of factors towards property investment, this
survey will not consider other groups such as property developers. Overall, 150
questionnaires were distributed and a total of 96 questionnaires were returned which
represents REIT managers (11), fund managers (55) and property advisors (30). A
personal interview of approximately 20 minutes was also conducted to obtain more
99
information regarding Malaysian REITs. Three different approaches were used: in
person, by phone and by email to maximize respondent participants. The overall
survey response rate was 64%, and the response rates within each group were
relatively high; REIT managers (85%), fund managers (65%) and property advisors
(58%). The quality of respondents was excellent, with all respondents consisting of
staff in senior positions; further reflecting the quality of this M-REIT survey
information.
Spearman rank correlation analysis is used to calculate the rank correlation coefficient
to assess the overall association of these three sub-groups regarding their responses.
The formula is as indicated below:
where:
di = xi − yi = sum of the squared difference between the ranks of corresponding
values Xi and Yi,
n = the number of values in each data set.
One-way ANOVA analysis will also be used to examine the significant differences in
responses between these 3 groups, with the Least Significant Difference procedure
used to identify specific statistical differences. Factor analysis was also used to assess
the underlying “property investment” dimensions of the 31 factors regarding the
ongoing success of Malaysian REITs and the 31 factors on the current performance of
Malaysian REITs. Varimax rotation will be used in this factor analysis as a method of
extraction to undertake the analysis. This was done at the overall level and for the
three sub-groups in the survey. Results are obtained using SPSS. Selection of the
significant factor analysis weights will be based on weights between 0.5-0.9.
100
CHAPTER 5
MALAYSIAN REIT PERFORMANCE ANALYSIS
5.1 Introduction
The purpose of this chapter is to examine the overall M-REIT performance analysis,
which includes risk-adjusted returns and portfolio diversification benefits for overall
and conventional M-REIT analysis from August 2005 to December 2008 and for
Islamic M-REIT analysis from August 2006 to December 2008. The significance of
M-REITs and Islamic M-REITs in a mixed-asset portfolio will also be discussed. To
assess the potential changing investment dynamics of the M-REIT sector, the full
period of 8 August 2005 – 29 December 2008 was broken into the two sub-periods of
8 August 2005 – 27 August 2007 and 3 September 2007 – 29 December 2008, while
for the potential changing investment dynamics of Islamic M-REIT sector, the full
period of 21 August 2006 – 29 December 2008 was broken into the two sub-periods
of 21 August 2006 – 27 August 2007 and 3 September 2007 – 29 December 2008.
This is particularly to assess whether these portfolio benefits have been enhanced in
more recent years as the Asian property markets have improved their levels of
maturity and to assess the impact of the global financial crisis on M-REITs (JLL,
2008).
Four new property indices, namely the PTF Index (1989-2005), M-REIT Index
(August 2005-December 2008), Conventional M-REIT Index (August 2005-
December 2008) and Islamic M-REIT Index (August 2006-December 2008) have
been developed for this M-REIT performance analysis section. M-REITs are added
subsequently from 8 August 2005 and 29 December 2008 as they were listed. With
the addition of more M-REITs, the market capitalisation of the M-REIT sector has
increased from RM117.91 million (US$34.03 million) in August 2005 to RM3948.54
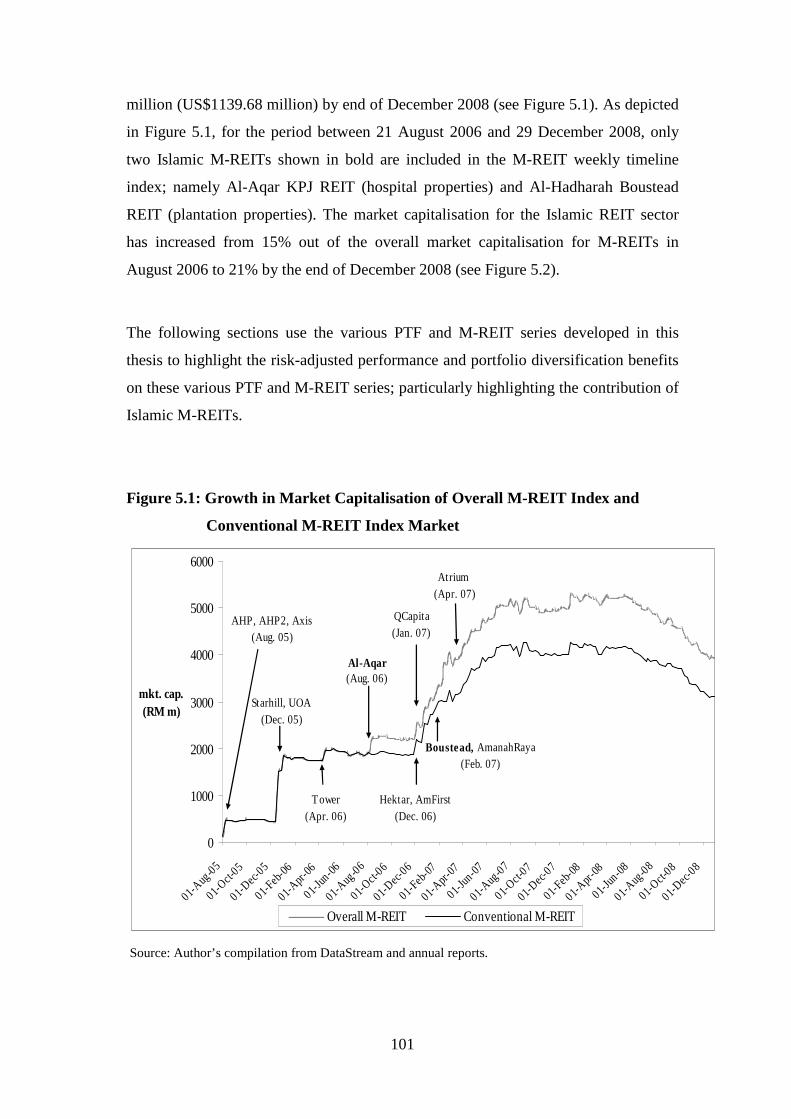
101
million (US$1139.68 million) by end of December 2008 (see Figure 5.1). As depicted
in Figure 5.1, for the period between 21 August 2006 and 29 December 2008, only
two Islamic M-REITs shown in bold are included in the M-REIT weekly timeline
index; namely Al-Aqar KPJ REIT (hospital properties) and Al-Hadharah Boustead
REIT (plantation properties). The market capitalisation for the Islamic REIT sector
has increased from 15% out of the overall market capitalisation for M-REITs in
August 2006 to 21% by the end of December 2008 (see Figure 5.2).
The following sections use the various PTF and M-REIT series developed in this
thesis to highlight the risk-adjusted performance and portfolio diversification benefits
on these various PTF and M-REIT series; particularly highlighting the contribution of
Islamic M-REITs.
Figure 5.1: Growth in Market Capitalisation of Overall M-REIT Index and
Conventional M-REIT Index Market
0
1000
2000
3000
4000
5000
6000
01-Aug
-05
01-Oct-
05
01-Dec
-05
01-Feb
-06
01-Apr
-06
01-Ju
n-06
01-Aug
-06
01-Oct-
06
01-Dec
-06
01-Feb
-07
01-Apr
-07
01-Ju
n-07
01-Aug
-07
01-Oct-
07
01-Dec
-07
01-Feb
-08
01-Apr
-08
01-Ju
n-08
01-Aug
-08
01-Oct-
08
01-Dec
-08
mkt. cap.
(RM m)
Overall M-REIT Conventional M-REIT
AHP, AHP2, Axis
(Aug. 05)
Starhill, UOA
(Dec. 05)
Tower
(Apr. 06)
Al-Aqar
(Aug. 06)
Hektar, AmFirst
(Dec. 06)
QCapita
(Jan. 07)
Boustead, AmanahRaya
(Feb. 07)
Atrium
(Apr. 07)
Source: Author’s compilation from DataStream and annual reports.
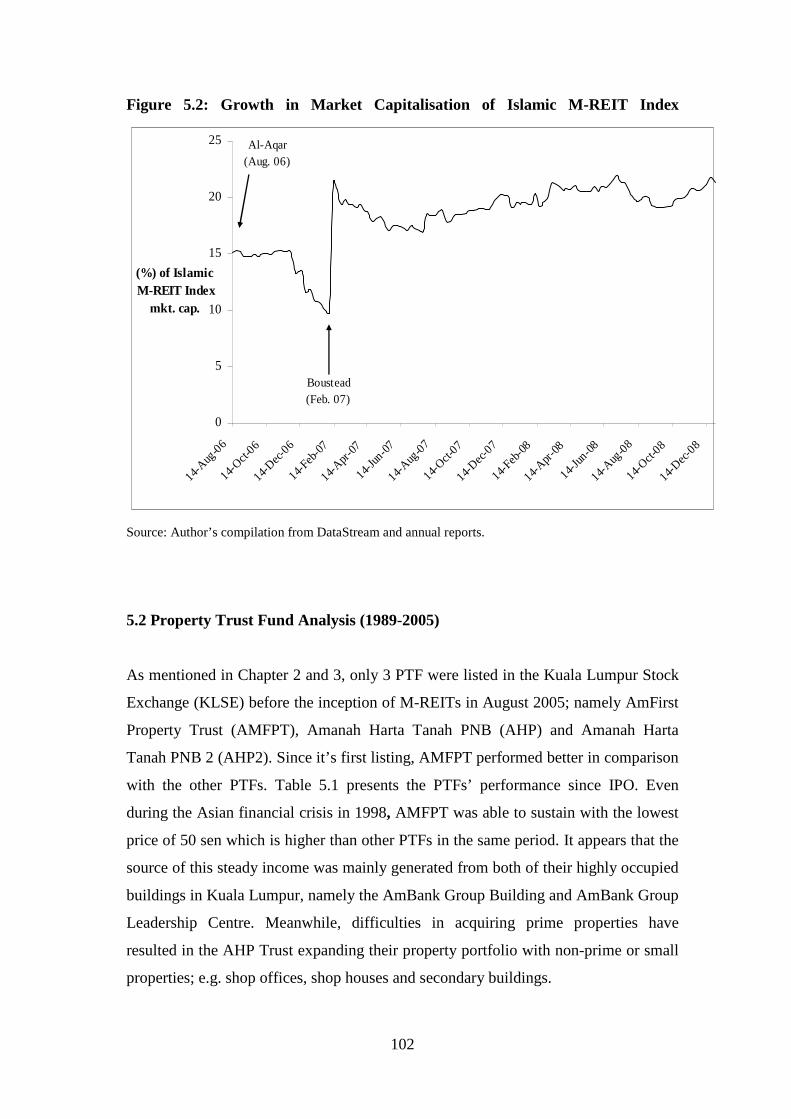
102
Figure 5.2: Growth in Market Capitalisation of Islamic M-REIT Index
0
5
10
15
20
25
14-A
ug-0
6
14-O
ct-0
6
14-D
ec-0
6
14-Feb
-07
14-A
pr-0
7
14-Ju
n-07
14-A
ug-0
7
14-O
ct-0
7
14-D
ec-0
7
14-Feb
-08
14-A
pr-0
8
14-Ju
n-08
14-A
ug-0
8
14-O
ct-0
8
14-D
ec-0
8
(%) of Islamic
M-REIT Index
mkt. cap.
Al-Aqar
(Aug. 06)
Boustead
(Feb. 07)
Source: Author’s compilation from DataStream and annual reports.
5.2 Property Trust Fund Analysis (1989-2005)
As mentioned in Chapter 2 and 3, only 3 PTF were listed in the Kuala Lumpur Stock
Exchange (KLSE) before the inception of M-REITs in August 2005; namely AmFirst
Property Trust (AMFPT), Amanah Harta Tanah PNB (AHP) and Amanah Harta
Tanah PNB 2 (AHP2). Since it’s first listing, AMFPT performed better in comparison
with the other PTFs. Table 5.1 presents the PTFs’ performance since IPO. Even
during the Asian financial crisis in 1998, AMFPT was able to sustain with the lowest
price of 50 sen which is higher than other PTFs in the same period. It appears that the
source of this steady income was mainly generated from both of their highly occupied
buildings in Kuala Lumpur, namely the AmBank Group Building and AmBank Group
Leadership Centre. Meanwhile, difficulties in acquiring prime properties have
resulted in the AHP Trust expanding their property portfolio with non-prime or small
properties; e.g. shop offices, shop houses and secondary buildings.
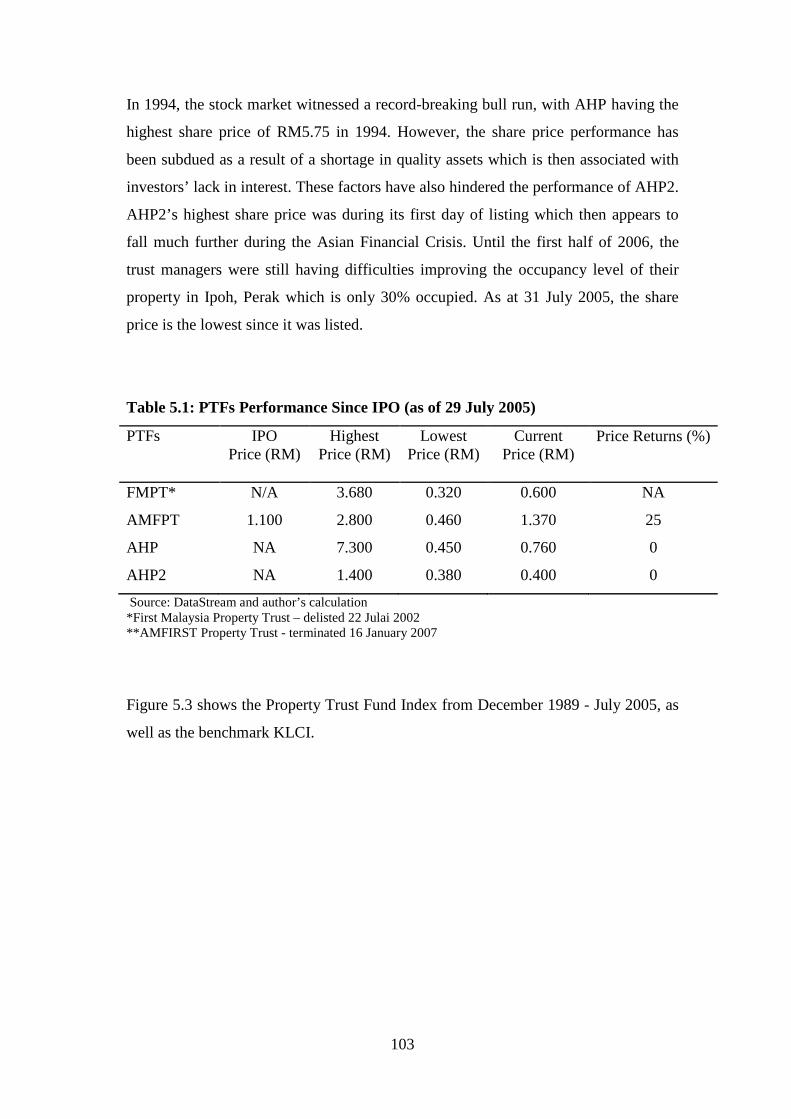
103
In 1994, the stock market witnessed a record-breaking bull run, with AHP having the
highest share price of RM5.75 in 1994. However, the share price performance has
been subdued as a result of a shortage in quality assets which is then associated with
investors’ lack in interest. These factors have also hindered the performance of AHP2.
AHP2’s highest share price was during its first day of listing which then appears to
fall much further during the Asian Financial Crisis. Until the first half of 2006, the
trust managers were still having difficulties improving the occupancy level of their
property in Ipoh, Perak which is only 30% occupied. As at 31 July 2005, the share
price is the lowest since it was listed.
Table 5.1: PTFs Performance Since IPO (as of 29 July 2005)
PTFs IPOPrice (RM)
HighestPrice (RM)
LowestPrice (RM)
CurrentPrice (RM)
Price Returns (%)
FMPT* N/A 3.680 0.320 0.600 NA
AMFPT 1.100 2.800 0.460 1.370 25
AHP NA 7.300 0.450 0.760 0
AHP2 NA 1.400 0.380 0.400 0
Source: DataStream and author’s calculation*First Malaysia Property Trust – delisted 22 Julai 2002**AMFIRST Property Trust - terminated 16 January 2007
Figure 5.3 shows the Property Trust Fund Index from December 1989 - July 2005, as
well as the benchmark KLCI.
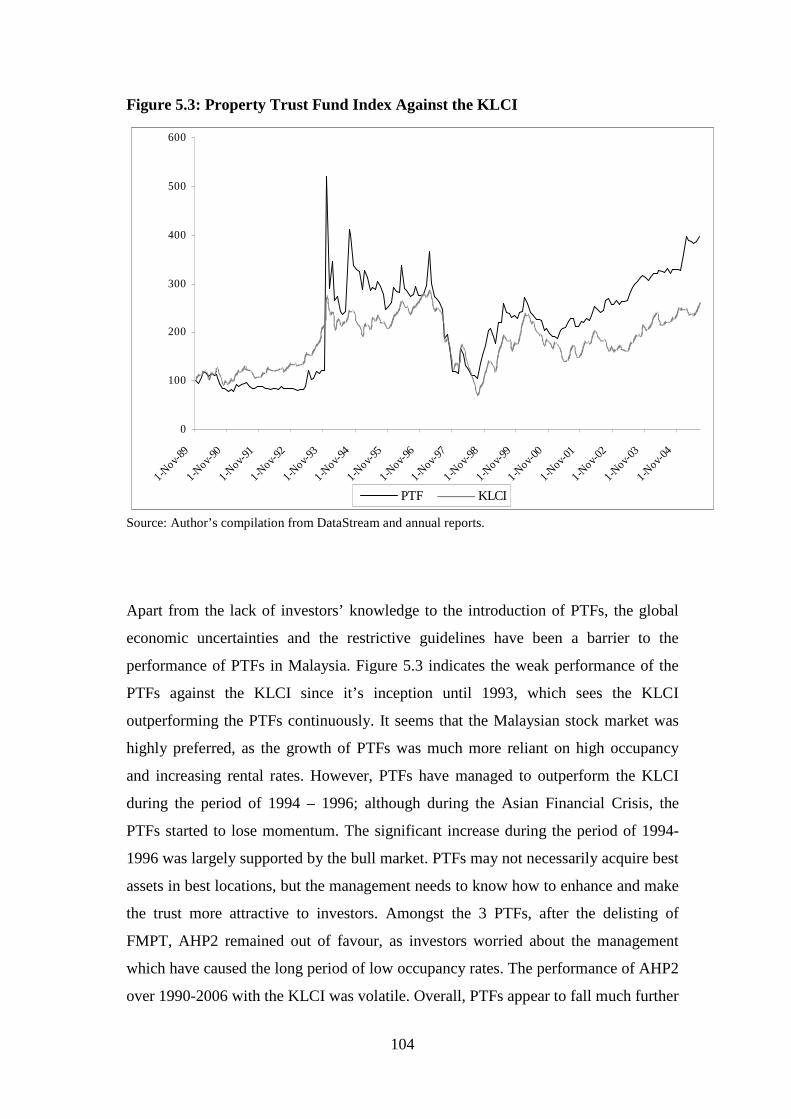
104
Figure 5.3: Property Trust Fund Index Against the KLCI
0
100
200
300
400
500
600
1-Nov-
89
1-Nov-
90
1-Nov-
91
1-Nov-
92
1-Nov-
93
1-Nov-
94
1-Nov-
95
1-Nov-
96
1-Nov-
97
1-Nov-
98
1-Nov-
99
1-Nov-
00
1-Nov-
01
1-Nov-
02
1-Nov-
03
1-Nov-
04
PTF KLCI
Source: Author’s compilation from DataStream and annual reports.
Apart from the lack of investors’ knowledge to the introduction of PTFs, the global
economic uncertainties and the restrictive guidelines have been a barrier to the
performance of PTFs in Malaysia. Figure 5.3 indicates the weak performance of the
PTFs against the KLCI since it’s inception until 1993, which sees the KLCI
outperforming the PTFs continuously. It seems that the Malaysian stock market was
highly preferred, as the growth of PTFs was much more reliant on high occupancy
and increasing rental rates. However, PTFs have managed to outperform the KLCI
during the period of 1994 – 1996; although during the Asian Financial Crisis, the
PTFs started to lose momentum. The significant increase during the period of 1994-
1996 was largely supported by the bull market. PTFs may not necessarily acquire best
assets in best locations, but the management needs to know how to enhance and make
the trust more attractive to investors. Amongst the 3 PTFs, after the delisting of
FMPT, AHP2 remained out of favour, as investors worried about the management
which have caused the long period of low occupancy rates. The performance of AHP2
over 1990-2006 with the KLCI was volatile. Overall, PTFs appear to fall much further
105
in the Asian economic crisis period of 1997 and 1998 and seeing recovery during the
post-crisis over the period of 1999 and 2000.
Different types of properties in different locations lead to different results. Learning
from the regional market, investors will lose interest if the PTF did not acquire new
properties to the existing portfolio. On a positive side, efforts have been taken to
increase investor interest to this industry; especially with the minimisation of
consumer spending following the increased price of oil and increased interest rates.
To stimulate the PTF market, the borrowing limit has been increased, although this
has led to increased expenditure, related to the transferred property to REITs.
Limitations to foreign investors still exist. Improved guidelines on REITs have
encouraged future demand.
5.2.1: Risk-adjusted Returns: PTF
Using the PTF index developed in this thesis, Table 5.2 presents the risk-adjusted
performance analysis for the overall PTF sector and other KLSE sectors over the
period of December 1989 - July 2005. The PTF sector showed the second highest
average annual returns (9.22% p.a.) in comparison to the other sectors, which ranged
from -3.95% to 11.17%. The lowest average annual return was given by the KLSE
property sector with -3.95%, while the highest was given by the KLSE financial
sector with 11.17%.
However, the PTF annual risk level (90.24%) has the highest risk level in comparison
to other sectors (29.05%to38.67%). The lowest risk was given by the KLCI (29.05%).
On a risk-adjusted basis, the PTF sector showed a Sharpe ratio of 0.04 over this
period, compared to the Sharpe ratios in the other sectors of -0.25 to 0.15. The highest
risk-adjusted return performance was given by the KLSE finance sector (0.15), while
the lowest risk-adjusted return performance was given by the KLSE property sector
(-0.25).
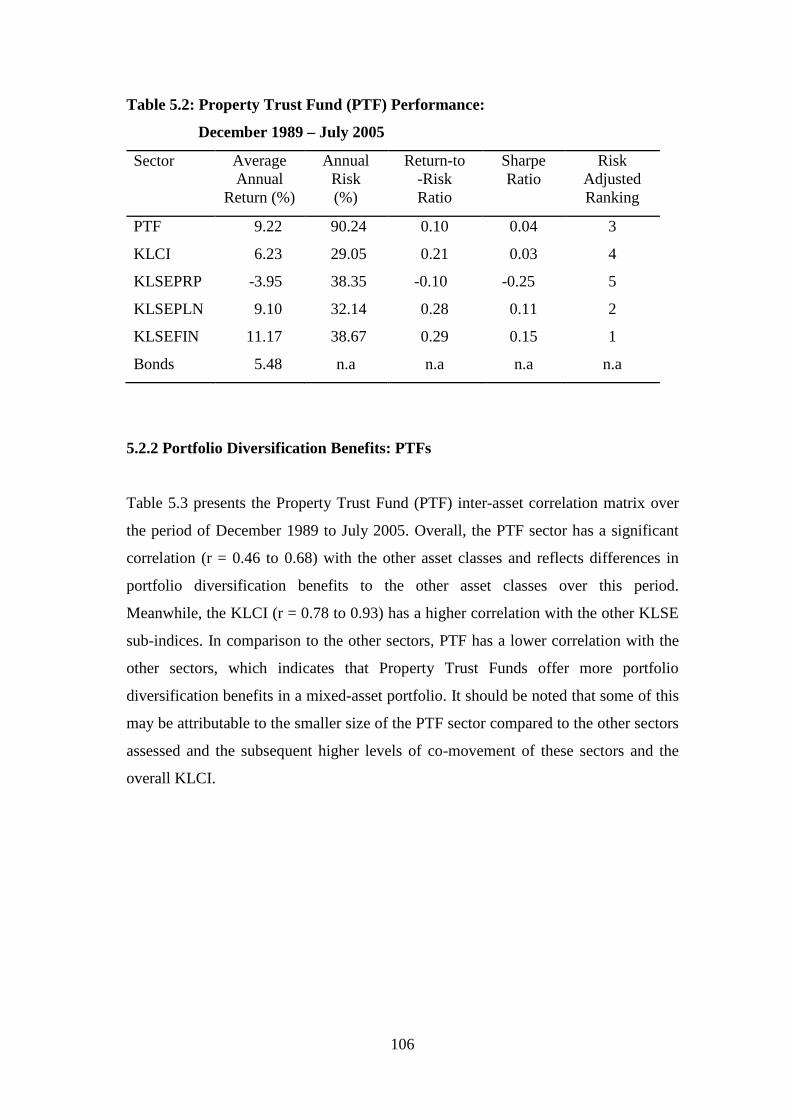
106
Table 5.2: Property Trust Fund (PTF) Performance:
December 1989 – July 2005
Sector AverageAnnual
Return (%)
AnnualRisk(%)
Return-to-RiskRatio
SharpeRatio
RiskAdjustedRanking
PTF 9.22 90.24 0.10 0.04 3
KLCI 6.23 29.05 0.21 0.03 4
KLSEPRP -3.95 38.35 -0.10 -0.25 5
KLSEPLN 9.10 32.14 0.28 0.11 2
KLSEFIN 11.17 38.67 0.29 0.15 1
Bonds 5.48 n.a n.a n.a n.a
5.2.2 Portfolio Diversification Benefits: PTFs
Table 5.3 presents the Property Trust Fund (PTF) inter-asset correlation matrix over
the period of December 1989 to July 2005. Overall, the PTF sector has a significant
correlation (r = 0.46 to 0.68) with the other asset classes and reflects differences in
portfolio diversification benefits to the other asset classes over this period.
Meanwhile, the KLCI (r = 0.78 to 0.93) has a higher correlation with the other KLSE
sub-indices. In comparison to the other sectors, PTF has a lower correlation with the
other sectors, which indicates that Property Trust Funds offer more portfolio
diversification benefits in a mixed-asset portfolio. It should be noted that some of this
may be attributable to the smaller size of the PTF sector compared to the other sectors
assessed and the subsequent higher levels of co-movement of these sectors and the
overall KLCI.
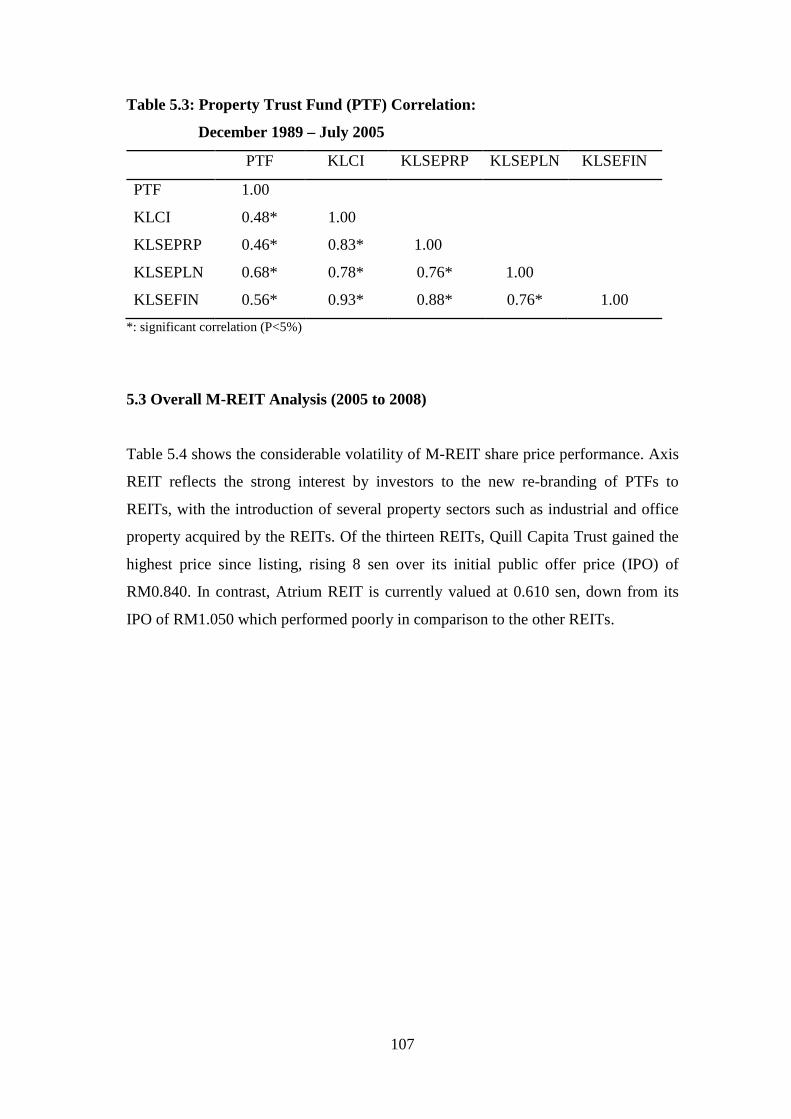
107
Table 5.3: Property Trust Fund (PTF) Correlation:
December 1989 – July 2005
PTF KLCI KLSEPRP KLSEPLN KLSEFIN
PTF 1.00
KLCI 0.48* 1.00
KLSEPRP 0.46* 0.83* 1.00
KLSEPLN 0.68* 0.78* 0.76* 1.00
KLSEFIN 0.56* 0.93* 0.88* 0.76* 1.00
*: significant correlation (P<5%)
5.3 Overall M-REIT Analysis (2005 to 2008)
Table 5.4 shows the considerable volatility of M-REIT share price performance. Axis
REIT reflects the strong interest by investors to the new re-branding of PTFs to
REITs, with the introduction of several property sectors such as industrial and office
property acquired by the REITs. Of the thirteen REITs, Quill Capita Trust gained the
highest price since listing, rising 8 sen over its initial public offer price (IPO) of
RM0.840. In contrast, Atrium REIT is currently valued at 0.610 sen, down from its
IPO of RM1.050 which performed poorly in comparison to the other REITs.
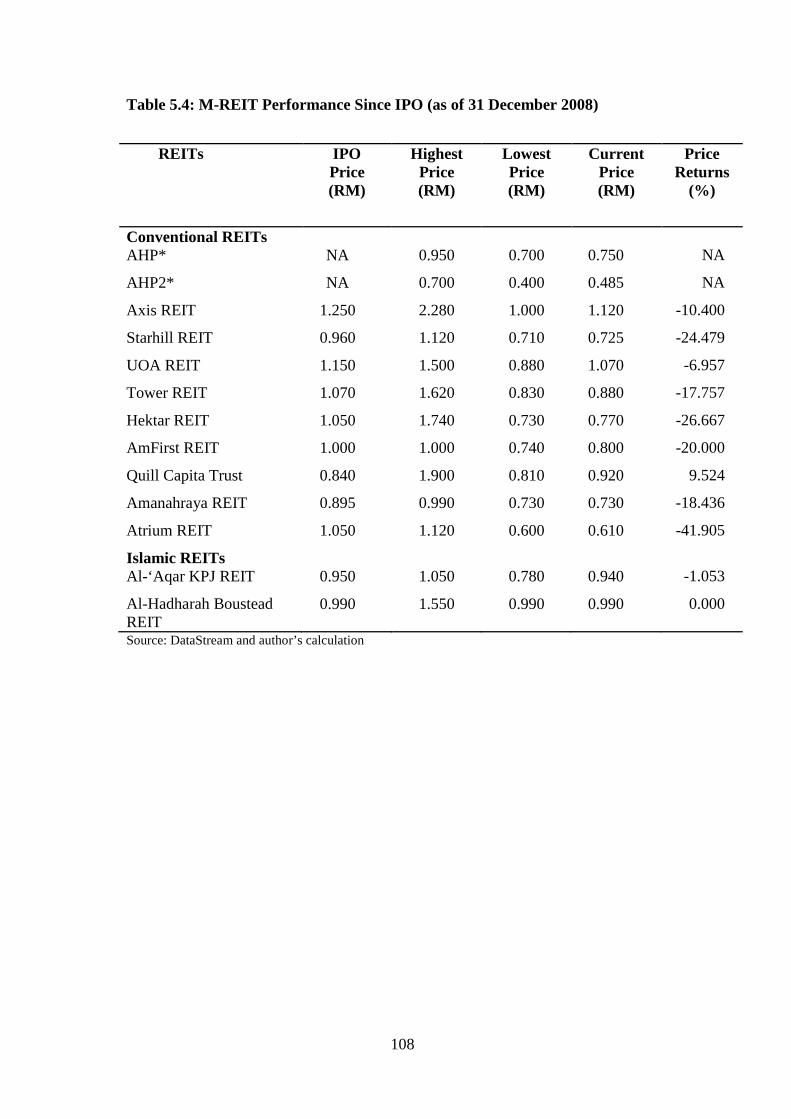
108
Table 5.4: M-REIT Performance Since IPO (as of 31 December 2008)
Source: DataStream and author’s calculation
REITs IPOPrice(RM)
HighestPrice(RM)
LowestPrice(RM)
CurrentPrice(RM)
PriceReturns
(%)
Conventional REITsAHP* NA 0.950 0.700 0.750 NA
AHP2* NA 0.700 0.400 0.485 NA
Axis REIT 1.250 2.280 1.000 1.120 -10.400
Starhill REIT 0.960 1.120 0.710 0.725 -24.479
UOA REIT 1.150 1.500 0.880 1.070 -6.957
Tower REIT 1.070 1.620 0.830 0.880 -17.757
Hektar REIT 1.050 1.740 0.730 0.770 -26.667
AmFirst REIT 1.000 1.000 0.740 0.800 -20.000
Quill Capita Trust 0.840 1.900 0.810 0.920 9.524
Amanahraya REIT 0.895 0.990 0.730 0.730 -18.436
Atrium REIT 1.050 1.120 0.600 0.610 -41.905
Islamic REITsAl-‘Aqar KPJ REIT 0.950 1.050 0.780 0.940 -1.053
Al-Hadharah BousteadREIT
0.990 1.550 0.990 0.990 0.000
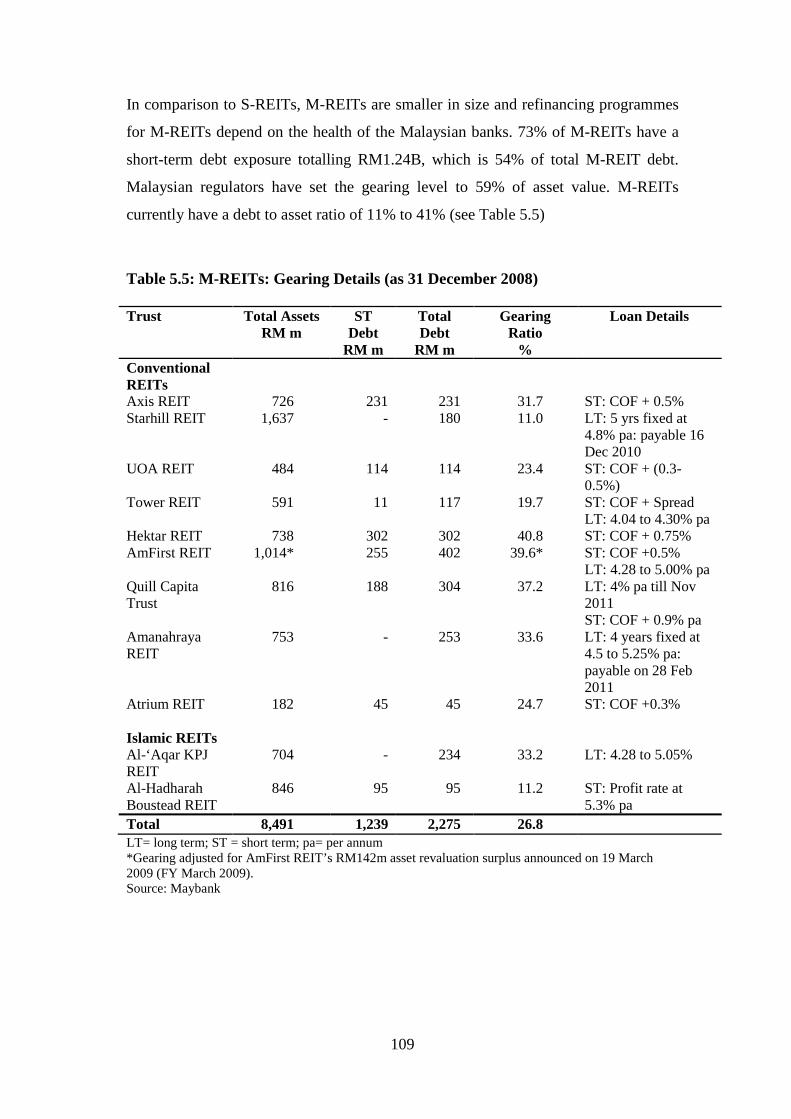
109
In comparison to S-REITs, M-REITs are smaller in size and refinancing programmes
for M-REITs depend on the health of the Malaysian banks. 73% of M-REITs have a
short-term debt exposure totalling RM1.24B, which is 54% of total M-REIT debt.
Malaysian regulators have set the gearing level to 59% of asset value. M-REITs
currently have a debt to asset ratio of 11% to 41% (see Table 5.5)
Table 5.5: M-REITs: Gearing Details (as 31 December 2008)
Trust Total AssetsRM m
STDebt
RM m
TotalDebt
RM m
GearingRatio
%
Loan Details
ConventionalREITsAxis REIT 726 231 231 31.7 ST: COF + 0.5%Starhill REIT 1,637 - 180 11.0 LT: 5 yrs fixed at
4.8% pa: payable 16Dec 2010
UOA REIT 484 114 114 23.4 ST: COF + (0.3-0.5%)
Tower REIT 591 11 117 19.7 ST: COF + SpreadLT: 4.04 to 4.30% pa
Hektar REIT 738 302 302 40.8 ST: COF + 0.75%AmFirst REIT 1,014* 255 402 39.6* ST: COF +0.5%
LT: 4.28 to 5.00% paQuill CapitaTrust
816 188 304 37.2 LT: 4% pa till Nov2011ST: COF + 0.9% pa
AmanahrayaREIT
753 - 253 33.6 LT: 4 years fixed at4.5 to 5.25% pa:payable on 28 Feb2011
Atrium REIT 182 45 45 24.7 ST: COF +0.3%
Islamic REITsAl-‘Aqar KPJREIT
704 - 234 33.2 LT: 4.28 to 5.05%
Al-HadharahBoustead REIT
846 95 95 11.2 ST: Profit rate at5.3% pa
Total 8,491 1,239 2,275 26.8LT= long term; ST = short term; pa= per annum*Gearing adjusted for AmFirst REIT’s RM142m asset revaluation surplus announced on 19 March2009 (FY March 2009).Source: Maybank
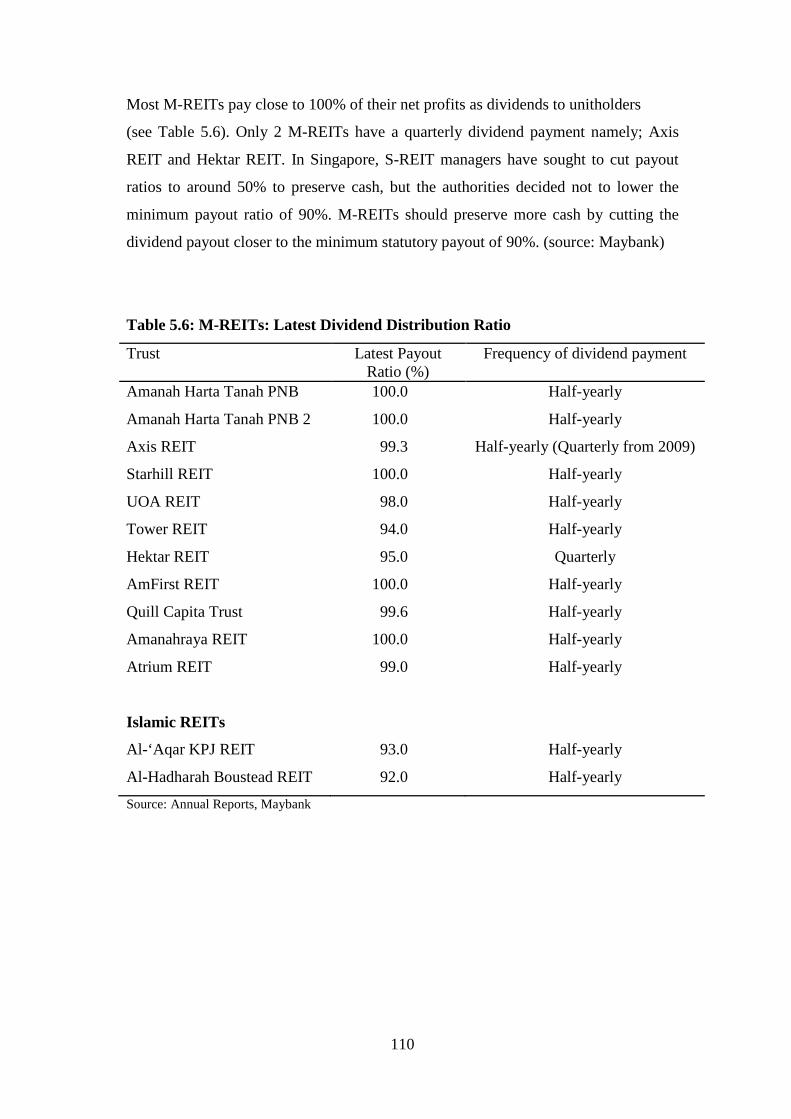
110
Most M-REITs pay close to 100% of their net profits as dividends to unitholders
(see Table 5.6). Only 2 M-REITs have a quarterly dividend payment namely; Axis
REIT and Hektar REIT. In Singapore, S-REIT managers have sought to cut payout
ratios to around 50% to preserve cash, but the authorities decided not to lower the
minimum payout ratio of 90%. M-REITs should preserve more cash by cutting the
dividend payout closer to the minimum statutory payout of 90%. (source: Maybank)
Table 5.6: M-REITs: Latest Dividend Distribution Ratio
Trust Latest PayoutRatio (%)
Frequency of dividend payment
Amanah Harta Tanah PNB 100.0 Half-yearly
Amanah Harta Tanah PNB 2 100.0 Half-yearly
Axis REIT 99.3 Half-yearly (Quarterly from 2009)
Starhill REIT 100.0 Half-yearly
UOA REIT 98.0 Half-yearly
Tower REIT 94.0 Half-yearly
Hektar REIT 95.0 Quarterly
AmFirst REIT 100.0 Half-yearly
Quill Capita Trust 99.6 Half-yearly
Amanahraya REIT 100.0 Half-yearly
Atrium REIT 99.0 Half-yearly
Islamic REITs
Al-‘Aqar KPJ REIT 93.0 Half-yearly
Al-Hadharah Boustead REIT 92.0 Half-yearly
Source: Annual Reports, Maybank
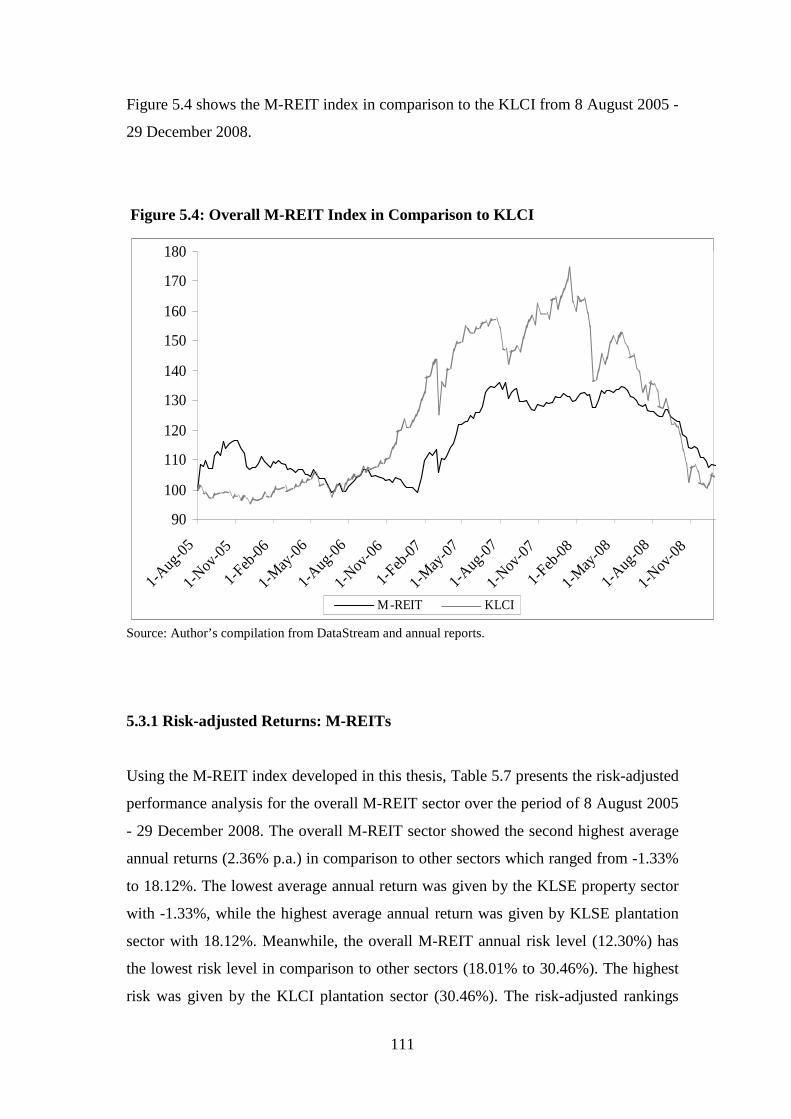
111
Figure 5.4 shows the M-REIT index in comparison to the KLCI from 8 August 2005 -
29 December 2008.
Figure 5.4: Overall M-REIT Index in Comparison to KLCI
90
100
110
120
130
140
150
160
170
180
1-Aug
-05
1-Nov
-05
1-Feb
-06
1-M
ay-0
6
1-Aug
-06
1-Nov
-06
1-Feb
-07
1-M
ay-0
7
1-Aug
-07
1-Nov
-07
1-Feb
-08
1-M
ay-0
8
1-Aug
-08
1-Nov
-08
M-REIT KLCI
Source: Author’s compilation from DataStream and annual reports.
5.3.1 Risk-adjusted Returns: M-REITs
Using the M-REIT index developed in this thesis, Table 5.7 presents the risk-adjusted
performance analysis for the overall M-REIT sector over the period of 8 August 2005
- 29 December 2008. The overall M-REIT sector showed the second highest average
annual returns (2.36% p.a.) in comparison to other sectors which ranged from -1.33%
to 18.12%. The lowest average annual return was given by the KLSE property sector
with -1.33%, while the highest average annual return was given by KLSE plantation
sector with 18.12%. Meanwhile, the overall M-REIT annual risk level (12.30%) has
the lowest risk level in comparison to other sectors (18.01% to 30.46%). The highest
risk was given by the KLCI plantation sector (30.46%). The risk-adjusted rankings
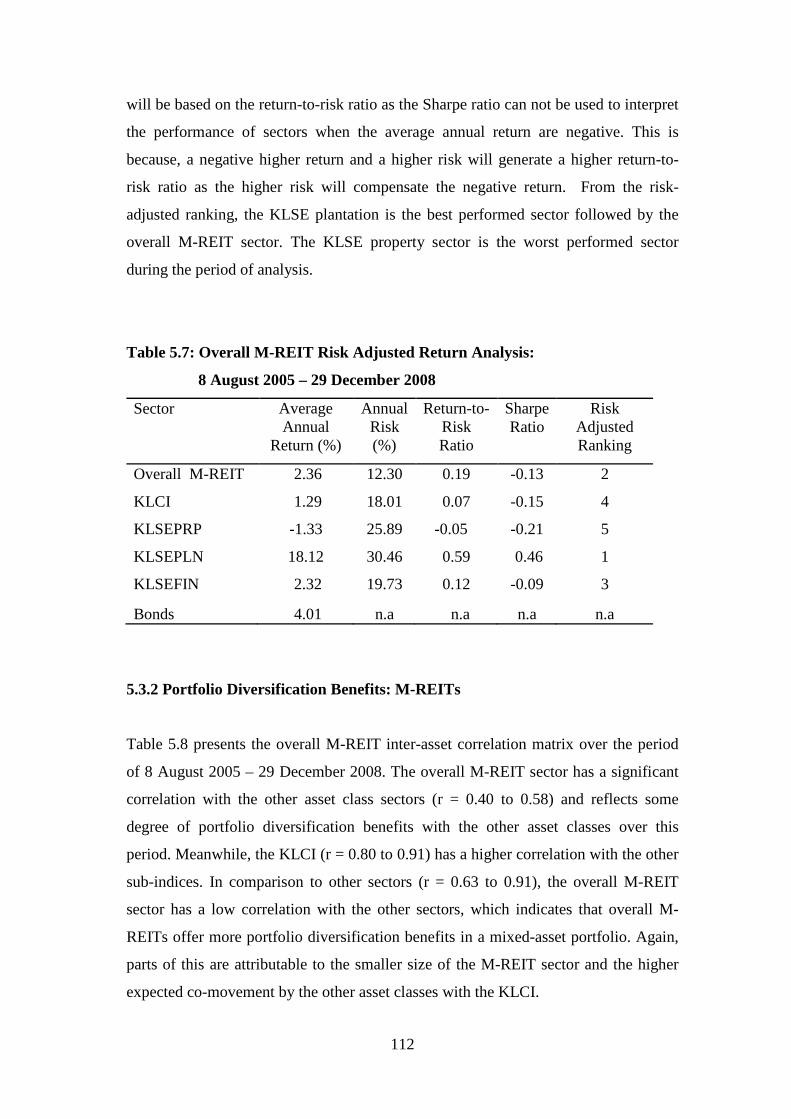
112
will be based on the return-to-risk ratio as the Sharpe ratio can not be used to interpret
the performance of sectors when the average annual return are negative. This is
because, a negative higher return and a higher risk will generate a higher return-to-
risk ratio as the higher risk will compensate the negative return. From the risk-
adjusted ranking, the KLSE plantation is the best performed sector followed by the
overall M-REIT sector. The KLSE property sector is the worst performed sector
during the period of analysis.
Table 5.7: Overall M-REIT Risk Adjusted Return Analysis:
8 August 2005 – 29 December 2008
Sector AverageAnnual
Return (%)
AnnualRisk(%)
Return-to-RiskRatio
SharpeRatio
RiskAdjustedRanking
Overall M-REIT 2.36 12.30 0.19 -0.13 2
KLCI 1.29 18.01 0.07 -0.15 4
KLSEPRP -1.33 25.89 -0.05 -0.21 5
KLSEPLN 18.12 30.46 0.59 0.46 1
KLSEFIN 2.32 19.73 0.12 -0.09 3
Bonds 4.01 n.a n.a n.a n.a
5.3.2 Portfolio Diversification Benefits: M-REITs
Table 5.8 presents the overall M-REIT inter-asset correlation matrix over the period
of 8 August 2005 – 29 December 2008. The overall M-REIT sector has a significant
correlation with the other asset class sectors (r = 0.40 to 0.58) and reflects some
degree of portfolio diversification benefits with the other asset classes over this
period. Meanwhile, the KLCI (r = 0.80 to 0.91) has a higher correlation with the other
sub-indices. In comparison to other sectors (r = 0.63 to 0.91), the overall M-REIT
sector has a low correlation with the other sectors, which indicates that overall M-
REITs offer more portfolio diversification benefits in a mixed-asset portfolio. Again,
parts of this are attributable to the smaller size of the M-REIT sector and the higher
expected co-movement by the other asset classes with the KLCI.
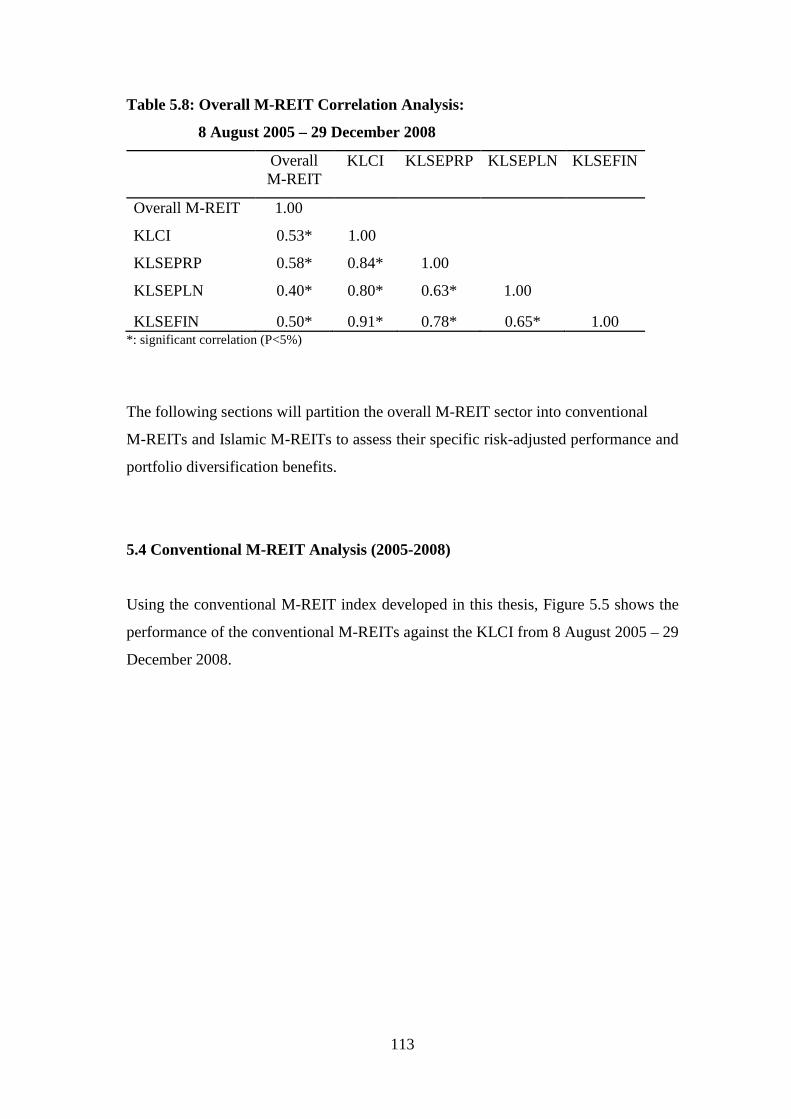
113
Table 5.8: Overall M-REIT Correlation Analysis:
8 August 2005 – 29 December 2008
OverallM-REIT
KLCI KLSEPRP KLSEPLN KLSEFIN
Overall M-REIT 1.00
KLCI 0.53* 1.00
KLSEPRP 0.58* 0.84* 1.00
KLSEPLN 0.40* 0.80* 0.63* 1.00
KLSEFIN 0.50* 0.91* 0.78* 0.65* 1.00*: significant correlation (P<5%)
The following sections will partition the overall M-REIT sector into conventional
M-REITs and Islamic M-REITs to assess their specific risk-adjusted performance and
portfolio diversification benefits.
5.4 Conventional M-REIT Analysis (2005-2008)
Using the conventional M-REIT index developed in this thesis, Figure 5.5 shows the
performance of the conventional M-REITs against the KLCI from 8 August 2005 – 29
December 2008.
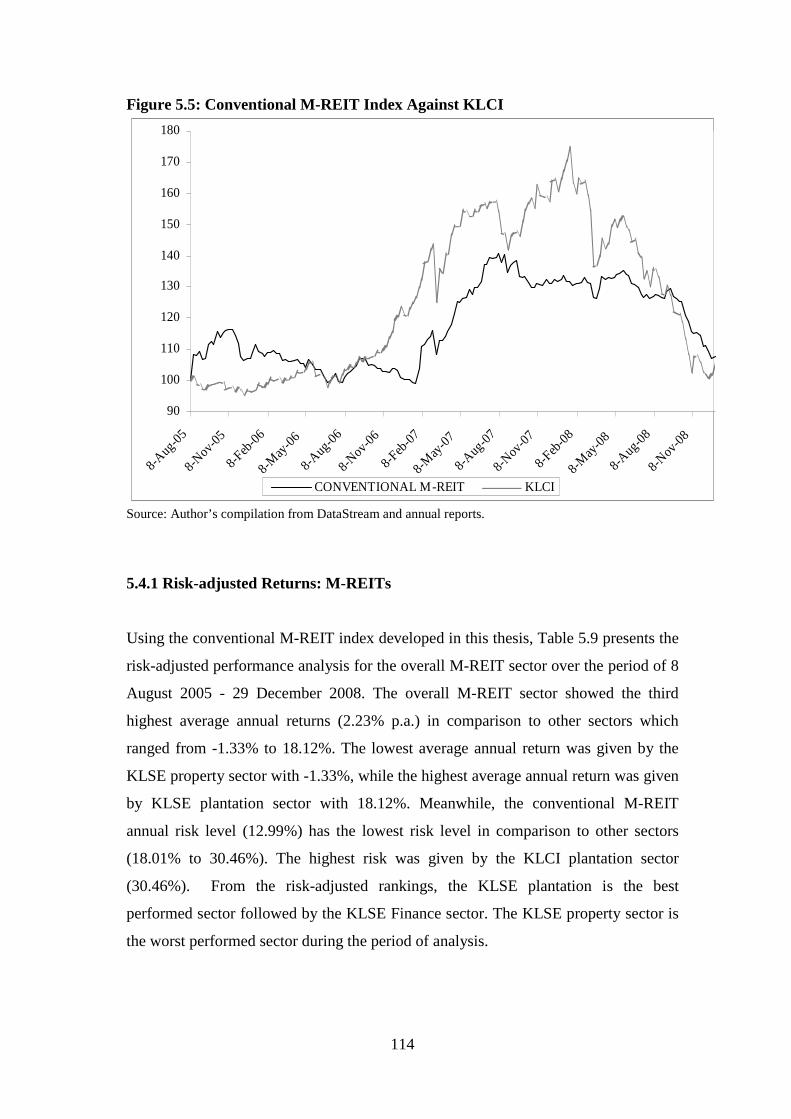
114
Figure 5.5: Conventional M-REIT Index Against KLCI
90
100
110
120
130
140
150
160
170
180
8-A
ug-0
5
8-N
ov-05
8-Feb
-06
8-May
-06
8-A
ug-0
6
8-N
ov-06
8-Feb
-07
8-M
ay-0
7
8-A
ug-0
7
8-N
ov-0
7
8-Feb
-08
8-M
ay-0
8
8-A
ug-0
8
8-N
ov-0
8
CONVENTIONAL M-REIT KLCI
Source: Author’s compilation from DataStream and annual reports.
5.4.1 Risk-adjusted Returns: M-REITs
Using the conventional M-REIT index developed in this thesis, Table 5.9 presents the
risk-adjusted performance analysis for the overall M-REIT sector over the period of 8
August 2005 - 29 December 2008. The overall M-REIT sector showed the third
highest average annual returns (2.23% p.a.) in comparison to other sectors which
ranged from -1.33% to 18.12%. The lowest average annual return was given by the
KLSE property sector with -1.33%, while the highest average annual return was given
by KLSE plantation sector with 18.12%. Meanwhile, the conventional M-REIT
annual risk level (12.99%) has the lowest risk level in comparison to other sectors
(18.01% to 30.46%). The highest risk was given by the KLCI plantation sector
(30.46%). From the risk-adjusted rankings, the KLSE plantation is the best
performed sector followed by the KLSE Finance sector. The KLSE property sector is
the worst performed sector during the period of analysis.
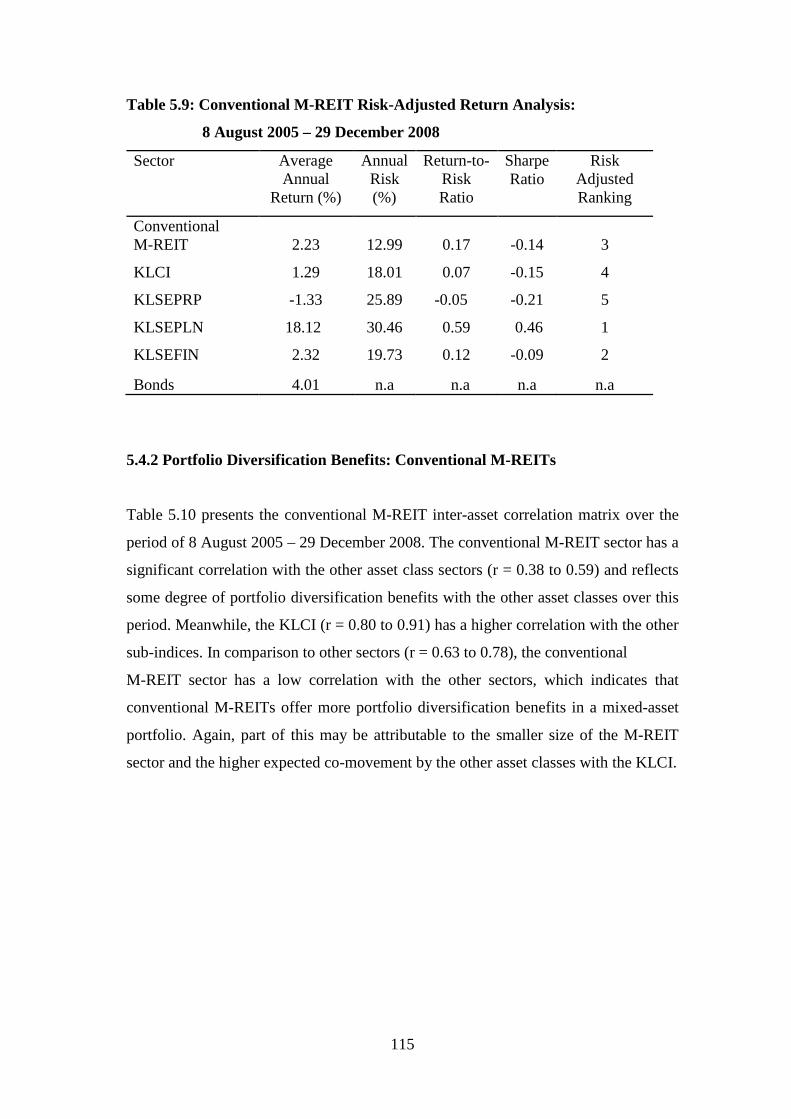
115
Table 5.9: Conventional M-REIT Risk-Adjusted Return Analysis:
8 August 2005 – 29 December 2008
Sector AverageAnnual
Return (%)
AnnualRisk(%)
Return-to-RiskRatio
SharpeRatio
RiskAdjustedRanking
ConventionalM-REIT 2.23 12.99 0.17 -0.14 3
KLCI 1.29 18.01 0.07 -0.15 4
KLSEPRP -1.33 25.89 -0.05 -0.21 5
KLSEPLN 18.12 30.46 0.59 0.46 1
KLSEFIN 2.32 19.73 0.12 -0.09 2
Bonds 4.01 n.a n.a n.a n.a
5.4.2 Portfolio Diversification Benefits: Conventional M-REITs
Table 5.10 presents the conventional M-REIT inter-asset correlation matrix over the
period of 8 August 2005 – 29 December 2008. The conventional M-REIT sector has a
significant correlation with the other asset class sectors (r = 0.38 to 0.59) and reflects
some degree of portfolio diversification benefits with the other asset classes over this
period. Meanwhile, the KLCI (r = 0.80 to 0.91) has a higher correlation with the other
sub-indices. In comparison to other sectors (r = 0.63 to 0.78), the conventional
M-REIT sector has a low correlation with the other sectors, which indicates that
conventional M-REITs offer more portfolio diversification benefits in a mixed-asset
portfolio. Again, part of this may be attributable to the smaller size of the M-REIT
sector and the higher expected co-movement by the other asset classes with the KLCI.
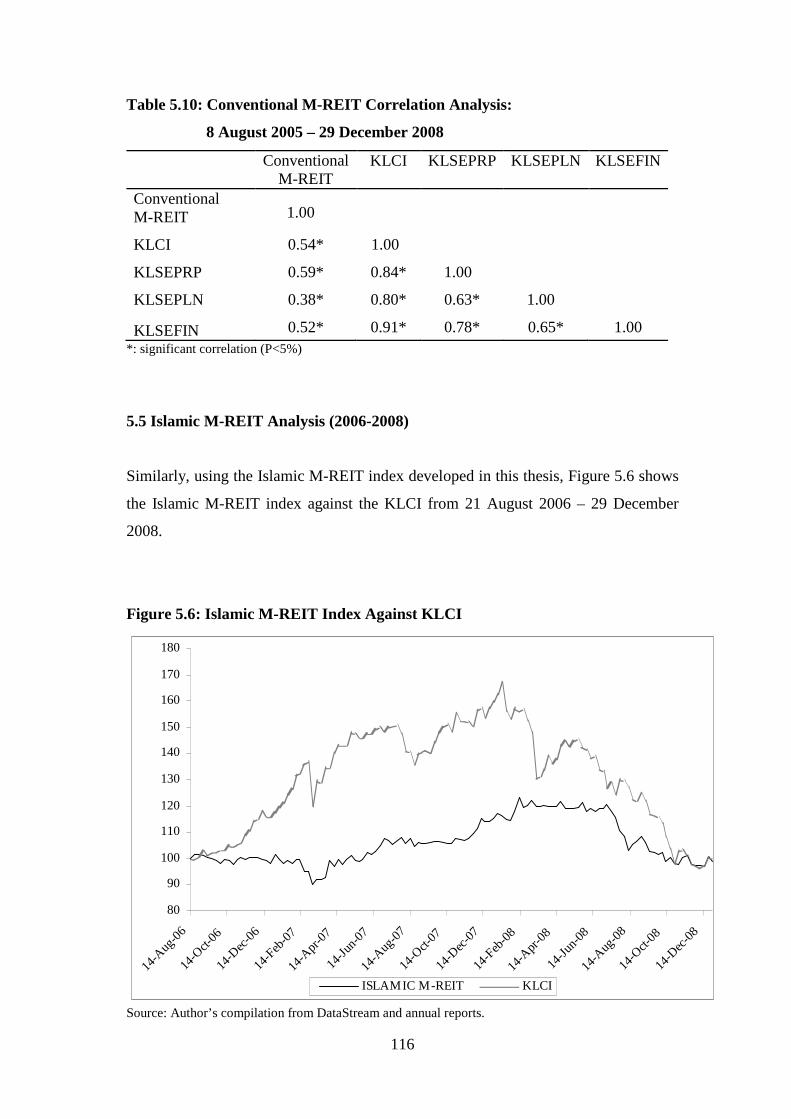
116
Table 5.10: Conventional M-REIT Correlation Analysis:
8 August 2005 – 29 December 2008
ConventionalM-REIT
KLCI KLSEPRP KLSEPLN KLSEFIN
ConventionalM-REIT 1.00
KLCI 0.54* 1.00
KLSEPRP 0.59* 0.84* 1.00
KLSEPLN 0.38* 0.80* 0.63* 1.00
KLSEFIN 0.52* 0.91* 0.78* 0.65* 1.00
*: significant correlation (P<5%)
5.5 Islamic M-REIT Analysis (2006-2008)
Similarly, using the Islamic M-REIT index developed in this thesis, Figure 5.6 shows
the Islamic M-REIT index against the KLCI from 21 August 2006 – 29 December
2008.
Figure 5.6: Islamic M-REIT Index Against KLCI
80
90
100
110
120
130
140
150
160
170
180
14-A
ug-0
6
14-O
ct-06
14-D
ec-0
6
14-F
eb-0
7
14-A
pr-0
7
14-J
un-0
7
14-A
ug-0
7
14-O
ct-07
14-D
ec-0
7
14-F
eb-0
8
14-A
pr-0
8
14-J
un-0
8
14-A
ug-0
8
14-O
ct-08
14-D
ec-0
8
ISLAMIC M-REIT KLCI
Source: Author’s compilation from DataStream and annual reports.
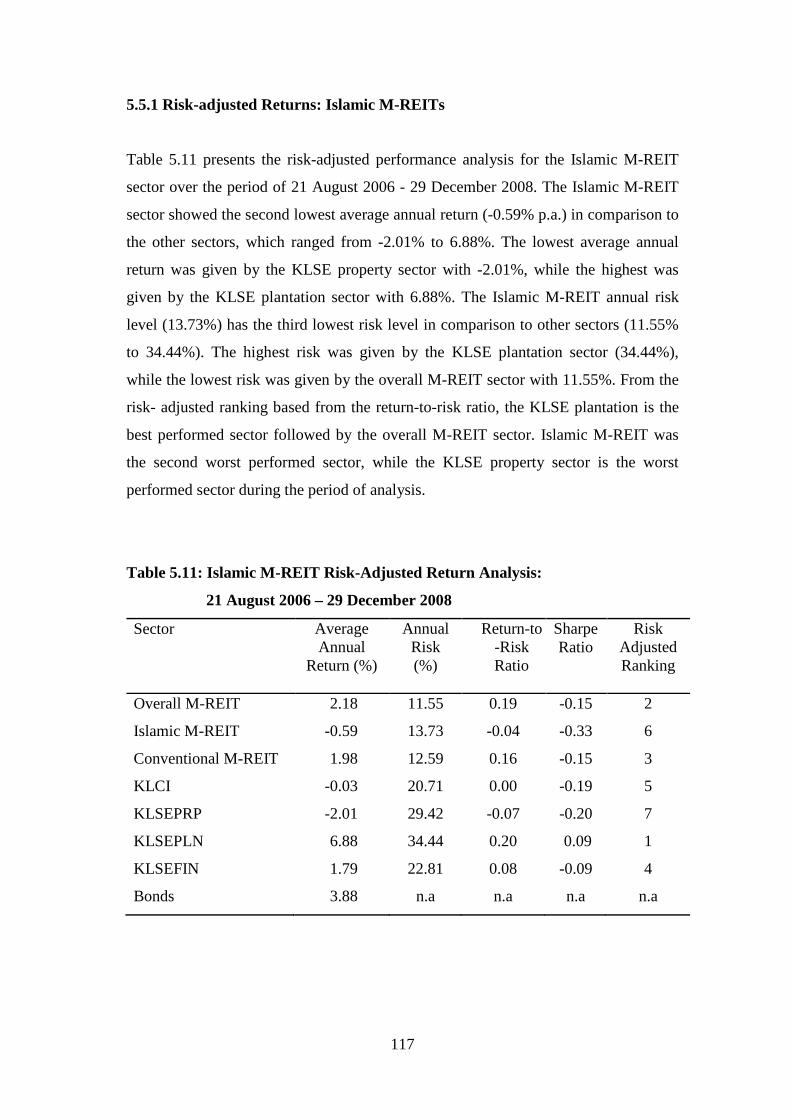
117
5.5.1 Risk-adjusted Returns: Islamic M-REITs
Table 5.11 presents the risk-adjusted performance analysis for the Islamic M-REIT
sector over the period of 21 August 2006 - 29 December 2008. The Islamic M-REIT
sector showed the second lowest average annual return (-0.59% p.a.) in comparison to
the other sectors, which ranged from -2.01% to 6.88%. The lowest average annual
return was given by the KLSE property sector with -2.01%, while the highest was
given by the KLSE plantation sector with 6.88%. The Islamic M-REIT annual risk
level (13.73%) has the third lowest risk level in comparison to other sectors (11.55%
to 34.44%). The highest risk was given by the KLSE plantation sector (34.44%),
while the lowest risk was given by the overall M-REIT sector with 11.55%. From the
risk- adjusted ranking based from the return-to-risk ratio, the KLSE plantation is the
best performed sector followed by the overall M-REIT sector. Islamic M-REIT was
the second worst performed sector, while the KLSE property sector is the worst
performed sector during the period of analysis.
Table 5.11: Islamic M-REIT Risk-Adjusted Return Analysis:
21 August 2006 – 29 December 2008
Sector AverageAnnual
Return (%)
AnnualRisk(%)
Return-to-RiskRatio
SharpeRatio
RiskAdjustedRanking
Overall M-REIT 2.18 11.55 0.19 -0.15 2
Islamic M-REIT -0.59 13.73 -0.04 -0.33 6
Conventional M-REIT 1.98 12.59 0.16 -0.15 3
KLCI -0.03 20.71 0.00 -0.19 5
KLSEPRP -2.01 29.42 -0.07 -0.20 7
KLSEPLN 6.88 34.44 0.20 0.09 1
KLSEFIN 1.79 22.81 0.08 -0.09 4
Bonds 3.88 n.a n.a n.a n.a
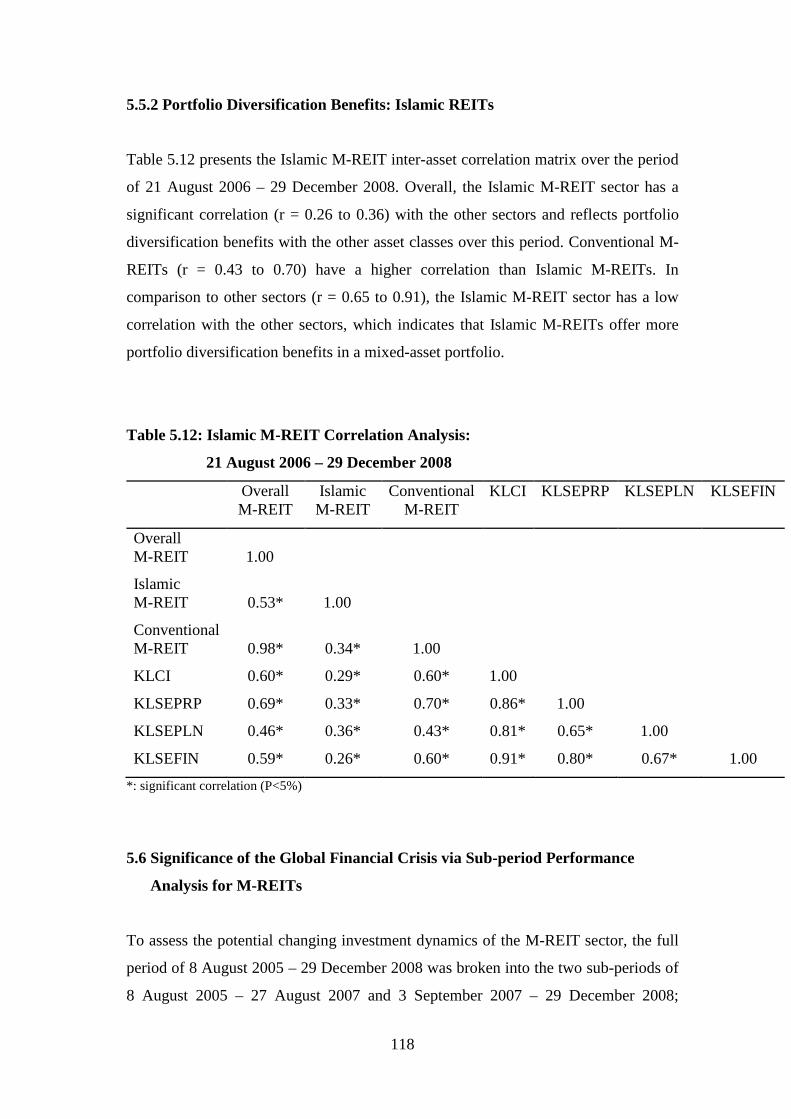
118
5.5.2 Portfolio Diversification Benefits: Islamic REITs
Table 5.12 presents the Islamic M-REIT inter-asset correlation matrix over the period
of 21 August 2006 – 29 December 2008. Overall, the Islamic M-REIT sector has a
significant correlation (r = 0.26 to 0.36) with the other sectors and reflects portfolio
diversification benefits with the other asset classes over this period. Conventional M-
REITs (r = 0.43 to 0.70) have a higher correlation than Islamic M-REITs. In
comparison to other sectors (r = 0.65 to 0.91), the Islamic M-REIT sector has a low
correlation with the other sectors, which indicates that Islamic M-REITs offer more
portfolio diversification benefits in a mixed-asset portfolio.
Table 5.12: Islamic M-REIT Correlation Analysis:
21 August 2006 – 29 December 2008
OverallM-REIT
IslamicM-REIT
ConventionalM-REIT
KLCI KLSEPRP KLSEPLN KLSEFIN
OverallM-REIT 1.00
IslamicM-REIT 0.53* 1.00
ConventionalM-REIT 0.98* 0.34* 1.00
KLCI 0.60* 0.29* 0.60* 1.00
KLSEPRP 0.69* 0.33* 0.70* 0.86* 1.00
KLSEPLN 0.46* 0.36* 0.43* 0.81* 0.65* 1.00
KLSEFIN 0.59* 0.26* 0.60* 0.91* 0.80* 0.67* 1.00
*: significant correlation (P<5%)
5.6 Significance of the Global Financial Crisis via Sub-period Performance
Analysis for M-REITs
To assess the potential changing investment dynamics of the M-REIT sector, the full
period of 8 August 2005 – 29 December 2008 was broken into the two sub-periods of
8 August 2005 – 27 August 2007 and 3 September 2007 – 29 December 2008;
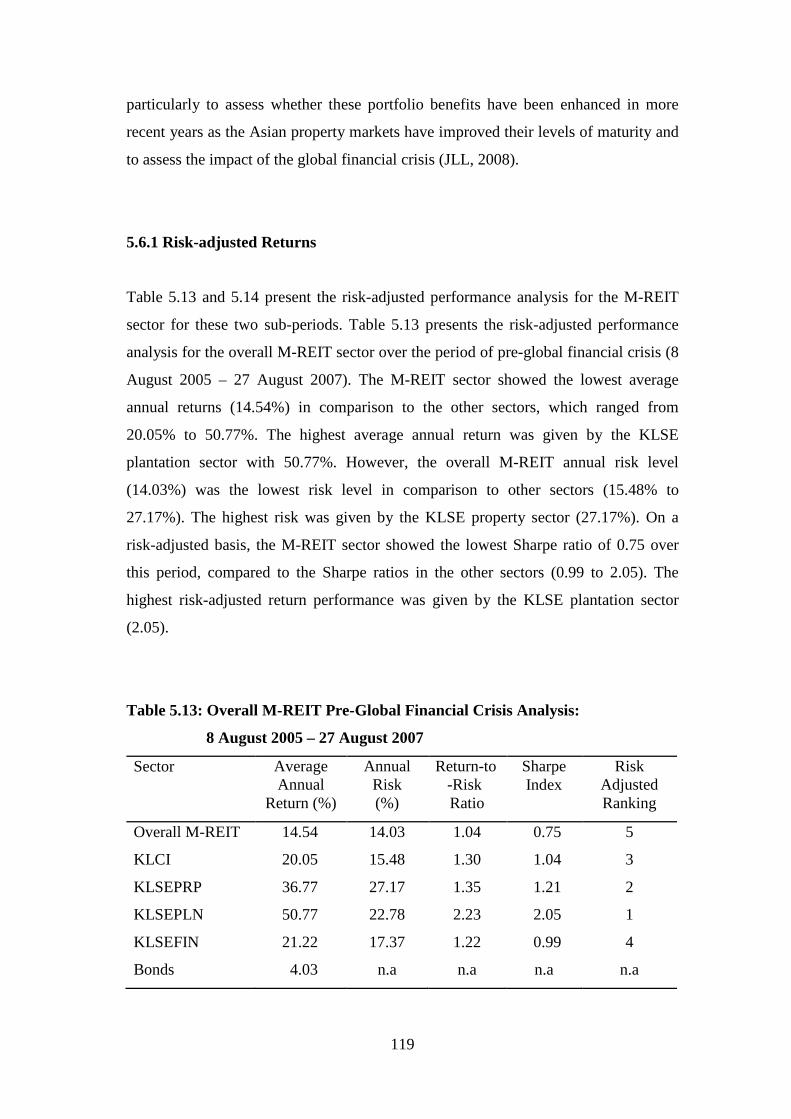
119
particularly to assess whether these portfolio benefits have been enhanced in more
recent years as the Asian property markets have improved their levels of maturity and
to assess the impact of the global financial crisis (JLL, 2008).
5.6.1 Risk-adjusted Returns
Table 5.13 and 5.14 present the risk-adjusted performance analysis for the M-REIT
sector for these two sub-periods. Table 5.13 presents the risk-adjusted performance
analysis for the overall M-REIT sector over the period of pre-global financial crisis (8
August 2005 – 27 August 2007). The M-REIT sector showed the lowest average
annual returns (14.54%) in comparison to the other sectors, which ranged from
20.05% to 50.77%. The highest average annual return was given by the KLSE
plantation sector with 50.77%. However, the overall M-REIT annual risk level
(14.03%) was the lowest risk level in comparison to other sectors (15.48% to
27.17%). The highest risk was given by the KLSE property sector (27.17%). On a
risk-adjusted basis, the M-REIT sector showed the lowest Sharpe ratio of 0.75 over
this period, compared to the Sharpe ratios in the other sectors (0.99 to 2.05). The
highest risk-adjusted return performance was given by the KLSE plantation sector
(2.05).
Table 5.13: Overall M-REIT Pre-Global Financial Crisis Analysis:
8 August 2005 – 27 August 2007
Sector AverageAnnual
Return (%)
AnnualRisk(%)
Return-to-RiskRatio
SharpeIndex
RiskAdjustedRanking
Overall M-REIT 14.54 14.03 1.04 0.75 5
KLCI 20.05 15.48 1.30 1.04 3
KLSEPRP 36.77 27.17 1.35 1.21 2
KLSEPLN 50.77 22.78 2.23 2.05 1
KLSEFIN 21.22 17.37 1.22 0.99 4
Bonds 4.03 n.a n.a n.a n.a
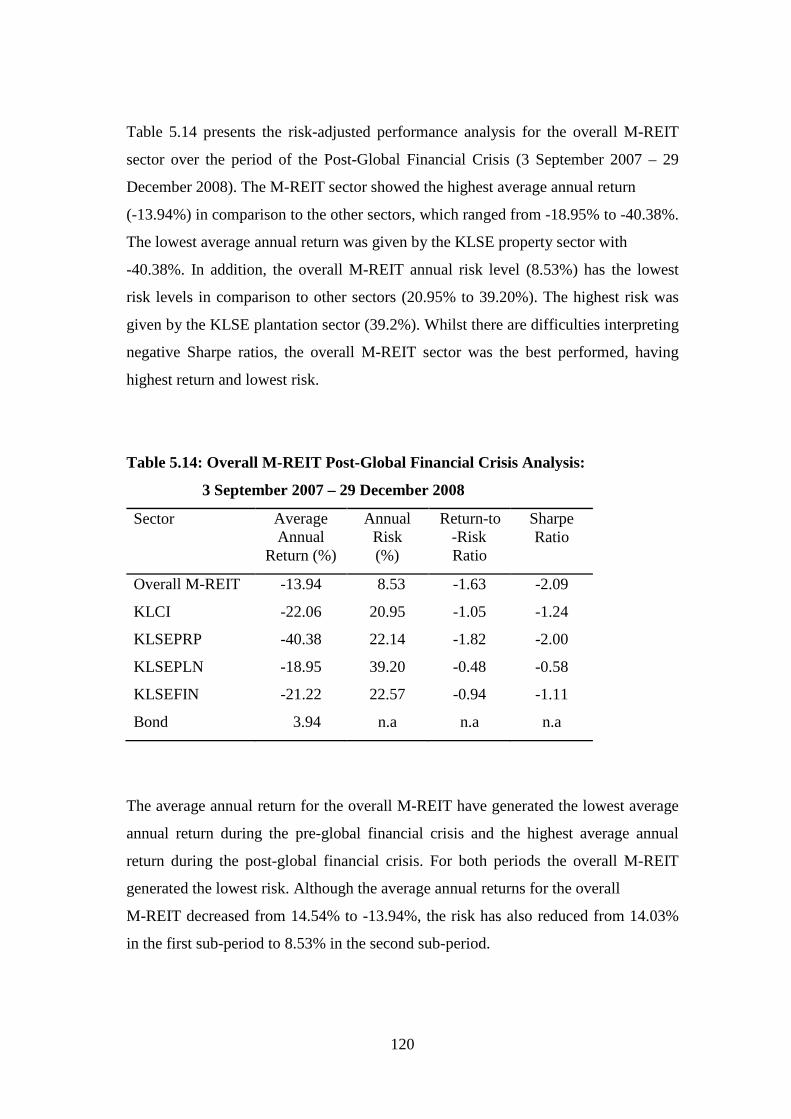
120
Table 5.14 presents the risk-adjusted performance analysis for the overall M-REIT
sector over the period of the Post-Global Financial Crisis (3 September 2007 – 29
December 2008). The M-REIT sector showed the highest average annual return
(-13.94%) in comparison to the other sectors, which ranged from -18.95% to -40.38%.
The lowest average annual return was given by the KLSE property sector with
-40.38%. In addition, the overall M-REIT annual risk level (8.53%) has the lowest
risk levels in comparison to other sectors (20.95% to 39.20%). The highest risk was
given by the KLSE plantation sector (39.2%). Whilst there are difficulties interpreting
negative Sharpe ratios, the overall M-REIT sector was the best performed, having
highest return and lowest risk.
Table 5.14: Overall M-REIT Post-Global Financial Crisis Analysis:
3 September 2007 – 29 December 2008
Sector AverageAnnual
Return (%)
AnnualRisk(%)
Return-to-RiskRatio
SharpeRatio
Overall M-REIT -13.94 8.53 -1.63 -2.09
KLCI -22.06 20.95 -1.05 -1.24
KLSEPRP -40.38 22.14 -1.82 -2.00
KLSEPLN -18.95 39.20 -0.48 -0.58
KLSEFIN -21.22 22.57 -0.94 -1.11
Bond 3.94 n.a n.a n.a
The average annual return for the overall M-REIT have generated the lowest average
annual return during the pre-global financial crisis and the highest average annual
return during the post-global financial crisis. For both periods the overall M-REIT
generated the lowest risk. Although the average annual returns for the overall
M-REIT decreased from 14.54% to -13.94%, the risk has also reduced from 14.03%
in the first sub-period to 8.53% in the second sub-period.
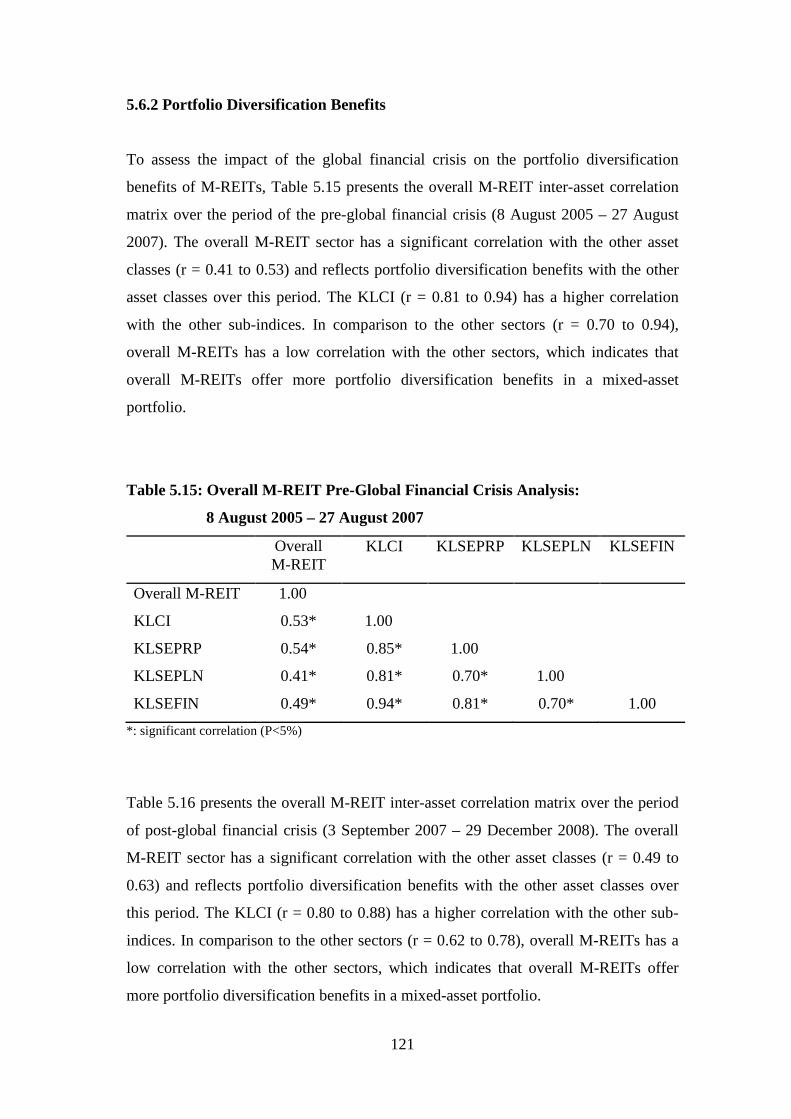
121
5.6.2 Portfolio Diversification Benefits
To assess the impact of the global financial crisis on the portfolio diversification
benefits of M-REITs, Table 5.15 presents the overall M-REIT inter-asset correlation
matrix over the period of the pre-global financial crisis (8 August 2005 – 27 August
2007). The overall M-REIT sector has a significant correlation with the other asset
classes (r = 0.41 to 0.53) and reflects portfolio diversification benefits with the other
asset classes over this period. The KLCI (r = 0.81 to 0.94) has a higher correlation
with the other sub-indices. In comparison to the other sectors (r = 0.70 to 0.94),
overall M-REITs has a low correlation with the other sectors, which indicates that
overall M-REITs offer more portfolio diversification benefits in a mixed-asset
portfolio.
Table 5.15: Overall M-REIT Pre-Global Financial Crisis Analysis:
8 August 2005 – 27 August 2007
OverallM-REIT
KLCI KLSEPRP KLSEPLN KLSEFIN
Overall M-REIT 1.00
KLCI 0.53* 1.00
KLSEPRP 0.54* 0.85* 1.00
KLSEPLN 0.41* 0.81* 0.70* 1.00
KLSEFIN 0.49* 0.94* 0.81* 0.70* 1.00
*: significant correlation (P<5%)
Table 5.16 presents the overall M-REIT inter-asset correlation matrix over the period
of post-global financial crisis (3 September 2007 – 29 December 2008). The overall
M-REIT sector has a significant correlation with the other asset classes (r = 0.49 to
0.63) and reflects portfolio diversification benefits with the other asset classes over
this period. The KLCI (r = 0.80 to 0.88) has a higher correlation with the other sub-
indices. In comparison to the other sectors (r = 0.62 to 0.78), overall M-REITs has a
low correlation with the other sectors, which indicates that overall M-REITs offer
more portfolio diversification benefits in a mixed-asset portfolio.
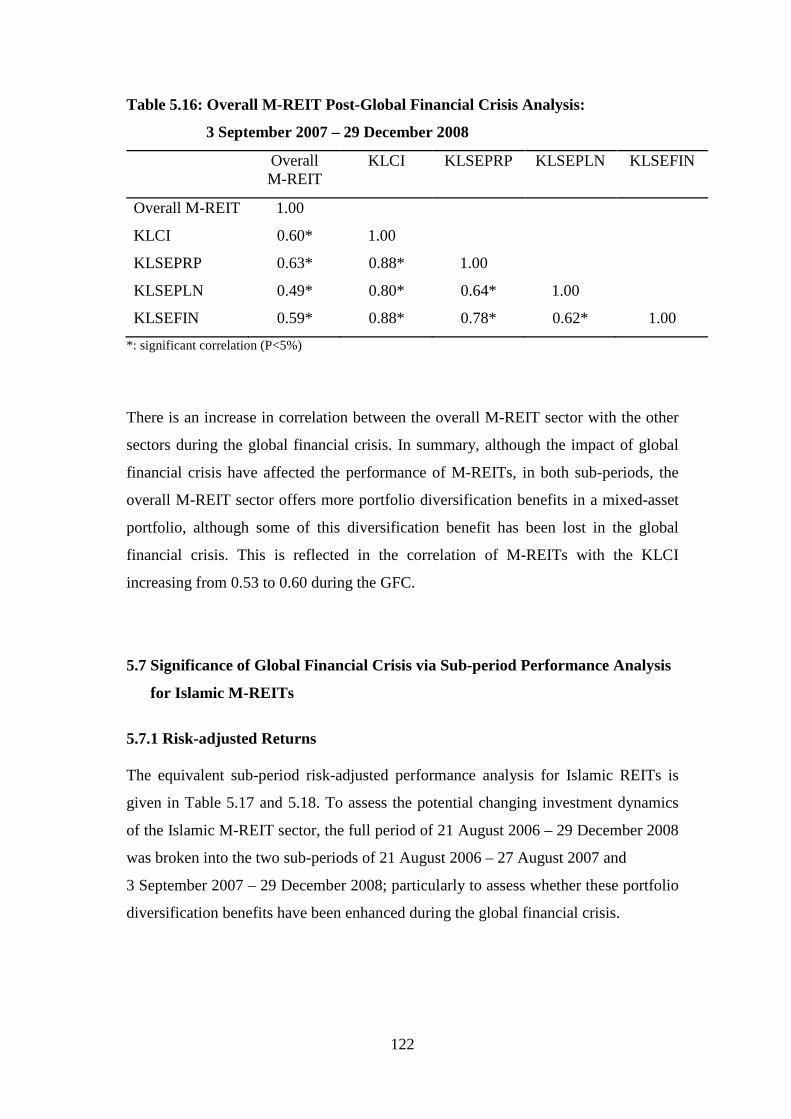
122
Table 5.16: Overall M-REIT Post-Global Financial Crisis Analysis:
3 September 2007 – 29 December 2008
OverallM-REIT
KLCI KLSEPRP KLSEPLN KLSEFIN
Overall M-REIT 1.00
KLCI 0.60* 1.00
KLSEPRP 0.63* 0.88* 1.00
KLSEPLN 0.49* 0.80* 0.64* 1.00
KLSEFIN 0.59* 0.88* 0.78* 0.62* 1.00
*: significant correlation (P<5%)
There is an increase in correlation between the overall M-REIT sector with the other
sectors during the global financial crisis. In summary, although the impact of global
financial crisis have affected the performance of M-REITs, in both sub-periods, the
overall M-REIT sector offers more portfolio diversification benefits in a mixed-asset
portfolio, although some of this diversification benefit has been lost in the global
financial crisis. This is reflected in the correlation of M-REITs with the KLCI
increasing from 0.53 to 0.60 during the GFC.
5.7 Significance of Global Financial Crisis via Sub-period Performance Analysis
for Islamic M-REITs
5.7.1 Risk-adjusted Returns
The equivalent sub-period risk-adjusted performance analysis for Islamic REITs is
given in Table 5.17 and 5.18. To assess the potential changing investment dynamics
of the Islamic M-REIT sector, the full period of 21 August 2006 – 29 December 2008
was broken into the two sub-periods of 21 August 2006 – 27 August 2007 and
3 September 2007 – 29 December 2008; particularly to assess whether these portfolio
diversification benefits have been enhanced during the global financial crisis.
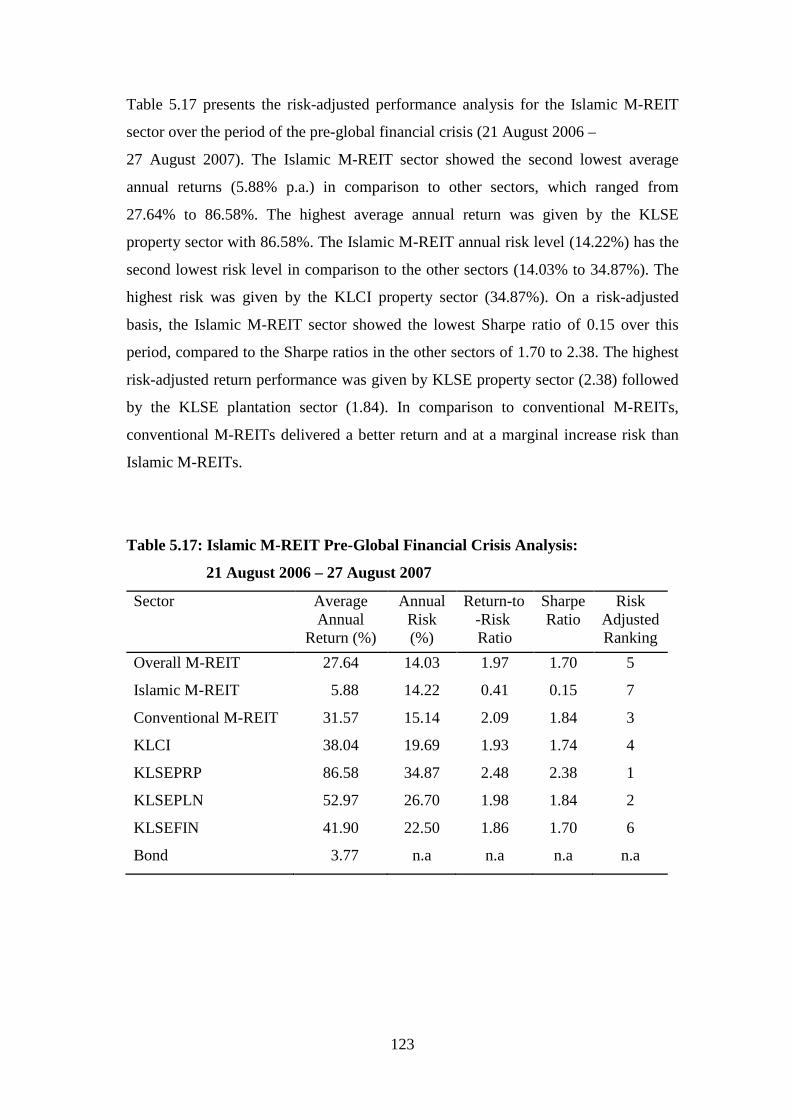
123
Table 5.17 presents the risk-adjusted performance analysis for the Islamic M-REIT
sector over the period of the pre-global financial crisis (21 August 2006 –
27 August 2007). The Islamic M-REIT sector showed the second lowest average
annual returns (5.88% p.a.) in comparison to other sectors, which ranged from
27.64% to 86.58%. The highest average annual return was given by the KLSE
property sector with 86.58%. The Islamic M-REIT annual risk level (14.22%) has the
second lowest risk level in comparison to the other sectors (14.03% to 34.87%). The
highest risk was given by the KLCI property sector (34.87%). On a risk-adjusted
basis, the Islamic M-REIT sector showed the lowest Sharpe ratio of 0.15 over this
period, compared to the Sharpe ratios in the other sectors of 1.70 to 2.38. The highest
risk-adjusted return performance was given by KLSE property sector (2.38) followed
by the KLSE plantation sector (1.84). In comparison to conventional M-REITs,
conventional M-REITs delivered a better return and at a marginal increase risk than
Islamic M-REITs.
Table 5.17: Islamic M-REIT Pre-Global Financial Crisis Analysis:
21 August 2006 – 27 August 2007
Sector AverageAnnual
Return (%)
AnnualRisk(%)
Return-to-RiskRatio
SharpeRatio
RiskAdjustedRanking
Overall M-REIT 27.64 14.03 1.97 1.70 5
Islamic M-REIT 5.88 14.22 0.41 0.15 7
Conventional M-REIT 31.57 15.14 2.09 1.84 3
KLCI 38.04 19.69 1.93 1.74 4
KLSEPRP 86.58 34.87 2.48 2.38 1
KLSEPLN 52.97 26.70 1.98 1.84 2
KLSEFIN 41.90 22.50 1.86 1.70 6
Bond 3.77 n.a n.a n.a n.a
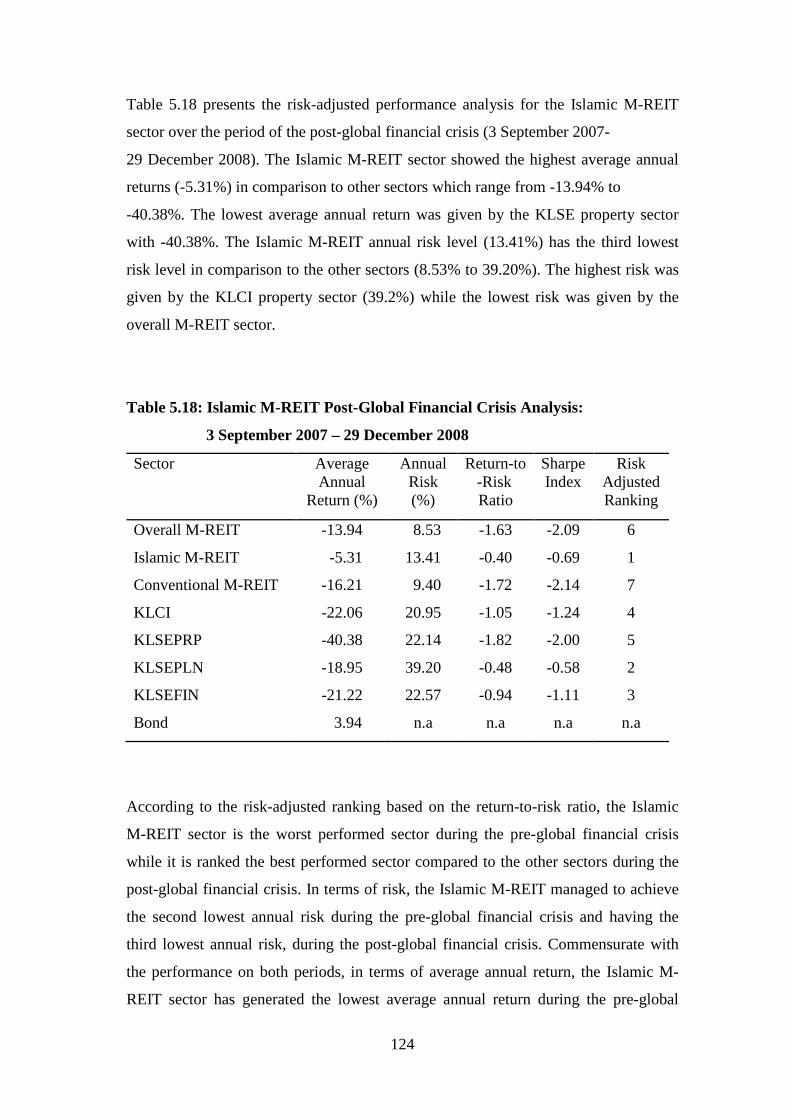
124
Table 5.18 presents the risk-adjusted performance analysis for the Islamic M-REIT
sector over the period of the post-global financial crisis (3 September 2007-
29 December 2008). The Islamic M-REIT sector showed the highest average annual
returns (-5.31%) in comparison to other sectors which range from -13.94% to
-40.38%. The lowest average annual return was given by the KLSE property sector
with -40.38%. The Islamic M-REIT annual risk level (13.41%) has the third lowest
risk level in comparison to the other sectors (8.53% to 39.20%). The highest risk was
given by the KLCI property sector (39.2%) while the lowest risk was given by the
overall M-REIT sector.
Table 5.18: Islamic M-REIT Post-Global Financial Crisis Analysis:
3 September 2007 – 29 December 2008
Sector AverageAnnual
Return (%)
AnnualRisk(%)
Return-to-RiskRatio
SharpeIndex
RiskAdjustedRanking
Overall M-REIT -13.94 8.53 -1.63 -2.09 6
Islamic M-REIT -5.31 13.41 -0.40 -0.69 1
Conventional M-REIT -16.21 9.40 -1.72 -2.14 7
KLCI -22.06 20.95 -1.05 -1.24 4
KLSEPRP -40.38 22.14 -1.82 -2.00 5
KLSEPLN -18.95 39.20 -0.48 -0.58 2
KLSEFIN -21.22 22.57 -0.94 -1.11 3
Bond 3.94 n.a n.a n.a n.a
According to the risk-adjusted ranking based on the return-to-risk ratio, the Islamic
M-REIT sector is the worst performed sector during the pre-global financial crisis
while it is ranked the best performed sector compared to the other sectors during the
post-global financial crisis. In terms of risk, the Islamic M-REIT managed to achieve
the second lowest annual risk during the pre-global financial crisis and having the
third lowest annual risk, during the post-global financial crisis. Commensurate with
the performance on both periods, in terms of average annual return, the Islamic M-
REIT sector has generated the lowest average annual return during the pre-global
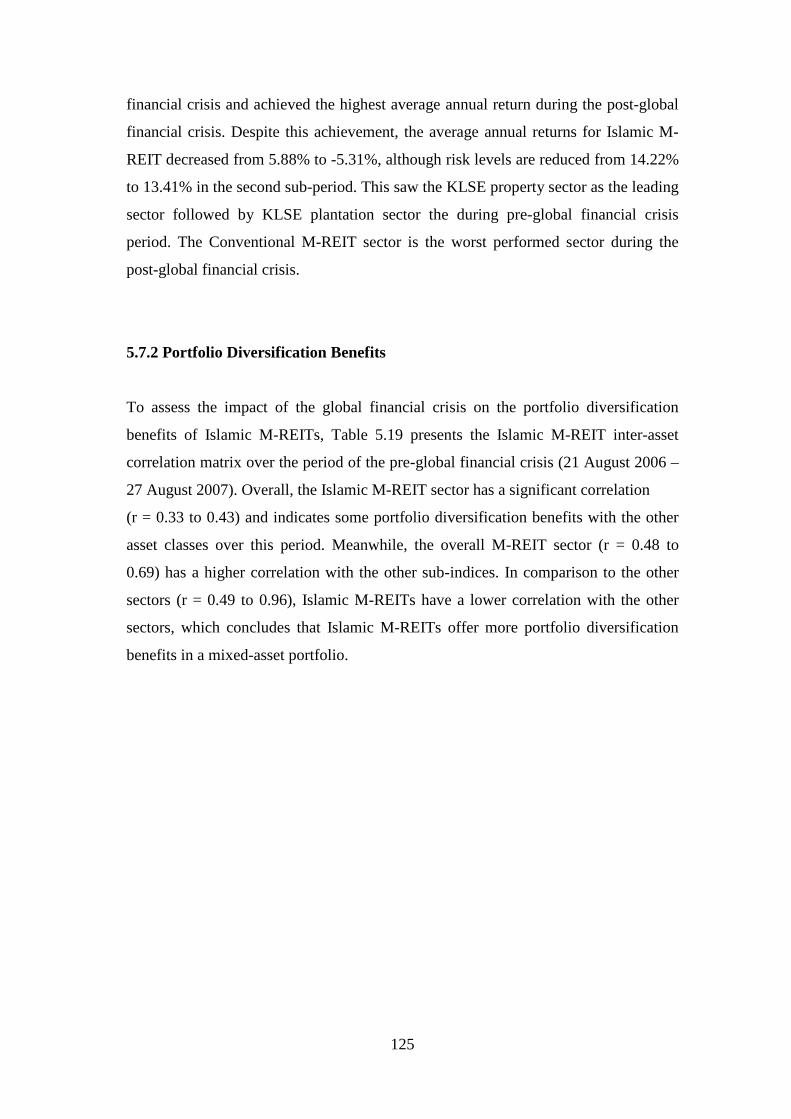
125
financial crisis and achieved the highest average annual return during the post-global
financial crisis. Despite this achievement, the average annual returns for Islamic M-
REIT decreased from 5.88% to -5.31%, although risk levels are reduced from 14.22%
to 13.41% in the second sub-period. This saw the KLSE property sector as the leading
sector followed by KLSE plantation sector the during pre-global financial crisis
period. The Conventional M-REIT sector is the worst performed sector during the
post-global financial crisis.
5.7.2 Portfolio Diversification Benefits
To assess the impact of the global financial crisis on the portfolio diversification
benefits of Islamic M-REITs, Table 5.19 presents the Islamic M-REIT inter-asset
correlation matrix over the period of the pre-global financial crisis (21 August 2006 –
27 August 2007). Overall, the Islamic M-REIT sector has a significant correlation
(r = 0.33 to 0.43) and indicates some portfolio diversification benefits with the other
asset classes over this period. Meanwhile, the overall M-REIT sector (r = 0.48 to
0.69) has a higher correlation with the other sub-indices. In comparison to the other
sectors (r = 0.49 to 0.96), Islamic M-REITs have a lower correlation with the other
sectors, which concludes that Islamic M-REITs offer more portfolio diversification
benefits in a mixed-asset portfolio.
126
Table 5.19: Islamic M-REIT Pre-Global Financial Crisis Analysis:
21 August 2006 – 27 August 2007
*: significant correlation (P<5%)
Table 5.20 presents the Islamic M-REIT inter-asset correlation matrix over the period
of the post-global financial crisis (3 September 2007 – 29 December 2008). Overall,
the Islamic M-REIT sector has a low correlation (r = 0.16 to 0.39) with the other asset
classes and reflects portfolio diversification benefits with the other asset classes over
this period. Meanwhile, the conventional M-REIT sector (r = 0.42 to 0.63) has a
higher correlation than Islamic M-REITs. In comparison to other sectors (r = 0.62 to
0.88), Islamic M-REITs have a lower correlation with the other sectors, which
concludes that Islamic M-REITs offer more portfolio diversification benefits in a
mixed-asset portfolio.
OverallM-REIT
IslamicM-REIT
ConventionalM-REIT
KLCI KLSEPRP KLSEPLN KLSEFIN
OverallM-REIT 1.00
IslamicM-REIT 0.56* 1.00
ConventionalM-REIT 0.99* 0.43* 1.00
KLCI 0.61* 0.36* 0.61* 1.00
KLSEPRP 0.69* 0.41* 0.70* 0.88* 1.00
KLSEPLN 0.48* 0.33* 0.49* 0.85* 0.78* 1.00
KLSEFIN 0.59* 0.37* 0.59* 0.96* 0.83* 0.77* 1.00
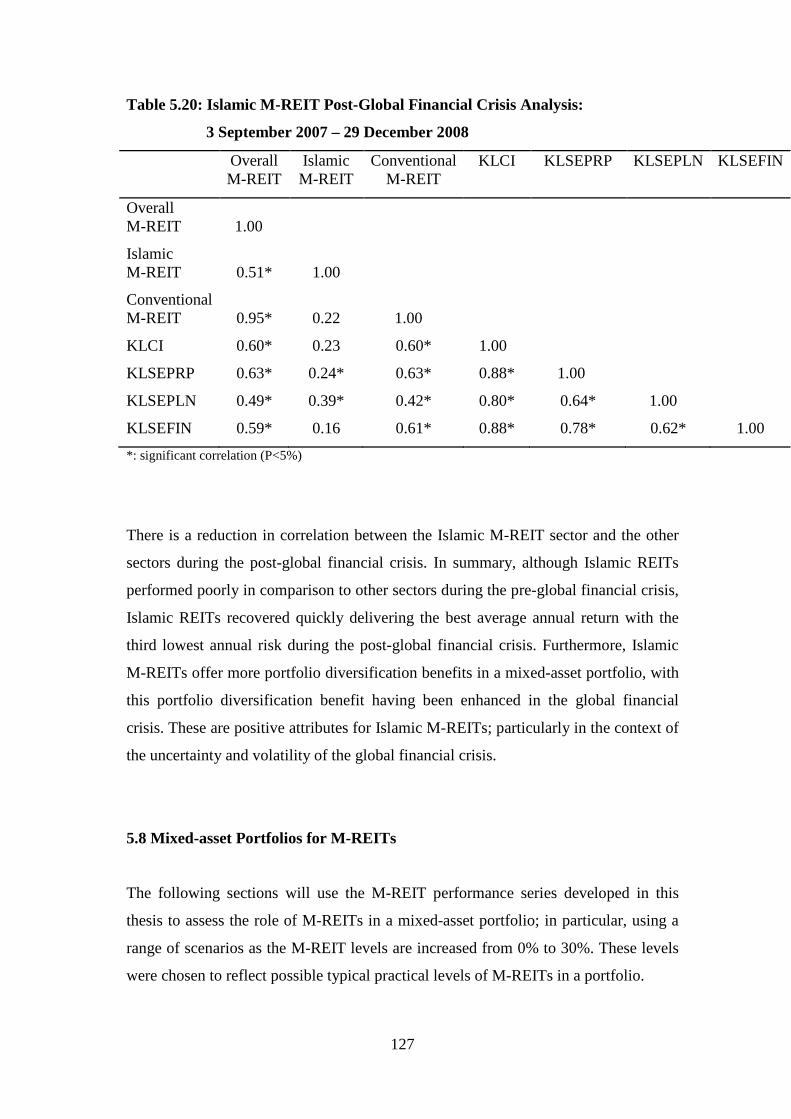
127
Table 5.20: Islamic M-REIT Post-Global Financial Crisis Analysis:
3 September 2007 – 29 December 2008
OverallM-REIT
IslamicM-REIT
ConventionalM-REIT
KLCI KLSEPRP KLSEPLN KLSEFIN
OverallM-REIT 1.00
IslamicM-REIT 0.51* 1.00
ConventionalM-REIT 0.95* 0.22 1.00
KLCI 0.60* 0.23 0.60* 1.00
KLSEPRP 0.63* 0.24* 0.63* 0.88* 1.00
KLSEPLN 0.49* 0.39* 0.42* 0.80* 0.64* 1.00
KLSEFIN 0.59* 0.16 0.61* 0.88* 0.78* 0.62* 1.00
*: significant correlation (P<5%)
There is a reduction in correlation between the Islamic M-REIT sector and the other
sectors during the post-global financial crisis. In summary, although Islamic REITs
performed poorly in comparison to other sectors during the pre-global financial crisis,
Islamic REITs recovered quickly delivering the best average annual return with the
third lowest annual risk during the post-global financial crisis. Furthermore, Islamic
M-REITs offer more portfolio diversification benefits in a mixed-asset portfolio, with
this portfolio diversification benefit having been enhanced in the global financial
crisis. These are positive attributes for Islamic M-REITs; particularly in the context of
the uncertainty and volatility of the global financial crisis.
5.8 Mixed-asset Portfolios for M-REITs
The following sections will use the M-REIT performance series developed in this
thesis to assess the role of M-REITs in a mixed-asset portfolio; in particular, using a
range of scenarios as the M-REIT levels are increased from 0% to 30%. These levels
were chosen to reflect possible typical practical levels of M-REITs in a portfolio.
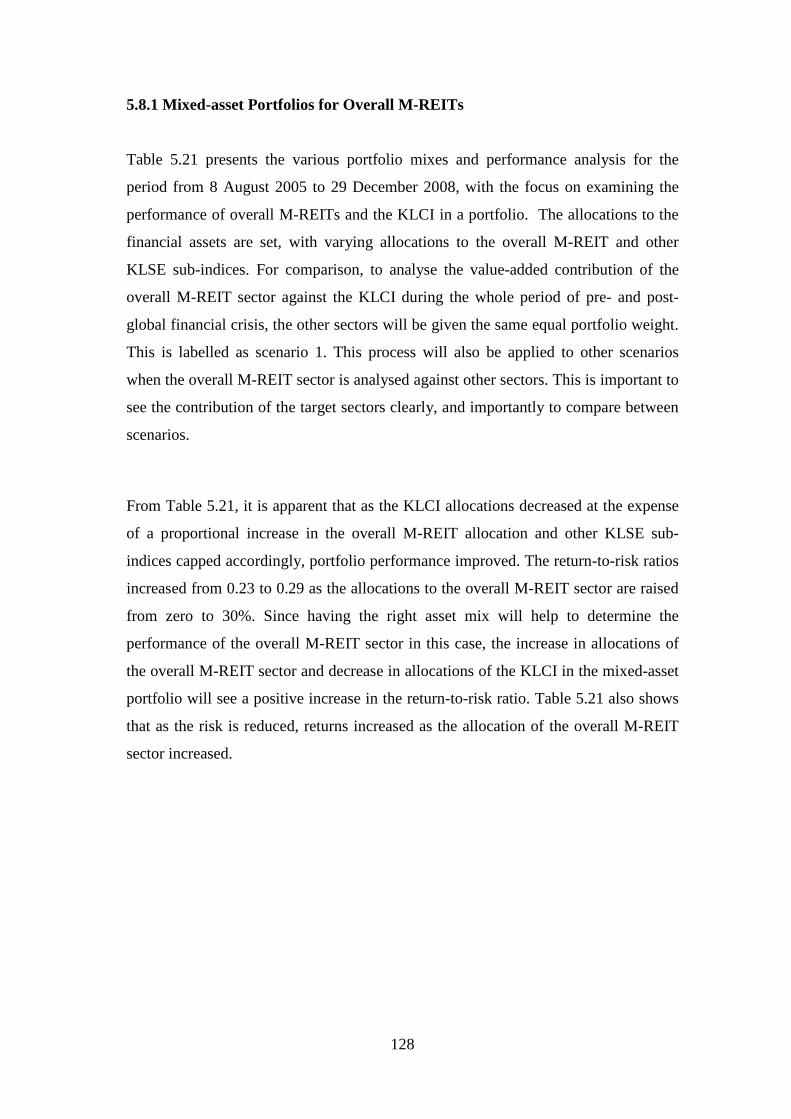
128
5.8.1 Mixed-asset Portfolios for Overall M-REITs
Table 5.21 presents the various portfolio mixes and performance analysis for the
period from 8 August 2005 to 29 December 2008, with the focus on examining the
performance of overall M-REITs and the KLCI in a portfolio. The allocations to the
financial assets are set, with varying allocations to the overall M-REIT and other
KLSE sub-indices. For comparison, to analyse the value-added contribution of the
overall M-REIT sector against the KLCI during the whole period of pre- and post-
global financial crisis, the other sectors will be given the same equal portfolio weight.
This is labelled as scenario 1. This process will also be applied to other scenarios
when the overall M-REIT sector is analysed against other sectors. This is important to
see the contribution of the target sectors clearly, and importantly to compare between
scenarios.
From Table 5.21, it is apparent that as the KLCI allocations decreased at the expense
of a proportional increase in the overall M-REIT allocation and other KLSE sub-
indices capped accordingly, portfolio performance improved. The return-to-risk ratios
increased from 0.23 to 0.29 as the allocations to the overall M-REIT sector are raised
from zero to 30%. Since having the right asset mix will help to determine the
performance of the overall M-REIT sector in this case, the increase in allocations of
the overall M-REIT sector and decrease in allocations of the KLCI in the mixed-asset
portfolio will see a positive increase in the return-to-risk ratio. Table 5.21 also shows
that as the risk is reduced, returns increased as the allocation of the overall M-REIT
sector increased.
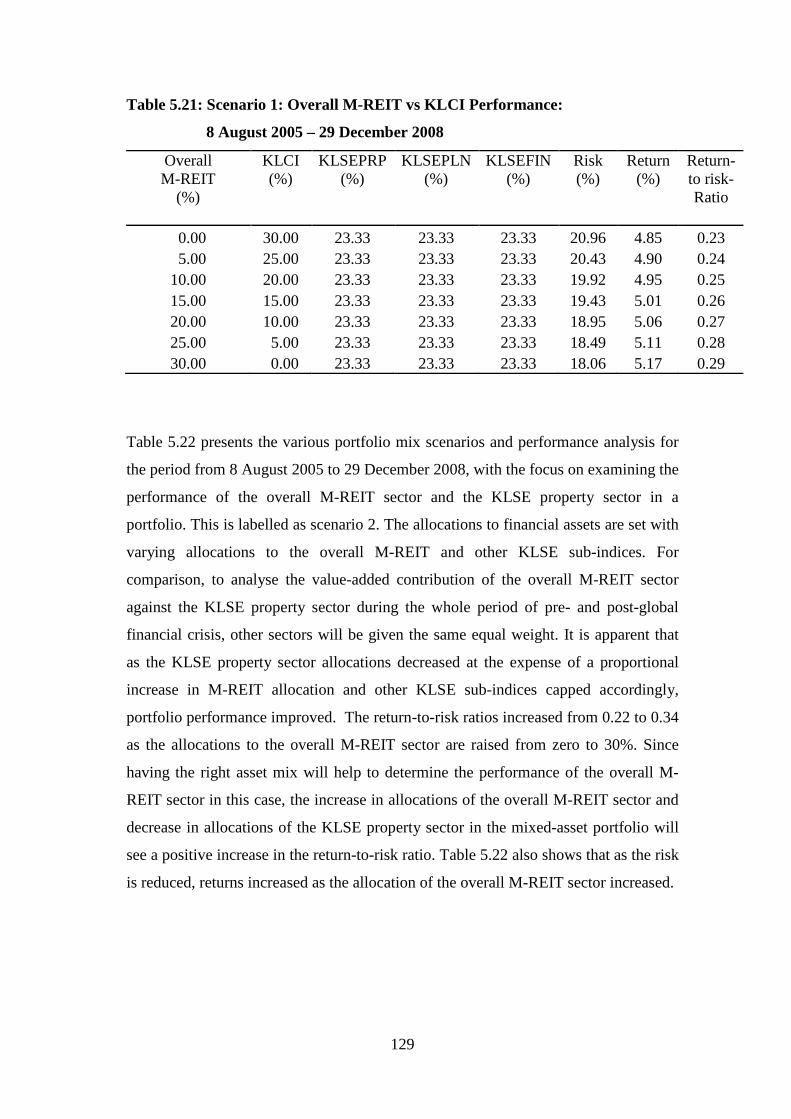
129
Table 5.21: Scenario 1: Overall M-REIT vs KLCI Performance:
8 August 2005 – 29 December 2008
OverallM-REIT
(%)
KLCI(%)
KLSEPRP(%)
KLSEPLN(%)
KLSEFIN(%)
Risk(%)
Return(%)
Return-to risk-Ratio
0.00 30.00 23.33 23.33 23.33 20.96 4.85 0.23
5.00 25.00 23.33 23.33 23.33 20.43 4.90 0.24
10.00 20.00 23.33 23.33 23.33 19.92 4.95 0.25
15.00 15.00 23.33 23.33 23.33 19.43 5.01 0.26
20.00 10.00 23.33 23.33 23.33 18.95 5.06 0.27
25.00 5.00 23.33 23.33 23.33 18.49 5.11 0.28
30.00 0.00 23.33 23.33 23.33 18.06 5.17 0.29
Table 5.22 presents the various portfolio mix scenarios and performance analysis for
the period from 8 August 2005 to 29 December 2008, with the focus on examining the
performance of the overall M-REIT sector and the KLSE property sector in a
portfolio. This is labelled as scenario 2. The allocations to financial assets are set with
varying allocations to the overall M-REIT and other KLSE sub-indices. For
comparison, to analyse the value-added contribution of the overall M-REIT sector
against the KLSE property sector during the whole period of pre- and post-global
financial crisis, other sectors will be given the same equal weight. It is apparent that
as the KLSE property sector allocations decreased at the expense of a proportional
increase in M-REIT allocation and other KLSE sub-indices capped accordingly,
portfolio performance improved. The return-to-risk ratios increased from 0.22 to 0.34
as the allocations to the overall M-REIT sector are raised from zero to 30%. Since
having the right asset mix will help to determine the performance of the overall M-
REIT sector in this case, the increase in allocations of the overall M-REIT sector and
decrease in allocations of the KLSE property sector in the mixed-asset portfolio will
see a positive increase in the return-to-risk ratio. Table 5.22 also shows that as the risk
is reduced, returns increased as the allocation of the overall M-REIT sector increased.
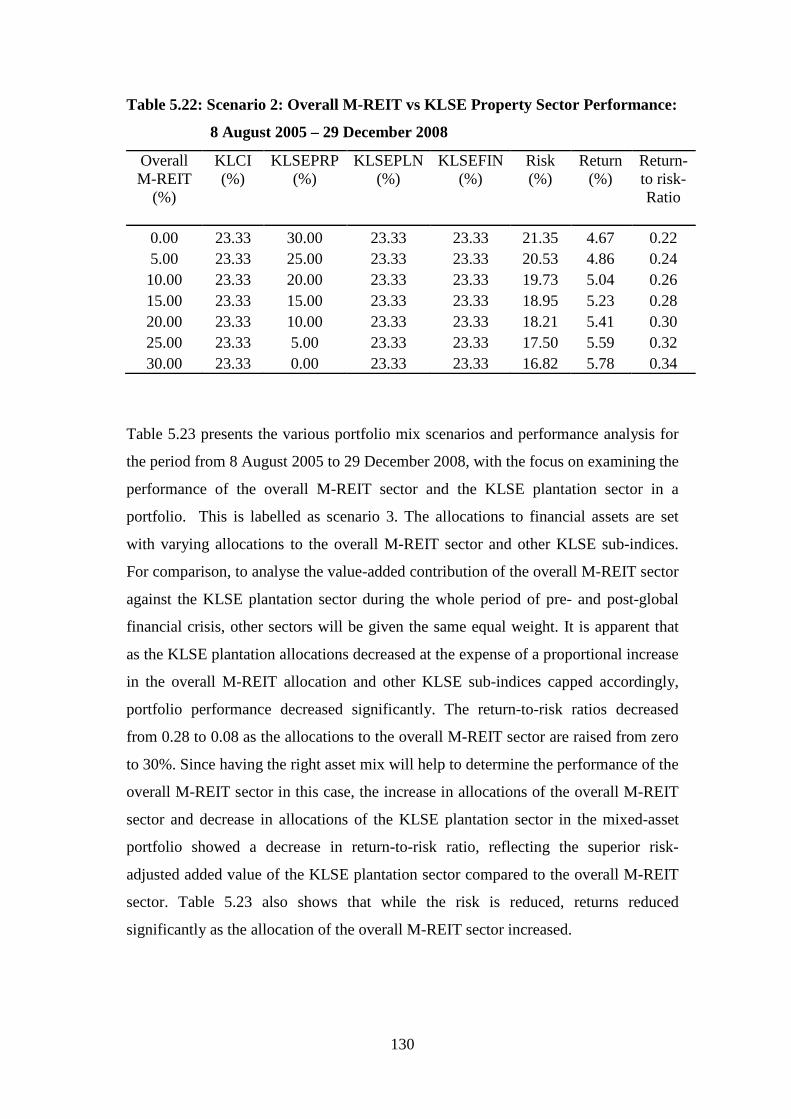
130
Table 5.22: Scenario 2: Overall M-REIT vs KLSE Property Sector Performance:
8 August 2005 – 29 December 2008
OverallM-REIT
(%)
KLCI(%)
KLSEPRP(%)
KLSEPLN(%)
KLSEFIN(%)
Risk(%)
Return(%)
Return-to risk-Ratio
0.00 23.33 30.00 23.33 23.33 21.35 4.67 0.22
5.00 23.33 25.00 23.33 23.33 20.53 4.86 0.24
10.00 23.33 20.00 23.33 23.33 19.73 5.04 0.26
15.00 23.33 15.00 23.33 23.33 18.95 5.23 0.28
20.00 23.33 10.00 23.33 23.33 18.21 5.41 0.30
25.00 23.33 5.00 23.33 23.33 17.50 5.59 0.32
30.00 23.33 0.00 23.33 23.33 16.82 5.78 0.34
Table 5.23 presents the various portfolio mix scenarios and performance analysis for
the period from 8 August 2005 to 29 December 2008, with the focus on examining the
performance of the overall M-REIT sector and the KLSE plantation sector in a
portfolio. This is labelled as scenario 3. The allocations to financial assets are set
with varying allocations to the overall M-REIT sector and other KLSE sub-indices.
For comparison, to analyse the value-added contribution of the overall M-REIT sector
against the KLSE plantation sector during the whole period of pre- and post-global
financial crisis, other sectors will be given the same equal weight. It is apparent that
as the KLSE plantation allocations decreased at the expense of a proportional increase
in the overall M-REIT allocation and other KLSE sub-indices capped accordingly,
portfolio performance decreased significantly. The return-to-risk ratios decreased
from 0.28 to 0.08 as the allocations to the overall M-REIT sector are raised from zero
to 30%. Since having the right asset mix will help to determine the performance of the
overall M-REIT sector in this case, the increase in allocations of the overall M-REIT
sector and decrease in allocations of the KLSE plantation sector in the mixed-asset
portfolio showed a decrease in return-to-risk ratio, reflecting the superior risk-
adjusted added value of the KLSE plantation sector compared to the overall M-REIT
sector. Table 5.23 also shows that while the risk is reduced, returns reduced
significantly as the allocation of the overall M-REIT sector increased.
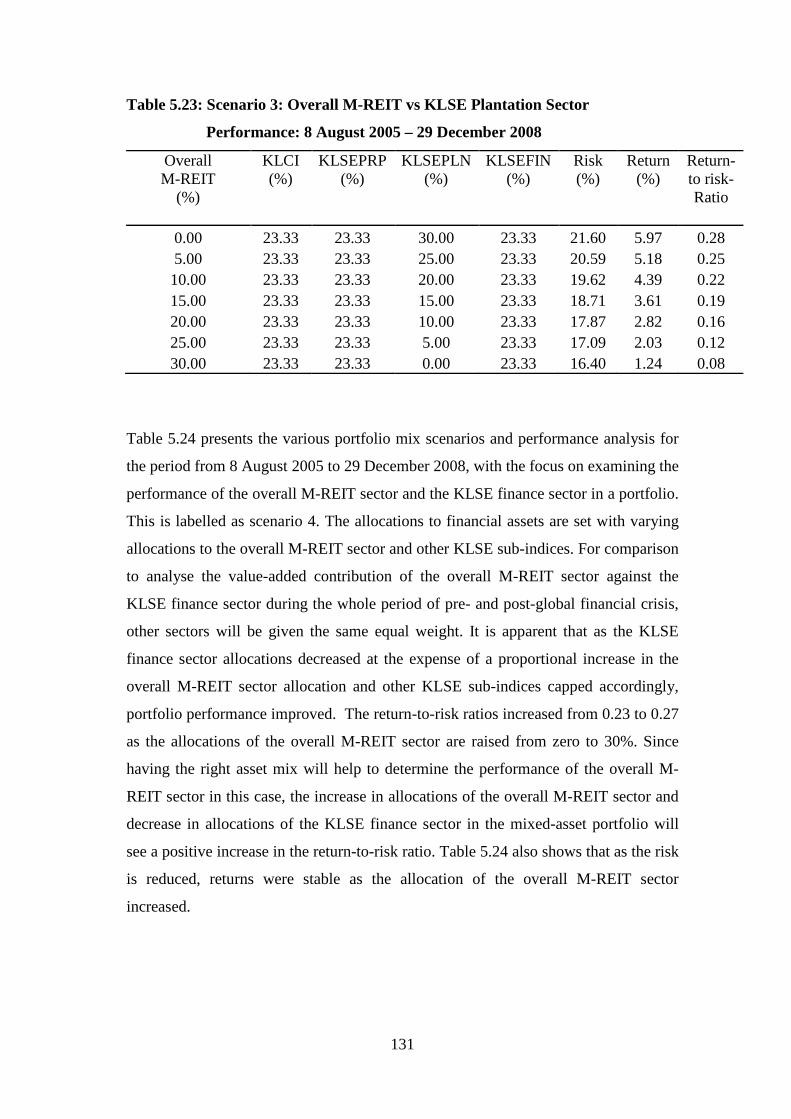
131
Table 5.23: Scenario 3: Overall M-REIT vs KLSE Plantation Sector
Performance: 8 August 2005 – 29 December 2008
OverallM-REIT
(%)
KLCI(%)
KLSEPRP(%)
KLSEPLN(%)
KLSEFIN(%)
Risk(%)
Return(%)
Return-to risk-Ratio
0.00 23.33 23.33 30.00 23.33 21.60 5.97 0.28
5.00 23.33 23.33 25.00 23.33 20.59 5.18 0.25
10.00 23.33 23.33 20.00 23.33 19.62 4.39 0.22
15.00 23.33 23.33 15.00 23.33 18.71 3.61 0.19
20.00 23.33 23.33 10.00 23.33 17.87 2.82 0.16
25.00 23.33 23.33 5.00 23.33 17.09 2.03 0.12
30.00 23.33 23.33 0.00 23.33 16.40 1.24 0.08
Table 5.24 presents the various portfolio mix scenarios and performance analysis for
the period from 8 August 2005 to 29 December 2008, with the focus on examining the
performance of the overall M-REIT sector and the KLSE finance sector in a portfolio.
This is labelled as scenario 4. The allocations to financial assets are set with varying
allocations to the overall M-REIT sector and other KLSE sub-indices. For comparison
to analyse the value-added contribution of the overall M-REIT sector against the
KLSE finance sector during the whole period of pre- and post-global financial crisis,
other sectors will be given the same equal weight. It is apparent that as the KLSE
finance sector allocations decreased at the expense of a proportional increase in the
overall M-REIT sector allocation and other KLSE sub-indices capped accordingly,
portfolio performance improved. The return-to-risk ratios increased from 0.23 to 0.27
as the allocations of the overall M-REIT sector are raised from zero to 30%. Since
having the right asset mix will help to determine the performance of the overall M-
REIT sector in this case, the increase in allocations of the overall M-REIT sector and
decrease in allocations of the KLSE finance sector in the mixed-asset portfolio will
see a positive increase in the return-to-risk ratio. Table 5.24 also shows that as the risk
is reduced, returns were stable as the allocation of the overall M-REIT sector
increased.
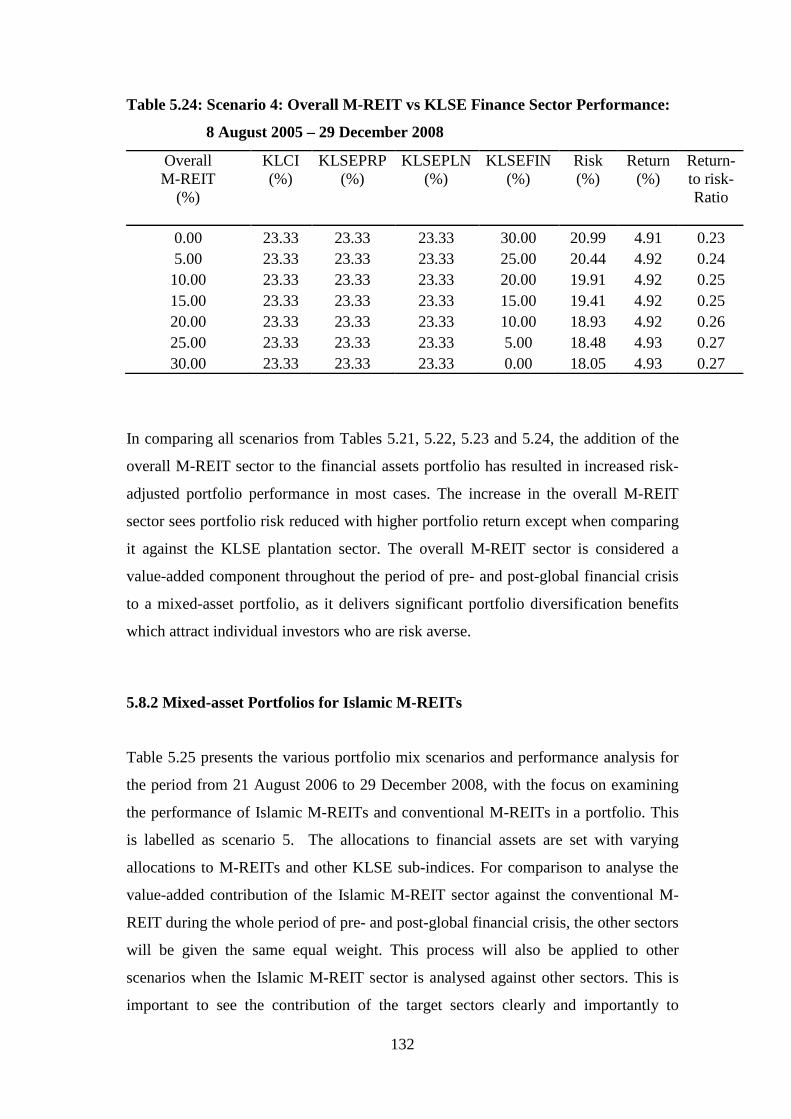
132
Table 5.24: Scenario 4: Overall M-REIT vs KLSE Finance Sector Performance:
8 August 2005 – 29 December 2008
OverallM-REIT
(%)
KLCI(%)
KLSEPRP(%)
KLSEPLN(%)
KLSEFIN(%)
Risk(%)
Return(%)
Return-to risk-Ratio
0.00 23.33 23.33 23.33 30.00 20.99 4.91 0.23
5.00 23.33 23.33 23.33 25.00 20.44 4.92 0.24
10.00 23.33 23.33 23.33 20.00 19.91 4.92 0.25
15.00 23.33 23.33 23.33 15.00 19.41 4.92 0.25
20.00 23.33 23.33 23.33 10.00 18.93 4.92 0.26
25.00 23.33 23.33 23.33 5.00 18.48 4.93 0.27
30.00 23.33 23.33 23.33 0.00 18.05 4.93 0.27
In comparing all scenarios from Tables 5.21, 5.22, 5.23 and 5.24, the addition of the
overall M-REIT sector to the financial assets portfolio has resulted in increased risk-
adjusted portfolio performance in most cases. The increase in the overall M-REIT
sector sees portfolio risk reduced with higher portfolio return except when comparing
it against the KLSE plantation sector. The overall M-REIT sector is considered a
value-added component throughout the period of pre- and post-global financial crisis
to a mixed-asset portfolio, as it delivers significant portfolio diversification benefits
which attract individual investors who are risk averse.
5.8.2 Mixed-asset Portfolios for Islamic M-REITs
Table 5.25 presents the various portfolio mix scenarios and performance analysis for
the period from 21 August 2006 to 29 December 2008, with the focus on examining
the performance of Islamic M-REITs and conventional M-REITs in a portfolio. This
is labelled as scenario 5. The allocations to financial assets are set with varying
allocations to M-REITs and other KLSE sub-indices. For comparison to analyse the
value-added contribution of the Islamic M-REIT sector against the conventional M-
REIT during the whole period of pre- and post-global financial crisis, the other sectors
will be given the same equal weight. This process will also be applied to other
scenarios when the Islamic M-REIT sector is analysed against other sectors. This is
important to see the contribution of the target sectors clearly and importantly to
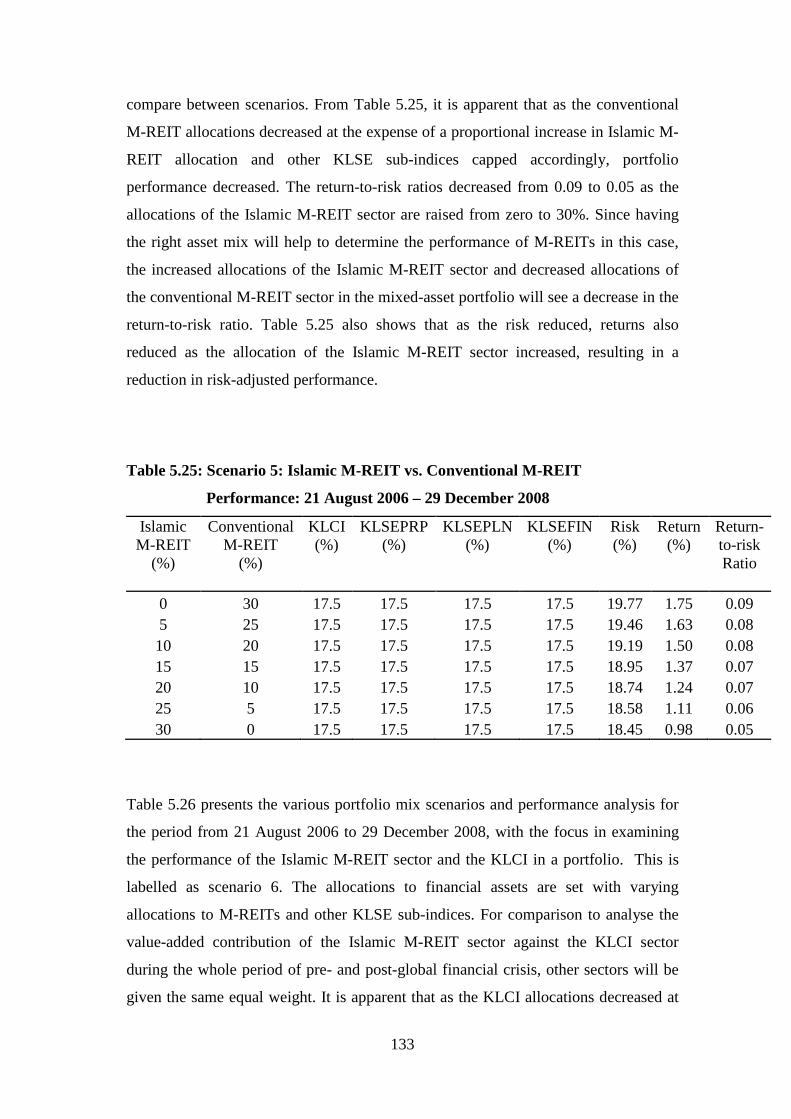
133
compare between scenarios. From Table 5.25, it is apparent that as the conventional
M-REIT allocations decreased at the expense of a proportional increase in Islamic M-
REIT allocation and other KLSE sub-indices capped accordingly, portfolio
performance decreased. The return-to-risk ratios decreased from 0.09 to 0.05 as the
allocations of the Islamic M-REIT sector are raised from zero to 30%. Since having
the right asset mix will help to determine the performance of M-REITs in this case,
the increased allocations of the Islamic M-REIT sector and decreased allocations of
the conventional M-REIT sector in the mixed-asset portfolio will see a decrease in the
return-to-risk ratio. Table 5.25 also shows that as the risk reduced, returns also
reduced as the allocation of the Islamic M-REIT sector increased, resulting in a
reduction in risk-adjusted performance.
Table 5.25: Scenario 5: Islamic M-REIT vs. Conventional M-REIT
Performance: 21 August 2006 – 29 December 2008
IslamicM-REIT
(%)
ConventionalM-REIT
(%)
KLCI(%)
KLSEPRP(%)
KLSEPLN(%)
KLSEFIN(%)
Risk(%)
Return(%)
Return-to-riskRatio
0 30 17.5 17.5 17.5 17.5 19.77 1.75 0.09
5 25 17.5 17.5 17.5 17.5 19.46 1.63 0.08
10 20 17.5 17.5 17.5 17.5 19.19 1.50 0.08
15 15 17.5 17.5 17.5 17.5 18.95 1.37 0.07
20 10 17.5 17.5 17.5 17.5 18.74 1.24 0.07
25 5 17.5 17.5 17.5 17.5 18.58 1.11 0.06
30 0 17.5 17.5 17.5 17.5 18.45 0.98 0.05
Table 5.26 presents the various portfolio mix scenarios and performance analysis for
the period from 21 August 2006 to 29 December 2008, with the focus in examining
the performance of the Islamic M-REIT sector and the KLCI in a portfolio. This is
labelled as scenario 6. The allocations to financial assets are set with varying
allocations to M-REITs and other KLSE sub-indices. For comparison to analyse the
value-added contribution of the Islamic M-REIT sector against the KLCI sector
during the whole period of pre- and post-global financial crisis, other sectors will be
given the same equal weight. It is apparent that as the KLCI allocations decreased at
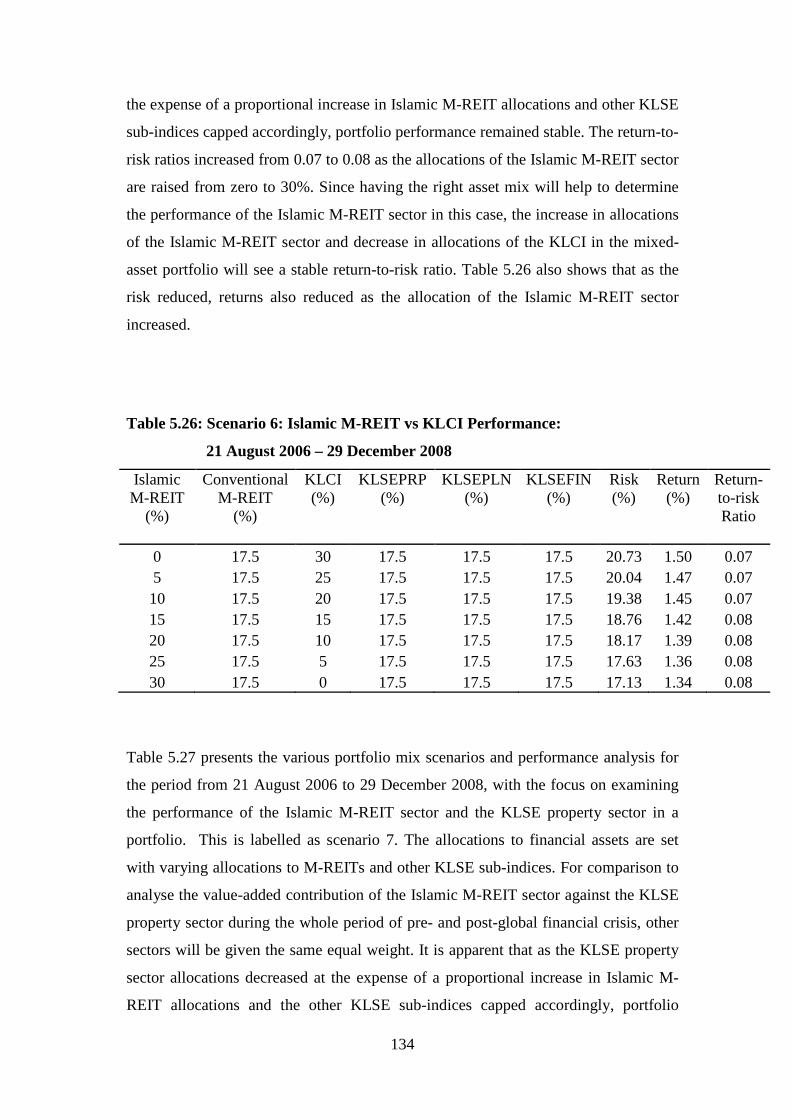
134
the expense of a proportional increase in Islamic M-REIT allocations and other KLSE
sub-indices capped accordingly, portfolio performance remained stable. The return-to-
risk ratios increased from 0.07 to 0.08 as the allocations of the Islamic M-REIT sector
are raised from zero to 30%. Since having the right asset mix will help to determine
the performance of the Islamic M-REIT sector in this case, the increase in allocations
of the Islamic M-REIT sector and decrease in allocations of the KLCI in the mixed-
asset portfolio will see a stable return-to-risk ratio. Table 5.26 also shows that as the
risk reduced, returns also reduced as the allocation of the Islamic M-REIT sector
increased.
Table 5.26: Scenario 6: Islamic M-REIT vs KLCI Performance:
21 August 2006 – 29 December 2008
IslamicM-REIT
(%)
ConventionalM-REIT
(%)
KLCI(%)
KLSEPRP(%)
KLSEPLN(%)
KLSEFIN(%)
Risk(%)
Return(%)
Return-to-riskRatio
0 17.5 30 17.5 17.5 17.5 20.73 1.50 0.07
5 17.5 25 17.5 17.5 17.5 20.04 1.47 0.07
10 17.5 20 17.5 17.5 17.5 19.38 1.45 0.07
15 17.5 15 17.5 17.5 17.5 18.76 1.42 0.08
20 17.5 10 17.5 17.5 17.5 18.17 1.39 0.08
25 17.5 5 17.5 17.5 17.5 17.63 1.36 0.08
30 17.5 0 17.5 17.5 17.5 17.13 1.34 0.08
Table 5.27 presents the various portfolio mix scenarios and performance analysis for
the period from 21 August 2006 to 29 December 2008, with the focus on examining
the performance of the Islamic M-REIT sector and the KLSE property sector in a
portfolio. This is labelled as scenario 7. The allocations to financial assets are set
with varying allocations to M-REITs and other KLSE sub-indices. For comparison to
analyse the value-added contribution of the Islamic M-REIT sector against the KLSE
property sector during the whole period of pre- and post-global financial crisis, other
sectors will be given the same equal weight. It is apparent that as the KLSE property
sector allocations decreased at the expense of a proportional increase in Islamic M-
REIT allocations and the other KLSE sub-indices capped accordingly, portfolio
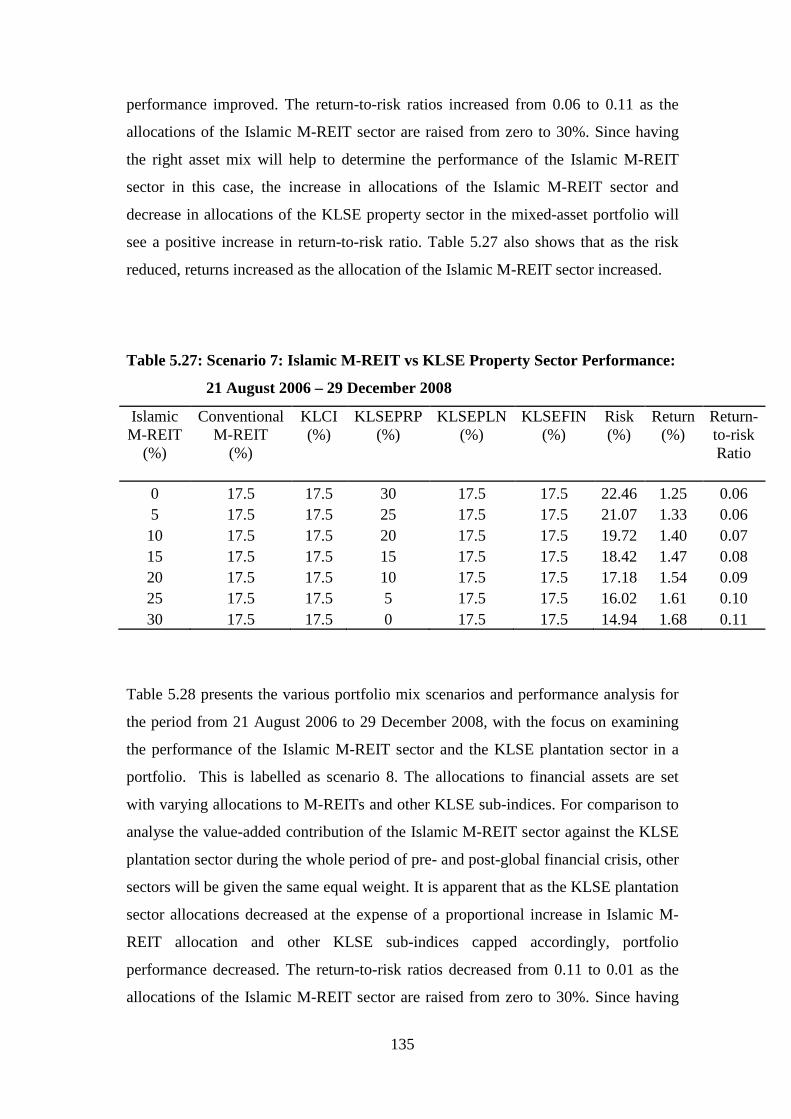
135
performance improved. The return-to-risk ratios increased from 0.06 to 0.11 as the
allocations of the Islamic M-REIT sector are raised from zero to 30%. Since having
the right asset mix will help to determine the performance of the Islamic M-REIT
sector in this case, the increase in allocations of the Islamic M-REIT sector and
decrease in allocations of the KLSE property sector in the mixed-asset portfolio will
see a positive increase in return-to-risk ratio. Table 5.27 also shows that as the risk
reduced, returns increased as the allocation of the Islamic M-REIT sector increased.
Table 5.27: Scenario 7: Islamic M-REIT vs KLSE Property Sector Performance:
21 August 2006 – 29 December 2008
IslamicM-REIT
(%)
ConventionalM-REIT
(%)
KLCI(%)
KLSEPRP(%)
KLSEPLN(%)
KLSEFIN(%)
Risk(%)
Return(%)
Return-to-riskRatio
0 17.5 17.5 30 17.5 17.5 22.46 1.25 0.06
5 17.5 17.5 25 17.5 17.5 21.07 1.33 0.06
10 17.5 17.5 20 17.5 17.5 19.72 1.40 0.07
15 17.5 17.5 15 17.5 17.5 18.42 1.47 0.08
20 17.5 17.5 10 17.5 17.5 17.18 1.54 0.09
25 17.5 17.5 5 17.5 17.5 16.02 1.61 0.10
30 17.5 17.5 0 17.5 17.5 14.94 1.68 0.11
Table 5.28 presents the various portfolio mix scenarios and performance analysis for
the period from 21 August 2006 to 29 December 2008, with the focus on examining
the performance of the Islamic M-REIT sector and the KLSE plantation sector in a
portfolio. This is labelled as scenario 8. The allocations to financial assets are set
with varying allocations to M-REITs and other KLSE sub-indices. For comparison to
analyse the value-added contribution of the Islamic M-REIT sector against the KLSE
plantation sector during the whole period of pre- and post-global financial crisis, other
sectors will be given the same equal weight. It is apparent that as the KLSE plantation
sector allocations decreased at the expense of a proportional increase in Islamic M-
REIT allocation and other KLSE sub-indices capped accordingly, portfolio
performance decreased. The return-to-risk ratios decreased from 0.11 to 0.01 as the
allocations of the Islamic M-REIT sector are raised from zero to 30%. Since having
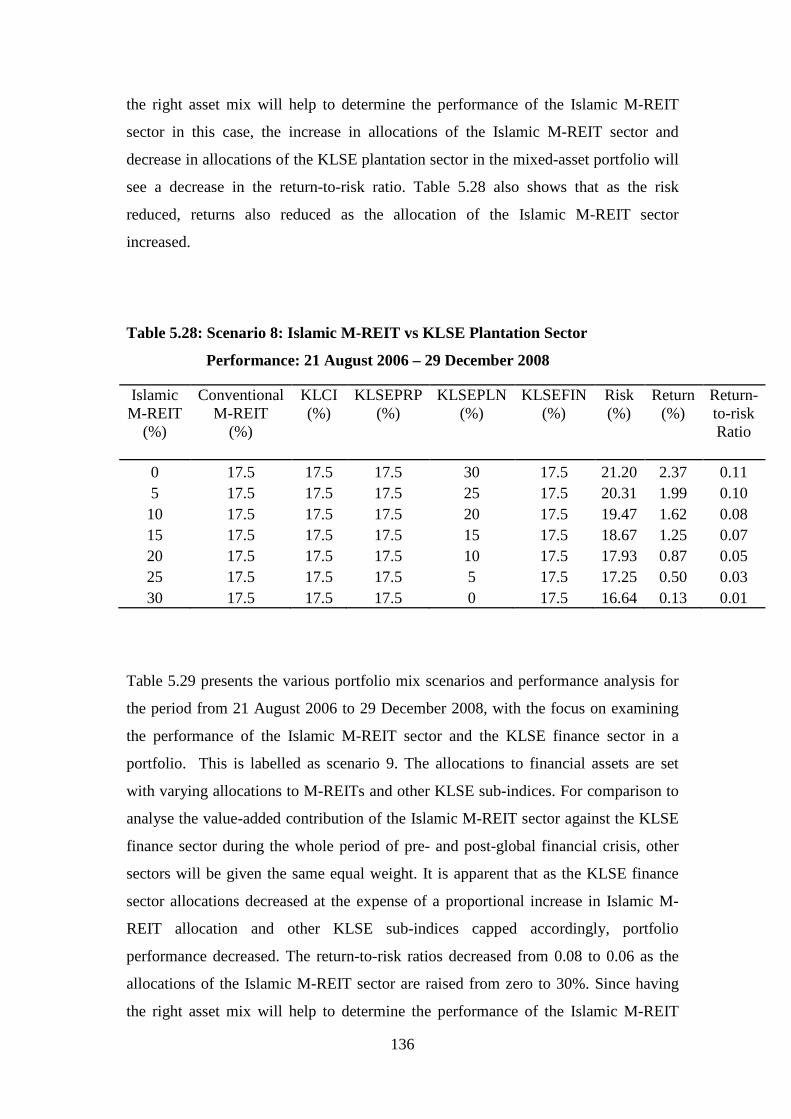
136
the right asset mix will help to determine the performance of the Islamic M-REIT
sector in this case, the increase in allocations of the Islamic M-REIT sector and
decrease in allocations of the KLSE plantation sector in the mixed-asset portfolio will
see a decrease in the return-to-risk ratio. Table 5.28 also shows that as the risk
reduced, returns also reduced as the allocation of the Islamic M-REIT sector
increased.
Table 5.28: Scenario 8: Islamic M-REIT vs KLSE Plantation Sector
Performance: 21 August 2006 – 29 December 2008
Table 5.29 presents the various portfolio mix scenarios and performance analysis for
the period from 21 August 2006 to 29 December 2008, with the focus on examining
the performance of the Islamic M-REIT sector and the KLSE finance sector in a
portfolio. This is labelled as scenario 9. The allocations to financial assets are set
with varying allocations to M-REITs and other KLSE sub-indices. For comparison to
analyse the value-added contribution of the Islamic M-REIT sector against the KLSE
finance sector during the whole period of pre- and post-global financial crisis, other
sectors will be given the same equal weight. It is apparent that as the KLSE finance
sector allocations decreased at the expense of a proportional increase in Islamic M-
REIT allocation and other KLSE sub-indices capped accordingly, portfolio
performance decreased. The return-to-risk ratios decreased from 0.08 to 0.06 as the
allocations of the Islamic M-REIT sector are raised from zero to 30%. Since having
the right asset mix will help to determine the performance of the Islamic M-REIT
IslamicM-REIT
(%)
ConventionalM-REIT
(%)
KLCI(%)
KLSEPRP(%)
KLSEPLN(%)
KLSEFIN(%)
Risk(%)
Return(%)
Return-to-riskRatio
0 17.5 17.5 17.5 30 17.5 21.20 2.37 0.11
5 17.5 17.5 17.5 25 17.5 20.31 1.99 0.10
10 17.5 17.5 17.5 20 17.5 19.47 1.62 0.08
15 17.5 17.5 17.5 15 17.5 18.67 1.25 0.07
20 17.5 17.5 17.5 10 17.5 17.93 0.87 0.05
25 17.5 17.5 17.5 5 17.5 17.25 0.50 0.03
30 17.5 17.5 17.5 0 17.5 16.64 0.13 0.01
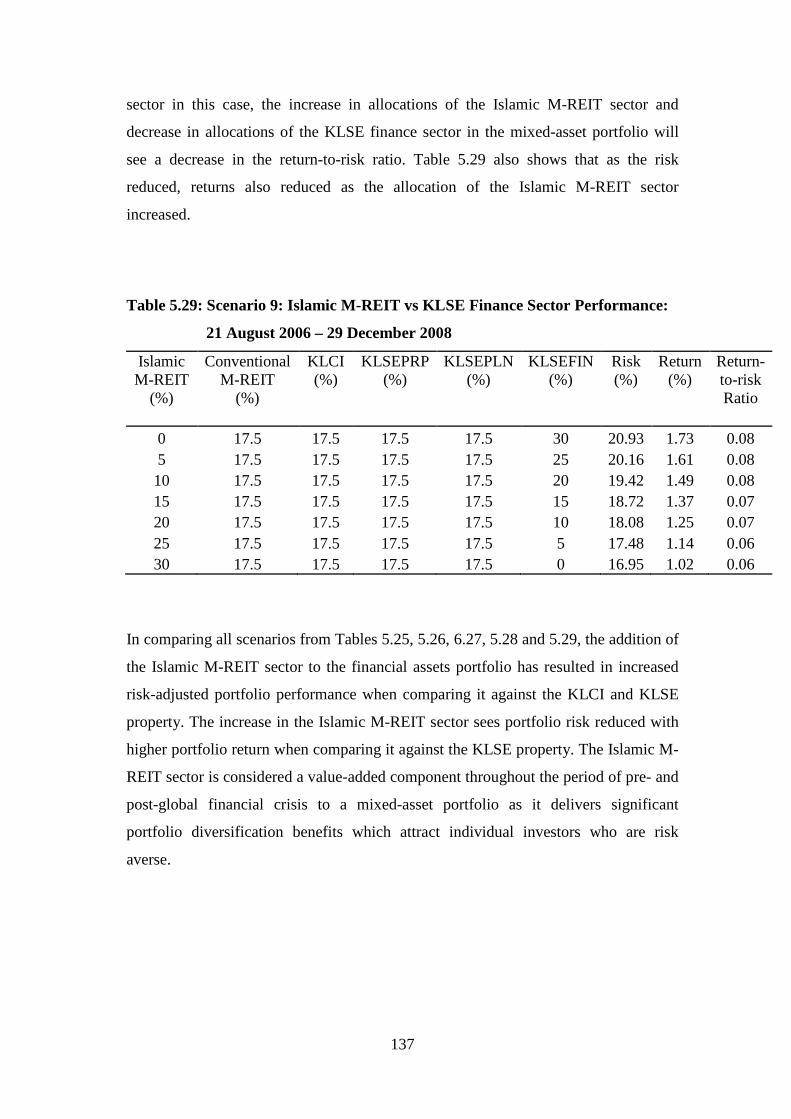
137
sector in this case, the increase in allocations of the Islamic M-REIT sector and
decrease in allocations of the KLSE finance sector in the mixed-asset portfolio will
see a decrease in the return-to-risk ratio. Table 5.29 also shows that as the risk
reduced, returns also reduced as the allocation of the Islamic M-REIT sector
increased.
Table 5.29: Scenario 9: Islamic M-REIT vs KLSE Finance Sector Performance:
21 August 2006 – 29 December 2008
IslamicM-REIT
(%)
ConventionalM-REIT
(%)
KLCI(%)
KLSEPRP(%)
KLSEPLN(%)
KLSEFIN(%)
Risk(%)
Return(%)
Return-to-riskRatio
0 17.5 17.5 17.5 17.5 30 20.93 1.73 0.08
5 17.5 17.5 17.5 17.5 25 20.16 1.61 0.08
10 17.5 17.5 17.5 17.5 20 19.42 1.49 0.08
15 17.5 17.5 17.5 17.5 15 18.72 1.37 0.07
20 17.5 17.5 17.5 17.5 10 18.08 1.25 0.07
25 17.5 17.5 17.5 17.5 5 17.48 1.14 0.06
30 17.5 17.5 17.5 17.5 0 16.95 1.02 0.06
In comparing all scenarios from Tables 5.25, 5.26, 6.27, 5.28 and 5.29, the addition of
the Islamic M-REIT sector to the financial assets portfolio has resulted in increased
risk-adjusted portfolio performance when comparing it against the KLCI and KLSE
property. The increase in the Islamic M-REIT sector sees portfolio risk reduced with
higher portfolio return when comparing it against the KLSE property. The Islamic M-
REIT sector is considered a value-added component throughout the period of pre- and
post-global financial crisis to a mixed-asset portfolio as it delivers significant
portfolio diversification benefits which attract individual investors who are risk
averse.
138
5.8.3 Importance of Global Financial Crisis on Overall M-REITs and Islamic
M-REITs
This section examines the impact of the global financial crisis on the role of M-REITs
and Islamic M-REITs in a portfolio.
5.8.3.1 Overall M-REITs
Table 5.30 presents the various portfolio mixes and performance analysis for the
period from 8 August 2005 to 27 August 2007, with the focus on examining the
performance of overall M-REITs and the KLCI in a portfolio. The allocations to
financial assets are set with varying allocations to the overall M-REIT sector and
other KLSE sub-indices. For comparison, to analyse the value-added contribution of
the overall M-REIT sector against the KLCI during the period of the pre-global
financial crisis, other sectors will be given the same equal weight. This is labelled as
scenario 10. This process will also be applied to other scenarios when the overall M-
REIT sector is analysed against other sectors. This is important to see the contribution
of the target sectors clearly, and importantly to compare between scenarios. From
Table 5.30, it is apparent that as the KLCI allocations decreased at the expense of a
proportional increase in the overall M-REIT allocation and other KLSE sub-indices
capped accordingly, portfolio performance improved. The return-to-risk ratios
increased from 1.68 to 1.76 as the allocations to the overall M-REIT sector are raised
from zero to 30%. Since having the right asset mix will help to determine the
performance of the overall M-REIT sector in this case, the increase in allocations of
the overall M-REIT sector and decrease in allocations of the KLCI in the mixed-asset
portfolio will see a positive increase in the return-to-risk ratio. Table 5.30 also shows
that as the risk is reduced, returns decreased as the allocation of the overall M-REIT
sector increased.
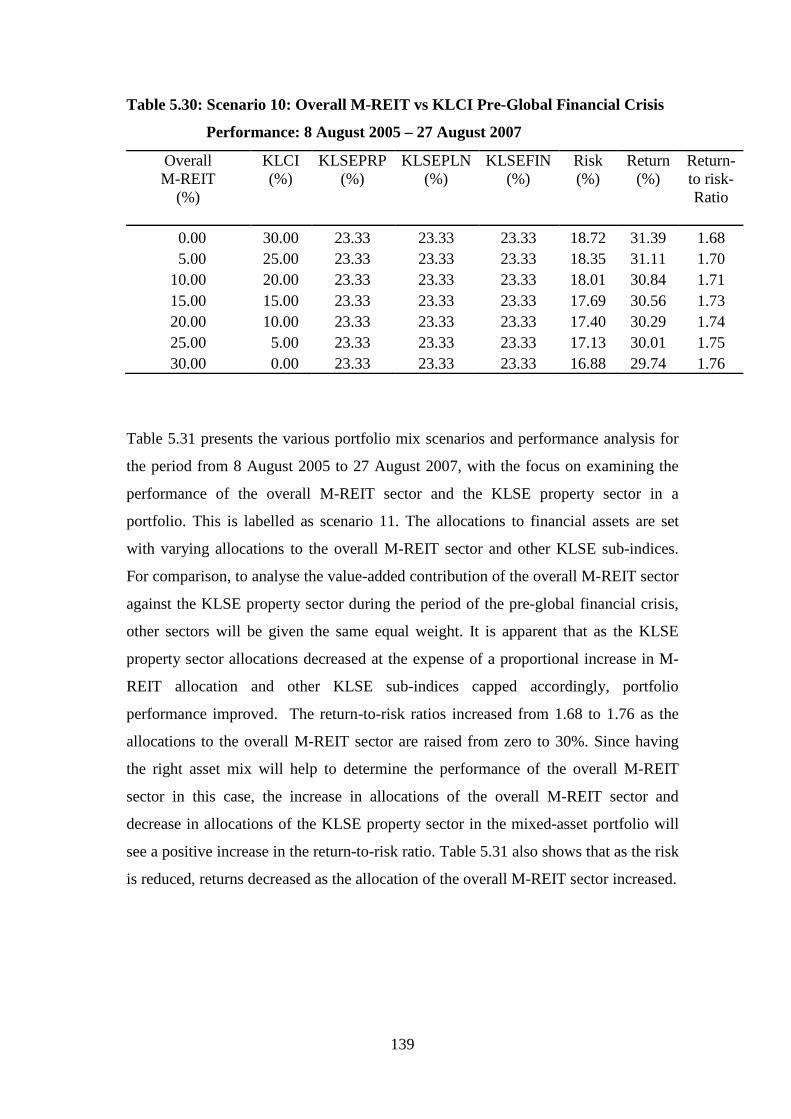
139
Table 5.30: Scenario 10: Overall M-REIT vs KLCI Pre-Global Financial Crisis
Performance: 8 August 2005 – 27 August 2007
OverallM-REIT
(%)
KLCI(%)
KLSEPRP(%)
KLSEPLN(%)
KLSEFIN(%)
Risk(%)
Return(%)
Return-to risk-Ratio
0.00 30.00 23.33 23.33 23.33 18.72 31.39 1.68
5.00 25.00 23.33 23.33 23.33 18.35 31.11 1.70
10.00 20.00 23.33 23.33 23.33 18.01 30.84 1.71
15.00 15.00 23.33 23.33 23.33 17.69 30.56 1.73
20.00 10.00 23.33 23.33 23.33 17.40 30.29 1.74
25.00 5.00 23.33 23.33 23.33 17.13 30.01 1.75
30.00 0.00 23.33 23.33 23.33 16.88 29.74 1.76
Table 5.31 presents the various portfolio mix scenarios and performance analysis for
the period from 8 August 2005 to 27 August 2007, with the focus on examining the
performance of the overall M-REIT sector and the KLSE property sector in a
portfolio. This is labelled as scenario 11. The allocations to financial assets are set
with varying allocations to the overall M-REIT sector and other KLSE sub-indices.
For comparison, to analyse the value-added contribution of the overall M-REIT sector
against the KLSE property sector during the period of the pre-global financial crisis,
other sectors will be given the same equal weight. It is apparent that as the KLSE
property sector allocations decreased at the expense of a proportional increase in M-
REIT allocation and other KLSE sub-indices capped accordingly, portfolio
performance improved. The return-to-risk ratios increased from 1.68 to 1.76 as the
allocations to the overall M-REIT sector are raised from zero to 30%. Since having
the right asset mix will help to determine the performance of the overall M-REIT
sector in this case, the increase in allocations of the overall M-REIT sector and
decrease in allocations of the KLSE property sector in the mixed-asset portfolio will
see a positive increase in the return-to-risk ratio. Table 5.31 also shows that as the risk
is reduced, returns decreased as the allocation of the overall M-REIT sector increased.
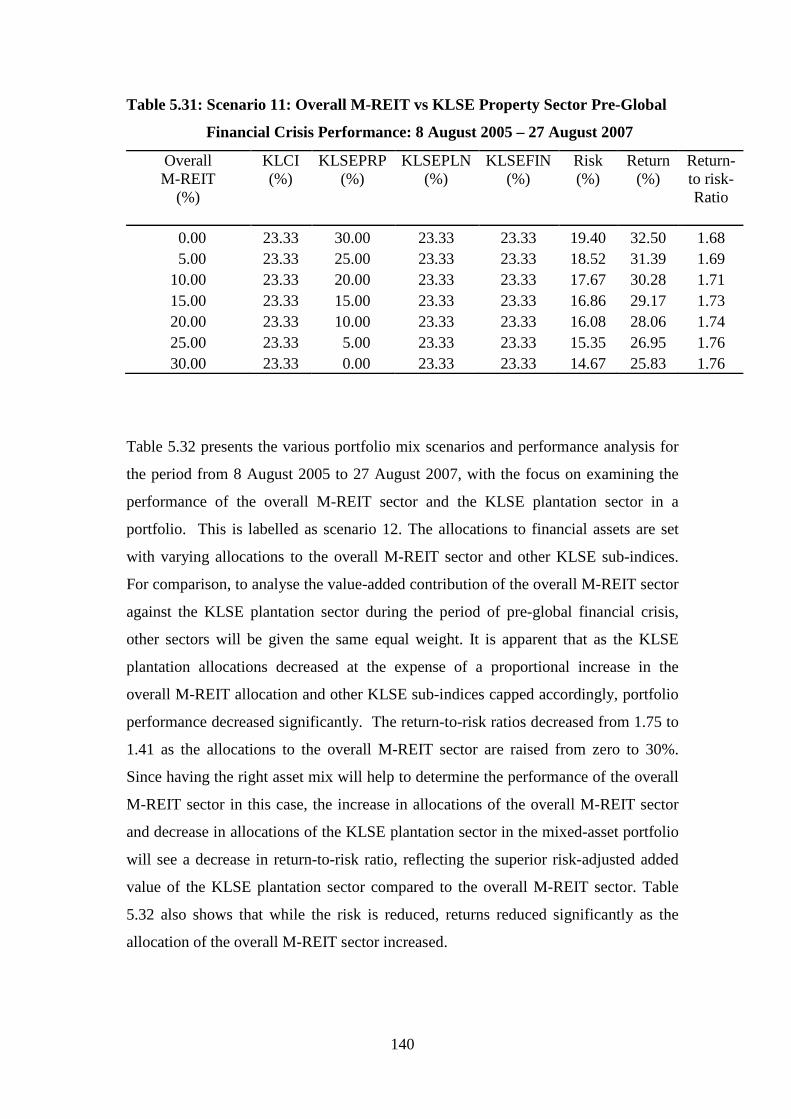
140
Table 5.31: Scenario 11: Overall M-REIT vs KLSE Property Sector Pre-Global
Financial Crisis Performance: 8 August 2005 – 27 August 2007
OverallM-REIT
(%)
KLCI(%)
KLSEPRP(%)
KLSEPLN(%)
KLSEFIN(%)
Risk(%)
Return(%)
Return-to risk-Ratio
0.00 23.33 30.00 23.33 23.33 19.40 32.50 1.68
5.00 23.33 25.00 23.33 23.33 18.52 31.39 1.69
10.00 23.33 20.00 23.33 23.33 17.67 30.28 1.71
15.00 23.33 15.00 23.33 23.33 16.86 29.17 1.73
20.00 23.33 10.00 23.33 23.33 16.08 28.06 1.74
25.00 23.33 5.00 23.33 23.33 15.35 26.95 1.76
30.00 23.33 0.00 23.33 23.33 14.67 25.83 1.76
Table 5.32 presents the various portfolio mix scenarios and performance analysis for
the period from 8 August 2005 to 27 August 2007, with the focus on examining the
performance of the overall M-REIT sector and the KLSE plantation sector in a
portfolio. This is labelled as scenario 12. The allocations to financial assets are set
with varying allocations to the overall M-REIT sector and other KLSE sub-indices.
For comparison, to analyse the value-added contribution of the overall M-REIT sector
against the KLSE plantation sector during the period of pre-global financial crisis,
other sectors will be given the same equal weight. It is apparent that as the KLSE
plantation allocations decreased at the expense of a proportional increase in the
overall M-REIT allocation and other KLSE sub-indices capped accordingly, portfolio
performance decreased significantly. The return-to-risk ratios decreased from 1.75 to
1.41 as the allocations to the overall M-REIT sector are raised from zero to 30%.
Since having the right asset mix will help to determine the performance of the overall
M-REIT sector in this case, the increase in allocations of the overall M-REIT sector
and decrease in allocations of the KLSE plantation sector in the mixed-asset portfolio
will see a decrease in return-to-risk ratio, reflecting the superior risk-adjusted added
value of the KLSE plantation sector compared to the overall M-REIT sector. Table
5.32 also shows that while the risk is reduced, returns reduced significantly as the
allocation of the overall M-REIT sector increased.
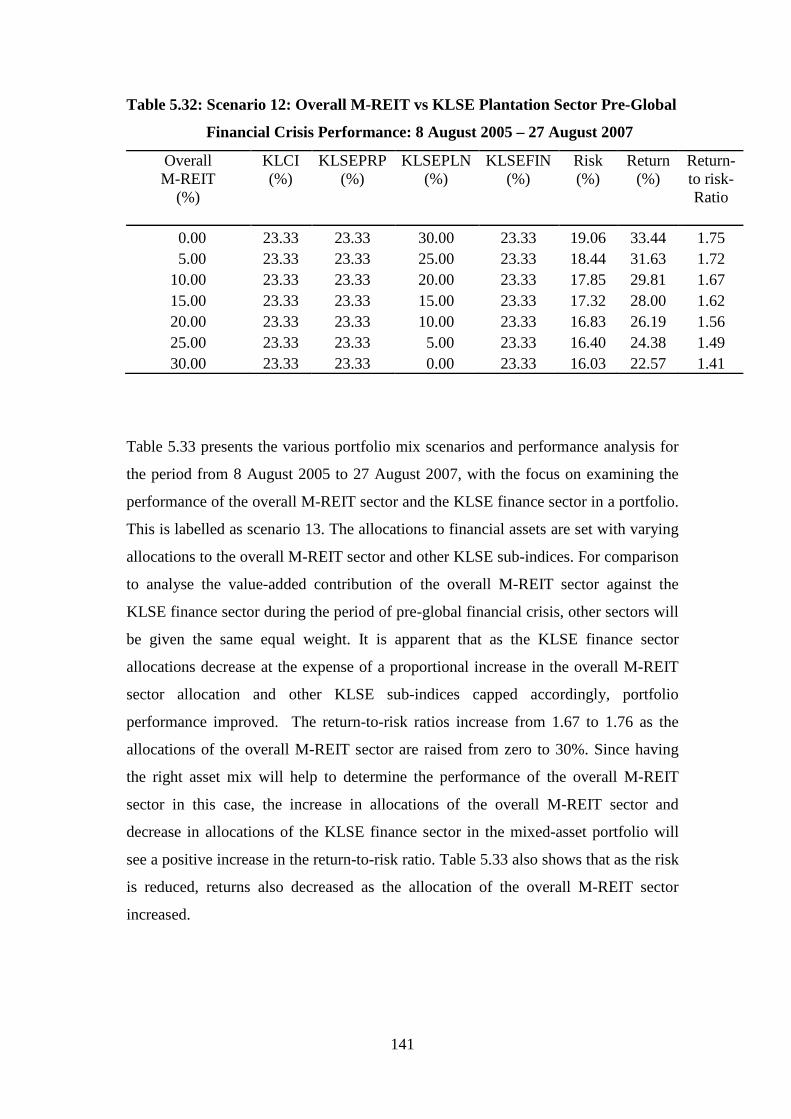
141
Table 5.32: Scenario 12: Overall M-REIT vs KLSE Plantation Sector Pre-Global
Financial Crisis Performance: 8 August 2005 – 27 August 2007
OverallM-REIT
(%)
KLCI(%)
KLSEPRP(%)
KLSEPLN(%)
KLSEFIN(%)
Risk(%)
Return(%)
Return-to risk-Ratio
0.00 23.33 23.33 30.00 23.33 19.06 33.44 1.75
5.00 23.33 23.33 25.00 23.33 18.44 31.63 1.72
10.00 23.33 23.33 20.00 23.33 17.85 29.81 1.67
15.00 23.33 23.33 15.00 23.33 17.32 28.00 1.62
20.00 23.33 23.33 10.00 23.33 16.83 26.19 1.56
25.00 23.33 23.33 5.00 23.33 16.40 24.38 1.49
30.00 23.33 23.33 0.00 23.33 16.03 22.57 1.41
Table 5.33 presents the various portfolio mix scenarios and performance analysis for
the period from 8 August 2005 to 27 August 2007, with the focus on examining the
performance of the overall M-REIT sector and the KLSE finance sector in a portfolio.
This is labelled as scenario 13. The allocations to financial assets are set with varying
allocations to the overall M-REIT sector and other KLSE sub-indices. For comparison
to analyse the value-added contribution of the overall M-REIT sector against the
KLSE finance sector during the period of pre-global financial crisis, other sectors will
be given the same equal weight. It is apparent that as the KLSE finance sector
allocations decrease at the expense of a proportional increase in the overall M-REIT
sector allocation and other KLSE sub-indices capped accordingly, portfolio
performance improved. The return-to-risk ratios increase from 1.67 to 1.76 as the
allocations of the overall M-REIT sector are raised from zero to 30%. Since having
the right asset mix will help to determine the performance of the overall M-REIT
sector in this case, the increase in allocations of the overall M-REIT sector and
decrease in allocations of the KLSE finance sector in the mixed-asset portfolio will
see a positive increase in the return-to-risk ratio. Table 5.33 also shows that as the risk
is reduced, returns also decreased as the allocation of the overall M-REIT sector
increased.
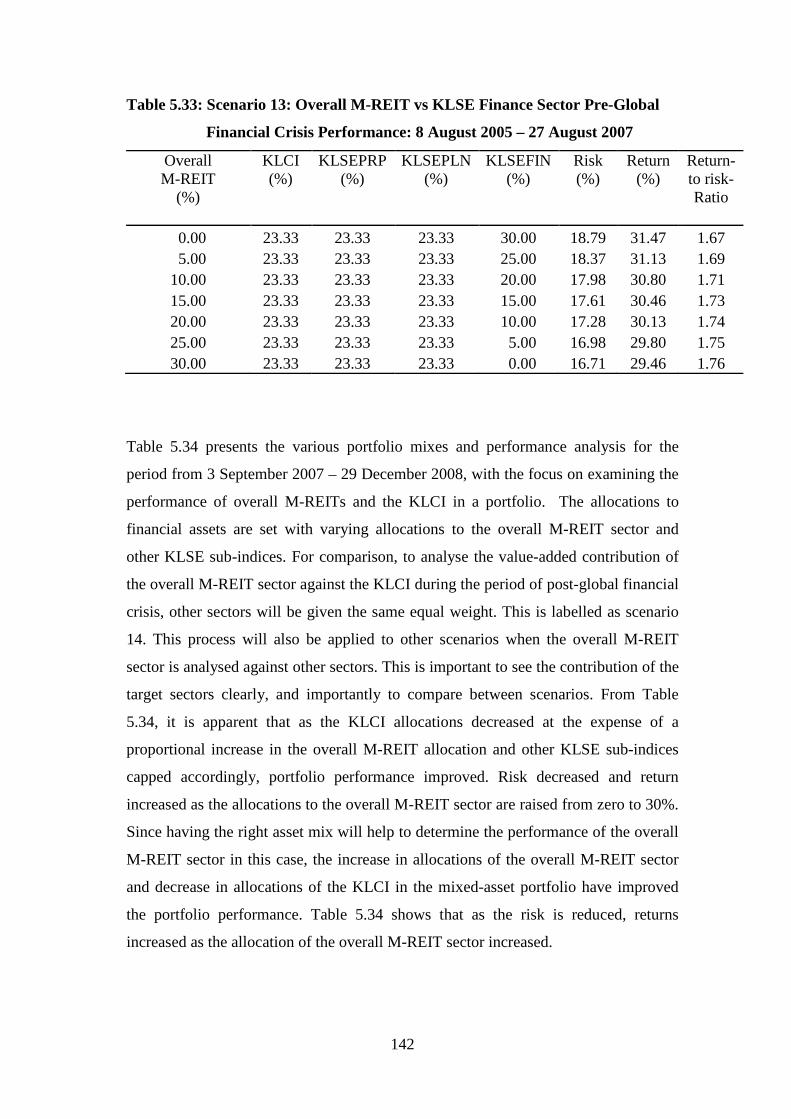
142
Table 5.33: Scenario 13: Overall M-REIT vs KLSE Finance Sector Pre-Global
Financial Crisis Performance: 8 August 2005 – 27 August 2007
OverallM-REIT
(%)
KLCI(%)
KLSEPRP(%)
KLSEPLN(%)
KLSEFIN(%)
Risk(%)
Return(%)
Return-to risk-Ratio
0.00 23.33 23.33 23.33 30.00 18.79 31.47 1.67
5.00 23.33 23.33 23.33 25.00 18.37 31.13 1.69
10.00 23.33 23.33 23.33 20.00 17.98 30.80 1.71
15.00 23.33 23.33 23.33 15.00 17.61 30.46 1.73
20.00 23.33 23.33 23.33 10.00 17.28 30.13 1.74
25.00 23.33 23.33 23.33 5.00 16.98 29.80 1.75
30.00 23.33 23.33 23.33 0.00 16.71 29.46 1.76
Table 5.34 presents the various portfolio mixes and performance analysis for the
period from 3 September 2007 – 29 December 2008, with the focus on examining the
performance of overall M-REITs and the KLCI in a portfolio. The allocations to
financial assets are set with varying allocations to the overall M-REIT sector and
other KLSE sub-indices. For comparison, to analyse the value-added contribution of
the overall M-REIT sector against the KLCI during the period of post-global financial
crisis, other sectors will be given the same equal weight. This is labelled as scenario
14. This process will also be applied to other scenarios when the overall M-REIT
sector is analysed against other sectors. This is important to see the contribution of the
target sectors clearly, and importantly to compare between scenarios. From Table
5.34, it is apparent that as the KLCI allocations decreased at the expense of a
proportional increase in the overall M-REIT allocation and other KLSE sub-indices
capped accordingly, portfolio performance improved. Risk decreased and return
increased as the allocations to the overall M-REIT sector are raised from zero to 30%.
Since having the right asset mix will help to determine the performance of the overall
M-REIT sector in this case, the increase in allocations of the overall M-REIT sector
and decrease in allocations of the KLCI in the mixed-asset portfolio have improved
the portfolio performance. Table 5.34 shows that as the risk is reduced, returns
increased as the allocation of the overall M-REIT sector increased.
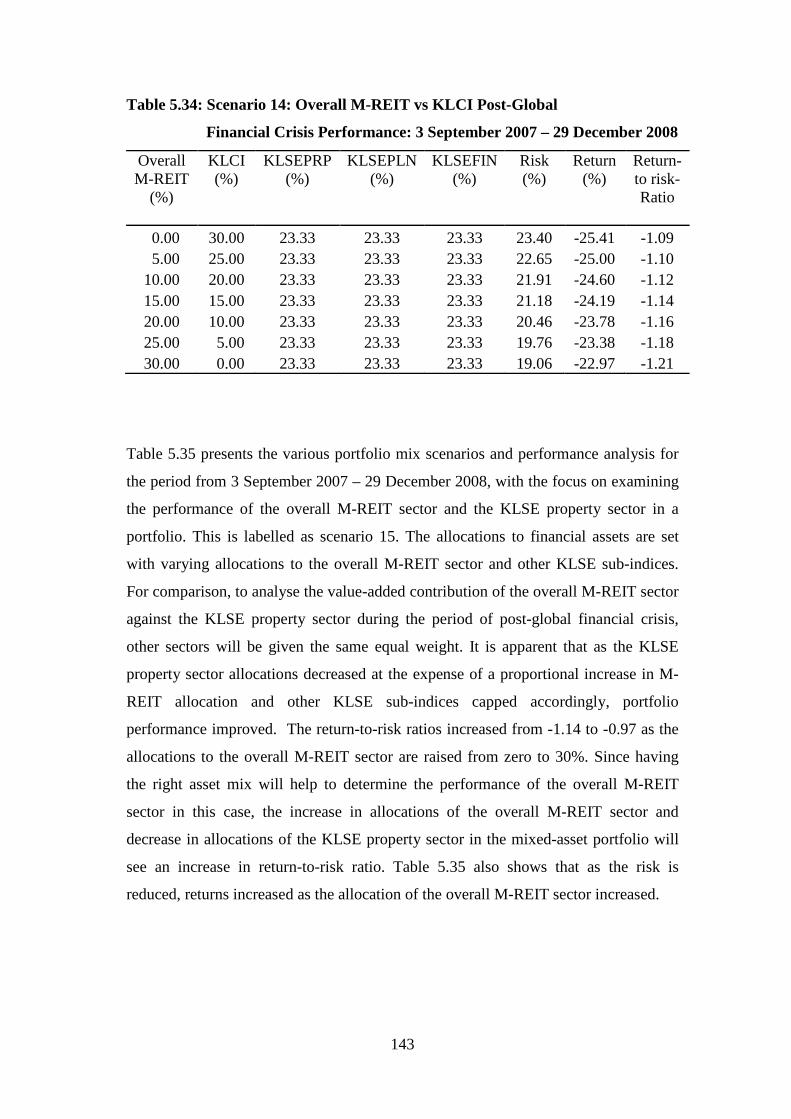
143
Table 5.34: Scenario 14: Overall M-REIT vs KLCI Post-Global
Financial Crisis Performance: 3 September 2007 – 29 December 2008
OverallM-REIT
(%)
KLCI(%)
KLSEPRP(%)
KLSEPLN(%)
KLSEFIN(%)
Risk(%)
Return(%)
Return-to risk-Ratio
0.00 30.00 23.33 23.33 23.33 23.40 -25.41 -1.09
5.00 25.00 23.33 23.33 23.33 22.65 -25.00 -1.10
10.00 20.00 23.33 23.33 23.33 21.91 -24.60 -1.12
15.00 15.00 23.33 23.33 23.33 21.18 -24.19 -1.14
20.00 10.00 23.33 23.33 23.33 20.46 -23.78 -1.16
25.00 5.00 23.33 23.33 23.33 19.76 -23.38 -1.18
30.00 0.00 23.33 23.33 23.33 19.06 -22.97 -1.21
Table 5.35 presents the various portfolio mix scenarios and performance analysis for
the period from 3 September 2007 – 29 December 2008, with the focus on examining
the performance of the overall M-REIT sector and the KLSE property sector in a
portfolio. This is labelled as scenario 15. The allocations to financial assets are set
with varying allocations to the overall M-REIT sector and other KLSE sub-indices.
For comparison, to analyse the value-added contribution of the overall M-REIT sector
against the KLSE property sector during the period of post-global financial crisis,
other sectors will be given the same equal weight. It is apparent that as the KLSE
property sector allocations decreased at the expense of a proportional increase in M-
REIT allocation and other KLSE sub-indices capped accordingly, portfolio
performance improved. The return-to-risk ratios increased from -1.14 to -0.97 as the
allocations to the overall M-REIT sector are raised from zero to 30%. Since having
the right asset mix will help to determine the performance of the overall M-REIT
sector in this case, the increase in allocations of the overall M-REIT sector and
decrease in allocations of the KLSE property sector in the mixed-asset portfolio will
see an increase in return-to-risk ratio. Table 5.35 also shows that as the risk is
reduced, returns increased as the allocation of the overall M-REIT sector increased.
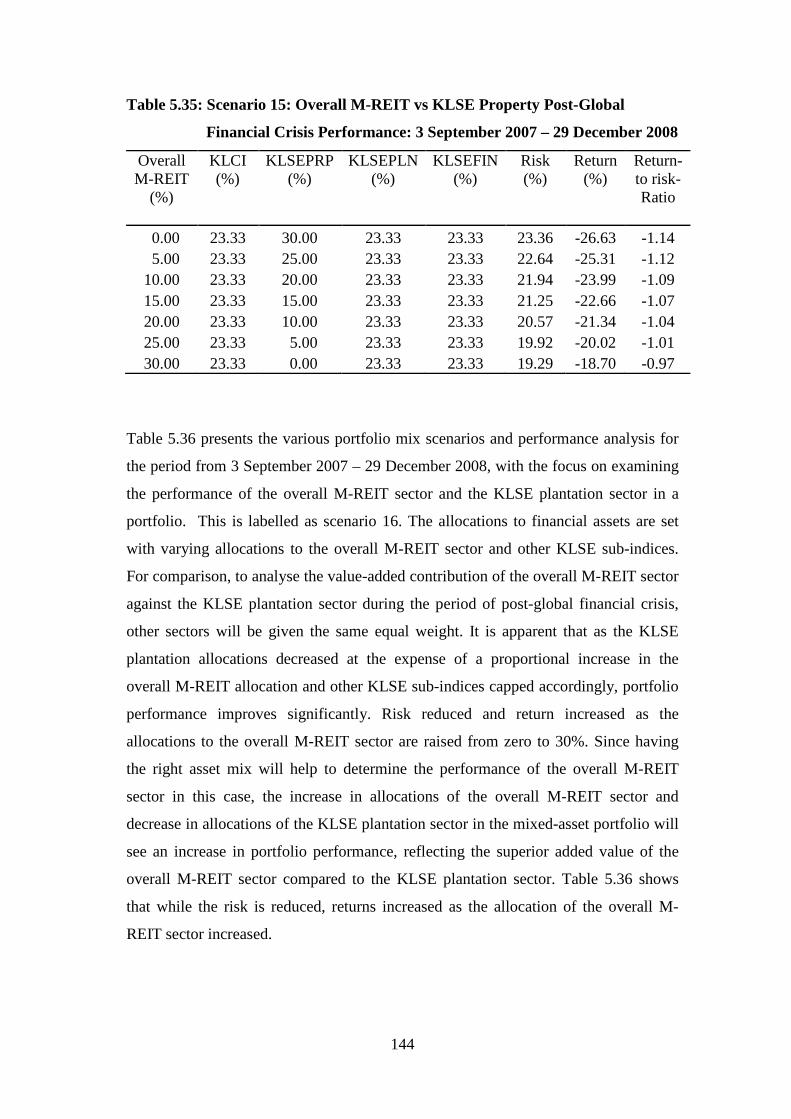
144
Table 5.35: Scenario 15: Overall M-REIT vs KLSE Property Post-Global
Financial Crisis Performance: 3 September 2007 – 29 December 2008
OverallM-REIT
(%)
KLCI(%)
KLSEPRP(%)
KLSEPLN(%)
KLSEFIN(%)
Risk(%)
Return(%)
Return-to risk-Ratio
0.00 23.33 30.00 23.33 23.33 23.36 -26.63 -1.14
5.00 23.33 25.00 23.33 23.33 22.64 -25.31 -1.12
10.00 23.33 20.00 23.33 23.33 21.94 -23.99 -1.09
15.00 23.33 15.00 23.33 23.33 21.25 -22.66 -1.07
20.00 23.33 10.00 23.33 23.33 20.57 -21.34 -1.04
25.00 23.33 5.00 23.33 23.33 19.92 -20.02 -1.01
30.00 23.33 0.00 23.33 23.33 19.29 -18.70 -0.97
Table 5.36 presents the various portfolio mix scenarios and performance analysis for
the period from 3 September 2007 – 29 December 2008, with the focus on examining
the performance of the overall M-REIT sector and the KLSE plantation sector in a
portfolio. This is labelled as scenario 16. The allocations to financial assets are set
with varying allocations to the overall M-REIT sector and other KLSE sub-indices.
For comparison, to analyse the value-added contribution of the overall M-REIT sector
against the KLSE plantation sector during the period of post-global financial crisis,
other sectors will be given the same equal weight. It is apparent that as the KLSE
plantation allocations decreased at the expense of a proportional increase in the
overall M-REIT allocation and other KLSE sub-indices capped accordingly, portfolio
performance improves significantly. Risk reduced and return increased as the
allocations to the overall M-REIT sector are raised from zero to 30%. Since having
the right asset mix will help to determine the performance of the overall M-REIT
sector in this case, the increase in allocations of the overall M-REIT sector and
decrease in allocations of the KLSE plantation sector in the mixed-asset portfolio will
see an increase in portfolio performance, reflecting the superior added value of the
overall M-REIT sector compared to the KLSE plantation sector. Table 5.36 shows
that while the risk is reduced, returns increased as the allocation of the overall M-
REIT sector increased.
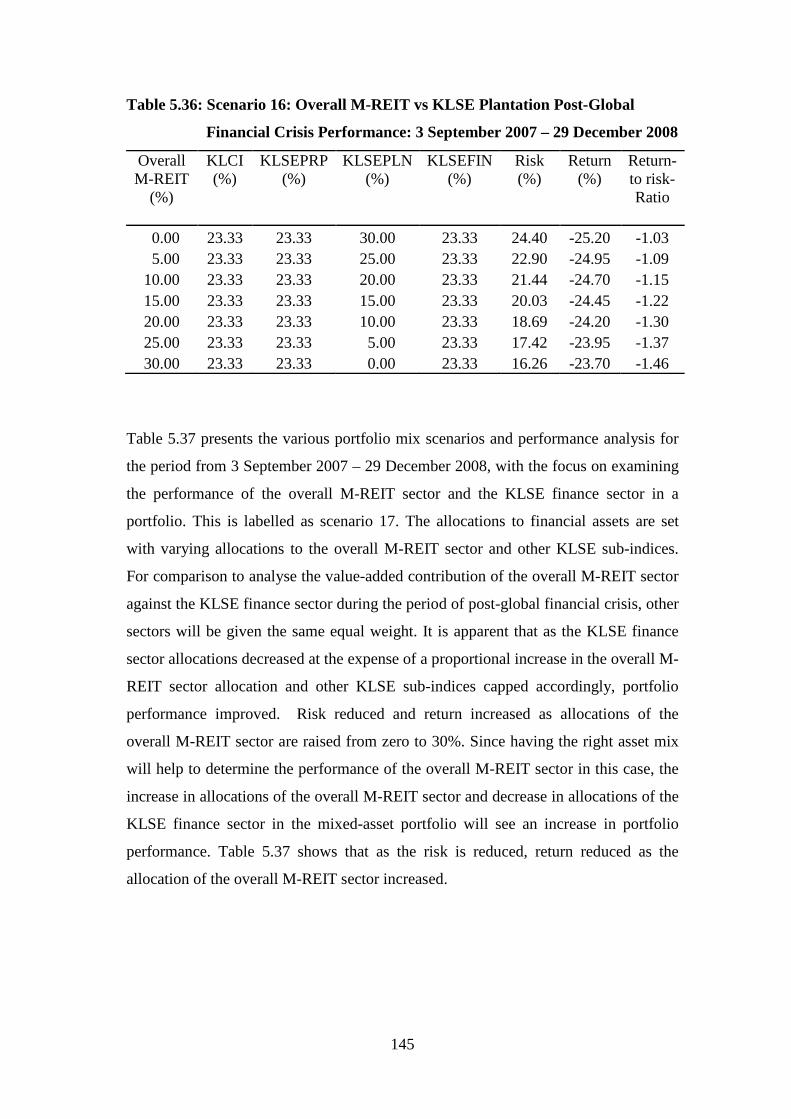
145
Table 5.36: Scenario 16: Overall M-REIT vs KLSE Plantation Post-Global
Financial Crisis Performance: 3 September 2007 – 29 December 2008
OverallM-REIT
(%)
KLCI(%)
KLSEPRP(%)
KLSEPLN(%)
KLSEFIN(%)
Risk(%)
Return(%)
Return-to risk-Ratio
0.00 23.33 23.33 30.00 23.33 24.40 -25.20 -1.03
5.00 23.33 23.33 25.00 23.33 22.90 -24.95 -1.09
10.00 23.33 23.33 20.00 23.33 21.44 -24.70 -1.15
15.00 23.33 23.33 15.00 23.33 20.03 -24.45 -1.22
20.00 23.33 23.33 10.00 23.33 18.69 -24.20 -1.30
25.00 23.33 23.33 5.00 23.33 17.42 -23.95 -1.37
30.00 23.33 23.33 0.00 23.33 16.26 -23.70 -1.46
Table 5.37 presents the various portfolio mix scenarios and performance analysis for
the period from 3 September 2007 – 29 December 2008, with the focus on examining
the performance of the overall M-REIT sector and the KLSE finance sector in a
portfolio. This is labelled as scenario 17. The allocations to financial assets are set
with varying allocations to the overall M-REIT sector and other KLSE sub-indices.
For comparison to analyse the value-added contribution of the overall M-REIT sector
against the KLSE finance sector during the period of post-global financial crisis, other
sectors will be given the same equal weight. It is apparent that as the KLSE finance
sector allocations decreased at the expense of a proportional increase in the overall M-
REIT sector allocation and other KLSE sub-indices capped accordingly, portfolio
performance improved. Risk reduced and return increased as allocations of the
overall M-REIT sector are raised from zero to 30%. Since having the right asset mix
will help to determine the performance of the overall M-REIT sector in this case, the
increase in allocations of the overall M-REIT sector and decrease in allocations of the
KLSE finance sector in the mixed-asset portfolio will see an increase in portfolio
performance. Table 5.37 shows that as the risk is reduced, return reduced as the
allocation of the overall M-REIT sector increased.
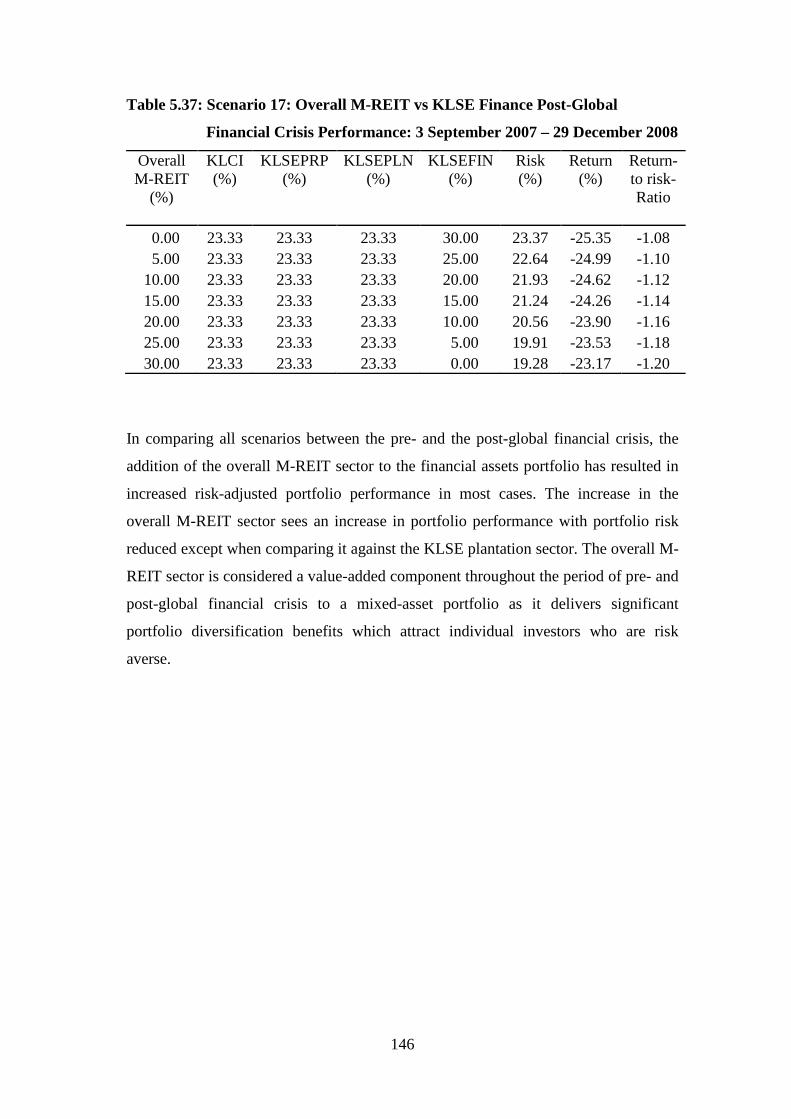
146
Table 5.37: Scenario 17: Overall M-REIT vs KLSE Finance Post-Global
Financial Crisis Performance: 3 September 2007 – 29 December 2008
OverallM-REIT
(%)
KLCI(%)
KLSEPRP(%)
KLSEPLN(%)
KLSEFIN(%)
Risk(%)
Return(%)
Return-to risk-Ratio
0.00 23.33 23.33 23.33 30.00 23.37 -25.35 -1.08
5.00 23.33 23.33 23.33 25.00 22.64 -24.99 -1.10
10.00 23.33 23.33 23.33 20.00 21.93 -24.62 -1.12
15.00 23.33 23.33 23.33 15.00 21.24 -24.26 -1.14
20.00 23.33 23.33 23.33 10.00 20.56 -23.90 -1.16
25.00 23.33 23.33 23.33 5.00 19.91 -23.53 -1.18
30.00 23.33 23.33 23.33 0.00 19.28 -23.17 -1.20
In comparing all scenarios between the pre- and the post-global financial crisis, the
addition of the overall M-REIT sector to the financial assets portfolio has resulted in
increased risk-adjusted portfolio performance in most cases. The increase in the
overall M-REIT sector sees an increase in portfolio performance with portfolio risk
reduced except when comparing it against the KLSE plantation sector. The overall M-
REIT sector is considered a value-added component throughout the period of pre- and
post-global financial crisis to a mixed-asset portfolio as it delivers significant
portfolio diversification benefits which attract individual investors who are risk
averse.
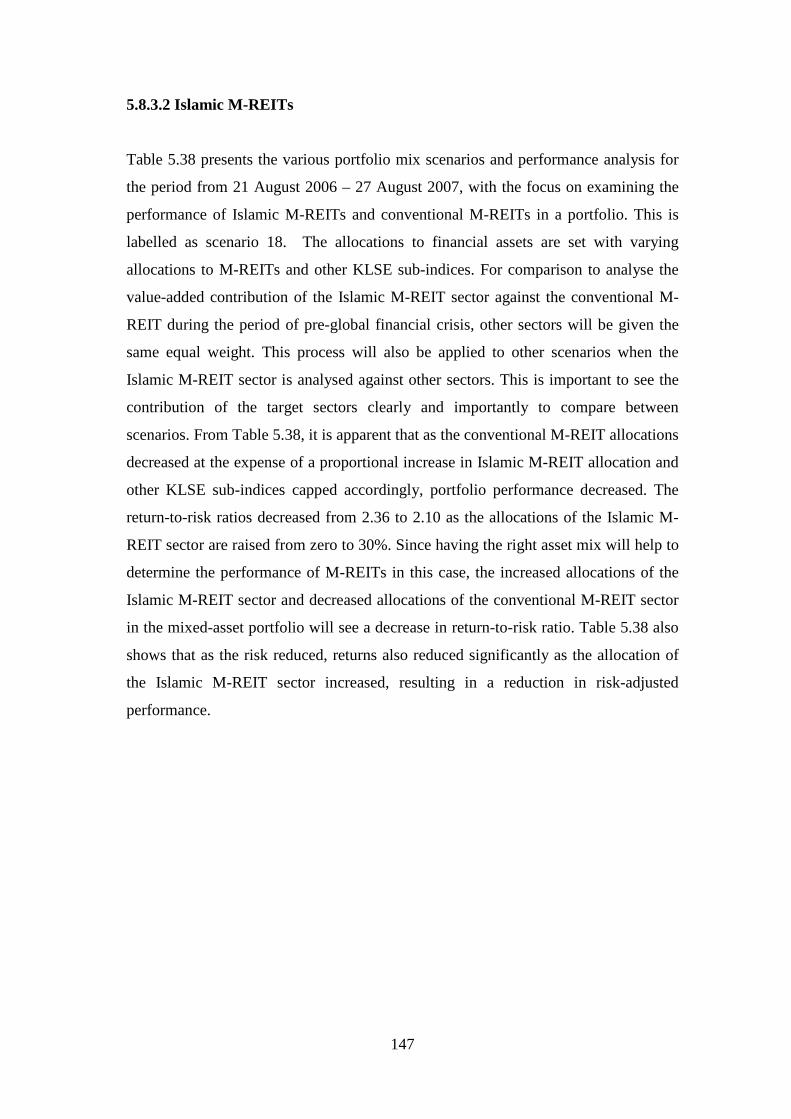
147
5.8.3.2 Islamic M-REITs
Table 5.38 presents the various portfolio mix scenarios and performance analysis for
the period from 21 August 2006 – 27 August 2007, with the focus on examining the
performance of Islamic M-REITs and conventional M-REITs in a portfolio. This is
labelled as scenario 18. The allocations to financial assets are set with varying
allocations to M-REITs and other KLSE sub-indices. For comparison to analyse the
value-added contribution of the Islamic M-REIT sector against the conventional M-
REIT during the period of pre-global financial crisis, other sectors will be given the
same equal weight. This process will also be applied to other scenarios when the
Islamic M-REIT sector is analysed against other sectors. This is important to see the
contribution of the target sectors clearly and importantly to compare between
scenarios. From Table 5.38, it is apparent that as the conventional M-REIT allocations
decreased at the expense of a proportional increase in Islamic M-REIT allocation and
other KLSE sub-indices capped accordingly, portfolio performance decreased. The
return-to-risk ratios decreased from 2.36 to 2.10 as the allocations of the Islamic M-
REIT sector are raised from zero to 30%. Since having the right asset mix will help to
determine the performance of M-REITs in this case, the increased allocations of the
Islamic M-REIT sector and decreased allocations of the conventional M-REIT sector
in the mixed-asset portfolio will see a decrease in return-to-risk ratio. Table 5.38 also
shows that as the risk reduced, returns also reduced significantly as the allocation of
the Islamic M-REIT sector increased, resulting in a reduction in risk-adjusted
performance.
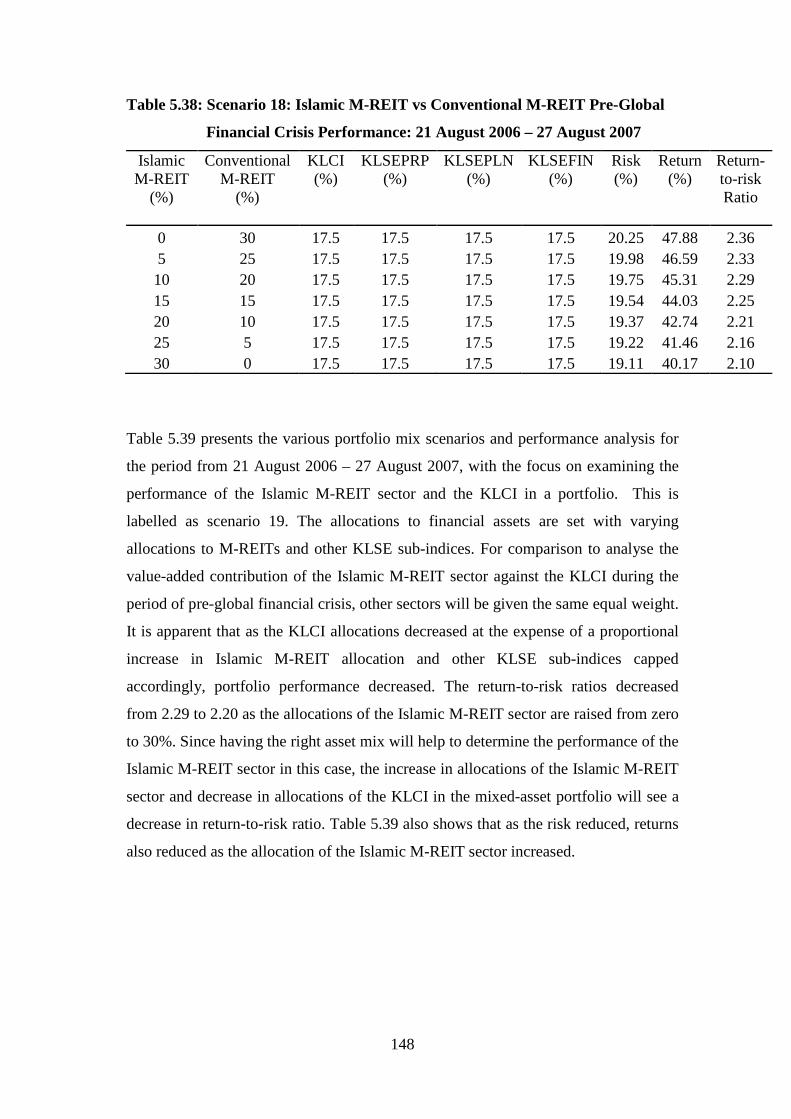
148
Table 5.38: Scenario 18: Islamic M-REIT vs Conventional M-REIT Pre-Global
Financial Crisis Performance: 21 August 2006 – 27 August 2007
IslamicM-REIT
(%)
ConventionalM-REIT
(%)
KLCI(%)
KLSEPRP(%)
KLSEPLN(%)
KLSEFIN(%)
Risk(%)
Return(%)
Return-to-riskRatio
0 30 17.5 17.5 17.5 17.5 20.25 47.88 2.36
5 25 17.5 17.5 17.5 17.5 19.98 46.59 2.33
10 20 17.5 17.5 17.5 17.5 19.75 45.31 2.29
15 15 17.5 17.5 17.5 17.5 19.54 44.03 2.25
20 10 17.5 17.5 17.5 17.5 19.37 42.74 2.21
25 5 17.5 17.5 17.5 17.5 19.22 41.46 2.16
30 0 17.5 17.5 17.5 17.5 19.11 40.17 2.10
Table 5.39 presents the various portfolio mix scenarios and performance analysis for
the period from 21 August 2006 – 27 August 2007, with the focus on examining the
performance of the Islamic M-REIT sector and the KLCI in a portfolio. This is
labelled as scenario 19. The allocations to financial assets are set with varying
allocations to M-REITs and other KLSE sub-indices. For comparison to analyse the
value-added contribution of the Islamic M-REIT sector against the KLCI during the
period of pre-global financial crisis, other sectors will be given the same equal weight.
It is apparent that as the KLCI allocations decreased at the expense of a proportional
increase in Islamic M-REIT allocation and other KLSE sub-indices capped
accordingly, portfolio performance decreased. The return-to-risk ratios decreased
from 2.29 to 2.20 as the allocations of the Islamic M-REIT sector are raised from zero
to 30%. Since having the right asset mix will help to determine the performance of the
Islamic M-REIT sector in this case, the increase in allocations of the Islamic M-REIT
sector and decrease in allocations of the KLCI in the mixed-asset portfolio will see a
decrease in return-to-risk ratio. Table 5.39 also shows that as the risk reduced, returns
also reduced as the allocation of the Islamic M-REIT sector increased.
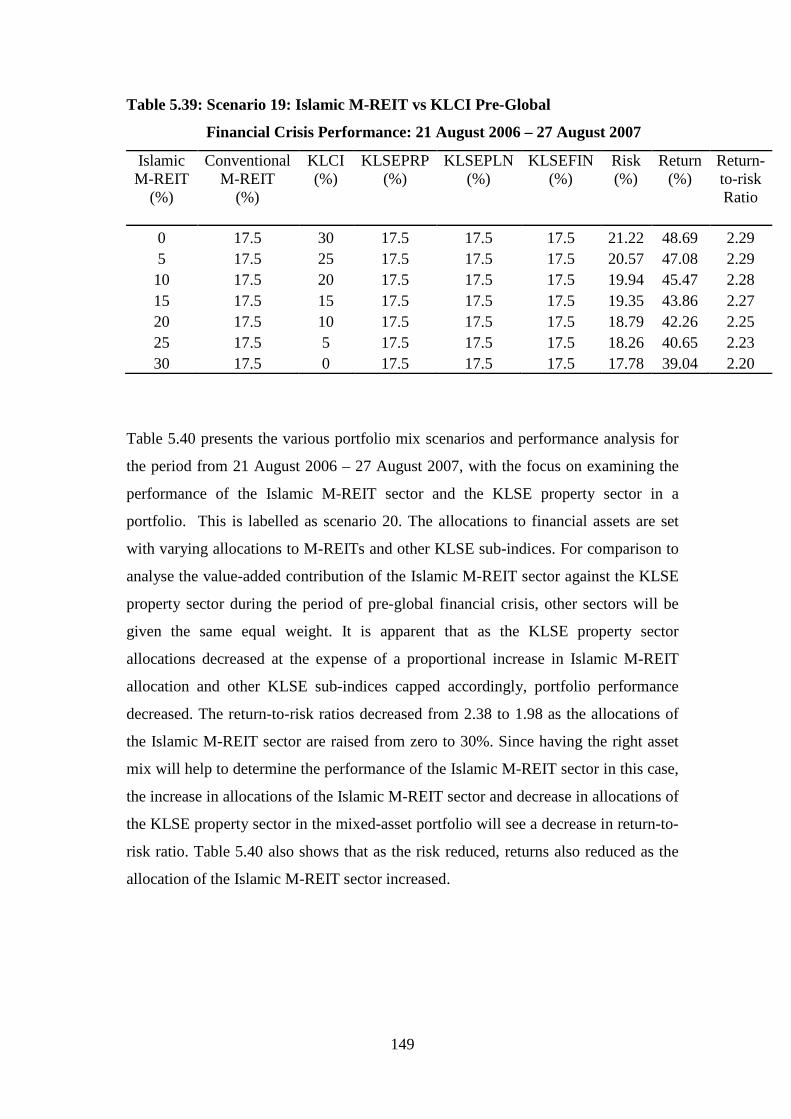
149
Table 5.39: Scenario 19: Islamic M-REIT vs KLCI Pre-Global
Financial Crisis Performance: 21 August 2006 – 27 August 2007
IslamicM-REIT
(%)
ConventionalM-REIT
(%)
KLCI(%)
KLSEPRP(%)
KLSEPLN(%)
KLSEFIN(%)
Risk(%)
Return(%)
Return-to-riskRatio
0 17.5 30 17.5 17.5 17.5 21.22 48.69 2.29
5 17.5 25 17.5 17.5 17.5 20.57 47.08 2.29
10 17.5 20 17.5 17.5 17.5 19.94 45.47 2.28
15 17.5 15 17.5 17.5 17.5 19.35 43.86 2.27
20 17.5 10 17.5 17.5 17.5 18.79 42.26 2.25
25 17.5 5 17.5 17.5 17.5 18.26 40.65 2.23
30 17.5 0 17.5 17.5 17.5 17.78 39.04 2.20
Table 5.40 presents the various portfolio mix scenarios and performance analysis for
the period from 21 August 2006 – 27 August 2007, with the focus on examining the
performance of the Islamic M-REIT sector and the KLSE property sector in a
portfolio. This is labelled as scenario 20. The allocations to financial assets are set
with varying allocations to M-REITs and other KLSE sub-indices. For comparison to
analyse the value-added contribution of the Islamic M-REIT sector against the KLSE
property sector during the period of pre-global financial crisis, other sectors will be
given the same equal weight. It is apparent that as the KLSE property sector
allocations decreased at the expense of a proportional increase in Islamic M-REIT
allocation and other KLSE sub-indices capped accordingly, portfolio performance
decreased. The return-to-risk ratios decreased from 2.38 to 1.98 as the allocations of
the Islamic M-REIT sector are raised from zero to 30%. Since having the right asset
mix will help to determine the performance of the Islamic M-REIT sector in this case,
the increase in allocations of the Islamic M-REIT sector and decrease in allocations of
the KLSE property sector in the mixed-asset portfolio will see a decrease in return-to-
risk ratio. Table 5.40 also shows that as the risk reduced, returns also reduced as the
allocation of the Islamic M-REIT sector increased.
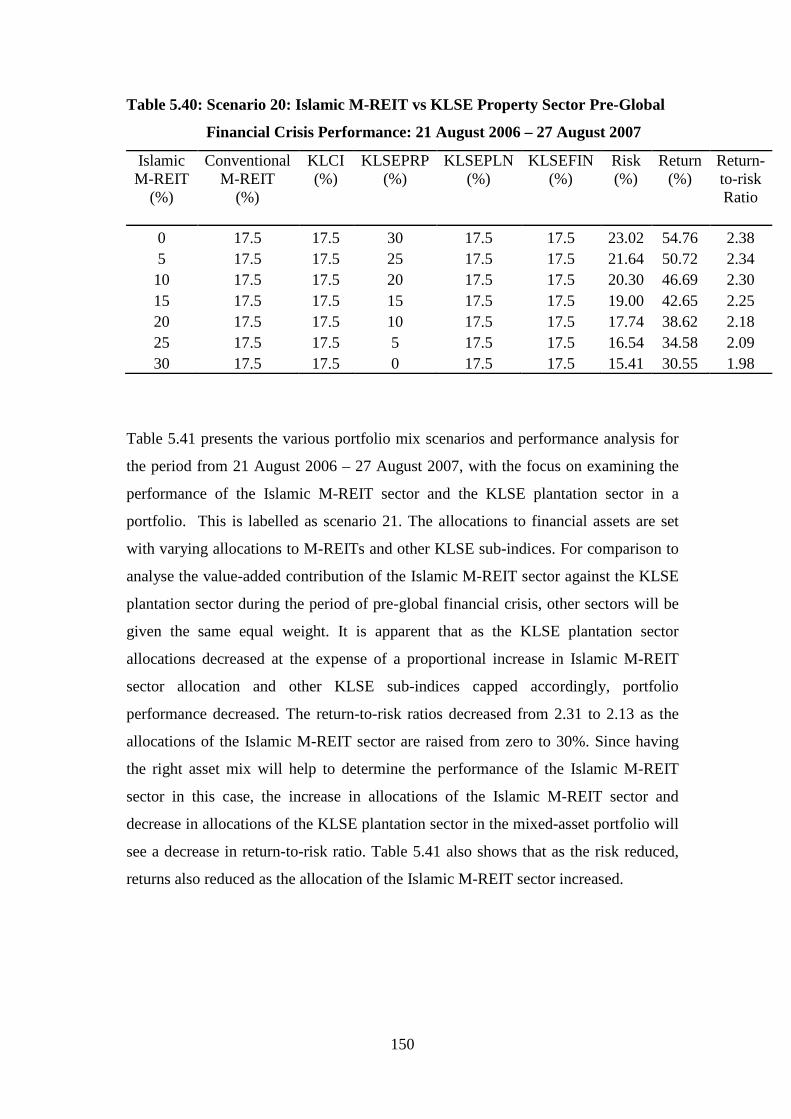
150
Table 5.40: Scenario 20: Islamic M-REIT vs KLSE Property Sector Pre-Global
Financial Crisis Performance: 21 August 2006 – 27 August 2007
IslamicM-REIT
(%)
ConventionalM-REIT
(%)
KLCI(%)
KLSEPRP(%)
KLSEPLN(%)
KLSEFIN(%)
Risk(%)
Return(%)
Return-to-riskRatio
0 17.5 17.5 30 17.5 17.5 23.02 54.76 2.38
5 17.5 17.5 25 17.5 17.5 21.64 50.72 2.34
10 17.5 17.5 20 17.5 17.5 20.30 46.69 2.30
15 17.5 17.5 15 17.5 17.5 19.00 42.65 2.25
20 17.5 17.5 10 17.5 17.5 17.74 38.62 2.18
25 17.5 17.5 5 17.5 17.5 16.54 34.58 2.09
30 17.5 17.5 0 17.5 17.5 15.41 30.55 1.98
Table 5.41 presents the various portfolio mix scenarios and performance analysis for
the period from 21 August 2006 – 27 August 2007, with the focus on examining the
performance of the Islamic M-REIT sector and the KLSE plantation sector in a
portfolio. This is labelled as scenario 21. The allocations to financial assets are set
with varying allocations to M-REITs and other KLSE sub-indices. For comparison to
analyse the value-added contribution of the Islamic M-REIT sector against the KLSE
plantation sector during the period of pre-global financial crisis, other sectors will be
given the same equal weight. It is apparent that as the KLSE plantation sector
allocations decreased at the expense of a proportional increase in Islamic M-REIT
sector allocation and other KLSE sub-indices capped accordingly, portfolio
performance decreased. The return-to-risk ratios decreased from 2.31 to 2.13 as the
allocations of the Islamic M-REIT sector are raised from zero to 30%. Since having
the right asset mix will help to determine the performance of the Islamic M-REIT
sector in this case, the increase in allocations of the Islamic M-REIT sector and
decrease in allocations of the KLSE plantation sector in the mixed-asset portfolio will
see a decrease in return-to-risk ratio. Table 5.41 also shows that as the risk reduced,
returns also reduced as the allocation of the Islamic M-REIT sector increased.
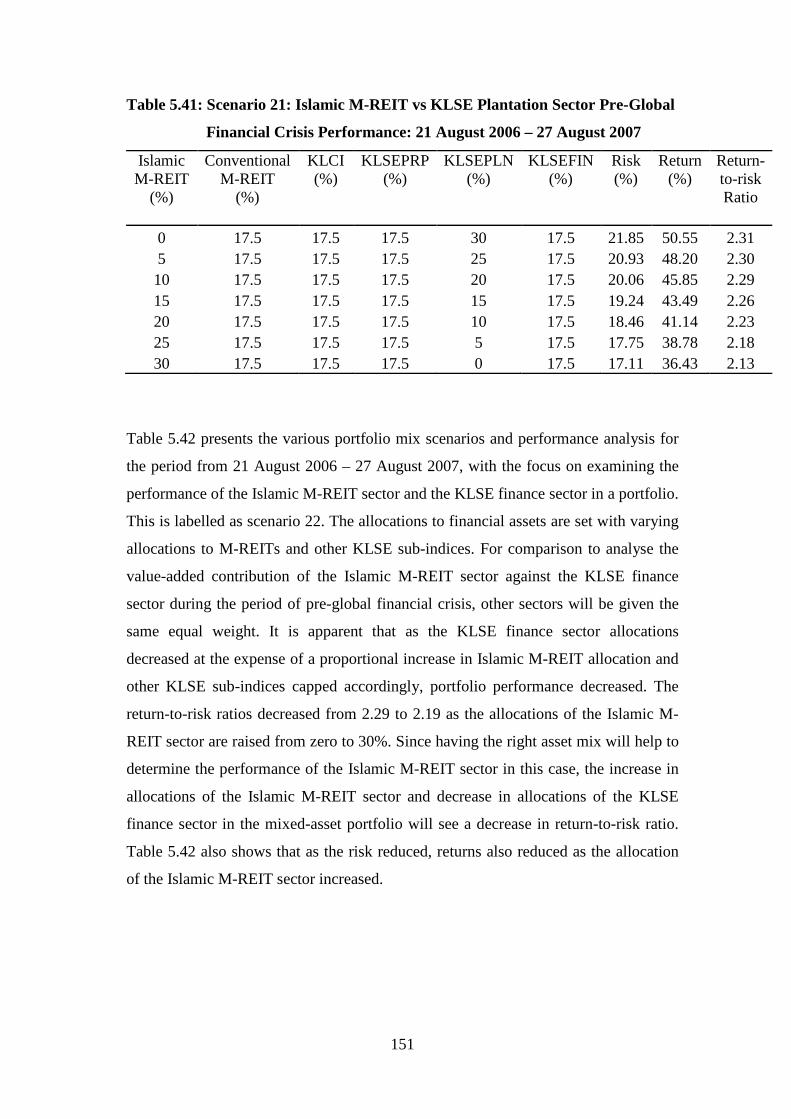
151
Table 5.41: Scenario 21: Islamic M-REIT vs KLSE Plantation Sector Pre-Global
Financial Crisis Performance: 21 August 2006 – 27 August 2007
IslamicM-REIT
(%)
ConventionalM-REIT
(%)
KLCI(%)
KLSEPRP(%)
KLSEPLN(%)
KLSEFIN(%)
Risk(%)
Return(%)
Return-to-riskRatio
0 17.5 17.5 17.5 30 17.5 21.85 50.55 2.31
5 17.5 17.5 17.5 25 17.5 20.93 48.20 2.30
10 17.5 17.5 17.5 20 17.5 20.06 45.85 2.29
15 17.5 17.5 17.5 15 17.5 19.24 43.49 2.26
20 17.5 17.5 17.5 10 17.5 18.46 41.14 2.23
25 17.5 17.5 17.5 5 17.5 17.75 38.78 2.18
30 17.5 17.5 17.5 0 17.5 17.11 36.43 2.13
Table 5.42 presents the various portfolio mix scenarios and performance analysis for
the period from 21 August 2006 – 27 August 2007, with the focus on examining the
performance of the Islamic M-REIT sector and the KLSE finance sector in a portfolio.
This is labelled as scenario 22. The allocations to financial assets are set with varying
allocations to M-REITs and other KLSE sub-indices. For comparison to analyse the
value-added contribution of the Islamic M-REIT sector against the KLSE finance
sector during the period of pre-global financial crisis, other sectors will be given the
same equal weight. It is apparent that as the KLSE finance sector allocations
decreased at the expense of a proportional increase in Islamic M-REIT allocation and
other KLSE sub-indices capped accordingly, portfolio performance decreased. The
return-to-risk ratios decreased from 2.29 to 2.19 as the allocations of the Islamic M-
REIT sector are raised from zero to 30%. Since having the right asset mix will help to
determine the performance of the Islamic M-REIT sector in this case, the increase in
allocations of the Islamic M-REIT sector and decrease in allocations of the KLSE
finance sector in the mixed-asset portfolio will see a decrease in return-to-risk ratio.
Table 5.42 also shows that as the risk reduced, returns also reduced as the allocation
of the Islamic M-REIT sector increased.
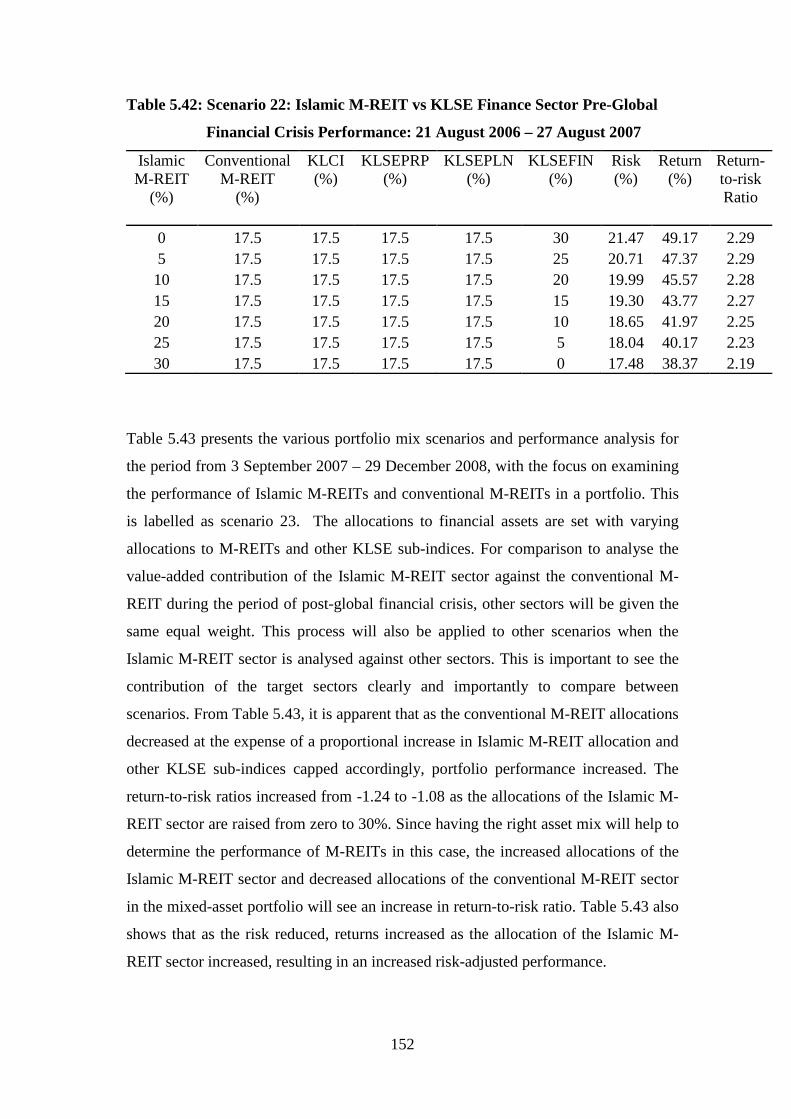
152
Table 5.42: Scenario 22: Islamic M-REIT vs KLSE Finance Sector Pre-Global
Financial Crisis Performance: 21 August 2006 – 27 August 2007
IslamicM-REIT
(%)
ConventionalM-REIT
(%)
KLCI(%)
KLSEPRP(%)
KLSEPLN(%)
KLSEFIN(%)
Risk(%)
Return(%)
Return-to-riskRatio
0 17.5 17.5 17.5 17.5 30 21.47 49.17 2.29
5 17.5 17.5 17.5 17.5 25 20.71 47.37 2.29
10 17.5 17.5 17.5 17.5 20 19.99 45.57 2.28
15 17.5 17.5 17.5 17.5 15 19.30 43.77 2.27
20 17.5 17.5 17.5 17.5 10 18.65 41.97 2.25
25 17.5 17.5 17.5 17.5 5 18.04 40.17 2.23
30 17.5 17.5 17.5 17.5 0 17.48 38.37 2.19
Table 5.43 presents the various portfolio mix scenarios and performance analysis for
the period from 3 September 2007 – 29 December 2008, with the focus on examining
the performance of Islamic M-REITs and conventional M-REITs in a portfolio. This
is labelled as scenario 23. The allocations to financial assets are set with varying
allocations to M-REITs and other KLSE sub-indices. For comparison to analyse the
value-added contribution of the Islamic M-REIT sector against the conventional M-
REIT during the period of post-global financial crisis, other sectors will be given the
same equal weight. This process will also be applied to other scenarios when the
Islamic M-REIT sector is analysed against other sectors. This is important to see the
contribution of the target sectors clearly and importantly to compare between
scenarios. From Table 5.43, it is apparent that as the conventional M-REIT allocations
decreased at the expense of a proportional increase in Islamic M-REIT allocation and
other KLSE sub-indices capped accordingly, portfolio performance increased. The
return-to-risk ratios increased from -1.24 to -1.08 as the allocations of the Islamic M-
REIT sector are raised from zero to 30%. Since having the right asset mix will help to
determine the performance of M-REITs in this case, the increased allocations of the
Islamic M-REIT sector and decreased allocations of the conventional M-REIT sector
in the mixed-asset portfolio will see an increase in return-to-risk ratio. Table 5.43 also
shows that as the risk reduced, returns increased as the allocation of the Islamic M-
REIT sector increased, resulting in an increased risk-adjusted performance.
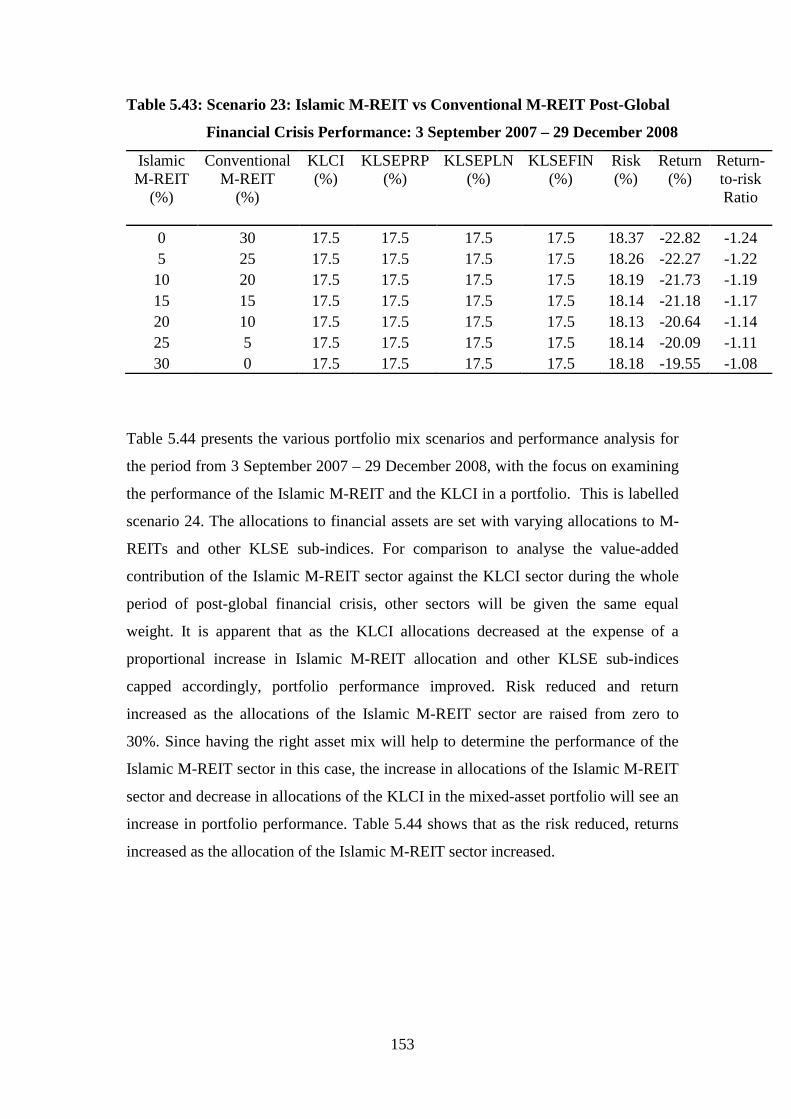
153
Table 5.43: Scenario 23: Islamic M-REIT vs Conventional M-REIT Post-Global
Financial Crisis Performance: 3 September 2007 – 29 December 2008
IslamicM-REIT
(%)
ConventionalM-REIT
(%)
KLCI(%)
KLSEPRP(%)
KLSEPLN(%)
KLSEFIN(%)
Risk(%)
Return(%)
Return-to-riskRatio
0 30 17.5 17.5 17.5 17.5 18.37 -22.82 -1.24
5 25 17.5 17.5 17.5 17.5 18.26 -22.27 -1.22
10 20 17.5 17.5 17.5 17.5 18.19 -21.73 -1.19
15 15 17.5 17.5 17.5 17.5 18.14 -21.18 -1.17
20 10 17.5 17.5 17.5 17.5 18.13 -20.64 -1.14
25 5 17.5 17.5 17.5 17.5 18.14 -20.09 -1.11
30 0 17.5 17.5 17.5 17.5 18.18 -19.55 -1.08
Table 5.44 presents the various portfolio mix scenarios and performance analysis for
the period from 3 September 2007 – 29 December 2008, with the focus on examining
the performance of the Islamic M-REIT and the KLCI in a portfolio. This is labelled
scenario 24. The allocations to financial assets are set with varying allocations to M-
REITs and other KLSE sub-indices. For comparison to analyse the value-added
contribution of the Islamic M-REIT sector against the KLCI sector during the whole
period of post-global financial crisis, other sectors will be given the same equal
weight. It is apparent that as the KLCI allocations decreased at the expense of a
proportional increase in Islamic M-REIT allocation and other KLSE sub-indices
capped accordingly, portfolio performance improved. Risk reduced and return
increased as the allocations of the Islamic M-REIT sector are raised from zero to
30%. Since having the right asset mix will help to determine the performance of the
Islamic M-REIT sector in this case, the increase in allocations of the Islamic M-REIT
sector and decrease in allocations of the KLCI in the mixed-asset portfolio will see an
increase in portfolio performance. Table 5.44 shows that as the risk reduced, returns
increased as the allocation of the Islamic M-REIT sector increased.
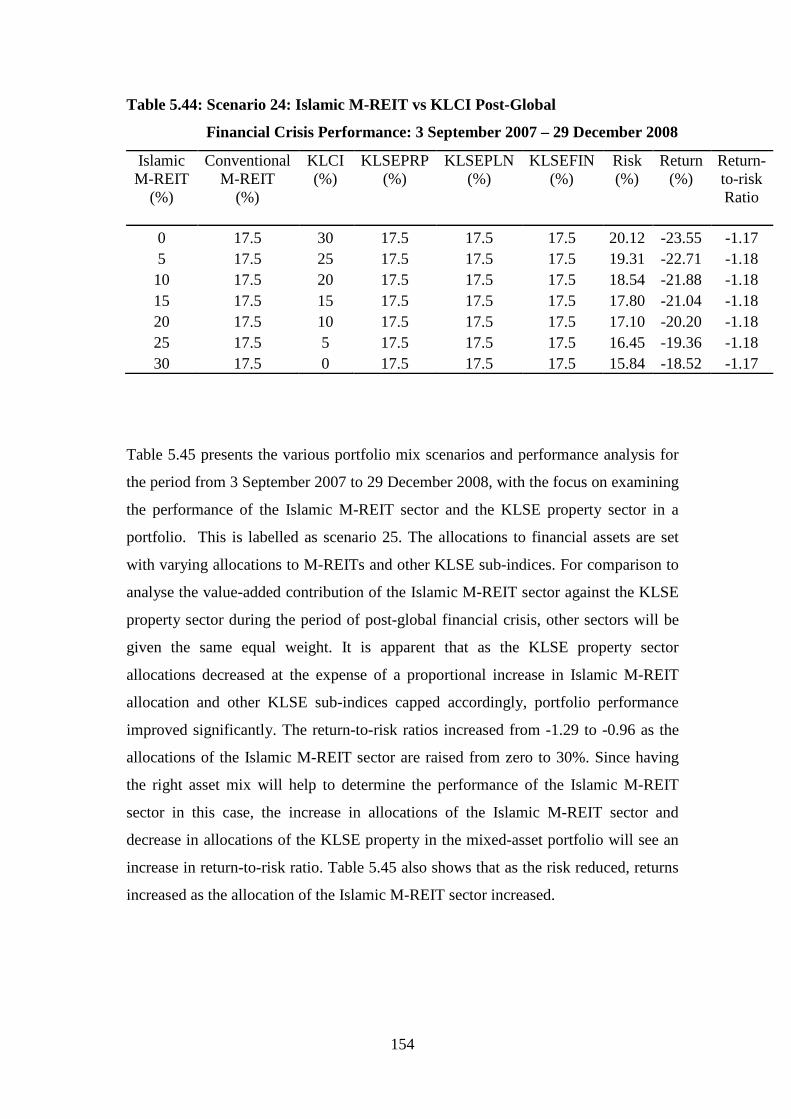
154
Table 5.44: Scenario 24: Islamic M-REIT vs KLCI Post-Global
Financial Crisis Performance: 3 September 2007 – 29 December 2008
IslamicM-REIT
(%)
ConventionalM-REIT
(%)
KLCI(%)
KLSEPRP(%)
KLSEPLN(%)
KLSEFIN(%)
Risk(%)
Return(%)
Return-to-riskRatio
0 17.5 30 17.5 17.5 17.5 20.12 -23.55 -1.17
5 17.5 25 17.5 17.5 17.5 19.31 -22.71 -1.18
10 17.5 20 17.5 17.5 17.5 18.54 -21.88 -1.18
15 17.5 15 17.5 17.5 17.5 17.80 -21.04 -1.18
20 17.5 10 17.5 17.5 17.5 17.10 -20.20 -1.18
25 17.5 5 17.5 17.5 17.5 16.45 -19.36 -1.18
30 17.5 0 17.5 17.5 17.5 15.84 -18.52 -1.17
Table 5.45 presents the various portfolio mix scenarios and performance analysis for
the period from 3 September 2007 to 29 December 2008, with the focus on examining
the performance of the Islamic M-REIT sector and the KLSE property sector in a
portfolio. This is labelled as scenario 25. The allocations to financial assets are set
with varying allocations to M-REITs and other KLSE sub-indices. For comparison to
analyse the value-added contribution of the Islamic M-REIT sector against the KLSE
property sector during the period of post-global financial crisis, other sectors will be
given the same equal weight. It is apparent that as the KLSE property sector
allocations decreased at the expense of a proportional increase in Islamic M-REIT
allocation and other KLSE sub-indices capped accordingly, portfolio performance
improved significantly. The return-to-risk ratios increased from -1.29 to -0.96 as the
allocations of the Islamic M-REIT sector are raised from zero to 30%. Since having
the right asset mix will help to determine the performance of the Islamic M-REIT
sector in this case, the increase in allocations of the Islamic M-REIT sector and
decrease in allocations of the KLSE property in the mixed-asset portfolio will see an
increase in return-to-risk ratio. Table 5.45 also shows that as the risk reduced, returns
increased as the allocation of the Islamic M-REIT sector increased.
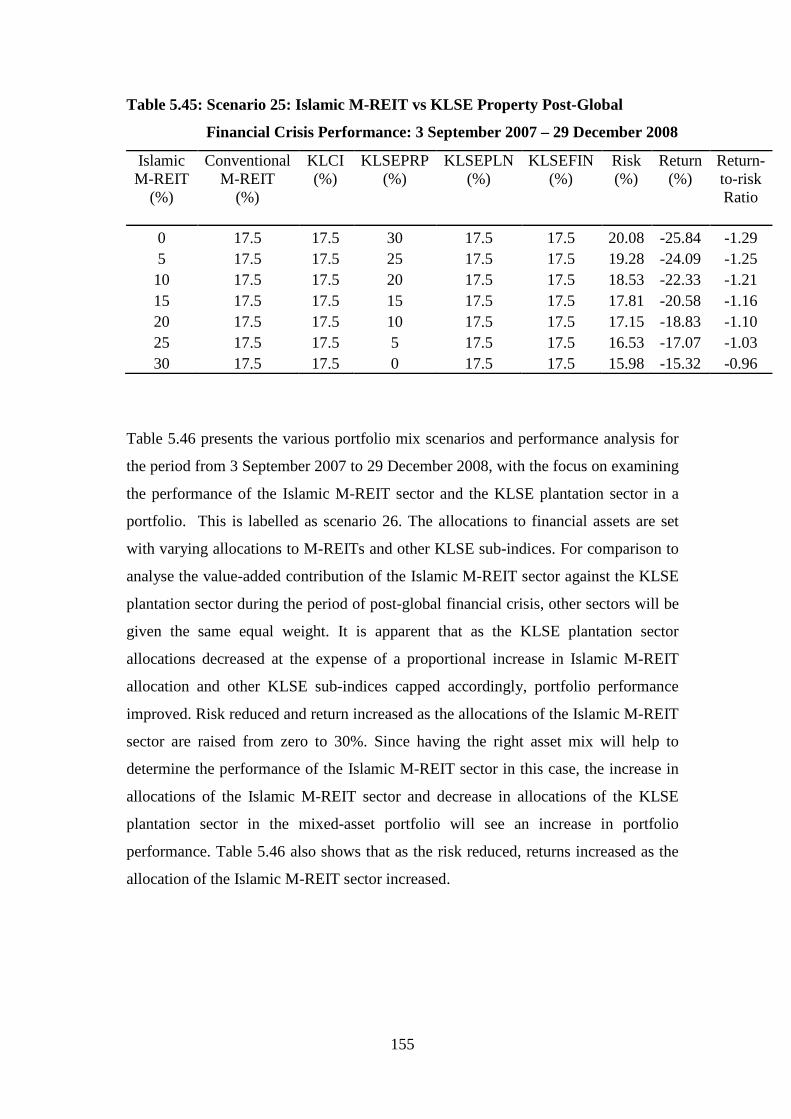
155
Table 5.45: Scenario 25: Islamic M-REIT vs KLSE Property Post-Global
Financial Crisis Performance: 3 September 2007 – 29 December 2008
IslamicM-REIT
(%)
ConventionalM-REIT
(%)
KLCI(%)
KLSEPRP(%)
KLSEPLN(%)
KLSEFIN(%)
Risk(%)
Return(%)
Return-to-riskRatio
0 17.5 17.5 30 17.5 17.5 20.08 -25.84 -1.29
5 17.5 17.5 25 17.5 17.5 19.28 -24.09 -1.25
10 17.5 17.5 20 17.5 17.5 18.53 -22.33 -1.21
15 17.5 17.5 15 17.5 17.5 17.81 -20.58 -1.16
20 17.5 17.5 10 17.5 17.5 17.15 -18.83 -1.10
25 17.5 17.5 5 17.5 17.5 16.53 -17.07 -1.03
30 17.5 17.5 0 17.5 17.5 15.98 -15.32 -0.96
Table 5.46 presents the various portfolio mix scenarios and performance analysis for
the period from 3 September 2007 to 29 December 2008, with the focus on examining
the performance of the Islamic M-REIT sector and the KLSE plantation sector in a
portfolio. This is labelled as scenario 26. The allocations to financial assets are set
with varying allocations to M-REITs and other KLSE sub-indices. For comparison to
analyse the value-added contribution of the Islamic M-REIT sector against the KLSE
plantation sector during the period of post-global financial crisis, other sectors will be
given the same equal weight. It is apparent that as the KLSE plantation sector
allocations decreased at the expense of a proportional increase in Islamic M-REIT
allocation and other KLSE sub-indices capped accordingly, portfolio performance
improved. Risk reduced and return increased as the allocations of the Islamic M-REIT
sector are raised from zero to 30%. Since having the right asset mix will help to
determine the performance of the Islamic M-REIT sector in this case, the increase in
allocations of the Islamic M-REIT sector and decrease in allocations of the KLSE
plantation sector in the mixed-asset portfolio will see an increase in portfolio
performance. Table 5.46 also shows that as the risk reduced, returns increased as the
allocation of the Islamic M-REIT sector increased.
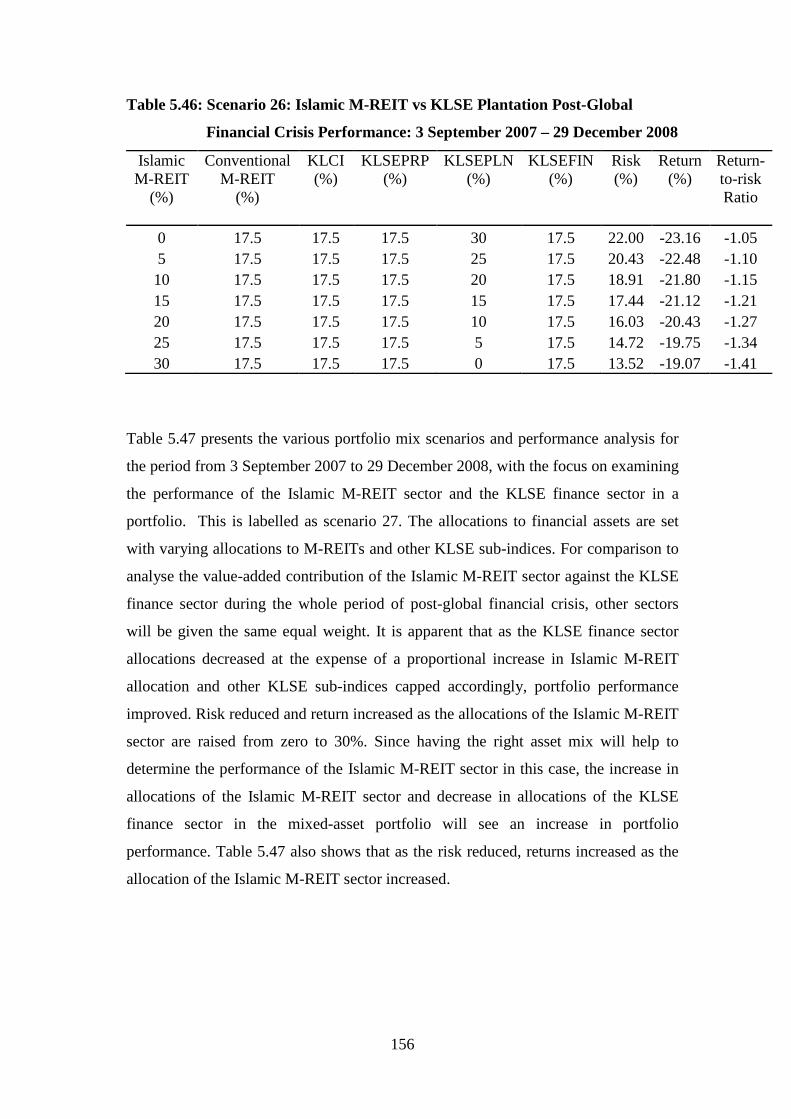
156
Table 5.46: Scenario 26: Islamic M-REIT vs KLSE Plantation Post-Global
Financial Crisis Performance: 3 September 2007 – 29 December 2008
IslamicM-REIT
(%)
ConventionalM-REIT
(%)
KLCI(%)
KLSEPRP(%)
KLSEPLN(%)
KLSEFIN(%)
Risk(%)
Return(%)
Return-to-riskRatio
0 17.5 17.5 17.5 30 17.5 22.00 -23.16 -1.05
5 17.5 17.5 17.5 25 17.5 20.43 -22.48 -1.10
10 17.5 17.5 17.5 20 17.5 18.91 -21.80 -1.15
15 17.5 17.5 17.5 15 17.5 17.44 -21.12 -1.21
20 17.5 17.5 17.5 10 17.5 16.03 -20.43 -1.27
25 17.5 17.5 17.5 5 17.5 14.72 -19.75 -1.34
30 17.5 17.5 17.5 0 17.5 13.52 -19.07 -1.41
Table 5.47 presents the various portfolio mix scenarios and performance analysis for
the period from 3 September 2007 to 29 December 2008, with the focus on examining
the performance of the Islamic M-REIT sector and the KLSE finance sector in a
portfolio. This is labelled as scenario 27. The allocations to financial assets are set
with varying allocations to M-REITs and other KLSE sub-indices. For comparison to
analyse the value-added contribution of the Islamic M-REIT sector against the KLSE
finance sector during the whole period of post-global financial crisis, other sectors
will be given the same equal weight. It is apparent that as the KLSE finance sector
allocations decreased at the expense of a proportional increase in Islamic M-REIT
allocation and other KLSE sub-indices capped accordingly, portfolio performance
improved. Risk reduced and return increased as the allocations of the Islamic M-REIT
sector are raised from zero to 30%. Since having the right asset mix will help to
determine the performance of the Islamic M-REIT sector in this case, the increase in
allocations of the Islamic M-REIT sector and decrease in allocations of the KLSE
finance sector in the mixed-asset portfolio will see an increase in portfolio
performance. Table 5.47 also shows that as the risk reduced, returns increased as the
allocation of the Islamic M-REIT sector increased.
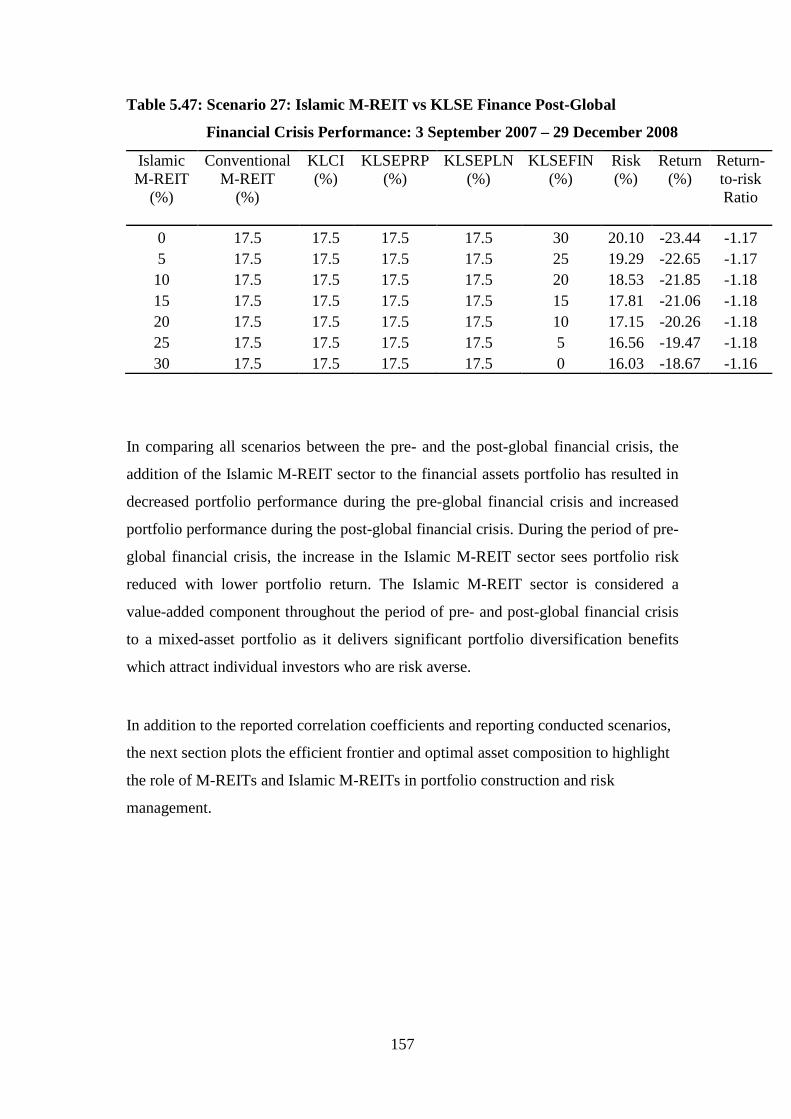
157
Table 5.47: Scenario 27: Islamic M-REIT vs KLSE Finance Post-Global
Financial Crisis Performance: 3 September 2007 – 29 December 2008
IslamicM-REIT
(%)
ConventionalM-REIT
(%)
KLCI(%)
KLSEPRP(%)
KLSEPLN(%)
KLSEFIN(%)
Risk(%)
Return(%)
Return-to-riskRatio
0 17.5 17.5 17.5 17.5 30 20.10 -23.44 -1.17
5 17.5 17.5 17.5 17.5 25 19.29 -22.65 -1.17
10 17.5 17.5 17.5 17.5 20 18.53 -21.85 -1.18
15 17.5 17.5 17.5 17.5 15 17.81 -21.06 -1.18
20 17.5 17.5 17.5 17.5 10 17.15 -20.26 -1.18
25 17.5 17.5 17.5 17.5 5 16.56 -19.47 -1.18
30 17.5 17.5 17.5 17.5 0 16.03 -18.67 -1.16
In comparing all scenarios between the pre- and the post-global financial crisis, the
addition of the Islamic M-REIT sector to the financial assets portfolio has resulted in
decreased portfolio performance during the pre-global financial crisis and increased
portfolio performance during the post-global financial crisis. During the period of pre-
global financial crisis, the increase in the Islamic M-REIT sector sees portfolio risk
reduced with lower portfolio return. The Islamic M-REIT sector is considered a
value-added component throughout the period of pre- and post-global financial crisis
to a mixed-asset portfolio as it delivers significant portfolio diversification benefits
which attract individual investors who are risk averse.
In addition to the reported correlation coefficients and reporting conducted scenarios,
the next section plots the efficient frontier and optimal asset composition to highlight
the role of M-REITs and Islamic M-REITs in portfolio construction and risk
management.
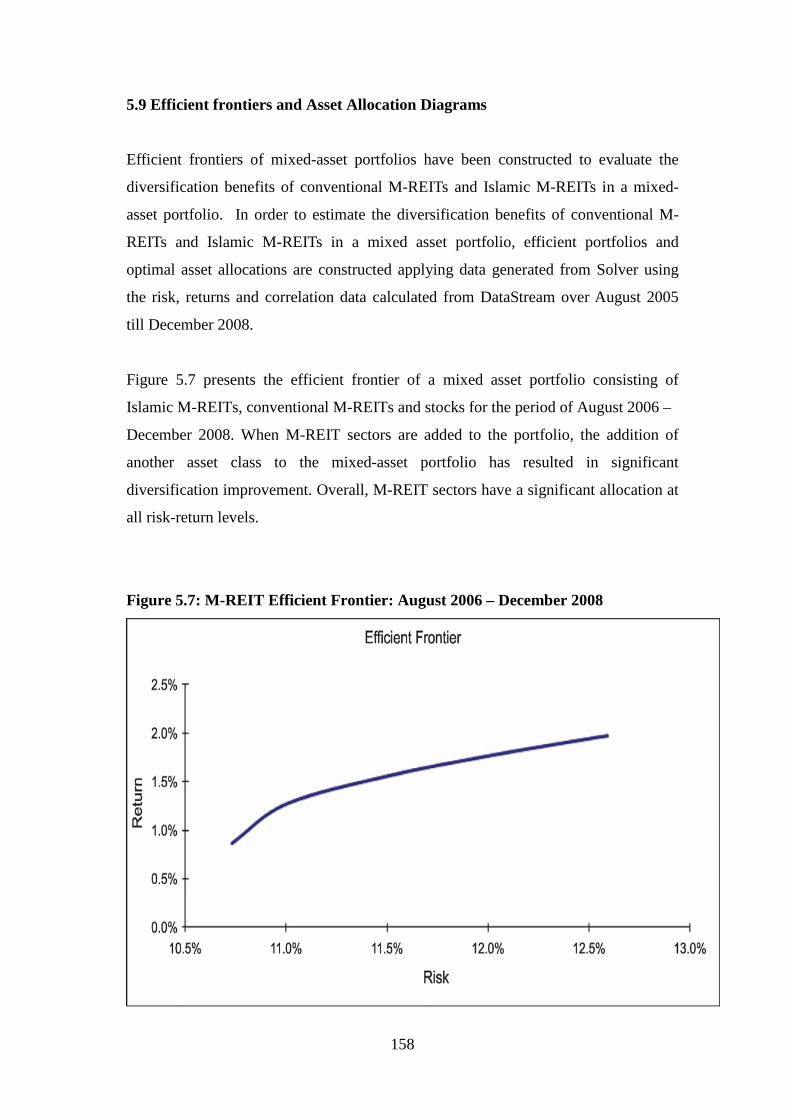
158
5.9 Efficient frontiers and Asset Allocation Diagrams
Efficient frontiers of mixed-asset portfolios have been constructed to evaluate the
diversification benefits of conventional M-REITs and Islamic M-REITs in a mixed-
asset portfolio. In order to estimate the diversification benefits of conventional M-
REITs and Islamic M-REITs in a mixed asset portfolio, efficient portfolios and
optimal asset allocations are constructed applying data generated from Solver using
the risk, returns and correlation data calculated from DataStream over August 2005
till December 2008.
Figure 5.7 presents the efficient frontier of a mixed asset portfolio consisting of
Islamic M-REITs, conventional M-REITs and stocks for the period of August 2006 –
December 2008. When M-REIT sectors are added to the portfolio, the addition of
another asset class to the mixed-asset portfolio has resulted in significant
diversification improvement. Overall, M-REIT sectors have a significant allocation at
all risk-return levels.
Figure 5.7: M-REIT Efficient Frontier: August 2006 – December 2008
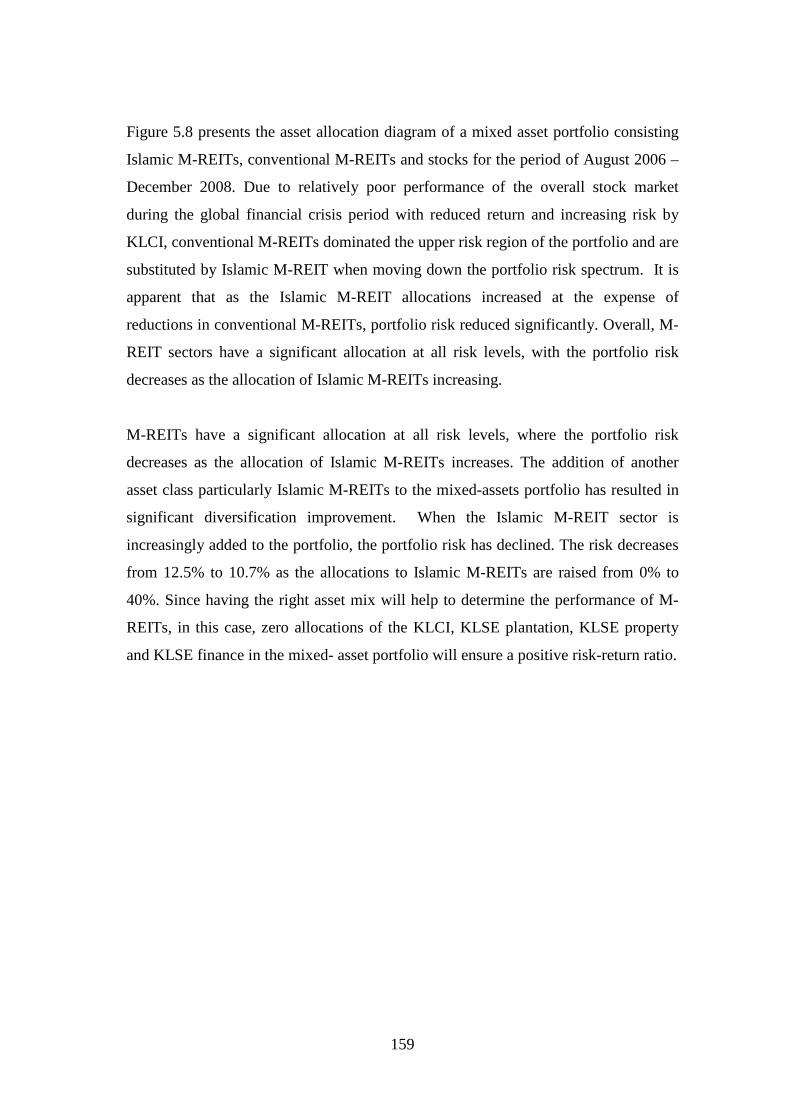
159
Figure 5.8 presents the asset allocation diagram of a mixed asset portfolio consisting
Islamic M-REITs, conventional M-REITs and stocks for the period of August 2006 –
December 2008. Due to relatively poor performance of the overall stock market
during the global financial crisis period with reduced return and increasing risk by
KLCI, conventional M-REITs dominated the upper risk region of the portfolio and are
substituted by Islamic M-REIT when moving down the portfolio risk spectrum. It is
apparent that as the Islamic M-REIT allocations increased at the expense of
reductions in conventional M-REITs, portfolio risk reduced significantly. Overall, M-
REIT sectors have a significant allocation at all risk levels, with the portfolio risk
decreases as the allocation of Islamic M-REITs increasing.
M-REITs have a significant allocation at all risk levels, where the portfolio risk
decreases as the allocation of Islamic M-REITs increases. The addition of another
asset class particularly Islamic M-REITs to the mixed-assets portfolio has resulted in
significant diversification improvement. When the Islamic M-REIT sector is
increasingly added to the portfolio, the portfolio risk has declined. The risk decreases
from 12.5% to 10.7% as the allocations to Islamic M-REITs are raised from 0% to
40%. Since having the right asset mix will help to determine the performance of M-
REITs, in this case, zero allocations of the KLCI, KLSE plantation, KLSE property
and KLSE finance in the mixed- asset portfolio will ensure a positive risk-return ratio.
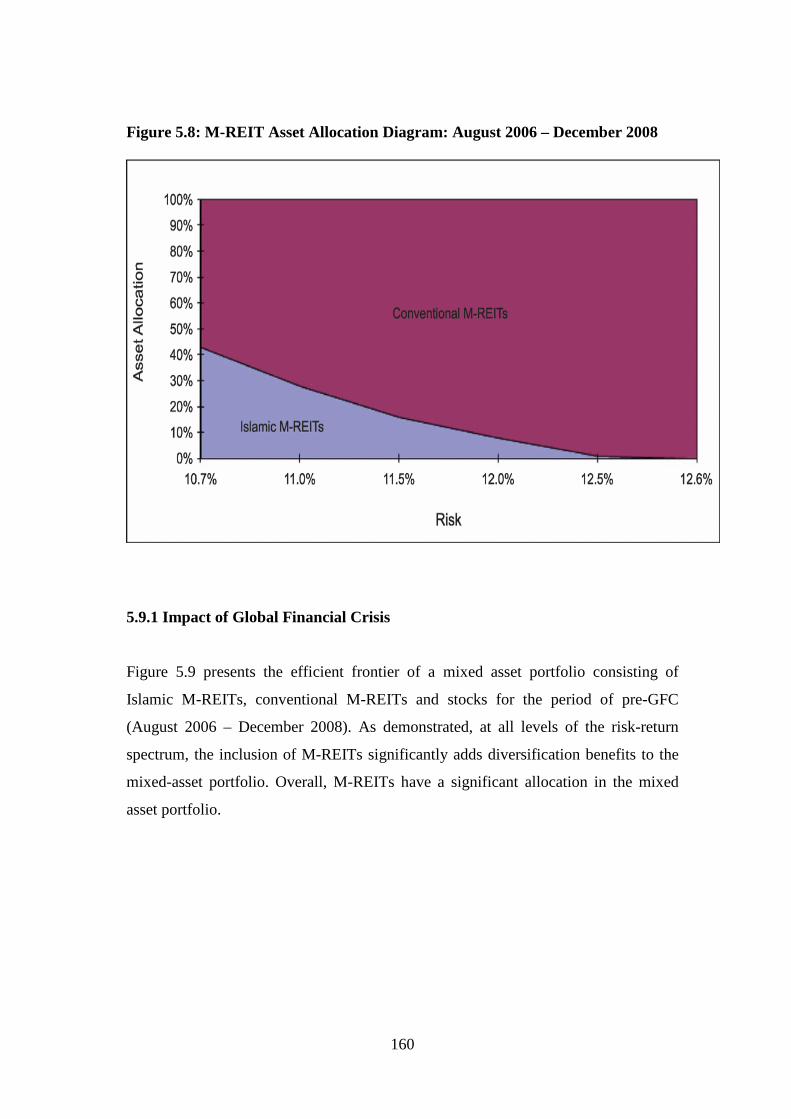
160
Figure 5.8: M-REIT Asset Allocation Diagram: August 2006 – December 2008
5.9.1 Impact of Global Financial Crisis
Figure 5.9 presents the efficient frontier of a mixed asset portfolio consisting of
Islamic M-REITs, conventional M-REITs and stocks for the period of pre-GFC
(August 2006 – December 2008). As demonstrated, at all levels of the risk-return
spectrum, the inclusion of M-REITs significantly adds diversification benefits to the
mixed-asset portfolio. Overall, M-REITs have a significant allocation in the mixed
asset portfolio.
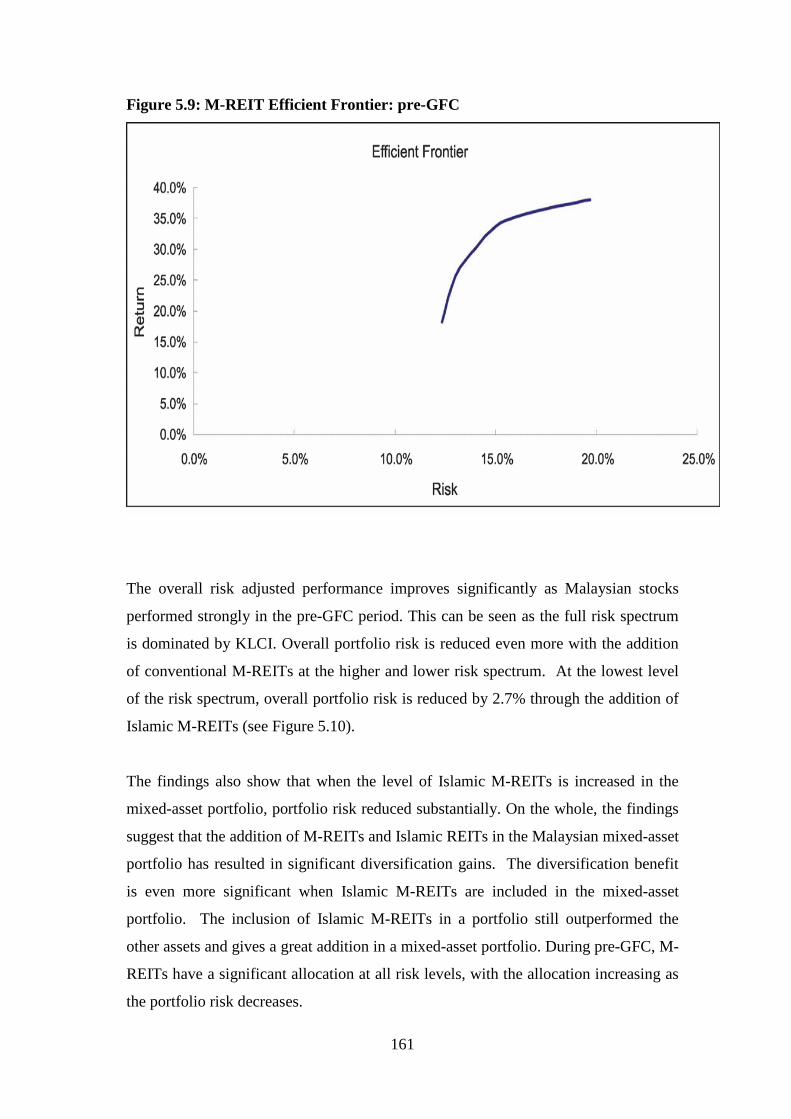
161
Figure 5.9: M-REIT Efficient Frontier: pre-GFC
The overall risk adjusted performance improves significantly as Malaysian stocks
performed strongly in the pre-GFC period. This can be seen as the full risk spectrum
is dominated by KLCI. Overall portfolio risk is reduced even more with the addition
of conventional M-REITs at the higher and lower risk spectrum. At the lowest level
of the risk spectrum, overall portfolio risk is reduced by 2.7% through the addition of
Islamic M-REITs (see Figure 5.10).
The findings also show that when the level of Islamic M-REITs is increased in the
mixed-asset portfolio, portfolio risk reduced substantially. On the whole, the findings
suggest that the addition of M-REITs and Islamic REITs in the Malaysian mixed-asset
portfolio has resulted in significant diversification gains. The diversification benefit
is even more significant when Islamic M-REITs are included in the mixed-asset
portfolio. The inclusion of Islamic M-REITs in a portfolio still outperformed the
other assets and gives a great addition in a mixed-asset portfolio. During pre-GFC, M-
REITs have a significant allocation at all risk levels, with the allocation increasing as
the portfolio risk decreases.
162
Although the number of M-REITs are currently small and is expected to increase
significantly in the near future, M-REITs have demonstrated their importance in the
mixed-asset portfolio, with most significant contributions to diversification benefits at
the lower portfolio risk level with significant risk reduction.
Allocations to Islamic M-REITs increased, with the maximum risk reduction recorded
at the 55% allocation level. When the allocation to Islamic M-REITs increased in the
mixed-asset portfolio, portfolio risk reduced substantially. The mixed-asset portfolio
analyses have seen significant portfolio performance improvement as allocations for
M-REITs, particularly Islamic M-REITs, increased at the expense of a reduction in
KLCI allocations. Overall, the risk of the portfolio has reduced significantly from
19.7% to 12.3%.
Figure 5.10: M-REIT Asset Allocation Diagram: pre-GFC
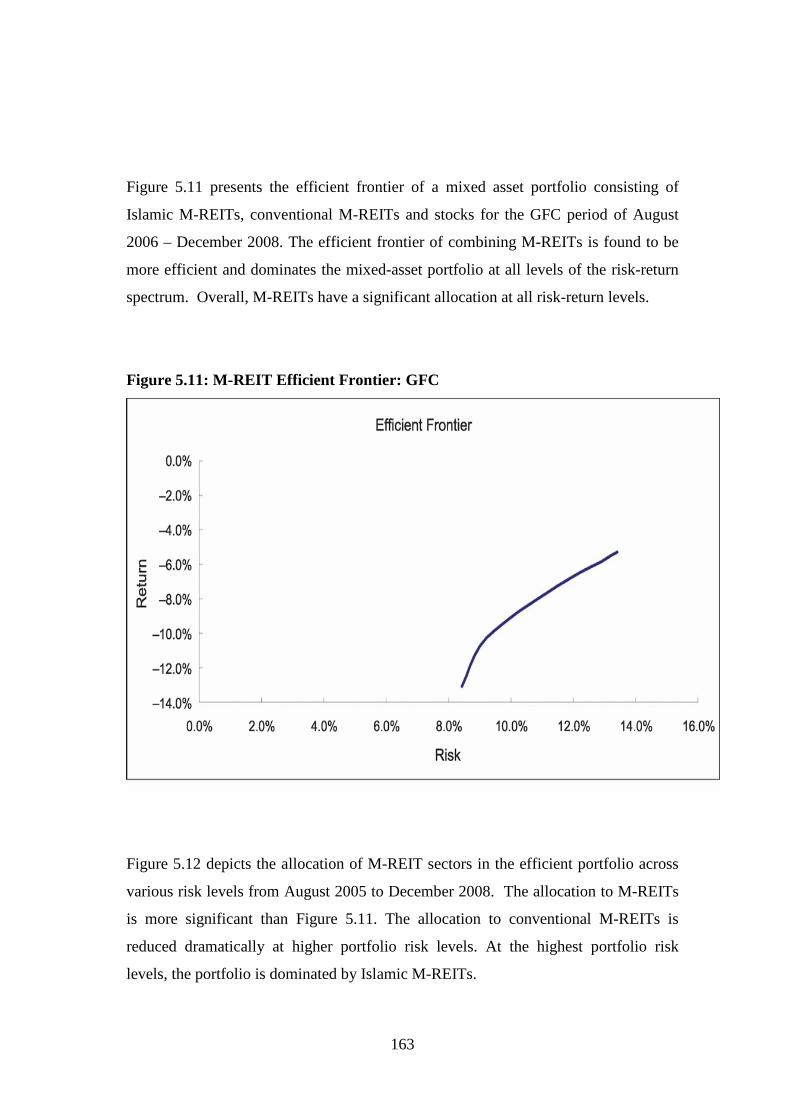
163
Figure 5.11 presents the efficient frontier of a mixed asset portfolio consisting of
Islamic M-REITs, conventional M-REITs and stocks for the GFC period of August
2006 – December 2008. The efficient frontier of combining M-REITs is found to be
more efficient and dominates the mixed-asset portfolio at all levels of the risk-return
spectrum. Overall, M-REITs have a significant allocation at all risk-return levels.
Figure 5.11: M-REIT Efficient Frontier: GFC
Figure 5.12 depicts the allocation of M-REIT sectors in the efficient portfolio across
various risk levels from August 2005 to December 2008. The allocation to M-REITs
is more significant than Figure 5.11. The allocation to conventional M-REITs is
reduced dramatically at higher portfolio risk levels. At the highest portfolio risk
levels, the portfolio is dominated by Islamic M-REITs.
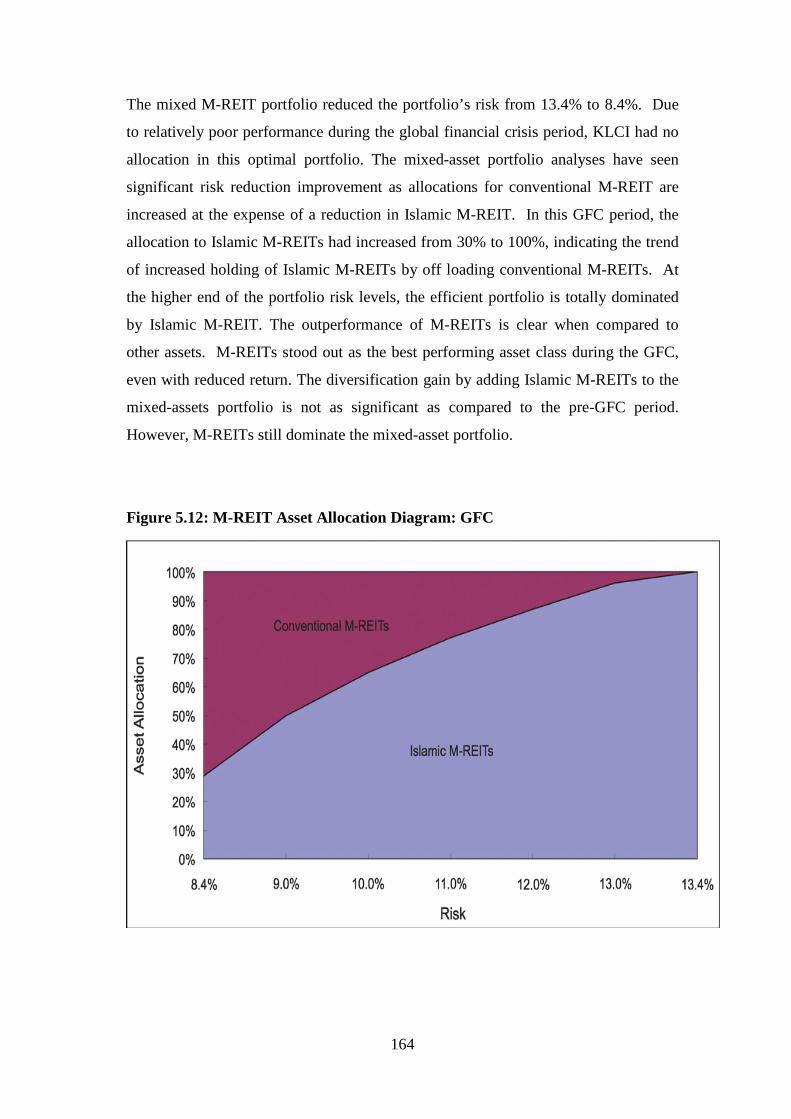
164
The mixed M-REIT portfolio reduced the portfolio’s risk from 13.4% to 8.4%. Due
to relatively poor performance during the global financial crisis period, KLCI had no
allocation in this optimal portfolio. The mixed-asset portfolio analyses have seen
significant risk reduction improvement as allocations for conventional M-REIT are
increased at the expense of a reduction in Islamic M-REIT. In this GFC period, the
allocation to Islamic M-REITs had increased from 30% to 100%, indicating the trend
of increased holding of Islamic M-REITs by off loading conventional M-REITs. At
the higher end of the portfolio risk levels, the efficient portfolio is totally dominated
by Islamic M-REIT. The outperformance of M-REITs is clear when compared to
other assets. M-REITs stood out as the best performing asset class during the GFC,
even with reduced return. The diversification gain by adding Islamic M-REITs to the
mixed-assets portfolio is not as significant as compared to the pre-GFC period.
However, M-REITs still dominate the mixed-asset portfolio.
Figure 5.12: M-REIT Asset Allocation Diagram: GFC
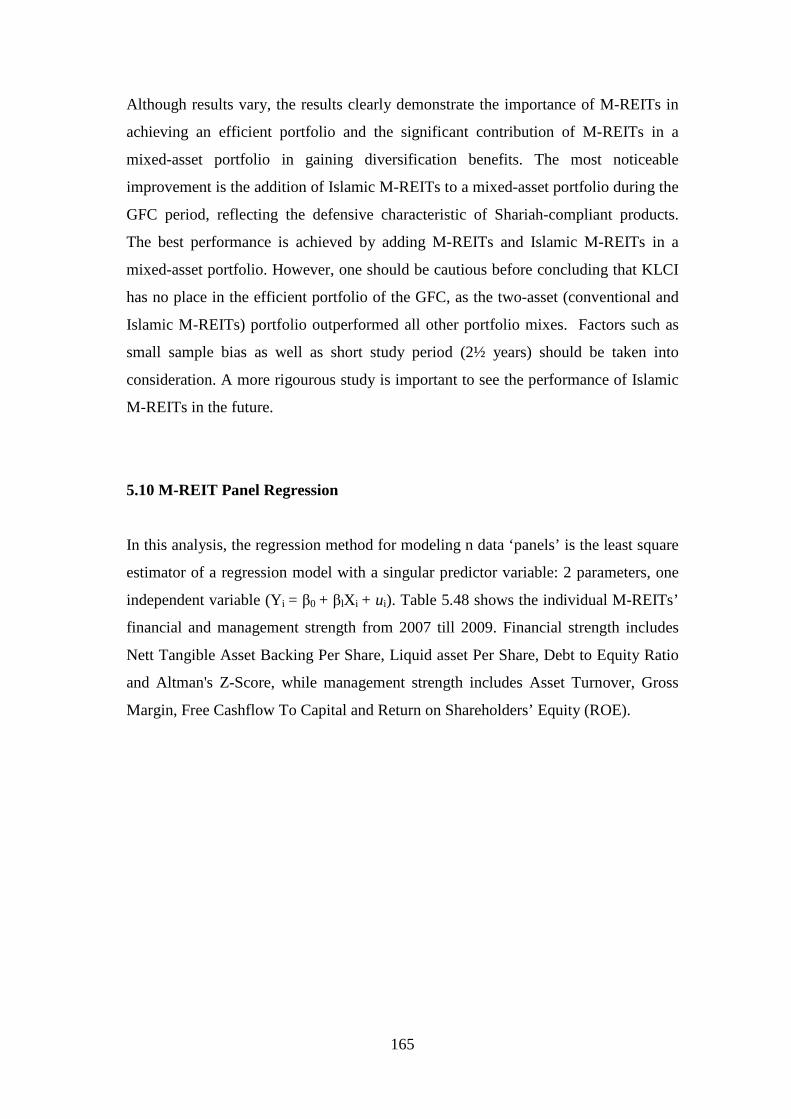
165
Although results vary, the results clearly demonstrate the importance of M-REITs in
achieving an efficient portfolio and the significant contribution of M-REITs in a
mixed-asset portfolio in gaining diversification benefits. The most noticeable
improvement is the addition of Islamic M-REITs to a mixed-asset portfolio during the
GFC period, reflecting the defensive characteristic of Shariah-compliant products.
The best performance is achieved by adding M-REITs and Islamic M-REITs in a
mixed-asset portfolio. However, one should be cautious before concluding that KLCI
has no place in the efficient portfolio of the GFC, as the two-asset (conventional and
Islamic M-REITs) portfolio outperformed all other portfolio mixes. Factors such as
small sample bias as well as short study period (2½ years) should be taken into
consideration. A more rigourous study is important to see the performance of Islamic
M-REITs in the future.
5.10 M-REIT Panel Regression
In this analysis, the regression method for modeling n data ‘panels’ is the least square
estimator of a regression model with a singular predictor variable: 2 parameters, one
independent variable (Yi = β0 + βlXi + ui). Table 5.48 shows the individual M-REITs’
financial and management strength from 2007 till 2009. Financial strength includes
Nett Tangible Asset Backing Per Share, Liquid asset Per Share, Debt to Equity Ratio
and Altman's Z-Score, while management strength includes Asset Turnover, Gross
Margin, Free Cashflow To Capital and Return on Shareholders’ Equity (ROE).
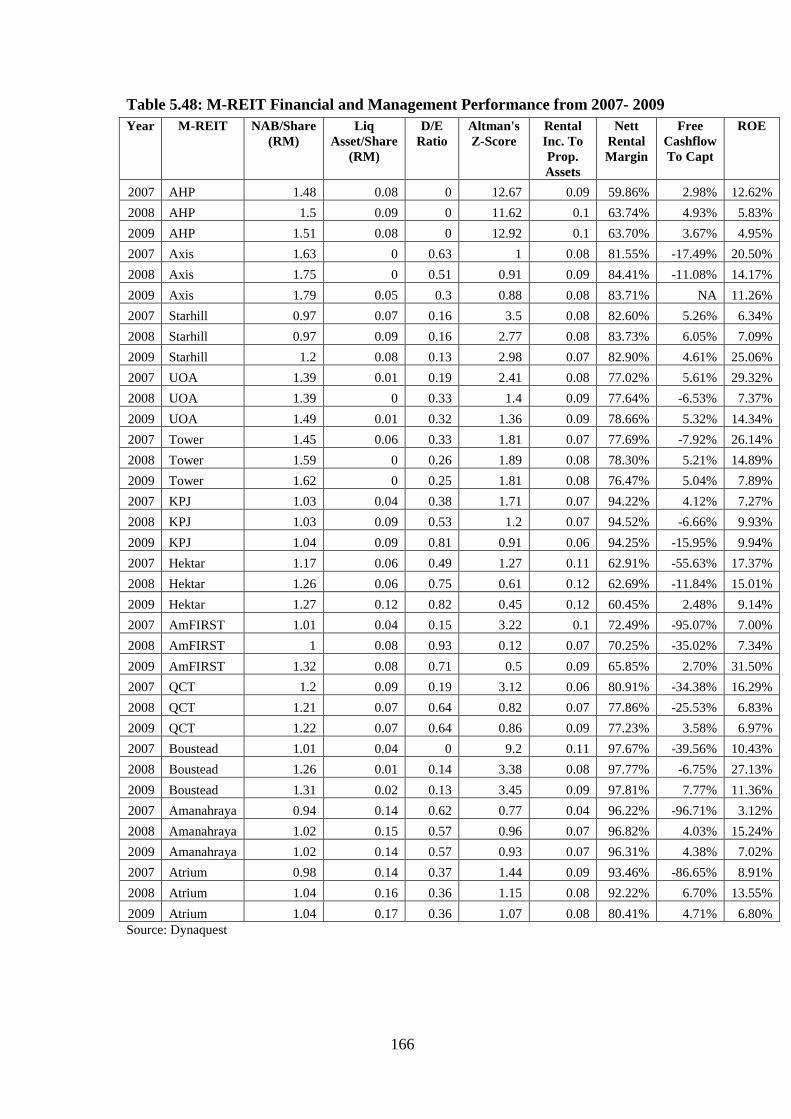
166
Table 5.48: M-REIT Financial and Management Performance from 2007- 2009
Year M-REIT NAB/Share(RM)
LiqAsset/Share
(RM)
D/ERatio
Altman'sZ-Score
RentalInc. ToProp.Assets
NettRentalMargin
FreeCashflowTo Capt
ROE
2007 AHP 1.48 0.08 0 12.67 0.09 59.86% 2.98% 12.62%
2008 AHP 1.5 0.09 0 11.62 0.1 63.74% 4.93% 5.83%
2009 AHP 1.51 0.08 0 12.92 0.1 63.70% 3.67% 4.95%
2007 Axis 1.63 0 0.63 1 0.08 81.55% -17.49% 20.50%
2008 Axis 1.75 0 0.51 0.91 0.09 84.41% -11.08% 14.17%
2009 Axis 1.79 0.05 0.3 0.88 0.08 83.71% NA 11.26%
2007 Starhill 0.97 0.07 0.16 3.5 0.08 82.60% 5.26% 6.34%
2008 Starhill 0.97 0.09 0.16 2.77 0.08 83.73% 6.05% 7.09%
2009 Starhill 1.2 0.08 0.13 2.98 0.07 82.90% 4.61% 25.06%
2007 UOA 1.39 0.01 0.19 2.41 0.08 77.02% 5.61% 29.32%
2008 UOA 1.39 0 0.33 1.4 0.09 77.64% -6.53% 7.37%
2009 UOA 1.49 0.01 0.32 1.36 0.09 78.66% 5.32% 14.34%
2007 Tower 1.45 0.06 0.33 1.81 0.07 77.69% -7.92% 26.14%
2008 Tower 1.59 0 0.26 1.89 0.08 78.30% 5.21% 14.89%
2009 Tower 1.62 0 0.25 1.81 0.08 76.47% 5.04% 7.89%
2007 KPJ 1.03 0.04 0.38 1.71 0.07 94.22% 4.12% 7.27%
2008 KPJ 1.03 0.09 0.53 1.2 0.07 94.52% -6.66% 9.93%
2009 KPJ 1.04 0.09 0.81 0.91 0.06 94.25% -15.95% 9.94%
2007 Hektar 1.17 0.06 0.49 1.27 0.11 62.91% -55.63% 17.37%
2008 Hektar 1.26 0.06 0.75 0.61 0.12 62.69% -11.84% 15.01%
2009 Hektar 1.27 0.12 0.82 0.45 0.12 60.45% 2.48% 9.14%
2007 AmFIRST 1.01 0.04 0.15 3.22 0.1 72.49% -95.07% 7.00%
2008 AmFIRST 1 0.08 0.93 0.12 0.07 70.25% -35.02% 7.34%
2009 AmFIRST 1.32 0.08 0.71 0.5 0.09 65.85% 2.70% 31.50%
2007 QCT 1.2 0.09 0.19 3.12 0.06 80.91% -34.38% 16.29%
2008 QCT 1.21 0.07 0.64 0.82 0.07 77.86% -25.53% 6.83%
2009 QCT 1.22 0.07 0.64 0.86 0.09 77.23% 3.58% 6.97%
2007 Boustead 1.01 0.04 0 9.2 0.11 97.67% -39.56% 10.43%
2008 Boustead 1.26 0.01 0.14 3.38 0.08 97.77% -6.75% 27.13%
2009 Boustead 1.31 0.02 0.13 3.45 0.09 97.81% 7.77% 11.36%
2007 Amanahraya 0.94 0.14 0.62 0.77 0.04 96.22% -96.71% 3.12%
2008 Amanahraya 1.02 0.15 0.57 0.96 0.07 96.82% 4.03% 15.24%
2009 Amanahraya 1.02 0.14 0.57 0.93 0.07 96.31% 4.38% 7.02%
2007 Atrium 0.98 0.14 0.37 1.44 0.09 93.46% -86.65% 8.91%
2008 Atrium 1.04 0.16 0.36 1.15 0.08 92.22% 6.70% 13.55%
2009 Atrium 1.04 0.17 0.36 1.07 0.08 80.41% 4.71% 6.80%Source: Dynaquest
167
According to Table 5.48, AHP has the overall highest value of Z-Score (12.40) and
the highest in yearly comparison of individual companies which indicates it is the
strongest company financially for 2007 (12.67), 2008 (11.62) and 2009 (12.92). For
the same years assessed, Axis, Hektar, Tower, KPJ, Amanahraya, Atrium had a score
below 2.00 for each year which is considered questionable while Starhill has a score
of above 2.00 for which is regarded as good. UOA, QCT, Boustead and Amfirst have
a mixed financial strength for their companies.
In terms of free cashflow to capital, Starhill is more efficient in using its capital with
an overall highest ratio of 5.31% from 2007 to 2009. In yearly comparison of
individual companies, UOA has the highest ratio of 5.61% in 2007, while Atrium has
the highest ratio in 2008 (6.70%). In 2009, Boustead has the highest ratio of 7.77% in
comparison to other companies. The overall least efficient company in using its
capital is AmFirst (-42.46%). In yearly comparison of individual companies,
Amanahraya has the lowest ratio of -96.71% in 2007, while AmFirst has the lowest
ratio in 2008 (-35.02%). In 2009, KPJ has the lowest ratio of 15.95% in comparison to
other companies.
From 2007 to 2009, KPJ is the only company with an ROE less than 10% for each
year. This probably means the company is poor in managing assets or high in
revaluing its assets or both. For the same years assessed individually, Axis REIT and
Al-Hadharah Boustead REIT have more than 10% of ROE for each year assessed
which means the management of the company is making use of the assets well in
generating return for its shareholders.
According to the Debt per Equity Ratio, the smaller the ratio, the stronger is the
company. From 2007 to 2009, AHP is financially the strongest company overall and
for each year assessed. The least strong company overall is Hektar (0.69) and has the
highest ratio of 0.82 in 2009. In comparing individual companies yearly, Axis (0.63)
and AmFirst (0.93) are the least strong company in 2007 and 2008 respectively.
To determine the high financial strength of a company according to Liquid Asset per
Share, Atrium is financially the strongest company overall and for each year assessed
in 2007 (0.14), 2008 (0.16) and 2009 (0.17). The overall least strong company
financially is UOA (0.01). In comparing individual companies yearly, Axis and
168
Tower is the least strong company financially in 2007 and 2009 respectively. Both
companies together with UOA is the least strong company financially in 2008.
In potential of obtaining more profit and better quality management, Boustead has the
highest gross margin overall (97.75%) and for each year assessed in 2007 (97.67%),
2008 (97.77%) and 2009 (97.81%). While Hektar have the lowest margin of 62.02%
overall. In comparing individual companies yearly, AHP has the lowest margin of
59.86% and 63.7% in 2007 and 2009 respectively while Hektar has the lowest margin
of 62.69% in 2008.
The higher a company’s total asset turnover indicates the efficiency of its assets being
used to generate sales. Hektar has the overall highest turnover ratio of 0.12 and the
highest turnover ratio in 2008 (0.12) and 2009 (0.12). Both Hektar and Boustead have
the highest turnover ratio in 2007. Overall, Amanahraya has the lowest turnover ratio
of 0.06 and the lowest turnover ratio in 2007 (0.04). In 2008, KPJ, AmFirst and QCT
have the lowest turnover ratio of 0.07 while KPJ still has the lowest ratio of 0.06 in
2009.
When using Yi = β0 + βlXi + ui as the regression equation, dependant variable (Y), then
constant term β0 (C) and then independent variables (Xs) should be typed in EVIEWS
estimation equation dialogue box (see Figure 5.13). In this case, the independent
variable (X) is year as it influences dependent variables (i.e ROE, nett rental margin).
Dependent variables (Y) are observed which is dependent to the changing year. The
task is to find value for β0 and βl (the slope, also called the regression coefficient)
when “u” representing the error or random disturbance is not accounted for by the
equation. If values for these coefficients determined, βl describes the effect of a unit
increase in X on Y. Often a regression line is a linear approximation to an underlying
relationship and the intercept β0 only has a useful meaning if observations around X=0
occur in the data.
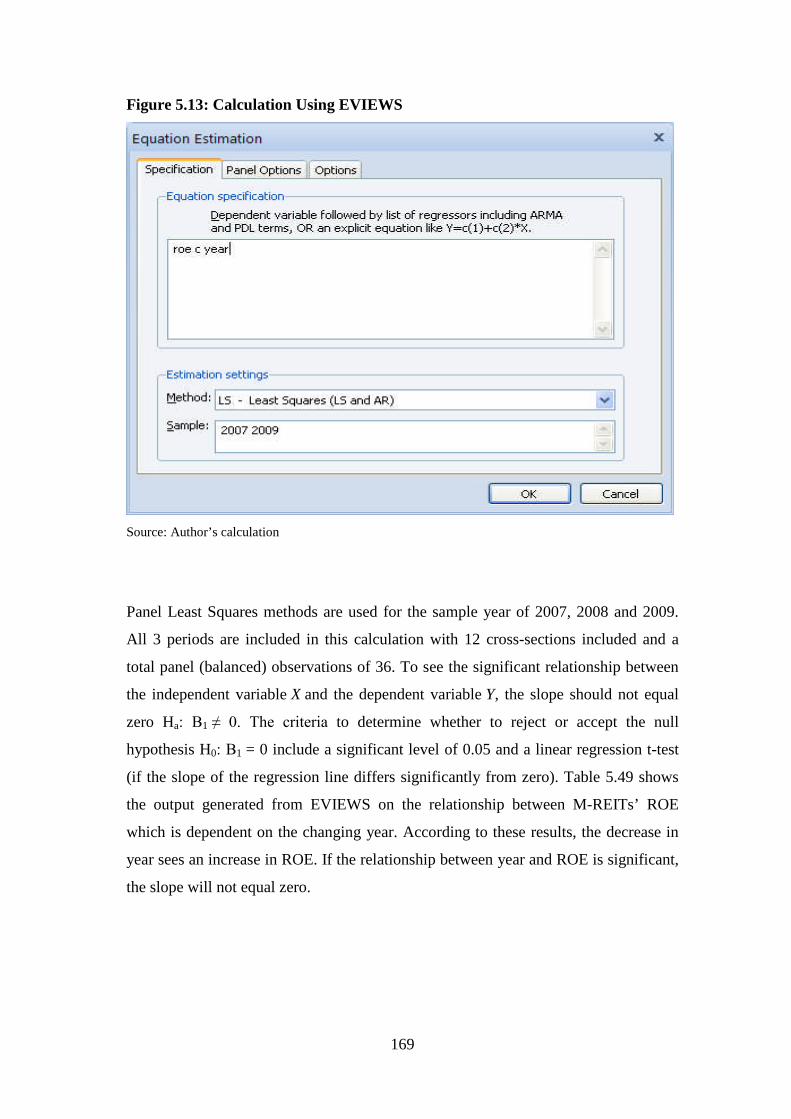
169
Figure 5.13: Calculation Using EVIEWS
Source: Author’s calculation
Panel Least Squares methods are used for the sample year of 2007, 2008 and 2009.
All 3 periods are included in this calculation with 12 cross-sections included and a
total panel (balanced) observations of 36. To see the significant relationship between
the independent variable X and the dependent variable Y, the slope should not equal
zero Ha: Β1 ≠ 0. The criteria to determine whether to reject or accept the null
hypothesis H0: Β1 = 0 include a significant level of 0.05 and a linear regression t-test
(if the slope of the regression line differs significantly from zero). Table 5.49 shows
the output generated from EVIEWS on the relationship between M-REITs’ ROE
which is dependent on the changing year. According to these results, the decrease in
year sees an increase in ROE. If the relationship between year and ROE is significant,
the slope will not equal zero.
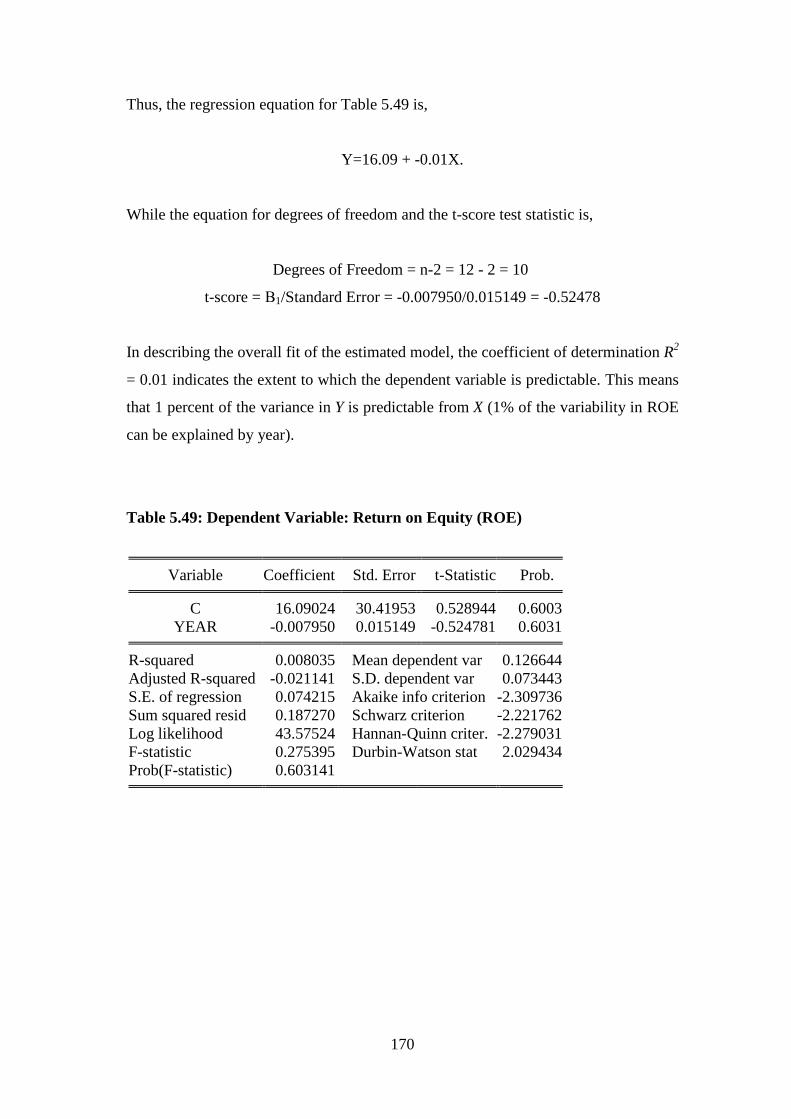
170
Thus, the regression equation for Table 5.49 is,
Y=16.09 + -0.01X.
While the equation for degrees of freedom and the t-score test statistic is,
Degrees of Freedom = n-2 = 12 - 2 = 10
t-score = Β1/Standard Error = -0.007950/0.015149 = -0.52478
In describing the overall fit of the estimated model, the coefficient of determination R2
= 0.01 indicates the extent to which the dependent variable is predictable. This means
that 1 percent of the variance in Y is predictable from X (1% of the variability in ROE
can be explained by year).
Table 5.49: Dependent Variable: Return on Equity (ROE)
Variable Coefficient Std. Error t-Statistic Prob.
C 16.09024 30.41953 0.528944 0.6003YEAR -0.007950 0.015149 -0.524781 0.6031
R-squared 0.008035 Mean dependent var 0.126644Adjusted R-squared -0.021141 S.D. dependent var 0.073443S.E. of regression 0.074215 Akaike info criterion -2.309736Sum squared resid 0.187270 Schwarz criterion -2.221762Log likelihood 43.57524 Hannan-Quinn criter. -2.279031F-statistic 0.275395 Durbin-Watson stat 2.029434Prob(F-statistic) 0.603141
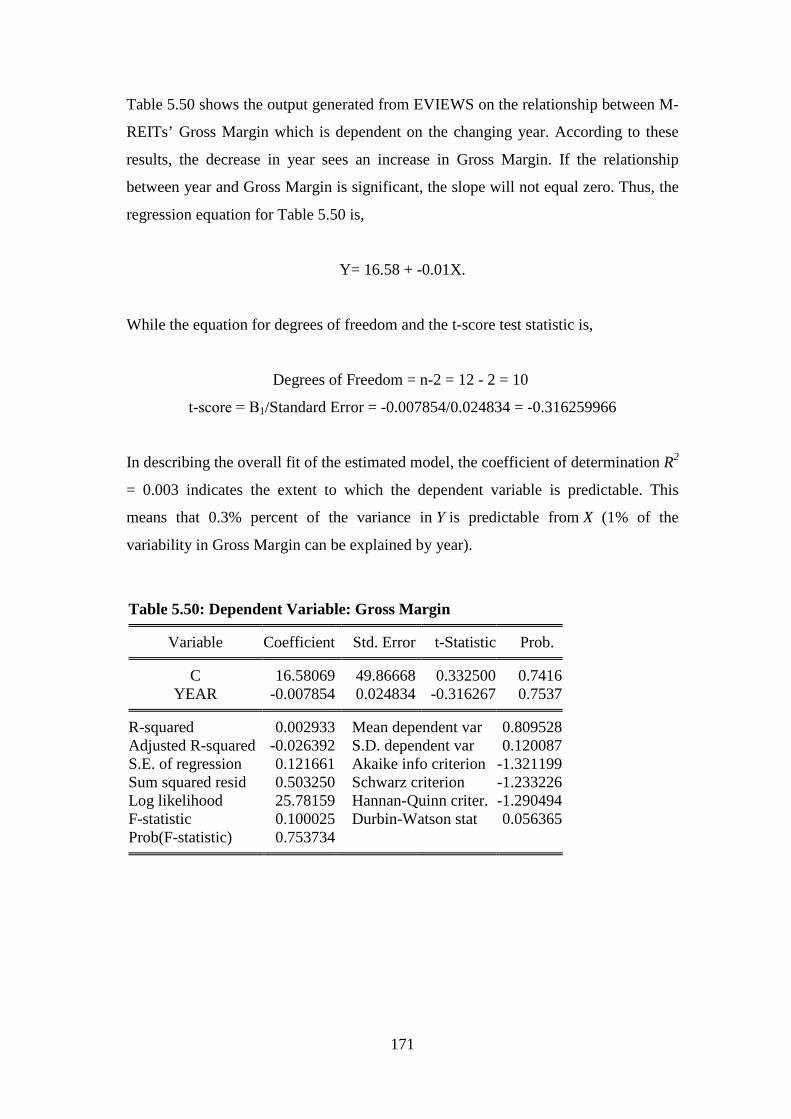
171
Table 5.50 shows the output generated from EVIEWS on the relationship between M-
REITs’ Gross Margin which is dependent on the changing year. According to these
results, the decrease in year sees an increase in Gross Margin. If the relationship
between year and Gross Margin is significant, the slope will not equal zero. Thus, the
regression equation for Table 5.50 is,
Y= 16.58 + -0.01X.
While the equation for degrees of freedom and the t-score test statistic is,
Degrees of Freedom = n-2 = 12 - 2 = 10
t-score = Β1/Standard Error = -0.007854/0.024834 = -0.316259966
In describing the overall fit of the estimated model, the coefficient of determination R2
= 0.003 indicates the extent to which the dependent variable is predictable. This
means that 0.3% percent of the variance in Y is predictable from X (1% of the
variability in Gross Margin can be explained by year).
Table 5.50: Dependent Variable: Gross Margin
Variable Coefficient Std. Error t-Statistic Prob.
C 16.58069 49.86668 0.332500 0.7416YEAR -0.007854 0.024834 -0.316267 0.7537
R-squared 0.002933 Mean dependent var 0.809528Adjusted R-squared -0.026392 S.D. dependent var 0.120087S.E. of regression 0.121661 Akaike info criterion -1.321199Sum squared resid 0.503250 Schwarz criterion -1.233226Log likelihood 25.78159 Hannan-Quinn criter. -1.290494F-statistic 0.100025 Durbin-Watson stat 0.056365Prob(F-statistic) 0.753734
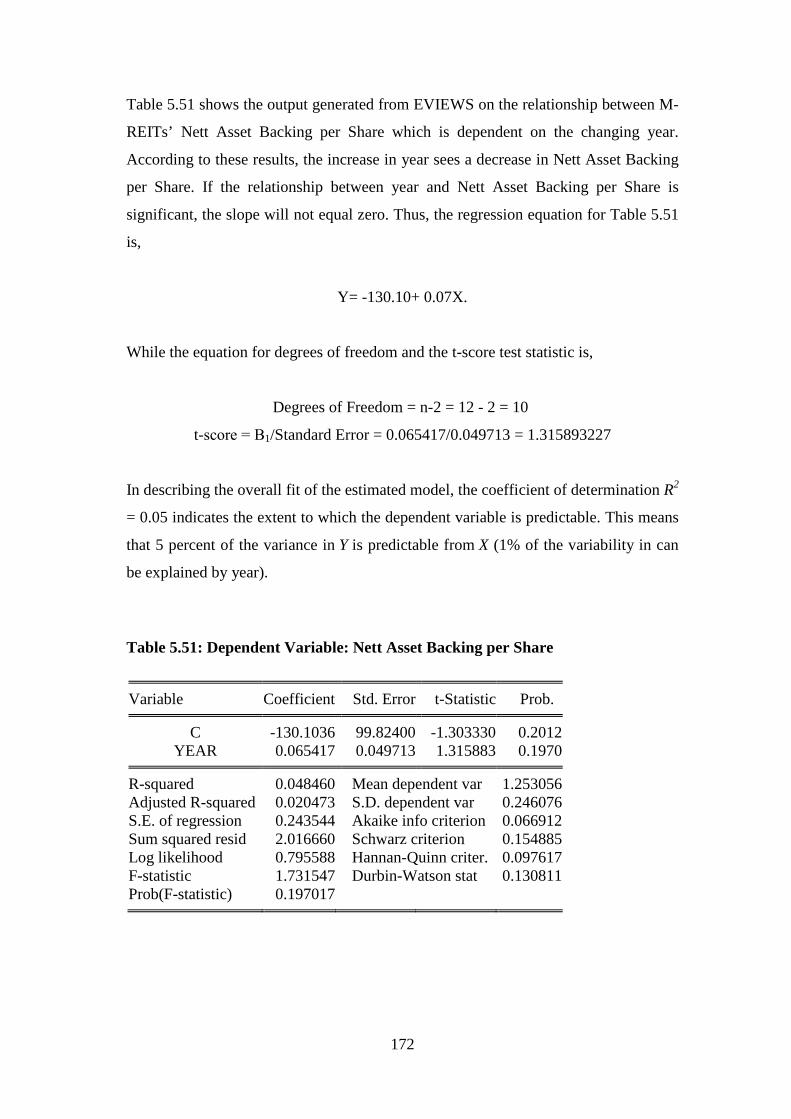
172
Table 5.51 shows the output generated from EVIEWS on the relationship between M-
REITs’ Nett Asset Backing per Share which is dependent on the changing year.
According to these results, the increase in year sees a decrease in Nett Asset Backing
per Share. If the relationship between year and Nett Asset Backing per Share is
significant, the slope will not equal zero. Thus, the regression equation for Table 5.51
is,
Y= -130.10+ 0.07X.
While the equation for degrees of freedom and the t-score test statistic is,
Degrees of Freedom = n-2 = 12 - 2 = 10
t-score = Β1/Standard Error = 0.065417/0.049713 = 1.315893227
In describing the overall fit of the estimated model, the coefficient of determination R2
= 0.05 indicates the extent to which the dependent variable is predictable. This means
that 5 percent of the variance in Y is predictable from X (1% of the variability in can
be explained by year).
Table 5.51: Dependent Variable: Nett Asset Backing per Share
Variable Coefficient Std. Error t-Statistic Prob.
C -130.1036 99.82400 -1.303330 0.2012YEAR 0.065417 0.049713 1.315883 0.1970
R-squared 0.048460 Mean dependent var 1.253056Adjusted R-squared 0.020473 S.D. dependent var 0.246076S.E. of regression 0.243544 Akaike info criterion 0.066912Sum squared resid 2.016660 Schwarz criterion 0.154885Log likelihood 0.795588 Hannan-Quinn criter. 0.097617F-statistic 1.731547 Durbin-Watson stat 0.130811Prob(F-statistic) 0.197017
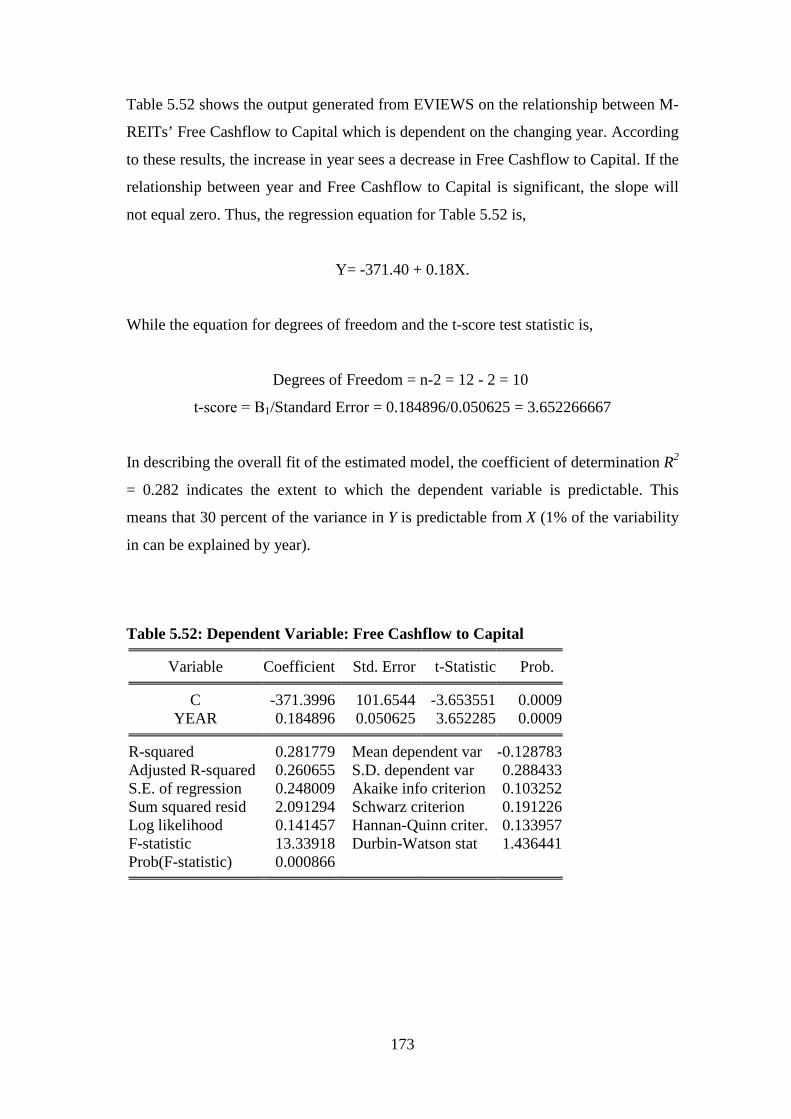
173
Table 5.52 shows the output generated from EVIEWS on the relationship between M-
REITs’ Free Cashflow to Capital which is dependent on the changing year. According
to these results, the increase in year sees a decrease in Free Cashflow to Capital. If the
relationship between year and Free Cashflow to Capital is significant, the slope will
not equal zero. Thus, the regression equation for Table 5.52 is,
Y= -371.40 + 0.18X.
While the equation for degrees of freedom and the t-score test statistic is,
Degrees of Freedom = n-2 = 12 - 2 = 10
t-score = Β1/Standard Error = 0.184896/0.050625 = 3.652266667
In describing the overall fit of the estimated model, the coefficient of determination R2
= 0.282 indicates the extent to which the dependent variable is predictable. This
means that 30 percent of the variance in Y is predictable from X (1% of the variability
in can be explained by year).
Table 5.52: Dependent Variable: Free Cashflow to Capital
Variable Coefficient Std. Error t-Statistic Prob.
C -371.3996 101.6544 -3.653551 0.0009YEAR 0.184896 0.050625 3.652285 0.0009
R-squared 0.281779 Mean dependent var -0.128783Adjusted R-squared 0.260655 S.D. dependent var 0.288433S.E. of regression 0.248009 Akaike info criterion 0.103252Sum squared resid 2.091294 Schwarz criterion 0.191226Log likelihood 0.141457 Hannan-Quinn criter. 0.133957F-statistic 13.33918 Durbin-Watson stat 1.436441Prob(F-statistic) 0.000866

174
Table 5.53 shows the output generated from EVIEWS on the relationship between M-
REITs’ Liquid Asser per Share which is dependent on the changing year. According
to these results, the increase in year sees a decrease in Liquid Asser per Share. If the
relationship between year and Liquid Asser per Share is significant, the slope will not
equal zero. Thus, the regression equation for Table 5.53 is,
Y= -11.64+ 0.01X.
While the equation for degrees of freedom and the t-score test statistic is,
Degrees of Freedom = n-2 = 12 - 2 = 10
t-score = Β1/Standard Error = 0.005833/0.010178 = 0.573098841
In describing the overall fit of the estimated model, the coefficient of determination R2
= 0.01 indicates the extent to which the dependent variable is predictable. This means
that 1 percent of the variance in Y is predictable from X (1% of the variability in can
be explained by year).
Table 5.53: Dependent Variable: Liquid Asset per Share
Variable Coefficient Std. Error t-Statistic Prob.
C -11.64444 20.43840 -0.569734 0.5726YEAR 0.005833 0.010178 0.573104 0.5703
R-squared 0.009568 Mean dependent var 0.068889Adjusted R-squared -0.019563 S.D. dependent var 0.049384S.E. of regression 0.049864 Akaike info criterion -3.105074Sum squared resid 0.084539 Schwarz criterion -3.017101Log likelihood 57.89134 Hannan-Quinn criter. -3.074369F-statistic 0.328448 Durbin-Watson stat 0.272253Prob(F-statistic) 0.570345
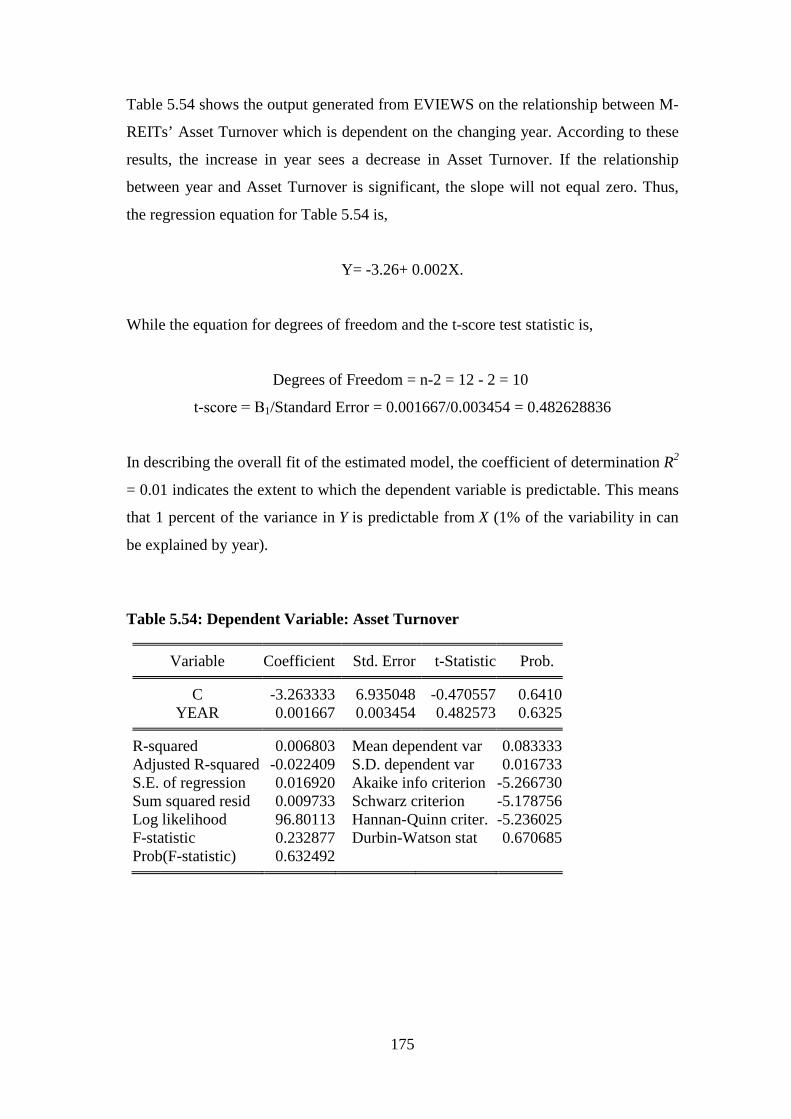
175
Table 5.54 shows the output generated from EVIEWS on the relationship between M-
REITs’ Asset Turnover which is dependent on the changing year. According to these
results, the increase in year sees a decrease in Asset Turnover. If the relationship
between year and Asset Turnover is significant, the slope will not equal zero. Thus,
the regression equation for Table 5.54 is,
Y= -3.26+ 0.002X.
While the equation for degrees of freedom and the t-score test statistic is,
Degrees of Freedom = n-2 = 12 - 2 = 10
t-score = Β1/Standard Error = 0.001667/0.003454 = 0.482628836
In describing the overall fit of the estimated model, the coefficient of determination R2
= 0.01 indicates the extent to which the dependent variable is predictable. This means
that 1 percent of the variance in Y is predictable from X (1% of the variability in can
be explained by year).
Table 5.54: Dependent Variable: Asset Turnover
Variable Coefficient Std. Error t-Statistic Prob.
C -3.263333 6.935048 -0.470557 0.6410YEAR 0.001667 0.003454 0.482573 0.6325
R-squared 0.006803 Mean dependent var 0.083333Adjusted R-squared -0.022409 S.D. dependent var 0.016733S.E. of regression 0.016920 Akaike info criterion -5.266730Sum squared resid 0.009733 Schwarz criterion -5.178756Log likelihood 96.80113 Hannan-Quinn criter. -5.236025F-statistic 0.232877 Durbin-Watson stat 0.670685Prob(F-statistic) 0.632492
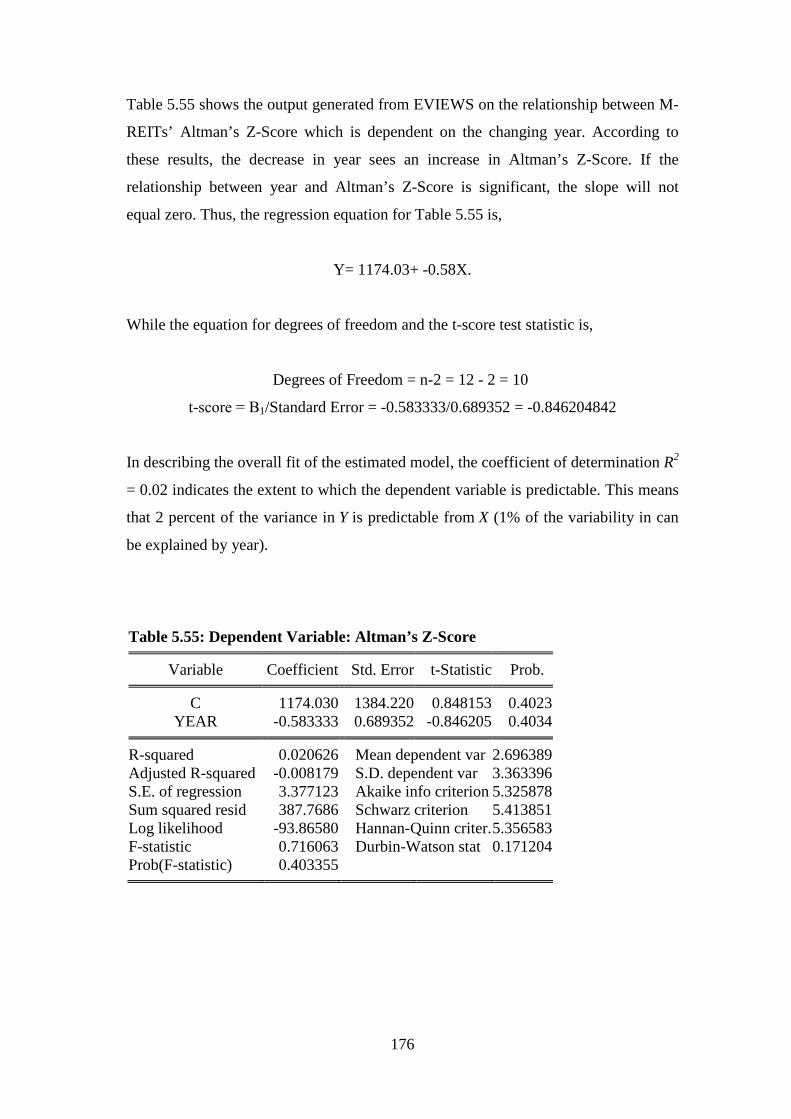
176
Table 5.55 shows the output generated from EVIEWS on the relationship between M-
REITs’ Altman’s Z-Score which is dependent on the changing year. According to
these results, the decrease in year sees an increase in Altman’s Z-Score. If the
relationship between year and Altman’s Z-Score is significant, the slope will not
equal zero. Thus, the regression equation for Table 5.55 is,
Y= 1174.03+ -0.58X.
While the equation for degrees of freedom and the t-score test statistic is,
Degrees of Freedom = n-2 = 12 - 2 = 10
t-score = Β1/Standard Error = -0.583333/0.689352 = -0.846204842
In describing the overall fit of the estimated model, the coefficient of determination R2
= 0.02 indicates the extent to which the dependent variable is predictable. This means
that 2 percent of the variance in Y is predictable from X (1% of the variability in can
be explained by year).
Table 5.55: Dependent Variable: Altman’s Z-Score
Variable Coefficient Std. Error t-Statistic Prob.
C 1174.030 1384.220 0.848153 0.4023YEAR -0.583333 0.689352 -0.846205 0.4034
R-squared 0.020626 Mean dependent var 2.696389Adjusted R-squared -0.008179 S.D. dependent var 3.363396S.E. of regression 3.377123 Akaike info criterion 5.325878Sum squared resid 387.7686 Schwarz criterion 5.413851Log likelihood -93.86580 Hannan-Quinn criter.5.356583F-statistic 0.716063 Durbin-Watson stat 0.171204Prob(F-statistic) 0.403355
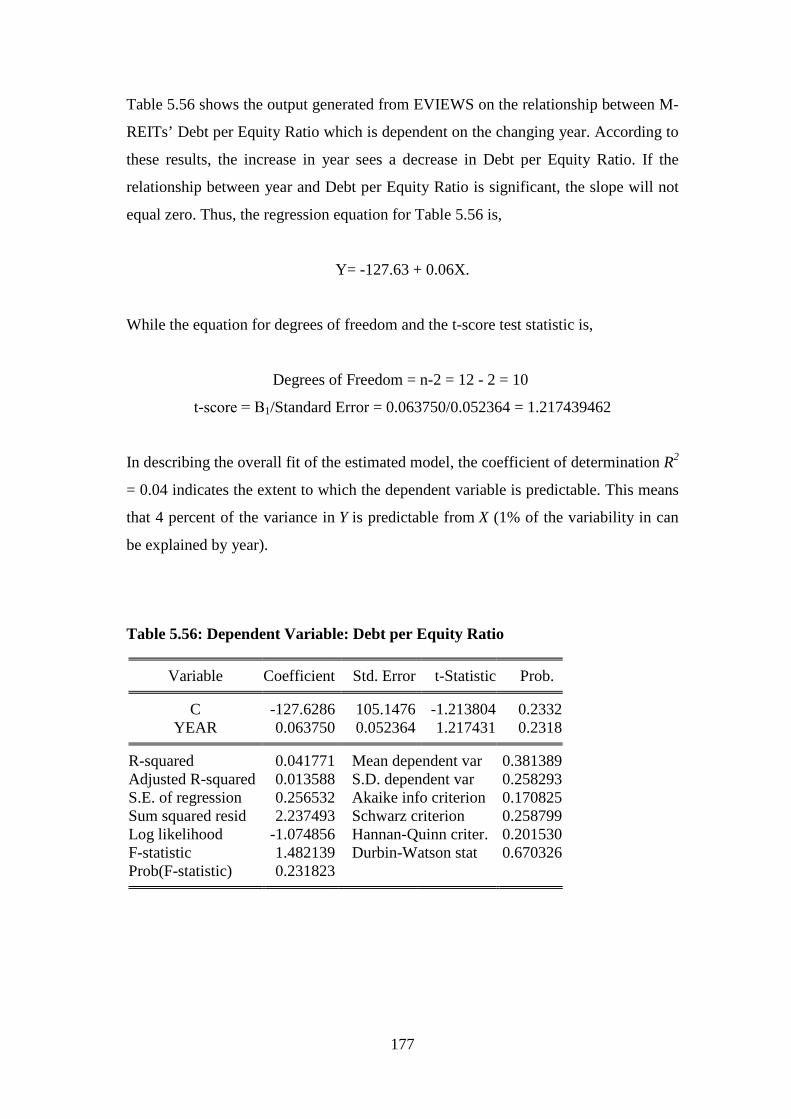
177
Table 5.56 shows the output generated from EVIEWS on the relationship between M-
REITs’ Debt per Equity Ratio which is dependent on the changing year. According to
these results, the increase in year sees a decrease in Debt per Equity Ratio. If the
relationship between year and Debt per Equity Ratio is significant, the slope will not
equal zero. Thus, the regression equation for Table 5.56 is,
Y= -127.63 + 0.06X.
While the equation for degrees of freedom and the t-score test statistic is,
Degrees of Freedom = n-2 = 12 - 2 = 10
t-score = Β1/Standard Error = 0.063750/0.052364 = 1.217439462
In describing the overall fit of the estimated model, the coefficient of determination R2
= 0.04 indicates the extent to which the dependent variable is predictable. This means
that 4 percent of the variance in Y is predictable from X (1% of the variability in can
be explained by year).
Table 5.56: Dependent Variable: Debt per Equity Ratio
Variable Coefficient Std. Error t-Statistic Prob.
C -127.6286 105.1476 -1.213804 0.2332YEAR 0.063750 0.052364 1.217431 0.2318
R-squared 0.041771 Mean dependent var 0.381389Adjusted R-squared 0.013588 S.D. dependent var 0.258293S.E. of regression 0.256532 Akaike info criterion 0.170825Sum squared resid 2.237493 Schwarz criterion 0.258799Log likelihood -1.074856 Hannan-Quinn criter. 0.201530F-statistic 1.482139 Durbin-Watson stat 0.670326Prob(F-statistic) 0.231823
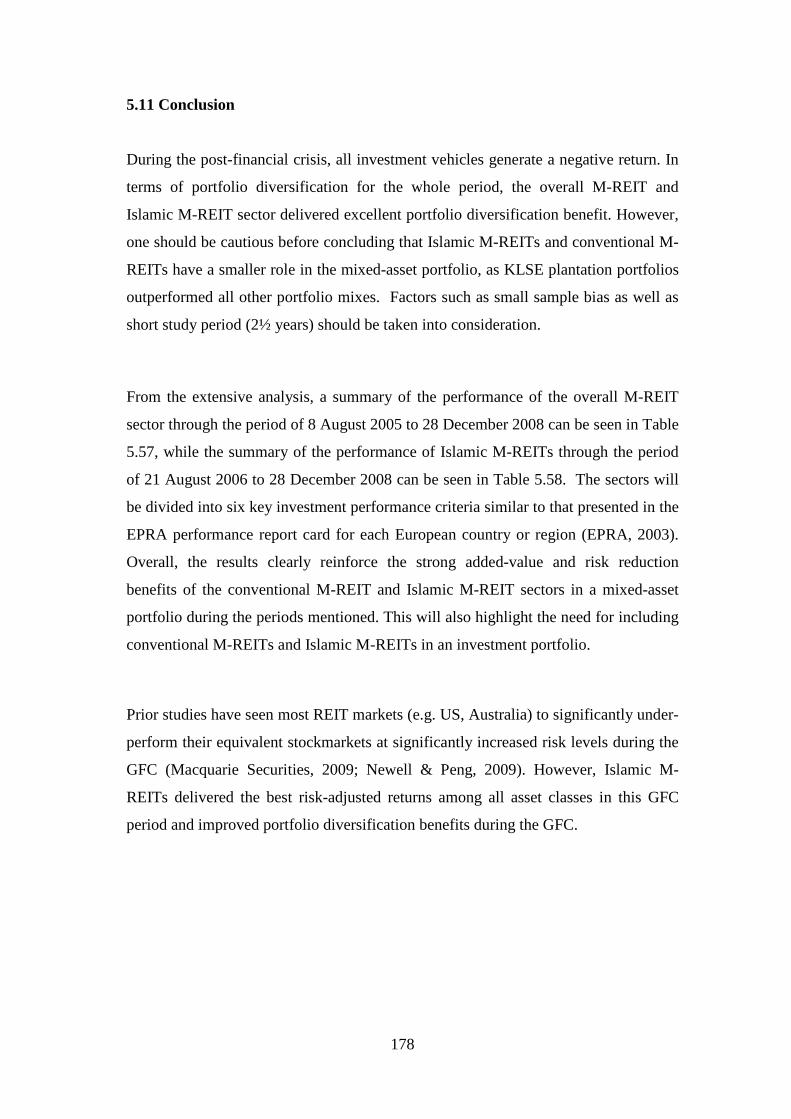
178
5.11 Conclusion
During the post-financial crisis, all investment vehicles generate a negative return. In
terms of portfolio diversification for the whole period, the overall M-REIT and
Islamic M-REIT sector delivered excellent portfolio diversification benefit. However,
one should be cautious before concluding that Islamic M-REITs and conventional M-
REITs have a smaller role in the mixed-asset portfolio, as KLSE plantation portfolios
outperformed all other portfolio mixes. Factors such as small sample bias as well as
short study period (2½ years) should be taken into consideration.
From the extensive analysis, a summary of the performance of the overall M-REIT
sector through the period of 8 August 2005 to 28 December 2008 can be seen in Table
5.57, while the summary of the performance of Islamic M-REITs through the period
of 21 August 2006 to 28 December 2008 can be seen in Table 5.58. The sectors will
be divided into six key investment performance criteria similar to that presented in the
EPRA performance report card for each European country or region (EPRA, 2003).
Overall, the results clearly reinforce the strong added-value and risk reduction
benefits of the conventional M-REIT and Islamic M-REIT sectors in a mixed-asset
portfolio during the periods mentioned. This will also highlight the need for including
conventional M-REITs and Islamic M-REITs in an investment portfolio.
Prior studies have seen most REIT markets (e.g. US, Australia) to significantly under-
perform their equivalent stockmarkets at significantly increased risk levels during the
GFC (Macquarie Securities, 2009; Newell & Peng, 2009). However, Islamic M-
REITs delivered the best risk-adjusted returns among all asset classes in this GFC
period and improved portfolio diversification benefits during the GFC.
179
Table 5.57: Overall M-REIT and Performance Report Card: 8 August 2005 – 28
December 2008
*N/A = difficulties interpreting negative return to risk ratio
Table 5.58: Islamic M-REIT performance report card: 21 August 2006 – 28
December 2008
*N/A = difficulties interpreting negative return to risk ratio
Sectors Superioraverageannualreturns
Lowerannual
risk
Superiorrisk
adjustedreturns
Enhancedportfolio
diversificationbenefits
Superiorrisk
adjustedportfolioreturns
Pre Post Pre Post Pre Post Pre Post Pre PostOverallM-REIT × × × N/A
KLCI × × N/A
KLSEProperty × × × × N/A
KLSEPlantation × × N/A
KLSEFinance × × × × N/A
Sectors Superioraverageannualreturns
Lowerannual
risk
Superiorrisk
adjustedreturns
Enhancedportfolio
diversificationbenefits
Superiorrisk
adjustedportfolioreturns*
Pre Post Pre Post Pre Post Pre Post Pre PostOverallM-REIT × × × N/A N/A
IslamicM-REIT × × × N/A
ConventionalM-REIT × × N/A
KLCI × × × × × × × N/A
KLSE Property × × × × N/A
KLSEPlantation × × × N/A
KLSE Finance × × × × × N/A
180
CHAPTER 6
ANALYSIS OF THE M-REIT SURVEY
6.1 Introduction
The M-REIT survey listing the potential factors affecting the development of
Malaysian REITs was conducted between October 2007 and December 2007. Three
similar questionnaires have been developed and personal interviews conducted for
three distinct groups of participants; REIT managers, fund managers and property
advisors. A copy of each survey and covering letter are attached in Appendix I, II and
III. The common questions in the questionnaire included:
31 specific factors on the ongoing success of Malaysian REITs
31 specific factors on the current performance of Malaysian REITs
Qualitative questions regarding Malaysian REITs.
A total of 150 surveys had been sent out and a total of 96 completed surveys were
returned, which consisted of local senior and experienced REIT managers (11), fund
managers (55) and property advisors (30) in Malaysia. Due to limitations on time and
location, several interviews are conducted face to face, while others were by phone
and by email. No differences in the quality of responses were seen to be evident with
these three methods, based on the conduct of these surveys. This gave an overall
response rate of 64% which is considered highly satisfactory, given the difficulties of
conducting surveys with senior executives; particularly in Asia. The percentage and
response rate within each group was also relatively high for REIT managers (85%),
fund managers (65%) and property advisors (58%). The quality of survey respondents
was also excellent, with all respondents consisting of staff in senior positions in their
organisation; this further reinforces the quality of the survey responses. The following
181
sections highlight the survey results and differences between the three groups of
participants. The identities of respondents are anonymous. The value of conducting
these surveys is to give a better view in respect of the Malaysian REIT industry.
These 3 groups are especially selected as they represent professional workers working
closely with the Malaysian REIT industry.
6.2 Importance of Factors Regarding the Current Performance of M-REITs
This will be presented starting with overall results; then for the 3 groups separately;
followed by a comparison of the 3 groups. The comparison between the 3 groups will
include rank correlation and ANOVA analyses.
6.2.1 Overall
Table 6.1 presents the average scores and respective ranks for the 31 specific issues
for the 96 survey respondents relating to the current performance of M-REITs. This is
presented for the overall respondents, as well as for the three groups of participants.
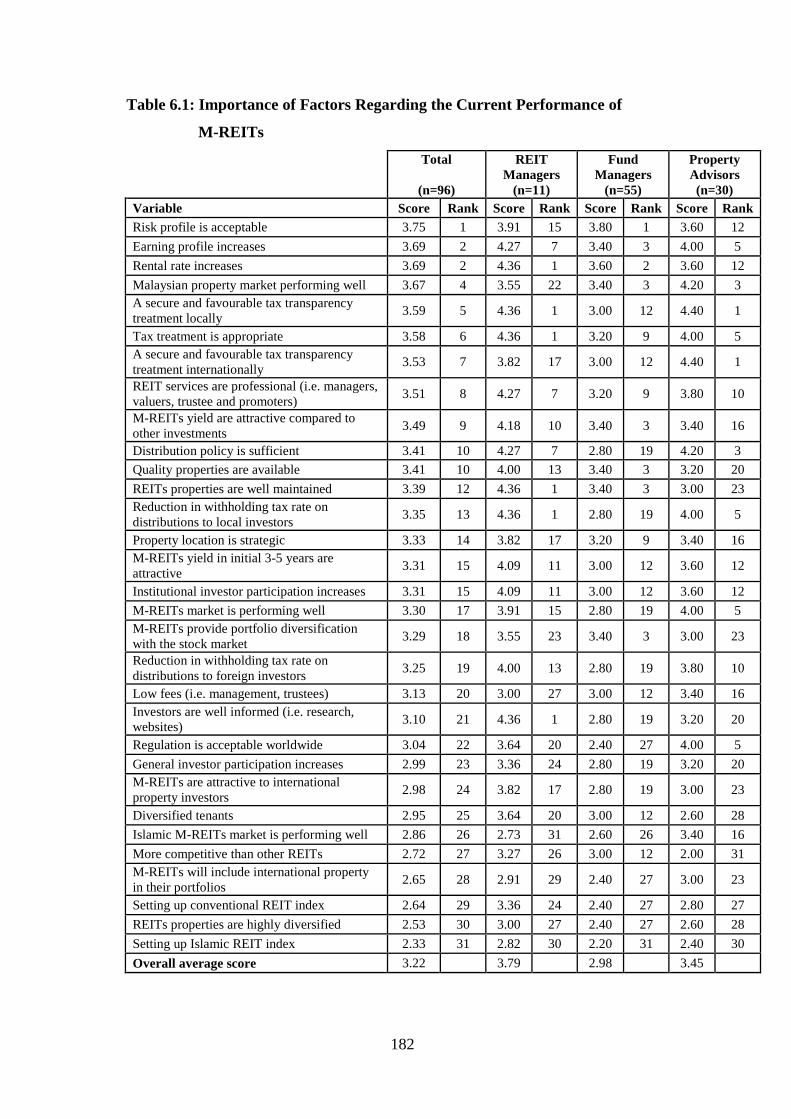
182
Table 6.1: Importance of Factors Regarding the Current Performance of
M-REITs
Total
(n=96)
REITManagers
(n=11)
FundManagers
(n=55)
PropertyAdvisors(n=30)
Variable Score Rank Score Rank Score Rank Score Rank
Risk profile is acceptable 3.75 1 3.91 15 3.80 1 3.60 12
Earning profile increases 3.69 2 4.27 7 3.40 3 4.00 5
Rental rate increases 3.69 2 4.36 1 3.60 2 3.60 12
Malaysian property market performing well 3.67 4 3.55 22 3.40 3 4.20 3
A secure and favourable tax transparencytreatment locally
3.59 5 4.36 1 3.00 12 4.40 1
Tax treatment is appropriate 3.58 6 4.36 1 3.20 9 4.00 5
A secure and favourable tax transparencytreatment internationally
3.53 7 3.82 17 3.00 12 4.40 1
REIT services are professional (i.e. managers,valuers, trustee and promoters)
3.51 8 4.27 7 3.20 9 3.80 10
M-REITs yield are attractive compared toother investments
3.49 9 4.18 10 3.40 3 3.40 16
Distribution policy is sufficient 3.41 10 4.27 7 2.80 19 4.20 3
Quality properties are available 3.41 10 4.00 13 3.40 3 3.20 20
REITs properties are well maintained 3.39 12 4.36 1 3.40 3 3.00 23
Reduction in withholding tax rate ondistributions to local investors
3.35 13 4.36 1 2.80 19 4.00 5
Property location is strategic 3.33 14 3.82 17 3.20 9 3.40 16
M-REITs yield in initial 3-5 years areattractive
3.31 15 4.09 11 3.00 12 3.60 12
Institutional investor participation increases 3.31 15 4.09 11 3.00 12 3.60 12
M-REITs market is performing well 3.30 17 3.91 15 2.80 19 4.00 5
M-REITs provide portfolio diversificationwith the stock market
3.29 18 3.55 23 3.40 3 3.00 23
Reduction in withholding tax rate ondistributions to foreign investors
3.25 19 4.00 13 2.80 19 3.80 10
Low fees (i.e. management, trustees) 3.13 20 3.00 27 3.00 12 3.40 16
Investors are well informed (i.e. research,websites)
3.10 21 4.36 1 2.80 19 3.20 20
Regulation is acceptable worldwide 3.04 22 3.64 20 2.40 27 4.00 5
General investor participation increases 2.99 23 3.36 24 2.80 19 3.20 20
M-REITs are attractive to internationalproperty investors
2.98 24 3.82 17 2.80 19 3.00 23
Diversified tenants 2.95 25 3.64 20 3.00 12 2.60 28
Islamic M-REITs market is performing well 2.86 26 2.73 31 2.60 26 3.40 16
More competitive than other REITs 2.72 27 3.27 26 3.00 12 2.00 31
M-REITs will include international propertyin their portfolios
2.65 28 2.91 29 2.40 27 3.00 23
Setting up conventional REIT index 2.64 29 3.36 24 2.40 27 2.80 27
REITs properties are highly diversified 2.53 30 3.00 27 2.40 27 2.60 28
Setting up Islamic REIT index 2.33 31 2.82 30 2.20 31 2.40 30
Overall average score 3.22 3.79 2.98 3.45
183
The overall top 5 specific factors regarding the current performance of M-REITs and
their average ratings were:
1. Risk profile is acceptable 3.75
2. Earning profile increases 3.69
3. Rental rate increases 3.69
4. Malaysian property market performing well 3.67
5. A secure and favourable tax transparency treatment locally 3.59 ,
with “risk profile is acceptable” and “earning profile increases” seen as top priorities,
while “setting up Islamic REIT index” is seen to be in the lowest priority.
Meanwhile, the REIT managers’ top 6 specific factors (all equal) regarding the
current performance of M-REITs and their average ratings were:
1. Rental rate increases 4.36
1. A secure and favourable tax transparency treatment locally 4.36
1. Tax treatment is appropriate 4.36
1. REITs properties are well maintained 4.36
1. Reduction in withholding tax rate on distributions to local investors 4.36
1. Investors are well informed (i.e. research, websites) 4.36 ,
with “Islamic M-REITs market is performing well” being the lowest priority.
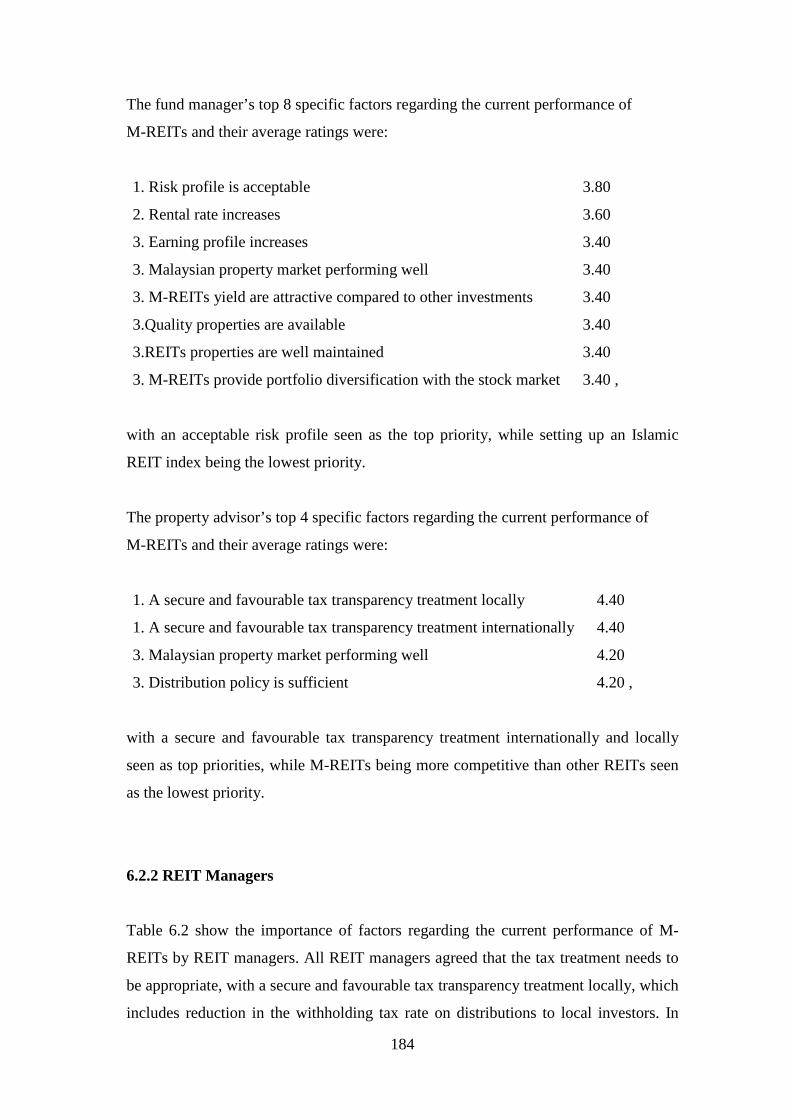
184
The fund manager’s top 8 specific factors regarding the current performance of
M-REITs and their average ratings were:
1. Risk profile is acceptable 3.80
2. Rental rate increases 3.60
3. Earning profile increases 3.40
3. Malaysian property market performing well 3.40
3. M-REITs yield are attractive compared to other investments 3.40
3.Quality properties are available 3.40
3.REITs properties are well maintained 3.40
3. M-REITs provide portfolio diversification with the stock market 3.40 ,
with an acceptable risk profile seen as the top priority, while setting up an Islamic
REIT index being the lowest priority.
The property advisor’s top 4 specific factors regarding the current performance of
M-REITs and their average ratings were:
1. A secure and favourable tax transparency treatment locally 4.40
1. A secure and favourable tax transparency treatment internationally 4.40
3. Malaysian property market performing well 4.20
3. Distribution policy is sufficient 4.20 ,
with a secure and favourable tax transparency treatment internationally and locally
seen as top priorities, while M-REITs being more competitive than other REITs seen
as the lowest priority.
6.2.2 REIT Managers
Table 6.2 show the importance of factors regarding the current performance of M-
REITs by REIT managers. All REIT managers agreed that the tax treatment needs to
be appropriate, with a secure and favourable tax transparency treatment locally, which
includes reduction in the withholding tax rate on distributions to local investors. In
185
addition, distribution policy needs to be sufficient. It is also required that REIT
properties should be well maintained to increase the rental rate and earning profile. To
assure investors are well informed (i.e. research, websites), REIT services need to be
professional (i.e. managers, valuers, trustee and promoters).
91% of respondents suggest quality properties should be available, whilst 82% agree
the M-REIT market should perform well, with the risk profile being acceptable and
institutional investor participation increasing. In terms of yield, M-REIT yields should
be attractive compared to other investments, with M-REIT yields in the initial 3-5
needing to be attractive. 73% of respondents agreed that the Malaysian property
market should perform well, with 64% suggesting the importance of a reduction in the
withholding tax rate on distributions to foreign investors. Only 55% of respondents
agreed property location should be strategic, accompanied with diversified tenants
and M-REITs should be attractive to international property investors. In terms of
regulation, only 45% of the respondents recommended a regulation which is
acceptable worldwide; with a secure and favourable tax transparency treatment
internationally; whereas 36% suggested M-REITs should provide portfolio
diversification with the stock market and the importance of the setting up of a
conventional M-REIT index.
Only 27% of the respondents agreed to the importance of a well performing Islamic
M-REIT market and the need for setting up an Islamic REIT index. In addition,
general investor’s participation should increase and M-REIT should be more
competitive than other REITs; whereas 18% of the respondents suggest REIT
properties should be highly diversified and M-REITs should include international
property in their portfolios, while having low fees (i.e. management, trustees).

186
Table 6.2: Importance of Factors Regarding the Current Performance of
M-REITs: REIT Managers
AverageScore
% 'very-important' /'essential'
Tax treatment is appropriate 4.36 100%
REITs properties are well maintained 4.36 100%
Rental rate increases 4.36 100%
Investors are well informed (i.e. research, websites) 4.36 100%
A secure and favourable tax transparency treatment locally 4.36 100%
Reduction in withholding tax rate on distributions to local investors 4.36 100%
Earning profile increases 4.27 100%
Distribution policy is sufficient 4.27 100%
REIT services are professional (i.e. managers, valuers, trustee and promoters) 4.27 100%
Quality properties are available 4.00 91%
M-REITs market is performing well 3.91 82%
Risk profile is acceptable 3.91 82%
M-REITs yield are attractive compared to other investments 4.18 82%
M-REITs yield in initial 3-5 years are attractive 4.09 82%
Institutional investor participation increases 4.09 82%
Malaysian property market performing well 3.55 73%
Reduction in withholding tax rate on distributions to foreign investors 4.00 64%
Property location is strategic 3.82 55%
M-REITs are attractive to international property investors 3.82 55%
Diversified tenants 3.64 55%
A secure and favourable tax transparency treatment internationally 3.82 45%
Regulation is acceptable worldwide 3.64 45%
M-REITs provide portfolio diversification with the stock market 3.55 36%
Setting up conventional REIT index 3.36 36%
General investor participation increases 3.36 27%
More competitive than other REITs 3.27 27%
Setting up Islamic REIT index 2.82 27%
Islamic M-REITs market is performing well 2.73 27%
REITs properties are highly diversified 3.00 18%
Low fees (i.e. management, trustees) 3.00 18%
M-REITs will include international property in their portfolios 2.91 18%
187
6.2.3 Property Advisors
Table 6.3 shows the importance of the factors regarding the current performance of
M-REITs by property advisors. 80% of the respondents suggest the importance of a
secure and favourable tax transparency treatment locally and internationally, while the
Malaysian property and M-REIT market should perform well, along with the increase
in institutional investor participation.
60% of the respondents agreed on the need for a regulation which is acceptable
worldwide, accompanied with an appropriate tax treatment and a reduction in the
withholding tax rate on distributions to local and foreign investors. In addition, REIT
services should be professional (i.e. managers, valuers, trustee and promoters) and
assure a sufficient distribution policy with an acceptable risk profile and increase in
earnings profile. Furthermore, REIT properties should be well maintained to generate
attractive yields in the initial 3-5 years. However, only 40% of the respondents
suggest the importance of M-REIT yields to be attractive compared to other
investments. In addition, property location should be strategic, with the availability of
quality properties and an increase in the rental rate. It is also suggested that M-REITs
should be attractive to international property investors and M-REITs should include
international property in their portfolios, while providing low fees (i.e. management,
trustees). It was expected that Islamic M-REIT market should perform well.
For 20% of the respondents, they agree on the importance of well informed investors
through research and websites and setting up a conventional REIT index to increase
general investor participation. Meanwhile, M-REITs should provide portfolio
diversification with the stock market and REIT properties should be highly diversified
with diversified tenants. However, none of the respondents agree on the importance of
setting up an Islamic REIT index and M-REITs being more competitive than other
REITs.
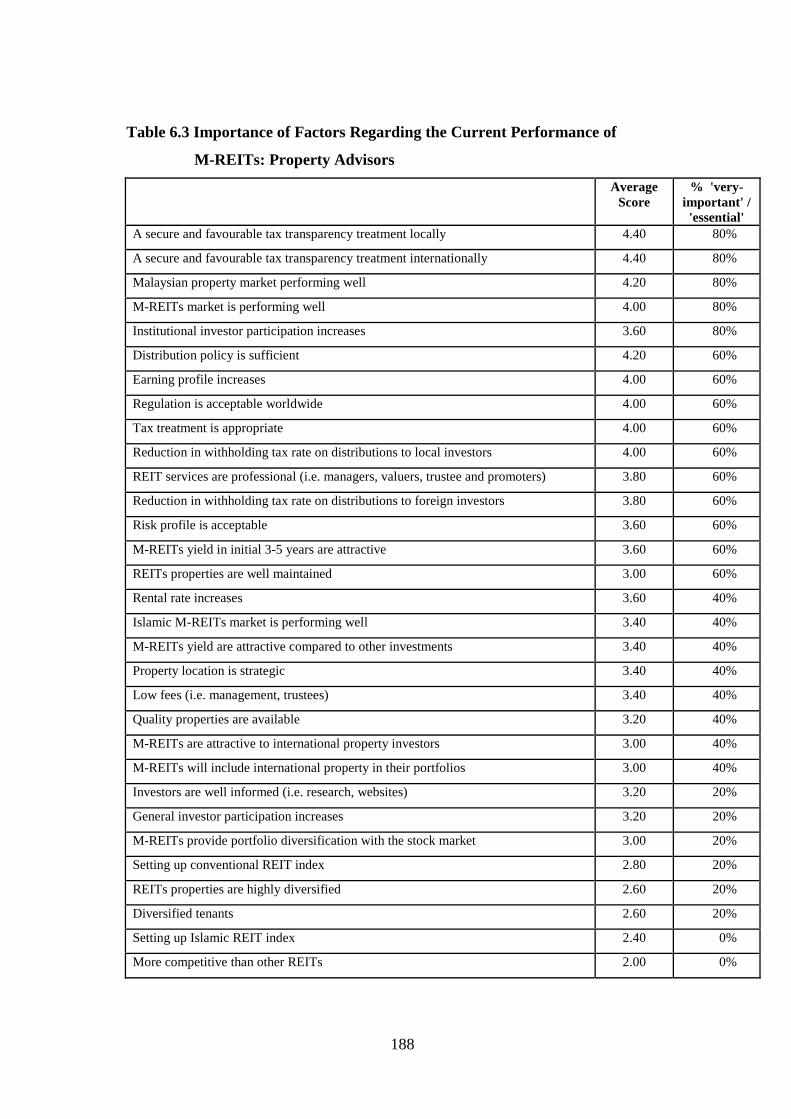
188
Table 6.3 Importance of Factors Regarding the Current Performance of
M-REITs: Property Advisors
AverageScore
% 'very-important' /'essential'
A secure and favourable tax transparency treatment locally 4.40 80%
A secure and favourable tax transparency treatment internationally 4.40 80%
Malaysian property market performing well 4.20 80%
M-REITs market is performing well 4.00 80%
Institutional investor participation increases 3.60 80%
Distribution policy is sufficient 4.20 60%
Earning profile increases 4.00 60%
Regulation is acceptable worldwide 4.00 60%
Tax treatment is appropriate 4.00 60%
Reduction in withholding tax rate on distributions to local investors 4.00 60%
REIT services are professional (i.e. managers, valuers, trustee and promoters) 3.80 60%
Reduction in withholding tax rate on distributions to foreign investors 3.80 60%
Risk profile is acceptable 3.60 60%
M-REITs yield in initial 3-5 years are attractive 3.60 60%
REITs properties are well maintained 3.00 60%
Rental rate increases 3.60 40%
Islamic M-REITs market is performing well 3.40 40%
M-REITs yield are attractive compared to other investments 3.40 40%
Property location is strategic 3.40 40%
Low fees (i.e. management, trustees) 3.40 40%
Quality properties are available 3.20 40%
M-REITs are attractive to international property investors 3.00 40%
M-REITs will include international property in their portfolios 3.00 40%
Investors are well informed (i.e. research, websites) 3.20 20%
General investor participation increases 3.20 20%
M-REITs provide portfolio diversification with the stock market 3.00 20%
Setting up conventional REIT index 2.80 20%
REITs properties are highly diversified 2.60 20%
Diversified tenants 2.60 20%
Setting up Islamic REIT index 2.40 0%
More competitive than other REITs 2.00 0%
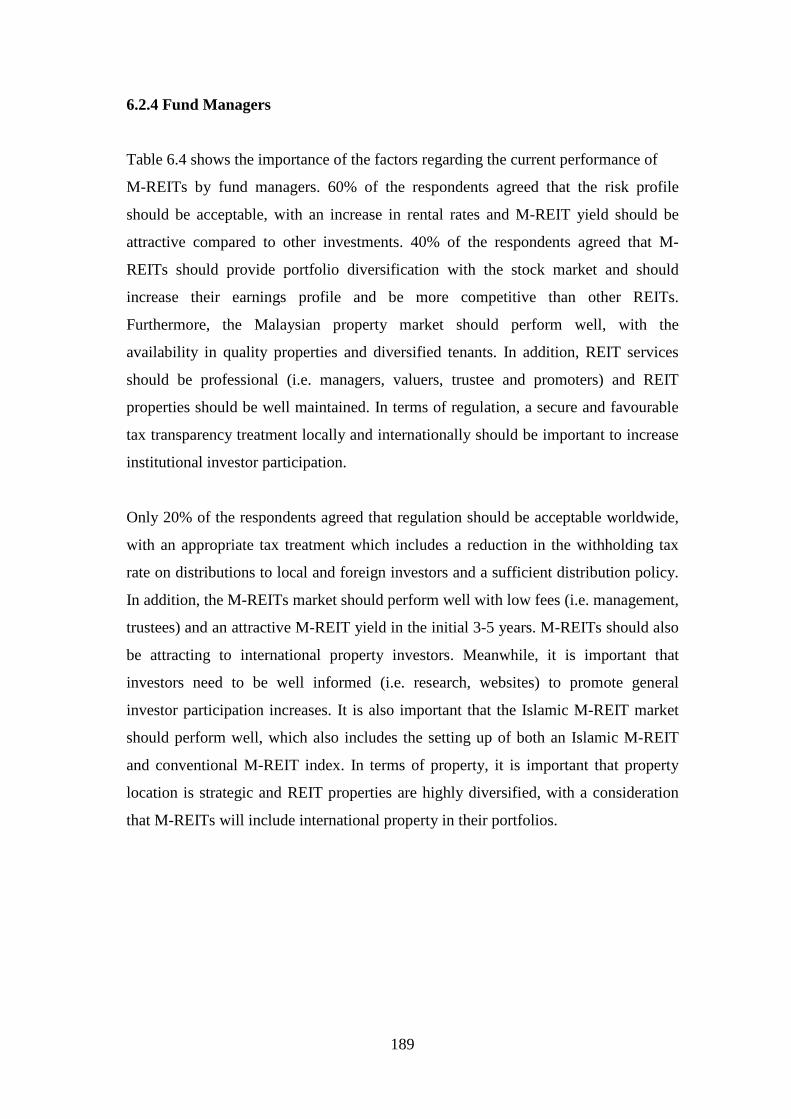
189
6.2.4 Fund Managers
Table 6.4 shows the importance of the factors regarding the current performance of
M-REITs by fund managers. 60% of the respondents agreed that the risk profile
should be acceptable, with an increase in rental rates and M-REIT yield should be
attractive compared to other investments. 40% of the respondents agreed that M-
REITs should provide portfolio diversification with the stock market and should
increase their earnings profile and be more competitive than other REITs.
Furthermore, the Malaysian property market should perform well, with the
availability in quality properties and diversified tenants. In addition, REIT services
should be professional (i.e. managers, valuers, trustee and promoters) and REIT
properties should be well maintained. In terms of regulation, a secure and favourable
tax transparency treatment locally and internationally should be important to increase
institutional investor participation.
Only 20% of the respondents agreed that regulation should be acceptable worldwide,
with an appropriate tax treatment which includes a reduction in the withholding tax
rate on distributions to local and foreign investors and a sufficient distribution policy.
In addition, the M-REITs market should perform well with low fees (i.e. management,
trustees) and an attractive M-REIT yield in the initial 3-5 years. M-REITs should also
be attracting to international property investors. Meanwhile, it is important that
investors need to be well informed (i.e. research, websites) to promote general
investor participation increases. It is also important that the Islamic M-REIT market
should perform well, which also includes the setting up of both an Islamic M-REIT
and conventional M-REIT index. In terms of property, it is important that property
location is strategic and REIT properties are highly diversified, with a consideration
that M-REITs will include international property in their portfolios.
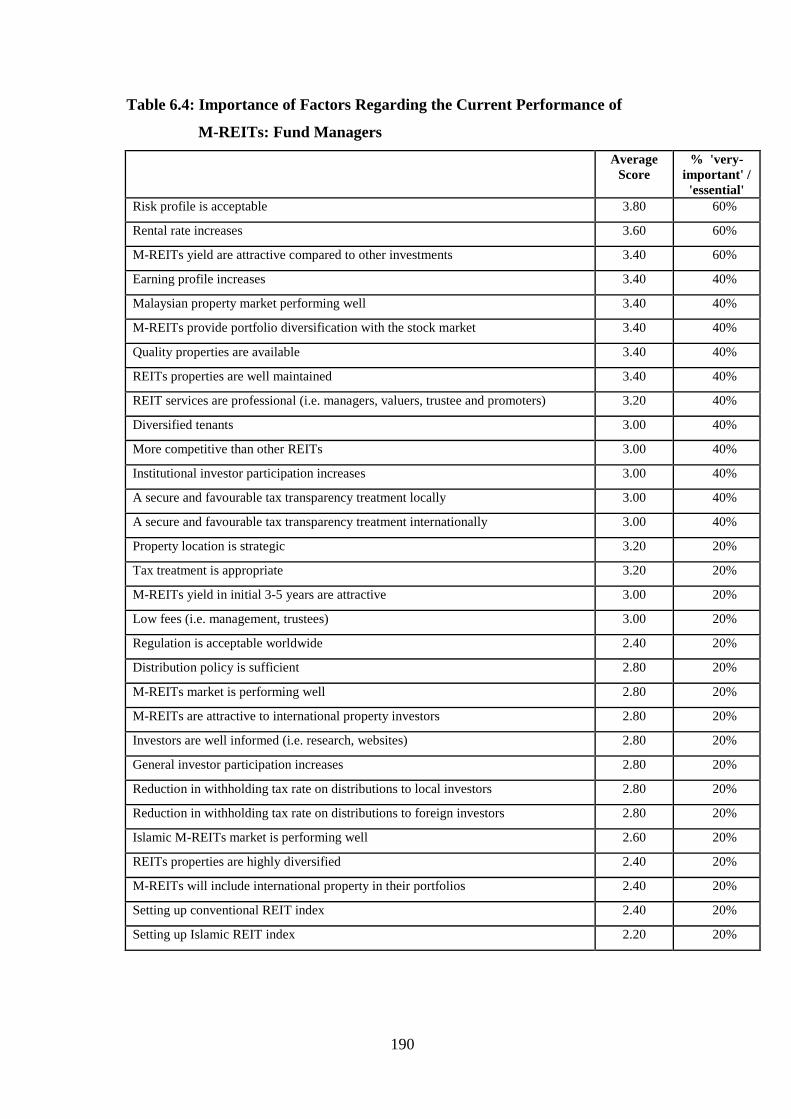
190
Table 6.4: Importance of Factors Regarding the Current Performance of
M-REITs: Fund Managers
AverageScore
% 'very-important' /'essential'
Risk profile is acceptable 3.80 60%
Rental rate increases 3.60 60%
M-REITs yield are attractive compared to other investments 3.40 60%
Earning profile increases 3.40 40%
Malaysian property market performing well 3.40 40%
M-REITs provide portfolio diversification with the stock market 3.40 40%
Quality properties are available 3.40 40%
REITs properties are well maintained 3.40 40%
REIT services are professional (i.e. managers, valuers, trustee and promoters) 3.20 40%
Diversified tenants 3.00 40%
More competitive than other REITs 3.00 40%
Institutional investor participation increases 3.00 40%
A secure and favourable tax transparency treatment locally 3.00 40%
A secure and favourable tax transparency treatment internationally 3.00 40%
Property location is strategic 3.20 20%
Tax treatment is appropriate 3.20 20%
M-REITs yield in initial 3-5 years are attractive 3.00 20%
Low fees (i.e. management, trustees) 3.00 20%
Regulation is acceptable worldwide 2.40 20%
Distribution policy is sufficient 2.80 20%
M-REITs market is performing well 2.80 20%
M-REITs are attractive to international property investors 2.80 20%
Investors are well informed (i.e. research, websites) 2.80 20%
General investor participation increases 2.80 20%
Reduction in withholding tax rate on distributions to local investors 2.80 20%
Reduction in withholding tax rate on distributions to foreign investors 2.80 20%
Islamic M-REITs market is performing well 2.60 20%
REITs properties are highly diversified 2.40 20%
M-REITs will include international property in their portfolios 2.40 20%
Setting up conventional REIT index 2.40 20%
Setting up Islamic REIT index 2.20 20%
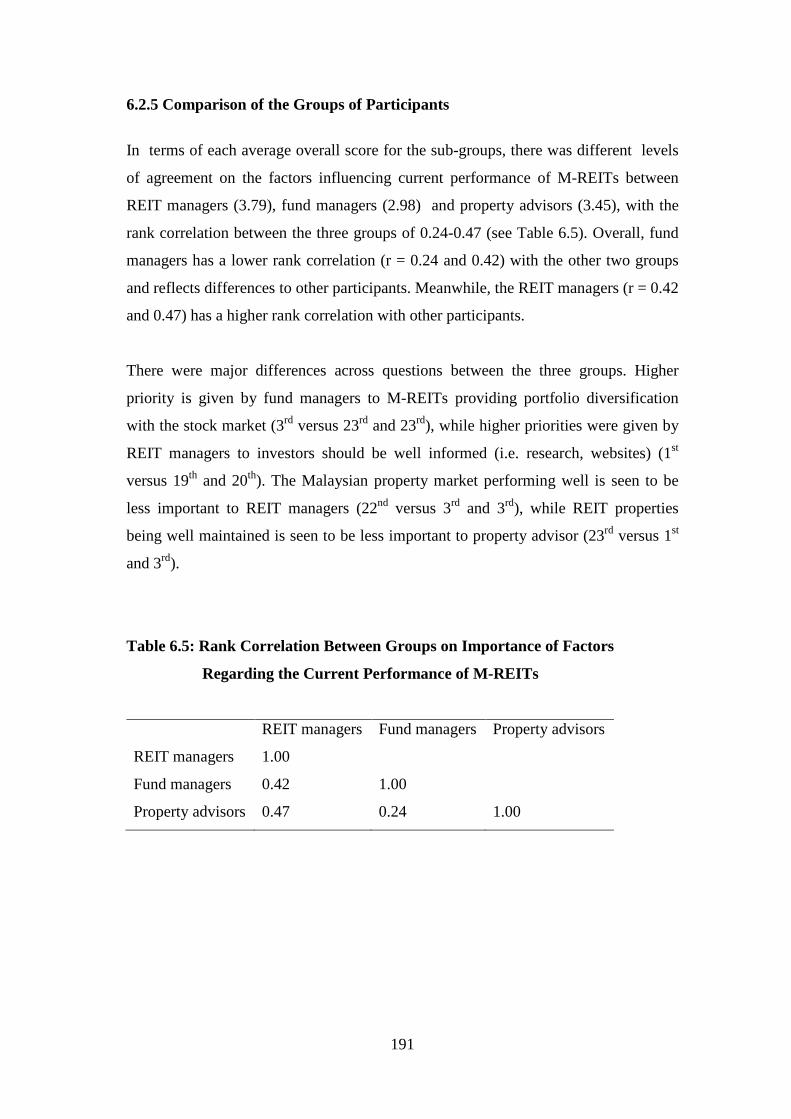
191
6.2.5 Comparison of the Groups of Participants
In terms of each average overall score for the sub-groups, there was different levels
of agreement on the factors influencing current performance of M-REITs between
REIT managers (3.79), fund managers (2.98) and property advisors (3.45), with the
rank correlation between the three groups of 0.24-0.47 (see Table 6.5). Overall, fund
managers has a lower rank correlation (r = 0.24 and 0.42) with the other two groups
and reflects differences to other participants. Meanwhile, the REIT managers (r = 0.42
and 0.47) has a higher rank correlation with other participants.
There were major differences across questions between the three groups. Higher
priority is given by fund managers to M-REITs providing portfolio diversification
with the stock market (3rd versus 23rd and 23rd), while higher priorities were given by
REIT managers to investors should be well informed (i.e. research, websites) (1st
versus 19th and 20th). The Malaysian property market performing well is seen to be
less important to REIT managers (22nd versus 3rd and 3rd), while REIT properties
being well maintained is seen to be less important to property advisor (23rd versus 1st
and 3rd).
Table 6.5: Rank Correlation Between Groups on Importance of Factors
Regarding the Current Performance of M-REITs
REIT managers Fund managers Property advisors
REIT managers 1.00
Fund managers 0.42 1.00
Property advisors 0.47 0.24 1.00

192
In comparing all three groups for significant differences, ANOVA single factor
analysis was used to assess these differences. From the analysis, the p-value less than
0.05 means the differences between the groups are significantly different. Pairwise
comparisons of the means are used to show the least significance difference between
2 specific groups. Table 6.6 shows the importance of factors regarding the current
performance of M-REITs.
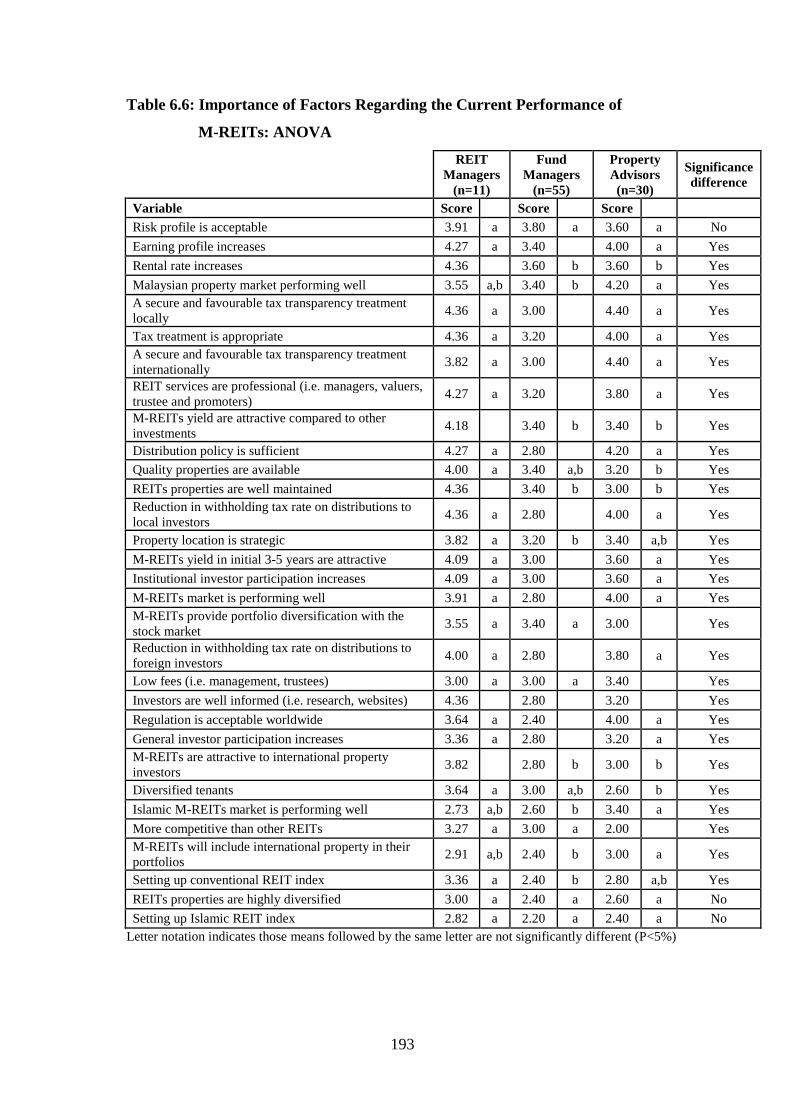
193
Table 6.6: Importance of Factors Regarding the Current Performance of
M-REITs: ANOVA
REITManagers
(n=11)
FundManagers
(n=55)
PropertyAdvisors(n=30)
Significancedifference
Variable Score Score Score
Risk profile is acceptable 3.91 a 3.80 a 3.60 a No
Earning profile increases 4.27 a 3.40 4.00 a Yes
Rental rate increases 4.36 3.60 b 3.60 b Yes
Malaysian property market performing well 3.55 a,b 3.40 b 4.20 a Yes
A secure and favourable tax transparency treatmentlocally
4.36 a 3.00 4.40 a Yes
Tax treatment is appropriate 4.36 a 3.20 4.00 a Yes
A secure and favourable tax transparency treatmentinternationally
3.82 a 3.00 4.40 a Yes
REIT services are professional (i.e. managers, valuers,trustee and promoters)
4.27 a 3.20 3.80 a Yes
M-REITs yield are attractive compared to otherinvestments
4.18 3.40 b 3.40 b Yes
Distribution policy is sufficient 4.27 a 2.80 4.20 a Yes
Quality properties are available 4.00 a 3.40 a,b 3.20 b Yes
REITs properties are well maintained 4.36 3.40 b 3.00 b Yes
Reduction in withholding tax rate on distributions tolocal investors
4.36 a 2.80 4.00 a Yes
Property location is strategic 3.82 a 3.20 b 3.40 a,b Yes
M-REITs yield in initial 3-5 years are attractive 4.09 a 3.00 3.60 a Yes
Institutional investor participation increases 4.09 a 3.00 3.60 a Yes
M-REITs market is performing well 3.91 a 2.80 4.00 a Yes
M-REITs provide portfolio diversification with thestock market
3.55 a 3.40 a 3.00 Yes
Reduction in withholding tax rate on distributions toforeign investors
4.00 a 2.80 3.80 a Yes
Low fees (i.e. management, trustees) 3.00 a 3.00 a 3.40 Yes
Investors are well informed (i.e. research, websites) 4.36 2.80 3.20 Yes
Regulation is acceptable worldwide 3.64 a 2.40 4.00 a Yes
General investor participation increases 3.36 a 2.80 3.20 a Yes
M-REITs are attractive to international propertyinvestors
3.82 2.80 b 3.00 b Yes
Diversified tenants 3.64 a 3.00 a,b 2.60 b Yes
Islamic M-REITs market is performing well 2.73 a,b 2.60 b 3.40 a Yes
More competitive than other REITs 3.27 a 3.00 a 2.00 Yes
M-REITs will include international property in theirportfolios
2.91 a,b 2.40 b 3.00 a Yes
Setting up conventional REIT index 3.36 a 2.40 b 2.80 a,b Yes
REITs properties are highly diversified 3.00 a 2.40 a 2.60 a No
Setting up Islamic REIT index 2.82 a 2.20 a 2.40 a No
Letter notation indicates those means followed by the same letter are not significantly different (P<5%)
194
Results show that all three groups are significantly different in terms of investors are
well informed (i.e. research, websites). However, all three groups are not significantly
different in terms of risk profile is acceptable, REITs properties are highly diversified
and setting up Islamic REIT index. Between the groups, REIT managers find these
factors to be more important.
Meanwhile, REIT managers and property advisors are significantly different, but not
significantly different with fund managers in terms of quality properties are available
and diversified tenants. However, REIT managers and property advisors are not
significantly different, but significantly different with fund managers in terms of
M-REIT market is performing well, earning profile increases, regulation is acceptable
worldwide, distribution policy is sufficient, M-REITs yield in initial 3-5 years are
attractive, tax treatment is appropriate, general investor participation increases,
institutional investor participation increases, REIT services are professional (i.e.
managers, valuers, trustee and promoters), a secure and favourable tax transparency
treatment locally and internationally together with reduction in withholding tax rate
on distributions to local and foreign investors.
Property advisors and fund managers are significantly different, but are not
significantly different with REIT managers in terms of M-REITs will include
international property in their portfolios, Malaysian property market and Islamic M-
REITs market is performing well. However, property advisors and fund mangers are
not significantly different, but significantly different with REIT manager in terms of
rental rate increases, M-REITs are attractive to international property investors,
REITs properties are well maintained and M-REITs yield are attractive compared to
other investments.
REIT managers and fund managers are significantly different, but are not significantly
different with property advisors in terms of property location is strategic and setting
up conventional REIT index. However, REIT managers and fund managers are not
significantly different, while both are significantly different with property advisors in
terms of low fees (i.e. management, trustees), M-REITs provide portfolio
diversification with the stock market and being more competitive than other REITs.
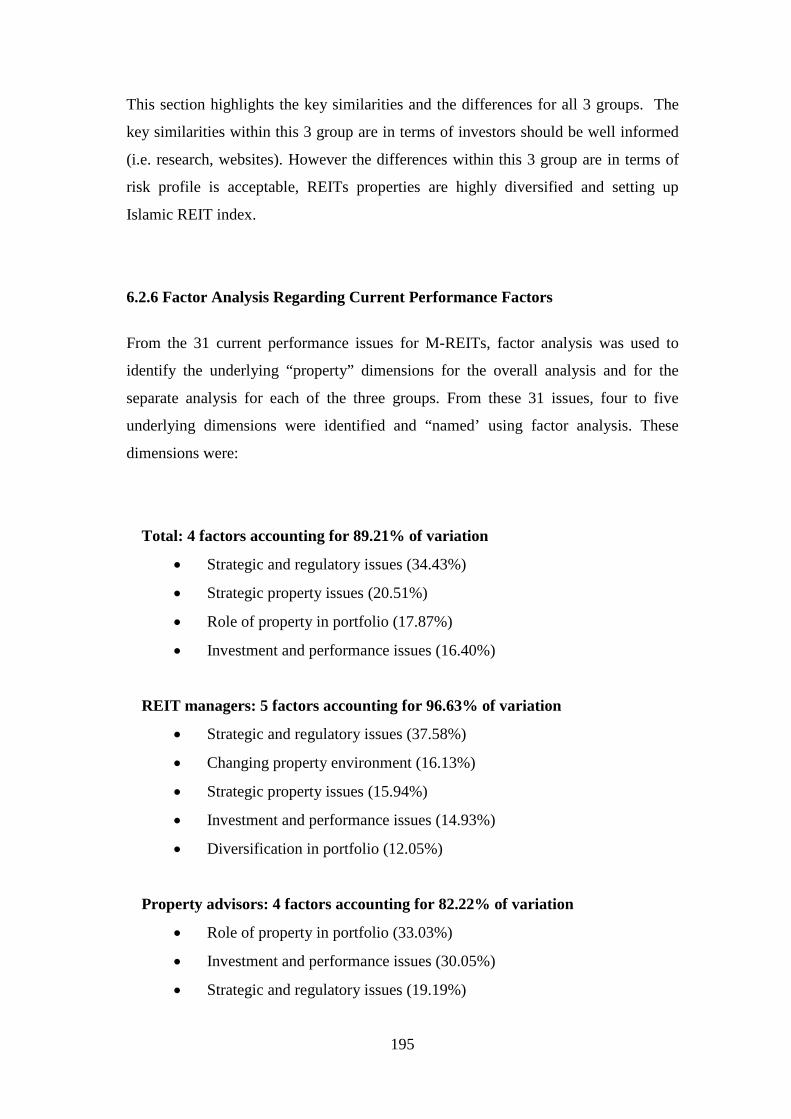
195
This section highlights the key similarities and the differences for all 3 groups. The
key similarities within this 3 group are in terms of investors should be well informed
(i.e. research, websites). However the differences within this 3 group are in terms of
risk profile is acceptable, REITs properties are highly diversified and setting up
Islamic REIT index.
6.2.6 Factor Analysis Regarding Current Performance Factors
From the 31 current performance issues for M-REITs, factor analysis was used to
identify the underlying “property” dimensions for the overall analysis and for the
separate analysis for each of the three groups. From these 31 issues, four to five
underlying dimensions were identified and “named’ using factor analysis. These
dimensions were:
Total: 4 factors accounting for 89.21% of variation
Strategic and regulatory issues (34.43%)
Strategic property issues (20.51%)
Role of property in portfolio (17.87%)
Investment and performance issues (16.40%)
REIT managers: 5 factors accounting for 96.63% of variation
Strategic and regulatory issues (37.58%)
Changing property environment (16.13%)
Strategic property issues (15.94%)
Investment and performance issues (14.93%)
Diversification in portfolio (12.05%)
Property advisors: 4 factors accounting for 82.22% of variation
Role of property in portfolio (33.03%)
Investment and performance issues (30.05%)
Strategic and regulatory issues (19.19%)
196
Fund managers: 3 factors accounting for 82.94% of variation
Strategic and regulatory issues (36.26%)
Strategic property issues (24.00%)
Specific market dynamics (22.68%)
In terms of the current performance of M-REITs, both REIT managers and fund
manager agree that the strategic and regulatory issues are the most important
dimension which is then followed by the property and other investment dimension.
6.3 Importance of Factors Regarding the Ongoing Success of M-REITs
This will be presented starting with the overall results; then the 3 groups separately;
then followed by a comparison of the 3 groups. The comparison between the 3 groups
will include rank correlation and ANOVA analyses.
6.3.1 Overall
Table 6.7 presents the average scores and respective ranks for the 31 specific issues
for the 96 survey respondents relating to the ongoing success of M-REITs.
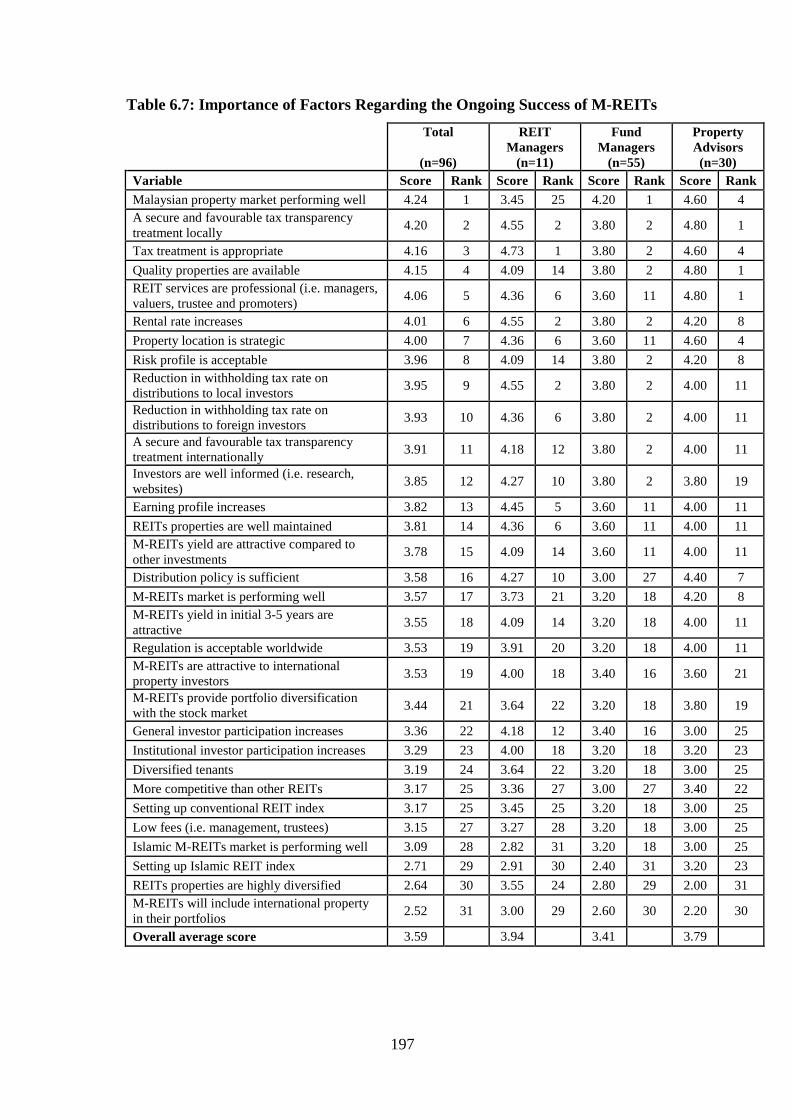
197
Table 6.7: Importance of Factors Regarding the Ongoing Success of M-REITs
Total
(n=96)
REITManagers
(n=11)
FundManagers
(n=55)
PropertyAdvisors(n=30)
Variable Score Rank Score Rank Score Rank Score Rank
Malaysian property market performing well 4.24 1 3.45 25 4.20 1 4.60 4
A secure and favourable tax transparencytreatment locally
4.20 2 4.55 2 3.80 2 4.80 1
Tax treatment is appropriate 4.16 3 4.73 1 3.80 2 4.60 4
Quality properties are available 4.15 4 4.09 14 3.80 2 4.80 1
REIT services are professional (i.e. managers,valuers, trustee and promoters)
4.06 5 4.36 6 3.60 11 4.80 1
Rental rate increases 4.01 6 4.55 2 3.80 2 4.20 8
Property location is strategic 4.00 7 4.36 6 3.60 11 4.60 4
Risk profile is acceptable 3.96 8 4.09 14 3.80 2 4.20 8
Reduction in withholding tax rate ondistributions to local investors
3.95 9 4.55 2 3.80 2 4.00 11
Reduction in withholding tax rate ondistributions to foreign investors
3.93 10 4.36 6 3.80 2 4.00 11
A secure and favourable tax transparencytreatment internationally
3.91 11 4.18 12 3.80 2 4.00 11
Investors are well informed (i.e. research,websites)
3.85 12 4.27 10 3.80 2 3.80 19
Earning profile increases 3.82 13 4.45 5 3.60 11 4.00 11
REITs properties are well maintained 3.81 14 4.36 6 3.60 11 4.00 11
M-REITs yield are attractive compared toother investments
3.78 15 4.09 14 3.60 11 4.00 11
Distribution policy is sufficient 3.58 16 4.27 10 3.00 27 4.40 7
M-REITs market is performing well 3.57 17 3.73 21 3.20 18 4.20 8
M-REITs yield in initial 3-5 years areattractive
3.55 18 4.09 14 3.20 18 4.00 11
Regulation is acceptable worldwide 3.53 19 3.91 20 3.20 18 4.00 11
M-REITs are attractive to internationalproperty investors
3.53 19 4.00 18 3.40 16 3.60 21
M-REITs provide portfolio diversificationwith the stock market
3.44 21 3.64 22 3.20 18 3.80 19
General investor participation increases 3.36 22 4.18 12 3.40 16 3.00 25
Institutional investor participation increases 3.29 23 4.00 18 3.20 18 3.20 23
Diversified tenants 3.19 24 3.64 22 3.20 18 3.00 25
More competitive than other REITs 3.17 25 3.36 27 3.00 27 3.40 22
Setting up conventional REIT index 3.17 25 3.45 25 3.20 18 3.00 25
Low fees (i.e. management, trustees) 3.15 27 3.27 28 3.20 18 3.00 25
Islamic M-REITs market is performing well 3.09 28 2.82 31 3.20 18 3.00 25
Setting up Islamic REIT index 2.71 29 2.91 30 2.40 31 3.20 23
REITs properties are highly diversified 2.64 30 3.55 24 2.80 29 2.00 31
M-REITs will include international propertyin their portfolios
2.52 31 3.00 29 2.60 30 2.20 30
Overall average score 3.59 3.94 3.41 3.79
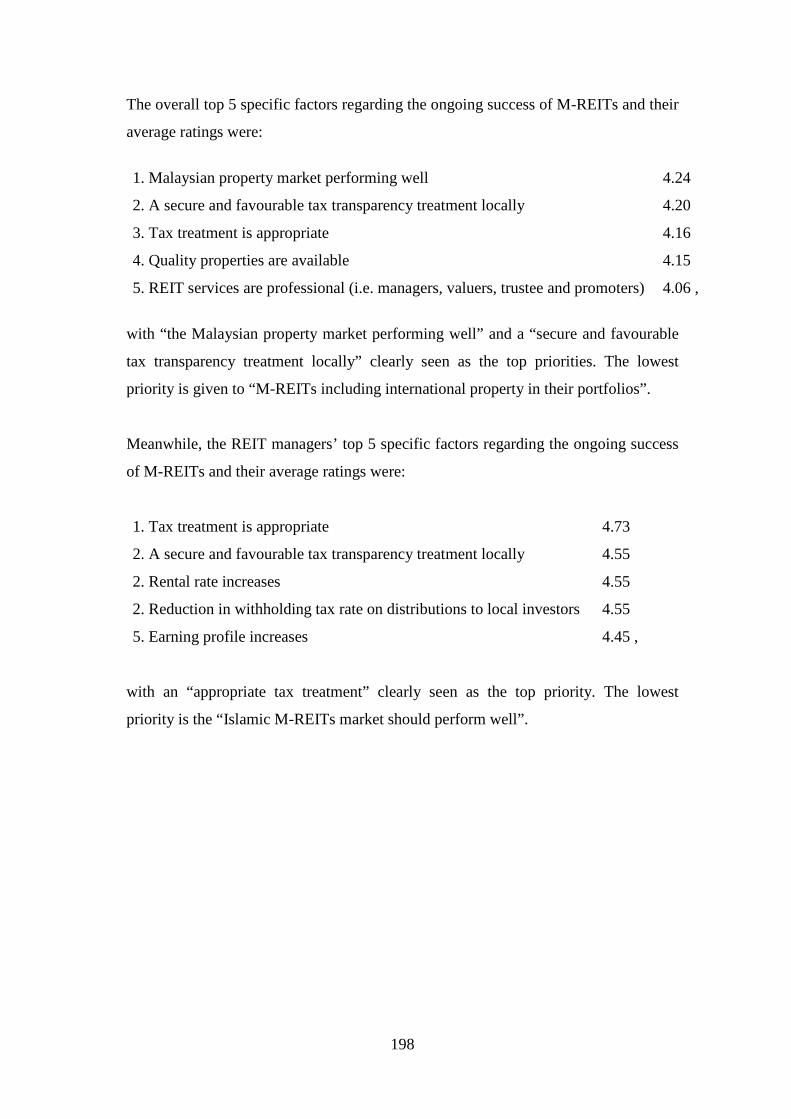
198
The overall top 5 specific factors regarding the ongoing success of M-REITs and their
average ratings were:
1. Malaysian property market performing well 4.24
2. A secure and favourable tax transparency treatment locally 4.20
3. Tax treatment is appropriate 4.16
4. Quality properties are available 4.15
5. REIT services are professional (i.e. managers, valuers, trustee and promoters) 4.06 ,
with “the Malaysian property market performing well” and a “secure and favourable
tax transparency treatment locally” clearly seen as the top priorities. The lowest
priority is given to “M-REITs including international property in their portfolios”.
Meanwhile, the REIT managers’ top 5 specific factors regarding the ongoing success
of M-REITs and their average ratings were:
1. Tax treatment is appropriate 4.73
2. A secure and favourable tax transparency treatment locally 4.55
2. Rental rate increases 4.55
2. Reduction in withholding tax rate on distributions to local investors 4.55
5. Earning profile increases 4.45 ,
with an “appropriate tax treatment” clearly seen as the top priority. The lowest
priority is the “Islamic M-REITs market should perform well”.
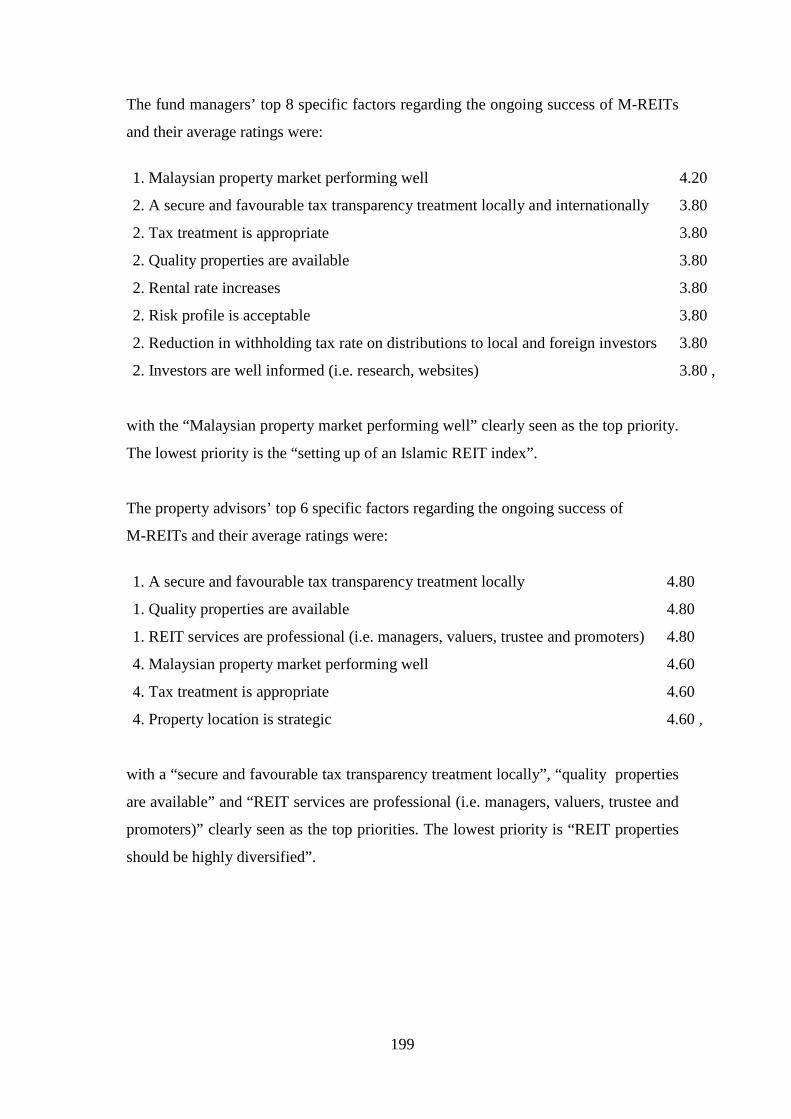
199
The fund managers’ top 8 specific factors regarding the ongoing success of M-REITs
and their average ratings were:
1. Malaysian property market performing well 4.20
2. A secure and favourable tax transparency treatment locally and internationally 3.80
2. Tax treatment is appropriate 3.80
2. Quality properties are available 3.80
2. Rental rate increases 3.80
2. Risk profile is acceptable 3.80
2. Reduction in withholding tax rate on distributions to local and foreign investors 3.80
2. Investors are well informed (i.e. research, websites) 3.80 ,
with the “Malaysian property market performing well” clearly seen as the top priority.
The lowest priority is the “setting up of an Islamic REIT index”.
The property advisors’ top 6 specific factors regarding the ongoing success of
M-REITs and their average ratings were:
1. A secure and favourable tax transparency treatment locally 4.80
1. Quality properties are available 4.80
1. REIT services are professional (i.e. managers, valuers, trustee and promoters) 4.80
4. Malaysian property market performing well 4.60
4. Tax treatment is appropriate 4.60
4. Property location is strategic 4.60 ,
with a “secure and favourable tax transparency treatment locally”, “quality properties
are available” and “REIT services are professional (i.e. managers, valuers, trustee and
promoters)” clearly seen as the top priorities. The lowest priority is “REIT properties
should be highly diversified”.
200
6.3.2 REIT Managers
Table 6.8 shows the importance of factors regarding the current performance of
M-REITs by REIT managers. All 11 REIT managers fully agree the importance of
increasing earning profile accompanied by an appropriate tax treatment, which
includes a secure and favourable tax transparency treatment locally and a reduction in
withholding tax rate on distributions to local investors. In addition, it is important for
property location to be strategic, REIT properties should be well maintained and the
rental rate should increase.
91% of the REIT managers find that it is important for the availability of quality
properties and well-informed investors; whereas 82% agree that the risk profile
should be acceptable, while M-REITs having attractive yields in the initial 3-5 years
and general investor participation increases, which are accompanied by professional
REIT services (i.e. managers, valuers, trustee and promoters). In addition, a secure
and favourable tax transparency treatment internationally, with a reduction in the
withholding tax rate on distributions to foreign investors is also important.
73% recognize it is essential for REIT properties to be highly diversified with
sufficient distribution policy, while 64% agree the M-REIT market should perform
well, resulting from acceptable regulation worldwide, along with diversified tenants
and M-REITs having an attractive yield compared to other investments. Other factors
include M-REITs should be attractive to international property investors, while
institutional investor participation should increase. 45% agree that the Malaysian
property market should perform well and M-REITs should provide portfolio
diversification with the stock market. 36% consider it is important to have low fees
(i.e. management, trustees) and to set up the conventional REIT index. Meanwhile,
27% agree Islamic M-REITs market should perform well and M-REITs should be
more competitive than other REITs, while 18% agree the importance of setting up an
Islamic REIT index and including international property in M-REIT portfolios.
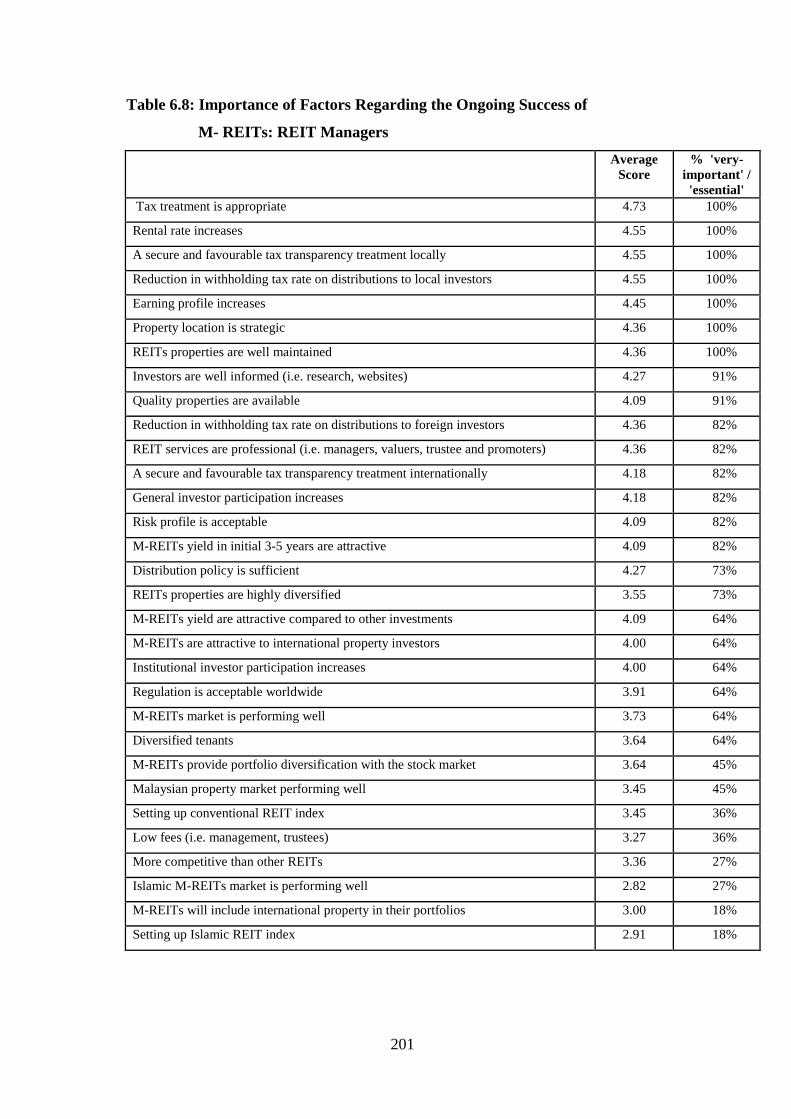
201
Table 6.8: Importance of Factors Regarding the Ongoing Success of
M- REITs: REIT Managers
AverageScore
% 'very-important' /'essential'
Tax treatment is appropriate 4.73 100%
Rental rate increases 4.55 100%
A secure and favourable tax transparency treatment locally 4.55 100%
Reduction in withholding tax rate on distributions to local investors 4.55 100%
Earning profile increases 4.45 100%
Property location is strategic 4.36 100%
REITs properties are well maintained 4.36 100%
Investors are well informed (i.e. research, websites) 4.27 91%
Quality properties are available 4.09 91%
Reduction in withholding tax rate on distributions to foreign investors 4.36 82%
REIT services are professional (i.e. managers, valuers, trustee and promoters) 4.36 82%
A secure and favourable tax transparency treatment internationally 4.18 82%
General investor participation increases 4.18 82%
Risk profile is acceptable 4.09 82%
M-REITs yield in initial 3-5 years are attractive 4.09 82%
Distribution policy is sufficient 4.27 73%
REITs properties are highly diversified 3.55 73%
M-REITs yield are attractive compared to other investments 4.09 64%
M-REITs are attractive to international property investors 4.00 64%
Institutional investor participation increases 4.00 64%
Regulation is acceptable worldwide 3.91 64%
M-REITs market is performing well 3.73 64%
Diversified tenants 3.64 64%
M-REITs provide portfolio diversification with the stock market 3.64 45%
Malaysian property market performing well 3.45 45%
Setting up conventional REIT index 3.45 36%
Low fees (i.e. management, trustees) 3.27 36%
More competitive than other REITs 3.36 27%
Islamic M-REITs market is performing well 2.82 27%
M-REITs will include international property in their portfolios 3.00 18%
Setting up Islamic REIT index 2.91 18%
202
6.3.3 Property Advisors
Table 6.9 shows the importance of factors regarding the ongoing success of
M-REITs by property advisors. All property advisors fully agree on the importance of
professional REIT services (i.e. managers, valuers, trustee and promoters) and a
secure and favourable tax transparency treatment locally, with availability in quality
properties. Meanwhile, 80% recognize the importance of the Malaysian property
market performing well, resulting from an acceptable risk profile and an appropriate
tax treatment, with an acceptable regulation worldwide that includes a sufficient
distribution policy. In addition, property location must be strategic and M-REIT
properties well maintained.
60% of the respondents agree that it is important for the M-REIT market to perform
well, with an increase in earnings profile. In terms of yield, M-REITs should be
attractive compared to other investments, M-REIT yields in initial 3-5 years should be
exceptional and M-REITs providing portfolio diversification with the stock market.
Furthermore, they believe rental rates should increase, while investors should be well
informed (i.e. research, websites). Additionally, it is also deemed important to have a
secure and favourable tax transparency treatment internationally and for a reduction in
the withholding tax rate on distributions to local and foreign investors.
40% of respondents recognized that tenants should be diversified and M-REITs
should be more attractive to international property investors and more competitive
than other REITs. Other than that, setting up an Islamic REIT index is considered to
be important. However, only 20% agree that setting up a conventional REIT index is
important, while supporting the idea that the Islamic M-REITs market should perform
well. In addition, they agree that general and institutional investor participation should
increase and have low fees (i.e. management, trustees). None of the respondents
consider it is important for M-REITs to include international property in their
portfolios and highly diversify REIT properties.
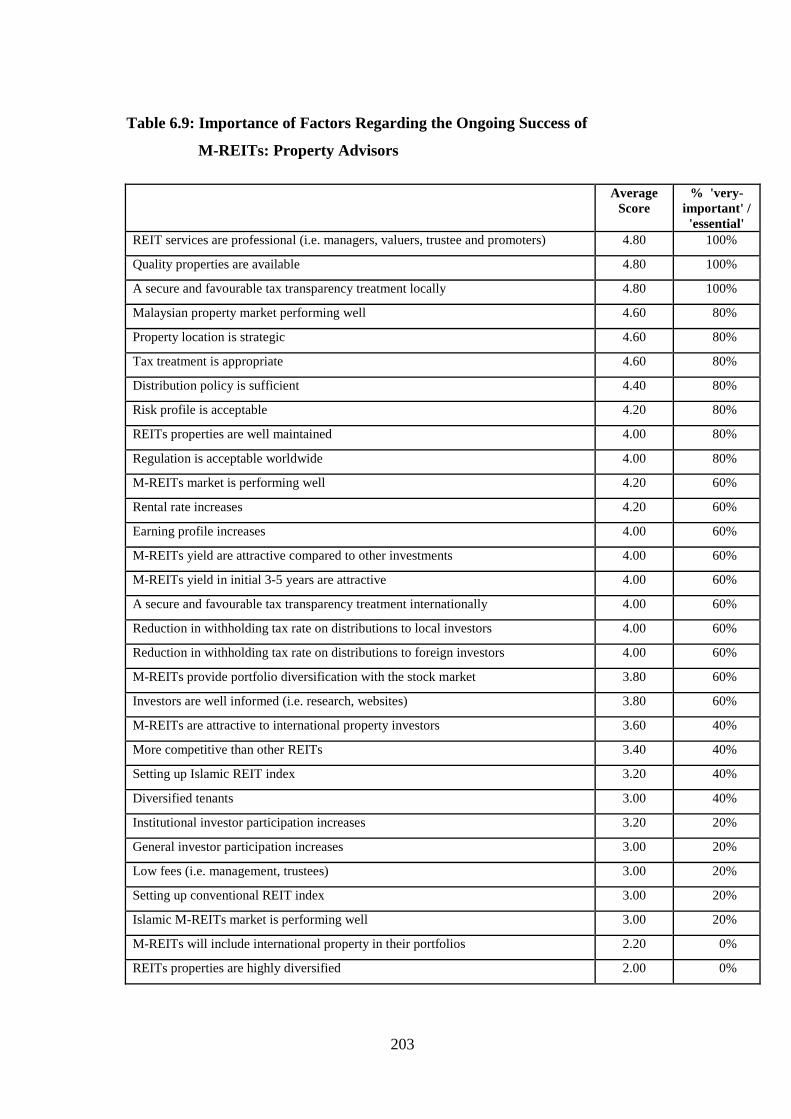
203
Table 6.9: Importance of Factors Regarding the Ongoing Success of
M-REITs: Property Advisors
AverageScore
% 'very-important' /'essential'
REIT services are professional (i.e. managers, valuers, trustee and promoters) 4.80 100%
Quality properties are available 4.80 100%
A secure and favourable tax transparency treatment locally 4.80 100%
Malaysian property market performing well 4.60 80%
Property location is strategic 4.60 80%
Tax treatment is appropriate 4.60 80%
Distribution policy is sufficient 4.40 80%
Risk profile is acceptable 4.20 80%
REITs properties are well maintained 4.00 80%
Regulation is acceptable worldwide 4.00 80%
M-REITs market is performing well 4.20 60%
Rental rate increases 4.20 60%
Earning profile increases 4.00 60%
M-REITs yield are attractive compared to other investments 4.00 60%
M-REITs yield in initial 3-5 years are attractive 4.00 60%
A secure and favourable tax transparency treatment internationally 4.00 60%
Reduction in withholding tax rate on distributions to local investors 4.00 60%
Reduction in withholding tax rate on distributions to foreign investors 4.00 60%
M-REITs provide portfolio diversification with the stock market 3.80 60%
Investors are well informed (i.e. research, websites) 3.80 60%
M-REITs are attractive to international property investors 3.60 40%
More competitive than other REITs 3.40 40%
Setting up Islamic REIT index 3.20 40%
Diversified tenants 3.00 40%
Institutional investor participation increases 3.20 20%
General investor participation increases 3.00 20%
Low fees (i.e. management, trustees) 3.00 20%
Setting up conventional REIT index 3.00 20%
Islamic M-REITs market is performing well 3.00 20%
M-REITs will include international property in their portfolios 2.20 0%
REITs properties are highly diversified 2.00 0%
204
6.3.4 Fund Managers
Table 6.10 show the importance of factors regarding the ongoing success of
M-REITs by fund managers. 80% of the respondents agree it is important for the
Malaysian property market to perform well, while the risk profile needs to be
acceptable and rental rates increase. Meanwhile, 60% consider M-REIT yields should
be attractive compared to other investments and increase its earning profile. In
addition, tax treatment should be appropriate, with a secure and favourable tax
transparency treatment locally and internationally. Reduction in the withholding tax
rate on distributions to local and foreign investors should also be important.
Furthermore, REIT services should be professional (i.e. managers, valuers, trustee and
promoters) since investors need to be well informed (i.e. research, websites), while
REIT properties should be well maintained, with availability of quality properties.
40% of the respondents deem it important for the M-REIT market to perform well;
therefore, the regulations should be acceptable worldwide and distribution policy
sufficient. In addition, M-REIT yields in the initial 3-5 years should be attractive, as it
is essential for M-REITs to be attractive to international property investors; thus
increasing institutional investor participation. Other factors include strategic property
location, diversified tenants and setting up a conventional REIT index.
However, only 20% of the respondents agree on the importance of setting up an
Islamic REIT index and consider the Islamic M-REIT market should perform well. In
this matter, it is required for M-REITs to have low fees (i.e. management, trustees),
while REIT properties need to be highly diversified and M-REITs should consider
including international property in their portfolios. This means REITs need to be more
competitive and provide portfolio diversification with the stock market to increase
general investor participation.
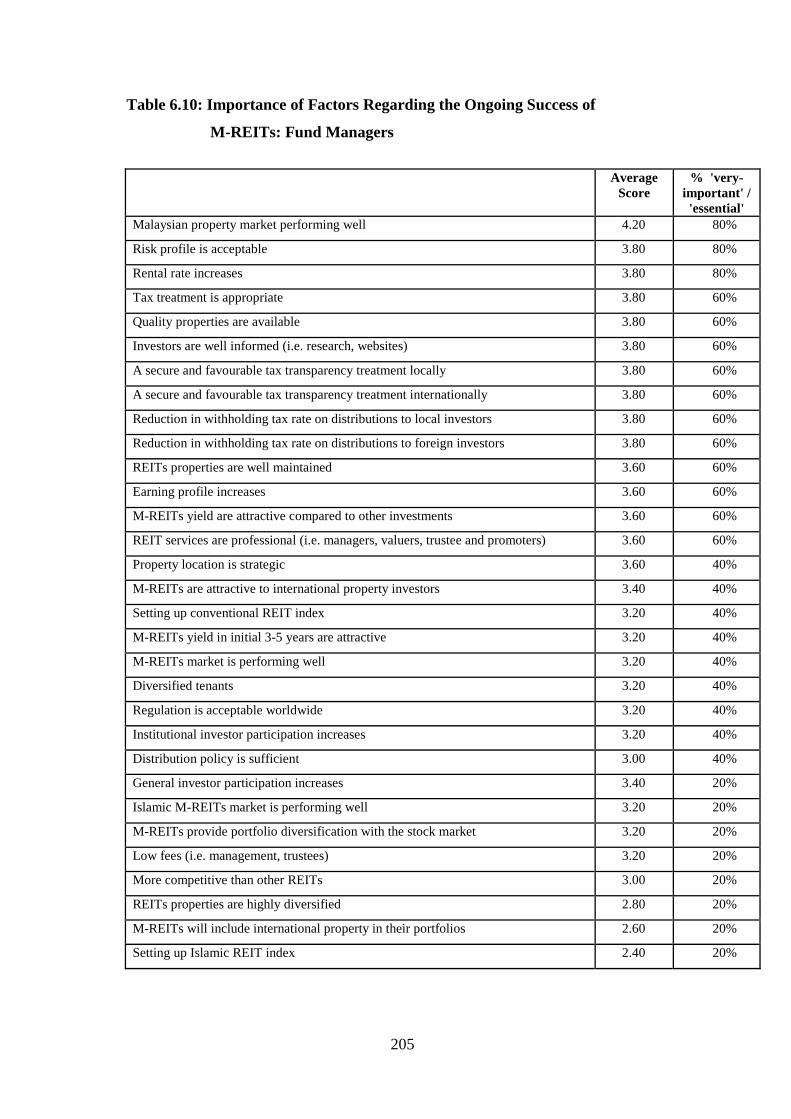
205
Table 6.10: Importance of Factors Regarding the Ongoing Success of
M-REITs: Fund Managers
AverageScore
% 'very-important' /'essential'
Malaysian property market performing well 4.20 80%
Risk profile is acceptable 3.80 80%
Rental rate increases 3.80 80%
Tax treatment is appropriate 3.80 60%
Quality properties are available 3.80 60%
Investors are well informed (i.e. research, websites) 3.80 60%
A secure and favourable tax transparency treatment locally 3.80 60%
A secure and favourable tax transparency treatment internationally 3.80 60%
Reduction in withholding tax rate on distributions to local investors 3.80 60%
Reduction in withholding tax rate on distributions to foreign investors 3.80 60%
REITs properties are well maintained 3.60 60%
Earning profile increases 3.60 60%
M-REITs yield are attractive compared to other investments 3.60 60%
REIT services are professional (i.e. managers, valuers, trustee and promoters) 3.60 60%
Property location is strategic 3.60 40%
M-REITs are attractive to international property investors 3.40 40%
Setting up conventional REIT index 3.20 40%
M-REITs yield in initial 3-5 years are attractive 3.20 40%
M-REITs market is performing well 3.20 40%
Diversified tenants 3.20 40%
Regulation is acceptable worldwide 3.20 40%
Institutional investor participation increases 3.20 40%
Distribution policy is sufficient 3.00 40%
General investor participation increases 3.40 20%
Islamic M-REITs market is performing well 3.20 20%
M-REITs provide portfolio diversification with the stock market 3.20 20%
Low fees (i.e. management, trustees) 3.20 20%
More competitive than other REITs 3.00 20%
REITs properties are highly diversified 2.80 20%
M-REITs will include international property in their portfolios 2.60 20%
Setting up Islamic REIT index 2.40 20%
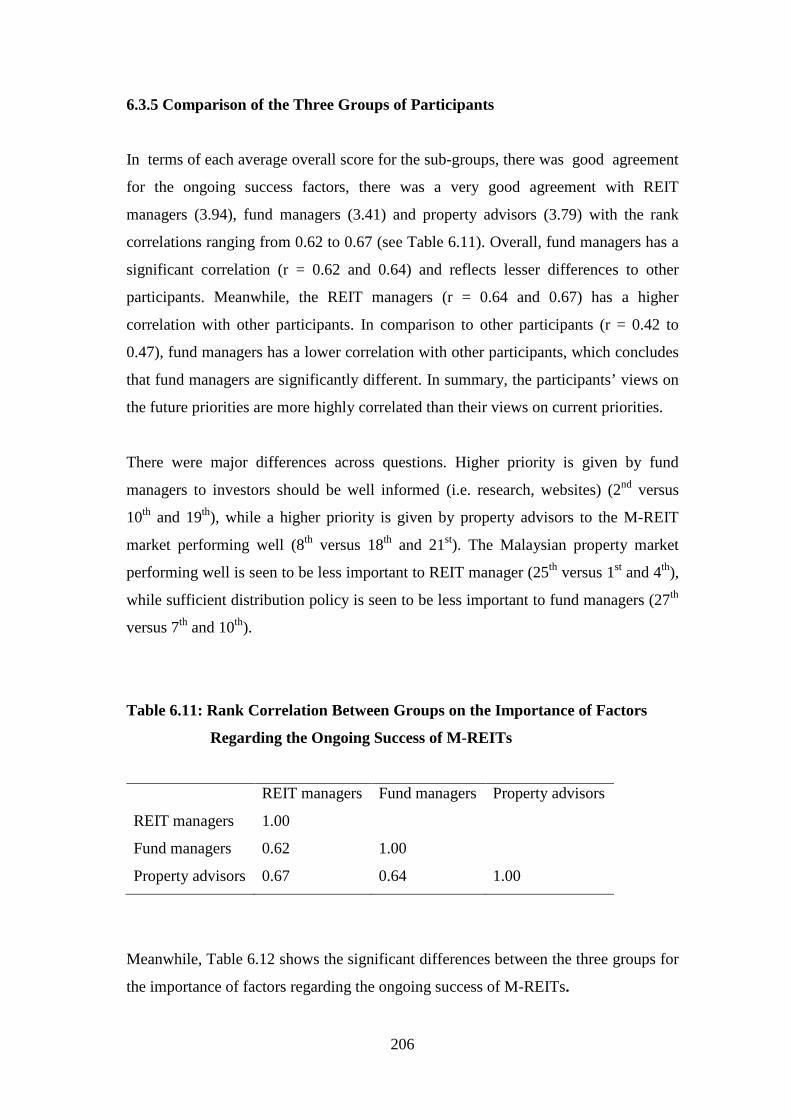
206
6.3.5 Comparison of the Three Groups of Participants
In terms of each average overall score for the sub-groups, there was good agreement
for the ongoing success factors, there was a very good agreement with REIT
managers (3.94), fund managers (3.41) and property advisors (3.79) with the rank
correlations ranging from 0.62 to 0.67 (see Table 6.11). Overall, fund managers has a
significant correlation (r = 0.62 and 0.64) and reflects lesser differences to other
participants. Meanwhile, the REIT managers (r = 0.64 and 0.67) has a higher
correlation with other participants. In comparison to other participants (r = 0.42 to
0.47), fund managers has a lower correlation with other participants, which concludes
that fund managers are significantly different. In summary, the participants’ views on
the future priorities are more highly correlated than their views on current priorities.
There were major differences across questions. Higher priority is given by fund
managers to investors should be well informed (i.e. research, websites) (2nd versus
10th and 19th), while a higher priority is given by property advisors to the M-REIT
market performing well (8th versus 18th and 21st). The Malaysian property market
performing well is seen to be less important to REIT manager (25th versus 1st and 4th),
while sufficient distribution policy is seen to be less important to fund managers (27th
versus 7th and 10th).
Table 6.11: Rank Correlation Between Groups on the Importance of Factors
Regarding the Ongoing Success of M-REITs
REIT managers Fund managers Property advisors
REIT managers 1.00
Fund managers 0.62 1.00
Property advisors 0.67 0.64 1.00
Meanwhile, Table 6.12 shows the significant differences between the three groups for
the importance of factors regarding the ongoing success of M-REITs.
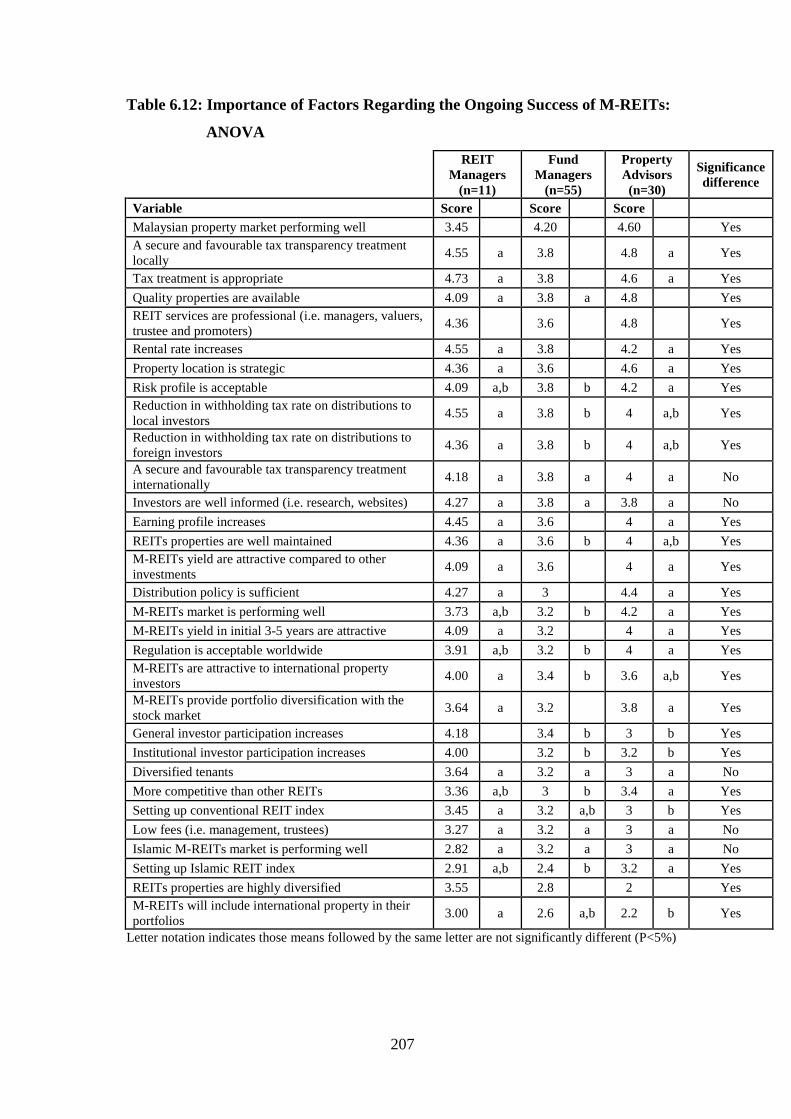
207
Table 6.12: Importance of Factors Regarding the Ongoing Success of M-REITs:
ANOVA
REITManagers
(n=11)
FundManagers
(n=55)
PropertyAdvisors(n=30)
Significancedifference
Variable Score Score Score
Malaysian property market performing well 3.45 4.20 4.60 Yes
A secure and favourable tax transparency treatmentlocally
4.55 a 3.8 4.8 a Yes
Tax treatment is appropriate 4.73 a 3.8 4.6 a Yes
Quality properties are available 4.09 a 3.8 a 4.8 Yes
REIT services are professional (i.e. managers, valuers,trustee and promoters)
4.36 3.6 4.8 Yes
Rental rate increases 4.55 a 3.8 4.2 a Yes
Property location is strategic 4.36 a 3.6 4.6 a Yes
Risk profile is acceptable 4.09 a,b 3.8 b 4.2 a Yes
Reduction in withholding tax rate on distributions tolocal investors
4.55 a 3.8 b 4 a,b Yes
Reduction in withholding tax rate on distributions toforeign investors
4.36 a 3.8 b 4 a,b Yes
A secure and favourable tax transparency treatmentinternationally
4.18 a 3.8 a 4 a No
Investors are well informed (i.e. research, websites) 4.27 a 3.8 a 3.8 a No
Earning profile increases 4.45 a 3.6 4 a Yes
REITs properties are well maintained 4.36 a 3.6 b 4 a,b Yes
M-REITs yield are attractive compared to otherinvestments
4.09 a 3.6 4 a Yes
Distribution policy is sufficient 4.27 a 3 4.4 a Yes
M-REITs market is performing well 3.73 a,b 3.2 b 4.2 a Yes
M-REITs yield in initial 3-5 years are attractive 4.09 a 3.2 4 a Yes
Regulation is acceptable worldwide 3.91 a,b 3.2 b 4 a Yes
M-REITs are attractive to international propertyinvestors
4.00 a 3.4 b 3.6 a,b Yes
M-REITs provide portfolio diversification with thestock market
3.64 a 3.2 3.8 a Yes
General investor participation increases 4.18 3.4 b 3 b Yes
Institutional investor participation increases 4.00 3.2 b 3.2 b Yes
Diversified tenants 3.64 a 3.2 a 3 a No
More competitive than other REITs 3.36 a,b 3 b 3.4 a Yes
Setting up conventional REIT index 3.45 a 3.2 a,b 3 b Yes
Low fees (i.e. management, trustees) 3.27 a 3.2 a 3 a No
Islamic M-REITs market is performing well 2.82 a 3.2 a 3 a No
Setting up Islamic REIT index 2.91 a,b 2.4 b 3.2 a Yes
REITs properties are highly diversified 3.55 2.8 2 Yes
M-REITs will include international property in theirportfolios
3.00 a 2.6 a,b 2.2 b Yes
Letter notation indicates those means followed by the same letter are not significantly different (P<5%)
208
Results show that all three groups are significantly different in terms of Malaysian
property market performing well, REIT properties are highly diversified and REIT
services are professional (i.e. managers, valuers, trustee and promoters). REITs
properties are highly diversified is the more important factor to REIT managers, while
property advisors find the other two factors to be more important. However, all three
groups are not significantly different in terms of Islamic M-REITs market is
performing well, diversified tenants, investors are well informed (i.e. research,
websites), low fees (i.e. management, trustees), a secure and favourable tax
transparency treatment internationally. Islamic M-REITs market performing well is
seen to be more important to fund managers, while the later factors are seen to be
more important to REIT managers.
REIT managers and property advisors are significantly different, but not significantly
different with fund managers in terms of M-REITs will include international property
in their portfolios and setting up conventional REIT index. However, REIT managers
and property advisors are not significantly different, but significantly different with
fund managers in terms of earning profile increases, distribution policy is sufficient,
M-REITs yield are attractive compared to other investments, M-REITs yield in initial
3-5 years are attractive, tax treatment is appropriate, M-REITs provide portfolio
diversification with the stock market, property location is strategic, rental rate
increases, and a secure and favourable tax transparency treatment locally.
Property advisors and fund managers are significantly different, but are not
significantly different with REIT managers in terms of M-REIT market is performing
well, risk profile is acceptable, regulation is acceptable worldwide, more competitive
than other REITs and setting up Islamic M-REIT index. However, property advisors
and fund mangers are not significantly different, but significantly different with REIT
manager in terms of general investor participation increases and institutional investor
participation increases
REIT managers and fund managers are significantly different, but are not significantly
different with property advisors in terms of REIT properties are well maintained,
M-REITs are attractive to international property investors, reduction in withholding
tax rate on distributions to local and foreign investors. However, REIT managers and
209
fund managers are not significantly different while both are significantly different
with property advisors in terms of quality properties are available.
The key similarities within the 3 groups are in terms of Islamic M-REIT market is
performing well, diversified tenants, investors are well informed (i.e. research,
websites), low fees (i.e. management, trustees), a secure and favourable tax
transparency treatment internationally. However the differences within the 3 groups
are in terms of Malaysian property market performing well, REIT properties are
highly diversified and REIT services are professional (i.e. managers, valuers, trustee
and promoters).
6.3.6 Factor Analysis Regarding Ongoing Success Factors for M-REITs
From the 31 issues regarding the ongoing success of M-REITs, underlying
dimensions were identified using factor analysis for overall and the three groups.
These dimensions are named, based on the results of the factors generated using
SPSS. These dimensions were:
Total: 5 factors accounting for 88.97% of variation
Investment and performance issues (26.87%)
Strategic and regulatory issues (26.15%)
Specific market dynamics (16.83%)
Diversification in portfolio (12.72%)
Strategic property issues (6.41%)
210
REIT managers: 6 factors accounting for 98.79% of variation
Strategic property issues (26.07%)
Strategic and regulatory issues (26.02%)
Investment and performance issues (17.44%)
Diversification in portfolio (15.04%)
Role of property in portfolio (7.70%)
Changing property environment (6.53%)
Property advisors: 3 factors accounting for 97.06% of variation
Investment and performance issues (42.47%)
Strategic and regulatory issues (35.52%)
Diversification in portfolio (19.07%)
Fund managers: 3 factors accounting for 96.79% of variation
Investment and performance issues (35.59%)
Strategic and regulatory issues (33.43%)
Strategic property issues (27.77%)
In terms of the important factors regarding the ongoing success of M-REITs, both
fund managers and property advisors agree that the regulatory issues are the most
important dimension, which is then followed by investment and performance issues
and other property investment issues. This further reinforces the similarities between
the key dimensions for the current performance of M-REIT and the important
dimensions regarding the ongoing success of M-REITs.
6.4 Comments from Respondents
As well as the quantitative aspects of this M-REIT survey, respondents also gave
specific comments concerning M-REITs. These comments are summarised in this
section.
211
6.4.1 M-REIT Fund Managers
REITs are capital market instruments with a mandate to invest and optimize property
assets; thus REITs are dependent on the inter-relationship between the capital markets
and property markets. Upturns in the property market may provide potential income
increases for REITs, while downturns may provide acquisition opportunities. It is
essential for the M-REIT market to perform well, as the cost of capital is typically
advantageous for M-REITs to grow their asset base. It is also very important for the
risk profile to be acceptable, as risk management is important from the standpoint of
income or dividend stability. It is suggested that the REIT portfolio must be structured
to maintain low risk to avoid dividend disruption, as the majority of REIT investors
are income-oriented. Thus, dividend forecasts, distribution policy and increases in
earning profile are essential. As foreign investors are increasing their investment in
M-REITs, it is very important for the M-REIT regulations to be consistent with
worldwide REIT developments regarding REIT structures and guidelines. Given the
nascent development of M-REITs, it is essential for M-REIT yields to be attractive
compared to other investments, as most domestic investors currently assess M-REIT
yields vis-à-vis current investment alternatives such as equities and bonds. It is also
essential that M-REIT yields in the initial 3-5 years are attractive to attract domestic
investors, who are relatively unfamiliar with the REIT product; however a high-
yielding REIT also includes an additional risk premium.
Several M-REITs are still conventional M-REITs as there are limitations on Islamic
REITs. Property investment must be Shariah-compliant and limitations also exist on
the type of properties and it’s percentage as stated in the Securities Commission’s
REIT guidelines and the trust deed. An appropriate tax treatment is essential as M-
REITs are compared to domestic investment alternatives; thus tax transparency is
relevant. It is also very important that M-REITs provide portfolio diversification with
the stock market, following worldwide trends. M-REITs should provide
diversification with the market, i.e. a low beta, to enable M-REITs to act as an
alternative asset class compared to stocks and bonds. To a certain point, the
availability of quality properties seems to be a subjective issue, as quality properties
may be construed as high-end properties. REITs manage and optimise a portfolio of
properties; thus yield, yield accretion and risk management are important assessment
212
factors, as REITs can invest and manage high-quality or low-end properties (e.g.
lower income hypermarkets, etc). Strategic property location is generally essential as
a key fundamental to ensure that a property maintains a high-yielding performance or
income stability. Diversification of REIT’s properties need be done at a portfolio level
or where the economies of property portfolio make sense. REIT properties should be
well maintained and generate high-yield and improving that yield requires
professional property management. Diversified tenants are very important to ensure
that the property tenant mix is not too dependent on any specific industry sector or
tenant which may be prone to economic cyclical downturns, thus affecting the REIT's
income. It is necessary for distribution policy to be attractive, as distribution policy
and dividend forecasts are essential for a majority of REIT investors. In generating
growth for M-REITs, positive rental reversion is important to enable growth in REIT
income.
In international context, it is essential for M-REITs to be attractive to international
property investors. International property investors from mature REIT markets
provide implicit guidance and support for the M-REIT sector to develop along
international best practices. M-REITs may include international property in their
portfolios in the future. The key imperative for M-REITs is to actively manage and
optimise property portfolio performance. Managing properties in international
locations requires understanding of the respective international markets to ensure
competitive performance. M-REITs need to be more competitive than other REITs as
foreign investors will prompt comparison with other REITs worldwide.
It is also very important for the increase in general investor’s participation on M-
REITs. Investors should be well informed (i.e. research, websites); hence, it is
essential to maintain continual and consistent disclosure to key investors. Creating
awareness and educating retail investors is important to develop them in the market
while institutional investor participation ensures REITs remain a primary product for
institutional investors.
In terms of management, professional REIT services are essential (i.e. managers,
valuers, trustee and promoters). The competitive advantage of REITs over other
property-owning vehicles will be seen in their professional execution of their duties
213
and responsibilities. Low fee structures (i.e. management, trustees) should be
benchmarked internationally according to measures such as MER. The setting up of a
conventional REIT index would be helpful to provide a benchmark for existing
REITs. However, the overall end result is the performance of the REIT.
A secure and favourable tax transparency treatment locally and internationally is
essential, as REITs worldwide are known to be tax transparent. Reductions in the
withholding tax rate on distributions to local and foreign investors are important.
Relative to the REIT market in Malaysia, the withholding tax is 10% for individual
investors by 2009 and is constantly compared to Singapore which allows 0% for its
resident investors. In addition, the key to attracting foreign investors would be to
maintain a competitive tax regime vis-a-vis local regional REIT markets.
Some of the respondents’ suggestions for the ongoing success of M-REITs included
loosening regulations on M-REITs to equivalent practices overseas, e.g. debt gearing
cap by remove existing 50% cap and allow free-market forces (as in the US),
development capability which allow REITs partial development capability (e.g. total
value not exceeding 20% of current asset size), review of the existing Valuers,
Appraisers and Estate Agents Act 1981 which only permits registered valuers as third-
party property managers - a regulation which applies and restricts REITs, and
harmonisation of the withholding tax regime to international standards. By 2009,
Malaysian residents are taxed at 10% (vs 0% in Singapore) while foreigners are taxed
at 10% for non-resident individual and institutional and 25% for non-resident
corporate (vs 10% in Singapore).
6.4.2 Property Advisors
There are several factors deemed important in the opinion of property advisors on the
current performance of M-REIT; this includes dividend growth and accumulation of
new assets. Other significant risk factors regarding M-REITs are the sale and
leaseback mechanism on a guaranteed return of 7% is not wholly desirable and debt
leverage has helped to arbitrage, and it is helpful if the loan levels are kept low. Other
important factors for the ongoing success of M-REITs includes the strength of the
214
owners behind the REITs, the accumulation and injection of new properties indicating
growth strategies, dividend growth, volatility market, transparency and open
disclosure of all matters finance and legal.
6.4.3 Fund Managers
From the fund manager’s extensive survey, all respondents agree South East Asia is
seen to be a very good REIT market, although the M-REIT market is still in its early
phase. There is a lot to develop, as they were just launched 2 years ago. Currently, the
performance of M-REITs varies. Only a few can be considered to have performed
well. Many M-REITs initially did well after IPO, but have faltered; due to several
factors particularly since the government did not lower the withholding tax on
dividends, which had been expected. At the time of the survey, there are still no M-
REITs which included international property. To a certain extent, it is important that
low fees are given to management and trustees, although it is considered appropriate
to give higher fees to professional REIT managers to reduce costs and ensure that
REITs are properly managed. Many REITs do not have managers who are dedicated
to the REIT, but are only doing it part-time. During the survey, interest rates
narrowing by 50 basis points. A narrowing interest rate differential between Malaysia
and U.S. rates suggests little pressure on the ringgit peg. This would encourage trades
more attractive at 200-280 bps difference. Respondents agree on the other significant
risk factors on the current performance of M-REITs, which include management
delivery, liquidity and gearing.
The survey also indicated future plans to invest in M-REITs, as it has defensive
features; particularly in light of the US economic slowdown and Malaysian equities
becoming expensive. M-REITs provide a stable income stream for at least 2 years and
low risk associated due to this stable income. It is important for M-REIT risk profiles
to be acceptable, especially during the US economic slowdown period. The fully
valued Malaysian stock market encourages many fund managers to seek defensive
stocks such as M-REITs. Other factors which influence fund managers to invest in M-
REITs include liquidity, market stability, quality of the assets, gearing, and delivery
of proactive management with a proven track record, the ability to increase asset size,
215
attractive yield relative to other fixed income instrument vis-à-vis risk-free rate and
tax advantages. Respondents also agreed the assessment on specific REIT players will
also influence fund managers’ decisions to invest in REITs.
Several of the fund managers invest in Islamic M-REITs as it is a defensive stock that
is Shariah compliant, and their clients require them to invest in Shariah compliant
stocks only. Unfortunately, during the survey period, Axis REIT, which is probably
the best managed REIT in Malaysia, was not Shariah compliant; only converting to
being an Islamic REIT in December 2008. A number of fund managers favour
Al-Hadharah Boustead–CPO REIT which leverages on the increasing CPO.
According to the average fund manager’s survey results, the percentage of M-REITs
in investment portfolios ranges between 1-10% for conventional M-REITs and 0.5-
3% for Islamic M-REITs.
However, several fund managers decline to invest in M-REITs as yields are not
attractive and there are not many REITs in the market. The small size of most
Malaysian REITs renders them not attractive to big funds. Size of the assets is not
large enough to attract foreign buyers, resulting from a difficulty to find quality
assets. This is followed by poor liquidity. Another reason which deterred the interest
of foreign investors towards M-REITs is the tax treatments which are not attractive
relative to other countries (i.e. Singapore). Almost all Malaysian REITs were set up
by companies wanting to dispose of their properties, particularly since they were
exempted from capital gains tax if they allocated them into REITs. The risk is that the
appointed REIT manager, who is usually an employee of the selling company, will
not manage the properties very well. The only Malaysian REIT which appears to add
value to its properties and continuously search for undervalued properties to acquire is
Axis REIT. As decreasing rents will affect yields and other associated risks (i.e.
regulatory risk, sector risk, country risk, execution risk), more companies are shifting
outside of Kuala Lumpur due to higher rent prices. Meanwhile, all Islamic M-REITs
appear to be vehicles used by the vendor companies to dispose of their properties.
For the ongoing success of M-REITs, all fund managers agree that it is important for
M-REITs to yield attractive dividends compared to other investments, as high
dividend gives more incentives to investors. This is essential to gain investors’
216
confident. Several respondents also find it important for M-REITs to be attractive to
international property investors and to REITs in other international markets.
Currently, the M-REIT market needs to compare with other markets (i.e. Singapore);
especially in terms of tax transparency. All respondents agree that a reduction in
withholding tax is important. For a REIT to grow, a number of respondents agree that
buying a good property is essential, as well as the investor’s track record on
management and results. It is not easy for REITs to grow in Malaysia, as the property
market in Malaysia is small. Although the REIT market is undervalued, there is still
potential in terms of commercial REITs, as retail REITs were seen to improve
significantly in the last 3 years.
6.5 Conclusion
The survey results have revealed the key elements on the importance of the factors
regarding the current performance and the ongoing success of M-REITs. For all three
groups, the key points in which they have equal agreement on the importance of
factors regarding the current performance of M-REITs are dividend growth and
acquisition of new assets, while the significant risk factors regarding M-REITs is the
level of borrowings. In terms of factors for the ongoing success, growth strategy is
considered to be a significant factor, which includes professional management,
acquisition of new assets, dividend growth and transparency in every aspect;
especially in terms of regulation and finance.
217
CHAPTER 7
SUMMARY
7.1 Summary of Contributions of the Research
As stated in Chapter 1, this research aims to contribute and expand on the existing
research on REITs; particularly concerning the significance of Malaysian REITs and
Islamic REITs in regional and global aspects. Among the contributions include the
development of a Malaysian REIT index and Islamic M-REIT index, since a Malaysian
REIT performance series is currently not available. This will provide clear empirical
information on M-REIT and give greater opportunity to all M-REIT investors.
7.2 Summary of Limitations
This research is only a preliminary analysis of M-REITs and Islamic REITs in
Malaysia. A short sample period is not nearly long enough in terms of analysing
investment returns comparable to those achievable in regional markets (eg. Singapore
and Hong Kong) in a pan-Asia portfolio (Osmadi, 2007a). The use of a short sample
period to draw longer term inferences on the performance of REITs is inappropriate
as the sample period may coincide with a boom or bust period (Han and Liang, 1995).
Moreover, a short time period accompanied by a small number of M-REITs is not a
reliable indicator to the long term performance of M-REITs, let alone Islamic REITs.
At this stage, M-REITs have only been available since September 2006, so a fuller
time series will need to be subsequently analysed before rigorous recommendations
regarding M-REITs and Islamic REITs can be made.
218
In addition, the use of KLCI as a performance comparison is not fully appropriate as
the KLCI consists of large capitalisation shares while M-REITs consist of smaller
capitalisation shares. Furthermore, the lack of direct property performance measures
constrains the performance results. Performance analyses will be conducted in the
future as there is potential in regulation changes (Jones Lang LaSalle, 2006), investor
participation and property acquisition into REITs.
7.3 Suggestions
The short history in M-REIT data is not nearly long enough in terms of analysing
investment returns comparable to those achievable in regional markets. Despite
anticipated rising interest rates, the share price is expected to pick up again following
improvements to the M-REIT guidelines in the future. Malaysian REITs are destined
to grow further with the right strategy. To be sustained in the challenging environment
of investment, parties involved need to revive and monitor to improve the M-REIT
industry to attract more investors: Suggestions are as follows:
Generate more interest and confidence to investors by education which
includes research and understanding.
Acquire diversified and quality properties in strategic locations to obtain high
returns. Properties such as government-linked companies, airports, banks
(conventional and Islamic bank) and infrastructure projects such as toll roads
should be considered. High-income generating properties would be significant
during an economy downturn.
More relaxation to the current guidelines-possibility of a new tax structure and
tax-exemption to unit-holders to promote growth as modelled by the
Singapore REIT structure.
219
Management strength needs to be enhanced with more professional and
experienced property managers especially in building a competitive business
model, acquiring diversified tenants, using a good strategy in arranging lease
agreements and refinancing for future growth particularly in rental earnings,
further property development and capital appreciation to increase the unit
price.
Consistent and high distribution yields of >8% or higher than other defensive
investment vehicles, this includes high distribution ratios of >90% of net
income.
Cross-border listing and acquiring overseas assets to boost growth.
However, there is number of issues that could limit the further development for
Islamic M-REITs:
Given the constraints and the limitations given by the Islamic law, would
companies choose to issue an Islamic REIT? Given Islamic law restrictions,
this would make Islamic REITs less desirable compared to conventional
REITs. Policymakers need to tackle the regulatory framework.
Efforts should be made to increase the capacity of Shariah compliant
buildings.
Attaining standardised guidelines for Islamic M-REITs should be generally
acceptable to all Muslims investors around the world.
The need to assign a specific compliance committee to monitor every potential
investment decision made for an Islamic M-REIT.
220
To make the Islamic market a success, Shariah expertise should address the
needs of Muslim investors worldwide and not just cater for investors in the
Gulf region but target the local market as well.
Educating investors-experts need to raise the level of understanding,
awareness and acceptance of Islamic M-REITs.
To make Islamic M-REITs a complete success, the regulators should consider a
global marketing strategy. With the introduction of Islamic M-REITs, M-REITs will
play an important role in the Malaysian real estate market and it is likely that the
Islamic compliant property market is poised to become significant within the global
financial markets. Islamic investment products are likely to see significant future
growth in many countries. With the introduction of Islamic M-REITs in the future, it
is likely that the Islamic compliant property market is poised to become significant
within the global financial markets. The main purpose of Islamic finance is to
eliminate unethical financial transactions such as interest. Currently, Islamic financial
institutions are advancing and improving their products to attract more diversified
global investors.
7.4 Summary of Future Research
Future research will need to be conducted which will examine the development,
performance and impact of Malaysian REITs in the local and global REIT market.
Analyses will also need to be conducted over longer time period for Malaysian
REITs to provide the basis for future research regarding the performance and
strategic development of Malaysian REITs and Islamic M-REITs as a successful
REIT product in Asia. Associated investor surveys will see a much richer and
informed analysis than that just provided by the empirical performance analysis.
Personal interviews will also need to be conducted and a survey in the form of a
questionnaire will also need to be distributed to assess investor attitudes to Malaysian
REITs and Islamic M-REITs both with Malaysian and international investors. As
221
there are more Malaysian REITs to be developed, this on-going research will be
significant to the successful growth of the Malaysian REIT market.
Although the market for Islamic M-REITs is still small, there is plenty of room for
further development. Support for this product is growing as Muslims become more
concerned over true Islamic regulation and more investors become aware that they
can get a better advantage with Islamic products. Since Islamic M-REITs were only
recently listed, the short time series shows that it is too early to say that Islamic M-
REITs will not be a successful product in the future. There is an increased demand for
Islamic products, as there is success in Islamic bonds and Islamic finance. In addition,
conventional foreign banks, such as HSBC, Citibank and UBS, are also offering a
range of Islamic financial products.
The future for Islamic REITs at an international level looks promising, as Dubai is
also considering an Islamic REIT structure, while Amanah Raya Bhd (the first
Malaysian Government firm to form a REIT) plans to list its second real estate
investment trust (REIT) in both Malaysia and in Dubai. It is also expected that the UK
will establish an Islamic REIT market as it is the most preferred location for Shariah
investment compared to other countries in Europe (Parsa, 2005). Undeniably, a global
property investment strategy is the key to a successful REIT market. As this area will
have an increased importance in the future, investors and property related companies
should take this opportunity to expand their knowledge and expertise in this area of
Islamic finance and Islamic REITs to extend their property business opportunities
globally.
222
Research by the RICS (2006) concluded that the UK is the most preferred location for
Shariah investment compared to other countries in Europe. However, 62% of overall
respondents think that the Middle East is a good location for Shariah investments, as
the Middle East consists of more Muslim populations compared to other countries.
Only 38% view South East Asia as potential locations for Shariah investment.
Based on the Jones Lang LaSalle (2004) Real Estate Transparency Index, Southeast
Asia seems to be the most probable location for the introduction of an Islamic REIT
market, as it is more transparent compared to the Middle East. Al Islami Far Eastern
Real Estate Fund, sponsored by Dubai Bank and Cheung Kong Group in Hong Kong
aims to make opportunistic property investments in selected Asian cities including
Hong Kong, Singapore, Kuala Lumpur, Seoul, Shanghai, and Beijing. Malaysia and
Indonesia are the both populous Islamic countries in Asia whilst Singapore, Thailand
and the Philippines have a sizable share of Muslim communities. Their growth is
expected to increase with an enhanced regulatory framework to encourage REITs.
Furthermore, investors in Southeast Asian countries are taxed higher than the Middle
East, and REITs therefore offer tax efficient investments that are seem to be more
favourable investments.
In addition, Malaysia and Indonesia are gearing up in terms of developing and
refining their Islamic financial instruments to attract more Middle Eastern investment
in these countries. Singapore is trying to expand their horizon further, but with lack of
expertise and knowledge in Islamic laws, their efforts seem to be stalled. However, to
draw more international investors, Malaysian policymakers need to review the current
withholding tax of 25 per cent for foreign investors which are less favourable
compared with Singapore 10 percent and Hong Kong at 17.5 percent.

223
Overall, further research is clearly needed to further expand the understanding of
REITs in Malaysia, their investment dynamics and investor appeal. With the expected
future growth of M-REITs after the global financial crisis, this research will provide
increased understanding of M-REITs in an investment portfolio. In particular, this
understanding will also be relevant to the development of Islamic REITs, with the
expected future growth in Islamic property investment products and opportunities
globally.
224
REFERENCES
Abdullah, F. , Hassan, T. and Mohamad, S. 2007. Investigation of performance ofMalaysian Islamic unit trust funds. Managerial Finance 33: 142-153.
Ahmad, Z. and Ibrahim, H. 2002. A study of the performance of the KLSE Syariahindex. Malaysian Management Journal 6: 25-34.
Albaity, M. and Ahmad, R. 2008. Performance of Syariah and composite indices:Evidence from Bursa Malaysia. Asian Academy of Management Journal ofAccounting and Finance 4: 23-43.
Allen, P. and C. Sirmans. 1987. An analysis of gains to acquiring firm’s shareholders:The special case of REITs. Journal of Financial Economics 18: 175-184.
AME Capital. 2008. Global REIT Research. Monthly report for December 2008.
Ameer, R. 2007. Dividend payout of the property firms in Malaysia. Pacific RimProperty Research Journal 13: 451-472.
Asian Public Real Estate Association. 2009. Weekly Asia REIT Report. APREA.
Bardhan, A., R. Edelstein and D. Tsang. 2008. Global economic and financialintegration and real estate security returns. Real Estate Economics 36:2.
Barkham, R. and Geltner, D. 1995. Price discovery and efficiency in American andBritish property markets. Real Estate Economics 23:21.
Barkham, R.J., Geltner, D.M. 1996. Price discovery and efficiency in the UK housingmarket. Journal of Housing Economics 5(1): 41-63.
Bond, S.A., G.A. Karolyi and A.B. Sanders. 2003. International real estate returns: AMultifactor, Multicountry approach. Real Estate Economics 31:3.
Burns, W.L and D. R. Epley. 1982. The performance of portfolio of REITs + stocks.Journal of Portfolio Management Winter: 37-41.
Byrne, P. and Lee, S. 1997. Real estate portfolio analysis under conditions of non-normality: The case of NCREIF. Journal of Real Estate Portfolio Management 3(1):37-46.
Carr, M., Dimovski, W., Newell, G., Ooi, J. and Yap, C.J. REIT IPO underpricing inSingapore, Hong Kong and Malaysia (paper accepted).
CB Richard Ellis. 2009. REITs across Asia: 2H 2008. CBRE.
225
Chan, K., Hendershott, P. and Saunders, A. 1990. Risk and return on real estate:Evidence from equity REITs. AREUEA Journal 18: 431-52.
Chikolwa, B. 2007. The development of commercial mortgage-backed securities inAustralia. Pacific Rim Property Research Journal 13(4): 397-422.
Chikolwa, B. 2008. Determinants of Australian LPT bond ratings. Pacific RimProperty Research Journal 14(2): 123-149.
Chin, W. and Dent, P. 2006. An analysis of the level of maturity in South-East Asianproperty markets. Pacific Rim Property Research Journal 11(4): 355-372.
Chin, W. Dent, P. and Roberts, C. 2006. An exploratory analysis of barriers toinvestment and market maturity in Southeast Asian Cities. Journal of Real EstatePortfolio Management 12(1): 49-58.
Chu , Y. and Sing, T.F. 2004. Inflation hedging characteristics of the Chinese realestate market. Journal of Real Estate Portfolio Management 10(2): 145-154.
CIA. 2008. The World Factbook.
CIA. 2009. The World Factbook.
Clayton, J. and MacKinnon, G. 2003. The relative importance of stock, bond and realestate factors in explaining REIT returns. Journal of Real Estate Finance andEconomics 27(1): 39-60.
Conover, M., Friday, S. and Sirmans, S. 2002. Diversification benefits from foreignreal estate investment. Journal of Real Estate Portfolio Management 8: 17-26.
Corgel, J. G., W. McIntosh and S. H. Ott. 1995. Real Estate Investment Trusts: Areview of the financial economics literature. Journal of Real Estate Literature 3(1):13–43.
Craft, T. M. 2001. The role of private and public real estate in pension plan portfolioallocation choices. Journal of Real Estate Portfolio Management 7(1): 17–23.
De Wit, D. 1997. Real estate diversification benefits. Journal of Real EstateResearch 14(1/2): 117-135.
Deutsche Bank. 2007. Shariah Real Estate Funds: Sizing the opportunities DB.
Dimovski, W. and R. Brooks. 2006a. The pricing of property trust IPOs in Australia,Journal of Real Estate Finance and Economics 32: 185-199.
Dimovski, W. and R. Brooks. 2006b. Factors influencing money left on the table byproperty trust IPO issuers. Journal of Property Research 23: 269-280.
226
Dimovski, W. and Brooks, R. 2007. Factors influencing the direct costs of propertytrust IPOs. Pacific Rim Property Research Journal 13(1): 2-15.
Ming-Long Lee, Ming-Te Lee, Kevin C.H. Chiang. 2005. Real estate risk exposure ofequity Real Estate Investment Trusts. PRRES 2005 Conference.
Ennis, R. and P. Burik. 1991. Pension fund real estate investment under a simpleequilibrium pricing model. Financial Analysts Journal 47(3).
EPRA. 2008. Global REIT survey EPRA. Brussels.
EPRA. 2009. Global real estate universe. EPRA News 29: 53.
Ernst and Young. 2006. Global REIT Report 2006.
Ernst and Young. 2007. Global REITs Report & Market Review 2007.
Ernst and Young. 2008. Riding out the storm: Global Real Estate Investment TrustReport 2008.
Errico, L. and Farahbaksh, M. 1998. Islamic Banking: Issues in Prudential regulationsand supervision. IMF Working Paper No. 98/30.
Fama, E., Schwert, G. 1977. Asset returns and inflation. Journal of FinancialEconomics 5: 115-46.
Foong, S. 2005. Road to Riches with REIT (Real Estate Investment Trust), Women’sinstitute management. Malaysia.
Ganesan, S. and Chiang, Y.H. 1998. The inflation-hedging characteristics of real andfinancial assets in Hong Kong. Journal of Real Estate Portfolio Management 4(1): 55-68.
Garvey, R., Santry. G. and Stevenson, S. 2001. The linkages between real estatesecurities in the Asia Pacific. Pacific Rim Property Research Journal 7: 240-258.
Geltner, D. and N. Miller. 2001. Commercial Real Estate Analysis and Investments.South-Western College Publishing Co. Cincinnati. OH.
Giliberto, M. 1990. Equity REITs and real estate returns. Journal of Real EstateResearch 5:259.
Girard, E. and Hassan, M. 2008. Is there a cost to faith-based investing: Evidencefrom FTSE Islamic indices. Journal of Investing 17: 112-121.
Glascock, J.L., Lu, C., and So, R.W. 2000. Further evidence on the integration ofREIT, bond and stock returns. Journal of Real Estate Finance and Economics 20(2):177-94.
227
Goebel, P.R. and K.S. Kim. 1989. Performance Evaluation of Finite-Life Real EstateInvestment Trusts. Journal of Real Estate Research 4(2): 57-70.
Goldstein, M. and Nelling, E. 1999. REIT return behaviour in advancing anddeclining stockmarkets. Real Estate Finance 15(4): 68-77.
Gray, L. 2009. Asset values take a hit. Institutional Real Estate Letter – Europe.
Guerard, J. 1997. Is there a cost to being socially responsible in investing? Journal ofInvesting 6: 11-17.
Gyourko, J. and Keim, D.B. 1992. What does the stockmarket tell us about real estatereturns. AREUEA Journal 20(3): 457-485.
Gyourko, J., Linneman, P. 1988. Owner-occupied homes, income-producingproperties and REITs as inflation hedges: Empirical findings. Journal of Real EstateFinance and Economics 1: 347-72.
Hakim, S. and Rashidian, M. 2002. Risk and return of Islamic stock market. Sharjah.UAE.
Hamelink, F. and Hoesli, M. 1996. Swiss real estate as a hedge against inflation: Newadvance using hedonic and autoregressive models. Journal of Property Finance 7(1):33-49.
Han, J. and Liang, Y. 1995. The historical performance of Real Estate InvestmentTruts, Journal of Real Estate Research 235-262.
Hartzell, D., Hekman, J. and Miles, M. 1987. Real estate returns and inflation.AREUEA Journal 15: 617-627.
Herald, K. December 2006/January 2007. Islamic Investment: It’s a matter ofcompliance. Property Australia.
Hoesli, M., Lekander, J. and Witkiewicz, W. 2004. International evidence on realestate as a portfolio diversifier. Journal of Real Estate 26(2): 161-206.
Howe, J.S. and J.D. Shilling. 1990. REIT advisor performance. AREUEA Journal18(4): 479-500.
Hussein, K. 2004. Ethical investment: Empirical evidence from FTSE Islamic index.Islamic Economic Studies 12: 21-40.
Hussein, K. and Omran, M. 2005 Ethical investment revisited: evidence from DowJones Islamic indices. Journal of Investing 14: 105-124.
Ibrahim, M.F. and Ong, S.E. 2008. Shariah compliance in real estate investment.Journal of Real Estate Portfolio Management 14(4): 401-414.
228
Ibrahim, M.,Ong, S. E. and Parsa, A. 2009. Shariah property investment in Asia.Journal of Real Estate Literature 17: 233-248.
IFSL. 2009. Islamic finance 2009. IFSL.
IMD world competitiveness yearbook 2008. IMD.
IPE. 2005. www.ipe.com.
KPMG. 2007. Growth and diversification of Islamic finance. KPMG.
Jin, C., T. Grissom and A. Ziobrowski. 2007. The mixed-asset portfolio for Asia-Pacific markets. Journal of Real Estate Portfolio Management 13: 249-256.
Jones Lang LaSalle. 2004. Real Estate Transparency Index. JLL, Chicago.
Jones Lang LaSalle. 2006. Real Estate Transparency Index. JLL, Chicago.
Jones Lang LaSalle. 2008. Global real estate capital. Jones Lang LaSalle Research.
Jones Lang LaSalle. 2009. Global real estate Transparency Index 2008. Jones LangLaSalle Research.
Jones Lang LaSalle. 2008. Global real estate capital. Jones Lang LaSalle Research.
JPMorgan. July 2007. Asia real estate sector, Singapore Real Estate Sector, SingaporeREITs/Malaysia REITs. JPMorgan.
Kallberg, J.G., Liu, C.H. and Greig D.W. 1996. The role of real estate in the portfolioallocation process. Real Estate Economics 24(3): 359-377.
Kallberg Jarl G., Liu, Crocker H. and Srinivasan, Anand. November 2002. Limitedpartnerships and reputation formation. NYU Working Paper No. FIN-02-060.
Kok, S., Giorgioni, G. and Lewis, J. 2009. Performance of Shariah-compliant indicesin London and New York stockmarkets and their potential for diversification.International Journal of Monetary Economics and Finance 2: 398-408.
Kok, K. K. and Khoo, K. L. 1995. Performance of property trusts in the KualaLumpur Stock Exchange. Capital Markets Review 3(2): 1-19.
KPMG.. 2007. Growth and diversification in Islamic finance. Publication No.306-328.March 2007.
Kuhle, J. 1987. Portfolio diversification and return benefits: Common stocks versusREITs. Journal of Real Estate Research 2: 1-9.
Kuhle, J.L. and C.H. Walther. 1986. REIT vs. common stock investments: Anhistorical perspective: A survey of performance results, 1973-1984. Real EstateFinance 3(1): 477-52.
229
Kreander, N., Gray, R., Power, D. and Sinclair, C. 2005. Evaluating the performanceof ethical and non-ethical funds: A matched pair analysis. Journal of Business Financeand Accounting 32: 1465-1493.
Kutsuna, K., Dimovski, W. and Brooks, R. 2008. The pricing and underwriting costof Japanese REIT IPOs. Journal of Property Research 25: 225-239.
Lee, C.L., Reed, R. and Robinson, J. 2007. Momentum profits in Australian listedproperty trusts. Pacific Rim Property Research Journal 13(3): 322-343.
Lee, C.L., Reed, R. and Robinson, J. 2008. Downside beta and the cross-sectiondeterminants of LPTs returns. Journal of Real Estate Portfolio Management 14(1): 49-62.
Lee, J. Y. M., Hishamuddin, M. A., and Lee, C. L. 2005. The new Real EstateInvestment Trusts in Malaysia: Lessons from Listed Property Trust. Real EstateEducators and Researchers Association 1st Conference. Universiti TeknologiMalaysia.
Lee, M. L., & Lee, M. T. 2003. Institutional involvement and the REIT January effectover time. Journal of Property Investment & Finance 21(6) : 435.
Liang, Y. and McIntosh, W. 1998. REIT style and performance. Journal of RealEstate Portfolio Management 4(1): 69-78.
Limmack, R. J. and C. W. R. Ward. 1988. Property returns and inflation. LandDevelopment Studies. 1988 5(3): 47-55.
Lin, T.C. 2007. The development of REIT markets and real estate appraisal inTaiwan. Journal of Real Estate Literature 15: 281-301.
Ling, D. and Naranjo, A. 2002. Commercial and real estate return performance: Across-country analysis. Journal of Real Estate Finance and Economics 24(1): 119-142.
Liow, K.H. 2000. The dynamics of the Singapore commercial property market.Journal of Property Research 17(4): 279-292.
Liow, K.H. 2001a. The long-term investment performance of Singapore real estateand property stocks. Journal of Property Investment and Finance 19: 156-174.
Liow, K.H. 2001b. The abnormal return performance of Singapore propertycompanies. Pacific Rim Real Estate Journal 7: 104-112.
Liow, K.H. 2007. The dynamics of return volatility and systematic risk ininternational real estate security markets. Journal of Property Research 24: 1-29.
Liow, K.H. 2008. Financial crisis and Asian real estate securities marketinterdependence: Some additional evidence. Journal of Property Research 25: 127-155.
230
Liow, K.H. and A. Adair. 2009. Do Asian real estate companies add value toinvestment portfolios. Journal of Property Investment and Finance 27: 42-64.
Liow, K.H. and M.C. Sim. 2006. The risk and returm profile of Asian real estatestocks. Pacific Rim Property Research Journal 12: 283-310.
Liu, C.H., Hartzell, D.J., Terry Grissom, and Wylie Greig, 1990. The composition ofthe market portfolio and real estate investment performance. AREUEA Journal 18:49-75.
Liu, C.H., Hartzell, D.J., Hoesli, M.E. 1997. International evidence on real estatesecurities as an inflation hedge. Real Estate Economics 25: 193-221.
Liu, C. and Mei, J., 1992. The predicability of returns on equity REITs and theirco-movement with other assets. Journal of Real Estate Finance and Economics5: 401-418.
Malaysian REIT. 2008. companies’ annual reports.
Macquarie Securities. 2009. Global property securities analytics: September 2009.Macquarie Securities.
Mahmood, W. and Zakaria, R. 2007. Profitability and capital structure of the propertyand construction sectors in Malaysia. Pacific Rim Property Research Journal 13: 92-105.
Matysiak, G., Hoesli, M. and Nanthakumaran, N. 1996. The long-term inflationhedging characteristics of UK commercial property. Journal of Property Finance 7(1):50-61.
McKinsey. 2006. The world Islamic banking competitiveness report. McKinsey.London.
Moss, A. and Hughes, F. 2007. Global and global REIT funds update. EPRANewsletter December: 13-18.
Newell, G. 1995. Is Canadian real estate a hedge against inflation? The CanadianAppraiser 39: 25-7.
Newell, G. 1996. The inflation-hedging characteristics of Australian commercialproperty: 1984-1995. Journal of Property Finance 7(1): 6-20.
Newell, G. 2006. The changing risk profile of Listed Property Trusts. AustralianProperty Journal 39:172-180.
Newell, G. 2007a. The significance of property in industry-based superannuationfunds. Australian and New Zealand Property Journal 1: 34-43.
231
Newell, G. 2007b. The significance of wholesale property funds. Australian and NewZealand Property Journal 1: 216-233.
Newell, G. 2008. The significance of property in superannuation funds. Australianand New Zealand Property Journal 1: 670-677.
Newell, G. 2009. PPA lecture notes at UWS.
Newell, G. and Boyd, T. 1995. Inflation-hedging attributes of New Zealandcommercial property. New Zealand Valuers Journal December: 50-54.
Newell, G. and Fife, A. 1995. Major property investor attitudes to propertysecuritisation. Journal of Property Finance 6(2): 8-19.
Newell, G. and Chau, K. 1996. Linkages between direct and indirect propertyperformance in Hong Kong. Journal of Property Finance 7(4): 9-29.
Newell, G. and Kamineni., R. 2007. The significance and performance of real estatemarkets in India. Journal of Real Estate Portfolio Management 13: 161-172.
Newell, G., Liow, K. H., Ooi, J. and Haihong, Z. 2005 The impact of informationtransparency and market capitalisation on out-performance in Asian propertycompanies. Pacific Rim Property Research Journal 11: 393-411.
Newell, G. and MacIntosh, I. 2007. Currency risk management practices byAustralian LPTs. Pacific Rim Property Research Journal 13: 214-234.
Newell, G. and M. Razali. 2009. The impact of the global financial crisis oncommercial property investment in Asia. Pacific Rim Property Research Journal15: 452-469.
Newell, G. and Manaf, Z. 2008. The significance of sustainability practices by theMalaysian property sector. Local Economy 23: 152-167.
Newell, G. and Peng, H.W. 2006. The significance of emerging property sectors inproperty portfolios. Pacific Rim Property Research Journal 12: 177-197.
Newell, G. and Peng, H.W. 2008. LPT fund manager decision-making in theemerging property sectors. Pacific Rim Property Research Journal 14(2): 222-240.
Newell, G. Tan, Y.K. 2003. The significance of property sector and geographicdiversification in Australian institutional property portfolios. Pacific Rim PropertyResearch Journal 9: 248-264.
Newell, G. Tan, Y.K. 2004. The development and performance of Listed PropertyTrust futures. Pacific Rim Property Research Journal 10: 132-145.
Newell, G., Ting, H.K. and Acheampong, P. 2002. Listed Property Trusts inMalaysia. Journal of Real Estate Literature 10: 109-118.
232
Peng, V. 2004. Selectivity, timing and the performance of Listed Property Trusts:Implications for investment strategies. Pacific Rim Property Research Journal 10:235-254.
Ong, S.E. 1994. Structural and vector autoregressive approaches to modelling realestate and property stock prices in Singapore. Journal of Property Finance 5: 4-18.
Ong. S.E. 1995. Singapore real estate and property stocks-a cointegration test. Journalof property research 12: 29-39.
Ooi, J. and K.H. Liow. 2004. Risk-adjusted performance of real estate stocks:Evidence from developing markets. Journal of Real Estate Research 26: 371-395.
Ooi, J. and Newell, G. 2005. The development of REIT markets in Asia. ERESconference. Dublin.
Ooi, J., Newell, G. and Sing, T.F. 2006. The growth of REITs in Asia. Journalof Real Estate Literature 14(2): 203-224.
Osmadi, A., 2006. A guide to Islamic finance and Islamic REITs. Australian PropertyJournal 39(3): 212-218.
Osmadi, A. 2007a. REITs: New property dimension to Islamic finance. 13th PacificRim Real Estate Society Annual Conference. Fremantle. Western Australia.
Osmadi, A. 2007b. Islamic REITs in Malaysia, APREA - Rent Roll Newsletter.APREA news. region Asia June: 9-15.
Osmadi, A. 2007c. Islamic REITs in Malaysia. European Public Real EstateAssociation. EPRA Newsletter 22: 12-13.
Osmadi, A. 2007d. The significance of Islamic REITs in Malaysia. 5th InternationalIslamic Finance Conference. Kuala Lumpur, Malaysia.
Park, J., Mullineaux, D., Chen, I. 1990. Are REITs inflation hedges? Journal of RealEstate Finance and Economics 3: 91-103.
Parsa, A. 2005. Shariah property investment: Developing an international strategy.RICS Research.
Parsa, A. and McIntosh, A. 2006. Current trends in Shariah property investment.Royal Institution of Chartered Surveyors (RICS) Research.
PCA. 2005. Investment performance index: June 2005. IPD. Melbourne.
Pierce. D. 2007. www.kualalumpurproperty.com
Pramerica Real Estate Investors. 2005. Global REIT: A new platform of ownership.PREI. Parsippany.
233
Real Capital Analytics. 2008. Global capital trends: March 2008. RCA. New York.
Real Capital Analytics. 2009. Global capital trends: February 2009 RCA. New York.
Ratcliffe, C. and Dimovski, W. 2007. An investigation into the responsiveness of LPTreturns and their attributes. 13th Pacific Rim Real Estate Society Annual Conference.Fremantle. Western Australia.
RICS. 2006. Shariah property investment: Developing an international strategy RICS.London
RICS. 2007. Current trends in Shariah property investment RICS , London .
Rozali, M. B. and Hamzah A. H. 2006. The performance of listed property Trusts InMalaysia: An empirical investigation. 12th Pacific Rim Real Estate Society AnnualConference. Auckland. New Zealand.
RREEF. 2007. Global real estate securities: The emergence of a discrete asset class.
RREEF Real Estate Research. 2008. Understanding shariah investment.
RREEF Real Estate Research. 2008. Asia pacific property cycle monitor.
RREEF Real Estate Research. 2009. Asia pacific property cycle monitor.
Rubens, J., Bond, M. and Webb, J. 1989. The inflation-hedging effectiveness of realestate. Journal of Real Estate Research 4: 45-56.
Sadeghi, M. 2008. Financial performance of Shariah-compliant investment: Evidencefrom the Malaysian stockmarket. International Research Journal of Finance andEconomics 20: 15-26.
Sagalyn, L.B. 1990. Real estate risk and business cycle: Evidence from securitymarkets. Journal of Real Estate Research 5(2): 203-19.
Schwann, G. and K.W. Chau. 2005. News effects and structural shifts in pricediscovery in Hong Kong. Journal of Real Estate Finance and Economics 27: 257-271.
Securities Commission, M. 2005a. Guidelines on Real Estate Investment Trusts.Securities Commission. Malaysia.
Securities Commission, M., 2005b. Guidelines on Islamic Real Estate InvestmentTrusts. Securities Commission. Malaysia.
Securities Commission, M. 2008a.
Shakir, R. 2008. Board size, executive directors and property firm performance inMalaysia. Pacific Rim Property Research Journal 14(1): 66-80.
234
Shakir, R. 2008a. Board size, executive directors and property firm performance inMalaysia. Pacific Rim Property Research Journal 14: 66-80.
Shakir, R. 2008b. Effect of block ownership on performance of Malaysian propertycompanies. Pacific Rim Property Research Journal 14: 361-382.
Shakir, R. 2009. Examining the effect of leadership structure and CEO tenure onMalaysian property firm performance, Journal of Real Estate Literature 17: 47-61.
Sing, T. F. and Low, S.H. 2000. The inflation-hedging characteristics of real estateand financial assets in Singapore. Journal of Real Estate Portfolio Management 6(4):373-386.
Smith, K.V. and D. Shulman. 1976. The performance of equity Real EstateInvestment Trusts. Financial Analysts Journal September-October: 61-66.
Standard & Poor’s. 2009. Global property and REIT report: 4th Quarter 2008.
Steinert, M. and S. Crowe. 2001. Global real estate investment: Characteristics,optimal portfolio allocation and future trends. Pacific Rim Property Research Journal7(4): 223-239.
Stevenson, S. 2001. The long-term advantages to incorporating indirect securities indirect real estate portfolios. Journal of Real Estate Portfolio Management 7(1): 5–16.
Tan, Y.K. 2004a. Benchmarking international property in Australian LPT portfolios.Pacific Rim Property Research Journal 10: 3-29.
Tan, Y.K. 2004b. The role of international property trusts in Australian mixed-aseetportfolios. Pacific Rim Property Research Journal 10: 215-234.
Tan, Y.K 2004c. Internal management and size the winning factors. PropertyAustralia 19(2): 58-59.
Tan, Y.K. 2004d. Is development good for LPTs? Property Australia 19(3): 50-51.
The Economist. 2008. www.economist.com
Ting, K. H. 1999. Listed Property Trust industry in Malaysia: Factors constraining itsgrowth and development. Proceedings of International Real Estate SocietyConference. Kuala Lumpur.
Ting, K. H. 2000. The Listed Property Trust industry in Malaysia: Factorsconstraining its growth and development. Journal of Valuation and Property Services3(1): 55-64.
Ting, K. H. 2002. Real Estate Investment Trust: Will they take off? AustralianProperty Journal 50-54.
235
Ting, K.H. 2007. Stability of dividends and FFOs: The case of REITs in Malaysia.13th Pacific Rim Real Estate Society Annual Conference. Fremantle. WesternAustralia.
Ting, K.H., A. Nassir, G. Newell and T. Hassan. 2006. Impact of Asian financialcrisis on Malaysian corporate real estate disposals. Pacific Rim Property ResearchJournal 12: 55-84.
Titman, S. and A. Warga. 1986. Risks and the performance of Real EstateInvestments Trusts: A Multiple Index approach. AREUEA Journal 14(3): 414–431.
Transparency International. 2008. Corruption Perception Index 2008. TI.
Trust. 2008. Asia Pacific REIT Survey. Trust. Singapore.
Trust. 2009. Asia-Pacific REIT Survey Trust. Singapore.
UBS. 2007. www.ubs.com
UK Financial Services Authority. 2006.
Whiting. D. 2007. Playing the REITs Game: Asia’s new Real Estate InvestmentTrusts. John Wiley and Sons.
Wilson, P. and Okunev. J. 1996. Evidence of segmentation in domestic andinternational property markets. Journal of property Finance 7:78-97.
Wilson, P and R. Zurbruegg, 2003. International diversification of real estate assets -is it worth it? Evidence from the literature. Journal of Real Estate Literature 11(3):259-277.
Wilson, P. and R. Zurbruegg. 2004. Contagion or interdependence? Evidence fromco-movements in Asia-Pacific securitised real estate markets during the 1997 crisis.Journal of Property Investment and Finance 22: 401-413.
Wilson, P., S. Stevenson and R. Zurbruedd. 2007. Measuring spillover effects acrossAsian property stocks. Journal of Property Research 24: 123-138.
World Economic Forum. 2007. Global competitiveness report: 2006-2007. WEF,Geneva.
World Economic Forum. 2008. Global competitiveness report: 2007-2008. WEF,Geneva.
World Federation of Exchanges. 2008. Annual report.
World Federation of Exchanges. 2009. Annual report.
Worzala, E. and Newell, G. 1997. International real estate: A review of strategicinvestment issues. Journal of Real Estate Portfolio Management 3(2): 87-96.
236
Worzala, E. and Sirmans, C. 2003. Investing in international real estate stocks: Areview of the literature. Urban Studies 40(5): 1115-1149.
Wurtzebach, C.H., Mueller, G. R. and Machi, D. 1991. The impact of inflation andvacancy on real estate returns. Journal of Real Estate Research 6(2): 153-68.
Yaakop Yahaya Al-Haj N. H and Hashim H. 2007. Empirical trend on factors thatinfluence the institutional investors towards investing in Malaysia Real EstateInvestment Trusts: A preliminary study. Oxford Business and Economics ConferenceProgram. Oxford. UK.
Yusof, R. and Majid, M. 2006. Policy and persistence of stock returns volatility:Conventional versus Islamic stockmarket. Journal of International Business andEntrepreneurship 12: 49-68.
Yusof, R. and Majid, M. 2007. Stock market volatility transmission in Malaysia:Islamic versus conventional stockmarket. Journal of Islamic Economics 20: 17-35.
Ziobrowski, B. and Ziobrowski, A. 1997. Higher real estate risk and mixed-assetportfolio performance. Journal of Real Estate Portfolio Management 3(2): 107-115.
Zietz, E.N., Sirmans, G.S., Friday, H.S. 2003. The environment and performance ofReal Estate Investment Trusts. Journal of Real Estate Portfolio Management 9(2):127-65.

237
APPENDICES
COPY OF QUESTIONNAIRES ANDPUBLISHED PAPERS

238
Appendix I
The Survey Questionnaire for REIT Managers

239
Appendix II
The Survey Questionnaire for Property Managers

240
Appendix III
The Survey Questionnaire for Fund Managers

241
Appendix IV
Global REITs

242
Appendix V
M-REITs Case Studies

243
Appendix VI
Newell, G. and Osmadi, A.The development and preliminary performance analysis of
Islamic REITsin MalaysiaJournal of Property Research, 26: 4, 329 — 347
Special issue: Global perspectives on REITs and property companies

244
Appendix VII
Newell, G. and Osmadi, A.Assessing the importance of factors influencingthe future development of REITs in Malaysia
Pacific Rim Property Research Journal, 16: 3, 358-374


