Embed Size (px)
Citation preview
For Private Circulation Only. FOR IMPORTANT INFORMATION ABOUT KOTAK SECURITIES’ RATING SYSTEM AND OTHER DISCLOSURES. REFER TO THE END OF THIS MATERIAL.
[email protected]: +91 22 6218 6427
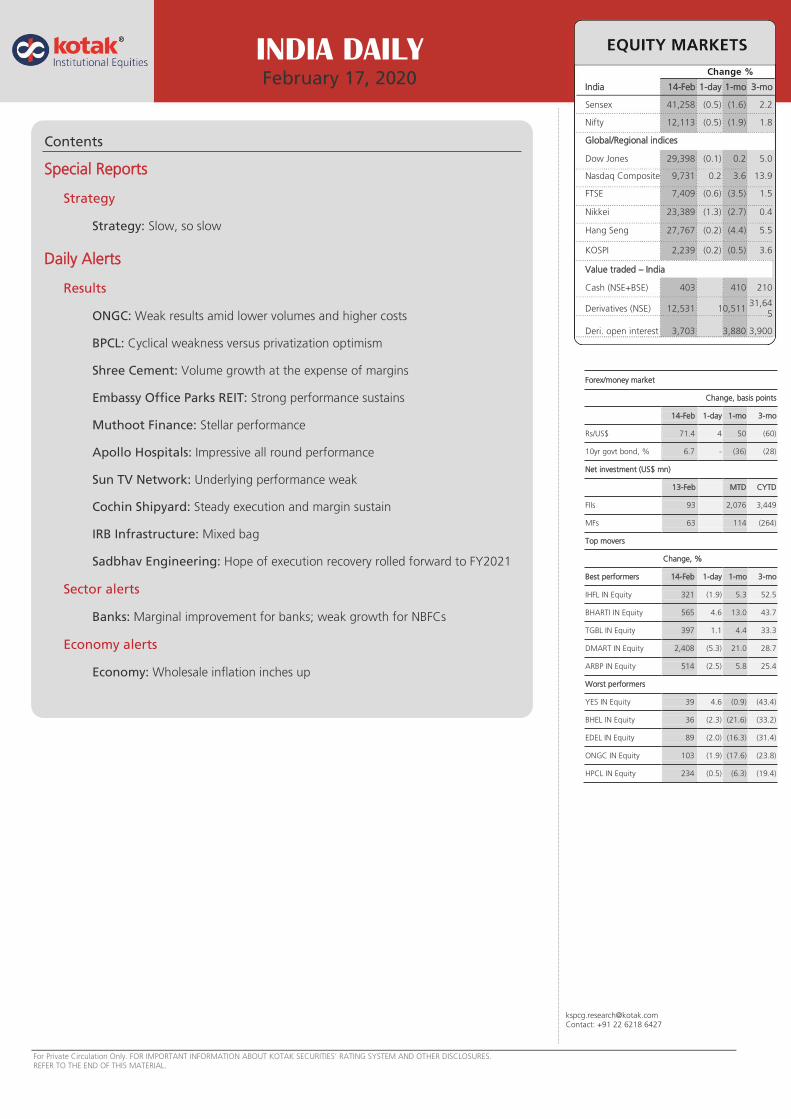
Contents
Special Reports
Strategy
Strategy: Slow, so slow
Daily Alerts
Results
ONGC: Weak results amid lower volumes and higher costs
BPCL: Cyclical weakness versus privatization optimism
Shree Cement: Volume growth at the expense of margins
Embassy Office Parks REIT: Strong performance sustains
Muthoot Finance: Stellar performance
Apollo Hospitals: Impressive all round performance
Sun TV Network: Underlying performance weak
Cochin Shipyard: Steady execution and margin sustain
IRB Infrastructure: Mixed bag
Sadbhav Engineering: Hope of execution recovery rolled forward to FY2021
Sector alerts
Banks: Marginal improvement for banks; weak growth for NBFCs
Economy alerts
Economy: Wholesale inflation inches up
INDIA DAILY February 17, 2020
India 14-Feb 1-day 1-mo 3-mo
Sensex 41,258 (0.5) (1.6) 2.2
Nifty 12,113 (0.5) (1.9) 1.8
Global/Regional indices
Dow Jones 29,398 (0.1) 0.2 5.0
Nasdaq Composite 9,731 0.2 3.6 13.9
FTSE 7,409 (0.6) (3.5) 1.5
Nikkei 23,389 (1.3) (2.7) 0.4
Hang Seng 27,767 (0.2) (4.4) 5.5
KOSPI 2,239 (0.2) (0.5) 3.6
Value traded – India
Cash (NSE+BSE) 403 410 210
Derivatives (NSE) 12,531 10,511 31,64
5
Deri. open interest 3,703 3,880 3,900
Forex/money market
Change, basis points
14-Feb 1-day 1-mo 3-mo
Rs/US$ 71.4 4 50 (60)
10yr govt bond, % 6.7 - (36) (28)
Net investment (US$ mn)
13-Feb MTD CYTD
FIIs 93 2,076 3,449
MFs 63 114 (264)
Top movers
Change, %
Best performers 14-Feb 1-day 1-mo 3-mo
IHFL IN Equity 321 (1.9) 5.3 52.5
BHARTI IN Equity 565 4.6 13.0 43.7
TGBL IN Equity 397 1.1 4.4 33.3
DMART IN Equity 2,408 (5.3) 21.0 28.7
ARBP IN Equity 514 (2.5) 5.8 25.4
Worst performers
YES IN Equity 39 4.6 (0.9) (43.4)
BHEL IN Equity 36 (2.3) (21.6) (33.2)
EDEL IN Equity 89 (2.0) (16.3) (31.4)
ONGC IN Equity 103 (1.9) (17.6) (23.8)
HPCL IN Equity 234 (0.5) (6.3) (19.4)

Company Report
For Private Circulation Only. In the US, this document may only be distributed to QIBs (qualified institutional buyers) as defined under rule 144A of the Securities Act of 1933. This document is not for public distribution and has been furnished to you solely for your information and may not be reproduced or redistributed to any other person. The manner of circulation and distribution of this document may be restricted by law or regulation in certain countries, including the United States. Persons into whose possession this document may come are required to inform themselves of, and to observe, such restrictions.
Strategy
INDIA
Slow, so slow. 3QFY20 results provided further evidence of the ongoing slowdown in
India and more importantly, little evidence of an imminent recovery given subdued
management commentary on demand conditions. We continue to believe that the
current demand slowdown reflects structural demand and productivity issues arising
from under-investment in human and physical capital. This is unlikely to change
quickly. However, earnings growth may recover faster off a low base in key sectors.
3QFY20 results and management commentary highlight ongoing economic slowdown
3QFY20 results provided more evidence (if more evidence was required) of the ongoing slowdown
in India. More importantly, management commentary did not sound very hopeful of an imminent
revival in consumption demand. We have long argued that the current slowdown reflects both
cyclical and structural issues. Among the structural factors, continued under-investment in
productive capital (human and physical) may cap India’s potential GDP growth.
3QFY20 net profits of KIE Universe increased 6.6% yoy, Nifty-50 Index 11.5% yoy
3QFY20 net profits of KIE Universe increased 6.6% yoy versus our expectation of 21% growth.
Most sectors disappointed on earnings with only the automobiles sector (among the major sectors)
beating our low expectations. 3QFY20 net profits of Nifty-50 Index grew 11.5%, versus our
expectation of 21% growth and EBITDA grew 1.3%, 5% below expectations.
Economic recovery is some time away
We do not see any triggers for a quick recovery in the Indian economy and expect modest
recovery from 2HFY21 due to base effect and recovery in consumption demand. We see
challenges with all the major drivers of GDP—private consumption (low household income
growth), government consumption (high fiscal deficit) and investment (weak household income
growth, weak government fiscal position and corporate balance sheet). These factors are
unlikely to change quickly.
Earnings recovery may be faster
We expect net profits of the Nifty-50 Index to grow 10% in FY2020 despite the 10-15% uplift
to profits from the corporate tax cut. We note that the strong growth in net profits of banks will
be offset by sharp declines in net profits of the global commodity sectors, hurt by weak global
prices in 4QFY20 due to the ongoing COVID-19 issue. We expect net profits to bounce 26% in
FY2021 driven by higher profits of (1) banks due to lower loan-loss provisions, (2) metals
companies due to normalization in prices and profitability and (3) telecom sector due to higher
ARPUs, as companies align prices with costs after a period of aggressive price competition.
INDIA
February 15, 2020
BSE-30: 41,258
INSIDE
Nifty-50 Index trades
at 18.1X FY2021E
‘EPS’ and 15.2X
FY2022E ‘EPS’
.................. pg05
Nifty-50 Index net
profits to grow 26%
and 17% in FY2021
and FY2022...
.................. pg05
3QFY20 net profits
of Nifty-50 Index
grew 11.5% yoy
.................. pg28
Sanjeev Prasad [email protected]
Mumbai: +91-22-4336-0830
Sunita Baldawa [email protected]
Mumbai: +91-22-4336-0896
Anindya Bhowmik [email protected]
Mumbai: +91-22-4336-0897
[email protected]: +91 22 6218 6427

KOTAK INSTITUTIONAL EQUITIES RESEARCH 3
Strategy India
MARKET VIEW: SLOW ECONOMY, FAST EARNINGS
3QFY20 results provided more evidence of a solid slowdown in India. We have long argued that the demand
slowdown reflects structural investment and job challenges and thus, is unlikely to revive quickly. India has
limited options to revive growth in the short term and has wisely focused on investment reforms to revive
investment demand. Nonetheless, we expect decent earnings growth in FY2020 driven by corporate tax cut
and strong earnings growth in FY2021 due to rebound in earnings in sectors such as financials and telecom.
Disconnect between economy and market may continue
As argued over the past 12 months, we expect a gradual recovery in the Indian economy
given cyclical and structural issues with all the major drivers of GDP growth—private
consumption, government consumption and investment. We have serious doubts about a
quick change in the underlying drivers of economic growth.
On the other hand, the market may do relatively better supported by (1) likely strong
recovery in earnings driven by earnings rebound in certain sectors such as financials and
telecom, (2) inexpensive or reasonable valuations for most parts of the market, (3) continued
‘faith’ of the market in certain ‘growth’/’quality’ stocks; the ‘faith’ has finally broken in
certain consumer staples and discretionary names after several quarters of disappointing
numbers and (4) ongoing accommodative monetary policy of major central banks; the
COVID-19 issue will remove any lingering thoughts among the central banks to revert to a
less supportive monetary regime soon. We note that bond yields have come off sharply over
the past few weeks (see Exhibit 1), which provides further support to global equities. Our
mildly positive view assumes that the COVID-19 outbreak will be contained over the next
few months.
Exhibit 1: Global bond yields have declined in recent weeks Trend in 10-year benchmark yields across major DMs (%)
(2)
(1)
0
1
2
3
4
5
Feb-0
9
Feb-1
0
Feb-1
1
Feb-1
2
Feb-1
3
Feb-1
4
Feb-1
5
Feb-1
6
Feb-1
7
Feb-1
8
Feb-1
9
Feb-2
0
France Germany Japan Switzerland UK US
Source: Bloomberg, Kotak Institutional Equities
The valuations of the broader market seem reasonable viewed against (1) long-term
historical valuations (see Exhibit 2) and (2) government bond yields (see Exhibit 3). Of course,
forward valuations incorporate a smart recovery in earnings of the market, which may be
impacted if (1) current weak domestic macro-economic conditions were to persist for longer
and (2) global macro-economic conditions were to weaken considerably if the COVID-19
issue was to turn into a global epidemic.

4 KOTAK INSTITUTIONAL EQUITIES RESEARCH
India Strategy
Exhibit 2: Market valuations are 'fair' in the historical context 1-y rolling forward PE of Nifty-50 Index, March fiscal year-ends, 2004-20 (X)
4
8
12
16
20
24
Feb-0
5
Feb-0
6
Feb-0
7
Feb-0
8
Feb-0
9
Feb-1
0
Feb-1
1
Feb-1
2
Feb-1
3
Feb-1
4
Feb-1
5
Feb-1
6
Feb-1
7
Feb-1
8
Feb-1
9
Feb-2
0
P/E (X) Avg. Mean+1SD Mean-1SD
Source: BSE, RBI, Kotak Institutional Equities
Exhibit 3: Yield gap (difference between bond and earnings yields) at modest levels Nifty earnings yield and bond yield, March fiscal year-ends, 2004-20 (%)
(4)
(2)
0
2
4
6
8
10
12
14
Feb-0
5
Feb-0
6
Feb-0
7
Feb-0
8
Feb-0
9
Feb-1
0
Feb-1
1
Feb-1
2
Feb-1
3
Feb-1
4
Feb-1
5
Feb-1
6
Feb-1
7
Feb-1
8
Feb-1
9
Feb-2
0
Yield gap (%) Earnings yields (%) India 10-y G-Sec yields (%)
Source: Bloomberg, Kotak Institutional Equities estimates
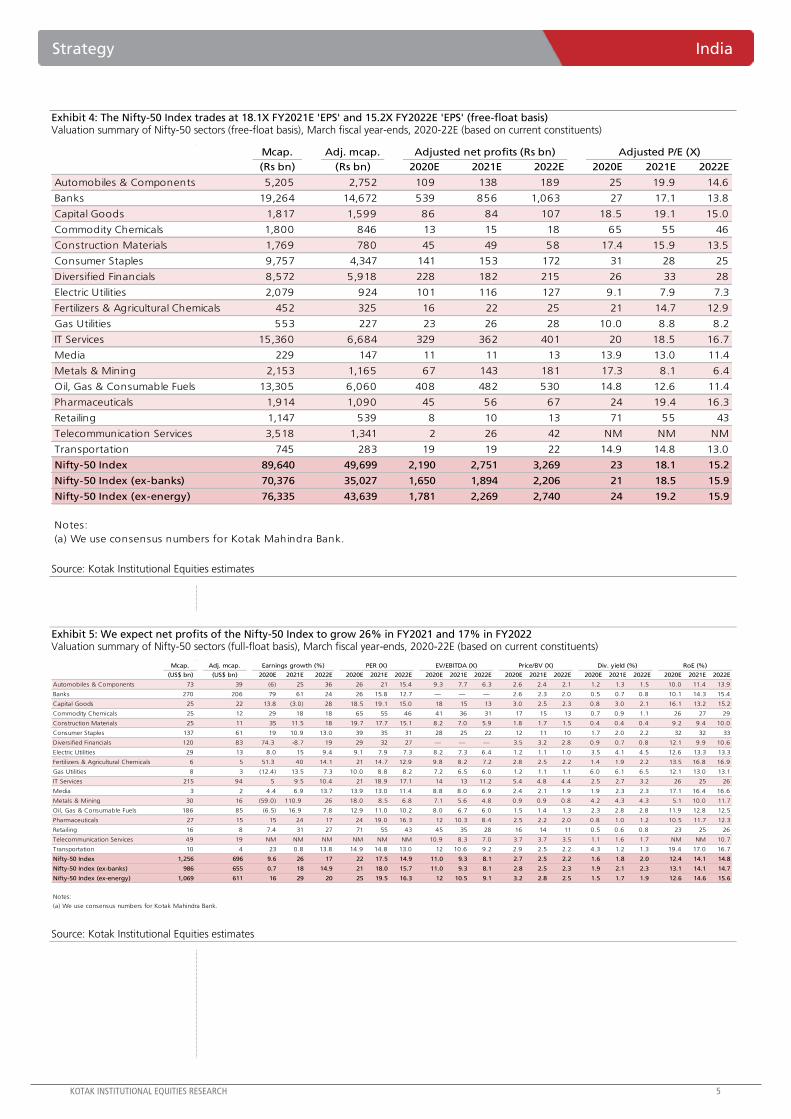
The Nifty-50 Index is trading at 18.1X FY2021E ‘EPS’ (free-float basis) and 15.2X FY2022E
‘EPS (see Exhibits 4-5). We model fairly strong growth in net profits of the Nifty-50 Index
over FY2020-22 reflecting (1) lower corporate tax rate from FY2020, following the reduction
in corporate tax rate to 22% (before surcharges) from the previous rate of 30%, (2) lower
loan-loss provisions for banks in FY2020-21; banks NPLs may have peaked and they have
created sufficient provisions against bad loans and (3) moderate recovery in consumption
demand from 2HFY21.
KOTAK INSTITUTIONAL EQUITIES RESEARCH 5
Strategy India
Exhibit 4: The Nifty-50 Index trades at 18.1X FY2021E 'EPS' and 15.2X FY2022E 'EPS' (free-float basis) Valuation summary of Nifty-50 sectors (free-float basis), March fiscal year-ends, 2020-22E (based on current constituents)
Mcap. Adj. mcap.
(Rs bn) (Rs bn) 2020E 2021E 2022E 2020E 2021E 2022E
Automobiles & Components 5,205 2,752 109 138 189 25 19.9 14.6
Banks 19,264 14,672 539 856 1,063 27 17.1 13.8
Capital Goods 1,817 1,599 86 84 107 18.5 19.1 15.0
Commodity Chemicals 1,800 846 13 15 18 65 55 46
Construction Materials 1,769 780 45 49 58 17.4 15.9 13.5
Consumer Staples 9,757 4,347 141 153 172 31 28 25
Diversified Financials 8,572 5,918 228 182 215 26 33 28
Electric Utilities 2,079 924 101 116 127 9.1 7.9 7.3
Fertilizers & Agricultural Chemicals 452 325 16 22 25 21 14.7 12.9
Gas Utilities 553 227 23 26 28 10.0 8.8 8.2
IT Services 15,360 6,684 329 362 401 20 18.5 16.7
Media 229 147 11 11 13 13.9 13.0 11.4
Metals & Mining 2,153 1,165 67 143 181 17.3 8.1 6.4
Oil, Gas & Consumable Fuels 13,305 6,060 408 482 530 14.8 12.6 11.4
Pharmaceuticals 1,914 1,090 45 56 67 24 19.4 16.3
Retailing 1,147 539 8 10 13 71 55 43
Telecommunication Services 3,518 1,341 2 26 42 NM NM NM
Transportation 745 283 19 19 22 14.9 14.8 13.0
Nifty-50 Index 89,640 49,699 2,190 2,751 3,269 23 18.1 15.2
Nifty-50 Index (ex-banks) 70,376 35,027 1,650 1,894 2,206 21 18.5 15.9
Nifty-50 Index (ex-energy) 76,335 43,639 1,781 2,269 2,740 24 19.2 15.9
Notes:
(a) We use consensus numbers for Kotak Mahindra Bank.
Adjusted net profits (Rs bn) Adjusted P/E (X)
Source: Kotak Institutional Equities estimates
Exhibit 5: We expect net profits of the Nifty-50 Index to grow 26% in FY2021 and 17% in FY2022 Valuation summary of Nifty-50 sectors (full-float basis), March fiscal year-ends, 2020-22E (based on current constituents)
Mcap. Adj. mcap.
(US$ bn) (US$ bn) 2020E 2021E 2022E 2020E 2021E 2022E 2020E 2021E 2022E 2020E 2021E 2022E 2020E 2021E 2022E 2020E 2021E 2022E
Automobiles & Components 73 39 (6) 25 36 26 21 15.4 9.3 7.7 6.3 2.6 2.4 2.1 1.2 1.3 1.5 10.0 11.4 13.9
Banks 270 206 79 61 24 26 15.8 12.7 — — — 2.6 2.3 2.0 0.5 0.7 0.8 10.1 14.3 15.4
Capital Goods 25 22 13.8 (3.0) 28 18.5 19.1 15.0 18 15 13 3.0 2.5 2.3 0.8 3.0 2.1 16.1 13.2 15.2
Commodity Chemicals 25 12 29 18 18 65 55 46 41 36 31 17 15 13 0.7 0.9 1.1 26 27 29
Construction Materials 25 11 35 11.5 18 19.7 17.7 15.1 8.2 7.0 5.9 1.8 1.7 1.5 0.4 0.4 0.4 9.2 9.4 10.0
Consumer Staples 137 61 19 10.9 13.0 39 35 31 28 25 22 12 11 10 1.7 2.0 2.2 32 32 33
Diversified Financials 120 83 74.3 -8.7 19 29 32 27 — — — 3.5 3.2 2.8 0.9 0.7 0.8 12.1 9.9 10.6
Electric Utilities 29 13 8.0 15 9.4 9.1 7.9 7.3 8.2 7.3 6.4 1.2 1.1 1.0 3.5 4.1 4.5 12.6 13.3 13.3
Fertilizers & Agricultural Chemicals 6 5 51.3 40 14.1 21 14.7 12.9 9.8 8.2 7.2 2.8 2.5 2.2 1.4 1.9 2.2 13.5 16.8 16.9
Gas Utilities 8 3 (12.4) 13.5 7.3 10.0 8.8 8.2 7.2 6.5 6.0 1.2 1.1 1.1 6.0 6.1 6.5 12.1 13.0 13.1
IT Services 215 94 5 9.5 10.4 21 18.9 17.1 14 13 11.2 5.4 4.8 4.4 2.5 2.7 3.2 26 25 26
Media 3 2 4.4 6.9 13.7 13.9 13.0 11.4 8.8 8.0 6.9 2.4 2.1 1.9 1.9 2.3 2.3 17.1 16.4 16.6
Metals & Mining 30 16 (59.0) 110.9 26 18.0 8.5 6.8 7.1 5.6 4.8 0.9 0.9 0.8 4.2 4.3 4.3 5.1 10.0 11.7
Oil, Gas & Consumable Fuels 186 85 (6.5) 16.9 7.8 12.9 11.0 10.2 8.0 6.7 6.0 1.5 1.4 1.3 2.3 2.8 2.8 11.9 12.8 12.5
Pharmaceuticals 27 15 15 24 17 24 19.0 16.3 12 10.3 8.4 2.5 2.2 2.0 0.8 1.0 1.2 10.5 11.7 12.3
Retailing 16 8 7.4 31 27 71 55 43 45 35 28 16 14 11 0.5 0.6 0.8 23 25 26
Telecommunication Services 49 19 NM NM NM NM NM NM 10.9 8.3 7.0 3.7 3.7 3.5 1.1 1.6 1.7 NM NM 10.7
Transportation 10 4 23 0.8 13.8 14.9 14.8 13.0 12 10.6 9.2 2.9 2.5 2.2 4.3 1.2 1.3 19.4 17.0 16.7
Nifty-50 Index 1,256 696 9.6 26 17 22 17.5 14.9 11.0 9.3 8.1 2.7 2.5 2.2 1.6 1.8 2.0 12.4 14.1 14.8
Nifty-50 Index (ex-banks) 986 655 0.7 18 14.9 21 18.0 15.7 11.0 9.3 8.1 2.8 2.5 2.3 1.9 2.1 2.3 13.1 14.1 14.7
Nifty-50 Index (ex-energy) 1,069 611 16 29 20 25 19.5 16.3 12 10.5 9.1 3.2 2.8 2.5 1.5 1.7 1.9 12.6 14.6 15.6
Notes:
(a) We use consensus numbers for Kotak Mahindra Bank.
RoE (%)Earnings growth (%) PER (X) EV/EBITDA (X) Price/BV (X) Div. yield (%)
Source: Kotak Institutional Equities estimates

6 KOTAK INSTITUTIONAL EQUITIES RESEARCH
India Strategy
Economic recovery likely to be slow
We do not expect a quick recovery in the Indian economy given challenges with all the
major drivers of GDP—private consumption, government consumption and investment.
India’s GDP growth has trundled down over the past few quarters (see Exhibit 6) and private
consumption and overall investment have decelerated sharply over the past 2-3 quarters.
3QFY20 results confirmed that 3QFY20 GDP growth would also be quite subdued. We
expect a gradual recovery at best once base effects kick in over the next few quarters (see
Exhibit 7).
Exhibit 6: Real GDP growth slumped to 4.5% in 2QFY20 Real GDP and components growth, March fiscal-year ends, 2014-20 (%)
2014 2015 2016 2017 2018 2019 4QFY18 2QFY19 3QFY19 4QFY19 1QFY20 2QFY20
Real GDP 6.4 7.4 8.0 8.3 7.0 6.1 8.1 7.0 6.6 5.8 5.0 4.5
Private consumption 7.3 6.4 7.9 8.1 7.0 7.2 8.8 9.8 8.1 7.2 3.1 5.1
Government consumption 0.6 7.6 7.5 6.1 11.8 10.1 21.1 10.9 6.5 13.1 8.8 15.6
Gross fixed capital formation 1.6 2.6 6.5 8.5 7.2 9.8 11.8 11.8 11.7 3.6 4.0 1.0
Inventory (35.6) 111.7 (12.8) (48.8) 76.0 22.5 25.3 4.7 4.3 1.0 2.1 (0.8)
Valuables (42.7) 26.2 (1.0) (18.6) 27.2 (11.9) 1.3 (0.5) 2.6 5.2 (3.4) (11.1)
Exports 7.8 1.8 (5.6) 5.0 4.6 12.3 2.8 12.7 16.7 10.6 5.7 (0.4)
Imports (8.1) 0.9 (5.9) 4.4 17.4 8.6 16.2 22.9 14.5 13.3 4.2 (6.9)
Source: CEIC, Kotak Institutional Equities estimates
Exhibit 7: Gradual recovery in growth over the quarters over FY2021E Real GVA and components growth (%)
1QFY19 2QFY19 3QFY19 4QFY19 1QFY20 2QFY20 3QFY20E 4QFY20E 1QFY21E 2QFY21E 3QFY21E 4QFY21E
Real GVA 7.7 6.9 6.3 5.7 4.9 4.3 4.4 4.4 4.8 5.4 5.5 5.8
Agriculture and allied 5.1 4.9 2.8 (0.1) 2.0 2.1 3.1 3.6 3.2 2.2 2.5 2.5
Industry 9.8 6.7 7.0 4.2 2.7 0.5 0.1 1.3 2.3 3.8 4.3 4.9
Mining 0.4 (2.2) 1.8 4.2 2.7 0.1 (1.6) (3.8) 0.5 2.1 3.0 3.3
Manufacturing 12.1 6.9 6.4 3.1 0.6 (1.0) (1.4) 1.1 2.6 3.4 4.3 4.2
Electricity 6.7 8.7 8.3 4.3 8.6 3.6 1.0 1.4 (0.5) 3.0 5.5 7.2
Construction 9.6 8.5 9.7 7.1 5.7 3.3 3.6 4.0 3.2 5.4 4.3 6.3
Services 7.1 7.3 7.2 8.4 6.9 6.8 7.4 6.5 6.5 6.8 7.2 7.3
Trade, hotel, transport, communication 7.8 6.9 6.9 6.0 7.1 4.8 5.1 5.1 4.8 6.8 6.9 6.9
Financial, real estate, professional services 6.5 7.0 7.2 9.5 5.9 5.8 5.9 6.0 5.6 6.0 6.2 6.2
Public admin, defence, and others 7.5 8.6 7.5 10.7 8.5 11.6 12.5 9.4 11.2 8.4 8.8 9.2
Real GDP 8.0 7.0 6.6 5.8 5.0 4.5 4.5 4.6 5.0 5.6 5.6 6.0
Source: CEIC, Kotak Institutional Equities estimates
Private consumption. We do not expect a quick recovery in private consumption as we
believe the slowdown in private consumption reflects a broader slowdown in household
income growth, which in turn reflects a more structural issue of inadequate investment
and jobs. We doubt the latter issues will be fixed quickly.
In our view, household consumption would require (1) a strong recovery in investment
and related creation of new jobs, which can boost overall household income and/or (2) a
large amount of fiscal benefits for households (higher government spending or personal
income tax cuts), which could increase disposable income. The government has provided
a small stimulus in the recent FY2021 budget with an alternative personal income tax
system with lower income tax rates (without any deductions or exemptions), which could
result in Rs400 bn of savings for households as per government’s estimates.
We would note that the high growth in private consumption over FY2012-19 simply
reflects households substituting savings with consumption (see Exhibit 8). In particular,
household physical savings rate declined sharply (see Exhibit 9). In other words,
households saved less in the form of residential real estate and used the ‘savings’ to sustain
consumption. There is a natural limit to this kind of a consumption ‘model’, in our view.

KOTAK INSTITUTIONAL EQUITIES RESEARCH 7
Strategy India
Exhibit 8: Share of private consumption has increased as savings rate has fallen Share of private domestic consumption expenditure and household savings in GDP, March fiscal year-ends, 2006-20E (%)
58
57
56 56
57
56
55
56 56
58 58
59 59
59 59
60 24 24 23
23
24
26
24 24
22
20 20 18 18
19
18
17
14
16
18
20
22
24
26
28
54
55
56
57
58
59
60
61
2005
2006
2007
2008
2009
2010
2011
2012
2013
2014
2015
2016
2017
2018
2019
2020E
Private consumption/GDP (%, LHS) Household savings/GDP (%, RHS)
Source: CSO, CEIC, Kotak Institutional Equities
Exhibit 9: Household savings has seen steady decline implying increased consumption as a proportion of income Savings rates as proportion of GDP, March fiscal year-ends, 2012-19 (%)
2012 2013 2014 2015 2016 2017 2018 2019
Household (physical + net financial savings) (a) 23.6 22.5 20.3 19.6 18.0 17.1 17.2 16.7
Household physical savings 16.3 15.1 12.9 12.5 9.9 10.8 10.6 10.1
- Savings in gold 0.4 0.4 0.3 0.4 0.3 0.3 0.2 0.2
Gross household financial savings 10.7 10.7 10.6 10.1 10.9 9.4 10.9 9.7
Financial liabilities (3.3) (3.3) (3.2) (3.0) (2.8) (3.1) (4.3) (3.1)
Net household financial savings 7.4 7.4 7.4 7.1 8.1 6.3 6.6 6.6
Public savings (b) 1.5 1.4 1.0 1.0 1.2 1.7 1.7 2.0
Private corporate savings (c) 9.5 10.0 10.7 11.7 11.9 11.5 11.6 11.6
Domestic savings rate (a) + (b) + (c) 34.6 33.9 32.1 32.2 31.1 30.3 30.5 30.3
Notes:
(a) Gold savings is assumed to be equal to net gold imports.
Source: CEIC, Kotak Institutional Equities estimates
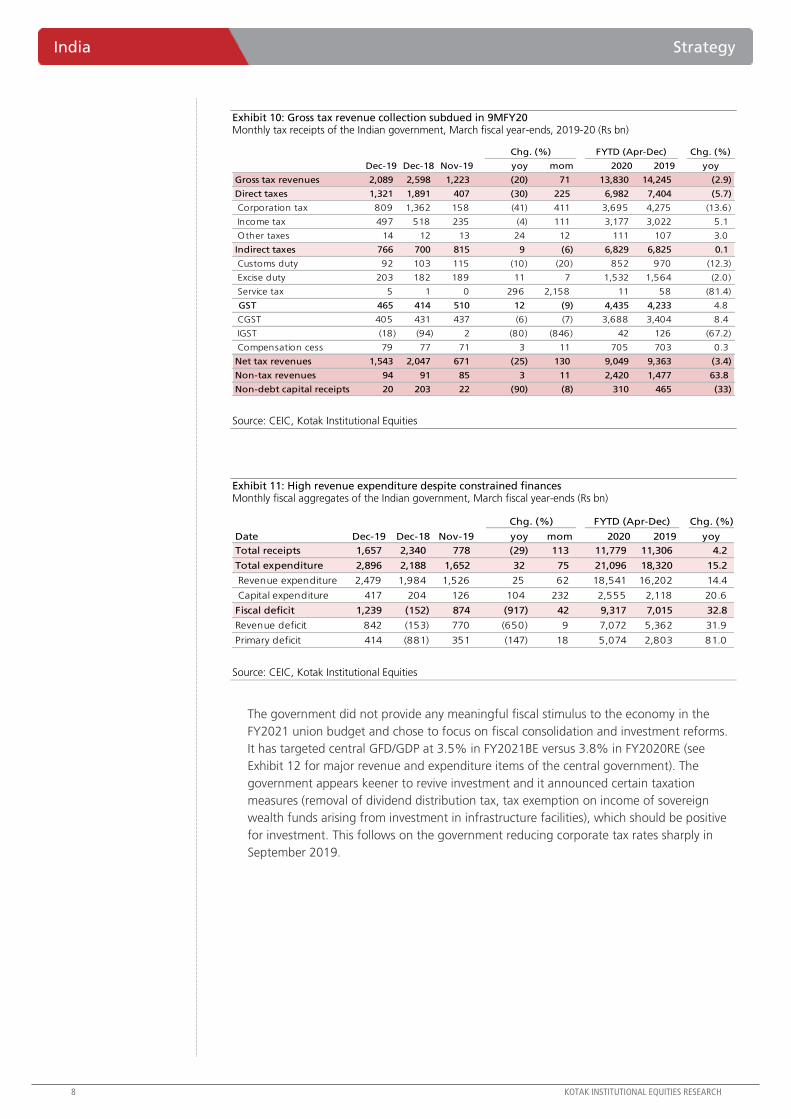
Government consumption. We expect a slowdown in government consumption
spending given severe fiscal challenges. We would note that high growth in government
consumption has supported overall GDP growth over the past few quarters when private
consumption and investment have seen a sharp deceleration. We doubt the government
can continue with its liberal fiscal approach given concerns around the government’s tax
revenues (see Exhibit 10) and its inability to manage revenue expenditure (see Exhibit 11).
8 KOTAK INSTITUTIONAL EQUITIES RESEARCH
India Strategy
Exhibit 10: Gross tax revenue collection subdued in 9MFY20 Monthly tax receipts of the Indian government, March fiscal year-ends, 2019-20 (Rs bn)
Chg. (%) FYTD (Apr-Dec) Chg. (%)
Dec-19 Dec-18 Nov-19 yoy mom 2020 2019 yoy
Gross tax revenues 2,089 2,598 1,223 (20) 71 13,830 14,245 (2.9)
Direct taxes 1,321 1,891 407 (30) 225 6,982 7,404 (5.7)
Corporation tax 809 1,362 158 (41) 411 3,695 4,275 (13.6)
Income tax 497 518 235 (4) 111 3,177 3,022 5.1
Other taxes 14 12 13 24 12 111 107 3.0
Indirect taxes 766 700 815 9 (6) 6,829 6,825 0.1
Customs duty 92 103 115 (10) (20) 852 970 (12.3)
Excise duty 203 182 189 11 7 1,532 1,564 (2.0)
Service tax 5 1 0 296 2,158 11 58 (81.4)
GST 465 414 510 12 (9) 4,435 4,233 4.8
CGST 405 431 437 (6) (7) 3,688 3,404 8.4
IGST (18) (94) 2 (80) (846) 42 126 (67.2)
Compensation cess 79 77 71 3 11 705 703 0.3
Net tax revenues 1,543 2,047 671 (25) 130 9,049 9,363 (3.4)
Non-tax revenues 94 91 85 3 11 2,420 1,477 63.8
Non-debt capital receipts 20 203 22 (90) (8) 310 465 (33)
Source: CEIC, Kotak Institutional Equities
Exhibit 11: High revenue expenditure despite constrained finances Monthly fiscal aggregates of the Indian government, March fiscal year-ends (Rs bn)
Chg. (%) FYTD (Apr-Dec) Chg. (%)
Date Dec-19 Dec-18 Nov-19 yoy mom 2020 2019 yoy
Total receipts 1,657 2,340 778 (29) 113 11,779 11,306 4.2
Total expenditure 2,896 2,188 1,652 32 75 21,096 18,320 15.2
Revenue expenditure 2,479 1,984 1,526 25 62 18,541 16,202 14.4
Capital expenditure 417 204 126 104 232 2,555 2,118 20.6
Fiscal deficit 1,239 (152) 874 (917) 42 9,317 7,015 32.8
Revenue deficit 842 (153) 770 (650) 9 7,072 5,362 31.9
Primary deficit 414 (881) 351 (147) 18 5,074 2,803 81.0
Source: CEIC, Kotak Institutional Equities
The government did not provide any meaningful fiscal stimulus to the economy in the
FY2021 union budget and chose to focus on fiscal consolidation and investment reforms.
It has targeted central GFD/GDP at 3.5% in FY2021BE versus 3.8% in FY2020RE (see
Exhibit 12 for major revenue and expenditure items of the central government). The
government appears keener to revive investment and it announced certain taxation
measures (removal of dividend distribution tax, tax exemption on income of sovereign
wealth funds arising from investment in infrastructure facilities), which should be positive
for investment. This follows on the government reducing corporate tax rates sharply in
September 2019.

KOTAK INSTITUTIONAL EQUITIES RESEARCH 9
Strategy India
Exhibit 12: FY2021 central GFD/GDP budgeted at 3.5% Major central government budgetary items, March fiscal year-ends, 2017-21E (Rs bn)
2018/ 2019/ 2020RE/ 2021BE/ 2021E/
2017 2018 2019 2020RE 2021BE 2021E 2017 2018 2019 2020RE 2020RE
Receipts
1. Revenue receipts (2d + 3) 13,742 14,352 15,529 18,501 20,209 19,981 4 8 19 9 8
2. Gross tax revenues (a + b ) 17,158 19,190 20,805 21,634 24,230 23,897 12 8 4 12 10
2.a. Direct taxes 8,539 10,068 11,431 11,769 13,265 13,265 18 14 3 13 13
2.a.1. Corporation tax 4,849 5,712 6,636 6,105 6,810 6,810 18 16 (8) 12 12
2.a.2. Income tax 3,646 4,308 4,730 5,595 6,380 6,380 18 10 18 14 14
2.a.3. Other taxes 43 48 66 69 75 75 11 37 5 9 9
2.b. Indirect taxes 8,620 9,122 9,373 9,865 10,965 10,632 6 3 5 11 8
2.b.1. Goods and Services Tax — 4,426 5,816 6,123 6,905 6,582 31 5 13 7
2.b.1.1. CGST — 2,033 4,575 5,140 5,800 5,520 125 12 13 7
2.b.1.2. IGST — 1,767 289 — — — (84)
2.b.1.3. Compensation cess — 626 951 983 1,105 1,062 52 3 12 8
2.b.2. Customs duty 2,254 1,290 1,178 1,250 1,380 1,380 (43) (9) 6 10 10
2.b.2.1. Basic duties 646 808 1,048 1,104 1,240 1,240 25 30 5 12 12
2.b.2.2. Others 1,608 483 130 146 140 140 (70) (73) 12 (4) (4)
2.b.3. Excise duty 3,821 2,594 2,310 2,480 2,670 2,670 (32) (11) 7 8 8
2.b.4. Service tax 2,545 812 69 12 10 — (68) (92) (83) (15)
2.c Transfers to states, UTs, etc. 6,145 6,765 7,633 6,588 7,871 7,767 10 13 (14) 19 18
2.d Net tax revenues 11,014 12,425 13,172 15,046 16,359 16,130 13 6 14 9 7
3. Non-tax revenues 2,728 1,927 2,357 3,455 3,850 3,850 (29) 22 47 11 11
3.a. RBI's transfer of surplus 659 407 680 1,476 600 600 (38) 67 117 (59) (59)
3.a. Telecommunications 702 321 408 590 1,330 1,330 (54) 27 45 126 126
4. Non-debt capital receipts (a + b) 654 1,157 1,128 816 2,250 2,250 77 (3) (28) 176 176
4.a Recovery of loans 176 156 181 166 150 150 (11) 15 (8) (10) (10)
4.b Other receipts (disinvestments) 477 1,000 947 650 2,100 2,100 110 (5) (31) 223 223
5. Total receipts (1 + 4) 14,396 15,509 16,657 19,317 22,459 22,230 8 7 16 16 15
Expenditure
6. Revenue expenditure 16,906 18,788 20,074 23,496 26,301 26,301 11 7 17 12 12
6.a. Interest payments 4,807 5,290 5,826 6,251 7,082 7,082 10 10 7 13 13
6.b. Subsidies 2,040 1,912 1,968 2,273 2,278 2,278 (6) 3 15 0 0
6.b.1. Food 1,102 1,003 1,013 1,087 1,156 1,156 (9) 1 7 6 6
6.b.2. Fertilizer 663 664 706 800 713 713 0 6 13 (11) (11)
6.b.3. Oil 275 245 248 386 409 409 (11) 2 55 6 6
6.c. Pay, allowances and pensions 3,996 4,464 4,957 5,447 5,877 5,877 12 11 10 8 8
6.c.1.a. Pay and allowances 2,682 3,007 3,291 3,606 3,770 3,770 12 9 10 5 5
6.c.1.b. Pensions 1,314 1,457 1,666 1,841 2,107 2,107 11 14 11 14 14
6.d. Agriculture and farmers' welfare 369 374 461 1,019 1,343 1,343 1 23 121 32 32
6.e. Education 720 800 781 927 972 972 11 (2) 19 5 5
6.f. Health and family welfare 364 483 506 608 639 639 33 5 20 5 5
6.g. Rural development 951 1,086 1,118 1,226 1,200 1,200 14 3 10 (2) (2)
6.h. Others 3,658 4,381 4,457 5,746 6,909 6,909 20 2 29 20 20
7. Capital expenditure 2,846 2,631 3,077 3,489 4,121 4,121 (8) 17 13 18 18
7. a. Defence 915 954 998 1,154 1,186 1,186 4 5 16 3 3
7. b. Railways 452 434 528 678 700 700 (4) 22 28 3 3
7. c. Roads and Highways 412 508 676 722 820 820 23 33 7 14 14
7. d. Housing and urban affairs 165 153 158 192 211 211 (7) 3 22 10 10
7. e. Others 902 582 717 743 1,204 1,204 (35) 23 4 62 62
8. Total expenditure (6 + 7) 19,752 21,420 23,151 26,986 30,422 30,422 8 8 17 13 13
Deficit
Primary deficit (PD) 549 621 668 1,417 881 1,110 13 7 112 (38) (22)
Revenue deficit (RD) 3,164 4,436 4,545 4,995 6,092 6,321 40 2 10 22 27
Gross fiscal deficit (GFD) 5,356 5,911 6,494 7,668 7,963 8,192 10 10 18 4 7
Gross borrowings (dated securities) 5,842 5,891 5,715 7,100 7,800 7,799 1 (3) 24 10 10
Net market borrowing 4,093 4,518 4,233 4,740 5,449 5,448 10 (6) 12 15 15
Net market borrowing (adjusted for buyback) 3,497 4,103 4,233 4,740 5,149 5,377 17 3 12 9 13
Short-term borrowing (T-bills) 55 449 69 250 250 250
Nominal GDP at market prices 153,917 170,983 189,712 204,422 224,894 223,842 11.1 11.0 7.8 10.0 9.5
PD/GDP (%) 0.4 0.4 0.4 0.7 0.4 0.5
RD/GDP (%) 2.1 2.6 2.4 2.4 2.7 2.8
GFD/GDP (%) 3.5 3.5 3.4 3.8 3.5 3.7
Notes:
(a) 'Gross tax revenues' means revenues post refunds and 'net tax revenues' means gross tax revenues minus devolution to states.
(b) RBI's transfer of surplus for FY2021BE and FY2020E are our estimates.
(c) Pay and allowances include pay and allowances of Ministry of Railways.
Change (%)
Source: Ministry of Finance, Kotak Institutional Equities estimates

10 KOTAK INSTITUTIONAL EQUITIES RESEARCH
India Strategy
Investment. We do not expect a quick turnaround in investment given challenges with
all the three components of investment—household investment, private sector investment
and public sector investment. Households have reduced investment in real estate for the
past several years and it is unlikely that they will step on investment in real estate given
challenges with both household income and sentiment. The private sector will likely go
slow on investment until the balance sheets of the companies in sectors such as metal &
mining, oil & gas, power, roads and telecom become better through deleveraging and/or
capital raise; many of them have stressed balance sheets and/or have made acquisitions,
which has further leveraged their balance sheets. Finally, the public sector has its own
challenges given the government’s stretched fiscal position. In fact, overall capital
expenditure of the major central government ministries shows a decline in capital
expenditure in FY2021BE versus FY2020RE levels (see Exhibit 13).
Exhibit 13: Market borrowing by government entities substituting capital expenditure by the government Revenue and capital expenditure through budget and IEBR (internal and extra budgetary resources), March fiscal year-ends, 2019-2021BE (Rs bn)
Revenue Capital IEBR Bonds Revenue Capital IEBR Bonds Revenue Capital IEBR Bonds
Atomic Energy 87 87 78 — 94 81 90 54 89 93 109 71
Communication and IT 284 24 158 30 281 52 306 50 516 261 152 25
Civil Aviation 56 40 72 — 37 0 348 295 38 0 52 —
Coal 7 — 145 32 9 — 181 59 9 — 185 48
Defense 3,037 998 — — 3,334 1,154 — — 3,528 1,186 — —
Food and Public Distribution 1,765 14 1,961 210 1,140 13 2,005 133 1,210 12 2,223 80
Housing and Urban Development 260 170 197 98 231 192 477 120 289 211 319 110
New and Renewable Energy 42 0 95 20 38 1 125 29 57 1 137 44
Petroleum and Natural Gas 305 20 944 39 423 6 950 182 420 9 985 134
Power 135 21 732 449 141 18 524 242 148 11 499 230
Railways 21 531 858 — 21 678 882 — 22 700 908 —
Road Transport and Highways 97 676 620 620 109 722 750 — 98 820 650 —
Others 13,979 496 267 252 17,640 573 467 256 19,877 817 508 330
All ministries 20,074 3,077 6,126 1,750 23,496 3,489 7,106 1,419 26,301 4,121 6,727 1,072
Notes:
(a) Bonds imply bonds and debentures issued as part of the IEBR.
(b) Data for bonds are based on revised estimates for each year.
2019 2020RE 2021BE
Source: Union Budget, Kotak Institutional Equities

KOTAK INSTITUTIONAL EQUITIES RESEARCH 11
Strategy India
In our view, the government may have to implement major reforms in (1) the factors of
production to increase investment in manufacturing and (2) the ownership and pricing
policies to increase private sector investment in infrastructure. The government reduced
the corporate tax rate in September 2019 and has also proposed to remove dividend
distribution tax in the FY2021 union budget, which would suggest that the government is
keen to increase India’s investment rate. It has steadfastly worked to improve India’s
position in global ‘ease of doing business’ indices (see Exhibit 14).
Exhibit 14: India’s ranking on ease of doing business has improved sharply in recent years Trend of India's ranking in 'ease of doing business' parameters
2013 2014 2015 2016 2017 2018 2019 2020
Overall ease of doing business 132 134 134 131 130 100 77 63
Starting a business 173 179 158 155 155 156 137 136
Dealing with construction permits 182 182 184 183 185 181 52 27
Getting electricity 105 111 137 70 26 29 24 22
Registering property 94 92 121 138 138 154 166 154
Getting credit 23 28 36 42 44 29 22 25
Protecting minority investors 49 34 7 8 13 4 7 13
Paying taxes 152 158 156 157 172 119 121 115
Trading across borders 127 132 126 178 143 146 80 68
Enforcing contracts 184 186 186 133 172 164 163 163
Resolving insolvency 116 121 137 136 136 103 108 52
Notes:
(a) Economies are ranked on their 'ease of doing business', from 1–190.
(b) A high 'ease of doing business' ranking means the regulatory environment is more conducive to the starting
and operation of a local firm.
Source: World Bank, Kotak Institutional Equities
The reduction in corporate tax has resulted in India’s corporate tax rates declining to
regional levels (see Exhibit 15). However, we do not expect a big increase in investment
solely because of the tax cuts or removal of DDT as companies in several sectors will
simply retain the benefits of the lower corporate tax rates and removal of dividend
distribution tax resulting in higher dividend payments to shareholders. In some cases, the
companies will have to share the benefits with borrowers or consumers in the form of
lower interest rates or prices; Exhibit 16 shows the impact of the corporate tax cut on the
investment a 2X2 matrix of (1) whether companies in a sector will be able to retain the
benefit of the corporate tax cut or not and (2) whether they will invest or not.
Exhibit 15: Corporate India will become more competitive compared with other Asian economies in
the new regime Base corporate tax rate of major Asian economies, Calendar year-ends, 2019 (%)
30 3028
25 25 25 25 24 23.222
20 20 20 20
1715
0
5
10
15
20
25
30
35
India
(old
)
Phili
ppin
es
Sri L
anka
Ban
gla
des
h
Chin
a
Indones
ia
Kor
ea
Mala
ysia
Japan
India
(new
)
Cam
bodia
Taiw
an
Thaila
nd
Vie
tnam
Singap
ore
India
(new
mfg
)
Source: Deloitte, KPMG, Kotak Institutional Equities

12 KOTAK INSTITUTIONAL EQUITIES RESEARCH
India Strategy
Exhibit 16: Only a few sectors will likely invest the benefits of lower corporate tax rate Impact of the corporate tax cut on investment of various sectors
Construction materials
Commodity chemicals
Oil, gas & consumable fuels
Banks, diversified financials Consumer staples
(Competitive lending segments such as
mortgage, high-rated corporate paper)
Electric utilities, gas utilities Metals & mining
(Pass-through of tax benefits) (De-leveraging)
No
t In
vest
Inve
st
Not retain Retain
Source: Kotak Institutional Equities estimates
We view the corporate tax cut as ‘a necessary but not sufficient condition’ for attracting
more private sector investment in India with India still lagging its regional peers in several
other parameters related to ‘ease of doing business’, especially enforcing contracts,
registering a property and starting a business. We have discussed this and related issues
in more detail in our October 11, 2019 report titled Hope.
Earnings recovery to be faster although risks exist
We expect FY2020 and FY2021 net profits of the Nifty-50 Index to grow 9.6% and 25.7%
from 11.3% and 25% at the beginning of the results season. The strong growth in net
profits of Nifty-50 Index for FY2020 and FY2021 reflects a rebound in the earnings of
financials, metals and mining and telecom sectors (see Exhibit 17).

KOTAK INSTITUTIONAL EQUITIES RESEARCH 13
Strategy India
Exhibit 17: Banks to contribute to the bulk of incremental profits of the Nifty-50 Index in FY2021 and FY2022 Break-up of net profits of the Nifty-50 Index across sectors, March fiscal year-ends, 2017-22E (based on current constituents)
2020E
2017 2018 2019 2020E 2021E 2022E 2018 2019 2020E 2021E 2022E (Rs bn) (%) (Rs bn) (%) (Rs bn) (%)
Automobiles & Components 292 288 211 199 249 338 9 6 5 5 6 (12) (3) 50 5 89 10
Tata Motors 94 68 (18) (12) 30 69 2 (0) (0) 1 1 6 2 42 4 40 5
Banks 495 320 422 755 1,219 1,514 10 11 19 24 25 333 93 464 44 295 34
ICICI Bank 98 68 34 118 205 244 2 1 3 4 4 85 24 87 8 39 4
State Bank of India 105 (65) 9 212 398 491 (2) 0 5 8 8 203 57 186 18 93 11
Capital Goods 59 72 86 98 95 121 2 2 2 2 2 12 3 (3) (0) 26 3
Commodity Chemicals 19 21 22 28 33 39 1 1 1 1 1 6 2 5 0 6 1
Construction Materials 59 56 66 90 100 117 2 2 2 2 2 23 7 10 1 17 2
Consumer Staples 163 183 213 253 280 317 6 6 6 5 5 40 11 27 3 36 4
Diversified Financials 118 161 168 294 268 319 5 5 7 5 5 125 35 (25) (2) 51 6
Electric Utilities 177 186 210 227 262 286 6 6 6 5 5 17 5 35 3 25 3
Fertilizers & Agricultural Chemicals 18 20 14 22 31 35 1 0 1 1 1 7 2 9 1 4 0
Gas Utilities 38 46 63 55 63 67 1 2 1 1 1 (8) (2) 7 1 5 1
IT Services 604 610 706 742 812 896 18 19 18 16 15 36 10 70 7 85 10
Media 13 14 16 17 18 20 0 0 0 0 0 1 0 1 0 2 0
Metals & Mining 168 273 292 120 253 318 8 8 3 5 5 (172) (48) 133 13 65 7
Tata Steel 40 80 104 11 80 112 2.4 2.8 0.3 1.6 1.9 (92) (26) 68 7 32 4
Oil, Gas & Consumable Fuels 948 917 1,103 1,031 1,206 1,300 28 30 25 24 22 (72) (20) 174 17 95 11
Coal India 93 70 175 175 186 171 2 5 4 4 3 0 0 12 1 (16) (2)
ONGC 217 223 296 274 261 280 7 8 7 5 5 (23) (6) (13) (1) 19 2
Reliance Industries 299 350 391 449 552 637 11 11 11 11 11 59 16 103 10 85 10
Pharmaceuticals 92 60 71 81 101 118 2 2 2 2 2 11 3 19 2 17 2
Retailing 8 11 15 16 21 27 0 0 0 0 0 1 0 5 0 6 1
Telecommunication Services 61 44 (1) (2) 62 106 1 (0) (0) 1 2 (1) (0) 64 6 44 5
Transportation 39 38 41 50 50 57 1 1 1 1 1 9 3 0 0 7 1
Nifty-50 Index 3,369 3,323 3,719 4,076 5,122 5,997 100 100 100 100 100 357 100 1,046 100 875 100
Nifty-50 change (%) 2.2 (1.3) 11.9 9.6 25.7 17.1
Nifty-50 EPS (FF) 439 449 480 532 670 796
Incremental profits
Net profits (Rs bn) Contribution (%) 2021E 2022E
Source: Kotak Institutional Equities estimates
The sharp recovery in net profits of (1) banks reflects our assumption of normalization of
provisions in the banking sector in FY2020-21, post peaking of NPLs in FY2018-19 and
creation of sufficient provisions over FY2017-19, (2) the metals sector highlights our view of
a moderate recovery in global metal prices from current depressed levels and (3) the telecom
sector reflects our assumption of increase in ARPUs following the decision of telecom
companies to align prices with costs after a period of cutthroat competition and steep
declines in ARPUs.
We discuss our earnings projections by sectors and the key drivers of earnings through
FY2022E below. We also examine the key risk factors to earnings by sectors, which become
relevant in the context of the rich valuations of several sectors.
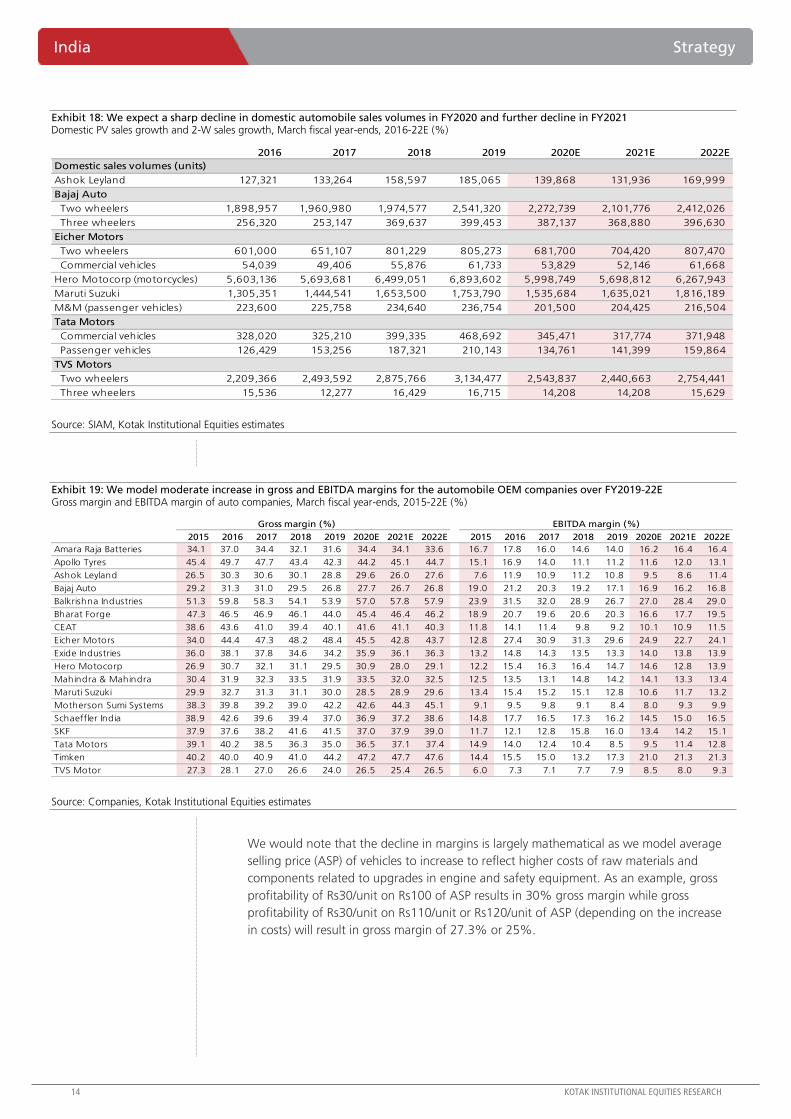
Automobiles and components. We expect net profits of the automobiles sector to
decline 6% in FY2020 due to extremely weak domestic demand conditions. However, we
expect a sharp bounce in net profits in FY2021-22 on the back of (1) recovery in domestic
volumes in the 2-W and 4-W segments in FY2022; FY2021 volumes will still be weak and
(2) profits at TTMT in FY2021-22 versus a loss in FY2020 (and FY2019).
However, we see downward risks to our volume assumptions of (1) 2-Ws and 4-Ws if
domestic demand conditions were to persist through FY2021 and (2) TTMT if global
economic conditions were to deteriorate on a wider-than-assumed spread of COVID-19
infection. We note that China contributes to around 17% of TTMT’s overall volumes.
We assume (1) a sharp decline in domestic volumes in FY2020 on weak domestic demand
and flattish FY2021 volumes (decline in the case of CVs) on higher cost of vehicles
following implementation of BS-VI fuel emission norms from April 1, 2020 (see Exhibit 18)
and (2) moderate decline in gross and EBITDA margins of the OEMs given higher costs
related to implementation of new safety regulations (ABS/CBS applicable from April 1,
2019 for 2-Ws and ABS applicable from July 1, 2019 for 4-Ws) and fuel emission
standards (BS-VI fuel standards applicable from April 1, 2020; see Exhibit 19).
14 KOTAK INSTITUTIONAL EQUITIES RESEARCH
India Strategy
Exhibit 18: We expect a sharp decline in domestic automobile sales volumes in FY2020 and further decline in FY2021 Domestic PV sales growth and 2-W sales growth, March fiscal year-ends, 2016-22E (%)
2016 2017 2018 2019 2020E 2021E 2022E
Domestic sales volumes (units)
Ashok Leyland 127,321 133,264 158,597 185,065 139,868 131,936 169,999
Bajaj Auto
Two wheelers 1,898,957 1,960,980 1,974,577 2,541,320 2,272,739 2,101,776 2,412,026
Three wheelers 256,320 253,147 369,637 399,453 387,137 368,880 396,630
Eicher Motors
Two wheelers 601,000 651,107 801,229 805,273 681,700 704,420 807,470
Commercial vehicles 54,039 49,406 55,876 61,733 53,829 52,146 61,668
Hero Motocorp (motorcycles) 5,603,136 5,693,681 6,499,051 6,893,602 5,998,749 5,698,812 6,267,943
Maruti Suzuki 1,305,351 1,444,541 1,653,500 1,753,790 1,535,684 1,635,021 1,816,189
M&M (passenger vehicles) 223,600 225,758 234,640 236,754 201,500 204,425 216,504
Tata Motors
Commercial vehicles 328,020 325,210 399,335 468,692 345,471 317,774 371,948
Passenger vehicles 126,429 153,256 187,321 210,143 134,761 141,399 159,864
TVS Motors
Two wheelers 2,209,366 2,493,592 2,875,766 3,134,477 2,543,837 2,440,663 2,754,441
Three wheelers 15,536 12,277 16,429 16,715 14,208 14,208 15,629
Source: SIAM, Kotak Institutional Equities estimates
Exhibit 19: We model moderate increase in gross and EBITDA margins for the automobile OEM companies over FY2019-22E Gross margin and EBITDA margin of auto companies, March fiscal year-ends, 2015-22E (%)
2015 2016 2017 2018 2019 2020E 2021E 2022E 2015 2016 2017 2018 2019 2020E 2021E 2022E
Amara Raja Batteries 34.1 37.0 34.4 32.1 31.6 34.4 34.1 33.6 16.7 17.8 16.0 14.6 14.0 16.2 16.4 16.4
Apollo Tyres 45.4 49.7 47.7 43.4 42.3 44.2 45.1 44.7 15.1 16.9 14.0 11.1 11.2 11.6 12.0 13.1
Ashok Leyland 26.5 30.3 30.6 30.1 28.8 29.6 26.0 27.6 7.6 11.9 10.9 11.2 10.8 9.5 8.6 11.4
Bajaj Auto 29.2 31.3 31.0 29.5 26.8 27.7 26.7 26.8 19.0 21.2 20.3 19.2 17.1 16.9 16.2 16.8
Balkrishna Industries 51.3 59.8 58.3 54.1 53.9 57.0 57.8 57.9 23.9 31.5 32.0 28.9 26.7 27.0 28.4 29.0
Bharat Forge 47.3 46.5 46.9 46.1 44.0 45.4 46.4 46.2 18.9 20.7 19.6 20.6 20.3 16.6 17.7 19.5
CEAT 38.6 43.6 41.0 39.4 40.1 41.6 41.1 40.3 11.8 14.1 11.4 9.8 9.2 10.1 10.9 11.5
Eicher Motors 34.0 44.4 47.3 48.2 48.4 45.5 42.8 43.7 12.8 27.4 30.9 31.3 29.6 24.9 22.7 24.1
Exide Industries 36.0 38.1 37.8 34.6 34.2 35.9 36.1 36.3 13.2 14.8 14.3 13.5 13.3 14.0 13.8 13.9
Hero Motocorp 26.9 30.7 32.1 31.1 29.5 30.9 28.0 29.1 12.2 15.4 16.3 16.4 14.7 14.6 12.8 13.9
Mahindra & Mahindra 30.4 31.9 32.3 33.5 31.9 33.5 32.0 32.5 12.5 13.5 13.1 14.8 14.2 14.1 13.3 13.4
Maruti Suzuki 29.9 32.7 31.3 31.1 30.0 28.5 28.9 29.6 13.4 15.4 15.2 15.1 12.8 10.6 11.7 13.2
Motherson Sumi Systems 38.3 39.8 39.2 39.0 42.2 42.6 44.3 45.1 9.1 9.5 9.8 9.1 8.4 8.0 9.3 9.9
Schaeffler India 38.9 42.6 39.6 39.4 37.0 36.9 37.2 38.6 14.8 17.7 16.5 17.3 16.2 14.5 15.0 16.5
SKF 37.9 37.6 38.2 41.6 41.5 37.0 37.9 39.0 11.7 12.1 12.8 15.8 16.0 13.4 14.2 15.1
Tata Motors 39.1 40.2 38.5 36.3 35.0 36.5 37.1 37.4 14.9 14.0 12.4 10.4 8.5 9.5 11.4 12.8
Timken 40.2 40.0 40.9 41.0 44.2 47.2 47.7 47.6 14.4 15.5 15.0 13.2 17.3 21.0 21.3 21.3
TVS Motor 27.3 28.1 27.0 26.6 24.0 26.5 25.4 26.5 6.0 7.3 7.1 7.7 7.9 8.5 8.0 9.3
Gross margin (%) EBITDA margin (%)
Source: Companies, Kotak Institutional Equities estimates
We would note that the decline in margins is largely mathematical as we model average
selling price (ASP) of vehicles to increase to reflect higher costs of raw materials and
components related to upgrades in engine and safety equipment. As an example, gross
profitability of Rs30/unit on Rs100 of ASP results in 30% gross margin while gross
profitability of Rs30/unit on Rs110/unit or Rs120/unit of ASP (depending on the increase
in costs) will result in gross margin of 27.3% or 25%.

KOTAK INSTITUTIONAL EQUITIES RESEARCH 15
Strategy India
Banks and diversified financials (NBFCs). We model the banks and diversified financials
sectors to account for the bulk of the incremental profits of the Nifty-50 Index in FY2020
and FY2021. We expect a sharp surge in the profits of certain banks (AXSB, ICICIBC and
SBI) due to a steep decline in loan-loss provisions driven by (1) peaking of NPLs and
slippages in 4QFY19/1QFY20; NPLs have declined moderately in 9MFY20 and slippages
fallen sharply over the same period, (2) high provision coverage ratio at end-FY2019 (see
Exhibit 20), which would result in a decline in loan-loss provisions (LLP) from FY2020 and
(3) possible recovery on loans already written off on successful resolution of a few large
cases in the NCLT. At the same time, we model continued strong growth in the net
profits of lenders such as BAF, HDFC, HDFCB and IIB.
Exhibit 20: We model steep decline in loan-loss provisions in FY2020-21 given comfortable PCR at end-FY2019 LLP as a percentage of average loans and provision coverage ratio (excluding write-off) and, March fiscal year-ends, 2015-22E (%)
2014 2015 2016 2017 2018 2019 2020E 2021E 2022E 2015 2016 2017 2018 2019 2020E 2021E 2022E
Public banks
Bank of Baroda 1.0 1.1 3.3 2.2 3.4 2.7 2.8 0.9 1.0 50 52 58 58 68 57 51 47
Canara Bank 1.0 1.3 3.1 2.1 3.9 3.1 1.3 1.2 0.9 33 34 37 40 41 52 53 69
Punjab National Bank 1.8 2.3 4.4 2.9 6.5 6.0 2.8 2.8 1.8 40 37 41 44 62 58 60 41
State Bank of India 1.4 1.6 2.2 2.3 3.8 2.6 1.6 1.2 1.2 51 43 48 50 62 70 66 67
Union Bank 1.2 1.2 1.5 2.4 4.4 3.8 2.8 2.3 1.8 47 42 44 51 58 61 68 72
Old private banks
City Union Bank 1.1 0.9 1.1 1.1 1.2 1.0 1.3 0.9 0.9 31 37 40 45 39 41 44 49
DCB Bank 0.5 0.7 0.6 0.8 0.7 0.6 0.7 0.9 0.9 43 51 51 60 65 55 64 79
Federal Bank 0.4 0.4 1.1 0.9 0.9 0.7 0.7 0.7 0.7 65 43 46 44 50 54 56 58
Karur Vysya Bank 0.7 1.6 0.8 1.6 2.8 2.8 2.5 1.7 1.0 59 58 30 38 46 50 62 62
New private banks
Axis Bank 1.0 0.9 1.5 3.3 4.0 2.4 2.5 1.1 0.8 67 57 57 52 62 50 52 53
HDFC Bank 0.7 0.6 0.6 0.7 0.9 1.0 1.2 1.2 1.1 74 70 69 70 71 75 78 78
ICICI Bank 0.8 0.9 2.7 3.2 3.0 3.1 1.5 0.8 0.8 59 51 40 48 71 78 80 79
IndusInd Bank 0.8 0.7 0.8 1.0 0.8 1.8 1.5 1.0 1.0 63 59 58 56 43 51 55 57
RBL Bank 0.6 0.3 0.6 0.8 0.9 1.1 3.5 2.0 1.5 65 40 47 45 51 40 42 49
Yes Bank 0.5 0.6 0.6 0.6 0.7 2.2 3.0 2.5 0.8 72 62 47 50 43 38 39 42
Small finance banks
AU Small Finance Bank 3.4 2.0 0.9 1.6 1.3 0.8 0.9 1.1 1.0 53 40 35 37 37 58 66 74
Bandhan Bank 0.9 0.5 1.4 2.2 1.2 1.4 1.4 29 54 72 61 62 69
Equitas Holdings 1.1 1.8 1.4 1.8 2.5 1.0 1.1 1.9 1.9 26 30 49 47 43 44 47 48
Ujjivan Small Finance Bank 0.6 0.7 2.2 3.0 2.5 0.8 47 50 43 38 39 42
LLP (%) PCR (%)
Source: Companies, Kotak Institutional Equities estimates
We see downside risks to our assumption of credit growth and potential upside risks to
our credit cost assumptions in the retail loan book of banks and NBFCs in the event of a
prolonged downturn in demand. However, we could see a positive surprise in the NIMs of
the larger banks and NBFCs, which could offset the aforementioned negatives. We expect
a meaningful decline in their cost of funds given large liquidity and weak credit demand,
which has resulted in banks being able to (1) raise cheaper funds in wholesale markets
and (2) reduce their retail term deposit rates (see Exhibit 21for term deposit rates of SBI).
Similarly, the better NBFCs will also see lower cost of funds given the sharp decline in
money market rates (see Exhibit 22 for one year CP and CD rates) and bond yields (see
Exhibit 23). Exhibit 24 gives the NIM and RoE of the major banks and NBFCs under our
coverage for FY2015-22E.

16 KOTAK INSTITUTIONAL EQUITIES RESEARCH
India Strategy
Exhibit 21: Retail term deposit rates for SBI declined by 75-100 bps since June, 2019 Retail term deposit rates for SBI, March fiscal year ends, 2018-20 (%)
Jan-18 Mar-18 Jun-18 Sep-18 Dec-18 Jan-19 Mar-19 Jun-19 Sep-19 Dec-19 Jan-20 Feb-20
7-14 days 5.25 5.75 5.75 5.75 5.75 5.75 5.75 5.75 4.50 4.50 4.50 4.50
15-30days 5.25 5.75 5.75 5.75 5.75 5.75 5.75 5.75 4.50 4.50 4.50 4.50
31-45days 5.25 5.75 5.75 5.75 5.75 5.75 5.75 5.75 4.50 4.50 4.50 4.50
46 -90 days 6.25 6.25 6.25 6.25 6.25 6.25 6.25 6.25 5.50 5.50 5.50 5.00
91-120days 6.25 6.25 6.25 6.25 6.25 6.25 6.25 6.25 5.50 5.50 5.50 5.00
120-180 days 6.25 6.25 6.25 6.25 6.25 6.25 6.25 6.25 5.50 5.50 5.50 5.00
181-210 days 6.25-6.50 6.35 6.35-6.4 6.35 6.35 6.35 6.35 6.35 6.00 5.80 5.80 5.50
211 days-1year 6.50 6.40 6.40 6.40 6.40 6.40 6.40 6.40 6.00 5.80 5.80 5.50
1 year-2year 6.25 6.40 6.40 6.70 6.80 6.80 6.80 7.00 6.70 6.25 6.10 6.00
2 year-3year 6.00 6.50 6.60 6.75 6.80 6.80 6.80 6.75 6.70 6.25 6.10 6.00
3 years-5 years 6.00 6.50 6.70 6.80 6.80 6.80 6.80 6.70 6.5-6.6 6.25 6.10 6.00
5 years-8 years 6.00 6.50 6.75 6.85 6.85 6.85 6.85 6.60 6.5-6.6 6.25 6.10 6.00
8years-10 years 6.00 6.50 6.75 6.85 6.85 6.85 6.85 6.60 6.5-6.6 6.25 6.10 6.00
Source: Company, Kotak Institutional Equities
Exhibit 22: Steady decline in CD rates since December, 2018 1-month Commercial Paper and Certificate of Deposit rates in India (%)
4.0
5.0
6.0
7.0
8.0
9.0
10.0
Feb-1
7
Apr-
17
Jun-1
7
Aug
-17
Oct
-17
Dec-
17
Feb-1
8
Apr-
18
Jun-1
8
Aug
-18
Oct
-18
Dec-
18
Feb-1
9
Apr-
19
Jun-1
9
Aug
-19
Oct
-19
Dec-
19
Feb-2
0
CP rate CD rate
Source: Bloomberg, Kotak Institutional Equities
Exhibit 23: Steady decline in corporate bond yields over the past one year Yields across corporate bonds and G-secs in India, 2010 onwards (%)
6
7
8
9
10
11
Feb-1
4
Aug
-14
Feb-1
5
Aug
-15
Feb-1
6
Aug
-16
Feb-1
7
Aug
-17
Feb-1
8
Aug
-18
Feb-1
9
Aug
-19
Feb-2
0
5-Year AAA 5-Year AA 10-Year G Sec
Source: Bloomberg, Kotak Institutional Equities

KOTAK INSTITUTIONAL EQUITIES RESEARCH 17
Strategy India
Exhibit 24: We expect improvement in NIM and RoEs of PSU and 'corporate' private banks; pressure in NIM and RoEs for NBFCs NIM and RoE of banks and NBFCs (Ind-AS from FY2019, I-GAAP before that), March fiscal year-ends, 2015-22E (%)
2015 2016 2017 2018 2019 2020E 2021E 2022E 2015 2016 2017 2018 2019 2020E 2021E 2022E
Banks
AU Small Finance Bank 12.3 12.2 10.1 6.9 5.4 5.2 5.3 4.9 19 23 55 14 14 19 17 18
Axis Bank 3.5 3.6 3.5 3.1 3.2 3.3 3.5 3.5 18 17 6 0 7 6 15 17
Bandhan Bank — 6.5 9.8 8.3 9.1 8.2 7.5 6.9 — 11 29 19 19 24 23 22
Bank of Baroda 2.0 1.9 2.1 2.3 2.6 3.2 2.8 2.9 9 (14) 3 (6) 1 1 16 16
Canara Bank 2.0 1.9 1.8 2.2 2.4 2.2 2.7 2.3 9 (9) 3 (12) 1 6 10 11
City Union Bank 3.2 3.5 3.7 4.0 3.9 3.8 3.9 3.8 17 15 15 15 15 14 15 15
DCB Bank 3.7 3.7 3.9 3.8 3.6 3.6 3.7 3.8 14 12 11 11 12 13 15 17
Equitas Holdings 10.5 10.0 9.7 7.9 8.2 8.8 8.7 8.1 11 13 9 1 9 10 11 14
Federal Bank 3.2 3.1 3.2 3.0 3.0 2.9 2.9 3.0 14 6 10 8 10 12 13 15
HDFC Bank 4.4 4.4 4.4 4.4 4.4 4.3 4.2 4.1 19 18 18 18 16 17 17 18
ICICI Bank 3.4 3.5 3.4 3.2 3.3 3.6 3.7 3.6 15 11 11 8 3 10 16 17
IndusInd Bank 3.7 3.8 4.0 4.0 3.8 4.2 4.4 4.3 20 17 16 17 14 17 18 18
Karur Vysya Bank 2.9 3.4 3.6 3.7 3.6 3.4 3.4 3.5 12 13 13 6 3 4 8 14
Punjab National Bank 3.0 2.5 2.3 2.1 2.4 2.3 3.0 2.7 8 (13) 4 (33) (25) 2 7 10
RBL Bank 2.5 2.5 2.9 3.3 3.7 4.3 4.5 4.3 10 11 12 12 12 5 14 16
State Bank of India 3.0 2.8 2.7 2.6 2.7 2.9 3.1 3.2 11 7 6 (3) 0 9 15 16
Ujjivan Small Finance Bank — — — 10.1 10.0 10.3 10.3 10.1 — — — 0 11 15 15 17
Union Bank 2.4 2.2 2.2 2.1 2.2 2.4 3.5 3.0 10 7 3 (24) (13) 0 13 13
YES Bank 3.0 3.2 3.3 3.1 3.0 2.3 2.3 2.4 21 20 19 18 7 (11) (4) 10
NBFCs
Bajaj Finance 11.3 11.4 11.6 9.8 9.8 10.0 9.9 9.5 20 21 22 20 22 23 22 22
Cholamandalam 4.7 5.1 5.1 6.4 6.0 6.0 6.1 6.0 17 18 18 20 21 21 21 21
HDFC 3.8 4.1 3.8 4.6 3.6 5.7 3.3 3.3 21 22 20 21 14 22 14 15
L&T Finance Holdings 6.2 6.2 6.3 4.9 5.7 5.9 5.9 6.1 14 13 14 13 18 13 16 17
LIC Housing Finance 2.3 2.5 2.7 2.3 2.4 2.5 2.5 2.5 16 17 17 12 17 15 18 18
Mahindra & Mahindra Financial 7.4 7.2 6.6 7.0 7.8 7.1 7.3 7.4 15 11 6 13 15 13 16 18
Muthoot Finance 9.5 10.7 13.0 15.1 14.3 13.8 13.7 13.5 14 15 19 25 22 24 23 22
PNB Housing Finance 3.0 3.1 2.9 2.9 2.5 2.4 2.4 2.5 15 18 14 14 17 14 15 15
Shriram City Union Finance 13.7 13.5 13.6 13.5 12.9 11.9 11.9 12.0 16 12 12 13 17 16 16 16
Shriram Transport 7.3 7.7 7.3 7.8 7.9 7.5 7.6 7.6 14 12 12 20 17 18 16 16
RoE (%)NIM (%)
Source: Companies, Kotak Institutional Equities estimates
Construction materials. We assume higher profitability for cement stocks under our
coverage for FY2020-22. We note that realizations and profitability have increased
sharply over the past 12 months. Cement prices have held up surprisingly despite demand
conditions having worsened significantly over the past few months. We expect capacity
utilization to remain low on large supply-demand imbalance through FY2022 (see Exhibit
25).
Exhibit 25: Capacity utilization to remain around 70% through FY2022E Cement demand supply balance, March fiscal year-ends, 2016-22E (mn tons)
2016 2017 2018 2019 2020E 2021E 2022E
All-India
Closing installed capacity (mtpa) 434 455 470 482 508 530 549
Incremental installed capacity (mtpa) 16 21 15 12 26 22 19
Effective capacity (mtpa) 434 455 468 481 511 529 550
Incremental effective capacity (mtpa) 38 21 14 12 30 18 21
Capacity growth (%) 3.9 4.8 3.0 2.6 6.3 3.5 4.0
Cement consumption (mn tons) 279 275 293 333 336 354 377
Incremental consumption (mn tons) 13 (3) 18 39 4 18 23
Consumption growth (%) 4.8 (1.2) 6.5 13.4 1.1 5.5 6.5
Cement production (mn tons) 283 280 298 337 341 359 382
Incremental production (mn tons) 13 (3) 18 39 4 18 23
Growth (%) 4.6 (1.2) 6.3 13.3 1.1 5.4 6.4
Capacity utilization (%) 65 61 63 70 67 68 70
Source: CMA, Kotak Institutional Equities estimates

18 KOTAK INSTITUTIONAL EQUITIES RESEARCH
India Strategy
Exhibit 26 compares the historical profitability (Rs/ton) with our assumptions for FY2020-
22E. We would note that cement companies’ earnings have very high sensitivity to
profitability assumptions. Exhibit 27 shows the FY2020-22E EPS of the cement companies
under our coverage at various levels of profitability (Rs100/ton higher and lower versus
our base-case profitability estimates).
Exhibit 26: We model steady profitability of cement companies under our coverage over FY2020-22 Profitability (EBITDA/ton) of cement companies, March fiscal year-ends, 2015-22E (Rs/ton)
2015 2016 2017 2018 2019 2020E 2021E 2022E 2015 2016 2017 2018 2019 2020E 2021E 2022E
ACC 623 651 641 728 718 834 851 863 10 5 (1) 14 (1) 16 2 1
Ambuja Cements 899 712 797 840 782 943 957 993 13 (21) 12 5 (7) 21 1 4
J K Cement 900 869 881 768 761 1,226 1,297 1,343 54 (4) 1 (13) (1) 61 6 3
JK Lakshmi Cement 425 246 353 446 347 632 673 718 (21) (42) 43 27 (22) 82 7 7
Orient Cement 208 (104) (196) 377 487 643 684 723 (58) (150) 89 (292) 29 32 6 6
Shree Cement 753 789 1,145 1,084 955 1,458 1,531 1,558 13 5 45 (5) (12) 53 5 2
Ultratech Cement 894 977 986 970 989 1,201 1,232 1,249 7 9 1 (2) 2 21 3 1
Growth (% yoy)Profitability (Rs/ton)
Source: Companies, Kotak Institutional Equities estimates
Exhibit 27: Earnings of cement companies are highly sensitive to cement profitability assumptions EPS sensitivity of cement companies for change in EBITDA/ton, March fiscal year-ends, 2020-22E
2020E 2021E 2022E 2020E 2021E 2022E 2020E 2021E 2022E
ACC
Volumes (mn tons) 30.0 31.2 33.1 30.0 31.2 33.1 30.0 31.2 33.1
EBITDA/ton (Rs) 740 749 741 851 863 857 962 976 973
EBITDA (Rs bn) 22.2 23.4 24.6 25.6 27.0 28.4 28.9 30.5 32.2
PAT (Rs bn) 11.7 12.2 12.2 13.9 14.6 14.8 16.1 17.0 17.3
EPS (Rs) 62.0 65.0 64.8 73.9 77.7 78.5 85.8 90.3 92.2
Ambuja standalone
Volumes (mn tons) 23.9 25.0 27.0 23.9 25.0 27.0 23.9 25.0 27.0
EBITDA/ton (Rs) 843 856 889 943 957 993 1,043 1,058 1,097
EBITDA (Rs bn) 20.1 21.4 24.1 22.5 24.0 26.9 24.9 26.5 29.7
PAT (Rs bn) 13.6 14.6 16.2 15.4 16.5 18.3 17.1 18.4 20.4
EPS (Rs) 6.8 7.4 8.2 7.7 8.3 9.2 8.6 9.3 10.3
Shree Cement
Volumes (mn tons) 24.6 28.5 32.9 24.6 28.5 32.9 24.6 28.5 32.9
EBITDA/ton (Rs) 1,360 1,430 1,456 1,458 1,531 1,558 1,555 1,631 1,660
EBITDA (Rs bn) 34.8 42.1 49.3 37.3 45.1 52.8 39.8 48.0 56.2
PAT (Rs bn) 14.3 19.9 24.6 16.3 22.1 27.3 18.2 24.4 29.9
EPS (Rs) 397 551 682 450 613 755 503 676 829
Ultratech- Standalone
Volumes (mn tons) 80.1 87.3 94.9 80.1 87.3 94.9 80.1 87.3 94.9
EBITDA/ton (Rs) 1,111 1,141 1,155 1,201 1,232 1,249 1,291 1,324 1,342
EBITDA (Rs bn) 7.8 8.0 8.1 7.8 8.0 8.1 7.8 8.0 8.1
PAT (Rs bn) (7.3) (7.2) (7.3) (7.3) (7.2) (7.3) (7.3) (7.2) (7.3)
EPS (Rs) 1,186 1,193 1,197 1,287 1,296 1,304 1,388 1,400 1,412
(EBITDA: +Rs100/ton)(EBITDA: -Rs100/ton) Base Case
Source: Companies, Kotak Institutional Equities estimates
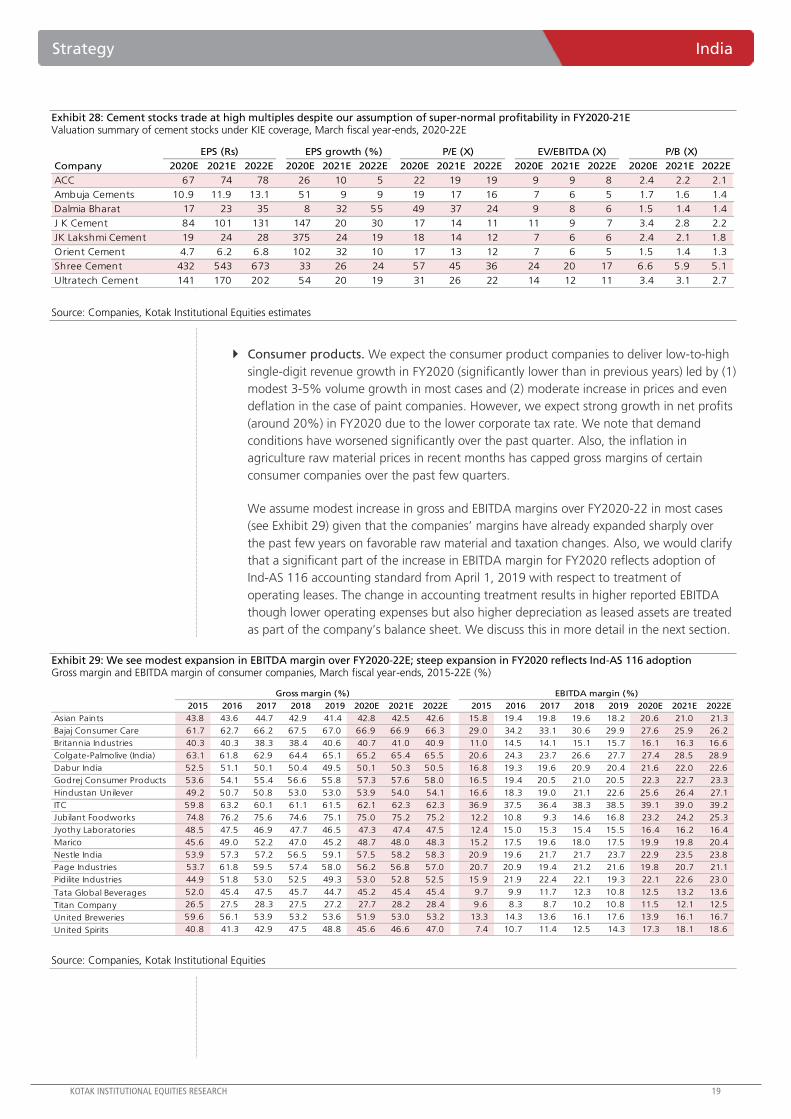
We note that cement stocks trade at high multiples (see Exhibit 28) despite our
assumption of strong growth in EBITDA/EPS for the cement stocks over FY2020-22E.
KOTAK INSTITUTIONAL EQUITIES RESEARCH 19
Strategy India
Exhibit 28: Cement stocks trade at high multiples despite our assumption of super-normal profitability in FY2020-21E Valuation summary of cement stocks under KIE coverage, March fiscal year-ends, 2020-22E
EPS (Rs) EPS growth (%) P/E (X) EV/EBITDA (X)
Company 2020E 2021E 2022E 2020E 2021E 2022E 2020E 2021E 2022E 2020E 2021E 2022E 2020E 2021E 2022E
ACC 67 74 78 26 10 5 22 19 19 9 9 8 2.4 2.2 2.1
Ambuja Cements 10.9 11.9 13.1 51 9 9 19 17 16 7 6 5 1.7 1.6 1.4
Dalmia Bharat 17 23 35 8 32 55 49 37 24 9 8 6 1.5 1.4 1.4
J K Cement 84 101 131 147 20 30 17 14 11 11 9 7 3.4 2.8 2.2
JK Lakshmi Cement 19 24 28 375 24 19 18 14 12 7 6 6 2.4 2.1 1.8
Orient Cement 4.7 6.2 6.8 102 32 10 17 13 12 7 6 5 1.5 1.4 1.3
Shree Cement 432 543 673 33 26 24 57 45 36 24 20 17 6.6 5.9 5.1
Ultratech Cement 141 170 202 54 20 19 31 26 22 14 12 11 3.4 3.1 2.7
P/B (X)
Source: Companies, Kotak Institutional Equities estimates
Consumer products. We expect the consumer product companies to deliver low-to-high
single-digit revenue growth in FY2020 (significantly lower than in previous years) led by (1)
modest 3-5% volume growth in most cases and (2) moderate increase in prices and even
deflation in the case of paint companies. However, we expect strong growth in net profits
(around 20%) in FY2020 due to the lower corporate tax rate. We note that demand
conditions have worsened significantly over the past quarter. Also, the inflation in
agriculture raw material prices in recent months has capped gross margins of certain
consumer companies over the past few quarters.
We assume modest increase in gross and EBITDA margins over FY2020-22 in most cases
(see Exhibit 29) given that the companies’ margins have already expanded sharply over
the past few years on favorable raw material and taxation changes. Also, we would clarify
that a significant part of the increase in EBITDA margin for FY2020 reflects adoption of
Ind-AS 116 accounting standard from April 1, 2019 with respect to treatment of
operating leases. The change in accounting treatment results in higher reported EBITDA
though lower operating expenses but also higher depreciation as leased assets are treated
as part of the company’s balance sheet. We discuss this in more detail in the next section.
Exhibit 29: We see modest expansion in EBITDA margin over FY2020-22E; steep expansion in FY2020 reflects Ind-AS 116 adoption Gross margin and EBITDA margin of consumer companies, March fiscal year-ends, 2015-22E (%)
2015 2016 2017 2018 2019 2020E 2021E 2022E 2015 2016 2017 2018 2019 2020E 2021E 2022E
Asian Paints 43.8 43.6 44.7 42.9 41.4 42.8 42.5 42.6 15.8 19.4 19.8 19.6 18.2 20.6 21.0 21.3
Bajaj Consumer Care 61.7 62.7 66.2 67.5 67.0 66.9 66.9 66.3 29.0 34.2 33.1 30.6 29.9 27.6 25.9 26.2
Britannia Industries 40.3 40.3 38.3 38.4 40.6 40.7 41.0 40.9 11.0 14.5 14.1 15.1 15.7 16.1 16.3 16.6
Colgate-Palmolive (India) 63.1 61.8 62.9 64.4 65.1 65.2 65.4 65.5 20.6 24.3 23.7 26.6 27.7 27.4 28.5 28.9
Dabur India 52.5 51.1 50.1 50.4 49.5 50.1 50.3 50.5 16.8 19.3 19.6 20.9 20.4 21.6 22.0 22.6
Godrej Consumer Products 53.6 54.1 55.4 56.6 55.8 57.3 57.6 58.0 16.5 19.4 20.5 21.0 20.5 22.3 22.7 23.3
Hindustan Unilever 49.2 50.7 50.8 53.0 53.0 53.9 54.0 54.1 16.6 18.3 19.0 21.1 22.6 25.6 26.4 27.1
ITC 59.8 63.2 60.1 61.1 61.5 62.1 62.3 62.3 36.9 37.5 36.4 38.3 38.5 39.1 39.0 39.2
Jubilant Foodworks 74.8 76.2 75.6 74.6 75.1 75.0 75.2 75.2 12.2 10.8 9.3 14.6 16.8 23.2 24.2 25.3
Jyothy Laboratories 48.5 47.5 46.9 47.7 46.5 47.3 47.4 47.5 12.4 15.0 15.3 15.4 15.5 16.4 16.2 16.4
Marico 45.6 49.0 52.2 47.0 45.2 48.7 48.0 48.3 15.2 17.5 19.6 18.0 17.5 19.9 19.8 20.4
Nestle India 53.9 57.3 57.2 56.5 59.1 57.5 58.2 58.3 20.9 19.6 21.7 21.7 23.7 22.9 23.5 23.8
Page Industries 53.7 61.8 59.5 57.4 58.0 56.2 56.8 57.0 20.7 20.9 19.4 21.2 21.6 19.8 20.7 21.1
Pidilite Industries 44.9 51.8 53.0 52.5 49.3 53.0 52.8 52.5 15.9 21.9 22.4 22.1 19.3 22.1 22.6 23.0
Tata Global Beverages 52.0 45.4 47.5 45.7 44.7 45.2 45.4 45.4 9.7 9.9 11.7 12.3 10.8 12.5 13.2 13.6
Titan Company 26.5 27.5 28.3 27.5 27.2 27.7 28.2 28.4 9.6 8.3 8.7 10.2 10.8 11.5 12.1 12.5
United Breweries 59.6 56.1 53.9 53.2 53.6 51.9 53.0 53.2 13.3 14.3 13.6 16.1 17.6 13.9 16.1 16.7
United Spirits 40.8 41.3 42.9 47.5 48.8 45.6 46.6 47.0 7.4 10.7 11.4 12.5 14.3 17.3 18.1 18.6
Gross margin (%) EBITDA margin (%)
Source: Companies, Kotak Institutional Equities

20 KOTAK INSTITUTIONAL EQUITIES RESEARCH
India Strategy
IT services. The Indian IT sector will contribute 10% of the incremental profits of the
Nifty-50 Index in FY2020, much lower than the 24% contribution in FY2019. We expect
net profit growth of IT stocks in the Nifty-50 Index to taper down to 5% in FY2020 from
16% in FY2019 as we expect (1) a more gradual depreciation in the INR versus US Dollar
in FY2020 versus the steep depreciation seen in FY2019; we model INR-USD rate at
Rs70.6/US$ for FY2020 versus Rs69.9/US$ in FY2019 and Rs64.5/US$ in FY2018, (2)
decline in margins on higher costs (higher share of on-shoring given industry and visa
issues) and limited tailwind from currency depreciation and (3) weaker demand from
customers given worries about general slowdown in global economic growth; FY2019
revenues were also boosted by stronger demand from US clients who increased spending
on IT following tax cuts in CY2018.
We expect IT companies to deliver 9.5% growth in net profits in FY2021 led by high-
single digit revenue growth (around 8% US$ revenue growth for most of the Tier-1 IT
companies) and modest improvement in margins. Exhibit 30 gives the key volume and
profitability assumptions for the IT stocks in the Nifty-50 Index.
Exhibit 30: We expect steady revenue growth for the industry in FY2019-22 Assumptions built into our models for the tier-I Indian IT companies, March fiscal year-ends, 2016-22E
2016 2017 2018 2019 2020E 2021E 2022E 2016 2017 2018 2019 2020E 2021E 2022E
HCL Tech Infosys
Revenues (US$ mn) 4,698 6,975 7,838 8,632 9,976 10,803 11,600 Revenues (US$ mn) 9,501 10,208 10,939 11,799 12,872 13,948 15,102
US$ revenue growth yoy (%) (21.1) 48.5 12.4 10.1 15.6 8.3 7.4 US$ revenue growth yoy (%) 9.1 7.4 7.2 7.9 9.1 8.4 8.3
Volume growth yoy (%) (19.3) 40.4 8.4 8.3 15.4 9.0 6.7 Volume growth yoy (%) 14.5 10.2 0.6 9.2 10.5 8.1 8.2
Pricing change (%) Pricing change (%)
Onsite (0.2) 4.4 5.9 3.3 3.1 (0.1) 0.9 Onsite (4.0) (3.3) 0.7 0.8 (0.4) 0.5 0.1
Offshore (3.4) 4.5 2.9 (0.7) (0.5) 0.1 1.0 Offshore (7.1) (3.2) 5.8 (2.5) (1.6) 1.0 0.1
Blended (2.2) 5.7 3.7 1.7 3.0 (0.3) 1.1 Blended (4.8) (2.7) 4.3 (1.8) (1.3) 0.2 0.1
Directs costs (as % of revenues) 65.8 66.1 65.7 65.0 64.6 63.9 64.2 Directs costs (as % of revenues) 60.3 60.7 61.4 62.7 63.6 63.0 63.0
SG&A expenses (as % of revenues) 12.7 11.8 11.7 11.9 12.1 12.8 12.8 SG&A expenses (as % of revenues) 12.4 12.2 11.7 12.0 11.6 11.7 11.7
EBIT margin (%) 20.1 20.3 19.7 19.5 19.3 19.0 18.9 EBIT margin (%) 25.0 24.7 24.3 22.8 21.6 22.3 22.5
Net income (Rs mn) 55,649 84,560 87,783 100,854 107,809 118,007 130,380 Net income (Rs mn) 134,920 143,830 146,670 157,272 165,139 181,077 201,532
Re/US$ rate (average) 66.3 67.0 64.5 70.0 70.8 72.5 74.0 Re/US$ rate (average) 65.7 67.1 64.5 70.1 70.8 72.5 74.0
2016 2017 2018 2019 2020E 2021E 2022E 2016 2017 2018 2019 2020E 2021E 2022E
TCS Wipro
Revenues (US$ mn) 16,543 17,575 19,089 20,913 22,238 23,948 25,871 Revenues (US$ mn) 7,346 7,705 8,060 8,190 8,302 8,719 9,129
US$ revenue growth yoy (%) 7.0 6.2 8.6 9.6 6.3 7.7 8.0 US$ revenue growth yoy (%) 3.7 4.9 4.6 1.6 1.4 5.0 4.7
Volume growth yoy (%) 8.8 9.3 8.1 5.8 5.3 6.7 6.8 Volume growth yoy (%) 5.6 6.9 5.8 3.7 (1.2) 4.3 4.2
Pricing change (%) Pricing change (%)
Onsite (1.7) (3.5) 1.0 2.6 1.0 1.1 1.3 Onsite 0.1 0.2 (0.1) (1.0) (0.9) 0.5 0.3
Offshore (1.4) (2.6) (0.0) 3.1 0.4 1.1 1.3 Offshore (3.3) (6.5) 0.5 (4.5) 2.9 0.9 0.3
Blended (1.2) (2.8) 0.2 4.4 0.9 0.9 1.0 Blended (2.4) (3.6) 0.3 (3.6) 2.1 (0.0) 0.0
Directs costs (as % of revenues) 56.1 56.7 57.9 58.1 58.9 58.5 58.6 Directs costs (as % of revenues) 64.6 65.2 66.0 65.7 66.0 65.8 66.0
SG&A expenses (as % of revenues) 17.4 17.6 17.3 16.3 16.5 16.5 16.3 SG&A expenses (as % of revenues) 11.9 13.0 14.2 13.8 12.1 12.2 12.2
EBIT margin (%) 26.5 25.7 24.8 25.6 24.6 25.0 25.1 IT services EBIT margin (%) 20.5 17.4 15.8 17.1 18.4 18.4 18.3
Net income (Rs mn) 242,148 262,890 258,260 314,720 326,991 357,033 391,476 Net income (Rs mn) 88,924 84,893 80,081 90,032 100,051 107,917 118,029
Re/US$ rate (average) 65.7 67.1 64.5 70.0 70.9 72.5 74.0 Re/US$ rate (average) 66.3 68.6 65.6 70.0 71.5 72.5 74.0
Source: Companies, Kotak Institutional Equities estimates
Metals & mining. We expect the net profits of the metal stocks in the Nifty-50 Index to
decline 59% in FY2020 after a 7% growth in FY2019. Tata Steel will account for the bulk
of our expected decline in net profits of the metal stocks in the Nifty-50 Index given weak
profitability at its Tata Steel Europe operations (FY2020E EBITDA/ton of -US$11/ton versus
FY2019 EBITDA/ton of US$48/ton).
However, we expect the metal sector to show strong growth in net profits in FY2021 led
by recovery in realizations and profitability on (1) normalization of current weak global
demand conditions (due to the COVID-19 issue) and (2) moderate improvement in
domestic demand from a modest recovery in demand from the Indian automobile sector.
The metals sector will contribute to 13% of the incremental profits of the Nifty-50 Index
in FY2021. In particular, we expect Tata Steel’s profits to rebound strongly on higher
profitability at both its domestic and Europe operations.
We assume a moderate recovery in global metal prices from current low levels. However,
our FY2021 metal price assumptions are similar to FY2020 average prices and in fact,
moderately lower in the case of lead and zinc on weak supply-demand conditions. It is
possible that demand conditions may improve on China implementing a moderate
stimulus to counter the sharp slowdown in 1QCY20 due to the COVID-19 epidemic in a
crucial province in China. Exhibit 31 gives our price and profitability assumptions and
Exhibit 32 our volume assumptions for the metal stocks under our coverage.

KOTAK INSTITUTIONAL EQUITIES RESEARCH 21
Strategy India
Exhibit 31: Our metal price assumptions may be at risk; dependent on strength of the Chinese
economy Price assumptions for metal companies, March fiscal year-ends, 2018-22E (US$/ton)
Historical prices
2018 2019 2020E 2021E 2022E Spot 5-year avg.
Non-ferrous
Hindalco Industries
Aluminum prices (all-in) 2,167 2,175 1,900 1,925 1,925 1,878 2,058
Hindustan Zinc
Lead (LME) 2,379 2,121 1,980 1,998 1,955 1,796 2,089
Zinc (LME) 3,057 2,743 2,475 2,350 2,300 2,126 2,000
Nalco
Aluminum prices (all-in) 2,167 2,175 1,900 1,925 1,925 1,878 1,948
Vedanta
Aluminum prices (all-in) 2,167 2,175 1,900 1,925 1,925 1,878 1,948
Lead (LME) 2,379 2,121 1,980 1,998 1,955 1,796 2,089
Zinc (LME) 3,057 2,743 2,475 2,350 2,300 2,126 2,000
Ferrous
JSW Steel
HRC price (domestic) 604 647 574 577 590 511 551
NMDC
Iron ore fines (Rs/ton) 2,270 2,860 3,000 2,425 2,346 2,827 2,366
Iron ore lumps (Rs/ton) 2,544 3,238 3,200 2,625 2,366 2,923 3,089
Tata Steel
HRC price (domestic) 618 663 583 592 607 511 557
Price assumptions
Source: Bloomberg, Company, Kotak Institutional Equities estimates
Exhibit 32: We model strong growth in domestic steel and zinc volumes Volume assumptions of metal companies, March fiscal year-ends, 2018-22E ('000 tons)
2018 2019 2020E 2021E 2022E
Non-ferrous
Hindalco Industries
Aluminum 1,281 1,274 1,276 1,276 1,276
Copper 164 243 275 310 345
Hindustan Zinc
Lead 168 198 203 221 219
Zinc 791 696 706 778 850
Nalco
Aluminum 426 441 391 442 442
Vedanta
Aluminum (mn tons) 2,150,000 2,491,000 2,512,500 2,575,000 2,575,000
Lead 168 198 203 221 219
Zinc 791 696 706 778 850
Iron ore sales (mt) 43,352 43,739 41,886 50,956 56,495
Oil—gross ('000 boe/d) 186 189 187 225 248
Ferrous
Jindal Steel and Power
Finished steel sales 137 218 224 221 274
JSW Steel
Finished steel sales 15,622 15,760 15,596 17,074 19,293
NMDC
Iron ore sales 36,075 32,361 32,800 38,000 42,000
Tata Steel
Steel deliveries (Standalone) 12,150 12,690 13,140 13,140 13,190
Steel deliveries (Europe) 9,990 9,640 9,579 9,579 9,579
Notes:
(a) We have included volumes of Bhushan Steel in Tata Steel standalone from FY2021.
Volume assumptions
Source: Company data, Kotak Institutional Equities estimates

22 KOTAK INSTITUTIONAL EQUITIES RESEARCH
India Strategy
Oil, gas and consumable fuels. We expect the profits of the oil, gas and consumable
fuels sector to decline sharply in FY2020 on the back of weak refining margins for the
downstream oil companies. In fact, the sector would be a major drag to the profits of the
Nifty-50 Index despite higher profits of RIL.
We expect net profits to grow 17% in FY2021 led by higher profits of RIL’s telecom
business and higher refining margins for BPCL, IOCL and RIL. We have modeled a
moderate improvement in refining margins from current depressed levels assuming
normalization in Chinese demand over the next few months. However, we are not very
bullish on global refining margins given continued large capacity addition in CY2020
(almost 2 mn b/d), which would result in weaker supply-demand dynamics.
Downstream oil companies. We note that the profits of the downstream oil
companies have very high sensitivity to refining margin assumptions as can be seen in
Exhibit 33. We assume a steep decline in refining margins for FY2020 versus FY2019
levels and a moderate improvement in FY2021 from FY2020 levels. Refining margins
are very weak currently (see Exhibit 34).
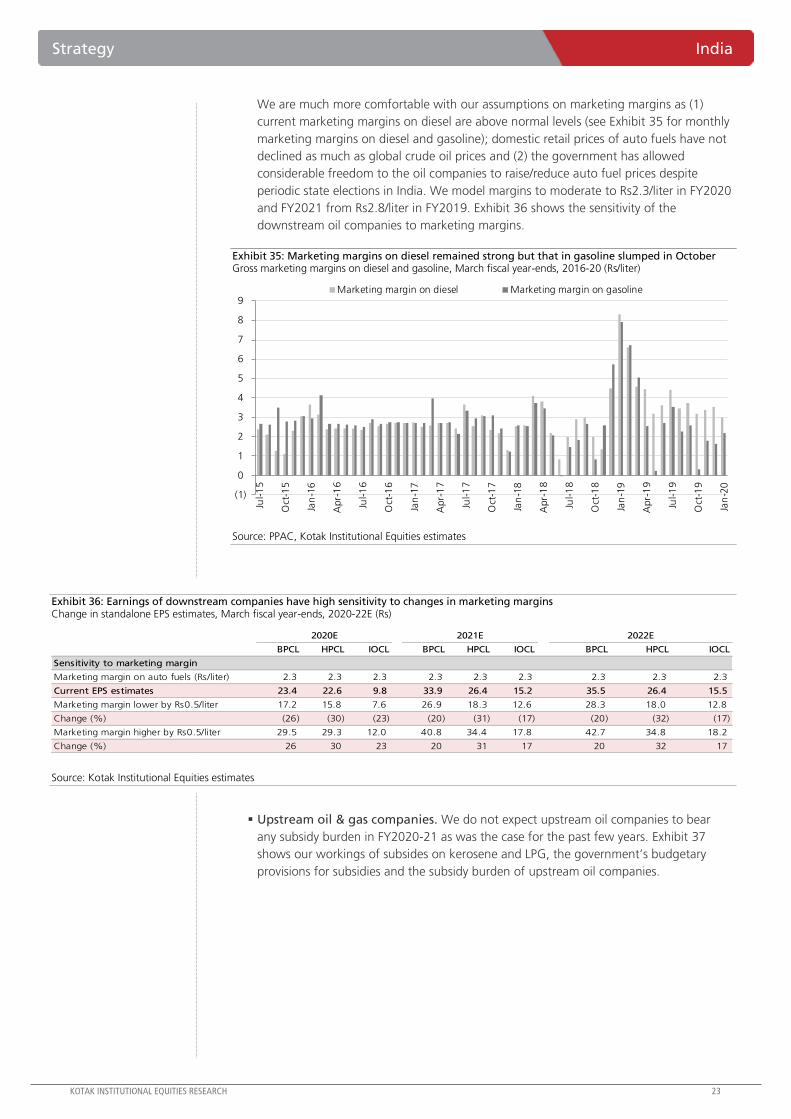
Exhibit 33: Earnings of downstream companies have high sensitivity to changes in refining margins Change in standalone EPS estimates, March fiscal year-ends, 2020-22E (Rs)
2020E 2021E 2022E
BPCL HPCL IOCL BPCL HPCL IOCL BPCL HPCL IOCL
Sensitivity to refining margin
Refining margins (US$/bbl) 3.3 2.2 3.3 4.3 3.5 4.5 4.6 3.9 4.6
Current EPS estimates 23.4 22.6 9.8 33.9 26.4 15.2 35.5 26.4 15.5
Refining margin lower by US$1/bbl 17.6 18.8 7.2 27.5 21.7 12.2 29.0 21.0 12.4
Change (%) (24) (17) (27) (19) (18) (20) (18) (20) (20)
Refining margin higher by US$1/bbl 29.1 26.3 12.4 40.2 31.0 18.3 42.0 31.8 18.6
Change (%) 24 17 27 19 18 20 18 20 20
Source: Kotak Institutional Equities estimates
Exhibit 34: Reuters Singapore refining margins declined in the recent weeks Singapore refining margins (US$/bbl)
Reuters Singapore refining margins, March fiscal year-ends (US$/bbl) Complex refining margins, March fiscal year-ends (US$/bbl) Simple refining margins, March fiscal year-ends (US$/bbl)
2013 2014 2015 2016 2017 2018 2019 2020 2013 2014 2015 2016 2017 2018 2019 2020 2012 2013 2014 2015 2016 2017 2018 2019 2020
1Q 6.7 6.6 5.8 8.1 5.1 6.4 6.1 3.5 1Q 2.9 2.5 1.4 5.5 4.0 4.4 4.0 2.0 1Q 1.3 1.1 0.2 (2.4) 2.4 0.4 2.3 1.7 0.7
2Q 9.1 5.2 4.8 6.2 5.1 8.3 6.1 6.5 2Q 5.1 1.3 0.7 3.9 3.6 5.9 3.8 5.3 2Q 1.9 2.7 (2.1) (2.2) (0.1) 1.2 3.4 2.0 4.0
3Q 6.6 5.4 6.3 8.0 6.7 7.3 4.3 2.0 3Q 3.0 0.9 3.8 6.6 5.4 4.9 3.7 2.9 3Q 2.0 (0.3) (2.1) 1.0 2.6 3.2 2.5 3.3 (2.4)
4Q 8.5 6.2 8.6 7.8 6.4 7.0 3.2 0.4 4Q 4.3 2.6 6.9 6.1 4.5 4.6 2.2 0.9 4Q 1.1 0.7 (0.7) 4.3 2.6 2.0 1.9 1.9 (2.6)
Average 7.7 5.9 6.3 7.5 5.8 7.2 4.9 3.6 Average 3.8 1.8 4.3 5.5 4.4 4.9 3.4 3.1 Average 1.6 1.1 (1.2) 0.2 1.9 1.7 2.5 2.2 0.4
Weekly margins Weekly margins Weekly margins
Current -1 Wk -2 Wk -3 Wk -4 Wk Current -1 Wk -2 Wk -3 Wk -4 Wk Current -1 Wk -2 Wk -3 Wk -4 Wk
6.6 7.2 7.5 7.3 5.4 5.4 6.1 5.6 5.2 3.9 5.1 5.8 5.1 4.9 3.2
Singapore refining margins, March fiscal year-ends (US$/bbl)
2012 2013 2014 2015 2016 2017 2018 2019
Simple 1.6 1.1 (1.2) 0.2 1.9 1.7 2.5 2.2
Complex 3.8 1.8 4.3 5.5 4.4 4.9 3.4
(6)
(3)
0
3
6
9
12
15
Jan-07 Jul-07 Jan-08 Jul-08 Jan-09 Jul-09 Jan-10 Jul-10 Jan-11 Jul-11 Jan-12 Jul-12 Jan-13 Jul-13 Jan-14 Jul-14 Jan-15 Jul-15 Jan-16 Jul-16 Jan-17 Jul-17 Jan-18 Jul-18 Jan-19 Jul-19 Jan-20
Singapore simple refining margins Singapore complex refining margins Reuters Singapore refining margins
(US$/bbl)
Source: Argus, Kotak Institutional Equities estimates
KOTAK INSTITUTIONAL EQUITIES RESEARCH 23
Strategy India
We are much more comfortable with our assumptions on marketing margins as (1)
current marketing margins on diesel are above normal levels (see Exhibit 35 for monthly
marketing margins on diesel and gasoline); domestic retail prices of auto fuels have not
declined as much as global crude oil prices and (2) the government has allowed
considerable freedom to the oil companies to raise/reduce auto fuel prices despite
periodic state elections in India. We model margins to moderate to Rs2.3/liter in FY2020
and FY2021 from Rs2.8/liter in FY2019. Exhibit 36 shows the sensitivity of the
downstream oil companies to marketing margins.
Exhibit 35: Marketing margins on diesel remained strong but that in gasoline slumped in October Gross marketing margins on diesel and gasoline, March fiscal year-ends, 2016-20 (Rs/liter)
(1)
0
1
2
3
4
5
6
7
8
9
Jul-1
5
Oct
-15
Jan
-16
Apr-
16
Jul-1
6
Oct
-16
Jan
-17
Apr-
17
Jul-1
7
Oct
-17
Jan
-18
Apr-
18
Jul-1
8
Oct
-18
Jan
-19
Apr-
19
Jul-1
9
Oct
-19
Jan
-20
Marketing margin on diesel Marketing margin on gasoline
Source: PPAC, Kotak Institutional Equities estimates
Exhibit 36: Earnings of downstream companies have high sensitivity to changes in marketing margins Change in standalone EPS estimates, March fiscal year-ends, 2020-22E (Rs)
2020E 2021E 2022E
BPCL HPCL IOCL BPCL HPCL IOCL BPCL HPCL IOCL
Sensitivity to marketing margin
Marketing margin on auto fuels (Rs/liter) 2.3 2.3 2.3 2.3 2.3 2.3 2.3 2.3 2.3
Current EPS estimates 23.4 22.6 9.8 33.9 26.4 15.2 35.5 26.4 15.5
Marketing margin lower by Rs0.5/liter 17.2 15.8 7.6 26.9 18.3 12.6 28.3 18.0 12.8
Change (%) (26) (30) (23) (20) (31) (17) (20) (32) (17)
Marketing margin higher by Rs0.5/liter 29.5 29.3 12.0 40.8 34.4 17.8 42.7 34.8 18.2
Change (%) 26 30 23 20 31 17 20 32 17
Source: Kotak Institutional Equities estimates
Upstream oil & gas companies. We do not expect upstream oil companies to bear
any subsidy burden in FY2020-21 as was the case for the past few years. Exhibit 37
shows our workings of subsides on kerosene and LPG, the government’s budgetary
provisions for subsidies and the subsidy burden of upstream oil companies.
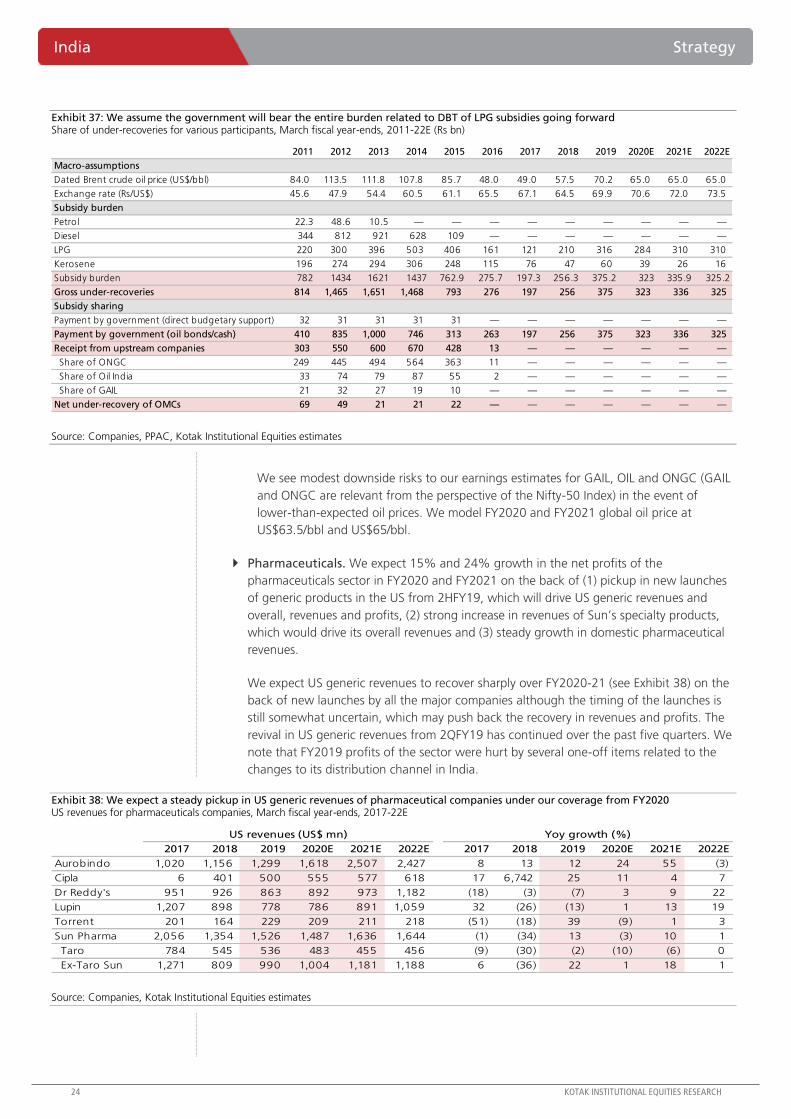
24 KOTAK INSTITUTIONAL EQUITIES RESEARCH
India Strategy
Exhibit 37: We assume the government will bear the entire burden related to DBT of LPG subsidies going forward Share of under-recoveries for various participants, March fiscal year-ends, 2011-22E (Rs bn)
2011 2012 2013 2014 2015 2016 2017 2018 2019 2020E 2021E 2022E
Macro-assumptions
Dated Brent crude oil price (US$/bbl) 84.0 113.5 111.8 107.8 85.7 48.0 49.0 57.5 70.2 65.0 65.0 65.0
Exchange rate (Rs/US$) 45.6 47.9 54.4 60.5 61.1 65.5 67.1 64.5 69.9 70.6 72.0 73.5
Subsidy burden
Petrol 22.3 48.6 10.5 — — — — — — — — —
Diesel 344 812 921 628 109 — — — — — — —
LPG 220 300 396 503 406 161 121 210 316 284 310 310
Kerosene 196 274 294 306 248 115 76 47 60 39 26 16
Subsidy burden 782 1434 1621 1437 762.9 275.7 197.3 256.3 375.2 323 335.9 325.2
Gross under-recoveries 814 1,465 1,651 1,468 793 276 197 256 375 323 336 325
Subsidy sharing
Payment by government (direct budgetary support) 32 31 31 31 31 — — — — — — —
Payment by government (oil bonds/cash) 410 835 1,000 746 313 263 197 256 375 323 336 325
Receipt from upstream companies 303 550 600 670 428 13 — — — — — —
Share of ONGC 249 445 494 564 363 11 — — — — — —
Share of Oil India 33 74 79 87 55 2 — — — — — —
Share of GAIL 21 32 27 19 10 — — — — — — —
Net under-recovery of OMCs 69 49 21 21 22 — — — — — — —
Source: Companies, PPAC, Kotak Institutional Equities estimates
We see modest downside risks to our earnings estimates for GAIL, OIL and ONGC (GAIL
and ONGC are relevant from the perspective of the Nifty-50 Index) in the event of
lower-than-expected oil prices. We model FY2020 and FY2021 global oil price at
US$63.5/bbl and US$65/bbl.
Pharmaceuticals. We expect 15% and 24% growth in the net profits of the
pharmaceuticals sector in FY2020 and FY2021 on the back of (1) pickup in new launches
of generic products in the US from 2HFY19, which will drive US generic revenues and
overall, revenues and profits, (2) strong increase in revenues of Sun’s specialty products,
which would drive its overall revenues and (3) steady growth in domestic pharmaceutical
revenues.
We expect US generic revenues to recover sharply over FY2020-21 (see Exhibit 38) on the
back of new launches by all the major companies although the timing of the launches is
still somewhat uncertain, which may push back the recovery in revenues and profits. The
revival in US generic revenues from 2QFY19 has continued over the past five quarters. We
note that FY2019 profits of the sector were hurt by several one-off items related to the
changes to its distribution channel in India.
Exhibit 38: We expect a steady pickup in US generic revenues of pharmaceutical companies under our coverage from FY2020 US revenues for pharmaceuticals companies, March fiscal year-ends, 2017-22E
2017 2018 2019 2020E 2021E 2022E 2017 2018 2019 2020E 2021E 2022E
Aurobindo 1,020 1,156 1,299 1,618 2,507 2,427 8 13 12 24 55 (3)
Cipla 6 401 500 555 577 618 17 6,742 25 11 4 7
Dr Reddy's 951 926 863 892 973 1,182 (18) (3) (7) 3 9 22
Lupin 1,207 898 778 786 891 1,059 32 (26) (13) 1 13 19
Torrent 201 164 229 209 211 218 (51) (18) 39 (9) 1 3
Sun Pharma 2,056 1,354 1,526 1,487 1,636 1,644 (1) (34) 13 (3) 10 1
Taro 784 545 536 483 455 456 (9) (30) (2) (10) (6) 0
Ex-Taro Sun 1,271 809 990 1,004 1,181 1,188 6 (36) 22 1 18 1
US revenues (US$ mn) Yoy growth (%)
Source: Companies, Kotak Institutional Equities estimates

KOTAK INSTITUTIONAL EQUITIES RESEARCH 25
Strategy India
Model Portfolio: A few changes
Exhibit 39 is our recommended large-cap. Model Portfolio. We remove LPC (160 bps) and
replace the same with TTAN (200 bps). We make minor adjustments elsewhere.
Exhibit 39: 'Barbell' portfolio of 'growth' and 'value' stocks KIE large-cap. model portfolio
Price (Rs) Price (Rs)
Company 14-Feb-20 14-Feb-20
Banks IT Services
Axis Bank 737 3.8 HCL Technologies 622 2.3
HDFC Bank 1,219 9.0 Infosys 786 8.5
ICICI Bank 546 10.0 L&T Infotech 2,032 2.1
State Bank of India 319 6.8 Tech Mahindra 834 2.1
Banks 29.5 IT Services 14.9
Capital Goods Metals & Mining
L&T 1,295 3.2 Hindalco Industries 194 2.2
Capital Goods 3.2 Tata Steel 435 2.4
Consumer Staples Metals & Mining 4.6
Colgate-Palmolive (India) 1,340 2.0 Oil, Gas & Consumable Fuels
Hindustan Unilever 2,255 2.6 Reliance Industries 1,487 9.7
United Breweries 1,282 1.6 Oil, Gas & Consumable Fuels 9.7
United Spirits 704 2.1 Pharmaceuticals
Consumer Staples 8.3 Cipla 447 1.9
Diversified Financials Pharmaceuticals 1.9
Bajaj Finserv 9,691 2.1 Real Estate
HDFC 2,402 9.3 DLF 226 2.2
Diversified Financials 11.3 Real Estate 2.2
Electric Utilities Retailing
Power Grid 184 1.9 Titan Company 1,292 2.0
Electric Utilities 1.9 Retailing 2.0
Gas Utilities Telecommunication Services
GAIL (India) 123 2.0 Bharti Airtel 565 2.7
Gas Utilities 2.0 Telecommunication Services 2.7
Insurance Transportation
ICICI Prudential Life 481 2.1 Interglobe Aviation 1,439 1.7
SBI Life Insurance 914 2.0 Transportation 1.7
Insurance 4.0 BSE-30 41,258 100
KIE weight
(%)
KIE weight
(%)
Source: Kotak Institutional Equities estimates
Exhibit 40 is our recommended mid-cap. Model Portfolio. We remove Bajaj Consumer Care
from the recommended mid-cap, portfolio and add Max Financial Services (MAXF).
Exhibit 40: We recommend mid-cap. stocks in automobiles & components, banks, capital goods, diversified financials and gas utilities KIE mid-cap. model portfolio
Fair
Price Value Upside EPS (Rs)
Company Sector Rating (Rs) (Rs) (%) (Rs bn) (US$ mn) 2020E 2021E 2022E 2020E 2021E 2022E 2020E 2021E 2022E 2020E 2021E 2022E
CESC Electric Utilities BUY 713 820 15 95 1,325 84 101 114 8 7 6 0.7 0.7 0.6 9 10 10
Escorts Automobiles & Components BUY 883 1,080 22 78 1,516 54 63 75 16 14 12 2.3 2.0 1.8 14 14 15
Equitas Holdings Banks BUY 108 160 48 37 517 8 11 14 14 10 7 1.3 1.2 1.0 10 11 14
Federal Bank Banks BUY 87 120 38 174 2,432 8 10 13 10 9 7 1.3 1.2 1.0 12 13 15
Jubilant Foodworks Hotels & Restaurants ADD 1,813 1,900 5 239 3,351 27 38 52 67 47 35 19.3 14.5 11.0 28 35 36
Kalpataru Power Transmission Capital Goods BUY 385 591 54 60 834 34 38 46 11 10 8 1.7 1.4 1.3 16 15 16
Max Financial Services Insurance ADD 487 550 13 131 1,839 7 10 14 71 49 34 — — — 14 18 23
Narayana Hrudayalaya Health Care Services BUY 346 410 19 71 990 7 9 11 52 39 31 5.8 5.1 4.3 12 14 15
Petronet LNG Gas Utilities BUY 261 325 25 391 5,480 18 21 23 15 13 11 3.5 3.1 2.8 25 26 26
Prestige Estates Projects Real Estate ADD 365 410 12 142 1,986 15 16 16 24 23 23 2.7 2.5 2.3 12 11 10
Shriram City Union Finance Diversified Financials BUY 1,460 1,975 35 96 1,350 171 191 214 9 8 7 1.4 1.2 1.1 16 16 16
SRF Speciality Chemicals ADD 4,192 3,900 (7) 241 3,375 144 174 207 29 24 20 4.8 4.1 3.5 18 18 19
Shriram Transport Diversified Financials BUY 1,286 1,525 19 292 4,089 134 136 162 10 9 8 1.7 1.5 1.3 18 16 16
Tata Global Beverages Consumer Staples ADD 397 400 1 250 3,509 9 10 12 45 38 35 3.3 3.1 3.0 7 8 9
Tata Power Electric Utilities BUY 54 72 34 146 2,039 4 5 7 15 10 7 0.8 0.8 0.7 6 8 10
Thermax Capital Goods BUY 990 1,140 15 118 1,652 26 39 47 38 25 21 3.5 3.2 2.9 10 13 14
Mkt cap. PER (X) PBR (X) RoE (%)
Source: Companies, Kotak Institutional Equities estimates
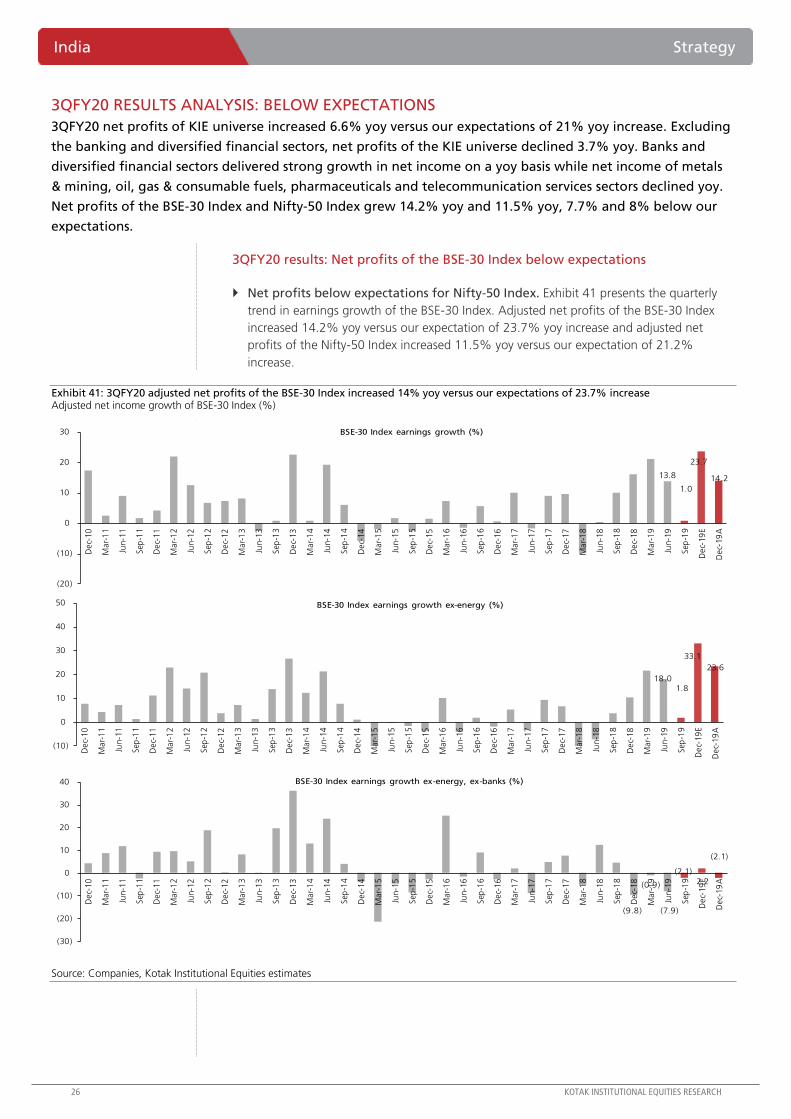
26 KOTAK INSTITUTIONAL EQUITIES RESEARCH
India Strategy
3QFY20 RESULTS ANALYSIS: BELOW EXPECTATIONS
3QFY20 net profits of KIE universe increased 6.6% yoy versus our expectations of 21% yoy increase. Excluding
the banking and diversified financial sectors, net profits of the KIE universe declined 3.7% yoy. Banks and
diversified financial sectors delivered strong growth in net income on a yoy basis while net income of metals
& mining, oil, gas & consumable fuels, pharmaceuticals and telecommunication services sectors declined yoy.
Net profits of the BSE-30 Index and Nifty-50 Index grew 14.2% yoy and 11.5% yoy, 7.7% and 8% below our
expectations.
3QFY20 results: Net profits of the BSE-30 Index below expectations
Net profits below expectations for Nifty-50 Index. Exhibit 41 presents the quarterly
trend in earnings growth of the BSE-30 Index. Adjusted net profits of the BSE-30 Index
increased 14.2% yoy versus our expectation of 23.7% yoy increase and adjusted net
profits of the Nifty-50 Index increased 11.5% yoy versus our expectation of 21.2%
increase.
Exhibit 41: 3QFY20 adjusted net profits of the BSE-30 Index increased 14% yoy versus our expectations of 23.7% increase Adjusted net income growth of BSE-30 Index (%)
13.8
1.0
23.7
14.2
(20)
(10)
0
10
20
30
Dec-
10
Mar-
11
Jun-1
1
Sep
-11
Dec-
11
Mar-
12
Jun-1
2
Sep
-12
Dec-
12
Mar-
13
Jun-1
3
Sep
-13
Dec-
13
Mar-
14
Jun-1
4
Sep
-14
Dec-
14
Mar-
15
Jun-1
5
Sep
-15
Dec-
15
Mar-
16
Jun-1
6
Sep
-16
Dec-
16
Mar-
17
Jun-1
7
Sep
-17
Dec-
17
Mar-
18
Jun-1
8
Sep
-18
Dec-
18
Mar-
19
Jun-1
9
Sep
-19
Dec-
19
E
Dec-
19
A
BSE-30 Index earnings growth (%)
18.0 1.8
33.1
23.6
(10)
0
10
20
30
40
50
Dec-
10
Mar-
11
Jun-1
1
Sep
-11
Dec-
11
Mar-
12
Jun-1
2
Sep
-12
Dec-
12
Mar-
13
Jun-1
3
Sep
-13
Dec-
13
Mar-
14
Jun-1
4
Sep
-14
Dec-
14
Mar-
15
Jun-1
5
Sep
-15
Dec-
15
Mar-
16
Jun-1
6
Sep
-16
Dec-
16
Mar-
17
Jun-1
7
Sep
-17
Dec-
17
Mar-
18
Jun-1
8
Sep
-18
Dec-
18
Mar-
19
Jun-1
9
Sep
-19
Dec-
19
E
Dec-
19
A
BSE-30 Index earnings growth ex-energy (%)
(9.8)
(0.9)
(7.9)
(2.1)
2.2
(2.1)
(30)
(20)
(10)
0
10
20
30
40
Dec-
10
Mar-
11
Jun-1
1
Sep
-11
Dec-
11
Mar-
12
Jun-1
2
Sep
-12
Dec-
12
Mar-
13
Jun-1
3
Sep
-13
Dec-
13
Mar-
14
Jun-1
4
Sep
-14
Dec-
14
Mar-
15
Jun-1
5
Sep
-15
Dec-
15
Mar-
16
Jun-1
6
Sep
-16
Dec-
16
Mar-
17
Jun-1
7
Sep
-17
Dec-
17
Mar-
18
Jun-1
8
Sep
-18
Dec-
18
Mar-
19
Jun-1
9
Sep
-19
Dec-
19
E
Dec-
19
A
BSE-30 Index earnings growth ex-energy, ex-banks (%)
Source: Companies, Kotak Institutional Equities estimates

KOTAK INSTITUTIONAL EQUITIES RESEARCH 27
Strategy India
Exhibit 42 compares 3QFY20 adjusted net profits of the BSE-30 stocks with 3QFY19,
2QFY20 and 3QFY20E adjusted net profits while Exhibit 43 compares 3QFY20 adjusted
net profits of the Nifty-50 Index with 3QFY19, 2QFY20 and 3QFY20E adjusted net profits.
Among Nifty-50 Index stocks that underperformed our estimates at the net income level
were (1) Axis Bank (high provisions), (2) BPCL (lower-than-expected refining margins and
lower other income), (3) IOCL (weak refining and petrochemical margins), (4) JSW Steel
(lower realizations in standalone business and higher losses at international subsidiaries),
(5) Maruti Suzuki (weaker product mix and higher discounting per vehicle), (6) Tata Steel
(EBITDA loss at Europe and lower domestic realizations) and (7) UltraTech Cement
(weaker-than-expected volume growth).
Exhibit 42: 3QFY20 results of the BSE-30 Index were below expectations Comparison of 3QFY20 net income of BSE-30 stocks, actual versus expected
Adjusted net income (Rs bn) Change (%)
Company Sector Dec-18 Sep-19 Dec-19A Dec-19E A versus E yoy qoq
Bajaj Auto Automobiles & Components 11.0 14.0 12.6 11.0 15 14 (10)
Hero Motocorp Automobiles & Components 7.7 9.2 8.8 6.6 32 14 (4)
Mahindra & Mahindra Automobiles & Components 14.5 13.5 9.8 11.4 (14) (32) (28)
Maruti Suzuki Automobiles & Components 14.9 13.6 15.6 17.5 (10) 5 15
Axis Bank Banks 16.8 (1.1) 17.6 26.5 (34) 5 1,668
HDFC Bank Banks 55.9 63.4 74.2 68.7 8 33 17
ICICI Bank Banks 16.0 6.5 41.5 50.2 (17) 158 533
IndusInd Bank Banks 9.9 13.8 13.0 11.6 12 32 (6)
Kotak Mahindra Bank Banks 18.4 24.1 23.5 27.0 (13) 27 (2)
State Bank of India Banks 39.5 30.1 55.8 77.4 (28) 41 85
Bajaj Finance Diversified Financials 10.6 15.1 16.1 15.6 4 52 7
HDFC Diversified Financials 21.1 39.6 83.7 85.3 (2) 296 111
L&T Capital Goods 19.0 23.1 21.6 24.3 (11) 14 (6)
Asian Paints Commodity Chemicals 6.4 7.2 7.6 7.8 (3) 20 6
UltraTech Cement Construction Materials 4.3 6.4 7.3 9.2 (20) 69 15
Hindustan Unilever Consumer Staples 14.0 18.3 16.9 17.1 (1) 21 (8)
ITC Consumer Staples 32.1 36.8 39.3 38.0 4 23 7
Nestle India Consumer Staples 4.0 6.0 4.7 5.4 (13) 16 (22)
NTPC Electric Utilities 23.9 32.6 30.0 29.1 3 26 (8)
Power Grid Electric Utilities 23.3 25.3 26.7 25.5 5 15 6
HCL Technologies IT Services 26.0 26.5 30.4 26.3 16 17 15
Infosys IT Services 39.3 40.2 44.6 40.9 9 14 11
TCS IT Services 81.1 80.4 81.2 82.2 (1) 0 1
Tech Mahindra IT Services 12.0 11.2 11.5 9.3 23 (5) 2
Tata Steel Metals & Mining 23.0 (3.7) (18.7) (1.1) (1,556) (181) (403)
ONGC Oil, Gas & Consumable Fuels 82.6 62.6 41.5 58.7 (29) (50) (34)
Reliance Industries Oil, Gas & Consumable Fuels 102.5 112.6 118.2 118.5 (0) 15 5
Sun Pharmaceuticals Pharmaceuticals 12.4 10.6 9.1 10.4 (12) (26) (14)
Titan Company Retailing 4.6 3.2 4.7 5.0 (7) 2 47
Bharti Airtel Telecommunication Services (13.3) (6.5) (11.1) (7.8) (42) 16 (71)
BSE-30 Index 734 735 838 907 (7.7) 14.2 14.0
BSE-30 Index (ex-oil, gas & consumable fuels) 548 560 678 730 (7.1) 23.6 21.2
BSE-30 Index (ex-financials) 545 543 512 545 (6.0) (6.0) (5.7)
BSE-30 Index (ex-financials, oil, gas & consumable fuels) 360 368 353 368 (4.2) (2.1) (4.2)
Growth (%)
Source: Companies, Kotak Institutional Equities estimates

28 KOTAK INSTITUTIONAL EQUITIES RESEARCH
India Strategy
Exhibit 43: 3QFY20 results of the Nifty-50 Index below estimates Comparison of 3QFY20 net income of Nifty-50 stocks, actual versus expected
Adjusted net income (Rs bn) Change (%)
Company Sector Dec-18 Sep-19 Dec-19A Dec-19E A versus E yoy qoq
Bajaj Auto Automobiles & Components 11.0 14.0 12.6 11.0 15 14 (10)
Eicher Motors Automobiles & Components 5.3 5.7 5.0 4.9 1 (6) (13)
Hero Motocorp Automobiles & Components 7.7 9.2 8.8 6.6 32 14 (4)
Mahindra & Mahindra Automobiles & Components 14.5 13.5 9.8 11.4 (14) (32) (28)
Maruti Suzuki Automobiles & Components 14.9 13.6 15.6 17.5 (10) 5 15
Tata Motors Automobiles & Components (19.3) (1.6) 15.9 10.7 48 182 1,101
Axis Bank Banks 16.8 (1.1) 17.6 26.5 (34) 5 1,668
HDFC Bank Banks 55.9 63.4 74.2 68.7 8 33 17
ICICI Bank Banks 16.0 6.5 41.5 50.2 (17) 158 533
IndusInd Bank Banks 9.9 13.8 13.0 11.6 12 32 (6)
Kotak Mahindra Bank Banks 18.4 24.1 23.5 27.0 (13) 27 (2)
State Bank of India Banks 39.5 30.1 55.8 77.4 (28) 41 85
YES Bank Banks 10.0 (6.0) (9.6) (9.6) - (195) (59)
Bajaj Finance Diversified Financials 10.6 15.1 16.1 15.6 4 52 7
Bajaj Finserv Diversified Financials 8.5 12.0 11.3 13.8 (19) 32 (6)
HDFC Diversified Financials 21.1 39.6 83.7 85.3 (2) 296 111
L&T Capital Goods 19.0 23.1 21.6 24.3 (11) 14 (6)
Asian Paints Commodity Chemicals 6.4 7.2 7.6 7.8 (3) 20 6
Grasim Industries Construction Materials 6.1 5.3 1.9 2.5 (22) (68) (63)
UltraTech Cement Construction Materials 4.3 6.4 7.3 9.2 (20) 69 15
Britannia Industries Consumer Staples 3.0 4.1 3.7 3.7 (0) 24 (8)
Hindustan Unilever Consumer Staples 14.0 18.3 16.9 17.1 (1) 21 (8)
ITC Consumer Staples 32.1 36.8 39.3 38.0 4 23 7
Nestle India Consumer Staples 4.0 6.0 4.7 5.4 (13) 16 (22)
NTPC Electric Utilities 23.9 32.6 30.0 29.1 3 26 (8)
Power Grid Electric Utilities 23.3 25.3 26.7 25.5 5 15 6
UPL Fertilizers & Agricultural Chemicals 5.5 5.3 7.8 6.7 17 41 48
GAIL (India) Gas Utilities 16.8 11.9 12.5 13.6 (8) (26) 5
HCL Technologies IT Services 26.0 26.5 30.4 26.3 16 17 15
Infosys IT Services 39.3 40.2 44.6 40.9 9 14 11
TCS IT Services 81.1 80.4 81.2 82.2 (1) 0 1
Tech Mahindra IT Services 12.0 11.2 11.5 9.3 23 (5) 2
Wipro IT Services 25.1 25.5 24.6 24.4 1 (2) (4)
Zee Entertainment Enterprises Media 5.3 5.9 3.9 4.1 (6) (26) (35)
Hindalco Industries Metals & Mining 2.5 0.8 1.9 1.0 86 (22) 147
JSW Steel Metals & Mining 16.2 (0.9) (0.4) 3.7 (111) (102) 58
Tata Steel Metals & Mining 23.0 (3.7) (18.7) (1.1) (1,556) (181) (403)
Vedanta Metals & Mining 15.7 0.8 4.4 8.0 (44) (72) 455
BPCL Oil, Gas & Consumable Fuels 5.0 11.3 12.0 19.5 (39) 142 6
Coal India Oil, Gas & Consumable Fuels 45.7 35.2 39.2 38.8 1 (14) 11
IOCL Oil, Gas & Consumable Fuels 7.2 5.6 23.4 34.3 (32) 226 315
ONGC Oil, Gas & Consumable Fuels 82.6 62.6 41.5 58.7 (29) (50) (34)
Reliance Industries Oil, Gas & Consumable Fuels 102.5 112.6 118.2 118.5 (0) 15 5
Cipla Pharmaceuticals 3.3 4.8 4.4 4.2 5 32 (8)
Dr Reddy's Laboratories Pharmaceuticals 4.4 3.8 5.9 5.5 8 35 55
Sun Pharmaceuticals Pharmaceuticals 12.4 10.6 9.1 10.4 (12) (26) (14)
Titan Company Retailing 4.6 3.2 4.7 5.0 (7) 2 47
Bharti Airtel Telecommunication Services (13.3) (6.5) (11.1) (7.8) (42) 16 (71)
Bharti Infratel Telecommunication Services 6.1 8.3 6.9 7.4 (6) 13 (17)
Adani Ports and SEZ Transportation 14.1 10.5 13.5 10.1 33 (4) 28
Nifty-50 Index 920 883 1,026 1,115 (8.0) 11.5 16.2
Nifty-50 Index (ex-oil, gas & consumable fuels) 677 656 792 845 (6.3) 16.9 20.7
Nifty-50 Index (ex-financials) 713 686 699 749 (6.6) (2.0) 2.0
Nifty-50 Index (ex-financials, oil, gas & consumable fuels) 470 458 465 479 (2.9) (1.2) 1.4
Growth (%)
Source: Companies, Kotak Institutional Equities estimates
On the other hand, a few companies significantly outperformed our estimates: (1) Bajaj
Auto (higher-than-expected gross margins and lower-than-expected other expenses), (2)
Cipla (tight cost control on staff costs and lower R&D cost, (3) Hero MotoCorp (higher-
than-expected gross margins due to aggressive cost reduction and lower tax rate), (4) HCL
Technologies (treasury gains and lower-than-expected ETR), (5) Tata Motors (led by
deferred tax credit) and (6) Tech Mahindra (led by forex gains).
EBITDA below expectations. Adjusted EBITDA of the BSE-30 Index increased 0.4% yoy
versus our expectations of 4.1% yoy increase. Exhibit 44 compares 3QFY20 EBITDA of the
BSE-30 Index with 3QFY19, 2QFY20 and 3QFY20E EBITDA. Out of the 22 non-finance
companies in the BSE-30 Index, four companies beat our estimates by more than 5% but
six companies missed our EBITDA estimates by more than 5%.

KOTAK INSTITUTIONAL EQUITIES RESEARCH 29
Strategy India
Exhibit 44: 3QFY20 EBITDA of the BSE-30 Index was below estimates Comparison of 3QFY20 EBITDA of BSE-30 stocks, actual versus expected
Adjusted EBITDA (Rs bn) Change (%) Growth (%)
Company Sector Dec-18 Sep-19 Dec-19A Dec-19E A versus E yoy qoq
Bajaj Auto Automobiles & Components 11.6 12.8 13.7 11.4 19 18 7
Hero Motocorp Automobiles & Components 11.0 11.0 10.4 8.9 17 (6) (6)
Mahindra & Mahindra Automobiles & Components 17.0 15.4 17.9 17.4 3 5 16
Maruti Suzuki Automobiles & Components 19.3 16.1 21.0 25.7 (18) 9 31
L&T Capital Goods 37.5 40.2 41.2 43.1 (5) 10 2
Asian Paints Commodity Chemicals 10.4 9.5 11.9 12.2 (2) 14 25
UltraTech Cement Construction Materials 15.3 18.1 19.2 22.5 (15) 25 6
Hindustan Unilever Consumer Staples 20.5 24.4 24.5 24.7 (1) 20 0
ITC Consumer Staples 43.3 45.6 46.1 46.7 (1) 7 1
Nestle India Consumer Staples 6.1 7.6 6.7 7.4 (9) 10 (11)
NTPC Electric Utilities 65.8 63.5 69.8 63.7 10 6 10
Power Grid Electric Utilities 74.1 79.1 82.4 80.2 3 11 4
HCL Technologies IT Services 36.3 41.0 44.7 41.6 8 23 9
Infosys IT Services 54.1 56.4 58.0 58.3 (1) 7 3
TCS IT Services 100.8 102.3 108.7 107.2 1 8 6
Tech Mahindra IT Services 17.2 15.0 15.6 15.1 4 (9) 4
Tata Steel Metals & Mining 67.2 36.0 24.5 42.6 (42) (63) (32)
ONGC Oil, Gas & Consumable Fuels 165.7 132.9 123.0 136.9 (10) (26) (7)
Reliance Industries Oil, Gas & Consumable Fuels 213.2 221.5 223.9 237.2 (6) 5 1
Sun Pharmaceuticals Pharmaceuticals 21.5 17.8 17.6 17.5 1 (18) (1)
Titan Company Retailing 6.5 5.1 7.4 7.3 0 12 43
Bharti Airtel Telecommunication Services 62.2 88.6 92.7 92.9 (0) 49 5
BSE-30 Index 1,077 1,060 1,081 1,121 (3.6) 0.4 2.0
BSE-30 Index (ex-oil, gas & consumable fuels) 698 706 734 746 (1.7) 5.2 4.0
Source: Companies, Kotak Institutional Equities estimates
We do the same exercise for the Nifty-50 Index in Exhibit 45. For the Nifty-50 Index,
adjusted EBITDA increased 1.3% yoy and was 4.9% below expectations. Of the 40 non-
finance companies in the Nifty-50 Index, eight beat our estimates by more than 5%,
while 14 missed our EBITDA estimates by more than 5%.
Exhibit 45: 3QFY20 EBITDA of the Nifty-50 Index was below estimates Comparison of 3QFY20 EBITDA of Nifty-50 stocks, actual versus expected
Adjusted EBITDA (Rs bn) Change (%) Growth (%)
Company Sector Dec-18 Sep-19 Dec-19A Dec-19E A versus E yoy qoq
Bajaj Auto Automobiles & Components 11.6 12.8 13.7 11.4 19 18 7
Eicher Motors Automobiles & Components 6.8 5.4 5.9 6.0 (1) (13) 9
Hero Motocorp Automobiles & Components 11.0 11.0 10.4 8.9 17 (6) (6)
Mahindra & Mahindra Automobiles & Components 17.0 15.4 17.9 17.4 3 5 16
Maruti Suzuki Automobiles & Components 19.3 16.1 21.0 25.7 (18) 9 31
Tata Motors Automobiles & Components 59.6 71.6 72.0 84.4 (15) 21 1
L&T Capital Goods 37.5 40.2 41.2 43.1 (5) 10 2
Asian Paints Commodity Chemicals 10.4 9.5 11.9 12.2 (2) 14 25
Grasim Industries Construction Materials 10.5 6.6 4.1 6.0 (32) (61) (37)
UltraTech Cement Construction Materials 15.3 18.1 19.2 22.5 (15) 25 6
Britannia Industries Consumer Staples 4.5 4.9 5.0 4.9 2 11 2
Hindustan Unilever Consumer Staples 20.5 24.4 24.5 24.7 (1) 20 0
ITC Consumer Staples 43.3 45.6 46.1 46.7 (1) 7 1
Nestle India Consumer Staples 6.1 7.6 6.7 7.4 (9) 10 (11)
NTPC Electric Utilities 65.8 63.5 69.8 63.7 10 6 10
Power Grid Electric Utilities 74.1 79.1 82.4 80.2 3 11 4
UPL Fertilizers & Agricultural Chemicals 10.2 15.4 20.7 19.6 5 104 35
GAIL (India) Gas Utilities 26.7 17.5 20.7 20.7 0 (22) 19
HCL Technologies IT Services 36.3 41.0 44.7 41.6 8 23 9
Infosys IT Services 54.1 56.4 58.0 58.3 (1) 7 3
TCS IT Services 100.8 102.3 108.7 107.2 1 8 6
Tech Mahindra IT Services 17.2 15.0 15.6 15.1 4 (9) 4
Wipro IT Services 33.8 31.2 32.4 32.1 1 (4) 4
Zee Entertainment Enterprises Media 7.5 6.9 5.7 6.0 (6) (25) (18)
Hindalco Industries Metals & Mining 9.3 7.9 10.2 8.7 17 10 29
JSW Steel Metals & Mining 45.0 22.3 22.0 26.8 (18) (51) (1)
Tata Steel Metals & Mining 67.2 36.0 24.5 42.6 (42) (63) (32)
Vedanta Metals & Mining 56.5 44.2 47.8 47.6 0 (15) 8
BPCL Oil, Gas & Consumable Fuels 7.4 23.7 27.0 37.3 (27) 267 14
Coal India Oil, Gas & Consumable Fuels 51.3 22.2 33.5 31.5 6 (35) 51
IOCL Oil, Gas & Consumable Fuels 36.1 35.7 66.5 80.1 (17) 84 86
ONGC Oil, Gas & Consumable Fuels 165.7 132.9 123.0 136.9 (10) (26) (7)
Reliance Industries Oil, Gas & Consumable Fuels 213.2 221.5 223.9 237.2 (6) 5 1
Cipla Pharmaceuticals 7.1 9.1 7.6 8.1 (7) 7 (17)
Dr Reddy's Laboratories Pharmaceuticals 8.2 14.1 10.2 10.0 2 25 (28)
Sun Pharmaceuticals Pharmaceuticals 21.5 17.8 17.6 17.5 1 (18) (1)
Titan Company Retailing 6.5 5.1 7.4 7.3 0 12 43
Bharti Airtel Telecommunication Services 62.2 88.6 92.7 92.9 (0) 49 5
Bharti Infratel Telecommunication Services 14.5 13.8 13.9 14.9 (7) (4) 1
Adani Ports and SEZ Transportation 18.4 17.9 22.9 20.4 12 24 28
Nifty-50 Index 1,490 1,431 1,509 1,586 (4.9) 1.3 5.5
Nifty-50 Index (ex-oil, gas & consumable fuels) 1,016 995 1,035 1,063 (2.6) 1.8 4.1
Source: Companies, Kotak Institutional Equities estimates

30 KOTAK INSTITUTIONAL EQUITIES RESEARCH
India Strategy
Among the companies that reported weaker-than-expected EBITDA were (1) BPCL (lower
refining and marketing margins), (2) IOCL (weak refining and petrochemical margins), (3)
JSW Steel (lower realizations), (4) Maruti Suzuki (weaker product mix and higher
discounting), (5) Reliance Industries (lower-than-expected refining margins and higher
operating expenses), (6) Tata Steel (operating loss at Europe and lower domestic
realizations), (7) Tata Motors (weaker performance in both JLR and standalone entity) and
(8) UltraTech Cement (sharp fall in volumes coupled with declining realizations).
However, a few companies in the Nifty-50 Index outperformed at the EBITDA level. The
notable outperformers were (1) Bajaj Auto (better gross margin and cost control), (2)
Hero MotoCorp (higher-than-expected spare part revenues and improvement in gross
margins) and (3) M&M (cost cutting initiatives in 3QFY20).
Reported net income of the Nifty-50 Index increased 54% yoy and 36% qoq.
Exhibit 46 shows the reported net income of the Nifty-50 Index for 3QFY19, 2QFY20 and
3QFY20. Many companies had large extraordinary items in 3QFY20.
Exhibit 46: Reported net income of the Nifty-50 Index increased 54% yoy and 36% qoq Comparison of 3QFY20 reported net income of Nifty-50 stocks
Reported net income (Rs bn)
Company Sector Dec-18 Sep-19 Dec-19 yoy qoq
Bajaj Auto Automobiles & Components 11.0 14.0 12.6 14 (10)
Eicher Motors Automobiles & Components 5.3 5.7 5.0 (6) (13)
Hero Motocorp Automobiles & Components 7.7 8.7 8.8 14 1
Mahindra & Mahindra Automobiles & Components 14.0 13.5 3.8 (73) (72)
Maruti Suzuki Automobiles & Components 14.9 13.6 15.6 5 15
Tata Motors Automobiles & Components (269.9) (2.2) 17.4 106 903
Axis Bank Banks 16.8 (1.1) 17.6 5 1,668
HDFC Bank Banks 55.9 63.4 74.2 33 17
ICICI Bank Banks 16.0 6.5 41.5 158 533
IndusInd Bank Banks 9.9 13.8 13.0 32 (6)
Kotak Mahindra Bank Banks 18.4 24.1 23.5 27 (2)
State Bank of India Banks 39.5 30.1 55.8 41 85
YES Bank Banks 10.0 (6.0) (9.6) (195) (59)
Bajaj Finance Diversified Financials 10.6 15.1 16.1 52 7
Bajaj Finserv Diversified Financials 8.5 12.0 11.3 32 (6)
HDFC Diversified Financials 21.1 39.6 83.7 296 111
L&T Capital Goods 19.0 23.1 21.6 14 (6)
Asian Paints Commodity Chemicals 6.4 8.2 7.6 20 (7)
Grasim Industries Construction Materials 6.1 5.3 1.8 (70) (65)
UltraTech Cement Construction Materials 4.3 6.4 6.4 49 1
Britannia Industries Consumer Staples 3.0 4.0 3.7 24 (8)
Hindustan Unilever Consumer Staples 14.4 18.5 16.2 12 (13)
ITC Consumer Staples 32.1 40.2 41.4 29 3
Nestle India Consumer Staples 3.4 6.0 4.7 38 (21)
NTPC Electric Utilities 23.9 32.6 30.0 26 (8)
Power Grid Electric Utilities 23.3 25.3 26.7 15 6
UPL Fertilizers & Agricultural Chemicals 4.6 2.2 7.0 52 217
GAIL (India) Gas Utilities 16.8 10.6 12.5 (26) 18
HCL Technologies IT Services 26.0 26.5 30.4 17 15
Infosys IT Services 36.1 40.2 44.6 23 11
TCS IT Services 81.1 80.4 81.2 0 1
Tech Mahindra IT Services 12.0 11.2 11.5 (5) 2
Wipro IT Services 25.1 25.5 24.6 (2) (4)
Zee Entertainment Enterprises Media 5.6 4.1 3.5 (38) (16)
Hindalco Industries Metals & Mining 2.5 0.8 1.9 (22) 147
JSW Steel Metals & Mining 16.2 25.6 2.1 (87) (92)
Tata Steel Metals & Mining 23.3 40.4 (10.3) (144) (125)
Vedanta Metals & Mining 15.7 21.6 23.5 49 9
BPCL Oil, Gas & Consumable Fuels 5.0 17.1 12.6 155 (26)
Coal India Oil, Gas & Consumable Fuels 45.7 35.2 39.2 (14) 11
IOCL Oil, Gas & Consumable Fuels 7.2 5.6 23.4 226 315
ONGC Oil, Gas & Consumable Fuels 82.6 62.6 41.5 (50) (34)
Reliance Industries Oil, Gas & Consumable Fuels 102.5 112.6 116.4 14 3
Cipla Pharmaceuticals 3.3 4.8 3.5 5 (27)
Dr Reddy's Laboratories Pharmaceuticals 4.9 10.9 (5.7) (217) (152)
Sun Pharmaceuticals Pharmaceuticals 12.4 10.6 8.4 (33) (21)
Titan Company Retailing 4.2 3.2 4.7 13 47
Bharti Airtel Telecommunication Services 0.9 (230.4) (10.4) (1,300) 96
Bharti Infratel Telecommunication Services 6.5 9.7 7.6 17 (22)
Adani Ports and SEZ Transportation 10.8 14.9 15.0 39 0
Nifty-50 Index 677 767 1,039 53.6 35.5
Growth (%)
Source: Companies, Kotak Institutional Equities
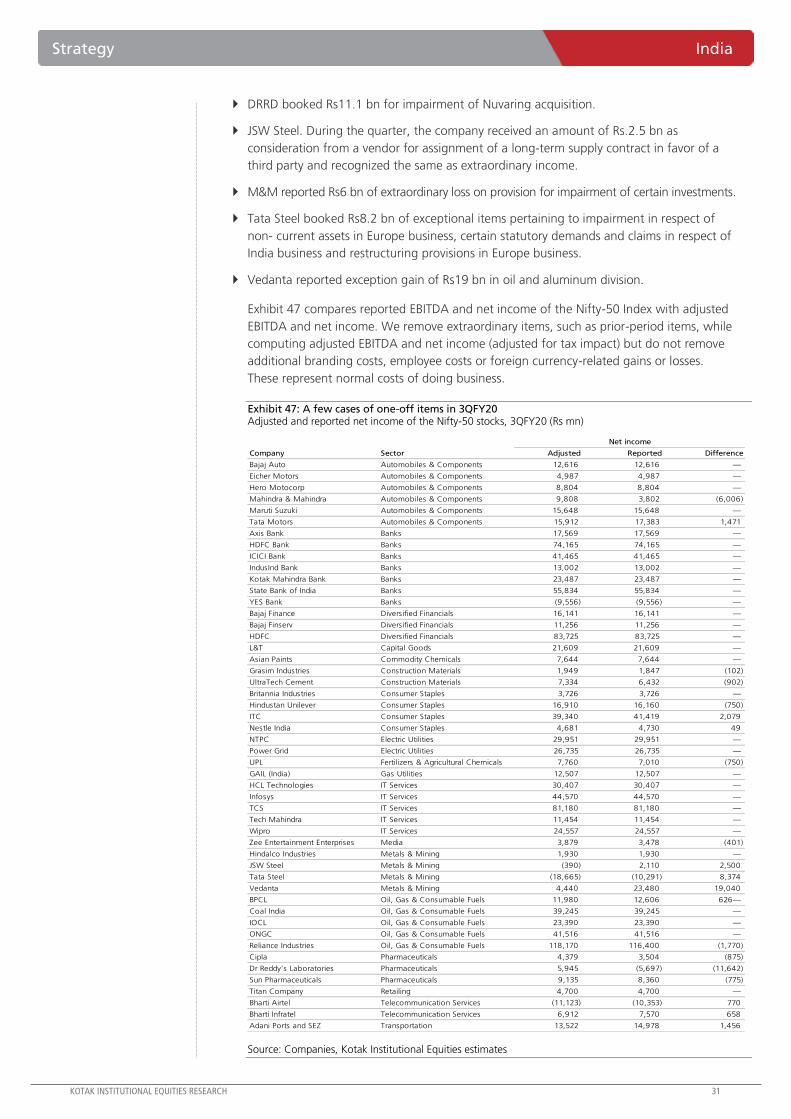
KOTAK INSTITUTIONAL EQUITIES RESEARCH 31
Strategy India
DRRD booked Rs11.1 bn for impairment of Nuvaring acquisition.
JSW Steel. During the quarter, the company received an amount of Rs.2.5 bn as
consideration from a vendor for assignment of a long-term supply contract in favor of a
third party and recognized the same as extraordinary income.
M&M reported Rs6 bn of extraordinary loss on provision for impairment of certain investments.
Tata Steel booked Rs8.2 bn of exceptional items pertaining to impairment in respect of
non- current assets in Europe business, certain statutory demands and claims in respect of
India business and restructuring provisions in Europe business.
Vedanta reported exception gain of Rs19 bn in oil and aluminum division.
Exhibit 47 compares reported EBITDA and net income of the Nifty-50 Index with adjusted
EBITDA and net income. We remove extraordinary items, such as prior-period items, while
computing adjusted EBITDA and net income (adjusted for tax impact) but do not remove
additional branding costs, employee costs or foreign currency-related gains or losses.
These represent normal costs of doing business.
Exhibit 47: A few cases of one-off items in 3QFY20 Adjusted and reported net income of the Nifty-50 stocks, 3QFY20 (Rs mn)
Net income
Company Sector Adjusted Reported Difference
Bajaj Auto Automobiles & Components 12,616 12,616 —
Eicher Motors Automobiles & Components 4,987 4,987 —
Hero Motocorp Automobiles & Components 8,804 8,804 —
Mahindra & Mahindra Automobiles & Components 9,808 3,802 (6,006)
Maruti Suzuki Automobiles & Components 15,648 15,648 —
Tata Motors Automobiles & Components 15,912 17,383 1,471
Axis Bank Banks 17,569 17,569 —
HDFC Bank Banks 74,165 74,165 —
ICICI Bank Banks 41,465 41,465 —
IndusInd Bank Banks 13,002 13,002 —
Kotak Mahindra Bank Banks 23,487 23,487 —
State Bank of India Banks 55,834 55,834 —
YES Bank Banks (9,556) (9,556) —
Bajaj Finance Diversified Financials 16,141 16,141 —
Bajaj Finserv Diversified Financials 11,256 11,256 —
HDFC Diversified Financials 83,725 83,725 —
L&T Capital Goods 21,609 21,609 —
Asian Paints Commodity Chemicals 7,644 7,644 —
Grasim Industries Construction Materials 1,949 1,847 (102)
UltraTech Cement Construction Materials 7,334 6,432 (902)
Britannia Industries Consumer Staples 3,726 3,726 —
Hindustan Unilever Consumer Staples 16,910 16,160 (750)
ITC Consumer Staples 39,340 41,419 2,079
Nestle India Consumer Staples 4,681 4,730 49
NTPC Electric Utilities 29,951 29,951 —
Power Grid Electric Utilities 26,735 26,735 —
UPL Fertilizers & Agricultural Chemicals 7,760 7,010 (750)
GAIL (India) Gas Utilities 12,507 12,507 —
HCL Technologies IT Services 30,407 30,407 —
Infosys IT Services 44,570 44,570 —
TCS IT Services 81,180 81,180 —
Tech Mahindra IT Services 11,454 11,454 —
Wipro IT Services 24,557 24,557 —
Zee Entertainment Enterprises Media 3,879 3,478 (401)
Hindalco Industries Metals & Mining 1,930 1,930 —
JSW Steel Metals & Mining (390) 2,110 2,500
Tata Steel Metals & Mining (18,665) (10,291) 8,374
Vedanta Metals & Mining 4,440 23,480 19,040
BPCL Oil, Gas & Consumable Fuels 11,980 12,606 626—
Coal India Oil, Gas & Consumable Fuels 39,245 39,245 —
IOCL Oil, Gas & Consumable Fuels 23,390 23,390 —
ONGC Oil, Gas & Consumable Fuels 41,516 41,516 —
Reliance Industries Oil, Gas & Consumable Fuels 118,170 116,400 (1,770)
Cipla Pharmaceuticals 4,379 3,504 (875)
Dr Reddy's Laboratories Pharmaceuticals 5,945 (5,697) (11,642)
Sun Pharmaceuticals Pharmaceuticals 9,135 8,360 (775)
Titan Company Retailing 4,700 4,700 —
Bharti Airtel Telecommunication Services (11,123) (10,353) 770
Bharti Infratel Telecommunication Services 6,912 7,570 658
Adani Ports and SEZ Transportation 13,522 14,978 1,456
Source: Companies, Kotak Institutional Equities estimates

32 KOTAK INSTITUTIONAL EQUITIES RESEARCH
India Strategy
KIE coverage universe: Net profits increased 6.6% yoy, 12% below expectations
3QFY20 net profits of the KIE coverage universe increased 6.6% yoy versus our
expectations of 21% increase. In our coverage universe, 52 stocks beat our earnings
forecast by more than 5%, 52 reported adjusted net income in the -5% and +5% range of
our estimates and 81 missed our estimates by more than 5%.
Exhibit 48 compares 3QFY20 net profits of KIE coverage sectors with 3QFY19, 2QFY20 and
3QFY20E net profits. As can be seen, a few sectors such as banks, diversified financials,
healthcare services and real estate delivered strong growth in net income on a yoy basis
while net income of metals & mining and pharmaceuticals sectors declined yoy.
Exhibit 48: Banks and diversified financials sectors reported strong PAT growth on a yoy basis Comprehensive sector-wise PAT analysis of 3QFY20 earnings season (Rs bn)
Dec-18 Sep-19 Dec-19A Dec-19E A/E yoy qoq
Automobiles & Components 63 80 89 88 1 41 11
Banks 189 151 221 300 (26) 17 46
Building Products 0 1 1 1 (18) 52 (20)
Capital Goods 42 43 40 47 (14) (4) (7)
Commodity Chemicals 11 14 12 14 (12) 10 (12)
Construction Materials 23 22 21 25 (14) (9) (2)
Consumer Durables & Apparel 3 2 2 3 (18) (26) (5)
Consumer Staples 72 89 86 86 (0) 19 (4)
Diversified Financials 67 100 144 146 (1) 115 44
Electric Utilities 54 80 68 63 7 26 (16)
Fertilizers & Agricultural Chemicals 8 11 12 9 23 53 4
Gas Utilities 28 29 26 28 (4) (6) (7)
Health Care Services 2 2 3 3 8 43 43
Hotels & Restaurants 1 1 1 1 (11) (8) 4
Internet Software & Services 1 2 2 2 (8) 14 (36)
IT Services 193 193 203 193 5 5 5
Media 11 12 10 10 (3) (9) (16)
Metals & Mining 98 22 16 41 (62) (84) (27)
Oil, Gas & Consumable Fuels 258 244 246 291 (16) (5) 1
Pharmaceuticals 34 33 33 35 (5) (2) 1
Real Estate 7 11 11 12 (1) 54 1
Retailing 7 7 9 9 (8) 20 32
Speciality Chemicals 6 7 9 8 5 37 20
Telecommunication Services (50) (201) (61) (40) (54) (23) 70
Transportation 19 4 22 16 35 16 489
KIE universe 1,148 961 1,225 1,391 (12.0) 6.6 27.5
KIE universe (ex-oil, gas & consumable fuels) 891 716 979 1,100 (11.0) 9.9 36.6
KIE universe (ex-financials) 893 709 860 945 (9.0) (3.7) 21.2
KIE universe (ex-financials, oil, gas & consumable fuels) 635 465 614 654 (6.1) (3.4) 31.9
Change (%)
Source: Kotak Institutional Equities estimates
The performance of auto industry remained under pressure due to weak demand, increase
in vehicle prices due to regulatory changes and inventory correction by OEMs. The banking
sector reported improvement in asset quality. Weak spending in BFSI and retail verticals and
higher furloughs led to moderation in revenue growth of Tier-I IT companies; however
lower-than-expected ETR, treasury and forex gains led the beat at net income level. Weak
realization marred the earnings of construction material and metals & mining sectors while
pharmaceuticals sector showed strong performance in domestic segment.
Exhibit 49 shows sectors that exceeded or fell short of our expectations on sales, EBITDA and
net profits. Electric utilities, metals & mining and oil, gas & consumables fuels sectors beat
our estimates at the revenue level while automobiles & components, capital goods and
commodity chemicals missed our revenue expectations. Electric utilities, IT services and
transportation sectors beat EBITDA estimates but construction materials, metals & mining
and oil, gas & consumable fuel sectors disappointed. Finally, electric utilities, healthcare
services and transportation sectors beat our expectations at the net income level while banks,
metals & mining and telecommunication services disappointed.

KOTAK INSTITUTIONAL EQUITIES RESEARCH 33
Strategy India
Exhibit 49: Banks, metals & mining and telecom sectors disappointed at net income levels Performance of sectors versus expectations (KIE universe) in 3QFY20/4QCY19 (Rs bn)
Companies Net sales (Rs bn) Change
(#) Actual Expected (%)
Revenues: Sectors posting positive surprises
Oil, Gas & Consumable Fuels 7 4,713 4,588 3
Electric Utilities 6 455 447 2
Metals & Mining 8 1,027 1,016 1
Transportation 6 162 161 1
Real Estate 8 71 70 1
Revenues: Sectors posting negative surprises
Building Products 1 7 7 (11)
Capital Goods 15 642 711 (10)
Commodity Chemicals 4 110 119 (8)
Automobiles & Components 23 1,727 1,808 (4)
Speciality Chemicals 4 51 53 (3)
Companies EBITDA (Rs bn) Change
(#) Actual Expected (%)
EBITDA: Sectors posting positive surprises
Transportation 6 45 41 10
Fertilizers & Agricultural Chemicals 6 26 24 8
Electric Utilities 6 191 183 4
Speciality Chemicals 4 13 12 3
IT Services 9 274 269 2
EBITDA: Sectors posting negative surprises
Building Products 1 1 1 (13)
Construction Materials 9 53 61 (12)
Metals & Mining 8 162 183 (11)
Oil, Gas & Consumable Fuels 7 504 567 (11)
Consumer Durables & Apparel 2 4 5 (11)
Companies PAT (Rs bn) Change
(#) Actual Expected (%)
PAT: Sectors posting positive surprises
Transportation 6 22 16 35
Fertilizers & Agricultural Chemicals 6 12 9 23
Health Care Services 6 3 3 8
Electric Utilities 6 68 63 7
Speciality Chemicals 4 9 8 5
PAT: Sectors posting negative surprises
Metals & Mining 8 16 41 (62)
Telecommunication Services 4 (61) (40) (54)
Banks 18 221 300 (26)
Building Products 1 1 1 (18)
Consumer Durables & Apparel 2 2 3 (18)
Source: Kotak Institutional Equities estimates
Exhibit 50 shows the movement in EBITDA margins across sectors over the past few quarters.
We do not focus on EBITDA margins for certain sectors (construction materials, oil, gas and
consumable fuels and metals & mining) and focus on absolute profitability (Rs/ton or
US$/ton). Nonetheless, the exercise is useful to understand specific issues dogging some
sectors.
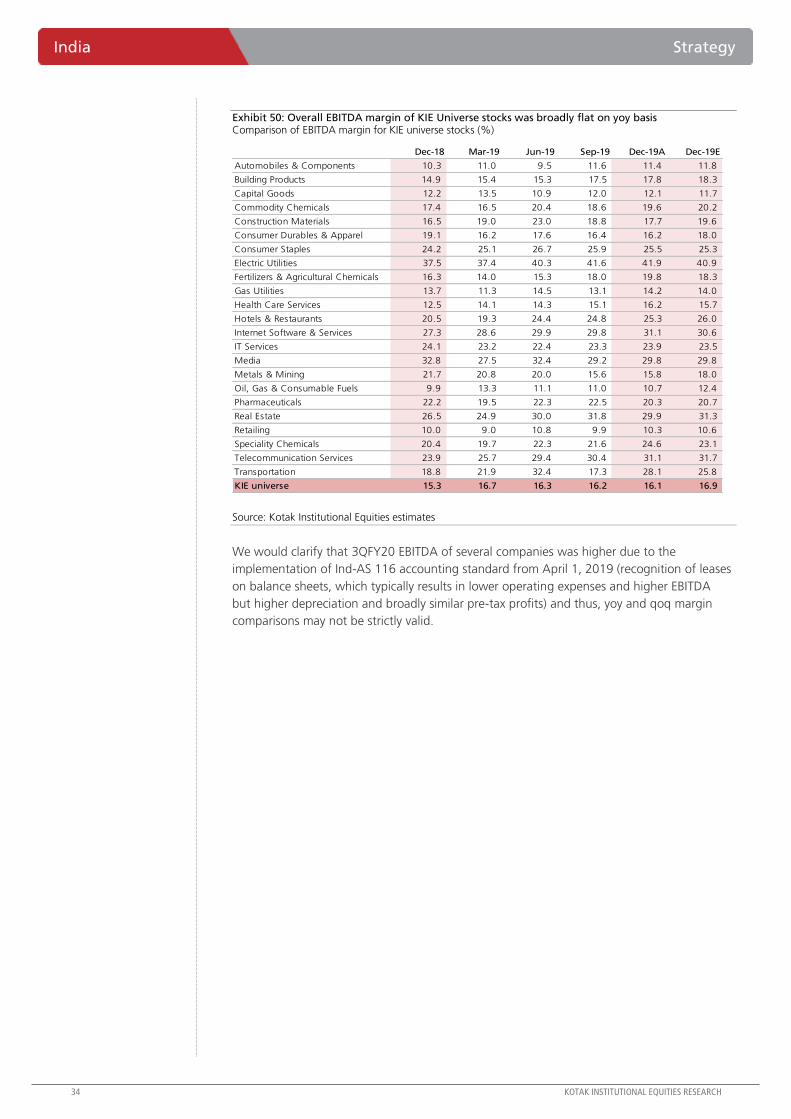
34 KOTAK INSTITUTIONAL EQUITIES RESEARCH
India Strategy
Exhibit 50: Overall EBITDA margin of KIE Universe stocks was broadly flat on yoy basis Comparison of EBITDA margin for KIE universe stocks (%)
Dec-18 Mar-19 Jun-19 Sep-19 Dec-19A Dec-19E
Automobiles & Components 10.3 11.0 9.5 11.6 11.4 11.8
Building Products 14.9 15.4 15.3 17.5 17.8 18.3
Capital Goods 12.2 13.5 10.9 12.0 12.1 11.7
Commodity Chemicals 17.4 16.5 20.4 18.6 19.6 20.2
Construction Materials 16.5 19.0 23.0 18.8 17.7 19.6
Consumer Durables & Apparel 19.1 16.2 17.6 16.4 16.2 18.0
Consumer Staples 24.2 25.1 26.7 25.9 25.5 25.3
Electric Utilities 37.5 37.4 40.3 41.6 41.9 40.9
Fertilizers & Agricultural Chemicals 16.3 14.0 15.3 18.0 19.8 18.3
Gas Utilities 13.7 11.3 14.5 13.1 14.2 14.0
Health Care Services 12.5 14.1 14.3 15.1 16.2 15.7
Hotels & Restaurants 20.5 19.3 24.4 24.8 25.3 26.0
Internet Software & Services 27.3 28.6 29.9 29.8 31.1 30.6
IT Services 24.1 23.2 22.4 23.3 23.9 23.5
Media 32.8 27.5 32.4 29.2 29.8 29.8
Metals & Mining 21.7 20.8 20.0 15.6 15.8 18.0
Oil, Gas & Consumable Fuels 9.9 13.3 11.1 11.0 10.7 12.4
Pharmaceuticals 22.2 19.5 22.3 22.5 20.3 20.7
Real Estate 26.5 24.9 30.0 31.8 29.9 31.3
Retailing 10.0 9.0 10.8 9.9 10.3 10.6
Speciality Chemicals 20.4 19.7 22.3 21.6 24.6 23.1
Telecommunication Services 23.9 25.7 29.4 30.4 31.1 31.7
Transportation 18.8 21.9 32.4 17.3 28.1 25.8
KIE universe 15.3 16.7 16.3 16.2 16.1 16.9
Source: Kotak Institutional Equities estimates
We would clarify that 3QFY20 EBITDA of several companies was higher due to the
implementation of Ind-AS 116 accounting standard from April 1, 2019 (recognition of leases
on balance sheets, which typically results in lower operating expenses and higher EBITDA
but higher depreciation and broadly similar pre-tax profits) and thus, yoy and qoq margin
comparisons may not be strictly valid.

KOTAK INSTITUTIONAL EQUITIES RESEARCH 35
Strategy India
3QFY20 RESULTS TAKEAWAYS: IN SEARCH OF SILVER LINING
3QFY20 results provided little evidence of economic recovery. Banks reported weak loan growth, stable-to-
declining NPLs and higher slippages in 3QFY20. Consumer staples companies reported weak volume growth
but their EBITDA margins improved on a yoy basis. Passenger vehicles volumes witnessed further slowdown
and commercial vehicle volumes saw a large decline. However, cement companies reported decent volume
growth (but lower profitability) and order inflows for industrial companies were reasonable.
Lenders showed stability; consumption faced stiff challenges
Slippages inched up while credit growth remained under pressure. Most ‘corporate’
banks reported an increase in slippages in 3QFY20 due to one large housing finance
company (DHFL) and one stock broking account (Karvy) being downgraded to NPL status
in the quarter. However, these two accounts were already known to be bad loans by the
market and thus, the reported increase in slippages did not come as a surprise though.
However, many banks reported higher slippages in their MSME and retail loan books, an
ominous sign if the current weak macro-economic conditions were to continue.
‘Corporate’ banks with large NPLs in their corporate loan books reported a slight increase
in NPLs while ‘retail’ banks also reported some stress (see Exhibit 51). Slippages remained
high for AXSB, as a result of increase in corporate slippages to Rs29 bn in 3QFY20 from
Rs28 bn in 2QFY20; 91% of corporate slippages (net) were from the BB and below pool.
For ICICIBC, corporate slippages of Rs24.7 bn (4.2% of corporate loans) were mainly
from outside the ‘BB and below’ book (70% of corporate slippages) and were largely
driven by stock broking account (fully provided during the quarter). Meanwhile, SBIN
reported high corporate slippages, which included Rs70 bn from the large housing finance
company, excluding which corporate slippages were below normalized levels of 1.7%.
Exhibit 51: GNPL and NNPLs sequentially stable; a few 'corporate' banks reported increase in slippages Trend in gross NPLs, net NPLs and slippages, March fiscal year-ends, 2016-20 (%)
2016 2017 2018 2019 1QFY20 2QFY20 3QFY20 2016 2017 2018 2019 1QFY20 2QFY20 3QFY20 2016 2017 2018 2019 1QFY20 2QFY20 3QFY20
Public banks
Bank of Baroda 10.0 10.5 12.3 9.6 10.3 10.3 10.4 5.1 4.7 5.5 3.3 4.0 3.9 4.1 6.5 3.5 6.3 3.7 5.7 4.6 7.4
Canara Bank 9.4 9.6 11.8 8.8 8.8 8.7 8.4 6.4 6.3 7.5 5.4 5.4 5.2 5.1 7.5 3.6 7.2 4.1 3.4 2.4 4.5
Punjab National Bank 12.9 12.5 18.4 15.5 16.5 16.8 16.3 8.6 7.8 11.2 6.6 7.2 7.7 7.2 11.1 5.4 10.6 5.6 4.7 7.7 6.3
State Bank of India 6.5 6.9 10.9 7.5 7.5 7.2 6.9 3.8 3.7 5.7 3.0 3.1 2.8 2.7 4.9 2.7 6.0 2.1 3.1 1.7 3.7
Union Bank 8.7 11.2 15.7 15.0 15.2 15.2 14.9 5.3 6.6 8.4 6.9 7.2 7.0 7.0 5.1 5.0 7.5 4.7 3.8 5.2 6.3
Old private banks
City Union Bank 2.4 2.8 3.0 3.0 3.3 3.4 3.5 1.5 1.7 1.7 1.8 1.9 1.9 2.0 2.3 2.2 2.3 2.2 2.4 2.5 2.8
Federal Bank 2.8 2.3 3.0 2.9 3.0 3.1 3.0 1.6 1.3 1.7 1.5 1.5 1.6 1.6 3.6 1.8 3.0 1.9 1.6 2.0 2.0
Karur Vysya Bank 1.3 3.6 6.6 8.8 9.2 8.9 8.9 0.6 2.5 4.2 5.0 4.9 4.5 4.1 3.1 3.3 4.9 5.5 3.7 4.1 3.6
New private banks
Axis Bank 1.7 5.0 6.8 5.3 5.3 5.0 5.0 0.7 2.1 3.4 2.1 2.0 2.0 2.1 2.6 5.8 9.0 3.2 3.9 4.0 3.9
Bandhan Bank 0.2 0.5 1.3 2.0 2.0 1.8 1.9 0.1 0.4 0.6 0.6 0.6 0.6 0.8 0.8 2.1 2.6 0.0 0.0 0.0
DCB Bank 1.5 1.6 1.8 1.8 2.0 2.1 2.2 0.8 0.8 0.7 0.7 0.8 1.0 1.0 2.1 2.0 2.2 2.0 2.5 2.7 3.4
HDFC Bank 0.9 1.1 1.3 1.4 1.4 1.4 1.4 0.3 0.3 0.4 0.4 0.4 0.4 0.5 1.6 1.5 2.3 2.2 — — —
ICICI Bank 5.8 8.7 8.8 6.7 6.5 6.4 6.0 3.0 5.4 4.8 2.1 1.8 1.6 1.5 4.3 7.7 6.2 2.5 1.9 1.7 2.8
IndusInd Bank 0.9 0.9 1.2 2.1 2.2 2.2 2.2 0.4 0.4 0.5 1.2 1.2 1.1 1.1 1.2 1.6 2.1 3.7 1.6 2.3 3.9
RBL Bank 1.0 1.2 1.4 1.4 1.4 2.6 3.3 0.6 0.6 0.7 0.7 0.7 1.6 2.1 2.5 1.9 1.7 1.7 9.7 7.2
Yes Bank 0.8 1.5 1.3 3.2 5.0 7.4 NA 0.3 0.8 0.6 1.9 2.9 4.4 NA 1.2 2.7 6.2 3.9 10.3 10.1 NA
Small finance banks
Au Small Finance Bank 0.7 1.8 2.0 2.0 2.1 2.0 1.9 0.4 1.2 1.3 1.3 1.3 1.1 1.0 1.0 1.9 3.1 3.4 2.5 2.5 2.1
Equitas Holdings 1.3 3.5 2.7 2.5 2.8 2.9 2.9 0.9 1.8 1.4 1.4 1.7 1.6 1.7 2.8 4.8 4.0 2.6 2.7 3.5 3.8
Ujjivan Financial Services 0.2 0.3 3.5 0.9 0.8 0.9 1.0 0.0 0.2 0.7 0.3 0.3 0.3 0.4 — — 8.7 1.1 0.8 1.4 NA
Total 6.3 7.7 9.4 7.2 7.4 7.3 7.1 2.3 4.4 4.9 2.9 2.9 2.8 2.8
Public banks 8.4 9.9 12.5 9.5 9.7 9.6 9.3 3.1 6.2 6.6 3.8 4.0 3.8 3.7
Private banks 2.7 4.1 4.7 4.0 4.0 4.0 3.9 0.8 1.3 2.1 1.5 1.4 1.5 1.5
Gross NPLs (%) Net NPLs (%) Slippages (%)
Source: Companies, Kotak Institutional Equities
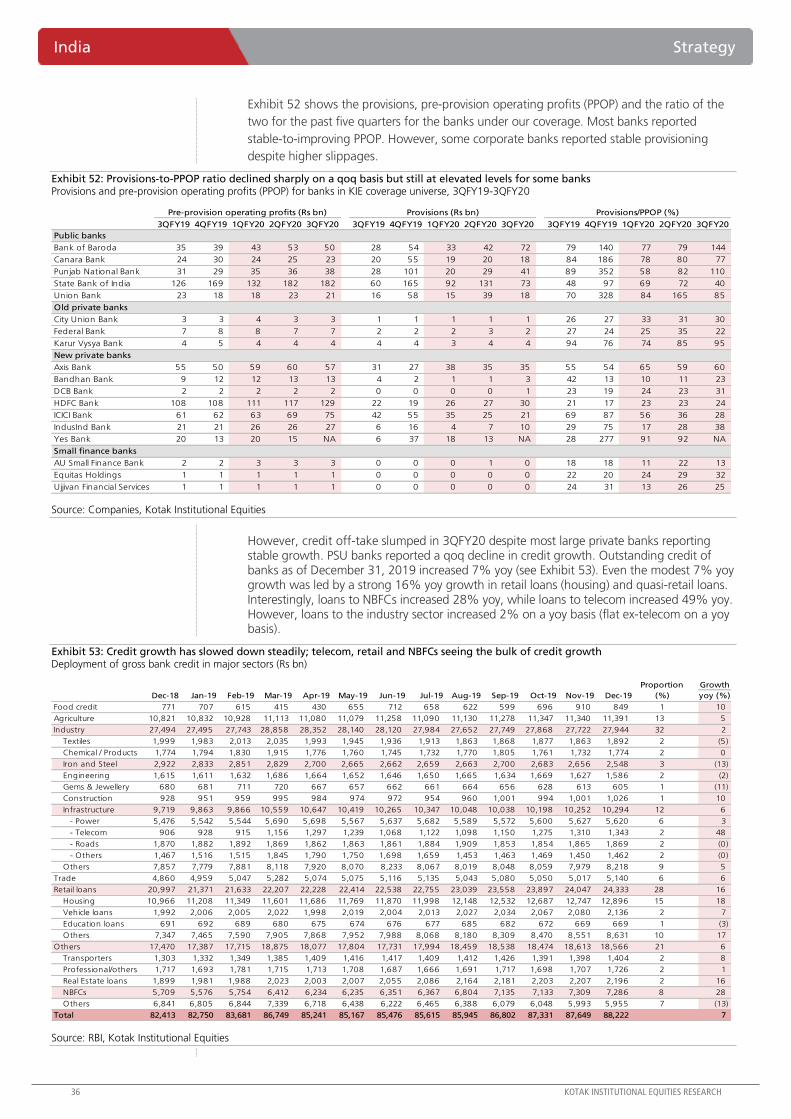
36 KOTAK INSTITUTIONAL EQUITIES RESEARCH
India Strategy
Exhibit 52 shows the provisions, pre-provision operating profits (PPOP) and the ratio of the
two for the past five quarters for the banks under our coverage. Most banks reported
stable-to-improving PPOP. However, some corporate banks reported stable provisioning
despite higher slippages.
Exhibit 52: Provisions-to-PPOP ratio declined sharply on a qoq basis but still at elevated levels for some banks Provisions and pre-provision operating profits (PPOP) for banks in KIE coverage universe, 3QFY19-3QFY20
3QFY19 4QFY19 1QFY20 2QFY20 3QFY20 3QFY19 4QFY19 1QFY20 2QFY20 3QFY20 3QFY19 4QFY19 1QFY20 2QFY20 3QFY20
Public banks
Bank of Baroda 35 39 43 53 50 28 54 33 42 72 79 140 77 79 144
Canara Bank 24 30 24 25 23 20 55 19 20 18 84 186 78 80 77
Punjab National Bank 31 29 35 36 38 28 101 20 29 41 89 352 58 82 110
State Bank of India 126 169 132 182 182 60 165 92 131 73 48 97 69 72 40
Union Bank 23 18 18 23 21 16 58 15 39 18 70 328 84 165 85
Old private banks
City Union Bank 3 3 4 3 3 1 1 1 1 1 26 27 33 31 30
Federal Bank 7 8 8 7 7 2 2 2 3 2 27 24 25 35 22
Karur Vysya Bank 4 5 4 4 4 4 4 3 4 4 94 76 74 85 95
New private banks
Axis Bank 55 50 59 60 57 31 27 38 35 35 55 54 65 59 60
Bandhan Bank 9 12 12 13 13 4 2 1 1 3 42 13 10 11 23
DCB Bank 2 2 2 2 2 0 0 0 0 1 23 19 24 23 31
HDFC Bank 108 108 111 117 129 22 19 26 27 30 21 17 23 23 24
ICICI Bank 61 62 63 69 75 42 55 35 25 21 69 87 56 36 28
IndusInd Bank 21 21 26 26 27 6 16 4 7 10 29 75 17 28 38
Yes Bank 20 13 20 15 NA 6 37 18 13 NA 28 277 91 92 NA
Small finance banks
AU Small Finance Bank 2 2 3 3 3 0 0 0 1 0 18 18 11 22 13
Equitas Holdings 1 1 1 1 1 0 0 0 0 0 22 20 24 29 32
Ujjivan Financial Services 1 1 1 1 1 0 0 0 0 0 24 31 13 26 25
Pre-provision operating profits (Rs bn) Provisions (Rs bn) Provisions/PPOP (%)
Source: Companies, Kotak Institutional Equities
However, credit off-take slumped in 3QFY20 despite most large private banks reporting stable growth. PSU banks reported a qoq decline in credit growth. Outstanding credit of banks as of December 31, 2019 increased 7% yoy (see Exhibit 53). Even the modest 7% yoy growth was led by a strong 16% yoy growth in retail loans (housing) and quasi-retail loans. Interestingly, loans to NBFCs increased 28% yoy, while loans to telecom increased 49% yoy. However, loans to the industry sector increased 2% on a yoy basis (flat ex-telecom on a yoy basis).
Exhibit 53: Credit growth has slowed down steadily; telecom, retail and NBFCs seeing the bulk of credit growth Deployment of gross bank credit in major sectors (Rs bn)
Growth
Dec-18 Jan-19 Feb-19 Mar-19 Apr-19 May-19 Jun-19 Jul-19 Aug-19 Sep-19 Oct-19 Nov-19 Dec-19 yoy (%)
Food credit 771 707 615 415 430 655 712 658 622 599 696 910 849 1 10
Agriculture 10,821 10,832 10,928 11,113 11,080 11,079 11,258 11,090 11,130 11,278 11,347 11,340 11,391 13 5
Industry 27,494 27,495 27,743 28,858 28,352 28,140 28,120 27,984 27,652 27,749 27,868 27,722 27,944 32 2
Textiles 1,999 1,983 2,013 2,035 1,993 1,945 1,936 1,913 1,863 1,868 1,877 1,863 1,892 2 (5)
Chemical / Products 1,774 1,794 1,830 1,915 1,776 1,760 1,745 1,732 1,770 1,805 1,761 1,732 1,774 2 0
Iron and Steel 2,922 2,833 2,851 2,829 2,700 2,665 2,662 2,659 2,663 2,700 2,683 2,656 2,548 3 (13)
Engineering 1,615 1,611 1,632 1,686 1,664 1,652 1,646 1,650 1,665 1,634 1,669 1,627 1,586 2 (2)
Gems & Jewellery 680 681 711 720 667 657 662 661 664 656 628 613 605 1 (11)
Construction 928 951 959 995 984 974 972 954 960 1,001 994 1,001 1,026 1 10
Infrastructure 9,719 9,863 9,866 10,559 10,647 10,419 10,265 10,347 10,048 10,038 10,198 10,252 10,294 12 6
- Power 5,476 5,542 5,544 5,690 5,698 5,567 5,637 5,682 5,589 5,572 5,600 5,627 5,620 6 3
- Telecom 906 928 915 1,156 1,297 1,239 1,068 1,122 1,098 1,150 1,275 1,310 1,343 2 48
- Roads 1,870 1,882 1,892 1,869 1,862 1,863 1,861 1,884 1,909 1,853 1,854 1,865 1,869 2 (0)
- Others 1,467 1,516 1,515 1,845 1,790 1,750 1,698 1,659 1,453 1,463 1,469 1,450 1,462 2 (0)
Others 7,857 7,779 7,881 8,118 7,920 8,070 8,233 8,067 8,019 8,048 8,059 7,979 8,218 9 5
Trade 4,860 4,959 5,047 5,282 5,074 5,075 5,116 5,135 5,043 5,080 5,050 5,017 5,140 6 6
Retail loans 20,997 21,371 21,633 22,207 22,228 22,414 22,538 22,755 23,039 23,558 23,897 24,047 24,333 28 16
Housing 10,966 11,208 11,349 11,601 11,686 11,769 11,870 11,998 12,148 12,532 12,687 12,747 12,896 15 18
Vehicle loans 1,992 2,006 2,005 2,022 1,998 2,019 2,004 2,013 2,027 2,034 2,067 2,080 2,136 2 7
Education loans 691 692 689 680 675 674 676 677 685 682 672 669 669 1 (3)
Others 7,347 7,465 7,590 7,905 7,868 7,952 7,988 8,068 8,180 8,309 8,470 8,551 8,631 10 17
Others 17,470 17,387 17,715 18,875 18,077 17,804 17,731 17,994 18,459 18,538 18,474 18,613 18,566 21 6
Transporters 1,303 1,332 1,349 1,385 1,409 1,416 1,417 1,409 1,412 1,426 1,391 1,398 1,404 2 8
Professional/others 1,717 1,693 1,781 1,715 1,713 1,708 1,687 1,666 1,691 1,717 1,698 1,707 1,726 2 1
Real Estate loans 1,899 1,981 1,988 2,023 2,003 2,007 2,055 2,086 2,164 2,181 2,203 2,207 2,196 2 16
NBFCs 5,709 5,576 5,754 6,412 6,234 6,235 6,351 6,367 6,804 7,135 7,133 7,309 7,286 8 28
Others 6,841 6,805 6,844 7,339 6,718 6,438 6,222 6,465 6,388 6,079 6,048 5,993 5,955 7 (13)
Total 82,413 82,750 83,681 86,749 85,241 85,167 85,476 85,615 85,945 86,802 87,331 87,649 88,222 7
Proportion
(%)
Source: RBI, Kotak Institutional Equities

KOTAK INSTITUTIONAL EQUITIES RESEARCH 37
Strategy India
Exhibit 54 shows yoy credit growth for the banks under our coverage as well as total
credit growth for the past few quarters. Most of the banks have reported steady growth
in disbursements; however, loan growth tapered off for private banks partly due to a
slowdown in auto and unsecured loans, while public sector banks showed lower loan
growth versus in the previous quarters.
Exhibit 54: Steady growth in overall bank credit with private sector continuing to outstrip public banks Yoy growth in loans for banks in KIE universe, 3QFY17-3QFY20 (%)
3QFY17 4QFY17 1QFY18 2QFY18 3QFY18 4QFY18 1QFY19 2QFY19 3QFY19 4QFY19 1QFY20 2QFY20 3QFY20
Public banks
Bank of Baroda (6.8) (0.3) 2.2 6.4 12.7 11.2 11.2 13.0 11.1 5.0 4.3 1.0 1.1 6.0
Canara Bank (0.1) 5.3 6.7 9.5 12.5 11.6 12.7 14.3 11.8 12.1 12.0 4.8 1.3 6.4
Punjab National Bank (1.8) 1.7 2.1 4.2 17.2 3.4 3.9 5.0 (3.9) 5.7 1.6 (0.7) (2.0) (3.0)
State Bank of India 29.9 33.4 0.5 0.9 1.1 (0.9) 4.0 8.6 12.1 13.0 13.8 9.6 7.4 9.8
Union Bank 5.5 8.6 9.9 11.3 13.5 4.0 7.9 2.5 1.0 3.7 0.9 3.0 5.8 3.4
Old private banks
City Union Bank 12.5 12.1 13.4 15.6 19.7 16.9 17.3 17.2 17.4 18.7 14.2 11.9 10.4 13.9
Federal Bank 32.0 26.2 29.1 24.7 22.0 25.4 23.6 25.2 24.2 19.9 18.8 14.8 13.0 18.5
Karur Vysya Bank 1.5 5.0 7.7 11.9 16.6 11.0 12.9 8.8 6.5 10.1 2.7 2.6 3.8 5.2
New private banks
Axis Bank 10.1 10.1 11.8 16.1 21.2 17.8 14.4 11.2 12.9 12.5 12.7 14.4 15.8 14.3
Bandhan Bank 76.5 62.9 64.0 47.7 33.4 35.9 88.4 78.9 62.6
DCB Bank 24.3 22.4 22.0 20.5 27.5 28.6 30.6 26.9 23.1 15.9 13.2 12.4 11.1 17.0
HDFC Bank 13.4 19.4 23.4 22.3 27.5 18.7 22.0 24.1 23.7 24.5 17.1 19.5 19.9 21.8
ICICI Bank 5.2 6.7 3.3 6.3 10.5 10.4 11.3 12.8 11.7 14.5 14.7 12.6 12.6 12.1
IndusInd Bank 25.1 27.9 24.3 24.5 25.1 28.2 29.4 32.4 34.7 28.6 28.4 20.8 19.8 27.0
Yes Bank 38.7 34.7 32.1 34.9 46.5 53.9 53.4 61.2 42.2 18.7 10.1 (6.3) (17.2) 8.5
Small finance banks
Au Small Finance Bank 13.4 35.7 66.7 101.9 112.1 112.3 99.4 71.4 51.3 36.9 32.9 62.8
Equitas Holdings 17.4 15.0 6.9 13.6 22.2 33.8 37.7 50.5 48.9 50.3 44.8 35.0 34.9 41.7
Ujjivan Financial Services 33.2 15.9 10.0 6.1 14.6 28.8 78.9 28.3 31.0 39.6 6.6 55.6 49.2 39.8
Total 5.1 9.0 7.0 6.9 12.6 9.0 11.7 13.9 13.4 13.4 12.0 9.5 8.3 10.8
Public sector 0.9 5.1 2.3 1.2 6.9 3.1 6.3 8.9 8.9 9.9 9.5 5.9 4.5 6.7
Private sector 13.3 16.6 16.6 18.5 23.6 20.6 21.4 22.5 21.1 19.4 16.0 15.0 14.2 17.6
Notes:
(a) We have used merged entity numbers in case of BOB.
CAGR
2-year
Source: Companies, Kotak Institutional Equities estimates
Most NBFCs, under our coverage, had a decent quarter amid a challenging environment
as they reported improvement in NIMs led by reduction in borrowing costs. Exhibit 55
shows the yields, cost of borrowings, spread and NIMs for NBFC stocks under our
coverage. With RBI keeping surplus liquidity in the system and the government
announcing several measures over the past 6-9 months for real estate and HFC sector (see
Exhibit 56), most NBFCs may be able to tide over the current liquidity and credit risks, the
weak demand environment notwithstanding. However, we still have plentiful concerns
about weak demand for high-end residential real estate and cash-flow/solvency of certain
real estate developers, which may affect the HFCs.
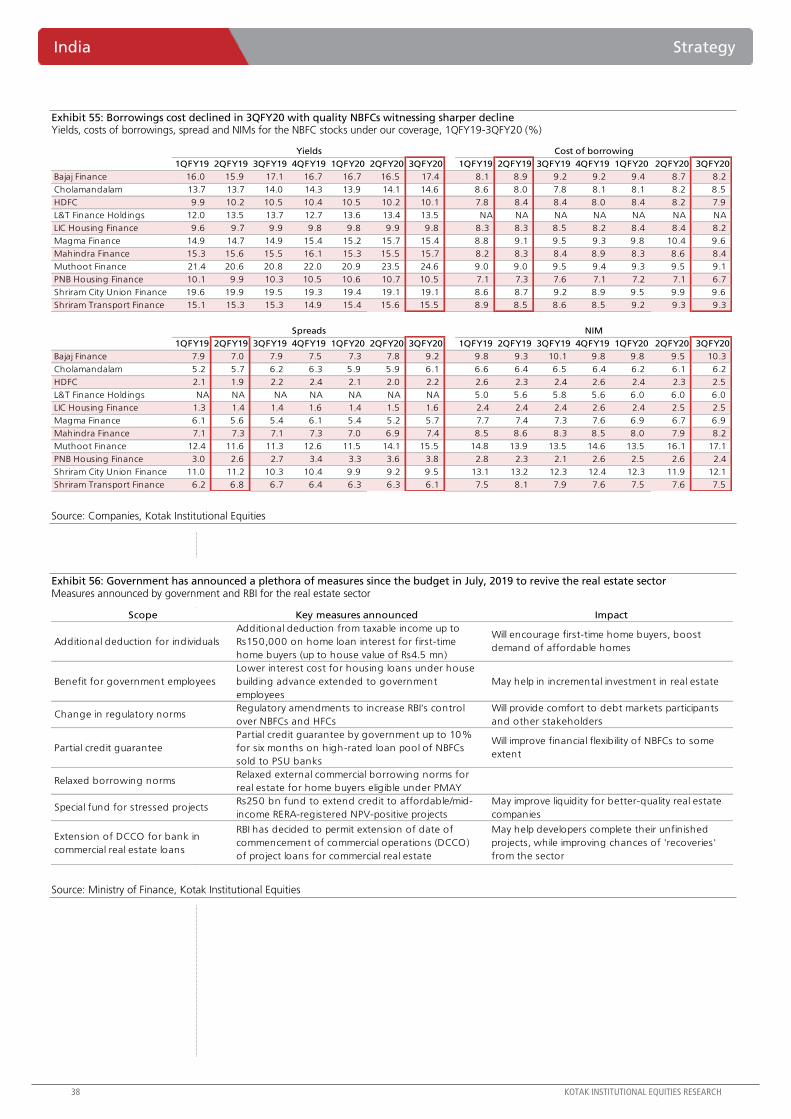
38 KOTAK INSTITUTIONAL EQUITIES RESEARCH
India Strategy
Exhibit 55: Borrowings cost declined in 3QFY20 with quality NBFCs witnessing sharper decline Yields, costs of borrowings, spread and NIMs for the NBFC stocks under our coverage, 1QFY19-3QFY20 (%)
1QFY19 2QFY19 3QFY19 4QFY19 1QFY20 2QFY20 3QFY20 1QFY19 2QFY19 3QFY19 4QFY19 1QFY20 2QFY20 3QFY20
Bajaj Finance 16.0 15.9 17.1 16.7 16.7 16.5 17.4 8.1 8.9 9.2 9.2 9.4 8.7 8.2
Cholamandalam 13.7 13.7 14.0 14.3 13.9 14.1 14.6 8.6 8.0 7.8 8.1 8.1 8.2 8.5
HDFC 9.9 10.2 10.5 10.4 10.5 10.2 10.1 7.8 8.4 8.4 8.0 8.4 8.2 7.9
L&T Finance Holdings 12.0 13.5 13.7 12.7 13.6 13.4 13.5 NA NA NA NA NA NA NA
LIC Housing Finance 9.6 9.7 9.9 9.8 9.8 9.9 9.8 8.3 8.3 8.5 8.2 8.4 8.4 8.2
Magma Finance 14.9 14.7 14.9 15.4 15.2 15.7 15.4 8.8 9.1 9.5 9.3 9.8 10.4 9.6
Mahindra Finance 15.3 15.6 15.5 16.1 15.3 15.5 15.7 8.2 8.3 8.4 8.9 8.3 8.6 8.4
Muthoot Finance 21.4 20.6 20.8 22.0 20.9 23.5 24.6 9.0 9.0 9.5 9.4 9.3 9.5 9.1
PNB Housing Finance 10.1 9.9 10.3 10.5 10.6 10.7 10.5 7.1 7.3 7.6 7.1 7.2 7.1 6.7
Shriram City Union Finance 19.6 19.9 19.5 19.3 19.4 19.1 19.1 8.6 8.7 9.2 8.9 9.5 9.9 9.6
Shriram Transport Finance 15.1 15.3 15.3 14.9 15.4 15.6 15.5 8.9 8.5 8.6 8.5 9.2 9.3 9.3
1QFY19 2QFY19 3QFY19 4QFY19 1QFY20 2QFY20 3QFY20 1QFY19 2QFY19 3QFY19 4QFY19 1QFY20 2QFY20 3QFY20
Bajaj Finance 7.9 7.0 7.9 7.5 7.3 7.8 9.2 9.8 9.3 10.1 9.8 9.8 9.5 10.3
Cholamandalam 5.2 5.7 6.2 6.3 5.9 5.9 6.1 6.6 6.4 6.5 6.4 6.2 6.1 6.2
HDFC 2.1 1.9 2.2 2.4 2.1 2.0 2.2 2.6 2.3 2.4 2.6 2.4 2.3 2.5
L&T Finance Holdings NA NA NA NA NA NA NA 5.0 5.6 5.8 5.6 6.0 6.0 6.0
LIC Housing Finance 1.3 1.4 1.4 1.6 1.4 1.5 1.6 2.4 2.4 2.4 2.6 2.4 2.5 2.5
Magma Finance 6.1 5.6 5.4 6.1 5.4 5.2 5.7 7.7 7.4 7.3 7.6 6.9 6.7 6.9
Mahindra Finance 7.1 7.3 7.1 7.3 7.0 6.9 7.4 8.5 8.6 8.3 8.5 8.0 7.9 8.2
Muthoot Finance 12.4 11.6 11.3 12.6 11.5 14.1 15.5 14.8 13.9 13.5 14.6 13.5 16.1 17.1
PNB Housing Finance 3.0 2.6 2.7 3.4 3.3 3.6 3.8 2.8 2.3 2.1 2.6 2.5 2.6 2.4
Shriram City Union Finance 11.0 11.2 10.3 10.4 9.9 9.2 9.5 13.1 13.2 12.3 12.4 12.3 11.9 12.1
Shriram Transport Finance 6.2 6.8 6.7 6.4 6.3 6.3 6.1 7.5 8.1 7.9 7.6 7.5 7.6 7.5
Yields
Spreads
Cost of borrowing
NIM
Source: Companies, Kotak Institutional Equities
Exhibit 56: Government has announced a plethora of measures since the budget in July, 2019 to revive the real estate sector Measures announced by government and RBI for the real estate sector
Scope Key measures announced Impact
Additional deduction for individuals
Additional deduction from taxable income up to
Rs150,000 on home loan interest for first-time
home buyers (up to house value of Rs4.5 mn)
Will encourage first-time home buyers, boost
demand of affordable homes
Benefit for government employees
Lower interest cost for housing loans under house
building advance extended to government
employees
May help in incremental investment in real estate
Change in regulatory normsRegulatory amendments to increase RBI's control
over NBFCs and HFCs
Will provide comfort to debt markets participants
and other stakeholders
Partial credit guarantee
Partial credit guarantee by government up to 10%
for six months on high-rated loan pool of NBFCs
sold to PSU banks
Will improve financial flexibility of NBFCs to some
extent
Relaxed borrowing normsRelaxed external commercial borrowing norms for
real estate for home buyers eligible under PMAY
Special fund for stressed projectsRs250 bn fund to extend credit to affordable/mid-
income RERA-registered NPV-positive projects
May improve liquidity for better-quality real estate
companies
Extension of DCCO for bank in
commercial real estate loans
RBI has decided to permit extension of date of
commencement of commercial operations (DCCO)
of project loans for commercial real estate
May help developers complete their unfinished
projects, while improving chances of 'recoveries'
from the sector
Source: Ministry of Finance, Kotak Institutional Equities

KOTAK INSTITUTIONAL EQUITIES RESEARCH 39
Strategy India
Consumer-facing businesses struggled in a challenging demand environment.
Most of the consumer staples and discretionary companies under our coverage reported
feeble performance in 3QFY20. They reported weak volume growth in general, with only
a handful of segments being able to deliver modest volume growth.
Exhibit 57 shows the trends in the volume growth of the major consumer staples and
discretionary companies under our coverage over the past several quarters. Most
consumer companies reported a slowdown in volume growth with volume growth
slumping to low single-digits for most companies. Volume growth for consumer
companies has seen progressive deterioration since 3QFY19 as companies struggled in a
weak demand environment. However, volume growth in most consumer staples and
discretionary categories is reasonably strong on a 2-year CAGR basis.
Exhibit 57: Consumer companies witnessed sharp slowdown in volumes in 3QFY20 although 2-year growth CAGR is still fine Volume growth of consumer companies, 3QFY18-3QFY20 (%)
3QFY18 4QFY18 1QFY19 2QFY19 3QFY19 4QFY19 1QFY20 2QFY20 3QFY20 2-y CAGR
Staples
Bajaj Consumer Care - Almond Drop Hair Oil 4.5 6.9 11.2 (0.6) 9.4 7.3 1.5 1.3 (7.2) 0.8
Britannia Industries - Domestic 13.0 12.5 12.5 11.0 8.0 7.0 3.0 3.5 2.0 5.0
Colgate - Overall 12.0 4.0 4.0 7.0 7.0 5.0 4.0 4.0 2.3 4.6
Dabur - Domestic 13.0 7.7 21.0 8.1 12.4 4.2 9.6 4.8 5.6 8.9
GSK Consumer 17.0 8.0 12.8 8.7 8.0 6.5 5.4 3.6 3.0 5.5
GCPL - Soaps 15.0 12.0 12.0 12.0 4.0 2.0 4.0 5.0 5.0 4.5
HUL (FMCG business) 11.0 11.0 12.0 10.0 10.0 7.0 5.0 5.0 5.0 7.5
Marico - Domestic 9.4 1.0 12.4 6.0 6.0 8.0 6.0 1.0 (1.0) 2.4
Marico - Parachute 15.0 (5.0) 9.0 8.0 9.0 6.0 9.0 (1.0) (2.0) 3.4
Marico - Saffola - (1.0) 10.0 5.0 2.0 18.0 3.0 1.0 11.0 6.4
Marico - Value-added hair oils 8.0 11.0 15.0 5.0 7.0 1.0 7.0 — (7.0) (0.2)
Discretionary
Asian Paints 6.0 10.0 13.0 11.0 22.0 11.0 17.0 14.0 11.0 16.4
ITC - Cigarettes (5.0) (5.0) 1.0 7.0 7.5 10.0 3.0 3.0 3.5 5.5
Jubilant Foodworks - SSG 17.8 26.5 25.9 20.5 14.6 6.0 4.1 4.9 5.9 10.2
Pidilite - Domestic consumer business 23.0 13.0 20.0 11.0 13.0 4.0 6.0 (1.0) 2.0 7.4
Titan - Jewelry 6.0 6.0 (2.6) 24.0 20.0 15.0 6.0 (14.0) (5.0) 6.8
Source: Companies, Kotak Institutional Equities
Gross margin of most companies improved on a yoy as well as qoq basis. Ind-AS 116
adoption boosted reported EBITDA margins on a yoy basis but strict internal cost control
and low media intensity helped most companies report better EBITDA margins on an
adjusted (life-for-like) basis (see Exhibit 58).

40 KOTAK INSTITUTIONAL EQUITIES RESEARCH
India Strategy
Exhibit 58: Margins expanded on a yoy basis for most consumer staple companies Gross and EBITDA margin of consumer companies under our coverage, 3QFY18-3QFY20 (%)
3QFY18 4QFY18 1QFY19 2QFY19 3QFY19 4QFY19 1QFY20 2QFY20 3QFY20 3QFY18 4QFY18 1QFY19 2QFY19 3QFY19 4QFY19 1QFY20 2QFY20 3QFY20
Asian Paints 42.2 43.2 43.2 39.8 41.0 41.6 43.5 42.4 43.0 20.9 18.7 19.9 16.9 19.7 16.4 22.5 18.9 21.9
Bajaj Consumer care 69.0 67.3 66.6 67.3 67.4 66.3 67.7 67.1 68.0 32.6 32.4 31.2 28.5 30.9 31.6 29.3 28.7 29.5
Britannia Industries 38.7 38.5 40.0 40.0 41.3 41.2 40.4 40.2 41.2 15.5 15.6 15.3 15.8 15.9 15.6 14.6 15.1 16.3
Colgate-Palmolive (India) 65.2 65.7 65.9 64.8 65.1 64.6 65.9 64.7 65.7 27.4 28.2 27.0 28.2 28.6 26.9 27.6 26.4 27.6
Dabur India 51.6 50.7 49.6 49.4 49.3 49.8 49.5 50.8 50.1 20.5 23.9 18.6 21.2 20.3 21.5 20.1 22.1 20.9
GlaxoSmithKline Consumer 69.0 68.3 69.6 69.7 70.7 70.0 70.0 70.7 70.6 20.0 21.2 20.8 27.8 21.4 24.8 23.5 29.4 22.6
Godrej Consumer Products 57.2 59.0 55.8 54.7 56.3 58.7 57.1 56.6 56.7 22.4 23.6 17.9 20.3 22.3 23.6 19.4 21.9 22.7
Hindustan Unilever 54.5 52.6 54.0 52.0 53.8 52.3 54.0 54.5 54.2 19.6 22.5 23.7 21.9 21.4 23.3 26.2 24.8 24.9
ITC 63.4 62.2 61.6 61.3 61.7 61.5 63.4 61.5 61.4 40.0 39.1 39.2 38.0 38.5 38.1 40.4 39.1 39.1
Jubilant Foodworks 74.5 74.3 74.5 74.6 75.6 76.1 75.5 75.3 74.9 17.2 16.4 16.6 16.7 18.4 17.1 23.3 23.8 23.9
Jyothy Laboratories 48.3 50.6 47.9 46.7 47.8 45.2 48.6 46.4 48.7 16.1 17.1 13.7 16.3 17.6 15.8 15.5 16.6 15.8
Marico 46.5 46.6 42.3 44.0 46.3 49.0 47.5 49.6 49.1 18.6 17.0 17.5 16.6 18.8 17.6 21.3 19.3 20.4
Nestle India 58.9 59.1 59.6 59.7 58.9 58.5 58.3 57.6 57.4 24.8 25.8 24.6 25.2 21.2 25.0 23.6 23.6 23.0
Page Industries 55.6 62.6 55.0 57.8 57.1 63.6 55.1 57.5 56.6 20.8 24.1 23.2 20.7 22.4 19.7 22.4 21.5 23.0
Pidilite Industries 53.4 52.1 50.5 49.4 47.2 50.3 51.4 52.0 53.8 24.0 18.4 20.8 20.8 18.5 17.0 22.0 22.4 24.0
Tata Global Beverages 46.4 44.3 45.6 43.3 44.7 45.2 44.3 44.9 46.2 13.6 8.6 13.8 9.5 10.3 9.8 14.0 12.8 12.2
Titan Company 25.8 29.0 26.9 27.8 25.1 27.2 26.8 29.2 24.9 10.5 11.6 11.5 11.3 11.5 10.7 11.4 11.6 11.9
United Breweries 52.3 52.7 54.1 55.6 53.3 50.5 50.3 52.1 52.0 12.7 14.1 21.5 20.9 17.1 10.5 16.1 12.2 12.6
United Spirits 47.4 49.9 49.1 49.1 48.6 46.5 47.3 45.0 44.4 12.0 12.7 11.3 19.4 14.3 12.6 17.8 18.1 16.4
Gross margin (%) EBITDA margin (%)
Source: Companies, Kotak Institutional Equities
Automobile companies had a disappointing quarter across the board with most
companies reporting double-digit decline in volumes on a yoy basis. Volumes in the PV
segment were muted with MSIL reporting a sluggish 1% yoy decline in volumes after
reporting 28% yoy decline in volumes in 1HFY20. This would suggest that PV demand
may have some-what stabilized. However, 2-W demand continues to be quite weak.
HMCL reported 14% yoy decline in volumes (two-year CAGR of (-) 5%), BJAUT reported
16% yoy decline in domestic volumes (two-year CAGR of 8%) and EIM reported a 9%
yoy decline (two-year CAGR of (-)7%).
Exhibit 59 shows the quarterly volumes of various automobile segments. CV volumes
were also weak with AL and TTMT reporting 31% and 20% yoy volume decline
respectively, indicating a very weak underlying demand environment.
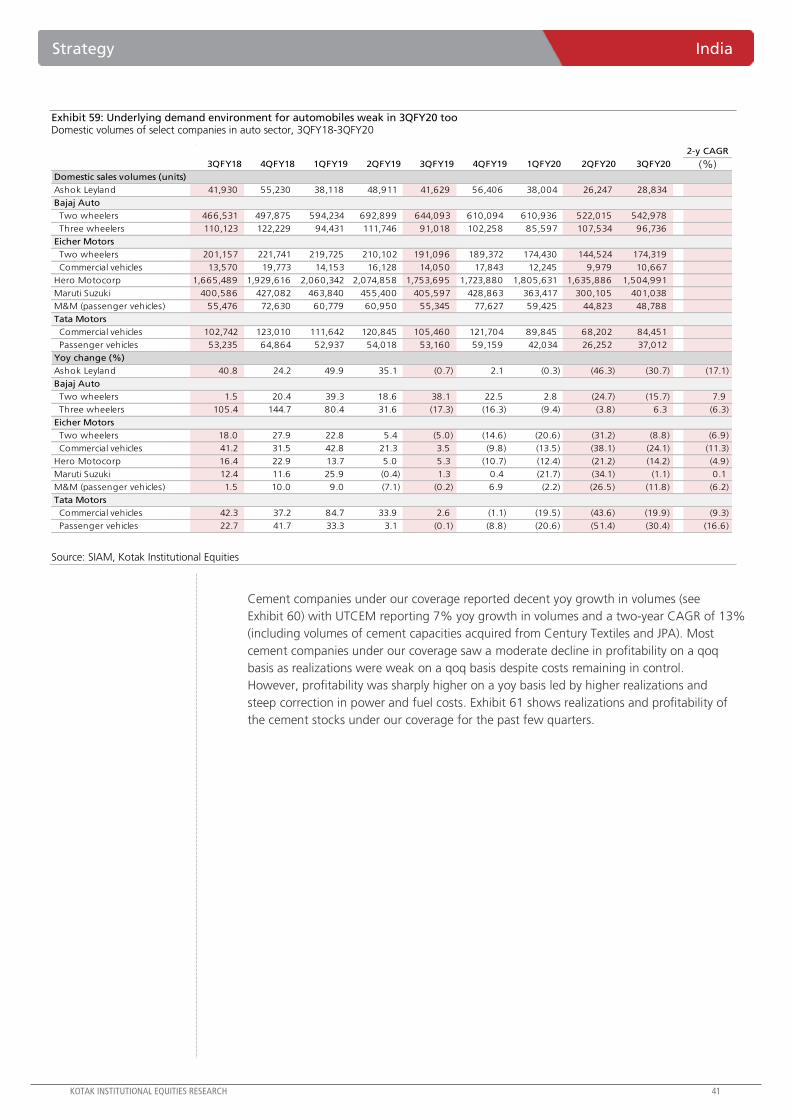
KOTAK INSTITUTIONAL EQUITIES RESEARCH 41
Strategy India
Exhibit 59: Underlying demand environment for automobiles weak in 3QFY20 too Domestic volumes of select companies in auto sector, 3QFY18-3QFY20
2-y CAGR
3QFY18 4QFY18 1QFY19 2QFY19 3QFY19 4QFY19 1QFY20 2QFY20 3QFY20 (%)Domestic sales volumes (units)
Ashok Leyland 41,930 55,230 38,118 48,911 41,629 56,406 38,004 26,247 28,834
Bajaj Auto
Two wheelers 466,531 497,875 594,234 692,899 644,093 610,094 610,936 522,015 542,978
Three wheelers 110,123 122,229 94,431 111,746 91,018 102,258 85,597 107,534 96,736
Eicher Motors
Two wheelers 201,157 221,741 219,725 210,102 191,096 189,372 174,430 144,524 174,319
Commercial vehicles 13,570 19,773 14,153 16,128 14,050 17,843 12,245 9,979 10,667
Hero Motocorp 1,665,489 1,929,616 2,060,342 2,074,858 1,753,695 1,723,880 1,805,631 1,635,886 1,504,991
Maruti Suzuki 400,586 427,082 463,840 455,400 405,597 428,863 363,417 300,105 401,038
M&M (passenger vehicles) 55,476 72,630 60,779 60,950 55,345 77,627 59,425 44,823 48,788
Tata Motors
Commercial vehicles 102,742 123,010 111,642 120,845 105,460 121,704 89,845 68,202 84,451
Passenger vehicles 53,235 64,864 52,937 54,018 53,160 59,159 42,034 26,252 37,012
Yoy change (%)
Ashok Leyland 40.8 24.2 49.9 35.1 (0.7) 2.1 (0.3) (46.3) (30.7) (17.1)
Bajaj Auto
Two wheelers 1.5 20.4 39.3 18.6 38.1 22.5 2.8 (24.7) (15.7) 7.9
Three wheelers 105.4 144.7 80.4 31.6 (17.3) (16.3) (9.4) (3.8) 6.3 (6.3)
Eicher Motors
Two wheelers 18.0 27.9 22.8 5.4 (5.0) (14.6) (20.6) (31.2) (8.8) (6.9)
Commercial vehicles 41.2 31.5 42.8 21.3 3.5 (9.8) (13.5) (38.1) (24.1) (11.3)
Hero Motocorp 16.4 22.9 13.7 5.0 5.3 (10.7) (12.4) (21.2) (14.2) (4.9)
Maruti Suzuki 12.4 11.6 25.9 (0.4) 1.3 0.4 (21.7) (34.1) (1.1) 0.1
M&M (passenger vehicles) 1.5 10.0 9.0 (7.1) (0.2) 6.9 (2.2) (26.5) (11.8) (6.2)
Tata Motors
Commercial vehicles 42.3 37.2 84.7 33.9 2.6 (1.1) (19.5) (43.6) (19.9) (9.3)
Passenger vehicles 22.7 41.7 33.3 3.1 (0.1) (8.8) (20.6) (51.4) (30.4) (16.6)
Source: SIAM, Kotak Institutional Equities
Cement companies under our coverage reported decent yoy growth in volumes (see
Exhibit 60) with UTCEM reporting 7% yoy growth in volumes and a two-year CAGR of 13%
(including volumes of cement capacities acquired from Century Textiles and JPA). Most
cement companies under our coverage saw a moderate decline in profitability on a qoq
basis as realizations were weak on a qoq basis despite costs remaining in control.
However, profitability was sharply higher on a yoy basis led by higher realizations and
steep correction in power and fuel costs. Exhibit 61 shows realizations and profitability of
the cement stocks under our coverage for the past few quarters.
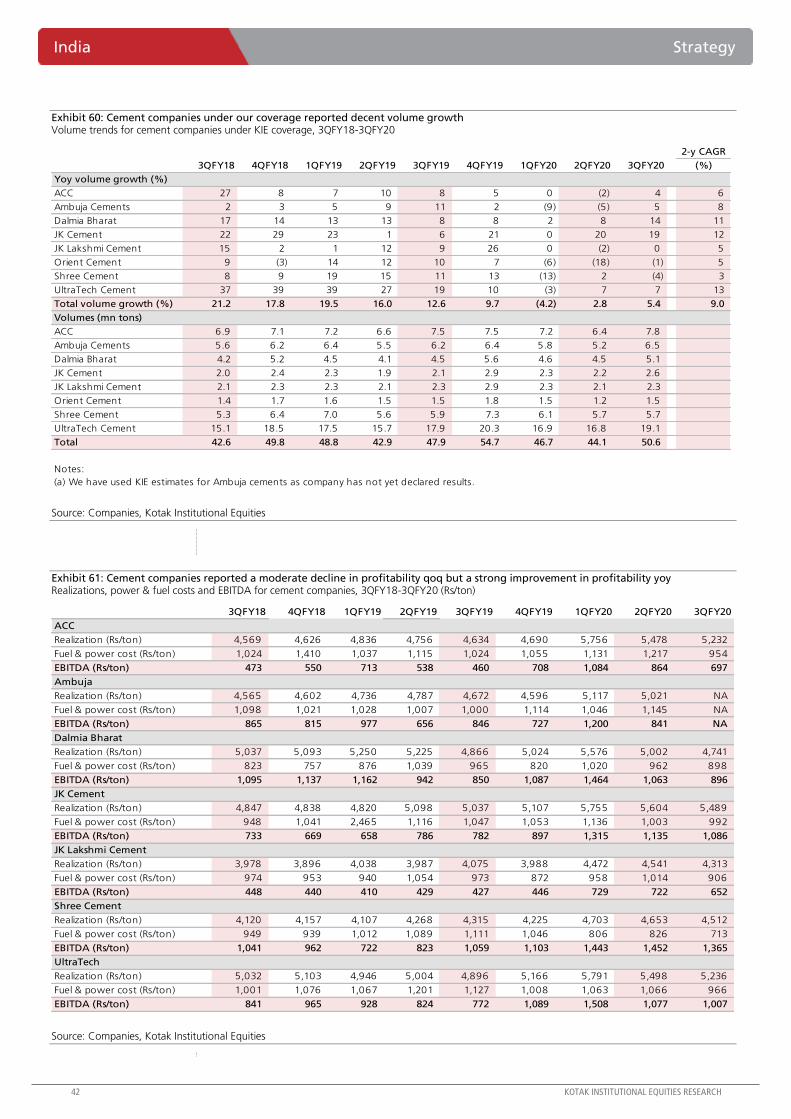
42 KOTAK INSTITUTIONAL EQUITIES RESEARCH
India Strategy
Exhibit 60: Cement companies under our coverage reported decent volume growth Volume trends for cement companies under KIE coverage, 3QFY18-3QFY20
2-y CAGR
3QFY18 4QFY18 1QFY19 2QFY19 3QFY19 4QFY19 1QFY20 2QFY20 3QFY20 (%)
Yoy volume growth (%)
ACC 27 8 7 10 8 5 0 (2) 4 6
Ambuja Cements 2 3 5 9 11 2 (9) (5) 5 8
Dalmia Bharat 17 14 13 13 8 8 2 8 14 11
JK Cement 22 29 23 1 6 21 0 20 19 12
JK Lakshmi Cement 15 2 1 12 9 26 0 (2) 0 5
Orient Cement 9 (3) 14 12 10 7 (6) (18) (1) 5
Shree Cement 8 9 19 15 11 13 (13) 2 (4) 3
UltraTech Cement 37 39 39 27 19 10 (3) 7 7 13
Total volume growth (%) 21.2 17.8 19.5 16.0 12.6 9.7 (4.2) 2.8 5.4 9.0
Volumes (mn tons)
ACC 6.9 7.1 7.2 6.6 7.5 7.5 7.2 6.4 7.8
Ambuja Cements 5.6 6.2 6.4 5.5 6.2 6.4 5.8 5.2 6.5
Dalmia Bharat 4.2 5.2 4.5 4.1 4.5 5.6 4.6 4.5 5.1
JK Cement 2.0 2.4 2.3 1.9 2.1 2.9 2.3 2.2 2.6
JK Lakshmi Cement 2.1 2.3 2.3 2.1 2.3 2.9 2.3 2.1 2.3
Orient Cement 1.4 1.7 1.6 1.5 1.5 1.8 1.5 1.2 1.5
Shree Cement 5.3 6.4 7.0 5.6 5.9 7.3 6.1 5.7 5.7
UltraTech Cement 15.1 18.5 17.5 15.7 17.9 20.3 16.9 16.8 19.1
Total 42.6 49.8 48.8 42.9 47.9 54.7 46.7 44.1 50.6
Notes:
(a) We have used KIE estimates for Ambuja cements as company has not yet declared results.
Source: Companies, Kotak Institutional Equities
Exhibit 61: Cement companies reported a moderate decline in profitability qoq but a strong improvement in profitability yoy Realizations, power & fuel costs and EBITDA for cement companies, 3QFY18-3QFY20 (Rs/ton)
3QFY18 4QFY18 1QFY19 2QFY19 3QFY19 4QFY19 1QFY20 2QFY20 3QFY20
ACC
Realization (Rs/ton) 4,569 4,626 4,836 4,756 4,634 4,690 5,756 5,478 5,232
Fuel & power cost (Rs/ton) 1,024 1,410 1,037 1,115 1,024 1,055 1,131 1,217 954
EBITDA (Rs/ton) 473 550 713 538 460 708 1,084 864 697
Ambuja
Realization (Rs/ton) 4,565 4,602 4,736 4,787 4,672 4,596 5,117 5,021 NA
Fuel & power cost (Rs/ton) 1,098 1,021 1,028 1,007 1,000 1,114 1,046 1,145 NA
EBITDA (Rs/ton) 865 815 977 656 846 727 1,200 841 NA
Dalmia Bharat
Realization (Rs/ton) 5,037 5,093 5,250 5,225 4,866 5,024 5,576 5,002 4,741
Fuel & power cost (Rs/ton) 823 757 876 1,039 965 820 1,020 962 898
EBITDA (Rs/ton) 1,095 1,137 1,162 942 850 1,087 1,464 1,063 896
JK Cement
Realization (Rs/ton) 4,847 4,838 4,820 5,098 5,037 5,107 5,755 5,604 5,489
Fuel & power cost (Rs/ton) 948 1,041 2,465 1,116 1,047 1,053 1,136 1,003 992
EBITDA (Rs/ton) 733 669 658 786 782 897 1,315 1,135 1,086
JK Lakshmi Cement
Realization (Rs/ton) 3,978 3,896 4,038 3,987 4,075 3,988 4,472 4,541 4,313
Fuel & power cost (Rs/ton) 974 953 940 1,054 973 872 958 1,014 906
EBITDA (Rs/ton) 448 440 410 429 427 446 729 722 652
Shree Cement
Realization (Rs/ton) 4,120 4,157 4,107 4,268 4,315 4,225 4,703 4,653 4,512
Fuel & power cost (Rs/ton) 949 939 1,012 1,089 1,111 1,046 806 826 713
EBITDA (Rs/ton) 1,041 962 722 823 1,059 1,103 1,443 1,452 1,365
UltraTech
Realization (Rs/ton) 5,032 5,103 4,946 5,004 4,896 5,166 5,791 5,498 5,236
Fuel & power cost (Rs/ton) 1,001 1,076 1,067 1,201 1,127 1,008 1,063 1,066 966
EBITDA (Rs/ton) 841 965 928 824 772 1,089 1,508 1,077 1,007
Source: Companies, Kotak Institutional Equities

KOTAK INSTITUTIONAL EQUITIES RESEARCH 43
Strategy India
Weak execution and weakness in order inflows for industrial companies. 3QFY20
domestic revenues of industrial companies for the stocks under our coverage increased 7%
yoy (see Exhibit 62) while order inflows declined 3% yoy (see Exhibit 63). Order inflows
were weak in hydro-carbon and power segments, but were relatively stronger in
infrastructure segments. The slowdown in ordering also reflects the fiscal challenges of
governments at various levels and financial issues (high leverage) of private companies.
Exhibit 62: Industrials companies reported moderate growth in revenues despite a difficult investment environment Domestic revenues of industrials companies under KIE coverage, 3QFY18-3QFY20
3QFY18 4QFY18 1QFY19 2QFY19 3QFY19 4QFY19 1QFY20 2QFY20 3QFY20 3QFY18 4QFY18 1QFY19 2QFY19 3QFY19 4QFY19 1QFY20 2QFY20 3QFY20
ABB 24 21 23 21 17 16 15 15 17 13 12 28 34 (29) (23) (36) (28) 1
BHEL 62 91 54 61 66 91 41 56 51 2 (1) 2 3 7 0 (24) (9) (23)
Cummins 9 8 9 10 10 10 10 10 11 3 (4) (5) 34 14 21 16 (5) 4
Larsen & Toubro 148 246 139 168 194 270 203 232 232 11 13 13 27 31 10 47 39 20
Siemens 21 28 26 26 24 30 27 35 22 6 12 16 (2) 16 8 4 34 (7)
Thermax 7 9 6 8 8 13 8 8 8 19 (7) 12 45 22 45 32 1 2
Total 270 403 256 295 320 430 304 356 341 8 9 11 19 19 7 19 21 7
Notes:
(a) We use historical share of exports to estimate domestic revenues of ABB, BHEL, Siemens and Thermax.
(b) We have adjusted revenues for ABB India from 3QFY19 (to make like to like comparison with 3QFY20) to include only continued business as power grid is now demerged.
Domestic revenues (Rs bn) Growth (%, yoy)
Source: Companies, Kotak Institutional Equities
Exhibit 63: Industrials companies saw a deceleration in order inflows Order inflows of key industrials and construction companies, 3QFY18-3QFY20 (Rs bn)
3QFY18 4QFY18 1QFY19 2QFY19 3QFY19 4QFY19 1QFY20 2QFY20 3QFY20 3QFY18 4QFY18 1QFY19 2QFY19 3QFY19 4QFY19 1QFY20 2QFY20 3QFY20
ABB 29 26 25 24 19 18 20 16 16 (48) 10 8 22 (35) (31) (20) (32) (16)
BHEL 121 252 37 52 77 59 39 74 47 651 52 110 175 (36) (77) 4 43 (38)
Larsen & Toubro 353 363 192 288 225 342 297 312 240 82 26 27 100 (36) (6) 55 8 6
Siemens 33 29 28 28 34 36 30 32 32 1 (38) (0) 5 4 24 6 12 (6)
Thermax 8 9 9 7 10 12 12 17 16 9 16 58 3 35 35 43 141 57
Voltas 6 12 4 11 11 10 7 26 12 (9) 29 (66) 61 79 (19) 59 142 16
Total 549 691 295 410 376 476 405 477 364 96 40 24 84 (32) (31) 37 17 (3)
Notes:
(a) We use domestic order inflows for L&T; for others, we use total order inflows.
(b) For ABB India, order inflows are not available for the discontinued Power Grids business.
Order inflows (Rs bn) Growth (%, yoy)
Source: Companies, Kotak Institutional Equities
Capital goods and infrastructure stocks have seen some de-rating over the past few
quarters as the market is increasingly worried about a delay in revival in capital
expenditure given the challenges of both the government and the private sector and their
multiples look more interesting (see Exhibit 64). We model moderate growth in revenues,
order inflows and profits of the capital goods companies for FY2020-21 and expect net
profit of the sector to grow 4% in FY2020 and 3% in FY2021.

44 KOTAK INSTITUTIONAL EQUITIES RESEARCH
India Strategy
Exhibit 64: Valuations of industrial stocks have moderated over the past few months but still high in general Valuation summary of industrials stocks under KIE coverage, March fiscal year-ends, 2020-22E
Company 2020E 2021E 2022E 2020E 2021E 2022E 2020E 2021E 2022E 2020E 2021E 2022E 2020E 2021E 2022E
ABB 18 20 25 46 13 27 70 62 49 46 40 32 7.4 6.9 6.3
BHEL 2.6 2.5 3.7 (25) (6) 51 14 15 10 5 5 4 0.4 0.4 0.4
Cummins India 27 29 32 1 8 12 20 19 17 20 18 16 3.4 3.2 3.0
Kalpataru Power Transmission 34 38 46 13 10 23 11 10 8 5 4 4 1.7 1.4 1.3
KEC International 25 28 33 30 14 18 14 12 10 8 7 6 2.9 2.4 2.0
L&T 70 68 86 14 (3) 28 19 19 15 18 15 13 3.0 2.5 2.3
Siemens 35 40 46 14 15 14 40 35 31 28 25 21 5.0 4.6 4.2
Thermax 26 39 47 (28) 48 21 38 25 21 23 20 17 3.5 3.2 2.9
Voltas 17 21 24 8 22 17 41 33 28 30 26 22 5.0 4.5 4.0
P/B (X)EPS growth (%) P/E (X) EV/EBITDA (X)EPS (Rs)
Source: Companies, Kotak Institutional Equities estimates
Pharmaceuticals companies saw moderation in US sales. US sales of pharmaceutical
companies were mixed in 3QFY20. The five large pharmaceutical companies under our
coverage with a large US presence reported 5% yoy and (-)0.6% qoq growth in overall
revenues and 18% yoy growth and 6% qoq growth in US revenues (see Exhibit 65).
Exhibit 65: Pharmaceutical companies had varied success in their US businesses with ARBP, CIPLA and DRRD reporting strong growth Trend of quarterly sales of Indian pharmaceuticals across geographies, 3QFY18-3QFY20 (Rs mn)
3QFY18 4QFY18 1QFY19 2QFY19 3QFY19 4QFY19 1QFY20 2QFY20 3QFY20 3QFY19 4QFY19 1QFY20 2QFY20 3QFY20
Aurobindo
Total sales 43,361 40,491 42,503 47,514 52,697 52,922 54,446 56,005 58,950 22 31 28 18 12 17
ARV 2,389 1,486 1,556 2,440 2,813 2,915 3,185 2,379 3,134 18 96 105 (3) 11 15
Europe 11,716 11,516 11,991 11,565 12,928 13,118 13,916 14,013 14,763 10 14 16 21 14 12
RoW 2,502 2,096 2,565 3,075 3,405 2,891 3,134 3,192 3,459 36 38 22 4 2 18
US 19,096 17,388 18,894 22,268 24,332 24,811 26,884 28,355 29,694 27 43 42 27 22 25
Others 7,658 8,005 7,497 8,166 9,219 9,187 7,327 8,066 7,900 20 15 (2) (1) (14) 2
Cipla
Total sales 39,138 36,980 39,390 40,119 40,075 44,040 39,890 43,958 43,710 2 19 1 10 9 6
Europe 1,710 1,360 1,340 1,410 1,890 2,360 2,010 1,900 1,900 11 74 50 35 1 5
India 16,010 13,530 15,440 16,440 15,850 15,000 13,550 17,450 17,770 (1) 11 (12) 6 12 5
RoW 3,710 3,940 4,690 4,720 3,930 4,060 2,790 4,510 3,230 6 3 (41) (4) (18) (7)
South Africa 5,200 5,330 5,750 5,030 5,570 5,130 5,320 5,460 5,940 7 (4) (7) 9 7 7
US 6,500 6,750 6,700 7,580 8,490 11,430 11,190 9,585 9,443 31 69 67 26 11 21
Others 6,008 6,070 5,470 4,939 4,345 6,060 5,030 5,053 5,427 (28) (0) (8) 2 25 (5)
Dr Reddy's Laboratories
Total sales 38,060 35,349 37,365 38,175 38,500 40,166 38,435 48,009 43,925 1 14 3 26 14 7
CIS 990 1,150 1,180 1,440 1,440 1,180 1,200 1,700 1,656 45 3 2 18 15 29
Europe 2,006 1,711 2,016 1,915 2,000 1,912 2,404 2,764 2,600 (0) 12 19 44 30 14
India 6,126 6,138 6,074 6,864 6,741 6,505 6,960 7,511 7,483 10 6 15 9 11 11
RoW 1,540 1,790 1,670 2,260 2,200 2,210 2,100 2,500 2,464 43 23 26 11 12 26
Russia 3,370 2,560 3,790 3,790 4,100 3,620 4,000 4,100 4,715 22 41 6 8 15 18
US 16,073 14,487 15,903 14,265 14,832 14,957 16,322 14,265 17,280 (8) 3 3 - 17 4
Others 7,955 7,513 6,732 7,641 7,187 9,782 5,449 15,169 7,728 (10) 30 (19) 99 8 (1)
Lupin
Total sales 39,004 39,785 37,746 38,909 43,779 43,259 38,155 38,202 37,161 12 9 1 (2) (15) (2)
Europe 1,359 1,808 1,416 1,525 1,332 1,709 1,416 1,729 1,528 (2) (5) 0 13 15 6
India 10,688 9,647 11,924 12,032 11,902 10,525 13,077 13,419 12,969 11 9 10 12 9 10
Japan 5,729 5,098 5,032 5,321 5,868 5,517 2 8
US 14,321 14,990 11,858 12,487 14,174 17,406 15,412 13,244 13,766 (1) 16 30 6 (3) (2)
Others 6,906 8,242 7,516 7,544 10,504 8,102 8,250 9,811 8,898 52 (2) 10 30 (15) 14
Sun Pharma
Total sales 65,982 67,110 71,388 68,465 76,567 70,443 82,593 79,492 80,387 16 5 16 16 5 10
EM 12,212 12,794 13,087 13,720 14,618 12,199 13,486 14,117 13,901 20 (5) 3 3 (5) 7
India 20,850 19,626 21,520 18,597 22,351 11,013 23,137 25,148 25,170 7 (44) 8 35 13 10
RoW 7,766 7,437 7,178 7,615 8,981 10,780 11,591 11,371 11,035 16 45 61 49 23 19
US 21,254 23,716 25,437 23,979 26,059 31,238 29,474 23,898 24,924 23 32 16 (0) (4) 8
Others 3,899 3,538 4,167 4,553 4,559 5,211 4,905 4,959 5,356 17 47 18 9 17 17
Sales (Rs mn) Growth (%, yoy) 2-y CAGR
(%)
Source: Companies, Kotak Institutional Equities

KOTAK INSTITUTIONAL EQUITIES RESEARCH 45
Strategy India
Domestic revenues of the pharmaceutical companies were quite strong (see Exhibit 66).
SUNP’s domestic portfolio witnessed 13% yoy growth (two-year CAGR of 10%) and
Cipla’s volumes recovered to 12% yoy growth.
Exhibit 66: Most pharmaceutical companies saw decent growth in domestic sales in 3QFY20 Domestic sales of Indian pharmaceuticals, 3QFY18-3QFY20 (Rs mn)
2-y CAGR
3QFY18 4QFY18 1QFY19 2QFY19 3QFY19 4QFY19 1QFY20 2QFY20 3QFY20 3QFY19 4QFY19 1QFY20 2QFY20 3QFY20 (%)
Cipla 16,010 13,530 15,440 16,440 15,850 15,000 13,550 17,450 17,770 (1.0) 10.9 (12.2) 6.1 12.1 5.4
Dr Reddy's Laboratories 6,126 6,138 6,074 6,864 6,741 6,505 6,960 7,511 7,483 10.0 6.0 14.6 9.4 11.0 10.5
Lupin 10,688 9,647 11,924 12,032 11,902 10,525 13,077 13,419 12,969 11.4 9.1 9.7 11.5 9.0 10.2
Sun Pharma 20,850 19,626 21,520 18,600 22,350 11,013 23,137 25,148 25,170 7.2 (43.9) 7.5 35.2 12.6 9.9
Torrent Pharmaceuticals 5,860 6,930 8,300 8,160 8,350 7,540 9,070 8,990 8,710 42.5 8.8 9.3 10.2 4.3 21.9
Domestic sales (Rs mn) Growth (%, yoy)
Source: Companies, Kotak Institutional Equities
Among the major pharmaceutical companies under our coverage, (1) ARBP reported 12%
yoy growth (+5.3% qoq) in overall revenues, (2) Cipla reported 11% yoy (-1.5% qoq)
growth in US revenues while domestic revenues increased 12% yoy leading to 9% yoy
growth in overall sales, (3) DRRD’s US sales increased 17% yoy and 21% qoq, (4) LPC’s
US sales declined 3% yoy (+4% qoq) and overall sales declined 15% yoy (-2.7% qoq) and
(5) SUNP’s US sales were down 4% yoy (+4.3% qoq) but overall sales increased 5% yoy
(+1.1% qoq).

For Private Circulation Only. FOR IMPORTANT INFORMATION ABOUT KOTAK SECURITIES’ RATING SYSTEM AND OTHER DISCLOSURES, REFER TO THE END OF THIS MATERIAL.
[email protected]: +91 22 6218 6427
Persisting decline in volumes, higher costs and lower other income mar 3QFY20 performance
ONGC’s revenue declined 3.2% qoq to Rs237.1 bn and EBITDA declined 7.5% qoq to Rs122.9 bn
in 3QFY20, 6-10% below estimates, reflecting (1) 3.4% qoq decline in crude sales volumes,
(2) 1.9% qoq decline in gas volumes, (3) 12.5% lower gas price and (4) sharp jump in other
expenses. Net income declined 34% qoq to Rs41.5 bn (EPS of Rs3.3), further impacted by lower
other income due to lower dividend receipts and unexpected increase in depletion expenses.
The company continued with higher tax rate regime given unutilized MAT credits of ~Rs50 bn.
Consolidated net income was higher at Rs53.8 bn (EPS of Rs3.9), including OVL’s net income of
Rs9.8 bn, HPCL’s net income of Rs10.3 bn and MRPL’s net loss of Rs0.4 bn. ONGC has incurred
lower capex of Rs190 bn in 9MFY20; however, it maintained its FY2020 guidance of Rs319 bn
pending milestone-based payments for KG-DWN-98/2 field, which may be due in 4QFY20.
Persisting decline in oil production albeit at a slower pace; sharp decline in gas production
Crude production from own fields declined 1.9% yoy, a tad lower than 3-7% over the past
seven quarters. Overall crude oil sales volumes declined 2.9% yoy to 5.22 mn tons, reflecting a
4.2% reduction in sales volumes from own fields, which was partly offset by 4.6% increase in
volumes from JVs. Gas production from own fields declined sharply by 8.6% yoy. Overall
natural gas sales volumes declined 9.4% yoy to 4.83 bcm, reflecting 10.4% yoy decline in sales
volumes from own fields, which was partly offset by 14.6% in gas sales from JVs. VAP sales
volumes declined 3.3% yoy, but increased 4.7% qoq from a low base to 0.89 mn tons.
12-18% cut in FY2020-22 EPS estimates to reflect lower volumes, gas price and higher costs
We cut our consolidated EPS estimates to Rs17.5 (-18%) in FY2020, Rs17.5 (-15%) in FY2021
and Rs19.6 (-12%) in FY2022 factoring in (1) lower domestic gas price at US$2.5-3/mn BTU for
FY2021-22E; we estimate domestic gas price (NCV) to fall sharply to ~US$2.6/mn BTU for 1HFY21
from US$3.6/mn BTU in 2HFY20, attributed to lower NBP and HH benchmark gas prices,
(2) lower oil and gas sales volumes, (3) higher operating costs and DD&A expenses, (4) lower
contribution from HPCL and MRPL and (5) other minor changes. Our fair value reduces to
Rs140 from Rs170, based on 9X FY2021E EPS plus the value of investments and write-off of
acquisition cost for Area-1 block in Mozambique. We retain our BUY rating on the stock, noting
inexpensive valuation at 6X FY2021E EPS and attractive dividend yield at ~7.5%.
ONGC (ONGC) Oil, Gas & Consumable Fuels
Weak results amid lower volumes and higher costs. ONGC’s 3QFY20 performance
was well below our expectations led by sustained decline in oil and gas sales volumes
and sharp jump in operating costs and DD&A expenses. We cut our FY2020-22 EPS
estimates by 12-18% and fair value to Rs140 (Rs170 earlier) factoring in lower volumes,
lower gas price and higher costs. Inexpensive valuations and high dividend yield keeps
us positive on the stock; a recovery in production will be crucial for it to perform.
BUY
FEBRUARY 17, 2020
RESULT
Sector view: Attractive
CMP (`): 103
Fair Value (`): 140
BSE-30: 41,258
Tarun Lakhotia
Hemang Khanna
ONGC
Stock data Forecasts/valuations 2020E 2021E 2022E
52-week range (Rs) (high,low) EPS (Rs) 18.1 17.8 19.7
Mcap (bn) (Rs/US$) EPS growth (%) (23.2) (1.8) 10.7
ADTV-3M (mn) (Rs/US$) P/E (X) 5.7 5.8 5.2
Shareholding pattern (%) P/B (X) 0.5 0.5 0.5
Promoters 62.8 EV/EBITDA (X) 3.0 2.9 2.6
FIIs 8.7 RoE (%) 9.4 8.8 9.1
MFs/BFIs Div. yield (%) 7.3 7.5 7.7
Price performance (%) 1M 3M 12M Sales (Rs bn) 1,870 1,968 2,081
Absolute (17) (24) (22) EBITDA (Rs bn) 662 659 706
Rel. to BSE-30 (16) (26) (32) Net profits (Rs bn) 228 224 248
179-102
1,300/18.3
4.8/11.1
1,512/21

Oil, Gas & Consumable Fuels ONGC
4 KOTAK INSTITUTIONAL EQUITIES RESEARCH
Key highlights of 9MFY20 performance
Revenues and EBITDA declined 10% and 14% yoy to Rs748 bn and Rs407 bn respectively
in 9MFY20, led by (1) 4.4% decline in crude sales volumes and 3.4% decline in gas sales
volumes and (2) 11.7% lower crude realization, which was partly offset by 12% jump in
domestic gas price. Net income declined 28% yoy to Rs163.2 bn (EPS of Rs13), further
impacted by a sharp increase in DD&A expenses and lower other income.
Overall crude oil sales volumes declined 4.4% yoy to 15.9 mn tons reflecting a 3.3%
decline in production from own fields and 11.4% decline in production from JVs. Overall
natural gas sales volume declined 3.4% to 14.7 bcm, reflecting 2.7% decline in
production from own fields. VAP sales volume moderated 1% yoy to 2.7 mn tons.
Consolidated net income was modestly higher at Rs179.1 bn (EPS of Rs13.4) as compared
to standalone net income, as healthy net income of Rs25.3 bn from OVL and Rs26.7 bn
from HPCL was offset by net loss of Rs11.1 bn from MRPL and negative contribution
from other subsidiaries/JVs during 9MFY20.

ONGC Oil, Gas & Consumable Fuels
KOTAK INSTITUTIONAL EQUITIES RESEARCH 5
Exhibit 1: ONGC’s interim results, March fiscal year-ends (Rs mn)
Source: Company, Kotak Institutional Equities estimates
(% chg.) vov
3QFY20 3QFY20E 3QFY19 2QFY20 3QFY20E 3QFY19 2QFY20 9MFY20 9MFY19 (% chg.) FY2020E
Net sales 237,101 251,433 276,941 244,926 (5.7) (14.4) (3.2) 747,574 828,961 (9.8) 990,700
Total expenditure (114,118) (114,554) (111,233) (112,026) (0.4) 2.6 1.9 (340,571) (358,045) (4.9) (469,891)
Increase/(decrease) in stock in trade 2,047 — (251) 38 2,226 1,965 —
Raw materials (a) (6,681) (7,211) (5,790) (6,932) (7.4) 15.4 (3.6) (20,005) (15,970) 25.3 (24,286)
Staff expenditure (6,674) (6,901) (6,775) (6,332) (3.3) (1.5) 5.4 (19,088) (19,233) (0.8) (27,197)
Statutory levies (56,671) (58,106) (59,732) (58,606) (2.5) (5.1) (3.3) (177,638) (193,126) (8.0) (230,915)
Other expenditure (46,139) (42,336) (38,684) (40,194) 9.0 19.3 14.8 (126,066) (131,681) (4.3) (187,493)
EBITDA 122,983 136,879 165,708 132,900 (10.2) (25.8) (7.5) 407,003 470,916 (13.6) 520,809
Other income 14,025 17,333 22,246 26,853 (19.1) (37.0) (47.8) 48,353 52,687 (8.2) 74,530
Interest (6,264) (6,272) (5,807) (6,818) (0.1) 7.9 (8.1) (19,542) (19,585) (0.2) (25,988)
DD&A (70,759) (63,223) (61,517) (62,553) 11.9 15.0 13.1 (194,874) (160,271) 21.6 (260,228)
Depletion (44,482) (33,699) (30,984) (33,304) 32.0 43.6 33.6 (111,001) (97,166) 14.2 (146,940)
Depreciation (8,910) (8,771) (3,980) (8,750) 1.6 123.9 1.8 (26,230) (11,610) 125.9 (35,084)
Dry wells written off (14,846) (14,500) (23,884) (14,159) 2.4 (37.8) 4.9 (43,524) (42,267) 3.0 (60,000)
Survey expenses (2,331) (6,003) (2,859) (1,820) (61.2) (18.5) 28.0 (12,929) (9,049) 42.9 (17,014)
Impairment loss and others (190) (250) 190 (4,520) (1,190) (180) (1,190)
Pretax profits 59,986 84,717 120,630 90,383 (29.2) (50.3) (33.6) 240,940 343,748 (29.9) 309,124
Extraordinary/prior-period adjustment — — — — — — —
Current tax (12,109) (21,610) (32,310) (26,650) (62,129) (99,230) (84,391)
Deferred tax (6,360) (4,398) (5,693) (1,102) (15,621) (17,806) (15,456)
Net income 41,516 58,709 82,627 62,631 (29.3) (49.8) (33.7) 163,190 226,712 (28.0) 209,277
Adjusted net income 41,516 58,709 82,627 62,631 (29.3) (49.8) (33.7) 163,190 226,712 (28.0) 209,277
Adjusted EPS (Rs) 3.3 4.7 6.6 5.0 (29.3) (49.8) (33.7) 13.0 18.0 (28.0) 16.6
Tax rate (%) 30.8 30.7 31.5 30.7 32.3 34.0 32.3
Volume data
Subsidy loss — — — — — — —
Crude production ex JVs ('000 tons) 5,135 5,232 5,116 (1.9) 0.4 15,388 15,908 (3.3)
Crude production - JVs ('000 tons) 687 804 726 (14.6) (5.4) 2,146 2,422 (11.4)
Gas production ex JVs (mcm) 5,847 6,399 5,945 (8.6) (1.6) 17,920 18,416 (2.7)
Gas production - JVs (mcm) 326 292 324 11.6 0.6 938 836 12.2
Crude production ('000 tons) 5,822 6,036 5,842 (3.5) (0.3) 17,534 18,330 (4.3)
Gas production (mcm) 6,173 6,691 6,269 (7.7) (1.5) 18,858 19,252 (2.0)
Crude sales ex JVs ('000 tons) 4,391 4,507 4,583 4,505 (2.6) (4.2) (2.5) 13,284 13,942 (4.7) 17,665
Crude sales - JVs ('000 tons) 825 880 789 896 (6.3) 4.6 (7.9) 2,619 2,700 (3.0) 3,865
Gas sales ex JVs (mcm) 4,574 4,581 5,104 4,665 (0.1) (10.4) (2.0) 14,011 14,633 (4.3) 18,777
Gas sales - JVs (mcm) 251 230 219 253 8.9 14.6 (0.8) 728 632 15.2 1,011
Crude sales ('000 tons) 5,216 5,387 5,372 5,401 (3.2) (2.9) (3.4) 15,903 16,642 (4.4) 21,530
Gas sales (mcm) 4,825 4,811 5,323 4,918 0.3 (9.4) (1.9) 14,739 15,265 (3.4) 19,788
LPG (000 tons) 260 250 280 242 751 845 987
Naphtha/NGL (000 tons) 284 296 321 287 902 897 1,167
C2/C3/C4 (000 tons) 314 294 285 280 920 870 1,267
SKO (000 tons) 10 16 18 18 50 50 72
Others (000 tons) 22 30 16 23 69 55 90
Total VAP sales ('000 tons) 890 885 920 850 0.5 (3.3) 4.7 2,692 2,717 (0.9) 3,583
Pricing data
Gross crude price realization (US$/bbl) 59.7 61.0 66.4 60.3 (2.1) (10.0) (0.9) 62.1 70.3 (11.7) 61.3
Domestic gas price (US$/mn BTU) 3.6 3.6 3.7 4.1 0.0 (3.8) (12.5) 3.9 3.5 12.0 3.8

Oil, Gas & Consumable Fuels ONGC
6 KOTAK INSTITUTIONAL EQUITIES RESEARCH
Exhibit 2: ONGC’s own crude production declined at a slower pace over the past few months Daily crude production volumes from ONGC's fields, April 2012 onwards (ktoe/d)
Source: MoPNG, Kotak Institutional Equities
Exhibit 3: ONGC’s own gas production has moderated in recent months Daily gas production volumes from ONGC's fields, April 2012 onwards (mcm/d)
Source: MoPNG, Kotak Institutional Equities
0
10
20
30
40
50
60
70
Apr-
12
Jun-1
2
Aug
-12
Oct
-12
Dec-
12
Feb-1
3
Apr-
13
Jun-1
3
Aug
-13
Oct
-13
Dec-
13
Feb-1
4
Apr-
14
Jun-1
4
Aug
-14
Oct
-14
Dec-
14
Feb-1
5
Apr-
15
Jun-1
5
Aug
-15
Oct
-15
Dec-
15
Feb-1
6
Apr-
16
Jun-1
6
Aug
-16
Oct
-16
Dec-
16
Feb-1
7
Apr-
17
Jun-1
7
Aug
-17
Oct
-17
Dec-
17
Feb-1
8
Apr-
18
Jun-1
8
Aug
-18
Oct
-18
Dec-
18
Feb-1
9
Apr-
19
Jun-1
9
Aug
-19
Oct
-19
Dec-
19
Crude oil production(ktoe/d)
0
10
20
30
40
50
60
70
80
Apr-
12
Jun-1
2
Aug
-12
Oct
-12
Dec-
12
Feb-1
3
Apr-
13
Jun-1
3
Aug
-13
Oct
-13
Dec-
13
Feb-1
4
Apr-
14
Jun-1
4
Aug
-14
Oct
-14
Dec-
14
Feb-1
5
Apr-
15
Jun-1
5
Aug
-15
Oct
-15
Dec-
15
Feb-1
6
Apr-
16
Jun-1
6
Aug
-16
Oct
-16
Dec-
16
Feb-1
7
Apr-
17
Jun-1
7
Aug
-17
Oct
-17
Dec-
17
Feb-1
8
Apr-
18
Jun-1
8
Aug
-18
Oct
-18
Dec-
18
Feb-1
9
Apr-
19
Jun-1
9
Aug
-19
Oct
-19
Dec-
19
Natural gas production(mcm/d)

ONGC Oil, Gas & Consumable Fuels
KOTAK INSTITUTIONAL EQUITIES RESEARCH 7
Exhibit 4: OVL’s oil volumes moderated, while gas volumes increased modestly in 3QFY20 Production volumes of OVL, March fiscal year-ends, 2017-20YTD
Source: Company, Kotak Institutional Equities
Exhibit 5: Consistent increase in ONGC’s 2P reserves from own fields over the past several years Reserves of ONGC, March fiscal year-ends, 2011-19 (mn toe)
Source: Company, Kotak Institutional Equities
FY2018 1QFY19 2QFY19 3QFY19 4QFY19 FY2019 1QFY20 2QFY20 3QFY20
Crude oil (mn tons)
Vietnam, Block 06.1 0.022 0.005 0.005 0.030 — 0.016 0.003 0.003 0.003
Sudan, GNOP 0.282 0.066 0.068 0.063 0.060 0.257 0.058 0.039 —
Sudan, Block 5A — — 0.008 0.045 0.078 0.131 0.106 0.144 0.165
Russia, Sakhalin-1 1.856 0.528 0.624 0.663 0.674 2.489 0.639 0.640 0.640
Columbia, MECL 0.514 0.139 0.135 0.106 0.178 0.558 0.166 0.168 0.165
Venezuela, Sancristobal 0.348 0.070 0.067 0.065 0.055 0.257 0.050 0.043 0.031
Venezuela, Carabobo 0.154 0.031 0.029 0.030 0.024 0.114 0.025 0.020 0.022
ACG fields 0.762 0.168 0.165 0.163 0.160 0.656 0.145 0.154 0.147
Imperial Energy 0.257 0.055 0.054 0.050 0.048 0.207 0.054 0.050 0.047
Russia, Vankor 4.444 1.055 1.060 1.049 0.976 4.140 0.935 0.894 0.853
Brazil, BC-10 0.663 0.133 0.106 0.138 0.138 0.515 0.118 0.134 0.145
Lower Zakum,UAE 0.051 0.176 0.190 0.205 0.186 0.757 0.190 0.197 0.211
Total crude oil 9.302 2.426 2.511 2.607 2.577 10.097 2.489 2.486 2.429
Natural gas (bcm)
Vietnam, Block 06.1 1.403 0.368 0.333 0.376 0.473 1.550 0.501 0.492 0.437
Russia, Sakhalin-1 0.594 0.129 0.116 0.182 0.195 0.622 0.131 0.110 0.182
Brazil, BC-10 0.04 0.008 0.007 0.009 0.009 0.033 0.008 0.008 0.009
A1 & A3 Myanmar 0.828 0.206 0.063 0.177 0.251 0.697 0.263 0.263 0.277
Russia, Vankor 1.747 0.425 0.430 0.405 0.400 1.660 0.392 0.367 0.372
ACG, MECL, IEC & PIVSA 0.198 0.043 0.045 0.045 0.041 0.174 0.045 0.047 0.044
Total natural gas 4.811 1.179 0.994 1.194 1.369 4.736 1.340 1.287 1.321
2011 2012 2013 2014 2015 2016 2017 2018 2019
1P reserves
ONGC 724 737 741 724 711 691 696 683 626
PSC JV 35 33 32 31 23 19 14 11 20
OVL 203 193 196 207 202 202 271 287 346
Total 962 964 969 962 936 912 982 982 991
2P reserves
ONGC 986 998 1,021 1,033 1,051 1,074 1,095 1,137 1,155
PSC JV 39 35 34 33 (1) 23 19 15 23
OVL 402 393 396 601 612 596 704 711 676
Total 1,427 1,426 1,451 1,667 1,662 1,693 1,818 1,863 1,853
3P reserves
ONGC 1,212 1,250 1,291 1,331 1,359 1,366 1,380 1,397
PSC JV 41 37 36 36 3 24 19 23
OVL 435 426 433 637 647 633 743 738 NA
Total 1,688 1,713 1,759 2,004 2,009 2,022 2,142 2,157 NA
Reserves to production
ONGC's production (mn toe) 48 47 46 46 44 44 44 46 46
ONGC's 2P R/P ratio (# years) 21 21 22 23 24 25 25 25 25
Overall production (mn toe) 61 61 59 58 58 57 62 64 65
Overall 2P R/P ratio (# years) 23 23 25 29 28 30 29 29 29
1,419

Oil, Gas & Consumable Fuels ONGC
8 KOTAK INSTITUTIONAL EQUITIES RESEARCH
Exhibit 6: We assume steady crude realization, lower gas price and modest recovery in production volumes Key assumptions, March fiscal year-ends, 2016-22E
Source: Company, Kotak Institutional Equities estimates
Exhibit 7: ONGC's earnings are highly sensitive to oil and gas prices and exchange rate assumptions EPS sensitivity of ONGC to crude, gas price and exchange rate, March fiscal year-ends, 2021-22E
Source: Kotak Institutional Equities estimates
2016 2017 2018 2019 2020E 2021E 2022E
Macro assumptions
Exchange rate (Rs/US$) 65.5 67.1 64.5 69.9 70.6 72.0 73.5
Subsidy loss (Rs bn) 11 — — — — — —
Import tariff on crude oil (%) — — — — — — —
Pricing and volumes assumptions
Crude price
Crude price, Dated Brent (US$/bbl) 47.5 49.0 57.6 70.2 63.5 65.0 65.0
Gross realized crude price, India (US$/bbl) 48.3 50.3 57.3 70.2 63.5 65.0 65.0
Net realized crude price, India (US$/bbl) 47.1 50.3 57.3 70.2 63.5 65.0 65.0
Natural gas price
Natural gas price, India (Rs/cu m) 12.2 8.2 7.6 9.9 10.5 7.1 8.7
Natural gas price, India (US$/mn BTU) 4.7 3.1 3.0 3.6 3.8 2.5 3.0
Sales volumes—Domestic fields
Crude oil - own fields (mn tons) 19.8 19.8 19.7 18.5 17.7 18.0 18.3
Crude oil - JV (mn tons) 4.3 4.0 3.9 4.0 3.9 4.5 4.9
Natural gas - own fields (bcm) 16.1 17.0 18.6 19.6 18.8 20.6 22.8
Natural gas - JV (bcm) 1.0 0.9 0.9 0.9 1.0 1.4 1.3
Sales volumes—Overseas fields
Crude oil (mn tons) 5.5 8.4 9.4 10.1 10.0 9.7 9.4
Natural gas (bcm) 3.4 4.4 4.8 4.7 4.7 4.6 4.5
Total sales
Crude oil (mn tons) 29.7 32.3 33.0 32.6 31.5 32.1 32.5
Natural gas (bcm) 20.5 22.3 24.3 25.2 24.5 26.5 28.6
Total sales (mn toe) 48.1 52.4 54.9 55.3 53.6 56.0 58.3
Total sales (mn boe) 351 382 401 404 391 409 426
Crude oil (%) 62 62 60 59 59 57 56
Natural gas (%) 38 38 40 41 41 43 44
2021E 2022E
Downside Base case Upside Downside Base case Upside
Exchange rate
Exchange rate (Rs/US$) 71.0 72.0 73.0 72.5 73.5 74.5
Net profits (Rs mn) 214,870 223,666 232,462 238,344 247,685 257,026
Earnings per share (Rs) 17.1 17.8 18.5 18.9 19.7 20.4
% upside/(downside) (3.9) 3.9 (3.8) 3.8
Average crude realization
Net crude realization (US$/bbl) 64.0 65.0 66.0 64.0 65.0 66.0
Net profits (Rs mn) 215,343 223,666 231,989 239,130 247,685 256,240
Earnings per share (Rs) 17.1 17.8 18.4 19.0 19.7 20.4
% upside/(downside) (3.7) 3.7 (3.5) 3.5
Natural gas prices
Natural gas price (US$/mn BTU) 2.0 2.5 3.0 2.5 3.0 3.5
Net profits (Rs mn) 208,663 223,666 238,669 231,978 247,685 263,392
Earnings per share (Rs) 16.6 17.8 19.0 18.4 19.7 20.9
% upside/(downside) (6.7) 6.7 (6.3) 6.3

ONGC Oil, Gas & Consumable Fuels
KOTAK INSTITUTIONAL EQUITIES RESEARCH 9
Exhibit 8: We compute fair value of ONGC at Rs140/share Fair value of ONGC, March 2021E (Rs/share)
Source: Kotak Institutional Equities estimates
March 2021E consolidated EPS 18
Less: income from investments valued separately 1
March 2021E EPS (adjusted) 17
P/E (X) 9.0
Valuation of operating business 150
Write-off of acquisition cost for Mozambique block (23)
Valuation of investments 13
IOCL 8
PLNG 3
GAIL 2
Fair value 140

Oil, Gas & Consumable Fuels ONGC
10 KOTAK INSTITUTIONAL EQUITIES RESEARCH
Exhibit 9: Combined financials of ONGC, OVL and MRPL, March fiscal year-ends, 2016-22E (Rs mn)
Source: Company, Kotak Institutional Equities estimates
2016 2017 2018 2019 2020E 2021E 2022E
Profit model (Rs mn)
Net sales 1,295,756 1,394,116 1,557,541 2,053,357 1,870,163 1,968,214 2,080,900
EBITDA 472,852 539,958 573,182 760,518 662,068 658,849 705,501
Other income 82,532 60,913 84,521 81,363 77,687 80,117 81,467
Finance cost (31,505) (28,659) (41,559) (46,951) (55,061) (51,217) (46,737)
Depreciation, depletion and amortization (230,932) (236,807) (285,510) (321,142) (343,762) (362,997) (384,096)
Pretax profits 292,947 335,405 330,635 473,787 340,931 324,752 356,135
Current tax (68,608) (69,177) (69,194) (148,499) (99,922) (85,463) (90,718)
Deferred tax (16,258) (37,264) (32,418) (22,093) (15,083) (13,984) (15,882)
Net profits 151,355 222,987 231,504 287,287 225,927 225,305 249,536
Adjusted net profits after minority interests 174,218 216,692 223,468 296,326 227,707 223,666 247,685
Adjusted EPS (Rs) 13.6 16.9 17.4 23.6 18.1 17.8 19.7
Balance sheet (Rs mn)
Equity 2,019,567 2,261,254 2,290,529 2,402,550 2,519,411 2,642,490 2,853,609
Deferred tax liability 208,099 238,457 283,946 297,288 312,371 326,355 342,237
Liability for abandonment cost 235,593 235,206 259,746 276,394 276,394 276,394 276,394
Borrowings 392,148 568,924 818,939 808,261 733,914 676,037 623,914
Other liabilities 550,109 414,469 445,286 471,397 471,815 489,079 503,377
Total liabilities and equity 3,405,517 3,718,311 4,098,446 4,255,890 4,313,904 4,410,355 4,599,530
Cash and equivalent 250,199 130,554 32,430 16,974 17,495 36,224 62,973
Current assets 620,530 628,481 699,369 816,509 796,750 818,873 837,247
Fixed and intangible assets 2,062,589 2,331,733 2,490,533 2,552,212 2,622,421 2,680,662 2,760,134
Goodwill 167,378 167,378 98,753 100,946 105,440 102,797 167,378
Investments 301,401 444,588 760,477 753,514 756,064 756,064 756,064
Deferred expenditure 3,420 15,577 16,884 15,735 15,735 15,735 15,735
Total assets 3,405,517 3,718,311 4,098,446 4,255,890 4,313,905 4,410,355 4,599,530
Free cash flow (Rs mn)
Operating cash flow, excl. working capital 358,988 386,698 453,380 549,020 403,530 415,142 456,226
Working capital changes 145,704 (30,051) (3,459) (104,149) 20,177 (4,859) (4,077)
Capital expenditure (313,908) (466,654) (400,224) (330,171) (310,416) (314,211) (351,747)
Investments (668) (104,608) (59) (1,530) (2,550) — —
Other income 39,917 45,828 62,980 49,828 77,687 80,117 81,467
Free cash flow 230,033 (168,788) 112,617 162,998 188,428 176,189 181,869
Ratios (%)
Debt/equity 19.4 25.2 35.8 33.6 29.1 25.6 21.9
Net debt/equity 7.0 19.4 34.3 32.9 28.4 24.2 19.7
RoAE 7.0 9.1 9.0 11.0 8.3 7.8 8.1
RoACE 8.7 9.5 9.3 11.2 8.6 8.2 8.4
Key assumptions
Exchange rate (Rs/US$) 65.5 67.1 64.5 69.9 70.6 72.0 73.5
Net realized crude price, India (US$/bbl) 47.1 50.3 57.3 70.2 63.5 65.0 65.0
Natural gas price, India (US$/mn BTU) 4.7 3.1 3.0 3.6 3.8 2.5 3.0
Subsidy loss (Rs bn) 11 — — — — — —
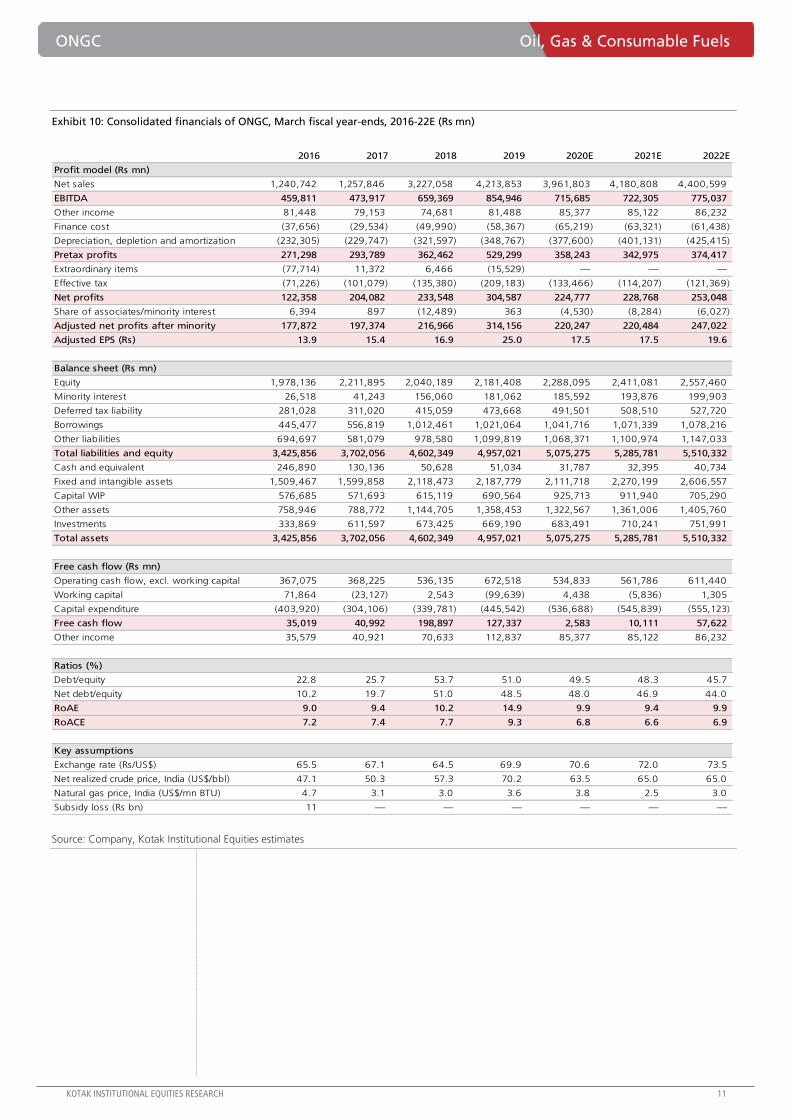
ONGC Oil, Gas & Consumable Fuels
KOTAK INSTITUTIONAL EQUITIES RESEARCH 11
Exhibit 10: Consolidated financials of ONGC, March fiscal year-ends, 2016-22E (Rs mn)
Source: Company, Kotak Institutional Equities estimates
2016 2017 2018 2019 2020E 2021E 2022E
Profit model (Rs mn)
Net sales 1,240,742 1,257,846 3,227,058 4,213,853 3,961,803 4,180,808 4,400,599
EBITDA 459,811 473,917 659,369 854,946 715,685 722,305 775,037
Other income 81,448 79,153 74,681 81,488 85,377 85,122 86,232
Finance cost (37,656) (29,534) (49,990) (58,367) (65,219) (63,321) (61,438)
Depreciation, depletion and amortization (232,305) (229,747) (321,597) (348,767) (377,600) (401,131) (425,415)
Pretax profits 271,298 293,789 362,462 529,299 358,243 342,975 374,417
Extraordinary items (77,714) 11,372 6,466 (15,529) — — —
Effective tax (71,226) (101,079) (135,380) (209,183) (133,466) (114,207) (121,369)
Net profits 122,358 204,082 233,548 304,587 224,777 228,768 253,048
Share of associates/minority interest 6,394 897 (12,489) 363 (4,530) (8,284) (6,027)
Adjusted net profits after minority 177,872 197,374 216,966 314,156 220,247 220,484 247,022
Adjusted EPS (Rs) 13.9 15.4 16.9 25.0 17.5 17.5 19.6
Balance sheet (Rs mn)
Equity 1,978,136 2,211,895 2,040,189 2,181,408 2,288,095 2,411,081 2,557,460
Minority interest 26,518 41,243 156,060 181,062 185,592 193,876 199,903
Deferred tax liability 281,028 311,020 415,059 473,668 491,501 508,510 527,720
Borrowings 445,477 556,819 1,012,461 1,021,064 1,041,716 1,071,339 1,078,216
Other liabilities 694,697 581,079 978,580 1,099,819 1,068,371 1,100,974 1,147,033
Total liabilities and equity 3,425,856 3,702,056 4,602,349 4,957,021 5,075,275 5,285,781 5,510,332
Cash and equivalent 246,890 130,136 50,628 51,034 31,787 32,395 40,734
Fixed and intangible assets 1,509,467 1,599,858 2,118,473 2,187,779 2,111,718 2,270,199 2,606,557
Capital WIP 576,685 571,693 615,119 690,564 925,713 911,940 705,290
Other assets 758,946 788,772 1,144,705 1,358,453 1,322,567 1,361,006 1,405,760
Investments 333,869 611,597 673,425 669,190 683,491 710,241 751,991
Total assets 3,425,856 3,702,056 4,602,349 4,957,021 5,075,275 5,285,781 5,510,332
Free cash flow (Rs mn)
Operating cash flow, excl. working capital 367,075 368,225 536,135 672,518 534,833 561,786 611,440
Working capital 71,864 (23,127) 2,543 (99,639) 4,438 (5,836) 1,305
Capital expenditure (403,920) (304,106) (339,781) (445,542) (536,688) (545,839) (555,123)
Free cash flow 35,019 40,992 198,897 127,337 2,583 10,111 57,622
Other income 35,579 40,921 70,633 112,837 85,377 85,122 86,232
Ratios (%)
Debt/equity 22.8 25.7 53.7 51.0 49.5 48.3 45.7
Net debt/equity 10.2 19.7 51.0 48.5 48.0 46.9 44.0
RoAE 9.0 9.4 10.2 14.9 9.9 9.4 9.9
RoACE 7.2 7.4 7.7 9.3 6.8 6.6 6.9
Key assumptions
Exchange rate (Rs/US$) 65.5 67.1 64.5 69.9 70.6 72.0 73.5
Net realized crude price, India (US$/bbl) 47.1 50.3 57.3 70.2 63.5 65.0 65.0
Natural gas price, India (US$/mn BTU) 4.7 3.1 3.0 3.6 3.8 2.5 3.0
Subsidy loss (Rs bn) 11 — — — — — —
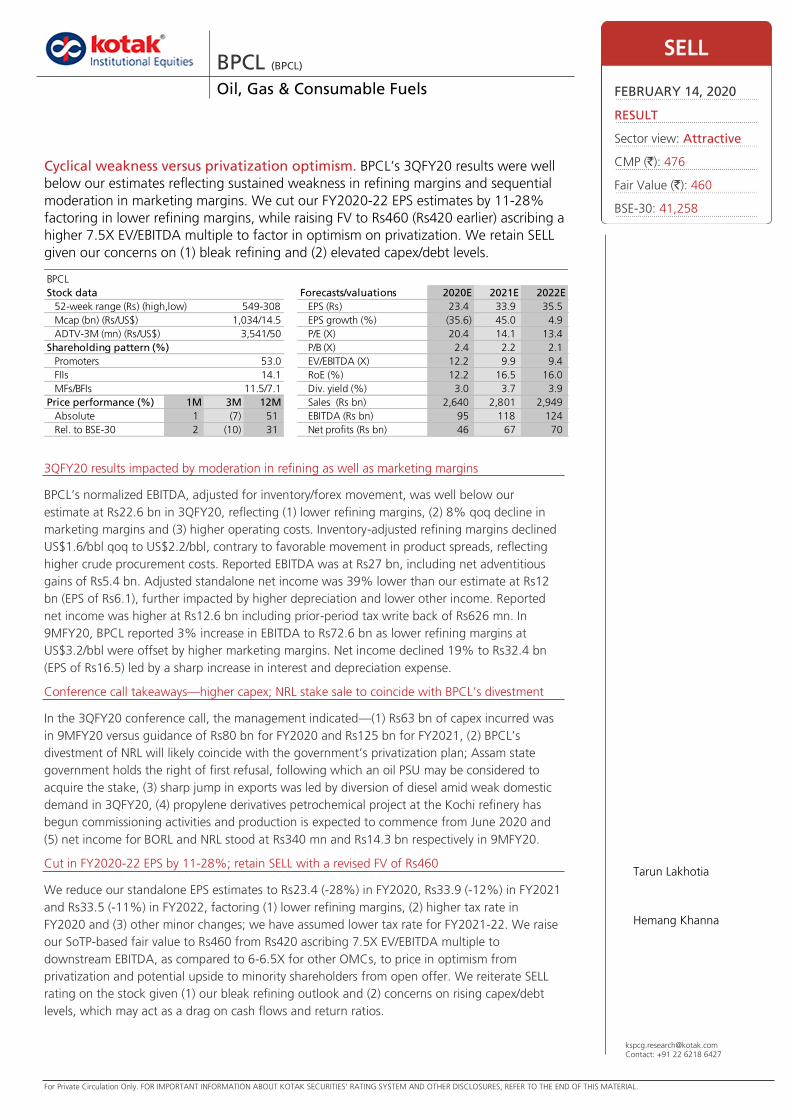
For Private Circulation Only. FOR IMPORTANT INFORMATION ABOUT KOTAK SECURITIES’ RATING SYSTEM AND OTHER DISCLOSURES, REFER TO THE END OF THIS MATERIAL.
[email protected]: +91 22 6218 6427
3QFY20 results impacted by moderation in refining as well as marketing margins
BPCL’s normalized EBITDA, adjusted for inventory/forex movement, was well below our
estimate at Rs22.6 bn in 3QFY20, reflecting (1) lower refining margins, (2) 8% qoq decline in
marketing margins and (3) higher operating costs. Inventory-adjusted refining margins declined
US$1.6/bbl qoq to US$2.2/bbl, contrary to favorable movement in product spreads, reflecting
higher crude procurement costs. Reported EBITDA was at Rs27 bn, including net adventitious
gains of Rs5.4 bn. Adjusted standalone net income was 39% lower than our estimate at Rs12
bn (EPS of Rs6.1), further impacted by higher depreciation and lower other income. Reported
net income was higher at Rs12.6 bn including prior-period tax write back of Rs626 mn. In
9MFY20, BPCL reported 3% increase in EBITDA to Rs72.6 bn as lower refining margins at
US$3.2/bbl were offset by higher marketing margins. Net income declined 19% to Rs32.4 bn
(EPS of Rs16.5) led by a sharp increase in interest and depreciation expense.
Conference call takeaways—higher capex; NRL stake sale to coincide with BPCL’s divestment
In the 3QFY20 conference call, the management indicated—(1) Rs63 bn of capex incurred was
in 9MFY20 versus guidance of Rs80 bn for FY2020 and Rs125 bn for FY2021, (2) BPCL’s
divestment of NRL will likely coincide with the government’s privatization plan; Assam state
government holds the right of first refusal, following which an oil PSU may be considered to
acquire the stake, (3) sharp jump in exports was led by diversion of diesel amid weak domestic
demand in 3QFY20, (4) propylene derivatives petrochemical project at the Kochi refinery has
begun commissioning activities and production is expected to commence from June 2020 and
(5) net income for BORL and NRL stood at Rs340 mn and Rs14.3 bn respectively in 9MFY20.
Cut in FY2020-22 EPS by 11-28%; retain SELL with a revised FV of Rs460
We reduce our standalone EPS estimates to Rs23.4 (-28%) in FY2020, Rs33.9 (-12%) in FY2021
and Rs33.5 (-11%) in FY2022, factoring (1) lower refining margins, (2) higher tax rate in
FY2020 and (3) other minor changes; we have assumed lower tax rate for FY2021-22. We raise
our SoTP-based fair value to Rs460 from Rs420 ascribing 7.5X EV/EBITDA multiple to
downstream EBITDA, as compared to 6-6.5X for other OMCs, to price in optimism from
privatization and potential upside to minority shareholders from open offer. We reiterate SELL
rating on the stock given (1) our bleak refining outlook and (2) concerns on rising capex/debt
levels, which may act as a drag on cash flows and return ratios.
BPCL (BPCL) Oil, Gas & Consumable Fuels
Cyclical weakness versus privatization optimism. BPCL’s 3QFY20 results were well
below our estimates reflecting sustained weakness in refining margins and sequential
moderation in marketing margins. We cut our FY2020-22 EPS estimates by 11-28%
factoring in lower refining margins, while raising FV to Rs460 (Rs420 earlier) ascribing a
higher 7.5X EV/EBITDA multiple to factor in optimism on privatization. We retain SELL
given our concerns on (1) bleak refining and (2) elevated capex/debt levels.
SELL
FEBRUARY 14, 2020
RESULT
Sector view: Attractive
CMP (`): 476
Fair Value (`): 460
BSE-30: 41,258
Tarun Lakhotia
Hemang Khanna
BPCL
Stock data Forecasts/valuations 2020E 2021E 2022E
52-week range (Rs) (high,low) EPS (Rs) 23.4 33.9 35.5
Mcap (bn) (Rs/US$) EPS growth (%) (35.6) 45.0 4.9
ADTV-3M (mn) (Rs/US$) P/E (X) 20.4 14.1 13.4
Shareholding pattern (%) P/B (X) 2.4 2.2 2.1
Promoters 53.0 EV/EBITDA (X) 12.2 9.9 9.4
FIIs 14.1 RoE (%) 12.2 16.5 16.0
MFs/BFIs Div. yield (%) 3.0 3.7 3.9
Price performance (%) 1M 3M 12M Sales (Rs bn) 2,640 2,801 2,949
Absolute 1 (7) 51 EBITDA (Rs bn) 95 118 124
Rel. to BSE-30 2 (10) 31 Net profits (Rs bn) 46 67 70
549-308
1,034/14.5
11.5/7.1
3,541/50

BPCL Oil, Gas & Consumable Fuels
KOTAK INSTITUTIONAL EQUITIES RESEARCH 13
Key highlights of 3QFY20 performance
Dismal normalized refining margins at US$2.2/bbl. Inventory-adjusted refining
contribution moderated to Rs9.5 bn in 3QFY20 from Rs15.1 bn in 2QFY20, led by
US$1.6/bbl sequential decline in normalized margins to US$2.2/bbl. Reported refining
margin of US$3.2/bbl included US$1/bbl (Rs4.6 bn) of adventitious gain. Crude
throughput increased 9.8% qoq to 8.4 mn tons.
8% qoq moderation in marketing margins. Inventory-adjusted implied marketing
contribution increased to Rs63.4 bn in 3QFY20 from Rs60.4 bn in 2QFY20, as seasonal
increase in volumes was offset by 8% qoq decline in realized marketing margins to
Rs5,138/ton. Reported marketing EBITDA included Rs820 mn of adventitious gains on
products.
3.3% growth in domestic volumes; 0.4%, growth in auto fuels. BPCL’s domestic
volumes increased 3.3% yoy to 11 mn tons; exports jumped to 1.3 mn tons from 0.6 mn
tons in 2QFY20. BPCL’s diesel sales volumes declined 1.6% yoy, while gasoline increased
5.9% yoy, both slower than the underlying growth in domestic consumption
Exhibit 1: Interim results of BPCL, March fiscal year-ends (Rs mn)
Source: Company, Kotak Institutional Equities estimates
(% chg.) yoy
3QFY20 3QFY20E 3QFY19 2QFY20 3QFY20E 3QFY19 2QFY20 9MFY20 9MFY19 (% chg.) FY2020E
Net sales 747,328 706,294 791,688 643,408 5.8 (5.6) 16.2 2,153,915 2,231,574 (3.5) 2,639,607
Increase/(decrease) in stock (32,887) — (46,541) 28,469 (20,534) 1,746 —
Raw material (292,865) (296,060) (309,990) (272,522) (1.1) (5.5) 7.5 (853,403) (906,559) (5.9) (1,024,275)
Trading purchase (343,350) (323,947) (386,205) (324,157) 6.0 (11.1) 5.9 (1,056,190) (1,102,086) (4.2) (1,306,452)
Staff cost (8,934) (8,097) (8,020) (9,224) 10.3 11.4 (3.1) (27,607) (26,273) 5.1 (39,390)
Other expenses (42,259) (40,907) (33,559) (42,225) 3.3 25.9 0.1 (123,601) (128,081) (3.5) (167,461)
Total expenditure (720,294) (669,012) (784,315) (619,659) 7.7 (8.2) 16.2 (2,081,334) (2,161,254) (3.7) (2,537,577)
EBITDA 27,034 37,282 7,374 23,749 (27.5) 266.6 13.8 72,581 70,320 3.2 102,030
Other income 5,148 7,558 9,672 8,713 (31.9) (46.8) (40.9) 19,246 20,532 (6.3) 32,232
Interest (5,121) (6,416) (3,369) (6,388) (20.2) 52.0 (19.8) (16,033) (9,664) 65.9 (19,667)
Depreciation (9,731) (9,711) (7,781) (9,523) 0.2 25.1 2.2 (28,395) (22,744) 24.8 (37,822)
Pretax profits 17,330 28,714 5,895 16,551 (39.6) 194.0 4.7 47,399 58,445 (18.9) 76,773
Extraordinary item 626 — — 5,803 8,063 — 7,437
Current tax (1,640) (7,626) (254) (2,500) (6,940) (10,844) (36.0) (19,085)
Deferred tax (3,710) (1,563) (690) (2,770) (8,080) (7,530) (6,250)
Net income 12,606 19,525 4,951 17,085 (35.4) 154.6 (26.2) 40,442 40,071 0.9 58,875
Adjusted net income 11,980 19,525 4,951 11,281 (38.6) 142.0 6.2 32,379 40,071 (19.2) 51,438
Adjusted EPS (Rs) 6.1 9.9 2.5 5.7 16.5 20.4 26.2
Tax rate (%) 30.9 32.0 16.0 31.8 31.7 31.4 33.0
Volume data
Crude throughput (mn tons) 8.4 8.1 7.5 7.7 3.7 12.3 9.8 23.5 22.8 3.2 31.2
Domestic sales volume (mn tons) 11.0 10.9 10.7 10.3 1.0 3.3 7.5 32.4 31.7 2.1 43.6
Exports sales volume (mn tons) 1.3 0.8 0.8 0.6 65.0 67.1 135.7 2.1 1.6 31.1 1.9
Reported refining margin (US$/bbl) 3.2 5.5 2.8 3.4 (40.9) 16.5 (4.1) 3.2 5.3 (40.0) 3.8
Normalized refining margin (US$/bbl) 2.2 5.0 6.0 3.8 (56.2) (63.5) (42.4) 3.2 4.5 (29.7) 4.1
Implied marketing margins (Rs/ton) 5,125 5,285 5,097 5,588 (3.0) 0.6 (8.3) 5,354 4,943 8.3 5,442
Adventitious gain/(loss) - refining 4,550 1,944 (12,920) (1,750) (480) 8,170 (5,270)
Adventitious gain/(loss) - marketing 820 1,293 (20,410) 1,490 1,050 (980) 220
Net over-recovery/(under-recovery) — — — — — — —
Exchange gain/(loss) (957) (1,472) 6,590 (3,870) (4,512) (9,762) (3,555)

Oil, Gas & Consumable Fuels BPCL
14 KOTAK INSTITUTIONAL EQUITIES RESEARCH
Exhibit 2: Normalized results were well below expectations led by lower refining and marketing
margins Calculation of normalized profitability, 1QFY18 onwards (Rs bn)
Source: Company, Kotak Institutional Equities estimates
Exhibit 3: Normalized refining margin declined to US$2.2/bbl; marketing margin declined 8% qoq Calculation of segment-wise contribution, 1QFY18 onwards (Rs bn)
Source: Company, Kotak Institutional Equities estimates
Exhibit 4 BPCL's adjusted refining margins were at significant discount to Kotak India refining margins Refining margin performance, 1QFY16 onwards (US$/bbl)
Source: Company, Reuters, Kotak Institutional Equities
1QFY19 2QFY19 3QFY19 4QFY19 1QFY20 2QFY20 3QFY20 3QFY20E
Gross contribution 93.7 82.0 49.0 99.9 70.4 75.2 78.2 86.3
Operating expenses 55.0 57.8 41.6 51.9 48.6 51.4 51.2 49.0
Reported EBITDA 38.8 24.2 7.4 48.0 21.8 23.7 27.0 37.3
Add: net under-recovery — — — — — — — —
Add: forex-related loss/(gain) 7.1 9.3 (6.6) (2.8) 0.3 3.9 1.0 1.5
Add: adventitious loss/(gain) (26.8) (14.4) 33.3 (3.6) 4.8 0.3 (5.4) (3.2)
Normalized EBITDA 19.0 19.1 34.1 41.7 26.9 27.9 22.6 35.5
Other income 5.5 5.4 9.7 10.6 5.1 12.6 6.1 9.0
Interest expense 3.0 3.3 3.4 3.5 4.5 6.4 5.1 6.4
Depreciation 7.4 7.6 7.8 9.1 9.1 9.5 9.7 9.7
Normalized PBT 14.1 13.7 32.6 39.6 18.3 24.6 13.9 28.4
1QFY19 2QFY19 3QFY19 4QFY19 1QFY20 2QFY20 3QFY20 3QFY20E
Segment-wise contribution
Gross contribution 93.7 82.0 49.0 99.9 70.4 75.2 78.2 86.3
Add: net under-recovery — — — — — — — —
Add: adventitious loss/(gain) (26.8) (14.4) 33.3 (3.6) 4.8 0.3 (5.4) (3.2)
Normalized gross contribution 66.9 67.6 82.3 96.3 75.2 75.5 72.9 83.0
Refining segment 15.6 12.6 23.9 10.7 14.4 15.1 9.5 21.2
Marketing and other segments 51.3 55.0 58.4 85.6 60.8 60.4 63.4 61.9
Blended marketing margins (Rs/ton) 4,552 5,195 5,097 7,349 5,357 5,588 5,138 5,285
Reported refining margins (US$/bbl) 7.5 5.6 2.8 2.7 2.8 3.4 3.2 5.5
Normalized refining margins (US$/bbl) 4.2 3.3 6.0 2.6 3.7 3.8 2.2 5.0
Crude throughput (mn tons) 7.7 7.6 7.5 8.2 7.5 7.7 8.4 8.1
Domestic sales (mn tons) 11.0 10.1 10.7 11.4 11.1 10.3 11.0 10.9
Export sales (mn tons) 0.3 0.5 0.8 0.3 0.2 0.6 1.3 0.8
Exchange rate (Rs/US$) 67.0 70.1 72.1 70.4 71.2 70.4 70.4 71.2
2.6
3.8 3.6
6.0
6.9 6.5
4.9
5.6
4.2
3.3
6.0
2.6
3.7 3.8
2.2
6.1
5.2
7.4
6.7 6.4
8.3 7.9
7.2
6.6 6.8
5.7
4.1 4.0
6.8 7.1
0
1
2
3
4
5
6
7
8
9
1QFY17 2QFY17 3QFY17 4QFY17 1QFY18 2QFY18 3QFY18 4QFY18 1QFY19 2QFY19 3QFY19 4QFY19 1QFY20 2QFY20 3QFY20
(US$/bbl) BPCL's inventory-adjusted margins Kotak India refining margin

BPCL Oil, Gas & Consumable Fuels
KOTAK INSTITUTIONAL EQUITIES RESEARCH 15
Exhibit 5: BPCL's auto fuels volume growth continue to lag growth in domestic consumption Growth in auto fuels volumes across industry, 1QFY18 onwards
Source: Companies, PPAC, Kotak Institutional Equities estimates
Exhibit 6: Kotak India margins have moderated from recent highs Kotak India refining margins, January 2018 onwards (US$/bbl)
Source: Reuters, Kotak Institutional Equities estimates
0
2
4
6
8
10
12
14
1QFY18 2QFY18 3QFY18 4QFY18 1QFY19 2QFY19 3QFY19 4QFY19 1QFY20 2QFY20 3QFY20
(%) BPCL HPCL IOCL Consumption
0.0
2.0
4.0
6.0
8.0
10.0
12.0
1-J
an-1
8
25-J
an-1
8
18-F
eb-1
8
14-M
ar-1
8
7-A
pr-
18
1-M
ay-1
8
25-M
ay-1
8
18-J
un-1
8
12-J
ul-18
5-A
ug-
18
29-A
ug-1
8
22-S
ep-1
8
16-O
ct-1
8
9-N
ov-
18
3-D
ec-1
8
27-D
ec-1
8
20-J
an-1
9
13-F
eb-1
9
9-M
ar-1
9
2-A
pr-
19
26-A
pr-1
9
20-M
ay-1
9
13-J
un-1
9
7-J
ul-19
31-J
ul-19
24-A
ug-1
9
17-S
ep-1
9
11-O
ct-1
9
4-N
ov-
19
28-N
ov-1
9
22-D
ec-1
9
15-J
an-2
0
8-F
eb-
20
(US$/bbl) Kotak India refining margin

Oil, Gas & Consumable Fuels BPCL
16 KOTAK INSTITUTIONAL EQUITIES RESEARCH
Exhibit 7: Marketing margins on auto fuels have moderated from abnormal levels in 4QFY19 Gross margins on diesel and gasoline, January 2017 onwards (Rs/liter)
Source: Company, PPAC, Kotak Institutional Equities estimates
Exhibit 8: Key assumptions of BPCL, March fiscal year-ends, 2014-22E (Rs mn)
Source: Company, Kotak Institutional Equities estimates
Exhibit 9: Earnings sensitivity of BPCL to refining margins and marketing margins (Rs mn)
Source: Kotak Institutional Equities estimates
2.7 2.5 2.6 2.7 2.7 2.4
3.6
2.5 3.1
2.3 2.2
1.3
2.5 2.6
4.1 3.8
2.2
0.8
2.0
2.9 3.0
2.0 1.3
4.5
8.3
6.5
4.6 4.5
3.2 3.6
4.4
3.5 3.7 3.2 3.4 3.5
3.0
3.8
2.7 2.7 4.0
2.7 2.8 2.1
3.3 2.9 3.1 3.1 2.4
1.2 2.6 2.6
3.7 3.4 2.1
(0.0)
1.4 1.8 2.7
0.8 2.6
5.7
7.9 6.6
5.0
2.5 0.2
2.7 3.5
2.3 2.6 0.3 1.8 1.6
2.2 2.7
(1.0)
0.0
1.0
2.0
3.0
4.0
5.0
6.0
7.0
8.0
9.0
Jan-1
7
Feb-1
7
Mar-
17
Apr-
17
May-
17
Jun-1
7
Jul-17
Aug-1
7
Sep-1
7
Oct
-17
Nov-
17
Dec
-17
Jan-1
8
Feb-1
8
Mar-
18
Apr-
18
May-
18
Jun-1
8
Jul-18
Aug-1
8
Sep-1
8
Oct
-18
Nov-
18
Dec
-18
Jan-1
9
Feb-1
9
Mar-
19
Apr-
19
May-
19
Jun-1
9
Jul-19
Aug-1
9
Sep-1
9
Oct
-19
Nov-
19
Dec
-19
Jan-2
0
Feb-2
0
Gross marketing margin on diesel Gross marketing margin on gasoline(Rs/liter)
2014 2015 2016 2017 2018 2019 2020E 2021E 2022E
Refining assumptions
Exchange rate (Rs/US$) 60.5 61.2 65.4 67.1 64.5 69.9 70.6 72.0 73.5
Effective tariff protection (%) 2.3 2.4 2.4 2.4 2.3 2.5 2.6 2.6 2.6
Crude throughput (mn tons) 23.4 23.4 24.1 25.4 28.5 31.0 31.9 32.0 32.0
Net refining margin (US$/bbl) 4.3 3.6 6.6 5.3 6.9 4.6 3.3 4.3 4.6
Refining EBITDA (Rs bn) 27.4 20.0 55.7 43.7 65.1 39.2 17.7 34.5 38.2
Marketing assumptions
Sales volume (mn tons) 37.0 36.7 38.4 40.2 43.2 45.0 46.2 47.9 49.6
Marketing margin on auto fuels (Rs/liter) — — 1.9 1.8 1.8 2.8 2.3 2.3 2.3
Subsidy under-recoveries (Rs bn) (5.1) (4.9) — — — — — — —
Implied marketing EBITDA (Rs bn) 53.5 63.2 54.5 64.6 51.5 80.4 77.7 83.2 85.5
Fiscal 2021E Fiscal 2022E
Downside Base case Upside Downside Base case Upside
Refining margins
Refining margins (US$/bbl) 3.3 4.3 5.3 3.6 4.6 5.6
Net profits (Rs mn) 54,097 66,604 79,110 57,082 69,849 82,616
EPS (Rs) 27.5 33.9 40.2 29.0 35.5 42.0
% upside/(downside) (18.8) 18.8 (18.3) 18.3
Marketing margins
Auto fuels marketing margin (Rs/liter) 1.8 2.3 2.8 1.8 2.3 2.8
Net profits (Rs mn) 52,966 66,604 80,242 55,631 69,849 84,068
EPS (Rs) 26.9 33.9 40.8 28.3 35.5 42.7
% upside/(downside) (20.5) 20.5 (20.4) 20.4
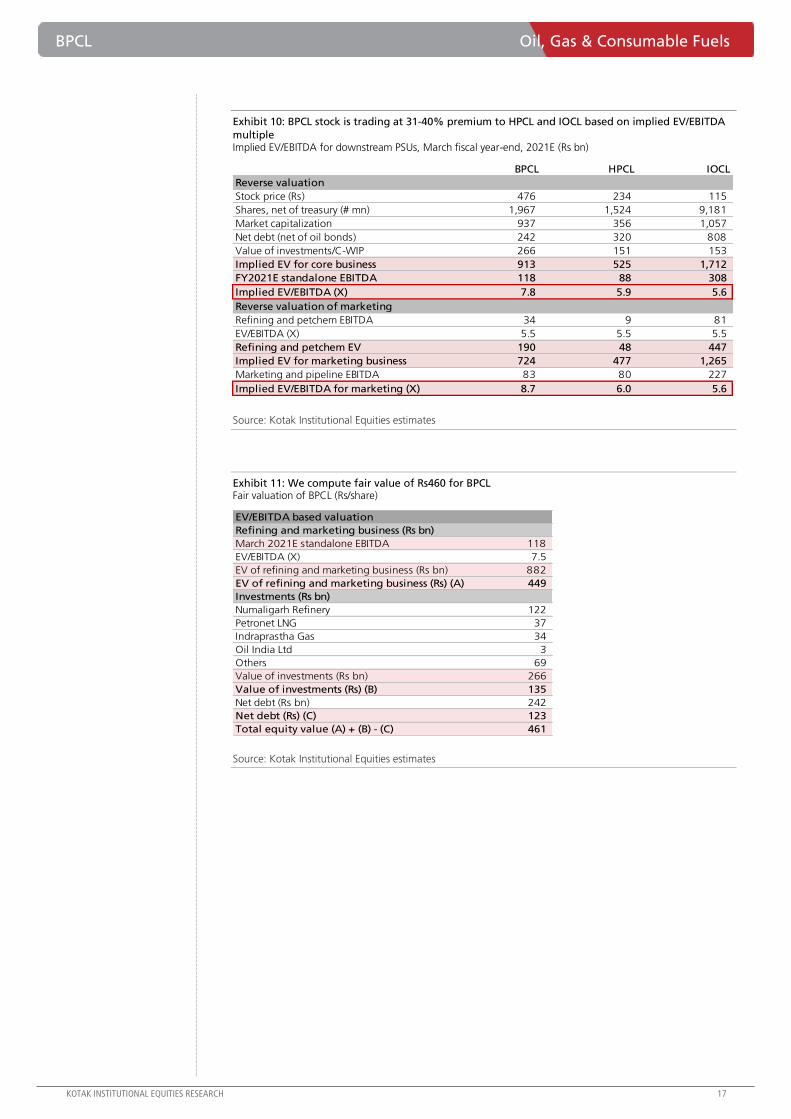
BPCL Oil, Gas & Consumable Fuels
KOTAK INSTITUTIONAL EQUITIES RESEARCH 17
Exhibit 10: BPCL stock is trading at 31-40% premium to HPCL and IOCL based on implied EV/EBITDA
multiple Implied EV/EBITDA for downstream PSUs, March fiscal year-end, 2021E (Rs bn)
Source: Kotak Institutional Equities estimates
Exhibit 11: We compute fair value of Rs460 for BPCL Fair valuation of BPCL (Rs/share)
Source: Kotak Institutional Equities estimates
BPCL HPCL IOCL
Reverse valuation
Stock price (Rs) 476 234 115
Shares, net of treasury (# mn) 1,967 1,524 9,181
Market capitalization 937 356 1,057
Net debt (net of oil bonds) 242 320 808
Value of investments/C-WIP 266 151 153
Implied EV for core business 913 525 1,712
FY2021E standalone EBITDA 118 88 308
Implied EV/EBITDA (X) 7.8 5.9 5.6
Reverse valuation of marketing
Refining and petchem EBITDA 34 9 81
EV/EBITDA (X) 5.5 5.5 5.5
Refining and petchem EV 190 48 447
Implied EV for marketing business 724 477 1,265
Marketing and pipeline EBITDA 83 80 227
Implied EV/EBITDA for marketing (X) 8.7 6.0 5.6
EV/EBITDA based valuation
Refining and marketing business (Rs bn)
March 2021E standalone EBITDA 118
EV/EBITDA (X) 7.5
EV of refining and marketing business (Rs bn) 882
EV of refining and marketing business (Rs) (A) 449
Investments (Rs bn)
Numaligarh Refinery 122
Petronet LNG 37
Indraprastha Gas 34
Oil India Ltd 3
Others 69
Value of investments (Rs bn) 266
Value of investments (Rs) (B) 135
Net debt (Rs bn) 242
Net debt (Rs) (C) 123
Total equity value (A) + (B) - (C) 461

Oil, Gas & Consumable Fuels BPCL
18 KOTAK INSTITUTIONAL EQUITIES RESEARCH
Exhibit 12: Profit model, balance sheet, cash model of BPCL, March fiscal year-ends, 2014-22E (Rs mn)
Source: Company, Kotak Institutional Equities estimates
2014 2015 2016 2017 2018 2019 2020E 2021E 2022E
Profit model (Rs mn)
Net sales 2,600,605 2,380,869 1,884,046 2,022,106 2,363,131 2,972,751 2,639,764 2,801,497 2,948,721
EBITDA 80,862 76,567 110,246 113,193 116,689 119,643 95,463 117,664 123,740
Other income 14,687 22,000 17,762 26,007 30,109 29,836 31,232 32,082 32,932
Interest (13,591) (5,831) (5,652) (4,959) (8,333) (13,190) (21,159) (19,111) (18,431)
Depreciation (22,468) (25,160) (18,446) (18,913) (26,485) (31,893) (38,322) (41,206) (44,452)
Pretax profits 59,490 67,576 103,910 115,328 111,980 104,396 67,213 89,429 93,789
Extraordinary items — 6,579 — (4,900) — — 8,063 — —
Current tax (21,829) (19,836) (26,987) (20,988) (18,468) (20,790) (12,023) (13,075) (13,690)
Deferred tax 2,948 (3,474) (6,360) (9,047) (14,318) (12,286) (9,250) (9,750) (10,250)
Adjusted net profits 40,609 46,334 70,564 83,960 79,194 71,320 45,940 66,604 69,849
Adjusted EPS (Rs) 20.6 23.6 35.9 42.7 40.3 36.3 23.4 33.9 35.5
Balance sheet (Rs mn)
Total equity 194,588 224,675 273,230 296,684 341,520 367,377 387,582 419,551 453,079
Deferred taxation liability 13,609 17,083 35,118 36,182 50,924 64,245 73,495 83,245 93,495
Total borrowings 203,298 130,976 158,575 231,592 233,507 290,993 291,993 299,993 296,993
Currrent liabilities 312,780 324,555 286,651 355,439 376,274 433,658 424,108 424,640 427,295
Total liabilities and equity 724,274 697,289 753,574 919,896 1,002,225 1,156,273 1,177,177 1,227,429 1,270,862
Cash 2,038 13,602 20,674 647 881 954 1,599 1,866 1,917
Current assets 382,722 279,968 246,069 342,637 369,285 459,864 434,583 440,842 446,744
Total fixed assets 221,046 279,807 358,721 430,598 473,852 535,539 579,079 620,804 656,284
Investments 118,469 123,911 128,110 146,015 158,208 159,916 161,916 163,916 165,916
Total assets 724,274 697,289 753,574 919,896 1,002,225 1,156,273 1,177,177 1,227,429 1,270,861
Free cash flow (Rs mn)
Operating cash flow, excl. working capital 62,232 58,016 86,450 79,658 92,074 99,718 68,578 83,422 89,188
Working capital changes 7,086 117,160 7,522 (8,441) (10,640) (34,022) 15,730 (5,727) (3,247)
Capital expenditure (47,439) (80,349) (93,246) (89,824) (69,154) (90,568) (80,096) (80,875) (77,500)
Investments (6,527) (9,092) 26 (29,314) (59) (5,699) (2,000) (2,000) (2,000)
Other income 11,107 10,351 13,338 17,836 21,718 20,901 31,232 32,082 32,932
Free cash flow 26,459 96,085 14,090 (30,086) 33,938 (9,671) 33,443 26,902 39,373
Ratios (%)
Debt/equity 104.5 58.3 58.0 78.1 68.4 79.2 75.3 71.5 65.5
Net debt/equity 103.4 52.2 50.5 77.8 68.1 78.9 74.9 71.1 65.1
RoAE 20.8 22.6 25.7 25.1 21.8 17.3 12.1 13.8 13.3
RoACE 12.0 12.8 17.7 17.0 14.3 11.9 8.2 10.4 10.2
Key assumptions
Crude throughput (mn tons) 23.4 23.4 24.1 25.4 28.5 31.0 31.9 32.0 32.0
Effective tariff protection (%) 2.3 2.4 2.4 2.4 2.3 2.5 2.6 2.6 2.6
Net refining margin (US$/bbl) 4.3 3.6 6.6 5.3 6.9 4.6 3.3 4.3 4.6
Sales volume (mn tons) 37.0 36.7 38.4 40.2 43.2 45.0 46.2 47.9 49.6
Marketing margin on auto fuels (Rs/liter) 0.0 0.0 1.9 1.8 1.8 2.8 2.3 2.3 2.3
Subsidy under-recoveries (Rs mn) (5,115) (4,874) — — — — — — —
Adventitious gain/(loss) (Rs mn) 15,770 (31,420) (23,710) 19,872 1,210 1,740 1,050 — —

For Private Circulation Only. FOR IMPORTANT INFORMATION ABOUT KOTAK SECURITIES’ RATING SYSTEM AND OTHER DISCLOSURES, REFER TO THE END OF THIS MATERIAL.
[email protected]: +91 22 6218 6427
3QFY20 earnings— strong volumes and realization drives growth
SRCM’s 3QFY20 EBITDA missed our estimates due to higher costs in cement division and lower
merchant power sales. The company reported revenues of Rs28.4 bn (+2% yoy, 2% qoq),
EBITDA of Rs8.5 bn (+20% yoy, +1% qoq) and net-income of Rs3.1 bn (+3% yoy, flat qoq)
against our estimate of Rs29.2bn, Rs9.1 bn and Rs3.6 bn, respectively.
Cement realization declined to Rs4,512/ton (+5%yoy, -3% qoq), and was in line with our
estimate due to industry wide price correction during the quarter. During the quarter, cement
prices in North declined by 2% qoq whereas South and East witnessed 4-5% qoq decline.
Costs/ton of Rs3,147/ton declined by 2% yoy (-2% qoq) with higher than expected freight
costs (-6% yoy, +2% qoq) possibly due to higher lead distance to achieve strong volumes.
Cement EBITDA of Rs8.3 bn or 1,365/ton (+31% yoy, +3% qoq) moderated from record high
levels led by lower prices. Power division reported EBITDA loss of Rs30mn (-105%, -122%qoq)
due to sharp reduction in external power sales to 68 mn units (-85% yoy, -81% qoq).
The company declared an interim dividend of Rs110/share. During the quarter ended December
31, 2019, the company has raised Rs24 bn through a QIP and allotted 1.2 mn equity shares of
Rs10 each at a price of Rs19,300/share on November 23, 2019.
Capacity addition plans remain undeterred by demand slowdown
SRCM aims to increase its capacity from 40.4mtpa currently to 46.4 mtpa by 1HFY21E. The 2.5
mtpa grinding unit (GU) at Jharkhand has commissioned whereas the 3 mtpa Odisha GU is on
track to commission in 2HFY20E. Further, the 3 mtpa GU at Pune is on track to complete by
1QFY21E and increase its cement capacity to 46.4 mtpa. We estimate capacity utilisation to
increase to 71% in FY2022E from 61% in FY2021E factoring a 15% CAGR volume over
FY2020-22E and see sufficient headroom for growth. SRCM plans to increase capacity to 56
mtpa in three years (FY2023E) and to 80 mtpa in six years (FY2026E) implying a 12% CAGR.
We expect the board to approve 9-10 mtpa capacity addition in the next 1-2 quarters.
We maintain SELL on expensive valuations; fair value revised to Rs16,200 (from Rs15,200)
We have increased our EBITDA by 2/8/8% due to 1/4/4% higher volumes and 2/3/3% lower
costs/ton for FY2020/21/22E. Our fair value increases to Rs16,200/share at 10X EV/EBITDA
September 2021E. We maintain SELL on expensive valuations—18X/15X EV/EBITDA and
US$250/240/ton EV FY2021/22E.
Shree Cement (SRCM) Construction Materials
Volume growth at the expense of margins. SRCM’s 3QFY20 cement volumes grew
by 5% yoy in 3QFY20, higher than the market, after a weak 1HFY20, however, margins
declined sequentially with 3% qoq lower realization. EBITDA loss at the power division
was a minor drag. SRCM is on track to reach 46 mtpa by 1HFY21 and aims to increase
its capacity by 40% to 56 mtpa in three years. The recent Rs24bn equity raise would
help it remain debt free. We increase EBITDA by 2/8/8% for FY20/21/22E and revise our
fair value to Rs16,200 (from Rs15,200). Maintain SELL on expensive valuation.
SELL
FEBRUARY 14, 2020
RESULT
Sector view: Cautious
CMP (`): 24,434
Fair Value (`): 16,200
BSE-30: 41,258
Sumangal Nevatia
Murtuza Arsiwalla
Prayatn Mahajan
Shree Cement
Stock data Forecasts/valuations 2020E 2021E 2022E
52-week range (Rs) (high,low) EPS (Rs) 450.4 613.5 755.4
Mcap (bn) (Rs/US$) EPS growth (%) 39.3 36.2 23.1
ADTV-3M (mn) (Rs/US$) P/E (X) 54.2 39.8 32.3
Shareholding pattern (%) P/B (X) 6.7 5.9 5.1
Promoters 62.6 EV/EBITDA (X) 23.0 18.8 15.9
FIIs 13.2 RoE (%) 14.3 15.8 17.0
MFs/BFIs Div. yield (%) 0.5 0.5 0.5
Price performance (%) 1M 3M 12M Sales (Rs bn) 124 147 172
Absolute 4 24 57 EBITDA (Rs bn) 38 46 54
Rel. to BSE-30 5 21 36 Net profits (Rs bn) 16 22 27
25,355-15,046
882/12.4
7.5/1.1
592/8
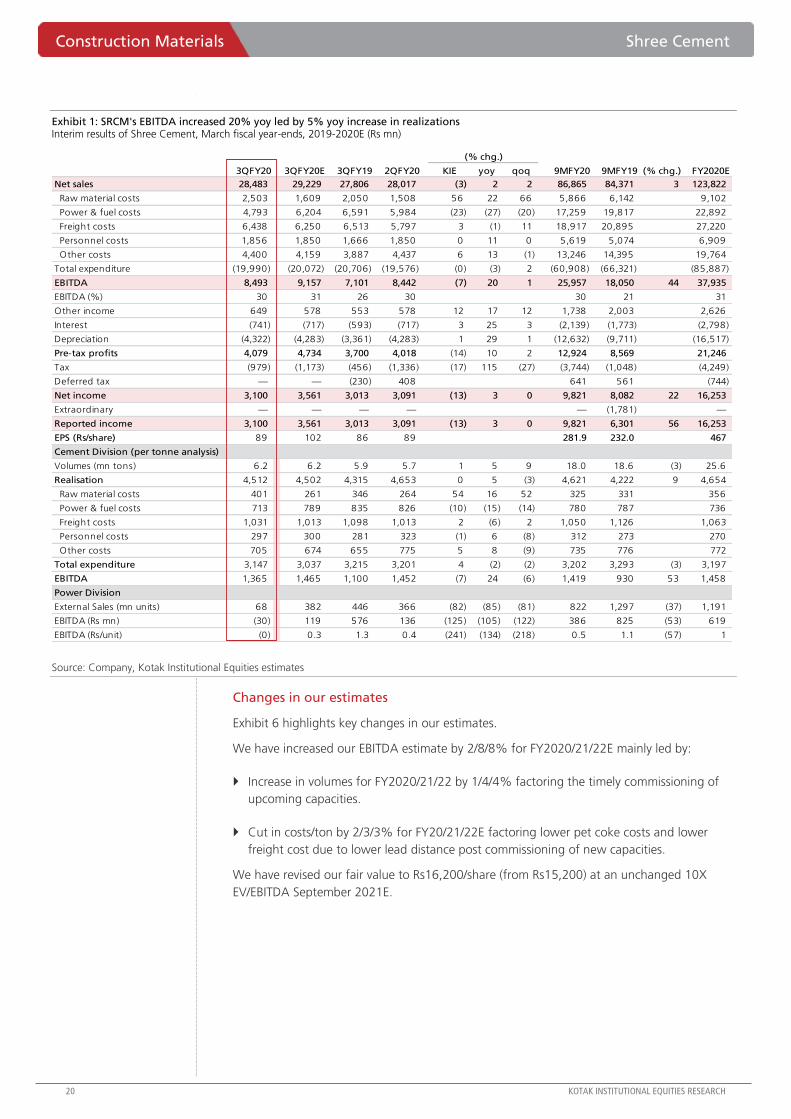
Construction Materials Shree Cement
20 KOTAK INSTITUTIONAL EQUITIES RESEARCH
Exhibit 1: SRCM's EBITDA increased 20% yoy led by 5% yoy increase in realizations Interim results of Shree Cement, March fiscal year-ends, 2019-2020E (Rs mn)
Source: Company, Kotak Institutional Equities estimates
Changes in our estimates
Exhibit 6 highlights key changes in our estimates.
We have increased our EBITDA estimate by 2/8/8% for FY2020/21/22E mainly led by:
Increase in volumes for FY2020/21/22 by 1/4/4% factoring the timely commissioning of
upcoming capacities.
Cut in costs/ton by 2/3/3% for FY20/21/22E factoring lower pet coke costs and lower
freight cost due to lower lead distance post commissioning of new capacities.
We have revised our fair value to Rs16,200/share (from Rs15,200) at an unchanged 10X
EV/EBITDA September 2021E.
(% chg.)
3QFY20 3QFY20E 3QFY19 2QFY20 KIE yoy qoq 9MFY20 9MFY19 (% chg.) FY2020E
Net sales 28,483 29,229 27,806 28,017 (3) 2 2 86,865 84,371 3 123,822
Raw material costs 2,503 1,609 2,050 1,508 56 22 66 5,866 6,142 9,102
Power & fuel costs 4,793 6,204 6,591 5,984 (23) (27) (20) 17,259 19,817 22,892
Freight costs 6,438 6,250 6,513 5,797 3 (1) 11 18,917 20,895 27,220
Personnel costs 1,856 1,850 1,666 1,850 0 11 0 5,619 5,074 6,909
Other costs 4,400 4,159 3,887 4,437 6 13 (1) 13,246 14,395 19,764
Total expenditure (19,990) (20,072) (20,706) (19,576) (0) (3) 2 (60,908) (66,321) (85,887)
EBITDA 8,493 9,157 7,101 8,442 (7) 20 1 25,957 18,050 44 37,935
EBITDA (%) 30 31 26 30 30 21 31
Other income 649 578 553 578 12 17 12 1,738 2,003 2,626
Interest (741) (717) (593) (717) 3 25 3 (2,139) (1,773) (2,798)
Depreciation (4,322) (4,283) (3,361) (4,283) 1 29 1 (12,632) (9,711) (16,517)
Pre-tax profits 4,079 4,734 3,700 4,018 (14) 10 2 12,924 8,569 21,246
Tax (979) (1,173) (456) (1,336) (17) 115 (27) (3,744) (1,048) (4,249)
Deferred tax — — (230) 408 641 561 (744)
Net income 3,100 3,561 3,013 3,091 (13) 3 0 9,821 8,082 22 16,253
Extraordinary — — — — — (1,781) —
Reported income 3,100 3,561 3,013 3,091 (13) 3 0 9,821 6,301 56 16,253
EPS (Rs/share) 89 102 86 89 281.9 232.0 467
Cement Division (per tonne analysis)
Volumes (mn tons) 6.2 6.2 5.9 5.7 1 5 9 18.0 18.6 (3) 25.6
Realisation 4,512 4,502 4,315 4,653 0 5 (3) 4,621 4,222 9 4,654
Raw material costs 401 261 346 264 54 16 52 325 331 356
Power & fuel costs 713 789 835 826 (10) (15) (14) 780 787 736
Freight costs 1,031 1,013 1,098 1,013 2 (6) 2 1,050 1,126 1,063
Personnel costs 297 300 281 323 (1) 6 (8) 312 273 270
Other costs 705 674 655 775 5 8 (9) 735 776 772
Total expenditure 3,147 3,037 3,215 3,201 4 (2) (2) 3,202 3,293 (3) 3,197
EBITDA 1,365 1,465 1,100 1,452 (7) 24 (6) 1,419 930 53 1,458
Power Division
External Sales (mn units) 68 382 446 366 (82) (85) (81) 822 1,297 (37) 1,191
EBITDA (Rs mn) (30) 119 576 136 (125) (105) (122) 386 825 (53) 619
EBITDA (Rs/unit) (0) 0.3 1.3 0.4 (241) (134) (218) 0.5 1.1 (57) 1

Shree Cement Construction Materials
KOTAK INSTITUTIONAL EQUITIES RESEARCH 21
Exhibit 2: Shree Cements’ EBITDA/ton declined 6% qoq to Rs1,365/ton on lower realizations EBITDA/ton and cost/ton for Shree Cements, March fiscal year-ends, 2015-20 (Rs/ton)
Source: Company, Kotak Institutional Equities
Exhibit 3: Shree Cement's new capacity additions are in East, South and West regions SRCM's cement capacity at various locations, March fiscal year-ends, 2012-2021E (Rs mn)
Source: Company, Kotak Institutional Equities estimates
Exhibit 4: Pet-coke prices remain stable in 4QFY20E at US$65/ton US pet coke prices (CFR basis), 2016 –2019 (US$/ton)
Source: Company, Kotak Institutional Equities
0
500
1,000
1,500
2,000
2,500
3,000
3,500
4,000
4,500
5,000
1Q
FY15
2Q
FY15
3Q
FY15
4Q
FY15
1Q
FY16
2Q
FY16
3Q
FY16
4Q
FY16
1Q
FY17
2Q
FY17
3Q
FY17
4Q
FY17
1Q
FY18
2Q
FY18
3Q
FY18
4Q
FY18
1Q
FY19
2Q
FY19
3Q
FY19
4Q
FY19
1Q
FY20
2Q
FY20
3Q
FY20
Cost/ton EBITDA/ton
Location 2012 2013 2014 2015 2016 2017 2018 2019 2020E 2021E 2022E
Cuttack, Odisha — — — — — — — — — 3.0 —
Jharkhand — — — — — — — — 2.5 — —
East — — — — — — — 3.0 — — —
Pune — — — — — — — — — 3.0 —
West — — — — — — — — — 3.0 —
Total Cement capacity (mtpa) — — 4— 6.1 2.0 3.7 5.6 3.0 2.5 6.0 —
20
40
60
80
100
120
140
Oct
-16
Dec
-16
Feb-1
7
Apr-
17
Jun-1
7
Aug-1
7
Oct
-17
Dec
-17
Feb-1
8
Apr-
18
Jun-1
8
Aug-1
8
Oct
-18
Dec
-18
Feb-1
9
Apr-
19
Jun-1
9
Aug-1
9
Oct
-19
Dec
-19
Feb-2
0
US Petcoke prices (US$/ton) (CFR)
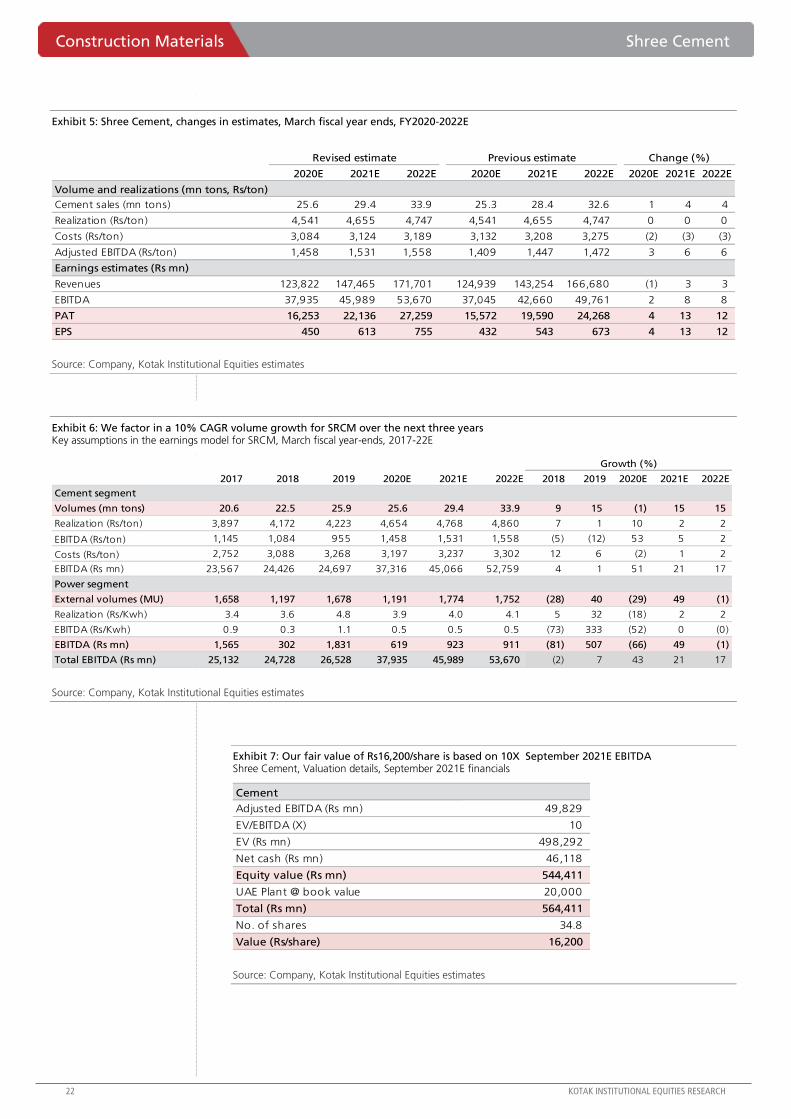
Construction Materials Shree Cement
22 KOTAK INSTITUTIONAL EQUITIES RESEARCH
Exhibit 5: Shree Cement, changes in estimates, March fiscal year ends, FY2020-2022E
Source: Company, Kotak Institutional Equities estimates
Exhibit 6: We factor in a 10% CAGR volume growth for SRCM over the next three years Key assumptions in the earnings model for SRCM, March fiscal year-ends, 2017-22E
Source: Company, Kotak Institutional Equities estimates
Exhibit 7: Our fair value of Rs16,200/share is based on 10X September 2021E EBITDA Shree Cement, Valuation details, September 2021E financials
Source: Company, Kotak Institutional Equities estimates
2020E 2021E 2022E 2020E 2021E 2022E 2020E 2021E 2022E
Volume and realizations (mn tons, Rs/ton)
Cement sales (mn tons) 25.6 29.4 33.9 25.3 28.4 32.6 1 4 4
Realization (Rs/ton) 4,541 4,655 4,747 4,541 4,655 4,747 0 0 0
Costs (Rs/ton) 3,084 3,124 3,189 3,132 3,208 3,275 (2) (3) (3)
Adjusted EBITDA (Rs/ton) 1,458 1,531 1,558 1,409 1,447 1,472 3 6 6
Earnings estimates (Rs mn)
Revenues 123,822 147,465 171,701 124,939 143,254 166,680 (1) 3 3
EBITDA 37,935 45,989 53,670 37,045 42,660 49,761 2 8 8
PAT 16,253 22,136 27,259 15,572 19,590 24,268 4 13 12
EPS 450 613 755 432 543 673 4 13 12
Revised estimate Previous estimate Change (%)
2017 2018 2019 2020E 2021E 2022E 2018 2019 2020E 2021E 2022E
Cement segment
Volumes (mn tons) 20.6 22.5 25.9 25.6 29.4 33.9 9 15 (1) 15 15
Realization (Rs/ton) 3,897 4,172 4,223 4,654 4,768 4,860 7 1 10 2 2
EBITDA (Rs/ton) 1,145 1,084 955 1,458 1,531 1,558 (5) (12) 53 5 2
Costs (Rs/ton) 2,752 3,088 3,268 3,197 3,237 3,302 12 6 (2) 1 2
EBITDA (Rs mn) 23,567 24,426 24,697 37,316 45,066 52,759 4 1 51 21 17
Power segment
External volumes (MU) 1,658 1,197 1,678 1,191 1,774 1,752 (28) 40 (29) 49 (1)
Realization (Rs/Kwh) 3.4 3.6 4.8 3.9 4.0 4.1 5 32 (18) 2 2
EBITDA (Rs/Kwh) 0.9 0.3 1.1 0.5 0.5 0.5 (73) 333 (52) 0 (0)
EBITDA (Rs mn) 1,565 302 1,831 619 923 911 (81) 507 (66) 49 (1)
Total EBITDA (Rs mn) 25,132 24,728 26,528 37,935 45,989 53,670 (2) 7 43 21 17
Growth (%)
Cement
Adjusted EBITDA (Rs mn) 49,829
EV/EBITDA (X) 10
EV (Rs mn) 498,292
Net cash (Rs mn) 46,118
Equity value (Rs mn) 544,411
UAE Plant @ book value 20,000
Total (Rs mn) 564,411
No. of shares 34.8
Value (Rs/share) 16,200

Shree Cement Construction Materials
KOTAK INSTITUTIONAL EQUITIES RESEARCH 23
Exhibit 8: Shree Cement, Profit model, balance sheet and cash flow model, March fiscal year-ends, 2016-2022E (Rs mn)
Source: Company, Kotak Institutional Equities estimates
2016 2017 2018 2019 2020E 2021E 2022E
Profit model (Rs mn)
Net sales 55,678 85,943 98,331 117,220 123,822 147,465 171,701
EBITDA 13,203 25,132 24,728 26,528 37,935 45,989 53,670
Other Income 1,201 3,616 3,891 2,454 2,626 3,915 5,056
Interest (751) (1,294) (1,353) (2,470) (2,798) (2,798) (2,798)
Depreciaton (9,084) (12,146) (8,994) (13,917) (16,517) (18,170) (20,295)
Profit before tax 4,568 15,307 18,272 12,596 21,246 28,936 35,632
Extra-ordinary items 530 — — (1,754) — — —
Current tax (1,231) (3,263) (4,466) (2,204) (4,249) (5,787) (7,126)
Deferred tax 682 1,346 36 873 (744) (1,013) (1,247)
Net profit 4,549 13,390 13,842 9,510 16,253 22,136 27,259
Adjusted PAT 4,019 13,390 13,842 11,265 16,253 22,136 27,259
Earnings per share (Rs) 115.4 384.3 397.3 323.3 450.4 613.5 755.4
Balance sheet (Rs mn)
Equity 61,802 76,981 88,968 95,974 131,506 148,920 171,457
Borrowings 8,629 12,926 34,030 27,980 27,980 27,980 27,980
Current liabilities 17,459 21,753 17,500 14,755 15,520 18,482 21,518
Other Current Liabilities — — 10,920 13,224 13,224 13,224 13,224
Total liabilities 87,889 111,661 151,418 151,933 188,229 208,605 234,178
Fixed assets 33,147 33,096 50,043 55,862 56,845 63,850 68,555
Goodwill — — 121 106 106 106 106
Investments 23,661 42,426 54,343 44,439 44,439 44,439 44,439
Cash 2,830 1,110 1,209 3,078 36,971 43,970 58,515
Other current assets 25,617 29,952 32,682 36,512 38,676 46,060 53,631
Deferred tax asset 2,634 5,077 6,133 7,234 6,490 5,478 4,230
Other Non Current Assets — — 6,887 4,702 4,702 4,702 4,702
Total assets 87,889 111,661 151,418 151,933 188,229 208,605 234,178
Net Debt (17,863) (30,610) (21,523) 2,046 (31,847) (38,846) (53,391)
Free cash flow (Rs mn)
Operating cash flow excl. working capital 12,374 25,292 26,350 25,638 33,514 41,319 48,801
Working capital changes (2,059) (509) (1,131) (5,302) (1,399) (4,423) (4,534)
Capital expenditure (7,348) (12,947) (25,263) (18,853) (17,500) (25,175) (25,000)
Free cash flow 2,968 11,836 (43) 1,484 14,615 11,720 19,266
Ratios
EV/EBITDA 63 33 34 32 22 18 15
P/E 187 64 61 90 54 40 32
P/B 14 11 10 9 7 6 5
EV/Ton 497 417 369 322 296 250 241
Book value (Rs/share) 1,774 2,210 2,554 2,755 3,775 4,274 4,921
RoAE (%) 7.0 19.3 16.7 12.2 14.3 15.8 17.0
RoACE (%) 5.6 14.2 11.2 9.0 11.6 12.7 13.6
CRoCI (%) 13.2 29.8 31.0 26.2 28.2 29.8 30.7

For Private Circulation Only. FOR IMPORTANT INFORMATION ABOUT KOTAK SECURITIES’ RATING SYSTEM AND OTHER DISCLOSURES, REFER TO THE END OF THIS MATERIAL.
[email protected]: +91 22 6218 6427
Contractual escalations and re-leasing of assets aid 15% yoy growth in revenues
Embassy reported revenue from operations at Rs5.5 bn (+14% yoy) against our estimate of
Rs5.3 bn on the back of (1) contractual escalation on 6.1 mn sq. ft since 3QFY19 (30%),
(2) lease up of 1.8 mn sq. ft across assets (30%) and (3) incremental contribution from Four
Season Hotels launched in May 2019 (23%). Growth in NOI and EBITDA at 16% yoy and 15%
yoy, respectively was commensurate with the increase in revenues. NOI margin for the quarter
improved 153 bps yoy to 85%.
Distributions for 3QFY20 were at Rs4.7 bn (DPU of Rs6.1) taking total distribution in 9MFY20 to
Rs13.5 bn against our estimated NDCF of Rs18 bn for FY2020. Embassy has achieved revenues
of Rs16 bn, NOI of Rs13.5 bn and NDCF of Rs13.5 bn in 9MFY20 compared to estimates of
Rs22 bn, Rs18 bn and Rs18 bn, respectively for the full year FY2020.
Strong operational performance continued with 0.5 mn sq. ft of re-leasing at 15% premium
During the quarter, Embassy leased 0.5 mn sq. ft with 0.16 mn sq. ft of area re-leased
achieving re-leasing premium of 15%. The company also completed construction of 1.4 mn sq.
ft two quarters ahead of schedule with 44% area pre-committed. Embassy has an additional
lease pipeline of 1.3 mn sq. ft. Embassy REIT improved occupancy by 220 bps to 95.1% for its
operational assets of 24.8 msf in 3QFY20.
Maintain ADD rating with revised fair value of Rs450/share
We view Embassy REIT as a medium risk, high dividend yield (7.6% in FY2022E on CMP)
investment with dividend payouts growing at 18% CAGR between FY2020 and FY2023.
We have assigned a value of Rs447 bn (attributable Rs420 bn) for the operational as well as
under-construction assets of Embassy REIT. Consequently, our fair value estimate increased to
Rs450/share (from Rs410/share) as we roll forward to March 2022 based DCF valuations.
Commissioning of under construction properties ahead of schedule as well as acquisition of
6.2 mn sq. ft of operational portfolio at Embassy Tech Village at lucrative valuations could prove
the next positive catalysts for the REIT. Maintain ADD.
Embassy Office Parks REIT (EMBASSY) Real Estate
Strong performance sustains. Embassy REIT maintained the earnings momentum
demonstrated up to 1HFY20 with 14% yoy and 16% yoy growth in revenues and NOI
at Rs5.4 bn and Rs4.6 bn respectively (NOI margins at 85%) in 3QFY20. Operational
performance remains robust with occupancy of 95.1% and re-leasing of 0.5 mn sq. ft
during the quarter at 15% re-leasing spread. Embassy has declared quarterly pay-out of
Rs6.1/unit though may marginally fall short of committed guidance of Rs19 bn for full
year FY2020. Maintain ADD, revise fair value to Rs450 (from Rs410 previously).
ADD
FEBRUARY 17, 2020
RESULT
Sector view: Neutral
CMP (`): 449
Fair Value (`): 450
BSE-30: 41,258
Murtuza Arsiwalla
Samrat Verma
Embassy Office Parks REIT
Stock data Forecasts/valuations 2020E 2021E 2022E
52-week range (Rs) (high,low) EPS (Rs) 11.9 15.5 18.2
Mcap (bn) (Rs/US$) EPS growth (%) 151.2 30.1 17.9
ADTV-3M (mn) (Rs/US$) P/E (X) 37.8 29.0 24.6
Shareholding pattern (%) P/B (X) 1.6 1.7 1.8
Promoters 70.3 EV/EBITDA (X) 21.1 17.3 15.4
FIIs 16.4 RoE (%) 4.1 5.6 6.9
MFs/BFIs Div. yield (%) 5.2 6.6 7.6
Price performance (%) 1M 3M 12M Sales (Rs bn) 22 27 32
Absolute 11 8 20 EBITDA (Rs bn) 17 21 25
Rel. to BSE-30 13 5 4 Net profits (Rs bn) 9 12 14
462-300
347/4.9
0.4/0.3
195/3

Embassy Office Parks REIT Real Estate
KOTAK INSTITUTIONAL EQUITIES RESEARCH 25
Exhibit 1: Embassy Office Parks REIT reported revenue and NOI growth of 14% and 16% yoy in 3QFY20 Profit and loss statement for Embassy REIT, March fiscal year-ends, 2018-2020E (Rs mn)
Source: Company, Kotak Institutional Equities estimates
Other highlights from the earnings call
Dividend distribution tax. Management expects limited impact on the change in
taxation regime for the post-tax yields owing to lower quantum of dividend in the near-
term NDCF. On pro-forma analysis, an increase in dividend share to 10% could lead to
potential yield dilution for FII by 9 bps, DII by 15 bps and retail investor (in the highest tax
bracket) by 26 bps. Management highlighted that various representations are being made
by industry bodies to the Finance Ministry to maintain status quo on the treatment of
dividend income in the hands of investors of REITs and InVITs.
Under construction assets. Embassy has under construction assets with area of 4.6
mn sq. ft across cities that are likely to be commissioned by March 2023 in addition to
619 keys through two hotels at Hilton Manyata. Embassy has commissioned 1.4 mn sq. ft
across two assets in 4QFY20. As of 3QFY20, Embassy has incurred a capex of Rs9.5 bn
towards under construction assets and has another Rs25 bn that has to be incurred on
projects aggregating 3.9 mn sq. ft and 619 hotel keys.
Acquisition. Embassy REIT completed acquisition of 0.6 mn sq. ft at its existing business
park Manyata, Bengaluru which currently operates at 99.3% occupancy. The asset has
been acquired at an EV of Rs7.4 bn of which is to be paid through debt with a spread of
100 bps over Embassy’s cost of borrowing. The asset upon completion in 4QFY23 is
expected to be DPU accretive (+0.13%) with a yield of 9.25%.
ROFO. Embassy REIT received an offer from Embassy Sponsor for the sale of 6.2 mn sq. ft
of completed office space and 2.5 mn sq. ft of under-construction area in Embassy Tech
Village, Bengaluru. The opportunity is still under evaluation by the manager under the
ROFO framework.
Debt. Embassy REIT raised Rs16.4 during the quarter at an interest rate of 9.03%, 86 bps
lower than in-place debt cost.
Embassy REIT might miss the NDCF target for FY2020 by 3-4% due to slower-than-
anticipated lease of Embassy One assets as well as slower ramp up of Four Seasons Hotel.
% change
3QFY20 3QFY20E 3QFY19 2QFY20 3QFY20E 3QFY19 2QFY20 9MFY20 9MFY20 % change 2020E 2019 % change
Real estate (Rental) 4,241 4,250 4,116 (0) 3 16,925 14,069 20
Real estate (Other) 494 450 452 10 9 1,950 2,468 (21)
Hotel (Room revenue) 199 182 162 10 23 812 586 39
Hotel (F&B) 123 107 96 15 28 337 221 52
Hotel (Other revenue) 18 53 48 (66) (61) 101 41 146
Solar 383 300 333 28 15 1,495 1,386 8
Revenues 5,459 5,342 4,774 5,206 2 14 5 16,016 13,792 16 21,620 18,771 15
Direct expenses (820) (871) (790) (822) (2,464) (2,222) (3,271) (3,030)
NOI 4,639 4,472 3,984 4,384 4 16 6 13,551 11,570 17 18,349 15,741 17
Indirect expenses (400) (380) (290) (365) 5 10 (1,115) (651) 71 (1,591) (2,144) (26)
EBITDA 4,239 4,092 3,694 4,019 4 15 5 12,437 10,919 14 16,758 13,597 23
Other income 223 200 175 11 27 915 1,539
Depreciation (1,182) (1,450) (1,444) (18) (18) (5,218) (3,563)
Finance costs (944) (820) (823) 15 15 (3,503) (7,060)
Impairment loss — — — — —
Profit before tax and associates 2,336 2,022 1,927 16 21 8,952 4,514 98
Profit from associates 246 400 248 (38) (0) 1,348 1,152
Profit before tax 2,582 2,422 2,175 7 19 10,300 5,665 82
Tax (48) (250) 148 (81) (132) (1,122) (2,012)
Net profit 2,535 2,172 2,322 17 9 9,178 3,653 151
Margins (%)
NOI 85 84 83 84 85 84 85 84 109
EBITDA 78 77 77 77 78 79 78 72 153
PAT 46 41 45 42 19 997

Real Estate Embassy Office Parks REIT
26 KOTAK INSTITUTIONAL EQUITIES RESEARCH
Exhibit 2: Earnings performance during the quarter was dragged down by inferior performance in the hotel segment Segmental income statement for Embassy REIT, March fiscal year-ends (Rs mn)
Source: Company, Kotak Institutional Equities estimates
Exhibit 3: Embassy Manyata continues to the highest revenue contributor in the overall portfolio Asset-wise contribution to revenues in 3QFY20 (Rs mn)
Source: Company, Kotak Institutional Equities
% change
3QFY20 3QFY20E 3QFY19 2QFY20 3QFY20E 3QFY19 2QFY20 9MFY20 9MFY19 % change 2020E 2019
Revenues
Commercial 4,722 4,700 4,231 4,567 0 12 3 14,027 12,767 10 18,876 16,537
Hospitality 354 342 200 311 4 77 14 889 606 47 1,249 848
Others 383 300 344 333 28 11 15 1,104 954 16 1,495 1,386
Revenues 5,459 5,342 4,774 5,206 2 14 5 16,016 13,792 16 21,620 18,771
NOI
Commercial 4,213 4,136 3,715 4,028 2 13 5 12,426 10,979 13 16,772 14,128
Hospitality 85 68 24 53 24 254 60 124 38 226 206 332
Others 341 267 245 303 28 39 13 1,001 835 20 1,371 1,281
NOI 4,639 4,472 3,984 4,384 4 16 6 13,551 11,570 17 18,349 15,741
NOI Margins
Commercial 89 88 88 88 89 86 89 85
Hospitality 24 20 12 17 14 6 16 39
Others 89 89 71 91 91 88 92 92
NOI Margins 85 84 83 84 85 84 85 84
Revenues (Rs mn) NOI (Rs mn) NDCF (Rs mn)
Asset City 2019 1QFY19 2QFY19 1QFY20 2QFY20 3QFY20 1QFY19 2QY19 1QFY20 2QFY20 3QFY20 1QFY19 2QY19 1QFY20 2QFY20 3QFY20
Embassy Manyata Bengaluru 8,142 2,028 2,003 2,132 2,176 2,181 1,867 1,850 1,975 2,043 2,050 NA NA 1,672 1,999 2,130
Express Towers Mumbai 1,462 350 376 388 354 371 324 356 354 312 331 NA NA 299 116 298
Embassy Quadron Pune 1,445 352 331 375 363 360 288 161 297 290 299 NA NA 284 187 203
Embassy Energy Bengaluru 1,386 274 336 388 333 383 273 317 357 303 341 NA NA 275 (31) 225
Embassy Oxygen Noida 1,211 291 271 355 334 362 217 195 272 237 280 NA NA 295 141 215
Embassy 247 Mumbai 1,037 222 238 355 365 350 171 356 308 315 303 NA NA 112 227 208
Embassy Techzone Pune 1,050 260 251 507 282 373 238 236 467 260 356 NA NA 604 652 245
Embassy Qubix Pune 867 218 211 229 226 228 180 174 193 190 192 NA NA 172 155 177
Embassy Galaxy Noida 861 205 216 226 222 225 149 148 170 162 175 NA NA 185 141 75
Hilton at Embassy Golflinks Bengaluru 848 208 198 206 245 216 50 83 70 108 99 NA NA 42 107 75
FIFC Mumbai 463 84 94 171 240 256 62 67 149 219 234 NA NA 212 206 175
Embassy One Bengaluru NA NA — 19 66 153 NA NA (84) (55) (21) NA NA NA NA NA
Revenue from operations 18,772 4,492 4,525 5,351 5,206 5,458 3,819 3,943 4,528 4,384 4,639 NA NA 4,152 3,900 4,026
Embassy Golflinks Bengaluru 820 820 839 957 913 905 788 767 874 835 848 — — —

Embassy Office Parks REIT Real Estate
KOTAK INSTITUTIONAL EQUITIES RESEARCH 27
Exhibit 4: Embassy Manyata has a re-leasing premium of 53% compared to overall re-leasing premium of 30% Portfolio summary for Embassy REIT
Source: Company, Kotak Institutional Equities
Exhibit 5: Contractual increase in rentals contributed 31% for increase in revenues in 9MFY20 Revenue bridge for Embassy REIT, March fiscal year-ends, 3QFY19-3QFY20 (Rs mn)
Source: Company, Kotak Institutional Equities
Leasable area (msf) WALE Occupancy (%) Rent (Rs psf/month)
Property Completed Development Total (years) (%) In-place Market MTM (%)
Embassy Manyata 11.0 3.3 14.3 7.4 99.3 57.0 87.0 52.6
Embassy Golflinks 2.7 — 2.7 9.1 97.5 114.0 146.0 28.1
Embassy One 0.3 — 0.3 9.2 5.5 156.0 153.0 (1.9)
Bengaluru Sub-total 14.0 3.3 17.3 7.9 97.3 69.0 99.0 43.5
Express Towers 0.5 — 0.5 4.9 92.2 254.0 275.0 8.3
Embassy 247 1.2 — 1.2 4.2 94.0 99.0 105.0 6.1
FIFC 0.4 — 0.4 4.3 77.8 296.0 290.0 (2.0)
Mumbai Sub-total 2.1 — 2.1 4.5 90.7 166.0 174.0 4.8
Embassy Techzone 2.2 3.3 5.5 5.7 91.7 49.0 48.0 (2.0)
Emabassy Quadron 1.9 — 1.9 4.4 91.4 42.0 50.0 19.0
Embassy Qubix 1.5 — 1.5 4.9 100.0 37.0 48.0 29.7
Pune Sub-total 5.6 3.3 8.9 5.1 92.8 43.0 49.0 14.0
Embassy Oxygen 1.9 1.3 3.2 10.6 85.3 47.0 54.0 14.9
Embassy Galaxy 1.4 — 1.4 3.4 99.2 34.0 45.0 32.4
Noida Sub-total 3.3 1.3 4.6 7.9 91.0 41.0 50.0 22.0
Total 25.0 7.9 32.9 6.9 95.1 67.0 87.0 29.9
Four Seasons at Embassy One 230 keys — 230 keys — — — —
Hilton at Embassy Golflinks 247 keys — 247 keys — — — —
Hilton at Embassy Manyata (5 & 3 star) — 619 keys 619 keys — — — — —
Embassy Energy 100 MW — 100 MW — — — — —
Sub-total (Infrastructure assets)477 keys/
100 MW619 keys
1,096 keys/
100 MW
Total
13,760 704 821 96 635
16,016
-
2,000
4,000
6,000
8,000
10,000
12,000
14,000
16,000
18,000
9M
FY1
9
Con
trac
tual
New
Lea
ses
Deve
lopm
ent
Hote
ls
9M
FY2
0

Real Estate Embassy Office Parks REIT
28 KOTAK INSTITUTIONAL EQUITIES RESEARCH
Exhibit 6: EOP REIT distributed 99.7% of NDCF in 3QFY20 Cash flows for Embassy REIT, March fiscal year-ends, 1QFY19-3QFY20 (Rs mn)
Source: Company, Kotak Institutional Equities
Exhibit 7: Commercial office contributed 87% of revenues Revenue contribution by segment in 2QFY20 (%)
Exhibit 8: Bengaluru was the highest contributor in 3QFY20 Revenue contribution by cities in 2QFY20 (%)
Source: Company, Kotak Institutional Equities Source: Company, Kotak Institutional Equities
1QFY19 1QFY20 2QFY20 3QFY20
Revenue from operations 4,494 5,351 5,206 5,459
Property taxes and insurance (191) (179) (181) (180)
Direct operating expenses (486) (643) (641) (639)
NOI 3,817 4,529 4,384 4,640
Other income 466 142 300 153
Property management fees (68) (119) (115) (125)
Indirect operating expenses (277) (174) (180) (139)
EBITDA 3,938 4,378 4,389 4,529
Working captial adjustments (313) 857 245 187
Cash taxes (618) (326) (356) (356)
Other adjustments (288) (209) (381) (177)
Cash flow from operating activities 2,719 4,700 3,897 4,183
External Debt (Interest & Principal) NA (667) (238) (258)
Other adjustments NA 117 241 105
NDCF at SPV level NA 4,150 3,900 4,030
Distribution from SPVs to REIT NA 3,749 4,249 4,323
Distribution from Embassy Golflinks NA 480 480 480
REIT management fees NA (42) (61) (55)
Other inflows at REIT (net of expenses) NA (7) (6) (38)
NDCF at REIT level NA 4,180 4,662 4,710
Distribution 4,167 4,630 4,707
Commercial office, 87
Hospitality, 6
Others, 7
Bengaluru, 54
Mumbai, 18
Pune, 18
Noida, 11

Embassy Office Parks REIT Real Estate
KOTAK INSTITUTIONAL EQUITIES RESEARCH 29
Exhibit 9: Existing tenants accounted for 78% of the new space
take-up Operational highlights for 2QFY20, March fiscal year-ends
Exhibit 10: Leases of 0.5 msf were signed in 3QFY20 Details of leases signed in 2QFY20 ('000 sq. ft)
Source: Company, Kotak Institutional Equities Source: Company, Kotak Institutional Equities
Exhibit 11: EOP leased 0.6 msf in 2QFY20 with 95% re-leasing spread Leasing details for EOP REIT, March fiscal-year ends, 2016-2020
Source: Company, Kotak Institutional Equities
Exhibit 12: 0.5 msf of average new lease signed in 3QFY20 Vacancy lease-up for EOP REIT (msf)
Exhibit 13: 15% of average re-leasing spread in 3QFY20 Re-leasing spread for EOP REIT (%)
Source: Company, Kotak Institutional Equities Source: Company, Kotak Institutional Equities
1QFY20 2QFY20 3QFY20
New leases signed (mn sq. ft) 0.60 0.60 0.53
Area released (mn sq. ft) 0.57 0.32 0.17
Re-leasing spread (%) 50.60 95.00 15.00
Existing tenant expansion (%) 56.70 95.00 78.00
Renewals (mn sq. ft) 0.23 0.08 0.13
Occupancy (%) 94.30 94.70 95.10
Tenant Asset City Area ('000 sq. ft)
WeWork Embassy Manyata Bengaluru 220
ANSR Embassy Manyata Bengaluru 75
Motorola Embassy Manyata Bengaluru 64
Value Momentum Embassy Techzone Pune 43
Fulcrum Digital Embassy Techzone Pune 26
Virtusa Embassy Techzone Pune 25
Norwest Venture Partners Express Towers Mumbai 10
Various Others Various 64
Total 527
FY2016 FY2017 FY2018 FY2019 1QFY20 2QFY20 3QFY20
Completed area (mn sq. ft) 22.5 23.1 24.2 24.8 24.8 24.8 24.8
Occupancy area (%) 93.4 94.7 93.5 94.3 94.3 94.7 95.1
Vacancy lease-up (mn sq. ft) 2.1 1.9 1.3 1.8 0.6 0.6 0.5
Re-leasing (mn sq. ft) 0.3 1.1 0.5 1.2 0.6 0.3 0.2
Re-leasing spread (%) 26.6 60.7 35.3 34.9 50.6 95.0 15.0
New leasing to existing tenant (%) 71.0 50.0 69.0 59.0 56.7 78.0
Renewals (msf) 2.3 1.6 2.9 0.9 0.2 0.1 0.1
2.1
1.9
1.3
1.8
0.6 0.6 0.5
-
0.5
1.0
1.5
2.0
2.5
FY20
16
FY20
17
FY20
18
FY20
19
1Q
FY2
0
2Q
FY2
0
3Q
FY2
0
Vacancy lease-up (mn sq. ft)
26.6
60.7
35.3 34.9
50.6
95.0
15.0
0
10
20
30
40
50
60
70
80
90
100
FY20
16
FY20
17
FY20
18
FY20
19
1Q
FY2
0
2Q
FY2
0
3Q
FY2
0
Re-leasing spread (%)

Real Estate Embassy Office Parks REIT
30 KOTAK INSTITUTIONAL EQUITIES RESEARCH
Exhibit 14: 43% of gross rentals originate from top 10 tenants Top 10 tenants of Embassy REIT
Source: Company, Kotak Institutional Equities
Exhibit 15: Four Seasons at Embassy One is expected to ramp-up in coming quarters Performance of hospitality portfolio
Source: Company, Kotak Institutional Equities
Exhibit 16: 2.6 msf of on-campus new build pipeline under various stages of development Development status of various projects (as on November 2019)
Source: Company, Kotak Institutional Equities
Sector Rentals (%)
IBM Technology 12
Cognizant Technology 10
NTT Data Technology 5
Cerner Healthcare 3
PwC RCA 3
Google India Technology 3
Nokia Telecom 2
JP Morgan Financial services 2
Lowe's Retail 2
L&T Infotech Technology 1
Total 43
Property
Hilton at
Embassy
Golflinks
Four Sesason at
Embassy One
Hilton & Hilton
Garden Inn at
Embassy Manyata
Status Operational Launched in May 2019 Under construction
Keys 247 230 619
Occupancy 62.0 26.0 —
ADR 10,554 10,782 —
RevPAR 6,551 — —
Expected completion — — 3QFY22
Asset Status
Embassy Manyata M3 Block A - Design complete; pre-construction and pilling works underway
(Front parcel, 1.6 msf) Targeting June 2022 completion
M3 Block B – Pre-construction works initiated. Targeting Mar 2023 completion
Embassy Oxygen Design completed; excavation and pre-construction works initiated
(Tower 2, 0.7 msf) Targeting December 2022 completion
Embassy Techzone Ganges Block, design completeed; excavation and sub-strucutue work underway
Hudson (0.5 mn sq, ft)M3 Block (Embassy Manyata) - Design complete, pre-construction and pilling
works underway
Ganges (0.4 mn sq, ft)Hudson Block (Embassy Techzone) - 0.5 msf, design and excavation completed,
sub-structure underway

Embassy Office Parks REIT Real Estate
KOTAK INSTITUTIONAL EQUITIES RESEARCH 31
Exhibit 17: We factor 2-4% growth in market rentals across the four cities Key assumptions for different properties under Embassy REIT, March fiscal year-ends, 2019-2023E (Rs per sq. ft per month)
Source: Company, Kotak Institutional Equities estimates
Exhibit 18: Operational and under-construction assets are ascribed an EV of Rs408.5 bn Valuation of Embassy REIT based on March 2022E ( Rs mn)
Source: Company, Kotak Institutional Equities estimates
2018 2019 2020E 2021E 2022E 2023E
Operational metrics
Real estate
Leasable area (mn sq. ft) 21 22 22 24 25 27
Occupancy (%) 94 94 96 96 99 99
Area leased (msf) 20 20 21 23 25 27
In-place rent (Rs/sf) 55 57 68 74 78 83
Market rent (Rs/sf) 71 75 80 84 86 89
Hotel
Keys (#) 247 247 477 477 1,096 1,096
RevPAR (Rs/day) 5,705 6,501 4,663 6,741 5,473 6,456
Solar
Capacity (MW) 8 100 100 100 100 100
PLF (%) 24 20 20 20 20 20
Tariff (Rs/kwh) 6 8 9 9 9 9
Financial metrics
Revenue 16,118 18,771 21,620 26,732 31,786 36,097
Real estate 15,242 16,537 18,876 23,383 26,784 30,437
Hotel 728 848 1,249 1,824 3,447 4,074
Solar 105 1,386 1,495 1,525 1,555 1,586
NOI 13,362 15,741 18,349 22,876 26,938 30,711
Real estate 13,124 14,128 16,772 20,769 23,785 26,998
Hotel 171 332 206 712 1,734 2,270
Solar 25 1,281 1,371 1,395 1,419 1,443
EBITDA 12,059 13,597 16,758 21,134 24,894 28,430
PAT 2,569 3,653 9,178 11,945 14,087 14,528
NDCF — — 18,007 22,962 26,453 29,738
Mar-22
Enterprise value 447,419
Enterprise value (attributable) 420,856
Net debt 73,726
Equity value 347,130
Equity value (Rs/unit) 450
Key assumptions
WACC 11.0
Capitalization rate 7.8
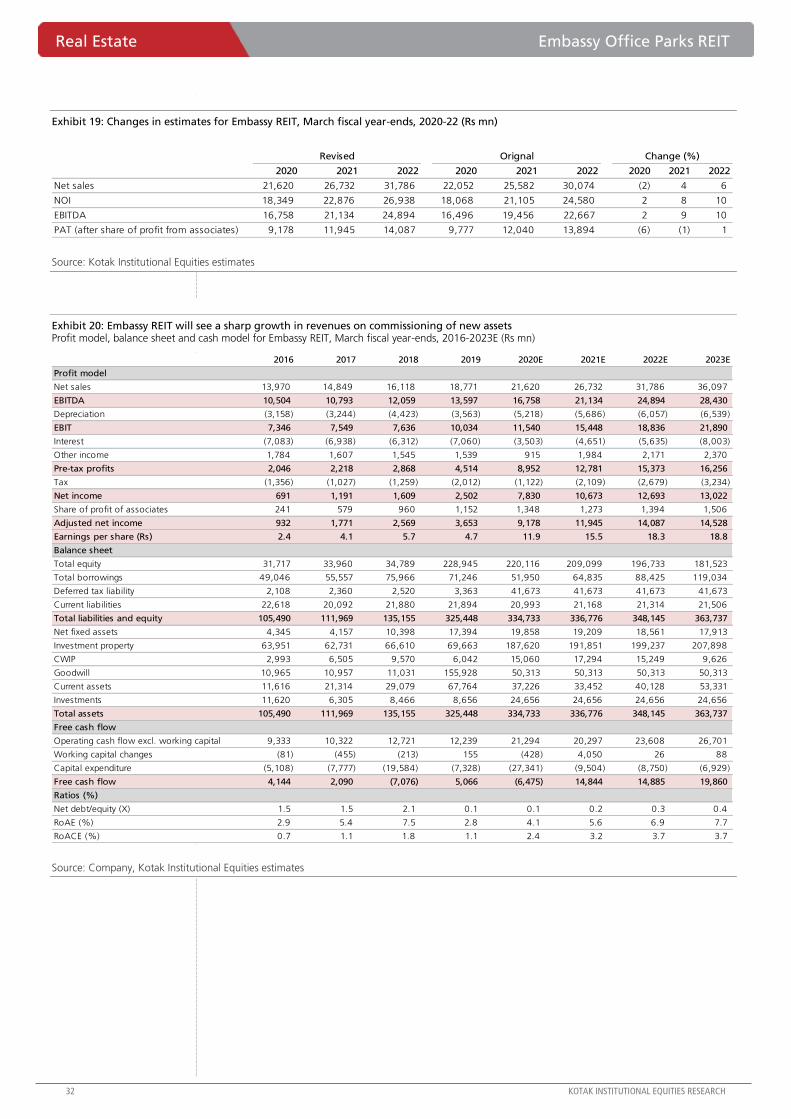
Real Estate Embassy Office Parks REIT
32 KOTAK INSTITUTIONAL EQUITIES RESEARCH
Exhibit 19: Changes in estimates for Embassy REIT, March fiscal year-ends, 2020-22 (Rs mn)
Source: Kotak Institutional Equities estimates
Exhibit 20: Embassy REIT will see a sharp growth in revenues on commissioning of new assets Profit model, balance sheet and cash model for Embassy REIT, March fiscal year-ends, 2016-2023E (Rs mn)
Source: Company, Kotak Institutional Equities estimates
Revised Orignal Change (%)
2020 2021 2022 2020 2021 2022 2020 2021 2022
Net sales 21,620 26,732 31,786 22,052 25,582 30,074 (2) 4 6
NOI 18,349 22,876 26,938 18,068 21,105 24,580 2 8 10
EBITDA 16,758 21,134 24,894 16,496 19,456 22,667 2 9 10
PAT (after share of profit from associates) 9,178 11,945 14,087 9,777 12,040 13,894 (6) (1) 1
2016 2017 2018 2019 2020E 2021E 2022E 2023E
Profit model
Net sales 13,970 14,849 16,118 18,771 21,620 26,732 31,786 36,097
EBITDA 10,504 10,793 12,059 13,597 16,758 21,134 24,894 28,430
Depreciation (3,158) (3,244) (4,423) (3,563) (5,218) (5,686) (6,057) (6,539)
EBIT 7,346 7,549 7,636 10,034 11,540 15,448 18,836 21,890
Interest (7,083) (6,938) (6,312) (7,060) (3,503) (4,651) (5,635) (8,003)
Other income 1,784 1,607 1,545 1,539 915 1,984 2,171 2,370
Pre-tax profits 2,046 2,218 2,868 4,514 8,952 12,781 15,373 16,256
Tax (1,356) (1,027) (1,259) (2,012) (1,122) (2,109) (2,679) (3,234)
Net income 691 1,191 1,609 2,502 7,830 10,673 12,693 13,022
Share of profit of associates 241 579 960 1,152 1,348 1,273 1,394 1,506
Adjusted net income 932 1,771 2,569 3,653 9,178 11,945 14,087 14,528
Earnings per share (Rs) 2.4 4.1 5.7 4.7 11.9 15.5 18.3 18.8
Balance sheet
Total equity 31,717 33,960 34,789 228,945 220,116 209,099 196,733 181,523
Total borrowings 49,046 55,557 75,966 71,246 51,950 64,835 88,425 119,034
Deferred tax liability 2,108 2,360 2,520 3,363 41,673 41,673 41,673 41,673
Current liabilities 22,618 20,092 21,880 21,894 20,993 21,168 21,314 21,506
Total liabilities and equity 105,490 111,969 135,155 325,448 334,733 336,776 348,145 363,737
Net fixed assets 4,345 4,157 10,398 17,394 19,858 19,209 18,561 17,913
Investment property 63,951 62,731 66,610 69,663 187,620 191,851 199,237 207,898
CWIP 2,993 6,505 9,570 6,042 15,060 17,294 15,249 9,626
Goodwill 10,965 10,957 11,031 155,928 50,313 50,313 50,313 50,313
Current assets 11,616 21,314 29,079 67,764 37,226 33,452 40,128 53,331
Investments 11,620 6,305 8,466 8,656 24,656 24,656 24,656 24,656
Total assets 105,490 111,969 135,155 325,448 334,733 336,776 348,145 363,737
Free cash flow
Operating cash flow excl. working capital 9,333 10,322 12,721 12,239 21,294 20,297 23,608 26,701
Working capital changes (81) (455) (213) 155 (428) 4,050 26 88
Capital expenditure (5,108) (7,777) (19,584) (7,328) (27,341) (9,504) (8,750) (6,929)
Free cash flow 4,144 2,090 (7,076) 5,066 (6,475) 14,844 14,885 19,860
Ratios (%)
Net debt/equity (X) 1.5 1.5 2.1 0.1 0.1 0.2 0.3 0.4
RoAE (%) 2.9 5.4 7.5 2.8 4.1 5.6 6.9 7.7
RoACE (%) 0.7 1.1 1.8 1.1 2.4 3.2 3.7 3.7
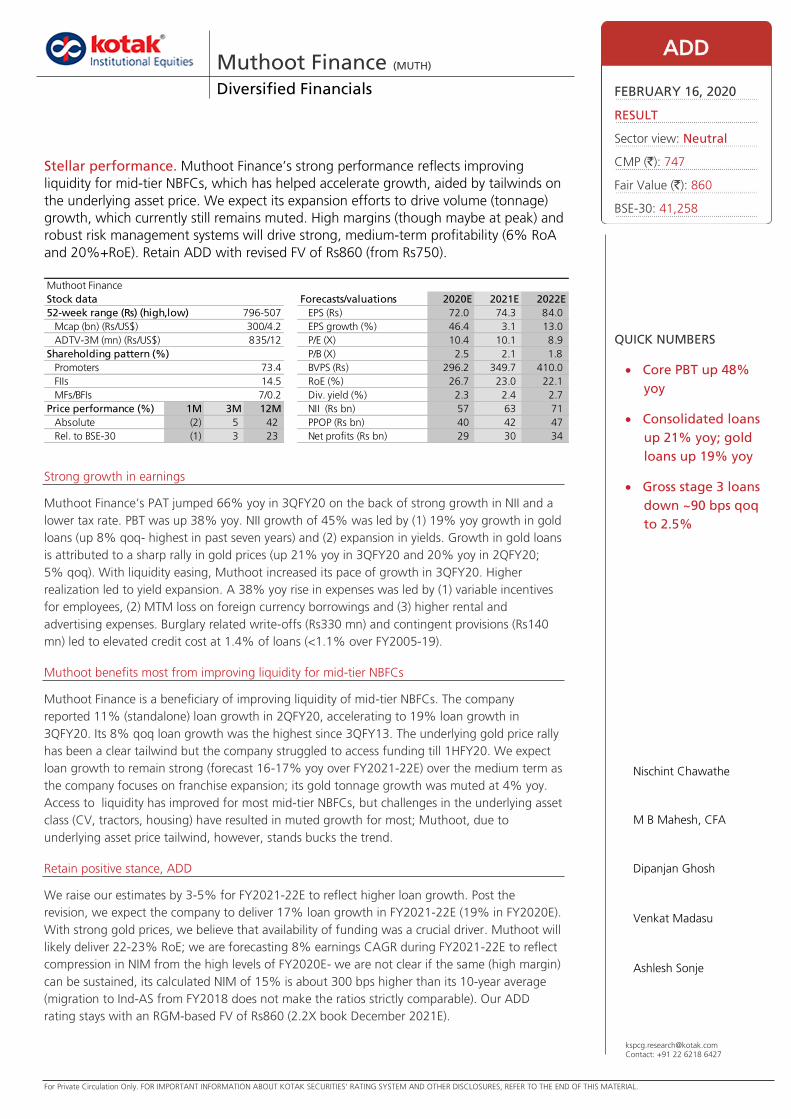
For Private Circulation Only. FOR IMPORTANT INFORMATION ABOUT KOTAK SECURITIES’ RATING SYSTEM AND OTHER DISCLOSURES, REFER TO THE END OF THIS MATERIAL.
[email protected]: +91 22 6218 6427
Strong growth in earnings
Muthoot Finance’s PAT jumped 66% yoy in 3QFY20 on the back of strong growth in NII and a
lower tax rate. PBT was up 38% yoy. NII growth of 45% was led by (1) 19% yoy growth in gold
loans (up 8% qoq- highest in past seven years) and (2) expansion in yields. Growth in gold loans
is attributed to a sharp rally in gold prices (up 21% yoy in 3QFY20 and 20% yoy in 2QFY20;
5% qoq). With liquidity easing, Muthoot increased its pace of growth in 3QFY20. Higher
realization led to yield expansion. A 38% yoy rise in expenses was led by (1) variable incentives
for employees, (2) MTM loss on foreign currency borrowings and (3) higher rental and
advertising expenses. Burglary related write-offs (Rs330 mn) and contingent provisions (Rs140
mn) led to elevated credit cost at 1.4% of loans (<1.1% over FY2005-19).
Muthoot benefits most from improving liquidity for mid-tier NBFCs
Muthoot Finance is a beneficiary of improving liquidity of mid-tier NBFCs. The company
reported 11% (standalone) loan growth in 2QFY20, accelerating to 19% loan growth in
3QFY20. Its 8% qoq loan growth was the highest since 3QFY13. The underlying gold price rally
has been a clear tailwind but the company struggled to access funding till 1HFY20. We expect
loan growth to remain strong (forecast 16-17% yoy over FY2021-22E) over the medium term as
the company focuses on franchise expansion; its gold tonnage growth was muted at 4% yoy.
Access to liquidity has improved for most mid-tier NBFCs, but challenges in the underlying asset
class (CV, tractors, housing) have resulted in muted growth for most; Muthoot, due to
underlying asset price tailwind, however, stands bucks the trend.
Retain positive stance, ADD
We raise our estimates by 3-5% for FY2021-22E to reflect higher loan growth. Post the
revision, we expect the company to deliver 17% loan growth in FY2021-22E (19% in FY2020E).
With strong gold prices, we believe that availability of funding was a crucial driver. Muthoot will
likely deliver 22-23% RoE; we are forecasting 8% earnings CAGR during FY2021-22E to reflect
compression in NIM from the high levels of FY2020E- we are not clear if the same (high margin)
can be sustained, its calculated NIM of 15% is about 300 bps higher than its 10-year average
(migration to Ind-AS from FY2018 does not make the ratios strictly comparable). Our ADD
rating stays with an RGM-based FV of Rs860 (2.2X book December 2021E).
Muthoot Finance (MUTH) Diversified Financials
Stellar performance. Muthoot Finance’s strong performance reflects improving
liquidity for mid-tier NBFCs, which has helped accelerate growth, aided by tailwinds on
the underlying asset price. We expect its expansion efforts to drive volume (tonnage)
growth, which currently still remains muted. High margins (though maybe at peak) and
robust risk management systems will drive strong, medium-term profitability (6% RoA
and 20%+RoE). Retain ADD with revised FV of Rs860 (from Rs750).
ADD
FEBRUARY 16, 2020
RESULT
Sector view: Neutral
CMP (`): 747
Fair Value (`): 860
BSE-30: 41,258
QUICK NUMBERS
Core PBT up 48%
yoy
Consolidated loans
up 21% yoy; gold
loans up 19% yoy
Gross stage 3 loans
down ~90 bps qoq
to 2.5%
Nischint Chawathe
M B Mahesh, CFA
Dipanjan Ghosh
Venkat Madasu
Ashlesh Sonje
Stock data Forecasts/valuations 2020E 2021E 2022E
52-week range (Rs) (high,low) EPS (Rs) 72.0 74.3 84.0
Mcap (bn) (Rs/US$) EPS growth (%) 46.4 3.1 13.0
ADTV-3M (mn) (Rs/US$) P/E (X) 10.4 10.1 8.9
Shareholding pattern (%) P/B (X) 2.5 2.1 1.8
Promoters 73.4 BVPS (Rs) 296.2 349.7 410.0
FIIs 14.5 RoE (%) 26.7 23.0 22.1
MFs/BFIs Div. yield (%) 2.3 2.4 2.7
Price performance (%) 1M 3M 12M NII (Rs bn) 57 63 71
Absolute (2) 5 42 PPOP (Rs bn) 40 42 47
Rel. to BSE-30 (1) 3 23 Net profits (Rs bn) 29 30 34
7/0.2
Muthoot Finance
300/4.2
835/12
796-507

Diversified Financials Muthoot Finance
34 KOTAK INSTITUTIONAL EQUITIES RESEARCH
Strong linkage between gold prices and performance of gold loan NBFCs
Over the past 13 years, gold prices have seen two rallies and one downcycle. We capture
financial metrics related to top two gold loan NBFCs during these periods. Based on our
analysis, we observe (1) strong linkage between movement in gold prices and overall growth
in gold loans and (2) expansion in yields during phases of rallies in gold prices translating to
higher NIM and RoA.
Strong linkage between movement in gold prices and growth in gold loans. Over
the past 13 years, growth in gold loans has seen a strong linkage to movement in growth
prices. During the first gold price rally (FY2008-12), gold prices increased at 24-34% yoy
(barring FY2010 when gold price growth was relatively muted at 8% yoy) and growth in
gold loan loans for Muthoot and Manappuram was strong at 51-122% yoy and 48-
188% yoy, respectively. Similarly, gold loan growth for Muthoot and Manappuram was
lower at -16 to 12% yoy and -18 to 13% yoy, respectively, during FY2013-17 when
growth in gold prices was muted at -8 to 10% yoy. Strong recovery in gold prices during
the past two quarters (up 20% yoy and 21% yoy) has led to a sharp rise in disbursements
(and hence loan growth) for these two companies. Gold loan companies are essentially a
play on gold prices and as such are counter-cyclical plays on the overall economy.
Tonnage growth-with a lag. In a phase of rising gold prices, gold loan acceleration is
driven initially by higher gold prices, followed by tonnage growth, with a lag. Two likely
reasons (1) benefits of expansion efforts of the gold loan companies that may drive
meaningful volume growth over times and (2) retail behavior to increase gold
monetization may see a lag.
Yields expand during rallies in gold prices. Gold loans NBFCs have seen yield
expansion during phases of rally in gold prices. Collections and hence realization (in
auctions) are relatively high during these periods, which results in yield expansion.
Additionally, the ability of the company to charge penal interest is higher. Most
customers repay their loans for fear of their gold being auctioned.
ROA and RoE expansion during rally in gold prices. Higher yields and lower credit
cost drive elevated ROEs during phases of rallying gold prices. On a high leverage, ROEs
were elevated at 30-52% for Muthoot in FY2008-12. ROEs for Manappuram were also
high at 22-34% during the same period. In times of downturn (muted growth or decline
in gold prices), ROE is lower at 14-19% for Muthoot and 9-24% for Manappuram
(FY2014-17). A sharp rise in gold prices during the past two quarters will likely drive ROE
expansion going ahead.
Gold loan NBFCs -among the best counter-cyclical plays; Muthoot- best pure play.
Gold prices tend to increase at a sharp price during economic downcycles as gold is
considered a relatively better investment vehicle during these times. Gold loan NBFCs are
direct plays on gold prices. Over the past decade, gold loan NBFCs have gained significant
market share from unorganized players. Among key gold finance companies, Muthoot
and Manappuram are key listed entities and have demonstrated strong performance over
the years. Between the two, Muthoot is a more pure play gold loan NBFC (gold loan is
~90% of overall loans) as compared to Manappuram (67% of AUM is gold loans).

Muthoot Finance Diversified Financials
KOTAK INSTITUTIONAL EQUITIES RESEARCH 35
Exhibit 1: Strong relationship between growth in gold loans and movement in gold prices Select data points for Muthoot and Manappuram, March fiscal year-ends, 2007-2019, 1QFY20-3QFY20, 1HFY20, 9MFY20
Notes: (1) For Manappuram, data prior to FY2012 refers to consolidated entity. (2) For Manappuram, data for interest income prior to FY2012 refers to overall operational revenues. (3) Numbers from FY2018 onwards are based on Ind-AS.
Source: Company, Kotak Institutional Equities estimates
Rally in gold prices Drop in gold prices Rally in gold prices
2007 2008 2009 2010 2011 2012 2013 2014 2015 2016 2017 2018 2019 1QFY20 2QFY20 3QFY20 1HFY20 9MFY20
YoY growth in gold prices (%)
Gold price yoy 10 29 24 8 27 34 10 (7) (8) 9 (0) 8 4 8 20 21 20 21
Muthoot Standalone
AUM (Rs bn) 14 22 33 73 157 247 260 219 234 244 273 291 342 358 357 385 357 385
YoY (%) 53 51 122 114 57 5 (16) 7 4 12 7 18 16 11 19 11 19
Gold weight (tons) 23 30 39 66 112 137 134 118 131 142 149 155 169 176 171 173 171 173
YoY (%) 30 30 69 70 22 (2) (12) 11 8 5 4 9 9 2 4 2 4
Key ratios (%)
Yield on AUM 19.9 22.1 20.2 19.9 22.4 21.1 20.4 18.8 20.1 21.9 22.0 21.3 20.9 23.5 24.6 22.5 22.8
NII/AUM 9.9 10.8 11.3 11.0 10.9 10.0 9.5 9.5 10.7 13.0 15.1 14.3 13.5 16.1 17.1 15.0 15.4
Cost-to-income 48.3 52.1 43.4 38.2 38.0 37.6 46.7 52.0 43.5 36.2 29.9 33.2 32.6 27.0 29.3 29.5 29.5
Cost-to-average AUM 5.1 5.9 5.0 4.2 4.2 3.8 4.5 5.1 4.8 4.8 4.7 4.9 4.5 4.4 5.1 4.5 4.7
Credit cost 0.0 0.0 0.1 0.3 0.2 0.3 0.2 0.2 0.7 1.1 0.8 0.1 0.0 0.3 0.7 0.2 0.3
Return ratios (%)
ROAAUM 3.5 3.6 4.3 4.3 4.4 4.0 3.3 3.0 3.4 4.6 6.3 6.2 6.1 9.6 8.7 7.9 7.9
ROE 29.7 33.9 48.1 51.5 41.9 29.3 19.0 14.3 15.1 19.4 24.8 22.4 21.7 33.7 29.2 27.2 27.0
Asset quality
GNPL/gross stage 3 (%) 0.5 0.3 0.6 2.0 1.9 2.2 2.9 2.1 4.4 2.7 3.2 3.4 2.5 3.4 2.5
Manappuram (Rs mn) Consolidated Standalone
Gold AUM (Rs mn) 4 6 10 26 75 115 99 82 92 101 111 117 130 133 152 161 152 161
YoY (%) 48 73 167 188 53 (14) (18) 13 9 10 5 10 7 20 29 20 29
Gold weight (tons) 22 53 66 51 46 53 60 61 64 68 68 72 74 72 74
YoY (%) 136 24 (22) (11) 17 12 3 5 5 4 7 11 7 11
Key ratios (%)
Yield on AUM 16.5 20.8 26.5 23.2 27.5 20.9 22.9 22.4 22.7 28.1 25.3 27.3 28.5 28.6 28.3 27.8 28.1
NII/AUM 13.4 15.8 18.9 16.7 16.2 9.8 11.5 12.4 13.5 18.7 18.3 19.1 19.3 19.1 19.2 18.9 19.1
Cost-to-income 46.4 49.8 42.6 44.8 44.3 63.9 64.1 60.3 58.6 41.6 48.9 48.4 45.3 40.2 39.2 43.3 41.9
Cost-to-average AUM 6.4 8.2 8.1 7.5 7.3 6.4 7.7 7.7 8.1 7.9 9.2 9.4 8.9 8.3 7.8 8.6 8.4
Credit cost 0.7 2.3 0.8 0.9 0.0 0.8 0.5 0.3 0.3 0.5 0.4 0.2 0.6 0.4 0.4 0.5 0.4
Return ratios
ROAAUM 4.4 3.9 6.7 5.5 6.2 1.9 2.5 3.1 3.5 6.8 6.0 6.4 6.7 9.4 8.5 8.0 8.2
ROE 34.2 23.2 30.8 22.0 27.5 8.6 9.2 10.6 12.6 24.0 19.3 19.3 19.8 28.8 27.0 24.6 25.3
Asset quality
GNPL (%) 1.1 1.2 1.2 1.0 2.0 0.7 0.5 0.7 0.6 0.5 0.6 0.5

Diversified Financials Muthoot Finance
36 KOTAK INSTITUTIONAL EQUITIES RESEARCH
Exhibit 2: Muthoot Finance-quarterly summary March fiscal year-ends, 3QFY19-3QFY20 (Rs mn)
Notes: (1) FY2018-FY2022E numbers are based on Ind-AS.
Source: Company, Bloomberg, Kotak Institutional Equities estimates
Rally in gold prices and easing liquidity drive strong gold loan growth
Gold loans up 19% yoy. Muthoot reported a 19% yoy increase in gold loans in
3QFY20; the highest since 3QFY13. This is driven by a sharp rise in gold prices (up 21%
yoy in 3QFY20 and 20% yoy in 2QFY20; 5% qoq in 3QFY20) while LTV declined
marginally by ~100-200 bps. The demand environment has been strong over the past
two quarters, though a squeeze in liquidity led to moderate growth over the past few
quarters. With diversification in the funding profile and liquidity easing, growth is likely to
retain its strong momentum.
Liquidity fuelled increase in disbursements across gold loan NBFCs. Muthoot’s
average monthly disbursements increased to Rs91 bn during 3QFY20 compared to Rs68
bn in 2QFY20 and Rs65 bn in 1QFY20. Average monthly disbursements were lower at
Rs43-61 bn over FY2015-19. Similarly, SCUF witnessed a sharp rebound in gold
disbursements during 3QFY20 (2QFY20 growth was constrained by liquidity).
Manappuram average monthly disbursements increased 90% qoq in 2QFY20 (down 20%
qoq on a high base of 2QFY20); Manappuram’s monthly disbursements anyway tend to
be higher (in absolute terms) compared to Muthoot owing to the higher share of short
tenure products.
Ind-AS Ind-AS Ind-AS Ind-AT (% chg.) Ind-AS Ind-AS Ind-AS Ind-AS Ind-AS
3QFY20 3QFY20E 3QFY19 2QFY20 3QFY20E 3QFY19 2QFY20 9MFY20 9MFY19 (% chg.) 2020E 2019 (% chg.) 2021E
Income statement
Operational income 23,100 20,129 17,165 21,369 14.8 34.6 8.1 63,037 49,985 26.1 87,516 68,788 27.2 97,233
Interest income 22,806 19,854 16,827 21,057 14.9 35.5 8.3 62,138 49,251 26.2 86,270 67,570 27.7 96,183
Net gain on fair value change 81 100 165 100 (18.8) (50.6) (18.5) 277 203 36.4 500 481 4.1 300
Sale of services 46 50 54 51 (8.4) (15.6) (9.5) 150 175 (14.2) 236 230 2.7 240
Service charges 167 125 119 148 33.3 39.8 12.3 458 355 29.1 500 502 (0.4) 500
Other operational income - - - 13 13 - 10 6 77.9 10
Interest expense 6,938 6,707 5,889 6,699 3.4 17.8 3.6 20,052 16,258 23.3 29,295 22,368 31.0 33,630
NII 15,869 13,147 10,938 14,358 20.7 45.1 10.5 42,085 32,993 27.6 56,975 45,202 26.0 62,553
Net operational income 16,162 13,422 11,276 14,670 20.4 43.3 10.2 42,985 33,727 27.4 58,220 46,419 25.4 63,603
Other income 32 20 6 37 58.1 432.3 (13.6) 87 17 403.0 35 19 88.2 35
Total income 16,194 13,442 11,282 14,707 20.5 43.5 10.1 43,072 33,744 27.6 58,255 46,438 25.4 63,638
Operating expenses 4,751 4,102 3,440 3,969 15.8 38.1 19.7 12,692 10,847 17.0 18,228 15,394 18.4 21,267
Employee expense 2,580 2,437 1,980 2,327 5.9 30.3 10.9 7,201 6,235 15.5 10,488 8,976 16.8 12,969
Depreciation expense 110 100 110 103 9.7 (0.3) 6.7 308 301 2.3 412 421 (2.1) 461
Other operating expenses 2,062 1,565 1,350 1,539 31.8 52.8 33.9 5,182 4,311 20.2 7,328 5,998 22.2 7,837
PPOP 11,443 9,340 7,842 10,738 22.5 45.9 6.6 30,380 22,897 32.7 40,028 31,044 28.9 42,371
Provisions 640 226 19 265 183.6 3,255.7 141.9 937 71 1,221.1 1,231 275 346.9 2,150
PBT 10,803 9,115 7,823 10,473 18.5 38.1 3.1 29,442 22,826 29.0 38,797 30,768 26.1 40,221
Tax 2,769 2,333 2,971 1,894 18.7 (6.8) 46.2 7,529 8,220 (8.4) 9,932 11,047 (10.1) 10,457
PAT 8,034 6,781 4,852 8,579 18.5 65.6 (6.4) 21,914 14,606 50.0 28,865 19,721 46.4 29,764
Core PBT 11,316 9,190 7,624 10,575 23.1 48.4 7.0 29,939 22,518 33.0 39,287 30,334 29.5 41,826
Tax rate (%) 26 26 38 18 3 bps -1234 bps 755 bps 26 36 -1044 bps 26 36 -1030 bps 26
Key highlights (Rs mn)
AUM 384,982 364,643 324,704 357,305 5.6 18.6 7.7 384,982 324,704 18.6 407,248 342,461 18.9 477,696
Borrowings 325,942 252,206 284,777 29.2 14.5 325,942 252,206 29.2 315,793 269,223 17.3 370,527
Net worth 113,990 92,782 105,986 22.9 7.6 113,990 92,782 22.9 118,687 97,928 21.2 140,094
Key calculated ratios (%)
Yield on loans on balance sheet 24.6 20.8 23.5 380 bps 103 bps 22.8 21.3 146 bps 23.0 21.3 169 bps 21.7
Cost of borrowings 9.1 9.5 9.5 -42 bps -38 bps 9.0 9.3 -34 bps 10.0 9.3 73 bps 9.8
NIM 17.1 14.6 13.5 16.1 253 bps 360 bps 105 bps 15.4 14.3 115 bps 15.2 14.3 94 bps 14.1
Cost-to-income 29.3 30.5 30.5 27.0 -118 bps -115 bps 235 bps 29.5 32.1 -268 bps 31.3 33.2 -186 bps 33.4
Cost-to-average AUM 5.1 4.5 4.2 4.4 58 bps 87 bps 68 bps 4.7 4.7 -4 bps 4.9 4.9 1 bps 4.8
Credt cost (% of AUM) 0.7 0.3 0.0 0.3 44 bps 67 bps 39 bps 0.3 0.0 31 bps 0.3 0.1 24 bps 0.5
Asset quality
Gross stage-3 (Rs mn) 9,769 6,372 12,267 53.3 (20.4) 9,769 6,372 53.3 12,625 9,326 35.4 14,331
Gross stage-3 (%) 2.5 2.0 3.4 58 bps -90 bps 2.5 2.0 58 bps 3.1 2.7 38 bps 3.0
Capital adequacy details (%)
CAR 26.5 25.7 27.1 77 bps -59 bps 26.5 25.7 77 bps
Tier-I 26.2 25.2 26.7 96 bps -56 bps 26.2 25.2 96 bps
Operational highlights
Branches (#) 4,536 4,422 4,540 2.6 (0.1) 4,536 4,422 2.6 4,580 4,480 2.2 4,610
Gold (weight in tons) 173 166 171 4.2 1.2 173 166 4.2
Employees (#) 25,149 24,063 25,091 4.5 0.2 25,149 24,063 4.5 25,500 24,224 5.3 27,420
Loan per gram (Rs) 2,225 1,956 2,090 13.8 6.5 2,225 1,956 13.8

Muthoot Finance Diversified Financials
KOTAK INSTITUTIONAL EQUITIES RESEARCH 37
Growth in gold tonnage yet to pick pace. Growth in gold tonnage is muted at 4%
yoy/1.2% qoq in 3QFY20 (2% yoy in 2QFY20). This is however higher for Manappuram
at 11% yoy/2% qoq (up 7% yoy in 2QFY20). A sharp spike in gold prices has led to
strong loan growth for Muthoot, while overall growth in gold volumes is yet to gain
traction. This is similar to the trend observed during the previous rally in gold prices when
growth in gold tonnage was relatively muted at 30% yoy during FY2008-09 prior to
picking up to 69-70% yoy during FY2010-11.
Non-gold business up 21% yoy. Muthoot is gradually shifting focus to grow its non-
gold loan portfolio via its subsidiaries (housing, MFI and vehicle business). Loan growth
was robust for Belstar Investment and Finance Limited at 46% yoy/8% qoq; albeit lower
than pervious quarters. For Muthoot Homefin, disbursements slowed down to Rs995 mn;
the lowest since 3QFY17. The company is going slow in select pockets due to
slowdown/stress by developers although it is not directly engaged in developer funding.
Loan growth slowed down to 10% yoy from 18% yoy in 2QFY0 and 22% yoy in
1QFY20. These two subsidiaries contribute ~11% of its consolidated loan book. The
vehicle finance arm (Muthoot Money) which commenced operations from October 1,
2018 in Telengana and Andhra Pradesh has AUM of Rs4.9 bn (up 15% qoq) as of
3QFY20.
Strong gold prices will drive loan growth over medium term. We model loan
(standalone) growth of 19% yoy in FY2020E, reflecting a strong uptick in gold prices
from 1QFY20. Disbursements picked up sharply to Rs92 bn in 3QFY20 as funding
constraints eased. As gold prices continue to increase (up 5% qoq in 4QFY20E), loan
growth may likely remain strong. On a high base, loan growth will marginally moderate
to ~17% CAGR over FY2020-22E. Muthoot stands as one of the biggest beneficiaries of
the easing liquidity situation and underlying tailwinds in asset pricing will drive loan
growth going ahead.
Among major subsidiaries, MFI AUM will likely maintain strong growth momentum on
the back of penetration into newer geographies. AUM for the vehicle finance business
will grow at a fast pace (on a low base) despite muted demand. Amidst asset quality
concerns in select geographies, home loan disbursements will be tepid.
Exhibit 3: 17% CAGR in loan over FY2020-22E Loans and yoy growth (standalone), March fiscal year-ends, 2007-2022E (%)
Notes: (1) Numbers from FY2018 onwards are based on Ind-AS.
Source: Company, Kotak Institutional Equities estimates
15 22 34 74
159
247 260 219 234 244
273 291
342
407
478
555
-35
0
35
70
105
140
-
120
240
360
480
600
20
07
20
08
20
09
20
10
20
11
20
12
20
13
20
14
20
15
20
16
20
17
20
18
20
19
20
20
E
20
21
E
20
22
E
AUM (LHS) YoY (RHS)(Rs bn) (%)
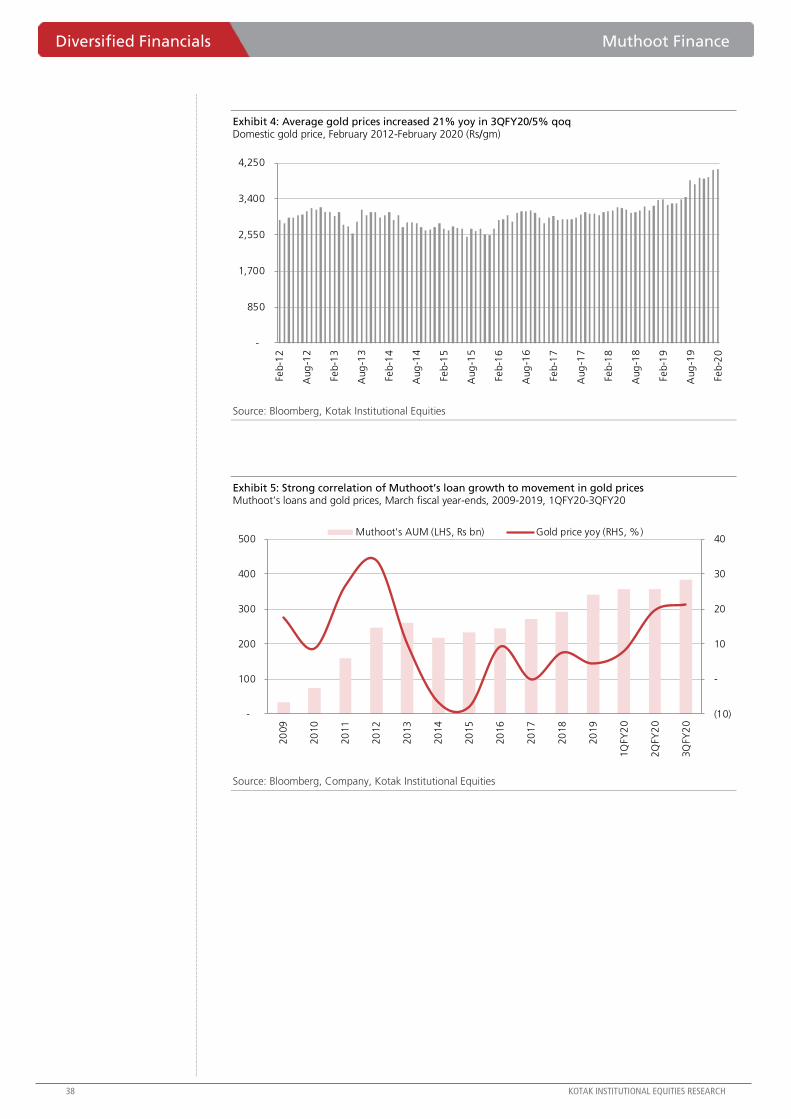
Diversified Financials Muthoot Finance
38 KOTAK INSTITUTIONAL EQUITIES RESEARCH
Exhibit 4: Average gold prices increased 21% yoy in 3QFY20/5% qoq Domestic gold price, February 2012-February 2020 (Rs/gm)
Source: Bloomberg, Kotak Institutional Equities
Exhibit 5: Strong correlation of Muthoot’s loan growth to movement in gold prices Muthoot’s loans and gold prices, March fiscal year-ends, 2009-2019, 1QFY20-3QFY20
Source: Bloomberg, Company, Kotak Institutional Equities
-
850
1,700
2,550
3,400
4,250
Feb-1
2
Aug
-12
Feb-1
3
Aug
-13
Feb-1
4
Aug
-14
Feb-1
5
Aug
-15
Feb-1
6
Aug
-16
Feb-1
7
Aug
-17
Feb-1
8
Aug
-18
Feb-1
9
Aug
-19
Feb-2
0 (10)
-
10
20
30
40
-
100
200
300
400
500
20
09
20
10
20
11
20
12
20
13
20
14
20
15
20
16
20
17
20
18
20
19
1Q
FY2
0
2Q
FY2
0
3Q
FY2
0
Muthoot's AUM (LHS, Rs bn) Gold price yoy (RHS, %)

Muthoot Finance Diversified Financials
KOTAK INSTITUTIONAL EQUITIES RESEARCH 39
Exhibit 6: Lower qoq disbursements in 1QFY20 and 2QFY20 for Muthoot and SCUF attributed to squeeze in liquidity Monthly run-rate of disbursements for select NBFCs, March fiscal year-ends, 2015-2019, 1QFY20-3QFY20
Notes: (1) To arrive at monthly disbursement run-rate for Manappuram and SUCF, we divided overall disbursements for the period by number of months in the respective period.
Source: Company, Kotak Institutional Equities estimates
Exhibit 7: Muthoot’s loan growth improved significantly in 3QFY20 reflecting benefit of improving liquidity AUM growth of major NBFCs, March fiscal year-ends, 3QFY19-3QFY20 (%)
Source: Company, Kotak Institutional Equities
2015 2016 2017 2018 2019 1QFY20 2QFY20 3QFY20
Growth in gold price
YoY growth (7.9) 9.4 (0.2) 7.6 4.3 7.9 19.6 21.3
QoQ growth (%) 4.0 10.5 4.7
Disbursement monthly run-rate (Rs bn)
Muthoot 43 41 48 55 61 65 68 91
YoY (%) (5) 17 15 11
QoQ (%) 5 34
Manappuram 20 31 44 52 75 88 168 134
YoY (%) 52 41 18 44
QoQ (%) 91 (20)
SCUF 5.2 4.1 5.5 5.6 4.8 6.0 5.5 6.1
YoY (%) (22) 35 1 (15)
QoQ (%) (8) 12
1QFY19 2QFY19 3QFY19 4QFY19 1QFY20 2QFY20 3QFY20
AUM growth (%)- yoy
HFCs
HDFC 18 18 16 15 13 13 14
LICHF 15 16 16 16 16 14 13
PNBHF 47 43 38 36 29 22 8
Vehicle finance
Chola 30 31 29 26 27 24 20
Magma 3 6 6 8 9 (0) 1
MMFS 21 26 30 27 22 22 20
STFC 22 21 14 9 6 4 5
Other NBFCs
Bajaj Finance 33 35 38 41 41 38 35
L&TFH 9 9 9 6 24 19 14
Manappuram gold AUM 16 17 11 10 7 20 29
Muthoot 11 17 15 18 16 11 19
SCUF 26 18 9 7 4 0 3
AUM growth (%)- qoq
HFCs
HDFC 4 3 3 5 3 3 3
LICHF 1 4 3 7 2 2 2
PNBHF 10 7 9 6 4 1 (4)
Vehicle finance
Chola 6 5 6 8 6 3 2
Magma 1 4 (1) 3 2 (5) 1
MMFS 11 1 6 6 6 2 4
STFC 4 4 (1) 1 2 2 1
Other NBFCs
Bajaj Finance 11 7 10 8 11 5 7
L&TFH (13) 6 6 7 2 3 1
Manappuram gold AUM 6 1 (1) 3 3 14 6
Muthoot 6 4 0 5 5 (0) 8
SCUF 5 2 (3) 3 3 (2) (1)

Diversified Financials Muthoot Finance
40 KOTAK INSTITUTIONAL EQUITIES RESEARCH
Exhibit 8: Strong 10% qoq rise in average ticket size in 3QFY20 led by rally in gold prices Average ticket size, loan accounts and loan book, March fiscal year-ends, 2011-2019, 1QFY20-3QFY20
Notes: (1) Numbers from FY2018 onwards are based on Ind-AS.
Source: Company, Kotak Institutional Equities
Microfinance holds on; other businesses slow down
Sharp decline in home finance disbursements. Muthoot HomeFin (MHIL) is a wholly
owned subsidiary of Muthoot Finance which focuses on extending affordable housing
finance loans and targets customers to Economically Weaker Sections (EWS) and Lower
Income Groups (LIG) in Tier II & Tier III locations. It has a loan book of Rs20 bn (up 10%
yoy /down 3% qoq). Disbursements slowed down to Rs995 mn (lowest since 3QFY17).
Whole growth picked up marginally in 2QFY20, increased concerns over asset quality in
select geographies led to a slowdown in incremental business from these areas.
Average ticket size stands at ~Rs1 mn in 3QFY20.
NIM declined 60 bps qoq to 4.8% owing to 130 bps qoq decline in reported yields to
11.6%.
Cost-income ratio spiked 720 bps qoq/2,065 bps yoy to 44.3% on the back of 71%
yoy rise in operating expenses.
Asset quality performance deteriorated further in 3QFY20, led by increased
delinquencies in select states. Gross stage 3 loans were up 113 bps yoy/77 qoq to
1.9%. ECL coverage on stage 3 loans decreased 710 bps qoq to 80.6%. Overall ECL
coverage at 190 bps (up 135 bps qoq) is comparable to most peers.
Strong growth for MFI business. Muthoot owns 70% in Belstar Investment Finance - a
microfinance business with loan book of Rs22.8 bn (up 46% yoy, 8% qoq). Loan growth
is higher than industry average on a low base. The company has increased penetration
into newer geographies. The company operates its MFI business in 16 states (entered five
states in 3QFY20) and one union territory. It has 573 branches (75 net new additions
qoq), with 101 controlling regional offices (net addition of 2 in 3QFY20) and an employee
force of 4,269 3,837 (up 432 employees qoq). Gross stage 3 ratio increased 10 bps qoq
to 1.1%.
Asset quality woes for Muthoot Money. Muthoot Money is a wholly owned subsidiary
of Muthoot Finance that commenced operations from October 2018. The company is
involved in extending loans for commercial vehicles, equipment and cars. The operations
are centered in Hyderabad. AUM growth was strong at 15% qoq (on a low base). Gross
Stage 3 loans increased 155 bps qoq to 2.5%. The deterioration in asset quality is similar
to other vehicle financiers, given that it is not sufficiently seasoned risks the book to
further asset quality deterioration.
CAGR (%)
2011 2012 2013 2014 2015 2016 2017 2018 2019 1QFY20 2QFY20 3QFY20 (2011-3QFY20)
Average ticket size (Rs) 33,438 39,900 41,120 40,000 37,865 36,500 37,186 38,345 42,279 43,678 44,112 48,123 3
Loan accounts (# mn) 4.7 6.2 6.3 5.7 6.2 6.6 7.3 7.6 8.1 8.2 8.1 8.0 6
Loan book (Rs mn) 117,518 246,730 260,004 218,620 234,050 243,789 272,785 291,420 342,461 358,159 357,305 384,982 14
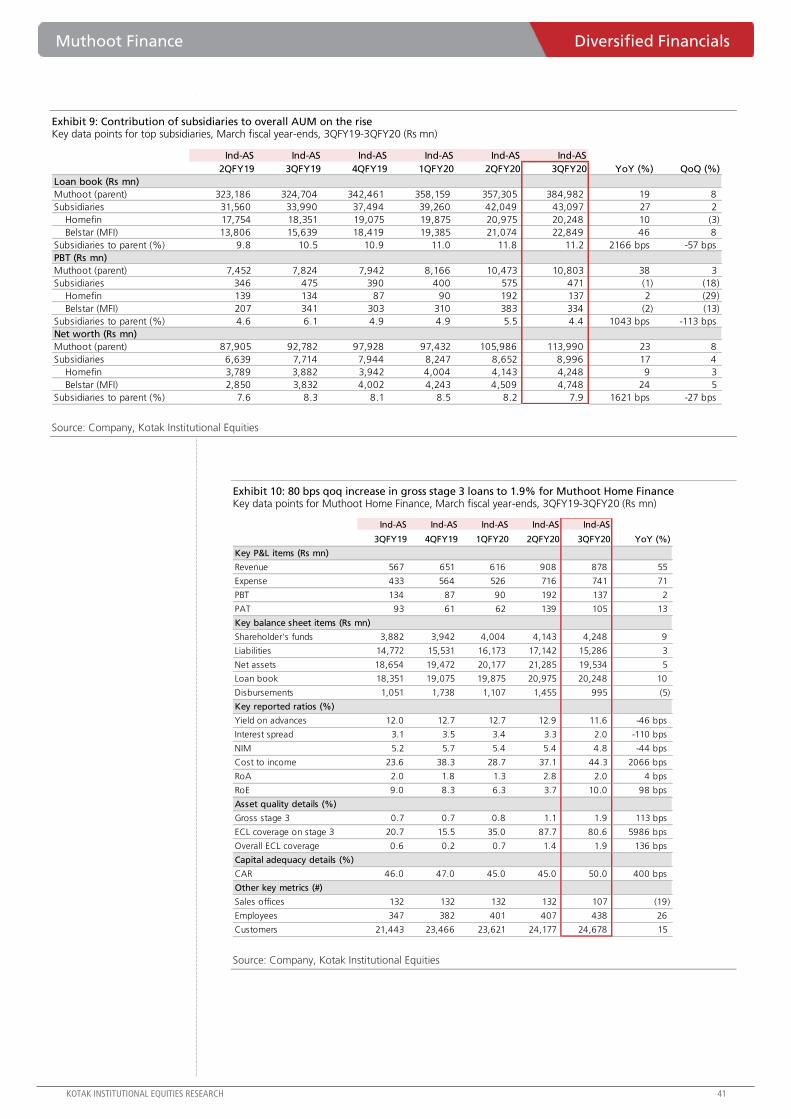
Muthoot Finance Diversified Financials
KOTAK INSTITUTIONAL EQUITIES RESEARCH 41
Exhibit 9: Contribution of subsidiaries to overall AUM on the rise Key data points for top subsidiaries, March fiscal year-ends, 3QFY19-3QFY20 (Rs mn)
Source: Company, Kotak Institutional Equities
Exhibit 10: 80 bps qoq increase in gross stage 3 loans to 1.9% for Muthoot Home Finance Key data points for Muthoot Home Finance, March fiscal year-ends, 3QFY19-3QFY20 (Rs mn)
Source: Company, Kotak Institutional Equities
Ind-AS Ind-AS Ind-AS Ind-AS Ind-AS Ind-AS
2QFY19 3QFY19 4QFY19 1QFY20 2QFY20 3QFY20 YoY (%) QoQ (%)
Loan book (Rs mn)
Muthoot (parent) 323,186 324,704 342,461 358,159 357,305 384,982 19 8
Subsidiaries 31,560 33,990 37,494 39,260 42,049 43,097 27 2
Homefin 17,754 18,351 19,075 19,875 20,975 20,248 10 (3)
Belstar (MFI) 13,806 15,639 18,419 19,385 21,074 22,849 46 8
Subsidiaries to parent (%) 9.8 10.5 10.9 11.0 11.8 11.2 2166 bps -57 bps
PBT (Rs mn)
Muthoot (parent) 7,452 7,824 7,942 8,166 10,473 10,803 38 3
Subsidiaries 346 475 390 400 575 471 (1) (18)
Homefin 139 134 87 90 192 137 2 (29)
Belstar (MFI) 207 341 303 310 383 334 (2) (13)
Subsidiaries to parent (%) 4.6 6.1 4.9 4.9 5.5 4.4 1043 bps -113 bps
Net worth (Rs mn)
Muthoot (parent) 87,905 92,782 97,928 97,432 105,986 113,990 23 8
Subsidiaries 6,639 7,714 7,944 8,247 8,652 8,996 17 4
Homefin 3,789 3,882 3,942 4,004 4,143 4,248 9 3
Belstar (MFI) 2,850 3,832 4,002 4,243 4,509 4,748 24 5
Subsidiaries to parent (%) 7.6 8.3 8.1 8.5 8.2 7.9 1621 bps -27 bps
Ind-AS Ind-AS Ind-AS Ind-AS Ind-AS
3QFY19 4QFY19 1QFY20 2QFY20 3QFY20 YoY (%)
Key P&L items (Rs mn)
Revenue 567 651 616 908 878 55
Expense 433 564 526 716 741 71
PBT 134 87 90 192 137 2
PAT 93 61 62 139 105 13
Key balance sheet items (Rs mn)
Shareholder's funds 3,882 3,942 4,004 4,143 4,248 9
Liabilities 14,772 15,531 16,173 17,142 15,286 3
Net assets 18,654 19,472 20,177 21,285 19,534 5
Loan book 18,351 19,075 19,875 20,975 20,248 10
Disbursements 1,051 1,738 1,107 1,455 995 (5)
Key reported ratios (%)
Yield on advances 12.0 12.7 12.7 12.9 11.6 -46 bps
Interest spread 3.1 3.5 3.4 3.3 2.0 -110 bps
NIM 5.2 5.7 5.4 5.4 4.8 -44 bps
Cost to income 23.6 38.3 28.7 37.1 44.3 2066 bps
RoA 2.0 1.8 1.3 2.8 2.0 4 bps
RoE 9.0 8.3 6.3 3.7 10.0 98 bps
Asset quality details (%)
Gross stage 3 0.7 0.7 0.8 1.1 1.9 113 bps
ECL coverage on stage 3 20.7 15.5 35.0 87.7 80.6 5986 bps
Overall ECL coverage 0.6 0.2 0.7 1.4 1.9 136 bps
Capital adequacy details (%)
CAR 46.0 47.0 45.0 45.0 50.0 400 bps
Other key metrics (#)
Sales offices 132 132 132 132 107 (19)
Employees 347 382 401 407 438 26
Customers 21,443 23,466 23,621 24,177 24,678 15
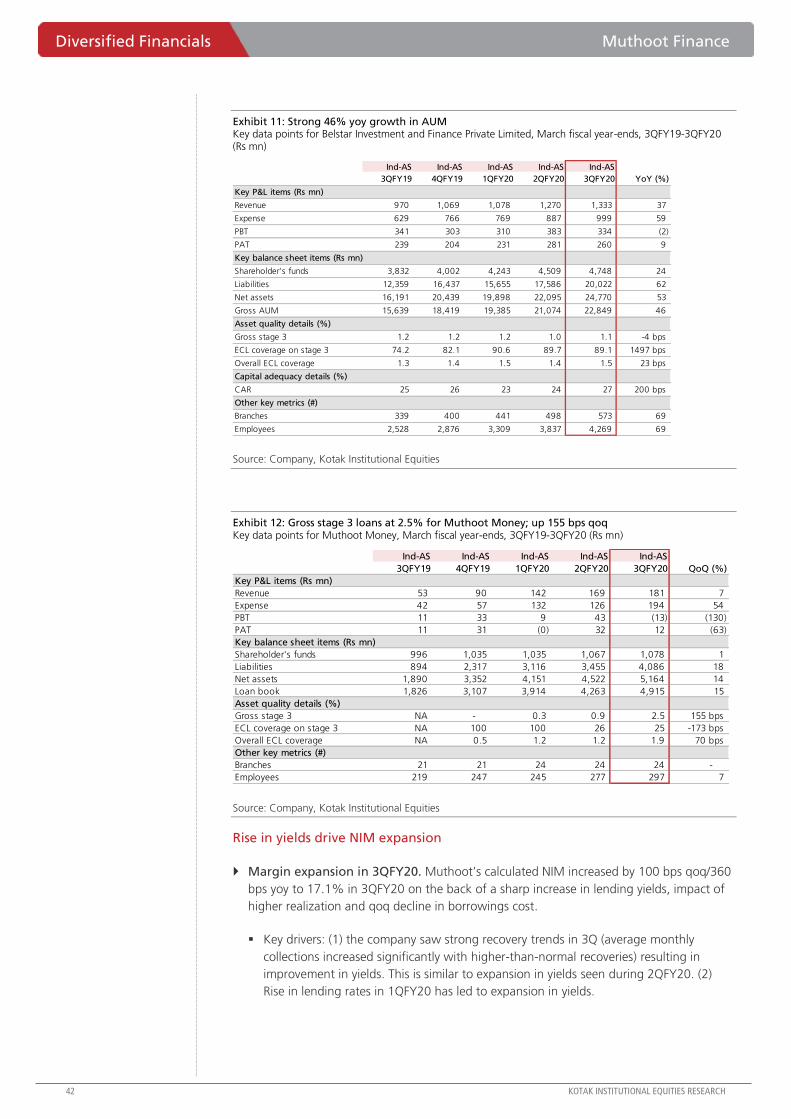
Diversified Financials Muthoot Finance
42 KOTAK INSTITUTIONAL EQUITIES RESEARCH
Exhibit 11: Strong 46% yoy growth in AUM Key data points for Belstar Investment and Finance Private Limited, March fiscal year-ends, 3QFY19-3QFY20 (Rs mn)
Source: Company, Kotak Institutional Equities
Exhibit 12: Gross stage 3 loans at 2.5% for Muthoot Money; up 155 bps qoq Key data points for Muthoot Money, March fiscal year-ends, 3QFY19-3QFY20 (Rs mn)
Source: Company, Kotak Institutional Equities
Rise in yields drive NIM expansion
Margin expansion in 3QFY20. Muthoot’s calculated NIM increased by 100 bps qoq/360
bps yoy to 17.1% in 3QFY20 on the back of a sharp increase in lending yields, impact of
higher realization and qoq decline in borrowings cost.
Key drivers: (1) the company saw strong recovery trends in 3Q (average monthly
collections increased significantly with higher-than-normal recoveries) resulting in
improvement in yields. This is similar to expansion in yields seen during 2QFY20. (2)
Rise in lending rates in 1QFY20 has led to expansion in yields.
Ind-AS Ind-AS Ind-AS Ind-AS Ind-AS
3QFY19 4QFY19 1QFY20 2QFY20 3QFY20 YoY (%)
Key P&L items (Rs mn)
Revenue 970 1,069 1,078 1,270 1,333 37
Expense 629 766 769 887 999 59
PBT 341 303 310 383 334 (2)
PAT 239 204 231 281 260 9
Key balance sheet items (Rs mn)
Shareholder's funds 3,832 4,002 4,243 4,509 4,748 24
Liabilities 12,359 16,437 15,655 17,586 20,022 62
Net assets 16,191 20,439 19,898 22,095 24,770 53
Gross AUM 15,639 18,419 19,385 21,074 22,849 46
Asset quality details (%)
Gross stage 3 1.2 1.2 1.2 1.0 1.1 -4 bps
ECL coverage on stage 3 74.2 82.1 90.6 89.7 89.1 1497 bps
Overall ECL coverage 1.3 1.4 1.5 1.4 1.5 23 bps
Capital adequacy details (%)
CAR 25 26 23 24 27 200 bps
Other key metrics (#)
Branches 339 400 441 498 573 69
Employees 2,528 2,876 3,309 3,837 4,269 69
Ind-AS Ind-AS Ind-AS Ind-AS Ind-AS
3QFY19 4QFY19 1QFY20 2QFY20 3QFY20 QoQ (%)
Key P&L items (Rs mn)
Revenue 53 90 142 169 181 7
Expense 42 57 132 126 194 54
PBT 11 33 9 43 (13) (130)
PAT 11 31 (0) 32 12 (63)
Key balance sheet items (Rs mn)
Shareholder's funds 996 1,035 1,035 1,067 1,078 1
Liabilities 894 2,317 3,116 3,455 4,086 18
Net assets 1,890 3,352 4,151 4,522 5,164 14
Loan book 1,826 3,107 3,914 4,263 4,915 15
Asset quality details (%)
Gross stage 3 NA - 0.3 0.9 2.5 155 bps
ECL coverage on stage 3 NA 100 100 26 25 -173 bps
Overall ECL coverage NA 0.5 1.2 1.2 1.9 70 bps
Other key metrics (#)
Branches 21 21 24 24 24 -
Employees 219 247 245 277 297 7
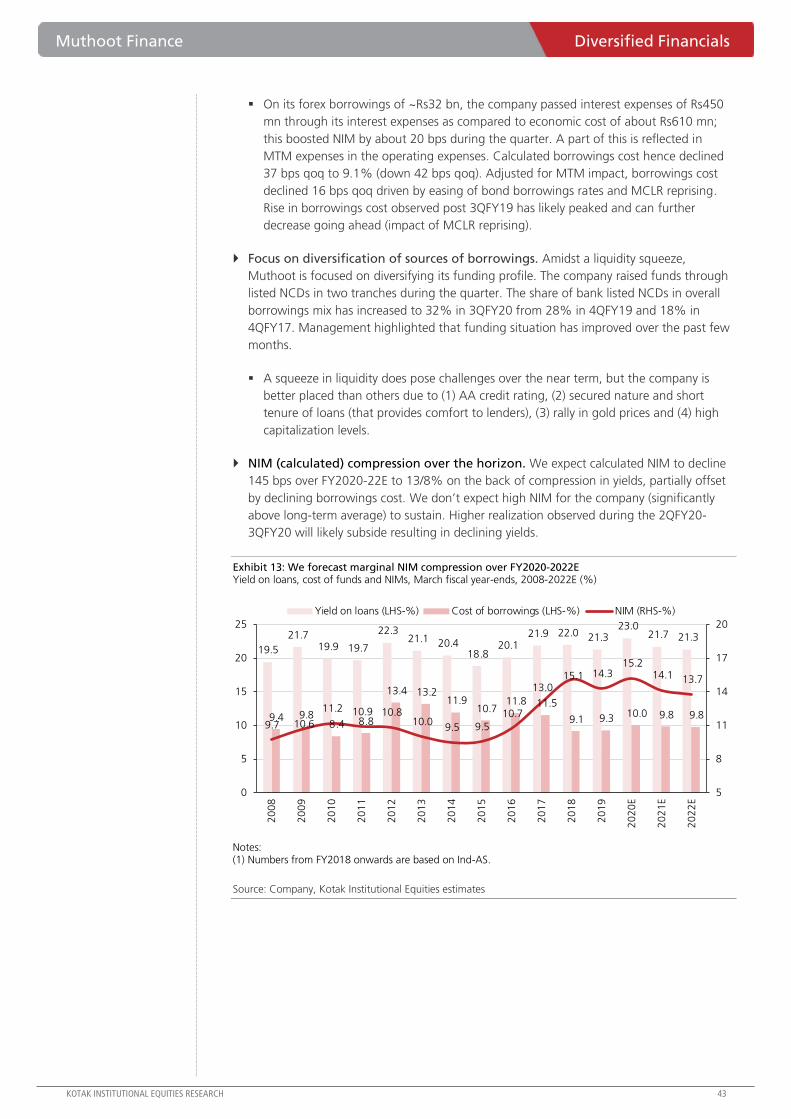
Muthoot Finance Diversified Financials
KOTAK INSTITUTIONAL EQUITIES RESEARCH 43
On its forex borrowings of ~Rs32 bn, the company passed interest expenses of Rs450
mn through its interest expenses as compared to economic cost of about Rs610 mn;
this boosted NIM by about 20 bps during the quarter. A part of this is reflected in
MTM expenses in the operating expenses. Calculated borrowings cost hence declined
37 bps qoq to 9.1% (down 42 bps qoq). Adjusted for MTM impact, borrowings cost
declined 16 bps qoq driven by easing of bond borrowings rates and MCLR reprising.
Rise in borrowings cost observed post 3QFY19 has likely peaked and can further
decrease going ahead (impact of MCLR reprising).
Focus on diversification of sources of borrowings. Amidst a liquidity squeeze,
Muthoot is focused on diversifying its funding profile. The company raised funds through
listed NCDs in two tranches during the quarter. The share of bank listed NCDs in overall
borrowings mix has increased to 32% in 3QFY20 from 28% in 4QFY19 and 18% in
4QFY17. Management highlighted that funding situation has improved over the past few
months.
A squeeze in liquidity does pose challenges over the near term, but the company is
better placed than others due to (1) AA credit rating, (2) secured nature and short
tenure of loans (that provides comfort to lenders), (3) rally in gold prices and (4) high
capitalization levels.
NIM (calculated) compression over the horizon. We expect calculated NIM to decline
145 bps over FY2020-22E to 13/8% on the back of compression in yields, partially offset
by declining borrowings cost. We don’t expect high NIM for the company (significantly
above long-term average) to sustain. Higher realization observed during the 2QFY20-
3QFY20 will likely subside resulting in declining yields.
Exhibit 13: We forecast marginal NIM compression over FY2020-2022E Yield on loans, cost of funds and NIMs, March fiscal year-ends, 2008-2022E (%)
Notes: (1) Numbers from FY2018 onwards are based on Ind-AS.
Source: Company, Kotak Institutional Equities estimates
19.5
21.7 19.9 19.7
22.3 21.1 20.4
18.8 20.1
21.9 22.0 21.3 23.0
21.7 21.3
9.4 9.8 8.4 8.8
13.4 13.2 11.9
10.7 11.8 11.5
9.1 9.3 10.0 9.8 9.8 9.7 10.6
11.2 10.9 10.8 10.0
9.5 9.5
10.7
13.0 15.1 14.3
15.2 14.1 13.7
5
8
11
14
17
20
0
5
10
15
20
25
20
08
20
09
20
10
20
11
20
12
20
13
20
14
20
15
20
16
20
17
20
18
20
19
20
20
E
20
21
E
20
22
E
Yield on loans (LHS-%) Cost of borrowings (LHS-%) NIM (RHS-%)
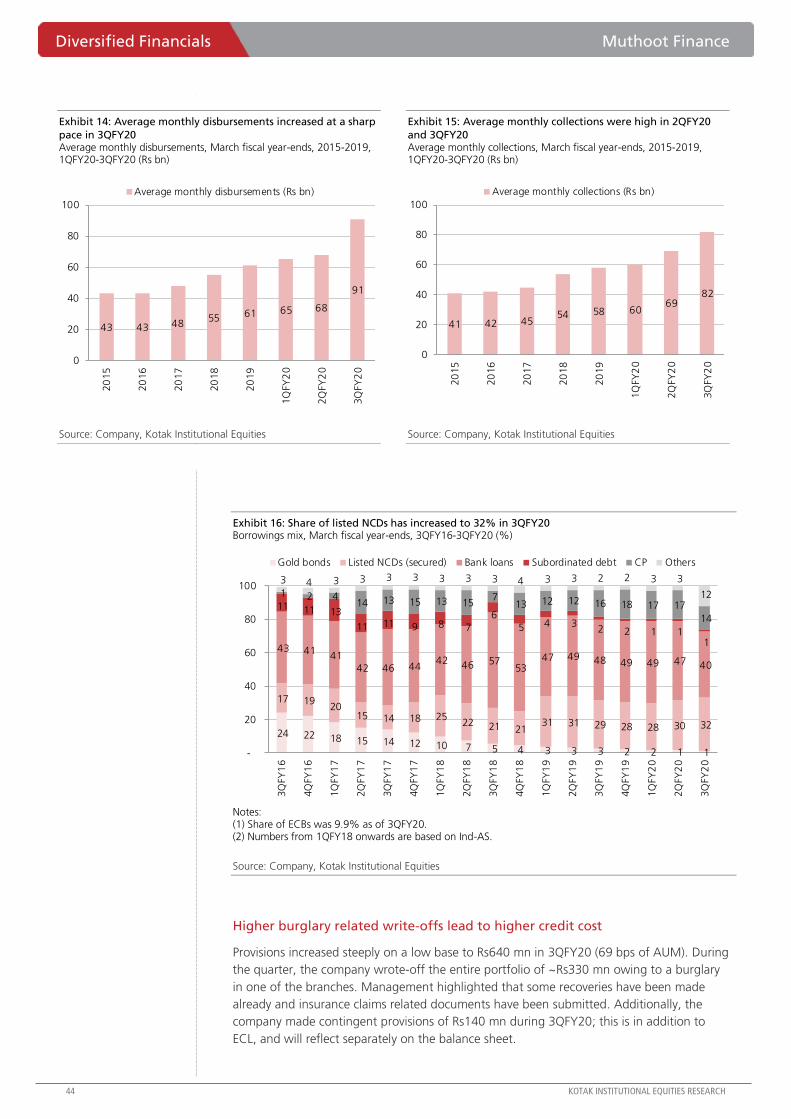
Diversified Financials Muthoot Finance
44 KOTAK INSTITUTIONAL EQUITIES RESEARCH
Exhibit 14: Average monthly disbursements increased at a sharp
pace in 3QFY20 Average monthly disbursements, March fiscal year-ends, 2015-2019, 1QFY20-3QFY20 (Rs bn)
Source: Company, Kotak Institutional Equities
Exhibit 15: Average monthly collections were high in 2QFY20
and 3QFY20 Average monthly collections, March fiscal year-ends, 2015-2019, 1QFY20-3QFY20 (Rs bn)
Source: Company, Kotak Institutional Equities
Exhibit 16: Share of listed NCDs has increased to 32% in 3QFY20 Borrowings mix, March fiscal year-ends, 3QFY16-3QFY20 (%)
Notes: (1) Share of ECBs was 9.9% as of 3QFY20. (2) Numbers from 1QFY18 onwards are based on Ind-AS.
Source: Company, Kotak Institutional Equities
Higher burglary related write-offs lead to higher credit cost
Provisions increased steeply on a low base to Rs640 mn in 3QFY20 (69 bps of AUM). During
the quarter, the company wrote-off the entire portfolio of ~Rs330 mn owing to a burglary
in one of the branches. Management highlighted that some recoveries have been made
already and insurance claims related documents have been submitted. Additionally, the
company made contingent provisions of Rs140 mn during 3QFY20; this is in addition to
ECL, and will reflect separately on the balance sheet.
43 43 4855 61 65 68
91
0
20
40
60
80
100
20
15
20
16
20
17
20
18
20
19
1Q
FY2
0
2Q
FY2
0
3Q
FY2
0
Average monthly disbursements (Rs bn)
41 42 4554 58 60
6982
0
20
40
60
80
100
20
15
20
16
20
17
20
18
20
19
1Q
FY2
0
2Q
FY2
0
3Q
FY2
0
Average monthly collections (Rs bn)
24 22 18 15 14 12 10 7 5 4 3 3 3 2 2 1 1
17 19 20
15 14 18 25 22 21 21
31 31 29 28 28 30 32
43 41 41
42 46 44 42 46 57
53 47 49 48 49 49 47 40
11 11 13
11 11 9 8 7
6
5 4 3 2 2 1 1
1
1 2 4 14 13 15 13 15
7 13 12 12 16 18 17 17
14
3 4 3 3 3 3 3 3 3 4 3 3 2 2 3 3
12
-
20
40
60
80
100
3Q
FY1
6
4Q
FY1
6
1Q
FY1
7
2Q
FY1
7
3Q
FY1
7
4Q
FY1
7
1Q
FY1
8
2Q
FY1
8
3Q
FY1
8
4Q
FY1
8
1Q
FY1
9
2Q
FY1
9
3Q
FY1
9
4Q
FY1
9
1Q
FY2
0
2Q
FY2
0
3Q
FY2
0
Gold bonds Listed NCDs (secured) Bank loans Subordinated debt CP Others
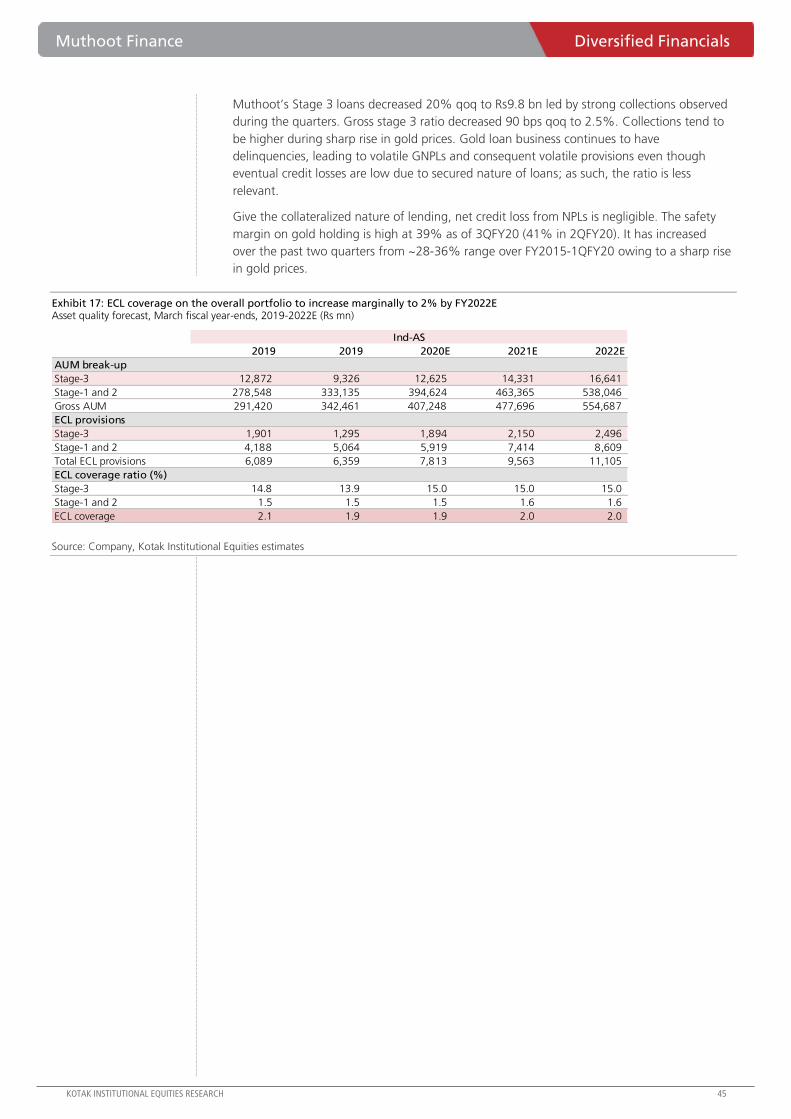
Muthoot Finance Diversified Financials
KOTAK INSTITUTIONAL EQUITIES RESEARCH 45
Muthoot’s Stage 3 loans decreased 20% qoq to Rs9.8 bn led by strong collections observed
during the quarters. Gross stage 3 ratio decreased 90 bps qoq to 2.5%. Collections tend to
be higher during sharp rise in gold prices. Gold loan business continues to have
delinquencies, leading to volatile GNPLs and consequent volatile provisions even though
eventual credit losses are low due to secured nature of loans; as such, the ratio is less
relevant.
Give the collateralized nature of lending, net credit loss from NPLs is negligible. The safety
margin on gold holding is high at 39% as of 3QFY20 (41% in 2QFY20). It has increased
over the past two quarters from ~28-36% range over FY2015-1QFY20 owing to a sharp rise
in gold prices.
Exhibit 17: ECL coverage on the overall portfolio to increase marginally to 2% by FY2022E Asset quality forecast, March fiscal year-ends, 2019-2022E (Rs mn)
Source: Company, Kotak Institutional Equities estimates
Ind-AS
2019 2019 2020E 2021E 2022E
AUM break-up
Stage-3 12,872 9,326 12,625 14,331 16,641
Stage-1 and 2 278,548 333,135 394,624 463,365 538,046
Gross AUM 291,420 342,461 407,248 477,696 554,687
ECL provisions
Stage-3 1,901 1,295 1,894 2,150 2,496
Stage-1 and 2 4,188 5,064 5,919 7,414 8,609
Total ECL provisions 6,089 6,359 7,813 9,563 11,105
ECL coverage ratio (%)
Stage-3 14.8 13.9 15.0 15.0 15.0
Stage-1 and 2 1.5 1.5 1.5 1.6 1.6
ECL coverage 2.1 1.9 1.9 2.0 2.0

Diversified Financials Muthoot Finance
46 KOTAK INSTITUTIONAL EQUITIES RESEARCH
Exhibit 18: 60% of cumulative disbursements repaid within 6 months Collection efficiency, March fiscal year-ends, 1QFY20-3QFY20 (%)
Source: Company, Kotak Institutional Equities
1QFY20
2QFY20
3QFY20

Muthoot Finance Diversified Financials
KOTAK INSTITUTIONAL EQUITIES RESEARCH 47
Exhibit 19: 28-41% safety margin on gold loans over the years Margin of safety on loans, March fiscal year-ends, 2015-2019, 1QFY20-3QFY20 (%)
Source: Company, Kotak Institutional Equities
Strong growth in operating expenses at 38% yoy
Growth in operating expenses was strong at 38% yoy led by a 30% yoy rise in employee
expenses and 53% yoy increase other expenses. Growth in employee expenses is led by
higher variable remuneration; impact of higher business volumes. Other expenses increased
53% yoy on the back of (1) higher rental expenses and (2) MTM loss on foreign borrowings.
Additionally, Muthoot continues to invest in advertising and publicity expenses to enhance
brand recognition as competition from smaller players and fintech companies gathers pace.
We expect expenses to remain high at 16% CAGR over FY2020-22E on the back of strong
investment in advertising and a growing employee base. Additionally, Muthoot will continue
to incur other marketing and technology related expenses. Cost-to-average AUM will likely
drop marginally by 10 bps over FY2020-22E to 4.8%.
Exhibit 20: Branch productivity broadly stable since FY2019 Business per branch, March fiscal year-ends, 2015-2019, 1QFY20-3QFY20 (Rs mn)
Notes: (1) Numbers from 1QFY18 onwards are based on Ind-AS.
Source: Company, Kotak Institutional Equities
2015 2016 2017 2018 2019 1QFY20 2QFY20 3QFY20
Gold loans assets (Rs bn) 233 243 272 288 336 352 349 377
Gold volume (tonnes) 131 142 149 155 169 176 171 173
Gold price per gram (Rs) 2,470 2,670 2,725 2,824 2,910 3,126 3,452 3,594
Lender's perspective
Market price of gold held as ornaments (Rs bn) 324 379 406 438 492 550 590 622
Margin of safety on loans (%) 28 36 33 34 32 36 41 39
2015 2016 2017 2018 2019 1QFY20 2QFY20 3QFY20
East 66 80 74 90 102 91 101 109
West 59 65 76 85 96 99 98 106
North 76 78 86 91 103 108 106 115
South 48 48 53 54 61 65 63 68
Overall business 55 57 64 68 76 80 79 85
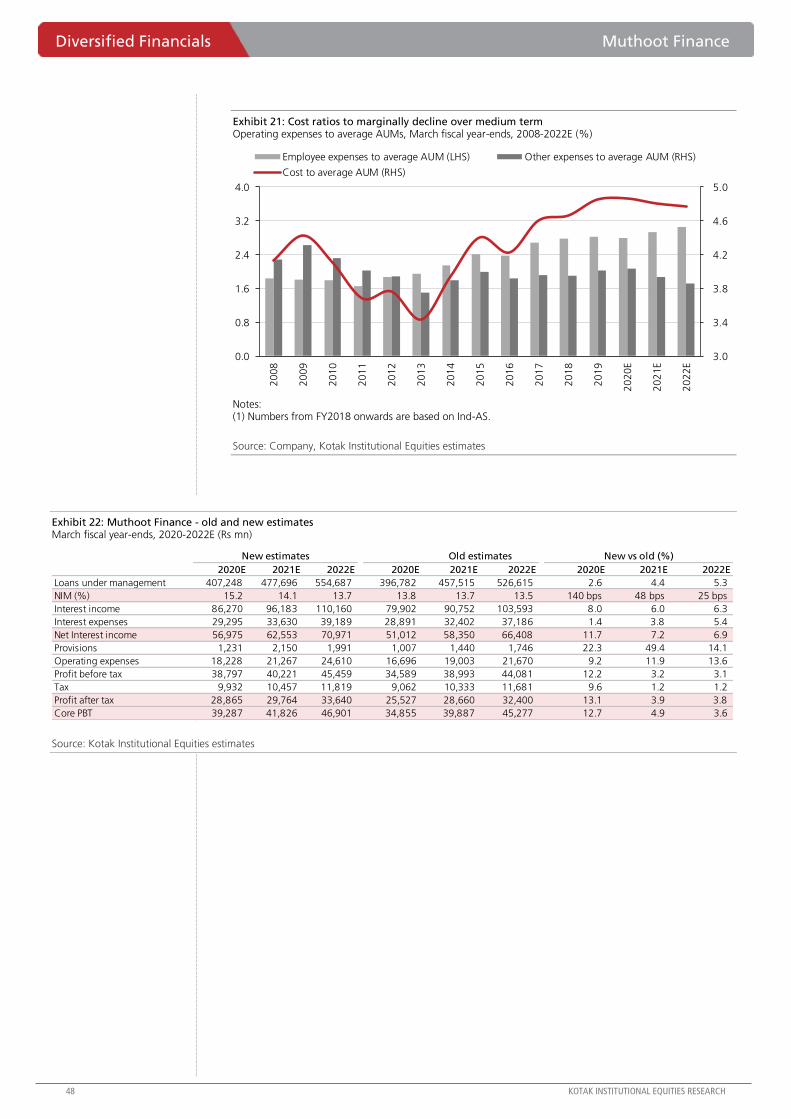
Diversified Financials Muthoot Finance
48 KOTAK INSTITUTIONAL EQUITIES RESEARCH
Exhibit 21: Cost ratios to marginally decline over medium term Operating expenses to average AUMs, March fiscal year-ends, 2008-2022E (%)
Notes: (1) Numbers from FY2018 onwards are based on Ind-AS.
Source: Company, Kotak Institutional Equities estimates
Exhibit 22: Muthoot Finance - old and new estimates March fiscal year-ends, 2020-2022E (Rs mn)
Source: Kotak Institutional Equities estimates
3.0
3.4
3.8
4.2
4.6
5.0
0.0
0.8
1.6
2.4
3.2
4.0
20
08
20
09
20
10
20
11
20
12
20
13
20
14
20
15
20
16
20
17
20
18
20
19
20
20
E
20
21
E
20
22
E
Employee expenses to average AUM (LHS) Other expenses to average AUM (RHS)
Cost to average AUM (RHS)
New estimates Old estimates New vs old (%)
2020E 2021E 2022E 2020E 2021E 2022E 2020E 2021E 2022E
Loans under management 407,248 477,696 554,687 396,782 457,515 526,615 2.6 4.4 5.3
NIM (%) 15.2 14.1 13.7 13.8 13.7 13.5 140 bps 48 bps 25 bps
Interest income 86,270 96,183 110,160 79,902 90,752 103,593 8.0 6.0 6.3
Interest expenses 29,295 33,630 39,189 28,891 32,402 37,186 1.4 3.8 5.4
Net Interest income 56,975 62,553 70,971 51,012 58,350 66,408 11.7 7.2 6.9
Provisions 1,231 2,150 1,991 1,007 1,440 1,746 22.3 49.4 14.1
Operating expenses 18,228 21,267 24,610 16,696 19,003 21,670 9.2 11.9 13.6
Profit before tax 38,797 40,221 45,459 34,589 38,993 44,081 12.2 3.2 3.1
Tax 9,932 10,457 11,819 9,062 10,333 11,681 9.6 1.2 1.2
Profit after tax 28,865 29,764 33,640 25,527 28,660 32,400 13.1 3.9 3.8
Core PBT 39,287 41,826 46,901 34,855 39,887 45,277 12.7 4.9 3.6

Muthoot Finance Diversified Financials
KOTAK INSTITUTIONAL EQUITIES RESEARCH 49
Exhibit 23: Muthoot is trading at 2.2X one-year forward book One-year forward trading PER and PBR, March fiscal year-ends, February 2012-February 2020 (X)
Notes: (1) FY2018-FY2022E numbers are based on Ind-AS.
Source: Company, Bloomberg, Kotak Institutional Equities estimates
0.5
1.0
1.5
2.0
2.5
3.0
0.0
3.0
6.0
9.0
12.0
15.0
Feb
-12
Au
g-1
2
Feb
-13
Au
g-1
3
Feb
-14
Au
g-1
4
Feb
-15
Au
g-1
5
Feb
-16
Au
g-1
6
Feb
-17
Au
g-1
7
Feb
-18
Au
g-1
8
Feb
-19
Au
g-1
9
Feb
-20
Rolling PER (LHS) Rolling PBR (RHS)
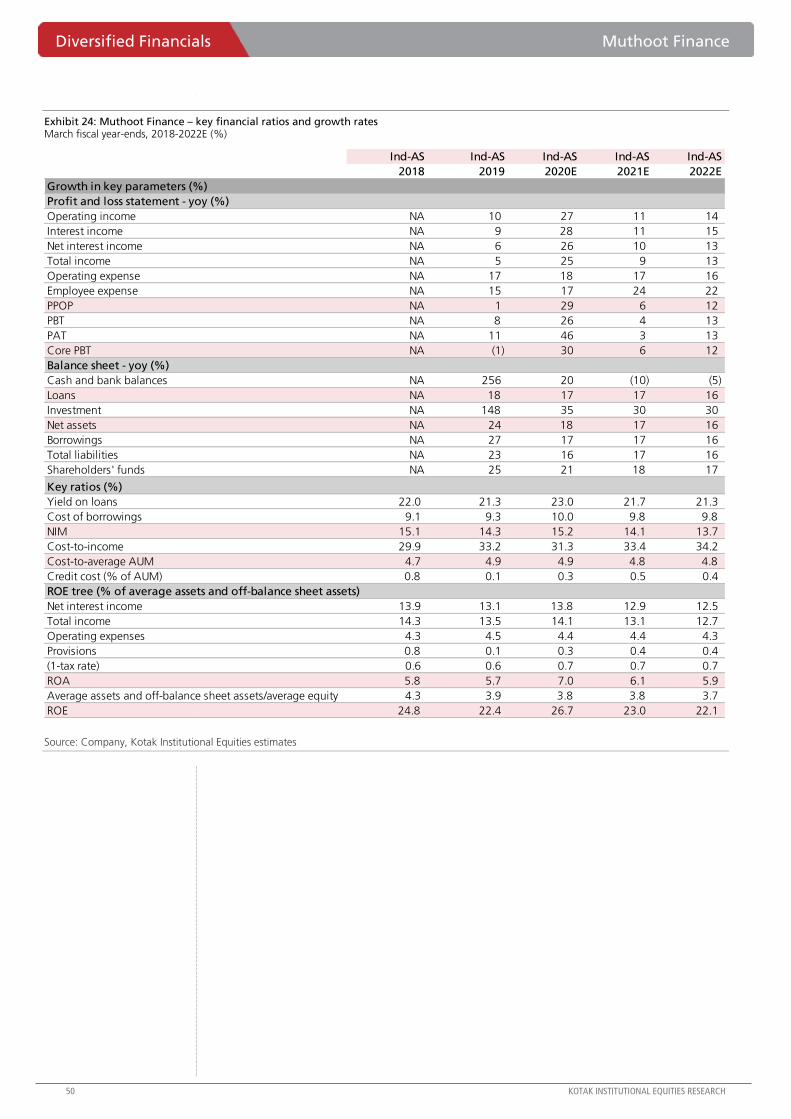
Diversified Financials Muthoot Finance
50 KOTAK INSTITUTIONAL EQUITIES RESEARCH
Exhibit 24: Muthoot Finance – key financial ratios and growth rates March fiscal year-ends, 2018-2022E (%)
Source: Company, Kotak Institutional Equities estimates
Ind-AS Ind-AS Ind-AS Ind-AS Ind-AS
2018 2019 2020E 2021E 2022E
Growth in key parameters (%)
Profit and loss statement - yoy (%)
Operating income NA 10 27 11 14
Interest income NA 9 28 11 15
Net interest income NA 6 26 10 13
Total income NA 5 25 9 13
Operating expense NA 17 18 17 16
Employee expense NA 15 17 24 22
PPOP NA 1 29 6 12
PBT NA 8 26 4 13
PAT NA 11 46 3 13
Core PBT NA (1) 30 6 12
Balance sheet - yoy (%)
Cash and bank balances NA 256 20 (10) (5)
Loans NA 18 17 17 16
Investment NA 148 35 30 30
Net assets NA 24 18 17 16
Borrowings NA 27 17 17 16
Total liabilities NA 23 16 17 16
Shareholders' funds NA 25 21 18 17
Key ratios (%)
Yield on loans 22.0 21.3 23.0 21.7 21.3
Cost of borrowings 9.1 9.3 10.0 9.8 9.8
NIM 15.1 14.3 15.2 14.1 13.7
Cost-to-income 29.9 33.2 31.3 33.4 34.2
Cost-to-average AUM 4.7 4.9 4.9 4.8 4.8
Credit cost (% of AUM) 0.8 0.1 0.3 0.5 0.4
ROE tree (% of average assets and off-balance sheet assets)
Net interest income 13.9 13.1 13.8 12.9 12.5
Total income 14.3 13.5 14.1 13.1 12.7
Operating expenses 4.3 4.5 4.4 4.4 4.3
Provisions 0.8 0.1 0.3 0.4 0.4
(1-tax rate) 0.6 0.6 0.7 0.7 0.7
ROA 5.8 5.7 7.0 6.1 5.9
Average assets and off-balance sheet assets/average equity 4.3 3.9 3.8 3.8 3.7
ROE 24.8 22.4 26.7 23.0 22.1

Muthoot Finance Diversified Financials
KOTAK INSTITUTIONAL EQUITIES RESEARCH 51
Exhibit 25: Muthoot Finance – income statement and balance sheet March fiscal year-ends, 2018-2022E (Rs mn)
Source: Company, Kotak Institutional Equities estimates
Ind-AS Ind-AS Ind-AS Ind-AS Ind-AS
2018 2019 2020E 2021E 2022E
Operating income 62,670 68,788 87,516 97,233 111,215
Interest income 62,021 67,570 86,270 96,183 110,160
Net gain on fair value change 101 481 500 300 300
Other operational income 548 737 746 750 754.49
Interest expense 19,314 22,368 29,295 33,630 39,189
Net interest income 42,707 45,202 56,975 62,553 70,971
Net operational income 43,356 46,419 58,220 63,603 72,026
Other income 662 19 35 35 35
Total income 44,017 46,438 58,255 63,638 72,061
Employee expense 7,824 8,976 10,488 12,969 15,794
Other expenses 36,194 37,462 47,768 50,669 56,267
PPOP 30,843 31,044 40,028 42,371 47,451
Provisions 2,397 275 1,231 2,150 1,991
PBT 28,447 30,768 38,797 40,221 45,459
Tax 10,671 11,047 9,932 10,457 11,819
PAT 17,776 19,721 28,865 29,764 33,640
Core PBT 30,495 30,334 39,287 41,826 46,901
Balance sheet (Rs mn)
Cash and cash equivalents 4,552 17,135 20,562 18,506 17,580
Bank balance other than above 318 220 242 266 293
Loans 295,068 349,329 407,248 477,696 554,687
Investment 3,954 9,826 13,265 17,244 22,417
Property plant and equipment 1,922 1,867 1,761 2,005 2,252
Other intangible assets 140 287 300 300 300
Other assets 1,968 2,023 4,096 7,792 11,488
Net assets 307,923 380,687 447,474 523,809 609,018
Borrowings 212,680 269,223 315,793 370,527 431,044
Provisions 2,239 2,106 2,500 2,500 2,500
Other liabilities 14,883 11,431 10,494 10,688 11,185
Total liabilities 229,802 282,760 328,787 383,715 444,729
Equity share capital 4,000 4,007 4,007 4,007 4,007
Reserves and surplus 74,120 93,921 114,681 136,087 160,282
Total shareholder funds 78,120 97,927 118,687 140,094 164,289
Loans under management 291,420 342,461 407,248 477,696 554,687

For Private Circulation Only. FOR IMPORTANT INFORMATION ABOUT KOTAK SECURITIES’ RATING SYSTEM AND OTHER DISCLOSURES, REFER TO THE END OF THIS MATERIAL.
[email protected]: +91 22 6218 6427
3QFY20: Margin expansion drives EBITDA beat
APHS delivered another solid quarter, registering 17% yoy growth in consolidated revenues
(largely in line with our estimates) with EBITDA (pre-IndAS) of Rs3.6bn (+5% vs KIE) growing
28% yoy. Healthcare segment delivered robust 13% yoy growth while pharmacy segment grew
22% yoy (+2% vs KIE). Revenue growth at mature centers of 9% yoy (-2% vs KIE) decelerated
a tad, however, new centers continue to ramp-up well registering 23% yoy growth. Key cluster
of Tamil Nadu grew at 11% yoy, with AP and Karnataka are both growing at a steady pace of
9% yoy. Apollo Health & Lifestyle Limited (AHLL) registered strong 23% yoy growth (+5% vs
KIE) in revenues. 3QFY20 EBITDA margin (pre Ind-AS) of 12.2% (-50 bps vs KIE) expanded 20
bps qoq despite seasonal weakness led by margin improvement across all segments. Healthcare
division posted 18.4% EBITDA margin (+30 bps vs KIE) while pharmacy margins improved 10
bps qoq to 6.1% (+20 bps vs KIE) despite an addition of 93 stores in the quarter as pre-FY2012
stores have reached 8.5% margins. Mature hospitals’ margin remained healthy at 22.1% while
new centers’ margins expanded 240 bps qoq to reach 7.9%. Proton Center’s (commissioned in
Jan 2019) losses declined Rs30 mn qoq to Rs34 mn with revenues increasing to revenues now
at Rs220 mn. AHLL’s impressive turn around continued in 3QFY20 with an EBITDA of Rs56 mn.
Net debt increased by Rs1 bn qoq to Rs35.2 bn led by incremental capex incurred on Proton.
Focus now on deleveraging given declining capex intensity
Apollo continued its strong momentum across all segments with (1) mature centers growing at
12% yoy in 9MFY20 (2) margins at new centers improving gradually (3) robust growth and
improvement in pharmacy margins with increasing contribution of private label (8.1% in 3Q)
and (4) successful turnaround of AHLL which is likely to post positive EBITDA in FY2020. Post
completion of its capex cycle, we expect APHS to now execute on its debt reduction guidance
and expect Rs10 bn decline in debt by end of FY2021 driven by (1) Rs4-5 bn reduction after
completion of pharmacy transaction (in March) and cash inflow from Munich divestment and
(2) healthy cash generation from operations during FY2021.
ADD with revised fair value of Rs1,840
We increase our FY2020-22E EBITDA (pre-IndAS) by 3-4% led by higher margins at mature
centers, pharmacies and AHLL. Our fair value now stands at Rs1,840 (versus Rs1,700 earlier)
based on 17X December 2021E attributable pre-IndAS EBITDA (adjusted for Gleneagles stake).
ADD.
Apollo Hospitals (APHS) Health Care Services
Impressive all round performance. APHS registered healthy revenue and EBITDA
growth of 17% and 28% yoy respectively in 3QFY20, led by strong growth and margin
improvement across all segments. We expect APHS’ improving operational performance
to continue over FY2020-22E and focus to now shift on debt reduction led by
pharmacy deal completion and strong FCF generation over FY2021-22 as capex
intensity moderates. ADD with revised fair value of Rs1,840 (versus Rs1,700 earlier).
ADD
FEBRUARY 14, 2020
RESULT
Sector view: Attractive
CMP (`): 1,704
Fair Value (`): 1,840
BSE-30: 41,258
Chirag Talati, CFA
Kumar Gaurav
Apollo Hospitals
Stock data Forecasts/valuations 2020E 2021E 2022E
52-week range (Rs) (high,low) EPS (Rs) 28.5 37.8 52.2
Mcap (bn) (Rs/US$) EPS growth (%) 68.0 32.6 38.1
ADTV-3M (mn) (Rs/US$) P/E (X) 59.8 45.1 32.7
Shareholding pattern (%) P/B (X) 6.6 6.1 5.5
Promoters 30.8 EV/EBITDA (X) 16.4 16.2 14.1
FIIs 48.9 RoE (%) 11.5 14.1 17.7
MFs/BFIs Div. yield (%) 0.6 0.9 1.2
Price performance (%) 1M 3M 12M Sales (Rs bn) 113 119 133
Absolute 14 20 48 EBITDA (Rs bn) 16 16 18
Rel. to BSE-30 16 17 29 Net profits (Rs bn) 4 5 7
1,748-1,083
238/3.4
8.1/5.3
1,181/17

Apollo Hospitals Health Care Services
KOTAK INSTITUTIONAL EQUITIES RESEARCH 53
Exhibit 1: APHS 3QFY20 EBITDA was 5% ahead of our estimates APHS interim results, March fiscal year-ends (Rs mn)
Source: Company, Kotak Institutional Equities estimates
% chg.
3QFY20 3QFY20E 3QFY19 2QFY20 3QFY20E 3QFY19 2QFY20 9MFY20 9MFY19 yoy (%) FY2020E FY2019 yoy (%)
Total revenues 29,117 28,869 24,950 28,407 1 17 2 83,244 71,179 16.9 112,624 96,174 17.1
COGS (14,172) (14,002) (12,101) (13,729) 1 17 3 (40,278) (34,622) 16.3 (54,623) (46,609) 17.2
Gross profit 14,946 14,868 12,850 14,679 1 16 2 42,966 36,558 17.5 58,002 49,566 17.0
Employee expenses (4,754) (4,710) (4,181) (4,687) 1 14 1 (13,774) (11,726) 17.5 (17,740) (15,982) 11.0
Other expenses (5,892) (6,048) (5,878) (5,857) (3) 0 1 (17,120) (16,990) 0.8 (24,049) (22,947) 4.8
EBITDA 4,300 4,110 2,791 4,135 5 54 4 12,072 7,841 54.0 16,212 10,637 52.4
EBITDA (Ind-AS adjusted) 3,551 3,370 2,768 3,395 5 28 5 9,892 7,810 26.7 13,448 10,637 26.4
Depreciation (1,573) (1,550) (984) (1,545) 1 60 2 (4,558) (2,906) 56.8 (6,138) (3,955) 55.2
EBIT 2,727 2,560 1,807 2,590 7 51 5 7,514 4,934 52.3 10,074 6,681 50.8
Other income 97 50 125 35 93 (23) 176 230 197 325 314
Interest expense (1,374) (1,360) (844) (1,343) 1 63 2 (3,975) (2,416) (5,006) (3,270)
Share of JVs 4 50 (57) 55 (93) (106) (93) (35) (99) 160 10
Exceptional item — — — — — — — —
PBT 1,453 1,300 1,030 1,337 12 41 9 3,734 2,616 5,553 3,735
Tax (554) (416) (531) (506) (1,512) (1,343) (1,888) (1,734)
Net profit 900 884 499 831 2,222 1,273 3,666 2,002
Minority interest 22 25 72 31 134 271 300 359
PAT 921 909 571 862 1 NM 7 2,356 1,544 52.6 3,966 2,360 68.0
Margin (%)
Gross profit (%) 51.3 51.5 51.5 51.7 51.6 51.4 51.5 51.5
Employee expenses (%) (16.3) (16.3) (16.8) (16.5) (16.5) (16.5) (15.8) (16.6)
Other expenses (%) (20.2) (20.9) (23.6) (20.6) (20.6) (23.9) (21.4) (23.9)
EBITDA margin (%) 14.8 14.2 11.2 14.6 14.5 11.0 14.4 11.1
EBIT margin (%) 9.4 8.9 7.2 9.1 9.0 6.9 8.9 6.9
Segmental revenues
Healthcare 14,938 14,927 13,277 14,865 0 13 0 43,332 37,971 14.1 58,575 51,426 13.9
SAP 12,326 12,143 10,119 11,727 2 22 5 34,621 28,677 20.7 46,866 38,860 20.6
AHLL 1,854 1,800 1,512 1,815 3 23 2 5,291 4,312 22.7 7,183 5,888 22.0
Revenues 29,118 28,869 24,908 28,407 1 17 3 83,244 70,960 17.3 112,624 96,174 17.1
Segmental EBITDA
Healthcare 2,943 2,843 2,386 2,861 4 23 3 8,387 6,838 22.7 11,267 9,204 22.4
SAP 1,145 1,098 549 1,090 4 109 5 3,179 1,474 115.7 4,217 2,031 107.6
AHLL 213 169 (167) 184 NM NM NM 507 (502) NM 728 (599) NM
EBITDA 4,301 4,110 2,768 4,135 5 55 4 12,073 7,810 54.6 16,212 10,636 52.4
Segmental EBITDA margins (%)
Healthcare 19.7 19.0 18.0 19.2 19.4 18.0 ` 19.2 17.9 `
SAP 9.3 9.0 5.4 9.3 9.2 5.1 9.0 5.2
AHLL 11.5 9.4 (11.0) 10.1 9.6 (11.6) 10.1 (10.2)
EBITDA margin 14.8 14.2 11.1 14.6 14.5 11.0 14.4 11.1
Segmental EBITDA (pre Ind-AS)
Healthcare 2,743 2,644 2,386 2,662 4 15 3 7,811 6,838 14.2 10,559 9,204 14.7
SAP 751 716 549 708 5 37 6 2,046 1,474 38.8 2,789 2,031 37.3
AHLL 56 10 (167) 25 NM NM NM 34 (502) NM 100 (599) NM
EBITDA 3,550 3,370 2,768 3,395 5 28 5 9,891 7,810 26.6 13,448 10,636 26.4
Segmental margins (pre IndAS) (%)
Healthcare 18.4 17.7 18.0 17.9 18.0 18.0 ` 18.0 17.9 `
SAP 6.1 5.9 5.4 6.0 5.9 5.1 6.0 5.2
AHLL 3.0 0.6 (11.0) 1.4 0.6 (11.6) 1.4 (10.2)
EBITDA margin 12.2 11.7 11.1 12.0 11.9 11.0 11.9 11.1
Healthcare revenues
Mature 11,044 11,227 10,114 11,203 (1.6) 9.2 (1.4) 32,567 29,151 11.7 43,600 39,279 11.0
New 3,893 3,700 3,162 3,663 5.2 23.1 6.3 10,765 8,820 22.1 14,975 12,147 23.3
Total 14,937 14,927 13,276 14,866 0.1 12.5 0.5 43,332 37,971 14.1 58,575 51,426 13.9
Healthcare EBITDA (post Ind-AS)
Mature 2,547 2,554 2,174 2,571 (0.3) 17.2 (0.9) 7,464 6,261 19.2
New 396 289 212 290 37.2 87 36.6 923 577 60.0
Total 2,943 2,843 2,386 2,861 3.5 23.3 2.9 8,387 6,838 22.7
Healthcare margins (post Ind-AS) (%)
Existing 23.1 22.8 21.5 22.9 22.9 21.5 — —
New 10.2 7.8 6.7 7.9 8.6 6.5 — —
Total 19.7 19.0 18.0 19.2 19.4 18.0 — —
Healthcare EBITDA (pre-IndAS)
Mature 2,437 2,441 2,174 2,461 (0.2) 12.1 (1.0) 7,137 6,261 14.0 9,548 8,430 13.3
New 307 220 212 201 39.5 45 52.7 675 577 17.0 1,011 774 30.6
Total 2,744 2,661 2,386 2,662 3.1 15.0 3.1 7,812 6,838 14.2 10,559 9,204 14.7
Healthcare margins (pre-IndAS) (%)
Existing 22.1 22.0 21.5 22.0 21.9 21.5 21.9 21.5
New 7.9 6.1 6.7 5.5 6.3 6.5 6.8 6.4
Total 18.4 18.1 18.0 17.9 18.0 18.0 18.0 17.9

Health Care Services Apollo Hospitals
54 KOTAK INSTITUTIONAL EQUITIES RESEARCH
Exhibit 2: Mature cluster growth healthy Mature cluster growth, March fiscal year-ends, 1QFY17-3QFY20 (%)
Source: Company, Kotak Institutional Equities estimates
Exhibit 3: Performance across new centers has now stabilized New center EBITDA, March fiscal year-ends,1QFY17-2QFY20 (Rs mn)
Source: Company, Kotak Institutional Equities estimates
Exhibit 4: Increasing private label contribution… Private label contribution, March fiscal year-ends (%)
Source: Company, Kotak Institutional Equities estimates
Exhibit 5: …aiding sharp uptick in pharmacy margins Pharmacy EBITDA margin, March fiscal year-ends, 1QFY16-3QFY20 (%)
Source: Company, Kotak Institutional Equities estimates
1.9
4.8 4.4
2.0
4.0 4.0
6.3
1.7
8.8
6.7
12.1
18.0
12.8 13.3
9.2
-
2.0
4.0
6.0
8.0
10.0
12.0
14.0
16.0
18.0
20.0
1Q
FY17
2Q
FY17
3Q
FY17
4Q
FY17
1Q
FY18
2Q
FY18
3Q
FY18
4Q
FY18
1Q
FY19
2Q
FY19
3Q
FY19
4Q
FY19
1Q
FY20
2Q
FY20
3Q
FY20
29
126
13
(228)
(62)
145 143
5
154
211 212 198 167
201
307
(300)
(200)
(100)
-
100
200
300
400
1Q
FY17
2Q
FY17
3Q
FY17
4Q
FY17
1Q
FY18
2Q
FY18
3Q
FY18
4Q
FY18
1Q
FY19
2Q
FY19
3Q
FY19
4Q
FY19
1Q
FY20
2Q
FY20
3Q
FY20
6.56.0
6.3 6.57.0
7.9 8.1
0
1
2
3
4
5
6
7
8
9
2016
2017
2018
2019
1Q
FY20
2Q
FY20
3Q
FY20
3.4 3.5 3.6
3.3 3.5
4.9 4.6
4.1 4.3 4.5 4.6 4.7 4.7
5.3 5.4 5.5 5.6 6.0 6.1
-
1.0
2.0
3.0
4.0
5.0
6.0
7.0
1Q
FY16
2Q
FY16
3Q
FY16
4Q
FY16
1Q
FY17
2Q
FY17
3Q
FY17
4Q
FY17
1Q
FY18
2Q
FY18
3Q
FY18
4Q
FY18
1Q
FY19
2Q
FY19
3Q
FY19
4Q
FY19
1Q
FY20
2Q
FY20
3Q
FY20

Apollo Hospitals Health Care Services
KOTAK INSTITUTIONAL EQUITIES RESEARCH 55
Exhibit 6: We increase our FY2020-22 pre Ind-AS EBITDA estimates by 3-4% Earnings revision, March fiscal year-ends, FY2019-21E (Rs mn)
Source: Company, Kotak Institutional Equities estimates
New estimates Old estimates Change (%)
2020E 2021E 2022E 2020E 2021E 2022E 2020E 2021E 2021E
Sales 112,624 119,096 132,893 104,323 117,343 131,013 8.0 1.5 1.4
EBITDA 16,212 16,280 18,375 15,746 15,660 17,852 3.0 4.0 2.9
EBITDA (Ind-AS adjusted) 13,448 14,877 16,903 12,982 14,257 16,379 3.6 4.3 3.2
PAT 3,966 5,258 7,262 3,788 4,812 6,860 4.7 9.3 5.9
EPS 29 38 52 27 35 49 4.7 9.3 5.9
EBITDA margin (%) 14.4 13.7 13.8 15.1 13.3 13.6
Sales
Healthcare 58,575 64,787 70,612 57,715 63,723 69,524 1.5 1.7 1.6
Pharmacy 46,866 45,833 52,534 39,836 45,833 52,534 17.6 — —
Munich — — — — — —
AHLL 7,183 8,476 9,748 6,771 7,787 8,955 6.1 8.9 8.9
Total 112,624 119,096 132,893 104,323 117,343 131,013 8.0 1.5 1.4
EBITDA
Healthcare 11,267 12,778 14,243 10,925 12,259 13,819 3.1 4.2 3.1
Pharmacy 4,217 2,642 3,090 4,193 2,642 3,090 0.6 — —
AHLL 728 859 1,042 628 759 942 NM NM NM
Total 13,448 14,877 16,903 12,982 14,257 16,379 3.6 4.3 3.2
EBITDA (Ind-AS adjusted)
Healthcare 10,559 12,035 13,462 10,217 11,515 13,039 3.4 4.5 3.2
Pharmacy 2,789 2,642 3,090 2,765 2,642 3,090 0.8 — —
AHLL 100 200 350 — 100 250 NM NM NM
Total 13,448 14,877 16,903 12,982 14,257 16,379 3.6 4.3 3.2
EBITDA margin (%)
Healthcare 19.2 19.7 20.2 18.9 19.2 19.9
Pharmacy 9.0 5.8 5.9 10.5 5.8 5.9
AHLL 10.1 10.1 10.7 9.3 9.8 10.5
Total 11.9 12.5 12.7 12.4 12.2 12.5
EBITDA margin (Ind-AS adjusted) (%)
Healthcare 18.0 18.6 19.1 17.7 18.1 18.8
Pharmacy 6.0 5.8 5.9 6.9 5.8 5.9
AHLL 1.4 2.4 3.6 0.0 1.3 2.8
Total 11.9 12.5 12.7 12.4 12.2 12.5

Health Care Services Apollo Hospitals
56 KOTAK INSTITUTIONAL EQUITIES RESEARCH
Exhibit 7: We expect operational improvement across all segments to continue APHS segmental break-up, March fiscal year-ends, FY2013-22E (Rs mn)
Source: Company, Kotak Institutional Equities estimates
2013 2014 2015 2016 2017 2018 2019 2020E 2021E 2022E
Revenues
Hospitals 25,573 28,843 32,250 37,033 41,363 45,157 51,426 58,575 64,787 70,612
Standalone pharmacy 11,017 13,648 17,726 23,220 28,745 32,689 38,860 46,866 45,833 52,534
Munich 497 607 735 — — — — — — —
AHLL 601 743 1,074 1,894 2,441 4,589 5,888 7,183 8,476 9,748
Total 37,687 43,841 51,785 62,147 72,549 82,435 96,174 112,624 119,096 132,893
EBITDA (pre Ind-AS)
Hospitals 5,876 6,478 7,049 7,236 7,122 7,599 9,204 10,559 12,035 13,462
Standalone pharmacy 293 449 580 803 1,233 1,479 2,031 2,789 2,642 3,090
Munich (1) (30) 10 — — — — — — —
AHLL (86) (172) (292) (1,162) (1,069) (1,146) (599) 100 200 350
Total 6,082 6,725 7,347 6,877 7,286 7,932 10,636 13,448 14,877 16,903
EBITDA margin % (pre-IndAS)
Hospitals 23.0 22.5 21.9 19.5 17.2 16.8 17.9 18.0 18.6 19.1
Standalone pharmacy 2.7 3.3 3.3 3.5 4.3 4.5 5.2 6.0 5.8 5.9
Munich (0.2) (4.9) 1.4
AHLL (14.3) (23.1) (27.2) (61.4) (43.8) (25.0) (10.2) 1.4 2.4 3.6
Total 16.1 15.3 14.2 11.1 10.0 9.6 11.1 11.9 12.5 12.7
EBITDA (post-Ind-AS)
Hospitals 5,876 6,478 7,049 7,236 7,122 7,599 9,204 11,267 12,778 14,243
Standalone pharmacy 293 449 580 803 1,233 1,479 2,031 4,217 2,642 3,090
Munich (1) (30) 10 — — — — — — —
AHLL (86) (172) (292) (1,162) (1,069) (1,146) (599) 728 859 1,042
Total 6,082 6,725 7,347 6,877 7,286 7,932 10,636 16,212 16,280 18,375
EBITDA margin % (post-Ind-AS)
Hospitals 23.0 22.5 21.9 19.5 17.2 16.8 17.9 19.2 19.7 20.2
Standalone pharmacy 2.7 3.3 3.3 3.5 4.3 4.5 5.2 9.0 5.8 5.9
Munich (0.2) (4.9) 1.4
AHLL (14.3) (23.1) (27.2) (61.4) (43.8) (25.0) (10.2) 10.1 10.1 10.7
Total 16.1 15.3 14.2 11.1 10.0 9.6 11.1 14.4 13.7 13.8
Contribution (%)
Hospitals 67.9 65.8 62.3 59.6 57.0 54.8 53.5 52.0 54.4 53.1
Standalone pharmacy 29.2 31.1 34.2 37.4 39.6 39.7 40.4 41.6 38.5 39.5
Munich 1.3 1.4 1.4 0.0 0.0 0.0 0.0 0.0 0.0 0.0
AHLL 1.6 1.7 2.1 3.0 3.4 5.6 6.1 6.4 7.1 7.3
Total 100.0 100.0 100.0 100.0 100.0 100.0 100.0 100.0 100.0 100.0
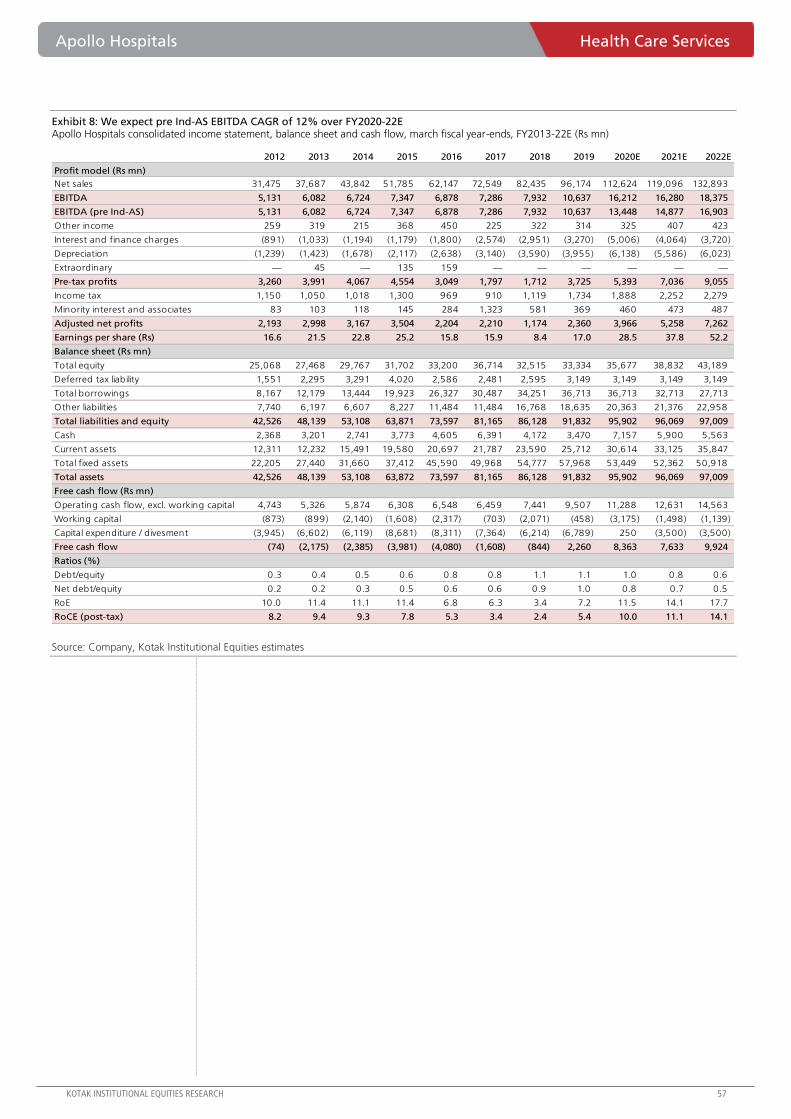
Apollo Hospitals Health Care Services
KOTAK INSTITUTIONAL EQUITIES RESEARCH 57
Exhibit 8: We expect pre Ind-AS EBITDA CAGR of 12% over FY2020-22E Apollo Hospitals consolidated income statement, balance sheet and cash flow, march fiscal year-ends, FY2013-22E (Rs mn)
Source: Company, Kotak Institutional Equities estimates
2012 2013 2014 2015 2016 2017 2018 2019 2020E 2021E 2022E
Profit model (Rs mn)
Net sales 31,475 37,687 43,842 51,785 62,147 72,549 82,435 96,174 112,624 119,096 132,893
EBITDA 5,131 6,082 6,724 7,347 6,878 7,286 7,932 10,637 16,212 16,280 18,375
EBITDA (pre Ind-AS) 5,131 6,082 6,724 7,347 6,878 7,286 7,932 10,637 13,448 14,877 16,903
Other income 259 319 215 368 450 225 322 314 325 407 423
Interest and finance charges (891) (1,033) (1,194) (1,179) (1,800) (2,574) (2,951) (3,270) (5,006) (4,064) (3,720)
Depreciation (1,239) (1,423) (1,678) (2,117) (2,638) (3,140) (3,590) (3,955) (6,138) (5,586) (6,023)
Extraordinary — 45 — 135 159 — — — — — —
Pre-tax profits 3,260 3,991 4,067 4,554 3,049 1,797 1,712 3,725 5,393 7,036 9,055
Income tax 1,150 1,050 1,018 1,300 969 910 1,119 1,734 1,888 2,252 2,279
Minority interest and associates 83 103 118 145 284 1,323 581 369 460 473 487
Adjusted net profits 2,193 2,998 3,167 3,504 2,204 2,210 1,174 2,360 3,966 5,258 7,262
Earnings per share (Rs) 16.6 21.5 22.8 25.2 15.8 15.9 8.4 17.0 28.5 37.8 52.2
Balance sheet (Rs mn)
Total equity 25,068 27,468 29,767 31,702 33,200 36,714 32,515 33,334 35,677 38,832 43,189
Deferred tax liability 1,551 2,295 3,291 4,020 2,586 2,481 2,595 3,149 3,149 3,149 3,149
Total borrowings 8,167 12,179 13,444 19,923 26,327 30,487 34,251 36,713 36,713 32,713 27,713
Other liabilities 7,740 6,197 6,607 8,227 11,484 11,484 16,768 18,635 20,363 21,376 22,958
Total liabilities and equity 42,526 48,139 53,108 63,871 73,597 81,165 86,128 91,832 95,902 96,069 97,009
Cash 2,368 3,201 2,741 3,773 4,605 6,391 4,172 3,470 7,157 5,900 5,563
Current assets 12,311 12,232 15,491 19,580 20,697 21,787 23,590 25,712 30,614 33,125 35,847
Total fixed assets 22,205 27,440 31,660 37,412 45,590 49,968 54,777 57,968 53,449 52,362 50,918
Total assets 42,526 48,139 53,108 63,872 73,597 81,165 86,128 91,832 95,902 96,069 97,009
Free cash flow (Rs mn)
Operating cash flow, excl. working capital 4,743 5,326 5,874 6,308 6,548 6,459 7,441 9,507 11,288 12,631 14,563
Working capital (873) (899) (2,140) (1,608) (2,317) (703) (2,071) (458) (3,175) (1,498) (1,139)
Capital expenditure / divesment (3,945) (6,602) (6,119) (8,681) (8,311) (7,364) (6,214) (6,789) 250 (3,500) (3,500)
Free cash flow (74) (2,175) (2,385) (3,981) (4,080) (1,608) (844) 2,260 8,363 7,633 9,924
Ratios (%)
Debt/equity 0.3 0.4 0.5 0.6 0.8 0.8 1.1 1.1 1.0 0.8 0.6
Net debt/equity 0.2 0.2 0.3 0.5 0.6 0.6 0.9 1.0 0.8 0.7 0.5
RoE 10.0 11.4 11.1 11.4 6.8 6.3 3.4 7.2 11.5 14.1 17.7
RoCE (post-tax) 8.2 9.4 9.3 7.8 5.3 3.4 2.4 5.4 10.0 11.1 14.1

For Private Circulation Only. FOR IMPORTANT INFORMATION ABOUT KOTAK SECURITIES’ RATING SYSTEM AND OTHER DISCLOSURES, REFER TO THE END OF THIS MATERIAL.
[email protected]: +91 22 6218 6427
3QFY20—ad revenues decline 13% yoy on reported basis and 16-17% like-for-like (LFL)
Ad revenues (incl. slot sale fees) declined 13% yoy (KIE -6%); underlying decline adjusted for
the ongoing slot-sale-to-commissioned shift was 16-17%. Sun TV ‘s viewership has improved in
the recent weeks; if it sustains, it would augur well for FY2021E ad growth. Domestic
subscription revenues grew 18% yoy: (1) DTH revenues declined 11% yoy (LFL), (2) cable
revenues grew 74%/22% yoy/qoq to Rs2.05 bn aided by digital content deal with Jio Cinema
(Rs250 mn+ per quarter per our estimate). A LFL yoy comparison of cable revenues is difficult as
3QFY20 numbers are reported gross of distribution costs (per our understanding) as against
net-level reporting in 3QFY19; the management did not call out distribution costs.
Direct costs (programming + distribution) declined 10%/29% yoy/qoq; the management
attributed the qoq decline to a lack of one-time costs. A yoy decline in direct costs is difficult to
comprehend given (1) launch of the Bangla channel (Feb 2019), (2) slot-sale-to-commissioned
shift, (3) Sun’s claim of higher investments in content and digital, and (3) distribution costs post
NTO implementation. There is a disconnect between management guidance for investments
and reported direct costs. EBIT declined 13% yoy and PBT declined 10% yoy. Net profit was up
3% yoy due to a reduction in the corporate tax rate. For 9MFY20, ad revenues (including slot
sale fees) declined 6% yoy (9-10% adjusted), EBIT declined 17% yoy and PBT declined 13% yoy.
Sun is focusing on short-term gains; REDUCE stays owing to lack of comfort on strategy
Sun’s present approach is tactical in nature with little focus on making the business future-
proof. For instance, Sun recently signed a digital content deal with Jio Cinema wherein its entire
movie library and catch-up content would be available on Jio Cinema. This deal would fetch
revenues of Rs1 bn/year for Sun. We would have liked a strategic partnership rather than
monetization of the asset. Sun’s underinvestment in content continues—there is a disconnect
between actual investments in content and the management’s guidance. The recent improvement
in Sun TV’s viewership is encouraging but it is not clear to us whether it is driven by content
investments or higher distribution incentives/commissions or telecast of more movies (tactical).
We tweak estimates, rollover and revise fair value to Rs525 (Rs510)
We broadly maintain our FY2020-22E earnings estimates. We rollover and revise FV to Rs525
(Rs510 earlier) valuing Sun at 12X FY2022E earnings. Valuations are undemanding but for us to
turn constructive, we need to see a decisive change in strategy and sharper execution.
Sun TV Network (SUNTV) Media
Underlying performance weak. Sun reported a 13% yoy decline in ad revenues (16-
17% decline adjusted for slot-sale-to-commissioned shift), 13% decline in EBIT and
10% decline in PBT. Even as Sun TV’s viewership has improved marginally in recent
weeks, Sun’s underinvestment in business continues and does not lend comfort on
sustained improvement. We rollover and revise FV to Rs525 (Rs510) valuing it at 12X
FY2022E earnings. Retain REDUCE.
REDUCE
FEBRUARY 16, 2020
RESULT
Sector view: Attractive
CMP (`): 497
Fair Value (`): 525
BSE-30: 41,258
Jaykumar Doshi
Sun TV Network
Stock data Forecasts/valuations 2020E 2021E 2022E
52-week range (Rs) (high,low) EPS (Rs) 37.8 41.4 43.8
Mcap (bn) (Rs/US$) EPS growth (%) 4.1 9.5 5.7
ADTV-3M (mn) (Rs/US$) P/E (X) 13.1 12.0 11.4
Shareholding pattern (%) P/B (X) 3.3 3.0 2.8
Promoters 75.0 EV/EBITDA (X) 9.3 8.4 7.8
FIIs 8.7 RoE (%) 26.1 26.1 25.3
MFs/BFIs Div. yield (%) 4.0 4.5 4.9
Price performance (%) 1M 3M 12M Sales (Rs bn) 36 41 43
Absolute 7 1 (14) EBITDA (Rs bn) 19 20 21
Rel. to BSE-30 9 (1) (25) Net profits (Rs bn) 15 16 17
651-389
196/2.8
8.1/1.2
1,167/16

Sun TV Network Media
KOTAK INSTITUTIONAL EQUITIES RESEARCH 59
Sun considering higher dividend payout in FY2020
Sun’s cash and cash equivalents stood at Rs30 bn+ as at end-3QFY20. The management
indicated that it is considering distribution of excess cash to shareholders in the current year
as tax on dividends would increase for HNIs (including promoters) starting next year. Further,
it also indicated that the board may also consider a buyback over dividend in future. Given
this, we would not be surprised if the company announced a special dividend of Rs40-
50/share in 4QFY20.
Exhibit 1: Interim standalone financials of Sun TV Network (Rs mn)
Source: Companies, Kotak Institutional Equities estimates
3QFY20 3QFY20E 3QFY19 2QFY20 KIE yoy qoq 9MFY20 9MFY19 % chg. FY2020E FY2019 % chg.
Total revenues 8,150 8,362 9,148 7,739 (3) (11) 5 26,693 27,847 (4.1) 35,805 37,825 (5.3)
Ad revenues (incl slot sales) 3,480 3,752 4,000 3,450 (7) (13) 1 10,712 11,400 (6.0) 13,904 14,920 (6.8)
Domestic subscription rev 4,120 4,100 3,500 3,757 0 18 10 11,637 10,010 16.3 15,927 13,104 21.5
- DTH 2,070 2,110 2,320 2,077 (2) (11) (0) 6,217 6,633 (6.3) 8,311 8,502 (2.3)
- Cable 2,050 1,770 1,180 1,680 16 74 22 5,420 3,377 60.5 7,616 4,602 65.5
International subscription rev 410 410 460 410 — (11) — 1,230 1,370 (10.2) 1,647 1,790 (8.0)
IPL revenues — — — — 2,444 3,859 (36.7) 2,444 4,439 (44.9)
Radio revenues — — — — — — 998 1,109 (10.0)
Others (incl. Sun Pictures) 140 100 1,188 123 671 1,208 (44) 885 2,463 (64.1)
Total expenditure (3,782) (4,170) (4,133) (4,316) (9) (8) (12) (13,658) (12,233) 11.6 (18,208) (18,387) (1.0)
Direct costs (programming) (1,106) (1,580) (1,228) (1,551) (30) (10) (29) (4,070) (2,938) 38.6 (5,914) (4,484) 31.9
Employee costs (710) (750) (717) (748) (5) (1) (5) (2,193) (2,303) (4.8) (3,141) (3,299) (4.8)
SG&A expenses (531) (500) (428) (573) 6 24 (7) (1,545) (1,077) 43.4 (1,985) (1,735) 14.4
IPL expenses - - - - (1,384) (1,867) (25.9) (1,384) (2,242) (38.3)
Depreciation expense (220) (220) (165) (220) - 33 - (650) (485) 34.0 (959) (728) 31.7
Movie amortization (1,216) (900) (1,596) (1,224) 35 (24) (1) (3,815) (3,562) 7.1 (4,825) (5,900) (18.2)
EBIT 4,367 4,192 5,014 3,423 4 (13) 28 13,035 15,614 (16.5) 17,596 19,438 (9.5)
EBIT margin (%) 53.6 50.1 54.8 44.2 48.8 56.1 49.1 51.4
Other income 636 750 516 721 (15) 23 (12) 1,924 1,527 26.0 2,425 2,271 6.8
Interest expense (19) (20) (7) (20) (59) (15) 284.4 (80) (17) 384.8
PBT 4,985 4,922 5,523 4,125 1 (10) 21 14,900 17,126 (13.0) 19,941 21,693 (8.1)
Extraordinaries - - - (180) (180) - (180) -
Tax provision (1,250) (1,240) (1,907) (280) 1 (34) 347 (3,502) (5,905) (40.7) (5,039) (7,511) (32.9)
Minority interest — — — — - - 48 137
Reported PAT 3,735 3,682 3,616 3,665 1 3 2 11,218 11,221 (0.0) 14,770 14,320 3.1
Adjusted PAT 3,735 3,682 3,616 3,845 1 3 (3) 11,398 11,221 1.6 14,904 14,320 4.1
EPS (Rs/share) 9.5 9.3 9.2 9.8 1 3 (3) 28.9 28.5 1.6 37.8 36.3 4.1
Tax rate (%) 25.1 25.2 34.5 7.1 23.5 34.5 25.5 34.6
Core business financials (excluding IPL)
Revenues 8,150 8,362 9,148 7,739 (3) (11) 5 24,249 23,988 33,361 33,386
Adjusted EBITDA (a) 4,587 4,412 5,179 3,643 4 (11) 26 12,625 14,107 (10.5) 17,496 17,969 (2.6)
EBITDA margin (%) 56.3 52.8 56.6 47.1 352 bps -33 bps 921 bps 52.1 58.8 52.4 53.8
IPL franchise
Revenues - - - - 2,444 3,859 (36.7) 2,444 4,439 (44.9)
Operating costs - - - - (1,384) (1,867) (25.9) (1,384) (2,242) (38.3)
Operating profit - - - - 1,060 1,993 NA 1,060 2,197 NA
Notes:
(a) EBITDA of core business (excludes IPL) after deducting amortization costs associated with movies.
(b) Core business and IPL frachise are in standalone financials. Radio business is in subsidiary and JV.
(a) Quarterly financials are standalone whereas full year numbers are consolidated (includes radio subsidiaries).
% chg.

Media Sun TV Network
60 KOTAK INSTITUTIONAL EQUITIES RESEARCH
Exhibit 2: Revised earnings estimates of Sun TV Network, FY2020E-22E (Rs mn)
Source: Company, Kotak Institutional Equities estimates
2020E 2021E 2022E 2020E 2021E 2022E 2020E 2021E 2021E
Advertising revenues (incl. slot sale) 13,904 14,923 15,649 14,588 15,444 16,196 (5) (3) (3)
Domestic subscription revenues 15,927 17,485 18,972 16,637 19,047 20,699 (4) (8) (8)
- DTH subscription revenues 8,311 8,726 9,337 9,182 10,100 10,858 (9) (14) (14)
- Cable subscription revenues 7,616 8,759 9,635 7,455 8,946 9,841 2 (2) (2)
Overseas subscription revenues 1,647 1,647 1,647 1,647 1,647 1,647 0 0 0
Radio revenues 998 1,078 1,164 1,165 1,281 1,409 (14) (16) (17)
Sun Pictures (movie production) 600 1,750 1,750 1,000 2,000 2,000 (40) (13) (13)
Other operating revenues (incl IPL) 2,729 3,625 3,625 2,734 3,625 3,625 (0) 0 0
Total revenues 35,805 40,507 42,807 37,770 43,043 45,576 (5) (6) (6)
Direct expenses 5,914 7,233 8,019 7,928 9,591 10,607 (25) (25) (24)
Employee expenses 3,141 3,578 3,846 3,321 3,786 4,070 (5) (5) (6)
SG&A expenses 3,369 3,919 4,036 3,365 4,002 4,121 0 (2) (2)
D&A expenses (incl movie amortization) 5,784 6,684 6,934 5,784 7,034 7,284 - (5) (5)
Total expenditure 18,208 21,415 22,835 20,398 24,413 26,083 (11) (12) (12)
EBIT 17,596 19,093 19,971 17,373 18,630 19,493 1 2 2
EBIT margin (%) 49.1 47.1 46.7 46.0 43.3 42.8
PAT 14,904 16,321 17,256 14,869 16,202 17,154 0 1 1
EPS (Rs/share) 37.8 41.4 43.8 37.7 41.1 43.5 0 1 1
Key assumptions
Ad revenue (incl slot sale) growth (%) (6.8) 7.3 4.9 (2.2) 5.9 4.9
Domestic subs revenue growth (%) 21.5 9.8 8.5 27.0 14.5 8.7
- DTH subscription revenue growth (%) (2.3) 5.0 7.0 8.0 10.0 7.5
- Cable subscription revenue growth (%) 65.5 15.0 10.0 62.0 20.0 10.0
Overseas subscription revenue growth (%) (8.0) - - (8.0) - -
Radio revenue growth (%) (10.0) 8.0 8.0 5.0 10.0 10.0
Movies amortization expense 4,825 5,675 5,875 4,825 6,025 6,225 - (6) (6)
IPL operating profit / (loss) 1,059 1,427 1,427 1,059 1,377 1,377 - 4 4
Change (%)PreviousRevised

Sun TV Network Media
KOTAK INSTITUTIONAL EQUITIES RESEARCH 61
Exhibit 3: BARC ratings market share, 1-Apr-17 to 7-Feb-20 (Week 14, 2017 to Week 05, 2020) (%)
Notes:
(1) Top 5-7 channels (relevant channels) in each genre are considered for market share calculation.
Source: BARC data, Kotak Institutional Equities
4QFY20
1QFY18 2QFY18 3QFY18 4QFY18 1QFY19 2QFY19 3QFY19 4QFY19 1QFY20 2QFY20 3QFY20 so far
Tamil GEC (Urban + Rural)- Viewership share in the top 6 channels (%)
Sun TV 55.9 49.2 51.5 49.3 45.5 44.2 41.5 40.2 39.6 41.1 44.2 47.6
STAR Vijay 16.5 24.0 21.4 19.9 20.7 21.5 21.8 22.7 23.5 25.7 22.6 21.2
Zee Tamil 13.2 13.9 15.2 17.6 19.6 20.9 22.7 22.1 22.5 19.6 20.3 18.3
Polimer 4.7 3.7 3.6 3.2 3.1 2.5 2.1 2.1 1.7 1.4 1.3 1.3
Kalaignar TV 3.1 2.8 3.4 3.3 2.4 2.2 2.0 3.9 3.9 3.5 3.5 3.3
Jaya TV 3.9 3.8 2.4 2.3 2.2 2.3 2.3 1.6 1.3 1.8 1.7 2.1
Colors Tamil 1.5 3.7 3.1 3.8 3.4 3.3 3.0 2.8 3.2
Sun Life 2.8 2.5 2.4 2.8 2.9 3.2 3.8 4.0 4.1 3.9 3.5 3.0
Total of top 8 100.0 100.0 100.0 100.0 100.0 100.0 100.0 100.0 100.0 100.0 100.0 100.0
Telugu GEC (Urban + Rural)- Viewership share in the top 4 channels (%)
Zee Telugu 24.3 22.9 24.6 24.0 26.8 25.1 24.8 24.9 23.6 21.1 20.9 21.0
Star Maa TV 22.2 27.7 24.5 25.7 27.8 30.1 31.9 31.0 33.4 36.3 36.6 35.1
Gemini TV (Sun) 29.4 25.6 24.4 24.8 22.4 22.0 21.6 19.6 20.5 19.9 19.6 20.7
ETV Telugu 24.1 23.8 26.4 25.6 23.0 22.8 21.8 24.5 22.5 22.7 22.8 23.3
Total of Top 4 100.0 100.0 100.0 100.0 100.0 100.0 100.0 100.0 100.0 100.0 100.0 100.0
Kannada GEC (Urban + Rural)- Viewership share in the top 5 channels (%)
Colors Kannada 34.4 35.0 34.8 35.0 33.9 33.5 32.4 31.2 28.1 23.9 24.7 20.6
Colors Super 8.0 8.4 11.4 10.3 8.0 8.9 10.7 9.2 10.2 9.6 7.4 6.4
Zee Kannada 25.6 24.5 22.3 24.7 25.0 29.2 29.6 31.3 32.1 35.9 38.1 39.3
Udaya TV (Sun) 13.6 16.4 18.7 18.0 18.8 17.0 16.1 16.7 16.9 16.9 15.6 17.4
Star Suvarna 18.3 15.6 12.8 12.0 14.4 11.3 11.1 11.7 12.7 13.7 14.3 16.2
Total of Top 5 100.0 100.0 100.0 100.0 100.0 100.0 100.0 100.0 100.0 100.0 100.0 100.0
Malayalam GEC (Urban + Rural)- Viewership share in the top 4 channels (%)
Star Asianet 54.9 51.9 43.7 48.1 52.8 52.7 49.7 46.9 43.9 46.0 49.1 51.6
Surya TV (Sun) 15.5 20.1 20.3 18.4 16.6 16.8 14.2 12.4 12.6 11.2 11.0 10.8
Mazhavil Manorama 18.2 16.7 21.3 16.9 15.5 15.8 15.0 17.3 17.8 16.0 15.3 13.4
Flowers TV 11.4 11.3 14.8 16.6 15.1 14.7 17.0 19.3 19.8 18.3 14.2 13.6
Zee Keralam 4.0 4.1 5.9 8.5 10.4 10.6
Total of Top 4 100.0 100.0 100.0 100.0 100.0 100.0 100.0 100.0 100.0 100.0 100.0 100.0
Telugu movie channels (Urban + Rural)- Viewership share in the top 4 channels (%)
Gemini movies (Sun) 35.6 32.2 31.9 33.1 28.4 32.2 31.7 31.3 27.1 29.7 27.9 27.6
Zee Cinemalu 18.9 21.7 21.8 23.1 26.0 24.6 25.3 25.8 28.7 27.2 26.5 27.7
Star MAA movies 29.2 32.4 30.2 28.3 31.8 27.7 27.6 28.6 32.7 30.3 32.5 31.5
ETV cinema 16.2 13.6 16.1 15.5 13.7 15.5 15.3 14.3 11.5 12.9 13.1 13.2
Total of Top 4 100.0 100.0 100.0 100.0 100.0 100.0 100.0 100.0 100.0 100.0 100.0 100.0
Malayalam movie channels (Urban + Rural)- Viewership share in the top 2 channels (%)
Star Asianet movies 49.2 51.3 50.4 55.3 53.9 54.5 56.0 53.9 53.9 55.0 54.6 55.5
Surya movies (Sun) 50.8 48.7 49.6 44.7 46.1 45.5 44.0 46.1 46.1 45.0 45.4 44.5
Total of Top 2 100.0 100.0 100.0 100.0 100.0 100.0 100.0 100.0 100.0 100.0 100.0 100.0
Tamil movie channel (Urban + Rural)- (GVMs)
KTV (Sun) 316 332 337 294 275 306 339 273 258 265 274 300
Kannada movie channel (Urban + Rural)- (GVMs)
Udaya movies (Sun) 190 193 186 191 185 216 190 159 154 145 150 155
Notes:
(1) Top 5-7 channels (relevant channels) in each genre are considered for market share calculation.
(2) Colors Tamil's viewership share was 4.5% in the month of March 2018 (Channel ratings were released starting March)
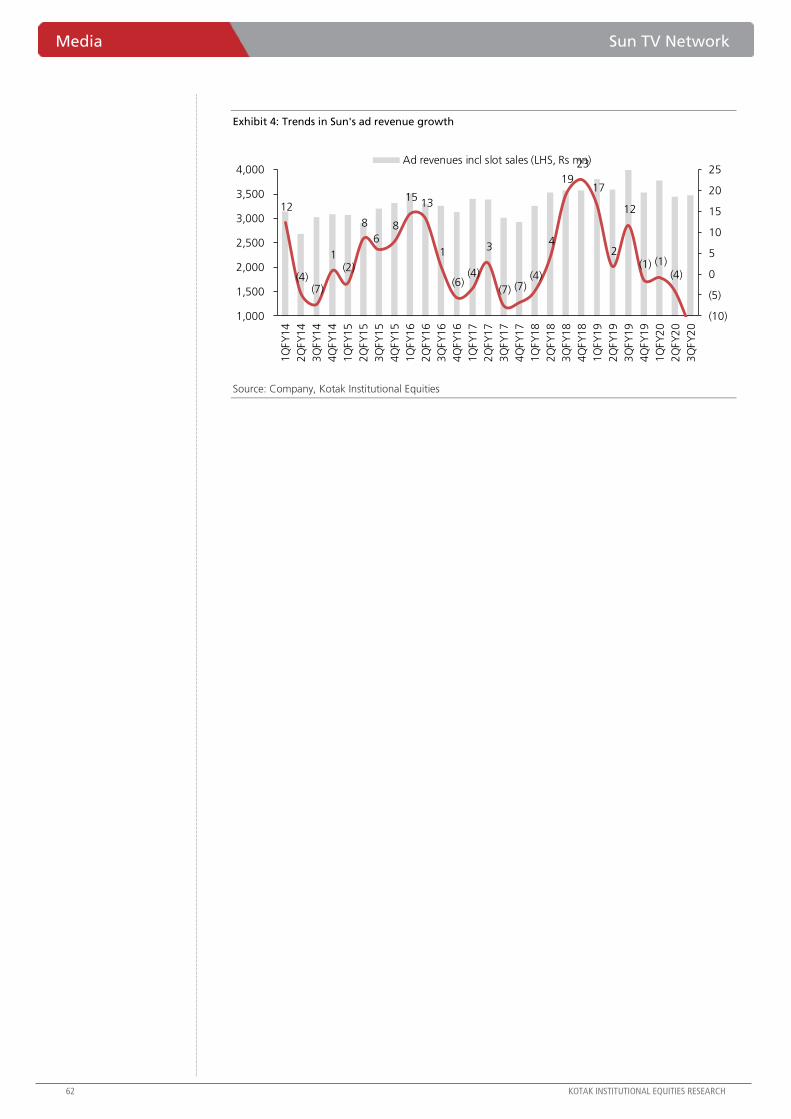
Media Sun TV Network
62 KOTAK INSTITUTIONAL EQUITIES RESEARCH
Exhibit 4: Trends in Sun's ad revenue growth
Source: Company, Kotak Institutional Equities
12
(4)(7)
1 (2)
8
6 8
15 13
1
(6)(4)
3
(7) (7)(4)
4
19
23
17
2
12
(1) (1)(4)
(10)
(5)
0
5
10
15
20
25
1,000
1,500
2,000
2,500
3,000
3,500
4,000
1Q
FY
14
2Q
FY
14
3Q
FY
14
4Q
FY
14
1Q
FY
15
2Q
FY
15
3Q
FY
15
4Q
FY
15
1Q
FY
16
2Q
FY
16
3Q
FY
16
4Q
FY
16
1Q
FY
17
2Q
FY
17
3Q
FY
17
4Q
FY
17
1Q
FY
18
2Q
FY
18
3Q
FY
18
4Q
FY
18
1Q
FY
19
2Q
FY
19
3Q
FY
19
4Q
FY
19
1Q
FY
20
2Q
FY
20
3Q
FY
20
Ad revenues incl slot sales (LHS, Rs mn)

Sun TV Network Media
KOTAK INSTITUTIONAL EQUITIES RESEARCH 63
Exhibit 5: Consolidated financial summary of Sun TV Network, FY2013-22E (Rs mn)
Source: Company, Kotak Institutional Equities estimates
2013 2014 2015 2016 2017 2018 2019 2020E 2021E 2022E
Profit model (Rs mn)
Net sales 19,230 22,236 23,954 25,698 26,457 29,630 37,825 35,805 40,507 42,807
EBIT 9,674 10,314 10,619 12,693 13,694 15,538 19,438 17,596 19,093 19,971
Other income 722 866 989 1,106 1,538 1,423 2,271 2,425 2,781 3,142
Interest (expense)/income (49) (46) (23) (22) (10) (11) (17) (80) (80) (80)
Pretax profits 10,347 11,134 11,586 13,777 15,222 16,950 21,693 19,941 21,794 23,033
Tax-cash (3,359) (3,730) (3,760) (4,755) (5,203) (5,822) (7,511) (5,039) (5,558) (5,873)
Tax-deferred 53 48 — — — — — — — —
Minority interest 54 28 (6) (68) 288 224 137 48 84 97
Recurring PAT 7,096 7,480 7,820 9,015 10,307 11,351 14,320 14,904 16,321 17,256
Recurring EPS (Rs) 18.0 19.0 19.8 22.9 26.2 28.8 36.3 37.8 41.4 43.8
Balance sheet (Rs mn)
Total equity 27,854 30,954 33,481 35,263 40,285 46,121 54,510 59,791 65,436 71,067
Deferred Tax 284 260 226 176 521 763 763 763 763 763
Total borrowings — — — — — — — — — —
Currrent liabilities 3,006 3,082 2,262 2,765 2,941 5,832 6,871 7,586 8,605 9,568
Total capital 32,396 35,636 37,450 40,894 43,782 52,756 62,184 68,180 74,843 81,438
Cash 6,599 10,810 12,924 16,850 15,925 20,812 24,425 30,900 35,262 40,481
Current assets 12,000 11,075 12,716 14,950 11,519 15,632 20,522 19,562 21,989 23,453
Total fixed assets 8,564 7,976 7,330 4,544 7,841 7,763 7,785 7,825 7,775 7,725
Intangible assets 5,233 5,775 4,481 4,551 4,421 4,246 5,012 5,404 5,404 5,404
Total assets 32,396 35,636 37,450 40,894 43,782 52,756 62,184 68,180 75,003 81,733
Free cash flow (Rs mn)
Operating cash flow, excl. WC 10,325 12,358 13,034 13,300 12,794 14,216 18,556 18,162 20,220 21,032
Working capital (WC) (1,926) (710) (1,519) (254) (293) (1,221) (3,851) 1,675 (1,408) (501)
Capital expenditure (4,037) (4,305) (4,400) (3,735) (5,324) (4,357) (7,416) (6,217) (6,880) (6,875)
Other income 403 773 823 938 1,089 1,423 2,271 2,425 2,781 3,142
Free cash flow 4,765 8,116 7,938 10,249 8,267 10,061 9,560 16,045 14,713 16,798
Ratios (%)
Debt/equity — — — — — — — — — —
Net debt/equity (24) (35) (39) (48) (40) (45) (45) (52) (54) (57)
RoAE 26 25 24 26 27 26 28 26 26 25
RoACE 27 25 24 26 26 25 28 26 26 25
Ratios (%)
Ad revenue (incl slot sale) growth (%) 7.6 0.1 4.8 5.6 (3.7) 9.7 7.0 (6.8) 7.3 4.9
Domestic subs revenue growth (%) 3.2 25.9 14.5 10.5 15.7 18.9 16.9 21.5 9.8 8.5
- DTH subscription revenue growth (%) 12.0 20.2 17.3 11.3 12.2 12.3 15.2 (2.3) 5.0 7.0
- Cable subscription revenue growth (%) (14.7) 41.2 8.1 8.3 24.6 33.9 20.2 65.5 15.0 10.0
Overseas subscription revenue growth (%) 22.3 21.2 8.8 5.5 7.4 7.1 8.5 (8.0) - -
Radio revenue growth (%) 25.9 20.4 20.2 11.2 (47.7) 15.3 8.0 (10.0) 8.0 8.0
Movies amortization expense 3,202 3,827 5,261 4,292 3,442 3,783 5,900 4,825 5,675 5,875
IPL operating profit / (loss) — (308) (583) (566) (318) (227) 2,197 1,059 1,427 1,427
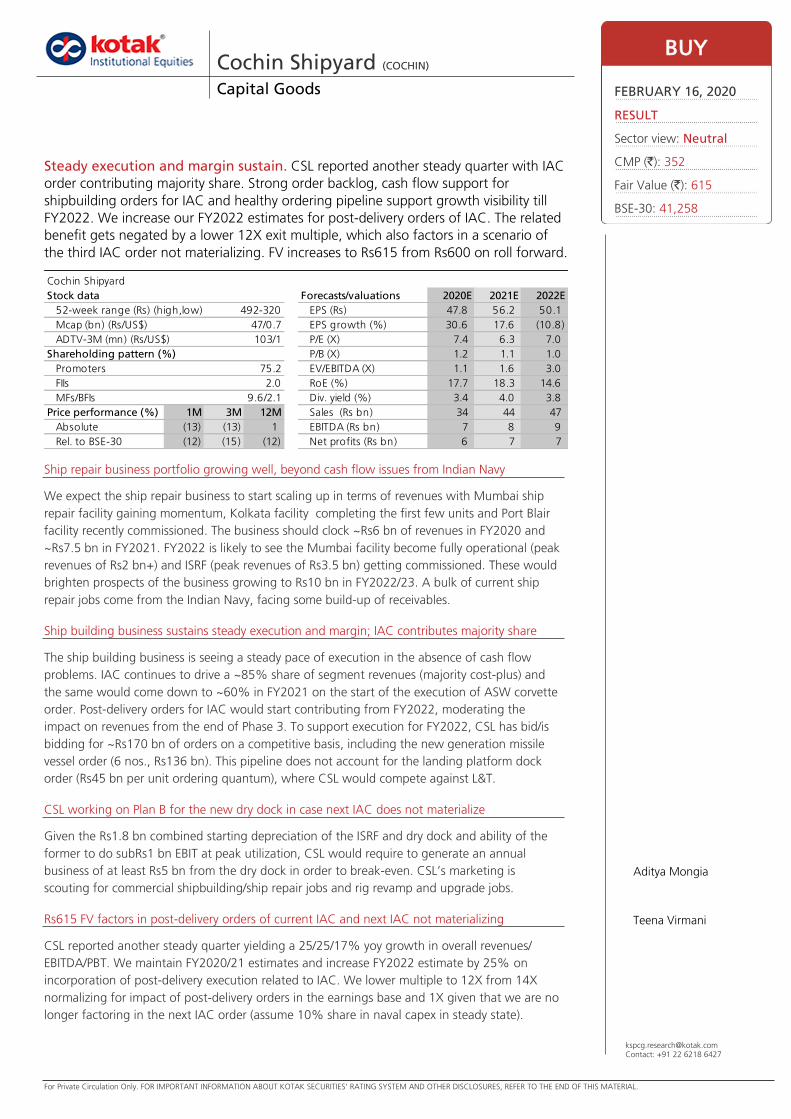
For Private Circulation Only. FOR IMPORTANT INFORMATION ABOUT KOTAK SECURITIES’ RATING SYSTEM AND OTHER DISCLOSURES, REFER TO THE END OF THIS MATERIAL.
[email protected]: +91 22 6218 6427
Ship repair business portfolio growing well, beyond cash flow issues from Indian Navy
We expect the ship repair business to start scaling up in terms of revenues with Mumbai ship
repair facility gaining momentum, Kolkata facility completing the first few units and Port Blair
facility recently commissioned. The business should clock ~Rs6 bn of revenues in FY2020 and
~Rs7.5 bn in FY2021. FY2022 is likely to see the Mumbai facility become fully operational (peak
revenues of Rs2 bn+) and ISRF (peak revenues of Rs3.5 bn) getting commissioned. These would
brighten prospects of the business growing to Rs10 bn in FY2022/23. A bulk of current ship
repair jobs come from the Indian Navy, facing some build-up of receivables.
Ship building business sustains steady execution and margin; IAC contributes majority share
The ship building business is seeing a steady pace of execution in the absence of cash flow
problems. IAC continues to drive a ~85% share of segment revenues (majority cost-plus) and
the same would come down to ~60% in FY2021 on the start of the execution of ASW corvette
order. Post-delivery orders for IAC would start contributing from FY2022, moderating the
impact on revenues from the end of Phase 3. To support execution for FY2022, CSL has bid/is
bidding for ~Rs170 bn of orders on a competitive basis, including the new generation missile
vessel order (6 nos., Rs136 bn). This pipeline does not account for the landing platform dock
order (Rs45 bn per unit ordering quantum), where CSL would compete against L&T.
CSL working on Plan B for the new dry dock in case next IAC does not materialize
Given the Rs1.8 bn combined starting depreciation of the ISRF and dry dock and ability of the
former to do subRs1 bn EBIT at peak utilization, CSL would require to generate an annual
business of at least Rs5 bn from the dry dock in order to break-even. CSL’s marketing is
scouting for commercial shipbuilding/ship repair jobs and rig revamp and upgrade jobs.
Rs615 FV factors in post-delivery orders of current IAC and next IAC not materializing
CSL reported another steady quarter yielding a 25/25/17% yoy growth in overall revenues/
EBITDA/PBT. We maintain FY2020/21 estimates and increase FY2022 estimate by 25% on
incorporation of post-delivery execution related to IAC. We lower multiple to 12X from 14X
normalizing for impact of post-delivery orders in the earnings base and 1X given that we are no
longer factoring in the next IAC order (assume 10% share in naval capex in steady state).
Cochin Shipyard (COCHIN) Capital Goods
Steady execution and margin sustain. CSL reported another steady quarter with IAC
order contributing majority share. Strong order backlog, cash flow support for
shipbuilding orders for IAC and healthy ordering pipeline support growth visibility till
FY2022. We increase our FY2022 estimates for post-delivery orders of IAC. The related
benefit gets negated by a lower 12X exit multiple, which also factors in a scenario of
the third IAC order not materializing. FV increases to Rs615 from Rs600 on roll forward.
BUY
FEBRUARY 16, 2020
RESULT
Sector view: Neutral
CMP (`): 352
Fair Value (`): 615
BSE-30: 41,258
Aditya Mongia
Teena Virmani
Cochin Shipyard
Stock data Forecasts/valuations 2020E 2021E 2022E
52-week range (Rs) (high,low) EPS (Rs) 47.8 56.2 50.1
Mcap (bn) (Rs/US$) EPS growth (%) 30.6 17.6 (10.8)
ADTV-3M (mn) (Rs/US$) P/E (X) 7.4 6.3 7.0
Shareholding pattern (%) P/B (X) 1.2 1.1 1.0
Promoters 75.2 EV/EBITDA (X) 1.1 1.6 3.0
FIIs 2.0 RoE (%) 17.7 18.3 14.6
MFs/BFIs Div. yield (%) 3.4 4.0 3.8
Price performance (%) 1M 3M 12M Sales (Rs bn) 34 44 47
Absolute (13) (13) 1 EBITDA (Rs bn) 7 8 9
Rel. to BSE-30 (12) (15) (12) Net profits (Rs bn) 6 7 7
492-320
47/0.7
9.6/2.1
103/1

Cochin Shipyard Capital Goods
KOTAK INSTITUTIONAL EQUITIES RESEARCH 65
Exhibit 1: Cochin Shipyard reported a better-than-expected result with a 25/25/17% yoy growth in sales/EBITDA/PAT. Shipbuilding
revenues again drove the revenues growth as ship repair revenues continued to moderate. Quarterly standalone financials of Cochin Shipyard, March fiscal year-end, 3QFY20 (Rs mn)
Source: Company, Kotak Institutional Equities estimates
Exhibit 2: Strong growth witnessed in ship building. Margins witnessed a correction in ship repair. Quarterly segmental financials of Cochin Shipyard, March fiscal year-end, 3QFY20 (Rs mn)
Source: Company, Kotak Institutional Equities estimates
3QFY20 3QFY20E 3QFY19 2QFY20 vs est. yoy qoq 9MFY20 9MFY19 % change FY2020E FY2019 % change
Net sales 8,961 8,427 7,164 9,712 6 25 (8) 26,027 21,746 20 33,957 29,622 15
Total expenses (6,977) (6,631) (5,579) (7,655) 5 25 (9) (20,569) (17,128) 20 (26,996) (23,904) 13
Stock - - - - - - - -
Operating expenses (RM and others) (5,716) (5,056) (3,960) (6,257) 44 (9) (16,861) (10,868) 55 (22,072) (15,017) 47
Employee cost (752) (732) (731) (739) 3 2 (2,194) (2,091) 5 (2,950) (2,776) 6
Other expenses (incl. subcontracting) (509) (843) (889) (658) (43) (23) (1,514) (4,169) (64) (1,974) (6,112) (68)
EBITDA 1,984 1,796 1,585 2,057 10 25 (4) 5,458 4,618 18 6,961 5,717 22
Other income 549 979 497 801 10 (32) 2,030 1,631 24 2,447 2,281 7
EBITDA (incl. other income) 2,533 2,775 2,082 2,858 (9) 22 (11) 7,487 6,249 20 9,408 7,998 18
Depreciation (124) (132) (86) (121) 44 2 (366) (254) 44 (488) (342) 43
EBIT 2,409 2,643 1,996 2,737 (9) 21 (12) 7,122 5,994 19 8,920 7,657 17
Interest (112) (295) (27) (111) 320 1 (335) (90) 272 (383) (143) 168
Profit before tax 2,297 2,348 1,970 2,626 (2) 17 (13) 6,787 5,904 15 8,537 7,514 14
Tax expense (586) (475) (672) (550) (1,798) (2,068) (2,251) (2,702)
Net profit 1,711 1,873 1,297 2,076 (9) 32 (18) 4,989 3,837 30 6,286 4,812 31
Exceptional items - - - - - - - -
Reported PAT 1,711 1,873 1,297 2,076 (9) 32 (18) 4,989 3,837 30 6,286 4,812 31
Key ratios (%)
Operating expenses/ Sales 63.8 60.0 55.3 64.4 64.8 50.0 65.0 50.7
Employee exp./ Sales 8.4 8.7 10.2 7.6 8.4 9.6 8.7 9.4
Other exp./ Sales 5.7 10.0 12.4 6.8 5.8 19.2 5.8 20.6
EBITDA margin 22.1 21.3 22.1 21.2 21.0 21.2 20.5 19.3
PBT Margin 25.6 27.9 27.5 27.0 26.1 27.2 25.1 25.4
Tax rate 25.5 20.2 34.1 20.9 26.5 35.0 26.4 36.0
PAT Margin 19.1 22.2 18.1 21.4 19.2 17.6 18.5 16.2
EPS 13.0 14.2 9.9 15.8 37.9 29.2 47.8 36.6
% change
3QFY20 3QFY20E 3QFY19 2QFY20 vs est. yoy qoq 9MFY20 9MFY19 % change FY2020E FY2019 % change
Net sales
Shipbuilding 7,474 6,929 5,521 7,880 8 35 (5) 21,374 14,685 46 27,717 21,302 30
Ship repair 1,487 1,498 1,644 1,832 (1) (10) (19) 4,653 7,060 (34) 6,240 8,320 (25)
Total 8,961 8,427 7,164 9,712 6 25 (8) 26,027 21,746 20 33,957 29,622 15
EBIT
Shipbuilding 1,752 1,070 1,752 64 4,515 2,640 71 4,450
Ship repair 199 654 569 (70) 1,180 2,443 (52) 2,373
Total 1,951 1,724 2,320 13 5,695 5,084 12 6,823
EBIT margin (%)
Shipbuilding 23.4 19.4 22.2 21.1 18.0 20.9
Ship repair 13.4 39.8 31.1 25.4 34.6 28.5
Total 21.8 24.1 23.9 21.9 23.4 23.0
% change
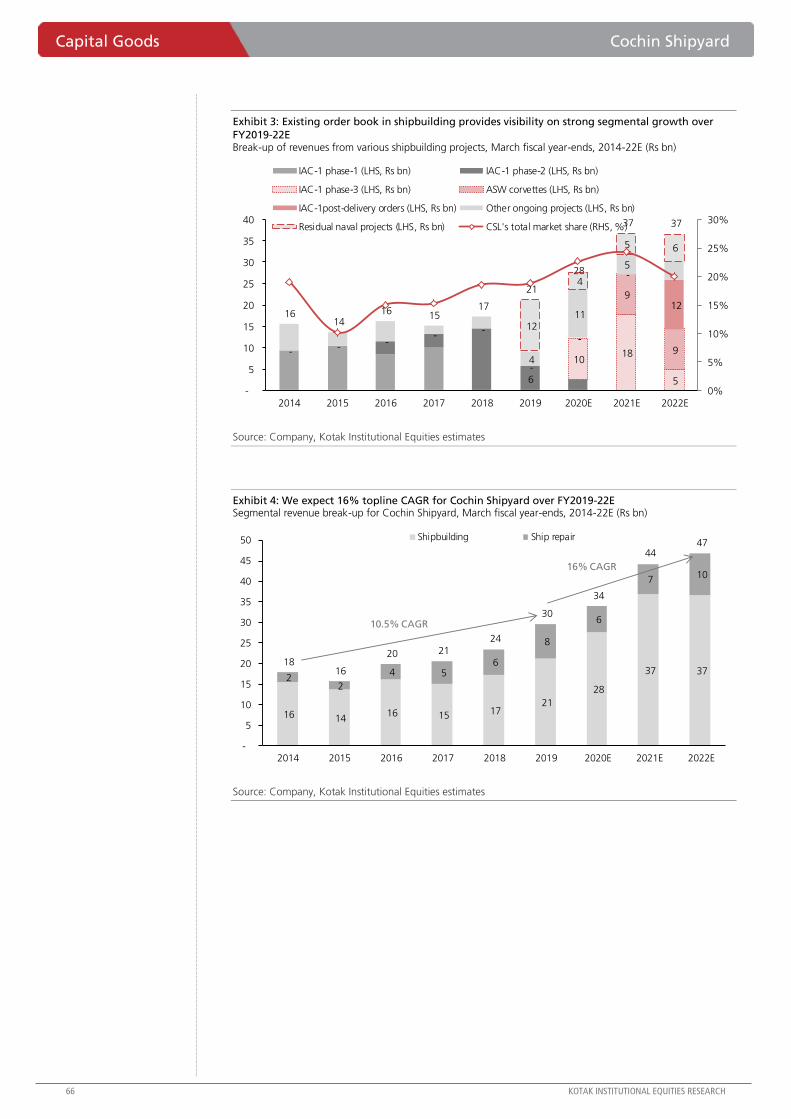
Capital Goods Cochin Shipyard
66 KOTAK INSTITUTIONAL EQUITIES RESEARCH
Exhibit 3: Existing order book in shipbuilding provides visibility on strong segmental growth over
FY2019-22E Break-up of revenues from various shipbuilding projects, March fiscal year-ends, 2014-22E (Rs bn)
Source: Company, Kotak Institutional Equities estimates
Exhibit 4: We expect 16% topline CAGR for Cochin Shipyard over FY2019-22E Segmental revenue break-up for Cochin Shipyard, March fiscal year-ends, 2014-22E (Rs bn)
Source: Company, Kotak Institutional Equities estimates
6
10 18
5
-
9
9 4
11
5
12
4
5 6
16 14
16 15 17
21
28
37 37
- --
--
-
-
-
12
0%
5%
10%
15%
20%
25%
30%
-
5
10
15
20
25
30
35
40
2014 2015 2016 2017 2018 2019 2020E 2021E 2022E
IAC-1 phase-1 (LHS, Rs bn) IAC-1 phase-2 (LHS, Rs bn)
IAC-1 phase-3 (LHS, Rs bn) ASW corvettes (LHS, Rs bn)
IAC-1post-delivery orders (LHS, Rs bn) Other ongoing projects (LHS, Rs bn)
Residual naval projects (LHS, Rs bn) CSL's total market share (RHS, %)
16 14 16 15 17
21
28
37 37 2
2
4 5 6
8
6
7 10
18 16
20 21
24
30
34
44 47
-
5
10
15
20
25
30
35
40
45
50
2014 2015 2016 2017 2018 2019 2020E 2021E 2022E
Shipbuilding Ship repair
10.5% CAGR
16% CAGR
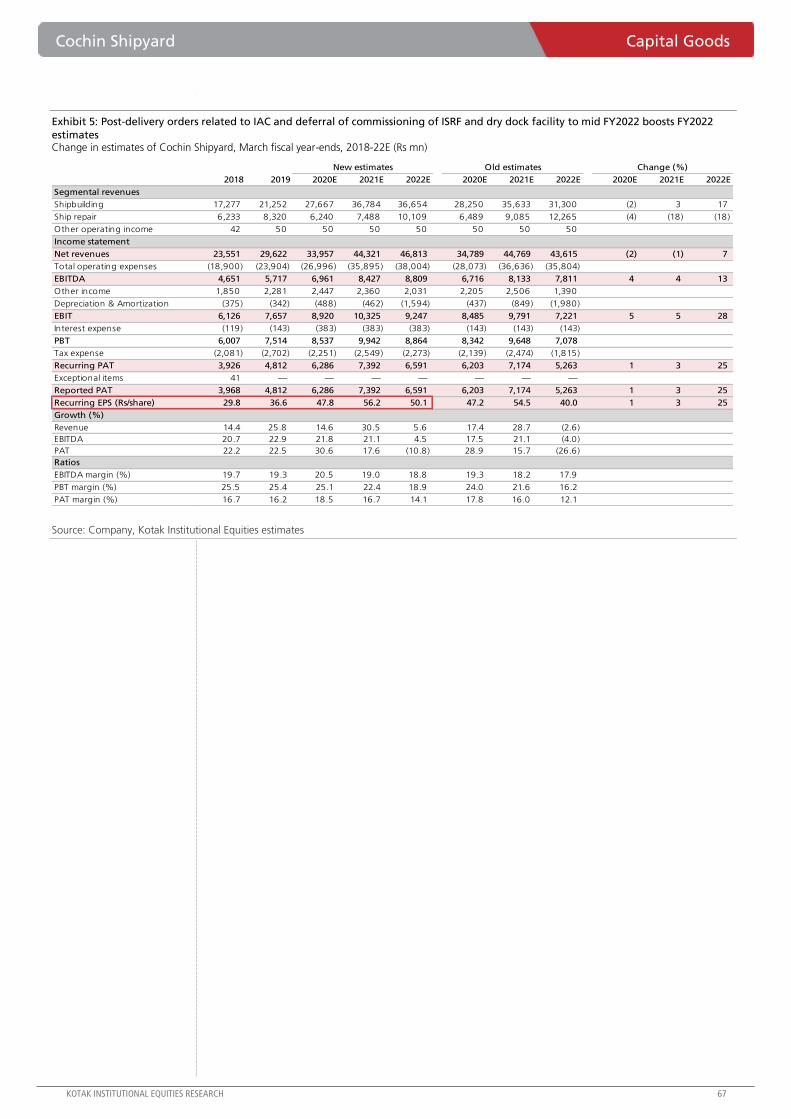
Cochin Shipyard Capital Goods
KOTAK INSTITUTIONAL EQUITIES RESEARCH 67
Exhibit 5: Post-delivery orders related to IAC and deferral of commissioning of ISRF and dry dock facility to mid FY2022 boosts FY2022
estimates Change in estimates of Cochin Shipyard, March fiscal year-ends, 2018-22E (Rs mn)
Source: Company, Kotak Institutional Equities estimates
2018 2019 2020E 2021E 2022E 2020E 2021E 2022E 2020E 2021E 2022E
Segmental revenues
Shipbuilding 17,277 21,252 27,667 36,784 36,654 28,250 35,633 31,300 (2) 3 17
Ship repair 6,233 8,320 6,240 7,488 10,109 6,489 9,085 12,265 (4) (18) (18)
Other operating income 42 50 50 50 50 50 50 50
Income statement
Net revenues 23,551 29,622 33,957 44,321 46,813 34,789 44,769 43,615 (2) (1) 7
Total operating expenses (18,900) (23,904) (26,996) (35,895) (38,004) (28,073) (36,636) (35,804)
EBITDA 4,651 5,717 6,961 8,427 8,809 6,716 8,133 7,811 4 4 13
Other income 1,850 2,281 2,447 2,360 2,031 2,205 2,506 1,390
Depreciation & Amortization (375) (342) (488) (462) (1,594) (437) (849) (1,980)
EBIT 6,126 7,657 8,920 10,325 9,247 8,485 9,791 7,221 5 5 28
Interest expense (119) (143) (383) (383) (383) (143) (143) (143)
PBT 6,007 7,514 8,537 9,942 8,864 8,342 9,648 7,078
Tax expense (2,081) (2,702) (2,251) (2,549) (2,273) (2,139) (2,474) (1,815)
Recurring PAT 3,926 4,812 6,286 7,392 6,591 6,203 7,174 5,263 1 3 25
Exceptional items 41 — — — — — — —
Reported PAT 3,968 4,812 6,286 7,392 6,591 6,203 7,174 5,263 1 3 25
Recurring EPS (Rs/share) 29.8 36.6 47.8 56.2 50.1 47.2 54.5 40.0 1 3 25
Growth (%)
Revenue 14.4 25.8 14.6 30.5 5.6 17.4 28.7 (2.6)
EBITDA 20.7 22.9 21.8 21.1 4.5 17.5 21.1 (4.0)
PAT 22.2 22.5 30.6 17.6 (10.8) 28.9 15.7 (26.6)
Ratios
EBITDA margin (%) 19.7 19.3 20.5 19.0 18.8 19.3 18.2 17.9
PBT margin (%) 25.5 25.4 25.1 22.4 18.9 24.0 21.6 16.2
PAT margin (%) 16.7 16.2 18.5 16.7 14.1 17.8 16.0 12.1
New estimates Old estimates Change (%)

Capital Goods Cochin Shipyard
68 KOTAK INSTITUTIONAL EQUITIES RESEARCH
Exhibit 6: Strong backlog, large Rs170 bn shipbuilding orders and commissioning of the ISRF and other facilities will drive the growth for
Cochin Shipyard over the next few years Summary financials of Cochin Shipyard, March fiscal year-ends, 2014-22E (Rs mn)
Source: Company, Kotak Institutional Equities estimates
2014 2015 2016 2017 2018 2019 2020E 2021E 2022E
Income statement
Net revenues 17,979 15,833 19,900 20,589 23,551 29,622 33,957 44,321 46,813
Total operating expenses (13,808) (14,934) (15,976) (16,734) (18,900) (23,904) (26,996) (35,895) (38,004)
EBITDA 4,171 899 3,924 3,854 4,651 5,717 6,961 8,427 8,809
Other income 611 772 1,069 1,583 1,850 2,281 2,447 2,360 2,031
Depreciation & Amortization (253) (377) (372) (385) (375) (342) (488) (462) (1,594)
Interest expense (198) (189) (125) (122) (119) (143) (383) (383) (383)
PBT 4,331 1,105 4,497 4,931 6,007 7,514 8,537 9,942 8,864
Tax expense (1,513) (412) (1,579) (1,719) (2,081) (2,702) (2,251) (2,549) (2,273)
Recurring PAT 2,818 693 2,918 3,212 3,926 4,812 6,286 7,392 6,591
Exceptional items (0) (1) (0) 3 41 — — — —
Reported PAT 2,818 693 2,918 3,216 3,968 4,812 6,286 7,392 6,591
Recurring EPS (Rs/share) 21.4 5.3 22.2 24.4 29.8 36.6 47.8 56.2 50.1
Balance sheet
Shareholders' funds 14,896 15,539 18,242 20,286 32,559 33,321 37,721 42,895 47,341
Minority interest — — — — — — — — —
Debt 3,339 1,230 1,230 1,230 1,230 1,230 1,230 1,230 1,230
Deferred tax liabilities (163) (237) (322) (243) (433) (657) (557) (557) (557)
Total sources of funds 18,072 16,533 19,150 21,273 33,356 33,893 38,393 43,568 48,014
Net fixed assets 3,777 3,829 3,944 4,245 4,638 7,157 7,669 14,885 28,428
Net working capital (ex-cash and customer advances) 13,550 5,059 4,722 3,771 7,375 9,482 7,650 8,527 9,186
Customer advances (balance liability) (4,822) (6,552) (7,721) (6,658) (13,725) (8,578) (17,376) (14,419) (11,689)
Investments 2 2 1 1 164 604 604 604 604
Cash and bank balances and current investments 5,564 14,195 18,204 19,913 34,903 25,229 39,847 33,972 21,485
Total application of funds 18,072 16,533 19,150 21,273 33,356 33,893 38,393 43,568 48,014
Free cash flow
Operating profit before working capital changes 4,493 926 3,953 4,039 4,925 5,904 7,390 8,556 8,938
Change in working capital/other adjustments (9,452) 6,456 (2,219) (416) 2,949 (7,254) 10,630 (3,833) (3,390)
Direct taxes paid (net of refunds) (884) (749) (1,334) (1,500) (1,561) (2,903) (2,151) (2,549) (2,273)
Net cashflow from operating activites (5,842) 6,634 401 2,123 6,313 (4,252) 15,868 2,173 3,275
Fixed assets (208) (400) (461) (701) (744) (2,860) (1,000) (7,678) (15,136)
Cash (used)/realised in investing activities 152 155 467 648 (13,283) (1,206) 1,018 (5,447) (13,234)
Free cash flow (CFO + net capex) (6,050) 6,235 (61) 1,422 5,570 (7,113) 14,868 (5,505) (11,861)
Ratios
EBITDA margin (%) 23.2 5.7 19.7 18.7 19.7 19.3 20.5 19.0 18.8
PBT margin (%) 24.1 7.0 22.6 23.9 25.5 25.4 25.1 22.4 18.9
PAT margin (%) 15.7 4.4 14.7 15.6 16.7 16.2 18.5 16.7 14.1
Book value per share (Rs) 113.2 118.1 138.7 154.2 247.5 253.3 286.8 326.1 359.9
RoAE (%) 20.8 4.6 17.3 16.7 14.9 14.6 17.7 18.3 14.6
Post-tax RoIC ex-CWIP (%) 19.0 2.5 26.8 28.4 30.5 28.6 39.5 53.3 21.9
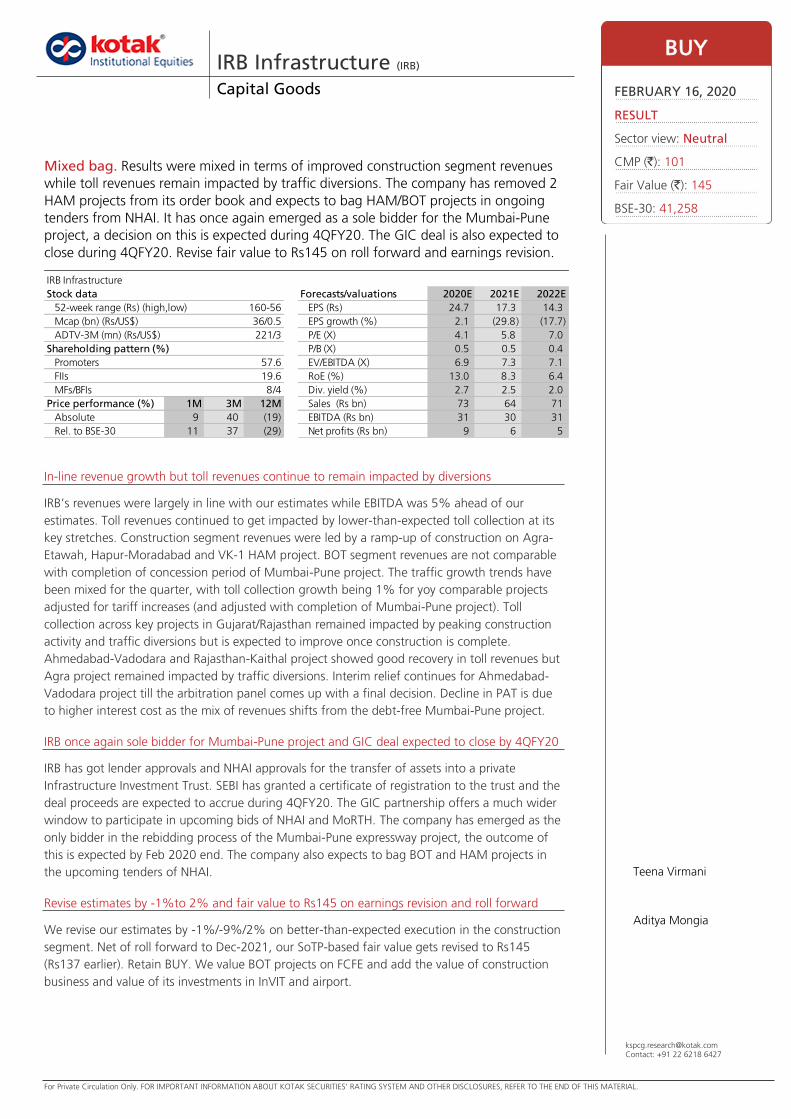
For Private Circulation Only. FOR IMPORTANT INFORMATION ABOUT KOTAK SECURITIES’ RATING SYSTEM AND OTHER DISCLOSURES, REFER TO THE END OF THIS MATERIAL.
[email protected]: +91 22 6218 6427
In-line revenue growth but toll revenues continue to remain impacted by diversions
IRB’s revenues were largely in line with our estimates while EBITDA was 5% ahead of our
estimates. Toll revenues continued to get impacted by lower-than-expected toll collection at its
key stretches. Construction segment revenues were led by a ramp-up of construction on Agra-
Etawah, Hapur-Moradabad and VK-1 HAM project. BOT segment revenues are not comparable
with completion of concession period of Mumbai-Pune project. The traffic growth trends have
been mixed for the quarter, with toll collection growth being 1% for yoy comparable projects
adjusted for tariff increases (and adjusted with completion of Mumbai-Pune project). Toll
collection across key projects in Gujarat/Rajasthan remained impacted by peaking construction
activity and traffic diversions but is expected to improve once construction is complete.
Ahmedabad-Vadodara and Rajasthan-Kaithal project showed good recovery in toll revenues but
Agra project remained impacted by traffic diversions. Interim relief continues for Ahmedabad-
Vadodara project till the arbitration panel comes up with a final decision. Decline in PAT is due
to higher interest cost as the mix of revenues shifts from the debt-free Mumbai-Pune project.
IRB once again sole bidder for Mumbai-Pune project and GIC deal expected to close by 4QFY20
IRB has got lender approvals and NHAI approvals for the transfer of assets into a private
Infrastructure Investment Trust. SEBI has granted a certificate of registration to the trust and the
deal proceeds are expected to accrue during 4QFY20. The GIC partnership offers a much wider
window to participate in upcoming bids of NHAI and MoRTH. The company has emerged as the
only bidder in the rebidding process of the Mumbai-Pune expressway project, the outcome of
this is expected by Feb 2020 end. The company also expects to bag BOT and HAM projects in
the upcoming tenders of NHAI.
Revise estimates by -1%to 2% and fair value to Rs145 on earnings revision and roll forward
We revise our estimates by -1%/-9%/2% on better-than-expected execution in the construction
segment. Net of roll forward to Dec-2021, our SoTP-based fair value gets revised to Rs145
(Rs137 earlier). Retain BUY. We value BOT projects on FCFE and add the value of construction
business and value of its investments in InVIT and airport.
IRB Infrastructure (IRB) Capital Goods
Mixed bag. Results were mixed in terms of improved construction segment revenues
while toll revenues remain impacted by traffic diversions. The company has removed 2
HAM projects from its order book and expects to bag HAM/BOT projects in ongoing
tenders from NHAI. It has once again emerged as a sole bidder for the Mumbai-Pune
project, a decision on this is expected during 4QFY20. The GIC deal is also expected to
close during 4QFY20. Revise fair value to Rs145 on roll forward and earnings revision.
BUY.
BUY
FEBRUARY 16, 2020
RESULT
Sector view: Neutral
CMP (`): 101
Fair Value (`): 145
BSE-30: 41,258
Teena Virmani
Aditya Mongia
IRB Infrastructure
Stock data Forecasts/valuations 2020E 2021E 2022E
52-week range (Rs) (high,low) EPS (Rs) 24.7 17.3 14.3
Mcap (bn) (Rs/US$) EPS growth (%) 2.1 (29.8) (17.7)
ADTV-3M (mn) (Rs/US$) P/E (X) 4.1 5.8 7.0
Shareholding pattern (%) P/B (X) 0.5 0.5 0.4
Promoters 57.6 EV/EBITDA (X) 6.9 7.3 7.1
FIIs 19.6 RoE (%) 13.0 8.3 6.4
MFs/BFIs Div. yield (%) 2.7 2.5 2.0
Price performance (%) 1M 3M 12M Sales (Rs bn) 73 64 71
Absolute 9 40 (19) EBITDA (Rs bn) 31 30 31
Rel. to BSE-30 11 37 (29) Net profits (Rs bn) 9 6 5
160-56
36/0.5
8/4
221/3
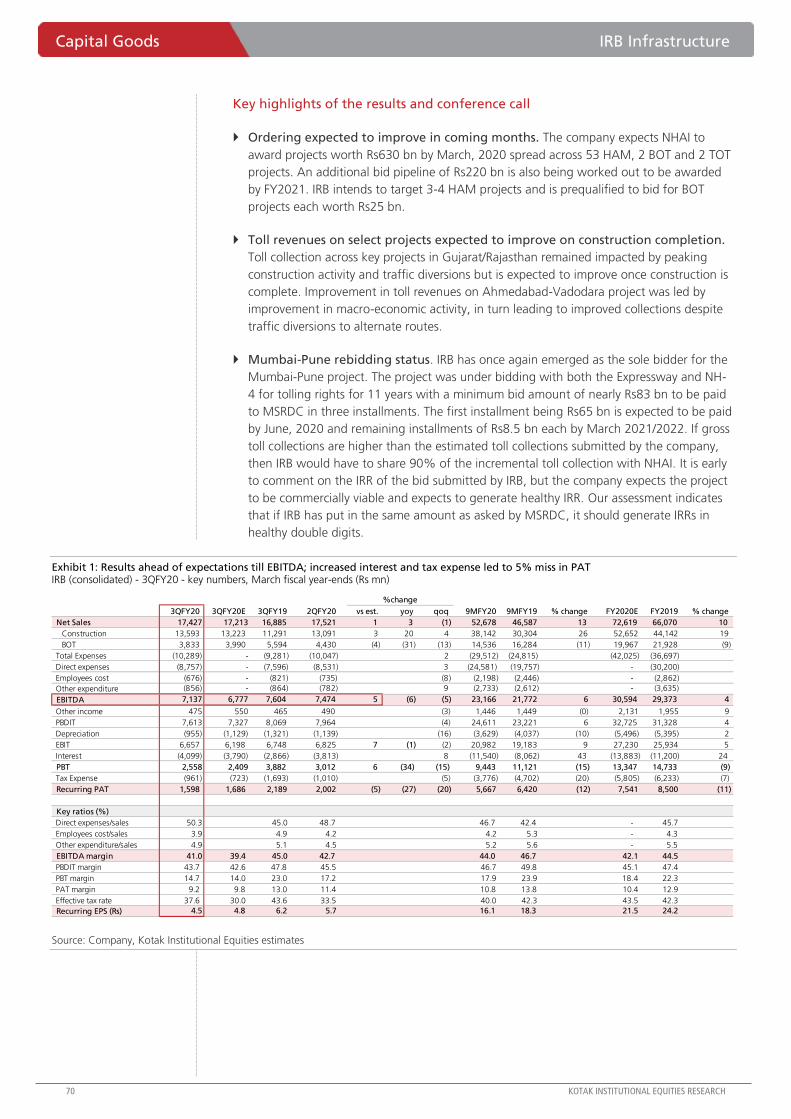
Capital Goods IRB Infrastructure
70 KOTAK INSTITUTIONAL EQUITIES RESEARCH
Key highlights of the results and conference call
Ordering expected to improve in coming months. The company expects NHAI to
award projects worth Rs630 bn by March, 2020 spread across 53 HAM, 2 BOT and 2 TOT
projects. An additional bid pipeline of Rs220 bn is also being worked out to be awarded
by FY2021. IRB intends to target 3-4 HAM projects and is prequalified to bid for BOT
projects each worth Rs25 bn.
Toll revenues on select projects expected to improve on construction completion.
Toll collection across key projects in Gujarat/Rajasthan remained impacted by peaking
construction activity and traffic diversions but is expected to improve once construction is
complete. Improvement in toll revenues on Ahmedabad-Vadodara project was led by
improvement in macro-economic activity, in turn leading to improved collections despite
traffic diversions to alternate routes.
Mumbai-Pune rebidding status. IRB has once again emerged as the sole bidder for the
Mumbai-Pune project. The project was under bidding with both the Expressway and NH-
4 for tolling rights for 11 years with a minimum bid amount of nearly Rs83 bn to be paid
to MSRDC in three installments. The first installment being Rs65 bn is expected to be paid
by June, 2020 and remaining installments of Rs8.5 bn each by March 2021/2022. If gross
toll collections are higher than the estimated toll collections submitted by the company,
then IRB would have to share 90% of the incremental toll collection with NHAI. It is early
to comment on the IRR of the bid submitted by IRB, but the company expects the project
to be commercially viable and expects to generate healthy IRR. Our assessment indicates
that if IRB has put in the same amount as asked by MSRDC, it should generate IRRs in
healthy double digits.
Exhibit 1: Results ahead of expectations till EBITDA; increased interest and tax expense led to 5% miss in PAT IRB (consolidated) - 3QFY20 - key numbers, March fiscal year-ends (Rs mn)
Source: Company, Kotak Institutional Equities estimates
3QFY20 3QFY20E 3QFY19 2QFY20 vs est. yoy qoq 9MFY20 9MFY19 % change FY2020E FY2019 % change
Net Sales 17,427 17,213 16,885 17,521 1 3 (1) 52,678 46,587 13 72,619 66,070 10
Construction 13,593 13,223 11,291 13,091 3 20 4 38,142 30,304 26 52,652 44,142 19
BOT 3,833 3,990 5,594 4,430 (4) (31) (13) 14,536 16,284 (11) 19,967 21,928 (9)
Total Expenses (10,289) - (9,281) (10,047) 2 (29,512) (24,815) (42,025) (36,697)
Direct expenses (8,757) - (7,596) (8,531) 3 (24,581) (19,757) - (30,200)
Employees cost (676) - (821) (735) (8) (2,198) (2,446) - (2,862)
Other expenditure (856) - (864) (782) 9 (2,733) (2,612) - (3,635)
EBITDA 7,137 6,777 7,604 7,474 5 (6) (5) 23,166 21,772 6 30,594 29,373 4
Other income 475 550 465 490 (3) 1,446 1,449 (0) 2,131 1,955 9
PBDIT 7,613 7,327 8,069 7,964 (4) 24,611 23,221 6 32,725 31,328 4
Depreciation (955) (1,129) (1,321) (1,139) (16) (3,629) (4,037) (10) (5,496) (5,395) 2
EBIT 6,657 6,198 6,748 6,825 7 (1) (2) 20,982 19,183 9 27,230 25,934 5
Interest (4,099) (3,790) (2,866) (3,813) 8 (11,540) (8,062) 43 (13,883) (11,200) 24
PBT 2,558 2,409 3,882 3,012 6 (34) (15) 9,443 11,121 (15) 13,347 14,733 (9)
Tax Expense (961) (723) (1,693) (1,010) (5) (3,776) (4,702) (20) (5,805) (6,233) (7)
Recurring PAT 1,598 1,686 2,189 2,002 (5) (27) (20) 5,667 6,420 (12) 7,541 8,500 (11)
Key ratios (%)
Direct expenses/sales 50.3 45.0 48.7 46.7 42.4 - 45.7
Employees cost/sales 3.9 4.9 4.2 4.2 5.3 - 4.3
Other expenditure/sales 4.9 5.1 4.5 5.2 5.6 - 5.5
EBITDA margin 41.0 39.4 45.0 42.7 44.0 46.7 42.1 44.5
PBDIT margin 43.7 42.6 47.8 45.5 46.7 49.8 45.1 47.4
PBT margin 14.7 14.0 23.0 17.2 17.9 23.9 18.4 22.3
PAT margin 9.2 9.8 13.0 11.4 10.8 13.8 10.4 12.9
Effective tax rate 37.6 30.0 43.6 33.5 40.0 42.3 43.5 42.3
Recurring EPS (Rs) 4.5 4.8 6.2 5.7 16.1 18.3 21.5 24.2
%change

IRB Infrastructure Capital Goods
KOTAK INSTITUTIONAL EQUITIES RESEARCH 71
Exhibit 2: Margins were ahead of expectation IRB – key segmental numbers – 3QFY20, March fiscal year-ends (Rs mn)
Source: Company, Kotak Institutional Equities estimates
Exhibit 3: Current order book provides limited visibility on HAM project cancellations Break-up of the order backlog of IRB at end of 3QFY20, March fiscal year-ends
Source: Company, Kotak Institutional Equities
3QFY20 3QFY20E 3QFY19 2QFY20 vs est. yoy qoq 9MFY20 9MFY19 % change FY2020E FY2019 % change
Revenues 17,427 17,213 16,885 17,521 1 3 (1) 52,678 46,587 13.1 72,619 66,070 9.9
Construction 13,593 13,223 11,291 13,091 3 20 4 38,142 30,304 25.9 52,652 44,142 19.3
BOT 3,833 3,990 5,594 4,430 (4) (31) (13) 14,536 16,284 (10.7) 19,967 21,928 (8.9)
EBITDA 7,137 6,777 7,604 7,474 5 (6) (5) 23,164 21,770 6.4 30,594 29,371 4.2
Construction 3,622 3,306 2,720 3,614 10 33 0 10,323 7,399 39.5 13,690 10,019 36.6
BOT 3,515 3,471 4,884 3,860 1 (28) (9) 12,840 14,371 (10.6) 16,904 19,352 (12.6)
Margins (%) 41.0 39.4 45.0 42.7 44.0 46.7 42.1 44.5
Construction 26.6 25.0 24.1 27.6 27.1 24.4 26.0 22.7
BOT 91.7 87.0 87.3 87.1 88.3 88.3 84.7 88.3
PBT 2,558 - 3,882 3,012 (34.1) (15.1) 9,442 11,121 (15.1)
Construction 2,967 - 2,294 3,083 29.3 (3.8) 8,636 6,267 37.8
BOT (409) - 1,588 (71) (125.8) 476.9 806 4,854 (83.4)
PAT 1,597 - 2,189 2,002 (27.0) (20.2) 5,666 6,419 (11.7)
Construction 2,143 - 1,360 2,436 57.6 (12.0) 6,140 3,888 57.9
BOT (546) - 829 (434) (165.9) 25.8 (474) 2,531 (118.7)
%change
Ongoing BOT/HAM projects
85%
O&M of InVIT projects
15%
Order backlog: Rs68 bn

Capital Goods IRB Infrastructure
72 KOTAK INSTITUTIONAL EQUITIES RESEARCH
Exhibit 4: IRB - project-wise toll collection, March fiscal year-ends (Rs mn)
Source: Company, Kotak Institutional Equities
Exhibit 5: Our valuation of Rs145 per share for IRB is at a significant discount to the GIC deal valuations for 9 assets Sum-of-the-parts analysis of IRB
Source: Company, Kotak Institutional Equities estimates
Exhibit 6: Our implied valuation of 9 BOT assets is at 0.5X P/BV on equity invested till FY2020 as against GIC valuation of 1X, indicating
upside when the GIC deal fructifies Project cost structure before the deal was signed with GIC (Rs mn)
Source: Company, Kotak Institutional Equities estimates
3QFY20 2QFY20 3QFY19 yoy qoq
Total toll collection 3,730 4,358 5,531 (33) (14)
Pune - Nashik 90 83 91 (1) 8
Thane - Ghodbunder 138 128 97 42 8
Ahemdabad Vadodara 1,260 1,098 1,126 12 15
Agra Etawah 217 191 231 (6) 14
Udaipur-Gujarat Border 336 321 359 (6) 5
Kaithal-Rajasthan Border 248 228 217 14 9
Kishengarh Gulabpura 282 279 334 (16) 1
Chittorgarh – Gulabpura BOT 399 394 473 (16) 1
Hapur Moradabad 340 294 - NA 16
Yedeshi Aurangabad 260 253 - NA 3
Solapur Yedeshi 160 150 168 (5) 7
Others - 939 2,435 (100) (100)
Adj Toll collection for comparable projects 3,130 2,872 3,096 1 9
% Change
Value Stake
Value of IRB's
stake Per share
(Rs mn) (%) (Rs mn) (Rs) Comment
BOT FCFE 20,039 20,039 57 FCFE
Thane - Ghodbunder 690 100.0 690 2 One-year forward FCFE
Ahmedabad Vadodara (8,127) 100.0 (8,127) (23) One-year forward FCFE
Solapur-Yedeshi 1,807 100.0 1,807 5 One-year forward FCFE
Yedeshi-Aurangabad 2,213 100.0 2,213 6 One-year forward FCFE
Goa-Kundapur 2,198 100.0 2,198 6 One-year forward FCFE
Rajasthan Kaithal 3,450 100.0 3,450 10 One-year forward FCFE
Agra Etawah (5,184) 100.0 (5,184) (15) One-year forward FCFE
Kolhapur urban road project 730 100.0 730 2 Pending payment
Udaipur – Gujarat Border 3,812 100.0 3,812 11 One-year forward FCFE
Gulabpura – Chittorgarh 7,723 100.0 7,723 22 One-year forward FCFE
Kishengarh Gulabpura 2,974 100.0 2,974 8 One-year forward FCFE
Hapur Moradabad 6,497 100.0 6,497 18 One-year forward FCFE
Value of InVIT and Sindhudurg investment 9,265 100.0 9,265 26 1X book value
Construction business 21,608 100.0 21,608 61 4X one-year forward EV/EBITDA
Sum 29,305 29,305 145
Projects to be transferred to private InVIT Project cost Debt Equity Grant Conc. period Equity(by FY2020) KIE valuation
Solapur-Yedeshi 14,880 9,080 3,910 1,890 29 yrs 3,930 1,807
Yedeshi-Aurangabad 31,850 18,150 8,120 5,580 26 yrs 8,630 2,213
Goa-Kundapur 26,390 14,430 6,598 5,362 28 yrs 6,968 2,198
Rajasthan Kaithal 23,000 13,760 6,900 2,340 27 yrs 6,560 3,450
Agra Etawah 26,500 18,550 7,950 — 24 years 8,389 (5,184)
Hapur Moradabad 33,280 23,296 9,984 — 22 years 1,997 6,497
Udaipur – Gujarat Border 20,879 14,615 6,264 — 21 years 6,264 3,812
Gulabpura – Chittorgarh 21,000 14,700 6,300 — 20 years 6,300 7,723
Kishengarh Gulabpura 15,260 10,682 4,578 — 20 years 4,578 2,974
Total 213,039 137,264 60,603 15,172 53,615 25,490

IRB Infrastructure Capital Goods
KOTAK INSTITUTIONAL EQUITIES RESEARCH 73
Exhibit 7: Revision in estimates is largely led by improved construction segment revenues and lower toll revenues Change in estimates for IRB Infrastructure, March fiscal year-ends, 2018-21E (Rs mn)
Source: Company, Kotak Institutional Equities estimates
Exhibit 8: Consolidated financials of IRB Infrastructure Consolidated financials of IRB Infrastructure, March fiscal year-ends, 2012-24E (Rs mn)
Source: Company, Kotak Institutional Equities estimates
2018 2019 2020E 2021E 2022E 2020E 2021E 2022E 2020E 2021E 2022E
Income statement
Total operating income 56,941 66,070 72,619 64,052 71,186 69,390 63,824 69,245 5 0 3
Construction 38,047 44,142 52,652 42,145 48,158 47,224 39,881 46,216 11 6 4
Toll collection BOT 18,894 21,928 19,967 21,907 23,029 22,167 23,942 23,029 (10) (9) —
Total operating costs (30,147) (36,697) (42,025) (34,052) (40,667) (39,897) (33,596) (38,710) 5 1 5
Construction expenses (27,190) (34,121) (38,963) (30,766) (37,082) (36,834) (30,310) (35,124) 6 2 6
BOT expenses (2,957) (2,576) (3,063) (3,286) (3,586) (3,063) (3,286) (3,586)
EBITDA 26,794 29,373 30,594 30,000 30,519 29,494 30,228 30,535 4 (1) (0)
Other income 1,687 1,955 2,131 1,769 1,633 2,620 1,632 1,458
PBDIT 28,480 31,328 32,725 31,769 32,152 32,114 31,860 31,993
Financial charges (9,667) (11,200) (13,883) (15,602) (17,818) (13,883) (15,602) (17,818) — — —
Depreciation (5,440) (5,395) (5,496) (5,636) (6,692) (5,496) (5,636) (6,692)
Pre-tax profit 13,373 14,733 13,347 10,532 7,642 12,735 10,623 7,482 5 (1) 2
Taxation (5,444) (6,233) (5,805) (4,440) (2,631) (5,086) (3,942) (2,590)
PAT prior to minority interest 7,930 8,500 7,541 6,092 5,011 7,650 6,681 4,892
Minority interest or extra ord gain 1,140 — — 1,140 — —
Adjusted PAT 7,930 8,500 8,681 6,092 5,011 8,790 6,681 4,892
EPS (Rs) 22.6 24.2 24.7 17.3 14.3 25.0 19.0 13.9 (1) (9) 2
Key ratios (%)
EBITDA margin 42.1 44.5 42.1 46.8 42.9 42.5 47.4 44.1
PAT margin 13.9 12.9 12.0 9.5 7.0 12.7 10.5 7.1
RoE 13.0 14.2 13.0 8.3 6.4 13.1 9.1 6.2
Yoy growth (%)
Revenues 9.9 16.0 9.9 (11.8) 11.1 5.0 (8.0) 8.5
EBITDA 14.2 9.6 4.2 (1.9) 1.7 0.4 2.5 1.0
PAT 2.1 7.2 2.1 (29.8) (17.7) 3.4 (24.0) (26.8)
New estimates Old estimates % revision
2012 2013 2014 2015 2016 2017 2018 2019 2020E 2021E 2022E 2023E 2024E
Income statement
Total operating income 31,330 36,872 37,319 38,475 51,279 58,459 56,941 66,070 72,619 64,052 71,186 79,419 86,220
Construction 22,002 25,988 25,364 20,029 30,049 34,675 38,047 44,142 52,652 42,145 48,158 53,791 58,139
Toll collection BOT 9,328 10,884 11,955 18,356 21,231 23,784 18,894 21,928 19,967 21,907 23,029 25,628 28,081
Total operating costs (17,637) (20,540) (19,782) (16,358) (24,676) (27,976) (30,147) (36,697) (42,025) (34,052) (40,667) (47,364) (51,039)
Construction expenses (16,131) (19,126) (18,189) (13,871) (21,694) (24,540) (27,190) (34,121) (38,963) (30,766) (37,082) (41,419) (44,767)
BOT expenses (1,506) (1,414) (1,593) (2,487) (2,983) (3,436) (2,957) (2,576) (3,063) (3,286) (3,586) (5,945) (6,272)
EBITDA 13,694 16,333 17,537 22,117 26,603 30,483 26,794 29,373 30,594 30,000 30,519 32,054 35,181
Other income 1,252 1,301 1,214 1,130 1,271 1,232 1,687 1,955 2,131 1,769 1,633 2,103 2,710
Financial charges (5,464) (6,153) (7,561) (9,312) (10,639) (13,327) (9,667) (11,200) (13,883) (15,602) (17,818) (19,291) (19,652)
Depreciation (2,970) (4,415) (4,770) (7,071) (8,533) (8,548) (5,440) (5,395) (5,496) (5,636) (6,692) (7,268) (7,934)
Pre-tax profit 6,512 7,066 6,419 6,865 8,702 9,840 13,373 14,733 13,347 10,532 7,642 7,598 10,306
Taxation (1,501) (1,530) (1,823) (1,441) (2,306) (2,685) (5,444) (6,233) (5,805) (4,440) (2,631) (2,889) (3,421)
Adjusted PAT 5,011 5,536 4,596 5,424 6,396 7,155 7,930 8,500 7,541 6,092 5,011 4,710 6,884
EPS (Rs) 15.1 16.7 13.8 15.4 18.2 20.4 22.6 24.2 24.7 17.3 14.3 13.4 19.6
Balance sheet
Share holder's funds 28,566 32,556 35,607 43,609 48,363 52,716 56,925 63,151 70,668 75,704 79,882 83,988 90,271
Minority interest 1,123 1,092 356 351 355 — — — — — — — —
Loan funds 70,722 87,761 110,841 125,762 156,261 139,631 138,256 165,931 196,941 197,041 186,563 190,620 185,926
Total sources of funds 100,670 121,667 146,947 385,391 407,759 449,306 347,787 362,124 399,644 403,597 396,223 403,119 403,197
Net block 79,995 104,248 130,411 365,991 390,565 310,826 367,115 367,320 398,925 411,869 413,735 406,652 398,693
Investments 139 620 145 88 1,483 2,574 9,533 6,532 6,532 6,532 6,532 6,532 6,532
Cash & bank balances 18,208 14,710 15,012 15,798 15,008 13,077 12,678 15,603 21,517 12,526 5,322 22,339 36,793
Net current assets (ecl. cash) 2,328 2,089 1,379 3,515 703 (4,006) (41,539) (27,330) (27,330) (27,330) (29,366) (32,403) (38,821)
Total application of funds 100,670 121,667 146,947 385,391 407,759 449,306 347,787 362,124 399,644 403,597 396,223 403,119 403,197
Yoy growth (%)
Revenues 28.5 17.7 1.2 3.1 33.3 14.0 (2.6) 16.0 9.9 (11.8) 11.1 11.6 8.6
EBITDA 25.2 19.3 7.4 26.1 20.3 14.6 (12.1) 9.6 4.2 (1.9) 1.7 5.0 9.8
PAT 10.8 11.1 (17.5) 18.2 17.9 11.8 10.8 7.2 2.1 (29.8) (17.7) (6.0) 46.2
Key ratios (%)
EBITDA margin 43.7 44.3 47.0 57.5 51.9 52.1 47.1 44.5 42.1 46.8 42.9 40.4 40.8
PAT margin 16.0 15.0 12.3 14.1 12.5 12.2 13.9 12.9 10.4 9.5 7.0 5.9 8.0
Net debt: Equity (X) 1.8 2.2 2.7 2.5 2.9 2.4 2.2 2.4 2.5 2.4 2.3 2.0 1.7
RoE 18.9 18.2 13.5 13.7 13.9 14.2 14.5 14.2 13.0 8.3 6.4 5.7 7.9
RoCE 10.7 9.3 7.5 4.8 3.6 3.9 3.4 4.2 4.3 3.8 4.2 4.2 5.0

For Private Circulation Only. FOR IMPORTANT INFORMATION ABOUT KOTAK SECURITIES’ RATING SYSTEM AND OTHER DISCLOSURES, REFER TO THE END OF THIS MATERIAL.
[email protected]: +91 22 6218 6427
Results disappointed sharply on execution
Revenue execution was much below our estimates and impacted by the extended monsoon till
October, RoW issues in certain HAM projects, forest clearance issues in Mumbai-Nagpur
expressway project. Along with this, incremental funding done by SEL for SIPL on reduced fund
disbursal from banks also resulted in constrained cash flows resulting in sharp execution
slowdown. Extended monsoon impacted mining projects execution and land availability issues
resulted in marginal revenue booking from the irrigation segment. Order book has declined yoy
on the removal of 3 projects worth Rs18 bn in 9MFY20 and change of scope resulting in a
reduction of Rs1.8-2 bn during the quarter. Nearly 17% of the order book is currently very slow
moving including Gadag Hanalli project. However, the company expects its execution to ramp-
up from FY2021.
Deal payments to start flowing from Feb 2020, provide some support to working capital
SIPL has been allotted InVIT units worth Rs7.24 bn during Feb, 2020 and expects to receive
remaining proceeds of Rs12 bn by next week for 6 NHAI projects and Rs4.7 bn by end-Feb,
2020 for Aurangabad and Mysore-Bellary project. This results in total proceeds of Rs23.65 bn.
Net of debt repayment of SIPL and other payments (detailed in Exhibit 4), SEL is expected to
receive nearly Rs5.5 bn including Rs 2.5bn from Ahmedabad ring road proceeds. This is
expected to reduce loans and advances of SEL by Rs5 bn and debt by Rs500 mn. Remaining
loans and advances of Rs3 bn are expected to be repaid on receipt of arbitration claims by SIPL
as against earlier expectation of entire loans and advances getting repaid on deal completion.
Post finalization of stake-sale of nine projects to IndInfraVit, we expect SEL standalone D/E to
come down to 0.1X by FY2022 from 0.8X in FY2019. For the other under-construction HAM
projects, SIPL has already invested Rs6 bn and further investment of Rs3.75 bn is expected to be
made over the next two years. SIPL expects to fund these investments from dividend proceeds
and O&M proceeds.
Cut estimates on poor execution; Revise fair value to Rs137 (from Rs167)
We cut our estimates by 17%/14% for FY2021/22 and arrive at a fair value of Rs137 net of roll
forward. This reduction is largely led by a sharp cut in revenue estimates and lower-than-
expected reduction in SEL’s loans and advances in the near term. Retain BUY on inexpensive
valuations. We, however, expect the stock to underperform peers till execution starts improving.
Sadbhav Engineering (SADE) Capital Goods
Hope of execution recovery rolled forward to FY2021. The company disappointed by moving from a no-growth scenario to a negative growth scenario during FY2020 and hope of execution recovery now moves to FY2021. Positives emerge from near completion of a stake sale deal and fund flows coming in by Feb-end which can help in deleveraging the balance sheet. We cut estimates on the guidance cut and sharp execution slowdown. We revise our fair value to Rs137. BUY stays on low valuations, expectations of better execution and balance sheet deleveraging.
BUY
FEBRUARY 16, 2020
RESULT
Sector view: Neutral
CMP (`): 100
Fair Value (`): 137
BSE-30: 41,258
Teena Virmani
Aditya Mongia
Sadbhav Engineering
Stock data Forecasts/valuations 2020E 2021E 2022E
52-week range (Rs) (high,low) EPS (Rs) 7.2 11.7 13.6
Mcap (bn) (Rs/US$) EPS growth (%) (33.4) 61.1 16.3
ADTV-3M (mn) (Rs/US$) P/E (X) 13.8 8.5 7.3
Shareholding pattern (%) P/B (X) 0.8 0.7 0.7
Promoters 46.5 EV/EBITDA (X) 7.9 5.1 4.4
FIIs 12.2 RoE (%) 5.9 9.0 9.6
MFs/BFIs Div. yield (%) 0.0 0.0 0.0
Price performance (%) 1M 3M 12M Sales (Rs bn) 25 31 35
Absolute (19) (19) (40) EBITDA (Rs bn) 3 4 4
Rel. to BSE-30 (18) (20) (48) Net profits (Rs bn) 1 2 2
274-99
18/0.3
24.6/11
29/0

Sadbhav Engineering Capital Goods
KOTAK INSTITUTIONAL EQUITIES RESEARCH 75
Exhibit 1: SEL reported an extremely weak quarter on execution on delays in appointed dates and extended monsoons Sadbhav Engineering 3QFY20 results (standalone), March fiscal year-ends (Rs mn)
Source: Company, Kotak Institutional Equities estimates
Exhibit 2: Road projects from SIPL continue to dominate SEL’s order backlog with 72% share Mix of order backlog of SEL, March fiscal year-end, 3QFY20
Source: Company, Kotak Institutional Equities
3QFY20 3QFY20E 3QFY19 2QFY20 vs est. yoy qoq 9MFY20 9MFY19 % change FY2020E FY2019 % change
Operational income 4,400 7,926 9,255 5,651 (44) (52) (22) 18,428 25,276 (27) 24,631 35,492 (31)
Total expenditure (3,852) (8,147) (4,955) (53) (22) (16,138) (22,264) (28) (21,612) (31,213) (31)
Construction expenses (3,362) (7,543) (4,403) (55) (24) (14,504) (20,469) (28,521)
Employee expenses (307) (441) (426) (31) (28) (1,153) (1,215) (1,676)
Other expenses (183) (163) (125) 12 46 (480) (580) (1,016)
EBITDA 548 975 1,108 696 (44) (50) (21) 2,290 3,012 (24) 3,019 4,279 (29)
Other income 76 108 127 64 (40) 20 181 302 (40) 1,049 1,049 —
Depreciation (268) (267) (241) (277) 11 (3) (825) (726) 14 (1,092) (957) 14
Net Interest (231) (210) (291) (207) (21) 12 (711) (821) (13) (1,222) (1,749) (30)
PBT 126 606 703 276 (79) (82) (54) 936 1,767 (47) 1,755 2,583 (32)
Taxes (10) (155) (141) (17) (166) (187) (11) (512) (714) (28)
Net PAT 117 451 563 259 (74) (79) (55) 770 1,580 (51) 1,242 1,861 (33)
Extraordinary / prior period items — — — — — — — 8
Reported PAT 117 451 563 259 (74) (79) (55) 770 1,580 1,242 1,869 (34)
Key ratios (%)
Construction expenses/ sales 76.4 81.5 77.9 78.7 81.0 80.4
Staff cost/ sales 7.0 4.8 7.5 6.3 4.8 4.7
Other expenses/ sales 4.2 1.8 2.2 2.6 2.3 2.9
EBITDA margin 12.5 12.3 12.0 12.3 12.4 11.9 12.3 12.1
PBT margin 2.9 7.6 7.6 4.9 5.1 7.0 7.1 7.3
Effective tax rate 7.6 25.6 20.0 6.2 17.8 10.6 29.2 27.6
PAT margin 2.6 5.7 6.1 4.6 4.2 6.3 5.0 5.2
EPS (Rs) 0.7 2.6 3.3 1.5 4.5 9.2 7.2 10.8
% change
Roads - BOT50%
Roads - Cash28%
Irrigation4%
Mining18%
3QFY19-end backlog (Rs129 bn)
Roads - BOT39%
Roads - Cash33%
Irrigation4%
Mining24%
3QFY20-end backlog (Rs87 bn)

Capital Goods Sadbhav Engineering
76 KOTAK INSTITUTIONAL EQUITIES RESEARCH
Exhibit 3: Traffic growth has remained weak for past four quarters
Source: Company, Kotak Institutional Equities
Exhibit 4: Flow of proceeds from the stake sale in terms of debt repayment and repayment of loans
and advances of SEL Payment schedule of deal proceeds for various entities, March fiscal year ends (Rs bn)
Source: Company, Kotak Institutional Equities estimates
Yoy growth
Revenues (Rs mn) 1QFY18 2QFY18 3QFY18 4QFY18 1QFY19 2QFY19 3QFY19 4QFY19 1QFY20 2QFY20 3QFY20 (%)
Quarterly collections
Ahemdabad ring road 219 211 231 245 239 232 242 243 232 239 258 (6.0)
Aurangabad Jalna 93 86 96 102 102 95 100 106 127 113 119 (16.0)
Bijapur-Hungud 296 297 300 319 316 315 296 298 308 314 280 5.8
Hyderabad Yadgiri 171 159 185 179 202 171 193 203 221 177 212 (8.7)
Maharastra border check-post 451 432 493 494 582 574 567 573 557 527 546 4.0
Rohtak Panipat 247 250 284 290 303 264 262 234 234 210 223 17.7
Dhule Palasner 426 441 475 475 457 484 482 488 477 477 487 (1.0)
Gomati Ka Chauraha Udaipur 263 265 273 262 282 280 311 331 339 315 330 (5.7)
BRTPL 116 110 108 104 115 120 134 146 147 136 144 (7.0)
RHTPL 132 136 153 150 151 150 171 178 172 171 190 (10.2)
Total (for yoy comparable
projects)2,414 2,386 2,583 2,605 2,732 2,668 2,741 2,783 2,796 2,663 2,770 (1.1)
Yoy growth (%) 4.8 12.0 13.0 9.3 13.2 11.8 6.1 6.8 2.3 (0.2) 1.1
Schedule of payment Amount
Deal Value 26.2
Ahmedabad ring road 2.5
Net deal value 23.7
InVIT units 7.2
Net cash 16.5
External debt repayment of SIPL 9.5
Proceeds left post repayment of debt 7.0
Payment to Monte carlo 0.7
Payment to SEL for stake purchase in Mysore Bellary 1.0
Payment to SPVs on loan taken for SIPL 2.1
Transaction Taxes 0.8
Proceeds to be paid to SEL 3.1
Ahmedabad ring road proceeds to be received later 2.5
Final payment to SEL 5.6

Sadbhav Engineering Capital Goods
KOTAK INSTITUTIONAL EQUITIES RESEARCH 77
Exhibit 5: SEL and SIPL amalgamation expected to be concluded in 6-9 months. Amalgamated entity
will have 3 operational BOT projects and 11 HAM projects
Source: Company, Kotak Institutional Equities
Changes in estimates
We revise our execution estimates sharply downwards on poor execution seen during
3QFY20 and also due to downward revision of revenue guidance for FY2020/2021 to
Rs24 bn/Rs32 bn (from earlier guidance of Rs32 bn/Rs36 bn for FY2020/2021).
Execution pick up in FY2021 is expected to be led by (1) Vadodara Kim project, (2)
Jodhpur ring road project, (3) Gadag Honalli project and (4) Mumbai-Nagpur expressway
project. Also, with fund flows from the stake sale of projects, working capital would ease,
thereby helping improve execution. The company has received appointed dates for the
Vadodara-Kim expressway and is expected to get the same for Gadag Honalli project by
Feb 2020. Forest clearances for the Mumbai-Nagpur expressway project have also been
received and work is expected to ramp-up.
From deal proceeds, SEL would now be able to reduce its loans and advances by Rs5 bn
(earlier estimate of Rs8 bn) by FY2020/21. We incorporate the same in our estimates.
BOT Projects EPC cost(Rs mn) Status
Maharashtra Border Check Post Network 14,264 Partly operational
Rohtak Panipat Tollway 12,401 Operational
Rohtak Hissar Tollway 12,709 Operational
HAM Projects EPC cost(Rs mn) Status
Bhavnagar – Talaja Section 8,190 Under-construction;PCoD expected in FY2020
Una – Kodinar Section 6,230 Under-construction
Rampur – Kathgodam Section (Pkg-I) 7,380 Under-construction;PCoD expected in FY2020
Waranga to Mahagaon (Pkg-I) 10,710 Under-construction
Greenfield Proposed Udaipur bypass (Pkg-IV) 8,910 Under-construction;PCoD expected in FY2020
BRT Tiger Reserve Boundary to Bangalore Section 10,080 Under-construction;PCoD expected in FY2020
Rampur – Kathgodam Section (Pkg-II) 6,570 Under-construction
Jodhpur RR 11,060 Under-construction
Tumkur Shivamogga section 7,000 Terminated
Bhimasar-Bhuj project 11,520 Terminated
Connectivity to Visakhapatnam Port Road 4,210 Terminated
Vadodara Kim expressway Phase 1A package V 10,050 Appointed Date received in Nov, 2019
Owned by SEL
Gadag Honalli - KSHIP project 8,880 Appointed date expected in Feb, 2020; FC done

Capital Goods Sadbhav Engineering
78 KOTAK INSTITUTIONAL EQUITIES RESEARCH
Exhibit 6: Change in estimates for SEL (standalone), March fiscal year-ends (Rs mn)
Source: Company, Kotak Institutional Equities estimates
Exhibit 7: Sum-of-the-parts valuation of Sadbhav Engineering
Source: Company, Kotak Institutional Equities estimates
2019 2020E 2021E 2022E 2020E 2021E 2022E 2020E 2021E 2022E
Profit model
Order inflows 29,381 22,193 44,112 48,523 27,964 46,461 51,107 (21) (5) (5)
Total income 35,492 24,631 31,493 35,206 33,024 36,674 40,071 (25) (14) (12)
EBITDA 4,279 3,019 3,899 4,351 4,057 4,516 4,931 (26) (14) (12)
PBT 2,576 1,755 2,786 3,214 2,736 3,340 3,703 (36) (17) (13)
Tax (714) (512) (785) (885) (785) (914) (1,008)
PAT 1,864 1,242 2,002 2,328 1,952 2,426 2,695 (36) (17) (14)
EPS (Rs) 10.9 7.2 11.7 13.6 11.4 14.1 15.7
Ratios
Revenue growth (%) 1.3 (30.6) 27.9 11.8 (7.0) 11.1 9.3
EBITDA margin (%) 12.1 12.3 12.4 12.4 12.3 12.3 12.3
PAT margin (%) 5.3 5.0 6.4 6.6 5.9 6.6 6.7
Tax rate (%) 27.6 29.2 28.2 27.5 28.7 27.4 27.2
Net debt/equity (X) 0.8 0.3 0.1 0.1 0.3 0.3 0.2
RoAE (%) 14.1 8.7 12.4 12.8 13.0 14.1 13.8
RoACE (%) 10.9 7.3 10.1 11.1 10.3 12.0 12.1
New estimates Old estimates % revision
Value
Proportionate
value Shareholding Per share
Business (Rs mn) (Rs mn) (%) (Rs) Comments
EPC business 10,078 10,078 100 59 4X EV/EBITDA- one-year forward basis
Sadbhav Infrastructure Projects 92 FCFE valuation of projects
Operational projects 3,788 2,173 69 9
MBCPNL 15,967 14,352 89.7% stake
Rohtak-Panipat (6,994) (6,993) 100% stake
Rohtak Hissar (5,186) (5,186) 100% stake
SIPL standalone operations+HAM operations 20,691 20,691 69 83 4X EV/EBITDA -one year forward and book value of inv
15% holding company discount for SIPL (14)
Total 137

Sadbhav Engineering Capital Goods
KOTAK INSTITUTIONAL EQUITIES RESEARCH 79
Exhibit 8: Segmental numbers for Sadbhav Engineering (standalone), March fiscal year-ends, 2012-22E (Rs mn)
Source: Company, Kotak Institutional Equities estimates
2012 2013 2014 2015 2016 2017 2018 2019 2020E 2021E 2022E
Total standalone
Order inflows 32,607 46,518 23,298 22,211 25,040 35,035 93,662 29,381 22,193 44,112 48,523
Yoy growth (%) 35.6 42.7 (49.9) (4.7) 12.7 39.9 167.3 (68.6) (24.5) 98.8 10.0
Revenues 26,706 18,039 23,523 29,621 31,816 33,134 35,493 35,402 24,631 31,493 35,206
Yoy growth (%) 20.9 (32.5) 30.4 25.9 7.4 4.1 7.1 (0.3) (30.4) 27.9 11.8
Order backlog 75,541 104,020 89,410 82,000 74,873 76,834 132,493 112,277 109,839 122,458 135,775
Roads (BOT/HAM/EPC)
Order inflows 25,175 27,593 7,288 12,632 25,040 34,648 87,665 22,141 20,000 37,700 41,470
Yoy growth (%) 46.0 9.6 (73.6) 73.3 98.2 38.4 153.0 (74.7) (9.7) 88.5 10.0
Revenues 22,406 12,782 17,098 20,303 22,263 25,386 29,883 32,299 21,995 26,755 30,091
Yoy growth (%) 24.1 (43.0) 33.8 18.7 9.7 14.0 17.7 8.1 (31.9) 21.6 12.5
Order backlog 53,989 68,800 45,599 37,929 40,706 49,969 107,751 86,049 84,054 94,999 106,378
Irrigation
Order inflows 2,474 7,898 8,620 4,537 — — — 1,993 2,193 2,412 2,653
Yoy growth (%) (43.7) 219.2 9.1 (47.4) (50.0) — — - 10.0 10.0 10.0
Revenues 2,106 2,856 2,861 4,060 5,359 4,580 2,851 1,608 1,328 1,544 1,779
Yoy growth (%) 68.0 35.6 0.2 41.9 32.0 (14.5) (37.8) (43.6) (17.4) 16.3 15.2
Order backlog 9,958 15,000 19,670 20,146 14,419 9,899 4,539 4,438 5,302 6,170 7,045
Mining
Order inflows 4,958 11,027 7,390 5,042 — 386 5,997 5,247 - 4,000 4,400
Yoy growth (%) 106.5 122.4 (33.0) (31.8) (60.0) — 2,500.0 (12.5) 10.0 10.0 10.0
Revenues 2,194 2,401 3,565 5,258 4,194 3,168 2,759 1,496 1,307 3,194 3,337
Yoy growth (%) (21.0) 9.4 48.5 47.5 (20.2) (24.5) (12.9) (45.8) (12.6) 144.3 4.5
Order backlog 11,594 20,220 24,141 23,925 19,748 16,966 20,204 21,790 20,483 21,289 22,352

Capital Goods Sadbhav Engineering
80 KOTAK INSTITUTIONAL EQUITIES RESEARCH
Exhibit 9: Financials of Sadbhav Engineering (standalone), March fiscal year-ends, 2012-22E (Rs mn)
Source: Company, Kotak Institutional Equities estimates
2012 2013 2014 2015 2016 2017 2018 2019 2020E 2021E 2022E
Profit model
Total income 26,755 18,110 23,581 29,698 31,863 33,203 35,051 35,492 24,631 31,493 35,206
Expenses (23,853) (16,552) (21,092) (26,696) (28,608) (29,646) (30,898) (31,213) (21,612) (27,594) (30,855)
EBITDA 2,903 1,558 2,489 3,002 3,254 3,557 4,152 4,279 3,019 3,899 4,351
Interest (expense)/income (651) (844) (1,181) (1,382) (1,515) (1,534) (1,907) (1,749) (1,222) (882) (669)
Depreciation (274) (318) (474) (817) (849) (1,000) (979) (958) (1,092) (1,198) (1,315)
Other income 108 103 369 655 905 875 897 1,003 1,049 967 847
Pretax profits 2,086 499 1,203 1,458 1,795 1,897 2,163 2,576 1,755 2,786 3,214
Tax (681) (166) 55 (346) (405) (18) 44 (714) (512) (785) (885)
Adjusted net income 1,404 741 874 1,112 1,342 1,879 2,207 1,864 1,242 2,002 2,328
EPS (Rs) 9.3 4.9 5.8 7.1 7.8 11.0 12.9 10.9 7.2 11.7 13.6
Balance sheet
Total equity 7,623 8,325 9,572 13,521 14,715 16,609 18,668 20,337 21,442 23,223 25,294
Deferred taxation liability 235 317 357 244 232 (477) (994) (994) (994) (994) (994)
Total borrowings 4,488 7,630 10,257 10,963 12,166 15,183 14,840 15,873 12,873 7,873 7,873
Total liabilities and equity 12,346 16,272 20,186 24,728 27,112 31,316 32,514 35,216 33,321 30,102 32,173
Net fixed assets 2,881 3,303 4,982 5,357 5,550 5,229 5,028 4,972 4,655 4,309 3,932
Investments 3,323 5,385 5,210 5,313 5,278 5,694 5,775 6,094 6,094 6,094 6,094
Net current assets (excl. cash) 5,015 7,150 8,471 13,356 15,552 19,934 21,458 22,943 10,574 9,805 10,815
Cash 563 218 762 351 366 230 127 604 5,999 4,947 5,666
Total assets 12,346 16,272 20,186 24,728 27,113 31,316 32,514 35,216 33,321 30,102 32,173
Free cash flow
Cash flow from operations 722 (293) 1,047 (1,163) 1,543 169 3,672 2,607 10,530 5,902 2,583
Cash flow from investing (778) (2,802) (1,914) (1,351) (841) 2,213 (627) (1,024) (775) (852) (938)
Free cash flow (56) (3,095) (866) (2,514) 702 2,382 3,044 1,583 9,754 5,050 1,645
Ratios
EBITDA margin (%) 10.8 8.6 10.6 10.1 10.2 10.7 11.8 12.1 12.3 12.4 12.4
PAT margin (%) 5.2 4.1 3.7 3.7 4.2 5.7 6.3 5.3 5.0 6.4 6.6
Net debt/equity (X) 0.5 0.9 1.0 0.8 0.8 0.9 0.8 0.8 0.3 0.1 0.1
RoAE (%) 30.5 22.5 18.5 13.2 13.9 18.0 18.6 14.1 8.7 12.4 12.8
RoACE (%) 22.7 13.0 12.8 11.8 11.4 12.2 13.3 10.9 7.3 10.1 11.1
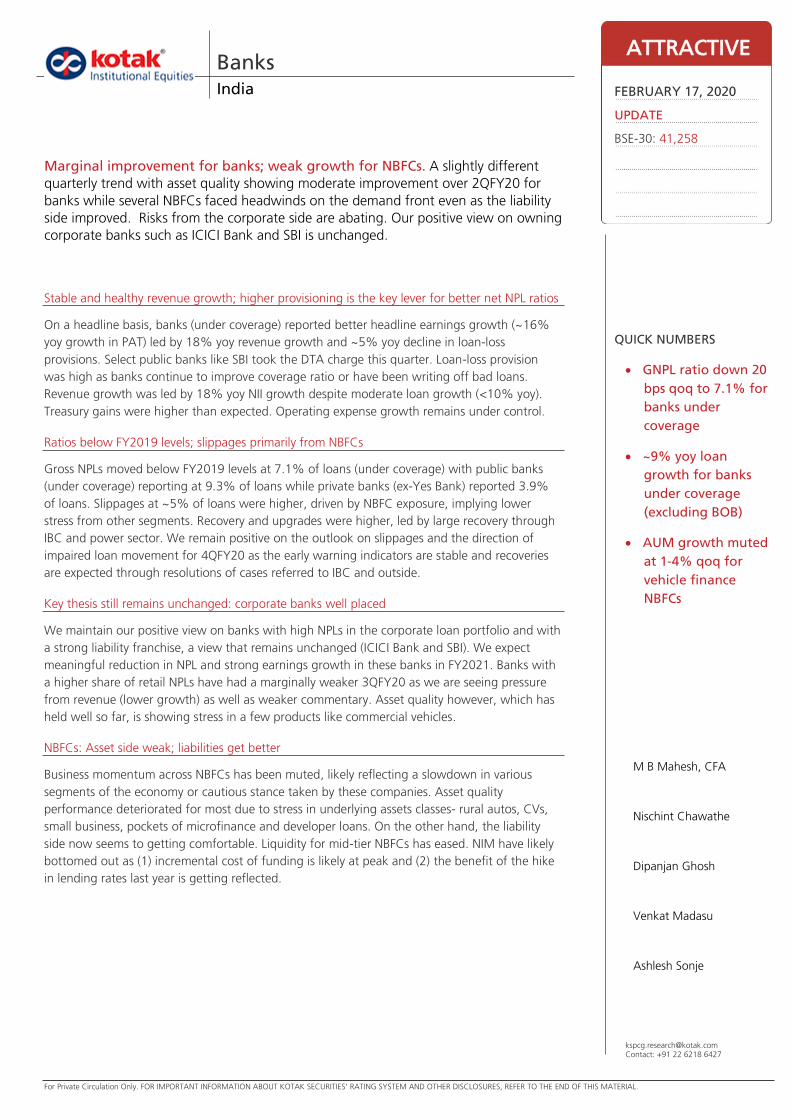
For Private Circulation Only. FOR IMPORTANT INFORMATION ABOUT KOTAK SECURITIES’ RATING SYSTEM AND OTHER DISCLOSURES, REFER TO THE END OF THIS MATERIAL.
[email protected]: +91 22 6218 6427
Stable and healthy revenue growth; higher provisioning is the key lever for better net NPL ratios
On a headline basis, banks (under coverage) reported better headline earnings growth (~16%
yoy growth in PAT) led by 18% yoy revenue growth and ~5% yoy decline in loan-loss
provisions. Select public banks like SBI took the DTA charge this quarter. Loan-loss provision
was high as banks continue to improve coverage ratio or have been writing off bad loans.
Revenue growth was led by 18% yoy NII growth despite moderate loan growth (<10% yoy).
Treasury gains were higher than expected. Operating expense growth remains under control.
Ratios below FY2019 levels; slippages primarily from NBFCs
Gross NPLs moved below FY2019 levels at 7.1% of loans (under coverage) with public banks
(under coverage) reporting at 9.3% of loans while private banks (ex-Yes Bank) reported 3.9%
of loans. Slippages at ~5% of loans were higher, driven by NBFC exposure, implying lower
stress from other segments. Recovery and upgrades were higher, led by large recovery through
IBC and power sector. We remain positive on the outlook on slippages and the direction of
impaired loan movement for 4QFY20 as the early warning indicators are stable and recoveries
are expected through resolutions of cases referred to IBC and outside.
Key thesis still remains unchanged: corporate banks well placed
We maintain our positive view on banks with high NPLs in the corporate loan portfolio and with
a strong liability franchise, a view that remains unchanged (ICICI Bank and SBI). We expect
meaningful reduction in NPL and strong earnings growth in these banks in FY2021. Banks with
a higher share of retail NPLs have had a marginally weaker 3QFY20 as we are seeing pressure
from revenue (lower growth) as well as weaker commentary. Asset quality however, which has
held well so far, is showing stress in a few products like commercial vehicles.
NBFCs: Asset side weak; liabilities get better
Business momentum across NBFCs has been muted, likely reflecting a slowdown in various
segments of the economy or cautious stance taken by these companies. Asset quality
performance deteriorated for most due to stress in underlying assets classes- rural autos, CVs,
small business, pockets of microfinance and developer loans. On the other hand, the liability
side now seems to getting comfortable. Liquidity for mid-tier NBFCs has eased. NIM have likely
bottomed out as (1) incremental cost of funding is likely at peak and (2) the benefit of the hike
in lending rates last year is getting reflected.
Banks India
Marginal improvement for banks; weak growth for NBFCs. A slightly different
quarterly trend with asset quality showing moderate improvement over 2QFY20 for
banks while several NBFCs faced headwinds on the demand front even as the liability
side improved. Risks from the corporate side are abating. Our positive view on owning
corporate banks such as ICICI Bank and SBI is unchanged.
ATTRACTIVE
FEBRUARY 17, 2020
UPDATE
BSE-30: 41,258
QUICK NUMBERS
GNPL ratio down 20
bps qoq to 7.1% for
banks under
coverage
~9% yoy loan
growth for banks
under coverage
(excluding BOB)
AUM growth muted
at 1-4% qoq for
vehicle finance
NBFCs
M B Mahesh, CFA
Nischint Chawathe
Dipanjan Ghosh
Venkat Madasu
Ashlesh Sonje

India Banks
82 KOTAK INSTITUTIONAL EQUITIES RESEARCH
Exhibit 1: Healthy overall earnings growth in 3QFY20 Consolidated earnings for banks under coverage, March fiscal year-ends, 3QFY19-3QFY20 (Rs bn)
Source: Company, Kotak Institutional Equities
Exhibit 2: Strong earnings growth for private banks (~27% yoy) and public banks ex-BoB (~28% yoy) Growth in PAT, March fiscal year-ends, 3QFY16-3QFY20 (%)
Source: Company, Kotak Institutional Equities
3QFY19 4QFY19 1QFY20 2QFY20 3QFY20 QoQ (%) YoY (%)
NII 740 758 780 817 872 6.8 17.8
Non interest income 325 377 335 402 394 (2.0) 21.1
Total income 1,049 1,121 1,103 1,205 1,241 3.0 18.3
Provisions 274 600 314 400 362 (9.5) 32.2
Loan loss provisions 375 583 328 367 358 (2.4) (4.5)
PAT 175 5 171 123 202 64.7 15.7
PAT (ex-SBI) 135 (4) 147 93 146 58.0 8.2
PAT (ex-BOB) 170 15 163 115 216 87.4 27.1
(225)
(150)
(75)
0
75
150
3Q
FY
16
4Q
FY
16
1Q
FY
17
2Q
FY
17
3Q
FY
17
4Q
FY
17
1Q
FY
18
2Q
FY
18
3Q
FY
18
4Q
FY
18
1Q
FY
19
2Q
FY
19
3Q
FY
19
4Q
FY
19
1Q
FY
20
2Q
FY
20
3Q
FY
20
Public banks (LHS) Private banks (LHS)

Banks India
KOTAK INSTITUTIONAL EQUITIES RESEARCH 83
Exhibit 3: NII growth stable qoq at ~18% yoy Growth in NII, March fiscal year-ends, 3QFY16-3QFY20 (%)
Source: Company, Kotak Institutional Equities
Exhibit 4: Provisions flat qoq and yoy Loan-loss provisions, March fiscal year-ends, 3QFY17-3QFY20 (Rs bn)
Source: Company, Kotak Institutional Equities
Exhibit 5: Gross NPLs for PSU banks decreased 30 bps qoq Public banks (under coverage), March fiscal year-ends, 3QFY17-3QFY20 (%)
Source: Company, Kotak Institutional Equities
Exhibit 6: Gross NPLs for private banks decreased 10 bps qoq Private banks (under coverage), March fiscal year-ends, 3QFY17-3QFY20 (%)
Source: Company, Kotak Institutional Equities
(7.5)
0.0
7.5
15.0
22.5
30.0
3Q
FY
16
4Q
FY
16
1Q
FY
17
2Q
FY
17
3Q
FY
17
4Q
FY
17
1Q
FY
18
2Q
FY
18
3Q
FY
18
4Q
FY
18
1Q
FY
19
2Q
FY
19
3Q
FY
19
4Q
FY
19
1Q
FY
20
2Q
FY
20
3Q
FY
20
Public banks (LHS) Private banks (LHS)
Sector (RHS)
0
180
360
540
720
900
3Q
FY
17
4Q
FY
17
1Q
FY
18
2Q
FY
18
3Q
FY
18
4Q
FY
18
1Q
FY
19
2Q
FY
19
3Q
FY
19
4Q
FY
19
1Q
FY
20
2Q
FY
20
3Q
FY
20
Public banks (LHS) Private banks (LHS)
10.0 9.9 10.9 10.7 10.9
12.5 12.4 11.6 10.7
9.5 9.7 9.6 9.3
3.0 2.5 2.3 2.1 1.5
0.6 0.5 0.5
0.5
0.5 0.8 0.5 0.5
0
3
6
9
12
15
3Q
FY1
7
4Q
FY1
7
1Q
FY1
8
2Q
FY1
8
3Q
FY1
8
4Q
FY1
8
1Q
FY1
9
2Q
FY1
9
3Q
FY1
9
4Q
FY1
9
1Q
FY2
0
2Q
FY2
0
3Q
FY2
0
Gross NPL Restructured loans
3.8 4.0 4.0 4.2 4.1 4.5 4.4 4.2 4.1 3.9 4.0 4.0 3.9
1.0 0.7 0.6 0.4 0.6 0.2 0.2
0.2 0.1
0.1 0.1 0.1 0.1
0.0
1.2
2.4
3.6
4.8
6.0
3Q
FY1
7
4Q
FY1
7
1Q
FY1
8
2Q
FY1
8
3Q
FY1
8
4Q
FY1
8
1Q
FY1
9
2Q
FY1
9
3Q
FY1
9
4Q
FY1
9
1Q
FY2
0
2Q
FY2
0
3Q
FY2
0
Gross NPL Restructured loans

India Banks
84 KOTAK INSTITUTIONAL EQUITIES RESEARCH
BANKS: GROWTH SLOWS, ASSET QUALITY IMPROVES LED BY RECOVERIES
Strong recoveries offset a spike in slippages; headline asset quality improves
Headline asset quality numbers improved in 3QFY20 despite higher slippages, mainly led by
large resolutions in the corporate segment during the quarter. Gross NPL ratio and Net NPL
ratios improved for both PSU (~30 bps) and private banks (~10 bps) in 3QFY20. Aggregate
slippages for banks under coverage were high led by a large HFC account and multiple other
corporate accounts slipping into NPLs during the quarter. Retail asset quality was marginally
worse, mainly driven by the CV portfolio, while agricultural slippages were higher for a few
banks led by divergences detected by RBI. Most banks have seen higher slippages in
3QFY20. Asset quality of MFI loans was broadly stable, although stress showed up in early
warning indicators led by a few states, including Assam.
Most banks under coverage reported higher slippages in 3QFY20 (Exhibit 9). Slippages were
worse for PSU banks (PNB, BOB and Union at ~6-7% and SBI and Canara at ~4%) led by
multiple corporate accounts and agriculture loans. Among private banks, RBL Bank
continued to report high slippages at ~7%, while others reported slippages of 3-4%, except
Federal Bank at 2% of loans. Overall GNPL ratio declined by ~20 bps qoq to 7.1% (down
~20 bps to 9.2% for the broader sector). PSU Banks reported ~30 bps qoq improvement in
GNPL ratio to 9.3%, while private banks reported ~10 bps improvement to 7.1% in
3QFY20.
Slippages into the watch-list or ‘BB and below’ portfolios continued in 3QFY20, led by
multiple corporate accounts across sectors including telecom and construction. Overall
stressed accounts including GNPLs and sub-investment grade/SMA book declined for major
banks including Axis Bank, ICICI Bank and SBI. Overall stressed assets (GNPL, SR, BB and
below book, standard restructured and other dispensations) dropped 70 bps qoq to ~9.3%
for ICICI Bank. Gross stressed loans (GNPL, sub-investment grade, other dispensation, other
non-fund based exposure and SR) dropped 20 bps qoq to 8.0% for Axis Bank. SBI witnessed
~70 bps qoq improvement in gross stressed loans 7.3% in 3QFY20.
We note than ~25-30% of GNPL of most banks (excluding new private banks and SFBs) is
under NCLT lists 1 and 2 (with multiple accounts at advanced stages of resolution).
Additional accounts have been registered by various banks under NCLT or other schemes. As
resolutions pick pace, GNPL is expected to show significant reduction going ahead.

Banks India
KOTAK INSTITUTIONAL EQUITIES RESEARCH 85
Exhibit 7: Gross and Net NPL ratios improve qoq Gross NPLs and net NPLs, March fiscal year-ends, 3QFY19-3QFY20
Source: Company, Kotak Institutional Equities
Gross NPL (Rs bn) Gross NPLs (%) Net NPLs (Rs bn) Net NPLs (%)
3QFY19 4QFY19 1QFY20 2QFY20 3QFY20 3QFY19 4QFY19 1QFY20 2QFY20 3QFY20 3QFY19 4QFY19 1QFY20 2QFY20 3QFY20 3QFY19 4QFY19 1QFY20 2QFY20 3QFY20
Public banks
BoB 532 482 697 700 731 11.0 9.6 10.3 10.3 10.4 191 156 250 249 265 4.3 3.3 4.0 3.9 4.1
Canara 446 392 394 387 366 10.3 8.8 8.8 8.7 8.4 266 230 231 221 213 6.4 5.4 5.4 5.2 5.1
PNB 777 785 773 795 768 16.3 15.5 16.5 16.8 16.3 357 300 302 327 305 8.2 6.6 7.2 7.7 7.2
SBI 1,878 1,727 1,685 1,616 1,597 8.7 7.5 7.5 7.2 6.9 809 659 656 599 582 4.0 3.0 3.1 2.8 2.7
Union 497 487 488 499 499 15.7 15.0 15.2 15.2 14.9 241 203 212 208 215 8.3 6.9 7.2 7.0 7.0
Old private
CUBK 9 10 11 11 12 2.9 3.0 3.3 3.4 3.5 5 6 6 6 6 1.7 1.8 1.9 1.9 2.0
Federal 34 33 34 36 36 3.1 2.9 3.0 3.1 3.0 18 16 17 18 19 1.7 1.5 1.5 1.6 1.6
KVB 41 44 45 44 44 8.5 8.8 9.2 8.9 8.9 23 24 23 21 19 5.0 5.0 4.9 4.5 4.1
New private
Axis 309 298 294 291 301 5.8 5.3 5.3 5.0 5.0 122 113 110 111 122 2.4 2.1 2.0 2.0 2.1
Bandhan 8 8 9 11 12 2.4 2.0 2.0 1.8 1.9 2 2 2 3 5 0.7 0.6 0.6 0.6 0.8
DCB 4 4 5 5 6 1.9 1.8 2.0 2.1 2.2 2 2 2 2 3 0.7 0.7 0.8 1.0 1.0
HDFC Bank 109 112 118 125 134 1.4 1.4 1.4 1.4 1.4 33 32 36 38 45 0.4 0.4 0.4 0.4 0.5
ICICI 516 463 458 456 435 7.8 6.7 6.5 6.4 6.0 163 136 119 109 104 2.9 2.3 2.0 1.8 1.6
IndusInd 20 39 42 44 46 1.1 2.1 2.2 2.2 2.2 10 22 24 22 22 0.6 1.2 1.2 1.1 1.1
RBL 7 8 8 15 20 1.4 1.4 1.4 2.6 3.3 4 4 4 9 12 0.7 0.7 0.7 1.6 2.1
Yes 52 79 121 171 NA 2.1 3.2 5.0 7.4 NA 29 45 69 98 NA 1.2 1.9 2.9 4.4 NA
Small finance banks
AU 4 5 5 5 5 2.1 2.0 2.1 2.0 1.9 3 3 3 3 3 1.3 1.3 1.3 1.1 1.0
Equitas 3 3 3 4 4 3.1 2.5 2.8 2.9 2.9 2 2 2 2 2 1.8 1.6 1.7 1.6 1.7
Ujjivan 1 1 1 1 1 1.4 0.9 0.8 0.9 1.0 0 0 0 0 1 0.3 0.3 0.3 0.3 0.4
Total 5,247 4,981 5,189 5,216 5,189 8.0 7.2 7.4 7.3 7.1 2,281 1,955 2,068 2,048 2,041 3.7 3.0 3.1 3.0 3.0
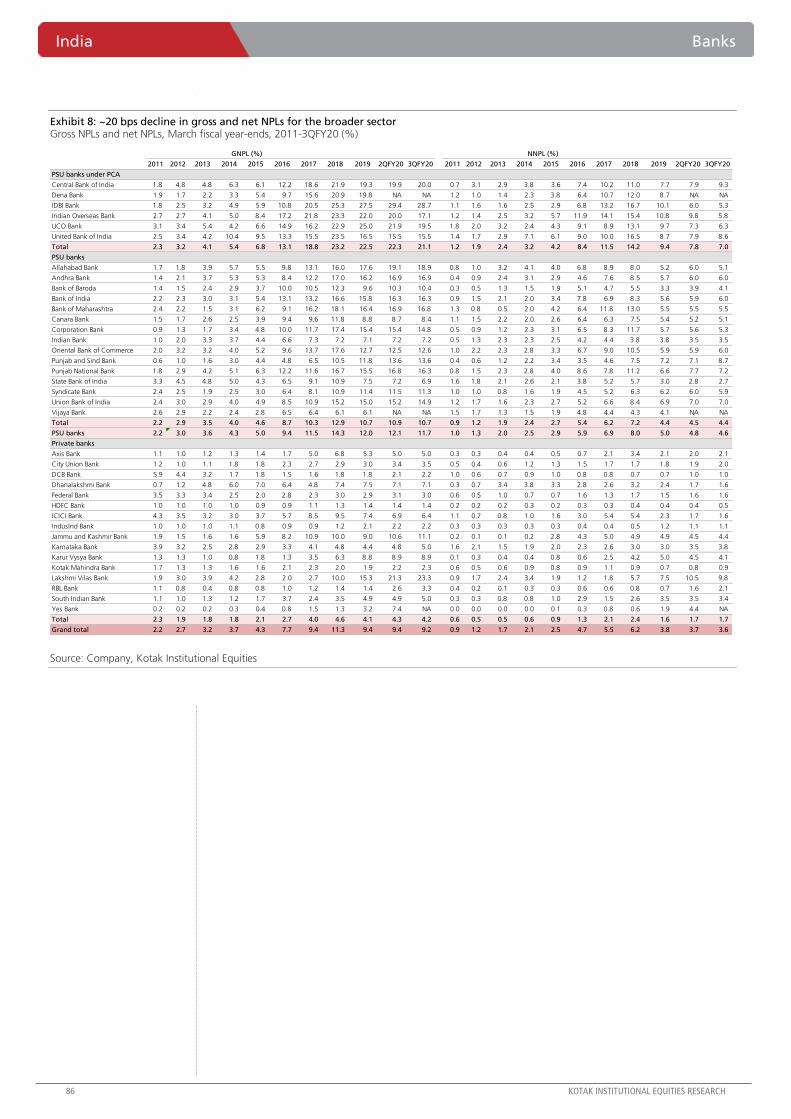
India Banks
86 KOTAK INSTITUTIONAL EQUITIES RESEARCH
Exhibit 8: ~20 bps decline in gross and net NPLs for the broader sector Gross NPLs and net NPLs, March fiscal year-ends, 2011-3QFY20 (%)
Source: Company, Kotak Institutional Equities
2011 2012 2013 2014 2015 2016 2017 2018 2019 2QFY20 3QFY20 2011 2012 2013 2014 2015 2016 2017 2018 2019 2QFY20 3QFY20
PSU banks under PCA
Central Bank of India 1.8 4.8 4.8 6.3 6.1 12.2 18.6 21.9 19.3 19.9 20.0 0.7 3.1 2.9 3.8 3.6 7.4 10.2 11.0 7.7 7.9 9.3
Dena Bank 1.9 1.7 2.2 3.3 5.4 9.7 15.6 20.9 19.8 NA NA 1.2 1.0 1.4 2.3 3.8 6.4 10.7 12.0 8.7 NA NA
IDBI Bank 1.8 2.5 3.2 4.9 5.9 10.8 20.5 25.3 27.5 29.4 28.7 1.1 1.6 1.6 2.5 2.9 6.8 13.2 16.7 10.1 6.0 5.3
Indian Overseas Bank 2.7 2.7 4.1 5.0 8.4 17.2 21.8 23.3 22.0 20.0 17.1 1.2 1.4 2.5 3.2 5.7 11.9 14.1 15.4 10.8 9.8 5.8
UCO Bank 3.1 3.4 5.4 4.2 6.6 14.9 16.2 22.9 25.0 21.9 19.5 1.8 2.0 3.2 2.4 4.3 9.1 8.9 13.1 9.7 7.3 6.3
United Bank of India 2.5 3.4 4.2 10.4 9.5 13.3 15.5 23.5 16.5 15.5 15.5 1.4 1.7 2.9 7.1 6.1 9.0 10.0 16.5 8.7 7.9 8.6
Total 2.3 3.2 4.1 5.4 6.8 13.1 18.8 23.2 22.5 22.3 21.1 1.2 1.9 2.4 3.2 4.2 8.4 11.5 14.2 9.4 7.8 7.0
PSU banks
Allahabad Bank 1.7 1.8 3.9 5.7 5.5 9.8 13.1 16.0 17.6 19.1 18.9 0.8 1.0 3.2 4.1 4.0 6.8 8.9 8.0 5.2 6.0 5.1
Andhra Bank 1.4 2.1 3.7 5.3 5.3 8.4 12.2 17.0 16.2 16.9 16.9 0.4 0.9 2.4 3.1 2.9 4.6 7.6 8.5 5.7 6.0 6.0
Bank of Baroda 1.4 1.5 2.4 2.9 3.7 10.0 10.5 12.3 9.6 10.3 10.4 0.3 0.5 1.3 1.5 1.9 5.1 4.7 5.5 3.3 3.9 4.1
Bank of India 2.2 2.3 3.0 3.1 5.4 13.1 13.2 16.6 15.8 16.3 16.3 0.9 1.5 2.1 2.0 3.4 7.8 6.9 8.3 5.6 5.9 6.0
Bank of Maharashtra 2.4 2.2 1.5 3.1 6.2 9.1 16.2 18.1 16.4 16.9 16.8 1.3 0.8 0.5 2.0 4.2 6.4 11.8 13.0 5.5 5.5 5.5
Canara Bank 1.5 1.7 2.6 2.5 3.9 9.4 9.6 11.8 8.8 8.7 8.4 1.1 1.5 2.2 2.0 2.6 6.4 6.3 7.5 5.4 5.2 5.1
Corporation Bank 0.9 1.3 1.7 3.4 4.8 10.0 11.7 17.4 15.4 15.4 14.8 0.5 0.9 1.2 2.3 3.1 6.5 8.3 11.7 5.7 5.6 5.3
Indian Bank 1.0 2.0 3.3 3.7 4.4 6.6 7.3 7.2 7.1 7.2 7.2 0.5 1.3 2.3 2.3 2.5 4.2 4.4 3.8 3.8 3.5 3.5
Oriental Bank of Commerce 2.0 3.2 3.2 4.0 5.2 9.6 13.7 17.6 12.7 12.5 12.6 1.0 2.2 2.3 2.8 3.3 6.7 9.0 10.5 5.9 5.9 6.0
Punjab and Sind Bank 0.6 1.0 1.6 3.0 4.4 4.8 6.5 10.5 11.8 13.6 13.6 0.4 0.6 1.2 2.2 3.4 3.5 4.6 7.5 7.2 7.1 8.7
Punjab National Bank 1.8 2.9 4.2 5.1 6.3 12.2 11.6 16.7 15.5 16.8 16.3 0.8 1.5 2.3 2.8 4.0 8.6 7.8 11.2 6.6 7.7 7.2
State Bank of India 3.3 4.5 4.8 5.0 4.3 6.5 9.1 10.9 7.5 7.2 6.9 1.6 1.8 2.1 2.6 2.1 3.8 5.2 5.7 3.0 2.8 2.7
Syndicate Bank 2.4 2.5 1.9 2.5 3.0 6.4 8.1 10.9 11.4 11.5 11.3 1.0 1.0 0.8 1.6 1.9 4.5 5.2 6.3 6.2 6.0 5.9
Union Bank of India 2.4 3.0 2.9 4.0 4.9 8.5 10.9 15.2 15.0 15.2 14.9 1.2 1.7 1.6 2.3 2.7 5.2 6.6 8.4 6.9 7.0 7.0
Vijaya Bank 2.6 2.9 2.2 2.4 2.8 6.5 6.4 6.1 6.1 NA NA 1.5 1.7 1.3 1.5 1.9 4.8 4.4 4.3 4.1 NA NA
Total 2.2 2.9 3.5 4.0 4.6 8.7 10.3 12.9 10.7 10.9 10.7 0.9 1.2 1.9 2.4 2.7 5.4 6.2 7.2 4.4 4.5 4.4
PSU banks 2.2 3.0 3.6 4.3 5.0 9.4 11.5 14.3 12.0 12.1 11.7 1.0 1.3 2.0 2.5 2.9 5.9 6.9 8.0 5.0 4.8 4.6
Private banks
Axis Bank 1.1 1.0 1.2 1.3 1.4 1.7 5.0 6.8 5.3 5.0 5.0 0.3 0.3 0.4 0.4 0.5 0.7 2.1 3.4 2.1 2.0 2.1
City Union Bank 1.2 1.0 1.1 1.8 1.8 2.3 2.7 2.9 3.0 3.4 3.5 0.5 0.4 0.6 1.2 1.3 1.5 1.7 1.7 1.8 1.9 2.0
DCB Bank 5.9 4.4 3.2 1.7 1.8 1.5 1.6 1.8 1.8 2.1 2.2 1.0 0.6 0.7 0.9 1.0 0.8 0.8 0.7 0.7 1.0 1.0
Dhanalakshmi Bank 0.7 1.2 4.8 6.0 7.0 6.4 4.8 7.4 7.5 7.1 7.1 0.3 0.7 3.4 3.8 3.3 2.8 2.6 3.2 2.4 1.7 1.6
Federal Bank 3.5 3.3 3.4 2.5 2.0 2.8 2.3 3.0 2.9 3.1 3.0 0.6 0.5 1.0 0.7 0.7 1.6 1.3 1.7 1.5 1.6 1.6
HDFC Bank 1.0 1.0 1.0 1.0 0.9 0.9 1.1 1.3 1.4 1.4 1.4 0.2 0.2 0.2 0.3 0.2 0.3 0.3 0.4 0.4 0.4 0.5
ICICI Bank 4.3 3.5 3.2 3.0 3.7 5.7 8.5 9.5 7.4 6.9 6.4 1.1 0.7 0.8 1.0 1.6 3.0 5.4 5.4 2.3 1.7 1.6
IndusInd Bank 1.0 1.0 1.0 1.1 0.8 0.9 0.9 1.2 2.1 2.2 2.2 0.3 0.3 0.3 0.3 0.3 0.4 0.4 0.5 1.2 1.1 1.1
Jammu and Kashmir Bank 1.9 1.5 1.6 1.6 5.9 8.2 10.9 10.0 9.0 10.6 11.1 0.2 0.1 0.1 0.2 2.8 4.3 5.0 4.9 4.9 4.5 4.4
Karnataka Bank 3.9 3.2 2.5 2.8 2.9 3.3 4.1 4.8 4.4 4.8 5.0 1.6 2.1 1.5 1.9 2.0 2.3 2.6 3.0 3.0 3.5 3.8
Karur Vysya Bank 1.3 1.3 1.0 0.8 1.8 1.3 3.5 6.3 8.8 8.9 8.9 0.1 0.3 0.4 0.4 0.8 0.6 2.5 4.2 5.0 4.5 4.1
Kotak Mahindra Bank 1.7 1.3 1.3 1.6 1.6 2.1 2.3 2.0 1.9 2.2 2.3 0.6 0.5 0.6 0.9 0.8 0.9 1.1 0.9 0.7 0.8 0.9
Lakshmi Vilas Bank 1.9 3.0 3.9 4.2 2.8 2.0 2.7 10.0 15.3 21.3 23.3 0.9 1.7 2.4 3.4 1.9 1.2 1.8 5.7 7.5 10.5 9.8
RBL Bank 1.1 0.8 0.4 0.8 0.8 1.0 1.2 1.4 1.4 2.6 3.3 0.4 0.2 0.1 0.3 0.3 0.6 0.6 0.8 0.7 1.6 2.1
South Indian Bank 1.1 1.0 1.3 1.2 1.7 3.7 2.4 3.5 4.9 4.9 5.0 0.3 0.3 0.8 0.8 1.0 2.9 1.5 2.6 3.5 3.5 3.4
Yes Bank 0.2 0.2 0.2 0.3 0.4 0.8 1.5 1.3 3.2 7.4 NA 0.0 0.0 0.0 0.0 0.1 0.3 0.8 0.6 1.9 4.4 NA
Total 2.3 1.9 1.8 1.8 2.1 2.7 4.0 4.6 4.1 4.3 4.2 0.6 0.5 0.5 0.6 0.9 1.3 2.1 2.4 1.6 1.7 1.7
Grand total 2.2 2.7 3.2 3.7 4.3 7.7 9.4 11.3 9.4 9.4 9.2 0.9 1.2 1.7 2.1 2.5 4.7 5.5 6.2 3.8 3.7 3.6
GNPL (%) NNPL (%)

Banks India
KOTAK INSTITUTIONAL EQUITIES RESEARCH 87
Exhibit 9: Higher slippages for most banks in 3QFY20
Slippages, March fiscal year-ends, 3QFY19-3QFY20
Source: Company, Kotak Institutional Equities
Exhibit 10: Write-offs higher at 2.2% of loans in 3QFY20 Write-off of loans, March fiscal year-ends, 3QFY19-3QFY20
Source: Company, Kotak Institutional Equities
Slippages (Rs mn) Slippages (%) Advances
3QFY19 4QFY19 1QFY20 2QFY20 3QFY20 3QFY19 4QFY19 1QFY20 2QFY20 3QFY20
Bank of Baroda 37,330 37,450 66,240 72,590 118,200 3.4 3.3 5.7 4.6 7.4
Canara Bank 51,090 24,690 36,760 26,020 48,160 5.0 2.4 3.4 2.4 4.5
Punjab National Bank 39,880 73,020 54,120 81,190 67,830 3.7 6.7 4.7 7.7 6.3
State Bank of India 65,410 79,610 169,950 91,260 200,980 1.3 1.6 3.1 1.7 3.7
Union Bank 29,830 32,750 30,900 42,190 51,120 3.8 4.1 3.8 5.2 6.3
Axis Bank 37,460 30,120 47,980 49,830 51,240 3.3 2.5 3.9 4.0 3.9
ICICI Bank 20,910 35,470 27,790 24,820 43,630 1.5 2.5 1.9 1.7 2.8
IndusInd Bank 8,060 36,880 7,250 11,020 19,450 2.0 8.5 1.6 2.3 3.9
Yes Bank 22,970 34,800 62,320 59,500 45,000 3.8 5.7 10.3 10.1 8.0
City Union Bank 1,657 2,044 1,999 2,003 2,295 2.2 2.7 2.4 2.5 2.8
DCB 1,143 985 1,454 1,609 2,107 2.1 1.7 2.5 2.7 3.4
RBL 2,110 2,060 2,250 13,770 10,480 1.8 1.7 1.7 9.7 7.2
Federal Bank 4,260 2,560 4,340 5,710 5,930 1.7 1.0 1.6 2.0 2.0
Karur Vysya Bank 9,070 6,230 4,740 5,000 4,490 7.5 5.2 3.7 4.1 3.6
Total 331,180 398,669 518,093 486,512 670,912 2.4 3.0 3.7 3.4 4.6
Total (ex-SBI) 265,770 319,059 348,143 395,252 469,932 3.1 3.8 4.0 4.4 5.1
Write-offs (Rs mn) Write-offs (% of advances) Advances
3QFY19 4QFY19 1QFY20 2QFY20 3QFY20 3QFY19 4QFY19 1QFY20 2QFY20 3QFY20
Bank of Baroda 30,510 67,500 45,320 33,550 54,590 2.7 5.8 2.9 2.1 3.3
Canara Bank 31,030 69,180 19,380 12,860 21,880 3.0 6.5 1.8 1.2 2.1
Punjab National Bank 29,670 25,180 23,050 18,910 50,430 2.7 2.2 2.2 1.8 4.7
State Bank of India 180,240 172,640 154,820 120,530 85,200 3.5 3.2 2.9 2.2 1.5
Union Bank 16,300 28,470 22,370 18,780 22,010 2.1 3.5 2.8 2.3 2.6
Axis Bank 22,070 17,010 30,050 31,040 27,900 1.9 1.4 2.4 2.4 2.0
ICICI Bank 9,255 73,255 21,989 13,433 24,599 0.7 5.0 1.5 0.9 1.5
City Union Bank 620 589 528 624 518 0.8 0.7 0.7 0.8 0.6
RBL 1,030 910 1,470 3,130 4,430 0.8 0.7 1.0 2.1 3.0
DCB 166 241 433 353 416 0.3 0.4 0.7 0.6 0.7
Total 320,891 454,975 319,410 253,210 291,973 2.7 3.6 2.5 1.9 2.2

India Banks
88 KOTAK INSTITUTIONAL EQUITIES RESEARCH
Exhibit 11: Higher recoveries and upgrades in 3QFY20 driven by large resolutions including Essar Steel Recoveries and up-gradation of loans, March fiscal year-ends, 3QFY19-3QFY20
Source: Company, Kotak Institutional Equities
Exhibit 12: Mixed trends in credit costs Credit cost, March fiscal year-ends, 3QFY19-3QFY20 (%)
Source: Company, Kotak Institutional Equities
Recovery and upgradation (Rs mn) Recovery/upgradation (% of advances)
3QFY19 4QFY19 1QFY20 2QFY20 3QFY20 3QFY19 4QFY19 1QFY20 2QFY20 3QFY20
Bank of Baroda 26,191 19,465 22,280 36,540 31,910 2.3 1.7 1.4 2.3 2.0
Canara Bank 26,180 9,482 15,631 20,677 68,824 2.5 0.9 1.4 1.9 6.5
Punjab National Bank 45,385 40,446 43,124 49,652 94,319 4.2 3.5 4.1 4.6 8.9
State Bank of India 66,170 57,120 57,690 39,310 135,530 1.3 1.0 1.1 0.7 2.5
Union Bank 17,971 14,122 7,701 20,705 50,389 2.3 1.7 1.0 2.5 6.0
Axis Bank 16,227 23,762 21,775 27,995 41,224 1.4 1.9 1.8 2.1 3.0
ICICI Bank 40,630 15,220 11,080 3,023 65,479 2.9 1.0 0.7 0.2 4.1
City Union Bank 597 604 479 842 1,795 0.8 0.7 0.6 1.0 2.1
DCB 626 800 652 1,140 1,819 1.1 1.4 1.1 1.8 2.9
Federal Bank 2,493 3,566 3,000 3,536 5,864 0.9 1.3 1.1 1.2 2.0
RBL 574 559 434 6,271 5,766 0.5 0.4 0.3 4.3 3.9
Total 243,042 185,146 183,847 209,690 502,919 2.0 1.4 1.4 1.6 3.7
Total (ex-SBI) 176,872 128,026 126,157 170,380 367,389 1.4 1.0 1.0 1.3 2.7
3QFY19 4QFY19 1QFY20 2QFY20 3QFY20
Public banks
Bank of Baroda 3.0 4.7 2.0 2.1 4.0
Canara Bank 2.6 4.8 2.1 2.1 1.1
Punjab National Bank 2.4 8.0 2.0 3.0 4.2
State Bank of India 2.7 3.2 2.2 2.1 1.5
Union Bank 2.7 7.0 1.8 4.0 1.8
Old private banks
City Union Bank 1.0 0.9 1.8 1.2 1.0
Federal Bank 0.8 0.6 0.6 0.8 0.6
Karur Vysya Bank 3.6 2.2 2.6 2.7 2.8
New private banks
Axis Bank 2.8 1.3 3.1 2.5 2.5
Bandhan 5.6 1.6 1.3 1.0 1.9
DCB 0.7 0.6 0.6 0.7 0.8
HDFC Bank 1.1 0.8 1.3 1.2 1.2
ICICI Bank 3.0 3.7 2.4 1.6 1.3
IndusInd Bank 1.3 4.3 0.6 1.5 1.9
RBL 1.2 1.2 1.4 3.7 4.3
Yes Bank 1.3 5.6 1.0 2.3 4.6
Small finance banks
AU 0.4 0.3 0.4 0.4 0.2
Equitas 0.9 0.8 1.0 1.4 1.1
Ujjivan 0.3 0.4 0.6 0.8 0.9

Banks India
KOTAK INSTITUTIONAL EQUITIES RESEARCH 89
Exhibit 13: Steady improvement in provision coverage ratio for most banks Provision coverage ratio, March fiscal year-ends, 3QFY19-3QFY20 (%)
Source: Company, Kotak Institutional Equities
Further moderation in loan growth, frontline private players fare better
Loan growth was at ~9% yoy for banks under coverage (excluding BOB), down from ~15%
in FY2019. This is compares to industry loan growth of ~7% as for 3QFY20. Loan growth
was driven by growth in retail loans while corporate loan growth is down to ~2% yoy as of
3QFY20. Loan growth for the private sector under coverage moderated to ~14% (20% in
FY2019). Loan growth of PSU banks under coverage (excluding BOB) was down to 5% yoy.
Loan growth for the industry has decelerated to ~7% in 2QFY20 compared to 13% as of
FY2019 due to weakness in corporate loan growth, deceleration in retail demand,
slowdown in auto loans and 2W.
There has been a gradual shift in the loan mix for most banks towards a higher share of
retail loans; a trend observed over the past few quarters. The shift has picked pace for most
PSU banks. Within retail, home loan growth held up for most banks while unsecured loans
remained strong. For private banks like HDFC, Axis, ICICI and others, a majority of retail
loans growth has been driven by unsecured loans like personal loans and credit cards.
Personal loans and credit cards increased ~25% yoy for HDFC Bank down from peak growth
rates of ~35-40% yoy during FY2018-19. Growth in SME/ MSME loans was muted in
3QFY20 for most banks as the macro environment remains unfavorable.
Corporate loan growth has weakened further partly led continued lack of demand for capex
and further decline in working capital utilization levels. Asset quality issues at certain private
lenders including RBL Bank and IndusInd Bank also led to weaker corporate loan growth in
these banks. HDFC Bank grew its corporate book at a robust pace of ~26%. Additionally,
most banks are focused on lending to better rated corporates. Growth remains muted at
PSU banks at <8% yoy. SBI’s loan growth has moderated to 7% from ~10% in 2QFY20.
Ex technical write-off Including technical write-off
3QFY19 4QFY19 1QFY20 2QFY20 3QFY20 3QFY19 4QFY19 1QFY20 2QFY20 3QFY20
Public banks
BoB 64.0 67.6 64.1 64.4 63.8 73.5 78.7 77.2 77.9 77.8
Canara 40.4 41.5 41.2 42.9 41.8 62.5 68.1 68.6 70.1 71.0
PNB 54.1 61.7 60.9 58.9 60.3 68.9 74.5 74.6 73.6 75.3
SBI 56.9 61.9 61.1 62.9 63.5 74.6 78.7 79.4 81.2 81.7
Union 51.4 58.3 56.5 58.3 56.9 58.8 66.2 65.9 67.8 67.4
Old private banks
City Union Bank 40.8 39.5 44.3 45.0 45.2 65.0 63.0 65.0 65.0 65.5
Federal Bank 45.9 50.1 50.7 49.0 46.4 64.2 67.0 67.4 66.2 66.4
Karur Vysya Bank 43.4 45.6 48.5 51.8 56.0 56.1 56.9 59.1 61.8 65.4
New private banks
Axis Bank 60.4 62.1 62.5 61.7 59.6
Bandhan 71.5 72.1 72.7 68.3 58.4
DCB 63.3 65.1 58.9 54.5 52.8
HDFC Bank 69.7 71.4 69.7 69.7 66.7
ICICI Bank 68.4 70.7 74.1 76.1 76.1
Yes 44.2 43.1 43.1 43.1 NA
RBL 47.8 50.0 52.9 40.0 37.8
IndusInd Bank 47.7 43.0 43.3 49.5 52.5
New private banks
AU 37.6 37.4 40.5 43.9 46.8
Equitas 44.2 43.4 44.0 43.8 43.5
Ujjivan 79.2 71.8 69.0 61.0 60.2

India Banks
90 KOTAK INSTITUTIONAL EQUITIES RESEARCH
Among private banks, loan growth slowed down at all banks except HDFC Bank, Axis Bank
and ICICI Ban where loan growth was broadly stable. RBL Bank witnessed further
deceleration in loan growth led by asset quality issues. Axis Bank and ICICI Bank reported
moderate loan growth at 13-16% yoy; a trend similar to previous quarters. With the gradual
fading away of asset quality concerns and adequate liquidity, loan growth is expected to
gain momentum subject to a pick-up in the demand outlook, which remains weak as of
now. As per RBI’s recent release on project loan sanctions (private sector) by banks/FI shows
fresh sanctions (~2.3% of loans in FY2019) and pending disbursements (~1% of loans)
suggesting muted loan growth in the corporate segment in the absence of significant pick
up in sanctions from FY2021. Loan growth for HDFC Bank picked pace from the prior
quarter as the bank has been positioning itself more aggressively in the market.
City Union Bank, Federal Bank and DCB bank witnessed further deceleration in 3QFY20 to
~10-13% owing to significant weakness in the MSME and mid-corporate segments. Banks
CUBK and DCB retained their cautious stance amid rising stress in the SME space. Loan
growth at SFBs remains robust at ~30-45%.
Exhibit 14: Industry loan growth down to ~7% yoy as of January 2020 YoY growth in loans, March fiscal year-ends, 2016-2020 YTD (%)
Source: Company, Kotak Institutional Equities
0
4
8
12
16
20
Ap
r
May
Jun
Jul
Au
g
Sep
Oct
No
v
Dec
Jan
Feb
Mar
2016 2017 2018 2019 2020

Banks India
KOTAK INSTITUTIONAL EQUITIES RESEARCH 91
Exhibit 15: Loan growth down to ~9% for banks under coverage (excluding BOB) in 3QFY20 YoY growth in loans, March fiscal year-ends, 2QFY16-2QFY20 (%)
Source: Company, Kotak Institutional Equities
Margins improve for most banks led by a decline in cost of funds
Calculated NIM was higher for most banks qoq, driven by a decline in cost of funds and in
certain cases, one-off interest recognition from resolutions (mainly Essar Steel) while yields
were broadly stable in 3QFY20. As per RBI’s latest release, fresh lending rates declined 20
bps MoM in December 2019 to 9.3% (down ~60 bps versus December 2018). Most banks
have decreased MCLR rates in the past few months as the policy rate cut transmission
picked pace. Weighted average term deposit rates have continued to decline as banks pass
on interest rate cuts to deposit customers. Weighted average deposit rates declined 30 bps
in 3QFY20, compared to a ~15 bps decline in weighted average lending rates on
outstanding loans.
At this point, a bulk of the loan portfolio is still benchmarked to MCLR, however, we would
start seeing the impact of repo linked rate loans in a few quarters for banks. At the outset,
we believe the spread between repo and term deposit rates or the spread between repo and
G-Sec rate would be better indicators of the underlying progress of NIM for banks. We
believe further repo rate cuts are unlikely in the near term, but we would wait to see if this is
likely to pressure NIMs as banks may take less-than-required cuts in deposit rates. So far, the
trends appear to be positive from a NIM perspective as deposits rates are easing while repo
rates have been flat in recent months.
3QFY17 4QFY17 1QFY18 2QFY18 3QFY18 4QFY18 1QFY19 2QFY19 3QFY19 4QFY19 1QFY20 2QFY20 3QFY20
Public banks
Bank of Baroda (8.9) (0.1) 4.1 9.4 14.1 11.5 9.8 11.9 12.3 9.7 52.8 47.0 45.9
Canara Bank (0.1) 5.3 6.7 9.5 12.5 11.6 12.7 14.3 11.8 12.1 12.0 4.8 1.3
PNB (1.8) 1.7 2.1 4.2 17.2 3.4 3.9 5.0 (3.9) 5.7 1.6 (0.7) (2.0)
SBI 29.9 33.4 0.5 (0.1) 1.1 3.5 4.0 8.6 12.1 13.0 13.8 9.6 7.4
Union Bank 5.5 8.6 9.9 11.3 13.5 4.0 7.9 2.5 1.0 3.7 0.9 3.0 5.8
Old private banks
CUBK 12.5 12.1 13.4 15.6 19.7 18.5 17.3 17.2 17.4 17.1 14.2 11.9 10.4
Federal Bank 30.6 26.4 28.8 26.0 21.1 25.8 23.9 23.9 24.6 18.3 17.3 14.8 13.0
KVB 1.5 5.0 7.7 11.9 16.6 11.0 12.9 8.8 6.5 10.1 2.7 2.6 3.8
New private banks
Axis Bank 10.1 10.1 11.8 16.1 21.2 17.8 14.4 11.2 12.9 12.5 12.7 14.4 15.8
Bandhan 76.5 62.9 64.0 47.7 33.4 35.9 88.4 78.9
DCB 24.3 22.4 22.0 20.5 27.5 28.6 30.6 26.9 23.1 15.9 13.2 12.4 11.1
HDFC Bank 13.4 19.4 23.4 22.3 27.5 18.7 22.0 24.1 23.7 24.5 17.1 19.5 19.9
ICICI Bank 5.2 6.7 3.3 6.3 10.5 10.4 11.3 12.8 11.7 14.5 14.7 12.6 12.6
Yes Bank 38.7 34.7 32.1 34.9 46.5 53.9 53.4 61.2 42.2 18.7 10.1 (6.3) NA
RBL 46.3 38.7 39.7 35.0 37.8 36.7 35.6 36.6 35.2 34.9 34.7 27.5 19.5
IndusInd Bank 25.1 27.9 24.3 24.5 25.1 28.2 29.4 32.4 34.7 28.6 28.4 20.8 19.8
Small finance banks
AU 13.4 35.7 66.7 101.9 112.1 112.3 99.4 71.4 51.3 36.9 32.9
Equitas 30.4 17.1 7.3 3.5 7.5 14.8 26.9 36.2 40.7 43.7 38.4 33.2 36.7
Ujjivan 43.6 18.4 10.4 2.8 7.7 18.5 20.6 24.7 31.8 46.2 51.3 54.7 45.7
Public sector 0.4 2.0 2.5 3.5 6.8 5.3 5.9 8.6 8.9 10.7 15.6 11.8 10.2
Public sector (ex SBI) (2.0) 3.4 5.3 8.3 14.5 7.6 8.4 8.6 5.1 7.9 17.9 14.5 13.7
Public sector (ex BOB) 1.7 2.3 2.3 2.8 5.9 4.5 5.4 8.1 8.5 10.9 10.5 6.9 5.2
Private sector 13.8 16.9 16.9 18.7 23.7 20.8 21.5 22.6 21.3 19.6 16.5 15.3 14.3
Private sector 13.8 16.9 16.9 18.7 23.7 20.8 21.5 22.6 21.3 19.6 16.5 15.3 14.3
Total (ex BOB) 6.0 7.5 7.8 8.8 12.6 10.8 11.9 14.1 13.8 14.6 13.1 10.6 9.2
Total 4.7 6.8 7.4 8.8 12.9 10.9 11.8 14.0 13.7 14.2 15.9 13.1 11.7
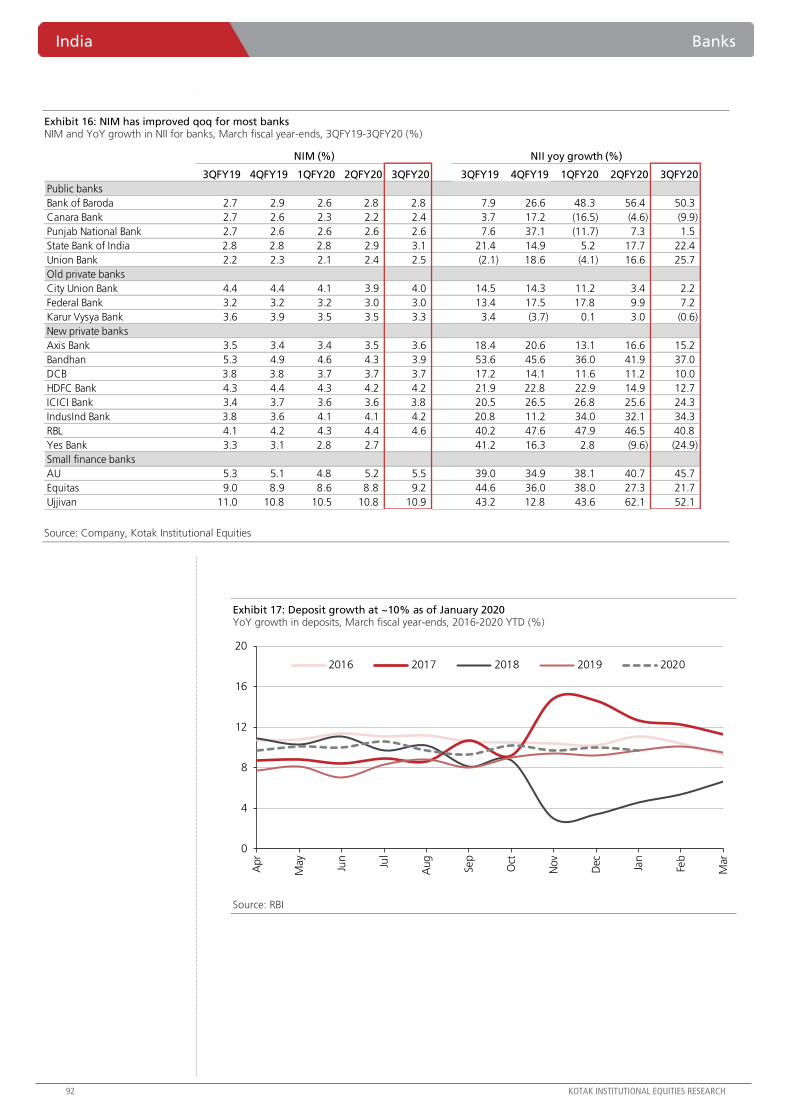
India Banks
92 KOTAK INSTITUTIONAL EQUITIES RESEARCH
Exhibit 16: NIM has improved qoq for most banks NIM and YoY growth in NII for banks, March fiscal year-ends, 3QFY19-3QFY20 (%)
Source: Company, Kotak Institutional Equities
Exhibit 17: Deposit growth at ~10% as of January 2020 YoY growth in deposits, March fiscal year-ends, 2016-2020 YTD (%)
Source: RBI
NIM (%) NII yoy growth (%)
3QFY19 4QFY19 1QFY20 2QFY20 3QFY20 3QFY19 4QFY19 1QFY20 2QFY20 3QFY20
Public banks
Bank of Baroda 2.7 2.9 2.6 2.8 2.8 7.9 26.6 48.3 56.4 50.3
Canara Bank 2.7 2.6 2.3 2.2 2.4 3.7 17.2 (16.5) (4.6) (9.9)
Punjab National Bank 2.7 2.6 2.6 2.6 2.6 7.6 37.1 (11.7) 7.3 1.5
State Bank of India 2.8 2.8 2.8 2.9 3.1 21.4 14.9 5.2 17.7 22.4
Union Bank 2.2 2.3 2.1 2.4 2.5 (2.1) 18.6 (4.1) 16.6 25.7
Old private banks
City Union Bank 4.4 4.4 4.1 3.9 4.0 14.5 14.3 11.2 3.4 2.2
Federal Bank 3.2 3.2 3.2 3.0 3.0 13.4 17.5 17.8 9.9 7.2
Karur Vysya Bank 3.6 3.9 3.5 3.5 3.3 3.4 (3.7) 0.1 3.0 (0.6)
New private banks
Axis Bank 3.5 3.4 3.4 3.5 3.6 18.4 20.6 13.1 16.6 15.2
Bandhan 5.3 4.9 4.6 4.3 3.9 53.6 45.6 36.0 41.9 37.0
DCB 3.8 3.8 3.7 3.7 3.7 17.2 14.1 11.6 11.2 10.0
HDFC Bank 4.3 4.4 4.3 4.2 4.2 21.9 22.8 22.9 14.9 12.7
ICICI Bank 3.4 3.7 3.6 3.6 3.8 20.5 26.5 26.8 25.6 24.3
IndusInd Bank 3.8 3.6 4.1 4.1 4.2 20.8 11.2 34.0 32.1 34.3
RBL 4.1 4.2 4.3 4.4 4.6 40.2 47.6 47.9 46.5 40.8
Yes Bank 3.3 3.1 2.8 2.7 41.2 16.3 2.8 (9.6) (24.9)
Small finance banks
AU 5.3 5.1 4.8 5.2 5.5 39.0 34.9 38.1 40.7 45.7
Equitas 9.0 8.9 8.6 8.8 9.2 44.6 36.0 38.0 27.3 21.7
Ujjivan 11.0 10.8 10.5 10.8 10.9 43.2 12.8 43.6 62.1 52.1
0
4
8
12
16
20
Apr
May
Jun
Jul
Aug
Sep
Oct
Nov
Dec Jan
Feb
Mar
2016 2017 2018 2019 2020

Banks India
KOTAK INSTITUTIONAL EQUITIES RESEARCH 93
Exhibit 18: CP rates have remained stable in recent months CP and CD rates, January 2016 – January 2020 (%)
Source: Bloomberg, Kotak Institutional Equities
Exhibit 19: Liquidity has eased considerably Net Reverse Repo, December 2017 – December 2019 (Rs bn)
Source: Bloomberg, Kotak Institutional Equities
Exhibit 20: Deposit growth has moderated for most banks in 3QFY20 YoY growth in deposits and CASA ratio, March fiscal year-ends, 3QFY19-3QFY20 (%)
Source: Company, Kotak Institutional Equities
4
5
6
7
8
9
Jan
-16
Jul-
16
Jan
-17
Jul-
17
Jan
-18
Jul-
18
Jan
-19
Jul-
19
Jan
-20
CP rate CD rate
(3,300)
(2,200)
(1,100)
0
1,100
2,200
Dec-
17
Feb
-18
Ap
r-1
8
Jun
-18
Au
g-1
8
Oct
-18
Dec-
18
Feb
-19
Ap
r-1
9
Jun
-19
Au
g-1
9
Oct
-19
Dec-
19
Net LAF Net term repo
Others (MSF/SLF) Total liquidity deficit
Deposit growth (%) CASA ratio (%)
3QFY19 4QFY19 1QFY20 2QFY20 3QFY20 3QFY19 4QFY19 1QFY20 2QFY20 3QFY20
Public banks
Bank of Baroda 6.5 8.0 54.0 47.3 46.8 40.0 40.2 36.6 37.9 38.8
Canara Bank 14.2 14.2 14.5 10.4 8.6 32.2 30.9 29.5 30.5 30.9
Punjab National Bank 0.4 5.3 6.7 7.1 8.9 43.4 43.5 42.8 43.5 43.7
State Bank of India 6.8 7.6 7.3 8.0 9.9 43.7 44.2 43.6 46.8 46.7
Union Bank 0.9 1.8 6.0 11.0 10.6 35.5 36.1 34.0 33.8 34.4
Old private banks
City Union Bank 13.3 17.0 16.3 17.1 12.1 23.9 25.2 23.4 24.7 23.3
Federal Bank 22.8 20.5 19.1 18.1 17.1 33.4 32.9 31.4 31.6 31.5
Karur Vysya Bank 2.6 5.2 7.2 6.8 6.2 30.0 30.0 30.0 30.0 31.0
New private banks
Axis Bank 25.7 20.9 20.9 21.7 15.1 45.8 44.4 41.3 41.1 41.2
Bandhan 36.9 27.6 42.3 49.3 58.5 41.4 40.8 36.1 32.9 34.3
DCB 29.2 18.4 15.0 12.2 8.1 24.2 24.0 24.5 23.2 23.3
HDFC Bank 22.0 17.0 18.5 22.6 25.2 40.7 42.4 39.7 39.3 39.5
ICICI Bank 17.3 16.4 20.8 24.6 18.1 49.3 49.6 45.2 46.7 47.0
IndusInd Bank 20.3 28.5 26.3 23.2 23.3 43.6 43.1 43.1 41.4 42.4
RBL 35.1 33.0 35.3 31.5 20.5 24.6 25.0 25.8 26.5 26.8
Yes Bank 29.7 13.4 5.9 (6.0) NA 33.3 33.1 30.2 30.8 NA
Small finance banks
AU 295.2 145.1 98.5 72.1 62.5 24.0 21.0 19.0 16.0 17.0
Equitas 78.9 69.9 51.5 44.1 32.6 30.5 28.3 25.8 22.4 20.9
Ujjivan 130.2 95.6 109.2 141.9 98.2 10.4 10.6 10.4 11.9 11.6
India Banks
94 KOTAK INSTITUTIONAL EQUITIES RESEARCH
Exhibit 21: Marginal (~10 bps) decline in yields in 3QFY20 Yield on advances, March fiscal year-ends, 3QFY19-3QFY20 (%)
Source: Company, Kotak Institutional Equities estimates
Exhibit 22: Sharper decline (~20 bps) in cost of funds aided NIM expansion in 3QFY20 Cost of funds/deposits, March fiscal year-ends, 3QFY19-3QFY20 (%)
Source: Company, Kotak Institutional Equities
3QFY19 4QFY19 1QFY20 2QFY20 3QFY20
Public banks
Bank of Baroda 7.7 7.9 8.0 8.2 7.9
Canara Bank 8.5 8.4 8.2 8.2 8.2
Punjab National Bank 7.8 7.5 7.6 7.8 7.8
State Bank of India 8.5 8.5 8.6 8.7 8.9
Union Bank 7.8 7.5 7.8 7.9 8.0
Old private banks
City Union Bank 11.0 11.1 11.0 10.8 10.7
Federal Bank 9.2 8.9 9.4 9.3 9.2
Karur Vysya Bank 9.6 9.8 9.6 9.9 9.5
New private banks
Axis Bank 9.1 9.2 9.2 9.4 9.2
Bandhan 9.5 9.3 9.2 8.3 7.1
DCB 11.3 11.6 11.6 11.5 11.5
HDFC Bank 10.6 10.5 10.6 10.4 10.2
ICICI Bank 9.0 9.0 9.2 9.5 9.5
IndusInd Bank 11.5 11.3 12.0 12.0 12.0
RBL 11.2 11.8 12.0 12.1 12.3
Yes Bank 10.2 10.2 10.0 9.8 NA
Small finance banks
AU 14.3 14.3 14.5 14.7 14.7
Equitas 19.3 18.5 18.4 18.6 18.6
Ujjivan 20.3 17.5 20.7 20.6 20.1
3QFY19 4QFY19 1QFY20 2QFY20 3QFY20
Public banks
Bank of Baroda 4.8 4.8 5.1 5.0 4.9
Canara Bank 5.6 5.7 5.8 5.7 5.6
Punjab National Bank 5.1 5.2 5.2 5.3 5.2
State Bank of India 5.1 5.1 5.1 5.0 5.0
Union Bank 5.6 5.7 5.6 5.7 5.5
Old private banks
City Union Bank 6.2 6.3 6.3 6.3 6.2
Federal Bank 6.2 6.0 6.2 6.3 6.1
Karur Vysya Bank 5.8 5.8 5.8 6.0 5.8
New private banks
Axis Bank 5.4 5.7 5.7 5.6 5.4
Bandhan 6.1 5.9 6.5 8.5 7.1
DCB 6.7 7.1 7.1 7.1 7.1
HDFC Bank 5.5 5.3 5.4 5.4 5.3
ICICI Bank 5.0 4.9 5.0 5.0 4.9
IndusInd Bank 5.8 5.9 5.9 5.9 5.7
RBL 6.8 6.9 7.0 6.9 6.7
Yes Bank 6.5 6.7 6.8 6.7 NA
Small finance banks
AU 7.9 8.0 7.9 7.8 7.6
Equitas 8.1 8.1 8.2 8.5 8.0
Ujjivan 8.5 8.5 8.5 8.4 8.1

Banks India
KOTAK INSTITUTIONAL EQUITIES RESEARCH 95
Exhibit 23: Term deposit rates are on a downward trend Retail term deposit rates for various maturities, January 2020 (%)
Source: Company, Kotak Institutional Equities
Exhibit 24: SBI’s 1-year MCLR rate declined 70 bps in FY2020 YTD SBI’s MCLR rate, March fiscal year-ends, November 2017 - November 2019
Source: Company, Kotak Institutional Equities
7-14
days
15-30
days
31-45
days
46-90
days
91-179
days
180-269
days
270-364
days
1 Year- less
than 2 years
2 Year- less
than 3 years
3 years and
above
Allahabad Bank 4.95 4.95 5.20 5.45-5.95 6.20-6.45 6.45 6.45-6.70 6.50 6.35 6.25
Andhra Bank 3.50 3.50 3.50 5.00 5.00 5.75 5.75 6.00 6.10 6.10
AU SFB 5.25 5.25 5.25 6.00 6.50 7.00 7.00 7.50-7.63 7.77 7.25-7.5
Bandhan bank 3.50 4.00 4.00 4.00 4.50 6.70 6.70 6.95 6.95 6.75
Bank of Baroda 4.50 4.50 4.50 4.75 5.50 5.90 5.90 6.25 6.25 6.25
Bank of India 4.25 4.25 4.25 5.50 5.50 6.00 6.00 6.40 6.25 6.25
Canara Bank 4.50 4.50 4.50 5.50 5.50 5.95 5.95 6.0-6.4 6.00 6.25
Corporation Bank 4.55 4.55 4.55 5.5-5.6 6.0-6.1 6.15 6.15 6.35-6.55 6.35 6.35
OBC 4.50 4.50 4.50 5.25 5.50 5.75 5.80 6.25 6.25 6.25
Punjab National Bank 4.50 4.50 4.50 5.00 5.00 6.00 6.0-6.1 6.30 6.25 6.25-6.30
State Bank of India 4.50 4.50 4.50 5.50 5.50 5.80 5.80 6.10 6.10 6.10
Union Bank of India 5.00 5.00 5.00 5.50 6.0-6.1 6.15 6.15 6.30-6.45 6.30 6.30
IDFC First Bank 4.00 5.00 6.25 6.50 6.75 7.00 7.00 7.25-7.50 7.25 7.25
ICICI Bank 4.00 4.25 4.75 5.25 5.25 5.25-5.75 5.75-6.00 6.2-6.3 6.40 6.40
Axis Bank 3.50 4.25 4.90 5.40 5.40 5.80 6.05 6.40-6.55 6.50-6.65 6.50
HDFC Bank 3.50 4.00 4.90 5.40 5.40 5.80 6.05 6.30 6.40 6.30
Federal Bank 3.50 4.50 5.00 5-5.5 5.75 6.25 6.40 6.5-6.6 6.5-6.6 6.5-6.6
RBL 5.00 5.50 5.50 6.15 6.40 6.65 6.65 7.4 7.2 6.85-7.35
Yes Bank 5.00 5.00 5.00 6.25 6.25 6.85 7.15 7.25-7.40 7.50 7.25
IndusInd Bank 4.00 4.25 5.00 5.50 5.75 6.00 6.25 6.65-6.75 6.75 6.65-6.75
Kotak 3.50 4.00 4.75 5.25 5.40 5.75-5.80 5.80-6.05 6.30 6.25 6.1-6.2
Equitas 5.00 5.50 6.00 6.25 6.50 6.75 7.50 7.7-8.0 7.80-8.25 7.00
Ujjivan 5.50 5.50 6.10 6.10 6.60 7.00 7.00 8.00 7.5-8.1 6.5-7.0
Mar-19 Apr-19 May-19 Jun-19 Jul-19 Aug-19 Sep-19 Oct-19 Nov-19 Dec-19 Jan-20 Feb-20
Overnight 8.20 8.15 8.10 8.10 8.05 7.90 7.80 7.70 7.65 7.65 7.65 7.60
One month 8.20 8.15 8.10 8.10 8.05 7.90 7.80 7.70 7.65 7.65 7.65 7.60
Three month 8.25 8.20 8.15 8.15 8.10 7.95 7.85 7.75 7.70 7.70 7.70 7.65
Six month 8.40 8.35 8.30 8.30 8.25 8.10 8.00 7.90 7.85 7.85 7.85 7.80
One year 8.55 8.50 8.45 8.45 8.40 8.25 8.15 8.05 8.00 7.90 7.90 7.85
Two years 8.65 8.60 8.55 8.55 8.50 8.35 8.20 8.15 8.10 8.10 8.10 8.05
Three years 8.75 8.70 8.65 8.65 8.60 8.45 8.35 8.25 8.20 8.20 8.20 8.15

India Banks
96 KOTAK INSTITUTIONAL EQUITIES RESEARCH
Exhibit 25: MCLR rates down 40-50 bps yoy for most banks yoy MCLR rates, March fiscal year-ends, January 2019- January 2020 (%)
Source: Company, Kotak Institutional Equities
(bps change)
Jan-19 Feb-19 Mar-19 Apr-19 May-19 Jun-19 Jul-19 Aug-19 Sep-19 Oct-19 Nov-19 Dec-19 Jan-20 (Jan-19 to Jan-20)
Public sector banks
Allahabad 8.75 8.75 8.75 8.65 8.60 8.60 8.60 8.55 8.40 8.40 8.35 8.30 8.30 (0.45)
Andhra 8.70 8.75 8.75 8.75 8.75 8.75 8.70 8.70 8.40 8.40 8.30 8.30 8.30 (0.40)
BoB 8.65 8.75 8.65 8.65 8.70 8.70 8.60 8.50 8.40 8.40 8.30 8.25 8.25 (0.40)
BoI 8.70 8.70 8.65 8.65 8.70 8.70 8.60 8.50 8.35 8.35 8.30 8.20 8.20 (0.50)
BoMH 8.75 8.75 8.75 8.75 8.70 8.70 8.60 8.50 8.50 8.50 8.40 8.40 8.25 (0.50)
Canara 8.70 8.70 8.70 8.70 8.70 8.70 8.60 8.50 8.40 8.40 8.35 8.35 8.35 (0.35)
Central 8.60 8.65 8.65 8.60 8.55 8.55 8.50 8.50 8.25 8.25 8.20 8.15 8.10 (0.50)
Corporation 8.95 8.95 8.95 8.90 8.90 8.90 8.85 8.85 8.65 8.65 8.60 8.60 8.50 (0.45)
IDBI 8.95 9.05 9.05 9.05 9.00 9.00 8.95 8.95 8.85 8.85 8.65 8.65 8.65 (0.30)
Indian 8.75 8.75 8.65 8.75 8.65 8.65 8.60 8.60 8.45 8.45 8.35 8.35 8.30 (0.45)
IOB 8.80 8.80 8.80 8.80 8.65 8.65 8.65 8.65 8.50 8.50 8.50 8.50 8.50 (0.30)
OBC 8.75 8.75 8.75 8.75 8.75 8.75 8.65 8.65 8.40 8.40 8.35 8.30 8.15 (0.60)
PNB 8.50 8.55 8.45 8.45 8.45 8.45 8.40 8.30 8.30 8.30 8.15 8.15 8.05 (0.45)
PSB 8.85 8.85 8.85 8.85 8.75 8.75 8.70 8.70 8.50 8.50 8.50 8.45 8.45 (0.40)
SBI 8.55 8.55 8.55 8.50 8.45 8.45 8.40 8.25 8.15 8.05 8.00 7.90 7.90 (0.65)
Syndicate 8.75 8.75 8.65 8.65 8.65 8.65 8.60 8.60 8.35 8.35 8.35 8.25 8.25 (0.50)
UCO 8.70 8.70 8.70 8.70 8.65 8.65 8.65 8.65 8.50 8.50 8.40 8.30 8.30 (0.40)
Union 8.70 8.70 8.60 8.60 8.60 8.60 8.55 8.50 8.35 8.35 8.25 8.25 8.10 (0.60)
United Bank 8.85 8.85 8.85 8.85 8.10 8.10 8.70 8.70 8.45 8.45 8.45 8.40 8.30 (0.55)
Old private banks
CUBK 9.25 9.25 9.25 9.25 9.25 9.25 9.25 9.25 9.15 9.15 9.15 9.15 9.15 (0.10)
FB 9.20 9.20 9.20 9.20 9.15 9.15 9.15 9.15 9.00 9.00 8.90 8.90 8.90 (0.30)
J&K 9.00 9.00 9.00 9.00 8.95 8.95 8.85 8.85 8.70 8.70 8.55 8.45 8.40 (0.60)
KVB 9.65 9.65 9.65 9.65 9.65 9.65 9.55 9.55 9.45 9.45 9.45 9.40 9.30 (0.35)
New private banks
Axis 8.85 8.90 8.90 8.90 8.90 8.80 8.70 8.65 8.45 8.45 8.25 8.15 8.15 (0.70)
Bandhan 10.45 10.45 10.45 10.45 10.11 10.11 10.11 10.11 10.11 10.11 10.06 10.06 9.95 (0.50)
DCB 10.84 10.84 10.84 10.84 10.84 10.84 10.84 10.65 10.65 10.65 10.31 10.31 10.31 (0.53)
HDFC 8.75 8.75 8.75 8.75 8.50 8.70 8.70 8.60 8.45 8.35 8.30 8.15 8.15 (0.60)
ICICI 8.80 8.80 8.80 8.75 8.75 8.75 8.65 8.65 8.55 8.55 8.35 8.25 8.20 (0.60)
IDFC 9.30 9.25 9.25 9.25 9.50 9.50 9.50 9.50 9.30 9.30 9.30 9.30 9.30 -
IndusInd 9.80 9.90 9.90 9.90 9.85 9.85 9.75 9.70 9.55 9.55 9.45 9.40 9.40 (0.40)
Karnataka 9.10 9.15 9.45 9.45 9.40 9.40 9.40 9.35 9.25 9.25 9.25 9.20 9.10 -
Kotak 9.00 9.05 9.00 8.90 8.90 8.90 8.85 8.85 8.75 8.75 8.50 8.40 8.40 (0.60)
LVB 9.80 9.90 9.90 9.90 10.05 10.00 10.00 9.95 9.95 9.95 10.40 10.40 10.65 0.85
RBL 10.25 10.25 10.25 10.25 10.15 10.15 10.10 9.95 9.95 9.95 9.80 9.70 9.55 (0.70)
SIB 9.45 9.45 9.45 9.45 9.50 9.50 9.50 9.50 9.25 9.25 9.20 9.00 9.00 (0.45)
Yes 9.85 9.80 9.70 9.70 9.70 9.70 9.70 9.75 9.70 9.70 9.70 9.70 9.70 (0.15)
Small finance banks
AU 12.55 12.50 12.35 12.35 11.85 11.85 11.70 11.70 11.55 11.55 11.50 11.50 11.50 (1.05)
Equitas 16.15 16.00 16.25 16.25 15.30 15.50 15.60 14.95 15.05 15.05 14.45 14.90 14.60 (1.55)
Ujjivan 16.00 15.70 15.40 17.20 17.20 17.40 17.00 16.70 16.10 16.10 15.80 15.50 15.60 (0.30)
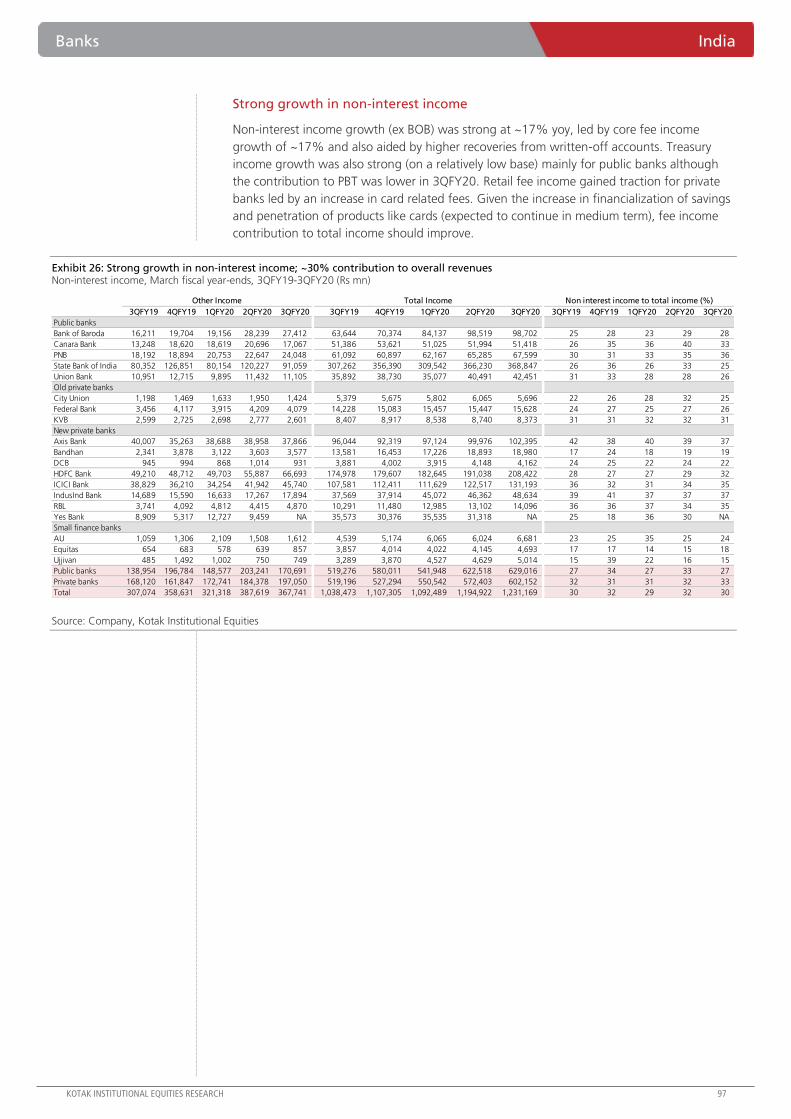
Banks India
KOTAK INSTITUTIONAL EQUITIES RESEARCH 97
Strong growth in non-interest income
Non-interest income growth (ex BOB) was strong at ~17% yoy, led by core fee income
growth of ~17% and also aided by higher recoveries from written-off accounts. Treasury
income growth was also strong (on a relatively low base) mainly for public banks although
the contribution to PBT was lower in 3QFY20. Retail fee income gained traction for private
banks led by an increase in card related fees. Given the increase in financialization of savings
and penetration of products like cards (expected to continue in medium term), fee income
contribution to total income should improve.
Exhibit 26: Strong growth in non-interest income; ~30% contribution to overall revenues Non-interest income, March fiscal year-ends, 3QFY19-3QFY20 (Rs mn)
Source: Company, Kotak Institutional Equities
Other Income Total Income Non interest income to total income (%)
3QFY19 4QFY19 1QFY20 2QFY20 3QFY20 3QFY19 4QFY19 1QFY20 2QFY20 3QFY20 3QFY19 4QFY19 1QFY20 2QFY20 3QFY20
Public banks
Bank of Baroda 16,211 19,704 19,156 28,239 27,412 63,644 70,374 84,137 98,519 98,702 25 28 23 29 28
Canara Bank 13,248 18,620 18,619 20,696 17,067 51,386 53,621 51,025 51,994 51,418 26 35 36 40 33
PNB 18,192 18,894 20,753 22,647 24,048 61,092 60,897 62,167 65,285 67,599 30 31 33 35 36
State Bank of India 80,352 126,851 80,154 120,227 91,059 307,262 356,390 309,542 366,230 368,847 26 36 26 33 25
Union Bank 10,951 12,715 9,895 11,432 11,105 35,892 38,730 35,077 40,491 42,451 31 33 28 28 26
Old private banks
City Union 1,198 1,469 1,633 1,950 1,424 5,379 5,675 5,802 6,065 5,696 22 26 28 32 25
Federal Bank 3,456 4,117 3,915 4,209 4,079 14,228 15,083 15,457 15,447 15,628 24 27 25 27 26
KVB 2,599 2,725 2,698 2,777 2,601 8,407 8,917 8,538 8,740 8,373 31 31 32 32 31
New private banks
Axis Bank 40,007 35,263 38,688 38,958 37,866 96,044 92,319 97,124 99,976 102,395 42 38 40 39 37
Bandhan 2,341 3,878 3,122 3,603 3,577 13,581 16,453 17,226 18,893 18,980 17 24 18 19 19
DCB 945 994 868 1,014 931 3,881 4,002 3,915 4,148 4,162 24 25 22 24 22
HDFC Bank 49,210 48,712 49,703 55,887 66,693 174,978 179,607 182,645 191,038 208,422 28 27 27 29 32
ICICI Bank 38,829 36,210 34,254 41,942 45,740 107,581 112,411 111,629 122,517 131,193 36 32 31 34 35
IndusInd Bank 14,689 15,590 16,633 17,267 17,894 37,569 37,914 45,072 46,362 48,634 39 41 37 37 37
RBL 3,741 4,092 4,812 4,415 4,870 10,291 11,480 12,985 13,102 14,096 36 36 37 34 35
Yes Bank 8,909 5,317 12,727 9,459 NA 35,573 30,376 35,535 31,318 NA 25 18 36 30 NA
Small finance banks
AU 1,059 1,306 2,109 1,508 1,612 4,539 5,174 6,065 6,024 6,681 23 25 35 25 24
Equitas 654 683 578 639 857 3,857 4,014 4,022 4,145 4,693 17 17 14 15 18
Ujjivan 485 1,492 1,002 750 749 3,289 3,870 4,527 4,629 5,014 15 39 22 16 15
Public banks 138,954 196,784 148,577 203,241 170,691 519,276 580,011 541,948 622,518 629,016 27 34 27 33 27
Private banks 168,120 161,847 172,741 184,378 197,050 519,196 527,294 550,542 572,403 602,152 32 31 31 32 33
Total 307,074 358,631 321,318 387,619 367,741 1,038,473 1,107,305 1,092,489 1,194,922 1,231,169 30 32 29 32 30

India Banks
98 KOTAK INSTITUTIONAL EQUITIES RESEARCH
Exhibit 27: Treasury income beat expectations in 3QFY20 Treasury income and treasury-to-PBT of banks, March fiscal year-ends, 3QFY19-3QFY20
Source: Company, Kotak Institutional Equities
Exhibit 28: Fee income growth picks up to ~16% yoy in 3QFY20 Fee income, March fiscal year-ends, 3QFY19-3QFY20 (Rs mn)
Source: Company, Kotak Institutional Equities
Modest growth in operating expenses
Growth in operating expenses was lower at 9% yoy for the sector in 3QFY20. Growth for
private banks was strong at ~17%, in line with recent quarters while yoy growth was lower
for PSU banks (ex-BoB) at 2% yoy. Provisions retirement related benefits are the key variable
for public banks as other operating expenses remain muted. Private banks saw stronger
growth (18% yoy) in operating expenses owing to continued investments in business
expansion and technology initiatives (Exhibit 29).
Income from treasury (Rs mn) Income from treasury (% of PBT) PBT (Rs mn)
3QFY19 4QFY19 1QFY20 2QFY20 3QFY20 3QFY19 4QFY19 1QFY20 2QFY20 3QFY20
Public banks
Bank of Baroda 3,820 4,160 3,380 9,420 4,640 51 NM 34 84 NM
Canara Bank 920 2,420 1,560 2,590 1,600 24 NM 29 51 30
PNB 4,190 2,520 5,000 5,190 2,030 121 NM 34 82 NM
State Bank of India 4,250 5,340 4,850 76,423 6,960 11 64 21 254 12
Union Bank 1,100 1,880 2,550 2,920 820 83 NM 69 NM 14
Old private banks
City Union Bank 208 256 446 789 418 9 10 19 33 18
Federal Bank 550 740 910 820 650 11 13 15 18 11
Karur Vysya Bank 270 570 670 910 450 110 51 58 138 220
New private banks
Axis Bank 3,790 3,540 8,320 8,090 5,150 15 15 40 33 23
DCB Bank 112 90 159 249 70 10 7 11 20 5
HDFC Bank 4,740 2,289 2,120 4,807 6,765 6 3 2 5 7
ICICI Bank 4,790 1,560 1,790 3,410 5,310 25 20 6 8 10
IndusInd Bank 2,030 1,400 2,410 2,590 2,840 13 28 11 14 17
RBL Bank 277 205 722 530 146 8 6 18 52 16
Yes Bank (592) 50 4,500 2,200 NA (4) NM 257 180 NA
Total 30,455 27,020 39,387 120,938 38,649 13 NM 17 54 17
Public banks 14,280 16,320 17,340 96,543 16,050 26 NM 31 264 39
Private banks 16,175 10,700 22,047 24,395 22,599 9 9 13 13 12
Fee income (Rs mn) Fee income (% of other income)
3QFY19 4QFY19 1QFY20 2QFY20 3QFY20 3QFY19 4QFY19 1QFY20 2QFY20 3QFY20
PSU banks
BOB 8,360 9,620 10,700 11,320 12,570 51.6 48.8 55.9 40.1 45.9
Canara 2,200 2,960 4,130 3,050 2,980 16.6 15.9 22.2 14.7 17.5
PNB 9,050 9,525 11,260 9,270 8,970 49.7 50.4 54.3 40.9 37.3
SBI 47,240 85,890 51,770 50,400 56,350 58.8 67.7 64.6 41.9 61.9
Union 6,600 7,310 4,810 6,050 6,480 60.3 57.5 48.6 52.9 58.4
Old private banks
CUBK 712 777 796 759 745 59.4 52.9 48.7 38.9 52.3
Federal 2,050 2,310 2,260 2,580 2,590 59.3 56.1 57.7 61.3 63.5
KVB 1,610 1,630 1,680 1,530 1,780 61.9 59.8 62.3 55.1 68.4
New private banks
Axis 26,150 30,200 26,630 26,490 27,750 65.4 85.6 68.8 68.0 73.3
Bandhan 1,684 2,879 2,205 2,418 2,429 71.9 74.2 70.6 67.1 67.9
DCB 594 648 546 578 625 62.9 65.2 62.9 57.0 67.2
HDFC 36,468 36,921 35,516 40,545 45,268 74.1 75.8 71.5 72.5 67.9
ICICI 30,620 31,780 30,390 34,780 35,960 78.9 87.8 88.7 82.9 78.6
IndusInd 12,660 14,190 14,220 14,680 15,060 86.2 91.0 85.5 85.0 84.2
RBL 796 892 781 466 521 21.3 21.8 16.2 10.5 10.7
Yes 8,248 2,944 4,084 3,823 NA 92.6 55.4 32.1 40.4 NA
Total 195,042 240,477 201,778 208,739 220,079 63.8 67.5 63.1 54.0 60.1
Public banks 73,450 115,305 82,670 80,090 87,350 52.9 58.6 55.6 39.4 51.2
Private 121,592 125,172 119,108 128,649 132,729 72.3 77.3 69.0 69.8 67.4

Banks India
KOTAK INSTITUTIONAL EQUITIES RESEARCH 99
Cost-to-income ratio remained stable at ~46% in 3QFY20 (Exhibit 30). Among Small
Finance Banks, AU, Equitas and Ujjivan maintained elevated cost-income ratios at ~55%,
~65% and ~70%, respectively.
Cost-income ratio will see significant improvement in the medium-term driven by (1) decline
in investment in branch expansion and infrastructure and focus on improving productivity,
(2) cost-efficiencies from investment in digital initiatives, (3) improvement in revenue growth
driven by increase in NII; a result of the drop in interest reversals and one-off interest income
from resolution of accounts under NCLT and (4) reduction in transition related cost for Small
Finance Banks. One of the risks is high competitive intensity by smaller well-capitalized banks
and new banks such as small finance banks and payment banks, which can push cost ratios
higher.
Exhibit 29: Growth in operating expenses at ~9% yoy (ex-BoB) in 3QFY20; higher for private banks Operating expenses, March fiscal year-ends, 3QFY18-3QFY20 (Rs mn)
Notes: (1) 2QFY20 estimate for J&K Bank.
Source: Company, Kotak Institutional Equities
3QFY18 4QFY18 1QFY19 2QFY19 3QFY19 4QFY19 1QFY20 2QFY20 3QFY20 YoY (%)
Public banks
Bank of Baroda 24,170 30,327 25,233 27,622 28,258 31,766 41,375 45,160 49,118 73.8
Canara Bank 24,142 25,546 27,830 25,092 27,814 23,886 26,625 26,547 28,074 0.9
PNB 28,255 50,718 24,564 28,442 30,094 32,285 27,352 29,666 29,970 (0.4)
State Bank of India 150,171 165,862 165,047 163,759 181,013 187,059 177,081 184,243 186,622 3.1
Union Bank 17,668 17,884 17,453 16,207 18,389 21,428 16,213 18,084 18,436 0.3
Old private banks
City Union 1,904 1,935 2,045 2,206 2,311 2,297 2,288 2,600 2,612 13.0
Federal Bank 6,172 6,588 6,480 6,478 7,150 7,535 7,629 8,259 8,190 14.5
KVB 3,653 3,718 3,789 3,933 4,157 4,269 4,087 4,429 4,525 8.9
New private banks
Axis Bank 34,708 38,469 37,198 38,165 40,797 42,175 38,197 40,460 44,969 10.2
Bandhan 3,155 3,630 4,273 4,339 4,576 4,921 5,150 5,824 6,341 38.6
DCB 2,029 2,070 2,144 2,092 2,143 2,150 2,250 2,302 2,263 5.6
HDFC Bank 57,322 60,506 59,839 62,991 67,193 71,171 71,173 74,057 78,968 17.5
ICICI Bank 38,144 41,863 41,453 43,244 46,117 50,077 48,744 53,776 55,707 20.8
IndusInd Bank 14,169 14,467 15,129 15,281 16,400 17,237 19,163 20,363 21,178 29.1
RBL 3,921 4,293 4,464 4,770 5,307 5,880 6,797 6,744 6,775 27.7
Yes Bank 13,093 14,398 14,586 15,245 15,669 17,142 15,944 16,734 16,203 3.4
Small finance banks
AU 2,035 2,668 2,370 2,684 2,752 3,018 3,157 3,247 3,552 29.1
Equitas 2,246 2,243 2,395 2,342 2,632 2,751 2,760 2,862 3,108 18.1
Ujjivan 1,674 1,751 2,143 2,325 2,560 3,017 2,914 3,216 3,574 39.6
Public banks 244,406 290,337 260,128 261,122 285,567 296,424 288,645 303,700 312,219 9.3
Private banks 184,224 198,599 198,307 206,094 219,764 233,639 230,252 244,872 257,963 17.4
Total 428,630 488,937 458,435 467,216 505,330 530,063 518,897 548,572 570,182 12.8

India Banks
100 KOTAK INSTITUTIONAL EQUITIES RESEARCH
Exhibit 30: Cost-income ratio broadly flat qoq Operating expense-to-income ratio of banks, March fiscal year-ends, 3QFY19-3QFY20 (%)
Source: Companies, Kotak Institutional Equities
Exhibit 31: Employee expenses form a major chunk of operating expenses Employee expenses to total expenses, March fiscal year-ends, 3QFY19-3QFY20 (%)
Source: Company, Kotak Institutional Equities
3QFY19 4QFY19 1QFY20 2QFY20 3QFY20
Public banks
Bank of Baroda 44.4 45.1 49.2 45.8 49.8
Canara Bank 54.1 44.5 52.2 51.1 54.6
Punjab National Bank 49.3 53.0 44.0 45.4 44.3
State Bank of India 58.9 52.5 57.2 50.3 50.6
Union Bank 51.2 55.3 46.2 44.7 43.4
Old private banks
City Union 43.0 40.5 39.4 42.9 45.9
Federal Bank 50.3 50.0 49.4 53.5 52.4
KVB 49.4 47.9 47.9 50.7 54.0
New private banks
Axis Bank 42.5 45.7 39.3 40.5 43.9
Bandhan 33.7 29.9 29.9 30.8 33.4
DCB 55.2 53.7 57.5 55.5 54.4
HDFC Bank 38.4 39.6 39.0 38.8 37.9
ICICI Bank 42.9 44.5 43.7 43.9 42.5
IndusInd Bank 43.7 45.5 42.5 43.9 43.5
RBL Bank 51.6 51.2 52.3 51.5 48.1
Yes Bank 44.0 56.4 44.9 53.4 57.5
Small finance banks
AU 60.6 58.3 52.0 53.9 53.2
Equitas 68.2 68.5 68.6 69.1 66.2
Ujjivan 77.8 78.0 64.4 69.5 71.3
Public banks 55.0 51.1 53.3 48.8 49.6
Private banks 42.3 44.3 41.8 42.8 42.8
Total 48.7 47.9 47.5 45.9 46.3
3QFY19 4QFY19 1QFY20 2QFY20 3QFY20
PSU banks
BOB 46 44 47 51 53
Canara 56 44 59 57 57
PNB 63 62 61 56 58
SBI 37 35 38 37 37
Union 44 46 44 42 47
Old private banks
CUBK 40 40 44 43 43
Federal 49 49 52 53 51
KVB 48 50 50 48 50
New private banks
Axis 29 27 34 32 30
Bandhan 56 55 62 57 54
DCB 51 49 52 50 51
HDFC 29 29 31 32 31
ICICI 38 38 40 40 35
IndusInd 28 28 34 25 26
RBL 31 29 27 29 28
Yes 40 38 41 39 39
Small finance banks
AU 55 53 59 56 53
Equitas 51 54 61 60 59
Ujjivan 53 50 55 55 55

Banks India
KOTAK INSTITUTIONAL EQUITIES RESEARCH 101
Exhibit 32: Public banks are yet to move to the lower tax regime Tax rate for banks, March fiscal year-ends, 3QFY19-3QFY20 (%)
Source: Company, Kotak Institutional Equities
3QFY19 4QFY19 1QFY20 2QFY20 3QFY20
Public sector banks
Bank of Baroda 37 NM 28 35 NM
Canara 16 NM 39 28 38
PNB 29 NM 30 20 NM
SBI 40 (94) 43 40 49
Union (15) NM 39 NM 1
Old private banks
CUBK 22 29 21 19 15
Federal bank 36 34 35 11 24
J&K 40 4 81 NM 5
KVB 14 47 37 4 26
New private banks
Axis 32 35 34 105 23
Bandhan 37 35 35 16 25
DCB 36 36 36 35 26
HDFC 35 34 35 29 25
ICICI 16 (24) 32 85 24
IndusInd 35 29 34 26 24
RBL bank 33 31 34 47 25
Yes 30 NM 35 591 NM
Small Finance banks
AU 35 33 27 21 30
Equitas 36 32 35 53 19
Ujjivan 31 12 30 25 21
Notes:
1) "NM" indicates negative PBT.
2) Negative tax rate implies a tax refund/ benefit.

India Banks
102 KOTAK INSTITUTIONAL EQUITIES RESEARCH
NBFCS: ASSET SIDE WEAK; LIABILITIES BETTER
Business momentum across NBFCs has been muted, likely reflecting a slowdown in various segments of the
economy or cautious stances taken by these companies. Asset quality performance deteriorated for most,
reflecting stress in underlying assets classes - rural autos, CVs, small business, pockets of microfinance and
developer loans. On the other hand, the liability side now seems to getting comfortable. Liquidity for mid-tier
NBFCs has eased. NIM have likely bottomed out as (1) incremental cost of funding is likely at peak and (2)
benefit of hike in lending rates last year is getting reflected.
Business momentum muted
Loan growth moderated across the board with a slowdown in auto loans and construction
finance loans. Additionally, most companies have followed a cautious stance in lending to
MFI, affordable housing and LAP segments. NBFCs (excluding Bajaj Finance) under coverage
reported muted AUM growth of -1 to 4% (qoq) despite strong festive season. Growth
momentum has slowed for Bajaj Finance as well, owing to lower sales finance volumes and
cautious LAS lending. The liquidity situation has eased, though (1) auto volumes declined
(CVs down 21% yoy, PVs down 16% and 2W down 16% in 9MFY20) and (2) a selective
slowdown in LAP, developer finance, MFI and affordable housing led to moderation in
overall AUM growth.
Among vehicle financiers, AUM was muted at 1-4% qoq. This was driven by a sharp decline
in disbursements from MHCVs and LCVs. Tractor and 2W disbursements were strong for
most companies (SCUF reported highest ever 2W disbursements while MMFS reported
highest ever tractor disbursements during 3QFY20; LTFH reported record volumes in
tractors). High water reservoir levels on the back of a strong monsoon and expectation a
robust winter (rabi season) crop likely supported tractor disbursements. 2W disbursements
were led by strong festive and pent up demand.
Retail home loan AUM growth was strong for HDFC and LICHF on the back of traction in
affordable housing loans. For smaller players, Aavas, CanFin and REPCO growth moderated,
led by the cautious stance in select states and tightening of credit under-writing norms, even
as some HFCs like Magma Housing delivered high growth on a low base. Construction
finance and LAP disbursements declined for most companies amidst weakening asset
quality.
Bajaj Finance reported a decline in the pace of new customer acquisitions and new loans
booked during the quarter, indicating a slowdown in consumer lending appetite.
Select companies have started to focus on expanding product offerings, as liquidity starts to
ease, to support growth over the next few quarters. L&TFH ventured into consumer loans in
3QFY20 to support growth in the rural segment. STFC has started to gain traction in tire and
fuel lending. Apart from propelling growth, these new segments are relatively high-yielding
and will lead to expansion in yields.
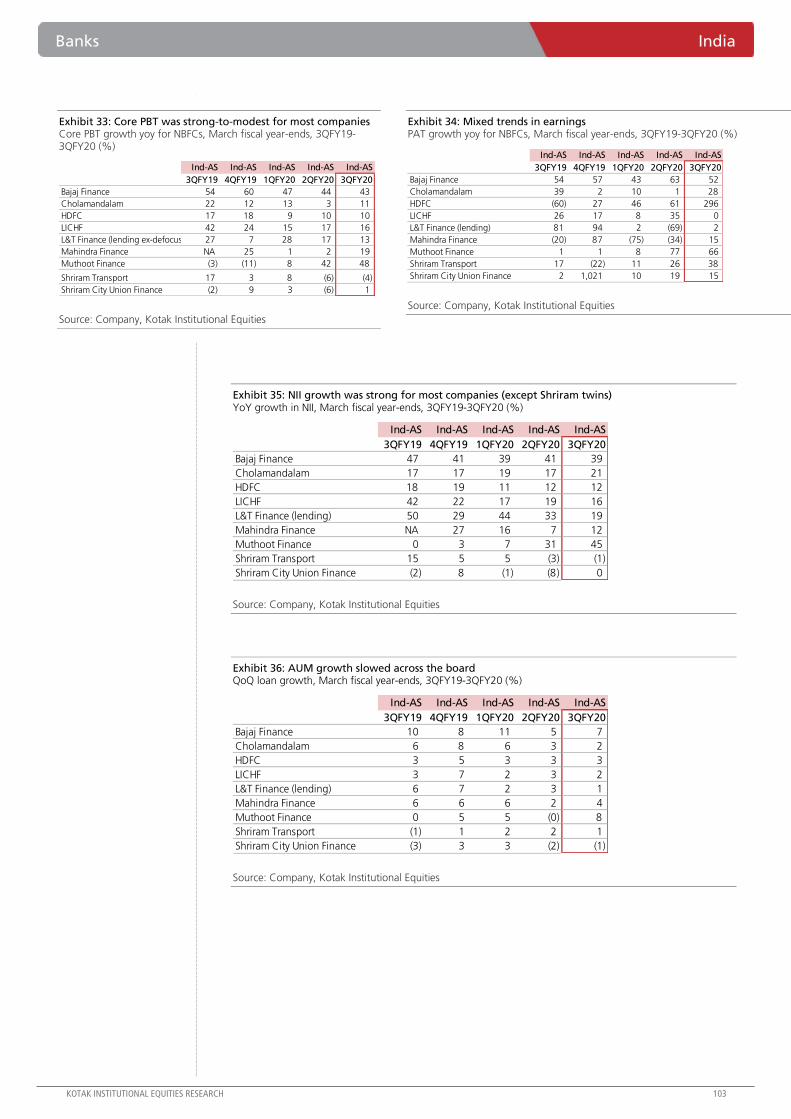
Banks India
KOTAK INSTITUTIONAL EQUITIES RESEARCH 103
Exhibit 33: Core PBT was strong-to-modest for most companies Core PBT growth yoy for NBFCs, March fiscal year-ends, 3QFY19-3QFY20 (%)
Source: Company, Kotak Institutional Equities
Exhibit 34: Mixed trends in earnings PAT growth yoy for NBFCs, March fiscal year-ends, 3QFY19-3QFY20 (%)
Source: Company, Kotak Institutional Equities
Exhibit 35: NII growth was strong for most companies (except Shriram twins) YoY growth in NII, March fiscal year-ends, 3QFY19-3QFY20 (%)
Source: Company, Kotak Institutional Equities
Exhibit 36: AUM growth slowed across the board QoQ loan growth, March fiscal year-ends, 3QFY19-3QFY20 (%)
Source: Company, Kotak Institutional Equities
Ind-AS Ind-AS Ind-AS Ind-AS Ind-AS
3QFY19 4QFY19 1QFY20 2QFY20 3QFY20
Bajaj Finance 54 60 47 44 43
Cholamandalam 22 12 13 3 11
HDFC 17 18 9 10 10
LICHF 42 24 15 17 16
L&T Finance (lending ex-defocused) 27 7 28 17 13
Mahindra Finance NA 25 1 2 19
Muthoot Finance (3) (11) 8 42 48
Shriram Transport 17 3 8 (6) (4)
Shriram City Union Finance (2) 9 3 (6) 1
Ind-AS Ind-AS Ind-AS Ind-AS Ind-AS
3QFY19 4QFY19 1QFY20 2QFY20 3QFY20
Bajaj Finance 54 57 43 63 52
Cholamandalam 39 2 10 1 28
HDFC (60) 27 46 61 296
LICHF 26 17 8 35 0
L&T Finance (lending) 81 94 2 (69) 2
Mahindra Finance (20) 87 (75) (34) 15
Muthoot Finance 1 1 8 77 66
Shriram Transport 17 (22) 11 26 38
Shriram City Union Finance 2 1,021 10 19 15
Ind-AS Ind-AS Ind-AS Ind-AS Ind-AS
3QFY19 4QFY19 1QFY20 2QFY20 3QFY20
Bajaj Finance 47 41 39 41 39
Cholamandalam 17 17 19 17 21
HDFC 18 19 11 12 12
LICHF 42 22 17 19 16
L&T Finance (lending) 50 29 44 33 19
Mahindra Finance NA 27 16 7 12
Muthoot Finance 0 3 7 31 45
Shriram Transport 15 5 5 (3) (1)
Shriram City Union Finance (2) 8 (1) (8) 0
Ind-AS Ind-AS Ind-AS Ind-AS Ind-AS
3QFY19 4QFY19 1QFY20 2QFY20 3QFY20
Bajaj Finance 10 8 11 5 7
Cholamandalam 6 8 6 3 2
HDFC 3 5 3 3 3
LICHF 3 7 2 3 2
L&T Finance (lending) 6 7 2 3 1
Mahindra Finance 6 6 6 2 4
Muthoot Finance 0 5 5 (0) 8
Shriram Transport (1) 1 2 2 1
Shriram City Union Finance (3) 3 3 (2) (1)
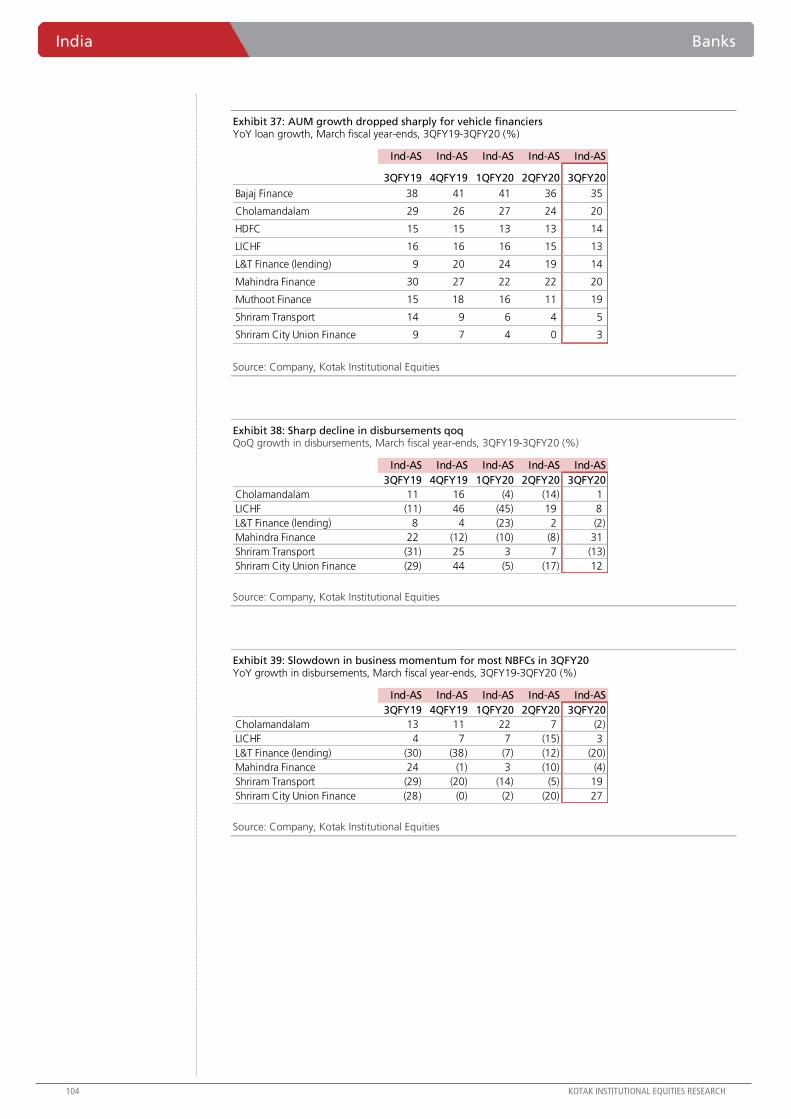
India Banks
104 KOTAK INSTITUTIONAL EQUITIES RESEARCH
Exhibit 37: AUM growth dropped sharply for vehicle financiers YoY loan growth, March fiscal year-ends, 3QFY19-3QFY20 (%)
Source: Company, Kotak Institutional Equities
Exhibit 38: Sharp decline in disbursements qoq QoQ growth in disbursements, March fiscal year-ends, 3QFY19-3QFY20 (%)
Source: Company, Kotak Institutional Equities
Exhibit 39: Slowdown in business momentum for most NBFCs in 3QFY20 YoY growth in disbursements, March fiscal year-ends, 3QFY19-3QFY20 (%)
Source: Company, Kotak Institutional Equities
Ind-AS Ind-AS Ind-AS Ind-AS Ind-AS
3QFY19 4QFY19 1QFY20 2QFY20 3QFY20
Bajaj Finance 38 41 41 36 35
Cholamandalam 29 26 27 24 20
HDFC 15 15 13 13 14
LICHF 16 16 16 15 13
L&T Finance (lending) 9 20 24 19 14
Mahindra Finance 30 27 22 22 20
Muthoot Finance 15 18 16 11 19
Shriram Transport 14 9 6 4 5
Shriram City Union Finance 9 7 4 0 3
Ind-AS Ind-AS Ind-AS Ind-AS Ind-AS
3QFY19 4QFY19 1QFY20 2QFY20 3QFY20
Cholamandalam 11 16 (4) (14) 1
LICHF (11) 46 (45) 19 8
L&T Finance (lending) 8 4 (23) 2 (2)
Mahindra Finance 22 (12) (10) (8) 31
Shriram Transport (31) 25 3 7 (13)
Shriram City Union Finance (29) 44 (5) (17) 12
Ind-AS Ind-AS Ind-AS Ind-AS Ind-AS
3QFY19 4QFY19 1QFY20 2QFY20 3QFY20
Cholamandalam 13 11 22 7 (2)
LICHF 4 7 7 (15) 3
L&T Finance (lending) (30) (38) (7) (12) (20)
Mahindra Finance 24 (1) 3 (10) (4)
Shriram Transport (29) (20) (14) (5) 19
Shriram City Union Finance (28) (0) (2) (20) 27

Banks India
KOTAK INSTITUTIONAL EQUITIES RESEARCH 105
Exhibit 40: All vehicle financiers have slowed down Disbursement and AUM growth for vehicle financiers, March fiscal year-ends, 1QFY19-3QFY20 (%)
Source: Company, Kotak Institutional Equities
Liquidity easing, NIM has likely bottomed out
Most companies reported qoq expansion in NIM expansion led by (1) a flat to marginal
decline in cost of funds, (2) expansion in yields led by a shift in product mix towards a higher
share of high-yielding products like used CV, consumer loans, etc. and (3) impact of hike in
lending rates observed over 4QFY19-2QFY20. A sharp rise in funding cost observed post
3QFY19 has likely peaked. Additionally, a diversification of the funding profile, availability of
unutilized bank lines and resource mobilization through government supported schemes like
on-tap lending and partial credit guarantee scheme provide comfort on the improving
liquidity situation. ALM position has improved over the quarters while there is a decline in
the share of short-term borrowings.
Bond borrowing rates have started to improve for most companies. Our discussion with
market participants suggests that debt investors have been keen to invest in large retail
players with strong parentage but are now opening up to the mid-tier NBFCs as well.
Constrain for off take now seems to be from the demand side as NBFCs struggle on growth
in traditional segments and prefer to reduce dependence on bond markets. As a
consequence, MFs exposure to NBFCs (ex-PFC/REC) reduced to Rs3.2 tn in December 2019
i.e. 23% of total exposure from Rs3.4 bn in September 2019 (26% of overall exposure). This
has however increased marginally to Rs3.3 bn in January 2020 (Exhibits 44 and 45).
Banks, mostly PSUs, are opening up lines of credit for smaller retail players. MCLR rates of
banks have declined by 40-100 bps over the past few quarters, which is further encouraging
NBFCs to continue increasing funding from banks.
Further, diversification of funding sources including (1) securitization/assignment and (2) on-
tap lending, supported a decline in funding cost.
Market sources suggest that the partial guarantee scheme on loan securitization has taken
off. The share of securitization has increased for most companies in 3QFY20 and
management commentary suggests further rise going ahead. For example, SCUF’s
securitization in overall funding mix is expected to increase to 25-30% over the medium
term from 14% in 3QFY20. The share of securitized loans in overall borrowings increased
250 bps qoq (up 890 bps yoy) to 14.7% in 3QFY20 for MMFS.
1QFY19 2QFY19 3QFY19 4QFY19 1QFY20 2QFY20 3QFY20
Disbursement growth (%)- yoy
Chola 45 26 13 11 22 7 (2)
Magma 25 34 10 16 12 (54) (6)
MMFS 35 43 24 (1) 3 (10) (4)
STFC 32 12 (29) (20) (14) (5) 19
Sundaram 20 13 (11) 23 8 (10) (8)
AUM growth (%)- yoy
Chola 30 31 29 26 27 24 20
Magma 3 5 5 8 9 (0) 1
MMFS 21 26 30 27 22 22 20
STFC 22 21 14 9 6 4 5
Sundaram 21 19 14 16 16 11 8
AUM growth (%)- qoq
Chola 6 5 6 8 6 3 2
Magma 0 4 (1) 4 2 (5) 1
MMFS 11 1 6 6 6 2 4
STFC 4 4 (1) 1 2 2 1
Sundaram 4 5 3 3 3 1 1

India Banks
106 KOTAK INSTITUTIONAL EQUITIES RESEARCH
In order to diversify the funding profile, select NBFCs have focused on garnering retail
deposits (tend to be more sticky) and ECBs. Cost is indeed The cost is indeed higher relative
to other sources, though these tend to be relatively longer tenure and sticky in nature (retail
deposits).
Exhibit 45 shows that NBFC exposure of banking sector is up 28% yoy in 3QFY20 (peak of
58% yoy growth in November 2018; highest since FY2011) making banks a bit guarded on
the sector; these prudential limits are board-prescribed.
Exhibit 41: Steep decline in growth across most segments in the auto industry Auto sales yoy growth, March fiscal year-ends, 2007-2019, 9MFY20 (%)
Source: SIAM, RBI,Company, Kotak Institutional Equities
Exhibit 42: Monthly average freight income ex-fuel cost reached trough levels in July-August 2019 Freight income ex fuel cost, March fiscal year-ends, January 2017-November 2019 (Rs/ton-km)
Notes: (1) From 1QFY18 onwards, gross stage 1 and 2 loans are calculated as difference between overall AUM and reported gross stage 3 loans. (2) From 1QFY18 onwards, gross stage 3 ratio is calculated as ratio of reported gross stage 3 loans to overall AUM.
Source: Company, Kotak Institutional Equities
(66)
(44)
(22)
-
22
44
20
07
20
08
20
09
20
10
20
11
20
12
20
13
20
14
20
15
20
16
20
17
20
18
20
19
9M
FY2
0
Cars (LHS) MHCVs LCVs (LHS) 2W (LHS) Tractors (LHS)
1.0
1.1
1.2
1.3
1.4
1.5
Jan
-17
Feb
-17
Mar-
17
Ap
r-1
7
May-
17
Jun
-17
Jul-
17
Au
g-1
7
Sep
-17
Oct
-17
No
v-1
7
Dec-
17
Jan
-18
Feb
-18
Mar-
18
Ap
r-1
8
May-
18
Jun
-18
Jul-
18
Au
g-1
8
Sep
-18
Oct
-18
No
v-1
8
Dec-
18
Jan
-19
Feb
-19
Mar-
19
Ap
r-1
9
May-
19
Jun
-19
Jul-
19
Au
g-1
9
Sep
-19
Oct
-19
No
v-1
9

Banks India
KOTAK INSTITUTIONAL EQUITIES RESEARCH 107
Exhibit 43: NIM expansion qoq for most companies in 3QFY20 Core NIM, March fiscal year-ends, 3QFY19-3QFY20 (%)
Source: Company, Kotak Institutional Equities
Exhibit 44: Pace of bank lending to NBFCs marginally declined in 3QFY20 Lending to NBFCs by SCBs, March fiscal year-ends, December 2017-December 2019
Source: RBI, Kotak Institutional Equities
Ind-AS Ind-AS Ind-AS Ind-AS Ind-AS
3QFY19 4QFY19 1QFY20 2QFY20 3QFY20
Bajaj Finance 10.1 9.8 9.8 9.5 10.3
Cholamandalam 6.4 6.2 6.1 6.2 6.5
HDFC 2.4 2.6 2.4 2.3 2.5
L&T Finance Holdings 5.9 5.7 6.0 6.0 6.0
LIC Housing Finance 2.4 2.6 2.4 2.5 2.5
Mahindra Finance 7.7 7.8 7.2 6.9 7.2
Muthoot Finance 13.5 14.6 13.5 16.1 17.1
Shriram City Union Finance 12.3 12.4 12.3 11.9 12.1
Shriram Transport Finance 7.9 7.6 7.5 7.6 7.5
3.7 3.8 3.9 5.0 4.5 4.4 4.6 4.7 4.9
5.5 5.6 5.7 5.7 5.6 5.8 6.4 6.2 6.2 6.4 6.4 6.8 7.1 7.1 7.3 7.3
5.1 5.1 5.3
6.4 5.9 5.8 6.0 6.2 6.3
6.8 7.0 6.9 6.9 6.7 6.9 7.4 7.3 7.3 7.4 7.4
7.9 8.2 8.2 8.3 8.3
0
2
4
6
8
10
0.0
1.5
3.0
4.5
6.0
7.5
Dec-
17
Jan
-18
Feb
-18
Mar-
18
Ap
r-1
8
May-
18
Jun
-18
Jul-
18
Au
g-1
8
Sep
-18
Oct
-18
No
v-1
8
Dec-
18
Jan
-19
Feb
-19
Mar-
19
Ap
r-1
9
May-
19
Jun
-19
Jul-
19
Au
g-1
9
Sep
-19
Oct
-19
No
v-1
9
Dec-
19
(%)(Rs tn)
Bank loans to NBFCs (LHS) NBFC share of bank credit (%)

India Banks
108 KOTAK INSTITUTIONAL EQUITIES RESEARCH
Exhibit 45: Share of NBFCs (excluding PFC/REC) in overall MF debt exposure down to 23% in December 2019 from 33% in September 2018 Schedule of CP/NCD redemptions of NBFC/HFCs to MFs, March fiscal year-ends, 2QFY19-3QFY20, January 2020 (Rs bn)
Source: ACE MF Database, Kotak Institutional Equities
2QFY19 3QFY19 4QFY19 1QFY20 2QFY20 3QFY20 Jan-20
CPs NCDs Total (% of total) CPs NCDs Total (% of total) CPs NCDs Total (% of total) CPs NCDs Total (% of total) CPs NCDs Total (% of total) CPs NCDs Total (% of total) CPs NCDs Total (% of total)
Jan-19 75 43 118 2 615 53 668 15 NA NA NA NA NA NA NA NA NA NA NA NA NA NA NA NA NA NA NA NA
Feb-19 122 81 204 4 686 94 780 17 NA NA NA NA NA NA NA NA NA NA NA NA NA NA NA NA NA NA NA NA
Mar-19 37 167 204 4 284 192 477 10 NA NA NA NA NA NA NA NA NA NA NA NA NA NA NA NA NA NA NA NA
Apr-19 2 81 83 2 32 84 116 3 408 95 503 11 NA NA NA NA NA NA NA NA NA NA NA NA NA NA NA NA
May-19 0 34 34 1 77 36 113 2 632 49 681 15 NA NA NA NA NA NA NA NA NA NA NA NA NA NA NA NA
Jun-19 14 122 136 3 56 117 173 4 339 151 490 11 NA NA NA NA NA NA NA NA NA NA NA NA NA NA NA NA
Jul-19 - 56 56 1 — 50 50 1 10 47 57 1 619 58 677 15 NA NA NA NA NA NA NA NA NA NA NA NA
Aug-19 9 110 119 2 13 107 120 3 33 89 122 3 460 86 546 12 NA NA NA NA NA NA NA NA NA NA NA NA
Sep-19 - 117 117 2 — 105 105 2 49 107 157 3 227 117 344 8 NA NA NA NA NA NA NA NA NA NA NA NA
Oct-19 - 42 42 1 0 36 36 1 3 37 40 1 14 47 61 1 389 54 443 10 NA NA NA NA NA NA NA NA
Nov-19 - 56 56 1 23 48 71 2 39 46 85 2 65 50 115 3 403 60 463 11 NA NA NA NA NA NA NA NA
Dec-19 - 40 40 1 19 53 73 2 72 54 127 3 91 54 145 3 310 66 375 9 - 0 0 0 NA NA NA NA
Jan-20 - 60 60 1 — 62 62 1 23 62 85 2 33 55 87 2 44 60 104 2 253 79 332 8 NA NA NA NA
Feb-20 - 58 58 1 — 62 62 1 61 72 133 3 89 75 164 4 99 84 183 4 381 100 481 12 404 112 516 12
Mar-20 - 137 137 3 - 145 145 3 63 154 216 5 116 167 283 6 122 173 296 7 307 199 507 12 379 202 582 14
Apr-20 - 52 52 1 - 52 52 1 - 54 54 1 2 58 61 1 2 63 66 2 3 65 68 2 96 66 162 4
May-20 - 52 52 1 - 57 57 1 - 82 82 2 25 89 115 3 28 95 123 3 63 93 156 4 75 103 179 4
Jun-20 - 160 160 3 - 171 171 4 - 180 180 4 13 181 194 4 27 200 227 5 39 210 248 6 44 205 249 6
Jul-20 - 51 51 1 - 41 41 1 - 42 42 1 - 44 44 1 23 55 78 2 32 62 93 2 36 62 98 2
Aug-20 - 59 59 1 - 55 55 1 - 64 64 1 - 62 62 1 27 66 93 2 24 71 96 2 25 75 100 2
Sep-20 - 78 78 2 - 74 74 2 - 93 93 2 5 109 114 3 23 119 142 3 24 123 147 3
Oct-20 - 25 25 0 - 24 24 1 - 38 38 1 - 32 32 1 5 31 37 1 5 32 37 1
Nov-20 - 16 16 0 - 11 11 0 - 12 12 0 - 19 19 0 20 25 45 1 21 29 50 1
Dec-20 - 22 22 0 - 43 43 1 1 67 68 2 7 68 75 2
Jan-21 - 7 7 0 - 10 10 0 - 32 32 1 27 32 59 1
Feb-21 - 17 17 0 - 17 17 0 - 19 19 0 - 20 20 0
Mar-21 - 115 115 2 - 140 140 3 - 141 141 3
Apr-21 - 114 114 2 - 122 122 3 - 123 123 3
May-21 - 60 60 1 - 82 82 2 - 82 82 2
Total NBFC/HFCs 2,396 2,683 5,080 100 1,806 2,749 4,556 100 1,731 2,874 4,606 100 1,755 2,719 4,474 100 1,485 2,783 4,267 100 1,153 2,981 4,135 100 1,148 3,144 4,291 100
Total NBFCs (ex PFC, REC) 4,329 3,726 1,558 2,004 3,562 81 1,405 2,028 3,433 80 1,093 2,117 3,210 78 1,087 2,213 3,300 77
Total debt 13,160 12,879 13,419 13,353 13,997 13,266
Share of NBFC/HFC (% of total) 38.6 35.8 33.3 32.0 29.5 32.3
Share of NBFC/HFC-ex PFC/REC (% of total) 32.9 28.9 26.5 25.7 22.9 24.9
HFC (% of total) 13.8 11.2 10.1 10.5 9.6 10.5
NBFC (% of total) 19.1 17.8 16.4 15.2 13.3 14.4

Banks India
KOTAK INSTITUTIONAL EQUITIES RESEARCH 109
Exhibit 46: Share of CPs have declined from peak levels Composition of borrowings, March fiscal year-ends, 3QFY19-3QFY20 (% of total)
Notes: (1) For 2QFY20, CPs is clubbed with CBLO for Bajaj Finance. For 3QFY20, CBLO and CPs are clubbed with NCDs.
Source: Company, Kotak Institutional Equities
3QFY19 4QFY19 1QFY20 2QFY20 3QFY20
HDFC 3,547,280 3,652,660 3,736,290 3,889,760 3,951,280
Term loans 21 21 23 22 23
Bonds/ debenture/ CPs 49 50 47 47 45
Deposits 30 29 30 31 32
LICHF 1,602,910 1,706,290 1,730,250 1,788,490 1,849,660
Bank 14 15 14 15 19
NCDs 74 75 73 72 68
Tier-II 1 1 1 1 1
Deposit 5 4 5 6 6
NHB 1 1 1 1 1
CP and others 5 4 6 5 5
L&TFH
Term loan 36 39 38 42 43
NCDs and Others 48 47 49 48 48
LOC/CC/WCL/STL NA NA NA NA NA
CP 16 14 13 10 9
STFC 895,460 879,680 906,040 905,930 915,160
Public deposits 11 12 12 13 13
Term loans 21 21 16 16 16
CPs (incl embedded NCDs) 7 4 2 0 1
Subordinated debts 7 7 7 7 7
Securitization 20 20 22 25 24
Bonds 33 35 40 37 37
Other borrowings 2 2 2 3 2
SCUF 233,730 223,950 225,720 222,260 213,960
Retail 16 17 20 22 23
Bank borrowings 54 59 58 61 63
Market borrowings 30 24 22 17 14
Chola 472,340 505,670 551,220 559,030 565,463
Bank 39 49 51 61 NA
CP 16 11 14 14 NA
Debenture 25 21 17 14 NA
Subordinated debt 20 19 18 11 NA
Mahindra Finance 500515 531120 550039 567060 589500
Bank loans 28 28 28 27 25
NCDs 44 44 41 39 37
FDs 9 11 12 14 14
CP/ ICD 13 9 7 4 5
Securitisation/ assignment 6 8 9 12 15
Offshore borrowings 3 4 4
Muthoot Finance 252206 269223 281485 284777 325942
Gold bonds 3 2 2 1 1
Listed NCDs 29 28 28 30 32
Bank loans 48 49 49 47 40
CPs 16 18 17 17 14
Subordinated debt 2 2 1 1 1
Others 2 2 3 3 12
Bajaj Finance 738,220 808,620 863,520 944,620 1,195,390
Banks 32 34 33 38 38
NCDs 36 38 35 35 42
Subordinate debt 5 5 4 4 3
Deposits 14 15 16 15 17
CPs 11 7 10 NA NA
CBLO 1 0 1 8 NA
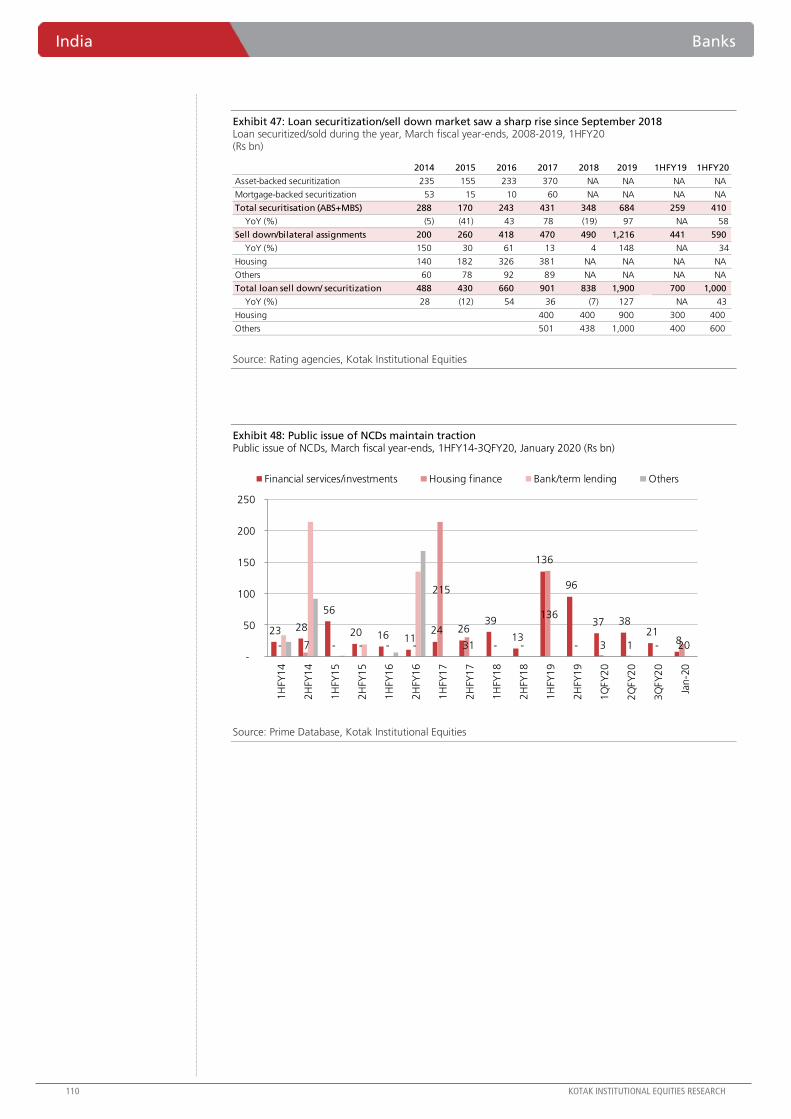
India Banks
110 KOTAK INSTITUTIONAL EQUITIES RESEARCH
Exhibit 47: Loan securitization/sell down market saw a sharp rise since September 2018 Loan securitized/sold during the year, March fiscal year-ends, 2008-2019, 1HFY20 (Rs bn)
Source: Rating agencies, Kotak Institutional Equities
Exhibit 48: Public issue of NCDs maintain traction Public issue of NCDs, March fiscal year-ends, 1HFY14-3QFY20, January 2020 (Rs bn)
Source: Prime Database, Kotak Institutional Equities
2014 2015 2016 2017 2018 2019 1HFY19 1HFY20
Asset-backed securitization 235 155 233 370 NA NA NA NA
Mortgage-backed securitization 53 15 10 60 NA NA NA NA
Total securitisation (ABS+MBS) 288 170 243 431 348 684 259 410
YoY (%) (5) (41) 43 78 (19) 97 NA 58
Sell down/bilateral assignments 200 260 418 470 490 1,216 441 590
YoY (%) 150 30 61 13 4 148 NA 34
Housing 140 182 326 381 NA NA NA NA
Others 60 78 92 89 NA NA NA NA
Total loan sell down/ securitization 488 430 660 901 838 1,900 700 1,000
YoY (%) 28 (12) 54 36 (7) 127 NA 43
Housing 400 400 900 300 400
Others 501 438 1,000 400 600
23 28
56
20 16 11 24 26
39
13
136
96
37 38 21
8 - 7 - - - -
215
31 - -
136
- 3 1 - 20 -
50
100
150
200
250
1H
FY1
4
2H
FY1
4
1H
FY1
5
2H
FY1
5
1H
FY1
6
2H
FY1
6
1H
FY1
7
2H
FY1
7
1H
FY1
8
2H
FY1
8
1H
FY1
9
2H
FY1
9
1Q
FY
20
2Q
FY
20
3Q
FY
20
Jan
-20
Financial services/investments Housing finance Bank/term lending Others
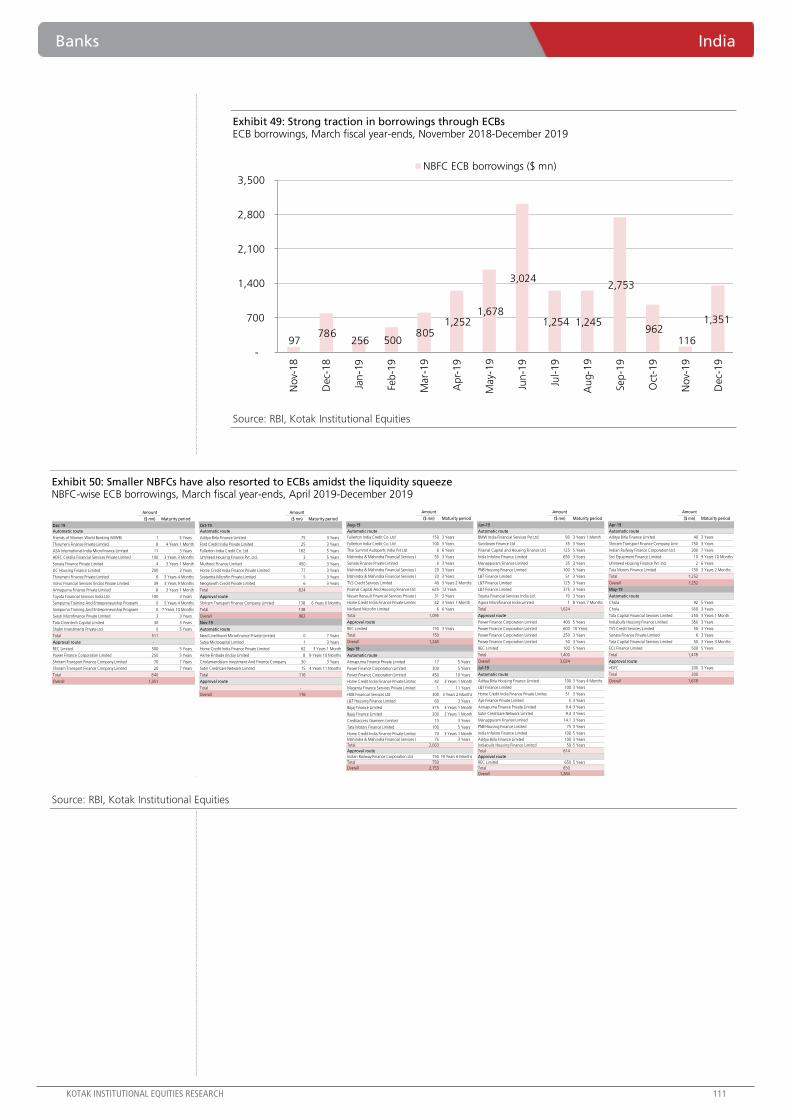
Banks India
KOTAK INSTITUTIONAL EQUITIES RESEARCH 111
Exhibit 49: Strong traction in borrowings through ECBs ECB borrowings, March fiscal year-ends, November 2018-December 2019
Source: RBI, Kotak Institutional Equities
Exhibit 50: Smaller NBFCs have also resorted to ECBs amidst the liquidity squeeze NBFC-wise ECB borrowings, March fiscal year-ends, April 2019-December 2019
Source: RBI, Kotak Institutional Equities
97 786
256 500 805
1,252 1,678
3,024
1,254 1,245
2,753
962 116
1,351
-
700
1,400
2,100
2,800
3,500
No
v-1
8
Dec-
18
Jan
-19
Feb
-19
Mar-
19
Ap
r-1
9
May-
19
Jun
-19
Jul-
19
Au
g-1
9
Sep
-19
Oct
-19
No
v-1
9
Dec-
19
NBFC ECB borrowings ($ mn)
Amount Amount Amount Amount Amount
($ mn) Maturity period ($ mn) Maturity period ($ mn) Maturity period ($ mn) Maturity period ($ mn) Maturity period
Dec-19 Oct-19 Aug-19 Jun-19 Apr-19
Automatic route Automatic route Automatic route Automatic route Automatic route
Friends of Women World Banking (WWB) 1 5 Years Aditya Birla Finance Limited 75 3 Years Fullerton India Credit Co. Ltd 150 3 Years BMW India Financial Services Pvt Ltd 58 3 Years 1 Month Aditya Birla Finance Limited 40 3 Years
Thirumeni Finance Private Limited 8 4 Years 1 Month Ford Credit India Private Limited 25 3 Years Fullerton India Credit Co. Ltd 100 3 Years Sundaram Finance Ltd 35 3 Years Shriram Transport Finance Company Limited 750 3 Years
ASA International India Microfinance Limited 11 3 Years Fullerton India Credit Co. Ltd 182 5 Years Thai Summit Autoparts India Pvt Ltd 6 6 Years Piramal Capital and Housing Finance Ltd 125 5 Years Indian Railway Finance Corporation Ltd. 300 7 Years
HDFC Credila Financial Services Private Limited 100 3 Years 3 Months Ummeed Housing Finance Pvt. Ltd. 3 5 Years Mahindra & Mahindra Financial Services Limited 50 3 Years India Infoline Finance Limited 650 3 Years Srei Equipment Finance Limited 10 9 Years 10 Months
Sonata Finance Private Limited 4 3 Years 1 Month Muthoot Finance Limited 450 3 Years Sonata Finance Private Limited 6 3 Years Manappuram Finance Limited 35 3 Years Ummeed Housing Finance Pvt. Ltd. 2 6 Years
LIC Housing Finance Limited 200 3 Years Home Credit India Finance Private Limited 77 3 Years Mahindra & Mahindra Financial Services Limited 20 3 Years PNB Housing Finance Limited 100 5 Years Tata Motors Finance Limited 150 3 Years 2 Months
Thirumeni Finance Private Limited 6 3 Years 4 Months Svatantra Microfin Private Limited 5 3 Years Mahindra & Mahindra Financial Services Limited 20 3 Years L&T Finance Limited 51 3 Years Total 1,252
Volvo Financial Services (India) Private Limited 39 3 Years 9 Months Neogrowth Credit Private Limited 6 3 Years TVS Credit Services Limited 40 3 Years 2 Months L&T Finance Limited 125 3 Years Overall 1,252
Annapurna Finance Private Limited 8 3 Years 1 Month Total 824 Piramal Capital And Housing Finance Ltd 625 12 Years L&T Finance Limited 375 3 Years May-19
Toyota Financial Services India Ltd. 100 3 Years Approval route Nissan Renault Financial Services Private Limited 31 3 Years Toyota Financial Services India Ltd. 70 3 Years Automatic route
Sampurna Training And Entrepreneurship Programme 0 5 Years 4 Months Shriram Transport Finance Company Limited 138 6 Years 6 Months Home Credit India Finance Private Limited 42 3 Years 1 Month Agora Microfinance India Limited 1 8 Years 7 Months Chola 92 5 Years
Sampurna Training And Entrepreneurship Programme 0 7 Years 10 Months Total 138 Midland Microfin Limited 6 6 Years Total 1,624 Chola 180 3 Years
Svasti Microfinance Private Limited 3 3 Years Overall 962 Total 1,095 Approval route Tata Capital Financial Services Limited 250 3 Years 1 Month
Tata Cleantech Capital Limited 30 3 Years Nov-19 Approval route Power Finance Corporation Limited 400 5 Years Indiabulls Housing Finance Limited 350 3 Years
Shabri Investments Private Ltd 0 5 Years Automatic route REC Limited 150 3 Years Power Finance Corporation Limited 600 10 Years TVS Credit Services Limited 50 3 Years
Total 511 Need Livelihood Microfinance Private Limited 0 7 Years Total 150 Power Finance Corporation Limited 250 3 Years Sonata Finance Private Limited 6 3 Years
Approval route - Satya Microcapital Limited 1 3 Years Overall 1,245 Power Finance Corporation Limited 50 3 Years Tata Capital Financial Services Limited 50 3 Years 3 Months
REC Limited 500 5 Years Home Credit India Finance Private Limited 62 3 Years 1 Month Sep-19 REC Limited 100 5 Years ECL Finance Limited 500 5 Years
Power Finance Corporation Limited 250 5 Years Akme Fintrade (India) Limited 8 9 Years 10 Months Automatic route Total 1,400 Total 1,478
Shriram Transport Finance Company Limited 70 7 Years Cholamandalam Investment And Finance Company Limited 30 3 Years Annapurna Finance Private Limited 17 5 Years Overall 3,024 Approval route
Shriram Transport Finance Company Limited 20 7 Years Satin Creditcare Network Limited 15 4 Years 11 Months Power Finance Corporation Limited 300 5 Years Jul-19 HDFC 200 3 Years
Total 840 Total 116 Power Finance Corporation Limited 450 10 Years Automatic route Total 200
Overall 1,351 Approval route Home Credit India Finance Private Limited 42 3 Years 1 Month Aditya Birla Housing Finance Limited 100 3 Years 4 Months Overall 1,678
Total - Magenta Finance Services Private Limited 1 11 Years L&T Finance Limited 100 3 Years
Overall 116 HDB Financial Services Ltd 300 3 Years 2 Months Home Credit India Finance Private Limited 51 3 Years
L&T Housing Finance Limited 60 3 Years Aye Finance Private Limited 5 3 Years
Bajaj Finance Limited 375 3 Years 1 Month Annapurna Finance Private Limited 9.4 3 Years
Bajaj Finance Limited 200 3 Years 1 Month Satin Creditcare Network Limited 9.4 3 Years
Creditaccess Grameen Limited 13 3 Years Manappuram Finance Limited 14.1 3 Years
Tata Motors Finance Limited 100 5 Years PNB Housing Finance Limited 75 3 Years
Home Credit India Finance Private Limited 70 3 Years 1 Month India Infoline Finance Limited 100 5 Years
Mahindra & Mahindra Financial Services Limited 75 3 Years Aditya Birla Finance Limited 100 3 Years
Total 2,003 Indiabulls Housing Finance Limited 50 5 Years
Approval route Total 614
Indian Railway Finance Corporation Ltd 750 19 Years 6 Months Approval route
Total 750 REC Limited 650 5 Years
Overall 2,753 Total 650
Overall 1,264
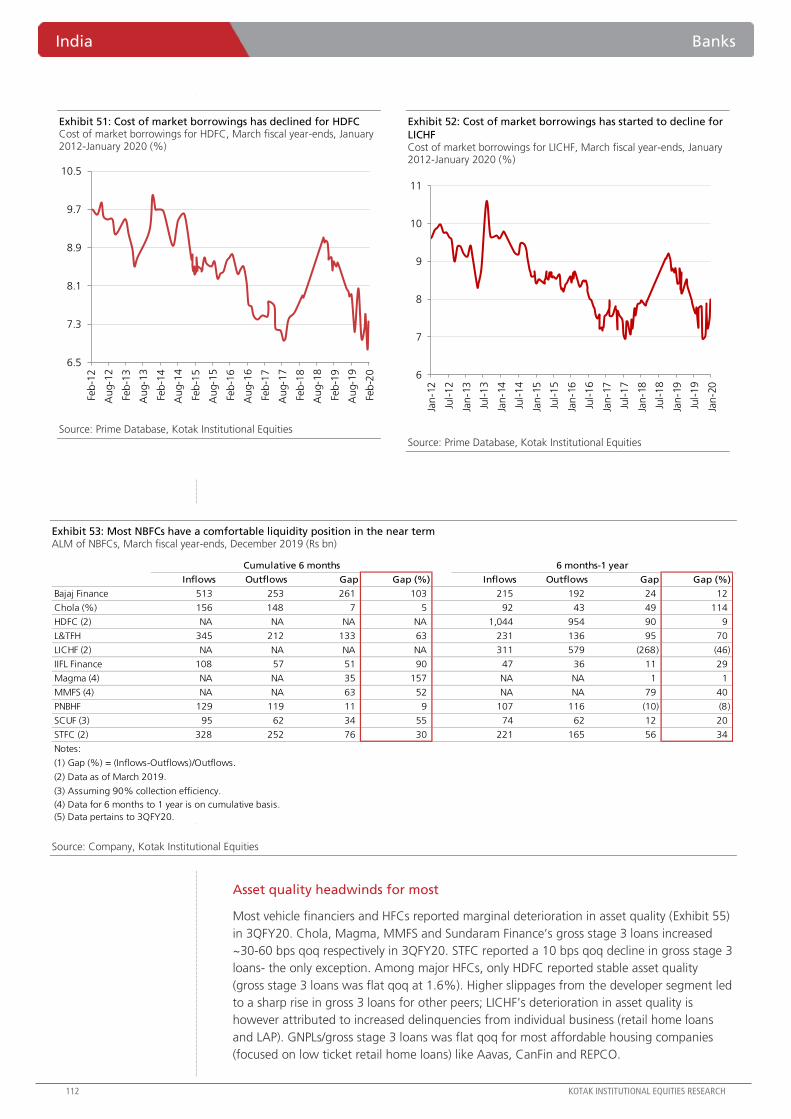
India Banks
112 KOTAK INSTITUTIONAL EQUITIES RESEARCH
Exhibit 51: Cost of market borrowings has declined for HDFC Cost of market borrowings for HDFC, March fiscal year-ends, January 2012-January 2020 (%)
Source: Prime Database, Kotak Institutional Equities
Exhibit 52: Cost of market borrowings has started to decline for
LICHF Cost of market borrowings for LICHF, March fiscal year-ends, January 2012-January 2020 (%)
Source: Prime Database, Kotak Institutional Equities
Exhibit 53: Most NBFCs have a comfortable liquidity position in the near term ALM of NBFCs, March fiscal year-ends, December 2019 (Rs bn)
Source: Company, Kotak Institutional Equities
Asset quality headwinds for most
Most vehicle financiers and HFCs reported marginal deterioration in asset quality (Exhibit 55)
in 3QFY20. Chola, Magma, MMFS and Sundaram Finance’s gross stage 3 loans increased
~30-60 bps qoq respectively in 3QFY20. STFC reported a 10 bps qoq decline in gross stage 3
loans- the only exception. Among major HFCs, only HDFC reported stable asset quality
(gross stage 3 loans was flat qoq at 1.6%). Higher slippages from the developer segment led
to a sharp rise in gross 3 loans for other peers; LICHF’s deterioration in asset quality is
however attributed to increased delinquencies from individual business (retail home loans
and LAP). GNPLs/gross stage 3 loans was flat qoq for most affordable housing companies
(focused on low ticket retail home loans) like Aavas, CanFin and REPCO.
6.5
7.3
8.1
8.9
9.7
10.5
Feb
-12
Au
g-1
2
Feb
-13
Au
g-1
3
Feb
-14
Au
g-1
4
Feb
-15
Au
g-1
5
Feb
-16
Au
g-1
6
Feb
-17
Au
g-1
7
Feb
-18
Au
g-1
8
Feb
-19
Au
g-1
9
Feb
-20 6
7
8
9
10
11
Jan
-12
Jul-
12
Jan
-13
Jul-
13
Jan
-14
Jul-
14
Jan
-15
Jul-
15
Jan
-16
Jul-
16
Jan
-17
Jul-
17
Jan
-18
Jul-
18
Jan
-19
Jul-
19
Jan
-20
Cumulative 6 months 6 months-1 year
Inflows Outflows Gap Gap (%) Inflows Outflows Gap Gap (%)
Bajaj Finance 513 253 261 103 215 192 24 12
Chola (%) 156 148 7 5 92 43 49 114
HDFC (2) NA NA NA NA 1,044 954 90 9
L&TFH 345 212 133 63 231 136 95 70
LICHF (2) NA NA NA NA 311 579 (268) (46)
IIFL Finance 108 57 51 90 47 36 11 29
Magma (4) NA NA 35 157 NA NA 1 1
MMFS (4) NA NA 63 52 NA NA 79 40
PNBHF 129 119 11 9 107 116 (10) (8)
SCUF (3) 95 62 34 55 74 62 12 20
STFC (2) 328 252 76 30 221 165 56 34
Notes:
(1) Gap (%) = (Inflows-Outflows)/Outflows.
(2) Data as of March 2019.
(3) Assuming 90% collection efficiency.
(4) Data for 6 months to 1 year is on cumulative basis.
(5) Data pertains to 3QFY20.

Banks India
KOTAK INSTITUTIONAL EQUITIES RESEARCH 113
Weak collections and recoveries from the CV segment led to marginal deterioration in asset
quality for most vehicle financiers. Muted infrastructure activities and tepid sand mining
activities led to a decline in freight rates (Exhibit 42) during October 2019 (prior to picking
up in December 2019). STFC was the only vehicle financier to report improvement in asset
quality on the back of (1) higher share of used CVs (~75% vehicles financed are 5-10 years
old) to first time buyers and small fleet operators which are used for consumption related
activities and (2) sharp slowdown at the start of the downturn. In line with trends observed
in the previous cycles, most vehicle financiers have slowed their pace of growth in 2QFY20
and 3QFY20.
LAP GNPLs/gross stage 3 loans increased steeply for LICHF to 3.9% in 3QFY20 (3.4%
excluding single borrower NPL recognition norms) from 2.4% in 2QFY20. Bajaj Finance’s
LAP portfolio witnessed deterioration in asset quality led by 25 bps qoq drop in collections
and 55 bps qoq rise in PAR 30 to 2.8%.
Among MFIs, CreditAccess Grameen reported a marginal deterioration in asset quality led by
elevated delinquencies in select districts on Karnataka and Assam. Other like Spandana and
L&FH have reported drop in gross stage 3 loans during the quarter. During the past few
months, players have witnessed drops in collections from select districts in Assam and
Karnataka owing to political disruptions. Repayments declined sharply to ~<80% for most
players in September-October 2019, thought this has started to improve since. Most players
have made sufficient provisions against these portfolios.
Exhibit 54: NBFC share in developer financing has started to decline Developer finance mix across NBFCs and banks, March fiscal year-ends, 2015-2019, 1QFY20-3QFY20 (Rs bn)
Notes: (1) Real estate financing for NBFCs has been computed bottom-up and is an approximate value.
Source: Company, Rating agencies, Kotak Institutional Equities
-
1,000
2,000
3,000
4,000
5,000
2015 2016 2017 2018 2019 1QFY20 2QFY20 3QFY20
NBFCs Banks (RBI)
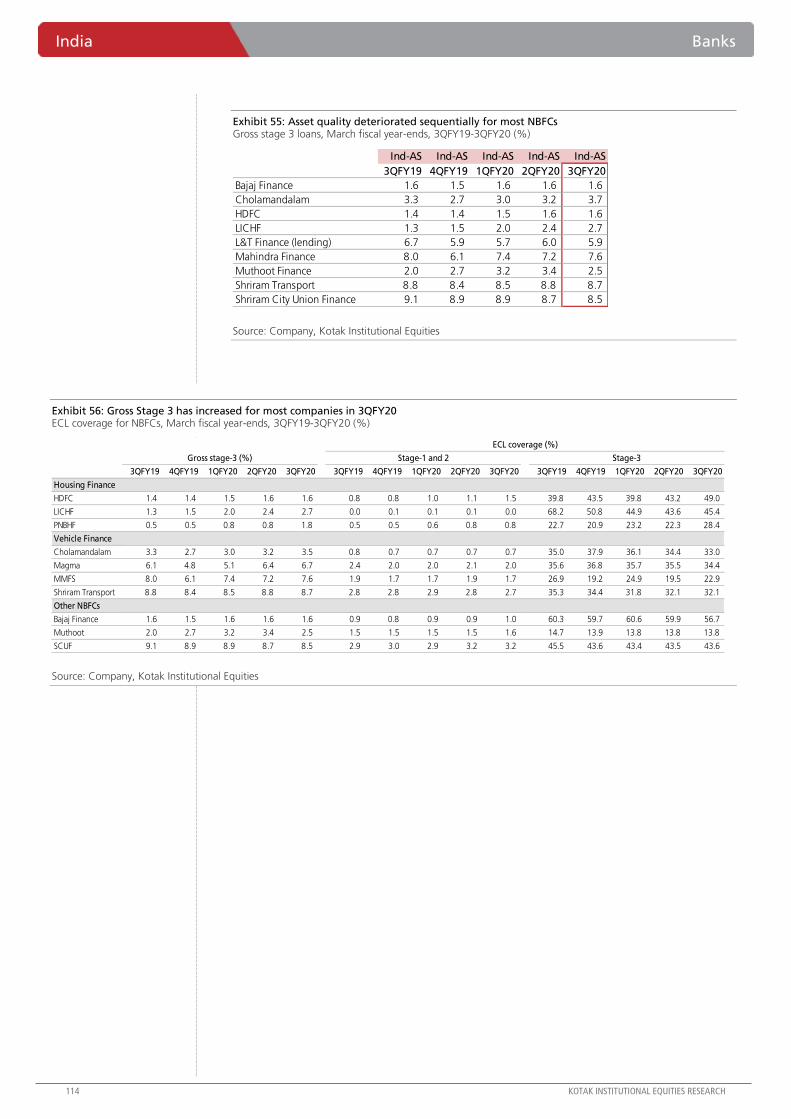
India Banks
114 KOTAK INSTITUTIONAL EQUITIES RESEARCH
Exhibit 55: Asset quality deteriorated sequentially for most NBFCs Gross stage 3 loans, March fiscal year-ends, 3QFY19-3QFY20 (%)
Source: Company, Kotak Institutional Equities
Exhibit 56: Gross Stage 3 has increased for most companies in 3QFY20 ECL coverage for NBFCs, March fiscal year-ends, 3QFY19-3QFY20 (%)
Source: Company, Kotak Institutional Equities
Ind-AS Ind-AS Ind-AS Ind-AS Ind-AS
3QFY19 4QFY19 1QFY20 2QFY20 3QFY20
Bajaj Finance 1.6 1.5 1.6 1.6 1.6
Cholamandalam 3.3 2.7 3.0 3.2 3.7
HDFC 1.4 1.4 1.5 1.6 1.6
LICHF 1.3 1.5 2.0 2.4 2.7
L&T Finance (lending) 6.7 5.9 5.7 6.0 5.9
Mahindra Finance 8.0 6.1 7.4 7.2 7.6
Muthoot Finance 2.0 2.7 3.2 3.4 2.5
Shriram Transport 8.8 8.4 8.5 8.8 8.7
Shriram City Union Finance 9.1 8.9 8.9 8.7 8.5
ECL coverage (%)
Gross stage-3 (%) Stage-1 and 2 Stage-3
3QFY19 4QFY19 1QFY20 2QFY20 3QFY20 3QFY19 4QFY19 1QFY20 2QFY20 3QFY20 3QFY19 4QFY19 1QFY20 2QFY20 3QFY20
Housing Finance
HDFC 1.4 1.4 1.5 1.6 1.6 0.8 0.8 1.0 1.1 1.5 39.8 43.5 39.8 43.2 49.0
LICHF 1.3 1.5 2.0 2.4 2.7 0.0 0.1 0.1 0.1 0.0 68.2 50.8 44.9 43.6 45.4
PNBHF 0.5 0.5 0.8 0.8 1.8 0.5 0.5 0.6 0.8 0.8 22.7 20.9 23.2 22.3 28.4
Vehicle Finance
Cholamandalam 3.3 2.7 3.0 3.2 3.5 0.8 0.7 0.7 0.7 0.7 35.0 37.9 36.1 34.4 33.0
Magma 6.1 4.8 5.1 6.4 6.7 2.4 2.0 2.0 2.1 2.0 35.6 36.8 35.7 35.5 34.4
MMFS 8.0 6.1 7.4 7.2 7.6 1.9 1.7 1.7 1.9 1.7 26.9 19.2 24.9 19.5 22.9
Shriram Transport 8.8 8.4 8.5 8.8 8.7 2.8 2.8 2.9 2.8 2.7 35.3 34.4 31.8 32.1 32.1
Other NBFCs
Bajaj Finance 1.6 1.5 1.6 1.6 1.6 0.9 0.8 0.9 0.9 1.0 60.3 59.7 60.6 59.9 56.7
Muthoot 2.0 2.7 3.2 3.4 2.5 1.5 1.5 1.5 1.5 1.6 14.7 13.9 13.8 13.8 13.8
SCUF 9.1 8.9 8.9 8.7 8.5 2.9 3.0 2.9 3.2 3.2 45.5 43.6 43.4 43.5 43.6
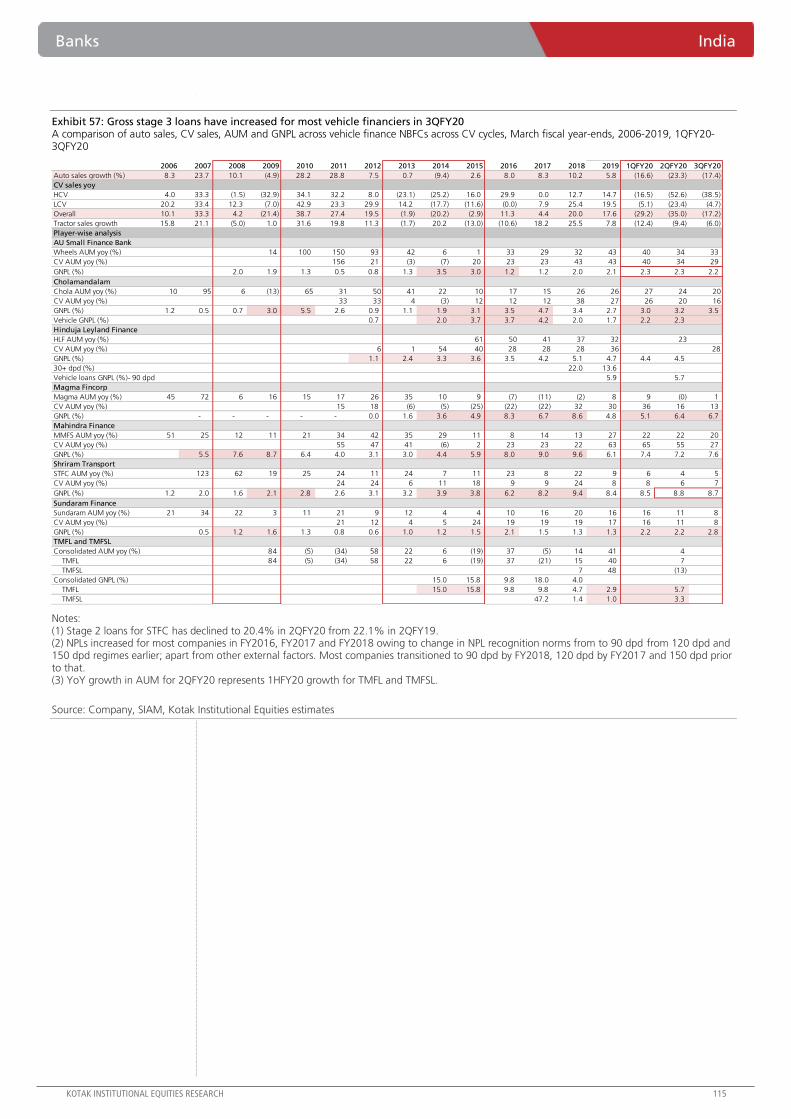
Banks India
KOTAK INSTITUTIONAL EQUITIES RESEARCH 115
Exhibit 57: Gross stage 3 loans have increased for most vehicle financiers in 3QFY20 A comparison of auto sales, CV sales, AUM and GNPL across vehicle finance NBFCs across CV cycles, March fiscal year-ends, 2006-2019, 1QFY20-3QFY20
Notes: (1) Stage 2 loans for STFC has declined to 20.4% in 2QFY20 from 22.1% in 2QFY19. (2) NPLs increased for most companies in FY2016, FY2017 and FY2018 owing to change in NPL recognition norms from to 90 dpd from 120 dpd and 150 dpd regimes earlier; apart from other external factors. Most companies transitioned to 90 dpd by FY2018, 120 dpd by FY2017 and 150 dpd prior to that. (3) YoY growth in AUM for 2QFY20 represents 1HFY20 growth for TMFL and TMFSL.
Source: Company, SIAM, Kotak Institutional Equities estimates
2006 2007 2008 2009 2010 2011 2012 2013 2014 2015 2016 2017 2018 2019 1QFY20 2QFY20 3QFY20
Auto sales growth (%) 8.3 23.7 10.1 (4.9) 28.2 28.8 7.5 0.7 (9.4) 2.6 8.0 8.3 10.2 5.8 (16.6) (23.3) (17.4)
CV sales yoy
HCV 4.0 33.3 (1.5) (32.9) 34.1 32.2 8.0 (23.1) (25.2) 16.0 29.9 0.0 12.7 14.7 (16.5) (52.6) (38.5)
LCV 20.2 33.4 12.3 (7.0) 42.9 23.3 29.9 14.2 (17.7) (11.6) (0.0) 7.9 25.4 19.5 (5.1) (23.4) (4.7)
Overall 10.1 33.3 4.2 (21.4) 38.7 27.4 19.5 (1.9) (20.2) (2.9) 11.3 4.4 20.0 17.6 (29.2) (35.0) (17.2)
Tractor sales growth 15.8 21.1 (5.0) 1.0 31.6 19.8 11.3 (1.7) 20.2 (13.0) (10.6) 18.2 25.5 7.8 (12.4) (9.4) (6.0)
Player-wise analysis
AU Small Finance Bank
Wheels AUM yoy (%) 14 100 150 93 42 6 1 33 29 32 43 40 34 33
CV AUM yoy (%) 156 21 (3) (7) 20 23 23 43 43 40 34 29
GNPL (%) 2.0 1.9 1.3 0.5 0.8 1.3 3.5 3.0 1.2 1.2 2.0 2.1 2.3 2.3 2.2
Cholamandalam
Chola AUM yoy (%) 10 95 6 (13) 65 31 50 41 22 10 17 15 26 26 27 24 20
CV AUM yoy (%) 33 33 4 (3) 12 12 12 38 27 26 20 16
GNPL (%) 1.2 0.5 0.7 3.0 5.5 2.6 0.9 1.1 1.9 3.1 3.5 4.7 3.4 2.7 3.0 3.2 3.5
Vehicle GNPL (%) 0.7 2.0 3.7 3.7 4.2 2.0 1.7 2.2 2.3
Hinduja Leyland Finance
HLF AUM yoy (%) 61 50 41 37 32 23
CV AUM yoy (%) 6 1 54 40 28 28 28 36 28
GNPL (%) 1.1 2.4 3.3 3.6 3.5 4.2 5.1 4.7 4.4 4.5
30+ dpd (%) 22.0 13.6
Vehicle loans GNPL (%)- 90 dpd 5.9 5.7
Magma Fincorp
Magma AUM yoy (%) 45 72 6 16 15 17 26 35 10 9 (7) (11) (2) 8 9 (0) 1
CV AUM yoy (%) 15 18 (6) (5) (25) (22) (22) 32 30 36 16 13
GNPL (%) - - - - - 0.0 1.6 3.6 4.9 8.3 6.7 8.6 4.8 5.1 6.4 6.7
Mahindra Finance
MMFS AUM yoy (%) 51 25 12 11 21 34 42 35 29 11 8 14 13 27 22 22 20
CV AUM yoy (%) 55 47 41 (6) 2 23 23 22 63 65 55 27
GNPL (%) 5.5 7.6 8.7 6.4 4.0 3.1 3.0 4.4 5.9 8.0 9.0 9.6 6.1 7.4 7.2 7.6
Shriram Transport
STFC AUM yoy (%) 123 62 19 25 24 11 24 7 11 23 8 22 9 6 4 5
CV AUM yoy (%) 24 24 6 11 18 9 9 24 8 8 6 7
GNPL (%) 1.2 2.0 1.6 2.1 2.8 2.6 3.1 3.2 3.9 3.8 6.2 8.2 9.4 8.4 8.5 8.8 8.7
Sundaram Finance
Sundaram AUM yoy (%) 21 34 22 3 11 21 9 12 4 4 10 16 20 16 16 11 8
CV AUM yoy (%) 21 12 4 5 24 19 19 19 17 16 11 8
GNPL (%) 0.5 1.2 1.6 1.3 0.8 0.6 1.0 1.2 1.5 2.1 1.5 1.3 1.3 2.2 2.2 2.8
TMFL and TMFSL
Consolidated AUM yoy (%) 84 (5) (34) 58 22 6 (19) 37 (5) 14 41 4
TMFL 84 (5) (34) 58 22 6 (19) 37 (21) 15 40 7
TMFSL 7 48 (13)
Consolidated GNPL (%) 15.0 15.8 9.8 18.0 4.0
TMFL 15.0 15.8 9.8 9.8 4.7 2.9 5.7
TMFSL 47.2 1.4 1.0 3.3

India Banks
116 KOTAK INSTITUTIONAL EQUITIES RESEARCH
Exhibit 58: AUM up 16% yoy AUM excluding custody for IIFL Wealth, March fiscal year-ends, 2016-2019, 1QFY20-3QFY20
Source: Company, Kotak Institutional Equities
Exhibit 59: Recurring AUM up 33% yoy; advisory AUM up 42%
qoq Recurring AUM for IIFL Wealth, March fiscal year-ends, 2016-2019, 1QFY20-3QFY20
Source: Company, Kotak Institutional Equities
Exhibit 60: New money inflows muted in 3QFY20 Movement of IIFL’s wealth AUM, March fiscal year-ends, 2018-2019,1QFY20-3QFY20 (Rs bn)
Source: Company, Kotak Institutional Equities
Exhibit 61: Advisory yields declined 4 bps qoq to 26 bps IIFL's asset yields across segments for IIFL Wealth, March fiscal year-ends, 3QFY19-3QFY20 (bps)
Notes: (1) Asset yields are calculated as revenue/average closing assets in the segment.
Source: Company, Kotak Institutional Equities
0.6 0.9 1.1 1.4 1.4 1.4 1.5
44.9
30.9
21.5 24.3
19.7
15.9
0
10
20
30
40
50
-
0.4
0.8
1.2
1.6
2.0
2016 2017 2018 2019 1QFY202QFY203QFY20
(%)(Rs tn)AUM ex. custody (LHS)YoY (RHS)
0.2 0.3 0.4 0.6 0.6 0.6 0.7
41.2
50.2
29.9
41.1 40.5
33.1
25
32
39
46
53
60
0.0
0.3
0.6
0.9
1.2
1.5
2016 2017 2018 2019 1QFY20 2QFY20 3QFY20
(%)(Rs tn) Recurring AUM (LHS)
YoY (RHS)
2018 2019 1QFY20 2QFY20 3QFY20
Opening AUM 949 1,318 1,677 1,732 1,728
Net new money 251 184 66 5 18
(% of opening AUM) 26 14 16 1 4
Inorganic growth — 107 — — —
Market performance 118 78 (11) (11) 43
(% of opening AUM) 12 6 (3) (3) 10
Forex fluctuations 0 6 (0) 2 0
Closing AUM 1,318 1,713 1,732 1,728 1,789
3QFY19 4QFY19 1QFY20 2QFY20 3QFY20
Recurring AUM 94 90 85 78 83
PMS -discretionary/non-discretionary and advisory 47 35 29 30 26
Funds managed by IIFL AMC 44 47 58 58 65
MFs 50 52 43 40 47
Managed accounts 110 84 67 56 64
Loans 440 511 518 529 589
Brokerage AUM 25 35 34 43 33
Direct stock 11 6 8 12 10
Structured notes and bonds 131 171 114 47 58
Overall AUM 70 74 61 65 60

Banks India
KOTAK INSTITUTIONAL EQUITIES RESEARCH 117
Performance highlights of key NBFCs: 3QFY20
Bajaj Finance: Business slows down; PAR-30 up qoq across most segments. Bajaj
Finance’s PAT was up 52% yoy on the back of strong growth in NII (up 39% yoy) and a
lower tax rate. Higher credit cost constrained earnings. Core PBT (before provisions) was
up 43% yoy. NII growth was led by NIM expansion (up 17 bps yoy/80 bps qoq) and
robust 35% yoy growth in AUM. Declining cost of funds led to yoy NIM expansion. AUM
growth has slowed down from peak levels. Bajaj reported 34% yoy growth in consumer
(lower sales finance volumes) and 32% yoy growth in SME business; rural business, on a
low base, was up 49% yoy while commercial business further moderated to 10%. Credit
costs were up 85% to Rs8.3 bn, this reflects (1) accelerated provisions of Rs850 mn in the
LAS business on a broking account and (2) Rs150 mn provision on a coffee conglomerate.
Even excluding these two, growth in credit cost was high at about 60%. GNPLs were flat
qoq at 1.6% while the deterioration in asset quality indicators (PAR-30 was up qoq across
most segments) poses near-term headwinds.
Chola: Gross stage 3 loans up ~35 bps qoq to 3.5%. Chola’s PAT growth of 28% yoy
was supported by (1) lower tax rate and (2) high assignment income booked during the
quarter (Rs825 mn versus Rs310 mn in 3QFY19). Core PBT growth was low at 11% yoy.
Growth in NII was strong at 21% yoy, while high operating expenses (up 34% yoy) and
credit cost (up 41% yoy) dampened core earnings. Calculated NIM expansion of ~15 bps
yoy/35 bps qoq to ~6.5% was most likely led by yield expansion and offset higher
expenses and provisions. AUM growth slowed down to ~20% yoy from 24-31% yoy
growth observed since 1QFY19, led by a sharp decline in pace of disbursements. Vehicle
finance disbursements were muted with 5% yoy decline and 2% qoq growth during
3QFY20, reflecting industry-wide slowdown and cautious stance on home equity led to
5%yoy/15% qoq de-growth. Investment in business expansion, IT-related expenses and
increase in focus on collections led to 26 bps yoy/8 bps qoq increase in cost-to-average
AUM to 2.8%. Higher credit cost reflects marginal deterioration in asset quality most
likely from the CV business. Gross stage-3 ratio increased 36 bps qoq to 3.5%. A back-
of-the-envelope calculation suggests that gross stage-3 loans on an absolute basis
increased ~17-19% qoq/25-30% yoy.
HDFC: Individual loan growth strong at 16% yoy. HDFC’s core PBT (excluding capital
gains, dividend, provisions, assignment income, fair value changes and ESOP expenses)
was up ~10% yoy. NII growth at 12% yoy was led by expansion in core NIM (up 15 bps
qoq/10 bps yoy to 2.5%) owing to a drop in borrowing cost; impact of a drop in bond
borrowings rate and MCLR. Overall, AUM was up 14% yoy on the back of 16% yoy
growth in individual AUMs while growth in the non-retail segment was muted at 6%
yoy/2% qoq’ albeit higher than the run-rate observed over the past few quarters. Gross
stage-3 loans were flat qoq at 1.6% (developer gross stage-3 loans were up 4 bps qoq to
2.91%). HDFC made large extra provisions from fair value change gains consequent to
merger of Gruh with Bandhan (driving earnings up by 2.96X yoy); ECL coverage on
overall portfolio was up 54 bps qoq to 2.25%.
IIFL wealth: Strong traction in advisory business. IIFL Wealth’s core PBT dropped 16%
yoy and 25% qoq. Higher variable pay expenses and lower brokerage (non-recurring)
revenues offset strong growth in revenues from the recurring business. Strong growth in
other income Rs230 mn in 3QFY20 versus Rs130 mn in 3QFY19 and a loss of Rs190 mn
in 2QFY20 and lower tax rate supported overall earnings. Recurring revenues increased
11% qoq due to strong growth in AUM across most segments (PMS and advisory AUM
was up 42% qoq and AUM of AMC business up 15% qoq) and expansion in yields (except
advisory business). The company reported strong growth in recurring AUMs in 3QFY20,
following sluggishness over the past two quarters; net new money, however, remained
tepid. Non-recurring revenues declined 23% qoq due to large syndication income booked
in 2QFY20. Operating expenses were up 12% qoq/yoy led by higher variable expenses
(ESOP expenses and change in incentive structure to include a new bonus program); cost-
to-income ratio marginally declined to 59.4% in 3QFY20 from 61% in 2QFY20.

India Banks
118 KOTAK INSTITUTIONAL EQUITIES RESEARCH
L&TFH: Business growth slows further. LTFH’s consolidated PAT growth was muted at
2% yoy. PAT from lending business (including defocused business) was flat yoy. PBT
before provisions of the focused businesses was up 13% (flat qoq) led by 19% yoy
growth in NII; impact of NIM expansion while loan growth has slowed down (up 14% yoy
compared to >20% over the past five quarters). NIM expansion was on the back of
improvement in yields and marginal qoq decline in borrowing cost. Calculated NIM (for
focused lending business) expanded by 15 bps yoy/3 bps qoq to 6.1%, largely due to a
hike in lending rates, mainly in the rural business. The company is selectively slowing
down in most business segments, including the rural businesses that have been its key
focus segments. A slowdown in growth is likely an outcome of a combination of factors:
a slowdown in select markets, management’s cautious outlook and shifting out of
businesses with limited competencies. Fee income moderated to 1.2% of loans from
peak levels of 1.5-1.7%, reflecting a slowdown in disbursements. Operating expenses
were up 37% yoy due to increase in MFI business and partially due to commencement of
the consumer business. Gross stage 3 (GS3) loans decreased 1.5% qoq/6% yoy to Rs56.6
bn. Gross stage 3 ratio was down 4 bps qoq to 5.9%.
LICHF: Higher delinquencies from individual segment drive down asset quality. LIC
Housing Finance’s PAT was flat yoy, owing to a sharp rise in credit cost reflecting
weakening asset quality. Core PBT was up 16% yoy led by similar growth in NII (flat qoq).
Growth in NII was driven by 13% yoy/2% qoq AUM growth while NIM was marginally up
by 4 bps yoy (down 4 bps qoq) to 2.5%. Strong growth in the highly competitive retail
home loan space seems to have put pressure on its NIM. A slowdown in the pace of AUM
growth is driven by a sharp decline in the pace of LAP and construction finance
disbursements over the past few quarters. Growth in operating expenses was high at
18% yoy. Cost ratios were stable with cost-to-average AUM at 27 bps. Credit cost
increased 50 bps yoy/22 bps qoq to 0.78% on the back of deterioration in asset quality in
the individual business led by 17% qoq increase in gross stage 3 loans to 2.7%. The
continued increase in individual (retail and LAP) NPLs over the past few quarters pose
concerns (GS3 in the individual home loan segment increased to ~1.5% from 1.05% in
2QFY20, increasingly linearly from 0.4% in 4QFY18). Another worrying aspect is the low
coverage on stage 1 and 2 loans. LICHF has coverage of 2 bps on stage 1 and 2 loans,
down from 6 bps qoq, despite the fact that stage 2 loans increased 24% qoq.
Mahindra Finance: Business slows down and asset quality deteriorates; similar to
most vehicle financiers. Mahindra Finance’s reported PAT increased 15% yoy on the
back of strong growth in NII at 12% yoy and stringent cost control (operating expenses
were muted at 8% yoy). Growth in NII was led by AUM growth at 20% yoy/ 4% qoq
(lowest since 1QFY19) and yoy NIM compression of 9 bps, though up sequentially 40 bps
(likely reflecting decline in cost of funds). Lower auto volumes and higher repayments
offset strong traction in used vehicle financing. MMFS reported 4% yoy decline in
disbursements in 3QFY20, though better than the 10% yoy decline in 2QFY20. Declining
auto sales and weak rural sentiment have likely prompted the company to go slow. The
company continues to focus on cost control led to decrease in cost-to-average AUM ratio
to 2.8% (down 35 bps yoy/9 bps qoq). Credit cost (up 77% yoy) increased 70 bps yoy/15
bps qoq to 2.15% of loans due to 11% qoq rise in stage-3 loans and increase in
coverage by 20 bps qoq to >3%.
Muthoot Finance: strong loan growth. Muthoot Finance’s PAT jumped 66% yoy in
3QFY20 on the back of strong growth in NII and lower tax rate. PBT was up 38% yoy. NII
growth of 45% was led by (1) 19% yoy growth in gold loans (up 8% qoq- highest in the
past seven years) and (2) expansion in yields. Growth in gold loans is attributed to a sharp
rally in gold prices (up 21% yoy in 3QFY20 and 20% yoy in 2QFY20; 5% qoq). With
liquidity easing, Muthoot increased the pace of its growth in 3QFY20. Higher realization
led to yield expansion. A 38% yoy rise in expenses was driven by (1) variable incentives
for employees, (2) MTM loss on foreign currency borrowings and (3) higher rental and
advertising expenses. Burglary related write-offs (Rs330 mn) and contingent provisions
(Rs140 mn) led to elevated credit cost at 1.4% of loans (<1.1% over FY2005-19).
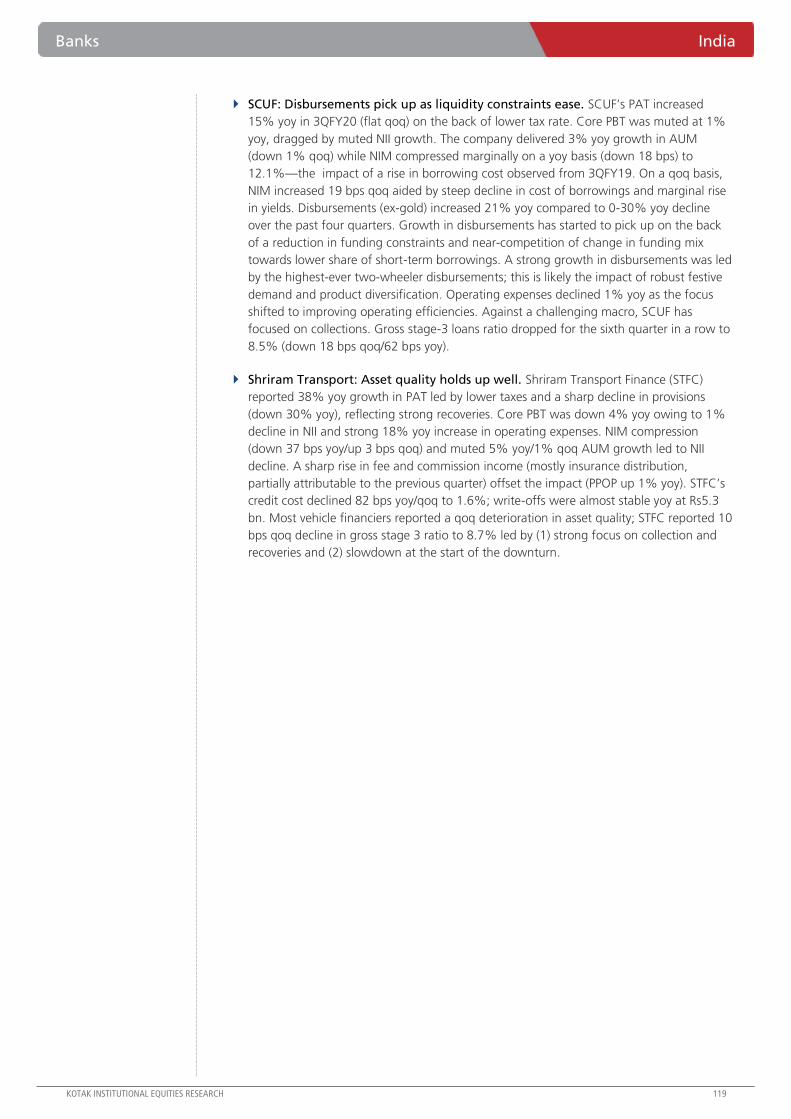
Banks India
KOTAK INSTITUTIONAL EQUITIES RESEARCH 119
SCUF: Disbursements pick up as liquidity constraints ease. SCUF’s PAT increased
15% yoy in 3QFY20 (flat qoq) on the back of lower tax rate. Core PBT was muted at 1%
yoy, dragged by muted NII growth. The company delivered 3% yoy growth in AUM
(down 1% qoq) while NIM compressed marginally on a yoy basis (down 18 bps) to
12.1%—the impact of a rise in borrowing cost observed from 3QFY19. On a qoq basis,
NIM increased 19 bps qoq aided by steep decline in cost of borrowings and marginal rise
in yields. Disbursements (ex-gold) increased 21% yoy compared to 0-30% yoy decline
over the past four quarters. Growth in disbursements has started to pick up on the back
of a reduction in funding constraints and near-competition of change in funding mix
towards lower share of short-term borrowings. A strong growth in disbursements was led
by the highest-ever two-wheeler disbursements; this is likely the impact of robust festive
demand and product diversification. Operating expenses declined 1% yoy as the focus
shifted to improving operating efficiencies. Against a challenging macro, SCUF has
focused on collections. Gross stage-3 loans ratio dropped for the sixth quarter in a row to
8.5% (down 18 bps qoq/62 bps yoy).
Shriram Transport: Asset quality holds up well. Shriram Transport Finance (STFC)
reported 38% yoy growth in PAT led by lower taxes and a sharp decline in provisions
(down 30% yoy), reflecting strong recoveries. Core PBT was down 4% yoy owing to 1%
decline in NII and strong 18% yoy increase in operating expenses. NIM compression
(down 37 bps yoy/up 3 bps qoq) and muted 5% yoy/1% qoq AUM growth led to NII
decline. A sharp rise in fee and commission income (mostly insurance distribution,
partially attributable to the previous quarter) offset the impact (PPOP up 1% yoy). STFC’s
credit cost declined 82 bps yoy/qoq to 1.6%; write-offs were almost stable yoy at Rs5.3
bn. Most vehicle financiers reported a qoq deterioration in asset quality; STFC reported 10
bps qoq decline in gross stage 3 ratio to 8.7% led by (1) strong focus on collection and
recoveries and (2) slowdown at the start of the downturn.
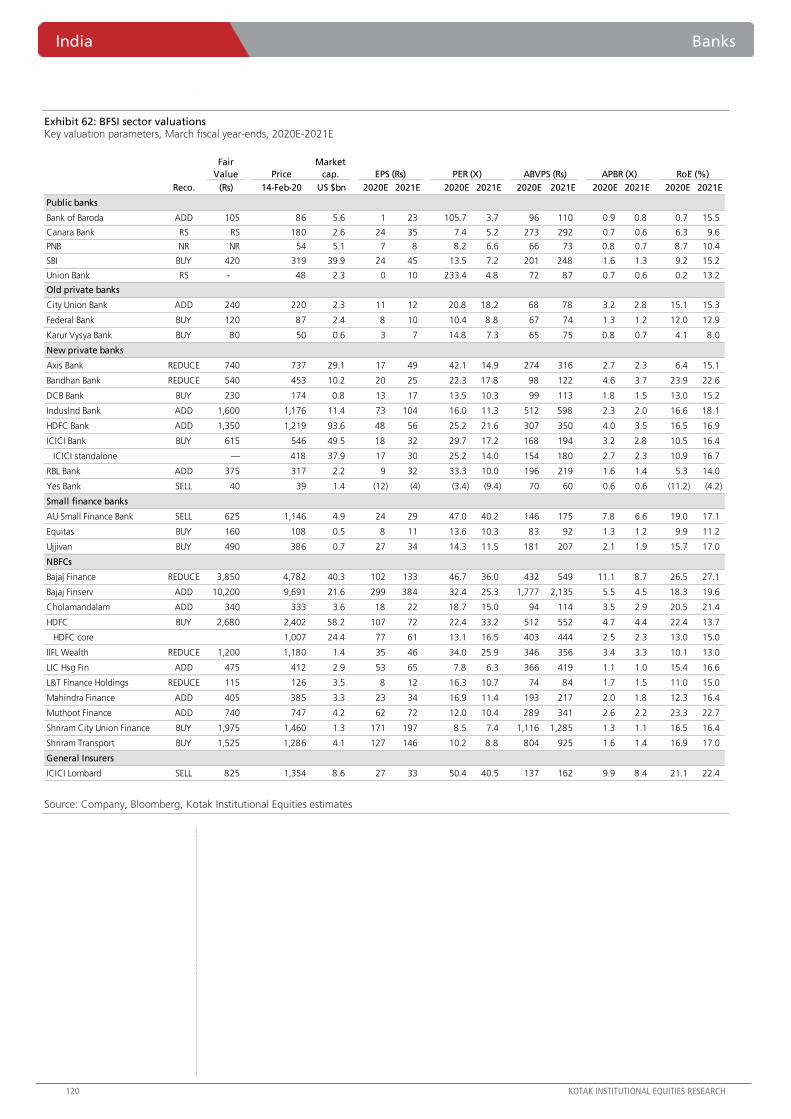
India Banks
120 KOTAK INSTITUTIONAL EQUITIES RESEARCH
Exhibit 62: BFSI sector valuations Key valuation parameters, March fiscal year-ends, 2020E-2021E
Source: Company, Bloomberg, Kotak Institutional Equities estimates
Fair
Value Price
Reco. (Rs) 14-Feb-20 US $bn 2020E 2021E 2020E 2021E 2020E 2021E 2020E 2021E 2020E 2021E
Public banks
Bank of Baroda ADD 105 86 5.6 1 23 105.7 3.7 96 110 0.9 0.8 0.7 15.5
Canara Bank RS RS 180 2.6 24 35 7.4 5.2 273 292 0.7 0.6 6.3 9.6
PNB NR NR 54 5.1 7 8 8.2 6.6 66 73 0.8 0.7 8.7 10.4
SBI BUY 420 319 39.9 24 45 13.5 7.2 201 248 1.6 1.3 9.2 15.2
Union Bank RS - 48 2.3 0 10 233.4 4.8 72 87 0.7 0.6 0.2 13.2
Old private banks
City Union Bank ADD 240 220 2.3 11 12 20.8 18.2 68 78 3.2 2.8 15.1 15.3
Federal Bank BUY 120 87 2.4 8 10 10.4 8.8 67 74 1.3 1.2 12.0 12.9
Karur Vysya Bank BUY 80 50 0.6 3 7 14.8 7.3 65 75 0.8 0.7 4.1 8.0
New private banks
Axis Bank REDUCE 740 737 29.1 17 49 42.1 14.9 274 316 2.7 2.3 6.4 15.1
Bandhan Bank REDUCE 540 453 10.2 20 25 22.3 17.8 98 122 4.6 3.7 23.9 22.6
DCB Bank BUY 230 174 0.8 13 17 13.5 10.3 99 113 1.8 1.5 13.0 15.2
IndusInd Bank ADD 1,600 1,176 11.4 73 104 16.0 11.3 512 598 2.3 2.0 16.6 18.1
HDFC Bank ADD 1,350 1,219 93.6 48 56 25.2 21.6 307 350 4.0 3.5 16.5 16.9
ICICI Bank BUY 615 546 49.5 18 32 29.7 17.2 168 194 3.2 2.8 10.5 16.4
ICICI standalone — 418 37.9 17 30 25.2 14.0 154 180 2.7 2.3 10.9 16.7
RBL Bank ADD 375 317 2.2 9 32 33.3 10.0 196 219 1.6 1.4 5.3 14.0
Yes Bank SELL 40 39 1.4 (12) (4) (3.4) (9.4) 70 60 0.6 0.6 (11.2) (4.2)
Small finance banks
AU Small Finance Bank SELL 625 1,146 4.9 24 29 47.0 40.2 146 175 7.8 6.6 19.0 17.1
Equitas BUY 160 108 0.5 8 11 13.6 10.3 83 92 1.3 1.2 9.9 11.2
Ujjivan BUY 490 386 0.7 27 34 14.3 11.5 181 207 2.1 1.9 15.7 17.0
NBFCs
Bajaj Finance REDUCE 3,850 4,782 40.3 102 133 46.7 36.0 432 549 11.1 8.7 26.5 27.1
Bajaj Finserv ADD 10,200 9,691 21.6 299 384 32.4 25.3 1,777 2,135 5.5 4.5 18.3 19.6
Cholamandalam ADD 340 333 3.6 18 22 18.7 15.0 94 114 3.5 2.9 20.5 21.4
HDFC BUY 2,680 2,402 58.2 107 72 22.4 33.2 512 552 4.7 4.4 22.4 13.7
HDFC core 1,007 24.4 77 61 13.1 16.5 403 444 2.5 2.3 13.0 15.0
IIFL Wealth REDUCE 1,200 1,180 1.4 35 46 34.0 25.9 346 356 3.4 3.3 10.1 13.0
LIC Hsg Fin ADD 475 412 2.9 53 65 7.8 6.3 366 419 1.1 1.0 15.4 16.6
L&T Finance Holdings REDUCE 115 126 3.5 8 12 16.3 10.7 74 84 1.7 1.5 11.0 15.0
Mahindra Finance ADD 405 385 3.3 23 34 16.9 11.4 193 217 2.0 1.8 12.3 16.4
Muthoot Finance ADD 740 747 4.2 62 72 12.0 10.4 289 341 2.6 2.2 23.3 22.7
Shriram City Union Finance BUY 1,975 1,460 1.3 171 197 8.5 7.4 1,116 1,285 1.3 1.1 16.5 16.4
Shriram Transport BUY 1,525 1,286 4.1 127 146 10.2 8.8 804 925 1.6 1.4 16.9 17.0
General Insurers
ICICI Lombard SELL 825 1,354 8.6 27 33 50.4 40.5 137 162 9.9 8.4 21.1 22.4
APBR (X) RoE (%)
Market
cap. EPS (Rs) PER (X) ABVPS (Rs)
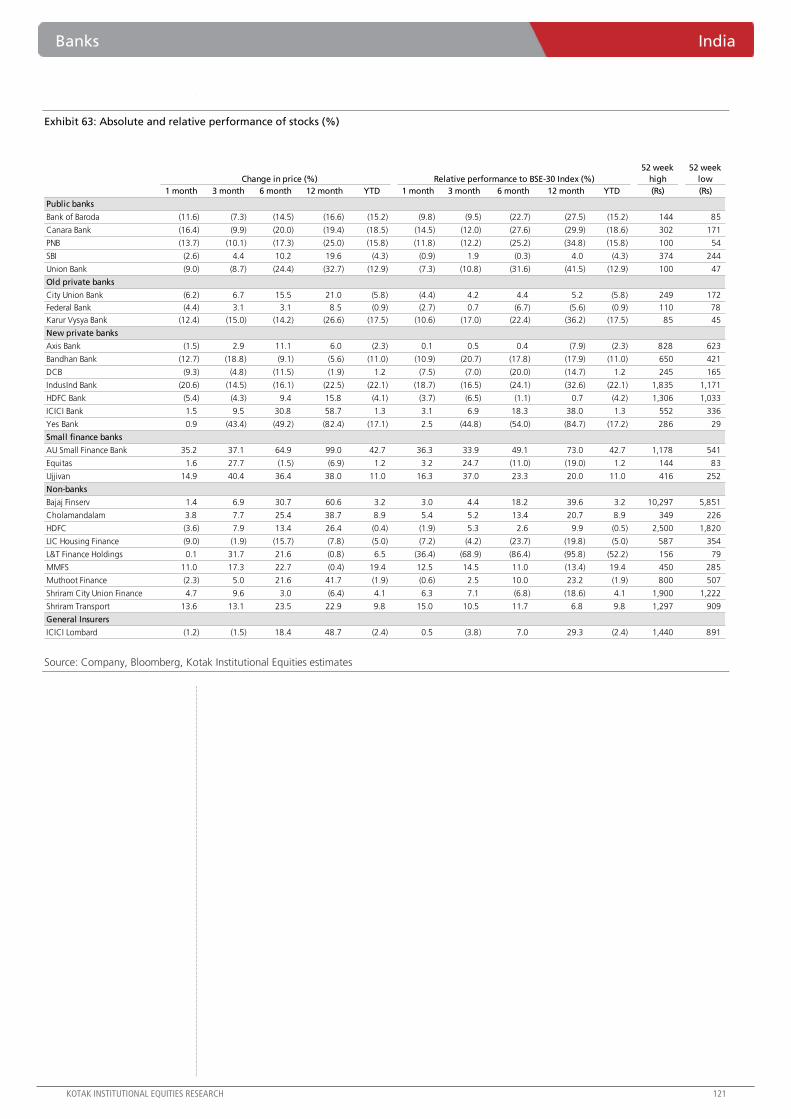
Banks India
KOTAK INSTITUTIONAL EQUITIES RESEARCH 121
Exhibit 63: Absolute and relative performance of stocks (%)
Source: Company, Bloomberg, Kotak Institutional Equities estimates
52 week
high
52 week
low
1 month 3 month 6 month 12 month YTD 1 month 3 month 6 month 12 month YTD (Rs) (Rs)
Public banks
Bank of Baroda (11.6) (7.3) (14.5) (16.6) (15.2) (9.8) (9.5) (22.7) (27.5) (15.2) 144 85
Canara Bank (16.4) (9.9) (20.0) (19.4) (18.5) (14.5) (12.0) (27.6) (29.9) (18.6) 302 171
PNB (13.7) (10.1) (17.3) (25.0) (15.8) (11.8) (12.2) (25.2) (34.8) (15.8) 100 54
SBI (2.6) 4.4 10.2 19.6 (4.3) (0.9) 1.9 (0.3) 4.0 (4.3) 374 244
Union Bank (9.0) (8.7) (24.4) (32.7) (12.9) (7.3) (10.8) (31.6) (41.5) (12.9) 100 47
Old private banks
City Union Bank (6.2) 6.7 15.5 21.0 (5.8) (4.4) 4.2 4.4 5.2 (5.8) 249 172
Federal Bank (4.4) 3.1 3.1 8.5 (0.9) (2.7) 0.7 (6.7) (5.6) (0.9) 110 78
Karur Vysya Bank (12.4) (15.0) (14.2) (26.6) (17.5) (10.6) (17.0) (22.4) (36.2) (17.5) 85 45
New private banks
Axis Bank (1.5) 2.9 11.1 6.0 (2.3) 0.1 0.5 0.4 (7.9) (2.3) 828 623
Bandhan Bank (12.7) (18.8) (9.1) (5.6) (11.0) (10.9) (20.7) (17.8) (17.9) (11.0) 650 421
DCB (9.3) (4.8) (11.5) (1.9) 1.2 (7.5) (7.0) (20.0) (14.7) 1.2 245 165
IndusInd Bank (20.6) (14.5) (16.1) (22.5) (22.1) (18.7) (16.5) (24.1) (32.6) (22.1) 1,835 1,171
HDFC Bank (5.4) (4.3) 9.4 15.8 (4.1) (3.7) (6.5) (1.1) 0.7 (4.2) 1,306 1,033
ICICI Bank 1.5 9.5 30.8 58.7 1.3 3.1 6.9 18.3 38.0 1.3 552 336
Yes Bank 0.9 (43.4) (49.2) (82.4) (17.1) 2.5 (44.8) (54.0) (84.7) (17.2) 286 29
Small finance banks
AU Small Finance Bank 35.2 37.1 64.9 99.0 42.7 36.3 33.9 49.1 73.0 42.7 1,178 541
Equitas 1.6 27.7 (1.5) (6.9) 1.2 3.2 24.7 (11.0) (19.0) 1.2 144 83
Ujjivan 14.9 40.4 36.4 38.0 11.0 16.3 37.0 23.3 20.0 11.0 416 252
Non-banks
Bajaj Finserv 1.4 6.9 30.7 60.6 3.2 3.0 4.4 18.2 39.6 3.2 10,297 5,851
Cholamandalam 3.8 7.7 25.4 38.7 8.9 5.4 5.2 13.4 20.7 8.9 349 226
HDFC (3.6) 7.9 13.4 26.4 (0.4) (1.9) 5.3 2.6 9.9 (0.5) 2,500 1,820
LIC Housing Finance (9.0) (1.9) (15.7) (7.8) (5.0) (7.2) (4.2) (23.7) (19.8) (5.0) 587 354
L&T Finance Holdings 0.1 31.7 21.6 (0.8) 6.5 (36.4) (68.9) (86.4) (95.8) (52.2) 156 79
MMFS 11.0 17.3 22.7 (0.4) 19.4 12.5 14.5 11.0 (13.4) 19.4 450 285
Muthoot Finance (2.3) 5.0 21.6 41.7 (1.9) (0.6) 2.5 10.0 23.2 (1.9) 800 507
Shriram City Union Finance 4.7 9.6 3.0 (6.4) 4.1 6.3 7.1 (6.8) (18.6) 4.1 1,900 1,222
Shriram Transport 13.6 13.1 23.5 22.9 9.8 15.0 10.5 11.7 6.8 9.8 1,297 909
General Insurers
ICICI Lombard (1.2) (1.5) 18.4 48.7 (2.4) 0.5 (3.8) 7.0 29.3 (2.4) 1,440 891
Change in price (%) Relative performance to BSE-30 Index (%)

India Banks
122 KOTAK INSTITUTIONAL EQUITIES RESEARCH
Exhibit 64: Public banks continue to trade at low multiples PBR– public banks, January 2013- January 2020 (X)
Source: Company, Bloomberg, Kotak Institutional Equities estimates
Exhibit 65: Private banks have seen corrections in recent months PBR and PER – private banks, January 2013- January 2020 (X)
Source: Company, Bloomberg, Kotak Institutional Equities estimates
Exhibit 66: Public banks continue to trade at steep discount to private banks Adjusted PBR of private banks relative to public banks, March fiscal year-ends, January 2014-January 2020 (X)
Source: Company, Bloomberg, Kotak Institutional Equities estimates
-
0.5
1.0
1.5
2.0
2.5
Jan
-13
Jan
-14
Jan
-15
Jan
-16
Jan
-17
Jan
-18
Jan
-19
Jan
-20
PBR (LHS)
-
6
13
19
26
32
-
1.0
2.0
3.0
4.0
5.0
Jan
-13
Jan
-14
Jan
-15
Jan
-16
Jan
-17
Jan
-18
Jan
-19
Jan
-20
PBR (LHS) PER (RHS)
1.0
1.6
2.2
2.8
3.4
4.0
Jan
-14
Jul-
14
Jan
-15
Jul-
15
Jan
-16
Jul-
16
Jan
-17
Jul-
17
Jan
-18
Jul-
18
Jan
-19
Jul-
19
Jan
-20

For Private Circulation Only.
[email protected]: +91 22 6218 6427
WPI inflation continues to inch up
January WPI inflation rose to 3.1% (Kotak: 2.9%, Consensus: 3%) as against 2.6% in
December, primarily due to a slight adverse base effect despite muted momentum (Exhibit 1).
Even as food inflation moved lower to 11.5% (13.2% in December) much of the increase in
WPI inflation was on the back of manufacturing and fuel and power (Exhibit 2). Food inflation
remained in double-digits on the back of high inflation in vegetables (52.7%), pulses (12.7%),
and eggs, meat and fish (6.7%) (Exhibit 3). Primary non-food inflation was at 7.1% (7.7% in
November) due to a sequential increase in crude prices. Fuel and power inflation moved into
positive territory at 3.4% ((-)1.5% in December). We expect WPI inflation to average 1.9% in
FY2020 and 3.5% in FY2021 (Exhibit 4).
Core inflation remains weak
Core WPI inflation (manufactured products excluding food products) remained muted at (-)
1.1% in January ((-)1.6% in December) on a sequential basis, with prices increasing by 0.3%.
Among the heavyweights, prices of ‘basic metals’ rose by 2.2% mom and prices of ‘chemicals
and chemical products’ increased by 0.1%. Trade-related optimism has led to recovery in
commodity prices in December (which reflects with a lag in inflation) but prices corrected
sharply in January-February on fears of the economic impact of COVID-19 virus (Exhibit 5). We
expect core WPI inflation to trend towards (-) 0.8% by March 2020 and average (-) 0.5% in
FY2020 and 0.8% in FY2021.
MPC to remain on an extended pause
January WPI inflation is unlikely to ring any alarm bells, especially as the global as well as the
domestic industrial sector remains in a soft patch. Further, while we expect CPI inflation to have
peaked in January amidst moderation in food inflation, the readings continue to remain
alarmingly higher than the MPC’s mandate of maintaining headline CPI in the 2-6% band.
Despite weak growth, CPI inflation is likely to remain elevated above 6% for most of 1HFY21 as
food inflation becomes more generalized (such as in pulses, eggs, fish, and meat and hinted in
the WPI inflation too). High inflation will restrict any monetary easing though the policy rate
cuts through 1HFY2. Any repo rate cuts beyond that will remain contingent on the evolving
growth-inflation mix. However, we continue to expect stealth easing through the liquidity
channel to facilitate monetary transmission and support growth.
Economy Prices
Wholesale inflation inches up. Even as wholesale inflation remained benign, a slow
reversal in the fuel and manufacturing sector inflation continued to push it up. Certain
food items such as pulses, milk, eggs, meat, and fish have seen substantial price
increases recently, in line with the trend seen in retail prices. The MPC, while focusing
on the CPI trajectory, will likely stay on hold through 1HFY21, with room for additional
easing contingent on the evolution of the growth-inflation mix.
INDIA
FEBRUARY 14, 2020
UPDATE
BSE-30: 41,258
QUICK NUMBERS
January core WPI
inflation at (-)1.1%
Expect average
FY2020E WPI
inflation at 1.9%;
FY2021E likely at
3.5%
Expect MPC to
pause through
1HFY21
Suvodeep Rakshit
Upasna Bhardwaj
Avijit Puri

India Economy
124 KOTAK ECONOMIC RESEARCH
Exhibit 1: Marginally adverse base effect led to some uptick in WPI inflation Trend in momentum, base effect, and monthly change in WPI inflation (%)
Source: CEIC, Kotak Economics Research
Exhibit 2: Manufacturing sector inflation contributed to the uptick in WPI inflation Contribution of key items to WPI inflation (%)
Source: CEIC, Kotak Economics Research
Notes:
(a) Momentum is mom growth while base effect is 12-m prior mom change with signs reversed.
(2.0)
(1.5)
(1.0)
(0.5)
0.0
0.5
1.0
1.5
2.0
2.5
Jun-1
7
Sep
-17
Dec-
17
Mar-
18
Jun-1
8
Sep
-18
Dec-
18
Mar-
19
Jun-1
9
Sep
-19
Dec-
19
Mar-
20
Jun-2
0
Momentum Base effect Monthly change in WPI inflation
(8)
(6)
(4)
(2)
0
2
4
6
Jan
-16
Apr-
16
Jul-1
6
Oct
-16
Jan
-17
Apr-
17
Jul-1
7
Oct
-17
Jan
-18
Apr-
18
Jul-1
8
Oct
-18
Jan
-19
Apr-
19
Jul-1
9
Oct
-19
Jan
-20
Primary food articles Primary non-food articles Minerals
Crude and natural gas Fuel and power Manufactured products
WPI inflation

Economy India
KOTAK ECONOMIC RESEARCH 125
Exhibit 3: Contribution of fruits and vegetables being substituted by pulses and protein items Trend in components of WPI primary food inflation (%)
Source: CEIC, Kotak Economics Research
Exhibit 4: Unlikely to see much upside to WPI inflation Trend and estimate of WPI inflation (%)
Source: CEIC, Kotak Economics Research estimates
(6)
(4)
(2)
0
2
4
6
8
10
12
14
Jan
-16
Apr-
16
Jul-1
6
Oct
-16
Jan
-17
Apr-
17
Jul-1
7
Oct
-17
Jan
-18
Apr-
18
Jul-1
8
Oct
-18
Jan
-19
Apr-
19
Jul-1
9
Oct
-19
Jan
-20
Foodgrains Fruits & vegetables
Milk, eggs, meat & fish Other primary food articles
Primary food articles
(8)
(6)
(4)
(2)
0
2
4
6
8
Jun-1
5
Sep
-15
Dec-
15
Mar-
16
Jun-1
6
Sep
-16
Dec-
16
Mar-
17
Jun-1
7
Sep
-17
Dec-
17
Mar-
18
Jun-1
8
Sep
-18
Dec-
18
Mar-
19
Jun-1
9
Sep
-19
Dec-
19
Mar-
20
Jun-2
0
Sep
-20
Dec-
20
Mar-
21
WPI inflation Core WPI inflation
Mar 2020: 2.9%
Mar 2020: (-)0.8%
Mar 2021: 2.8%
Mar 2021: 1.6%

India Economy
126 KOTAK ECONOMIC RESEARCH
Exhibit 5: Commodities recovered due to trade deal but fell sharply as COVID-19 fears increased Trend in CRB commodities index (X)
Source: Bloomberg, Kotak Economics Research
160
170
180
190
200
210
Jan
-18
Feb-1
8
Mar-
18
Apr-
18
May-
18
Jun-1
8
Jul-1
8
Aug
-18
Sep
-18
Oct
-18
Nov-
18
Dec-
18
Jan
-19
Feb-1
9
Mar-
19
Apr-
19
May-
19
Jun-1
9
Jul-1
9
Aug
-19
Sep
-19
Oct
-19
Nov-
19
Dec-
19
Jan
-20
Feb-2
0
CRB Commodities Index
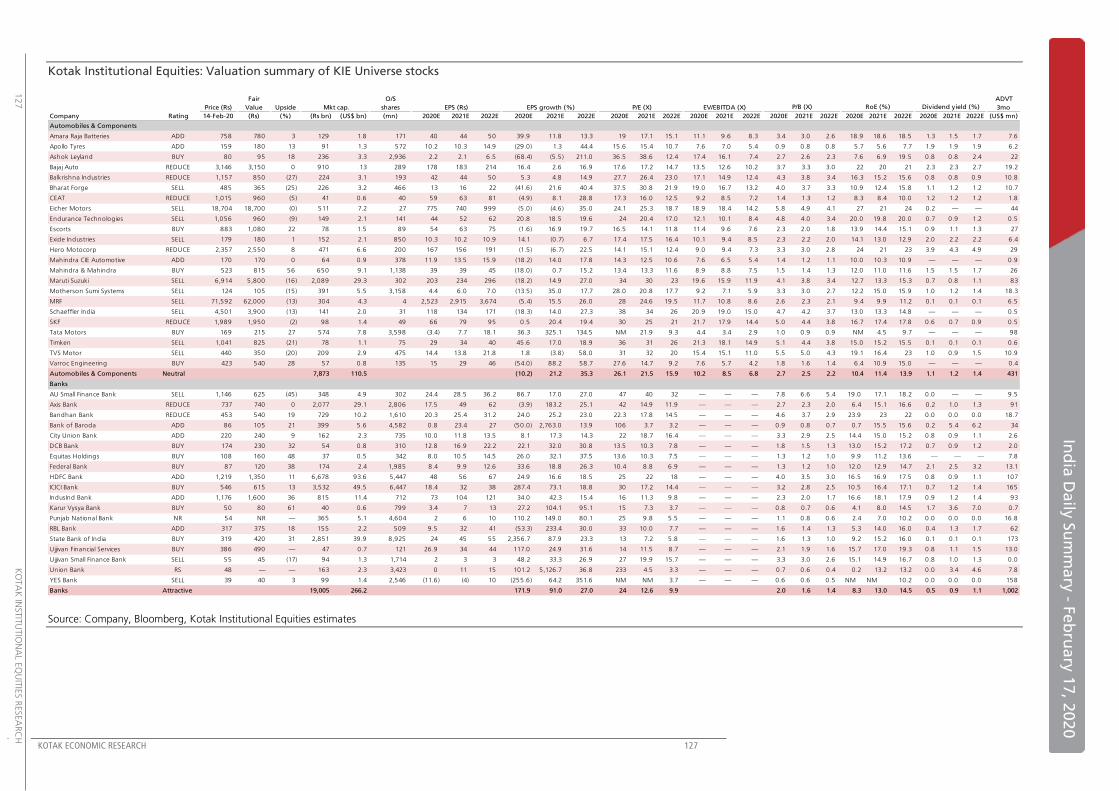
KOTAK ECONOMIC RESEARCH 127
Ind
ia D
aily
Su
mm
ary
- Fe
bru
ary
17
, 202
0
127
K
OTA
K IN
STIT
UTIO
NA
L EQ
UIT
IES R
ESEA
RC
H
Kotak Institutional Equities: Valuation summary of KIE Universe stocks
Source: Company, Bloomberg, Kotak Institutional Equities estimates
Fair O/S ADVT
Price (Rs) Value Upside Mkt cap. shares EPS (Rs) EPS growth (%) P/E (X) EV/EBITDA (X) 3mo
Company Rating 14-Feb-20 (Rs) (%) (Rs bn) (US$ bn) (mn) 2020E 2021E 2022E 2020E 2021E 2022E 2020E 2021E 2022E 2020E 2021E 2022E 2020E 2021E 2022E 2020E 2021E 2022E 2020E 2021E 2022E (US$ mn)
Automobiles & Components
Amara Raja Batteries ADD 758 780 3 129 1.8 171 40 44 50 39.9 11.8 13.3 19 17.1 15.1 11.1 9.6 8.3 3.4 3.0 2.6 18.9 18.6 18.5 1.3 1.5 1.7 7.6
Apollo Tyres ADD 159 180 13 91 1.3 572 10.2 10.3 14.9 (29.0) 1.3 44.4 15.6 15.4 10.7 7.6 7.0 5.4 0.9 0.8 0.8 5.7 5.6 7.7 1.9 1.9 1.9 6.2
Ashok Leyland BUY 80 95 18 236 3.3 2,936 2.2 2.1 6.5 (68.4) (5.5) 211.0 36.5 38.6 12.4 17.4 16.1 7.4 2.7 2.6 2.3 7.6 6.9 19.5 0.8 0.8 2.4 22
Bajaj Auto REDUCE 3,146 3,150 0 910 13 289 178 183 214 16.4 2.6 16.9 17.6 17.2 14.7 13.5 12.6 10.2 3.7 3.3 3.0 22 20 21 2.3 2.3 2.7 19.2
Balkrishna Industries REDUCE 1,157 850 (27) 224 3.1 193 42 44 50 5.3 4.8 14.9 27.7 26.4 23.0 17.1 14.9 12.4 4.3 3.8 3.4 16.3 15.2 15.6 0.8 0.8 0.9 10.8
Bharat Forge SELL 485 365 (25) 226 3.2 466 13 16 22 (41.6) 21.6 40.4 37.5 30.8 21.9 19.0 16.7 13.2 4.0 3.7 3.3 10.9 12.4 15.8 1.1 1.2 1.2 10.7
CEAT REDUCE 1,015 960 (5) 41 0.6 40 59 63 81 (4.9) 8.1 28.8 17.3 16.0 12.5 9.2 8.5 7.2 1.4 1.3 1.2 8.3 8.4 10.0 1.2 1.2 1.2 1.8
Eicher Motors SELL 18,704 18,700 (0) 511 7.2 27 775 740 999 (5.0) (4.6) 35.0 24.1 25.3 18.7 18.9 18.4 14.2 5.8 4.9 4.1 27 21 24 0.2 — — 44
Endurance Technologies SELL 1,056 960 (9) 149 2.1 141 44 52 62 20.8 18.5 19.6 24 20.4 17.0 12.1 10.1 8.4 4.8 4.0 3.4 20.0 19.8 20.0 0.7 0.9 1.2 0.5
Escorts BUY 883 1,080 22 78 1.5 89 54 63 75 (1.6) 16.9 19.7 16.5 14.1 11.8 11.4 9.6 7.6 2.3 2.0 1.8 13.9 14.4 15.1 0.9 1.1 1.3 27
Exide Industries SELL 179 180 1 152 2.1 850 10.3 10.2 10.9 14.1 (0.7) 6.7 17.4 17.5 16.4 10.1 9.4 8.5 2.3 2.2 2.0 14.1 13.0 12.9 2.0 2.2 2.2 6.4
Hero Motocorp REDUCE 2,357 2,550 8 471 6.6 200 167 156 191 (1.5) (6.7) 22.5 14.1 15.1 12.4 9.0 9.4 7.3 3.3 3.0 2.8 24 21 23 3.9 4.3 4.9 29
Mahindra CIE Automotive ADD 170 170 0 64 0.9 378 11.9 13.5 15.9 (18.2) 14.0 17.8 14.3 12.5 10.6 7.6 6.5 5.4 1.4 1.2 1.1 10.0 10.3 10.9 — — — 0.9
Mahindra & Mahindra BUY 523 815 56 650 9.1 1,138 39 39 45 (18.0) 0.7 15.2 13.4 13.3 11.6 8.9 8.8 7.5 1.5 1.4 1.3 12.0 11.0 11.6 1.5 1.5 1.7 26
Maruti Suzuki SELL 6,914 5,800 (16) 2,089 29.3 302 203 234 296 (18.2) 14.9 27.0 34 30 23 19.6 15.9 11.9 4.1 3.8 3.4 12.7 13.3 15.3 0.7 0.8 1.1 83
Motherson Sumi Systems SELL 124 105 (15) 391 5.5 3,158 4.4 6.0 7.0 (13.5) 35.0 17.7 28.0 20.8 17.7 9.2 7.1 5.9 3.3 3.0 2.7 12.2 15.0 15.9 1.0 1.2 1.4 18.3
MRF SELL 71,592 62,000 (13) 304 4.3 4 2,523 2,915 3,674 (5.4) 15.5 26.0 28 24.6 19.5 11.7 10.8 8.6 2.6 2.3 2.1 9.4 9.9 11.2 0.1 0.1 0.1 6.5
Schaeffler India SELL 4,501 3,900 (13) 141 2.0 31 118 134 171 (18.3) 14.0 27.3 38 34 26 20.9 19.0 15.0 4.7 4.2 3.7 13.0 13.3 14.8 — — — 0.5
SKF REDUCE 1,989 1,950 (2) 98 1.4 49 66 79 95 0.5 20.4 19.4 30 25 21 21.7 17.9 14.4 5.0 4.4 3.8 16.7 17.4 17.8 0.6 0.7 0.9 0.5
Tata Motors BUY 169 215 27 574 7.8 3,598 (3.4) 7.7 18.1 36.3 325.1 134.5 NM 21.9 9.3 4.4 3.4 2.9 1.0 0.9 0.9 NM 4.5 9.7 — — — 98
Timken SELL 1,041 825 (21) 78 1.1 75 29 34 40 45.6 17.0 18.9 36 31 26 21.3 18.1 14.9 5.1 4.4 3.8 15.0 15.2 15.5 0.1 0.1 0.1 0.6
TVS Motor SELL 440 350 (20) 209 2.9 475 14.4 13.8 21.8 1.8 (3.8) 58.0 31 32 20 15.4 15.1 11.0 5.5 5.0 4.3 19.1 16.4 23 1.0 0.9 1.5 10.9
Varroc Engineering BUY 423 540 28 57 0.8 135 15 29 46 (54.0) 88.2 58.7 27.6 14.7 9.2 7.6 5.7 4.2 1.8 1.6 1.4 6.4 10.9 15.0 — — — 0.4
Automobiles & Components Neutral 7,873 110.5 (10.2) 21.2 35.3 26.1 21.5 15.9 10.2 8.5 6.8 2.7 2.5 2.2 10.4 11.4 13.9 1.1 1.2 1.4 431
Banks
AU Small Finance Bank SELL 1,146 625 (45) 348 4.9 302 24.4 28.5 36.2 86.7 17.0 27.0 47 40 32 — — — 7.8 6.6 5.4 19.0 17.1 18.2 0.0 — — 9.5
Axis Bank REDUCE 737 740 0 2,077 29.1 2,806 17.5 49 62 (3.9) 183.2 25.1 42 14.9 11.9 — — — 2.7 2.3 2.0 6.4 15.1 16.6 0.2 1.0 1.3 91
Bandhan Bank REDUCE 453 540 19 729 10.2 1,610 20.3 25.4 31.2 24.0 25.2 23.0 22.3 17.8 14.5 — — — 4.6 3.7 2.9 23.9 23 22 0.0 0.0 0.0 18.7
Bank of Baroda ADD 86 105 21 399 5.6 4,582 0.8 23.4 27 (50.0) 2,763.0 13.9 106 3.7 3.2 — — — 0.9 0.8 0.7 0.7 15.5 15.6 0.2 5.4 6.2 34
City Union Bank ADD 220 240 9 162 2.3 735 10.0 11.8 13.5 8.1 17.3 14.3 22 18.7 16.4 — — — 3.3 2.9 2.5 14.4 15.0 15.2 0.8 0.9 1.1 2.6
DCB Bank BUY 174 230 32 54 0.8 310 12.8 16.9 22.2 22.1 32.0 30.8 13.5 10.3 7.8 — — — 1.8 1.5 1.3 13.0 15.2 17.2 0.7 0.9 1.2 2.0
Equitas Holdings BUY 108 160 48 37 0.5 342 8.0 10.5 14.5 26.0 32.1 37.5 13.6 10.3 7.5 — — — 1.3 1.2 1.0 9.9 11.2 13.6 — — — 7.8
Federal Bank BUY 87 120 38 174 2.4 1,985 8.4 9.9 12.6 33.6 18.8 26.3 10.4 8.8 6.9 — — — 1.3 1.2 1.0 12.0 12.9 14.7 2.1 2.5 3.2 13.1
HDFC Bank ADD 1,219 1,350 11 6,678 93.6 5,447 48 56 67 24.9 16.6 18.5 25 22 18 — — — 4.0 3.5 3.0 16.5 16.9 17.5 0.8 0.9 1.1 107
ICICI Bank BUY 546 615 13 3,532 49.5 6,447 18.4 32 38 287.4 73.1 18.8 30 17.2 14.4 — — — 3.2 2.8 2.5 10.5 16.4 17.1 0.7 1.2 1.4 165
IndusInd Bank ADD 1,176 1,600 36 815 11.4 712 73 104 121 34.0 42.3 15.4 16 11.3 9.8 — — — 2.3 2.0 1.7 16.6 18.1 17.9 0.9 1.2 1.4 93
Karur Vysya Bank BUY 50 80 61 40 0.6 799 3.4 7 13 27.2 104.1 95.1 15 7.3 3.7 — — — 0.8 0.7 0.6 4.1 8.0 14.5 1.7 3.6 7.0 0.7
Punjab National Bank NR 54 NR — 365 5.1 4,604 2 6 10 110.2 149.0 80.1 25 9.8 5.5 — — — 1.1 0.8 0.6 2.4 7.0 10.2 0.0 0.0 0.0 16.8
RBL Bank ADD 317 375 18 155 2.2 509 9.5 32 41 (53.3) 233.4 30.0 33 10.0 7.7 — — — 1.6 1.4 1.3 5.3 14.0 16.0 0.4 1.3 1.7 62
State Bank of India BUY 319 420 31 2,851 39.9 8,925 24 45 55 2,356.7 87.9 23.3 13 7.2 5.8 — — — 1.6 1.3 1.0 9.2 15.2 16.0 0.1 0.1 0.1 173
Ujjivan Financial Services BUY 386 490 — 47 0.7 121 26.9 34 44 117.0 24.9 31.6 14 11.5 8.7 — — — 2.1 1.9 1.6 15.7 17.0 19.3 0.8 1.1 1.5 13.0
Ujjivan Small Finance Bank SELL 55 45 (17) 94 1.3 1,714 2 3 3 48.2 33.3 26.9 27 19.9 15.7 — — — 3.3 3.0 2.6 15.1 14.9 16.7 0.8 1.0 1.3 0.0
Union Bank RS 48 — — 163 2.3 3,423 0 11 15 101.2 5,126.7 36.8 233 4.5 3.3 — — — 0.7 0.6 0.4 0.2 13.2 13.2 0.0 3.4 4.6 7.8
YES Bank SELL 39 40 3 99 1.4 2,546 (11.6) (4) 10 (255.6) 64.2 351.6 NM NM 3.7 — — — 0.6 0.6 0.5 NM NM 10.2 0.0 0.0 0.0 158
Banks Attractive 19,005 266.2 171.9 91.0 27.0 24 12.6 9.9 2.0 1.6 1.4 8.3 13.0 14.5 0.5 0.9 1.1 1,002
P/B (X) RoE (%) Dividend yield (%)
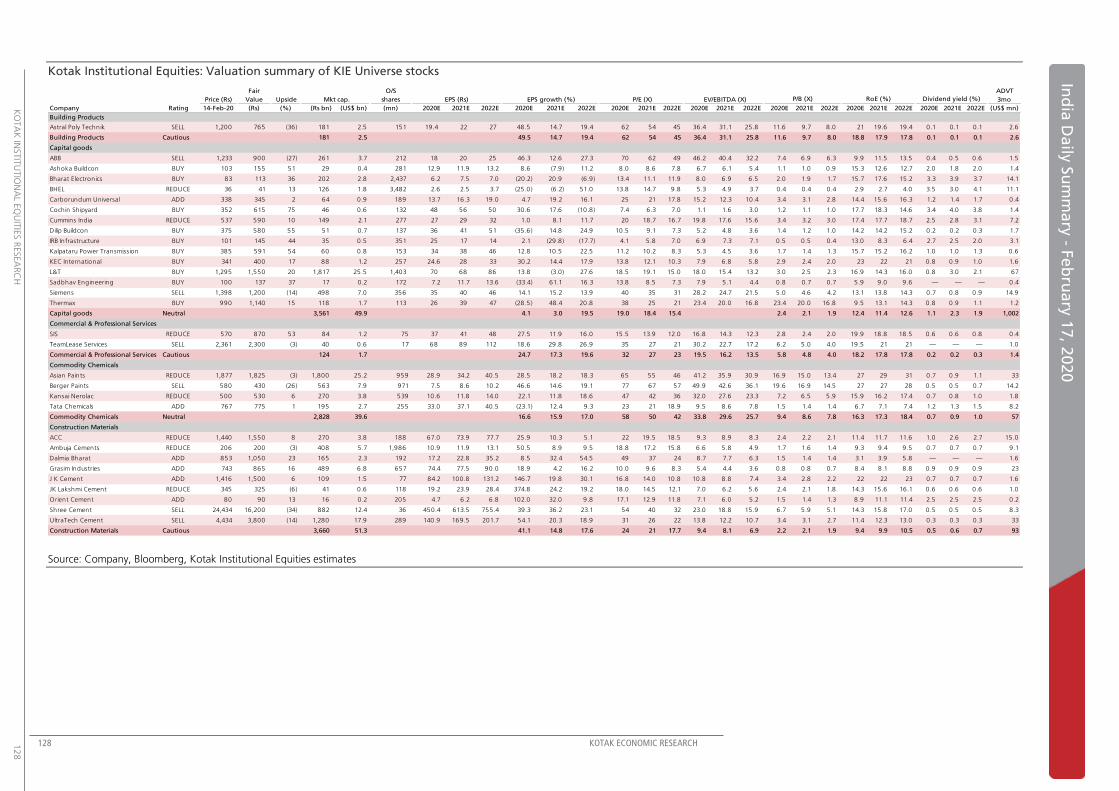
128 KOTAK ECONOMIC RESEARCH
K
OTA
K IN
STIT
UTIO
NA
L EQ
UIT
IES R
ESEA
RC
H
128
Ind
ia D
aily
Su
mm
ary
- Fe
bru
ary
17
, 202
0
Kotak Institutional Equities: Valuation summary of KIE Universe stocks
Source: Company, Bloomberg, Kotak Institutional Equities estimates
Fair O/S ADVT
Price (Rs) Value Upside Mkt cap. shares EPS (Rs) EPS growth (%) P/E (X) EV/EBITDA (X) 3mo
Company Rating 14-Feb-20 (Rs) (%) (Rs bn) (US$ bn) (mn) 2020E 2021E 2022E 2020E 2021E 2022E 2020E 2021E 2022E 2020E 2021E 2022E 2020E 2021E 2022E 2020E 2021E 2022E 2020E 2021E 2022E (US$ mn)
Building Products
Astral Poly Technik SELL 1,200 765 (36) 181 2.5 151 19.4 22 27 48.5 14.7 19.4 62 54 45 36.4 31.1 25.8 11.6 9.7 8.0 21 19.6 19.4 0.1 0.1 0.1 2.6
Building Products Cautious 181 2.5 49.5 14.7 19.4 62 54 45 36.4 31.1 25.8 11.6 9.7 8.0 18.8 17.9 17.8 0.1 0.1 0.1 2.6
Capital goods
ABB SELL 1,233 900 (27) 261 3.7 212 18 20 25 46.3 12.6 27.3 70 62 49 46.2 40.4 32.2 7.4 6.9 6.3 9.9 11.5 13.5 0.4 0.5 0.6 1.5
Ashoka Buildcon BUY 103 155 51 29 0.4 281 12.9 11.9 13.2 8.6 (7.9) 11.2 8.0 8.6 7.8 6.7 6.1 5.4 1.1 1.0 0.9 15.3 12.6 12.7 2.0 1.8 2.0 1.4
Bharat Electronics BUY 83 113 36 202 2.8 2,437 6.2 7.5 7.0 (20.2) 20.9 (6.9) 13.4 11.1 11.9 8.0 6.9 6.5 2.0 1.9 1.7 15.7 17.6 15.2 3.3 3.9 3.7 14.1
BHEL REDUCE 36 41 13 126 1.8 3,482 2.6 2.5 3.7 (25.0) (6.2) 51.0 13.8 14.7 9.8 5.3 4.9 3.7 0.4 0.4 0.4 2.9 2.7 4.0 3.5 3.0 4.1 11.1
Carborundum Universal ADD 338 345 2 64 0.9 189 13.7 16.3 19.0 4.7 19.2 16.1 25 21 17.8 15.2 12.3 10.4 3.4 3.1 2.8 14.4 15.6 16.3 1.2 1.4 1.7 0.4
Cochin Shipyard BUY 352 615 75 46 0.6 132 48 56 50 30.6 17.6 (10.8) 7.4 6.3 7.0 1.1 1.6 3.0 1.2 1.1 1.0 17.7 18.3 14.6 3.4 4.0 3.8 1.4
Cummins India REDUCE 537 590 10 149 2.1 277 27 29 32 1.0 8.1 11.7 20 18.7 16.7 19.8 17.6 15.6 3.4 3.2 3.0 17.4 17.7 18.7 2.5 2.8 3.1 7.2
Dilip Buildcon BUY 375 580 55 51 0.7 137 36 41 51 (35.6) 14.8 24.9 10.5 9.1 7.3 5.2 4.8 3.6 1.4 1.2 1.0 14.2 14.2 15.2 0.2 0.2 0.3 1.7
IRB Infrastructure BUY 101 145 44 35 0.5 351 25 17 14 2.1 (29.8) (17.7) 4.1 5.8 7.0 6.9 7.3 7.1 0.5 0.5 0.4 13.0 8.3 6.4 2.7 2.5 2.0 3.1
Kalpataru Power Transmission BUY 385 591 54 60 0.8 153 34 38 46 12.8 10.5 22.5 11.2 10.2 8.3 5.3 4.5 3.6 1.7 1.4 1.3 15.7 15.2 16.2 1.0 1.0 1.3 0.6
KEC International BUY 341 400 17 88 1.2 257 24.6 28 33 30.2 14.4 17.9 13.8 12.1 10.3 7.9 6.8 5.8 2.9 2.4 2.0 23 22 21 0.8 0.9 1.0 1.6
L&T BUY 1,295 1,550 20 1,817 25.5 1,403 70 68 86 13.8 (3.0) 27.6 18.5 19.1 15.0 18.0 15.4 13.2 3.0 2.5 2.3 16.9 14.3 16.0 0.8 3.0 2.1 67
Sadbhav Engineering BUY 100 137 37 17 0.2 172 7.2 11.7 13.6 (33.4) 61.1 16.3 13.8 8.5 7.3 7.9 5.1 4.4 0.8 0.7 0.7 5.9 9.0 9.6 — — — 0.4
Siemens SELL 1,398 1,200 (14) 498 7.0 356 35 40 46 14.1 15.2 13.9 40 35 31 28.2 24.7 21.5 5.0 4.6 4.2 13.1 13.8 14.3 0.7 0.8 0.9 14.9
Thermax BUY 990 1,140 15 118 1.7 113 26 39 47 (28.5) 48.4 20.8 38 25 21 23.4 20.0 16.8 23.4 20.0 16.8 9.5 13.1 14.3 0.8 0.9 1.1 1.2
Capital goods Neutral 3,561 49.9 4.1 3.0 19.5 19.0 18.4 15.4 2.4 2.1 1.9 12.4 11.4 12.6 1.1 2.3 1.9 1,002
Commercial & Professional Services
SIS REDUCE 570 870 53 84 1.2 75 37 41 48 27.5 11.9 16.0 15.5 13.9 12.0 16.8 14.3 12.3 2.8 2.4 2.0 19.9 18.8 18.5 0.6 0.6 0.8 0.4
TeamLease Services SELL 2,361 2,300 (3) 40 0.6 17 68 89 112 18.6 29.8 26.9 35 27 21 30.2 22.7 17.2 6.2 5.0 4.0 19.5 21 21 — — — 1.0
Commercial & Professional Services Cautious 124 1.7 24.7 17.3 19.6 32 27 23 19.5 16.2 13.5 5.8 4.8 4.0 18.2 17.8 17.8 0.2 0.2 0.3 1.4
Commodity Chemicals
Asian Paints REDUCE 1,877 1,825 (3) 1,800 25.2 959 28.9 34.2 40.5 28.5 18.2 18.3 65 55 46 41.2 35.9 30.9 16.9 15.0 13.4 27 29 31 0.7 0.9 1.1 33
Berger Paints SELL 580 430 (26) 563 7.9 971 7.5 8.6 10.2 46.6 14.6 19.1 77 67 57 49.9 42.6 36.1 19.6 16.9 14.5 27 27 28 0.5 0.5 0.7 14.2
Kansai Nerolac REDUCE 500 530 6 270 3.8 539 10.6 11.8 14.0 22.1 11.8 18.6 47 42 36 32.0 27.6 23.3 7.2 6.5 5.9 15.9 16.2 17.4 0.7 0.8 1.0 1.8
Tata Chemicals ADD 767 775 1 195 2.7 255 33.0 37.1 40.5 (23.1) 12.4 9.3 23 21 18.9 9.5 8.6 7.8 1.5 1.4 1.4 6.7 7.1 7.4 1.2 1.3 1.5 8.2
Commodity Chemicals Neutral 2,828 39.6 16.6 15.9 17.0 58 50 42 33.8 29.6 25.7 9.4 8.6 7.8 16.3 17.3 18.4 0.7 0.9 1.0 57
Construction Materials
ACC REDUCE 1,440 1,550 8 270 3.8 188 67.0 73.9 77.7 25.9 10.3 5.1 22 19.5 18.5 9.3 8.9 8.3 2.4 2.2 2.1 11.4 11.7 11.6 1.0 2.6 2.7 15.0
Ambuja Cements REDUCE 206 200 (3) 408 5.7 1,986 10.9 11.9 13.1 50.5 8.9 9.5 18.8 17.2 15.8 6.6 5.8 4.9 1.7 1.6 1.4 9.3 9.4 9.5 0.7 0.7 0.7 9.1
Dalmia Bharat ADD 853 1,050 23 165 2.3 192 17.2 22.8 35.2 8.5 32.4 54.5 49 37 24 8.7 7.7 6.3 1.5 1.4 1.4 3.1 3.9 5.8 — — — 1.6
Grasim Industries ADD 743 865 16 489 6.8 657 74.4 77.5 90.0 18.9 4.2 16.2 10.0 9.6 8.3 5.4 4.4 3.6 0.8 0.8 0.7 8.4 8.1 8.8 0.9 0.9 0.9 23
J K Cement ADD 1,416 1,500 6 109 1.5 77 84.2 100.8 131.2 146.7 19.8 30.1 16.8 14.0 10.8 10.8 8.8 7.4 3.4 2.8 2.2 22 22 23 0.7 0.7 0.7 1.6
JK Lakshmi Cement REDUCE 345 325 (6) 41 0.6 118 19.2 23.9 28.4 374.8 24.2 19.2 18.0 14.5 12.1 7.0 6.2 5.6 2.4 2.1 1.8 14.3 15.6 16.1 0.6 0.6 0.6 1.0
Orient Cement ADD 80 90 13 16 0.2 205 4.7 6.2 6.8 102.0 32.0 9.8 17.1 12.9 11.8 7.1 6.0 5.2 1.5 1.4 1.3 8.9 11.1 11.4 2.5 2.5 2.5 0.2
Shree Cement SELL 24,434 16,200 (34) 882 12.4 36 450.4 613.5 755.4 39.3 36.2 23.1 54 40 32 23.0 18.8 15.9 6.7 5.9 5.1 14.3 15.8 17.0 0.5 0.5 0.5 8.3
UltraTech Cement SELL 4,434 3,800 (14) 1,280 17.9 289 140.9 169.5 201.7 54.1 20.3 18.9 31 26 22 13.8 12.2 10.7 3.4 3.1 2.7 11.4 12.3 13.0 0.3 0.3 0.3 33
Construction Materials Cautious 3,660 51.3 41.1 14.8 17.6 24 21 17.7 9.4 8.1 6.9 2.2 2.1 1.9 9.4 9.9 10.5 0.5 0.6 0.7 93
P/B (X) RoE (%) Dividend yield (%)

KOTAK ECONOMIC RESEARCH 129
In
dia
Da
ily S
um
ma
ry - F
eb
rua
ry 1
7, 2
02
0
129
K
OTA
K IN
STIT
UTIO
NA
L EQ
UIT
IES R
ESEA
RC
H
Kotak Institutional Equities: Valuation summary of KIE Universe stocks
Source: Company, Bloomberg, Kotak Institutional Equities estimates
Fair O/S ADVT
Price (Rs) Value Upside Mkt cap. shares EPS (Rs) EPS growth (%) P/E (X) EV/EBITDA (X) 3mo
Company Rating 14-Feb-20 (Rs) (%) (Rs bn) (US$ bn) (mn) 2020E 2021E 2022E 2020E 2021E 2022E 2020E 2021E 2022E 2020E 2021E 2022E 2020E 2021E 2022E 2020E 2021E 2022E 2020E 2021E 2022E (US$ mn)
Consumer Durables & Apparel
Crompton Greaves Consumer SELL 282 210 (26) 177 2.5 627 7.1 8.4 9.5 19.1 18.3 13.6 40 34 30 25 21 19 12.5 9.9 8.0 35 33 30 0.9 0.9 0.0 6.3
Havells India SELL 612 520 (15) 383 5.4 625 13.2 17.1 20.4 4.8 29.4 19.8 46 36 30 29 23 19 8.1 7.2 6.3 18.5 21 22 0.8 1.0 1.2 14.6
Page Industries REDUCE 22,447 22,000 (2) 250 3.5 11 363 449 539 2.9 23.6 20.0 62 50 42 40 34 29 27.9 22.2 18.1 48 50 48 0.7 1.0 1.2 10.2
Polycab BUY 1,078 700 (35) 160 2.2 149 37 44 49 9.0 19.1 11.3 29 25 22 16 14 13 4.3 3.7 3.3 16.6 16.3 15.7 0.3 0.4 0.5 4.8
TCNS Clothing Co. ADD 568 770 35 35 0.5 65 9 12 16 (54.3) 31.7 26.0 60 46 36 14 12 9.7 5.2 4.6 4.0 9.2 10.7 11.9 1.5 2.1 2.2 0.2
Vardhman Textiles ADD 996 1,000 0 57 0.8 56 92 120 130 (28.9) 30.0 8.5 10.8 8.3 7.7 7.5 5.9 5.2 1.0 0.9 0.8 9.0 11.0 11.0 3.0 3.0 3.0 0.2
Voltas SELL 688 500 (27) 228 3.2 331 16.9 20.7 24.2 7.8 22.3 16.7 41 33 28 30 26 22 5.0 4.5 4.0 13.0 14.3 14.9 0.5 0.6 0.7 11.9
Whirlpool SELL 2,226 1,260 (43) 282 4.0 127 38 44 52 17.9 16.8 18.6 59 50 42 36 31 27 11.3 9.9 8.8 21 21 22 0.3 0.6 0.9 3.4
Consumer Durables & Apparel Cautious 1,573 22.0 0.6 23.6 41 33 29 25 20 18 6.5 5.7 15.8 17.2 17.6 0.7 0.9 51
Consumer Staples
Bajaj Consumer Care BUY 198 280 42 29 0.4 148 15.3 15.8 17.7 1.6 3.3 12.1 12.9 12.5 11.2 10.3 9.9 8.7 5.7 5.0 4.4 46 42 42 5.1 5.6 6.1 0.6
Britannia Industries REDUCE 3,097 2,900 (6) 745 10.4 240 59 68 79 22.7 14.3 16.2 52 46 39 39 34 30 16.5 13.4 11.0 32 32 30 0.6 0.9 1.1 17.3
Colgate-Palmolive (India) ADD 1,340 1,600 19 365 5.1 272 30 36 41 12.5 18.5 14.6 45 38 33 28.1 24.1 21.2 24.8 24.4 23.9 56 65 74 1.9 2.2 2.5 14.5
Dabur India REDUCE 506 440 (13) 894 12.5 1,766 9.5 11.0 12.0 16.8 15.5 9.7 53 46 42 44 39 33 13.9 12.4 11.3 28 28 28 0.9 1.1 1.3 12.8
GlaxoSmithKline Consumer RS 9,694 — — 408 5.7 42 299 335 378 28 12.0 12.9 32 29 26 27 24 21 8.5 7.4 6.4 28 27 27 1.2 1.3 1.5 2.6
Godrej Consumer Products REDUCE 626 720 15 640 9.0 1,022 15.4 17.7 20.6 6.2 15.3 16.2 41 35 30 28 24 21 7.5 6.8 6.1 20.0 20 21 1.0 1.2 1.3 10.9
Hindustan Unilever REDUCE 2,255 1,900 (16) 4,882 68.4 2,160 34 40 47 19.8 18.4 16.5 67 56 48 46 40 34 53.7 43.5 34.9 87 85 80 1.1 1.2 1.3 42
ITC BUY 208 300 44 2,554 35.8 12,300 11.9 12.6 13.9 17.0 5.9 10.1 17.5 16.5 15.0 12.1 11.4 10.3 4.0 3.7 3.5 21 22 23 3.1 4.3 4.8 45
Jyothy Laboratories ADD 135 170 26 50 0.7 367 5.8 6.5 7.4 4.7 11.9 13.0 23 21 18.3 16.2 14.6 12.9 3.6 3.4 3.2 15.8 16.7 17.8 2.6 3.0 3.3 0.6
Marico ADD 302 365 21 390 5.5 1,290 8.2 8.8 10.0 13.5 7.1 13.7 37 34 30 25 23 21 12.2 11.6 10.9 34 34 37 1.8 2.1 2.3 10.3
Nestle India SELL 16,356 14,000 (14) 1,577 22.1 96 204 238 278 22.6 16.6 16.6 80 69 59 55 48 42 81.6 66.3 54.6 70 107 102 2.1 1.2 1.4 16.9
Tata Global Beverages ADD 397 400 1 250 3.5 631 8.8 10.3 11.5 25.1 18.2 11.1 45 38 35 26 23 20 3.3 3.1 3.0 7.4 8.3 8.8 0.8 0.9 1.1 27
United Breweries ADD 1,282 1,430 12 339 4.7 264 17.9 25.5 32.6 (15.8) 42.2 27.8 71 50 39 36 27 22 9.5 8.1 6.9 14.0 17.4 18.9 0.1 0.3 0.4 8.0
United Spirits REDUCE 704 670 (5) 511 7.2 727 13.7 16.7 20.7 44.8 22.5 23.6 52 42 34 32 27 23 13.1 8.7 6.3 28 25 21 0.3 0.4 0.4 18.5
Varun Beverages ADD 819 900 10 237 3.3 289 16.2 24.8 33.5 51.9 52.4 35.3 50 33 24 19 14 12 7.1 5.8 4.8 17.6 19.3 21 0.1 0.2 0.2 2.5
Consumer Staples Cautious 13,870 194.3 18.1 12.8 14.0 40 36 31 28 25 22 11.2 10.0 8.9 28 28 29 1.5 1.7 2.0 230
Diversified Financials
Bajaj Finance REDUCE 4,782 3,850 (19) 2,877 40.3 599 101 135 163 46 33 21 47 35 29 — — — 8.5 7.0 5.8 23 22 22 0.2 0.3 0.3 81
Bajaj Finserv ADD 9,691 10,200 5 1,542 21.6 159 304 394 475 50 30 21 32 25 20 — — — 4.6 3.9 3.3 16.8 17.1 17.5 0.1 0.1 0.1 30
Cholamandalam ADD 333 340 2 260 3.6 782 17.9 22.0 25.8 18 23.0 17.4 18.6 15.1 12.9 — — — 3.6 3.0 2.5 21 21 21 0.6 0.7 0.9 8.9
HDFC BUY 2,402 2,680 12 4,153 58.2 1,721 107 72 85 88.2 (33) 17.4 22 33 28 — — — 4.7 4.4 4.0 22 13.7 14.8 1.7 1.1 1.3 106
IIFL Wealth REDUCE 1,585 1,200 (24) 138 1.9 85 34.7 45.6 66.8 (23) 31.4 46.5 46 35 24 — — — 4.6 4.4 4.3 10.1 13.0 18.4 1.6 1.9 2.7 0.5
L&T Finance Holdings REDUCE 126 115 (9) 253 3.5 1,999 9 13 16 (15.7) 35 27.8 13.4 9.9 7.8 — — — 1.7 1.5 1.3 13.2 15.7 17.4 1.0 1.1 1.3 18.5
LIC Housing Finance ADD 412 475 15 208 2.9 505 53.2 72.1 83.1 16 35.6 15.2 7.8 5.7 5.0 — — — 1.3 1.1 1.0 15.4 18.2 18.1 2.1 2.9 3.3 24
Mahindra & Mahindra Financial ADD 385 405 5 238 3.3 615 24.5 32.5 40.6 (3) 32.5 24.8 15.7 11.8 9.5 — — — 2.2 2.0 1.7 13.2 15.8 17.5 1.6 2.2 2.7 11.1
Muthoot Finance ADD 747 860 15 299 4.2 401 72 74 84 46.4 3 13.0 10.4 10.1 8.9 — — — 2.5 2.1 1.8 27 23 22 2.3 2.4 2.7 11.7
PNB Housing Finance NR 417 — — 70 1.0 169 66.9 77.6 88.6 (6) 16.0 14.2 6.2 5.4 4.7 — — — 0.9 0.8 0.7 14.1 14.6 14.8 1.8 2.0 2.3 6.9
Shriram City Union Finance BUY 1,460 1,975 35 96 1.3 66 171 191 214 14.0 12 12.0 8.5 7.7 6.8 — — — 1.4 1.2 1.1 16.4 15.9 15.6 1.5 1.7 1.9 0.2
Shriram Transport BUY 1,286 1,525 19 292 4.1 227 134.4 136.2 162.2 19 1.3 19.1 9.6 9.4 7.9 — — — 1.7 1.5 1.3 17.8 15.7 16.4 1.5 1.6 1.9 18.9
Diversified Financials Neutral 10,426 146.1 45.4 0.9 19.1 23 23 19.3 3.0 2.7 2.4 13.0 11.7 12.4 1.0 0.9 1.0 317
P/B (X) RoE (%) Dividend yield (%)

130 KOTAK ECONOMIC RESEARCH
K
OTA
K IN
STIT
UTIO
NA
L EQ
UIT
IES R
ESEA
RC
H
130
Ind
ia D
aily
Su
mm
ary
- Fe
bru
ary
17
, 202
0
Kotak Institutional Equities: Valuation summary of KIE Universe stocks
Source: Company, Bloomberg, Kotak Institutional Equities estimates
Fair O/S ADVT
Price (Rs) Value Upside shares 3mo
Company Rating 14-Feb-20 (Rs) (%) (Rs bn) (US$ bn) (mn) 2020E 2021E 2022E 2020E 2021E 2022E 2020E 2021E 2022E 2020E 2021E 2022E 2020E 2021E 2022E 2020E 2021E 2022E 2020E 2021E 2022E (US$ mn)
Electric Utilities
CESC BUY 713 820 15 95 1.3 133 84 101 114 (7) 19.9 12.3 8.5 7.1 6.3 6.1 5.5 5.0 0.7 0.7 0.6 8.9 9.9 10.3 1.7 1.7 1.8 3.3
JSW Energy ADD 63 75 19 103 1.4 1,640 6.4 5.7 5.2 53 (10) (8.5) 9.9 11.0 12.0 5.2 4.4 3.7 0.8 0.7 0.7 8.5 7.0 6.0 — — — 0.7
NHPC ADD 23 27 15 236 3.3 10,045 3.4 3.4 3.7 34.3 2 6.8 6.9 6.8 6.4 6.1 6.6 6.0 0.7 0.7 0.7 10.8 10.5 10.6 7.3 6.5 7.1 2.9
NTPC BUY 113 160 42 1,116 15.6 9,895 12.3 14.3 15.5 9.4 16.8 7.9 9.2 7.9 7.3 9.5 8.2 6.6 1.0 0.9 0.8 10.9 11.8 11.7 3.3 3.8 4.1 18.4
Power Grid BUY 184 235 28 963 13.5 5,232 20.2 23 25 6 13.5 11.1 9.1 8.0 7.2 7.1 6.6 6.2 1.5 1.3 1.2 17.0 17.4 17.5 3.8 4.4 4.8 31
Tata Power BUY 54 72 34 146 2.0 2,705 3.6 5.4 7.2 72 48 33.4 14.8 10.0 7.5 7.6 7.3 6.7 0.8 0.8 0.7 5.7 7.9 9.7 — — — 6.1
Electric Utilities Attractive 2,658 37.2 12.2 14.0 9.8 9.1 8.0 7.3 1.0 1.0 0.9 11.4 12.0 12.1 3.5 3.8 4.2 62
Fertilizers & Agricultural Chemicals
Bayer Cropscience SELL 4,358 3,000 (31) 196 2.7 45 103.8 119.4 138.3 32.3 15.1 15.8 42 36 32 31 26 23 7.8 6.7 5.8 19.6 19.7 19.7 0.5 0.5 0.6 1.0
Dhanuka Agritech SELL 530 470 (11) 25 0.4 48 28.0 30.3 33.4 18.1 8.5 10.1 19.0 17.5 15.9 15.0 13.3 11.6 3.4 2.9 2.5 19.1 17.9 17.1 1.1 1.1 1.3 0.4
Godrej Agrovet SELL 521 470 (10) 100 1.4 192 11.8 16.4 19.9 2.9 39.2 21 44 32 26 24 17 15 4.5 4.0 3.5 10.5 13.3 14.3 0.6 0.8 1.0 0.8
PI Industries SELL 1,550 1,280 (17) 214 3.0 138 37.2 46.1 56.1 25.3 24 22 42 34 28 29 23 19 7.9 6.7 5.6 21 22 22 0.4 0.5 0.7 3.1
Rallis India ADD 232 230 (1) 45 0.6 195 10.9 12.5 14.4 29.4 14.8 14.8 21.2 18.5 16.1 14.7 12.5 10.7 3.1 2.8 2.5 15.6 16.0 16.4 1.2 1.3 1.4 1.7
UPL SELL 592 510 (14) 452 6.3 765 28.6 40.1 45.8 51.3 40.2 14.1 21 14.7 12.9 9.8 8.2 7.2 2.8 2.5 2.2 14.2 17.8 17.9 1.4 1.9 2.2 25
Fertilizers & Agricultural Chemicals Attractive 1,032 14.5 39.0 32.2 15.6 28 21 18.0 13.6 11.3 9.9 4.0 3.5 3.1 14.5 16.8 17.0 0.9 1.2 1.4 32
Gas Utilities
GAIL (India) BUY 123 175 43 553 7.7 4,510 12.2 13.9 14.9 (12.4) 13.5 7.3 10.0 8.8 8.2 7.2 6.5 6.0 1.2 1.1 1.1 12.3 13.3 13.5 6.0 6.1 6.5 20
GSPL SELL 241 225 (7) 136 1.9 564 17.0 14.2 13.1 20.4 (16.1) (7.9) 14.2 16.9 18.4 6.7 7.5 7.7 2.0 1.9 1.7 15.4 11.5 9.7 1.1 0.9 1.1 1.8
Indraprastha Gas SELL 488 365 (25) 341 4.8 700 17.3 19.7 22.1 43.7 13.8 12.2 28.2 24.8 22.1 21.1 18.0 15.7 6.9 5.8 4.9 27 25 24 0.8 1.0 1.2 15.8
Mahanagar Gas ADD 1,161 1,300 12 115 1.6 99 76.8 84.0 89.4 36.7 9.4 6.5 15.1 13.8 13.0 9.8 8.6 7.8 4.1 3.5 3.1 29 27 25 2.8 3.3 3.9 14.8
Petronet LNG BUY 261 325 25 391 5.5 1,500 17.9 20.8 23.1 19.4 16.0 11.1 14.5 12.5 11.3 8.4 7.2 6.4 3.5 3.1 2.8 25 26 26 3.8 4.8 5.8 8.6
Gas Utilities Attractive 1,536 21.5 3.7 11.3 7.8 13.8 12.4 11.5 8.9 8.1 7.4 2.2 2.0 1.8 15.6 16.0 15.9 3.6 4.0 4.5 61
Health Care Services
Apollo Hospitals ADD 1,704 1,840 8 237 3.3 139 28.5 38 52 68 33 38 59.8 45.1 32.7 16.4 16.2 14.1 6.6 6.1 5.5 11.5 14.1 17.7 0.6 0.9 1.2 16.5
Aster DM Healthcare NR 173 - (100) 87 1.2 505 6.9 8.8 10.6 4 27.5 21 25.2 19.7 16.3 8.9 7.7 6.7 3.2 2.8 2.4 13.3 15.0 15.8 — — — 0.8
Dr Lal Pathlabs SELL 1,650 1,080 (35) 137 1.9 83 31.5 36.6 42.1 31.9 16.2 15.2 52.4 45.1 39.2 34.5 29.6 25.4 12.2 10.3 8.7 25 25 24 0.6 0.7 0.8 2.9
HCG BUY 117 190 62 10 0.1 85 (8.0) (5.4) (5.2) (130) 33 3 NM NM NM 9.4 8.0 7.0 2.0 2.2 2.4 NM NM NM — — — 0.1
Metropolis Healthcare SELL 1,770 1,130 (36) 89 1.2 50 32.2 37.2 42.9 34.6 15.4 15 54.9 47.6 41.2 34.6 29.5 25.9 17.1 13.9 11.4 35 32 30 0.5 0.6 0.7 1.1
Narayana Hrudayalaya BUY 346 410 19 71 1.0 204 6.7 8.8 11.2 131.2 31 27 51.7 39.3 31.0 17.9 15.2 12.9 5.8 5.1 4.3 11.9 13.7 15.1 — — — 2.6
Health Care Services Attractive 632 8.9 35 29 26 51.1 39.6 31.4 16.7 15.0 13.1 6.5 5.8 5.1 12.8 14.7 16.3 0.4 0.6 0.7 24
Hotels & Restaurants
Jubilant Foodworks ADD 1,813 1,900 5 239 3.4 132 27 38 52 12 42.1 36 67.4 47.4 35.0 24.5 19.6 15.7 19.3 14.5 11.0 28 35 36 0.3 0.6 0.9 21
Lemon Tree Hotels BUY 56 70 25 44 0.6 789 1.0 1.8 2.2 44 83 23 58.2 31.8 25.9 19.9 13.8 10.5 4.7 4.3 3.9 8.3 14.0 15.7 — 1.0 1.3 0.9
Hotels & Restaurants Attractive 284 4.0 17 50 33 65.6 43.8 32.9 23.4 18.0 14.3 12.9 10.5 8.5 19.7 24 26 0.3 0.6 1.0 22
Insurance
HDFC Life Insurance ADD 574 590 3 1,159 16.2 2,009 7.2 8.4 9.8 12.6 17.9 16.1 80.1 68.0 59 — — — 18.5 16.6 14.9 24 26 27 0.3 0.4 0.4 24
ICICI Lombard SELL 1,354 825 (39) 615 8.6 454 26.8 33.4 38.9 16 25 16 50.4 40.5 35 — — — 9.9 8.4 7.1 21 22 22 0.4 0.5 0.6 9.8
ICICI Prudential Life BUY 481 580 21 691 9.7 1,436 8.2 9.0 10.3 4 9.0 15.3 58.5 53.6 47 — — — 8.8 7.8 6.9 16.1 15.5 15.7 0.3 0.3 0.4 21
Max Financial Services ADD 487 550 13 131 1.8 417 6.9 9.9 14.4 275 44 45 70.9 49.2 34 — — — — — — 13.7 17.9 23 0.5 0.7 1.1 16.0
SBI Life Insurance ADD 914 1,010 10 914 12.8 1,000 13.7 16.1 17.7 3.5 17.5 9.4 66.6 56.7 52 — — — 10.6 9.2 8.0 17.1 17.4 16.5 0.2 0.3 0.3 40
Insurance Attractive 3,510 49.2 13.5 18.8 16.2 63.8 53.7 46 11.3 9.9 8.6 17.7 18.4 18.7 0.2 0.3 0.3 110
Mkt cap. EPS (Rs) EPS growth (%) P/E (X) EV/EBITDA (X) P/B (X) RoE (%) Dividend yield (%)

KOTAK ECONOMIC RESEARCH 131
In
dia
Da
ily S
um
ma
ry - F
eb
rua
ry 1
7, 2
02
0
131
K
OTA
K IN
STIT
UTIO
NA
L EQ
UIT
IES R
ESEA
RC
H
Kotak Institutional Equities: Valuation summary of KIE Universe stocks
Source: Company, Bloomberg, Kotak Institutional Equities estimates
Fair O/S ADVT
Price (Rs) Value Upside shares 3mo
Company Rating 14-Feb-20 (Rs) (%) (Rs bn) (US$ bn) (mn) 2020E 2021E 2022E 2020E 2021E 2022E 2020E 2021E 2022E 2020E 2021E 2022E 2020E 2021E 2022E 2020E 2021E 2022E 2020E 2021E 2022E (US$ mn)
Internet Software & Services
Info Edge SELL 2,850 2,470 (13) 349 4.9 122.0 31.0 39.7 48.7 20.0 28.0 22.7 92.0 71.8 58.6 78.5 59.2 47.8 13.2 11.7 10.3 15.3 17.3 18.7 0.3 0.3 0.4 16.8
Just Dial REDUCE 508 570 12 33 0.5 64.8 40.0 40.9 42.4 25.4 2.2 3.5 12.7 12.4 12.0 6.6 5.4 4.5 2.7 2.3 1.9 23 19.7 17.4 0.8 0.8 0.8 21
Internet Software & Services Attractive 382 5.4 22.1 17.5 15.9 59.9 51.0 44.0 50.7 41.3 35.4 9.9 8.6 7.5 16.5 16.9 17.1 0.4 0.4 0.5 37
IT Services
HCL Technologies ADD 622 650 5 1,687 23.6 2,702 39.9 43.5 48.0 9.0 8.9 10.4 15.6 14.3 13.0 9.9 8.8 7.7 3.4 3.0 2.6 24 22 21 2.5 2.6 2.6 27
Hexaware Technologies REDUCE 371 390 5 111 1.6 302 21.2 24.4 26.5 9.9 15.2 8.6 17.5 15.2 14.0 12.7 11.0 9.4 4.1 3.6 3.1 25 25 24 2.3 3.2 3.2 2.5
Infosys ADD 786 865 10 3,349 46.9 4,256 38.7 42.5 47.3 9.3 9.9 11.3 20.3 18.5 16.6 14.2 12.4 11.1 5.3 5.0 4.6 26 28 29 2.8 3.3 3.8 80
L&T Infotech ADD 2,032 2,060 1 354 5.0 175 84.5 102.1 120.6 (2) 20.8 18.2 24.1 19.9 16.9 16.5 13.6 11.4 6.2 5.2 4.4 28 29 28 1.5 1.6 1.8 4.4
Mindtree REDUCE 960 830 (14) 158 2.2 165 38.5 55.6 63.9 (16) 44 15 24.9 17.3 15.0 13.8 10.2 8.7 4.7 4.0 3.4 19.1 25 25 3.1 1.7 2.0 10.3
Mphasis REDUCE 910 960 5 170 2.4 186 60.2 65.6 70.7 7 8.9 7.8 15.1 13.9 12.9 9.3 8.3 7.6 3.0 2.7 2.5 20 21 21 3.3 4.4 4.9 3.0
TCS REDUCE 2,184 2,020 (8) 8,196 114.8 3,752 87.1 95.1 104.3 5 9.2 9.6 25.1 23.0 20.9 18.1 16.1 14.5 8.5 7.9 7.3 35 36 36 2.8 2.8 3.1 101
Tech Mahindra ADD 834 890 7 740 10.4 880 47.8 54.4 62.6 0.1 13.9 15.0 17.5 15.3 13.3 11.2 9.0 7.6 3.2 2.9 2.5 19.5 19.7 20 2.0 2.2 2.5 23
Wipro REDUCE 243 265 9 1,388 19.4 5,827 17.2 18.9 20.7 14.8 10.2 9.4 14.2 12.8 11.7 8.7 7.4 6.6 2.6 2.1 2.0 17.9 18.0 17.4 0.6 0.8 3.5 10.9
IT Services Cautious 16,152 226.3 4.7 10.0 10.6 20.7 18.8 17.0 14.2 12.5 11.1 5.3 4.8 4.3 26 25 25 2.5 2.7 3.2 261
Media
DB Corp. REDUCE 126 135 7 22 0.3 175 18.0 18.7 18.6 14.6 4.1 (0.5) 7.0 6.7 6.8 3.6 3.3 3.4 1.2 1.2 1.2 16.9 17.4 17.4 9.9 11.9 13.5 0.2
Jagran Prakashan REDUCE 68 60 (12) 20 0.3 296 8.7 9.9 10.7 (0.9) 14 NA 7.8 6.9 NA 3.3 3.1 NA 1.1 1.1 NA 13.7 15.4 16.7 13.2 13.2 13.2 0.7
PVR REDUCE 2,076 1,850 (11) 107 1.5 51 43.0 59.8 69.1 (0) 39 15 48.3 34.7 30.0 16.5 14.2 12.3 5.5 4.8 4.2 13.9 14.8 15.0 0.2 0.3 0.3 10.5
Sun TV Network REDUCE 497 525 6 196 2.7 394 37.8 41.4 43.8 4 9.5 5.7 13.1 12.0 11.4 9.3 8.4 7.8 3.3 3.0 2.8 26 26 25 4.0 4.5 4.9 16.3
Zee Entertainment Enterprises ADD 239 340 42 229 3.2 960 17.2 18.4 21.0 4.4 6.9 13.7 13.9 13.0 11.4 8.8 8.0 6.9 2.4 2.1 1.9 17.8 17.3 17.6 1.9 2.3 2.3 93
Media Attractive 574 8.0 4.9 9.9 9.4 14.6 13.3 12.1 8.9 8.1 7.3 2.7 2.5 2.2 18.4 18.6 18.6 3.0 3.4 3.6 121
Metals & Mining
Hindalco Industries BUY 194 250 29 436 6.1 2,224 22.1 24.9 28.1 (10.5) 12.6 13 8.8 7.8 6.9 5.4 5.0 4.3 0.7 0.6 0.6 8.2 8.6 8.9 0.6 0.6 0.6 24
Hindustan Zinc REDUCE 191 210 10 806 11.3 4,225 16.4 16.9 18.4 (13.1) 3.3 9.0 11.7 11.3 10.4 7.1 6.9 6.4 2.6 2.9 3.2 22 24 29 10.5 10.5 10.5 1.7
Jindal Steel and Power BUY 191 240 26 194 2.7 1,016 2.7 33.2 23.2 259 1,112 (30) 69.6 5.7 8.2 7.0 4.4 4.7 0.6 0.5 0.5 0.9 9.8 6.3 — — — 53
JSW Steel ADD 289 290 0 699 9.8 2,402 8.7 21.6 28.8 (72.8) 150 32.9 33.4 13.4 10.1 10.2 7.2 5.9 1.9 1.7 1.5 5.8 13.3 15.7 1.5 1.5 1.5 29
National Aluminium Co. SELL 41 35 (14) 76 1.1 1,866 0.6 2.3 2.2 (92) 254 (3.0) 63.3 17.9 18.5 10.3 6.4 8.1 0.7 0.7 0.7 1.2 4.1 4.0 3.0 5.6 5.4 5.9
NMDC ADD 106 135 27 326 4.6 3,062 16.9 17.3 15.7 14.6 2.4 (9) 6.3 6.1 6.8 4.4 4.3 4.8 1.2 1.1 1.0 19.2 18.3 15.5 7.9 8.1 7.4 13.6
Tata Steel BUY 435 560 29 494 6.9 1,146 9.8 65.0 91.4 (89) 562 41 44.2 6.7 4.8 7.6 5.5 4.3 0.7 0.6 0.6 1.6 10.3 12.9 2.3 2.3 2.3 96
Vedanta BUY 141 175 24 524 7.3 3,717 10.4 17.7 20.1 (32) 71 13.5 13.6 8.0 7.0 6.1 5.1 4.8 0.8 0.9 0.9 6.2 10.7 12.3 12.8 12.8 12.8 30
Metals & Mining Attractive 3,555 49.8 (43.2) 69.7 13.6 14.5 8.6 7.5 6.9 5.5 5.0 1.1 1.0 0.9 7.3 11.7 12.5 5.7 5.8 5.7 50
RoE (%) Dividend yield (%)Mkt cap. EPS (Rs) EPS growth (%) P/E (X) EV/EBITDA (X) P/B (X)
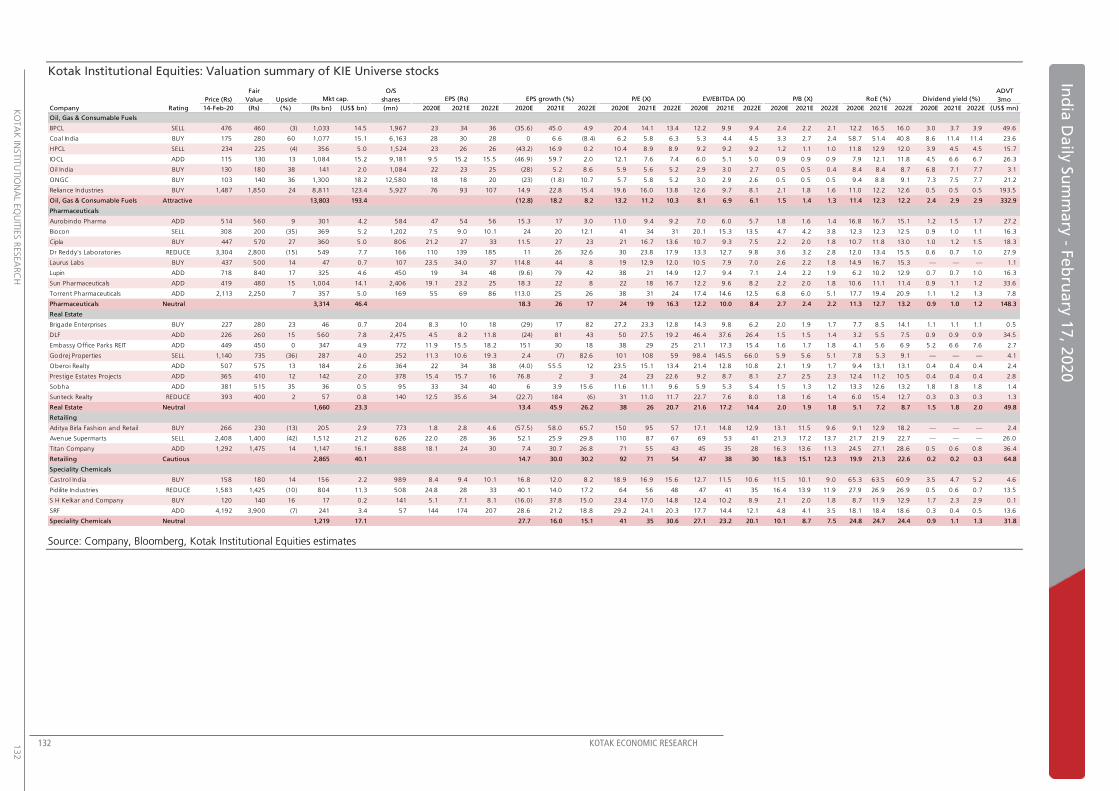
132 KOTAK ECONOMIC RESEARCH
K
OTA
K IN
STIT
UTIO
NA
L EQ
UIT
IES R
ESEA
RC
H
132
Ind
ia D
aily
Su
mm
ary
- Fe
bru
ary
17
, 202
0
Kotak Institutional Equities: Valuation summary of KIE Universe stocks
Source: Company, Bloomberg, Kotak Institutional Equities estimates
Fair O/S ADVT
Price (Rs) Value Upside shares 3mo
Company Rating 14-Feb-20 (Rs) (%) (Rs bn) (US$ bn) (mn) 2020E 2021E 2022E 2020E 2021E 2022E 2020E 2021E 2022E 2020E 2021E 2022E 2020E 2021E 2022E 2020E 2021E 2022E 2020E 2021E 2022E (US$ mn)
Oil, Gas & Consumable Fuels
BPCL SELL 476 460 (3) 1,033 14.5 1,967 23 34 36 (35.6) 45.0 4.9 20.4 14.1 13.4 12.2 9.9 9.4 2.4 2.2 2.1 12.2 16.5 16.0 3.0 3.7 3.9 49.6
Coal India BUY 175 280 60 1,077 15.1 6,163 28 30 28 0 6.6 (8.4) 6.2 5.8 6.3 5.3 4.4 4.5 3.3 2.7 2.4 58.7 51.4 40.8 8.6 11.4 11.4 23.6
HPCL SELL 234 225 (4) 356 5.0 1,524 23 26 26 (43.2) 16.9 0.2 10.4 8.9 8.9 9.2 9.2 9.2 1.2 1.1 1.0 11.8 12.9 12.0 3.9 4.5 4.5 15.7
IOCL ADD 115 130 13 1,084 15.2 9,181 9.5 15.2 15.5 (46.9) 59.7 2.0 12.1 7.6 7.4 6.0 5.1 5.0 0.9 0.9 0.9 7.9 12.1 11.8 4.5 6.6 6.7 26.3
Oil India BUY 130 180 38 141 2.0 1,084 22 23 25 (28) 5.2 8.6 5.9 5.6 5.2 2.9 3.0 2.7 0.5 0.5 0.4 8.4 8.4 8.7 6.8 7.1 7.7 3.1
ONGC BUY 103 140 36 1,300 18.2 12,580 18 18 20 (23) (1.8) 10.7 5.7 5.8 5.2 3.0 2.9 2.6 0.5 0.5 0.5 9.4 8.8 9.1 7.3 7.5 7.7 21.2
Reliance Industries BUY 1,487 1,850 24 8,811 123.4 5,927 76 93 107 14.9 22.8 15.4 19.6 16.0 13.8 12.6 9.7 8.1 2.1 1.8 1.6 11.0 12.2 12.6 0.5 0.5 0.5 193.5
Oil, Gas & Consumable Fuels Attractive 13,803 193.4 (12.8) 18.2 8.2 13.2 11.2 10.3 8.1 6.9 6.1 1.5 1.4 1.3 11.4 12.3 12.2 2.4 2.9 2.9 332.9
Pharmaceuticals
Aurobindo Pharma ADD 514 560 9 301 4.2 584 47 54 56 15.3 17 3.0 11.0 9.4 9.2 7.0 6.0 5.7 1.8 1.6 1.4 16.8 16.7 15.1 1.2 1.5 1.7 27.2
Biocon SELL 308 200 (35) 369 5.2 1,202 7.5 9.0 10.1 24 20 12.1 41 34 31 20.1 15.3 13.5 4.7 4.2 3.8 12.3 12.3 12.5 0.9 1.0 1.1 16.3
Cipla BUY 447 570 27 360 5.0 806 21.2 27 33 11.5 27 23 21 16.7 13.6 10.7 9.3 7.5 2.2 2.0 1.8 10.7 11.8 13.0 1.0 1.2 1.5 18.3
Dr Reddy's Laboratories REDUCE 3,304 2,800 (15) 549 7.7 166 110 139 185 11 26 32.6 30 23.8 17.9 13.3 12.7 9.8 3.6 3.2 2.8 12.0 13.4 15.5 0.6 0.7 1.0 27.9
Laurus Labs BUY 437 500 14 47 0.7 107 23.5 34.0 37 114.8 44 8 19 12.9 12.0 10.5 7.9 7.0 2.6 2.2 1.8 14.9 16.7 15.3 — — — 1.1
Lupin ADD 718 840 17 325 4.6 450 19 34 48 (9.6) 79 42 38 21 14.9 12.7 9.4 7.1 2.4 2.2 1.9 6.2 10.2 12.9 0.7 0.7 1.0 16.3
Sun Pharmaceuticals ADD 419 480 15 1,004 14.1 2,406 19.1 23.2 25 18.3 22 8 22 18 16.7 12.2 9.6 8.2 2.2 2.0 1.8 10.6 11.1 11.4 0.9 1.1 1.2 33.6
Torrent Pharmaceuticals ADD 2,113 2,250 7 357 5.0 169 55 69 86 113.0 25 26 38 31 24 17.4 14.6 12.5 6.8 6.0 5.1 17.7 19.4 20.9 1.1 1.2 1.3 7.8
Pharmaceuticals Neutral 3,314 46.4 18.3 26 17 24 19 16.3 12.2 10.0 8.4 2.7 2.4 2.2 11.3 12.7 13.2 0.9 1.0 1.2 148.3
Real Estate
Brigade Enterprises BUY 227 280 23 46 0.7 204 8.3 10 18 (29) 17 82 27.2 23.3 12.8 14.3 9.8 6.2 2.0 1.9 1.7 7.7 8.5 14.1 1.1 1.1 1.1 0.5
DLF ADD 226 260 15 560 7.8 2,475 4.5 8.2 11.8 (24) 81 43 50 27.5 19.2 46.4 37.6 26.4 1.5 1.5 1.4 3.2 5.5 7.5 0.9 0.9 0.9 34.5
Embassy Office Parks REIT ADD 449 450 0 347 4.9 772 11.9 15.5 18.2 151 30 18 38 29 25 21.1 17.3 15.4 1.6 1.7 1.8 4.1 5.6 6.9 5.2 6.6 7.6 2.7
Godrej Properties SELL 1,140 735 (36) 287 4.0 252 11.3 10.6 19.3 2.4 (7) 82.6 101 108 59 98.4 145.5 66.0 5.9 5.6 5.1 7.8 5.3 9.1 — — — 4.1
Oberoi Realty ADD 507 575 13 184 2.6 364 22 34 38 (4.0) 55.5 12 23.5 15.1 13.4 21.4 12.8 10.8 2.1 1.9 1.7 9.4 13.1 13.1 0.4 0.4 0.4 2.4
Prestige Estates Projects ADD 365 410 12 142 2.0 378 15.4 15.7 16 76.8 2 3 24 23 22.6 9.2 8.7 8.1 2.7 2.5 2.3 12.4 11.2 10.5 0.4 0.4 0.4 2.8
Sobha ADD 381 515 35 36 0.5 95 33 34 40 6 3.9 15.6 11.6 11.1 9.6 5.9 5.3 5.4 1.5 1.3 1.2 13.3 12.6 13.2 1.8 1.8 1.8 1.4
Sunteck Realty REDUCE 393 400 2 57 0.8 140 12.5 35.6 34 (22.7) 184 (6) 31 11.0 11.7 22.7 7.6 8.0 1.8 1.6 1.4 6.0 15.4 12.7 0.3 0.3 0.3 1.3
Real Estate Neutral 1,660 23.3 13.4 45.9 26.2 38 26 20.7 21.6 17.2 14.4 2.0 1.9 1.8 5.1 7.2 8.7 1.5 1.8 2.0 49.8
Retailing
Aditya Birla Fashion and Retail BUY 266 230 (13) 205 2.9 773 1.8 2.8 4.6 (57.5) 58.0 65.7 150 95 57 17.1 14.8 12.9 13.1 11.5 9.6 9.1 12.9 18.2 — — — 2.4
Avenue Supermarts SELL 2,408 1,400 (42) 1,512 21.2 626 22.0 28 36 52.1 25.9 29.8 110 87 67 69 53 41 21.3 17.2 13.7 21.7 21.9 22.7 — — — 26.0
Titan Company ADD 1,292 1,475 14 1,147 16.1 888 18.1 24 30 7.4 30.7 26.8 71 55 43 45 35 28 16.3 13.6 11.3 24.5 27.1 28.6 0.5 0.6 0.8 36.4
Retailing Cautious 2,865 40.1 14.7 30.0 30.2 92 71 54 47 38 30 18.3 15.1 12.3 19.9 21.3 22.6 0.2 0.2 0.3 64.8
Speciality Chemicals
Castrol India BUY 158 180 14 156 2.2 989 8.4 9.4 10.1 16.8 12.0 8.2 18.9 16.9 15.6 12.7 11.5 10.6 11.5 10.1 9.0 65.3 63.5 60.9 3.5 4.7 5.2 4.6
Pidilite Industries REDUCE 1,583 1,425 (10) 804 11.3 508 24.8 28 33 40.1 14.0 17.2 64 56 48 47 41 35 16.4 13.9 11.9 27.9 26.9 26.9 0.5 0.6 0.7 13.5
S H Kelkar and Company BUY 120 140 16 17 0.2 141 5.1 7.1 8.1 (16.0) 37.8 15.0 23.4 17.0 14.8 12.4 10.2 8.9 2.1 2.0 1.8 8.7 11.9 12.9 1.7 2.3 2.9 0.1
SRF ADD 4,192 3,900 (7) 241 3.4 57 144 174 207 28.6 21.2 18.8 29.2 24.1 20.3 17.7 14.4 12.1 4.8 4.1 3.5 18.1 18.4 18.6 0.3 0.4 0.5 13.6
Speciality Chemicals Neutral 1,219 17.1 27.7 16.0 15.1 41 35 30.6 27.1 23.2 20.1 10.1 8.7 7.5 24.8 24.7 24.4 0.9 1.1 1.3 31.8
Mkt cap. EPS (Rs) EPS growth (%) P/E (X) EV/EBITDA (X) P/B (X) RoE (%) Dividend yield (%)

KOTAK ECONOMIC RESEARCH 133
In
dia
Da
ily S
um
ma
ry - F
eb
rua
ry 1
7, 2
02
0
133
K
OTA
K IN
STIT
UTIO
NA
L EQ
UIT
IES R
ESEA
RC
H
Kotak Institutional Equities: Valuation summary of KIE Universe stocks
Source: Company, Bloomberg, Kotak Institutional Equities estimates
Fair O/S ADVT
Price (Rs) Value Upside shares 3mo
Company Rating 14-Feb-20 (Rs) (%) (Rs bn) (US$ bn) (mn) 2020E 2021E 2022E 2020E 2021E 2022E 2020E 2021E 2022E 2020E 2021E 2022E 2020E 2021E 2022E 2020E 2021E 2022E 2020E 2021E 2022E (US$ mn)
Telecommunication Services
Bharti Airtel BUY 565 600 6 3,082 43.2 5,455 (5.5) 6.0 13.5 NM NM NM NM 93.8 42.0 11.4 8.5 7.1 3.8 3.9 3.7 NM 4.1 9.0 0.7 1.1 1.1 128.1
Bharti Infratel REDUCE 235 230 (2) 435 6.1 1,850 15.3 15.7 17.8 16.9 2.4 13.1 15.4 15.0 13.3 7.5 7.0 6.3 2.9 2.8 2.7 19.0 18.8 20.9 4.1 5.1 5.8 41.2
Vodafone Idea RS 3 — — 98 1.4 28,736 (22.3) (4.0) (6.2) NM NM NM NM NM NM 19.0 9.3 8.6 0.4 0.8 (1.6) NM NM NM — — — 34
Tata Communications ADD 390 500 28 111 1.6 285 11.0 14.0 17.9 35.3 26.5 28.0 35.3 27.9 21.8 6.6 6.0 5.4 211.7 25.3 11.9 NM 162 74.1 1.9 1.9 1.9 1.3
Telecommunication Services Cautious 3,727 52.2 NM 65.3 47.2 NM NM NM 11.7 8.4 7.3 3.1 3.5 4.0 NM NM NM 1.1 1.5 1.6 204.3
Transportation
Adani Ports and SEZ BUY 367 475 29 745 10.4 2,032 24.6 24.8 28.2 23.1 0.8 13.8 14.9 14.8 13.0 12.3 10.6 9.2 2.9 2.5 2.2 19.9 18.2 17.9 4.3 1.2 1.3 23.1
Container Corp. SELL 560 515 (8) 341 4.8 609 16.6 20.6 26.7 1.9 23.6 29.7 34 27 21 18.8 16.0 12.2 3.2 3.1 2.9 9.7 11.5 14.1 0.4 1.6 2.0 9.8
Gateway Distriparks BUY 125 162 30 14 0.2 109 3.9 6.0 9.2 (42.8) 55.9 51.7 32.2 20.6 13.6 7.5 6.2 5.1 0.9 0.8 0.8 2.9 4.1 6.0 2.4 2.4 2.4 0.5
Gujarat Pipavav Port BUY 81 118 46 39 0.5 483 6.2 5.7 7.2 44.9 (8.2) 26.7 13.1 14.3 11.3 7.5 6.6 5.8 1.9 1.9 1.9 14.7 13.4 16.9 6.6 6.2 7.8 0.6
InterGlobe Aviation REDUCE 1,439 1,535 7 554 7.8 383 70.0 97.8 115.1 1,615.5 39.8 17.7 21 15 12.5 5.2 3.8 3.1 5.6 4.2 3.3 32.1 32.8 29.4 — 0.7 0.8 28
Mahindra Logistics ADD 400 415 4 29 0.4 71 10.5 15.4 18.6 (16.4) 47.0 20.7 38 26 21 17.1 12.7 10.6 5.2 4.5 3.8 14.3 18.5 19.2 — — — 0.2
Transportation Attractive 1,722 24.1 63.2 15.1 17.8 19 16 13.9 9.6 7.9 6.6 3.4 3.0 2.5 18.1 18.0 18.2 2.2 1.2 1.4 62
KIE universe 121,725 1705.4 7.3 35.0 18.5 25 18.3 15.5 11.7 9.9 8.7 2.7 2.4 2.2 11.0 13.3 14.2 1.5 1.8 2.0
Notes:
(a) We have used adjusted book values for banking companies.
(b) 2020 means calendar year 2019, similarly for 2021 and 2022 for these particular companies.
(c) Exchange rate (Rs/US$)= 71.38
Mkt cap. EPS (Rs) EPS growth (%) P/E (X) EV/EBITDA (X) P/B (X) RoE (%) Dividend yield (%)

Ind
ia D
aily
Su
mm
ary
-Fe
bru
ary
17
, 202
0
Ratings and other definitions/identifiers
Definitions of ratings
BUY. We expect this stock to deliver more than 15% returns over the next 12 months.
ADD. We expect this stock to deliver 5-15% returns over the next 12 months.
REDUCE. We expect this stock to deliver -5-+5% returns over the next 12 months.
SELL. We expect this stock to deliver <-5% returns over the next 12 months.
Our Fair Value estimates are also on a 12-month horizon basis.
Our Ratings System does not take into account short-term volatility in stock prices related to movements in the market. Hence, a particular Rating may not
strictly be in accordance with the Rating System at all times.
Other definitions
Coverage view. The coverage view represents each analyst’s overall fundamental outlook on the Sector. The coverage view will consist of one of the following
designations: Attractive, Neutral, Cautious.
Other ratings/identifiers
NR = Not Rated. The investment rating and fair value, if any, have been suspended temporarily. Such suspension is in compliance with applicable regulation(s)
and/or Kotak Securities policies in circumstances when Kotak Securities or its affiliates is acting in an advisory capacity in a merger or strategic transaction
involving this company and in certain other circumstances.
CS = Coverage Suspended. Kotak Securities has suspended coverage of this company.
NC = Not Covered. Kotak Securities does not cover this company.
RS = Rating Suspended. Kotak Securities Research has suspended the investment rating and fair value, if any, for this stock, because there is not a sufficient
fundamental basis for determining an investment rating or fair value. The previous investment rating and fair value, if any, are no longer in effect for this stock
and should not be relied upon.
NA = Not Available or Not Applicable. The information is not available for display or is not applicable.
NM = Not Meaningful. The information is not meaningful and is therefore excluded.
Kotak Institutional Equities Research coverage universe
Distribution of ratings/investment banking relationships
Source: Kotak Institutional Equities As of December 31, 2019
Percentage of companies covered by Kotak Institutional
Equities, within the specified category.
* The above categories are defined as follows: Buy = We
expect this stock to deliver more than 15% returns over
the next 12 months; Add = We expect this stock to
deliver 5-15% returns over the next 12 months; Reduce
= We expect this stock to deliver -5-+5% returns over
the next 12 months; Sell = We expect this stock to deliver
less than -5% returns over the next 12 months. Our
target prices are also on a 12-month horizon basis.
These ratings are used illustratively to comply with
applicable regulations. As of 31/12/2019 Kotak
Institutional Equities Investment Research had
investment ratings on 202 equity securities.
Percentage of companies within each category for
which Kotak Institutional Equities and or its affiliates has
provided investment banking services within the
previous 12 months.
29.7%27.7%
20.3%22.3%
2.5% 2.5% 1.5% 1.0%
0%
10%
20%
30%
40%
50%
60%
70%
BUY ADD REDUCE SELL

Corporate Office Overseas Affiliates
Kotak Securities Ltd.
27 BKC, Plot No. C-27, “G Block”
Bandra Kurla Complex, Bandra (E)
Mumbai 400 051, India
Tel: +91-22-43360000
Kotak Mahindra (UK) Ltd
8th Floor, Portsoken House
155-157 Minories
London EC3N 1LS
Tel: +44-20-7977-6900
Kotak Mahindra Inc
369 Lexington Avenue
28th Floor, New York
NY 10017, USA
Tel:+1 212 600 8856
Copyright 2020 Kotak Institutional Equities (Kotak Securities Limited). All rights reserved. 1. Note that the research analysts contributing to this report may not be registered/qualified as research analysts with FINRA; and
2. Such research analysts may not be associated persons of Kotak Mahindra Inc and therefore, may not be subject to NASD Rule 2711 restrictions on communications with a subject company, public appearances and trading securities held by a research analyst account.
3. Any U.S. recipients of the research who wish to effect transactions in any security covered by the report should do so with or through Kotak Mahindra Inc and (ii) any transactions in the securities covered by the research by U.S. recipients must be effected only through Kotak Mahindra Inc at [email protected].
This report is distributed in Singapore by Kotak Mahindra (UK) Limited (Singapore Branch) to institutional investors, accredited investors or expert investors only as defined under the Securities and Futures Act. Recipients of this analysis / report are to contact Kotak Mahindra (UK) Limited (Singapore Branch) (16 Raffles Quay, #35-02/03, Hong Leong Building, Singapore 048581) in respect of any matters arising from, or in connection with, this analysis / report. Kotak Mahindra (UK) Limited (Singapore Branch) is regulated by the Monetary Authority of Singapore. Kotak Securities Limited and its affiliates are a full-service, integrated investment banking, investment management, brokerage and financing group. We along with our affiliates are leading underwriter of securities and participants in virtually all securities trading markets in India. We and our affiliates have investment banking and other business relationships with a significant percentage of the companies covered by our Investment Research Department. Our research professionals provide important input into our investment banking and other business selection processes. Investors should assume that Kotak Securities Limited and/or its affiliates are seeking or will seek investment banking or other business from the company or companies that are the subject of this material and that the research professionals who were involved in preparing this material may participate in the solicitation of such business. Our research professionals are paid in part based on the profitability of Kotak Securities Limited, which include earnings from investment banking and other business. Kotak Securities Limited generally prohibits its analysts, persons reporting to analysts, and members of their households from maintaining a financial interest in the securities or derivatives of any companies that the analysts cover. Additionally, Kotak Securities Limited generally prohibits its analysts and persons reporting to analysts from serving as an officer, director, or advisory board member of any companies that the analysts cover. Our salespeople, traders, and other professionals may provide oral or written market commentary or trading strategies to our clients that reflect opinions that are contrary to the opinions expressed herein, and our proprietary trading and investing businesses may make investment decisions that are inconsistent with the recommendations expressed herein. In reviewing these materials, you should be aware that any or all of the foregoing, among other things, may give rise to real or potential conflicts of interest. Additionally, other important information regarding our relationships with the company or companies that are the subject of this material is provided herein. This material should not be construed as an offer to sell or the solicitation of an offer to buy any security in any jurisdiction where such an offer or solicitation would be illegal. We are not soliciting any action based on this material. It is for the general information of clients of Kotak Securities Limited. It does not constitute a personal recommendation or take into account the particular investment objectives, financial situations, or needs of individual clients. Before acting on any advice or recommendation in this material, clients should consider whether it is suitable for their particular circumstances and, if necessary, seek professional advice. The price and value of the investments referred to in this material and the income from them may go down as well as up, and investors may realize losses on any investments. Past performance is not a guide for future performance, future returns are not guaranteed and a loss of original capital may occur. Kotak Securities Limited does not provide tax advise to its clients, and all investors are strongly advised to consult with their tax advisers regarding any potential investment. Certain transactions -including those involving futures, options, and other derivatives as well as non-investment-grade securities - give rise to substantial risk and are not suitable for all investors. The material is based on information that we consider reliable, but we do not represent that it is accurate or complete, and it should not be relied on as such. Opinions expressed are our current opinions as of the date appearing on this material only. We endeavor to update on a reasonable basis the information discussed in this material, but regulatory, compliance, or other reasons may prevent us from doing so. We and our affiliates, officers, directors, and employees, including persons involved in the preparation or issuance of this material, may from time to time have "long" or "short" positions in, act as principal in, and buy or sell the securities or derivatives thereof of companies mentioned herein. Kotak Securities Limited and its non US affiliates may, to the extent permissible under applicable laws, have acted on or used this research to the extent that it relates to non US issuers, prior to or immediately following its publication. Foreign currency denominated securities are subject to fluctuations in exchange rates that could have an adverse effect on the value or price of or income derived from the investment. In addition, investors in securities such as ADRs, the value of which are influenced by foreign currencies affectively assume currency risk. In addition options involve risks and are not suitable for all investors. Please ensure that you have read and understood the current derivatives risk disclosure document before entering into any derivative transactions. Kotak Securities Limited established in 1994, is a subsidiary of Kotak Mahindra Bank Limited. Kotak Securities is one of India's largest brokerage and distribution house. Kotak Securities Limited is a corporate trading and clearing member of Bombay Stock Exchange Limited (BSE), National Stock Exchange of India Limited (NSE), Metropolitan Stock Exchange of India Limited (MSE), National Commodity and Derivatives Exchange (NCDEX) and Multi Commodity Exchange(MCX). Our businesses include stock broking, services rendered in connection with distribution of primary market issues and financial products like mutual funds and fixed deposits, depository services and Portfolio Management. Kotak Securities Limited is also a depository participant with National Securities Depository Limited (NSDL) and Central Depository Services (India) Limited (CDSL). Kotak Securities Limited is also registered with Insurance Regulatory and Development Authority as Corporate Agent for Kotak Mahindra Old Mutual Life Insurance Limited and is also a Mutual Fund Advisor registered with Association of Mutual Funds in India (AMFI). Kotak Securities Limited is registered as a Research Analyst under SEBI (Research Analyst) Regulations, 2014. We hereby declare that our activities were neither suspended nor we have defaulted with any stock exchange authority with whom we are registered in last five years. However SEBI, Exchanges and Depositories have conducted the routine inspection and based on their observations have issued advise letters or levied minor penalty on KSL for certain operational deviations. We have not been debarred from doing business by any Stock Exchange / SEBI or any other authorities; nor has our certificate of registration been cancelled by SEBI at any point of time. We offer our research services to primarily institutional investors and their employees, directors, fund managers, advisors who are registered with us Details of Associates are available on website i.e. www.kotak.com Research Analyst has served as an officer, director or employee of subject company(ies): No We or our associates may have received compensation from the subject company(ies) in the past 12 months. We or our associates have managed or co-managed public offering of securities for the subject company(ies) in the past 12 months. YES. Visit our website for more details We or our associates may have received compensation for investment banking or merchant banking or brokerage services from the subject company(ies) in the past 12 months. We or our associates may have received any compensation for products or services other than investment banking or merchant banking or brokerage services from the subject company(ies) in the past 12 months. We or our associates may have received compensation or other benefits from the subject company(ies) or third party in connection with the research report. Our associates may have financial interest in the subject company(ies). Research Analyst or his/her relative's financial interest in the subject company(ies): No Kotak Securities Limited has financial interest in the subject company(ies) at the end of the month immediately preceding the date of publication of Research Report: Apollo Hospitals, Shree Cement, Sun TV Network, Muthoot Finance, ONGC - YES Nature of Financial interest: Holding equity shares or derivatives of the subject company. Our associates may have actual/beneficial ownership of 1% or more securities of the subject company(ies) at the end of the month immediately preceding the date of publication of Research Report. Research Analyst or his/her relatives has actual/beneficial ownership of 1% or more securities of the subject company(ies) at the end of the month immediately preceding the date of publication of Research Report: No Kotak Securities Limited has actual/beneficial ownership of 1% or more securities of the subject company(ies) at the end of the month immediately preceding the date of publication of Research Report: No Subject company(ies) may have been client during twelve months preceding the date of distribution of the research report. A graph of daily closing prices of securities is available at https://www.moneycontrol.com/india/stockpricequote/ and http://economictimes.indiatimes.com/markets/stocks/stock-quotes. (Choose a company from the list on the browser and select the"three years" icon in the price chart).
Kotak Securities Limited. Registered Office: 27 BKC, C 27, G Block, Bandra Kurla Complex, Bandra (E), Mumbai 400051. CIN: U99999MH1994PLC134051, Telephone No.: +22 43360000, Fax No.: +22 67132430. Website: www.kotak.com / www.kotaksecurities.com. Correspondence Address: Infinity IT Park, Bldg. No 21, Opp. Film City Road, A K Vaidya Marg, Malad (East), Mumbai 400097. Telephone No: 42856825. SEBI Registration No. INZ000200137(Member of NSE, BSE, MSE, MCX & NCDEX). Member Id: NSE-08081; BSE-673; MSE-1024; MCX-56285; NCDEX-1262. AMFI ARN 0164, PMS INP000000258 and Research Analyst INH000000586. NSDL/CDSL: IN-DP-NSDL-23-97. Compliance Officer Details: Mr. Manoj Agarwal. Call: 022 - 4285 8484, or Email: [email protected]. Investments in securities market are subject to market risks, read all the related documents carefully before investing. In case you require any clarification or have any concern, kindly write to us at below email ids: Level 1: For Trading related queries, contact our customer service at ‘[email protected]’ and for demat account related queries contact us at [email protected] or call us on: Toll free numbers 18002099191 / 1860 266 9191 Level 2: If you do not receive a satisfactory response at Level 1 within 3 working days, you may write to us at [email protected] or call us on 022-42858445 and if you feel you are still unheard, write to our customer service HOD at [email protected] or call us on 022-42858208. Level 3: If you still have not received a satisfactory response at Level 2 within 3 working days, you may contact our Compliance Officer (Name: Mr. Manoj Agarwal) at [email protected] or call on 91- (022) 4285 8484. Level 4 : If you have not received a satisfactory response at Level 3 within 7 working days, you may also approach Managing Director / CEO (Mr. Jaideep Hansraj) at [email protected] or call on 91-(022) 4285 8301. First Cut notes published on this site are for information purposes only. They represent early notations and responses by analysts to recent events. Data in the notes may not have been verified by us and investors should not act upon any data or views in these notes. Most First Cut notes, but not necessarily all, will be followed by final research reports on the subject. There could be variance between the First cut note and the final research note on any subject, in which case the contents of the final research note would prevail. We accept no liability for the contents of the First Cut Notes.


![[Kotak] India Daily, June 07, 2013 - Google Groups](https://img.dokumen.tips/doc/110x75/631ed20f1aedb9cd850fee8c/kotak-india-daily-june-07-2013-google-groups.jpg)


![[Kotak] India Daily, February 18, 2016 - Kotak Securities](https://img.dokumen.tips/doc/110x75/633a76e102bd8edb4701c87a/kotak-india-daily-february-18-2016-kotak-securities.jpg)


![[Kotak] India Daily, September 02, 2016 - Kotak Securities](https://img.dokumen.tips/doc/110x75/631eaab825add517740b26fe/kotak-india-daily-september-02-2016-kotak-securities.jpg)
