Embed Size (px)
Citation preview
For Private Circulation Only. FOR IMPORTANT INFORMATION ABOUT KOTAK SECURITIES’ RATING SYSTEM AND OTHER DISCLOSURES. REFER TO THE END OF THIS MATERIAL.
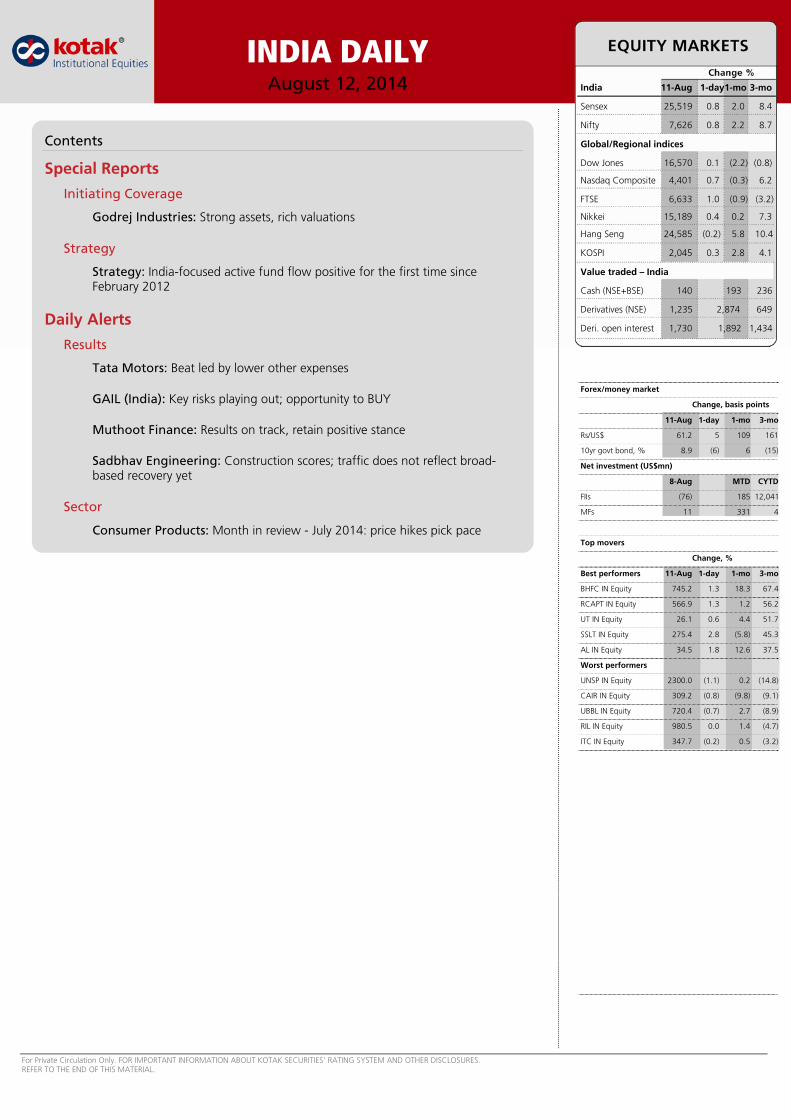
INDIA DAILYAugust 12, 2014 India 11-Aug 1-day1-mo 3-mo
Sensex 25,519 0.8 2.0 8.4
Nifty 7,626 0.8 2.2 8.7
Global/Regional indices
Dow Jones 16,570 0.1 (2.2) (0.8)
Nasdaq Composite 4,401 0.7 (0.3) 6.2
FTSE 6,633 1.0 (0.9) (3.2)
Nikkei 15,189 0.4 0.2 7.3
Hang Seng 24,585 (0.2) 5.8 10.4
KOSPI 2,045 0.3 2.8 4.1
Value traded – India
Cash (NSE+BSE) 140 193 236
Derivatives (NSE) 1,235 2,874 649
Deri. open interest 1,730 1,892 1,434
Forex/money market
Change, basis points
11-Aug 1-day 1-mo 3-mo
Rs/US$ 61.2 5 109 161
10yr govt bond, % 8.9 (6) 6 (15)
Net investment (US$mn)
8-Aug MTD CYTD
FIIs (76) 185 12,041
MFs 11 331 4
Top movers
Change, %
Best performers 11-Aug 1-day 1-mo 3-mo
BHFC IN Equity 745.2 1.3 18.3 67.4
RCAPT IN Equity 566.9 1.3 1.2 56.2
UT IN Equity 26.1 0.6 4.4 51.7
SSLT IN Equity 275.4 2.8 (5.8) 45.3
AL IN Equity 34.5 1.8 12.6 37.5
Worst performers
UNSP IN Equity 2300.0 (1.1) 0.2 (14.8)
CAIR IN Equity 309.2 (0.8) (9.8) (9.1)
UBBL IN Equity 720.4 (0.7) 2.7 (8.9)
RIL IN Equity 980.5 0.0 1.4 (4.7)
ITC IN Equity 347.7 (0.2) 0.5 (3.2)
Contents
Special Reports
Initiating Coverage
Godrej Industries: Strong assets, rich valuations
Strategy
Strategy: India-focused active fund flow positive for the first time since February 2012
Daily Alerts
Results
Tata Motors: Beat led by lower other expenses
GAIL (India): Key risks playing out; opportunity to BUY
Muthoot Finance: Results on track, retain positive stance
Sadbhav Engineering: Construction scores; traffic does not reflect broad-based recovery yet
Sector
Consumer Products: Month in review - July 2014: price hikes pick pace
For private Circulation Only. FOR IMPORTANT INFORMATION ABOUT KOTAK SECURITIES’ RATING SYSTEM AND OTHER DISCLOSURES, REFER TO THE END OF THIS MATERIAL.
We initiate coverage on Godrej Industries with a REDUCE rating and target price of `330
We initiate coverage on GIL with a REDUCE rating and March 2016E SOTP-based target price of `330. Godrej Consumer Products (GCPL) and Godrej Properties (GPL), GIL’s listed subsidiaries, account for about 65% of GIL’s value and Godrej Agrovet (GAVL) accounts for about 22%. We value the chemicals business (8% of GIL’s value) at 7X EV/EBITDA, as we believe the cycle is on the upturn, and GIL’s remaining businesses at book value of investments.
Aggressive triad: Godrej Agrovet, Godrej Consumer, Godrej Properties
Godrej Agrovet’s (GAVL’s) growth driven by its two main businesses: (1) animal feeds—a play on increasing demand for proteins in India, and (2) oil palm—whose prospects are brightened by rising acreage as farmers overcome their resistance to the long-gestation crop thanks to government support and private sector efforts. GAVL contributes 22% to GIL’s fair value.
We like Godrej Consumer’s (GCPL’s) dominant positioning in fast-growing niche categories (HI and hair color) and its execution and innovation track-record. However, we believe the trading multiple (27X March 2016E P/E) adequately captures all positives and an aggressive revenue-growth-centric model driven by inorganic focus (at expense of return ratios) should command lower-than-sector multiple. GCPL contributes 42% to GIL’s fair value.
Godrej Properties (GPL) follows an asset-light model of property development. GPL has expanded aggressively and shifted its focus to residential developments from commercial and restricted its project additions to metros. Since FY2013, GPL has been adding low-investment, high-RoE projects. Its balance sheet is still affected by certain legacy investments, (resulting in high leverage and low margins). GPL contributes 23% to GIL’s fair value.
Godrej Industries’ PAT set to double in three years; investments to increase
We expect GIL to post PAT CAGR of 27% over FY2014-17 with an improving chemicals business and better dividends from its maturing investments. We expect GAVL and GCPL to turn net cash positive by FY2016 and increase investments and GPL to start generating positive cash from operations from 1HFY16.
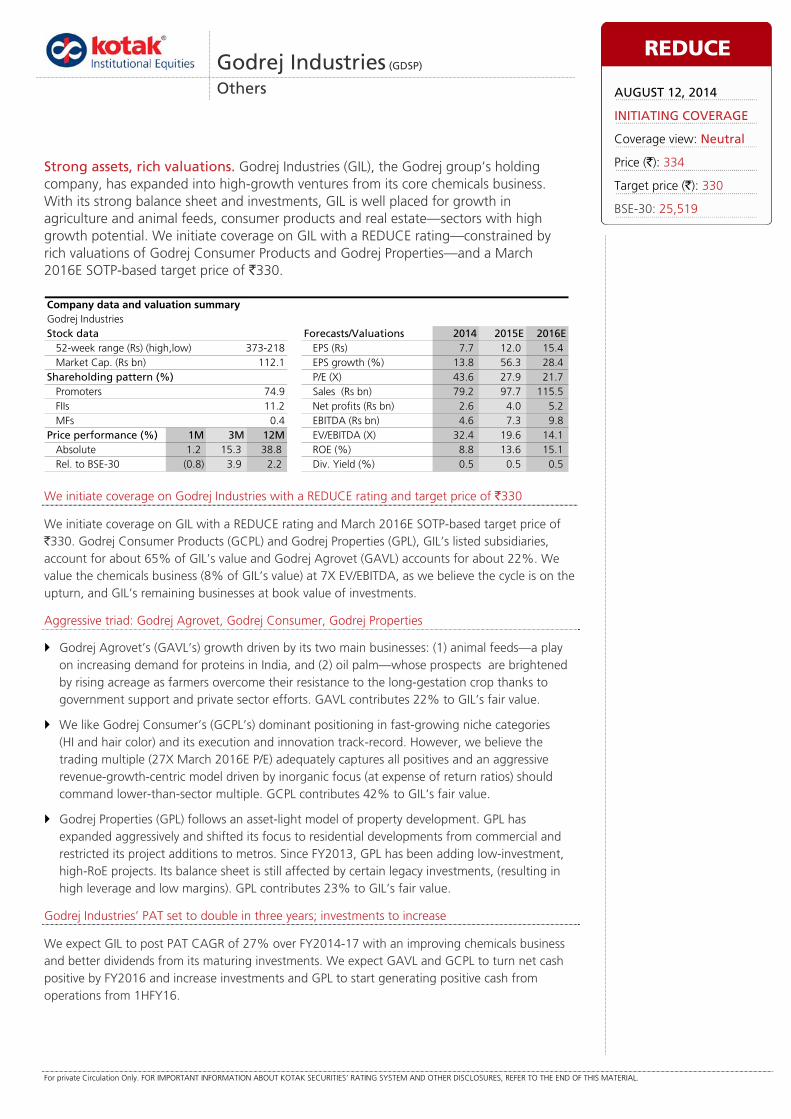
Godrej Industries (GDSP)
Others
Strong assets, rich valuations. Godrej Industries (GIL), the Godrej group’s holding company, has expanded into high-growth ventures from its core chemicals business. With its strong balance sheet and investments, GIL is well placed for growth in agriculture and animal feeds, consumer products and real estate—sectors with high growth potential. We initiate coverage on GIL with a REDUCE rating—constrained by rich valuations of Godrej Consumer Products and Godrej Properties—and a March 2016E SOTP-based target price of `330.
Godrej IndustriesStock data Forecasts/Valuations 2014 2015E 2016E
52-week range (Rs) (high,low) EPS (Rs) 7.7 12.0 15.4Market Cap. (Rs bn) 112.1 EPS growth (%) 13.8 56.3 28.4
Shareholding pattern (%) P/E (X) 43.6 27.9 21.7Promoters 74.9 Sales (Rs bn) 79.2 97.7 115.5FIIs 11.2 Net profits (Rs bn) 2.6 4.0 5.2MFs 0.4 EBITDA (Rs bn) 4.6 7.3 9.8
Price performance (%) 1M 3M 12M EV/EBITDA (X) 32.4 19.6 14.1Absolute 1.2 15.3 38.8 ROE (%) 8.8 13.6 15.1Rel. to BSE-30 (0.8) 3.9 2.2 Div. Yield (%) 0.5 0.5 0.5
Company data and valuation summary
373-218
REDUCE
AUGUST 12, 2014
INITIATING COVERAGE
Coverage view: Neutral
Price (`): 334
Target price (`): 330
BSE-30: 25,519
Godrej Industries Others
KOTAK INSTITUTIONAL EQUITIES RESEARCH 3
VALUATION: WE INITIATE COVERAGE WITH A REDUCE RATING, TARGET PRICE: `330 We initiate coverage on Godrej Industries (GIL) with a REDUCE rating and an SOTP-based target price of `330.
We like GIL for its (1) aggressive expansion into high-growth businesses like animal feed, vegetable oils and
real estate, (2) strong presence in the consumer business and (3) strong balance sheet. We expect two of GIL’s
three businesses to turn net cash positive over the next three years; we believe the stock trades at a premium
to our March 2016E SOTP-based fair value estimate of `330.
We initiate coverage with a REDUCE rating and target price of `330
We initiate coverage on Godrej Industries (GIL) with a REDUCE rating and sum-of-the-parts-based value of `330/share. GIL’s businesses are spread across (1) animal feed and vegetable oils (Godrej Agrovet), (2) chemicals, (3) consumer products (Godrej Consumer Products), (4) estate and property development (Godrej Properties) and (5) international trading, finance and investment. It also has other smaller businesses. As most of its businesses are diverse in nature, we value each one separately.
We assign a 20% discount to GIL’s holding in GCPL, an associate company of GIL. We are not assigning any holding-company discount to GAVL and GPL, owing to the set-off benefits which GIL derives on dividend payments. We value the remaining businesses, including Nature’s Basket, at book value of the investment. GCPL and GPL, both listed entities (GCPL IN and GPL IN), contribute about 65% to the value of GIL. We have REDUCE ratings on GCPL and GPL, which have a bearing on the valuation of GIL.
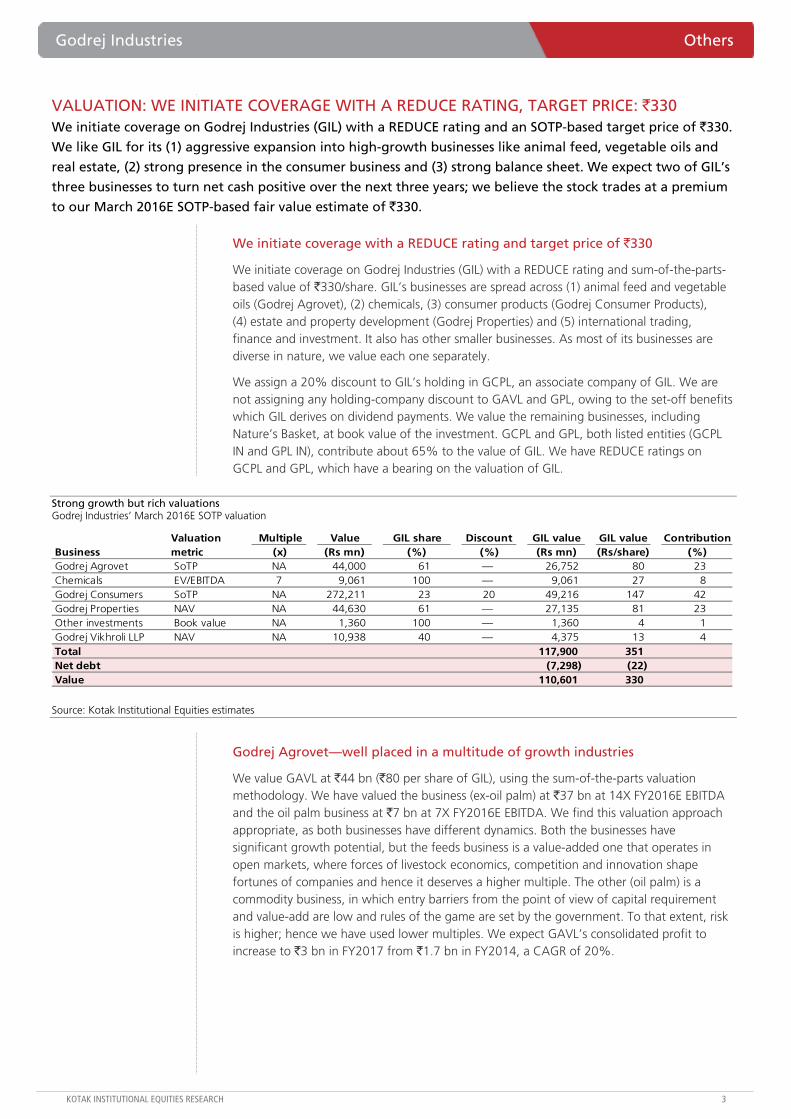
Strong growth but rich valuations Godrej Industries’ March 2016E SOTP valuation
Multiple Value GIL share Discount GIL value GIL value ContributionBusiness (x) (Rs mn) (%) (%) (Rs mn) (Rs/share) (%)Godrej Agrovet SoTP NA 44,000 61 — 26,752 80 23Chemicals EV/EBITDA 7 9,061 100 — 9,061 27 8Godrej Consumers SoTP NA 272,211 23 20 49,216 147 42Godrej Properties NAV NA 44,630 61 — 27,135 81 23Other investments Book value NA 1,360 100 — 1,360 4 1Godrej Vikhroli LLP NAV NA 10,938 40 — 4,375 13 4Total 117,900 351Net debt (7,298) (22)Value 110,601 330
Valuation metric
Source: Kotak Institutional Equities estimates
Godrej Agrovet—well placed in a multitude of growth industries
We value GAVL at `44 bn (`80 per share of GIL), using the sum-of-the-parts valuation methodology. We have valued the business (ex-oil palm) at `37 bn at 14X FY2016E EBITDA and the oil palm business at `7 bn at 7X FY2016E EBITDA. We find this valuation approach appropriate, as both businesses have different dynamics. Both the businesses have significant growth potential, but the feeds business is a value-added one that operates in open markets, where forces of livestock economics, competition and innovation shape fortunes of companies and hence it deserves a higher multiple. The other (oil palm) is a commodity business, in which entry barriers from the point of view of capital requirement and value-add are low and rules of the game are set by the government. To that extent, risk is higher; hence we have used lower multiples. We expect GAVL’s consolidated profit to increase to `3 bn in FY2017 from `1.7 bn in FY2014, a CAGR of 20%.
Others Godrej Industries
4 KOTAK INSTITUTIONAL EQUITIES RESEARCH
We value GAVL’s equity at `44 bn
We value GAVL’s equity at `44 bn . We have valued the oil palm business at an EV of `7 bn, at 7X FY2016E EBITDA. We used lower multiples due to (1) the commodity nature of the business and (2) low entry barriers. Regional oil palm plantation companies trade at higher multiples than GAVL as they own the plantations whereas GAVL only runs the processing facility.
We have valued the rest (animal feed, agri-inputs, and processed foods) of the businesses at an EV of `37 bn, at 14X FY2016E EBITDA. We have valued this business at a premium to regional multiples for the following reasons.
Most regional companies are forward integrated into processed meat and other livestock products. Hence, these businesses are much more capital-intensive than GAVL and RoEs are inferior.
In our view, the animal-feed market in India is in initial stages of development. The unorganized sector has a large share of the market in practically every feed category. We believe the organized segment, represented by companies like GAVL, will grow much faster than the feed industry, led by market-share gains from the unorganized segment. The Indian feed industry will itself grow faster than its regional peers as rising per capita incomes drive higher demand for proteins. Milk, meat (all forms) and egg volumes in India have been growing at CAGRs of 5%, 8% and 5%, respectively.
We expect GAVL’s growth to accelerate in the next two years as it scales up volumes/margins in the aqua feed category with the commissioning of its green field aqua-feed capacities (50,000 tons of fish feed and 60,000 tons of shrimp feed). In the past, GAVL has been selling aqua feed purely through a trading model. New capacities should aid growth, in both volumes and margins.
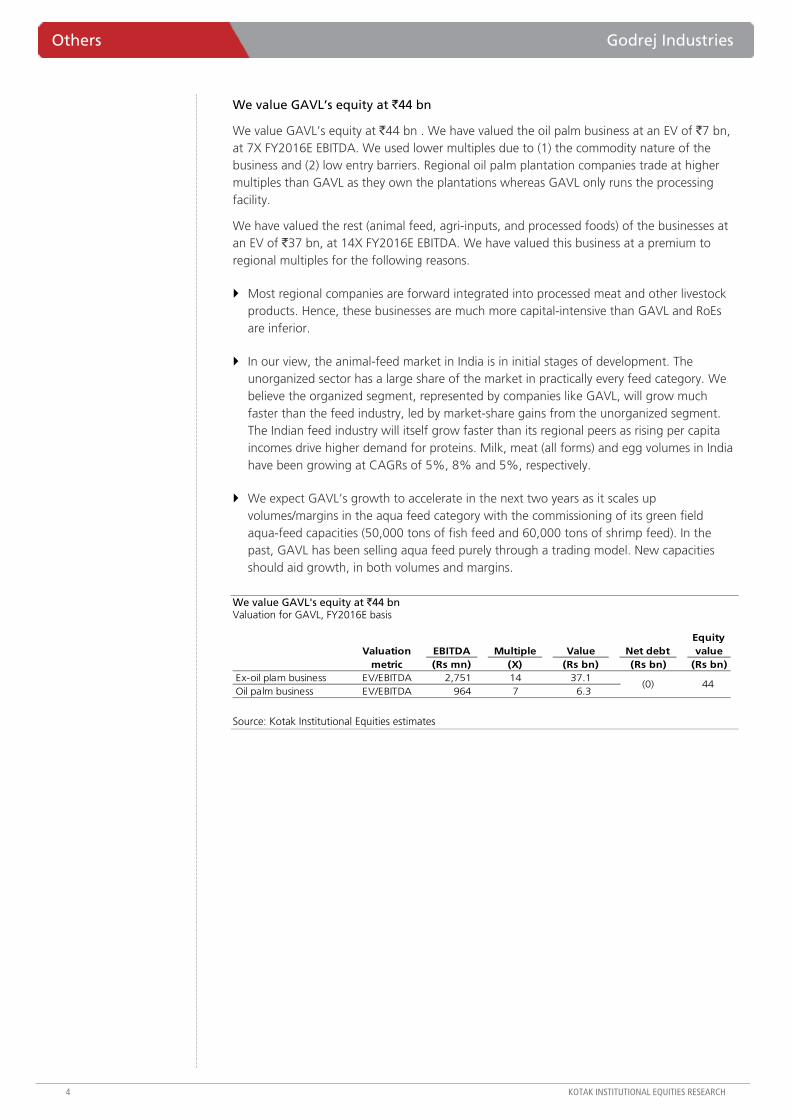
We value GAVL's equity at `44 bn Valuation for GAVL, FY2016E basis
EBITDA Multiple Value Net debtEquity value
(Rs mn) (X) (Rs bn) (Rs bn) (Rs bn)Ex-oil plam business EV/EBITDA 2,751 14 37.1 Oil palm business EV/EBITDA 964 7 6.3
Valuation metric
44(0)
Source: Kotak Institutional Equities estimates
Godrej Industries Others
KOTAK INSTITUTIONAL EQUITIES RESEARCH 5
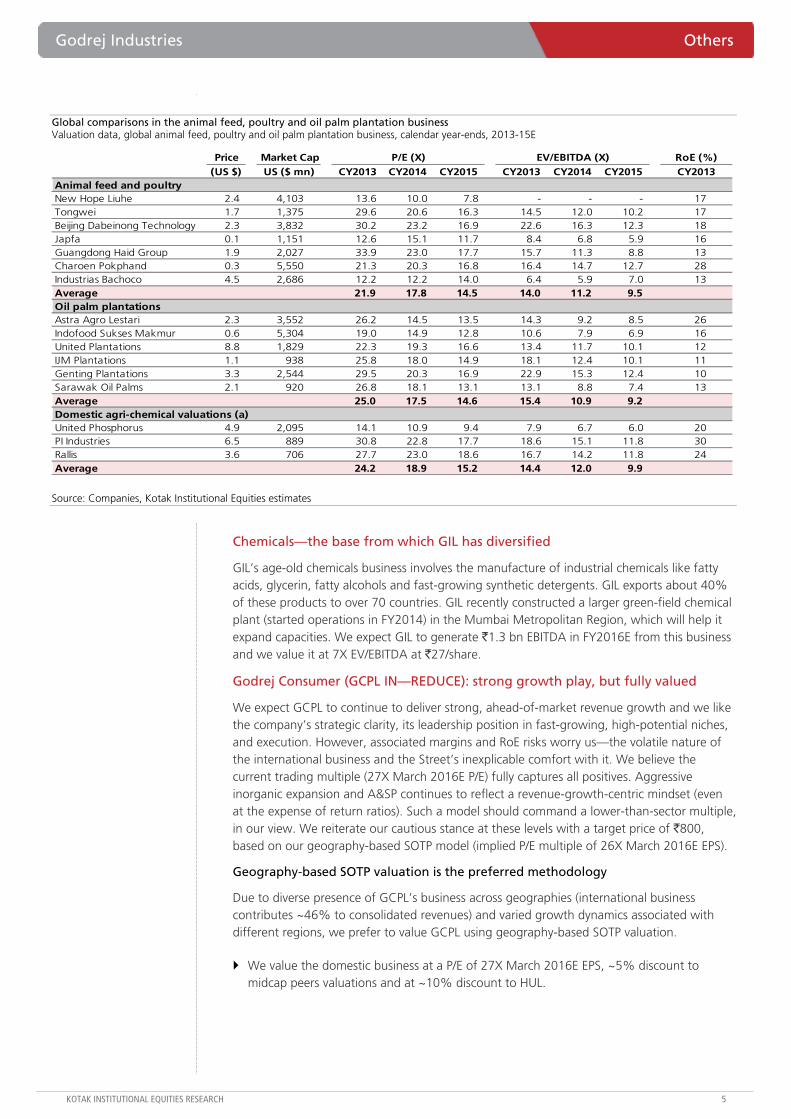
Global comparisons in the animal feed, poultry and oil palm plantation business Valuation data, global animal feed, poultry and oil palm plantation business, calendar year-ends, 2013-15E
Price RoE (%)(US $) CY2013 CY2014 CY2015 CY2013 CY2014 CY2015 CY2013
Animal feed and poultryNew Hope Liuhe 2.4 4,103 13.6 10.0 7.8 - - - 17 Tongwei 1.7 1,375 29.6 20.6 16.3 14.5 12.0 10.2 17 Beijing Dabeinong Technology 2.3 3,832 30.2 23.2 16.9 22.6 16.3 12.3 18 Japfa 0.1 1,151 12.6 15.1 11.7 8.4 6.8 5.9 16 Guangdong Haid Group 1.9 2,027 33.9 23.0 17.7 15.7 11.3 8.8 13 Charoen Pokphand 0.3 5,550 21.3 20.3 16.8 16.4 14.7 12.7 28 Industrias Bachoco 4.5 2,686 12.2 12.2 14.0 6.4 5.9 7.0 13 Average 21.9 17.8 14.5 14.0 11.2 9.5 Oil palm plantations Astra Agro Lestari 2.3 3,552 26.2 14.5 13.5 14.3 9.2 8.5 26 Indofood Sukses Makmur 0.6 5,304 19.0 14.9 12.8 10.6 7.9 6.9 16 United Plantations 8.8 1,829 22.3 19.3 16.6 13.4 11.7 10.1 12 IJM Plantations 1.1 938 25.8 18.0 14.9 18.1 12.4 10.1 11 Genting Plantations 3.3 2,544 29.5 20.3 16.9 22.9 15.3 12.4 10 Sarawak Oil Palms 2.1 920 26.8 18.1 13.1 13.1 8.8 7.4 13 Average 25.0 17.5 14.6 15.4 10.9 9.2 Domestic agri-chemical valuations (a)United Phosphorus 4.9 2,095 14.1 10.9 9.4 7.9 6.7 6.0 20 PI Industries 6.5 889 30.8 22.8 17.7 18.6 15.1 11.8 30 Rallis 3.6 706 27.7 23.0 18.6 16.7 14.2 11.8 24 Average 24.2 18.9 15.2 14.4 12.0 9.9
P/E (X) EV/EBITDA (X) Market CapUS ($ mn)
Source: Companies, Kotak Institutional Equities estimates
Chemicals—the base from which GIL has diversified
GIL’s age-old chemicals business involves the manufacture of industrial chemicals like fatty acids, glycerin, fatty alcohols and fast-growing synthetic detergents. GIL exports about 40% of these products to over 70 countries. GIL recently constructed a larger green-field chemical plant (started operations in FY2014) in the Mumbai Metropolitan Region, which will help it expand capacities. We expect GIL to generate `1.3 bn EBITDA in FY2016E from this business and we value it at 7X EV/EBITDA at `27/share.
Godrej Consumer (GCPL IN—REDUCE): strong growth play, but fully valued
We expect GCPL to continue to deliver strong, ahead-of-market revenue growth and we like the company’s strategic clarity, its leadership position in fast-growing, high-potential niches, and execution. However, associated margins and RoE risks worry us—the volatile nature of the international business and the Street’s inexplicable comfort with it. We believe the current trading multiple (27X March 2016E P/E) fully captures all positives. Aggressive inorganic expansion and A&SP continues to reflect a revenue-growth-centric mindset (even at the expense of return ratios). Such a model should command a lower-than-sector multiple, in our view. We reiterate our cautious stance at these levels with a target price of `800, based on our geography-based SOTP model (implied P/E multiple of 26X March 2016E EPS).
Geography-based SOTP valuation is the preferred methodology
Due to diverse presence of GCPL’s business across geographies (international business contributes ~46% to consolidated revenues) and varied growth dynamics associated with different regions, we prefer to value GCPL using geography-based SOTP valuation.
We value the domestic business at a P/E of 27X March 2016E EPS, ~5% discount to midcap peers valuations and at ~10% discount to HUL.
Others Godrej Industries
6 KOTAK INSTITUTIONAL EQUITIES RESEARCH
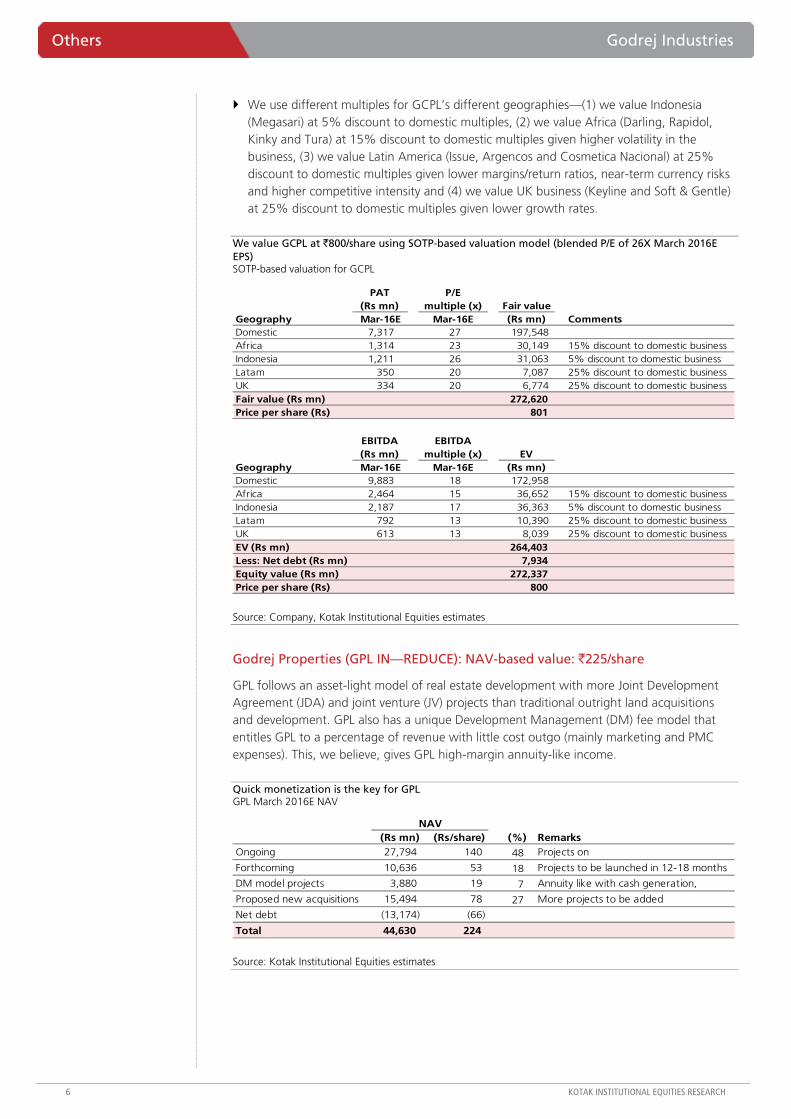
We use different multiples for GCPL’s different geographies—(1) we value Indonesia (Megasari) at 5% discount to domestic multiples, (2) we value Africa (Darling, Rapidol, Kinky and Tura) at 15% discount to domestic multiples given higher volatility in the business, (3) we value Latin America (Issue, Argencos and Cosmetica Nacional) at 25% discount to domestic multiples given lower margins/return ratios, near-term currency risks and higher competitive intensity and (4) we value UK business (Keyline and Soft & Gentle) at 25% discount to domestic multiples given lower growth rates.
We value GCPL at `800/share using SOTP-based valuation model (blended P/E of 26X March 2016E EPS) SOTP-based valuation for GCPL
Fair valueGeography (Rs mn) CommentsDomestic 7,317 27 197,548 Africa 1,314 23 30,149 15% discount to domestic businessIndonesia 1,211 26 31,063 5% discount to domestic businessLatam 350 20 7,087 25% discount to domestic businessUK 334 20 6,774 25% discount to domestic businessFair value (Rs mn) 272,620 Price per share (Rs) 801
EVGeography (Rs mn)Domestic 9,883 18 172,958 Africa 2,464 15 36,652 15% discount to domestic businessIndonesia 2,187 17 36,363 5% discount to domestic businessLatam 792 13 10,390 25% discount to domestic businessUK 613 13 8,039 25% discount to domestic businessEV (Rs mn) 264,403 Less: Net debt (Rs mn) 7,934 Equity value (Rs mn) 272,337 Price per share (Rs) 800
PAT (Rs mn)Mar-16E
EBITDA (Rs mn)Mar-16E
EBITDA multiple (x)
Mar-16E
P/E multiple (x)
Mar-16E
Source: Company, Kotak Institutional Equities estimates
Godrej Properties (GPL IN—REDUCE): NAV-based value: `225/share
GPL follows an asset-light model of real estate development with more Joint Development Agreement (JDA) and joint venture (JV) projects than traditional outright land acquisitions and development. GPL also has a unique Development Management (DM) fee model that entitles GPL to a percentage of revenue with little cost outgo (mainly marketing and PMC expenses). This, we believe, gives GPL high-margin annuity-like income.
Quick monetization is the key for GPL GPL March 2016E NAV
(Rs mn) (Rs/share) (%) RemarksOngoing 27,794 140 48 Projects on
Forthcoming 10,636 53 18 Projects to be launched in 12-18 months
DM model projects 3,880 19 7 Annuity like with cash generation,
Proposed new acquisitions 15,494 78 27 More projects to be added
Net debt (13,174) (66)
Total 44,630 224
NAV
Source: Kotak Institutional Equities estimates
Godrej Industries Others
KOTAK INSTITUTIONAL EQUITIES RESEARCH 7
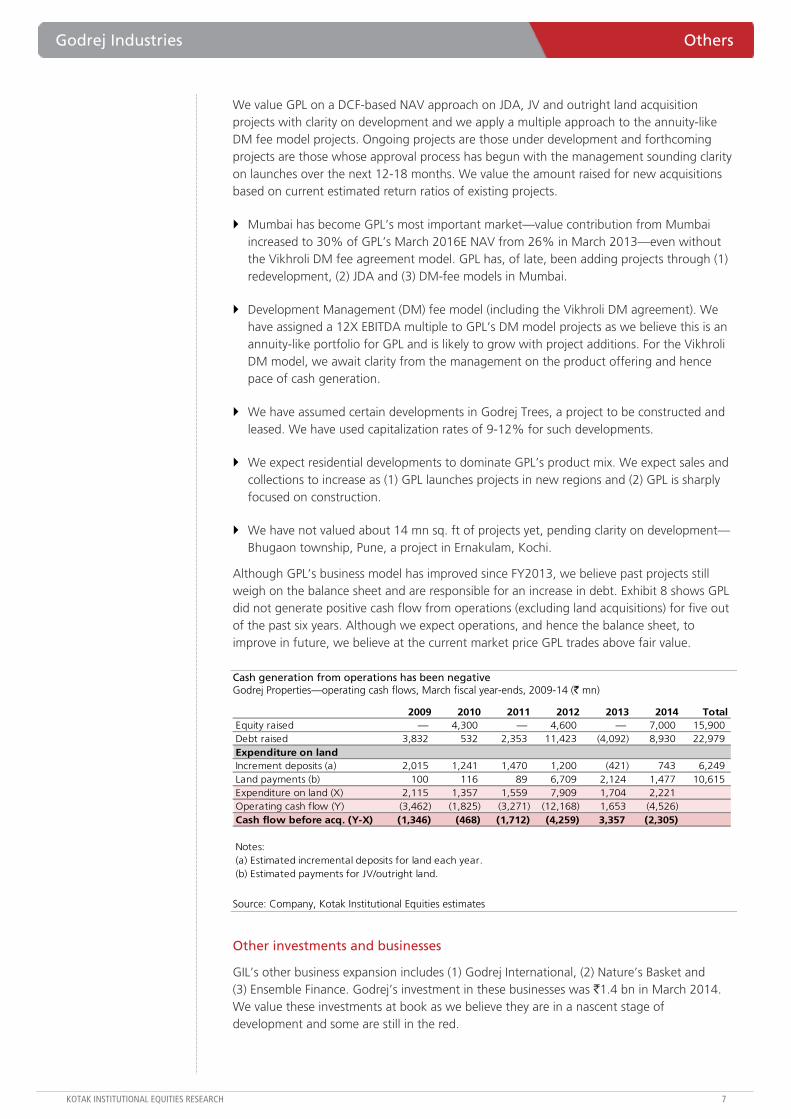
We value GPL on a DCF-based NAV approach on JDA, JV and outright land acquisition projects with clarity on development and we apply a multiple approach to the annuity-like DM fee model projects. Ongoing projects are those under development and forthcoming projects are those whose approval process has begun with the management sounding clarity on launches over the next 12-18 months. We value the amount raised for new acquisitions based on current estimated return ratios of existing projects.
Mumbai has become GPL’s most important market—value contribution from Mumbai increased to 30% of GPL’s March 2016E NAV from 26% in March 2013—even without the Vikhroli DM fee agreement model. GPL has, of late, been adding projects through (1) redevelopment, (2) JDA and (3) DM-fee models in Mumbai.
Development Management (DM) fee model (including the Vikhroli DM agreement). We have assigned a 12X EBITDA multiple to GPL’s DM model projects as we believe this is an annuity-like portfolio for GPL and is likely to grow with project additions. For the Vikhroli DM model, we await clarity from the management on the product offering and hence pace of cash generation.
We have assumed certain developments in Godrej Trees, a project to be constructed and leased. We have used capitalization rates of 9-12% for such developments.
We expect residential developments to dominate GPL’s product mix. We expect sales and collections to increase as (1) GPL launches projects in new regions and (2) GPL is sharply focused on construction.
We have not valued about 14 mn sq. ft of projects yet, pending clarity on development—Bhugaon township, Pune, a project in Ernakulam, Kochi.
Although GPL’s business model has improved since FY2013, we believe past projects still weigh on the balance sheet and are responsible for an increase in debt. Exhibit 8 shows GPL did not generate positive cash flow from operations (excluding land acquisitions) for five out of the past six years. Although we expect operations, and hence the balance sheet, to improve in future, we believe at the current market price GPL trades above fair value.
Cash generation from operations has been negative Godrej Properties—operating cash flows, March fiscal year-ends, 2009-14 (` mn)
2009 2010 2011 2012 2013 2014 TotalEquity raised — 4,300 — 4,600 — 7,000 15,900 Debt raised 3,832 532 2,353 11,423 (4,092) 8,930 22,979 Expenditure on landIncrement deposits (a) 2,015 1,241 1,470 1,200 (421) 743 6,249 Land payments (b) 100 116 89 6,709 2,124 1,477 10,615 Expenditure on land (X) 2,115 1,357 1,559 7,909 1,704 2,221 Operating cash flow (Y) (3,462) (1,825) (3,271) (12,168) 1,653 (4,526) Cash flow before acq. (Y-X) (1,346) (468) (1,712) (4,259) 3,357 (2,305)
Notes:(a) Estimated incremental deposits for land each year.(b) Estimated payments for JV/outright land.
Source: Company, Kotak Institutional Equities estimates
Other investments and businesses
GIL’s other business expansion includes (1) Godrej International, (2) Nature’s Basket and (3) Ensemble Finance. Godrej’s investment in these businesses was `1.4 bn in March 2014. We value these investments at book as we believe they are in a nascent stage of development and some are still in the red.

Others Godrej Industries
8 KOTAK INSTITUTIONAL EQUITIES RESEARCH
GODREJ INDUSTRIES FINANCIALS—INVESTMENTS MADE, PAYBACK TIME IS HERE! Godrej Industries invested over `10.5 bn to set up and expand its businesses over the past four years,
additionally some of the individual businesses raised equity. We believe Godrej Properties has a year to go
before turning operating-cash positive, GCPL and GAVL are generating positive cash from operations and we
believe they will be net cash by FY2016 (excluding heavy investments/new acquisitions). In the chemicals
business, we believe an improving market and recent capacity addition will boost volumes and margins and
Godrej Industries’ other businesses, like Nature’s Basket, will drain cash for at least two years.
Godrej Agrovet, Godrej Properties lead growth from a low base
In addition to the chemicals business, Godrej Industries’ consolidated revenues include revenue from Godrej Agrovet, Godrej Properties, Godrej Trading, Godrej International Trading and Finance and Nature’s Basket. Godrej Agrovet and Godrej Properties account for about 55% of revenue and 95% of operating margins. We estimate net income CAGR of 20% over FY2014-17 due to strong growth in the two companies. Godrej Properties is also Godrej Industries’ fastest growing business and contributes the best margins (operating margins of about 25%). With Godrej Properties’ strong focus on construction and increase in pace of launches (and hence sales), we expect its contribution to Godrej Industries’ revenue to increase from 15% in FY2014 to 29% in FY2017. We believe this will improve Godrej Industries’ consolidated margins.
Strong revenue growth for Godrej Industries due to Godrej Agrovet and Godrej Properties Godrej Industries (consolidated) profit model, March fiscal year-ends, 2013-17E (` mn)
2013 2014 2015E 2016E 2017ETotal revenues 69,643 79,179 97,685 115,493 136,250 Cost of goods sold (55,688) (63,191) (76,591) (90,185) (106,086) Employee costs (2,698) (2,942) (3,501) (3,888) (4,270) SG&A costs (7,484) (8,469) (10,336) (11,634) (13,074) EBITDA 3,774 4,577 7,257 9,787 12,819 Other income 528 1,558 1,777 1,902 2,111 Interest (1,103) (1,457) (1,503) (1,247) (1,020) Depreciation / amortisation (595) (704) (837) (924) (1,015) Pre-tax profits 2,604 3,973 6,694 9,517 12,895 Extraordinary items 1,654 694 854 828 908 Current tax (1,215) (1,712) (2,214) (3,177) (4,064) Deferred tax (128) — — — —Net income 2,916 2,955 5,334 7,168 9,739 Minority interests (762.4) (1,430.0) (2,588.6) (3,745.8) (6,003.3) Share of profit from associates 1,758.1 1,738.5 2,104.2 2,533.4 2,957.4 Adjusted net income 3,912 3,264 4,850 5,956 6,693 EPS (Rs)Fully diluted 11.7 9.7 14.5 17.8 20.0 DPS (Rs) 1.8 1.8 1.8 1.8 1.8 Shares outstanding (mn)Fully diluted 335 335 335 335 335 Cash flow per share (Rs)Fully diluted 13.8 12.4 16.9 20.5 23.0 Margins (%)EBITDA 5.4 5.8 7.4 8.5 9.4 Adjusted net income 5.6 4.1 5.0 5.2 4.9 Cash tax rate (%) 46.6 43.1 33.1 33.4 31.5 Effective tax rate (%) 51.5 43.1 33.1 33.4 31.5 Growth (%)Total revenues 24.1 13.7 23.4 18.2 18.0 Net adjusted income 34.1 (16.6) 48.6 22.8 12.4
Source: Company, Kotak Institutional Equities estimates
With expect Godrej Agrovet to become net cash positive in another two years and Godrej Properties to start generating positive cash flow from operations from FY2016.
Godrej Industries Others
KOTAK INSTITUTIONAL EQUITIES RESEARCH 9
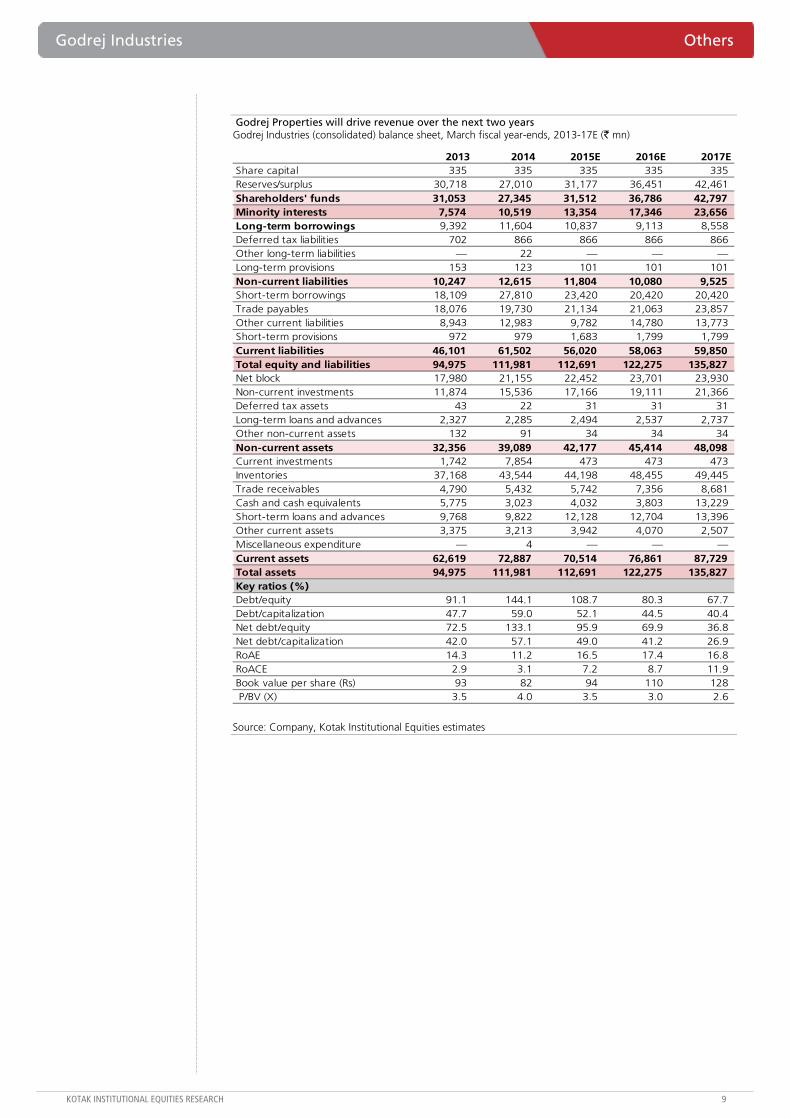
Godrej Properties will drive revenue over the next two years Godrej Industries (consolidated) balance sheet, March fiscal year-ends, 2013-17E (` mn)
2013 2014 2015E 2016E 2017EShare capital 335 335 335 335 335 Reserves/surplus 30,718 27,010 31,177 36,451 42,461 Shareholders' funds 31,053 27,345 31,512 36,786 42,797 Minority interests 7,574 10,519 13,354 17,346 23,656 Long-term borrowings 9,392 11,604 10,837 9,113 8,558 Deferred tax liabilities 702 866 866 866 866 Other long-term liabilities — 22 — — —Long-term provisions 153 123 101 101 101 Non-current liabilities 10,247 12,615 11,804 10,080 9,525 Short-term borrowings 18,109 27,810 23,420 20,420 20,420 Trade payables 18,076 19,730 21,134 21,063 23,857 Other current liabilities 8,943 12,983 9,782 14,780 13,773 Short-term provisions 972 979 1,683 1,799 1,799 Current liabilities 46,101 61,502 56,020 58,063 59,850 Total equity and liabilities 94,975 111,981 112,691 122,275 135,827 Net block 17,980 21,155 22,452 23,701 23,930 Non-current investments 11,874 15,536 17,166 19,111 21,366 Deferred tax assets 43 22 31 31 31 Long-term loans and advances 2,327 2,285 2,494 2,537 2,737 Other non-current assets 132 91 34 34 34 Non-current assets 32,356 39,089 42,177 45,414 48,098 Current investments 1,742 7,854 473 473 473 Inventories 37,168 43,544 44,198 48,455 49,445 Trade receivables 4,790 5,432 5,742 7,356 8,681 Cash and cash equivalents 5,775 3,023 4,032 3,803 13,229 Short-term loans and advances 9,768 9,822 12,128 12,704 13,396 Other current assets 3,375 3,213 3,942 4,070 2,507 Miscellaneous expenditure — 4 — — —Current assets 62,619 72,887 70,514 76,861 87,729 Total assets 94,975 111,981 112,691 122,275 135,827 Key ratios (%)Debt/equity 91.1 144.1 108.7 80.3 67.7 Debt/capitalization 47.7 59.0 52.1 44.5 40.4 Net debt/equity 72.5 133.1 95.9 69.9 36.8 Net debt/capitalization 42.0 57.1 49.0 41.2 26.9 RoAE 14.3 11.2 16.5 17.4 16.8 RoACE 2.9 3.1 7.2 8.7 11.9 Book value per share (Rs) 93 82 94 110 128 P/BV (X) 3.5 4.0 3.5 3.0 2.6
Source: Company, Kotak Institutional Equities estimates
Others Godrej Industries
10 KOTAK INSTITUTIONAL EQUITIES RESEARCH
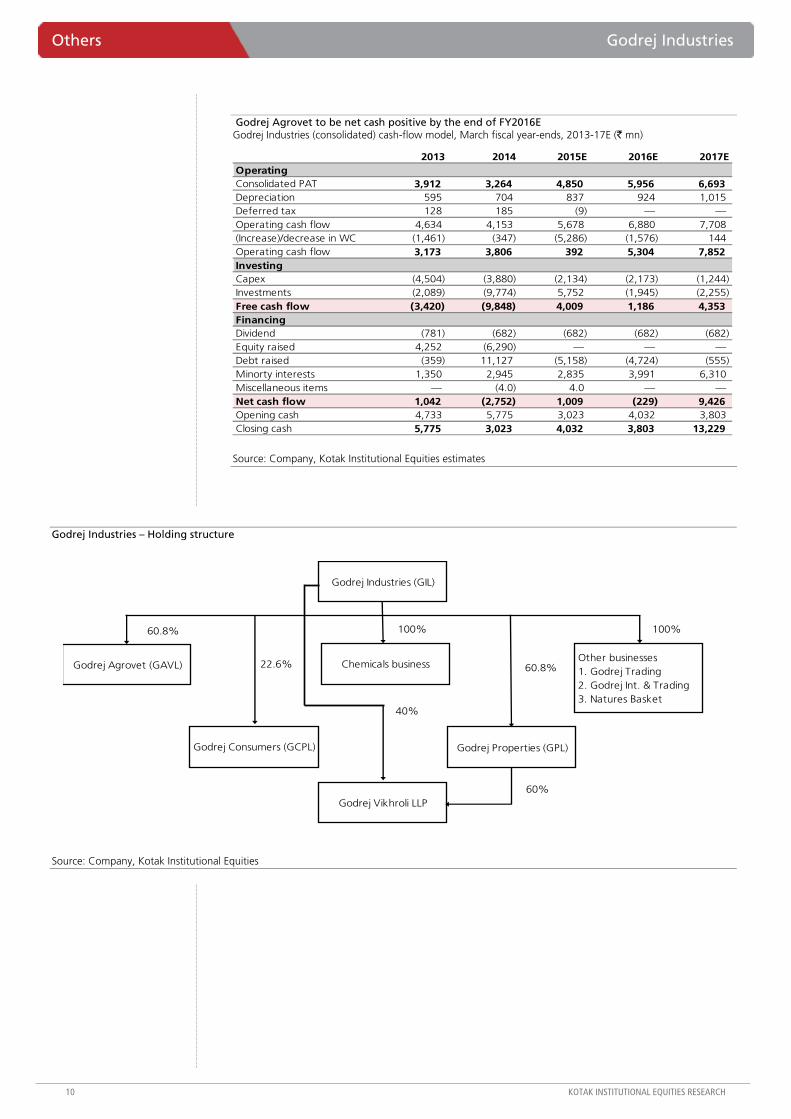
Godrej Agrovet to be net cash positive by the end of FY2016E Godrej Industries (consolidated) cash-flow model, March fiscal year-ends, 2013-17E (` mn)
2013 2014 2015E 2016E 2017EOperatingConsolidated PAT 3,912 3,264 4,850 5,956 6,693 Depreciation 595 704 837 924 1,015 Deferred tax 128 185 (9) — —Operating cash flow 4,634 4,153 5,678 6,880 7,708 (Increase)/decrease in WC (1,461) (347) (5,286) (1,576) 144 Operating cash flow 3,173 3,806 392 5,304 7,852 InvestingCapex (4,504) (3,880) (2,134) (2,173) (1,244) Investments (2,089) (9,774) 5,752 (1,945) (2,255) Free cash flow (3,420) (9,848) 4,009 1,186 4,353 FinancingDividend (781) (682) (682) (682) (682) Equity raised 4,252 (6,290) — — —Debt raised (359) 11,127 (5,158) (4,724) (555) Minorty interests 1,350 2,945 2,835 3,991 6,310 Miscellaneous items — (4.0) 4.0 — —Net cash flow 1,042 (2,752) 1,009 (229) 9,426 Opening cash 4,733 5,775 3,023 4,032 3,803 Closing cash 5,775 3,023 4,032 3,803 13,229
Source: Company, Kotak Institutional Equities estimates
Godrej Industries – Holding structure
Godrej Industries (GIL)
Chemicals business
Godrej Consumers (GCPL)
Other businesses1. Godrej Trading2. Godrej Int. & Trading3. Natures Basket
Godrej Properties (GPL)
Godrej Agrovet (GAVL)
60.8%
22.6%
100%
60.8%
100%
Godrej Vikhroli LLP 60%
40%
Source: Company, Kotak Institutional Equities

For private Circulation Only. FOR IMPORTANT INFORMATION ABOUT KOTAK SECURITIES’ RATING SYSTEM AND OTHER DISCLOSURES, REFER TO THE END OF THIS MATERIAL.
Country flows—India-focused active funds turn positive after 28 months
India-focused active funds have seen net inflows for the first time in the past 28 months. After witnessing outflows worth US$4.9 bn since February 2012, these funds attracted capital worth US$88 mn in July. Total listed fund flows into India amounted to US$0.95 bn during the period. ETF participation was India-focused (US$0.13 bn) as well as EM-focused (US$0.38 bn). With total net FII inflows into India (US$2.5 bn) superseding listed fund activity substantially, other market participants were active in July as well.
Country allocations—allocations to India continue to climb
Allocations to India by Asia ex-Japan funds touched 12.7% in June 2014, which was 0.3% higher than May (12.4%). China, India and Taiwan were the preferred investment destinations in the Asia ex-Japan region in June. GEM funds have seen allocations to India stabilize at 10.6%. Taiwan and Russia saw an increase in allocations over the past three months. Korea saw reduction in allocations by Asia ex-Japan funds and GEM funds.
Fund flows—‘smart’ beta being preferred within the Indian ETF space
Smart beta is being preferred over plain vanilla products in the India ETF landscape with WisdomTree India Earnings Fund (EPI) attracting US$0.6 bn over the past three months. While most prevalent index methodologies base their index construction on free-float and investability, EPI allocates higher weights to more profitable companies thereby offering cheaper benchmark valuations. EM-focused ETFs continued to attract capital with ~US$3.5 bn inflows over the month. EM-focused active funds also picked up the mantle, seeing inflows worth US$1.4 bn during the same period.
Strategy.dot
Strategy Foreign fund-flow tracker
India-focused active fund flow positive for the first time since February 2012. KIE’s foreign fund-flow tracker gives us a comprehensive view of market flow activity by listed funds into India and its emerging market peers. These market participants are further classified based on their investment styles (passive ETFs or active Non-ETFs) in an attempt to understand the intent and sentiments governing the flows.
INDIA
AUGUST 12, 2014
UPDATE
BSE-30: 25,519
QUICK NUMBERS
• Listed funds saw inflows worth US$0.95 bn in July
• Allocations to India by Asia ex-Japan up to 12.7% in June
• WisdomTree India Earnings fund has seen inflows worth US$0.6 bn in the past three months
• EM-focused ETFs saw inflows worth US$3.5 bn in the month
For private Circulation Only. FOR IMPORTANT INFORMATION ABOUT KOTAK SECURITIES’ RATING SYSTEM AND OTHER DISCLOSURES, REFER TO THE END OF THIS MATERIAL.
JLR surprises again but this time it’s lower publicity expenses
JLR reported net profit of GBP693 mn (+128% yoy), which was 53% above our estimates. JLR reported 68% yoy growth in EBITDA in 1QFY15 driven by ~31% yoy increase in revenues and 450 bps yoy expansion in EBITDA margin. The key surprise was lower-than-expected other expenses. Other expenses declined sharply qoq led by lower publicity expenses despite a 5% qoq decline in volumes. The company attributed this to superior product mix, which led to lower marketing costs. Other expenses included GBP98 mn forex gain on hedges in 1QFY15 versus GBP80 mn forex gain in 4QFY14. Adjusted EBITDA (excluding forex gains) was up 253 bps qoq, which largely came from GBP100 mn qoq decline in other expenses like publicity, warranty and other fixed costs.
Standalone business remains under pressure
Standalone business reported an adjusted PBT loss of `11,302 mn in 1QFY15, which was higher than our estimate of a loss of `10,241 mn led by 15.4% yoy decline in net sales. EBITDA margin in standalone business at -3.9% declined by 510 bps yoy as passenger vehicle losses increased. We expect standalone EBITDA margin to improve over the coming quarters due to lower discounting in the commercial vehicle business and pick-up in volumes of passenger vehicle business led by Zest launch.
We continue to stay bullish; Street underestimating JLR’s upcoming model launch potential
We maintain our BUY rating on the stock as we continue to expect positive surprises on JLR volume growth. We expect new launches to improve JLR volume growth. Jaguar XE and Jaguar SUV will be the key launches for the company over the next two years, in our view. We have increased our consolidated earnings estimates by 5-11% over FY2015/16E led by increase in our EBITDA margin assumptions for JLR. We have thus increased our target price to `590 (from `575) based on sum-of-the-parts valuation methodology.
Tata Motors (TTMT)
Automobiles
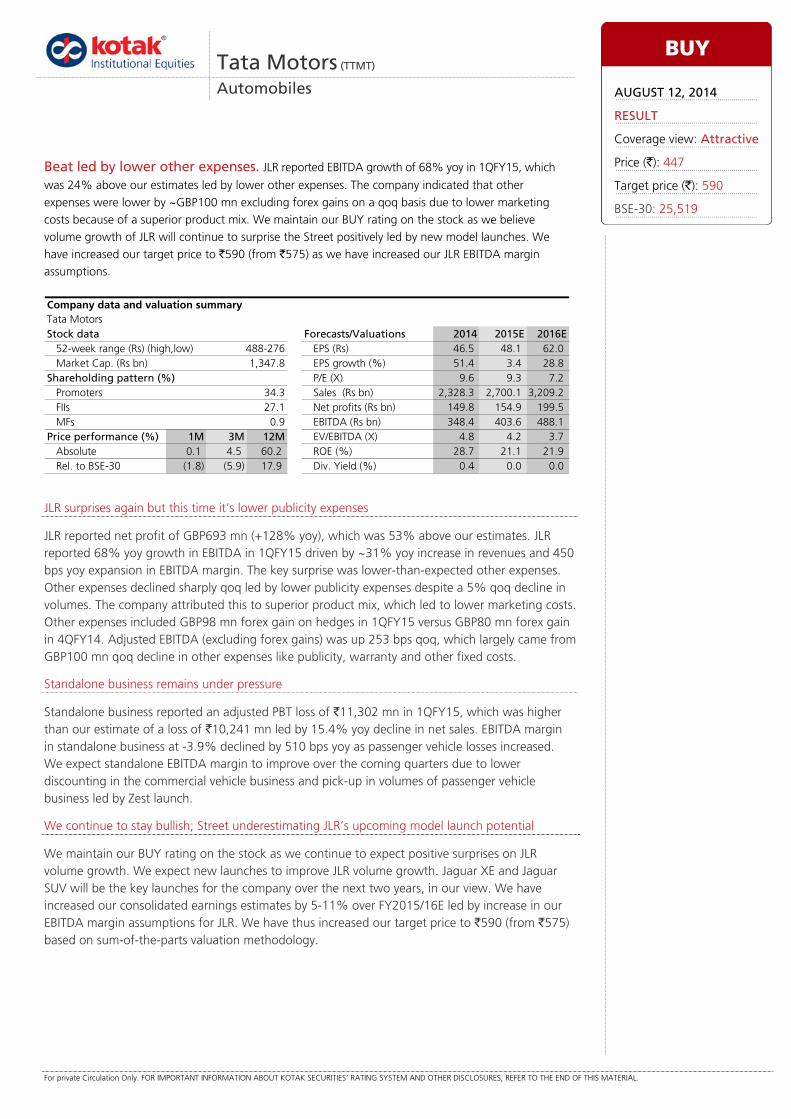
Beat led by lower other expenses. JLR reported EBITDA growth of 68% yoy in 1QFY15, which
was 24% above our estimates led by lower other expenses. The company indicated that other expenses were lower by ~GBP100 mn excluding forex gains on a qoq basis due to lower marketing costs because of a superior product mix. We maintain our BUY rating on the stock as we believe volume growth of JLR will continue to surprise the Street positively led by new model launches. We have increased our target price to `590 (from `575) as we have increased our JLR EBITDA margin assumptions.
Tata MotorsStock data Forecasts/Valuations 2014 2015E 2016E
52-week range (Rs) (high,low) EPS (Rs) 46.5 48.1 62.0Market Cap. (Rs bn) 1,347.8 EPS growth (%) 51.4 3.4 28.8
Shareholding pattern (%) P/E (X) 9.6 9.3 7.2Promoters 34.3 Sales (Rs bn) 2,328.3 2,700.1 3,209.2FIIs 27.1 Net profits (Rs bn) 149.8 154.9 199.5MFs 0.9 EBITDA (Rs bn) 348.4 403.6 488.1
Price performance (%) 1M 3M 12M EV/EBITDA (X) 4.8 4.2 3.7Absolute 0.1 4.5 60.2 ROE (%) 28.7 21.1 21.9Rel. to BSE-30 (1.8) (5.9) 17.9 Div. Yield (%) 0.4 0.0 0.0
Company data and valuation summary
488-276
BUY
AUGUST 12, 2014
RESULT
Coverage view: Attractive
Price (`): 447
Target price (`): 590
BSE-30: 25,519
Tata Motors Automobiles
KOTAK INSTITUTIONAL EQUITIES RESEARCH 13
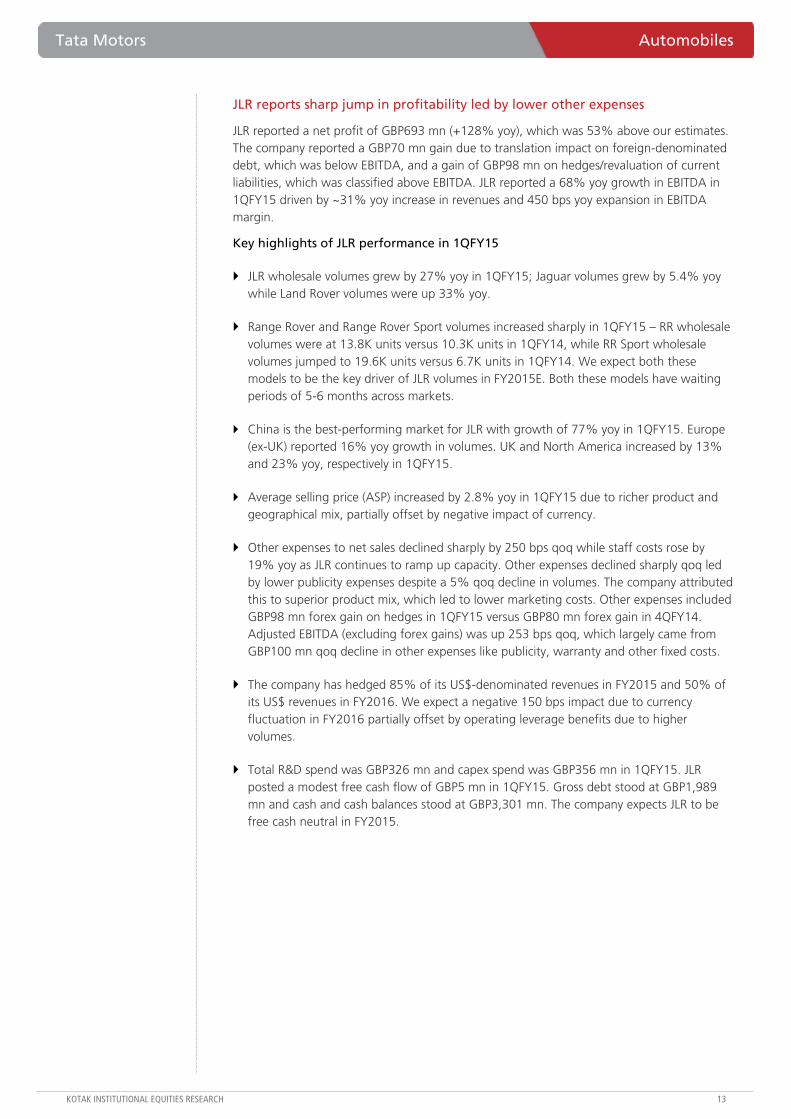
JLR reports sharp jump in profitability led by lower other expenses
JLR reported a net profit of GBP693 mn (+128% yoy), which was 53% above our estimates. The company reported a GBP70 mn gain due to translation impact on foreign-denominated debt, which was below EBITDA, and a gain of GBP98 mn on hedges/revaluation of current liabilities, which was classified above EBITDA. JLR reported a 68% yoy growth in EBITDA in 1QFY15 driven by ~31% yoy increase in revenues and 450 bps yoy expansion in EBITDA margin.
Key highlights of JLR performance in 1QFY15
JLR wholesale volumes grew by 27% yoy in 1QFY15; Jaguar volumes grew by 5.4% yoy while Land Rover volumes were up 33% yoy.
Range Rover and Range Rover Sport volumes increased sharply in 1QFY15 – RR wholesale volumes were at 13.8K units versus 10.3K units in 1QFY14, while RR Sport wholesale volumes jumped to 19.6K units versus 6.7K units in 1QFY14. We expect both these models to be the key driver of JLR volumes in FY2015E. Both these models have waiting periods of 5-6 months across markets.
China is the best-performing market for JLR with growth of 77% yoy in 1QFY15. Europe (ex-UK) reported 16% yoy growth in volumes. UK and North America increased by 13% and 23% yoy, respectively in 1QFY15.
Average selling price (ASP) increased by 2.8% yoy in 1QFY15 due to richer product and geographical mix, partially offset by negative impact of currency.
Other expenses to net sales declined sharply by 250 bps qoq while staff costs rose by 19% yoy as JLR continues to ramp up capacity. Other expenses declined sharply qoq led by lower publicity expenses despite a 5% qoq decline in volumes. The company attributed this to superior product mix, which led to lower marketing costs. Other expenses included GBP98 mn forex gain on hedges in 1QFY15 versus GBP80 mn forex gain in 4QFY14. Adjusted EBITDA (excluding forex gains) was up 253 bps qoq, which largely came from GBP100 mn qoq decline in other expenses like publicity, warranty and other fixed costs.
The company has hedged 85% of its US$-denominated revenues in FY2015 and 50% of its US$ revenues in FY2016. We expect a negative 150 bps impact due to currency fluctuation in FY2016 partially offset by operating leverage benefits due to higher volumes.
Total R&D spend was GBP326 mn and capex spend was GBP356 mn in 1QFY15. JLR posted a modest free cash flow of GBP5 mn in 1QFY15. Gross debt stood at GBP1,989 mn and cash and cash balances stood at GBP3,301 mn. The company expects JLR to be free cash neutral in FY2015.
Automobiles Tata Motors
14 KOTAK INSTITUTIONAL EQUITIES RESEARCH
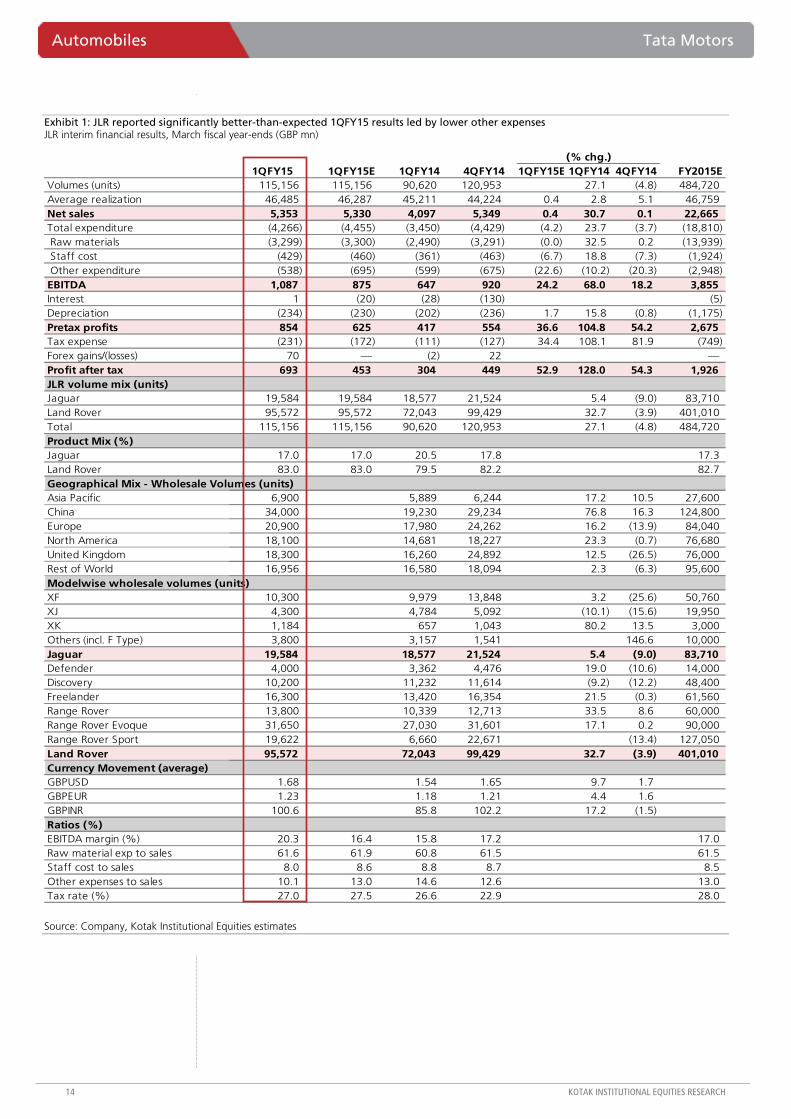
Exhibit 1: JLR reported significantly better-than-expected 1QFY15 results led by lower other expenses JLR interim financial results, March fiscal year-ends (GBP mn)
(% chg.)1QFY15 1QFY15E 1QFY14 4QFY14 1QFY15E 1QFY14 4QFY14 FY2015E
Volumes (units) 115,156 115,156 90,620 120,953 27.1 (4.8) 484,720 Average realization 46,485 46,287 45,211 44,224 0.4 2.8 5.1 46,759 Net sales 5,353 5,330 4,097 5,349 0.4 30.7 0.1 22,665 Total expenditure (4,266) (4,455) (3,450) (4,429) (4.2) 23.7 (3.7) (18,810) Raw materials (3,299) (3,300) (2,490) (3,291) (0.0) 32.5 0.2 (13,939) Staff cost (429) (460) (361) (463) (6.7) 18.8 (7.3) (1,924) Other expenditure (538) (695) (599) (675) (22.6) (10.2) (20.3) (2,948) EBITDA 1,087 875 647 920 24.2 68.0 18.2 3,855 Interest 1 (20) (28) (130) (5) Depreciation (234) (230) (202) (236) 1.7 15.8 (0.8) (1,175) Pretax profits 854 625 417 554 36.6 104.8 54.2 2,675 Tax expense (231) (172) (111) (127) 34.4 108.1 81.9 (749) Forex gains/(losses) 70 — (2) 22 —Profit after tax 693 453 304 449 52.9 128.0 54.3 1,926 JLR volume mix (units)Jaguar 19,584 19,584 18,577 21,524 5.4 (9.0) 83,710 Land Rover 95,572 95,572 72,043 99,429 32.7 (3.9) 401,010 Total 115,156 115,156 90,620 120,953 27.1 (4.8) 484,720 Product Mix (%)Jaguar 17.0 17.0 20.5 17.8 17.3 Land Rover 83.0 83.0 79.5 82.2 82.7 Geographical Mix - Wholesale Volumes (units)Asia Pacific 6,900 5,889 6,244 17.2 10.5 27,600 China 34,000 19,230 29,234 76.8 16.3 124,800 Europe 20,900 17,980 24,262 16.2 (13.9) 84,040 North America 18,100 14,681 18,227 23.3 (0.7) 76,680 United Kingdom 18,300 16,260 24,892 12.5 (26.5) 76,000 Rest of World 16,956 16,580 18,094 2.3 (6.3) 95,600 Modelwise wholesale volumes (units)XF 10,300 9,979 13,848 3.2 (25.6) 50,760 XJ 4,300 4,784 5,092 (10.1) (15.6) 19,950 XK 1,184 657 1,043 80.2 13.5 3,000 Others (incl. F Type) 3,800 3,157 1,541 146.6 10,000 Jaguar 19,584 18,577 21,524 5.4 (9.0) 83,710 Defender 4,000 3,362 4,476 19.0 (10.6) 14,000 Discovery 10,200 11,232 11,614 (9.2) (12.2) 48,400 Freelander 16,300 13,420 16,354 21.5 (0.3) 61,560 Range Rover 13,800 10,339 12,713 33.5 8.6 60,000 Range Rover Evoque 31,650 27,030 31,601 17.1 0.2 90,000 Range Rover Sport 19,622 6,660 22,671 (13.4) 127,050 Land Rover 95,572 72,043 99,429 32.7 (3.9) 401,010 Currency Movement (average)GBPUSD 1.68 1.54 1.65 9.7 1.7 GBPEUR 1.23 1.18 1.21 4.4 1.6 GBPINR 100.6 85.8 102.2 17.2 (1.5) Ratios (%)EBITDA margin (%) 20.3 16.4 15.8 17.2 17.0 Raw material exp to sales 61.6 61.9 60.8 61.5 61.5 Staff cost to sales 8.0 8.6 8.8 8.7 8.5 Other expenses to sales 10.1 13.0 14.6 12.6 13.0 Tax rate (%) 27.0 27.5 26.6 22.9 28.0
Source: Company, Kotak Institutional Equities estimates
Tata Motors Automobiles
KOTAK INSTITUTIONAL EQUITIES RESEARCH 15
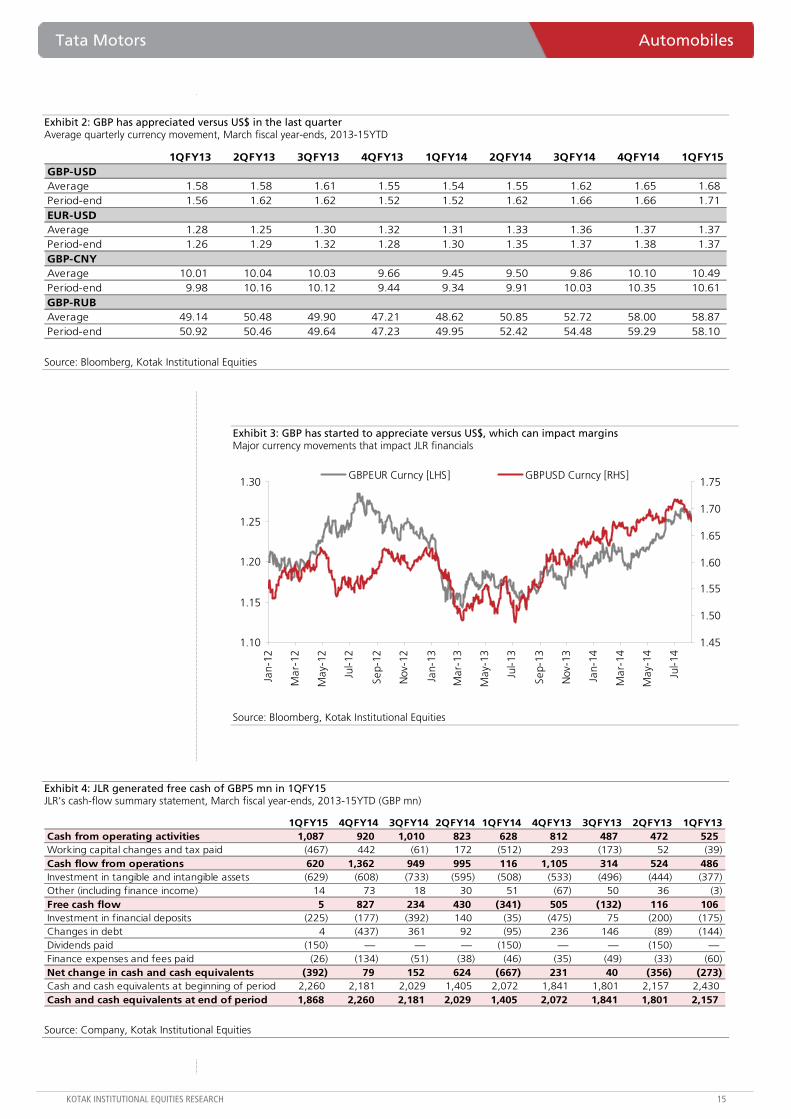
Exhibit 2: GBP has appreciated versus US$ in the last quarter Average quarterly currency movement, March fiscal year-ends, 2013-15YTD
1QFY13 2QFY13 3QFY13 4QFY13 1QFY14 2QFY14 3QFY14 4QFY14 1QFY15GBP-USDAverage 1.58 1.58 1.61 1.55 1.54 1.55 1.62 1.65 1.68 Period-end 1.56 1.62 1.62 1.52 1.52 1.62 1.66 1.66 1.71 EUR-USDAverage 1.28 1.25 1.30 1.32 1.31 1.33 1.36 1.37 1.37 Period-end 1.26 1.29 1.32 1.28 1.30 1.35 1.37 1.38 1.37 GBP-CNYAverage 10.01 10.04 10.03 9.66 9.45 9.50 9.86 10.10 10.49 Period-end 9.98 10.16 10.12 9.44 9.34 9.91 10.03 10.35 10.61 GBP-RUBAverage 49.14 50.48 49.90 47.21 48.62 50.85 52.72 58.00 58.87 Period-end 50.92 50.46 49.64 47.23 49.95 52.42 54.48 59.29 58.10
Source: Bloomberg, Kotak Institutional Equities
Exhibit 3: GBP has started to appreciate versus US$, which can impact margins Major currency movements that impact JLR financials
1.10
1.15
1.20
1.25
1.30
Jan-
12
Mar
-12
May
-12
Jul-1
2
Sep-
12
Nov
-12
Jan-
13
Mar
-13
May
-13
Jul-1
3
Sep-
13
Nov
-13
Jan-
14
Mar
-14
May
-14
Jul-1
4
1.45
1.50
1.55
1.60
1.65
1.70
1.75GBPEUR Curncy [LHS] GBPUSD Curncy [RHS]
Source: Bloomberg, Kotak Institutional Equities
Exhibit 4: JLR generated free cash of GBP5 mn in 1QFY15 JLR's cash-flow summary statement, March fiscal year-ends, 2013-15YTD (GBP mn)
1QFY15 4QFY14 3QFY14 2QFY14 1QFY14 4QFY13 3QFY13 2QFY13 1QFY13Cash from operating activities 1,087 920 1,010 823 628 812 487 472 525 Working capital changes and tax paid (467) 442 (61) 172 (512) 293 (173) 52 (39) Cash flow from operations 620 1,362 949 995 116 1,105 314 524 486 Investment in tangible and intangible assets (629) (608) (733) (595) (508) (533) (496) (444) (377) Other (including finance income) 14 73 18 30 51 (67) 50 36 (3) Free cash flow 5 827 234 430 (341) 505 (132) 116 106 Investment in financial deposits (225) (177) (392) 140 (35) (475) 75 (200) (175) Changes in debt 4 (437) 361 92 (95) 236 146 (89) (144) Dividends paid (150) — — — (150) — — (150) —Finance expenses and fees paid (26) (134) (51) (38) (46) (35) (49) (33) (60) Net change in cash and cash equivalents (392) 79 152 624 (667) 231 40 (356) (273) Cash and cash equivalents at beginning of period 2,260 2,181 2,029 1,405 2,072 1,841 1,801 2,157 2,430 Cash and cash equivalents at end of period 1,868 2,260 2,181 2,029 1,405 2,072 1,841 1,801 2,157
Source: Company, Kotak Institutional Equities

Automobiles Tata Motors
16 KOTAK INSTITUTIONAL EQUITIES RESEARCH
Exhibit 5: JLR expensed only ~16% of R&D in P&L in 1QFY15 Break-up of JLR R&D and capex spend, March fiscal year-ends, 2013-15YTD (GBP mn)
1QFY15 4QFY14 3QFY14 2QFY14 1QFY14 4QFY13 3QFY13 2QFY13 1QFY13R&D expenseCapitalized 273 258 271 259 242 198 229 218 215 Expensed 53 69 55 62 50 54 46 51 47 Total R&D expense 326 327 326 321 292 252 275 269 262 Investment in tangible and other intangible assets 356 350 462 336 266 335 267 226 162 Total product and other investment 682 677 788 657 558 587 542 488 424 R&D capitalized as % of total R&D 83.7 78.9 83.1 80.7 82.9 78.6 83.3 81.0 82.1
Source: Company, Kotak Institutional Equities
Exhibit 6: China share will continue to grow in the product mix Geography-wise volume mix, March fiscal year-ends, 2012-17E (units, %)
2012 2013 2014 2015E 2016E 2017EGeographyN.A 58,327 64,939 71,385 76,680 98,680 108,548 UK 61,796 68,028 75,856 76,000 96,000 105,600 Europe (excl Russia and UK) 71,580 78,809 82,711 70,000 90,000 94,500 Russia 15,201 16,721 13,000 14,040 21,040 24,196 China 54,532 79,458 103,910 124,800 176,800 231,520 Asia Pac (excl China) 14,467 18,280 22,693 27,600 32,600 37,600 Rest of World 38,530 45,827 60,306 95,600 107,089 85,030 Total Volumes 314,433 372,062 429,861 484,720 622,209 686,994 Yoy growth (%) 29.1 18.3 15.5 12.8 28.4 10.4 Geographical mix (%)N.A 18.5 17.5 16.6 15.8 15.9 15.8 UK 19.7 18.3 17.6 15.7 15.4 15.4 Europe (excl Russia and UK) 22.8 21.2 19.2 14.4 14.5 13.8 Russia 4.8 4.5 3.0 2.9 3.4 3.5 China 17.3 21.4 24.2 25.7 28.4 33.7 Asia Pac (excl China) 4.6 4.9 5.3 5.7 5.2 5.5 Rest of World 12.3 12.3 14.0 19.7 17.2 12.4 Total Volumes 100 100 100 100 100 100
Source: Company, Kotak Institutional Equities estimates
Tata Motors Automobiles
KOTAK INSTITUTIONAL EQUITIES RESEARCH 17
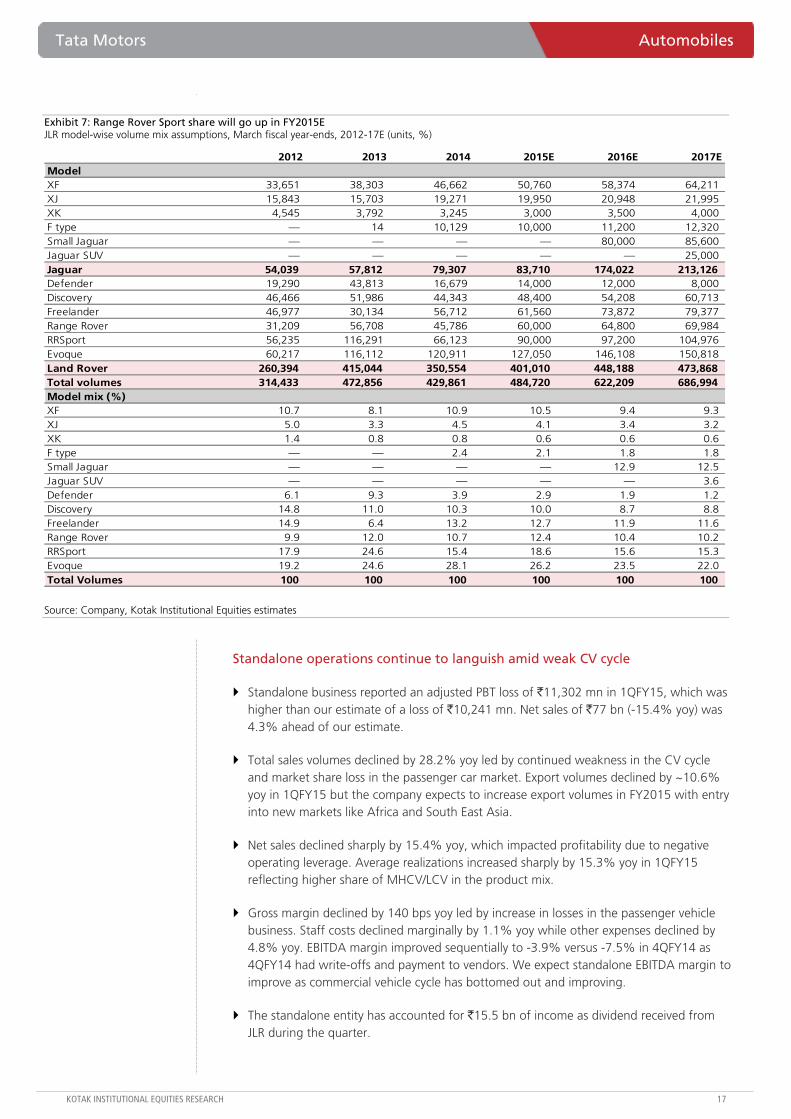
Exhibit 7: Range Rover Sport share will go up in FY2015E JLR model-wise volume mix assumptions, March fiscal year-ends, 2012-17E (units, %)
2012 2013 2014 2015E 2016E 2017EModelXF 33,651 38,303 46,662 50,760 58,374 64,211 XJ 15,843 15,703 19,271 19,950 20,948 21,995 XK 4,545 3,792 3,245 3,000 3,500 4,000 F type — 14 10,129 10,000 11,200 12,320 Small Jaguar — — — — 80,000 85,600 Jaguar SUV — — — — — 25,000 Jaguar 54,039 57,812 79,307 83,710 174,022 213,126 Defender 19,290 43,813 16,679 14,000 12,000 8,000 Discovery 46,466 51,986 44,343 48,400 54,208 60,713 Freelander 46,977 30,134 56,712 61,560 73,872 79,377 Range Rover 31,209 56,708 45,786 60,000 64,800 69,984 RRSport 56,235 116,291 66,123 90,000 97,200 104,976 Evoque 60,217 116,112 120,911 127,050 146,108 150,818 Land Rover 260,394 415,044 350,554 401,010 448,188 473,868 Total volumes 314,433 472,856 429,861 484,720 622,209 686,994 Model mix (%)XF 10.7 8.1 10.9 10.5 9.4 9.3 XJ 5.0 3.3 4.5 4.1 3.4 3.2 XK 1.4 0.8 0.8 0.6 0.6 0.6 F type — — 2.4 2.1 1.8 1.8 Small Jaguar — — — — 12.9 12.5 Jaguar SUV — — — — — 3.6 Defender 6.1 9.3 3.9 2.9 1.9 1.2 Discovery 14.8 11.0 10.3 10.0 8.7 8.8 Freelander 14.9 6.4 13.2 12.7 11.9 11.6 Range Rover 9.9 12.0 10.7 12.4 10.4 10.2 RRSport 17.9 24.6 15.4 18.6 15.6 15.3 Evoque 19.2 24.6 28.1 26.2 23.5 22.0 Total Volumes 100 100 100 100 100 100
Source: Company, Kotak Institutional Equities estimates
Standalone operations continue to languish amid weak CV cycle
Standalone business reported an adjusted PBT loss of `11,302 mn in 1QFY15, which was higher than our estimate of a loss of `10,241 mn. Net sales of `77 bn (-15.4% yoy) was 4.3% ahead of our estimate.
Total sales volumes declined by 28.2% yoy led by continued weakness in the CV cycle and market share loss in the passenger car market. Export volumes declined by ~10.6% yoy in 1QFY15 but the company expects to increase export volumes in FY2015 with entry into new markets like Africa and South East Asia.
Net sales declined sharply by 15.4% yoy, which impacted profitability due to negative operating leverage. Average realizations increased sharply by 15.3% yoy in 1QFY15 reflecting higher share of MHCV/LCV in the product mix.
Gross margin declined by 140 bps yoy led by increase in losses in the passenger vehicle business. Staff costs declined marginally by 1.1% yoy while other expenses declined by 4.8% yoy. EBITDA margin improved sequentially to -3.9% versus -7.5% in 4QFY14 as 4QFY14 had write-offs and payment to vendors. We expect standalone EBITDA margin to improve as commercial vehicle cycle has bottomed out and improving.
The standalone entity has accounted for `15.5 bn of income as dividend received from JLR during the quarter.
Automobiles Tata Motors
18 KOTAK INSTITUTIONAL EQUITIES RESEARCH
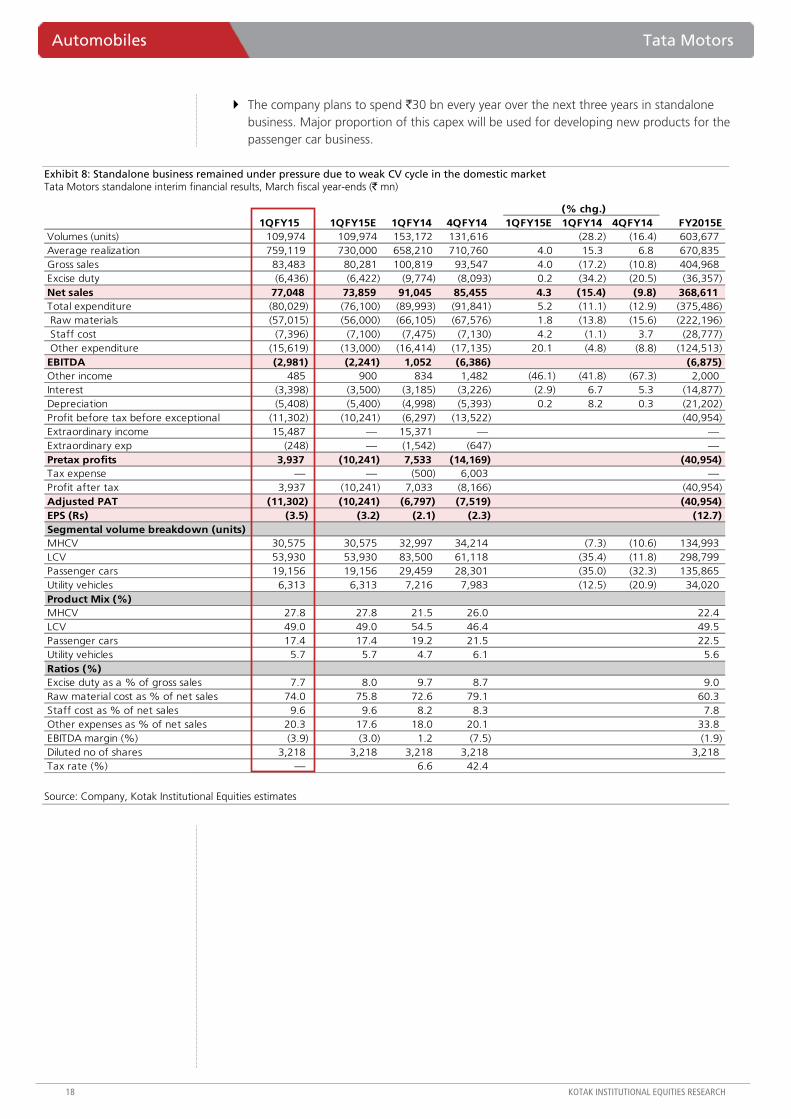
The company plans to spend `30 bn every year over the next three years in standalone business. Major proportion of this capex will be used for developing new products for the passenger car business.
Exhibit 8: Standalone business remained under pressure due to weak CV cycle in the domestic market Tata Motors standalone interim financial results, March fiscal year-ends (` mn)
(% chg.)1QFY15 1QFY15E 1QFY14 4QFY14 1QFY15E 1QFY14 4QFY14 FY2015E
Volumes (units) 109,974 109,974 153,172 131,616 (28.2) (16.4) 603,677 Average realization 759,119 730,000 658,210 710,760 4.0 15.3 6.8 670,835 Gross sales 83,483 80,281 100,819 93,547 4.0 (17.2) (10.8) 404,968 Excise duty (6,436) (6,422) (9,774) (8,093) 0.2 (34.2) (20.5) (36,357) Net sales 77,048 73,859 91,045 85,455 4.3 (15.4) (9.8) 368,611 Total expenditure (80,029) (76,100) (89,993) (91,841) 5.2 (11.1) (12.9) (375,486) Raw materials (57,015) (56,000) (66,105) (67,576) 1.8 (13.8) (15.6) (222,196) Staff cost (7,396) (7,100) (7,475) (7,130) 4.2 (1.1) 3.7 (28,777) Other expenditure (15,619) (13,000) (16,414) (17,135) 20.1 (4.8) (8.8) (124,513) EBITDA (2,981) (2,241) 1,052 (6,386) (6,875) Other income 485 900 834 1,482 (46.1) (41.8) (67.3) 2,000 Interest (3,398) (3,500) (3,185) (3,226) (2.9) 6.7 5.3 (14,877) Depreciation (5,408) (5,400) (4,998) (5,393) 0.2 8.2 0.3 (21,202) Profit before tax before exceptional (11,302) (10,241) (6,297) (13,522) (40,954) Extraordinary income 15,487 — 15,371 — —Extraordinary exp (248) — (1,542) (647) —Pretax profits 3,937 (10,241) 7,533 (14,169) (40,954) Tax expense — — (500) 6,003 —Profit after tax 3,937 (10,241) 7,033 (8,166) (40,954) Adjusted PAT (11,302) (10,241) (6,797) (7,519) (40,954) EPS (Rs) (3.5) (3.2) (2.1) (2.3) (12.7) Segmental volume breakdown (units)MHCV 30,575 30,575 32,997 34,214 (7.3) (10.6) 134,993 LCV 53,930 53,930 83,500 61,118 (35.4) (11.8) 298,799 Passenger cars 19,156 19,156 29,459 28,301 (35.0) (32.3) 135,865 Utility vehicles 6,313 6,313 7,216 7,983 (12.5) (20.9) 34,020 Product Mix (%)MHCV 27.8 27.8 21.5 26.0 22.4 LCV 49.0 49.0 54.5 46.4 49.5 Passenger cars 17.4 17.4 19.2 21.5 22.5 Utility vehicles 5.7 5.7 4.7 6.1 5.6 Ratios (%)Excise duty as a % of gross sales 7.7 8.0 9.7 8.7 9.0 Raw material cost as % of net sales 74.0 75.8 72.6 79.1 60.3 Staff cost as % of net sales 9.6 9.6 8.2 8.3 7.8 Other expenses as % of net sales 20.3 17.6 18.0 20.1 33.8 EBITDA margin (%) (3.9) (3.0) 1.2 (7.5) (1.9) Diluted no of shares 3,218 3,218 3,218 3,218 3,218 Tax rate (%) — 6.6 42.4
Source: Company, Kotak Institutional Equities estimates
Tata Motors Automobiles
KOTAK INSTITUTIONAL EQUITIES RESEARCH 19
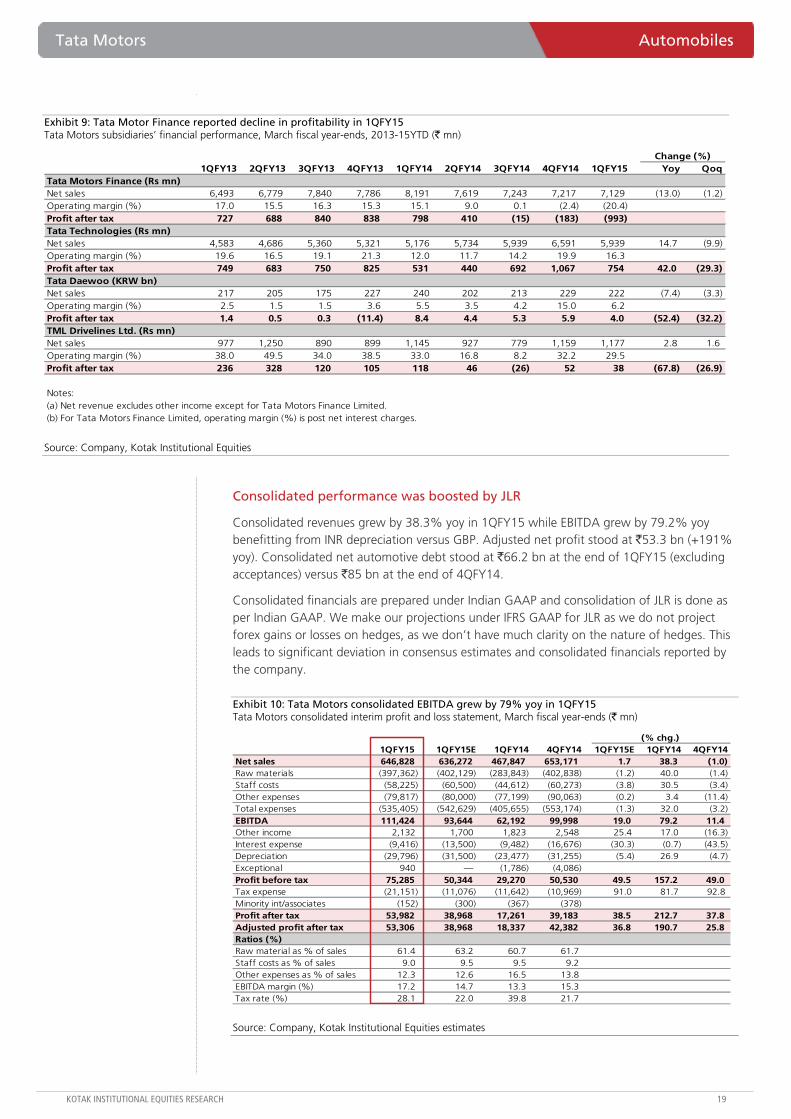
Exhibit 9: Tata Motor Finance reported decline in profitability in 1QFY15 Tata Motors subsidiaries’ financial performance, March fiscal year-ends, 2013-15YTD (` mn)
Change (%)1QFY13 2QFY13 3QFY13 4QFY13 1QFY14 2QFY14 3QFY14 4QFY14 1QFY15 Yoy Qoq
Tata Motors Finance (Rs mn)Net sales 6,493 6,779 7,840 7,786 8,191 7,619 7,243 7,217 7,129 (13.0) (1.2) Operating margin (%) 17.0 15.5 16.3 15.3 15.1 9.0 0.1 (2.4) (20.4) Profit after tax 727 688 840 838 798 410 (15) (183) (993) Tata Technologies (Rs mn)Net sales 4,583 4,686 5,360 5,321 5,176 5,734 5,939 6,591 5,939 14.7 (9.9) Operating margin (%) 19.6 16.5 19.1 21.3 12.0 11.7 14.2 19.9 16.3 Profit after tax 749 683 750 825 531 440 692 1,067 754 42.0 (29.3) Tata Daewoo (KRW bn)Net sales 217 205 175 227 240 202 213 229 222 (7.4) (3.3) Operating margin (%) 2.5 1.5 1.5 3.6 5.5 3.5 4.2 15.0 6.2 Profit after tax 1.4 0.5 0.3 (11.4) 8.4 4.4 5.3 5.9 4.0 (52.4) (32.2) TML Drivelines Ltd. (Rs mn)Net sales 977 1,250 890 899 1,145 927 779 1,159 1,177 2.8 1.6 Operating margin (%) 38.0 49.5 34.0 38.5 33.0 16.8 8.2 32.2 29.5 Profit after tax 236 328 120 105 118 46 (26) 52 38 (67.8) (26.9)
Notes:(a) Net revenue excludes other income except for Tata Motors Finance Limited.(b) For Tata Motors Finance Limited, operating margin (%) is post net interest charges.
Source: Company, Kotak Institutional Equities
Consolidated performance was boosted by JLR
Consolidated revenues grew by 38.3% yoy in 1QFY15 while EBITDA grew by 79.2% yoy benefitting from INR depreciation versus GBP. Adjusted net profit stood at `53.3 bn (+191% yoy). Consolidated net automotive debt stood at `66.2 bn at the end of 1QFY15 (excluding acceptances) versus `85 bn at the end of 4QFY14.
Consolidated financials are prepared under Indian GAAP and consolidation of JLR is done as per Indian GAAP. We make our projections under IFRS GAAP for JLR as we do not project forex gains or losses on hedges, as we don’t have much clarity on the nature of hedges. This leads to significant deviation in consensus estimates and consolidated financials reported by the company.
Exhibit 10: Tata Motors consolidated EBITDA grew by 79% yoy in 1QFY15 Tata Motors consolidated interim profit and loss statement, March fiscal year-ends (` mn)
(% chg.)1QFY15 1QFY15E 1QFY14 4QFY14 1QFY15E 1QFY14 4QFY14
Net sales 646,828 636,272 467,847 653,171 1.7 38.3 (1.0) Raw materials (397,362) (402,129) (283,843) (402,838) (1.2) 40.0 (1.4) Staff costs (58,225) (60,500) (44,612) (60,273) (3.8) 30.5 (3.4) Other expenses (79,817) (80,000) (77,199) (90,063) (0.2) 3.4 (11.4) Total expenses (535,405) (542,629) (405,655) (553,174) (1.3) 32.0 (3.2) EBITDA 111,424 93,644 62,192 99,998 19.0 79.2 11.4 Other income 2,132 1,700 1,823 2,548 25.4 17.0 (16.3) Interest expense (9,416) (13,500) (9,482) (16,676) (30.3) (0.7) (43.5) Depreciation (29,796) (31,500) (23,477) (31,255) (5.4) 26.9 (4.7) Exceptional 940 — (1,786) (4,086) Profit before tax 75,285 50,344 29,270 50,530 49.5 157.2 49.0 Tax expense (21,151) (11,076) (11,642) (10,969) 91.0 81.7 92.8 Minority int/associates (152) (300) (367) (378) Profit after tax 53,982 38,968 17,261 39,183 38.5 212.7 37.8 Adjusted profit after tax 53,306 38,968 18,337 42,382 36.8 190.7 25.8 Ratios (%)Raw material as % of sales 61.4 63.2 60.7 61.7 Staff costs as % of sales 9.0 9.5 9.5 9.2 Other expenses as % of sales 12.3 12.6 16.5 13.8 EBITDA margin (%) 17.2 14.7 13.3 15.3 Tax rate (%) 28.1 22.0 39.8 21.7
Source: Company, Kotak Institutional Equities estimates
Automobiles Tata Motors
20 KOTAK INSTITUTIONAL EQUITIES RESEARCH
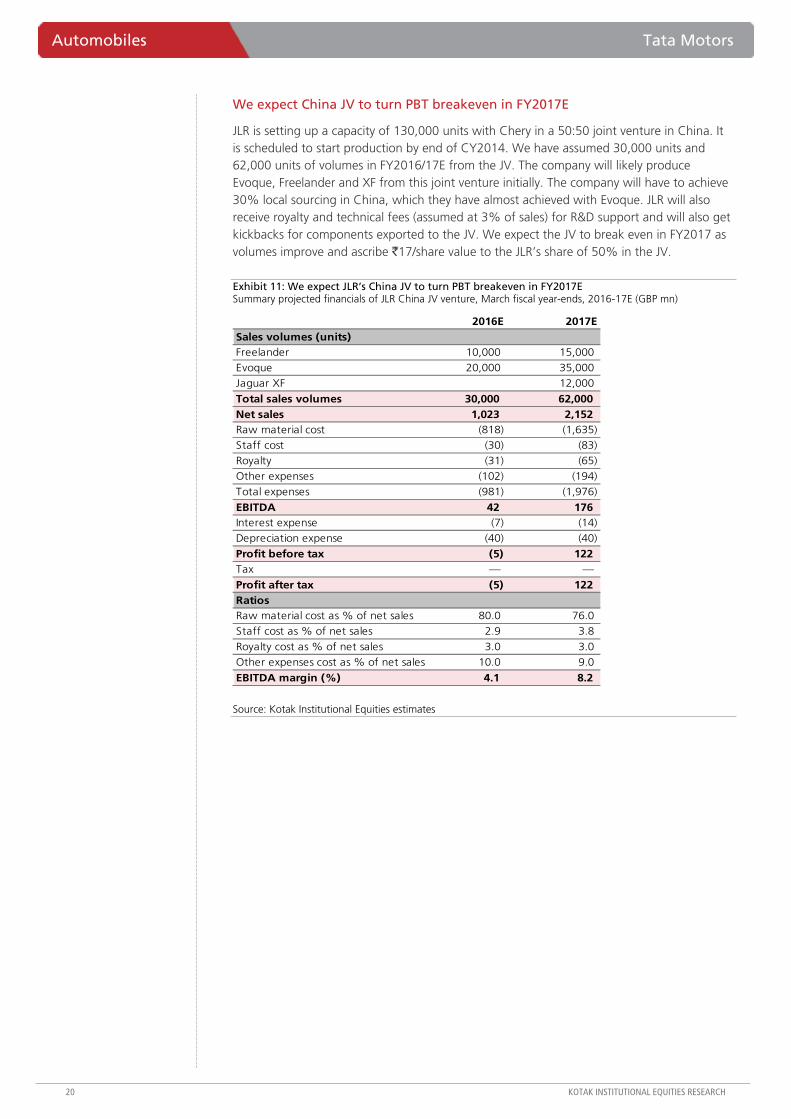
We expect China JV to turn PBT breakeven in FY2017E
JLR is setting up a capacity of 130,000 units with Chery in a 50:50 joint venture in China. It is scheduled to start production by end of CY2014. We have assumed 30,000 units and 62,000 units of volumes in FY2016/17E from the JV. The company will likely produce Evoque, Freelander and XF from this joint venture initially. The company will have to achieve 30% local sourcing in China, which they have almost achieved with Evoque. JLR will also receive royalty and technical fees (assumed at 3% of sales) for R&D support and will also get kickbacks for components exported to the JV. We expect the JV to break even in FY2017 as volumes improve and ascribe `17/share value to the JLR’s share of 50% in the JV.
Exhibit 11: We expect JLR’s China JV to turn PBT breakeven in FY2017E Summary projected financials of JLR China JV venture, March fiscal year-ends, 2016-17E (GBP mn)
2016E 2017ESales volumes (units)Freelander 10,000 15,000
Evoque 20,000 35,000
Jaguar XF 12,000
Total sales volumes 30,000 62,000 Net sales 1,023 2,152 Raw material cost (818) (1,635)
Staff cost (30) (83)
Royalty (31) (65)
Other expenses (102) (194)
Total expenses (981) (1,976)
EBITDA 42 176 Interest expense (7) (14)
Depreciation expense (40) (40)
Profit before tax (5) 122 Tax — —
Profit after tax (5) 122 RatiosRaw material cost as % of net sales 80.0 76.0
Staff cost as % of net sales 2.9 3.8
Royalty cost as % of net sales 3.0 3.0
Other expenses cost as % of net sales 10.0 9.0
EBITDA margin (%) 4.1 8.2
Source: Kotak Institutional Equities estimates
Tata Motors Automobiles
KOTAK INSTITUTIONAL EQUITIES RESEARCH 21
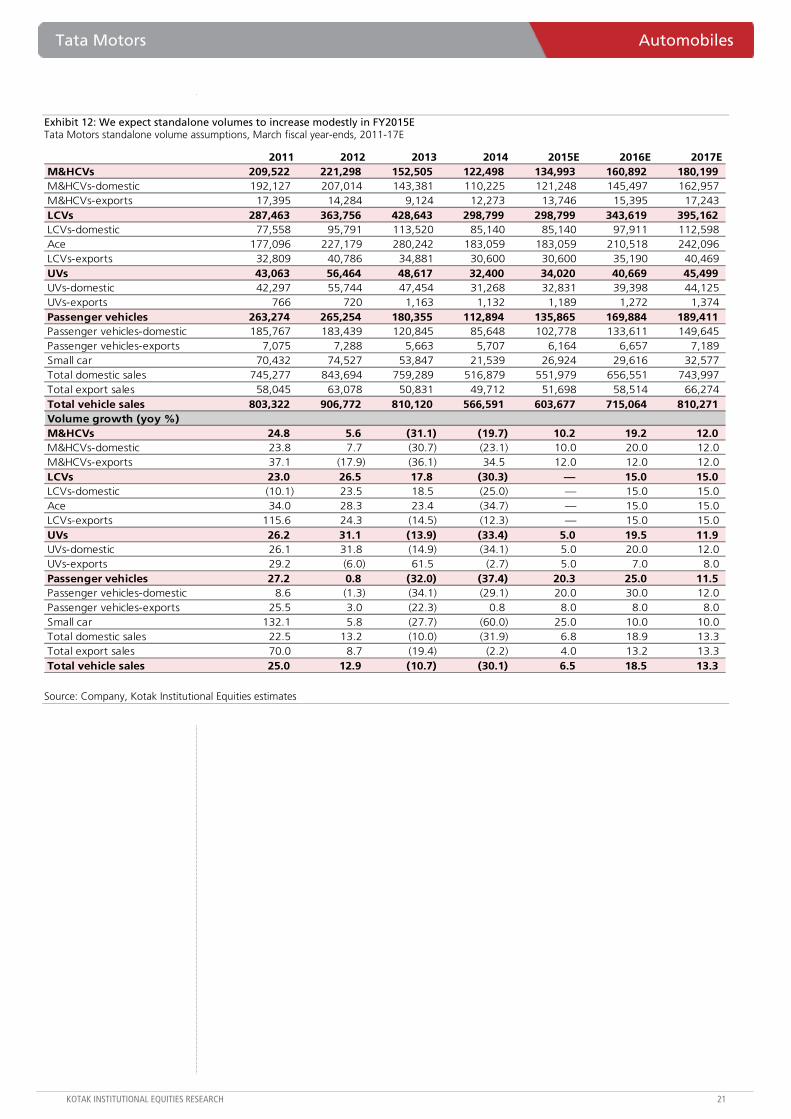
Exhibit 12: We expect standalone volumes to increase modestly in FY2015E Tata Motors standalone volume assumptions, March fiscal year-ends, 2011-17E
2011 2012 2013 2014 2015E 2016E 2017EM&HCVs 209,522 221,298 152,505 122,498 134,993 160,892 180,199 M&HCVs-domestic 192,127 207,014 143,381 110,225 121,248 145,497 162,957 M&HCVs-exports 17,395 14,284 9,124 12,273 13,746 15,395 17,243 LCVs 287,463 363,756 428,643 298,799 298,799 343,619 395,162 LCVs-domestic 77,558 95,791 113,520 85,140 85,140 97,911 112,598 Ace 177,096 227,179 280,242 183,059 183,059 210,518 242,096 LCVs-exports 32,809 40,786 34,881 30,600 30,600 35,190 40,469 UVs 43,063 56,464 48,617 32,400 34,020 40,669 45,499 UVs-domestic 42,297 55,744 47,454 31,268 32,831 39,398 44,125 UVs-exports 766 720 1,163 1,132 1,189 1,272 1,374 Passenger vehicles 263,274 265,254 180,355 112,894 135,865 169,884 189,411 Passenger vehicles-domestic 185,767 183,439 120,845 85,648 102,778 133,611 149,645 Passenger vehicles-exports 7,075 7,288 5,663 5,707 6,164 6,657 7,189 Small car 70,432 74,527 53,847 21,539 26,924 29,616 32,577 Total domestic sales 745,277 843,694 759,289 516,879 551,979 656,551 743,997 Total export sales 58,045 63,078 50,831 49,712 51,698 58,514 66,274 Total vehicle sales 803,322 906,772 810,120 566,591 603,677 715,064 810,271 Volume growth (yoy %)M&HCVs 24.8 5.6 (31.1) (19.7) 10.2 19.2 12.0 M&HCVs-domestic 23.8 7.7 (30.7) (23.1) 10.0 20.0 12.0 M&HCVs-exports 37.1 (17.9) (36.1) 34.5 12.0 12.0 12.0 LCVs 23.0 26.5 17.8 (30.3) — 15.0 15.0 LCVs-domestic (10.1) 23.5 18.5 (25.0) — 15.0 15.0 Ace 34.0 28.3 23.4 (34.7) — 15.0 15.0 LCVs-exports 115.6 24.3 (14.5) (12.3) — 15.0 15.0 UVs 26.2 31.1 (13.9) (33.4) 5.0 19.5 11.9 UVs-domestic 26.1 31.8 (14.9) (34.1) 5.0 20.0 12.0 UVs-exports 29.2 (6.0) 61.5 (2.7) 5.0 7.0 8.0 Passenger vehicles 27.2 0.8 (32.0) (37.4) 20.3 25.0 11.5 Passenger vehicles-domestic 8.6 (1.3) (34.1) (29.1) 20.0 30.0 12.0 Passenger vehicles-exports 25.5 3.0 (22.3) 0.8 8.0 8.0 8.0 Small car 132.1 5.8 (27.7) (60.0) 25.0 10.0 10.0 Total domestic sales 22.5 13.2 (10.0) (31.9) 6.8 18.9 13.3 Total export sales 70.0 8.7 (19.4) (2.2) 4.0 13.2 13.3 Total vehicle sales 25.0 12.9 (10.7) (30.1) 6.5 18.5 13.3
Source: Company, Kotak Institutional Equities estimates
Automobiles Tata Motors
22 KOTAK INSTITUTIONAL EQUITIES RESEARCH
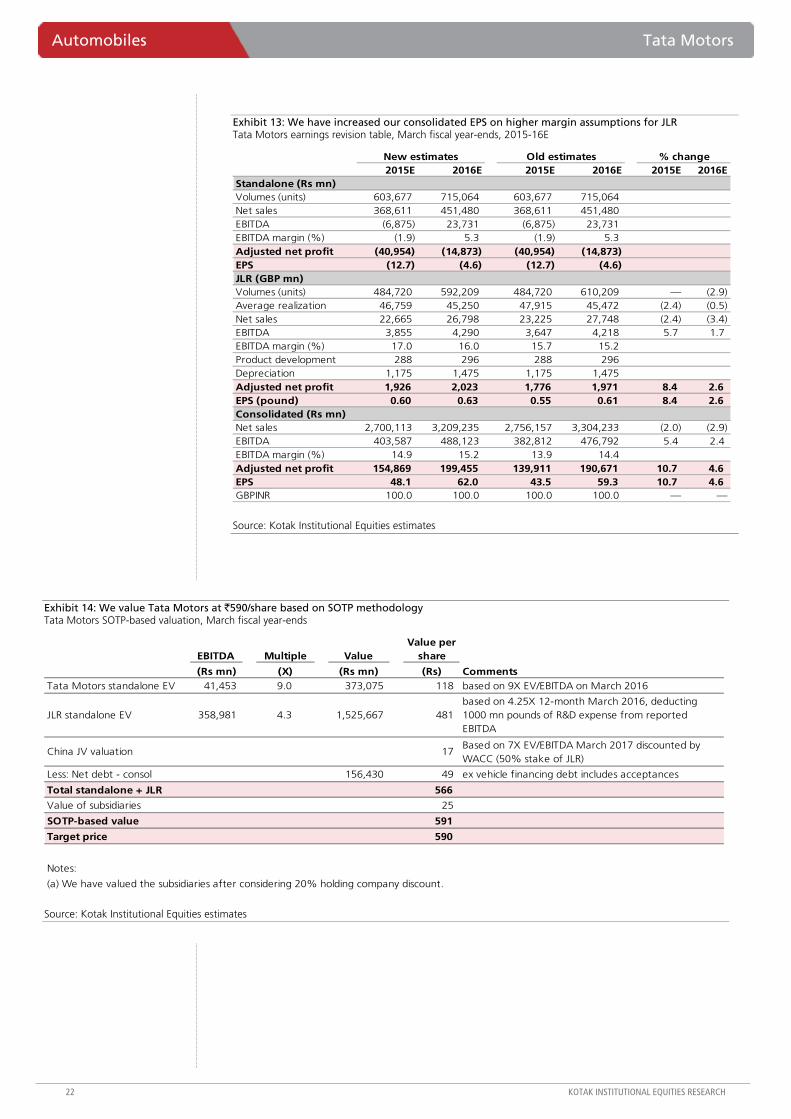
Exhibit 13: We have increased our consolidated EPS on higher margin assumptions for JLR Tata Motors earnings revision table, March fiscal year-ends, 2015-16E
New estimates Old estimates % change2015E 2016E 2015E 2016E 2015E 2016E
Standalone (Rs mn)Volumes (units) 603,677 715,064 603,677 715,064 Net sales 368,611 451,480 368,611 451,480 EBITDA (6,875) 23,731 (6,875) 23,731 EBITDA margin (%) (1.9) 5.3 (1.9) 5.3 Adjusted net profit (40,954) (14,873) (40,954) (14,873) EPS (12.7) (4.6) (12.7) (4.6) JLR (GBP mn)Volumes (units) 484,720 592,209 484,720 610,209 — (2.9) Average realization 46,759 45,250 47,915 45,472 (2.4) (0.5) Net sales 22,665 26,798 23,225 27,748 (2.4) (3.4) EBITDA 3,855 4,290 3,647 4,218 5.7 1.7 EBITDA margin (%) 17.0 16.0 15.7 15.2 Product development 288 296 288 296 Depreciation 1,175 1,475 1,175 1,475 Adjusted net profit 1,926 2,023 1,776 1,971 8.4 2.6 EPS (pound) 0.60 0.63 0.55 0.61 8.4 2.6 Consolidated (Rs mn)Net sales 2,700,113 3,209,235 2,756,157 3,304,233 (2.0) (2.9) EBITDA 403,587 488,123 382,812 476,792 5.4 2.4 EBITDA margin (%) 14.9 15.2 13.9 14.4 Adjusted net profit 154,869 199,455 139,911 190,671 10.7 4.6 EPS 48.1 62.0 43.5 59.3 10.7 4.6 GBPINR 100.0 100.0 100.0 100.0 — —
Source: Kotak Institutional Equities estimates
Exhibit 14: We value Tata Motors at `590/share based on SOTP methodology Tata Motors SOTP-based valuation, March fiscal year-ends
EBITDA Multiple ValueValue per
share
(Rs mn) (X) (Rs mn) (Rs) CommentsTata Motors standalone EV 41,453 9.0 373,075 118 based on 9X EV/EBITDA on March 2016
JLR standalone EV 358,981 4.3 1,525,667 481 based on 4.25X 12-month March 2016, deducting 1000 mn pounds of R&D expense from reported EBITDA
China JV valuation 17 Based on 7X EV/EBITDA March 2017 discounted by WACC (50% stake of JLR)
Less: Net debt - consol 156,430 49 ex vehicle financing debt includes acceptances
Total standalone + JLR 566
Value of subsidiaries 25
SOTP-based value 591
Target price 590
Notes:
(a) We have valued the subsidiaries after considering 20% holding company discount.
Source: Kotak Institutional Equities estimates
Tata Motors Automobiles
KOTAK INSTITUTIONAL EQUITIES RESEARCH 23
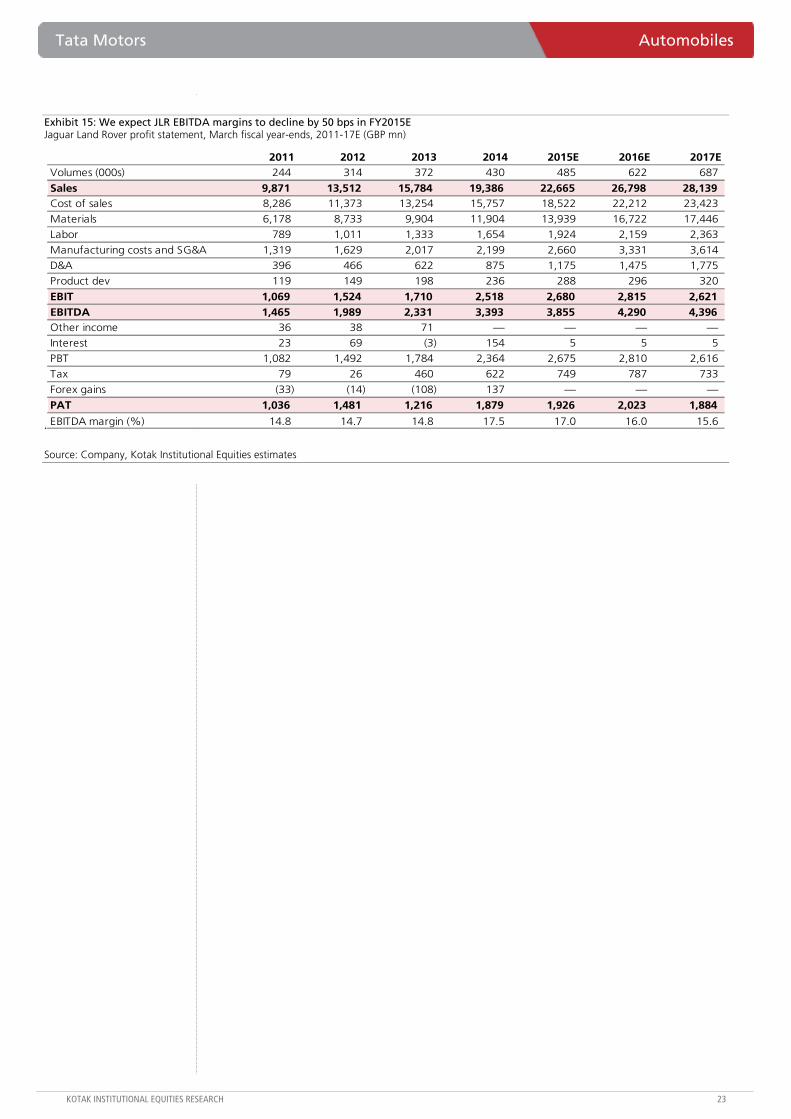
Exhibit 15: We expect JLR EBITDA margins to decline by 50 bps in FY2015E Jaguar Land Rover profit statement, March fiscal year-ends, 2011-17E (GBP mn)
.
2011 2012 2013 2014 2015E 2016E 2017EVolumes (000s) 244 314 372 430 485 622 687
Sales 9,871 13,512 15,784 19,386 22,665 26,798 28,139 Cost of sales 8,286 11,373 13,254 15,757 18,522 22,212 23,423
Materials 6,178 8,733 9,904 11,904 13,939 16,722 17,446
Labor 789 1,011 1,333 1,654 1,924 2,159 2,363
Manufacturing costs and SG&A 1,319 1,629 2,017 2,199 2,660 3,331 3,614
D&A 396 466 622 875 1,175 1,475 1,775
Product dev 119 149 198 236 288 296 320
EBIT 1,069 1,524 1,710 2,518 2,680 2,815 2,621 EBITDA 1,465 1,989 2,331 3,393 3,855 4,290 4,396 Other income 36 38 71 — — — —
Interest 23 69 (3) 154 5 5 5
PBT 1,082 1,492 1,784 2,364 2,675 2,810 2,616
Tax 79 26 460 622 749 787 733
Forex gains (33) (14) (108) 137 — — —
PAT 1,036 1,481 1,216 1,879 1,926 2,023 1,884
EBITDA margin (%) 14.8 14.7 14.8 17.5 17.0 16.0 15.6
Source: Company, Kotak Institutional Equities estimates
Automobiles Tata Motors
24 KOTAK INSTITUTIONAL EQUITIES RESEARCH
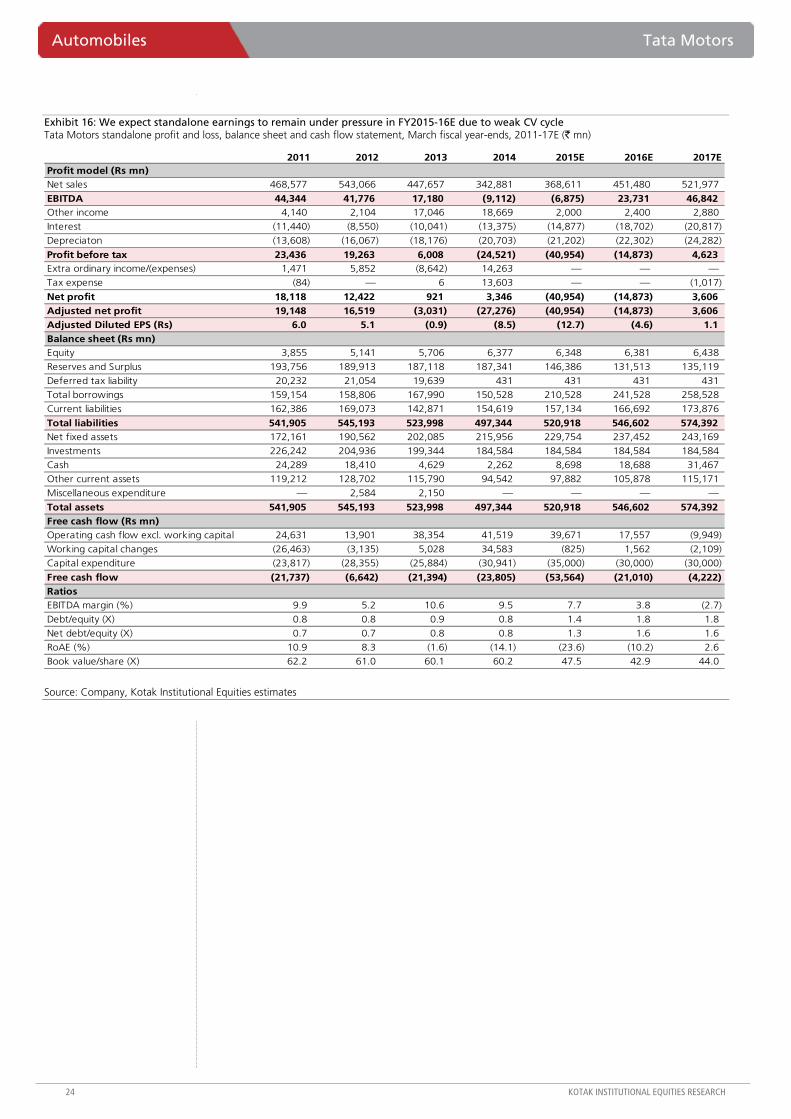
Exhibit 16: We expect standalone earnings to remain under pressure in FY2015-16E due to weak CV cycle Tata Motors standalone profit and loss, balance sheet and cash flow statement, March fiscal year-ends, 2011-17E (` mn)
2011 2012 2013 2014 2015E 2016E 2017EProfit model (Rs mn)Net sales 468,577 543,066 447,657 342,881 368,611 451,480 521,977
EBITDA 44,344 41,776 17,180 (9,112) (6,875) 23,731 46,842 Other income 4,140 2,104 17,046 18,669 2,000 2,400 2,880
Interest (11,440) (8,550) (10,041) (13,375) (14,877) (18,702) (20,817)
Depreciaton (13,608) (16,067) (18,176) (20,703) (21,202) (22,302) (24,282)
Profit before tax 23,436 19,263 6,008 (24,521) (40,954) (14,873) 4,623 Extra ordinary income/(expenses) 1,471 5,852 (8,642) 14,263 — — —
Tax expense (84) — 6 13,603 — — (1,017)
Net profit 18,118 12,422 921 3,346 (40,954) (14,873) 3,606 Adjusted net profit 19,148 16,519 (3,031) (27,276) (40,954) (14,873) 3,606 Adjusted Diluted EPS (Rs) 6.0 5.1 (0.9) (8.5) (12.7) (4.6) 1.1 Balance sheet (Rs mn)Equity 3,855 5,141 5,706 6,377 6,348 6,381 6,438
Reserves and Surplus 193,756 189,913 187,118 187,341 146,386 131,513 135,119
Deferred tax liability 20,232 21,054 19,639 431 431 431 431 Total borrowings 159,154 158,806 167,990 150,528 210,528 241,528 258,528
Current liabilities 162,386 169,073 142,871 154,619 157,134 166,692 173,876
Total liabilities 541,905 545,193 523,998 497,344 520,918 546,602 574,392 Net fixed assets 172,161 190,562 202,085 215,956 229,754 237,452 243,169
Investments 226,242 204,936 199,344 184,584 184,584 184,584 184,584 Cash 24,289 18,410 4,629 2,262 8,698 18,688 31,467
Other current assets 119,212 128,702 115,790 94,542 97,882 105,878 115,171
Miscellaneous expenditure — 2,584 2,150 — — — —
Total assets 541,905 545,193 523,998 497,344 520,918 546,602 574,392 Free cash flow (Rs mn)Operating cash flow excl. working capital 24,631 13,901 38,354 41,519 39,671 17,557 (9,949)
Working capital changes (26,463) (3,135) 5,028 34,583 (825) 1,562 (2,109)
Capital expenditure (23,817) (28,355) (25,884) (30,941) (35,000) (30,000) (30,000)
Free cash flow (21,737) (6,642) (21,394) (23,805) (53,564) (21,010) (4,222) RatiosEBITDA margin (%) 9.9 5.2 10.6 9.5 7.7 3.8 (2.7)
Debt/equity (X) 0.8 0.8 0.9 0.8 1.4 1.8 1.8
Net debt/equity (X) 0.7 0.7 0.8 0.8 1.3 1.6 1.6
RoAE (%) 10.9 8.3 (1.6) (14.1) (23.6) (10.2) 2.6 Book value/share (X) 62.2 61.0 60.1 60.2 47.5 42.9 44.0
Source: Company, Kotak Institutional Equities estimates
Tata Motors Automobiles
KOTAK INSTITUTIONAL EQUITIES RESEARCH 25
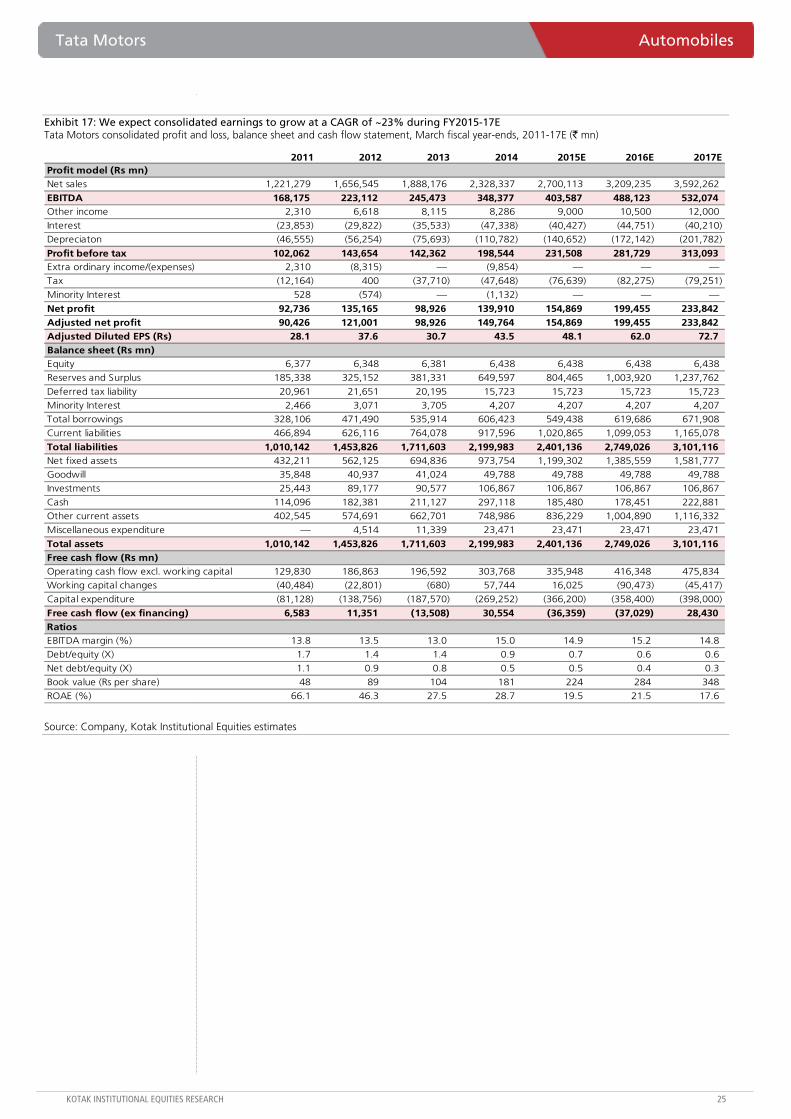
Exhibit 17: We expect consolidated earnings to grow at a CAGR of ~23% during FY2015-17E Tata Motors consolidated profit and loss, balance sheet and cash flow statement, March fiscal year-ends, 2011-17E (` mn)
2011 2012 2013 2014 2015E 2016E 2017EProfit model (Rs mn)Net sales 1,221,279 1,656,545 1,888,176 2,328,337 2,700,113 3,209,235 3,592,262
EBITDA 168,175 223,112 245,473 348,377 403,587 488,123 532,074 Other income 2,310 6,618 8,115 8,286 9,000 10,500 12,000
Interest (23,853) (29,822) (35,533) (47,338) (40,427) (44,751) (40,210) Depreciaton (46,555) (56,254) (75,693) (110,782) (140,652) (172,142) (201,782)
Profit before tax 102,062 143,654 142,362 198,544 231,508 281,729 313,093 Extra ordinary income/(expenses) 2,310 (8,315) — (9,854) — — —Tax (12,164) 400 (37,710) (47,648) (76,639) (82,275) (79,251)
Minority Interest 528 (574) — (1,132) — — —
Net profit 92,736 135,165 98,926 139,910 154,869 199,455 233,842 Adjusted net profit 90,426 121,001 98,926 149,764 154,869 199,455 233,842 Adjusted Diluted EPS (Rs) 28.1 37.6 30.7 43.5 48.1 62.0 72.7 Balance sheet (Rs mn)Equity 6,377 6,348 6,381 6,438 6,438 6,438 6,438 Reserves and Surplus 185,338 325,152 381,331 649,597 804,465 1,003,920 1,237,762
Deferred tax liability 20,961 21,651 20,195 15,723 15,723 15,723 15,723 Minority Interest 2,466 3,071 3,705 4,207 4,207 4,207 4,207 Total borrowings 328,106 471,490 535,914 606,423 549,438 619,686 671,908
Current liabilities 466,894 626,116 764,078 917,596 1,020,865 1,099,053 1,165,078
Total liabilities 1,010,142 1,453,826 1,711,603 2,199,983 2,401,136 2,749,026 3,101,116 Net fixed assets 432,211 562,125 694,836 973,754 1,199,302 1,385,559 1,581,777 Goodwill 35,848 40,937 41,024 49,788 49,788 49,788 49,788 Investments 25,443 89,177 90,577 106,867 106,867 106,867 106,867
Cash 114,096 182,381 211,127 297,118 185,480 178,451 222,881 Other current assets 402,545 574,691 662,701 748,986 836,229 1,004,890 1,116,332
Miscellaneous expenditure — 4,514 11,339 23,471 23,471 23,471 23,471
Total assets 1,010,142 1,453,826 1,711,603 2,199,983 2,401,136 2,749,026 3,101,116 Free cash flow (Rs mn)Operating cash flow excl. working capital 129,830 186,863 196,592 303,768 335,948 416,348 475,834 Working capital changes (40,484) (22,801) (680) 57,744 16,025 (90,473) (45,417)
Capital expenditure (81,128) (138,756) (187,570) (269,252) (366,200) (358,400) (398,000)
Free cash flow (ex financing) 6,583 11,351 (13,508) 30,554 (36,359) (37,029) 28,430 RatiosEBITDA margin (%) 13.8 13.5 13.0 15.0 14.9 15.2 14.8 Debt/equity (X) 1.7 1.4 1.4 0.9 0.7 0.6 0.6
Net debt/equity (X) 1.1 0.9 0.8 0.5 0.5 0.4 0.3 Book value (Rs per share) 48 89 104 181 224 284 348
ROAE (%) 66.1 46.3 27.5 28.7 19.5 21.5 17.6
Source: Company, Kotak Institutional Equities estimates
For private Circulation Only. FOR IMPORTANT INFORMATION ABOUT KOTAK SECURITIES’ RATING SYSTEM AND OTHER DISCLOSURES, REFER TO THE END OF THIS MATERIAL.
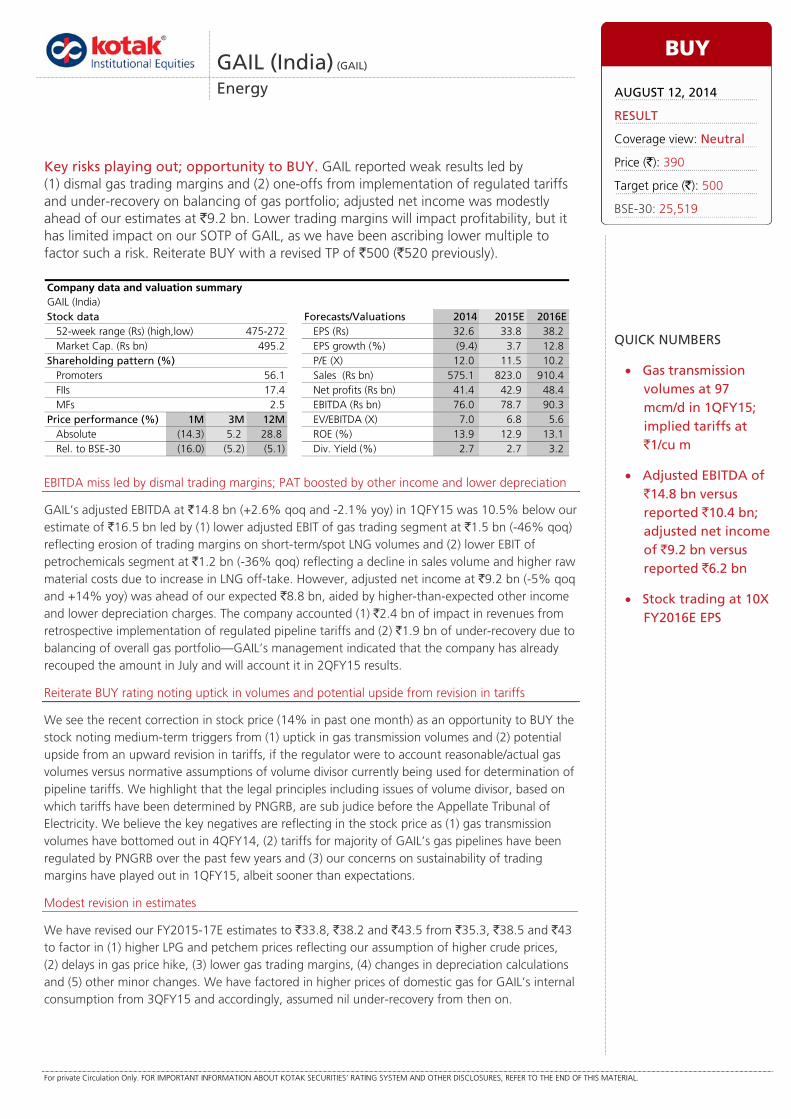
EBITDA miss led by dismal trading margins; PAT boosted by other income and lower depreciation
GAIL’s adjusted EBITDA at `14.8 bn (+2.6% qoq and -2.1% yoy) in 1QFY15 was 10.5% below our estimate of `16.5 bn led by (1) lower adjusted EBIT of gas trading segment at `1.5 bn (-46% qoq) reflecting erosion of trading margins on short-term/spot LNG volumes and (2) lower EBIT of petrochemicals segment at `1.2 bn (-36% qoq) reflecting a decline in sales volume and higher raw material costs due to increase in LNG off-take. However, adjusted net income at `9.2 bn (-5% qoq and +14% yoy) was ahead of our expected `8.8 bn, aided by higher-than-expected other income and lower depreciation charges. The company accounted (1) `2.4 bn of impact in revenues from retrospective implementation of regulated pipeline tariffs and (2) `1.9 bn of under-recovery due to balancing of overall gas portfolio—GAIL’s management indicated that the company has already recouped the amount in July and will account it in 2QFY15 results.
Reiterate BUY rating noting uptick in volumes and potential upside from revision in tariffs
We see the recent correction in stock price (14% in past one month) as an opportunity to BUY the stock noting medium-term triggers from (1) uptick in gas transmission volumes and (2) potential upside from an upward revision in tariffs, if the regulator were to account reasonable/actual gas volumes versus normative assumptions of volume divisor currently being used for determination of pipeline tariffs. We highlight that the legal principles including issues of volume divisor, based on which tariffs have been determined by PNGRB, are sub judice before the Appellate Tribunal of Electricity. We believe the key negatives are reflecting in the stock price as (1) gas transmission volumes have bottomed out in 4QFY14, (2) tariffs for majority of GAIL’s gas pipelines have been regulated by PNGRB over the past few years and (3) our concerns on sustainability of trading margins have played out in 1QFY15, albeit sooner than expectations.
Modest revision in estimates
We have revised our FY2015-17E estimates to `33.8, `38.2 and `43.5 from `35.3, `38.5 and `43 to factor in (1) higher LPG and petchem prices reflecting our assumption of higher crude prices, (2) delays in gas price hike, (3) lower gas trading margins, (4) changes in depreciation calculations and (5) other minor changes. We have factored in higher prices of domestic gas for GAIL’s internal consumption from 3QFY15 and accordingly, assumed nil under-recovery from then on.
GAIL (India) (GAIL)
Energy
Key risks playing out; opportunity to BUY. GAIL reported weak results led by (1) dismal gas trading margins and (2) one-offs from implementation of regulated tariffs and under-recovery on balancing of gas portfolio; adjusted net income was modestly ahead of our estimates at `9.2 bn. Lower trading margins will impact profitability, but it has limited impact on our SOTP of GAIL, as we have been ascribing lower multiple to factor such a risk. Reiterate BUY with a revised TP of `500 (`520 previously).
GAIL (India)Stock data Forecasts/Valuations 2014 2015E 2016E
52-week range (Rs) (high,low) EPS (Rs) 32.6 33.8 38.2Market Cap. (Rs bn) 495.2 EPS growth (%) (9.4) 3.7 12.8
Shareholding pattern (%) P/E (X) 12.0 11.5 10.2Promoters 56.1 Sales (Rs bn) 575.1 823.0 910.4FIIs 17.4 Net profits (Rs bn) 41.4 42.9 48.4MFs 2.5 EBITDA (Rs bn) 76.0 78.7 90.3
Price performance (%) 1M 3M 12M EV/EBITDA (X) 7.0 6.8 5.6Absolute (14.3) 5.2 28.8 ROE (%) 13.9 12.9 13.1Rel. to BSE-30 (16.0) (5.2) (5.1) Div. Yield (%) 2.7 2.7 3.2
Company data and valuation summary
475-272
BUY
AUGUST 12, 2014
RESULT
Coverage view: Neutral
Price (`): 390
Target price (`): 500
BSE-30: 25,519
QUICK NUMBERS
• Gas transmission volumes at 97 mcm/d in 1QFY15; implied tariffs at `1/cu m
• Adjusted EBITDA of `14.8 bn versus reported `10.4 bn; adjusted net income of `9.2 bn versus reported `6.2 bn
• Stock trading at 10X FY2016E EPS
GAIL (India) Energy
KOTAK INSTITUTIONAL EQUITIES RESEARCH 27
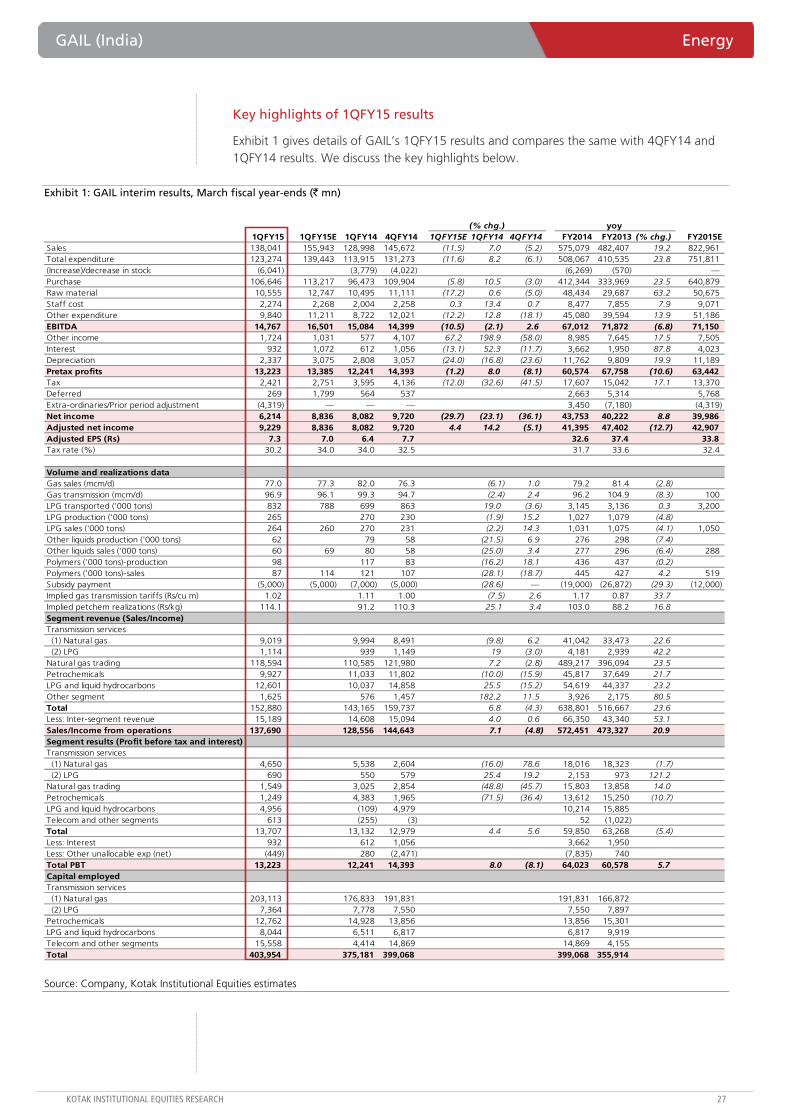
Key highlights of 1QFY15 results
Exhibit 1 gives details of GAIL’s 1QFY15 results and compares the same with 4QFY14 and 1QFY14 results. We discuss the key highlights below.
Exhibit 1: GAIL interim results, March fiscal year-ends (` mn)
(% chg.) yoy1QFY15 1QFY15E 1QFY14 4QFY14 1QFY15E 1QFY14 4QFY14 FY2014 FY2013 (% chg.) FY2015E
Sales 138,041 155,943 128,998 145,672 (11.5) 7.0 (5.2) 575,079 482,407 19.2 822,961Total expenditure 123,274 139,443 113,915 131,273 (11.6) 8.2 (6.1) 508,067 410,535 23.8 751,811(Increase)/decrease in stock (6,041) (3,779) (4,022) (6,269) (570) —Purchase 106,646 113,217 96,473 109,904 (5.8) 10.5 (3.0) 412,344 333,969 23.5 640,879Raw material 10,555 12,747 10,495 11,111 (17.2) 0.6 (5.0) 48,434 29,687 63.2 50,675Staff cost 2,274 2,268 2,004 2,258 0.3 13.4 0.7 8,477 7,855 7.9 9,071Other expenditure 9,840 11,211 8,722 12,021 (12.2) 12.8 (18.1) 45,080 39,594 13.9 51,186EBITDA 14,767 16,501 15,084 14,399 (10.5) (2.1) 2.6 67,012 71,872 (6.8) 71,150 Other income 1,724 1,031 577 4,107 67.2 198.9 (58.0) 8,985 7,645 17.5 7,505Interest 932 1,072 612 1,056 (13.1) 52.3 (11.7) 3,662 1,950 87.8 4,023Depreciation 2,337 3,075 2,808 3,057 (24.0) (16.8) (23.6) 11,762 9,809 19.9 11,189Pretax profits 13,223 13,385 12,241 14,393 (1.2) 8.0 (8.1) 60,574 67,758 (10.6) 63,442 Tax 2,421 2,751 3,595 4,136 (12.0) (32.6) (41.5) 17,607 15,042 17.1 13,370Deferred 269 1,799 564 537 2,663 5,314 5,768 Extra-ordinaries/Prior period adjustment (4,319) — — — 3,450 (7,180) (4,319) Net income 6,214 8,836 8,082 9,720 (29.7) (23.1) (36.1) 43,753 40,222 8.8 39,986 Adjusted net income 9,229 8,836 8,082 9,720 4.4 14.2 (5.1) 41,395 47,402 (12.7) 42,907 Adjusted EPS (Rs) 7.3 7.0 6.4 7.7 32.6 37.4 33.8 Tax rate (%) 30.2 34.0 34.0 32.5 31.7 33.6 32.4
Volume and realizations dataGas sales (mcm/d) 77.0 77.3 82.0 76.3 (6.1) 1.0 79.2 81.4 (2.8) Gas transmission (mcm/d) 96.9 96.1 99.3 94.7 (2.4) 2.4 96.2 104.9 (8.3) 100 LPG transported ('000 tons) 832 788 699 863 19.0 (3.6) 3,145 3,136 0.3 3,200LPG production ('000 tons) 265 270 230 (1.9) 15.2 1,027 1,079 (4.8) LPG sales ('000 tons) 264 260 270 231 (2.2) 14.3 1,031 1,075 (4.1) 1,050Other liquids production ('000 tons) 62 79 58 (21.5) 6.9 276 298 (7.4) Other liquids sales ('000 tons) 60 69 80 58 (25.0) 3.4 277 296 (6.4) 288Polymers ('000 tons)-production 98 117 83 (16.2) 18.1 436 437 (0.2) Polymers ('000 tons)-sales 87 114 121 107 (28.1) (18.7) 445 427 4.2 519Subsidy payment (5,000) (5,000) (7,000) (5,000) (28.6) — (19,000) (26,872) (29.3) (12,000) Implied gas transmission tariffs (Rs/cu m) 1.02 1.11 1.00 (7.5) 2.6 1.17 0.87 33.7 Implied petchem realizations (Rs/kg) 114.1 91.2 110.3 25.1 3.4 103.0 88.2 16.8 Segment revenue (Sales/Income)Transmission services (1) Natural gas 9,019 9,994 8,491 (9.8) 6.2 41,042 33,473 22.6 (2) LPG 1,114 939 1,149 19 (3.0) 4,181 2,939 42.2 Natural gas trading 118,594 110,585 121,980 7.2 (2.8) 489,217 396,094 23.5 Petrochemicals 9,927 11,033 11,802 (10.0) (15.9) 45,817 37,649 21.7 LPG and liquid hydrocarbons 12,601 10,037 14,858 25.5 (15.2) 54,619 44,337 23.2 Other segment 1,625 576 1,457 182.2 11.5 3,926 2,175 80.5 Total 152,880 143,165 159,737 6.8 (4.3) 638,801 516,667 23.6 Less: Inter-segment revenue 15,189 14,608 15,094 4.0 0.6 66,350 43,340 53.1 Sales/Income from operations 137,690 128,556 144,643 7.1 (4.8) 572,451 473,327 20.9 Segment results (Profit before tax and interest)Transmission services (1) Natural gas 4,650 5,538 2,604 (16.0) 78.6 18,016 18,323 (1.7) (2) LPG 690 550 579 25.4 19.2 2,153 973 121.2 Natural gas trading 1,549 3,025 2,854 (48.8) (45.7) 15,803 13,858 14.0 Petrochemicals 1,249 4,383 1,965 (71.5) (36.4) 13,612 15,250 (10.7) LPG and liquid hydrocarbons 4,956 (109) 4,979 10,214 15,885Telecom and other segments 613 (255) (3) 52 (1,022)Total 13,707 13,132 12,979 4.4 5.6 59,850 63,268 (5.4) Less: Interest 932 612 1,056 3,662 1,950Less: Other unallocable exp (net) (449) 280 (2,471) (7,835) 740Total PBT 13,223 12,241 14,393 8.0 (8.1) 64,023 60,578 5.7 Capital employedTransmission services (1) Natural gas 203,113 176,833 191,831 191,831 166,872 (2) LPG 7,364 7,778 7,550 7,550 7,897Petrochemicals 12,762 14,928 13,856 13,856 15,301LPG and liquid hydrocarbons 8,044 6,511 6,817 6,817 9,919Telecom and other segments 15,558 4,414 14,869 14,869 4,155Total 403,954 375,181 399,068 399,068 355,914
Source: Company, Kotak Institutional Equities estimates
Energy GAIL (India)
28 KOTAK INSTITUTIONAL EQUITIES RESEARCH
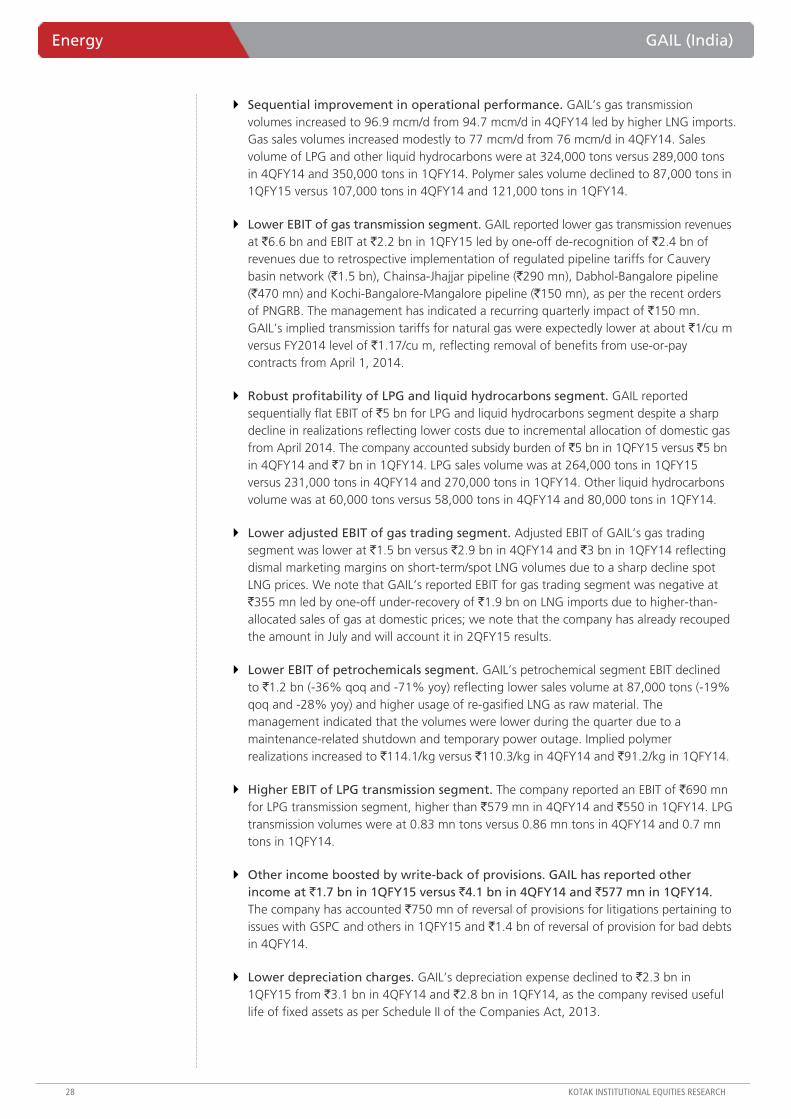
Sequential improvement in operational performance. GAIL’s gas transmission volumes increased to 96.9 mcm/d from 94.7 mcm/d in 4QFY14 led by higher LNG imports. Gas sales volumes increased modestly to 77 mcm/d from 76 mcm/d in 4QFY14. Sales volume of LPG and other liquid hydrocarbons were at 324,000 tons versus 289,000 tons in 4QFY14 and 350,000 tons in 1QFY14. Polymer sales volume declined to 87,000 tons in 1QFY15 versus 107,000 tons in 4QFY14 and 121,000 tons in 1QFY14.
Lower EBIT of gas transmission segment. GAIL reported lower gas transmission revenues at `6.6 bn and EBIT at `2.2 bn in 1QFY15 led by one-off de-recognition of `2.4 bn of revenues due to retrospective implementation of regulated pipeline tariffs for Cauvery basin network (`1.5 bn), Chainsa-Jhajjar pipeline (`290 mn), Dabhol-Bangalore pipeline (`470 mn) and Kochi-Bangalore-Mangalore pipeline (`150 mn), as per the recent orders of PNGRB. The management has indicated a recurring quarterly impact of `150 mn. GAIL’s implied transmission tariffs for natural gas were expectedly lower at about `1/cu m versus FY2014 level of `1.17/cu m, reflecting removal of benefits from use-or-pay contracts from April 1, 2014.
Robust profitability of LPG and liquid hydrocarbons segment. GAIL reported sequentially flat EBIT of `5 bn for LPG and liquid hydrocarbons segment despite a sharp decline in realizations reflecting lower costs due to incremental allocation of domestic gas from April 2014. The company accounted subsidy burden of `5 bn in 1QFY15 versus `5 bn in 4QFY14 and `7 bn in 1QFY14. LPG sales volume was at 264,000 tons in 1QFY15 versus 231,000 tons in 4QFY14 and 270,000 tons in 1QFY14. Other liquid hydrocarbons volume was at 60,000 tons versus 58,000 tons in 4QFY14 and 80,000 tons in 1QFY14.
Lower adjusted EBIT of gas trading segment. Adjusted EBIT of GAIL’s gas trading segment was lower at `1.5 bn versus `2.9 bn in 4QFY14 and `3 bn in 1QFY14 reflecting dismal marketing margins on short-term/spot LNG volumes due to a sharp decline spot LNG prices. We note that GAIL’s reported EBIT for gas trading segment was negative at `355 mn led by one-off under-recovery of `1.9 bn on LNG imports due to higher-than-allocated sales of gas at domestic prices; we note that the company has already recouped the amount in July and will account it in 2QFY15 results.
Lower EBIT of petrochemicals segment. GAIL’s petrochemical segment EBIT declined to `1.2 bn (-36% qoq and -71% yoy) reflecting lower sales volume at 87,000 tons (-19% qoq and -28% yoy) and higher usage of re-gasified LNG as raw material. The management indicated that the volumes were lower during the quarter due to a maintenance-related shutdown and temporary power outage. Implied polymer realizations increased to `114.1/kg versus `110.3/kg in 4QFY14 and `91.2/kg in 1QFY14.
Higher EBIT of LPG transmission segment. The company reported an EBIT of `690 mn for LPG transmission segment, higher than `579 mn in 4QFY14 and `550 in 1QFY14. LPG transmission volumes were at 0.83 mn tons versus 0.86 mn tons in 4QFY14 and 0.7 mn tons in 1QFY14.
Other income boosted by write-back of provisions. GAIL has reported other income at `1.7 bn in 1QFY15 versus `4.1 bn in 4QFY14 and `577 mn in 1QFY14. The company has accounted `750 mn of reversal of provisions for litigations pertaining to issues with GSPC and others in 1QFY15 and `1.4 bn of reversal of provision for bad debts in 4QFY14.
Lower depreciation charges. GAIL’s depreciation expense declined to `2.3 bn in 1QFY15 from `3.1 bn in 4QFY14 and `2.8 bn in 1QFY14, as the company revised useful life of fixed assets as per Schedule II of the Companies Act, 2013.
GAIL (India) Energy
KOTAK INSTITUTIONAL EQUITIES RESEARCH 29
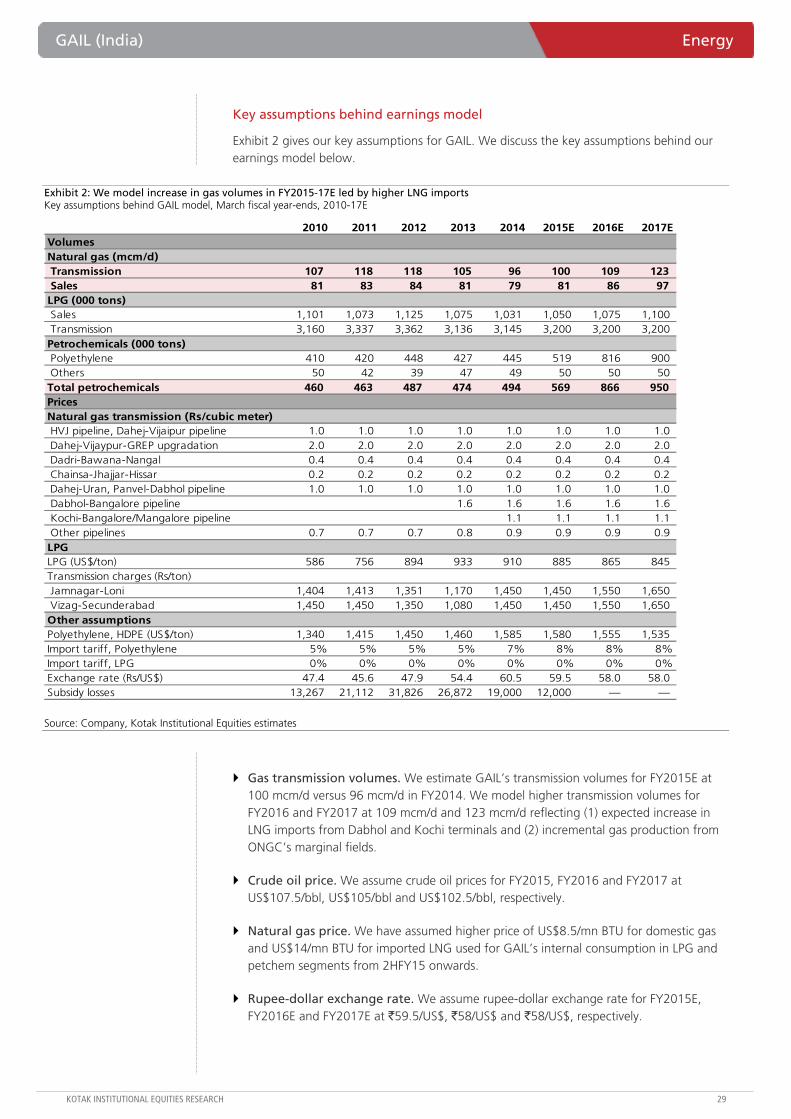
Key assumptions behind earnings model
Exhibit 2 gives our key assumptions for GAIL. We discuss the key assumptions behind our earnings model below.
Exhibit 2: We model increase in gas volumes in FY2015-17E led by higher LNG imports Key assumptions behind GAIL model, March fiscal year-ends, 2010-17E
2010 2011 2012 2013 2014 2015E 2016E 2017EVolumesNatural gas (mcm/d) Transmission 107 118 118 105 96 100 109 123 Sales 81 83 84 81 79 81 86 97LPG (000 tons) Sales 1,101 1,073 1,125 1,075 1,031 1,050 1,075 1,100 Transmission 3,160 3,337 3,362 3,136 3,145 3,200 3,200 3,200 Petrochemicals (000 tons) Polyethylene 410 420 448 427 445 519 816 900 Others 50 42 39 47 49 50 50 50 Total petrochemicals 460 463 487 474 494 569 866 950 PricesNatural gas transmission (Rs/cubic meter) HVJ pipeline, Dahej-Vijaipur pipeline 1.0 1.0 1.0 1.0 1.0 1.0 1.0 1.0 Dahej-Vijaypur-GREP upgradation 2.0 2.0 2.0 2.0 2.0 2.0 2.0 2.0 Dadri-Bawana-Nangal 0.4 0.4 0.4 0.4 0.4 0.4 0.4 0.4 Chainsa-Jhajjar-Hissar 0.2 0.2 0.2 0.2 0.2 0.2 0.2 0.2 Dahej-Uran, Panvel-Dabhol pipeline 1.0 1.0 1.0 1.0 1.0 1.0 1.0 1.0 Dabhol-Bangalore pipeline 1.6 1.6 1.6 1.6 1.6 Kochi-Bangalore/Mangalore pipeline 1.1 1.1 1.1 1.1 Other pipelines 0.7 0.7 0.7 0.8 0.9 0.9 0.9 0.9 LPGLPG (US$/ton) 586 756 894 933 910 885 865 845 Transmission charges (Rs/ton) Jamnagar-Loni 1,404 1,413 1,351 1,170 1,450 1,450 1,550 1,650 Vizag-Secunderabad 1,450 1,450 1,350 1,080 1,450 1,450 1,550 1,650Other assumptionsPolyethylene, HDPE (US$/ton) 1,340 1,415 1,450 1,460 1,585 1,580 1,555 1,535 Import tariff, Polyethylene 5% 5% 5% 5% 7% 8% 8% 8%Import tariff, LPG 0% 0% 0% 0% 0% 0% 0% 0%Exchange rate (Rs/US$) 47.4 45.6 47.9 54.4 60.5 59.5 58.0 58.0 Subsidy losses 13,267 21,112 31,826 26,872 19,000 12,000 — —
Source: Company, Kotak Institutional Equities estimates
Gas transmission volumes. We estimate GAIL’s transmission volumes for FY2015E at 100 mcm/d versus 96 mcm/d in FY2014. We model higher transmission volumes for FY2016 and FY2017 at 109 mcm/d and 123 mcm/d reflecting (1) expected increase in LNG imports from Dabhol and Kochi terminals and (2) incremental gas production from ONGC’s marginal fields.
Crude oil price. We assume crude oil prices for FY2015, FY2016 and FY2017 at US$107.5/bbl, US$105/bbl and US$102.5/bbl, respectively.
Natural gas price. We have assumed higher price of US$8.5/mn BTU for domestic gas and US$14/mn BTU for imported LNG used for GAIL’s internal consumption in LPG and petchem segments from 2HFY15 onwards.
Rupee-dollar exchange rate. We assume rupee-dollar exchange rate for FY2015E, FY2016E and FY2017E at `59.5/US$, `58/US$ and `58/US$, respectively.
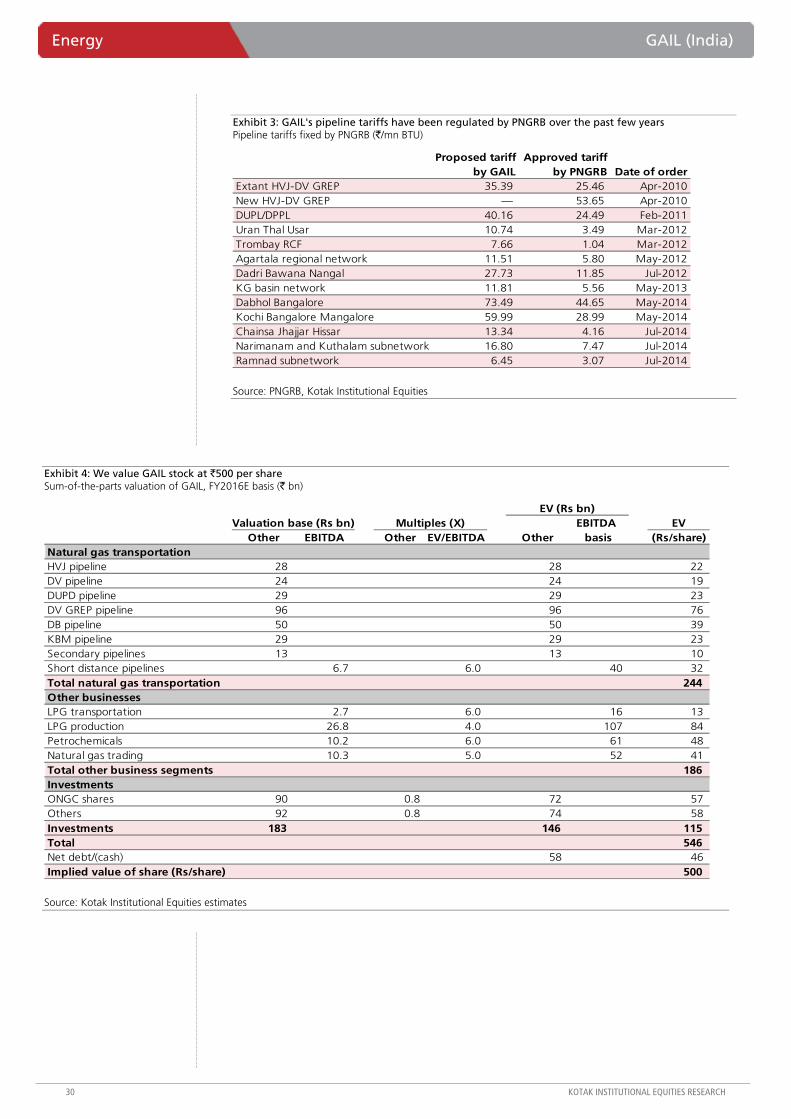
Energy GAIL (India)
30 KOTAK INSTITUTIONAL EQUITIES RESEARCH
Exhibit 3: GAIL's pipeline tariffs have been regulated by PNGRB over the past few years Pipeline tariffs fixed by PNGRB (`/mn BTU)
Proposed tariff by GAIL
Approved tariff by PNGRB Date of order
Extant HVJ-DV GREP 35.39 25.46 Apr-2010New HVJ-DV GREP — 53.65 Apr-2010DUPL/DPPL 40.16 24.49 Feb-2011Uran Thal Usar 10.74 3.49 Mar-2012Trombay RCF 7.66 1.04 Mar-2012Agartala regional network 11.51 5.80 May-2012Dadri Bawana Nangal 27.73 11.85 Jul-2012KG basin network 11.81 5.56 May-2013Dabhol Bangalore 73.49 44.65 May-2014Kochi Bangalore Mangalore 59.99 28.99 May-2014Chainsa Jhajjar Hissar 13.34 4.16 Jul-2014Narimanam and Kuthalam subnetwork 16.80 7.47 Jul-2014Ramnad subnetwork 6.45 3.07 Jul-2014
Source: PNGRB, Kotak Institutional Equities
Exhibit 4: We value GAIL stock at `500 per share Sum-of-the-parts valuation of GAIL, FY2016E basis (` bn)
EV (Rs bn)Valuation base (Rs bn) Multiples (X) EBITDA EV
Other EBITDA Other EV/EBITDA Other basis (Rs/share)Natural gas transportationHVJ pipeline 28 28 22 DV pipeline 24 24 19 DUPD pipeline 29 29 23 DV GREP pipeline 96 96 76 DB pipeline 50 50 39 KBM pipeline 29 29 23 Secondary pipelines 13 13 10 Short distance pipelines 6.7 6.0 40 32 Total natural gas transportation 244 Other businessesLPG transportation 2.7 6.0 16 13 LPG production 26.8 4.0 107 84 Petrochemicals 10.2 6.0 61 48 Natural gas trading 10.3 5.0 52 41 Total other business segments 186 InvestmentsONGC shares 90 0.8 72 57 Others 92 0.8 74 58 Investments 183 146 115 Total 546 Net debt/(cash) 58 46 Implied value of share (Rs/share) 500
Source: Kotak Institutional Equities estimates
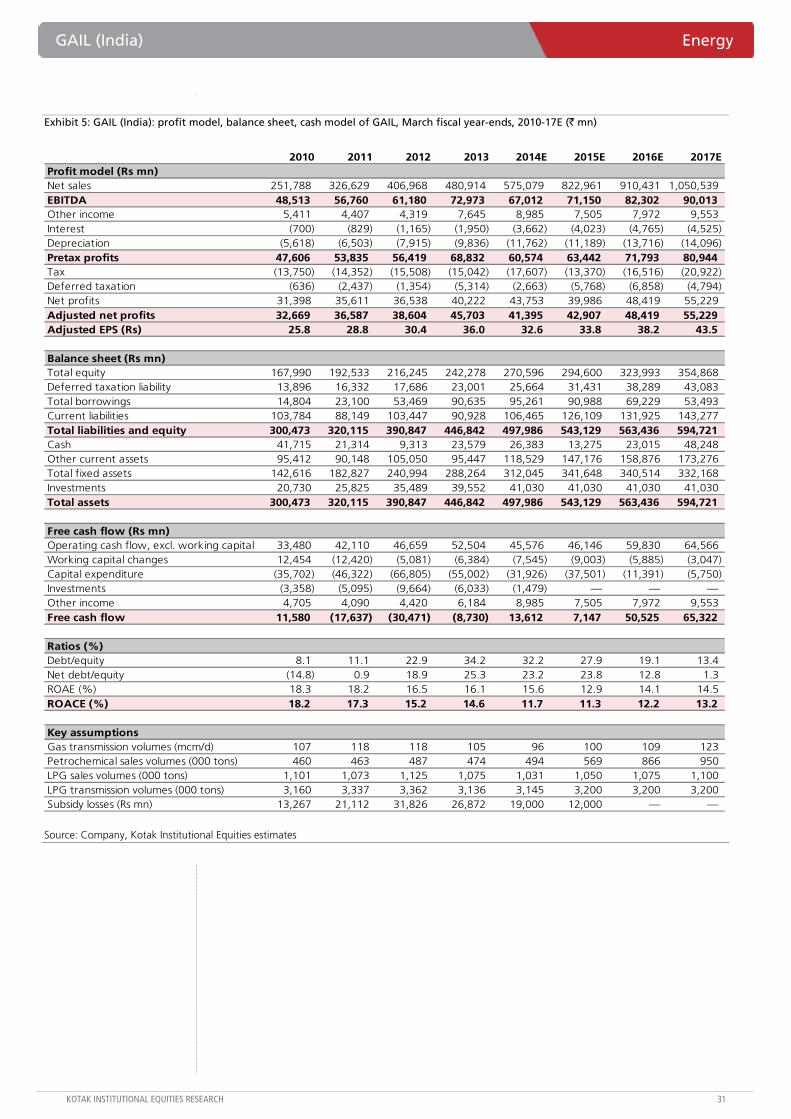
GAIL (India) Energy
KOTAK INSTITUTIONAL EQUITIES RESEARCH 31
Exhibit 5: GAIL (India): profit model, balance sheet, cash model of GAIL, March fiscal year-ends, 2010-17E (` mn)
2010 2011 2012 2013 2014E 2015E 2016E 2017EProfit model (Rs mn)Net sales 251,788 326,629 406,968 480,914 575,079 822,961 910,431 1,050,539EBITDA 48,513 56,760 61,180 72,973 67,012 71,150 82,302 90,013Other income 5,411 4,407 4,319 7,645 8,985 7,505 7,972 9,553Interest (700) (829) (1,165) (1,950) (3,662) (4,023) (4,765) (4,525)Depreciation (5,618) (6,503) (7,915) (9,836) (11,762) (11,189) (13,716) (14,096)Pretax profits 47,606 53,835 56,419 68,832 60,574 63,442 71,793 80,944Tax (13,750) (14,352) (15,508) (15,042) (17,607) (13,370) (16,516) (20,922)Deferred taxation (636) (2,437) (1,354) (5,314) (2,663) (5,768) (6,858) (4,794)Net profits 31,398 35,611 36,538 40,222 43,753 39,986 48,419 55,229Adjusted net profits 32,669 36,587 38,604 45,703 41,395 42,907 48,419 55,229Adjusted EPS (Rs) 25.8 28.8 30.4 36.0 32.6 33.8 38.2 43.5
Balance sheet (Rs mn)Total equity 167,990 192,533 216,245 242,278 270,596 294,600 323,993 354,868Deferred taxation liability 13,896 16,332 17,686 23,001 25,664 31,431 38,289 43,083Total borrowings 14,804 23,100 53,469 90,635 95,261 90,988 69,229 53,493Current liabilities 103,784 88,149 103,447 90,928 106,465 126,109 131,925 143,277Total liabilities and equity 300,473 320,115 390,847 446,842 497,986 543,129 563,436 594,721Cash 41,715 21,314 9,313 23,579 26,383 13,275 23,015 48,248Other current assets 95,412 90,148 105,050 95,447 118,529 147,176 158,876 173,276Total fixed assets 142,616 182,827 240,994 288,264 312,045 341,648 340,514 332,168Investments 20,730 25,825 35,489 39,552 41,030 41,030 41,030 41,030Total assets 300,473 320,115 390,847 446,842 497,986 543,129 563,436 594,721
Free cash flow (Rs mn)Operating cash flow, excl. working capital 33,480 42,110 46,659 52,504 45,576 46,146 59,830 64,566Working capital changes 12,454 (12,420) (5,081) (6,384) (7,545) (9,003) (5,885) (3,047)Capital expenditure (35,702) (46,322) (66,805) (55,002) (31,926) (37,501) (11,391) (5,750)Investments (3,358) (5,095) (9,664) (6,033) (1,479) — — —Other income 4,705 4,090 4,420 6,184 8,985 7,505 7,972 9,553Free cash flow 11,580 (17,637) (30,471) (8,730) 13,612 7,147 50,525 65,322
Ratios (%)Debt/equity 8.1 11.1 22.9 34.2 32.2 27.9 19.1 13.4Net debt/equity (14.8) 0.9 18.9 25.3 23.2 23.8 12.8 1.3ROAE (%) 18.3 18.2 16.5 16.1 15.6 12.9 14.1 14.5ROACE (%) 18.2 17.3 15.2 14.6 11.7 11.3 12.2 13.2
Key assumptionsGas transmission volumes (mcm/d) 107 118 118 105 96 100 109 123Petrochemical sales volumes (000 tons) 460 463 487 474 494 569 866 950LPG sales volumes (000 tons) 1,101 1,073 1,125 1,075 1,031 1,050 1,075 1,100LPG transmission volumes (000 tons) 3,160 3,337 3,362 3,136 3,145 3,200 3,200 3,200Subsidy losses (Rs mn) 13,267 21,112 31,826 26,872 19,000 12,000 — —
Source: Company, Kotak Institutional Equities estimates
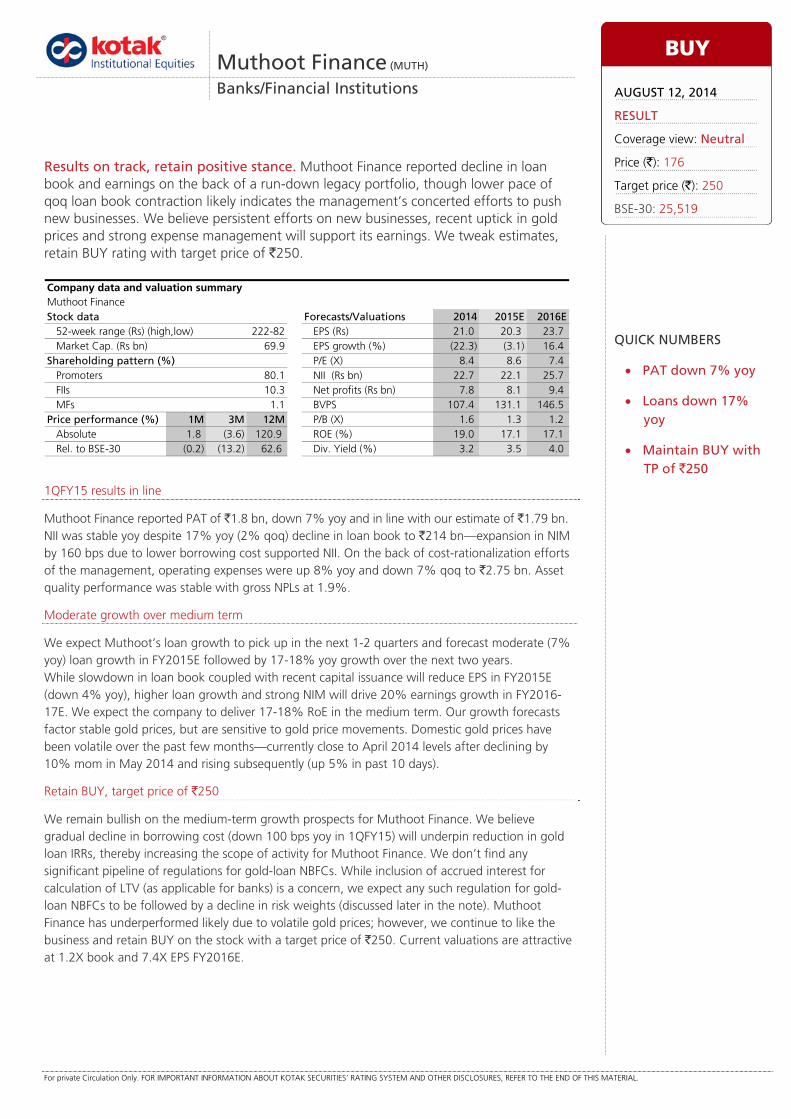
For private Circulation Only. FOR IMPORTANT INFORMATION ABOUT KOTAK SECURITIES’ RATING SYSTEM AND OTHER DISCLOSURES, REFER TO THE END OF THIS MATERIAL.
1QFY15 results in line
Muthoot Finance reported PAT of `1.8 bn, down 7% yoy and in line with our estimate of `1.79 bn. NII was stable yoy despite 17% yoy (2% qoq) decline in loan book to `214 bn—expansion in NIM by 160 bps due to lower borrowing cost supported NII. On the back of cost-rationalization efforts of the management, operating expenses were up 8% yoy and down 7% qoq to `2.75 bn. Asset quality performance was stable with gross NPLs at 1.9%.
Moderate growth over medium term
We expect Muthoot’s loan growth to pick up in the next 1-2 quarters and forecast moderate (7% yoy) loan growth in FY2015E followed by 17-18% yoy growth over the next two years. While slowdown in loan book coupled with recent capital issuance will reduce EPS in FY2015E (down 4% yoy), higher loan growth and strong NIM will drive 20% earnings growth in FY2016-17E. We expect the company to deliver 17-18% RoE in the medium term. Our growth forecasts factor stable gold prices, but are sensitive to gold price movements. Domestic gold prices have been volatile over the past few months—currently close to April 2014 levels after declining by 10% mom in May 2014 and rising subsequently (up 5% in past 10 days).
Retain BUY, target price of `250
We remain bullish on the medium-term growth prospects for Muthoot Finance. We believe gradual decline in borrowing cost (down 100 bps yoy in 1QFY15) will underpin reduction in gold loan IRRs, thereby increasing the scope of activity for Muthoot Finance. We don’t find any significant pipeline of regulations for gold-loan NBFCs. While inclusion of accrued interest for calculation of LTV (as applicable for banks) is a concern, we expect any such regulation for gold-loan NBFCs to be followed by a decline in risk weights (discussed later in the note). Muthoot Finance has underperformed likely due to volatile gold prices; however, we continue to like the business and retain BUY on the stock with a target price of `250. Current valuations are attractive at 1.2X book and 7.4X EPS FY2016E.
Muthoot Finance (MUTH)
Banks/Financial Institutions
Results on track, retain positive stance. Muthoot Finance reported decline in loan book and earnings on the back of a run-down legacy portfolio, though lower pace of qoq loan book contraction likely indicates the management’s concerted efforts to push new businesses. We believe persistent efforts on new businesses, recent uptick in gold prices and strong expense management will support its earnings. We tweak estimates, retain BUY rating with target price of `250.
Muthoot FinanceStock data Forecasts/Valuations 2014 2015E 2016E
52-week range (Rs) (high,low) EPS (Rs) 21.0 20.3 23.7Market Cap. (Rs bn) 69.9 EPS growth (%) (22.3) (3.1) 16.4
Shareholding pattern (%) P/E (X) 8.4 8.6 7.4Promoters 80.1 NII (Rs bn) 22.7 22.1 25.7FIIs 10.3 Net profits (Rs bn) 7.8 8.1 9.4MFs 1.1 BVPS 107.4 131.1 146.5
Price performance (%) 1M 3M 12M P/B (X) 1.6 1.3 1.2Absolute 1.8 (3.6) 120.9 ROE (%) 19.0 17.1 17.1Rel. to BSE-30 (0.2) (13.2) 62.6 Div. Yield (%) 3.2 3.5 4.0
Company data and valuation summary
222-82
BUY
AUGUST 12, 2014
RESULT
Coverage view: Neutral
Price (`): 176
Target price (`): 250
BSE-30: 25,519
QUICK NUMBERS
• PAT down 7% yoy
• Loans down 17% yoy
• Maintain BUY with TP of `250

Muthoot Finance Banks/Financial Institutions
KOTAK INSTITUTIONAL EQUITIES RESEARCH 33
Loan growth declines albeit moderately
Gold loan book down qoq. Muthoot reported 17% yoy decline in loan book, down 1.8% qoq compared to 3% qoq in 4QFY14 and 7% qoq in 3QFY14. The management has maintained its guidance of loan book growth in 2HFY15 and flat loan book in 2QFY15.
Pace of decline was lower. According to the management, high repayments from the legacy loan book (originated at higher LTV) and auctions thereof have driven high repayments. The company has made concerted efforts to acquire new customers. According to the management, the trend in disbursements (details not available) is strong and indicates that loan book will deliver net growth in 2HFY15. Muthoot’s gold loan book was down qoq by `18 bn in 3QFY14, down `7 bn qoq in 4QFY14 and down `3 bn qoq in 1QFY15.
We forecast moderate growth in FY2015E. Muthoot’s business was subdued in the past two years, 5% loan growth in FY2013 and 16% decline in FY2014 led by decline in gold prices and multiple RBI regulations. We expect gold loan book to grow by 7% in FY2015E and 17% yoy in FY2016E and FY2017E. Relaxation in LTV (increase in maximum LTVs to 75% from 60%) and recent increase in domestic gold prices will aid growth.
Branch expansion will support medium-term growth. Despite slowdown in business, Muthoot added about 178 new branches in FY2014; overall, branches were stable qoq in 1QFY15 due to the cost-rationalization efforts of the management. We expect Muthoot to set up 100 new branches in 2HFY15 and about 300 branches annually in the subsequent years.
Exhibit 1: We expect Muthoot to add 700 branches in next three years Growth in branches, March fiscal year-ends, 2010-17E
1,605
2,733
3,500
4,082 4,260 4,3604,660
4,960
-
1,200
2,400
3,600
4,800
6,000
2010
2011
2012
2013
2014
2015
E
2016
E
2017
E
Branches(#)
Source: Company, Kotak Institutional Equities estimates
Exhibit 2: Loan growth likely to pick up in FY2016-17E Growth in branches, March fiscal year-ends, 2010-17E
-
70
140
210
280
350
2010
2011
2012
2013
2014
2015
E
2016
E
2017
E
(32)
-
32
64
96
128
Loans (LHS)YoY growth (RHS)(Rs bn) (%)
Source: Company, Kotak Institutional Equities estimates
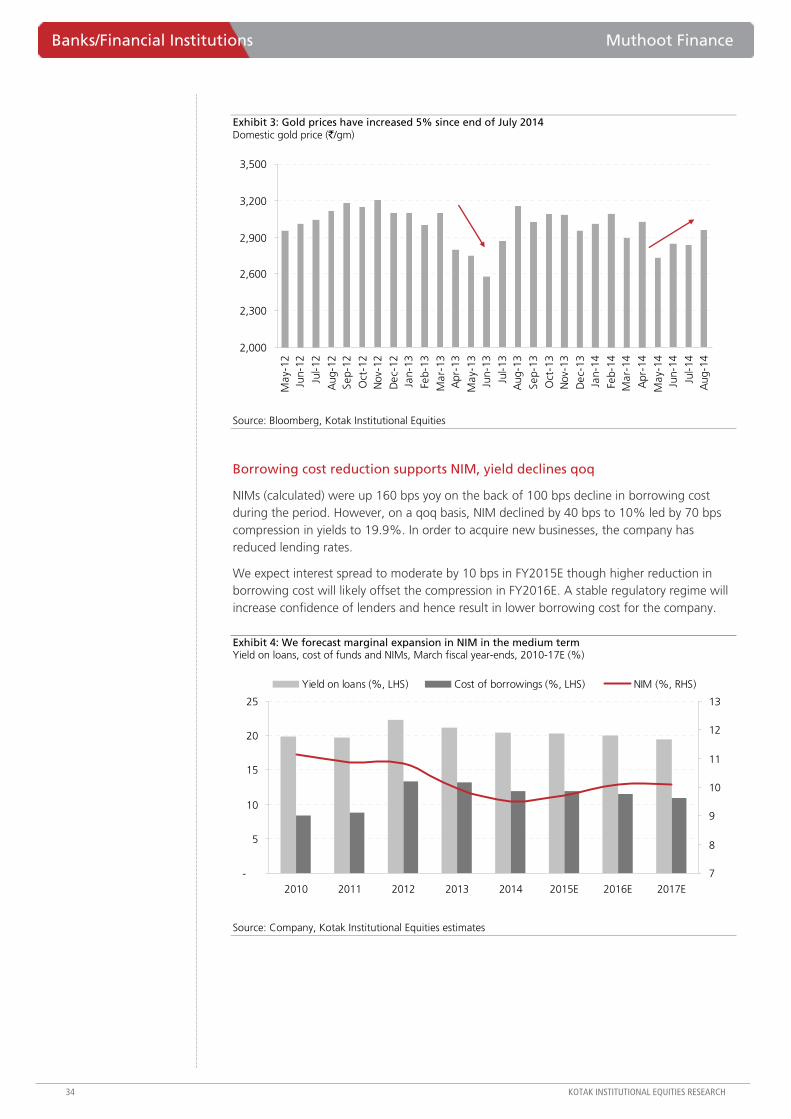
Banks/Financial Institutions Muthoot Finance
34 KOTAK INSTITUTIONAL EQUITIES RESEARCH
Exhibit 3: Gold prices have increased 5% since end of July 2014 Domestic gold price (`/gm)
2,000
2,300
2,600
2,900
3,200
3,500
May
-12
Jun-
12
Jul-1
2
Aug
-12
Sep-
12
Oct
-12
Nov
-12
Dec
-12
Jan-
13
Feb-
13
Mar
-13
Apr
-13
May
-13
Jun-
13
Jul-1
3A
ug-1
3
Sep-
13
Oct
-13
Nov
-13
Dec
-13
Jan-
14
Feb-
14M
ar-1
4
Apr
-14
May
-14
Jun-
14
Jul-1
4A
ug-1
4
Source: Bloomberg, Kotak Institutional Equities
Borrowing cost reduction supports NIM, yield declines qoq
NIMs (calculated) were up 160 bps yoy on the back of 100 bps decline in borrowing cost during the period. However, on a qoq basis, NIM declined by 40 bps to 10% led by 70 bps compression in yields to 19.9%. In order to acquire new businesses, the company has reduced lending rates.
We expect interest spread to moderate by 10 bps in FY2015E though higher reduction in borrowing cost will likely offset the compression in FY2016E. A stable regulatory regime will increase confidence of lenders and hence result in lower borrowing cost for the company.
Exhibit 4: We forecast marginal expansion in NIM in the medium term Yield on loans, cost of funds and NIMs, March fiscal year-ends, 2010-17E (%)
-
5
10
15
20
25
2010 2011 2012 2013 2014 2015E 2016E 2017E
7
8
9
10
11
12
13
Yield on loans (%, LHS) Cost of borrowings (%, LHS) NIM (%, RHS)
Source: Company, Kotak Institutional Equities estimates

Muthoot Finance Banks/Financial Institutions
KOTAK INSTITUTIONAL EQUITIES RESEARCH 35
Operating costs growth remains moderate
Muthoot reported moderate growth in operating expenses for the third quarter in a row, 8% yoy, led by cost-rationalization efforts of the management. While branches were stable qoq at 4,271, employee strength declined to 24,140 from 25,012 in 4QFY14. Average employees per branch are now down to 5.7, compared to 5.9 in FY2014 and 6.1 in FY2013.
Muthoot made additional depreciation provisions of `88 mn due to change in the accounting policy.
We forecast improvement in cost-to-asset ratio to 3.6% by FY2017E from 3.9% in FY2014. We expect branch expansion to remain moderate in FY2015E as the management focuses on productivity.
Exhibit 5: Operating expenses to assets to reduce in the medium term with moderation in branch expansion Operating expenses to average AUMs, March fiscal year-ends, 2010-17E
-
0.5
1.0
1.5
2.0
2.5
2010 2011 2012 2013 2014 2015E 2016E 2017E
3.0
3.3
3.6
3.9
4.2
4.5
Staff expenses (LHS) Non-staff expenses (LHS) Operating expenses (RHS)
Source: Company, Kotak Institutional Equities
Improvement in asset quality
Muthoot’s gross NPLs were down 5% qoq to `3.96 bn, 1.85% of loans compared to 1.9% in FY2014 and 1.99% in FY2013. Provision expenses declined to `80 mn from `181 mn in 4QFY14. We believe bulk of the stress on the asset quality front is now behind us, especially with recent moderate rise in gold prices. We, however, remain cautious and factor provisioning expenses at 18 bps of average assets and 21 bps in FY2016E, compared to 16 bps in FY2014.
Assessing impact of change in LTV guidelines (if applicable to Muthoot)
RBI regulation for banks. RBI has recently clarified to banks that the latter should maintain 75% LTV ratio (including accrued interest on loans at all times). With the clarification of including accrued interest for calculation of LTV, most banks recently went slow in this segment.
Regulations for NBFCs. The LTV calculation for NBFCs primarily pertains to the loan principal and does not include accrued interest. Notably, RBI has recently increased the maximum LTV for gold-loan NBFCs to 75% from 60% likely following a strong representation by the industry. A similar regulation by RBI (to include accrued interest in LTV calculation) for NBFCs will have significant ramifications on the growth trajectory of NBFCs. Inclusion of accrued interest will reduce the loan tenures, LTV and rate of interest offered by gold-loan NBFCs.
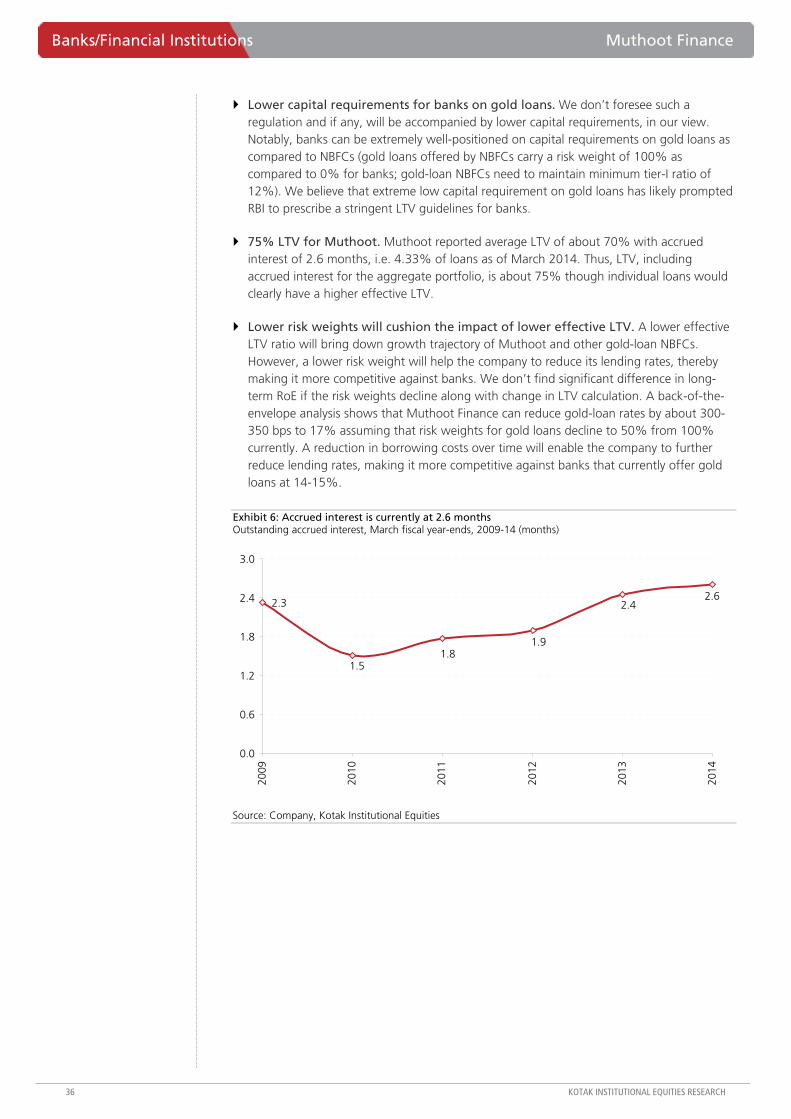
Banks/Financial Institutions Muthoot Finance
36 KOTAK INSTITUTIONAL EQUITIES RESEARCH
Lower capital requirements for banks on gold loans. We don’t foresee such a regulation and if any, will be accompanied by lower capital requirements, in our view. Notably, banks can be extremely well-positioned on capital requirements on gold loans as compared to NBFCs (gold loans offered by NBFCs carry a risk weight of 100% as compared to 0% for banks; gold-loan NBFCs need to maintain minimum tier-I ratio of 12%). We believe that extreme low capital requirement on gold loans has likely prompted RBI to prescribe a stringent LTV guidelines for banks.
75% LTV for Muthoot. Muthoot reported average LTV of about 70% with accrued interest of 2.6 months, i.e. 4.33% of loans as of March 2014. Thus, LTV, including accrued interest for the aggregate portfolio, is about 75% though individual loans would clearly have a higher effective LTV.
Lower risk weights will cushion the impact of lower effective LTV. A lower effective LTV ratio will bring down growth trajectory of Muthoot and other gold-loan NBFCs. However, a lower risk weight will help the company to reduce its lending rates, thereby making it more competitive against banks. We don’t find significant difference in long-term RoE if the risk weights decline along with change in LTV calculation. A back-of-the-envelope analysis shows that Muthoot Finance can reduce gold-loan rates by about 300-350 bps to 17% assuming that risk weights for gold loans decline to 50% from 100% currently. A reduction in borrowing costs over time will enable the company to further reduce lending rates, making it more competitive against banks that currently offer gold loans at 14-15%.
Exhibit 6: Accrued interest is currently at 2.6 months Outstanding accrued interest, March fiscal year-ends, 2009-14 (months)
2.32.6
1.9
1.5
2.4
1.8
0.0
0.6
1.2
1.8
2.4
3.0
2009
2010
2011
2012
2013
2014
Source: Company, Kotak Institutional Equities
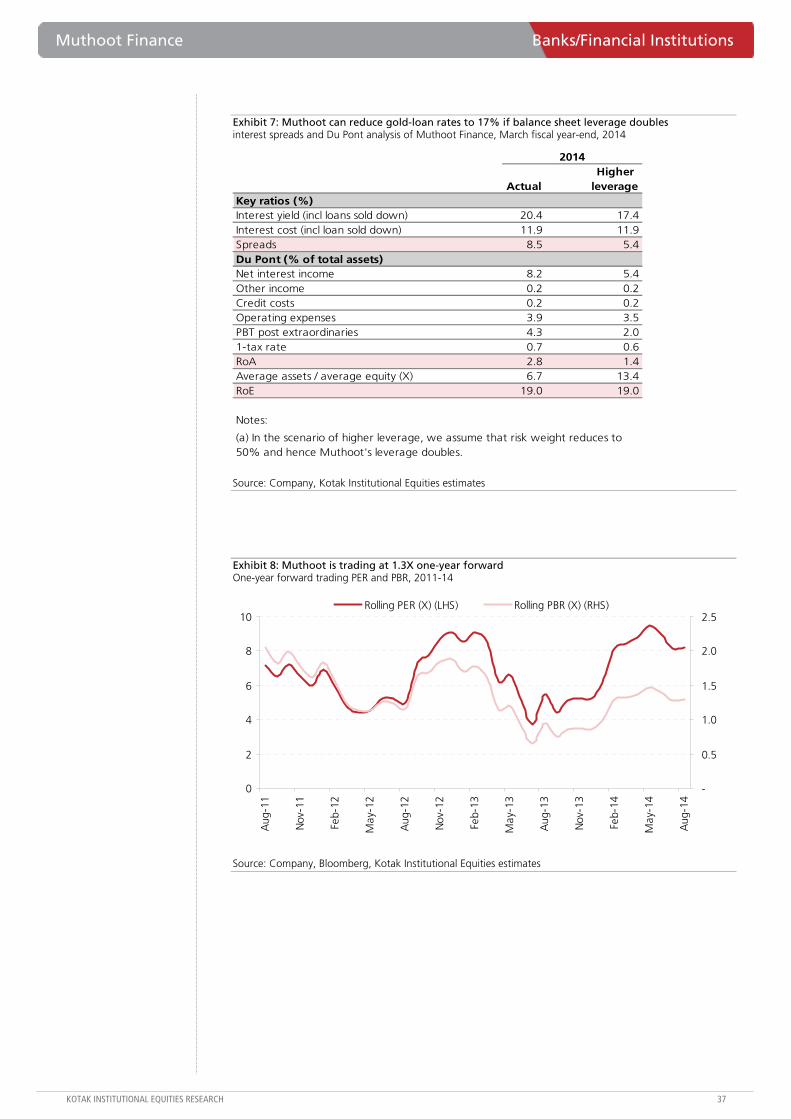
Muthoot Finance Banks/Financial Institutions
KOTAK INSTITUTIONAL EQUITIES RESEARCH 37
Exhibit 7: Muthoot can reduce gold-loan rates to 17% if balance sheet leverage doubles interest spreads and Du Pont analysis of Muthoot Finance, March fiscal year-end, 2014
2014
ActualHigher
leverageKey ratios (%)Interest yield (incl loans sold down) 20.4 17.4Interest cost (incl loan sold down) 11.9 11.9Spreads 8.5 5.4Du Pont (% of total assets)Net interest income 8.2 5.4Other income 0.2 0.2Credit costs 0.2 0.2Operating expenses 3.9 3.5PBT post extraordinaries 4.3 2.01-tax rate 0.7 0.6RoA 2.8 1.4Average assets / average equity (X) 6.7 13.4RoE 19.0 19.0
Notes:
(a) In the scenario of higher leverage, we assume that risk weight reduces to 50% and hence Muthoot's leverage doubles.
Source: Company, Kotak Institutional Equities estimates
Exhibit 8: Muthoot is trading at 1.3X one-year forward One-year forward trading PER and PBR, 2011-14
0
2
4
6
8
10
Aug
-11
Nov
-11
Feb-
12
May
-12
Aug
-12
Nov
-12
Feb-
13
May
-13
Aug
-13
Nov
-13
Feb-
14
May
-14
Aug
-14
-
0.5
1.0
1.5
2.0
2.5Rolling PER (X) (LHS) Rolling PBR (X) (RHS)
Source: Company, Bloomberg, Kotak Institutional Equities estimates
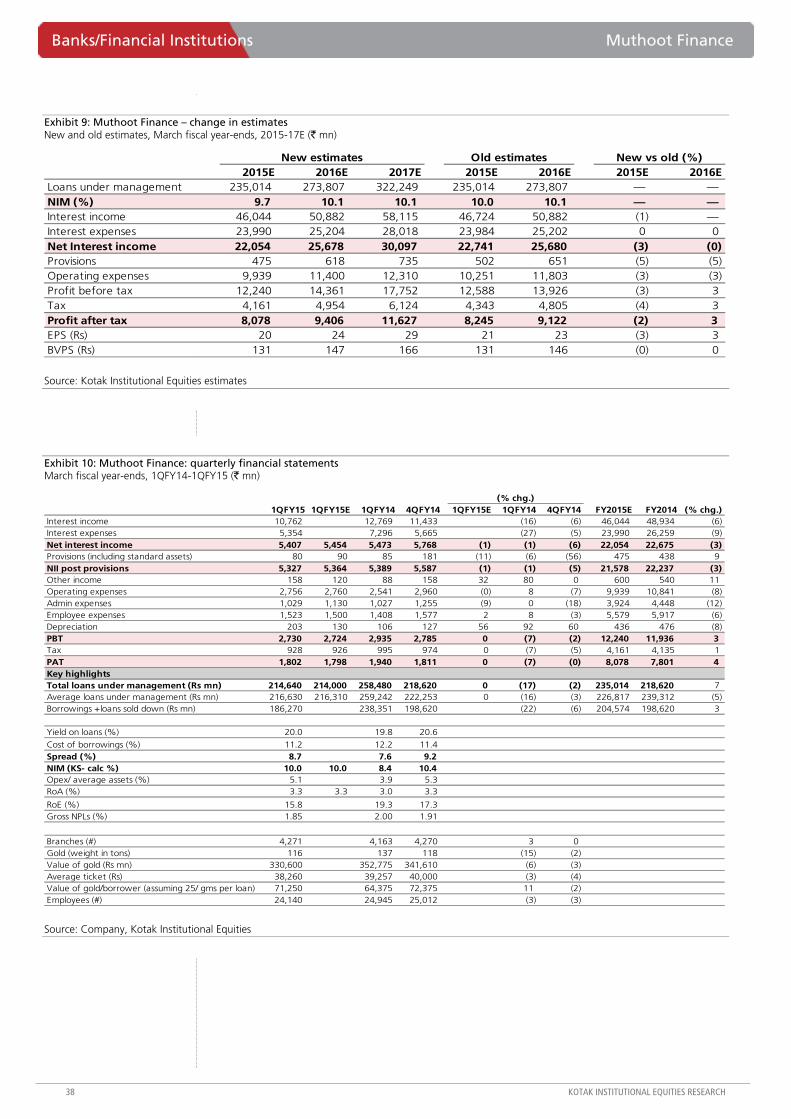
Banks/Financial Institutions Muthoot Finance
38 KOTAK INSTITUTIONAL EQUITIES RESEARCH
Exhibit 9: Muthoot Finance – change in estimates New and old estimates, March fiscal year-ends, 2015-17E (` mn)
Old estimates New vs old (%)2015E 2016E 2017E 2015E 2016E 2015E 2016E
Loans under management 235,014 273,807 322,249 235,014 273,807 — — NIM (%) 9.7 10.1 10.1 10.0 10.1 — — Interest income 46,044 50,882 58,115 46,724 50,882 (1) — Interest expenses 23,990 25,204 28,018 23,984 25,202 0 0 Net Interest income 22,054 25,678 30,097 22,741 25,680 (3) (0) Provisions 475 618 735 502 651 (5) (5) Operating expenses 9,939 11,400 12,310 10,251 11,803 (3) (3) Profit before tax 12,240 14,361 17,752 12,588 13,926 (3) 3 Tax 4,161 4,954 6,124 4,343 4,805 (4) 3 Profit after tax 8,078 9,406 11,627 8,245 9,122 (2) 3 EPS (Rs) 20 24 29 21 23 (3) 3 BVPS (Rs) 131 147 166 131 146 (0) 0
New estimates
Source: Kotak Institutional Equities estimates
Exhibit 10: Muthoot Finance: quarterly financial statements March fiscal year-ends, 1QFY14-1QFY15 (` mn)
1QFY15 1QFY15E 1QFY14 4QFY14 1QFY15E 1QFY14 4QFY14 FY2015E FY2014 (% chg.)Interest income 10,762 12,769 11,433 (16) (6) 46,044 48,934 (6) Interest expenses 5,354 7,296 5,665 (27) (5) 23,990 26,259 (9) Net interest income 5,407 5,454 5,473 5,768 (1) (1) (6) 22,054 22,675 (3) Provisions (including standard assets) 80 90 85 181 (11) (6) (56) 475 438 9 NII post provisions 5,327 5,364 5,389 5,587 (1) (1) (5) 21,578 22,237 (3) Other income 158 120 88 158 32 80 0 600 540 11 Operating expenses 2,756 2,760 2,541 2,960 (0) 8 (7) 9,939 10,841 (8) Admin expenses 1,029 1,130 1,027 1,255 (9) 0 (18) 3,924 4,448 (12) Employee expenses 1,523 1,500 1,408 1,577 2 8 (3) 5,579 5,917 (6) Depreciation 203 130 106 127 56 92 60 436 476 (8) PBT 2,730 2,724 2,935 2,785 0 (7) (2) 12,240 11,936 3 Tax 928 926 995 974 0 (7) (5) 4,161 4,135 1 PAT 1,802 1,798 1,940 1,811 0 (7) (0) 8,078 7,801 4 Key highlightsTotal loans under management (Rs mn) 214,640 214,000 258,480 218,620 0 (17) (2) 235,014 218,620 7 Average loans under management (Rs mn) 216,630 216,310 259,242 222,253 0 (16) (3) 226,817 239,312 (5) Borrowings +loans sold down (Rs mn) 186,270 238,351 198,620 (22) (6) 204,574 198,620 3
Yield on loans (%) 20.0 19.8 20.6
Cost of borrowings (%) 11.2 12.2 11.4 Spread (%) 8.7 7.6 9.2 NIM (KS- calc %) 10.0 10.0 8.4 10.4 Opex/ average assets (%) 5.1 3.9 5.3 RoA (%) 3.3 3.3 3.0 3.3
RoE (%) 15.8 19.3 17.3 Gross NPLs (%) 1.85 2.00 1.91
Branches (#) 4,271 4,163 4,270 3 0 Gold (weight in tons) 116 137 118 (15) (2) Value of gold (Rs mn) 330,600 352,775 341,610 (6) (3) Average ticket (Rs) 38,260 39,257 40,000 (3) (4) Value of gold/borrower (assuming 25/ gms per loan) 71,250 64,375 72,375 11 (2) Employees (#) 24,140 24,945 25,012 (3) (3)
(% chg.)
Source: Company, Kotak Institutional Equities
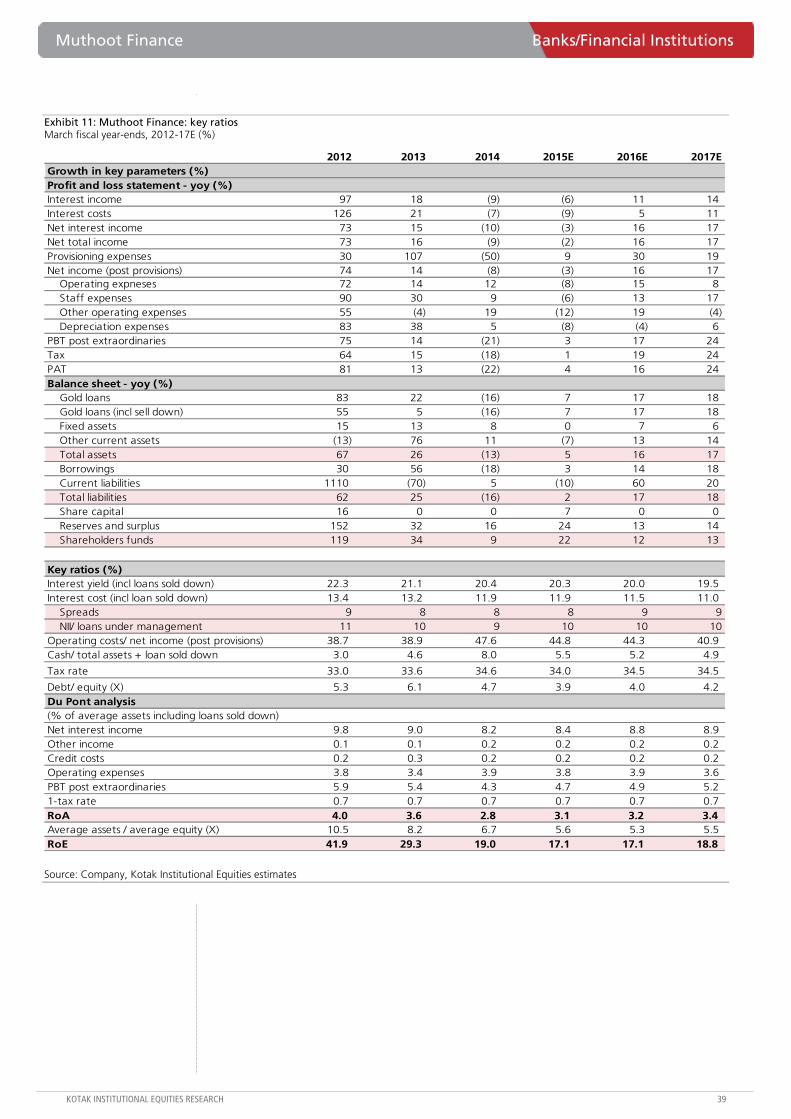
Muthoot Finance Banks/Financial Institutions
KOTAK INSTITUTIONAL EQUITIES RESEARCH 39
Exhibit 11: Muthoot Finance: key ratios March fiscal year-ends, 2012-17E (%)
2012 2013 2014 2015E 2016E 2017EGrowth in key parameters (%)Profit and loss statement - yoy (%)Interest income 97 18 (9) (6) 11 14Interest costs 126 21 (7) (9) 5 11Net interest income 73 15 (10) (3) 16 17Net total income 73 16 (9) (2) 16 17Provisioning expenses 30 107 (50) 9 30 19Net income (post provisions) 74 14 (8) (3) 16 17
Operating expneses 72 14 12 (8) 15 8Staff expenses 90 30 9 (6) 13 17Other operating expenses 55 (4) 19 (12) 19 (4)Depreciation expenses 83 38 5 (8) (4) 6
PBT post extraordinaries 75 14 (21) 3 17 24Tax 64 15 (18) 1 19 24PAT 81 13 (22) 4 16 24Balance sheet - yoy (%)
Gold loans 83 22 (16) 7 17 18Gold loans (incl sell down) 55 5 (16) 7 17 18Fixed assets 15 13 8 0 7 6Other current assets (13) 76 11 (7) 13 14Total assets 67 26 (13) 5 16 17Borrowings 30 56 (18) 3 14 18Current liabilities 1110 (70) 5 (10) 60 20Total liabilities 62 25 (16) 2 17 18Share capital 16 0 0 7 0 0Reserves and surplus 152 32 16 24 13 14Shareholders funds 119 34 9 22 12 13
Key ratios (%)Interest yield (incl loans sold down) 22.3 21.1 20.4 20.3 20.0 19.5 Interest cost (incl loan sold down) 13.4 13.2 11.9 11.9 11.5 11.0
Spreads 9 8 8 8 9 9NII/ loans under management 11 10 9 10 10 10
Operating costs/ net income (post provisions) 38.7 38.9 47.6 44.8 44.3 40.9 Cash/ total assets + loan sold down 3.0 4.6 8.0 5.5 5.2 4.9
Tax rate 33.0 33.6 34.6 34.0 34.5 34.5
Debt/ equity (X) 5.3 6.1 4.7 3.9 4.0 4.2 Du Pont analysis (% of average assets including loans sold down)Net interest income 9.8 9.0 8.2 8.4 8.8 8.9 Other income 0.1 0.1 0.2 0.2 0.2 0.2 Credit costs 0.2 0.3 0.2 0.2 0.2 0.2 Operating expenses 3.8 3.4 3.9 3.8 3.9 3.6 PBT post extraordinaries 5.9 5.4 4.3 4.7 4.9 5.2 1-tax rate 0.7 0.7 0.7 0.7 0.7 0.7 RoA 4.0 3.6 2.8 3.1 3.2 3.4 Average assets / average equity (X) 10.5 8.2 6.7 5.6 5.3 5.5 RoE 41.9 29.3 19.0 17.1 17.1 18.8
Source: Company, Kotak Institutional Equities estimates
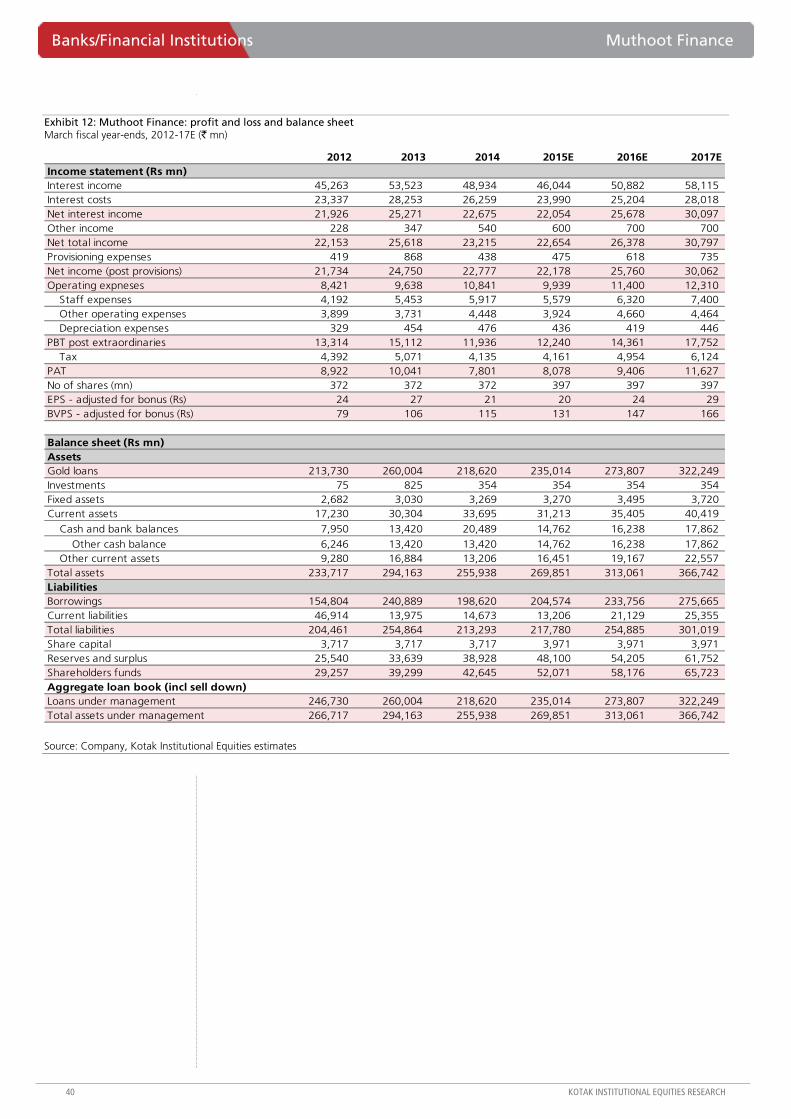
Banks/Financial Institutions Muthoot Finance
40 KOTAK INSTITUTIONAL EQUITIES RESEARCH
Exhibit 12: Muthoot Finance: profit and loss and balance sheet March fiscal year-ends, 2012-17E (` mn)
2012 2013 2014 2015E 2016E 2017EIncome statement (Rs mn)Interest income 45,263 53,523 48,934 46,044 50,882 58,115 Interest costs 23,337 28,253 26,259 23,990 25,204 28,018 Net interest income 21,926 25,271 22,675 22,054 25,678 30,097 Other income 228 347 540 600 700 700 Net total income 22,153 25,618 23,215 22,654 26,378 30,797 Provisioning expenses 419 868 438 475 618 735 Net income (post provisions) 21,734 24,750 22,777 22,178 25,760 30,062 Operating expneses 8,421 9,638 10,841 9,939 11,400 12,310
Staff expenses 4,192 5,453 5,917 5,579 6,320 7,400 Other operating expenses 3,899 3,731 4,448 3,924 4,660 4,464 Depreciation expenses 329 454 476 436 419 446
PBT post extraordinaries 13,314 15,112 11,936 12,240 14,361 17,752 Tax 4,392 5,071 4,135 4,161 4,954 6,124
PAT 8,922 10,041 7,801 8,078 9,406 11,627 No of shares (mn) 372 372 372 397 397 397 EPS - adjusted for bonus (Rs) 24 27 21 20 24 29 BVPS - adjusted for bonus (Rs) 79 106 115 131 147 166
Balance sheet (Rs mn)Assets Gold loans 213,730 260,004 218,620 235,014 273,807 322,249 Investments 75 825 354 354 354 354 Fixed assets 2,682 3,030 3,269 3,270 3,495 3,720 Current assets 17,230 30,304 33,695 31,213 35,405 40,419
Cash and bank balances 7,950 13,420 20,489 14,762 16,238 17,862
Other cash balance 6,246 13,420 13,420 14,762 16,238 17,862 Other current assets 9,280 16,884 13,206 16,451 19,167 22,557
Total assets 233,717 294,163 255,938 269,851 313,061 366,742 LiabilitiesBorrowings 154,804 240,889 198,620 204,574 233,756 275,665 Current liabilities 46,914 13,975 14,673 13,206 21,129 25,355 Total liabilities 204,461 254,864 213,293 217,780 254,885 301,019 Share capital 3,717 3,717 3,717 3,971 3,971 3,971 Reserves and surplus 25,540 33,639 38,928 48,100 54,205 61,752 Shareholders funds 29,257 39,299 42,645 52,071 58,176 65,723 Aggregate loan book (incl sell down)Loans under management 246,730 260,004 218,620 235,014 273,807 322,249 Total assets under management 266,717 294,163 255,938 269,851 313,061 366,742
Source: Company, Kotak Institutional Equities estimates
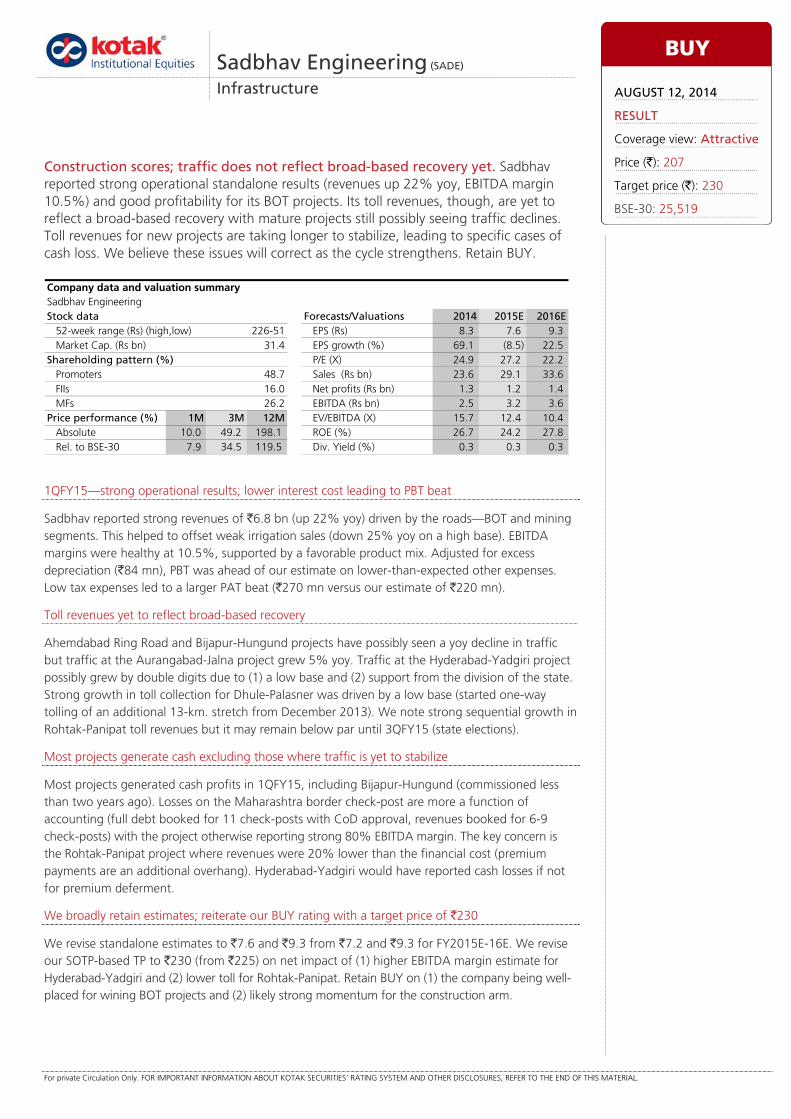
For private Circulation Only. FOR IMPORTANT INFORMATION ABOUT KOTAK SECURITIES’ RATING SYSTEM AND OTHER DISCLOSURES, REFER TO THE END OF THIS MATERIAL.
1QFY15—strong operational results; lower interest cost leading to PBT beat
Sadbhav reported strong revenues of `6.8 bn (up 22% yoy) driven by the roads—BOT and mining segments. This helped to offset weak irrigation sales (down 25% yoy on a high base). EBITDA margins were healthy at 10.5%, supported by a favorable product mix. Adjusted for excess depreciation (`84 mn), PBT was ahead of our estimate on lower-than-expected other expenses. Low tax expenses led to a larger PAT beat (`270 mn versus our estimate of `220 mn).
Toll revenues yet to reflect broad-based recovery
Ahemdabad Ring Road and Bijapur-Hungund projects have possibly seen a yoy decline in traffic but traffic at the Aurangabad-Jalna project grew 5% yoy. Traffic at the Hyderabad-Yadgiri project possibly grew by double digits due to (1) a low base and (2) support from the division of the state. Strong growth in toll collection for Dhule-Palasner was driven by a low base (started one-way tolling of an additional 13-km. stretch from December 2013). We note strong sequential growth in Rohtak-Panipat toll revenues but it may remain below par until 3QFY15 (state elections).
Most projects generate cash excluding those where traffic is yet to stabilize
Most projects generated cash profits in 1QFY15, including Bijapur-Hungund (commissioned less than two years ago). Losses on the Maharashtra border check-post are more a function of accounting (full debt booked for 11 check-posts with CoD approval, revenues booked for 6-9 check-posts) with the project otherwise reporting strong 80% EBITDA margin. The key concern is the Rohtak-Panipat project where revenues were 20% lower than the financial cost (premium payments are an additional overhang). Hyderabad-Yadgiri would have reported cash losses if not for premium deferment.
We broadly retain estimates; reiterate our BUY rating with a target price of `230
We revise standalone estimates to `7.6 and `9.3 from `7.2 and `9.3 for FY2015E-16E. We revise our SOTP-based TP to `230 (from `225) on net impact of (1) higher EBITDA margin estimate for Hyderabad-Yadgiri and (2) lower toll for Rohtak-Panipat. Retain BUY on (1) the company being well-placed for wining BOT projects and (2) likely strong momentum for the construction arm.
Sadbhav Engineering (SADE)
Infrastructure
Construction scores; traffic does not reflect broad-based recovery yet. Sadbhav reported strong operational standalone results (revenues up 22% yoy, EBITDA margin 10.5%) and good profitability for its BOT projects. Its toll revenues, though, are yet to reflect a broad-based recovery with mature projects still possibly seeing traffic declines. Toll revenues for new projects are taking longer to stabilize, leading to specific cases of cash loss. We believe these issues will correct as the cycle strengthens. Retain BUY.
Sadbhav EngineeringStock data Forecasts/Valuations 2014 2015E 2016E
52-week range (Rs) (high,low) EPS (Rs) 8.3 7.6 9.3Market Cap. (Rs bn) 31.4 EPS growth (%) 69.1 (8.5) 22.5
Shareholding pattern (%) P/E (X) 24.9 27.2 22.2Promoters 48.7 Sales (Rs bn) 23.6 29.1 33.6FIIs 16.0 Net profits (Rs bn) 1.3 1.2 1.4MFs 26.2 EBITDA (Rs bn) 2.5 3.2 3.6
Price performance (%) 1M 3M 12M EV/EBITDA (X) 15.7 12.4 10.4Absolute 10.0 49.2 198.1 ROE (%) 26.7 24.2 27.8Rel. to BSE-30 7.9 34.5 119.5 Div. Yield (%) 0.3 0.3 0.3
Company data and valuation summary
226-51
BUY
AUGUST 12, 2014
RESULT
Coverage view: Attractive
Price (`): 207
Target price (`): 230
BSE-30: 25,519
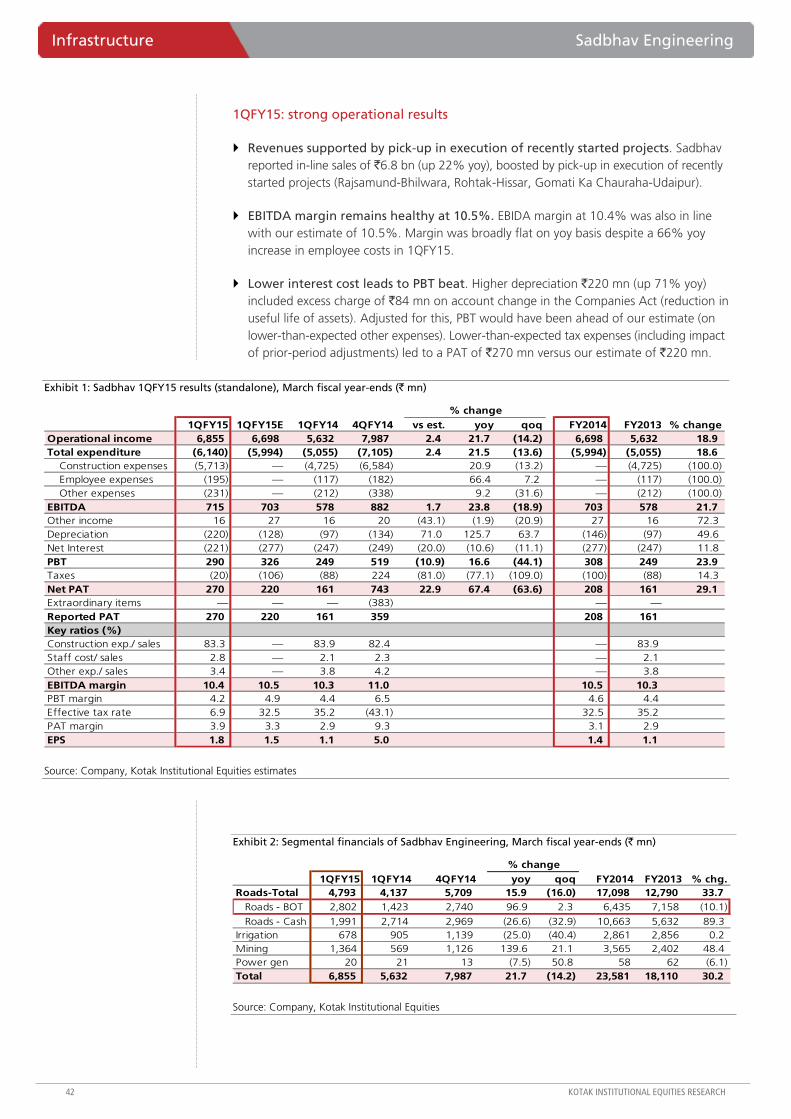
Infrastructure Sadbhav Engineering
42 KOTAK INSTITUTIONAL EQUITIES RESEARCH
1QFY15: strong operational results
Revenues supported by pick-up in execution of recently started projects. Sadbhav reported in-line sales of `6.8 bn (up 22% yoy), boosted by pick-up in execution of recently started projects (Rajsamund-Bhilwara, Rohtak-Hissar, Gomati Ka Chauraha-Udaipur).
EBITDA margin remains healthy at 10.5%. EBIDA margin at 10.4% was also in line with our estimate of 10.5%. Margin was broadly flat on yoy basis despite a 66% yoy increase in employee costs in 1QFY15.
Lower interest cost leads to PBT beat. Higher depreciation `220 mn (up 71% yoy) included excess charge of `84 mn on account change in the Companies Act (reduction in useful life of assets). Adjusted for this, PBT would have been ahead of our estimate (on lower-than-expected other expenses). Lower-than-expected tax expenses (including impact of prior-period adjustments) led to a PAT of `270 mn versus our estimate of `220 mn.
Exhibit 1: Sadbhav 1QFY15 results (standalone), March fiscal year-ends (` mn)
1QFY15 1QFY15E 1QFY14 4QFY14 vs est. yoy qoq FY2014 FY2013 % changeOperational income 6,855 6,698 5,632 7,987 2.4 21.7 (14.2) 6,698 5,632 18.9Total expenditure (6,140) (5,994) (5,055) (7,105) 2.4 21.5 (13.6) (5,994) (5,055) 18.6
Construction expenses (5,713) — (4,725) (6,584) 20.9 (13.2) — (4,725) (100.0)Employee expenses (195) — (117) (182) 66.4 7.2 — (117) (100.0)Other expenses (231) — (212) (338) 9.2 (31.6) — (212) (100.0)
EBITDA 715 703 578 882 1.7 23.8 (18.9) 703 578 21.7Other income 16 27 16 20 (43.1) (1.9) (20.9) 27 16 72.3Depreciation (220) (128) (97) (134) 71.0 125.7 63.7 (146) (97) 49.6Net Interest (221) (277) (247) (249) (20.0) (10.6) (11.1) (277) (247) 11.8PBT 290 326 249 519 (10.9) 16.6 (44.1) 308 249 23.9Taxes (20) (106) (88) 224 (81.0) (77.1) (109.0) (100) (88) 14.3Net PAT 270 220 161 743 22.9 67.4 (63.6) 208 161 29.1Extraordinary items — — — (383) — —Reported PAT 270 220 161 359 208 161Key ratios (%)Construction exp./ sales 83.3 — 83.9 82.4 — 83.9Staff cost/ sales 2.8 — 2.1 2.3 — 2.1Other exp./ sales 3.4 — 3.8 4.2 — 3.8EBITDA margin 10.4 10.5 10.3 11.0 10.5 10.3PBT margin 4.2 4.9 4.4 6.5 4.6 4.4Effective tax rate 6.9 32.5 35.2 (43.1) 32.5 35.2PAT margin 3.9 3.3 2.9 9.3 3.1 2.9EPS 1.8 1.5 1.1 5.0 1.4 1.1
% change
Source: Company, Kotak Institutional Equities estimates
Exhibit 2: Segmental financials of Sadbhav Engineering, March fiscal year-ends (` mn)
1QFY15 1QFY14 4QFY14 yoy qoq FY2014 FY2013 % chg.Roads-Total 4,793 4,137 5,709 15.9 (16.0) 17,098 12,790 33.7
Roads - BOT 2,802 1,423 2,740 96.9 2.3 6,435 7,158 (10.1)
Roads - Cash 1,991 2,714 2,969 (26.6) (32.9) 10,663 5,632 89.3 Irrigation 678 905 1,139 (25.0) (40.4) 2,861 2,856 0.2 Mining 1,364 569 1,126 139.6 21.1 3,565 2,402 48.4 Power gen 20 21 13 (7.5) 50.8 58 62 (6.1) Total 6,855 5,632 7,987 21.7 (14.2) 23,581 18,110 30.2
% change
Source: Company, Kotak Institutional Equities
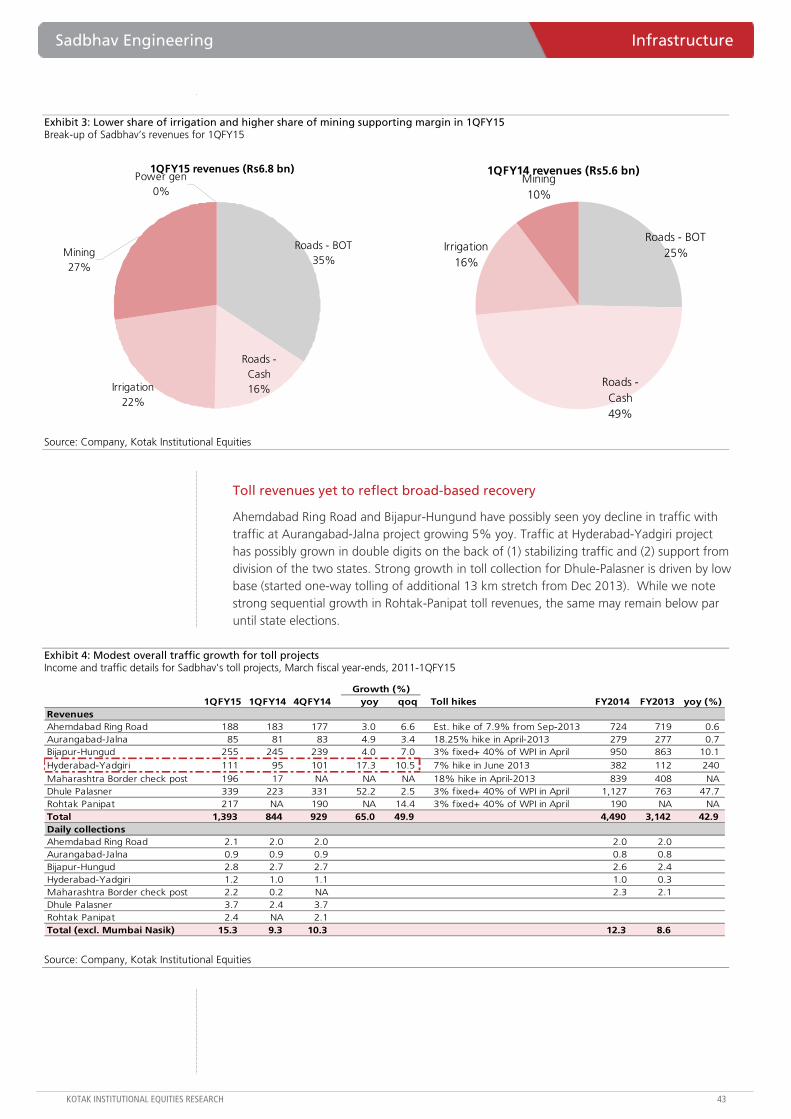
Sadbhav Engineering Infrastructure
KOTAK INSTITUTIONAL EQUITIES RESEARCH 43
Exhibit 3: Lower share of irrigation and higher share of mining supporting margin in 1QFY15 Break-up of Sadbhav’s revenues for 1QFY15
1QFY15 revenues (Rs6.8 bn)
Roads - BOT35%
Roads - Cash16%Irrigation
22%
Mining27%
Power gen0%
1QFY14 revenues (Rs5.6 bn)Mining10%
Irrigation16%
Roads - Cash49%
Roads - BOT25%
Source: Company, Kotak Institutional Equities
Toll revenues yet to reflect broad-based recovery
Ahemdabad Ring Road and Bijapur-Hungund have possibly seen yoy decline in traffic with traffic at Aurangabad-Jalna project growing 5% yoy. Traffic at Hyderabad-Yadgiri project has possibly grown in double digits on the back of (1) stabilizing traffic and (2) support from division of the two states. Strong growth in toll collection for Dhule-Palasner is driven by low base (started one-way tolling of additional 13 km stretch from Dec 2013). While we note strong sequential growth in Rohtak-Panipat toll revenues, the same may remain below par until state elections.
Exhibit 4: Modest overall traffic growth for toll projects Income and traffic details for Sadbhav's toll projects, March fiscal year-ends, 2011-1QFY15
1QFY15 1QFY14 4QFY14 yoy qoq Toll hikes FY2014 FY2013 yoy (%)RevenuesAhemdabad Ring Road 188 183 177 3.0 6.6 Est. hike of 7.9% from Sep-2013 724 719 0.6 Aurangabad-Jalna 85 81 83 4.9 3.4 18.25% hike in April-2013 279 277 0.7 Bijapur-Hungud 255 245 239 4.0 7.0 3% fixed+ 40% of WPI in April 950 863 10.1
Hyderabad-Yadgiri 111 95 101 17.3 10.5 7% hike in June 2013 382 112 240 Maharashtra Border check post 196 17 NA NA NA 18% hike in April-2013 839 408 NADhule Palasner 339 223 331 52.2 2.5 3% fixed+ 40% of WPI in April 1,127 763 47.7 Rohtak Panipat 217 NA 190 NA 14.4 3% fixed+ 40% of WPI in April 190 NA NATotal 1,393 844 929 65.0 49.9 4,490 3,142 42.9 Daily collectionsAhemdabad Ring Road 2.1 2.0 2.0 2.0 2.0 Aurangabad-Jalna 0.9 0.9 0.9 0.8 0.8 Bijapur-Hungud 2.8 2.7 2.7 2.6 2.4 Hyderabad-Yadgiri 1.2 1.0 1.1 1.0 0.3 Maharashtra Border check post 2.2 0.2 NA 2.3 2.1 Dhule Palasner 3.7 2.4 3.7 Rohtak Panipat 2.4 NA 2.1 Total (excl. Mumbai Nasik) 15.3 9.3 10.3 12.3 8.6
Growth (%)
Source: Company, Kotak Institutional Equities
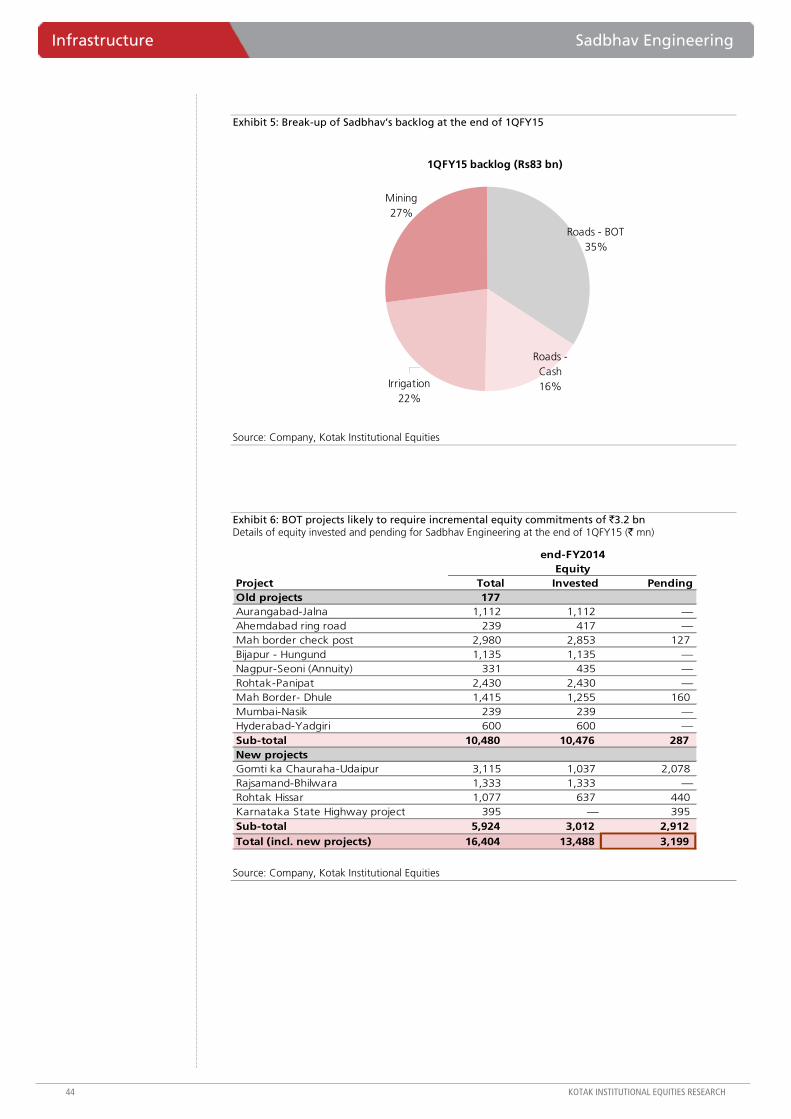
Infrastructure Sadbhav Engineering
44 KOTAK INSTITUTIONAL EQUITIES RESEARCH
Exhibit 5: Break-up of Sadbhav’s backlog at the end of 1QFY15
1QFY15 backlog (Rs83 bn)
Roads - BOT35%
Roads - Cash16%Irrigation
22%
Mining27%
Source: Company, Kotak Institutional Equities
Exhibit 6: BOT projects likely to require incremental equity commitments of `3.2 bn Details of equity invested and pending for Sadbhav Engineering at the end of 1QFY15 (` mn)
Project Total Invested PendingOld projects 177 Aurangabad-Jalna 1,112 1,112 —Ahemdabad ring road 239 417 —Mah border check post 2,980 2,853 127 Bijapur - Hungund 1,135 1,135 —Nagpur-Seoni (Annuity) 331 435 —Rohtak-Panipat 2,430 2,430 —Mah Border- Dhule 1,415 1,255 160 Mumbai-Nasik 239 239 —Hyderabad-Yadgiri 600 600 —Sub-total 10,480 10,476 287 New projectsGomti ka Chauraha-Udaipur 3,115 1,037 2,078 Rajsamand-Bhilwara 1,333 1,333 —Rohtak Hissar 1,077 637 440 Karnataka State Highway project 395 — 395 Sub-total 5,924 3,012 2,912 Total (incl. new projects) 16,404 13,488 3,199
end-FY2014Equity
Source: Company, Kotak Institutional Equities
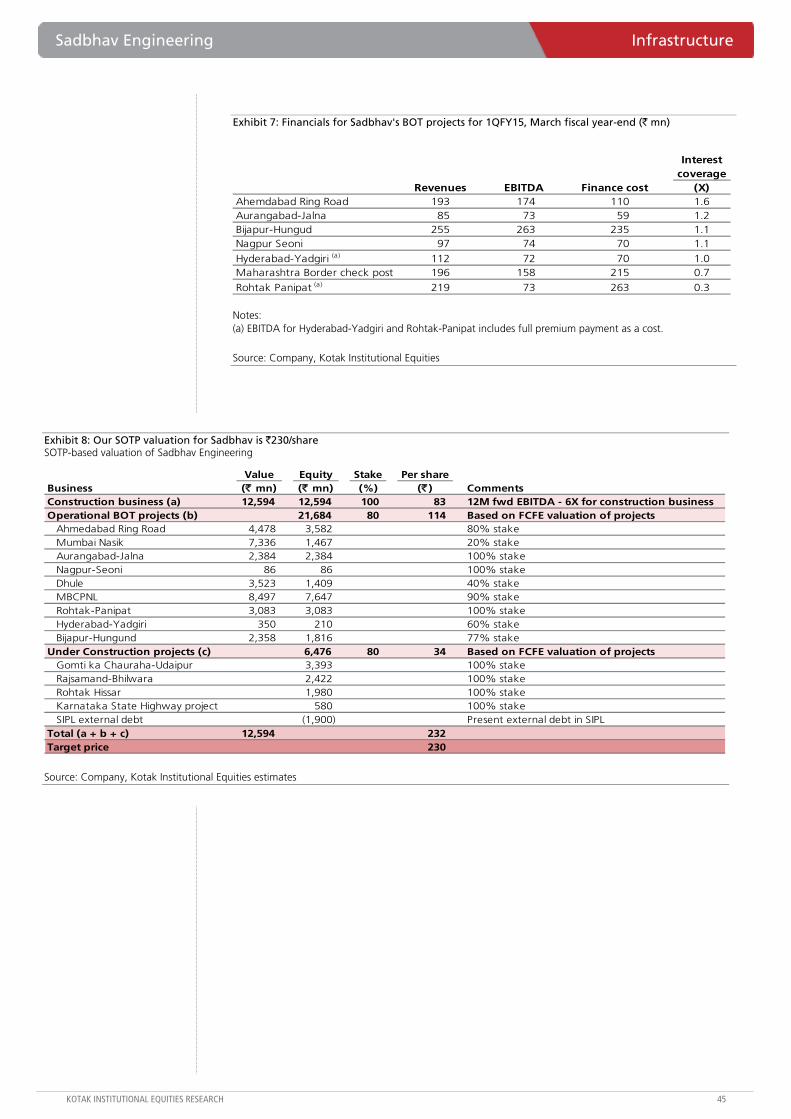
Sadbhav Engineering Infrastructure
KOTAK INSTITUTIONAL EQUITIES RESEARCH 45
Exhibit 7: Financials for Sadbhav's BOT projects for 1QFY15, March fiscal year-end (` mn)
Interest coverage
Revenues EBITDA Finance cost (X)Ahemdabad Ring Road 193 174 110 1.6Aurangabad-Jalna 85 73 59 1.2Bijapur-Hungud 255 263 235 1.1Nagpur Seoni 97 74 70 1.1
Hyderabad-Yadgiri (a) 112 72 70 1.0Maharashtra Border check post 196 158 215 0.7
Rohtak Panipat (a) 219 73 263 0.3 Notes: (a) EBITDA for Hyderabad-Yadgiri and Rohtak-Panipat includes full premium payment as a cost.
Source: Company, Kotak Institutional Equities
Exhibit 8: Our SOTP valuation for Sadbhav is `230/share SOTP-based valuation of Sadbhav Engineering
Value Equity Stake Per share Business (` mn) (` mn) (%) (` ) CommentsConstruction business (a) 12,594 12,594 100 83 12M fwd EBITDA - 6X for construction businessOperational BOT projects (b) 21,684 80 114 Based on FCFE valuation of projects
Ahmedabad Ring Road 4,478 3,582 80% stakeMumbai Nasik 7,336 1,467 20% stakeAurangabad-Jalna 2,384 2,384 100% stakeNagpur-Seoni 86 86 100% stakeDhule 3,523 1,409 40% stakeMBCPNL 8,497 7,647 90% stakeRohtak-Panipat 3,083 3,083 100% stakeHyderabad-Yadgiri 350 210 60% stakeBijapur-Hungund 2,358 1,816 77% stake
Under Construction projects (c) 6,476 80 34 Based on FCFE valuation of projects Gomti ka Chauraha-Udaipur 3,393 100% stakeRajsamand-Bhilwara 2,422 100% stakeRohtak Hissar 1,980 100% stakeKarnataka State Highway project 580 100% stakeSIPL external debt (1,900) Present external debt in SIPL
Total (a + b + c) 12,594 232Target price 230
Source: Company, Kotak Institutional Equities estimates
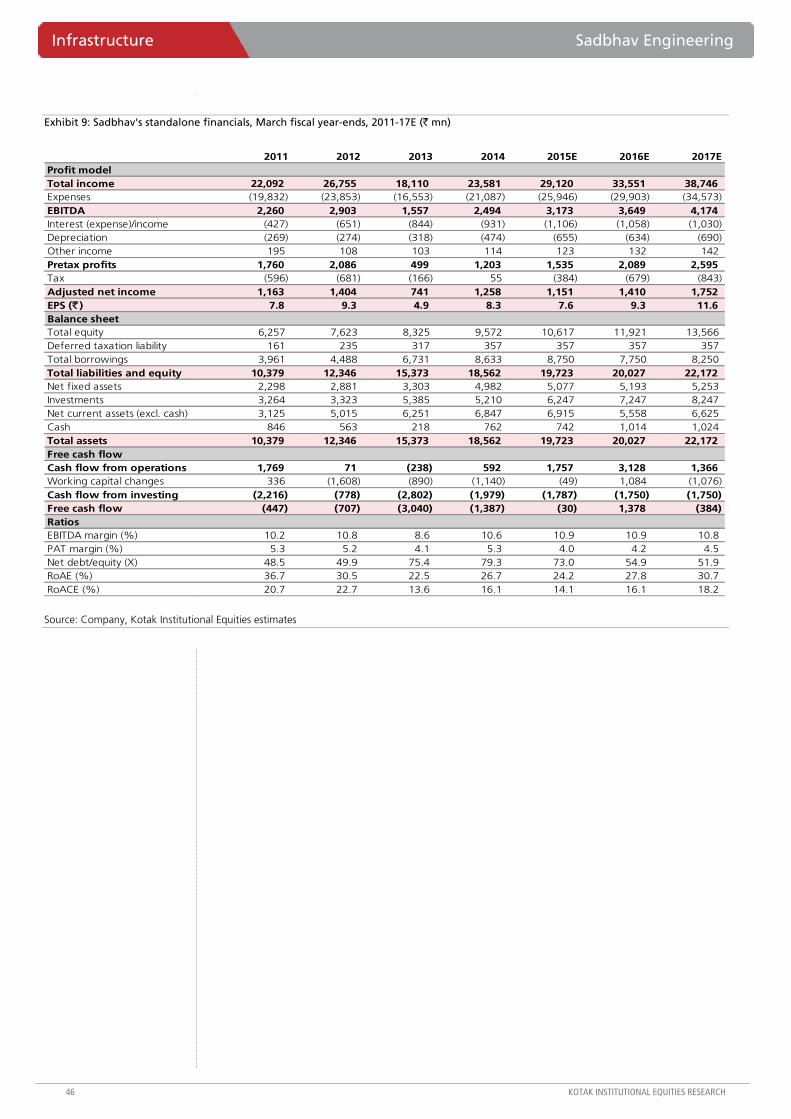
Infrastructure Sadbhav Engineering
46 KOTAK INSTITUTIONAL EQUITIES RESEARCH
Exhibit 9: Sadbhav's standalone financials, March fiscal year-ends, 2011-17E (` mn)
2011 2012 2013 2014 2015E 2016E 2017EProfit model Total income 22,092 26,755 18,110 23,581 29,120 33,551 38,746 Expenses (19,832) (23,853) (16,553) (21,087) (25,946) (29,903) (34,573) EBITDA 2,260 2,903 1,557 2,494 3,173 3,649 4,174 Interest (expense)/income (427) (651) (844) (931) (1,106) (1,058) (1,030) Depreciation (269) (274) (318) (474) (655) (634) (690) Other income 195 108 103 114 123 132 142 Pretax profits 1,760 2,086 499 1,203 1,535 2,089 2,595 Tax (596) (681) (166) 55 (384) (679) (843) Adjusted net income 1,163 1,404 741 1,258 1,151 1,410 1,752 EPS (` ) 7.8 9.3 4.9 8.3 7.6 9.3 11.6 Balance sheetTotal equity 6,257 7,623 8,325 9,572 10,617 11,921 13,566 Deferred taxation liability 161 235 317 357 357 357 357 Total borrowings 3,961 4,488 6,731 8,633 8,750 7,750 8,250 Total liabilities and equity 10,379 12,346 15,373 18,562 19,723 20,027 22,172 Net fixed assets 2,298 2,881 3,303 4,982 5,077 5,193 5,253 Investments 3,264 3,323 5,385 5,210 6,247 7,247 8,247 Net current assets (excl. cash) 3,125 5,015 6,251 6,847 6,915 5,558 6,625 Cash 846 563 218 762 742 1,014 1,024 Total assets 10,379 12,346 15,373 18,562 19,723 20,027 22,172 Free cash flowCash flow from operations 1,769 71 (238) 592 1,757 3,128 1,366 Working capital changes 336 (1,608) (890) (1,140) (49) 1,084 (1,076) Cash flow from investing (2,216) (778) (2,802) (1,979) (1,787) (1,750) (1,750) Free cash flow (447) (707) (3,040) (1,387) (30) 1,378 (384) RatiosEBITDA margin (%) 10.2 10.8 8.6 10.6 10.9 10.9 10.8 PAT margin (%) 5.3 5.2 4.1 5.3 4.0 4.2 4.5 Net debt/equity (X) 48.5 49.9 75.4 79.3 73.0 54.9 51.9 RoAE (%) 36.7 30.5 22.5 26.7 24.2 27.8 30.7 RoACE (%) 20.7 22.7 13.6 16.1 14.1 16.1 18.2
Source: Company, Kotak Institutional Equities estimates

Sadbhav Engineering Infrastructure
KOTAK INSTITUTIONAL EQUITIES RESEARCH 47
Exhibit 10: Consolidated financials of Sadbhav Engineering, March fiscal year-ends, 2011-17E (` mn)
2011 2012 2013 2014E 2015E 2016E 2017EIncome statementRevenues 23,296 28,663 21,596 27,325 35,773 41,011 49,929 Operating expenses (19,962) (24,519) (17,655) (22,870) (27,645) (32,072) (36,962) EBITDA 3,335 4,144 3,941 4,456 8,128 8,939 12,967 EBITDA margin (%) 14.3 14.5 18.2 16.3 22.7 21.8 26.0 Other income 262 273 382 306 425 476 497 Finance cost (1,399) (1,559) (3,042) (4,555) (6,108) (6,261) (8,229) Depreciation (789) (860) (1,707) (1,305) (2,195) (2,332) (3,792) PBT 1,409 1,998 (426) (1,098) 251 822 1,442 Tax paid (638) (808) (435) 141 (324) (631) (770) Net PAT 771 1,190 (861) (956) (73) 190 672 Exceptional items — — 609 1,217 — — —Minority interest 157 56 374 181 180 165 131 Share of associates — (23) (48) 2 (102) 49 123 Reported PAT 928 1,223 75 444 4 405 927 EPS (` ) 6.1 8.1 (3.5) (5.1) 0.0 2.7 6.1 Balance sheetShareholders funds 8,722 11,733 12,102 13,358 13,256 13,555 14,375
Share capital 150 150 151 152 152 152 152 Reserves & surplus 8,573 11,582 11,951 13,206 13,104 13,403 14,224
Minority interest 2,017 1,746 1,557 1,375 1,196 1,030 899 Loan funds 19,601 34,156 44,273 60,915 70,163 78,120 81,861 Deferred tax liabilities (net) 161 234 317 317 317 317 317 Total sources of funds 30,501 47,869 58,249 75,965 84,931 93,022 97,452 Net block 18,287 38,629 48,393 64,879 75,596 82,619 83,482 Investments 261 402 327 327 327 327 327 Cash & bank balance 1,365 1,801 735 2,313 512 2,665 3,656 Net working capital 10,588 7,036 8,794 8,446 8,495 7,411 9,986 Total application of funds 30,501 47,869 58,249 75,965 84,931 93,022 97,452
Source: Company, Kotak Institutional Equities estimates
For private Circulation Only. FOR IMPORTANT INFORMATION ABOUT KOTAK SECURITIES’ RATING SYSTEM AND OTHER DISCLOSURES, REFER TO THE END OF THIS MATERIAL.
Pricing action – hikes in several categories; Nestle at it again; select promotional offers continue
(Refer to Exhibit 2 for complete pricing monitor and Exhibit 3 for ongoing promotional offers) –
Soaps & detergents. Select price hikes in soaps continued – Dove 75 gm SKU hiked by 4% and Vivel 3X 100 gm SKU hiked by 6%. Within detergents – both HUL and P&G withdrew select promotions from their brands Surf Excel Quickwash and Ariel, respectively; however, HUL continues to run promotional price-offs in all SKUs of Surf Excel Easywash. Few price hikes in detergents – Wheel 1 kg SKU hiked by 2%, Ariel matic complete 1 kg SKU hiked by 16% (withdrew promotional price-off) and Surf Excel matic 2 kg SKU hiked by 3%.
Other personal care items. (1) Oral care – Dabur has hiked prices of its toothpaste offerings Dabur Red and Meswak by 3-7% and (2) shampoos – we noticed a host of new promotional offers (freebies) across L’Oreal (most notable), P&G and HUL.
Home care. A host of offers in household insecticides continued for almost the fourth consecutive month with all top-3 companies offering price-offs and freebies across SKUs and formats.
Food items.
Biscuits – a host of promotional offers continued across players and segments. Britannia continued to take select hikes for the second consecutive month – it has hiked price of its `10 SKU in Bourbon by 20% to `12. We note last month Britannia had hiked Vita Marie Gold prices by 11%, Marie Gold prices by 12% and select Good Day variants by ~7-14%.
Chocolates – Nestle has re-launched its Kit Kat offerings and has taken steep price hikes across SKUs – (1) `10 SKU grammage reduced from 18 gm to 13 gm, (2) 18 gm SKU price point moved up from `10 to `15, (3) `20 SKU hiked to `25 (both in normal and dark variant) and (4) 108 gm SKU for `65 changed to 90 gm SKU for `75. We note Cadbury has also initiated hikes in select Dairy Milk SKUs by ~7-14%.
Baby food – Nestle has again hiked prices of its baby food offerings by ~4-8% across different sub-brands. We note this is the third hike Nestle has initiated over last 9 months.
Other foods items – (1) soups – both Nestle and HUL have hiked instant soup prices by ~13%, (2) noodles - Nestle has hiked price of Maggi atta noodles by 9% and (3) ketchup – we noticed a host of offers across ketchup offerings from HUL and Nestle.
Tea & coffee. (1) Tea – HUL has hiked price of Red Label 1 kg SKU by 15% (removed promotional price-off) and (2) coffee – Nestle has hiked price of Nescafe 200 gm SKU by 4%.
Consumer Products India
Month in review – July 2014: price hikes pick pace. The KIE consumer universe outperformed the broader market by 2% last month led by APNT, BRIT, HUVR, and MRCO. Earnings reports disappointed on balance, even as select names bucked the trend. Forecasts as well as valuations (34X 12-month forward PE, ex-ITC) bake in fair amount of optimism. Tread selectively. Our top picks are ITC, Dabur, Britannia, Bajaj Corp and Colgate (on dips).
NEUTRAL
AUGUST 12, 2014
UPDATE
BSE-30: 25,519
Consumer Products India
KOTAK INSTITUTIONAL EQUITIES RESEARCH 49
Raw material inflation – tea, wheat, barley, vegetable oils and copra inch up while select paint inputs correct; overall RM inflation high in select pockets
Refer to Exhibit 4 for detailed RM inflation impact.
Agri-inputs. Domestic tea prices have shot by 10% mom (~30% over last 3 months). Among other agri-commodities – wheat and barley have inched up a tad this month by ~4-6%, sugar has risen marginally by 2% and milk (both liquid and powder) corrected by ~3-4% on mom basis. On a yoy basis, international coffee Arabica, milk powder and cocoa bean are up ~30-40% yoy.
Oil commodities basket. Within the oil basket, crude oil corrected by 4% mom and mentha oil dropped 7% mom (continues to be a tailwind for Emami (not rated)). However, copra bounced back again, inching up by 7% mom while other vegetable oils like groundnut oil and castor oil also rose by ~3-6% mom.
Other commodities. Tio2 (Anatese) continued to correct dropping by 12% mom and select other paint inputs like PAN, turpentine oil, formaldehyde and acrylic acid corrected by ~2-20% on mom basis. However, VAM (monomer) remained inflationary and was up 3% on mom basis (up ~60% yoy). Among others – soda ash inched up by 6% mom (up ~20% yoy).
Sector (KIE consumer universe) performance mixed; select stocks outperform
Our overall coverage universe delivered 4% absolute returns last month, outperforming the broader market by 2%. Asian Paints (up 8%), Britannia (up 18%), HUVR (up 9%), GCPL (up 9%) and Marico (up 10%) were the key outperforming stocks while TGBL, JUBI and Jyothy underperformed.
Sector forward P/E multiple remained at around 29X 12-month forward earnings (34X ex-ITC). Sector premium (relative to Sensex) stays high at around 80%. We continue to find sector valuations rich and retain our ‘tread selectively’ stance. Our preferred picks in the sector are ITC, Dabur, Britannia, Colgate (on dips) and Bajaj Corp.
Key industry/stock developments
New launches
Emami has introduced a new extension under Zandu balm called Zandu Balm Ultra Power – a strong formulation offering a multipurpose solution for severe headache, body ache and cold. The product is priced at `30 for 8 ml SKU (11% premium to the base variant). We note the topical pain management segment in India is pegged at around `25 bn.
Nestle has launched oats noodles under its flagship brand Maggi in an effort aimed at regaining the market share it lost to newer entrants and healthy alternatives such as savoury oats. The product is priced at `25 for single pack, at ~14% premium to single pack of Maggi Atta noodles priced at `22.
Nestle also re-launched its Kit Kat range of wafer chocolates with new packaging and a ‘rich new taste’ positioning. It has also increased the prices across select SKUs by ~25%+.
Britannia has launched premium cake offering called Nut and Raisin Romance. It is available at all modern and general trade outlets in a slab format at a price point of `50 for 160 gm SKU – ~60%+ premium to its other cake offerings.
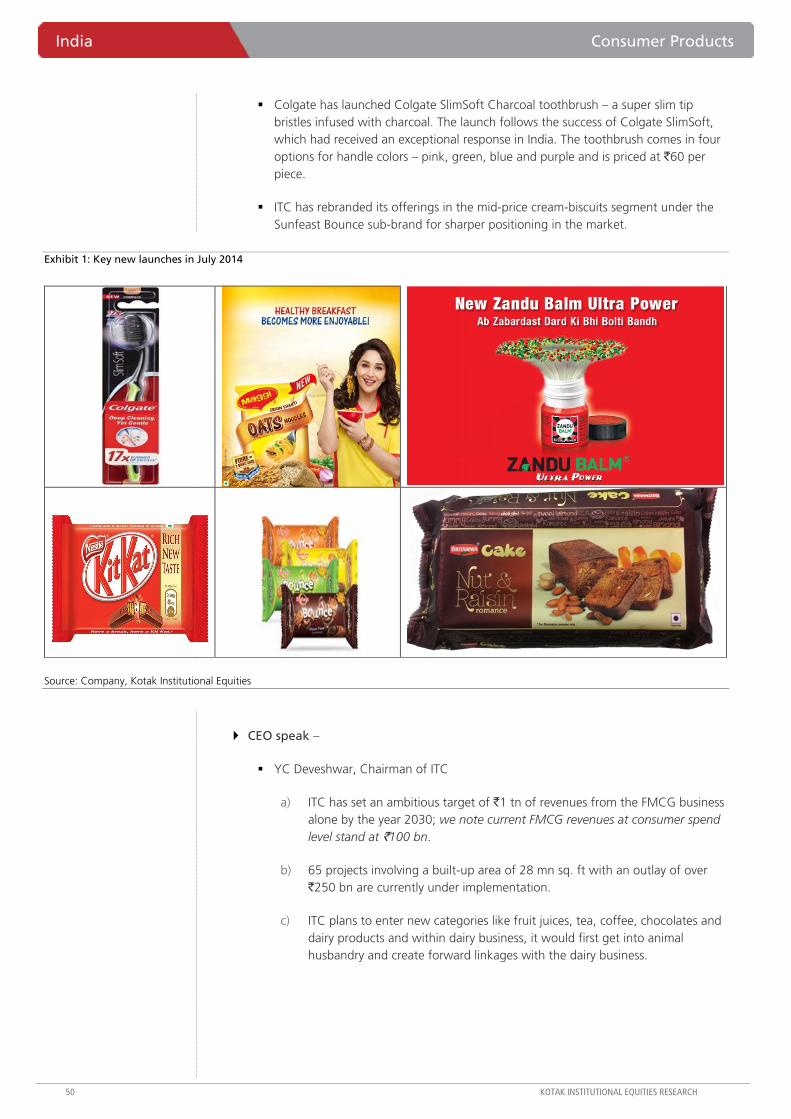
India Consumer Products
50 KOTAK INSTITUTIONAL EQUITIES RESEARCH
Colgate has launched Colgate SlimSoft Charcoal toothbrush – a super slim tip bristles infused with charcoal. The launch follows the success of Colgate SlimSoft, which had received an exceptional response in India. The toothbrush comes in four options for handle colors – pink, green, blue and purple and is priced at `60 per piece.
ITC has rebranded its offerings in the mid-price cream-biscuits segment under the Sunfeast Bounce sub-brand for sharper positioning in the market.
Exhibit 1: Key new launches in July 2014
Source: Company, Kotak Institutional Equities
CEO speak –
YC Deveshwar, Chairman of ITC
a) ITC has set an ambitious target of `1 tn of revenues from the FMCG business alone by the year 2030; we note current FMCG revenues at consumer spend level stand at `100 bn.
b) 65 projects involving a built-up area of 28 mn sq. ft with an outlay of over `250 bn are currently under implementation.
c) ITC plans to enter new categories like fruit juices, tea, coffee, chocolates and dairy products and within dairy business, it would first get into animal husbandry and create forward linkages with the dairy business.
Consumer Products India
KOTAK INSTITUTIONAL EQUITIES RESEARCH 51
Other newsflow –
GSK Consumer Healthcare (GSKCH) is planning to expand its reach in the rural markets and is looking to add 1 mn more stores to its existing network of around 2.7 mn stores in next 18 months. It expects the distribution expansion to drive additional sales of `5 bn to `15 bn. GSKCH would also cover the top 40 towns with 1 mn and above population and would cover 200,000 more stores in these cities over the next 18 months. These stores would address the slum-dwellers in these growing towns, where the company would spread awareness about malnutrition and the need for the health food drink. It is also looking at promoting social entrepreneurship by employing women from rural locality and provide them with micro loans to start brand promotion and sales of GSK's consumer healthcare products. The concept, ‘Horlicks Akka’ (which in Hindi is Horlicks Didi), would work as GSK’s representative for one or two villages and supply the company products.
Godrej Consumer Products (GCPL) is launching a slew of initiatives, including an additional layer in its sales force called ’pilot sales representatives‘ (PSR) and ’Project Daksh‘ to improve the performance of its sales team. PSR is an initiative to drive greater focus in the sub 1-lakh population urban markets and Project Daksh has been launched in a bid to improve productivity of sales force and enhance go-to-market efficiencies in urban markets.
ITC is revitalizing its distribution strategy its FMCG products with a greater focus on supplying products directly to retailers. This involves an ambitious target of directly reaching out to one lakh villages, which account for 80% of India’s rural consumer goods consumption. ITC’s plan is to immediately expand its reach and investment in the top 16,000 rural markets.
GSKCH plans to bring in more of its parents products under its over-the-counter products portfolio in India. Skincare brand Physiogel and anti-smoking product NiQuitin are among the ones being evaluated for India launch. Physiogel is a skincare brand of Stiefel Laboratories with products like moisturizers, cleansers, lotions, shower creams and sunscreen lotion. Stiefel, the US-based pharmaceutical company that GSK acquired in 2009, is a leading name among dermatological product manufacturers and its products are available in 132 countries. NiQuitin is a nicotine replacement product and is available in patches, gums and lozenges.
ITC is likely to add 3,000 rooms in eight new hotels, including owned and managed properties, over the next two to three years and another 15-18 projects are at the drawing board stage. The company’s first overseas hotel will come up in Colombo in Sri Lanka and construction work is likely to start soon.

India Consumer Products
52 KOTAK INSTITUTIONAL EQUITIES RESEARCH
ITC has emerged the second largest player in the domestic deodorant market within a year of entering the business, overtaking rival brands like Axe and Old Spice. ITC’s Engage recorded an 8.1% volume share in May across India’s urban markets that account for 90% of the overall deodorant space as per Nielsen (media reports). Vini Cosmetics’ Fogg held 12.5%, while Hindustan Unilever’s Axe and McNROE Consumer Products’ Wildstone were at the joint third spot with a 6.9% share each. By value, Fogg is significantly ahead at 17.8% share followed by Wildstone (6.7%), Engage (6.6%) and Axe (6.5%). In markets like Kolkata, Kanpur and Kochi, Engage was the largest by both value and volume in May. According to Nielsen, there are more than 500 deodorant brands in India and the number of sub-brands and variants is 986, with more than 100 new launches or re-launches over the past year, We note ITC itself initially launched six variants of Engage and the range has been scaled up to 14 variants in less than a year.
Tata Starbucks, the 50:50 JV between Starbucks Coffee Company and Tata Global Beverages opened its first store in Chennai, taking the total number of company's outlets in the country to 50+. Starbucks entered the Indian market in October 2012 and currently operates stores across Mumbai, Delhi NCR, Pune, Bengaluru and Chennai and plans to enter Hyderabad next.
Akzo Nobel India has launched a new production facility in India at Thane, Maharashtra for its industrial coatings business. The plant will manufacture coatings for the metal packaging and flexible packaging industries and will serve markets like India, Bangladesh, Sri Lanka and Southeast Asia.
Himalayan natural mineral water will soon be sold through Starbucks outlets in the UK and US. In terms of international distribution, NourishCo is already helping the Himalayan brand reach markets in West Asia such as Dubai and Saudi Arabia and the brand has already been successfully rolled out in the Singapore market.
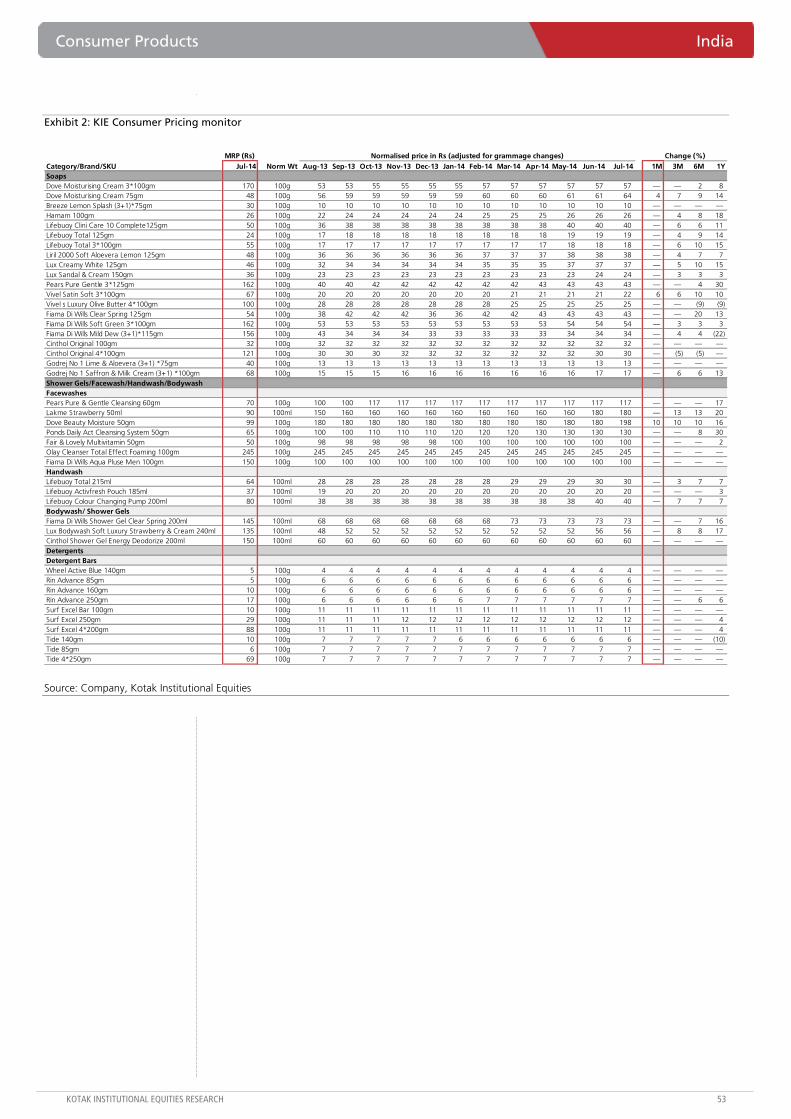
Consumer Products India
KOTAK INSTITUTIONAL EQUITIES RESEARCH 53
Exhibit 2: KIE Consumer Pricing monitor
MRP (Rs)Category/Brand/SKU Jul-14 Norm Wt Aug-13 Sep-13 Oct-13 Nov-13 Dec-13 Jan-14 Feb-14 Mar-14 Apr-14 May-14 Jun-14 Jul-14 1M 3M 6M 1YSoapsDove Moisturising Cream 3*100gm 170 100g 53 53 55 55 55 55 57 57 57 57 57 57 — — 2 8 Dove Moisturising Cream 75gm 48 100g 56 59 59 59 59 59 60 60 60 61 61 64 4 7 9 14 Breeze Lemon Splash (3+1)*75gm 30 100g 10 10 10 10 10 10 10 10 10 10 10 10 — — — — Hamam 100gm 26 100g 22 24 24 24 24 24 25 25 25 26 26 26 — 4 8 18 Lifebuoy Clini Care 10 Complete125gm 50 100g 36 38 38 38 38 38 38 38 38 40 40 40 — 6 6 11 Lifebuoy Total 125gm 24 100g 17 18 18 18 18 18 18 18 18 19 19 19 — 4 9 14 Lifebuoy Total 3*100gm 55 100g 17 17 17 17 17 17 17 17 17 18 18 18 — 6 10 15 Liril 2000 Soft Aloevera Lemon 125gm 48 100g 36 36 36 36 36 36 37 37 37 38 38 38 — 4 7 7 Lux Creamy White 125gm 46 100g 32 34 34 34 34 34 35 35 35 37 37 37 — 5 10 15 Lux Sandal & Cream 150gm 36 100g 23 23 23 23 23 23 23 23 23 23 24 24 — 3 3 3 Pears Pure Gentle 3*125gm 162 100g 40 40 42 42 42 42 42 42 43 43 43 43 — — 4 30 Vivel Satin Soft 3*100gm 67 100g 20 20 20 20 20 20 20 21 21 21 21 22 6 6 10 10 Vivel s Luxury Olive Butter 4*100gm 100 100g 28 28 28 28 28 28 28 25 25 25 25 25 — — (9) (9) Fiama Di Wills Clear Spring 125gm 54 100g 38 42 42 42 36 36 42 42 43 43 43 43 — — 20 13 Fiama Di Wills Soft Green 3*100gm 162 100g 53 53 53 53 53 53 53 53 53 54 54 54 — 3 3 3 Fiama Di Wills Mild Dew (3+1)*115gm 156 100g 43 34 34 34 33 33 33 33 33 34 34 34 — 4 4 (22) Cinthol Original 100gm 32 100g 32 32 32 32 32 32 32 32 32 32 32 32 — — — — Cinthol Original 4*100gm 121 100g 30 30 30 32 32 32 32 32 32 32 30 30 — (5) (5) — Godrej No 1 Lime & Aloevera (3+1) *75gm 40 100g 13 13 13 13 13 13 13 13 13 13 13 13 — — — — Godrej No 1 Saffron & Milk Cream (3+1) *100gm 68 100g 15 15 15 16 16 16 16 16 16 16 17 17 — 6 6 13 Shower Gels/Facewash/Handwash/BodywashFacewashesPears Pure & Gentle Cleansing 60gm 70 100g 100 100 117 117 117 117 117 117 117 117 117 117 — — — 17 Lakme Strawberry 50ml 90 100ml 150 160 160 160 160 160 160 160 160 160 180 180 — 13 13 20 Dove Beauty Moisture 50gm 99 100g 180 180 180 180 180 180 180 180 180 180 180 198 10 10 10 16 Ponds Daily Act Cleansing System 50gm 65 100g 100 100 110 110 110 120 120 120 130 130 130 130 — — 8 30 Fair & Lovely Multivitamin 50gm 50 100g 98 98 98 98 98 100 100 100 100 100 100 100 — — — 2 Olay Cleanser Total Effect Foaming 100gm 245 100g 245 245 245 245 245 245 245 245 245 245 245 245 — — — — Fiama Di Wills Aqua Pluse Men 100gm 150 100g 100 100 100 100 100 100 100 100 100 100 100 100 — — — — HandwashLifebuoy Total 215ml 64 100ml 28 28 28 28 28 28 28 29 29 29 30 30 — 3 7 7 Lifebuoy Activfresh Pouch 185ml 37 100ml 19 20 20 20 20 20 20 20 20 20 20 20 — — — 3 Lifebuoy Colour Changing Pump 200ml 80 100ml 38 38 38 38 38 38 38 38 38 38 40 40 — 7 7 7 Bodywash/ Shower GelsFiama Di Wills Shower Gel Clear Spring 200ml 145 100ml 68 68 68 68 68 68 68 73 73 73 73 73 — — 7 16 Lux Bodywash Soft Luxury Strawberry & Cream 240ml 135 100ml 48 52 52 52 52 52 52 52 52 52 56 56 — 8 8 17 Cinthol Shower Gel Energy Deodorize 200ml 150 100ml 60 60 60 60 60 60 60 60 60 60 60 60 — — — — DetergentsDetergent BarsWheel Active Blue 140gm 5 100g 4 4 4 4 4 4 4 4 4 4 4 4 — — — — Rin Advance 85gm 5 100g 6 6 6 6 6 6 6 6 6 6 6 6 — — — — Rin Advance 160gm 10 100g 6 6 6 6 6 6 6 6 6 6 6 6 — — — — Rin Advance 250gm 17 100g 6 6 6 6 6 6 7 7 7 7 7 7 — — 6 6 Surf Excel Bar 100gm 10 100g 11 11 11 11 11 11 11 11 11 11 11 11 — — — — Surf Excel 250gm 29 100g 11 11 11 12 12 12 12 12 12 12 12 12 — — — 4 Surf Excel 4*200gm 88 100g 11 11 11 11 11 11 11 11 11 11 11 11 — — — 4 Tide 140gm 10 100g 7 7 7 7 7 6 6 6 6 6 6 6 — — — (10) Tide 85gm 6 100g 7 7 7 7 7 7 7 7 7 7 7 7 — — — — Tide 4*250gm 69 100g 7 7 7 7 7 7 7 7 7 7 7 7 — — — —
Change (%)Normalised price in Rs (adjusted for grammage changes)
Source: Company, Kotak Institutional Equities

India Consumer Products
54 KOTAK INSTITUTIONAL EQUITIES RESEARCH
Exhibit 2: KIE Consumer Pricing monitor (continued)
MRP (Rs)Category/Brand/SKU Jul-14 Norm Wt Aug-13 Sep-13 Oct-13 Nov-13 Dec-13 Jan-14 Feb-14 Mar-14 Apr-14 May-14 Jun-14 Jul-14 1M 3M 6M 1YDetergent PowdersWheel Active Lemon & Jasmine 1kg 47 100g 4 4 4 4 4 5 5 5 5 5 5 5 2 2 4 18 Wheel Act Gold 1.5kg 86 100g 5 5 5 5 6 6 6 6 6 6 6 6 — — 2 15 Rin Advance 1kg 80 100g 8 8 8 8 8 8 8 8 8 8 8 8 — 3 5 5 Rin Matic 1kg 115 100g 11 12 12 12 12 12 12 12 12 12 12 12 — — — 6 Surf Excel Easy Wash 1.5kg 187 100g 13 13 13 14 14 14 14 14 14 14 12 12 — (10) (10) (6) Surf Excel Matic 1kg 205 100g 20 20 20 21 21 21 21 21 21 21 21 21 — — — 4 Surf Excel Matic Front Load 1kg 224 100g 22 22 22 22 22 22 22 22 22 22 22 22 — — — 4 Surf Excel Quickwash 1kg 182 100g 18 18 18 18 18 18 18 18 18 18 18 18 — — — 4 Ariel Complete Pp 1kg 182 100g 18 18 18 18 18 18 18 18 18 18 18 18 — — 4 4 Ariel 24Hour Fresh Complete 1kg 199 100g 19 19 19 19 19 19 20 20 20 20 20 20 — — 3 3 Ariel Matic Complete Box 1kg 224 100g 22 22 22 19 19 19 19 19 19 19 19 22 16 21 21 4 Tide Natural Lemon & Chandan 170gm 10 100g 5 5 5 6 6 6 6 6 6 6 6 6 — — — 12 Tide Plus 1kg 95 100g 9 9 9 9 10 10 10 10 10 10 10 10 — — — 3 Henko 1kg 135 100g 14 14 14 14 14 14 14 14 14 14 14 14 — — — — Fabric Conditioners/ Dishwash/ Floor CleanersFabric Conditioners/LiquidsRin Liquid Fabric Blue Perfect Shine 250ml 49 100ml 20 20 20 20 20 20 20 20 20 20 20 20 — — — — Comfort Fabric Conditioner Anti Bacterial 200ml 46 100ml 21 21 18 18 18 22 22 22 22 23 23 23 — 5 5 10 Ezee Detergent Liquid 500gm 85 100g 16 17 17 17 17 17 17 17 17 17 17 17 — — — 6 Dishwashing Bar/Gels/PowderVim Drop Dishwash Active Gel Green Lime 250ml 55 100g 22 22 22 21 21 21 22 22 22 22 22 22 — — 4 6 Vim Drop Dw Active Gel Green Lime 500ml 104 100g 20 20 20 20 20 20 20 20 21 21 21 21 — — 5 6 Vim Utensil Bar 130gm 10 100g 7 7 7 8 8 8 8 8 8 7 7 7 — (7) (7) — Vim Utensil Bar 200gm 16 100g 7 7 7 8 8 8 8 8 8 8 8 8 — — 7 14 Floor Cleaners/Other CleanersCif All Puprose Cleaner White 120ml 29 100ml 24 24 24 24 24 24 24 24 24 24 24 24 — — — — Domex Floor Cleaner Thick 500ml 65 100ml 12 12 13 13 13 13 13 13 13 13 13 13 — 2 3 12 Sanifresh Toilet Cleaner Shine 1L 96 100ml 9 9 9 9 9 9 9 9 9 9 9 10 2 2 2 2 Oral CareToothpasteColgate Cdc 150gm 55 100g 35 35 35 35 35 37 37 37 37 37 37 37 — — — 6 Colgate Cibaca 175gm 42 100g 23 23 23 23 23 23 23 23 23 24 24 24 — 5 5 11 Colgate Active Salt 100gm 45 100g 42 44 44 44 44 44 44 45 45 45 45 45 — — 2 7 Colgate Maxfresh Blue 150gm 82 100g 52 52 52 52 52 52 52 52 55 55 55 55 — — 5 5 Colgate Sensitive Pro Relief 70gm 99 100g 136 136 136 136 136 136 136 136 141 141 141 141 — — 4 4 Colgate Sensitive 80gm 95 100g 113 113 113 113 113 113 113 113 113 113 119 119 — 6 6 6 Colgate Total Adv Health 140gm 96 100g 66 66 66 66 66 66 66 69 69 69 69 69 — — 4 4 Pepsodent 2 In 1 150gm 78 100g 52 52 52 52 52 52 52 52 52 52 52 52 — — — — Pepsodent Centre Fresh 150gm 82 100g 50 55 55 55 55 55 55 55 55 55 55 55 — — — 9 Pepsodent Whitening 150gm 84 100g 55 55 55 55 55 55 55 55 55 56 56 56 — 2 2 12 Pepsodent Exp Prot Complete 150gm 105 100g 63 63 63 63 63 63 66 66 66 66 70 70 — 6 11 11 Pepsodent Expert Prot Sensitive 80gm 80 100g 100 100 100 100 100 100 100 100 100 100 100 100 — — — — Pepsodent Expert Prot Pro Sensitive 80gm 99 100g 124 124 124 124 124 124 124 124 124 124 124 124 — — — — Close Up Fire Freeze 150gm 100 100g 57 63 63 67 67 67 67 67 67 67 67 67 — — — 16 Close Up Red 150gm 80 100g 51 51 51 53 53 53 53 53 53 53 53 53 — — — 5 Babool 180gm 40 100g 19 19 19 22 22 22 22 22 22 22 22 22 — — — 17 Dabur Red 200gm 80 100g 36 38 38 38 38 38 38 38 38 38 38 40 7 7 7 11 Meswak 200gm 80 100g 36 38 38 39 39 39 39 39 39 39 39 40 3 3 3 11 Sensodyne Fresh Gel 80gm 100 100g 113 113 113 113 125 125 125 125 125 125 125 125 — — — 11 ToothpowdersColgate 200gm 62 100g 30 30 30 30 30 31 31 31 31 31 31 31 — — — 5 Dabur Lal Dant Manjan 100gm 34 100g 30 30 32 32 32 32 32 32 32 32 34 34 — 6 6 13 MouthwashesColgate Plax Complete Care 250ml 115 100ml 46 46 46 46 46 46 46 46 46 46 46 46 — — — — Colgate Plax Freshmint 250ml 105 100ml 40 40 34 34 34 34 34 34 42 42 42 42 — — 24 6
Change (%)Normalised price in Rs (adjusted for grammage changes)
Source: Company, Kotak Institutional Equities
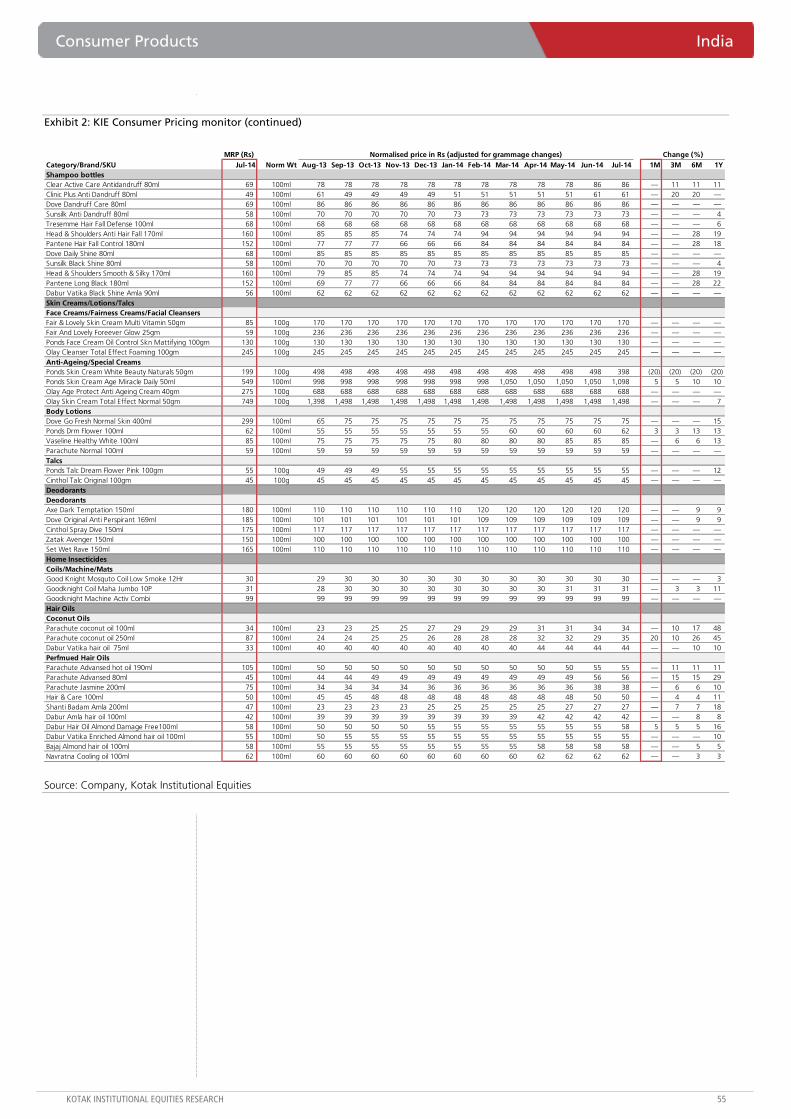
Consumer Products India
KOTAK INSTITUTIONAL EQUITIES RESEARCH 55
Exhibit 2: KIE Consumer Pricing monitor (continued)
MRP (Rs)Category/Brand/SKU Jul-14 Norm Wt Aug-13 Sep-13 Oct-13 Nov-13 Dec-13 Jan-14 Feb-14 Mar-14 Apr-14 May-14 Jun-14 Jul-14 1M 3M 6M 1YShampoo bottlesClear Active Care Antidandruff 80ml 69 100ml 78 78 78 78 78 78 78 78 78 78 86 86 — 11 11 11 Clinic Plus Anti Dandruff 80ml 49 100ml 61 49 49 49 49 51 51 51 51 51 61 61 — 20 20 — Dove Dandruff Care 80ml 69 100ml 86 86 86 86 86 86 86 86 86 86 86 86 — — — — Sunsilk Anti Dandruff 80ml 58 100ml 70 70 70 70 70 73 73 73 73 73 73 73 — — — 4 Tresemme Hair Fall Defense 100ml 68 100ml 68 68 68 68 68 68 68 68 68 68 68 68 — — — 6 Head & Shoulders Anti Hair Fall 170ml 160 100ml 85 85 85 74 74 74 94 94 94 94 94 94 — — 28 19 Pantene Hair Fall Control 180ml 152 100ml 77 77 77 66 66 66 84 84 84 84 84 84 — — 28 18 Dove Daily Shine 80ml 68 100ml 85 85 85 85 85 85 85 85 85 85 85 85 — — — — Sunsilk Black Shine 80ml 58 100ml 70 70 70 70 70 73 73 73 73 73 73 73 — — — 4 Head & Shoulders Smooth & Silky 170ml 160 100ml 79 85 85 74 74 74 94 94 94 94 94 94 — — 28 19 Pantene Long Black 180ml 152 100ml 69 77 77 66 66 66 84 84 84 84 84 84 — — 28 22 Dabur Vatika Black Shine Amla 90ml 56 100ml 62 62 62 62 62 62 62 62 62 62 62 62 — — — — Skin Creams/Lotions/TalcsFace Creams/Fairness Creams/Facial CleansersFair & Lovely Skin Cream Multi Vitamin 50gm 85 100g 170 170 170 170 170 170 170 170 170 170 170 170 — — — — Fair And Lovely Foreever Glow 25gm 59 100g 236 236 236 236 236 236 236 236 236 236 236 236 — — — — Ponds Face Cream Oil Control Skn Mattifying 100gm 130 100g 130 130 130 130 130 130 130 130 130 130 130 130 — — — — Olay Cleanser Total Effect Foaming 100gm 245 100g 245 245 245 245 245 245 245 245 245 245 245 245 — — — — Anti-Ageing/Special CreamsPonds Skin Cream White Beauty Naturals 50gm 199 100g 498 498 498 498 498 498 498 498 498 498 498 398 (20) (20) (20) (20) Ponds Skin Cream Age Miracle Daily 50ml 549 100ml 998 998 998 998 998 998 998 1,050 1,050 1,050 1,050 1,098 5 5 10 10 Olay Age Protect Anti Ageing Cream 40gm 275 100g 688 688 688 688 688 688 688 688 688 688 688 688 — — — — Olay Skin Cream Total Effect Normal 50gm 749 100g 1,398 1,498 1,498 1,498 1,498 1,498 1,498 1,498 1,498 1,498 1,498 1,498 — — — 7 Body LotionsDove Go Fresh Normal Skin 400ml 299 100ml 65 75 75 75 75 75 75 75 75 75 75 75 — — — 15 Ponds Drm Flower 100ml 62 100ml 55 55 55 55 55 55 55 60 60 60 60 62 3 3 13 13 Vaseline Healthy White 100ml 85 100ml 75 75 75 75 75 80 80 80 80 85 85 85 — 6 6 13 Parachute Normal 100ml 59 100ml 59 59 59 59 59 59 59 59 59 59 59 59 — — — — TalcsPonds Talc Dream Flower Pink 100gm 55 100g 49 49 49 55 55 55 55 55 55 55 55 55 — — — 12 Cinthol Talc Original 100gm 45 100g 45 45 45 45 45 45 45 45 45 45 45 45 — — — — DeodorantsDeodorantsAxe Dark Temptation 150ml 180 100ml 110 110 110 110 110 110 120 120 120 120 120 120 — — 9 9 Dove Original Anti Perspirant 169ml 185 100ml 101 101 101 101 101 101 109 109 109 109 109 109 — — 9 9 Cinthol Spray Dive 150ml 175 100ml 117 117 117 117 117 117 117 117 117 117 117 117 — — — — Zatak Avenger 150ml 150 100ml 100 100 100 100 100 100 100 100 100 100 100 100 — — — — Set Wet Rave 150ml 165 100ml 110 110 110 110 110 110 110 110 110 110 110 110 — — — — Home InsecticidesCoils/Machine/MatsGood Knight Mosquto Coil Low Smoke 12Hr 30 29 30 30 30 30 30 30 30 30 30 30 30 — — — 3 Goodknight Coil Maha Jumbo 10P 31 28 30 30 30 30 30 30 30 30 31 31 31 — 3 3 11 Goodknight Machine Activ Combi 99 99 99 99 99 99 99 99 99 99 99 99 99 — — — — Hair OilsCoconut OilsParachute coconut oil 100ml 34 100ml 23 23 25 25 27 29 29 29 31 31 34 34 — 10 17 48 Parachute coconut oil 250ml 87 100ml 24 24 25 25 26 28 28 28 32 32 29 35 20 10 26 45 Dabur Vatika hair oil 75ml 33 100ml 40 40 40 40 40 40 40 40 44 44 44 44 — — 10 10 Perfmued Hair OilsParachute Advansed hot oil 190ml 105 100ml 50 50 50 50 50 50 50 50 50 50 55 55 — 11 11 11 Parachute Advansed 80ml 45 100ml 44 44 49 49 49 49 49 49 49 49 56 56 — 15 15 29 Parachute Jasmine 200ml 75 100ml 34 34 34 34 36 36 36 36 36 36 38 38 — 6 6 10 Hair & Care 100ml 50 100ml 45 45 48 48 48 48 48 48 48 48 50 50 — 4 4 11 Shanti Badam Amla 200ml 47 100ml 23 23 23 23 25 25 25 25 25 27 27 27 — 7 7 18 Dabur Amla hair oil 100ml 42 100ml 39 39 39 39 39 39 39 39 42 42 42 42 — — 8 8 Dabur Hair Oil Almond Damage Free100ml 58 100ml 50 50 50 50 55 55 55 55 55 55 55 58 5 5 5 16 Dabur Vatika Enriched Almond hair oil 100ml 55 100ml 50 55 55 55 55 55 55 55 55 55 55 55 — — — 10 Bajaj Almond hair oil 100ml 58 100ml 55 55 55 55 55 55 55 55 58 58 58 58 — — 5 5 Navratna Cooling oil 100ml 62 100ml 60 60 60 60 60 60 60 60 62 62 62 62 — — 3 3
Change (%)Normalised price in Rs (adjusted for grammage changes)
Source: Company, Kotak Institutional Equities
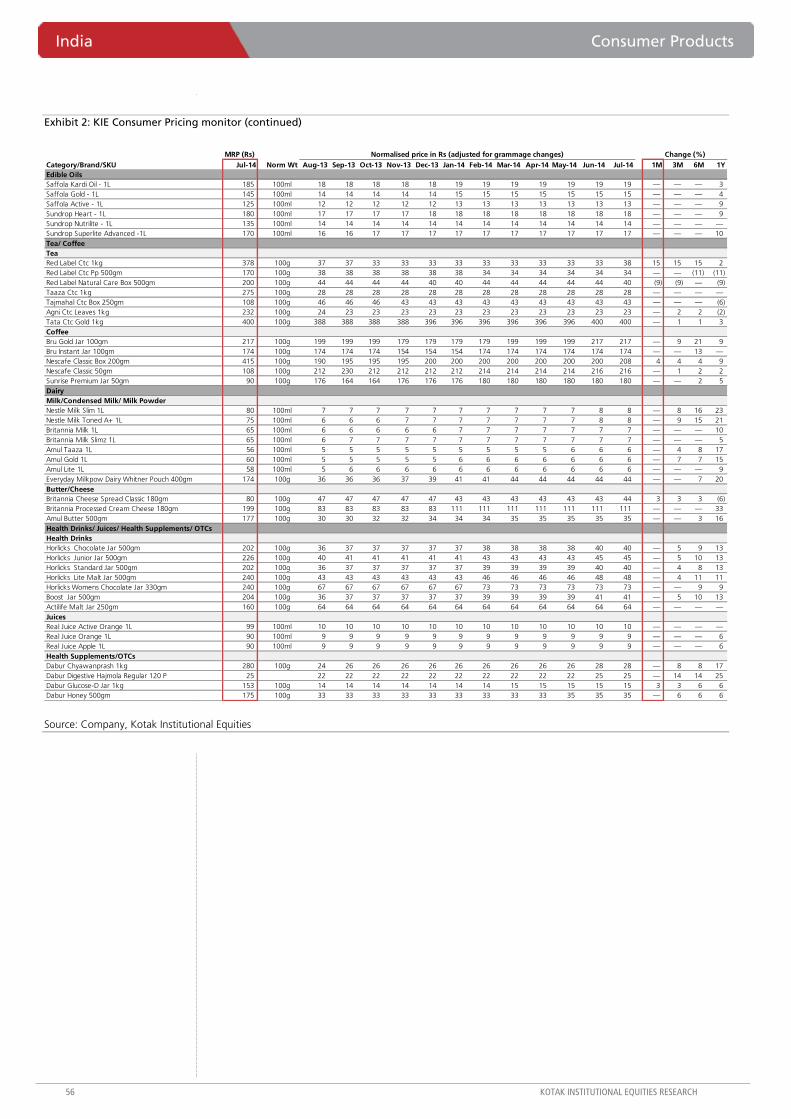
India Consumer Products
56 KOTAK INSTITUTIONAL EQUITIES RESEARCH
Exhibit 2: KIE Consumer Pricing monitor (continued)
MRP (Rs)Category/Brand/SKU Jul-14 Norm Wt Aug-13 Sep-13 Oct-13 Nov-13 Dec-13 Jan-14 Feb-14 Mar-14 Apr-14 May-14 Jun-14 Jul-14 1M 3M 6M 1YEdible OilsSaffola Kardi Oil - 1L 185 100ml 18 18 18 18 18 19 19 19 19 19 19 19 — — — 3 Saffola Gold - 1L 145 100ml 14 14 14 14 14 15 15 15 15 15 15 15 — — — 4 Saffola Active - 1L 125 100ml 12 12 12 12 12 13 13 13 13 13 13 13 — — — 9 Sundrop Heart - 1L 180 100ml 17 17 17 17 18 18 18 18 18 18 18 18 — — — 9 Sundrop Nutrilite - 1L 135 100ml 14 14 14 14 14 14 14 14 14 14 14 14 — — — — Sundrop Superlite Advanced -1L 170 100ml 16 16 17 17 17 17 17 17 17 17 17 17 — — — 10 Tea/ CoffeeTeaRed Label Ctc 1kg 378 100g 37 37 33 33 33 33 33 33 33 33 33 38 15 15 15 2 Red Label Ctc Pp 500gm 170 100g 38 38 38 38 38 38 34 34 34 34 34 34 — — (11) (11) Red Label Natural Care Box 500gm 200 100g 44 44 44 44 40 40 44 44 44 44 44 40 (9) (9) — (9) Taaza Ctc 1kg 275 100g 28 28 28 28 28 28 28 28 28 28 28 28 — — — — Tajmahal Ctc Box 250gm 108 100g 46 46 46 43 43 43 43 43 43 43 43 43 — — — (6) Agni Ctc Leaves 1kg 232 100g 24 23 23 23 23 23 23 23 23 23 23 23 — 2 2 (2) Tata Ctc Gold 1kg 400 100g 388 388 388 388 396 396 396 396 396 396 400 400 — 1 1 3 CoffeeBru Gold Jar 100gm 217 100g 199 199 199 179 179 179 179 199 199 199 217 217 — 9 21 9 Bru Instant Jar 100gm 174 100g 174 174 174 154 154 154 174 174 174 174 174 174 — — 13 — Nescafe Classic Box 200gm 415 100g 190 195 195 195 200 200 200 200 200 200 200 208 4 4 4 9 Nescafe Classic 50gm 108 100g 212 230 212 212 212 212 214 214 214 214 216 216 — 1 2 2 Sunrise Premium Jar 50gm 90 100g 176 164 164 176 176 176 180 180 180 180 180 180 — — 2 5 DairyMilk/Condensed Milk/ Milk PowderNestle Milk Slim 1L 80 100ml 7 7 7 7 7 7 7 7 7 7 8 8 — 8 16 23 Nestle Milk Toned A+ 1L 75 100ml 6 6 6 7 7 7 7 7 7 7 8 8 — 9 15 21 Britannia Milk 1L 65 100ml 6 6 6 6 6 7 7 7 7 7 7 7 — — — 10 Britannia Milk Slimz 1L 65 100ml 6 7 7 7 7 7 7 7 7 7 7 7 — — — 5 Amul Taaza 1L 56 100ml 5 5 5 5 5 5 5 5 5 6 6 6 — 4 8 17 Amul Gold 1L 60 100ml 5 5 5 5 5 6 6 6 6 6 6 6 — 7 7 15 Amul Lite 1L 58 100ml 5 6 6 6 6 6 6 6 6 6 6 6 — — — 9 Everyday Milkpow Dairy Whitner Pouch 400gm 174 100g 36 36 36 37 39 41 41 44 44 44 44 44 — — 7 20 Butter/CheeseBritannia Cheese Spread Classic 180gm 80 100g 47 47 47 47 47 43 43 43 43 43 43 44 3 3 3 (6) Britannia Processed Cream Cheese 180gm 199 100g 83 83 83 83 83 111 111 111 111 111 111 111 — — — 33 Amul Butter 500gm 177 100g 30 30 32 32 34 34 34 35 35 35 35 35 — — 3 16 Health Drinks/ Juices/ Health Supplements/ OTCsHealth DrinksHorlicks Chocolate Jar 500gm 202 100g 36 37 37 37 37 37 38 38 38 38 40 40 — 5 9 13 Horlicks Junior Jar 500gm 226 100g 40 41 41 41 41 41 43 43 43 43 45 45 — 5 10 13 Horlicks Standard Jar 500gm 202 100g 36 37 37 37 37 37 39 39 39 39 40 40 — 4 8 13 Horlicks Lite Malt Jar 500gm 240 100g 43 43 43 43 43 43 46 46 46 46 48 48 — 4 11 11 Horlicks Womens Chocolate Jar 330gm 240 100g 67 67 67 67 67 67 73 73 73 73 73 73 — — 9 9 Boost Jar 500gm 204 100g 36 37 37 37 37 37 39 39 39 39 41 41 — 5 10 13 Actilife Malt Jar 250gm 160 100g 64 64 64 64 64 64 64 64 64 64 64 64 — — — — JuicesReal Juice Active Orange 1L 99 100ml 10 10 10 10 10 10 10 10 10 10 10 10 — — — — Real Juice Orange 1L 90 100ml 9 9 9 9 9 9 9 9 9 9 9 9 — — — 6 Real Juice Apple 1L 90 100ml 9 9 9 9 9 9 9 9 9 9 9 9 — — — 6 Health Supplements/OTCsDabur Chyawanprash 1kg 280 100g 24 26 26 26 26 26 26 26 26 26 28 28 — 8 8 17 Dabur Digestive Hajmola Regular 120 P 25 22 22 22 22 22 22 22 22 22 22 25 25 — 14 14 25 Dabur Glucose-D Jar 1kg 153 100g 14 14 14 14 14 14 14 15 15 15 15 15 3 3 6 6 Dabur Honey 500gm 175 100g 33 33 33 33 33 33 33 33 33 35 35 35 — 6 6 6
Change (%)Normalised price in Rs (adjusted for grammage changes)
Source: Company, Kotak Institutional Equities
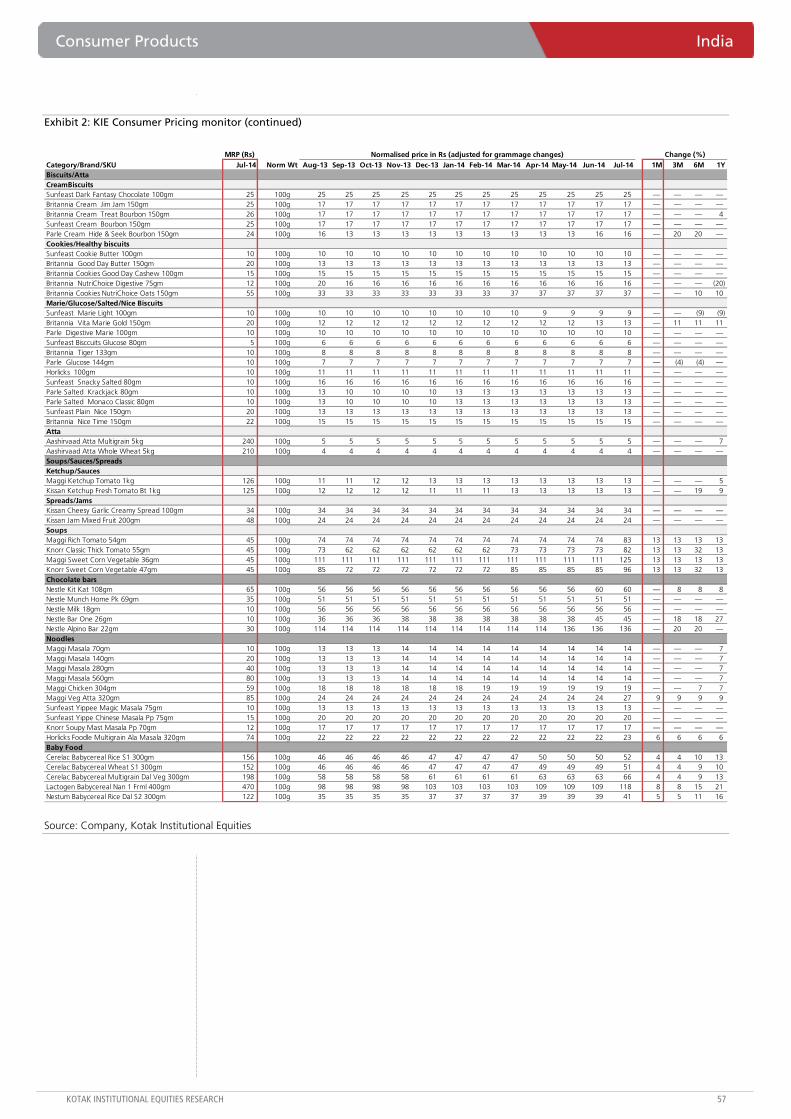
Consumer Products India
KOTAK INSTITUTIONAL EQUITIES RESEARCH 57
Exhibit 2: KIE Consumer Pricing monitor (continued)
MRP (Rs)Category/Brand/SKU Jul-14 Norm Wt Aug-13 Sep-13 Oct-13 Nov-13 Dec-13 Jan-14 Feb-14 Mar-14 Apr-14 May-14 Jun-14 Jul-14 1M 3M 6M 1YBiscuits/AttaCreamBiscuitsSunfeast Dark Fantasy Chocolate 100gm 25 100g 25 25 25 25 25 25 25 25 25 25 25 25 — — — — Britannia Cream Jim Jam 150gm 25 100g 17 17 17 17 17 17 17 17 17 17 17 17 — — — — Britannia Cream Treat Bourbon 150gm 26 100g 17 17 17 17 17 17 17 17 17 17 17 17 — — — 4 Sunfeast Cream Bourbon 150gm 25 100g 17 17 17 17 17 17 17 17 17 17 17 17 — — — — Parle Cream Hide & Seek Bourbon 150gm 24 100g 16 13 13 13 13 13 13 13 13 13 16 16 — 20 20 — Cookies/Healthy biscuitsSunfeast Cookie Butter 100gm 10 100g 10 10 10 10 10 10 10 10 10 10 10 10 — — — — Britannia Good Day Butter 150gm 20 100g 13 13 13 13 13 13 13 13 13 13 13 13 — — — — Britannia Cookies Good Day Cashew 100gm 15 100g 15 15 15 15 15 15 15 15 15 15 15 15 — — — — Britannia NutriChoice Digestive 75gm 12 100g 20 16 16 16 16 16 16 16 16 16 16 16 — — — (20) Britannia Cookies NutriChoice Oats 150gm 55 100g 33 33 33 33 33 33 33 37 37 37 37 37 — — 10 10 Marie/Glucose/Salted/Nice BiscuitsSunfeast Marie Light 100gm 10 100g 10 10 10 10 10 10 10 10 9 9 9 9 — — (9) (9) Britannia Vita Marie Gold 150gm 20 100g 12 12 12 12 12 12 12 12 12 12 13 13 — 11 11 11 Parle Digestive Marie 100gm 10 100g 10 10 10 10 10 10 10 10 10 10 10 10 — — — — Sunfeast Bisccuits Glucose 80gm 5 100g 6 6 6 6 6 6 6 6 6 6 6 6 — — — — Britannia Tiger 133gm 10 100g 8 8 8 8 8 8 8 8 8 8 8 8 — — — — Parle Glucose 144gm 10 100g 7 7 7 7 7 7 7 7 7 7 7 7 — (4) (4) — Horlicks 100gm 10 100g 11 11 11 11 11 11 11 11 11 11 11 11 — — — — Sunfeast Snacky Salted 80gm 10 100g 16 16 16 16 16 16 16 16 16 16 16 16 — — — — Parle Salted Krackjack 80gm 10 100g 13 10 10 10 10 13 13 13 13 13 13 13 — — — — Parle Salted Monaco Classic 80gm 10 100g 13 10 10 10 10 13 13 13 13 13 13 13 — — — — Sunfeast Plain Nice 150gm 20 100g 13 13 13 13 13 13 13 13 13 13 13 13 — — — — Britannia Nice Time 150gm 22 100g 15 15 15 15 15 15 15 15 15 15 15 15 — — — — AttaAashirvaad Atta Multigrain 5kg 240 100g 5 5 5 5 5 5 5 5 5 5 5 5 — — — 7 Aashirvaad Atta Whole Wheat 5kg 210 100g 4 4 4 4 4 4 4 4 4 4 4 4 — — — — Soups/Sauces/SpreadsKetchup/SaucesMaggi Ketchup Tomato 1kg 126 100g 11 11 12 12 13 13 13 13 13 13 13 13 — — — 5 Kissan Ketchup Fresh Tomato Bt 1kg 125 100g 12 12 12 12 11 11 11 13 13 13 13 13 — — 19 9 Spreads/JamsKissan Cheesy Garlic Creamy Spread 100gm 34 100g 34 34 34 34 34 34 34 34 34 34 34 34 — — — — Kissan Jam Mixed Fruit 200gm 48 100g 24 24 24 24 24 24 24 24 24 24 24 24 — — — — SoupsMaggi Rich Tomato 54gm 45 100g 74 74 74 74 74 74 74 74 74 74 74 83 13 13 13 13 Knorr Classic Thick Tomato 55gm 45 100g 73 62 62 62 62 62 62 73 73 73 73 82 13 13 32 13 Maggi Sweet Corn Vegetable 36gm 45 100g 111 111 111 111 111 111 111 111 111 111 111 125 13 13 13 13 Knorr Sweet Corn Vegetable 47gm 45 100g 85 72 72 72 72 72 72 85 85 85 85 96 13 13 32 13 Chocolate barsNestle Kit Kat 108gm 65 100g 56 56 56 56 56 56 56 56 56 56 60 60 — 8 8 8 Nestle Munch Home Pk 69gm 35 100g 51 51 51 51 51 51 51 51 51 51 51 51 — — — — Nestle Milk 18gm 10 100g 56 56 56 56 56 56 56 56 56 56 56 56 — — — — Nestle Bar One 26gm 10 100g 36 36 36 38 38 38 38 38 38 38 45 45 — 18 18 27 Nestle Alpino Bar 22gm 30 100g 114 114 114 114 114 114 114 114 114 136 136 136 — 20 20 — NoodlesMaggi Masala 70gm 10 100g 13 13 13 14 14 14 14 14 14 14 14 14 — — — 7 Maggi Masala 140gm 20 100g 13 13 13 14 14 14 14 14 14 14 14 14 — — — 7 Maggi Masala 280gm 40 100g 13 13 13 14 14 14 14 14 14 14 14 14 — — — 7 Maggi Masala 560gm 80 100g 13 13 13 14 14 14 14 14 14 14 14 14 — — — 7 Maggi Chicken 304gm 59 100g 18 18 18 18 18 18 19 19 19 19 19 19 — — 7 7 Maggi Veg Atta 320gm 85 100g 24 24 24 24 24 24 24 24 24 24 24 27 9 9 9 9 Sunfeast Yippee Magic Masala 75gm 10 100g 13 13 13 13 13 13 13 13 13 13 13 13 — — — — Sunfeast Yippe Chinese Masala Pp 75gm 15 100g 20 20 20 20 20 20 20 20 20 20 20 20 — — — — Knorr Soupy Mast Masala Pp 70gm 12 100g 17 17 17 17 17 17 17 17 17 17 17 17 — — — — Horlicks Foodle Multigrain Ala Masala 320gm 74 100g 22 22 22 22 22 22 22 22 22 22 22 23 6 6 6 6 Baby FoodCerelac Babycereal Rice S1 300gm 156 100g 46 46 46 46 47 47 47 47 50 50 50 52 4 4 10 13 Cerelac Babycereal Wheat S1 300gm 152 100g 46 46 46 46 47 47 47 47 49 49 49 51 4 4 9 10 Cerelac Babycereal Multigrain Dal Veg 300gm 198 100g 58 58 58 58 61 61 61 61 63 63 63 66 4 4 9 13 Lactogen Babycereal Nan 1 Frml 400gm 470 100g 98 98 98 98 103 103 103 103 109 109 109 118 8 8 15 21 Nestum Babycereal Rice Dal S2 300gm 122 100g 35 35 35 35 37 37 37 37 39 39 39 41 5 5 11 16
Change (%)Normalised price in Rs (adjusted for grammage changes)
Source: Company, Kotak Institutional Equities

India Consumer Products
58 KOTAK INSTITUTIONAL EQUITIES RESEARCH
Exhibit 3: Ongoing promotional activity across FMCG categories for July 2014
SKU Original Offer Eff change (%) Promotional offersDetergentsSurf Excel Matic Top Load 1kg 210 210 Free - Comfort blue bottle 200ml worth Rs46Mr White 4kg 328 249 (31.4) Price off of Rs79Surf Excel Easywash 500gm 68 55 (19.1) Price off of Rs13 #Surf Excel Easywash 700gm 96 77 (19.8) Price off of Rs19 #Surf Excel Easywash 1.5Kg 207 187 (9.7) Price off of Rs20 #Surf Excel Quickwash 1Kg 182 182 Free - Comfort blue bottle 200ml worth Rs46 #Tide detergent bar 140gm 10 10 (9.7) Free 15g extra #Other personal care itemsLoreal - range of shampoos 360ml 259 259 Free - shampoo 175ml worth Rs145Garnier fructis - range of shampoos 340ml 230 230 Free - shampoo 175ml worth Rs135Head & Shoulders Anti-Dandruff shampoo 375ml 299 299 Free - conditioner worth Rs75Sunsilk shampoo 340ml 200 200 Free - Sunsilk shampoo 80mlPantene Pro Silky Smooth Care shampoo 340ml 259 259 Free - conditioner worth Rs69Pond's dreamflower talc 400gm 150 150 Free - Vaseline health white 40mlCinthol Original soap 400gm 128 121 (5.5) Price off of Rs7 #Home care itemsGood Knight Advanced refill cartridge 45ml 63 58 (7.9) Price off of Rs5 #Good Knight aerosol 225ml 84 74 (11.9) Price off of Rs10 #Mortein Refill cartridge 35ml 62 52 (16.1) Price off of Rs10 #Mortein PowerGard 35ml 59 59 Offer - Buy 2 get 1 Free #Mortein PowerGard aerosol 225ml 84 74 (11.9) Price off of Rs10 #Hit Spray Mosquitoes 400ml 189 159 (15.9) Price off of Rs30 #Hit Spray Mosquitoes 625ml 260 230 (11.5) Price off of Rs30 #Hit Spray Cockroaches 625ml 260 260 Free - Fairglow soap worth Rs81 #BiscuitsBritannia Bourbon 150gm 26 26 (25.0) 33% extra grammage freeBritannia Treat 64gm 10 10 (24.7) 33% extra grammage freeParle Krackjack 75.6gm 10 10 (20.0) 25% extra grammage freeMcvities Digestive 250gm 50 45 Price off of Rs5Britannia Marie Gold 250gm 25 25 (16.7) 20% extra grammage free # Britannia NutriChoice Digestive 100gm 20 20 (33.3) 50% extra grammage free # Britannia Pure Magic 100gm 25 20 (20.0) Price off of Rs5 # Britannia 50-50 Maska Chaska 80gm 10 10 (20.0) 25% extra grammage free #Parle Marie 100gm 10 10 (16.7) 20% extra grammage free # Parle Hide & Seek Bourbon 150gm 24 20 (16.7) Free - Happy Happy cookies worth Rs5 #Parle Hide & Seek 120gm 25 25 (20.0) 25% extra grammage free # Parle Monaco 75gm 10 10 (18.8) 23% extra grammage free # Parle Top 90gm 10 10 (21.7) 25% extra grammage free # Parle Hide & Seek Bourbon 75gm 12 10 (16.7) Price off of Rs2 #Parle Jam-in 150gm 23 20 (13.0) Price off of Rs3 # Parle Kreams Gold 100gm 10 10 (14.3) 16% extra grammage free # Sunfeast Dream Cream 120gm 20 20 (20.0) 25% extra grammage free # Mcvities Digestive 100gm 20 20 (33.3) 50% extra grammage free # Other food itemsKissan sweet and spicy sauce 500gm 85 75 (11.8) Price off of Rs10Kissan squeezo 900gm 170 160 (5.9) Price off of Rs10Maggi Rich tomato sauce 1Kg 126 114 (9.5) Price off of Rs12Maggi Rich tomato ketchup 1Kg 126 126 Free - Maggi noodlesMaggi hot & sweet tomato chilli sauce 500gm 88 88 Free - Maggi atta noodlesKissan mixed fruit jam 500gm 110 99 (10.0) Price off of Rs11Knorr instant soups 40 45 12.5 Buy 2 get 1 freeFortune rice bran oil 5L 615 615 Free - 1Litre pouchCadbury Dairy Milk Silk 145gm 150 150 Free - Coffee for 2 at CCD outlet via voucher codeSundrop Heart pouch 1L 180 180 Free - Act Popcorn worth Rs25 # Sundrop Superlite Advanced pouch 1L 170 170 Free - Act Popcorn worth Rs25 # Sundrop Superlite Advanced bottle 1L 175 175 Free - Sundrop Heart bottle 200 ml worth Rs40 # Sundrop Superlite Advanced 5L 863 863 Free - Sundrop Heart pouch 500 ml worth Rs90 # BeveragesComplan Strawberry 500gm 225 225 Free - Complan cupRed Label 500gm 190 170 (10.5) Price off of Rs20Bru gold pouch 50gm 107 97 (9.3) Price off of Rs10Women's Horlicks jar 400gm 240 240 Free - Kellogg's Special K cereal worth Rs56Brooke Bond Taj Mahal 250gm 115 108 (6.1) Price off of Rs7 #
Notes:(1) # offer was available in June, as well.
MRP (Rs)
Source: Company, Kotak Institutional Equities
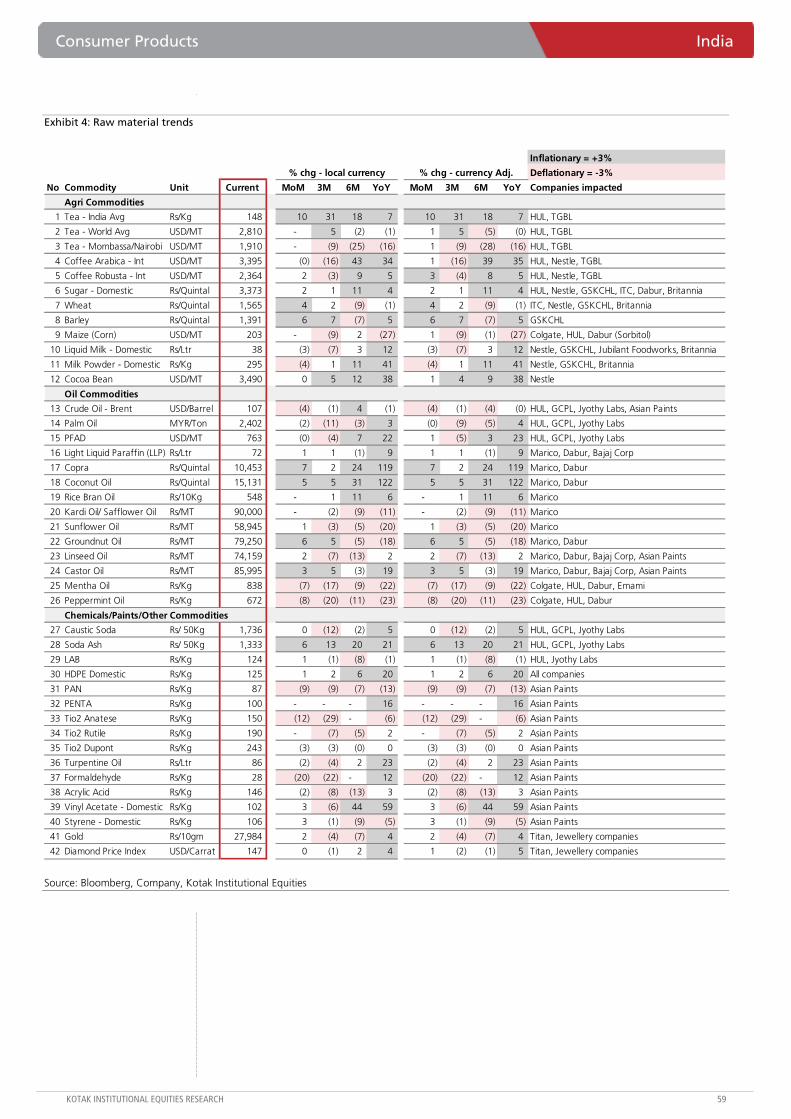
Consumer Products India
KOTAK INSTITUTIONAL EQUITIES RESEARCH 59
Exhibit 4: Raw material trends
Inflationary = +3%
Deflationary = -3%
No Commodity Unit Current MoM 3M 6M YoY MoM 3M 6M YoY Companies impacted
Agri Commodities
1 Tea - India Avg Rs/Kg 148 10 31 18 7 10 31 18 7 HUL, TGBL
2 Tea - World Avg USD/MT 2,810 - 5 (2) (1) 1 5 (5) (0) HUL, TGBL
3 Tea - Mombassa/Nairobi USD/MT 1,910 - (9) (25) (16) 1 (9) (28) (16) HUL, TGBL
4 Coffee Arabica - Int USD/MT 3,395 (0) (16) 43 34 1 (16) 39 35 HUL, Nestle, TGBL
5 Coffee Robusta - Int USD/MT 2,364 2 (3) 9 5 3 (4) 8 5 HUL, Nestle, TGBL
6 Sugar - Domestic Rs/Quintal 3,373 2 1 11 4 2 1 11 4 HUL, Nestle, GSKCHL, ITC, Dabur, Britannia
7 Wheat Rs/Quintal 1,565 4 2 (9) (1) 4 2 (9) (1) ITC, Nestle, GSKCHL, Britannia
8 Barley Rs/Quintal 1,391 6 7 (7) 5 6 7 (7) 5 GSKCHL
9 Maize (Corn) USD/MT 203 - (9) 2 (27) 1 (9) (1) (27) Colgate, HUL, Dabur (Sorbitol)
10 Liquid Milk - Domestic Rs/Ltr 38 (3) (7) 3 12 (3) (7) 3 12 Nestle, GSKCHL, Jubilant Foodworks, Britannia
11 Milk Powder - Domestic Rs/Kg 295 (4) 1 11 41 (4) 1 11 41 Nestle, GSKCHL, Britannia
12 Cocoa Bean USD/MT 3,490 0 5 12 38 1 4 9 38 Nestle
Oil Commodities
13 Crude Oil - Brent USD/Barrel 107 (4) (1) 4 (1) (4) (1) (4) (0) HUL, GCPL, Jyothy Labs, Asian Paints
14 Palm Oil MYR/Ton 2,402 (2) (11) (3) 3 (0) (9) (5) 4 HUL, GCPL, Jyothy Labs
15 PFAD USD/MT 763 (0) (4) 7 22 1 (5) 3 23 HUL, GCPL, Jyothy Labs
16 Light Liquid Paraffin (LLP) Rs/Ltr 72 1 1 (1) 9 1 1 (1) 9 Marico, Dabur, Bajaj Corp
17 Copra Rs/Quintal 10,453 7 2 24 119 7 2 24 119 Marico, Dabur
18 Coconut Oil Rs/Quintal 15,131 5 5 31 122 5 5 31 122 Marico, Dabur
19 Rice Bran Oil Rs/10Kg 548 - 1 11 6 - 1 11 6 Marico
20 Kardi Oil/ Safflower Oil Rs/MT 90,000 - (2) (9) (11) - (2) (9) (11) Marico
21 Sunflower Oil Rs/MT 58,945 1 (3) (5) (20) 1 (3) (5) (20) Marico
22 Groundnut Oil Rs/MT 79,250 6 5 (5) (18) 6 5 (5) (18) Marico, Dabur
23 Linseed Oil Rs/MT 74,159 2 (7) (13) 2 2 (7) (13) 2 Marico, Dabur, Bajaj Corp, Asian Paints
24 Castor Oil Rs/MT 85,995 3 5 (3) 19 3 5 (3) 19 Marico, Dabur, Bajaj Corp, Asian Paints
25 Mentha Oil Rs/Kg 838 (7) (17) (9) (22) (7) (17) (9) (22) Colgate, HUL, Dabur, Emami
26 Peppermint Oil Rs/Kg 672 (8) (20) (11) (23) (8) (20) (11) (23) Colgate, HUL, Dabur
Chemicals/Paints/Other Commodities
27 Caustic Soda Rs/ 50Kg 1,736 0 (12) (2) 5 0 (12) (2) 5 HUL, GCPL, Jyothy Labs
28 Soda Ash Rs/ 50Kg 1,333 6 13 20 21 6 13 20 21 HUL, GCPL, Jyothy Labs
29 LAB Rs/Kg 124 1 (1) (8) (1) 1 (1) (8) (1) HUL, Jyothy Labs
30 HDPE Domestic Rs/Kg 125 1 2 6 20 1 2 6 20 All companies
31 PAN Rs/Kg 87 (9) (9) (7) (13) (9) (9) (7) (13) Asian Paints
32 PENTA Rs/Kg 100 - - - 16 - - - 16 Asian Paints
33 Tio2 Anatese Rs/Kg 150 (12) (29) - (6) (12) (29) - (6) Asian Paints
34 Tio2 Rutile Rs/Kg 190 - (7) (5) 2 - (7) (5) 2 Asian Paints
35 Tio2 Dupont Rs/Kg 243 (3) (3) (0) 0 (3) (3) (0) 0 Asian Paints
36 Turpentine Oil Rs/Ltr 86 (2) (4) 2 23 (2) (4) 2 23 Asian Paints
37 Formaldehyde Rs/Kg 28 (20) (22) - 12 (20) (22) - 12 Asian Paints
38 Acrylic Acid Rs/Kg 146 (2) (8) (13) 3 (2) (8) (13) 3 Asian Paints
39 Vinyl Acetate - Domestic Rs/Kg 102 3 (6) 44 59 3 (6) 44 59 Asian Paints
40 Styrene - Domestic Rs/Kg 106 3 (1) (9) (5) 3 (1) (9) (5) Asian Paints
41 Gold Rs/10gm 27,984 2 (4) (7) 4 2 (4) (7) 4 Titan, Jewellery companies
42 Diamond Price Index USD/Carrat 147 0 (1) 2 4 1 (2) (1) 5 Titan, Jewellery companies
% chg - local currency % chg - currency Adj.
Source: Bloomberg, Company, Kotak Institutional Equities
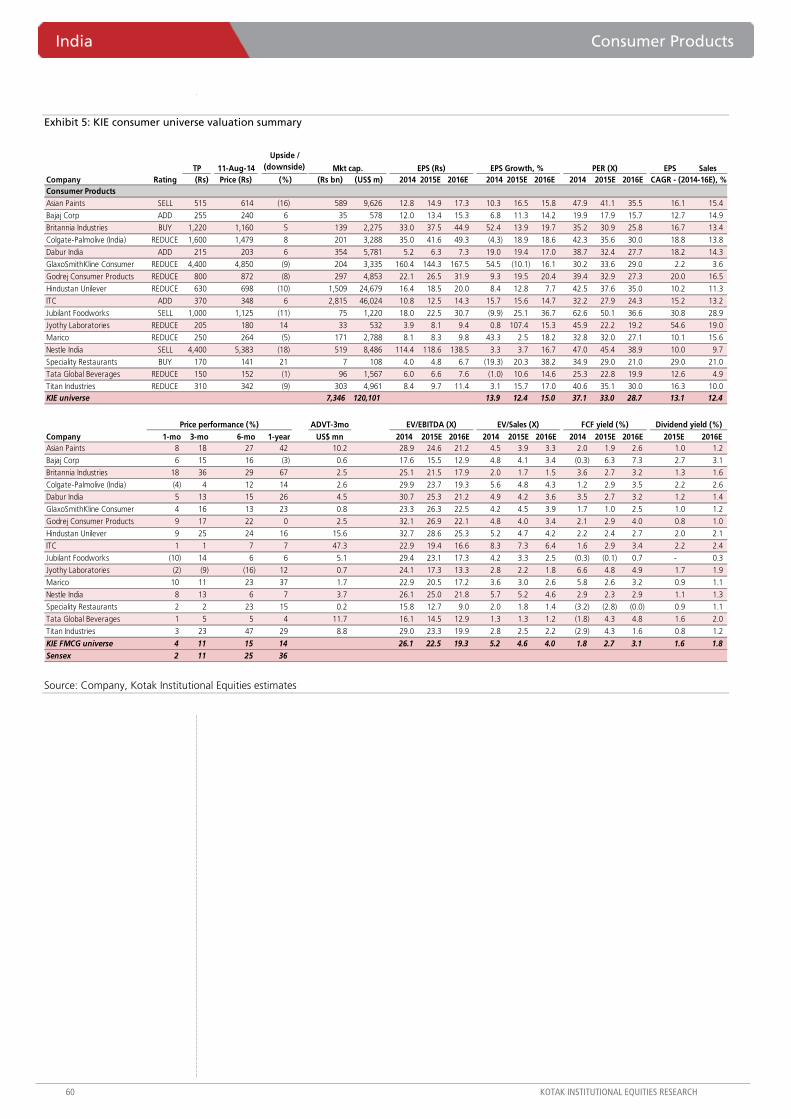
India Consumer Products
60 KOTAK INSTITUTIONAL EQUITIES RESEARCH
Exhibit 5: KIE consumer universe valuation summary
TP 11-Aug-14 EPS SalesCompany Rating (Rs) Price (Rs) (Rs bn) (US$ m) 2014 2015E 2016E 2014 2015E 2016E 2014 2015E 2016EConsumer ProductsAsian Paints SELL 515 614 (16) 589 9,626 12.8 14.9 17.3 10.3 16.5 15.8 47.9 41.1 35.5 16.1 15.4
Bajaj Corp ADD 255 240 6 35 578 12.0 13.4 15.3 6.8 11.3 14.2 19.9 17.9 15.7 12.7 14.9
Britannia Industries BUY 1,220 1,160 5 139 2,275 33.0 37.5 44.9 52.4 13.9 19.7 35.2 30.9 25.8 16.7 13.4
Colgate-Palmolive (India) REDUCE 1,600 1,479 8 201 3,288 35.0 41.6 49.3 (4.3) 18.9 18.6 42.3 35.6 30.0 18.8 13.8
Dabur India ADD 215 203 6 354 5,781 5.2 6.3 7.3 19.0 19.4 17.0 38.7 32.4 27.7 18.2 14.3
GlaxoSmithKline Consumer REDUCE 4,400 4,850 (9) 204 3,335 160.4 144.3 167.5 54.5 (10.1) 16.1 30.2 33.6 29.0 2.2 3.6
Godrej Consumer Products REDUCE 800 872 (8) 297 4,853 22.1 26.5 31.9 9.3 19.5 20.4 39.4 32.9 27.3 20.0 16.5
Hindustan Unilever REDUCE 630 698 (10) 1,509 24,679 16.4 18.5 20.0 8.4 12.8 7.7 42.5 37.6 35.0 10.2 11.3
ITC ADD 370 348 6 2,815 46,024 10.8 12.5 14.3 15.7 15.6 14.7 32.2 27.9 24.3 15.2 13.2
Jubilant Foodworks SELL 1,000 1,125 (11) 75 1,220 18.0 22.5 30.7 (9.9) 25.1 36.7 62.6 50.1 36.6 30.8 28.9
Jyothy Laboratories REDUCE 205 180 14 33 532 3.9 8.1 9.4 0.8 107.4 15.3 45.9 22.2 19.2 54.6 19.0
Marico REDUCE 250 264 (5) 171 2,788 8.1 8.3 9.8 43.3 2.5 18.2 32.8 32.0 27.1 10.1 15.6
Nestle India SELL 4,400 5,383 (18) 519 8,486 114.4 118.6 138.5 3.3 3.7 16.7 47.0 45.4 38.9 10.0 9.7
Speciality Restaurants BUY 170 141 21 7 108 4.0 4.8 6.7 (19.3) 20.3 38.2 34.9 29.0 21.0 29.0 21.0 Tata Global Beverages REDUCE 150 152 (1) 96 1,567 6.0 6.6 7.6 (1.0) 10.6 14.6 25.3 22.8 19.9 12.6 4.9
Titan Industries REDUCE 310 342 (9) 303 4,961 8.4 9.7 11.4 3.1 15.7 17.0 40.6 35.1 30.0 16.3 10.0 KIE universe 7,346 120,101 13.9 12.4 15.0 37.1 33.0 28.7 13.1 12.4
ADVT-3moCompany 1-mo 3-mo 6-mo 1-year US$ mn 2014 2015E 2016E 2014 2015E 2016E 2014 2015E 2016E 2015E 2016EAsian Paints 8 18 27 42 10.2 28.9 24.6 21.2 4.5 3.9 3.3 2.0 1.9 2.6 1.0 1.2
Bajaj Corp 6 15 16 (3) 0.6 17.6 15.5 12.9 4.8 4.1 3.4 (0.3) 6.3 7.3 2.7 3.1
Britannia Industries 18 36 29 67 2.5 25.1 21.5 17.9 2.0 1.7 1.5 3.6 2.7 3.2 1.3 1.6
Colgate-Palmolive (India) (4) 4 12 14 2.6 29.9 23.7 19.3 5.6 4.8 4.3 1.2 2.9 3.5 2.2 2.6 Dabur India 5 13 15 26 4.5 30.7 25.3 21.2 4.9 4.2 3.6 3.5 2.7 3.2 1.2 1.4
GlaxoSmithKline Consumer 4 16 13 23 0.8 23.3 26.3 22.5 4.2 4.5 3.9 1.7 1.0 2.5 1.0 1.2
Godrej Consumer Products 9 17 22 0 2.5 32.1 26.9 22.1 4.8 4.0 3.4 2.1 2.9 4.0 0.8 1.0
Hindustan Unilever 9 25 24 16 15.6 32.7 28.6 25.3 5.2 4.7 4.2 2.2 2.4 2.7 2.0 2.1
ITC 1 1 7 7 47.3 22.9 19.4 16.6 8.3 7.3 6.4 1.6 2.9 3.4 2.2 2.4
Jubilant Foodworks (10) 14 6 6 5.1 29.4 23.1 17.3 4.2 3.3 2.5 (0.3) (0.1) 0.7 - 0.3
Jyothy Laboratories (2) (9) (16) 12 0.7 24.1 17.3 13.3 2.8 2.2 1.8 6.6 4.8 4.9 1.7 1.9
Marico 10 11 23 37 1.7 22.9 20.5 17.2 3.6 3.0 2.6 5.8 2.6 3.2 0.9 1.1
Nestle India 8 13 6 7 3.7 26.1 25.0 21.8 5.7 5.2 4.6 2.9 2.3 2.9 1.1 1.3
Speciality Restaurants 2 2 23 15 0.2 15.8 12.7 9.0 2.0 1.8 1.4 (3.2) (2.8) (0.0) 0.9 1.1
Tata Global Beverages 1 5 5 4 11.7 16.1 14.5 12.9 1.3 1.3 1.2 (1.8) 4.3 4.8 1.6 2.0
Titan Industries 3 23 47 29 8.8 29.0 23.3 19.9 2.8 2.5 2.2 (2.9) 4.3 1.6 0.8 1.2
KIE FMCG universe 4 11 15 14 26.1 22.5 19.3 5.2 4.6 4.0 1.8 2.7 3.1 1.6 1.8 Sensex 2 11 25 36
Mkt cap. EPS (Rs) EPS Growth, % PER (X)
Price performance (%)
CAGR - (2014-16E), %
Upside / (downside)
(%)
EV/EBITDA (X) EV/Sales (X) FCF yield (%) Dividend yield (%)
Source: Company, Kotak Institutional Equities estimates
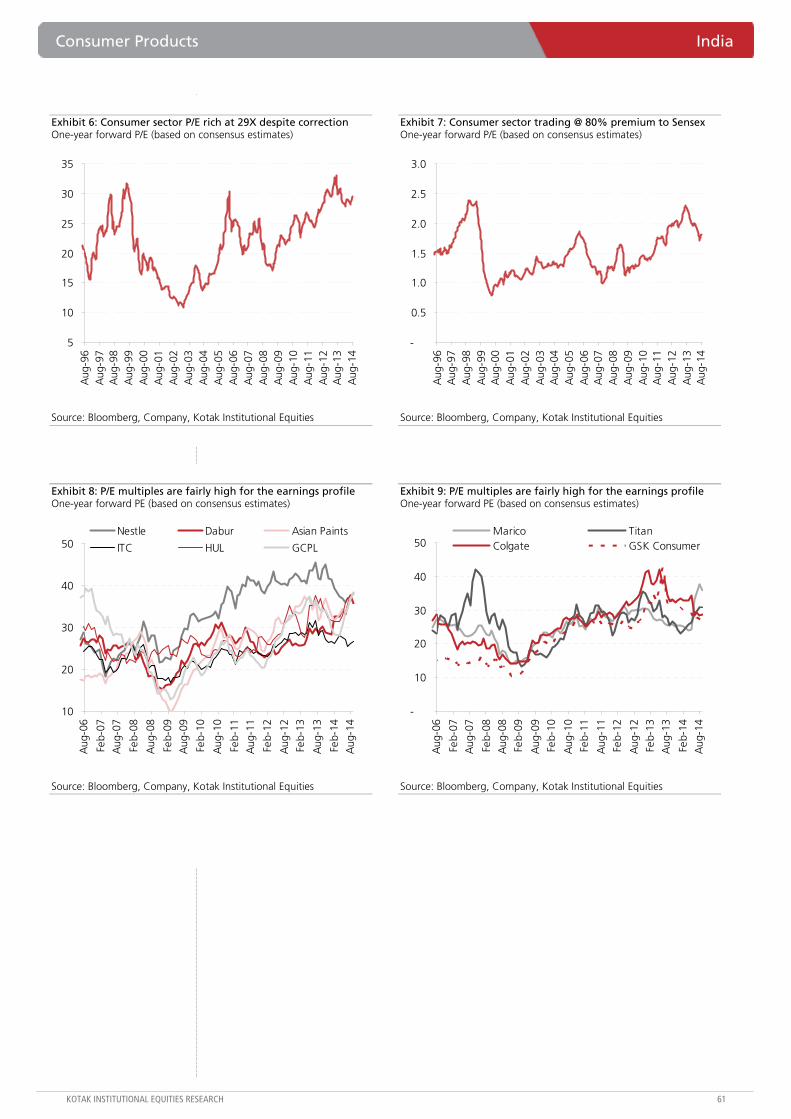
Consumer Products India
KOTAK INSTITUTIONAL EQUITIES RESEARCH 61
Exhibit 6: Consumer sector P/E rich at 29X despite correction One-year forward P/E (based on consensus estimates)
5
10
15
20
25
30
35
Aug
-96
Aug
-97
Aug
-98
Aug
-99
Aug
-00
Aug
-01
Aug
-02
Aug
-03
Aug
-04
Aug
-05
Aug
-06
Aug
-07
Aug
-08
Aug
-09
Aug
-10
Aug
-11
Aug
-12
Aug
-13
Aug
-14
Source: Bloomberg, Company, Kotak Institutional Equities
Exhibit 7: Consumer sector trading @ 80% premium to Sensex One-year forward P/E (based on consensus estimates)
-
0.5
1.0
1.5
2.0
2.5
3.0
Aug
-96
Aug
-97
Aug
-98
Aug
-99
Aug
-00
Aug
-01
Aug
-02
Aug
-03
Aug
-04
Aug
-05
Aug
-06
Aug
-07
Aug
-08
Aug
-09
Aug
-10
Aug
-11
Aug
-12
Aug
-13
Aug
-14
Source: Bloomberg, Company, Kotak Institutional Equities
Exhibit 8: P/E multiples are fairly high for the earnings profile One-year forward PE (based on consensus estimates)
10
20
30
40
50
Aug
-06
Feb-
07
Aug
-07
Feb-
08
Aug
-08
Feb-
09
Aug
-09
Feb-
10
Aug
-10
Feb-
11
Aug
-11
Feb-
12
Aug
-12
Feb-
13
Aug
-13
Feb-
14
Aug
-14
Nestle Dabur Asian Paints
ITC HUL GCPL
Source: Bloomberg, Company, Kotak Institutional Equities
Exhibit 9: P/E multiples are fairly high for the earnings profile One-year forward PE (based on consensus estimates)
-
10
20
30
40
50
Aug
-06
Feb-
07
Aug
-07
Feb-
08
Aug
-08
Feb-
09
Aug
-09
Feb-
10
Aug
-10
Feb-
11
Aug
-11
Feb-
12
Aug
-12
Feb-
13
Aug
-13
Feb-
14
Aug
-14
Marico TitanColgate GSK Consumer
Source: Bloomberg, Company, Kotak Institutional Equities

India Consumer Products
62 KOTAK INSTITUTIONAL EQUITIES RESEARCH
Exhibit 10: FMCG sector/several stocks trading at ~10-30% premium to 5-year average except ITC, Marico, GCPL, Nestle and TGBL One-year forward PE (based on consensus estimates)
HUL ITC Nestle Colgate GSKCHL APAINTS GCPL Marico Dabur Titan TGBL Britannia SectorAverage P/E3-Yr 31.2 27.0 40.7 34.0 29.7 32.6 29.7 27.7 27.0 28.5 22.0 21.7 28.5 5-Yr 28.7 25.3 38.6 30.6 27.3 29.5 27.0 26.7 27.1 26.8 21.9 24.2 26.7 10-Yr 26.8 23.0 31.7 25.6 21.1 24.2 26.4 23.9 24.1 25.6 17.8 23.2 24.0 Current P/E 37.0 26.6 38.2 35.7 30.9 38.4 28.8 27.9 31.1 32.3 22.4 27.4 29.5 Current Prem/Disct to AvgPrem/Disc to 3-Yr Avg 19 (1) (6) 5 4 18 (3) 1 15 13 2 26 3 Prem/Disc to 5-Yr Avg 29 5 (1) 17 13 30 7 4 15 20 2 13 10 Prem/Disc to 10-Yr Avg 38 16 20 39 47 59 9 17 29 26 25 18 23 5 Year VariablesMedian 27.6 25.1 39.8 29.7 26.4 29.7 26.2 26.8 27.1 27.5 22.4 24.2 26.5 Average 28.7 25.3 38.6 30.6 27.3 29.5 27.0 26.7 27.1 26.8 21.9 24.2 26.7 STD 4.3 2.9 3.9 5.3 4.8 5.3 5.3 2.5 2.3 4.7 3.6 4.4 3.0 Max 37.7 31.6 45.6 42.1 42.5 38.4 37.4 31.3 31.1 35.5 28.0 32.4 33.0 +1 STD 33.0 28.1 42.5 35.9 32.1 34.8 32.3 29.2 29.4 31.5 25.5 28.6 29.7 Min 22.9 20.1 29.4 20.3 17.9 16.4 18.6 20.4 22.2 16.0 15.0 15.6 21.0 -1 STD 24.4 22.4 34.7 25.3 22.5 24.3 21.7 24.2 24.9 22.1 18.4 19.8 23.7 Vs. Current P/EMedian 34 6 (4) 20 17 29 10 4 15 17 (0) 13 11 Average P/E 29 5 (1) 17 13 30 7 4 15 20 2 13 10 Max (2) (16) (16) (15) (27) - (23) (11) (0) (9) (20) (16) (11) +1 STD 12 (6) (10) (1) (4) 10 (11) (5) 6 2 (12) (4) (1) Min 62 32 30 76 72 134 55 37 40 101 49 76 40 -1 STD 52 19 10 41 37 58 33 15 25 46 22 38 24
Source: Bloomberg, Company, Kotak Institutional Equities estimates
Exhibit 11: Relative valuation (to Sensex) – premium has come down over last few months due to rally in benchmark One-year forward premium to Sensex (based on consensus estimates)
HUL ITC Nestle Colgate GSKCHL APAINTS GCPL Marico Dabur Titan TGBL Britannia SectorAverage Relative P/E3-Yr 2.1 1.8 2.8 2.3 2.0 2.2 2.0 1.9 1.8 1.9 1.5 1.5 1.9 5-Yr 1.9 1.6 2.5 2.0 1.8 1.9 1.8 1.7 1.7 1.7 1.4 1.5 1.7 10-Yr 1.8 1.5 2.1 1.7 1.4 1.6 1.7 1.5 1.6 1.6 1.1 1.5 1.6 Current Relative P/E 2.3 1.6 2.3 2.2 1.9 2.4 1.8 1.7 1.9 2.0 1.4 1.7 1.8 Current Prem/Disct to AvgPrem/Disc to 3-Yr Avg 7 (12) (16) (5) (7) 6 (13) (10) 4 2 (8) 13 (7) Prem/Disc to 5-Yr Avg 22 (0) (6) 10 7 23 1 (1) 9 14 (3) 9 5 Prem/Disc to 10-Yr Avg 29 9 13 31 38 50 3 11 23 21 19 12 16 5 Year VariablesMedian 1.9 1.7 2.7 2.1 1.8 2.0 1.6 1.8 1.7 1.8 1.4 1.6 1.8 Average 1.9 1.6 2.5 2.0 1.8 1.9 1.8 1.7 1.7 1.7 1.4 1.5 1.7 STD 0.4 0.3 0.4 0.5 0.4 0.4 0.4 0.3 0.2 0.4 0.2 0.2 0.3 Max 2.6 2.2 3.2 2.8 3.0 2.6 2.6 2.2 2.1 2.4 1.9 1.9 2.3 +1 STD 2.3 1.9 2.9 2.5 2.2 2.4 2.2 2.0 1.9 2.1 1.6 1.8 2.0 Min 1.3 1.1 1.6 1.1 1.0 0.9 1.1 1.1 1.2 0.9 1.0 1.0 1.2 -1 STD 1.5 1.3 2.1 1.5 1.4 1.5 1.3 1.5 1.6 1.4 1.2 1.3 1.4 Vs. Current Relative P/EMedian 20 (2) (12) 7 6 18 12 (3) 10 9 (4) 5 3 Average P/E 22 (0) (6) 10 7 23 1 (1) 9 14 (3) 9 5 Max (14) (26) (26) (22) (37) (9) (32) (22) (11) (18) (27) (10) (21) +1 STD 1 (16) (20) (11) (13) (0) (20) (14) (2) (6) (17) (4) (11) Min 71 43 42 93 89 156 58 50 54 120 43 62 54 -1 STD 54 21 13 43 39 60 35 17 23 44 17 27 27
Source: Bloomberg, Company, Kotak Institutional Equities estimates
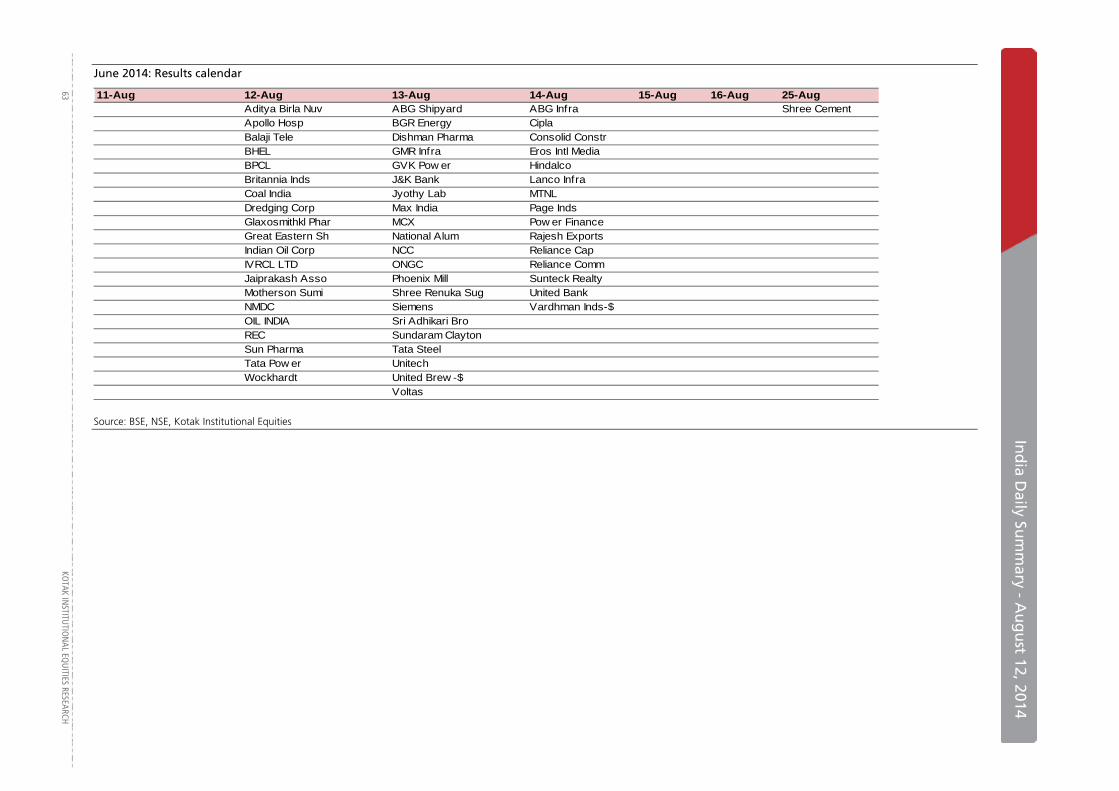
In
dia D
aily Sum
mary - A
ug
ust 12, 2014
63
KOTAK IN
STITUTIO
NAL EQ
UITIES RESEARCH
June 2014: Results calendar
11-Aug 12-Aug 13-Aug 14-Aug 15-Aug 16-Aug 25-AugAndhra Cements Aditya Birla Nuv ABG Shipyard ABG Infra Shree CementBosch Apollo Hosp BGR Energy CiplaDivis Lab Balaji Tele Dishman Pharma Consolid ConstrEicher Motors BHEL GMR Infra Eros Intl MediaGail India BPCL GVK Pow er HindalcoHPCL Britannia Inds J&K Bank Lanco InfraJet Air India Coal India Jyothy Lab MTNLMuthoot Fin Dredging Corp Max India Page IndsNational Alum Glaxosmithkl Phar MCX Pow er FinanceRico Auto Great Eastern Sh National Alum Rajesh ExportsSadbhav Engr Indian Oil Corp NCC Reliance CapSAIL IVRCL LTD ONGC Reliance CommSpeciality Rest Jaiprakash Asso Phoenix Mill Sunteck RealtyTata Motors Motherson Sumi Shree Renuka Sug United Bank
NMDC Siemens Vardhman Inds-$OIL INDIA Sri Adhikari BroREC Sundaram ClaytonSun Pharma Tata SteelTata Pow er UnitechWockhardt United Brew -$
Voltas
Source: BSE, NSE, Kotak Institutional Equities
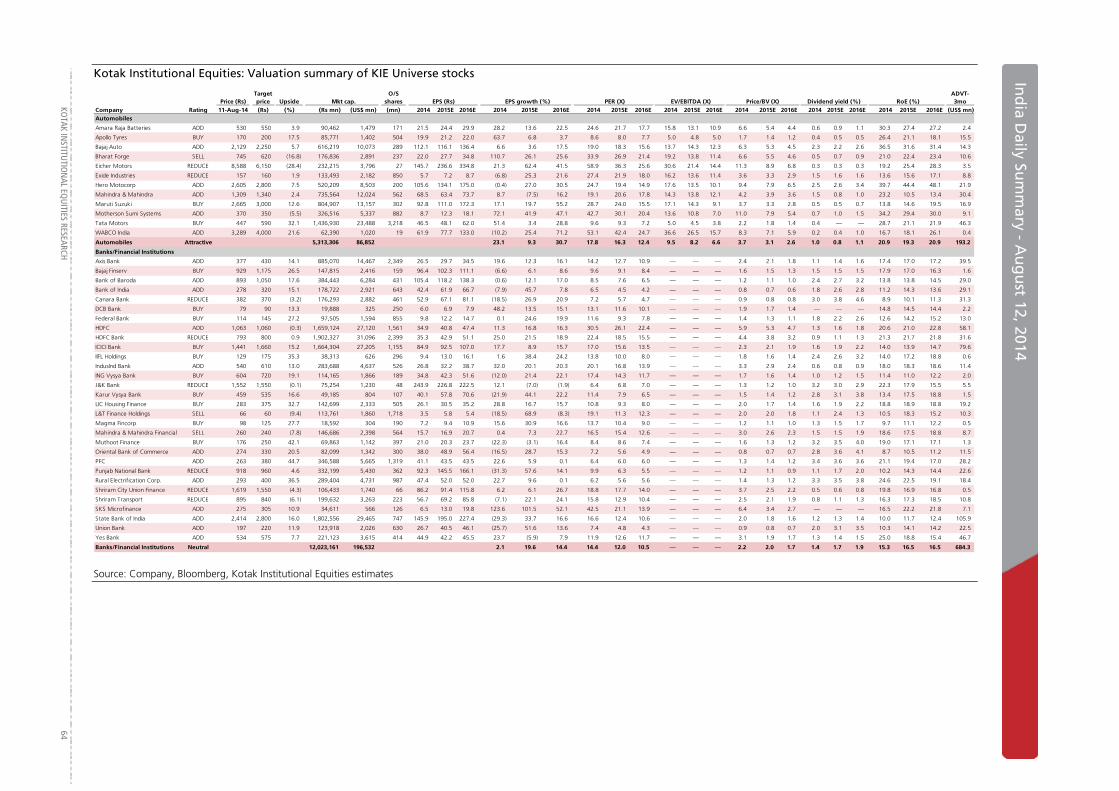
KO
TAK INSTITUTIO
NAL EQ
UITIES RESEARCH 64
In
dia D
aily Sum
mary - A
ug
ust 1
Ind
ia Daily Su
mm
ary - Au
gu
st 12, 2014
Kotak Institutional Equities: Valuation summary of KIE Universe stocks
Price (Rs)Target price Upside Mkt cap.
O/S shares EPS (Rs) EPS growth (%) PER (X) EV/EBITDA (X) RoE (%)
ADVT-3mo
Company Rating 11-Aug-14 (Rs) (%) (Rs mn) (US$ mn) (mn) 2014 2015E 2016E 2014 2015E 2016E 2014 2015E 2016E 2014 2015E 2016E 2014 2015E 2016E 2014 2015E 2016E 2014 2015E 2016E (US$ mn)Automobiles
Amara Raja Batteries ADD 530 550 3.9 90,462 1,479 171 21.5 24.4 29.9 28.2 13.6 22.5 24.6 21.7 17.7 15.8 13.1 10.9 6.6 5.4 4.4 0.6 0.9 1.1 30.3 27.4 27.2 2.4
Apollo Tyres BUY 170 200 17.5 85,771 1,402 504 19.9 21.2 22.0 63.7 6.8 3.7 8.6 8.0 7.7 5.0 4.8 5.0 1.7 1.4 1.2 0.4 0.5 0.5 26.4 21.1 18.1 15.5
Bajaj Auto ADD 2,129 2,250 5.7 616,219 10,073 289 112.1 116.1 136.4 6.6 3.6 17.5 19.0 18.3 15.6 13.7 14.3 12.3 6.3 5.3 4.5 2.3 2.2 2.6 36.5 31.6 31.4 14.3
Bharat Forge SELL 745 620 (16.8) 176,836 2,891 237 22.0 27.7 34.8 110.7 26.1 25.6 33.9 26.9 21.4 19.2 13.8 11.4 6.6 5.5 4.6 0.5 0.7 0.9 21.0 22.4 23.4 10.6
Eicher Motors REDUCE 8,588 6,150 (28.4) 232,215 3,796 27 145.7 236.6 334.8 21.3 62.4 41.5 58.9 36.3 25.6 30.6 21.4 14.4 11.3 8.9 6.8 0.3 0.3 0.3 19.2 25.4 28.3 3.5
Exide Industries REDUCE 157 160 1.9 133,493 2,182 850 5.7 7.2 8.7 (6.8) 25.3 21.6 27.4 21.9 18.0 16.2 13.6 11.4 3.6 3.3 2.9 1.5 1.6 1.6 13.6 15.6 17.1 8.8
Hero Motocorp ADD 2,605 2,800 7.5 520,209 8,503 200 105.6 134.1 175.0 (0.4) 27.0 30.5 24.7 19.4 14.9 17.6 13.5 10.1 9.4 7.9 6.5 2.5 2.6 3.4 39.7 44.4 48.1 21.9
Mahindra & Mahindra ADD 1,309 1,340 2.4 735,564 12,024 562 68.5 63.4 73.7 8.7 (7.5) 16.2 19.1 20.6 17.8 14.3 13.8 12.1 4.2 3.9 3.6 1.5 0.8 1.0 23.2 10.5 13.4 30.4
Maruti Suzuki BUY 2,665 3,000 12.6 804,907 13,157 302 92.8 111.0 172.3 17.1 19.7 55.2 28.7 24.0 15.5 17.1 14.3 9.1 3.7 3.3 2.8 0.5 0.5 0.7 13.8 14.6 19.5 16.9
Motherson Sumi Systems ADD 370 350 (5.5) 326,516 5,337 882 8.7 12.3 18.1 72.1 41.9 47.1 42.7 30.1 20.4 13.6 10.8 7.0 11.0 7.9 5.4 0.7 1.0 1.5 34.2 29.4 30.0 9.1
Tata Motors BUY 447 590 32.1 1,436,930 23,488 3,218 46.5 48.1 62.0 51.4 3.4 28.8 9.6 9.3 7.2 5.0 4.5 3.8 2.2 1.8 1.4 0.4 — — 28.7 21.1 21.9 46.3
WABCO India ADD 3,289 4,000 21.6 62,390 1,020 19 61.9 77.7 133.0 (10.2) 25.4 71.2 53.1 42.4 24.7 36.6 26.5 15.7 8.3 7.1 5.9 0.2 0.4 1.0 16.7 18.1 26.1 0.4
Automobiles Attractive 5,313,306 86,852 23.1 9.3 30.7 17.8 16.3 12.4 9.5 8.2 6.6 3.7 3.1 2.6 1.0 0.8 1.1 20.9 19.3 20.9 193.2
Banks/Financial Institutions
Axis Bank ADD 377 430 14.1 885,070 14,467 2,349 26.5 29.7 34.5 19.6 12.3 16.1 14.2 12.7 10.9 — — — 2.4 2.1 1.8 1.1 1.4 1.6 17.4 17.0 17.2 39.5
Bajaj Finserv BUY 929 1,175 26.5 147,815 2,416 159 96.4 102.3 111.1 (6.6) 6.1 8.6 9.6 9.1 8.4 — — — 1.6 1.5 1.3 1.5 1.5 1.5 17.9 17.0 16.3 1.6
Bank of Baroda ADD 893 1,050 17.6 384,443 6,284 431 105.4 118.2 138.3 (0.6) 12.1 17.0 8.5 7.6 6.5 — — — 1.2 1.1 1.0 2.4 2.7 3.2 13.8 13.8 14.5 29.0
Bank of India ADD 278 320 15.1 178,722 2,921 643 42.4 61.9 66.7 (7.9) 45.7 7.8 6.5 4.5 4.2 — — — 0.8 0.7 0.6 1.8 2.6 2.8 11.2 14.3 13.6 29.1
Canara Bank REDUCE 382 370 (3.2) 176,293 2,882 461 52.9 67.1 81.1 (18.5) 26.9 20.9 7.2 5.7 4.7 — — — 0.9 0.8 0.8 3.0 3.8 4.6 8.9 10.1 11.3 31.3
DCB Bank BUY 79 90 13.3 19,888 325 250 6.0 6.9 7.9 48.2 13.5 15.1 13.1 11.6 10.1 — — — 1.9 1.7 1.4 — — — 14.8 14.5 14.4 2.2
Federal Bank BUY 114 145 27.2 97,505 1,594 855 9.8 12.2 14.7 0.1 24.6 19.9 11.6 9.3 7.8 — — — 1.4 1.3 1.1 1.8 2.2 2.6 12.6 14.2 15.2 13.0
HDFC ADD 1,063 1,060 (0.3) 1,659,124 27,120 1,561 34.9 40.8 47.4 11.3 16.8 16.3 30.5 26.1 22.4 — — — 5.9 5.3 4.7 1.3 1.6 1.8 20.6 21.0 22.8 58.1
HDFC Bank REDUCE 793 800 0.9 1,902,327 31,096 2,399 35.3 42.9 51.1 25.0 21.5 18.9 22.4 18.5 15.5 — — — 4.4 3.8 3.2 0.9 1.1 1.3 21.3 21.7 21.8 31.6
ICICI Bank BUY 1,441 1,660 15.2 1,664,304 27,205 1,155 84.9 92.5 107.0 17.7 8.9 15.7 17.0 15.6 13.5 — — — 2.3 2.1 1.9 1.6 1.9 2.2 14.0 13.9 14.7 79.6
IIFL Holdings BUY 129 175 35.3 38,313 626 296 9.4 13.0 16.1 1.6 38.4 24.2 13.8 10.0 8.0 — — — 1.8 1.6 1.4 2.4 2.6 3.2 14.0 17.2 18.8 0.6
IndusInd Bank ADD 540 610 13.0 283,688 4,637 526 26.8 32.2 38.7 32.0 20.1 20.3 20.1 16.8 13.9 — — — 3.3 2.9 2.4 0.6 0.8 0.9 18.0 18.3 18.6 11.4
ING Vysya Bank BUY 604 720 19.1 114,165 1,866 189 34.8 42.3 51.6 (12.0) 21.4 22.1 17.4 14.3 11.7 — — — 1.7 1.6 1.4 1.0 1.2 1.5 11.4 11.0 12.2 2.0
J&K Bank REDUCE 1,552 1,550 (0.1) 75,254 1,230 48 243.9 226.8 222.5 12.1 (7.0) (1.9) 6.4 6.8 7.0 — — — 1.3 1.2 1.0 3.2 3.0 2.9 22.3 17.9 15.5 5.5
Karur Vysya Bank BUY 459 535 16.6 49,185 804 107 40.1 57.8 70.6 (21.9) 44.1 22.2 11.4 7.9 6.5 — — — 1.5 1.4 1.2 2.8 3.1 3.8 13.4 17.5 18.8 1.5
LIC Housing Finance BUY 283 375 32.7 142,699 2,333 505 26.1 30.5 35.2 28.8 16.7 15.7 10.8 9.3 8.0 — — — 2.0 1.7 1.4 1.6 1.9 2.2 18.8 18.9 18.8 19.2
L&T Finance Holdings SELL 66 60 (9.4) 113,761 1,860 1,718 3.5 5.8 5.4 (18.5) 68.9 (8.3) 19.1 11.3 12.3 — — — 2.0 2.0 1.8 1.1 2.4 1.3 10.5 18.3 15.2 10.3
Magma Fincorp BUY 98 125 27.7 18,592 304 190 7.2 9.4 10.9 15.6 30.9 16.6 13.7 10.4 9.0 — — — 1.2 1.1 1.0 1.3 1.5 1.7 9.7 11.1 12.2 0.5
Mahindra & Mahindra Financial SELL 260 240 (7.8) 146,686 2,398 564 15.7 16.9 20.7 0.4 7.3 22.7 16.5 15.4 12.6 — — — 3.0 2.6 2.3 1.5 1.5 1.9 18.6 17.5 18.8 8.7
Muthoot Finance BUY 176 250 42.1 69,863 1,142 397 21.0 20.3 23.7 (22.3) (3.1) 16.4 8.4 8.6 7.4 — — — 1.6 1.3 1.2 3.2 3.5 4.0 19.0 17.1 17.1 1.3
Oriental Bank of Commerce ADD 274 330 20.5 82,099 1,342 300 38.0 48.9 56.4 (16.5) 28.7 15.3 7.2 5.6 4.9 — — — 0.8 0.7 0.7 2.8 3.6 4.1 8.7 10.5 11.2 11.5
PFC ADD 263 380 44.7 346,588 5,665 1,319 41.1 43.5 43.5 22.6 5.9 0.1 6.4 6.0 6.0 — — — 1.3 1.4 1.2 3.4 3.6 3.6 21.1 19.4 17.0 28.2
Punjab National Bank REDUCE 918 960 4.6 332,199 5,430 362 92.3 145.5 166.1 (31.3) 57.6 14.1 9.9 6.3 5.5 — — — 1.2 1.1 0.9 1.1 1.7 2.0 10.2 14.3 14.4 22.6
Rural Electrification Corp. ADD 293 400 36.5 289,404 4,731 987 47.4 52.0 52.0 22.7 9.6 0.1 6.2 5.6 5.6 — — — 1.4 1.3 1.2 3.3 3.5 3.8 24.6 22.5 19.1 18.4
Shriram City Union Finance REDUCE 1,619 1,550 (4.3) 106,433 1,740 66 86.2 91.4 115.8 6.2 6.1 26.7 18.8 17.7 14.0 — — — 3.7 2.5 2.2 0.5 0.6 0.8 19.8 16.9 16.8 0.5
Shriram Transport REDUCE 895 840 (6.1) 199,632 3,263 223 56.7 69.2 85.8 (7.1) 22.1 24.1 15.8 12.9 10.4 — — — 2.5 2.1 1.9 0.8 1.1 1.3 16.3 17.3 18.5 10.8
SKS Microfinance ADD 275 305 10.9 34,611 566 126 6.5 13.0 19.8 123.6 101.5 52.1 42.5 21.1 13.9 — — — 6.4 3.4 2.7 — — — 16.5 22.2 21.8 7.1
State Bank of India ADD 2,414 2,800 16.0 1,802,556 29,465 747 145.9 195.0 227.4 (29.3) 33.7 16.6 16.6 12.4 10.6 — — — 2.0 1.8 1.6 1.2 1.3 1.4 10.0 11.7 12.4 105.9
Union Bank ADD 197 220 11.9 123,918 2,026 630 26.7 40.5 46.1 (25.7) 51.6 13.6 7.4 4.8 4.3 — — — 0.9 0.8 0.7 2.0 3.1 3.5 10.3 14.1 14.2 22.5
Yes Bank ADD 534 575 7.7 221,123 3,615 414 44.9 42.2 45.5 23.7 (5.9) 7.9 11.9 12.6 11.7 — — — 3.1 1.9 1.7 1.3 1.4 1.5 25.0 18.8 15.4 46.7
Banks/Financial Institutions Neutral 12,023,161 196,532 2.1 19.6 14.4 14.4 12.0 10.5 — — — 2.2 2.0 1.7 1.4 1.7 1.9 15.3 16.5 16.5 684.3
Price/BV (X) Dividend yield (%)
Source: Company, Bloomberg, Kotak Institutional Equities estimates
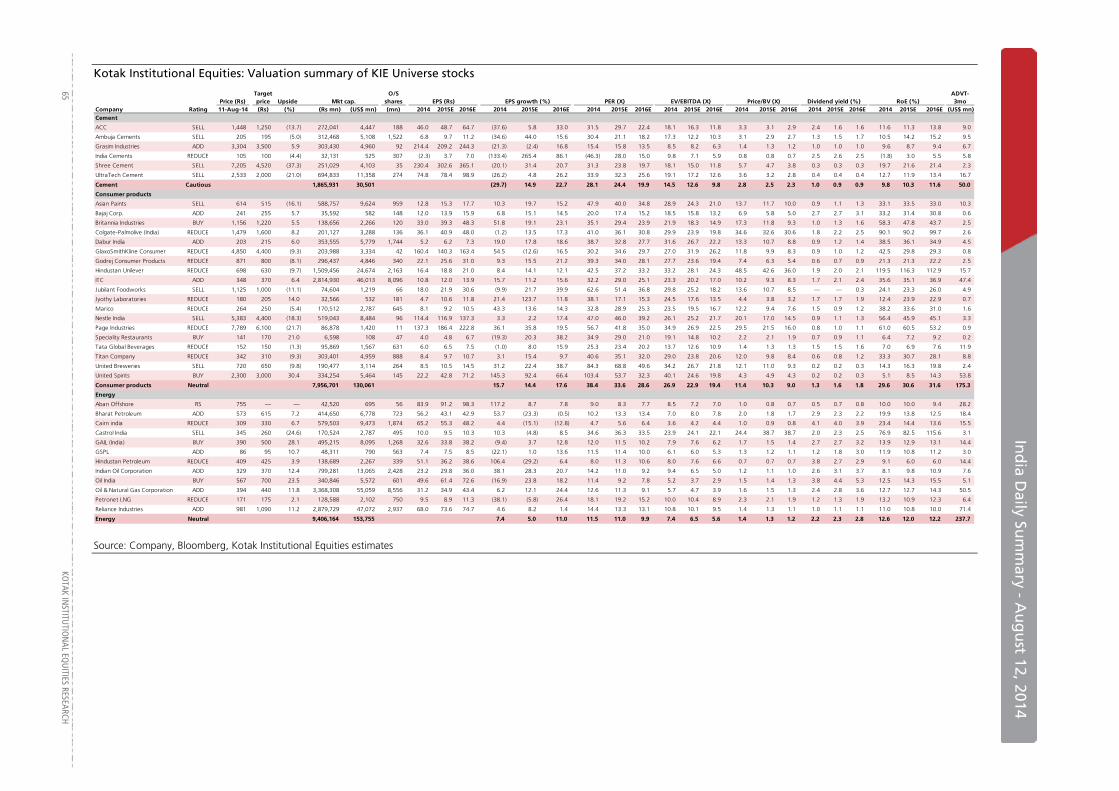
In
dia D
aily Sum
mary - A
ug
ust 12, 2014
65
KOTAK IN
STITUTIO
NAL EQ
UITIES RESEARCH
Kotak Institutional Equities: Valuation summary of KIE Universe stocks
Price (Rs)Target price Upside Mkt cap.
O/S shares EPS (Rs) EPS growth (%) PER (X) EV/EBITDA (X) Price/BV (X) RoE (%)
ADVT-3mo
Company Rating 11-Aug-14 (Rs) (%) (Rs mn) (US$ mn) (mn) 2014 2015E 2016E 2014 2015E 2016E 2014 2015E 2016E 2014 2015E 2016E 2014 2015E 2016E 2014 2015E 2016E 2014 2015E 2016E (US$ mn)Cement
ACC SELL 1,448 1,250 (13.7) 272,041 4,447 188 46.0 48.7 64.7 (37.6) 5.8 33.0 31.5 29.7 22.4 18.1 16.3 11.8 3.3 3.1 2.9 2.4 1.6 1.6 11.6 11.3 13.8 9.0
Ambuja Cements SELL 205 195 (5.0) 312,468 5,108 1,522 6.8 9.7 11.2 (34.6) 44.0 15.6 30.4 21.1 18.2 17.3 12.2 10.3 3.1 2.9 2.7 1.3 1.5 1.7 10.5 14.2 15.2 9.5
Grasim Industries ADD 3,304 3,500 5.9 303,430 4,960 92 214.4 209.2 244.3 (21.3) (2.4) 16.8 15.4 15.8 13.5 8.5 8.2 6.3 1.4 1.3 1.2 1.0 1.0 1.0 9.6 8.7 9.4 6.7
India Cements REDUCE 105 100 (4.4) 32,131 525 307 (2.3) 3.7 7.0 (133.4) 265.4 86.1 (46.3) 28.0 15.0 9.8 7.1 5.9 0.8 0.8 0.7 2.5 2.6 2.5 (1.8) 3.0 5.5 5.8
Shree Cement SELL 7,205 4,520 (37.3) 251,029 4,103 35 230.4 302.6 365.1 (20.1) 31.4 20.7 31.3 23.8 19.7 18.1 15.0 11.8 5.7 4.7 3.8 0.3 0.3 0.3 19.7 21.6 21.4 2.3
UltraTech Cement SELL 2,533 2,000 (21.0) 694,833 11,358 274 74.8 78.4 98.9 (26.2) 4.8 26.2 33.9 32.3 25.6 19.1 17.2 12.6 3.6 3.2 2.8 0.4 0.4 0.4 12.7 11.9 13.4 16.7
Cement Cautious 1,865,931 30,501 (29.7) 14.9 22.7 28.1 24.4 19.9 14.5 12.6 9.8 2.8 2.5 2.3 1.0 0.9 0.9 9.8 10.3 11.6 50.0
Consumer products
Asian Paints SELL 614 515 (16.1) 588,757 9,624 959 12.8 15.3 17.7 10.3 19.7 15.2 47.9 40.0 34.8 28.9 24.3 21.0 13.7 11.7 10.0 0.9 1.1 1.3 33.1 33.5 33.0 10.3
Bajaj Corp. ADD 241 255 5.7 35,592 582 148 12.0 13.9 15.9 6.8 15.1 14.5 20.0 17.4 15.2 18.5 15.8 13.2 6.9 5.8 5.0 2.7 2.7 3.1 33.2 31.4 30.8 0.6
Britannia Industries BUY 1,156 1,220 5.5 138,656 2,266 120 33.0 39.3 48.3 51.8 19.1 23.1 35.1 29.4 23.9 21.9 18.3 14.9 17.3 11.8 9.3 1.0 1.3 1.6 58.3 47.8 43.7 2.5
Colgate-Palmolive (India) REDUCE 1,479 1,600 8.2 201,127 3,288 136 36.1 40.9 48.0 (1.2) 13.5 17.3 41.0 36.1 30.8 29.9 23.9 19.8 34.6 32.6 30.6 1.8 2.2 2.5 90.1 90.2 99.7 2.6
Dabur India ADD 203 215 6.0 353,555 5,779 1,744 5.2 6.2 7.3 19.0 17.8 18.6 38.7 32.8 27.7 31.6 26.7 22.2 13.3 10.7 8.8 0.9 1.2 1.4 38.5 36.1 34.9 4.5
GlaxoSmithKline Consumer REDUCE 4,850 4,400 (9.3) 203,988 3,334 42 160.4 140.3 163.4 54.5 (12.6) 16.5 30.2 34.6 29.7 27.0 31.9 26.2 11.8 9.9 8.3 0.9 1.0 1.2 42.5 29.8 29.3 0.8
Godrej Consumer Products REDUCE 871 800 (8.1) 296,437 4,846 340 22.1 25.6 31.0 9.3 15.5 21.2 39.3 34.0 28.1 27.7 23.6 19.4 7.4 6.3 5.4 0.6 0.7 0.9 21.3 21.3 22.2 2.5
Hindustan Unilever REDUCE 698 630 (9.7) 1,509,456 24,674 2,163 16.4 18.8 21.0 8.4 14.1 12.1 42.5 37.2 33.2 33.2 28.1 24.3 48.5 42.6 36.0 1.9 2.0 2.1 119.5 116.3 112.9 15.7
ITC ADD 348 370 6.4 2,814,930 46,013 8,096 10.8 12.0 13.9 15.7 11.2 15.6 32.2 29.0 25.1 23.3 20.2 17.0 10.2 9.3 8.3 1.7 2.1 2.4 35.6 35.1 36.9 47.4
Jubilant Foodworks SELL 1,125 1,000 (11.1) 74,604 1,219 66 18.0 21.9 30.6 (9.9) 21.7 39.9 62.6 51.4 36.8 29.8 25.2 18.2 13.6 10.7 8.5 — — 0.3 24.1 23.3 26.0 4.9
Jyothy Laboratories REDUCE 180 205 14.0 32,566 532 181 4.7 10.6 11.8 21.4 123.7 11.8 38.1 17.1 15.3 24.5 17.6 13.5 4.4 3.8 3.2 1.7 1.7 1.9 12.4 23.9 22.9 0.7
Marico REDUCE 264 250 (5.4) 170,512 2,787 645 8.1 9.2 10.5 43.3 13.6 14.3 32.8 28.9 25.3 23.5 19.5 16.7 12.2 9.4 7.6 1.5 0.9 1.2 38.2 33.6 31.0 1.6
Nestle India SELL 5,383 4,400 (18.3) 519,043 8,484 96 114.4 116.9 137.3 3.3 2.2 17.4 47.0 46.0 39.2 26.1 25.2 21.7 20.1 17.0 14.5 0.9 1.1 1.3 56.4 45.9 45.1 3.3
Page Industries REDUCE 7,789 6,100 (21.7) 86,878 1,420 11 137.3 186.4 222.8 36.1 35.8 19.5 56.7 41.8 35.0 34.9 26.9 22.5 29.5 21.5 16.0 0.8 1.0 1.1 61.0 60.5 53.2 0.9
Speciality Restaurants BUY 141 170 21.0 6,598 108 47 4.0 4.8 6.7 (19.3) 20.3 38.2 34.9 29.0 21.0 19.1 14.8 10.2 2.2 2.1 1.9 0.7 0.9 1.1 6.4 7.2 9.2 0.2
Tata Global Beverages REDUCE 152 150 (1.3) 95,869 1,567 631 6.0 6.5 7.5 (1.0) 8.0 15.9 25.3 23.4 20.2 13.7 12.6 10.9 1.4 1.3 1.3 1.5 1.5 1.6 7.0 6.9 7.6 11.9
Titan Company REDUCE 342 310 (9.3) 303,401 4,959 888 8.4 9.7 10.7 3.1 15.4 9.7 40.6 35.1 32.0 29.0 23.8 20.6 12.0 9.8 8.4 0.6 0.8 1.2 33.3 30.7 28.1 8.8
United Breweries SELL 720 650 (9.8) 190,477 3,114 264 8.5 10.5 14.5 31.2 22.4 38.7 84.3 68.8 49.6 34.2 26.7 21.8 12.1 11.0 9.3 0.2 0.2 0.3 14.3 16.3 19.8 2.4
United Spirits BUY 2,300 3,000 30.4 334,254 5,464 145 22.2 42.8 71.2 145.3 92.4 66.4 103.4 53.7 32.3 40.1 24.6 19.8 4.3 4.9 4.3 0.2 0.2 0.3 5.1 8.5 14.3 53.8
Consumer products Neutral 7,956,701 130,061 15.7 14.4 17.6 38.4 33.6 28.6 26.9 22.9 19.4 11.4 10.3 9.0 1.3 1.6 1.8 29.6 30.6 31.6 175.3
Energy
Aban Offshore RS 755 — — 42,520 695 56 83.9 91.2 98.3 117.2 8.7 7.8 9.0 8.3 7.7 8.5 7.2 7.0 1.0 0.8 0.7 0.5 0.7 0.8 10.0 10.0 9.4 28.2
Bharat Petroleum ADD 573 615 7.2 414,650 6,778 723 56.2 43.1 42.9 53.7 (23.3) (0.5) 10.2 13.3 13.4 7.0 8.0 7.8 2.0 1.8 1.7 2.9 2.3 2.2 19.9 13.8 12.5 18.4
Cairn india REDUCE 309 330 6.7 579,503 9,473 1,874 65.2 55.3 48.2 4.4 (15.1) (12.8) 4.7 5.6 6.4 3.6 4.2 4.4 1.0 0.9 0.8 4.1 4.0 3.9 23.4 14.4 13.6 15.5
Castrol India SELL 345 260 (24.6) 170,524 2,787 495 10.0 9.5 10.3 10.3 (4.8) 8.5 34.6 36.3 33.5 23.9 24.1 22.1 24.4 38.7 38.7 2.0 2.3 2.5 76.9 82.5 115.6 3.1
GAIL (India) BUY 390 500 28.1 495,215 8,095 1,268 32.6 33.8 38.2 (9.4) 3.7 12.8 12.0 11.5 10.2 7.9 7.6 6.2 1.7 1.5 1.4 2.7 2.7 3.2 13.9 12.9 13.1 14.4
GSPL ADD 86 95 10.7 48,311 790 563 7.4 7.5 8.5 (22.1) 1.0 13.6 11.5 11.4 10.0 6.1 6.0 5.3 1.3 1.2 1.1 1.2 1.8 3.0 11.9 10.8 11.2 3.0
Hindustan Petroleum REDUCE 409 425 3.9 138,689 2,267 339 51.1 36.2 38.6 106.4 (29.2) 6.4 8.0 11.3 10.6 8.0 7.6 6.6 0.7 0.7 0.7 3.8 2.7 2.9 9.1 6.0 6.0 14.4
Indian Oil Corporation ADD 329 370 12.4 799,281 13,065 2,428 23.2 29.8 36.0 38.1 28.3 20.7 14.2 11.0 9.2 9.4 6.5 5.0 1.2 1.1 1.0 2.6 3.1 3.7 8.1 9.8 10.9 7.6
Oil India BUY 567 700 23.5 340,846 5,572 601 49.6 61.4 72.6 (16.9) 23.8 18.2 11.4 9.2 7.8 5.2 3.7 2.9 1.5 1.4 1.3 3.8 4.4 5.3 12.5 14.3 15.5 5.1
Oil & Natural Gas Corporation ADD 394 440 11.8 3,368,308 55,059 8,556 31.2 34.9 43.4 6.2 12.1 24.4 12.6 11.3 9.1 5.7 4.7 3.9 1.6 1.5 1.3 2.4 2.8 3.6 12.7 12.7 14.3 50.5
Petronet LNG REDUCE 171 175 2.1 128,588 2,102 750 9.5 8.9 11.3 (38.1) (5.8) 26.4 18.1 19.2 15.2 10.0 10.4 8.9 2.3 2.1 1.9 1.2 1.3 1.9 13.2 10.9 12.3 6.4
Reliance Industries ADD 981 1,090 11.2 2,879,729 47,072 2,937 68.0 73.6 74.7 4.6 8.2 1.4 14.4 13.3 13.1 10.8 10.1 9.5 1.4 1.3 1.1 1.0 1.1 1.1 11.0 10.8 10.0 71.4
Energy Neutral 9,406,164 153,755 7.4 5.0 11.0 11.5 11.0 9.9 7.4 6.5 5.6 1.4 1.3 1.2 2.2 2.3 2.8 12.6 12.0 12.2 237.7
Dividend yield (%)
Source: Company, Bloomberg, Kotak Institutional Equities estimates
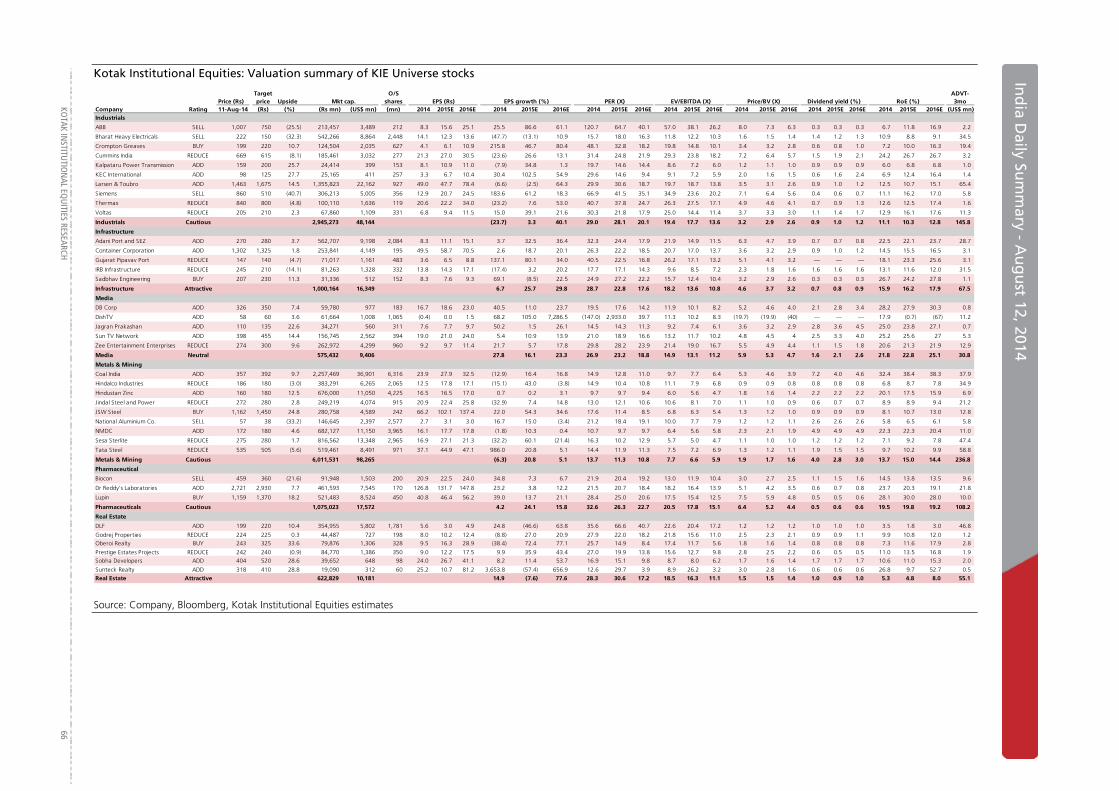
KO
TAK INSTITUTIO
NAL EQ
UITIES RESEARCH 66
In
dia D
aily Sum
mary - A
ug
ust 1
Ind
ia Daily Su
mm
ary - Au
gu
st 12, 2014
Kotak Institutional Equities: Valuation summary of KIE Universe stocks
Price (Rs)Target price Upside Mkt cap.
O/S shares EPS (Rs) EPS growth (%) PER (X) EV/EBITDA (X) Price/BV (X) RoE (%)
ADVT-3mo
Company Rating 11-Aug-14 (Rs) (%) (Rs mn) (US$ mn) (mn) 2014 2015E 2016E 2014 2015E 2016E 2014 2015E 2016E 2014 2015E 2016E 2014 2015E 2016E 2014 2015E 2016E 2014 2015E 2016E (US$ mn)Industrials
ABB SELL 1,007 750 (25.5) 213,457 3,489 212 8.3 15.6 25.1 25.5 86.6 61.1 120.7 64.7 40.1 57.0 38.1 26.2 8.0 7.3 6.3 0.3 0.3 0.3 6.7 11.8 16.9 2.2
Bharat Heavy Electricals SELL 222 150 (32.3) 542,266 8,864 2,448 14.1 12.3 13.6 (47.7) (13.1) 10.9 15.7 18.0 16.3 11.8 12.2 10.3 1.6 1.5 1.4 1.4 1.2 1.3 10.9 8.8 9.1 34.5
Crompton Greaves BUY 199 220 10.7 124,504 2,035 627 4.1 6.1 10.9 215.8 46.7 80.4 48.1 32.8 18.2 19.8 14.8 10.1 3.4 3.2 2.8 0.6 0.8 1.0 7.2 10.0 16.3 19.4
Cummins India REDUCE 669 615 (8.1) 185,461 3,032 277 21.3 27.0 30.5 (23.6) 26.6 13.1 31.4 24.8 21.9 29.3 23.8 18.2 7.2 6.4 5.7 1.5 1.9 2.1 24.2 26.7 26.7 3.2
Kalpataru Power Transmission ADD 159 200 25.7 24,414 399 153 8.1 10.9 11.0 (7.9) 34.8 1.3 19.7 14.6 14.4 8.6 7.2 6.0 1.2 1.1 1.0 0.9 0.9 0.9 6.0 6.8 6.8 1.0
KEC International ADD 98 125 27.7 25,165 411 257 3.3 6.7 10.4 30.4 102.5 54.9 29.6 14.6 9.4 9.1 7.2 5.9 2.0 1.6 1.5 0.6 1.6 2.4 6.9 12.4 16.4 1.4
Larsen & Toubro ADD 1,463 1,675 14.5 1,355,823 22,162 927 49.0 47.7 78.4 (6.6) (2.5) 64.3 29.9 30.6 18.7 19.7 18.7 13.8 3.5 3.1 2.6 0.9 1.0 1.2 12.5 10.7 15.1 65.4
Siemens SELL 860 510 (40.7) 306,213 5,005 356 12.9 20.7 24.5 183.6 61.2 18.3 66.9 41.5 35.1 34.9 23.6 20.2 7.1 6.4 5.6 0.4 0.6 0.7 11.1 16.2 17.0 5.8
Thermax REDUCE 840 800 (4.8) 100,110 1,636 119 20.6 22.2 34.0 (23.2) 7.6 53.0 40.7 37.8 24.7 26.3 27.5 17.1 4.9 4.6 4.1 0.7 0.9 1.3 12.6 12.5 17.4 1.6
Voltas REDUCE 205 210 2.3 67,860 1,109 331 6.8 9.4 11.5 15.0 39.1 21.6 30.3 21.8 17.9 25.0 14.4 11.4 3.7 3.3 3.0 1.1 1.4 1.7 12.9 16.1 17.6 11.3
Industrials Cautious 2,945,273 48,144 (23.7) 3.3 40.1 29.0 28.1 20.1 19.4 17.7 13.6 3.2 2.9 2.6 0.9 1.0 1.2 11.1 10.3 12.8 145.8
Infrastructure
Adani Port and SEZ ADD 270 280 3.7 562,707 9,198 2,084 8.3 11.1 15.1 3.7 32.5 36.4 32.3 24.4 17.9 21.9 14.9 11.5 6.3 4.7 3.9 0.7 0.7 0.8 22.5 22.1 23.7 28.7
Container Corporation ADD 1,302 1,325 1.8 253,841 4,149 195 49.5 58.7 70.5 2.6 18.7 20.1 26.3 22.2 18.5 20.7 17.0 13.7 3.6 3.2 2.9 0.9 1.0 1.2 14.5 15.5 16.5 3.1
Gujarat Pipavav Port REDUCE 147 140 (4.7) 71,017 1,161 483 3.6 6.5 8.8 137.1 80.1 34.0 40.5 22.5 16.8 26.2 17.1 13.2 5.1 4.1 3.2 — — — 18.1 23.3 25.6 3.1
IRB Infrastructure REDUCE 245 210 (14.1) 81,263 1,328 332 13.8 14.3 17.1 (17.4) 3.2 20.2 17.7 17.1 14.3 9.6 8.5 7.2 2.3 1.8 1.6 1.6 1.6 1.6 13.1 11.6 12.0 31.5
Sadbhav Engineering BUY 207 230 11.3 31,336 512 152 8.3 7.6 9.3 69.1 (8.5) 22.5 24.9 27.2 22.2 15.7 12.4 10.4 3.2 2.9 2.6 0.3 0.3 0.3 26.7 24.2 27.8 1.1
Infrastructure Attractive 1,000,164 16,349 6.7 25.7 29.8 28.7 22.8 17.6 18.2 13.6 10.8 4.6 3.7 3.2 0.7 0.8 0.9 15.9 16.2 17.9 67.5
Media
DB Corp ADD 326 350 7.4 59,780 977 183 16.7 18.6 23.0 40.5 11.0 23.7 19.5 17.6 14.2 11.9 10.1 8.2 5.2 4.6 4.0 2.1 2.8 3.4 28.2 27.9 30.3 0.8
DishTV ADD 58 60 3.6 61,664 1,008 1,065 (0.4) 0.0 1.5 68.2 105.0 7,286.5 (147.0) 2,933.0 39.7 11.3 10.2 8.3 (19.7) (19.9) (40) — — — 17.9 (0.7) (67) 11.2
Jagran Prakashan ADD 110 135 22.6 34,271 560 311 7.6 7.7 9.7 50.2 1.5 26.1 14.5 14.3 11.3 9.2 7.4 6.1 3.6 3.2 2.9 2.8 3.6 4.5 25.0 23.8 27.1 0.7
Sun TV Network ADD 398 455 14.4 156,745 2,562 394 19.0 21.0 24.0 5.4 10.9 13.9 21.0 18.9 16.6 13.2 11.7 10.2 4.8 4.5 4 2.5 3.3 4.0 25.2 25.6 27 5.3
Zee Entertainment Enterprises REDUCE 274 300 9.6 262,972 4,299 960 9.2 9.7 11.4 21.7 5.7 17.8 29.8 28.2 23.9 21.4 19.0 16.7 5.5 4.9 4.4 1.1 1.5 1.8 20.6 21.3 21.9 12.9
Media Neutral 575,432 9,406 27.8 16.1 23.3 26.9 23.2 18.8 14.9 13.1 11.2 5.9 5.3 4.7 1.6 2.1 2.6 21.8 22.8 25.1 30.8
Metals & Mining
Coal India ADD 357 392 9.7 2,257,469 36,901 6,316 23.9 27.9 32.5 (12.9) 16.4 16.8 14.9 12.8 11.0 9.7 7.7 6.4 5.3 4.6 3.9 7.2 4.0 4.6 32.4 38.4 38.3 37.9
Hindalco Industries REDUCE 186 180 (3.0) 383,291 6,265 2,065 12.5 17.8 17.1 (15.1) 43.0 (3.8) 14.9 10.4 10.8 11.1 7.9 6.8 0.9 0.9 0.8 0.8 0.8 0.8 6.8 8.7 7.8 34.9
Hindustan Zinc ADD 160 180 12.5 676,000 11,050 4,225 16.5 16.5 17.0 0.7 0.2 3.1 9.7 9.7 9.4 6.0 5.6 4.7 1.8 1.6 1.4 2.2 2.2 2.2 20.1 17.5 15.9 6.9
Jindal Steel and Power REDUCE 272 280 2.8 249,219 4,074 915 20.9 22.4 25.8 (32.9) 7.4 14.8 13.0 12.1 10.6 10.6 8.1 7.0 1.1 1.0 0.9 0.6 0.7 0.7 8.9 8.9 9.4 21.2
JSW Steel BUY 1,162 1,450 24.8 280,758 4,589 242 66.2 102.1 137.4 22.0 54.3 34.6 17.6 11.4 8.5 6.8 6.3 5.4 1.3 1.2 1.0 0.9 0.9 0.9 8.1 10.7 13.0 12.8
National Aluminium Co. SELL 57 38 (33.2) 146,645 2,397 2,577 2.7 3.1 3.0 16.7 15.0 (3.4) 21.2 18.4 19.1 10.0 7.7 7.9 1.2 1.2 1.1 2.6 2.6 2.6 5.8 6.5 6.1 5.8
NMDC ADD 172 180 4.6 682,127 11,150 3,965 16.1 17.7 17.8 (1.8) 10.3 0.4 10.7 9.7 9.7 6.4 5.6 5.8 2.3 2.1 1.9 4.9 4.9 4.9 22.3 22.3 20.4 11.0
Sesa Sterlite REDUCE 275 280 1.7 816,562 13,348 2,965 16.9 27.1 21.3 (32.2) 60.1 (21.4) 16.3 10.2 12.9 5.7 5.0 4.7 1.1 1.0 1.0 1.2 1.2 1.2 7.1 9.2 7.8 47.4
Tata Steel REDUCE 535 505 (5.6) 519,461 8,491 971 37.1 44.9 47.1 986.0 20.8 5.1 14.4 11.9 11.3 7.5 7.2 6.9 1.3 1.2 1.1 1.9 1.5 1.5 9.7 10.2 9.9 58.8
Metals & Mining Cautious 6,011,531 98,265 (6.3) 20.8 5.1 13.7 11.3 10.8 7.7 6.6 5.9 1.9 1.7 1.6 4.0 2.8 3.0 13.7 15.0 14.4 236.8
Pharmaceutical
Biocon SELL 459 360 (21.6) 91,948 1,503 200 20.9 22.5 24.0 34.8 7.3 6.7 21.9 20.4 19.2 13.0 11.9 10.4 3.0 2.7 2.5 1.1 1.5 1.6 14.5 13.8 13.5 9.6
Dr Reddy's Laboratories ADD 2,721 2,930 7.7 461,593 7,545 170 126.8 131.7 147.8 23.2 3.8 12.2 21.5 20.7 18.4 18.2 16.4 13.9 5.1 4.2 3.5 0.6 0.7 0.8 23.7 20.3 19.1 21.8
Lupin BUY 1,159 1,370 18.2 521,483 8,524 450 40.8 46.4 56.2 39.0 13.7 21.1 28.4 25.0 20.6 17.5 15.4 12.5 7.5 5.9 4.8 0.5 0.5 0.6 28.1 30.0 28.0 10.0
Pharmaceuticals Cautious 1,075,023 17,572 4.2 24.1 15.8 32.6 26.3 22.7 20.5 17.8 15.1 6.4 5.2 4.4 0.5 0.6 0.6 19.5 19.8 19.2 108.2
Real Estate
DLF ADD 199 220 10.4 354,955 5,802 1,781 5.6 3.0 4.9 24.8 (46.6) 63.8 35.6 66.6 40.7 22.6 20.4 17.2 1.2 1.2 1.2 1.0 1.0 1.0 3.5 1.8 3.0 46.8
Godrej Properties REDUCE 224 225 0.3 44,487 727 198 8.0 10.2 12.4 (8.8) 27.0 20.9 27.9 22.0 18.2 21.8 15.6 11.0 2.5 2.3 2.1 0.9 0.9 1.1 9.9 10.8 12.0 1.2
Oberoi Realty BUY 243 325 33.6 79,876 1,306 328 9.5 16.3 28.9 (38.4) 72.4 77.1 25.7 14.9 8.4 17.4 11.7 5.6 1.8 1.6 1.4 0.8 0.8 0.8 7.3 11.6 17.9 2.8
Prestige Estates Projects REDUCE 242 240 (0.9) 84,770 1,386 350 9.0 12.2 17.5 9.9 35.9 43.4 27.0 19.9 13.8 15.6 12.7 9.8 2.8 2.5 2.2 0.6 0.5 0.5 11.0 13.5 16.8 1.9
Sobha Developers ADD 404 520 28.6 39,652 648 98 24.0 26.7 41.1 8.2 11.4 53.7 16.9 15.1 9.8 8.7 8.0 6.2 1.7 1.6 1.4 1.7 1.7 1.7 10.6 11.0 15.3 2.0
Sunteck Realty ADD 318 410 28.8 19,090 312 60 25.2 10.7 81.2 3,653.8 (57.4) 656.9 12.6 29.7 3.9 8.9 26.2 3.2 3.0 2.8 1.6 0.6 0.6 0.6 26.8 9.7 52.7 0.5
Real Estate Attractive 622,829 10,181 14.9 (7.6) 77.6 28.3 30.6 17.2 18.5 16.3 11.1 1.5 1.5 1.4 1.0 0.9 1.0 5.3 4.8 8.0 55.1
Dividend yield (%)
Source: Company, Bloomberg, Kotak Institutional Equities estimates
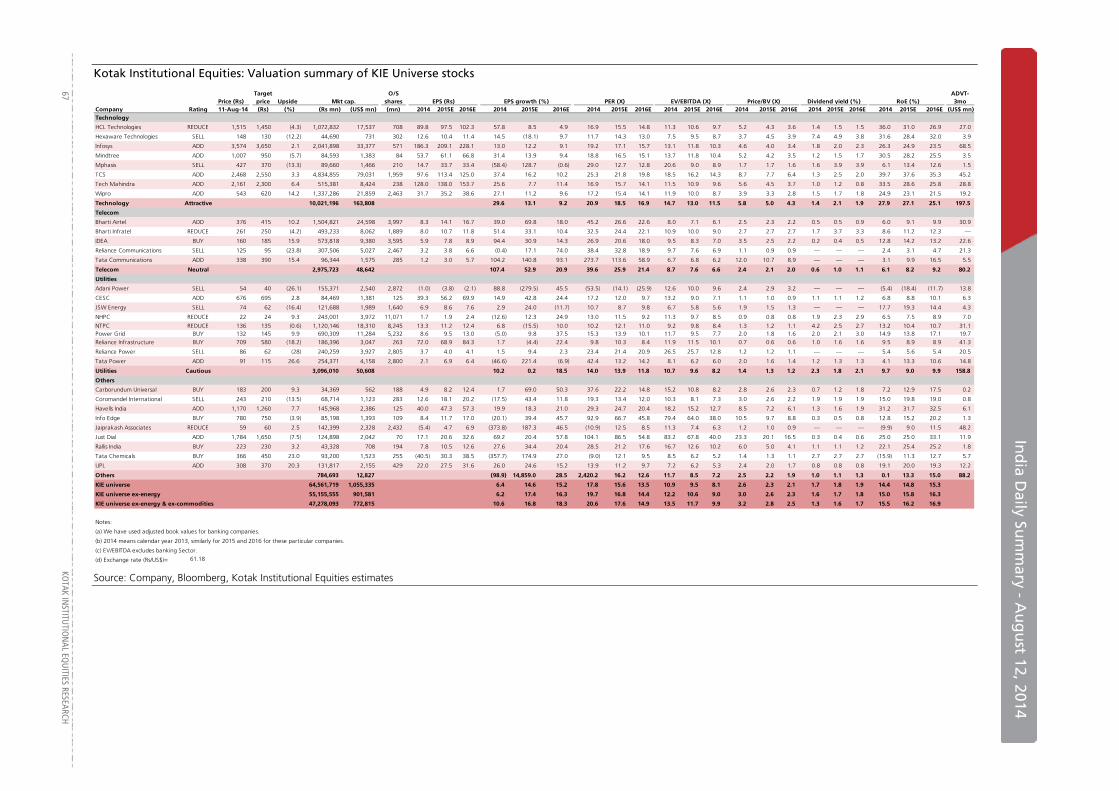
In
dia D
aily Sum
mary - A
ug
ust 12, 2014
67
KOTAK IN
STITUTIO
NAL EQ
UITIES RESEARCH
Kotak Institutional Equities: Valuation summary of KIE Universe stocks
Price (Rs)Target price Upside Mkt cap.
O/S shares EPS (Rs) EPS growth (%) PER (X) EV/EBITDA (X) Price/BV (X) RoE (%)
ADVT-3mo
Company Rating 11-Aug-14 (Rs) (%) (Rs mn) (US$ mn) (mn) 2014 2015E 2016E 2014 2015E 2016E 2014 2015E 2016E 2014 2015E 2016E 2014 2015E 2016E 2014 2015E 2016E 2014 2015E 2016E (US$ mn)Technology
HCL Technologies REDUCE 1,515 1,450 (4.3) 1,072,832 17,537 708 89.8 97.5 102.3 57.8 8.5 4.9 16.9 15.5 14.8 11.3 10.6 9.7 5.2 4.3 3.6 1.4 1.5 1.5 36.0 31.0 26.9 27.0
Hexaware Technologies SELL 148 130 (12.2) 44,690 731 302 12.6 10.4 11.4 14.5 (18.1) 9.7 11.7 14.3 13.0 7.5 9.5 8.7 3.7 4.5 3.9 7.4 4.9 3.8 31.6 28.4 32.0 3.9
Infosys ADD 3,574 3,650 2.1 2,041,898 33,377 571 186.3 209.1 228.1 13.0 12.2 9.1 19.2 17.1 15.7 13.1 11.8 10.3 4.6 4.0 3.4 1.8 2.0 2.3 26.3 24.9 23.5 68.5
Mindtree ADD 1,007 950 (5.7) 84,593 1,383 84 53.7 61.1 66.8 31.4 13.9 9.4 18.8 16.5 15.1 13.7 11.8 10.4 5.2 4.2 3.5 1.2 1.5 1.7 30.5 28.2 25.5 3.5
Mphasis SELL 427 370 (13.3) 89,660 1,466 210 14.7 33.7 33.4 (58.4) 128.7 (0.6) 29.0 12.7 12.8 20.6 9.0 8.9 1.7 1.7 1.6 1.6 3.9 3.9 6.1 13.4 12.6 1.5
TCS ADD 2,468 2,550 3.3 4,834,855 79,031 1,959 97.6 113.4 125.0 37.4 16.2 10.2 25.3 21.8 19.8 18.5 16.2 14.3 8.7 7.7 6.4 1.3 2.5 2.0 39.7 37.6 35.3 45.2
Tech Mahindra ADD 2,161 2,300 6.4 515,381 8,424 238 128.0 138.0 153.7 25.6 7.7 11.4 16.9 15.7 14.1 11.5 10.9 9.6 5.6 4.5 3.7 1.0 1.2 0.8 33.5 28.6 25.8 28.8
Wipro ADD 543 620 14.2 1,337,286 21,859 2,463 31.7 35.2 38.6 27.1 11.2 9.6 17.2 15.4 14.1 11.9 10.0 8.7 3.9 3.3 2.8 1.5 1.7 1.8 24.9 23.1 21.5 19.2
Technology Attractive 10,021,196 163,808 29.6 13.1 9.2 20.9 18.5 16.9 14.7 13.0 11.5 5.8 5.0 4.3 1.4 2.1 1.9 27.9 27.1 25.1 197.5
Telecom
Bharti Airtel ADD 376 415 10.2 1,504,821 24,598 3,997 8.3 14.1 16.7 39.0 69.8 18.0 45.2 26.6 22.6 8.0 7.1 6.1 2.5 2.3 2.2 0.5 0.5 0.9 6.0 9.1 9.9 30.9
Bharti Infratel REDUCE 261 250 (4.2) 493,233 8,062 1,889 8.0 10.7 11.8 51.4 33.1 10.4 32.5 24.4 22.1 10.9 10.0 9.0 2.7 2.7 2.7 1.7 3.7 3.3 8.6 11.2 12.3 —
IDEA BUY 160 185 15.9 573,818 9,380 3,595 5.9 7.8 8.9 94.4 30.9 14.3 26.9 20.6 18.0 9.5 8.3 7.0 3.5 2.5 2.2 0.2 0.4 0.5 12.8 14.2 13.2 22.6
Reliance Communications SELL 125 95 (23.8) 307,506 5,027 2,467 3.2 3.8 6.6 (0.4) 17.1 74.0 38.4 32.8 18.9 9.7 7.6 6.9 1.1 0.9 0.9 — — — 2.4 3.1 4.7 21.3
Tata Communications ADD 338 390 15.4 96,344 1,575 285 1.2 3.0 5.7 104.2 140.8 93.1 273.7 113.6 58.9 6.7 6.8 6.2 12.0 10.7 8.9 — — — 3.1 9.9 16.5 5.5
Telecom Neutral 2,975,723 48,642 107.4 52.9 20.9 39.6 25.9 21.4 8.7 7.6 6.6 2.4 2.1 2.0 0.6 1.0 1.1 6.1 8.2 9.2 80.2
Utilities
Adani Power SELL 54 40 (26.1) 155,371 2,540 2,872 (1.0) (3.8) (2.1) 88.8 (279.5) 45.5 (53.5) (14.1) (25.9) 12.6 10.0 9.6 2.4 2.9 3.2 — — — (5.4) (18.4) (11.7) 13.8
CESC ADD 676 695 2.8 84,469 1,381 125 39.3 56.2 69.9 14.9 42.8 24.4 17.2 12.0 9.7 13.2 9.0 7.1 1.1 1.0 0.9 1.1 1.1 1.2 6.8 8.8 10.1 6.3
JSW Energy SELL 74 62 (16.4) 121,688 1,989 1,640 6.9 8.6 7.6 2.9 24.0 (11.7) 10.7 8.7 9.8 6.7 5.8 5.6 1.9 1.5 1.3 — — — 17.7 19.3 14.4 4.3
NHPC REDUCE 22 24 9.3 243,001 3,972 11,071 1.7 1.9 2.4 (12.6) 12.3 24.9 13.0 11.5 9.2 11.3 9.7 8.5 0.9 0.8 0.8 1.9 2.3 2.9 6.5 7.5 8.9 7.0
NTPC REDUCE 136 135 (0.6) 1,120,146 18,310 8,245 13.3 11.2 12.4 6.8 (15.5) 10.0 10.2 12.1 11.0 9.2 9.8 8.4 1.3 1.2 1.1 4.2 2.5 2.7 13.2 10.4 10.7 31.1 Power Grid BUY 132 145 9.9 690,309 11,284 5,232 8.6 9.5 13.0 (5.0) 9.8 37.5 15.3 13.9 10.1 11.7 9.5 7.7 2.0 1.8 1.6 2.0 2.1 3.0 14.9 13.8 17.1 19.7
Reliance Infrastructure BUY 709 580 (18.2) 186,396 3,047 263 72.0 68.9 84.3 1.7 (4.4) 22.4 9.8 10.3 8.4 11.9 11.5 10.1 0.7 0.6 0.6 1.0 1.6 1.6 9.5 8.9 8.9 41.3
Reliance Power SELL 86 62 (28) 240,259 3,927 2,805 3.7 4.0 4.1 1.5 9.4 2.3 23.4 21.4 20.9 26.5 25.7 12.8 1.2 1.2 1.1 — — — 5.4 5.6 5.4 20.5
Tata Power ADD 91 115 26.6 254,371 4,158 2,800 2.1 6.9 6.4 (46.6) 221.4 (6.9) 42.4 13.2 14.2 8.1 6.2 6.0 2.0 1.6 1.4 1.2 1.3 1.3 4.1 13.3 10.6 14.8
Utilities Cautious 3,096,010 50,608 10.2 0.2 18.5 14.0 13.9 11.8 10.7 9.6 8.2 1.4 1.3 1.2 2.3 1.8 2.1 9.7 9.0 9.9 158.8
Others
Carborundum Universal BUY 183 200 9.3 34,369 562 188 4.9 8.2 12.4 1.7 69.0 50.3 37.6 22.2 14.8 15.2 10.8 8.2 2.8 2.6 2.3 0.7 1.2 1.8 7.2 12.9 17.5 0.2
Coromandel International SELL 243 210 (13.5) 68,714 1,123 283 12.6 18.1 20.2 (17.5) 43.4 11.8 19.3 13.4 12.0 10.3 8.1 7.3 3.0 2.6 2.2 1.9 1.9 1.9 15.0 19.8 19.0 0.8
Havells India ADD 1,170 1,260 7.7 145,968 2,386 125 40.0 47.3 57.3 19.9 18.3 21.0 29.3 24.7 20.4 18.2 15.2 12.7 8.5 7.2 6.1 1.3 1.6 1.9 31.2 31.7 32.5 6.1
Info Edge BUY 780 750 (3.9) 85,198 1,393 109 8.4 11.7 17.0 (20.1) 39.4 45.7 92.9 66.7 45.8 79.4 64.0 38.0 10.5 9.7 8.8 0.3 0.5 0.8 12.8 15.2 20.2 1.3
Jaiprakash Associates REDUCE 59 60 2.5 142,399 2,328 2,432 (5.4) 4.7 6.9 (373.8) 187.3 46.5 (10.9) 12.5 8.5 11.3 7.4 6.3 1.2 1.0 0.9 — — — (9.9) 9.0 11.5 48.2
Just Dial ADD 1,784 1,650 (7.5) 124,898 2,042 70 17.1 20.6 32.6 69.2 20.4 57.8 104.1 86.5 54.8 83.2 67.8 40.0 23.3 20.1 16.5 0.3 0.4 0.6 25.0 25.0 33.1 11.9
Rallis India BUY 223 230 3.2 43,328 708 194 7.8 10.5 12.6 27.6 34.4 20.4 28.5 21.2 17.6 16.7 12.6 10.2 6.0 5.0 4.1 1.1 1.1 1.2 22.1 25.4 25.2 1.8
Tata Chemicals BUY 366 450 23.0 93,200 1,523 255 (40.5) 30.3 38.5 (357.7) 174.9 27.0 (9.0) 12.1 9.5 8.5 6.2 5.2 1.4 1.3 1.1 2.7 2.7 2.7 (15.9) 11.3 12.7 5.7
UPL ADD 308 370 20.3 131,817 2,155 429 22.0 27.5 31.6 26.0 24.6 15.2 13.9 11.2 9.7 7.2 6.2 5.3 2.4 2.0 1.7 0.8 0.8 0.8 19.1 20.0 19.3 12.2
Others 784,693 12,827 (98.9) 14,859.0 28.5 2,420.2 16.2 12.6 11.7 8.5 7.2 2.5 2.2 1.9 1.0 1.1 1.3 0.1 13.3 15.0 88.2
KIE universe 64,561,719 1,055,335 6.4 14.6 15.2 17.8 15.6 13.5 10.9 9.5 8.1 2.6 2.3 2.1 1.7 1.8 1.9 14.4 14.8 15.3
KIE universe ex-energy 55,155,555 901,581 6.2 17.4 16.3 19.7 16.8 14.4 12.2 10.6 9.0 3.0 2.6 2.3 1.6 1.7 1.8 15.0 15.8 16.3
KIE universe ex-energy & ex-commodities 47,278,093 772,815 10.6 16.8 18.3 20.6 17.6 14.9 13.5 11.7 9.9 3.2 2.8 2.5 1.3 1.6 1.7 15.5 16.2 16.9
Notes:
(a) We have used adjusted book values for banking companies.
(b) 2014 means calendar year 2013, similarly for 2015 and 2016 for these particular companies.
(c) EV/EBITDA excludes banking Sector.
(d) Exchange rate (Rs/US$)= 61.18
Dividend yield (%)
Source: Company, Bloomberg, Kotak Institutional Equities estimates
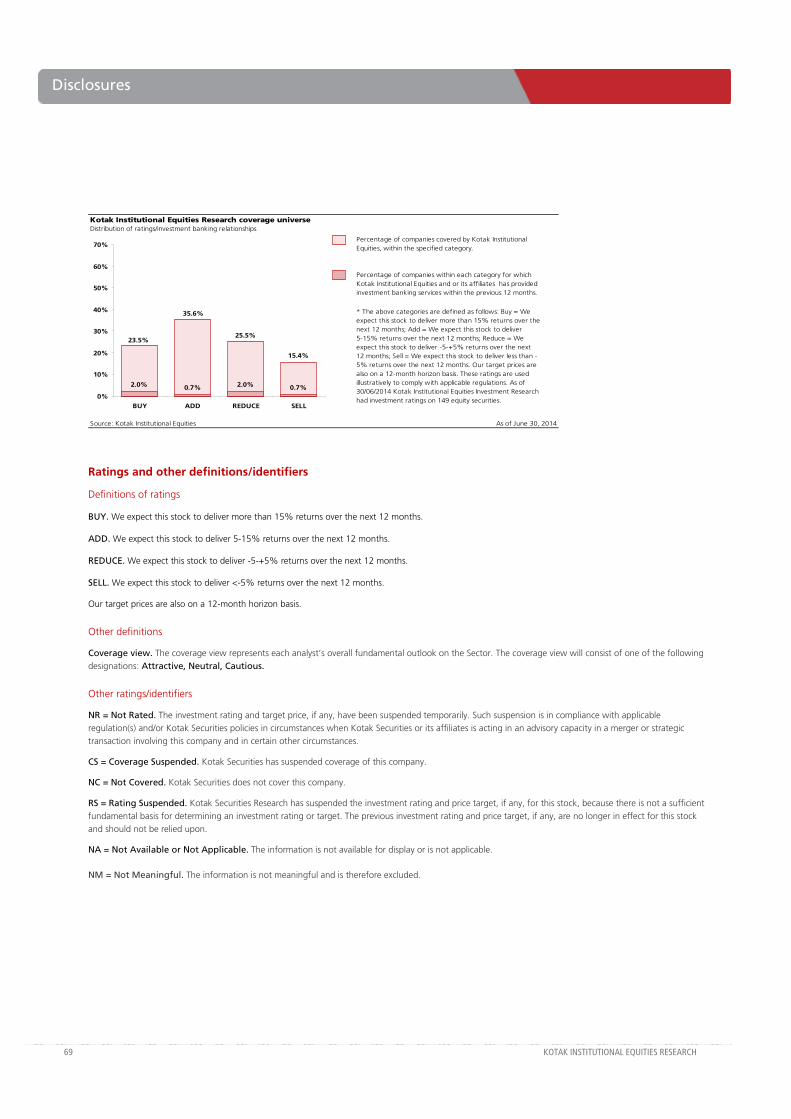
69 KOTAK INSTITUTIONAL EQUITIES RESEARCH
Disclosures
Kotak Institutional Equities Research coverage universeDistribution of ratings/investment banking relationships
Source: Kotak Institutional Equities As of June 30, 2014
Percentage of companies covered by Kotak Institutional Equities, within the specified category.
Percentage of companies within each category for which Kotak Institutional Equities and or its affiliates has provided investment banking services within the previous 12 months.
* The above categories are defined as follows: Buy = We expect this stock to deliver more than 15% returns over the next 12 months; Add = We expect this stock to deliver 5-15% returns over the next 12 months; Reduce = We expect this stock to deliver -5-+5% returns over the next 12 months; Sell = We expect this stock to deliver less than -5% returns over the next 12 months. Our target prices are also on a 12-month horizon basis. These ratings are used illustratively to comply with applicable regulations. As of 30/06/2014 Kotak Institutional Equities Investment Research had investment ratings on 149 equity securities.
15.4%
23.5%
35.6%
25.5%
2.0% 0.7% 2.0% 0.7%0%
10%
20%
30%
40%
50%
60%
70%
BUY ADD REDUCE SELL
Ratings and other definitions/identifiers
Definitions of ratings
BUY. We expect this stock to deliver more than 15% returns over the next 12 months.
ADD. We expect this stock to deliver 5-15% returns over the next 12 months.
REDUCE. We expect this stock to deliver -5-+5% returns over the next 12 months.
SELL. We expect this stock to deliver <-5% returns over the next 12 months.
Our target prices are also on a 12-month horizon basis.
Other definitions
Coverage view. The coverage view represents each analyst’s overall fundamental outlook on the Sector. The coverage view will consist of one of the following designations: Attractive, Neutral, Cautious.
Other ratings/identifiers
NR = Not Rated. The investment rating and target price, if any, have been suspended temporarily. Such suspension is in compliance with applicable regulation(s) and/or Kotak Securities policies in circumstances when Kotak Securities or its affiliates is acting in an advisory capacity in a merger or strategic transaction involving this company and in certain other circumstances.
CS = Coverage Suspended. Kotak Securities has suspended coverage of this company.
NC = Not Covered. Kotak Securities does not cover this company.
RS = Rating Suspended. Kotak Securities Research has suspended the investment rating and price target, if any, for this stock, because there is not a sufficient fundamental basis for determining an investment rating or target. The previous investment rating and price target, if any, are no longer in effect for this stock and should not be relied upon.
NA = Not Available or Not Applicable. The information is not available for display or is not applicable.
NM = Not Meaningful. The information is not meaningful and is therefore excluded.

Corporate Office Overseas Offices
Kotak Securities Ltd.
27 BKC, Plot No. C-27, “G Block”
Bandra Kurla Complex, Bandra (E)
Mumbai 400 051, India
Tel: +91-22-43360000
Kotak Mahindra (UK) Ltd
8th Floor, Portsoken House
155-157 Minories
London EC3N 1LS
Tel: +44-20-7977-6900
Kotak Mahindra Inc
50 Main Street, Ste. 890
Westchester Financial Centre
White Plains, New York 10606
Tel:+1-914-997-6120
Copyright 2014 Kotak Institutional Equities (Kotak Securities Limited). All rights reserved.
1. Note that the research analysts contributing to this report may not be registered/qualified as research analysts with FINRA; and
2. Such research analysts may not be associated persons of Kotak Mahindra Inc and therefore, may not be subject to NASD Rule 2711 restrictions on communications with a subject company, public appearances and trading securities held by a research analyst account.
3. Any U.S. recipients of the research who wish to effect transactions in any security covered by the report should do so with or through Kotak Mahindra Inc and (ii) any transactions in the securities covered by the research by U.S. recipients must be effected only through Kotak Mahindra Inc at [email protected].
Kotak Securities Limited and its affiliates are a full-service, integrated investment banking, investment management, brokerage and financing group. We along with our affiliates are leading underwriter of securities and participants in virtually all securities trading markets in India. We and our affiliates have investment banking and other business relationships with a significant percentage of the companies covered by our Investment Research Department. Our research professionals provide important input into our investment banking and other business selection processes. Investors should assume that Kotak Securities Limited and/or its affiliates are seeking or will seek investment banking or other business from the company or companies that are the subject of this material and that the research professionals who were involved in preparing this material may participate in the solicitation of such business. Our research professionals are paid in part based on the profitability of Kotak Securities Limited, which include earnings from investment banking and other business. Kotak Securities Limited generally prohibits its analysts, persons reporting to analysts, and members of their households from maintaining a financial interest in the securities or derivatives of any companies that the analysts cover. Additionally, Kotak Securities Limited generally prohibits its analysts and persons reporting to analysts from serving as an officer, director, or advisory board member of any companies that the analysts cover. Our salespeople, traders, and other professionals may provide oral or written market commentary or trading strategies to our clients that reflect opinions that are contrary to the opinions expressed herein, and our proprietary trading and investing businesses may make investment decisions that are inconsistent with the recommendations expressed herein. In reviewing these materials, you should be aware that any or all of the foregoing, among other things, may give rise to real or potential conflicts of interest. Additionally, other important information regarding our relationships with the company or companies that are the subject of this material is provided herein.
This material should not be construed as an offer to sell or the solicitation of an offer to buy any security in any jurisdiction where such an offer or solicitation would be illegal. We are not soliciting any action based on this material. It is for the general information of clients of Kotak Securities Limited. It does not constitute a personal recommendation or take into account the particular investment objectives, financial situations, or needs of individual clients. Before acting on any advice or recommendation in this material, clients should consider whether it is suitable for their particular circumstances and, if necessary, seek professional advice. The price and value of the investments referred to in this material and the income from them may go down as well as up, and investors may realize losses on any investments. Past performance is not a guide for future performance, future returns are not guaranteed and a loss of original capital may occur. Kotak Securities Limited does not provide tax advise to its clients, and all investors are strongly advised to consult with their tax advisers regarding any potential investment.
Certain transactions -including those involving futures, options, and other derivatives as well as non-investment-grade securities - give rise to substantial risk and are not suitable for all investors. The material is based on information that we consider reliable, but we do not represent that it is accurate or complete, and it should not be relied on as such. Opinions expressed are our current opinions as of the date appearing on this material only. We endeavor to update on a reasonable basis the information discussed in this material, but regulatory, compliance, or other reasons may prevent us from doing so. We and our affiliates, officers, directors, and employees, including persons involved in the preparation or issuance of this material, may from time to time have “long” or “short” positions in, act as principal in, and buy or sell the securities or derivatives thereof of companies mentioned herein. For the purpose of calculating whether Kotak Securities Limited and its affiliates holds beneficially owns or controls, including the right to vote for directors, 1% of more of the equity shares of the subject issuer of a research report, the holdings does not include accounts managed by Kotak Mahindra Mutual Fund. Kotak Securities Limited and its non US affiliates may, to the extent permissible under applicable laws, have acted on or used this research to the extent that it relates to non US issuers, prior to or immediately following its publication. Foreign currency denominated securities are subject to fluctuations in exchange rates that could have an adverse effect on the value or price of or income derived from the investment. In addition, investors in securities such as ADRs, the value of which are influenced by foreign currencies affectively assume currency risk. In addition options involve risks and are not suitable for all investors. Please ensure that you have read and understood the current derivatives risk disclosure document before entering into any derivative transactions.
This report has not been prepared by Kotak Mahindra Inc. (KMInc). However KMInc has reviewed the report and, in so far as it includes current or historical information, it is believed to be reliable, although its accuracy and completeness cannot be guaranteed. Any reference to Kotak Securities Limited shall also be deemed to mean and include Kotak Mahindra Inc.
This report is distributed in Singapore by Kotak Mahindra (UK) Limited (Singapore Branch) to institutional investors, accredited investors or expert investors only as defined under the Securities and Futures Act. Recipients of this analysis / report are to contact Kotak Mahindra (UK) Limited (Singapore Branch) (16 Raffles Quay, #35-02/03, Hong Leong Building, Singapore 048581) in respect of any matters arising from, or in connection with, this analysis / report. Kotak Mahindra (UK) Limited (Singapore Branch) is regulated by the Monetary Authority of Singapore.
![[Kotak] India Daily, June 07, 2013 - Google Groups](https://img.dokumen.tips/doc/110x75/631ed20f1aedb9cd850fee8c/kotak-india-daily-june-07-2013-google-groups.jpg)
![[Kotak] India Daily, February 18, 2016 - Kotak Securities](https://img.dokumen.tips/doc/110x75/633a76e102bd8edb4701c87a/kotak-india-daily-february-18-2016-kotak-securities.jpg)


![[Kotak] India Daily, January 22, 2016 - Kotak Securities](https://img.dokumen.tips/doc/110x75/63326d5a3108fad7760e9e33/kotak-india-daily-january-22-2016-kotak-securities.jpg)


![[Kotak] India Daily, September 02, 2016 - Kotak Securities](https://img.dokumen.tips/doc/110x75/631eaab825add517740b26fe/kotak-india-daily-september-02-2016-kotak-securities.jpg)


