Embed Size (px)
Citation preview
Hindawi Publishing CorporationJournal of Biomedicine and BiotechnologyVolume 2012, Article ID 282989, 13 pagesdoi:10.1155/2012/282989
Review Article
Pharmacokinetic Models for FcRn-Mediated IgG Disposition
Jim J. Xiao
Department of Clinical Pharmacology, Genentech Inc., 1 DNA Way, MS 463A, South San Francisco, CA 94080, USA
Correspondence should be addressed to Jim J. Xiao, [email protected]
Received 30 January 2012; Accepted 28 February 2012
Academic Editor: Dobromir Dobrev
Copyright © 2012 Jim J. Xiao. This is an open access article distributed under the Creative Commons Attribution License, whichpermits unrestricted use, distribution, and reproduction in any medium, provided the original work is properly cited.
The objectives were to review available PK models for saturable FcRn-mediated IgG disposition, and to explore an alternativesemimechanistic model. Most available empirical and mechanistic PK models assumed equal IgG concentrations in plasma andendosome in addition to other model-specific assumptions. These might have led to inappropriate parameter estimates andmodel interpretations. Some physiologically based PK (PBPK) models included FcRn-mediated IgG recycling. The nature ofPBPK models requires borrowing parameter values from literature, and subtle differences in the assumptions may render dramaticchanges in parameter estimates related to the IgG recycling kinetics. These models might have been unnecessarily complicated toaddress FcRn saturation and nonlinear IgG PK especially in the IVIG setting. A simple semimechanistic PK model (cutoff model)was developed that assumed a constant endogenous IgG production rate and a saturable FcRn-binding capacity. The FcRn-bindingcapacity was defined as MAX, and IgG concentrations exceeding MAX in endosome resulted in lysosomal degradation. The modelparameters were estimated using simulated data from previously published models. The cutoff model adequately described the ratand mouse IgG PK data simulated from published models and allowed reasonable estimation of endogenous IgG turnover rates.
1. Introduction
Under physiological conditions, IgG has prolonged half-life(t1/2) relative to other plasma proteins, while IgG eliminationis faster at much higher concentrations. These observationsprompted Brambell et al. to propose a theoretical saturableprotective Fc receptor in 1964 [1]. Subsequently, Brambelldemonstrated that a neonatal intestinal receptor (FcRn)is responsible for maternal-to-infant IgG transport [2].Waldmann and Strober later showed that FcRn preferentiallybinds to IgG Fc at lower pH [3]. The expression of FcRnin neonatal gut is transient [4], while in adults FcRn isexpressed primarily in muscle, skin, vascular endothelium atrelatively high levels [5–8]. The FcRn-mediated IgG recyclingcan be described as a 3-step process: (1) passive pinocytosisof IgG into endothelial cells; (2) acidification in endosome byH+ ATPase to approximately pH 6 allowing IgG binding toFcRn; (3) unbound IgG is destined to lysosomal degradationwhile bound IgG is diverted back to circulation. Fc-FcRnbinding in endosome may change FcRn distribution andintracellular trafficking of FcRn-coated endosome vesicles[9]. This directed endosome trafficking mechanism mayfurther explain the high efficiency of IgG recycling.
FcRn is similar to the MHC class I molecule, consisting ofa three-domain alpha subunit coupled with β-2 microglob-ulin. Mutation of the FcRn β-2 microglobulin in mice(β2m −/−) led to approximately 8–15-fold increase in IgGclearance [4, 6, 10]. This more-than-8-fold lower IgG clear-ance due to FcRn protection implies that an IgG moleculeundergoes multiple cycles of FcRn-mediated endosomalrecycling before its degradation in lysosome in mice.
Quantitative understanding of IgG recycling has beenevolving. The first attempts in the 1960s by Brambell et al. [1]and Waldmann and Strober [3] were empirical by correlatingfraction catabolic rate with plasma IgG concentrations. In1966, Wochner et al. studied IgG disposition in patientswith myotonic dystrophy, a hereditary error resulting inplasma deficiency of IgG but not albumin [11]. In 1990,Waldmann and Terru published IgG disposition in twopatients with familial hypercatabolic hypoproteinemia [12].These data provided insightful human kinetic data of theimpact of FcRn on IgG disposition. In 2006, Kim et al.developed a mechanistic PK model for FcRn-mediated IgGPK in human [13]. The paper was an elegant review ofavailable quantitative human IgG data in this field; it was

2 Journal of Biomedicine and Biotechnology
also the first attempt to quantitatively assess IgG homeostasisand its disturbance by genetic FcRn diseases. Despite theseveral identified gaps due to limited available experimentaldata [14], the proposed model seems to be so far the bestmechanistic model in human.
Saturation of FcRn by intravenous administration ofhigh doses of pooled immunoglobulin (IVIG) has been a suc-cessful approach to clear pathogenic autoimmune antibodiesfrom circulation, especially in patients with immune throm-bocytopenia (ITP) [15]. Several semimechanistic modelshave been proposed to describe IgG disposition in IVIG set-ting in experimental animal models [16–19]. These modelsare discussed in detail in this paper. Quantitative models inclinical IVIG settings have not been published.
In addition, physiologically based PK (PBPK) modelshave been developed [20–23]. The models included multipleorgans/tissues of interest, investigated the kinetics and deter-minants of IgG tissue distribution, and allowed studying thenonlinear FcRn and IgG recycling kinetics. However, thesemodels are complicated in nature, and interpretations ofFcRn-mediated IgG recycling seem very different among themodels.
A new semimechanistic PK model is proposed. Inthis model, the saturable FcRn binding in endosome andsubsequent IgG degradation are captured using a simplecutoff approach. The model avoided several questionableassumptions in previous work and adequately described datasimulated from a previously published rat and mouse IVIGmodel.
2. Methods
2.1. Source IgG PK Data for Model Fitting. The rat andmouse semimechanistic IgG PK models [24] developed byHansen and Balthasar were reconstructed in NONMEM(version 6.2.0; Icon Development Solutions, Ellicott City,MD). Since Hansen’s model was derived from [17, 25] andadequately described [24] the experimental data, Hansen’smodels were used to simulate (reconstruct) the rat andmouse PK data according to the designs of the originalexperiments. Intersubject variability was fixed to 0. Thesimulated data were then used as source data to estimate thePK parameters in the new proposed rat and mouse cutoffmodels.
The rat experimental designs were as follows. In Study1, an IV bolus dose of a monoclonal antibody 7E3, aplatelet-binding antibody, was given to rats at 0.8, 4, or8 mg/kg. Plasma PK was determined at 1, 3, 6, 12, 24, 48,72, 96, and 168 hours after dose. In Study 2, rats receiveda single high dose IVIG at 0.4, 1, or 2 g/kg, followed bya single IV bolus dose of 7E3 at 8 mg/kg. Plasma PK wasdetermined at 1, 3, 6, 12, 24, 48, 96, and 168 hours after dose.The simulated PK profiles using the reconstructed Hansen’smodel looked identical to the published results [24]. Both7E3 and endogenous IgG concentration-time profiles weresimulated, but only the plasma 7E3 PK data was used toestimate the parameter values of the new models.
The mouse study was as follows: an IV bolus dose of 7E3was given to FcRn wild-type (WT) mice with or without
concomitant dosing of 1 g/kg IVIG. PK plasma samples werecollected at 1 and 12 hour, and 1, 2, 4, 7, 14, 23, 30, and 60days after dose. Similarly, an IV bolus dose of 7E3 was givento FcRn knockout (KO) mice with or without concomitantdosing of 1 g/kg IVIG. PK plasma samples were collected at 1and 12 hour, and 1, 2, 3, and 4 days after dose. Note that themouse PK sampling time points were estimated based on thepublished figures [24] and may be slightly different from theoriginal designs.
2.2. Full Mechanistic PK Model. The concept of the modelis presented in Figure 1. In the full model scheme (upperpanel), IgG disposition involves 3 compartments, that is, acentral (plasma) compartment, a peripheral (tissue) com-partment, and an endosome compartment nested in theperipheral compartment. As in Hansen’s paper, IgG of differ-ent sources (i.e., 7E3, IVIG, and endogenous) were assumedto follow the same disposition kinetics [24]. In additionto first-order distribution (Q) between the central andperipheral compartments and first-order elimination (CL)from the central compartment, IgGs in the peripheral com-partment also undergo endosome circulation/degradation.This starts with a nonspecific uptake by pinocytosis of first-order kinetics (CLU), and followed by two transient stepsgoverned by transit time τ1 and τ2. During τ1, the endosomalpH decreases to approximately 6 by H+ ATPase in parallel toIgG sorting when IgG molecules compete for FcRn. Duringτ2, unbound IgGs get degraded. The FcRn-bound IgG is thenrecycled to circulation. A convenient assumption was madethat the endosome vesicle volume does not change from theinitial pinocytosis to the final fusion to plasma membrane.This allowed inferring FcRn saturation and fraction ofunbound drug ( fU) using the total IgG concentration in theperipheral compartment. The total volume of endosome at agiven time is determined by CLU and the transit time τ1 andτ2.
2.3. Reduced Semimechanistic PK Model (Cutoff Model). Itwas reported that the endosome transit time is about 7 min[26, 27]. The whole recycling cycle can be instantaneouslycompared with the relatively slow elimination phase. Forthis reason, a simplified model was proposed where theendosome process collapsed into a nonlinear eliminationdirectly from the peripheral compartment, that is, CLU × fU(Figure 1, lower panel).
The cutoff model has 6 compartments (CMTs). All thethree sources of IgGs (i.e., 7E3, IVIG, and endogenous IgGs)were incorporated in the model and share the same PKparameters including CL, Q, CLU , the central compartmentvolume (VC = V1 = V3 = V5), and the peripheralcompartment volume (VP = V2 = V4 = V6). In addition,it was assumed that kin is the same regardless of the FcRnstatus in mice.
A key assumption was made for the fU calculation. Ahypothetical FcRn capacity parameter (Max) was proposed,fU = (CP,T − Max)/CP,T , where CP,T is the total IgGconcentration in the peripheral compartments (CMTs 2,4, and 6). When CP,T ≤ Max, fU = 0. In FcRn KO

Journal of Biomedicine and Biotechnology 3
Central CMT
Peripheral CMT
Endosome
CMT
Central CMT Peripheral CMT
τ1 τ2
×
CL
Q
Q
CL
ink
VC
VP
CLU × fU
CLU × fU
CLUCLU (1− fU )
VE
(2) Ab 7E3(1) Ab 7E3
(4) IVIG IgG(3) IVIG IgG
(5) Endogenous IgG (6) Endogenous IgG
Figure 1: The proposed cutoff PK models. The full physiologicalmodel scheme (upper panel) describes physical processes, includingIgG distribution in central, peripheral, and endosome compart-ments, nonspecific elimination from central compartment (CL),and FcRn-mediated endosomal IgG recycling and elimination in theendosome. The endosome space is nested in the peripheral com-partment. In the reduced cutoff PK model scheme (lower panel),the endosome compartment is collapsed. The net endosomal IgGclearance is determined by endosomal uptake clearance (CLU) fromthe peripheral compartment, the FcRn capacity (Max), the total IgGconcentration in peripheral compartment (CP,T), and the unboundfraction ( fU), where fU = (CP,T −Max)/CP,T if CP,T > Max; fU = 0if CP,T < Max or in FcRn KO mice.
mice (i.e., MAX = 0), fU = 1. It was assumed that 7E3,IVIG, and endogenous IgGs have similar binding affinity forFcRn. In addition, instead of assuming that the microrateconstants for endosome uptake (kup) and return rate (kret)are equal as in other semimechanistic models [13, 16–19], a constant intercompartment clearance was assumedwhere the pinocytosis uptake clearance (CLU) is the sumof endosome degradation clearance (CLU × fU) and thereturning clearance (CLU × (1− fU)).
The baseline endogenous plasma IgG concentrationsin FcRn WT animals (C5,WT,0) were fixed to 103 μM and14.7 μM for rats and mice, respectively [24], where thesubscript 5 is the compartment number (Figure 1, lowerpanel), WT stands for FcRn WT, and 0 represents time 0(baseline). Since the endosome recycling and eliminationare linked to the peripheral compartments (CMTs 2, 4,and 6), C6,WT,0 may be lower than C5,WT,0 if fU > 0. Asa result, conditional equations were derived to calculatesecondary parameters, including C6,WT,0, the endogenousIgG production rate (kin), and baseline fU ( fU ,WT,0)
C6,WT,0 = C5,WT,0 ×Q + CLU ×MAXQ + CLU
, (1)
kin = C5,.WT,0 × CL + CLU × C6,WT,0 − CLU ×MAX, (2)
fU ,WT,0 = C6,WT,0 −MAXC6,WT,0
. (3)
However, when C6,WT,0 ≤ MAX,
C6,WT,0 = C5,WT,0, (4)
kin = C5,WT,0 × CL, (5)
fU ,WT,0 = 0. (6)
Note that (1)–(6) rely on the C5,WT,0 values reported inthe literature with normal FcRn expressions. In order toallow the model to predict endogenous IgG levels in FcRnKO mice, baseline endogenous IgG levels need to be definedindependent of C5,WT,0
A6,0= VP× kin×Q + CLU× CL×MAX + CLU×Q ×MAXQ × CL + CLU× CL + CLU×Q
,
(7)
A5,0 = VC × kin − CLU ×(A6,0/VP
)+ CLU ×MAX
CL, (8)
fU = A6,0 −MAX×VP
A6,0, (9)
where A5,0 and A6,0 are the endogenous IgG levels at baselinein the central and peripheral compartment, respectively.
In FcRn KO animals, MAX = 0 and the baseline can besimplified to the following:
A6,0 = VP × kin ×Q
Q × CL + CLU × CL + CLU ×Q, (10)
A5,0 = VC × kin − CLU ×(A6,0/VP
)
CL, (11)
fU = 1. (12)
When A6,0/VP ≤ MAX, there is no IgG elimination fromthe peripheral compartment, and the baseline condition isdefined as follows:
A6,0 = VP × kin
CL,
A5,0 = VC × kin
CL,
fU = 0.
(13)
The derivations of the above equations are provided inthe appendix.
The PK of 7E3, IVIG, and endogenous IgGs were furtherdefined by differential equations:
dA1
dt= −CL× A1
VC− Q × A1
VC+Q × A2
VP, (14)
dA2
dt= Q × A1
VC− Q × A2
VP− CLU × fU × A2
VP, (15)

4 Journal of Biomedicine and Biotechnology
dA3
dt= −CL× A3
VC− Q × A3
VC+Q × A4
VP, (16)
dA4
dt= Q × A3
VC− Q × A4
VP− CLU × fU × A4
VP, (17)
dA5
dt= −CL× A5
VC− Q × A5
VC+Q × A6
VP+ kin, (18)
dA6
dt= Q × A5
VC− Q × A6
VP− CLU × fU × A6
VP, (19)
where CP,T = (A2 + A4 + A6)/VP , and fU = (CP,T −MAX)/CP,T .
2.4. Cutoff Model Parameter Estimation and Simulation. Themodels were coded in NONMEM (version 6.2.0) with FOCEmethod. A total of 6 model parameters (i.e., VC , VP , CL,Max, Q, and CLU) were estimated by fitting the modelwith the simulated rat or mouse 7E3 plasma PK data. Aconstant coefficient of variation error model was used. Modelperformance was assessed visually by diagnostic plots. Themodel was then used to simulate 7E3, IVIG, and endogenousIgG concentrations under the experimental conditions. Asensitivity test was conducted to assess the effects of Max andCLU on the 7E3 PK profile in the presence or absence of IVIG(2 g/kg) using the rat model.
3. Results
The parameter estimates of the reduced models are summa-rized in Table 1.
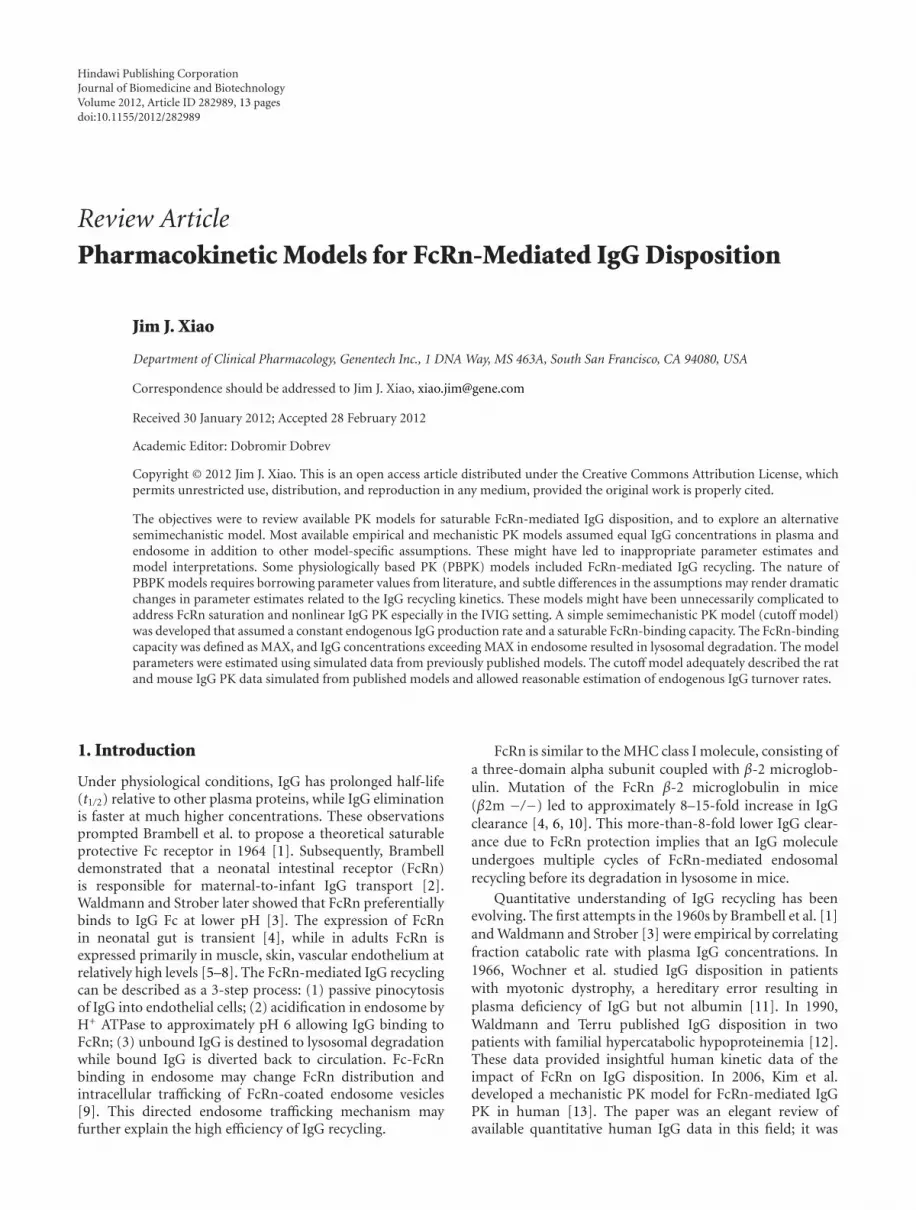
The rat cutoff model adequately described the simulatedplasma 7E3 concentrations with or without IVIG usingHansen’s model (Figures 2(a) and 2(b)). The estimatedVC and VP values were 39.8 and 29.3 mL/kg, respectively,comparable to typical values for IgG reported in theliterature [27]. The Cutoff Max was estimated to be 108 μM(16.2 mg/mL). With the endogenous IgG level of 103 μM,rat FcRn should not be saturated at baseline, that is, fU= 0. CLU , CL, and Q were estimated to be 2580, 24.5,and 81.0 mL/d/kg, respectively. The high CLU value wassomewhat unexpected, but physiologically it may make sensebecause a big component of the empirical peripheral com-partment is comprised of endothelial cells expressing FcRn.As schematically shown in Figure 1, the nested structureand the fast CLU suggest high intracompartment traffickingrate and endosomal recycling rate. Since FcRn was notsaturated at baseline, the zero-order kin was estimated tobe 2.52 μmol/d/kg (or 378 μg/d/kg) using (5) instead of (2).All disposition PK parameters were estimated with goodprecisions (%RSE ≤ 6.7%). However, cautions should beused in interpreting the %RSE values because of the use ofsimulated data in the model fitting.
The plasma and peripheral concentration profiles of7E3, IVIG, and endogenous IgGs were simulated usingthe rat cutoff model (Figure 3). Similar to plasma 7E3 PK
profiles, the peripheral 7E3 exposures were lower with theincreasing IVIG. The IVIG exposures increased at higherdose levels, with the highest plasma IVIG IgG concen-tration of 336 μM following 2 g/kg IVIG, approximately3.3 times the endogenous level. This increased the totalIgG concentration above MAX and was the driver for thenonlinear 7E3 PK. The endogenous IgG PK was minimallyimpacted by 7E3 alone (8 mg/kg), but decreased follow-ing IVIG treatment in an IVIG-dose-dependent manner,reaching maximum suppression of 13%, 28%, and 42%with 0.4, 1, and 2 g/kg IVIG, respectively. The extent ofendogenous IgG suppression was similar to the valuesestimated using Hansen’s model (differences within ±2%)[24].
Similarly, the mouse cutoff model adequately describedthe simulated plasma 7E3 concentrations using Hansen’smodel (Figure 2(c)), with or without IVIG, and in FcRnWT or KO mice. The estimated VC and VP values were66.8 and 65.5 mL/kg, respectively, larger than the estimatesin the rat cutoff model. The CLU , CL, and Q values were564, 5.63, and 72.1 mL/d/kg, respectively, similar to therat estimates. FcRn was not expected to be saturated atthe baseline as MAX was estimated to be 20.1 μM, higherthan the mouse baseline endogenous IgG concentrationof 14.7 μM. Consistent with Hansen’s model, the levels of7E3 were eliminated monoexponentially in FcRn KO miceregardless of IVIG dose as IgGs were no longer protectedby FcRn (Figure 2(c)). The endogenous IgG production ratewas estimated to be 0.0827 μmol/d/kg. All PK parameterswere estimated with reasonable precisions except Q that hada %RSE of 29.8% (Table 1).
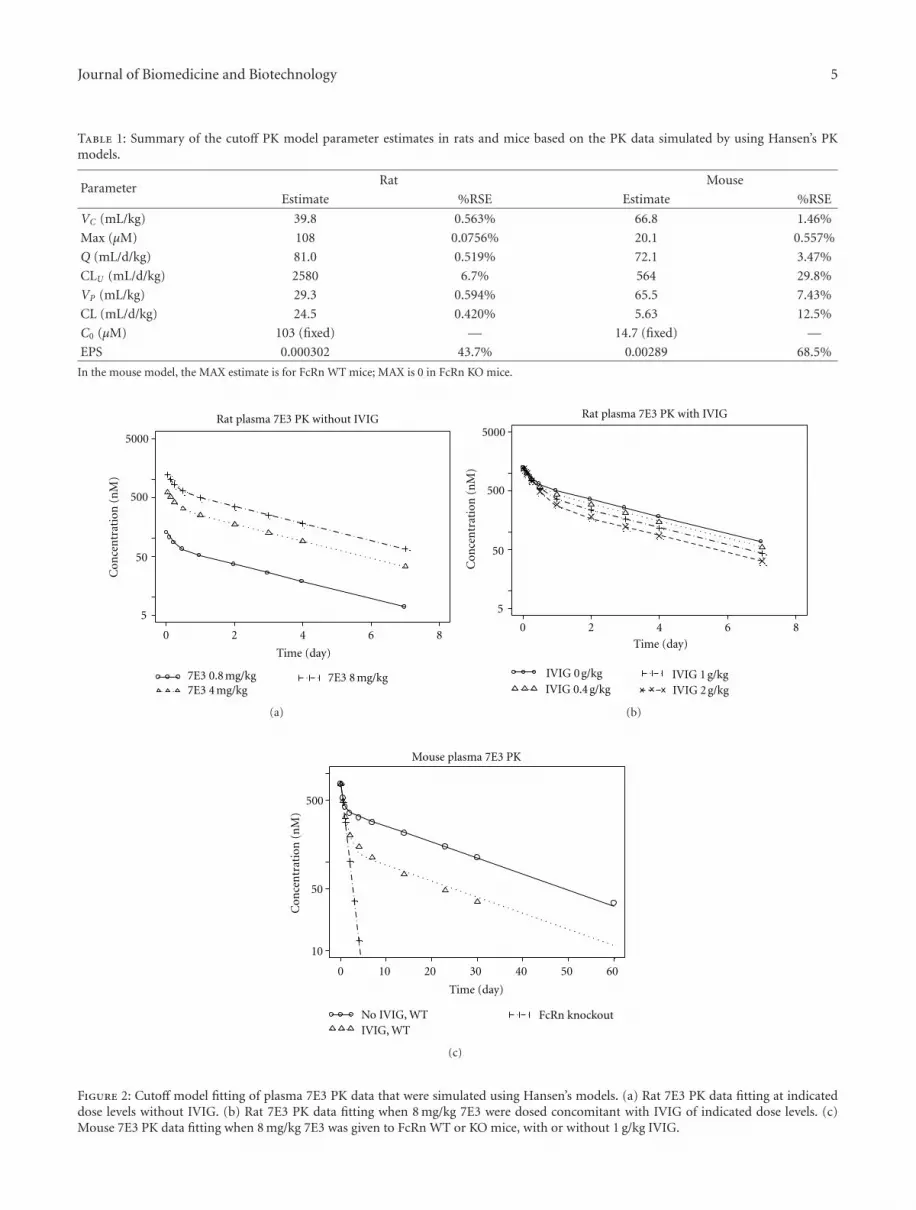
The mouse cutoff model was then used to simulate theplasma and peripheral concentration profiles of 7E3, IVIG,and endogenous IgG under the experimental conditions(Figure 4). Similar to plasma 7E3 PK profiles, the peripheral7E3 exposures were lower with IVIG in FcRn WT mice.The highest plasma IVIG IgG concentration following 1 g/kgIVIG was approximately 100 μM (7.8 times the endogenouslevel), thus transiently decreased the endogenous IgG level byup to 62%. In FcRn KO mice, IgG is not protected by FcRn(MAX = 0 and fU = 1) while kin remained the same as inFcRn WT mice. As a result, the plasma endogenous IgG levelsat the baseline were 14.7 and 1.19 μM in WT and KO mice,respectively.
Sensitivity test was conducted with the rat model toevaluate the effects of Max and CLU on plasma 7E3. Inthe absence of IVIG, the plasma 7E3 level increased withincreasing Max when Max was less than total IgG level, butremained superimposable as Max was ≥108 μM and fU = 0(Figure 5). Concomitant 2 g/kg IVIG potentiated the effectof Max, and plasma 7E3 levels increased with the increasingMax throughout the tested Max range. On the other hand,changes in CLU did not show appreciable impact on 7E3PK profiles (data not shown), indicating that CLU could notbe well estimated. This is consistent with the higher %RSEvalues for CLU in both species (Table 1) and is likely due tolack of informative data about endosomal IgG eliminationkinetics.
Journal of Biomedicine and Biotechnology 5
Table 1: Summary of the cutoff PK model parameter estimates in rats and mice based on the PK data simulated by using Hansen’s PKmodels.
ParameterRat Mouse
Estimate %RSE Estimate %RSE
VC (mL/kg) 39.8 0.563% 66.8 1.46%
Max (μM) 108 0.0756% 20.1 0.557%
Q (mL/d/kg) 81.0 0.519% 72.1 3.47%
CLU (mL/d/kg) 2580 6.7% 564 29.8%
VP (mL/kg) 29.3 0.594% 65.5 7.43%
CL (mL/d/kg) 24.5 0.420% 5.63 12.5%
C0 (μM) 103 (fixed) — 14.7 (fixed) —
EPS 0.000302 43.7% 0.00289 68.5%
In the mouse model, the MAX estimate is for FcRn WT mice; MAX is 0 in FcRn KO mice.
0 2 4 6 8
5
50
500
5000
Time (day)
7E3 0.8 mg/kg7E3 4 mg/kg
7E3 8 mg/kg
Con
cen
trat
ion
(n
M)
Rat plasma 7E3 PK without IVIG
(a)
0 2 4 6 8
5
50
500
5000
IVIG 0.4 g/kgIVIG 0 g/kg
IVIG 2 g/kgIVIG 1 g/kg
Time (day)
Con
cen
trat
ion
(n
M)
Rat plasma 7E3 PK with IVIG
(b)
0 10 20 30 40 50 60
IVIG, WT
50
10
500
Con
cen
trat
ion
(n
M)
No IVIG, WT FcRn knockout
Time (day)
Mouse plasma 7E3 PK
(c)
Figure 2: Cutoff model fitting of plasma 7E3 PK data that were simulated using Hansen’s models. (a) Rat 7E3 PK data fitting at indicateddose levels without IVIG. (b) Rat 7E3 PK data fitting when 8 mg/kg 7E3 were dosed concomitant with IVIG of indicated dose levels. (c)Mouse 7E3 PK data fitting when 8 mg/kg 7E3 was given to FcRn WT or KO mice, with or without 1 g/kg IVIG.

6 Journal of Biomedicine and Biotechnology
0 2 4 6 8
Time (day)
5
50
500
5000
Pla
sma
con
cen
trat
ion
(n
M)
7E3 PK
IVIG 0 g/kgIVIG 0.4 g/kg IVIG 2 g/kg
IVIG 1 g/kg
(a)
0 2 4 6 8
Time (day)
1
5
50
500
Pla
sma
con
cen
trat
ion
(μ
M)
IVIG PK
IVIG 0.4 g/kg IVIG 2 g/kgIVIG 1 g/kg
(b)
0 2 4 6 8
Time (day)
10
50
100
500
Pla
sma
con
cen
trat
ion
(μ
M)
Endogenous IgG PK
IVIG 0 g/kgIVIG 0.4 g/kg IVIG 2 g/kg
IVIG 1 g/kg
(c)
5
50
500
5000
Peri
pher
al c
once
ntr
atio
n (
nM
)
0 2 4 6 8
Time (day)
IVIG 0 g/kgIVIG 0.4 g/kg IVIG 2 g/kg
IVIG 1 g/kg
(d)
0 2 4 6 8
Time (day)
1
5
50
500
Peri
pher
al c
once
ntr
atio
n (μ
M)
IVIG 0.4 g/kg IVIG 2 g/kgIVIG 1 g/kg
(e)
0 2 4 6 8
Time (day)
10
50
100
500
Peri
pher
al c
once
ntr
atio
n (μ
M)
IVIG 0 g/kgIVIG 0.4 g/kg IVIG 2 g/kg
IVIG 1 g/kg
(f)
Figure 3: Simulated PK profiles using the rat cutoff model. All rats receive 8 mg/kg 7E3, as well as IVIG at indicated dose levels. Plasma andperipheral concentrations of 7E3, IVIG IgG, and endogenous IgG are plotted.
In most published models, the FcRn-IgG binding andFcRn saturation were based on either multiexponent func-tions [1, 3, 20], Langmuir-type binding isotherm, andquadratic equation solution of unbound concentration [16,19, 24], or Michaelis-Menten kinetics [13]. In this proposedmodel, a simplified cutoff concept was introduced to describethe saturable FcRn-mediated kinetics. The relationshipbetween the model estimated fU and total peripheral IgGconcentration is plotted in Figure 6. Under the simulatedexperimental conditions, the fU ranged from 0 to 0.076 inrats, 0 to 0.25 in FcRn WT mice, and remained 1 in FcRnKO mice. For both species (FcRn WT), the cutoff model esti-mated fU-total peripheral IgG concentration profiles are inparallel with the fU-total plasma IgG concentration profilesestimated using Hansen’s models. The difference is largelydue to the different model structures and the additional
nonspecific linear IgG elimination (CL) in the cutoff modelswhich is absent in Hansen’s models.
4. Discussion
4.1. Bleeker’s Model [28]. The relationship between fractionclearance rate (FCR) and plasma IgG concentration wasdescribed by exponential equations in both human andmice using previously published data. This approach wasempirical and did not allow physiological interpretationsuch as recycling rate and efficiency [13]. A mammillaryPK model coupled with the predicted FCR was used forsimulation and the results were consistent with IgG t1/2 underphysiological conditions and some clinical data. However,it underestimated IVIG effect on autoantibody suppressionand overpredicted IgG exposures in FcRn KO model [18].
Journal of Biomedicine and Biotechnology 7
Time (day)
1
10
100
1000
Con
cen
trat
ion
(n
M)
0 10 30 50
KO
Plasma 7E3 PK
No IVIG, WT
IVIG, WT
(a)
0 10 30 50
Time (day)
Plasma IVIG PK
Con
cen
trat
ion
(μ
M)
0.01
1
100
KOWT
(b)
0 10 30 50
Time (day)
Plasma endogenous PK
Con
cen
trat
ion
(μ
M)
0.1
5
50
0.5
KONo IVIG, WT
IVIG, WT
(c)
1
5
50
500
Con
cen
trat
ion
(n
M)
0 10 30 50
Time (day)
Peripheral 7E3 PK
KONo IVIG, WT
IVIG, WT
(d)
0 10 30 50
Time (day)
Peripheral IVIG PK
Con
cen
trat
ion
(μ
M)
0.1
10
1000
1
KOWT
(e)
0 10 30 50
Time (day)
Peripheral endogenous PK
Con
cen
trat
ion
(μ
M)
0.1
5
50
0.5
KONo IVIG, WT
IVIG, WT
(f)
Figure 4: Simulated PK profiles using the mouse cutoff model. All mice receive 8 mg/kg 7E3 with or without concomitant 1 g/kg IVIG ineither FcRn WT or KO mice. Plasma and peripheral concentrations of 7E3, IVIG IgG, and endogenous IgG are plotted.
4.2. Hansen’s Model [24]. The model was comprised ofthe central and endosomal compartments (Figure 7(a)).It considered endogenous IgG, autoantibody (7E3), andIVIG simultaneously. The strengths of the model includesimplicity, mechanistic basis, and ability to adapt to differentsituations. The model adequately described 7E3 PK data innormal and FcRn KO mice, and 7E3 PK data in rats withor without IVIG. The model was also used to infer the totalFcRn-binding capacity and endogenous IgG turnover rate.However, the assumption of kup = kret is questionable. Atsteady-state in endosome, C1 × kup = CE × kret(1 − fU) +CE × kdeg × fU . It implied that V1 = VE when the equationwas to be scaled from concentration to amount. This maynot be likely as it was estimated by the same group later
that endosomal space volume is approximately 5 mL/kg inmice [21], much smaller than the plasma volume of 50 mL/kg[29].
According to Hansen’s model, it appears that the endo-some compartment has dual functions, that is, to explain thesaturable elimination of IgG and to serve as a distributioncompartment. The PK profiles of 7E3 in the absence of IVIGin the central and the endosome compartments look liketypical 2-compartment PK model [24]. In the presence ofIVIG, the PK profiles of 7E3 were lowered due to FcRnsaturation [24]. While it is theoretically sound and practicallyconvenient to assume that IgG concentration in the earlyendosome is the same as that in the circulation, dualfunctions of the endosome compartment had implication on

8 Journal of Biomedicine and Biotechnology
5
50
500
5000
Pla
sma
7E3
(nM
)
0 2 4 6 8
Time (day)
Effect of Max without IVIG
Max = 0.1-foldMax = 0.5-fold
Max = 1-foldMax = 2-fold
(a)
5
50
500
5000
Pla
sma
7E3
(nM
)
0 2 4 6 8
Time (day)
Effect of Max with IVIG
Max = 0.1-foldMax = 0.5-fold
Max = 1-foldMax = 2-fold
(b)
Figure 5: Sensitivity tests for Max. The effect of different MAX values on the plasma 7E3 pharmacokinetics was simulated in the presence orabsence of IVIG (2 g/kg) using the rat PK model. The tested range was 0.1- to 2-fold the estimated Max (108 μM).
0 100 200 300 400 500
Rat models
0
0.4
0.8
Frac
tion
un
bou
nd
Total IgG concentration (μM)
(a)
0
0.4
0.8
Frac
tion
un
bou
nd
0 100 200 300 400 500
Total IgG concentration (μM)
Mouse models
(b)
Figure 6: Relationship between fU and total peripheral IgG concentration (cutoff models, solid lines) or total plasma IgG concentration(Hansen’s models, dashed lines). The fU values for Hansen’s models were calculated according to the published models [4]. The fU valuesfor the cutoff models were based on the model parameters in Table 1.
the fU estimation. To illustrate this, two sets of fU valueswere calculated using the plasma or endosome total IgGconcentrations simulated with Hansen’s model, and plottedin Figure 8. The significant discrepancies and hysteresisindicate that it may not be appropriate to infer FcRnsaturation using plasma total IgG concentrations under theparticular model assumptions.
In addition, fU was first calculated with the total plasmaIgG concentration under the assumption that the totalconcentrations in plasma and endosome were the same. Onthe other hand, the steady-state endosome IgG concentra-tion was redefined differently based on endosomal massbalance of IgG at steady state. These different definitionsand empirical assumptions reflect the lack of informative
experimental data of the endosome compartment and castsdoubt in the interpretation of the model-derived parametervalues. For example, the rat endogenous IgG production ratewas estimated to be 62.9 μmol/d/kg in Hansen’s model basedon steady-state condition [24], while it was reported that theendogenous IgG CL in rats is only 1.9 μmol/d/kg (rangedfrom 1 to 2.9 μmol/d/kg) following a dose of 131I-labeled ratIgGs [30].
Since the only mechanism of IgG elimination is throughthe endosome pathway (Figure 6(a)) in Hansen’s model, thetotal FcRn-binding capacity (Rt) had to be smaller than theendogenous levels of IgG in order to describe the PK data(i.e., Rt = 83μM and 12.2 μM for mice and rats, resp.)[24]. In other words, the model structure predetermined

Journal of Biomedicine and Biotechnology 9
Central compartment
Endosome
1C
×
CE
× (1− fU )
fU
IgG + FcRn↔ FcRn − IgG
kup
kin
kret
kdeg
(a)
AbH
AbSC
Abcp
pcup
deg
FcAb
AbH
FcAbH
inH
H25 AbHP
deg
+pc
cp
onA(Fctot−FcAb −FcAbH )
ka, F
kR
AbE
E
E E
E
E
k
kk
kH
k
k
k kR
konH
koffH
AbP
k
kk k
k
(b)
Vascular ExtravascularV1 V2
k12
k21
JPro
= Jmax/V1/(km + CSS)
CSS CSS,2
krmr
krmr
kcat = − krmrkintkcat
kint
(c)
Figure 7: Published semimechanistic PK models. (a) Hansen’s model; (b) Xiao’s model; (c) Kim’s model. Models schemes are redrawn basedon published papers.
0
0.2
0.6
0.4
1
0.8
0 0.2 0.60.4 10.8
IgG
con
cen
trat
ion
IVIG 0.4 g/kgIVIG 1 g/kg
IVIG 2 g/kgLine of unity
fU estimated based on plasma IgG concentration
f Ues
tim
ated
bas
ed o
n e
ndo
som
e
Figure 8: Comparison of fU values derived from IgG concen-trations in endosome and plasma using Hansen’s rat model aftera single IV dose of 8 mg/kg 7E3 in the presence or absence ofIVIG. Significant counter clockwise hysteresis was observed due toIgG distribution delays. In the absence of IVIG, the line visuallycollapsed into a short line at the ending point of the counter-clockwise hysteresis loop as the lack of significant change in totalIgG level kept fU relatively constant.
that FcRn had to be saturated at physiological condition.Furthermore, simulations using the mouse model showedan accumulation of IgGs in the endosomal compartment inFcRn KO mice, and the same endogenous IgG concentrations
at the baseline between FcRn WT and KO mice (data notshown). These indicate inappropriate model assumptions,and cautions should be used when interpreting the modelingresults.
An improved PK/PD model was developed to describethe IVIG effect on the disposition of MWReg30, an anti-platelet antibody, and on MWReg30-induced thrombocy-topenia in mice [16]. The PK model was similar to Hansen’smodel except that the PK data of both MWReg30 and IVIGwere available, and the differential equations were writtenwith respect to amounts of MWReg30 and IVIG as opposedto concentrations in Hansen’s model. This avoided some ofthe confusion of distribution volume in Hansen’s model.However, the differential equations for endogenous IgGswere still written with respect to concentration. This wasprobably for model simplification purpose and due to thelack of endogenous IgG PK data. Although this hybrid modeloffered some improvement, it was still subject to similarconcerns.
4.3. Xiao’s Model [19]. Another mechanistic FcRn-IgGmodel was developed by Xiao et al. recently [19] based ontotal hepcidin and an antihepcidin mAb (Ab 12B9m) con-centrations (unbound + complex) in cynomolgus monkeysafter single or multiple doses of Ab 12B9m (Figure 7(b)).Higher clearance of Ab 12B9m was observed after multipleweekly IV and SC doses of 300 mg/kg Ab 12B9m andwas attributed to FcRn saturation. In addition, target-mediated IgG disposition (TMDD) was incorporated inorder to infer the unbound hepcidin and unbound Ab12B9m concentrations.

10 Journal of Biomedicine and Biotechnology
The model was a modified version of Hansen’s modelby inheriting the assumption of Langmuir-type FcRn-IgGinteraction and kup = kret. The model had a peripheralcompartment, so that the endosomal compartment did nothave to bear the dual functions as discussed in Hansen’smodel. Because it included unbound Ab 12B9m and itscomplex with hepcidin, endogenous IgG was not consideredin the model to minimize the model complexity. As aresult, interpretation of FcRn saturation should be viewedwith caution. Another difference was that the endosomecompartment volume (VE) was included in the model toallow a better sense of mass transfer. However, the endosomalvolume VE and the dissociation constant kD for FcRn-IgGbinding were estimated as a product rather than separatelysince they operated in the model only as a product.
4.4. Kim’s Model [13]. A mechanism-based PK model forhuman IgG was developed based on saturable kinetics anddata from the literature using easily measurable plasmaconcentrations (Figure 7(c)). This appeared to be the firstpaper that addressed FcRn-mediated IgG recycling kineticsquantitatively in human. Note that this model was designedfor endogenous IgG only although it may be adapted fortherapeutic IgG and/or IVIG. All parameter values, withexception of km, were borrowed from the literature. It wasrecognized that the plasma concentration was not identicaltoo but as an index for endosomal unbound IgG concentra-tion. In addition, as an improvement from previous models,kup = kret was no longer assumed.
In this model, the rate constants for IgG internalization,catabolism, and recycling were defined as kint, kcat, and krmr,respectively. Because the plasma compartment (V1) and theendosome compartment (VE) were collapsed as the vascularspace in the simplified model, the IgG concentrationsbecame the same (CSS). Although the kint retained itsphysiological meaning to describe the IgG catabolism andtrafficking within vascular space, that is, kint = kcat + krmr,according to equations Jrmr = Jmax × CSS/(km + CSS) andJcat = kcat ×Css ×V1, the recycling rate Jrmr and the catabolicrate Jcat were directly linked to the vascular space, and nolonger rely on kint despite of the sequential events as shownin the model scheme (Figure 7(c)). As a result, kint is notkinetically informed by other processes in the model, andobtaining kint value solely relied on the literature. This mightbe a problem especially when the values of most parameterswere borrowed from literature where different physiologicaland/or mechanistic assumptions might have been made.Probably because of this, the model did not seem to be ableto explain the high fractional catabolic rate of IgG in patientswith familial hypercatabolic hypoproteinemia.
In addition, as the author pointed out, the estimatedrate of pinocytosis (kup) was smaller in magnitude than thereal unidirectional uptake rate, so the daily fractional uptakerate (18%), the fractional recycling rate (10.6%), and thefraction catabolic rate (7.4%) should be interpreted withcautions. Indeed, the inferred efficiency of FcRn-mediatedIgG recycling (∼60%) was lower than what can be inferredfrom the IgG PK data from two reported cases of familial
hypercatabolic hypoproteinemia with non-functional FcRndue to a mutant β2m gene. In these patients with normal IgGsynthesis rates, IgG survival was short. The IgG fractionalcatabolic rates increased fivefold to 31% and 36% of theintravenous pool per day (normal 6.7 ± 2%/d) [12]. Thisapproximate 5-fold increase in FCR suggested that undernormal physiological conditions, an average IgG molecule isdegraded after approximately 5 times endothelial pinocyto-sis, or approximately 80% efficiency of FcRn-mediated IgGrecycling.
Another difference between Kim’s model and previouslydiscussed models was the empirical Emax model for FcRn-IgG binding. It was equivalent to early regression models byBrambell and Waldmann [1, 3]. km was defined as the serumIgG concentration at which a half maximal IgG recycling wasachieved and was estimated to be 21 mg/mL. Choosing thetotal serum IgG concentration for FcRn-binding estimationmight have been a convenient approximation; however,cautions should be used when comparing results frommodels with different structures.
4.5. Physiological Models. Several physiologically based PK(PBPK) models were developed for anticarcinoembryonicantigen (CEA) antibodies [20, 22] or 7E3 [21] in mice.The models included organs/tissues of interest, lymphaticcirculation, FcRn-IgG binding, and IgG-CEA binding (ifapplicable). Most physiological parameters regarding plasmaflow rate, vascular, interstitial, and total tissue volume wereavailable from the literature. Lymphatic circulation ratewas either assumed [21] or estimated [20, 22]. Endosomeupdate and return rates were either fixed to be the samevalue [22] or estimated [20, 21]. In general, the modelsdescribed/predicted the anti-CEA antibody PK reasonablywell. However, depending on the model assumptions, theFcRn or endosome-related parameter values might be verydifferent. For example, Ferl’s estimations of kint and krec
were 1.38 day−1 and 0.5 day−1, respectively [20], whilein Garg’s model, the values were 1.96 day−1 and 20.4day−1, respectively [21, 24]. In a recent revision of themodel, target-mediated disposition was included in addi-tion to the FcRn-IgG binding, where kint and krec wereassumed to be the same and estimated to be 0.715 day−1
[22]. In addition, the percentage and mechanism of IgGelimination in each organ were interpreted differently.According to Ferl’s model, approximately 40% of IgGeliminated was attributed to linear elimination kineticsin liver and other organs, while in Garg’s model, skin,muscle, liver, and gut were the major organs responsiblefor 33, 24, 16, and 12% of total IgG elimination, respec-tively.
It is well recognized that the PBPK models have thepotential to better describe the physiological processes, andthus may allow more meaningful interpretations. On theother hand, it should be noted that these models usuallyhave complicated structures and heavily depend on availabledata from the literature. The complexity as an effort to bestdescribe the physiological processes came with the need formore sophisticated modeling assumptions. Multiplicity of

Journal of Biomedicine and Biotechnology 11
assumptions and potential error prorogation may lead toliabilities to model misspecification and result in misinter-pretation. The routinely performed “model validation” usinga small experimental data set might not be sufficient formodel testing and assumption justification, as the inherentmodel flexibility may sometimes allow apparent good datafitting even when some inappropriate assumptions weremade.
4.6. The Proposed Semimechanistic Cutoff Model. It has beenreported that some IgGs with higher affinity for FcRnshowed prolonged t1/2 [31, 32]. However, affinity for FcRnmay not be the only major contributor to IgG catabolicrate [33]. Physiological PK models have been proposed,including the one in Figure 1(a), to depict the saturableFcRn-mediated IgG kinetics based on known physiology.However, in a strict sense, quantitative physiological modelshave not been published. The reason might be twofold.First, there is insufficient understanding of the intracellularevents and difficulty in scaling data from in vitro to in vivo(e.g., volume, rate, and transit time). In addition, there isinsufficient or uninformative in vivo PK data to developand differentiate such PK models. The simulated data usingHansen’s model was easily described by the new cutoffmodel. The model parameters were estimated fairly precisely(Table 1). However, other models with different structuralassumptions might be able to describe the data equally well.To better test a model, additional PK data are required, forexample, PK of total IgG.
It is fair to say that none of the available models (includ-ing the cutoff model) adequately mimicked the physiologyof FcRn-mediated IgG recycling, and more sophisticatedphysiological models cannot be developed simply becausethe lack of informative experimental data in the endosomecompartment. For example, the rate of pinocytosis at awhole body level is difficult to measure experimentally.In addition, although the mean transit time of endosomewas inferred to be about 7 min [26, 27], it remains largelyunknown how endosome is destined to lysosome kineticallyand how IgG degradation changes as a function of themean transit. For example, it was reported that FcRn-IgGbinding in endosome triggers more efficient intracellulartrafficking and transcytosis [9], but the quantitative impacton the endosomal recycling is not clear. And the dynamicsof pH lowering in early endosome is not easy to describemathematically. Furthermore, it was realized that FcRnsaturation estimated based on plasma IgG levels may notapproximate the real situation in endosome as discussedfor Hansen’s model. The technical difficulties in estimatingthe parameters governing the FcRn-mediated IgG recyclingprocess prevent developing models that truly resembles thephysiology.
Taken together, it might be practically justified to utilizesimple models of FcRn-mediated IgG disposition such as thecutoff model, especially in the IVIG setting, and leave moresophisticated models for later optimization when cumulativeunderstanding of this physiological process allows so.
The proposed cutoff model has only 6 parameters(Table 1). The distribution volume parameters VC and VP
were clearly defined. The collapsed IgG recycling was basedon the relative short endosome mean transit time, and theassumption that FcRn-IgG dissociation did not happen, ormore appropriately, only happened to a constant extent. Itallows estimation of nonspecific linear CL and nonlinearendosomal elimination. At baseline level in both rats andFcRn WT mice, the linear CL accounted for 100% of endoge-nous IgG elimination. The apparent nonspecific linear CLat baseline should be further discussed. Mathematically, CLaccounted for the linear portion of IgG elimination, butit did not necessarily imply endosome-unrelated processes.For example, a fraction of IgG in endosome could endup in the lysosome degradation pathway even when FcRnis not saturated. This is possible considering variability inthe biological processes such as the endosome acidificationdynamics, transit time of endosome intracellular trafficking,and conversion to lysosome, as well as proteolysis kinetics. Ata whole-body level, the above could have led to an apparentnonspecific linear. It is also important to realize that althoughseveral organs and tissues have been identified to expressFcRn, the expression levels may be different. It has beenreported that the dispersed pinocytotic activities of virtuallyall cells capture and process all soluble plasma proteins at arate of ≈2x per day with equivalent degradative rates unlessthey are protected by specific mechanisms [4]. This highpinocytosis rate not only explains the nonspecific linear CL,but also is consistent with the high CLU values in both speciesestimated by the cutoff models (Table 1).
In rats, the estimated production rate of endogenousIgGs in rats was 2.52 μmol/d/kg using the cutoff model,slightly lower than the measured value of 1.9 μmol/d/kg (ran-ged 1 to 2.9 μmol/d/kg) [30]. In FcRn WT mice, the endoge-nous production rate was estimated to be 0.0827 μmol/d/kg,lower than previously reported value 0.132 μmol/d/day(assumed 50 mL/kg plasma) [4, 34]. Apparently, there isroom for further model improvement and more preciseparameter estimation (e.g., CLU) with emerging experimen-tal data and better understanding of the physiology. However,it is important to note there has been a big improvementfrom in the previous model [24], where the kin estimateswere 62.9 and 1.21 μmol/d/kg in rats and FcRn WT mice,respectively.
Different plasma endogenous IgG levels were reportedbetween rats (103 μM) and mice (14.7 μM) at the baseline[24]. According to the cutoff model results, FcRn was almostsaturated in rats (MAX = 108 μM) at the baseline but notin FcRn WT mice (MAX = 20.1 μM). In addition, ratsseemed to have higher CL and CLU than mice according tothe cutoff models (Table 1). These differences translated toan estimated 30-fold faster kin in rats than in mice versusapproximately a 14-fold difference reported in the literature[4, 30, 34]. Further investigation would help understand thebetween-species difference in endogenous IgG turnover.
According to the cutoff model, FcRn should not besaturated at baseline, and the baseline total IgG clearancewas determined solely by the nonspecific linear CL. Thetotal body IgG clearance started to increase when the totalperipheral IgG concentration exceeded MAX. In both ratsand FcRn WT mice, the 7E3 plasma exposure decreased with

12 Journal of Biomedicine and Biotechnology
the concomitant IVIG (Figures 2(b) and 2(c)). This is differ-ent from Hansen’s model which predicted FcRn saturationat the baseline [24]. In addition, the mouse cutoff modelis able to predict the endogenous IgG concentrations forFcRn WT and KO mice. The estimated baseline endogenousIgG concentrations in plasma were estimated to be 14.7 and1.19 μM for FcRn WT and KO mice, respectively. This 12-fold decrease in the baseline IgG level reflects accelerated IgGcatabolism in the absence of FcRn, consistent with reportedvalues of 8–15-fold [4, 6, 10]. On the other hand, Hansen’smodel infers that the baseline endogenous IgG level remainsthe same in FcRn WT and KO mice [24].
In conclusion, A simple cutoff model was proposedfor IgG PK modeling with saturable FcRn-mediated IgGdisposition in rats and mice.
Appendix
Detailed Derivation of Equations
(1) Derivation of secondary PK parameters with the baselineplasma endogenous IgG concentration in rats and FcRn WTmice.
Based on mass balance of endogenous IgGs betweenCMT5 and CMT6, C5,WT,0 × Q = C6,WT,0 × Q + C6,WT,0 ×CLU × fU , where fU = (C6,WT,0 −MAX)/C6,WT,0.
So C5,WT,0×Q = C6,WT,0×Q+CLU×(C6,WT,0−MAX),
If C6,WT,0 > MAX,
then C6,WT,0 = (C5,WT,0×Q+CLU×MAX)/(Q+CLU)and fU ,WT,0 = (C6,WT,0 −MAX)/C6,WT,0
If C6,WT,0 ≤ MAX, then C6,WT,0 = C5,WT,0 andfU ,WT,0 = 0.
For endogenous IgGs at baseline, production rate = eli-mination rate,
kin = C5,WT,0 × CL + C6,WT,0 × CLU × fU . (A.1)
If C6,WT,0 > MAX, kin = C5,WT,0 × CL + CLU ×(C6,WT,0 −MAX);
If C6,WT,0 ≤ MAX, kin = C5,WT,0 × CL.
(2) Derivation of baseline endogenous IgG levels. Thekey is to allow model prediction of baseline plasma andperipheral IgG levels in both FcRn WT and KO animals.
With mass balance at baseline,
kin = A5,0
VC× CL +
A6,0
VP× CLU × fU ,
A5,0
VC×Q = A6,0
VP×Q +
A6,0
VP× CLU × fU ,
(A.2)
Solve the above equations for A5,0/VC and A6,0/VP ,
A6,0
VP= kin ×Q
Q × CL + CLU × CL× ((A6,0/VP −MAX)/(A6,0/VP
))+ CLU ×Q × ((A6,0/VP −MAX
)/(A6,0/VP
)) . (A.3)
If A6,0/VP > MAX,
then A6,0/VP = (kin×Q+ CLU ×CL×MAX + CLU ×Q ×MAX)/(Q× CL + CLU × CL + CLU ×Q),
and A5,0/VC = (kin − CLU × (A6,0/VP −MAX))/CL.
If A6,0/VP ≤ MAX,
then A6,0/VP = kin ×Q/(Q× CL) = kin/CL,
and A5,0/VC = kin/CL.
In FcRn KO mice, A6,0/VP and A5,0/VC do not need to beseparately coded. Instead, an NONMEM input data entry hasFCRN = 0 for KO mice or FCRN = 1 for WT mice. MAX isdefined as MAX0× FCRN, where MAX0 is the MAX in FcRnWT mice. So MAX = 0 for KO mice, and A6,0/VP and A5,0/VC
equations can be simplified as
A6,0
VP= kin ×Q
Q × CL + CLU × CL + CLU ×Q, (A.4)
A5,0
VC= kin − CLU ×
(A6,0/VP
)
CL. (A.5)
Acknowledgment
The author is an employee of Genentech Inc. and has noconflict of interests to declare.
References
[1] F. W. R. Brambell, W. A. Hemmings, and I. G. Morris, “Atheoretical model of γ-globulin catabolism,” Nature, vol. 203,no. 4952, pp. 1352–1355, 1964.
[2] F. W. Brambell, “The transmission of immunity from motherto young and the catabolism of immunoglobulins.,” TheLancet, vol. 2, no. 7473, pp. 1087–1093, 1966.
[3] T. A. Waldmann and W. Strober, “Metabolism of immuno-globulins,” Progress in Allergy, vol. 13, pp. 1–110, 1969.
[4] R. P. Junghans and C. L. Anderson, “The protection receptorfor IgG catabolism is the β2-microglobulin-containing neona-tal intestinal transport receptor,” Proceedings of the NationalAcademy of Sciences of the United States of America, vol. 93, no.11, pp. 5512–5516, 1996.
[5] J. Borvak, J. Richardson, C. Medesan et al., “Functionalexpression of the MHC class I-related receptor, FcRn, inendothelial cells of mice,” International Immunology, vol. 10,no. 9, pp. 1289–1298, 1998.
[6] V. Ghetie, J. G. Hubbard, J. K. Kim, M. F. Tsen, Y. Lee,and E. S. Ward, “Abnormally short serum half-lives of IgG
Journal of Biomedicine and Biotechnology 13
in β2-microglobulin-deficient mice,” European Journal ofImmunology, vol. 26, no. 3, pp. 690–696, 1996.
[7] R. M. Campbell, D. P. Cuthbertson, C. M. Matthews, and A.S. McFarlane, “Behaviour of 14C- and 131I-labelled plasmaproteins in the rat,” The International Journal of AppliedRadiation and Isotopes, vol. 1, no. 1-2, pp. 66–84, 1956.
[8] A. S. McFarlane, “The behavior of I 131-labeled plasmaproteins in vivo,” Annals of the New York Academy of Sciences,vol. 70, no. 1, pp. 19–25, 1957.
[9] T. S. Ramalingam, S. A. Detmer, W. L. Martin, and P. J.Bjorkman, “IgG transcytosis and recycling by FcRn expressedin MDCK cells reveals ligand-induced redistribution,” TheEMBO Journal, vol. 21, no. 4, pp. 590–601, 2002.
[10] E. J. Israel, D. F. Wilsker, K. C. Hayes, D. Schoenfeld, and N.E. Simister, “Increased clearance of IgG in mice that lack β2-microglobulin: possible protective role of FcRn,” Immunology,vol. 89, no. 4, pp. 573–578, 1996.
[11] R. D. Wochner, G. Drews, W. Strober, and T. A. Waldmann,“Accelerated breakdown of immunoglobulin G (IgG) inmyotonic dystrophy: a hereditary error of immunoglobulincatabolism.,” The Journal of Clinical Investigation, vol. 45, no.3, pp. 321–329, 1966.
[12] T. A. Waldmann and W. D. Terru, “Familial hypercatabolichypoproteinemia. A disorder of endogenous catabolism ofalbumin and immunoglobulin,” The Journal of Clinical Inves-tigation, vol. 86, no. 6, pp. 2093–2098, 1990.
[13] J. Kim, W. L. Hayton, J. M. Robinson, and C. L. Anderson,“Kinetics of FcRn-mediated recycling of IgG and albumin inhuman: pathophysiology and therapeutic implications usinga simplified mechanism-based model,” Clinical Immunology,vol. 122, no. 2, pp. 146–155, 2007.
[14] B. Gurbaxani, “Mathematical modeling as accounting: pre-dicting the fate of serum proteins and therapeutic monoclonalantibodies,” Clinical Immunology, vol. 122, no. 2, pp. 121–124,2007.
[15] P. Imbach, S. Barandun, V. d’Apuzzo et al., “High-doseintravenous gammaglobulin for idiopathic thrombocytopenicpurpura in childhood,” The Lancet, vol. 1, no. 8232, pp. 1228–1231, 1981.
[16] R. Deng and J. P. Balthasar, “Pharmacokinetic/pharmacody-namic modeling of IVIG effects in a murine model of immunethrombocytopenia,” Journal of Pharmaceutical Sciences, vol.96, no. 6, pp. 1625–1637, 2007.
[17] R. J. Hansen and J. P. Balthasar, “Pharmacokinetics, phar-macodynamics, and platelet binding of an anti-glycoproteinIIb/IIIa monoclonal antibody (7E3) in the rat: a quantitativerat model of immune thrombocytopenic purpura,” Journal ofPharmacology and Experimental Therapeutics, vol. 298, no. 1,pp. 165–171, 2001.
[18] F. Jin and J. P. Balthasar, “Mechanisms of intravenousimmunoglobulin action in immune thrombocytopenic pur-pura,” Human Immunology, vol. 66, no. 4, pp. 403–410, 2005.
[19] J. J. Xiao, W. Krzyzanski, Y. M. Wang et al., “Pharmacokineticsof anti-hepcidin monoclonal antibody Ab 12B9m and hep-cidin in cynomolgus monkeys,” AAPS Journal, vol. 12, no. 4,pp. 646–657, 2010.
[20] G. Z. Ferl, A. M. Wu, and J. J. DiStefano, “A predictive modelof therapeutic monoclonal antibody dynamics and regulationby the neonatal Fc receptor (FcRn),” Annals of BiomedicalEngineering, vol. 33, no. 11, pp. 1640–1652, 2005.
[21] A. Garg and J. P. Balthasar, “Physiologically-based pharma-cokinetic (PBPK) model to predict IgG tissue kinetics in wild-type and FcRn-knockout mice,” Journal of Pharmacokinetics
and Pharmacodynamics, vol. 34, no. 5, pp. 687–709, 2007.[22] S. R. Urva, V. C. Yang, and J. P. Balthasar, “Physiologically
based pharmacokinetic model for T84.66: a monoclonal anti-CEA antibody,” Journal of Pharmaceutical Sciences, vol. 99, no.3, pp. 1582–1600, 2010.
[23] J. P. Davda, M. Jain, S. K. Batra, P. R. Gwilt, and D. H.Robinson, “A physiologically based pharmacokinetic (PBPK)model to characterize and predict the disposition of mon-oclonal antibody CC49 and its single chain Fv constructs,”International Immunopharmacology, vol. 8, no. 3, pp. 401–413,2008.
[24] R. J. Hansen and J. P. Balthasar, “Pharmacokinetic/pharmaco-dynamic modeling of the effects of intravenous immunoglob-ulin on the disposition of antiplatelet antibodies in a rat modelof immune thrombocytopenia,” Journal of PharmaceuticalSciences, vol. 92, no. 6, pp. 1206–1215, 2003.
[25] R. J. Hansen and J. P. Balthasar, “Effects of intravenousimmunoglobulin on platelet count and antiplatelet antibodydisposition in a rat model of immune thrombocytopenia,”Blood, vol. 100, no. 6, pp. 2087–2093, 2002.
[26] C. R. Hopkins and I. S. Trowbridge, “Internalization andprocessing of transferrin and the transferrin receptor inhuman carcinoma A431 cells,” Journal of Cell Biology, vol. 97,no. 2, pp. 508–521, 1983.
[27] R. J. Ober, C. Martinez, C. Vaccaro, J. Zhou, and E. S. Ward,“Visualizing the site and dynamics of IgG salvage by the MHCclass I-related receptor, FcRn,” Journal of Immunology, vol.172, no. 4, pp. 2021–2029, 2004.
[28] W. K. Bleeker, J. L. Teeling, and C. Erik Hack, “Acceler-ated autoantibody clearance by intravenous immunoglobulintherapy: studies in experimental models to determine themagnitude and time course of the effect,” Blood, vol. 98, no.10, pp. 3136–3142, 2001.
[29] B. Davies and T. Morris, “Physiological parameters in labora-tory animals and humans,” Pharmaceutical Research, vol. 10,no. 7, pp. 1093–1095, 1993.
[30] S. F. Cure and N. E. Cremer, “Decreased rate of synthesisof immunoglobulin (IgG) in rats infected with moloneyleukemia virus.,” Journal of Immunology, vol. 102, no. 6, pp.1345–1353, 1969.
[31] V. Ghetie, S. Popov, J. Borvak et al., “Increasing the serumpersistence of an IgG fragment by random mutagenesis,”Nature Biotechnology, vol. 15, no. 7, pp. 637–640, 1997.
[32] P. R. Hinton, M. G. Johlfs, J. M. Xiong et al., “Engineeredhuman IgG antibodies with longer serum half-lives in pri-mates,” The Journal of Biological Chemistry, vol. 279, no. 8, pp.6213–6216, 2004.
[33] B. Gurbaxani, L. L. Dela Cruz, K. Chintalacharuvu, and S. L.Morrison, “Analysis of a family of antibodies with differenthalf-lives in mice fails to find a correlation between affinity forFcRn and serum half-life,” Molecular Immunology, vol. 43, no.9, pp. 1462–1473, 2006.
[34] R. P. Junghans, “IgG biosynthesis: no ‘immunoregulatoryfeedback’,” Blood, vol. 90, no. 10, pp. 3815–3818, 1997.