Embed Size (px)
Citation preview
Biomedicines 2022, 10, 1774. https://doi.org/10.3390/biomedicines10081774 www.mdpi.com/journal/biomedicines
Article
IgG N‐Glycosylation from Patients with Pemphigus Treated
with Rituximab
Guillaume Font 1, Marie‐Laure Walet‐Balieu 2, Marie Petit 3, Carole Burel 2, Maud Maho‐Vaillant 1, Vivien Hébert 1,
Philippe Chan 4, Manuel Fréret 5, Olivier Boyer 6, Pascal Joly 1, Sébastien Calbo 3, Muriel Bardor 2,7,†
and Marie‐Laure Golinski 1,*,†
1 Université de Rouen Normandie, Inserm U1234, CHU Rouen, Department of Dermatology,
F‐76000 Rouen, France; guillaume.font@chu‐rouen.fr (G.F.); maud.maho@univ‐rouen.fr (M.M.‐V.);
vivien.hebert@chu‐rouen.fr (V.H.); pascal.joly@chu‐rouen.fr (P.J.) 2 Université de Rouen Normandie, Laboratoire Glyco‐MEV UR 4358, SFR Normandie Végétal FED 4277,
Innovation Chimie Carnot, F‐76000 Rouen, France; marie‐laure.walet‐balieu@univ‐rouen.fr (M.‐L.W.‐B.);
carole.burel@univ‐rouen.fr (C.B.); muriel.bardor@univ‐rouen.fr (M.B.) 3 Université de Rouen Normandie, Inserm U1234, F‐76000 Rouen, France; [email protected] (M.P.);
sebastien.calbo@univ‐rouen.fr (S.C.) 4 Université de Rouen Normandie, INSERM US 51, CNRS UAR 2026, HeRacLeS‐PISSARO, Normandie
Université, F‐76000 Rouen, France; philippe.chan@univ‐rouen.fr 5 Université de Rouen Normandie, Inserm U1234, CHU Rouen, Department of Rhumatology, F‐76000 Rouen,
France; [email protected] 6 Université de Rouen Normandie, Inserm U1234, CHU Rouen, Department of Immunology and Biotherapy,
F‐76000 Rouen, France; olivier.boyer@chu‐rouen.fr 7 Université de Lille, CNRS, UMR 8576‐UGSF‐Unité de Glycobiologie Structurale et Fonctionnelle,
F‐59000 Lille, France
* Correspondence: marie‐laure.golinski@chu‐rouen.fr; Tel.: +33‐2‐35‐14‐83‐49
† These authors contributed equally to this work.
Abstract: Pemphigus is a life‐threatening auto‐immune blistering disease of the skin and mucous
membrane that is caused by the production of auto‐antibodies (auto‐Abs) directed against adhesion
proteins: desmoglein 1 and 3. We demonstrated in the “Ritux3” trial, the high efficacy of rituximab,
an anti‐CD20 recombinant monoclonal antibody, as the first‐line treatment for pemphigus. How‐
ever, 25% of patients relapsed during the six‐month period after rituximab treatment. These early
relapses were associated with a lower decrease in anti‐desmoglein auto‐Abs after the initial cycle of
rituximab. The N‐glycosylation of immunoglobulin‐G (IgG) can affect their affinity for Fc receptors
and their serum half‐life. We hypothesized that the extended half‐life of Abs could be related to
modifications of IgG N‐glycans. The IgG N‐glycome from pemphigus patients and its evolution
under rituximab treatment were analyzed. Pemphigus patients presented a different IgG N‐gly‐
come than healthy donors, with less galactosylated, sialylated N‐glycans, as well as a lower level of
N‐glycans bearing an additional N‐acetylglucosamine. IgG N‐glycome from patients who achieved
clinical remission was not different to the one observed at baseline. Moreover, our study did not
identify the N‐glycans profile as discriminating between relapsing and non‐relapsing patients. We
report that pemphigus patients present a specific IgG N‐glycome. The changes observed in these
patients could be a biomarker of autoimmunity susceptibility rather than a sign of inflammation.
Keywords: pemphigus; rituximab; IgG; glycosylation; N‐glycome; N‐glycans; sialic acid
1. Introduction
Pemphigus is a rare, life‐threatening auto‐immune blistering disease of the skin and
mucosa that causes painful erosions and severe weight loss. This disease is induced by
the production of pathogenic auto‐antibodies (auto‐Abs) directed against desmoglein 1
(DSG1) and desmoglein 3 (DSG3), two proteins located in desmosomes and involved in
Citation: Font, G.; Walet‐Balieu,
M.‐L.; Petit, M.; Burel, C.;
Maho‐Vaillant, M.; Hébert, V.; Chan,
P.; Fréret, M.; Boyer, O.; Joly, P.; et
al. IgG N‐glycosylation from
Patients with Pemphigus Treated
with Rituximab. Biomedicines 2022,
10, 1774. https://doi.org/
10.3390/biomedicines10081774
Academic Editor: Cezary
Kowalewski
Received: 25 May 2022
Accepted: 18 July 2022
Published: 22 July 2022
Publisher’s Note: MDPI stays neu‐
tral with regard to jurisdictional
claims in published maps and institu‐
tional affiliations.
Copyright: © 2022 by the authors. Li‐
censee MDPI, Basel, Switzerland.
This article is an open access article
distributed under the terms and con‐
ditions of the Creative Commons At‐
tribution (CC BY) license (https://cre‐
ativecommons.org/licenses/by/4.0/).
Biomedicines 2022, 10, 1774 2 of 17
keratinocytes adhesion. The interaction between auto‐Abs and their target antigen in‐
duces structural changes that lead to a loss of keratinocytes adhesion, called “acantho‐
lysis”, which results in the formation of skin and mucosal blisters. There are two main
forms of pemphigus: pemphigus vulgaris (PV) characterized by preferential mucosal in‐
volvement and the presence of auto‐Abs that are mainly directed against DSG3, and pem‐
phigus foliaceus (PF) characterized by exclusive skin lesions associated with the presence
of anti‐DSG1 auto‐Abs [1,2].
Until recently, high doses of oral corticosteroids (CS) sometimes combined with im‐
munosuppressive drugs (azathioprine, mycophenolate mofetil) were the mainstay of
treatment for pemphigus [3]. The randomized, controlled clinical trial “Ritux 3” demon‐
strated the interest in the first‐line use of rituximab (RTX) in the treatment of pemphigus.
In the “Ritux 3” clinical trial, 89% of patients treated with RTX and the short‐term CS
(prednisone) arm were in complete remission and off therapy after 2 years, compared to
34% of patients treated with CS (prednisone) alone (p < 0.001) [4].
During this clinical trial, nine patients (22%) relapsed during the 12‐month period
following the initial infusion of RTX. As predictors of relapse, we identified an initial Pem‐
phigus Disease Area Index (PDAI) score ≥45 and the persistence of anti‐DSG1 and anti‐
DSG3 auto‐Abs three months after the initial cycle of RTX [5]. These results suggest that
the relapses might be related to more persistent anti‐DSG1 and anti‐DSG3 auto‐Abs se‐
creting plasma cells or a longer immunoglobulin‐G (IgG) half‐life. Several mechanisms
have been proposed to explain the second hypothesis, such as FcRn polymorphism [6], an
IgG isotype [7] or the specific modification of the IgG N‐glycan profile [8].
N‐glycosylation is a post‐translational modification occurring on IgG, particularly at
the asparagine (Asn)‐297 located in the CH2 domain of the Fc fragment [9]. In addition, it
should be noted that 15 to 25% of IgG also bear N‐glycans on the Fab [10]. IgG N‐glyco‐
sylation includes high heterogeneity. For example, IgG Fc N‐glycosylation displays 36 ma‐
jor isoforms composed of a N‐glycan core constituted with seven monosaccharides: four
N‐acetylglucosamine (GlcNAc) and three mannose (Man) residues. In addition, each N‐
glycan isoform differs by the types and numbers of additional monosaccharides leading
to fucosylation, galactosylation and sialylation of the N‐glycan structures as well as the
addition of a bisecting GlcNAc in some cases [11]. In contrast, the human IgG1 N‐glycan
repertoire presents less heterogeneity as 11 distinct complex biantennary Fc glycoforms
represent up to 90% of its N‐glycan profile [12]. This polymorphism defines an IgG “N‐
glycome” that impacts auto‐immune diseases. Indeed, an “inflammatory profile” in
Crohn’s disease has been showed to be associated with lower galactosylated IgG N‐gly‐
cans [13]. Moreover, N‐glycome of IgG may be associated with a more severe or relapsing
course, as demonstrated by the lower galactosylated N‐glycans in patients with rheuma‐
toid arthritis [14], or with the low galactosylation and sialylation that have been associated
with active disease or relapses in patients with granulomatosis with polyangiitis and sys‐
temic lupus erythematosus [15–17]. It has also been shown that the removal of N‐glycans
from the Fc domain altered the pro‐inflammatory activity in auto‐immune mouse models
[18]. Moreover, recent studies showed that sialylation could prolong the serum half‐life of
therapeutic monoclonal antibodies [8,19]. Furthermore, several studies have shown that
the N‐glycosylation of therapeutic intravenous immunoglobulins (IVIg) could influence
their anti‐inflammatory properties. Indeed, it has been demonstrated in an auto‐immune
mouse model that the removal of terminal sialic acid residues from IgG resulted in a loss
of the anti‐inflammatory activity of IVIg [20–22].
A transcriptomic study conducted by our team identified that the MGAT5 gene (en‐
coding for the alpha‐1,6‐mannosyl‐glycoprotein beta‐1,6‐N‐acetylglucosaminyltransfer‐
ase), involved in N‐glycan biosynthesis, is deregulated in the B cells of relapsing patients
compared to non‐relapsing patients after treatment [23]. These preliminary results indi‐
cate that a modulation of the N‐glycan biosynthesis pathway may be involved in IgG N‐
glycosylation, and that this may have an impact on the clinical status of patients with
pemphigus after treatment.
Biomedicines 2022, 10, 1774 3 of 17
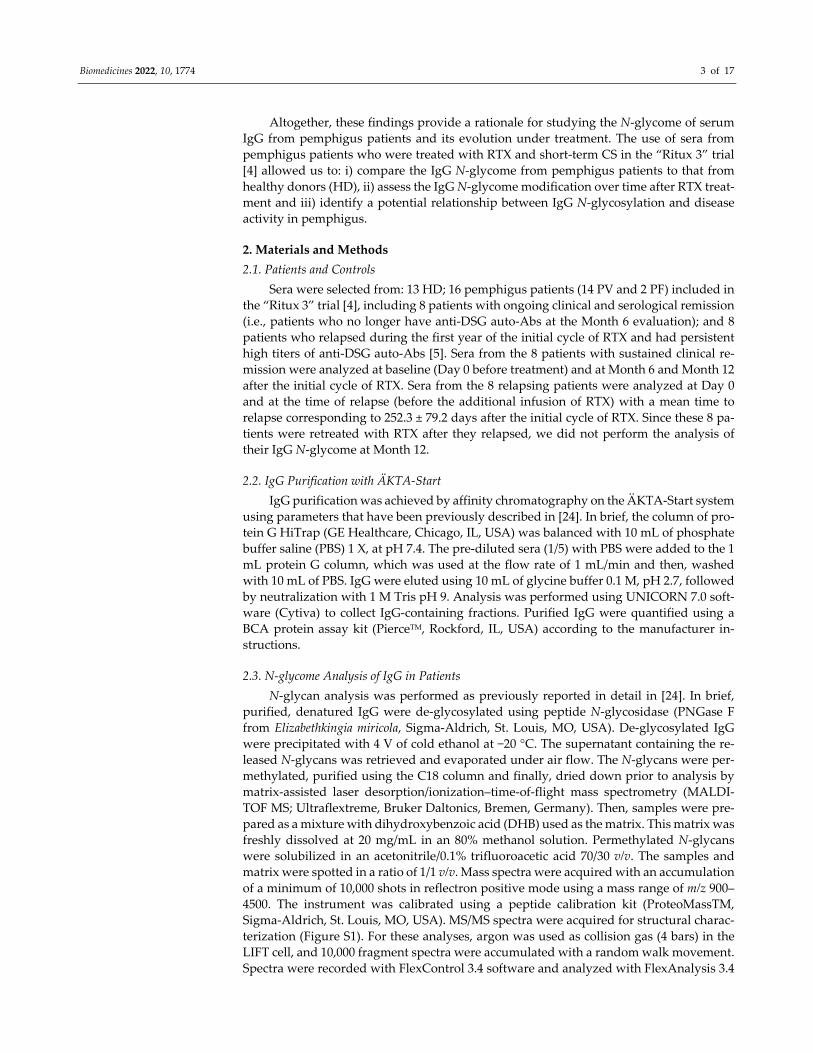
Altogether, these findings provide a rationale for studying the N‐glycome of serum
IgG from pemphigus patients and its evolution under treatment. The use of sera from
pemphigus patients who were treated with RTX and short‐term CS in the “Ritux 3” trial
[4] allowed us to: i) compare the IgG N‐glycome from pemphigus patients to that from
healthy donors (HD), ii) assess the IgG N‐glycome modification over time after RTX treat‐
ment and iii) identify a potential relationship between IgG N‐glycosylation and disease
activity in pemphigus.
2. Materials and Methods
2.1. Patients and Controls
Sera were selected from: 13 HD; 16 pemphigus patients (14 PV and 2 PF) included in
the “Ritux 3” trial [4], including 8 patients with ongoing clinical and serological remission
(i.e., patients who no longer have anti‐DSG auto‐Abs at the Month 6 evaluation); and 8
patients who relapsed during the first year of the initial cycle of RTX and had persistent
high titers of anti‐DSG auto‐Abs [5]. Sera from the 8 patients with sustained clinical re‐
mission were analyzed at baseline (Day 0 before treatment) and at Month 6 and Month 12
after the initial cycle of RTX. Sera from the 8 relapsing patients were analyzed at Day 0
and at the time of relapse (before the additional infusion of RTX) with a mean time to
relapse corresponding to 252.3 ± 79.2 days after the initial cycle of RTX. Since these 8 pa‐
tients were retreated with RTX after they relapsed, we did not perform the analysis of
their IgG N‐glycome at Month 12.
2.2. IgG Purification with ÄKTA‐Start
IgG purification was achieved by affinity chromatography on the ÄKTA‐Start system
using parameters that have been previously described in [24]. In brief, the column of pro‐
tein G HiTrap (GE Healthcare, Chicago, IL, USA) was balanced with 10 mL of phosphate
buffer saline (PBS) 1 X, at pH 7.4. The pre‐diluted sera (1/5) with PBS were added to the 1
mL protein G column, which was used at the flow rate of 1 mL/min and then, washed
with 10 mL of PBS. IgG were eluted using 10 mL of glycine buffer 0.1 M, pH 2.7, followed
by neutralization with 1 M Tris pH 9. Analysis was performed using UNICORN 7.0 soft‐
ware (Cytiva) to collect IgG‐containing fractions. Purified IgG were quantified using a
BCA protein assay kit (PierceTM, Rockford, IL, USA) according to the manufacturer in‐
structions.
2.3. N‐glycome Analysis of IgG in Patients
N‐glycan analysis was performed as previously reported in detail in [24]. In brief,
purified, denatured IgG were de‐glycosylated using peptide N‐glycosidase (PNGase F
from Elizabethkingia miricola, Sigma‐Aldrich, St. Louis, MO, USA). De‐glycosylated IgG
were precipitated with 4 V of cold ethanol at −20 °C. The supernatant containing the re‐
leased N‐glycans was retrieved and evaporated under air flow. The N‐glycans were per‐
methylated, purified using the C18 column and finally, dried down prior to analysis by
matrix‐assisted laser desorption/ionization–time‐of‐flight mass spectrometry (MALDI‐
TOF MS; Ultraflextreme, Bruker Daltonics, Bremen, Germany). Then, samples were pre‐
pared as a mixture with dihydroxybenzoic acid (DHB) used as the matrix. This matrix was
freshly dissolved at 20 mg/mL in an 80% methanol solution. Permethylated N‐glycans
were solubilized in an acetonitrile/0.1% trifluoroacetic acid 70/30 v/v. The samples and
matrix were spotted in a ratio of 1/1 v/v. Mass spectra were acquired with an accumulation
of a minimum of 10,000 shots in reflectron positive mode using a mass range of m/z 900–
4500. The instrument was calibrated using a peptide calibration kit (ProteoMassTM,
Sigma‐Aldrich, St. Louis, MO, USA). MS/MS spectra were acquired for structural charac‐
terization (Figure S1). For these analyses, argon was used as collision gas (4 bars) in the
LIFT cell, and 10,000 fragment spectra were accumulated with a random walk movement.
Spectra were recorded with FlexControl 3.4 software and analyzed with FlexAnalysis 3.4
Biomedicines 2022, 10, 1774 4 of 17
software (Bruker Daltonics, Bremen, Germany). Based on the m/z ratio, Glycoworkbench
2.1 and reports from the literature on IgG N‐glycosylation, each ion was assigned to a N‐
glycan structure that was drawn according to the recently updated international nomen‐
clature [25]. The threshold used for the peak peaking was adapted for each MALDI‐TOF
mass spectra according to the signal‐to‐noise ratio. The chosen value for each spectrum is
indicated in the Tables S1–S3. For relative quantification analysis, we reported each N‐
glycan subtype intensity to the sum of N‐glycome intensity to obtain N‐glycan relative
percentages.
2.4. Keratinocyte Dissociation Assay
A keratinocyte dissociation assay is currently the main tool for the analysis of anti‐
body‐induced acantholysis in PV in vitro [26], and it was performed as previously de‐
scribed in [24]. In brief, HaCaT cells were cultivated in 24‐well plates with DMEM con‐
taining GlutaMAX (Gibco, Grand Island, NY, USA) and CaCl2 (1 mM) in a controlled at‐
mosphere (CO2 5%) at 37 °C. Twenty‐four hours after reaching the confluence, positive
control (AK23: 10 μg/mL), purified IgG from HD (62.5 μg/mL) or from PV patients (62.5
μg/mL) were added and incubated for 24 h. The HaCaT cells were then treated with a
dispase solution (2.4 U/mL; Sigma‐Aldrich, St. Louis, MO, USA) at 37 °C until the mono‐
layers were separated from the plate. The monolayers were stained with crystal violet
(Sigma‐Aldrich, St. Louis, MO, USA) and mechanical stressed by pipetting 7 times with a
1 mL pipette. After the fixation of cell fragments, pictures were taken, and the number of
fragments were counted manually. Each experiment was performed in triplicate.
2.5. Statistical Analysis
All statistical analyses were performed using GraphPad Prism (GraphPad Software,
La Jolla, CA, USA). Comparisons of IgG N‐glycomes between HD and pemphigus patients
were performed before and after RTX treatment and short‐term CS, using an unpaired t‐
test. A Wilcoxon paired test was used to compare the evolution of IgG N‐glycomes in all
pemphigus patients (n = 16) at baseline to Month 6 after RTX and short‐term CS, and be‐
tween baseline and Month 12 in non‐relapsing patients (n = 8). N‐glycosylation profiles in
relapsing and non‐relapsing pemphigus patients after RTX and short‐term CS treatment
were compared using the non‐parametric Mann–Whitney test. Correlations between the
PDAI score and N‐glycan proportions were assessed using Pearson’s rank correlation co‐
efficient. Differences were considered significant when p cor. <0.006 with Bonferroni ad‐
justment.
3. Results
3.1. Population of Patients
Sixteen patients with pemphigus were included in the present study. Characteristics
of the patients such as age, gender, type of pemphigus as well as the clinical and immu‐
nological specificities are reported in Table 1. All of them presented with circulating anti‐
DSG1 and/or anti‐DSG3 auto‐Abs at baseline (before RTX and short‐term CS treatment),
with mean ELISA values of 372.3 ± 221.0 IU/mL and 1215.1 ± 427.6 IU/mL, respectively.
The main clinical characteristics, blood B cell frequencies and serum anti‐DSG1 and anti‐
DSG3 auto‐Abs ELISA values of relapsing and non‐relapsing patients are indicated in Ta‐
ble 1. For comparison, the sera of 13 healthy donors (HD) were analyzed in this study.
However, for these sera, no information regarding age and gender was available.
Biomedicines 2022, 10, 1774 5 of 17
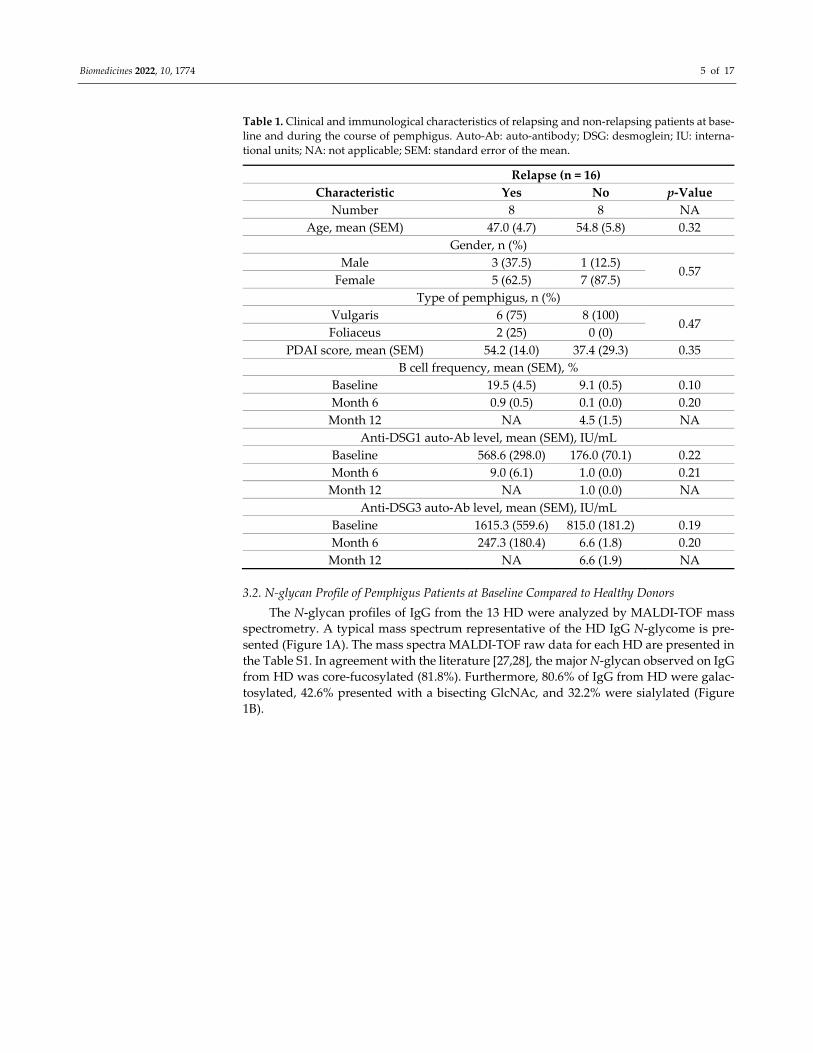
Table 1. Clinical and immunological characteristics of relapsing and non‐relapsing patients at base‐
line and during the course of pemphigus. Auto‐Ab: auto‐antibody; DSG: desmoglein; IU: interna‐
tional units; NA: not applicable; SEM: standard error of the mean.
Relapse (n = 16)
Characteristic Yes No p‐Value
Number 8 8 NA
Age, mean (SEM) 47.0 (4.7) 54.8 (5.8) 0.32
Gender, n (%)
Male 3 (37.5) 1 (12.5) 0.57
Female 5 (62.5) 7 (87.5)
Type of pemphigus, n (%)
Vulgaris 6 (75) 8 (100) 0.47
Foliaceus 2 (25) 0 (0)
PDAI score, mean (SEM) 54.2 (14.0) 37.4 (29.3) 0.35
B cell frequency, mean (SEM), %
Baseline 19.5 (4.5) 9.1 (0.5) 0.10
Month 6 0.9 (0.5) 0.1 (0.0) 0.20
Month 12 NA 4.5 (1.5) NA
Anti‐DSG1 auto‐Ab level, mean (SEM), IU/mL
Baseline 568.6 (298.0) 176.0 (70.1) 0.22
Month 6 9.0 (6.1) 1.0 (0.0) 0.21
Month 12 NA 1.0 (0.0) NA
Anti‐DSG3 auto‐Ab level, mean (SEM), IU/mL
Baseline 1615.3 (559.6) 815.0 (181.2) 0.19
Month 6 247.3 (180.4) 6.6 (1.8) 0.20
Month 12 NA 6.6 (1.9) NA
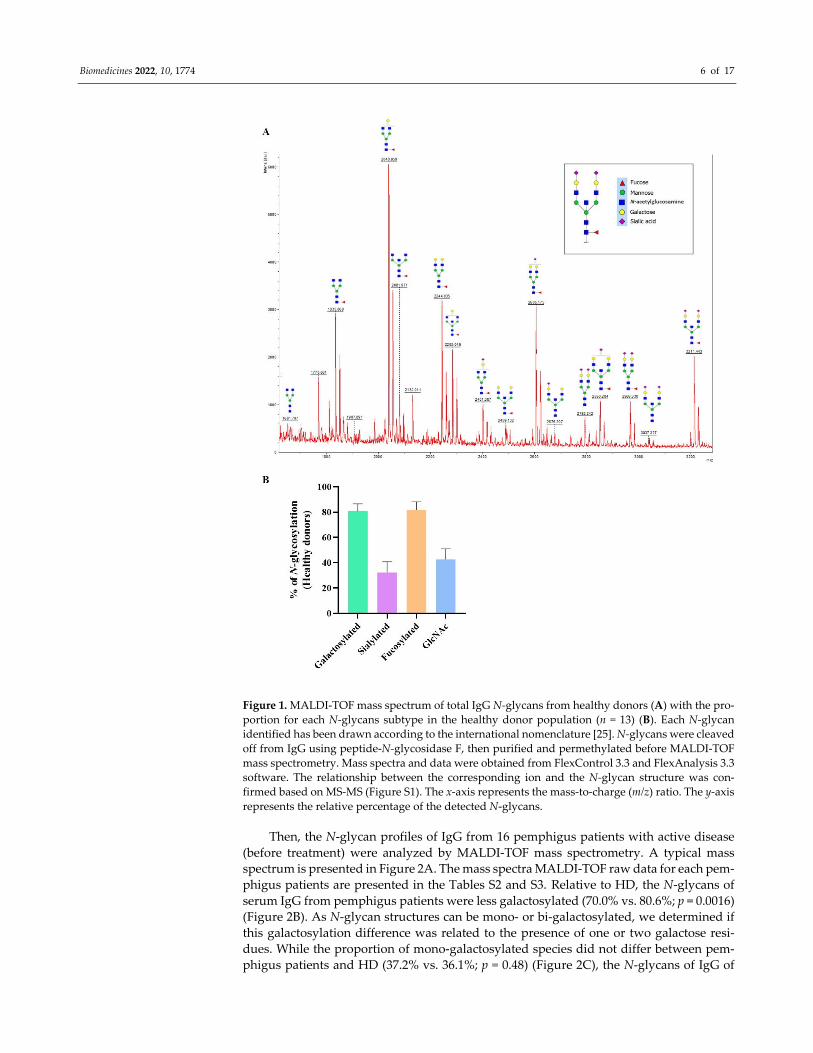
3.2. N‐glycan Profile of Pemphigus Patients at Baseline Compared to Healthy Donors
The N‐glycan profiles of IgG from the 13 HD were analyzed by MALDI‐TOF mass
spectrometry. A typical mass spectrum representative of the HD IgG N‐glycome is pre‐
sented (Figure 1A). The mass spectra MALDI‐TOF raw data for each HD are presented in
the Table S1. In agreement with the literature [27,28], the major N‐glycan observed on IgG
from HD was core‐fucosylated (81.8%). Furthermore, 80.6% of IgG from HD were galac‐
tosylated, 42.6% presented with a bisecting GlcNAc, and 32.2% were sialylated (Figure
1B).
Biomedicines 2022, 10, 1774 6 of 17
Figure 1. MALDI‐TOF mass spectrum of total IgG N‐glycans from healthy donors (A) with the pro‐
portion for each N‐glycans subtype in the healthy donor population (n = 13) (B). Each N‐glycan
identified has been drawn according to the international nomenclature [25]. N‐glycans were cleaved
off from IgG using peptide‐N‐glycosidase F, then purified and permethylated before MALDI‐TOF
mass spectrometry. Mass spectra and data were obtained from FlexControl 3.3 and FlexAnalysis 3.3
software. The relationship between the corresponding ion and the N‐glycan structure was con‐
firmed based on MS‐MS (Figure S1). The x‐axis represents the mass‐to‐charge (m/z) ratio. The y‐axis
represents the relative percentage of the detected N‐glycans.
Then, the N‐glycan profiles of IgG from 16 pemphigus patients with active disease
(before treatment) were analyzed by MALDI‐TOF mass spectrometry. A typical mass
spectrum is presented in Figure 2A. The mass spectra MALDI‐TOF raw data for each pem‐
phigus patients are presented in the Tables S2 and S3. Relative to HD, the N‐glycans of
serum IgG from pemphigus patients were less galactosylated (70.0% vs. 80.6%; p = 0.0016)
(Figure 2B). As N‐glycan structures can be mono‐ or bi‐galactosylated, we determined if
this galactosylation difference was related to the presence of one or two galactose resi‐
dues. While the proportion of mono‐galactosylated species did not differ between pem‐
phigus patients and HD (37.2% vs. 36.1%; p = 0.48) (Figure 2C), the N‐glycans of IgG of
Biomedicines 2022, 10, 1774 7 of 17
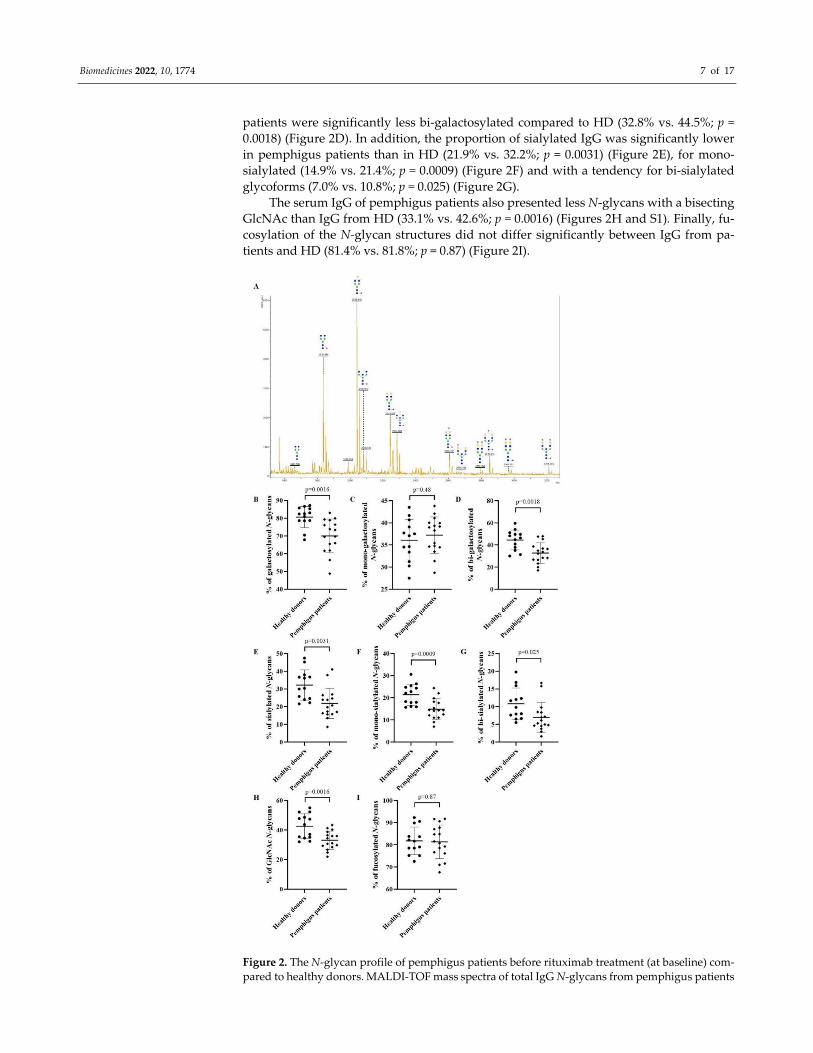
patients were significantly less bi‐galactosylated compared to HD (32.8% vs. 44.5%; p =
0.0018) (Figure 2D). In addition, the proportion of sialylated IgG was significantly lower
in pemphigus patients than in HD (21.9% vs. 32.2%; p = 0.0031) (Figure 2E), for mono‐
sialylated (14.9% vs. 21.4%; p = 0.0009) (Figure 2F) and with a tendency for bi‐sialylated
glycoforms (7.0% vs. 10.8%; p = 0.025) (Figure 2G).
The serum IgG of pemphigus patients also presented less N‐glycans with a bisecting
GlcNAc than IgG from HD (33.1% vs. 42.6%; p = 0.0016) (Figures 2H and S1). Finally, fu‐
cosylation of the N‐glycan structures did not differ significantly between IgG from pa‐
tients and HD (81.4% vs. 81.8%; p = 0.87) (Figure 2I).
Figure 2. The N‐glycan profile of pemphigus patients before rituximab treatment (at baseline) com‐
pared to healthy donors. MALDI‐TOF mass spectra of total IgG N‐glycans from pemphigus patients
Biomedicines 2022, 10, 1774 8 of 17
(A). The N‐glycan structures were drawn according to the international nomenclature [25]. Blue
square: N‐acetylglucosamine; green circle: mannose; yellow circle: galactose; purple diamond: N‐
acetylneuraminic acid; red triangle: fucose. The percentage based on the relative quantification of
galactosylated (B), mono‐galactosylated (C), bi‐galactosylated (D), sialylated (E), mono‐sialylated
(F), bi‐sialylated (G), N‐acetylglucosamine (GlcNAc) (H), fucosylated (I) N‐glycans from IgG. Dif‐
ferences were considered significant when p cor. <0.006 with Bonferroni adjustment.
Therefore, the IgG N‐glycome of patients at baseline was different from HD.
3.3. Evolution of the IgG N‐glycome of Pemphigus Patients under Treatment
3.3.1. Evolution of the IgG N‐glycome under Treatment in the Whole Population
of Patients
To assess the evolution of IgG N‐glycome of pemphigus patients after RTX and short‐
term CS treatment, we compared the IgG N‐glycome analyzed by MALDI‐TOF mass spec‐
trometry in sera collected at baseline (n = 16; 8 relapsing and 8 non‐relapsing patients) to
those collected after the initial cycle of RTX at Month 6 (n = 16; 8 relapsing and 8 non‐
relapsing patients) and Month 12 (n = 8, non‐relapsing patients), respectively. Since the
relapse time of the relapsing patients occurred around 6 months (252.3 ± 79.2 days) after
the initial cycle of RTX, the latter were analyzed at the Month 6 time‐point of the non‐
relapsing patients.
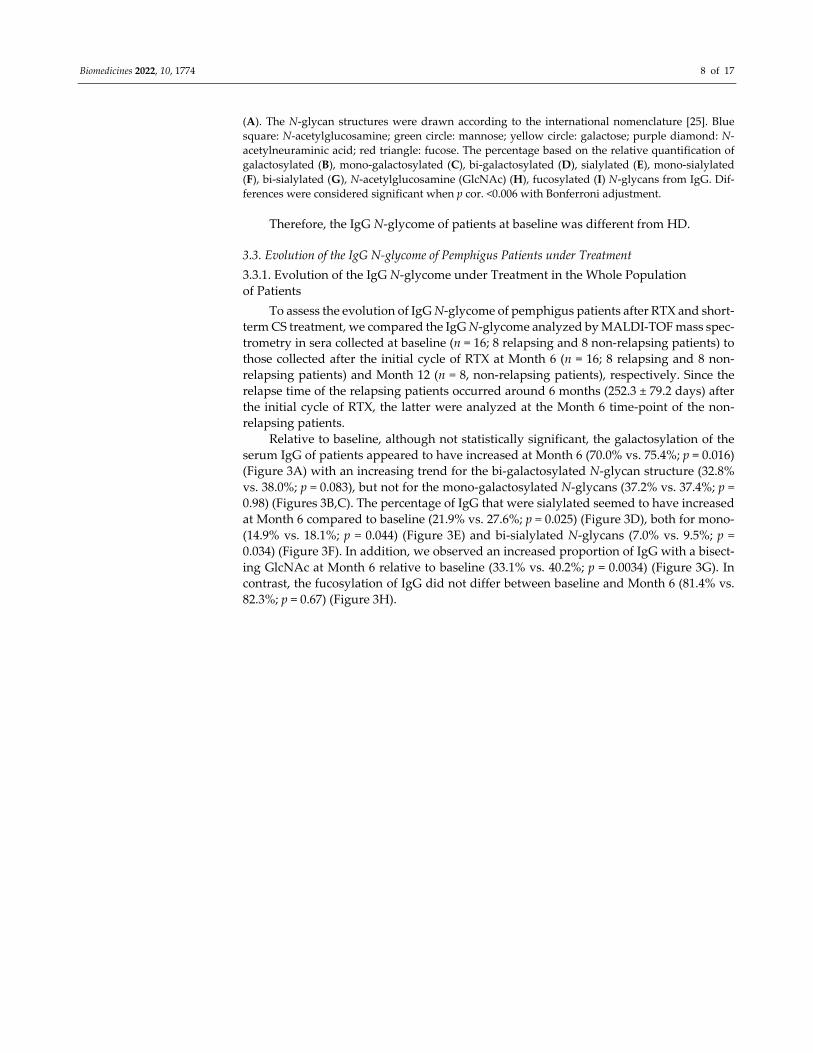
Relative to baseline, although not statistically significant, the galactosylation of the
serum IgG of patients appeared to have increased at Month 6 (70.0% vs. 75.4%; p = 0.016)
(Figure 3A) with an increasing trend for the bi‐galactosylated N‐glycan structure (32.8%
vs. 38.0%; p = 0.083), but not for the mono‐galactosylated N‐glycans (37.2% vs. 37.4%; p =
0.98) (Figures 3B,C). The percentage of IgG that were sialylated seemed to have increased
at Month 6 compared to baseline (21.9% vs. 27.6%; p = 0.025) (Figure 3D), both for mono‐
(14.9% vs. 18.1%; p = 0.044) (Figure 3E) and bi‐sialylated N‐glycans (7.0% vs. 9.5%; p =
0.034) (Figure 3F). In addition, we observed an increased proportion of IgG with a bisect‐
ing GlcNAc at Month 6 relative to baseline (33.1% vs. 40.2%; p = 0.0034) (Figure 3G). In
contrast, the fucosylation of IgG did not differ between baseline and Month 6 (81.4% vs.
82.3%; p = 0.67) (Figure 3H).
Biomedicines 2022, 10, 1774 9 of 17
Figure 3. N‐glycome evolution of pemphigus patients over time and comparison between before
(baseline) and 6 months (M6) and 12 months (M12) after rituximab treatment. Comparison of per‐
centages based on relative quantification of galactosylated (A), mono‐galactosylated (B), bi‐galacto‐
sylated (C), sialylated (D), mono‐sialylated (E), bi‐sialylated (F), N‐acetylglucosamine (GlcNAc) (G),
fucosylated (H) subgroups of N‐glycans from IgG. Analyses were performed at baseline and M6 for
all patients (n = 16) and at M12 only for non‐relapsing patients (n = 8). Means ± standard deviations
were compared using the Wilcoxon paired test. Differences were considered significant when p cor.
<0.006 with Bonferroni adjustment.
Interestingly, we observed changes in the IgG N‐glycomes of RTX‐treated patients
from baseline to Month 6, resulting in the IgG N‐glycome of patients at Month 6 being
very similar to that observed in HD IgG, in particular regarding the proportions of galac‐
tosylated (patients: 75.4%; HD: 80.6%), sialylated (patients: 27.6%; HD: 32.2%) and the
presence of additional GlcNAc on IgG N‐glycome (patients: 40.2%; HD: 42.6%) (Figure
S2).
Biomedicines 2022, 10, 1774 10 of 17
Surprisingly, the IgG N‐glycome of non‐relapsing patients was not significantly dif‐
ferent between baseline and Month 12 (Figures 3A–H).
3.3.2. Evolution of the IgG N‐glycome Depending on Response to Treatment
To assess whether a difference in the IgG N‐glycome could be observed between sera
from patients who achieved sustained complete remission after treatment and those who
relapsed, we studied the IgG N‐glycome in the serum of patients collected at Month 6 for
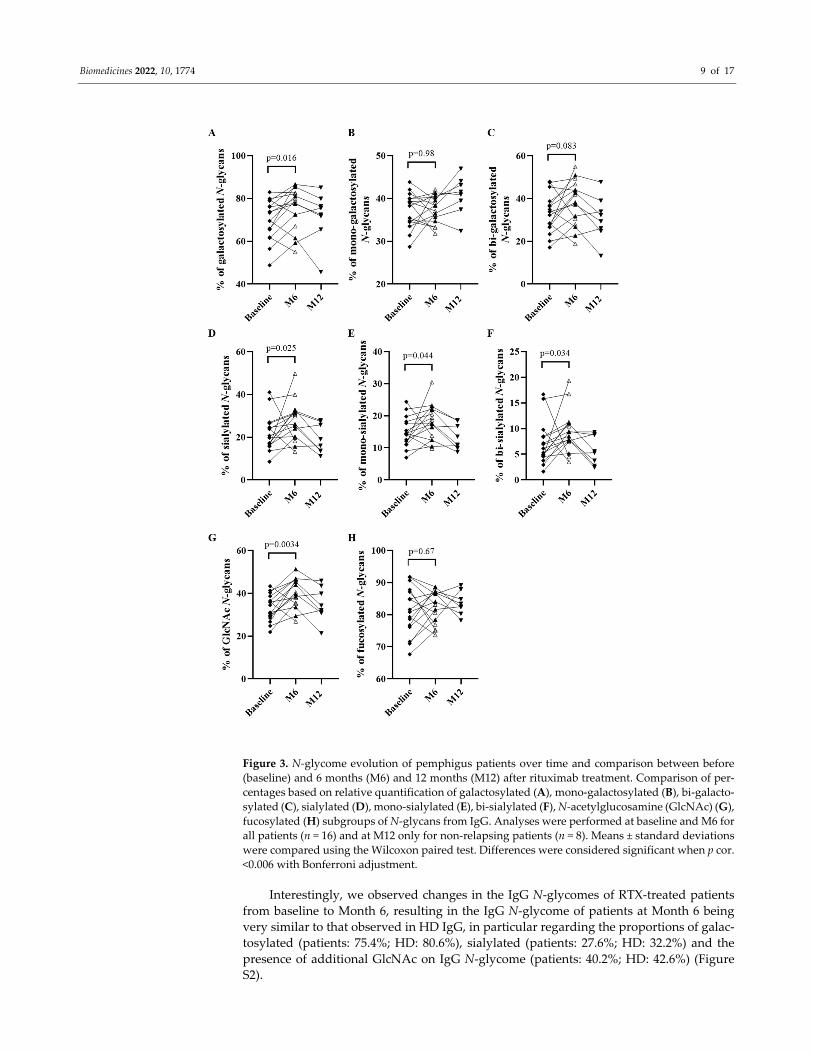
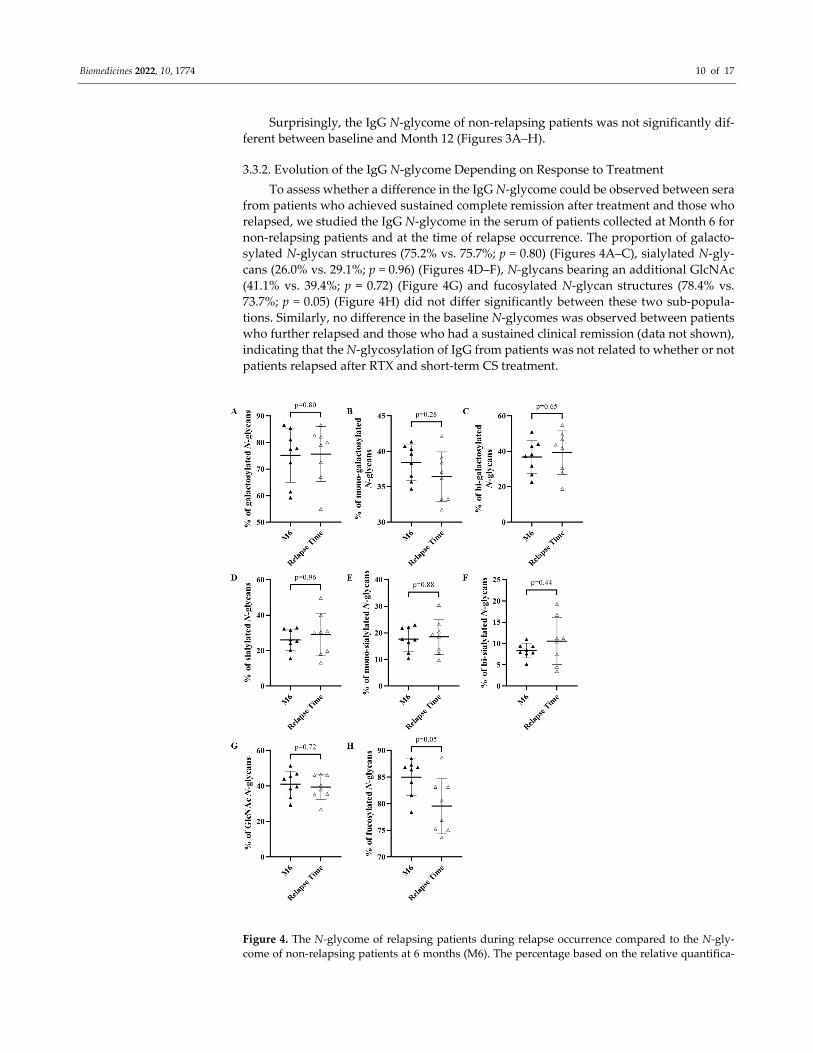
non‐relapsing patients and at the time of relapse occurrence. The proportion of galacto‐
sylated N‐glycan structures (75.2% vs. 75.7%; p = 0.80) (Figures 4A–C), sialylated N‐gly‐
cans (26.0% vs. 29.1%; p = 0.96) (Figures 4D–F), N‐glycans bearing an additional GlcNAc
(41.1% vs. 39.4%; p = 0.72) (Figure 4G) and fucosylated N‐glycan structures (78.4% vs.
73.7%; p = 0.05) (Figure 4H) did not differ significantly between these two sub‐popula‐
tions. Similarly, no difference in the baseline N‐glycomes was observed between patients
who further relapsed and those who had a sustained clinical remission (data not shown),
indicating that the N‐glycosylation of IgG from patients was not related to whether or not
patients relapsed after RTX and short‐term CS treatment.
Figure 4. The N‐glycome of relapsing patients during relapse occurrence compared to the N‐gly‐
come of non‐relapsing patients at 6 months (M6). The percentage based on the relative quantifica‐
Biomedicines 2022, 10, 1774 11 of 17
tion of galactosylated (A), mono‐galactosylated (B), bi‐galactosylated (C), sialylated (D), mono‐si‐
alylated (E), bi‐sialylated (F), N‐acetylglucosamine (GlcNAc) (G), fucosylated (H) subgroup of N‐
glycans from IgG of non‐relapsing and relapsing patients for M6 and relapse occurrence, respec‐
tively. Means ± standard deviations were compared using a Mann–Whitney test. Differences were
considered significant when p cor. < 0.006 with Bonferroni adjustment.
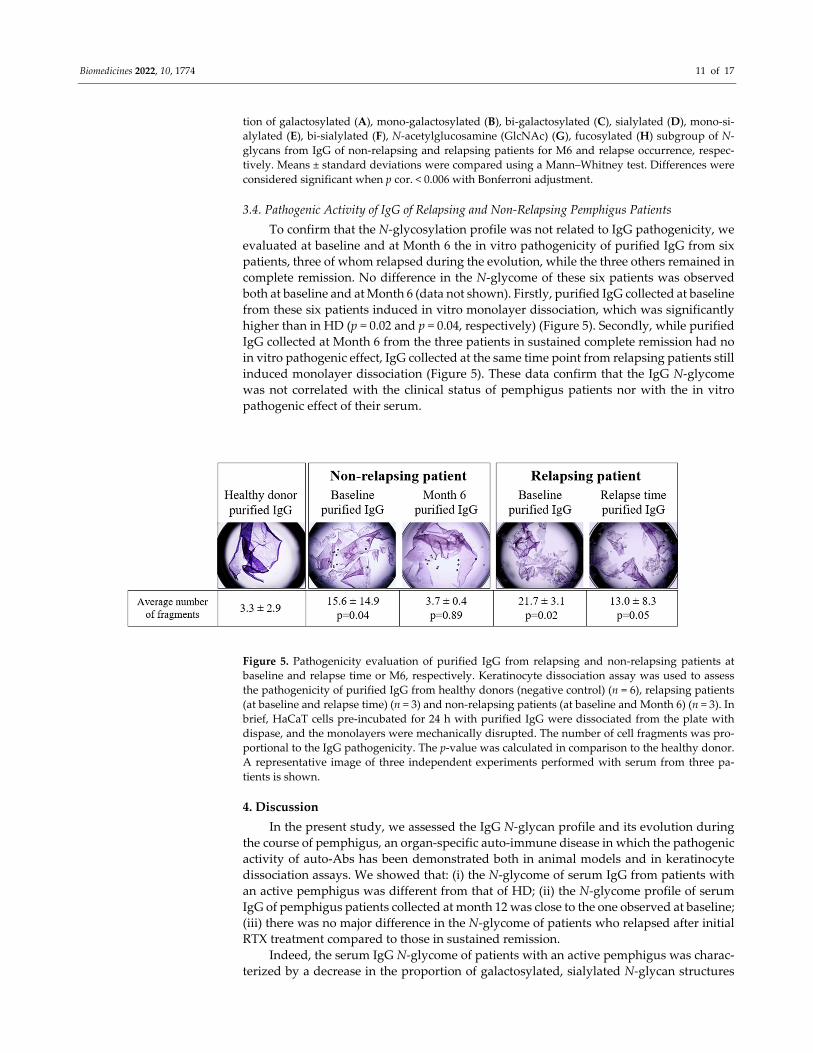
3.4. Pathogenic Activity of IgG of Relapsing and Non‐Relapsing Pemphigus Patients
To confirm that the N‐glycosylation profile was not related to IgG pathogenicity, we
evaluated at baseline and at Month 6 the in vitro pathogenicity of purified IgG from six
patients, three of whom relapsed during the evolution, while the three others remained in
complete remission. No difference in the N‐glycome of these six patients was observed
both at baseline and at Month 6 (data not shown). Firstly, purified IgG collected at baseline
from these six patients induced in vitro monolayer dissociation, which was significantly
higher than in HD (p = 0.02 and p = 0.04, respectively) (Figure 5). Secondly, while purified
IgG collected at Month 6 from the three patients in sustained complete remission had no
in vitro pathogenic effect, IgG collected at the same time point from relapsing patients still
induced monolayer dissociation (Figure 5). These data confirm that the IgG N‐glycome
was not correlated with the clinical status of pemphigus patients nor with the in vitro
pathogenic effect of their serum.
Figure 5. Pathogenicity evaluation of purified IgG from relapsing and non‐relapsing patients at
baseline and relapse time or M6, respectively. Keratinocyte dissociation assay was used to assess
the pathogenicity of purified IgG from healthy donors (negative control) (n = 6), relapsing patients
(at baseline and relapse time) (n = 3) and non‐relapsing patients (at baseline and Month 6) (n = 3). In
brief, HaCaT cells pre‐incubated for 24 h with purified IgG were dissociated from the plate with
dispase, and the monolayers were mechanically disrupted. The number of cell fragments was pro‐
portional to the IgG pathogenicity. The p‐value was calculated in comparison to the healthy donor.
A representative image of three independent experiments performed with serum from three pa‐
tients is shown.
4. Discussion
In the present study, we assessed the IgG N‐glycan profile and its evolution during
the course of pemphigus, an organ‐specific auto‐immune disease in which the pathogenic
activity of auto‐Abs has been demonstrated both in animal models and in keratinocyte
dissociation assays. We showed that: (i) the N‐glycome of serum IgG from patients with
an active pemphigus was different from that of HD; (ii) the N‐glycome profile of serum
IgG of pemphigus patients collected at month 12 was close to the one observed at baseline;
(iii) there was no major difference in the N‐glycome of patients who relapsed after initial
RTX treatment compared to those in sustained remission.
Indeed, the serum IgG N‐glycome of patients with an active pemphigus was charac‐
terized by a decrease in the proportion of galactosylated, sialylated N‐glycan structures
Biomedicines 2022, 10, 1774 12 of 17
as well as the ones bearing an additional GlcNAc relative to HD. Our results are in agree‐
ment with those previously reported for rheumatoid arthritis [29]. A decrease in the pro‐
portion of galactosylated and sialylated N‐glycan structures was also observed in systemic
lupus erythematosus patients relative to HD, with, nevertheless, an increase in the pro‐
portion of N‐glycans bearing an additional GlcNAc [17]. The decrease in sialylated N‐gly‐
cans from the IgG of pemphigus patients was directly related to the decrease in galacto‐
sylation. Many studies have reported that the lack of galactose and sialic acid residues
was related to inflammation [29,30]. We did not observe any significant modification of
fucosylation as previously described in other auto‐immune diseases with an underlying
ADCC (antibody‐dependent cell‐mediated cytotoxicity) mechanism [17,31,32]. Indeed, fu‐
cosylation induces a 100‐fold decrease in the affinity of IgG for the FcγRIIIA, thus avoid‐
ing an excessive ADCC response [33–36]. However, such modifications of IgG fucosyla‐
tion have rarely been reported in auto‐immune diseases that do not involve an ADCC
mechanism such as pemphigus [31].
We also observed a trend in the modification of the N‐glycome of serum IgG from
pemphigus patients after treatment with RTX and short‐term CS. Indeed, analyses of the
serum IgG samples collected at Month 6 showed a significant increase of N‐glycan struc‐
tures bearing a bisecting GlcNAc residue as well as a slightly increased proportion of ga‐
lactosylated, sialylated N‐glycans than at baseline in patients with an active disease. Alt‐
hough these findings were not statistically significant, they agreed with the increase in
galactosylation and sialylation reported in the N‐glycan structures of patients with rheu‐
matoid arthritis after treatment with methotrexate [37]. These changes could be explained
by the depletion of circulating B cells 6 months after RTX and short‐term CS, whereby the
IgG N‐glycans analyzed were derived only from long‐lived plasma cells. Indeed, we pre‐
viously showed that the initial infusion of RTX induced a dramatic decrease in peripheral
whole blood B cells at Month 6, followed by a transient re‐increase from Month 9 to Month
12 and associated with a disappearance of serum IgG anti‐DSG Abs [38].
However, few N‐glycans differences were reported in patients with auto‐immune
thrombocytopenia treated with RTX [39]. Indeed, although IgG N‐glycosylation in this
auto‐immune disease was similar to HD and did not predict treatment responses to RTX,
a modification of IgG N‐glycome was reported 2 months after RTX treatment compared
to baseline.
Interestingly, the modifications of the N‐glycome that we observed between baseline
and Month 6 seemed transient, since the N‐glycome profile of serum IgG collected at
Month 12 was close to that observed at baseline. As CS treatment was stopped at Month
6 for most patients in this study, it is likely that the modifications of IgG N‐glycome ob‐
served between baseline and Month 6 might be related to the effect of CS rather than to
RTX. Accordingly, it has been described in the collagen‐induced arthritis animal model
that dexamethasone modified the IgG N‐glycosylation, resulting in a higher proportion of
galactosylated N‐glycans compared to naive mice [40]. It has also been reported that diet
and/or some drug intake could modify the N‐glycome of serum IgG [41,42] or that it could
be a consequence of reduced inflammation due to general immunosuppression. Indeed,
it is clearly established that agalactosylated and asialylated serum IgG is associated with
inflammation, whereas the presence of galactosylated and sialylated IgG correlates with
an improved inflammation [20,43–45]. Unfortunately, in a previous study conducted by
our team on only three CS‐treated patients, this hypothesis could not be confirmed due to
a lack of statistical power and the inter‐individual variations observed [24].
Our results do not argue for a relationship between serum IgG N‐glycome and the
pathogenic activity of corresponding sera. Firstly, we did not observe any relationship
between IgG N‐glycome and the clinical severity of pemphigus assessed at baseline (data
not shown). The clinical severity of pemphigus was assessed using the PDAI scoring sys‐
tem as previously reported [46]. Secondly, the analysis of IgG N‐glycome in serum col‐
lected at Month 12 in patients in clinical remission was close to that observed before treat‐
ment in patients with an active disease. Thirdly, we did not evidence any major difference
Biomedicines 2022, 10, 1774 13 of 17
between the N‐glycome of patients who relapsed after the initial treatment and those who
remained in sustained clinical remission. Finally, these observations were in accordance
with the demonstration of the persistent in vitro pathogenic activity of sera from relapsing
patients compared to sera from remitted patients, while both sera had a quite similar N‐
glycome.
Some studies have reported an effect of the N‐glycosylation on disease activity in
patients with inflammatory bowel disease, systemic vasculitis and rheumatoid arthritis
[13,14,16], which all involve an ADCC mechanism. Indeed, it is well known that N‐glyco‐
sylation of IgG modifies the affinity between the Fc part of the IgG and the Fcγ receptors
[9]. In contrast, the absence of a relationship between pemphigus severity and modifica‐
tions of IgG N‐glycosylation might be related to the fact that ADCC is not involved in the
pathogenesis of pemphigus, and that N‐glycosylation only slightly modifies the anti‐
gen/Ab affinity [9]. Furthermore, Fab N‐glycosylation changes might impact the anti‐
gen/Ab affinity [47], but only 15 to 25% of IgG also bear N‐glycans on the Fab [10]. Thus,
the results of our study mainly reflect the overall IgG N‐glycans.
Finally, the results of this study agree with the findings of a recently published study
conducted on CS‐treated patients [24]. Although this study was only conducted on three
pemphigus patients, they showed that: (i) the N‐glycan profile of pemphigus IgG was
different from that of HD but was not modified by the treatment, (ii) the pathogenicity of
pemphigus IgG did not seem to be related to the variability of the IgG N‐glycome during
the course of pemphigus.
The main limitation of this study is the fact that our analyses were performed on
whole serum IgG as most studies in the literature [14,16], which does not necessarily im‐
ply that our results are relevant to the population of anti‐DSG auto‐Abs. It should be noted
that such anti‐DSG auto‐Abs, especially the anti‐DSG3, represent above 4% of the overall
IgG population. Therefore, despite several attempts to purify the anti‐DSG3 auto‐Abs, the
quantities of anti‐DSG IgG obtained after purification on affinity columns were not suffi‐
cient for N‐glycome analyses.
Moreover, it would be interesting to analyze the IgG N‐glycome from a higher num‐
ber of HD in order to improve the statistical power of this study. Some studies have shown
evidence of high inter‐individual variability in the IgG N‐glycome, which could explain
the absence of statistical difference observed in some of our analyses [48,49]. These studies
have also demonstrated that very few modulations of the IgG N‐glycome were observed
over time, suggesting that the modulations observed in our study were likely to be related
to the treatment. In addition, we had no information about the age and gender of the HD
included in our study, which would be interesting data, since many studies have shown
that these two parameters can influence changes in IgG N‐glycosylation [31,50–53]. How‐
ever, the pemphigus patients included in this study constituted a heterogeneous popula‐
tion (age and sex) with very few co‐morbidities that was comparable to the population of
the French blood donors.
5. Conclusions
Overall, despite the fact that pemphigus patients had a different N‐glycome from
HD, and a transient modification of N‐glycome was observed under treatment, our find‐
ings do not support a clear relationship between IgG N‐glycosylation and disease activity
in pemphigus. This might be related to the fact that pemphigus does not involve an ADCC
mechanism unlike many other non‐organ specific auto‐immune diseases, in which modi‐
fications of IgG N‐glycosylation have been correlated with response to treatment. These
results suggest that the IgG N‐glycome changes (i.e., a decrease in the proportion of ga‐
lactosylated, sialylated N‐glycan structures as well as the ones bearing a bisecting Glc‐
NAc) observed in pemphigus patients before treatment in comparison with HD could be
a biomarker of autoimmunity susceptibility rather than a sign of inflammation.
Biomedicines 2022, 10, 1774 14 of 17
Supplementary Materials: The following supporting information can be downloaded at:
www.mdpi.com/article/10.3390/biomedicines10081774/s1, Figure S1: Examples of MALDI‐TOF MS‐
MS spectra allowing the identification of the N‐glycan structures assigned to the different ions. (A)
LIFT MS‐MS MALDI‐TOF spectra of the ion at m/z 1835 corresponding to the biantennary N‐glycan
containing two terminal N‐acetylglucosamine. (B) LIFT MS‐MS MALDI‐TOF spectra of the ion at
m/z 2676 corresponding to a complex‐type N‐glycan bearing an additional bisecting N‐acetylglu‐
cosamine. The N‐glycan structures were drawn according to the international nomenclature [25].
Blue Square: N‐acetylglucosamine; green circle: mannose; yellow circle: galactose; purple diamond:
N‐acetylneuraminic acid, red triangle: fucose; Figure S2: Pemphigus patient’s N‐glycan profile after
rituximab treatment (M6) (n = 16) compared to healthy donor (n = 13). Percentage based on relative
quantification of galactosylated (A), mono‐galactosylated (B), bi‐galactosylated (C), sialylated (D),
mono‐sialylated (E), bi‐sialylated (F), N‐acetylglucosamine (GlcNAc) (G), fucosylated (H) N‐glycans
from IgG. Means ± standard deviations were compared using unpaired standard t‐test. Differences
were considered significant when p cor. <0.006 with Bonferroni adjustment; Table S1: Mass spectra
MALDI‐TOF raw data from heathy donors; Table S2: Mass spectra MALDI‐TOF raw data from non‐
relapsing patients; Table S3: Mass spectra MALDI‐TOF raw data from relapsing patients.
Author Contributions: G.F., M.‐L.W.‐B., M.P., C.B., M.M.‐V., V.H., P.C., M.F., M.B. and M.‐L.G.
conceived the program of work or provided essential experimental tools. G.F., P.J., S.C., M.B. and
M.‐L.G. wrote the first draft of the manuscript. O.B., P.J., S.C., M.B. and M.‐L.G. revised the manu‐
script regarding important intellectual content. All authors have read and agreed to the published
version of the manuscript.
Funding: This study was supported by INSERM, University of Rouen Normandie, GlycoMEV UR
4358 lab and Rouen University Hospital, Dermatology Department, France. The HeRacLeS PIS‐
SARO platform was co‐supported by European Union and Région Normandie. Europe gets in‐
volved in Normandie with “European Regional Development Fund (ERDF)”.
Institutional Review Board Statement: The study was conducted in accordance with the Declara‐
tion of Helsinki, and approved by the Institutional Review Board of ClinicalTrials.gov
(NCT00784589, 4 November 2008).
Informed Consent Statement: Informed consent was obtained from all subjects involved in the
study.
Data Availability Statement: All data are available upon request.
Conflicts of Interest: The authors declare that the research was conducted in the absence of any
commercial or financial relationships that could be construed as a potential conflict of interest.
References
1. Ding, X.; Aoki, V.; Mascaro, J.M.; Lopez‐Swiderski, A.; Diaz, L.A.; Fairley, J.A. Mucosal and Mucocutaneous (Generalized)
Pemphigus Vulgaris Show Distinct Autoantibody Profiles. J. Invest. Dermatol. 1997, 109, 592–596. https://doi.org/10.1111/1523‐
1747.ep12337524.
2. Schmidt, E.; Kasperkiewicz, M.; Joly, P. Pemphigus. Lancet Lond. Engl. 2019, 394, 882–894.
https://doi.org/10.1016/S0140‐6736(19)31778‐7. 3. Zhao, C.Y.; Murrell, D.F. Pemphigus Vulgaris: An Evidence‐Based Treatment Update. Drugs 2015, 75, 271–284.
https://doi.org/10.1007/s40265‐015‐0353‐6.
4. Joly, P.; Maho‐Vaillant, M.; Prost‐Squarcioni, C.; Hebert, V.; Houivet, E.; Calbo, S.; Caillot, F.; Golinski, M.L.; Labeille, B.; Picard‐
Dahan, C.; et al. First‐Line Rituximab Combined with Short‐Term Prednisone versus Prednisone Alone for the Treatment of
Pemphigus (Ritux 3): A Prospective, Multicentre, Parallel‐Group, Open‐Label Randomised Trial. Lancet Lond. Engl. 2017, 389,
2031–2040. https://doi.org/10.1016/S0140‐6736(17)30070‐3.
5. Mignard, C.; Maho‐Vaillant, M.; Golinski, M.‐L.; Balayé, P.; Prost‐Squarcioni, C.; Houivet, E.; Calbo, S.B.; Labeille, B.; Picard‐
Dahan, C.; Konstantinou, M.P.; et al. Factors Associated With Short‐Term Relapse in Patients With Pemphigus Who Receive
Rituximab as First‐Line Therapy: A Post Hoc Analysis of a Randomized Clinical Trial. JAMA Dermatol. 2020, 156, 545–552.
https://doi.org/10.1001/jamadermatol.2020.0290.
6. Passot, C.; Azzopardi, N.; Renault, S.; Baroukh, N.; Arnoult, C.; Ohresser, M.; Boisdron‐Celle, M.; Gamelin, E.; Watier, H.;
Paintaud, G.; et al. Influence of FCGRT Gene Polymorphisms on Pharmacokinetics of Therapeutic Antibodies. mAbs 2013, 5,
614–619. https://doi.org/10.4161/mabs.24815.
7. Vidarsson, G.; Dekkers, G.; Rispens, T. IgG Subclasses and Allotypes: From Structure to Effector Functions. Front. Immunol. 2014,
5, 520. https://doi.org/10.3389/fimmu.2014.00520.
Biomedicines 2022, 10, 1774 15 of 17
8. Bas, M.; Terrier, A.; Jacque, E.; Dehenne, A.; Pochet‐Béghin, V.; Beghin, C.; Dezetter, A.‐S.; Dupont, G.; Engrand, A.; Beaufils,
B.; et al. Fc Sialylation Prolongs Serum Half‐Life of Therapeutic Antibodies. J. Immunol. 2019, 202, 1582–1594.
https://doi.org/10.4049/jimmunol.1800896.
9. Jennewein, M.F.; Alter, G. The Immunoregulatory Roles of Antibody Glycosylation. Trends Immunol. 2017, 38, 358–372.
https://doi.org/10.1016/j.it.2017.02.004.
10. van de Bovenkamp, F.S.; Hafkenscheid, L.; Rispens, T.; Rombouts, Y. The Emerging Importance of IgG Fab Glycosylation in
Immunity. J. Immunol. 2016, 196, 1435–1441. https://doi.org/10.4049/jimmunol.1502136.
11. Cobb, B.A. The History of IgG Glycosylation and Where We Are Now. Glycobiology 2020, 30, 202–213.
https://doi.org/10.1093/glycob/cwz065.
12. Wang, T.T. IgG Fc Glycosylation in Human Immunity. Curr. Top. Microbiol. Immunol. 2019, 423, 63–75.
https://doi.org/10.1007/82_2019_152.
13. Dubé, R.; Rook, G.A.; Steele, J.; Brealey, R.; Dwek, R.; Rademacher, T.; Lennard‐Jones, J. Agalactosyl IgG in Inflammatory Bowel
Disease: Correlation with C‐Reactive Protein. Gut 1990, 31, 431–434. https://doi.org/10.1136/gut.31.4.431.
14. Parekh, R.B.; Roitt, I.M.; Isenberg, D.A.; Dwek, R.A.; Ansell, B.M.; Rademacher, T.W. Galactosylation of IgG Associated
Oligosaccharides: Reduction in Patients with Adult and Juvenile Onset Rheumatoid Arthritis and Relation to Disease Activity.
Lancet Lond. Engl. 1988, 1, 966–969. https://doi.org/10.1016/s0140‐6736(88)91781‐3.
15. Espy, C.; Morelle, W.; Kavian, N.; Grange, P.; Goulvestre, C.; Viallon, V.; Chéreau, C.; Pagnoux, C.; Michalski, J.‐C.; Guillevin,
L.; et al. Sialylation Levels of Anti‐Proteinase 3 Antibodies Are Associated with the Activity of Granulomatosis with Polyangiitis
(Wegener’s). Arthritis Rheum. 2011, 63, 2105–2115. https://doi.org/10.1002/art.30362.
16. Kemna, M.J.; Plomp, R.; van Paassen, P.; Koeleman, C.A.M.; Jansen, B.C.; Damoiseaux, J.G.M.C.; Cohen Tervaert, J.W.; Wuhrer,
M. Galactosylation and Sialylation Levels of IgG Predict Relapse in Patients With PR3‐ANCA Associated Vasculitis.
eBioMedicine 2017, 17, 108–118. https://doi.org/10.1016/j.ebiom.2017.01.033.
17. Vučković, F.; Krištić, J.; Gudelj, I.; Teruel, M.; Keser, T.; Pezer, M.; Pučić‐Baković, M.; Štambuk, J.; Trbojević‐Akmačić, I.; Barrios,
C.; et al. Association of Systemic Lupus Erythematosus with Decreased Immunosuppressive Potential of the IgG Glycome.
Arthritis Rheumatol. Hoboken NJ 2015, 67, 2978–2989. https://doi.org/10.1002/art.39273.
18. Albert, H.; Collin, M.; Dudziak, D.; Ravetch, J.V.; Nimmerjahn, F. In Vivo Enzymatic Modulation of IgG Glycosylation Inhibits
Autoimmune Disease in an IgG Subclass‐Dependent Manner. Proc. Natl. Acad. Sci. USA 2008, 105, 15005–15009.
https://doi.org/10.1073/pnas.0808248105.
19. Wada, R.; Matsui, M.; Kawasaki, N. Influence of N‐Glycosylation on Effector Functions and Thermal Stability of
Glycoengineered IgG1 Monoclonal Antibody with Homogeneous Glycoforms. mAbs 2019, 11, 350–372.
https://doi.org/10.1080/19420862.2018.1551044.
20. Kaneko, Y.; Nimmerjahn, F.; Ravetch, J.V. Anti‐Inflammatory Activity of Immunoglobulin G Resulting from Fc Sialylation.
Science 2006, 313, 670–673. https://doi.org/10.1126/science.1129594.
21. Schwab, I.; Biburger, M.; Krönke, G.; Schett, G.; Nimmerjahn, F. IVIg‐Mediated Amelioration of ITP in Mice Is Dependent on
Sialic Acid and SIGNR1. Eur. J. Immunol. 2012, 42, 826–830. https://doi.org/10.1002/eji.201142260.
22. Schwab, I.; Mihai, S.; Seeling, M.; Kasperkiewicz, M.; Ludwig, R.J.; Nimmerjahn, F. Broad Requirement for Terminal Sialic Acid
Residues and FcγRIIB for the Preventive and Therapeutic Activity of Intravenous Immunoglobulins in Vivo. Eur. J. Immunol.
2014, 44, 1444–1453. https://doi.org/10.1002/eji.201344230.
23. Caillot, F.; Derambure, C.; Berkani, N.; Riou, G.; Maho‐Vaillant, M.; Calbo, S.; Joly, P.; Musette, P. Long‐Term Increase of Kcnn4
Potassium Channel Surface Expression on B Cells in Pemphigus Patients after Rituximab Treatment. J. Invest. Dermatol. 2018,
138, 2666–2668. https://doi.org/10.1016/j.jid.2018.05.034.
24. Petit, M.; Walet‐Balieu, M.‐L.; Schapman, D.; Golinski, M.‐L.; Burel, C.; Barray, M.; Drouot, L.; Maho‐Vaillant, M.; Hébert, V.;
Boyer, O.; et al. Longitudinal Pathogenic Properties and N‐Glycosylation Profile of Antibodies from Patients with Pemphigus
after Corticosteroid Treatment. Biomedicines 2021, 9, 1411. https://doi.org/10.3390/biomedicines9101411.
25. Neelamegham, S.; Aoki‐Kinoshita, K.; Bolton, E.; Frank, M.; Lisacek, F.; Lütteke, T.; O’Boyle, N.; Packer, N.H.; Stanley, P.;
Toukach, P.; et al. Updates to the Symbol Nomenclature for Glycans Guidelines. Glycobiology 2019, 29, 620–624.
https://doi.org/10.1093/glycob/cwz045.
26. Ishii, K.; Harada, R.; Matsuo, I.; Shirakata, Y.; Hashimoto, K.; Amagai, M. In Vitro Keratinocyte Dissociation Assay for
Evaluation of the Pathogenicity of Anti‐Desmoglein 3 IgG Autoantibodies in Pemphigus Vulgaris. J. Invest. Dermatol. 2005, 124,
939–946. https://doi.org/10.1111/j.0022‐202X.2005.23714.x.
27. Arnold, J.N.; Wormald, M.R.; Sim, R.B.; Rudd, P.M.; Dwek, R.A. The Impact of Glycosylation on the Biological Function and
Structure of Human Immunoglobulins. Annu. Rev. Immunol. 2007, 25, 21–50.
https://doi.org/10.1146/annurev.immunol.25.022106.141702.
28. Wuhrer, M.; Stam, J.C.; van de Geijn, F.E.; Koeleman, C.A.M.; Verrips, C.T.; Dolhain, R.J.E.M.; Hokke, C.H.; Deelder, A.M.
Glycosylation Profiling of Immunoglobulin G (IgG) Subclasses from Human Serum. Proteomics 2007, 7, 4070–4081.
https://doi.org/10.1002/pmic.200700289.
29. Seeling, M.; Brückner, C.; Nimmerjahn, F. Differential Antibody Glycosylation in Autoimmunity: Sweet Biomarker or
Modulator of Disease Activity? Nat. Rev. Rheumatol. 2017, 13, 621–630. https://doi.org/10.1038/nrrheum.2017.146.
Biomedicines 2022, 10, 1774 16 of 17
30. Biermann, M.H.C.; Griffante, G.; Podolska, M.J.; Boeltz, S.; Stürmer, J.; Muñoz, L.E.; Bilyy, R.; Herrmann, M. Sweet but
Dangerous—the Role of Immunoglobulin G Glycosylation in Autoimmunity and Inflammation. Lupus 2016, 25, 934–942.
https://doi.org/10.1177/0961203316640368.
31. Gudelj, I.; Lauc, G.; Pezer, M. Immunoglobulin G Glycosylation in Aging and Diseases. Cell. Immunol. 2018, 333, 65–79.
https://doi.org/10.1016/j.cellimm.2018.07.009.
32. Rombouts, Y.; Ewing, E.; van de Stadt, L.A.; Selman, M.H.J.; Trouw, L.A.; Deelder, A.M.; Huizinga, T.W.J.; Wuhrer, M.; van
Schaardenburg, D.; Toes, R.E.M.; et al. Anti‐Citrullinated Protein Antibodies Acquire a pro‐Inflammatory Fc Glycosylation
Phenotype Prior to the Onset of Rheumatoid Arthritis. Ann. Rheum. Dis. 2015, 74, 234–241. https://doi.org/10.1136/annrheumdis‐
2013‐203565.
33. Ferrara, C.; Grau, S.; Jäger, C.; Sondermann, P.; Brünker, P.; Waldhauer, I.; Hennig, M.; Ruf, A.; Rufer, A.C.; Stihle, M.; et al.
Unique Carbohydrate‐Carbohydrate Interactions Are Required for High Affinity Binding between FcgammaRIII and
Antibodies Lacking Core Fucose. Proc. Natl. Acad. Sci. USA 2011, 108, 12669–12674. https://doi.org/10.1073/pnas.1108455108.
34. Scanlan, C.N.; Burton, D.R.; Dwek, R.A. Making Autoantibodies Safe. Proc. Natl. Acad. Sci. USA 2008, 105, 4081–4082.
https://doi.org/10.1073/pnas.0801192105.
35. Shields, R.L.; Lai, J.; Keck, R.; O’Connell, L.Y.; Hong, K.; Meng, Y.G.; Weikert, S.H.A.; Presta, L.G. Lack of Fucose on Human
IgG1 N‐Linked Oligosaccharide Improves Binding to Human Fcgamma RIII and Antibody‐Dependent Cellular Toxicity. J. Biol.
Chem. 2002, 277, 26733–26740. https://doi.org/10.1074/jbc.M202069200.
36. Shinkawa, T.; Nakamura, K.; Yamane, N.; Shoji‐Hosaka, E.; Kanda, Y.; Sakurada, M.; Uchida, K.; Anazawa, H.; Satoh, M.;
Yamasaki, M.; et al. The Absence of Fucose but Not the Presence of Galactose or Bisecting N‐Acetylglucosamine of Human IgG1
Complex‐Type Oligosaccharides Shows the Critical Role of Enhancing Antibody‐Dependent Cellular Cytotoxicity. J. Biol. Chem.
2003, 278, 3466–3473. https://doi.org/10.1074/jbc.M210665200.
37. Gińdzieńska‐Sieśkiewicz, E.; Radziejewska, I.; Domysławska, I.; Klimiuk, P.A.; Sulik, A.; Rojewska, J.; Gabryel‐Porowska, H.;
Sierakowski, S. Changes of Glycosylation of IgG in Rheumatoid Arthritis Patients Treated with Methotrexate. Adv. Med. Sci.
2016, 61, 193–197. https://doi.org/10.1016/j.advms.2015.12.009.
38. Maho‐Vaillant, M.; Perals, C.; Golinski, M.‐L.; Hébert, V.; Caillot, F.; Mignard, C.; Riou, G.; Petit, M.; Viguier, M.; Hertl, M.; et
al. Rituximab and Corticosteroid Effect on Desmoglein‐Specific B Cells and Desmoglein‐Specific T Follicular Helper Cells in
Pemphigus. J. Invest. Dermatol. 2021, 141, 2132–2140. https://doi.org/10.1016/j.jid.2021.01.031.
39. Schmidt, D.E.; de Haan, N.; Sonneveld, M.E.; Porcelijn, L.; van der Schoot, C.E.; de Haas, M.; Zwaginga, J.‐J.; Wuhrer, M.;
Vidarsson, G. IgG‐Fc Glycosylation before and after Rituximab Treatment in Immune Thrombocytopenia. Sci. Rep. 2020, 10,
3051. https://doi.org/10.1038/s41598‐020‐59651‐7.
40. Van Beneden, K.; Coppieters, K.; Laroy, W.; De Keyser, F.; Hoffman, I.E.; Van den Bosch, F.; Vander Cruyssen, B.; Drennan, M.;
Jacques, P.; Rottiers, P.; et al. Reversible Changes in Serum Immunoglobulin Galactosylation during the Immune Response and
Treatment of Inflammatory Autoimmune Arthritis. Ann. Rheum. Dis. 2009, 68, 1360–1365.
https://doi.org/10.1136/ard.2008.089292.
41. Keser, T.; Vučković, F.; Barrios, C.; Zierer, J.; Wahl, A.; Akinkuolie, A.O.; Štambuk, J.; Nakić, N.; Pavić, T.; Periša, J.; et al. Effects
of Statins on the Immunoglobulin G Glycome. Biochim. Biophys. Acta Gen. Subj. 2017, 1861, 1152–1158.
https://doi.org/10.1016/j.bbagen.2017.02.029.
42. Kim, T.; Xie, Y.; Li, Q.; Artegoitia, V.M.; Lebrilla, C.B.; Keim, N.L.; Adams, S.H.; Krishnan, S. Diet Affects Glycosylation of Serum
Proteins in Women at Risk for Cardiometabolic Disease. Eur. J. Nutr. 2021, 60, 3727–3741. https://doi.org/10.1007/s00394‐021‐
02539‐7.
43. Bartsch, Y.C.; Rahmöller, J.; Mertes, M.M.M.; Eiglmeier, S.; Lorenz, F.K.M.; Stoehr, A.D.; Braumann, D.; Lorenz, A.K.; Winkler,
A.; Lilienthal, G.‐M.; et al. Sialylated Autoantigen‐Reactive IgG Antibodies Attenuate Disease Development in Autoimmune
Mouse Models of Lupus Nephritis and Rheumatoid Arthritis. Front. Immunol. 2018, 9, 1183.
https://doi.org/10.3389/fimmu.2018.01183.
44. Pagan, J.D.; Kitaoka, M.; Anthony, R.M. Engineered Sialylation of Pathogenic Antibodies In Vivo Attenuates Autoimmune
Disease. Cell 2018, 172, 564–577. https://doi.org/10.1016/j.cell.2017.11.041.
45. Pincetic, A.; Bournazos, S.; DiLillo, D.J.; Maamary, J.; Wang, T.T.; Dahan, R.; Fiebiger, B.‐M.; Ravetch, J.V. Type I and Type II Fc
Receptors Regulate Innate and Adaptive Immunity. Nat. Immunol. 2014, 15, 707–716. https://doi.org/10.1038/ni.2939.
46. Hébert, V.; Boulard, C.; Houivet, E.; Duvert Lehembre, S.; Borradori, L.; Della Torre, R.; Feliciani, C.; Fania, L.; Zambruno, G.;
Camaioni, D.B.; et al. Large International Validation of ABSIS and PDAI Pemphigus Severity Scores. J. Invest. Dermatol. 2019,
139, 31–37. https://doi.org/10.1016/j.jid.2018.04.042.
47. Coloma, M.J.; Trinh, R.K.; Martinez, A.R.; Morrison, S.L. Position Effects of Variable Region Carbohydrate on the Affinity and
in Vivo Behavior of an Anti‐(1‐‐>6) Dextran Antibody. J. Immunol. 1999, 162, 2162–2170.
48. Knezević, A.; Polasek, O.; Gornik, O.; Rudan, I.; Campbell, H.; Hayward, C.; Wright, A.; Kolcic, I.; O’Donoghue, N.; Bones, J.;
et al. Variability, Heritability and Environmental Determinants of Human Plasma N‐Glycome. J. Proteome Res. 2009, 8, 694–701.
https://doi.org/10.1021/pr800737u.
49. Hennig, R.; Cajic, S.; Borowiak, M.; Hoffmann, M.; Kottler, R.; Reichl, U.; Rapp, E. Towards Personalized Diagnostics via
Longitudinal Study of the Human Plasma N‐Glycome. Biochim. Biophys. Acta 2016, 1860, 1728–1738.
https://doi.org/10.1016/j.bbagen.2016.03.035.
Biomedicines 2022, 10, 1774 17 of 17
50. Shikata, K.; Yasuda, T.; Takeuchi, F.; Konishi, T.; Nakata, M.; Mizuochi, T. Structural Changes in the Oligosaccharide Moiety of
Human IgG with Aging. Glycoconj. J. 1998, 15, 683–689. https://doi.org/10.1023/a:1006936431276.
51. Parekh, R.; Roitt, I.; Isenberg, D.; Dwek, R.; Rademacher, T. Age‐Related Galactosylation of the N‐Linked Oligosaccharides of
Human Serum IgG. J. Exp. Med. 1988, 167, 1731–1736. https://doi.org/10.1084/jem.167.5.1731.
52. Krištić, J.; Vučković, F.; Menni, C.; Klarić, L.; Keser, T.; Beceheli, I.; Pučić‐Baković, M.; Novokmet, M.; Mangino, M.; Thaqi, K.;
et al. Glycans Are a Novel Biomarker of Chronological and Biological Ages. J. Gerontol. A Biol. Sci. Med. Sci. 2014, 69, 779–789.
https://doi.org/10.1093/gerona/glt190.
53. Vanhooren, V.; Desmyter, L.; Liu, X.‐E.; Cardelli, M.; Franceschi, C.; Federico, A.; Libert, C.; Laroy, W.; Dewaele, S.; Contreras,
R.; et al. N‐Glycomic Changes in Serum Proteins during Human Aging. Rejuvenation Res. 2007, 10, 521–531.
https://doi.org/10.1089/rej.2007.0556.