Embed Size (px)
Citation preview
IMPORTANT: This guidance document was developed for use on the web. Please review the following disclaimers before using the PDF version of the web-based document:
• Web-based formatting may not be optimal when usingthis document as a PDF.
• Hyperlinks will send users to the web-based document.• Glossary terms are not hyperlinked.• The majority of the references are not hyperlinked.
Per- and Polyfluoroalkyl Substances (PFAS)
Technical/Regulatory Guidance
April 2020Prepared by
The Interstate Technology & Regulatory Council (ITRC)Per- and Polyfluoroalkyl Substances (PFAS) Team
ITRC PFAS-1
Table of Contents
Home Page ................................................................................................................................ 1
1. Introduction ........................................................................................................................... 3
2. Naming Conventions and Use .............................................................................................. 5
2.1 Environmental Significance ................................................................................................ 6
2.2 Chemistry, Terminology, and Acronyms ............................................................................ 8
2.3 Emerging Health and Environmental Concerns ............................................................... 25
2.4 PFAS Reductions and Alternative PFAS Formulations .................................................... 28
2.5 PFAS Uses ...................................................................................................................... 32
2.6 PFAS Releases to the Environment ................................................................................. 35
3. Firefighting Foam ................................................................................................................ 42
3.1 Foam Formulations .......................................................................................................... 44
3.2 Mechanisms for Release to the Environment ................................................................... 47
3.3 AFFF Procurement and Inventory .................................................................................... 48
3.4 Foam Systems and Operations........................................................................................ 49
3.5 Emergency Firefighting Operations .................................................................................. 50
3.6 Immediate Investigative and Cleanup Actions .................................................................. 53
3.7 Treatment and Disposal ................................................................................................... 54
3.8 Firefighting Foam System Replacement .......................................................................... 54
3.9 Federal, State, and International Regulations and Guidance ........................................... 56
3.10 Foam Research and Development ................................................................................ 58
4. Physical and Chemical Properties .................................................................................... 61
4.1 Challenges and Limitations Related to PFAS and Physical and Chemical Properties ...... 61
4.2 Physical Properties .......................................................................................................... 61
4.3 Chemical Properties ........................................................................................................ 64
5. Fate and Transport ............................................................................................................. 68
5.1 Fate and Transport Introduction ....................................................................................... 68
5.2 Phase Partitioning ........................................................................................................... 70
5.3 Media-Specific Migration Processes ................................................................................ 74
5.4 Transformations ............................................................................................................... 76
5.5 PFAS Uptake into Aquatic Organisms ............................................................................. 80
5.6 PFAS Uptake into Plants ................................................................................................ 83
IITRC PFAS-1
6. Media Specific Occurence .................................................................................................. 85
6.1 Air .................................................................................................................................... 85
6.2 Soil and Sediments .......................................................................................................... 87
6.3 Groundwater .................................................................................................................... 88
6.4 Surface Water .................................................................................................................. 89
6.5 Biota ................................................................................................................................ 90
7. Health Effects ..................................................................................................................... 92
7.1 Human Health Effects ...................................................................................................... 92
7.2 Ecological Toxicology ...................................................................................................... 97
8. Basis of Regulations ......................................................................................................... 107
8.1 Introduction .................................................................................................................... 107
8.2 Regulatory Programs ..................................................................................................... 107
8.3 Differences in the Available Regulations, Advisories, and Guidance.............................. 115
9. Site Risk Assessment ....................................................................................................... 124
9.1 Human Health ................................................................................................................ 124
9.2 Ecological Risk Assessment .......................................................................................... 130
9.3 Uncertainty .................................................................................................................... 136
10. Site Characterization ...................................................................................................... 138
10.1 Site Characterization Issues Relevant to PFAS ........................................................... 138
10.2 Initial Steps .................................................................................................................. 140
10.3 Site Investigation ......................................................................................................... 141
10.4 Data Analysis and Interpretation .................................................................................. 143
10.5 Source Identification .................................................................................................... 147
11. Sampling and Analysis ................................................................................................... 150
11.1 Sampling ..................................................................................................................... 150
11.2 Analytical Methods/Techniques ................................................................................... 161
11.3 Data Evaluation ........................................................................................................... 169
12. Treatment Technologies ................................................................................................. 177
12.1 Overview ..................................................................................................................... 177
12.2 Field-Implemented Liquids Treatment Technologies .................................................... 180
12.3 Field-Implemented Solids Treatment Technologies ..................................................... 191
12.4 Limited Application and Developing Liquids Treatment Technologies .......................... 194
12.5 Limited Application and Developing Solids Treatment Technologies ........................... 204
12.6 Integrated Remedial Solutions ..................................................................................... 205
12.7 Sustainability of PFAS Treatment ................................................................................ 206
IIITRC PFAS-1

12.8 Improving Evaluation of PFAS Treatment Technologies .............................................. 207
13. Stakeholder Perspectives ............................................................................................... 208
13.1 Stakeholder Concerns ................................................................................................. 209
13.2 Specific Tribal Stakeholder Concerns .......................................................................... 214
13.3 Stakeholder Resources ............................................................................................... 215
14. Risk Communication ...................................................................................................... 216
14.1 Role of Risk Perception: Public Stakeholders and Decision Makers ............................ 216
14.2 Risk Communication Challenges ................................................................................. 218
14.3 Risk Communication Planning and Engagement Tools ................................................ 220
15. Case Studies ................................................................................................................... 229
15.1 Site Characterization Case Studies ............................................................................ 229
15.2 Treatment Case Studies .............................................................................................. 233
15.3 Risk Assessment Case Study ...................................................................................... 244
15.4 Risk Communication Case Studies.............................................................................. 247
16. References ....................................................................................................................... 257
17. Additional Information .................................................................................................... 324
17.1 Additional Information for Media-Specific Occurence ................................................... 324
17.2 Additional Information for Human Health Effects .......................................................... 336
17.3 Additional Information for Risk Assessment ................................................................. 349
Acronyms .............................................................................................................................. 354
Glossary ............................................................................................................................... 361
Acknowledgements .............................................................................................................. 364
Team Contacts ...................................................................................................................... 375
IIIITRC PFAS-1
About ITRCThe Interstate Technology and Regulatory Council (ITRC) is a state-led coalition working to reduce barriers to the use ofinnovative environmental technologies and approaches so that compliance costs are reduced and cleanup efficacy ismaximized. ITRC produces documents and training that broaden and deepen technical knowledge and expedite qualityregulatory decision making while protecting human health and the environment. With private and public sector membersfrom all 50 states and the District of Columbia, ITRC truly provides a national perspective. More information on ITRC isavailable at www.itrcweb.org. ITRC is a program of the Environmental Research Institute of the States (ERIS), a 501(c)(3)organization incorporated in the District of Columbia and managed by the Environmental Council of the States (ECOS). ECOSis the national, nonprofit, nonpartisan association representing the state and territorial environmental commissioners. Itsmission is to serve as a champion for states; to provide a clearinghouse of information for state environmentalcommissioners; to promote coordination in environmental management; and to articulate state positions on environmentalissues to Congress, federal agencies, and the public.
DisclaimerThis material was prepared as an account of work sponsored by an agency of the United States Government. Neither theUnited States Government nor any agency thereof, nor any of their employees, makes any warranty, express or implied, orassumes any legal liability or responsibility for the accuracy, completeness, or usefulness of any information, apparatus,product, or process disclosed, or represents that its use would not infringe privately owned rights. Reference herein to anyspecific commercial product, process, or service by trade name, trademark, manufacturer, or otherwise does not necessarilyconstitute or imply its endorsement, recommendation, or favoring by the United States Government or any agency thereof.The views and opinions of authors expressed herein do not necessarily state or reflect those of the United StatesGovernment or any agency thereof and no official endorsement should be inferred.
The information provided in documents, training curricula, and other print or electronic materials created by the InterstateTechnology and Regulatory Council (“ITRC” and such materials are referred to as “ITRC Materials”) is intended as a generalreference to help regulators and others develop a consistent approach to their evaluation, regulatory approval, anddeployment of environmental technologies. The information in ITRC Materials was formulated to be reliable and accurate.However, the information is provided “as is” and use of this information is at the users’ own risk.
ITRC Materials do not necessarily address all applicable health and safety risks and precautions with respect to particularmaterials, conditions, or procedures in specific applications of any technology. Consequently, ITRC recommends consultingapplicable standards, laws, regulations, suppliers of materials, and safety data sheets for information concerning safety andhealth risks and precautions and compliance with then-applicable laws and regulations. ITRC, ERIS and ECOS shall not beliable in the event of any conflict between information in ITRC Materials and such laws, regulations, and/or other ordinances.The content in ITRC Materials may be revised or withdrawn at any time without prior notice.
ITRC, ERIS, and ECOS make no representations or warranties, express or implied, with respect to information in ITRCMaterials and specifically disclaim all warranties to the fullest extent permitted by law (including, but not limited to,merchantability or fitness for a particular purpose). ITRC, ERIS, and ECOS will not accept liability for damages of any kindthat result from acting upon or using this information.
ITRC, ERIS, and ECOS do not endorse or recommend the use of specific technology or technology provider through ITRCMaterials. Reference to technologies, products, or services offered by other parties does not constitute a guarantee by ITRC,ERIS, and ECOS of the quality or value of those technologies, products, or services. Information in ITRC Materials is forgeneral reference only; it should not be construed as definitive guidance for any specific site and is not a substitute forconsultation with qualified professional advisors.
IV
This Interstate Technology and Regulatory Council (ITRC) online document includes the PFAS Technical and RegulatoryGuidance Document, PFAS Fact Sheets and Explainer Videos, Training Module Videos and external tables of data andinformation prepared by the ITRC PFAS Team. Internal links in the online document will help the reader locate interrelatedtopics, refer back to key concepts, and locate references, while external links provide connection to the training modulevideos, see below, on key topics. Finally, the web-based nature of this document lends itself to updating of key informationin this rapidly evolving subject. It is the intention of ITRC to periodically update the document as significant new informationand regulatory approaches for PFAS develop. The guidance document can be downloaded as a PDF.
The Technical and Regulatory document is designed specifically to support state and federal environmental staff, as well asothers (including stakeholders, project managers, and decision makers), to gain a working knowledge of the current state ofPFAS science and practice. Developed by a team of over 400 environmental practitioners drawn from state and federalgovernment, academia, industry, environmental consulting, and public interest groups, it also provides a summary of thecurrent understanding of all aspects of PFAS from a broad perspective. While every effort was made to keep the informationaccessible to a wide audience, it is assumed the reader has some basic technical background in chemistry, environmentalsciences, and risk assessment.
An Introduction is provided for the document.
The document addresses these questions:
Questions Document Sections
What are PFAS?
• Naming Conventions and Use• Chemistry, Terminology, and Acronyms• PFAS Uses• PFAS Releases to the Environment
How do they behave in the environment?• Physical and Chemical Properties• Environmental Fate and Transport Processes• Media-Specific Occurrence
Why are we concerned about PFAS?• Human and Ecological Health Effects• Basis of Regulations• Site Risk Assessment
How do we evaluate PFAS in the environment?• Site Characterization• Sampling and Analytical Methods
How do we remediate PFAS? • Treatment Technologies
What are the major concerns of communities and Tribes andhow do we share what we know about PFAS?
• Stakeholder Perspectives• Risk Communication
Special topics• Firefighting Foams• Case Studies
PFAS Training Module VideosThe PFAS Team developed training module videos to accompany this Technical and Regulatory Document. The followinglinks will redirect you to ITRC’s PFAS Training Module Videos on Youtube:
PFAS introductionNaming Conventions and Physical and Chemical PropertiesProduction, Uses, Sources and Site CharacterizationSampling and Analysis
Page 1ITRC PFAS-1

Fate and TransportHuman and Ecological Effects Risk Assessment and RegulationsTreatment TechnologiesAqueous Film-Forming FoamRisk Communication
Updated April 1 2020.
Page 2ITRC PFAS-1
1 IntroductionPer- and polyfluoroalkyl substances (PFAS) are a very large family of thousands of chemicals that vary widely in theirchemical and physical properties, as well as their potential risks to human health and the environment. Buck et al. (2011)provides a very precise definition of PFAS (see text box) stating that all PFAS contain within their molecular structure astraight or branching (but not cyclic) chain of carbon atoms in which one or more of the carbon atoms have fluorine atomsattached at all bonding sites not occupied by another carbon atom and the fluorinated part of the molecule (the“perfluoroalkyl moiety”) can be expressed as CnF2n+1.
PFAS are “… highly fluorinated aliphatic substances thatcontain one or more carbon (C) atoms on which all thehydrogen (H) substituents (present in the nonfluorinatedanalogues from which they are notionally derived) have beenreplaced by fluorine (F) atoms, in such a manner that theycontain the perfluoroalkyl moiety CnF2n+1-.” (Buck et al. 2011)
The persistence and mobility of some PFAS, combinedwith decades of widespread use in industrial processes,certain types of firefighting foams, and consumerproducts, have resulted in their being present in mostenvironmental media at trace levels across the globe.PFAS have only recently come to the attention ofinvestigators and the public in large part due to the factthat until the early 2000s analytical methods to detectlow levels of PFAS in the environment were availableonly in a few select research institutions. It was not untilthe early 2010s that these methods became widelyavailable and had detection limits in water low enoughto be commensurate with levels of potential humanhealth effects. Toxicological studies have raisedconcerns regarding the bioaccumulative nature andpotential health concerns of some PFAS. As a result, ourunderstanding of PFAS and the risks they may pose israpidly evolving.
This guidance document is designed specifically to support state and federal environmental staff, as well as others (includingstakeholders, project managers, and decision makers), to gain a working knowledge of the current state of PFAS science andpractice. Developed by a team of over 400 environmental practitioners drawn from state and federal government, academia,industry, environmental consulting, and public interest groups, it also provides a summary of the current understanding ofall aspects of PFAS from a broad perspective. While every effort was made to keep the information accessible to a wideaudience, it is assumed the reader has some basic technical background in chemistry, environmental sciences, and riskassessment. The document addresses the following questions:
Questions Document Sections
What are PFAS?
• Naming Conventions and Use• Chemistry, Terminology, and Acronyms• PFAS Uses• PFAS Releases to the Environment
How do they behave in the environment?• Physical and Chemical Properties• Environmental Fate and Transport Processes• Media-Specific Occurrence
Why are we concerned about PFAS?• Human and Ecological Health Effects• Basis of Regulations• Site Risk Assessment
How do we evaluate PFAS in the environment?• Site Characterization• Sampling and Analytical Methods
Page 3ITRC PFAS-1
Questions Document Sections
How do we remediate PFAS? • Treatment Technologies
What are the major concerns of communities and Tribes andhow do we share what we know about PFAS?
• Stakeholder Perspectives• Risk Communication
Special topics• Firefighting Foams• Case Studies
The thousands of chemicals that make up the large family known as PFAS can be divided into two major classes:nonpolymers and polymers. This document focuses primarily on those nonpolymer PFAS that, to date, are most commonlydetected in the environment, particularly the highly persistent perfluoroalkyl acids (PFAAs), some of the better knownreplacements for phased-out long-chain PFAAs, and some of the “precursor” chemicals—PFAS that can break down to formPFAAs. These precursors include polyfluorinated alkyl substances and a subset of polymer PFAS known as side-chainfluorinated polymers (Washington et al. 2018). Many polymer PFAS, especially certain high–molecular weight fluoropolymers,are insoluble in the environment and not bioavailable, and therefore less of a concern to human and ecological health (Henryet al. 2018), so are not discussed in detail in this document. As this paragraph illustrates, it is important to be very clearabout which PFAS is being discussed and what its particular physical and chemical properties are, and that is where thisdocument begins.
The physical and chemical properties that make some PFAS persistent and mobile in the environment also make themparticularly challenging to analyze and remediate. Analytical methods sensitive enough to detect environmentally relevantconcentrations became widely available in the early 2010s. Although analyte lists continue to expand, currently availablemethods still only allow identification of a small fraction of the thousands of PFAS that have reportedly been created andused since the 1950s. As existing analytical methods improve and new, nontargeted analyses become commerciallyavailable, it is likely that additional PFAS and new release sites will be identified.
Concerns have been raised regarding human health and ecological risks associated with certain PFAS. These are based onwidespread detections of some PFAS in humans and wildlife, evidence that certain PFAS bioaccumulate in individuals andbioconcentrate in the food chain, and studies reporting multiple toxicological effects in animals and potential health effectsin humans. However, risk assessment of PFAS is hampered by the unique physical and chemical properties of many PFAS,which result in uncertainty in identifying sources and quantifying source area mass, complex fate and transport in theenvironment, poorly understood biological and chemical transformation pathways, and unique bioaccumulation processes.Moreover, the widespread presence of some PFAS in environmental media and the many potential PFAS sources alsocomplicate interpretation of site data. Data evaluation methods to help distinguish between site-specific anthropogenic“background” PFAS, PFAS that are site-related, and PFAS from another nearby source are still being developed.
As with other emerging contaminants, our evolving understanding of PFAS and the volume of scientific studies makes itdifficult for most environmental practitioners to stay current with the critical information about these chemicals. Meanwhile,public concern about PFAS has created pressure on state and federal agencies to take action, resulting in a patchwork ofevolving regulatory approaches and regulatory standards, screening values, and guidance values. As with any new andevolving area of science, our knowledge is far from complete. We have attempted to alert the reader to areas whereinformation is still uncertain or conflicting interpretations exist.
Updated April 14, 2020.
Page 4ITRC PFAS-1
2 PFAS Chemistry and Naming Conventions, History and Use ofPFAS, and Sources of PFAS Releases to the EnvironmentPFAS chemistry was discovered in the late 1930s. Since the 1950s, many products commonly used by consumers andindustry have been manufactured with or from PFAS, as the unique physical and chemical properties of PFAS impart oil,water, stain, and soil repellency, chemical and thermal stability, and friction reduction to a range of products. Theseproducts have application in many industries, including the aerospace, semiconductor, medical, automotive, construction,electronics, and aviation industries, as well as in consumer products (such as carpets, clothing, furniture, outdoorequipment, food packaging), and firefighting applications (3M Company 1999a; Buck et al. 2011; KEMI 2015a; USEPA2017b).
The number of PFAS and their uses have expanded over the years. It has been estimated that the PFAS family may includeapproximately 5,000–10,000 chemicals (USEPA 2018i). A recent inventory of PFAS identified Chemical Abstracts Service(CAS) Registry Numbers for more than 4,700 PFAS that could have been, or may be, on the global market (OECD 2018),although the uses of each of these PFAS may not be known (KEMI 2015a). Publicly available health and toxicity studies arelimited to only a small fraction of these PFAS, and modern commercially available analytical technologies typically identifyonly about 20–30 PFAS.
Scientific, regulatory, and public concerns have emerged about potential health and environmental impacts associated withchemical production, product manufacture and use, and disposal of PFAS-containing wastes. These concerns have led toefforts to reduce the use of or replace certain PFAS, such as the two most widely produced, commonly encountered, andmost studied compounds: perfluorooctane sulfonic acid (PFOS) and perfluorooctanoic acid (PFOA) (USEPA 2016e; WA DER2017).
The objective of this section is to lay a foundation for identifying potential PFAS sources in the environment.
Section Number Topic
2.1 Environmental Significance
2.2 Chemistry, Terminology, and Acronyms
2.3 Emerging Health and Environmental Concerns
2.4 PFAS Reductions and Alternative PFAS Formulations
2.5 PFAS Uses
2.6 PFAS Releases to the Environment
Updated April 14, 2020.
Page 5ITRC PFAS-1
2.1 Environmental SignificancePFAS have been and still are widely used, but not all types and uses of PFAS result in the same level of environmental impactand exposure. When considering potential environmental impacts from PFAS, it is critical to be as specific as possible notonly about the particular PFAS involved, but also where and how they are released to the environment. For example, astable, insoluble fluoropolymer such as polytetrafluoroethylene (PTFE) may pose little environmental or health risk once it isin a product, but potentially significant environmental releases may occur if controls are not used during PTFEmanufacturing, when nonpolymer PFAS, such as PFAAs, are used to make the PTFE. Such considerations may help to focusinvestigation resources on major sources.
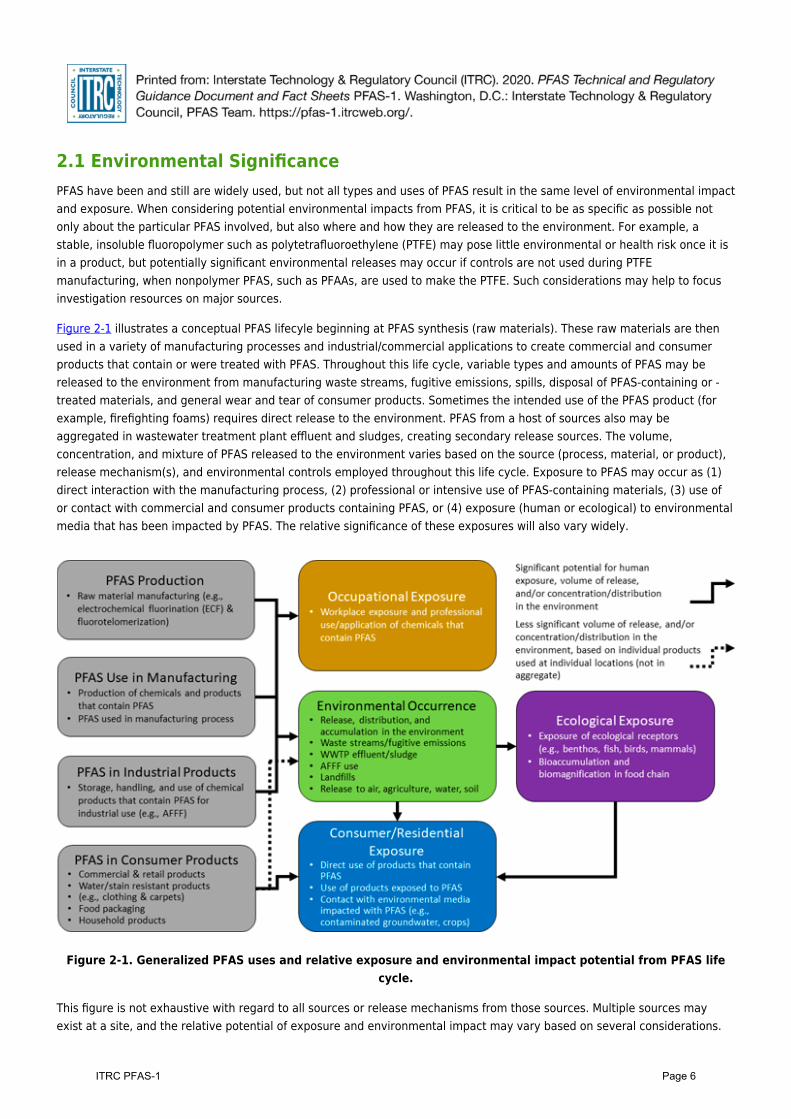
Figure 2-1 illustrates a conceptual PFAS lifecyle beginning at PFAS synthesis (raw materials). These raw materials are thenused in a variety of manufacturing processes and industrial/commercial applications to create commercial and consumerproducts that contain or were treated with PFAS. Throughout this life cycle, variable types and amounts of PFAS may bereleased to the environment from manufacturing waste streams, fugitive emissions, spills, disposal of PFAS-containing or -treated materials, and general wear and tear of consumer products. Sometimes the intended use of the PFAS product (forexample, firefighting foams) requires direct release to the environment. PFAS from a host of sources also may beaggregated in wastewater treatment plant effluent and sludges, creating secondary release sources. The volume,concentration, and mixture of PFAS released to the environment varies based on the source (process, material, or product),release mechanism(s), and environmental controls employed throughout this life cycle. Exposure to PFAS may occur as (1)direct interaction with the manufacturing process, (2) professional or intensive use of PFAS-containing materials, (3) use ofor contact with commercial and consumer products containing PFAS, or (4) exposure (human or ecological) to environmentalmedia that has been impacted by PFAS. The relative significance of these exposures will also vary widely.
Figure 2-1. Generalized PFAS uses and relative exposure and environmental impact potential from PFAS lifecycle.
This figure is not exhaustive with regard to all sources or release mechanisms from those sources. Multiple sources mayexist at a site, and the relative potential of exposure and environmental impact may vary based on several considerations.
Page 6ITRC PFAS-1
Due to the widespread use of PFAS in commercial and consumer products, other minor point and diffuse releases of PFAS tothe environment may occur during use and disposal of some PFAS-containing products. Although these may result in locallysignificant environmental impacts, these releases typically affect smaller geographic areas and have lower total PFAS massthan major sources, such as PFAS chemical manufacturing, PFAS use in certain industries, and application of certainfirefighting foams.
Different PFAS products and sources differ in their relative environmental significance, volumes released, distributionmechanisms, area affected, and relative concentration of impacted media. For instance, application of Class B firefightingfoam may impact a moderate area relative to air dispersion from fluoropolymer production, but may exhibit higherassociated groundwater concentrations near the source area.
The type of PFAS involved also determines the relative environmental significance. Nonpolymer PFAS (both per- andpolyfluorinated) and some side-chain fluorinated polymer PFAS are likely to pose greater risks when released to theenvironment than certain fluoropolymer sources, such as the fluoropolymers PTFE, fluorinated ethylene-propylene (FEP),perfluoroalkoxy polymer (PFA), and ethylene tetrafluoroethylene (ETFE). These fluoropolymers are considered to bepolymers of low concern (Section 2.2.2.1) because they are relatively stable, insoluble in the environment, and notbioavailable (Henry et al. 2018). However, environmental impact from the production or manufacturing uses of somefluoropolymers can pose a significant risk if emissions are not properly controlled at the industrial site. Also, releases to theenvironment from the disposal of fluoropolymers cannot be ruled out, as nonpolymer PFAS (such as the PFAAs used aspolymerization aids) may be found at trace levels as impurities and byproducts in some fluoropolymer products (3MCompany 1999a). Research suggests side-chain fluorinated polymers and fluorotelomer-based polymers are likely to breakdown into nonpolymer PFAS with time (Li et al. 2018; Washington et al. 2018), although it is documented that onefluoropolymer (PTFE) did not degrade to significant levels of PFAAs during incineration (Aleksandrov et al. 2019).
Finally, another consideration regarding environmental impacts is the issue of anthropogenic (human-caused, not naturallyoccurring) ambient or “background” levels of PFAS. As discussed in Section 6, the long duration of PFAS use and theirrelease from many types of sources may have resulted in low-level contamination of environmental media worldwide. Theimplications of such ambient levels of PFAS should be considered in evaluating exposures and risk levels, establishing siteaction levels and cleanup goals, and identifying PFAS sources.
Updated April 14, 2020.
Page 7ITRC PFAS-1
2.2 Chemistry, Terminology, and AcronymsThis section focuses on chemistry, terminology, names, and acronyms for those PFAS most commonly reported in theenvironment, identified in scientific literature, and those PFAS most commonly tested for by current analytical methods.Other important classes of PFAS are introduced. This section also introduces the chemical manufacturing processes thatinfluence the types of PFAS that are found in the environment.
General Concepts of Organofluorine Chemistry for PFAS
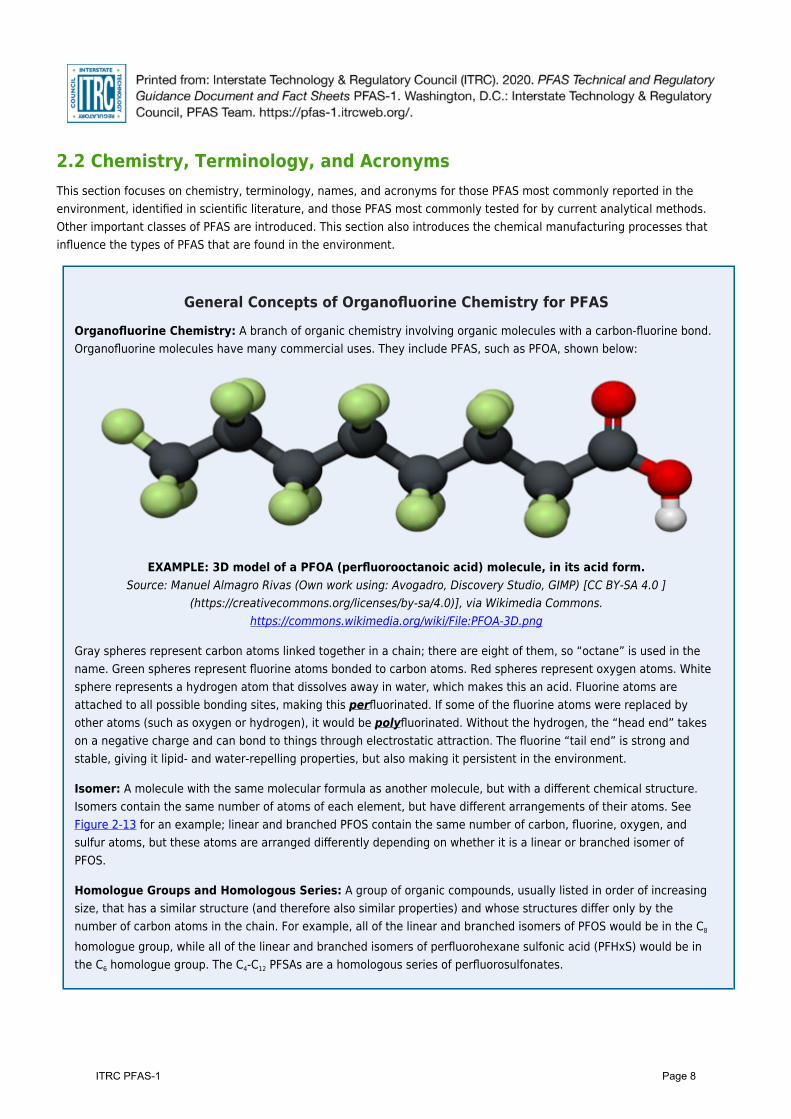
Organofluorine Chemistry: A branch of organic chemistry involving organic molecules with a carbon-fluorine bond.Organofluorine molecules have many commercial uses. They include PFAS, such as PFOA, shown below:
EXAMPLE: 3D model of a PFOA (perfluorooctanoic acid) molecule, in its acid form.Source: Manuel Almagro Rivas (Own work using: Avogadro, Discovery Studio, GIMP) [CC BY-SA 4.0 ]
(https://creativecommons.org/licenses/by-sa/4.0)], via Wikimedia Commons.https://commons.wikimedia.org/wiki/File:PFOA-3D.png
Gray spheres represent carbon atoms linked together in a chain; there are eight of them, so “octane” is used in thename. Green spheres represent fluorine atoms bonded to carbon atoms. Red spheres represent oxygen atoms. Whitesphere represents a hydrogen atom that dissolves away in water, which makes this an acid. Fluorine atoms areattached to all possible bonding sites, making this perfluorinated. If some of the fluorine atoms were replaced byother atoms (such as oxygen or hydrogen), it would be polyfluorinated. Without the hydrogen, the “head end” takeson a negative charge and can bond to things through electrostatic attraction. The fluorine “tail end” is strong andstable, giving it lipid- and water-repelling properties, but also making it persistent in the environment.
Isomer: A molecule with the same molecular formula as another molecule, but with a different chemical structure.Isomers contain the same number of atoms of each element, but have different arrangements of their atoms. SeeFigure 2-13 for an example; linear and branched PFOS contain the same number of carbon, fluorine, oxygen, andsulfur atoms, but these atoms are arranged differently depending on whether it is a linear or branched isomer ofPFOS.
Homologue Groups and Homologous Series: A group of organic compounds, usually listed in order of increasingsize, that has a similar structure (and therefore also similar properties) and whose structures differ only by thenumber of carbon atoms in the chain. For example, all of the linear and branched isomers of PFOS would be in the C8
homologue group, while all of the linear and branched isomers of perfluorohexane sulfonic acid (PFHxS) would be inthe C6 homologue group. The C4-C12 PFSAs are a homologous series of perfluorosulfonates.
Page 8ITRC PFAS-1
“PFAS,” not “PFASs”: The acronym “PFAS” stands for “per-and polyfluoroalkyl substances.” No single chemical within thePFAS class can be both perfluorinated and polyfluorinated, soby definition “PFAS” is plural and a small “s” is not needed.Some authors elect to add a small “s” to this acronym (PFASs)to emphasize the fact that it is plural, but it is not needed.When referring to a single chemical within the PFAS class, it ismore accurate to simply name that specific chemical.
The use of nonspecific acronyms, such as perfluorinatedcompound (PFC), has hampered clarity of investigativeresults. The acronym “PFC” is poorly defined in the scientificliterature, but typically refers to “perfluorinated compounds.”It does not include “polyfluorinated substances,” which areincreasingly recognized as important contaminants at manyPFAS sites.
There is confusion among the environmental community and the public due to overgeneralization when describing PFAS and the lack of consistent naming of specific PFAS. The use of consistent naming conventions would reduce confusion and support clearer communication (Buck et al. 2011) (Wang, DeWitt, et al. 2017).
Consistent naming also helps to distinguish PFAS from other organic compounds that contain fluorine. As defined in the literature, PFAS include only fluorinated aliphatic (carbon chain) substances. PFAS do not include fluorinated compounds that contain aromatic (carbon ring) features in their structures (for example, active pharmaceutical ingredients, crop protection agents, or chlorofluorocarbons (refrigerants)). This definition distinguishes PFAS from the more generic term “PFC,” which can include aromatic compounds.
In the future, it may be necessary to expand the current naming conventions and acronym approaches to ensure thatstandardized naming is available for additional members of the PFAS family of compounds. Buck et al. (2011) is an open-access paper that provides a more detailed explanation of PFAS terminology, classification, and origins, and recommendsspecific and descriptive terminology, names, and acronyms for PFAS.
Chemicals in the PFAS family can exist in various ionic states(for example, acids, anions, cations), which have importantimplications for their chemical and physical properties. Inmost cases for PFAAs, this section uses the anionic form of agiven PFAS name, as this is the state in which most PFAAsexist in the environment.
CAS numbers are another helpful tool for clearlyidentifying the chemical that is being referenced;however, care must be taken in selecting the correctCAS number to avoid confusion regarding the chemistryand behavior of the chemical being described. SomePFAS may occur in various ionic states, such as acids,anions (negatively charged), cations (positivelycharged), and zwitterions (both positively andnegatively charged dipolar molecules), and each has itsown CAS number (and some have no CAS number). Theionic state determines electrical charge and physicaland chemical properties, which in turn control fate andtransport in the environment and potential humanhealth and ecological effects. The ionic state ofindividual PFAS can result in significantly differentphysical and chemical properties, such as solubility,volatility, and bioaccumulative potential.
2.2.2 Introduction to the PFAS FamilyPFAS encompass a wide universe of substances with very different physical and chemical properties (Section 4), includinggases (for example, perfluorobutane), liquids (for example, fluorotelomer alcohols), and solid material high–molecular weightpolymers (for example, PTFE). For this reason, it is helpful to group PFAS that share similar chemical and physical properties.
As shown in Figure 2-2, the PFAS family may be divided into two primary classes: polymers and nonpolymers. Each classmay contain many subclasses, groups, and subgroups, some of which are shown in the figure. This document focusesprimarily on those nonpolymer PFAS most commonly detected in the environment and those PFAS that may be significant as“precursors” that can transform to more persistent forms.
Page 9
2.2.1 Naming Convention Considerations
ITRC PFAS-1
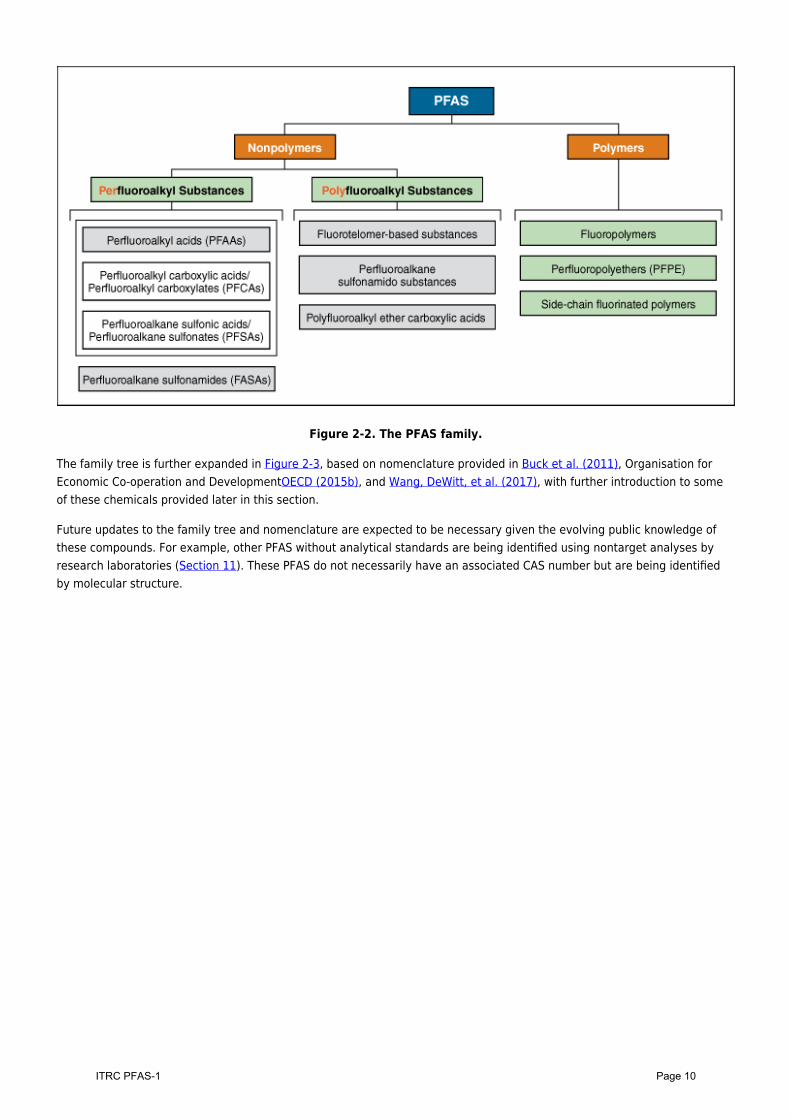
Figure 2-2. The PFAS family.
The family tree is further expanded in Figure 2-3, based on nomenclature provided in Buck et al. (2011), Organisation forEconomic Co-operation and DevelopmentOECD (2015b), and Wang, DeWitt, et al. (2017), with further introduction to someof these chemicals provided later in this section.
Future updates to the family tree and nomenclature are expected to be necessary given the evolving public knowledge ofthese compounds. For example, other PFAS without analytical standards are being identified using nontarget analyses byresearch laboratories (Section 11). These PFAS do not necessarily have an associated CAS number but are being identifiedby molecular structure.
Page 10ITRC PFAS-1
Page 11ITRC PFAS-1
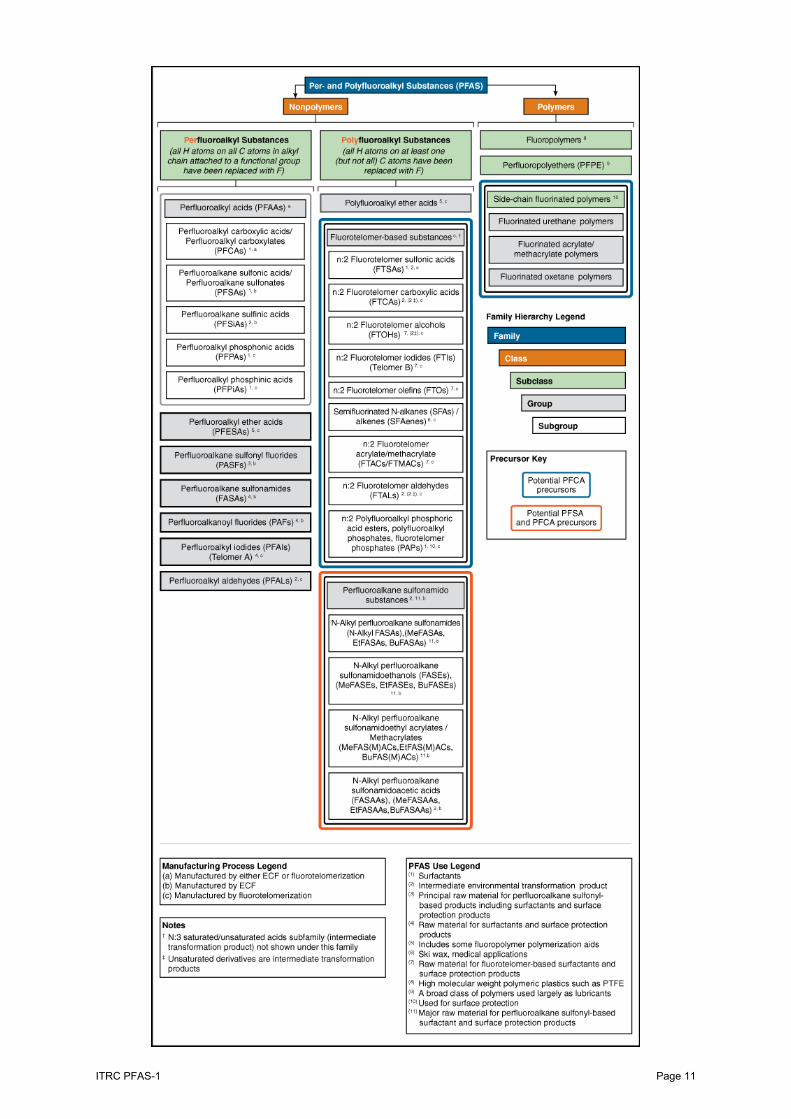
Figure 2-3. PFAS family tree.Adapted from a graphic provided courtesy of Paul Caprio, EA Engineering.
A stand-alone PDF version of Figure 2-3 is available.
2.2.2.1 Polymer PFASPolymers are large molecules formed by combining many identical smaller molecules (or monomers (which are shorter chainmolecules with no repeating units)) in a repeating pattern. Oligomers are smaller polymers, with relatively fewer repeatingunits.
The PFAS polymer class includes fluoropolymers, perfluoropolyethers, and side-chain fluorinated polymers (Henry et al.2018; Buck et al. 2011; Wang, Cousins, et al. 2013):
Fluoropolymers contain a carbon-only polymer backbone with fluorines directly attached to the carbon.Fluoropolymers include polymers like PTFE, ETFE, copolymer FEP, and PFA, which were historically made usingammonium perfluoroocanoate (APFO) or sodium perfluorooctanoate (NaPFO), which are salts ofperfluorooctanoate (PFOA). Fluoropolymers also include polyvinylidene fluoride (PVDF), which was historicallymade using ammonium perfluoronanoate (APFN), the ammonium salt of perfluorononanoate (PFNA) (OECD2015b), (Buck et al. 2011).The specific fluoropolymers PTFE, FEP, ETFE, and PFA have been referred to as “polymers of low concern”because they have high molecular weight and are extremely stable. PTFE has been demonstrated to not bebioavailable (Henry et al. 2018). Based on this, Henry et al. (2018) suggest polymers of low concern should beconsidered separately from other PFAS when evaluating risk. Polymers of low concern are reported to pose littleenvironmental or health risk once in a consumer product.Perfluoropolyethers (PFPE) contain a carbon and oxygen polymer backbone with fluorines directly attached tocarbon. Relatively little is known about these chemicals in the environment.Side-chain fluorinated polymers contain a nonfluorinated polymer backbone, off of which fluorinated side chainsbranch. These PFAS include fluorinated urethane polymers, fluorinated acrylate/methacrylate polymers, andfluorinated oxetane polymers. Some side-chain fluorinated polymers may become precursors for PFAAs, Section2.2.3.1, when the point of connection of a fluorinated side chain on a polymer is broken to release a PFAA.
During the manufacture and manufacturing uses of some fluoropolymers, controls are necessary to mitigate potentialreleases of nonpolymer PFAS. Nonpolymer PFAS may be used as processing aids in the manufacture of some fluoropolymerPFAS, and may be found as impurities in some fluoropolymer products, and due to potential degradation of somefluoropolymers (3M Company 1999b; CalEPA 2018; Washington et al. 2018), see also Section 5.4.5.
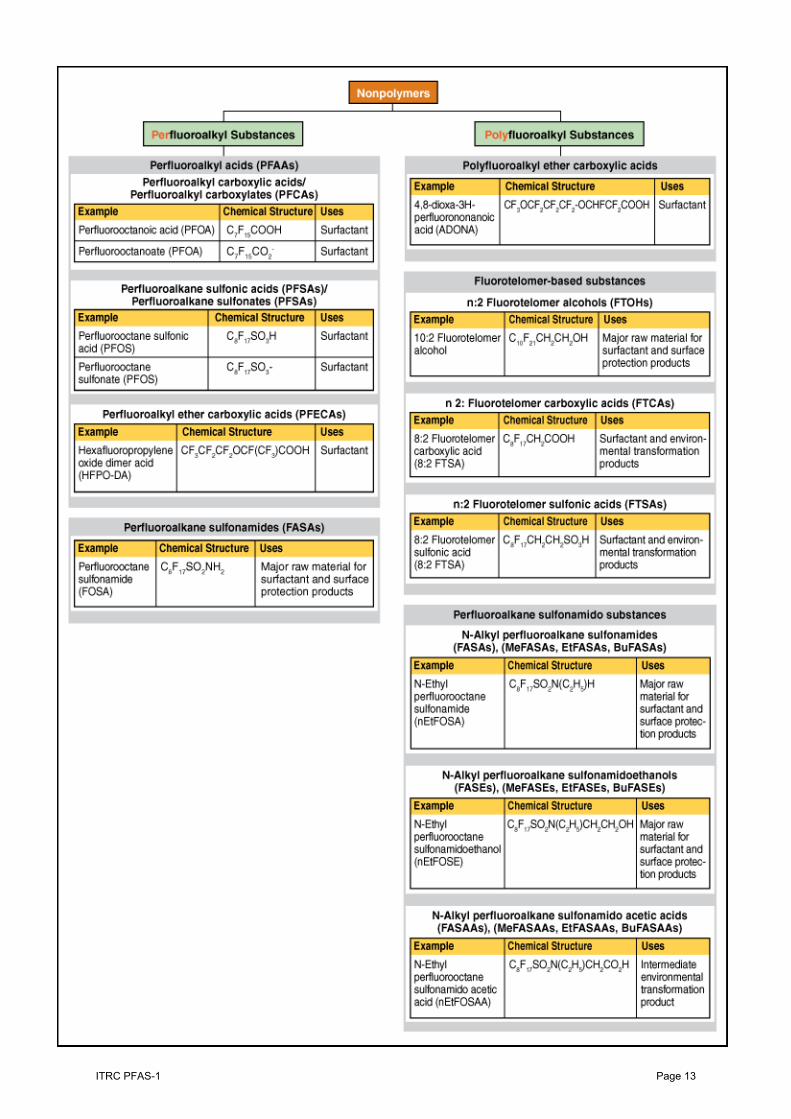
2.2.2.2 Nonpolymer PFASNonpolymer PFAS encompass two major subclasses: perfluoroalkyl substances and polyfluoroalkyl substances, whichinclude many groups and subgroups of chemicals. Figure 2-4 provides general classification and chemical structures,examples of each group, and examples of the primary uses of the nonpolymer PFAS highlighted in Figure 2-2 and Figure 2-3.
Nonpolymer PFAS were selected as the focus of this document because:
they are the PFAS most commonly detected (to date) in humans, biota, and other environmental media andappear to be relatively more abundant at PFAS investigation sites (Section 6)data may be available regarding potential human health and ecological effects from environmental exposure forsome of these chemicals (Section 7)state or federal standards or guidance values may exist for some of these chemicals (Section 8)they are included in most laboratory PFAS analyte lists (Section 11).
Page 12ITRC PFAS-1
Page 13ITRC PFAS-1
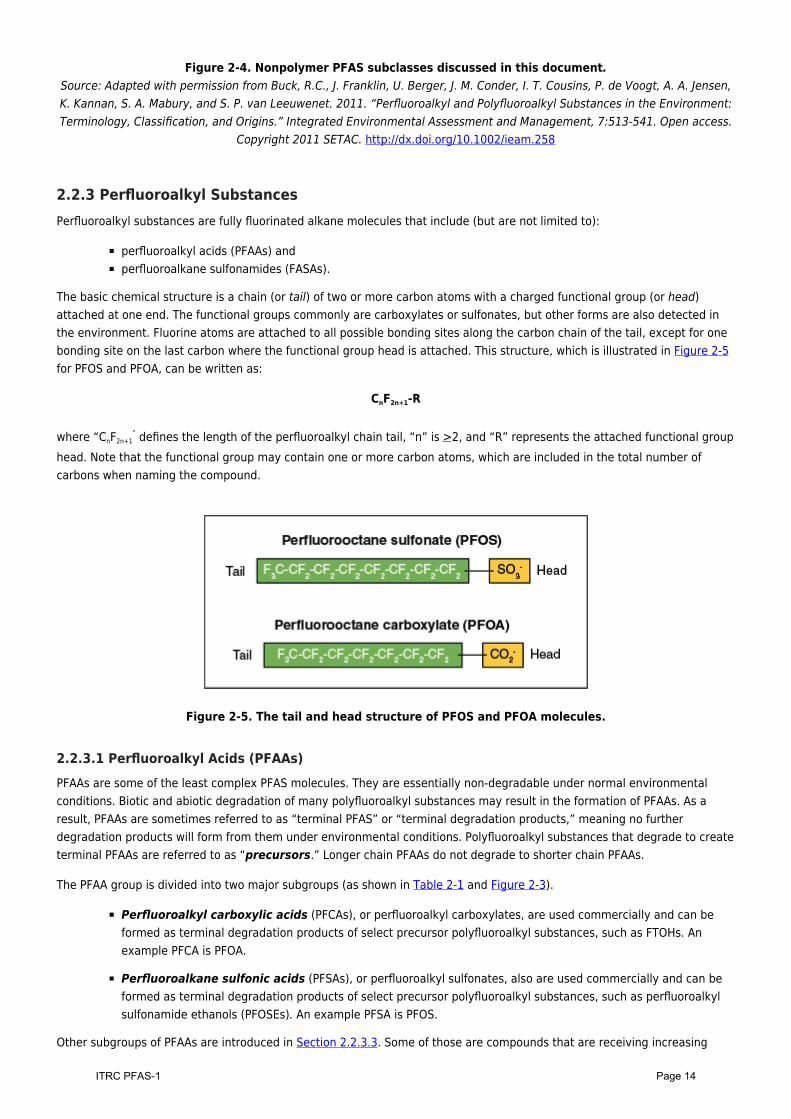
Figure 2-4. Nonpolymer PFAS subclasses discussed in this document.Source: Adapted with permission from Buck, R.C., J. Franklin, U. Berger, J. M. Conder, I. T. Cousins, P. de Voogt, A. A. Jensen,K. Kannan, S. A. Mabury, and S. P. van Leeuwenet. 2011. “Perfluoroalkyl and Polyfluoroalkyl Substances in the Environment:Terminology, Classification, and Origins.” Integrated Environmental Assessment and Management, 7:513-541. Open access.
Copyright 2011 SETAC. http://dx.doi.org/10.1002/ieam.258
2.2.3 Perfluoroalkyl SubstancesPerfluoroalkyl substances are fully fluorinated alkane molecules that include (but are not limited to):
perfluoroalkyl acids (PFAAs) andperfluoroalkane sulfonamides (FASAs).
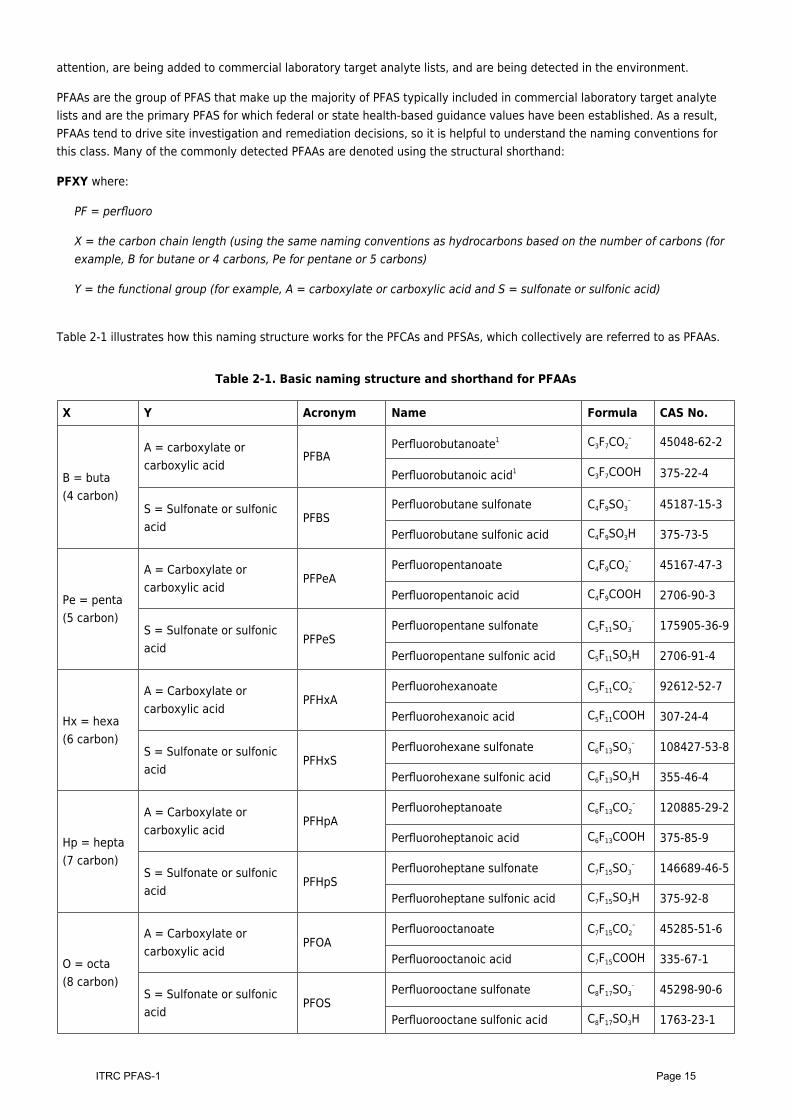
The basic chemical structure is a chain (or tail) of two or more carbon atoms with a charged functional group (or head)attached at one end. The functional groups commonly are carboxylates or sulfonates, but other forms are also detected inthe environment. Fluorine atoms are attached to all possible bonding sites along the carbon chain of the tail, except for onebonding site on the last carbon where the functional group head is attached. This structure, which is illustrated in Figure 2-5for PFOS and PFOA, can be written as:
CnF2n+1-R
where “CnF2n+1” defines the length of the perfluoroalkyl chain tail, “n” is >2, and “R” represents the attached functional group
head. Note that the functional group may contain one or more carbon atoms, which are included in the total number ofcarbons when naming the compound.
Figure 2-5. The tail and head structure of PFOS and PFOA molecules.
2.2.3.1 Perfluoroalkyl Acids (PFAAs)PFAAs are some of the least complex PFAS molecules. They are essentially non-degradable under normal environmentalconditions. Biotic and abiotic degradation of many polyfluoroalkyl substances may result in the formation of PFAAs. As aresult, PFAAs are sometimes referred to as “terminal PFAS” or “terminal degradation products,” meaning no furtherdegradation products will form from them under environmental conditions. Polyfluoroalkyl substances that degrade to createterminal PFAAs are referred to as “precursors.” Longer chain PFAAs do not degrade to shorter chain PFAAs.
The PFAA group is divided into two major subgroups (as shown in Table 2-1 and Figure 2-3).
Perfluoroalkyl carboxylic acids (PFCAs), or perfluoroalkyl carboxylates, are used commercially and can beformed as terminal degradation products of select precursor polyfluoroalkyl substances, such as FTOHs. Anexample PFCA is PFOA.
Perfluoroalkane sulfonic acids (PFSAs), or perfluoroalkyl sulfonates, also are used commercially and can beformed as terminal degradation products of select precursor polyfluoroalkyl substances, such as perfluoroalkylsulfonamide ethanols (PFOSEs). An example PFSA is PFOS.
Other subgroups of PFAAs are introduced in Section 2.2.3.3. Some of those are compounds that are receiving increasing
Page 14ITRC PFAS-1
attention, are being added to commercial laboratory target analyte lists, and are being detected in the environment.
PFAAs are the group of PFAS that make up the majority of PFAS typically included in commercial laboratory target analytelists and are the primary PFAS for which federal or state health-based guidance values have been established. As a result,PFAAs tend to drive site investigation and remediation decisions, so it is helpful to understand the naming conventions forthis class. Many of the commonly detected PFAAs are denoted using the structural shorthand:
PFXY where:
PF = perfluoro
X = the carbon chain length (using the same naming conventions as hydrocarbons based on the number of carbons (forexample, B for butane or 4 carbons, Pe for pentane or 5 carbons)
Y = the functional group (for example, A = carboxylate or carboxylic acid and S = sulfonate or sulfonic acid)
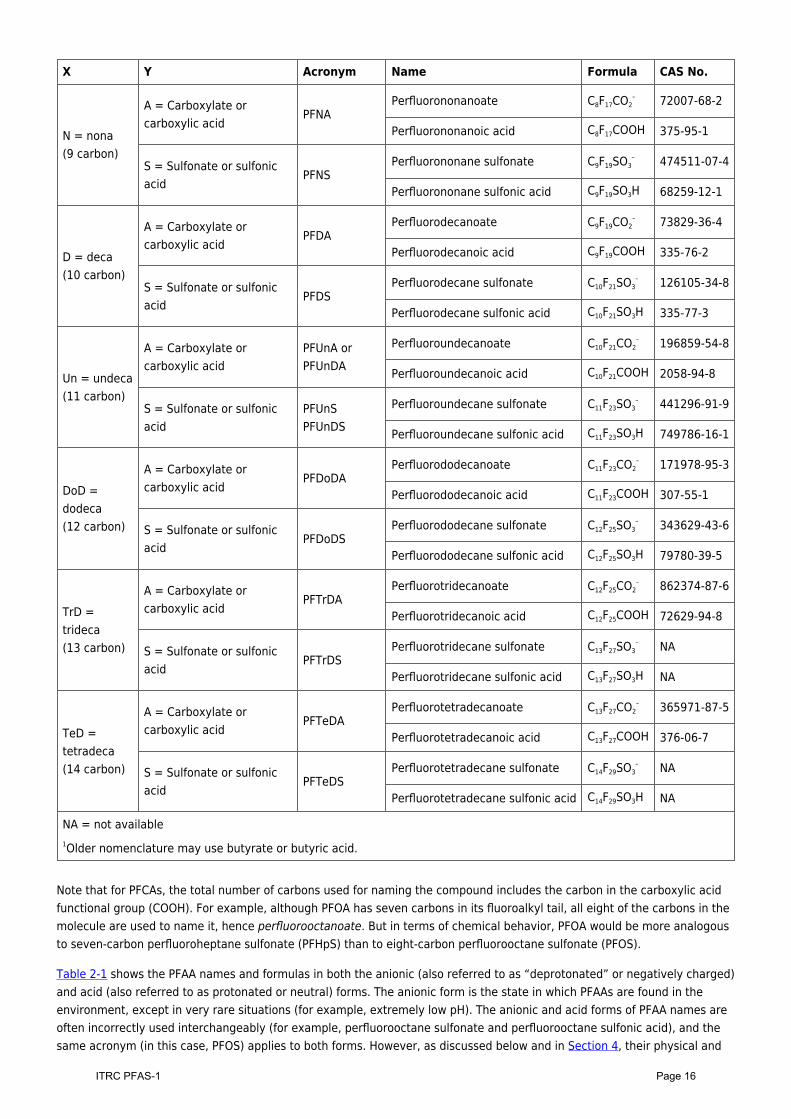
Table 2-1 illustrates how this naming structure works for the PFCAs and PFSAs, which collectively are referred to as PFAAs.
Table 2-1. Basic naming structure and shorthand for PFAAs
X Y Acronym Name Formula CAS No.
B = buta(4 carbon)
A = carboxylate orcarboxylic acid
PFBAPerfluorobutanoate1 C3F7CO2
– 45048-62-2
Perfluorobutanoic acid1 C3F7COOH 375-22-4
S = Sulfonate or sulfonicacid
PFBSPerfluorobutane sulfonate C4F9SO3
– 45187-15-3
Perfluorobutane sulfonic acid C4F9SO3H 375-73-5
Pe = penta(5 carbon)
A = Carboxylate orcarboxylic acid
PFPeAPerfluoropentanoate C4F9CO2
– 45167-47-3
Perfluoropentanoic acid C4F9COOH 2706-90-3
S = Sulfonate or sulfonicacid
PFPeSPerfluoropentane sulfonate C5F11SO3
– 175905-36-9
Perfluoropentane sulfonic acid C5F11SO3H 2706-91-4
Hx = hexa(6 carbon)
A = Carboxylate orcarboxylic acid
PFHxAPerfluorohexanoate C5F11CO2
– 92612-52-7
Perfluorohexanoic acid C5F11COOH 307-24-4
S = Sulfonate or sulfonicacid
PFHxSPerfluorohexane sulfonate C6F13SO3
– 108427-53-8
Perfluorohexane sulfonic acid C6F13SO3H 355-46-4
Hp = hepta(7 carbon)
A = Carboxylate orcarboxylic acid
PFHpAPerfluoroheptanoate C6F13CO2
– 120885-29-2
Perfluoroheptanoic acid C6F13COOH 375-85-9
S = Sulfonate or sulfonicacid
PFHpSPerfluoroheptane sulfonate C7F15SO3
– 146689-46-5
Perfluoroheptane sulfonic acid C7F15SO3H 375-92-8
O = octa(8 carbon)
A = Carboxylate orcarboxylic acid
PFOAPerfluorooctanoate C7F15CO2
– 45285-51-6
Perfluorooctanoic acid C7F15COOH 335-67-1
S = Sulfonate or sulfonicacid
PFOSPerfluorooctane sulfonate C8F17SO3
– 45298-90-6
Perfluorooctane sulfonic acid C8F17SO3H 1763-23-1
Page 15ITRC PFAS-1
X Y Acronym Name Formula CAS No.
N = nona(9 carbon)
A = Carboxylate orcarboxylic acid
PFNAPerfluorononanoate C8F17CO2
– 72007-68-2
Perfluorononanoic acid C8F17COOH 375-95-1
S = Sulfonate or sulfonicacid
PFNSPerfluorononane sulfonate C9F19SO3
– 474511-07-4
Perfluorononane sulfonic acid C9F19SO3H 68259-12-1
D = deca(10 carbon)
A = Carboxylate orcarboxylic acid
PFDAPerfluorodecanoate C9F19CO2
– 73829-36-4
Perfluorodecanoic acid C9F19COOH 335-76-2
S = Sulfonate or sulfonicacid
PFDSPerfluorodecane sulfonate C10F21SO3
– 126105-34-8
Perfluorodecane sulfonic acid C10F21SO3H 335-77-3
Un = undeca(11 carbon)
A = Carboxylate orcarboxylic acid
PFUnA orPFUnDA
Perfluoroundecanoate C10F21CO2– 196859-54-8
Perfluoroundecanoic acid C10F21COOH 2058-94-8
S = Sulfonate or sulfonicacid
PFUnSPFUnDS
Perfluoroundecane sulfonate C11F23SO3– 441296-91-9
Perfluoroundecane sulfonic acid C11F23SO3H 749786-16-1
DoD =dodeca(12 carbon)
A = Carboxylate orcarboxylic acid
PFDoDAPerfluorododecanoate C11F23CO2
– 171978-95-3
Perfluorododecanoic acid C11F23COOH 307-55-1
S = Sulfonate or sulfonicacid
PFDoDSPerfluorododecane sulfonate C12F25SO3
– 343629-43-6
Perfluorododecane sulfonic acid C12F25SO3H 79780-39-5
TrD =trideca(13 carbon)
A = Carboxylate orcarboxylic acid
PFTrDAPerfluorotridecanoate C12F25CO2
– 862374-87-6
Perfluorotridecanoic acid C12F25COOH 72629-94-8
S = Sulfonate or sulfonicacid
PFTrDSPerfluorotridecane sulfonate C13F27SO3
– NA
Perfluorotridecane sulfonic acid C13F27SO3H NA
TeD =tetradeca(14 carbon)
A = Carboxylate orcarboxylic acid
PFTeDAPerfluorotetradecanoate C13F27CO2
– 365971-87-5
Perfluorotetradecanoic acid C13F27COOH 376-06-7
S = Sulfonate or sulfonicacid
PFTeDSPerfluorotetradecane sulfonate C14F29SO3
– NA
Perfluorotetradecane sulfonic acid C14F29SO3H NA
NA = not available1Older nomenclature may use butyrate or butyric acid.
Note that for PFCAs, the total number of carbons used for naming the compound includes the carbon in the carboxylic acidfunctional group (COOH). For example, although PFOA has seven carbons in its fluoroalkyl tail, all eight of the carbons in themolecule are used to name it, hence perfluorooctanoate. But in terms of chemical behavior, PFOA would be more analogousto seven-carbon perfluoroheptane sulfonate (PFHpS) than to eight-carbon perfluorooctane sulfonate (PFOS).
Table 2-1 shows the PFAA names and formulas in both the anionic (also referred to as “deprotonated” or negatively charged)and acid (also referred to as protonated or neutral) forms. The anionic form is the state in which PFAAs are found in theenvironment, except in very rare situations (for example, extremely low pH). The anionic and acid forms of PFAA names areoften incorrectly used interchangeably (for example, perfluorooctane sulfonate and perfluorooctane sulfonic acid), and thesame acronym (in this case, PFOS) applies to both forms. However, as discussed below and in Section 4, their physical and
Page 16ITRC PFAS-1
chemical properties are different, and it is important to know which form is being described.
Until recently, PFCAs and PFSAs have been the subgroups most commonly tested for in the environment; however, a widerange of PFAS with other functional groups exists for which the same “PFXY” shorthand shown above may or may not apply.For naming conventions for these compounds, please refer to Buck et al. (2011).
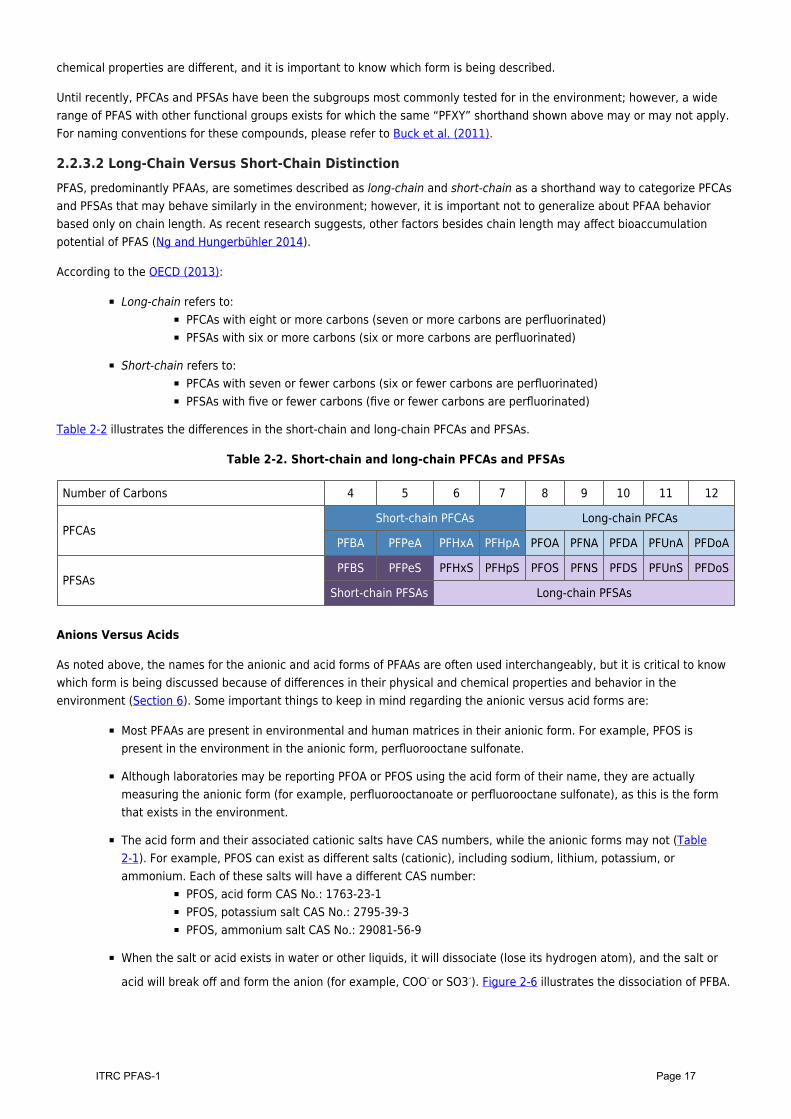
2.2.3.2 Long-Chain Versus Short-Chain DistinctionPFAS, predominantly PFAAs, are sometimes described as long-chain and short-chain as a shorthand way to categorize PFCAsand PFSAs that may behave similarly in the environment; however, it is important not to generalize about PFAA behaviorbased only on chain length. As recent research suggests, other factors besides chain length may affect bioaccumulationpotential of PFAS (Ng and Hungerbühler 2014).
According to the OECD (2013):
Long-chain refers to:PFCAs with eight or more carbons (seven or more carbons are perfluorinated)PFSAs with six or more carbons (six or more carbons are perfluorinated)
Short-chain refers to:PFCAs with seven or fewer carbons (six or fewer carbons are perfluorinated)PFSAs with five or fewer carbons (five or fewer carbons are perfluorinated)
Table 2-2 illustrates the differences in the short-chain and long-chain PFCAs and PFSAs.
Table 2-2. Short-chain and long-chain PFCAs and PFSAs
Number of Carbons 4 5 6 7 8 9 10 11 12
PFCAsShort-chain PFCAs Long-chain PFCAs
PFBA PFPeA PFHxA PFHpA PFOA PFNA PFDA PFUnA PFDoA
PFSAsPFBS PFPeS PFHxS PFHpS PFOS PFNS PFDS PFUnS PFDoS
Short-chain PFSAs Long-chain PFSAs
Anions Versus Acids
As noted above, the names for the anionic and acid forms of PFAAs are often used interchangeably, but it is critical to knowwhich form is being discussed because of differences in their physical and chemical properties and behavior in theenvironment (Section 6). Some important things to keep in mind regarding the anionic versus acid forms are:
Most PFAAs are present in environmental and human matrices in their anionic form. For example, PFOS ispresent in the environment in the anionic form, perfluorooctane sulfonate.
Although laboratories may be reporting PFOA or PFOS using the acid form of their name, they are actuallymeasuring the anionic form (for example, perfluorooctanoate or perfluorooctane sulfonate), as this is the formthat exists in the environment.
The acid form and their associated cationic salts have CAS numbers, while the anionic forms may not (Table2-1). For example, PFOS can exist as different salts (cationic), including sodium, lithium, potassium, orammonium. Each of these salts will have a different CAS number:
PFOS, acid form CAS No.: 1763-23-1PFOS, potassium salt CAS No.: 2795-39-3PFOS, ammonium salt CAS No.: 29081-56-9
When the salt or acid exists in water or other liquids, it will dissociate (lose its hydrogen atom), and the salt or
acid will break off and form the anion (for example, COO– or SO3–). Figure 2-6 illustrates the dissociation of PFBA.
Page 17ITRC PFAS-1
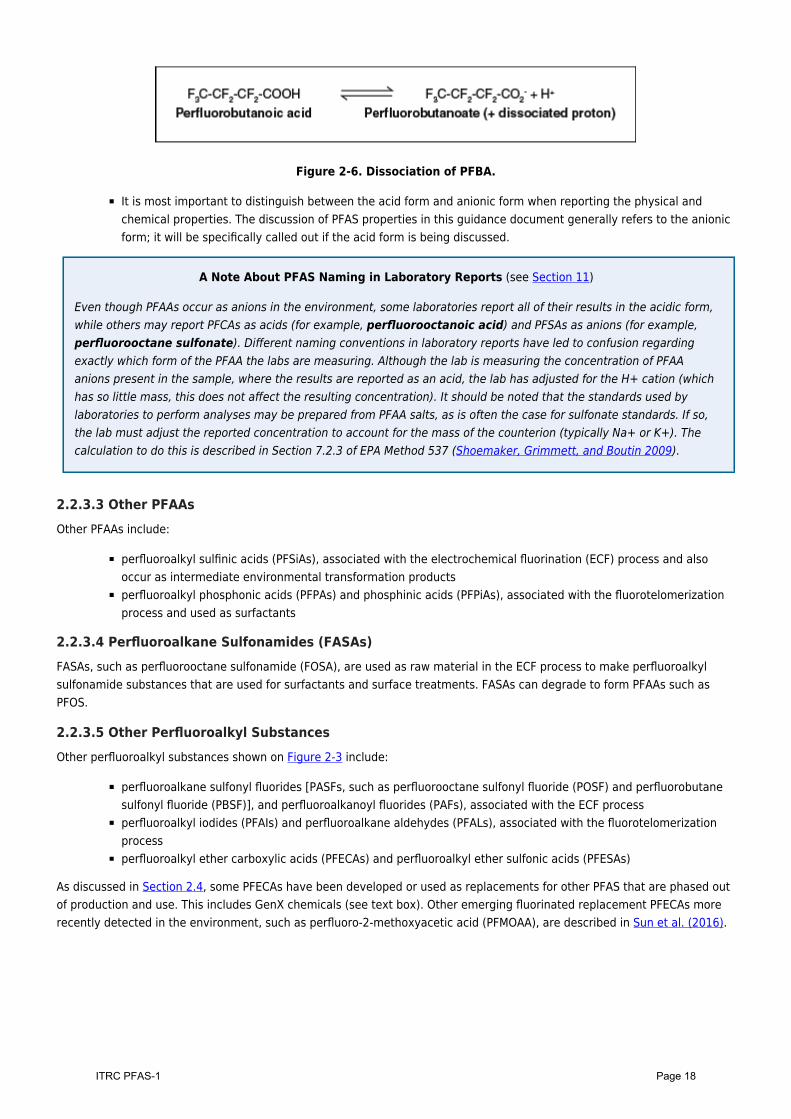
Figure 2-6. Dissociation of PFBA.
It is most important to distinguish between the acid form and anionic form when reporting the physical andchemical properties. The discussion of PFAS properties in this guidance document generally refers to the anionicform; it will be specifically called out if the acid form is being discussed.
A Note About PFAS Naming in Laboratory Reports (see Section 11)
Even though PFAAs occur as anions in the environment, some laboratories report all of their results in the acidic form,while others may report PFCAs as acids (for example, perfluorooctanoic acid) and PFSAs as anions (for example,perfluorooctane sulfonate). Different naming conventions in laboratory reports have led to confusion regardingexactly which form of the PFAA the labs are measuring. Although the lab is measuring the concentration of PFAAanions present in the sample, where the results are reported as an acid, the lab has adjusted for the H+ cation (whichhas so little mass, this does not affect the resulting concentration). It should be noted that the standards used bylaboratories to perform analyses may be prepared from PFAA salts, as is often the case for sulfonate standards. If so,the lab must adjust the reported concentration to account for the mass of the counterion (typically Na+ or K+). Thecalculation to do this is described in Section 7.2.3 of EPA Method 537 (Shoemaker, Grimmett, and Boutin 2009).
2.2.3.3 Other PFAAsOther PFAAs include:
perfluoroalkyl sulfinic acids (PFSiAs), associated with the electrochemical fluorination (ECF) process and alsooccur as intermediate environmental transformation productsperfluoroalkyl phosphonic acids (PFPAs) and phosphinic acids (PFPiAs), associated with the fluorotelomerizationprocess and used as surfactants
2.2.3.4 Perfluoroalkane Sulfonamides (FASAs)FASAs, such as perfluorooctane sulfonamide (FOSA), are used as raw material in the ECF process to make perfluoroalkylsulfonamide substances that are used for surfactants and surface treatments. FASAs can degrade to form PFAAs such asPFOS.
2.2.3.5 Other Perfluoroalkyl SubstancesOther perfluoroalkyl substances shown on Figure 2-3 include:
perfluoroalkane sulfonyl fluorides [PASFs, such as perfluorooctane sulfonyl fluoride (POSF) and perfluorobutanesulfonyl fluoride (PBSF)], and perfluoroalkanoyl fluorides (PAFs), associated with the ECF processperfluoroalkyl iodides (PFAIs) and perfluoroalkane aldehydes (PFALs), associated with the fluorotelomerizationprocessperfluoroalkyl ether carboxylic acids (PFECAs) and perfluoroalkyl ether sulfonic acids (PFESAs)
As discussed in Section 2.4, some PFECAs have been developed or used as replacements for other PFAS that are phased outof production and use. This includes GenX chemicals (see text box). Other emerging fluorinated replacement PFECAs morerecently detected in the environment, such as perfluoro-2-methoxyacetic acid (PFMOAA), are described in Sun et al. (2016).
Page 18ITRC PFAS-1
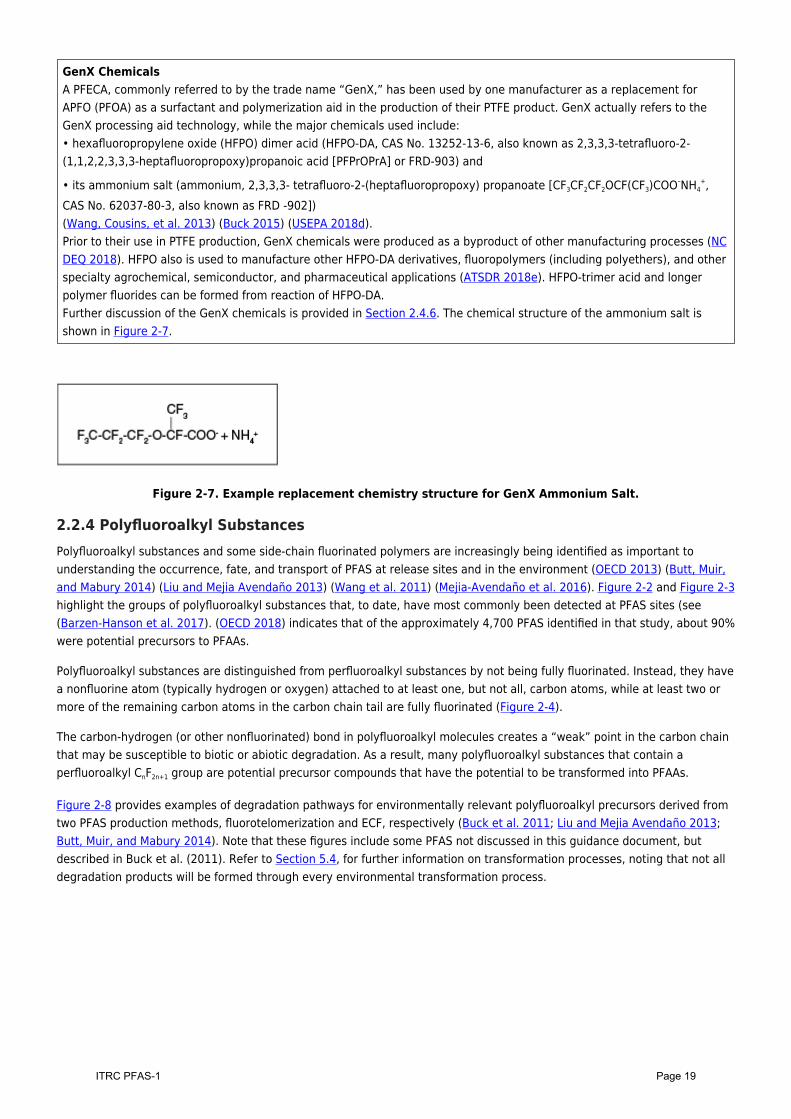
GenX ChemicalsA PFECA, commonly referred to by the trade name “GenX,” has been used by one manufacturer as a replacement forAPFO (PFOA) as a surfactant and polymerization aid in the production of their PTFE product. GenX actually refers to theGenX processing aid technology, while the major chemicals used include:• hexafluoropropylene oxide (HFPO) dimer acid (HFPO-DA, CAS No. 13252-13-6, also known as 2,3,3,3-tetrafluoro-2-(1,1,2,2,3,3,3-heptafluoropropoxy)propanoic acid [PFPrOPrA] or FRD-903) and
• its ammonium salt (ammonium, 2,3,3,3- tetrafluoro-2-(heptafluoropropoxy) propanoate [CF3CF2CF2OCF(CF3)COO–NH4+,
CAS No. 62037-80-3, also known as FRD -902])(Wang, Cousins, et al. 2013) (Buck 2015) (USEPA 2018d).Prior to their use in PTFE production, GenX chemicals were produced as a byproduct of other manufacturing processes (NCDEQ 2018). HFPO also is used to manufacture other HFPO-DA derivatives, fluoropolymers (including polyethers), and otherspecialty agrochemical, semiconductor, and pharmaceutical applications (ATSDR 2018e). HFPO-trimer acid and longerpolymer fluorides can be formed from reaction of HFPO-DA.Further discussion of the GenX chemicals is provided in Section 2.4.6. The chemical structure of the ammonium salt isshown in Figure 2-7.
Figure 2-7. Example replacement chemistry structure for GenX Ammonium Salt.
2.2.4 Polyfluoroalkyl SubstancesPolyfluoroalkyl substances and some side-chain fluorinated polymers are increasingly being identified as important tounderstanding the occurrence, fate, and transport of PFAS at release sites and in the environment (OECD 2013) (Butt, Muir,and Mabury 2014) (Liu and Mejia Avendaño 2013) (Wang et al. 2011) (Mejia-Avendaño et al. 2016). Figure 2-2 and Figure 2-3highlight the groups of polyfluoroalkyl substances that, to date, have most commonly been detected at PFAS sites (see(Barzen-Hanson et al. 2017). (OECD 2018) indicates that of the approximately 4,700 PFAS identified in that study, about 90%were potential precursors to PFAAs.
Polyfluoroalkyl substances are distinguished from perfluoroalkyl substances by not being fully fluorinated. Instead, they havea nonfluorine atom (typically hydrogen or oxygen) attached to at least one, but not all, carbon atoms, while at least two ormore of the remaining carbon atoms in the carbon chain tail are fully fluorinated (Figure 2-4).
The carbon-hydrogen (or other nonfluorinated) bond in polyfluoroalkyl molecules creates a “weak” point in the carbon chainthat may be susceptible to biotic or abiotic degradation. As a result, many polyfluoroalkyl substances that contain aperfluoroalkyl CnF2n+1 group are potential precursor compounds that have the potential to be transformed into PFAAs.
Figure 2-8 provides examples of degradation pathways for environmentally relevant polyfluoroalkyl precursors derived fromtwo PFAS production methods, fluorotelomerization and ECF, respectively (Buck et al. 2011; Liu and Mejia Avendaño 2013;Butt, Muir, and Mabury 2014). Note that these figures include some PFAS not discussed in this guidance document, butdescribed in Buck et al. (2011). Refer to Section 5.4, for further information on transformation processes, noting that not alldegradation products will be formed through every environmental transformation process.
Page 19ITRC PFAS-1
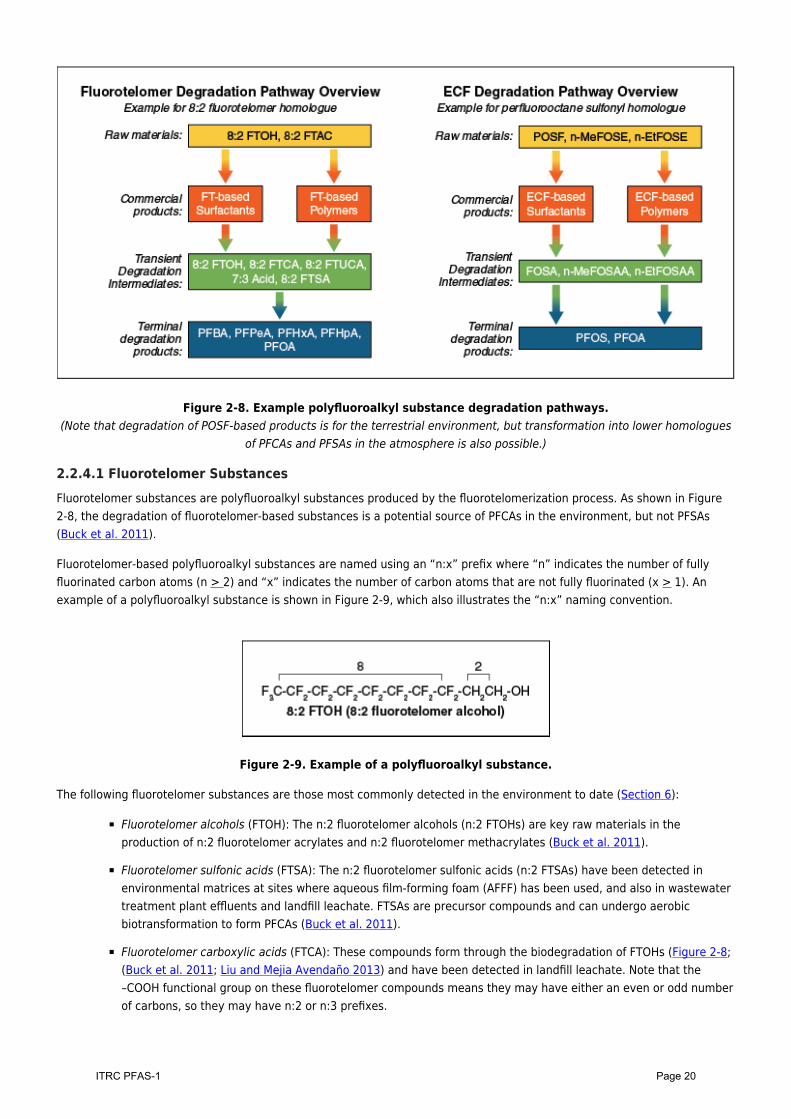
Figure 2-8. Example polyfluoroalkyl substance degradation pathways.(Note that degradation of POSF-based products is for the terrestrial environment, but transformation into lower homologues
of PFCAs and PFSAs in the atmosphere is also possible.)
2.2.4.1 Fluorotelomer SubstancesFluorotelomer substances are polyfluoroalkyl substances produced by the fluorotelomerization process. As shown in Figure2-8, the degradation of fluorotelomer-based substances is a potential source of PFCAs in the environment, but not PFSAs(Buck et al. 2011).
Fluorotelomer-based polyfluoroalkyl substances are named using an “n:x” prefix where “n” indicates the number of fullyfluorinated carbon atoms (n > 2) and “x” indicates the number of carbon atoms that are not fully fluorinated (x > 1). Anexample of a polyfluoroalkyl substance is shown in Figure 2-9, which also illustrates the “n:x” naming convention.
Figure 2-9. Example of a polyfluoroalkyl substance.
The following fluorotelomer substances are those most commonly detected in the environment to date (Section 6):
Fluorotelomer alcohols (FTOH): The n:2 fluorotelomer alcohols (n:2 FTOHs) are key raw materials in theproduction of n:2 fluorotelomer acrylates and n:2 fluorotelomer methacrylates (Buck et al. 2011).
Fluorotelomer sulfonic acids (FTSA): The n:2 fluorotelomer sulfonic acids (n:2 FTSAs) have been detected inenvironmental matrices at sites where aqueous film-forming foam (AFFF) has been used, and also in wastewatertreatment plant effluents and landfill leachate. FTSAs are precursor compounds and can undergo aerobicbiotransformation to form PFCAs (Buck et al. 2011).
Fluorotelomer carboxylic acids (FTCA): These compounds form through the biodegradation of FTOHs (Figure 2-8;(Buck et al. 2011; Liu and Mejia Avendaño 2013) and have been detected in landfill leachate. Note that the–COOH functional group on these fluorotelomer compounds means they may have either an even or odd numberof carbons, so they may have n:2 or n:3 prefixes.
Page 20ITRC PFAS-1
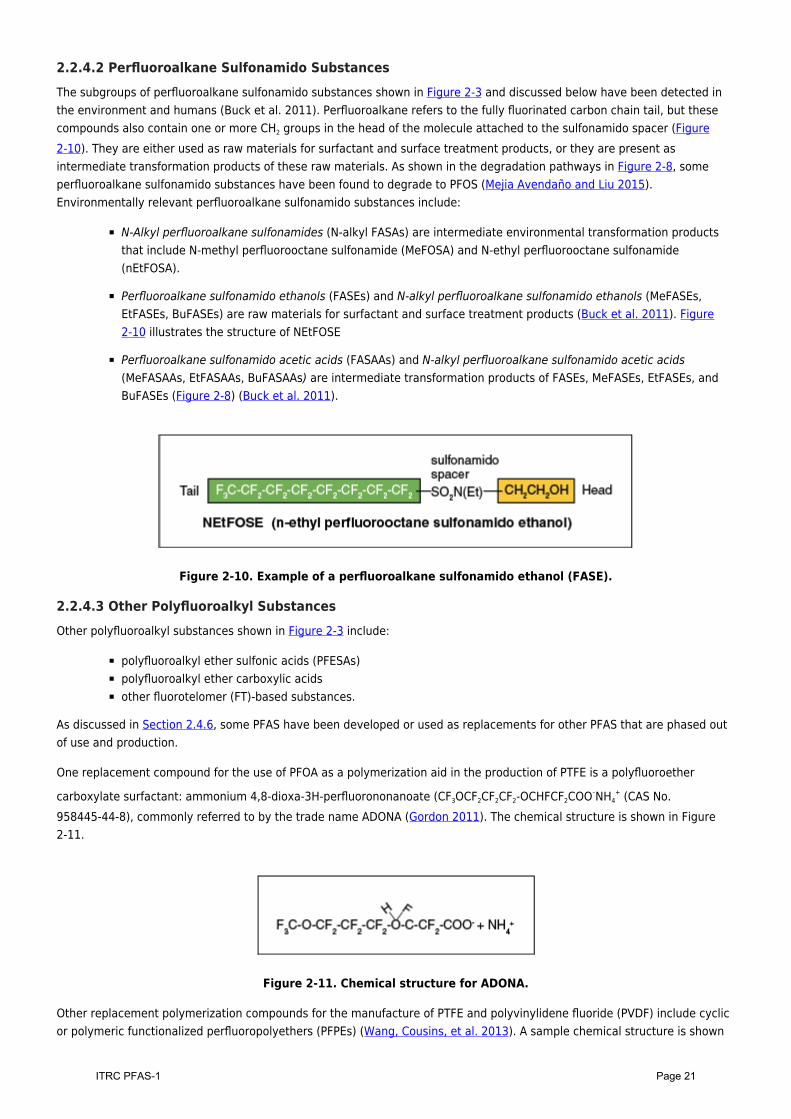
2.2.4.2 Perfluoroalkane Sulfonamido SubstancesThe subgroups of perfluoroalkane sulfonamido substances shown in Figure 2-3 and discussed below have been detected inthe environment and humans (Buck et al. 2011). Perfluoroalkane refers to the fully fluorinated carbon chain tail, but thesecompounds also contain one or more CH2 groups in the head of the molecule attached to the sulfonamido spacer (Figure2-10). They are either used as raw materials for surfactant and surface treatment products, or they are present asintermediate transformation products of these raw materials. As shown in the degradation pathways in Figure 2-8, someperfluoroalkane sulfonamido substances have been found to degrade to PFOS (Mejia Avendaño and Liu 2015).Environmentally relevant perfluoroalkane sulfonamido substances include:
N-Alkyl perfluoroalkane sulfonamides (N-alkyl FASAs) are intermediate environmental transformation productsthat include N-methyl perfluorooctane sulfonamide (MeFOSA) and N-ethyl perfluorooctane sulfonamide(nEtFOSA).
Perfluoroalkane sulfonamido ethanols (FASEs) and N-alkyl perfluoroalkane sulfonamido ethanols (MeFASEs,EtFASEs, BuFASEs) are raw materials for surfactant and surface treatment products (Buck et al. 2011). Figure2-10 illustrates the structure of NEtFOSE
Perfluoroalkane sulfonamido acetic acids (FASAAs) and N-alkyl perfluoroalkane sulfonamido acetic acids(MeFASAAs, EtFASAAs, BuFASAAs) are intermediate transformation products of FASEs, MeFASEs, EtFASEs, andBuFASEs (Figure 2-8) (Buck et al. 2011).
Figure 2-10. Example of a perfluoroalkane sulfonamido ethanol (FASE).
2.2.4.3 Other Polyfluoroalkyl SubstancesOther polyfluoroalkyl substances shown in Figure 2-3 include:
polyfluoroalkyl ether sulfonic acids (PFESAs)polyfluoroalkyl ether carboxylic acidsother fluorotelomer (FT)-based substances.
As discussed in Section 2.4.6, some PFAS have been developed or used as replacements for other PFAS that are phased outof use and production.
One replacement compound for the use of PFOA as a polymerization aid in the production of PTFE is a polyfluoroether
carboxylate surfactant: ammonium 4,8-dioxa-3H-perfluorononanoate (CF3OCF2CF2CF2-OCHFCF2COO–NH4+ (CAS No.
958445-44-8), commonly referred to by the trade name ADONA (Gordon 2011). The chemical structure is shown in Figure2-11.
Figure 2-11. Chemical structure for ADONA.
Other replacement polymerization compounds for the manufacture of PTFE and polyvinylidene fluoride (PVDF) include cyclicor polymeric functionalized perfluoropolyethers (PFPEs) (Wang, Cousins, et al. 2013). A sample chemical structure is shown
Page 21ITRC PFAS-1
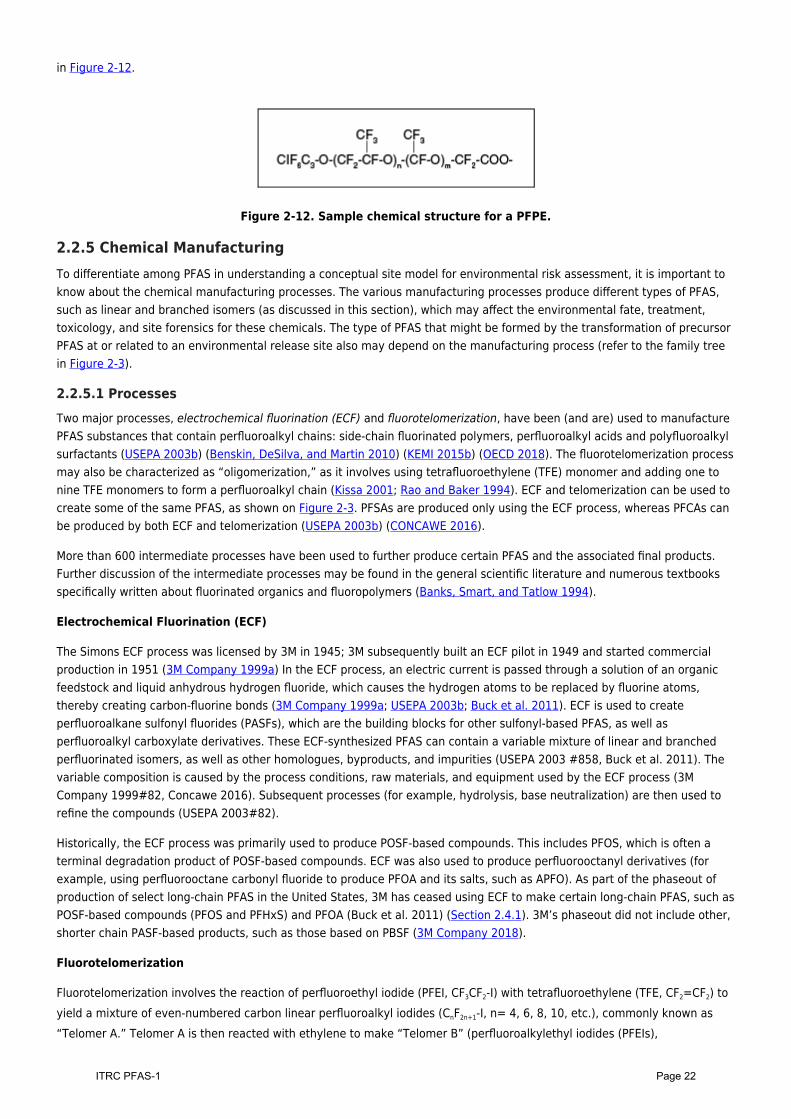
in Figure 2-12.
Figure 2-12. Sample chemical structure for a PFPE.
2.2.5 Chemical ManufacturingTo differentiate among PFAS in understanding a conceptual site model for environmental risk assessment, it is important toknow about the chemical manufacturing processes. The various manufacturing processes produce different types of PFAS,such as linear and branched isomers (as discussed in this section), which may affect the environmental fate, treatment,toxicology, and site forensics for these chemicals. The type of PFAS that might be formed by the transformation of precursorPFAS at or related to an environmental release site also may depend on the manufacturing process (refer to the family treein Figure 2-3).
2.2.5.1 ProcessesTwo major processes, electrochemical fluorination (ECF) and fluorotelomerization, have been (and are) used to manufacturePFAS substances that contain perfluoroalkyl chains: side-chain fluorinated polymers, perfluoroalkyl acids and polyfluoroalkylsurfactants (USEPA 2003b) (Benskin, DeSilva, and Martin 2010) (KEMI 2015b) (OECD 2018). The fluorotelomerization processmay also be characterized as “oligomerization,” as it involves using tetrafluoroethylene (TFE) monomer and adding one tonine TFE monomers to form a perfluoroalkyl chain (Kissa 2001; Rao and Baker 1994). ECF and telomerization can be used tocreate some of the same PFAS, as shown on Figure 2-3. PFSAs are produced only using the ECF process, whereas PFCAs canbe produced by both ECF and telomerization (USEPA 2003b) (CONCAWE 2016).
More than 600 intermediate processes have been used to further produce certain PFAS and the associated final products.Further discussion of the intermediate processes may be found in the general scientific literature and numerous textbooksspecifically written about fluorinated organics and fluoropolymers (Banks, Smart, and Tatlow 1994).
Electrochemical Fluorination (ECF)
The Simons ECF process was licensed by 3M in 1945; 3M subsequently built an ECF pilot in 1949 and started commercialproduction in 1951 (3M Company 1999a) In the ECF process, an electric current is passed through a solution of an organicfeedstock and liquid anhydrous hydrogen fluoride, which causes the hydrogen atoms to be replaced by fluorine atoms,thereby creating carbon-fluorine bonds (3M Company 1999a; USEPA 2003b; Buck et al. 2011). ECF is used to createperfluoroalkane sulfonyl fluorides (PASFs), which are the building blocks for other sulfonyl-based PFAS, as well asperfluoroalkyl carboxylate derivatives. These ECF-synthesized PFAS can contain a variable mixture of linear and branchedperfluorinated isomers, as well as other homologues, byproducts, and impurities (USEPA 2003 #858, Buck et al. 2011). Thevariable composition is caused by the process conditions, raw materials, and equipment used by the ECF process (3MCompany 1999#82, Concawe 2016). Subsequent processes (for example, hydrolysis, base neutralization) are then used torefine the compounds (USEPA 2003#82).
Historically, the ECF process was primarily used to produce POSF-based compounds. This includes PFOS, which is often aterminal degradation product of POSF-based compounds. ECF was also used to produce perfluorooctanyl derivatives (forexample, using perfluorooctane carbonyl fluoride to produce PFOA and its salts, such as APFO). As part of the phaseout ofproduction of select long-chain PFAS in the United States, 3M has ceased using ECF to make certain long-chain PFAS, such asPOSF-based compounds (PFOS and PFHxS) and PFOA (Buck et al. 2011) (Section 2.4.1). 3M’s phaseout did not include other,shorter chain PASF-based products, such as those based on PBSF (3M Company 2018).
Fluorotelomerization
Fluorotelomerization involves the reaction of perfluoroethyl iodide (PFEI, CF3CF2-I) with tetrafluoroethylene (TFE, CF2=CF2) toyield a mixture of even-numbered carbon linear perfluoroalkyl iodides (CnF2n+1-I, n= 4, 6, 8, 10, etc.), commonly known as“Telomer A.” Telomer A is then reacted with ethylene to make “Telomer B” (perfluoroalkylethyl iodides (PFEIs),
Page 22ITRC PFAS-1
CnF2n+1CH2CH2-I, n= 4, 6, 8, 10, etc.). Telomer B is reacted to make fluorotelomer alcohols (FTOHs, CnF2n+1CH2CH2-OH, n= 4, 6,8,10, etc.) Telomer A, Telomer B, and FTOHs are the basic raw materials used to manufacture fluorotelomer-basedsurfactant (nonpolymer) and polymer products (Kissa 2001; Rao and Baker 1994).
As part of the USEPA 2010/2015 Stewardship Program (USEPA 2018a)) (Section 2.4.3), eight major global fluorotelomermanufacturers phased out production of long-chain (Table 2-2) fluorotelomer-based products that were potential precursorsto PFOA and other long-chain perfluorocarboxylic acids (PFCAs). Today, the major global fluorotelomer manufacturers arereported to have refined their processes and predominantly manufacture short-chain (C6) fluorotelomer-based products(www.fluorocouncil.org). Some manufacturers outside of the United States (for example, China, India) have not phased outlong-chain PFAS production (Song et al. 2018).
Fluorotelomerization has been primarily used to produce linear (straight-chain) PFAS isomers with an even number of carbonatoms (Buck et al. 2011), although some sources indicate that the process can also produce compounds with an odd numberof carbons and branched chains (Lindstrom, Strynar, and Libelo 2011) (Danish EPA 2015).
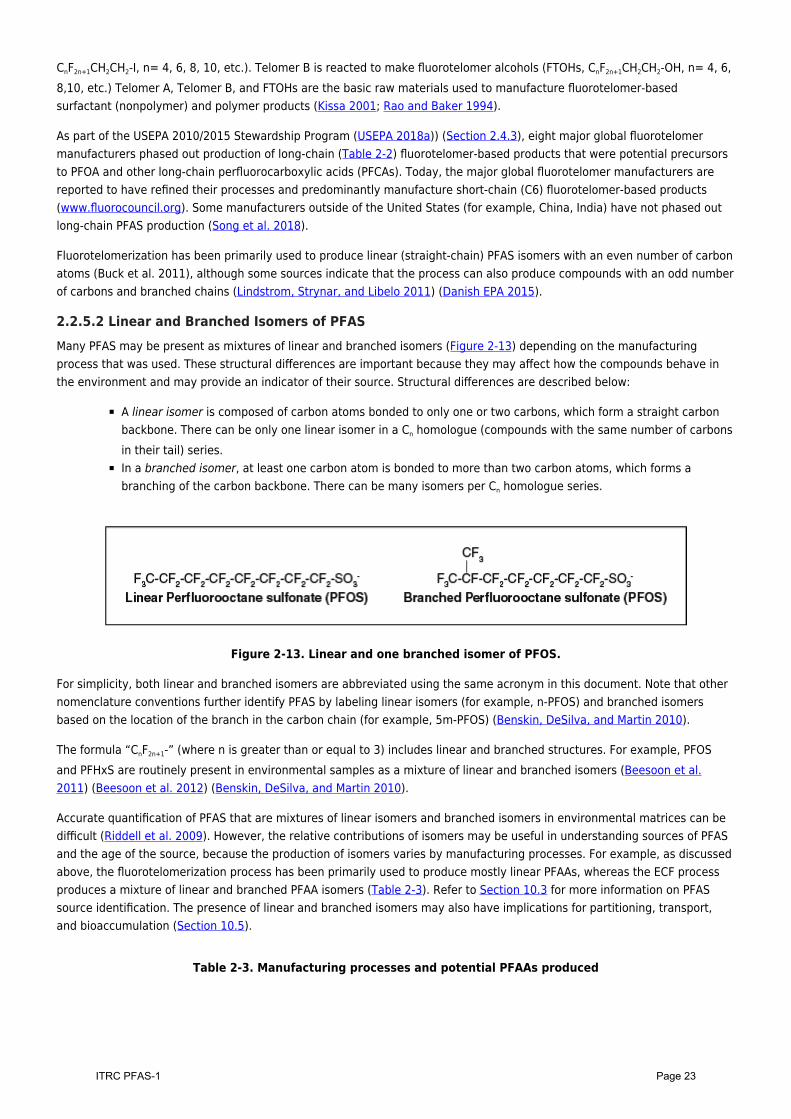
2.2.5.2 Linear and Branched Isomers of PFASMany PFAS may be present as mixtures of linear and branched isomers (Figure 2-13) depending on the manufacturingprocess that was used. These structural differences are important because they may affect how the compounds behave inthe environment and may provide an indicator of their source. Structural differences are described below:
A linear isomer is composed of carbon atoms bonded to only one or two carbons, which form a straight carbonbackbone. There can be only one linear isomer in a Cn homologue (compounds with the same number of carbonsin their tail) series.In a branched isomer, at least one carbon atom is bonded to more than two carbon atoms, which forms abranching of the carbon backbone. There can be many isomers per Cn homologue series.
Figure 2-13. Linear and one branched isomer of PFOS.
For simplicity, both linear and branched isomers are abbreviated using the same acronym in this document. Note that othernomenclature conventions further identify PFAS by labeling linear isomers (for example, n-PFOS) and branched isomersbased on the location of the branch in the carbon chain (for example, 5m-PFOS) (Benskin, DeSilva, and Martin 2010).
The formula “CnF2n+1-” (where n is greater than or equal to 3) includes linear and branched structures. For example, PFOSand PFHxS are routinely present in environmental samples as a mixture of linear and branched isomers (Beesoon et al.2011) (Beesoon et al. 2012) (Benskin, DeSilva, and Martin 2010).
Accurate quantification of PFAS that are mixtures of linear isomers and branched isomers in environmental matrices can bedifficult (Riddell et al. 2009). However, the relative contributions of isomers may be useful in understanding sources of PFASand the age of the source, because the production of isomers varies by manufacturing processes. For example, as discussedabove, the fluorotelomerization process has been primarily used to produce mostly linear PFAAs, whereas the ECF processproduces a mixture of linear and branched PFAA isomers (Table 2-3). Refer to Section 10.3 for more information on PFASsource identification. The presence of linear and branched isomers may also have implications for partitioning, transport,and bioaccumulation (Section 10.5).
Table 2-3. Manufacturing processes and potential PFAAs produced
Page 23ITRC PFAS-1

Manufacturing ProcessCommonly Found Polyfluorinated Substance(Precursors)
Potential PFAAs Produced
Fluorotelomerization
FTSA1 Linear PFCAs3
FTCA2 Linear PFCAs3
FTOH Linear PFCAs3
Electrochemical fluorinationFASE
Branched and linear PFCAsBranched and linear PFSAs
FASAABranched and linear PFCAsBranched and linear PFSAs
1Fluorotelomer sulfonate: for example, may be found at AFFF sites2Fluorotelomer carboxylic acids: for example, 5:3 acid may be found in landfill leachate3Under certain instances, can produce mixture of linear and branched PFCAs
Updated April 14, 2020.
Page 24ITRC PFAS-1
2.3 Emerging Health and Environmental ConcernsLike other emerging contaminants, knowledge and concern about PFAS in the environment has evolved through a series ofphases discussed in this section:
discovery and/or synthesis of PFAS, followed by growth in commercial production and use (Section 2.2.5)emerging health and environmental concerns, including:
awareness of potential health impacts (Section 2.3.1)analytical developments (Section 2.3.2)detection in the environment (Section 2.3.3)response in science, regulatory, and legal actions (Section 2.3.4)
subsequent efforts to reduce use of contaminants of concern and/or replace the contaminants of concern withalternate technologies and chemicals, accompanied by health and environmental questions about thosechemicals (Section 2.4)
2.3.1 Awareness of Potential Health ImpactsOccupational studies in the 1970s found detections of some PFAS in the blood of exposed workers, and further studies in the1990s reported detections in the blood of the general human population (Buck et al. 2011). In recent years, the presence ofseveral long-chain PFAAs (PFOA, PFOS, PFNA, and PFHxS) have been measured in the low parts per billion (ppb, equivalent tonanograms per milliliter (ng/ml)) range in the blood serum of almost all residents of the United States and otherindustrialized nations (Kato 2015) (CDC 2018). These PFAS are present whether or not people were exposed in theworkplace, likely due to the widespread use of PFAS in consumer products and industries (Kannan et al. 2004) (Kärrman etal. 2006) (Olsen et al. 2003). Further information and discussion of studies and human health effects can be found in Section7.1.
These findings led to increased awareness of PFAAs in the environment, associated human exposure, and the potential forhealth effects. Occupational workers may be more highlyexposed, and at risk, than other populations (ATSDR 2018b).Laboratory studies using animals and epidemiological studies of human populations show that exposure to some PFAS maybe associated with a wide range of adverse human health effects (USEPA 2016c, d) (ASTDR 2018e). Toxicity studies havemostly focused on PFOS and PFOA, as well as some other long-chain PFAAs (Section 7.1). More recently, the toxicology ofother PFAS, such as fluorotelomers and shorter chain PFAAs, as well as replacement PFAS chemicals (such as GenXchemicals, Section 2.4.6), have received increased attention (CONCAWE 2016) (USEPA 2016e) (USEPA 2018g).
2.3.2 Analytical DevelopmentsEarly detection of PFAS in environmental media was hindered by the analytical capability challenges arising from the uniquesurface-active properties of PFAS (Giesy and Kannan 2001; 3M Company 2000b). Since the 2000s, methods have been, andcontinue to be, developed with lower detection limits (for example, parts per trillion (ppt)) in water, that are commensuratewith levels of potential human health effects. More commercial laboratories now offer these analytical capabilities. Forfurther information on analytical methods, refer to Section 9.
The list of PFAS that can be tested for has also evolved over time, with longer lists of compounds and changing commercialavailability helping to drive the evolving health and environmental concerns. Early focus was on PFOA and PFOS, butnationwide testing of drinking water supplies under the USEPA’s Third Unregulated Contaminant Monitoring Rule (UCMR3)led to four additional PFAAs (PFHpA, PFNA, PFBS, PFHxS) gaining greater attention. More information about UCMR3 isprovided in Section 6.3, and a summary of the occurrence data for the six PFAAs analyzed during UCMR3 is provided inSection 8.2.2.2. In Germany, von der Trenck et al. (2018) presented health- and ecological-based PFAS significancethresholds for 7 of 13 priority PFAS for the assessment of contaminated groundwater.
Many state regulatory agencies now request or require testing for an expanded list of long- and short-chain PFAAs, and somepotential precursors to PFAAs, such as fluorotelomers. Other polyfluoroalkyl substances are also receiving increasedattention, as illustrated in Figure 2-14. Many of these PFAS are also summarized in Figure 2-4.
Page 25ITRC PFAS-1
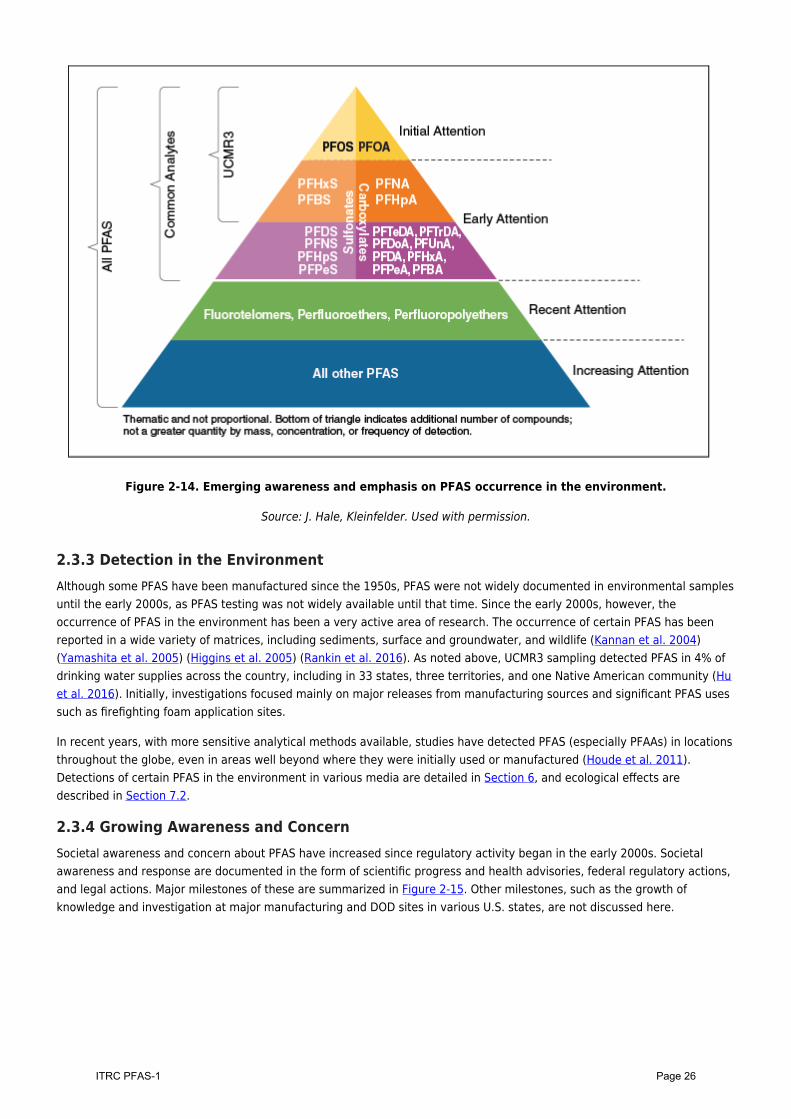
Figure 2-14. Emerging awareness and emphasis on PFAS occurrence in the environment.
Source: J. Hale, Kleinfelder. Used with permission.
2.3.3 Detection in the EnvironmentAlthough some PFAS have been manufactured since the 1950s, PFAS were not widely documented in environmental samplesuntil the early 2000s, as PFAS testing was not widely available until that time. Since the early 2000s, however, theoccurrence of PFAS in the environment has been a very active area of research. The occurrence of certain PFAS has beenreported in a wide variety of matrices, including sediments, surface and groundwater, and wildlife (Kannan et al. 2004)(Yamashita et al. 2005) (Higgins et al. 2005) (Rankin et al. 2016). As noted above, UCMR3 sampling detected PFAS in 4% ofdrinking water supplies across the country, including in 33 states, three territories, and one Native American community (Huet al. 2016). Initially, investigations focused mainly on major releases from manufacturing sources and significant PFAS usessuch as firefighting foam application sites.
In recent years, with more sensitive analytical methods available, studies have detected PFAS (especially PFAAs) in locationsthroughout the globe, even in areas well beyond where they were initially used or manufactured (Houde et al. 2011).Detections of certain PFAS in the environment in various media are detailed in Section 6, and ecological effects aredescribed in Section 7.2.
2.3.4 Growing Awareness and ConcernSocietal awareness and concern about PFAS have increased since regulatory activity began in the early 2000s. Societalawareness and response are documented in the form of scientific progress and health advisories, federal regulatory actions,and legal actions. Major milestones of these are summarized in Figure 2-15. Other milestones, such as the growth ofknowledge and investigation at major manufacturing and DOD sites in various U.S. states, are not discussed here.
Page 26ITRC PFAS-1
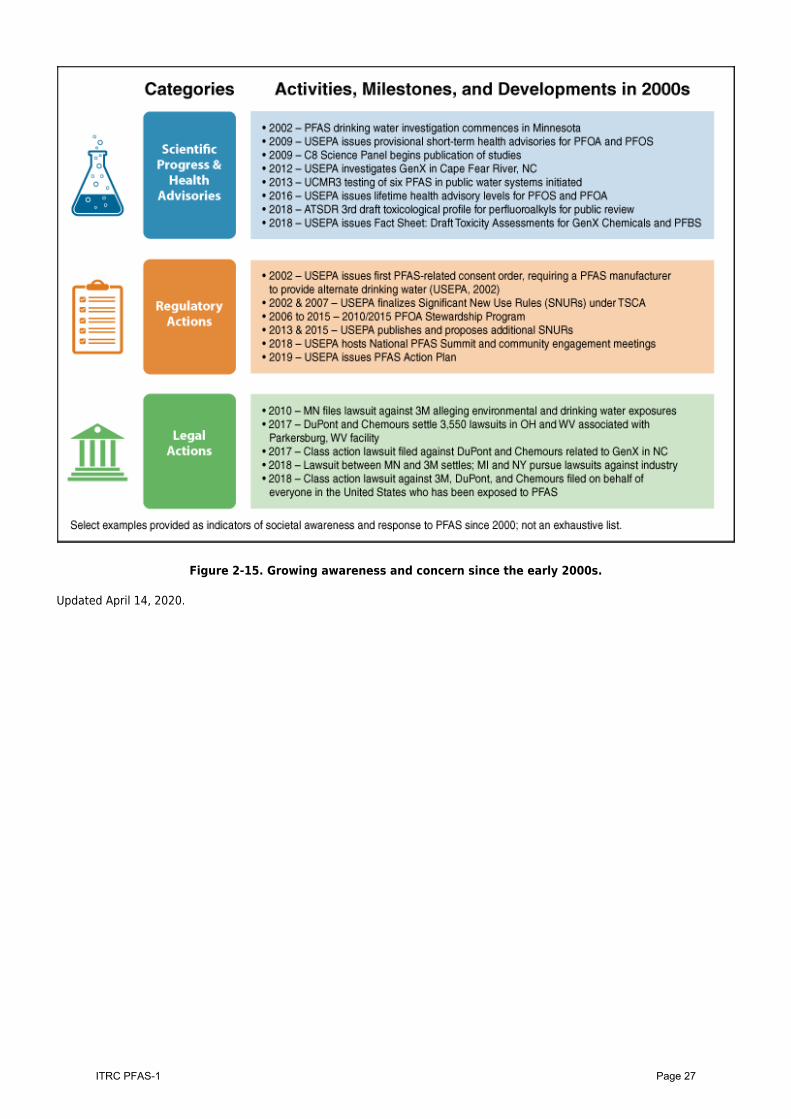
Figure 2-15. Growing awareness and concern since the early 2000s.
Updated April 14, 2020.
Page 27ITRC PFAS-1
2.4 PFAS Reductions and Alternative PFAS FormulationsConcern regarding the persistence, bioaccumulation, and possible ecological and human health effects of long-chain PFAAshas led manufacturers to use replacement PFAS chemistries, which include reformulating or substituting longer chainsubstances with generally shorter chain perfluoroalkyl or polyfluorinated substances that should not degrade to long-chainPFAAs, or replacing manufacturing processes with nonfluorinated chemicals or alternate methods (USEPA 2006a; OECD2017). Manufacturing reductions and phaseouts are described in this section.
2.4.1 3M Voluntary Phaseout of Certain Long-Chain PFASIn early 2000, 3M was the principal worldwide manufacturer of PFOA and POSF-derived PFAS (for example, PFOS) (Buck et al.2011). This represented about 80–90% of global POSF-based production (Prevedouros et al. 2006), with 3M the sole U.S.manufacturer of PFOS (USEPA 2003b). In 2000, 3M announced a voluntary, unilateral phaseout (this only applied to 3M) ofPOSF-derived PFAS, which at the time represented more than 95% of the company’s perfluorooctanyl production (3MCompany 2000a). The 3M phaseout included the six-, eight-, and ten-carbon PFSAs (PFHxS, PFOS, and PFDS) and relatedprecursors, as well as PFOA (Buck et al., 2011). 3M reportedly completed most of the phaseout by the end of 2002, with theremaining phaseout completed by 2008 (USEPA 2017e); (3M Company 2017).
At the time of the phaseout, 3M’s POSF-derived PFAS were used in several applications:
~41% for paper and packaging protectors~36% for textiles, leather, and carpet treatment and fabric protectors~19% as industrial surfactants, additives, and coatings (including electroplating and etching surfactants,household additives, insecticides, and other applications)~3% in firefighting foam (3M Company 2000a).
The paper and packaging protectors included POSF-based side-chain fluorinated polymers and phosphate diesters (Wang,Cousins, et al. 2013).
PFOA produced by 3M was primarily used as a fluoropolymer processing aid, with only about 3% of PFOA production used forother applications: mostly in antistatic coatings in medical films, with limited quantities used for electronics applications (forexample, to create a humidity barrier on printed circuit boards and to coat precision bearings with silicone oil) (3M Company2003).
This phaseout applied only to 3M, and only to select PFAS. 3M subsequently used (and reportedly continues to use) ECF toproduce PBSF-based PFAS (for example, the four carbon PFSA: PFBS) (OECD 2013), (Wang, Cousins, et al. 2015)). Any newmanufacture and/or import of the PFAS phased out by 3M requires USEPA review based on the Significant New Use Rules(SNURs) described in Section 2.4.2. Based on the 2012 Chemical Data Reporting effort, no company reported manufacture orimport of PFOS into the United States (reporting was required for quantities greater than 25,000 pounds) (USEPA 2018a).
When 3M stopped producing PFOA in the early 2000s, it is reported that the manufacture of PFOA was continued by otherdomestic producers using fluorotelomerization (USEPA 2003b). Domestic PFOA production was later phased out by the eightmajor domestic producers as described in Section 2.4.3.
2.4.2 USEPA Significant New Use Rules (SNURs)In conjunction with these voluntary reductions and phase-outs, USEPA used its authority under the Toxic Substances ControlAct (TSCA) to finalize four SNURs between 2002 and 2013 to require notification to USEPA before any manufacture (includingimport) of select PFAS, which include, but are not limited to, some of the PFAS included in 3M’s voluntary phaseout of PFOSand related chemicals (Section 2.4.1). USEPA proposed another SNUR for select PFAS in 2015 that has yet to be finalized,primarily focused on certain PFCAs (e.g., PFOA) and their precursors included in the 2010/2015 PFOA Stewardship Program(Section 2.4.3). For further discussion of the SNURs, see Section 8.
Page 28ITRC PFAS-1
2.4.3 USEPA PFOA Stewardship ProgramIn January 2006, USEPA initiated the 2010/2015 PFOA Stewardship Program (USEPA 2006b). Most PFOA produced in 2003(around the time of the phaseout described in Section 2.4.1) was used as a processing aid in the manufacture offluoropolymers, such as PTFE (USEPA 2003b), and this was likely still the case at the time the stewardship program began.
The eight major manufacturing or processing companies that participated in the program are reportedly those thatmanufactured or processed the majority of these chemicals, including Arkema, Asahi, BASF Corporation (successor to Ciba),Clariant, Daikin, 3M/Dyneon, DuPont, and Solvay Solexis (USEPA 2018a). There may be other manufacturing or processingcompanies that did not participate in the program (USEPA 2015d). USEPA indicated that the eight participating companiessuccessfully met the program goals, meeting a 95% reduction by 2010 in global facility emissions and product content, andeliminating production (100% reduction) of PFOA, certain longer chain PFCAs (higher homologues such as PFNA and PFDA),and related PFOA precursors (for example, 8:2 FTOH) by 2015 (USEPA 2017e). Even though the program goals were met bythe eight companies, the ongoing use of PFOA stock and imported materials has not been fully restricted (USEPA 2018a).Products manufactured and imported prior to 2015, and materials with ongoing uses, may still contain these PFAS (USEPA2018b), and PFOA may be present as a trace contaminant in some other PFAS and fluoropolymer products (3M Company2003). As discussed in Section 2.4.5, production is ongoing in other nations.
2.4.4 Stockholm Convention on Persistent Organic PollutantsThe Stockholm Convention on Persistent Organic Pollutants (POPs) is a United Nations treaty signed in 2001 aimed atreducing or eliminating the production, use, and release of key POPs. POPs are defined as synthetic, organic compoundsthat, to varying degrees, resist photolytic, biological, and chemical degradation (KEMI 2004, 2015b); (USEPA 2017j).Chemicals listed as POPs satisfy screening criteria for persistence, bioaccumulation, long-range environmental transport, andadverse effects (Stockholm Convention 2001). The Stockholm Convention targets PFAS in these ways:
In 2009, Annex B of the Stockholm Convention (which restricts production and use) was amended to includePFOS (and its salts and POSF), because it is persistent in the environment and is not known to degrade at anyenvironmental condition. Currently, the United States has not ratified the amendment (KEMI 2017)). Annex B isnot an outright ban; it allows certain approved uses and exemptions of POPs. Prior to 2019, approved, ongoinguses for PFOS under Annex B included select applications in photoimaging, semiconductor coatings and etchingagents, metal plating, insect baits, chemically driven oil production, aviation hydraulic fluids, some medicaldevices, and color printer electronic parts (UNEP 2008, 2009).According to the Stockhom Convention website:
In May 2019, Annex B was amended to discontinue several of the previously allowed ongoing uses(UNEP 2019a).Annex A was amended in May 2019 to prohibit and/or eliminate the production and use of PFOA (itssalts and PFOA-related compounds), with certain exemptions (UNEP 2019a).the POPs Review Committee recommended in October 2019 to list PFHxS (and its salts and relatedcompounds) in Annex A without specific exemptions (UNEP 2019b)
2.4.5 Global Manufacture and Use of PFASPFAS are still manufactured globally, despite some PFAS (most notably PFOA and PFOS) no longer being produced in theUnited States, Europe, and Japan (FluoroCouncil 2018). For further information, see OECD’s “Risk Reduction Approaches forPFASs” (OECD 2015b). In addition to the domestic reductions discussed in Section 2.4.1 and 2.4.3, some of the phase-outsand restrictions are summarized below.
In 2017, the South Australia state government took initial steps to develop legislation banning environmentally harmfulfoams, such as Class B firefighting foams containing PFAS (SA EPA 2017).
Canada embarked on an Environmental Performance Agreement with four major manufacturers to phase out PFOA andrelated compounds from 2010 to 2015 (CEPA 2006). In 2008, Canada prohibited the use of most PFOS, with selectexemptions such as use of existing stocks of PFOS-based firefighting foams, and then added PFOS to the Virtual EliminationList in 2009 and to the Prohibition of Certain Toxic Substances Regulations in 2016 (CEPA 2018). By 2016, Canada prohibitedthe import, manufacture, use and sale of PFOS, PFOA, and other long-chain PFCAs (and salts and precursors), with limitedexemptions (CEPA 2018), and subsequently in 2018, Canada proposed further modification to those restrictions(Government of Canada 2018).
Page 29ITRC PFAS-1
In 2009, the European Union (EU), through the European Chemicals Agency (ECHA), regulated PFOS as a POP, and use ofPFOS is limited to certain restrictions (Vierke et al. 2012). In 2017, the EU banned the sale, use, and import of PFOA, its saltsand PFOA-related substances through Annex XVII of the European Chemicals Regulation (REACH), with phase-outs occurringthrough 2032 and certain allowed uses. ECHA is currently considering restrictions for other long-chain PFCAs, their salts andprecursors, as well as other compounds, such as PFHxA (ECHA 2018).
In Japan, there are restrictions on the manufacture, import, export, and use of PFOS and its salts (OECD 2015a).
The global reduction anticipated with the U.S. phaseout of PFOA has potentially been offset by increased production of PFOAand related PFAS in China, India, and Russia (OECD 2015b). PFAS manufacture began in China in the 1980s (World Bank2017b) (2017a), and PFOS production in China increased coincident with the long-chain PFAA phaseout in the United States(CONCAWE 2016) (OECD 2015b). In 2016, PFOS and its derivatives were still being produced in Germany, Italy, and China(TTE 2016), but by early 2017, China was the only known producer of PFOS. China has ratified the Stockholm Convention onPOPs and was awarded a grant from the Global Environment Facility (GEF) in 2017 to support the reduction of PFOS in China(World Bank 2017b). China has developed some guidance for restriction and limitations of some PFAS (OECD 2015b). InBrazil, EtFOSA, which is a precursor to FOSA and PFOS and used in the pesticide sulfluramid, which is still being produced onan industrial scale, is allowed as an approved use by the Stockholm Convention (Löfstedt Gilljam et al. 2016).
There does not appear to be a comprehensive reference publically available to document the individual PFAS and thequantity of PFAS produced over the years. This is possibly because these data are proprietary, but also due to modificationsto chemistries and products over the years (Lindstrom, Strynar, and Libelo 2011), complexity of the issue, and the generallack of publically available data (OECD 2018). That said, some estimates of production and emissions of select PFAS havebeen made based on the limited available data.
Prevedouros et al. (2006) estimated global emission of PFCAs at about 3,500–8,000 tons between the 1950s and 2002, withapproximately 80% of emissions related to fluoropolymer manufacture (and use), based on overall annual productionestimates of:
APFO (ammonium salt of PFOA)-about 335–525 tons per year between 1951 and 2002APFN (ammonium salt of PFNA)-about 60–225 tons per year between 1975 and 2004POSF (building block for PFOS)-about 9,550 tons per year from 1960 to 2002.
Other production and emissions estimates for PFCAs are available from OECD (2015b), and for PFOS and PFOS precursorsfrom Armitage et al. (2009), and Paul, Jones, and Sweetman (2009). OECD (2015b) calls for a new, comprehensive survey toevaluate both historical and ongoing emissions.
2.4.6 PFAS-Based Replacement ChemistryWith the emerging awareness of potential health and environmental impacts of some PFAS and related limitations onproduction of some PFAS, such as the SNURs (Section 2.4.2) and 2010/2015 PFOA Stewardship Program (Section 2.4.3),manufacturers began efforts to replace the use of long-chain PFAS chemistries with nonfluorinated chemicals, alternatetechnologies, and/or other, shorter chain PFAS (Wang, Cousins, et al. 2013). For example, decorative chrome platingtypically now uses less toxic chromium III instead of chromium VI so that PFAS are not needed (Wang et al. 2013).
Some of the replacement chemicals are said to achieve the same performance effectiveness of some of their predecessors.A carpet manufacturer has found that performance of fluorine-free alternatives is “equivalent or superior to the fluorinatedtreatments” pg. 66, (CalEPA 2018). Conversely, a 2015 study concluded that there are no nonfluorinated alternatives thatprovide equivalent technical performance in textiles (Danish EPA 2015). PFAS-free AFFF has yet to be demonstrated to meetUS Department of Defense performance specifications, but have been adopted by some other users (Section 3.8.1 and 3.10).
Several studies suggest some of the alternate PFAS chemistries may or may not be less hazardous than the long-chainpredecessors, although publicly available information on most replacement chemicals is limited (Wang, Cousins, et al. 2015)(RIVM 2016); (OECD 2015b). Documentation regarding the USEPA’s review of hundreds of “shorter chain-length PFAStelomeric” substitutes is available under the TSCA New Chemicals Program (OECD 2013); (USEPA 2017i), and otherdocumentation regarding replacement PFAS chemistries is available from the FluoroCouncil (2017). Draft toxicologicalevaluations have been provided for public comment by the USEPA for GenX chemicals and PFBS (USEPA 2018d) (USEPA2018e). For further discussion of toxicity documentation for select PFAAs and replacement chemistries, see Section 7.
Although a full discussion of such PFAS chemistries is not possible here, it is important to be aware of the trend toward
Page 30ITRC PFAS-1
shorter chain chemistries, as some of these PFAS increasingly may be detected in the environment. Some replacement PFAShave been detected in the environment and generated public concern and regulatory actions; however, information onsignificant environmental contamination by replacement PFAS is limited, and most are not detected by standard analyticalmethods (Wang, Cousins, et al. 2013). Some PFAS used as replacement chemicals, such as HFPO-DA and ADONA (used asreplacements for APFO/PFOA in PTFE manufacture), and F53B (used as a replacement for PFOS in plating), have recentlybeen added to USEPA Method 537.1 (Shoemaker and Tettenhorst 2018). Treatment processes used to remove thesechemicals from waste streams may not be as effective as with longer chain PFAS (Sun et al. 2016).
Alternate PFAS chemistries are being used to replace long-chain PFAAs that have been phased out of production and/or use.In many cases, although similar legacy PFAAs were manufactured and used by many companies, these same companieshave transitioned to the use of many different types of other PFAS as alternative chemicals. Many of these replacement PFASare structurally similar to their long-chain predecessors, and are typically also manufactured using electrochemicalfluorination (ECF) or fluorotelomerization (Wang, Cousins, et al. 2015) (CONCAWE 2016). Some of these fluorinatedsubstitutes may degrade to form short-chain PFAAs. Some short-chain PFAAs, PFECAs, and related chemicals weremanufactured as early as the 1980s, or earlier (Wang, Cousins, et al. 2015). Some PFAS used to replace long-chain PFAS arepresented below (Hori et al. 2006; OECD 2007; Herzke, Olsson, and Posner 2012; Buck 2015; Wang, Cousins, et al. 2013;Wang et al. 2014; Wang, Cousins, et al. 2015; KEMI 2015b; Sun et al. 2016; Holmquist et al. 2016):
short chain homologues of the long-chain PFAAs, including PBSF-based derivatives (for example, 4-carbon chainPFBS in lieu of POSF-based six-, eight-, and ten-carbon chain compounds) in many applications, including surfacetreatmentperfluorohexane sulfonyl fluoride (PHxSF, which can degrade to PFHxS and is considered to be phased out in theUnited States) as an alternative to PFOS, primarily in Chinafluorotelomer-based products such as FTOH, for example, those with a six-carbon perfluorohexyl chain, including6:2 fluorotelomer-based compounds in AFFF formulations and other six-carbon fluorotelomer-based products,side-chain fluorinated polymers, and PFPE products for surface treatment of food contact materialsper- and poly-fluoroalkyl ether substances used as polymerization aids in manufacture of fluoropolymers, suchas GenX chemicals (Section 2.2.3.5) and ADONA used as a replacement for APFO in the manufacture of PTFE, aswell as other types of PFAS, such as cyclic or polymeric functionalized PFPEs as a replacement for APFN in themanufacture of polyvinylidene fluoride (PVDF)6:2 fluorotelomer-based compounds, a PFBS-based compound, and fluorotelomer-based F-53 and F-53B(perfluoroalkyl ether potassium sulfonate) in lieu of PFOS in metal plating applications.
Updated April 14, 2020.
Page 31ITRC PFAS-1
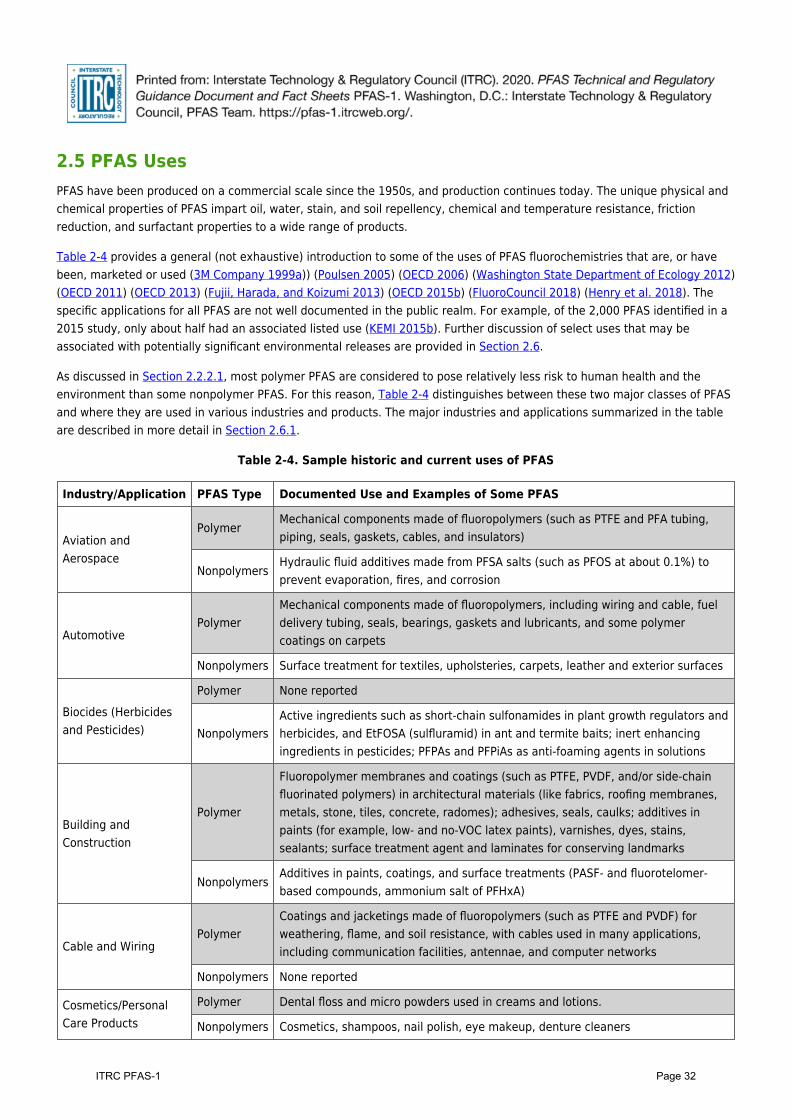
2.5 PFAS UsesPFAS have been produced on a commercial scale since the 1950s, and production continues today. The unique physical andchemical properties of PFAS impart oil, water, stain, and soil repellency, chemical and temperature resistance, frictionreduction, and surfactant properties to a wide range of products.
Table 2-4 provides a general (not exhaustive) introduction to some of the uses of PFAS fluorochemistries that are, or havebeen, marketed or used (3M Company 1999a)) (Poulsen 2005) (OECD 2006) (Washington State Department of Ecology 2012)(OECD 2011) (OECD 2013) (Fujii, Harada, and Koizumi 2013) (OECD 2015b) (FluoroCouncil 2018) (Henry et al. 2018). Thespecific applications for all PFAS are not well documented in the public realm. For example, of the 2,000 PFAS identified in a2015 study, only about half had an associated listed use (KEMI 2015b). Further discussion of select uses that may beassociated with potentially significant environmental releases are provided in Section 2.6.
As discussed in Section 2.2.2.1, most polymer PFAS are considered to pose relatively less risk to human health and theenvironment than some nonpolymer PFAS. For this reason, Table 2-4 distinguishes between these two major classes of PFASand where they are used in various industries and products. The major industries and applications summarized in the tableare described in more detail in Section 2.6.1.
Table 2-4. Sample historic and current uses of PFAS
Industry/Application PFAS Type Documented Use and Examples of Some PFAS
Aviation andAerospace
PolymerMechanical components made of fluoropolymers (such as PTFE and PFA tubing,piping, seals, gaskets, cables, and insulators)
NonpolymersHydraulic fluid additives made from PFSA salts (such as PFOS at about 0.1%) toprevent evaporation, fires, and corrosion
AutomotivePolymer
Mechanical components made of fluoropolymers, including wiring and cable, fueldelivery tubing, seals, bearings, gaskets and lubricants, and some polymercoatings on carpets
Nonpolymers Surface treatment for textiles, upholsteries, carpets, leather and exterior surfaces
Biocides (Herbicidesand Pesticides)
Polymer None reported
NonpolymersActive ingredients such as short-chain sulfonamides in plant growth regulators andherbicides, and EtFOSA (sulfluramid) in ant and termite baits; inert enhancingingredients in pesticides; PFPAs and PFPiAs as anti-foaming agents in solutions
Building andConstruction
Polymer
Fluoropolymer membranes and coatings (such as PTFE, PVDF, and/or side-chainfluorinated polymers) in architectural materials (like fabrics, roofing membranes,metals, stone, tiles, concrete, radomes); adhesives, seals, caulks; additives inpaints (for example, low- and no-VOC latex paints), varnishes, dyes, stains,sealants; surface treatment agent and laminates for conserving landmarks
NonpolymersAdditives in paints, coatings, and surface treatments (PASF- and fluorotelomer-based compounds, ammonium salt of PFHxA)
Cable and WiringPolymer
Coatings and jacketings made of fluoropolymers (such as PTFE and PVDF) forweathering, flame, and soil resistance, with cables used in many applications,including communication facilities, antennae, and computer networks
Nonpolymers None reported
Cosmetics/PersonalCare Products
Polymer Dental floss and micro powders used in creams and lotions.
Nonpolymers Cosmetics, shampoos, nail polish, eye makeup, denture cleaners
Page 32ITRC PFAS-1
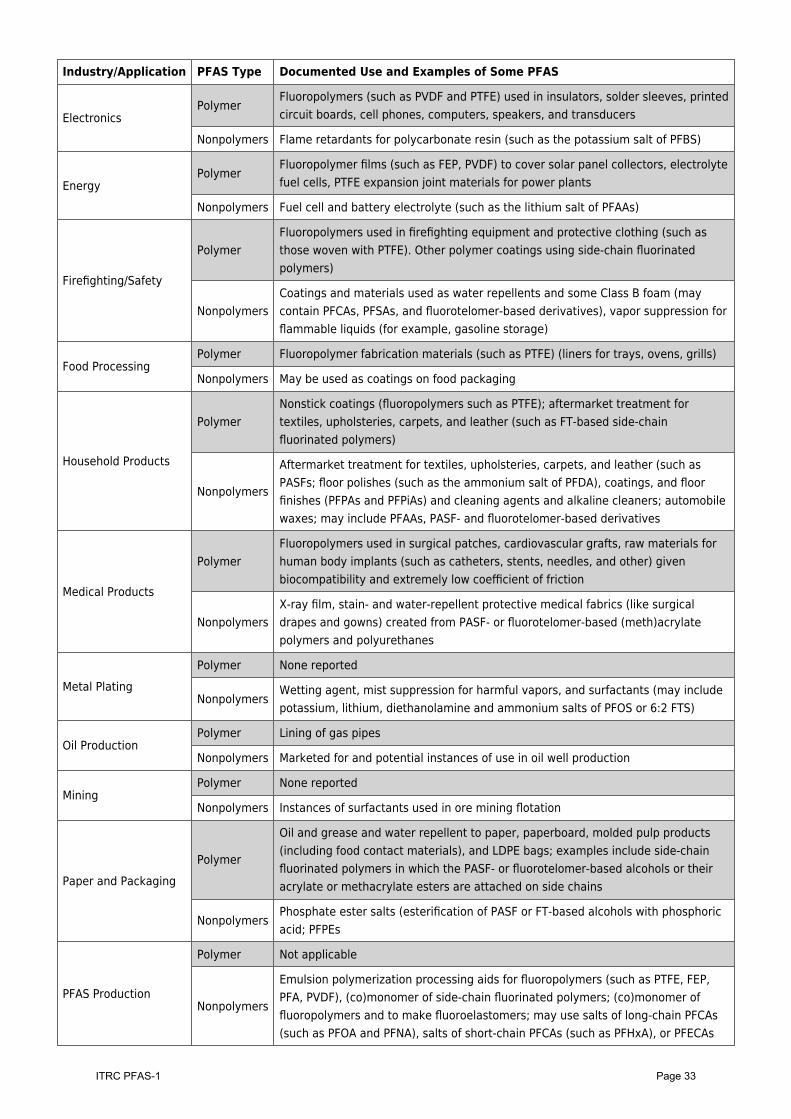
Industry/Application PFAS Type Documented Use and Examples of Some PFAS
ElectronicsPolymer
Fluoropolymers (such as PVDF and PTFE) used in insulators, solder sleeves, printedcircuit boards, cell phones, computers, speakers, and transducers
Nonpolymers Flame retardants for polycarbonate resin (such as the potassium salt of PFBS)
EnergyPolymer
Fluoropolymer films (such as FEP, PVDF) to cover solar panel collectors, electrolytefuel cells, PTFE expansion joint materials for power plants
Nonpolymers Fuel cell and battery electrolyte (such as the lithium salt of PFAAs)
Firefighting/Safety
PolymerFluoropolymers used in firefighting equipment and protective clothing (such asthose woven with PTFE). Other polymer coatings using side-chain fluorinatedpolymers)
NonpolymersCoatings and materials used as water repellents and some Class B foam (maycontain PFCAs, PFSAs, and fluorotelomer-based derivatives), vapor suppression forflammable liquids (for example, gasoline storage)
Food ProcessingPolymer Fluoropolymer fabrication materials (such as PTFE) (liners for trays, ovens, grills)
Nonpolymers May be used as coatings on food packaging
Household Products
PolymerNonstick coatings (fluoropolymers such as PTFE); aftermarket treatment fortextiles, upholsteries, carpets, and leather (such as FT-based side-chainfluorinated polymers)
Nonpolymers
Aftermarket treatment for textiles, upholsteries, carpets, and leather (such asPASFs; floor polishes (such as the ammonium salt of PFDA), coatings, and floorfinishes (PFPAs and PFPiAs) and cleaning agents and alkaline cleaners; automobilewaxes; may include PFAAs, PASF- and fluorotelomer-based derivatives
Medical Products
PolymerFluoropolymers used in surgical patches, cardiovascular grafts, raw materials forhuman body implants (such as catheters, stents, needles, and other) givenbiocompatibility and extremely low coefficient of friction
NonpolymersX-ray film, stain- and water-repellent protective medical fabrics (like surgicaldrapes and gowns) created from PASF- or fluorotelomer-based (meth)acrylatepolymers and polyurethanes
Metal PlatingPolymer None reported
NonpolymersWetting agent, mist suppression for harmful vapors, and surfactants (may includepotassium, lithium, diethanolamine and ammonium salts of PFOS or 6:2 FTS)
Oil ProductionPolymer Lining of gas pipes
Nonpolymers Marketed for and potential instances of use in oil well production
MiningPolymer None reported
Nonpolymers Instances of surfactants used in ore mining flotation
Paper and PackagingPolymer
Oil and grease and water repellent to paper, paperboard, molded pulp products(including food contact materials), and LDPE bags; examples include side-chainfluorinated polymers in which the PASF- or fluorotelomer-based alcohols or theiracrylate or methacrylate esters are attached on side chains
NonpolymersPhosphate ester salts (esterification of PASF or FT-based alcohols with phosphoricacid; PFPEs
PFAS Production
Polymer Not applicable
Nonpolymers
Emulsion polymerization processing aids for fluoropolymers (such as PTFE, FEP,PFA, PVDF), (co)monomer of side-chain fluorinated polymers; (co)monomer offluoropolymers and to make fluoroelastomers; may use salts of long-chain PFCAs(such as PFOA and PFNA), salts of short-chain PFCAs (such as PFHxA), or PFECAs
Page 33ITRC PFAS-1
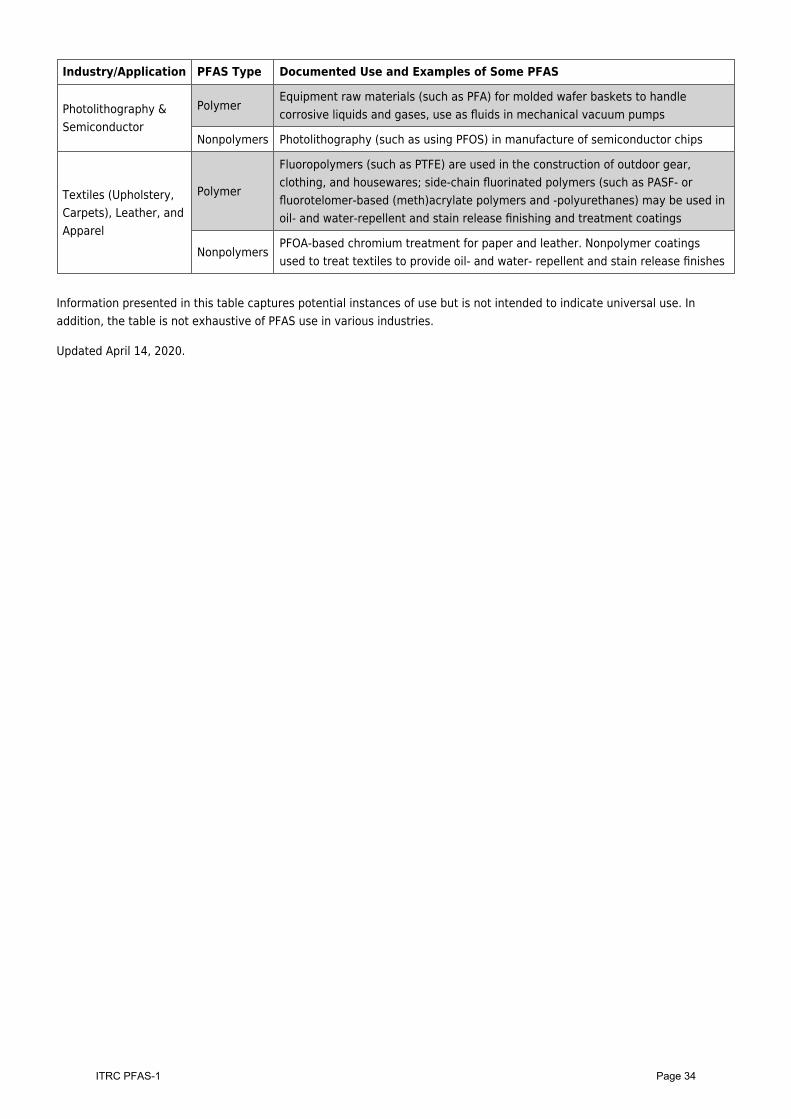
Industry/Application PFAS Type Documented Use and Examples of Some PFAS
Photolithography &Semiconductor
PolymerEquipment raw materials (such as PFA) for molded wafer baskets to handlecorrosive liquids and gases, use as fluids in mechanical vacuum pumps
Nonpolymers Photolithography (such as using PFOS) in manufacture of semiconductor chips
Textiles (Upholstery,Carpets), Leather, andApparel
Polymer
Fluoropolymers (such as PTFE) are used in the construction of outdoor gear,clothing, and housewares; side-chain fluorinated polymers (such as PASF- orfluorotelomer-based (meth)acrylate polymers and -polyurethanes) may be used inoil- and water-repellent and stain release finishing and treatment coatings
NonpolymersPFOA-based chromium treatment for paper and leather. Nonpolymer coatingsused to treat textiles to provide oil- and water- repellent and stain release finishes
Information presented in this table captures potential instances of use but is not intended to indicate universal use. Inaddition, the table is not exhaustive of PFAS use in various industries.
Updated April 14, 2020.
Page 34ITRC PFAS-1
2.6 PFAS Releases to the EnvironmentThis section summarizes sources of PFAS releases to the environment that have the potential for significant environmentalimpact, based on the type and magnitude of the release, and the types and concentrations of PFAS associated with thatrelease. These sources are sites where PFAS could be, or are known to have been, released to the environment, even if thesite is not the location where the PFAS were generated or used. Refer to Section 2.1 for a discussion of the relativesignificance of releases and source control, as not all of these facilities will have, or have been documented to have, PFASreleases, and not all releases are of the same magnitude.
These major sources are located both in the United States and abroad, and include:
industrial facilities that produce PFAS or process PFAS, or facilities that use PFAS chemicals or products inmanufacturing or other activities (Section 2.6.1)areas where fluorine-containing Class B firefighting foams are stored, used, or released (Section 2.6.2)waste management facilities, such as landfills (Section 2.6.3)wastewater treatment residuals and areas of biosolids production and application, with more significant impactsassociated with industrial wastewater discharges (Section 2.6.4).
The fate and transport processes and distribution of PFAS in the environment are discussed in Section 5. Media-specificoccurrence data are discussed in Section 6. Information about risk assessment, and human and ecological receptors isincluded in Section 9. Discussion of conceptual site model (CSM) components for each of the PFAS release catagories listedabove is included in Section 10.2.1.
2.6.1 Major Manufacturing and Industry SourcesIndustrial source sites include primary and secondary manufacturing facilities. Primary manufacturing facilities are thosewhere PFAS-containing products are synthesized and made into products or chemical feedstocks, or where PFAS are used asprocessing aids in fluoropolymer production. PFAS processing aids are not intended to be in the final product, but may bepresent at trace quantities (3M Company 2003) (Buck et al. 2011).
Secondary manufacturing facilities may use fluoropolymers and PFAS-based materials produced at primary manufacturingfacilities as part of industrial processes, such as the application of coatings to finished products. In some industrial settings,PFAS are used for worker safety purposes, such as using PFOS-based materials to suppress harmful mists duringelectroplating activities (Section 2.6.1.3).
PFAS composition and release mechanisms will vary for each facility. The composition of PFAS released from industrialfacilities depends on the type of PFAS produced or used by the facility.
The general PFAS release mechanisms and pathways at industrial facilities are illustrated in CSM Figure 2-16 and includewastewater and stormwater discharges; on- and off-site disposal of solid wastes; accidental releases such as leaks and spills;and stack and fugitive emissions. Stack emissions may result in aerial deposition of PFAS to soil and surface water (withsubsequent leaching and infiltration to groundwater) related to the facility (Davis et al. 2007; Shin et al. 2011), as well asshort- and long-range air transport of PFAS. Industrial facilities may also contain areas where fire training or fire responseusing AFFF has occurred, AFFF storage areas, and AFFF fire suppression systems inside buildings. Like many AFFF releasesites, industrial sites may also have releases of co-contaminants (solvents, petroleum products, etc.) that could potentiallyinfluence fate and transport of PFAS.
Page 35ITRC PFAS-1
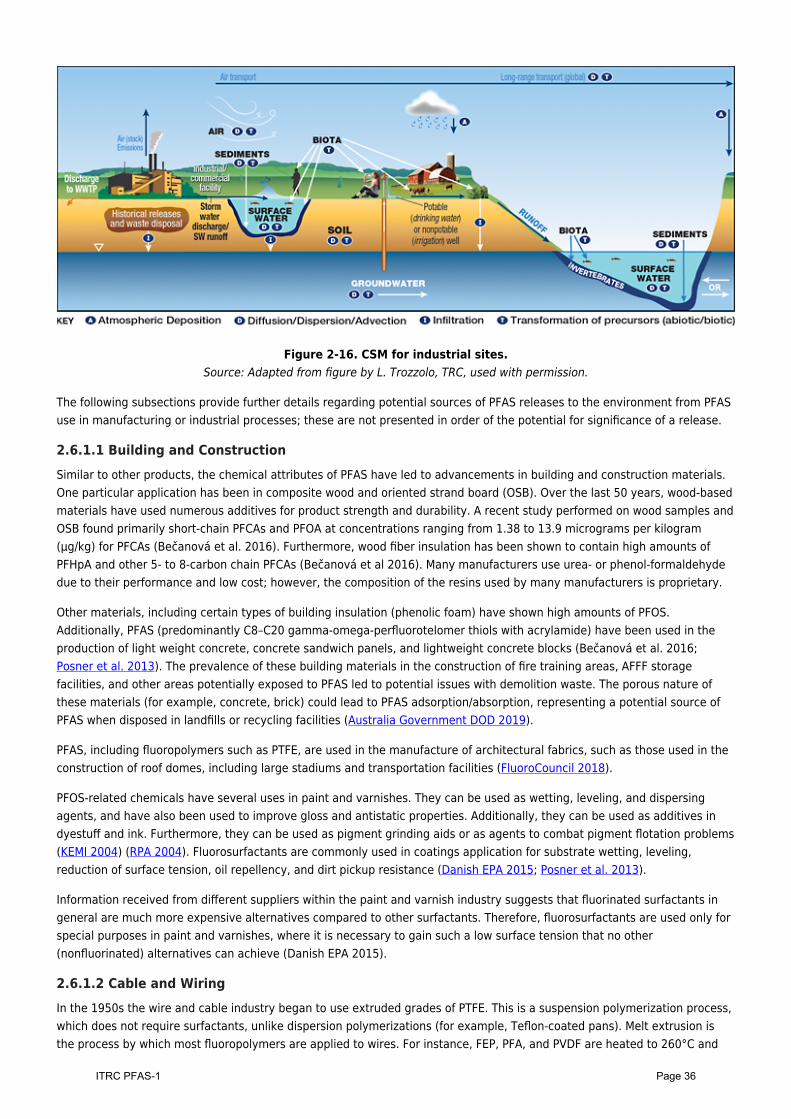
Figure 2-16. CSM for industrial sites.Source: Adapted from figure by L. Trozzolo, TRC, used with permission.
The following subsections provide further details regarding potential sources of PFAS releases to the environment from PFASuse in manufacturing or industrial processes; these are not presented in order of the potential for significance of a release.
2.6.1.1 Building and ConstructionSimilar to other products, the chemical attributes of PFAS have led to advancements in building and construction materials.One particular application has been in composite wood and oriented strand board (OSB). Over the last 50 years, wood-basedmaterials have used numerous additives for product strength and durability. A recent study performed on wood samples andOSB found primarily short-chain PFCAs and PFOA at concentrations ranging from 1.38 to 13.9 micrograms per kilogram(µg/kg) for PFCAs (Bečanová et al. 2016). Furthermore, wood fiber insulation has been shown to contain high amounts ofPFHpA and other 5- to 8-carbon chain PFCAs (Bečanová et al 2016). Many manufacturers use urea- or phenol-formaldehydedue to their performance and low cost; however, the composition of the resins used by many manufacturers is proprietary.
Other materials, including certain types of building insulation (phenolic foam) have shown high amounts of PFOS.Additionally, PFAS (predominantly C8–C20 gamma-omega-perfluorotelomer thiols with acrylamide) have been used in theproduction of light weight concrete, concrete sandwich panels, and lightweight concrete blocks (Bečanová et al. 2016;Posner et al. 2013). The prevalence of these building materials in the construction of fire training areas, AFFF storagefacilities, and other areas potentially exposed to PFAS led to potential issues with demolition waste. The porous nature ofthese materials (for example, concrete, brick) could lead to PFAS adsorption/absorption, representing a potential source ofPFAS when disposed in landfills or recycling facilities (Australia Government DOD 2019).
PFAS, including fluoropolymers such as PTFE, are used in the manufacture of architectural fabrics, such as those used in theconstruction of roof domes, including large stadiums and transportation facilities (FluoroCouncil 2018).
PFOS-related chemicals have several uses in paint and varnishes. They can be used as wetting, leveling, and dispersingagents, and have also been used to improve gloss and antistatic properties. Additionally, they can be used as additives indyestuff and ink. Furthermore, they can be used as pigment grinding aids or as agents to combat pigment flotation problems(KEMI 2004) (RPA 2004). Fluorosurfactants are commonly used in coatings application for substrate wetting, leveling,reduction of surface tension, oil repellency, and dirt pickup resistance (Danish EPA 2015; Posner et al. 2013).
Information received from different suppliers within the paint and varnish industry suggests that fluorinated surfactants ingeneral are much more expensive alternatives compared to other surfactants. Therefore, fluorosurfactants are used only forspecial purposes in paint and varnishes, where it is necessary to gain such a low surface tension that no other(nonfluorinated) alternatives can achieve (Danish EPA 2015).
2.6.1.2 Cable and WiringIn the 1950s the wire and cable industry began to use extruded grades of PTFE. This is a suspension polymerization process,which does not require surfactants, unlike dispersion polymerizations (for example, Teflon-coated pans). Melt extrusion isthe process by which most fluoropolymers are applied to wires. For instance, FEP, PFA, and PVDF are heated to 260°C and
Page 36ITRC PFAS-1
then melt extruded over wire to continuous lengths. The equipment used for melt-processable fluoropolymers requirestemperature sensitivity of 427°F. PTFE is processed via paste extrusion for coating PTFE over wires due to its high meltingpoint (ASTSWMO 2015) (Kotthoff et al. 2015) (Lau et al. 2007) (Lindstrom, Strynar, and Libelo 2011) (Oliaei et al. 2013)(Renner 2001) (Trudel et al. 2008). For more information on the safe handling of fluoropolymer resins during processing, seethe Plastics Industry Association (2019) guidance document.
2.6.1.3 Metal Finishing and PlatingElectroplating is a process that uses electric current to apply a metal coating to the surface of an object. Metallic ions in anacidic electrolyte solution are used in the electrochemical deposition of metal coatings to the surface of the cathode (USEPA1996a).
PFAS, particularly PFOS, have been used as mist suppressants that are added to metal plating and finishing baths to preventair emissions of toxic metal fumes. In the United States, amendments to the National Emissions Standards for Hazardous AirPollutants (NESHAP) under the Clean Air Act included a requirement to phase out the use of PFOS-based fume suppressants(a fume suppressant that contains 1% or greater PFOS by weight) in chromium electroplating by 2015 (USEPA 2012e). Somecountries have phased out the use of PFOS in some electroplating operations, adopting the use of other fluorotelomers (forexample, 6:2 FTS) as a substitute in hard chrome plating operations (Danish EPA 2015), (KEMI 2015b) or changingdecorative chrome plating operations to employ the less toxic trivalent chromium.
Many different types of electroplating solutions can be used in plating activities, including hard and decorative chromeplating; chromic acid anodizing; nickel, cadmium, or lead plating; metal plating on plastics; and alkaline zinc plating. Chromeelectroplating is the most significant contributor as it relates to PFAS use. In this process, PFAS are used as surfactants toreduce the surface tension of the electrolyte solution. Historically, PFOS was commonly used at a concentration of 5–10% tolimit the development of bubbles and the emission of hexavalent chromium aerosols to workplace air, thereby reducing thepotential hazard to workers posed by hexavalent chromium (USEPA 2009b) (OSHA 2013) (Danish EPA 2015).
Studies show use of PFAS in these settings can result in high concentration wastewater discharges (USEPA 2009#890) andair emissions. Once the electrolyte solution can no longer be used, it may be treated to remove chromium and other metals,but PFOS and other PFAS may be present in effluent and deposited in sewage sludge (Danish EPA 2015). Investigations inMinnesota traced PFOS releases from one chrome plating operation to a wastewater treatment plant (WWTP) where elevatedlevels of PFOS were detected in the biosolids, effluent water, and fish in the receiving surface water (ATSDR 2008). Airemissions from another Minnesota chrome plater were found to have accumulated on the roof of the facility and from therecontaminated stormwater and snow melting from the roof, which in turn contaminated the groundwater, a nearby surfacewater system, and fish (MPCA 2016).
2.6.1.4 Industrial Surfactants and Fluoropolymer ProductionPFAS have been, and currently are, instrumental as surfactants in industrial and commercial production. It is noted thatmany specific surfactant uses of PFAS are not publically available or published (KEMI 2015b). Most well documented is thehistorical use of PFOA as a processing aid in the manufacturing of PTFE, where APFO is used to help mix together thechemicals needed to combine units of tetrafluoroethylene (TFE) to make PTFE. Similarly, APFN, the ammonium salt ofperfluorononanoic acid (PFNA), has also been used in the production of PVDF. PVDF polymers that are produced with the aidof APFN are sold in solid phase, with notable residual APFN concentrations (100–200 ppm) (Prevedouros et al. 2006).
Since the voluntary phaseout of PFOA and related PFAS chemistries, replacement chemistries such as ADONA and the GenXprocess chemicals are now used in the production of fluoropolymers.
The PFAAs used as polymerization aids may occur as impurities/residuals in some fluoropolymer products; however, it isdocumented that PTFE does not degrade to significant leves of PFAAs during incineration (Aleksandrov et al. 2019) andfluoropolymers of low concern are shown to be stable (Henry et al. 2018).
PFAS are also used in the manufacturing of plastics and fluoropolymers, rubber, and compression mold release coatings.These have applications in tubing, piping, drums, molds, and resins (Poulsen 2005) (Prevedouros et al. 2006).
2.6.1.5 Paper Products and PackagingSince the 1960s, PFAS have been used as grease-proofing agents on food contact materials (FCM) to prevent oil, grease, andmoisture from foods from leaking through the packaging. This includes coated paper and cardboard such as pizza boxes,microwavable popcorn bags, parchment paper, fast food wrappers, paper cups, pet food bags, and other items (Rao and
Page 37ITRC PFAS-1
Baker 1994) (Hekster, Laane, and De Voogt 2003) (Poulsen 2005) (Trudel et al. 2008) (Buck et al. 2011).
The U.S. Food and Drug Administration (FDA) currently approves more than 90 unique monomer and polymer PFAS in FCMs(USFDA 2016). In January 2016, the FDA rescinded approval for three families of long-chain PFAS used in FCMs, but thesehad been voluntarily removed from the market in 2011. N-MeFOSE and NEtFOSE were historically used to produce surfacecoatings for textiles and paper products (Zaggia and Ameduri 2012). PFAS currently used in FCM include polyfluorinatedpolyether-based polymers and shorter chain PFAAs (Wang, Cousins, et al. 2015) (Schaider et al. 2017).
The most common PFAS detected in U.S. fast food wrappers include PFCAs (for example, PFOA and PFHxA), PFSAs (forexample, PFBS), and fluorotelomer sulfonates (for example, 6:2 FTS) (Schaider et al. 2017). Six of 20 FCM tested were foundto contain detectable levels of PFOA even though in 2011 U.S. manufacturers had voluntarily agreed to stop distributing FCMthat were manufactured using PFOA via an FDA initiative. The methodology was not sensitive enough to detect if the PFASswere intentionally added to the packaging material or if they were attributed to unintentional background levels (Schaider etal. 2017). Refer also to Section 2.4.3 on the USEPA 2010/2015 PFOA Stewardship Program, which discusses the phaseout ofPFOA and potential sources of PFOA that may remain in commercial and consumer products.
2.6.1.6 Photolithography/Semiconductor IndustryThe semiconductor industry historically has used PFOS for their surface-active properties in the fabrication of imagingdevices such as digital cameras, cell phones, printers, and scanners (Poulsen 2005). Studies have shown semiconductorwaste streams containing the PFAAs PFBS, PFHxS, PFOS, PFHxA, PFHpA, PFOA, PFNA, PFDA, PFUnA, and PFDoA (Lin,Panchangam, and Lo 2009). Similarly, in photolithography processes, PFOS has been used predominantly in applying top-layer antireflective coatings (TARCs), bottom antireflective coatings (BARCs), and etchants. Smaller quantities of PFOS andlonger-chain PFAS have been used in wet etchants, film developers, cleaners, protective coatings, and color filters (SIA2008), with ongoing uses permitted (Section 2.4).
2.6.1.7 Textiles, Leather, and Apparel (Including Carpet and Furniture)Surface treatment of textiles, leather, carpet, and furniture upholstery with PFAS to make them stain, oil, and water repellentoccurs both before (that is, at the factory) and after consumer acquisition for ongoing stain, oil, and water repellency(Prevedouros et al. 2006); (Ahrens 2011); (Herzke, Olsson, and Posner 2012). Aftermarket PFAS-containing stain-repellentproducts for carpets allow consumers to treat carpets and textiles at home (Renner 2001) (Hekster, Laane, and De Voogt2003). Losses to the environment can be related to dry cleaning and laundering activities (Poulsen 2005) (3M Company2000b).
Home textiles, including furniture and carpeting, as well as aftermarket PFAS surface treatment products, are also sources oflong-chain perfluorinated chemical exposure (Guo et al. 2009). Textile coating operations may use water-emulsion orpowdered feedstocks that contain greater proportions of PFCAs compared to PFSAs (Lassen et al. 2015) (Gremmel, Frömel,and Knepper 2016). According to California EPA (CalEPA) CalEPA (2018), pg. 12, “The PFAS polymers used in carpets, rugs,and other textiles can contain various amounts of mobile residual raw materials, impurities, or degradation products,including PFAAs and other PFAA precursors such as fluorotelomer alcohols (FTOHs) and perfluoroalkyl sulfonamide alcohols.”Releases to the environment could occur from disposal of carpet cleaning wastewater (CalEPA 2018). Physical degradation ofsome consumer products (such as PFAS-treated textiles and carpets, as well as paper) may be a source of PFAS in housedust (Björklund, Thuresson, and de Wit 2009).
It should be noted that many treated home textiles and carpets are now manufactured with alternatives to long-chain PFAS;however, these products can have a long useful life, making it possible that items previously treated with long-chain PFASare still in use (Brooke 2004). A 2009 study of over 100 consumer products conducted by the USEPA and Arcadis indicatedthat pretreated carpet, treated upholstery and textiles, as well as other floor treatments, are likely the largest source ofPFAS receptor exposure in American homes (Guo et al. 2009).
Other studies have since shown nonpolymeric PFAS in leather samples and outdoor textiles to impart water, oil and stainresistance; applications include protective clothing, outerwear, footware, umbrellas, tents, and sails (OECD 2013; Waltersand Santillo 2006) (Kotthoff et al. 2015). Durable water repellent (DWR) is a fabric surface finish that creates a protectivebarrier. It is typically added at the factory, but is also available to consumers for apparel maintenance (Brooke 2004). Thefinishes/treatments are applied to materials in mills/tanneries and as aftermarket applications by professionals or do-it-yourself consumers as aqueous dispersions. In some aftermarket applications, they are applied as solutions in hydrocarbon-based or halogenated solvents (OECD 2013).
Page 38ITRC PFAS-1
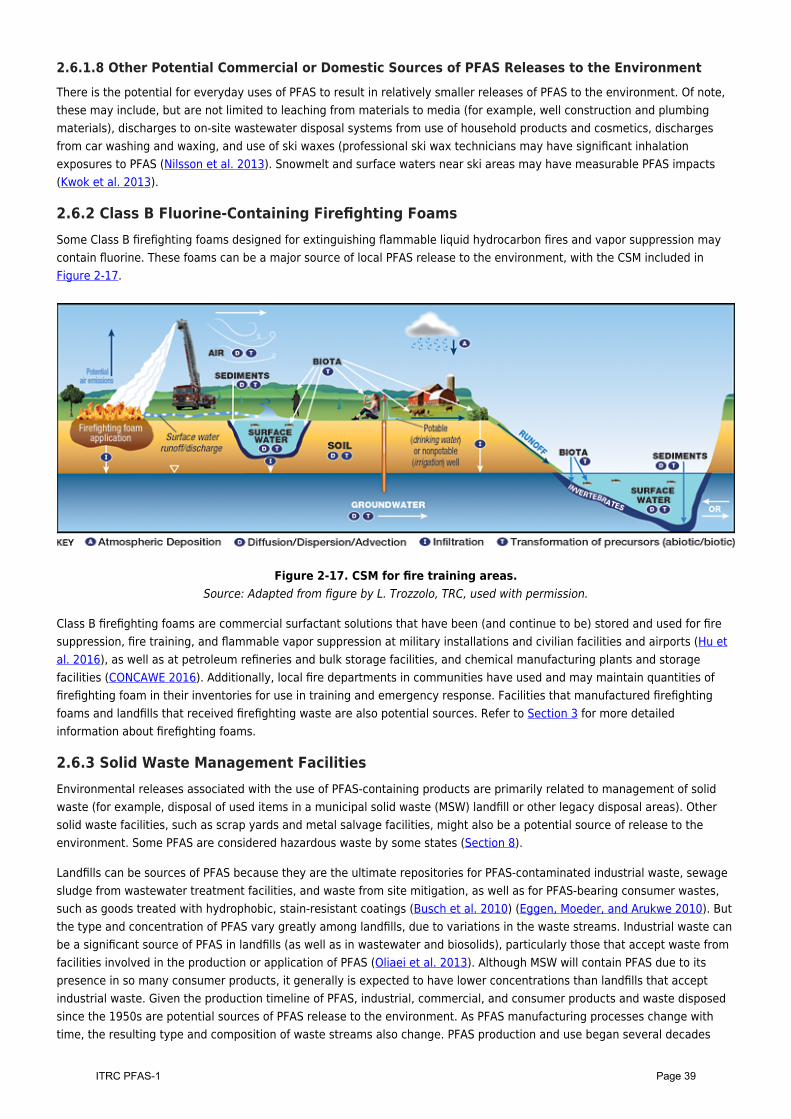
2.6.1.8 Other Potential Commercial or Domestic Sources of PFAS Releases to the EnvironmentThere is the potential for everyday uses of PFAS to result in relatively smaller releases of PFAS to the environment. Of note,these may include, but are not limited to leaching from materials to media (for example, well construction and plumbingmaterials), discharges to on-site wastewater disposal systems from use of household products and cosmetics, dischargesfrom car washing and waxing, and use of ski waxes (professional ski wax technicians may have significant inhalationexposures to PFAS (Nilsson et al. 2013). Snowmelt and surface waters near ski areas may have measurable PFAS impacts(Kwok et al. 2013).
2.6.2 Class B Fluorine-Containing Firefighting FoamsSome Class B firefighting foams designed for extinguishing flammable liquid hydrocarbon fires and vapor suppression maycontain fluorine. These foams can be a major source of local PFAS release to the environment, with the CSM included inFigure 2-17.
Figure 2-17. CSM for fire training areas.Source: Adapted from figure by L. Trozzolo, TRC, used with permission.
Class B firefighting foams are commercial surfactant solutions that have been (and continue to be) stored and used for firesuppression, fire training, and flammable vapor suppression at military installations and civilian facilities and airports (Hu etal. 2016), as well as at petroleum refineries and bulk storage facilities, and chemical manufacturing plants and storagefacilities (CONCAWE 2016). Additionally, local fire departments in communities have used and may maintain quantities offirefighting foam in their inventories for use in training and emergency response. Facilities that manufactured firefightingfoams and landfills that received firefighting waste are also potential sources. Refer to Section 3 for more detailedinformation about firefighting foams.
2.6.3 Solid Waste Management FacilitiesEnvironmental releases associated with the use of PFAS-containing products are primarily related to management of solidwaste (for example, disposal of used items in a municipal solid waste (MSW) landfill or other legacy disposal areas). Othersolid waste facilities, such as scrap yards and metal salvage facilities, might also be a potential source of release to theenvironment. Some PFAS are considered hazardous waste by some states (Section 8).
Landfills can be sources of PFAS because they are the ultimate repositories for PFAS-contaminated industrial waste, sewagesludge from wastewater treatment facilities, and waste from site mitigation, as well as for PFAS-bearing consumer wastes,such as goods treated with hydrophobic, stain-resistant coatings (Busch et al. 2010) (Eggen, Moeder, and Arukwe 2010). Butthe type and concentration of PFAS vary greatly among landfills, due to variations in the waste streams. Industrial waste canbe a significant source of PFAS in landfills (as well as in wastewater and biosolids), particularly those that accept waste fromfacilities involved in the production or application of PFAS (Oliaei et al. 2013). Although MSW will contain PFAS due to itspresence in so many consumer products, it generally is expected to have lower concentrations than landfills that acceptindustrial waste. Given the production timeline of PFAS, industrial, commercial, and consumer products and waste disposedsince the 1950s are potential sources of PFAS release to the environment. As PFAS manufacturing processes change withtime, the resulting type and composition of waste streams also change. PFAS production and use began several decades
Page 39ITRC PFAS-1
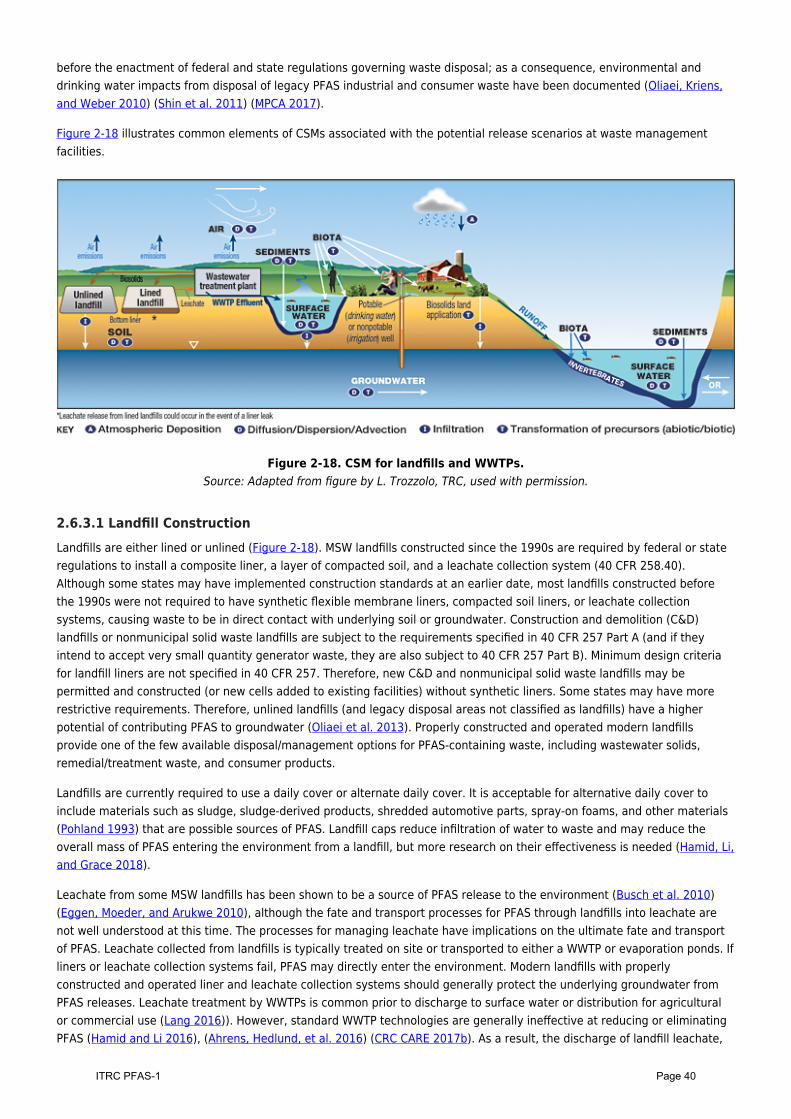
before the enactment of federal and state regulations governing waste disposal; as a consequence, environmental anddrinking water impacts from disposal of legacy PFAS industrial and consumer waste have been documented (Oliaei, Kriens,and Weber 2010) (Shin et al. 2011) (MPCA 2017).
Figure 2-18 illustrates common elements of CSMs associated with the potential release scenarios at waste managementfacilities.
Figure 2-18. CSM for landfills and WWTPs.Source: Adapted from figure by L. Trozzolo, TRC, used with permission.
2.6.3.1 Landfill ConstructionLandfills are either lined or unlined (Figure 2-18). MSW landfills constructed since the 1990s are required by federal or stateregulations to install a composite liner, a layer of compacted soil, and a leachate collection system (40 CFR 258.40).Although some states may have implemented construction standards at an earlier date, most landfills constructed beforethe 1990s were not required to have synthetic flexible membrane liners, compacted soil liners, or leachate collectionsystems, causing waste to be in direct contact with underlying soil or groundwater. Construction and demolition (C&D)landfills or nonmunicipal solid waste landfills are subject to the requirements specified in 40 CFR 257 Part A (and if theyintend to accept very small quantity generator waste, they are also subject to 40 CFR 257 Part B). Minimum design criteriafor landfill liners are not specified in 40 CFR 257. Therefore, new C&D and nonmunicipal solid waste landfills may bepermitted and constructed (or new cells added to existing facilities) without synthetic liners. Some states may have morerestrictive requirements. Therefore, unlined landfills (and legacy disposal areas not classified as landfills) have a higherpotential of contributing PFAS to groundwater (Oliaei et al. 2013). Properly constructed and operated modern landfillsprovide one of the few available disposal/management options for PFAS-containing waste, including wastewater solids,remedial/treatment waste, and consumer products.
Landfills are currently required to use a daily cover or alternate daily cover. It is acceptable for alternative daily cover toinclude materials such as sludge, sludge-derived products, shredded automotive parts, spray-on foams, and other materials(Pohland 1993) that are possible sources of PFAS. Landfill caps reduce infiltration of water to waste and may reduce theoverall mass of PFAS entering the environment from a landfill, but more research on their effectiveness is needed (Hamid, Li,and Grace 2018).
Leachate from some MSW landfills has been shown to be a source of PFAS release to the environment (Busch et al. 2010)(Eggen, Moeder, and Arukwe 2010), although the fate and transport processes for PFAS through landfills into leachate arenot well understood at this time. The processes for managing leachate have implications on the ultimate fate and transportof PFAS. Leachate collected from landfills is typically treated on site or transported to either a WWTP or evaporation ponds. Ifliners or leachate collection systems fail, PFAS may directly enter the environment. Modern landfills with properlyconstructed and operated liner and leachate collection systems should generally protect the underlying groundwater fromPFAS releases. Leachate treatment by WWTPs is common prior to discharge to surface water or distribution for agriculturalor commercial use (Lang 2016)). However, standard WWTP technologies are generally ineffective at reducing or eliminatingPFAS (Hamid and Li 2016), (Ahrens, Hedlund, et al. 2016) (CRC CARE 2017b). As a result, the discharge of landfill leachate,
Page 40ITRC PFAS-1
even if treated at WWTPs, can be a significant source of release of some PFAS to the environment (Ahrens et al. 2015) (CRCCare 2017).
2.6.3.2 Waste AgeLandfills containing sources of PFAS may continue to release PFAS to leachate at slow but relatively steady rates for decadesfollowing initial placement. In modeled anaerobic landfill reactors, most of the release is attributed to biological, notphysical, mechanisms, indicating that the low solubility of the compounds is not solely responsible for slow release ratesfrom landfills (Allred et al. 2015) (Lang et al. 2016). Although landfill leachate PFAS concentrations can be relatively high,landfill leachate discharged to WWTPs for treatment generally is considered a relatively minor source to the environmentbecause the volume of leachate generated annually and sent to a WWTP for treatment is low compared to the flow volumein most WWTPs (Busch et al. 2010). However, legacy industrial waste landfills may constitute a major source of PFAS releaseto the environment (ATSDR 2008) (2012).
2.6.3.3 PFAS CompositionPFAS composition and concentration in leachates vary depending on waste age, climate, and waste composition (Allred et al.2015) (Lang et al. 2017). Relative concentrations of PFAS in leachate and groundwater from landfills are different from thoseat WWTPs and AFFF-contaminated sites. PFAS with fewer than eight carbons tend to dominate landfill leachate because theyare less hydrophobic and therefore more likely to partition to the aqueous phase (Huset et al. 2011) (Higgins and Luthy2007). In particular, 5:3 fluorotelomer carboxylic acid (FTCA) is a common and often dominant constituent of PFAS found inlandfills and is released from carpet in model anaerobic landfill reactors. This compound could prove to be an indicator ofPFAS in the environment originating from landfills (Lang et al. 2017, 2016).
PFAS may also be released to the air from landfills, predominantly as fluorotelomer alcohols (FTOHs) and perfluorobutanoate(PFBA). In one study, total PFAS concentrations were 5–30 times greater at landfills than at background reference sites(Ahrens et al. 2011). PFAS release rates vary with time for a given waste mass, with climate (for example, rainfall) as theapparent driving factor for the variations (Lang et al. 2017; Benskin, Li, et al. 2012). Gas collection systems commonlyemployed at modern landfills should reduce possible PFAS emissions to air.
2.6.4 Wastewater Treatment and Wastewater Treatement Residuals and BiosolidsConsumer and industrial use of PFAS-containing materials, including disposal of landfill leachate and firefighting foam, maydischarge PFAS-containing wastewater to municipal and industrial WWTPs (Lin, Panchangam, and Lo 2009; Ahrens et al.2009) private septic systems, or other wastewater disposal systems.
2.6.4.1 Wastewater TreatmentWWTPs can provide the following pathways for PFAS to the environment (Figure 2-18):
point source discharges of effluentleakage or unintended releases from surface impoundments and structuresair emissionsmanagement and disposal of biosolids and other byproducts generated during the treatment process (Section2.6.4.2).
The composition of PFAS in these media is a function of the different sources to the WWTP influent and the WWTP processes(Chen, Lo, and Lee 2012; Oliaei, D. Kriens, and Kessler 2006; Frömel 2016) (Schultz et al. 2006), including:
type and concentration of PFAS received by the WWTP, particularly those that receive industrial wastewaterdischarges from industrial facilities manufacturing or using PFASbiological and chemical transformation of polyfluorinated substances (that is, precursor PFAS) to intermediateand terminal degradation products, such as PFAAsphysical or chemical partitioning, or both.
Conventional sewage treatment methods used in WWTPs do not efficiently remove PFAAs (Ahrens et al. 2011) (Schultz et al.2006). Even WWTPs with advanced treatment technologies (such as granular activated carbon (GAC), powdered activatedcarbon (PAC), or reverse osmosis (RO)) may not fully remove all PFAS if these systems were not designed with the intent toremove PFAS in addition to other targeted contaminants. Some PFAAs are frequently detected in WWTP effluent (forexample, PFOA and PFBS), with concentrations of some PFAS ranging up to hundreds of ng/L. Ahrens et al. (2011) and Hamidand Li (2016) suggested that WWTP effluent is a major source of PFAAs to surface waters.
Page 41ITRC PFAS-1
Evaluation of full-scale WWTPs has indicated that conventional primary (sedimentation and clarification) and secondary(aerobic biodegradation of organic matter) treatment processes can change PFAS concentrations and subgroups. Forexample, studies have shown increased concentrations of PFAAs in effluent, presumably from degradation of precursor PFAS(Schultz et al. 2006), and the possible creation of PFAAs from the oxidation of polyfluorinated precursors during thetreatment process (Oliaei, D. Kriens, and Kessler 2006) (Frömel 2016; Houtz 2018).
PFAS may be concentrated in wastewater solids (for example, sewage sludge) generated throughout the wastewatertreatment process (Schultz et al. 2006). PFAS may also be present in septage (solids removed from septic systems).Depending on waste management and disposal practices, land application or landfill disposal of wastewater solids, biosolids,or septage could potentially contaminate the environment.
Hu et al. (2016) suggested that the presence of WWTPs in an area could be predictive of the presence of PFOS and PFOA indrinking water. PFOS and PFOA are two of the most frequently detected PFAS in wastewater (Hamid and Li 2016). UsingWWTP effluent-impacted surface water as a source of drinking water can, in turn, recycle the PFAS back to the WWTP,recirculating PFAS in the water cycle (Hamid and Li 2016).
At some WWTPs, studies have shown concentrations of PFAS in ambient air at WWTPs to be 1.5–15 times greater thanbackground reference sites (Hamid and Li 2016). Hamid and Li (2016) noted that these elevated air concentrations of totalPFAS include polyfluoroalkyls and that this has important implications considering the potential for their long-range transportand subsequent degradation to recalcitrant PFAAs. PFAS distribution (primarily PFAAs and FTOH, with higher concentrationsof FTOH) changes based on the specific PFAS sources in the effluent and the type of treatment methods employed at theWWTP. Lagoon systems contain a greater fraction of PFAAs.
2.6.4.2 Biosolids Production and ApplicationPFAS (measured as PFCAs and PFSAs) have been found in domestic sewage sludge (Higgins et al. 2005), and PFASoccurrence in biosolids is reported to be prevalent and nationwide (Venkatesan and Halsden 2013). Given that more thanhalf of the sewage sludge produced in the United States is applied to agricultural land as biosolids (USEPA 2017m), there isthe potential for release of PFAS to the environment associated with biosolids production and application. PFAS are notknown to be added to biosolids during processing or application.
PFAS may be introduced to the environment through the land application of biosolids as a beneficial soil amendment,potentially allowing PFAS to enter surface water through runoff or to infiltrate to groundwater (Lindstrom et al. 2011). Thepotential effects on groundwater or surface water depend on the amount and composition of PFAS present in biosolids, soilproperties, infiltration rate, and land application practices. PFAS concentrations can be elevated in surface and groundwaterin the vicinity of agricultural fields that received PFAS-contaminated biosolids over an extended period of time (Washingtonet al. 2010). The Washington et al. study was completed in an area that received industrial wastewater discharges fromseveral PFAS-related industrial dischargers. Other studies indicate that the potential PFAS releases from municipal biosolids(for example, those generated from facilities that do not receive PFAS-related industrial discharges), may still impact waterquality, but at an apparent lower relative impact than at the industrial-influenced biosolids application sites (Gottschall et al.2017).
The most abundant PFAS found in biosolids (PFOS and PFOA) are the same as those found in WWTP effluent, althoughbiosolids may also contain other long-chain PFAS (Hamid and Li 2016). Although transformation polyfluorinated substancesto PFAAs in land-applied biosolids has been suggested (Sepulvado et al. 2011), other evidence suggests that somepolyfluorinated substances remain in biosolids-amended soils for many years (Rich et al. 2015).
Application of municipal biosolids as a soil amendment can result in a transfer of PFAS to soil (Sepulvado et al. 2011). ThesePFAS can then be available for uptake by some plants and soil organisms. There are indications that PFAAs can enter thefood chain through the use of biosolids-amended soil (Lindstrom et al. 2011; Blaine et al. 2013; Blaine, Rich, Sedlacko,Hundal, et al. 2014) (Navarro et al. 2017). It is noted, however, that PFAAs present at one municipal biosolids application sitewere not found in grain grown in the application plot (Gottschall et al. 2017). Hamid and Li (2016) suggested that short-chain(< C7) PFAAs in biosolids subsequently used in land applications can lead to contamination of food (Section 5.6).
Updated April 14, 2020.
Page 42ITRC PFAS-1
3 Firefighting FoamsThe purpose of this section is to assist aqueous film-forming foam (AFFF) users (first responders, regulators, environmentalmanagers and environmental professionals) who manage AFFF releases. The section includes information about variousaspects of using firefighting foams.
Section Number Topic
3.1 Foam Formulations
3.2 Mechanisms for Release to the Environment
3.3 AFFF Procurement and Inventory
3.4 Foam Systems and Operations
3.5 Emergency Firefighting Operations
3.6 Immediate Investigative and Cleanup Actions
3.7 Treatment and Disposal Options
3.8 Firefighting Foam System Replacement
3.9 Federal, State and International Regulations and Guidance
3.10 Foam Research and Development
It should be noted that the priority of firefighters and first responders is to protect life and property. The informationprovided supports decision-making about firefighting using AFFF so that potential impacts to the environment can beminimized and mitigated once the fire emergency is ended, or at such time that sufficient resources are deployed to thescene to both handle the fire emergency and mitigate the environmental risks posed by AFFF use. Figure 3-1 illustrates thelife cycle considerations of AFFF. The considerations are discussed in sections 3.3 to 3.8.
Page 43ITRC PFAS-1
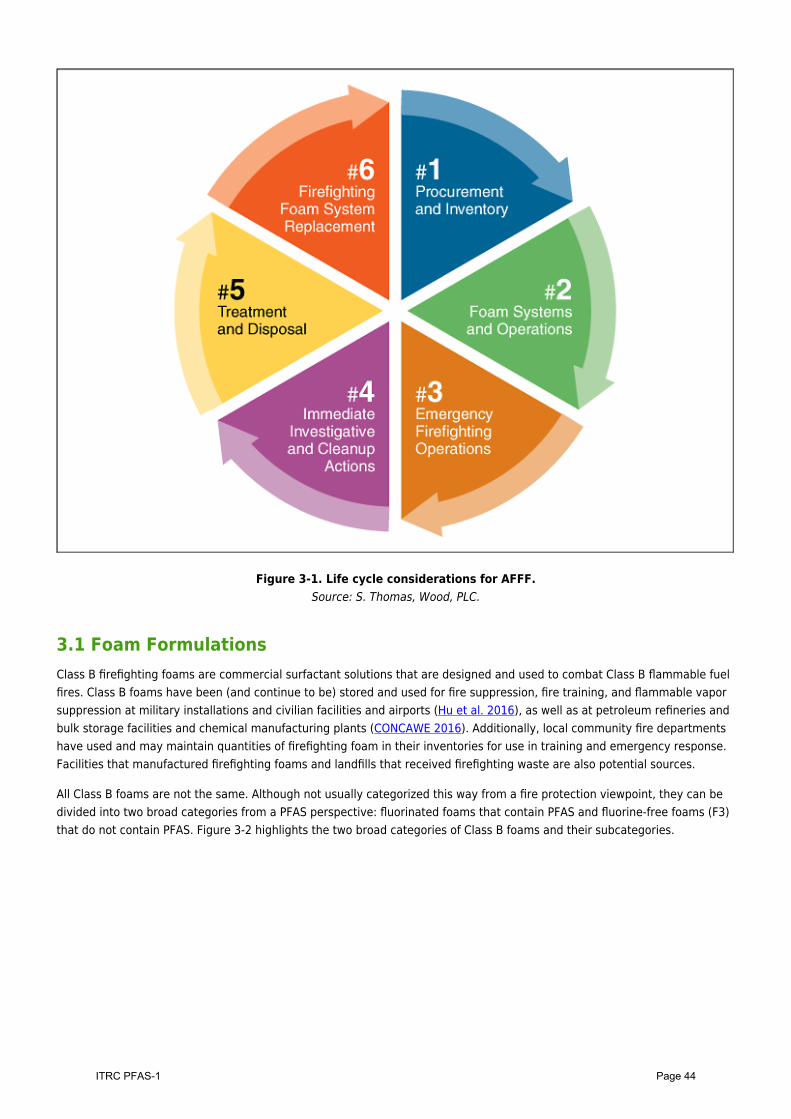
Figure 3-1. Life cycle considerations for AFFF.Source: S. Thomas, Wood, PLC.
3.1 Foam FormulationsClass B firefighting foams are commercial surfactant solutions that are designed and used to combat Class B flammable fuelfires. Class B foams have been (and continue to be) stored and used for fire suppression, fire training, and flammable vaporsuppression at military installations and civilian facilities and airports (Hu et al. 2016), as well as at petroleum refineries andbulk storage facilities and chemical manufacturing plants (CONCAWE 2016). Additionally, local community fire departmentshave used and may maintain quantities of firefighting foam in their inventories for use in training and emergency response.Facilities that manufactured firefighting foams and landfills that received firefighting waste are also potential sources.
All Class B foams are not the same. Although not usually categorized this way from a fire protection viewpoint, they can bedivided into two broad categories from a PFAS perspective: fluorinated foams that contain PFAS and fluorine-free foams (F3)that do not contain PFAS. Figure 3-2 highlights the two broad categories of Class B foams and their subcategories.
Page 44ITRC PFAS-1
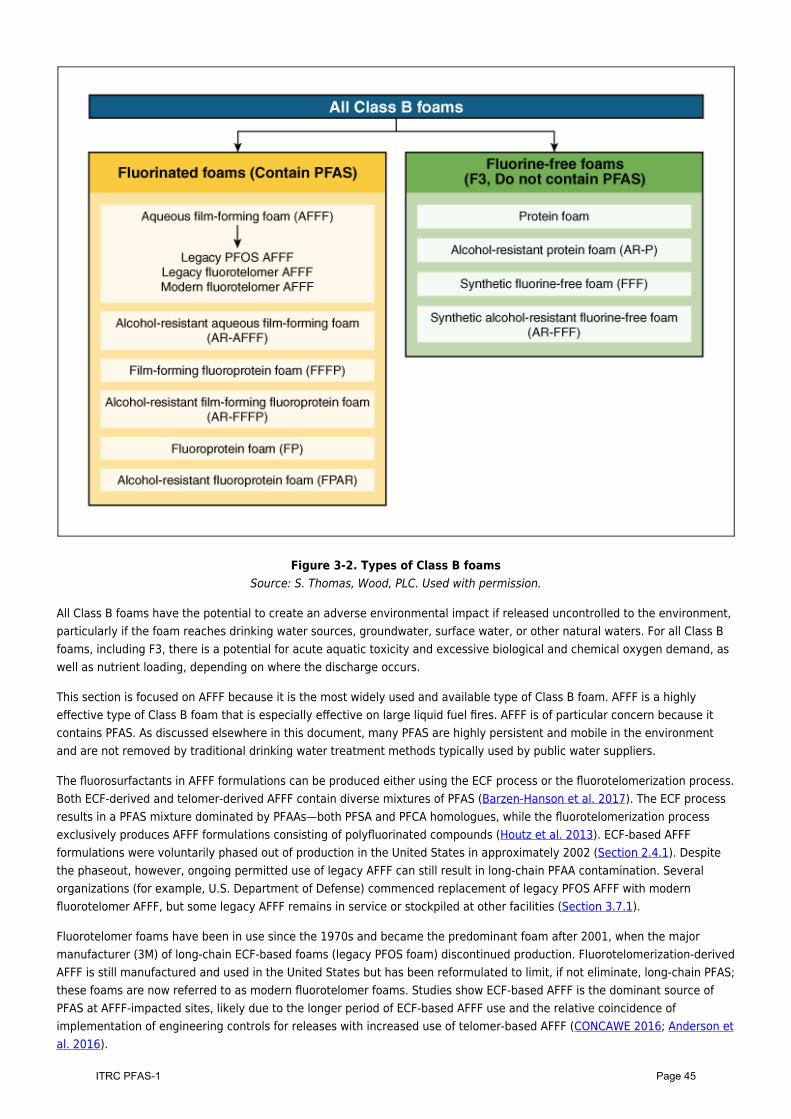
Figure 3-2. Types of Class B foamsSource: S. Thomas, Wood, PLC. Used with permission.
All Class B foams have the potential to create an adverse environmental impact if released uncontrolled to the environment,particularly if the foam reaches drinking water sources, groundwater, surface water, or other natural waters. For all Class Bfoams, including F3, there is a potential for acute aquatic toxicity and excessive biological and chemical oxygen demand, aswell as nutrient loading, depending on where the discharge occurs.
This section is focused on AFFF because it is the most widely used and available type of Class B foam. AFFF is a highlyeffective type of Class B foam that is especially effective on large liquid fuel fires. AFFF is of particular concern because itcontains PFAS. As discussed elsewhere in this document, many PFAS are highly persistent and mobile in the environmentand are not removed by traditional drinking water treatment methods typically used by public water suppliers.
The fluorosurfactants in AFFF formulations can be produced either using the ECF process or the fluorotelomerization process.Both ECF-derived and telomer-derived AFFF contain diverse mixtures of PFAS (Barzen-Hanson et al. 2017). The ECF processresults in a PFAS mixture dominated by PFAAs—both PFSA and PFCA homologues, while the fluorotelomerization processexclusively produces AFFF formulations consisting of polyfluorinated compounds (Houtz et al. 2013). ECF-based AFFFformulations were voluntarily phased out of production in the United States in approximately 2002 (Section 2.4.1). Despitethe phaseout, however, ongoing permitted use of legacy AFFF can still result in long-chain PFAA contamination. Severalorganizations (for example, U.S. Department of Defense) commenced replacement of legacy PFOS AFFF with modernfluorotelomer AFFF, but some legacy AFFF remains in service or stockpiled at other facilities (Section 3.7.1).
Fluorotelomer foams have been in use since the 1970s and became the predominant foam after 2001, when the majormanufacturer (3M) of long-chain ECF-based foams (legacy PFOS foam) discontinued production. Fluorotelomerization-derivedAFFF is still manufactured and used in the United States but has been reformulated to limit, if not eliminate, long-chain PFAS;these foams are now referred to as modern fluorotelomer foams. Studies show ECF-based AFFF is the dominant source ofPFAS at AFFF-impacted sites, likely due to the longer period of ECF-based AFFF use and the relative coincidence ofimplementation of engineering controls for releases with increased use of telomer-based AFFF (CONCAWE 2016; Anderson etal. 2016).
Page 45ITRC PFAS-1
To further classify AFFF products in terms of current usage and environmental considerations, they can be divided into threecategories, including legacy PFOS AFFF, legacy fluorotelomer AFFF, and modern fluorotelomer AFFF (as shown in Figure 3-2).
Legacy PFOS AFFF was manufactured in the United States from the late 1960s until 2002 exclusively by 3M andsold under the brand name “Lightwater” (USDOD 2014a). 3M did license some companies overseas to use theirproducts and formulations. Legacy PFOS AFFFs contain PFOS and perflouroalkane sulfonates (PFSAs) such asperfluorohexane sulfonate (PFHxS) (Backe, Day, and Field 2013). Although phased out of production in 2002,legacy PFOS AFFFs are the dominant source of PFAS at AFFF-impacted sites (CONCAWE 2016). Furthermore,because of its long shelf life, stock of legacy PFOS AFFF could exist at any given fire department today.Legacy fluorotelomer AFFF were manufactured and sold in the United States from the 1970s until 2016 andencompass all other brands of AFFF besides 3M Lightwater or their licensed products (Schultz et al. 2006).Although they are not made with PFOA, they contain polyfluorinated precursors (Backe, Day, and Field 2013)(Place and Field 2012) that are known to degrade to PFCAs, including PFOA (Weiner et al. 2013) (Harding-Marjanovic et al. 2015).
Modern fluorotelomer AFFF was developed in response to the USEPA 2010/2015 voluntary PFOA Stewardship Program(USEPA 2018a). Most foam manufacturers have now transitioned to the production of only short-chain (C6) fluorotelomer-based fluorosurfactants. These modern fluorotelomer AFFFs, or “C6 foams,” do not contain or break down in theenvironment to PFOS or PFOA and are currently considered to be less toxic and have reduced bioaccumulative potentialcompared to long-chain (C8) fluorosurfactants. But under particular environmental conditions, breakdown products of C6foams can include PFHxA, PFPeA, and 5:3 FTCA (Kempisty, Xing, and Racz 2018). Modern fluorotelomer AFFF may containtrace levels of PFOA as an unintended manufacturing impurity or byproduct.
Fluorotelomer foams, short-chain fluorotelomer foams, and C6 foams are analogous and will be referred to as “modernfluorotelomer foams.” When discussing legacy PFOS or C8 foams, the term “legacy foams” will include both legacy PFOSAFFF and legacy fluorotelomer AFFF.
Legacy foams were first introduced by the naval firefighting services in 1964 (Gipe and Peterson 1972). The U.S. NavalResearch Laboratory (NRL) began research on the development of firefighting foams in the 1960s. This led to advancementsin fire suppression performance and increased firefighting safety (US Naval Research Laboratory 2017). In 1969, the U.S.Department of Defense (USDOD) issued military specification MIL-F-24385, which dictates the performance of all AFFF (withperformance standards referred to as “Mil-Spec”). AFFFs shown to perform to MIL-F-24385 requirements are listed on theU.S. military’s AFFF Qualified Product Listing (QPL). The first date AFFF was placed on this list was May 15, 1970 (MIL-F-24385 QPL/QPD History of Type 6 AFFF). DOD maintains the online qualified products database (QPD) that lists all AFFFagents that have been tested and qualified by the NRL to meet the Mil-Spec, currently referenced as MIL-PRF-24385,(USDOD 2018b). On July 1, 2006, the Federal Aviation Administration (FAA) required that commercial airports certified under14 CFR Part 139 purchase only AFFF that is Mil-Spec compliant (FAA 2006, 2016; 14 CFR 139.317). Recently, the FAAReauthorization Act modified that requirement. More information can be found in Section 3.9.3.1.
Different types of AFFF were produced to meet firefighting specifications, such as Mil-Spec, rather than formulated to containa specified mixture of PFAS. Firefighting foams are a complex mixture of both known and unidentified PFAS. Multiple AFFFformulations have been produced over the years, and the exact composition of any given AFFF used or manufactured in anygiven year is variable (Backe, Day, and Field 2013). However, due to the production methods, any given AFFF formulationcontains complex mixtures of PFAS, many of which can be identified only by nontargeted analytical methods (Barzen-Hansonet al. 2017).
AFFF is typically formed by combining hydrocarbon surfactants, organic solvents, fluorosurfactants, polymers, and otheradditives (Kempisty, Xing, and Racz 2018). AFFF concentrates are commercially available in both 3% and 6%. Figure 3-3illustrates the typical composition of a 3% AFFF concentrate; water/diluent makes up more than 60% of the concentrate, upto 20% is solvents, and as much as 18% is surfactants, of which less than 2% is fluorosurfactants. When the concentrate ismixed with water, the resulting solution achieves the interfacial tension characteristics needed to produce an aqueous filmthat spreads across the surface of a hydrocarbon fuel to extinguish the flame or reduce the hydrocarbon vapors.
Page 46ITRC PFAS-1
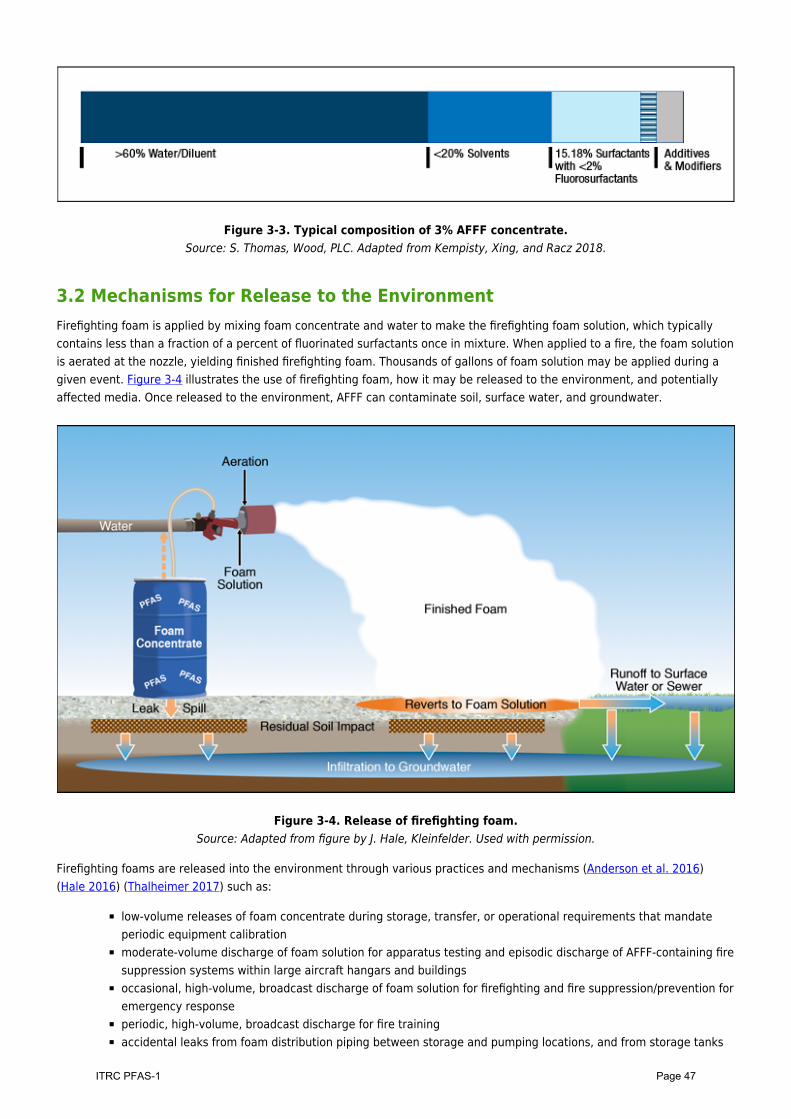
Figure 3-3. Typical composition of 3% AFFF concentrate.Source: S. Thomas, Wood, PLC. Adapted from Kempisty, Xing, and Racz 2018.
3.2 Mechanisms for Release to the EnvironmentFirefighting foam is applied by mixing foam concentrate and water to make the firefighting foam solution, which typicallycontains less than a fraction of a percent of fluorinated surfactants once in mixture. When applied to a fire, the foam solutionis aerated at the nozzle, yielding finished firefighting foam. Thousands of gallons of foam solution may be applied during agiven event. Figure 3-4 illustrates the use of firefighting foam, how it may be released to the environment, and potentiallyaffected media. Once released to the environment, AFFF can contaminate soil, surface water, and groundwater.
Figure 3-4. Release of firefighting foam.Source: Adapted from figure by J. Hale, Kleinfelder. Used with permission.
Firefighting foams are released into the environment through various practices and mechanisms (Anderson et al. 2016)(Hale 2016) (Thalheimer 2017) such as:
low-volume releases of foam concentrate during storage, transfer, or operational requirements that mandateperiodic equipment calibrationmoderate-volume discharge of foam solution for apparatus testing and episodic discharge of AFFF-containing firesuppression systems within large aircraft hangars and buildingsoccasional, high-volume, broadcast discharge of foam solution for firefighting and fire suppression/prevention foremergency responseperiodic, high-volume, broadcast discharge for fire trainingaccidental leaks from foam distribution piping between storage and pumping locations, and from storage tanks
Page 47ITRC PFAS-1
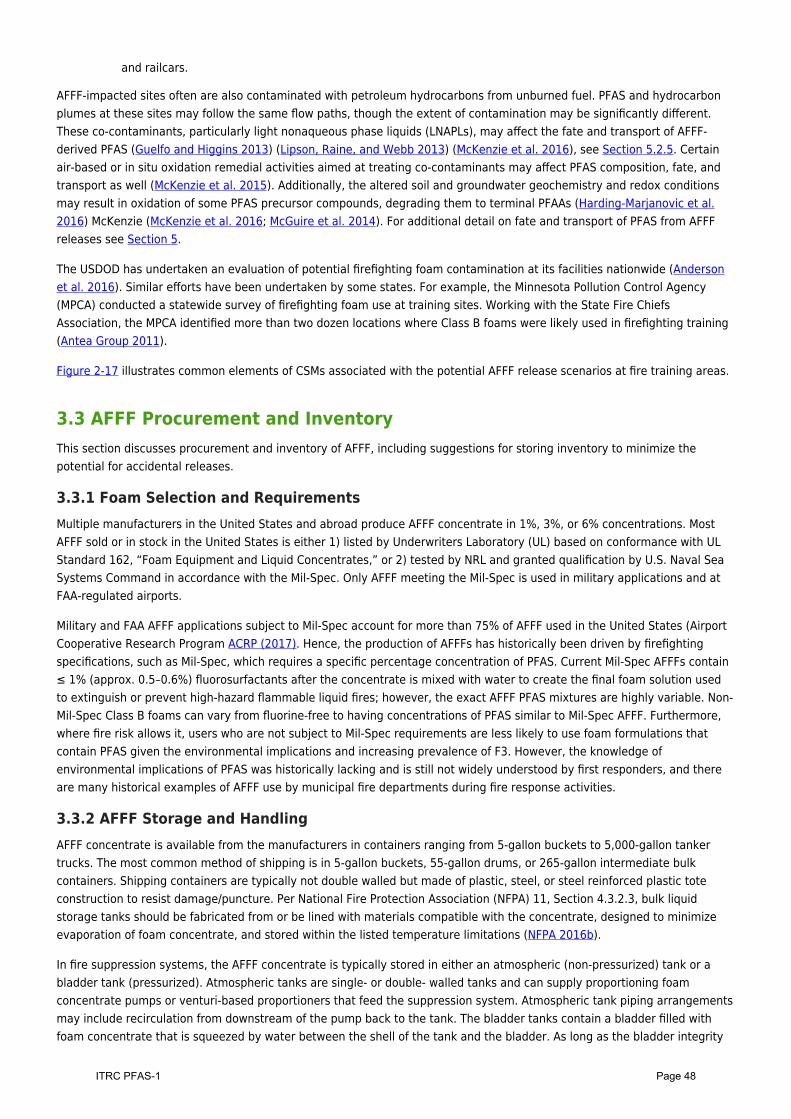
and railcars.
AFFF-impacted sites often are also contaminated with petroleum hydrocarbons from unburned fuel. PFAS and hydrocarbonplumes at these sites may follow the same flow paths, though the extent of contamination may be significantly different.These co-contaminants, particularly light nonaqueous phase liquids (LNAPLs), may affect the fate and transport of AFFF-derived PFAS (Guelfo and Higgins 2013) (Lipson, Raine, and Webb 2013) (McKenzie et al. 2016), see Section 5.2.5. Certainair-based or in situ oxidation remedial activities aimed at treating co-contaminants may affect PFAS composition, fate, andtransport as well (McKenzie et al. 2015). Additionally, the altered soil and groundwater geochemistry and redox conditionsmay result in oxidation of some PFAS precursor compounds, degrading them to terminal PFAAs (Harding-Marjanovic et al.2016) McKenzie (McKenzie et al. 2016; McGuire et al. 2014). For additional detail on fate and transport of PFAS from AFFFreleases see Section 5.
The USDOD has undertaken an evaluation of potential firefighting foam contamination at its facilities nationwide (Andersonet al. 2016). Similar efforts have been undertaken by some states. For example, the Minnesota Pollution Control Agency(MPCA) conducted a statewide survey of firefighting foam use at training sites. Working with the State Fire ChiefsAssociation, the MPCA identified more than two dozen locations where Class B foams were likely used in firefighting training(Antea Group 2011).
Figure 2-17 illustrates common elements of CSMs associated with the potential AFFF release scenarios at fire training areas.
3.3 AFFF Procurement and InventoryThis section discusses procurement and inventory of AFFF, including suggestions for storing inventory to minimize thepotential for accidental releases.
3.3.1 Foam Selection and RequirementsMultiple manufacturers in the United States and abroad produce AFFF concentrate in 1%, 3%, or 6% concentrations. MostAFFF sold or in stock in the United States is either 1) listed by Underwriters Laboratory (UL) based on conformance with ULStandard 162, “Foam Equipment and Liquid Concentrates,” or 2) tested by NRL and granted qualification by U.S. Naval SeaSystems Command in accordance with the Mil-Spec. Only AFFF meeting the Mil-Spec is used in military applications and atFAA-regulated airports.
Military and FAA AFFF applications subject to Mil-Spec account for more than 75% of AFFF used in the United States (AirportCooperative Research Program ACRP (2017). Hence, the production of AFFFs has historically been driven by firefightingspecifications, such as Mil-Spec, which requires a specific percentage concentration of PFAS. Current Mil-Spec AFFFs contain≤ 1% (approx. 0.5–0.6%) fluorosurfactants after the concentrate is mixed with water to create the final foam solution usedto extinguish or prevent high-hazard flammable liquid fires; however, the exact AFFF PFAS mixtures are highly variable. Non-Mil-Spec Class B foams can vary from fluorine-free to having concentrations of PFAS similar to Mil-Spec AFFF. Furthermore,where fire risk allows it, users who are not subject to Mil-Spec requirements are less likely to use foam formulations thatcontain PFAS given the environmental implications and increasing prevalence of F3. However, the knowledge ofenvironmental implications of PFAS was historically lacking and is still not widely understood by first responders, and thereare many historical examples of AFFF use by municipal fire departments during fire response activities.
3.3.2 AFFF Storage and HandlingAFFF concentrate is available from the manufacturers in containers ranging from 5-gallon buckets to 5,000-gallon tankertrucks. The most common method of shipping is in 5-gallon buckets, 55-gallon drums, or 265-gallon intermediate bulkcontainers. Shipping containers are typically not double walled but made of plastic, steel, or steel reinforced plastic toteconstruction to resist damage/puncture. Per National Fire Protection Association (NFPA) 11, Section 4.3.2.3, bulk liquidstorage tanks should be fabricated from or be lined with materials compatible with the concentrate, designed to minimizeevaporation of foam concentrate, and stored within the listed temperature limitations (NFPA 2016b).
In fire suppression systems, the AFFF concentrate is typically stored in either an atmospheric (non-pressurized) tank or abladder tank (pressurized). Atmospheric tanks are single- or double- walled tanks and can supply proportioning foamconcentrate pumps or venturi-based proportioners that feed the suppression system. Atmospheric tank piping arrangementsmay include recirculation from downstream of the pump back to the tank. The bladder tanks contain a bladder filled withfoam concentrate that is squeezed by water between the shell of the tank and the bladder. As long as the bladder integrity
Page 48ITRC PFAS-1
is maintained, the foam concentrate does not mix with the shell water.
Safety data sheets are provided by all manufacturers for each specific type of AFFF. Labels on shipping containers conformto U.S. Department of Transportation (USDOT) standards. AFFF and AFFF-impacted materials (soils and absorptionmaterials), including concentrate being disposed, rinsate, and foam supply system materials, are not currently considered tobe hazardous materials under federal regulations. Some individual states have passed legislation to include PFOS, PFOA, andother PFAS on their hazardous substances list and otherwise restrict the sale and use of AFFF (for example, (WashingtonSenate 2018) (New York State 2017). Regulations are discussed further in Section 3.9.
Best practice is to treat foam concentrate with caution and to ensure containment until proper disposal. AFFF materialsshould be labeled to clearly indicate the contents of the container. It is important that all containers are kept clean so thatany signs of leakage can be easily and quickly identified during container inspections, with the labeling pointed outward foreasier reading. Refer to the best management practices (BMP) table in the ITRC AFFF fact sheet (ITRC 2018a) for moreinformation.
3.4 Foam Systems and OperationsClass B firefighting foams are employed globally to fight flammable liquids fires where risk of damage to property or humanlife is high. These products are particularly prevalent in airport settings. This section describes common AFFF systemoperations, including system testing and training. Additionally, information is provided in Section 3.8 for organizations thatwant to replace legacy PFOS AFFF systems with modern fluorotelomer AFFF or F3.
3.4.1 Fixed System TestingFixed fire suppression systems that utilize any of the foam types and application methods are permanent designs and shouldincorporate the containment, collection, and runoff components in the event of system discharge into the design. Examplesinclude flammable liquid warehouse, waste treatment facility, and aircraft hanger fire suppression systems. New systemsshould be designed to include foam containment and collection mechanisms such that foam releases that occur duringtesting or activitation are not released to the environment, or the AFFF can be captured for disposal. AFFF design standardsrequire minimum durations for foam system discharge to meet the suppression/control requirements and in some casesrequire specific volumes of concentrates and foam solution to be contained in on-site storage tanks. Fixed AFFFproportioning systems that are connected to city water mains should be fitted with backflow preventers to protect the citywater mains from potential AFFF contamination.
Codes, standards, and authorities having jurisdiction over fixed system testing, such as NFPA Standards 16 (NFPA 2019) and25 (NFPA 2017), can require that the equipment produce a foam/foam solution that can be tested and compared tolaboratory standards. System testing generates a small amount of foam that should be contained or controlled by the designto the best extent possible for proper disposal. Foam can be wetted with fog nozzles/mist to knock down the foam and diluteit. Gentle squeegee and sweeping are required to keep the solution from aspirating during cleanup and dilution. Alternatives,such as testing with water (without foam) or testing with fluorine-free training foam or surrogate liquids having similarphysical properties, may be considered to minimize disposal issues. Check applicable regulatory requirements for testing todetermine frequency and type of testing required, as well as what is specifically mandated for foam type before anyalternatives are considered to ensure compliance with appropriate laws.
3.4.2 Mobile Firefighting Equipment TestingFirefighting equipment requires inspection, calibration, and testing to ensure reliability and performance to specifications. Inaccordance with fire protection standards (for example, NFPA Standard 412, (NFPA 2020) and manufacturer’srecommendations, the testing of mobile firefighting equipment should be conducted routinely and documented.
Multiple pieces of equipment can be tested or inspected simultaneously. Mobile equipment, including but not limited tomobile foam extinguishers, firefighting vehicles, and marine craft, can be collected, tested, and cleaned and foamconcentrate samples can be collected in a single location to minimize potential impacts. It is recommended that testing ofmobile firefighting equipment is executed at purpose-built facilities specifically designed to capture and contain allgenerated foam and wastewater for treatment, reuse, or disposal.
Conditions during equipment testing should include secondary containment measures to ensure foam solutions can becaptured and managed and environmental impact minimized. Alternatives to traditional testing methods may be considered,
Page 49ITRC PFAS-1
such as:
using water or surrogate solutions for trainingtesting equipment indoorsspraying into drums or other containerstesting within lined pits or spill containment equipmenttesting with closed-loop AFFF testing systems to minimize and eliminate discharge (for example, FAA CertAlert19-01 (FAA 2019).
Other controls include not testing during adverse weather conditions, not testing where the facility is not deemed fit forpurpose, conducting a risk assessment of the activity, and minimizing foam wastewater volume generated whereeverpossible. As with fixed fire suppression systems, mobile equipment that complies with NFPA Standard 412 requires that theequipment produce a foam/foam solution that can be tested and compared to laboratory-analyzed solutions (NFPA 2020).
3.4.3 Training ExercisesFacilities should have specifically designed areas and structures to conduct training exercises involving flammable liquidfires and foam systems. The fire training areas (FTAs) should be arranged to contain/control the training site for the safety ofthe persons being trained. Control of training fires as well as applied foam and/or foam solutions is maintained by the facilitydesign. The FTA should also be designed for collection/recovery of unburned fuels as well as the foam solution and fire waterfollowing the completion of training exercises. Conducting outside exercises during windy weather conditions should beavoided, as the foam solutions can be difficult to contain due to natural aspiration and windblown transport.
Past training exercises at airports and military installations employed large quantities of foam/foam solutions. To preventfurther releases to groundwater, USDOD issued a policy in January 2016 requiring prevention of uncontrolled land-basedAFFF releases during maintenance, testing, and training activities. Current USDOD policies prohibit using AFFF with PFOS fortesting, maintenance, or training exercises with the exception of shipboard activities.
Consider minimizing the volume of foam used to the greatest extent possible. If permitted by the applicable regulatoryrequirements for training, consider entirely discontinuing the practice of using expired legacy AFFF and modernfluorotelomer AFFF as training foam. Whenever possible, seek fluorine-free alternatives for training events; consider trainingwith water or training foam where practicable, not Class B foam, and certainly not with Class B foam containing PFAS. Anywastewater or foam generated from training activities should be kept to a minimum and foam spraying should be restrictedto target areas only (not sprayed over wide areas). Preplanning responses that deploy AFFF can identify weaknesses in bothAFFF use strategies and in fuel and fire water runoff and containment. This can also identify the need for calling mutual aidearly to assist with containment tactics.
3.5 Emergency Firefighting OperationsFire response planning in advance can identify various options for firefighting and contingency planning for fire wastewatercapture. Where possible and as setup allows, consider containing and recovering AFFF used for emergencies for disposal.Use mutual aid resources to assist with containing the fuel and fire water runoff should your department not have theresources available to fight the fire emergency and contain the runoff (Section 3.4). Although federal law currently does notprohibit the use of existing stocks of legacy AFFF, any discharge of foam containing PFAS to public waters can be considereda release of a “pollutant or contaminant” under the Comprehensive Environmental Response Compensation and Liability Act(CERCLA), 42 U.S. Code § 9601, and therefore may be subject to remediation requirements.
Consideration should be given to parts of facilities notprotected by the fixed foam system that could be subject toAFFF application in the event of an emergency incident andopportunity for containment of foam.
Emergency scenarios vary case by case. Industrial plantfire brigades and responding emergency crews utilizeportable foam generators or monitor nozzles to applyfoam to pooled flammable liquids (potential fires) orexisting fires. In cases where the fire involves a fixedsystem, it is critical that an arrangement forcontainment/control of runoff is included in the design.The following are examples of how preplanning canbetter inform the use and containment of AFFF at anindustrial facility:
Page 50ITRC PFAS-1
Industrial processes have many components, and only portions of the process are protected by the fixed foamsystems. For example, a scrubber, or filter found within industrial smokestacks, may be part of the process thatis not protected by the foam system and may be outside the discharge area where design considerations havebeen made for containment/control. Emergency response units may be required to apply foam/water to thelocation of the scrubber, outside the planning boundaries, in the event the fire that originated in the process wasconveyed to the scrubber unit.At oil refineries, F3 may be used for small incidents and fluorinated foam reserved for the large tank fires.Fluorine-free and new generation C6 foams have been tested in large-scale tests (involving up to 40 m foamtravel requirements) and could be considered suitable for application to fires involving some tank sizes and theassociated dike area fires. But firefighting foam use is rapidly evolving, and as such, those responsible for tankapplication foam selection should refer to the latest test results from any recognized independent source (forexample, LASTFIRE) to determine whether F3 could meet the performance requirements.On some remote industrial sites, where no immediate threat to life or property exists, and given the additionalresources necessary to manage the wastewater produced, the best response may be to let the fire burn insteadof applying AFFF.
3.5.1 Personal Protective EquipmentThe use of personal protective equipment (PPE) is highly recommended when exposure to AFFF, as well as other firefightingfoams, is anticipated. A critical aspect of PPE is ensuring the proper use of the equipment. The equipment should be usedcorrectly, maintained, and decontaminated routinely (Queensland Government 2018).
During the application or immediate cleanup of AFFF foam, the use of a self-contained breathing apparatus or positivepressure–supplied air respirator is recommended to avoid respiratory exposure. Dermal exposure should also be avoided, asskin contact can result in irritation and dryness. When responding to fires, first responders should wear appropriate turnoutgear, or proximity gear per their specifc department requirements.
PPE cleanup after using AFFF (as well as other foams) is discussed in the next section.
3.5.1.1 DecontaminationAlthough PPE will prevent initial exposure to AFFF, contamination of the PPE itself can present health risks. Decontaminationof the PPE and personal hygiene are crucial preventative measures in reducing or avoiding exposure to AFFF, as well as inavoiding cross-contamination.
When handling AFFF concentrate or foam, it is imperative to avoid hand-to-mouth contact. After the use or cleanup of AFFF,responders should wash hands and use other decontamination procedures to remove any residual AFFF from the skin.Responders should remove contaminated clothing and launder before reuse.
PPE should be placed in a bag and container after exposure to AFFF as well as other foams. In 2014, NFPA released its latestedition of NFPA 1851: Selection, Care and Maintenance of Protective Ensembles for Structural Firefighting and ProximityFirefighting. This standard provides guidance for proper care of firefighting protective gear as well as health hazardsassociated with improper maintenance or contamination of protective equipment (NFPA 2014). The standard outlinesdifferent decontamination measures for turnout gear as well as proximity gear.
Turnout gear is the general PPE for firefighting. It should be machine washed in warm water in the normal cycle. Turnoutgear should be spot treated with warm water, a soft brush, and mild detergent prior to being machine washed. When handwashing and spot treating PPE, wear protective gloves—either latex or PVC— to avoid skin contact with any residual AFFF.No fabric softener or bleach should be used. The turnout gear should never be washed in home washing machines, as thispractice has the potential to contaminate personal clothing. Advanced cleaning is suggested at least on a yearly basis(Avsec 2015).
Although PPE decontamination prior to reuse is important, it is equally important to recognize when decontamination is notpossible. In this case, the gear should be discarded in accordance with local, state, and federal regulations.
When decontaminating or laundering PPE, the disposition of the waste stream should be considered. The potential forenvironmental impacts due to laundering in washing machines is not well defined, but the potential does exist. Regulatoryagencies should consider including decontamination procedures when working with firefighters, refinery safety personnel,and other potential first responders to develop BMPs.
Page 51ITRC PFAS-1
3.5.2 Initial Mitigation Efforts for Firefighting FoamInitial mitigation efforts following a release of firefighting foam include source control, containment tactics, and recoverytactics. Each is further described in this section.
Discharges of AFFF can occur during firefighting operations, system testing, equipment malfunctions, or incidental releases.In addition to foam, a large amount of water is often applied when attempting to suppress a fire. Due to the highly misciblenature of AFFF, the main objective of the initial mitigation efforts should be to reduce the footprint of contamination bylimiting the spread of foam and fire water. This is often done through various containment and recovery tactics while makingsure that the release has been abated and response personnel are safe.
Specific department or facility fire wastewater management considerations may be outlined in a fire response plan, whichshould include information such as resources available within the facility or department fire protection jurisdiction to containand recover fire water, protect sensitive areas (for example, public and private water systems, storm drains, surface water,critical wildlife habitat), and address safety considerations when conducting water management tactics. By using the fireresponse plan, first responders familiar with the content can increase the potential for a successful response while reducingor eliminating any imminent or substantial threat to human health, safety, welfare, or the environment.
3.5.2.1 Source ControlIn addition to AFFF application for emergency response, accidental discharge of AFFF can occur from faulty or malfunctioningequipment such as hard-lined fire suppression systems in aircraft hangers or equipment used to apply or contain foam (forexample, fire engines or storage tanks). The first step in any response is to stop the accidental discharge or release at thesource by disabling or shutting off the system, if possible, and then temporarily or permanently repairing the malfunctioningequipment. By controlling the source, the impact to the environment is minimized.
3.5.2.2 Containment TacticsDue to AFFF’s miscible nature, as well as the large amount of water often applied in combination with the foam, containmenttactics that prevent or minimize surface water runoff are critical during and after emergency response activities. Propercontainment tactics may also reduce the footprint of the affected area to make the containment and cleanup easier.Depending on resources available to response personnel and conditions of the release, tactics such as ditching, berming,diking, damming, and blocking storm drains, culverts, or other surface inlets can help to contain runoff. When using thesetactics, it is important to ensure that any digging activity will not result in breaking through a confining layer that wouldallow contaminated water to move more quickly into the subsurface and specifically to groundwater. Several responseorganizations have tactics manuals available online for review, including the Spill Tactics for Alaska Responders (STAR)Manual (AK DEC 2014) and Alaska Clean Seas Tactics Manual (Alaska Clean Seas 2017). Most manuals are targeted attactics proposed to be conducted after a release of oil or other petroleum products, but most of these tactics will also applyto AFFF releases. General guidance, similar to this section, on containment tactics to be conducted after a foam dischargehas been provided by several other organizations, including the Firefighting Foam Coalition (FFFC 2016, 2018) and theQueensland Department of Environment and Science (Queensland Government 2018).
As stated previously in this section, preplanning can greatly assist with prioritizing sensitive areas or locations that needprotection during the mitigation or response effort after an AFFF discharge, as well as the resources necessary to succeedwith this strategy. The containment tactics used and resources required will differ among sites. Preparedness can beincreased by identifying potentially sensitive areas. Also, designing infrastructure such as aircraft hangars with foam-applying fire suppression systems so that the discharged foam is automatically directed to storage tanks or containmentstructures can minimize the need for any cleanup. The DOD has provided guidance via Engineer Technical Letters (USACE2018) that address containment/disposal system design for AFFF discharges from open systems (such as nozzle and delugesprinkler systems) and closed systems (in which individual sprinkler heads are activated only by heat of a fire).
Because no single set of containment tactics is going to be applicable to all facilities or departments where a foam dischargeoccurs, it is important for each user to conduct preplanning to identify solutions that fit its facilities, objectives, and specificresponse scenarios.
3.5.2.3 Initial Recovery TacticsRecovery tactics can differ depending on the amount of AFFF released, as well as whether the AFFF is discharged duringfirefighting operations or accidentally (for example, from malfunctioning equipment). Collection of large volumes of AFFFconcentrate or the 1%, 3%, or 6% AFFF mixture combined with water could require the use of mechanical devices such as
Page 52ITRC PFAS-1
pumps or vacuum trucks, while absorbent material might suffice to clean up after a smaller release. The AFFF and watermixture has a low flammability and a high flash point, so there is no need to use intrinsically safe pumps or mechanicaldevices unless other, more flammable compounds are present in the fire water being recovered.
It may be beneficial to remove affected AFFF saturated materials such as soil and vegetation to reduce or eliminate surfaceor subsurface migration of potential contaminants. Removal of contaminated media may reduce or eliminate the need foradditional investigation and cleanup in the future; however, focus during the initial mitigation effort should be on the moreeasily recoverable media such as affected waters or slurries. Initiating recovery tactics as soon as possible after a release ofAFFF will greatly reduce the footprint of PFAS-contaminated materials and lower the cost of the total mitigation effort.
3.6 Immediate Investigative and Cleanup ActionsA series of immediate investigative actions can be taken after the use of AFFF at the site of a fire to determine the level,nature, and extent of the contamination. First responders should collect information regarding the volume of AFFFdischarged, its concentration, active ingredients, and discharge location information.
Information about actions to be taken after the immediate actions is included in Section 10, Site Characterization; Section11, Sampling and Analytical Methods; and Section 12, Treatment Technologies.
Traditional field-screening methods used for other types of contaminants (for example, PID field screening for petroleum) arenot effective for PFAS due to their unique chemistry, generally low volatility, and lack of development of colorimetric orreactive chemistry technologies. Some efforts have been made to develop mobile analytical laboratories, which are coveredin Section 10.3.1.2 of this document.
3.6.1 Visual Site DelineationVisual site delineation refers to outlining the affected area of contamination based on visual clues, such a visible foam andwet ground, as a guide. The extent of foam should be marked using survey tape, lathe, and pin flags placed to identifylocations of AFFF contamination. This technique of determining the initial expanse of the contamination is simple to performdirectly after a discharge and can be useful for reference in future testing on the site. In addition, photographs of the sitetaken during or immediately after the incident can be used to determine the extent of AFFF impacts.
3.6.2 The Shake TestThe shake test is an informal qualitative field-screening method that provides a visual analysis of the site contamination. Theshake test can apply to both water and soil-water solutions. In the shake test, a small sample (10–25 mL) is collected on siteby the field personnel and shaken. After it is shaken, if there is foaming in the sample, it should be noted and then submittedfor analysis (Transport Canada 2017). Photographs of the samples may be helpful. The presence of foam implies the sampleis contaminated with AFFF. This test is a good indicator for high concentration contamination. It may not be able to detectlower concentrations of contaminants, so lab testing may still be required.
3.6.3 Initial Investigative SamplingInvestigative sampling is used to determine the nature and extent of contamination, including concentrations at andsurrounding release areas. Initial investigative sampling can help to determine whether additional characterization isnecessary, in addition to informing the need for and extent of interim or permanent remedial actions. Combining theinformation gained from investigative and confirmation sampling with information from a CSM will inform project managersas to whether further site characterization and remediation or mitigation efforts are needed. See Section 5 (EnvironmentalFate and Transport Processes), Section 10 (Site Characterization) and Section 12 (Treatment Technologies) for additionalinformation on the actions that may be needed following initial response.
3.6.4 Interim RemovalFollowing the information gathering described above, or possibly prior to initial investigative sampling, additional sourcecontrol can be achieved through removal of soils that are expected to be highly contaminated. During an initial removalaction intended to target PFAS hot spots, soil excavation can be guided by shake tests (Section 3.6.2). An interim removal isnot necessarily designed or expected to remove all contamination but can help to reduce the migration of PFAS into othermedia, including groundwater and surface water. To determine how to dispose of the soil, see Section 12 (TreatmentTechnologies).
Page 53ITRC PFAS-1
3.6.5 Confirmation SamplesOnce removal actions take place, confirmation samples are taken to confirm that an excavation or interim removalsuccessfully removed the soil contamination that exceeds applicable regulatory or risk-based levels. If confirmation samplingdetermines that soil contamination still exists at levels of concern, additional removal actions or other types of remediationor mitigation may be required. The type, number, and distribution of confirmation samples is determined on a site-specificbasis according to local regulatory guidance.
3.7 Treatment and DisposalBMPs suggest that all AFFF foam concentrate volume be fully accounted for at each storage location, from fire trucks tosuppression systems to storage containers. Weights of other AFFF system components requiring disposal should be similarlyobserved. Disposal certificates for materials bound for removal should indicate volumes of AFFF concentrate or solution orweights of system components or debris, as applicable. Total volumes or weights generated for disposal should match thatindicated on disposal certificates.
3.7.1 AFFF ConcentrateThe disposal of AFFF concentrate is dependent on the product type and the ingredients present in the product to bedisposed. Manufacturers’ product literature should be consulted for information regarding the specific foam concentrate tobe disposed. As of the writing of this document, the Firefighting Foam Coalition recommends high temperature incineration(that is, at 1,000°C) at a hazardous waste management facility as the preferred disposal method for AFFF concentrate in theUnited States (FFFC 2016 (FFFC 2016)). In some cases, disposal via burial of a stabilized concentrate at a hazardous wastemanagement facility may be acceptable. AFFF concentrate bound for disposal should be properly documented in compliancewith state and federal transportation regulations (as discussed in Section 3.3.2) and shipped to the selected disposal facilityunder a proper manifest. After the concentrate product has been incinerated, a certificate of disposal should be generatedby the waste management facility and transmitted to the product owner. This certificate of disposal should be transmitted tothe state regulatory agency for review and maintained on file by the product owner.
DOD is currently replacing legacy foam concentrates with modern fluorotelomer foams at many installations across theUnited States. Legacy foams are being removed from active use as part of this replacement project and the removedproduct is being disposed of through incineration; however, approximately three-quarters of respondents of a 2016nationwide survey of municipal airports (non-DOD facilities) said that they were not aware that replacements existed (ACRP2017 (ACRP 2017)).
3.7.2 Fire – and Flush Water Containing AFFFFire water produced during training or emergency response, as well as flush water produced during the rinsing of firefightingsystems and equipment, is managed and disposed of as a generated waste because these waters contain diluteconcentrations of PFAS. Practitioners may consult with local regulatory agency personnel ideally prior to the generation offire- and flush water so that there is a good understanding of local laws and regulations governing disposal. Standardpractices for foam containment and cleanup should be developed prior to use such that response teams have the neededequipment and training before an event occurs. Some fire water disposal options are focused on reducing the volume ofwastewater through concentration and disposal of the generated concentrate via incineration, landfilling, stabilization, orother mechanisms. Widely used treatment methods, as presented in Section 12 are as follows:
granular activated carbon treatmentdischarge to and treatment at a wastewater treatment plantpumping AFFF-impacted fire water into watertight, secure containment basins and allowing the water phase toevaporate, leaving behind a solid or semi-solid material containing the AFFF concentrate. The remaining materialis then disposed of at a certified waste management facility (USDOD 1997). This method is an option only insome localities and where climatic conditions are favorable.
3.8 Firefighting Foam System ReplacementThe AFFF application design is specific for each foam and use. Changing between foam types or application objectives couldrequire a complete system review and, potentially, redesign and modification of system components to meet the newobjectives or material and performance requirements. When objectives or requirements are changed, each subject system
Page 54ITRC PFAS-1
should be evaluated and modified individually to ensure that operational objectives are met.
Procurement at U.S. aiports is primarily driven by regulatory performance requirements, notably the DOD Mil-Spec, MIL-PRF-24385, as well as FAA requirements (ACRP 2017). DOD recommends complete replacement of the required AFFFconcentrate supply and rinsing of the storage and discharge system prior to refilling with a different concentrate product(USDOD 2017). This not only prevents any unforeseen incompatibility issues, but also grealty reduces possible cross-contamination and the uncertainty of AFFF formulations (PFAS profile/content).
Applicable replacement products standards include NFPA Standards 11 (NFPA 2016b) and 16 (NFPA 2019) for foam watersprinkler and foam water spray systems and NFPA Standards 1901 (NFPA 2016a) and 412 (NFPA 2020) for equipment.
3.8.1 Replacement ProductsReplacing foams and foam systems generally follows four steps:
Assess and understand the specific hazards and application objectives.1.Ensure that foam product to be adopted is listed and approved for use on the specific assets that are being2.protected and the hazards that that are being mitigated.Ensure that the foam product storage system and the foam/water application system meet product storage (for3.example, materials compatibility and storage temperature), proportioning, and application requirements.Ensure that the selected foam product(s) meet applicable requirements (such as Mil-Spec, Underwriters4.Laboratories (UL), or Factory Mutual compliance). These organizations audit manufacturers to ensure compliancewith their standards.
Where two or more foam products meet applicable performance requirements, the foam with the best environmentalperformance should be selected. Alternatives currently available as replacement products for legacy AFFF include productsdiscussed in the following sections.
3.8.1.1 Fluorine-Free Foams (F3)Most foam manufacturers now produce Class B F3s. Performance of these foams should be evaluated carefully as futurepurchasing decisions are made. As of September 2019, F3s are not yet approved for use on Class B fires at federal- and FAA-regulated facilities that require Mil-Spec–compliant AFFF. But a mandate within the FAA Reauthorization Act of 2018(enacted October 5, 2018) directs the FAA to stop requiring the use of fluorinated foam no later than 3 years from the dateof enactment (October 4, 2021), so F3 use is anticipated at FAA-regulated facilities in the near future.
There continues to be robust discussion regarding the replacement of AFFF products with F3 formulations. For example, theorganization IPEN has published a document titled Fluorine-Free Firefighting Foams (3F): Viable Alternatives to FluorinatedAqueous Film-Forming Foams (AFFF), which states that F3 products are as effective in combating Class B fires as AFFF andconcludes that because of the lower environmental impact of F3 products, the use of AFFF should be discontinued (IPEN2018). The Fire Fighting Foam Coalition (FFFC) produced a three-page document responding to the IPEN paper, whichdiscusses technical details regarding differences in foam performance for certain types of Class B fires and performancestandards (as opposed to composition standards) that continue to necessitate the use of AFFF or other fluorochemicalproducts for certain hazards. Additional challenges to the replacement of AFFF with F3 foams are also described in the FFFCdocument (FFFC 2018).
3.8.1.2 Modern Fluorotelomer FoamsIf it is determined that the performance of a fluorinated Class B foam is required for a specific hazard (for example, thefederal regulation requiring AFFF use for military applications, at FAA-regulated airports, and/or other high hazard Class Bfires and potential incidents), users should purchase modern fluorotelomer foams. Most foam manufacturers havetransitioned to the production of only short-chain (C6) fluorosurfactants, so it is likely that any AFFF bought today meets thatrequirement. But foams made with only short-chain (C6) PFAS may still contain trace quantities (parts per billion) of PFOAand PFOA precursors as byproducts of the manufacturing process. This should be confirmed with the supplier.
Although there are currently mandated specifications requiring the use of fluorinated foams at airports and militaryinstallations, users should be aware that compounds in modern fluorotelomer foams are regulated by several states and areknown to have probable effects on human health (Section 7.1). Use of these foams may be restricted to emergencysituations only and not for use in firefighting training activities. Local and state regulations may require reporting of theirrelease, including emergency use. Section 3.9 discusses the current state of regulations on AFFF use.
Page 55ITRC PFAS-1
3.8.2 System Decontamination and Sampling During Foam ReplacementThe replacement of Mil-Spec legacy foam with the modern foams requires review of system components, particularly theproportioning system, to ensure that appropriate system performance will be maintained. During foam replacement, athorough clean-out of storage tanks and associated pipework is highly recommended prior to filling with replacement foamconcentrate. There is potential for PFOS and PFOA contamination from legacy AFFF, as described in Section 3.1, and fromPFOA and other PFAS from fluorotelomer foams. For nonmilitary applications, legacy AFFF and replacement modern foamsmay not be compatible. In these cases, the foam manufacturers should be consulted when a foam change is required andcurrent best practices for foam replacement, system decontamination, and verification sampling should be considered.
Currently, there are no regulatory guidelines or requirements pertaining to the clean-out of AFFF firefighting systems whenfoam concentrates containing legacy foams are replaced with alternative foams; however, local and state governments andother organizations continue to develop policy and guidance on replacing foams. DOD (and other foam users) requires theircontractors to perform a triple rinsing step after the legacy AFFF is removed from a system. The rinse water is containerizedand managed as a waste material as presented in Section 3.3.2. After the rinse water is removed, the modern fluorotelomerAFFF concentrate is added to the system and the system is function tested and placed back into service. Specificdepartment or facility fire wastewater management considerations may be outlined in the facility or installation spillresponse plan, which should include information and resources available within the facility or on the installation to containand recover AFFF-containing fire water to protect the environment. Organizations should check with local and stateregulatory agencies regarding local policies and guidance for foam change-out. Sampling of rinsate to ensure that residualcontamination has been removed may be considered before adding replacement foams, and sampling of replacement foamsthat have gone through the system may provide the best assurance that PFAS will not continue to be released when thesystems are used.
3.9 Federal, State, and International Regulations and Guidance
3.9.1 OverviewThis section summarizes representative information on the regulation of PFAS-containing firefighting foams (AFFF). Althoughfederal law currently does not prohibit the use of existing stocks of legacy AFFF, any discharge of foam containing PFAS topublic waters can be considered a release of a “pollutant or contaminant” under CERCLA, 42 U.S. Code § 9601, and thereforesubject to remediation requirements. In February 2019, the USEPA announced in its PFAS Action Plan that the agency isbeginning to evaluate designating PFOA and PFOS as “hazardous substances” through one of the available statutorymechanisms, including potentially CERCLA Section 102 (USEPA 2019h).
As of September 2019, AFFF use is explicitly regulated by some states, such as the State of Washington and the State ofNew York (Table 3-1); however, other states regulate PFOA, PFOS or their salts, and other PFAS in AFFF as hazardoussubstances or hazardous waste. These regulations effectively limit the storage and/or environmental release of legacy AFFF(both legacy PFOS AFFF and legacy fluorotelomer AFFF), as well as potentially triggering cleanup actions. Similar bills,banning the use of AFFF for testing and training, have been passed in other states such as Arizona, Colorado, Georgia,Kentucky, and Minnesota.
Examples of hazardous substance and hazardous waste regulations, as well as other federal, state, and internationalguidance pertaining to AFFF, are presented below. For more information pertaining to the regulation of PFAS, see Section 8.This section addresses only regulations related to AFFF.
Table 3-1. Representative state AFFF regulatory and legislative activity
Page 56ITRC PFAS-1
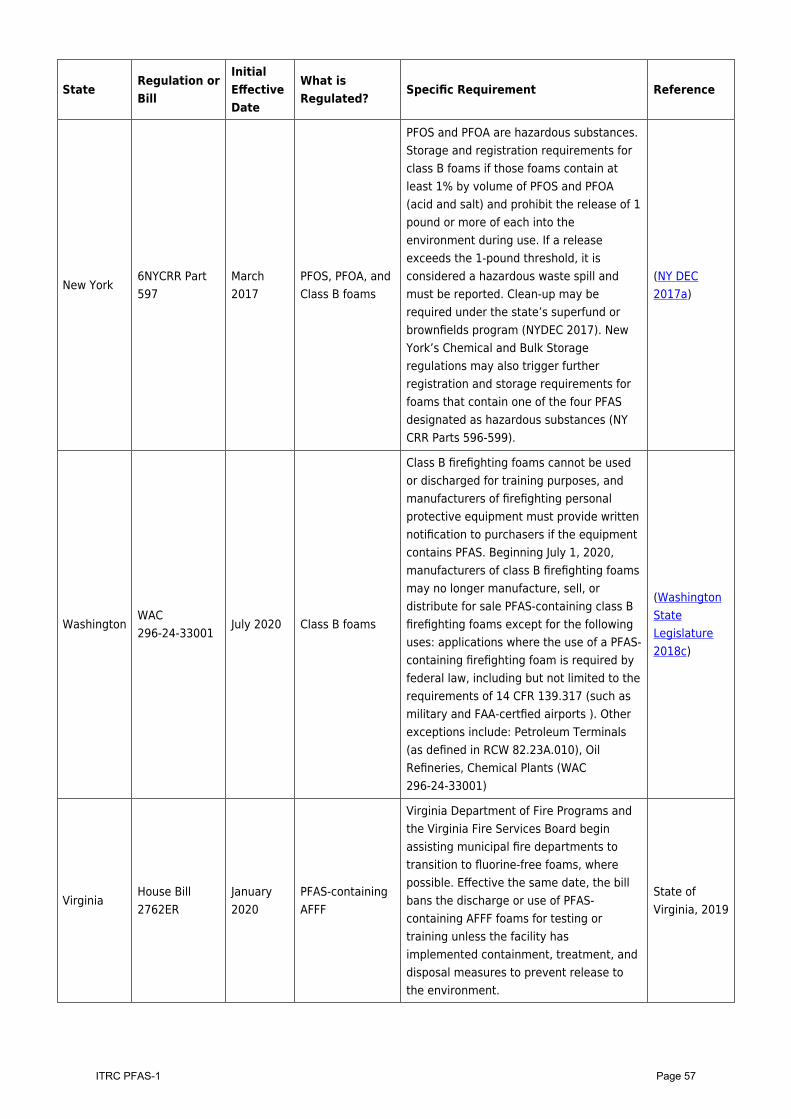
StateRegulation orBill
InitialEffectiveDate
What isRegulated?
Specific Requirement Reference
New York6NYCRR Part597
March2017
PFOS, PFOA, andClass B foams
PFOS and PFOA are hazardous substances.Storage and registration requirements forclass B foams if those foams contain atleast 1% by volume of PFOS and PFOA(acid and salt) and prohibit the release of 1pound or more of each into theenvironment during use. If a releaseexceeds the 1-pound threshold, it isconsidered a hazardous waste spill andmust be reported. Clean-up may berequired under the state’s superfund orbrownfields program (NYDEC 2017). NewYork’s Chemical and Bulk Storageregulations may also trigger furtherregistration and storage requirements forfoams that contain one of the four PFASdesignated as hazardous substances (NYCRR Parts 596-599).
(NY DEC2017a)
WashingtonWAC296-24-33001
July 2020 Class B foams
Class B firefighting foams cannot be usedor discharged for training purposes, andmanufacturers of firefighting personalprotective equipment must provide writtennotification to purchasers if the equipmentcontains PFAS. Beginning July 1, 2020,manufacturers of class B firefighting foamsmay no longer manufacture, sell, ordistribute for sale PFAS-containing class Bfirefighting foams except for the followinguses: applications where the use of a PFAS-containing firefighting foam is required byfederal law, including but not limited to therequirements of 14 CFR 139.317 (such asmilitary and FAA-certfied airports ). Otherexceptions include: Petroleum Terminals(as defined in RCW 82.23A.010), OilRefineries, Chemical Plants (WAC296-24-33001)
(WashingtonStateLegislature2018c)
VirginiaHouse Bill2762ER
January2020
PFAS-containingAFFF
Virginia Department of Fire Programs andthe Virginia Fire Services Board beginassisting municipal fire departments totransition to fluorine-free foams, wherepossible. Effective the same date, the billbans the discharge or use of PFAS-containing AFFF foams for testing ortraining unless the facility hasimplemented containment, treatment, anddisposal measures to prevent release tothe environment.
State ofVirginia, 2019
Page 57ITRC PFAS-1
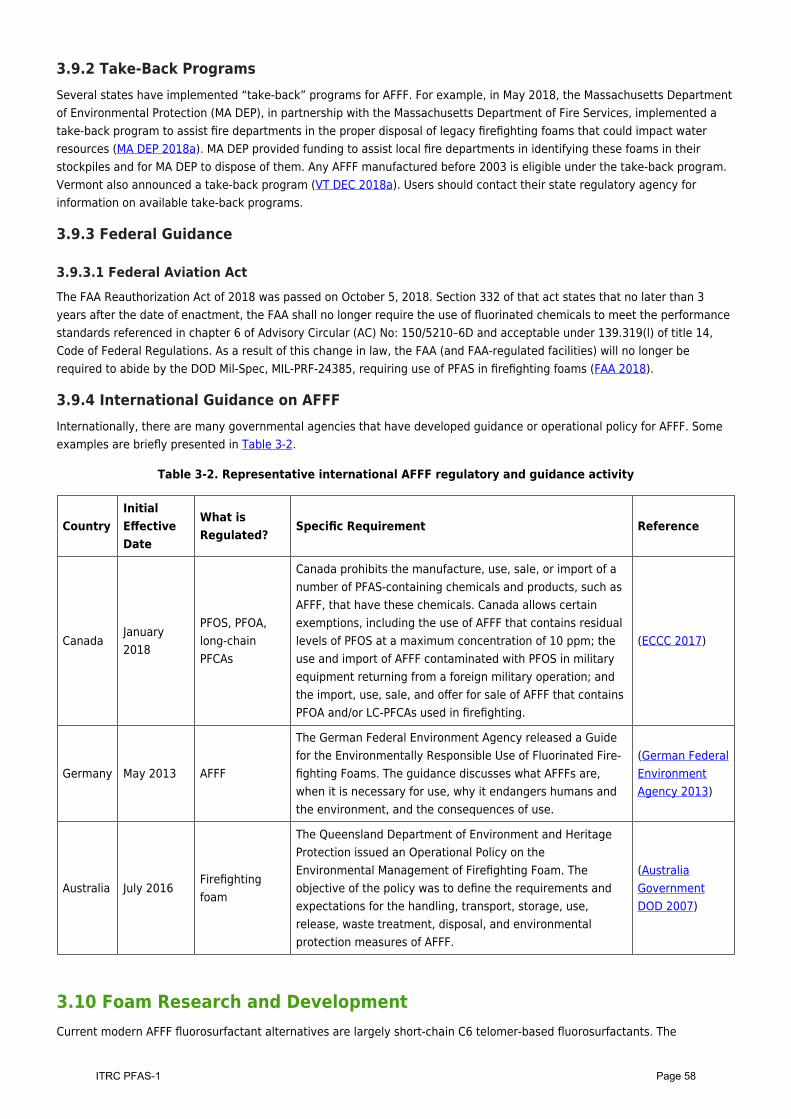
3.9.2 Take-Back ProgramsSeveral states have implemented “take-back” programs for AFFF. For example, in May 2018, the Massachusetts Departmentof Environmental Protection (MA DEP), in partnership with the Massachusetts Department of Fire Services, implemented atake-back program to assist fire departments in the proper disposal of legacy firefighting foams that could impact waterresources (MA DEP 2018a). MA DEP provided funding to assist local fire departments in identifying these foams in theirstockpiles and for MA DEP to dispose of them. Any AFFF manufactured before 2003 is eligible under the take-back program.Vermont also announced a take-back program (VT DEC 2018a). Users should contact their state regulatory agency forinformation on available take-back programs.
3.9.3 Federal Guidance
3.9.3.1 Federal Aviation ActThe FAA Reauthorization Act of 2018 was passed on October 5, 2018. Section 332 of that act states that no later than 3years after the date of enactment, the FAA shall no longer require the use of fluorinated chemicals to meet the performancestandards referenced in chapter 6 of Advisory Circular (AC) No: 150/5210–6D and acceptable under 139.319(l) of title 14,Code of Federal Regulations. As a result of this change in law, the FAA (and FAA-regulated facilities) will no longer berequired to abide by the DOD Mil-Spec, MIL-PRF-24385, requiring use of PFAS in firefighting foams (FAA 2018).
3.9.4 International Guidance on AFFFInternationally, there are many governmental agencies that have developed guidance or operational policy for AFFF. Someexamples are briefly presented in Table 3-2.
Table 3-2. Representative international AFFF regulatory and guidance activity
CountryInitialEffectiveDate
What isRegulated?
Specific Requirement Reference
CanadaJanuary2018
PFOS, PFOA,long-chainPFCAs
Canada prohibits the manufacture, use, sale, or import of anumber of PFAS-containing chemicals and products, such asAFFF, that have these chemicals. Canada allows certainexemptions, including the use of AFFF that contains residuallevels of PFOS at a maximum concentration of 10 ppm; theuse and import of AFFF contaminated with PFOS in militaryequipment returning from a foreign military operation; andthe import, use, sale, and offer for sale of AFFF that containsPFOA and/or LC-PFCAs used in firefighting.
(ECCC 2017)
Germany May 2013 AFFF
The German Federal Environment Agency released a Guidefor the Environmentally Responsible Use of Fluorinated Fire-fighting Foams. The guidance discusses what AFFFs are,when it is necessary for use, why it endangers humans andthe environment, and the consequences of use.
(German FederalEnvironmentAgency 2013)
Australia July 2016Firefightingfoam
The Queensland Department of Environment and HeritageProtection issued an Operational Policy on theEnvironmental Management of Firefighting Foam. Theobjective of the policy was to define the requirements andexpectations for the handling, transport, storage, use,release, waste treatment, disposal, and environmentalprotection measures of AFFF.
(AustraliaGovernmentDOD 2007)
3.10 Foam Research and DevelopmentCurrent modern AFFF fluorosurfactant alternatives are largely short-chain C6 telomer-based fluorosurfactants. The
Page 58ITRC PFAS-1
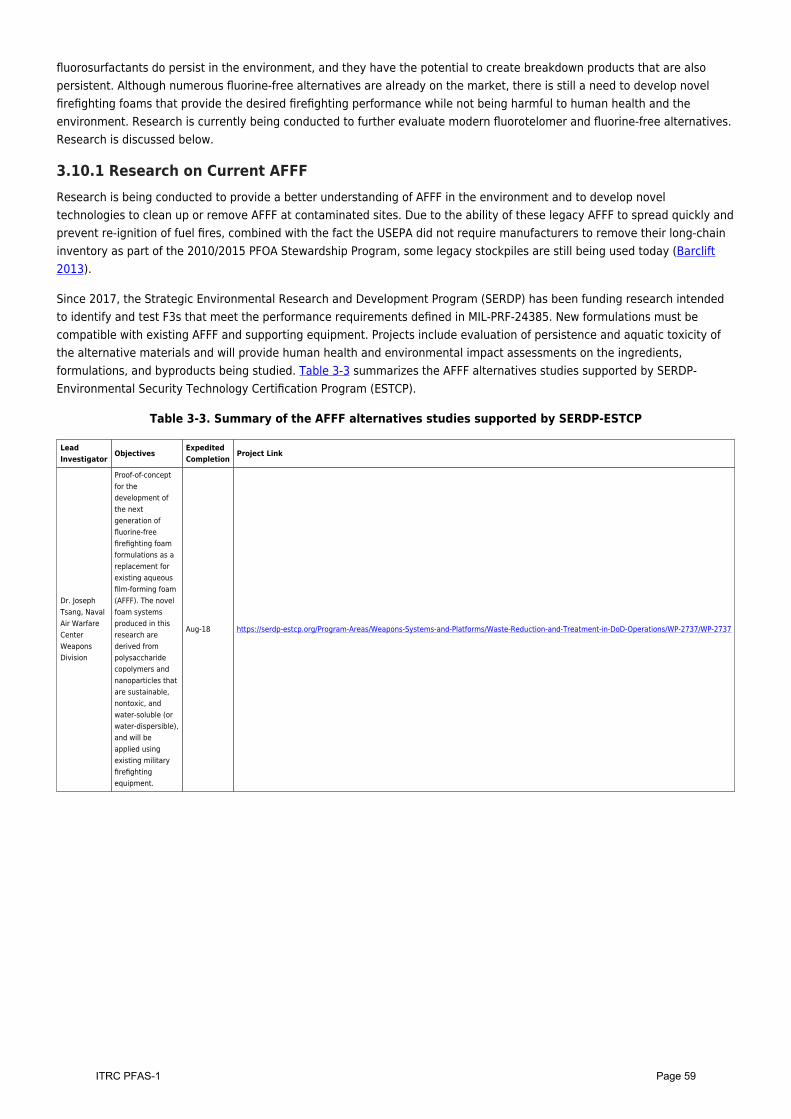
fluorosurfactants do persist in the environment, and they have the potential to create breakdown products that are alsopersistent. Although numerous fluorine-free alternatives are already on the market, there is still a need to develop novelfirefighting foams that provide the desired firefighting performance while not being harmful to human health and theenvironment. Research is currently being conducted to further evaluate modern fluorotelomer and fluorine-free alternatives.Research is discussed below.
3.10.1 Research on Current AFFFResearch is being conducted to provide a better understanding of AFFF in the environment and to develop noveltechnologies to clean up or remove AFFF at contaminated sites. Due to the ability of these legacy AFFF to spread quickly andprevent re-ignition of fuel fires, combined with the fact the USEPA did not require manufacturers to remove their long-chaininventory as part of the 2010/2015 PFOA Stewardship Program, some legacy stockpiles are still being used today (Barclift2013).
Since 2017, the Strategic Environmental Research and Development Program (SERDP) has been funding research intendedto identify and test F3s that meet the performance requirements defined in MIL-PRF-24385. New formulations must becompatible with existing AFFF and supporting equipment. Projects include evaluation of persistence and aquatic toxicity ofthe alternative materials and will provide human health and environmental impact assessments on the ingredients,formulations, and byproducts being studied. Table 3-3 summarizes the AFFF alternatives studies supported by SERDP-Environmental Security Technology Certification Program (ESTCP).
Table 3-3. Summary of the AFFF alternatives studies supported by SERDP-ESTCP
LeadInvestigator
ObjectivesExpeditedCompletion
Project Link
Dr. JosephTsang, NavalAir WarfareCenterWeaponsDivision
Proof-of-conceptfor thedevelopment ofthe nextgeneration offluorine-freefirefighting foamformulations as areplacement forexisting aqueousfilm-forming foam(AFFF). The novelfoam systemsproduced in thisresearch arederived frompolysaccharidecopolymers andnanoparticles thatare sustainable,nontoxic, andwater-soluble (orwater-dispersible),and will beapplied usingexisting militaryfirefightingequipment.
Aug-18 https://serdp-estcp.org/Program-Areas/Weapons-Systems-and-Platforms/Waste-Reduction-and-Treatment-in-DoD-Operations/WP-2737/WP-2737
Page 59ITRC PFAS-1
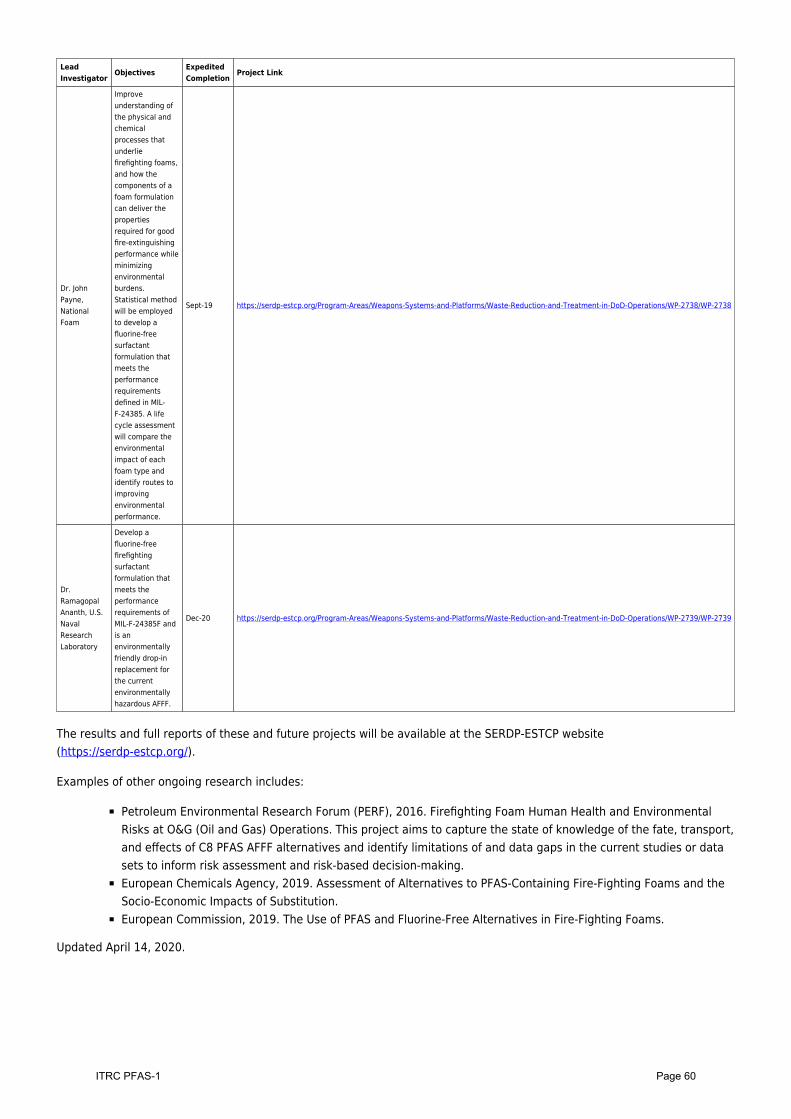
LeadInvestigator
ObjectivesExpeditedCompletion
Project Link
Dr. JohnPayne,NationalFoam
Improveunderstanding ofthe physical andchemicalprocesses thatunderliefirefighting foams,and how thecomponents of afoam formulationcan deliver thepropertiesrequired for goodfire-extinguishingperformance whileminimizingenvironmentalburdens.Statistical methodwill be employedto develop afluorine-freesurfactantformulation thatmeets theperformancerequirementsdefined in MIL-F-24385. A lifecycle assessmentwill compare theenvironmentalimpact of eachfoam type andidentify routes toimprovingenvironmentalperformance.
Sept-19 https://serdp-estcp.org/Program-Areas/Weapons-Systems-and-Platforms/Waste-Reduction-and-Treatment-in-DoD-Operations/WP-2738/WP-2738
Dr.RamagopalAnanth, U.S.NavalResearchLaboratory
Develop afluorine-freefirefightingsurfactantformulation thatmeets theperformancerequirements ofMIL-F-24385F andis anenvironmentallyfriendly drop-inreplacement forthe currentenvironmentallyhazardous AFFF.
Dec-20 https://serdp-estcp.org/Program-Areas/Weapons-Systems-and-Platforms/Waste-Reduction-and-Treatment-in-DoD-Operations/WP-2739/WP-2739
The results and full reports of these and future projects will be available at the SERDP-ESTCP website(https://serdp-estcp.org/).
Examples of other ongoing research includes:
Petroleum Environmental Research Forum (PERF), 2016. Firefighting Foam Human Health and EnvironmentalRisks at O&G (Oil and Gas) Operations. This project aims to capture the state of knowledge of the fate, transport,and effects of C8 PFAS AFFF alternatives and identify limitations of and data gaps in the current studies or datasets to inform risk assessment and risk-based decision-making.European Chemicals Agency, 2019. Assessment of Alternatives to PFAS-Containing Fire-Fighting Foams and theSocio-Economic Impacts of Substitution.European Commission, 2019. The Use of PFAS and Fluorine-Free Alternatives in Fire-Fighting Foams.
Updated April 14, 2020.
Page 60ITRC PFAS-1
4 Physical and Chemical PropertiesThis section provides information about available physical and chemical properties of PFAS. Understanding of the physicaland chemical properties of PFAS is important for the prediction of their fate and transport in the environment. The availableinformation about physical and chemical properties varies between the different PFAS. Tabulated values are included in thePhysical and Chemical Properties Table (Table 4-1 provided as a separate Excel file) that is provided as a separate Excel file.
Section Number Topic
4.1 Challenges and Limitations Related to PFAS Physical and Chemical Properties
4.2 Physical Properties
4.3 Chemical Properties
4.1 Challenges and Limitations Related to PFAS Physical and ChemicalPropertiesUnderstanding the physical and chemical properties of PFAS is important for the prediction of their fate and transport in theenvironment. More specifically, reliable values are very important when attempting to explain the environmental behavior ofPFAS through mathematical fate and transport modeling, where small variations in values can have large implications onpredictions (see Section 10.4 on data analysis and interpretation, which includes a discussion of fate and transportmodeling). There is large variation in the depth of published data (a lot is known about some PFAS, but almost nothing aboutothers) on chemical and physical properties of PFAS. Reliable physical and chemical properties of PFAS are scarce (forexample, vapor pressure and Henry’s Law constants), and some of the available values are estimated using predictivemathematical techniques, which predict properties of compounds from knowledge of their chemical structure. These arecollectively referred to as quantitative structure-activity relationship (QSAR) models. Predicted, as opposed to directlymeasured, values are accompanied by additional uncertainty that may be significant in certain fate and transport modelingscenarios. In addition, many of the available properties are based on the acid form of the PFAA, which is not present in theenvironment except at low pH. These uncertainties limit confidence in the precision of current fate and transport models.The Physical and Chemical Properties Table (Table 4-1 provided as a separate Excel file) summarizes some of the physicaland chemical properties that are available for PFAS.
4.2 Physical PropertiesThis section briefly describes some standard physical properties of PFAS. Additional references for more information areprovided. In addition, the Physical and Chemical Properties Table (Table 4-1 provided as a separate Excel file) summarizessome of the physical and chemical properties that have been published for PFAS and are discussed in this section.
4.2.1 Physical State/AppearanceMost PFAS are solids, often crystalline or powdery in form, at room temperature; however, shorter chained compounds (theacid forms of PFCA and PFSA, FTSA and FTOH with a 4- to 6-carbon tail) tend to take liquid form at room temperature(melting point is addressed in Section 4.2.3).
4.2.2 DensityDensity (ρ) is the mass per unit volume of a substance. For an individual PFAS compound (or mixture of PFAS) that exists asa liquid at ambient temperatures, density can influence its behavior in the environment.
If the density of the liquid PFAS is greater than that of water, the liquid PFAS has the potential to migrate downward throughthe water column in groundwater or surface water as a dense nonaqueous phase liquid (DNAPL); see ITRC (2003) for
Page 61ITRC PFAS-1
discussion on density and solubility impacts on DNAPL behavior.. For example, 4:2 FTOH, which is a liquid at 20oC and has a
density and aqueous solubility of 1.59 g/cm3 and 974 mg/L (Table 4-1), respectively, would be predicted to behave similarly
to carbon tetrachloride (with a density of 1.59 g/cm3 and a solubility of 800 mg/L) if released into the environment as a pureproduct (also referred to as a neat liquid). However, if 4:2 FTOH dissolved in water, the change in density of the solutionrelative to water is unlikely to result in a separate layer. See Sections 5.2.2 and 5.2.4.1 for additional information on thebehavior of PFAS in aqueous solutions.
4.2.3 Melting/Boiling PointsMelting and boiling point information refers to the temperature of phase transitions of pure compounds. These propertiesdetermine whether a specific pure PFAS compound will exist as a liquid, solid, or gas under typical environmentaltemperatures. These data are sparse and can vary among references. Predicted melting and boiling point values areavailable for most PFAS, but empirically derived values are not available for entire groups of chemicals like FTSAs andFASAAs. Predicted values are generally useful in understanding the various physical states of PFAS; however, the accuracy ofthese results is still unknown and warrants further investigation. Like all organic carbon compounds, available data indicatethat melting and boiling points of PFAS will tend to increase as the fluorinated chain increases in length. For example, themelting point of PFBA is -17.5°C while the melting point of perfluorotetradecanoic acid (PFTeDA) is 130–135°C. See Table 4-1for a list of melting and boiling points.
4.2.4 SolubilitySolubility (S) refers to the ability of a given substance, the solute, to dissolve in a solvent. It is measured in terms of themaximum amount of solute dissolved in a solvent at a specified temperature and pressure. Typical units are milligrams perliter (mg/L) or moles per liter (mol/L). Currently, experimentally measured data for the solubility of PFAS in water areavailable for just a few of the more studied compounds such as the PFCAs, PFOS, FTSAs, and fluorotelomer alcohols. Thislimited availability of experimental data should be considered when relying on PFAS solubility data. Most cited values arebased on predicted or modeled values and the input values to these calculations may themselves be estimates. Further,because PFCAs and PFSAs can form micelles and hemimicelles, as discussed in Section 4.2.7, the reported water solubilitiesmay include microdispersions of micelles in addition to truly solubilized molecules.
Values of solubility for the acid forms of PFAAs and other PFAS are summarized in Table 4-1. Reported values for solubility ofindividual PFAS analytes may vary depending upon the method used to determine solubility, the form of the analyte (that is,acid or salt), pH, salinity, and whether the value is empirical or obtained through modeling. For example, laboratory studiesof water solubilities for PFOS indicate that solubility decreases when the water salt content increases (3M Company 2000b).Other factors may affect the reported value of solubility as well.
4.2.5 Vapor Pressures (Vp)Vapor pressure is an indication of the tendency of a substance to partition into the gas phase. Vapor pressure is a measureof volatility in that the higher the vapor pressure of a compound, the more volatile it is. Compounds with higher vaporpressures, because they are in the gaseous phase or sorbed to water vapor in the atmosphere, have a higher potential forlong-range transport. Compounds with lower vapor pressures, which are more likely to remain in solid or liquid form, aretransported only via soil or surface/groundwater (Barton, Botelho, and Kaiser 2008), unless they are dissolved into airbornewater droplets or sorbedon airborne particulates, as discussed in Sections 5.3.2 and 6.1.
Values for vapor pressure of PFAS are summarized in Table 4-1. Very little data on measured vapor pressure values for PFASexist, and much of the data on PFAS is extrapolated or modeled. Caution must be taken when using the vapor pressures forPFAAs listed in the Physical and Chemical Properties Table with respect to the acid or anion form of the compound, whichmay have very different vapor pressures. Efforts were made to report the values for the acidic form in Table 4-1, butreferences are not always clear. These values also should not be used for their corresponding salt form for the same reason(for example, the vapor pressure of ammonium perfluorooctanoate has been measured experimentally to be three orders of
magnitude lower than the vapor pressure of perfluorooctanoic acid at 25oC (Barton, Botelho, and Kaiser 2009).
4.2.6 Henry’s Law Constant (Kh)The Henry’s law constant (Kh ), as well as the air-water partition coefficient (Kaw), indicate the relative concentrations of acompound between an aqueous solution and gas phase at equilibrium (air-water distribution ratio) and provide an indication
Page 62ITRC PFAS-1
of the propensity of a chemical to remain dissolved in water versus volatilizing into the gas phase. A chemical with lowersolubility and higher volatility will have a higher Henry’s law constant than a chemical with higher solubility and lowervolatility.
For most organic compounds of moderate to low solubility, Kh can be approximated by:
Kh = (Vp)(M)/S
where Kh is the Henry’s law constant, Vp is vapor pressure, M is molecular weight, and S is solubility. This constant can beexpressed in a variety of units or as the inverse (water-air distribution ratio); thus, the units of expression should always be
confirmed prior to use of this constant. Kh also displays nonlinear temperature-dependence and is typically reported at 25oC,which is higher than most ambient environmental conditions.
Experimental and modeled Henry’s law constants are available for fluorotelomer alcohols (for example, Wu and Chang(2011) and Xie, Zhao, et al. (2013)), PFSAs, PFCAs, FTCAs, FTSAs, FASEs, and FASAAs (for example, Kwan (2001) and Zhanget al. (2010)). For PFAS that can dissociate into anions or cations, as discussed in Section 4.3.2, the Henry’s law constant ispH-dependent and reported constants may not be applicable depending on the pH conditions within the solution (forexample, Rayne and Forest (2009) and Johansson et al. (2017)). In a study of airborne PFOA release in industrial settings,monitoring above sumps found concentrations 40 times greater when the pH was 1.8 than at neutral pH, and PFOA releasefrom aqueous solution was found to be several times greater at pH 4 than at pH 7 (Kaiser et al. 2010). Henry’s law constantvalues are not presented in Table 4-1.
4.2.7 Critical Micelle ConcentrationGiven the difference in behavior between the “head” and “tail” of a PFAA molecule, these compounds, when in water, tendto aggregate into micelles (form a sphere with the hydrophobic portion of the molecules on the inside) when present abovea certain concentration. Other aggregates, such as hemimicelles or mixed micelles (micelles composed of a mixture ofsurfactant-type molecules), can form either independently in solution or at boundaries occurring between phases (Krafft andRiess 2015). Theoretical threshold concentrations for aggregation, generally referred to as critical micelle concentrations(CMCs), are presented in Table 4-1. It is important to note that several studies suggest aggregations may occur at muchlower concentrations in groundwater, either due to interactions with particles and/or co-contaminants, or because ofspatially variable concentrations within soil matrices (Brusseau 2018). The formation of these molecular-level assembliescan impact transport properties and the partitioning at air-water interfaces, as discussed in Section 5.2.
4.2.8 Octanol/Water Partition Coefficient (Kow)The Kow is defined as “the ratio of a chemical’s concentration in the octanol phase to its concentration in the aqueous phaseof a two-phase” (USEPA 2015f). The Kow is a useful descriptor of the tendency of a compound to associate with hydrophobicor hydrophilic substances. Direct measurement of the Kow of alkyl acids has proven difficult because alkyl acids tend toaggregate at the interface between octanol and water (Kim et al. 2015), although some researchers have employednontraditional methods with some success (Jing, Rodgers, and Amemiya 2009). Alternatively, Kow can be estimated usingquantitative tools that predict physical and chemical properties. The Kow values that are typically tabulated for the PFCAs andPFSAs are for the acid form and are therefore not relevant because PFCAs and PFSAs are anionic within the typical range ofenvironmental pH.
It should be noted that although Kow values for some organic contaminants can be used for estimating Koc and/or uptake inbiological systems, they cannot be used for estimating such values for PFAS because they do not behave like a traditionalhydrophobic chemicals (see Section 5.5 for further discussion about PFAS uptake into aquatic organisms). For these reasons,Kow values are not presented in Table 4-1.
4.2.9 Organic Carbon/Water Partition Coefficient (Koc)The soil organic carbon/water partition coefficient (Koc) is a metric commonly used to quantify the potential of a givendissolved compound to associate with, or sorb to, organic matter occurring in soil. Shorter chained PFAS are more soluble inwater, while the longer chain PFAS adsorb and partition more in to sediments (Dalahmeh et al. 2018). Relative to commonPFAS like PFOA and PFOS, studies have suggested Koc can be appropriately defined as a distribution coefficient (Kd)normalized to organic carbon content, thus implying Koc specifically represents the singular process of hydrophobic
Page 63ITRC PFAS-1
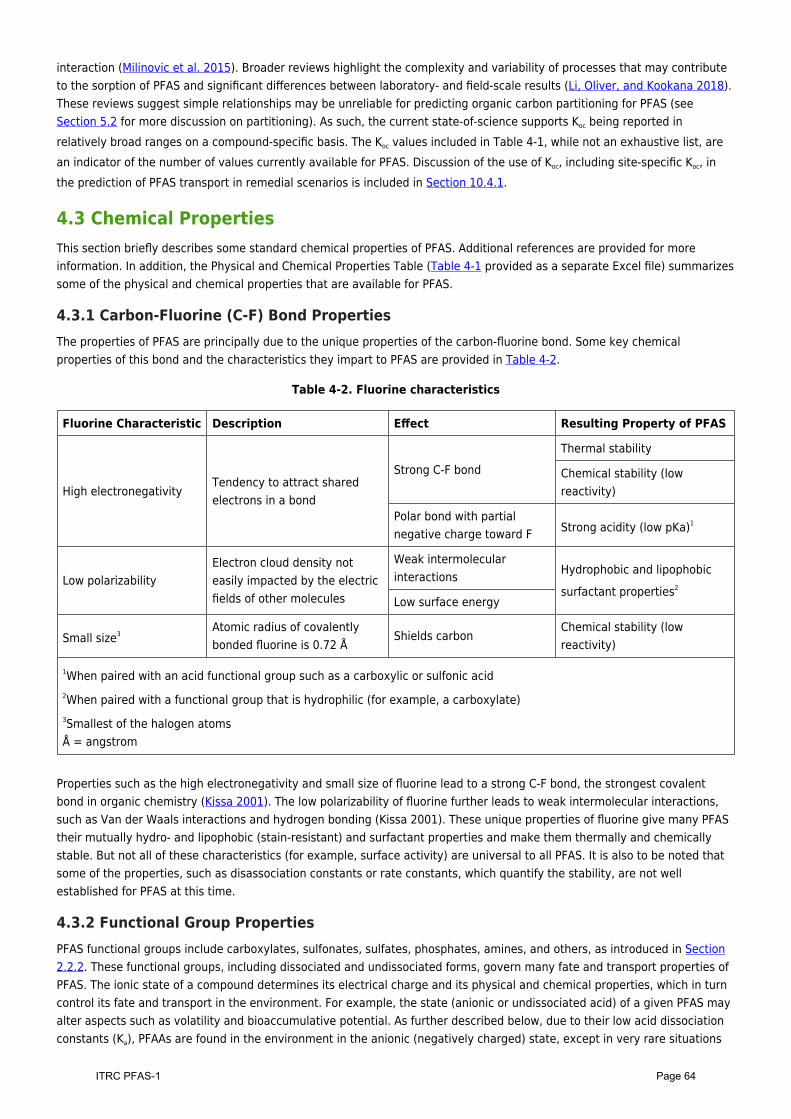
interaction (Milinovic et al. 2015). Broader reviews highlight the complexity and variability of processes that may contributeto the sorption of PFAS and significant differences between laboratory- and field-scale results (Li, Oliver, and Kookana 2018).These reviews suggest simple relationships may be unreliable for predicting organic carbon partitioning for PFAS (seeSection 5.2 for more discussion on partitioning). As such, the current state-of-science supports Koc being reported inrelatively broad ranges on a compound-specific basis. The Koc values included in Table 4-1, while not an exhaustive list, arean indicator of the number of values currently available for PFAS. Discussion of the use of Koc, including site-specific Koc, inthe prediction of PFAS transport in remedial scenarios is included in Section 10.4.1.
4.3 Chemical PropertiesThis section briefly describes some standard chemical properties of PFAS. Additional references are provided for moreinformation. In addition, the Physical and Chemical Properties Table (Table 4-1 provided as a separate Excel file) summarizessome of the physical and chemical properties that are available for PFAS.
4.3.1 Carbon-Fluorine (C-F) Bond PropertiesThe properties of PFAS are principally due to the unique properties of the carbon-fluorine bond. Some key chemicalproperties of this bond and the characteristics they impart to PFAS are provided in Table 4-2.
Table 4-2. Fluorine characteristics
Fluorine Characteristic Description Effect Resulting Property of PFAS
High electronegativityTendency to attract sharedelectrons in a bond
Strong C-F bondThermal stability
Chemical stability (lowreactivity)
Polar bond with partialnegative charge toward F Strong acidity (low pKa)1
Low polarizabilityElectron cloud density noteasily impacted by the electricfields of other molecules
Weak intermolecularinteractions Hydrophobic and lipophobic
surfactant properties2
Low surface energy
Small size3Atomic radius of covalentlybonded fluorine is 0.72 Å
Shields carbonChemical stability (lowreactivity)
1When paired with an acid functional group such as a carboxylic or sulfonic acid2When paired with a functional group that is hydrophilic (for example, a carboxylate)3Smallest of the halogen atomsÅ = angstrom
Properties such as the high electronegativity and small size of fluorine lead to a strong C-F bond, the strongest covalentbond in organic chemistry (Kissa 2001). The low polarizability of fluorine further leads to weak intermolecular interactions,such as Van der Waals interactions and hydrogen bonding (Kissa 2001). These unique properties of fluorine give many PFAStheir mutually hydro- and lipophobic (stain-resistant) and surfactant properties and make them thermally and chemicallystable. But not all of these characteristics (for example, surface activity) are universal to all PFAS. It is also to be noted thatsome of the properties, such as disassociation constants or rate constants, which quantify the stability, are not wellestablished for PFAS at this time.
4.3.2 Functional Group PropertiesPFAS functional groups include carboxylates, sulfonates, sulfates, phosphates, amines, and others, as introduced in Section2.2.2. These functional groups, including dissociated and undissociated forms, govern many fate and transport properties ofPFAS. The ionic state of a compound determines its electrical charge and its physical and chemical properties, which in turncontrol its fate and transport in the environment. For example, the state (anionic or undissociated acid) of a given PFAS mayalter aspects such as volatility and bioaccumulative potential. As further described below, due to their low acid dissociationconstants (Ka), PFAAs are found in the environment in the anionic (negatively charged) state, except in very rare situations
Page 64ITRC PFAS-1
(for example, pH <3).
Functional groups of some PFAS (ionic PFAS) can dissociate into anions or cations in aqueous solution under appropriate pHconditions. For example, as discussed in Section 2.2.2, PFOA dissociates into the perfluorooctanoate anion and the hydrogenion when dissolved in water over a wide range of pH conditions. The ion associated with the fluoroalkyl portion of ionic PFAS,other than PFAAs, can be a negatively charged anion, a positively charged cation, or a zwitterion. Therefore, PFAS can beclassified into four groups based on functional groups (examples of the structures of many ionic PFAS can be found inBarzen-Hanson et al. (2017):
anionic–contains one or more acidic functional groups such as carboxylic acids, sulfonic acids, sulfates, andphosphates, and can release a hydrogen ion, thereby forming an anion (see Figure 2-6 for PFBA dissociation)cationic–contains one or more basic functional groups such as amines, which can gain a hydrogen ion and form acation, or have a permanent charge as in the case of a quaternary ammonium groupzwitterionic–contains two or more functional groups, at least one of which can form an anion and one of whichcan form a cationnonionic–does not dissociate into ions; for example, alcohols.
Based on the behavior of other cationic and anionic surfactants, cationic PFAS are expected to have different environmentaltransport characteristics than anionic PFAS (Place and Field 2012). For example, sorption of organic anions such as PFAAanions is typically suppressed at higher pH due to electrostatic repulsion with the increasingly negative charge fromdeprotonated oxides and other functional groups present on the soil surface (Lee and Mabury 2017). Cations can beexpected to sorb strongly to soils, which often possess a net negative charge over a range of environmentally relevant pHs.For example, cationic fluorotelomer-based PFAS in an AFFF product have been found to sorb strongly to soils and sediments(Barzen-Hanson et al. 2017). Zwitterionic PFAS can be expected to sorb to soils and sediment more strongly than anionicPFAS, but less strongly than cationic PFAS, owing to the mixed charges on the functional groups. The transportcharacteristics of specific PFAS are also highly dependent on matrix interactions, and detailed site-specific information isnecessary to accurately predict PFAS transport (Guelfo and Higgins 2013). See Section 5.2.3 for further discussion ofpartitioning onto solid matrices.
For PFAAs, the acid dissociation constant Ka is the equilibrium constant for the dissociation of the acid in aqueous solutioninto the anion and hydrogen ion, and at dilute to moderate concentrations, is defined by the equation:
Ka = [anion–]*[H+]/[acid]
where [acid] is the concentration of the undissociated acid form, [anion–] is the concentration of the anion, and [H+] is theconcentration of the hydrogen ion at equilibrium.
The dissociation constant is also commonly expressed as its negative logarithm, pKa, where:
pKa = – log10(Ka)
Higher pKa values indicate that an acid will dissociate less in water at a given pH than will an acid with a lower pKa. Whenthe pH of a solution equals the pKa, then one of half of the PFAS molecules will exist as the undissociated acid and one halfwill exist as the dissociated anion. PFAS with pKa values of 4 or less will exist in aqueous solutions at neutral pH (7) almostentirely as the dissociated acid (see Figure 4-1 for a representation of reported pKa values for PFOA in relation toenvironmental pHs from Table 4-1). Because the undissociated acid and anionic forms of PFAAs have very different physicaland chemical properties, it is essential to distinguish between the undissociated acid form and the anionic form to select theappropriate physical and chemical parameters for fate and transport evaluations.
Page 65ITRC PFAS-1
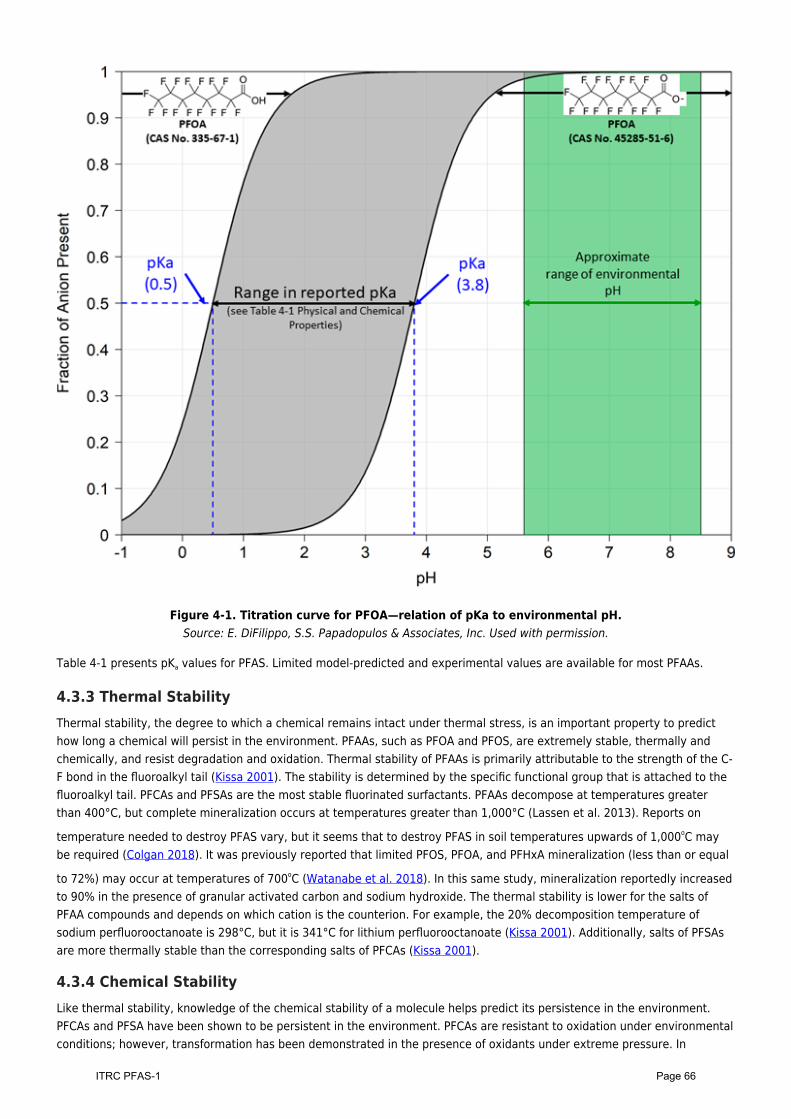
Figure 4-1. Titration curve for PFOA—relation of pKa to environmental pH.Source: E. DiFilippo, S.S. Papadopulos & Associates, Inc. Used with permission.
Table 4-1 presents pKa values for PFAS. Limited model-predicted and experimental values are available for most PFAAs.
4.3.3 Thermal StabilityThermal stability, the degree to which a chemical remains intact under thermal stress, is an important property to predicthow long a chemical will persist in the environment. PFAAs, such as PFOA and PFOS, are extremely stable, thermally andchemically, and resist degradation and oxidation. Thermal stability of PFAAs is primarily attributable to the strength of the C-F bond in the fluoroalkyl tail (Kissa 2001). The stability is determined by the specific functional group that is attached to thefluoroalkyl tail. PFCAs and PFSAs are the most stable fluorinated surfactants. PFAAs decompose at temperatures greaterthan 400°C, but complete mineralization occurs at temperatures greater than 1,000°C (Lassen et al. 2013). Reports on
temperature needed to destroy PFAS vary, but it seems that to destroy PFAS in soil temperatures upwards of 1,000oC maybe required (Colgan 2018). It was previously reported that limited PFOS, PFOA, and PFHxA mineralization (less than or equal
to 72%) may occur at temperatures of 700oC (Watanabe et al. 2018). In this same study, mineralization reportedly increasedto 90% in the presence of granular activated carbon and sodium hydroxide. The thermal stability is lower for the salts ofPFAA compounds and depends on which cation is the counterion. For example, the 20% decomposition temperature ofsodium perfluorooctanoate is 298°C, but it is 341°C for lithium perfluorooctanoate (Kissa 2001). Additionally, salts of PFSAsare more thermally stable than the corresponding salts of PFCAs (Kissa 2001).
4.3.4 Chemical StabilityLike thermal stability, knowledge of the chemical stability of a molecule helps predict its persistence in the environment.PFCAs and PFSA have been shown to be persistent in the environment. PFCAs are resistant to oxidation under environmentalconditions; however, transformation has been demonstrated in the presence of oxidants under extreme pressure. In
Page 66ITRC PFAS-1

contrast, transformation of precursors can be associated with substantial changes in the physicochemical properties of thosecompounds (CONCAWE 2016).
In the perfluorinated tail of the alkyl acids, the strength of the C-F bond, shielding of carbon by fluorine, and inductive effects(caused by fluorine electronegativity) also lead to chemical stability. For example, electron-rich chemical species callednucleophiles normally would be attracted to the partial positive charge of carbon. If these nucleophiles could get closeenough to the carbon to bond, the subsequent reaction could replace a fluorine with the nucleophile and potentially makethe molecule vulnerable to degradation. But the relatively large size of the fluorine atoms surrounding the carbon (whencompared to hydrogen) prevents this from happening (Schwarzenbach, Gschwend, and Imboden 2003). This is whyprocesses such as hydrolysis, which involve eliminating one or more fluorines, are ineffective at degrading the perfluorinatedtails of PFAAs. Similarly, many PFAAs are resistant to degradation by oxidative processes that rely on a loss of electrons(Kissa 2001). PFAAs are also resistant to reductive processes, which involve gaining electrons. Despite having a high affinityfor electrons, fluorine does not have vacant orbitals favorable for accepting additional electrons (Park et al. 2009). Incontrast to the stability of perfluorinated tails, polar regions of PFAS (the functional groups), as well as polyfluorinatedgroups, can be vulnerable to a range of chemical transformations. See Section 5.4 for further discussion of abiotic and biotictransformations.
Updated April 14, 2020.
Page 67ITRC PFAS-1
5 Environmental Fate and Transport ProcessesThis section provides current information about PFAS fate and transport in the environment. Understanding relevant fate andtransport processes for PFAS is critical in evaluating the potential risk from a release, where to look for PFAS following arelease, and what treatment alternatives may be effective. The available information about fate and transport processesvaries between the different PFAS. PFAS fate and transport is a rapidly evolving field of science.
Section Number Topic
5.1 Fate and Transport Introduction
5.2 Phase Partitioning
5.3 Media-Specific Migration Processes
5.4 Transformations
5.5 PFAS Uptake into Aquatic Organisms
5.6 PFAS Uptake into Plants
5.1 Fate and Transport Introduction
5.1.1 Overview of PFAS Fate and TransportPFAS fate and transport describes the behavior of these compounds following their release to the environment. This includesthe physical, chemical, and biological processes that influence distribution of PFAS in various media, as well as the extent ofmigration within and between media (for example, plume development, groundwater discharge to surface water). Given thewide variety of PFAS, it is not surprising that they collectively exhibit a wide range of different physical and chemicalcharacteristics that can affect their behavior in the environment. This adds to the complexity of fate and transportassessments and highlights the risk in making broad assumptions based on the behavior of a few well-studied PFAS.
Understanding relevant fate and transport processes for PFAS is critical in answering several key questions:
What is the potential risk from a PFAS release? An understanding of fate and transport processes providesthe basis for defensible predictions about occurrence, migration, persistence, and potential for exposure.
Where do I need to look for PFAS following a release? Knowledge of PFAS fate and transportcharacteristics strongly informs site characterization by providing insight on where efforts should be focused anddeveloping an appropriate CSM.
How can I treat PFAS? Establishing how these compounds behave in the environment is important indeveloping and/or selecting PFAS treatment strategies because this helps establish the potential effectiveness ofa particular treatment.
5.1.2 Factors Affecting PFAS Fate and TransportFactors that influence PFAS fate and transport can be broadly divided into two categories:
PFAS characteristics: Critical factors include the chain length, the ionic state of the compound (for example,the charge(s) carried by the molecule at a typical environmental pH), the type of functional group(s), and theextent of fluorination (for example, perfluorinated versus polyfluorinated compounds). These properties stronglyinfluence the type and extent of PFAS partitioning and transformation that can be expected to occur. Adescription of these physical-chemical properties is provided in Section 4.
site characteristics: Site characteristics generally define the nature of the source but also have an effect onPFAS-media interactions. Potentially relevant characteristics include soil type (including properties such as
Page 68ITRC PFAS-1
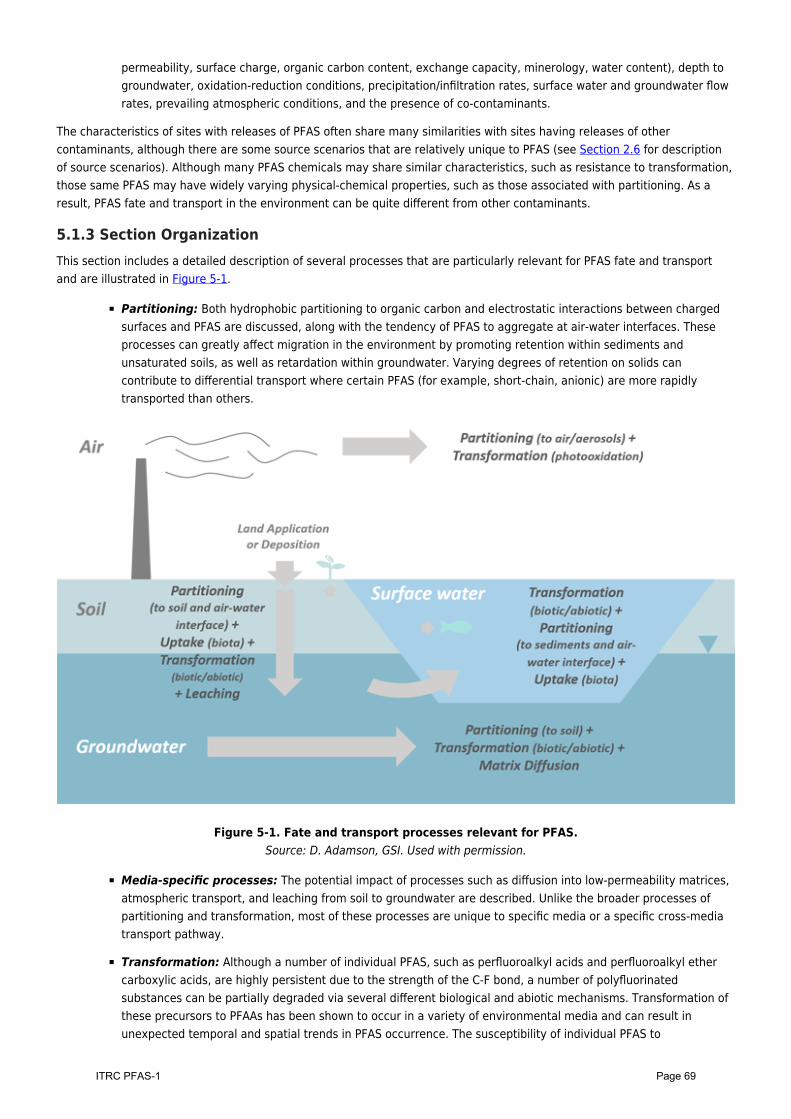
permeability, surface charge, organic carbon content, exchange capacity, minerology, water content), depth togroundwater, oxidation-reduction conditions, precipitation/infiltration rates, surface water and groundwater flowrates, prevailing atmospheric conditions, and the presence of co-contaminants.
The characteristics of sites with releases of PFAS often share many similarities with sites having releases of othercontaminants, although there are some source scenarios that are relatively unique to PFAS (see Section 2.6 for descriptionof source scenarios). Although many PFAS chemicals may share similar characteristics, such as resistance to transformation,those same PFAS may have widely varying physical-chemical properties, such as those associated with partitioning. As aresult, PFAS fate and transport in the environment can be quite different from other contaminants.
5.1.3 Section OrganizationThis section includes a detailed description of several processes that are particularly relevant for PFAS fate and transportand are illustrated in Figure 5-1.
Partitioning: Both hydrophobic partitioning to organic carbon and electrostatic interactions between chargedsurfaces and PFAS are discussed, along with the tendency of PFAS to aggregate at air-water interfaces. Theseprocesses can greatly affect migration in the environment by promoting retention within sediments andunsaturated soils, as well as retardation within groundwater. Varying degrees of retention on solids cancontribute to differential transport where certain PFAS (for example, short-chain, anionic) are more rapidlytransported than others.
Figure 5-1. Fate and transport processes relevant for PFAS.Source: D. Adamson, GSI. Used with permission.
Media-specific processes: The potential impact of processes such as diffusion into low-permeability matrices,atmospheric transport, and leaching from soil to groundwater are described. Unlike the broader processes ofpartitioning and transformation, most of these processes are unique to specific media or a specific cross-mediatransport pathway.
Transformation: Although a number of individual PFAS, such as perfluoroalkyl acids and perfluoroalkyl ethercarboxylic acids, are highly persistent due to the strength of the C-F bond, a number of polyfluorinatedsubstances can be partially degraded via several different biological and abiotic mechanisms. Transformation ofthese precursors to PFAAs has been shown to occur in a variety of environmental media and can result inunexpected temporal and spatial trends in PFAS occurrence. The susceptibility of individual PFAS to
Page 69ITRC PFAS-1
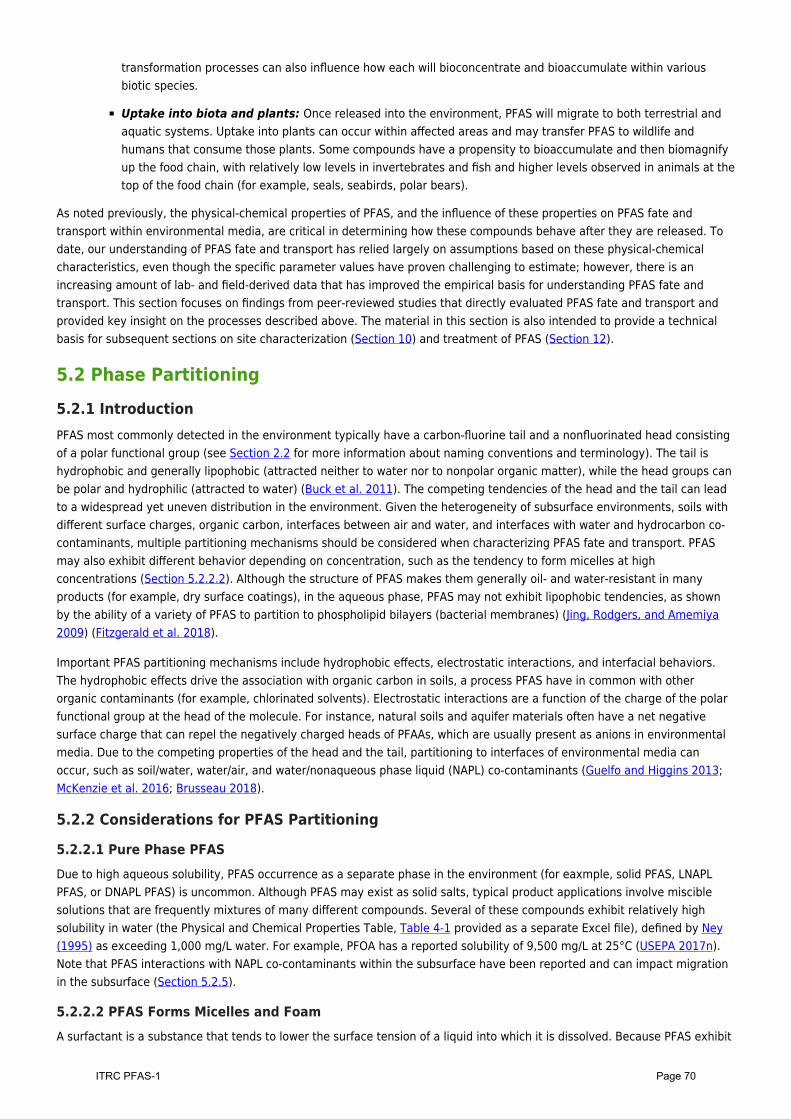
transformation processes can also influence how each will bioconcentrate and bioaccumulate within variousbiotic species.
Uptake into biota and plants: Once released into the environment, PFAS will migrate to both terrestrial andaquatic systems. Uptake into plants can occur within affected areas and may transfer PFAS to wildlife andhumans that consume those plants. Some compounds have a propensity to bioaccumulate and then biomagnifyup the food chain, with relatively low levels in invertebrates and fish and higher levels observed in animals at thetop of the food chain (for example, seals, seabirds, polar bears).
As noted previously, the physical-chemical properties of PFAS, and the influence of these properties on PFAS fate andtransport within environmental media, are critical in determining how these compounds behave after they are released. Todate, our understanding of PFAS fate and transport has relied largely on assumptions based on these physical-chemicalcharacteristics, even though the specific parameter values have proven challenging to estimate; however, there is anincreasing amount of lab- and field-derived data that has improved the empirical basis for understanding PFAS fate andtransport. This section focuses on findings from peer-reviewed studies that directly evaluated PFAS fate and transport andprovided key insight on the processes described above. The material in this section is also intended to provide a technicalbasis for subsequent sections on site characterization (Section 10) and treatment of PFAS (Section 12).
5.2 Phase Partitioning
5.2.1 IntroductionPFAS most commonly detected in the environment typically have a carbon-fluorine tail and a nonfluorinated head consistingof a polar functional group (see Section 2.2 for more information about naming conventions and terminology). The tail ishydrophobic and generally lipophobic (attracted neither to water nor to nonpolar organic matter), while the head groups canbe polar and hydrophilic (attracted to water) (Buck et al. 2011). The competing tendencies of the head and the tail can leadto a widespread yet uneven distribution in the environment. Given the heterogeneity of subsurface environments, soils withdifferent surface charges, organic carbon, interfaces between air and water, and interfaces with water and hydrocarbon co-contaminants, multiple partitioning mechanisms should be considered when characterizing PFAS fate and transport. PFASmay also exhibit different behavior depending on concentration, such as the tendency to form micelles at highconcentrations (Section 5.2.2.2). Although the structure of PFAS makes them generally oil- and water-resistant in manyproducts (for example, dry surface coatings), in the aqueous phase, PFAS may not exhibit lipophobic tendencies, as shownby the ability of a variety of PFAS to partition to phospholipid bilayers (bacterial membranes) (Jing, Rodgers, and Amemiya2009) (Fitzgerald et al. 2018).
Important PFAS partitioning mechanisms include hydrophobic effects, electrostatic interactions, and interfacial behaviors.The hydrophobic effects drive the association with organic carbon in soils, a process PFAS have in common with otherorganic contaminants (for example, chlorinated solvents). Electrostatic interactions are a function of the charge of the polarfunctional group at the head of the molecule. For instance, natural soils and aquifer materials often have a net negativesurface charge that can repel the negatively charged heads of PFAAs, which are usually present as anions in environmentalmedia. Due to the competing properties of the head and the tail, partitioning to interfaces of environmental media canoccur, such as soil/water, water/air, and water/nonaqueous phase liquid (NAPL) co-contaminants (Guelfo and Higgins 2013;McKenzie et al. 2016; Brusseau 2018).
5.2.2 Considerations for PFAS Partitioning
5.2.2.1 Pure Phase PFASDue to high aqueous solubility, PFAS occurrence as a separate phase in the environment (for eaxmple, solid PFAS, LNAPLPFAS, or DNAPL PFAS) is uncommon. Although PFAS may exist as solid salts, typical product applications involve misciblesolutions that are frequently mixtures of many different compounds. Several of these compounds exhibit relatively highsolubility in water (the Physical and Chemical Properties Table, Table 4-1 provided as a separate Excel file), defined by Ney(1995) as exceeding 1,000 mg/L water. For example, PFOA has a reported solubility of 9,500 mg/L at 25°C (USEPA 2017n).Note that PFAS interactions with NAPL co-contaminants within the subsurface have been reported and can impact migrationin the subsurface (Section 5.2.5).
5.2.2.2 PFAS Forms Micelles and FoamA surfactant is a substance that tends to lower the surface tension of a liquid into which it is dissolved. Because PFAS exhibit
Page 70ITRC PFAS-1
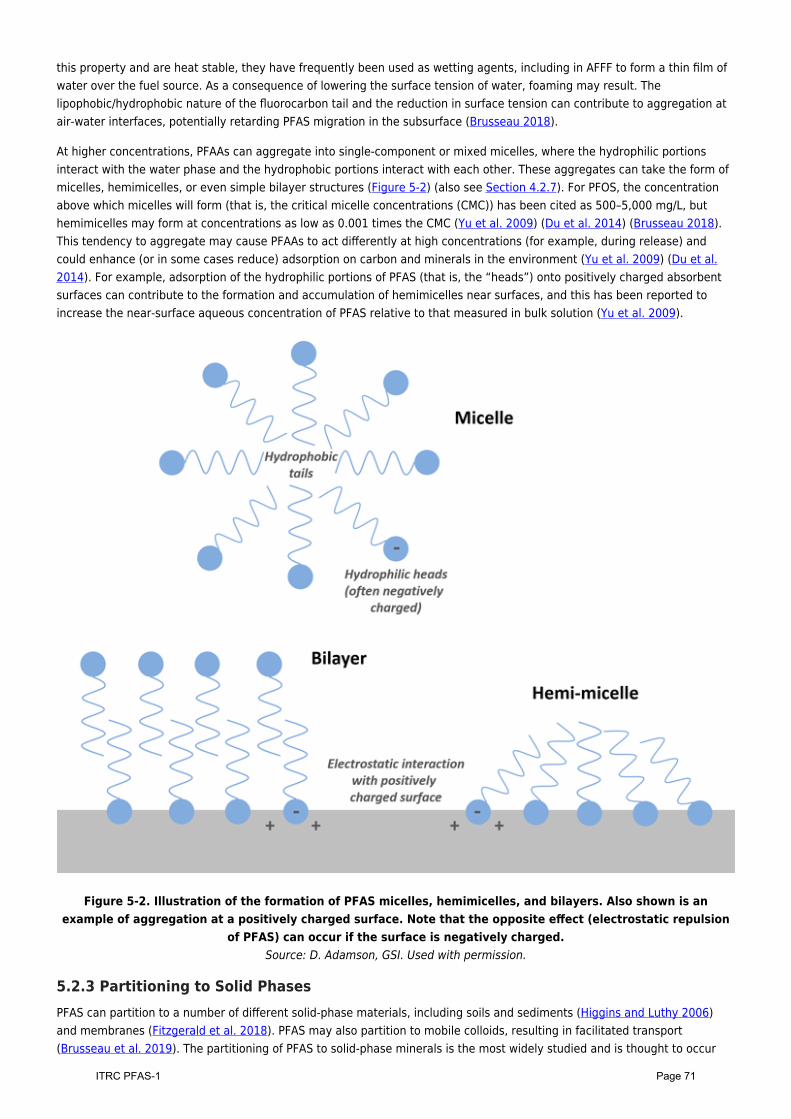
this property and are heat stable, they have frequently been used as wetting agents, including in AFFF to form a thin film ofwater over the fuel source. As a consequence of lowering the surface tension of water, foaming may result. Thelipophobic/hydrophobic nature of the fluorocarbon tail and the reduction in surface tension can contribute to aggregation atair-water interfaces, potentially retarding PFAS migration in the subsurface (Brusseau 2018).
At higher concentrations, PFAAs can aggregate into single-component or mixed micelles, where the hydrophilic portionsinteract with the water phase and the hydrophobic portions interact with each other. These aggregates can take the form ofmicelles, hemimicelles, or even simple bilayer structures (Figure 5-2) (also see Section 4.2.7). For PFOS, the concentrationabove which micelles will form (that is, the critical micelle concentrations (CMC)) has been cited as 500–5,000 mg/L, buthemimicelles may form at concentrations as low as 0.001 times the CMC (Yu et al. 2009) (Du et al. 2014) (Brusseau 2018).This tendency to aggregate may cause PFAAs to act differently at high concentrations (for example, during release) andcould enhance (or in some cases reduce) adsorption on carbon and minerals in the environment (Yu et al. 2009) (Du et al.2014). For example, adsorption of the hydrophilic portions of PFAS (that is, the “heads”) onto positively charged absorbentsurfaces can contribute to the formation and accumulation of hemimicelles near surfaces, and this has been reported toincrease the near-surface aqueous concentration of PFAS relative to that measured in bulk solution (Yu et al. 2009).
Figure 5-2. Illustration of the formation of PFAS micelles, hemimicelles, and bilayers. Also shown is anexample of aggregation at a positively charged surface. Note that the opposite effect (electrostatic repulsion
of PFAS) can occur if the surface is negatively charged.Source: D. Adamson, GSI. Used with permission.
5.2.3 Partitioning to Solid PhasesPFAS can partition to a number of different solid-phase materials, including soils and sediments (Higgins and Luthy 2006)and membranes (Fitzgerald et al. 2018). PFAS may also partition to mobile colloids, resulting in facilitated transport(Brusseau et al. 2019). The partitioning of PFAS to solid-phase minerals is the most widely studied and is thought to occur
Page 71ITRC PFAS-1
through two primary processes: 1) sorption to organic carbon via hydrophobic interactions, and 2) electrostatic interactions(Higgins and Luthy 2006). The relative contribution of each process can vary depending on surface chemistry and othergeochemical factors.
PFAS partitioning to solids isvariable and uncertain, anddepends on site-specificfactors.
In particular, understanding the partitioning behavior of PFCAs and PFSAs to soil organiccarbon has been the subject of significant research. PFCAs and PFSAs are present asorganic anions at relevant environmental pH values, and are therefore relatively mobilein groundwater (Xiao et al. 2015), but will also tend to associate with the organic carbonfraction of soil or sediment (Higgins and Luthy 2006) (Guelfo and Higgins 2013) in thesaturated zone. Sorption to organic carbon generally increases with increasingperfluoroalkyl tail length (Higgins and Luthy 2006; Guelfo and Higgins 2013; Sepulvadoet al. 2011; Campos Pereira et al. 2018), indicating that the short-chain PFSAs (forexample, PFBS) and PFCAs (for example, PFHxA) are less retarded than their long-chaincounterparts (PFOS and PFOA, respectively). In addition, PFSAs tend to sorb morestrongly than PFCAs of equal chain length (Higgins and Luthy 2006), and branchedisomers are less sorptive than linear isomers (Karrman et al. 2011).
Table 4-1 presents the range of available organic carbon partitioning coefficients (Koc) for environmentally relevant PFAS. Koc
is a soil organic carbon-normalized sorption coefficient and may serve as a useful parameter for evaluating transportpotential. However, this parameter does not directly capture any contributions from electrostatic interactions, meaning thatestimating retardation in groundwater by measuring the fraction of organic carbon (foc) in soil in combination with aliterature-derived Koc value may underestimate (or in some cases, overestimate) retardation.
Li, Oliver, and Kookana (2018) compiled data from several literature studies to show that the bulk partitioning coefficients(Kd) estimated for various PFAS included in these studies were best correlated with organic carbon content and pH. However,a study by Barzen-Hanson (2017) showed a general lack of correlations between soil parameters (such as organic carbon)and partition coefficients derived for some PFAS, such as anionic fluorotelomer sulfonates as well as several cationic andzwitterionic PFAS. Anderson, Adamson, and Stroo (2019) used field data from a large number of sites with AFFF releases toestablish that organic carbon significantly influenced PFAS soil-to-groundwater concentration ratios, and they used statisticalmodeling to derive apparent Koc values for 18 different PFAS based on these data. Soil type and the nature of the organiccarbon also strongly influence sorption of PFAS associated with hydrophobic partitioning. For example, Zhi and Liu (2018)reported that the PFAS sorption potential of pyrogenic carbonaceous material (for example, biochar) was 14–780 timeshigher than humic-based material with a comparable fraction of organic carbon.
Understanding the effects of sorption associated with hydrophobic partitioning on contaminant transport typically relies onassumptions that 1) there is equilibrium between contaminants in the solid phase and the aqueous phase, and 2) sorption isreversible. In idealized systems, PFAS sorption kinetics vary by constituent, but equilibrium is generally achieved overseveral days to weeks (Xiao, Ulrich, et al. 2017). However, in surface water bodies and groundwater, sorption is more likelyto be subject to mass transfer effects, and temporal changes in conditions (for example, episodic releases, precipitationevents) may also make assumptions about equilibrium challenging. The meta-analysis by Anderson, Adamson, and Stroo(2019) showed that PFAS soil-to-groundwater concentration ratios across multiple sites were strongly influenced by thedegree of flushing that had occurred. These results suggest that mass transfer limitations are contributing to increased soilretention at poorly flushed sites (those with low precipitation and deep groundwater), such that equilibrium assumptions forhydrophobic partitioning are not necessarily valid. In addition, there is evidence that desorption occurs more slowly thansorption for certain PFAS (Higgins and Luthy 2006; Chen, Reinhard, et al. 2016; Zhi and Liu 2018). These findings areparticularly relevant for more strongly sorbing compounds like PFOS (Chen, Jiao, et al. 2016) and have importantimplications for PFAS fate and transport. For example, any portion of the released PFAS that is strongly retained withinsediments or the soil matrix would be more persistent but likely less bioavailable and less subject to migration. Lab-based Kd
values (derived using sorption isotherms) would also likely underestimate the impact of sorption during fate and transportmodeling.
The contribution of electrostatic interactions to partitioning is highly dependent on soil type and soil solution chemistry. Mostsoils contain both fixed-charge and variably charged surfaces, such that the net charge on the soil, as well as charge offunctional groups of individual PFAS, can be strongly influenced by pH. For example, the net negative charge on most clayminerals can result in electrostatic interactions with cationic functional groups that are present on some PFAS; however,many PFAS, such as PFOA and PFOS, are anionic at environmentally relevant pH, such that electrostatic repulsion in soils
Page 72ITRC PFAS-1
dominated by negatively charged minerals would enhance the mobility of anionic PFAS relative to cationic and zwitterionicPFAS. Changes in pH potentially impact these electrostatic processes by altering surface charges (or possibly the ionicnature of the PFAS). As a result, decreases in pH have been shown to enhance sorption by anionic PFAS such as PFOS andother PFAAs (Higgins and Luthy 2006), although the buffering capacity of some soils (for example, carbonates) may mitigate
these impacts. Furthermore, increased levels of polyvalent cations such as Ca2+ can lead to increased partitioning to soil(Higgins and Luthy 2006; (McKenzie et al. 2015). The effects of these various electrostatic interactions can be complex in anenvironmental setting and may hinder or facilitate transport of PFAS following a release.
For PFAS such as PFOA and PFOS that are anionic at environmentally relevant pH, measuring the anionic exchange capacityin representative soils may serve as a positive indicator of the importance of electrostatic interactions with minerals.However, because soil pH can range considerably, pH can also serve as a useful measure of potential PFAS mobility.Measurements of cation concentrations or the ionic strength of an aqueous solution may also provide useful information onthe potential contribution of electrostatic attraction to enhanced partitioning (through bridging and/or neutralization ofnegative surface charges). As noted above, additional research is needed to further evaluate if any of these bulk parameterscan be used predictively for fate and transport studies (Barzen-Hanson 2017). Regardless, interactions with organic carbonare insufficient to reliably predict PFAS partitioning coefficients, thus field values may be more appropriate for understandingPFAS transport (Knight et al. 2019; Anderson et al. 2016; Li, Oliver, and Kookana 2018).
5.2.4 Partitioning to AirPFAAs are, in general, far less volatile than many other groundwater contaminants. Measured vapor pressures for someselect PFAAs are available, including the acidic forms of PFOA, perfluorononanoic acid (PFNA), perfluorodecanoic acid (PFDA),perfluoroundecanoic acid (PFUnA), and perfluorododecanoic acid (PFDoDA) (Barton, Botelho, and Kaiser 2008; Kaiser et al.2005), and fluorotelomer alcohols (Krusic et al. 2005). Henry’s law constants for several PFAS are reported in Section 4.2.6.Vapor pressures of these compounds are generally low and water solubilities are high, limiting partitioning from water to air(USEPA 2000a). However, under certain conditions, particularly within industrial stack emissions, PFAS can be transportedthrough the atmosphere. In particular, volatiles like FTOHs may be present in the gas phase and anionic PFAS may be sorbedto particulates (Ahrens et al. 2012).
Kaiser et al. (2010) demonstrated the partitioning of PFOA to workplace air from water and dry surfaces. Partitioning to airfrom these substrates appears to dependent on conditions within the substrate, with lower pH environments contributingmore PFOA mass to air. The protonated acid form of PFOA has an elevated vapor pressure, which may explain theseobservations (Kaiser et al. 2005). Interestingly, these authors showed that more PFOA partitions from dry surfaces than fromwater and may contribute significantly to workplace exposures.
5.2.4.1 Partitioning to Air/Water InterfacesAs described above, PFAS often exhibit surfactant properties because many contain hydrophobic and hydrophilic portions.The impacts of these properties on transport are complex and have not been extensively investigated. By design, manyPFAS will preferentially form films at the air-water interface, with the hydrophobic carbon-fluorine (C-F) tail oriented towardthe air and the hydrophilic head group dissolved in the water (Krafft and Riess 2015) (Figure 5-3). This behavior influencesaerosol-based transport and deposition, and suggests that accumulation of PFAS at water surfaces will occur (Prevedouros etal. 2006). In addition, this preference for the air-water interface may have important implications for vadose zone transport,where unsaturated conditions provide significant air-water interfacial area (Brusseau 2018; Brusseau et al. 2019). Thisincludes the potential for enhanced retention at the water table and the capillary fringe, which is the subject of significantongoing research. For example, Brusseau (2018) showed that adsorption of PFOS and PFOA at the air-water interface canincrease the retardation factor for aqueous-phase transport; this interfacial process accounted for approximately 50% of thetotal retention in a model system with 20% air saturation. Using field data, Anderson, Adamson, and Stroo (2019) reportedthat soils with higher clay contents were associated with lower soil-to-water concentration ratios for multiple PFAS. Theauthors surmised that the higher water content within these clay-rich zones (relative to zones with more coarse-grainedmaterial) decreased the air/water interfacial area available for PFAS partitioning and thus decreased overall soil retention.This pattern was observed despite the potential for negatively charged clay surfaces to reduce anionic PFAS adsorptionthrough electrostatic repulsion.
Page 73ITRC PFAS-1
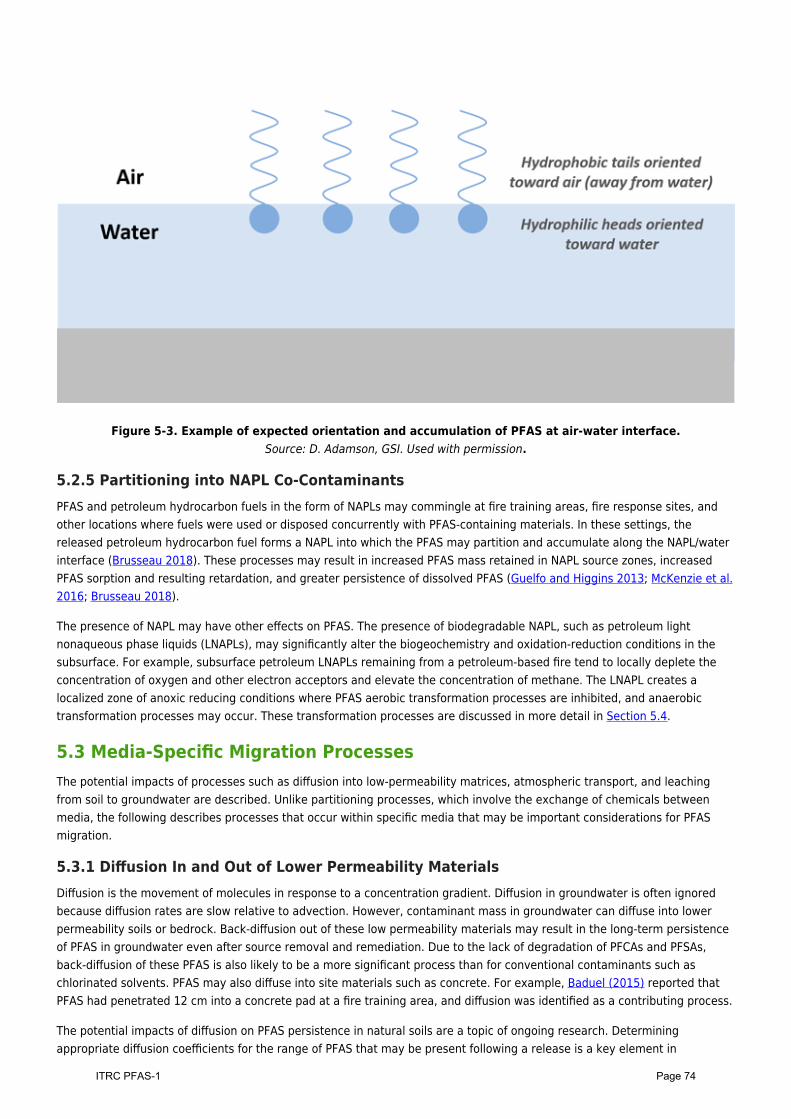
Figure 5-3. Example of expected orientation and accumulation of PFAS at air-water interface.Source: D. Adamson, GSI. Used with permission.
5.2.5 Partitioning into NAPL Co-ContaminantsPFAS and petroleum hydrocarbon fuels in the form of NAPLs may commingle at fire training areas, fire response sites, andother locations where fuels were used or disposed concurrently with PFAS-containing materials. In these settings, thereleased petroleum hydrocarbon fuel forms a NAPL into which the PFAS may partition and accumulate along the NAPL/waterinterface (Brusseau 2018). These processes may result in increased PFAS mass retained in NAPL source zones, increasedPFAS sorption and resulting retardation, and greater persistence of dissolved PFAS (Guelfo and Higgins 2013; McKenzie et al.2016; Brusseau 2018).
The presence of NAPL may have other effects on PFAS. The presence of biodegradable NAPL, such as petroleum lightnonaqueous phase liquids (LNAPLs), may significantly alter the biogeochemistry and oxidation-reduction conditions in thesubsurface. For example, subsurface petroleum LNAPLs remaining from a petroleum-based fire tend to locally deplete theconcentration of oxygen and other electron acceptors and elevate the concentration of methane. The LNAPL creates alocalized zone of anoxic reducing conditions where PFAS aerobic transformation processes are inhibited, and anaerobictransformation processes may occur. These transformation processes are discussed in more detail in Section 5.4.
5.3 Media-Specific Migration ProcessesThe potential impacts of processes such as diffusion into low-permeability matrices, atmospheric transport, and leachingfrom soil to groundwater are described. Unlike partitioning processes, which involve the exchange of chemicals betweenmedia, the following describes processes that occur within specific media that may be important considerations for PFASmigration.
5.3.1 Diffusion In and Out of Lower Permeability MaterialsDiffusion is the movement of molecules in response to a concentration gradient. Diffusion in groundwater is often ignoredbecause diffusion rates are slow relative to advection. However, contaminant mass in groundwater can diffuse into lowerpermeability soils or bedrock. Back-diffusion out of these low permeability materials may result in the long-term persistenceof PFAS in groundwater even after source removal and remediation. Due to the lack of degradation of PFCAs and PFSAs,back-diffusion of these PFAS is also likely to be a more significant process than for conventional contaminants such aschlorinated solvents. PFAS may also diffuse into site materials such as concrete. For example, Baduel (2015) reported thatPFAS had penetrated 12 cm into a concrete pad at a fire training area, and diffusion was identified as a contributing process.
The potential impacts of diffusion on PFAS persistence in natural soils are a topic of ongoing research. Determiningappropriate diffusion coefficients for the range of PFAS that may be present following a release is a key element in
Page 74ITRC PFAS-1
understanding how this process impacts PFAS persistence.
5.3.2 PFAS Transport via AirMany PFAS have been measured in air (Section 6.1) and are known to be released to air from a variety of sources (Section2.6). Air serves as an important transport media for PFAS, allowing PFAS to disperse in all wind directions, contributing toglobal dispersion, and leading to localized PFAS deposition to soils and surface water in the vicinity of emission sources (forexample, (Shin et al. 2012) which is of potential concern to site investigations.
The role of atmospheric transport depends on PFAS-specific properties such as vapor-particle partitioning, and mechanismscan be complex. Aerosols, representing a suspension of solid particles and liquid droplets in the air, provide a variety ofenvironmental media and surfaces within or upon which a range of PFAS partitioning behavior can be observed. Forexample, McMurdo et al. (2008) described the release of concentrated PFAS aerosols from a water surface (where PFAS areoften located). Airborne transport of PFAS is a potentially relevant migration pathway due to the common types of industrialrelease (for example, stack emissions). The specific means of PFAS releases from industrial sources have not beenextensively studied, but could involve processes such as droplet mobilization from drying and agitation of liquid surfaces.The importance of other sources, such as combustion emissions or windblown foam from fire training and fire response sites,on the fate and transport of PFAS in air may need to be assessed.
Differences between process temperatures (such as those found in drying operations in textile coating operations) andambient air can plausibly be expected to affect PFAS partitioning. Both water droplets and solid particles can convey PFAS instack emissions, and some PFAS may exist as vapors at elevated temperatures in stack exhaust. PFAS partitioning can alsochange as stack effluent cools, for example, as PFAS-containing droplets evaporate and leave solid particulate matter.Technologies such as fabric filters and wet scrubbers are effective at controlling particle emissions, though applications toPFAS have not been formally evaluated.
Once airborne, PFAS can occur in a gaseous state or be incorporated within particulate matter or other aerosols suspendedwithin the air. The composition of the gas phase will be dependent on the industrial process(es) contributing to emissions.Neutral volatile precursor compounds, such as FTOHs, are often the dominant PFAS present in the gas phase (Table 17-1A)and can account for at least 80% of the total PFAS mass in ambient air in an urban area (Ahrens et al. 2012).
Over the open oceans and in remote regions, FTOHs also dominate neutral PFAS and almost all are present in the gas phase(Bossi R. 2016; Lai et al. 2016; Wang, Xie, et al. 2015; Dreyer et al. 2009). In contrast, ionic PFAS, such as PFOA and PFOS,characterized by low vapor pressure and high water solubility, tend to be the dominant species found in airborne particulatematter. PFOA is associated with smaller, ultrafine particles, while PFOS is associated with larger, coarser fractions in bothurban and semirural areas (Ge et al. 2017; Dreyer et al. 2015). Wet and dry deposition are the major mechanisms of removalof PFAS from the atmosphere and can occur from the scavenging of particle-bound PFAS or partitioning of gaseous PFAS towater droplets (Dreyer et al. 2010; Barton 2007; Hurley et al. 2004). PFAS are commonly found in precipitation (rain andsnow), with wet and dry deposition estimated to occur on a time scale of a few days (Chen, Jiao, et al. 2016; Lin et al. 2014;Taniyasu et al. 2013; Zhao, Zhou, et al. 2013; Dreyer et al. 2010; Kwok et al. 2010; Liu et al. 2009; Barton 2007; Kim andKannan 2007; Hurley et al. 2004).
Atmospheric deposition can occur as dry or wet deposition, both of which are relevant for PFAS (Barton 2007, 2010; Dreyeret al. 2010; Taniyasu et al. 2013). During dry deposition, PFAS that are preferentially associated with liquid or particlephases in air (aerosols) can be naturally deposited onto surfaces via settling, diffusion, or other processes. Whenprecipitation contributes to washout of these PFAS-containing aerosols, the process is known as wet deposition. Wet and drydeposition are the major mechanisms for removal of PFAS from the atmosphere and can occur from the scavenging ofparticle-bound PFAS or partitioning of gaseous PFAS from water droplets (Dreyer et al. 2010; Barton 2007 (Hurley et al.2004). Deposition is considered a sink term for the atmosphere because mass is removed and the potential for longer rangeatmospheric transport is reduced. However, this same process thus represents a potential source of PFAS to terrestrial andaquatic environments. Once settled, PFAS adsorbed onto soils or other surfaces (including indoor surfaces) can beresuspended when particulate matter is disturbed by wind or other physical means. See Section 6.1 for further discussion ofatmospheric deposition of PFAS.
Short-range atmospheric transport and deposition can result in PFAS contamination in terrestrial and aquatic systems nearpoints of significant emissions, impacting soil, groundwater, and other media of concern (Davis et al. 2007). Evidence ofreleases has been observed in areas where hydrologic transport could not plausibly explain the presence of PFAS ingroundwater, with the extent of contamination reaching several miles from sources and in distribution patterns independent
Page 75ITRC PFAS-1
of regional hydrology (Frisbee et al. 2009; Post 2013; Post, Cohn, and Cooper 2012; NYS DOH 2016b; NH DES 2017; VT DEC2016b). Releases of ionic PFAS from factories are likely tied to particulate matter (Barton et al. 2006), which settle to theground in dry weather and are also wet-scavenged by precipitation (Slinn 1984; Sehmel 1984).
Predictive models have been applied to estimate PFAS deposition (Shin et al. 2012). The American MeteorologicalSociety/USEPA regulatory model AERMOD system contains modules to estimate both wet and dry deposition of both aerosolsand gases (USEPA 2016a). It is important to note that validation of these deposition modules has not been completed.Hence, uncertainty exists, and deposition model predictions should be interpreted with caution. Nevertheless, the modelmay be useful in understanding the pattern of PFAS found in soil and groundwater in the vicinity of PFAS emission sources(Shin et al. 2012). Key input parameters for emissions from a smokestack or vent include the height of the release point andadjacent structures, source emission rates and particle size distributions, stack effluent properties (temperature andvolumetric flow rate), meteorological data, local topography, and land use characteristics. Temporal variability can beimportant as AERMOD operates on an hourly basis. Several states have recently engaged in or reviewed AERMODapplications to industrial sources, and regulatory agencies including the New Jersey Department of EnvironmentalProtection, New Hampshire Department of Environmental Services, and the Vermont Department of EnvironmentalConservation can provide valuable information and advice on deposition model application.
Long-range transport processes are responsible for the wide distribution of neutral and ionic PFAS across the earth asevidenced by their occurrence in biota, surface snow, ice cores, seawater, and other environmental media in remote regionsas far as the Arctic and Antarctic (Bossi R. 2016; Kirchgeorg et al. 2016; Rankin et al. 2016; Wang, Xie, et al. 2015; Codlinget al. 2014; Wang et al. 2014; Kirchgeorg et al. 2013; Kwok et al. 2013; Benskin, Muir, et al. 2012; Cai, Yang, et al. 2012; Cai,Xie, et al. 2012; Cai, Zhao, et al. 2012; Ahrens, Xie, and Ebinghaus 2010; Dreyer et al. 2009; Young et al. 2007). Distributionof PFAS to remote regions far removed from direct industrial input is believed to occur from both (1) long-range atmospherictransport and subsequent degradation of volatile precursors and (2) transport via ocean currents and release into the air asmarine aerosols (sea spray) (DeSilva, Muir, and Mabury 2009; Armitage et al. 2009; Wania 2007; Ellis et al. 2004).
5.3.3 LeachingPFAS present in unsaturated soils are subject to downward leaching during precipitation, flooding, or irrigation events thatpromote dissolution of soil-bound contaminant mass (Sepulvado et al. 2011) (Ahrens and Bundshuh 2014). This process canresult in PFAS transport from surface soils to groundwater and surface water, because releases often involve surfaceapplications (for example, AFFF and biosolids) or atmospheric deposition. Leaching is also potentially relevant for plantuptake and transport of PFAS contained in landfill waste without adequate leachate control (Benskin, Muir, et al. 2012; Yanet al. 2015; Lang et al. 2017). Leaching potential is a function of media properties (for example, pH, redox conditions, andincreased partitioning with organic carbon in soil), PFAS structural properties (for example, ionic charge and chain length),and site conditions that influence the degree of flushing (for example, precipitation rates and depth togroundwater)(Gellrich, Stahl, and Knepper 2012; Anderson, Adamson, and Stroo 2019).
Although some studies have reported PFAS transport by leaching (Lindstrom et al. 2011 (Lindstrom et al. 2011; Filipovic etal. 2015; Hellsing et al. 2016; Bräunig et al. 2017), others have observed long-term retention of longer chain PFAS on shallowsoils after extended percolation (Sepulvado et al. 2011; Stahl et al. 2013; Anderson et al. 2016). In a long-term lysimeterstudy using a silty soil with some clay and natural rainfall, PFOA and shorter chained PFCAs and PFSAs traveled more rapidlythrough the soil column than did PFOS (Stahl et al. 2013). However, even after 5 years, 96.88% and 99.98% of the mass ofPFOA and PFOS, respectively, remained in the soil. This retention of PFOA and PFOS may increase the long-term persistenceof the (soil-bound) source (Baduel 2015).
5.4 Transformations
5.4.1 IntroductionNumerous studies have reported both biotic and abiotic transformations of some polyfluorinated PFAS. Polyfluorinated PFASshown to transform are referred to as precursors and typically form PFAAs. However, PFAAs have not been shown to degradeor otherwise transform under ambient environmental conditions. The fundamental differences between polyfluorinatedprecursors and perfluorinated chemicals that affect transformation potential are the presence, location, and number ofcarbon-hydrogen (C-H) bonds and potentially carbon-oxygen (C-O) bonds throughout the alkyl carbon chain. Specifically,PFAS with C-H bonds are subject to a variety of biotic and abiotic reactions that ultimately result in the formation of shorterchain PFAAs. Although available studies on both biotic and abiotic transformation of polyfluorinated PFAS primarily consist ofcontrolled laboratory experiments (discussed below), an increasing number of field studies have also been published
Page 76ITRC PFAS-1
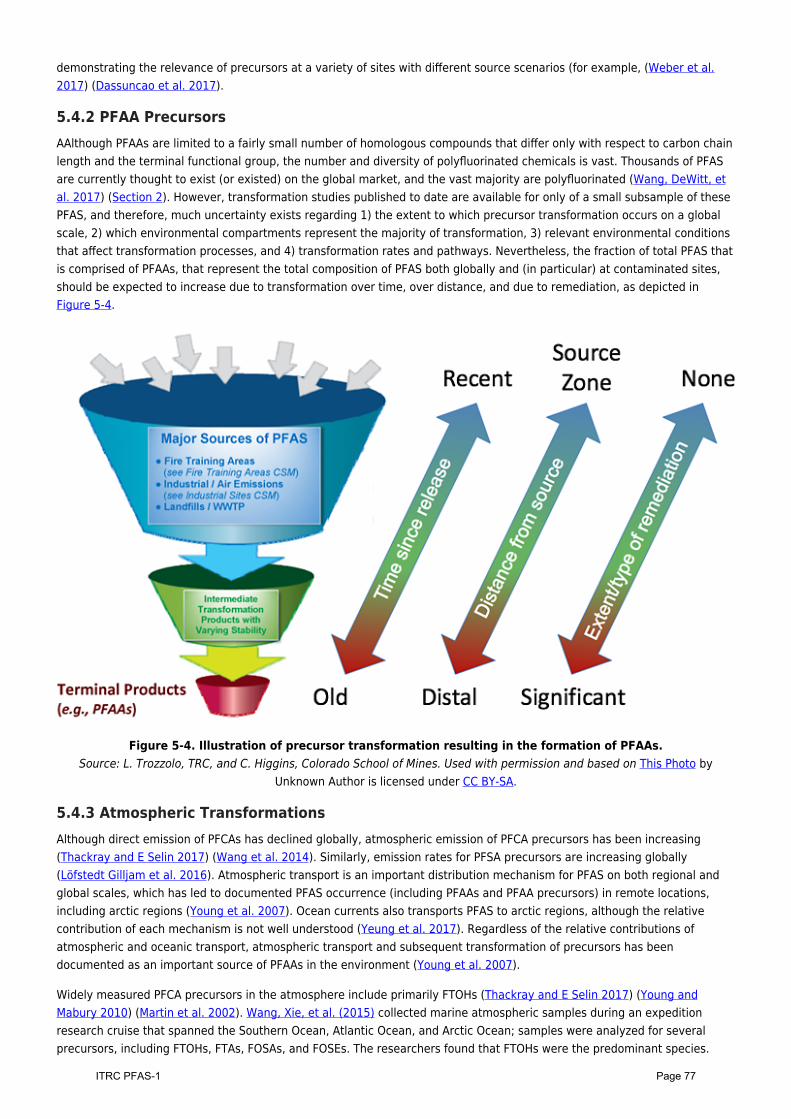
demonstrating the relevance of precursors at a variety of sites with different source scenarios (for example, (Weber et al.2017) (Dassuncao et al. 2017).
5.4.2 PFAA PrecursorsAAlthough PFAAs are limited to a fairly small number of homologous compounds that differ only with respect to carbon chainlength and the terminal functional group, the number and diversity of polyfluorinated chemicals is vast. Thousands of PFASare currently thought to exist (or existed) on the global market, and the vast majority are polyfluorinated (Wang, DeWitt, etal. 2017) (Section 2). However, transformation studies published to date are available for only of a small subsample of thesePFAS, and therefore, much uncertainty exists regarding 1) the extent to which precursor transformation occurs on a globalscale, 2) which environmental compartments represent the majority of transformation, 3) relevant environmental conditionsthat affect transformation processes, and 4) transformation rates and pathways. Nevertheless, the fraction of total PFAS thatis comprised of PFAAs, that represent the total composition of PFAS both globally and (in particular) at contaminated sites,should be expected to increase due to transformation over time, over distance, and due to remediation, as depicted inFigure 5-4.
Figure 5-4. Illustration of precursor transformation resulting in the formation of PFAAs.Source: L. Trozzolo, TRC, and C. Higgins, Colorado School of Mines. Used with permission and based on This Photo by
Unknown Author is licensed under CC BY-SA.
5.4.3 Atmospheric TransformationsAlthough direct emission of PFCAs has declined globally, atmospheric emission of PFCA precursors has been increasing(Thackray and E Selin 2017) (Wang et al. 2014). Similarly, emission rates for PFSA precursors are increasing globally(Löfstedt Gilljam et al. 2016). Atmospheric transport is an important distribution mechanism for PFAS on both regional andglobal scales, which has led to documented PFAS occurrence (including PFAAs and PFAA precursors) in remote locations,including arctic regions (Young et al. 2007). Ocean currents also transports PFAS to arctic regions, although the relativecontribution of each mechanism is not well understood (Yeung et al. 2017). Regardless of the relative contributions ofatmospheric and oceanic transport, atmospheric transport and subsequent transformation of precursors has beendocumented as an important source of PFAAs in the environment (Young et al. 2007).
Widely measured PFCA precursors in the atmosphere include primarily FTOHs (Thackray and E Selin 2017) (Young andMabury 2010) (Martin et al. 2002). Wang, Xie, et al. (2015) collected marine atmospheric samples during an expeditionresearch cruise that spanned the Southern Ocean, Atlantic Ocean, and Arctic Ocean; samples were analyzed for severalprecursors, including FTOHs, FTAs, FOSAs, and FOSEs. The researchers found that FTOHs were the predominant species.
Page 77ITRC PFAS-1
Atmospheric transformation of precursors, including FTOHs, may be an important source of PFCAs in the environment, suchas those identified in the Arctic (Schenker et al. 2008). Although direct photolysis of PFAS has not been observed, indirectphotolysis of some precursors does occur in the atmosphere and can be a significant contributor to PFCA deposition(Armitage, MacLeod, and Cousins 2009; Yarwood et al. 2007). For example, hydroxyl and chlorine radicals degrade 8:2 FTOHto PFOA in the atmosphere through reactions with hydroxyl and chlorine radicals, with similar reactions for 6:2 and 4:2FTOHs (Ellis et al. 2004) and perfluoroalkylsulfonamides, which may degrade to PFCAs and PFSAs (Martin et al. 2006). Inaddition to FTOH, other semivolatile precursors may also undergo atmospheric transformation to PFCAs (Young and Mabury2010).
Atmospheric transformation of precursors to PFCAs is a multistep process, and the PFCA product yield is a function of severalfactors, including ratio of nitros oxides (NOx) and peroxy radicals (RO2) species. High NOx levels result in lower long-chainPFCA yields, thus long-chain PFCA yields are typically higher in remote regions (Young and Mabury 2010). Thackray and ESelin (2017) calculated theoretical maximum yields for formation of PFOA and PFNA from 8:2 FTOH that were highly variable,ranging from far less than 1% to 40% (PFOA) or 80% (PFNA), depending on local photochemical conditions.
5.4.4 In Situ Transformations
5.4.4.1 Abiotic PathwaysAbiotic processes shown to cause transformations of precursors in soil and water under ambient environmental conditionsinclude hydrolysis, photolysis, and oxidation. Hydrolysis of some precursors, followed by subsequent biotransformation, canproduce PFSAs. An important example is the production of PFOS from perfluorooctane sulfonyl fluoride (POSF) (Martin et al.2010). Other hydrolysis reactions produce PFCAs. In particular, Washington and Jenkins (2015) showed that the hydrolysis offluorotelomer-derived polymeric precursors forms monomeric precursors of PFOA and other PFCAs with half-lives of 50–90years at neutral pH. Also, oxidation of precursors by hydroxyl radicals can occur in natural waters, with the fluorotelomer-derived precursors being oxidized more rapidly than electrochemical fluorination (ECF)-derived precursors (Gauthier andMabury 2005; Plumlee, McNeill, and Reinhard 2009). Shorter chain PFCAs as well as PFSAs such as perfluorobutane sulfonate(PFBS) also can be produced by oxidation reactions between hydroxyl radicals and sulfonamido derivatives (D’Eon et al.2006). Finally, in some cases, abiotic precursor transformations may not initially produce any PFAA (for example, theformation of various polyfluorinated sulfonamido intermediate compounds from ECF-derived precursors), though eventualformation of PFAAs may still be possible.
5.4.4.2 Aerobic Biological PathwaysEvidence of aerobic biotransformation is provided from studies of PFAS composition throughout the continuum ofwastewater treatment (see Arvaniti (2015) for a comprehensive review), field studies at AFFF-impacted sites (for example,(Houtz et al. 2013; McGuire et al. 2014) (Anderson et al. 2016; Weber et al. 2017), and most authoritatively from microcosmexperiments.
The literature on aerobic biotransformation collectively demonstrates, or indirectly supports, conclusions such as thefollowing:
Numerous aerobic biotransformation pathways exist with relatively rapid kinetics.All polyfluorinated precursors studied to date have the potential to aerobically biotransform to PFAAs.Aerobic biotransformation of various fluorotelomer-derived precursors exclusively results in the formation ofPFCAs, including PFOA.Aerobic biotransformation of various ECF-derived precursors primarily results in the formation of PFSAs,including PFOS.
In detail, most commonly studied in microcosm experiments have been the 6:2 and 8:2 FTOHs in soil, sludge, or aqueousmatrices. Although observed degradation rates and intermediates are variable among these studies, ≤ C8 PFCAs have beenconsistently observed as terminal transformation products (Dinglasan et al. 2004; Wang, Szostek, Buck, et al. 2005; Wang,Szostek, Folsom, et al. 2005; Liu et al. 2007; Saez, de Voogt, and Parsons 2008; Wang et al. 2009). However, a pure cultureexperiment with P. chrysosporium (a white-rot fungus) reported much lower PFCA yields with alternate pathways (Tseng etal. 2014). Other telomer-derived polyfluorinated PFAS investigated include the 6:2 fluorotelomer mercapto alkylamidosulfonate (Weiner et al. 2013), the 6:2 fluorotelomer sulfonate (Wang et al. 2011), the 4:2, 6:2, and 8:2 fluorotelomerthioether amido sulfonates (Harding-Marjanovic et al. 2015), the perfluorooctane amido quaternary ammonium salt (Mejia-Avendaño et al. 2016), the 6:2 fluorotelomer sulfonamide alkylamine, and the 6:2 fluorotelomer sulfonamide alkylbetaine(D’Agostino and Mabury 2017). All demonstrate the formation of PFCAs with variable rates and inferred pathways. Aerobic
Page 78ITRC PFAS-1
biotransformation of various ECF-derived polyfluorinated PFAS has also been demonstrated in several studies. Studied PFSAprecursors include N-ethyl perfluorooctane sulfonamido ethanol (Rhoads et al. 2008; Zhao et al. 2016; Zhang et al. 2017), N-ethyl perfluorooctane sulfonamide (Mejia Avendaño and Liu 2015), and perfluorooctane sulfonamide quaternary ammoniumsalt (Mejia-Avendaño et al. 2016). All demonstrate formation of PFSAs with variable rates and inferred pathways.
5.4.4.3 Anaerobic Biological PathwaysOnly two studies have been published to date conclusively demonstrating biotransformation of polyfluorinated PFAS underanaerobic conditions. In both instances FTOHs were studied. Both studies demonstrated the production of stablepolyfluorinated acids under methane-reducing conditions with much slower kinetics relative to aerobic biotransformation(Zhang, Szostek, et al. 2013) (Allred et al. 2015). In general, anaerobic biotransformation of polyfluorinated PFAS is notexpected to be a significant source of environmental PFAAs.
5.4.5 Polymer TransformationPolymeric substances in the PFAS family include fluoropolymers, polymeric perfluoropolyethers, and side-chain fluorinatedpolymers (Buck et al. 2011). Detailed descriptions of these polymers appear in Section 2.2.2.1. Briefly,
fluoropolymers are high–molecular weight solid plastics (> 100,000 Daltons, or Da according to Henry et al.(2018)) containing a carbon polymer backbone with fluorine directly attached to backbone carbon atoms.polymeric perfluoropolyethers contain an ether polymer backbone with F directly attached to carbon atoms.These polymeric PFAS are complex and mainly used as surfactants and surface protectants.side-chain fluorinated polymers contain a nonfluorinated polymeric backbone with fluorinated side chains; theseare synthesized from telomer-derived precursors.
Polymer transformation research has indicated the following.
Given the wide range of estimated half-lives, modeling assumptions for estimating the half-lives, different levelsof residuals present in the polymer studied, highly variable molecular weights of the polymers studied withdifferent surface area and size and with different extraction protocols, the polymer degradation studies areinconsistent.Other environmental conditions that need to be considered are redox, pH, temperature, percent moisture, andmicrobial activity in the soil microcosms for these long-term studies.Additional research is needed primarily on the biotransformation of side-chain fluorinated polymers, which arepotential precursors to PFAAs.
Side-chain fluorinated polymers are widely used for many commercial and industrial applications as surfactant and surface-protecting products (Buck et al. 2011). Therefore, understanding the biotransformation potential of these polyfluorinatedpolymers is essential. However, few studies have reported on the potential biotransformation of side-chain polymers—forexample, the fluorotelomer-based urethane polymer (Russell et al. 2010). Given the complexity of side-chain fluorinatedpolymers, there are many discrepancies among these studies. Primarily, the inability to monitor polymer concentrations isproblematic. Because analytical methods for direct quantitation of polymers are not available, all the studies except Rankinet al. (2014) monitored suspected FTOH degradation products rather than the disappearance of the polymer (Wang, Szostek,Buck, et al. 2005; Liu et al. 2007; Wang et al. 2009; Dasu, Liu, and Lee 2012; Dasu and Lee 2016). Rankin et al. (2014)qualitatively monitored the disappearance of the polymer using matrix-assisted laser desorption/ionization time-of-flight(MALDI-TOF) mass spectrometry, in addition to monitoring known degradation products. Also, the presence of impurities ornonpolymerized residuals (monomers, oligomers, PFCAs, FTOHs, etc.) complicates data interpretation and potentiallyconfounds conclusions on polymer biodegradation. Finally, the time frame for the biodegradability studies (max = 2 years) ismuch shorter than the extrapolated half-lives (decades to thousands of years) of these side-chain fluorinated polymers.Hence, modeling assumptions are also critical sources of variability.
Russell et al. (2008); Russell et al. (2010) investigated the biodegradation potential of two types of side-chainfluoropolymers, fluorotelomer-based acrylate polymer and urethane polymer in soils for 2 years. Based on the experimentaldata for PFOA, the estimated half-life of acrylate polymer was 1,200–1,700 years and urethane polymer was 28–241 years(geometric mean of 102 years). However, the polymer used in this study contained high residuals. Later, Washington et al.(2009) studied the biodegradation potential of fluorotelomer-based polyacrylate, which contained low residuals, and basedon the experimental data for PFOA, the acrylate polymer half-life was estimated at 870–1,400 years. Further, based on theassumption that degradation is surface-mediated, the authors also modeled and estimated the half-life for finely grainedpolymers, which are typical of commercial products. They did this by normalizing to the estimated surface area of the
Page 79ITRC PFAS-1
polymer and derived a half-life of 10-17 years, which suggests fine-grained, side-chain fluoropolymer products may be apotentially significant source of PFCAs to the environment. Washington et al. (2015) studied the biodegradability ofcommercial acrylate polymer for 376 days in soils using exhaustive extractions (Washington et al. 2014) and estimated half-lives ranging from 33 to 112 years. In this study, it was also observed that the acrylate polymer can undergo OH-mediatedhydrolysis in pH 10 water and it degrades 10-fold faster than in the neutral treatment. This is the only abiotic transformationof side-chain fluorinated polymer reported in the literature, so the mechanism of abiotic degradation needs furtherinvestigation. Another research group, Rankin et al. (2014) studied the biodegradation of laboratory-synthesizedfluorotelomer-based acrylate polymer in soil, plant, and biosolids for 5.5 months. Degradation rates were faster in plants andbiosolids than in soils. Even in this study, a broad range of estimated half-lives of 8–111 years was reported. The modelingassumptions used in different studies lead to variability in reported half-lives (Russell et al. 2008; Russell et al. 2010;Washington et al. 2009; Washington et al. 2010; Washington et al. 2015; Washington et al. 2018).
5.4.6 Practical ImplicationsPrecursor transformation can complicate CSMs (and risk assessments) and should be considered during comprehensive siteinvestigations. For example, atmospheric emissions of volatile precursors can result in long-range transport wheresubsequent transformation and deposition can result in detectable levels of PFAAs in environmental media independent ofobvious point sources (Vedagiri et al. 2018). With respect to site-related precursors, transformation of otherwiseunmeasured PFAS into detectable PFAAs is obviously relevant to site investigations to the extent transformation occurs afterinitial site characterization efforts. Additionally, differential transport rates between precursor PFAS and the correspondingterminal PFAA could also confound CSMs if transformation rates are slower than transport rates, as has been suggested(Weber et al. 2017).
To account for otherwise unmeasurable precursors, several surrogate analytical methods have been developed, includingthe total oxidizable precursor (TOP) assay (Houtz and Sedlak 2012), particle-induced gamma-ray emission spectroscopy(PIGE) (Schaider et al. 2017), and adsorbable organic fluorine (AOF) followed by combustion ion chromatography (Wagner etal. 2013). For more information on these surrogate analytical methods to measure precursor concentrations, see Section11.2.
5.5 PFAS Uptake into Aquatic OrganismsBecause of their unique chemical properties and persistence in the environment, some PFAS compounds have a propensityto bioaccumulate. With the exception of biota exposed to gross contamination (for example, AFFF spill sites), lower levelsare observed in invertebrates and fish and higher levels are observed in animals at the top of the food chain (for example,seagulls, polar bears) (Furl and Meredith 2010), (Ahrens and Bundshuh 2014). Tissue levels of PFAS in the rural environment,compared to lipophilic legacy compounds (for example, polychlorinated biphenyls (PCBs), DDT, mercury), remain relativelylow (μg/kg).
Ionized PFAS are polar compounds and thus tend to bind to blood proteins instead of distributing into fatty tissues. Severalstudies (Jones et al. 2003; Han et al. 2003) reported that PFOS and PFOA are generally bound to serum albumin as well asproteins in the liver and kidney and that the binding does not adversely affect binding of hormones. Thus, traditionalmethods and models that assume partitioning to lipids to estimate or characterize fate and transport of PFAS in biota (forexample, log Kow) cannot be used with this class of compounds.
In fresh or marine waters, partitioning to biota is generally defined using three operational categories.
Bioconcentration factor (BCF)–the direct uptake of PFAS by an organism from the water column (through thegills), measured as the ratio of the concentration in an organism to the concentration in water (typicallymeasured in the laboratory, units typically in L/kg)Bioaccumulation factor (BAF)–the amount of PFAS taken up from bioconcentration plus the contribution of PFASin the diet of the organism (can be measured in the laboratory or field, typically unitless);Biomagnification factor (BMF)–an increase in tissue concentration as one moves up the food chain based on apredator/prey relationship (always measured in the field, typically unitless), often defined as the concentration ofchemical in an organism divided by the concentration of chemical in its food.
There are hundreds of publications addressing partitioning of PFAS into biota by all three mechanisms and the subject is toobroad to cover in this document. To assist in understanding this process, a sampling of data from some of the more visiblereview papers, along with references, is provided in Table 5-1 (as a separate Excel file). This table includes values for both
Page 80ITRC PFAS-1
invertebrates and fish. It is also important to add that due to both the historical precedence and domination of most mediaby PFOA/PFOS, most research evaluating PFAS uptake to aquatic organisms has focused on these two compounds.
5.5.1 BioconcentrationTable 5-1 presents BCFs that are available for aquatic organisms for PFOA, PFDA, PFUnA, PFDoA, PFTA, PFOS, and PFHxS.Information addressing the mechanism of bioconcentration is presented in a study conducted by Martin et al. (2003), whoexposed rainbow trout to relatively pure concentrations of each individual compound for 12 days. This study is veryinformative because it showed that the uptake of PFAS compounds is directly proportional to the length of the carbon chainand inversely proportional to the critical micelle concentration (CMC) (the level at which one half of the molecules areassociated as micelles). They also showed that PFAS accumulated to the greatest extent in the blood, followed by thekidney, liver, and gall bladder, with lower levels accumulating in the gonads, followed by adipose tissue and muscle tissue.This tissue-dependent distribution is apparently due to PFAS having a high affinity for serum albumin and fatty acid bindingproteins.
Carboxylates and sulfonates with perfluoroalkyl chain lengths shorter than seven and six carbons, respectively, could not bedetected in most tissues and were considered to have insignificant BCFs. Martin et al. (2003) also showed that sulfonateshad greater BCFs, half-lives, and rates of uptake than the corresponding carboxylate of equal chain length, indicating thathydrophobicity, as predicted by the CMC, is not the only determinant of PFAS bioaccumulation potential and that thefunctional group must be considered. PFOA had the lowest BCF, which is similar to its behavior in the field, having beenreported to be relatively inefficient in accumulating in aquatic organisms. Others have also shown that shorter chain PFCAsand PFSAs (less than eight and six carbons, respectively) are not readily bioconcentrated or accumulated (Conder et al.2008; Martin et al. 2013; Houde et al. 2011).
5.5.2 BioaccumulationPFAS have accumulated in a variety of wildlife, generally fish-eating species, across the globe. The large amount of literatureand inventories of wildlife samples containing PFAS residues attests to the widespread distribution of these compounds dueto multiple global sources, with the majority of sampling being conducted to support hypotheses on long-range fate andtransport, temporal trends, and industrial sources. Interestingly, most work has been done in the Northern Hemisphere andsome authors have opined that levels are lower in the Southern Hemisphere. One study in Australia, however, found amongthe highest PFOS concentrations reported worldwide in the livers of dolphins in heavily industrialized regions of SouthAustralia (Gaylard 2017). The study indicates that the population was the highest it has been in the last 30 years, suggestingPFAS is not adversely affecting this population.
Many authors will use the terms “bioconcentration” and “bioaccumulation” interchangeably, which is incorrect.Bioaccumulation can be measured in both the laboratory and the field, although the latter is the preferred method, as thishas more relevance to the real world, including useful data to apply to the protection of public health (for example,recreational fish consumption). It is also important to state that accumulation should be reported out as a whole-body value,because reporting BCF/BAF according to tissues (blood, liver, kidney) will overestimate the values.
Mechanistically, bioaccumulation in aquatic organisms is not that different from bioconcentration because diet does not playas big a role in uptake of PFAS as uptake from the water column (Giesy et al. 2010). The classical paradigm for organicpollutants, known as the “target lipid model,” allows for an accurate prediction of toxicants (PAHs, PCBs, chlorinatedpesticides) in aquatic organisms by simply knowing the water/octanol coefficient (Kow) of the compound. The uniqueness ofPFAS colligative properties means this model does not work and there is still a lot of uncertainty surrounding the mechanismof bioaccumulation.
A comparative study by Conder et al. (2008), addressing the differences in bioaccumulation between perfluorocarboxylates,perfluorosulfonates, and legacy compounds, provides key insights into the understanding of the disposition of PFAS inaquatic organisms.
Bioconcentration and bioaccumulation of perfluorinated acids are directly related to the length of eachcompound’s fluorinated carbon chain.Fluorinated sulfonates are more bioaccumulative than carboxylates of the same carbon chain length.Fluorinated carboxylates with seven carbons or fewer (perfluorooctanoate and shorter PFCAs) are not consideredbioaccumulative according to promulgated persistent, bioaccumulative, and toxic (PBT) criteria of 1,000–5,000L/kg.
Page 81ITRC PFAS-1
PFCAs with seven fluorinated carbons or fewer have low biomagnification potential in food webs.More research is necessary to characterize the bioaccumulation potential of carboxylates with longer fluorinatedcarbon chains (> 7 fluorinated carbons), as carboxylates with longer carbon chains may exhibit partitioningbehavior similar to or greater than PFOS.
Table 5-1, which presents some BAFs tabulated from a selection of journal/review articles, validates some of these insights.For example, in comparing BAFs for PFOA with PFOS across all species, it is clear that the BAFs for PFOA are about twoorders of magnitude lower than PFOS. Comprehensive reviews (Ahrens and Bundshuh 2014; Houde et al. 2008) indicate thatPFOS (8 carbon chain) is typically the dominant PFAS in animals. They also show that in invertebrates, PFOA and PFOS havesimilar concentrations (~1–10 ug/kg) and that tissue levels generally increase in concentration with an increase in trophicposition of the food chain. Ahrens (2014) Ahrens and Bundshuh (2014) opine that the lower bioaccumulation potential ofPFOA may be driven by the shorter (7 carbon) perfluorocarbon chain than seen in PFOS (8 carbon chain). In any event, it isapparent that, like other persistent compounds, bioaccumulation may take the shape of an inverted U-shaped curve; that is,accumulation is limited on one end by shorter chain compounds (≤ 7 carbons) and on the other end of the curve bymolecular size (for example, ≥ 13 fluorinated carbons).
Finally, it is important to note that PFAS precursors may contribute to the PFAS body burden. Atmospheric measurementshave shown the widespread occurrence of PFAS precursors like FTOHs and perfluorinated sulfonamide alcohols. The conceptis that, once absorbed by an organism, the precursor(s) would be metabolized to PFOA (for example, from 8:2 fluorotelomeralcohol) or to PFOS (for example, from N-ethyl perfluorooctane sulfonamidoethanol) (Gebbink, Berger, and Cousins 2015;Galatius et al. 2013). Additional research on how PFAS precursor may contribute to the body burden of fish and wildlife willbe needed to determine the overall dynamics involved with the bioaccumulation process.
5.5.3 BiomagnificationStudies of PFAS in the Great Lakes and marine/arctic ecosystems have generally shown that there can be trophic levelbiomagnification within a food web, particularly for PFOS and some long-chain PFCAs (Martin et al. 2004; Houde et al. 2006;Houde et al. 2011; Butt et al. 2010; Tomy et al. 2004; 2009). Because the BMF is the concentration in a predator divided bythe concentration in its prey, calculated BMFs are highly variable depending on what types of tissues were analyzed andwhat assumptions the researcher made in defining biomagnification relative to the animals’ prey diet (often determinedthrough analysis of stomach contents). Some authors adjust BMFs according to enrichment based on stable isotopes ofcarbon and nitrogen, which are termed “trophic magnification factors” (TMFs). TMFs are believed to be a more objectivemetric in terms of biomagnfication between different trophic levels.
Table 5-1 (provided as a separate Excel file) presents BMFs and TMFs calculated for a number of different PFAS compounds.Most of the values in this table are cited from a review by Franklin (2016), who analyzed the results of 24 peer-reviewedstudies reporting field-derived BMFs or TMFs for 14 PFAS (with BMF values ranging over several orders of magnitude from<<1.0 to >>1.0). Franklin (2016) made the case that “in practice, the study-to-study (and even within-study) variability ofthe results is so great that they are of very restricted usefulness for assessing bioaccumulation potential status.” Heattributes this variability to several factors, including differing ways in which the metrics are expressed (for example,individual tissue analyses versus whole body), nonachievement of the assumed steady-state conditions, uncertainties infeeding ecology, and the metabolism of precursor compounds. Some of the references cited in Franklin (2016) are discussedbelow.
Martin et al. (2010) estimated BMFs for a pelagic food web in Lake Ontario, with the lake trout as the top predator. Theywere able to show, after adjusting for benthic versus pelagic organisms, that some PFAS compounds biomagnify, with TMFsranging from 0.51 for FOSA to 5.88 for PFOS. Contrary to other freshwater studies, Lescord et al. (2015) showed that trophicposition did not correlate with the degree of biomagnification. These authors observed negative relationships between PFASand stable nitrogen isotope ratios (δ15N) in three out of six lakes, suggesting no biomagnification of PFAS throughfreshwater arctic food webs. Overall, their results suggested that a taxon’s horizontal but not vertical position in the foodweb affects its PFAS concentrations.
A study by Houde et al. (2006) looked at PFOS and C8–C14 perfluorinated carboxylates in the bottlenose dolphin at twomarine sites (Sarasota Bay, FL, and Charleston, SC). Based on estimated TMFs, those authors concluded that PFOS andC8–C11 PFCAs biomagnified in this marine food web (Table 5-1, also cited by (Franklin 2016)). Interestingly, for PFCAs, PFOAhad the highest TMF, with values progressively decreasing as chain length increased. Conder et al. (2008) reported similarresults for perfluorinated acids, with BMF values ranging from 0.1 to 20 (geometric mean of 2). They concluded and Lescordet al. (2015) affirmed that PFCAs with less than seven carbons, and PFSAs with less than six carbons, do not biomagnify and
Page 82ITRC PFAS-1
that the bioaccumulation of PFCAs can be directly related to fluorinated carbon chain length (just as the bioaccumulation ofpersistent lipophilic compounds can be related to hydrophobicity). Conder et al. (2008) also noted that the biomagnificationof PFCAs in aquatic food webs is lower than that of most persistent lipophilic compounds, with PFOS being the onlyperfluorinated acid consistently exhibiting the potential for biomagnification. Finally, Butt et al. (2008) observedbiomagnification factors for PFAS in “ringed seal–polar bear” food webs of the Canadian Arctic. Biomagnification factors weregreater than one for C8–C14 PFCAs, as well as for PFOS and PFOSA. Like Houde et al. (2006), they observed a decrease inBMF as the carbon chain number increased.
5.6 PFAS Uptake into PlantsBecause PFAS have both hydrophilic and hydrophobic properties, plants can be expected to take these compounds upthrough their root systems, after which they would be translocated to stems, shoots, leaves, and fruiting bodies. It is logicalto assume that plants growing closer to contaminated sources or irrigated with PFAS-containing water would have higherlevels of PFAS compounds compared to plants more distant from the PFAS source, subject to site-specific conditions such assoil properties. It has already been documented that the land application of biosolids may contaminate soil with PFAScompounds and that animals fed silage from land-applied fields will have elevated levels in their tissues (Lindstrom et al.2011; Skutlarek, Exner, and Farber 2006). This also raises concerns about contamination of wildlife consuming plants fromagricultural areas. Airborne PFAS emissions from industrial sites in China were found to impact the concentration of PFAS inbark and tree leaves, with the theory that the bioconcentration in the latter may occur through uptake through the stomata(Shan et al. 2014).
5.6.1 Bioconcentration/BioaccumulationTable 5-2 (provided as a separate Excel file) contains BCF and BAF values for 14 different PFAS for a variety of plant species.In the cited plant uptake studies, BCF and BAF are defined as PFAS concentration in plant(mass/mass) divided by PFASconcentration in soil (mass/mass) and are used interchangeably. This differs from the definition of BCF and BAF for animalsin Section 5.5. A number of BAF values were obtained from studies in which PFAS was introduced to crops through irrigationwater or biosolids-amended soils (Blaine et al. 2013; Blaine, Rich, Sedlacko, Hundal, et al. 2014; Blaine, Rich, Sedlacko,Hyland, et al. 2014). The materials harvested for analysis included both inedible (for example, plant leaves) and edibleportions of crops (fruit, lettuce leaves, and roots). Other BCFs and BAFs were obtained from investigations of plants exposedto PFAS from soil, groundwater, surface water, or air in close proximity to PFAS release sites (Mudumbi et al. 2014; Zhang etal. 2015; Gobelius, Lewis, and Ahrens 2017). In general, it can be observed that 1) the shorter chain (more water soluble)PFAS are taken up more readily than the longer chain homologues, and 2) the majority of the plant BCFs and BAFs fallbetween a range of 0.1 and 10. A BCF or BAF of 1.0 indicates no net accumulation of PFAS from soil to plant. Such a BCF orBAF indicates that the soils and the plant of interest have the same concentration of PFAS per unit weight. This, however,does not indicate that an equilibrium condition exists between soils and plants. Some plants, like lettuce, contain a largepercentage of water, which may help to explain the relatively high BAF of 56.8 observed by Blaine et al. (2013). In thecontrolled studies of edible crops, short-chain PFCAs and PFSAs exhibited greater BAFs compared to long-chain compounds.
Blaine et al. (2013) studied the uptake of PFAAs by greenhouse lettuce and tomato grown in soils prepared to mimic anindustrially impacted biosolids-amended soil, a municipal biosolids-amended soil, and a control soil (but incorporatedcontaminated biosolids equivalent to 10 times higher than the agronomic rates allowed for Class B biosolids), a municipalbiodolids-amended soil, and a control soil. BCFs for many PFAAs were well above unity, with PFBA having the highest BCF inlettuce (56.8) and PFPeA the highest in tomato (17.1) in the industrially impacted biosolids-amended soil. BAFs for PFCAsand PFSAs were, in general, slightly higher in the industrially impacted soil than in the municipal soil (∼0.3−0.8 log units).The BCFs for PFAAs in greenhouse lettuce decreased approximately 0.3 log units per -CF2 group (one carbon, two fluorinegroups in a molecule). They also conducted a limited field study, in which they measured PFAA levels in lettuce and tomatogrown in field soil amended with only a single application of biosolids (at the agronomic rate for nitrogen). The PFAA levelswere predominantly below the limit of quantitation (LOQ). In addition, corn stover, corn grains, and soil were collected fromseveral full-scale biosolids-amended farm fields. At these fields, all PFAAs were below the LOQ in the corn grains and onlytrace amounts of PFBA and PFPeA were detected in the corn stover. The Blaine et al. (2013) study confirms that thebioconcentration of PFAAs from biosolids-amended soils depends strongly on PFAA concentrations, soil properties, type ofcrop, and analyte. BCFs developed in Blaine et al. (2013) Blaine et al. (2013) can be seen in Table 5-2.
Gobelius, Lewis, and Ahrens (2017) studied the uptake of 26 PFAS in plants (trees) at an AFFF (fire training) site withcontaminated soil and groundwater. Samples from groundwater and different plant species (birch, spruce, cherry, ash, elder,beechfern, and wild strawberry) and tissues (that is, roots, trunk/cores, twigs, leaves/needles) were collected. Foliage had
Page 83ITRC PFAS-1

the highest BCFs of all tissues, ranging from 0 to 14,000 and accumulated the highest number ofPFAS (8 out of 26), withbirch sap showing BCF values up to 41 for 6:2 FTSA. The highest mean BCFs were found for 6:2 FTSA (472; n = 52), PFOS(28; n = 36), PFHxS (10; n = 42), and PFOA (5; n = 24), which might correspond to the AFFF composition used at the site.For PFOA, the mean BCFs (±s.d.) were 18 ± 15 for spruce, followed by birch (1.2 ± 1.5) and cherry (0.25 ± 0.043). Theauthors concluded that PFAS were detected in all plant species, and the distribution followed the order of “shoots toroots”—that is, leaves > twigs/stems > trunk > roots. They cited other authors who have shown that “this order has provenapplicable to all samples and species.” Hence, PFAS tend to accumulate in the vegetative portions rather than in the plantstorage tissues.
Updated April 14, 2020.
Page 84ITRC PFAS-1
6 Media-Specific OccurrenceThe long period of time during which PFAS have been produced and the many sources of PFAS release to the environmenthave resulted in low-level contamination of most environmental media worldwide. The concentrations of these human-caused ambient or “background” concentrations may vary widely, based on proximity to industrial areas, patterns of air andwater dispersion, and many other factors. As a result, any claims regarding “universal” values for background levels of PFASshould be viewed skeptically. This section provides a relative understanding of PFAS concentrations in various environmentalmedia but does not represent an exhaustive literature review. Note that media-specific occurrences of PFAS are constantlybeing added in the literature and on state, federal, and other countries’ PFAS websites.
The following sections include figures summarizing the observed concentrations of PFAS that have been reported in theliterature. Important details concerning each study used in developing the figures are included in the tables in Section 17.1.As discussed under PFAS Releases to the Environment (Section 2.6), the presence of PFAS in environmental media andecological receptors has been traced to air emissions; direct discharges to soil, groundwater, and surface water; and leakagefrom landfills. Sections on Phase Partitioning (Section 5.2) and Media-Specific Migration Processes (Section 5.3) illustrate thatPFAS occurrence in the air, aqueous, and solid phases is highly interrelated. Subsequent sections on Human Health Effects(Section 7.1) and Ecological Toxicology (Section 7.2) suggest that PFAS risks to human health may result from exposure viadrinking water, groundwater, soils, food, and other media types. Further, ecological impacts are observed on a global scale.This suggests that a complete assessment of PFAS sources and exposure risks, including fate and transport processes thatmay drive future exposure concerns, requires understanding of PFAS occurrence across multiple phases. This sectionfocuses on occurrence in air, soil and sediment, groundwater, surface water, and biota.
PFAS occurrence in several media types is an active area of research. As discussed in Section 11, sampling and analyticalmethods are still being optimized and standardized; thus, it is difficult to compare results between studies and conclusionsmay change over time. PFAS concentrations presented below for different media often indicate maximum values; mean ormedian values are often well below the maximum values reported for different studies. The processes that influence media-specific PFAS concentrations are illustrated in CSMs shown in Figure 2-16, Figure 2-17 and Figure 2-18.
Section Number Topic
6.1 Air
6.2 Soil and Sediment
6.3 Groundwater
6.4 Surface Water
6.5 Biota
6.1 AirCertain PFAS are found in ambient air, with elevated concentrations observed or expected in urban areas nearest to majoremission sources described in Section 2.6, such as industrial facilities that produce PFAS or use PFAS chemicals or productsin manufacturing; areas where Class B (fluorine-containing) firefighting foams are used or released; waste managementfacilities, including landfills and wastewater treatment plants; and areas of biosolids production and application (Barton et al.2006; Ahrens et al. 2011; Liu et al. 2015). Reported concentrations for ionic species such as PFOA and PFOS typically fall
within a range of about 1–20 pg/m3 (picograms/cubic meter), although concentrations of PFOA as high as 900,000 pg/m3
have been observed near large manufacturing facilities, including in Parkersburg, West Virginia (Barton (Barton et al. 2006).
Concentrations of volatile PFAS such as FTOHs can be in the hundreds of pg/m3 in outdoor air (Figure 6-1A and Table 17-1A).
PFAS have also been observed in indoor air and dust in homes, offices, and other indoor environments (Figure 6-1B and
Page 85ITRC PFAS-1
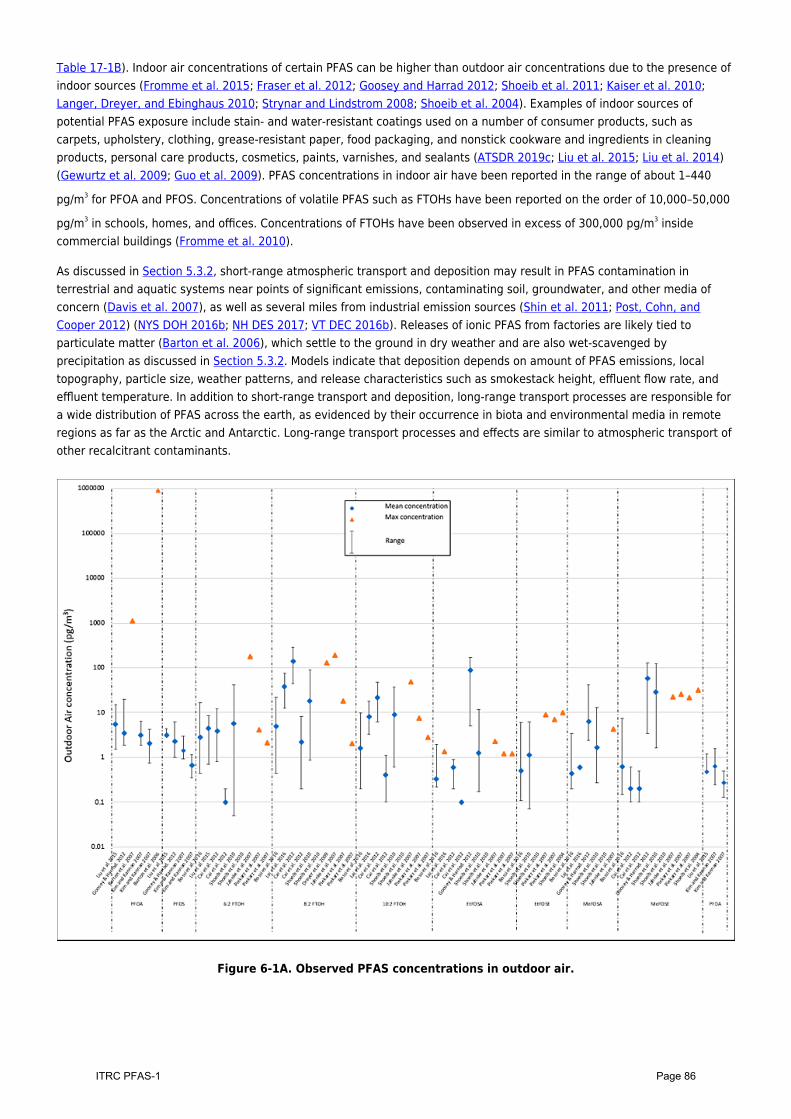
Table 17-1B). Indoor air concentrations of certain PFAS can be higher than outdoor air concentrations due to the presence ofindoor sources (Fromme et al. 2015; Fraser et al. 2012; Goosey and Harrad 2012; Shoeib et al. 2011; Kaiser et al. 2010;Langer, Dreyer, and Ebinghaus 2010; Strynar and Lindstrom 2008; Shoeib et al. 2004). Examples of indoor sources ofpotential PFAS exposure include stain- and water-resistant coatings used on a number of consumer products, such ascarpets, upholstery, clothing, grease-resistant paper, food packaging, and nonstick cookware and ingredients in cleaningproducts, personal care products, cosmetics, paints, varnishes, and sealants (ATSDR 2019c; Liu et al. 2015; Liu et al. 2014)(Gewurtz et al. 2009; Guo et al. 2009). PFAS concentrations in indoor air have been reported in the range of about 1–440
pg/m3 for PFOA and PFOS. Concentrations of volatile PFAS such as FTOHs have been reported on the order of 10,000–50,000
pg/m3 in schools, homes, and offices. Concentrations of FTOHs have been observed in excess of 300,000 pg/m3 insidecommercial buildings (Fromme et al. 2010).
As discussed in Section 5.3.2, short-range atmospheric transport and deposition may result in PFAS contamination interrestrial and aquatic systems near points of significant emissions, contaminating soil, groundwater, and other media ofconcern (Davis et al. 2007), as well as several miles from industrial emission sources (Shin et al. 2011; Post, Cohn, andCooper 2012) (NYS DOH 2016b; NH DES 2017; VT DEC 2016b). Releases of ionic PFAS from factories are likely tied toparticulate matter (Barton et al. 2006), which settle to the ground in dry weather and are also wet-scavenged byprecipitation as discussed in Section 5.3.2. Models indicate that deposition depends on amount of PFAS emissions, localtopography, particle size, weather patterns, and release characteristics such as smokestack height, effluent flow rate, andeffluent temperature. In addition to short-range transport and deposition, long-range transport processes are responsible fora wide distribution of PFAS across the earth, as evidenced by their occurrence in biota and environmental media in remoteregions as far as the Arctic and Antarctic. Long-range transport processes and effects are similar to atmospheric transport ofother recalcitrant contaminants.
Figure 6-1A. Observed PFAS concentrations in outdoor air.
Page 86ITRC PFAS-1
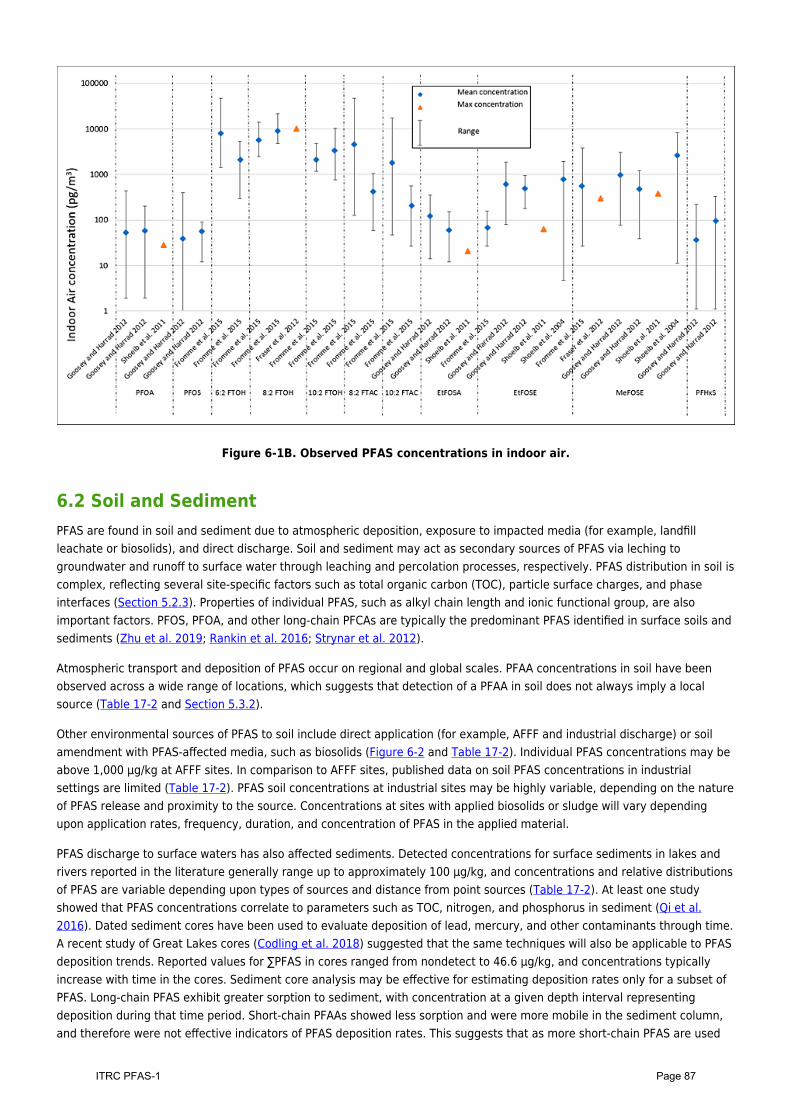
Figure 6-1B. Observed PFAS concentrations in indoor air.
6.2 Soil and SedimentPFAS are found in soil and sediment due to atmospheric deposition, exposure to impacted media (for example, landfillleachate or biosolids), and direct discharge. Soil and sediment may act as secondary sources of PFAS via leching togroundwater and runoff to surface water through leaching and percolation processes, respectively. PFAS distribution in soil iscomplex, reflecting several site-specific factors such as total organic carbon (TOC), particle surface charges, and phaseinterfaces (Section 5.2.3). Properties of individual PFAS, such as alkyl chain length and ionic functional group, are alsoimportant factors. PFOS, PFOA, and other long-chain PFCAs are typically the predominant PFAS identified in surface soils andsediments (Zhu et al. 2019; Rankin et al. 2016; Strynar et al. 2012).
Atmospheric transport and deposition of PFAS occur on regional and global scales. PFAA concentrations in soil have beenobserved across a wide range of locations, which suggests that detection of a PFAA in soil does not always imply a localsource (Table 17-2 and Section 5.3.2).
Other environmental sources of PFAS to soil include direct application (for example, AFFF and industrial discharge) or soilamendment with PFAS-affected media, such as biosolids (Figure 6-2 and Table 17-2). Individual PFAS concentrations may beabove 1,000 μg/kg at AFFF sites. In comparison to AFFF sites, published data on soil PFAS concentrations in industrialsettings are limited (Table 17-2). PFAS soil concentrations at industrial sites may be highly variable, depending on the natureof PFAS release and proximity to the source. Concentrations at sites with applied biosolids or sludge will vary dependingupon application rates, frequency, duration, and concentration of PFAS in the applied material.
PFAS discharge to surface waters has also affected sediments. Detected concentrations for surface sediments in lakes andrivers reported in the literature generally range up to approximately 100 μg/kg, and concentrations and relative distributionsof PFAS are variable depending upon types of sources and distance from point sources (Table 17-2). At least one studyshowed that PFAS concentrations correlate to parameters such as TOC, nitrogen, and phosphorus in sediment (Qi et al.2016). Dated sediment cores have been used to evaluate deposition of lead, mercury, and other contaminants through time.A recent study of Great Lakes cores (Codling et al. 2018) suggested that the same techniques will also be applicable to PFASdeposition trends. Reported values for ∑PFAS in cores ranged from nondetect to 46.6 μg/kg, and concentrations typicallyincrease with time in the cores. Sediment core analysis may be effective for estimating deposition rates only for a subset ofPFAS. Long-chain PFAS exhibit greater sorption to sediment, with concentration at a given depth interval representingdeposition during that time period. Short-chain PFAAs showed less sorption and were more mobile in the sediment column,and therefore were not effective indicators of PFAS deposition rates. This suggests that as more short-chain PFAS are used
Page 87ITRC PFAS-1
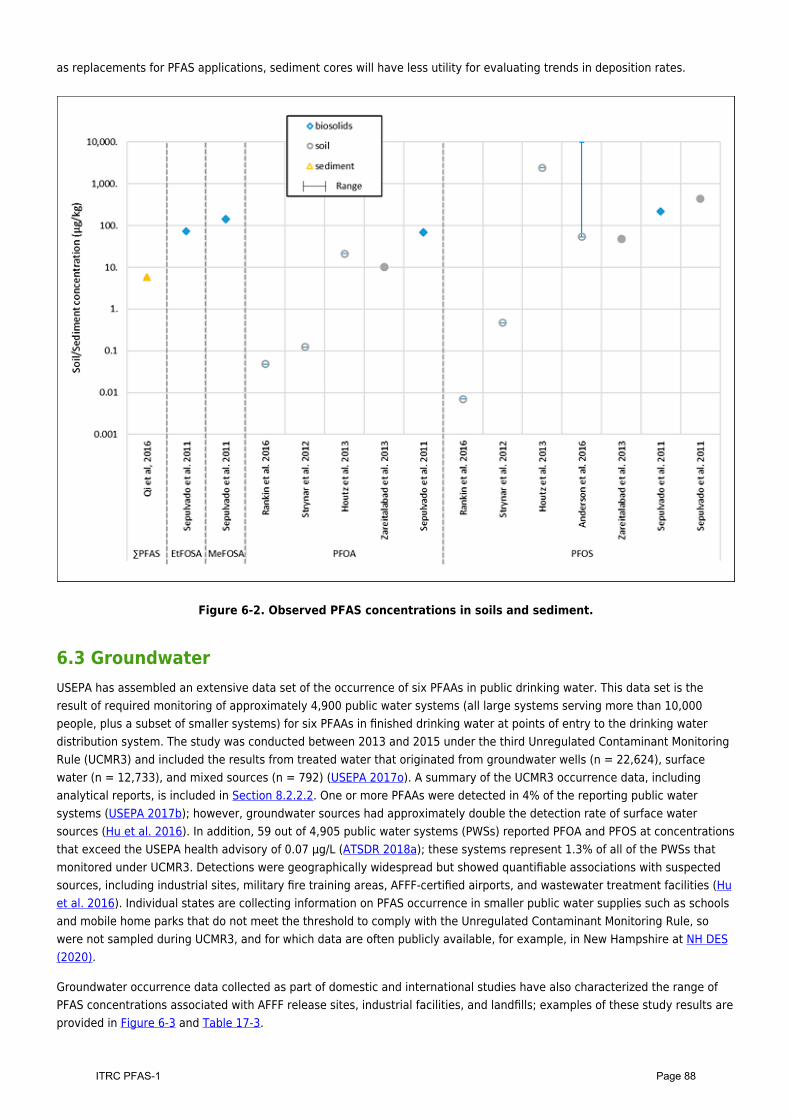
as replacements for PFAS applications, sediment cores will have less utility for evaluating trends in deposition rates.
Figure 6-2. Observed PFAS concentrations in soils and sediment.
6.3 GroundwaterUSEPA has assembled an extensive data set of the occurrence of six PFAAs in public drinking water. This data set is theresult of required monitoring of approximately 4,900 public water systems (all large systems serving more than 10,000people, plus a subset of smaller systems) for six PFAAs in finished drinking water at points of entry to the drinking waterdistribution system. The study was conducted between 2013 and 2015 under the third Unregulated Contaminant MonitoringRule (UCMR3) and included the results from treated water that originated from groundwater wells (n = 22,624), surfacewater (n = 12,733), and mixed sources (n = 792) (USEPA 2017o). A summary of the UCMR3 occurrence data, includinganalytical reports, is included in Section 8.2.2.2. One or more PFAAs were detected in 4% of the reporting public watersystems (USEPA 2017b); however, groundwater sources had approximately double the detection rate of surface watersources (Hu et al. 2016). In addition, 59 out of 4,905 public water systems (PWSs) reported PFOA and PFOS at concentrationsthat exceed the USEPA health advisory of 0.07 μg/L (ATSDR 2018a); these systems represent 1.3% of all of the PWSs thatmonitored under UCMR3. Detections were geographically widespread but showed quantifiable associations with suspectedsources, including industrial sites, military fire training areas, AFFF-certified airports, and wastewater treatment facilities (Huet al. 2016). Individual states are collecting information on PFAS occurrence in smaller public water supplies such as schoolsand mobile home parks that do not meet the threshold to comply with the Unregulated Contaminant Monitoring Rule, sowere not sampled during UCMR3, and for which data are often publicly available, for example, in New Hampshire at NH DES(2020).
Groundwater occurrence data collected as part of domestic and international studies have also characterized the range ofPFAS concentrations associated with AFFF release sites, industrial facilities, and landfills; examples of these study results areprovided in Figure 6-3 and Table 17-3.
Page 88ITRC PFAS-1
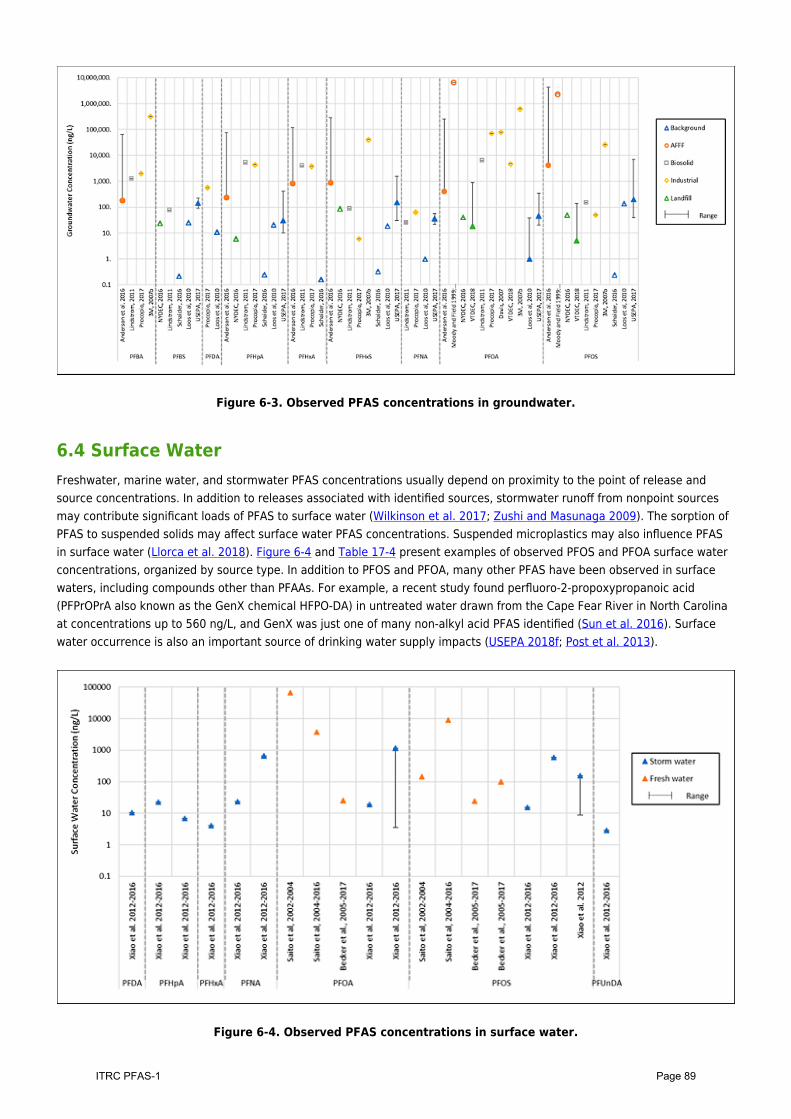
Figure 6-3. Observed PFAS concentrations in groundwater.
6.4 Surface WaterFreshwater, marine water, and stormwater PFAS concentrations usually depend on proximity to the point of release andsource concentrations. In addition to releases associated with identified sources, stormwater runoff from nonpoint sourcesmay contribute significant loads of PFAS to surface water (Wilkinson et al. 2017; Zushi and Masunaga 2009). The sorption ofPFAS to suspended solids may affect surface water PFAS concentrations. Suspended microplastics may also influence PFASin surface water (Llorca et al. 2018). Figure 6-4 and Table 17-4 present examples of observed PFOS and PFOA surface waterconcentrations, organized by source type. In addition to PFOS and PFOA, many other PFAS have been observed in surfacewaters, including compounds other than PFAAs. For example, a recent study found perfluoro-2-propoxypropanoic acid(PFPrOPrA also known as the GenX chemical HFPO-DA) in untreated water drawn from the Cape Fear River in North Carolinaat concentrations up to 560 ng/L, and GenX was just one of many non-alkyl acid PFAS identified (Sun et al. 2016). Surfacewater occurrence is also an important source of drinking water supply impacts (USEPA 2018f; Post et al. 2013).
Figure 6-4. Observed PFAS concentrations in surface water.
Page 89ITRC PFAS-1
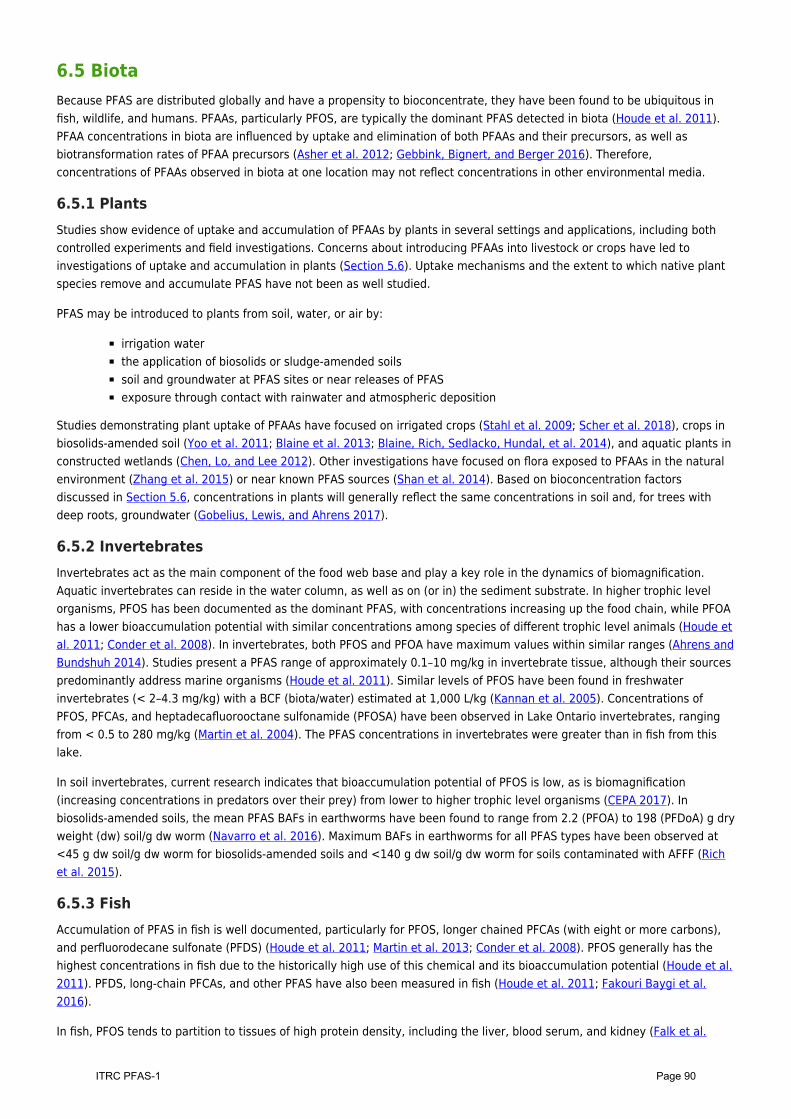
6.5 BiotaBecause PFAS are distributed globally and have a propensity to bioconcentrate, they have been found to be ubiquitous infish, wildlife, and humans. PFAAs, particularly PFOS, are typically the dominant PFAS detected in biota (Houde et al. 2011).PFAA concentrations in biota are influenced by uptake and elimination of both PFAAs and their precursors, as well asbiotransformation rates of PFAA precursors (Asher et al. 2012; Gebbink, Bignert, and Berger 2016). Therefore,concentrations of PFAAs observed in biota at one location may not reflect concentrations in other environmental media.
6.5.1 PlantsStudies show evidence of uptake and accumulation of PFAAs by plants in several settings and applications, including bothcontrolled experiments and field investigations. Concerns about introducing PFAAs into livestock or crops have led toinvestigations of uptake and accumulation in plants (Section 5.6). Uptake mechanisms and the extent to which native plantspecies remove and accumulate PFAS have not been as well studied.
PFAS may be introduced to plants from soil, water, or air by:
irrigation waterthe application of biosolids or sludge-amended soilssoil and groundwater at PFAS sites or near releases of PFASexposure through contact with rainwater and atmospheric deposition
Studies demonstrating plant uptake of PFAAs have focused on irrigated crops (Stahl et al. 2009; Scher et al. 2018), crops inbiosolids-amended soil (Yoo et al. 2011; Blaine et al. 2013; Blaine, Rich, Sedlacko, Hundal, et al. 2014), and aquatic plants inconstructed wetlands (Chen, Lo, and Lee 2012). Other investigations have focused on flora exposed to PFAAs in the naturalenvironment (Zhang et al. 2015) or near known PFAS sources (Shan et al. 2014). Based on bioconcentration factorsdiscussed in Section 5.6, concentrations in plants will generally reflect the same concentrations in soil and, for trees withdeep roots, groundwater (Gobelius, Lewis, and Ahrens 2017).
6.5.2 InvertebratesInvertebrates act as the main component of the food web base and play a key role in the dynamics of biomagnification.Aquatic invertebrates can reside in the water column, as well as on (or in) the sediment substrate. In higher trophic levelorganisms, PFOS has been documented as the dominant PFAS, with concentrations increasing up the food chain, while PFOAhas a lower bioaccumulation potential with similar concentrations among species of different trophic level animals (Houde etal. 2011; Conder et al. 2008). In invertebrates, both PFOS and PFOA have maximum values within similar ranges (Ahrens andBundshuh 2014). Studies present a PFAS range of approximately 0.1–10 mg/kg in invertebrate tissue, although their sourcespredominantly address marine organisms (Houde et al. 2011). Similar levels of PFOS have been found in freshwaterinvertebrates (< 2–4.3 mg/kg) with a BCF (biota/water) estimated at 1,000 L/kg (Kannan et al. 2005). Concentrations ofPFOS, PFCAs, and heptadecafluorooctane sulfonamide (PFOSA) have been observed in Lake Ontario invertebrates, rangingfrom < 0.5 to 280 mg/kg (Martin et al. 2004). The PFAS concentrations in invertebrates were greater than in fish from thislake.
In soil invertebrates, current research indicates that bioaccumulation potential of PFOS is low, as is biomagnification(increasing concentrations in predators over their prey) from lower to higher trophic level organisms (CEPA 2017). Inbiosolids-amended soils, the mean PFAS BAFs in earthworms have been found to range from 2.2 (PFOA) to 198 (PFDoA) g dryweight (dw) soil/g dw worm (Navarro et al. 2016). Maximum BAFs in earthworms for all PFAS types have been observed at<45 g dw soil/g dw worm for biosolids-amended soils and <140 g dw soil/g dw worm for soils contaminated with AFFF (Richet al. 2015).
6.5.3 FishAccumulation of PFAS in fish is well documented, particularly for PFOS, longer chained PFCAs (with eight or more carbons),and perfluorodecane sulfonate (PFDS) (Houde et al. 2011; Martin et al. 2013; Conder et al. 2008). PFOS generally has thehighest concentrations in fish due to the historically high use of this chemical and its bioaccumulation potential (Houde et al.2011). PFDS, long-chain PFCAs, and other PFAS have also been measured in fish (Houde et al. 2011; Fakouri Baygi et al.2016).
In fish, PFOS tends to partition to tissues of high protein density, including the liver, blood serum, and kidney (Falk et al.
Page 90ITRC PFAS-1
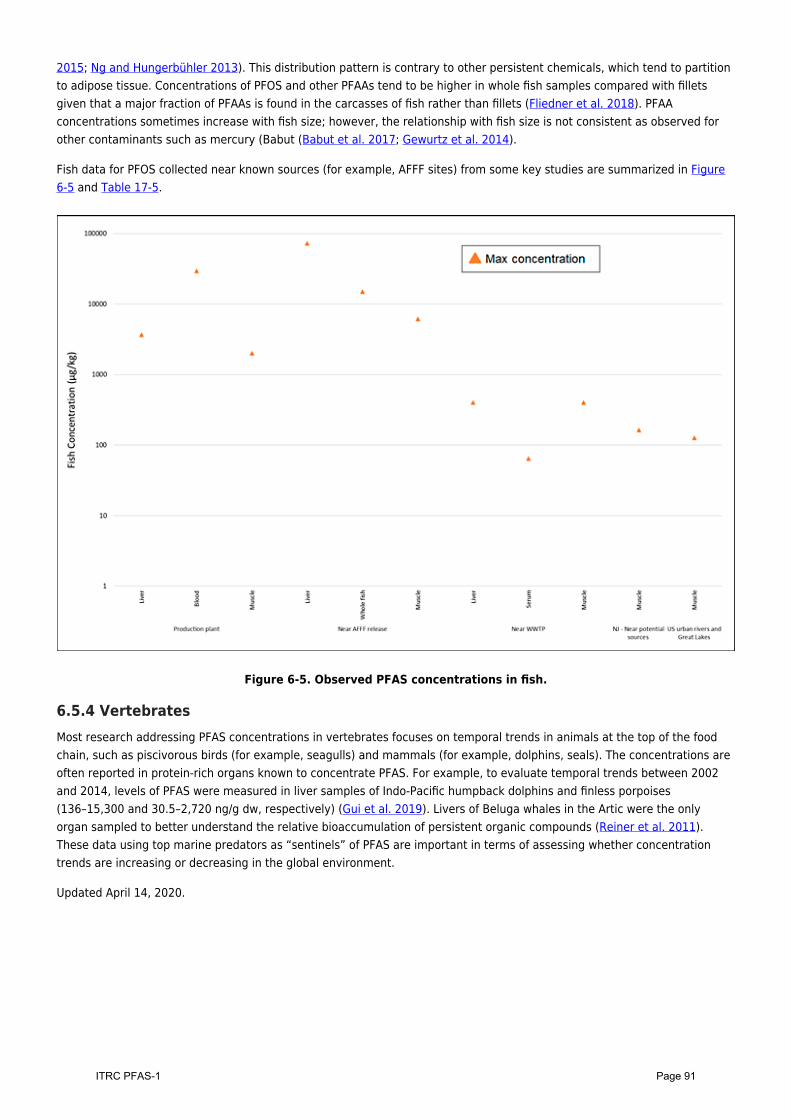
2015; Ng and Hungerbühler 2013). This distribution pattern is contrary to other persistent chemicals, which tend to partitionto adipose tissue. Concentrations of PFOS and other PFAAs tend to be higher in whole fish samples compared with filletsgiven that a major fraction of PFAAs is found in the carcasses of fish rather than fillets (Fliedner et al. 2018). PFAAconcentrations sometimes increase with fish size; however, the relationship with fish size is not consistent as observed forother contaminants such as mercury (Babut (Babut et al. 2017; Gewurtz et al. 2014).
Fish data for PFOS collected near known sources (for example, AFFF sites) from some key studies are summarized in Figure6-5 and Table 17-5.
Figure 6-5. Observed PFAS concentrations in fish.
6.5.4 VertebratesMost research addressing PFAS concentrations in vertebrates focuses on temporal trends in animals at the top of the foodchain, such as piscivorous birds (for example, seagulls) and mammals (for example, dolphins, seals). The concentrations areoften reported in protein-rich organs known to concentrate PFAS. For example, to evaluate temporal trends between 2002and 2014, levels of PFAS were measured in liver samples of Indo-Pacific humpback dolphins and finless porpoises(136–15,300 and 30.5–2,720 ng/g dw, respectively) (Gui et al. 2019). Livers of Beluga whales in the Artic were the onlyorgan sampled to better understand the relative bioaccumulation of persistent organic compounds (Reiner et al. 2011).These data using top marine predators as “sentinels” of PFAS are important in terms of assessing whether concentrationtrends are increasing or decreasing in the global environment.
Updated April 14, 2020.
Page 91ITRC PFAS-1
7 Human and Ecological Health Effects of select PFASThis section discusses both the information related to assessing health effects of PFAS in humans (Section 7.1) and theadverse effects on ecological (nonhuman) species (Section 7.2). Section 7.1 provides information on human biomonitoringand exposure, toxicokinetics, toxicology in mammalian species, and human epidemiology for long-chain and short-chainPFAAs and the fluorinated ether carboxylates (FECAs) commonly known as the GenX chemical HFPO-DA and ADONA. Thesection is supplemented by additional material on each of these topics, which is included as Section 17.2. Section 7.2 isorganized to include ecological toxicology information on invertebrates (aquatic, benthic, terrestrial), vertebrates (fish, birds,reptiles, amphibians, mammals), and plants. PFAS ecotoxicology data summary tables have been developed as separateExcel spreadsheets.
For further information on the scientific names and carbon chain length of PFAAs addressed in these sections, see ITRCNaming Conventions Fact Sheet (ITRC 2018a) and Section 2.2 of this document. Use of the human health effects informationin guidance values is discussed in Section 8.3 and in site risk assessment in Section 9.1.
Section Number Topic
7.1 Human Health Effects
7.2 Ecological Toxicology
7.1 Human Health EffectsThe PFAS discussed in this section and in Section 17.2 include perfluorocarboxylic acids (PFCAs) with 4–14 carbons andperfluorosulfonic acids (PFSAs) with four or more carbons. Also covered are two FECAs: ammonium 2,3,3,3-tetrafluoro-2-(heptafluoropropoxy)propanoate (also known as perfluoro-2-propoxypropanoic acid, PFPrOPrA and as the GenX chemicalhexafluoropropylene oxide [HFPO] dimer acid; and 4,8-dioxa-3H-perfluorononanoate, commonly known as ADONA. TheseFECAs are replacements for PFOA as processing aids in certain fluoropolymer production. They are included because theyare of current interest and health effects data are available. There is little or no publicly available health effects informationfor most of the many other PFAS used in commerce (Section 2.5), including precursors that can be converted to PFAAs inthe environment and in the human body.
The best studied PFAAs are PFOS and PFOA, although considerable information is available for some other PFAS, includingPFNA, PFHxS, PFBA, PFBS, and the GenX chemical HFPO-DA. Laboratory animal toxicology studies and humanepidemiological studies suggest health effects that may occur as a result of long-term exposure to PFOA and PFOS atenvironmentally relevant levels. Figure 7-1 summarizes current health effects information, the references for which arediscussed in this section. The other PFAS mentioned above cause generally similar effects in animal studies, with toxicitygenerally occurring at higher doses for the short-chain PFAAs than for long-chain PFAAs. These health effects, discussed inmore detail in Sections 7.1.3, and 7.1.4 are the basis for current guidance values and regulations for PFOA, PFOS, andseveral other PFAS. These are available in a separate Excel file published regularly by ITRC on the fact sheets page.
Page 92ITRC PFAS-1
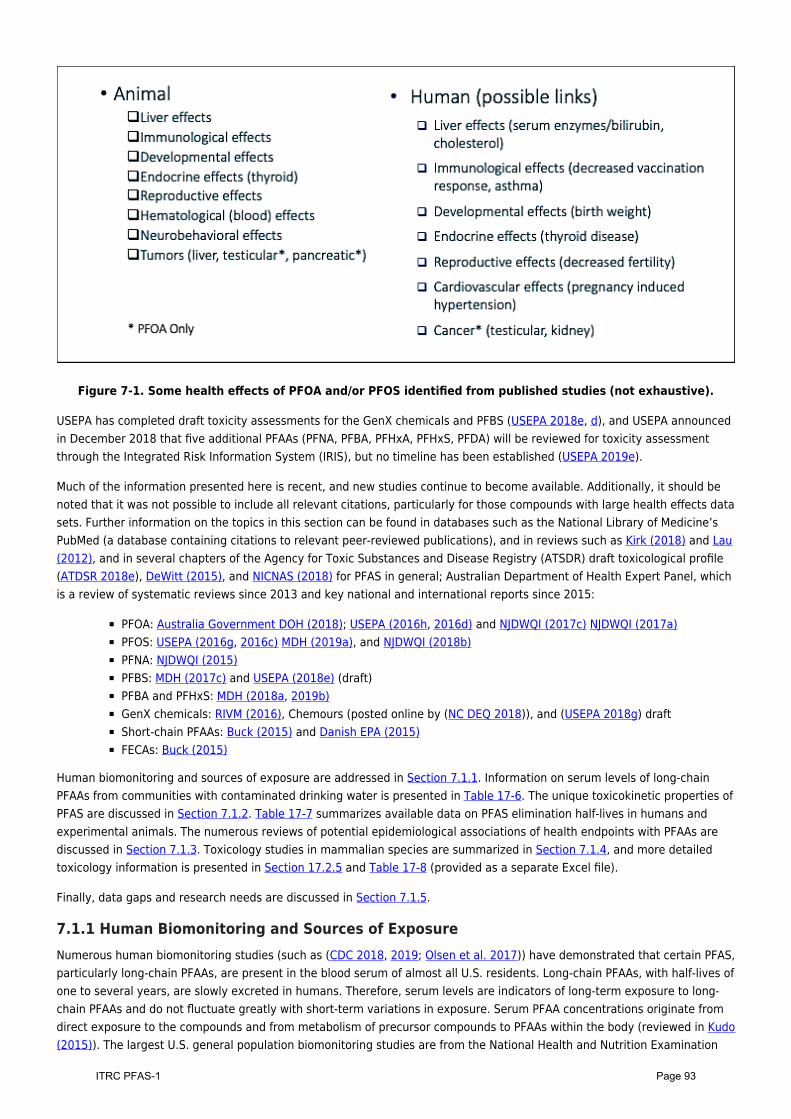
Figure 7-1. Some health effects of PFOA and/or PFOS identified from published studies (not exhaustive).
USEPA has completed draft toxicity assessments for the GenX chemicals and PFBS (USEPA 2018e, d), and USEPA announcedin December 2018 that five additional PFAAs (PFNA, PFBA, PFHxA, PFHxS, PFDA) will be reviewed for toxicity assessmentthrough the Integrated Risk Information System (IRIS), but no timeline has been established (USEPA 2019e).
Much of the information presented here is recent, and new studies continue to become available. Additionally, it should benoted that it was not possible to include all relevant citations, particularly for those compounds with large health effects datasets. Further information on the topics in this section can be found in databases such as the National Library of Medicine’sPubMed (a database containing citations to relevant peer-reviewed publications), and in reviews such as Kirk (2018) and Lau(2012), and in several chapters of the Agency for Toxic Substances and Disease Registry (ATSDR) draft toxicological profile(ATDSR 2018e), DeWitt (2015), and NICNAS (2018) for PFAS in general; Australian Department of Health Expert Panel, whichis a review of systematic reviews since 2013 and key national and international reports since 2015:
PFOA: Australia Government DOH (2018); USEPA (2016h, 2016d) and NJDWQI (2017c) NJDWQI (2017a)PFOS: USEPA (2016g, 2016c) MDH (2019a), and NJDWQI (2018b)PFNA: NJDWQI (2015)PFBS: MDH (2017c) and USEPA (2018e) (draft)PFBA and PFHxS: MDH (2018a, 2019b)GenX chemicals: RIVM (2016), Chemours (posted online by (NC DEQ 2018)), and (USEPA 2018g) draftShort-chain PFAAs: Buck (2015) and Danish EPA (2015)FECAs: Buck (2015)
Human biomonitoring and sources of exposure are addressed in Section 7.1.1. Information on serum levels of long-chainPFAAs from communities with contaminated drinking water is presented in Table 17-6. The unique toxicokinetic properties ofPFAS are discussed in Section 7.1.2. Table 17-7 summarizes available data on PFAS elimination half-lives in humans andexperimental animals. The numerous reviews of potential epidemiological associations of health endpoints with PFAAs arediscussed in Section 7.1.3. Toxicology studies in mammalian species are summarized in Section 7.1.4, and more detailedtoxicology information is presented in Section 17.2.5 and Table 17-8 (provided as a separate Excel file).
Finally, data gaps and research needs are discussed in Section 7.1.5.
7.1.1 Human Biomonitoring and Sources of ExposureNumerous human biomonitoring studies (such as (CDC 2018, 2019; Olsen et al. 2017)) have demonstrated that certain PFAS,particularly long-chain PFAAs, are present in the blood serum of almost all U.S. residents. Long-chain PFAAs, with half-lives ofone to several years, are slowly excreted in humans. Therefore, serum levels are indicators of long-term exposure to long-chain PFAAs and do not fluctuate greatly with short-term variations in exposure. Serum PFAA concentrations originate fromdirect exposure to the compounds and from metabolism of precursor compounds to PFAAs within the body (reviewed in Kudo(2015)). The largest U.S. general population biomonitoring studies are from the National Health and Nutrition Examination
Page 93ITRC PFAS-1
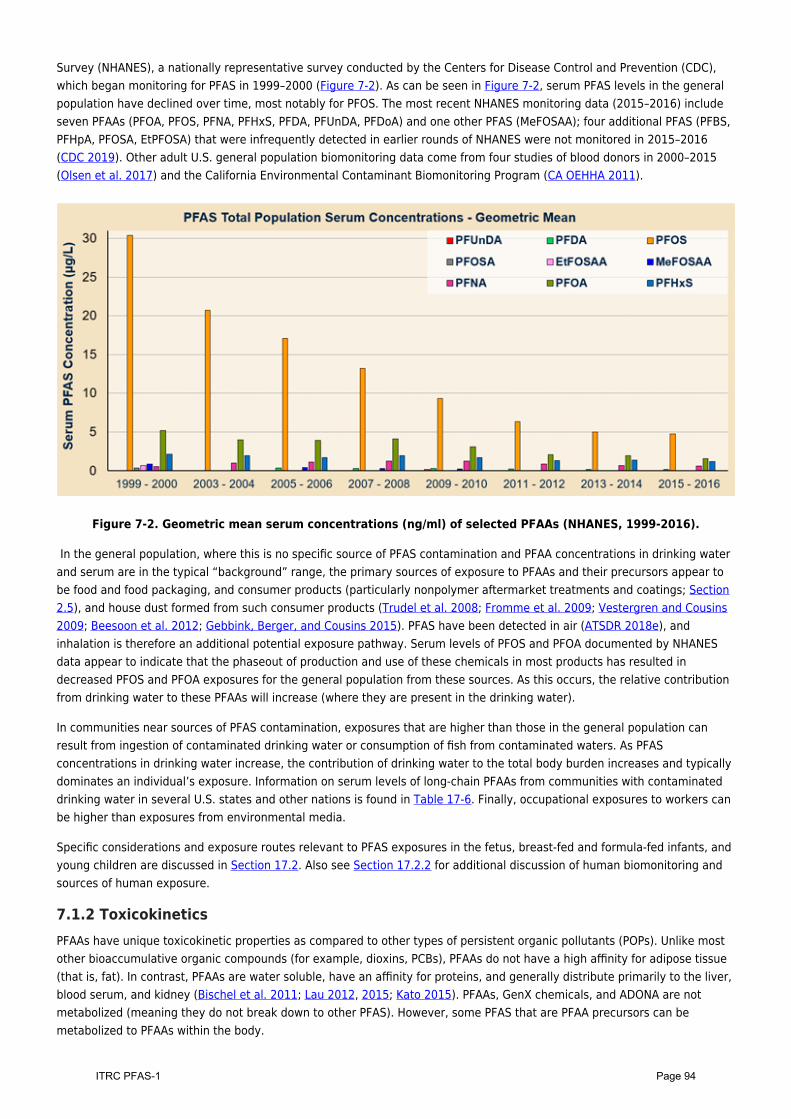
Survey (NHANES), a nationally representative survey conducted by the Centers for Disease Control and Prevention (CDC),which began monitoring for PFAS in 1999–2000 (Figure 7-2). As can be seen in Figure 7-2, serum PFAS levels in the generalpopulation have declined over time, most notably for PFOS. The most recent NHANES monitoring data (2015–2016) includeseven PFAAs (PFOA, PFOS, PFNA, PFHxS, PFDA, PFUnDA, PFDoA) and one other PFAS (MeFOSAA); four additional PFAS (PFBS,PFHpA, PFOSA, EtPFOSA) that were infrequently detected in earlier rounds of NHANES were not monitored in 2015–2016(CDC 2019). Other adult U.S. general population biomonitoring data come from four studies of blood donors in 2000–2015(Olsen et al. 2017) and the California Environmental Contaminant Biomonitoring Program (CA OEHHA 2011).
Figure 7-2. Geometric mean serum concentrations (ng/ml) of selected PFAAs (NHANES, 1999-2016).
In the general population, where this is no specific source of PFAS contamination and PFAA concentrations in drinking waterand serum are in the typical “background” range, the primary sources of exposure to PFAAs and their precursors appear tobe food and food packaging, and consumer products (particularly nonpolymer aftermarket treatments and coatings; Section2.5), and house dust formed from such consumer products (Trudel et al. 2008; Fromme et al. 2009; Vestergren and Cousins2009; Beesoon et al. 2012; Gebbink, Berger, and Cousins 2015). PFAS have been detected in air (ATSDR 2018e), andinhalation is therefore an additional potential exposure pathway. Serum levels of PFOS and PFOA documented by NHANESdata appear to indicate that the phaseout of production and use of these chemicals in most products has resulted indecreased PFOS and PFOA exposures for the general population from these sources. As this occurs, the relative contributionfrom drinking water to these PFAAs will increase (where they are present in the drinking water).
In communities near sources of PFAS contamination, exposures that are higher than those in the general population canresult from ingestion of contaminated drinking water or consumption of fish from contaminated waters. As PFASconcentrations in drinking water increase, the contribution of drinking water to the total body burden increases and typicallydominates an individual’s exposure. Information on serum levels of long-chain PFAAs from communities with contaminateddrinking water in several U.S. states and other nations is found in Table 17-6. Finally, occupational exposures to workers canbe higher than exposures from environmental media.
Specific considerations and exposure routes relevant to PFAS exposures in the fetus, breast-fed and formula-fed infants, andyoung children are discussed in Section 17.2. Also see Section 17.2.2 for additional discussion of human biomonitoring andsources of human exposure.
7.1.2 ToxicokineticsPFAAs have unique toxicokinetic properties as compared to other types of persistent organic pollutants (POPs). Unlike mostother bioaccumulative organic compounds (for example, dioxins, PCBs), PFAAs do not have a high affinity for adipose tissue(that is, fat). In contrast, PFAAs are water soluble, have an affinity for proteins, and generally distribute primarily to the liver,blood serum, and kidney (Bischel et al. 2011; Lau 2012, 2015; Kato 2015). PFAAs, GenX chemicals, and ADONA are notmetabolized (meaning they do not break down to other PFAS). However, some PFAS that are PFAA precursors can bemetabolized to PFAAs within the body.
Page 94ITRC PFAS-1
In general, short-chain PFAS are excreted more rapidly than longer chain PFAS in humans and other mammalian species. Theexcretion rates for specific PFAS can vary substantially between species, and in some cases between males and females ofthe same species. Table 17-7 summarizes available data on PFAS elimination half-lives in humans and experimental animals.Half-lives in laboratory animals (rodents and nonhuman primates) generally range from hours to several months for long-chain PFAS, and hours to several days for short-chain PFAS. Human half-lives for PFAS are longer than in other mammalianspecies, with estimates of several years for long-chain PFAAs and several days to one month for shorter chain PFAAs such asPFBA, PFHxA, and PFBS. Because of the much longer human half-lives, animal-to-human comparisons must account for themuch higher internal dose (for example, blood serum level) in humans than in animals from the same administered dose.
Toxicokinetics relevant to developmental exposures to PFAAs are important because developmental effects are consideredto be sensitive endpoints for toxicity of long-chain PFAAs, and some human studies have found associations of long-chainPFAAs with decreased fetal growth. PFAAs cross the placenta (reviewed in Lau (2012) and Kudo (2015)) and are present inbreast milk (Luebker, Case, et al. 2005; White et al. 2009) (Kato 2015), and long-chain PFAAs have been found in cord blood(for example, (Wang et al. 2019) and amniotic fluid (Stein et al. 2012; Zhang, Sun, et al. 2013). In human infants, exposuresfrom breast milk result in substantial increases in long-chain PFAA serum levels during the first months after birth (Frommeet al. 2010; Mogensen et al. 2015). Exposures to infants from formula prepared with PFAS-contaminated water are alsohigher than in older individuals due to their higher rate of fluid consumption (USEPA 2011a).
Toxicokinetic factors called clearance factors, which indicate bioaccumulative potential, can be used to relate external doses(mg/kg/day) of PFOA and PFOS to steady-state serum levels (ng/L). When combined with average water ingestion rates(USEPA 2011a), these factors can be used to predict that the expected average increases in the levels of PFOA or PFOS inblood serum from long-term drinking water exposure are 100-fold or greater than the concentration in the drinking water(Bartell 2017; NJDWQI 2017a; Post, Gleason, and Cooper 2017).
Finally, toxicokinetics in rodents (Loveless et al. 2006; De Silva et al. 2009) and humans (Zhang, Beesoon, et al. 2013; Gaoet al. 2015; Beesoon et al. 2011) may differ among isomers of the same PFAA.
See Section 17.2.3 for additional discussion of PFAS excretion and excretion rates, toxicokinetics relative to developmentalexposure, the relationship of human exposure to serum levels, and isomer-specific toxicokinetics.
7.1.3 Human Epidemiology StudiesThe epidemiological database for long-chain PFAAs is more extensive than for many other environmental contaminants.Based on publications available through the National Library of Medicine’s PubMed database, well over 100 human studieshave examined associations (that is, statistical relationships) between PFAS, primarily long-chain PFAAs, and a wide varietyof diseases and health endpoints (NJDWQI 2018a). Some effects, such as changes in serum lipids, liver biomarkers, uric acidlevels, thyroid endpoints, vaccine response, and fetal growth, have been evaluated in multiple studies and populations, whileonly one or a few studies were located for many other effects.
These studies can be categorized based on the type of population evaluated: general population, communities withcontaminated drinking water, or occupationally exposed workers. Almost all of these studies were published within the past10 years, with the exception of a small number of occupational studies from a few years prior to that time.
Although discussion of individual epidemiological studies is beyond the scope of this section and the corresponding appendixsection, evidence for associations and/or causality for some PFAAs and certain health effects (for example, increasedcholesterol, increased liver enzymes, decreased vaccine response, thyroid disease, and for PFOA, some types of cancer) hasbeen evaluated by various academic researchers and government agencies. The conclusions of some of these evaluationsare discussed briefly below, with additional detail provided in Section 17.2.4.
For some health endpoints, there is general consensus for consistent evidence for association with one or more long-chainPFAAs, while conclusions differ among evaluations by different groups of scientists for other endpoints. For additionalendpoints, data are too limited to make a conclusion, results are inconsistent, or there is no evidence for an association. Thegeneral reviews cited in Section 17.2.4 include detailed discussions of epidemiological data for PFOA, PFOS, and PFNA. In-depth reviews for other individual PFAAs (for example, PFHxS, PFDA, PFUnA) are not available.
As shown in Table 7-1, associations in human epidemiological studies of PFAAs (primarily PFOA and PFOS) for someendpoints (for example, increased liver enzymes, decreased fetal growth, decreased vaccine response) are consistent withanimal toxicology studies (Section 7.1.4). For serum lipids (for example, cholesterol), conflicting observations (increases inhumans versus decreases in rodents) may be impacted by differences in the fat content in the diets of humans versus
Page 95ITRC PFAS-1
laboratory animals and/or large differences in the exposure levels in human versus animal studies (Tan et al. 2013; Rebholzet al. 2016).
Associations of some health endpoints with certain PFAAs are generally, although not totally, consistent, and someevaluations have concluded that the data for certain effects support multiple criteria for causality. However, risk-basedtoxicity factors (Reference Doses for noncancer effects and slope factors for cancer risk) developed by most governmentagencies are based on dose-response relationships from animal data, with the human data used to support the hazardidentification component of toxicity factor development. A major factor that has precluded the use of human data in thedose-response component of toxicity factor development is the concurrent exposure to multiple PFAAs in most or all studypopulations. Because serum levels of co-occurring PFAAs tend to correlate with each other, it is difficult to determine thedose-response relationship for individual PFAAs. Notwithstanding, German Human Biomonitoring Commission (2018) theGerman Environment Agency (2016) developed Human Biomonitoring Values (serum levels below which adverse effects arenot expected) and the European Food Safety Authority (EFSA 2018) developed Tolerable Weekly Intakes for PFOA and PFOSbased on human data from the general population. These values are lower than many of the values that are based ontoxicity data from animals. It is noted that the approaches and policies used to develop these European human-based valuesmay differ from those used by U.S. agencies in toxicity factor development.
See Section 17.2.4 for additional discussion of epidemiologic studies that have been conducted on PFAS.
7.1.4 Animal Toxicology StudiesThis section focuses on the most notable toxicological effects in mammalian studies of certain PFCAs, PFSAs, and FECAs. AllPFAS covered in this section for which data are available cause increased liver weight; additional effects common to some ofthese PFAS include immune system, hematological (blood cell), and developmental toxicity, as well as more severe types ofliver toxicity. Of the four PFAS that have been tested for carcinogenicity in rodents, PFOA, PFOS, and the GenX chemicalHFPO-DA caused tumors while PFHxA did not.
In general, toxicity is dependent on both intrinsic potency of the compound (Gomis et al. 2018) and its toxicokinetics. Longerchain PFAAs are generally toxic at lower administered doses than shorter chain compounds because their slower excretionresults in a higher internal dose from the same administered dose. Similarly, for those PFAS that are excreted much morerapidly in female rats than in males (Section 7.1.2 and Table 17-7), higher doses in females than in males are needed toachieve the same internal dose.
Toxicological data from animal studies are used as the basis for almost all human health toxicity factors (for example,Reference Doses, cancer slope factors) for PFAS, with the few exceptions from Europe that are based on human data(Section 7.1.3); all current PFAS standards and guidance values for environmental media are based on animal toxicologydata (also see Sections 8.3 and 9.1). As is the case for toxicology studies in general, the doses used in most of these studiesare higher than the doses to which humans are generally exposed from environmental contamination. Conversely, unlikemost other environmental contaminants, PFAS have been associated with health effects in humans at much lower exposurelevels than the doses used in animal toxicology studies.
Table 17-8 (provided as a separate Excel file)provides information on toxicological effects in mammalian species (hazardidentification information) for the following PFAS:
PFCAs including PFBA, PFPeA, PFHxA, PFHpA, PFOA, PFNA, PFDA, PFUnA, and PFDoAPFSAs including PFBS, PFPeS, PFHxS, PFHpS, and PFOSFECAs including ADONA and the GenX chemical HFPO-DA.
Section 17.2.5 also summarizes information on systemic effects; reproductive and developmental effects, and chronictoxicity and tumorigenicity of these PFAS.
Largest publicly available toxicological data sets for: PFOA and PFOSConsiderable data for: PFBA, PFHxA, PFNA, PFDA, PFBS, and the GenX chemicals HFPO-DA and its ammoniumsaltOne or a few studies for: PFHpA, PFUnA, PFDoA, PFHxS, and ADONANo toxicological data were located for PFPeA, PFTrDA, PFTeDA, PFPeS, PFHpS, PFNS, or PFDS.
Most studies were conducted in rats and mice, with a few studies in nonhuman primates (monkeys) and other species suchas rabbits. The National Toxicology Program (NTP 2019b, c) has conducted 28-day studies of seven PFAS (PFHxA, PFOA,
Page 96ITRC PFAS-1
PFNA, PFDA, PFBS, PFHxS, PFOS) in male and female rats that evaluated numerous toxicological endpoints and providedserum PFAA data for each dosed group; results of these studies are included in Table 17-8 (provided as a separate Excelfile). Although the doses at which effects occurred are not provided in this section or in the supporting appendix material, itis emphasized that No Observed Adverse Effect Level (NOAELs) and Lowest Observed Adverse Effect Level (LOAELs) varywidely between compounds for a given endpoint, between different endpoints for the same compound, and between species(and sexes in some cases) for the same compound and endpoint. Furthermore, the effects noted may not have beenobserved in all studies in which they were evaluated.
NTP has also completed a chronic carcinogenicity study of PFOA in rats that assessed the contribution of combinedgestational and lactational (perinatal) exposure. The draft report (NTP 2019a)for this study concludes that there was clearevidence of carcinogenic activity in male rats based on the increased incidence of liver tumors and pancreatie acinar celltumors, and some evidence of carcinogenic activity in female rats based on increased incidence of pancreatic acinar celltumors, and the peer review panel for this study agreed with these conclusions at a December 2019 meeting.
See Section 17.2.5 for additional discussion of studies in animals that have evaluated the effects of PFAS on noncancer andcancer endpoints.
7.1.5 Data Gaps and Research NeedsAlthough many studies relevant to health effects of PFAAs have become available in the last few years, important data gapsremain for most of the PFAAs and FECAs discussed here and in Section 17.2, as well as for many additional PFAS used incommerce or found in AFFF. The data gaps (discussed in more detail in Section 17.2.6) include:
Human half-lives and other toxicokinetic data are not available for some PFAS found in drinking water and otherenvironmental media.Currently available data indicate that reactive intermediates may form in the body from the metabolism of PFAAprecursors to PFAAs. More studies are needed to understand the toxicologic significance of these intermediates.With the exception of PFOA, there is a lack of epidemiologic data from communities exposed to AFFF, PFOS,and/or other PFAS in drinking water.Additional toxicology data are needed for some PFAAs found in environmental media, including drinking water. Inparticular, very little toxicologic data are available for PFHpA, and no information was located for PFPeA. There isalso a need for toxicologic studies on the effects of PFAS mixtures.Multigeneration studies of the reproductive and developmental effects of additional PFAS are needed.Chronic toxicity and carcinogenicity studies are currently available for only four PFAS (PFHxA, PFOA, PFOS,GenX), and are needed for PFHxS, PFNA, ADONA, and other PFAS to which humans may be exposed.The majority of the many thousands of PFAS, including those in commercial use, have very limited or no toxicitydata. This is a critical data gap in health effects information for PFAS.Similarly, current NHANES biomonitoring includes only 11 PFAS, primarily PFAAs. There is limited or nobiomonitoring data for many other PFAS produced or used in the United States, some of which are known to bebioaccumulative in humans.
7.2 Ecological ToxicologyThis section is organized around currently available toxicity information for invertebrates (aquatic/benthic/terrestrial),vertebrates (fish, birds, reptiles/amphibians, mammals), and plants. Toxicological data were obtained from a generalliterature review as well as querying of the USEPA Ecotox Database (USEPA 2019c). However, as discussed below, this is anactive area of research, and interested readers are encouraged to query the literature for updated research and reviews.PFAS ecotoxicology data summary tables have been developed as a separate Excel spreadsheet. The Excel file includesecotoxicology data for Table 7-1 aquatic species, Table 7-2 terrestrial species and Table 7-3 mammalian species.
7.2.1 IntroductionBiomonitoring studies across a variety of organisms, habitats, and geographies show that certain PFAS compounds canaccumulate in wildlife and that exposures are occurring on a global scale (Reiner and Place 2015; Giesy and Kannan 2001).Therefore, it is important to understand how such exposure and bioaccumulation may manifest in adverse effects,particularly as they relate to ecological communities. Information on bioaccumulation of PFAS is addressed in Section 6.5.Section 7.1 focused on the toxicological effects of PFAS on humans and summarized toxicity data from experimentalexposures of laboratory animals. This section provides an overview of available, published toxicological data relating
Page 97ITRC PFAS-1
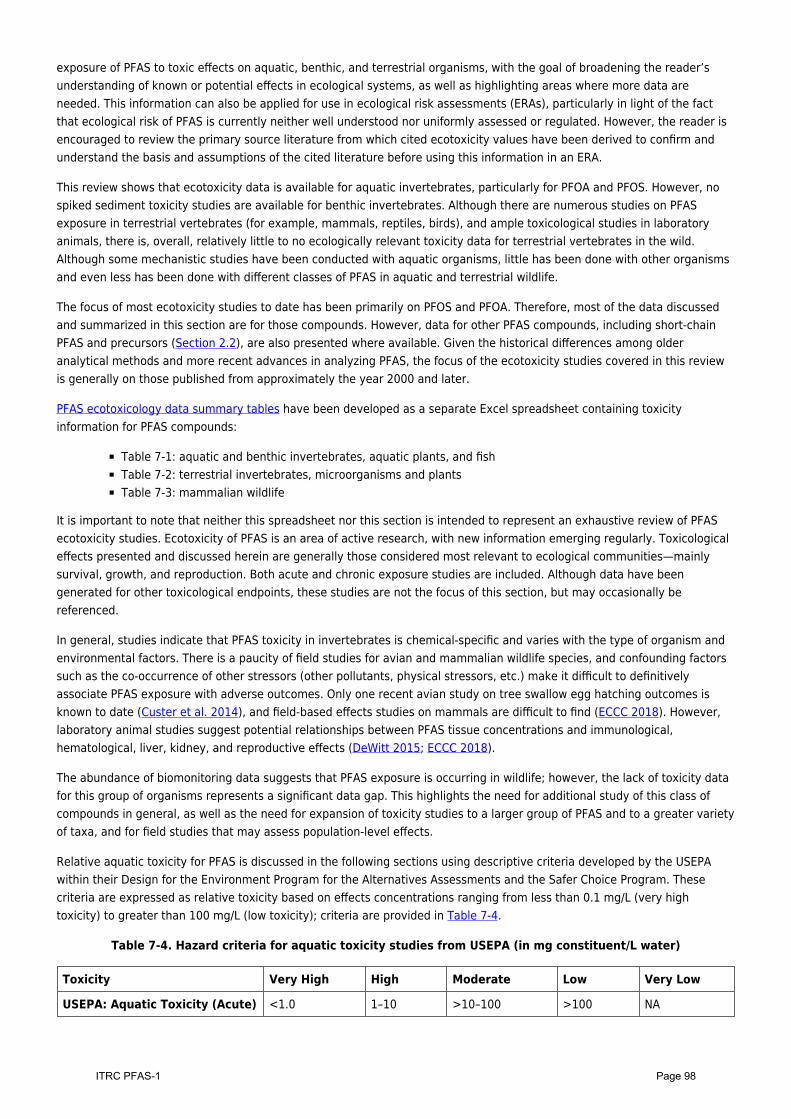
exposure of PFAS to toxic effects on aquatic, benthic, and terrestrial organisms, with the goal of broadening the reader’sunderstanding of known or potential effects in ecological systems, as well as highlighting areas where more data areneeded. This information can also be applied for use in ecological risk assessments (ERAs), particularly in light of the factthat ecological risk of PFAS is currently neither well understood nor uniformly assessed or regulated. However, the reader isencouraged to review the primary source literature from which cited ecotoxicity values have been derived to confirm andunderstand the basis and assumptions of the cited literature before using this information in an ERA.
This review shows that ecotoxicity data is available for aquatic invertebrates, particularly for PFOA and PFOS. However, nospiked sediment toxicity studies are available for benthic invertebrates. Although there are numerous studies on PFASexposure in terrestrial vertebrates (for example, mammals, reptiles, birds), and ample toxicological studies in laboratoryanimals, there is, overall, relatively little to no ecologically relevant toxicity data for terrestrial vertebrates in the wild.Although some mechanistic studies have been conducted with aquatic organisms, little has been done with other organismsand even less has been done with different classes of PFAS in aquatic and terrestrial wildlife.
The focus of most ecotoxicity studies to date has been primarily on PFOS and PFOA. Therefore, most of the data discussedand summarized in this section are for those compounds. However, data for other PFAS compounds, including short-chainPFAS and precursors (Section 2.2), are also presented where available. Given the historical differences among olderanalytical methods and more recent advances in analyzing PFAS, the focus of the ecotoxicity studies covered in this reviewis generally on those published from approximately the year 2000 and later.
PFAS ecotoxicology data summary tables have been developed as a separate Excel spreadsheet containing toxicityinformation for PFAS compounds:
Table 7-1: aquatic and benthic invertebrates, aquatic plants, and fishTable 7-2: terrestrial invertebrates, microorganisms and plantsTable 7-3: mammalian wildlife
It is important to note that neither this spreadsheet nor this section is intended to represent an exhaustive review of PFASecotoxicity studies. Ecotoxicity of PFAS is an area of active research, with new information emerging regularly. Toxicologicaleffects presented and discussed herein are generally those considered most relevant to ecological communities—mainlysurvival, growth, and reproduction. Both acute and chronic exposure studies are included. Although data have beengenerated for other toxicological endpoints, these studies are not the focus of this section, but may occasionally bereferenced.
In general, studies indicate that PFAS toxicity in invertebrates is chemical-specific and varies with the type of organism andenvironmental factors. There is a paucity of field studies for avian and mammalian wildlife species, and confounding factorssuch as the co-occurrence of other stressors (other pollutants, physical stressors, etc.) make it difficult to definitivelyassociate PFAS exposure with adverse outcomes. Only one recent avian study on tree swallow egg hatching outcomes isknown to date (Custer et al. 2014), and field-based effects studies on mammals are difficult to find (ECCC 2018). However,laboratory animal studies suggest potential relationships between PFAS tissue concentrations and immunological,hematological, liver, kidney, and reproductive effects (DeWitt 2015; ECCC 2018).
The abundance of biomonitoring data suggests that PFAS exposure is occurring in wildlife; however, the lack of toxicity datafor this group of organisms represents a significant data gap. This highlights the need for additional study of this class ofcompounds in general, as well as the need for expansion of toxicity studies to a larger group of PFAS and to a greater varietyof taxa, and for field studies that may assess population-level effects.
Relative aquatic toxicity for PFAS is discussed in the following sections using descriptive criteria developed by the USEPAwithin their Design for the Environment Program for the Alternatives Assessments and the Safer Choice Program. Thesecriteria are expressed as relative toxicity based on effects concentrations ranging from less than 0.1 mg/L (very hightoxicity) to greater than 100 mg/L (low toxicity); criteria are provided in Table 7-4.
Table 7-4. Hazard criteria for aquatic toxicity studies from USEPA (in mg constituent/L water)
Toxicity Very High High Moderate Low Very Low
USEPA: Aquatic Toxicity (Acute) <1.0 1–10 >10–100 >100 NA
Page 98ITRC PFAS-1
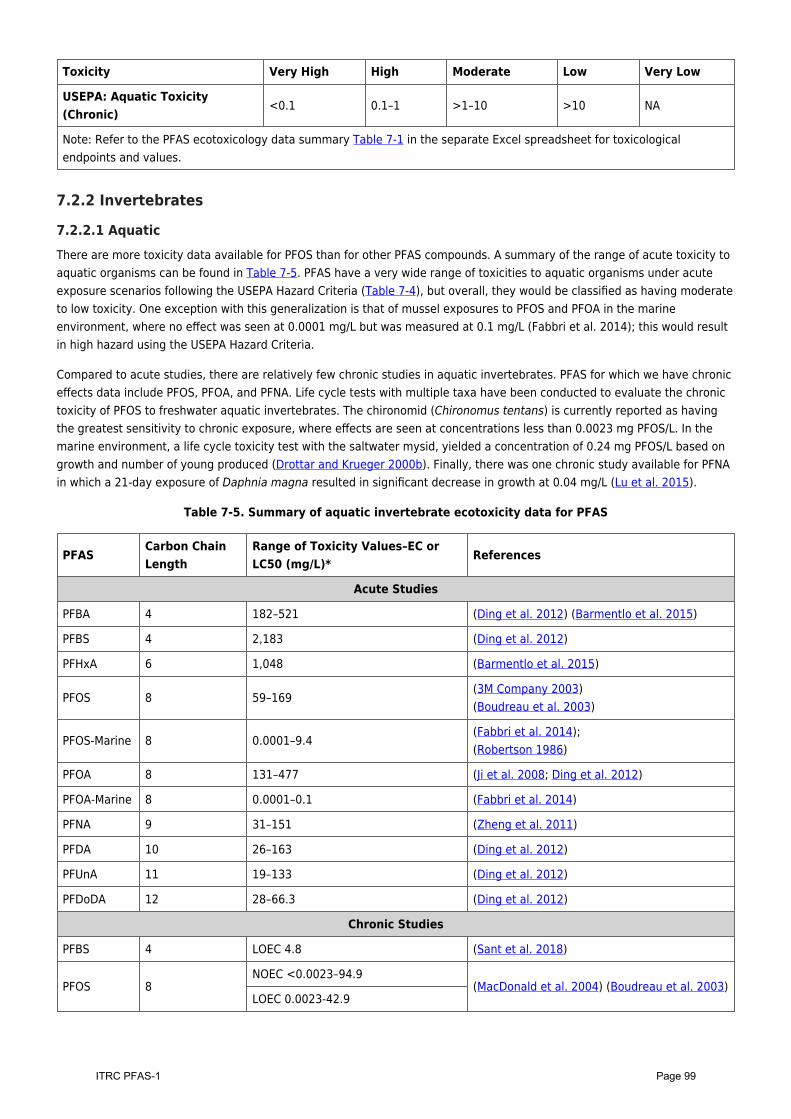
Toxicity Very High High Moderate Low Very Low
USEPA: Aquatic Toxicity(Chronic)
<0.1 0.1–1 >1–10 >10 NA
Note: Refer to the PFAS ecotoxicology data summary Table 7-1 in the separate Excel spreadsheet for toxicologicalendpoints and values.
7.2.2 Invertebrates
7.2.2.1 AquaticThere are more toxicity data available for PFOS than for other PFAS compounds. A summary of the range of acute toxicity toaquatic organisms can be found in Table 7-5. PFAS have a very wide range of toxicities to aquatic organisms under acuteexposure scenarios following the USEPA Hazard Criteria (Table 7-4), but overall, they would be classified as having moderateto low toxicity. One exception with this generalization is that of mussel exposures to PFOS and PFOA in the marineenvironment, where no effect was seen at 0.0001 mg/L but was measured at 0.1 mg/L (Fabbri et al. 2014); this would resultin high hazard using the USEPA Hazard Criteria.
Compared to acute studies, there are relatively few chronic studies in aquatic invertebrates. PFAS for which we have chroniceffects data include PFOS, PFOA, and PFNA. Life cycle tests with multiple taxa have been conducted to evaluate the chronictoxicity of PFOS to freshwater aquatic invertebrates. The chironomid (Chironomus tentans) is currently reported as havingthe greatest sensitivity to chronic exposure, where effects are seen at concentrations less than 0.0023 mg PFOS/L. In themarine environment, a life cycle toxicity test with the saltwater mysid, yielded a concentration of 0.24 mg PFOS/L based ongrowth and number of young produced (Drottar and Krueger 2000b). Finally, there was one chronic study available for PFNAin which a 21-day exposure of Daphnia magna resulted in significant decrease in growth at 0.04 mg/L (Lu et al. 2015).
Table 7-5. Summary of aquatic invertebrate ecotoxicity data for PFAS
PFASCarbon ChainLength
Range of Toxicity Values–EC orLC50 (mg/L)*
References
Acute Studies
PFBA 4 182–521 (Ding et al. 2012) (Barmentlo et al. 2015)
PFBS 4 2,183 (Ding et al. 2012)
PFHxA 6 1,048 (Barmentlo et al. 2015)
PFOS 8 59–169(3M Company 2003)(Boudreau et al. 2003)
PFOS-Marine 8 0.0001–9.4(Fabbri et al. 2014);(Robertson 1986)
PFOA 8 131–477 (Ji et al. 2008; Ding et al. 2012)
PFOA-Marine 8 0.0001–0.1 (Fabbri et al. 2014)
PFNA 9 31–151 (Zheng et al. 2011)
PFDA 10 26–163 (Ding et al. 2012)
PFUnA 11 19–133 (Ding et al. 2012)
PFDoDA 12 28–66.3 (Ding et al. 2012)
Chronic Studies
PFBS 4 LOEC 4.8 (Sant et al. 2018)
PFOS 8NOEC <0.0023–94.9
(MacDonald et al. 2004) (Boudreau et al. 2003)LOEC 0.0023-42.9
Page 99ITRC PFAS-1
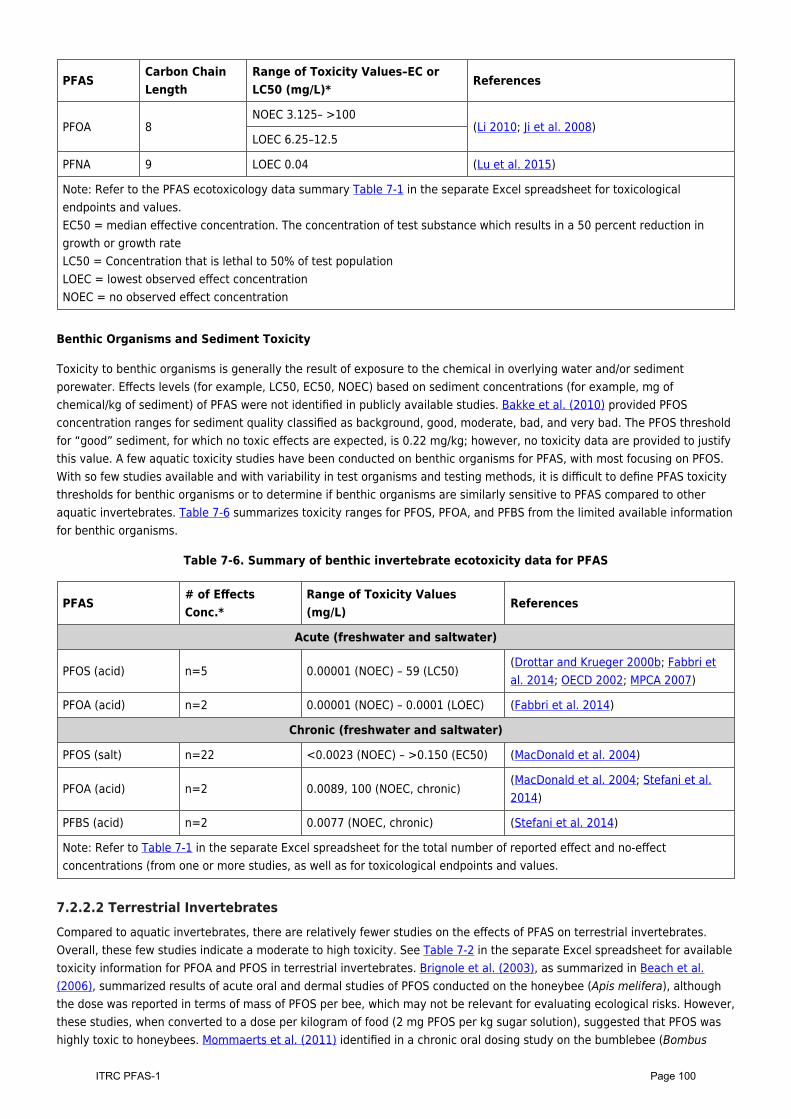
PFASCarbon ChainLength
Range of Toxicity Values–EC orLC50 (mg/L)*
References
PFOA 8NOEC 3.125– >100
(Li 2010; Ji et al. 2008)LOEC 6.25–12.5
PFNA 9 LOEC 0.04 (Lu et al. 2015)
Note: Refer to the PFAS ecotoxicology data summary Table 7-1 in the separate Excel spreadsheet for toxicologicalendpoints and values.EC50 = median effective concentration. The concentration of test substance which results in a 50 percent reduction ingrowth or growth rateLC50 = Concentration that is lethal to 50% of test populationLOEC = lowest observed effect concentrationNOEC = no observed effect concentration
Benthic Organisms and Sediment Toxicity
Toxicity to benthic organisms is generally the result of exposure to the chemical in overlying water and/or sedimentporewater. Effects levels (for example, LC50, EC50, NOEC) based on sediment concentrations (for example, mg ofchemical/kg of sediment) of PFAS were not identified in publicly available studies. Bakke et al. (2010) provided PFOSconcentration ranges for sediment quality classified as background, good, moderate, bad, and very bad. The PFOS thresholdfor “good” sediment, for which no toxic effects are expected, is 0.22 mg/kg; however, no toxicity data are provided to justifythis value. A few aquatic toxicity studies have been conducted on benthic organisms for PFAS, with most focusing on PFOS.With so few studies available and with variability in test organisms and testing methods, it is difficult to define PFAS toxicitythresholds for benthic organisms or to determine if benthic organisms are similarly sensitive to PFAS compared to otheraquatic invertebrates. Table 7-6 summarizes toxicity ranges for PFOS, PFOA, and PFBS from the limited available informationfor benthic organisms.
Table 7-6. Summary of benthic invertebrate ecotoxicity data for PFAS
PFAS# of EffectsConc.*
Range of Toxicity Values(mg/L)
References
Acute (freshwater and saltwater)
PFOS (acid) n=5 0.00001 (NOEC) – 59 (LC50)(Drottar and Krueger 2000b; Fabbri etal. 2014; OECD 2002; MPCA 2007)
PFOA (acid) n=2 0.00001 (NOEC) – 0.0001 (LOEC) (Fabbri et al. 2014)
Chronic (freshwater and saltwater)
PFOS (salt) n=22 <0.0023 (NOEC) – >0.150 (EC50) (MacDonald et al. 2004)
PFOA (acid) n=2 0.0089, 100 (NOEC, chronic)(MacDonald et al. 2004; Stefani et al.2014)
PFBS (acid) n=2 0.0077 (NOEC, chronic) (Stefani et al. 2014)
Note: Refer to Table 7-1 in the separate Excel spreadsheet for the total number of reported effect and no-effectconcentrations (from one or more studies, as well as for toxicological endpoints and values.
7.2.2.2 Terrestrial InvertebratesCompared to aquatic invertebrates, there are relatively fewer studies on the effects of PFAS on terrestrial invertebrates.Overall, these few studies indicate a moderate to high toxicity. See Table 7-2 in the separate Excel spreadsheet for availabletoxicity information for PFOA and PFOS in terrestrial invertebrates. Brignole et al. (2003), as summarized in Beach et al.(2006), summarized results of acute oral and dermal studies of PFOS conducted on the honeybee (Apis melifera), althoughthe dose was reported in terms of mass of PFOS per bee, which may not be relevant for evaluating ecological risks. However,these studies, when converted to a dose per kilogram of food (2 mg PFOS per kg sugar solution), suggested that PFOS washighly toxic to honeybees. Mommaerts et al. (2011) identified in a chronic oral dosing study on the bumblebee (Bombus
Page 100ITRC PFAS-1
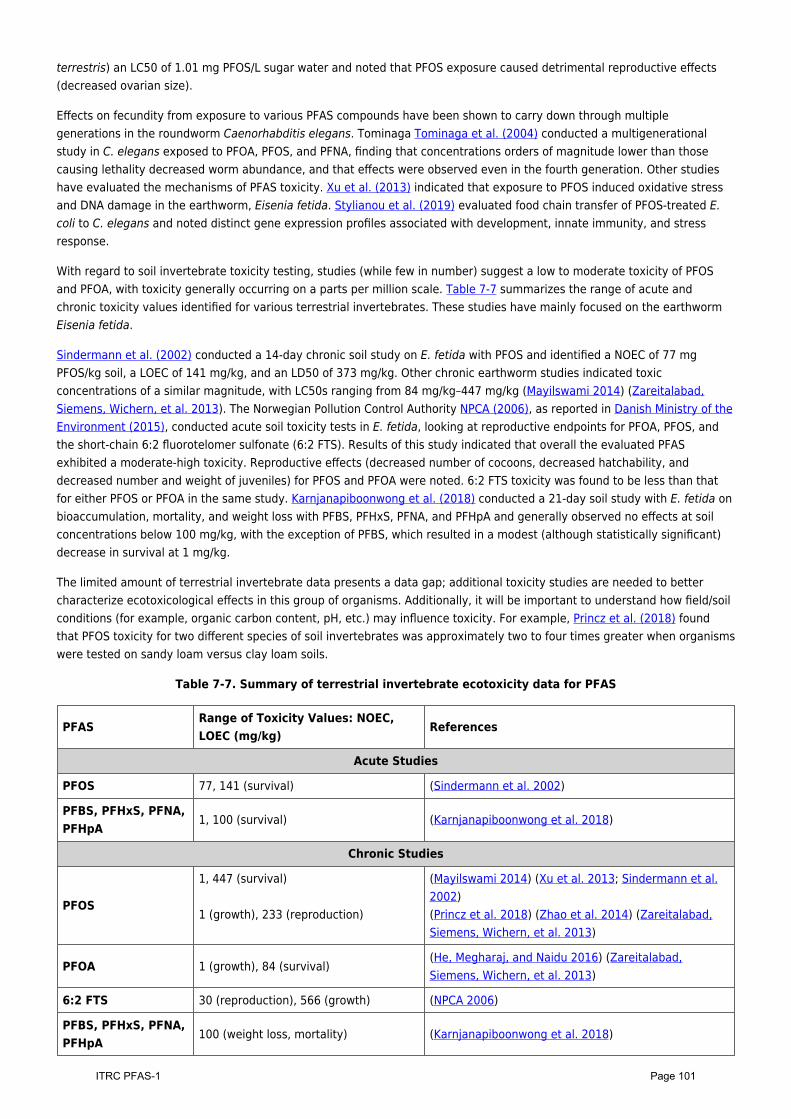
terrestris) an LC50 of 1.01 mg PFOS/L sugar water and noted that PFOS exposure caused detrimental reproductive effects(decreased ovarian size).
Effects on fecundity from exposure to various PFAS compounds have been shown to carry down through multiplegenerations in the roundworm Caenorhabditis elegans. Tominaga Tominaga et al. (2004) conducted a multigenerationalstudy in C. elegans exposed to PFOA, PFOS, and PFNA, finding that concentrations orders of magnitude lower than thosecausing lethality decreased worm abundance, and that effects were observed even in the fourth generation. Other studieshave evaluated the mechanisms of PFAS toxicity. Xu et al. (2013) indicated that exposure to PFOS induced oxidative stressand DNA damage in the earthworm, Eisenia fetida. Stylianou et al. (2019) evaluated food chain transfer of PFOS-treated E.coli to C. elegans and noted distinct gene expression profiles associated with development, innate immunity, and stressresponse.
With regard to soil invertebrate toxicity testing, studies (while few in number) suggest a low to moderate toxicity of PFOSand PFOA, with toxicity generally occurring on a parts per million scale. Table 7-7 summarizes the range of acute andchronic toxicity values identified for various terrestrial invertebrates. These studies have mainly focused on the earthwormEisenia fetida.
Sindermann et al. (2002) conducted a 14-day chronic soil study on E. fetida with PFOS and identified a NOEC of 77 mgPFOS/kg soil, a LOEC of 141 mg/kg, and an LD50 of 373 mg/kg. Other chronic earthworm studies indicated toxicconcentrations of a similar magnitude, with LC50s ranging from 84 mg/kg–447 mg/kg (Mayilswami 2014) (Zareitalabad,Siemens, Wichern, et al. 2013). The Norwegian Pollution Control Authority NPCA (2006), as reported in Danish Ministry of theEnvironment (2015), conducted acute soil toxicity tests in E. fetida, looking at reproductive endpoints for PFOA, PFOS, andthe short-chain 6:2 fluorotelomer sulfonate (6:2 FTS). Results of this study indicated that overall the evaluated PFASexhibited a moderate-high toxicity. Reproductive effects (decreased number of cocoons, decreased hatchability, anddecreased number and weight of juveniles) for PFOS and PFOA were noted. 6:2 FTS toxicity was found to be less than thatfor either PFOS or PFOA in the same study. Karnjanapiboonwong et al. (2018) conducted a 21-day soil study with E. fetida onbioaccumulation, mortality, and weight loss with PFBS, PFHxS, PFNA, and PFHpA and generally observed no effects at soilconcentrations below 100 mg/kg, with the exception of PFBS, which resulted in a modest (although statistically significant)decrease in survival at 1 mg/kg.
The limited amount of terrestrial invertebrate data presents a data gap; additional toxicity studies are needed to bettercharacterize ecotoxicological effects in this group of organisms. Additionally, it will be important to understand how field/soilconditions (for example, organic carbon content, pH, etc.) may influence toxicity. For example, Princz et al. (2018) foundthat PFOS toxicity for two different species of soil invertebrates was approximately two to four times greater when organismswere tested on sandy loam versus clay loam soils.
Table 7-7. Summary of terrestrial invertebrate ecotoxicity data for PFAS
PFASRange of Toxicity Values: NOEC,LOEC (mg/kg)
References
Acute Studies
PFOS 77, 141 (survival) (Sindermann et al. 2002)
PFBS, PFHxS, PFNA,PFHpA
1, 100 (survival) (Karnjanapiboonwong et al. 2018)
Chronic Studies
PFOS
1, 447 (survival) 1 (growth), 233 (reproduction)
(Mayilswami 2014) (Xu et al. 2013; Sindermann et al.2002)(Princz et al. 2018) (Zhao et al. 2014) (Zareitalabad,Siemens, Wichern, et al. 2013)
PFOA 1 (growth), 84 (survival)(He, Megharaj, and Naidu 2016) (Zareitalabad,Siemens, Wichern, et al. 2013)
6:2 FTS 30 (reproduction), 566 (growth) (NPCA 2006)
PFBS, PFHxS, PFNA,PFHpA
100 (weight loss, mortality) (Karnjanapiboonwong et al. 2018)
Page 101ITRC PFAS-1
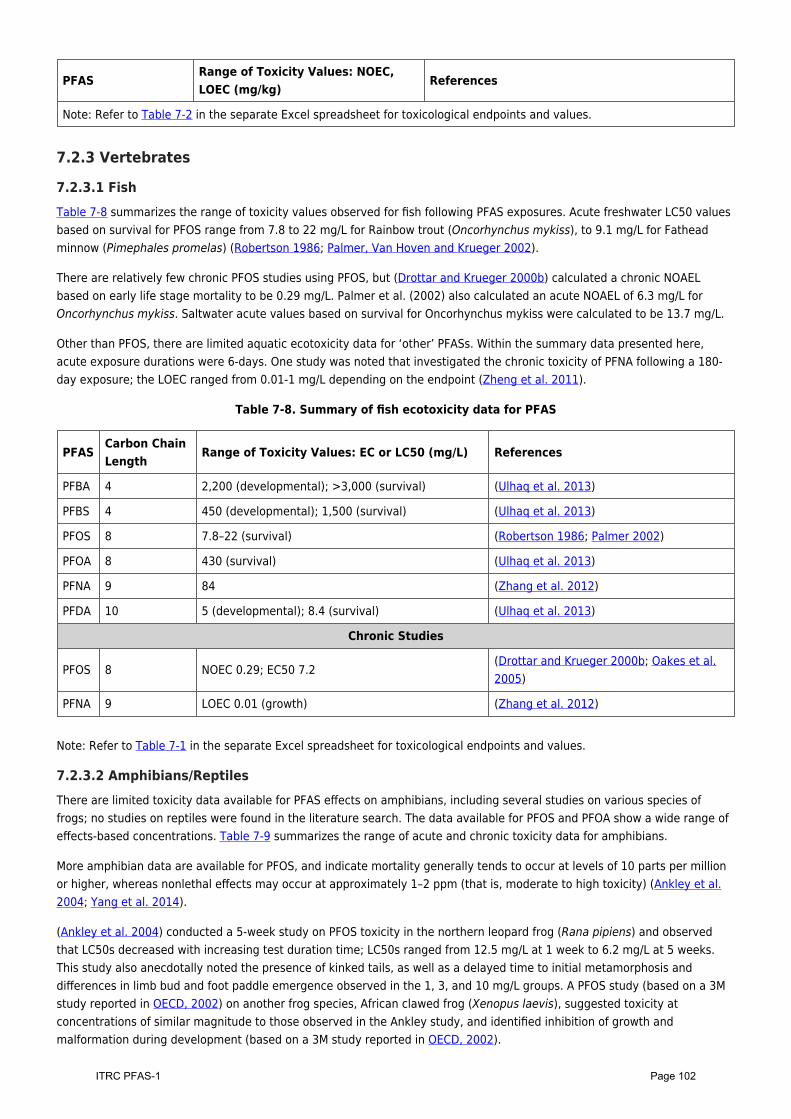
PFASRange of Toxicity Values: NOEC,LOEC (mg/kg)
References
Note: Refer to Table 7-2 in the separate Excel spreadsheet for toxicological endpoints and values.
7.2.3 Vertebrates
7.2.3.1 FishTable 7-8 summarizes the range of toxicity values observed for fish following PFAS exposures. Acute freshwater LC50 valuesbased on survival for PFOS range from 7.8 to 22 mg/L for Rainbow trout (Oncorhynchus mykiss), to 9.1 mg/L for Fatheadminnow (Pimephales promelas) (Robertson 1986; Palmer, Van Hoven and Krueger 2002).
There are relatively few chronic PFOS studies using PFOS, but (Drottar and Krueger 2000b) calculated a chronic NOAELbased on early life stage mortality to be 0.29 mg/L. Palmer et al. (2002) also calculated an acute NOAEL of 6.3 mg/L forOncorhynchus mykiss. Saltwater acute values based on survival for Oncorhynchus mykiss were calculated to be 13.7 mg/L.
Other than PFOS, there are limited aquatic ecotoxicity data for ‘other’ PFASs. Within the summary data presented here,acute exposure durations were 6-days. One study was noted that investigated the chronic toxicity of PFNA following a 180-day exposure; the LOEC ranged from 0.01-1 mg/L depending on the endpoint (Zheng et al. 2011).
Table 7-8. Summary of fish ecotoxicity data for PFAS
PFASCarbon ChainLength
Range of Toxicity Values: EC or LC50 (mg/L) References
PFBA 4 2,200 (developmental); >3,000 (survival) (Ulhaq et al. 2013)
PFBS 4 450 (developmental); 1,500 (survival) (Ulhaq et al. 2013)
PFOS 8 7.8–22 (survival) (Robertson 1986; Palmer 2002)
PFOA 8 430 (survival) (Ulhaq et al. 2013)
PFNA 9 84 (Zhang et al. 2012)
PFDA 10 5 (developmental); 8.4 (survival) (Ulhaq et al. 2013)
Chronic Studies
PFOS 8 NOEC 0.29; EC50 7.2(Drottar and Krueger 2000b; Oakes et al.2005)
PFNA 9 LOEC 0.01 (growth) (Zhang et al. 2012)
Note: Refer to Table 7-1 in the separate Excel spreadsheet for toxicological endpoints and values.
7.2.3.2 Amphibians/ReptilesThere are limited toxicity data available for PFAS effects on amphibians, including several studies on various species offrogs; no studies on reptiles were found in the literature search. The data available for PFOS and PFOA show a wide range ofeffects-based concentrations. Table 7-9 summarizes the range of acute and chronic toxicity data for amphibians.
More amphibian data are available for PFOS, and indicate mortality generally tends to occur at levels of 10 parts per millionor higher, whereas nonlethal effects may occur at approximately 1–2 ppm (that is, moderate to high toxicity) (Ankley et al.2004; Yang et al. 2014).
(Ankley et al. 2004) conducted a 5-week study on PFOS toxicity in the northern leopard frog (Rana pipiens) and observedthat LC50s decreased with increasing test duration time; LC50s ranged from 12.5 mg/L at 1 week to 6.2 mg/L at 5 weeks.This study also anecdotally noted the presence of kinked tails, as well as a delayed time to initial metamorphosis anddifferences in limb bud and foot paddle emergence observed in the 1, 3, and 10 mg/L groups. A PFOS study (based on a 3Mstudy reported in OECD, 2002) on another frog species, African clawed frog (Xenopus laevis), suggested toxicity atconcentrations of similar magnitude to those observed in the Ankley study, and identified inhibition of growth andmalformation during development (based on a 3M study reported in OECD, 2002).
Page 102ITRC PFAS-1
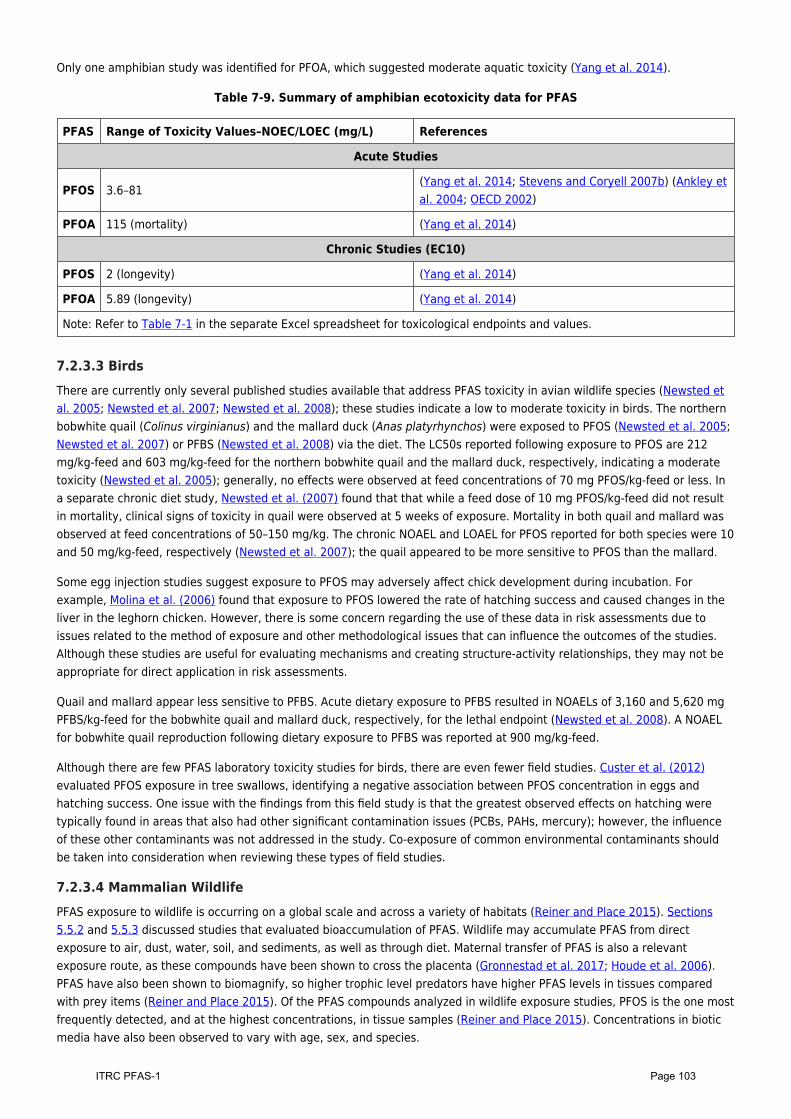
Only one amphibian study was identified for PFOA, which suggested moderate aquatic toxicity (Yang et al. 2014).
Table 7-9. Summary of amphibian ecotoxicity data for PFAS
PFAS Range of Toxicity Values–NOEC/LOEC (mg/L) References
Acute Studies
PFOS 3.6–81(Yang et al. 2014; Stevens and Coryell 2007b) (Ankley etal. 2004; OECD 2002)
PFOA 115 (mortality) (Yang et al. 2014)
Chronic Studies (EC10)
PFOS 2 (longevity) (Yang et al. 2014)
PFOA 5.89 (longevity) (Yang et al. 2014)
Note: Refer to Table 7-1 in the separate Excel spreadsheet for toxicological endpoints and values.
7.2.3.3 BirdsThere are currently only several published studies available that address PFAS toxicity in avian wildlife species (Newsted etal. 2005; Newsted et al. 2007; Newsted et al. 2008); these studies indicate a low to moderate toxicity in birds. The northernbobwhite quail (Colinus virginianus) and the mallard duck (Anas platyrhynchos) were exposed to PFOS (Newsted et al. 2005;Newsted et al. 2007) or PFBS (Newsted et al. 2008) via the diet. The LC50s reported following exposure to PFOS are 212mg/kg-feed and 603 mg/kg-feed for the northern bobwhite quail and the mallard duck, respectively, indicating a moderatetoxicity (Newsted et al. 2005); generally, no effects were observed at feed concentrations of 70 mg PFOS/kg-feed or less. Ina separate chronic diet study, Newsted et al. (2007) found that that while a feed dose of 10 mg PFOS/kg-feed did not resultin mortality, clinical signs of toxicity in quail were observed at 5 weeks of exposure. Mortality in both quail and mallard wasobserved at feed concentrations of 50–150 mg/kg. The chronic NOAEL and LOAEL for PFOS reported for both species were 10and 50 mg/kg-feed, respectively (Newsted et al. 2007); the quail appeared to be more sensitive to PFOS than the mallard.
Some egg injection studies suggest exposure to PFOS may adversely affect chick development during incubation. Forexample, Molina et al. (2006) found that exposure to PFOS lowered the rate of hatching success and caused changes in theliver in the leghorn chicken. However, there is some concern regarding the use of these data in risk assessments due toissues related to the method of exposure and other methodological issues that can influence the outcomes of the studies.Although these studies are useful for evaluating mechanisms and creating structure-activity relationships, they may not beappropriate for direct application in risk assessments.
Quail and mallard appear less sensitive to PFBS. Acute dietary exposure to PFBS resulted in NOAELs of 3,160 and 5,620 mgPFBS/kg-feed for the bobwhite quail and mallard duck, respectively, for the lethal endpoint (Newsted et al. 2008). A NOAELfor bobwhite quail reproduction following dietary exposure to PFBS was reported at 900 mg/kg-feed.
Although there are few PFAS laboratory toxicity studies for birds, there are even fewer field studies. Custer et al. (2012)evaluated PFOS exposure in tree swallows, identifying a negative association between PFOS concentration in eggs andhatching success. One issue with the findings from this field study is that the greatest observed effects on hatching weretypically found in areas that also had other significant contamination issues (PCBs, PAHs, mercury); however, the influenceof these other contaminants was not addressed in the study. Co-exposure of common environmental contaminants shouldbe taken into consideration when reviewing these types of field studies.
7.2.3.4 Mammalian WildlifePFAS exposure to wildlife is occurring on a global scale and across a variety of habitats (Reiner and Place 2015). Sections5.5.2 and 5.5.3 discussed studies that evaluated bioaccumulation of PFAS. Wildlife may accumulate PFAS from directexposure to air, dust, water, soil, and sediments, as well as through diet. Maternal transfer of PFAS is also a relevantexposure route, as these compounds have been shown to cross the placenta (Gronnestad et al. 2017; Houde et al. 2006).PFAS have also been shown to biomagnify, so higher trophic level predators have higher PFAS levels in tissues comparedwith prey items (Reiner and Place 2015). Of the PFAS compounds analyzed in wildlife exposure studies, PFOS is the one mostfrequently detected, and at the highest concentrations, in tissue samples (Reiner and Place 2015). Concentrations in bioticmedia have also been observed to vary with age, sex, and species.
Page 103ITRC PFAS-1
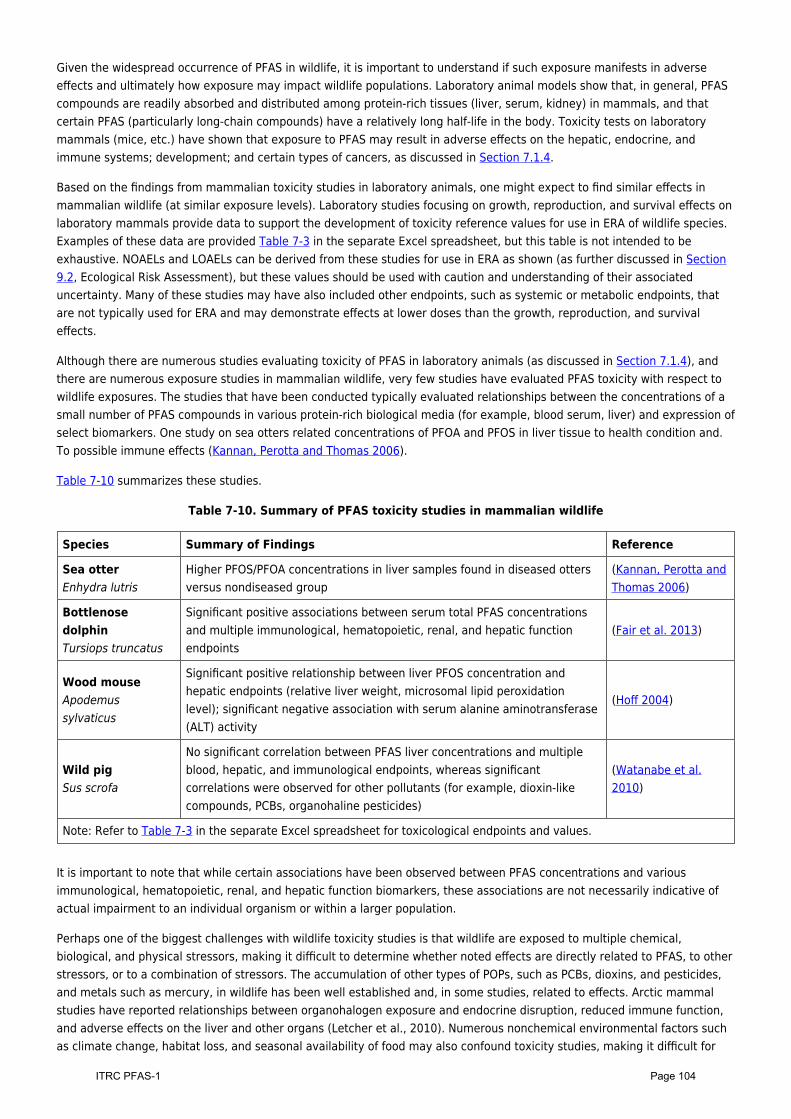
Given the widespread occurrence of PFAS in wildlife, it is important to understand if such exposure manifests in adverseeffects and ultimately how exposure may impact wildlife populations. Laboratory animal models show that, in general, PFAScompounds are readily absorbed and distributed among protein-rich tissues (liver, serum, kidney) in mammals, and thatcertain PFAS (particularly long-chain compounds) have a relatively long half-life in the body. Toxicity tests on laboratorymammals (mice, etc.) have shown that exposure to PFAS may result in adverse effects on the hepatic, endocrine, andimmune systems; development; and certain types of cancers, as discussed in Section 7.1.4.
Based on the findings from mammalian toxicity studies in laboratory animals, one might expect to find similar effects inmammalian wildlife (at similar exposure levels). Laboratory studies focusing on growth, reproduction, and survival effects onlaboratory mammals provide data to support the development of toxicity reference values for use in ERA of wildlife species.Examples of these data are provided Table 7-3 in the separate Excel spreadsheet, but this table is not intended to beexhaustive. NOAELs and LOAELs can be derived from these studies for use in ERA as shown (as further discussed in Section9.2, Ecological Risk Assessment), but these values should be used with caution and understanding of their associateduncertainty. Many of these studies may have also included other endpoints, such as systemic or metabolic endpoints, thatare not typically used for ERA and may demonstrate effects at lower doses than the growth, reproduction, and survivaleffects.
Although there are numerous studies evaluating toxicity of PFAS in laboratory animals (as discussed in Section 7.1.4), andthere are numerous exposure studies in mammalian wildlife, very few studies have evaluated PFAS toxicity with respect towildlife exposures. The studies that have been conducted typically evaluated relationships between the concentrations of asmall number of PFAS compounds in various protein-rich biological media (for example, blood serum, liver) and expression ofselect biomarkers. One study on sea otters related concentrations of PFOA and PFOS in liver tissue to health condition and.To possible immune effects (Kannan, Perotta and Thomas 2006).
Table 7-10 summarizes these studies.
Table 7-10. Summary of PFAS toxicity studies in mammalian wildlife
Species Summary of Findings Reference
Sea otterEnhydra lutris
Higher PFOS/PFOA concentrations in liver samples found in diseased ottersversus nondiseased group
(Kannan, Perotta andThomas 2006)
BottlenosedolphinTursiops truncatus
Significant positive associations between serum total PFAS concentrationsand multiple immunological, hematopoietic, renal, and hepatic functionendpoints
(Fair et al. 2013)
Wood mouseApodemussylvaticus
Significant positive relationship between liver PFOS concentration andhepatic endpoints (relative liver weight, microsomal lipid peroxidationlevel); significant negative association with serum alanine aminotransferase(ALT) activity
(Hoff 2004)
Wild pigSus scrofa
No significant correlation between PFAS liver concentrations and multipleblood, hepatic, and immunological endpoints, whereas significantcorrelations were observed for other pollutants (for example, dioxin-likecompounds, PCBs, organohaline pesticides)
(Watanabe et al.2010)
Note: Refer to Table 7-3 in the separate Excel spreadsheet for toxicological endpoints and values.
It is important to note that while certain associations have been observed between PFAS concentrations and variousimmunological, hematopoietic, renal, and hepatic function biomarkers, these associations are not necessarily indicative ofactual impairment to an individual organism or within a larger population.
Perhaps one of the biggest challenges with wildlife toxicity studies is that wildlife are exposed to multiple chemical,biological, and physical stressors, making it difficult to determine whether noted effects are directly related to PFAS, to otherstressors, or to a combination of stressors. The accumulation of other types of POPs, such as PCBs, dioxins, and pesticides,and metals such as mercury, in wildlife has been well established and, in some studies, related to effects. Arctic mammalstudies have reported relationships between organohalogen exposure and endocrine disruption, reduced immune function,and adverse effects on the liver and other organs (Letcher et al., 2010). Numerous nonchemical environmental factors suchas climate change, habitat loss, and seasonal availability of food may also confound toxicity studies, making it difficult for
Page 104ITRC PFAS-1
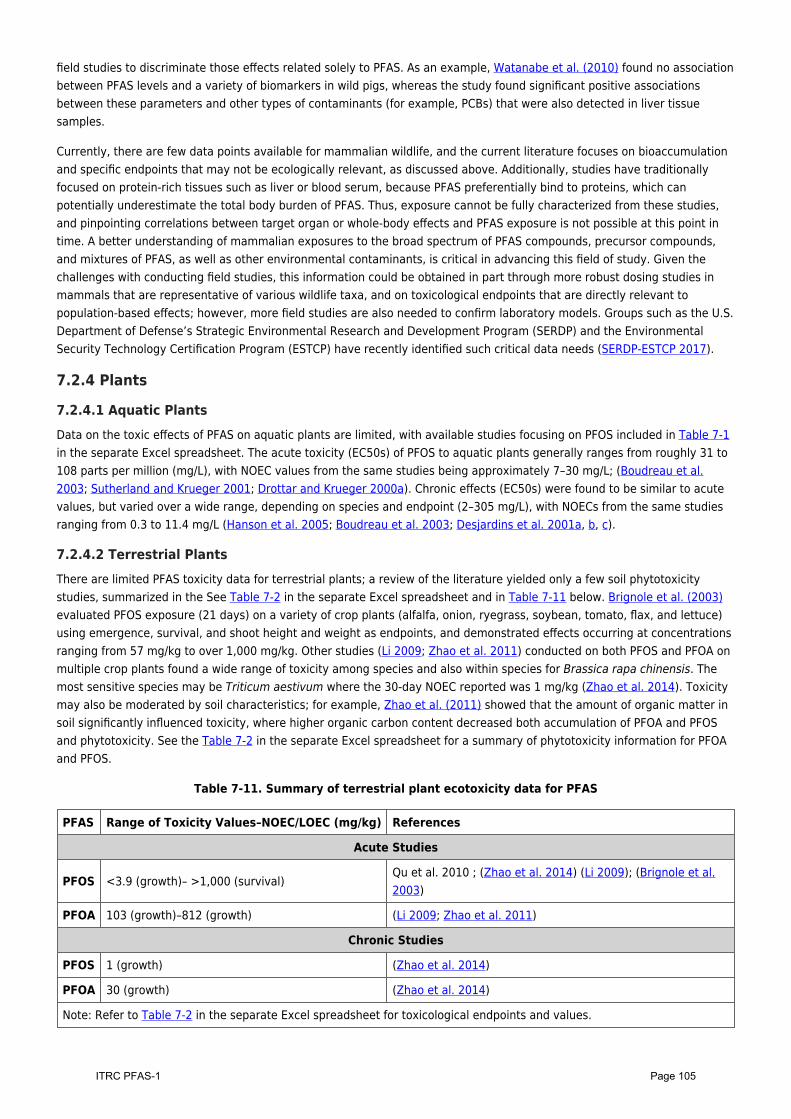
field studies to discriminate those effects related solely to PFAS. As an example, Watanabe et al. (2010) found no associationbetween PFAS levels and a variety of biomarkers in wild pigs, whereas the study found significant positive associationsbetween these parameters and other types of contaminants (for example, PCBs) that were also detected in liver tissuesamples.
Currently, there are few data points available for mammalian wildlife, and the current literature focuses on bioaccumulationand specific endpoints that may not be ecologically relevant, as discussed above. Additionally, studies have traditionallyfocused on protein-rich tissues such as liver or blood serum, because PFAS preferentially bind to proteins, which canpotentially underestimate the total body burden of PFAS. Thus, exposure cannot be fully characterized from these studies,and pinpointing correlations between target organ or whole-body effects and PFAS exposure is not possible at this point intime. A better understanding of mammalian exposures to the broad spectrum of PFAS compounds, precursor compounds,and mixtures of PFAS, as well as other environmental contaminants, is critical in advancing this field of study. Given thechallenges with conducting field studies, this information could be obtained in part through more robust dosing studies inmammals that are representative of various wildlife taxa, and on toxicological endpoints that are directly relevant topopulation-based effects; however, more field studies are also needed to confirm laboratory models. Groups such as the U.S.Department of Defense’s Strategic Environmental Research and Development Program (SERDP) and the EnvironmentalSecurity Technology Certification Program (ESTCP) have recently identified such critical data needs (SERDP-ESTCP 2017).
7.2.4 Plants
7.2.4.1 Aquatic PlantsData on the toxic effects of PFAS on aquatic plants are limited, with available studies focusing on PFOS included in Table 7-1in the separate Excel spreadsheet. The acute toxicity (EC50s) of PFOS to aquatic plants generally ranges from roughly 31 to108 parts per million (mg/L), with NOEC values from the same studies being approximately 7–30 mg/L; (Boudreau et al.2003; Sutherland and Krueger 2001; Drottar and Krueger 2000a). Chronic effects (EC50s) were found to be similar to acutevalues, but varied over a wide range, depending on species and endpoint (2–305 mg/L), with NOECs from the same studiesranging from 0.3 to 11.4 mg/L (Hanson et al. 2005; Boudreau et al. 2003; Desjardins et al. 2001a, b, c).
7.2.4.2 Terrestrial PlantsThere are limited PFAS toxicity data for terrestrial plants; a review of the literature yielded only a few soil phytotoxicitystudies, summarized in the See Table 7-2 in the separate Excel spreadsheet and in Table 7-11 below. Brignole et al. (2003)evaluated PFOS exposure (21 days) on a variety of crop plants (alfalfa, onion, ryegrass, soybean, tomato, flax, and lettuce)using emergence, survival, and shoot height and weight as endpoints, and demonstrated effects occurring at concentrationsranging from 57 mg/kg to over 1,000 mg/kg. Other studies (Li 2009; Zhao et al. 2011) conducted on both PFOS and PFOA onmultiple crop plants found a wide range of toxicity among species and also within species for Brassica rapa chinensis. Themost sensitive species may be Triticum aestivum where the 30-day NOEC reported was 1 mg/kg (Zhao et al. 2014). Toxicitymay also be moderated by soil characteristics; for example, Zhao et al. (2011) showed that the amount of organic matter insoil significantly influenced toxicity, where higher organic carbon content decreased both accumulation of PFOA and PFOSand phytotoxicity. See the Table 7-2 in the separate Excel spreadsheet for a summary of phytotoxicity information for PFOAand PFOS.
Table 7-11. Summary of terrestrial plant ecotoxicity data for PFAS
PFAS Range of Toxicity Values–NOEC/LOEC (mg/kg) References
Acute Studies
PFOS <3.9 (growth)– >1,000 (survival)Qu et al. 2010 ; (Zhao et al. 2014) (Li 2009); (Brignole et al.2003)
PFOA 103 (growth)–812 (growth) (Li 2009; Zhao et al. 2011)
Chronic Studies
PFOS 1 (growth) (Zhao et al. 2014)
PFOA 30 (growth) (Zhao et al. 2014)
Note: Refer to Table 7-2 in the separate Excel spreadsheet for toxicological endpoints and values.
Page 105ITRC PFAS-1
7.2.5 Uncertainties and ConclusionsThis section presented ecotoxicological information from an array of studies with the intent of providing the reader with anoverview of the types of organisms and ecotoxicity studies available for PFAS compounds in the current literature. Thissection also presented available information about the ranges of concentrations of PFAS (notably, PFOS) in soil, sediment,and water that have been associated with adverse effects. In summary, ecotoxicity studies demonstrate a wide range ofeffects concentrations across the various terrestrial and aquatic biota. In general, aquatic invertebrates appear to be moresensitive to PFOS and other PFAS compounds than their terrestrial counterparts. Differences in species sensitivities,analytical methods, environmental substrate, test conditions, and reproducibility of results make it difficult to generalizeoverall effects, and some species may be more or less sensitive than others.
Although there are numerous studies on the toxicity of select PFAS to aquatic invertebrates, these studies are generallylimited to a very small number of PFAS compounds (typically PFOS, and to a lesser extent, PFOA). Because PFAS represent abroad spectrum of compounds, it is important to expand ecotoxicity studies in this field to evaluate additional PFAS,including short-chain and precursor compounds, as well as “next generation” replacement compounds. Furthermore, theavailable studies indicate a wide range of effects levels for PFAS compounds in aquatic invertebrates, suggesting a level ofcomplexity that has not yet been adequately assessed.
Significantly fewer toxicity studies are available for other groups of aquatic or benthic organisms, and few to no studies areavailable for avian or mammalian wildlife or plants, presenting a significant gap in our understanding of how the widespreadpresence of PFAS in the environment may be affecting ecological communities. Additional (or any) data on toxicologicalendpoints most relevant to community-level effects, such as survival, growth, and reproduction, will be extremely beneficialin understanding potential ecological impacts.
Updated April 14, 2020.
Page 106ITRC PFAS-1
8 Basis of RegulationsThis section describes various federal and state regulatory programs that apply to PFAS. Because state regulations for PFASin environmental media are changing rapidly, only a few state regulations are summarized in this section, as examples. ITRCalso maintains updated tables of PFAS water values, and PFAS soil values from state, federal, and some internationalcountries posted as an Excel file). This section also includes a brief explanation of examples of various health-based criteria.ITRC also has tables posted as an Excel file of the basis for PFOA and PFOS values in the United States that is updatedperiodically.
Section Number Topic
8.1 Introduction
8.2 Regulatory Programs
8.3 Differences in the Available Regulations, Advisories, and Guidance
8.1 IntroductionPFAS became contaminants of emerging concern in the early 2000s. In recent years federal, state, and internationalauthorities have established a number of health-based regulatory values and evaluation criteria. As with the case for mostemerging contaminants, the regulatory process dealing with PFAS is in various stages of development, and the values andcriteria being established vary between individual states, the U.S. government, and international agencies. This sectiondescribes examples of various federal and state regulatory programs and includes links to tables that provide establishedPFAS health-based criteria.
The terms “regulatory” or “regulation” are used in this document to refer to requirements that have gone through a formalprocess to be promulgated and legally enforceable as identified under local, state, federal, or international programs. Theterms “guidance” and “advisory” apply to all other policies and numerical values.
8.2 Regulatory Programs
8.2.1 Background to Regulation of PFASThe scientific community is rapidly recognizing and evolving its understanding of PFAS in the environment, causing anincreased pace of development of guidance values and regulations. Human health protection is the primary focus of thePFAS regulations, guidance, and advisories developed to date. Regulations and guidance have focused on the PFAAs,precursor compounds, and FECAs. Like many other emerging contaminants, the regulatory and guidance values for PFOSand PFOA can vary across programs, with differences due to the selection and interpretation of different key toxicity studies,choice of uncertainty factors, and approaches used for animal-to-human extrapolation. The choice of exposure assumptions,including the life stage and the percentage of exposure assumed to come from non-drinking water sources, may also differ.Thus, both differences in scientific conclusions and public health policy choices affect the myriad of regulatory and guidanceinitiatives for PFAS. See the tables of the basis for PFOA and PFOS values in the United States for the specific differencesunderlying drinking water or groundwater regulations and advisories for PFOA and PFOS.
In addition to values that specify health-based concentration limits, agencies have used various strategies to limit the useand release of PFAS. For example, the USEPA worked with the eight primary U.S. PFAS manufacturers and processors toeliminate PFOA and many PFOA precursors and higher homologues by 2015 (USEPA 2017a). Additionally, the Organisationfor Economic Co-operation and Development OECD (2015a) has described various international policies, voluntary initiatives,biomonitoring, and environmental monitoring programs to control PFAS. More information regarding the history of thesedevelopments is in Section 2.4.
Page 107ITRC PFAS-1
Authority for regulating PFAS in the United States is derived from a number of federal and state statutes, regulations, andpolicy initiatives. This section provides a brief overview of the major federal statutes and regulatory programs that governPFAS.
8.2.2 Federal PFAS RegulationsWithin the United States, currently both the USEPA and the FDA have regulatory or guidance initiatives for PFAS. The USEPAhas the authority to regulate PFAS under several different acts, as provided below; however, USEPA has not yet listed PFASas hazardous wastes or substances under its available statutory authorities, including the Resource Conservation andRecovery Act (RCRA), Comprehensive Environmental Response, Compensation and Liability Act (CERCLA), EmergencyPlanning and Community Right-to-Know Act, or the Clean Air Act. To date, USEPA has also not regulated any PFAS under theSafe Drinking Water Act.
8.2.2.1 Toxic Substances Control Act (TSCA)TSCA authorizes the USEPA to require reporting, record keeping, testing, and restrictions of chemicals and chemical mixturesthat may pose a risk to human health or the environment. Section 5 of TSCA authorizes the USEPA to issue Significant NewUse Rules (SNURs) to limit the use of a chemical when it is newly identified, or when a significant new use of an existingchemical is identified, before it is allowed into the marketplace (USEPA 2017a). From 2002 to 2013, USEPA issued four finalSNURs covering 271 PFAS, including PFOS and PFOA. The first three SNURs covered PFAS included in the 3M Corporation’svoluntary phaseout of PFOS. The 2013 SNUR required notification to USEPA prior to manufacture or import of seven PFASthat had been reviewed by USEPA under the TSCA New Chemicals Program, but had yet to be commercially manufactured orimported into the United States. This SNUR also included long-chain PFCAs and their salts and precursors that were used incarpets or to treat carpets (USEPA 2015e). Collectively, these SNURs placed notification requirements on the manufacture(including import) of specific PFAS for new use. The SNURs allowed for continued, low-volume use of some PFAS inphotographic/imaging, semiconductor, etching, metal plating, and aviation industries (USEPA 2017a). In January 2015,USEPA proposed another SNUR to require notification to USEPA before any future manufacture (including import) of PFOAand PFOA-related chemicals, including as part of articles, and processing of these chemicals. The proposed SNUR does notplace a regulatory restriction on the imports of fluoropolymers dispersions and emulsions containing PFOA or its salts(FluoroCouncil 2018). As a result of changes made to section 5(a) of TSCA when TSCA was amended in June 2016, USEPA isnow developing a supplemental proposed SNUR for the import of certain long-chain PFCA and PFSAs as part of categories ofcertain articles (USEPA 2018i).
USEPA continues to review the new short-chain PFAS chemicals through USEPA’s New Chemicals Program before approvingcommercialization. Since 2006, USEPA has reviewed around 300 Premanufacture Notices for PFAS chemicals and hasregulated about 200 of them through a combination of Consent Orders and SNURs (USEPA 2018j).
8.2.2.2 Safe Drinking Water Act (SDWA)The SDWA is the federal law that protects public drinking water supplies throughout the nation (USEPA 1974). Under theSDWA, the USEPA has authority to set enforceable Maximum Contaminant Levels (MCLs) for specific chemicals and requiretesting of public water supplies. The SDWA applies to all public water systems (PWSs) in the United States but does notapply to private domestic drinking water wells nor to water not being used for drinking.
USEPA has not established regulations for any PFAS under SDWA; however, the agency recently indicated in its PFAS ActionPlan (USEPA 2019h) that it will be initiating steps to evaluate the need for MCLs for PFOA and PFOS. The SDWA specifies thefollowing three requirements for making a Regulatory Determination regarding MCL development:
The chemical may have an adverse effect on the health of persons.The chemical is known to occur or there is a substantial likelihood that it will occur in PWSs with a frequency andat levels of public health concern.In the sole judgment of the EPA administrator, regulating the contaminant presents a meaningful opportunity forhealth risk reductions for persons served by PWSs.
More information regarding USEPA’s PFAS Action Plan is found below in this section.
In May 2016, USEPA established a lifetime health advisory (LHA) of 70 ng/L for PFOA and PFOS in drinking water. This LHA isapplicable to PFOA and PFOS individually or in combination if both chemicals are present at concentrations above thereporting limit (USEPA 2016c, d). The LHA supersedes USEPA’s 2009 short-term (week to months) provisional healthadvisories of 200 ng/L for PFOS and 400 ng/L for PFOA (USEPA 2009c). The LHA for PFOA and PFOS is advisory in nature; it is
Page 108ITRC PFAS-1
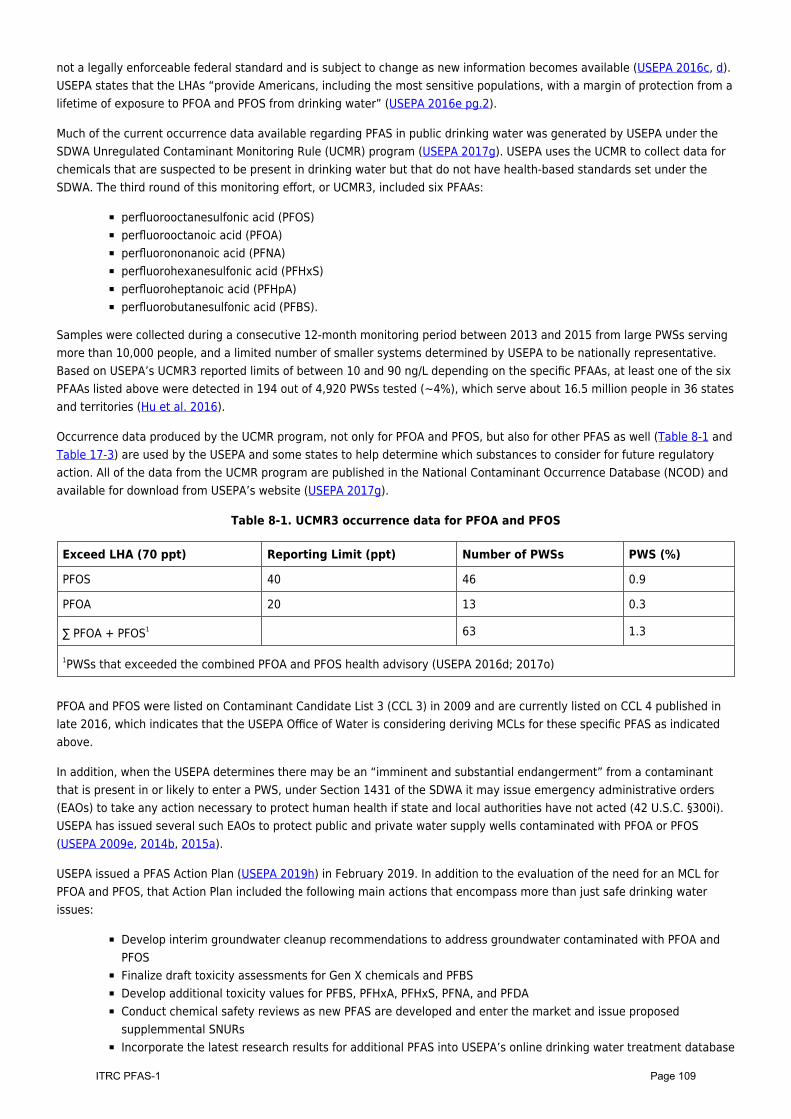
not a legally enforceable federal standard and is subject to change as new information becomes available (USEPA 2016c, d).USEPA states that the LHAs “provide Americans, including the most sensitive populations, with a margin of protection from alifetime of exposure to PFOA and PFOS from drinking water” (USEPA 2016e pg.2).
Much of the current occurrence data available regarding PFAS in public drinking water was generated by USEPA under theSDWA Unregulated Contaminant Monitoring Rule (UCMR) program (USEPA 2017g). USEPA uses the UCMR to collect data forchemicals that are suspected to be present in drinking water but that do not have health-based standards set under theSDWA. The third round of this monitoring effort, or UCMR3, included six PFAAs:
perfluorooctanesulfonic acid (PFOS)perfluorooctanoic acid (PFOA)perfluorononanoic acid (PFNA)perfluorohexanesulfonic acid (PFHxS)perfluoroheptanoic acid (PFHpA)perfluorobutanesulfonic acid (PFBS).
Samples were collected during a consecutive 12-month monitoring period between 2013 and 2015 from large PWSs servingmore than 10,000 people, and a limited number of smaller systems determined by USEPA to be nationally representative.Based on USEPA’s UCMR3 reported limits of between 10 and 90 ng/L depending on the specific PFAAs, at least one of the sixPFAAs listed above were detected in 194 out of 4,920 PWSs tested (~4%), which serve about 16.5 million people in 36 statesand territories (Hu et al. 2016).
Occurrence data produced by the UCMR program, not only for PFOA and PFOS, but also for other PFAS as well (Table 8-1 andTable 17-3) are used by the USEPA and some states to help determine which substances to consider for future regulatoryaction. All of the data from the UCMR program are published in the National Contaminant Occurrence Database (NCOD) andavailable for download from USEPA’s website (USEPA 2017g).
Table 8-1. UCMR3 occurrence data for PFOA and PFOS
Exceed LHA (70 ppt) Reporting Limit (ppt) Number of PWSs PWS (%)
PFOS 40 46 0.9
PFOA 20 13 0.3
∑ PFOA + PFOS1 63 1.3
1PWSs that exceeded the combined PFOA and PFOS health advisory (USEPA 2016d; 2017o)
PFOA and PFOS were listed on Contaminant Candidate List 3 (CCL 3) in 2009 and are currently listed on CCL 4 published inlate 2016, which indicates that the USEPA Office of Water is considering deriving MCLs for these specific PFAS as indicatedabove.
In addition, when the USEPA determines there may be an “imminent and substantial endangerment” from a contaminantthat is present in or likely to enter a PWS, under Section 1431 of the SDWA it may issue emergency administrative orders(EAOs) to take any action necessary to protect human health if state and local authorities have not acted (42 U.S.C. §300i).USEPA has issued several such EAOs to protect public and private water supply wells contaminated with PFOA or PFOS(USEPA 2009e, 2014b, 2015a).
USEPA issued a PFAS Action Plan (USEPA 2019h) in February 2019. In addition to the evaluation of the need for an MCL forPFOA and PFOS, that Action Plan included the following main actions that encompass more than just safe drinking waterissues:
Develop interim groundwater cleanup recommendations to address groundwater contaminated with PFOA andPFOSFinalize draft toxicity assessments for Gen X chemicals and PFBSDevelop additional toxicity values for PFBS, PFHxA, PFHxS, PFNA, and PFDAConduct chemical safety reviews as new PFAS are developed and enter the market and issue proposedsupplemmental SNURsIncorporate the latest research results for additional PFAS into USEPA’s online drinking water treatment database
Page 109ITRC PFAS-1
Evaluate listing of PFOA and PFOS as hazardous substancesEvaluate performance and identify costs associated with treatment and remediation approaches to address PFASin the environmentSupport communities that have PFAS releases by using federal enforcement authorities where relevant andappropriateDevelop an interactive map providing the public with available information on sources and occurrence of PFASDevelop coordinated messaging on PFAS across the federal governmentDevelop a risk communications toolbox for PFAS to be used for the publicEvaluate the listing of PFAS chemicals to the Toxics Release InventoryDetermine if available data for PFAS are sufficient to establish ambient water quality criteria for human healthExplore identifying industrial sources that may warrant regulation through national Effluent Limitation Guidelinesand Standards (ELGs) and the setting of minimum levels of control needed for National Pollutant DischargeElimination System (NPDES) permitsDevelop toxicity information for a larger group of PFAS and potentially address groups of PFASAdd PFAS monitoring to UCMR5, using newer analytical methods for a wider suite of PFAS, while achieving lowerminimum reporting levels than earlier UCMRsDevelop an inventory of PFAS data for media other than drinking waterAssess ecological risk from PFAS exposureEvaluate air transport of PFAS.
8.2.2.3 Comprehensive Environmental Response, Compensation, and Liability Act(CERCLA)—“Superfund”PFAS, including PFOA and PFOS, are not listed as CERCLA hazardous substances but may be addressed as CERCLA pollutantsor contaminants, for example, as defined by section 101 (33) of CERCLA (40 CFR 300.5). As listed above in Section 8.2.2.2,under its PFAS Action Plan (USEPA 2019h), USEPA is evaluating listing PFOA and PFOS as hazardous substances. The actionplan also includes a priority action to develop interim cleanup recommendations for groundwater contaminated with PFOAand PFOS. The USEPA released a draft recommendation for public comment in spring 2019, which includes using a screeninglevel of 40 ppt for each (individually) of PFOA and PFOS (hazard index of 0.1), and using 70 ppt combined as a preliminaryremediation goal. CERCLA investigations are beginning to include PFAS when supported by the CSMs (for example, (USEPA2017d). PFAS are often included in a remediation site’s 5-year review, when supported by site-specific information.According to USEPA, as of April 2018, there were active PFAS investigations occurring at 32 federal facility National PrioritiesList (NPL) sites and 17 non-federal sites, and these numbers are expected to continue to increase as PFAS are included inmore remediation programs (Peter Gravatt, Director of USEPA’s Office of Ground Water and Drinking Water, ITRC PFAS teampresentation April 24, 2018). Section 9 provides a discussion and recommendations for how to consider PFAS during a site-specific risk assessment.
CERCLA Protection of Human Health. CERCLA requires, among other things, that Superfund response actions ensureprotectiveness of human health and the environment, and compliance with laws and regulations that constitute “applicableor relevant and appropriate requirements” (ARARs); the statute also provides possible ARAR waivers in limitedcircumstances. The lead agency (as defined in 40 CFR 300.5) identifies potential ARARs and to-be-considered values (TBCs),based in part on the timely identification of potential ARARs by states. Risk-based goals may be calculated and used todetermine cleanup levels when chemical-specific ARARs are not available or are determined not to be sufficiently protective(USEPA 1997a). The ARAR process can be complex and can result in impacts on scope, budget, and public acceptancecomponents of a project (USEPA 2019k).
The tables of PFAS water values, and PFAS soil values from state, federal, and some international countries posted as anExcel file include current state regulatory and guidance values for PFAS. These values are not necessarily automaticallyrecognized as ARARs and must be evaluated by the lead agency to determine their ARAR status. In the Superfund program,USEPA regions evaluate potential ARARs, including state standards, on a site-specific basis to determine whether a specificstandard or requirement is an ARAR for response decision and implementation purposes. Determining if a state requirementis promulgated, substantive, and enforceable are some of the factors in evaluating whether a specific standard mayconstitute an ARAR or TBC (40 CFR 300.5 2001; 40 CFR 300.400 2019, (g); USEPA 1988, 1991).
As mentioned above, risk-based cleanup goals may be calculated when chemical-specific ARARs are not available or aredetermined not to be protective (USEPA 1997). The USEPA’s Regional Screening Levels (RSLs) Generic Tables (USEPA 2017l)and the RSL online calculator(USEPA 2017k) are used by risk assessors to identify screening levels and preliminary remedial
Page 110ITRC PFAS-1
goals for contaminants of potential concern at a site. These goals are typically based on toxicity values that have beenselected in accordance with the USEPA’s published hierarchy (USEPA 2003a). Currently, PFBS and the potassium salt of PFBSare the only PFAS listed in the RSL generic tables. For PFBS and its salt, the generic tables provide a noncancer referencedose (RfD), screening levels for soil and tap water, and soil screening levels for the protection of groundwater. As stated inits PFAS Action Plan, USEPA is in the process of developing toxicity values for PFBS and GenX chemicals. Draft toxicityassessments were posted on November 14, 2018, for public review(USEPA 2018d, e). When finalized, these toxicity valuesmay be incorporated into the RSL table for these PFAS, as well. The online RSL calculator currently supports site-specificcalculations for PFBS, PFOA, and PFOS in tap water and soil. The noncancer RfDs derived by the USEPA Office of Water areprovided as Tier 3 toxicity values for PFOA and PFOS. The USEPA 2016 cancer ingestion slope factor is also provided forPFOA, but screening levels are based on the noncancer endpoint. The USEPA also provides tables and a calculator forremoval management levels (RMLs). In general, RMLs are not final cleanup levels, but can provide a reference whenconsidering the need for a removal action (for example, drinking water treatment or replacement) (USEPA 2016b).
Because RSLs and RMLs are periodically updated, they should be reviewed for revisions and additions before using them.RSLs and RMLs are not ARARs, but they may be evaluated as TBCs. The USEPA has emphasized that RSLs and RMLs are notcleanup standards (USEPA 2016g) and suggests that final remedial goals be informed by a baseline risk assessment so thatsite-specific information can be incorporated. Section 9 provides more information on site-specific risk assessment for PFAS.
CERCLA Protection of the Environment. CERCLA requires that remedies also be protective of the environment. Risk-basedcleanup goals that are protective of the environment are site-specific and depend in part on the identification of theecological receptors to be protected. To date noU.S. regulatory agency has established ecological criteria for PFAS. Anotherexample of a risk-based goal is a cleanup standard for a chemical in soil that is protective of groundwater quality and isdeveloped on a site-specific basis. Given the challenge associated with deriving accurate physical and chemical propertiesfor PFAS (Sections 4.1 and 5.1), site-specific values will need to be derived.
8.2.2.4 Resource Conservation and Recovery Act (RCRA)RCRA provides USEPA with the authority to regulate hazardous waste management, nonhazardous solid waste facilities andpractices, and underground storage tanks holding petroleum or certain hazardous substances. No PFAS have been formallylisted as RCRA hazardous waste for regulation under this program. However, there are at least a couple of examples whereaction on PFAS was taken under the auspices of RCRA. For example, in 2004 USEPA pursued violations of RCRA and TSCA atan E.I. DuPont de Nemours and Company (DuPont) facility in West Virginia due to environmental release of the hazardousconstituent PFOA (USEPA 2015c). In the case of DuPont, the facility already had a RCRA permit for hazardous waste disposaland was under a Corrective Action Permit. Some states, Texas, for example, are regulating certain PFAS under their RCRApermits and requiring investigation and cleanup.
In February 2017, a U.S. District Court denied motions to dismiss RCRA “imminent and substantial endangerment” claimsrelating to PFAS (Tennessee Riverkeeper, Inc. v. 3M Co., No. 5:16-cv-01029-AKK, 2017 WL 784991 (N.D. Ala. Feb. 10, 2017)).This case involved the alleged continuing contamination of the Tennessee River and associated public drinking watersupplies with PFAS that the plaintiff claims originated from a local manufacturing facility and two local landfills. There wereseveral arguments that the claims should be dismissed. One argument by the landfill owners was that the claims were anattack on existing, valid permits that included a solid waste permit authorizing disposal in the landfill of PFAS-bearingmaterials. The court denied the motion to dismiss, stating that the permits only authorize disposal of nonhazardous waste,and there is a dispute over whether the PFAS-containing material is a hazardous waste. Additionally, there are a continuallygrowing number of citizen lawsuits filed under RCRA in state courts throughout the United States. Thus, the applicability ofRCRA regulations and statutes to PFAS does not appear to be settled and can be complicated.
8.2.2.5 Clean Air Act (CAA)Under the CAA, USEPA is required to regulate toxic air pollutants from large industrial facilities. USEPA may developstandards for controlling certain air toxic emissions from sources in a specific industry group. Within 8 years of establishingemission standards, USEPA must determine whether the standards are sufficiently protective of human health and protectagainst adverse environmental effects. This determination also considers improvements in air pollution controls andevaluates effective and feasible alternatives.
According to the USEPA (2018j) website on PFAS Laws and Regulations, the CAA applies to discharges of PFAS to air underNational Emission Standards for Hazardous Air Pollutants; however, there are no air emission standards for PFAS at this time.There is no indication how far along USEPA is in this process for regulating PFAS under the CAA.
Page 111ITRC PFAS-1
8.2.2.6 Clean Water Act (CWA)Since 1972, the CWA has given the USEPA authority to control water pollution by regulating discharges into the nation’ssurface water by setting wastewater standards for industry. There are no federal water quality standards for any PFAS at thistime. However, USEPA released the Final 2016 Effluent Guidelines Program Plan in May 2018, which listed PFAS as a topic forfuture investigation (USEPA 2018f). The USEPA plans to review PFAS surface water discharges from industrial categories forboth long-chain and short-chain PFAS. The regulation of PFAS in discharge effluents is discussed below in Section 8.2.3.
8.2.2.7 U.S. Food and Drug Administration (FDA)One of the responsibilities of the FDA is regulation of “food contact substances” (FCSs), chemicals added to or componentsof “food contact materials” (FCMs), such as food wrappers and packaging. The FDA currently regulates certain PFAS used asgrease-proofing agents for food packaging via a Food Contact Notification Program within the Center for Food Safety andApplied Nutrition’s Office of Food Additive Safety. The PFAS used in FCMs and their known degradants and impurities have allundergone review for human health and environmental safety concerns through the food contact notification process, whichrequired submission of chemical, toxicological, and environmental information on the FCS itself and on any potentialimpurities.
Currently, the FDA has banned three perfluoroalkyl ethyl compounds from use in food packaging material (81 FRN 5, Jan. 4,2016, Indirect Food Additives: Paper and Paperboard Components): diethanolamine salts of mono- and bis (1 H, 1H, 2H, 2Hperfluoroalkyl) phosphates with even-numbered alkyl groups in the range of C8–C18; pentanoic acid, 4,4-bis[(gamma–omega-perfluoro-C8-20-alkyl)thio]; and perfluoroalkyl substituted phosphate ester acids, ammonium salts formedby the reaction of 2,2-bis[([gamma],[omega]-perfluoro C4–C20 alkylthio) methyl]-1,3-propanediol, polyphosphoric acid, andammonium hydroxide. Side-chain acrylate and methacrylate fluoropolymers are currently approved and used within theUnited States for FCS. As of September 2019, there were approximately 60 specific FCS with PFAS that are listed on FDA’sinventory of effective FCS notifications (recognizing its approval for specific uses, designated in the application).
8.2.2.8 Other Federal Agency ActionsOther U.S. federal agencies and programs are actively involved in PFAS-related matters; however, their work largely focuseson data generation and analysis to help inform regulations/restrictions/regulatory action. These federal programs oftenprovide valuable information, guidance, and resources for state regulatory and public health agencies. For example, the U.S.Centers for Disease Control and Prevention (CDC) National Health and Nutrition Examination Survey (NHANES) programprovides valuable information about human exposure to chemicals. Since 1999, the NHANES program has been providing anassessment of the exposure of the U.S. population to a small subgroup of PFAAs. This information is useful to scientists andregulatory agencies to understand “background” (that is, likely nonsite-related) human exposure levels and trends overtime. CDC has recently expanded their NHANES analysis to include evaluation of PFAAs in serum and urine (Kato et al.2018).
Under the Superfund Amendments and Reauthorization Act of 1986 (SARA) [42 U.S.C. 9601 et seq.] amendment to CERCLA(or Superfund) [42 U.S.C. 9601 et seq.], the U.S. Department of Health and Human Services, Agency for Toxic Substancesand Disease Registry (ATSDR) was established to assess the potential public health risk from exposure to hazardoussubstances commonly found at National Priorities List facilities. CERCLA provides ATSDR with the authority to developtoxicological profiles that describe the health effects of these hazardous substances and to support site-specific responseactions with health consultations and/or exposure investigations. A full description of ATSDR’s actions regarding PFAS is ontheir web page (ATSDR, 2018a). On June 20, 2018, ATSDR issued a revised draft Toxicological Profile for Perfluoroalkyls forpublic comment (ATSDR 2018e). In this revision, the agency discussed potential human health risks related to 14 specificPFAS and derived “provisional intermediate Minimal Risk Levels” (MRLs) for PFOA, PFNA, PFOS, and PFHxS. ATSDR statedthat these provisional MRLs are intended to serve as “screening levels” for identifying contaminants and potential healtheffects that may be of concern at hazardous waste sites and are not intended to be used for regulatory action, including todefine cleanup or action levels.
The U.S. Geological Survey (USGS) has had an emerging contaminants program for over a decade within which theymeasure emerging contaminants, including PFAAs, in various environmental media and ecological receptors. The objectiveof their work is to characterize environmental occurrence, sources, and source pathways that may contribute toenvironmental exposure. This has been a useful source of information for scientists and regulatory agencies on occurrence,fate, and transport of PFAS. Information on the USGS program can be found on their web page (USGS 2017).
The U.S. Department of Defense SERDP and ESTCP are jointly managed with USEPA and the U.S. Department of Energy to
Page 112ITRC PFAS-1
develop the latest science and technology to improve DOD’s environmental footprint and mission capabilities. Beginning infiscal year 2011, SERDP and ESTCP have funded a significant number of projects related to developing a betterunderstanding of PFAS occurrence, fate and transport, ecotoxicity, and remediation treatments, as well as investigating thenext generation of fluorine-free firefighting foams. More information on SERDP and ESTCP funding projects and statementsof need can be found on their website (SERDP-ESTCP 2019).
8.2.3 State PFAS Regulations and GuidanceState regulatory agencies often have the delegated authority to regulate and enforce environmental and public healthrequirements, although the 50 states have different priorities, resources, and processes. Several states have been activelyinvolved with addressing PFAS contamination across multiple regulatory programs. Examples of key state programs forwater, soil, remediation, hazardous substances, and consumer products are described below, and information aboutregulatory, advisory, and guidance values is discussed in Section 8.2.3.4. The information below is meant to provideexamples only; the ITRC tables of PFAS water values, and PFAS soil values from state, federal, and some internationalcountries posted as an Excel file should be consulted for more current and detailed information.
The ITRC PFAS team and the Environmental Council of States (ECOS) jointly issued a survey to state agencies to identify thevarious ways in which each state may be addressing PFAS, as discussed in Section 8.2.3.6.
The following subsections provide several different categories of state-adopted laws and regulations along with examples ofeach.
8.2.3.1 Product Labeling and Consumer Protection LawsSeveral states have programs regulating PFAS in consumer products, including product labeling. Note that due to the statelegislative review and finalization process, only bills that have been finalized into law are discussed below.
In November 2017, PFOS and PFOA were listed as potential developmental toxicants under California’s Proposition 65(California Office of Environmental Health Hazard Assessment [CA OEHHA] (2018)). The listing includes labelingrequirements for manufacturers, distributors, and retailers, and will prohibit companies from discharging PFOA or PFOS (ortheir related salts) to sources of drinking water if the discharges would result in exposures that exceed a health-based “safeharbor” level, which has not yet been defined as of September 2019 by the state. The California Department of ToxicSubstances Control Safer Consumer Products program is also addressing PFAS. This program has labeled the entire family ofPFAS as “Candidate Chemicals” and is drafting “Priority Product” work plans to evaluate the use of these chemicals on“converted textiles or leathers such as carpet, upholstery, clothing, and shoes” (CA DTSC 2019a) and food packaging (CADTSC 2019b).
Washington State has required the reporting of PFOS in children’s products since 2012 (Washington State Legislature 2008).The 2017 Children’s Safe Products Act update added reporting of PFOA in children’s products starting in January 2019.Washington also tests products for chemicals to ensure manufacturers are reporting accurate information. In 2018,Washington enacted two laws addressing PFAS in specific products: AFFF (Washington State Legislature 2018a)) and foodcontact materials (Washington State Legislature 2018b). After July 2018, PFAS-containing AFFF is not allowed to be used fortraining. After July 2020, PFAS-containing AFFF will not be allowed for sale or distribution. The AFFF sale ban does not applyto the U.S. Department of Defense, FAA, oil and gas terminals, or chemical plants. The AFFF restrictions do not apply to theuse of AFFF in response to fire emergencies. After 2022, PFAS will be banned in food packaging materials if results of theDepartment of Ecology’s alternatives assessment identify safer alternatives.
8.2.3.2 State of Washington Chemical Action PlansChemical action plans (CAPs) identify, characterize, and evaluate uses and releases of specific persistent, bioaccumulative,and toxic (PBT) chemicals or metals. Washington State prepares CAPs under an administrative rule (Washington StateLegislature 2006). Washington has prepared an interim PFAS CAP and is planning to release recommendations to addressPFAS contamination in 2019. The CAP, as developed so far, recommends setting state drinking water levels or advisorylevels for PFAS, expanding water testing near potential sources of contamination, developing cleanup levels for PFAS, andevaluating and producing best practices for cleaning up soils, surface water, and groundwater. The CAP also recommendsinvestigating other sources of PFAS by requiring manufacturers of products containing PFAS to provide information regardingsafety of their products and performing assessment of alternatives to PFAS in AFFF, food contact paper, and textiles. Moreinformation on the Washington CAP process for PFAS is available from their web page (Washington State Department ofEcology 2018).
Page 113ITRC PFAS-1
8.2.3.3 Designation of Hazardous Waste or Hazardous SubstanceRegulations that target select PFAAs as hazardous wastes or hazardous substances have not been promulgated in moststates. Formal PFAA regulations as hazardous substances have been promulgated in Vermont, New York, New Jersey,Colorado, and Alaska (ITRC State Survey 2018, unpublished), and are under development in several other states. Vermontregulates PFOA and PFOS as hazardous wastes when present in a liquid at a concentration > 20 ppt, but allows exemptionsfor 1) consumer products that were treated with PFOA and are not specialty products; 2) remediation wastes managed underan approved CAP or disposal plan; and 3) sludge from wastewater treatment facilities, residuals from drinking watersupplies, or leachate from landfills when managed under an approved plan (VT DEC 2016b, a).
In 2017, the New York State Department of Environmental Conservation (NYDEC) finalized regulations that identify PFOA(the acid)and its salt, ammonium perfluorooctanoate and PFOS (the acid) and its salt, perfluorooctane sulfonate, ashazardous substances that may be found in Class B firefighting foams (NY DEC 2017a). The regulations specify storage andregistration requirements for Class B foams that contain at least 1% by volume of one or more of these four PFAS, andprohibit the release of 1 pound or more of each into the environment during use. If a release exceeds the 1-pound threshold,it is considered a hazardous waste spill and must be reported; cleanup may be required under the state’s Superfund orbrownfields programs (NY DEC 2017a).
8.2.3.4 Drinking Water, Groundwater, Soil, and Remediation ProgramsSeveral states have developed standards and guidance values for PFAS in drinking water, groundwater, and soil (see theITRC tables of PFAS water values, and PFAS soil values from state, federal, and some international countries posted as anExcel file). Many states have either adopted the USEPA LHAs for PFOA and PFOS or selected the same health-based values,choosing to use the concentrations as advisory, nonregulated levels to guide the interpretation of PFOA and PFOSdetections. As with any contaminant of potential concern at a remediation site, available toxicity values that meet USEPApolicy requirements (USEPA 1993, 2003a, 2013e)) can be used to derive screening levels for groundwater and soil. As of May2018, the USEPA has not adopted the PFOA and PFOS toxicity values as “Tier 3” to officially derive an RSL; however, thenecessary information is available within the online USEPA RSL calculator and screening levels for PFOA, PFOS, and PFBS arereadily available (USEPA 2017k). Section 9 provides more information on site-specific risk assessment for PFAS.
In addition to the process using the USEPA RSL calculator discussed above, some states have developed screening levels forPFOA and PFOS in soils assuming direct contact and/or ingestion. See ITRC tables of PFAS water and soil values and USEPA(2017l) At least a couple of states (for example, Alaska, Connecticut) have developed values for protection of groundwater(ITRC State Survey 2018, unpublished).
Some states, such as California and Minnesota, have “antidegradation” policies aimed at protecting the quality ofgroundwater and (in California) high quality (or Tier 2) surface waters. Those polices can be used in decisions on cleanup anddischarge under permits. As an example, in California, the State Water Resources Control Board adopted Resolution 68-16 asits antidegradation policy. When evaluating the discharge or cleanup of chemicals, the Regional Water Quality ControlBoards are required to initially set the effluent limitation or cleanup standard at the background concentration of eachchemical. This is done regardless of whether there is a drinking water standard or other health-based value available. Finaldischarge or cleanup values consider potential health impacts, designated beneficial uses of the water body, and technicaland economic feasibility in their development.
8.2.3.5 Surface Water Discharge and PermittingNational Pollutant Discharge Elimination System (NPDES) permits use a standard process for developing effluent limits forpollutants. Effluent and receiving water limitations would be established in the same manner as other pollutants. Michigan iscurrently the only state with a PFAS discharge standard. The Michigan Department of Environmental Quality Rule 57 WaterQuality Values can be found on their web page (MI EGLE 2019).
8.2.3.6 Other State Regulations or ProgramsAnother concern for PFAS is in the application of biosolids from municipal wastewater treatment plants to land for disposal orreuse. In the ITRC 2018 State Survey on PFAS, no state indicated that they had regulations on PFAS in biosolids applicationto land. However, Alaska, Delaware, Illinois, Michigan, Montana, New York, Vermont, and Wisconsin were in the process ofconsidering and/or developing such regulations. In March 2019, Maine began requiring land applicators of biosolids to testfor PFOA, PFOS, and PFBS before application, and prohibited application of biosolids if those PFAAs exceed specific levels(2.5 ppb for PFOA, 5.2 ppb for PFOS, and 1900 ppb for PFBS) (ME DEP 2019).
Page 114ITRC PFAS-1
New Hampshire has an ambient air limit for ammonium perfluorooctanoate of 0.05 ug/m3 (24-hour) (NH DES 2016).
On March 6, 2019 California’s Water Resources Control Board held a public meeting where it unveiled its PFAS Investigation Plan (CA Water Boards 2019). That plan has been reassessed and there is now only a second phase with no timeline. One part of the reassessed plan has been completed which was issuing informational orders to plating shops. The next set of orders will be issued to wastewater treatment plants (to be completed spring 2020). After those orders are completed, informational orders will be issued for biosolids application areas and potentially bulk fuel/chemical facilities with AFFF capabilities. Sampling of domestic water supply wells in the vicinity of these sites is also planned. Results will be available on the CA Water Boards (2020) web page.
Finally, some states have issued state regulations or programs related to AFFF. For example, New York, Vermont, and Massachusetts have established AFFF take-back programs in an attempt to reduce the potential discharge of PFAS associated with AFFF into the environment. Other states (for example, New Hampshire) are in the process of developing an AFFF take-back programs. See Section 3 for a more detailed discussion on AFFF and related regulations and guidance.
8.3 Differences in the Available Regulations, Advisories, and GuidanceRegulatoryHuman health protection is the primary focus of the PFAS regulations, guidance, and advisories developed to date. Internationally, including in the United States, the nonpolymer PFAS have been the regulatory focus, primarily nonpolymer long-chain PFAAs. There are a number of draft toxicity evaluations available for different PFAS. This is an area of active research. Additional information is presented in Section 7.1 and 17.2.
As of September 2019, regulatory human health–based guidance values and/or standards have been derived for 16 PFAAs, two polyfluoroalkyl precursors, and one fluorinated ether carboxylate (FECA) by state and/or federal agencies in the United States. The values for these nonpolymeric PFAS vary across programs, with differences due to the selection and interpretation of different key toxicity studies, choice of uncertainty factors, and approaches used for animal-to-human extrapolation. The choice of exposure assumptions, including the life stage and the percentage of exposure assumed to come from non-drinking water sources, also differs. PFOA and PFOS have the vast majority of regulatory guidance and/or standards available, and the key differences in regulatory decisions within the United States for those chemicals can be seen in the ITRC tables posted as an Excel file of the basis for PFOA and PFOS values. These same key decision points also underlie the differences that exist in the other perfluoroalkyl substance regulatory values, but are not documented in the tables. Some examples that describe differences in these toxicity values for PFAAs, including some of the bases of these values, their commonalities are the focus of the remainder of this section.
Table 8-2 provides the underlying definition and context for the various federal regulations, standards, and guidance values that may apply to PFAS in the United States.
Page 115ITRC PFAS-1

Term Acronym Agency Definition Link
MinimumRisk Level
MRLCDCATSDR
An MRL is anestimate of thedaily humanexposure to ahazardoussubstance that islikely to bewithoutappreciable riskof adversenoncancer healtheffects over aspecifiedduration ofexposure. MRLsare intended toserve asscreening levelsto identifycontaminantsand potentialhealth effectsthat may be ofconcern. MRLsare not intendedto define cleanupor action levelsfor ATSDR orother agencies.(ATSDR 2018d)Importantly, theMRL is a dailydose, applicablefor any oralexposure; it isnot a thresholdconcentration inwater or otherenvironmentalmedia.
https://www.atsdr.cdc.gov/mrls/index.asp
Page 116
Table 8-2. Definition of terms associated with drinking water and/or groundwater standards or guidance
ITRC PFAS-1

Term Acronym Agency Definition Link
RegionalScreeningLevel
RSLUSEPARegions
Default screeninglevel tablesincludingchemical-specificconcentrationsfor individualcontaminants inair, drinkingwater, and soilthat may warrantfurtherinvestigation orsite cleanup.Genericscreening levels(SLs) are basedon defaultexposureparameters andfactors thatrepresentreasonablemaximumexposureconditions forlong-term/chronicexposures andare based on themethods outlinedin EPA’s RiskAssessmentGuidance forSuperfund, Part BManual (1991)and SoilScreeningGuidancedocuments (1996and 2002). Itshould beemphasized thatSLs are notcleanupstandards.(USEPA 2019i)
https://www.epa.gov/risk/regional-screening-levels-rsls-users-guide#intro
Page 117ITRC PFAS-1
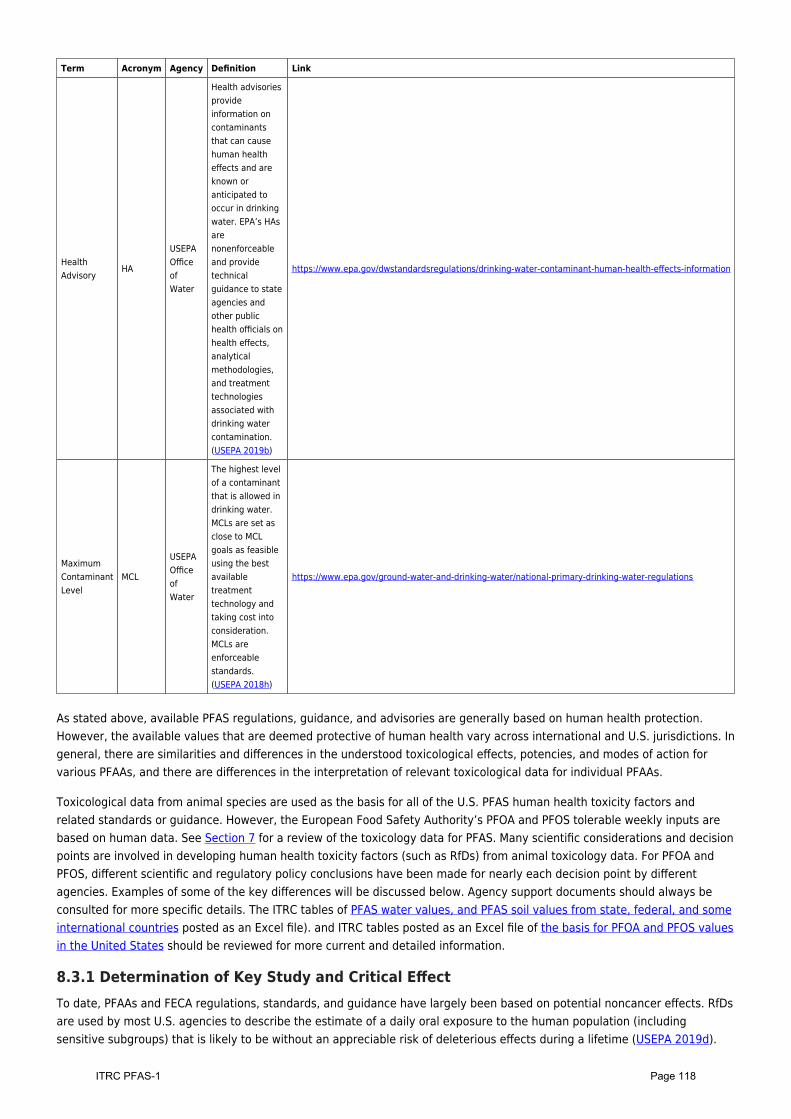
Term Acronym Agency Definition Link
HealthAdvisory
HA
USEPAOfficeofWater
Health advisoriesprovideinformation oncontaminantsthat can causehuman healtheffects and areknown oranticipated tooccur in drinkingwater. EPA’s HAsarenonenforceableand providetechnicalguidance to stateagencies andother publichealth officials onhealth effects,analyticalmethodologies,and treatmenttechnologiesassociated withdrinking watercontamination.(USEPA 2019b)
https://www.epa.gov/dwstandardsregulations/drinking-water-contaminant-human-health-effects-information
MaximumContaminantLevel
MCL
USEPAOfficeofWater
The highest levelof a contaminantthat is allowed indrinking water.MCLs are set asclose to MCLgoals as feasibleusing the bestavailabletreatmenttechnology andtaking cost intoconsideration.MCLs areenforceablestandards.(USEPA 2018h)
https://www.epa.gov/ground-water-and-drinking-water/national-primary-drinking-water-regulations
As stated above, available PFAS regulations, guidance, and advisories are generally based on human health protection.However, the available values that are deemed protective of human health vary across international and U.S. jurisdictions. Ingeneral, there are similarities and differences in the understood toxicological effects, potencies, and modes of action forvarious PFAAs, and there are differences in the interpretation of relevant toxicological data for individual PFAAs.
Toxicological data from animal species are used as the basis for all of the U.S. PFAS human health toxicity factors andrelated standards or guidance. However, the European Food Safety Authority’s PFOA and PFOS tolerable weekly inputs arebased on human data. See Section 7 for a review of the toxicology data for PFAS. Many scientific considerations and decisionpoints are involved in developing human health toxicity factors (such as RfDs) from animal toxicology data. For PFOA andPFOS, different scientific and regulatory policy conclusions have been made for nearly each decision point by differentagencies. Examples of some of the key differences will be discussed below. Agency support documents should always beconsulted for more specific details. The ITRC tables of PFAS water values, and PFAS soil values from state, federal, and someinternational countries posted as an Excel file). and ITRC tables posted as an Excel file of the basis for PFOA and PFOS valuesin the United States should be reviewed for more current and detailed information.
8.3.1 Determination of Key Study and Critical EffectTo date, PFAAs and FECA regulations, standards, and guidance have largely been based on potential noncancer effects. RfDsare used by most U.S. agencies to describe the estimate of a daily oral exposure to the human population (includingsensitive subgroups) that is likely to be without an appreciable risk of deleterious effects during a lifetime (USEPA 2019d).
Page 118ITRC PFAS-1
However, the USEPA, New Jersey Drinking Water Quality Institute (NJDWQI), and California OEHHA also considered potentialcancer endpoints for PFOA and PFOS, and concluded that PFOA and PFOS are “suggestive” carcinogens and developedcancer toxicity values (cancer slope factor, CSF) for PFOA, while only OEHHA developed a CSF for PFOS. The threshold levelsderived from RfDs by USEPA and NJDWQI are lower, that is, more protective, than those based on CSFs; thus, regulating orscreening based on chronic noncancer risks was deemed to be protective of potential cancer risk by those entities. Themethodology for deriving a chemical-specific toxicity values is generally applicable to both cancer and noncancer endpointswhere dose-response relationships and weight-of-evidence analyses of available data sets are evaluated, and is described indetail, specific to PFOA and PFOS, below.
The first step in deriving a human health-based toxicity value (that is, RfD) is the review of applicable data to identifypotential human health hazards (toxicity endpoints) based on sensitive effects that are consistently seen across severalstudies, are deemed related to an adverse health outcome or its known precursor, and are relevant to humans based onmode of action considerations. Not all agencies have utilized the same candidate studies and health endpoints for PFOA andPFOS due to differences in selection criteria and differences in opinion on the relevancy to human health and on adversity ofeffects seen in rodent bioassays. Older assessments relied upon primate studies due to concerns that rodent studies werenot relevant to human health because of rodent-specific modes of action and toxicokinetics (USEPA 2009c), (NCDENR 2012)(MDH 2008)). The more recent derivations of PFOA and PFOS toxicity values are based on rodent studies with lower effectlevels (compared to primate studies), citing potential modes of action that are relevant to humans and improvedtoxicokinetic models to extrapolate between species. Some agencies, such as the USEPA and NJDWQI, selected only keystudies with serum measurements of PFOA or PFOS, which enable the use of the more advanced toxicokinetic modeling inserum levels; rodent bioassays without serum measurements were used as supporting studies in weight-of-evidenceevaluation and decision-making. In general, all U.S. agencies with RfDs for PFOA and PFOS agree that liver effects,developmental effects, and/or immune effects are the most sensitive and relevant endpoints. However, methodologies forselection of the key studies and critical effects, and quantification of the RfD itself, vary widely. Some examples arediscussed below; however, the ITRC tables posted as an Excel file of the basis for PFOA and PFOS values in the United Statesshould be consulted for more current and detailed information.
8.3.1.1 PFOAUSEPA identified a subset of animal studies for their PFOA toxicity value derivation based on sensitivity and humanrelevancy of the endpoint, exposure durations of greater than 7 weeks, multiple dose groups, use of a concurrent control,and studies that provided serum data amenable for modeling. Although this last requirement, studies with measured serumlevels, excluded some studies, USEPA noted that the remaining studies encompassed the range of doses evaluated and theLOAELs observed in studies that lacked serum data. The resulting candidate studies included endpoints such as immuneeffects (Dewitt et al. 2008), developmental effects (Lau et al. 2006), increased liver weight and necrosis (Perkins et al.2004), reduced pup weight (Wolf et al. 2007), reduced relative body weight (BW), and increased relative kidney weight(Butenhoff et al. 2004). The Lau et al. (2006) developmental study (LOAEL for reduced ossification in proximal phalanges andaccelerated puberty in male mice) ultimately yielded the lowest RfD based on USEPA’s kinetic extrapolation, and wasdeemed to be protective of the other endpoints (USEPA 2016h). USEPA (2016h) reviewed the studies of mammary glanddevelopment in mice, but chose not to consider this endpoint as a potential critical effect due to unknown mode of actionand unclear functional significance. Minnesota Department of Health MDH (2018b) selected Lau et al. (2006) for their keystudy and critical effect, but also identified other health effects (liver effects, immune system effects, kidney weightchanges, and other development effects) as effects of concern.
Conversely, NJDWQI (2018a) determined that the developmental effects noted in Lau et al. (2006) were not permanentstructural changes and had unknown long-term consequences and unclear functional significance. Additionally, they notedthat there was not a typical dose-response relationship in these effects with increasing dose (the greatest effects for delayedossification and accelerated puberty occurred at the lowest dose, with less of an effect at higher doses) (NJDWQI 2017a).NJDWQI selected increased liver weight in mice (Loveless et al. 2006) as their critical effect for PFOA’s RfD. Additionally, theyapplied an uncertainty factor to account for delayed mammary gland development, persistent liver toxicity, and otherpotential developmental effects that they concluded could occur at lower exposure levels (NJDWQI 2017a). NJDWQIdetermined that the delayed mammary gland developmental effect (Macon et al. 2011) was a more sensitive critical effectthat was scientifically valid; however, its use as the basis for chemical risk assessment was unprecedented and therefore,ultimately not chosen. Texas Commission for Environmental Quality (TCEQ) selected the mammary gland developmentaleffects in mice (Macon et al. 2011) as their critical effect, stating that it was the most health protective (TCEQ 2016). TCEQdid not have a requirement that serum PFOA levels be measured in the key study and used administered dose as the dosemetric.
Page 119ITRC PFAS-1
Rather than selecting just one key study, Maine’s CDC selected six PFOA animal bioassays across multiple species (rats andmice) with increased liver weight and hepatocyte enlargement (Lau et al. 2006; Perkins et al. 2004 (three studies withvarying conditions; Sibinski 1987; Butenhoff, Kennedy, Frame, et al. 2004). MDEP used the geometric mean of thebenchmark dose limits from these six studies as their final point of departure (Maine CDC 2014).
8.3.1.2 PFOSSimilarly as for PFOA, USEPA identified a subset of animal studies for their PFOS toxicity value derivation based on sensitivityand human relevancy of the endpoint, exposure duration considerations, multiple dose groups, use of a concurrent control,and studies that provided serum data amenable for modeling. Using toxicokinetic models and dose-response modeling (bothdescribed below) of the selected studies and endpoints, USEPA concluded that the internal dose levels associated withdevelopmental and liver endpoints were similar; endpoints considered as critical effects included offspring growth andsurvival, liver weight changes, liver histopathology, and changes in serum biochemistry indicative of systemic effects.
USEPA did not consider the monkey study from Seacat et al. (2002) appropriate because of the premature deaths of two ofthe six male monkeys at the LOAEL. However, this was the key study and critical effect from USEPA’s provisional healthadvisory derived in (USEPA 2009c) and is the key study (critical effect of increased thyroid-stimulating hormone, reducedtotal T3, and reduced high-density lipoproteins) utilized by Maine Department of Environmental Protection (ME DEP) for theirPFOS RfD and development of their Remedial Action Guideline (ME DEP 2016). In 2017, MDH selected the same key studyand critical effect for PFOS as the USEPA but added a database uncertainty factor to the USEPA RfD for potentially moresensitive immune effects (MDH 2017a). In 2019, MDH selected a different key study in mice with immunotoxocity as thecritical effect (MDH 2019a).
Regarding immune effects, USEPA concluded that there is a concern for PFOS-mediated immune effects, but determined thatthe available studies (including Dong et al. (2009)) were not amenable to use in RfD derivation. They state that both humandosing information and low-dose confirmation of immune effects in animals is lacking (USEPA 2016g). The USEPA derived anRfD for PFOS based on decreased neonatal rat BW from the two-generation study by Luebker, York, et al. (2005) becausethis key study and critical effect combination yielded the lowest RfD of the remaining studies (USEPA 2016g).
New Jersey derived their PFOS RfD based on the NOAEL for plaque-forming cell response in mice, an indication ofimmunosuppression (Dong et al. 2009), as the critical effect to determine their RfD. NJDWQI stated that this endpoint ismore sensitive than the decreased neonatal BW from Luebker, Case, et al. (2005); Luebker, York, et al. (2005) and thisimmune effect is supported by other studies in mice and humans (NJDWQI 2018b). NJDWQI (2018a) discussed someconcerns and issues related to USEPA’s rationale and selection of the to Luebker, York, et al. (2005) endpoint.
Texas selected a study with hippocampus synapse structure effects (Zeng et al. 2011) as the critical effect to determinetheir RfD for PFOS. TCEQ (2016) stated that based on their calculations and examination of potential RfDs, use of Seacat etal. (2002) and protection again thyroid effects may not adequately protect against potential neurological developmentaleffects. Thus, TCEQ (2016) used Zeng et al. (2011), based on their toxicokinetic extrapolation methods (discussed below),for a lower and more health-protective RfD. NJDWQI (2018a) concluded that Zeng et al. (2011) provided only “mechanisticinformation” and did not include this study in their evaluation. USEPA discussed the results from Zeng et al. (2011) in theirPFOS Health Effects Support Document; however, it is not clear why this study was not moved forward as a potentialcandidate for the PFOS RfD (USEPA 2016g).
8.3.2 Approaches Used for Animal-to-Human ExtrapolationGiven that animal laboratory studies serve as the basis for human health risk assessments (HHRAs), derivation of humanhealth toxicity values requires conversion of the dose administered to the test species to an appropriate human equivalentdose. In lieu of robust chemical-specific toxicokinetic and toxicodynamic information, the accepted default method to derive
the human equivalent dose is by body-weight scaling to the 3/4 power (that is, BW3/4), which relies upon the knownrelationship between BW and the various metabolic and physiological functions of humans compared to rodents (USEPA
2011b). The use of BW3/4 scaling for deriving an RfD is recommended when the observed effects are associated with theparent compound or a stable metabolite in the absence of available chemical-specific toxicokinetic models (USEPA 2011b).When the necessary information is available, the preferred approach is to use chemical-specific physiologically basedtoxicokinetic modeling to convert toxicologically equivalent doses of orally administered agents from laboratory animals tohumans. Another approach may include using chemical-specific toxicokinetic and toxicodynamic information to derivechemical-specific adjustments. For chemicals such as long-chain PFAAs that exhibit species-specific pharmacokineticproperties, chemical-specific adjustment using specific information about the species differences is most appropriate. The
Page 120ITRC PFAS-1
type of chemical-specific pharmacokinetic information that is available dictates the complexity of the human equivalent doseextrapolation method, which may range from (1) using ratios of rodent to human clearance factors, to (2) using complexphysiologically based pharmacokinetic models to extrapolate from administered (oral) dose to internal dose in the rodent, tointernal dose in the human, and then to administered (oral) dose in the human.
Nonpolymeric long-chain perfluoroalkyl substances such as PFOA and PFOS exhibit marked differences in species-specificpharmacokinetics, mainly due to differences in elimination rates (because of higher renal reabsorption and serum proteinbinding in humans relative to rodents). To date, a wide range of technical approaches are employed to address thesespecies-specific differences for PFOA and PFOS. Examples of some approaches are described here; however, the ITRC tablesposted as an Excel file of the basis for PFOA and PFOS values in the United States should be consulted more current anddetailed description of agency approaches.
The USEPA chose to rely on animal bioassays that collected internal serum measurements for PFOA and PFOS, then employa pharmacokinetic model to estimate the animal’s average serum concentrations for each study-specific exposure duration(USEPA 2016c, d). USEPA used the serum concentration at the NOAEL or LOAEL in the animal studies, rather thanadministered dose, for animal-to-human dose comparison. USEPA then used a first-order kinetic model for chemicalclearance, using previously published single point estimates for elimination half-lives and volumes of distribution, to convertthe serum concentration at the PFOA or PFOS NOAEL or LOAEL in the animal study to an external administered human (oral)dose that would result in the same serum concentration in humans.
NJDWQI’s recommended MCL for PFOA and PFOS also relied upon studies that included serum measurements taken close tothe end of the dosing period; NJDWQI conducted dose-response modeling and applied uncertainty factors to the internalserum levels measured at the end of the dosing period from the animal bioassays to derive a target human serum level.NJDWQI then calculated the RfD by applying the same PFOA clearance factors used by USEPA to convert the target humanserum level to an administered dose in ug/kg-day.
Other agencies within the United States used different approaches for PFOA and/or PFOS. For example, Maine Department ofEnvironmental Protection used all available animal studies (they did not limit their pool to only those studies with internalserum measurements) and used the ratio of clearance for the animal species over human clearance to convert the animaladministered dose to a human equivalent dose. Agencies such as TCEQ used the ratio of elimination half-lives to convert therodent administered dose directly to the human equivalent administered dose.
There are only a few toxicity values derived for short-chain PFAAs, and the methods to extrapolate from animal to human
dose also vary and include either the use of BW scaling (allometric scaling of BW animal1/4 divided by BW human1/4) or theratios of elimination half-lives. The USEPA (2014c) derived a subchronic and chronic toxicity value for PFBS, based on asubchronic rat study, and used body-weight scaling to derive the human equivalent dose. They stated that based oninformation available at the time of their derivation, including a lack of definitive information regarding pharmacokineticdifferences between species, the use of BW scaling was most appropriate. USEPA (2018e) has a draft human health toxicityvalues report for PFBS.
More recently, the French National Agency for Food Safety, Environment, and Labor (ANSES) also used this same BW scalingapproach when deriving their toxicity values for short-chain PFAAs such as PFBS, PFBA, and PFHxA (ANSES 2017). Use of theallometric BW scaling approach to calculate a human equivalent dose is the default approach for chemicals that do notexhibit species-specific adsorption, distribution, metabolism, or elimination processes, and absent chemical-specificinformation.
Chemical-specific support for the use of BW scaling to derive the human equivalent dose for some short-chain PFAAs hasbeen demonstrated in recent studies. For example, Russell, Nilsson, and Buck (2013) and (Luz et al. 2019) found thatelimination rates of PFHxA scale by BW, given that there are no known species-specific elimination mechanisms thatdramatically alter elimination kinetics between species. Citing these reasons, the PFHxA toxicity value and related proposeddrinking water standard derived by Michigan uses the allometric BW scaling due to this chemical-specific information. Incontrast, the Minnesota Department of Health used the ratio of human to rodent half-lives to adjust the rodent-administereddose to a human equivalent dose for their derivation of PFBA and PFBS noncancer health risk limits (MDH 2018a, 2017c). MIalso used the ratio of half-lives for PFBS to calculate the human equivalent dose for toxicity value derivation (MI SAW 2019;MI DHHS 2019).
The estimation of an RfD includes two additional components that are shown in the ITRC tables posted as an Excel file of the
Page 121ITRC PFAS-1
basis for PFOA and PFOS values in the United States and includes the selection of the dose-response method and uncertaintyfactors. For dose-response evaluation, either the benchmark dose or the study NOAEL or LOAEL is utilized as the point ofdeparture, as detailed in the tables. Uncertainty factors used include the standard risk assessment extrapolations as detailedin the tables, and also vary by agency.
8.3.3 Exposure AssumptionsFor each of the expsosure factors discussed in this section, See the ITRC tables posted as an Excel file of the basis for PFOAand PFOS values in the United States for the most current information and details.
8.3.3.1 Body Weights, Drinking Water Ingestion, and Exposure DurationsOnce a human health toxicity value is derived in units of ug/kg-day (or ng/kg-day or mg/kg-day), the toxicity value iscombined with exposure parameters to result in the ultimate threshold concentration in drinking water (guidance orstandard). The choice of exposure parameters used can be a flexible science-based decision based on default assumptionsor chemical-specific data, or may be set based on regulatory framework. The exposure parameters used under the U.S.CERCLA program (for example, USEPA regional screening levels) include default exposure parameters and factors thatrepresent conditions for long-term/chronic exposures, including exposure frequency of 350 days per year, exposure durationof 6 years for a 15-kg child who drinks 0.78 L water per day, or 26 years for an 80-kg adult who drinks 2.5 L of water a day.In contrast to CERCLA, drinking water guidance values and standards (MCLs) developed by USEPA or states are generallybased on lifetime exposure using default adult parameters, and they do not usually include a duration of exposureparameter. For PFOA and PFOS, USEPA and state agencies have not always relied upon these default exposure parameters.Some have decided to utilize exposure parameters that are specific for more sensitive subpopulations (infants, children, orlactating/pregnant women). For example, MDH developed a toxicokinetic model to estimate the total exposure to breast-fedand formula-fed infants (Goeden, Greene, and Jacobus 2019), and this model was used to derive standards in Minnesota,New Hampshire, and Michigan.
USEPA combined their toxicity values with exposure parameters specific for lactating women. According to USEPA, thisaddressed the potential increased susceptibility during pregnancy and lactation. USEPA used the rate of 54 mL/kg-day basedon the “consumers only” estimate of combined direct and indirect water ingestion at the 90th percentile for lactating womenfrom their Exposure Factors Handbook (see table 3-81 in USEPA (2011a).
Vermont used USEPA Office of Water toxicity values for PFOA and PFOS, but combined those toxicity values with exposureparameters specific for infants (0–1 year of age), assuming a drinking water intake rate of 0.175 L/kgBW-day (Vermont DOH2016). Texas chose to combine their state-derived toxicity values with exposure parameters for children (ages 0–6 years);TCEQ (2016) used the default child BW of 15 kg and ingestion of 0.64 L-day, equivalent to 0.043 L/kg-day of water.
Minnesota is thus far unique in using specific exposure parameters based on exposure to breast-fed and formula-fed infantsfor the derivation of the PFOA and PFOS health-based guidance values. They selected the 95th percentile water intake ratesor upper percentile breast milk intake rates (USEPA 2011a) and calculated breast milk concentrations by multiplying thematernal serum concentration by a calculated breast milk transfer factor of 5.2% for PFOA and 1.3% for PFOS (MDH 2018b,2019a).
8.3.3.2 Relative Source ContributionHumans can be exposed to nonpolymeric PFAS, including precursor chemicals, via multiple sources, including air, food, andconsumer and industrial products. The most common route of exposure for the general public is via the diet, including water,and followed by indoor dust, especially for children. The relative source contribution (RSC) term is used in health-basedguidance and standards developed by the USEPA under the federal SDWA and related state programs to account forpotential non-drinking water exposures to chemicals. The concept ensures that when a criterion based on an RfD fornoncancer effects is established for a single exposure pathway, such as drinking water, potential exposures that occur fromother pathways are accounted for so that total exposure does not exceed the RfD. The default RSC of 20% means that thedrinking water pathway is assumed to contribute only 20% of the RfD, and all other exposure pathways contribute theremaining 80%. In practice, therefore, the drinking water concentration based on RfD and drinking water consumptionassumptions is multiplied by the RSC (for example, 20%) to account for the other pathways. Following USEPA’s exposuredecision tree (USEPA 2000c), USEPA determined that significant potential sources other than drinking water ingestion exist;however, they concluded that information is not available to quantitatively characterize exposure from all of the differentsources. Therefore, USEPA adopted a default RSC of 20% (0.20) for PFOA and PFOS drinking water health advisories.
Page 122ITRC PFAS-1

The RSC term generally does not exist in CERCLA/RCRA-based remediation programs because baseline risk assessmentsspecifically investigate and quantify risks associated with all potential site-specific exposure routes (not just drinking water),and then consider a receptor’s cumulative risk. Therefore, there is no downward adjustment to a residential groundwater(termed “tap water” by USEPA) drinking water screening level, for example, to account for potential other exposures—allsite-specific exposures are quantified.
Some state agencies have incorporated RSC when deriving their state guidance/standards for long-chain PFAAs. Forexample, New Jersey Department of Environmental Protection adopted a 50% RSC for PFNA (NJDWQI 2015) and a 20% RSCfor PFOA and PFOS (NJDWQI 2017a, 2018a), which they state also “implicitly accounts for greater exposures to breast-fedand formula-fed infants than older individuals.” Minnesota used an RSC of 50% based on their analysis of biomonitoringserum concentrations from local and national general populations (MDH 2017b, a).
Updated September 30, 2019.
Page 123ITRC PFAS-1
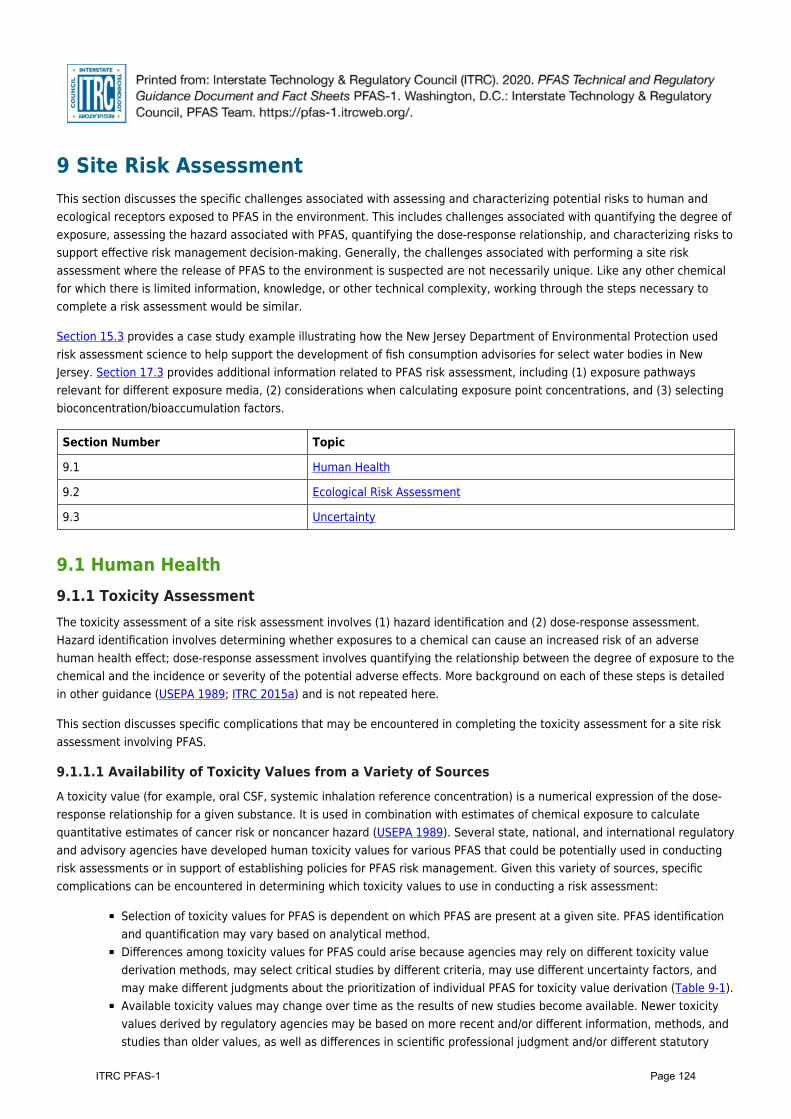
9 Site Risk AssessmentThis section discusses the specific challenges associated with assessing and characterizing potential risks to human andecological receptors exposed to PFAS in the environment. This includes challenges associated with quantifying the degree ofexposure, assessing the hazard associated with PFAS, quantifying the dose-response relationship, and characterizing risks tosupport effective risk management decision-making. Generally, the challenges associated with performing a site riskassessment where the release of PFAS to the environment is suspected are not necessarily unique. Like any other chemicalfor which there is limited information, knowledge, or other technical complexity, working through the steps necessary tocomplete a risk assessment would be similar.
Section 15.3 provides a case study example illustrating how the New Jersey Department of Environmental Protection usedrisk assessment science to help support the development of fish consumption advisories for select water bodies in NewJersey. Section 17.3 provides additional information related to PFAS risk assessment, including (1) exposure pathwaysrelevant for different exposure media, (2) considerations when calculating exposure point concentrations, and (3) selectingbioconcentration/bioaccumulation factors.
Section Number Topic
9.1 Human Health
9.2 Ecological Risk Assessment
9.3 Uncertainty
9.1 Human Health9.1.1 Toxicity AssessmentThe toxicity assessment of a site risk assessment involves (1) hazard identification and (2) dose-response assessment.Hazard identification involves determining whether exposures to a chemical can cause an increased risk of an adversehuman health effect; dose-response assessment involves quantifying the relationship between the degree of exposure to thechemical and the incidence or severity of the potential adverse effects. More background on each of these steps is detailedin other guidance (USEPA 1989; ITRC 2015a) and is not repeated here.
This section discusses specific complications that may be encountered in completing the toxicity assessment for a site riskassessment involving PFAS.
9.1.1.1 Availability of Toxicity Values from a Variety of SourcesA toxicity value (for example, oral CSF, systemic inhalation reference concentration) is a numerical expression of the dose-response relationship for a given substance. It is used in combination with estimates of chemical exposure to calculatequantitative estimates of cancer risk or noncancer hazard (USEPA 1989). Several state, national, and international regulatoryand advisory agencies have developed human toxicity values for various PFAS that could be potentially used in conductingrisk assessments or in support of establishing policies for PFAS risk management. Given this variety of sources, specificcomplications can be encountered in determining which toxicity values to use in conducting a risk assessment:
Selection of toxicity values for PFAS is dependent on which PFAS are present at a given site. PFAS identificationand quantification may vary based on analytical method.Differences among toxicity values for PFAS could arise because agencies may rely on different toxicity valuederivation methods, may select critical studies by different criteria, may use different uncertainty factors, andmay make different judgments about the prioritization of individual PFAS for toxicity value derivation (Table 9-1).Available toxicity values may change over time as the results of new studies become available. Newer toxicityvalues derived by regulatory agencies may be based on more recent and/or different information, methods, andstudies than older values, as well as differences in scientific professional judgment and/or different statutory
Page 124ITRC PFAS-1
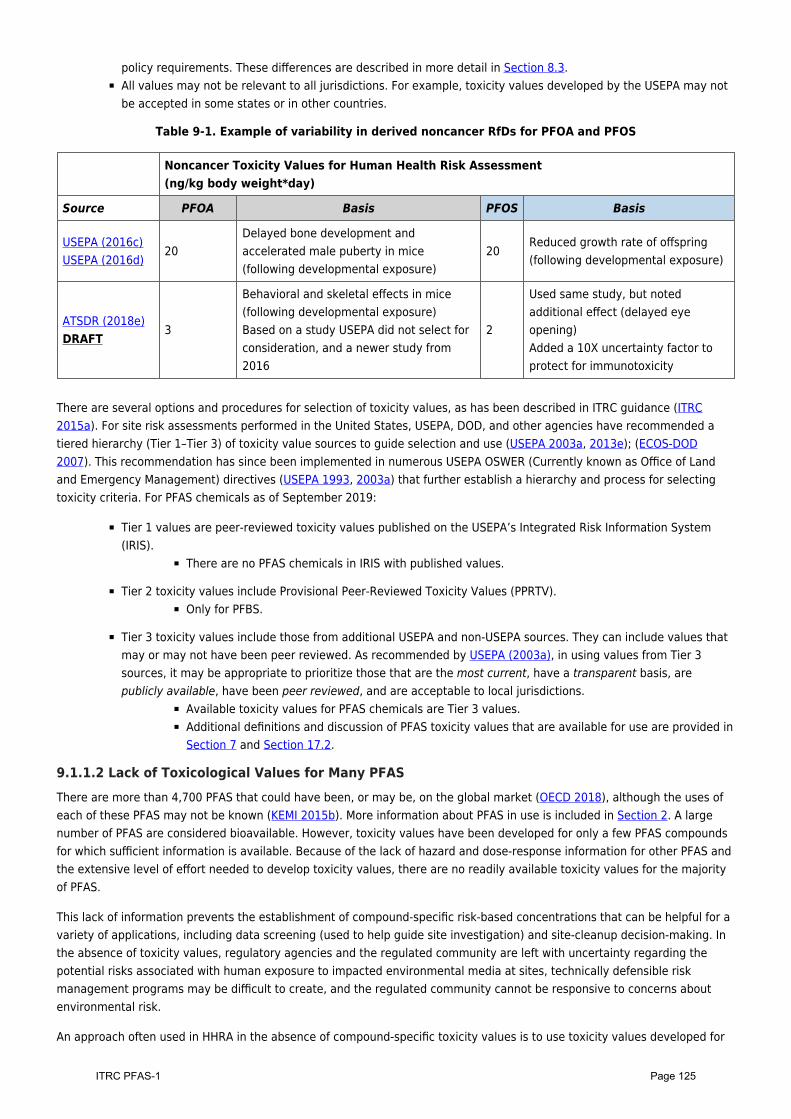
policy requirements. These differences are described in more detail in Section 8.3.All values may not be relevant to all jurisdictions. For example, toxicity values developed by the USEPA may notbe accepted in some states or in other countries.
Table 9-1. Example of variability in derived noncancer RfDs for PFOA and PFOS
Noncancer Toxicity Values for Human Health Risk Assessment(ng/kg body weight*day)
Source PFOA Basis PFOS Basis
USEPA (2016c)USEPA (2016d)
20Delayed bone development andaccelerated male puberty in mice(following developmental exposure)
20Reduced growth rate of offspring(following developmental exposure)
ATSDR (2018e)DRAFT
3
Behavioral and skeletal effects in mice(following developmental exposure)Based on a study USEPA did not select forconsideration, and a newer study from2016
2
Used same study, but notedadditional effect (delayed eyeopening)Added a 10X uncertainty factor toprotect for immunotoxicity
There are several options and procedures for selection of toxicity values, as has been described in ITRC guidance (ITRC2015a). For site risk assessments performed in the United States, USEPA, DOD, and other agencies have recommended atiered hierarchy (Tier 1–Tier 3) of toxicity value sources to guide selection and use (USEPA 2003a, 2013e); (ECOS-DOD2007). This recommendation has since been implemented in numerous USEPA OSWER (Currently known as Office of Landand Emergency Management) directives (USEPA 1993, 2003a) that further establish a hierarchy and process for selectingtoxicity criteria. For PFAS chemicals as of September 2019:
Tier 1 values are peer-reviewed toxicity values published on the USEPA’s Integrated Risk Information System(IRIS).
There are no PFAS chemicals in IRIS with published values.
Tier 2 toxicity values include Provisional Peer-Reviewed Toxicity Values (PPRTV).Only for PFBS.
Tier 3 toxicity values include those from additional USEPA and non-USEPA sources. They can include values thatmay or may not have been peer reviewed. As recommended by USEPA (2003a), in using values from Tier 3sources, it may be appropriate to prioritize those that are the most current, have a transparent basis, arepublicly available, have been peer reviewed, and are acceptable to local jurisdictions.
Available toxicity values for PFAS chemicals are Tier 3 values.Additional definitions and discussion of PFAS toxicity values that are available for use are provided inSection 7 and Section 17.2.
9.1.1.2 Lack of Toxicological Values for Many PFASThere are more than 4,700 PFAS that could have been, or may be, on the global market (OECD 2018), although the uses ofeach of these PFAS may not be known (KEMI 2015b). More information about PFAS in use is included in Section 2. A largenumber of PFAS are considered bioavailable. However, toxicity values have been developed for only a few PFAS compoundsfor which sufficient information is available. Because of the lack of hazard and dose-response information for other PFAS andthe extensive level of effort needed to develop toxicity values, there are no readily available toxicity values for the majorityof PFAS.
This lack of information prevents the establishment of compound-specific risk-based concentrations that can be helpful for avariety of applications, including data screening (used to help guide site investigation) and site-cleanup decision-making. Inthe absence of toxicity values, regulatory agencies and the regulated community are left with uncertainty regarding thepotential risks associated with human exposure to impacted environmental media at sites, technically defensible riskmanagement programs may be difficult to create, and the regulated community cannot be responsive to concerns aboutenvironmental risk.
An approach often used in HHRA in the absence of compound-specific toxicity values is to use toxicity values developed for
Page 125ITRC PFAS-1
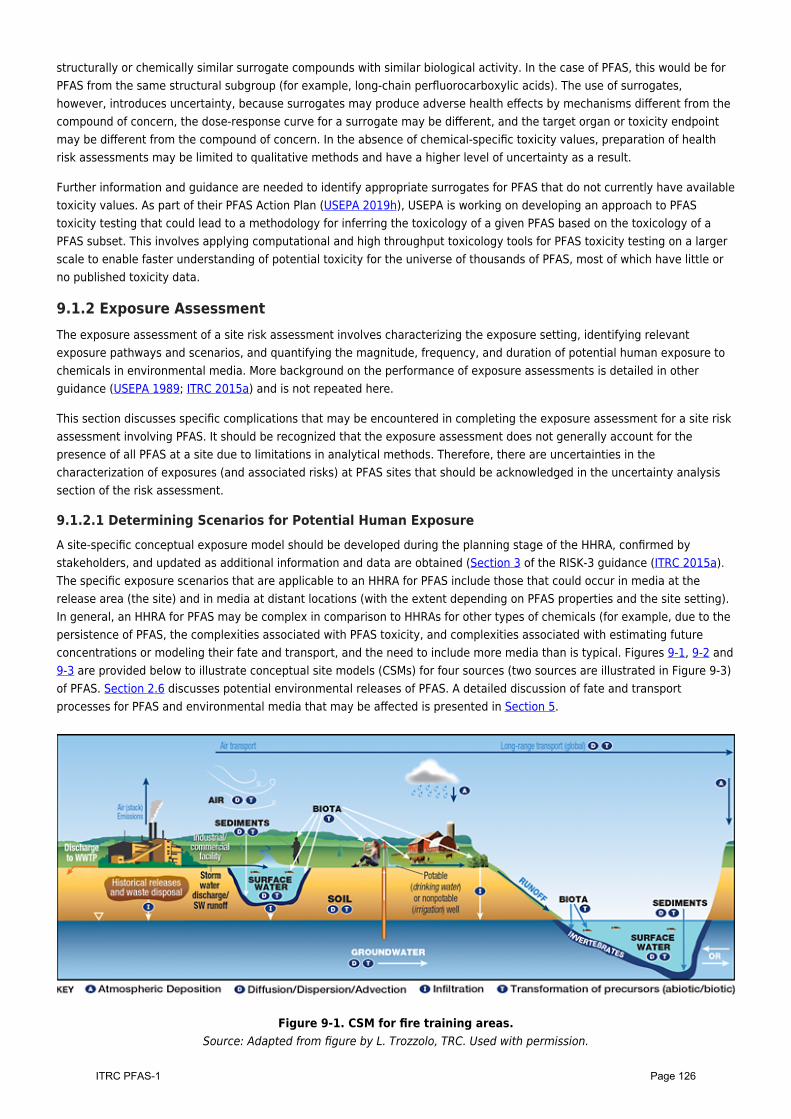
structurally or chemically similar surrogate compounds with similar biological activity. In the case of PFAS, this would be forPFAS from the same structural subgroup (for example, long-chain perfluorocarboxylic acids). The use of surrogates,however, introduces uncertainty, because surrogates may produce adverse health effects by mechanisms different from thecompound of concern, the dose-response curve for a surrogate may be different, and the target organ or toxicity endpointmay be different from the compound of concern. In the absence of chemical-specific toxicity values, preparation of healthrisk assessments may be limited to qualitative methods and have a higher level of uncertainty as a result.
Further information and guidance are needed to identify appropriate surrogates for PFAS that do not currently have availabletoxicity values. As part of their PFAS Action Plan (USEPA 2019h), USEPA is working on developing an approach to PFAStoxicity testing that could lead to a methodology for inferring the toxicology of a given PFAS based on the toxicology of aPFAS subset. This involves applying computational and high throughput toxicology tools for PFAS toxicity testing on a largerscale to enable faster understanding of potential toxicity for the universe of thousands of PFAS, most of which have little orno published toxicity data.
9.1.2 Exposure AssessmentThe exposure assessment of a site risk assessment involves characterizing the exposure setting, identifying relevantexposure pathways and scenarios, and quantifying the magnitude, frequency, and duration of potential human exposure tochemicals in environmental media. More background on the performance of exposure assessments is detailed in otherguidance (USEPA 1989; ITRC 2015a) and is not repeated here.
This section discusses specific complications that may be encountered in completing the exposure assessment for a site riskassessment involving PFAS. It should be recognized that the exposure assessment does not generally account for thepresence of all PFAS at a site due to limitations in analytical methods. Therefore, there are uncertainties in thecharacterization of exposures (and associated risks) at PFAS sites that should be acknowledged in the uncertainty analysissection of the risk assessment.
9.1.2.1 Determining Scenarios for Potential Human ExposureA site-specific conceptual exposure model should be developed during the planning stage of the HHRA, confirmed bystakeholders, and updated as additional information and data are obtained (Section 3 of the RISK-3 guidance (ITRC 2015a).The specific exposure scenarios that are applicable to an HHRA for PFAS include those that could occur in media at therelease area (the site) and in media at distant locations (with the extent depending on PFAS properties and the site setting).In general, an HHRA for PFAS may be complex in comparison to HHRAs for other types of chemicals (for example, due to thepersistence of PFAS, the complexities associated with PFAS toxicity, and complexities associated with estimating futureconcentrations or modeling their fate and transport, and the need to include more media than is typical. Figures 9-1, 9-2 and9-3 are provided below to illustrate conceptual site models (CSMs) for four sources (two sources are illustrated in Figure 9-3)of PFAS. Section 2.6 discusses potential environmental releases of PFAS. A detailed discussion of fate and transportprocesses for PFAS and environmental media that may be affected is presented in Section 5.
Figure 9-1. CSM for fire training areas.Source: Adapted from figure by L. Trozzolo, TRC. Used with permission.
Page 126ITRC PFAS-1
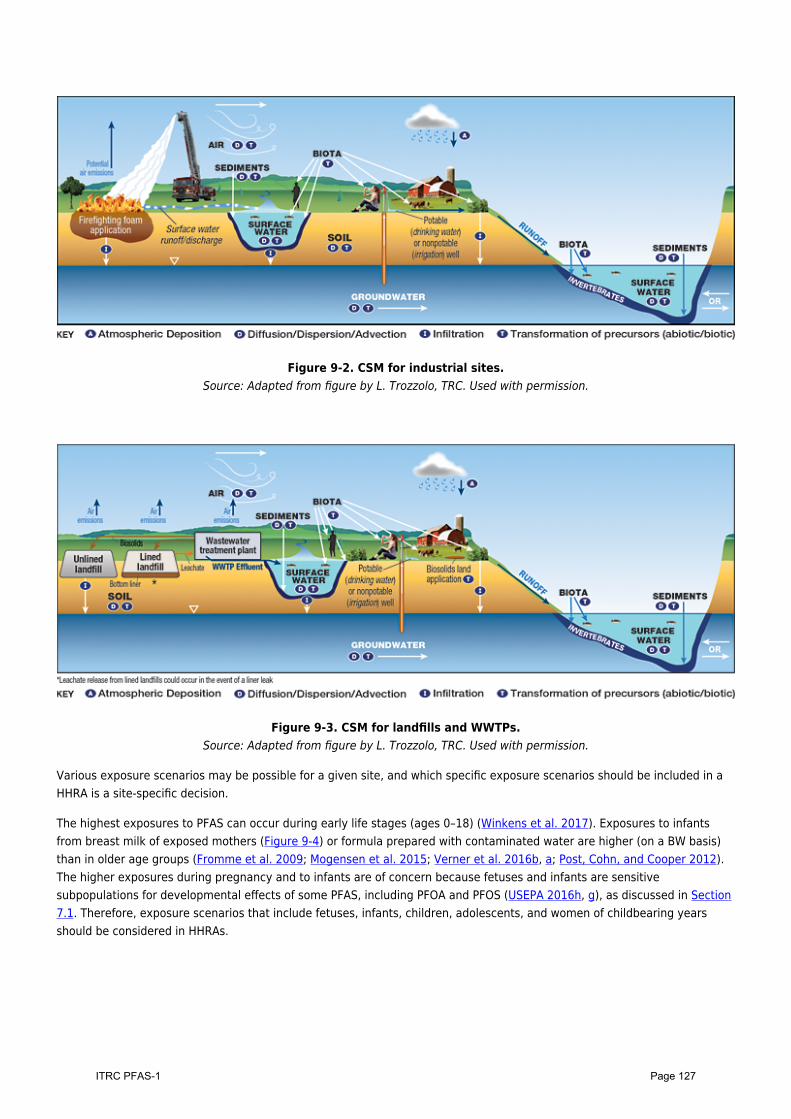
Figure 9-2. CSM for industrial sites.Source: Adapted from figure by L. Trozzolo, TRC. Used with permission.
Figure 9-3. CSM for landfills and WWTPs.Source: Adapted from figure by L. Trozzolo, TRC. Used with permission.
Various exposure scenarios may be possible for a given site, and which specific exposure scenarios should be included in aHHRA is a site-specific decision.
The highest exposures to PFAS can occur during early life stages (ages 0–18) (Winkens et al. 2017). Exposures to infantsfrom breast milk of exposed mothers (Figure 9-4) or formula prepared with contaminated water are higher (on a BW basis)than in older age groups (Fromme et al. 2009; Mogensen et al. 2015; Verner et al. 2016b, a; Post, Cohn, and Cooper 2012).The higher exposures during pregnancy and to infants are of concern because fetuses and infants are sensitivesubpopulations for developmental effects of some PFAS, including PFOA and PFOS (USEPA 2016h, g), as discussed in Section7.1. Therefore, exposure scenarios that include fetuses, infants, children, adolescents, and women of childbearing yearsshould be considered in HHRAs.
Page 127ITRC PFAS-1
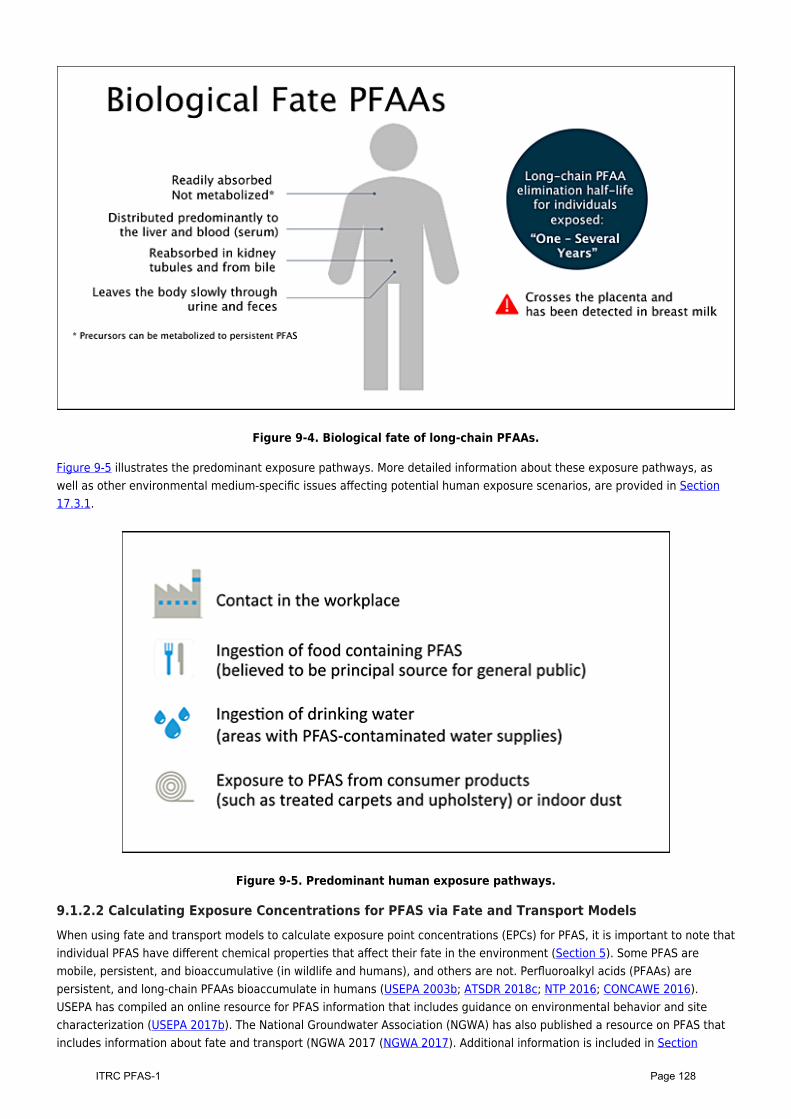
Figure 9-4. Biological fate of long-chain PFAAs.
Figure 9-5 illustrates the predominant exposure pathways. More detailed information about these exposure pathways, aswell as other environmental medium-specific issues affecting potential human exposure scenarios, are provided in Section17.3.1.
Figure 9-5. Predominant human exposure pathways.
9.1.2.2 Calculating Exposure Concentrations for PFAS via Fate and Transport ModelsWhen using fate and transport models to calculate exposure point concentrations (EPCs) for PFAS, it is important to note thatindividual PFAS have different chemical properties that affect their fate in the environment (Section 5). Some PFAS aremobile, persistent, and bioaccumulative (in wildlife and humans), and others are not. Perfluoroalkyl acids (PFAAs) arepersistent, and long-chain PFAAs bioaccumulate in humans (USEPA 2003b; ATSDR 2018c; NTP 2016; CONCAWE 2016).USEPA has compiled an online resource for PFAS information that includes guidance on environmental behavior and sitecharacterization (USEPA 2017b). The National Groundwater Association (NGWA) has also published a resource on PFAS thatincludes information about fate and transport (NGWA 2017 (NGWA 2017). Additional information is included in Section
Page 128ITRC PFAS-1
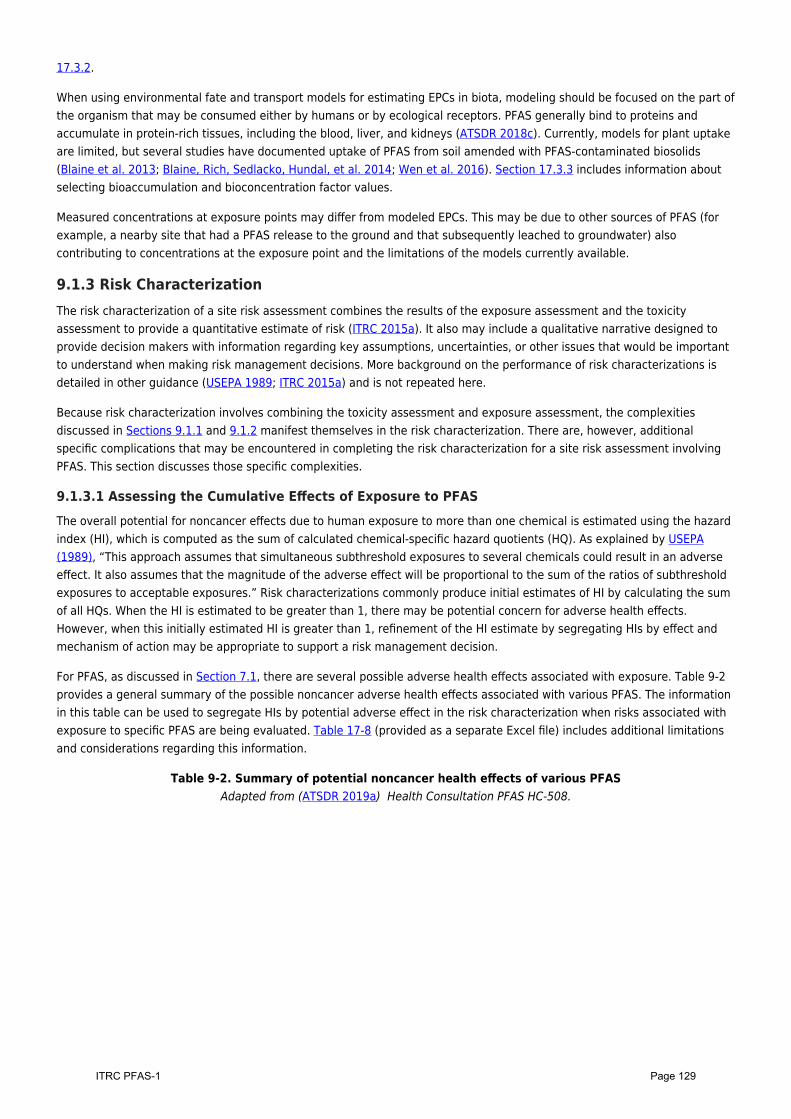
17.3.2.
When using environmental fate and transport models for estimating EPCs in biota, modeling should be focused on the part ofthe organism that may be consumed either by humans or by ecological receptors. PFAS generally bind to proteins andaccumulate in protein-rich tissues, including the blood, liver, and kidneys (ATSDR 2018c). Currently, models for plant uptakeare limited, but several studies have documented uptake of PFAS from soil amended with PFAS-contaminated biosolids(Blaine et al. 2013; Blaine, Rich, Sedlacko, Hundal, et al. 2014; Wen et al. 2016). Section 17.3.3 includes information aboutselecting bioaccumulation and bioconcentration factor values.
Measured concentrations at exposure points may differ from modeled EPCs. This may be due to other sources of PFAS (forexample, a nearby site that had a PFAS release to the ground and that subsequently leached to groundwater) alsocontributing to concentrations at the exposure point and the limitations of the models currently available.
9.1.3 Risk CharacterizationThe risk characterization of a site risk assessment combines the results of the exposure assessment and the toxicityassessment to provide a quantitative estimate of risk (ITRC 2015a). It also may include a qualitative narrative designed toprovide decision makers with information regarding key assumptions, uncertainties, or other issues that would be importantto understand when making risk management decisions. More background on the performance of risk characterizations isdetailed in other guidance (USEPA 1989; ITRC 2015a) and is not repeated here.
Because risk characterization involves combining the toxicity assessment and exposure assessment, the complexitiesdiscussed in Sections 9.1.1 and 9.1.2 manifest themselves in the risk characterization. There are, however, additionalspecific complications that may be encountered in completing the risk characterization for a site risk assessment involvingPFAS. This section discusses those specific complexities.
9.1.3.1 Assessing the Cumulative Effects of Exposure to PFASThe overall potential for noncancer effects due to human exposure to more than one chemical is estimated using the hazardindex (HI), which is computed as the sum of calculated chemical-specific hazard quotients (HQ). As explained by USEPA(1989), “This approach assumes that simultaneous subthreshold exposures to several chemicals could result in an adverseeffect. It also assumes that the magnitude of the adverse effect will be proportional to the sum of the ratios of subthresholdexposures to acceptable exposures.” Risk characterizations commonly produce initial estimates of HI by calculating the sumof all HQs. When the HI is estimated to be greater than 1, there may be potential concern for adverse health effects.However, when this initially estimated HI is greater than 1, refinement of the HI estimate by segregating HIs by effect andmechanism of action may be appropriate to support a risk management decision.
For PFAS, as discussed in Section 7.1, there are several possible adverse health effects associated with exposure. Table 9-2provides a general summary of the possible noncancer adverse health effects associated with various PFAS. The informationin this table can be used to segregate HIs by potential adverse effect in the risk characterization when risks associated withexposure to specific PFAS are being evaluated. Table 17-8 (provided as a separate Excel file) includes additional limitationsand considerations regarding this information.
Table 9-2. Summary of potential noncancer health effects of various PFASAdapted from (ATSDR 2019a) Health Consultation PFAS HC-508.
Page 129ITRC PFAS-1
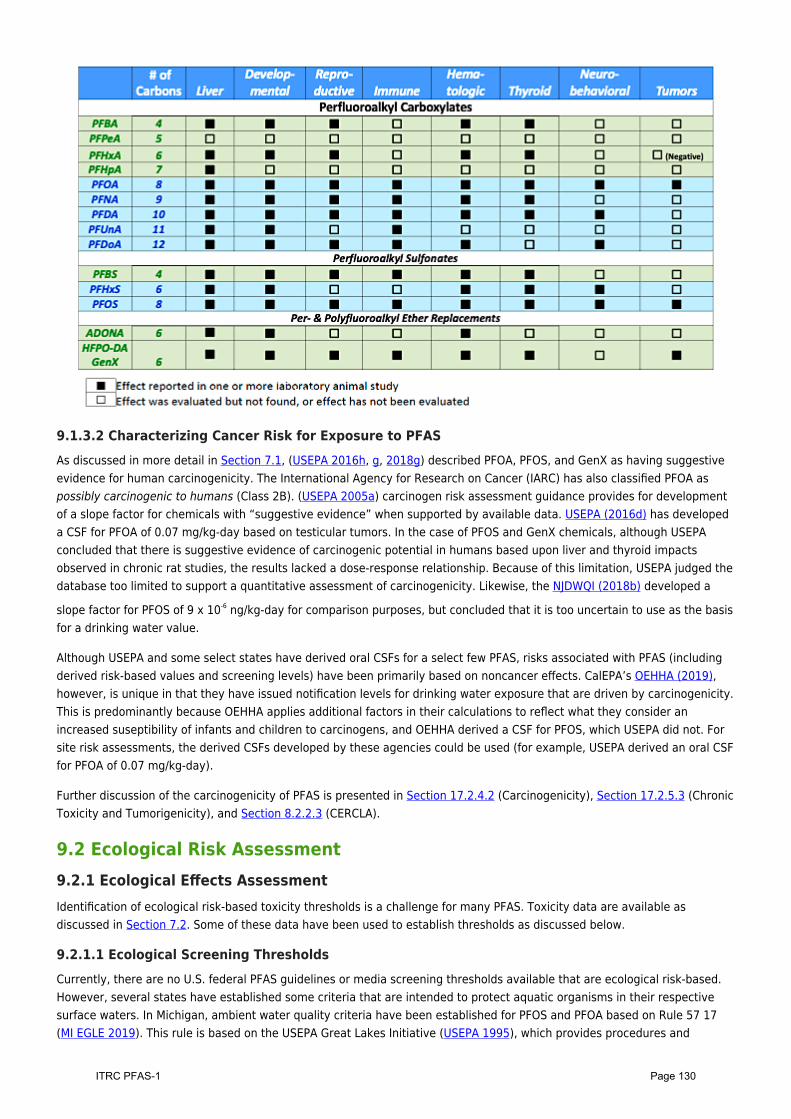
9.1.3.2 Characterizing Cancer Risk for Exposure to PFASAs discussed in more detail in Section 7.1, (USEPA 2016h, g, 2018g) described PFOA, PFOS, and GenX as having suggestiveevidence for human carcinogenicity. The International Agency for Research on Cancer (IARC) has also classified PFOA aspossibly carcinogenic to humans (Class 2B). (USEPA 2005a) carcinogen risk assessment guidance provides for developmentof a slope factor for chemicals with “suggestive evidence” when supported by available data. USEPA (2016d) has developeda CSF for PFOA of 0.07 mg/kg-day based on testicular tumors. In the case of PFOS and GenX chemicals, although USEPAconcluded that there is suggestive evidence of carcinogenic potential in humans based upon liver and thyroid impactsobserved in chronic rat studies, the results lacked a dose-response relationship. Because of this limitation, USEPA judged thedatabase too limited to support a quantitative assessment of carcinogenicity. Likewise, the NJDWQI (2018b) developed a
slope factor for PFOS of 9 x 10⁻⁶ ng/kg-day for comparison purposes, but concluded that it is too uncertain to use as the basisfor a drinking water value.
Although USEPA and some select states have derived oral CSFs for a select few PFAS, risks associated with PFAS (includingderived risk-based values and screening levels) have been primarily based on noncancer effects. CalEPA’s OEHHA (2019),however, is unique in that they have issued notification levels for drinking water exposure that are driven by carcinogenicity.This is predominantly because OEHHA applies additional factors in their calculations to reflect what they consider anincreased suseptibility of infants and children to carcinogens, and OEHHA derived a CSF for PFOS, which USEPA did not. Forsite risk assessments, the derived CSFs developed by these agencies could be used (for example, USEPA derived an oral CSFfor PFOA of 0.07 mg/kg-day).
Further discussion of the carcinogenicity of PFAS is presented in Section 17.2.4.2 (Carcinogenicity), Section 17.2.5.3 (ChronicToxicity and Tumorigenicity), and Section 8.2.2.3 (CERCLA).
9.2 Ecological Risk Assessment9.2.1 Ecological Effects AssessmentIdentification of ecological risk-based toxicity thresholds is a challenge for many PFAS. Toxicity data are available asdiscussed in Section 7.2. Some of these data have been used to establish thresholds as discussed below.
9.2.1.1 Ecological Screening ThresholdsCurrently, there are no U.S. federal PFAS guidelines or media screening thresholds available that are ecological risk-based.However, several states have established some criteria that are intended to protect aquatic organisms in their respectivesurface waters. In Michigan, ambient water quality criteria have been established for PFOS and PFOA based on Rule 57 17(MI EGLE 2019). This rule is based on the USEPA Great Lakes Initiative (USEPA 1995), which provides procedures and
Page 130ITRC PFAS-1
methodologies to derive numerical criteria that are protective of aquatic ecosystems. Rule 57 presents a two-tieredmethodology in which Tier I procedures are essentially the same as the methods used to derive federal national waterquality criteria (NWQC) (USEPA 1985) and Tier II can be used to derive values where the full extent of the toxicity datarequirements of NWQC are not fulfilled. Rule 57 presents procedures to develop three categories of numeric criteria—finalchronic values (FCVs), aquatic maximum values (AMVs), and final acute values (FAVs)—which can be developed under eitherTier I or Tier II. Due to the greater uncertainties associated with Tier II values, given the lesser data requirements, thesevalues tend to be more conservative than those derived with Tier I methodologies. The PFOA and PFOS numeric criteria forMichigan are all Tier II values due to the limited amount of peer-reviewed aquatic toxicity data. The final chronic values forthe protection of aquatic life (flora and fauna) for PFOA and PFOS were 880 and 140 µg/L, respectively, while aquaticmaximum values were 7,700 and 780 µg/L, respectively. In addition, the Michigan Department of Community Health (MDCH2015) derived provisional PFOS surface water values for mammalian and avian wildlife based on Rule 57 guidance. Thesurface water avian wildlife value, based on eagles, kingfishers, and herring gull characteristics, was 0.035 µg PFOS/L. Themammalian wildlife value, based on otter and mink characteristics, was 0.084 µg PFOS/L.
The State of Minnesota has also derived several PFAS-based surface water criteria for the protection of aquatic biota. Thesevalues were based on guidelines in Minnesota Rules chapter 7050 (MR7050). Continuous chronic criteria for the protection ofaquatic biota in surface water are for PFOA (1,700 µg/L) and PFOS (19 µg/L) (Stevens and Coryell 2007b; Stevens and Coryell2007a). No other surface water values have been derived for PFAS in either state (Michigan or Minnesota) and values forother states are unavailable.
Environment and Climate Change Canada (ECCC, previously known as Environment Canada) has proposed ecologicalFederal Environmental Quality Guidelines (FEQGs) for PFOS in surface waters, fish tissue, wildlife dietary values, and birdeggs (ECCC 2018). The PFOS threshold for surface waters was derived from a species sensitivity distribution (SSD) based onlong-term toxicity data that included data for amphibians, fish, invertebrates, phytoplankton, and macrophytes. Theguideline to protect all aquatic life forms for indefinite exposure periods to PFOS in surface waters is 6.8 µg/L, and a fishtissue guideline value of 9.4 mg/kg wet weight (ww) was based on these fish data and bioaccumulation factors for bluegillfrom Drottar, Van Hoven, and Kruger (2002). The tissue threshold is intended for both freshwater and marine environments.It was not calculated with both food and water (direct media) BAFs, and thus it could be underprotective. However, (Giesy etal. 2010) did use Drottar, Van Hoven, and Kruger (2002) data to calculate an acute no-effect threshold of 87 mg/kg ww. Toprotect mammalian and avian consumers of aquatic biota, ECCC derived wildlife dietary toxicity reference values (TRVs)using mammalian studies and avian chronic toxicity data. For mammals, the dietary value for PFOS was 4.6 µg/kg ww foodwhile the avian dietary value was 8.2 µg/kg ww food. Based on the avian reproduction studies that were the basis for thedietary values, a guideline of 1.9 µg/g ww whole egg was also derived for PFOS.
Screening level assessment values have also been derived for PFOA (Environment Canada 2012). Environment Canadaderived several predicted no-effect concentrations (PNECs) for PFOA for ecological species. PNECs are intentionallyconservative concentrations of chemicals designed to represent a concentration at which no adverse effects are likely.These PNECs for PFOA were based on LOAEL values from a limited set of single organism toxicity studies adjusted withuncertainty factors. FEQG values are developed from a distribution of acute and chronic studies conducted on groups oforganisms with an intent to be protective of a set percentage of organisms in that category (for example, a 95% protectionthreshold). Thus, these PFOA PNECs are not equivalent to FEQGs, though they still provide utility for screening level ERA. ThePNEC for aquatic organisms, based on a study with the freshwater alga Pseudokirchneriella subcapitata, was 20 µg/L; amammalian wildlife study based on cynomolgus monkey (Macaca fascicularis) derived a liver-based PNEC of 158 µg/kg ww.However, given the uncertainties associated with these values, care should be taken in their application to ERA. FEQGs forPFOA are currently under development by ECCC (ECCC 2018).
The Australian and the New Zealand Environment and Conservation Council and Agriculture and Resource ManagementCouncil of Australia and New Zealand (ANZECC/ARMCANZ) have established draft protective concentrations for freshwaterorganisms exposed to PFOS and PFOA. The values, as shown in Table 9-3, were developed by the Cooperative ResearchCentre for Contamination Assessment and Remediation of the Environment (CRC CARE) (2018). Only the freshwater valueshave been adopted in the PFAS National Environmental Management Plan (HEPA 2018) for Australia and New Zealand.Instead, the freshwater values have been identified as interim thresholds for marine waters. The values from CRC CAREincorporated multiple studies and were based on SSD for each compound. The 90 and 95% protective thresholds for PFOSare 2.0 and 0.13 µg/L, respectively. These values are within the range of other published values (Giesy et al. 2010; Qi et al.2011). A 99% protection value for PFOS was also proposed as 0.00023 µg/L, though this may be below ambientconcentrations. All three of the PFOS protection values are taken from an SSD that includes studies on the low end that are
Page 131ITRC PFAS-1
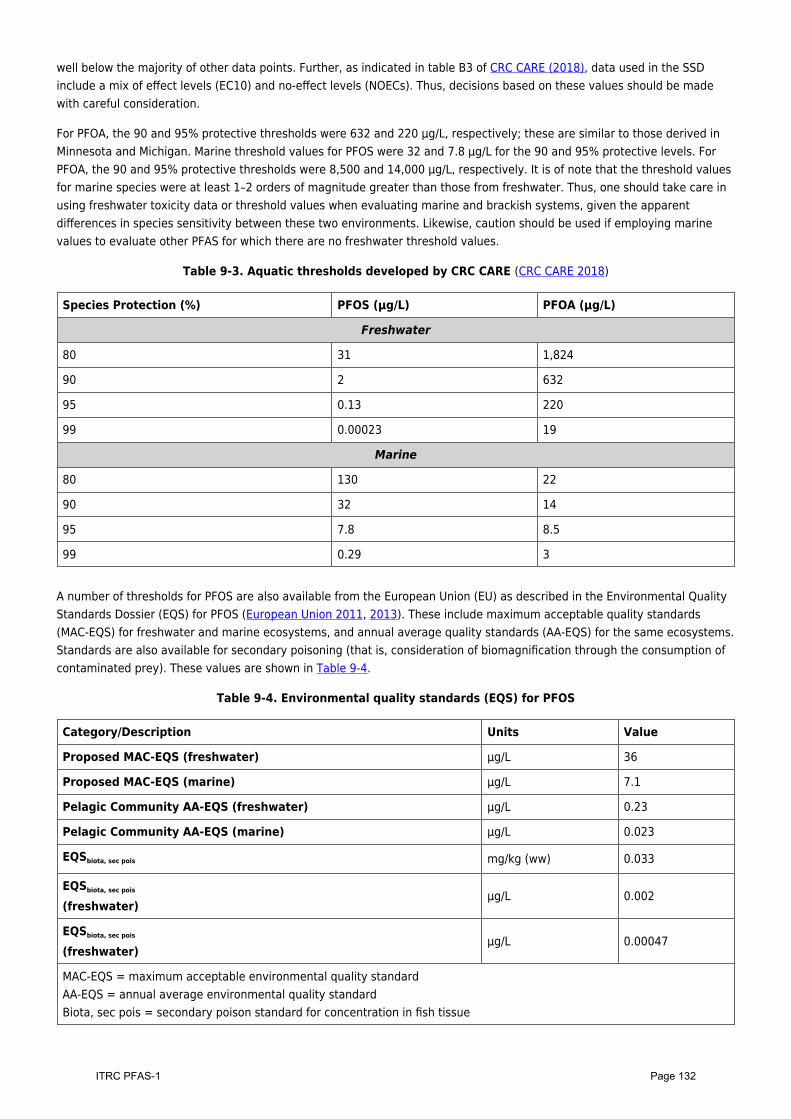
well below the majority of other data points. Further, as indicated in table B3 of CRC CARE (2018), data used in the SSDinclude a mix of effect levels (EC10) and no-effect levels (NOECs). Thus, decisions based on these values should be madewith careful consideration.
For PFOA, the 90 and 95% protective thresholds were 632 and 220 µg/L, respectively; these are similar to those derived inMinnesota and Michigan. Marine threshold values for PFOS were 32 and 7.8 µg/L for the 90 and 95% protective levels. ForPFOA, the 90 and 95% protective thresholds were 8,500 and 14,000 µg/L, respectively. It is of note that the threshold valuesfor marine species were at least 1–2 orders of magnitude greater than those from freshwater. Thus, one should take care inusing freshwater toxicity data or threshold values when evaluating marine and brackish systems, given the apparentdifferences in species sensitivity between these two environments. Likewise, caution should be used if employing marinevalues to evaluate other PFAS for which there are no freshwater threshold values.
Table 9-3. Aquatic thresholds developed by CRC CARE (CRC CARE 2018)
Species Protection (%) PFOS (μg/L) PFOA (μg/L)
Freshwater
80 31 1,824
90 2 632
95 0.13 220
99 0.00023 19
Marine
80 130 22
90 32 14
95 7.8 8.5
99 0.29 3
A number of thresholds for PFOS are also available from the European Union (EU) as described in the Environmental QualityStandards Dossier (EQS) for PFOS (European Union 2011, 2013). These include maximum acceptable quality standards(MAC-EQS) for freshwater and marine ecosystems, and annual average quality standards (AA-EQS) for the same ecosystems.Standards are also available for secondary poisoning (that is, consideration of biomagnification through the consumption ofcontaminated prey). These values are shown in Table 9-4.
Table 9-4. Environmental quality standards (EQS) for PFOS
Category/Description Units Value
Proposed MAC-EQS (freshwater) μg/L 36
Proposed MAC-EQS (marine) μg/L 7.1
Pelagic Community AA-EQS (freshwater) μg/L 0.23
Pelagic Community AA-EQS (marine) μg/L 0.023
EQSbiota, sec pois mg/kg (ww) 0.033
EQSbiota, sec pois
(freshwater)μg/L 0.002
EQSbiota, sec pois
(freshwater)μg/L 0.00047
MAC-EQS = maximum acceptable environmental quality standardAA-EQS = annual average environmental quality standardBiota, sec pois = secondary poison standard for concentration in fish tissue
Page 132ITRC PFAS-1
A survey of reports from various regulatory agencies demonstrates that although ecotoxicity data are available for variousPFAS, including PFBA, PFBS, and fluorotelomers (including 8:2 FTCA, 8:2 FTUCA, and several FTOHs), to date these typicallyconsider only a few aquatic species that include D. magna, a green alga, and perhaps a fish species. Regulations require arobust data set covering several classes of organisms, and due to limitations in the number of classes of organismsrepresented in the published peer reviewed data, it is difficult to derive ambient surface water quality criteria. Lack ofrelevant toxicity data is a greater issue for terrestrial wildlife given that the only chronic, reproductive studies that havebeen conducted to date are in two species, bobwhite quail and mallard duck, with PFOS and PFOA. No ecologically relevantstudies have been conducted with mink or an adequate surrogate. As a result, the development of benchmark or thresholdconcentrations for wildlife and aquatic organisms has been slow and incorporates greater levels of uncertainty in theirderivation.
Research on observed effects in benthic invertebrates for direct exposure to sediments contaminated with PFAS is limited.There are no published benchmarks and little published research. Research has focused more on aqueous exposurepathways. Observational data and monitoring have been used in some cases to develop an understanding of what exposuremay be associated with effects. A sediment no-effect threshold of 220 µg/kg, a chronic toxicity range of 220–630 µg/kg, andan acute short-term effects range of 630–3,100 µg/kg were established (Bakke et al. 2010) Norwegian Pollution ControlAgency NPCA . These sediment thresholds were reported for PFOS concentrations in marine sediments, though they providesome basis for screening level risk decisions for both marine and freshwater. Caution should be observed in using thesevalues because associated effects, if any, are unclear, and the original work is not readily available. Caution should also beused in applying these NPCA sediment values from marine waters to freshwater because the freshwater organisms could bemore exposed (as explained in Section 9.1.2) and either more or less sensitive than marine organisms. In its EQSD for PFOS,the European Union (2011) took the position that there is insufficient data available to confirm the need for a sedimentquality standard and insufficient data to derive a threshold, thus electing not to develop a value. Similarly, a workgroup innorthern Italy concluded that there was no need for a sediment environmental quality standard (EQS) for PFOA, PFBS, PFBA,and PFPeA and that data for a sediment EQS for PFHxA were insufficient (Valsecchi et al. 2017).
For soil, CRC CARE developed soil screening thresholds from SSDs for both PFOS and PFOA. The Canadian Council ofMinisters of Environment (CCME 2018) have also developed several draft thresholds for PFOS in soil. A value protective ofdirect toxicity was developed from an SSD of plant and invertebrate IC25 values (the concentration at which a 25% reductionin a non-lethal biological measurement, such as growth or reproduction, occurs). Food chain models were used to developvalues protective of soil and food ingestion by wildlife. CCME (2018) also developed a soil screening value protective ofaquatic life for use at sites where off-site migration to nearby surface water bodies may be a concern. These values fromCCME were issued draft for public comment, and final FEQGs have not yet been established. Soil threshold values for otherPFAS, however, are limited.
9.2.1.2 Ecological Receptor VariabilityA second major challenge with toxicity assessment for ERA is accounting for the large number of receptor types and theassociated unknown variable sensitivity to PFAS. Although it is commonly understood that sensitivity to contaminants canvary widely across kingdoms or across classes of animals, the challenge for PFAS may be greater due to the lack ofknowledge about this family of compounds. Studies have documented the presence of PFAS in various aquatic species sincethe 1950s (Danish EPA 2015; Giesy and Kannan 2001, 2002)), such as bottle-nosed dolphins (Houde et al. 2006), seals (Buttet al. 2008), squid (Yang et al. 2012), alligators (Bangma et al. 2017), and polar bears (Smithwick, Mabury, et al. 2005;Smithwick, Muir, et al. 2005; Greaves and Letcher 2013). The detection of PFAS within organisms is clear evidence ofexposure. Unlike many other commonly detected contaminants, however, the availability of toxicological data for PFAS islimited relative to the broad range of organisms within which PFAS have been detected.
Standard ERA practice includes developing TRVs that consider measures of exposure and effects that could adversely impactpopulations of wildlife (for example, chronic studies on reproduction, growth, and survival). Mammalian studies on numeroussublethal endpoints (for example, systemic, immunological, developmental, respiratory, cardiovascular, gastrointestinal,ocular, hepatic) have been conducted for PFOS, PFOA, and other PFAS and are well described in the Draft ToxicologicalProfile for Perfluoroalkyls (ATSDR 2018e), but these are less commonly used for TRV development for ERAs. These sublethal,mostly systemic or organ function-based TRVs are really only used for ERAs in the absence of reproduction, survival, orgrowth data. Mammalian TRVs for the purposes of ERA can be developed for the majority of the Third UnregulatedContaminant Monitoring Rule (UCMR3) PFAS compounds listed in Section 8.2.2.2. Avian oral dosing studies useful for ERA areless available. The dietary acute and chronic studies by Newsted et al. (2005); Newsted et al. (2007) examining PFOSexposure in mallard (A. platyrhynchos) and bobwhite quail (C. virginianus) may be the only currently published work relevant
Page 133ITRC PFAS-1
to ERA. Newsted et al. (2005) and Molina et al. (2006) have also reported the results of bird egg injection studies usingPFOS, while Cassone et al. (2012) and Norden, Berger, and Engwall (2016) have published in ovo studies with other PFAS. Acaution with interpreting these egg studies is the uncertainty as to whether naturally accumulated concentrations have thesame adverse effect as concentrations administered via injection in ovo. There also can be differences when measuringwhole egg, yolk, or albumin (Custer, Gray, and Custer 2010). Finally, there is currently not enough data for modeling eggtissue concentration for these chemicals.
Reptiles are among the least studied vertebrate taxa in ecotoxicology (Hopkins 2000) Weir, 2010 #1616} despitecontamination threatening reptile populations worldwide (Gibbons et al. 2000). To date, there are no published reptiletoxicity data available for any PFAS, although studies have shown PFAS tissue concentrations from some reptile species(Wang, Zhang, et al. 2013; Bangma et al. 2017). Amphibian toxicity data are also lacking, with just one study onnorthernleopard frogs (Rana pipiens) (Ankley et al. 2004) and one on African clawed frogs (Xenopus laevis) (Palmer and Krueger2001).
For lower trophic-level organisms such as plants and invertebrates, toxicological data are typically generated throughstudies with direct exposure to spiked media. Studies are available to develop thresholds for use in ERAs, as has been doneby both ECCC (2018) and CRC CARE (2017a). Giesy et al. (2010) and ECCC (2018) generated PFOS SSDs for freshwateraquatic organisms, from which thresholds were derived. CRC CARE presented SSDs for PFOS and PFOA for marine watersand for soil to establish their thresholds. Giesy et al. (2010) noted that some guidelines for developing criteria from SSDsrely heavily on the four lowest effect concentrations; thus, results can be skewed if one genus or species is significantlymore sensitive than others. In the freshwater SSD for PFOS generated by Giesy et al. (2010), Chironamous tentans (aspecies of midge) were 40 times more sensitive than the next most sensitive species, the fathead minnow (Pimephalespromelas). However, the ECCC (2018) SSD does not show the same difference in sensitivity with a reported fish 14-daygrowth LOEC for Japanese rice fish (Oryzias latipes) below the C. tentans 10-day NOEC. For marine waters, fish are amongthe most sensitive organisms for both PFOS and PFOA as shown in SSDs (CRC CARE 2017a), but by just an order ofmagnitude or less. SSDs produced by CRC CARE (2017a) did not use any of the same data and showed lettuce to be moresensitive to PFOS than earthworms, but found the opposite occurred for PFOA.
SSDs have not been published for avian, mammalian, reptilian, or amphibian species. Although SSDs could possibly begenerated for laboratory mammalian species, perhaps the most studied organisms for PFAS, there would not be a significantbreadth of applicability to wildlife species. Mammalian SSDs would include mostly rat and mouse studies with a few monkeyand rabbit studies. Extrapolation to other orders would be required, leaving an uncertainty. Existing data would be moreconducive to an effects distribution because the number of species within the class of organisms would be so limited.Insufficient published data are available for a robust SSD or even an effects distribution for avian, reptilian, or amphibiananimals.
Available toxicological data clearly do not adequately cover the range of organisms that are exposed to PFAS or within whichPFAS have been detected. Nor does the data have much breadth for chemicals beyond PFOS and PFOA. Sensitivity variationfor aquatic organisms is evident from the SSDs, and likely sensitivity ranges for untested wildlife leave a clear knowledgegap for some or even most ERAs. However, this problem is not unique to PFAS. As with many other bioaccumulative andbiomagnifying compounds, this knowledge gap can be addressed by using available data from surrogate organisms (forexample, the closest taxonomic laboratory test species) and making some assumptions. The uncertainty in the potentialdifference in sensitivity needs to be acknowledged and discussed within ERAs. However, pending the outcome ofquantitative analysis, risk conclusions and even risk management decisions are possible on a site-specific basis. Althoughextrapolations with surrogates is a common practice in ERA, caution should be used and decisions should be made inconcurrence with regulatory agencies or other applicable stakeholders.
9.2.1.3 Ecological Toxicity of MixturesA third major challenge in effects assessment for PFAS is considering the toxicity of mixtures. At this time there are onlylimited data available to sufficiently understand the toxicity of more than just a few chemicals with respect to direct toxicityto lower trophic level organisms or exposure to upper trophic level wildlife. Structural and physical properties could be usedto relate the toxicity of unknown PFAS to those with known toxicity. Giesy et al. (2010) explored quantitative structure-activity relationships (QSARs) for PFAS with the following conclusions, “Although the analysis given above indicates thatstructure-activity relationships can be derived from existing data, there are still numerous data gaps that need to beaddressed to quantify the toxicity of different classes of perfluorinated compounds and the relative susceptibility of aquaticorganisms and plants. When such data are available it will be feasible to develop more sophisticated models to predict the
Page 134ITRC PFAS-1
toxicity of fluorinated compounds to aquatic organisms.” There are a number of ongoing research projects investigatingmultiple PFAS (primarily the UCMR3 chemicals) and their precursors. However, the relative toxicity, additivity, or synergisticeffects of PFAS are not fully understood and still uncertain.
9.2.2 Ecological Exposure AssessmentDetections of PFAS in tissues of top predators within both aquatic and terrestrial ecosystems (Section 6.5) points to ongoingexposure from bioaccumulative and possibly biomagnifying PFAS (Section 5.5.3). Thus, accuracy and realism withinexposure and risk estimates for PFAS are important to making informed risk management decisions. With the challenges ofaccounting for multiple exposure pathways, building strong food web and ecological exposure pathway models is animportant foundation of PFAS ERAs. Once completed, these models can be used to identify the key receptors and measuresof exposure to complete the assessments.
For aquatic ecosystems, published data from laboratory studies and specific field sites are available that include both BCFs,BAFs, and biota-sediment accumulation factors (BSAFs). These values, some of which are discussed and presented in Section5 and Table 5-1 (provided as a separate Excel file), can be used to model the measures of exposure for aquatic ecosystems.(Larson, Conder, and Arblaster 2018) used such data to conduct food chain modeling in four different avian receptors.Published values for fish are common; however, to date these values are not standardized in how they are reported (forexample, wet versus dry weight; organic carbon or lipid normalization). Most importantly, these data are highly variant(Table 5-1); Environment Canada (2006) reported that field BAFs for PFOS in Canadian biota range from 6,300 to 125,000.Burkhard et al. (2012) reported that within published data sources (Giesy et al. 2010; Houde et al. 2006), laboratory andfield bioaccumulation metrics usually do not agree. According to Burkhard et al. (2012), field-generated BAFs (wet weighttissue to field water plus some ingestion) for PFOS exceed BCFs (wet weight tissue to lab water) predicted in the laboratory.This is undoubtedly due to the inability or inaccuracy of laboratory models to account for both direct and food ingestionexposure pathways. LaRoe et al. (2017) pointed out that laboratory values include only accumulation across the gillmembrane. Thus, ERAs are challenged with attempting to address both pathways. Larsen et al. (2018) demonstrated thatusing environmentally relevant sediment concentrations with standard food chain models with both BSAFs and BAFssuggested sediment pathways may be underrepresented and studied. Although the combination of direct and ingestionpathways is primarily a challenge for aquatic systems, assessing risk to wildlife exposed to multiple media (for example,amphibians, semiaquatic wildlife) is also problematic.
In addition to fish, accumulation values for benthic organisms (California black worm, Lumbriculus variegatus, Higgins(Higgins et al. 2007) and (Lasier et al. 2011); oysters, Ostrea edulis, (Thompson et al. 2011) and pelagic invertebrates (D.magna, (Dai et al. 2013) have also been reported. Example BSAF values from Lasier et al. (2011) for PFOS, PFOA, PFNA,PFBS, and PFHpA are all fairly low, ranging from 7 to 49.
Data for terrestrial systems are limited to primarily plants (agricultural crops) and earthworms, with little available forvertebrate prey tissue. One exception is Müller et al. (2011), which published data for a soil-to-caribou-to-wolf BAF used byECCC ECCC (2018) in establishing a soil threshold protective of terrestrial carnivores at 2.6 mg PFOS/kg soil. In nearly allcases, these BAFs and BSAFs are available only for PFOS, though the Lasier et al. (2011) study can be used to identify BSAFsfor five of the six UCMR3 PFAS.
Caution should be used in applying any of the published bioaccumulation or biomagnification data for desktop exposureestimates that are in turn used to justify remedial action. Several factors and uncertainties are associated with performingdesktop food chain modeling with the limited amount of published data. Some of these considerations include the following:
differences in diets of receptors at investigation sites versus that of studies documented in the publishedliterature: differences in the proportions of prey items; differences in the uptake and elimination rates of PFAS oroverall bioaccumulation of PFAS by the preydifferences in physiology between the site receptors and those in published literature: capacity and magnitudeof transformation; metabolism and uptake and elimination rates of PFAS; the amount/composition of protein-containing tissues to which PFAS bind; species home range and migrationdifferences in physiochemical properties of the abiotic media containing PFAS between investigation sites andpublished study sites: bioavailability and uptake of PFAS; environmental processes (photolysis, hydrolysis,microbial aerobic and anaerobic metabolism); the presence of precursors. There is not a sufficient set ofbioaccumulation data to date to account for these variations. Such studies were part of the 2019 Statements ofNeed for Strategic Environmental Research and Development Program (SERDP) grant projects.
Page 135ITRC PFAS-1
These uncertainties are not completely unique to PFAS, as there are many other contaminants for which risk assessmentsare performed. Though there is some uncertainty with desktop food chain models for PFAS based on abiotic media,quantitative modeling does not need to be avoided. Two conclusions should be reached through food chain modeling withabiotic media and literature based BAFs/BSAFs/BCFs: either concentrations at the site are sufficiently low such that it can beconcluded that risk to the environment is negligible and acceptable or concentrations suggest further evaluation by eitherrefined baseline problem formulation or a baseline ecological risk assessment (BERA). Conducting BERAs for sites with PFASshould not be substantially different from BERAs for sites with other chemicals. Either in situ or ex situ direct toxicity testswith representative organisms can and should be performed when exceeding the limited ecological risk thresholds that areavailable. Likewise, measured concentrations of PFAS in prey should be obtained if desktop food chain modeled exposureexceeds TRVs. But the biggest challenges for measuring PFAS in biota have to do with the unique analytical chemistrymethod issues (Section 11). Challenges such as selecting the correct biota to sample, matching the prey items to the diets ofupper trophic level biota, or obtaining sufficient tissue volume for chemical analysis may exist, but these issues are notunique to PFAS investigations.
9.2.3 Risk CharacterizationSome aquatic toxicity data (Table 7-1 provided as a separate Excel file) are available for environmental risk assessment for afew PFAS, but wildlife data are still incomplete. Adequate, though not abundant, data are available for completing wildliferisk assessment, primarily for PFOS. The ability to complete risk assessments for other PFAS regularly analyzed and detectedin environmental investigations (Section 6) is limited. However, with the exposure data discussed in Section 5.5 and Section6.5, and methods discussed in Section 9.2.2, the foundations of a quantitative risk characterization can be completed forPFOS and to an extent, PFOA. Risk assessment for other PFAS can be made with some conservative assumptions and use ofPFOS data as a surrogate. Such risk characterizations using nonsite-specific abiotic media, surrogate information, and toolscan form the basis of screening level assessments. These screening assessments can be used to make more informeddecisions regarding the need for site-specific assessments, including the collection of site-specific tissue data. However,within these screening assessments, discussion of the uncertainties and data gaps and assumptions made should beincluded to inform the risk management decisions.
9.3 UncertaintyIn performing a site risk assessment, including information and a discussion regarding key factors of uncertainty in the riskcharacterization can be important. As noted by (USEPA, 1989 #1323@@author-year}, the source and degree of uncertaintyassociated with the risk characterization is needed to help decision makers (for example, risk managers, stakeholders), withsufficient level of detail to allow them to make informed risk management decisions (National Research Council 2009).
As noted throughout this guidance, while the science of characterizing and evaluating potential risks associated with PFASexposure continues to develop, there are still uncertainties that arise in conducting site-specific risk assessments for siteswith PFAS impacts. This section lists potentially critical uncertainties that, depending on the methodologies and assumptionsused in a particular site-specific risk assessment, may warrant a discussion to help decision makers and stakeholdersinterpret and appropriately use the results of a risk assessment.
9.3.1 Fate and TransportSite-specific risk assessments typically characterize risks associated with potential contaminant exposure that could occurcurrently or in the future. To characterize potential future exposures, conservative models are often used as tools to predictthe fate and transport of chemicals in the environment. With regard to PFAS fate and transport, uncertainties can beintroduced as follows:
Estimating future environmental concentrations due to airborne wet and dry deposition (Section 5.3.2)
Estimating the transformation of PFAA precursors to PFAA daughter end products (Section 5.4.2, Section 10.4.4)in the environment
Modeling groundwater transport considering such factors as chemical-specific retardation (Section 10.4.1) andback-diffusion (Section 10.4.3.3)
Estimating the bioaccumulation/bioconcentration of PFAS (Section 5.5.2, Section 9.2.1, Section 9.2.2) in aparticular animal/plant or via food chain modeling
Page 136ITRC PFAS-1
9.3.2 Human ToxicityHuman health risk assessments typically involve the use of toxicity values that are derived in a manner that is intended torepresent a “reasonable conservative estimate” (USEPA 2012a) of the dose-response in humans. All of the toxicity valuesthat have been derived by agencies for PFAS for use in site risk assessments are based upon animal studies with humanstudies used to support the hazard identification component of the risk assessment (Section 7.1.4). There is also a lack oftoxicity values for many PFAS, which with their absence could result in an underestimate of the risks associated with PFASexposure.
Overall, with regard to PFAS human toxicity, uncertainties in conducting a risk assessment can be introduced as follows:
Missing dose-response information for site-related PFAS to which receptors could be exposed (Section 7.1,Section 9.1.1.2)
Using toxicity values for a particular PFAS as a surrogate for another (Section 9.1.1.2)
9.3.3 Ecological ToxicityAs with human health risk assessments, ERAs often use TRVs that are generic and not site-specific. These generic TRVs areconservative by design because they are used for screening purposes (USEPA 2004). Likewise, there is a degree ofconservatism incorporated into the derivation of generic criteria (for example, ambient water criteria) to account foruncertainty (Section 9.2.1).
Overall, with regard to PFAS ecological toxicity, uncertainties in conducting a risk assessment stem from using toxicologicalinformation from surrogate organism(s) to evaluate potential risks for organisms for which toxicity studies do not exist(Section 9.2.1)
9.3.4 Accounting for Nonsite-Related PFASSite-specific risk assessments rely on site characterization information (and as needed, modeling) to help estimate theamount of exposure receptors could be subject to currently or in the future. Given the widespread presence of PFAS in theenvironment (Section 6), including the potential of upgradient off-site PFAS impacts to migrate onto subject properties(Section 10.5), discerning “background” anthropogenic or off-site PFAS impacts at a site from site-related impacts can bechallenging. To streamline risk assessments, it may be conservatively assumed initially that concentrations of PFAS areentirely site-related. Doing so, however, may overestimate the risks associated with site-related releases.
Updated April 14, 2020.
Page 137ITRC PFAS-1
10 Site CharacterizationThe intent of this section is not to present general site characterization principles, but to highlight unique considerations forthis family of emerging contaminant. It is assumed that site characterization will follow all applicable state and federal(CERCLA or RCRA) guidelines. The general principles of site characterization are similar for PFAS as for any contaminant, inthat the physical setting, release specifics, proximity to receptors, and fate and transport characteristics will determine thesampling locations and requirements. Because of the toxicity, persistence, mobility, ubiquity, the large number ofcompounds in this family of chemicals, the variability and uncertainty of specific compounds and their criteria beingregulated, and the emerging nature of PFAS, it is necessary to consider specific concerns in PFAS site characterizationefforts.
Section Number Topic
10.1 Site Characterization Issues Relevant to PFAS
10.2 Initial Steps
10.3 Site Investigation
10.4 Data Analysis and Interpretation
10.5 Source Identification
Exposure to PFAS can occur through a variety of transport pathways involving all environmental media, as is described inSection 5. Because ingestion of water is deemed a major route of exposure in humans, current regulatory concerns arecentered on this pathway. In turn, this focus has led to an increased emphasis on investigation of the connection betweendrinking water sources and groundwater, including direct use of groundwater as drinking water and connections betweensurface water and groundwater. Because of this regulatory and investigatory focus, this section concentrates on thecharacterization of groundwater plumes. Although groundwater is the most common medium sampled in PFASinvestigations, site characterization may require data from soil, sediment, surface water, stormwater, air, biota, or othermedia depending upon the nature, duration, and time of the release.
The guidelines below include general considerations for the most common types of PFAS sites.
10.1 Site Characterization Issues Relevant to PFASHistorical investigations may have missed the potential for PFAS contamination at a site because, until recently, thesechemicals were not regulated, were not considered a health or environmental concern, or PFAS sampling and analyticalprocedures may not have been available. As a result, PFAS plumes had years to develop and migrate without detection orcharacterization. Comparing a site timeline (for example, processes, layout, chemical use, and release history, and firetraining and/or firefighting events when AFFF was used) with the timeline of PFAS development and use, and existingdrinking water data (for example, UCMR3) can be helpful in evaluating the types and potential occurrences of PFAS releases.Once a potential source has been identified, a site investigation would step out from the source to characterize the natureand distribution of the release. However, if a PFAS site is like one of the many without an identified source (ATSDR 2018e),an understanding of the site timeline or a general understanding of potential PFAS use may not be available. For siteswithout a known source release, the investigation approach starts with a review of available site information.
The following are some important considerations that are specific to PFAS sites.
10.1.1 Evolving Science and RegulationsState of the science: Understanding of many aspects of PFAS, such as toxicology and behavior in the environment, ischanging rapidly. This may require reevaluation of earlier assumptions and conclusions throughout the site characterizationprocess.
Page 138ITRC PFAS-1
Analytical methodologies: Analytical methodologies continue to be developed and improved. Specific attention must be paidto a wide variety of factors, such as analytical methods, detection/reporting limits, and parameter lists that are continuing toexpand. See Section 11.2, Analytical Methods/Techniques, for more details.
Sampling methodologies: Questions exist regarding cross-contamination potential due to the presence of PFAS in consumerproducts; many regulatory agencies require a precautionary approach to sampling prohibiting the use of materials that maybe treated with PFAS. See Section 11.1, Sampling, for more details.
Regulatory environment: The regulatory environment remains in flux, with changing regulatory limits, sampling procedures,and compounds of interest. Investigators must remain vigilant to identify impacts to the site characterization. See Section 8,Basis of Regulations, for more details.
10.1.2 Source, Fate, and Transport Properties
Secondary Sources
Sources created through movement of contaminated mediainto an area that was previously uncontaminated, (forexample, contaminated water from irrigation wells or reuseand application of biosolids), or an area where physical orchemical processes have concentrated PFAS, resulting in anadditional source (for example, multi-media interfaces; seeSections 5 and 6).
Sources: PFAS sources are discussed in Section 2.6,PFAS Releases to the Environment. There are also“secondary sources,” such as PFAS concentrating intoone portion of a plume (for example, groundwater intosurface water) that then acts as a source to furthergroundwater contamination.
Pathways: PFAS may be present or migrate viapathways that are not often encountered with otherconstituents. For example, PFAS may be present ingroundwater at a site via air deposition and no directon-site release.
Complex transitions between media: The behavior of PFAS compounds in the environment may deviate greatly from typicalcontaminants. Transitions between media may be complex because of specific characteristics of these compounds. Forexample, PFAS compounds may disperse more upon reaching the water table than is typical for most other compounds, or agroundwater plume discharging into a surface water body may continue into groundwater elsewhere, with contamination inthe surface water acting as a secondary source. See Sections 5 and 6 for additional detail.
Partitioning: Binding of PFAS to organic carbon is not as strong as traditional hydrophobic compounds (for example, PCBs,PAHs). So Koc alone may be a poor predictor of binding of PFAS to organic carbon (Section 4.2.9). Because various factors canaffect sorption of PFAS to organic carbon, published Koc values for PFAS cover a very broad range. To properly understandthe context of PFAS analytical results, it is often important to collect additional parameters, such as total organic carbon(TOC) and pH, and consider the partitioning behavior of specific compounds.
10.1.3 Other ConsiderationsHistorical view: Historical investigations may not have assessed PFAS contamination because it was not regulated, not apotential contaminant of concern, or analytical methods were unavailable at the time. Plumes may be extensive, havingyears or decades to develop before being discovered or addressed.
Balancing priorities: Because drinking water is a major pathway of exposure for PFAS and established plumes may havespread to downgradient areas, priority might be given to managing drinking-water exposure pathways over sitecharacterization.
Monitoring-point construction: Investigators must be mindful of ways that monitoring-point construction may influencesampling results. For example, historical wells might have employed fluoropolymer tape (Section 2.6.1.8), or have screenedintervals that make data interpretation difficult (owing to the uneven distribution of PFAS throughout a water column).
Site-Specific Anthropogenic Background
Concentrations of PFAS present in environmental media at thesite that are not the result of or influenced by site activities orreleases.
Widespread use: Because use of PFAS-containingproducts is widespread, there may be multiple sourcesin a given area that may act as additional or alternativesources of PFAS at a site. In addition, PFAS is oftendetected in low levels in samples from locations withoutan obvious source; there may be a need to evaluate
Page 139ITRC PFAS-1
site-specific anthropogenic background to determinecontributions in groundwater or soils that are not due toan on-site release. See, for example, Strynar et al.(2012).
Compound suite: Selection of a broad suite of compounds may prove useful for applications such as fingerprinting (ifmultiple sources are suspected) or understanding potential effects of precursor degradation (Section 10.5). Note that withcurrently available analytical methods, even a broad compound suite will not detect all PFAS.
Geologic heterogeneity: Because of the low delineation limits and mobile nature of certain PFAS, extra emphasis should beplaced on understanding the effects of hydrogeologic heterogeneity on the groundwater plume.
10.2 Initial StepsA comprehensive site preliminary assessment commonly starts with developing an understanding of potential PFAS uses inthe area, history of the site operations that potentially used the chemicals, air deposition patterns where PFAS may havebeen produced or processed (for example, manufacturer with PFAS emissions), and the regional geologic and hydrologicframework as it relates to contaminant transport to surface waters or drinking water wells. Following the preliminaryassessment, a series of site investigations may be required at a sufficient resolution to capture the effects of theheterogeneities that direct contaminant distribution, fate and transport, and remediation effectiveness. However, there maybe a need to prioritize the evaluation of certain exposure pathways (for example, drinking water wells) during the beginninginvestigations to quickly assess potential human exposures and because of constraints on resources and schedule.
When historical PFAS releases occur upgradient of drinking water sources, drinking water sampling may be the firstindication that there is a problem. In areas where there is a concern that a PFAS source may be present, it is common toidentify and sample nearby drinking water sources (for example, groundwater and surface water) to determine if PFAS arepresent in potable water sources and evaluate the potential exposure to human receptors. This approach is a policy for theDepartment of Defense (USDOD 2014b). In cases where sources are not well defined, reconnaissance sampling may beuseful to inform the development of the CSM and site investigation. In these instances, drinking water source sampling haspreceded typical site investigation work. Prior to further site characterization, proper notification to consumers andevaluating options to reduce or eliminate PFAS exposures, including alternative drinking water sources, may be required.
10.2.1 Initial Conceptual Site ModelCSMs are useful tools for the presentation and evaluation of site characteristics, releases, contaminant fate and transport,and exposure pathways. Generalized CSMs are presented in Figures 9-1, 9-2, and 9-3. The CSMs present most known andpotential PFAS source areas, transport mechanisms, and pathways on a simplified physical setting. The CSMs also illustrateexposure routes and receptors. CSM development is an iterative process over the project life cycle with information obtainedduring site investigation, remedy design, and remedy implementation and optimization. Similar to the USEPA’s data qualityobjectives (DQOs), it relies on a systematic objectives-based site characterization process (ITRC 2015b). The CSM for a PFASsite is developed with information on PFAS sources and releases (whether occurring on site or or off site from groundwater,surface water, sediment, or air), site characterization, pathways, and potential receptors.
Some specific challenges related to identifying the nature and extent of impacts for CSM development for PFAS sites aredescribed in the following sections.
10.2.1.1 Surface Water Body Secondary SourcesBecause certain PFAS are mobile and resistant to breakdown in the environment, there have been cases of surface watercreating very large dilute groundwater plumes through recharge (ATSDR 2008). Infiltration of PFAS along the course ofsurface water systems, including tidal zones, may result in widespread secondary sources to groundwater, further enlargingthe contamination area. In situations where PFAS-contaminated surface water is recharging groundwater, investigation ofthe potentially impacted groundwater should be conducted to fully characterize site-related contamination. Complicatingsurface water being a secondary source is that PFAS compounds have been shown to concentrate at the surface water-airinterface (Ju et al. 2008). PFAS contamination may also concentrate in naturally occurring surface water foam (due to anaffinity to organic material in the foam and the higher PFAS concentrations at the surface water-air interface where the foamis formed). Therefore, site characterization must consider whether or not surface water bodies are the most downgradientextent of contamination.
Page 140ITRC PFAS-1
10.2.1.2 Receptor IdentificationIdentification of potential ecological and human receptors as part of development of the CSM first includes identification ofpotential exposure pathways (for example, PFAS migration in groundwater to downgradient drinking water wells, creatinghuman exposure to PFAS; or water containing PFAS entering surface water bodies, creating aquatic life exposure to PFAS).See Section 9 for additional information on receptor identification in the context of risk-based evaluations for PFAS.
10.3 Site Investigation
10.3.1 Development of Site Investigation Work PlanPFAS investigation work plans should take into consideration the information provided in this guidance document (forexample, Sections 2, 4, 5, 6, 9, and 11), including items such as sampling procedures and equipment to prevent cross-contamination, analytical methods and compounds to be reported, geographically variable and changing regulatoryrequirements and criteria, and site-specific environmental setting. From a general perspective the work plan will depend onthe type of PFAS source and subsequent transport via various media. Attention should be paid to potential secondarysources from irrigation, sludge, or biosolid application, the use of soils not recognized to be contaminated, and otheranthropogenic factors affecting fate and transport of PFAS-contaminated media, such as discharge from landfills orwastewater treatment plants (WWTPs).
10.3.1.1 Geologic and Hydrogeologic InvestigationEvaluation of the geologic and hydrogeologic framework associated with the site is critical, and sometimes that frameworkmay need to be addressed on a regional basis, as the PFAS impacts may extend significant distances from the site.
In development of a work plan, consideration should be given to obtaining adequate information to allow for applyingEnvironmental Sequence Stratigraphy (ESS). ESS is an emerging best practice for understanding the geologic framework andrelated subsurface contaminant transport pathways, both regionally and underlying a site. The ESS approach is presented inUSEPA Groundwater Issue Paper “Best Practices for Environmental Site Management: A Practical Guide for ApplyingEnvironmental Sequence Stratigraphy to Improve Conceptual Site Models” (USEPA 2017c).
Geochemical parameters that may be pertinent to potential PFAS migration and possible remedies also require considerationduring the investigation. The understanding of soil and groundwater chemistry at the site (parameters such as pH, TOC,redox) is needed to assess transformation and migration in groundwater or desorption from soil. These and othergeochemical data can be used to assess the viability of PFAS remedy options should remediation be necessary. For example,the groundwater’s general chemistry, including cations, anions, total dissolved solids, and fouling parameters (for example,iron, manganese, hardness, biofoulants), as well as other organic compounds in groundwater, may have a significant impacton the selection, design, and implementation of potential groundwater remedies.
10.3.1.2 PFAS-Specific Tools for Site Screening or CharacterizationInvestigative techniques to characterize source soils and determine the three-dimensional extent of soil and groundwatercontamination should be considered. High-resolution site characterization techniques beyond those that provide lithologic orhydrologic information and are specific to PFAS are currently limited because reliable analytical procedures that are cost-effective and can be used for field screening are not readily available. However, analytical procedures that can be used in amobile laboratory and achieve ng/L detection limits are available. Use of a mobile laboratory can be expensive and is cost-effective only in specific situations when a sufficient number of samples can be collected in a short time period to keep themobile laboratory at or near its capacity. Use of a mobile laboratory and the quick turnaround of results they provide allowfor adaptive selection of additional sampling locations for delineation or other objectives. Other field-screeningmethodologies have either been tried or are in the research and development phase, including ion selective electrodes toquantify PFOS and a mobile field-screening unit for PFOS and PFAS, both of which are attempting quantification to ng/L levels(Deeb 2016). One of the main drawbacks associated with current field-screening methods is the inconsistency of resultsrelated to varying soil types and compositions.
10.3.2 Nature of PFAS SourcesThe nature of primary and secondary PFAS sources at a site will largely determine the extent of PFAS contamination at thesite. Multiple factors may contribute to the nature of PFAS sources at a site. Key factors related to secondary sources toconsider in development of a work plan include:
Page 141ITRC PFAS-1
Leaching from the vadose zone to the saturated zone: PFAS present in unsaturated soils are subject todownward leaching during precipitation or irrigation events that promote desorption of soil-bound contaminantmass (Sepulvado et al. 2011; Ahrens and Bundshuh 2014; Milinovic et al. 2015).Back-diffusion: PFAS dissolved in groundwater that accumulated in lower permeability silt/clay layers below thewater table may diffuse into the higher permeability zones due to changing relative concentrations (Section5.3.1).Desorption: PFAS resulting from desorption from solids in the vadose or saturated zones and resolubilizing inporewater or groundwater could occur when adsorption (that is, partitioning) is reversible (Milinovic et al. 2015);such desorption would have the effect of sustaining PFAS concentrations in porewater or groundwater.Nonaqueous phase liquids (NAPL) dissolution: PFAS entrained in NAPL in the subsurface may be associated withreleases of chlorinated solvents and/or petroleum hydrocarbons.Other sources: Given the widespread use of some PFAS, additional sources upgradient or within a plume may becontributing to PFAS concentrations at a site. Site-specific anthropogenic background may be a contributingfactor.Atmospheric deposition: PFAS are sometimes associated with stack or other air-emission sources and maycontribute to regional PFAS concentrations.Overland runoff: Runoff and stormwater conveyance systems can impact surface water locations downstream ofthe actual source or groundwater along the course of the conveyance system.Groundwater seepage into surface water or surface water seepage into groundwater: Groundwater elevationssurrounding surface water bodies (that is, gaining or losing) may influence the extent of a plume. Seepage ratesand directions may change seasonally, with extreme weather events, or during periods of drought orprecipitation.Suburface features, including utility lines: Preferential pathways may result from subsurface features. Forexample, flow may seep into or out of nonwatertight sewer lines based upon groundwater elevations relative tothe utility. The bedding material of a subsurface line may also convey groundwater.Multicomponent mixtures: At some sites, numerous PFAS compounds may be present in one or more sourcezones. Mixtures may be present for several reasons, including, but not limited to, the following: multiple sources,varying time frames, and a mixture of compounds introduced during production (Sections 5 and 10.5).Precursors: Delineating, as practicable, the extent of precursors that may degrade to PFSAs and PFCAs will helpthe investigator understand sources and potential long-term concentrations.
10.3.3 Extent of PFASAs with other consituents, a site investigation for PFAS relies upon understanding the extent of sources as well as the extentof contaminant transport. A PFAS release can be localized or highly extensive, both horizontally and vertically. PFAS may behighly mobile in groundwater. In addition, PFAS plumes may have had years to develop, as discussed above. Therefore, PFASplumes may be larger than expected. At some sites, plumes of more mobile, shorter chain PFAS have been observed to berelatively extensive due to limited attenuation and minimal retardation in groundwater. The partitioning behavior of PFAS isdiscussed in Section 5.2.
Depending upon site-specific conditions, several pathways need to be considered to assess potential upgradient sources.PFAS migration in air from industrial or commercial sources can influence soil or groundwater a great distance from largersources (Section 6.1) (for example, (Barton 2010) and (Shin et al. 2011)). Data from urban soils and groundwater indicatethat for sites near metropolitan areas, there may be measurable contributions of PFAS from other sources, unrelated to site-specific sources (Xiao et al. 2015).
Comingling of contaminants has a potential to impact PFAS extent. For example, for PFAS sites associated with industry, firetraining, or emergency response that have a chlorinated solvent or other NAPL source, investigators need to considerpotential effects on PFAS in the subsurface and related data collection requirements. Laboratory studies have demonstratedthat sorption or partitioning of perfluoroalkyl acids may increase in the presence of trichloroethene DNAPL in bench-scaletests (McKenzie et al. 2016). Conceptual modeling of published PFAS data suggests that NAPL-water partitioning and NAPL-water interface interactions may significantly increase retardation of some PFAS in source zones (Brusseau 2018). Thisresearch suggests that if PFAS and NAPL are present in media that make effective source treatment unlikely—for example,in low-permeability soils or fractured rock—that fraction will represent a long-term contributor to groundwater plumepersistence. At older sites where in situ (for example, oxidation) or pump and treat methods have been employed to reduceNAPL source areas prior to awareness of PFAS, those remedies may complicate characterization and distribution of PFAS.Depending upon the method employed, mobilization of PFAS may have increased (oxidative) or decreased (reductive)
Page 142ITRC PFAS-1
following treatment, and remedial actions may affect distribution and relative concentrations of individual PFAS (McKenzie etal. 2016; McGuire et al. 2014).
10.4 Data Analysis and InterpretationThere are a number of methods and tools available for characterizing a wide range of contaminated sites. Examples ofmethods and tools that may be relevant to PFAS sites are described below.
10.4.1 Retardation Coefficients and Travel TimeIt may be helpful to estimate retardation coefficients for PFAS compounds to evaluate contaminant-specific velocity andtravel time in groundwater, particularly for longer PFAS plumes. As discussed in Section 5.2.3, a linear sorption isotherm istypically assumed for PFAS sorption to organic matter in soil, and sorption coefficients. The Physical and Chemical PropertiesTable (Table 4-1) provided as a separate Excel file presents a range of available organic carbon partitioning coefficients forenvironmentally relevant PFAS.
However, as noted in Section 5.2, while common PFAS appear to be appropriately defined by linear sorption relative toorganic carbon concentration when sufficient organic carbon is present, the current state-of-science supports Koc beingreported in relatively broad ranges on a compound-specific basis. Section 4.2.9 presents a discussion of potential limitationsin using Koc values as a predictor of sorption and PFAS mobility. It is also important to note that other geochemical factors(for example, pH, presence of polyvalent cations, and electrostatic processes) may also impact PFAS sorption to solid phases(Section 5.2.3). Due to the uncertainty regarding Koc, it may be appropriate to evaluate transport of an individual PFAS usinga range of partitioning coefficients to account for uncertainties in this parameter. In addition, empirical estimation of site-specific Koc values in different areas of a site (for example, source zone versus downgradient plume) may be necessary ifquantification of the retardation coefficient is important to its characterization.
For example, McGuire et al. (2014) described the calculation of site-specific Koc values for various PFCAs and PFSAs at anAFFF-impacted site. These site-specific Koc values were calculated based on seven pairs of co-located groundwater and soilsamples, and fraction of organic carbon (foc) measurements at each sampling location. The soil samples were collected nearor at the water table, which was about 4.6–6.1 m below ground surface. McGuire et al. (2014) found that there was a rangeof between one and three orders of magnitude in site-specific Koc values for the PFAAs analyzed. This may reflect theenhanced sorption of PFAS that occurs at the NAPL-water or air-water interface (Brusseau 2018). There may be smallerranges in Koc values for PFAAs at greater depths below the water table and downgradient of a source zone (where NAPL isnot present). When using this type of site-specific Koc analysis method, it is also important that the groundwater samples berepresentative of conditions where the point soil samples are collected.
As another alternative to the use of Koc values and the assumption of a linear sorption isotherm, in situ or ex situ studies maybe used to develop parameters for simulation of PFAS transport. Such studies could allow development of pseudo-constantsto use in model simulations. For example, lysimeter studies were used to establish relative rates of transport of PFOA andshorter chained PFCAs, and PFSAs as compared with PFOS (Stahl et al. 2013).
Desorption of PFAS from solids in the vadose zone or below the water table could occur when partitioning is reversible; suchdesorption would have the effect of maintaining PFAS concentrations in porewater or groundwater. There is uncertaintyregarding the extent to which sorption is irreversible and rate-limited versus an equilibrium process (Section 5.2.3). It maybe important to characterize the extent and kinetics of desorption that may occur as a result of remedial activities at thesite.
10.4.2 Mass Flux/Mass DischargeNote that it may be challenging to estimate the relative mass flux contribution of multiple sources at some sites due to thelow PFAS concentrations present in groundwater. In addition, it is important to consider the potential for increases indissolved mass flux of some PFAS due to biotransformation reactions or desorption between transects.
ITRC (2010) presented a variety of methods available for estimating mass flux and mass discharge, including the use oftransects of temporary or permanent monitoring wells across the width of a plume. Even simple methods such as the use ofchemical isoconcentration figures to estimate mass discharge may be applicable for an initial order of magnitude estimate.Calibration of solute transport models is another method that may be used to estimate the mass discharge of PFAS from asource zone or at a point in a plume.
Page 143ITRC PFAS-1
10.4.3 Contributions from Different SourcesThe potential impact of multiple sources on a plume, particularly in proximity to urban or developed locations, needs to beaccounted for when assessing site data or identifying data gaps. Each source then needs to be assessed in terms of itsspecific contributions, and their relative importance or magnitude. Although there are no naturally occurring backgroundlevels of PFAS, it is critical to gain an understanding of the anthropogenic ambient or “background” concentrations that maybe present at a site, as these can have significant implications for site characterization, assessing exposures, evaluatingecological and human health risks, and establishing site action and cleanup levels. Tools available to quantify relevantcontributions from different types of sources are discussed below.
10.4.3.1 Atmospheric DepositionCertain PFAS may be present in ambient air and may be elevated near sources such as landfills, WWTPs, fire trainingfacilities, and manufacturing plants (Section 2.6). Many PFAS exhibit relatively low volatility; however, airborne transport ofsome PFAS can be a relevant migration pathway for some industrial releases. Sections 5.3.2 and 6.1 provide an overview oftransport of aerosols and particulates via air. To assess relative contributions from atmospheric sources, air sampling forPFAS compounds can be conducted. Additionally, air dispersion models, such as AERMOD or Industrial Source Complex(ISC3) Model, can be employed to estimate airborne PFAS concentrations and total wet and dry deposition rates atdesignated receptor locations. Examples where AERMOD could be beneficial during site characterization activities includesites with no obvious source area and sites in industrial areas with multiple potential sources of airborne PFAS. See Section2.6 for additional details on the most typical PFAS source scenarios.
10.4.3.2 Vadose Zone PercolationRecent research has illuminated the complexities of PFAS fate and transport in the vadose zone. PFAS surfactant propertiescan enhance or reduce PFAS sorption, in particular at high concentrations such as those encountered at release locations(Sections 5.2.2.2 and 5.2.3). At lower concentrations the air-water interface may have important implications for vadosezone transport (Section 5.2.4). Therefore, model simulations of PFAS transport in the vadose zone should be performed withappropriate caveats.
Models such as USEPA’s VLEACH and Seview’s Seasonal Soil (SESOIL) compartment model can simulate one-dimensionalvertical transport in the vadose zone via diffusion, adsorption, volatilization, biodegradation, cation exchange, and/orhydrolysis; however, these models do not include air-water interface interactions that may be important to the vadose zonemigration of PFAS and these models have not been validated for use with PFAS. For these reasons, these models may not beappropriate for use with PFAS at this time. Most PFAS are resistant to biotic or abiotic degradation, and in general PFAS arefar less volatile than many other contaminants. However, it is noted that certain PFAS are volatile, for example, the FTOHs(Section 4.2.3 and Table 4-1). With the exception of the few volatile PFAS, the most important vadose zone processes tomodel are the physical transport processes.
Analytical leaching methods such as Synthetic Precipitation Leaching Procedure (SPLP), USEPA Method 1312; ToxicityCharacteristic Leaching Procedure (TCLP), USEPA Method 1311; Leaching Environmental Assessment Framework (LEAF); andothers may provide insight into the leachability of PFAS from vadose zone materials. Care should be taken in selecting amethod to assess PFAS leachability that is appropriate for the settings and parameters that are present and considers theend use of the data.
Given the complexity of predicting the mass discharge from vadose soils to groundwater, along with modeling and leachingmethods, direct measures of mass discharge, including the use of soil lysimeters, may be considered.
10.4.3.3 Back-DiffusionWhen evaluating fate and transport of PFAS in a groundwater plume, including time frame for remediation of PFAS, matrixdiffusion may be an important process to consider (Section 5.3.1). As such, the potential impacts of diffusion on PFASpersistence in natural soils are a topic of ongoing research. Diffusion coefficients for PFAS are generally uncertain but are indevelopment using measurements and models (Pereira et al. 2014). During the characterization of PFAS plumes, it may bebeneficial to collect PFAS soil samples from the transmissive zone directly above a silt/clay layer, and at different depths intothe silt/clay layer, to evaluate the potential for back-diffusion to be occurring presently or in the future if there is a decline inPFAS concentrations in the transmissive zone (see Parker, Cherry, and Chapman (2004) and Chapman and Parker (2005) foran example of this sampling approach).
Page 144ITRC PFAS-1
10.4.3.4 Upgradient Site Contributions
Alternate Sources
Sources that may exist within, upgradient, or near a PFASplume under investigation, that come from releases of PFASseparate from the source being investigated.
PFAS persistence in the environment and their use in amultitude of industrial processes and commercialproducts result in potential for nonsite-related inputs,similar to other mobile contaminants (Figures 9-1, 9-2and 9-3). Assessment of site-specific background orupgradient site inputs is recommended. The very lowhealth advisory criteria for groundwater only increasethe potential importance of identifying what mightotherwise be considered “minor” upgradient sourcesand may result in alternate source identification(Sections 10.3.2 and 10.5). As part of site investigationof an air deposition release, soil data can be statisticallycompared to background samples, evaluated forvertical stratification, and assessed for spatialdistribution relative to the potential source.Groundwater data from the site may be compared todata from other locations using cluster analysis toassess whether there was evidence of other sourceterms, or if the site in question appeared to be the solesource.
10.4.4 Transformation Pathways and RatesAs discussed in Section 5.4, the transformation of precursors may result in increasing concentrations of PFAAs such as PFOSand PFOA along the flow path of a dissolved plume. Transformation reactions may occur due to aerobic biological orchemical oxidation. For example, McGuire et al. (2014) concluded that infusion of dissolved oxygen to bioremediatehydrocarbons downgradient of a former burn pit also likely caused the transformation of precursor compounds to PFAAs suchas PFHxS. Some methods that may be used to assess the degree to which transformation is affecting PFAS plume extent andstability include:
plotting concentration isopleths for precursors and various PFAAs (for example, McGuire et al. (2014)use of the total oxidizable precursor (TOP) assay to identify whether precursors are present that may beavailable for transformation to PFAAs at a point in the plume (Section 11.2.2)assessment of ratios of precursor and daughter product species at monitoring wells situated along the centerlineof a plume, or the ratio of various PFAAs in various portions of a plume. For example, McGuire et al. (2014)plotted an isopleth map for the ratio of PFHxS to PFOS to show that in areas where dissolved oxygen wasinjected this ratio was as high as 50, and in other areas where bioremediation was not conducted this ratio wasless than 1.use of concentration trends along a plume centerline and quantitative methods described in USEPA (1998) toestimate precursor transformation ratesgroundwater modeling to demonstrate that the relative plume lengths of different PFAAs with differentretardation coefficients can be explained only through the transformation of precursors (for example, McGuire etal. (2014))a literature review to identify potential precursor transformation mechanisms and evaluate whether sitegeochemistry and redox conditions are favorable for the occurrence of these mechanisms.
Another method that may be used to illustrate the occurrence of these transformations is radial diagrams. See the casestudy in Section 15.1.1.
Figure 10-1 shows three radial diagrams based on data from an AFFF release site (McGuire et al. 2014). Each radial diagramcompares groundwater concentrations at a monitoring well within the oxygen infusion zone to concentrations at a wellapproximately 76 m upgradient. The radial diagram shown at the left of Figure 10-1 compares concentrations for five PFCAsbetween these two wells; the middle diagram shows concentrations from the TOP assay conducted using samples from eachwell; and the radial diagram on the right compares concentrations for four PFSAs.
These radial diagrams illustrate that oxygen infusion into groundwater likely stimulated the production of mainly PFHxA,
Page 145ITRC PFAS-1
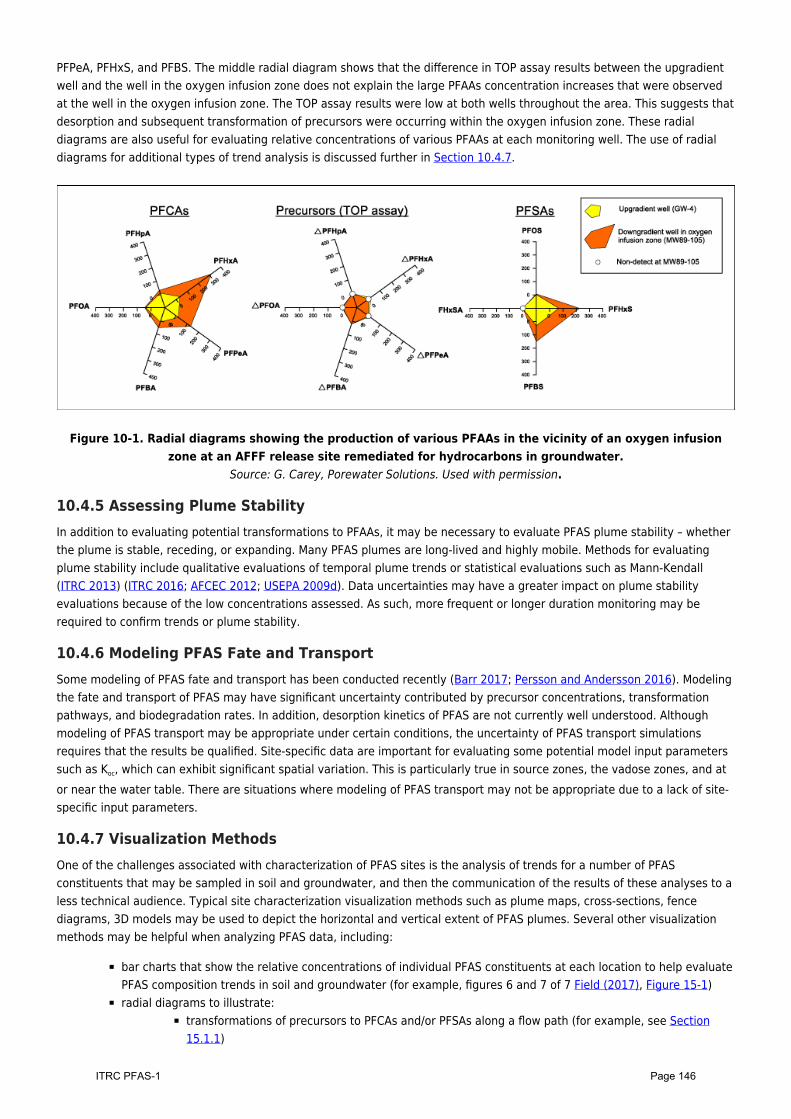
PFPeA, PFHxS, and PFBS. The middle radial diagram shows that the difference in TOP assay results between the upgradientwell and the well in the oxygen infusion zone does not explain the large PFAAs concentration increases that were observedat the well in the oxygen infusion zone. The TOP assay results were low at both wells throughout the area. This suggests thatdesorption and subsequent transformation of precursors were occurring within the oxygen infusion zone. These radialdiagrams are also useful for evaluating relative concentrations of various PFAAs at each monitoring well. The use of radialdiagrams for additional types of trend analysis is discussed further in Section 10.4.7.
Figure 10-1. Radial diagrams showing the production of various PFAAs in the vicinity of an oxygen infusionzone at an AFFF release site remediated for hydrocarbons in groundwater.
Source: G. Carey, Porewater Solutions. Used with permission.
10.4.5 Assessing Plume StabilityIn addition to evaluating potential transformations to PFAAs, it may be necessary to evaluate PFAS plume stability – whetherthe plume is stable, receding, or expanding. Many PFAS plumes are long-lived and highly mobile. Methods for evaluatingplume stability include qualitative evaluations of temporal plume trends or statistical evaluations such as Mann-Kendall(ITRC 2013) (ITRC 2016; AFCEC 2012; USEPA 2009d). Data uncertainties may have a greater impact on plume stabilityevaluations because of the low concentrations assessed. As such, more frequent or longer duration monitoring may berequired to confirm trends or plume stability.
10.4.6 Modeling PFAS Fate and TransportSome modeling of PFAS fate and transport has been conducted recently (Barr 2017; Persson and Andersson 2016). Modelingthe fate and transport of PFAS may have significant uncertainty contributed by precursor concentrations, transformationpathways, and biodegradation rates. In addition, desorption kinetics of PFAS are not currently well understood. Althoughmodeling of PFAS transport may be appropriate under certain conditions, the uncertainty of PFAS transport simulationsrequires that the results be qualified. Site-specific data are important for evaluating some potential model input parameterssuch as Koc, which can exhibit significant spatial variation. This is particularly true in source zones, the vadose zones, and ator near the water table. There are situations where modeling of PFAS transport may not be appropriate due to a lack of site-specific input parameters.
10.4.7 Visualization MethodsOne of the challenges associated with characterization of PFAS sites is the analysis of trends for a number of PFASconstituents that may be sampled in soil and groundwater, and then the communication of the results of these analyses to aless technical audience. Typical site characterization visualization methods such as plume maps, cross-sections, fencediagrams, 3D models may be used to depict the horizontal and vertical extent of PFAS plumes. Several other visualizationmethods may be helpful when analyzing PFAS data, including:
bar charts that show the relative concentrations of individual PFAS constituents at each location to help evaluatePFAS composition trends in soil and groundwater (for example, figures 6 and 7 of 7 Field (2017), Figure 15-1)radial diagrams to illustrate:
transformations of precursors to PFCAs and/or PFSAs along a flow path (for example, see Section15.1.1)
Page 146ITRC PFAS-1
relative concentrations of constituents at each sample location to assist with source fingerprintingand to identify potential risk drivers in different parts of a plumelocations of potential hot spotsgeneral extent of a PFAS plume.
Case study examples of these different methods are discussed in Section 15.1.
10.5 Source IdentificationSource identification is one of the challenges of PFAS investigations. Where records are available that document leaks, spills,and accidents, there may be a direct connection between sources and contaminant plumes. Where there are no documentedreleases, multiple lines of evidence may be needed for source identification. For example, due to the unique properties ofPFAS, it has been observed that soil and sediment concentrations do not always reflect the groundwater concentrations. Assuch, additional approaches for source identification may be needed to connect releases to contaminated media. Sourceidentification uses the evaluation of both typical and advanced chemical analyses to differentiate among contaminantsources and age-date release events. Advanced techniques can include:
chemical fingerprintingsignature chemicalsisotopic fingerprintingcontaminant transport modelsmolecular diagnostic ratiosradionuclide datingmicroscopic analysis.
Although these techniques have limitations and are relatively new in application to PFAS, some of these tools have beenused to identify regional and local PFAS sources. An overview of PFAS source identification analyses can be found inDorrance, Kellogg, and Love (2017).
Source identification of PFAS should include all information regarding release mechanisms, as well as fate and transportmechanisms, as they are complementary and can cause environmental fractionation, which can influence chemical profiles.In addition, long-range wind-driven transport and deposition of some PFAS could be considered (Ahrens, Rakovic, et al. 2016;Davis et al. 2007).
Multiple lines of evidence are needed for reliable source identification because of the complexity of PFAS composition andsource formulations, along with the potential for significant formation from precursors within a spill, which diminish thereliability of chemical fingerprinting. Additionally, information related to degradation expected based on case-specificconditions is needed for defensible chemical fingerprinting. With this being said, sources of PFAS could be deduced on acase-by-case basis, in particular when multiple independent lines of evidence are developed and as our knowledge relatedto fate and transport of different released commercial formulations improves. Library research, preliminary identification ofpotential PFAS sources, and information gathered from patents can assist in the identification of PFAS.
10.5.1 Source Identification ToolsChemical fingerprinting involves the evaluation of the relative proportions of different substances in a mixture to linkcontaminants in the environment back to a source or sources. The data from chemical analyses can be evaluated usingvarious graphical, statistical, or geospatial techniques. These methods have been commonly used for petroleum andchlorinated compound source identification and can potentially be applied to PFAS, because the release of PFAS into theenvironment generally involves the release of a complex mixture of substances, including different subclasses of PFAS, aswell as homologues and isomers of specific PFAS.
PFAAs are produced as a mixture of homologues of different chain lengths (Section 2.2). PFAAs produced by electrochemicalfluorination contain both even and odd chain-length homologues. PFAAs produced by fluorotelomers contain mostly evenchain-length homologues. Most commercial laboratories can report PFCA homologues ranging from C4 to C14 and selectPFSA homologues between C4 and C12. USEPA (2009a) published PFCA profiles in various commercial products that showeddifferent patterns of PFCA chain lengths. Chemical fingerprinting for source identification may be useful for PFAS sites;however, changes in raw materials and processes over time, as well as environmental fractionation, must be taken intoaccount.
Page 147ITRC PFAS-1
Examples of chemical fingerprinting for PFAS source identification can be found for wastewater treatment plants (Clara et al.2008), differentiating AFFF sources (KEMI 2015a; Hatton, Holton, and DiGuiseppi 2018) (Section 3), landfills (Lang et al.2017; Xiao et al. 2012), surface water (Xie, Wang, et al. 2013), sediment (Qi et al. 2016), and groundwater (Yao et al. 2014).Multivariate statistical analyses (that is, principal components analysis (PCA), cluster analysis, unmixing models) andgeospatial analysis have been used extensively to distinguish PFAS sources. Guelfo (2017) emphasized the importance ofgeospatial distribution of PFAS for source identification. Qi et al. (2016) used PCA–multiple linear regression, positive matrixfactorization, and unmix models to identify four PFAS sources (textile treatment, fluoropolymer processing aid/fluororesincoating, textile treatment/metal plating, and precious metals). Zhang et al. (2016) used PCA, hierarchical clustering, andgeospatial analysis to determine sources in the northeast United States, and Lu et al. (2017) used factor analysis to classifythree categories of PFAS in impacted groundwater. Pan, Ying, Liu, et al. (2014) used PCA in water and sediment samples todistinguish between rural/agricultural and urban/industrial sources.
Evaluation of isomer profiles has been used to assess sources in multiple environments. PFAAs are generally identified asthe straight-chain alkyl isomer. However, as discussed in Section 2.2, PFAA that are manufactured by electrochemicalfluorination contain about 20–30% branched-chain isomers, while the fluorotelomerization process produces mainly straight-chain isomers (Prevedouros et al. 2006; Kissa 2001; Parsons et al. 2008). Laboratories generally report the concentration ofa given PFAA as the total of the branched and linear forms; however, the concentration of the linear isomer and anestimated concentration for the branched isomers can be reported independently. The concentration of branched isomersmust be estimated because standards do not yet exist for most branched-chain PFAA isomers (Section 11.2.1).
Benskin (2011) used the absence of branched PFCA isomers in dated sediment cores of two lakes to support the conclusionthat oxidation of FTOH was the major atmospheric source of PFCAs in the lakes and not direct transport of PFOA. Fredriksson(2016) used isomer profiles along with homologue patterns to assess the sources of PFAS in avian eggs. The potential forenvironmental fractionation must be taken into account when evaluating isomer profiles because linear and branched-chainisomers have different physical and biological properties, adsorption, and bioaccumulation (Fredriksson 2016; Miralles-Marcoand Harrad 2015). Other examples of isomer analysis for PFAS source identification include Shi et al. (2015), Benskin,DeSilva, and Martin (2010), and Karrman et al. (2011).
PFAS releases into the environment can include fluorinated substances that are not captured by current analytical methodsand PFAS target analyte lists. Some of these substances are polyfluorinated and can be oxidized to form PFAAs that can bemeasured and reported. Such polyfluorinated substances are called “precursors.” The TOP assay, in which the samples arefirst oxidized and then analyzed for PFAAs, was developed to estimate the mass of these precursors. (See Section 11.2.2 forfurther information on the TOP assay). The results of PFAS analyses before and after oxidation can be used to generate atwo-dimensional PFAS comparison and may be able to support source identification.
In practice, the TOP assay has a number of limitations, and the results are subject to interpretation. Although there is apublished TOP procedure (Houtz and Sedlak 2012), each commercial laboratory has developed its own procedure and qualitycontrol steps, and these procedures have not been standardized, nor has interlaboratory validation been conducted.Comparability of TOP assay results between labs may not be possible and should proceed on a case-specific basis aftercareful review of the methods used and data validation. Another limitation is the potential for incomplete oxidation ofprecursors during the analysis in the presence of high levels of TOC or other compounds.
Quadrupole time-of-flight mass spectrometry (qTOF/MS) can be used to determine both the chemical formula and structureof unknown PFAS in a sample, but analytical standards are required for unequivocal structural identification (Newton et al.2017; Moschet et al. 2017) (Barzen-Hanson et al. 2017). This method has the potential to greatly increase the number ofidentified PFAS compounds and provide more accurate source identification.
Chiral fingerprinting through enantiospecific isomer differentiation is a potential method for source identification, althoughits use is still under development. Asher et al. (2012) applied this method to identify PFAS sources to an aquatic foodweb.However, they noted several limitations and assumptions when using this method for PFAS source identification.
10.5.2 Challenges and Reasonable ExpectationsFactors of importance when considering the analysis of source identification of PFAS can include:
data quality, where care must be taken to ensure that analytical results from different time periods, differentmethods, or different labs are comparable, as older data sets may provide incomplete information whencompared to more recent data
Page 148ITRC PFAS-1

target compound list, where a reduced compound list may prevent full differentiation between sources. Linearversus branched (isomer) distinction may also be important.temporal effect, where an understanding of historical production, use, and release of PFAS becomes important,as is an understanding of differences between samples due to weathering processes that may be interpreted asdifferent sourcesspatial effect of long-distance air deposition versus local sourcessample collection procedures to ensure there is no cross-contamination from other sources during samplingweight of evidence based on multiple lines of inquiry.
Updated April 14, 2020.
Page 149ITRC PFAS-1
11 Sampling and Analytical MethodsDue to the ubiquitous nature of the wide array of PFAS and the low parts per trillion screening levels, all aspects of asampling and analysis protocol require a heightened level of rigor to avoid cross-contamination and achieve the level ofaccuracy and precision required to support defensible project decisions. This section focuses on providing the user with theappropriate tools and information to develop a site-specific sampling and analysis program to satisfy the project data qualityobjectives (DQOs). Accurate, representative data supports the development of a defensible CSM, and ultimately the finalremedy.
Section Number Topic
11.1 Sampling
11.2 Analytical Methods and Techniques
11.3 Data Evaluation
Information on sample collection for PFAS is sparse, with only a handful of guidance documents available for a practitioner toreference. Further, as there are limited peer-reviewed studies (Denly et al. 2019) on the potential for cross-contaminationfrom commonly used sampling materials, most of these guidance documents default to a conservative approach inimplementing measures and controls for prevention of cross-contamination (for example, washing cotton shirts with nofabric softener prior to use in the field). Although the actual methods of sample collection are similar to those used for otherchemical compounds, there are several considerations for the practitioner when establishing a sampling program for PFAS.This includes selection of proper personal protective equipment (PPE), documentation of protocols for sample handling anddecontamination procedures, use of nonbiasing material (for example, tubing, sample bottles, pumps) that could come intocontact with the sample, and implementation of quality assurance/quality control (QA/QC) protocols to meet project DQOs,among other considerations. This section will give practitioners the tools needed to prepare a sampling program thatadequately addresses project-specific DQOs and limits, to the extent practicable, potential cross-contamination and sourcesof potential bias.
Additionally, analytical methods are still evolving for PFAS analysis with several in development. Currently, only two USEPAmethods are validated and published for the analysis of PFAS: USEPA Method 537.1(Shoemaker and Tettenhorst 2018),which replaced USEPA Method 537, Version 1.1 and USEPA Method 533 (USEPA 2019f). These methods are applicable only tofinished drinking waters. As a result, laboratories offering modified methods to analyze other media such as nonpotablewater, groundwater, soil, sediment, air, and biota in the absence of published methods. These modifications are notspecified in USEPA 537.1 or 533, resulting in variations from laboratory to laboratory and potentially inconsistent data.Because the quantification of PFAS within these media is key to completing a full site characterization, there is a demand forpublished methods that can accommodate the unique characteristics of each of these matrices and the changing complexityof the PFAS chemistry (our understanding of which continues to evolve). This section provides the essential PFAS-specificelements to understand and implement an analytical program using the USEPA 537.1 and 533 methodologies and toucheson the various other qualitative techniques and procedures available to practitioners to meet DQOs and support thedevelopment of a defensible CSM.
This section will be updated as new information on sampling considerations and analytical methods/procedures becomesavailable.
11.1 Sampling
11.1.1 GeneralSampling conducted to determine PFAS concentrations in water, soil, sediment, air, biota, and other media is similar to thatfor other chemical compounds, but with several additional specific considerations and protocols. Typical guidance andprocedures, such as ASTM International D 4823-95 and D 4448-01, USEPA compendium EPA 540/P-87/001a and OSWER
Page 150ITRC PFAS-1
9355.0-14, USEPA SESDPROC-513-R2, and USEPA SESDPROC-305-R3, remain the basis for a PFAS sampling protocol.Examples of special considerations for PFAS sampling include the types of sampling equipment or materials used due to thewidespread uses for and products containing PFAS; field and equipment blanks above and beyond what is normally required;the need for low laboratory quantitation limits; low state and federal screening levels, and in some cases, cleanup criteria;potential for background sources of PFAS in the environment; and the need for additional decontamination measures.
Examples of program-specific PFAS sampling protocols include:
USEPA (2015b) Region 4, Science and Ecosystems Support Division, Athens, GA, Field Equipment Cleaning andDecontamination at the FEC, SESDPROC-206-R3, 2015Transport Canada (2017) Per- and Polyfluoroalkyl Substances (PFAS) Field Sampling GuidanceGovernment of Western Australia (2016) Interim Guideline on the Assessment and Management of Perfluoroalkyland Polyfluoroalkyl Substances (PFAS)USDOD EDQW (2017) Environmental Data Quality Workgroup, Bottle Selection and other SamplingConsiderations When Sampling for Per- and Poly-Fluoroalkyl Substances (PFAS)State guidance:
MA DEP (2018b) Massachusetts Department of Environmental Protection, Interim Guidance onSampling and Analysis for PFAS at Disposal Sites Regulated under the Massachusetts ContingencyPlan.Washington Department of Ecology (2016) Quality Assurance Project Plan; Statewide Survey of Per-and Poly-fluoroalkyl Substances in Washington State Rivers and Lakes.NH DES (2019b)New Hampshire Department of Environmental Services, Laboratory TestingGuidelines for Per- and Polyfluoroalkyl Substances (PFAS) at Waste Sites, 2019
A comprehensive project-specific quality assurance project plan (QAPP) should be created to address PFAS-specificconsiderations. If a QAPP is not created for a project, the sampling and quality assurance and quality control elementsoutlined in Section 11.1.6 should be included in site-specific work plans. If regulatory procedures, methods, or guidelines areinconsistent with the needs of a PFAS sampling program, the governing agency should be contacted directly to determine ifan exception can be made or an alternate approach is needed. A CSM should be completed as part of the QAPP, includinginformation on previous site uses, PFAS use/manufacturing/handling practices, other possible contaminants and their uses,and/or related remediation activities (for example, granular activated carbon (GAC), in situ treatments, or dig and haul) todetermine all possible source areas of PFAS. Because PFAS is not typically analyzed along with other parameters attraditional remediation sites, and analytical methods are only recently becoming standardized, previous or ongoingremediation of other contaminants of concern can add a layer of complexity to a site’s geochemistry and the fate andtransport of PFAS.
Although some sampling elements (for example, sample bottle, preservation, and hold times) relating to drinking watersampling are defined by USEPA 537.1 and 533, they do not provide all information that is needed to conduct a samplingevent for PFAS. Because USEPA methodologies are still evolving for all other media, there currently is no USEPA publishedinformation relating to media other than drinking water. As a result, consultants and laboratories have derived their ownrequirements and protocols for these media, so they have yet to be standardized. It is important that thelaboratory/consultant selected has demonstrated the quality assurances (for example, sample hold time/preservationstudies, proficiency testing, and laboratory accreditation) necessary to providing credible results from theirsampling/analysis requirements and protocols. The USEPA is currently working on guidance for sampling/analysis of PFAS innonpotable water and solids.
Communication with the laboratory before, during, and after sampling is conducted is critical in ensuring that project needsare met. If a sample is from an area known or suspected to be highly contaminated with PFAS, it is important that this iscommunicated to the laboratory. Chain of custody should indicate samples that potentially contain a high concentration ofPFAS. The laboratory should screen all samples to select the necessary sample preparation procedures and to avoidcontamination of their laboratory equipment and contamination of other field samples.
Any water used for field sample blanks (for example, field and decontamination blanks) should be supplied by the laboratoryperforming the analysis. The laboratory should provide documentation verifying that the supplied water is PFAS-free. “PFAS-free” is the project-defined concentration that associated blank concentrations must be below (for example, less than thedetection limit or less than half the limit of quantitation (LOQ)) to ensure an unacceptable bias is not introduced into thesampling and analysis processes. The QAPP should clearly state the project’s definition of PFAS-free. Review of the
Page 151ITRC PFAS-1
laboratory’s standard definition of “PFAS-free” upfront is necessary to ensure that it meets project needs and is a criticalstep in laboratory selection for a project. Documentation of verification of PFAS-free water used in sampling should berequired to be maintained for data validation purposes.
11.1.2 Equipment and SuppliesMany materials used in environmental sampling can potentially contain PFAS. There is limited published research orguidance on how certain materials used by field staff or in sampling equipment affect sample results (see (Denly et al.2019)). However, a conservative approach is recommended to exclude materials known to contain the PFAS that are thetarget of the analysis from a sampling regimen, and such an approach should be documented accordingly in the QAPP.Obtain and review all Safety Data Sheets (SDSs) before considering materials for use during PFAS sampling, as productmanufacturing formulations can change over time. If PFAS are listed on the SDS, it is recommended that piece ofequipment/supply not be utilized. Exclusion from the SDS does not necessarily mean the equipment/supply is notcontaminated with PFAS. PFAS could have been used not as a component of the equipment/supply, but as a material used inthe manufacturing process itself (for example, mist suppressant or mold coating). This can result in the equipment/supplymanufactured containing PFAS. If necessary, materials in question can be sampled and analyzed for PFAS, or thoroughdecontamination and collection of equipment blanks can provide sufficient quality assurances. Ultimately, a samplingprogram should produce defensible data, and the best way to protect the integrity of samples is to ensure they are notcompromised by contaminants originating from sampling equipment or otherwise.
Due to the ubiquitous nature of PFAS, sampling crews must review all materials and sampling protocols to avoidcontamination and possible adsorption issues. Materials that may come into contact with samples and therefore couldpotentially introduce bias include, but are not limited to:
Teflon, polytetrafluoroethylene (PTFE)waterproof coatings containing PFASfluorinated ethylene-propylene (FEP)ethylene tetrafluoroethylene (ETFE)low-density polyethylene (LDPE)polyvinylidene fluoride (PVDF)pipe thread compounds and tape.
A conservative PFAS sampling program may additionally restrict materials that are allowed on the sampling personnel or inthe staging area. A tiered approach is used for materials restrictions in that case, where the first tier would includerestrictions on the sampling materials that will come in direct contact with the sample media, and the second tier wouldinclude restrictions on what materials are allowed on sampling personnel or within the staging area.
Four guidance documents identify materials and equipment that can be used in PFAS-focused investigations, as well asmaterials that should be avoided because they are known or suspected to be potential sources of PFAS:
Bottle Selection and other Sampling Considerations When Sampling for Per- and Poly-Fluoroalkyl Substances(PFAS) (USDOD EDQW 2017)Interim Guideline on the Assessment and Management of Perfluoroalkyl and Polyfluoralkyl Substances (PFAS),Contaminated Sites Guidelines, (Government of Western Australia 2016)Wastewater PFAS Sampling Guidance, 5/2018 (Michigan Department of Environmental Quality 2018b)General PFAS Sampling Guidance, 10/2018 (Michigan Department of Environmental Quality 2018a)
Sometimes it is impossible or financially infeasible to eliminate materials that affect PFAS results in samples. For example,these materials might be needed at sites where hazards warrant the use of specific PPE such as Tyvek suits, where PFAS arethe secondary or co-contaminant and the primary contaminant requires specific materials for proper sampling, or where theopportunity to collect a sample occurs before a proper sampling program is developed. At PFAS sites where co-contaminantsare not a factor, the same PPE is required as at traditional sampling sites (a minimum of nitrile gloves and safety glasses).
11.1.3 Bottle Selection
Whole Sample Versus Aliquot
Because the concentration level of PFAS in aqueous samplesdetermines whether the whole sample or an aliquot is used in
Sample container recommendations are dependent onthe analytical method and should be supplied by thelaboratory and laboratory-verified to be PFAS-free, asdefined by the QAPP. USEPA 537.1 requires the use of
Page 152ITRC PFAS-1
the laboratory preparation, the sampler should collect anadditional volume of each sample in a separate container.Then the laboratory can screen the extra sample for highconcentrations without affecting the final sample result. Forsoil or sediment, obtaining a representative subsample in thelaboratory is critical, so the entire sample should behomogenized in the laboratory prior to subsampling.Coordinating with the laboratory is crucial to determine theappropriate sample container volumes for environmentalmedia other than drinking water.
250 mL polypropylene containers and caps/lids fordrinking water sampling; USEPA 533 also requirespolypropylene containers and caps/lids but the bottlecan be 100-250 mL. Currently, USEPA has not issuedguidance or analytical methods for any sample mediaother than drinking water, but nonpotable watermethods guidance is expected to be published in thenear future. Depending on the analytical method used orprogram (for example, state or DOD) requirements,polypropylene or high-density polyethylene (HDPE)bottles with unlined plastic caps are typically used(USDOD EDQW 2017).
Best practices in sample preparation must be used when selecting the size, volume, and representativeness of samples. Tominimize effects from analyte sorption on sample containers, the laboratory must analyze the entire sample, including thesample container rinsate (USEPA 537.1 and 533). The project screening or applicable regulatory levels and the expected orpotential concentration of the analytes are also relevant. If the sample is known to contain high concentrations (ppm range)of PFAS (for example, AFFF formulations), loss due to adsorption onto the sample container is negligible and therefore theentire sample does not need to be used.
11.1.4 Sample Preservation, Shipping, Storage, and Hold Times
USEPA 537.1 Requirements
Samples must be chemically preserved with TRIS(Trizma).Samples must be chilled during shipment and notexceed 10°C during the first 48 hours aftercollection.When received by the laboratory, samples mustbe at or below 10°C and stored in the laboratoryat or below 6°C until extraction.Samples must be extracted within 14 days ofcollection.
USEPA 537.1 and 533 contain specific requirements fordrinking water sample preservation, shipping, storage,and holding times (Shoemaker and Tettenhorst 2018;USEPA 2019f). Currently, there is no USEPA guidance orrequirement for other sample media. The USEPA hasindicated that draft guidance covering nonpotable watersampling methods will be published in the near future.Until additional information is available, the thermalpreservation, shipping, storage, and holding timescontained in USEPA 537.1 and. 533 should be used for allother sample media except biota. Biota samples (forexample, vegetation, fish) should be frozen to limitmicrobial growth until sample preparation is performedat the laboratory. Microbial growth may result in PFAAsvalues biased high due to biodegradation of precursorcompounds; however, these effects have not been wellstudied. Note that the chemical preservation required byUSEPA Method 537.1, TRIS (Trizma), and USEPA Method533, ammonium acetate, is added for buffering and freechlorine removal and is applicable to drinking watersamples only.
11.1.5 Decontamination ProceduresSampling equipment should be thoroughly decontaminated before mobilization to each investigation area and betweensample locations at each investigation area or as required in the site-specific QAPP. Field sampling equipment, includingoil/water interface meters, water level indicators, nondisposable bailers, and other nondedicated equipment used at eachsample location requires cleaning between uses. The SDSs of detergents or soaps used in decontamination proceduresshould be reviewed to ensure fluorosurfactants are not listed as ingredients. Use laboratory-verified PFAS-free water for thefinal rinse during decontamination of sampling equipment. Decontaminate larger equipment (for example, drill rigs and largedownhole drilling and sampling equipment) with potable water using a high-pressure washer or steam. To the extentpractical, rinse parts of equipment coming in direct contact with samples with PFAS-free water. Heavy equipment is bestcleaned within a decontamination facility or other means of containment (for example, a bermed, lined pad and sump, or aportable, self-contained decontamination booth). Potable water sources should be analyzed in advance for PFAS, as well asduring the sampling event. Wherever possible, rinse equipment with PFAS-free water immediately before use.
Page 153ITRC PFAS-1
An example decontamination procedure is as follows.
Equipment caked with drill cuttings, soil, or other material will initially be scraped or brushed. The scrapings willbe sampled, containerized, and appropriately disposed.Equipment will then be sprayed with potable water using a high-pressure washer.Washed equipment will then be rinsed with PFAS-free water.Decontaminated downhole equipment (for example, drill pipe, drive casing, bits, tools, bailers, etc.) will beplaced on clean plastic sheeting (PFAS-free) to prevent contact with contaminated soil and allowed to air dry. Ifequipment is not used immediately, it will be covered or wrapped in plastic sheeting to minimize airbornecontamination.Field sampling equipment and other downhole equipment used multiple times at each sample location willrequire cleaning between uses utilizing a four-stage decontamination process. The equipment will first be rinsedin a bucket containing a mixture of potable water and PFAS-free soap. The equipment will then be rinsed in eachof two buckets of clean potable water. Water used for the final rinse during decontamination of samplingequipment will be laboratory-verified PFAS-free water.
Decontamination solutions should be replenished between sampling locations as needed. Spent decontamination fluidsshould be containerized, properly labeled, and appropriately disposed of according to the investigation-derived waste (IDW)plans addressed in the site-specific QAPP. Heavy machinery or motors should be inspected daily for leaks or problems thatmay result in an inadvertent release at an investigation area.
11.1.6 Field QC SamplesField QC samples are a means of assessing quality from the point of collection. Such field QC samples typically include fieldreagent blanks, source blanks, equipment rinse blanks, and sample duplicates. Collection and analysis of field QC samplesare important for PFAS investigations because of very low detection limits and regulatory criteria (ppt), to ensure accuracyand representativeness of the results to the sampled media, and to assess potential cross-contamination due to theubiquitous nature of PFAS. A sampling program should be designed to prevent cross-contamination and anthropogenicinfluence. However, the widespread commercial use (historical and current) of PFAS-containing products, and especially theirprevalence in commonly used sampling materials and PPE, should inform the sampling program. PFAS sites may also have awide range of concentrations with varying families of PFAS, as well as co-contaminants. Furthermore, PFAS sites have thepotential to be high profile in nature. Therefore, a comprehensive site-specific QAPP addressing DQOs and field QC samples,including frequency, criteria, and procedures, is vital to a PFAS sampling program (see also Section 11.3, Data Evaluation).
When planning QA/QC sample frequency, the risk of cross-contamination should be considered. Cross-contamination canoccur from several sources, including field conditions, ineffective decontamination, incidental contact with PFAS-containingmaterials, and sampling equipment and materials that were manufactured alongside PFAS-containing equipment.
USEPA 537.1 and 533 contain specific requirements for the field QC samples that must accompany drinking water samplesto be analyzed for PFAS. These include a minimum of one field reagent blank for each set of samples per site and and fieldduplicates. USEPA specifies the frequency of the field duplicate in terms of extraction batch (one per extraction batch, not toexceed 20 field samples), not collection frequency. Although USEPA methods are not yet available, media other thandrinking water also warrant field QC samples, with discussion and rationale provided in the following sections. Table 11-1provides a list of field QC samples typical to these methods and their typical minimum frequency. Once field QC sample dataare obtained, they should be evaluated against the field samples by a person knowledgeable on the DQOs set forth in thesite-specific QAPP. For laboratory QC considerations, see Section 11.2, Analytical Methods/Techniques.
Table 11-1. Typical field QC samples
QC Sample DescriptionMinimum SuggestedFrequency
Field reagent blank (fieldblank)
Laboratory-provided reagent water containingpreservative (if required) that, in the field, is pouredinto an empty sample bottle
One per day per matrix per sampleset
Source water blankWater collected from potable water source that isutilized during the sampling processes (such asdecontamination and drilling processes)
One per site, preferably prior tosampling event (if possible) and atleast once during sampling event
Page 154ITRC PFAS-1
QC Sample DescriptionMinimum SuggestedFrequency
Equipment rinse blank(decontamination blank)
Final rinse of nondedicated sampling equipment withlaboratory-verified PFAS-free water
One per day per type of samplingequipment used for each day ofsampling and each matrix sampled
Field duplicateTwo samples collected at the same time and locationunder identical circumstances
One per day per matrix up to 20samples
Performance evaluation (PE)sample
A sample containing known concentrations of projectanalytes
One per project per matrix
11.1.6.1 Field Reagent BlankA field reagent blank (FRB), described in the USEPA 537.1 and 533 for collection of drinking water samples, consists of asample bottle filled with reagent water and preservatives (same as those used for the samples) in the laboratory, sealed,and shipped to the sampling site along with the sample bottles. An empty sample bottle is also shipped along with each FRBinto which the sampler pours the preserved reagent water and seals and labels the bottle for shipment along with thesamples back to the laboratory for analysis. This ensures that PFAS were not introduced into the samples during samplecollection/handling. A laboratory reagent blank is also analyzed in a laboratory setting to ensure the reagent water meetsUSEPA 537.1 and 533.
Field blanks may also be warranted during collection of sampling media other than finished drinking water. In lieu of using aprepared quantity of laboratory reagent water/preservative solution as for drinking water FRB, a field blank can be preparedin the field using laboratory-verified PFAS-free water (may be equivalent to the laboratory reagent water) and filling anempty sample container in the field, which is then sealed and labeled as a field blank. This sample will be analyzed in thesame manner as the normal samples and can indicate whether or not PFAS were introduced during samplecollection/handling, and help to account for additional factors, such as introduction of contaminated air particulate.
As discussed above, the frequency of FRB samples for finished drinking water sampling is one FRB for every sample set ateach site. A sample set is described in USEPA 537.1 and 533 as “samples collected from the same sample site and at thesame time” (Shoemaker and Tettenhorst 2018; USEPA 2019f).
11.1.6.2 Source Water BlankLarge quantities of water may be necessary to carry out a field sampling program for various reasons, includingdecontamination and certain drilling techniques (Section 11.1.5, Decontamination Procedures). For equipment that maycome into contact with samples of any media type, a multistep process is common to adequately prevent cross-contamination. Quantities of laboratory-verified PFAS-free water are generally limited and can be costly. Therefore, potablewater sources are typically used in initial decontamination steps. It is imperative that these water sources be sampled andanalyzed the same as normal samples prior to and even during a PFAS sampling program to ensure that source water is notcontributing to PFAS detections in normal samples.
Collect a sample from the source the same way it is collected for use (for example, if the source water is collected through ahose, collect the source water blank from that same hose). If there are unnecessary fittings or hoses attached for collectionof the source water, consider removing them for the duration of the sampling program to avoid contamination of PFAS thatmay be present in their materials.
Frequency of collection of source water blanks is up to the professional judgment of the project manager, site owner, andother stakeholders. The source water should be sampled at least once prior to starting the field sampling program and onceduring the sampling event in case the analysis reveals that a different water source must be found. A more conservativesampling program may include provisions for additional periodic sampling and/or in cases where the conditions of the sourcewater change.
11.1.6.3 Equipment Rinse Blank
Equipment Rinse Blanks (ERBs)
ERBs can be collected from equipment or supplies prior to the
Field equipment rinse blanks (ERBs) are those collectedby rinsing a piece of field sampling equipment/supplieswith laboratory-verified PFAS-free water and collecting
Page 155ITRC PFAS-1
sampling event in cases where PFAS content is unknown orsuspected or to verify the cleanliness of nondedicatedequipment/supplies (Section 11.1.2).
the rinse water in a sample container for PFAS analysis.ERB collection is not required by the USEPA 537.1 or 533and is dependent on the sampling media and methodsthat are employed at a site. Generally, any equipmentthat is reused throughout the sampling program, ornondedicated, and must be decontaminated, shouldhave an ERB collected from it. That is, if a piece ofequipment is decontaminated, an ERB should becollected from it prior to its next use. Collection of ERBscan be avoided by using all dedicated or disposableequipment where possible. However, many of theseoptions are limited due to the ubiquitous nature of PFAScompounds in many of these equipment materials.
Field ERB collection frequency is largely up to the professional judgment of the project manager or other stakeholders and isdependent on the sampling media and methods. For instance, ERBs collected from decontaminated soil sampling trowelsmay only warrant a frequency of once per day, whereas ERBs collected from groundwater pumps may warrant an ERB priorto being deployed down each well due to their more rigorous decontamination procedure and higher contact time with thegroundwater being sampled.
11.1.6.4 Field DuplicateField duplicate (FD) samples are two samples collected at the same time and location under identical circumstances andtreated exactly the same throughout field and laboratory procedures. Analysis from these identical samples helps evaluatethe precision of sample collection, preservation, storage, and laboratory methods.
USEPA 537.1 and 533 do not specify the frequency of FD collection for finished drinking water samples; however, they dospecify the frequency of preparation (once per extraction batch, not to exceed 20 field samples). A more conservativesampling program may indicate a frequency of one FD per 10 field samples. FD collection frequency should be discussedwith stakeholders as necessary and be evaluated as part of the comprehensive site-specific QAPP.
11.1.6.5 Performance Evaluation SampleA PE sample contains project analytes with known concentrations of PFAS. This sample can be submitted to the laboratory asa single- or double-blind sample. Analysis from this sample provides a positive control from a second source.
11.1.6.6 Additional QA/QC SamplesQuality assurance replicate samples are defined here as co-located samples, taken at the same time and each sent to adifferent laboratory. These types of samples may not be required in all sampling events. Aqueous QA samples should not besplit into two samples from the original container. Analysis from these QA samples provides a measure of interlaboratoryvariability.
Trip spike samples are laboratory-spiked matrices that are included in the sampling kit sent to the field. These are used toevaluate desorption efficacy of the analytical extraction.
11.1.7 Sampling ProcedureStandard sampling procedures can be used at most PFAS sites. However, there may be some exceptions and additionalconsiderations related to PFAS behavior and issues associated with potential use of PFAS-containing or -adsorbing samplingequipment and supplies, as previously discussed. A site-specific QAPP should contain the standard operating proceduresincorporating these considerations and client requirements. Refer to Section 11.1.2 for materials to avoid during samplingand drilling. Consult the supplier to determine if PFAS-free options are available.
Pretesting any equipment or supplies to be utilized is recommended. The analysis of field reagent blanks may also provideuseful information for equipment that cannot be pretested. ERBs are recommended to ensure supplies such as bailers,beakers, and dippers are PFAS-free and that decontamination is effective.
11.1.7.1 Drinking Water/Non-Drinking Water SuppliesSampling a “potable water source,” as defined by the USEPA SDWA (Section 1401(4), August 1998), is conducted according
Page 156ITRC PFAS-1
to protocol established in the USEPA Methods 537.1 and 533. This protocol defines sample bottle preparation, samplecollection, field reagent blanks, sample shipment and storage, and sample and extraction holding times. The drinking watersource is further defined here as a public drinking water supply, as opposed to a private drinking water supply, as it appliesto the USEPA 537.1 and 533. The following summarizes the sampling considerations described in this protocol:
For Method 537.1: Sample bottle is a laboratory-provided 250-mL polypropylene bottle fitted with apolypropylene screw cap. For finished (treated) drinking water sampling only, a preservation agent is providedinside each bottle prior to sample collection. This agent acts as a buffer (TRIS pH 7, 5 g/L) and removes freechlorine from chlorine-treated drinking water supplies.For Method 533: Sample bottle is a laboratory-provided 100-250-mL polypropylene bottle fitted with apolypropylene screw cap. For finished (treated) drinking water sampling only, a preservation agent is providedinside each bottle prior to sample collection. This agent acts as a buffer (ammonium acetate, 1 g/L) and removesfree chlorine from chlorine-treated drinking water supplies.The sample handler must avoid PFAS contamination during sampling by thoroughly washing their hands andwearing nitrile gloves.Open the tap and flush the water (approximately 3–5 minutes) to obtain a “fresh” sample. Collect the samplewhile water is flowing, taking care not to flush out preservative. Samples do not need to be headspace-free. Capthe bottle and, if applicable, shake to completely dissolve preservative.Keep sample sealed and place sample on ice for shipment.Samples must be chilled during shipment and must not exceed 10°C during shipment.Laboratory extraction of the sample must take place within 14 days hold time.
Based on a review of industry experience and guidance, additional considerations for collecting drinking water samples forPFAS analysis are as follows.
Ideally, the sample should be collected from a tap or spigot located at or near the well head or pump house andbefore the water supply is introduced into any storage tanks or treatment units. If the sample must be collectedat a point in the water line beyond a tank, a sufficient volume of water should be purged to provide a completeexchange of fresh water into the tank and the tap or spigot. If the sample is collected from a tap or spigotlocated just before a storage tank, spigots located downstream of the tank should be turned on to prevent anybackflow from the tank to the tap or spigot. Several spigots may be opened to provide for a rapid exchange ofwater.The sample port for a private water supply well will be opened and allowed to flush for at least 15 minutes, whenpossible. When sampling from a drinking water well that is not in regular use, purge water until water qualityparameters (that is, pH, specific conductance, dissolved oxygen, oxidation-reduction potential, turbidity, andtemperature) have stabilized, to ensure formation water (as opposed to stagnant well column water) will besampled. An adequate purge is achieved when the pH and specific conductance of the potable water havestabilized (for example, within 10% across three consecutive measurements) and the turbidity has eitherstabilized or is below 10 nephelometric turbidity units. Note: According to USEPA (2013d), pg. 21 “[a] well withan intermittently run pump should, in all respects, be treated like a well without a pump. In these cases,parameters are measured and the well is sampled from the pump discharge after parameter conditions havebeen met. Generally, under these conditions, 15 to 30 minutes will be adequate.”When sampling from a tap, the tap must be protected from exterior contamination associated with being tooclose to a sink bottom or to the ground. Contaminated water or soil from the faucet exterior may enter the bottleduring the collection procedure because it is difficult to place a bottle under a low tap without grazing the neckinterior against the outside faucet surface. If the tap is obstructed in such a way that prevents direct collectioninto the appropriate sample container, it is acceptable to use a smaller container to transfer sample to a largercontainer. The smaller container should be made of HDPE or polypropylene and should be either new ordecontaminated as specified in Section 11.1.5. Evaluation of the transfer container is recommended to ensurethat it does not introduce a bias.When filling any sample container, care should be taken that splashing drops of water from the ground or sink donot enter either the bottle or cap.Leaking taps that allow water to discharge from around the valve stem handle and down the outside of thefaucet, or taps in which water tends to run up on the outside of the lip, are to be avoided as sampling locations.Disconnect any hoses, filters, or aerators attached to the tap before sampling. These devices can harbor abacterial population if they are not routinely cleaned or replaced when worn or cracked, and may contain PFAS.
Page 157ITRC PFAS-1
Taps where the water flow is not constant should be avoided because temporary fluctuation in line pressure may causeclumps of microbial growth that are lodged in a pipe section or faucet connection to break loose. A smooth flowing waterstream at moderate pressure without splashing should be used. The sample should be collected without changing the waterflow.
11.1.7.2 GroundwaterGroundwater PFAS sampling protocols are the same as those for drinking water sampling as discussed above with thefollowing exceptions and/or additional considerations.
Nonpotable water does not require a chemical preservative. Clean laboratory-provided HDPE or polypropylenebottles are recommended; typically 125 mL to 1L are used.Groundwater is typically sampled from a well, and therefore additional equipment is required. Purging andsampling equipment is constructed from a variety of materials. As a result, there are more opportunities forcontamination of the sample due to the sampling equipment. For example, pumps, bailers, and stopcocks cancontain O-rings and gaskets that may be Teflon, or another fluoropolymer, that can be changed out. The mostinert material (for example, stainless steel, silicone and HDPE), with respect to known or anticipatedcontaminants in the well(s), should be used whenever possible. The various types of purging and samplingequipment available for groundwater sampling are described in ASTM International Standard Guide for SamplingGround-Water Monitoring Wells, D 4448-01 (ASTM 2007) or Compendium of Superfund Field Operations Methods(USEPA 1987).Do not use dedicated sampling equipment installed in existing wells prior to the PFAS investigation withoutidentifying all materials found within the equipment and reviewing their chemical properties to ensure they arePFAS free. Pumps can be a source of PFAS contamination due to internal components (for example, bladderpumps that contain Teflon components that can be switched out for HDPE). Consult with the equipment vendorto determine if they have PFAS-free alternatives. For circumstances that warrant, such as very deep wells orsites with co-contaminants, samples may be collected in duplicate with and without existing dedicatedequipment. If PFAS analyses show that the equipment does not impact results, the equipment may be kept andused long term. However, this determination is dependent upon project-specific requirements and should beallowed by a project manager only with full disclosure to all stakeholders. It may also be acceptable to simplycollect an ERB after fully decontaminating equipment containing PFAS components to confirm it does notcontribute to groundwater sample concentrations. A site-specific procedure should be outlined in the QAPP.In addition to equipment, ensure tubing and bailing twine are PFAS-free.Within the context of sample collection objectives outlined in a site-specific QAPP, the sample location in thewater column should consider the potential stratification of PFAS in solution and their tendency to accumulate atthe air/water interface. For more information on stratification, see Section 5.2.Do not filter the sample, as filtration may be a source for contamination (Ahrens L 2009; Arp and Goss 2009) orPFAS may be adsorbed to the filter. If filtration is absolutely necessary, it should be performed in the laboratory,using a validated procedure that includes steps to eliminate the bias that can occur due to sorption issues. As analternative, laboratory-validated procedures may include centrifuging the sample due to potential filter sorptionor contamination issues.
In cases where co-contaminants require use of PFAS materials, sampling events should be separated to avoid contaminationfrom these materials. The PFAS sampling event would be completed first, followed by the sampling event for the co-contaminants. In some cases, it may be acceptable to use the same equipment and concurrent sampling event.
11.1.7.3 Surface WaterSurface water PFAS sampling is conducted in accordance with the traditional methods such as those described in theUSEPA’s Compendium of Superfund Field Operations Methods (USEPA 1987) with the following exceptions and/or additionalconsiderations.
Within the context of sample collection objectives outlined in a site-specific QAPP, the sample location in thewater column should consider the potential stratification of PFAS in solution and their tendency to accumulate atthe air/water interface. For more information on stratification, see Section 5.2. If possible, the transfer containerwill be lowered sufficiently below the water surface but above the bottom sediments.Transfer containers, such as beakers or dippers, which may be attached to extension rods, should be used ifsample containers have preservatives. Sampling by direct sample container immersion is not recommended.
Page 158ITRC PFAS-1
11.1.7.4 PorewaterSimilar in many ways to sampling techniques and equipment used in groundwater sampling for PFAS, porewater purging andsampling involves a variety of materials. The various types of purging and sampling equipment available for porewatersampling are described in Pore Water Sampling Operating Procedure (USEPA 2013c). For PFAS sampling, peristaltic pumpswith silicon and HDPE tubing are typically used for porewater sample collection, along with push point samplers, porewaterobservation devices (PODs), or drive point piezometers. Push point samplers and drive point piezometers are made ofstainless steel, while PODs consist of slotted PVC pipe and silicon tubing. PODs and drive point piezometers are permanent,or dedicated, sample points typically installed and used for multiple sample events, whereas push point samplers are usedfor a temporary sampling location. Otherwise, the standard procedure for porewater purging and sampling using a peristalticpump, as described in the Compendium of Superfund Field Operations Methods (USEPA 1987), can be followed.
11.1.7.5 SedimentMost core and grab sampling devices are constructed of stainless steel. Some core samplers include an HDPE sleeveinserted in the core barrel to retain the sample. Ensure that materials that contact the media to be sampled do not havewater-resistant coatings that contain PFAS that are the target of the analysis. Additional PPE may be required for samplingpersonnel, such as waders and personal flotation devices. Ensure that materials that will potentially contact sampling mediado not consist of water-resistant coatings or other PFAS-containing materials or substances. Refer to Section 11.1.2 fortypical materials used during sampling and drilling.
11.1.7.6 Surface SoilFor surface soil sampling, refer to Sections 11.1.2 and 11.1.5 for equipment and supplies and decontamination procedures.No additional considerations are recommended for PFAS sampling of surface soil.
11.1.7.7 Subsurface SoilNo additional considerations are recommended for PFAS sampling of subsurface soil.
11.1.7.8 FishThe species of fish collected, as well as the portion of fish sampled (whole versus fillet), depends on the project goals (forexample, ecological risk or human health). Studies have shown that the majority of the PFAS in fish are stored in the organs,not the flesh (Martin et al. 2004) (Yamada et al. 2014). Communicating project objectives to the laboratory is important priorto fieldwork to determine the necessary quantity and quality of tissue, fish handling requirements, laboratory samplepreparation (including single fish or composite fish samples, and whole or fillet preparation), and packing and shippingrequirements. Fish or other biota samples should be wrapped in HDPE or polypropylene bags.
11.1.7.9 Air Emissions and Ambient AirCurrently, there are no multilaboratory-validated, published sampling methods for PFAS in air emissions (for example, fromthermal treatment in manufacturing plants or incinerators). In their absence, sampling and analysis have been performedusing modifications of existing USEPA methods. For example, stack testing has been performed in a few states (NewHampshire, New Jersey) using a modified USEPA Method 5 sampling train.
There are currently no USEPA Federal Reference Methods (FRM) or Toxic Organic Methods (TO series) available specificallyfor the measurement of PFAS compounds in ambient air. In their absence, some sampling and analysis of ambient air hasbeen perfomed using modified TO methods, such as TO-13A and TO-9. Both of these methods make use of high-volume airsamplers fitted with both a particulate filter glass fiber filter/quartz fiber filter (GFF/QFF) and sorbent cartridge for thecollection of particulate and gaseous phases, respectively. USEPA TO-13A specifies collection of air samples at a flow rate of
approximately 225 liters/minute, resulting in an air volume greater than 300 m3. The solid sorbent used consists of a“sandwich” of polyurethane foam (PUF) and XAD-2 (polymer of styrene divinyl benzene).
PFAS in ambient air have been measured using both active (with actual flow) and passive (gas diffusion) samplingtechniques. The majority of techniques have made use of solid sorbents such as PUF, XAD-2, and sorbent-impregnated PUF(SIP). (Finely ground XAD-4 resin is often the sorbent of choice for impregnating the PUF). Active samples also include aparticulate filter (glass or quartz fiber) ahead of the sorbent module. To optimize detection limits, high-volume air sampleshave been used most often.
Detetion limits of air and emissions methods can be greatly influenced by PFAS artifacts found in the neat filter, sorbent
Page 159ITRC PFAS-1
media, or components within the sampler itself. For example, use of Teflon gaskets in high-volume samplers is notrecommended. Field sampling programs must include collection of field blanks as a means of assessing PFAS artifactspresent in sampling media and potentially introduced during sample handling in the field. Other quality control measuresthat should be considered include collection of duplicate or co-located samples and the use of isotopically labeled PFAS. Thelatter compounds are typically applied/spiked by the laboratory into the sorbent media prior to field deployment. Thesecompounds serve to assess analyte (“native PFAS in air”) collection efficiency, breakthrough, and the accuracy of thecombined sample collection and analysis method on a sample-specific basis.
Passive samplers should also make use of mass-labeled PFAS as a sample-specific quality control measure to account fornative PFAS losses during each sampling event. Volatilization of labeled PFAS during the deployment period providessampling rates on a site-specific basis and accounts for both temperature and wind influences.
USEPA and European groups (Verein Deutscher Ingenieure [VDI], association of German engineers) are currently evaluatingand investigating which sampling methods might be, in principle, the most suitable to capture PFAS and resultingbyproducts in all fractions of the emissions (particles, moisture, gas phase). An important consideration is that fluorinatedpolymers are used in common sampling equipment, which may cause contamination of the samples. For the purposes ofPFAS determinations, this material must be replaced.
Stack Emissions
Stationary source, or stack, emissions of PFAS have been measured in North Carolina (NC DEQ 2019a) and New Hampshire(NH DES 2019a) from industrial facilities that synthesized (Chemours, NC) or conducted manufacturing utilizing (Saint-Gobain, NH) PFAS. These test programs confirmed that stack emissions from industrial facilities contribute to ground andsurface water contamination (NC DEQ 2019b). As in the case of ambient air measurements, no USEPA FRMs are availablespecifically for the measurement of PFAS from stationary sources. In these tests PFAS were measured using USEPA SW846Method 0010 (Modified EPA Method 5 Sampling Train) (USEPA 1986), a method designed for measurement of semivolatileorganic compounds.
PFAS can be partitioned in stack emissions into several different fractions due to the physical properties of these species. Atthe elevated temperatures typically encountered in stack emissions the vapor pressure can be sufficiently high that some ispresent in the gas phase. The lower molecular weight fluorotelomer alcohols (FTOHs) have lower boiling points and so mayprimarily be present as vapors. PFAS can adsorb to particulate matter, are highly water soluble, and can dissolve in waterdroplets if present in the stack. To measure these partitioned fractions, the stack effluent is sampled isokinetically (that is,the air enters the probe at the same velocity as it is moving in the stack, to accurately sample particles and droplets) andcaptured on a heated filter, an XAD-2 sorbent resin tube, and in water impingers. In some test programs a second XAD-2sorbent cartridge is included in the sample train to determine if breakthrough has occurred. The filter, sorbent cartridge, andwater impingers are recovered separately, and the sample train components are rinsed with a methanol/ammoniumhydroxide solution.
The four fractions (filter, sorbent, water, and rinse) are extracted as defined in SW846 Method 3542 (Extraction ofSemivolatile Analytes Collected Using SW-846 Test Method 0010) (USEPA 1996b) and analyzed by a modified version of
USEPA Method 537 (Shoemaker and Tettenhorst 2018)utilizing isotope dilution. The more volatile (boiling point < 100oC)PFAS can be sampled by modified USEPA Method 18 (Measurement of Gaseous Organic Compound Emissions by GasChromatography) (USEPA 2017f), in which the analytes are captured in chilled methanol impingers.
The USEPA Office of Research and Development has been evaluating alternate sampling and analysis approaches for PFASair emissions (USEPA 2019j). According to the USEPA’s Per- and Polyfluoroalkyl Substances (PFAS) Action Plan (2/19) (USEPA2019h), a method for sampling and analyzing PFAS in factory stack air emissions is anticipated in 2020. USEPA has beenparticipating in the testing at Saint-Gobain (NH) and Chemours (NC) by either evaluating alternate sampling methods orperforming independent analysis of the stack test samples. As stated in the Action Plan pg. 51, USEPA is “testing anddeveloping additional methods for possible refinement, including methods to quantify PFAS precursors; Total OrganicFluorine for a general PFAS detection method; and refinement of non-targeted high-resolution mass spectrometryapproaches for suspect screening and novel PFAS discovery.”
To date, test reports from ten stack tests conducted at Chemours have been published on the North Carolina Department ofEnvironmental Quality website (NC DEQ 2019a). One stack test report from the Saint-Gobain facility has been published onthe New Hampshire Department of Environmental Services website (NH DES 2019a). These test reports detail the sampling
Page 160ITRC PFAS-1
and analysis methodologies used thus far in measuring PFAS stack emissions.
11.1.7.10 Human Blood, Serum, TissueCurrently, there is no official or standard method for testing blood, serum, or tissue. Laboratories and the Centers forDisease Control and Prevention (CDC) are in the process of developing best methods. A procedure developed by the CDC’sNational Center for Environmental Health has been published (CDC 2016). There are also several laboratories advertisingthis capability; however, the analytical methods and modifications from validated environmental laboratory protocols will notbe consistent between these vendors. Human testing is outside the scope of this document; however reference points thatcould be used for comparison of whole blood or serum results to geometric mean serum levels generated from the U.S.population are included in the ATSDR ToxGuide for Perfluoroalkyls (ATSDR 2018c).
11.1.7.11 Potential High Concentration SamplesThe CSM or previous sampling may indicate areas of high concentrations of PFAS for which single-use, disposable equipmentis recommended. If single-use is not possible, take additional precautions such as implementing a greater frequency of ERBsand not reusing equipment to sample potentially low PFAS concentration samples. High concentration samples should besegregated during shipping to the laboratory.
Some projects may require the analysis of AFFF product that has been used at the site. All AFFF product samples must beconsidered high concentration samples. These samples should be segregated from other samples during sampling andshipping to avoid cross-contamination. Notify the laboratory in advance, if possible, to expect serial dilutions so thatpractical quantitation limits can be met for high concentration samples. High concentration samples should be clearlyidentified on the chain of custody that is shipped with the samples. When alerted to potential high concentration samples,the laboratory will complete an initial screen of the sample and proceed with a serial dilution of the sample as necessary.
11.1.7.12 Field Test KitsField test kits are available for PFAS but have not been fully evaluated. Although these kits cannot achieve low detectionlimits, they could be helpful in screening for potential high concentrations of PFAS in the field.
11.2 Analytical Methods/Techniques
11.2.1 Quantitative
11.2.1.1 GeneralAnalytical methods are still evolving for PFAS analysis. Currently, very few methods are multilaboratory-validated andpublished. Two multilaboratory-validated methods, USEPA 537.1 and USEPA Method 533 have been published for analysis offinished drinking water samples (Shoemaker and Tettenhorst 2018; USEPA 2019f).
Method 537.1 tests for 18 PFAS analytes (12 PFAAs and 6 polyfluorinated precursors, including GenX processchemicals). In this method surrogates are added prior to solid-phase extraction (SPE) to assess for analyte lossdue to sample preparation. Internal standards are added to the final sample extract to assess instrumentperformance.Method 533 tests for 25 PFAS analytes (16 PFAAs and 9 polyfluorinated precursors, including both Genx processchemicals and ADONA). In this method isotopically labeled analogues are added prior to SPE to function asisotope dilution standards. Isotope performance standards are added to the final sample extract to assessinstrument performance.
Other methods have been published for media other than finished drinking water. Lists of these methods by variouscategories are provided in external tables (Excel spreadsheet).
External Table 11-2–Published Method Basics. Provides information on basic principles of each method (mediatype, validation status, method type, sample container requirements, holding time, preservation requirements,and analytical instrument.External Table 11-3–Published Methods Specifics. Provides more details of the methods such as samplepreparation requirements, quantitation scheme, confirmation requirements, quantitation limits, and isomerprofile.External Table 11-4–Analyte Lists. The method analyte list for each of these methods varies.
Page 161ITRC PFAS-1
External Table 11-5–Draft Published Methods
Currently, the DOD’s Quality Systems Manual (QSM) for Environmental Laboratories, Version 5.3, Appendix B, table B-15(USDOD 2019) provides the most current and comprehensive set of quality standards for PFAS analysis. These performance-based standards outline specific quality processes for sample preparation, instrument calibration, and analysis when workingwith PFAS. The USDOD (2019), QSM Version 5.3, Appendix B, table B-15 criteria currently require isotope dilutionquantitation of PFAS. The isotope dilution method accounts for interferences caused by complex sample matrices and biasintroduced by sample preparation and instrument issues.
Significant improvements in the trace level analysis of PFAS in environmental and biological matrices can be attributed tothe availability of good chemical standards and their mass-labeled internal standards. There is a need for well-characterizedand high-purity branched isomeric standards for the accurate measurement of branched and linear PFAS isomers.Additionally, innovations and availability of instrumentation and laboratory supplies that help to eliminate backgroundcontamination are being sought. Such advances include the availability of polyetherketone (PEEK) tubing for solvent linesand use of an additional column to delay the contamination peaks due to impurities in solvents and system components.
Quantification of the branched isomers is often performed using the calibration curve of linear isomers and reported as thetotal isomers (both linear and branched). Branched isomers interact with adsorbent materials and analytical columnsdifferently than their linear counterparts, which can make analyses of these PFAS challenging, especially if there are nobranched stable isotopically labeled analog standards available.
11.2.1.2 Sample PreparationAlthough ASTM International provides analytical methods for waters (D7979) and soils (D7968), there are no USEPA-promulgated analytical methods for nondrinking water matrices. Each laboratory creates their own method, and thecustomer should review and confirm that the laboratory method will meet their needs. Care must be taken to preventsample contamination during preparation and extraction because the limits of quantitation and detection are 1,000 timesbelow (ppt) those for more routine analyses such as volatiles or semivolatile analysis (ppb). It is recommended that allsupplies be checked and confirmed as PFAS-free prior to sample preparation. Intermittent contamination can occur due tovendor or manufacturing changes.
For PFAS analysis, isotope dilution analysis (IDA) requires the use of extraction internal standards (EIS) consisting ofisotopically labeled analogs of the PFAS targets when available, to be added to the sample at a designated point in samplepreparation or analysis, depending on the sample matrix:
aqueous samples–added to field samples while in the original container prior to extractionsolid samples and biota–added after homogenization and subsampling, prior to addition of water or extractionsolvent to samplesserial dilution–added to high concentration samples after final dilution for serial dilution prepared samples
Ensuring a representative sample/subsample for analysis is critical. For aqueous samples the entire sample and rinsate ofthe sample container received by the laboratory must be extracted by SPE, to recover any PFAS that adhere to the samplecontainer. Sample filtration is not recommended for sample with high particulate content because retention of PFAS ontofilters has been noted. Centrifuging is often used to reduce sample particulates. Due to limitations in SPE cartridge capacity,samples containing high concentrations of PFAS (for example, AFFF formulations) may be prepared by serial dilution. Thesehigh concentration samples are the only instance when adsorption onto the sample container is not an issue. The laboratoryshould prescreen aqueous samples using the small volume sample that was received to determine if the sample containsPFAS at concentrations too high for SPE sample preparation and may be prepared using serial dilution techniques.
It is recommended that for soil samples, the entire sample collected be homogenized in the laboratory prior to subsampling.
Solids are typically extracted using solvent, with the resulting extract being further extracted using SPE.
Cleanup procedures (such as ENVI-Carb) should be used on extracts and all associated batch QC samples (for example,method blank and laboratory control samples) when matrix interferences (for example, bile salts, gasoline range organics)could be present. Cleanup procedures should always be utilized for preparation of soil, sediment, and biota. PFAS loss mayoccur when extracts are evaporated to dryness or at temperature higher than 60ºC. Care must be taken to avoid theseoutcomes.
QC samples should be performed in accordance with the QAPP. Common laboratory QC samples included in PFAS analysis
Page 162ITRC PFAS-1
are:
method blank–(one per prep batch of 20 field samples or fewer) PFAS are ubiquitous and found in manyanalytical instrument systems, reagents, containers, and common laboratory environments. The method blank isthe same media as associated field samples and undergoes the same sample preparation procedure as theassociated field samples. It is a vital indicator for the analysis.instrument blank–(minimum of one prior to start of daily analysis and after samples exceeding the quantitationrange) Instrument blanks must contain internal standards, as they are used to measure backgroundconcentrations resulting from instrumentation and supplies and sample carryover.sample duplicate –(minimum of one per preparation batch of 20 field samples or fewer) A solid or highconcentration sample that cannot undergo SPE is prepared and analyzed in duplicate in a single laboratory toensure the laboratory’s subsampling procedures are capable of achieving a known level of precision as definedin the QAPP.lab control spike (LCS)–(one per prep batch of 20 field samples) Must contain all of the project-specific PFAS inthe same media as associated field samples and is used to evaluate bias associated with sample preparation aswell as analytical processes.certified reference material (CRM)–(if available, one per prep batch of 20 field samples or fewer) Unlike LCSs,which contain no matrix interferences, CRMs can be of significant value when dealing with complex matricessuch as soil and tissue.matrix spike (MS) and MS duplicate (MSD)–(one pair per prep batch of 20 field samples or fewer) An MS/MSD QCpair is not needed if IDA can be used for all of the PFAS of interest because the EIS used account for theinfluence of matrix interferences. If such standards are not available for a PFAS of interest, an MS/MSD QC pairmay be warranted to assess the effects of matrix interference on that specific PFAS.
When IDA is performed or for samples with high concentrations of PFAS, it is recommended that in lieu of an MS and MSD, anLCS duplicate and sample duplicate be prepared. If samples are prepared using serial dilutions, the sample duplicate shouldbe prepared using a different aliquot from the same sample bottle to create a second set of serial dilutions.
11.2.1.3 Sample AnalysisInstrument Type–LC/MS/MS
Currently, the analytical detection method of choice for PFAS analysis is liquid chromatography-mass spectrometry-massspectrometry (LC/MS/MS), which is especially suited for analysis of ionic compounds, such as the PFSAs and PFCAs. Gaschromatography-mass spectrometry (GC/MS) can also be used for PFAS analysis, specifically the neutral and nonionicanalytes, such as the fluorotelomer alcohols (FTOHs), perfluoroalkane sulfonamides, and perfluoroalkane sulfonamidoethanols. At this time, LC/MS/MS analysis of PFAS is available, whereas GC/MS analysis has very limited commercialavailability for PFAS. LC/MS/MS operated in multiple reaction monitoring (MRM) mode offers a unique fragment ion that ismonitored and quantified from a complex matrix. MRM is performed by specifying the mass-to-charge ratio of the compoundof interest for fragmentation within the MS/MS. This is facilitated by specifying the parent mass of the compound of interestfor MS/MS fragmentation and then monitoring only for product ions. Ions arising from that fragmentation are monitored forby the MS/MS, which yields improved specificity and sensitivity.
Standards Preparation and Storage
Certified analytical standards are available from several manufacturers. Products may have variable purity and isomerprofiles, which may compromise the accuracy, precision, and reproducibility of data. Only certified standards of the highestpurity available, for example, American Chemical Society grade, can be used for accurate quantitation. Standards containinglinear and branched isomers are not commercially available for all applicable analytes. Currently, such standards areavailable only for PFOS, perfluorohexane sulfonic acid (PFHxS), 2-(N-methylperfluorooctanesulfonamido) acetic acid(NMeFOSAA), and 2-(N-ethylperfluorooctanesulfonamido) acetic acid (N-EtFOSAA). Technical grades that contain branchedand linear isomers are available for other PFAS, but these standards do not have the accuracy needed for quantitationpurposes. These standards may, however, be qualitatively useful for verifying which peaks represent the branched isomers.Stock standards of PFAS analytes, internal standards, and surrogate standards supplied in glass ampoules by themanufacturer are acceptable. Manufacturers of the certified analytical standards often provide laboratories storage and shelflife guidance for stock and working standards.
Steps to Help Eliminate Laboratory/Instrument Contamination (Verification of Supplies, Instrument Blanks,
Page 163ITRC PFAS-1
Isolator Columns)
Laboratory and instrument contamination is of particular concern for PFAS given that the limits of detection are in the partsper trillion (ppt) range. Additionally, nonpolymer PFAS may be found at trace levels as impurities in some polymer products(3M 1999). PFAS are found in commonly used laboratory items such as polytetrafluoroethylene products (PTFE), solventlines, aluminum foil, and methanol, which could lead to method interferences and elevated baselines in chromatograms ifnot checked. USEPA 537.1 recommends that all of the above items must be “less than 1/3 the MRL (minimum reportinglimit) for each method analyte under the conditions of analysis by analyzing laboratory reagent blanks.” (Shoemaker andTettenhorst 2018) pg. 7. USEPA 533 further specifies that the isotopically labeled analogues and isotope performancestandards meet this same requirement (USEPA 2019f), pg. 7. The liquid chromatograph can be fitted with an isolator columnto separate contamination arising from the solvent delivery system, which allows for quantitation at low detection limits.Guard columns should be used to protect analytical columns.
Ion Transition Selection (Recommended Transitions for Primary and Confirmation Ions, Including RatioCriteria)
Quantification by LC/MS/MS may be accomplished using a variety of techniques. For relatively simple matrices such asdrinking water, USEPA 537.1 quantifies analytes by comparing the product ion of one precursor ion and retention time insamples to calibration standards. For more complex matrices, additional product ions and their ion ratios can be used todistinguish analytes from matrix interference. In an MS/MS system, most analytes can be fractured into more than one ion.By monitoring the area of each ion and comparing the ratio of those area counts, a more definitive identification can bemade. This identification allows the analyst to distinguish true target analytes from false positives. This more detailedquantification is not required for drinking water matrices, but it is useful for more complex matrices. It is recommended thattwo ion transitions from parent to characteristic product ions be monitored and documented for each analyte, with theexception of PFBA and PFPeA. Ion transition ratio criteria should be determined based on information obtained from analysisof standards and used to detect potential bias in sample results. To avoid biasing results high due to known interferences forsome transitions, the following are recommended transitions as defined in DOD QSM (2019), Version 5.3, Appendix B, tableB-15 (USDOD 2019): PFOA: 413 → 369, PFOS: 499 → 80, PFHxS: 399 → 80, PFBS: 299 → 80, 4:2 FTS: 327 → 307, 6:2 FTS: 427→ 407, 8:2 FTS: 527 → 507, N-EtFOSAA: 584 → 419, and NMeFOSAA: 570 → 419.
Mass Calibration, Calibration Criteria, and Calibration Verification
Mass calibration should be performed at setup, after performing maintenance that is required to maintain instrumentsensitivity and stability performance, and as needed based on QC indicators, such as calibration verifications. Masscalibration should be performed according to the manufacturer’s instructions.
USEPA Methods 537.1 and 533 contain requirements for instrument calibration and calibration verification specific fordrinking waters. It is suggested that until other USEPA or ISO methods are published, these criteria should be used for allnonisotope dilution/internal standard analyses. The instrument should be calibrated at setup and as needed following initialcalibration verification (ICV) or continuing calibration verification (CCV) failure. The lowest calibration point should be aconcentration at or below the LOQ. A standard at the LOQ concentration should be analyzed at least daily to document theinstrument’s ability to accurately quantitate down to that concentration.
An ICV prepared from a source separate from the calibration standards should be analyzed after each initial calibration andbefore sample analyses are performed. The minimum frequency for ICV should be once after each initial calibration, prior tosample analyses. At a minimum, CCV should be done prior to sample analysis on days an ICV is not analyzed, after every 10field samples, and at the end of the analytical sequence. CCVs should rotate in concentration to cover the entire calibratedrange of the instrument. For example, as in USEPA 537.1, the calibration acceptance criteria for each analyte are that thelowest calibration point must be within 50–150% of its known value while the other calibration points must be within70–130% of true known values.
To account for biases resulting from preparation steps, isotope dilution should be used for quantitation. Isotope dilution is aquantitation technique that considers sample matrix effects on each individual PFAS quantitation in the most precise mannerpossible. This technique quantifies analytes of interest against isotopically labeled analogs of the analytes, which are addedto the sample both prior to and after sample preparation. Addition of EIS prior to preparation helps account for loss ofanalyte during the preparation process and for bias associated with the instrumentation. Calibration criteria for methodsusing isotope dilution can be found in ISO Method 25101 or DoD QSM Version 5.3, Appendix B, table B-15. Methods usingisotope dilution should include isotope analog recovery for each sample and analyte in data reports. Isotope analog
Page 164ITRC PFAS-1
recoveries should be reported, and minimum/maximum isotope analog recoveries may be required by specific analyticalprocedures. Depending on project DQOs, low isotope recovery may indicate that quantitation was inadequate; the data arethen reported as estimated values.
Instrument Blanks: When Are They Needed, Criteria, and Corrective Actions to Take
Due to the ubiquitous nature of PFAS, instrument blanks are critical in determining if the instrument is potentially affectingPFAS concentrations in samples. Instrument blanks should be analyzed following the highest calibration standard analyzedand daily prior to sample analysis. The concentration of each analyte should be ≤ ½ the LOQ. If instrument blanks indicatecontamination following the highest calibration standard, corrective action, such as calibrating with a lower concentration forthe highest standard, should be taken. Successful analysis of an instrument blank following the highest standard analyzeddetermines the highest concentration for which carryover does not occur.
Matrix-Specific Information
Drinking Water
Interferences related to the matrix can be caused by the co-extraction of contaminants from the sample. These matrixinterferences can have considerable variation from sample to sample. For example, there are problems associated with freechlorine in chlorinated finished waters and using TRIS (Trizma; for USEPA Method 537.1) or ammonium acetate (for USEPAMethod 533) can help overcome some of these issues.
Potential High Concentration Samples: Postspike Verification of Reporting Limit (RL) for Those Reported as<RL.
Samples with concentrations greater than the highest standard will require dilution. As a standard practice, extrapolationbeyond the established calibration is prohibited. The sample may be diluted and the appropriate amount of internal standardis added to match the original concentration. The dilution factor must be accounted for in the final concentrationcalculations.
Postspike verification is suggested for samples prepared by a dilution. Analytes that will have a concentration less than theLOQ in the final dilution should be spiked at the LOQ. Recovery information should be reported with the samples to provideinformation on the effects of the dilution on quantitation.
11.2.2 QualitativeSeveral techniques employing indirect measurement have been developed that more comprehensively assess the range ofPFAS contamination at a site. These qualitative techniques are not standardized through a published USEPA method andrange in commercial availability. To date, these techniques have not undergone multilaboratory validation. Data from thesequalitative techniques may augment the definitive data from quantitative methods.
11.2.2.1 Overview of Qualitative TechniquesBecause of the large number of PFAS and their varied structural characteristics, a single targeted method on eitherLC/MS/MS or GC-MS/MS is unable to quantify all PFAS that may be present in a sample. When the release source is wellunderstood and the types of PFAS present are both known and amenable to regular PFAS analysis methods (for example,LC/MS/MS of ionic PFAS or GC-MS/MS analysis of neutral PFAS), a targeted analytical approach may be sufficient toadequately characterize a release. For releases that are not well understood or consist of multiple sources, alternative waysof measuring PFAS in a more comprehensive but less targeted fashion may be desirable. Additionally, PFAS that are inpolymeric form, such as those used in coatings for paper and textiles, are not amenable to LC- and GC-based separationtechniques; they may also not be effectively extracted, even with rigorous methods.
Four primary techniques have been developed to characterize unknown PFAS in a sample. These techniques are notmultilaboratory, validated, or promulgated. They are described in more detail in the following sections:
The total oxidizable precursor (TOP) assay measures PFAA precursors or polyfluorinated compounds that can beconverted to PFAAs by LC/MS/MS.Particle-induced gamma-ray emission (PIGE) spectroscopy measures elemental fluorine isolated on a thinsurface.Adsorbable organic fluorine (AOF) paired with combustion ion chromatography (CIC) measures the combusted
Page 165ITRC PFAS-1
organofluorine content of a sample as fluoride on an ion chromatograph.High-resolution mass spectrometry techniques, such as quadrupole time-of-flight (qTOF) MS/MS, can tentativelyidentify PFAS structures through library matching or in-depth data analysis.
11.2.2.2 TOP AssayTechnique Description
The TOP assay (or TOPA) converts PFAA precursor compounds to PFAAs through an oxidative digestion. The increase inPFAAs measured after the TOP assay, relative to before, is an estimate of the total concentration of PFAA precursors presentin a sample, because not all PFAS present will be subject to quantitation or reaction and some will remain as undetectedPFAS. The PFAAs generated have perfluoroalkyl chain lengths equal to, or shorter than, the perfluoroalkyl chain lengthspresent in the precursors (Houtz et al. 2013; Houtz and Sedlak 2012; Weber et al. 2017; Dauchy et al. 2017).
The TOP assay is a technique developed to estimate oxidizable precursors that can transform to perfluoroalkyl acids (PFAAs)end products that are included in the target analyte list (Houtz et al. 2013; Houtz and Sedlak 2012). A sample is measuredusing conventional LC/MS/MS to determine baseline levels of PFAAs present in the sample. A separate aliquot of the sampleis then exposed to a highly basic persulfate solution and then placed in a sealed container at an elevated temperature (forexample, 85°C) to thermolyze persulfate into sulfate radical. At elevated pH, the sulfate radical is scavenged by hydroxideand forms hydroxyl radical, which then converts the free PFAA precursor compounds to PFAAs. The predominant products(that is, > 95% in control experiments) of the precursors are the perfluoroalkyl carboxylates, whether or not the precursorscontain sulfonamido or telomer functionalities. After sufficient time has elapsed to convert all the persulfate, the samples areremoved from the heated environment (for example, a water bath), brought to room temperature, and neutralized prior toanalysis. The additional concentration of PFAAs generated after the oxidation step estimates the concentration of oxidizablePFAA precursors.
The technique can be applied to aqueous (Houtz et al. 2013; Houtz and Sedlak 2012; Houtz et al. 2016; Weber et al. 2017;Dauchy et al. 2017) and solid samples (Houtz et al. 2013). In most cases, samples need to be pretreated prior to oxidation toremove competitive organic compounds. For aqueous samples, dilution may be sufficient, although extraction techniquesmay be used to further remove matrix effects. Soil samples are extracted prior to persulfate treatment, and the extracts arecleaned with ENVI-Carb prior to treating the evaporated extract. The specific extraction procedure used may impact whichPFAA precursors are retained for oxidation. For example, acidic extraction procedures may be required to remove cationicprecursor compounds from soils (Barzen-Hanson 2017; Mejia-Avendaño et al. 2017).
Possible Technique Uses
TOP assay may be used to estimate a total concentration of free PFAA precursors in a sample. When measuring strictly asample post-TOP assay, the total concentration of PFAS measured may be thought of as a conservative measurement of thesample’s total PFAS concentration. In some cases, oxidation can be incomplete (Australia Government DOD 2019). The totalPFAA precursor or total PFAS concentration is considered conservative for the reasons explained below in TechniqueLimitations. Because the method depends on a compound containing a perfluoroalkyl group, it is highly specific to PFAS. Thechain lengths of the PFAAs generated after oxidation provide an indication of whether the precursors are predominantlyshort- or long-chained, although the production of a particular Cn (where “n” signifies the number of carbons in the alkylchain) PFAA is not equivalent to the concentration of PFAA precursors containing the same chain length. However, ifsignificant amounts of PFOA are generated after oxidation, that is an indication that the sample contains a comparableconcentration of C8 or longer PFAA precursor compounds.
TOP assay, the most widely commercially available of the qualitative techniques, is typically accepted as a means ofdetermining PFAS load on remediation substances to estimate the replacement cycle, but not for site characterization.
Technique Limitations
As mentioned above, the TOP assay does not easily differentiate between precursors that contain telomer or sulfonamidefunctionalities, because all these precursors are chemically oxidized primarily to perfluoroalkyl carboxylates. This issignificant because a precursor that would likely form PFOS in the presence of a mixed consortium of aerobic bacteria willconvert to PFOA under the conditions of TOP assay. The production of branched perfluoroalkyl carboxylates could beattributed to precursors derived from an ECF-based manufacturing process, but environmental samples may not contain thesame distribution of branched and linear isomers as was originally generated from the ECF manufacturing process.
Page 166ITRC PFAS-1
TOP assay results in a mixture of PFCA products upon the conversion of fluorotelomer-based compounds (Houtz and Sedlak2012). For example, 8:2 FTS was converted to 3% PFNA, 21% PFOA, 27% PFHpA, 19% PFHxA, 12% PFPeA, and 11% PFBA incontrol experiments. Because of this effect, two limitations arise. First, the production of PFOA, for example, is notequivalent to the C8 precursor concentration, because PFOA can be generated from longer-chain telomer compounds and isonly a partial product of C8 telomer products. Second, some shorter chain PFCA products of telomer compounds are notcaptured. Only 73% of 6:2 FtS was recovered as PFCA products PFBA and longer in control experiments (Houtz and Sedlak2012). As a result, TOP assay may underquantify short-chain PFAA precursors that are telomer-based. Sulfonamidocompounds in control experiments do not exhibit a distribution of products; the Cn precursor forms the Cn PFCA in a 1:1molar ratio.
TOP assay has not been demonstrated on large molecular weight polymer compounds or newer ether-linked PFAS such asGenX process chemicals; it is unknown if the oxidative process would liberate PFAAs from these types of compounds.Because PFAS polymers have shown limited ability to biodegrade (Russell et al. 2008; Russell et al. 2010) (Washington et al.2009) relative to low molecular weight free PFAA precursor compounds (Wang, Szostek, Buck, et al. 2005; Lee, D’eon, andMabury 2010; Wang et al. 2011; Harding-Marjanovic et al. 2015), TOP assay may be similarly ineffective at converting PFASpolymers to free PFAAs. TOP assay cannot be used to measure large molecular weight polymeric PFAS unless they areproven to break down in the assay.
For many samples, TOP assay requires adjustments in dilution, sample preparation, or reagent dosing to achieve completeconversion of PFAA precursors. Standardized quality guidelines are needed to ensure that TOP assay data reflect fullconversion of PFAA precursors.
11.2.2.3 PIGEPIGE is a nondestructive analytical technique that takes advantage of the unique gamma-ray wavelength emission offluorine when impacted with a proton ion beam. The technique is not compound-specific but able to assess total fluorinecontent of a variety of materials isolated on a thin surface (0.22 mm) (Ritter et al. 2017). The sample is secured in theinstrument and bombarded ex vacuo under a 3.4 MeV beam with an intensity of 10 nA for approximately 180 s. Two gammarays characteristic of the decay of the 19F nucleus (110 keV and 197 keV) are measured and the responses integrated.Quantification is achieved with comparison to fluorine-based calibration standards.
In the published literature, PIGE has been used to demonstrate total organofluorine concentrations in papers and textiles(Ritter et al. 2017; Robel et al. 2017) and food packaging (Schaider et al. 2017). It has also been used on an experimentalbasis to evaluate organofluorine concentrations in extracted water and soils, but those results are not yet available in thepeer-reviewed literature.
Possible Technique Uses
PIGE is a rapid screening technique to measure fluorine on surfaces. If a sample does not contain significant amounts offluoride or can be prepared to remove inorganic fluoride, PIGE can become a technique specific for organofluorine; however,it is not specific for PFAS. It is a proven way to measure total fluorine in matrices containing high concentration of fluorinepolymeric material, which is a limitation of both TOP assay and AOF. It also requires relatively minimal sample preparation toanalyze fluorine content in commercial products. Sample preparation of environmental samples for PIGE analysis is likely torequire a similar level of sample preparation, along with the limitations of extraction techniques, as TOP assay or AOF.
Technique Limitations
Like AOF, PIGE is not specific to PFAS and, depending on the preparation, it is also not specific to organofluorine. Thepolymeric compounds that PIGE has been used to detect in consumer products may not contain perfluoroalkyl groups or becapable of breaking down to free PFAS.
PIGE also does not provide any differentiation on PFAS perfluoroalkyl chain length present in a sample. Depending on howthe sample is prepared prior to the instrumental analysis, samples may be biased toward measurement of long-chain PFAS,as with TOP assay and AOF.
Extraction methods for PFAS in environmental samples have not yet been demonstrated for this technique. When using SPEto extract environmental aqueous samples prior to PIGE analysis, cartridges that are suitable to hydrophobic and anionicPFAS may not retain positively charged PFAS of interest. For soil samples, the extraction method also determines the PFASlikely retained. However, by using targeted extraction techniques for PFAS in environmental samples, the method becomes
Page 167ITRC PFAS-1
much more specific for PFAS.
As with AOF, the range of operating conditions for PIGE has not been standardized and so far the technique has beendemonstrated with only one commercial lab.
11.2.2.4 Adsorbable Organic Fluorine or Combustion Ion ChromatographyAOF (Wagner et al. 2013) or extractable organofluorine (Miyake, Yamashita, So, et al. 2007; Miyake, Yamashita, Rostkowski,et al. 2007; Yeung et al. 2008) paired with CIC (AOF/CIC) are complimentary terms for an analysis for fluorine content ofenvironmental samples. In this application, an aqueous sample is passed through a carbon-based sorbent on which thefluorine-containing organics adhere. The carbon sorbent is then combusted at high temperatures that should completelydecompose the organics into their elemental constituents. The gaseous stream is passed through deionized water, which isthen analyzed for fluorine content (as fluoride) by ion chromatography.
The technique has been demonstrated on human blood samples (Miyake, Yamashita, So, et al. 2007; Yeung et al. 2008) andvarious environmental aqueous samples (Miyake, Yamashita, Rostkowski, et al. 2007; Wagner et al. 2013; Dauchy et al.2017; Willach, Brauch, and Lange 2016). Presumably, the method could be adapted to other types of matrices to measureorganofluorine in soils or biota. The matrices could be extracted for PFAS, resuspended into an aqueous solution that couldadhere to the activated carbon, and then analyzed with CIC. As with TOP assay, the specific extraction procedures wouldinfluence whether some or all PFAS are retained and ultimately measured as combusted fluoride product. Alternatively, it ispossible that the technique could be used without extraction to directly combust organofluorine-containing products.
Possible Technique Uses
AOF can be used to measure PFAS or other fluorine-containing compounds as a total organofluorine concentration. If themethod is available more readily or at a lower cost than LC/MS/MS measurement of PFAS, it can be a quick screening tool todetermine if a significant concentration of fluorine-containing compounds is present in an aqueous sample or other samplefrom which the organofluorine content can be extracted. A detection limit of 0.77 µg/L fluorine (13 µg/L PFOS equivalent)(Willach, Brauch, and Lange 2016). was reported for one laboratory offering the technique, although the detection limit willvary by amount of sample processed and laboratory conducting the procedure.
Technique Limitations
AOF is not specific to PFAS. If a sample contains relatively high concentrations of non-PFAS that contain fluorine (forexample, fluorine-containing pharmaceuticals), then the organofluorine may be falsely attributed to PFAS content and bias“total PFAS” concentrations high.
AOF does not provide any differentiation on PFAS perfluoroalkyl chain length present in a sample. Some short-chain PFASmay be unable to sorb to the activated carbon material that is combusted, but this will depend significantly on laboratory-specific procedures.
Extraction methods for PFAS in commercial products and solid samples coupled with this technique have not yet beendemonstrated for this technique. Background fluoride concentrations may be challenging to remove from some matrices andwould result in samples biased high for total organofluorine that was actually attributable to fluoride.
The range of operating conditions for AOF-CIC has not been standardized. In addition to the limitations mentioned above,some matrices may contain sufficient competitive organics or other materials that coat the activated carbon to preventcomplete retention of organofluorine compounds.
11.2.2.5 High-Resolution Mass Spectrometry (qTOF/Orbitrap)Technique Description
Quadrupole time-of-flight mass spectrometry (qTOF/MS) can be used to determine both the chemical formula and structureof unknown PFAS in a sample, but analytical standards are required for unequivocal structural identification.
High-resolution mass spectrometry has been used to tentatively identify the molecular formulas and structures of unknownPFAS (Newton et al. 2017; Moschet et al. 2017; Barzen-Hanson et al. 2017). Similar to targeted PFAS analysis, separationtechniques such as LC or GC are used to separate compounds in a sample so that individual PFAS can be resolved. The massis measured using a time-of-flight or other high-resolution detector, and molecular formula are proposed. If an MS-MStechnique is used, the fragments of the parent compound can be used to piece together the structural arrangement of the
Page 168ITRC PFAS-1
compound. To identify compounds that are specifically PFAS versus other organics present in the sample, compounds withnegative mass defects (that is, the accurate mass is slightly less than the nominal mass) can be selected. Fluorine is one ofthe few elements that has a negative mass defect, and the inclusion of multiple fluorines in a PFAS molecule means that netmass defect of the molecule will likely be negative. Compounds that are either 50 or 100 mass units apart also identifyhomologous series of PFAS separated by one or two CF2 groups. MS libraries of previously identified PFAS exist for targetedmatching, although they will not definitively identify an unknown compound.
Possible Technique Uses
High-resolution mass spectrometry analysis of PFAS can tentatively identify the structures of unknown PFAS and can also beused, in comparison with analytical standards of known compounds, to semiquantitatively estimate their concentrations.Because accurate identification of compounds using high-resolution MS is a time-intensive and expensive process, a highmotivation for knowing the exact PFAS structure, for instance in differentiating forensically between two different sources,may be the biggest driver of its use for PFAS analysis. High-resolution MS is best suited for media in which unknown PFASare likely to be present in significant concentrations. When many other non-PFAS compounds are present in the sample, theMS signal of competing compounds will likely obscure the signal of PFAS. Sample preparation steps can inadvertently orintentionally select for certain types of PFAS. As user skill and data interpretation time increase, accurate identification ofPFAS is likely to improve.
Technique Limitations
High-resolution mass spectrometry cannot definitively identify the exact structure or formulas of PFAS without comparison toreference materials or analytical standards.
Not all PFAS, even if present in a prepared sample, can or will ionize under the conditions to which the instrument is tuned. Askilled instrument operator may be able to adjust the instrument conditions to match the types of compounds expected.
False positives are much more likely to result using high-resolution MS than with TOP assay, AOF, or PIGE. Compounds maybe mistakenly identified as PFAS, and if correctly identified, their concentrations may be greatly over- or underestimatedwhen other compounds are used for comparative quantitative purposes.
11.3 Data EvaluationEvaluation of data involves looking at all the factors that indicate whether the data are:
precise (agreement between results that are supposed to be similar)accurate (how close they are to the true concentrations)representative (results characterize the site properly)comparable (data compare well to other data)complete (all the samples and compounds requested were reported, especially for critical samples thatrepresent a point of exposure, such as drinking water)sensitive (nondetect data reported with concentrations below required regulatory or risk level)
These factors are illustrated in Figure 11-1, and guide users through the process of looking at their data (field collection andlaboratory information) with a critical eye.
The USEPA has guidance to aid in evaluating PFAS drinking water data generated in accordance with USEPA 537.1, DataReview and Validation Guidelines for Perfluoroalkyl Substances (PFASs) Analyzed Using EPA Method 537, as well as atechnical bulletin to aid in the review of PFAS data generated for all other media, Per- and Polyfluoroalkyl Substances (PFAS):Reviewing Analytical Methods Data for Environmental Samples.
Page 169ITRC PFAS-1
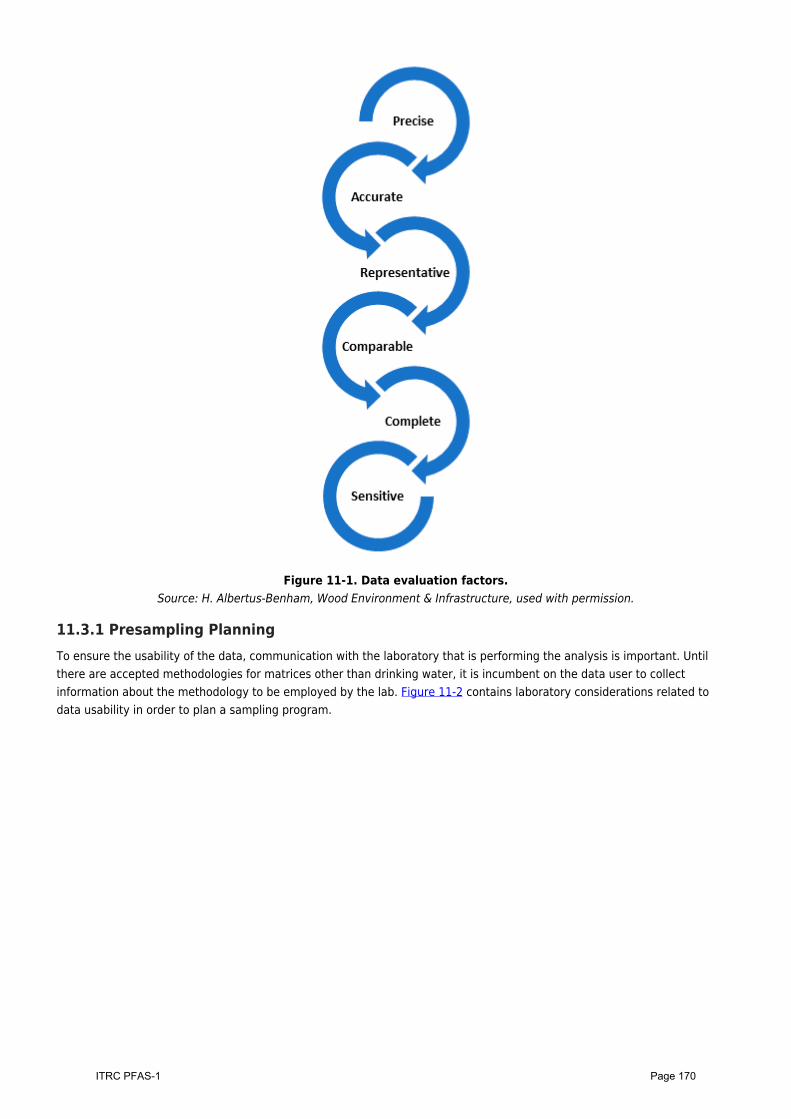
Figure 11-1. Data evaluation factors.Source: H. Albertus-Benham, Wood Environment & Infrastructure, used with permission.
11.3.1 Presampling PlanningTo ensure the usability of the data, communication with the laboratory that is performing the analysis is important. Untilthere are accepted methodologies for matrices other than drinking water, it is incumbent on the data user to collectinformation about the methodology to be employed by the lab. Figure 11-2 contains laboratory considerations related todata usability in order to plan a sampling program.
Page 170ITRC PFAS-1
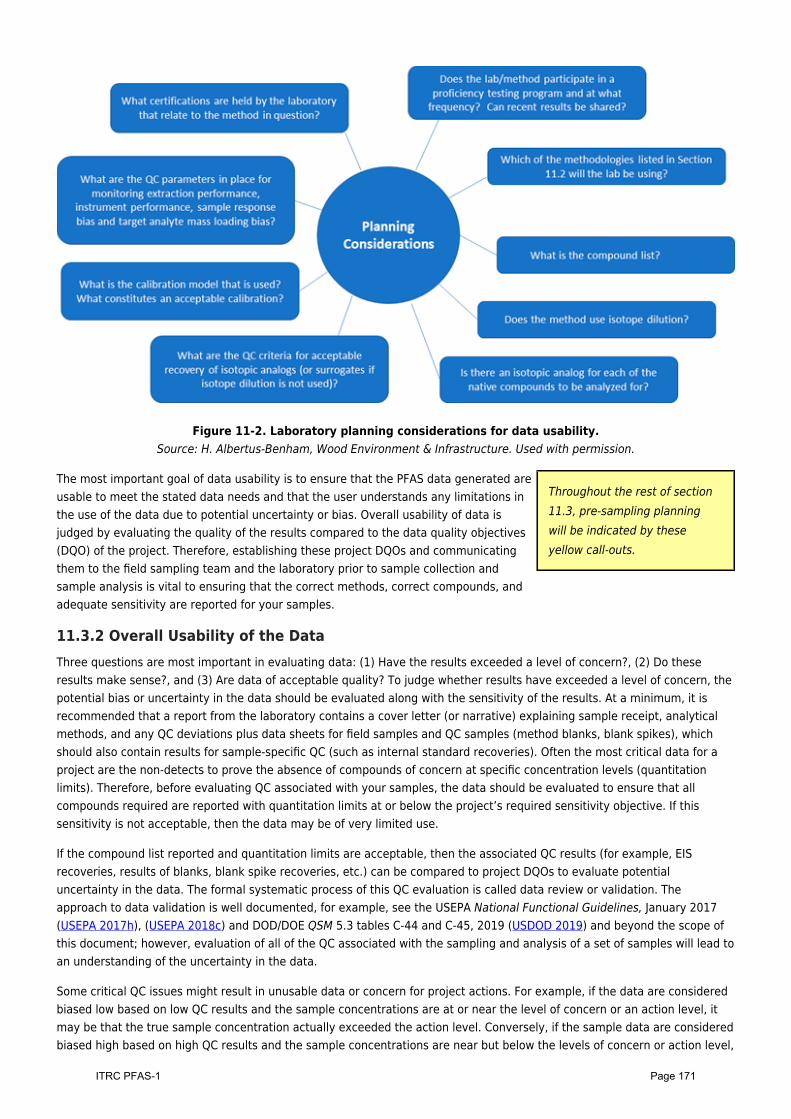
Figure 11-2. Laboratory planning considerations for data usability.Source: H. Albertus-Benham, Wood Environment & Infrastructure. Used with permission.
Throughout the rest of section11.3, pre-sampling planningwill be indicated by theseyellow call-outs.
The most important goal of data usability is to ensure that the PFAS data generated areusable to meet the stated data needs and that the user understands any limitations inthe use of the data due to potential uncertainty or bias. Overall usability of data isjudged by evaluating the quality of the results compared to the data quality objectives(DQO) of the project. Therefore, establishing these project DQOs and communicatingthem to the field sampling team and the laboratory prior to sample collection andsample analysis is vital to ensuring that the correct methods, correct compounds, andadequate sensitivity are reported for your samples.
11.3.2 Overall Usability of the DataThree questions are most important in evaluating data: (1) Have the results exceeded a level of concern?, (2) Do theseresults make sense?, and (3) Are data of acceptable quality? To judge whether results have exceeded a level of concern, thepotential bias or uncertainty in the data should be evaluated along with the sensitivity of the results. At a minimum, it isrecommended that a report from the laboratory contains a cover letter (or narrative) explaining sample receipt, analyticalmethods, and any QC deviations plus data sheets for field samples and QC samples (method blanks, blank spikes), whichshould also contain results for sample-specific QC (such as internal standard recoveries). Often the most critical data for aproject are the non-detects to prove the absence of compounds of concern at specific concentration levels (quantitationlimits). Therefore, before evaluating QC associated with your samples, the data should be evaluated to ensure that allcompounds required are reported with quantitation limits at or below the project’s required sensitivity objective. If thissensitivity is not acceptable, then the data may be of very limited use.
If the compound list reported and quantitation limits are acceptable, then the associated QC results (for example, EISrecoveries, results of blanks, blank spike recoveries, etc.) can be compared to project DQOs to evaluate potentialuncertainty in the data. The formal systematic process of this QC evaluation is called data review or validation. Theapproach to data validation is well documented, for example, see the USEPA National Functional Guidelines, January 2017(USEPA 2017h), (USEPA 2018c) and DOD/DOE QSM 5.3 tables C-44 and C-45, 2019 (USDOD 2019) and beyond the scope ofthis document; however, evaluation of all of the QC associated with the sampling and analysis of a set of samples will lead toan understanding of the uncertainty in the data.
Some critical QC issues might result in unusable data or concern for project actions. For example, if the data are consideredbiased low based on low QC results and the sample concentrations are at or near the level of concern or an action level, itmay be that the true sample concentration actually exceeded the action level. Conversely, if the sample data are consideredbiased high based on high QC results and the sample concentrations are near but below the levels of concern or action level,
Page 171ITRC PFAS-1
then there is added certainty that the data do not exceed the action levels.
Evaluating results may lead tooverall project changes suchas a need to increase samplingdensity to improve datarepresentativeness, correctionof procedures for collectingsamples to minimizecontamination, changes inmethods of analysis to achieveproject sensitivityrequirements, etc.
Once the data have been adequately reviewed for accuracy to determine if there arelimitations to their use or uncertainties to be considered during use, the results shouldbe evaluated by answering the following questions:
Do field duplicates, if performed, agree, indicating acceptable precision forthe sampling and analysis?Do the data from the current sampling event correlate with historical data?Do the data make sense from a temporal point of view?Do the data from one sampling point to the next make sense across theproject area?
This type of review can point out data trends or areas of concern (for example,interferences with project analytes) that could not be elucidated by looking at a singledata point and may lead to overall project changes such as a need to increase samplingdensity to improve data representativeness, correction of procedures for collectingsamples to minimize contamination, changes in methods of analysis to achieve projectsensitivity requirements, etc. Following this review, the data user can determinewhether the data set is complete and sufficient for project decisions and data uses orwhether additional samples need to be collected and analyzed.
11.3.3 SensitivityA reporting limit (RL) or quantitation limit (QL) is the limit of accurate quantitation for a specific analyte in a specific sampleafter any adjustments have been made for sample amount, dilutions, or percent moisture. Typically, the RL concentration isselected as the lowest nonzero standard in the calibration curve for each analyte. It takes into account the sample size,matrix effects, and any dilutions made during the analysis of that particular sample. Because of varying properties betweensamples, the RL can vary from sample to sample. The RL should represent the level at which reliable qualitative andquantitative information is routinely reported.
Sensitivity is related to the RL in that sensitivity refers to the capability of a method or instrument to detect a given analyteat a given concentration and reliably quantitate the analyte at that concentration. If a specified analyte is not reported by alaboratory to be in a specified sample, it does not necessarily mean that the chemical is not present; it is an indication thatthe concentration of the analyte may be below the method sensitivity.
It is imperative that the RLs(and not the MDLs) for eachmethod are evaluated versusthe project screening criteriaprior to submitting samples tothe laboratory. The RLs shouldbe below the project screeningcriteria to ensure achievementof project objectives.
Detected PFAS results between the method detection limit (MDL) and RL (that is, “J”values) can generally be reported as long as all qualitative identification criteria areachieved. Typical RLs for PFAS are as follows:
common PFAS analytes in aqueous matrices: 2–8 ng/Lcommon PFAS analytes in solid matrices: 0.2–2 ng/g
Sometimes even though lower RLs were planned for, the laboratory may have toperform dilutions, which causes the RLs to be elevated. Ensure that the dilutionperformed by the laboratory was reasonable. If there are elevated concentrations ofspecific target analytes or interferences, then the dilution is likely justified and thepresence of elevated RLs may not be an issue if these other target analytes are presentat very high levels.
If a dilution was performed and it is not obvious why (for example, low concentrations or nondetect results for targetanalytes), then inquire with the laboratory why the dilution was performed. This could happen due to elevatedconcentrations of nontarget compounds but should be documented.
The RLs can also be affected by the sample preparation parameters, the mass of solid sample or volume of aqueous sampleused in the extraction, or the final volume of the extracts. Typically, laboratories will utilize 100–250 mL for aqueous sampleextractions and 1–5 grams for solid sample extractions. Final extract volumes are typically between 0.5 mL and 1.0 mL. If acomplex matrix is encountered, the sample sizes may be reduced and/or the final extract volumes may be increased,causing the RL to be elevated accordingly.
Page 172ITRC PFAS-1
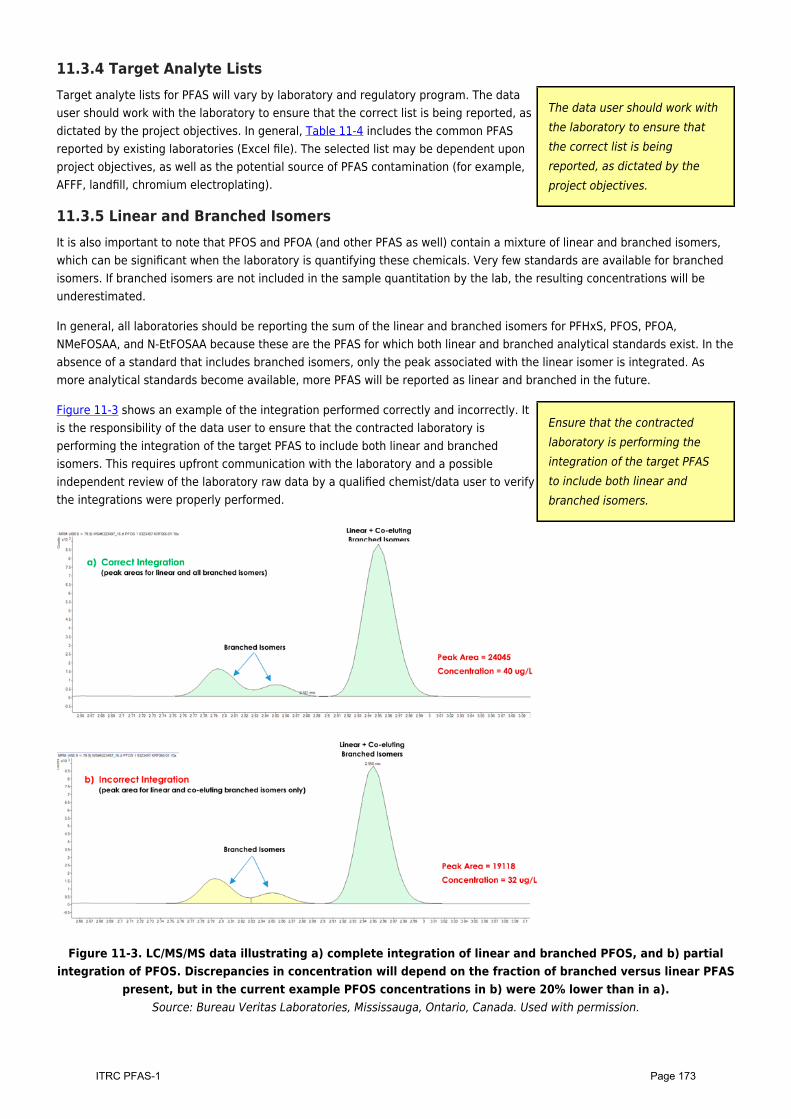
11.3.4 Target Analyte Lists
The data user should work withthe laboratory to ensure thatthe correct list is beingreported, as dictated by theproject objectives.
Target analyte lists for PFAS will vary by laboratory and regulatory program. The datauser should work with the laboratory to ensure that the correct list is being reported, asdictated by the project objectives. In general, Table 11-4 includes the common PFASreported by existing laboratories (Excel file). The selected list may be dependent uponproject objectives, as well as the potential source of PFAS contamination (for example,AFFF, landfill, chromium electroplating).
11.3.5 Linear and Branched IsomersIt is also important to note that PFOS and PFOA (and other PFAS as well) contain a mixture of linear and branched isomers,which can be significant when the laboratory is quantifying these chemicals. Very few standards are available for branchedisomers. If branched isomers are not included in the sample quantitation by the lab, the resulting concentrations will beunderestimated.
In general, all laboratories should be reporting the sum of the linear and branched isomers for PFHxS, PFOS, PFOA,NMeFOSAA, and N-EtFOSAA because these are the PFAS for which both linear and branched analytical standards exist. In theabsence of a standard that includes branched isomers, only the peak associated with the linear isomer is integrated. Asmore analytical standards become available, more PFAS will be reported as linear and branched in the future.
Ensure that the contractedlaboratory is performing theintegration of the target PFASto include both linear andbranched isomers.
Figure 11-3 shows an example of the integration performed correctly and incorrectly. Itis the responsibility of the data user to ensure that the contracted laboratory isperforming the integration of the target PFAS to include both linear and branchedisomers. This requires upfront communication with the laboratory and a possibleindependent review of the laboratory raw data by a qualified chemist/data user to verifythe integrations were properly performed.
Figure 11-3. LC/MS/MS data illustrating a) complete integration of linear and branched PFOS, and b) partialintegration of PFOS. Discrepancies in concentration will depend on the fraction of branched versus linear PFAS
present, but in the current example PFOS concentrations in b) were 20% lower than in a).Source: Bureau Veritas Laboratories, Mississauga, Ontario, Canada. Used with permission.
Page 173ITRC PFAS-1
11.3.6 Isotope Dilution Standard Results and SurrogatesThe isotope dilution technique involves quantitation of a compound of interest using a labeled isotope of that verycompound. A variety of isotopically labeled analogs (for example, carbon-13 isomers of the compounds of interest) areadded to a sample prior to extraction or prior to analysis when extraction is not required. These isotopically labeled analogsare sometimes referred to as surrogates or as extracted internal standard analytes as defined in the DOD/DOE (2019) QSM5.3 and function from a data usability standpoint as both a surrogate standard (calculation of the recovery of the standard)and as an internal standard (used in the calculation of the target compounds)(USDOD 2019). Generally, the number ofisotopically labeled analogs used in the isotope dilution technique matches the number of target compounds and exceedsthe number of surrogates used in nonisotope dilution procedures. For example, Method 537.1 uses three surrogates for 18target compounds, while isotope dilution attempts to use an isotopically labeled analog for each compound being reported.Internal standards are also added to the sample or extract immediately preceding analysis. For nonisotope dilution analyses,quantitation of the target compounds and surrogates is performed relative to these injection internal standards. The resultsfrom the nonisotope dilution technique report concentrations of the target compounds and recovery results for surrogatesand it is up to the data user to determine the impact (that is, bias) of the extraction and analysis on the sample results (thatis, results are not recovery-corrected).
For the isotope dilution methods, quantitation of the target compounds is performed relative to the response of theisotopically labeled analog, which should recover in a manner similar to how the nonlabeled compounds recover. Effectively,the sample data are recovery-corrected for losses that might have occurred during sample processing. The isotope dilutionrecovery correction procedure greatly improves the accuracy of the analysis and is considered to be an improvement overother techniques for the analysis of complex samples for analytes requiring high sensitivity. Chemical standardsmanufacturers are working to make a wider variety of labeled isotope compounds available to further improve accuracy ofthe methods for all compounds under investigation (for example, fluorotelomers, precursors, various isomers of carboxylatesand sulfonates).
Acceptance criteria or control limits for surrogate and isotopically labeled analog recoveries are either developed by thelaboratory or dictated by the requirements of the project (for example, QAPP-specified criteria, regulatory criteria, or methodcriteria). Poor recovery of surrogates in complex matrices is common; however, if a project requires ongoing analysis of aproblematic matrix, the laboratory should perform method development to improve recovery, if possible (for example,change in cleanup procedures, change in the transition ions monitored, etc.). If the recovery for a surrogate is below criteriain a sample for nonisotope dilution techniques, compounds associated with this surrogate may be biased low. If surrogate orEIS recovery is very low (for example, < 10% recovery), nondetects associated with the surrogate or EIS may be falsenegatives and should not be used for project decisions.
In the case where an isotope dilution extract is analyzed and requires re-analysis at a high dilution, the sample extract maybe refortified with labeled isotope compounds for adequate response. In reporting the final data, the isotope recovery resultsfrom the initial analysis should not be used to adjust the data from the secondary dilution analysis. The result from thisscenario is no longer quantitated from an isotope dilution but is calculated from an internal standard calculation and shouldbe noted as such in the case narrative.
11.3.7 Blank Contamination
The possible sources ofcontamination that may occurduring field collection activitiesand sample preparation andanalysis and therecommended procedures tominimize contamination havebeen previously addressed inSection 11.1.
As a consequence of the ubiquitous nature of PFAS, samples that may not contain PFAScan become contaminated if they come into contact with samples or materialscontaining PFAS. The types of blanks commonly used to evaluate contamination arefield-based blanks and lab-based blanks. Field-based blanks include field reagent blank(field blank), source water blank, and equipment rinse blank. Lab-based blanks includemethod blank, lab reagent blank, and instrument blank. Reagent, field, trip spike, andmethod blanks are prepared and analyzed using the same procedures as for the fieldsamples. Instrument blanks are analyzed periodically to verify the instrument is cleanfor analysis of subsequent samples.
The reagent blank is used to evaluate the potential PFAS contamination from thereagent water source used to generate the field-based and lab-based blanks. Asystematic review of all of the blank results compared to the associated field sampleresults (the group of samples associated with the field-based and lab-based blanks orthe analytical batch of samples associated with a specific method blank) must be made
Page 174ITRC PFAS-1
to determine whether the field sample results are accurate. For example, if the reagentwater source is nondetect for PFAS, then contamination found in the field-based blanksindicates potential contamination of the associated field samples from the sample bottleitself and/or during collection, handling, or transport to the laboratory.
However, if a lab-based blank is also contaminated, the contamination observed in the field-based blanks may have beendue to sample handling at the laboratory. If the conclusion of this systematic blank data review is that an associated sampleresult may have been contaminated, then the sample result is considered to be biased high or may be a false positive,depending on the magnitude of the blank contamination compared to the field sample result. A general rule of thumb is thatif sample contains a contaminant within 5x the concentration in the associated blank, the results may be biased high orresult in a false positive in the sample (USDOD 2019).
11.3.8 Duplicate ResultsLaboratory replicates are two separate aliquots of the same sample put through the entire sample preparation and analyticalprocedures. Field duplicates are two separate samples collected at the same location at the same date and time. Laboratoryreplicates may be performed in lieu of an LCS duplicate or MSD. It should be noted that sometimes laboratories report theresults of laboratory replicates performed on samples that are from a different project (that is, batch QC); if the laboratoryreplicates reported are not from a sample at the site of interest, then these results should not be used in the evaluation ofsample data.
Review regulatory or method-specific acceptance limits withthe laboratory, whether from aQAPP or laboratory-generated.
During data evaluation, the relative percent difference of each detected analyte versusthe acceptance limits should be reviewed. The acceptance limits should be providedwithin the laboratory report and are either regulatory- or method-specific. Theacceptance limits may have been provided in a QAPP, or may be laboratory-generated.When both results are < 2x the RL, the potential uncertainty increases and thereforethe acceptance criteria may need to be adjusted.
If both results are < 2x the RL, relative percent difference criteria can be doubled.If one result is detected and one result is not detected, then the evaluation will depend on whether the detectedresult is > 2x the RL or not. If one result is > 2x the RL and the other result is nondetect, then the variability isconsidered unacceptable and there may be potential uncertainty in the results for this sample.
Variability in laboratory replicate and field duplicate analyses could be from the sampling process, possibly due to aninefficient homogenization procedure in the field. It could also be from the laboratory aliquoting process or it could be due toheterogeneity in the sample matrix. The effect on project objectives will depend on the screening criteria and how far aboveor below these criteria the results are. If the results are close to the criteria with significant variability, this may requirecollection of more samples to better represent the location. If results are significantly above or below the screening criteriawith high variability, it may not adversely affect the ultimate decision-making process.
11.3.9 Acid Versus Anion Form of PFAAsThe data user must be aware of the form of PFAS the laboratory is reporting when comparing to project screening criteria.PFAS are typically formulated as acids, but they are present in the environment and in humans in the anionic form. Thedifferences in names used are the result of the different names for the acid form and the anion form of the chemical (seealso Section 2.2.3.1). For example, when perfluorobutanoic acid (PFBA) disassociates and loses its hydrogen in water, itbecomes the anionic form (perfluorobutanoate). This becomes more important when looking at physical and chemicalproperties of these chemicals, because whether they exist as an acid, an anion, or a salt (cation) will affect how they behavein the environment. Typically, laboratories are reporting the acid form of the perfluorocarboxylic acids and the anionic formof the perfluorosulfonates.
Some target PFAS, such as PFHxS and PFOS, are not available as acids, but rather as their corresponding potassium orsodium salts (K+ or Na+). These salts are acceptable starting materials for the stock standards provided the measured massis corrected for the salt content according to the equation below. Note that this correction will result in a minimal change tothe mass of the acid but still must be performed for consistency and comparability with other results to ensure the data userthat the correct form of PFAS is represented in the final concentration.
massacid = measured masssalt * (MWacid/MWsalt)
Page 175ITRC PFAS-1

MWacid = molecular weight of PFAA
MWsalt = molecular weight of purchased salt
CAS numbers will change depending on if the acid or anion form of the PFAS is reported (Table 11-6).
Table 11-6. Example of CAS number differences between acid and anion
Chemical CAS number
PFOA: Perfluorooctanoate (anion) 45285-51-6
PFOA: Perfluorooctanoic acid (acid) 335-67-1
Updated April 14, 2020.
Page 176ITRC PFAS-1
12 Treatment TechnologiesThis section provides information about treatment technologies for PFAS in environmental media. Treatment technologies forPFAS in environmental media are still evolving and it is prudent to use caution in implementing long-term remedies. Selection of remedial actions should prioritize protection of drinking water supplies and human health, with consideration ofother objectives (such as reducing risk to ecological receptors and environmental resources, liability, source area mass,mass flux, generation of PFAAs from precursors). At some sites, it might be reasonable to take short-term site stabilizationactions with the intent of applying more robust and cost-effective technologies as these are developed.
The treatment technologies described in this section are organized by degree of development and implementation, as wellas current confidence in the technology based on peer-reviewed literature and the professional judgment of the authors. Thelevels are field-implemented technologies, limited application technologies, and developing technologies.
Section Number Topic
12.1 Overview
12.2 Field-Implemented Liquids Treatment Technologies
12.3 Field-Implemented Solids Treatment Technologies
12.4 Limited Application and Developing Liquids Treatment Technologies
12.5 Limited Application and Developing Solids Treatment Technologies
12.6 Integrated Remedial Solutions
12.7 Sustainability of PFAS Treatment
12.8 Improving Evaluation of PFAS Treatment Technologies
12.1 OverviewTreatment technologies exploit a contaminant’s chemical and physical properties to immobilize, remove, or destroy thecontaminant. The stability and surfactant nature of PFAS make many treatment technologies ineffective, including those thatrely on contaminant volatilization (for example, air stripping, soil vapor extraction) or bioremediation (for example,biosparging, biostimulation, bioaugmentation). Even aggressive technologies such as thermal treatment and chemicaloxidation require extreme conditions beyond typical practices (for example, extreme temperatures, high chemical doses,extreme pH) to be effective or partially effective in destroying PFAS.
Treatment technologies can be employed either ex situ or in situ. For example, when groundwater is extracted via pumpingfrom wells and treated, this would be considered an ex situ approach. In contrast, when treatment materials are injected intothe subsurface to immobilize contaminants in groundwater under the surface, this would be considered an in situ approach.Because existing treatment technologies have generally shown to be inadequate, the unique chemical properties of PFASoften require new technologies or innovative combinations of existing technologies.
A range of unproven technologies exist for treatment of either liquids or solids that may be performed either in situ or exsitu. However, the most demonstrated technologies for treating PFAS in liquids are limited to the use of ex situ technologies.
“Treatment” versus “Remedial Action”
The term “treatment” refers to the application of certaintechnologies to specific impacted media to achieve desiredremedial action goals or objectives.
Full-scale treatment of PFAS-impacted liquids or solidsis currently limited to sequestration technologies thatremove or bind PFAS but do not destroy them. Sorptionusing granular activated carbon and ion exchangemedia has been proven effective at full scale (see Table12-1, provided as separate PDF, for references).
Page 177ITRC PFAS-1
As defined in the Superfund Amendments and ReauthorizationAct (SARA), a “remedial action” is the actual construction orimplementation phase of a site cleanup. Remedial action hasa broader context that includes concepts surroundingtargeted clean-up levels and monitoring but also addressesissues related to administrative elements, long-rangeplanning, and remediation/restoration.
Transformation or destruction technologies, includingbioremediation, chemical oxidation, chemical reduction,and thermal technologies, are currently being tested.This section discusses both proven and emergingtreatment technologies for liquids (waters, leachates, orother liquid wastes) and solids (soil, sediment, or othersolid wastes).
The treatment technologies described in this sectionare organized by degree of development andimplementation, as well as current confidence in thetechnology based on peer-reviewed literature and theprofessional judgment of the authors. Three levels ofimplementation/confidence are defined as follows:
Field-implemented technologies–Technologies that have been demonstrated under full-scale conditions atmultiple sites, by multiple practitioners and multiple applications, and are well documented in peer-reviewedliterature.
Technology Selection
Selecting a technology to meet treatment targets isdependent on:
an understanding of PFAS fate and transporta well-prepared conceptual site modelproven remediation technologiesdefined (and achievable) treatment targetsa stable regulatory environment.
Limited applicationtechnologies–Technologies that have beenimplemented on a limited number of sites,by a limited number of practitioners, andmay not have been documented in peer-reviewed literature. These limitedapplication technologies for liquids andsolids are contained in the technologycomparison Tables 12-1 and 12-2 (providedas separate PDF) and discussed in Section12.4 and Section 12.5.Developing technologies–Technologies thathave been researched at the laboratory orbench scale, but have not been fielddemonstrated. Often, these results arereported by only one group (for example,one university, practitioner, or vendor) orlack detailed validation of the treatmenteffectiveness or mechanisms. Experimentaltechniques to treat PFAS are underdevelopment, but only those technologiesthat have some level of publicly availabledocumentation demonstrating effectivenessare included here.
The limited application and developing technologies for liquids and solids are contained in the technology comparison Tables12-1 and 12-2 (provided as separate PDF) and discussed in Section 12.4 and Section 12.5.
The technology evaluations presented herein provide data for PFAS removal. This information varies widely amongtechnologies and the data provided are based on the reported test conditions and results. Ultimately, the feasibility of atechnology to meet applicable regulatory guidance values and standards often depends on site-specific conditions.
Currently in the United States, the regulatory standards for PFAS treatment are primarily driven by drinking water mitigationand focused on a small subset of PFAS. PFOS and PFOA are the only two compounds with federal regulatory guidelines(USEPA 2016c, d), and most regulatory discharge criteria for PFAS focus on PFOS and PFOA. Some states have guidelines,and a few states have regulatory criteria for additional PFAS, but precursor and short-chain PFAS are generally notconsidered in regulations or guidance, although that is changing. The technology evaluation information presented hereprovides data about all PFAS tested for a given technology. This information varies widely among technologies. Additional
Page 178ITRC PFAS-1
information on regulations is provided in Section 8.
12.1.1 Factors Affecting Technology SelectionSelection of a remedy, with confidence that treatment targets can be achieved, depends on a number of key factors,including the ability to reliably define the nature and extent of contamination, the availability of proven remediationtechnologies, and the capacity and tools to measure progress and compliance with desired regulatory criteria. A well-prepared CSM requires adequate information and is also fundamental to understanding and presenting the rationale andjustification for the selected remedy.
Moreover, proven remediation technologies are limited in capacity and demonstrated ability to meet chosen treatmenttargets. The comprehensive discussions contained herein reveal many questions and uncertainties that must be addressed.
Factors affecting PFAS remedy selection include:
characteristics of PFAS. The wide-ranging chemical and physical characteristics of PFAS affect the treatmenteffectiveness. Key factors include ionic state (anionic, cationic, and zwitterionic), types of ionic groups (sulfonateor carboxylate), lipo- and hydrophobicity, nature and reactivity of alkyl groups, chain length and branching,partitioning coefficients, phase behavior, volatility, solubility, acidity, total PFAS mass, and total concentration.changes in PFAS properties. Naturally occurring processes or remedial actions for other (commingled)contaminants, such as chlorinated solvents and petroleum hydrocarbons, can affect PFAS distribution andmobility in groundwater (McGuire et al. 2014). Example changes include:
The alkyl functional group of some PFAA precursors may be more readily subject to chemical orbiological transformation than the fully fluorinated aliphatic chain (PFAAs).Partial degradation of the carbon-carbon bonds in the aliphatic chain reported for some chemicalremedies generates short-chain PFAS, which may be more mobile (Guelfo and Higgins 2013).Modifications in aquifer properties (for example, redox or pH) during remediation of commingledcontaminants results in a conversion of some precursors to the more stable and mobile PFCAs(McKenzie et al. 2015; McKenzie et al. 2016).
co-contaminants, organic matter, and geochemistry. The presence of co-contaminants, total organiccarbon, natural organic matter, minerals, and anions can significantly affect remediation. Some technologiesthat are designed and implemented to treat PFAS co-contaminants may transform perfluoroalkyl acid (PFAA)precursors into more stable perfluorocarboxylic acids (PFCAs) (McKenzie et al. 2015).community acceptance. Stakeholders, including community members, are often faced with trade-offs in termsof cost, level of cleanup, and residual contamination as part of remediation efforts.
For those directly engaged in assessing the suitability of PFAS treatment technologies, a structured process for systematicevaluation is currently under development via a SERDP-funded project (ER18-1633). The project focuses on five lines ofevidence to evaluate technology performance and will provide resources to identify relevant information and data gaps andaddress key questions necessary for that assessment. Additional information is provided in Section 12.8.
12.1.2 Section OrganizationThe information presented in the following sections reflects the availability of performance results published, presented, orposted to the internet. Those technologies that have been implemented in the field at multiple sites, by multiple parties, andhave peer-reviewed documentation of performance are discussed in Section 12.2 and Section 12.3. Projects funded bySERDP and the Water Research Foundation (WRF) are also highlighted. This section discusses the following key elements foreach of these field-implemented technologies:
treatment description–background and development of technologytreatment mechanism–separation, sorption, or destructionstate of development–applications and degree of commercial availabilityeffectiveness–documented treatment effectiveness on PFAS and common co-contaminants along with waterquality considerations and pretreatment need and optionsdesign/operating considerations –critical or unique operational or design needssustainability–footprint, community enhancement, and cost.
Treatment case studies are presented in Section 15.2. Note that air treatment technologies are not included in this sectionbecause the current research is limited to liquid and soil treatment technologies and air exposures are not presently a
Page 179ITRC PFAS-1
regulatory priority.
12.2 Field-Implemented Liquids Treatment TechnologiesThese technologies have been implemented in the field by multiple parties at multiple sites and the results have beendocumented well in the peer-reviewed literature. The liquid treatment technologies in this section may be applied to avariety of PFAS-impacted media, including drinking water (regardless of source), surface water, groundwater, wastewater, orlandfill leachate. At this time, all technologies that are considered “field-implemented” are ex situ treatment systems,meaning PFAS-impacted water is extracted and treated. Although some of the technologies described in this section havebeen applied in situ, they are not considered field-implemented at this time. Not all technologies would be appropriate for allapplications. Site-specific evaluation is necessary to identify the best technology alternative for a given treatment media orscenario.
12.2.1 Sorption TechnologiesSorption technologies have been used for both ex situ and in situ water treatment applications. In situ applications are notcovered in this section, because they are still considered “limited application or developing technologies” as defined in thisdocument. Multiple sorption media types may be used in series for ex situ applications to optimize overall concentrationreduction and removal capacity. Adsorption and ion exchange are two “sorption” mechanisms by which PFAS can beremoved from water.
Adsorption is a physical mass transfer process that uses Van der Waals and/or other weak ionic forces to bind the entirePFAS molecule to the surface areas of the adsorptive media. Ion exchange is the exchange of ions of the same charge. Ionexchange targets and binds to the hydrophilic ionized or functional end of the molecule (for example, the sulfonate in PFOS)while releasing an equivalent amount of an innocuous ion (for example, chloride) into the treated water. A number ofinfluent water parameters can therefore be expected to impact the sorption efficiency for a specific PFAS compound. Theseinclude pH, ionic strength, the nature and concentrations of organic co-contaminants present (including naturally occurringorganic matter [NOM])), competing inorganic ions normally present (for example, sulfate, nitrate, bicarbonate, and chloride),and any suspended solids or potentially precipitating impurities (for example, iron, manganese, calcium carbonate) that canfoul and degrade the performance of the media. Pretreatment steps may be necessary to optimize the performance of suchmedia, including coagulation, precipitation, filtration, pH adjustment, or oxidant removal. Ion exchange media used for PFASremoval from water use both the adsorption and ion exchange mechanisms. The use of two or more different media in seriescan be considered if the expected increase in overall removal efficiency can be used to justify the increased equipment cost.
Key Cost Considerations for Sorption Media Selection
PFAS mix and competitive speciespretreatment needsinfluent concentrationsflow ratedischarge criteriamedia change-out criteriamedia disposal
Life cycle cost assessments can be used to compare thelong-term cost-performance benefits of various sorptionmedia types. Spent media management can be animportant cost component. Common options for spentmedia management are off-site disposal by thermaldestruction (via commercial incineration or cementkilns), reactivation/regeneration for reuse, landfilling,and on-site destruction. Media disposal regulations canvary from state to state. Because PFAS are highlysoluble in water, persistent, and resistant todegradation, some disposal options (for example,landfilling) may be less preferable. Disposal sites maynot accept PFAS-containing wastes. Incineration andthermal reactivation/regeneration offer the possibility ofdestruction of PFAS waste streams and elimination ofassociated liability.
Related Ongoing Research Funded by SERDP (ER) and Water Research Foundation (WRF)
ER18-1395 Electrically Assisted Sorption and Desorption of PFASsER18-1417 Molecular Design of Effective and Versatile Adsorbents for Ex Situ Treatment of AFFF-ImpactedGroundwaterER18-1052 Remediation of PFAS Contaminated Groundwater Using Cationic Hydrophobic Polymers as Ultra-HighAffinity Sorbents
Page 180ITRC PFAS-1
ER18-1306 Combined In Situ/Ex Situ Treatment Train for Remediation of Per- and Polyfluoroalkyl Substance(PFAS) Contaminated GroundwaterER18-5015 Removal and Destruction of PFAS and Co-contaminants from Groundwater via GroundwaterExtraction and Treatment with Ion-Exchange Media, and On-Site Regeneration, Distillation, and PlasmaDestructionER18-B3-5053: Evaluation and Life Cycle Comparison of Ex-Situ Treatment Technologies for Poly- andPerfluoroalkyl Substances in GroundwaterWRF 4913: Investigation of Treatment Alternatives for Short-Chain PFAS
12.2.1.1 Granular Activated Carbon (GAC)Treatment Description: GAC is an effective sorbent media for organics that has historically been used to reducecontaminants in a variety of water treatment applications. The information contained in this section describes ex situ GACtreatment in which water is extracted and transferred from the source of contamination and directed through the treatmentsystem.
Treatment Mechanism: Removal of PFAS by GAC is a physical mass transfer process (refer to Section 12.2.1) from theaqueous phase onto solid media that does not involve or trigger any form of chemical degradation or transformation.
State of Development: GAC is an established water treatment technology proven to effectively treat long-chain PFAS(such as PFOS, PFOA, and PFNA). The application of GAC as a treatment technology for PFAS removal has been practiced forover 15 years at more than 45 military installations, as well as several industrial sites and publicly owned treatment works(Forrester 2018) involving private and municipal drinking water supplies.
Effectiveness: The following references were used to support the treatability effectiveness discussion presented below forlong-chain PFAS by GAC: Appleman et al. (2013); Burdick et al. (2016); Cummings (2015); Dickenson (2016); Ochoa-Herreraand Sierra-Alvarez (2008); Szabo (2017) and Woodard, Berry, and Newman (2017). These references also include morecomprehensive bibliographies if further details are needed on specific topics or studies. Literature and supporting columnstudies have shown that newly placed GAC can reduce effluent concentrations for PFAS listed in USEPA Method 537.1(Shoemaker and Tettenhorst 2018) to below analytical detection limits until initial breakthrough begins to occur. Theadsorption removal mechanism is not expected to transform precursors (for example, telomer alcohols) to traditional PFASas would be the case when using advanced oxidation/reduction technology. Because GAC is generally used to treat manycommon groundwater contaminants, it is capable of also treating most organic co-contaminants that may be present, withthe primary impact being increased GAC consumption due to greater loading per unit of time, which may require morefrequent change-outs.
Individual PFAS have different GAC loading capacities and corresponding breakthrough times (often defined as the numberof bed volumes treated prior to detection in the effluent) (Eschauzier et al. 2012). GAC removal capacity for PFOS is greaterthan PFOA, but both can be effectively removed (McCleaf et al. 2017). In general, shorter chain PFAS have lower GAC loadingcapacities and faster breakthrough times. However, influent concentrations for the shorter chain PFAS are often an order ofmagnitude, or more, lower than the longer chain PFAS. For these types of applications where the influent concentrations forthe shorter chain PFAS are much lower and in the low ppt range, GAC can still be a cost-effective sorption media option thatmeets applicable regulatory discharge criteria. Figure 12-1 provides an example of removal curves and breakthroughinformation for a number of PFAS performed at a specific influent concentration based on vendor-supplied column studies.
Page 181ITRC PFAS-1
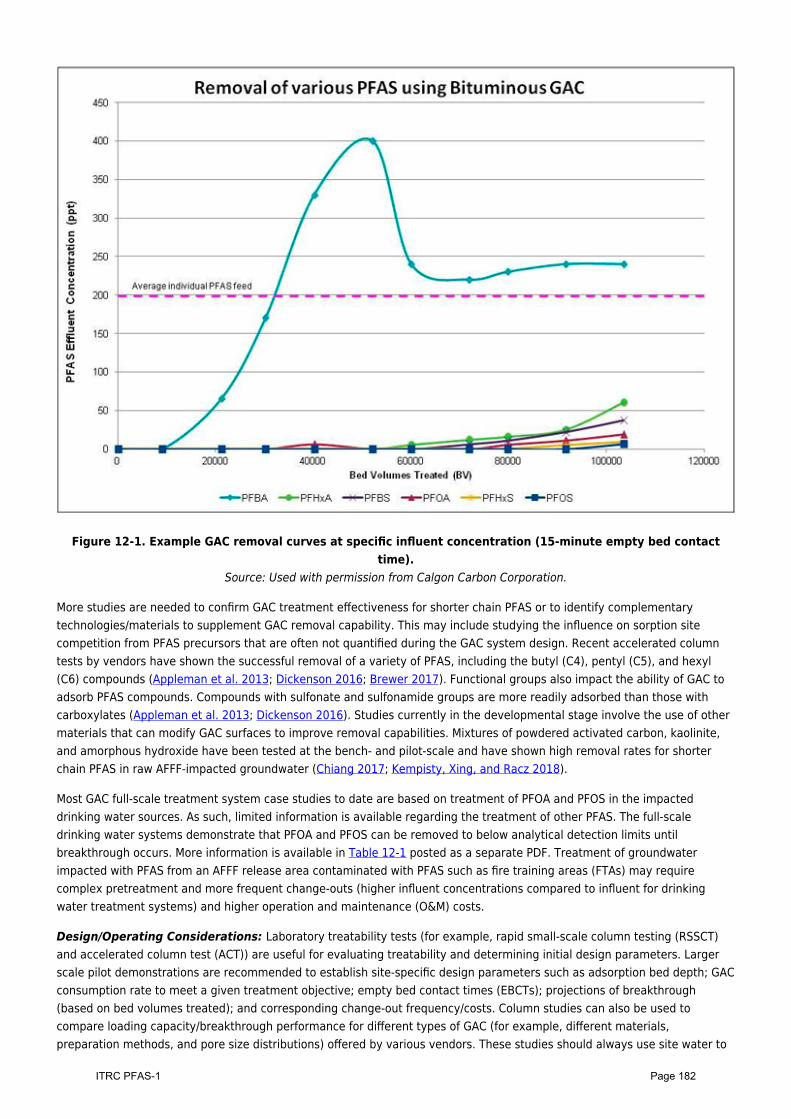
Figure 12-1. Example GAC removal curves at specific influent concentration (15-minute empty bed contacttime).
Source: Used with permission from Calgon Carbon Corporation.
More studies are needed to confirm GAC treatment effectiveness for shorter chain PFAS or to identify complementarytechnologies/materials to supplement GAC removal capability. This may include studying the influence on sorption sitecompetition from PFAS precursors that are often not quantified during the GAC system design. Recent accelerated columntests by vendors have shown the successful removal of a variety of PFAS, including the butyl (C4), pentyl (C5), and hexyl(C6) compounds (Appleman et al. 2013; Dickenson 2016; Brewer 2017). Functional groups also impact the ability of GAC toadsorb PFAS compounds. Compounds with sulfonate and sulfonamide groups are more readily adsorbed than those withcarboxylates (Appleman et al. 2013; Dickenson 2016). Studies currently in the developmental stage involve the use of othermaterials that can modify GAC surfaces to improve removal capabilities. Mixtures of powdered activated carbon, kaolinite,and amorphous hydroxide have been tested at the bench- and pilot-scale and have shown high removal rates for shorterchain PFAS in raw AFFF-impacted groundwater (Chiang 2017; Kempisty, Xing, and Racz 2018).
Most GAC full-scale treatment system case studies to date are based on treatment of PFOA and PFOS in the impacteddrinking water sources. As such, limited information is available regarding the treatment of other PFAS. The full-scaledrinking water systems demonstrate that PFOA and PFOS can be removed to below analytical detection limits untilbreakthrough occurs. More information is available in Table 12-1 posted as a separate PDF. Treatment of groundwaterimpacted with PFAS from an AFFF release area contaminated with PFAS such as fire training areas (FTAs) may requirecomplex pretreatment and more frequent change-outs (higher influent concentrations compared to influent for drinkingwater treatment systems) and higher operation and maintenance (O&M) costs.
Design/Operating Considerations: Laboratory treatability tests (for example, rapid small-scale column testing (RSSCT)and accelerated column test (ACT)) are useful for evaluating treatability and determining initial design parameters. Largerscale pilot demonstrations are recommended to establish site-specific design parameters such as adsorption bed depth; GACconsumption rate to meet a given treatment objective; empty bed contact times (EBCTs); projections of breakthrough(based on bed volumes treated); and corresponding change-out frequency/costs. Column studies can also be used tocompare loading capacity/breakthrough performance for different types of GAC (for example, different materials,preparation methods, and pore size distributions) offered by various vendors. These studies should always use site water to
Page 182ITRC PFAS-1
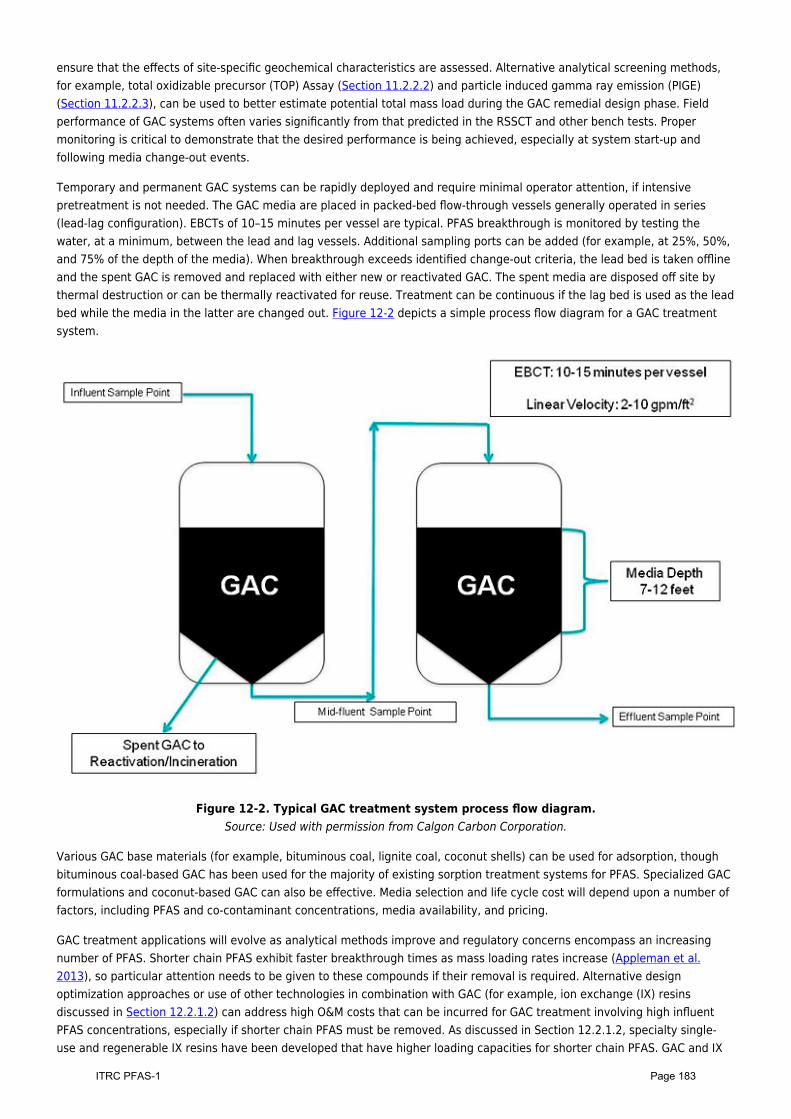
ensure that the effects of site-specific geochemical characteristics are assessed. Alternative analytical screening methods,for example, total oxidizable precursor (TOP) Assay (Section 11.2.2.2) and particle induced gamma ray emission (PIGE)(Section 11.2.2.3), can be used to better estimate potential total mass load during the GAC remedial design phase. Fieldperformance of GAC systems often varies significantly from that predicted in the RSSCT and other bench tests. Propermonitoring is critical to demonstrate that the desired performance is being achieved, especially at system start-up andfollowing media change-out events.
Temporary and permanent GAC systems can be rapidly deployed and require minimal operator attention, if intensivepretreatment is not needed. The GAC media are placed in packed-bed flow-through vessels generally operated in series(lead-lag configuration). EBCTs of 10–15 minutes per vessel are typical. PFAS breakthrough is monitored by testing thewater, at a minimum, between the lead and lag vessels. Additional sampling ports can be added (for example, at 25%, 50%,and 75% of the depth of the media). When breakthrough exceeds identified change-out criteria, the lead bed is taken offlineand the spent GAC is removed and replaced with either new or reactivated GAC. The spent media are disposed off site bythermal destruction or can be thermally reactivated for reuse. Treatment can be continuous if the lag bed is used as the leadbed while the media in the latter are changed out. Figure 12-2 depicts a simple process flow diagram for a GAC treatmentsystem.
Figure 12-2. Typical GAC treatment system process flow diagram.Source: Used with permission from Calgon Carbon Corporation.
Various GAC base materials (for example, bituminous coal, lignite coal, coconut shells) can be used for adsorption, thoughbituminous coal-based GAC has been used for the majority of existing sorption treatment systems for PFAS. Specialized GACformulations and coconut-based GAC can also be effective. Media selection and life cycle cost will depend upon a number offactors, including PFAS and co-contaminant concentrations, media availability, and pricing.
GAC treatment applications will evolve as analytical methods improve and regulatory concerns encompass an increasingnumber of PFAS. Shorter chain PFAS exhibit faster breakthrough times as mass loading rates increase (Appleman et al.2013), so particular attention needs to be given to these compounds if their removal is required. Alternative designoptimization approaches or use of other technologies in combination with GAC (for example, ion exchange (IX) resinsdiscussed in Section 12.2.1.2) can address high O&M costs that can be incurred for GAC treatment involving high influentPFAS concentrations, especially if shorter chain PFAS must be removed. As discussed in Section 12.2.1.2, specialty single-use and regenerable IX resins have been developed that have higher loading capacities for shorter chain PFAS. GAC and IX
Page 183ITRC PFAS-1
can also be used in series to optimize removal capacity and minimize O&M costs, generally with GAC ahead of IX to removenon-PFAS organics and longer carbon chain PFAS, followed by IX to remove the shorter carbon chain PFAS. This approachhas been implemented in the field and is presented in a case study in Section 15.2.2.1.
Spent GAC that contains PFAS can be thermally reactivated and reused, which may result in a lower cost media replacementoption versus new GAC. However, some regulatory agencies may not allow the use of reactivated GAC for drinking watersystems. NSF/ANSI standards require that the use of reactivated GAC for drinking water systems involve only mediagenerated by the treatment system owner/operator and cannot include a mixture of GAC that originated from other sources.The management of spent media should be planned during the life cycle assessment phase and be documented as thetreatment system is executed. Commercial facilities are available for thermal reactivation of spent GAC, which currently arenot available for other sorption media and can offer a potential life cycle cost benefit for spent media disposal. Based onvendor feedback (Mimna 2017), commercial thermal GAC reactivation is performed at higher operating temperatures thansteam or nitrogen regeneration systems, and is capable of complete desorption and destruction of PFAS from spent GAC(Watanabe et al. 2016; Yamada et al. 2005) et al. 2005). Additional studies are needed to verify PFAS destruction in the GACreactivation process.
Sustainability: GAC ex situ PFAS water treatment systems have unique sustainability considerations as well asconsiderations in common with other ex situ PFAS sorption media water treatment systems (treatment complexconstruction, utilities, water collection and pumping, and discharge infrastructure). Major sustainability considerationsunique to GAC systems are associated with:
raw material collection and transportationGAC manufacturing and transportationlarger media vessels relative to IX due to longer EBCTslarger treatment complex size due to larger vesselsspent media transportation followed by reactivation, destruction, or disposal.
Multiple resources are available for performing sustainability assessments for sorption remedial designs (Amini et al. 2015;Choe et al. 2013; Choe et al. 2015; Dominguez-Ramos et al. 2014; Favara et al. 2016; Maul et al. 2014; Rahman et al. 2014;Ras and von Blottnitz 2012).
12.2.1.2 Ion Exchange ResinTreatment Description: Like GAC, IX is an effective sorbent for other contaminants and has historically been used for avariety of water treatment applications (for example, nitrate, perchlorate, arsenic). To date, IX for PFAS removal from wateris limited to ex situ applications.
IX resin options for removal of PFAS include single-use and regenerable resins. Single-use resins are used until breakthroughoccurs at a pre-established threshold and are then removed from the vessel and preferably disposed of by high temperatureincineration or by landfilling where permitted. Regenerable resins are used until breakthrough but are then regenerated onsite using a regenerant solution capable of returning the full exchange capacity to the resin. Like GAC, temporary andpermanent IX systems can be rapidly deployed.
Related Ongoing Research Funded by SERDP (ER) and Water Research Foundation (WRF):
ER18-1027 Ex Situ Treatment of PFAS Contaminated Groundwater Using Ion Exchange with RegenerationER18-1063 Regenerable Resin Sorbent Technologies with Regenerant Solution Recycling for SustainableTreatment of PFASsER 18-5015 Removal and Destruction of PFAS and Co-Contaminants from Groundwater via GroundwaterExtraction and Treatment with Ion-Exchange Media, and On-site Regeneration, Distillation, and PlasmaDestructionER 18-1306 Combined In Situ/Ex Situ Treatment Train for Remediation of Per- and Polyfluoroalkyl Substance(PFAS) Contaminated GroundwaterER18-5053: Evaluation and Life Cycle Comparison of Ex-Situ Treatment Technologies for Poly- and PerfluoroalkylSubstances in GroundwaterWRF 4913: Investigation of Treatment Alternatives for Short Chain PFAS
Treatment Mechanism: Removal of PFAS by IX is a physical mass transfer process from the aqueous phase onto solidmedia that does not involve any form of chemical degradation or transformation. IX resins with positively charged functional
Page 184ITRC PFAS-1
groups can readily remove negatively charged PFAS compounds from water by forming ionic bonds (the sulfonic andcarboxylic acid heads of PFOS and PFOA are negatively charged at the typical range of pH values found in natural water).Simultaneously, the hydrophobic end of the PFAS structures can adsorb onto the hydrophobic surfaces of the IX resins. Thisdual removal mechanism can exhibit higher selectivity versus other sorption media that function largely by adsorption alone.
State of Development: Ion exchange technology has been used since the late 1930s for common water treatmentprocesses like softening, demineralization, and selective contaminant removal. The development and use of selective resinsfor PFAS removal is relatively new but already well established. As of 2019, a limited number of regenerable IX systems havebeen installed in full-scale applications after successful pilot testing. Collection of data on longer term treatment and on-siteregeneration of the IX resin is ongoing at a case study site (Section 15.2.2.2). In general, the removal capacity of the single-use resin is higher than that of regenerable resin, and single-use resin can be more fully exhausted in a lead-lag vesselconfiguration than regenerable resin. The relative efficiency of regenerable and single-use resins depends upon PFAS and co-contaminant influent concentrations and treatment goals.
Effectiveness: Selective IX has been demonstrated to reduce concentrations for a broad suite of PFAS at the bench andfield scale for influent concentrations as high as 100s of parts per billion (ppb) total PFAS to below analytical detection limitsin effluent (Kothawala et al. 2017; McCleaf et al. 2017; Woodard, Berry, and Newman 2017). The affinity of such resin forcommon subgroups of PFAS generally follows the order PFSA > PFCA. Within each subgroup, affinity increases withincreasing carbon chain length, and are not necessarily sequential (that is, longer chain PFCA may be adsorbed better thanshorter chain PFSA).
In general, IX resin systems being used for PFAS removal are not installed with the intention of removing co-contaminants.Co-contaminants (including organic and inorganic compounds) may significantly reduce the removal capacity of IX for PFAS,although this depends on the selectivity of the IX resin. Because of the variability in resin behavior, as well as groundwaterchemistry, influent characterization is needed to assess potential pretreatment options to remove co-contaminants.Pretreatment is necessary to preserve resin capacity for PFAS removal, particularly in the context of remediation wherecomplex co-contaminant chemistry is expected. Pretreatment needs for drinking water applications may be simpler or notrequired.
Single-use PFAS-selective IX resins are well-suited to treat low-concentration PFAS such as is typically encountered inpotable water treatment systems, where media change-out would be infrequent. Figure 12-3 provides an example ofremoval curves and breakthrough information for a number of PFAS at the specified influent concentrations (in the legend)based on vendor-supplied data for a full-scale single-use system.
Page 185ITRC PFAS-1
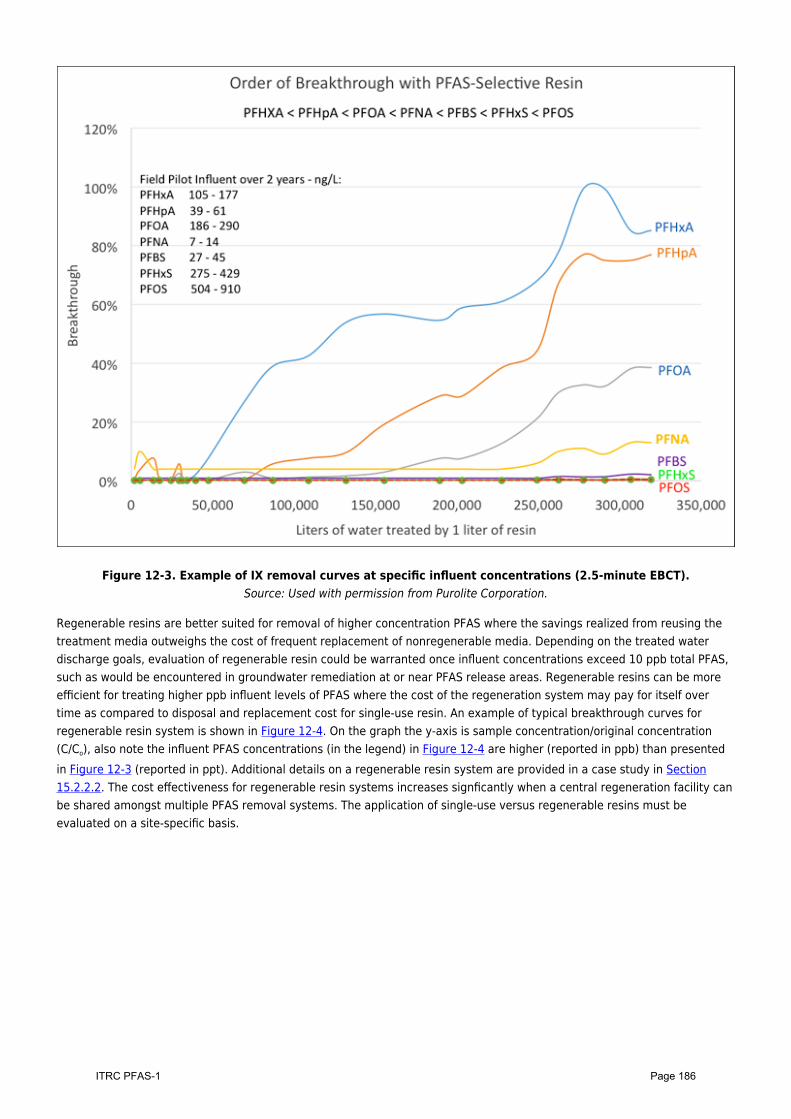
Figure 12-3. Example of IX removal curves at specific influent concentrations (2.5-minute EBCT).Source: Used with permission from Purolite Corporation.
Regenerable resins are better suited for removal of higher concentration PFAS where the savings realized from reusing thetreatment media outweighs the cost of frequent replacement of nonregenerable media. Depending on the treated waterdischarge goals, evaluation of regenerable resin could be warranted once influent concentrations exceed 10 ppb total PFAS,such as would be encountered in groundwater remediation at or near PFAS release areas. Regenerable resins can be moreefficient for treating higher ppb influent levels of PFAS where the cost of the regeneration system may pay for itself overtime as compared to disposal and replacement cost for single-use resin. An example of typical breakthrough curves forregenerable resin system is shown in Figure 12-4. On the graph the y-axis is sample concentration/original concentration(C/Co), also note the influent PFAS concentrations (in the legend) in Figure 12-4 are higher (reported in ppb) than presentedin Figure 12-3 (reported in ppt). Additional details on a regenerable resin system are provided in a case study in Section15.2.2.2. The cost effectiveness for regenerable resin systems increases signficantly when a central regeneration facility canbe shared amongst multiple PFAS removal systems. The application of single-use versus regenerable resins must beevaluated on a site-specific basis.
Page 186ITRC PFAS-1
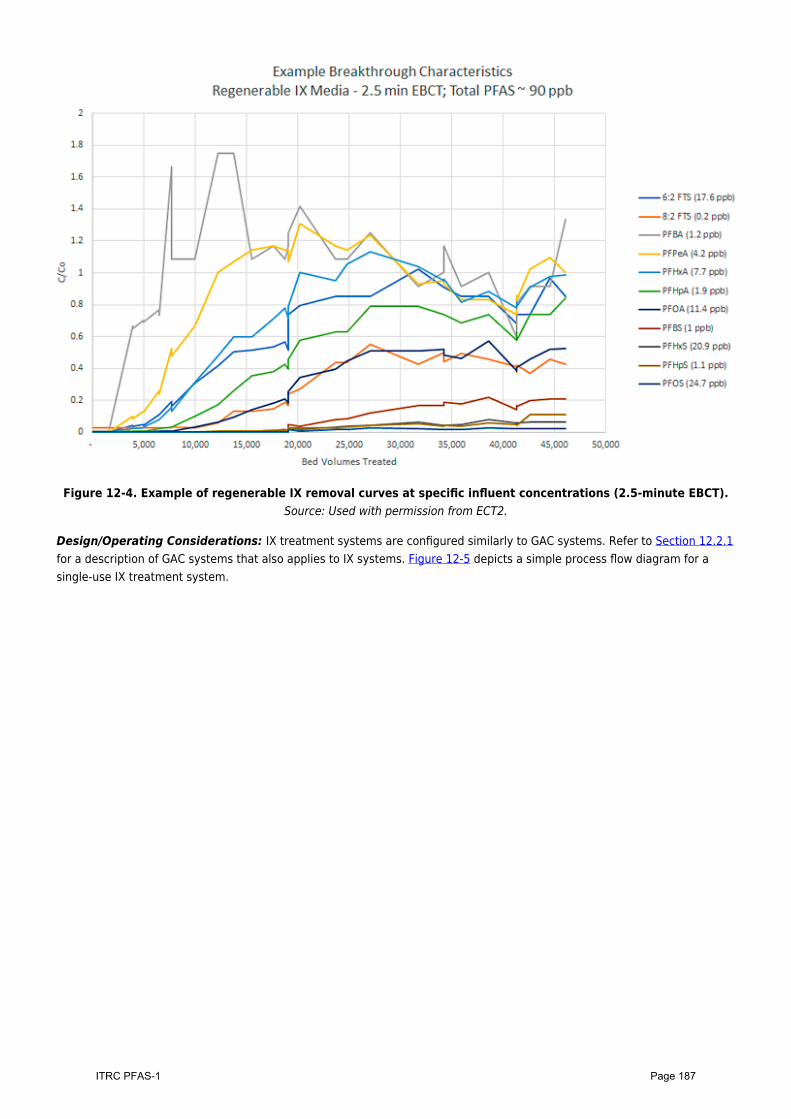
Figure 12-4. Example of regenerable IX removal curves at specific influent concentrations (2.5-minute EBCT).Source: Used with permission from ECT2.
Design/Operating Considerations: IX treatment systems are configured similarly to GAC systems. Refer to Section 12.2.1for a description of GAC systems that also applies to IX systems. Figure 12-5 depicts a simple process flow diagram for asingle-use IX treatment system.
Page 187ITRC PFAS-1
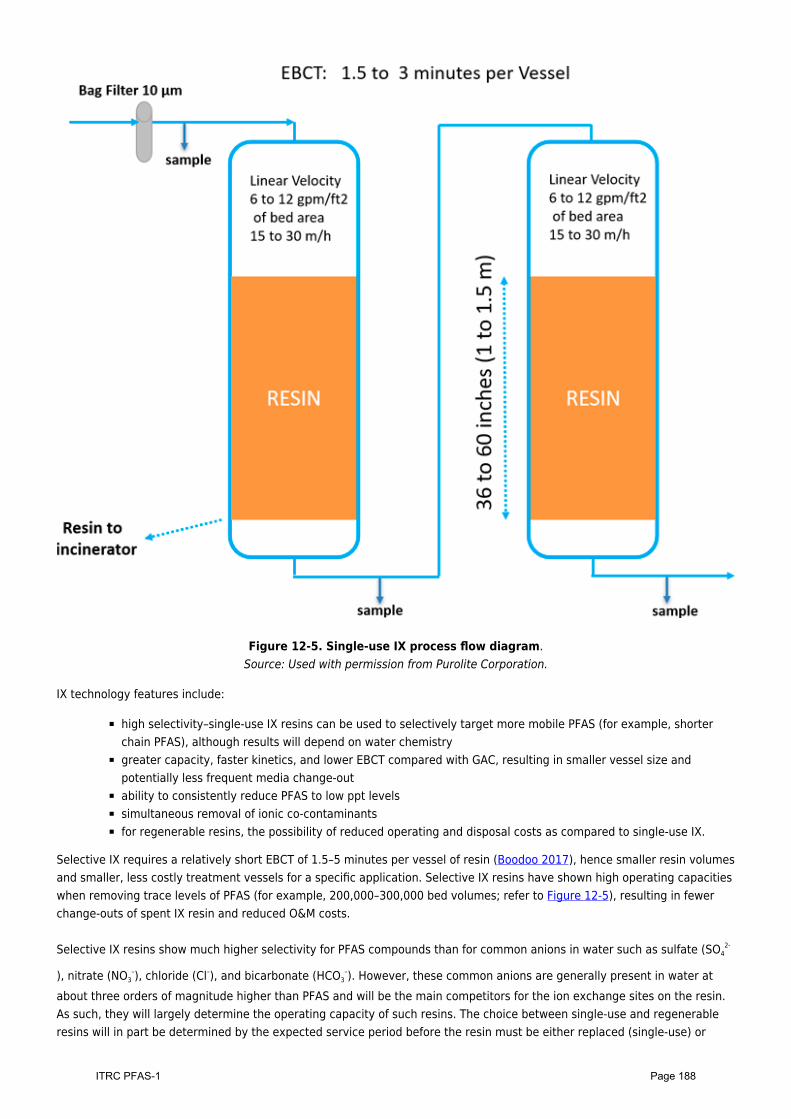
Figure 12-5. Single-use IX process flow diagram.Source: Used with permission from Purolite Corporation.
IX technology features include:
high selectivity–single-use IX resins can be used to selectively target more mobile PFAS (for example, shorterchain PFAS), although results will depend on water chemistrygreater capacity, faster kinetics, and lower EBCT compared with GAC, resulting in smaller vessel size andpotentially less frequent media change-outability to consistently reduce PFAS to low ppt levelssimultaneous removal of ionic co-contaminantsfor regenerable resins, the possibility of reduced operating and disposal costs as compared to single-use IX.
Selective IX requires a relatively short EBCT of 1.5–5 minutes per vessel of resin (Boodoo 2017), hence smaller resin volumesand smaller, less costly treatment vessels for a specific application. Selective IX resins have shown high operating capacitieswhen removing trace levels of PFAS (for example, 200,000–300,000 bed volumes; refer to Figure 12-5), resulting in fewerchange-outs of spent IX resin and reduced O&M costs.
Selective IX resins show much higher selectivity for PFAS compounds than for common anions in water such as sulfate (SO42-
), nitrate (NO3–), chloride (Cl–), and bicarbonate (HCO3
–). However, these common anions are generally present in water atabout three orders of magnitude higher than PFAS and will be the main competitors for the ion exchange sites on the resin.As such, they will largely determine the operating capacity of such resins. The choice between single-use and regenerableresins will in part be determined by the expected service period before the resin must be either replaced (single-use) or
Page 188ITRC PFAS-1
regenerated.
Regenerable IX resin can be reused for many years if protected from contact with strong oxidizing agents, foulants, andchemical/mechanical stresses. To date, insufficient operating data are available for PFAS regenerable systems to understandthe long-term durability of regenerable resin because the first regenerable IX systems were installed in 2018. IXregeneration is a chemical process. The only field-demonstrated regeneration method capable of fully restoring PFASremoval capacity is a proprietary process using a solvent-brine solution, where the brine dislodges the ionic head of thePFAS molecule and the solvent desorbs the fluorinated carbon chain (or “tail”) from the IX resin (Woodard, Berry, andNewman 2017; Amec Foster Wheeler 2017). For a regenerable IX system, it is possible to concentrate the regenerantsolution and reuse it by distillation (Nickelsen and Woodard 2017). The distillate residue then contains a concentrated PFASwaste that can be super-loaded onto specialized resin to create a small volume of solid waste that can be managed by off-site thermal destruction or through on-site destruction using other technologies currently under development and discussedin Table 12-1 (provided as separate PDF) (for example, plasma or electrochemical destruction).
Sustainability: Resin ex situ PFAS water treatment systems have unique sustainability considerations in addition to thoseshared with other ex situ PFAS sorption media water treatment systems. Major sustainability costs unique to resin systemsare associated with;
raw material collection and transportationresin manufacturing and transportationregeneration of multiple-use resingeneration, use, and disposal or destruction of regeneration residualsspent single-use and, eventually, multiple-use media transportation followed by destruction or disposal.
12.2.2 Reverse Osmosis (RO)RO is a technology used to remove a large majority of contaminants (including PFAS) from water by pushing the water underpressure through a semipermeable membrane as described below. The most common membrane module configuration isspiral-wound, which consists of flat sheet membrane material wrapped around a central collection tube.
Treatment Description: RO membranes are effective in removing most organic and inorganic compounds from watersolutions. In recent years, new polymer chemistry and manufacturing processes have improved efficiency, loweringoperating pressures and reducing costs. As a result, RO membranes are increasingly used by industry to concentrate orremove chemicals. RO is commonly used around the world in household drinking water purification systems, the productionof bottled mineral water, self-contained water purification units (for example, for branches of the U.S. military), andindustrial applications (for example, water supply to cooling towers, boilers, and deionized water). The largest application ofRO is in desalination.
Treatment Mechanism: RO removes compounds from water solutions by passing pressurized water across asemipermeable membrane. Treated water (permeate) passes through the membrane and the rejected water (concentrate) iscollected for disposal or discharge, depending on the nature of the compounds present.
State of Development: RO has been studied in bench-scale studies and pilot plants for wastewater and drinking waterapplications, offering the opportunity to compare both treatments operating simultaneously (Tang et al. 2006; Tang et al.2007; Flores 2013; Glover, Quiñones, and Dickenson 2018; Dickenson 2016; Merino et al. 2016; Appleman 2014; Snyder2007). This allows for an understanding of the effectiveness of traditional drinking and wastewater treatment methodsalongside PFAS-specific technologies.
Effectiveness: Pretreatment is important when working with RO membranes. Membranes are highly susceptible to fouling(loss of production capacity) because some accumulated material cannot be removed from the membrane surface.Therefore, effective pretreatment to remove suspended solids is a necessity for any RO system. Pretreatment technologieswould be specific to the RO feedwater quality.
RO removal of PFAS from various waters (for example, semiconductor wastewater, drinking water, surface water, andreclaimed water) has been studied and several studies have combined RO with nanofiltration (NF). NF is discussed in Section12.4.3. PFOS removal > 99% was achieved using four different types of membranes over a wide range of feedconcentrations (0.5–1,500 ppm [mg/L]) (Tang et al. 2006). Another study by Tang et al. (2007) tested five RO and three NFmembranes at feed concentrations of 10 ppm PFOS over 4 days. The PFOS rejection and permeate flux performances were
Page 189ITRC PFAS-1
> 99% for RO and 90–99% for NF (note that 99.9993% removal would be required to reduce 10 ppm to the USEPA healthadvisory of 70 ppt). The use of RO and NF as advanced drinking water treatments is still limited, but both technologies havebeen shown to be successful for the removal of longer chain (> C5) PFAAs (Loi-Brügger et al. 2008; Tang et al. 2006).
Thompson et al. (2011) studied the fate of perfluorinated sulfonates (PFSAs) and carboxylic acids (PFCAs) in two waterreclamation plants that further treat water from wastewater treatment plants (WWTPs) in Australia. One plant (Plant A) usedadsorption and filtration methods alongside ozonation; the other (Plant B) used membrane processes and an advancedoxidation process to produce purified recycled water. At both facilities, PFOS, perfluorohexane sulfonate (PFHxS),perfluorohexanoate (PFHxA), and PFOA were the most frequently detected PFAS. Comparing the two reclamation facilities,Plant A showed some removal during the adsorption/filtration stages. Overall, however, Plant A failed to completely removePFOS and the PFCAs shorter than PFNA in chain length. All PFAS present were removed by RO at Plant B from the finishedwater to concentrations below detection and reporting limits (0.4–1.5 ng/L).
Design/Operating Considerations: This section refers to design and operating considerations for both RO and NFsystems. In the process of planning and implementing a membrane filtration system, there are several important issues thataffect system design and operation and could impact system performance and thus PFAS removal. These issues includemembrane flux, water quality, and temperature.
Membrane Flux: One of the major challenges in the application of membrane technology is fouling (significantflux loss due to continuous accumulation of colloidal and organic matter, precipitation of inorganic salts, and/ormicrobial growth). There are several ways to avoid fouling: (1) changing operating conditions, (2) modifying themembrane, and (3) modifying the feed by adding antifoulants prior to filtration system (pretreatment) (Roux etal. 2005). Adequate pretreatment and appropriate membrane selection can slow the fouling rate, but themembrane cleaning is an essential step in maintaining the performance of the membrane process. Membranereplacement is a necessary part of plant operation to maintain the quality of the produced water (Abdul-KareemAl-Sofi 2001). Although there are a number of cleaning techniques, such as physical or chemical or acombination of both, only the chemical cleaning methods are widely used by NF and RO industries for membranecleaning and regeneration. Spent cleaning solution may contain PFAS and would need to be managed properly.Water Quality: Because water quality can have a significant impact on membrane flux, feedwater quality isalso a primary design consideration for membrane filtration systems. Poorer water quality will require lowerfluxes, which in turn increase the necessary membrane area and required number of modules, adding to boththe cost and the size of the system. However, pretreatment can often improve feedwater quality at a lower costthan additional membrane area.Temperature: Like other water quality parameters such as turbidity and total dissolved solids (TDS) (for NF/ROsystems), the temperature of the feedwater also affects the flux of a membrane filtration system. Waterbecomes increasingly viscous at lower temperatures; thus, lower temperatures reduce the flux across themembrane at constant transmembrane pressure or alternatively require an increase in pressure to maintainconstant flux. Because rejection decreases as membrane pores expand at higher temperatures, more leakage ofPFAS across the membrane could occur at higher operating temperatures.
Sustainability: The environmental footprint for this technology includes energy source and consumption during treatmentsystem operation, as well as manufacturing/disposal of pretreatment/treatment media (examples may include solids fromupstream precipitation/coagulation or microfiltration, used cartridge filters, and worn RO membrane modules) and cleaningsolutions to maintain the membrane. RO requires power for high-pressure pumps and the management of concentrate,which can be energy-intensive.
An issue inherent to contaminant removal by membrane processes is the disposal of the PFAS-enriched concentrate, whichmust be carefully considered. Development of effective treatment methods for the concentrate entails evaluating significantparameters, such as volume generated, concentration, characteristics of the feedwater, and operational conditions, andusing well-verified analytical methods to detect trace amounts of contaminants. Recycling concentrate to main treatmentunits is not the only option, and further research on integrated treatment systems must be performed (Joo and Tansel 2015).Recent studies show that wastes containing emerging contaminants such as PFOS and PFOA from RO concentrate stillrequire incineration (Hartten (Hartten 2014; MDH 2014; Vecitis et al. 2009).
12.2.3 Drinking Water ApplicationsRemedial actions for PFAS-impacted drinking water from private wells and municipal supplies can include providingalternative drinking water sources, such as bottled water, new nonimpacted source wells or surface water, point of entry
Page 190ITRC PFAS-1
(POE) treatment (also referred to as POET), and point of use (POU) treatment. POE treats water as it enters a home orbuilding (for example, immediately after a pressure tank for a private well system) and POU treats water at one or morespecific locations (for example, at a kitchen faucet where water is typically directly ingested or used for cooking). POEsystems provide “whole supply” treatment while POU provides selected usage point treatment.
NSF International has developed a testing method and protocol, P473: Drinking Water Treatment Units–PFOA and PFOS, toverify the ability of a water treatment device to reduce PFOA and PFOS to achieve the USEPA health advisory levels of 70ng/L (NSF International 2018). This method does not evaluate the removal of other PFAS or other organics, metals, andnonorganic compounds that also may adversely impact water supplies. Current systems with this certification are mainlysmall-scale POU systems such as sink faucet filters, refrigerator water filters, and pour-through filters. It should berecognized that although this certification exists, it is not required. This means that other POU systems as well as POEsystems (larger well head or large public-serving systems) may not be certified under NSF P473 but may be acceptable fortreatment of PFOA and PFOS. Public serving system components are required to be certified through NSF 61, which certifiesthat they are acceptable for potable water use. Treatment for PFAS in these systems typically uses adsorbents, GAC(Section 12.2.1.1) or IX (Section 12.2.1.2) or RO (Section 12.2.2).
12.3 Field-Implemented Solids Treatment TechnologiesField-implemented technologies are those that have been implemented in the field by multiple parties at multiple sites andthe results have been documented well in the peer-reviewed literature. The technologies in this section may be applied to avariety of PFAS-impacted media, including soil, sediments, or sludge. Site-specific evaluation is always needed to identify thebest technology alternative for a given treatment scenario. As with water treatment, solids treatment can be performed exsitu (for example, excavation or dredging) or in situ (for example, injection or reactive capping). At present, field-implemented solids treatment has been performed almost entirely ex situ. There are currently two known field-implementedtechnologies for treating soil contaminated with PFAS: sorption/stabilization and excavation/disposal.
12.3.1 Sorption and StabilizationTreatment Description: Amendments are added to the soil and sediment to reduce the potential for PFAS to mobilize fromsoil and sediment to groundwater and surface water. For sorption purposes, PFAS-adsorbing materials (for example,activated carbon) can be applied through in situ soil mixing or ex situ stabilization (for example, pug mill mixing) to reducethe leachability of PFAS from contaminated soil/sediment through physical and/or chemical bonding.
Sorption and stabilization (considered “immobilization” or “chemical fixation” technologies) is a relatively quick, simple, andlow-cost (relative to off-site disposal) way to reduce ongoing PFAS contamination transport to waterways and groundwaterfrom source zones. The main disadvantage is that these technologies do not destroy the contaminants, but rather bind orimmobilize them. For some amendments, established test methods have shown the binding to be stable over the long-term(see below).
Treatment Mechanism: Amendments adsorb or stabilize PFAS to reduce their release from soil. This occurs primarilythrough electrostatic interactions between the negative charge on the PFAS functional group and the positive charges on thesorbent and hydrophobic interactions between the amendment and the electronegative carbon-fluorine chain on the PFAS.Typical amendments that have been demonstrated in the field include activated carbon and composite materials such as ablend of aluminum hydroxide, kaolin, and carbon specifically designed to treat anionic, cationic, and zwitterionic long- andshort-chain PFAS (Kempisty, Xing, and Racz 2018).
State of Development: Sorption and stabilization techniques using carbon-based amendments are considered field-implemented technologies. Various amendments have been applied to soil/sediment both in situ and ex situ. Differentdelivery methods for amendments, such as injection or in situ mixing (ISM), may provide different results depending ongeology and objectives. Carbon amendments have been modified to enhance their sorption of PFAS. One patentedamendment consists of activated carbon enhanced with amorphous aluminum hydroxide, kaolin clay, and other proprietaryadditives (USEPA 2017p). This amendment has been used to immobilize PFAS-impacted soil at field-scale in Australia andEurope and at laboratory-scale in the United States. In 2015, a large-scale project involved the ex situ treatment of 900 tonsof PFAS-impacted soil from an airport site in Australia (Stewart 2017).
Effectiveness: Carbon- and mineral-based sorption and stabilization techniques vary in their effectiveness according to siteconditions, PFAS types, and mixing approaches. The PFAS characteristic that determines sorption is length of carbon-fluorinechain, with longer chains having increased sorption (Xiao, Ulrich, et al. 2017).
Page 191ITRC PFAS-1
Some specifically designed amendments have the ability to bind short- and long-chain compounds using differentmechanisms (Stewart, Lawrence and Kirk 2016). The carbon component binds to the hydrophobic backbone of longer chainPFAS, while the negatively charged functional groups of the PFAS anions bind electrostatically to the positively chargedsurfaces of aluminum hydroxide. Furthermore, the amorphous form of aluminum hydroxide presents a relatively high surfacearea of positive charges, and the pKa of around 9.1 means that these surfaces remain positively charged over a wideenvironmental pH range (~pH 3 to pH 9.1). The kaolin component contains some negatively charged surfaces thattheoretically have the ability to sorb PFAS cations and zwitterions (Stewart, Lawrence and Kirk 2016; Kempisty, Xing, andRacz 2018). However, standard analytical methods do not quantify cations and zwitterions, and actual field performance onthese PFAS compounds is generally undemonstrated.
The charge on the PFAS compounds affects sorption (for example, cations sorb more readily than zwitterions and anions).Aquifer and soil chemistry also affect the sorptive ability of PFAS onto the amendments. High organic content in soil canreduce effectiveness (NGWA 2017). Low pH, the presence of polyvalent cations in the soil, or treatment amendment alsoincreases sorption, retardation, and metals precipitation. An independent study at the University of Adelaide, Australia,showed that environmental ranges of pH and ionic strength did not adversely affect the binding of a specialized amendmentto PFOA (Lath et al. 2018). Co-contaminants also play a role in the effectiveness of PFAS sorption. A recent review article (Li,Oliver, and Kookana 2018) showed that the organic carbon component of natural soils and sediments plays less of a role inPFAS sorption than once thought; the mineral component of the soil/sediment and the pH conditions play a more importantrole in PFAS adsorption.
A patented amendment consisting of activated carbon blended with amorphous aluminum hydroxide, kaolin clay, and otherproprietary additives has been field-implemented and was used to successfully immobilize 28 PFAS analytes in more than 14different contaminated soils in a lab-based trial from fire training grounds across Australia (Stewart and MacFarland 2017).At average addition rates of around 2.5-5%, PFOS and PFOA in soil leachates were reduced by 95% to >99% following a 48-hour treatment process.
Sorption and stabilization do not destroy PFAS, and these technologies have not been implemented for enough time todemonstrate long-term stability of amendments for PFAS. However, in independent studies, the Multiple ExtractionProcedure (MEP; USEPA Method 1320) has been used to successfully demonstrate the simulated long-term stability ofimmobilized PFAS in amended soils (Stewart and MacFarland 2017). The MEP is designed to simulate 1,000 years of acid rainconditions in an improperly designed sanitary landfill. In another independent study, the accumulation of PFAS inearthworms and plants was reduced by >90% in soil treated by carbon-based immobilization compared to untreated soils(Bräunig 2016; Kempisty, Xing, and Racz 2018). The amended soil can be mixed with concrete and other stabilizers toimprove performance; however, the concrete increases pH and may influence binder performance (Ross et al. 2018).
Design/Operating Considerations: To establish design and application parameters for implementation of sorption andstabilization technology in soils, it is necessary to perform site-specific laboratory and/or pilot treatability tests. Informationand quantity of amendment material required (dose rates) for materials can be determined with either simple beaker or jar-type lab treatability tests. These studies are most applicable if site soils and water are used to ensure that the effects of site-specific geochemical characteristics are assessed. Once the dose of amendment material is determined, field pilot studiesare often conducted to validate lab data and design for full-scale implementation.
For in situ soil mixing, the amendments are added to soils at the design dose or application rate under controlled conditionswith specific types of equipment designed to perform mixing. In situ soil mixing can be performed on soils in place with awide range of standard construction equipment, including excavators, large diameter augers, and in situ blenders. Inaddition, with in situ soil mixing, soils can be removed and mixed in equipment such as a pug mill or other similar mixingsystems.
After implementation of in situ soil mixing, it is important to perform postconstruction quality assurance and quality controlto verify design endpoints. This may include leachability (Toxicity Characteristic Leaching Procedure (TCLP), USEPA Method1311; Synthetic Precipitation Leaching Procedure (SPLP), USEPA Method 1312; or Multiple Extraction Procedure (MEP),USEPA Method 1320), hydraulic conductivity (ASTM D5084), and strength tests (various).
Sustainability: The environmental footprint for sorption and stabilization includes emissions from earthwork equipment,manufacturing, and transporting amendment material. This footprint can be smaller than excavation if the treated soil isreused on site. Community impacts include hindrance of redevelopment due to land use restrictions. However, if the landuse is not expected to change, such as on active government-owned aviation or military sites, stabilization with
Page 192ITRC PFAS-1
amendments and reuse of the soil may be a viable and cost-effective approach.
Resources are available for performing a sustainability assessment for sorption and stabilization remedial design, relating toother contaminants (Goldenberg and Reddy 2014; Hou et al. 2016; Kuykendall and McMullan 2014).
12.3.2 Excavation and Disposal
Soil ContainmentThe focus of this section is to summarizethe state of various remediation technologies. Containment isnot listed as a specific technology but is commonly utilized forother contaminants and may be suitable for PFAS dependingon site-specific conditions.
Containment could include capping to prevent infiltration orexposure, construction of a slurry wall (or similar isolationbarrier), addition of sorptive media to prevent migration, orlandfill disposal (discussed further in this section and inSection 2.6.3.1). Containment options will depend on site-specific considerations, nature of PFAS materials, and localregulatory requirements.
Treatment Description: This approach involvesremoving contaminated soil/sediment for off-sitedisposal. The contaminated material is disposed of at apermitted landfill, then the excavated area is filled withclean backfill. Treatment with stabilizing agents canreduce PFAS leachability from excavated soils andshould be considered prior to landfilling. Sometimes,excavated soil/sediment can be treated on site usingthe sorption and stability approach or thermaltreatment (as discussed in the next section) followed bysoil reuse or off-site disposal.
Treatment Mechanism: This method is intended toremove PFAS from the source location. Transportationand disposal in a lined landfill is an option for excavatedsoil; however, leachate management should be aconsideration at these facilities. In addition, thepotential for future long-term liability related to soilsdisposed of at an off-site landfill should be taken intoconsideration.
State of Development: Soil excavation and disposal is a well-demonstrated, proven technology. However, PFAS have beenreported in landfill leachate (Lang et al. 2017), although the source for PFAS in leachate may be consumer product wastecontaining fluorochemicals. In some states, the leachate is not analyzed or regulated for PFAS. Disposal of PFAS waste tolandfills potentially adds to the PFAS contaminant load in the landfill leachate. Some nonhazardous waste landfills do notaccept PFAS waste.
Effectiveness: Excavation and disposal of PFAS-contaminated soil effectively removes a source area that may otherwiseserve as a continuing source of groundwater contamination but does not result in destruction of the PFAS unless the soil isincinerated. Disposal of PFAS-impacted soils or wastes into unlined landfills should be avoided as unlined or improperly linedlandfills can be sources of PFAS to the environment.
Design/Operating Considerations: Difficulties in finding landfills willing to accept the waste, coupled with rapidlychanging regulations regarding whether PFAS are hazardous or not, make this option less straightforward than one wouldexpect. Case-by-case inquiries to landfill facility owners is likely the best course of action. Overall, issues related to disposalof PFAS in landfills are similar to issues commonly encountered with other contaminants. See Section 2.6.3, Solid WasteManagement, for additional discussion on this topic.
Sustainability: The environmental footprint for excavation and disposal or incineration includes earth-moving equipmentemissions, transporting contaminated soil and backfill, and resource extraction (such as borrow area fill material) of backfillmaterial. Incineration of the contaminated soil and investigation-derived waste (IDW) is energy-intensive. Truck haulingtraffic affects the local community by creating additional traffic congestion, noise, and particulate matter emissions. The costfor this approach is high, but the solution is generally permanent and for smaller treatment volumes may be cost-competitive. Guidance is available for performing a sustainability assessment for an excavation and disposal remedial design(Cappuyns and Kessen 2013; Goldenberg and Reddy 2014; Söderqvist et al. 2015; Song et al. 2018).
12.3.3 IncinerationTreatment Description: Incineration is defined as destruction (mineralization) of chemicals using heat. Heat is applieddirectly to the PFAS-contaminated solids (soil/sediment/waste) or liquids (water/wastewater/chemicals). Vaporizedcombustion products can be captured (precipitation, wet scrubbing). Incineration can also be applied directly to liquids(water/wastewater/chemicals), although that is not the focus of this section.
Page 193ITRC PFAS-1
State of Development: Incineration is a mature technology that has been used for various solid wastes.
Effectiveness: Incineration is one of the few technologies that destroys PFAS. However, questions remain regardingproducts of incomplete combustion, stack gas analysis, and other factors.
Design/Operating Considerations: Hazardous waste incinerators are fixed facilities. Federal and state permits dictate thematerials processed, core incinerator operations (for example, temperature and time), and control of process air, liquid, andsolid wastes. Permit and design/construction similarities reduce the operational and performance differences betweenindividual incinerators.
Transportation costs, energy costs, and final disposition of process waste residues differ among incinerators. These can beused during waste disposal decisions; they also impact treatment pricing.
Sustainability: The environmental footprint for incineration includes earth-moving equipment emissions, transportingcontaminated soil and backfill, and resource extraction (such as borrow area fill material) of backfill material. Incineration ofthe contaminated soil and IDW is energy-intensive and PFAS emissions, including potential PFAS combustion byproducts,from incinerators are currently not well understood. Truck hauling traffic affects the local community by creating additionaltraffic congestion, noise, and particulate matter emissions. The cost for this approach is high, but the solution is generallypermanent and for smaller treatment volumes may be cost-competitive.
12.4 Limited Application and Developing Liquids Treatment TechnologiesThe treatment technologies presented in this document are provided in a hierarchy defined in Section 12.1, which is basedon level of implementation and confidence derived from widespread, well documented implementation. The threedevelopment levels include field-implemented technologies, limited application technologies, and developing technologies.Both in situ and ex situ technologies are included. It is not always clear if a limited application or developing technology maybe effective in situ, ex situ, or both; therefore, further distinction is not made in this section.
The field-implemented technologies described in the preceding sections have been applied at multiple sites and are welldocumented in the available literature. In addition to these well-demonstrated technologies, many technology approacheshave been tested in academic and other research laboratories at the bench scale or have progressed as far as field pilottests or limited field applications. These limited application technologies are briefly summarized Table 12-1 for liquids, Table12-2 for solids (provided as a separate PDF), and appropriate references are provided. Additional information is provided inthe following summary sections.
12.4.1 Sorption Summary
12.4.1.1 In Situ Remediation with Colloidal Activated CarbonColloidal activated carbon (CAC) consists of colloidal-sized particles (2 microns diameter on average) in aqueous suspension(the consistency of black-colored water), which can flow into aquifer flux zones upon gravity-feed or low-pressure injection.After injection, CAC particles will attach strongly to the aquifer matrix, where they can act as passive sorbents for organiccontaminants, including PFAS. This sorption mechanism is detailed in the Section 12.2.1. Due to the small size of theparticles, the kinetics of PFAS sorption on colloidal carbon are much faster than can be achieved with GAC, resulting inhigher removal efficiencies (Xiao, Ulrich, et al. 2017). The primary function of injectable CAC is to immobilize contaminantsand prevent their further horizontal and vertical migration in groundwater, thereby eliminating the risk to downgradientreceptors. By flowing CAC into the flux zones of an aquifer, contaminants moving through the aquifer, as well as thosecontaminants back-diffusing from lower permeability zones, are captured and taken out of solution.
CAC may be injected in situ using a grid pattern in source zones to immobilize contaminants, or it may be injected in atransect pattern perpendicular to the width of a plume to mitigate contaminant flux. Direct push or vertical wells can beused to inject CAC into the subsurface. The longevity will be dependent upon PFAS composition, rates of mass discharge,presence of co-contaminants, and groundwater geochemistry.
McGregor (2018) discussed the in situ injection of CAC at a site in central Canada to mitigate mass flux of PFOS and PFOAfrom the source zone. Fire training exercises were carried out at the site in the 1970s and 1980s. Prior to CAC injection,PFOS and PFOA were measured in groundwater monitoring wells at concentrations up to 1,450 ng/L and 3,260 ng/L,respectively. Monitoring wells at the site were screened in a shallow, thin silty sand overburden unit at depths ofapproximately 5–10 feet below ground surface. CAC was injected into the source zone at low pressure through temporary
Page 194ITRC PFAS-1
wells installed using direct push technology. Postinjection core sampling indicated that CAC was measured at distances of upto approximately 15–20 feet from the injection wells.
Carey et al. (2019) performed modeling with respect to the above site to predict the theoretical longevity and performanceof the CAC. The study noted that longevity of performance could be extended by increasing the CAC dose, increasing thethickness of the treatment zone perpendicular to flow, or by additional injection upon breakthrough.
12.4.1.2 Coated SandPolymer-coated sand is an adsorbent material that has high affinity for organic contaminants. Cyclodextrin molecules arepolymerized by a cross-linking agent and form inclusion complexes with many organics. The adsorbent material has twocomponents: (a) polymer coat (active component that removes the contaminants) and (b) support base (inactivecomponent); the combination of both provides an adsorbent with high selectivity and mechanical stability.
Related Ongoing Research Funded by SERDP:
ER18-1652 Destruction of PFAS and Organic Co-Contaminants in Water and Soil Present in Investigation-DerivedWaste at DoD Sites Using Novel Adsorbent and Ultrasound
The adsorbent showed similar performance in removing PFOA and PFOS as GAC, but one of the key features of thistechnology is the high regenerability of the adsorbent (filter) for reuse (Bhattarai, Manickavachagam, and Suri 2014).Another important feature of the technology is that it can remove other organic pollutants such as chlorinated solvents (forexample, trichloroethene (TCE), perchloroethylene (PCE), hexavalent chromium, and others (Badruddoza, Bhattarai, and Suri2017). Surface modification has been shown to improve the adsorption of PFOS (Zhou, Pan, and Zhang 2013) by usingorganic polymeric surfactants.
12.4.1.3 Zeolites/Clay Minerals (Natural or Surface-Modified)Zeolites are naturally occurring aluminosilicate compounds that are widely used in chemical separation and purification dueto their high surface area and small uniform pore size among other properties (Tao et al. 2006). Zeolites are also beingincreasingly considered as a medium for the sorption of various pollutants, including cationic heavy metals, ammonium, andsome volatile organic compounds, due to the aforementioned properties, as well as their high ion exchange capacity and lowcost (Delkash, Ebrazi Bakhshayesh, and Kazemian 2015). Clay minerals, including natural and surface-modified (see below),are also used as adsorbents and are similar to zeolites in composition but have different crystalline or chemical structure.
Both zeolites and clay minerals can be used ex situ (that is, pump and treat) by being placed in packed-bed flow-throughvessels or in situ via injection into aquifers. In situ applications are currently lacking in study or field application.
Zeolite and clay minerals use both ion exchange and adsorption mechanisms to remove PFAS from water. For removal ofPFAS, these natural materials have been shown to be inferior to activated carbon or ion exchange resins (Du et al. 2014).However, synthetic processing of zeolite can create highly siliceous material (Baerlocher 2007) or can incorporate cationicsurfactants into the surface structure (aka surface-modified zeolites–SMZ) (Jiménez-Castañeda and Medina 2017). One studyindicated that engineered zeolites with a high Si/Al ratio were effective at adsorption of PFOS, presumably due tohydrophobic interactions rather than ion exchange (Ochoa-Herrera and Sierra-Alvarez 2008). Surface-modified clay materialsare broadly considered organoclays.
Most available literature is limited to academic laboratory experiments (Ochoa-Herrera and Sierra-Alvarez 2008;Punyapalakul et al. 2013; Zhou, Pan, and Zhang 2013; Zhou et al. 2010). Du et al. (2014) and Arias Espana, Mallavarapu,and Naidu (2015) provided comprehensive literature reviews. Two modified clay-based adsorbent products are identified asbeing used in field pilots or small-scale field trial applications (Arias (Arias et al. 2013) et al. 2013; (Arias Espana,Mallavarapu, and Naidu 2015) to treat PFOA and/or PFOS.
High silica materials, such as H-form synthetic mordenite (HSM) and Y-form sodium zeolite (NA-Y80), and hydrotalcite clayprovided adsorption capacities that were equivalent or exceeded powdered activated carbon (PAC). Surfactant-modifiedclays also performed as well as or better than PAC. It should be noted that none of these studies were conducted in flow-through column experiments, so applicability to ex situ treatment systems cannot be assessed. Arias Espana, Mallavarapu,and Naidu (2015) stated that organoclays, clay minerals, and highly siliceous materials have fast kinetics (0.4–3 hr to reachequilibrium), making them suitable for remediation applications.
Page 195ITRC PFAS-1
12.4.1.4 BiocharBiochar is a hybrid word rooted in the words “biomass” and “charcoal.” Biochar is a carbon-rich porous solid that issynthesized by heating biomass, such as wood or manure, in a low oxygen environment (Ahmad et al. 2014). This materialhas primary applications for carbon sequestration, improvement of soil fertility, and most recently as an adsorbent forpollutant removal. Biochar is characterized to have high affinity for organic contaminants, which is dependent on both thepore structure and the surface functional groups of the biochar material (Guo et al. 2017).
Some of the key factors controlling the properties of biochar (for example, pore size composition and hydrophobicity) includethe temperature of pyrolysis and biomass feedstock, among others. In many respects, the properties of biochar are similarto but generally lower than those of GAC for sorptive purposes.
The available literature is limited to academic laboratory batch experiments on the bench-scale (Chen et al. 2011; Inyangand Dickenson 2017; Kupryianchyk et al. 2016; Rahman et al. 2014; Xiao, Ulrich, et al. 2017), with one published studyreporting pilot-scale column operation (Inyang and Dickenson 2017).
12.4.2 Precipitation/Coagulation/Flocculation SummaryPrecipitation/coagulation/flocculation is a common pretreatment approach used in wastewater treatment plants for removingvarious particles and dissolved constituents. Coagulants, either commodity or proprietary chemicals, can be added to water(conventional technology) or generated by anode-cathode reactions of metal plates inserted into the water(electrocoagulation). Common examples include:
inorganic cationic coagulants (for example, alum, iron-based)commodity (for example, polyDADMAC) and specialty (for example, Perfluorad) polymerselectrochemical precipitation
Coagulants assist in the formation of solids. Flocculation is typically conducted by adding a soluble polymer and slowlymixing to allow the particles to agglomerate and grow. Upon solid formation, constituents such as PFAS can be physicallyincorporated into, or sorbed onto, the flocculated particulate (which is known as co-precipitation). The precipitated solids arethen separated from the water by sedimentation and/or filtration processes. The solid material containing the PFAS requiresdisposal, see Table 12-2 for solids (provided as a separate PDF). See Section 12.3.2 for solids disposal options.
Current literature documents only bench-scale study results on treating PFAS via precipitation, flocculation, or coagulation;therefore, this is considered a partially developed technology. Evaluations have focused on conventional commoditychemical coagulation (for example, aluminum or ferric salts) and nonconventional coagulation (for example, proprietarychemical coagulants or electrocoagulation). Pilot- and full-scale applications have not been documented in the United States(Birk 2017).
Nonconventional precipitation (for example, electrocoagulation or advanced chemical precipitants) has shown morepotential for direct PFAS treatment, but has very limited data. High-affinity cyclodextrin polymer has been tested in bench-scale reactors and was found to have superior removal capacity to GAC (Xiao, Ling, et al. 2017).
Related Ongoing Research Funded by SERDP:
ER-2425 Development of a Novel Approach for In Situ Remediation of PFC-Contaminated Groundwater SystemsER18-1026 Rational Design and Implementation of Novel Polymer Adsorbents for Selective Uptake of PFASs fromGroundwater
Electrocoagulation reactors, which range from basic to very sophisticated designs, have been reported to be highly efficient,compact, relatively low cost, and completely automatable (Baudequin et al. 2011; Lin et al. 2015). Recent studies havefound that PFAAs, such as PFOA and PFOS, can be quickly sorbed on the surface of zinc hydroxide particulates generated byelectrocoagulation (Lin et al. 2015).
12.4.3 Nanofiltration (NF)NF is a form of membrane technology that is pressure-driven and shown to be effective in the removal of PFAS (Tang et al.2007). This method of filtration provides high water flux at low operating pressure (Izadpanah and Javidnia 2012).Nanometer-sized membrane pores are used to remove compounds in a process similar to RO, but NF does not removesmaller ions such as chloride and sodium. The most common membrane module configurations are spiral-wound (consistingof flat sheet membrane material wrapped around a central collection tube); however, hollow fiber NF modules may also be
Page 196ITRC PFAS-1
available for applications with higher fouling potential.
Available data on the removal of PFAS via NF consist of laboratory-scale tests performed on flat sheet membrane coupons(laboratory-scale sections of the membranes to be tested) and one full-scale drinking water treatment plant using an NFtreatment train. Therefore, variations in performance due to fouling, flux, and concentration distributions in standard spiral-wound membrane configurations have not been characterized (Boo et al. 2018).
NF membranes tested include the DuPont (formerly Dow FilmTec) membranes NF-270, NF-200, and NF-90, and the SUEZ(formerly GE Water & Process Technologies) DK membrane. Reported rejections were generally > 95% for PFAS withmolecular weights ranging from 214 grams per mole (g/mol) to 713 g/mol, though some compounds had lower rejections(PFPeA at 70% and perfluorooctane sulfonamide at 90%) (Steinle-Darling and Reinhard 2008; Appleman et al. 2013).Effective full-scale removal of PFAS by NF membranes was confirmed based on nondetectable PFAS concentrations (<4 ng/L)in NF permeate (Boiteux 2017). Salt passage for PFOS was reported to range from < 1% for the tighter NF-90 membrane toabout 6% for the looser NF-270 and DK membranes (Tang et al. 2007). As mentioned in Section 12.2.2, an appropriatedisposal or treatment of the membrane concentrate stream needs to be considered, especially the application of high-pressure membranes for inland communities.
12.4.4 Redox Manipulation SummaryRedox manipulation includes chemical oxidation and reduction technologies. These have been summarized in more detail inNzeribe et al. (2019). Chemical oxidation for PFAS is a technology approach that is achieved via the delivery of liquid, slurry,or gaseous oxidants to transfer electrons from a reactive oxidant species to a target (PFAS) and affect the cleavage of atomsin the PFAS molecular structure. Carboxylic or sulfonic group “heads” (functional groups) of PFAS are commonly moresusceptible to redox transformation than the fluorinated carbon chain “tails.” There is currently a lack of robust evidence ofdefluorination via chemical oxidation processes. The mechanisms involving multiple species of free radicals that trigger PFASoxidation are not well understood. PFAA precursors are also known to be oxidized to form persistent and terminal PFAAswithout further oxidation (Houtz and Sedlak 2012; Anumol et al. 2016). Consequently, care should be taken to monitor siteand plume conditions and understand potential formation and transport of transformation products.
Additional mechanistic studies are needed to develop chemical oxidation as a feasible PFAS remediation approach and tofurther assess factors that may promote or limit this technology. Common oxidants that have been documented to treatPFAS and other organic contaminants (for example, chlorinated solvents) include ozone, catalyzed hydrogen peroxide, andpersulfate, as discussed further below.
12.4.4.1 Ozone-Based SystemsOzone can be coupled with other oxidants such as hydrogen peroxide and persulfate to promote the generation of a suite ofaggressive free radicals capable of degrading PFAS. An ozone-based system was implemented for the treatment of PFAS in asingle field-scale test by Eberle, Ball, and Boving (2017) using combined ozone and activated persulfate.
The main pathway and mechanism behind the ozone-based system tested by Eberle, Ball, and Boving (2017) is unknown, asdetailed mechanistic studies have not been performed. However, they suggested that PFAS reduction in groundwater aftertreatment was not limited to partial degradation, but it is possible that sorption also had a role to play in the decliningaqueous PFAS concentration. They postulated that activated persulfate could lead to a decline in pH, thereby increasingsorption of PFAS to soil due to increased protonation.
This approach has been partially demonstrated in one field-scale setting, and results are encouraging for application usingex situ or in situ approaches. However, because there is an absence of supporting mechanistic data, it is likely that otherfactors could come into play that may promote or limit this technology.
The application of the ozone-based system for the treatment of PFAS has also been evaluated in bench studies (Lin,Panchangam, et al. 2012; Kerfoot 2014; Huang et al. 2016; Eberle, Ball, and Boving 2017). Lin, Panchangam, et al. (2012)used an ozone system without and inclusive of hydrogen peroxide addition in an alkaline environment, and Kerfoot (2014)used hydrogen peroxide and ozone bubbles for a bench-scale test of groundwater from a monitoring well foam firefightingsite in Canada. Huang et al. (2016) combined ozone with photolysis to produce hydroxyl radicals and photogeneratedelectrons.
In the field demonstration, PFAS concentrations in groundwater were reduced by 21–79% after treatment. Also, an initialpilot test at a fire training area using ozone and peroxide has shown removal of 98.5% and 92.3% for PFOS and PFOA,
Page 197ITRC PFAS-1
respectively, in groundwater and over 80% for PFOS on saturated soil with proportional release of fluoride (Kerfoot 2016).
In bench-scale studies, Eberle, Ball, and Boving (2017) decreased PFAS by 99.9% using PFAS-contaminated site groundwaterand spiked deionized water. Eberle, Ball, and Boving (2017) also reported that the system was not sensitive to othergroundwater organics. Kerfoot (2014) reported 89.8% removal of PFOS and > 80% for other PFAS (PFPeA 89.8%, PFHxA86.2%n and PFHxS 98.1%). These studies, however, do not confirm destruction through mass balance and analysis ofbyproducts.
Each of these approaches and test conditions used different water matrices and starting concentrations. It is difficult to statewhether current regulatory levels can be achieved in practice with these technologies, but in general they appear to beeffective as a polishing technology to achieve low part-per-trillion treatment requirements.
12.4.4.2 Catalyzed Hydrogen Peroxide (CHP)–Based SystemsCHP is one of the strongest oxidant systems used in environmental remediation. It involves reaction of hydrogen peroxidewith a catalyst to predominantly generate hydroxyl radicals. Some CHP systems produce nucleophiles and reductants,including superoxide and hydroperoxide (Mitchell et al. 2014). Common catalysts include transition metals such as iron(Fenton and Fenton-like reaction) or manganese, chelated metals, and naturally occurring minerals (for example, (Watts etal. 2005; Teel et al. 2007).
Hydroxyl radicals attack the alkyl groups of both PFCAs and PFSAs, but do not attack the perfluoroalkyl chain. As a result,PFCA and PFSA precursors are transformed to PFCAs of related perfluorinated chain length (Bruton and Sedlak 2017).Mitchell et al. (2014)demonstrated that superoxide and hydroperoxide (which are nucleophiles and reductants generated asa reaction in CHP but are not chemical oxidants) generated in alkaline pH CHP systems mineralize PFOA but did not elucidatea mechanism.
Bench-scale testing has been successfully demonstrated. Field deployment of hydroxyl radical-based CHP systems may belimited due to decomposition of PFAS precursors to PFOA and other PFCAs as unreactive transformation products (Brutonand Sedlak 2017).
CHP systems that predominantly generate hydroxyl radicals partially transform PFAAs to their PFCAs of relatedperfluorinated chain length, which are not further transformed (Houtz and Sedlak 2012; Bruton and Sedlak 2017). Systemsthat generate superoxide and hydroperoxide have been demonstrated at the bench test level to mineralize PFOA (Mitchell etal. 2014), but effectiveness with other PFAS is unknown.
12.4.4.3 Activated Persulfate
Persulfate anion (S2O82-) is activated to generate reactive radical species, primarily sulfate radicals (2.6 volts, or V) and
hydroxyl radicals (2.7 V). Methods to activate persulfate include transition metals, high pH, and heat activation (Siegrist,Crimi, and Simpkin 2011). Hydroxyl radicals are the predominant radicals formed at high pH conditions (Furman et al. 2011),while at acidic pH there is greater yield of sulfate radicals (Siegrist, Crimi, and Simpkin 2011).
PFCAs are attacked by sulfate radicals under acidic conditions, initiating a decarboxylation reaction, where cleavage of thecarbon-to-carbon (C-C) bonds occurs between PFCAs and the carboxyl group (-COOH), forming unstable perfluoroalkylradicals (CnF2n+1) (Hori et al. 2010; Lee et al. 2012; Yin et al. 2016). A stepwise series of decarboxylation and hydrogenfluoride (HF) elimination reactions continues to form shorter chain PFCAs until all PFCAs are mineralized to fluoride andcarbon dioxide. PFSAs such as PFOS are unreactive with sulfate radicals (Park et al. 2016; Bruton and Sedlak 2017). Hydroxylradicals attack the alkyl groups of both PFCAs and PFSAs, but do not attack the perfluoroalkyl chain. As a result, PFCA andPFSA precursors are transformed to PFCAs of related perfluorinated chain length (Bruton and Sedlak 2017). Under alkalinepH conditions the sulfate and hydroxyl radicals are reactive with the alkyl groups but similarly unreactive with theperfluoroalkyl chain, which is the basis of the TOP method (Houtz and Sedlak 2012).
Related Ongoing Research Funded by SERDP:
ER-2423 In Situ Treatment Train for Remediation of Perfluoroalkyl Contaminated Groundwater: In Situ ChemicalOxidation of Sorbed Contaminants (ISCO-SC)ER201729 Field Demonstration to Enhance PFAS Degradation and Mass Removal Using Thermally EnhancedPersulfate Oxidation Followed by Pump-and-TreatER18-1545 Innovative Treatment of Investigation-Derived Waste Polluted with Per- and Polyfluoroalkyl Substance
Page 198ITRC PFAS-1
Contaminants and Other Co-Contaminants.
Activated persulfate under acidic conditions has proven effective for PFOA (PFCAs) with nominal 100% degradation, butPFOS is not transformed. Sulfate radicals and hydroxyl radicals generated by alkaline persulfate activation transform PFCAand PFSA precursors to PFCAs of related perfluorinated chain length (Bruton and Sedlak 2017).
12.4.4.4 Sonochemical Oxidation/UltrasoundThe sonochemical process relies on the propagation of acoustic waves in liquids at frequencies ranging between 20 kHz and1,000 kHz (Furuta et al. 2004), which results in cavitation. Operating parameters such as frequency (Campbell and Hoffmann2015), power density (Hao et al. 2014), solution temperature, sparge gas, and initial concentration of PFAS (Rodriguez-Freireet al. 2015) play a significant role in the sonochemical degradation and defluorination rate of PFAS.
Sonochemical degradation occurs via two mechanisms: localized thermal treatment and free radical destruction (Rayaroth,Aravind, and Aravindakumar 2016). During cavitation, cyclic formation, growth, and collapse of microbubbles result in anintense increase in temperature and pressure (5000 Kelvin (K) and 2000 atmosphere (atm)), along with the generation offree radicals (Furuta et al. 2004; Chowdhury and Viraraghavan 2009).
Sonochemical oxidation has been successfully applied for rapid degradation of PFAS to fluoride (F–), sulfate (SO42-) and
carbon dioxide (CO2). Vecitis et al. (2008) reported a complete recovery of SO42- and >90% defluorination of PFOA and PFOS
with initial concentrations of 0.24 µM and 0.20 µM, respectively, for a field-scale application to treat groundwater from belowa landfill. At bench scale, sonolysis has been reported in the literature as one of the most effective treatment processes for
PFAS-contaminated water, because they almost immediately mineralize to SO42-, CO2, carbon monoxide (CO), and F– after
cleavage of their C-C/C-S bond. Studies have reported >90 percent degradation and defluorination for PFOA and PFOS(Moriwaki et al. 2005; Vecitis et al. 2008; Cheng et al. 2008, 2010). Gole et al. (2018) demonstrated removal anddefluorination of AFFF in a 91-L sonolytic reactor.
12.4.4.5 Photolysis/Photochemical OxidationA thorough review of photolysis/photochemical oxidation technology for PFAS decomposition is reported in Wang, Yang, etal. (2017). Chen, Zhang, and Liu (2007) and Giri et al. (2011) reported removal of PFAS by direct photolysis at 185 nm. Horiet al. (2004) and Chen, Zhang, and Liu (2007) reported that direct photolysis at 254 nm alone is not very effective because
PFAS do not absorb light at wavelengths >220 nm due to their chemical structure. Chemical reagents/catalysts such as Fe3+,
S2O82−, TiO2, heteropolyacid photocatalyst (H3PW12O40), CO3
2−, and IO4− when combined with ultraviolet (UV) (>220 nm) light
can effectively decompose PFAS (Hori et al. 2005; Chen and Zhang 2006) (Zhang, Pan, and Zhou 2016; Hori et al. 2007;
Wang et al. 2008; Cao et al. 2010). This is due to generation of strong and reactive oxidative species such as OH•, H•, CO3•–
and PFAS-Fe complexes. Photochemical oxidation of PFAS is said to be dependent on the light source (UV or vacuumultraviolet), initial concentration of PFAS, environmental matrix, temperature, pH, and type of reagent used (Lin,Panchangam, et al. 2012; Giri et al. 2012; Lyu et al. 2015b, a; Xu et al. 2017).
Related Ongoing Research Funded by SERDP:
ER18-1595 A Combined Photo/Electrochemical Reductive Pathway Towards Enhanced PFAS DegradationER18-1513 Effective Destruction of Per- and Polyfluoroalkyl Substances in Water by Modified SiC-BasedPhotocatalystsER18-1515 A Cost-Effective Technology for Destruction of Per- and Polyfluoroalkyl Substances from DoDSubsurface Investigation-Derived WastesER18-1599 Pilot Scale Assessment of a Deployable Photocatalytic Treatment System Modified with BiPO4Catalyst Particles for PFAS Destruction in Investigation-Derived Wastewater
The major degradation pathways involved in the photochemical oxidation of PFAS are direct photolysis and free radicalreactions. The C-C bond between PFAS is cleaved with the COOH group to form perfluoroalkyl radicals (Hori et al. 2003; Horiet al. 2008), which then react with water and undergoes hydrogen fluoride elimination to form shorter chain compounds.These then undergo hydrolysis to form subsequent shorter PFAS (losing CF2 units). During direct photolysis, the C-C and C-Sbonds of PFAS are broken by photoelectrons to generate perfluoroalkyl radicals and carbon dioxide (Wang, Yang, et al.2017).
Page 199ITRC PFAS-1
12.4.4.6 Electrochemical TreatmentElectrochemical treatment occurs via anodic oxidation; a variety of materials have been used as anodes. The treatmenteffectiveness of PFOS and PFOA using different anodes can vary significantly. Most research on PFAS, particularly PFOS andPFOA removal, has been conducted using a boron-doped diamond (BDD) electrode due to its mechanical, chemical, andthermal stability (Trautmann et al. 2015; Schaefer et al. 2017). Some other electrodes, such as lead dioxide (PbO2), titaniumoxide (TiO2), titanium suboxide (Ti4O7), and tin oxide (SnO2), also have the ability to treat PFAS-contaminated water (Ochiaiet al. 2011; Zhou et al. 2012) (Zhao, Gao, et al. 2013; Liang 2017; Liang et al. 2018). Operating conditions and parameterssuch as pH (Lin, Niu, et al. 2012) }(Zhou et al. 2012), current density, electrolyte type (Song et al. 2010; Zhuo et al. 2012),electrode distance (Lin, Niu, et al. 2012), initial PFAS concentration, and temperature are important factors that influenceelectrochemical oxidation of PFAS (Niu et al. 2016).
Electrochemical treatment proceeds via direct and indirect anodic oxidation (Radjenovic and Sedlak 2015; Niu et al. 2016;Schaefer et al. 2018). In direct electrolysis, contaminants are adsorbed onto and degraded directly at the electrode, while inindirect electrolysis, contaminants are degraded in the bulk liquid in reactions with oxidizing agents (that is, hydroxylradicals) formed at the electrode (Radjenovic and Sedlak 2015).
Bench-scale studies have shown success in the degradation and defluorination of PFAS, including short-chain, long-chainPFAAs as well as PFAA precursors (Chiang 2018). Electrochemical oxidation of precursors may lead to the transientgeneration of perfluorinated carboxylates (Schaefer et al. 2018). Ultimately, fluoride is released, with typical recoveriesranging from 60 to 80%; the fate of the remaining fluoride is unknown, but studies have suggested that losses due tovolatile perfluorinated alkanes may occur. Currently, technology has not been tested for PFAS-laden water with low PFASconcentrations. However, it has been tested as a stand-alone technology for PFAS concentrations at ppb levels and as adestruction technology to destroy concentrated PFAS waste streams generated from other treatment technologies such asion exchange resin and ozofractionation (Liang et al. 2018; Chiang 2018). It has been partially demonstrated as an ex situtreatment of PFAS. But in situ application is also being considered and funded in the SERDP program. The issue ofperchlorate formation as a byproduct during electrochemical oxidation of PFAS has been addressed by Schaefer et al. (2017)using a biological treatment polishing step. The issue can also be minimized by not using sodium chloride as the electrolyte(Chiang 2018).
Related Ongoing Research Funded by SERDP:
ER-2424 Investigating Electrocatalytic and Catalytic Approaches for In Situ Treatment of PerfluoroalkylContaminants in GroundwaterER-2718 Synergistic Treatment of Mixed 1,4-Dioxane and PFAS Contamination by Combining ElectrolyticDegradation and ElectrobiostimulationER18-1320 Electrochemical Oxidation of Perfluoroalkyl Acids in Still Bottoms from Regeneration of Ion ExchangeResinsER-2717 A Novel Reactive Electrochemical Membrane System for Treatment of Mixed ContaminantsER18-1491 Reactive Electrochemical Membrane (REM) Reactors for the Oxidation of Perfluoroalkyl CompoundContaminated Water
The technology has been demonstrated via bench studies and pilot-scale reactor to be very effective for treatment of short-chain, long-chain PFAAs, as well as most commonly detected PFAA precursors in spike water systems and severalremediation-derived waste streams laden with high PFAS concentrations.
12.4.4.7 Solvated Electrons (Advanced Reduction Processes)Advanced reduction processes (ARP) has been investigated for the reductive degradation of groundwater contaminants. ARPinvolves the combination of activation methods such as ultrasound, ultraviolet, microwaves, and electron beam withreducing agents (reductants) such as ferrous iron, sulfide, sulfite, iodide, and dithionite to generate very reactive reducingradicals and the hydrated electrons (e−aq) that mineralize contaminants to less toxic products (Vellanki, Batchelor, and
Abdel-Wahab 2013). The reducing hydrogen radical (H•) and the hydrated electron are strong reductants that react easilywith halogenated organic compounds (Buxton et al. 1988). ARP-induced degradation rates depend on initial solution pH andreductant concentration (Vellanki, Batchelor, and Abdel-Wahab 2013). Bentel et al. (2019) described insights gained from astructure-activity relationship analysis of the mechanisms involved in the reaction of solvated electrons with PFAS.
The degradation pathway of PFAS using ARP differs from that of oxidizing agents in that the hydrated electron (Song et al.
Page 200ITRC PFAS-1
2013) cleaves the C-F bond adjacent to the functional group of the PFAS rather than the C-C or C-S bond. Qu et al. (2014)proposed that hydrated electrons lead to the reductive cleavage of the C-F bonds, resulting in fluorine elimination fromPFOA. Furthermore, they proposed that under UV irradiation, cleavage of the C-C bond between the COOH group and theperfluoroalkyl group occurred as shorter chain intermediates were detected in solution. Qu et al. (2014) therefore concludedthat two reactions are responsible for the reductive defluorination of PFOA: (1) direct photolysis by UV irradiation, and (2)photoreduction by hydrated electrons.
Reductive processes have proven feasible for degradation of most PFAS, especially PFOS. It should be recognized thatelectrons will be scavenged by oxygen, nitrate, and chlorides, and this should be considered for treatment application.
Recent research using UV-activated sulfite demonstrated effective generation of hydrated (aka solvated) electrons.Laboratory tests showed >50% defluorination of both PFOS and PFOA within 24 hours (Strathmann 2018).
Related Ongoing Research Funded by SERDP:
ER-2426 Quantification of In Situ Chemical Reductive Defluorination (ISCRD) of Perfluoroalkyl Acids in GroundWater Impacted by AFFFsER18-1526 Complete Reductive Defluorination of Poly- and Perfluoroalkyl Substances (PFASs) by HydratedElectrons Generated from 3-Indole-acetic-acid in Chitosan-Modified Montmorillonite
12.4.4.8 Plasma TechnologyPlasma technology is a promising destructive PFAS treatment technology. Plasma is formed as a result of an electricaldischarge from the addition of sufficient energy to gas (Jiang et al. 2014) and is classified into two major groups based ontemperature and electronic density: thermal plasma (local thermal equilibrium) and nonthermal plasma (nonequilibriumplasma) (Bogaerts 2002). Due to lower energy requirements and selectivity, nonthermal plasma is most often used in watertreatment processes (Jiang et al. 2014). In water treatment plasma applications, electrical discharges can be dischargedabove the liquid surface, directly to the liquid, or in the form of bubbles in liquids (Locke, Lukes, and Brisset 2012) (Strattonet al. 2017). These electrical discharges diffuse in liquids to initiate various chemical and physical effects, including high
electric fields, intense UV radiation, shock waves, and formation of strong oxidative and reductive reactive species (H•, O•,
OH•, H2O2 aqueous electrons, H2, O2, O3), which are effective for the treatment and removal of contaminants (Lukes,Appleton, and Locke 2004; Lukes et al. 2005; Stratton et al. 2017).
Determination of plasma treatment mechanisms and degradation pathways for PFAS is currently a research focus, andseveral mechanisms and pathways have been proposed. Takeuchi et al. (2013) proposed that the main reaction pathway forPFOA by plasma treatment is by thermal cleavage of the C-C bonds resulting in direct decomposition to gaseous productswithout formation of shorter chain PFCAs. Others have proposed that PFAS decomposition is due to conversion to unstableradicals during interaction of PFAS with the most energized ions in the plasma (Hayashi et al. 2015; Obo, Takeuchi, andYasuoka 2015), or with positive ion(s) generated by the plasma (Yasuoka, Sasaki, and Hayashi 2011) at the bubble gas-liquidinterface. The unstable radicals produced during PFAS decomposition can result in a sequential loss of one carbon within thechain.
Related Ongoing Research Funded by SERDP:
ER18-1306 Combined In Situ/Ex Situ Treatment Train for Remediation of Per- and Polyfluoroalkyl Substance(PFAS) Contaminated GroundwaterER18-1624 Plasma Based Treatment Processes for PFAS Investigation-Derived WasteER18-1570 Application of Non-Thermal Plasma Technology for the Removal of Poly- and PerfluorinatedSubstances from Investigation-Derived WastesER18-5015 Removal and Destruction of PFAS and Co-contaminants from Groundwater
Plasma effectively degrades PFAS in a relatively short period of time (30-minute treatment) in both synthetic water andgroundwater. It has been reported that plasma treatment provided 90% degradation of PFOA and PFOS, with only about 10%of the destroyed PFOA and PFOS being converted to shorter chain PFAAs (Stratton et al. 2017). The degradation rate is notaffected by the presence of co-contaminants. This is an environment-friendly technology, because there is no demand onpressure or temperature and it does not require significant input of chemicals. Plasma also generates a broad range ofreactive species.
Page 201ITRC PFAS-1
12.4.4.9 Zero-Valent Iron (ZVI)/Doped-ZVIZVI is an inexpensive groundwater remediation technology. It is the most commonly used reductant for in situ groundwaterremediation. It is a strong reducing agent capable of successfully reducing major groundwater contaminants such aschlorinated solvents. Recently nanoscale zero-valent iron (nZVI) has had increased attention due to its higher reactivity,surface area, and potential in situ injectability compared to the micro-sized ZVI.
In general, the removal of PFAS by ZVI in reductive processes involves the mass transfer of contaminants to the ZVI surface,and their adsorption and reaction (transformation of contaminants into less toxic/nontoxic species) on the ZVI surface,followed by the desorption and mass transfer of byproducts into solution (Arvaniti et al. 2015). Because the reduction ofcontaminants by ZVI is a surface-mediated electron transfer process, the surface properties of ZVI influence contaminantreactivity.
Arvaniti et al. (2015) found that PFOS removal using Mg-aminoclay-coated nZVI occurred via adsorption of PFOS to the ZVIsurface followed by reduction. A similar decomposition mechanism for PFOS using ZVI in subcritical water was reported byHori et al. (2006), who suggested that adsorption of PFOS onto ZVI played a major role in PFOS decomposition, as fluoridewas detected in the treatment solution after treatment.
This technology is highly effective for the removal of PFOS, reacts relatively quickly, and has proven feasible for degradationof most PFAS.
12.4.4.10 Alkaline Metal ReductionAlkaline metal reduction involves the use of alkali metals (that is, the reductant) to reduce organic compounds to their anionradical. Reductive degradation of branched PFOS has been reported with vitamin B12 as a catalyst and Ti(III)-citrate ornanosized zero-valent zinc as a bulk reductant (Ochoa-Herrera et al. 2008; Park, de Perre, and Lee 2017) where degradationrates increase with increasing solution pH, bulk reductant dose, and temperature.
The degradation pathway of PFAS by alkali metal reduction as postulated by Ochoa-Herrera et al. (2008) suggests thatdestruction of branched PFOS isomers occurs via chemical reductive dehalogenation. Park, de Perre, and Lee (2017)suggested that the ability of vitamin B12 to reduce branched PFOS isomer and not linear is because the branched PFOSisomers possess greater electron density differences that are absent in linear PFOS isomers. Bench-scale studies have shownsuccess for branched PFOS isomers and have proven to be efficient (greater than 70% removal; see (Ochoa-Herrera et al.2008)). In situ applications have not been tested. Removal and defluorination are lower for PFHxS relative to PFOS.Polyfluorinated sulfonate intermediates (C5-C8) are the final products (Park, de Perre, and Lee 2017).
12.4.5 Biodegradation SummaryA limited number of studies have tested microbial degradation of PFAS and many conflicting reports exist, all suggesting thatmore work needs to be performed to fully understand the biotic transformations of these compounds.
Microbial degradation of PFAS has been observed to occur only with polyfluoroalkyl substances (Butt, Muir, and Mabury2014), which contain some carbon-hydrogen bonds instead of C-F bonds (Buck et al. 2011). Recent research documentedthe aerobic biotransformation of fluorotelomer thioether amido sulfonate (FtTAoS) over a 40-day period to produce 4:2, 6:2,and 8:2 fluorotelomer sulfonate (FTS), 6:2 fluorotelomer unsaturated carboxylic acid (FTUCA), 5:3 fluorotelomer carboxylicacid (FTCA), and C4 to C8 perfluorinated carboxylic acids (Harding-Marjanovic et al. 2015). An unintended consequence ofbiologically mediated transformations is the conversion of precursors (polyfluorinated) to perfluorinated compounds.
PFOA and PFOS have been shown to be resistant to microbial biotransformation under a variety of growth conditions (Liu andMejia Avendaño 2013). However, other PFAS, including chemicals in AFFF with nonfluorinated alkyl groups (polyfluorinatedsubstances), are likely amenable to biotransformation. Most recently, defluorination of PFOA and PFOS were observed usingan ammonium oxidizing autotroph (Huang and Jaffé 2019). Upon addition of PFOA or PFOS (0.1 mg/L and 100 mg/L,respectively) to the A6 culture, shorter chain perfluorinated products and acetate were observed. Incubations with hydrogenas a sole electron donor also resulted in the defluorination of up to 60% of PFOA and PFOS during 100-day incubations, whiletotal fluorine (organic plus fluoride) remained constant. Reductive defluorination of perfluoroalkyl substances may bepossible, as observed when using vitamin B12 and Ti(III)-citrate (Ochoa-Herrera et al. 2008). There are no known reports ofbiotransformation occurring under aerobic and anaerobic conditions.
A limited number of studies have tested microbial degradation of PFAS and many conflicting reports exist, all suggesting that
Page 202ITRC PFAS-1
more work needs to be performed to fully understand the biotic transformations of those compounds.
Research on the fungal degradation of PFAS has been ongoing due to the wide spectrum of substrate reduction catalyzed byextracellular ligninolytic enzymes. Experiments with white-rot fungus showed limited degradation of PFOA in microcosmstudies under certain conditions (Tseng 2012). The innovative delivery of fungal enzymes for PFAS treatment requiresfurther research.
Related Ongoing Research Funded by SERDP:
ER-2422 Bioaugmentation with Vaults: Novel In Situ Remediation Strategy for Transformation of PerfluoroalkylCompoundsER-2127 Remediation of Perfluoroalkyl Contaminated Aquifers using an In Situ Two-Layer Barrier: LaboratoryBatch and Column Study
The biodegradation of PFAS has been reported in a few studies as described above and in the following: 8:2 FTOH (Wang etal. 2009), 6:2 FTOH (Liu, Wang, et al. 2010), 6:2 FTSA (Wang et al. 2011), and N-ethyl perfluorooctane sulfonamidoethanol(Rhoads et al. 2008; Rhoads et al. 2013). Recently the PFOA-degrading strain YAB1 was isolated from soil that had beenimpacted by perfluorinated compounds through acclimation and enrichment culture, where perfluorooctanoic acid (PFOA)was amended as the sole carbon source (Yi et al. 2016). This strain was preliminarily identified as Pseudomonas parafulvabased on colony morphology, physiological and biochemical features, and 16S rRNA gene sequencing. Using shaking flaskfermentation, the maximum tolerable concentration of YAB1 on PFOA was found to be 1,000 mg/L, and the optimal PFOAconcentration for the growth of YAB1 was 500 mg/L. After 96 hours of culture, the PFOA degradation rate was 32.4%. When1 g/L glucose was added to the inorganic salt culture medium, the degradation rate increased to 48.1%. Glucose was thebest exogenous carbon source for the degradation of PFOA (Yi et al. 2016).
12.4.6 High-Energy Electron Beam (eBeam)High-energy electron beam (eBeam) is a high efficiency, flow-through, nonthermal, chemical-free technology that utilizeselectron accelerators to generate large numbers of highly energetic electrons from electricity (Cleland 2011; Pillai andShayanfar 2016). The technology has been commercialized globally for pasteurizing foods, sterilizing medical devices, cross-linking polymers, and eliminating insects and pests from fresh produce (Cleland 2011; Pillai 2016; Pillai and Shayanfar 2016;Zembouai et al. 2016). It provides a form of ionizing irradiation that does not involve the use of radioactive isotopes. Theamount of energy from eBeam that is absorbed by an irradiated material per unit mass is called dose. The absorbed doseduring eBeam treatment depends on the type and thickness of the material, the beam power, and the length of time thematerial is exposed to the electron beam (Waite 1998).
eBeam is applicable for use on soil and liquid matrices for many purposes: disinfection of sewage sludge (Praveen et al.2013; Waite 1998); remediation of heavy hydrocarbon-contaminated soils (Briggs 2015); and remediation of volatile organiccompounds (VOCs) and semivolatile organic compounds in liquid wastes such as groundwater, wastewater, and landfillleachate (USEPA 1997b). During irradiation of water, three primary reactive species are formed: solvated electrons andhydrogen radicals, which are strong reducing species, and hydroxyl radicals, which are strong oxidizing species. This createsboth advanced reduction and oxidation processes without the addition of any chemicals. The absolute concentration ofradicals formed during irradiation is dose- and water quality-dependent, but it has been measured at greater than millimolar(mM) levels in potable, raw, and secondary wastewater effluent (Waite 1998).
Related Ongoing Research Sponsored by SERDP:
ER18-1620 Ex Situ Remediation of Investigation-Derived Wastes containing PFAS by Electron Beam Technology
Researchers at Texas A&M University recently demonstrated defluorination of PFOA in aqueous samples by eBeamtechnology (Wang et al. 2016). The study measured defluorination efficiency as a function of molar concentration of freefluoride ions and initial molar concentration of PFOA to be treated. Final defluorination efficiencies ranged from 34.6 to 95%under various increasing concentrations of nitrate, alkalinity, and fluvic acid. The defluorination is possibly due to theformation of aqueous electrons and the formation of secondary radicals (Wang et al. 2016). An additional study furtherdemonstrated eBeam-mediated defluorination of PFOS and PFOA with decomposition efficiencies of 95.7% for PFOA and85.9% for PFOS in an anoxic alkaline solution (pH = 13). Radical scavenging experiments indicated that the aqueouselectron and hydrogen radical were important in the eBeam degradation of PFOA and PFOS (Ma et al. 2017). Furtherevaluation of this technology for treating other PFAS (polyfluorinated precursors and other long- and short-chain PFAAs) insoil and water, as well as testing over a range of concentrations, will be necessary to further understand treatment
Page 203ITRC PFAS-1
performance potential and to identify any deleterious byproducts.
12.4.7 Surface Activation Foam FractionationThe surfactant nature of PFAS make them prone to accumulation at surface interfaces. Surface activation foam fractionation(SAFF) is a process that generates fine air bubbles rising through a narrow water column. PFAS that accumulate at the top ofthe column as foam are vacuumed off for separate disposal. Using hundreds of columns, PFAS is progressively stripped outuntil drinking water standards have been achieved. The process reduces the volume of PFAS-contaminated water. The basetechnology was developed and built in Australia and is currently operating at full-scale for the Australian Department ofDefence, Army Aviation Centre Oakey (AACO) base near Toowoomba, Queensland. The AACO water treatment plan wascommissioned on May 13, 2019 and treats 66,000 gpd.
A small one-day field trial in Williamtown, New South Wales, has also been applied in situ in an existing downholegroundwater monitoring well using compressed air introduced at the base of the well and harvesting of PFAS-rich foam atthe top of the well (Phillips et al. 2018). This trial demonstrated that >C6 PFAS molecules could be removed from thetreatment well annulus where hydrogeology could replenish the treatment well with a continuous supply of impactedgroundwater. Further research to optimize the downhole foam fractionation engineering design is warranted.
12.4.8 Deep Well InjectionA potential alternative to treatment may be the use of on-site or off-site underground injection waste disposal wells forliquids containing PFAS. This approach eliminates discharges to surface water and groundwater, which could be aconsideration given the present climate of varying discharge limitations for PFAS. Class I wells, as defined by USEPA, areacceptable for both hazardous and nonhazardous liquid wastes (USEPA 2019a). The USEPA has published guidance on therequirements for the use of injection wells, which include siting, construction, operation, monitoring, testing, record keeping,reporting, and closure (USEPA 2019a). The USEPA has also studied the risks associated with underground injection wells(USEPA 2001), and these risks should be considered for the use of underground injection wells for PFAS-laden water. Thisoption may be most attractive as a disposal option for high concentration liquids, such as RO reject water, anion exchangeregeneration fluids, wastewater from manufacturing sites, and landfill leachate.
12.5 Limited Application and Developing Solids Treatment TechnologiesThe treatment technologies presented in this document are provided in a hierarchy defined in Section 12.1, based on levelof implementation and level of confidence in the technology from peer-reviewed literature and extent of documentedperformance. The three development levels include field-implemented technologies, limited application technologies, anddeveloping technologies. Where appropriate in the text both in situ and ex situ technologies are discussed. However, it is notalways clear if a limited application or developing technology may be effective in situ, ex situ, or both, thus furtherdistinction between in situ and ex situ is not made in this section. Table 12-2 (provided as separate PDF) presents limitedapplication and developing technologies for solids, which may be applicable to soil, sediments, biosolids, or other solidmedia, including PFAS-laden materials (for example, GAC, resin, scrubbers, filters). Thermal treatment warrants furtherdiscussion as a limited application technology because it has been field-demonstrated at multiple sites by multiplepractitioners but has not been well documented in peer-reviewed literature.
12.5.1 Sorption and Stabilization/SolidificationLimited application and developing materials being demonstrated or developed for sorption and stabilization includeminerals (for example, organically modified clays) or stabilization agents (for example, Portland cement).Stabilization/solidification through mixing with cementitious materials (for example, Portland cement or other amendments)can be applied to encapsulate PFAS-impacted soil/sediment to restrict PFAS leaching or migration. In situ solidification isalways performed with soils in place, and it is necessary to use specialized equipment and maintain careful control over theaddition of amendments and water content. In situ solidification is intended to yield a high-compressive-strength monoliththat has low permeability. A bench-scale study (Sörengård, Kleja, and Ahrens 2019) indicated that solidification using abinder (combination of Portland cement, fly ash, and ground granulated blast-furnace base slag) at a ratio of 9:1 reducedleaching for 13 out of 14 PFAS (except for PFBS). Introducing additional additives (for example, activated carbon, surface-modified clays) at a 2% concentration can further reduce leaching of PFAS in solidification-treated soil.
12.5.2 Thermal TreatmentThermal treatment is defined as mobilization and/or destruction of chemicals using heat. This can be accomplished by
Page 204ITRC PFAS-1
thermal desorption or thermal destruction and includes incineration. Heat is applied directly to the PFAS-contaminatedsoil/sediment. High temperatures can vaporize PFAS or potentially destroy them (thermal destruction) (<1,000°C). Vaporizedchemicals (thermal desorption) can be captured and destroyed using off-gas treatment.
Ex situ thermal treatment has been demonstrated (450–954°C) at field pilot-scale studies by a few technology vendors andis considered a partially demonstrated technology (Endpoint Consulting 2016; Enviropacific 2017; Grieco and Edwards2019). The effectiveness depends upon the ability to deliver heat to achieve sufficient and evenly distributed temperature atfield scale cost-effectively. The pilot studies conducted have reported >90% removal of PFAS from soil when high heat hasbeen applied.
In addition, lower temperature thermal desorption has been demonstrated to be effective for PFAS at 350–400°C on thebench scale. During a recent proof of concept laboratory bench test, 99.99% removal of PFAS from soils was demonstratedwhile heating the target volume to 400°C (Crownover et al. 2019; DiGuiseppi, Richter, and Riggle 2019).
No documented examples of in situ thermal treatment for PFAS-impacted soil have been identified. However, the ex situtesting at 350–400°C suggests that these temperatures are sufficient for desorption of PFAS and therefore in situ treatmentis potentially feasible for PFAS. In situ thermal treatment for PFAS is an energy-intensive treatment method. Itsenvironmental footprint includes the energy source and consumption during treatment system operation, as well asmanufacturing and installation of heating system materials.
At both bench and pilot scales, limited data sets are available and data gaps still exist mainly regarding fate of PFAS and airemissions. One concern is the volatilization of hydrogen fluoride, but there have not been sufficient pilot studies todetermine the validity of this concern. This could pose serious health and safety issues and could compromise equipmentcomponents. Management of hydrofluoric acid and other off-gas concerns can be managed through off-gas treatmentsystems. Air emissions from the thermal treatment of PFAS have not been thoroughly studied at the field scale to date, butPFAS destruction via high temperature air incineration and subsequent acid-gas scrubbing is a common practice duringcarbon reactivation (Mimna 2017). In addition, PFAS can be volatilized and/or destroyed at high temperature (> 1,000°C)(Colgan 2018; Lassen et al. 2013).
Related Ongoing Research Funded by SERDP:
ER18-1501 Hydrothermal Technologies for On-Site Destruction of Site Investigation Wastes Contaminated withPer- and Polyfluoroalkyl Substances (PFASs)ER18-1556 Small-Scale Thermal Treatment of Investigation-Derived Wastes (IDW) Containing Per- andPolyfluoroalkyl Substances (PFAS)ER18-1572 Evaluation of Indirect Thermal Desorption Coupled with Thermal Oxidation (ITD/TO) Technology toTreat Solid PFAS-Impacted Investigation-Derived Waste (IDW)ER18-1593 Demonstration of Smoldering Combustion Treatment of PFAS-Impacted Investigation-Derived WasteER18-1603 Field Demonstration of Infrared Thermal Treatment of PFAS-Contaminated Soils from SubsurfaceInvestigations
12.6 Integrated Remedial SolutionsThe information above focuses on in situ and ex situ technologies available to treat (that is, destroy, stabilize, or remove)PFAS in water and soil. There are also nontreatment remediation approaches that may be employed at PFAS sites, includingsource zone or plume containment or mass flux reduction, excavation and off-site disposal, underground injection, andinstitutional controls. These approaches can be used alone or together with one or more treatment methods. This discussionprovides some examples of remedial strategies that incorporate multiple approaches.
12.6.1 Combined Technologies for Treatment of PFAS and Co-ContaminantsIn a drinking water context, PFAS removal may be an isolated treatment objective without interference from co-contaminants; treatment may include a single technology such as GAC. However, for groundwater remediation, particularlyassociated with PFAS release/source areas, PFAS compounds are typically present with other contaminants. For example,plumes emanating from former fire training areas may consist of PFAS in addition to petroleum hydrocarbons andchlorinated solvents that require different treatment approaches. Natural groundwater geochemistry, such as high metals ororganic carbon concentration, can reduce PFAS treatment technology effectiveness and efficiency. A combined remedyapproach, using multiple technologies simultaneously or in series, is generally required to optimize PFAS removal in these
Page 205ITRC PFAS-1
situations.
For example, McGregor (2018) documented a case study in which CAC was successfully injected to mitigate the mass flux ofPFOS and PFOA from a source zone at a site in Ontario. At the same time, a slow-release oxygen amendment was injected tofacilitate the aerobic biodegradation of petroleum hydrocarbons that co-occurred with PFAS in one part of the site. This isalso an example of applying combined remedies in different areas of the site.
In some cases, the remediation of co-contaminants has affected the fate of PFAS compounds in plumes. Precursorcompounds may be transformed in situ to PFCAs or PFSAs through aerobic biological transformation or transformed in situ toPFCAs through chemical oxidation. For example, (McGuire et al. 2014) presented a case study of an AFFF release site whereoxygen infusion is believed to have resulted in accelerated transformation of precursors to PFHxS and PFCAs in part of theplume. This indicates that it is important to consider the potential influence of co-contaminant remediation on PFAStransformation or transport.
12.6.2 Addressing Source Areas and Plume with Multiple or Combined Remedies UsingMultiple Types of Treatment AlternativesIt may be necessary at some sites to address both mass flux from source areas into groundwater and to contain or controlplume migration.
The most commonly used plume containment alternative for PFAS plumes involves groundwater extraction with ex situtreatment. Options for reduction in mass flux leaving a source zone are partly discussed in the (ITRC 2008) EnhancedAttenuation of Chlorinated Organics guidance manual, although many of these are applicable to PFAS sites also. Mass fluxreduction strategies for PFAS sites may include:
injecting CAC to mitigate flux from the source zone (McGregor 2018), or at one or multiple locations within agroundwater plumecapping part of a site to reduce infiltration through a PFAS source zone above the water tableexcavating shallow soil (although this may not have much benefit if there is a PFAS source zone below the depthof excavation)engineering management of surface water runoff to mitigate nonpoint sources at or upgradient of a site (ITRC2018b)upgradient interception/diversion of groundwater to reduce the flux through a source zone below the watertable.
12.6.3 Combined Technologies for Efficient PFAS TreatmentBecause ultimate destruction of PFAS requires high-energy processes, combining practices that concentrate PFAS followedby destruction offers an opportunity for more efficient and cost-effective treatment. Examples of concentration processesthat enable follow-on destruction include, but are not limited to:
pump and treat using a regenerable ion exchange resinfoam fractionationmembrane separationreverse osmosis
Examples of destructive processes that are able to destroy separated waste, many of which are under development or havehad limited application to date, are provided in Sections 12.4.4 and 12.4.6. Incineration is an example of another destructivetechnology which is a demonstrated full-scale application.
12.7 Sustainability of PFAS TreatmentFederal and state environmental protection agencies have published myriad green remediation best management practicefact sheets and guidance documents covering a variety of remediation topics and emphasizing the minimization ofenvironmental cleanup footprints (USEPA 2012d, 2018b), including methods to quantify the environmental footprint (USEPA2019g). The best management practice fact sheets for excavation and surface restoration, implementing in situ thermaltechnologies, and (more generally) materials and waste management may offer supplemental sustainability information tothat already included alongside the remediation technologies presented within this section (USEPA 2008, 2012c, 2013b).
Page 206ITRC PFAS-1
Applying such a framework for PFAS cleanup projects, the environmental impact drivers for PFAS cleanup technologies thatshould be considered include the life cycle environmental footprint of all facets of the cleanup, including project sitepreparation; installation of the remedy; materials, equipment, and energy used to operate the remedy; waste materialsgenerated by the cleanup technology; and demolition and deconstruction of the remedy. In alignment with greenercleanups, green and sustainable remediation recommends the “the site-specific employment of products, processes,technologies, and procedures that mitigate contaminant risk to receptors while making decisions that are cognizant ofbalancing community goals, economic impacts, and environmental effects” (ITRC 2011b)2011(ITRC 2011a, p. 3). Economicand quality of life impacts to the community can be alleviated by early incorporation of green and sustainable remediationbest management practices, including meaningful stakeholder engagement, creation of employment opportunities, andadvancement of the local community’s skill set to help manage treatment systems and public outreach (USEPA 2012b).Lastly, climate change vulnerability and adaptation measures of remedial technologies should also be considered to ensureresiliency in the implemented remedial action (USEPA 2013a, 2014a).
In alignment with sustainability principles, performance of early and meaningful risk communication can assist professionalsin raising the community’s awareness of environmental hazards, empowering community participation in risk reductionmeasures, and increasing the quality of life for the community impacted by contamination and related risk managementactivities (USEPA 2007). Several environmental and public health regulatory agencies have prepared information documentsto assist professionals in performing effective risk communication for PFAS sites (for example, see (ATSDR 2018a).
In addition, a communication plan can be developed to assist with information dissemination and stakeholder engagement(Emmett et al. 2009). Section 14 provides further in-depth guidance on risk communication planning and performance. A riskcommunication toolbox is also being developed to help decision makers through the planning process and provide tools toassist with meeting performance metrics at each planning step. Additional guidance on stakeholder concerns andengagement is provided within this document in Section 13.
12.8 Improving Evaluation of PFAS Treatment TechnologiesSignificant effort has been completed with respect to reviewing and compiling comparative information on PFAS treatmenttechnologies. In a number of instances, proponents of innovative treatment technologies have claimed success in removingor destroying PFAS with limited confirmation of performance. For example, removal mechanisms may not have been proven,byproducts may not have been measured, and the effect of the technology in actual environmental matricies, atenvironmentally relevant concentrations, on PFAS mixtures, or with co-contaminants present may be unknown.
To guide future assessments and investments in developing PFAS treatment technologies, a SERDP project has preparedsuggested lines of evidence, recommended metrics, and decision tools to assess the effectiveness of PFAS treatmenttechnologies. These lines of evidence and decision-making tools can be used to identify priorities and next steps to advancea given technology, assess whether a technology is ready for field demonstration, and identify key areas of uncertaintyregarding technology performance.
Further SERDP-funded work (ER18-5053) is focused on developing a comprehensive assessment framework for ex situ PFAStreatment technologies and generating data to compare established and emerging approaches on a life cycle assessmentand costing basis.
Related Ongoing Research Funded by SERDP:
ER18-1633 Lines of Evidence to Assess the Effectiveness of PFAS Remedial TechnologiesER18-5053 Evaluation and Life Cycle Comparison of Ex Situ Treatment Technologies for Per- and PolyfluoroalkylSubstances (PFASs) in Groundwater
Updated April 14, 2020.
Page 207ITRC PFAS-1
13 Stakeholder PerspectivesThis section identifies the concerns of stakeholders who have been or may be affected by PFAS contamination. In thissection, we summarize many of the concerns that have been expressed by local communities, tribes, and environmentalgroups. Evaluation of exposure levels and potential human health consequences are of paramount concern to stakeholders.
Section Number Topic
13.1 Stakeholder Concerns
13.2 Specific Tribal Stakeholder Concerns
13.3 Stakeholder Resources
The term “stakeholder” is defined broadly by ITRC as members of environmental organizations, community advocacygroups, tribal entities or other citizens’ groups that deal with environmental issues, or a concerned citizen who is not amember of any organization or group. Public stakeholders, such as advocacy groups, often speak for the communities thatare affected by environmental issues. In this document, a differentiation is made between public stakeholders and interestedparties (responsible parties, state regulators, and owners and operators of contaminated sites).
Stakeholders share greater ownership of outcomes when they can influence site characterization, remedy selection, andlong-term site management. Because PFAS compounds are so abundant in consumer products, stakeholders are alsoconcerned with the production and eventual use of these products and are seeking safer alternatives and sometimesoutright bans. Environmental regulators and responsible parties also benefit from informed, constructive stakeholderinvolvement because it can help them make better decisions, reduce the likelihood of costly, time-consuming repeatedwork, and allow those in affected communities to have a voice in governing the long-term use of land, water, and otherresources. Often, stakeholders such as long-time residents have unique site knowledge as well as a major stake in theremedial outcome.
Developing site-specific characterization and remediation strategies for communities and tribal organizations can becontroversial, because there are many misconceptions about PFAS. The lack of scientific knowledge about many of thesePFAS compounds will be an impediment for educating the public. Therefore, early and effective community engagementemphasizing timely access to test data, transparency, and responsiveness is imperative. Community engagement may beable to address many stakeholder concerns and help to communicate risks. The ITRC Risk Communication Toolkit forEnvironmental Issues and Concerns includes information about stakeholder engagement and is published as a separatedocument.
This section identifies the concerns of stakeholders who have been or may be affected by PFAS contamination. Because it isan emerging contaminant and has been detected in ecological receptors (animals and plants) and blood serum in manyhumans, there are many individuals who are potentially affected worldwide.
In this section, we summarize many of the concerns that have been expressed by local communities, tribes, andenvironmental groups. Evaluation of exposure levels and potential human health consequences are of paramount concern tostakeholders. The list of concerns below is not all inclusive, as developments in science and identification of contaminants inthe environment are likely to lead to additional concerns. This list was developed from general research on PFAS, directcommunication and involvement with environmental and community groups, a consultant for one of the tribes, andextensive review of news reports. It is intended to highlight the concerns that have been expressed by various groups. It isnot intended to be a definitive statement of the technical merits of those concerns.
The following is a list of the concerns that have been identified. Detail of these concerns follows.
Lack of advisories for thousands of PFAS compoundsDesire for one standard or screening level for PFAS compounds
Page 208ITRC PFAS-1
Lack of advisory standards or screening levels for PFAS in environmental media other than drinking waterLack of sdvisory standars for human consumption of foodLack of occupational standardsLack of ecological risk guidelinesLack of comprehensive monitoring informationPrecautionary approachSafety of short-chain substitutesAFFF release sites and Unused AFFF DisposalDuty to warn AFFF respondersLimitations in sampling and analysis methodsLimited programs for health monitoring and blood testingPFAS in food packagingPotential PFAS contamination in recycling and compostLack of disclosure by product manufacturersLack of disclosure of information on the health effects of PFASResponsibility for sampling and treatment on private propertyLack of scientific evidence that current PFAS cleanup methods and remedies are fully protective of human andecological health and prevent toxic emissionsStormwater discharges that may contain PFASPsychological effectsEconomic consequences of local PFAS contamination
Stakeholders who use this document should consider that much of the information is very technical. Nevertheless, it aims tolay a framework by which to understand this set of compounds, the foundational nature of the science, and many of theuncertainties.
13.1 Stakeholder Concerns
13.1.1 Lack of Advisories for Thousands of PFAS CompoundsAs of September 2019, USEPA has set health advisories for only two of the over 4,000 PFAS compounds: PFOA(perfluorooctanoic acid) and PFOS (perfluorooctane sulfonate). The lifetime health advisory has been set at 70 nanogramsper liter (ng/L or parts per trillion) for the combined concentrations of PFOA and PFOS in drinking water. The healthconsequences of many PFAS compounds remain uncertain. Firm conclusions relating individual PFAS compounds to specifichealth outcomes remain elusive (Guelfo et al. 2018).
13.1.2 Desire for One Standard or Screening Level for PFAS CompoundsMany stakeholders believe that PFAS should be treated as a class of chemicals, similar to how PCBs or dioxin are currentlyregulated. Given the lack of toxicological information for the vast majority of PFAS, when even less is known about thepotential additive and synergistic effects associated with PFAS mixtures, many stakeholders support testing for total PFAS asthe preferred screening method, rather than limited compound‐specific testing using target analyte lists (CSWAB 2018). Forexample, the Conservation Law Foundation in New England put forth a petition requesting that PFAS in drinking water beregulated as a group with a treatment technique drinking water standard. Seehttps://www.nhpr.org/post/activists-ask-new-england-states-regulate-pfas-chemicals-class#stream/0 andhttps://www.mass.gov/lists/pfas-information-a-petition-for-rulemaking-to-establish-a-treatment-technique-drinking-water.However, many PFAS, like certain fluoropolymers, need significantly less toxicological information because of their inabilityto enter cells to cause adverse effects (Henry et al. 2018).
13.1.3 Lack of Advisory Standards or Screening Levels for PFAS in Environmental Mediaother than Drinking WaterWith the exception of regional soil screening levels for PFOS, PFOA, and PFBS, there are no federal standards or screeninglevels for monitoring environmental media (air, soil, and surface water and groundwater not used for drinking), and nofederal requirements that compel such monitoring. USEPA is planning to develop interim recommendations regardinggroundwater for PFOS and PFOA. USEPA is planning to develop interim cleanup recommendations to address groundwatercontaminated with PFOA and PFOS. Section 8 includes information about regulations, guidance, and advisories for PFAS.There are few limits by the federal and most state governments on PFAS in biosolids being applied to land for food and/or
Page 209ITRC PFAS-1
nonfood crops, nor on concentrations in surface water that may affect fish and consumers of fish. PFAS, including PFOA andPFOS, have been detected in biosolids produced at a wastewater treatment plant (WWTP), and in soil, surface waters, andleachate from landfills. WWTP sludge is commonly applied to land as a soil amendment. Botanical uptake by crops such ascorn, hay, and soybeans is suspected. Section 5.6 and Section 6.5.1 discuss plant uptake of PFAS. In addition, PFAS insurface water also creates an exposure pathway that potentially affects ecological and human health.
13.1.4 Lack of Advisory Standards for Human Consumption of FoodSome states have issued new fish consumption advisories for lakes and rivers after tests confirmed the presence of PFAS insurface water. Section 15.3 includes a case study example about a recently enacted fish consumption advisory by the NewJersey Department of Environmental Protection.
In February 2018, the Environmental Protection Authority of Victoria, Australia, “assessed waterfowl from three wetlands tobetter understand the extent and distribution of PFAS contamination ahead of the duck hunting season. PFAS was detectedin waterfowl from all three wetlands.” “In May and June 2018, the agency conducted a more extensive study into PFASconcentrations in waterfowl from 19 wetlands around the state …Waterfowl tissue samples were found to contain variablePFAS concentrations. Perfluorooctane sulfonate (PFOS) and perfluorohexane sulphonic acid (PFHxS) concentrations inwaterfowl from nine wetlands exceeded Food Standards Australia and New Zealand (FSANZ) trigger points for investigation.As a result, health risk assessments were undertaken on the samples that exceeded FSANZ trigger points for investigation,and health advisories were issued” (Environmental Protection Authority Victoria 2019)p.1.
In addition, PFOS is accumulating in the Arctic. The Alaska Community Action on Toxics (ACAT) reported that “A study on thepresence of PFOS in the livers of arctic animals revealed elevated PFOS levels in almost all species studied.” Furthermore, itreported that “In a recent study of foods consumed by a Canadian Inuit population, traditional foods were more widelycontaminated and contained higher concentrations of PFCs [PFAS] than nontraditional foods. Caribou had the highest
concentrations of perfluorinated compounds (PFCs), including PFOS.” (A Report for the Delegates of the 4th Conference of theParties Stockholm Convention on Persistent Organic Pollutants, seehttps://www.akaction.org/wp-content/uploads/2013/03/POPs_in_the_Arctic_ACAT_May_2009.pdf). At the request of the Yupikpeople of St. Lawrence Island, the ACAT is conducting a study to determine the safety of the traditional foods they eat forsubsistence.
13.1.5 Lack of Occupational StandardsWorkplace exposures seems to be poorly studied and there are no standards for occupational exposure for PFAS. Workers atpaper mills and wastewater treatment plants where PFAS have been documented in indoor air, as well as developers andindustrial users of PFAS, do not have specific occupational standards.
13.1.6 Lack of Ecological Risk GuidelinesThere is wide concern that ecological receptors have been or will be harmed by releases of PFAS to the environment (Section7.2). Currently, there are no federal risk-based ecological guidelines or thresholds for environmental media. Ecotoxicitystudies are generally limited to a relatively small number of PFAS compounds (typically PFOA and PFOS). It is important toexpand studies in this field to evaluate additional PFAS, including short-chain precursor compounds as well as “next-generation” substitute compounds. Several states have established some criteria that are intended to protect aquaticorganisms in their respective surface waters. Section 8.2.3 includes more information about state regulation of PFAS. Inaddition, the ITRC also maintains updated tables of PFAS water values, and PFAS soil values from state, federal, and someinternational countries posted as an Excel file https://pfas-1.itrcweb.org/fact-sheets/.
13.1.7 Lack of Comprehensive Monitoring InformationMany stakeholders are concerned that most individuals and communities do not have any testing for PFAS. America’s WaterInfrastructure Act of 2018 requires drinking water systems serving more than 3,300 people to test for unregulatedcontaminants pursuant to USEPA’s Unregulated Contaminants Monitoring Rule (UCMR). However, sampling for UCMR4(USEPA 2016f), which occurred between 2018-2020 did not include any PFAS compounds in its analyte list. Manystakeholders are concerned that an opportunity to better understand the magnitude of PFAS contamination on public watersystems (PWSs) will not be taken. Prior to this new law, only drinking water systems that served more than 10,000 peoplewere required to monitor for unregulated contaminants. Contaminants covered by the UCMR include PFOA, PFOS, 1,2,3-TCP,hexavalent chromium, and 1,4-dioxane. Additionally, smaller PWSs and private wells were not included in the third round ofUSEPA’s required monitoring (Unregulated Contaminant Monitoring Rule, UCMR3). The new testing requirement, which goes
Page 210ITRC PFAS-1
into effect in 2021, is expected to add more than 5,000 drinking water systems to the list of systems that are required totest for these unregulated contaminants. However, the UCMR4 does not cover PFAS(https://environblog.jenner.com/corporate_environmental_l/2018/10/new-law-requires-widespread-testing-for-unregulated-contaminants.html). UCMR5 is going to test for some PFAS chemicals.
More information about the UCMR3 data is included in Section 8.2.2.2. It is estimated that approximately six millionresidents of the United States have drinking water that exceeds the health advisory for PFOA or PFOS, or both (APHA 2016).Moreover, there is no ongoing federal requirement for PFAS testing of any drinking water systems or private wells. Somestates (for example, New Hampshire) have initiated testing of private wells in certain locations where there is a highpotential for PFAS contamination. The Washington State Department of Health recently announced that it will be conductingadditional testing for PFAS at several hundred untested water systems. The state of Michigan is also testing all publiccommunity water systems for PFAS (see https://www.michigan.gov/pfasresponse/0,9038,7-365-88059—,00.html).
13.1.8 Precautionary ApproachGiven the lack of toxicological data for the great majority of PFAS compounds and mixtures, many stakeholders want aprecautionary approach to the use, treatment, and analysis of PFAS-containing chemicals. This precautionary approachpresumes compounds of similar structure may be expected to have similar modes of action and pose a similar risk to humanhealth and the environment, lacking evidence to the contrary.
13.1.9 Safety of Short-chain SubstitutesMany stakeholders are concerned with the use of substitute short-chain PFAS. After concerns arose that PFOA and PFOS(both long-chain PFAS) have health risks at very low concentrations, industry began to develop and substitute them withshorter chain PFAS. Although some short-chain PFAS appear to be less bioaccumulative, the publicly available data arelimited. Short-chain PFAS are persistent, degrade into extremely persistent forms, and tend to be more water soluble andmore mobile than long-chain PFAS. Because of their greater water solubility, studies indicate short-chain substitutes aremore readily taken up by plants than longer chain PFAS, including food crops (Higgins 2017). In their Interim Chemical ActionPlan for PFAS, the Washington State Department of Ecology and Washington State Department of Health (2019 p. 1) statesthat short-chain PFAS are difficult to remove from water, noting further “Without additional health and safety data, it isimpossible for us to evaluate whether short-chain replacments are safe substitutes. If environmental exposures to short-chain PFAS are found to pose health risks to people or the environment, mitigation will be difficult and expensive.” Finally, inthe Helsingør Statement (Scheringer et al. 2014) and the Madrid Statement on Poly- and Perfluoroalkyl Substances (Blum etal. 2015), scientists and other professionals expressed concerns about the embrace of short-chain PFASs as preferablereplacements for long-chain PFAS.
13.1.10 AFFF Release SitesMany stakeholders believe that all potential AFFF release sites should be investigated, and where necessary, potentialexposure should be mitigated. Investigations to date have identified the use of AFFF as one of the main sources of PFASreleases to the environment, and AFFF releases have been responsible for PFAS contamination of multiple drinking watersources. Although AFFF foams typically contain less than 2% total PFAS, thousands of gallons of foam mixture may beapplied during a given event, and the concentrations of concern for PFAS are very low (below 100 parts per trillion (ppt)).Typical locations where AFFF is stored and used include civilian airports, military bases, chemical plants, municipal firedepartments, oil refineries, bulk fuel storage facilities and terminals, and crash sites. AFFF was used abundantly for trainingpurposes at military bases with flight operations and at civilian airports. Additional information is presented in the ITRC AFFFfact sheet (ITRC 2018a) and in Section 3.
13.1.11 AFFF DisposalStakeholders are concerned that the disposal method (incineration) for unused AFFF is not regulated and that there may bedangerous byproducts. The military is planning to collect and destroy unused firefighting foam that contains PFOS and PFOA(USDOD 2018a). More than 3 million gallons of the foam and related waste have been retrieved by the military. In a 2017request for AFFF disposal research project proposals (U.S. Air Force 2017), the Air Force acknowledged that the foam, whichwas designed to resist extremely high temperatures, is difficult to burn and that “the high-temperature chemistry of PFOSand PFOA has not been characterized, so there is no precedent to predict products of pyrolysis or combustion, temperaturesat which these will occur, or the extent of destruction that will be realized.” With unregulated chemicals, there are noprotocols that require incineration to reach certain temperatures. (Seehttps://theintercept.com/2019/01/27/toxic-firefighting-foam-pfas-pfoa/)
Page 211ITRC PFAS-1
13.1.12 Duty to Warn AFFF First RespondersAside from standard workplace safety requirements regarding hazardous materials right-to-know, there has been no legalduty to warn or to require notice of hazards to first responders who handle AFFF. Several studies have concluded that somePFAS were elevated in blood of first responders. The New Hampshire Department of Health and Human Services PFC BloodTesting Program (NH DHHS 2016) results indicate the geometric mean levels of PFOS and PFHxS in firefighters wereelevated versus the geometric mean levels of those who had not worked as firefighters. Numerous other studies indicatedthat blood serum levels were elevated in firefighters (LeMasters et al. 2006; Jim ey al. 2006; (Dobraca et al. 2015). It isdifficult to tease out whether these higher levels are related to exposures to AFFF, PFAS in firefighter gear (clothing), orconsumption of water from PFAS-contaminated drinking-water wells in affected communities, especially those that may belocated near training facilities that have used AFFF.
13.1.13 Limitations in Sampling and Analysis MethodsStakeholders are concerned that current PFAS site investigations may not adequately define the types and total mass ofPFAS present, due to limitations in analytical methods (see Section 11) that are still evolving. Moreover, the PFAS family ofcompounds contains thousands of chemicals, but standard analytical methods can identify only a few dozen.
A related concern is that the new specification for shorter chain AFFF published by the Department of Defense (USDOD2018b; NAVSEA 2017) still allows concentrations of PFOA and PFOS up to 800 ppb in AFFF concentrate, because that is thelowest concentration of either PFOA or PFOS that can be measured in the concentrate with current analytical methods. Thisis because the overall high concentrations of the many chemicals in the AFFF concentrate “swamp” the lab instrument,interfering with its ability to detect any individual compound except when it is present at high concentrations. The new,short-chain AFFF formulations are fluorotelomer-based, so PFOS (and other PFSAs) should not be present and PFOA may bepresent only as contamination from the production process (as discussed in Section 3.1), but without analytical methods toprove this users cannot know for certain if the new AFFF products are PFOS- and PFOA-free. The ITRC AFFF fact sheet (ITRC2018a) includes more information about AFFF specifications.
13.1.14 Limited Programs for Health Monitoring and Blood TestingSome PFAS (for example, PFOA, PFOS) bind to proteins in the blood, making blood testing a means of investigating humanexposure to PFAS. Many communities where PFAS has been detected have asked that the government establish a programfor blood serum testing and long-term health monitoring so that they can better understand any health risks associated withPFAS exposure. Some states have provided limited testing on people in high-impact areas. For example, New Hampshireprovided blood serum testing for people who worked on, lived on, or attended childcare on an AFFF-impacted site and wereexposed to contaminated drinking water (NH DHHS 2016). New Hampshire also performed blood tests in selected townswhere people used private wells that tested above health advisories for PFOA and PFOS. However, many state and localgovernments are wary of blood testing programs because there is no correlation between the PFAS level in blood serum andany definitive health effects. People who participate in such tests are usually informed of their results and provided contextabout how they compare with national and location-specific averages. It does not appear that any long-term program hasbeen established to monitor the health outcomes of exposed populations. If there is no assistance from the government,many community members cannot afford to have their blood tested.
13.1.15 PFAS in Food PackagingMany stakeholders are concerned that food packaging containing PFAS leaches into food. Food packaging, such as bowls,plates, clamshells, trays, and pizza boxes, often includes PFAS for anti-grease resistance, and PFAS is sometimes used in themolding process to manufacture paper plates and containers. A 2008 FDA study found that “fluorochemical paper additivesdo migrate to food during actual package use,” and oil and grease “can significantly enhance migration of a fluorochemicalfrom paper” (Begley et al. 2008).
There is only limited peer-reviewed information regarding PFAS transfer to food. One study documented that 6:2 FTOHmoves from dishware or containers into food (Yuan et al. 2016). A Canadian analytical lab found that PFBA moves fromcupcake liners into cupcakes (CEH 2018).
The FDA has approved 20 next-generation, short-chain PFAS for coating paper and paperboard used to serve food. The FDAEffective Food Contact Substance Notifications database is available online (FDA 2018). Concerns have been raised thatthese compounds have not been adequately tested for human impact. Because of trade secrecy laws with regard to patents,the government does not publicly disclose the identity of the specific chemicals in food packaging. However, according to
Page 212ITRC PFAS-1
The Intercept (Lerner 2016), in documents filed with the USEPA, under TSCA section 8(e) requirements, DuPont (2010)reported that substitute PFAS, called GenX chemicals, used to produce food contact paper could pose a “substantial risk ofinjury,” including cancerous tumors in the pancreas and testicles, liver damage, kidney disease, and reproductive harm.
The State of Washington has enacted a law to ban PFAS use in food packaging. Not only does PFAS in food packaging posepotential risks to consumers of the food, but the used packaging may end up in compost or landfills. Compost is eventuallyapplied to soil and potentially transferred to certain food crops. If it goes to a landfill, it potentially ends up in the landfill’sleachate.
13.1.16 Potential PFAS Contamination in Recycling, Compost, and FertilizerCarpeting, furniture, and numerous other items containing PFAS are often recycled. There is concern that the recycledmaterials are often used in products where the consumer has no way of knowing whether it is has PFAS contamination.Biosolids from wastewater treatment plants are used in some composts and fertilizers and PFAS sampling is not part of thescreening process for these products. Additionally, more testing and regulation is needed for land-applied paper mill waste.Paper mill waste is exempt from the Resource Conservation and Recovery Act (RCRA) as a beneficial reuse. Composting ofpaper mill waste to make fertilizer, which, for example, is still done in Michigan, should get more attention. It is difficult toknow which mills make “waterproof” or food contact papers.
13.1.17 Lack of Disclosure by Product ManufacturersSome stakeholders are concerned that chemical and product manufacturers are not required to disclose when they sell,make, or use PFAS in their products. For example, sturdy, waterproof and heat-resistant products are produced for theconstruction industry. Additionally, there is lack of disclosure and transparency concerning the composition of AFFF. AFFFsuppliers claim that formulations are proprietary.
13.1.18 Lack of Disclosure of Information on the Health Effects of PFASSome stakeholders are concerned that politics may delay or even prevent the full disclosure of PFAS toxicity information. Forexample, the release of ATSDR’s Draft Toxicological Profile for PFAS was reportedly delayed because of concerns about thepublic response. This example, if replicated, leads to distrust and reduces the efficacy of risk communication. Additionally,collected health data may not be clearly and fully shared or explained to stakeholders.
13.1.19 Responsibility for Sampling and Treatment on Private PropertyWhen off-site contamination is suspected or discovered, stakeholders believe that the responsible parties should beaccountable for establishing an entire program to deal with the problem. This includes sampling and analysis, disclosure ofPFAS content, health monitoring, and if appropriate, remediation and mitigation. Upon detection of PFAS above state or EPAlimits, responsible parties should be required to provide affected residents with alternative water supplies. Additionally,stakeholders believe that the cost of the program, including long-term treatment and monitoring, should be borne byresponsible parties.
13.1.20 Lack of Scientific Evidence that PFAS Cleanup Methods and Remedies Are FullyProtective of Human and Ecological Health and Prevent Toxic EmissionsStakeholders believe that treatment systems should be monitored for effectiveness. There is also concern that disposal orregeneration of GAC canisters, resins, and byproducts will add contaminant loads of PFAS compounds to the air, land, andwater. Companies that treat spent carbon filters that contain PFAS cannot document full destruction of all PFAS. Some claimall PFAS are destroyed, yet the research they cite is only on PFOS and PFOA destruction.
13.1.21 Stormwater and PFAS Manufacturing Discharges that May Contain PFASPFAS, including PFOA, have been detected at the storm drain outfalls at active facilities. Stakeholders are concerned thatmost NPDES effluent permits do not require PFAS sampling and the magnitude of PFAS concentrations in such dischargeremains unknown. Older and inactive facilities’ discharge areas, many of which have not been sampled for PFAS, can alsoact as long-term sources of PFAS in soil.
13.1.22 Psychological EffectsIt was reported at one EPA community forum that children in some communities are scared to drink water, and blood levelvalues have become an identity. This has occurred in other communities where contaminated drinking water supplies have
Page 213ITRC PFAS-1
the effect of deterring children from drinking clean water.
13.1.23 Economic Consequences of Local PFAS ContaminationIndividuals have voiced concerns about significant economic consequences on property values and businesses. In oneinstance, because PFAS was detected in water used by dairy cattle, they had difficulty selling the milk products.Stakeholders are particularly concerned about facilities located in economically disadvantaged communities. Thesecommunities need the economic benefits of a facility but have few resources to demand enough testing of air emissions andof potential health impacts on the community.
13.2 Specific Tribal Stakeholder ConcernsTribes share many concerns with other stakeholders; however, they differ from other stakeholders in several key aspects.The 573 federally recognized tribes are each culturally, governmentally, and socially unique. Some tribes view any level ofcontamination of their lands and natural and cultural resources as unacceptable. Many tribes have culturally significant orsacred areas, which may include springs, mountains, hunting areas, plant-gathering areas, or burial sites. When culturallysignificant or sacred areas are affected, traditional methodologies that nontribal environmental professionals rely on (suchas the applicable exposure scenarios or factors for a risk assessment) may not be sufficient to portray the effect to a tribe.For example, some plants and animals can have tremendous cultural or religious importance to a tribe, including birds andfeathers, game animals, and herbs. Additionally, many tribal cultural ceremonies include the use of water. Other areas ofdifference include diet (for example, some tribes consume more fish per capita) and growing crops or grazing animals onareas fertilized by biosolids from wastewater treatment facilities.
Tribes are sovereign entities that have established government-to-government relationships with federal, state, and localgovernments—relationships that must be recognized in the decision-making process. When a PFAS-contaminated site affectsa tribe, the project timeline must include tribal approvals in addition to other typical agency approvals. Sampling, research,and services on tribal lands generally require institutional review board or tribal council approval. Each sovereign nationoperates differently, ranging from tribes that have no research capacity to tribes that have a full review board with a formalapplication process. The initial steps in the approval process may include drafting a proposal, preparing a poster or podiumpresentation, and presenting to the tribal government.
Once tribal approval is granted and the project commences, the practitioner must obey tribal protocol with respect tocultural practices. The tribe may reserve the right to retain the findings in the case of exploratory research and restrictpublication. Regulatory findings for water and soil concentration, level of treatment, and monitoring are first reported to thetribe’s department of environmental quality or natural resources and then forwarded to state environmental organizationsand USEPA.
Most of the tribal concerns are listed in Section 13.1. However, as mentioned above, there may be some distinctions that areimportant to tribes:
PFAS in surface waters and lakes may have a higher level of concern when they are used for fishing, given thattribal members rely on these water bodies.Drinking water and irrigation water in the arid Southwest are limited, and there is heightened concern that tribeswill be unduly impacted if drinking or irrigation water is contaminated.Tribal lands are often close to installations that used AFFF (notably DOD) or other industrial sources of PFAS(manufacturers, leather tanneries).Where biosolids have been applied to tribal farmlands or grazing lands, there is a need to survey these triballands. In some cases, cities may have paid tribal communities to spread biosolids from WWTPs that may havebeen contaminated with PFAS.Activities on and near tribal lands may have involved use of PFAS-containing chemicals that could impact tribalmembers working in these facilities through inhalation and dermal exposure.Landfills on tribal lands that accepted outside waste need to be sampled for PFAS contamination, which may bein the landfill leachate. Companies that paid a fee to the tribes to use their land managed many of theselandfills. Although most required sampling, often the sampling plans did not include sampling landfill leachate forPFAS.A big issue facing tribes is that tribal environmental offices and budgets are typically small, and they do not havethe people or money to perform appropriate site investigations to determine if they have PFAS in theircommunity.
Page 214ITRC PFAS-1
13.3 Stakeholder ResourcesBelow are a number of resources for communities. These resources are websites of major environmental organizations andprojects that specifically deal with PFAS. These groups aim to help environmental and community groups to betterunderstand the issues and science about PFAS.
https://cswab.org/pfas/about-the-pfas-campaign/ andhttps://cswab.org/wp-content/uploads/2010/09/List-of-military-fire-and-crash-training-sites-2014.pdf
https://pfasproject.com (A project of Northeastern University)
https://earthjustice.org/features/breaking-down-toxic-pfas
http://www.testingforpease.com
https://www.civilianexposure.org/the-military-covers-up-the-extent-of-pfas-contamination-across-the-country-while-it-continues-to-poison-hundreds-of-communities/
https://toxicfreefuture.org/science/chemicals-of-concern/pfas-nonstick-nightmare/
http://gatehousenews.com/unwellwater/
https://www.ewg.org/interactive-maps/2017_pfa/
https://www.ewg.org/research/report-110-million-americans-could-have-pfas-contaminated-drinking-water
https://www.ewg.org/research/pfas-chemicals-contaminate-us-military-sites
https://www.ewg.org/research/many-fast-food-wrappers-still-coated-pfcs-kin-carcinogenic-teflon-chemical
https://greensciencepolicy.org/highly-fluorinated-chemicals/
https://www.sixclasses.org/videos/highly-fluorinated-chemicals
https://toxicsaction.org/issues/pfas-water-contamination/
https://www.ucsusa.org/center-science-and-democracy/preserving-science-based-safeguards/toxic-threat-pfas-contamination-military-bases
https://www.nrdc.org/experts/anna-reade/epa-finds-replacements-toxic-teflon-chemicals-are-also
https://silentspring.org/research-area/about-highly-fluorinated-chemicals-pfass
https://clu-in.org/contaminantfocus/default.focus/sec/Per-_and_Polyfluoroalkyl_Substances_(PFASs)/cat/Policy_and_Guidance/
USEPA conducted five community engagement events and one event with tribal representatives during the summer of 2018.Meeting materials, information, and summaries of each event are provided on USEPA’s website:https://www.epa.gov/pfas/pfas-community-engagement A series-specific topics of concern and associated social factorsidentified from presentations by public and community stakeholders during the USEPA PFAS community meetings held in2018 are provided in the ITRC Risk Communication Toolkit for Environmental Issues and Concerns is published as a separatedocument.
Updated April 14, 2020.
Page 215ITRC PFAS-1
14 Risk CommunicationThe ability to communicate potential risks to human health and the environment is a vital skill to facilitate communityparticipation and decision-making. Risk communication can be particularly challenging when dealing with science that israpidly evolving, as in the case with PFAS. Communicators must grapple with competing interpretations of uncertain scienceand risk management strategies, while earning community trust and promoting meaningful engagement. This sectionaddresses PFAS risk communication challenges and risk communication tools with PFAS site-specific examples. Case studiesthat demonstrate successful risk communication planning and performance are included in Section 15.4.
Section Number Topic
14.1 Role of Risk Perception
14.2 Risk Communication Challenges
14.3 Risk Communication Planning and Engagement Tools
According to USEPA’s Risk Communication in Action: The Risk Communication Workbook (USEPA 2007, p.1), the overallpurpose of risk communication is to assist affected communities [to] understand the processes of risk assessment andmanagement, to form [scientifically valid] perceptions of the likely hazards, and to participate in making decisions abouthow risk should be managed. Risk is the relationship between the probability of harm associated with an activity andvulnerability of exposed elements (Slovic 1987; Slovic 2003).
The ITRC Risk Communication Toolkit for Environmental Issues and Concerns is published as a separate document. Inaddition, guidance on general performance of risk communication for contaminated sites is provided in Risk Communicationin Action, the Risk Communication Handbook, (USEPA 2007); Decision Making at Contaminated Sites: Issues and Options inHuman Health Risk Assessment, (ITRC 2015a); and Improving Dialogue with Communities: A Risk Communication Manual forGovernment (New Jersey Department of Environmental Protection; (Hance 1991)).
The following subsections present risk communication challenges of PFAS and provide PFAS-specific risk communicationinformation for components of risk communication planning.
14.1 Role of Risk Perception: Public Stakeholders and Decision MakersIt is essential for decision makers to understand stakeholders’ risk perceptions of the hazard. Stakeholders include, but arenot limited to, the community, public entities, potential responsible parties, regulatory agencies, and municipal and stateofficials. Risk perception for PFAS is challenging to address because the science is rapidly evolving, the exposure isperceived as involuntary, the risk mangagement strategies are a moving target, and health impacts are greatest for themost sensitive populations. The risk management strategies can be a moving target because of these challenges.
The environmental management community is acting largely on the basis of growing evidence of health risks and generalprecaution as our understanding of PFAS exposure and associated risk is continuously redefined. In this context, riskamplification and attenuation can serve as guiding principles to better understand stakeholder context and site-specificfactors contributing to stakeholders’ perceived risk to proposed risk management strategies.
14.1.1 Role of Risk Perception and Public StakeholdersIn a scenario of risk amplification, stakeholders perceive their risk to a hazard as a major concern while experts assess thehazard as carrying a lesser degree of risk (for example, low or moderate) (Kasperson and Kasperson 1996). In the context ofPFAS, risk perception is heightened by uncertainties and variability among policies and standards due to developingsampling methodologies and analytical procedures; new scientific information on health effects, risk assessmentevaluations, and treatment technologies (NGWA 2017); and overall confidence/trust in the proponent or lead organizationthat is communicating risk. Additional human health and exposure factors that heighten risk perception for PFAS aresummarized in Section 14.2, Risk Communication Challenges.
Page 216ITRC PFAS-1
This heightened sense of risk may result in opposition to proposed risk management strategies, such as source control (inwhich there is scientific uncertainty pertaining to the “safe” level of exposure, if any, without risk).
To address risk amplification challenges, it is important to build trust among the community by maintaining transparentcommunication of these uncertainties and variabilities early in the project life cycle (USEPA 2005b, 2007). New data findingsand research on PFAS should be regularly shared with impacted stakeholders. Current knowledge, including uncertaintiesand information about variability of potential susceptibility to health effects in individuals with the same exposures, shouldbe conveyed accurately in an understandable manner.
Uncertainties in individual causation and variability in regulatory guidance can cause the affected individuals to lackconfidence in current scientific knowledge. Therefore, a risk communication project team should communicate theseuncertainties to the affected individuals in collaboration with risk assessors, community involvement coordinators, andcommunity members to develop site-specific messaging. It is important to understand that standards for the same chemicaloften differ depending on the entity setting them. This is not unexpected, because standard-setting guidance is not simply amathematical formula. Risk assessment approaches used in standard-setting processes include best professional judgmentin the selection of the factors involved. In addition, a collaborative effort can be made to develop performance metrics,supplemental to cleanup standards, that evaluate how the action will lead to measurable increased protection for publichealth and the environment, thus leading to the development of targets or objectives (Hadley, Arulanantham, and Gandhi2015) that offer reductions in risk. These metrics are referred to as secondary risk management performance metrics andcan be used to communicate and evaluate success of a proposed PFAS risk management strategy, as well as assist withalleviating stakeholder concerns associated with uncertainty. Examples of applicable secondary risk managementperformance metrics in the context of PFAS are reduction in contaminant bioavailability/loading, source control/removal, andmitigation of exposure pathways (NGWA 2017; Harclerode et al. 2016).
Furthermore, risk amplification can be heightened when a community perceives that they have limited control over risk.Explicit efforts to share control reduce outrage and risk amplification (Sandman 2013). Therefore, it is essential to create anatmosphere of collaboration. In situations where an open public forum is met by public outrage, it important to becompassionate and lend a listening ear. Acknowledgment and documentation of questions that cannot be answeredcommunicates transparency and can be a first step toward building trust. Effective participation is presented in the ITRC RiskCommunication Toolkit for Environmental Issues and Concerns.
In contrast, in a risk attenuation scenario, experts judge hazards as relatively serious while stakeholders do not payattention or pay comparatively little attention to that risk event (Kasperson and Kasperson 1996). This diminished sense ofrisk results in challenges in stakeholder participation in risk mitigation activities (“Why do we need to spend money/dotesting, etc., for this?”). In the context of PFAS, risk mitigation and monitoring measures include participation in bloodtesting, installation of a water treatment system, and use of an alternate water source. To address risk attenuationchallenges, site-specific risk perception factors related to inaction can be identified via stakeholder engagement andintegrated into a communication plan (NGWA 2017; Harclerode et al. 2015; Harclerode et al. 2016).
14.1.2 Role of Risk Perception and Decision MakersDue to the evolving science of PFAS, project managers, risk assessors, and risk communicators can also become caught inbetween those who amplify risk and those who deny risk. As noted, uncertainty in the toxicity and risk can lead to lack ofconsensus on how to evaluate risk and proposed risk management strategies. Due to risk amplification, there may be anelevated demand to take action to reduce potential risks beyond what is even technically and/or financially feasible. Theunderlying uncertainty feeding this risk amplification may also lead to opposition to proposed risk management strategiesfrom some decision makers prior to establishment of the “right number” to dictate such action. When communicating withthe public, it is essential to mitigate downplaying or embellishing risk due to lack of consensus on risk among decisionmakers.
Strategies should be implemented by the lead organization to navigate this rift to craft an approach and communicate a planthat is most likely to be reasonable and protective. One strategy is to incorporate the community’s needs and values toplace a greater weight on how risk management is considered. A second strategy is to develop secondary risk managementobjectives to help evaluate how interim and long-term action will lead to measurable increased protection for public healthand the environment (Hadley, Arulanantham, and Gandhi 2015; Harclerode et al. 2016). These complexities highlight theimportance of formulating a robust risk communication plan and team, including community and third-party involvement, asneeded, as well as considering the dimension of perception as part of the risk communication process.
Page 217ITRC PFAS-1
Case studies that showcase implementation of meaningful and effective community participation and inclusion of a third,neutral party to facilitate implementation of a successful risk communication strategy for PFAS-impacted communities areincluded in Section 15.4.
14.2 Risk Communication ChallengesThere are many general challenges to risk communication about any environmental situation, including diversity of audiencebackgrounds, importance of establishing trust among the parties, and clearly communicating about the scientific andregulatory requirements. ITRC’s Risk Communication Toolkit for Environmental Issues and Concerns includes a more detaileddiscussion of these challenges.
Emerging contaminants, and more specifically PFAS, pose unique challenges to achieving meaningful and effective riskcommunication. There is often divergent information available from different sources about the potential severity anduncertainty associated with exposure and adverse health impacts that may result from exposure, and the need fortreatment or response actions. For example, people will do their own research, which may result in conflicting information.Communicators need to be prepared to explain the choices and decisions made regardless of the conflicting information.Some of the risk communication challenges for PFAS are discussed in the following sections.
14.2.1 RegulatoryThere are regulatory challenges for emerging contaminants, see Section 8.
PFAS are emerging contaminants, which means that they are the subject of intensive investigation, so newinformation, and thus our understanding of hazard, exposure, and risk, are emerging and evolving. This canchallenge us to rethink determinations of protectiveness within very short time scales.Federal and state standards, guidance, and policies for PFAS are not uniform and are available for only a handfulof compounds.Regulatory standards and health advisories are in the parts per trillion range, and it is difficult to explain to alayperson what these low levels mean in terms of risk, or how they were derived.
14.2.2 Fate and TransportThere are technical and scientific challenges and uncertainties around fate and transport of PFAS in the environment, seeSection 5.
There are many sources for PFAS and many of them have multiple release mechanisms, so simply explainingwhere the PFAS came from and how it got into the environment can be complicated.Most people have only a very basic understanding of (and lots of misconceptions about) chemistry, geology,environmental systems, and groundwater. Risk communicators often need to provide this context before evendiscussing site or chemical specifics.Fate and transport behaviors differ among individual PFAS (although broad generalizations can be made basedon chain length and functional groups).The environmental persistence, solubility, and mobility of PFAAs can result in:very large impacted areas encompassing a wide range of environmental settings and potential transportpathwayscomplex transport pathways between interconnected environmental systems (groundwater-surface water; air-soil-groundwater; etc.).The multiplicity of sources and pathways can create a sense that everything is equally contaminated anddangerous. Communicators need to help people understand the variability in the degree of contamination andrelative risk related to each pathway.We are still identifying new PFAS sources (for example, PFAS from compost sites).Precursor transformation can affect how a PFAS site will evolve, but this is not well understood.Knowledge about uptake by plants and animals is increasing, but it is often difficult to answer questions aboutspecific species.
14.2.3 Toxicological/Epidemiological Information and Risk AssessmentThere are challenges and unknowns for toxicological and epidemiological information about PFAS, see Sections 7.1 and 17.2.
Page 218ITRC PFAS-1
One of the greatest challenges to risk communicators is having to craft messaging in the face of often intensedisagreements over the interpretation of available science and the magnitude of uncertainty; we arecommunicating health risks when the risks are not fully known or characterized.While human studies may conclude that there is evidence that elevated exposure to PFAS increases the risk ofcertain health effects, it is not possible to relate a current health effect in a specific individual to PFAS exposureor to predict whether future health effects will occur on an individual basis.There is reliable toxicological information for only a small subset of PFAS.There is a select subset of PFAS that has been studied in sufficient detail to support risk assessment andremedial decision-making.Athough most people have low levels of PFAS in their blood serum from consumer products and diet(anthropogenic background), certain populations may have elevated exposure due to localized sources, such asaqueous firefighting foam (AFFF) and industrial discharge, which can contaminate environmental media,particularly drinking water, leading to increased blood serum PFAS to levels that may increase the risk to humanhealth.Communities often learn that they have been unknowingly exposed to PFAS for up to several decades prior tothe discovery of their presence.Blood serum levels of certain PFAS can remain elevated for many years post-exposure, while levels of other PFASdecrease more rapidly, and currently there is no accepted method to hasten the reduction of PFAS blood levels.Individuals may be part of PFAS biomonitoring studies or can obtain their individual blood serum levels on theirown. These individuals have access to information for comparison to regional and national reported levels, andthus may be more informed on their personal exposure than the medical practitioner.There is a need to provide understandable and informative public health advice to exposed individuals, includingwoman of childbearing age and pregnant woman who are making decisions about whether to nurse and/or usewater known to be contaminated with PFAS to prepare formula (Section 7.1).
14.2.4 TechnicalThere are technical challenges in the areas of site characterization and treatment technologies, see Section 10 and 12.
There may be issues in the identification of responsible parties due to the difficulty in distinguishing between lowlevels of PFAS from use of consumer products (anthropogenic background) and PFAS contamination resultingfrom discrete sources, such as industrial uses.Although a subset of PFAS can be effectively removed by established treatment technologies, effective methodsfor the remaining compounds are in development.
14.2.5 Analytical AbilityThere are technical challenges in laboratory analytical methods and field sampling, see Section 11.
There are numerous PFAS compounds in existence, yet not all can be measured. Sampling methodologies andanalytical procedures to measure PFAS concentrations are still being developed and refined.Units used for reporting PFAS concentrations in environmental media and blood serum are not uniform, and canthereby confuse the audience.There are difficulties in clearly and concisely communicating unknowns and limitations of analytical technologiesrelated to the understanding of the extent of PFAS present in the environment, exposure pathways, andmagnitude of the potential risk.
14.2.6 Challenges to Risk Communication around Health RisksWhen performing risk communication, it is essential to acknowledge that individuals may receive their information from avariety of sources, which may provide conflicting or inconsistent messaging. As presented in Section 7.1, there is a growingbody of research pertaining the adverse health impacts of PFAS in humans and laboratory animals. The discussion potentialhuman health risks from PFAS exposure has been taken up in multiple venues, including peer-reviewed scientific studies,news media, and public comments on draft government documents and proposed regulations. The severity and uncertaintyof adverse health impacts that may be associated with PFAS and the need for subsequent action has been communicated inan inconsistent manner. Because of the seriousness of potential health effects such as cancer, developmental delays andaltered immune system response, as well as the persistence of PFAS in the human body, there is a case for prudence andprecautionary mitigation practices to reduce exposures even in the absence of unequivocal human health consequences.
Page 219ITRC PFAS-1

The risk communication challenge around health risks lends itself to a scenario in which stakeholders, including potentialresponsible parties and federal and state regulatory agencies, are not in consensus on the risk assessment andmanagement strategy. Consistent messaging about uncertainties is essential for risk communication to be successful and tobest help those in need. If stakeholders are in debate about the level of risk, then communicate by informing the public thatall parties are striving to get the risk evaluation “right” but that there may be a delay in taking action. Communities thatmay be impacted may request an interim measure, such as an alternate water source, to alleviate concerns with potentialexposure. Interim measures coupled with public outreach and community involvement can be a cost-effective riskmanagement strategy in the short term. Public outreach should include measures being taken as well as associatedmilestones for future actions toward making a more informed risk management decision that utilizes limited resourcesefficiently, while integrating stakeholder values and community needs.
14.3 Risk Communication Planning and Engagement ToolsPrior to preparing risk communication materials and performing outreach, a project team should develop a riskcommunication plan to ensure there is a robust risk communication process in place from the outset. A risk communicationplan is critical to guide decision makers to determine modes of information transfer as well as stakeholder engagementmethods and tools that are appropriate and applicable for identified target stakeholders and site-specific characteristics. Asstakeholder concerns and site characteristics are further defined, the communication team will need to continuously revisitthe steps of communication planning. The ERIS PFAS Risk Communications Hub is a resource for risk communicationinformation such as state FAQs, case studies and other resources.
14.3.1 Risk Communication Planning ModelThe ITRC Risk Communication Toolkit for Environmental Issues and Concerns presents a risk communication planning modelwhich has eight components or spokes on the wheel, as shown on Figure 14-1. At the center is review and evaluate. Thissuggests that communication is two-way, ongoing and continuous, allowing for review of where you are in your outreachefforts and where you may need to go.
The model is interactive, which allows for new information to be incorporated into the plan so that the outreach can bemodified accordingly. This approach encourages establishing ongoing dialogue between the lead organization and allstakeholders so that the resulting outreach plan reflects the priotities and concerns from all of the parties. This will help youdevelop a robust risk communication plan. The aspects of the risk communication planning model are briefly summarizedhere.
Issue identification helps you to clearly understand what the situation is in order to develop a responsive andeffective risk communication plan.Goals are the big picture or ultimate impact that is desired for a project, issue or situation.Identification of communities with whom you need to establish a dialogue and those who wish to talk with yourorganization is important.Community assessment is needed to gain a deeper insight into stakeholder concerns and values that facilitatethe development of a dialogue.Messages are the information you want/need to share with audiences about the issue or case, a question thatyou need them to answer, or both.A communication method is the means by which you communicate with your audiences.Once you have a clear goal, understand stakeholder concerns, know your message and have selected yourmethod, it is time to lay out the strategy in order to implement the plan.Evaluation is the systematic collection of information about activities, characteristics, and outcomes of projectsto make judgments about the project, improve effectiveness, or inform decisions about future programming. Many risk communication efforts require an ongoing presence or outreach to stakeholders. A debrief meeting isan opportunity for you to review the results of the evaluation and will identify what follow-up, if any is needed.
Page 220ITRC PFAS-1
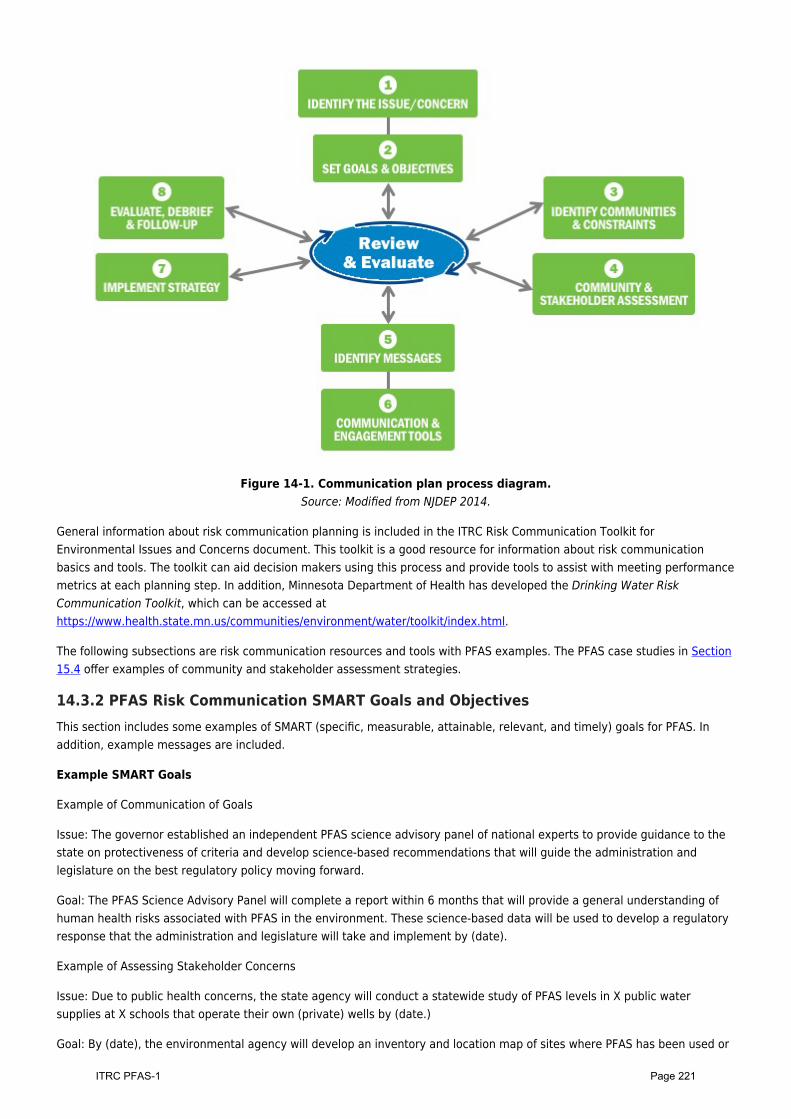
Figure 14-1. Communication plan process diagram.Source: Modified from NJDEP 2014.
General information about risk communication planning is included in the ITRC Risk Communication Toolkit forEnvironmental Issues and Concerns document. This toolkit is a good resource for information about risk communicationbasics and tools. The toolkit can aid decision makers using this process and provide tools to assist with meeting performancemetrics at each planning step. In addition, Minnesota Department of Health has developed the Drinking Water RiskCommunication Toolkit, which can be accessed athttps://www.health.state.mn.us/communities/environment/water/toolkit/index.html.
The following subsections are risk communication resources and tools with PFAS examples. The PFAS case studies in Section15.4 offer examples of community and stakeholder assessment strategies.
14.3.2 PFAS Risk Communication SMART Goals and ObjectivesThis section includes some examples of SMART (specific, measurable, attainable, relevant, and timely) goals for PFAS. Inaddition, example messages are included.
Example SMART Goals
Example of Communication of Goals
Issue: The governor established an independent PFAS science advisory panel of national experts to provide guidance to thestate on protectiveness of criteria and develop science-based recommendations that will guide the administration andlegislature on the best regulatory policy moving forward.
Goal: The PFAS Science Advisory Panel will complete a report within 6 months that will provide a general understanding ofhuman health risks associated with PFAS in the environment. These science-based data will be used to develop a regulatoryresponse that the administration and legislature will take and implement by (date).
Example of Assessing Stakeholder Concerns
Issue: Due to public health concerns, the state agency will conduct a statewide study of PFAS levels in X public watersupplies at X schools that operate their own (private) wells by (date.)
Goal: By (date), the environmental agency will develop an inventory and location map of sites where PFAS has been used or
Page 221ITRC PFAS-1
disposed; prioritize sites for further investigation based upon the potential to impact drinking water supplies (based uponstate groundwater maps, site history, and site ownership); incorporate data into a GIS-based data management system; anddevelop and implement a plan to sample private and or public water wells to assess potential impacts to drinking watersupplies from prioritized sites.
For this example:
specific: develop an inventory and location mapmeasurable: testingachievable: implement a plan to sample private and public water suppliesrelevant: testing at prioritized sites will define impacttimely: by X date
Example of a short-term SMART goal (from the Little Hocking Water Association case study, Section 15.4.1).
By (date), the community is informed via the municipal website, flyers, and canvassing that bottled water isavailable as an alternate water source and utilized by 85% of the population.After (months), the extent of the impacted water supply is known via well testing and communicated to thecommunity via a public meeting, municipal website, and newsletter.
Example of a long-term SMART goal (from the Little Hocking Water Association case study)
By (date) and after (months), using a community-first strategy that includes the establishment of a communityadvisory committee and using multiple methods of communication—media, social media, internet, andmeetings—determine whether the study area residents’ blood PFOA levels are elevated and provide actions that12,000 residents can take to produce a measurable reduction of PFOA blood levels.
14.3.3 Community Identification and Mapping ToolsDue to the persistent and recalcitrant nature of PFAS and its presence in the public drinking water supply, numerous andvariant federal, state, private, and public stakeholders can be impacted. Actor mapping is a tool to help guide acommunication team to lay out, track, and update stakeholder roles and relationships. During this exercise, practitionerslearn who is the most affected by site information and decisions, as well as their level of interest and influence.
The outcome of the tool will assist in identification of unengaged/disinterested stakeholder populations, identify needs forrelationship and/or capacity building, develop a site-specific communication team, and target outreach resources towardaffected and unengaged/disinterested stakeholder populations. In the context of PFAS, this is of particular importance toidentify and address affected groups who may not be participating in preventive and mitigation measures (such as aninterim drinking water supply and a fishing ban) and/or at sites in which stakeholder groups are facing conflict resolution.
Simplified examples of an actor-linkage matrix and interest-influence matrix are presented, followed by resources toperform complex actor mapping, such as social network analysis. The examples provided are not representative of anexisting project; stakeholder roles and relationships vary on a project-specific basis.
Example Context: A PFAS site consisting of a groundwater plume that has impacted drinking water supply wells and hasidentified contaminants in the local fish population.
Example 1: Actor-Linkage Matrix: A tool that assist practitioners in describing relationships among stakeholders throughcodes (Reed et al. 2009) (Figure 14-2).
Page 222ITRC PFAS-1
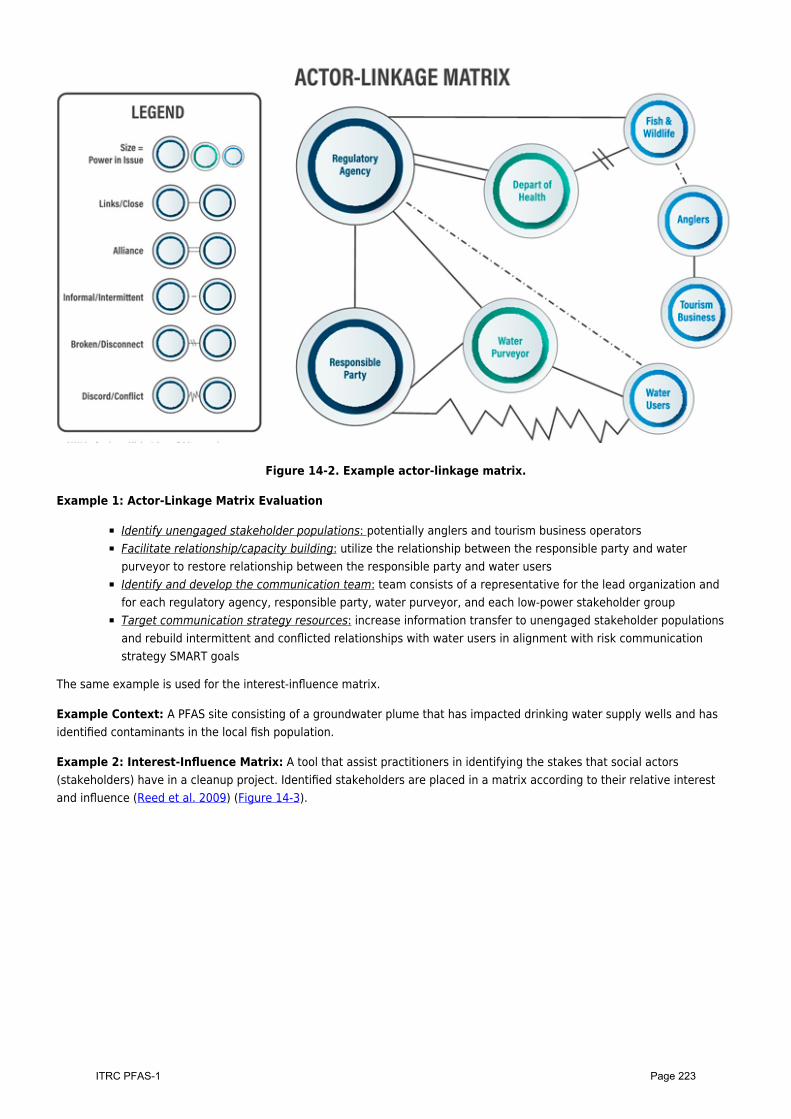
Figure 14-2. Example actor-linkage matrix.
Example 1: Actor-Linkage Matrix Evaluation
Identify unengaged stakeholder populations: potentially anglers and tourism business operatorsFacilitate relationship/capacity building: utilize the relationship between the responsible party and waterpurveyor to restore relationship between the responsible party and water usersIdentify and develop the communication team: team consists of a representative for the lead organization andfor each regulatory agency, responsible party, water purveyor, and each low-power stakeholder groupTarget communication strategy resources: increase information transfer to unengaged stakeholder populationsand rebuild intermittent and conflicted relationships with water users in alignment with risk communicationstrategy SMART goals
The same example is used for the interest-influence matrix.
Example Context: A PFAS site consisting of a groundwater plume that has impacted drinking water supply wells and hasidentified contaminants in the local fish population.
Example 2: Interest-Influence Matrix: A tool that assist practitioners in identifying the stakes that social actors(stakeholders) have in a cleanup project. Identified stakeholders are placed in a matrix according to their relative interestand influence (Reed et al. 2009) (Figure 14-3).
Page 223ITRC PFAS-1
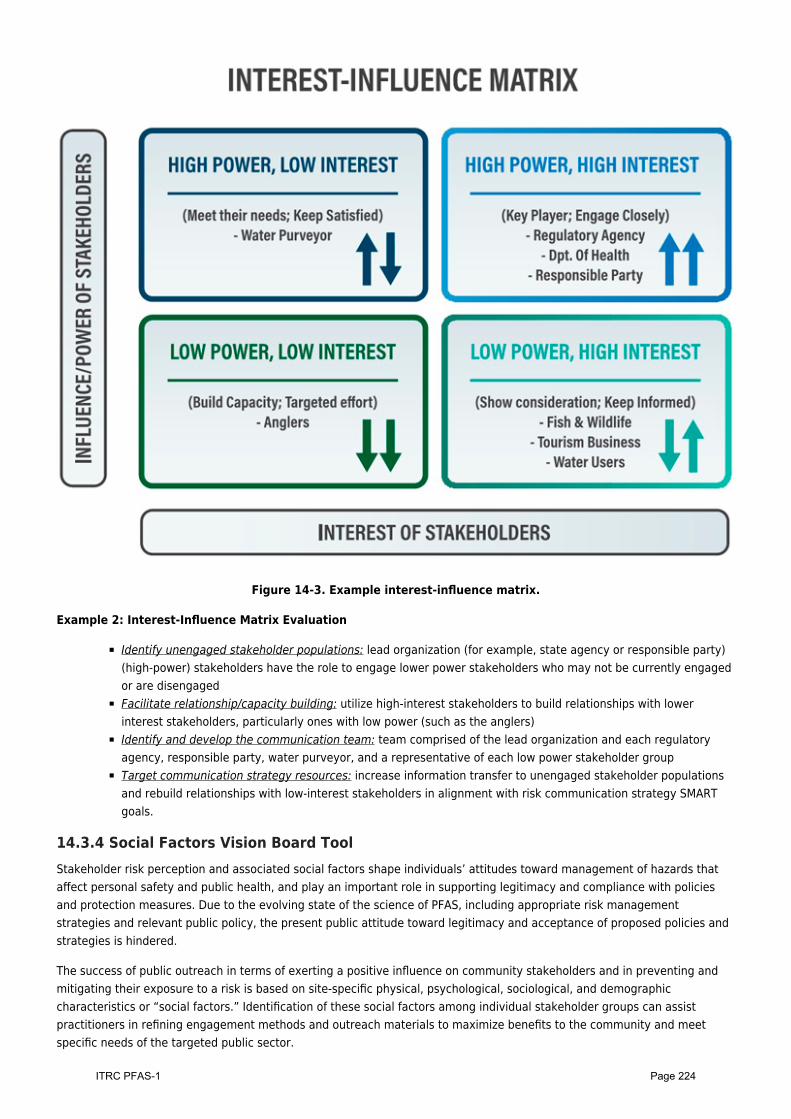
Figure 14-3. Example interest-influence matrix.
Example 2: Interest-Influence Matrix Evaluation
Identify unengaged stakeholder populations: lead organization (for example, state agency or responsible party)(high-power) stakeholders have the role to engage lower power stakeholders who may not be currently engagedor are disengagedFacilitate relationship/capacity building: utilize high-interest stakeholders to build relationships with lowerinterest stakeholders, particularly ones with low power (such as the anglers)Identify and develop the communication team: team comprised of the lead organization and each regulatoryagency, responsible party, water purveyor, and a representative of each low power stakeholder groupTarget communication strategy resources: increase information transfer to unengaged stakeholder populationsand rebuild relationships with low-interest stakeholders in alignment with risk communication strategy SMARTgoals.
14.3.4 Social Factors Vision Board ToolStakeholder risk perception and associated social factors shape individuals’ attitudes toward management of hazards thataffect personal safety and public health, and play an important role in supporting legitimacy and compliance with policiesand protection measures. Due to the evolving state of the science of PFAS, including appropriate risk managementstrategies and relevant public policy, the present public attitude toward legitimacy and acceptance of proposed policies andstrategies is hindered.
The success of public outreach in terms of exerting a positive influence on community stakeholders and in preventing andmitigating their exposure to a risk is based on site-specific physical, psychological, sociological, and demographiccharacteristics or “social factors.” Identification of these social factors among individual stakeholder groups can assistpractitioners in refining engagement methods and outreach materials to maximize benefits to the community and meetspecific needs of the targeted public sector.
Page 224ITRC PFAS-1
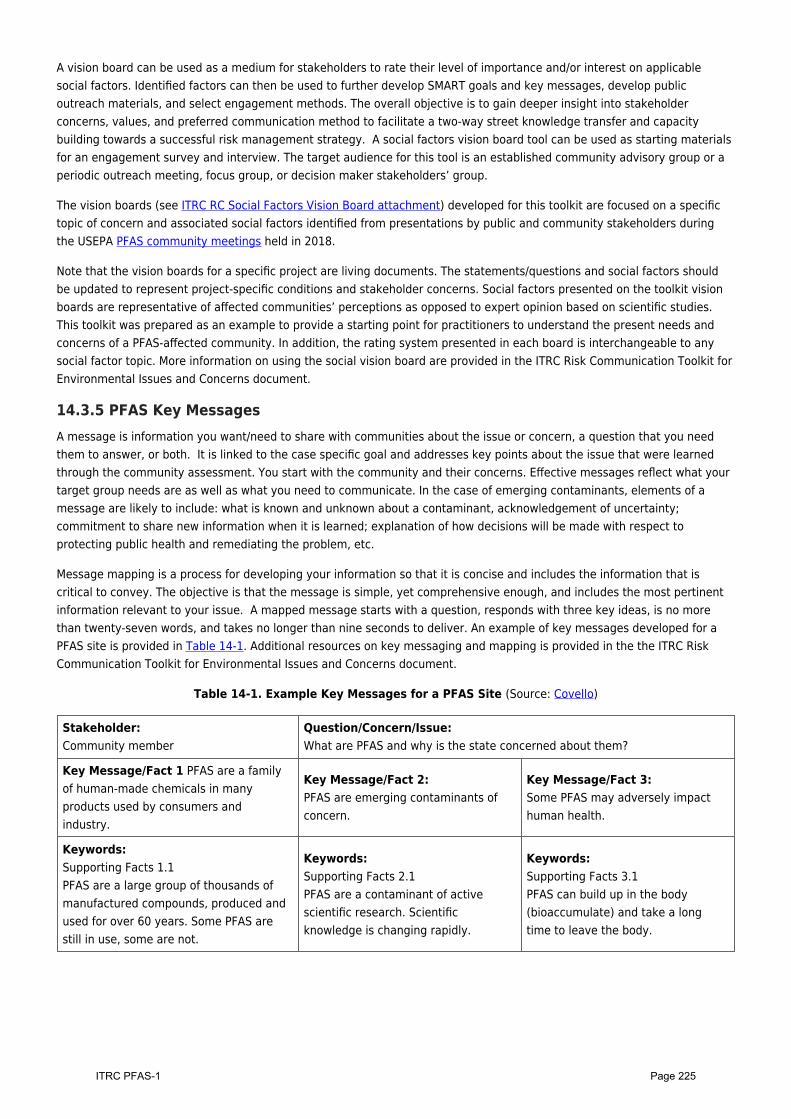
A vision board can be used as a medium for stakeholders to rate their level of importance and/or interest on applicablesocial factors. Identified factors can then be used to further develop SMART goals and key messages, develop publicoutreach materials, and select engagement methods. The overall objective is to gain deeper insight into stakeholderconcerns, values, and preferred communication method to facilitate a two-way street knowledge transfer and capacitybuilding towards a successful risk management strategy. A social factors vision board tool can be used as starting materialsfor an engagement survey and interview. The target audience for this tool is an established community advisory group or aperiodic outreach meeting, focus group, or decision maker stakeholders’ group.
The vision boards (see ITRC RC Social Factors Vision Board attachment) developed for this toolkit are focused on a specifictopic of concern and associated social factors identified from presentations by public and community stakeholders duringthe USEPA PFAS community meetings held in 2018.
Note that the vision boards for a specific project are living documents. The statements/questions and social factors shouldbe updated to represent project-specific conditions and stakeholder concerns. Social factors presented on the toolkit visionboards are representative of affected communities’ perceptions as opposed to expert opinion based on scientific studies.This toolkit was prepared as an example to provide a starting point for practitioners to understand the present needs andconcerns of a PFAS-affected community. In addition, the rating system presented in each board is interchangeable to anysocial factor topic. More information on using the social vision board are provided in the ITRC Risk Communication Toolkit forEnvironmental Issues and Concerns document.
14.3.5 PFAS Key MessagesA message is information you want/need to share with communities about the issue or concern, a question that you needthem to answer, or both. It is linked to the case specific goal and addresses key points about the issue that were learnedthrough the community assessment. You start with the community and their concerns. Effective messages reflect what yourtarget group needs are as well as what you need to communicate. In the case of emerging contaminants, elements of amessage are likely to include: what is known and unknown about a contaminant, acknowledgement of uncertainty;commitment to share new information when it is learned; explanation of how decisions will be made with respect toprotecting public health and remediating the problem, etc.
Message mapping is a process for developing your information so that it is concise and includes the information that iscritical to convey. The objective is that the message is simple, yet comprehensive enough, and includes the most pertinentinformation relevant to your issue. A mapped message starts with a question, responds with three key ideas, is no morethan twenty-seven words, and takes no longer than nine seconds to deliver. An example of key messages developed for aPFAS site is provided in Table 14-1. Additional resources on key messaging and mapping is provided in the the ITRC RiskCommunication Toolkit for Environmental Issues and Concerns document.
Table 14-1. Example Key Messages for a PFAS Site (Source: Covello)
Stakeholder:Community member
Question/Concern/Issue:What are PFAS and why is the state concerned about them?
Key Message/Fact 1 PFAS are a familyof human-made chemicals in manyproducts used by consumers andindustry.
Key Message/Fact 2:PFAS are emerging contaminants ofconcern.
Key Message/Fact 3:Some PFAS may adversely impacthuman health.
Keywords:Supporting Facts 1.1PFAS are a large group of thousands ofmanufactured compounds, produced andused for over 60 years. Some PFAS arestill in use, some are not.
Keywords:Supporting Facts 2.1PFAS are a contaminant of activescientific research. Scientificknowledge is changing rapidly.
Keywords:Supporting Facts 3.1PFAS can build up in the body(bioaccumulate) and take a longtime to leave the body.
Page 225ITRC PFAS-1
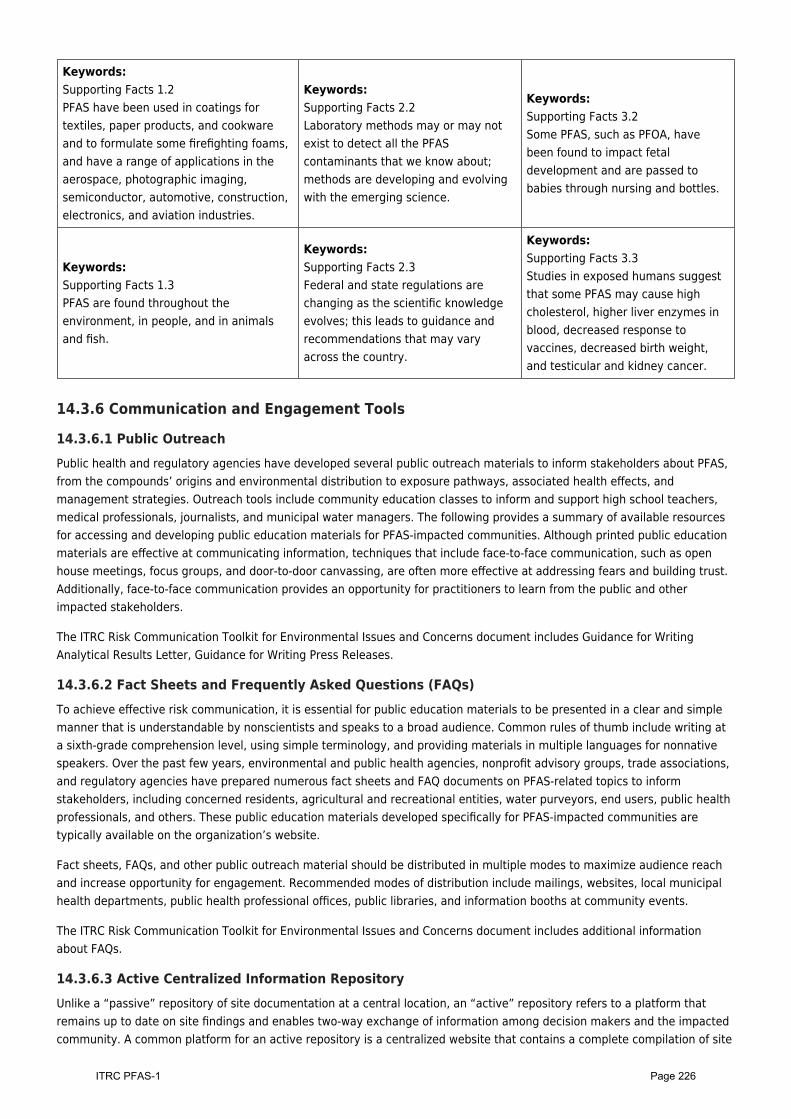
Keywords:Supporting Facts 1.2PFAS have been used in coatings fortextiles, paper products, and cookwareand to formulate some firefighting foams,and have a range of applications in theaerospace, photographic imaging,semiconductor, automotive, construction,electronics, and aviation industries.
Keywords:Supporting Facts 2.2Laboratory methods may or may notexist to detect all the PFAScontaminants that we know about;methods are developing and evolvingwith the emerging science.
Keywords:Supporting Facts 3.2Some PFAS, such as PFOA, havebeen found to impact fetaldevelopment and are passed tobabies through nursing and bottles.
Keywords:Supporting Facts 1.3PFAS are found throughout theenvironment, in people, and in animalsand fish.
Keywords:Supporting Facts 2.3Federal and state regulations arechanging as the scientific knowledgeevolves; this leads to guidance andrecommendations that may varyacross the country.
Keywords:Supporting Facts 3.3Studies in exposed humans suggestthat some PFAS may cause highcholesterol, higher liver enzymes inblood, decreased response tovaccines, decreased birth weight,and testicular and kidney cancer.
14.3.6 Communication and Engagement Tools
14.3.6.1 Public OutreachPublic health and regulatory agencies have developed several public outreach materials to inform stakeholders about PFAS,from the compounds’ origins and environmental distribution to exposure pathways, associated health effects, andmanagement strategies. Outreach tools include community education classes to inform and support high school teachers,medical professionals, journalists, and municipal water managers. The following provides a summary of available resourcesfor accessing and developing public education materials for PFAS-impacted communities. Although printed public educationmaterials are effective at communicating information, techniques that include face-to-face communication, such as openhouse meetings, focus groups, and door-to-door canvassing, are often more effective at addressing fears and building trust.Additionally, face-to-face communication provides an opportunity for practitioners to learn from the public and otherimpacted stakeholders.
The ITRC Risk Communication Toolkit for Environmental Issues and Concerns document includes Guidance for WritingAnalytical Results Letter, Guidance for Writing Press Releases.
14.3.6.2 Fact Sheets and Frequently Asked Questions (FAQs)To achieve effective risk communication, it is essential for public education materials to be presented in a clear and simplemanner that is understandable by nonscientists and speaks to a broad audience. Common rules of thumb include writing ata sixth-grade comprehension level, using simple terminology, and providing materials in multiple languages for nonnativespeakers. Over the past few years, environmental and public health agencies, nonprofit advisory groups, trade associations,and regulatory agencies have prepared numerous fact sheets and FAQ documents on PFAS-related topics to informstakeholders, including concerned residents, agricultural and recreational entities, water purveyors, end users, public healthprofessionals, and others. These public education materials developed specifically for PFAS-impacted communities aretypically available on the organization’s website.
Fact sheets, FAQs, and other public outreach material should be distributed in multiple modes to maximize audience reachand increase opportunity for engagement. Recommended modes of distribution include mailings, websites, local municipalhealth departments, public health professional offices, public libraries, and information booths at community events.
The ITRC Risk Communication Toolkit for Environmental Issues and Concerns document includes additional informationabout FAQs.
14.3.6.3 Active Centralized Information RepositoryUnlike a “passive” repository of site documentation at a central location, an “active” repository refers to a platform thatremains up to date on site findings and enables two-way exchange of information among decision makers and the impactedcommunity. A common platform for an active repository is a centralized website that contains a complete compilation of site
Page 226ITRC PFAS-1

documentation (among all agencies); frequent updates on site activities, health information and regulatory policy; and adepiction of the CSM (such as a source-exposure pathway graphic and geologic maps). The website should also contain aplatform to facilitate stakeholder involvement by providing an opportunity for them to ask questions, submit information,and join a listserv (an application that distributes messages to subscribers on an electronic mailing list).
Examples of centralized websites can be found at the following web links:
Michigan Department of Environmental Quality, Michigan PFAS Action Response Team (MPART):https://www.michigan.gov/pfasresponse/
Michigan agencies representing health, environment, and other branches of state government have joined together toinvestigate sources and locations of PFAS contamination, to take action to protect people’s drinking water, and to keep thepublic informed as we learn more about this emerging contaminant.
New Hampshire Department of Environmental Services (NHDES), NH PFAS Investigation:https://www4.des.state.nh.us/nh-pfas-investigation/
NHDES maintains a website to update interested parties on NHDES’s investigation into the presence of PFAS in NewHampshire. The website includes a map that shows PFOA and PFOS data from water samples collected around the state.
Vermont Department of Environmental Conservation (VDEC), Vermont PFOA Contamination Response:https://dec.vermont.gov/pfas/pfoa
Numerous Vermont agencies, including VDEC, Department of Health (VDH), Emergency Management, Agency of Agriculture,and Agency of Education have joined together to investigate and address PFAS contamination in Vermont. VDEC and VDHhave created and maintained web pages to push information out to the public as it becomes available to keep the publicinformed of the PFAS issue.
Not all stakeholders have access to the internet, and depending upon the seriousness of the site’s situation, it may beappropriate to hold regular meetings and/or office hours to provide more than one mode for stakeholders to obtaininformation and engage with decision makers.
14.3.6.4 Community EducationIndividual stakeholder groups and individuals themselves process information in a variety of modes and media. An effectiverisk communication strategy takes this factor into consideration and encompasses multiple forms of outreach. In addition toinformative materials, such as fact sheets, stakeholder meetings and interactive sessions (such as poster presentations,question and answer sessions) can be held to involve individuals in the learning and understanding process. Prior toselection of a method, an audience assessment should be conducted to determine how a community communicates and tolearn what tool is the most effective to use.
Community Education Example—Bennington College Community Education Strategy, Vermont
In 2016, PFAS were discovered in the public water system of Hoosick Falls, New York, and in hundreds of private residentialwells in Petersburgh, NY, and North Bennington, Vermont. In response to this nearby problem, Bennington College askedhow the scientific resources of a college or university might become a civic resource in times of environmental uncertainty.After some discussion about how to maintain the scientific and educational integrity of the college while also being a goodneighbor to impacted communities, Bennington College decided to open the doors of its science classrooms to the problemof PFAS contamination. This was done primarily in two ways: (1) a new introductory class on PFOA was offered to localcommunities free of charge, and (2) students in more advanced science classes in chemistry and geology worked to produceindependent data on PFAS contamination in the region. More information about both of these strategies is below.
Many residents impacted by PFAS voiced a desire to learn about the science of the problem even as there was a recognitionthat much of that science was currently quite difficult for residents to grasp. Indeed, many of the risks and ramifications ofPFAS contamination are currently published in daunting regulatory reports and peer-reviewed research articles (often behindpaywalls). Addressing these concerns, Bennington College designed a new class to review the chemical properties,environmental pathways, and policy concerns of PFOA, entitled “Understanding PFOA.” This class also taught residents howto collect water samples for PFAS analysis at a commercial lab and how to interpret laboratory results from PFAS analysis.Bennington College has offered this class every spring to local residents since 2016, free of charge. A number of localteachers, journalists, nurses, elected officials, parents, and students enrolled, and the class has become a vehicle for the
Page 227ITRC PFAS-1
community to get up to speed on the science of PFAS so they can engage the issue more productively.
Bennington College also put together faculty-led research teams to produce independent data on PFAS contamination inconversation with community questions. Bennington College realized that impacted communities often had interestingquestions about PFAS that fell outside of the urgent protocols of state agencies, which rightfully focused on safeguardingpublic health. These community questions, however, provided useful pathways to educate residents about the problem andto encourage local participation in research into PFAS contamination. Working with residents of Hoosick Falls, Petersburgh,and North Bennington, the college helped investigate a number of community concerns, such as:
“Is there any PFOA in my maple syrup?”Bennington College tapped two maple trees in the spring and analyzed the sap, finding 8.8 parts pertrillion (ppt) of PFOA in the sap of a maple tree about 1,000 feet from a plastics plant and 2.3 ppt ofPFOA in the sap a maple tree about a mile from the plant.
“My well had high levels of PFOA but now I have a filtration system in my basement. If my well wascontaminated for years, I wonder if there might be any residual PFOA in my water pipes. Could any built-up PFOAstill be contaminating the water coming out of my kitchen faucet?”
Bennington College analyzed water from the kitchen faucet from three homes with high levels ofPFOA in their well and a point of entry treatment filtration system (Hoosick Falls house, 2,100 ppt ofPFOA in well; Petersburgh house, 1,800 ppt of PFOA in well; North Bennington house, 3,000 ppt ofPFOA in well). In all three homes, PFAS were nondetectable in water from the kitchen sink.
“When the state tested my well, they found PFOA levels just below the health guidance level and thus we did notget a filtration system. How stable are detected levels of PFOA in the groundwater?”
Bennington College reviewed data from over 200 residential wells that had been sampled andanalyzed for PFOA at least twice in one year. They found an average variation of 24% in individualwells. PFOA levels increased in about half of the wells and decreased in about half the wells. Thisincrease and decrease did not have an obvious spatial pattern (for example, a plume moving in onedirection) but appeared to be fairly randomly scattered across the sampling area.
More information about Bennington College’s ongoing engagement with PFAS can be found at www.bennington.edu/pfoa.
Updated April 14, 2020.
Page 228ITRC PFAS-1
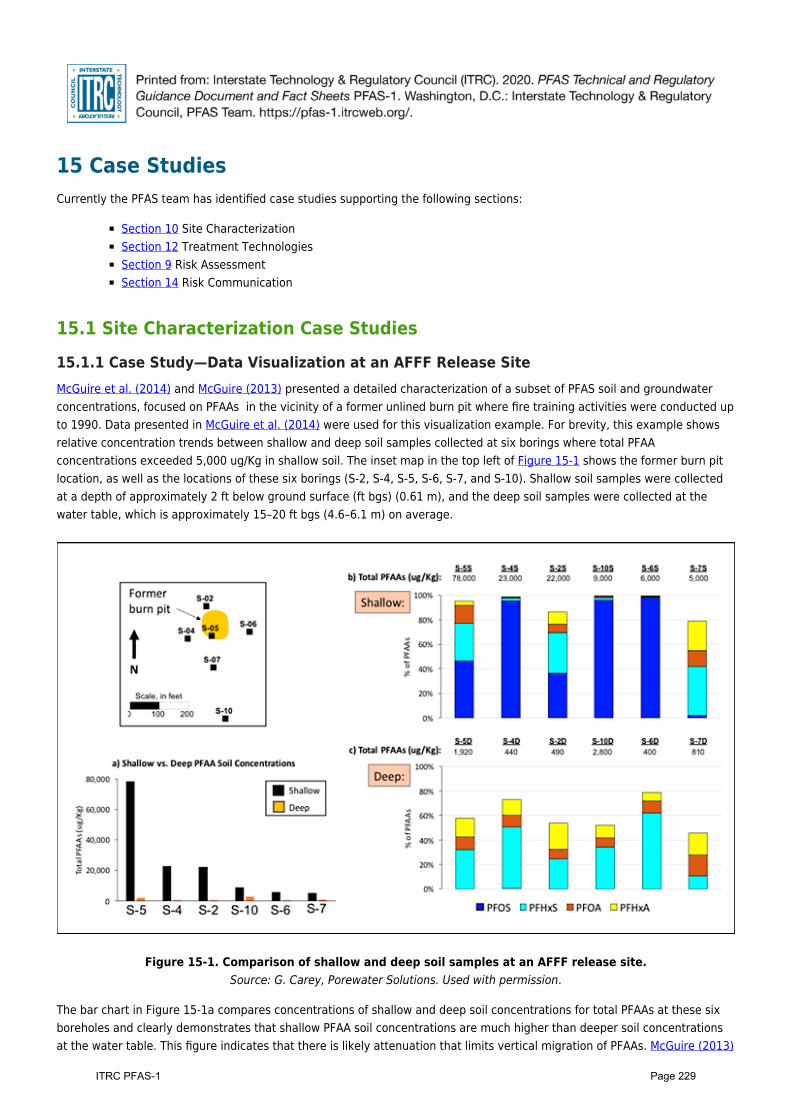
15 Case StudiesCurrently the PFAS team has identified case studies supporting the following sections:
Section 10 Site CharacterizationSection 12 Treatment TechnologiesSection 9 Risk AssessmentSection 14 Risk Communication
15.1 Site Characterization Case Studies
15.1.1 Case Study—Data Visualization at an AFFF Release SiteMcGuire et al. (2014) and McGuire (2013) presented a detailed characterization of a subset of PFAS soil and groundwaterconcentrations, focused on PFAAs in the vicinity of a former unlined burn pit where fire training activities were conducted upto 1990. Data presented in McGuire et al. (2014) were used for this visualization example. For brevity, this example showsrelative concentration trends between shallow and deep soil samples collected at six borings where total PFAAconcentrations exceeded 5,000 ug/Kg in shallow soil. The inset map in the top left of Figure 15-1 shows the former burn pitlocation, as well as the locations of these six borings (S-2, S-4, S-5, S-6, S-7, and S-10). Shallow soil samples were collectedat a depth of approximately 2 ft below ground surface (ft bgs) (0.61 m), and the deep soil samples were collected at thewater table, which is approximately 15–20 ft bgs (4.6–6.1 m) on average.
Figure 15-1. Comparison of shallow and deep soil samples at an AFFF release site.Source: G. Carey, Porewater Solutions. Used with permission.
The bar chart in Figure 15-1a compares concentrations of shallow and deep soil concentrations for total PFAAs at these sixboreholes and clearly demonstrates that shallow PFAA soil concentrations are much higher than deeper soil concentrationsat the water table. This figure indicates that there is likely attenuation that limits vertical migration of PFAAs. McGuire (2013)
Page 229ITRC PFAS-1
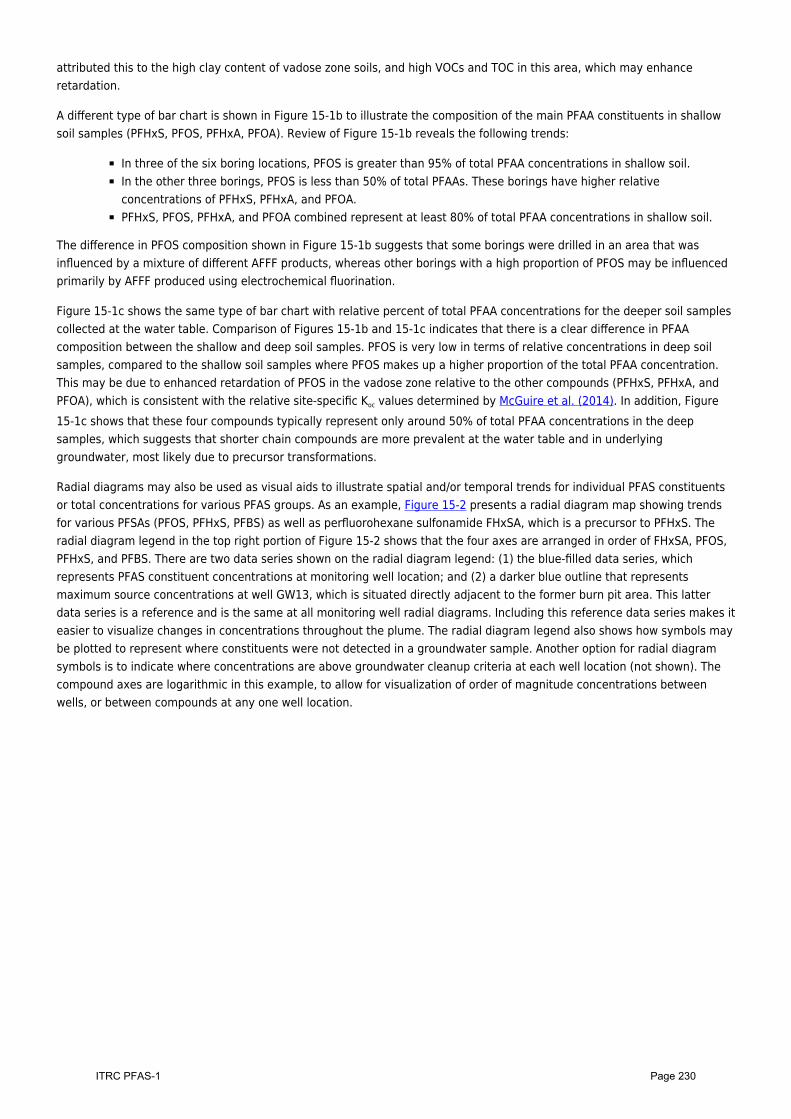
attributed this to the high clay content of vadose zone soils, and high VOCs and TOC in this area, which may enhanceretardation.
A different type of bar chart is shown in Figure 15-1b to illustrate the composition of the main PFAA constituents in shallowsoil samples (PFHxS, PFOS, PFHxA, PFOA). Review of Figure 15-1b reveals the following trends:
In three of the six boring locations, PFOS is greater than 95% of total PFAA concentrations in shallow soil.In the other three borings, PFOS is less than 50% of total PFAAs. These borings have higher relativeconcentrations of PFHxS, PFHxA, and PFOA.PFHxS, PFOS, PFHxA, and PFOA combined represent at least 80% of total PFAA concentrations in shallow soil.
The difference in PFOS composition shown in Figure 15-1b suggests that some borings were drilled in an area that wasinfluenced by a mixture of different AFFF products, whereas other borings with a high proportion of PFOS may be influencedprimarily by AFFF produced using electrochemical fluorination.
Figure 15-1c shows the same type of bar chart with relative percent of total PFAA concentrations for the deeper soil samplescollected at the water table. Comparison of Figures 15-1b and 15-1c indicates that there is a clear difference in PFAAcomposition between the shallow and deep soil samples. PFOS is very low in terms of relative concentrations in deep soilsamples, compared to the shallow soil samples where PFOS makes up a higher proportion of the total PFAA concentration.This may be due to enhanced retardation of PFOS in the vadose zone relative to the other compounds (PFHxS, PFHxA, andPFOA), which is consistent with the relative site-specific Koc values determined by McGuire et al. (2014). In addition, Figure15-1c shows that these four compounds typically represent only around 50% of total PFAA concentrations in the deepsamples, which suggests that shorter chain compounds are more prevalent at the water table and in underlyinggroundwater, most likely due to precursor transformations.
Radial diagrams may also be used as visual aids to illustrate spatial and/or temporal trends for individual PFAS constituentsor total concentrations for various PFAS groups. As an example, Figure 15-2 presents a radial diagram map showing trendsfor various PFSAs (PFOS, PFHxS, PFBS) as well as perfluorohexane sulfonamide FHxSA, which is a precursor to PFHxS. Theradial diagram legend in the top right portion of Figure 15-2 shows that the four axes are arranged in order of FHxSA, PFOS,PFHxS, and PFBS. There are two data series shown on the radial diagram legend: (1) the blue-filled data series, whichrepresents PFAS constituent concentrations at monitoring well location; and (2) a darker blue outline that representsmaximum source concentrations at well GW13, which is situated directly adjacent to the former burn pit area. This latterdata series is a reference and is the same at all monitoring well radial diagrams. Including this reference data series makes iteasier to visualize changes in concentrations throughout the plume. The radial diagram legend also shows how symbols maybe plotted to represent where constituents were not detected in a groundwater sample. Another option for radial diagramsymbols is to indicate where concentrations are above groundwater cleanup criteria at each well location (not shown). Thecompound axes are logarithmic in this example, to allow for visualization of order of magnitude concentrations betweenwells, or between compounds at any one well location.
Page 230ITRC PFAS-1
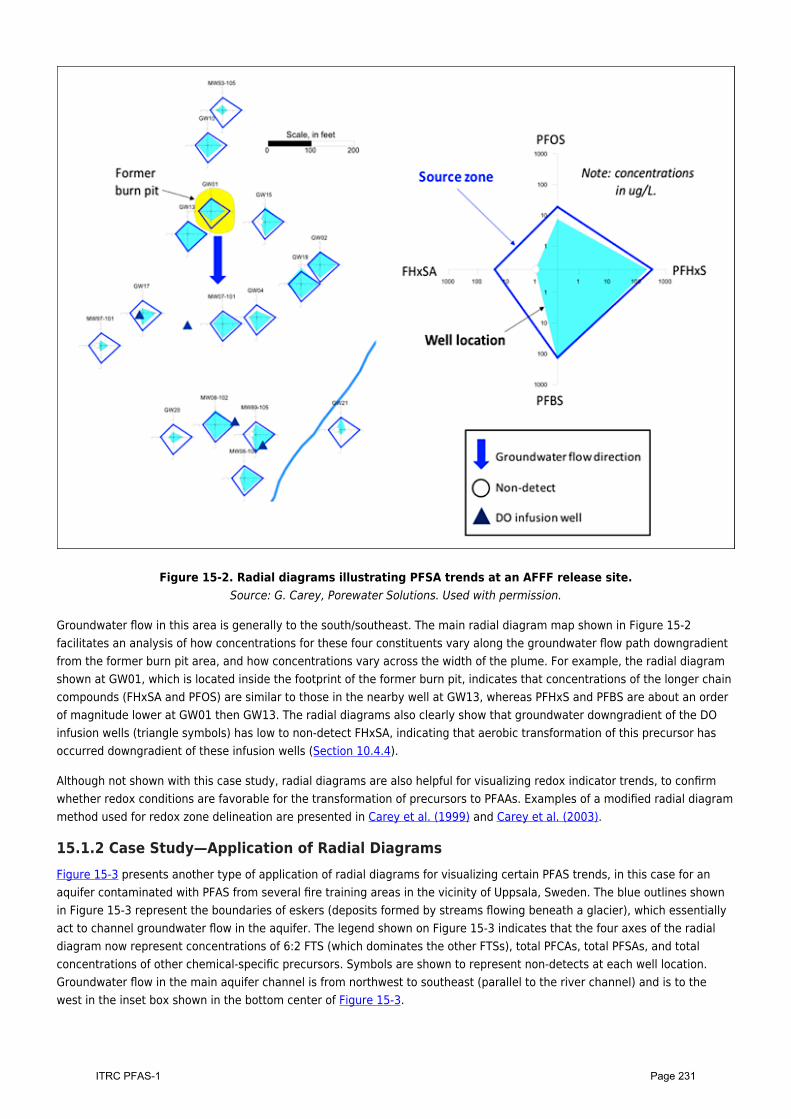
Figure 15-2. Radial diagrams illustrating PFSA trends at an AFFF release site.Source: G. Carey, Porewater Solutions. Used with permission.
Groundwater flow in this area is generally to the south/southeast. The main radial diagram map shown in Figure 15-2facilitates an analysis of how concentrations for these four constituents vary along the groundwater flow path downgradientfrom the former burn pit area, and how concentrations vary across the width of the plume. For example, the radial diagramshown at GW01, which is located inside the footprint of the former burn pit, indicates that concentrations of the longer chaincompounds (FHxSA and PFOS) are similar to those in the nearby well at GW13, whereas PFHxS and PFBS are about an orderof magnitude lower at GW01 then GW13. The radial diagrams also clearly show that groundwater downgradient of the DOinfusion wells (triangle symbols) has low to non-detect FHxSA, indicating that aerobic transformation of this precursor hasoccurred downgradient of these infusion wells (Section 10.4.4).
Although not shown with this case study, radial diagrams are also helpful for visualizing redox indicator trends, to confirmwhether redox conditions are favorable for the transformation of precursors to PFAAs. Examples of a modified radial diagrammethod used for redox zone delineation are presented in Carey et al. (1999) and Carey et al. (2003).
15.1.2 Case Study—Application of Radial DiagramsFigure 15-3 presents another type of application of radial diagrams for visualizing certain PFAS trends, in this case for anaquifer contaminated with PFAS from several fire training areas in the vicinity of Uppsala, Sweden. The blue outlines shownin Figure 15-3 represent the boundaries of eskers (deposits formed by streams flowing beneath a glacier), which essentiallyact to channel groundwater flow in the aquifer. The legend shown on Figure 15-3 indicates that the four axes of the radialdiagram now represent concentrations of 6:2 FTS (which dominates the other FTSs), total PFCAs, total PFSAs, and totalconcentrations of other chemical-specific precursors. Symbols are shown to represent non-detects at each well location.Groundwater flow in the main aquifer channel is from northwest to southeast (parallel to the river channel) and is to thewest in the inset box shown in the bottom center of Figure 15-3.
Page 231ITRC PFAS-1
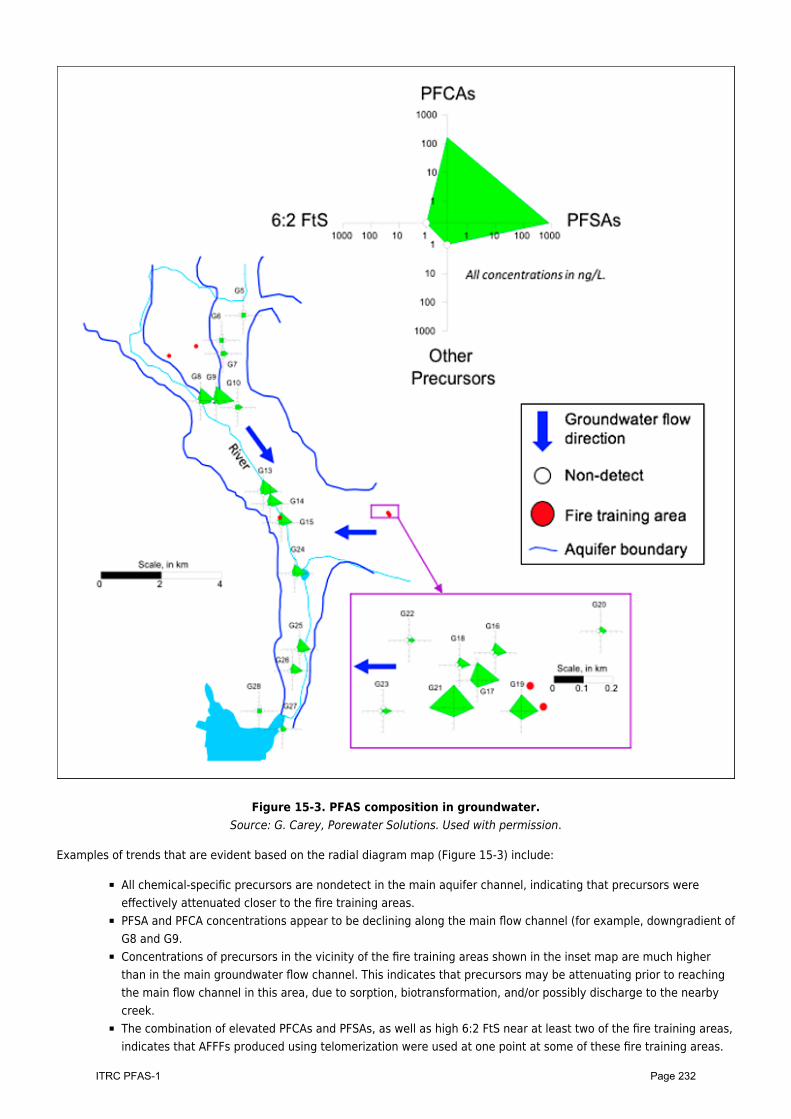
Figure 15-3. PFAS composition in groundwater.Source: G. Carey, Porewater Solutions. Used with permission.
Examples of trends that are evident based on the radial diagram map (Figure 15-3) include:
All chemical-specific precursors are nondetect in the main aquifer channel, indicating that precursors wereeffectively attenuated closer to the fire training areas.PFSA and PFCA concentrations appear to be declining along the main flow channel (for example, downgradient ofG8 and G9.Concentrations of precursors in the vicinity of the fire training areas shown in the inset map are much higherthan in the main groundwater flow channel. This indicates that precursors may be attenuating prior to reachingthe main flow channel in this area, due to sorption, biotransformation, and/or possibly discharge to the nearbycreek.The combination of elevated PFCAs and PFSAs, as well as high 6:2 FtS near at least two of the fire training areas,indicates that AFFFs produced using telomerization were used at one point at some of these fire training areas.
Page 232ITRC PFAS-1
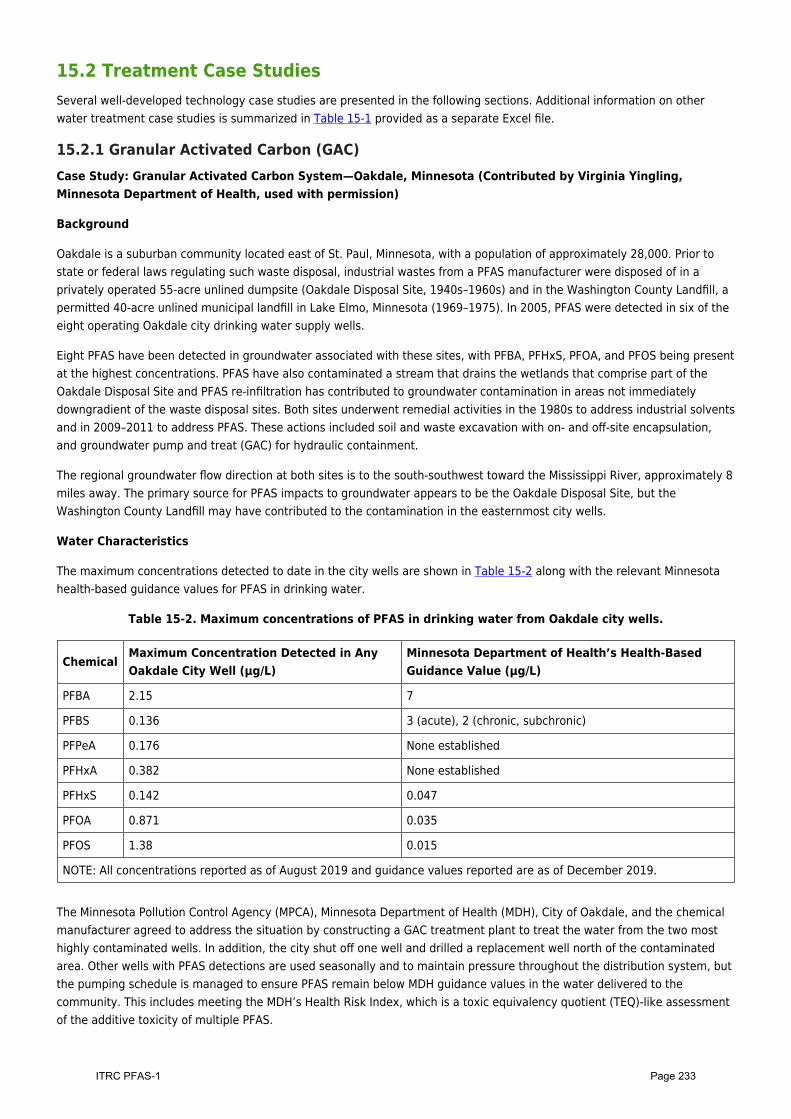
15.2 Treatment Case StudiesSeveral well-developed technology case studies are presented in the following sections. Additional information on otherwater treatment case studies is summarized in Table 15-1 provided as a separate Excel file.
15.2.1 Granular Activated Carbon (GAC)Case Study: Granular Activated Carbon System—Oakdale, Minnesota (Contributed by Virginia Yingling,Minnesota Department of Health, used with permission)
Background
Oakdale is a suburban community located east of St. Paul, Minnesota, with a population of approximately 28,000. Prior tostate or federal laws regulating such waste disposal, industrial wastes from a PFAS manufacturer were disposed of in aprivately operated 55-acre unlined dumpsite (Oakdale Disposal Site, 1940s–1960s) and in the Washington County Landfill, apermitted 40-acre unlined municipal landfill in Lake Elmo, Minnesota (1969–1975). In 2005, PFAS were detected in six of theeight operating Oakdale city drinking water supply wells.
Eight PFAS have been detected in groundwater associated with these sites, with PFBA, PFHxS, PFOA, and PFOS being presentat the highest concentrations. PFAS have also contaminated a stream that drains the wetlands that comprise part of theOakdale Disposal Site and PFAS re-infiltration has contributed to groundwater contamination in areas not immediatelydowngradient of the waste disposal sites. Both sites underwent remedial activities in the 1980s to address industrial solventsand in 2009–2011 to address PFAS. These actions included soil and waste excavation with on- and off-site encapsulation,and groundwater pump and treat (GAC) for hydraulic containment.
The regional groundwater flow direction at both sites is to the south-southwest toward the Mississippi River, approximately 8miles away. The primary source for PFAS impacts to groundwater appears to be the Oakdale Disposal Site, but theWashington County Landfill may have contributed to the contamination in the easternmost city wells.
Water Characteristics
The maximum concentrations detected to date in the city wells are shown in Table 15-2 along with the relevant Minnesotahealth-based guidance values for PFAS in drinking water.
Table 15-2. Maximum concentrations of PFAS in drinking water from Oakdale city wells.
ChemicalMaximum Concentration Detected in AnyOakdale City Well (µg/L)
Minnesota Department of Health’s Health-BasedGuidance Value (µg/L)
PFBA 2.15 7
PFBS 0.136 3 (acute), 2 (chronic, subchronic)
PFPeA 0.176 None established
PFHxA 0.382 None established
PFHxS 0.142 0.047
PFOA 0.871 0.035
PFOS 1.38 0.015
NOTE: All concentrations reported as of August 2019 and guidance values reported are as of December 2019.
The Minnesota Pollution Control Agency (MPCA), Minnesota Department of Health (MDH), City of Oakdale, and the chemicalmanufacturer agreed to address the situation by constructing a GAC treatment plant to treat the water from the two mosthighly contaminated wells. In addition, the city shut off one well and drilled a replacement well north of the contaminatedarea. Other wells with PFAS detections are used seasonally and to maintain pressure throughout the distribution system, butthe pumping schedule is managed to ensure PFAS remain below MDH guidance values in the water delivered to thecommunity. This includes meeting the MDH’s Health Risk Index, which is a toxic equivalency quotient (TEQ)-like assessmentof the additive toxicity of multiple PFAS.
Page 233ITRC PFAS-1
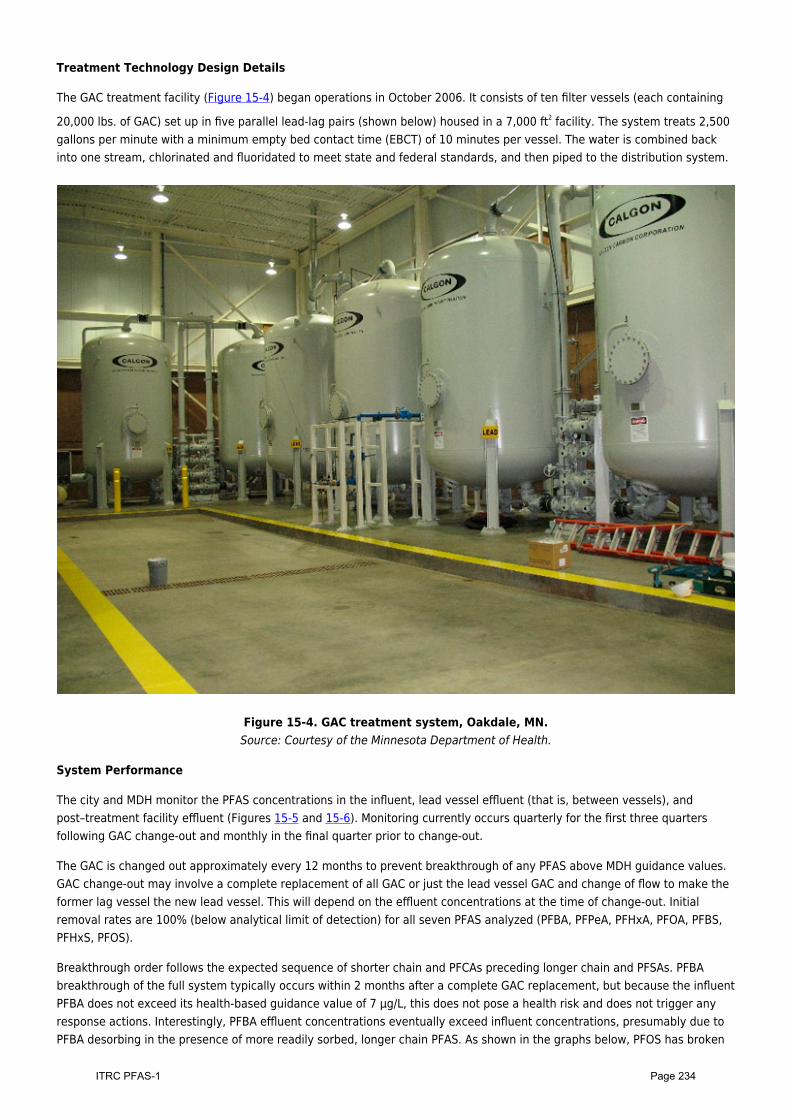
Treatment Technology Design Details
The GAC treatment facility (Figure 15-4) began operations in October 2006. It consists of ten filter vessels (each containing
20,000 lbs. of GAC) set up in five parallel lead-lag pairs (shown below) housed in a 7,000 ft2 facility. The system treats 2,500gallons per minute with a minimum empty bed contact time (EBCT) of 10 minutes per vessel. The water is combined backinto one stream, chlorinated and fluoridated to meet state and federal standards, and then piped to the distribution system.
Figure 15-4. GAC treatment system, Oakdale, MN.Source: Courtesy of the Minnesota Department of Health.
System Performance
The city and MDH monitor the PFAS concentrations in the influent, lead vessel effluent (that is, between vessels), andpost–treatment facility effluent (Figures 15-5 and 15-6). Monitoring currently occurs quarterly for the first three quartersfollowing GAC change-out and monthly in the final quarter prior to change-out.
The GAC is changed out approximately every 12 months to prevent breakthrough of any PFAS above MDH guidance values.GAC change-out may involve a complete replacement of all GAC or just the lead vessel GAC and change of flow to make theformer lag vessel the new lead vessel. This will depend on the effluent concentrations at the time of change-out. Initialremoval rates are 100% (below analytical limit of detection) for all seven PFAS analyzed (PFBA, PFPeA, PFHxA, PFOA, PFBS,PFHxS, PFOS).
Breakthrough order follows the expected sequence of shorter chain and PFCAs preceding longer chain and PFSAs. PFBAbreakthrough of the full system typically occurs within 2 months after a complete GAC replacement, but because the influentPFBA does not exceed its health-based guidance value of 7 µg/L, this does not pose a health risk and does not trigger anyresponse actions. Interestingly, PFBA effluent concentrations eventually exceed influent concentrations, presumably due toPFBA desorbing in the presence of more readily sorbed, longer chain PFAS. As shown in the graphs below, PFOS has broken
Page 234ITRC PFAS-1
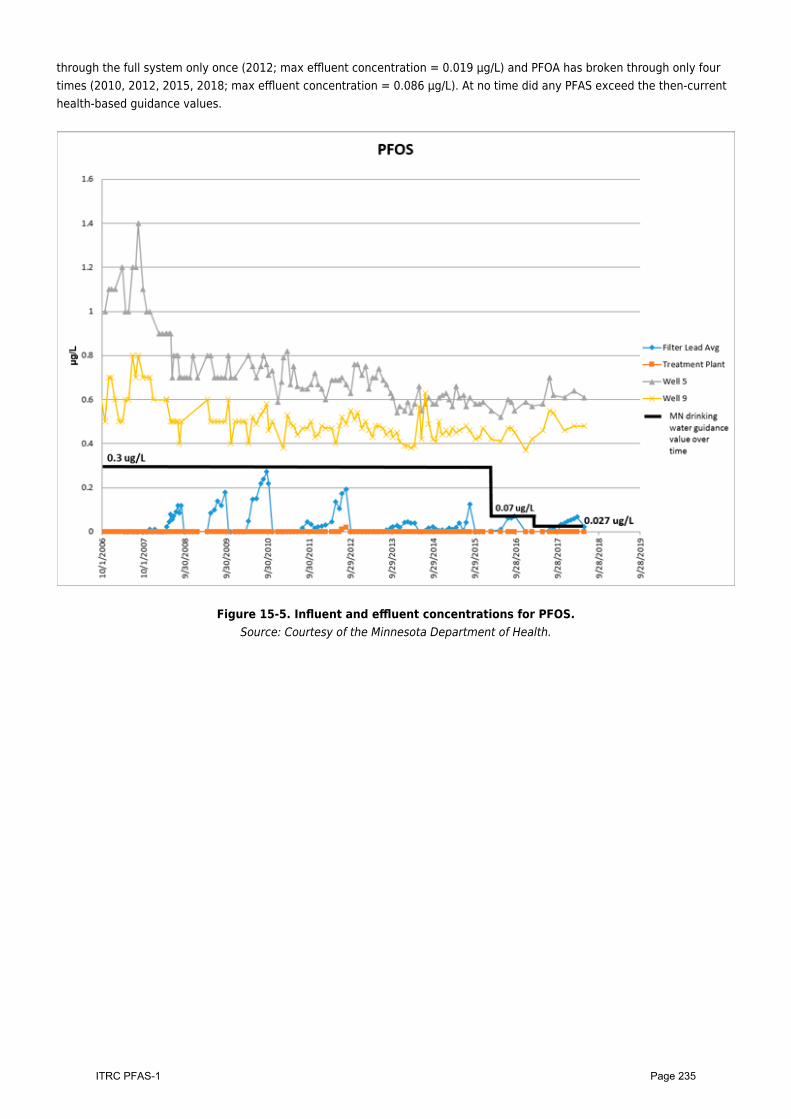
through the full system only once (2012; max effluent concentration = 0.019 µg/L) and PFOA has broken through only fourtimes (2010, 2012, 2015, 2018; max effluent concentration = 0.086 µg/L). At no time did any PFAS exceed the then-currenthealth-based guidance values.
Figure 15-5. Influent and effluent concentrations for PFOS.Source: Courtesy of the Minnesota Department of Health.
Page 235ITRC PFAS-1
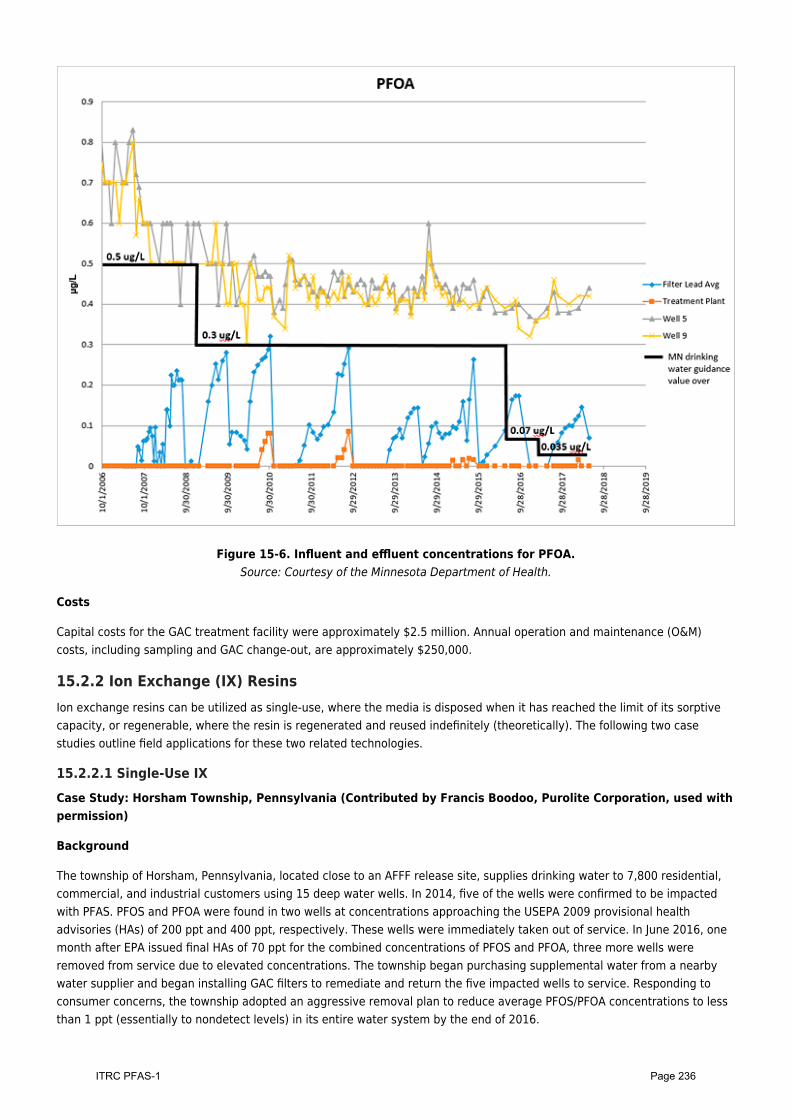
Figure 15-6. Influent and effluent concentrations for PFOA.Source: Courtesy of the Minnesota Department of Health.
Costs
Capital costs for the GAC treatment facility were approximately $2.5 million. Annual operation and maintenance (O&M)costs, including sampling and GAC change-out, are approximately $250,000.
15.2.2 Ion Exchange (IX) ResinsIon exchange resins can be utilized as single-use, where the media is disposed when it has reached the limit of its sorptivecapacity, or regenerable, where the resin is regenerated and reused indefinitely (theoretically). The following two casestudies outline field applications for these two related technologies.
15.2.2.1 Single-Use IXCase Study: Horsham Township, Pennsylvania (Contributed by Francis Boodoo, Purolite Corporation, used withpermission)
Background
The township of Horsham, Pennsylvania, located close to an AFFF release site, supplies drinking water to 7,800 residential,commercial, and industrial customers using 15 deep water wells. In 2014, five of the wells were confirmed to be impactedwith PFAS. PFOS and PFOA were found in two wells at concentrations approaching the USEPA 2009 provisional healthadvisories (HAs) of 200 ppt and 400 ppt, respectively. These wells were immediately taken out of service. In June 2016, onemonth after EPA issued final HAs of 70 ppt for the combined concentrations of PFOS and PFOA, three more wells wereremoved from service due to elevated concentrations. The township began purchasing supplemental water from a nearbywater supplier and began installing GAC filters to remediate and return the five impacted wells to service. Responding toconsumer concerns, the township adopted an aggressive removal plan to reduce average PFOS/PFOA concentrations to lessthan 1 ppt (essentially to nondetect levels) in its entire water system by the end of 2016.
Page 236ITRC PFAS-1
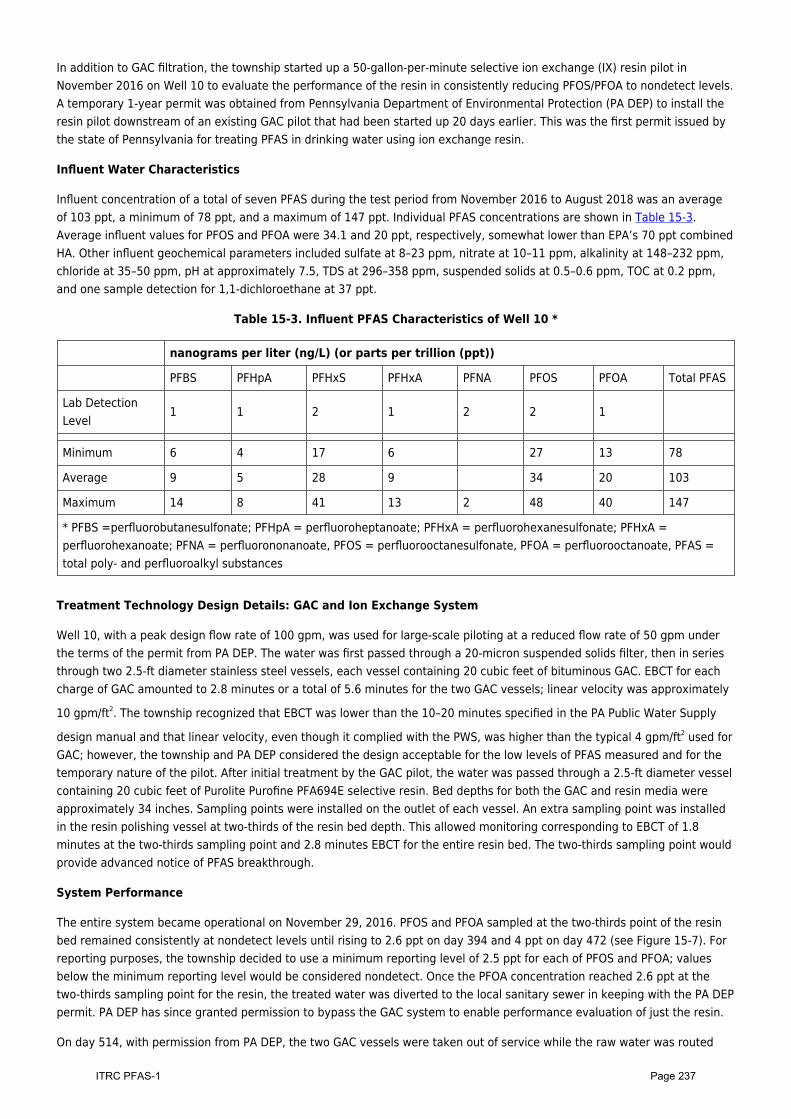
In addition to GAC filtration, the township started up a 50-gallon-per-minute selective ion exchange (IX) resin pilot inNovember 2016 on Well 10 to evaluate the performance of the resin in consistently reducing PFOS/PFOA to nondetect levels.A temporary 1-year permit was obtained from Pennsylvania Department of Environmental Protection (PA DEP) to install theresin pilot downstream of an existing GAC pilot that had been started up 20 days earlier. This was the first permit issued bythe state of Pennsylvania for treating PFAS in drinking water using ion exchange resin.
Influent Water Characteristics
Influent concentration of a total of seven PFAS during the test period from November 2016 to August 2018 was an averageof 103 ppt, a minimum of 78 ppt, and a maximum of 147 ppt. Individual PFAS concentrations are shown in Table 15-3.Average influent values for PFOS and PFOA were 34.1 and 20 ppt, respectively, somewhat lower than EPA’s 70 ppt combinedHA. Other influent geochemical parameters included sulfate at 8–23 ppm, nitrate at 10–11 ppm, alkalinity at 148–232 ppm,chloride at 35–50 ppm, pH at approximately 7.5, TDS at 296–358 ppm, suspended solids at 0.5–0.6 ppm, TOC at 0.2 ppm,and one sample detection for 1,1-dichloroethane at 37 ppt.
Table 15-3. Influent PFAS Characteristics of Well 10 *
nanograms per liter (ng/L) (or parts per trillion (ppt))
PFBS PFHpA PFHxS PFHxA PFNA PFOS PFOA Total PFAS
Lab DetectionLevel
1 1 2 1 2 2 1
Minimum 6 4 17 6 27 13 78
Average 9 5 28 9 34 20 103
Maximum 14 8 41 13 2 48 40 147
* PFBS =perfluorobutanesulfonate; PFHpA = perfluoroheptanoate; PFHxA = perfluorohexanesulfonate; PFHxA =perfluorohexanoate; PFNA = perfluorononanoate, PFOS = perfluorooctanesulfonate, PFOA = perfluorooctanoate, PFAS =total poly- and perfluoroalkyl substances
Treatment Technology Design Details: GAC and Ion Exchange System
Well 10, with a peak design flow rate of 100 gpm, was used for large-scale piloting at a reduced flow rate of 50 gpm underthe terms of the permit from PA DEP. The water was first passed through a 20-micron suspended solids filter, then in seriesthrough two 2.5-ft diameter stainless steel vessels, each vessel containing 20 cubic feet of bituminous GAC. EBCT for eachcharge of GAC amounted to 2.8 minutes or a total of 5.6 minutes for the two GAC vessels; linear velocity was approximately
10 gpm/ft2. The township recognized that EBCT was lower than the 10–20 minutes specified in the PA Public Water Supply
design manual and that linear velocity, even though it complied with the PWS, was higher than the typical 4 gpm/ft2 used forGAC; however, the township and PA DEP considered the design acceptable for the low levels of PFAS measured and for thetemporary nature of the pilot. After initial treatment by the GAC pilot, the water was passed through a 2.5-ft diameter vesselcontaining 20 cubic feet of Purolite Purofine PFA694E selective resin. Bed depths for both the GAC and resin media wereapproximately 34 inches. Sampling points were installed on the outlet of each vessel. An extra sampling point was installedin the resin polishing vessel at two-thirds of the resin bed depth. This allowed monitoring corresponding to EBCT of 1.8minutes at the two-thirds sampling point and 2.8 minutes EBCT for the entire resin bed. The two-thirds sampling point wouldprovide advanced notice of PFAS breakthrough.
System Performance
The entire system became operational on November 29, 2016. PFOS and PFOA sampled at the two-thirds point of the resinbed remained consistently at nondetect levels until rising to 2.6 ppt on day 394 and 4 ppt on day 472 (see Figure 15-7). Forreporting purposes, the township decided to use a minimum reporting level of 2.5 ppt for each of PFOS and PFOA; valuesbelow the minimum reporting level would be considered nondetect. Once the PFOA concentration reached 2.6 ppt at thetwo-thirds sampling point for the resin, the treated water was diverted to the local sanitary sewer in keeping with the PA DEPpermit. PA DEP has since granted permission to bypass the GAC system to enable performance evaluation of just the resin.
On day 514, with permission from PA DEP, the two GAC vessels were taken out of service while the raw water was routed
Page 237ITRC PFAS-1
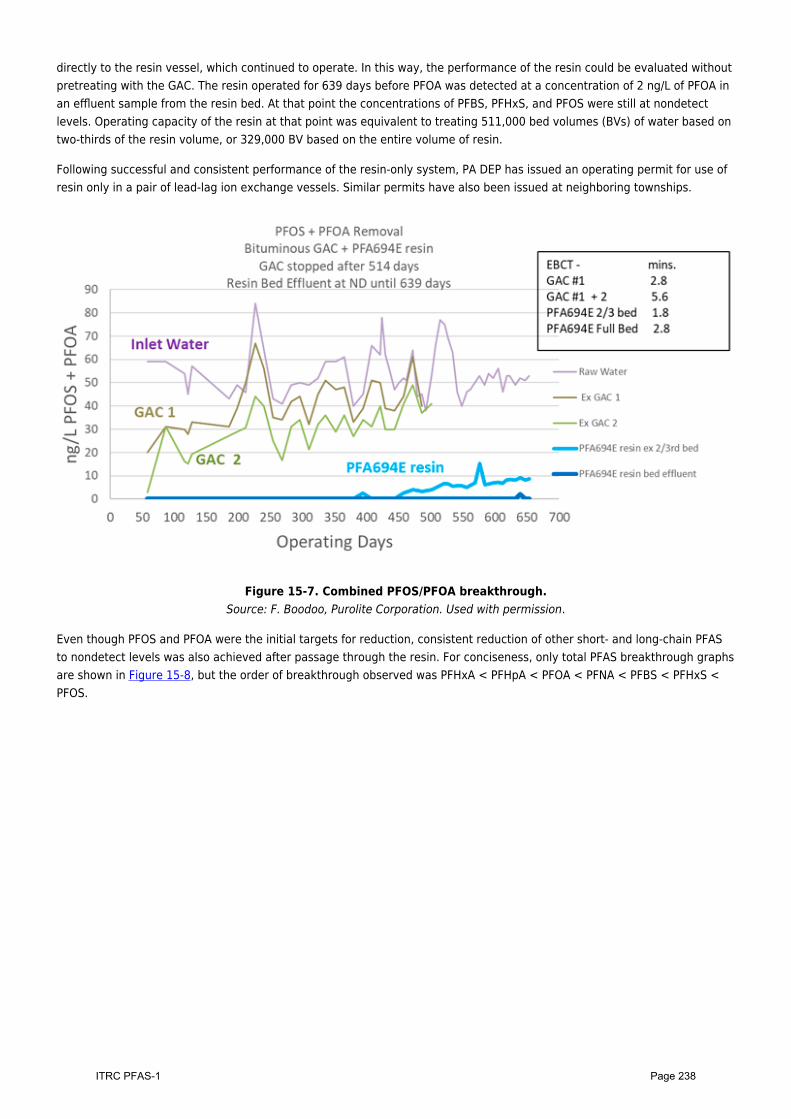
directly to the resin vessel, which continued to operate. In this way, the performance of the resin could be evaluated withoutpretreating with the GAC. The resin operated for 639 days before PFOA was detected at a concentration of 2 ng/L of PFOA inan effluent sample from the resin bed. At that point the concentrations of PFBS, PFHxS, and PFOS were still at nondetectlevels. Operating capacity of the resin at that point was equivalent to treating 511,000 bed volumes (BVs) of water based ontwo-thirds of the resin volume, or 329,000 BV based on the entire volume of resin.
Following successful and consistent performance of the resin-only system, PA DEP has issued an operating permit for use ofresin only in a pair of lead-lag ion exchange vessels. Similar permits have also been issued at neighboring townships.
Figure 15-7. Combined PFOS/PFOA breakthrough.Source: F. Boodoo, Purolite Corporation. Used with permission.
Even though PFOS and PFOA were the initial targets for reduction, consistent reduction of other short- and long-chain PFASto nondetect levels was also achieved after passage through the resin. For conciseness, only total PFAS breakthrough graphsare shown in Figure 15-8, but the order of breakthrough observed was PFHxA < PFHpA < PFOA < PFNA < PFBS < PFHxS <PFOS.
Page 238ITRC PFAS-1
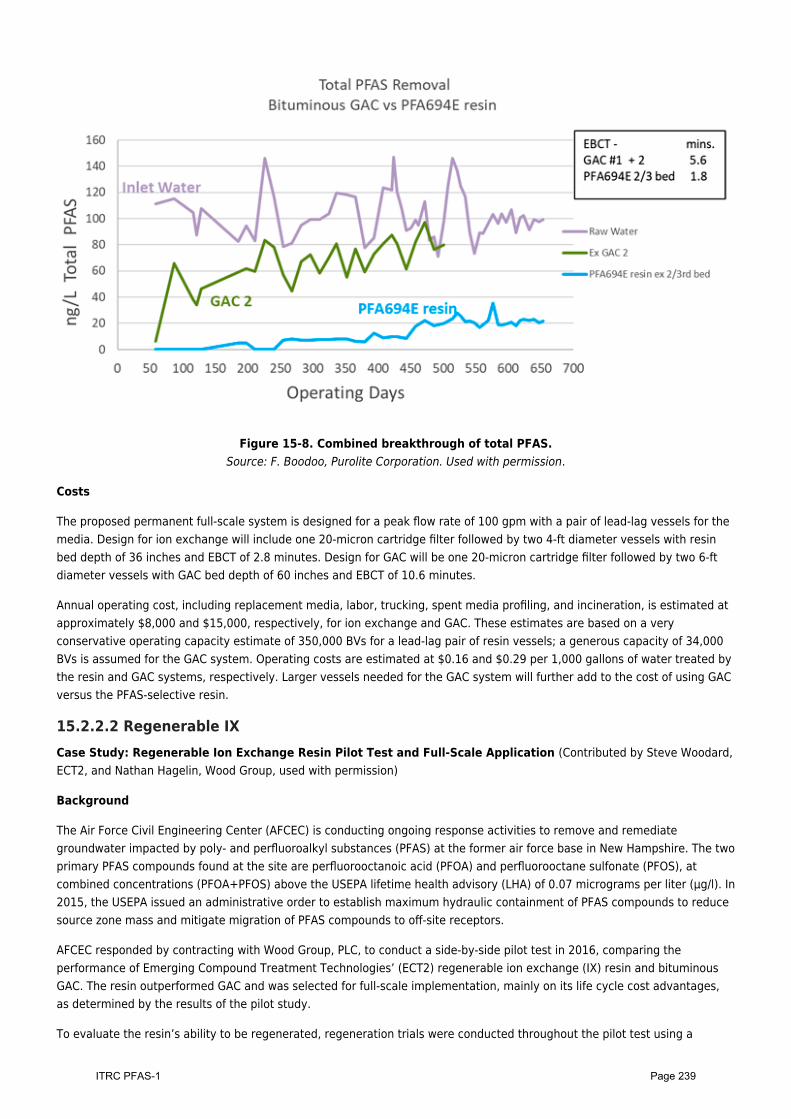
Figure 15-8. Combined breakthrough of total PFAS.Source: F. Boodoo, Purolite Corporation. Used with permission.
Costs
The proposed permanent full-scale system is designed for a peak flow rate of 100 gpm with a pair of lead-lag vessels for themedia. Design for ion exchange will include one 20-micron cartridge filter followed by two 4-ft diameter vessels with resinbed depth of 36 inches and EBCT of 2.8 minutes. Design for GAC will be one 20-micron cartridge filter followed by two 6-ftdiameter vessels with GAC bed depth of 60 inches and EBCT of 10.6 minutes.
Annual operating cost, including replacement media, labor, trucking, spent media profiling, and incineration, is estimated atapproximately $8,000 and $15,000, respectively, for ion exchange and GAC. These estimates are based on a veryconservative operating capacity estimate of 350,000 BVs for a lead-lag pair of resin vessels; a generous capacity of 34,000BVs is assumed for the GAC system. Operating costs are estimated at $0.16 and $0.29 per 1,000 gallons of water treated bythe resin and GAC systems, respectively. Larger vessels needed for the GAC system will further add to the cost of using GACversus the PFAS-selective resin.
15.2.2.2 Regenerable IXCase Study: Regenerable Ion Exchange Resin Pilot Test and Full-Scale Application (Contributed by Steve Woodard,ECT2, and Nathan Hagelin, Wood Group, used with permission)
Background
The Air Force Civil Engineering Center (AFCEC) is conducting ongoing response activities to remove and remediategroundwater impacted by poly- and perfluoroalkyl substances (PFAS) at the former air force base in New Hampshire. The twoprimary PFAS compounds found at the site are perfluorooctanoic acid (PFOA) and perfluorooctane sulfonate (PFOS), atcombined concentrations (PFOA+PFOS) above the USEPA lifetime health advisory (LHA) of 0.07 micrograms per liter (µg/l). In2015, the USEPA issued an administrative order to establish maximum hydraulic containment of PFAS compounds to reducesource zone mass and mitigate migration of PFAS compounds to off-site receptors.
AFCEC responded by contracting with Wood Group, PLC, to conduct a side-by-side pilot test in 2016, comparing theperformance of Emerging Compound Treatment Technologies’ (ECT2) regenerable ion exchange (IX) resin and bituminousGAC. The resin outperformed GAC and was selected for full-scale implementation, mainly on its life cycle cost advantages,as determined by the results of the pilot study.
To evaluate the resin’s ability to be regenerated, regeneration trials were conducted throughout the pilot test using a
Page 239ITRC PFAS-1
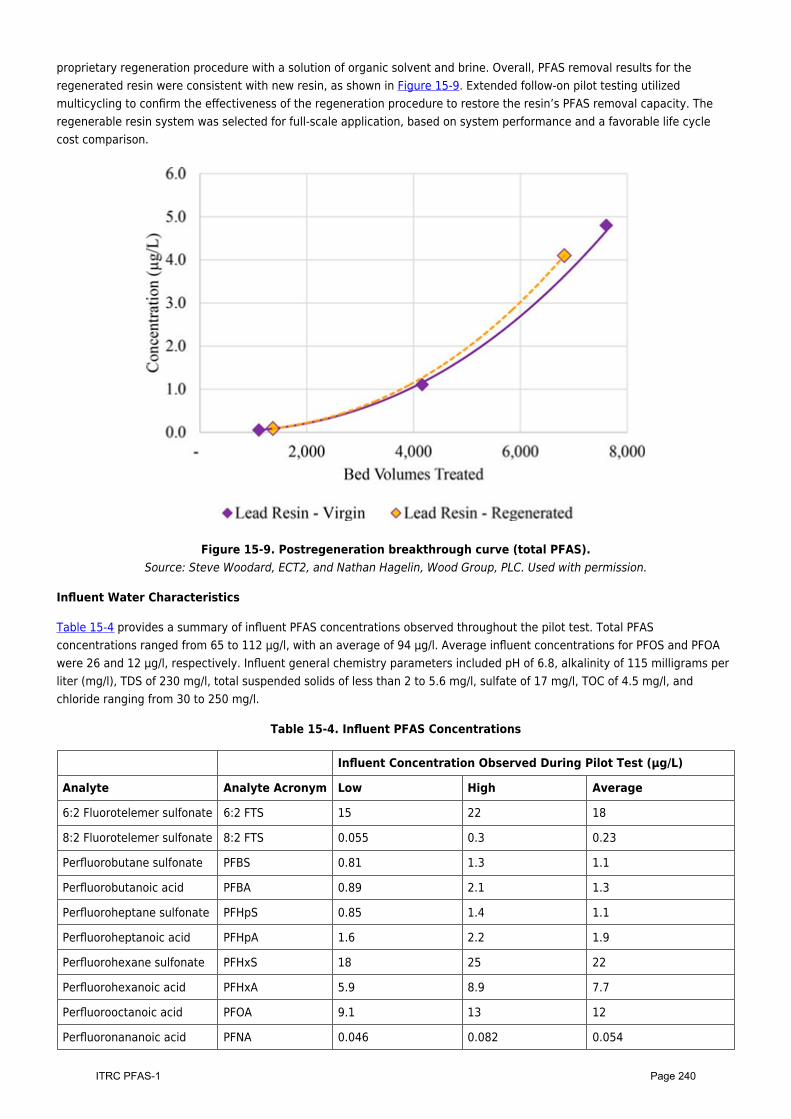
proprietary regeneration procedure with a solution of organic solvent and brine. Overall, PFAS removal results for theregenerated resin were consistent with new resin, as shown in Figure 15-9. Extended follow-on pilot testing utilizedmulticycling to confirm the effectiveness of the regeneration procedure to restore the resin’s PFAS removal capacity. Theregenerable resin system was selected for full-scale application, based on system performance and a favorable life cyclecost comparison.
Figure 15-9. Postregeneration breakthrough curve (total PFAS).Source: Steve Woodard, ECT2, and Nathan Hagelin, Wood Group, PLC. Used with permission.
Influent Water Characteristics
Table 15-4 provides a summary of influent PFAS concentrations observed throughout the pilot test. Total PFASconcentrations ranged from 65 to 112 µg/l, with an average of 94 µg/l. Average influent concentrations for PFOS and PFOAwere 26 and 12 µg/l, respectively. Influent general chemistry parameters included pH of 6.8, alkalinity of 115 milligrams perliter (mg/l), TDS of 230 mg/l, total suspended solids of less than 2 to 5.6 mg/l, sulfate of 17 mg/l, TOC of 4.5 mg/l, andchloride ranging from 30 to 250 mg/l.
Table 15-4. Influent PFAS Concentrations
Influent Concentration Observed During Pilot Test (µg/L)
Analyte Analyte Acronym Low High Average
6:2 Fluorotelemer sulfonate 6:2 FTS 15 22 18
8:2 Fluorotelemer sulfonate 8:2 FTS 0.055 0.3 0.23
Perfluorobutane sulfonate PFBS 0.81 1.3 1.1
Perfluorobutanoic acid PFBA 0.89 2.1 1.3
Perfluoroheptane sulfonate PFHpS 0.85 1.4 1.1
Perfluoroheptanoic acid PFHpA 1.6 2.2 1.9
Perfluorohexane sulfonate PFHxS 18 25 22
Perfluorohexanoic acid PFHxA 5.9 8.9 7.7
Perfluorooctanoic acid PFOA 9.1 13 12
Perfluoronananoic acid PFNA 0.046 0.082 0.054
Page 240ITRC PFAS-1
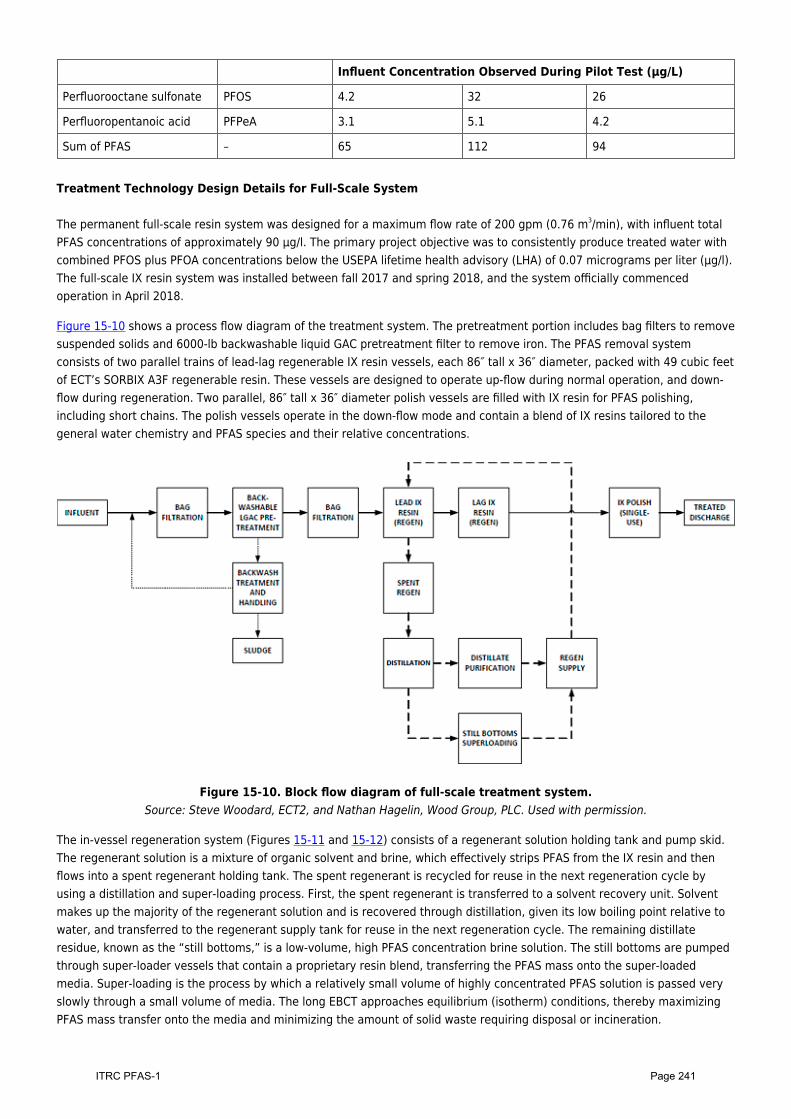
Influent Concentration Observed During Pilot Test (µg/L)
Perfluorooctane sulfonate PFOS 4.2 32 26
Perfluoropentanoic acid PFPeA 3.1 5.1 4.2
Sum of PFAS – 65 112 94
Treatment Technology Design Details for Full-Scale System
The permanent full-scale resin system was designed for a maximum flow rate of 200 gpm (0.76 m3/min), with influent totalPFAS concentrations of approximately 90 µg/l. The primary project objective was to consistently produce treated water withcombined PFOS plus PFOA concentrations below the USEPA lifetime health advisory (LHA) of 0.07 micrograms per liter (µg/l).The full-scale IX resin system was installed between fall 2017 and spring 2018, and the system officially commencedoperation in April 2018.
Figure 15-10 shows a process flow diagram of the treatment system. The pretreatment portion includes bag filters to removesuspended solids and 6000-lb backwashable liquid GAC pretreatment filter to remove iron. The PFAS removal systemconsists of two parallel trains of lead-lag regenerable IX resin vessels, each 86″ tall x 36″ diameter, packed with 49 cubic feetof ECT’s SORBIX A3F regenerable resin. These vessels are designed to operate up-flow during normal operation, and down-flow during regeneration. Two parallel, 86″ tall x 36″ diameter polish vessels are filled with IX resin for PFAS polishing,including short chains. The polish vessels operate in the down-flow mode and contain a blend of IX resins tailored to thegeneral water chemistry and PFAS species and their relative concentrations.
Figure 15-10. Block flow diagram of full-scale treatment system.Source: Steve Woodard, ECT2, and Nathan Hagelin, Wood Group, PLC. Used with permission.
The in-vessel regeneration system (Figures 15-11 and 15-12) consists of a regenerant solution holding tank and pump skid.The regenerant solution is a mixture of organic solvent and brine, which effectively strips PFAS from the IX resin and thenflows into a spent regenerant holding tank. The spent regenerant is recycled for reuse in the next regeneration cycle byusing a distillation and super-loading process. First, the spent regenerant is transferred to a solvent recovery unit. Solventmakes up the majority of the regenerant solution and is recovered through distillation, given its low boiling point relative towater, and transferred to the regenerant supply tank for reuse in the next regeneration cycle. The remaining distillateresidue, known as the “still bottoms,” is a low-volume, high PFAS concentration brine solution. The still bottoms are pumpedthrough super-loader vessels that contain a proprietary resin blend, transferring the PFAS mass onto the super-loadedmedia. Super-loading is the process by which a relatively small volume of highly concentrated PFAS solution is passed veryslowly through a small volume of media. The long EBCT approaches equilibrium (isotherm) conditions, thereby maximizingPFAS mass transfer onto the media and minimizing the amount of solid waste requiring disposal or incineration.
Page 241ITRC PFAS-1
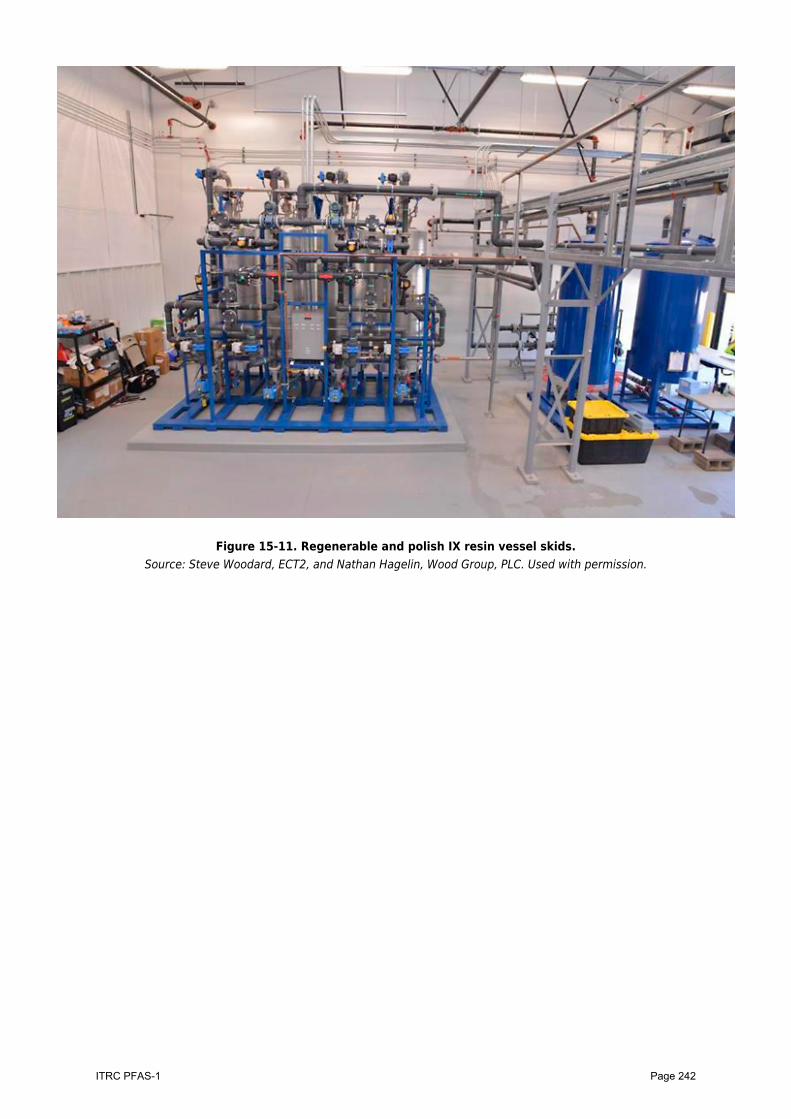
Figure 15-11. Regenerable and polish IX resin vessel skids.Source: Steve Woodard, ECT2, and Nathan Hagelin, Wood Group, PLC. Used with permission.
Page 242ITRC PFAS-1
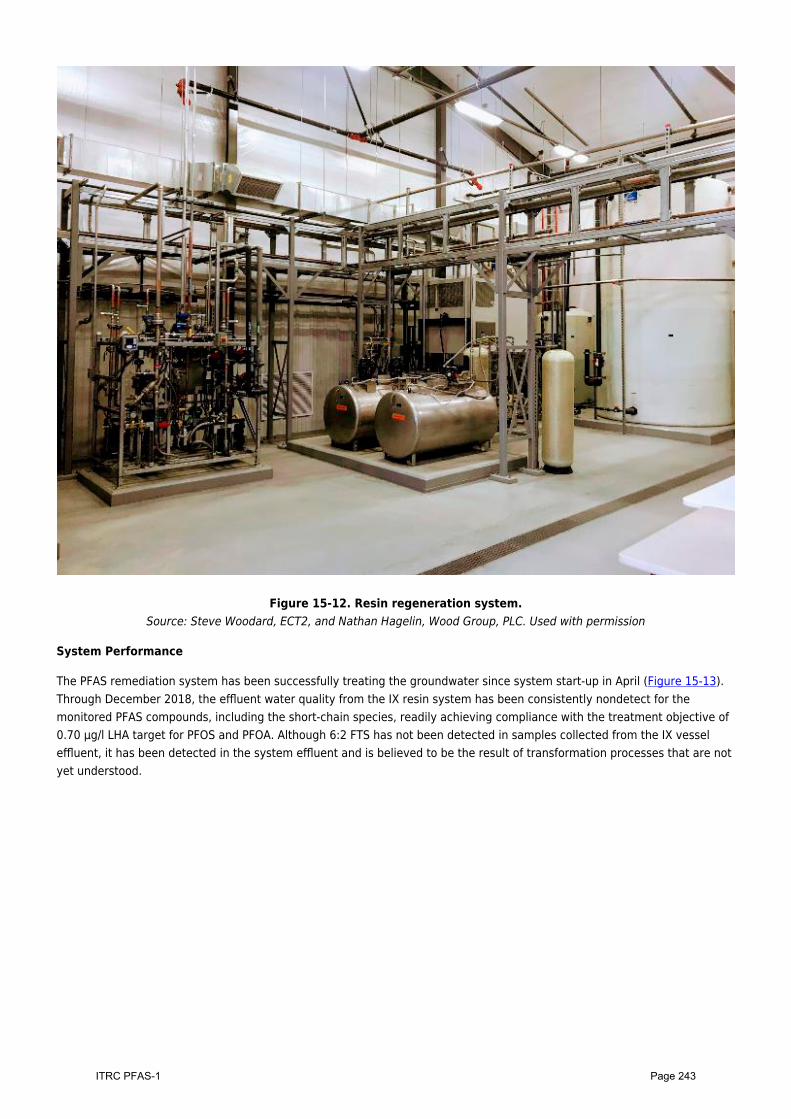
Figure 15-12. Resin regeneration system.Source: Steve Woodard, ECT2, and Nathan Hagelin, Wood Group, PLC. Used with permission
System Performance
The PFAS remediation system has been successfully treating the groundwater since system start-up in April (Figure 15-13).Through December 2018, the effluent water quality from the IX resin system has been consistently nondetect for themonitored PFAS compounds, including the short-chain species, readily achieving compliance with the treatment objective of0.70 µg/l LHA target for PFOS and PFOA. Although 6:2 FTS has not been detected in samples collected from the IX vesseleffluent, it has been detected in the system effluent and is believed to be the result of transformation processes that are notyet understood.
Page 243ITRC PFAS-1
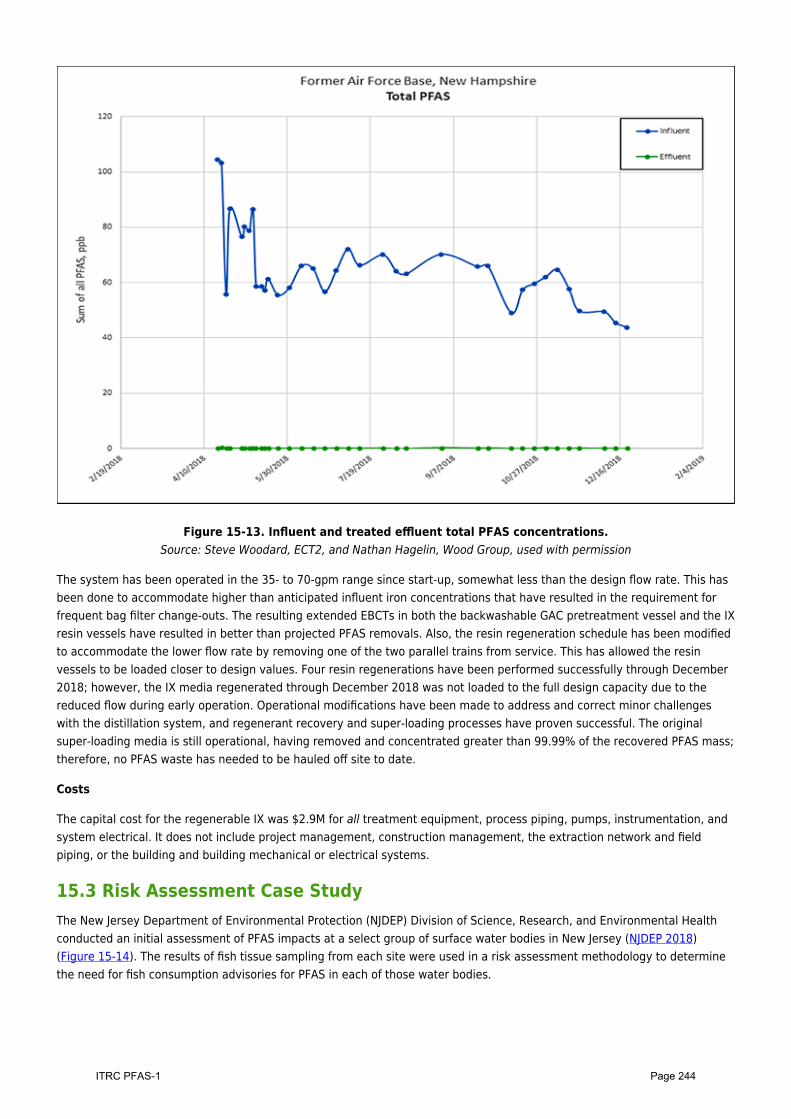
Figure 15-13. Influent and treated effluent total PFAS concentrations.Source: Steve Woodard, ECT2, and Nathan Hagelin, Wood Group, used with permission
The system has been operated in the 35- to 70-gpm range since start-up, somewhat less than the design flow rate. This hasbeen done to accommodate higher than anticipated influent iron concentrations that have resulted in the requirement forfrequent bag filter change-outs. The resulting extended EBCTs in both the backwashable GAC pretreatment vessel and the IXresin vessels have resulted in better than projected PFAS removals. Also, the resin regeneration schedule has been modifiedto accommodate the lower flow rate by removing one of the two parallel trains from service. This has allowed the resinvessels to be loaded closer to design values. Four resin regenerations have been performed successfully through December2018; however, the IX media regenerated through December 2018 was not loaded to the full design capacity due to thereduced flow during early operation. Operational modifications have been made to address and correct minor challengeswith the distillation system, and regenerant recovery and super-loading processes have proven successful. The originalsuper-loading media is still operational, having removed and concentrated greater than 99.99% of the recovered PFAS mass;therefore, no PFAS waste has needed to be hauled off site to date.
Costs
The capital cost for the regenerable IX was $2.9M for all treatment equipment, process piping, pumps, instrumentation, andsystem electrical. It does not include project management, construction management, the extraction network and fieldpiping, or the building and building mechanical or electrical systems.
15.3 Risk Assessment Case StudyThe New Jersey Department of Environmental Protection (NJDEP) Division of Science, Research, and Environmental Healthconducted an initial assessment of PFAS impacts at a select group of surface water bodies in New Jersey (NJDEP 2018)(Figure 15-14). The results of fish tissue sampling from each site were used in a risk assessment methodology to determinethe need for fish consumption advisories for PFAS in each of those water bodies.
Page 244ITRC PFAS-1
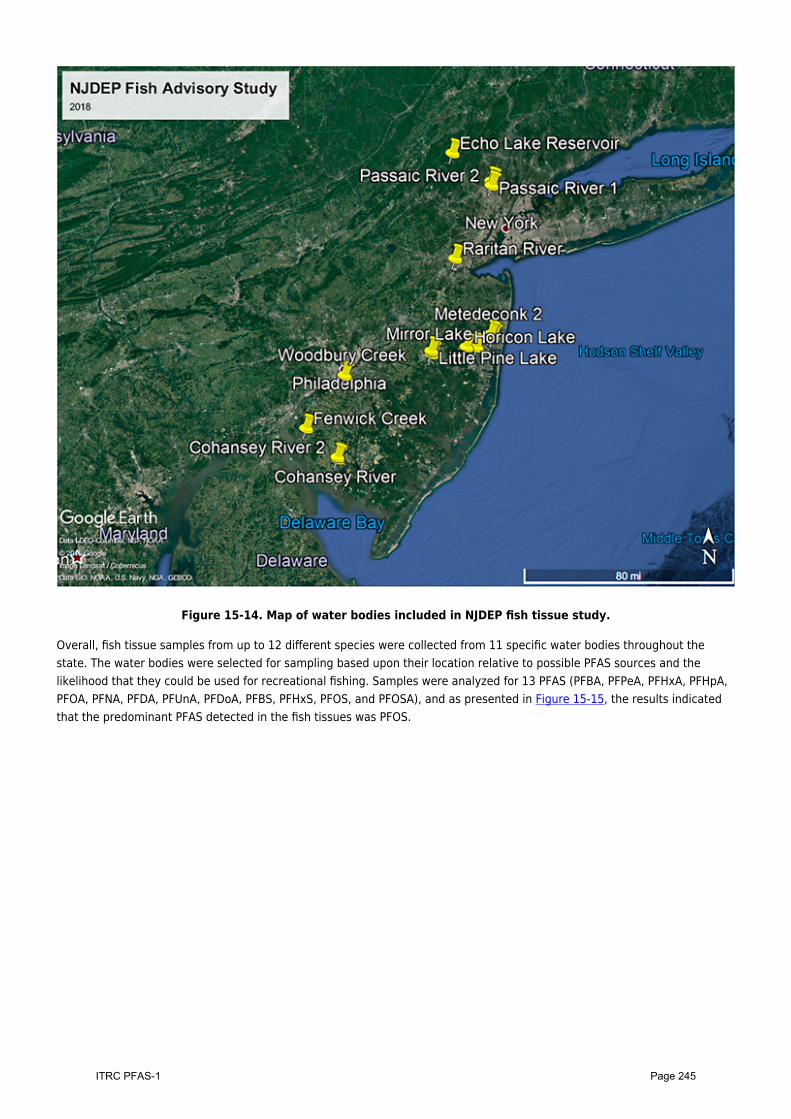
Figure 15-14. Map of water bodies included in NJDEP fish tissue study.
Overall, fish tissue samples from up to 12 different species were collected from 11 specific water bodies throughout thestate. The water bodies were selected for sampling based upon their location relative to possible PFAS sources and thelikelihood that they could be used for recreational fishing. Samples were analyzed for 13 PFAS (PFBA, PFPeA, PFHxA, PFHpA,PFOA, PFNA, PFDA, PFUnA, PFDoA, PFBS, PFHxS, PFOS, and PFOSA), and as presented in Figure 15-15, the results indicatedthat the predominant PFAS detected in the fish tissues was PFOS.
Page 245ITRC PFAS-1
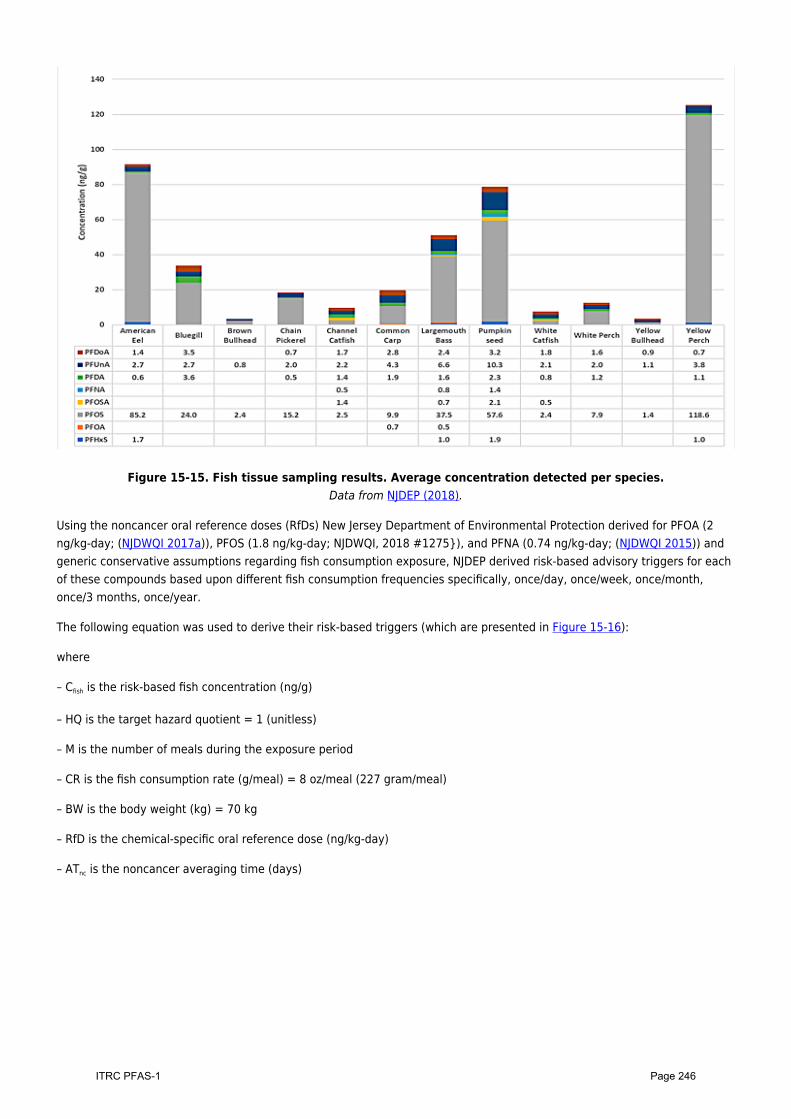
Figure 15-15. Fish tissue sampling results. Average concentration detected per species.Data from NJDEP (2018).
Using the noncancer oral reference doses (RfDs) New Jersey Department of Environmental Protection derived for PFOA (2ng/kg-day; (NJDWQI 2017a)), PFOS (1.8 ng/kg-day; NJDWQI, 2018 #1275}), and PFNA (0.74 ng/kg-day; (NJDWQI 2015)) andgeneric conservative assumptions regarding fish consumption exposure, NJDEP derived risk-based advisory triggers for eachof these compounds based upon different fish consumption frequencies specifically, once/day, once/week, once/month,once/3 months, once/year.
The following equation was used to derive their risk-based triggers (which are presented in Figure 15-16):
where
– Cfish is the risk-based fish concentration (ng/g)
– HQ is the target hazard quotient = 1 (unitless)
– M is the number of meals during the exposure period
– CR is the fish consumption rate (g/meal) = 8 oz/meal (227 gram/meal)
– BW is the body weight (kg) = 70 kg
– RfD is the chemical-specific oral reference dose (ng/kg-day)
– ATnc is the noncancer averaging time (days)
Page 246ITRC PFAS-1
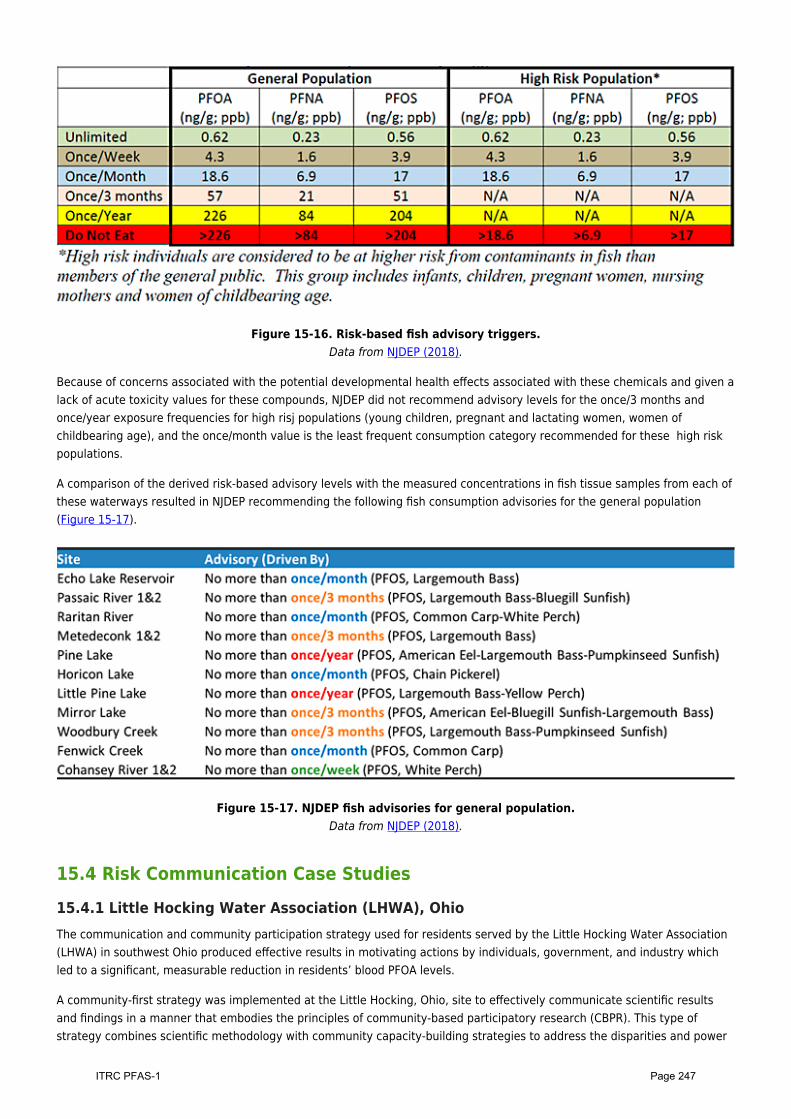
Figure 15-16. Risk-based fish advisory triggers.Data from NJDEP (2018).
Because of concerns associated with the potential developmental health effects associated with these chemicals and given alack of acute toxicity values for these compounds, NJDEP did not recommend advisory levels for the once/3 months andonce/year exposure frequencies for high risj populations (young children, pregnant and lactating women, women ofchildbearing age), and the once/month value is the least frequent consumption category recommended for these high riskpopulations.
A comparison of the derived risk-based advisory levels with the measured concentrations in fish tissue samples from each ofthese waterways resulted in NJDEP recommending the following fish consumption advisories for the general population(Figure 15-17).
Figure 15-17. NJDEP fish advisories for general population.Data from NJDEP (2018).
15.4 Risk Communication Case Studies
15.4.1 Little Hocking Water Association (LHWA), OhioThe communication and community participation strategy used for residents served by the Little Hocking Water Association(LHWA) in southwest Ohio produced effective results in motivating actions by individuals, government, and industry whichled to a significant, measurable reduction in residents’ blood PFOA levels.
A community-first strategy was implemented at the Little Hocking, Ohio, site to effectively communicate scientific resultsand findings in a manner that embodies the principles of community-based participatory research (CBPR). This type ofstrategy combines scientific methodology with community capacity-building strategies to address the disparities and power
Page 247ITRC PFAS-1
imbalances among stakeholder groups (business owners, residents, regulatory, and responsible party). If properlyimplemented, CBPR can result in trust rebuilding, management of environmental justice matters, empowerment to thoseaffected by providing information for informed action, and improved research and data collection (Viswanathan(Viswanathan et al. 2004; Hartwig, Calleson, and Williams 2006; O’Fallon, Tyson, and Dearry 2000; Executive Order 128981994). The following is a case study summary of the Little Hocking, Ohio, site (Emmett et al. 2006; Emmett et al. 2009;Emmett and Desai 2010).
15.4.1.1 Site DescriptionThe LHWA is a rural water authority that serves several small communities with a total population of approximately 12,000residents in 4,000 households. The reticulation system extends around 25 miles into Ohio from Little Hocking, a small ruralcommunity along the Ohio River in Washington County, Appalachian Ohio. Based on the 2010 U.S. Census, the totalpopulation of Little Hocking was 263, predominately Caucasian, majority between the ages of 18–64 years, and 21.5% ofindividuals live below the poverty level. The water intake wells for the LHWA are located directly across the Ohio River froma Teflon production plant that used ammonium perfluorooctanoate (APFO, the ammonium salt of PFOA). This plant wasphysically located in West Virginia; therefore, the enforcement and regulation of the plant and its emissions fell to the WestVirginia agencies.
Since the 1950s, the plant was known to historically release APFO into the air and water and to dispose of byproductscontaining APFO in local landfills (WV DEP 2002). APFO readily converts to its anionic form, PFOA, in the environment. Whentested in 2001 and 2002, the LHWA source wells had levels ranging from 0.855 ppb to 7.69 ppb. Community concerns wereraised because PFOA detections in the water supply were considerably higher than any reported PWS in the United States atthe time. Prior to the study summarized here, there was no information about the sources of PFOA that was being detectedin human blood in widespread locations. In the absence of this information, the West Virginia Department of EnvironmentalProtection convened the C-8 Assessment of Toxicity Team, and developed a health protective screening level for water at150 ppb. In addition, an interim action level of 14 ppb was established by a USEPA Consent Order with the responsible party.In August 2002, groundwater borings advanced in the LHWA well field contained PFOA concentrations up to 78 ppb. A classaction suit was initiated, and distrust increased among the affected community and both the government and responsibleparty.
To investigate community concerns about potential PFOA contamination of residents in the LHWA district, a partnership wasformed between the University of Pennsylvania School of Medicine, a local health provider, and the Decatur CommunityAssociation, made up of residents living within the LHWA district. The partnership obtained an environmental justiceresearch grant from the National Institute of Environmental Health Sciences. The research was designed to engage theaffected community on all aspects of the study to determine (1) whether blood PFOA levels were elevated in the community,compared with Philadelphia residents and with published population values; (2) if blood PFOA levels were elevated, was thesource air, water, or some other combination of exposures; and (3) if levels were elevated, were there changes in certainbiomarkers of potential toxic effects.
A community advisory committee (CAC) was formed with local residents served by the water supply, local physicians, stateand federal government representatives, a health researcher, and a school system representative. A community projectcoordinator was employed as a communication enabler. The CAC met quarterly and all meetings were open to the publicwith the only participation restrictions being that the attorneys and plant representatives were not permitted to take part inthe discussions. Community advice was particularly sought as to which scientific questions to address, development andwording of questionnaires, communications with residents, and citizen concerns. The CAC utilized newsletters to keep localresidents and other stakeholders informed. These newsletters and CAC meeting minutes were posted on a CAC studywebsite.
The study team collected blood serum PFOA, hematologic and biochemical biomarkers, a questionnaire to obtain informationon demographic and occupational information, and health conditions from a stratified random sample of residents in theLHWA reticulation area. The median blood PFOA levels for residents were approximately 80 times those of the generalpopulation and similar to levels reported for production workers at the fluoropolymer facility. PFOA levels were higher inchildren and the elderly. Residents using LHWA water who worked in production areas of the plant had PFOA levels thatreflected additive effects from both exposure pathways. Residents who primarily used well water for domestic purposes hadPFOA levels that correlated with the PFOA concentration in well water. No impact was seen from living in areas with higherestimated air levels.
Page 248ITRC PFAS-1
15.4.1.2 Community-First Communication StrategyAfter data had been collected from participants, but before any results were available, the CAC discussed and developed acommunication strategy. For this purpose, the CAC developed a set of general principles for communication and a list ofpriority targets representing the community’s preferred order for communication of results:
LHWA Residents’ General Principles for Communications, from Emmett and Desai (2010) and Emmett et al. (2009).
Results should be released promptly, but not before the investigators are comfortable in doing so.Individual participants should receive their results first to avoid participants first learning study results from thepress, neighbors, or friends.The press should be informed in a manner that is both timely and allows the investigators to control themessage as much as possible.The study must remain a credible source of information.Communications should maximize constructive responses to the findings.Communications should minimize pointless concern.Questions from individuals should be answered promptly.
LHWA District Residents’ List of Priority Targets for Communication of Results, from Emmett et al. (2009).
study participants and community (residents of the water district)community advisory committeerelevant authorities and representatives (county and state health departments, state Department ofEnvironmental Protection, local water authorities, state and federal elected government representatives for thearea, local townships, sheriffs’ departments, USEPA)local medical providerslocal medianational media, as necessary.
Once the general principles of engagement were established, the CAC developed a communication strategy and plan. TheCAC determined that the strategy required multiple modes of engagement that enforced consistent simple messages andconsideration of careful timing to mitigate development of inaccurate perception of risk and management strategies. Thecommunication plan was a “living document” to facilitate continued integration of stakeholder input, regulatorydevelopment, and scientific advancement. The sequence of communications commenced with mailings to participants at theend of July 2005 and culminated in a community meeting on August 15, 2005, where full results were presented.
15.4.1.3 Results and Use of Risk Communication Tools
Notifications to Participants and Authorities—Biomonitoring results were sent via next-day-delivery mailings to1.individual study participants. These results included the individual’s blood PFOA and biomarker levels as well ascomparative information on PFOA levels (including blood levels for national and site facility workers, general USpopulation, and community neighborhoods) and a toll-free telephone number to contact a study physician withany questions. Letters containing aggregated, not individual, results were sent simultaneously to identifiedauthorities and CAC members, to ensure that recipients would be able to respond appropriately to inquiries fromthe public.
Lessons and Takeaways: Calls often needed to be returned after business hours. Most concernsfocused on higher levels in children and the elderly, and possible interactions of elevated PFOAlevels and particular medical conditions.
Initial Press Release and Briefing—Key local and regional media were identified and informed of the2.communication plan around the date the participant letters were sent. An initial press release and briefing weremade the second day after the results were mailed to ensure that participants did not first learn of the issuethrough the press, while still providing investigators an opportunity to be the primary source of information tothe press. Identified media representatives and national news outlets were invited to the news briefing. Therelease simply identified that levels in LHWA residents were much higher than those in the general USpopulation, and that water had been identified as the major source of exposure. Interested stakeholders wereurged to attend a community meeting where comprehensive results would be released and discussed.
Lessons and Takeaways: The reporting by local and national media did not misconstrue informationand local media participated as per the communication plan. The CAC perceived the media coverage
Page 249ITRC PFAS-1
as constructive. The community expressed great satisfaction that participants had received theirresults first.
Closed Rehearsal of Community Presentation—A full closed-door rehearsal presentation (summarized in the3.subsequent bullet) was presented by the study team to the CAC prior to the community meeting. The closedrehearsal ensured that the community meeting presentation was as inclusive and useful as possible.
Lessons and Take-Away: The CAC requested a presentation that was careful and simple tounderstand, incorporating a clear visual map so that residents could locate their residences withrespect to the study results. During rehearsal, the CAC members provided feedback on the order ofthe agenda, comprehensibility of slides, choice of wordings to accord with terminology and usage inthe area, structure of the presentation, and dealing with likely questions.
Community Meeting—The meeting commenced with “ground rules,” such as lawyers were not to solicit clients4.and questions were to follow the presentation. It was also communicated that continual stakeholder feedback isa success factor of the communication plan. In addition, representatives from the facility were invited to attendbut were not permitted to present. The 45-minute presentation given by the study team detailed partnershipobjectives and study methods, results, and recommendations. A two-hour question and answer period followedthe presentation. A summary of the study, recommendations (including the use of bottled water), sources ofinformation, and how to access a study physician were distributed to all attendees on exit. The meetingsummary and information on accessing free bottled water were mailed to households in the LHWA district andlocal authorities and representatives.
Lessons and Takeaways: The meeting proceeded in a constructive manner as CAC communitymembers had predicted and not in the angry manner outside public relations experts had predicted.Any anger was directed at the responsible party and not at the investigators.
Publication of Results and Information—Following the community meeting, a newsletter with test result5.summaries was issued. A website with meeting presentation slides, test results, and FAQs was also developed. Asummary of results was sent to all LHWA district residents.
Lessons and Takeaways: The website received many hits. The study and recommendations did notprove controversial. The practitioners did not encounter antagonistic relationships between thedifferent parties.
Availability to Answer Questions—Physicians from the study team made themselves available to the public to6.answer questions from individuals and also from treating health care professionals.
Lessons and Takeaways: This service was appreciated. Questions mostly focused on the impact onresidents with particular conditions such as liver and kidney disease. The many uncertaintiessurrounding the risk to humans were openly acknowledged.
15.4.1.4 Effectiveness of CommunicationsOn the day results were presented and approximately 2 weeks after the initial press release, the responsible partyannounced that it would make free bottled water available to LHWA district residents (3 liters per day per person). Seventy-eight percent of eligible households accepted the offer.
Sixteen months after dissemination of the study results, a follow-up study of participants was made, which included repeatblood PFOA levels and questions about any changes in water usage. Sixty-five percent of those in the initial studyparticipated in the follow-up, of whom 95 percent had made some change in their residential water usage in a way thatwould be expected to reduce PFOA intake. Eighty-eight percent had followed study recommendations to switch to usingbottled water. The group median blood PFOA had declined 26%, consistent with a large effect for a pollutant with a half-lifeof approximately 4 years in humans.
USEPA used the results to enter into a consent agreement with DuPont to provide bottled water for the other impactedcommunities near the plant with >0.5 ppb of PFOA in water, and the states of Minnesota and New Jersey set provisionalstandards for PFOA levels in drinking water.
Lessons and Takeaways: The results and communications strategy resulted in 95% of participants had made a change totheir water source. This response greatly exceeds the usual level of response seen with public health interventions. Allparties, individuals, corporations, and governments acted in a prudent way with the disseminated information. Not allresidents reacted by adopting the specific recommendations from the study; the alternate actions some individuals took areconsistent with the information being incorporated into individuals’ own risk perceptions and with the development of a freemarket of solutions (individual decision making based on available information).
Page 250ITRC PFAS-1
15.4.1.5 Case Study SummaryThe Little Hocking Community-First Communication Strategy resulted in a great increase in alternate water source use byimpacted community members and subsequently, a reduction in community PFOA blood levels. The success of thecommunication plan at the Little Hocking site was underlain by the four dimensions of risk communication:
Understanding: Investigators worked with the community through the CAC to establish the communities’preferences and priorities in the form of a communication strategy and plan to maintain simplified andconsistent messaging among stakeholder groups and interested parties, such as the media.Perception: Risk perception factors were incorporated into the outreach strategy, including residents’knowledge of PFOA biomonitoring results and associated illnesses, ability to access a physician, presence ofvulnerable subpopulations (higher PFOA levels in children and the elderly), proximity of individual residences toelevated concentrations within the study area (sense of a safe place), and possible interactions of elevated PFOAlevels and particular medical conditions.Participation: The affected community actively participated in all components of the communications.Evaluation: Success and effectiveness of the communication process were assessed based on feedback fromthe CAC, surveys of residents, and review of newspaper articles and other media content. In addition, a follow-upstudy was performed that addressed the effectiveness in terms of lowered blood levels of PFOA and aquestionnaire about whether and how community members had changed their drinking water source as a resultof the risk communication strategy.
15.4.2 State-Led Community Involvement Case StudiesThe Environmental Council of the States (ECOS), in collaboration with the USEPA Office of Research and Development andthe Association of State and Territorial Health Professionals, has developed a series of case studies presenting how stateregulatory agencies are performing risk communication to PFAS-impacted stakeholders:https://www.ecos.org/documents/state-level-risk-communication-of-pfas-and-habs/
15.4.3 Washington County, MN: A State’s Approach to Risk CommunicationWashington County is home to 3M’s Cottage Grove manufacturing facility as well as several disposal facilities where PFAShad been routinely disposed. Beginning in 2002, the State of Minnesota pursued drinking water investigations at the 3Mfacility and later near 3M’s waste disposal sites in Washington County. According to the 2010 US Census, the population ofWashington County, Minnesota was about 238,136, with the majority being Caucasian and between the ages of 18 and 64.Over 1,800 private wells, four major aquifers, eight municipal water supply systems, and over 150 square miles ofgroundwater were affected by the contamination. This impacted the drinking water supply of over 140,000 residents. Afterthey were determined as the responsible party, 3M remained involved in the remediation efforts and paid for the majority ofsampling throughout the county in coordination with MPCA.
This case study is discussed in the context of the risk communication plan.
15.4.3.1 Identify the IssueThe most widespread PFAS compound found in the region is PFBA. Additional prominent compounds include PFOS, PFOA,PFHxS. PFPeA, PFHxA, and PFBS which were always present as a mixture. When investigations began in 2002, there weremany challenges to determining the impact for people as the science was in the very beginning stages of development.Therefore, MDH developed health-based guidance for PFOA and PFOS and the MDH lab developed the method to analyzewater sample for PFOA and PFOS. As the science has progressed, MDH continues to update methods and health-basedguidance.
Site communications are organized and performed in collaboration primarily between the Minnesota Department of Healthand the Minnesota Pollution Control agencies. However, as with other PFAS sites, the site covers multiple local, county andstate entities. Communications frequently entail only one or a few cities rather than the entire site. They may also need tobe coordinated through all the cities and the county. This leads to multiple plans with multiple partners that are specific toan issue or communications plans developed for a specific project. The fundamental traits of successful risk communicationover time and with all stakeholders for MDH include: empathy, care, competence, expertise, honesty, dedication, andcommitment.
Page 251ITRC PFAS-1
15.4.3.2 Set GoalsGeneral communication goals and objectives for the site:
Goal: Inform people about potential hazards to their person, property, or community and help them to makeinformed decisions about risks to their health.
Objective: Develop approved message blocks for PFAS topics and house in accessible format toencourage consistent information is used for all materials developed.Objective: Provide regular updates about remediation activities at stakeholder group meetingsincluding agency PFAS training meetings, county workgroup meetings, city council meetings andpublic meetingsObjective: Provide regular updates about health risks as scientific information changes/evolves atstakeholder group meetings including agency PFAS training meetings, county workgroup meetings,city council meetings and public meetings
Goal: Encourage people to take precautions to reduce exposure to PFASObjective: Homes with contaminated drinking water are issued drinking water advisories and eitherconnected to the city water or supplied with GAC filters that are maintained by the state.Objective: Keep updated information about actions people can take to lower their exposure to PFASon MDH website and MPCA website.Objective: Mobilize stakeholder groups in the county or local communities to encourage people intheir area to participate in remediation activities and processes offered by MPCA and contractors.
Goal: Provide background information and present risks in an understandable way, using plain-languagemessaging.
Objective: Provide opportunities for people impacted by contamination to connect with appropriatestaff to find information and to ask questions if concerned.Objective: User test materials using MDH Plain Language Workgroup
Goal: Bring new information as soon as available to build trust
Objective: Provide public meetings with open house sessions before and after a main presentation to bring new informationto community
Objective: Provide availability sessions to encourage concerned people impacted by changes to learn more about theirindividual situations.
Project specific communications goals example:
Since 2002, there have been multiple changes in PFAS health based values provided by MDH, analytical advances whichhave impacted lab results, an investigation that looked at PFAS in garden produce and dust, multiple biomonitoring studies,fish monitoring and consumption guidance, drinking water and source water investigations, and a study to test point-of-usewater treatment devices. All of these projects and scientific advances have resulted in specific communications to affectedcommunities with goals and objectives tailored to the issue or project.
15.4.3.3 Identify Communities and ConstraintsMDH catered their risk communication strategy to the following:
Residents of affected communitiesLocal governments: cities, townships, and their staff of varying sizesWashington County public health and environmental staffLegislatorsOther state agencies including MPCA
Constraints include the size of the area and the multiple local governments. The character of each township and city varywidely with different capacities to manage local information dissemination to affected residents. This requirescommunicators to develop relationships with each stakeholder group. The risks and impacts of PFAS contamination aremanaged differently for those on public water and private wells. Therefore, the correct information needs to be available inmany different forms for different stakeholders.
Page 252ITRC PFAS-1
15.4.3.4 Community and Stakeholder AssessmentMinnesota’s risk communication strategy in response to the Washington County PFAS drinking water contamination has beencentered around community engagement and forging strong relationships with community members. Building theserelationships enabled them to build trust with the community and develop new communication channels.
The Minnesota Department of Health (MDH), in conjunction with the Minnesota Pollution Control Agency (MPCA), maintains ahands-on risk communication approach. Information about community needs for information is gathered through regularupdate meetings with stakeholder groups and local government leaders. Public meetings, availability sessions and face toface interactions with community members during remediation activities provides a base of information for the ongoingcommunication efforts. MDH also maintains a 24/7 email and phone line for people to access with concerns or forinformation about site activities.
Minnesota had been engaging directly with affected communities since 2002. Having had a long-standing relationship withaffected communities, MDH has a history of responding to the specific needs of the affected communities and has tailored itsmessaging to their knowledge level. Although basic information about PFAS is always available, the general level ofknowledge amongst key stakeholders is high. For this reason and with these communities, MDH representatives lead withhigh-level information, as the attendees to the public meetings typically are interested in specific updates as opposed torudimentary background information.
15.4.3.5 Identify MessagesMDH maintains a message block document with approved message blocks about a variety of topics for internal staff use.This document serves as the basis for specific information sheets developed for different stakeholder activities. It is also aresource to answer questions from concerned community members. Topics include health risk of PFAS, MDH guidance valueinformation, current site activities, exposure information, fish consumption guidance, swimming, cumulative health risk,breastfeeding and health risks, PFAS and links to health problems, testing blood for PFAS, biomonitoring information,gardening and PFAS, and results of MN Cancer Surveillance System reports.
MDH notes the importance of discussing the scientific method with stakeholders to remain transparent about their course ofaction. They also share new knowledge as it becomes available and do not wait until they have a perfect message or untilthey know all of the facts to engage with the community. In an effort to uphold their principle of transparency, MDHacknowledges points of uncertainty and are clear about what they do not know when communicating with the public.
The messages are presented in different ways to different communities depending on the level of understanding that acommunity has about PFAS. For example, we had several meetings in 2018 for communities. One meeting was to acommunity which had not had PFAS contamination issues until 2018. The information for this community was presented inmore of an elementary, broad overview style and level. Another presentation in the same month was to a neighboringcommunity that had been involved with PFAS contamination since 2002. The presentation focused more on what the newinformation was rather than PFAS basics as the community had a more developed understanding of PFAS.
Examples of specific messages:
Testing is available for households on private wells that would like their drinking water tested for PFAS. If testresults show elevated levels, options are available from the MPCA for treating the water and reducing exposures.Currently, PFAS levels found in the drinking water supply in impacted communities have been within the marginof safety for the current drinking water guidance values, and outright negative health effects from theseexposures are not expected with what is currently known about PFAS exposures and health effects.Affected water supplies are safe to use to water produce in home gardens.Biomonitoring Data Shows Interventions are working
Figure 15-18 includes biomonitoring data for three PFAS compounds over the time period from 2008 to 2012. This studyshows that although we can’t answer questions about health effects, we can demonstrate the work we are doing to reduceexposures has paid off.
Page 253ITRC PFAS-1
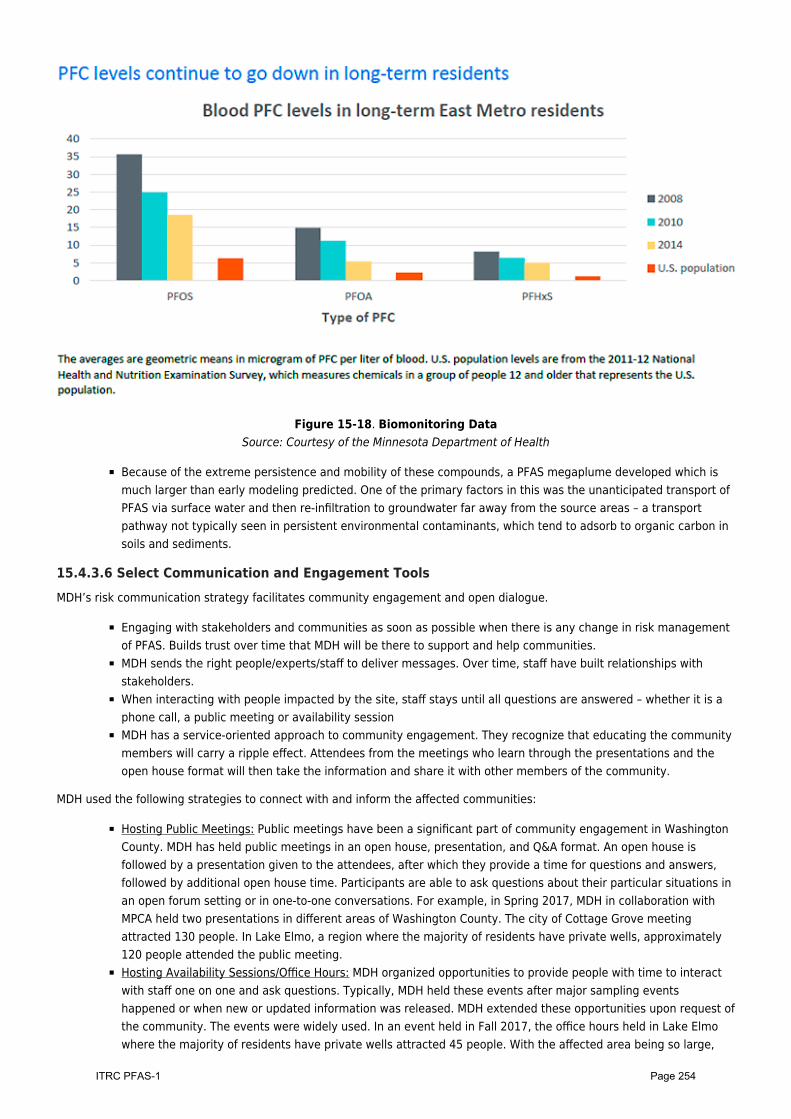
Figure 15-18. Biomonitoring DataSource: Courtesy of the Minnesota Department of Health
Because of the extreme persistence and mobility of these compounds, a PFAS megaplume developed which ismuch larger than early modeling predicted. One of the primary factors in this was the unanticipated transport ofPFAS via surface water and then re-infiltration to groundwater far away from the source areas – a transportpathway not typically seen in persistent environmental contaminants, which tend to adsorb to organic carbon insoils and sediments.
15.4.3.6 Select Communication and Engagement ToolsMDH’s risk communication strategy facilitates community engagement and open dialogue.
Engaging with stakeholders and communities as soon as possible when there is any change in risk managementof PFAS. Builds trust over time that MDH will be there to support and help communities.MDH sends the right people/experts/staff to deliver messages. Over time, staff have built relationships withstakeholders.When interacting with people impacted by the site, staff stays until all questions are answered – whether it is aphone call, a public meeting or availability sessionMDH has a service-oriented approach to community engagement. They recognize that educating the communitymembers will carry a ripple effect. Attendees from the meetings who learn through the presentations and theopen house format will then take the information and share it with other members of the community.
MDH used the following strategies to connect with and inform the affected communities:
Hosting Public Meetings: Public meetings have been a significant part of community engagement in WashingtonCounty. MDH has held public meetings in an open house, presentation, and Q&A format. An open house isfollowed by a presentation given to the attendees, after which they provide a time for questions and answers,followed by additional open house time. Participants are able to ask questions about their particular situations inan open forum setting or in one-to-one conversations. For example, in Spring 2017, MDH in collaboration withMPCA held two presentations in different areas of Washington County. The city of Cottage Grove meetingattracted 130 people. In Lake Elmo, a region where the majority of residents have private wells, approximately120 people attended the public meeting.Hosting Availability Sessions/Office Hours: MDH organized opportunities to provide people with time to interactwith staff one on one and ask questions. Typically, MDH held these events after major sampling eventshappened or when new or updated information was released. MDH extended these opportunities upon request ofthe community. The events were widely used. In an event held in Fall 2017, the office hours held in Lake Elmowhere the majority of residents have private wells attracted 45 people. With the affected area being so large,
Page 254ITRC PFAS-1
personal communication was helpful in establishing relationships with members of the community.Providing Online Resources: The MDH website outlined the history of PFAS in Minnesota as well as actions theyhave taken and health-based guidance information. An electronic online sampling request form was available onthe MDH website. An electronic map on the website shows where MDH is sampling and community memberscould see and check their property’s location in relation to the PFAS contaminated sites. MDH also had a widelyused email address for residents to ask questions directly to the department. They could also subscribe to thegovernment’s delivery email list to get new information directly to their inbox.Communicating with Local Government: MDH prioritized communication with local government because it was auseful tool in keeping the communities informed. They visited city councils to provide updates on the PFASinvestigations. They also provided technical support to local governments and their staff that were responsiblefor protecting public drinking water.Using the Media: MDH used press releases and interviews to disseminate information. Social media became auseful tool as well.
15.4.3.7 Implement StrategyStrategies implemented included:
Drinking Water Advisories: Over 2700 private wells have been sampled in the East Metro and over 1, 100drinking water advisories have been issued. Homes that have been issued drinking water advisories are eitherconnected to city water or provided bottled water and/or GAC filters maintained by the state. MDH and MPCAcollaborated to communicate and coordinate action for this work.Public Water Systems: There are five community public water supplies in the East Metro that have individualwells above the MDH health-based guidance values. All of these cities put in place interim measures to managetheir public water supply systems to provide drinking water at or below the MDH health-based guidance values.MDH collaborated with these communities to provide information to residents.Messages to Community: After developing health-based guidance values for PFAS compounds, MDH sought toexplain to the community what these values mean and what concerns they address. They also explained thenext steps in their action plan.Reiterating Commitment: MDH drives home the message that they are committed to bringing updatedinformation to the communities to inform them of the status of their efforts. This assures the community thatMDH is determined to support them and address their concerns.Collaboration with Other Stakeholders: MDH collaborated with MPCA on a response to the PFAS contamination.Any message that were released to the public by MDH was in conjunction with MPCA. ATSDR also developed acommunity engagement book which has guided MDH’s risk communication strategy. Additionally, MDH workedclosely with city administrators and community leaders to keep them informed prior to the public meetings.Concessions: When drinking water levels were found to be above guidance values in private wells, bottled waterwas provided by MPCA until a GAC system can be installed.
15.4.3.8 Evaluate, Debrief and Follow UpContinuous improvement of risk communications and activities through evaluation and through providing feedback loopswith stakeholders supports the ongoing implementation strategies described above. The sampling and remediation activitieshave been widely successful in part due to the community engagement and communications efforts that have built trust inthe community for the state agencies.
Evaluation methods used to understand effectiveness of communications content and process include one on one surveys atevents, hot washes with partner agencies after communications efforts, and feedback from community leaders at regularupdate meetings.
Continuously improving, refining, and developing materials to meet community concerns and needs that are identified byinquiries or contacts staff have with community members. Contacts are primarily through 24/7 email and phone line as wellas in person while in the field or at public events.
Materials have been developed in many formats over the years and have changed due to capacity for communities to usevarious methods and MDH capacity to produce them – video, face to face meetings, print, social media in coordination withpartners. Investigations and other information have also resulted from community concerns. These include Cancer IncidenceReports, home and garden study, site-specific meal advice for fish consumption, point-of-use filter testing, clinician
Page 255ITRC PFAS-1
information sheet, and an information sheet about testing blood for PFAS.
15.4.3.9 Successful OutcomesThe Minnesota Department of Health has been very successful in community engagement:
They have earned the trust of the community, and residents are assured that MDH is working hard to solve theissue at hand. The number of people participating in sampling and remediation speaks to the efforts made toconnect with affected people. Exit surveys from public events have shown that people feel staff are working hardand are good at the work they do.MDH also has invested their resources in research and has made strides in understanding the health impacts ofthe PFAS contamination their state is facing. Many of the investigations and projects were in response toconcerns collected through contacts with community members and leaders. These include Cancer IncidenceReports, home and garden study, site specific meal advice for fish consumption, point-of-use filter testing,clinician information sheet, and an information sheet about testing blood for PFAS.They have used biomonitoring to demonstrate that their efforts have reduced the PFAS levels in people’s bodies.This has provided the community with tangible evidence that the work they are doing is making a difference.
15.4.3.10 Lessons Learned
It is vital to be on the ground and engage with the community face-to-face. This helps build trusting relationshipswith the community which has facilitated the remediation efforts and supported reducing exposures to PFAS forcommunity members.The cross-agency effort to address the PFAS concerns in Minnesota is a challenge and takes effort to coordinate,but over time has been an effective strategy to address exposures to PFAS in a timely manner.Dealing with residential homes and homeowners can be complex. Because PFAS is a complex emergingcontaminant for which research and information is constantly evolving, it can be a challenging to return toresidents with new guidance values based on new health risks. The information has to fit for those who arefamiliar with PFAS and those who are new homeowners or residents in affected communities.It is important to learn what information residents are looking for and relay it in an articulate manner and in away that is useful to them. Another concern Minnesota residents have had is a potential decline in propertyvalue, but this concern has faded with time.Additionally, it is important to be understanding and sympathetic toward the affected residents when they areupset. They are concerned for the well-being of their families.
15.4.3.11 Better Practices Moving ForwardMoving forward, MDH notes that sites across the state have similar circumstances and similar concerns. The lessons learnedfrom sites they have already worked with have been beneficial in refining their approach with other affected communitiesand contaminants. They have had success with duplicating their strategies and methods at other sites. Although the generalprinciples have been effective, every community is slightly different. MDH takes the time to understand the dynamics ofeach particular community and tailor their risk communication methods accordingly.
Updated April 14, 2020.
Page 256ITRC PFAS-1
16 References3M Company. 1999a. Fluorochemical Use, Distribution and Release Overview. St. Paul, MN: USEPA.
https://www.ag.state.mn.us/Office/Cases/3M/docs/PTX/PTX2754.pdf.
3M Company. 1999b. The science of organic fluorochemistry.http://www.fluoridealert.org/pesticides/pfos.fr.final.docket.0006.pdf.
3M Company. 2000a. “Phase-out Plan for POSF-Based Products,”.https://www.regulations.gov/document?D=EPA-HQ-OPPT-2002-0051-0006.
3M Company. 2000b. “Sulfonated Perfluorochemicals in the Environment: Sources, Dispersion, fate and Effects.”. St.Paul, MN. https://www.ag.state.mn.us/Office/Cases/3M/docs/PTX/PTX1653.pdf.
3M Company. 2003. Environmental, Health and Safety Measures Relating To Perfluorooctanoic Acid And Its Salts (PFOA).
3M Company. 2007. Remedial investigation report. Phase 2. Fluorochemical (FC) data assessment report for the CottageGrove. St. Paul, MN.
3M Company. 2017. 3M and Fluorochemicals.
3M Company. 2018. 3MTM Fluorosurfactants.https://www.3m.com/3M/en_US/company-us/all-3m-products/~/All-3M-Products/Chemicals/Fluorochemicals/?N=5002385+8711017+8723740+8745514+3294857497&rt=r3.
40 CFR 300.5. 2001. “Definitions.”https://www.govinfo.gov/app/details/CFR-2001-title40-vol24/CFR-2001-title40-vol24-sec300-5.
40 CFR 300.400. 2019. “General.”https://www.govinfo.gov/app/details/CFR-2019-title40-vol30/CFR-2019-title40-vol30-sec300-400.
Abdul-Kareem Al-Sofi, M. 2001. “Seawater desalination — SWCC experience and vision.” Desalination 135 (1):121-139.doi: https://doi.org/10.1016/S0011-9164(01)00145-X.
ACRP. 2017. Use and Potential Impacts of AFFF Containing Per- and Polyfluoroalkyl Substances (PFASs) at Airports.http://www.trb.org/ACRP/Blurbs/175866.aspx.
AFCEC. 2012. Monitoring and Remediation Optimization System (MAROS) Software, User’s Guide and Technical Manual.
Ahmad, Mahtab, Anushka Upamali Rajapaksha, Jung Eun Lim, Ming Zhang, Nanthi Bolan, Dinesh Mohan, MeththikaVithanage, Sang Soo Lee, and Yong Sik Ok. 2014. “Biochar as a sorbent for contaminant management in soil andwater: A review.” Chemosphere 99:19-33. doi: https://doi.org/10.1016/j.chemosphere.2013.10.071.
Ahrens, L., S. Felizeter, R. Sturm, Z. Xie, and R. Ebinghaus. 2009. “Polyfluorinated compounds in waste water treatmentplant effluents and surface waters along the River Elbe, Germany.” Marine Pollution Bulletin 58.
Ahrens, L., J. Rakovic, S. Axelson, and R. Kallenborn. 2016. Source tracking and impact of per-and polyfluoroalkylsubstances at Svalbard.
Ahrens, L., M. Shoeib, T. Harner, D. Lane, R. Guo, and E.J. Reiner. 2011. “Comparison of Annular Diffusion Denuder andHigh-Volume Air Samplers for Measuring Per- and Polyfluoroalkyl Substances in the Atmosphere.” AnalyticalChemistry 83.
Ahrens, L., and M. Bundschuh. 2014. “Fate and effects of poly- and perfluoroalkyl substances in the aquaticenvironment: A review.” Environmental Toxicology and Chemistry 33 (9). doi: 10.1002/etc.2663.
Page 257ITRC PFAS-1
Ahrens, L., J. Hedlund, W. Durig, R. Troger, and K. Wiberg. 2016. Screening of PFAS in Groundwater and Surface Water.Swedish Environmental Protection Agency.http://naturvardsverket.diva-portal.org/smash/get/diva2:915446/FULLTEXT01.pdf.
Ahrens, Lutz. 2011. “Polyfluoroalkyl compounds in the aquatic environment: a review of their occurrence and fate.”Journal of Environmental Monitoring 13 (1):20-31. doi: 10.1039/C0EM00373E.
Ahrens, Lutz, Tom Harner, Mahiba Shoeib, Douglas A. Lane, and Jennifer G. Murphy. 2012. “Improved Characterization ofGas–Particle Partitioning for Per- and Polyfluoroalkyl Substances in the Atmosphere Using Annular Diffusion DenuderSamplers.” Environmental Science & Technology 46 (13):7199-7206. doi: 10.1021/es300898s.
Ahrens, Lutz, Mahiba Shoeib, Tom Harner, Sum Chi Lee, Rui Guo, and Eric J. Reiner. 2011. “Wastewater Treatment Plantand Landfills as Sources of Polyfluoroalkyl Compounds to the Atmosphere.” Environmental Science & Technology 45(19):8098-8105. doi: 10.1021/es1036173.
Ahrens, Lutz, Zhiyong Xie, and Ralf Ebinghaus. 2010. “Distribution of perfluoroalkyl compounds in seawater fromNorthern Europe, Atlantic Ocean, and Southern Ocean.” Chemosphere 78 (8):1011-1016. doi:https://doi.org/10.1016/j.chemosphere.2009.11.038.
AK DEC. 2014. Spill Tactics for Alaska Responders. Seldovia, AK.https://dec.alaska.gov/spar/ppr/response-resources/star-manual/.
Alaska Clean Seas. 2017. Alaska Clean Seas Tactics Manual.http://www.alaskacleanseas.org/wp-content/uploads/2015/02/Volume-1-Tactics-Descriptions.pdf.
Aleksandrov, Krasimir, Hans-Joachim Gehrmann, Manuela Hauser, Hartmut Mätzing, Daniel Pigeon, Dieter Stapf, andManuela Wexler. 2019. “Waste incineration of Polytetrafluoroethylene (PTFE) to evaluate potential formation of per-and Poly-Fluorinated Alkyl Substances (PFAS) in flue gas.” Chemosphere 226:898-906. doi:https://doi.org/10.1016/j.chemosphere.2019.03.191.
Alexander, B. H., and G. W. Olsen. 2007. “Bladder cancer in perfluorooctanesulfonyl fluoride manufacturing workers.”Ann Epidemiol 17 (6):471-8. doi: 10.1016/j.annepidem.2007.01.036.
Alexander, B. H., G. W. Olsen, J. M. Burris, J. H. Mandel, and J. S. Mandel. 2003. “Mortality of employees of aperfluorooctanesulphonyl fluoride manufacturing facility.” Occup Environ Med 60 (10):722-9. doi:10.1136/oem.60.10.722.
Allred, B. McKay, Johnsie R. Lang, Morton A. Barlaz, and Jennifer A. Field. 2015. “Physical and Biological Release of Poly-and Perfluoroalkyl Substances (PFASs) from Municipal Solid Waste in Anaerobic Model Landfill Reactors.”Environmental Science & Technology 49 (13):7648-7656. doi: 10.1021/acs.est.5b01040.
Amec Foster Wheeler. 2017. Site 8 Pilot Test Results Report, Former Pease Air Force Base. Texas Prepared for Air ForceCivil Engineering Center. Joint Base San Antonio – Lakeland.
Amini, Adib, Youngwoon Kim, Jie Zhang, Treavor Boyer, and Qiong Zhang. 2015. “Environmental and economicsustainability of ion exchange drinking water treatment for organics removal.” Journal of Cleaner Production104:413-421. doi: https://doi.org/10.1016/j.jclepro.2015.05.056.
Anderson, R. Hunter, Dave T. Adamson, and Hans F. Stroo. 2019. “Partitioning of poly- and perfluoroalkyl substancesfrom soil to groundwater within aqueous film-forming foam source zones.” Journal of Contaminant Hydrology220:59-65. doi: https://doi.org/10.1016/j.jconhyd.2018.11.011.
Anderson, R. Hunter, G. Cornell Long, Ronald C. Porter, and Janet K. Anderson. 2016. “Occurrence of select perfluoroalkylsubstances at U.S. Air Force aqueous film-forming foam release sites other than fire-training areas: Field-validationof critical fate and transport properties.” Chemosphere 150:678-685. doi:https://doi.org/10.1016/j.chemosphere.2016.01.014.
Andersson, Eva M., Kristin Scott, YiYi Xu, Ying Li, Daniel S. Olsson, Tony Fletcher, and Kristina Jakobsson. 2019. “Highexposure to perfluorinated compounds in drinking water and thyroid disease. A cohort study from Ronneby,Sweden.” Environmental Research 176:108540. doi: https://doi.org/10.1016/j.envres.2019.108540.
Page 258ITRC PFAS-1
Ankley, G. T., D. W. Kuehl, M. D. Kahl, K. M. Jensen, B. C. Butterworth, and J. W. Nichols. 2004. “Partial life-cycle toxicityand bioconcentration modeling of perfluorooctanesulfonate in the northern leopard frog (Rana pipiens).” EnvironToxicol Chem 23 (11):2745-55.
ANSES. 2017. Development of oral-administered treatment for TRV by Perfluorohexanoic acid (PFHxA). Maisons-Alfort,France: Environmental and Occupational Health & Safety French Agency for Food.
Antea Group. 2011. “Perfluorocarbon (PFC)-Containing Firefighting foams and their Use in Minnesota: Survey andSampling Activities, State Fiscal Year 2011.”.
Anumol, Tarun, Sonia Dagnino, Darcy R. Vandervort, and Shane A. Snyder. 2016. “Transformation of Polyfluorinatedcompounds in natural waters by advanced oxidation processes.” Chemosphere 144:1780-1787. doi:https://doi.org/10.1016/j.chemosphere.2015.10.070.
APHA. 2016. “Reducing Human Exposure to Highly Fluorinated Chemicals to Protect Public Health.”.
Appleman, T., C. P. Higgins, O. Quinones, B. Vanderford, C. Klstad, J. Ziegler-Holady, E. Dickenson. 2014. “Treatment ofPoly- and Perfluoroalkyl Substances in U.S. Full-Scale Water Treatment Systems.” Water Research 51:246-255. doi:https://doi.org/10.1016/j.watres.2013.10.067.
Appleman, Timothy D., Eric R. V. Dickenson, Christopher Bellona, and Christopher P. Higgins. 2013. “Nanofiltration andgranular activated carbon treatment of perfluoroalkyl acids.” Journal of Hazardous Materials 260:740-746. doi:https://doi.org/10.1016/j.jhazmat.2013.06.033.
Arias Espana, Victor Andres, Megharaj Mallavarapu, and Ravi Naidu. 2015. “Treatment technologies for aqueousperfluorooctanesulfonate (PFOS) and perfluorooctanoate (PFOA): A critical review with an emphasis on field testing.”Environmental Technology & Innovation 4:168-181. doi: https://doi.org/10.1016/j.eti.2015.06.001.
Arias, V. A., R. Naidu, Chadalavada S., and Mallavarapu. M. 2013. “A novel technology for treatment of aqueous firefighting foams (AFFF) contaminated wastewater.”
Armitage, J. M., U. Schenker, M. Scheringer, J. W. Martin, M. Macleod, and I. T. Cousins. 2009. “Modeling the Global Fateand Transport of Perfluorooctane Sulfonate (PFOS) and Precursor Compounds in Relation to Temporal Trends inWildlife Exposure.” Environmental Science & Technology 43. doi: 10.1021/Es901448p.
Armitage, James M., Matthew MacLeod, and Ian T. Cousins. 2009. “Modeling the Global Fate and Transport ofPerfluorooctanoic Acid (PFOA) and Perfluorooctanoate (PFO) Emitted from Direct Sources Using a Multispecies MassBalance Model.” Environmental Science & Technology 43 (4):1134-1140. doi: 10.1021/es802900n.
Arp, Hans Peter H., and Kai-Uwe Goss. 2009. “Irreversible sorption of trace concentrations of perfluorocarboxylic acids tofiber filters used for air sampling.” Atmospheric Environment 43:3654-3655. doi: 10.1016/j.atmosenv.2009.03.001.
Arrieta-Cortes, R., P. Farias, C. Hoyo-Vadillo, and M. Kleiche-Dray. 2017. “Carcinogenic risk of emerging persistentorganic pollutant perfluorooctane sulfonate (PFOS): A proposal of classification.” Regul Toxicol Pharmacol 83:66-80.doi: 10.1016/j.yrtph.2016.11.021.
Arvaniti, O. S., and A. S. Stasinakis. 2015. “Review on the occurrence, fate and removal of perfluorinated compoundsduring wastewater treatment.” Science of the Total Environment 524.
Arvaniti, Olga S., Yuhoon Hwang, Henrik R. Andersen, Athanasios S. Stasinakis, Nikolaos S. Thomaidis, and Maria Aloupi.2015. “Reductive degradation of perfluorinated compounds in water using Mg-aminoclay coated nanoscale zerovalent iron.” Chemical Engineering Journal 262:133-139. doi: https://doi.org/10.1016/j.cej.2014.09.079.
Asher, Brian J., Yuan Wang, Amila O. De Silva, Sean Backus, Derek C. G. Muir, Charles S. Wong, and Jonathan W. Martin.2012. “Enantiospecific Perfluorooctane Sulfonate (PFOS) Analysis Reveals Evidence for the Source Contribution ofPFOS-Precursors to the Lake Ontario Foodweb.” Environmental Science & Technology 46 (14):7653-7660. doi:10.1021/es301160r.
ASTM. 2007. Standard Guide for Sampling Ground-Water Monitoring Wells. www.astm.org.
ASTSWMO. 2015. Perfluorinated Chemicals (PFCs): Perfluorooctanoic Acid (PFOA) and Perfluorooctane Sulfonate (PFOS)
Page 259ITRC PFAS-1

Information Paper. . Washington, D. C.: Remediation and Reuse Focus Group. Federal Facilities Research Center.https://clu-in.org/download/contaminantfocus/pops/POPs-ASTSWMO-PFCs-2015.pdf.
ATSDR. 2008. Health Consultation: PFOS Detections in the City of Brainerd, Minnesota – City of Brainerd, Crow WingCounty, Minnesota.
ATSDR. 2012. Public Health Assessment for Perfluorochemical Contamination in Southern Washington County, NorthernDakota County, and Southeastern Ramsey County, Minnesota.
ATSDR. 2013. Health Consultation. Exposure Investigation Report. Perfluorochemical serum sampling in the vicinity ofDecatur, Alabama. Morgan, Lawrence, and Limestone Counties.http://www.atsdr.cdc.gov/HAC/pha/Decatur/Perfluorochemical_Serum%20Sampling.pdf
ATSDR. 2015. Draft Toxicological Profile for Perfluoroalkyls. http://www.atsdr.cdc.gov/toxprofiles/tp200.pdf.
ATSDR. 2018a. “Per- and Polyfluoroalkyl Substances (PFAS) and Your Health.” accessed September 2018.https://www.atsdr.cdc.gov/pfas/index.html.
ATSDR. 2018b. “Per- and Polyfluoroalkyl Substances (PFAS) and Your Health. Understanding PFAS Exposure.”https://www.atsdr.cdc.gov/pfas/understanding-PFAS-exposure.html.
ATSDR. 2018c. ToxGuide for Perfluoroalkyls. Atlanta, GA. https://www.atsdr.cdc.gov/toxguides/toxguide-200.pdf.
ATSDR. 2018d. “Toxic Substances Portal. Minimal Risk Levels (MRLs) for Professionals.” accessed 2019.https://www.atsdr.cdc.gov/mrls/index.asp.
ATSDR. 2018e. Toxicological profile for Perfluoroalkyls (Draft for Public Comment). U.S. Department of Health andHuman Services. https://www.atsdr.cdc.gov/toxprofiles/tp200.pdf.
ATSDR. 2019a. Health Consultation PFAS HC-508. EPA PWS ID: 1951020.https://www.atsdr.cdc.gov/HAC/pha/pease/Pease-Tradeport-Public-Water-PFAS-HC-508.pdf.
ATSDR. 2019b. “PFAS Exposure Assessments.” Agency for Toxic Substances and Disease Registry, Last Modified July 12,2019. accessed 2020. https://www.atsdr.cdc.gov/pfas/PFAS-Exposure-Assessments.html.
ATSDR. 2019c. “Per- and Polyfluoroalkyl Substances and Your Health: How can I be exposed to PFAS?” ATSDR. LastModified April 25, 2019. Accessed 2020. https://www.atsdr.cdc.gov/pfas/pfas-exposure.html.
Australia Government DOD. 2007. Environmental Guidelines for Management of Fire Fighting Aqueous Film FormingFoam (AFFF) Products. Directorate of Environmental Impact Management.
Australia Government DOD. 2019. Defense PFAS Construction and Maintenance Framework.https://www.defence.gov.au/estatemanagement/Governance/Policy/Environment/PFAS/docs/DefencePFASManagementFrameworkforConstructionandMaintenanceProjects.pdf.
Australia Government DOD. 2019. Improving Measurement Reliability of the PFAS TOP Assay.
Australia Government DOH. 2018. PFAS Expert Health Panel – Report to the Minister.https://www1.health.gov.au/internet/main/publishing.nsf/Content/C9734ED6BE238EC0CA2581BD00052C03/$File/expert-panel-report.pdf.
Avsec, R. 2015. “Seven steps to cleaner firefighter PPE.”.https://www.firerescue1.com/fire-products/turnoutgear/articles/3218580-7-steps-to-cleaner-firefighter-PPE/.
Babut, M., P. Labadie, C. Simonnet-Laprade, G. Munoz, M.-C. Roger, B. J. D. Ferrari, H. Budzinski, and E. Sivade. 2017.“Per- and poly-fluoroalkyl compounds in freshwater fish from the Rhône River: Influence of fish size, diet, preycontamination and biotransformation.” Science of The Total Environment 605-606:38-47.
Bach, C. C., B. H. Bech, N. Brix, E. A. Nohr, J. P. Bonde, and T. B. Henriksen. 2015. “Perfluoroalkyl and polyfluoroalkylsubstances and human fetal growth: a systematic review.” Crit Rev Toxicol 45 (1):53-67. doi:10.3109/10408444.2014.952400.
Page 260ITRC PFAS-1
Backe, Will J., Thomas C. Day, and Jennifer A. Field. 2013. “Zwitterionic, Cationic, and Anionic Fluorinated Chemicals inAqueous Film Forming Foam Formulations and Groundwater from U.S. Military Bases by Nonaqueous Large-VolumeInjection HPLC-MS/MS.” Environmental Science & Technology 47 (10):5226-5234. doi: 10.1021/es3034999.
Badruddoza, A.Z.M., B. Bhattarai, and R.P Suri. 2017. “Environmentally Friendly Cyclodextrin-Ionic Liquid Polyurethane-Modified Magnetic Sorbent for the Removal of PFOA.” ACS Sustainable Chemistry & Engineering 5.
Baduel, C., C. J. Paxman, and J. F. Mueller. 2015. “Perfluoroalkyl substances in a firefighting training ground (FTG),distribution and potential future release.” Journal of Hazardous Materials 296.
Baerlocher, C., L.B. McCusker, and D.H. Olson 2007. “Atlas of zeolite framework types.”.
Bakke, Torgeir, Torsten Källqvist, Anders Ruus, Gijs Breedveld, and Ketil Hylland. 2010. Development of sediment qualitycriteria in Norway. Vol. 10.
Ballesteros, V., O. Costa, C. Iniguez, T. Fletcher, F. Ballester, and M. J. Lopez-Espinosa. 2017. “Exposure to perfluoroalkylsubstances and thyroid function in pregnant women and children: A systematic review of epidemiologic studies.”Environ Int 99:15-28. doi: 10.1016/j.envint.2016.10.015.
Bangma, Jacqueline T., John A. Bowden, Arnold M. Brunell, Ian Christie, Brendan Finnell, Matthew P. Guillette, MartinJones, Russell H. Lowers, Thomas R. Rainwater, Jessica L. Reiner, Philip M. Wilkinson, and Louis J. Guillette Jr. 2017.“Perfluorinated alkyl acids in plasma of American alligators (Alligator mississippiensis) from Florida and SouthCarolina.” Environmental Toxicology and Chemistry 36 (4):917-925. doi: 10.1002/etc.3600.
Banks, R. E., B. E. Smart, and J.C. Tatlow. 1994. Organofluorine Chemistry: Principles and Commercial Applications,Spring Science + Business Media: Springer.
Barclift. 2013. “Navy Case Study: Occurrence of Two Emerging Contaminants (PFOA & PFOS) at former NAS SouthWeymouth, MA.” Federal Remediation Technology Roundtable Fall.
Barmentlo, S. H., J. M. Stel, M. van Doorn, C. Eschauzier, P. de Voogt, and M. H. Kraak. 2015. “Acute and chronic toxicityof short chained perfluoroalkyl substances to Daphnia magna.” Environ Pollut 198:47-53. doi:10.1016/j.envpol.2014.12.025.
Barr. 2017. DRAFT Conceptual Modeling of PFOA Fate and Transport: North Bennington, VT. Minneapolis, MN.https://anrweb.vt.gov/PubDocs/DEC/PFOA/Consent%20Order%20and%20Technical%20Documents/Core%20Technical%20Documents/Conceptual%20Site%20Model/Saint-Gobain%20VT%20Draft%20CSM%20June2017%20Main%20Report.pdf.
Bartell, S. M. 2017. “Online Serum PFOA Calculator for Adults.” Environ Health Perspect 125 (10):104502. doi:10.1289/ehp2820.
Bartell, S. M., A. M. Calafat, C. Lyu, K. Kato, P. B. Ryan, and K. Steenland. 2010. “Rate of decline in serum PFOAconcentrations after granular activated carbon filtration at two public water systems in Ohio and West Virginia.”Environ Health Perspect 118 (2):222-8. doi: 10.1289/ehp.0901252.
Barton, C. A., L.E. Butler, C. J. Zarzecki, J. Flaherty, and M. Kaiser. 2006. “Characterizing perfluorooctanoate in ambientair near the fence line of a manufacturing facility: comparing 11042 modeled and monitored values.” Journal of theAir and Waste Management Association 56 (48).
Barton, C. A., M. A. Kaiser, and M. H. Russell. 2007. “Partitioning and removal of perfluorooctanoate during rain events:the importance of physical-chemical properties.” Journal 11046 of Environmental Monitoring 8.
Barton, C. A., M. A. Kaiser, and M. H. Russell. 2010. ” A site-specific screening comparison of modeled and monitored airdispersion and deposition for perfluorooctanoate.” Journal of the Air and Waste Management Association 60.
Barton, Catherine A., Miguel A. Botelho, and Mary A. Kaiser. 2008. “Solid Vapor Pressure and Enthalpy of Sublimation forPerfluorooctanoic Acid.” Journal of Chemical & Engineering Data 53 (4):939-941. doi: 10.1021/je700593d.
Barton, Catherine A., Miguel A. Botelho, and Mary A. Kaiser. 2009. “Solid Vapor Pressure and Enthalpy of Sublimation forAmmonium Perfluorooctanoate.” Journal of Chemical & Engineering Data 54 (3):752-755. doi: 10.1021/je800418m.
Page 261ITRC PFAS-1
Barzen-Hanson, K. A., S. E. Davis, M. Kieber, and J. A. Field. 2017. “Sorption of Fluorotelomer Sulfonates, FluorotelomerSulfonamido Betaines, and a Fluorotelomer 11065 Sulfonamido Amine in National Foam Aqueous Film-Forming Foamto Soil.” Environmental Science and Technology 51.
Barzen-Hanson, Krista A., Simon C. Roberts, Sarah Choyke, Karl Oetjen, Alan McAlees, Nicole Riddell, Robert McCrindle,P. Lee Ferguson, Christopher P. Higgins, and Jennifer A. Field. 2017. “Discovery of 40 Classes of Per- andPolyfluoroalkyl Substances in Historical Aqueous Film-Forming Foams (AFFFs) and AFFF-Impacted Groundwater.”Environmental Science & Technology 51 (4):2047-2057. doi: 10.1021/acs.est.6b05843.
Baudequin, Clément, Estelle Couallier, Mohammed Rakib, Isabelle Deguerry, Romain Severac, and Martial Pabon. 2011.“Purification of firefighting water containing a fluorinated surfactant by reverse osmosis coupled toelectrocoagulation–filtration.” Separation and Purification Technology 76 (3):275-282. doi:https://doi.org/10.1016/j.seppur.2010.10.016.
Beach, S. A., J. L. Newsted, K. Coady, and J. P. Giesy. 2006. “Ecotoxicological evaluation of perfluorooctanesulfonate(PFOS).” Rev Environ Contam Toxicol 186:133-74.
Bečanová, Jitka, Lisa Melymuk, Šimon Vojta, Klára Komprdová, and Jana Klánová. 2016. “Screening for perfluoroalkylacids in consumer products, building materials and wastes.” Chemosphere 164:322-329. doi:https://doi.org/10.1016/j.chemosphere.2016.08.112.
Becker, Anna Maria, Silke Gerstmann, and Hartmut Frank. 2008. “Perfluorooctane surfactants in waste waters, the majorsource of river pollution.” Chemosphere 72 (1):115-121. doi: https://doi.org/10.1016/j.chemosphere.2008.01.009.
Becker, Anna Maria, Silke Gerstmann, and Hartmut Frank. 2010. “Perfluorooctanoic acid and perfluorooctane sulfonate intwo fish species collected from the Roter Main River, Bayreuth, Germany.” Bulletin of Environmental Contaminationand Toxicology 84 (1):132.
Beesoon, S., S.J. Genuis, J.P. Benskin, and J.W. Martin. 2012. “Exceptionally High Serum Concentrations ofPerfluorohexanesulfonate in a Canadian Family are Linked to Home Carpet Treatment Applications.” EnvironmentalScience and Technology 46.
Beesoon, S., G. M. Webster, M. Shoeib, T. Harner, J. P. Benskin, and J. W. Martin. 2011. “Isomer profiles ofperfluorochemicals in matched maternal, cord, and house dust samples: manufacturing sources and transplacentaltransfer.” Environ Health Perspect 119 (11):1659-64. doi: 10.1289/ehp.1003265.
Begley, T. H., W. Hsu, G. Noonan, and G. Diachenko. 2008. “Migration of fluorochemical paper additives from food-contact paper into foods and food simulants.” Food Additives & Contaminants: Part A 25 (3):384-390. doi:10.1080/02652030701513784.
Benskin, J. P., D.C. Muir, B.F. Scott, C. Spencer, A. O. DeSilva, H. Kylin, J. W. Martin, A. Morris, R. Lohmann, G. Tomy, B.Rosenberg, S. Taniyasu, and N. Yamashita. 2012. “Perfluoroalkyl acids in the Atlantic and Canadian Arctic Oceans.”Environmental Science and Technology 46.
Benskin, J. P., V. Phillips, V.L. St. Louis and J.W. Martin. 2011. “Source elucidation of perfluorinated carboxylic acids inremote alpine lake sediment cores.” Environ. Sci. Technol 45.
Benskin, J.P., A. O. DeSilva, and J. W. Martin. 2010. “Isomer Profiling of Perfluorinated Substances as a Tool for SourceTracking: A Review of Early Findings and Future Applications.” Reviews of Environmental Contamination andToxicology 208:111.
Benskin, Jonathan P., Belinda Li, Michael G. Ikonomou, John R. Grace, and Loretta Y. Li. 2012. “Per- and PolyfluoroalkylSubstances in Landfill Leachate: Patterns, Time Trends, and Sources.” Environmental Science & Technology 46(21):11532-11540. doi: 10.1021/es302471n.
Bentel, Michael J., Yaochun Yu, Lihua Xu, Zhong Li, Bryan M. Wong, Yujie Men, and Jinyong Liu. 2019. “Defluorination ofPer- and Polyfluoroalkyl Substances (PFASs) with Hydrated Electrons: Structural Dependence and Implications toPFAS Remediation and Management.” Environmental Science & Technology 53 (7):3718-3728. doi:10.1021/acs.est.8b06648.
Page 262ITRC PFAS-1
Bhattarai, B., M. Manickavachagam, and R.P.S. Suri. 2014. Development of Regenerable Adsorbents for the Removal ofEmerging Contaminants from Water. NSF Water and Environmental Technology Center.
Birk, G. and D. Alden. 2017. “Ex Situ Treatments of Aqueous Film-Forming Foam Impacted Water.” Fourth InternationalSymposium on Bioremediation and Sustainable Environmental Technologies.
Bischel, H. N., L. A. Macmanus-Spencer, C. Zhang, and R. G. Luthy. 2011. “Strong associations of short-chainperfluoroalkyl acids with serum albumin and investigation of binding mechanisms.” Environ Toxicol Chem 30(11):2423-30. doi: 10.1002/etc.647.
Björklund, Justina Awasum, Kaj Thuresson, and Cynthia A. de Wit. 2009. “Perfluoroalkyl Compounds (PFCs) in IndoorDust: Concentrations, Human Exposure Estimates, and Sources.” Environmental Science & Technology 43(7):2276-2281. doi: 10.1021/es803201a.
Blaine, A. C., C. D. Rich, L. S. Hundal, C. Lau, M. A. Mills, K. M. Harris, and C. P. Higgins. 2013. “Uptake of PerfluoroalkylAcids into Edible Crops via Land Applied Biosolids : Field and Greenhouse Studies.” Environmental Science andTechnology 47:14062.
Blaine, Andrea C., Courtney D. Rich, Erin M. Sedlacko, Lakhwinder S. Hundal, Kuldip Kumar, Christopher Lau, Marc A.Mills, Kimberly M. Harris, and Christopher P. Higgins. 2014. “Perfluoroalkyl Acid Distribution in Various PlantCompartments of Edible Crops Grown in Biosolids-Amended soils.” Environmental Science & Technology 48(14):7858-7865. doi: 10.1021/es500016s.
Blaine, Andrea C., Courtney D. Rich, Erin M. Sedlacko, Katherine C. Hyland, Cecil Stushnoff, Eric R. V. Dickenson, andChristopher P. Higgins. 2014. “Perfluoroalkyl Acid Uptake in Lettuce (Lactuca sativa) and Strawberry (Fragariaananassa) Irrigated with Reclaimed Water.” Environmental Science & Technology 48 (24):14361-14368. doi:10.1021/es504150h.
Blum, A., S. A. Balan, M. Scheringer, X. Trier, G. Goldenman, I. T. Cousins, M. Diamond, T. Fletcher, C. Higgins, A. E.Lindeman, G. Peaslee, P. de Voogt, Z. Wang, and R. Weber. 2015. “The Madrid statement on poly- and perfluoroalkylsubstances (PFASs).” Environmental Health Perspectives.
Bogaerts, A., E. Neyts, R. Gijbels, and J. van der Mullen. 2002. “Gas discharge plasmas and their applications.”Spectrochimica Acta 57.
Boiteux, V., X. Dauchy, C. Bach, A. Colin, J. Hemard, V. Sagres, and J.F. Munoz. 2017. “Concentrations and patterns ofperfluoroalkyl and polyfluoroalkyl substances in a river and three drinking water treatment plants near and far froma major production source.” Science of the Total Environment 583.
Boo, Chanhee, Yunkun Wang, Ines Zucker, Youngwoo Choo, Chinedum O. Osuji, and Menachem Elimelech. 2018. “HighPerformance Nanofiltration Membrane for Effective Removal of Perfluoroalkyl Substances at High Water Recovery.”Environmental Science & Technology 52 (13):7279-7288. doi: 10.1021/acs.est.8b01040.
Boodoo, F., J. Campos, and S. Kennedy. 2017. “Removal of PFOA, PFOS and other PFAS substances with ion exchange.”International Water Conferenc.
Bossi R., K. Vorkamp, and H. Skov. 2016. “Concentrations of organochlorine pesticides, polybrominated diphenyl ethersand perfluorinated compounds in the atmosphere of North Greenland.” Environmental Pollution 217.
Boudreau, T. M., P. K. Sibley, S. A. Mabury, D. G. C. Muir, and K. R. Solomon. 2003. “Laboratory Evaluation of the Toxicityof Perfluorooctane Sulfonate (PFOS) on Selenastrum capricornutum, Chlorella vulgaris, Lemna gibba, Daphniamagna, and Daphnia pulicaria.” Archives of Environmental Contamination and Toxicology 44 (3):0307-0313. doi:10.1007/s00244-002-2102-6.
Boulanger, B., J. D. Vargo, J. L. Schnoor, and K. C. Hornbuckle. 2005. “Evaluation of Perfluorooctane Surfactants in aWastewater Treatment System and in a Commercial Surface Protection Product.” Environmental Science andTechnology 39.
Bräunig, J., C. Baduel, and J. F. Mueller. 2016. “Influence of a commercial adsorbent on the leaching behavior andbioavailability of selected perfluoroalkyl acids (PFAAs) from soil impacted by AFFF.” Brisbane, Australia: National
Page 263ITRC PFAS-1
Research Center for Environmental Toxicology. The University of Queensland.
Bräunig, Jennifer, Christine Baduel, Amy Heffernan, Anna Rotander, Eric Donaldson, and Jochen F. Mueller. 2017. “Fateand redistribution of perfluoroalkyl acids through AFFF-impacted groundwater.” Science of The Total Environment596-597:360-368. doi: https://doi.org/10.1016/j.scitotenv.2017.04.095.
Brede, E., M. Wilhelm, T. Goen, J. Muller, K. Rauchfuss, M. Kraft, and J. Holzer. 2010. “Two-year follow-up biomonitoringpilot study of residents’ and controls’ PFC plasma levels after PFOA reduction in public water system in Arnsberg,Germany.” Int J Hyg Environ Health 213 (3):217-23. doi: 10.1016/j.ijheh.2010.03.007.
Brewer, J. 2017. “Granular Activated Carbon : A Proven Solution for PFAS.” Cleanup Conference.
Briggs, K., and D. Staack,. 2015. “Enhancement of bioremediation of soils contaminated with organic hydrocarbon usingan electron beam.” Third International Symposium on Bioremediation and Sustainable Environmental Technologies,Miami, Florida., May 18-21.
Brignole, A.J., J.R. Porch, H.O. Krueger, and R.L. Van Hoven. 2003. PFOS: a toxicity test to determine the effects of thetest substance on seedling emergence of seven species of plants. Toxicity to Terrestrial Plants. EPA DocketAR226-1369. . Easton, MD: Ltd. Wildlife International.
Brooke, D., A. Footitt, and T. A. Nwaogu,. 2004. “Perfluorooctanesulphonate (PFOS). Section 2 : General Information on11167 Exposure.” Environment Agency.
Brusseau, Mark L. 2018. “Assessing the potential contributions of additional retention processes to PFAS retardation inthe subsurface.” Science of The Total Environment 613-614:176-185. doi:https://doi.org/10.1016/j.scitotenv.2017.09.065.
Brusseau, Mark L., Ni Yan, Sarah Van Glubt, Yake Wang, Wei Chen, Ying Lyu, Barry Dungan, Kenneth C. Carroll, and FOmar Holguin. 2019. “Comprehensive retention model for PFAS transport in subsurface systems.” Water Research148:41-50.
Bruton, Thomas A., and David L. Sedlak. 2017. “Treatment of Aqueous Film-Forming Foam by Heat-Activated PersulfateUnder Conditions Representative of In Situ Chemical Oxidation.” Environmental Science & Technology 51(23):13878-13885. doi: 10.1021/acs.est.7b03969.
Buck, R. C. 2015. Toxicology Data for Alternative ” Short-Chain ” Fluorinated Substances, Toxicological Effects ofPerfluoroalkyl and Polyfluoroalkyl Substances.
Buck, Robert C., James Franklin, Urs Berger, Jason M. Conder, Ian T. Cousins, Pim de Voogt, Allan Astrup Jensen,Kurunthachalam Kannan, Scott A. Mabury, and Stefan P. J. van Leeuwen. 2011. “Perfluoroalkyl and polyfluoroalkylsubstances in the environment: Terminology, classification, and origins.” Integrated Environmental Assessment andManagement 7 (4):513-541. doi: 10.1002/ieam.258.
Burdick, J., I. Ross, J. McDonough, J. Miles, and Nowack. K. 2016. “Poly- and Perfluouroalkyl Substances (PFAS) Treatment:State of the Practice and Mythbusting.” Impacts from Fire Fighting Foams: Policy, Regulation, Characterization andTreatment for PFCs.
Burkhard, Lawrence P., Jon A. Arnot, Michelle R. Embry, Kevin J. Farley, Robert A. Hoke, Masaru Kitano, Heather A. Leslie,Guilherme R. Lotufo, Thomas F. Parkerton, Keith G. Sappington, Gregg T. Tomy, and Kent B. Woodburn. 2012.“Comparing laboratory and field measured bioaccumulation endpoints.” Integrated Environmental Assessment andManagement 8 (1):17-31. doi: 10.1002/ieam.260.
Busch, Jan, Lutz Ahrens, Renate Sturm, and Ralf Ebinghaus. 2010. “Polyfluoroalkyl compounds in landfill leachates.”Environmental Pollution 158 (5):1467-1471. doi: https://doi.org/10.1016/j.envpol.2009.12.031.
Butenhoff, J., and S. Chang. 2007. “ADME Study of Perfluorooctane Sulfonate in Rats. ST-179 Final Report. 3M StrategicToxicology Laboratory, 3M Center, St. Paul, MN (cited in EPA, 2016d).”.
Butenhoff, J. L., S. C. Chang, G. W. Olsen, and P. J. Thomford. 2012. “Chronic dietary toxicity and carcinogenicity studywith potassium perfluorooctanesulfonate in Sprague Dawley rats.” Toxicology 293 (1-3):1-15. doi:
Page 264ITRC PFAS-1
10.1016/j.tox.2012.01.003.
Butenhoff, J. L., D. W. Gaylor, J. A. Moore, G. W. Olsen, J. Rodricks, J. H. Mandel, and L. R. Zobel. 2004. “Characterizationof risk for general population exposure to perfluorooctanoate.” Regul Toxicol Pharmacol 39 (3):363-80. doi:10.1016/j.yrtph.2004.03.003.
Butenhoff, J. L., G. L. Kennedy, Jr., S. R. Frame, J. C. O’Connor, and R. G. York. 2004. “The reproductive toxicology ofammonium perfluorooctanoate (APFO) in the rat.” Toxicology 196 (1-2):95-116. doi: 10.1016/j.tox.2003.11.005.
Butenhoff, J. L., G. L. Kennedy, Jr., P. M. Hinderliter, P. H. Lieder, R. Jung, K. J. Hansen, G. S. Gorman, P. E. Noker, and P. J.Thomford. 2004. “Pharmacokinetics of perfluorooctanoate in cynomolgus monkeys.” Toxicol Sci 82 (2):394-406. doi:10.1093/toxsci/kfh302.
Butt, Craig M., Urs Berger, Rossana Bossi, and Gregg T. Tomy. 2010. “Levels and trends of poly- and perfluorinatedcompounds in the arctic environment.” Science of The Total Environment 408 (15):2936-2965. doi:https://doi.org/10.1016/j.scitotenv.2010.03.015.
Butt, Craig M., Scott A. Mabury, Michael Kwan, Xiaowa Wang, and Derek C. G. Muir. 2008. “Spatial trends ofperfluoroalkyl compounds in ringed seals (Phoca hispida) from the Canadian Arctic.” Environmental Toxicology andChemistry 27 (3):542-553. doi: 10.1897/07-428.1.
Butt, Craig M., Derek C. G. Muir, and Scott A. Mabury. 2014. “Biotransformation pathways of fluorotelomer-basedpolyfluoroalkyl substances: A review.” Environmental Toxicology and Chemistry 33 (2):243-267. doi:10.1002/etc.2407.
Buxton, G. V., C.L. Greenstock, W. P. W. P. Helman, and A. B. Ross. 1988. “Critical review of rate constants for reactionsof hydrated electrons, hydrogen atoms and hydroxyl radicals in aqueous solution.” Journal of Physical and ChemicalReference Data 17:513.
C8 Science Panel. 2011. Probable Link Evaluation of Pregnancy Induced Hypertension and Preeclampsia.http://www.c8sciencepanel.org/pdfs/Probable_Link_C8_PIH_5Dec2011.pdf
C8 Science Panel. 2012a. Probable Link Evaluation for heart disease (including high blood pressure, high cholesterol,coronary artery disease). http://www.c8sciencepanel.org/pdfs/Probable_Link_C8_Heart_Disease_29Oct2012.pdf
C8 Science Panel. 2012b. Probable Link Evaluation of Autoimmune Disease.http://www.c8sciencepanel.org/pdfs/Probable_Link_C8_Autoimmune_Disease_30Jul2012.pdf
C8 Science Panel. 2012c. Probable Link Evaluation of Thyroid disease.http://www.c8sciencepanel.org/pdfs/Probable_Link_C8_Thyroid_30Jul2012.pdf
C8 Science Panel. 2012d. Probably Link Evaluation of Cancer.http://www.c8sciencepanel.org/pdfs/Probable_Link_C8_Cancer_16April2012_v2.pdf.
C8 Science Panel. 2020. “C8 Science Panel website.” Last Modified 1/22/2020.http://www.c8sciencepanel.org/index.html.
CA DTSC. 2019a. Product – Chemical Profile for Treatments Containing Perfluoroalkyl or Polyfluoroalkyl Substances forUse on Converted Textiles or Leathers. Discussion Draft.https://dtsc.ca.gov/wp-content/uploads/sites/31/2019/11/Product-Chemical-Profile-for-Treatments-with-PFASs.pdf.
CA DTSC. 2019b. Work Plan Implementation: Food Packaging with Perfluoroalkyl and Polyfluoroalkyl Substances (PFASs).https://dtsc.ca.gov/wp-content/uploads/sites/31/2019/10/Food-Packaging_Perfluoroalkyl-and-Polyfluoroalkyl-Substances-PFASs.pdf.
CA OEHHA. 2011. “Biomonitoring California. Results for Perfluorochemicals (PFCs).”https://biomonitoring.ca.gov/results/chemical/154%2011.
CA OEHHA. 2018. “Chemicals Listed Effective November 10, 2017 as Known to the State of California to CauseReproductive Toxicity: Perfluorooctanoic Acid (PFOA) and Perfluorooctane Sulfonate (PFOS).”https://oehha.ca.gov/proposition-65/crnr/chemicals-listed-effective-november-10-2017-known-state-california-cause
Page 265ITRC PFAS-1
CA Water Boards. 2019. Water Boards PFAS Phased Investigation Approach.https://www.waterboards.ca.gov/pfas/docs/7_investigation_plan.pdf.
CA Water Boards. 2020. “Per- and Polyfluoroalkyl Substances (PFAS).” Last Modified 1/24/20. accessed 2020.https://www.waterboards.ca.gov/pfas/.
Cai, Minghong, Zhiyong Xie, Axel Möller, Zhigao Yin, Peng Huang, Minggang Cai, Haizhen Yang, Renate Sturm, JianfengHe, and Ralf Ebinghaus. 2012. “Polyfluorinated compounds in the atmosphere along a cruise pathway from the JapanSea to the Arctic Ocean.” Chemosphere 87 (9):989-997. doi: https://doi.org/10.1016/j.chemosphere.2011.11.010.
Cai, Minghong, Haizhen Yang, Zhiyong Xie, Zhen Zhao, Feng Wang, Zhibo Lu, Renate Sturm, and Ralf Ebinghaus. 2012.“Per- and polyfluoroalkyl substances in snow, lake, surface runoff water and coastal seawater in Fildes Peninsula,King George Island, Antarctica.” Journal of Hazardous Materials 209-210:335-342. doi:https://doi.org/10.1016/j.jhazmat.2012.01.030.
Cai, Minghong, Zhen Zhao, Zhigao Yin, Lutz Ahrens, Peng Huang, Minggang Cai, Haizhen Yang, Jianfeng He, RenateSturm, Ralf Ebinghaus, and Zhiyong Xie. 2012. “Occurrence of Perfluoroalkyl Compounds in Surface Waters from theNorth Pacific to the Arctic Ocean.” Environmental Science & Technology 46 (2):661-668. doi: 10.1021/es2026278.
CalEPA. 2018. “Product – Chemical Profile for Perfluoroalkyl and Polyfluroalkyl Substances (PFASs) in Carpets and RugsFebruary 2018 Discussion Draft.”
Campbell, Tammy, and Michael R. Hoffmann. 2015. “Sonochemical degradation of perfluorinated surfactants: Power andmultiple frequency effects.” Separation and Purification Technology 156:1019-1027. doi:https://doi.org/10.1016/j.seppur.2015.09.053.
Campos Pereira, Hugo, Malin Ullberg, Dan Berggren Kleja, Jon Petter Gustafsson, and Lutz Ahrens. 2018. “Sorption ofperfluoroalkyl substances (PFASs) to an organic soil horizon – Effect of cation composition and pH.” Chemosphere207:183-191. doi: https://doi.org/10.1016/j.chemosphere.2018.05.012.
Cao, M. H., B. B. Wang, H. S. Yu, L. L. Wang, S. H. Yuan, and J. Chen. 2010. “Photochemical decomposition ofperfluorooctanoic acid in aqueous periodate with VUV and UV light irradiation.” Journal of Hazardous Materials 179(1):1143-1146. doi: https://doi.org/10.1016/j.jhazmat.2010.02.030.
Cappuyns, Valérie, and Bram Kessen. 2013. Combining life cycle analysis, human health and financial risk assessmentfor the evaluation of contaminated site remediation. Vol. 57.
Carey, G.R., P.J. Van Geel, J.R. Murphy, E.A. McBean, and F.A. Rovers. 1999. “Modeling natural attenuation at thePlattsburgh Air Force Base.” In Natural attenuation of chlorinated solvents, petroleum hydrocarbons, and otherorganic compounds., edited by B. C. Alleman and A. Leeson, 77-82. Columbus, OH: Battelle Press.
Carey, Grant R., Rick McGregor, Anh Le-Tuan Pham, Brent Sleep, and Seyfollah Gilak Hakimabadi. 2019. “Evaluating thelongevity of a PFAS in situ colloidal activated carbon remedy.” Remediation Journal 29 (2):17-31. doi:10.1002/rem.21593.
Carey, Grant R., Paul J. Van Geel, Todd H. Wiedemeier, and Edward A. McBean. 2003. “A Modified Radial DiagramApproach for Evaluating Natural Attenuation Trends for Chlorinated Solvents and Inorganic Redox Indicators.”Groundwater Monitoring & Remediation 23 (4):75-84. doi: 10.1111/j.1745-6592.2003.tb00697.x.
Cassone, C. G., V. Vongphachan, S. Chiu, K. L. Williams, R. J. Letcher, E. Pelletier, D. Crump, and S. W. Kennedy. 2012.“In ovo effects of perfluorohexane sulfonate and perfluorohexanoate on pipping success, development, mRNAexpression, and thyroid hormone levels in chicken embryos.” Toxicol Sci 127 (1):216-24. doi: 10.1093/toxsci/kfs072.
CCME. 2018. Canadian Soil and Groundwater Quality Guidelines for the Protection of Environmental and Human Health,Perfluorooctane Sulfonate (PFOS) – Draft for Review. Canadian Council of Ministers of hte Environment.https://www.watercanada.net/soil-and-groundwater-quality-guidelines-available-for-public-comment/.
CDC. 2016. “National Health and Nutrition Examination Survey. 2013-2014 Data Documentation, Codebook andFrequencies.” accessed 2020. https://wwwn.cdc.gov/Nchs/Nhanes/2013-2014/SSPFAS_H.htm.
Page 266ITRC PFAS-1
CDC. 2018. Fourth National Report on Human Exposure to Environmental Chemicals, Updated Tables, March 2018,Volume 1. U.S. Department of Health and Human Services. Centers for Disease Control and Prevention.https://www.cdc.gov/exposurereport/pdf/FourthReport_UpdatedTables_Volume1_Mar2018.pdf.
CDC. 2019. Fourth National Report on Human Exposure to Environmental Chemicals Updated Tables, January 2019,Volume One U.S. Department of Health and Human Services. Centers for Disease Control and Prevention.https://www.cdc.gov/exposurereport/pdf/FourthReport_UpdatedTables_Volume1_Jan2019-508.pdf.
CEH. 2018. “Fact Sheet, Fluorinated Additives, Disposable Food Containers, and Contaminated Food: State of theEvidence.”
CEPA. 2006. “Environmental Performance Agreement (“Agreement”) Respecting Perfluorinated Carboxylic Acids (PFCAs)and their Precursors in Perfluorochemical Products Sold in Canada Environment and Climate Change Canada.”Environment and Climate Change Canada.
CEPA. 2017. “Canadian Environmental Protection Act, 1999. Federal Environmental Quality Guidelines: PerfluorooctaneSulfonate (PFOS).” Environment and Climate Change Canada.
CEPA. 2018. “Toxic Substances list: PFOS.” Environment and Climate Change Canada.
Chang, E. T., H. O. Adami, P. Boffetta, P. Cole, T. B. Starr, and J. S. Mandel. 2014. “A critical review of perfluorooctanoateand perfluorooctanesulfonate exposure and cancer risk in humans.” Crit Rev Toxicol 44 Suppl 1:1-81. doi:10.3109/10408444.2014.905767.
Chang, E. T., H. O. Adami, P. Boffetta, H. J. Wedner, and J. S. Mandel. 2016. “A critical review of perfluorooctanoate andperfluorooctanesulfonate exposure and immunological health conditions in humans.” Crit Rev Toxicol 46(4):279-331. doi: 10.3109/10408444.2015.1122573.
Chang, S. C., K. Das, D. J. Ehresman, M. E. Ellefson, G. S. Gorman, J. A. Hart, P. E. Noker, Y. M. Tan, P. H. Lieder, C. Lau, G.W. Olsen, and J. L. Butenhoff. 2008. “Comparative pharmacokinetics of perfluorobutyrate in rats, mice, monkeys,and humans and relevance to human exposure via drinking water.” Toxicol Sci 104 (1):40-53. doi:10.1093/toxsci/kfn057.
Chang, S. C., P. E. Noker, G. S. Gorman, S. J. Gibson, J. A. Hart, D. J. Ehresman, and J. L. Butenhoff. 2012. “Comparativepharmacokinetics of perfluorooctanesulfonate (PFOS) in rats, mice, and monkeys.” Reprod Toxicol 33 (4):428-440.doi: 10.1016/j.reprotox.2011.07.002.
Chapman, Steven W., and Beth L. Parker. 2005. “Plume persistence due to aquitard back diffusion following densenonaqueous phase liquid source removal or isolation.” Water Resources Research $V 41 (12):n/a-n/a.
Chen, H., M. Reinhard, V. T. Nguyen, and K. Y.-H. Gin. 2016. “Reversible and irreversible sorption of perfluorinatedcompounds (PFCs) by sediments of an urban reservoir.” Chemosphere 144:1747-1753. doi:https://doi.org/10.1016/j.chemosphere.2015.10.055.
Chen, J., and P. Zhang. 2006. Photodegradation of perfluorooctanoic acid in water under irradiation of 254 nm and 185nm light by use of persulfate. Vol. 54.
Chen, Jing, Peng-yi Zhang, and Jian Liu. 2007. “Photodegradation of perfluorooctanoic acid by 185 nm vacuum ultravioletlight.” Journal of Environmental Sciences 19 (4):387-390. doi: https://doi.org/10.1016/S1001-0742(07)60064-3.
Chen, Shu, Xing-Chun Jiao, Nan Gai, Xiao-Jie Li, Xiao-Chun Wang, Guo-Hui Lu, Hai-Tao Piao, Zhu Rao, and Yong-LiangYang. 2016. “Perfluorinated compounds in soil, surface water, and groundwater from rural areas in eastern China.”Environmental Pollution 211:124-131. doi: https://doi.org/10.1016/j.envpol.2015.12.024.
Chen, Xi, Xinghui Xia, Xilong Wang, Jinping Qiao, and Huiting Chen. 2011. “A comparative study on sorption ofperfluorooctane sulfonate (PFOS) by chars, ash and carbon nanotubes.” Chemosphere 83 (10):1313-1319. doi:https://doi.org/10.1016/j.chemosphere.2011.04.018.
Chen, Ying-Chin, Shang-Lien Lo, and yu-Chi Lee. 2012. Distribution and fate of perfluorinated compounds (PFCs) in apilot constructed wetland. Vol. 37.
Page 267ITRC PFAS-1
Cheng, Jie, Chad D. Vecitis, Hyunwoong Park, Brian T. Mader, and Michael R. Hoffmann. 2008. “SonochemicalDegradation of Perfluorooctane Sulfonate (PFOS) and Perfluorooctanoate (PFOA) in Landfill Groundwater:Environmental Matrix Effects.” Environmental Science & Technology 42 (21):8057-8063. doi: 10.1021/es8013858.
Cheng, Jie, Chad D. Vecitis, Hyunwoong Park, Brian T. Mader, and Michael R. Hoffmann. 2010. “SonochemicalDegradation of Perfluorooctane Sulfonate (PFOS) and Perfluorooctanoate (PFOA) in Groundwater: Kinetic Effects ofMatrix Inorganics.” Environmental Science & Technology 44 (1):445-450. doi: 10.1021/es902651g.
Chengelis, C. P., J. B. Kirkpatrick, N. R. Myers, M. Shinohara, P. L. Stetson, and D. W. Sved. 2009. “Comparison of thetoxicokinetic behavior of perfluorohexanoic acid (PFHxA) and nonafluorobutane-1-sulfonic acid (PFBS) in cynomolgusmonkeys and rats.” Reprod Toxicol 27 (3-4):400-406. doi: 10.1016/j.reprotox.2009.01.013.
Chiang, D., R. Stewart, G. Birk, Q. Huang, J. Field, and A. Bodour. 2017. “Ability of Aluminum-Based Adsorbent to RemovePFAS from Groundwater.” Battelle Conference, Palm Springs, CA.
Chiang, D., S. Laing, R. Casson, R. Mora, and Q. Huang. 2018. “Applications of Electrochemical Oxidation for PFASDestruction in Water, Liquid and Solid Wastes.” Battelle Conference, Palm Springs, CA.
Choe, Jong Kwon, Allison M. Bergquist, Sangjo Jeong, Jeremy S. Guest, Charles J. Werth, and Timothy J. Strathmann.2015. “Performance and life cycle environmental benefits of recycling spent ion exchange brines by catalytictreatment of nitrate.” Water Research 80:267-280. doi: https://doi.org/10.1016/j.watres.2015.05.007.
Choe, Jong Kwon, Michelle H. Mehnert, Jeremy S. Guest, Timothy J. Strathmann, and Charles J. Werth. 2013.“Comparative Assessment of the Environmental Sustainability of Existing and Emerging Perchlorate TreatmentTechnologies for Drinking Water.” Environmental Science & Technology 47 (9):4644-4652. doi: 10.1021/es3042862.
Chowdhury, Pankaj, and T. Viraraghavan. 2009. “Sonochemical degradation of chlorinated organic compounds, phenoliccompounds and organic dyes – A review.” Science of The Total Environment 407 (8):2474-2492. doi:https://doi.org/10.1016/j.scitotenv.2008.12.031.
Clara, M., Christoph Scheffknecht, S. Scharf, Stefan Weiss, and O. Gans. 2008. Emissions of perfluorinated alkylatedsubstances (PFAS) from point sources – Identification of relevant branches. Vol. 58.
Cleland, Marshall R. 2011. “ELECTRON BEAM MATERIALS IRRADIATORS.” In Industrial Accelerators and TheirApplications, 87-137. WORLD SCIENTIFIC doi: 10.1142/9789814307055_0004.
Codling, Garry, Crispin Halsall, Lutz Ahrens, Sabino Del Vento, Karin Wiberg, Magnus Bergknut, Hjalmar Laudon, and RalfEbinghaus. 2014. “The fate of per- and polyfluoroalkyl substances within a melting snowpack of a boreal forest.”Environmental Pollution 191:190-198. doi: https://doi.org/10.1016/j.envpol.2014.04.032.
Codling, Garry, Neil C. Sturchio, Karl Rockne, An Li, H. Peng, Timothy Tse, Paul Jones, and John P. Giesy. 2018. “Spatialand temporal trends in poly- and per-fluorinated compounds in the Laurentian Great Lakes Erie, Ontario and St.Clair.” Environmental Pollution 237:396-405. doi: https://doi.org/10.1016/j.envpol.2018.02.013.
Colgan, G., R. Richter, R. Grace, T. Fitzpatrick, R. Darlington, B. DiGuiseppi, L. Cook, and K. Rabe. 2018. “ThermalTreatment of Per- and Polyfluoroalkyl Substances (PFAS) in Soil.” Battelle Chlorinated Conference, Palm Springs,California.
CONCAWE. 2016. Environmental Fate and Effects of Poly- and Perfluoroalkyl Substances (PFAS). Auderghem, Belgium.https://www.concawe.eu/publication/environmental-fate-and-effects-of-poly-and-perfluoroalkyl-substances-pfas-report-no-816/.
Conder, Jason M., Robert A. Hoke, Watze de Wolf, Mark H. Russell, and Robert C. Buck. 2008. “Are PFCAsBioaccumulative? A Critical Review and Comparison with Regulatory Criteria and Persistent Lipophilic Compounds.”Environmental Science & Technology 42 (4):995-1003. doi: 10.1021/es070895g.
Coperchini, F., O. Awwad, M. Rotondi, F. Santini, M. Imbriani, and L. Chiovato. 2017. “Thyroid disruption byperfluorooctane sulfonate (PFOS) and perfluorooctanoate (PFOA).” J Endocrinol Invest 40 (2):105-121. doi:10.1007/s40618-016-0572-z.
Page 268ITRC PFAS-1

Corton, J. C., S. P. Anderson, and A. Stauber. 2000. “Central role of peroxisome proliferator-activated receptors in theactions of peroxisome proliferators.” Annu Rev Pharmacol Toxicol 40:491-518. doi:10.1146/annurev.pharmtox.40.1.491.
Covello, V.T. Message Mapping. Center for Risk Communication.https://www.orau.gov/cdcynergy/erc/content/activeinformation/resources/Covello_message_mapping.pdf.
CRC CARE. 2017a. Assessment, Management and Remediation Guidance for Perfluorooctanesulfonate (PFOS) andPerfluorooctanoic Acid (PFOA) – Part 3: ecological screening levels. CRC CARE Technical Report No. 38. Newcastle,Australia: CRC for Contamination Assessment and Remediation of the Environment.
CRC CARE. 2017b. Assessment, Management and Remediation Guidance for Perfluorooctanesulfonate (PFOS) andPerfluorooctanoic Acid (PFOA) – Part 5: Management and Remediation of PFOS and PFOA CRC CARE Technical ReportNo. 38. Newcastle, Australia: CRC for Contamination Assessment and Remediation of the Environment.www.crccare.com.
CRC CARE. 2018. Practitioner guide to risk-based assessment, remediation and management of PFAS site contamination.Newcastle, Australia: CRC for Contamination Assessment and Remediation of the Environment.https://www.crccare.com/publications/technical-reports.
Crownover, Emily, Daniel Oberle, Mark Kluger, and Gorm Heron. 2019. “Perfluoroalkyl and polyfluoroalkyl substancesthermal desorption evaluation.” Remediation Journal 29 (4):77-81. doi: 10.1002/rem.21623.
CSWAB. 2018. Community Priorities and Objectives for Test Methods and Remedies at Known and Potential PFAS Sites.
Cummings, L. A. Matarazzo, N. Nelson, F. Sickels, and C. T. Storms. 2015. “New Jersey Drinking Water Quality InstituteSubcommittee, Recommendation on Perfluorinated Compound Treatment Options for Drinking Water.” New JerseyDepartment of Environmental Protection.
Custer, C. M., B. R. Gray, and T. W. Custer. 2010. “Effects of egg order on organic and inorganic element concentrationsand egg characteristics in tree swallows, Tachycineta bicolor.” Environ Toxicol Chem 29 (4):909-21. doi:10.1002/etc.88.
Custer, Christine M., Thomas W. Custer, Paul M. Dummer, Matthew A. Etterson, Wayne E. Thogmartin, Qian Wu,Kurunthachalam Kannan, Annette Trowbridge, and Patrick C. McKann. 2014. “Exposure and Effects of PerfluoroalkylSubstances in Tree Swallows Nesting in Minnesota and Wisconsin, USA.” Archives of Environmental Contaminationand Toxicology 66 (1):120-138. doi: 10.1007/s00244-013-9934-0.
Custer, Christine M., Thomas W. Custer, Heiko L. Schoenfuss, Beth H. Poganski, and Laura Solem. 2012. “Exposure andeffects of perfluoroalkyl compounds on tree swallows nesting at Lake Johanna in east central Minnesota, USA.”Reproductive Toxicology 33 (4):556-562. doi: https://doi.org/10.1016/j.reprotox.2011.01.005.
D’Agostino, Lisa A., and Scott A. Mabury. 2017. “Aerobic biodegradation of 2 fluorotelomer sulfonamide–based aqueousfilm–forming foam components produces perfluoroalkyl carboxylates.” Environmental Toxicology and Chemistry 36(8):2012-2021. doi: 10.1002/etc.3750.
D’Eon, Jessica C., Michael D. Hurley, Timothy J. Wallington, and Scott A. Mabury. 2006. “Atmospheric Chemistry of N-methyl Perfluorobutane Sulfonamidoethanol, C4F9SO2N(CH3)CH2CH2OH: Kinetics and Mechanism of Reaction withOH.” Environmental Science & Technology 40 (6):1862-1868. doi: 10.1021/es0520767.
D’Eon, Jessica, and Scott A. Mabury. 2011. “Exploring Indirect Sources of Human Exposure to Perfluoroalkyl Carboxylates(PFCAs): Evaluating Uptake, Elimination, and Biotransformation of Polyfluoroalkyl Phosphate Esters (PAPs) in theRat.” Environ Health Perspectives 119 (3):344-50. doi: 10.1289/ehp.1002409.
Dai, Zhineng, Xinghui Xia, Jia Guo, and Xiaoman Jiang. 2013. “Bioaccumulation and uptake routes of perfluoroalkyl acidsin Daphnia magna.” Chemosphere 90 (5):1589-1596. doi: https://doi.org/10.1016/j.chemosphere.2012.08.026.
Dalahmeh, Sahar, Sana Tirgani, Allan John Komakech, Charles B. Niwagaba, and Lutz Ahrens. 2018. “Per- andpolyfluoroalkyl substances (PFASs) in water, soil and plants in wetlands and agricultural areas in Kampala, Uganda.”Science of The Total Environment 631-632:660-667. doi: https://doi.org/10.1016/j.scitotenv.2018.03.024.
Page 269ITRC PFAS-1
Danish EPA. 2015. “Perfluoroalkylated substances: PFOA, PFOS and PFOSA, Evaluation of health hazards and proposal ofa health based quality criterion for drinking water, soil and ground water.” Environmental project No. 1665.
Danish Ministry of the Environment. 2015. Short-chain Polyfluoroalkyl Substances (PFAS): A literature review ofinformation on human health effects and environmental fate and effect aspects of short-chain PFAS. . edited by TheDanish Environmental Protection Agency.
Darrow, L. A., C. R. Stein, and K. Steenland. 2013. “Serum perfluorooctanoic acid and perfluorooctane sulfonateconcentrations in relation to birth outcomes in the Mid-Ohio Valley, 2005-2010.” Environ Health Perspect 121(10):1207-13. doi: 10.1289/ehp.1206372.
Das, K. P., B. E. Grey, M. B. Rosen, C. R. Wood, K. R. Tatum-Gibbs, R. D. Zehr, M. J. Strynar, A. B. Lindstrom, and C. Lau.2015. “Developmental toxicity of perfluorononanoic acid in mice.” Reprod Toxicol 51:133-44. doi:10.1016/j.reprotox.2014.12.012.
Dassuncao, Clifton, Xindi C. Hu, Xianming Zhang, Rossana Bossi, Maria Dam, Bjarni Mikkelsen, and Elsie M. Sunderland.2017. “Temporal Shifts in Poly- and Perfluoroalkyl Substances (PFASs) in North Atlantic Pilot Whales Indicate LargeContribution of Atmospheric Precursors.” Environmental Science & Technology 51 (8):4512-4521. doi:10.1021/acs.est.7b00293.
Dasu, Kavitha, and Linda S. Lee. 2016. “Aerobic biodegradation of toluene-2,4-di(8:2 fluorotelomer urethane) andhexamethylene-1,6-di(8:2 fluorotelomer urethane) monomers in soils.” Chemosphere 144:2482-2488. doi:https://doi.org/10.1016/j.chemosphere.2015.11.021.
Dasu, Kavitha, Jinxia Liu, and Linda S. Lee. 2012. “Aerobic Soil Biodegradation of 8:2 Fluorotelomer Stearate Monoester.”Environmental Science & Technology 46 (7):3831-3836. doi: 10.1021/es203978g.
Dauchy, Xavier, Virginie Boiteux, Cristina Bach, Adeline Colin, Jessica Hemard, Christophe Rosin, and Jean-FrançoisMunoz. 2017. “Mass flows and fate of per- and polyfluoroalkyl substances (PFASs) in the wastewater treatment plantof a fluorochemical manufacturing facility.” Science of The Total Environment 576:549-558. doi:https://doi.org/10.1016/j.scitotenv.2016.10.130.
Davis, Katherine L., Michael D. Aucoin, Barbara S. Larsen, Mary A. Kaiser, and Andrew S. Hartten. 2007. “Transport ofammonium perfluorooctanoate in environmental media near a fluoropolymer manufacturing facility.” Chemosphere67 (10):2011-2019. doi: https://doi.org/10.1016/j.chemosphere.2006.11.049.
De Silva, A. O., J. P. Benskin, L. J. Martin, G. Arsenault, R. McCrindle, N. Riddell, J. W. Martin, and S. A. Mabury. 2009.“Disposition of perfluorinated acid isomers in Sprague-Dawley rats; part 2: subchronic dose.” Environ Toxicol Chem28 (3):555-67. doi: 10.1897/08-254.1.
Deeb, R.A. , A. Haghani, A. Eaton, and J. Chambon. 2016. “Development and Testing of an Analytical Method for RealTime Measurement of Polyfluoroalkyl and Perfluoroalkyl Substances (PFAS).” Battelle’s 2016 Chlorinated Conference.
Delinsky, Amy D., Mark J. Strynar, Patricia J. McCann, Jerry L. Varns, Larry McMillan, Shoji F. Nakayama, and Andrew B.Lindstrom. 2010. “Geographical Distribution of Perfluorinated Compounds in Fish from Minnesota Lakes and Rivers.”Environmental Science & Technology 44 (7):2549-2554. doi: 10.1021/es903777s.
Delkash, Madjid, Babak Ebrazi Bakhshayesh, and Hossein Kazemian. 2015. “Using zeolitic adsorbents to cleanup specialwastewater streams: A review.” Microporous and Mesoporous Materials 214:224-241. doi:https://doi.org/10.1016/j.micromeso.2015.04.039.
Denly, Elizabeth, Jim Occhialini, Phil Bassignani, Michael Eberle, and Nidal Rabah. 2019. “Per- and polyfluoroalkylsubstances in environmental sampling products: Fact or fiction?” Remediation Journal 29 (4):65-76. doi:10.1002/rem.21614.
DeSilva, Amila O., Derek C.G. Muir, and Scott A. Mabury. 2009. “Distribution of Perfluorocarboxylate Isomers in SelectSamples from the North American Environment.” Environmental Toxicology and Chemistry 28 (9):1801-1814.
Desjardins, D., C.A. Sutherland, R.L. Van Hoven, and H.O. Krueger. 2001a. PFOS: A 96-hr toxicity test with the freshwateralga (Anabaena flos-aquae). EPA Docket AR226-0186: Ltd. Wildlife International, Project Number 454A-110B.
Page 270ITRC PFAS-1
Desjardins, D., C.A. Sutherland, R. L. Van Hoven, and H. O. Krueger. 2001b. PFOS: A 96-hr toxicity test with the marinediatom (Skeletonema costatum). EPA Docket AR226-1030a056: Ltd. Wildlife International, Project Number454A-113A.
Desjardins, D., C.A. Sutherland, R. L. Van Hoven, and H. O. Krueger. 2001c. PFOS: A 7-d toxicity test with duckweed(Lemna gibba G3). EPA Docket AR226-1030a054: Ltd. Project Number 454-111 Wildlife International.
DeVito, M. 2018. REACT Program for Per- and Polyfluoroalkyl Substances. NIEHS/DNTP.https://ntp.niehs.nih.gov/ntp/about_ntp/bsc/2018/june/meetingmaterials/devito20180620_508.pdf.
Dewitt, J. C., C. B. Copeland, M. J. Strynar, and R. W. Luebke. 2008. “Perfluorooctanoic acid-induced immunomodulationin adult C57BL/6J or C57BL/6N female mice.” Environ Health Perspect 116 (5):644-50. doi: 10.1289/ehp.10896.
DeWitt, Jamie C. 2015. Toxicological Effects of Perfluoroalkyl and Polyfluoroalkyl Substances.
Dhingra, R., L. A. Darrow, M. Klein, A. Winquist, and K. Steenland. 2016. “Perfluorooctanoic acid exposure and naturalmenopause: A longitudinal study in a community cohort.” Environ Res 146:323-30. doi:10.1016/j.envres.2015.12.037.
Dhingra, R., C. Lally, L. A. Darrow, M. Klein, A. Winquist, and K. Steenland. 2016. “Perfluorooctanoic acid and chronickidney disease: Longitudinal analysis of a Mid-Ohio Valley community.” Environ Res 145:85-92. doi:10.1016/j.envres.2015.11.018.
Dickenson, E. and C. Higgins. 2016. “Treatment Mitigation Strategies for Poly- and Perfluorinated Chemicals. Project#4322.” Water Research Foundation: Denver, Colorado.
DiGuiseppi, W., R. Richter, and M. Riggle. 2019. “Low temperature desorption of per- and polyfloroalkyl substances.” TheMilitary Engineer:52-53.
Ding, G. H., T. Fromel, E. J. van den Brandhof, R. Baerselman, and W. J. Peijnenburg. 2012. “Acute toxicity of poly- andperfluorinated compounds to two cladocerans, Daphnia magna and Chydorus sphaericus.” Environ Toxicol Chem 31(3):605-10. doi: 10.1002/etc.1713.
Dinglasan, Mary Joyce A., Yun Ye, Elizabeth A. Edwards, and Scott A. Mabury. 2004. “Fluorotelomer AlcoholBiodegradation Yields Poly- and Perfluorinated Acids.” Environmental Science & Technology 38 (10):2857-2864. doi:10.1021/es0350177.
Dobraca, D., L. Israel, S. McNeel, R. Voss, M. Wang, R. Gajek, J. S. Park, S. Harwani, F. Barley, J. She, and R. Das. 2015.“Biomonitoring in California firefighters: metals and perfluorinated chemicals.” J Occup Environ Med 57 (1):88-97.doi: 10.1097/jom.0000000000000307.
Dominguez-Ramos, Antonio, Karan Chavan, Verónica García, Guillermo Jimeno, Jonathan Albo, Kumudini V. Marathe,Ganapati D. Yadav, and Angel Irabien. 2014. “Arsenic Removal from Natural Waters by Adsorption or Ion Exchange:An Environmental Sustainability Assessment.” Industrial & Engineering Chemistry Research 53 (49):18920-18927.doi: 10.1021/ie4044345.
Dong, G. H., Y. H. Zhang, L. Zheng, W. Liu, Y. H. Jin, and Q. C. He. 2009. “Chronic effects of perfluorooctanesulfonateexposure on immunotoxicity in adult male C57BL/6 mice.” Arch Toxicol 83 (9):805-15. doi:10.1007/s00204-009-0424-0.
Dorrance, Lydia R., Seth Kellogg, and Adam Love. 2017. “What You Should Know About Per- and PolyfluoroalkylSubstances (PFAS) for Environmental Claims.” 29:1-15. doi: 10.1080/10406026.2017.1377015.
Dreyer, A., T. Kirchgeorg, I. Weinberg, and V. Matthias. 2015. “Particle-size distribution of airborne poly- andperfluorinated alkyl substances.” Chemosphere 129:142-149. doi:https://doi.org/10.1016/j.chemosphere.2014.06.069.
Dreyer, Annekatrin, Volker Matthias, Ingo Weinberg, and Ralf Ebinghaus. 2010. “Wet deposition of poly- andperfluorinated compounds in Northern Germany.” Environmental Pollution 158 (5):1221-1227. doi:https://doi.org/10.1016/j.envpol.2010.01.030.
Page 271ITRC PFAS-1
Dreyer, Annekatrin, Ingo Weinberg, Christian Temme, and Ralf Ebinghaus. 2009. “Polyfluorinated Compounds in theAtmosphere of the Atlantic and Southern Oceans: Evidence for a Global Distribution.” Environmental Science &Technology 43 (17):6507-6514. doi: 10.1021/es9010465.
Drottar, K.R. and H.O. Krueger. 2000. PFOS: A 96-hr toxicity test with the freshwater alga (Selenastrum capricornutum).Wildlife International, Ltd., Project Number 454A-103A, EPA Docket AR226-0085.
Drottar, K.R., and H.O. Krueger. 2000b. PFOS: A 96-hr static acute toxicity test with the freshwater mussel (Uniocomplanatus). Wildlife International, Ltd.
Drottar, K.R., R.L. Van Hoven, and H. O. Kruger. 2002. Perfluorooctane sulfonate, potassium salt (PFOS): a flow-throughbioconcentration test with the bluegill (Lepomis macrochirus) – amended. Project number 454A-134 USEPA docketAR226-1108. : Wildlife International Ltd.
Du, Ziwen, Shubo Deng, Yue Bei, Qian Huang, Bin Wang, Jun Huang, and Gang Yu. 2014. “Adsorption behavior andmechanism of perfluorinated compounds on various adsorbents—A review.” Journal of Hazardous Materials274:443-454. doi: https://doi.org/10.1016/j.jhazmat.2014.04.038.
DuPont. 2008. “Cross-species comparison FRD-902 plasma pharmacokinetics in the rat and primate followingintravenous dosing.”.
DuPont. 2010. GenX Filings with USEPA TSCA section 8(e).https://assets.documentcloud.org/documents/2746960/GenX8eFilings.pdf.
DuPont. 2011a. “H-28548: Absorption, Distribution, Metabolism, and Elimination in the Mouse.”.
DuPont. 2011b. “H-28548: Absorption, Distribution, Metabolism, and Elimination in the Rat.”.
Eberle, Dylan, Raymond Ball, and Thomas B. Boving. 2017. “Impact of ISCO Treatment on PFAA Co-Contaminants at aFormer Fire Training Area.” Environmental Science & Technology 51 (9):5127-5136. doi: 10.1021/acs.est.6b06591.
ECCC. 2017. Aqueous film-forming foam and the Prohibition of Certain Toxic Substances Reguations.https://www.canada.ca/en/environment-climate-change/services/management-toxic-substances/list-canadian-environmental-protection-act/perfluorooctane-sulfonate/film-forming-foam-prohibition-toxic-substances.html.
ECCC. 2018. “Federal Environmental Quality Guidelines: Perfluorooctane Sulfonate (PFOS).” Last Modified June 2018.accessed 2020.https://www.canada.ca/en/environment-climate-change/services/evaluating-existing-substances/federal-environmental-quality-guidelines-perfluorooctane-sulfonate.html.
ECHA. 2018. Submitted restrictions under consideration. European Chemicals Agency.https://echa.europa.eu/restrictions-under-considerationhttps://echa.europa.eu/substances-of-very-high-concern-identification/-/substance-rev/20306/term?_viewsubstances_WAR_echarevsubstanceportlet_SEARCH_CRITERIA_EC_NUMBER=206-196-6&_viewsubstances_WAR_echarevsubstanceportlet_DISS=true.
ECOS-DOD. 2007. “Identification and Selection of Toxicity Values/Criteria for Comprehensive Environmental Response,Compensation, and Recovery Act (CERCLA) and Hazardous Waste Site Risk Assessments in the Absence of IRISValues. .”
EFSA. 2018. “Risk to human health related to the presence of perfluorooctane sulfonic acid and perfluorooctanoic acid infood.” European Food Safety Authority (EFSA) Journal 16 (12):5194.
Ege, S. N. 1999. Organic Chemistry: Structure and Reactivity: Fourth Edition. Boston, MA: Houghton Mifflin Company.
Eggen, Trine, Monika Moeder, and Augustine Arukwe. 2010. “Municipal landfill leachates: A significant source for newand emerging pollutants.” Science of The Total Environment 408 (21):5147-5157. doi:https://doi.org/10.1016/j.scitotenv.2010.07.049.
Ellis, David A., Jonathan W. Martin, Amila O. De Silva, Scott A. Mabury, Michael D. Hurley, Mads P. Sulbaek Andersen, andTimothy J. Wallington. 2004. “Degradation of Fluorotelomer Alcohols: A Likely Atmospheric Source of Perfluorinated
Page 272ITRC PFAS-1
Carboxylic Acids.” Environmental Science & Technology 38 (12):3316-3321. doi: 10.1021/es049860w.
Emmett, E. A., F. S. Shofer, H. Zhang, D. Freeman, C. Desai, and L. M. Shaw. 2006. “Community exposure toperfluorooctanoate: relationships between serum concentrations and exposure sources.” J Occup Environ Med 48(8):759-70. doi: 10.1097/01.jom.0000232486.07658.74.
Emmett, Edward A., and Chintan Desai. 2010. “Community First Communication: Reversing Information Disparities toAchieve Environmental Justice.” Environmental Justice 3 (3):79-84. doi: 10.1089/env.2009.0037.
Emmett, Edward Anthony, Hong Zhang, Frances Susan Shofer, Nancy Rodway, Chintan Desai, David Freeman, and MaryHufford. 2009. “Development and Successful Application of a “Community-First” Communication Model forCommunity-based Environmental Health Research.” Journal of Occupational and Environmental Medicine 51 (2).
Endpoint Consulting. 2016. Bench-Scale VEG Research and Development Study: Implementation Memorandum for Ex-Situ Thermal Desorption of Perfluoroalkyl Compounds (PFCs) in Soils.http://www.endpoint-inc.com/wp-content/uploads/2016/05/VEG-Bench-Scale-PFCs-Soil.pdf
Environment Canada. 2006. “Ecological Screening Assessment Report on Perfluorooctane Sulfonate, Its Salts, and ItsPrecursors that Contain the C8F17SO2 or C8F17SO3 or C8F17SO2N Moiety. .”
Environment Canada. 2012. Screening Assessment Report on Perfluorooctanoic Acid, Its Salts, and Its Precursors.https://www.ec.gc.ca/ese-ees/370AB133-3972-454F-A03A-F18890B58277/PFOA_EN.pdf
Environmental Protection Authority Victoria. 2019. PFAS in Victorian waterfowl. Publication 1734.https://ref.epa.vic.gov.au/~/media/Publications/1734.pdf.
Enviropacific. 2017. Treatment of PFAS in Soils, Sediments and Water.http://www.enviropacific.com.au/wp-content/uploads/2016/09/Enviropacific_Treatment-of-PFAS.pdf
Eriksson, Ulrika, Anna Karrman, Anna Rotander, Bjørg Mikkelsen, and Maria Dam. 2013. Perfluoroalkyl substances(PFASs) in food and water from Faroe Islands. Vol. 20.
Eschauzier, Christian, Erwin Beerendonk, Petra Scholte-Veenendaal, and Pim De Voogt. 2012. “Impact of TreatmentProcesses on the Removal of Perfluoroalkyl Acids from the Drinking Water Production Chain.” Environmental Science& Technology 46 (3):1708-1715. doi: 10.1021/es201662b.
European Union. 2011. PFOS EQS Dossier 2011. EQSD 2008/105/EC: Sub-Group on Review of the Priority SubstancesList.
European Union. 2013. Directive 2013/39/EU amending Directives 2000/60/EC and 2008/105/EC as regards prioritysubstances in the field of water policy. Official Journal of the European Union.
Executive Order 12898. 1994. Federal Actions to Address Environmental Justice in Minority Populations and Low-IncomePopulations. Federal Register 59 FR 7629.
FAA. 2018. FAA Reauthorization Act of 2018.https://www.congress.gov/bill/115th-congress/house-bill/302/text?q=%7B%22search%22%3A%5B%22FAA+Reauthorization%22%5D%7D&r=2.
FAA. 2019. FAA National Part 139 CertAlert. AFFF Testing at Cetricated Part 139 Airports. CertAlert No. 19-01.Washington, D. C. https://www.faa.gov/airports/airport_safety/certalerts/media/part-139-cert-alert-19-01-AFFF.pdf.
Fabbri, Rita, Michele Montagna, Teresa Balbi, Enrico Raffo, Franca Palumbo, and Laura Canesi. 2014. “Adaptation of thebivalve embryotoxicity assay for the high throughput screening of emerging contaminants in Mytilusgalloprovincialis.” Marine Environmental Research 99:1-8. doi: https://doi.org/10.1016/j.marenvres.2014.05.007.
Fair, P. A., T. Romano, A. M. Schaefer, J. S. Reif, G. D. Bossart, M. Houde, D. C. Muir, J. Adams, C. Rice, T. C. Hulsey, andM. Peden-Adams. 2013. “Associations between perfluoroalkyl compounds and immune and clinical chemistryparameters in highly exposed bottlenose dolphins (Tursiops truncatus).” Environmental Toxicology and Chemistry 32(4):736-746. doi: https://doi.org/10.1002/etc.2122.
Page 273ITRC PFAS-1
Fakouri Baygi, Sadjad, Bernard S. Crimmins, Philip K. Hopke, and Thomas M. Holsen. 2016. “Comprehensive EmergingChemical Discovery: Novel Polyfluorinated Compounds in Lake Michigan Trout.” Environmental Science &Technology 50 (17):9460-9468. doi: 10.1021/acs.est.6b01349.
Falk, Sandy, Klaus Failing, Sebastian Georgii, Hubertus Brunn, and Thorsten Stahl. 2015. “Tissue specific uptake andelimination of perfluoroalkyl acids (PFAAs) in adult rainbow trout (Oncorhynchus mykiss) after dietary exposure.”Chemosphere 129:150-156. doi: https://doi.org/10.1016/j.chemosphere.2014.06.061.
Fang, Shuhong, Xinwei Chen, Shuyan Zhao, Yifeng Zhang, Weiwei Jiang, Liping Yang, and Lingyan Zhu. 2014. “TrophicMagnification and Isomer Fractionation of Perfluoroalkyl Substances in the Food Web of Taihu Lake, China.”Environmental Science & Technology 48 (4):2173-2182. doi: 10.1021/es405018b.
Fasano, W. J., G. L. Kennedy, B. Szostek, D. G. Farrar, R. J. Ward, L. Haroun, and P. M. Hinderliter. 2005. “Penetration ofammonium perfluorooctanoate through rat and human skin in vitro.” Drug Chem Toxicol 28 (1):79-90. doi:10.1081/dct-39707.
Favara, Paul, John Tunks, Jim Hatton, and William DiGuiseppi. 2016. “Sustainable Remediation Considerations forTreatment of 1,4-Dioxane in Groundwater.” Remediation Journal 27 (1):133-158. doi: 10.1002/rem.21501.
FDA. 2018. “Inventory of Effective Food Contact Substance Notifications.”
Feng, X., X. Cao, S. Zhao, X. Wang, X. Hua, L. Chen, and L. Chen. 2017. “Exposure of Pregnant Mice toPerfluorobutanesulfonate Causes Hypothyroxinemia and Developmental Abnormalities in Female Offspring.” ToxicolSci 155 (2):409-419. doi: 10.1093/toxsci/kfw219.
FFFC. 2016. “Best Practice Guidance for Use of Class B Firefighting Foams.”.
FFFC. 2018. “Best Practice Guidance for Fluorinated Firefighting Foams Q&A.”
Field, J., Sedlak, D., Alvarez-Cohen, L., . 2017. “Final Report – Characterization of the Fate and Biotransformation ofFluorochemicals in AFFF-Contaminated Groundwater at Fire/Crash Testing Military Sites.” SERDP Project ER-2128.
Filipovic, Marko, Hjalmar Laudon, Michael S. McLachlan, and Urs Berger. 2015. “Mass Balance of Perfluorinated AlkylAcids in a Pristine Boreal Catchment.” Environmental Science & Technology 49 (20):12127-12135. doi:10.1021/acs.est.5b03403.
Fitzgerald, N.J., A. Wargenau, C. Sorenson, J. Pedersen, N. Tufenkji, P.J. Novak, and M.F. Simcik. 2018. “Partitioning andaccumulation of perfluoroalkyl substances in model lipid bilayers and bacteria.” Environmental Science &Technology 52 (18):10433-40.
Fliedner, A., H. Rüdel, N. Lohmann, G. Buchmeier, and J. Koschorreck. 2018. “Biota monitoring under the WaterFramework Directive: On tissue choice and fish species selection.” Environmental Pollution 235:129-140.
Flores, C., F. Ventura, J. Martin-Alonso, and J. Caixach. 2013. “Occurrence of perfluorooctane sulfonate (PFOS) andperfluorooctanoate (PFOA) in N.E. Spanish surface waters and their removal in a drinking water treatment plant thatcombines conventional and advanced treatments in parallel lines.” Science of the Total Environment.
FluoroCouncil. 2017. “Research Relevant to Short-Chain PFAS.” https://fluorocouncil.com/Resources/Research.
FluoroCouncil. 2018. “Applications.” https://fluorocouncil.com/applications/
Forrester, E., and J. Matthis. 2018. “Treatment Solutions for PFAS Removal: Evaluating Total Cost.”
Franklin, James. 2016. “How reliable are field-derived biomagnification factors and trophic magnification factors asindicators of bioaccumulation potential? Conclusions from a case study on per- and polyfluoroalkyl substances.”Integrated Environmental Assessment and Management 12 (1):6-20. doi: 10.1002/ieam.1642.
Franko, J., B. J. Meade, H. F. Frasch, A. M. Barbero, and S. E. Anderson. 2012. “Dermal penetration potential ofperfluorooctanoic acid (PFOA) in human and mouse skin.” J Toxicol Environ Health A 75 (1):50-62. doi:10.1080/15287394.2011.615108.
Page 274ITRC PFAS-1
Fraser, Alicia J., Thomas F. Webster, Deborah J. Watkins, Jessica W. Nelson, Heather M. Stapleton, Antonia M. Calafat,Kayoko Kato, Mahiba Shoeib, Verónica M. Vieira, and Michael D. McClean. 2012. “Polyfluorinated Compounds inSerum Linked to Indoor Air in Office Environments.” Environmental Science & Technology 46 (2):1209-1215. doi:10.1021/es2038257.
Freberg, Baard Ingegerdsson, Line Småstuen Haug, Raymond Olsen, Hanne Line Daae, Merete Hersson, CathrineThomsen, Syvert Thorud, Georg Becher, Paal Molander, and Dag G. Ellingsen. 2010. “Occupational Exposure toAirborne Perfluorinated Compounds during Professional Ski Waxing.” Environmental Science & Technology 44(19):7723-7728. doi: 10.1021/es102033k.
Fredriksson, F. 2016. “Analysis of Per- and Polyfluoroalkyl Substances (PFASs) in African Darter (Anhinga rufa) Eggsalong Vaal River, South Africa.” School of Science and Technology, Örebro University.
Frisbee, S. J., A. P. Brooks, Jr., A. Maher, P. Flensborg, S. Arnold, T. Fletcher, K. Steenland, A. Shankar, S. S. Knox, C.Pollard, J. A. Halverson, V. M. Vieira, C. Jin, K. M. Leyden, and A. M. Ducatman. 2009. “The C8 health project: design,methods, and participants.” Environ Health Perspect 117 (12):1873-82. doi: 10.1289/ehp.0800379.
Frömel, T., C. Gremmel, I. Dimzon, and P. de Voogt. . 2016. “Investigations on the presence and behavior of precursorsto perfluoroalkyl substances in the environment as a preparation of regulatory measures.”
Fromme, Hermann, Annekatrin Dreyer, Silvio Dietrich, Ludwig Fembacher, Thomas Lahrz, and Wolfgang Völkel. 2015.“Neutral polyfluorinated compounds in indoor air in Germany – The LUPE 4 study.” Chemosphere 139:572-578. doi:https://doi.org/10.1016/j.chemosphere.2015.07.024.
Fromme, Hermann, Christine Mosch, Maria Morovitz, Irene Alba-Alejandre, Sigrun Boehmer, Mandy Kiranoglu, FabienneFaber, Iris Hannibal, Orsolya Genzel-Boroviczény, Berthold Koletzko, and Wolfgang Völkel. 2010. “Pre- and PostnatalExposure to Perfluorinated Compounds (PFCs).” Environmental Science & Technology 44 (18):7123-7129. doi:10.1021/es101184f.
Fromme, Hermann, Sheryl A. Tittlemier, Wolfgang Völkel, Michael Wilhelm, and Dorothee Twardella. 2009.“Perfluorinated compounds – Exposure assessment for the general population in western countries.” InternationalJournal of Hygiene and Environmental Health 212 (3):239-270. doi: https://doi.org/10.1016/j.ijheh.2008.04.007.
Fromme, Hermann, Mandy Wöckner, Eike Roscher, and Wolfgang Völkel. 2017. “ADONA and perfluoroalkylatedsubstances in plasma samples of German blood donors living in South Germany.” International Journal of Hygieneand Environmental Health 220 (2):455-460. doi: http://dx.doi.org/10.1016/j.ijheh.2016.12.014.
Fujii, Yukiko, Kouji H. Harada, and Akio Koizumi. 2013. “Occurrence of perfluorinated carboxylic acids (PFCAs) in personalcare products and compounding agents.” Chemosphere 93 (3):538-544. doi:https://doi.org/10.1016/j.chemosphere.2013.06.049.
Furl, C., and C. Meredith. 2010. Perfluorinated compounds in Washington rivers and lakes. Publication Number10-03-034. Olympia, WA. https://fortress.wa.gov/ecy/publications/summarypages/1003034.html.
Furman, Olha, S., Amy Teel, L., Mushtaque Ahmad, Marissa Merker, C., and Richard Watts, J. 2011. “Effect of Basicity onPersulfate Reactivity.” Journal of Environmental Engineering 137 (4):241-247. doi:10.1061/(ASCE)EE.1943-7870.0000323.
Furuta, M., M. Yamaguchi, T. Tsukamoto, B. Yim, C. E. Stavarache, K. Hasiba, and Y. Maeda. 2004. “Inactivation ofEscherichia coli by ultrasonic irradiation.” Ultrasonics Sonochemistry 11 (2):57-60. doi:https://doi.org/10.1016/S1350-4177(03)00136-6.
Galatius, Anders, Rossana Bossi, Christian Sonne, Frank Farsø Rigét, Carl Kinze, Christina Lockyer, Jonas Teilmann, andRune Dietz. 2013. PFAS profiles in three North Sea top predators: Metabolic differences among species? Environ. Vol.20.
Gannon, S. A., W. J. Fasano, M. P. Mawn, D. L. Nabb, R. C. Buck, L. W. Buxton, G. W. Jepson, and S. R. Frame. 2016.“Absorption, distribution, metabolism, excretion, and kinetics of 2,3,3,3-tetrafluoro-2-(heptafluoropropoxy)propanoicacid ammonium salt following a single dose in rat, mouse, and cynomolgus monkey.” Toxicology 340:1-9. doi:10.1016/j.tox.2015.12.006.
Page 275ITRC PFAS-1
Gao, Yan, Jianjie Fu, Huiming Cao, Yawei Wang, Aiqian Zhang, Yong Liang, Thanh Wang, Chunyan Zhao, and Guibin Jiang.2015. “Differential Accumulation and Elimination Behavior of Perfluoroalkyl Acid Isomers in Occupational Workers ina Manufactory in China.” Environmental Science & Technology 49 (11):6953-6962. doi: 10.1021/acs.est.5b00778.
Gauthier, Suzanne A., and Scott A. Mabury. 2005. “Aqueous photolysis of 8:2 fluorotelomer alcohol.” EnvironmentalToxicology and Chemistry 24 (8):1837-1846. doi: 10.1897/04-591R.1.
Gaylard, S. 2017. Per and polyfluorinated alkyl substances (PFAS) in the marine environment – Preliminary ecologicalfindings. Adelaide, SA: Environment Protection Authority of South Australia.https://www.epa.sa.gov.au/files/12580_report_pfas_marine.pdf.
Ge, H., E. Yamazaki, N. Yamashita, S. Taniyasu, A. Ogata, and M. Furuuchi. 2017. “Particle size specific distribution ofperfluoro alkyl substances in atmospheric particulate matter in Asian cities.” Environmental Science: Processes &Impacts 19 (4):549-560. doi: 10.1039/C6EM00564K.
Gebbink, Wouter A., Urs Berger, and Ian T. Cousins. 2015. “Estimating human exposure to PFOS isomers and PFCAhomologues: The relative importance of direct and indirect (precursor) exposure.” Environment International74:160-169. doi: https://doi.org/10.1016/j.envint.2014.10.013.
Gebbink, Wouter A., Anders Bignert, and Urs Berger. 2016. “Perfluoroalkyl Acids (PFAAs) and Selected Precursors in theBaltic Sea Environment: Do Precursors Play a Role in Food Web Accumulation of PFAAs?” Environmental Science &Technology 50 (12):6354-6362. doi: 10.1021/acs.est.6b01197.
Gellrich, V., T. Stahl, and T. P. Knepper. 2012. “Behavior of perfluorinated compounds in soils during leachingexperiments.” Chemosphere 87 (9):1052-1056. doi: https://doi.org/10.1016/j.chemosphere.2012.02.011.
Gellrich, Vanessa, Hubertus Brunn, and Thorsten Stahl. 2013. “Perfluoroalkyl and polyfluoroalkyl substances (PFASs) inmineral water and tap water.” Journal of Environmental Science and Health, Part A 48 (2):129-135. doi:10.1080/10934529.2013.719431.
German Environment Agency. 2016. HBM I Values for Perfluorooctanoic acid (PFOA) and Perfluorooctane sulfonic acid(PFOS) in blood plasma. Statement of the German Human Biomonitoring Commission (HBM Commission).
German Federal Environment Agency. 2013. Environmentally Responsible Use of Fluorinated Fire-Fighting Foams.https://www.umweltbundesamt.de/sites/default/files/medien/378/publikationen/fluorinated_fire-fighting_foams_schaumloeschmittel_engl._version_25.6.2013.pdf.
German Human Biomonitoring Commission. 2018. “[HBM-I values for Perfluorooctanoic acid (PFOA) andPerfluorooctanesulfonic acid (PFOS) in blood plasma – Statement of the German Human Biomonitoring Commission(HBM Commission)].” Bundesgesundheitsblatt Gesundheitsforschung Gesundheitsschutz 61 (4):474-487. doi:10.1007/s00103-018-2709-z.
Gewurtz, Sarah B., Satyendra P. Bhavsar, Patrick W. Crozier, Miriam L. Diamond, Paul A. Helm, Chris H. Marvin, and EricJ. Reiner. 2009. “Perfluoroalkyl Contaminants in Window Film: Indoor/Outdoor, Urban/Rural, and Winter/SummerContamination and Assessment of Carpet as a Possible Source.” Environmental Science & Technology 43(19):7317-7323. doi: 10.1021/es9002718.
Gewurtz, Sarah B., Satyendra P. Bhavsar, Steve Petro, Chris G. Mahon, Xiaoming Zhao, Dave Morse, Eric J. Reiner, SherylA. Tittlemier, Eric Braekevelt, and Ken Drouillard. 2014. “High levels of perfluoroalkyl acids in sport fish speciesdownstream of a firefighting training facility at Hamilton International Airport, Ontario, Canada.” EnvironmentInternational 67:1-11. doi: https://doi.org/10.1016/j.envint.2014.02.005.
Gibbons, J. Whitfield, David E. Scott, Travis J. Ryan, Kurt A. Buhlmann, Tracey D. Tuberville, Brian S. Metts, Judith L.Greene, Tony Mills, Yale Leiden, Sean Poppy, and Christopher T. Winne. 2000. “The Global Decline of Reptiles, DéjàVu Amphibians: Reptile species are declining on a global scale. Six significant threats to reptile populations arehabitat loss and degradation, introduced invasive species, environmental pollution, disease, unsustainable use, andglobal climate change.” BioScience 50 (8):653-666. doi: 10.1641/0006-3568(2000)050[0653:TGDORD]2.0.CO;2.
Gibbs, S., S. Hong, W. Graves, C. Granville, B. Jayaram, C.R. Blystone, V. C. Robinson, and C. Smith. 2012.“Toxicokinetics of perfluorodecanoic acid (PFDA) after a single intravenous or gavage administration to Harlan
Page 276ITRC PFAS-1
Sprague Dawley rats.” The Toxicologist, Supplement to Toxicological Sciences 126 (1):Abstract #1875.
Giesy, John, Jonathan Naile, Jong Seong Khim, Paul Jones, and John Newsted. 2010. Aquatic Toxicology of PerfluorinatedChemicals. Vol. 202.
Giesy, John P., and Kurunthachalam Kannan. 2001. “Global Distribution of Perfluorooctane Sulfonate in Wildlife.”Environmental Science & Technology 35 (7):1339-1342. doi: 10.1021/es001834k.
Giesy, John P., and Kurunthachalam Kannan. 2002. “Peer Reviewed: Perfluorochemical Surfactants in the Environment.”Environmental Science & Technology 36 (7):146A-152A. doi: 10.1021/es022253t.
Gilliland, F. D., and J. S. Mandel. 1993. “Mortality among employees of a perfluorooctanoic acid production plant.” JOccup Med 35 (9):950-4.
Gipe, R. L., and H. B. Peterson. 1972. Proportioning Characteristics of Aqueous Film-Forming Foam Concentrates. NRLReport 7437. Washington, D.C.
Giri, Rabindra, Hiroaki Ozaki, T. Morigaki, Shogo Taniguchi, and R. Takanami. 2011. UV photolysis of perfluorooctanoicacid (PFOA) in dilute aqueous solution. Vol. 63.
Giri, Rabindra Raj, Hiroaki Ozaki, Tatsuya Okada, Shogo Taniguchi, and Ryohei Takanami. 2012. “Factors influencing UVphotodecomposition of perfluorooctanoic acid in water.” Chemical Engineering Journal 180:197-203. doi:https://doi.org/10.1016/j.cej.2011.11.049.
Gleason, J. A., G. B. Post, and J. A. Fagliano. 2015. “Associations of perfluorinated chemical serum concentrations andbiomarkers of liver function and uric acid in the US population (NHANES), 2007-2010.” Environ Res 136:8-14. doi:10.1016/j.envres.2014.10.004.
Glover, C.M., O. Quiñones, and E.R. Dickenson. 2018. “Removal of perfluoroalkyl and polyfluoroalkyl substances inpotable reuse systems.” Water Research 144:454-461.
Gobelius, Laura, Jeffrey Lewis, and Lutz Ahrens. 2017. “Plant Uptake of Per- and Polyfluoroalkyl Substances at aContaminated Fire Training Facility to Evaluate the Phytoremediation Potential of Various Plant Species.”Environmental Science & Technology 51 (21):12602-12610. doi: 10.1021/acs.est.7b02926.
Goeden, Helen M., Christopher W. Greene, and James A. Jacobus. 2019. “A transgenerational toxicokinetic model and itsuse in derivation of Minnesota PFOA water guidance.” Journal of Exposure Science & Environmental Epidemiology 29(2):183-195. doi: 10.1038/s41370-018-0110-5.
Goldenberg, M., and Krishna R. Reddy. 2014. Sustainability Assessment of Excavation and Disposal versus In SituStabilization of Heavy Metal-Contaminated Soil at a Superfund Site in Illinois.
Gole, Vitthal L., Reyes Sierra-Alvarez, Hui Peng, John P. Giesy, Pierre Deymier, and Manish Keswani. 2018. “Sono-chemical treatment of per- and poly-fluoroalkyl compounds in aqueous film-forming foams by use of a large-scalemulti-transducer dual-frequency based acoustic reactor.” Ultrasonics Sonochemistry 45:213-222. doi:https://doi.org/10.1016/j.ultsonch.2018.02.014.
Gomis, M. I., R. Vestergren, D. Borg, and I. T. Cousins. 2018. “Comparing the toxic potency in vivo of long-chainperfluoroalkyl acids and fluorinated alternatives.” Environ Int 113:1-9. doi: 10.1016/j.envint.2018.01.011.
Goosey, Emma, and Stuart Harrad. 2012. “Perfluoroalkyl substances in UK indoor and outdoor air: Spatial and seasonalvariation, and implications for human exposure.” Environment International 45:86-90. doi:https://doi.org/10.1016/j.envint.2012.04.007.
Gordon, Steven C. 2011. “Toxicological evaluation of ammonium 4,8-dioxa-3H-perfluorononanoate, a new emulsifier toreplace ammonium perfluorooctanoate in fluoropolymer manufacturing.” Regulatory Toxicology and Pharmacology59 (1):64-80. doi: https://doi.org/10.1016/j.yrtph.2010.09.008.
Gottschall, N., E. Topp, M. Edwards, M. Payne, S. Kleywegt, and D.R. Lapen. 2017. “Brominated flame retardants andperfluoroalkyl acids in groundwater, tile drainage, soil and crop grain following a high application of municipalbiosolids to a field.” Science of The Total Environment 574:1345-1359.
Page 277ITRC PFAS-1
Government of Canada. 2018. Consultation Document on Proposed Amendments to the Prohibition of Certain ToxicSubstances Regulations, 2012 for PFOS, PFOA, LC-PFCAs, HBCD, PBDEs, DP and DBDPE.https://www.canada.ca/en/environment-climate-change/services/canadian-environmental-protection-act-registry/proposed-amendments-certain-toxic-substances-2018-consultation.html.
Government of Western Australia. 2016. Interim Guideline on the Assessment and Management of Perfluoroalkyl andPolyfluoralkyl Substances (PFAS), Contaminated Sites Guidelines. Department of Environmental Regulation.https://www.der.wa.gov.au/images/documents/your-environment/contaminated-sites/guidelines/Guideline-on-Assessment-and-Management-of-PFAS-.pdf
Greaves, Alana K., and Robert J. Letcher. 2013. “Linear and branched perfluorooctane sulfonate (PFOS) isomer patternsdiffer among several tissues and blood of polar bears.” Chemosphere 93 (3):574-580. doi:https://doi.org/10.1016/j.chemosphere.2013.07.013.
Gremmel, Christoph, Tobias Frömel, and Thomas P. Knepper. 2016. “Systematic determination of perfluoroalkyl andpolyfluoroalkyl substances (PFASs) in outdoor jackets.” Chemosphere 160:173-180. doi:https://doi.org/10.1016/j.chemosphere.2016.06.043.
Grice, Mira M., Bruce H. Alexander, Richard Hoffbeck, and Diane M. Kampa. 2007. “Self-Reported Medical Conditions inPerfluorooctanesulfonyl Fluoride Manufacturing Workers.” Journal of Occupational and Environmental Medicine 49(7).
Grieco, S., and R. Edwards. 2019. “Thermal desorption to treat PFAS-contaminated soil.” CRC Care Clean-up, Adelaide,South Australia, Sept. 8-12.
Gronnestad, R., G. D. Villanger, A. Polder, K. M. Kovacs, C. Lydersen, B. M. Jenssen, and K. Borga. 2017. “Maternaltransfer of perfluoroalkyl substances in hooded seals.” Environmental Toxicology and Chemistry 36 (3):763-770. doi:https://doi.org/10.1002/etc.3623.
Guelfo, J. 2017. “Development of a user-friendly framework for geospatial identification of potential PFAS source zones.”
Guelfo, J. L., and C. P. Higgins. 2013. “Subsurface Transport Potential of Perfluoroalkyl Acids at Aqueous Film-FormingFoam (AFFF)-Impacted Sites.” Environmental Science & Technology 47 (9):4164-4171. doi: 10.1021/es3048043.
Guelfo, Jennifer, L., Thomas Marlow, M. Klein David, A. Savitz David, Scott Frickel, Michelle Crimi, and M. Suuberg Eric.2018. “Evaluation and Management Strategies for Per- and Polyfluoroalkyl Substances (PFASs) in Drinking WaterAquifers: Perspectives from Impacted U.S. Northeast Communities.” Environmental Health Perspectives 126(6):065001. doi: 10.1289/EHP2727.
Gui, Duan, Mei Zhang, Tao Zhang, Bo Zhang, Wenzhi Lin, Xian Sun, Xinjian Yu, Wen Liu, and Yuping Wu. 2019.“Bioaccumulation behavior and spatiotemporal trends of per- and polyfluoroalkyl substances in Indo-Pacifichumpback dolphins from the Pearl River Estuary, China.” Science of The Total Environment 658:1029-1038. doi:https://doi.org/10.1016/j.scitotenv.2018.12.278.
Guo, Wei, Shouliang Huo, Jinglan Feng, and Xiaofei Lu. 2017. “Adsorption of perfluorooctane sulfonate (PFOS) on cornstraw-derived biochar prepared at different pyrolytic temperatures.” Journal of the Taiwan Institute of ChemicalEngineers 78:265-271. doi: https://doi.org/10.1016/j.jtice.2017.06.013.
Guo, Z., X. Liu, K. Krebs, and N. Roache. 2009. Perfluorocarboxylic Acid Content in 116 Articles of Commerce.
Hadley, Paul W., Ravi Arulanantham, and Deepa Gandhi. 2015. “Yardsticks to Integrate Risk Assessment, RiskManagement, and Groundwater Remediation.” Remediation Journal 25:9-30. doi: 10.1002/rem.21430.
Hale, J. R. 2016. “Distribution of PFOS in Groundwater from AFFF Storage, Handling, and Use.” NGWA GroundwaterSolutions: Innovating to Address Emerging Issues in Groundwater Resources Symposium.
Hamid, H., and L. Y. Li. 2016. “Role of wastewater treatment plant (WWTP) in environmental cycling of poly- andperfluoroalkyl (PFAS) compounds.” Ecocycles 2:43-53. doi: 10.19040/ecocycles.v2i2.62.
Hamid, H., L. Y. Li, and J. R. Grace. 2018. “Review of the fate and transformation of per- and polyfluoroalkyl substances
Page 278ITRC PFAS-1

(PFASs) in landfills.” Environmental Pollution 235:74-84. doi: 10.1016/j.envpol.2017.12.030.
Han, H., T.A. Snow, R.A. Kemper, and G.W. Jepson. 2003. “Binding of perfluorooctanoic acid to rat and human plasmaproteins.” Chemical Research in Toxicology 16:775-781.
Hance, B. J., C. Chess and P. M. Sandman. . 1991. “Improving Dialogue with Communities: A Risk Communication Manualfor Government.” Division of Science and Research, New Jersey Department of Environmental Protection.
Hansen, K. J., H. O. Johnson, J. S. Eldridge, J. L. Butenhoff, and L. A. Dick. 2002. “Quantitative Characterization of TraceLevels of PFOS and PFOA in the Tennessee River.” Environmental Science & Technology 36 (8):1681-1685. doi:10.1021/es010780r.
Hanson, M.L., P.K. Sibley, R.A. Brain, S.A. Mabury, and K.R. Solomon. 2005. “Microcosm Evaluation of the Toxicity andRisk to Aquatic Macrophytes from Perfluorooctane Sulfonic Acid.” Archives of Environmental Contamination andToxicology 48 (3).
Hao, Feifei, Weilin Guo, Anqi Wang, Yanqiu Leng, and Helian Li. 2014. “Intensification of sonochemical degradation ofammonium perfluorooctanoate by persulfate oxidant.” Ultrasonics Sonochemistry 21 (2):554-558. doi:https://doi.org/10.1016/j.ultsonch.2013.09.016.
Harada, K. H., and A. Koizumi. 2009. “Environmental and biological monitoring of persistent fluorinated compounds inJapan and their toxicities.” Environ Health Prev Med 14 (1):7-19. doi: 10.1007/s12199-008-0058-5.
Harclerode, Melissa A., Pankaj Lal, Neeraj Vedwan, Bernabas Wolde, and Michael E. Miller. 2016. “Evaluation of the roleof risk perception in stakeholder engagement to prevent lead exposure in an urban setting.” Journal ofEnvironmental Management 184:132-142. doi: https://doi.org/10.1016/j.jenvman.2016.07.045.
Harclerode, Melissa, Reanne Ridsdale, D. Darmendrail, Paul Bardos, Filip Alexandrescu, Paul Nathanail, Lisa Pizzol, andErika Rizzo. 2015. Integrating the Social Dimension in Remediation Decision-Making: State of the Practice and WayForward. Vol. 26.
Harding-Marjanovic, Katie C., Erika F. Houtz, Shan Yi, Jennifer A. Field, David L. Sedlak, and Lisa Alvarez-Cohen. 2015.“Aerobic Biotransformation of Fluorotelomer Thioether Amido Sulfonate (Lodyne) in AFFF-Amended Microcosms.”Environmental Science & Technology 49 (13):7666-7674. doi: 10.1021/acs.est.5b01219.
Harding-Marjanovic, Katie C., Shan Yi, Tess S. Weathers, Jonathan O. Sharp, David L. Sedlak, and Lisa Alvarez-Cohen.2016. “Effects of Aqueous Film-Forming Foams (AFFFs) on Trichloroethene (TCE) Dechlorination by aDehalococcoides mccartyi-Containing Microbial Community.” Environmental Science & Technology 50(7):3352-3361. doi: 10.1021/acs.est.5b04773.
Hartten, Andrew S. 2014. Water Treatment of PFOA and PFOS. .http://www.epa.gov/oppt/pfoa/pubs/Water%20Treatment%20Methods%20Hartten%20Oct16-09.pdf.
Hartwig, K., D. Calleson, and M. Williams. 2006. Unit 1: Community-Based Participatory Research: Getting Grounded. TheExamining Community-Institutional Partnerships for Prevention.
Hatton, Jim, Chase Holton, and Bill DiGuiseppi. 2018. “Occurrence and behavior of per- and polyfluoroalkyl substancesfrom aqueous film-forming foam in groundwater systems.” Remediation Journal 28 (2):89-99. doi:10.1002/rem.21552.
Haug, L. S., S. Huber, G. Becher, and C. Thomsen. 2011. “Characterisation of human exposure pathways toperfluorinated compounds–comparing exposure estimates with biomarkers of exposure.” Environ Int 37 (4):687-93.doi: 10.1016/j.envint.2011.01.011.
Haukås, Marianne, Urs Berger, Haakon Hop, Bjørn Gulliksen, and Geir W. Gabrielsen. 2007. “Bioaccumulation of per- andpolyfluorinated alkyl substances (PFAS) in selected species from the Barents Sea food web.” Environmental Pollution148 (1):360-371. doi: https://doi.org/10.1016/j.envpol.2006.09.021.
Hayashi, Ryuichi, Hayato Obo, Nozomi Takeuchi, and Koichi Yasuoka. 2015. “Decomposition of PerfluorinatedCompounds in Water by DC Plasma within Oxygen Bubbles.” Electrical Engineering in Japan 190 (3):9-16. doi:
Page 279ITRC PFAS-1
10.1002/eej.22499.
He, W., M. Megharaj, and R. Naidu. 2016. “Toxicity of perfluorooctanoic acid towards earthworm and enzymatic activitiesin soil.” Environ Monit Assess 188 (7):424. doi: 10.1007/s10661-016-5416-y.
Hekster, Floris, Remi Laane, and Pim De Voogt. 2003. Environmental and Toxicity Effects of PerfluoroalkylatedSubstances. Vol. 179.
Hellsing, Maja S., Sarah Josefsson, Arwel V. Hughes, and Lutz Ahrens. 2016. “Sorption of perfluoroalkyl substances to twotypes of minerals.” Chemosphere 159:385-391. doi: https://doi.org/10.1016/j.chemosphere.2016.06.016.
Helmenstine, A.M. 2018. ” Hydroxyl Group Definition in Chemistry.” ThoughtCo, Last Modified Dec. 5, 2018, accessed9-28-19. thoughtco.com/definition-of-hydroxyl-group-608739.
Helmenstine, A.M. 2019. “Moiety Definition in Chemistry.” ThoughtCo, accessed 10-5-2019.https://www.thoughtco.com/definition-of-moiety-605357.
Hemat, H., M. Wilhelm, W. Volkel, C. Mosch, H. Fromme, and J. Wittsiepe. 2010. “Low serum levels of perfluorooctanoicacid (PFOA), perfluorooctane sulfonate (PFOS) and perfluorohexane sulfonate (PFHxS) in children and adults fromAfghanistan.” Sci Total Environ 408 (16):3493-5. doi: 10.1016/j.scitotenv.2010.04.040.
Henry, Barbara J., Joseph P. Carlin, Jon A. Hammerschmidt, Robert Buck, L. William Buxton, Heidelore Fiedler, JenniferSeed, and Oscar Hernandez. 2018. A Critical Review of the Application of Polymer of Low Concern and RegulatoryCriteria to Fluoropolymers. Vol. 14.
HEPA. 2018. PFAS National Environmental Management Plan. Heads of EPAs Australia and New Zealand.
Herrick, Robert L., Jeanette Buckholz, Frank M. Biro, Antonia M. Calafat, Xiaoyun Ye, Changchun Xie, and Susan M.Pinney. 2017. “Polyfluoroalkyl substance exposure in the Mid-Ohio River Valley, 1991–2012.” Environmental Pollution228:50-60. doi: https://doi.org/10.1016/j.envpol.2017.04.092.
Herzke, Dorte, Elisabeth Olsson, and Stefan Posner. 2012. “Perfluoroalkyl and polyfluoroalkyl substances (PFASs) inconsumer products in Norway – A pilot study.” Chemosphere 88 (8):980-987. doi:https://doi.org/10.1016/j.chemosphere.2012.03.035.
Higgins, C. 2017. “Accumulation of Perfluoroalkyl Acids in Food Crops.”
Higgins, C. P., and R. G. Luthy. 2006. “Sorption of Perfluorinated Surfactants on Sediments.” Environmental Science &Technology 40 (23):7251-7256. doi: 10.1021/es061000n.
Higgins, Christopher P., Jennifer A. Field, Craig S. Criddle, and Richard G. Luthy. 2005. “Quantitative Determination ofPerfluorochemicals in Sediments and Domestic Sludge.” Environmental Science & Technology 39 (11):3946-3956.doi: 10.1021/es048245p.
Higgins, Christopher P., and Richard G. Luthy. 2007. “Modeling Sorption of Anionic Surfactants onto Sediment Materials: An a priori Approach for Perfluoroalkyl Surfactants and Linear Alkylbenzene Sulfonates.” Environmental Science &Technology 41 (9):3254-3261. doi: 10.1021/es062449j.
Higgins, Christopher P., Pamela B. McLeod, Laura A. MacManus-Spencer, and Richard G. Luthy. 2007. “Bioaccumulationof Perfluorochemicals in Sediments by the Aquatic Oligochaete Lumbriculus variegatus.” Environmental Science &Technology 41 (13):4600-4606. doi: 10.1021/es062792o.
Hinderliter, P. M., M. P. DeLorme, and G. L. Kennedy. 2006. “Perfluorooctanoic acid: relationship between repeatedinhalation exposures and plasma PFOA concentration in the rat.” Toxicology 222 (1-2):80-5. doi:10.1016/j.tox.2006.01.029.
Hoff. 2004. “Refernce for Table 7-10.”
Hoffman, K., T. F. Webster, S. M. Bartell, M. G. Weisskopf, T. Fletcher, and V. M. Vieira. 2011. “Private drinking waterwells as a source of exposure to perfluorooctanoic acid (PFOA) in communities surrounding a fluoropolymerproduction facility.” Environ Health Perspect 119 (1):92-7. doi: 10.1289/ehp.1002503.
Page 280ITRC PFAS-1

Hogue, C. 2019. “The hunt is on for GenX chenicals in people.” Chemical & Engineering News 97 (14).
Holmquist, H., S. Schellenberger, I. van der Veen, G. M. Peters, P. E. G. Leonards, and I. T. Cousins. 2016. “Properties,performance and associated hazards of state-of-the-art durable water repellent (DWR) chemistry for textilefinishing.” Environment International 91:251-264. doi: https://doi.org/10.1016/j.envint.2016.02.035.
Hölzer, Jürgen, Oliver Midasch, Knut Rauchfuss, Martin Kraft, Rolf Reupert, Jürgen Angerer, Peter Kleeschulte, NinaMarschall, and Michael Wilhelm. 2008. “Biomonitoring of perfluorinated compounds in children and adults exposedto perfluorooctanoate-contaminated drinking water.” Environmental health perspectives 116 (5):651-657. doi:10.1289/ehp.11064.
Hong, Seongjin, Jong Seong Khim, Jinsoon Park, Minhee Kim, Woong-Ki Kim, Jinho Jung, Seunghun Hyun, Jeong-Gyu Kim,Hyojin Lee, Heeseon J. Choi, Garry Codling, and John P. Giesy. 2013. “In situ fate and partitioning of waterborneperfluoroalkyl acids (PFAAs) in the Youngsan and Nakdong River Estuaries of South Korea.” Science of The TotalEnvironment 445-446:136-145. doi: https://doi.org/10.1016/j.scitotenv.2012.12.040.
Hopkins, William A. 2000. “Reptile toxicology: Challenges and opportunities on the last frontier in vertebrateecotoxicology.” Environmental Toxicology and Chemistry 19 (10):2391-2393. doi: 10.1002/etc.5620191001.
Hopkins, Zachary R., Mei Sun, Jamie C. DeWitt, and Detlef R. U. Knappe. 2018. “Recently Detected Drinking WaterContaminants: GenX and Other Per- and Polyfluoroalkyl Ether Acids.” Journal – AWWA 110 (7):13-28. doi:10.1002/awwa.1073.
Hori, Hisao, Etsuko Hayakawa, Hisahiro Einaga, Shuzo Kutsuna, Kazuhide Koike, Takashi Ibusuki, Hiroshi Kiatagawa, andRyuichi Arakawa. 2004. “Decomposition of Environmentally Persistent Perfluorooctanoic Acid in Water byPhotochemical Approaches.” Environmental Science & Technology 38 (22):6118-6124. doi: 10.1021/es049719n.
Hori, Hisao, Misako Murayama, Naoko Inoue, Kyoko Ishida, and Shuzo Kutsuna. 2010. “Efficient mineralization ofhydroperfluorocarboxylic acids with persulfate in hot water.” Catalysis Today 151 (1):131-136. doi:https://doi.org/10.1016/j.cattod.2010.02.023.
Hori, Hisao, Yumiko Nagaoka, Misako Murayama, and Shuzo Kutsuna. 2008. “Efficient Decomposition ofPerfluorocarboxylic Acids and Alternative Fluorochemical Surfactants in Hot Water.” Environmental Science &Technology 42 (19):7438-7443. doi: 10.1021/es800832p.
Hori, Hisao, Yumiko Nagaoka, Ari Yamamoto, Taizo Sano, Nobuyoshi Yamashita, Sachi Taniyasu, Shuzo Kutsuna, IsseyOsaka, and Ryuichi Arakawa. 2006. “Efficient Decomposition of Environmentally Persistent Perfluorooctanesulfonateand Related Fluorochemicals Using Zerovalent Iron in Subcritical Water.” Environmental Science & Technology 40(3):1049-1054. doi: 10.1021/es0517419.
Hori, Hisao, Yuko Takano, Kazuhide Koike, Shuzo Kutsuna, Hisahiro Einaga, and Takashi Ibusuki. 2003. “Photochemicaldecomposition of pentafluoropropionic acid to fluoride ions with a water-soluble heteropolyacid photocatalyst.”Applied Catalysis B: Environmental 46 (2):333-340. doi: https://doi.org/10.1016/S0926-3373(03)00225-X.
Hori, Hisao, Ari Yamamoto, Etsuko Hayakawa, Sachi Taniyasu, Nobuyoshi Yamashita, Shuzo Kutsuna, Hiroshi Kiatagawa,and Ryuichi Arakawa. 2005. “Efficient Decomposition of Environmentally Persistent Perfluorocarboxylic Acids by Useof Persulfate as a Photochemical Oxidant.” Environmental Science & Technology 39 (7):2383-2388. doi:10.1021/es0484754.
Hori, Hisao, Ari Yamamoto, Kazuhide Koike, Shuzo Kutsuna, Issey Osaka, and Ryuichi Arakawa. 2007. “Photochemicaldecomposition of environmentally persistent short-chain perfluorocarboxylic acids in water mediated by iron(II)/(III)redox reactions.” Chemosphere 68 (3):572-578. doi: https://doi.org/10.1016/j.chemosphere.2006.12.038.
Hou, Deyi, Qingbao Gu, Fujun Ma, and Shannon O’Connell. 2016. “Life cycle assessment comparison of thermaldesorption and stabilization/solidification of mercury contaminated soil on agricultural land.” Journal of CleanerProduction 139:949-956. doi: https://doi.org/10.1016/j.jclepro.2016.08.108.
Houde, Magali, Trevor A. D. Bujas, Jeff Small, Randall S. Wells, Patricia A. Fair, Gregory D. Bossart, Keith R. Solomon, andDerek C. G. Muir. 2006. “Biomagnification of Perfluoroalkyl Compounds in the Bottlenose Dolphin (Tursiopstruncatus) Food Web.” Environmental Science & Technology 40 (13):4138-4144. doi: 10.1021/es060233b.
Page 281ITRC PFAS-1
Houde, Magali, Gertje Czub, Jeff M. Small, Sean Backus, Xiaowa Wang, Mehran Alaee, and Derek C. G. Muir. 2008.“Fractionation and Bioaccumulation of Perfluorooctane Sulfonate (PFOS) Isomers in a Lake Ontario Food Web.”Environmental Science & Technology 42 (24):9397-9403. doi: 10.1021/es800906r.
Houde, Magali, Amila De Silva, Derek C G Muir, and Robert Letcher. 2011. Monitoring of Perfluorinated Compounds inAquatic Biota: An Updated Review PFCs in Aquatic Biota. Vol. 45.
Houtz, E., M. Wang, and J. Park. 2018. “Identification and Fate of Aqueous Film Forming Foam Derived Per- andPolyfluoroalkyl Substancesin a Wastewater Treatment Plant.” Environmental Science and Technology52:13212-13221. doi: 10.1021/acs.est.8b04028.
Houtz, Erika F., Christopher P. Higgins, Jennifer A. Field, and David L. Sedlak. 2013. “Persistence of Perfluoroalkyl AcidPrecursors in AFFF-Impacted Groundwater and Soil.” Environmental Science & Technology 47 (15):8187-8195. doi:10.1021/es4018877.
Houtz, Erika F., and David L. Sedlak. 2012. “Oxidative Conversion as a Means of Detecting Precursors to PerfluoroalkylAcids in Urban Runoff.” Environmental Science & Technology 46 (17):9342-9349. doi: 10.1021/es302274g.
Houtz, Erika F., Rebecca Sutton, June-Soo Park, and Margaret Sedlak. 2016. “Poly- and perfluoroalkyl substances inwastewater: Significance of unknown precursors, manufacturing shifts, and likely AFFF impacts.” Water Research95:142-149. doi: https://doi.org/10.1016/j.watres.2016.02.055.
Hu, Xindi C., David Q. Andrews, Andrew B. Lindstrom, Thomas A. Bruton, Laurel A. Schaider, Philippe Grandjean, RainerLohmann, Courtney C. Carignan, Arlene Blum, Simona A. Balan, Christopher P. Higgins, and Elsie M. Sunderland.2016. “Detection of Poly- and Perfluoroalkyl Substances (PFASs) in U.S. Drinking Water Linked to Industrial Sites,Military Fire Training Areas, and Wastewater Treatment Plants.” Environmental Science & Technology Letters 3(10):344-350. doi: 10.1021/acs.estlett.6b00260.
Huang, Jiye, Xi Wang, Zhaoqi Pan, Xukai Li, Yu Ling, and Laisheng Li. 2016. “Efficient degradation of perfluorooctanoicacid (PFOA) by photocatalytic ozonation.” Chemical Engineering Journal 296:329-334. doi:https://doi.org/10.1016/j.cej.2016.03.116.
Huang, Shan, and Peter R. Jaffé. 2019. “Defluorination of Perfluorooctanoic Acid (PFOA) and Perfluorooctane Sulfonate(PFOS) by Acidimicrobium sp. Strain A6.” Environmental Science & Technology 53 (19):11410-11419. doi:10.1021/acs.est.9b04047.
Hurley, M. D., M. P. Sulbaek Andersen, T. J. Wallington, D. A. Ellis, J. W. Martin, and S. A. Mabury. 2004. “AtmosphericChemistry of Perfluorinated Carboxylic Acids: Reaction with OH Radicals and Atmospheric Lifetimes.” The Journal ofPhysical Chemistry A 108 (4):615-620. doi: 10.1021/jp036343b.
Huset, Carin A., Morton A. Barlaz, Douglas F. Barofsky, and Jennifer A. Field. 2011. “Quantitative determination offluorochemicals in municipal landfill leachates.” Chemosphere 82 (10):1380-1386. doi:https://doi.org/10.1016/j.chemosphere.2010.11.072.
IARC. 2016. “Some Chemicals Used as Solvents and in Polymer Manufacture.” IARC Monographs on the Evaluation ofCarcinogenic Risk to Humans 110.
Inyang, Mandu, and Eric R. V. Dickenson. 2017. “The use of carbon adsorbents for the removal of perfluoroalkyl acidsfrom potable reuse systems.” Chemosphere 184:168-175. doi: https://doi.org/10.1016/j.chemosphere.2017.05.161.
IPEN. 2018. POPRC-14, White Paper, Fluorine-free firefighting foams (F3) – Viable alternatives to fluorinated aqueousfilm-forming foams (AFFF).
ITRC. 2003. “An Introduction to Characterizing Sites Contaminated with DNAPLs.” ITRC, Dense Nonaqueous PhaseLiquids Team.
ITRC. 2008. Enhanced Attenuation: Chlorinated Organics. Washington D.C.: The Interstate Technology & RegulatoryCouncil. www.itrcweb.org/GuidanceDocuments/EACO-1.pdf.
ITRC. 2010. Technical and Regulatory Guidance Document on Use and Measurement of Mass Flux and Mass Discharge,
Page 282ITRC PFAS-1
MASSFLUX-1.
ITRC. 2011a. Green and sustainable remediation: A practical framework. GSR-2.
ITRC. 2011b. “Green and sustainable remediation: State of the science and practice. GSR-1.” Green and SustainableRemediation Team.
ITRC. 2013. Groundwater Statistics and Monitoring Compliance, Statistical Tools for the Project Life Cycle. GSMC-1.
ITRC. 2015a. Decision Making at Contaminated Sites, Issues and Options in Human Health Risk Assessment.
ITRC. 2015b. Integrated DNAPL Site Characterization and Tools Selection (ISC-1).
ITRC. 2016. “Geospatial Analysis for Optimization at Environmental Sites (GRO-1).” Web-Based Guidance.
ITRC. 2018a. PFAS Fact Sheets PFAS-1. Washington, D. C. www.itrcweb.org.
ITRC. 2018b. Stormwater Best Management Practices Performance Evaluation. Washington D.C.: The InterstateTechnology & Regulatory Council. https://stormwater-1.itrcweb.org.
Iwai, H. 2011. “Toxicokinetics of ammonium perfluorohexanoate.” Drug Chem Toxicol 34 (4):341-6. doi:10.3109/01480545.2011.585162.
Izadpanah, Amir, and Asghar Javidnia. 2012. The Ability of a Nanofiltration Membrane to Remove Hardness and Ions fromDiluted Seawater. Vol. 4.
Jahnke, Annika, Urs Berger, Ralf Ebinghaus, and Christian Temme. 2007. Latitudinal Gradient of Airborne PolyfluorinatedAlkyl Substances in the Marine Atmosphere between Germany and South Africa (53° N−33° S). Vol. 41.
Ji, K., Y. Kim, S. Oh, B. Ahn, H. Jo, and K. Choi. 2008. “Toxicity of perfluorooctane sulfonic acid and perfluorooctanoic acidon freshwater macroinvertebrates (Daphnia magna and Moina macrocopa) and fish (Oryzias latipes).” EnvironToxicol Chem 27 (10):2159-68. doi: 10.1897/07-523.1.
Jiang, Bo, Jingtang Zheng, Shi Qiu, Mingbo Wu, Qinhui Zhang, Zifeng Yan, and Qingzhong Xue. 2014. “Review onelectrical discharge plasma technology for wastewater remediation.” Chemical Engineering Journal 236:348-368.doi: https://doi.org/10.1016/j.cej.2013.09.090.
Jiménez-Castañeda, M.E., and D.I. Medina. 2017. “Use of surfactant-modified zeolites and clays for the removal of heavymetals from water.” Water 9 (4):235.
Jing, Ping, Patrick J. Rodgers, and Shigeru Amemiya. 2009. “High Lipophilicity of Perfluoroalkyl Carboxylate andSulfonate: Implications for Their Membrane Permeability.” Journal of the American Chemical Society 131(6):2290-2296. doi: 10.1021/ja807961s.
Johansson, Jana H., Hong Yan, Urs Berger, and Ian T. Cousins. 2017. “Water-to-air transfer of branched and linear PFOA:Influence of pH, concentration and water type.” Emerging Contaminants 3 (1):46-53. doi:https://doi.org/10.1016/j.emcon.2017.03.001.
Johnson, J.D., and R. E. Ober. 1979. Absorption of FC-95-14C in rats after a single oral dose. 3M. Submitted to the U.S.Environmental Protection Agency’s Administrative Record. AR226-0007. (cited in ATSDR, 2015).
Johnson, P. I., P. Sutton, D. S. Atchley, E. Koustas, J. Lam, S. Sen, K. A. Robinson, D. A. Axelrad, and T. J. Woodruff. 2014.“The Navigation Guide – evidence-based medicine meets environmental health: systematic review of humanevidence for PFOA effects on fetal growth.” Environ Health Perspect 122 (10):1028-39. doi: 10.1289/ehp.1307893.
Jones, Paul D., Wenyue Hu, Wim De Coen, John L. Newsted, and John P. Giesy. 2003. “Binding of perfluorinated fattyacids to serum proteins.” Environmental Toxicology and Chemistry 22 (11):2639-2649. doi: 10.1897/02-553.
Joo, S.H., and B. Tansel. 2015. “Novel technologies for reverse osmosis concentrate treatment: a review.” Journal ofEnvironmental Management 150:322-335.
Ju, Xiaodong, Yihe Jin, Kazuaki Sasaki, and Norimitsu Saito. 2008. “Perfluorinated Surfactants in Surface, Subsurface
Page 283ITRC PFAS-1
Water and Microlayer from Dalian Coastal Waters in China.” Environmental Science & Technology 42(10):3538-3542. doi: 10.1021/es703006d.
Kabadi, Shruti V., Jeffrey Fisher, Jason Aungst, and Penelope Rice. 2018. “Internal exposure-based pharmacokineticevaluation of potential for biopersistence of 6:2 fluorotelomer alcohol (FTOH) and its metabolites.” Food andChemical Toxicology 112:375-382. doi: https://doi.org/10.1016/j.fct.2018.01.012.
Kaiser, Mary A., Barbara Dawson, Catherine Barton, and Miguel Botelho. 2010. Understanding Potential ExposureSources of Perfluorinated Carboxylic Acids in the Workplace. Vol. 54.
Kaiser, Mary A., Barbara S. Larsen, Chien-Ping C. Kao, and Robert C. Buck. 2005. “Vapor Pressures of Perfluorooctanoic, -nonanoic, -decanoic, -undecanoic, and -dodecanoic Acids.” Journal of Chemical & Engineering Data 50(6):1841-1843. doi: 10.1021/je050070r.
Kannan, Kurunthachalam, Emily Perrotta and Nancy J. Thomas. 2006. Association between perfluorinated compoundsand pathological conditions in southern sea otters. Environmental Science & Technology 40 (16): 4943-8. DOI:10.1021/es060932o.
Kannan, Kurunthachalam, Simonetta Corsolini, Jerzy Falandysz, Gilberto Fillmann, Kurunthachalam Senthil Kumar,Bommanna G. Loganathan, Mustafa Ali Mohd, Jesus Olivero, Nathalie Van Wouwe, Jae Ho Yang, and Kenneth M.Aldous. 2004. “Perfluorooctanesulfonate and Related Fluorochemicals in Human Blood from Several Countries.”Environmental Science & Technology 38 (17):4489-4495. doi: 10.1021/es0493446.
Kannan, Kurunthachalam, Lin Tao, Ewan Sinclair, Stephanie D. Pastva, Dave J. Jude, and John P. Giesy. 2005.“Perfluorinated Compounds in Aquatic Organisms at Various Trophic Levels in a Great Lakes Food Chain.” Archivesof Environmental Contamination and Toxicology 48 (4):559-566. doi: 10.1007/s00244-004-0133-x.
Karnjanapiboonwong, Adcharee, Sanjit K. Deb, Seenivasan Subbiah, Degeng Wang, and Todd A. Anderson. 2018.“Perfluoroalkylsulfonic and carboxylic acids in earthworms (Eisenia fetida): Accumulation and effects results fromspiked soils at PFAS concentrations bracketing environmental relevance.” Chemosphere 199:168-173. doi:https://doi.org/10.1016/j.chemosphere.2018.02.027.
Karrman, Anna, K. Elgh-Dalgren, C. Lafossas, and Thomas Moskeland. 2011. Environmental levels and distribution ofstructural isomers of perfluoroalkyl acids after Aqueous Fire-Fighting Foam (AFFF) contamination. Vol. 8.
Kärrman, Anna, Bert van Bavel, Ulf Järnberg, Lennart Hardell, and Gunilla Lindström. 2006. “Perfluorinated chemicals inrelation to other persistent organic pollutants in human blood.” Chemosphere 64 (9):1582-1591. doi:https://doi.org/10.1016/j.chemosphere.2005.11.040.
Kasperson, Roger E., and Jeanne X. Kasperson. 1996. “The Social Amplification and Attenuation of Risk.” The ANNALS ofthe American Academy of Political and Social Science 545 (1):95-105. doi: 10.1177/0002716296545001010.
Kato, Kayoko, Akil A. Kalathil, Ayesha M. Patel, Xiaoyun Ye, Antonia M. Calafat. 2018. “Per- and Polyfluoroalkylsubstances and fluorinated alternatives in urine and serum by on-line solid phase extraction-liquid chromatography-tandem mass spectrometry. Chemosphere 209: 338-345
Kato, K., X. Ye, and A. M. Calafat. 2015. Toxicological Effects of Perfluoroalkyl and Polyfluoroalkyl Substances, Chapter 3:PFASs in the General Population: Humana Press.
KEMI. 2004. “Perfluorooctane Sulfonate (PFOS) Dossier Prepared in Support for a Nomination of PFOS to the UN-ECELRTAP Protocol and the Stockholm Convention.” Stockholm Convention, Stockholm, Sweden, August.
KEMI. 2015a. “Chemical analysis of selected fire-fighting foams on the Swedish Market 2014.” Swedish ChemicalsAgency, Stockholm.
KEMI. 2015b. “Occurrence and Use of Highly Fluorinated Substances and Alternatives.” Swedish Chemicals Agency,Report 7/15.
KEMI. 2017. “The 16 New POPs.”
Kemper, R. A., and G. W. Jepson. 2003. “Pharmacokinetics of perfluorooctanoic acid in male and female rats.” In
Page 284ITRC PFAS-1
Toxicolological Sciences, 148. Vol. 72. Oxford, England: Oxford Univ Press.
Kempisty, D., Y. Xing, and L. Racz. 2018. Perfluoroalkyl Substances in the Environment: Theory, Practice and innovation,CRC Press: Taylor & Francis Group: Boca Raton, FL.
Kerfoot, W. B. 2016. “Treatment of Emerging Contaminants of Concern with ActivateOzone.” Florida RemediationConference, Orlando, FL, November 30-December 1.
Kerfoot, W. B. . 2014. Method and Apparatus for Treating Perfluoroalkyl Compounds. edited by U.S. Patent andTrademark Office.
Khalil, K., Lee, M., and Steenland,K. . 2015. “Epidemiological Findings. .” In: Toxicological Effects of Perfluoroalkyl andPolyfluoroalkyl Substances. J.D. DeWitt, Editor. Humana Press. pp. 305-335.
Kim, Minhee, Loretta Y. Li, John R. Grace, and Chaoyang Yue. 2015. “Selecting reliable physiochemical properties ofperfluoroalkyl and polyfluoroalkyl substances (PFASs) based on molecular descriptors.” Environmental Pollution196:462-472.
Kim, Seung-Kyu, and Kurunthachalam Kannan. 2007. “Perfluorinated Acids in Air, Rain, Snow, Surface Runoff, and Lakes:Relative Importance of Pathways to Contamination of Urban Lakes.” Environmental Science & Technology 41(24):8328-8334. doi: 10.1021/es072107t.
Kim, Seung-Kyu, Dong-Hao Li, Mahiba Shoeib, and Kyung-Duk Zoh. 2014. “Contribution of diffuse inputs to the aqueousmass load of perfluoroalkyl acids in river and stream catchments in Korea.” Science of The Total Environment470-471:1430-1440. doi: https://doi.org/10.1016/j.scitotenv.2013.06.040.
Kinney, L. A., N. C. Chromey, and G. L. Kennedy, Jr. 1989. “Acute inhalation toxicity of ammonium perfluorononanoate.”Food Chem Toxicol 27 (7):465-8.
Kirchgeorg, T., A. Dreyer, P. Gabrielli, J. Gabrieli, L. G. Thompson, C. Barbante, and R. Ebinghaus. 2016. “Seasonalaccumulation of persistent organic pollutants on a high altitude glacier in the Eastern Alps.” Environmental Pollution218:804-812. doi: https://doi.org/10.1016/j.envpol.2016.08.004.
Kirchgeorg, Torben, Annekatrin Dreyer, Jacopo Gabrieli, Natalie Kehrwald, Michael Sigl, Margit Schwikowski, ClaudeBoutron, Andrea Gambaro, Carlo Barbante, and Ralf Ebinghaus. 2013. “Temporal variations of perfluoroalkylsubstances and polybrominated diphenyl ethers in alpine snow.” Environmental Pollution 178:367-374. doi:https://doi.org/10.1016/j.envpol.2013.03.043.
Kirk, M., Kayla Smurthwaite, Jennifer Bräunig, Susan Trevenar, Cate D’Este, Robyn Lucas, Aparna Lal, Rosemary Korda,Archie Clements, Jochen Mueller, Bruce Armstrong,. 2018. “The PFAS Health Study – Systematic Literature Review. .”Australian National University. .
Kissa, E. . 2001. “Fluorinated Surfactants and Repellents, Second Edition Revised and Expanded.” Hubbard, A. T., Ed.Surfactant Science Series, New York, New York.
Knight, Emma R., Leslie J. Janik, Divina A. Navarro, Rai S. Kookana, and Michael J. McLaughlin. 2019. “Predictingpartitioning of radiolabelled 14C-PFOA in a range of soils using diffuse reflectance infrared spectroscopy.” Science ofThe Total Environment 686:505-513. doi: https://doi.org/10.1016/j.scitotenv.2019.05.339.
Kothawala, Dolly N., Stephan J. Köhler, Anna Östlund, Karin Wiberg, and Lutz Ahrens. 2017. “Influence of dissolvedorganic matter concentration and composition on the removal efficiency of perfluoroalkyl substances (PFASs) duringdrinking water treatment.” Water Research 121:320-328. doi: https://doi.org/10.1016/j.watres.2017.05.047.
Kotthoff, Matthias, Josef Müller, Heinrich Juerling, Martin Schlummer, and Dominik Fiedler. 2015. Perfluoroalkyl andpolyfluoroalkyl substances in consumer products. Vol. 22.
Krafft, Marie Pierre, and Jean G. Riess. 2015. “Selected physicochemical aspects of poly- and perfluoroalkylatedsubstances relevant to performance, environment and sustainability—Part one.” Chemosphere 129:4-19. doi:https://doi.org/10.1016/j.chemosphere.2014.08.039.
Krusic, Paul J., Alexander A. Marchione, Fredric Davidson, Mary A. Kaiser, Chien-Ping C. Kao, Raymond E. Richardson,
Page 285ITRC PFAS-1
Miguel Botelho, Robert L. Waterland, and Robert C. Buck. 2005. “Vapor Pressure and Intramolecular HydrogenBonding in Fluorotelomer Alcohols.” The Journal of Physical Chemistry A 109 (28):6232-6241. doi:10.1021/jp0502961.
Kudo, N. 2015. “Metabolism and Pharmacokinetics.” In Toxicological Effects of Perfluoroalkyl and PolyfluoroalkylSubstances, edited by J. C. DeWitt, 151-76. Humana Press.
Kupryianchyk, Darya, Sarah E. Hale, Gijs D. Breedveld, and Gerard Cornelissen. 2016. “Treatment of sites contaminatedwith perfluorinated compounds using biochar amendment.” Chemosphere 142:35-40. doi:https://doi.org/10.1016/j.chemosphere.2015.04.085.
Kuykendall, D. C., and A. McMullan. 2014. “Using an Environmental Footprint Analysis to Evaluate the Sustainability ofRemedial Alternatives.” PE International Conference on Health, Safety, and Environment.
Kwan, W. C. 2001. “Physical property determination of perfluorinated surfactants PhD diss.” National Library of Canada.
Kwok, Karen Y., Sachi Taniyasu, Leo W. Y. Yeung, Margaret B. Murphy, Paul K. S. Lam, Yuichi Horii, KurunthachalamKannan, Gert Petrick, Ravindra K. Sinha, and Nobuyoshi Yamashita. 2010. “Flux of Perfluorinated Chemicals throughWet Deposition in Japan, the United States, And Several Other Countries.” Environmental Science & Technology 44(18):7043-7049. doi: 10.1021/es101170c.
Kwok, Karen Y., Eriko Yamazaki, Nobuyoshi Yamashita, Sachi Taniyasu, Margaret B. Murphy, Yuichi Horii, Gert Petrick,Roland Kallerborn, Kurunthachalam Kannan, Kentaro Murano, and Paul K. S. Lam. 2013. “Transport of Perfluoroalkylsubstances (PFAS) from an arctic glacier to downstream locations: Implications for sources.” Science of The TotalEnvironment 447:46-55. doi: https://doi.org/10.1016/j.scitotenv.2012.10.091.
Lai, Senchao, Junwei Song, Tianli Song, Zhijiong Huang, Yingyi Zhang, Yan Zhao, Guicheng Liu, Junyu Zheng, Wenying Mi,Jianhui Tang, Shichun Zou, Ralf Ebinghaus, and Zhiyong Xie. 2016. “Neutral polyfluoroalkyl substances in theatmosphere over the northern South China Sea.” Environmental Pollution 214:449-455. doi:https://doi.org/10.1016/j.envpol.2016.04.047.
Landsteiner, A., C. Huset, J. Johnson, and A. Williams. 2014. “Biomonitoring for perfluorochemicals in a Minnesotacommunity with known drinking water contamination.” J Environ Health 77 (5):14-9.
Lang, J. R. 2016. “Per- and Polyfluoroalkyl Substances in Municipal Solid Waste and Landfill Leachate.” Dr. Morton A.Barlaz.
Lang, Johnsie R., B. McKay Allred, Jennifer A. Field, James W. Levis, and Morton A. Barlaz. 2017. “National Estimate ofPer- and Polyfluoroalkyl Substance (PFAS) Release to U.S. Municipal Landfill Leachate.” Environmental Science &Technology 51 (4):2197-2205. doi: 10.1021/acs.est.6b05005.
Lang, Johnsie R., B. McKay Allred, Graham F. Peaslee, Jennifer A. Field, and Morton A. Barlaz. 2016. “Release of Per- andPolyfluoroalkyl Substances (PFASs) from Carpet and Clothing in Model Anaerobic Landfill Reactors.” EnvironmentalScience & Technology 50 (10):5024-5032. doi: 10.1021/acs.est.5b06237.
Langer, Vera, Annekatrin Dreyer, and Ralf Ebinghaus. 2010. “Polyfluorinated Compounds in Residential andNonresidential Indoor Air.” Environmental Science & Technology 44 (21):8075-8081. doi: 10.1021/es102384z.
Lanza, Heather A., Rebecca S. Cochran, Joseph F. Mudge, Adric D. Olson, Brett R. Blackwell, Jonathan D. Maul,Christopher J. Salice, and Todd A. Anderson. 2017. “Temporal monitoring of perfluorooctane sulfonate accumulationin aquatic biota downstream of historical aqueous film forming foam use areas.” Environmental Toxicology andChemistry 36 (8):2022-2029. doi: 10.1002/etc.3726.
LaRoe, S., J. Benaman, D.R. Opdyke, and J.P. Connolly. 2017. “Emerging concern about PFOS in freshwater fish: howbioaccumulative is it?” Ninth (9th) International Conference on the Remediation and Management of ContaminatedSediments, New Orleans, LA, January 9 – 12, 2017.
Larson, Emily S., Jason M. Conder, and Jennifer A. Arblaster. 2018. “Modeling avian exposures to perfluoroalkylsubstances in aquatic habitats impacted by historical aqueous film forming foam releases.” Chemosphere201:335-341. doi: https://doi.org/10.1016/j.chemosphere.2018.03.004.
Page 286ITRC PFAS-1
Lasier, Peter J., John W. Washington, Sayed M. Hassan, and Thomas M. Jenkins. 2011. “Perfluorinated chemicals insurface waters and sediments from northwest Georgia, USA, and their bioaccumulation in Lumbriculus variegatus.”Environmental Toxicology and Chemistry 30 (10):2194-2201. doi: 10.1002/etc.622.
Lassen, C., Allan Jensen, A Potrykus, Frans Christensen, J. Kjølholt, C. Jeppesen, Sonja Mikkelsen, and S. Innanen. 2013.Survey of PFOS, PFOA and other perfluoroalkyl and polyfluoroalkyl substances. Part of the LOUS-review.
Lassen, C., J. Kjølholt, Sonja Mikkelsen, M. Warming, Allan Jensen, Rossana Bossi, and I Nielsen. 2015. Polyfluoroalkylsubstances (PFASs) in textiles for children. Survey of chemical substances in consumer products.
Lath, Supriya, Divina A. Navarro, Dusan Losic, Anupama Kumar, and Michael J. McLaughlin. 2018. “Sorptive remediationof perfluorooctanoic acid (PFOA) using mixed mineral and graphene/carbon-based materials.” EnvironmentalChemistry 15 (8):472-480.
Lau, C. 2012. “Perfluorinated compounds.” Exp Suppl 101:47-86. doi: 10.1007/978-3-7643-8340-4_3.
Lau, C. 2015. “Perfluorinated Compounds: An Overview.” In Toxicological Effects of Perfluoroalkyl and PolyfluoroalkylSubstances, edited by J.D. DeWitt, pp 451-477. pp. 1-21. Humana Press.
Lau, C., J. R. Thibodeaux, R. G. Hanson, M. G. Narotsky, J. M. Rogers, A. B. Lindstrom, and M. J. Strynar. 2006. “Effects ofperfluorooctanoic acid exposure during pregnancy in the mouse.” Toxicol Sci 90 (2):510-8. doi:10.1093/toxsci/kfj105.
Lau, Christopher, Katherine Anitole, Colette Hodes, David Lai, Andrea Pfahles-Hutchens, and Jennifer Seed. 2007.Perfluoroalkyl Acids: A Review of Monitoring and Toxicological Findings. Vol. 99.
Lechner, Mareike, and Holger Knapp. 2011. “Carryover of Perfluorooctanoic Acid (PFOA) and Perfluorooctane Sulfonate(PFOS) from Soil to Plant and Distribution to the Different Plant Compartments Studied in Cultures of Carrots (Daucuscarota ssp. Sativus), Potatoes (Solanum tuberosum), and Cucumbers (Cucumis Sativus).” Journal of Agricultural andFood Chemistry 59 (20):11011-11018. doi: 10.1021/jf201355y.
Lee, C. K., S. G. Kang, J. T. Lee, S. W. Lee, J. H. Kim, D. H. Kim, B. C. Son, K. H. Kim, C. H. Suh, S. Y. Kim, and Y. B. Park.2015. “Effects of perfluorooctane sulfuric acid on placental PRL-family hormone production and fetal growthretardation in mice.” Mol Cell Endocrinol 401:165-72. doi: 10.1016/j.mce.2014.10.026.
Lee, Holly, Jessica D’eon, and Scott A. Mabury. 2010. “Biodegradation of Polyfluoroalkyl Phosphates as a Source ofPerfluorinated Acids to the Environment.” Environmental Science & Technology 44 (9):3305-3310. doi:10.1021/es9028183.
Lee, Holly, and Scott A. Mabury. 2011. “A Pilot Survey of Legacy and Current Commercial Fluorinated Chemicals inHuman Sera from United States Donors in 2009.” Environmental Science & Technology 45 (19):8067-8074. doi:10.1021/es200167q.
Lee, Holly, and Scott A. Mabury. 2017. “Sorption of Perfluoroalkyl Phosphonates and Perfluoroalkyl Phosphinates inSoils.” Environmental Science & Technology 51 (6):3197-3205. doi: 10.1021/acs.est.6b04395.
Lee, Yu-Chi, Shang-Lien Lo, Jeff Kuo, and Yi-Ling Lin. 2012. “Persulfate oxidation of perfluorooctanoic acid under thetemperatures of 20–40°C.” Chemical Engineering Journal 198-199:27-32. doi:https://doi.org/10.1016/j.cej.2012.05.073.
Leonard, R. C. . 2003. “Epidemiology Surveillance Program. Cancer Incidence Report 1959-2001 and All-Case MortalityReport 1957-2000 at the Washington Works, Parkersburg, WV. DuPont. USEPA. AR226-1307-6.”.
Lerner, S. 2016. “New Teflon Toxin Causes Cancer in Lab Animals.” Last Modified March 3. accessed 2020.https://theintercept.com/2016/03/03/new-teflon-toxin-causes-cancer-in-lab-animals/.
Lescord, Gretchen L., Karen A. Kidd, Amila O. De Silva, Mary Williamson, Christine Spencer, Xiaowa Wang, and Derek C.G. Muir. 2015. “Perfluorinated and Polyfluorinated Compounds in Lake Food Webs from the Canadian High Arctic.”Environmental Science & Technology 49 (5):2694-2702. doi: 10.1021/es5048649.
Li, M. H. 2009. “Toxicity of perfluorooctane sulfonate and perfluorooctanoic acid to plants and aquatic invertebrates.”
Page 287ITRC PFAS-1
Environ Toxicol 24 (1):95-101. doi: 10.1002/tox.20396.
Li, Mei-Hui. 2010. “Chronic Effects of Perfluorooctane Sulfonate and Ammonium Perfluorooctanoate on BiochemicalParameters, Survival and Reproduction of Daphnia magna.” Journal of Health Science 56:104-111. doi:10.1248/jhs.56.104.
Li, Xuemei, Leo Wai Yin Yeung, Muqi Xu, Sachi Taniyasu, Paul K. S. Lam, Nobuyoshi Yamashita, and Jiayin Dai. 2008.“Perfluorooctane sulfonate (PFOS) and other fluorochemicals in fish blood collected near the outfall of wastewatertreatment plant (WWTP) in Beijing.” Environmental Pollution 156 (3):1298-1303. doi:https://doi.org/10.1016/j.envpol.2008.03.008.
Li, Y., T. Fletcher, D. Mucs, K. Scott, C. H. Lindh, P. Tallving, and K. Jakobsson. 2018. “Half-lives of PFOS, PFHxS and PFOAafter end of exposure to contaminated drinking water.” Occup Environ Med 75 (1):46-51. doi:10.1136/oemed-2017-104651.
Li, Yasong, Danielle P. Oliver, and Rai S. Kookana. 2018. “A critical analysis of published data to discern the role of soiland sediment properties in determining sorption of per and polyfluoroalkyl substances (PFASs).” Science of The TotalEnvironment 628-629:110-120. doi: https://doi.org/10.1016/j.scitotenv.2018.01.167.
Liang, S. 2017. Enzymatic and electrochemical oxidation of emerging contaminants. Doctoral Dissertation. University ofGeorgia.
Liang, S., R. D. Pierce Jr, H. Lin, S. Y. Chiang, and Q. J. Huang. 2018. “Electrochemical oxidation of PFOA and PFOS inconcentrated waste streams.” Remediation Journal 28 (2):127-134. doi: 10.1002/rem.21554.
Lilienthal, H., H. H. Dieter, J. Holzer, and M. Wilhelm. 2017. “Recent experimental results of effects of perfluoroalkylsubstances in laboratory animals – Relation to current regulations and guidance values.” Int J Hyg Environ Health220 (4):766-775. doi: 10.1016/j.ijheh.2017.03.001.
Lin, A. Y.-C., S. C. Panchangam, C.-Y. Chang, P. K. A. Hong, and H.-F. Hsueh. 2012. “Removal of perfluorooctanoic acidand perfluorooctane sulfonate via ozonation under alkaline condition.” Journal of Hazardous Materials 243:272-277.doi: https://doi.org/10.1016/j.jhazmat.2012.10.029.
Lin, A. Y.-C., S. C. Panchangam, and C.-C. Lo. 2009. “The impact of semiconductor, electronics and optoelectronicindustries on downstream perfluorinated chemical contamination in Taiwanese rivers.” Environmental Pollution 157(4):1365-1372. doi: https://doi.org/10.1016/j.envpol.2008.11.033.
Lin, A. Y.-C., S. C. Panchangam, Y.-T. Tsai, and T.-H. Yu. 2014. “Occurrence of perfluorinated compounds in the aquaticenvironment as found in science park effluent, river water, rainwater, sediments, and biotissues.” EnvironmentalMonitoring and Assessment 186 (5):3265-3275. doi: 10.1007/s10661-014-3617-9.
Lin, H., J. Niu, S. Ding, and L. Zhang. 2012. “Electrochemical degradation of perfluorooctanoic acid (PFOA) by Ti/SnO2–Sb,Ti/SnO2–Sb/PbO2 and Ti/SnO2–Sb/MnO2 anodes.” Water Research 46 (7):2281-2289. doi:https://doi.org/10.1016/j.watres.2012.01.053.
Lin, H., Y. Wang, J. Niu, Z. Yue, and Q. Huang. 2015. “Efficient Sorption and Removal of Perfluoroalkyl Acids (PFAAs) fromAqueous Solution by Metal Hydroxides Generated in Situ by Electrocoagulation.” Environmental Science andTechnology 49 (17):10562-10569. doi: 10.1021/acs.est.5b02092.
Lindstrom, Andrew B., Mark J. Strynar, Amy D. Delinsky, Shoji F. Nakayama, Larry McMillan, E. Laurence Libelo, MichaelNeill, and Lee Thomas. 2011. “Application of WWTP Biosolids and Resulting Perfluorinated Compound Contaminationof Surface and Well Water in Decatur, Alabama, USA.” Environmental Science & Technology 45 (19):8015-8021. doi:10.1021/es1039425.
Lindstrom, Andrew B., Mark J. Strynar, and E. Laurence Libelo. 2011. “Polyfluorinated Compounds: Past, Present, andFuture.” Environmental Science & Technology 45 (19):7954-7961. doi: 10.1021/es2011622.
Lipson, D. S., B. Raine, and M. Webb. 2013. “Transport of Perluoooctance Sulfonate (PFOS) in Fractured Bedrock at aWell-Characterized Site.” SETAC Europe Conference, Glasglow.
Page 288ITRC PFAS-1
Liu, Baolin, Hong Zhang, Dan Yao, Juying Li, Liuwei Xie, Xinxuan Wang, Yanping Wang, Guoqing Liu, and Bo Yang. 2015.“Perfluorinated compounds (PFCs) in the atmosphere of Shenzhen, China: Spatial distribution, sources and healthrisk assessment.” Chemosphere 138:511-518. doi: https://doi.org/10.1016/j.chemosphere.2015.07.012.
Liu, J., J. Li, Y. Zhao, Y. Wang, L. Zhang, and Y. Wu. 2010. “The occurrence of perfluorinated alkyl compounds in humanmilk from different regions of China.” Environ Int 36 (5):433-8. doi: 10.1016/j.envint.2010.03.004.
Liu, Jinxia, Linda S. Lee, Loring F. Nies, Cindy H. Nakatsu, and Ronald F. Turco. 2007. “Biotransformation of 8:2Fluorotelomer Alcohol in Soil and by Soil Bacteria Isolates.” Environmental Science & Technology 41 (23):8024-8030.doi: 10.1021/es0708722.
Liu, Jinxia, and Sandra Mejia Avendaño. 2013. “Microbial degradation of polyfluoroalkyl chemicals in the environment: Areview.” Environment International 61:98-114. doi: https://doi.org/10.1016/j.envint.2013.08.022.
Liu, Jinxia, Ning Wang, Robert C. Buck, Barry W. Wolstenholme, Patrick W. Folsom, Lisa M. Sulecki, and Cheryl A. Bellin.2010. “Aerobic biodegradation of [14C] 6:2 fluorotelomer alcohol in a flow-through soil incubation system.”Chemosphere 80 (7):716-723. doi: https://doi.org/10.1016/j.chemosphere.2010.05.027.
Liu, W., Y. Jin, X. Quan, K. Sasaki, N. Saito, S. F. Nakayama, I. Sato, and S. Tsuda. 2009. “Perfluorosulfonates andperfluorocarboxylates in snow and rain in Dalian, China.” Environ Int 35 (4):737-42. doi:10.1016/j.envint.2009.01.016.
Liu, Xiaoyu, Zhishi Guo, Kenneth A. Krebs, Robert H. Pope, and Nancy F. Roache. 2014. “Concentrations and trends ofperfluorinated chemicals in potential indoor sources from 2007 through 2011 in the US.” Chemosphere 98:51-57.doi: https://doi.org/10.1016/j.chemosphere.2013.10.001.
Liu, Zhaoyang, Yonglong Lu, Tieyu Wang, Pei Wang, Qifeng Li, Andrew C. Johnson, Suriyanarayanan Sarvajayakesavalu,and Andrew J. Sweetman. 2016. “Risk assessment and source identification of perfluoroalkyl acids in surface andground water: Spatial distribution around a mega-fluorochemical industrial park, China.” Environment International91:69-77. doi: https://doi.org/10.1016/j.envint.2016.02.020.
Llorca, Marta, Gabriella Schirinzi, Mònica Martínez, Damia Barcelo, and Marinella Farré. 2018. Adsorption ofperfluoroalkyl substances on microplastics under environmental conditions. Vol. 235.
Locke, Bruce R., Petr Lukes, and Jean-Louis Brisset. 2012. “Elementary Chemical and Physical Phenomena in ElectricalDischarge Plasma in Gas–Liquid Environments and in Liquids.” Plasma Chemistry and Catalysis in Gases andLiquids:185-241. doi: 10.1002/9783527649525.ch6.
Loewen, M., F. Wania, F. Wang, and G. Tomy. 2008. “Altitudinal transect of atmospheric and aqueous fluorinated organiccompounds in Western Canada.” Environ Sci Technol 42 (7):2374-9.
Löfstedt Gilljam, John, Juliana Leonel, Ian T. Cousins, and Jonathan P. Benskin. 2016. “Is Ongoing Sulfluramid Use inSouth America a Significant Source of Perfluorooctanesulfonate (PFOS)? Production Inventories, Environmental Fate,and Local Occurrence.” Environmental Science & Technology 50 (2):653-659. doi: 10.1021/acs.est.5b04544.
Loi-Brügger, A., Stefan Panglisch, Grit Hoffmann, P. Buchta, R. Gimbel, and C. J. Nacke. 2008. “Removal of trace organicsubstances from river bank filtrate – Performance study of RO and NF membranes.” 8. doi: 10.2166/ws.2008.021.
Loos, Robert, Giovanni Locoro, Sara Comero, Serafino Contini, David Schwesig, Friedrich Werres, Peter Balsaa, OliverGans, Stefan Weiss, Ludek Blaha, Monica Bolchi, and Bernd Gawlik. 2010. Pan-European Survey on the Occurrenceof Selected Polar Organic Persistent Pollutants in Ground Water. Vol. 44.
Lorber, M., G. E. Eaglesham, P. Hobson, L. M. L. Toms, J. F. Mueller, and J. S. Thompson. 2015. “The effect of ongoingblood loss on human serum concentrations of perfluorinated acids.” Chemosphere 118:170-177. doi:https://doi.org/10.1016/j.chemosphere.2014.07.093.
Lorber, M., and P. P. Egeghy. 2011. “Simple intake and pharmacokinetic modeling to characterize exposure of Americansto perfluoroctanoic acid, PFOA.” Environ Sci Technol 45 (19):8006-14. doi: 10.1021/es103718h.
Loveless, S. E., C. Finlay, N. E. Everds, S. R. Frame, P. J. Gillies, J. C. O’Connor, C. R. Powley, and G. L. Kennedy. 2006.
Page 289ITRC PFAS-1
“Comparative responses of rats and mice exposed to linear/branched, linear, or branched ammoniumperfluorooctanoate (APFO).” Toxicology 220 (2-3):203-17. doi: 10.1016/j.tox.2006.01.003.
Lu, Guang-hua, Jian-chao Liu, Li-sha Sun, and Lu-jin Yuan. 2015. “Toxicity of perfluorononanoic acid and perfluorooctanesulfonate to Daphnia magna.” Water Science and Engineering 8 (1):40-48. doi:https://doi.org/10.1016/j.wse.2015.01.001.
Lu, Hao, Zhen-min Ma, Xiao Zhang, Peng Jiang, Ming Wen, and Wei-wei Yu. 2017. Source Apportionment ofPerfluorinated Compounds (PFCs) in Shallow Groundwater Around A Fluorine Chemistry Industrial Park in NorthChina.
Lu, S., and S.M. Bartell. 2019. “Serum PFAS Calculator for Adults. Version 1.1.”https://www.ics.uci.edu/~sbartell/pfascalc.html.
Lucas, R.M., and A.J. McMichael. 2005. “Association or causation: evaluating links between “environment anddisease”https://www.who.int/bulletin/volumes/83/10/792.pdf?ua=1.” Bulletin of the World Health Organization 83(10):792-795.
Luebker, D. J., M. T. Case, R. G. York, J. A. Moore, K. J. Hansen, and J. L. Butenhoff. 2005. “Two-generation reproductionand cross-foster studies of perfluorooctanesulfonate (PFOS) in rats.” Toxicology 215 (1-2):126-48. doi:10.1016/j.tox.2005.07.018.
Luebker, D. J., R. G. York, K. J. Hansen, J. A. Moore, and J. L. Butenhoff. 2005. “Neonatal mortality from in utero exposureto perfluorooctanesulfonate (PFOS) in Sprague-Dawley rats: dose-response, and biochemical and pharamacokineticparameters.” Toxicology 215 (1-2):149-69. doi: 10.1016/j.tox.2005.07.019.
Lukes, P., A.T. Appleton, and B. R. Locke. 2004. “Hydrogen peroxide and ozone formation in hybrid gas-liquid electricaldischarge Reactors.” IEEE Transactions on Industry Applications 40 (1):60-67. doi: 10.1109/TIA.2003.821799.
Lukes, P., M. Clupek, V. Babicky, and P. Sunka. 2005. “Plasma-Surface Interactions Induced by Pulsed Corona Dischargein Water.” IEEE Conference Record – Abstracts. 2005 IEEE International Conference on Plasma Science, 20-23 June2005.
Lundin, J. I., B. H. Alexander, G. W. Olsen, and T. R. Church. 2009. “Ammonium perfluorooctanoate production andoccupational mortality.” Epidemiology 20 (6):921-8. doi: 10.1097/EDE.0b013e3181b5f395.
Luz, A. L., J. K. Anderson, P. Goodrum, and J. Durda. 2019. “Perfluorohexanoic acid toxicity, part I: development of achronic human health toxicity value for use in risk assessment.” Regulatory Toxicology and Pharmacology103:41-55.
Lyu, Xian-Jin, Wen-Wei Li, Paul K. S. Lam, and Han-Qing Yu. 2015a. “Boiling significantly promotes photodegradation ofperfluorooctane sulfonate.” Chemosphere 138:324-327. doi: https://doi.org/10.1016/j.chemosphere.2015.06.027.
Lyu, Xian-Jin, Wen-Wei Li, Paul K. S. Lam, and Han-Qing Yu. 2015b. “Insights into perfluorooctane sulfonatephotodegradation in a catalyst-free aqueous solution.” Scientific Reports 5:9353. doi:https://doi.org/10.1038/srep09353.
MA DEP. 2018a. “Commonwealth Begins Program to Remove Legacy Firefighting Foams from Fire DepartmentStockpiles.” Massachusetts Department of Environmental Protection.https://www.mass.gov/news/commonwealth-begins-program-to-remove-legacy-firefighting-foams-from-fire-department
MA DEP. 2018b. Interim Guidance on Sampling and Analysis for PFAS at Disposal Sites Regulated under theMassachusetts Contingency Plan.
Ma, Si-Han, Ming-Hong Wu, Liang Tang, Rui Sun, Chao Zang, Jia-Jia Xiang, Xue-Xia Yang, Xu Li, and Gang Xu. 2017. “EBdegradation of perfluorooctanoic acid and perfluorooctane sulfonate in aqueous solution.” Nuclear Science andTechniques 28 (9):137. doi: 10.1007/s41365-017-0278-8.
MacDonald, M. M., A. L. Warne, N. L. Stock, S. A. Mabury, K. R. Solomon, and P. K. Sibley. 2004. “Toxicity of
Page 290ITRC PFAS-1
perfluorooctane sulfonic acid and perfluorooctanoic acid to Chironomus tentans.” Environ Toxicol Chem 23(9):2116-23.
Macon, M. B., L. R. Villanueva, K. Tatum-Gibbs, R. D. Zehr, M. J. Strynar, J. P. Stanko, S. S. White, L. Helfant, and S. E.Fenton. 2011. “Prenatal perfluorooctanoic acid exposure in CD-1 mice: low-dose developmental effects and internaldosimetry.” Toxicol Sci 122 (1):134-45. doi: 10.1093/toxsci/kfr076.
Maine CDC. 2014. Human health risk-based screening levels for perfluoroalkyl compounds. Maine Center for DiseaseControl and Prevention. Department of Health and Human Services.
Martin, J. W., D. A. Ellis, S. A. Mabury, M. D. Hurley, and T. J. Wallington. 2006. “Atmospheric Chemistry ofPerfluoroalkanesulfonamides: Kinetic and Product Studies of the OH Radical and Cl Atom Initiated Oxidation of N-Ethyl Perfluorobutanesulfonamide.” Environmental Science & Technology 40 (3):864-872. doi: 10.1021/es051362f.
Martin, J. W., S. A. Mabury, K. R. Solomon, and D. C. Muir. 2003. “Bioconcentration and tissue distribution ofperfluorinated acids in rainbow trout (Oncorhynchus mykiss).” Environ Toxicol Chem 22 (1):196-204.
Martin, J. W., S. A. Mabury, K. R. Solomon, and D. C. Muir. 2013. “Progress toward understanding the bioaccumulation ofperfluorinated alkyl acids.” Environ Toxicol Chem 32 (11):2421-3. doi: 10.1002/etc.2376.
Martin, Jonathan W., Brian J. Asher, Sanjay Beesoon, Jonathan P. Benskin, and Matthew S. Ross. 2010. “PFOS or PreFOS?Are perfluorooctane sulfonate precursors (PreFOS) important determinants of human and environmentalperfluorooctane sulfonate (PFOS) exposure?” Journal of Environmental Monitoring 12 (11):1979-2004. doi:10.1039/C0EM00295J.
Martin, Jonathan W., Derek C. G. Muir, Cheryl A. Moody, David A. Ellis, Wai Chi Kwan, Keith R. Solomon, and Scott A.Mabury. 2002. “Collection of Airborne Fluorinated Organics and Analysis by Gas Chromatography/ChemicalIonization Mass Spectrometry.” Analytical Chemistry 74 (3):584-590. doi: 10.1021/ac015630d.
Martin, Jonathan W., D. Michael Whittle, Derek C. G. Muir, and Scott A. Mabury. 2004. “Perfluoroalkyl Contaminants in aFood Web from Lake Ontario.” Environmental Science & Technology 38 (20):5379-5385. doi: 10.1021/es049331s.
Maul, Gabriel A., Youngwoon Kim, Adib Amini, Qiong Zhang, and Treavor H. Boyer. 2014. “Efficiency and life cycleenvironmental impacts of ion-exchange regeneration using sodium, potassium, chloride, and bicarbonate salts.”Chemical Engineering Journal 254:198-209. doi: https://doi.org/10.1016/j.cej.2014.05.086.
Mayilswami, S., Krishnan, K., Megharaj, M. and Naidu, R. 2014. “Effect of perfluorooctane sulfonate (PFOS) on survivaland DNA damage of earthworm in OECD soil compared to natural soils.” Centre for Environmental Risk Assessmentand Remediation (CERAR) and Cooperative Research Centre for Contamination Assessment and Remediation of theEnvironment (CRC CARE), Australia.
McCleaf, Philip, Sophie Englund, Anna Östlund, Klara Lindegren, Karin Wiberg, and Lutz Ahrens. 2017. “Removalefficiency of multiple poly- and perfluoroalkyl substances (PFASs) in drinking water using granular activated carbon(GAC) and anion exchange (AE) column tests.” Water Research 120:77-87. doi:https://doi.org/10.1016/j.watres.2017.04.057.
McGregor, Rick. 2018. “In Situ treatment of PFAS-impacted groundwater using colloidal activated Carbon.” RemediationJournal 28 (3):33-41. doi: 10.1002/rem.21558.
McGuire, M.E. 2013. “An In-Depth Site Characterization of Poly- And Perfluoroalkyl Substances at an Abandoned FireProtection Training Area.” Master of Science Environmental Science and Engineering, Colorado School of Mines.
McGuire, Meghan E., Charles Schaefer, Trenton Richards, Will J. Backe, Jennifer A. Field, Erika Houtz, David L. Sedlak,Jennifer L. Guelfo, Assaf Wunsch, and Christopher P. Higgins. 2014. “Evidence of Remediation-Induced Alteration ofSubsurface Poly- and Perfluoroalkyl Substance Distribution at a Former Firefighter Training Area.” EnvironmentalScience & Technology 48 (12):6644-6652. doi: 10.1021/es5006187.
McKenzie, Erica, Robert L. Siegrist, John McCray, and Christopher Higgins. 2016. The influence of a non-aqueous phaseliquid (NAPL) and chemical oxidant application on perfluoroalkyl acid (PFAA) fate and transport. Vol. 92.
Page 291ITRC PFAS-1
McKenzie, Erica R., Robert L. Siegrist, John E. McCray, and Christopher P. Higgins. 2015. “Effects of Chemical Oxidants onPerfluoroalkyl Acid Transport in One-Dimensional Porous Media Columns.” Environmental Science & Technology 49(3):1681-1689. doi: 10.1021/es503676p.
MDCH. 2014. Health Consultation: Technical Support Document for Assessment of Perfluorinated Chemicals andSelection of a Perfluorooctane Sulfonate (PFOS) Reference Dose as the basis for Michigan Fish ConsumptionScreening Values (FCSVs). Michigan Department of Community Health.http://www.michigan.gov/documents/mdch/MDCH_PFOS_Health_Consultation_2014_468766_7.pdf
MDCH. 2015. USEPA Great Lakes Restoration Initiative (GLRI) Project. Final Report. Michigan Department of CommunityHealth. https://www.michigan.gov/documents/mdch/MDCH_GL-00E01122-0_Final_Report_493494_7.pdf.
MDH. 2008. Health Consultation – PFOS Detections in the City of Brainerd, Minnesota. Minnesota Department of Health.https://www.health.state.mn.us/communities/environment/hazardous/docs/pfas/pfosdetectbrainerd.pdf.
MDH. 2009. East Metro Perfluorochemical Biomonitoring Pilot Project. Minnesota Department of Health.http://www.health.state.mn.us/divs/eh/tracking/finalpfcrpt.pdf.
MDH. 2014. Evaluation of Point-of-use Water Treatment Devices for Perfluorochemical Removal.
MDH. 2017a. Toxicological Summary for: Perfluorooctane Sulfonate. Environmental Health Division Health RiskAssessment Unit.
MDH. 2017b. Toxicological Summary for: Perfluorooctanoic Acid. Environmental Health Division Health Risk AssessmentUnit.
MDH. 2017c. “Toxicological Summary for: Perfluorbutane Sulfonate.”.
MDH. 2018a. “Toxicological Summary for: Perfluorobutanoate.”
MDH. 2018b. “Toxicological Summary for: Perfluorooctanoate.”
MDH. 2019a. “Toxicological Summary for: Perfluoroctane Sulfonate.”
MDH. 2019b. “Toxicological Summary for: Perfluorohexane Sulfonate.”
ME DEP. 2016. Maine Remedial Action Guidelines (RAGs) for Sites Contaminated with Hazardous Substances. Augusta,ME: Bureau of Remediation & Waste Management.
ME DEP. 2019. Memorandum: Requirement to analyze for PFAS compounds. State of Maine Department ofEnvironmental Protection. https://www.maine.gov/dep/spills/topics/pfas/03222019_Sludge_Memorandum.pdf.
Mejia Avendaño, Sandra, and Jinxia Liu. 2015. “Production of PFOS from aerobic soil biotransformation of twoperfluoroalkyl sulfonamide derivatives.” Chemosphere 119:1084-1090. doi:https://doi.org/10.1016/j.chemosphere.2014.09.059.
Mejia-Avendaño, Sandra, Gabriel Munoz, Sébastien Sauvé, and Jinxia Liu. 2017. “Assessment of the Influence of SoilCharacteristics and Hydrocarbon Fuel Cocontamination on the Solvent Extraction of Perfluoroalkyl andPolyfluoroalkyl Substances.” Analytical Chemistry 89 (4):2539-2546. doi: 10.1021/acs.analchem.6b04746.
Mejia-Avendaño, Sandra, Sung Vo Duy, Sébastien Sauvé, and Jinxia Liu. 2016. “Generation of Perfluoroalkyl Acids fromAerobic Biotransformation of Quaternary Ammonium Polyfluoroalkyl Surfactants.” Environmental Science &Technology 50 (18):9923-9932. doi: 10.1021/acs.est.6b00140.
Merino, Nancy, Yan Qu, Rula A. Deeb, Elisabeth L. Hawley, Michael R. Hoffmann, and Shaily Mahendra. 2016.“Degradation and Removal Methods for Perfluoroalkyl and Polyfluoroalkyl Substances in Water.” EnvironmentalEngineering Science 33 (9):615-649. doi: 10.1089/ees.2016.0233.
MI EGLE. 2019. “Rule 57 Water Quality Values.” Michigan Department of Environment, Great Lakes and Energy,.accessed 2019. https://www.michigan.gov/egle/0,9429,7-135-3313_3681_3686_3728-11383–,00.html.
Michalik, L., J. Auwerx, J. P. Berger, V. K. Chatterjee, C. K. Glass, F. J. Gonzalez, P. A. Grimaldi, T. Kadowaki, M. A. Lazar, S.
Page 292ITRC PFAS-1

O’Rahilly, C. N. Palmer, J. Plutzky, J. K. Reddy, B. M. Spiegelman, B. Staels, and W. Wahli. 2006. “International Unionof Pharmacology. LXI. Peroxisome proliferator-activated receptors.” Pharmacol Rev 58 (4):726-41. doi:10.1124/pr.58.4.5.
Michigan Department of Environmental Quality. 2018a. General PFAS Sampling Guidance.https://www.michigan.gov/documents/pfasresponse/General_PFAS_Sampling_Guidance_634597_7.pdf).
Michigan Department of Environmental Quality. 2018b. Wastewater PFAS Sampling Guidance.https://www.michigan.gov/documents/deq/deq-tou-wrd-WastewaterPFAS-Sampling_624506_7.pdf.
MI DHHS. 2019. Public Health drinking water screening levels for PFAS. Division of Environmental Health MichiganDepartment of Health and Human Services.
Milinovic, J., S. Lacorte, M. Vidal, and A. Rigol. 2015. “Sorption behaviour of perfluoroalkyl substances in soils.” Science ofThe Total Environment 511:63-71. doi: https://doi.org/10.1016/j.scitotenv.2014.12.017.
Mimna, R. 2017. Reactivation of Activated Carbon for PFAS Removal. Calgon Memorandum.
Miralles-Marco, Ana, and Stuart Harrad. 2015. “Perfluorooctane sulfonate: A review of human exposure, biomonitoringand the environmental forensics utility of its chirality and isomer distribution.” Environment International77:148-159. doi: https://doi.org/10.1016/j.envint.2015.02.002.
MI SAW. 2019. Health-Based Drinking Water Value Recommendations for PFAS in Michigan. Lansing, MI: MichiganScience Advisory Workgroup.
Mitchell, Shannon M., Mushtaque Ahmad, Amy L. Teel, and Richard J. Watts. 2014. “Degradation of PerfluorooctanoicAcid by Reactive Species Generated through Catalyzed H2O2 Propagation Reactions.” Environmental Science &Technology Letters 1 (1):117-121. doi: 10.1021/ez4000862.
Miyake, Yuichi, Nobuyoshi Yamashita, Pawel Rostkowski, Man Ka So, Sachi Taniyasu, Paul K. S. Lam, andKurunthachalam Kannan. 2007. “Determination of trace levels of total fluorine in water using combustion ionchromatography for fluorine: A mass balance approach to determine individual perfluorinated chemicals in water.”Journal of Chromatography A 1143 (1):98-104. doi: https://doi.org/10.1016/j.chroma.2006.12.071.
Miyake, Yuichi, Nobuyoshi Yamashita, Man Ka So, Pawel Rostkowski, Sachi Taniyasu, Paul K. S. Lam, andKurunthachalam Kannan. 2007. “Trace analysis of total fluorine in human blood using combustion ionchromatography for fluorine: A mass balance approach for the determination of known and unknown organofluorinecompounds.” Journal of Chromatography A 1154 (1):214-221. doi: https://doi.org/10.1016/j.chroma.2007.03.084.
Mogensen, Ulla B., Philippe Grandjean, Flemming Nielsen, Pal Weihe, and Esben Budtz-Jørgensen. 2015. “Breastfeedingas an Exposure Pathway for Perfluorinated Alkylates.” Environmental Science & Technology 49 (17):10466-10473.doi: 10.1021/acs.est.5b02237.
Molina, E. D., R. Balander, S. D. Fitzgerald, J. P. Giesy, K. Kannan, R. Mitchell, and S. J. Bursian. 2006. “Effects of air cellinjection of perfluorooctane sulfonate before incubation on development of the white leghorn chicken (Gallusdomesticus) embryo.” Environ Toxicol Chem 25 (1):227-32.
Mommaerts, V., A. Hagenaars, J. Meyer, W. De Coen, L. Swevers, H. Mosallanejad, and G. Smagghe. 2011. “Impact of aperfluorinated organic compound PFOS on the terrestrial pollinator Bombus terrestris (Insecta, Hymenoptera).”Ecotoxicology 20 (2):447-56. doi: 10.1007/s10646-011-0596-2.
Moody, C. A., G. N. Hebert, S. H. Strauss, and J. A. Field. 2003. “Occurrence and persistence of perfluorooctanesulfonateand other perfluorinated surfactants in groundwater at a fire-training area at Wurtsmith Air Force Base, Michigan,USA.” J Environ Monit 5 (2):341-5.
Moody, Cheryl A., and Jennifer A. Field. 1999. “Determination of Perfluorocarboxylates in Groundwater Impacted by Fire-Fighting Activity.” Environmental Science & Technology 33 (16):2800-2806. doi: 10.1021/es981355+.
Moody, Cheryl A., Jonathan W. Martin, Wai Chi Kwan, Derek C. G. Muir, and Scott A. Mabury. 2002. “MonitoringPerfluorinated Surfactants in Biota and Surface Water Samples Following an Accidental Release of Fire-Fighting Foam
Page 293ITRC PFAS-1
into Etobicoke Creek.” Environmental Science & Technology 36 (4):545-551. doi: 10.1021/es011001+.
Moriwaki, Hiroshi, Youichi Takagi, Masanobu Tanaka, Kenshiro Tsuruho, Kenji Okitsu, and Yasuaki Maeda. 2005.“Sonochemical Decomposition of Perfluorooctane Sulfonate and Perfluorooctanoic Acid.” Environmental Science &Technology 39 (9):3388-3392. doi: 10.1021/es040342v.
Moschet, Christoph, Bonny M. Lew, Simone Hasenbein, Tarun Anumol, and Thomas M. Young. 2017. “LC- and GC-QTOF-MS as Complementary Tools for a Comprehensive Micropollutant Analysis in Aquatic Systems.” EnvironmentalScience & Technology 51 (3):1553-1561. doi: 10.1021/acs.est.6b05352.
MPCA. 2007. Surface Water Quality Criterion for Perfluorooctane Sulfonic Acid. STS Project 200604796.
MPCA. 2016. MPCA announces resolution of investigation in PFOS in Lake Calhoun.https://www.pca.state.mn.us/news/mpca-announces-resolution-investigation-pfos-lake-calhoun.
MPCA. 2017. “Perfluorochemical (PFC) Waste Sites.”
Mudumbi, J. B. N., S. K. O. Ntwampe, M. Muganza, and J. O. Okonkwo. 2014. “Susceptibility of Riparian Wetland Plants toPerfluorooctanoic Acid (PFOA) Accumulation.” International Journal of Phytoremediation 16 (9):926-936. doi:10.1080/15226514.2013.810574.
Müller, Claudia E., Amila O. De Silva, Jeff Small, Mary Williamson, Xiaowa Wang, Adam Morris, Sharon Katz, MaryGamberg, and Derek C. G. Muir. 2011. “Biomagnification of Perfluorinated Compounds in a Remote Terrestrial FoodChain: Lichen–Caribou–Wolf.” Environmental Science & Technology 45 (20):8665-8673. doi: 10.1021/es201353v.
Mundt, D. J., K. A. Mundt, R. S. Luippold, M. D. Schmidt, and C. H. Farr. 2007. “Clinical epidemiological study ofemployees exposed to surfactant blend containing perfluorononanoic acid.” Occup Environ Med 64 (9):589-94. doi:10.1136/oem.2007.032664.
Munoz, G., L. C. Fechner, E. Geneste, P. Pardon, H. Budzinski, and P. Labadie. 2018. “Spatio-temporal dynamics of perand polyfluoroalkyl substances (PFAS) and transfer to periphytic biofilm in an urban river: case-study on the RiverSeine.” Environmental Science and Pollution Research 25 (24):23574-23582.
National Research Council. 2009. Science and Decisions: Advancing Risk Assessment. Washington, DC: The NationalAcademies Press.
Navarro, Irene, Adrián de la Torre, Paloma Sanz, Miguel Ángel Porcel, Javier Pro, Gregoria Carbonell, and María de losÁngeles Martínez. 2017. “Uptake of perfluoroalkyl substances and halogenated flame retardants by crop plantsgrown in biosolids-amended soils.” Environmental Research 152:199-206. doi:https://doi.org/10.1016/j.envres.2016.10.018.
Navarro, Irene, Adrián de la Torre, Paloma Sanz, Javier Pro, Gregoria Carbonell, and María de los Ángeles Martínez. 2016.“Bioaccumulation of emerging organic compounds (perfluoroalkyl substances and halogenated flame retardants) byearthworm in biosolid amended soils.” Environmental Research 149:32-39. doi:https://doi.org/10.1016/j.envres.2016.05.004.
NAVSEA. 2017. Performance Specification – Fire extinguishing agent, aqueous film-forming foam (AFFF) liquidconcentrate for fresh and sea water. MIL-PRF-24385F(SH) with Amendment 2.
NC DEQ. 2018. “GenX Frequently Asked Questions.”. https://files.nc.gov/ncdeq/GenX/SAB/FAQ_updated_021518.pdf.
NC DEQ. 2019a. “Air Quality Sampling.” accessed 2020.https://deq.nc.gov/news/key-issues/genx-investigation/air-quality-sampling.
NC DEQ. 2019b. Chemours Weekly Rainwater Summary.https://files.nc.gov/ncdeq/GenX/Data/air-sampling/2019-04-09-Chemours-Weekly-Rainwater-summary.pdf.
NC DHHS. 2018. Biological sampling for GenX and other Per- and Polyfluoroalkyl Substances (PFAS) – North Carolina,2018. North Carolina Dept. of Health and Human Services.https://epi.dph.ncdhhs.gov/oee/pfas/NCDHHS_PFAS%20Biomonitoring%20Report_8Nov2018.pdf.
Page 294ITRC PFAS-1
NCDENR. 2012. Memorandum. NCSAB Recommendation for the Revision of the IMAC for Perfluorooctanoic Acid (PFOA).Raleigh, NC: Division of Air Quality.
Negri, Eva, Francesca Metruccio, Valentina Guercio, Luca Tosti, Emilio Benfenati, Rossella Bonzi, Carlo La Vecchia, andAngelo Moretto. 2017. “Exposure to PFOA and PFOS and fetal growth: a critical merging of toxicological andepidemiological data.” Critical Reviews in Toxicology 47 (6):489-515. doi: 10.1080/10408444.2016.1271972.
New York State. 2017. Hazardous Substances Identification, Release Prohibition, and Release Reporting.http://www.dec.ny.gov/regulations/105074.html.
Newsted, J. L., S. A. Beach, S. P. Gallagher, and J. P. Giesy. 2008. “Acute and chronic effects of perfluorobutane sulfonate(PFBS) on the mallard and northern bobwhite quail.” Arch Environ Contam Toxicol 54 (3):535-45. doi:10.1007/s00244-007-9039-8.
Newsted, J. L., K. K. Coady, S. A. Beach, J. L. Butenhoff, S. Gallagher, and J. P. Giesy. 2007. “Effects of perfluorooctanesulfonate on mallard and northern bobwhite quail exposed chronically via the diet.” Environ Toxicol Pharmacol 23(1):1-9. doi: 10.1016/j.etap.2006.04.008.
Newsted, John L., Paul D. Jones, Katie Coady, and John P. Giesy. 2005. “Avian Toxicity Reference Values forPerfluorooctane Sulfonate.” Environmental Science & Technology 39 (23):9357-9362. doi: 10.1021/es050989v.
Newton, S., R. McMahen, J. A. Stoeckel, M. Chislock, A. Lindstrom, and M. Strynar. 2017. “Novel PolyfluorinatedCompounds Identified Using High Resolution Mass Spectrometry Downstream of Manufacturing Facilities nearDecatur, Alabama.” Environ Sci Technol 51 (3):1544-1552. doi: 10.1021/acs.est.6b05330.
Ney, R.E. 1995. Fate and Transport of Organic Chemicals in the Environment: A Practical Guide, Second Edition.Rockville, MD: Government Institutes.
NFPA. 2014. Standard on Selection, Care, and Maintenance of Protective Ensembles for Structural Fire Fighting andProximity Fire Fighting. In NFPA 1851 Quincy, MA: National Fire Protection Association https://www.nfpa.org.
NFPA. 2016a. Standard for Automotive Fire Apparatus. In NFPA 1901. Quincy, MA: National Fire Protection Associationhttps://www.nfpa.org.
NFPA. 2016b. Standard for Low-, Medium-, and High-Expansion Foam. In NFPA 11. Quincy, MA: National Fire ProtectionAssociation https://www.nfpa.org.
NFPA. 2017. Standard for the Inspection, Testing, and Maintenance of Water-Based Fire Protection Systems. In NFPA 25.Quincy, MA: National Fire Protection Association https://www.nfpa.org.
NFPA. 2019. Standard for the Installation of Foam-Water Sprinkler and Foam-Water Spray Systems. In NFPA 16. Quincy,MA: National Fire Protection Association https://www.nfpa.org.
NFPA. 2020. Standard for Evaluating Aircraft Rescue and Fire-Fighting Foam Equipment. In NFPA 412. Quincy, MA:National Fire Protection Association https://www.nfpa.org.
Ng, Carla A., and Konrad Hungerbühler. 2013. “Bioconcentration of Perfluorinated Alkyl Acids: How Important Is SpecificBinding?” Environmental Science & Technology 47 (13):7214-7223. doi: 10.1021/es400981a.
Ng, Carla A., and Konrad Hungerbühler. 2014. “Bioaccumulation of Perfluorinated Alkyl Acids: Observations and Models.”Environmental Science & Technology 48 (9):4637-4648. doi: 10.1021/es404008g.
NGWA. 2017. “Groundwater and PFAS: State of Knowledge and Practice.”
NH DES. 2016. “New Hampshire Code of Administrative Rules. Chapter Env-A 1400 Regulated Toxic Air Pollutants.”https://www.des.nh.gov/organization/commissioner/legal/rules/documents/env-a1400.pdf.
NH DES. 2017. “On-line GIS application, PFAS Sampling Results.” New Hampshire Department of Environmental Services.http://nhdes.maps.arcgis.com/apps/View/index.html?appid=66770bef141c43a98a445c54a17720e2&extent=-73.5743,42.5413,-69.6852,45.4489.
Page 295ITRC PFAS-1
NH DES. 2019a. “Air Emissions Monitoring for Stationary Sources.” accessed 2020.https://www.des.nh.gov/organization/divisions/air/cb/cmdps/tms/index.htm.
NH DES. 2019b. Laboratory Testing Guidelines for Per- and Polyfluoroalkyl Substances (PFAS) at Waste Sites.
NH DES. 2020. “NH PFAS Investigation. Public Water System Results.” accessed 2020.https://www4.des.state.nh.us/nh-pfas-investigation/?page_id=826.
NH DHHS. 2015. Perfluorochemical (PFC) Testing Program: Summary of test results for children <12 y.o. New HampshireDept. of Health and Human Services. http://www.dhhs.nh.gov/dphs/documents/pediatric-results-presentation.pdf
NH DHHS. 2016. “Pease PFC Blood Testing Program: April 2015 – October 2015.”
NH DHHS. 2017. Summary of the New Hamphire Department of Health and Human Services’ Perfluorochemical (PFC)Blood Testing Program, 2016-2017. https://www.dhhs.nh.gov/dphs/pfcs/documents/results-summary.pdf.
Nickelsen, M. G., and S.E. Woodard. 2017. A sustainable system and method for removing and concentrating per-andpolyfluoroalkyl substances (PFAS) from water. edited by U.S. Patent and Trademark Office.
NICNAS. 2018. “Per- and poly-fluorinated substances (PFAS). .” Australian Government Department of Health. .
Nilsson, H., A. Karrman, A. Rotander, B. van Bavel, G. Lindstrom, and H. Westberg. 2013. “Professional ski waxers’exposure to PFAS and aerosol concentrations in gas phase and different particle size fractions.” Environ Sci ProcessImpacts 15 (4):814-22. doi: 10.1039/c3em30739e.
Nilsson, H., A. Karrman, H. Westberg, A. Rotander, B. van Bavel, and G. Lindstrom. 2010. “A time trend study ofsignificantly elevated perfluorocarboxylate levels in humans after using fluorinated ski wax.” Environ Sci Technol 44(6):2150-5. doi: 10.1021/es9034733.
Niu, Junfeng, Yang Li, Enxiang Shang, Zesheng Xu, and Jinzi Liu. 2016. “Electrochemical oxidation of perfluorinatedcompounds in water.” Chemosphere 146:526-538. doi: https://doi.org/10.1016/j.chemosphere.2015.11.115.
NJDEP. 2018. Investigation of levels of perfluorinated compounds in New Jersey fish, surface water, and sediment.SR15-010: Division of Science New Jersey Department of Environmental Protection, Research, and EnvironmentalHealth.
NJDWQI. 2015. “Health-Based Maximum Contaminant Level Support Document: Perfluorononanoic Acid (PFNA).” NewJersey Drinking Water Quality Institute.
NJDWQI. 2017a. Health-Based Maximum Contaminant Level Support Document: Perfluorooctanoic Acid (PFOA).https://www.state.nj.us/dep/watersupply/pdf/pfoa-appendixa.pdf.
NJDWQI. 2017b. “Health-Based Maximum Contaminant Level Support Document: Perfluorooctanoic Acid (PFOA).” NewJersey Drinking Water Quality Institute.
NJDWQI. 2017c. Maximum Contaminant Level Recommendation for Perfluorooctanoic Acid in Drinking Water, Basis andBackground.
NJDWQI. 2018a. “Health-Based Maximum Contaminant Level Support Document: Perfluorooctane Sulfonate (PFOS).”New Jersey Drinking Water Quality Institute.
NJDWQI. 2018b. “Maximum Contaminant Level Recommendation for Perfluorooctane Sulfonate in Drinking Water.”.
Noker, P. E. 2001. A pharmacokinetic study of potassium perfluorohexanoate in the cynomolgus monkey. SouthernResearch Institute.
Norden, M., U. Berger, and M. Engwall. 2016. “Developmental toxicity of PFOS and PFOA in great cormorant(Phalacrocorax carbo sinensis), herring gull (Larus argentatus) and chicken (Gallus gallus domesticus).” Environ SciPollut Res Int 23 (11):10855-10862. doi: 10.1007/s11356-016-6285-1.
NPCA. 2006. Økotoksikologiske effekter av PFOS, PFOA og 6:2 FTS på meitemark (Eisenia fetida) [Ecotoxicological effectsof PFOS, PFOA and 6:2 FTS in earthworms]. edited by Statens foru-rensningstilsyn (SFT). Norway.
Page 296ITRC PFAS-1

NPCA. 2008. Screening of Polyfluorinated Organic Compounds at Four Fire Training Facilites in Norway. TA-2444/2008:Norwegian Pollution Control Authority.
NSF International. 2018. “PFOA/PFOS in Drinking Water.”http://www.nsf.org/consumer-resources/water-quality/drinking-water/perfluorooctanoic-acid-and-perfluorooctanesulfonic-acid-in-drinking-water.
NTP. 2016. “NTP Monograph on Immunotoxicity Aasociated with Exposure to Perfluorooctanoic Acid (PFOA) orPerfluorooctane Sulfonate (PFOS). .” Office of Health Assessment and Translation, Division of the National ToxicologyProgram, National Institute of Environmental Health Sciences.
NTP. 2019a. Draft NTP Technical Report on the Toxicology and Carcinogenesis Studies of Perfluorooctanoic Acid (CAS No.335-67-1) Administered in Feed to Sprague Dawley (Hsd: Sprague Dawley SD) Rats. Technical Report 598. ResearchTriangel Park, NC: National Toxicology Program. U. S. Department of Health and Human Services.https://ntp.niehs.nih.gov/ntp//about_ntp/trpanel/2019/december/tr598draft.pdf.
NTP. 2019b. NTP Technical Report on the Toxicity Studies of Perfluoroalkyl Carboxylates (Perfluorohexanoic Acid,Perfluorooctanoic Acid, Perfluorononanoic Acid and Perfluorodecanoic Acid) Administered by Gavage to SpragueDawley (HSD: Sprague Dawley SD) Rats. NTP TOX 97: National Toxicology Program. U. S. Department of Health andHuman Services. https://ntp.niehs.nih.gov/ntp/htdocs/st_rpts/tox097_508.pdf.
NTP. 2019c. NTP Technical Report on the Toxicity Studies of Perfluoroalkyl Sulfonates (Perfluorobutane Sulfonic Acid,Perfluorohexane Sulfonate Potassium Salt, and Perfluorooctane Sulfonic Acid) Administered by Gavage to SpragueDawley (HSD: Sprague Dawley SD) Rats. NTP TOX 96: National Toxicology Program. U. S. Department of Health andHuman Services. https://ntp.niehs.nih.gov/ntp/htdocs/st_rpts/tox096_508.pdf.
NY DEC. 2016. “Stewart Ang Base and Newburgh Watershed Investigation Report.”
NY DEC. 2017a. Adoption of Final Rule: 6NYCRR Part 597. http://www.dec.ny.gov/regulations/104968.html
NY DEC. 2017b. “Petersburgh. Information for Communities Impacted by Perfluorinated Compounds (PFCs).”http://www.dec.ny.gov/chemical/108820.html
NYS DOH. 2016a. “Information Sheet. PFOA Biomonitoring Group Level Results.”
NYS DOH. 2016b. “Village of Hoosick Falls and Town of Hoosick Private Well Sampling, Perfluorooctanoic Acid (PFOA)Results Map – Updated August 3, 2016.” New York State Department of Health.
Nzeribe, Blossom Nwedo, Michelle Crimi, Selma Mededovic Thagard, and Thomas M. Holsen. 2019. “Physico-ChemicalProcesses for the Treatment of Per- And Polyfluoroalkyl Substances (PFAS): A review.” Critical Reviews inEnvironmental Science and Technology 49 (10):866-915. doi: 10.1080/10643389.2018.1542916.
O’Fallon, L. R., F. L. Tyson, and A Dearry. 2000. Successful Models of Community-Based Participatory Research: FinalReport. Research Triangle Park, NC: National Institute of Environmental Health Sciences.
Oakes Ken D., Paul K. Sibley, Jon W. Martin, Dan D. MacLean, Keith R. Solomon, Scott A. Mabury, and Glen J. Van DerKraak. 2005. Short-term exposures of fish to perfluorooctane sulfonate: Acute effects on fatty acyl-CoA oxidaseactivity, oxidative stress, and circulating sex steroids. Environ Contam Toxicol 24 (5):1172-1181. DOI:10.1897/04-419.1
Obo, Hayato, Nozomi Takeuchi, and Koichi Yasuoka. 2015. Decomposition of Perfluoro Compounds using Plasmas withinBubbles in Water and Simulation of Decomposition System by Circuit Modeling of Plasma. Vol. 135.
Ochiai, Tsuyoshi, Yuichi Iizuka, Kazuya Nakata, Taketoshi Murakami, Donald A. Tryk, Akira Fujishima, Yoshihiro Koide,and Yuko Morito. 2011. “Efficient electrochemical decomposition of perfluorocarboxylic acids by the use of a boron-doped diamond electrode.” Diamond and Related Materials 20 (2):64-67. doi:https://doi.org/10.1016/j.diamond.2010.12.008.
Ochoa-Herrera, Valeria, and Reyes Sierra-Alvarez. 2008. “Removal of perfluorinated surfactants by sorption ontogranular activated carbon, zeolite and sludge.” Chemosphere 72 (10):1588-1593. doi:
Page 297ITRC PFAS-1
https://doi.org/10.1016/j.chemosphere.2008.04.029.
Ochoa-Herrera, Valeria, Reyes Sierra-Alvarez, Arpad Somogyi, Neil E. Jacobsen, Vicki H. Wysocki, and Jim A. Field. 2008.“Reductive Defluorination of Perfluorooctane Sulfonate.” Environmental Science & Technology 42 (9):3260-3264.doi: 10.1021/es702842q.
OECD. 2002. Hazard assessment of perfluorooctane sulfonate (PFOS) and its salts. edited by Pesticides ENV/JM/RD(2002)17/FINAL. Joint Meeting of the Chemicals Committee and the Working Party on Chemicals, and Biotechnology,Environment Directorate, Organisation for Economic Co-operation and Development. . Parishttp://www.oecd.org/dataoecd/23/18/2382880.pdf.
OECD. 2006. “Results of the 2006 Survey on Production and Use of PFOS, PFAS, PFOA, PFCA, Their Related Substancesand Products/Mixtures Containing These Substances.” ENV-JM-MONO(2006)36, Paris: OECD.
OECD. 2007. “Report of an OECD Workshop on Perfluorocarboxylic Acids (PFCAs) and Precursors.” ENV-JM-MONO(2007)11, Paris: OECD.
OECD. 2011. “PFCS: Outcome of the 2009 Survey – Survey on the Production, Use and Release of PFOS, PFAS, PFOA,PFCA, Their Related Substances and Products/Mixtures Containing These Substances.” ENV-JM-MONO(2011)1, Paris:OECD. .
OECD. 2013. Synthesis paper on per- and polyfluorinated chemicals (PFCs). OECD/UNEP Global PFC Group.https://www.oecd.org/env/ehs/risk-management/PFC_FINAL-Web.pdf
OECD. 2015a. Risk Reduction Approaches for PFASs – a Cross-Country Analysis.http://www.oecd.org/chemicalsafety/risk-management/Risk_Reduction_Approaches%20for%20PFASS.pdf.
OECD. 2015b. Working Towards a Global Emission Inventory of PFASs: Focus on PFCAs – Status Quo and the WayForward. No. 30. Paris, France: Health and Safety Publicaitons. Series on Risk Management OECD Environment.http://www.oecd.org/chemicalsafety/risk-management/Working%20Towards%20a%20Global%20Emission%20Inventory%20of%20PFASS.pdf
OECD. 2017. “Portal on Per and Poly Fluorinated Chemicals.” accessed 2017.http://www.oecd.org/chemicalsafety/portal-perfluorinated-chemicals/.
OECD. 2018. “Toward a New Comprehensive Global Database of Per- And Polyfluoroalkyl Substances (PFASs): SummaryReport on Updating the OECD 2007 List of Per- and Polyfluoroalkyl Substances (PFASs) ” ENV/JM/MONO(2018)7. Paris: OECD.
OEHHA. 2019. California Environmental Protection Agency.https://oehha.ca.gov/media/downloads/water/chemicals/nl/final-pfoa-pfosnl082119.pdf.
Ohmori, K., N. Kudo, K. Katayama, and Y. Kawashima. 2003. “Comparison of the toxicokinetics betweenperfluorocarboxylic acids with different carbon chain length.” Toxicology 184 (2-3):135-40.
Oliaei, F., D. Kriens, and K. Kessler. 2006. “Investigation of Perfluorochemical (PFC) Contamination in Minnesota PhaseOne.” Report to Senate Environment Committee.
Oliaei, F., D. Kriens, and R. Weber. 2010. “Discovery and Investigation of PFOS/PFCs Contamination from a PFCManufacturing Facility in Minnesota – Environmental Releases and Exposure Risks.” Organohalogen Compounds72:1338-1341.
Oliaei, Fardin, Don Kriens, Roland Weber, and Alan Watson. 2013. “PFOS and PFC releases and associated pollution froma PFC production plant in Minnesota (USA).” Environmental Science and Pollution Research 20 (4):1977-1992. doi:10.1007/s11356-012-1275-4.
Olsen, G. W. 2015. “PFAS biomonitoring in higher exposed populations.” In Toxicological Effects of Perfluoroalkyl andPolyfluoroalkyl Substances, edited by J.D. DeWitt, 77-126. Humana Press.
Olsen, G. W., M. M. Burlew, J. C. Marshall, J. M. Burris, and J. H. Mandel. 2004. “Analysis of episodes of care in aperfluorooctanesulfonyl fluoride production facility.” J Occup Environ Med 46 (8):837-46.
Page 298ITRC PFAS-1
Olsen, G. W., J. M. Burris, D. J. Ehresman, J. W. Froehlich, A. M. Seacat, J. L. Butenhoff, and L. R. Zobel. 2007. “Half-life ofserum elimination of perfluorooctanesulfonate,perfluorohexanesulfonate, and perfluorooctanoate in retiredfluorochemical production workers.” Environ Health Perspect 115 (9):1298-305. doi: 10.1289/ehp.10009.
Olsen, G. W., S. C. Chang, P. E. Noker, G. S. Gorman, D. J. Ehresman, P. H. Lieder, and J. L. Butenhoff. 2009. “Acomparison of the pharmacokinetics of perfluorobutanesulfonate (PFBS) in rats, monkeys, and humans.” Toxicology256 (1-2):65-74. doi: 10.1016/j.tox.2008.11.008.
Olsen, Geary W., Timothy R. Church, John P. Miller, Jean M. Burris, Kristen J. Hansen, James K. Lundberg, John B.Armitage, Ross M. Herron, Zahra Medhdizadehkashi, John B. Nobiletti, E. Mary O’Neill, Jeffrey H. Mandel, and Larry R.Zobel. 2003. “Perfluorooctanesulfonate and other fluorochemicals in the serum of American Red Cross adult blooddonors.” Environmental health perspectives 111 (16):1892-1901. doi: 10.1289/ehp.6316.
Olsen, Geary W., David C. Mair, Cleston Lange, Laura M. Harrington, Timothy Church, Corinne L. Goldberg, Ross Herron,Hank Hanna, John B. Nobiletti, Jorge A. Rios, William K. Reagen, and Carol A. Ley. 2017. Per- and polyfluoroalkylsubstances (PFAS) in American Red Cross adult blood donors, 2000-2015. Vol. 157.
OSHA. 2013. “Fact Sheet: Controlling Hexavalent Chromium Exposures during Electroplating.” United States Departmentof Labor. .
Pachkowski, B., G. B. Post, and A. H. Stern. 2019. “The derivation of a Reference Dose (RfD) for perfluorooctanesulfonate (PFOS) based on immune suppression.” Environ Res 171:452-469. doi: 10.1016/j.envres.2018.08.004.
Palmer, S.J., R.L Van Hoven, and H.O. Krueger. 2002. Perfluorooctanesulfonate, potassium salt (PFOS): a 96-hr staticacute toxicity test with the rainbow trout (Oncorhynchus mykiss). Wildlife International Ltd. Report No. 454A-145.EPA Docket AR226-1030a044.
Palmer, S. J., and H. O. Krueger. 2001. PFOS: A frog embryo teratogenesis assay-Xenopus(FETAX).
Pan, Chang-Gui, Guang-Guo Ying, You-Sheng Liu, Qian-Qian Zhang, Zhi-Feng Chen, Feng-Jiao Peng, and Guo-YongHuang. 2014. “Contamination profiles of perfluoroalkyl substances in five typical rivers of the Pearl River Deltaregion, South China.” Chemosphere 114:16-25. doi: https://doi.org/10.1016/j.chemosphere.2014.04.005.
Pan, Chang-Gui, Guang-Guo Ying, Jian-Liang Zhao, You-Sheng Liu, Yu-Xia Jiang, and Qian-Qian Zhang. 2014.“Spatiotemporal distribution and mass loadings of perfluoroalkyl substances in the Yangtze River of China.” Scienceof The Total Environment 493:580-587. doi: https://doi.org/10.1016/j.scitotenv.2014.06.033.
Park, Hyunwoong, Chad D. Vecitis, Jie Cheng, Wonyong Choi, Brian T. Mader, and Michael R. Hoffmann. 2009. “ReductiveDefluorination of Aqueous Perfluorinated Alkyl Surfactants: Effects of Ionic Headgroup and Chain Length.” TheJournal of Physical Chemistry A 113 (4):690-696. doi: 10.1021/jp807116q.
Park, S., C. de Perre, and L. S. Lee. 2017. “Alternate Reductants with VB12 to Transform C8 and C6 PerfluoroalkylSulfonates: Limitations and Insights into Isomer-Specific Transformation Rates, Products and Pathways.” Environ SciTechnol 51 (23):13869-13877. doi: 10.1021/acs.est.7b03744.
Park, Saerom, Linda S. Lee, Victor F. Medina, Aaron Zull, and Scott Waisner. 2016. “Heat-activated persulfate oxidationof PFOA, 6:2 fluorotelomer sulfonate, and PFOS under conditions suitable for in-situ groundwater remediation.”Chemosphere 145:376-383. doi: https://doi.org/10.1016/j.chemosphere.2015.11.097.
Parker, B. L., J. A. Cherry, and S. W. Chapman. 2004. “Field study of TCE diffusion profiles below DNAPL to assessaquitard integrity.” J Contam Hydrol 74 (1-4):197-230. doi: 10.1016/j.jconhyd.2004.02.011.
Parsons, J. R., M. Saez, J. Dolfing, and P. de Voogt. 2008. “Biodegradation of perfluorinated compounds.” Rev EnvironContam Toxicol 196:53-71.
Paul, Alexander G., Kevin C. Jones, and Andrew J. Sweetman. 2009. “A First Global Production, Emission, AndEnvironmental Inventory For Perfluorooctane Sulfonate.” Environmental Science & Technology 43 (2):386-392. doi:10.1021/es802216n.
Pereira, Luís A. M., Luís F. G. Martins, José R. Ascenso, Pedro Morgado, João P. Prates Ramalho, and Eduardo J. M. Filipe.
Page 299ITRC PFAS-1

2014. “Diffusion Coefficients of Fluorinated Surfactants in Water: Experimental Results and Prediction by ComputerSimulation.” Journal of Chemical & Engineering Data 59 (10):3151-3159. doi: 10.1021/je500211w.
Perkins, R. G., J. L. Butenhoff, G. L. Kennedy, Jr., and M. J. Palazzolo. 2004. “13-week dietary toxicity study of ammoniumperfluorooctanoate (APFO) in male rats.” Drug Chem Toxicol 27 (4):361-78. doi: 10.1081/DCT-200039773.
Persson, J., and N. Andersson. 2016. Modeling groundwater flow and PFOS transport. A case study at the old fire drill siteof Bromma Stockholm Airport. Stockholm, Sweden.http://www.diva-portal.org/smash/get/diva2:946450/FULLTEXT02.pdf.
Phillips, S., P. Murphy, G. Brickle, and D. Burns. 2018. Validation of Foam Fractionation as an Effective TreatmentTechnology. OPEC Systems.https://www.opecsystems.com/persistent/catalogue_files/categories/opecsystemspfassolutionsposterforecoforum.pdf.
Piekarz, Arkadiusz M., Toby Primbs, Jennifer A. Field, Douglas F. Barofsky, and Staci Simonich. 2007. “SemivolatileFluorinated Organic Compounds in Asian and Western U.S. Air Masses.” Environmental Science & Technology 41(24):8248-8255. doi: 10.1021/es0713678.
Pillai, Suresh. 2016. Introduction to Electron-Beam Food Irradiation. Vol. 112.
Pillai, Suresh, and Shima Shayanfar. 2016. Electron Beam Technology and Other Irradiation Technology Applications inthe Food Industry. Vol. 375.
Place, Benjamin J., and Jennifer A. Field. 2012. “Identification of Novel Fluorochemicals in Aqueous Film-Forming FoamsUsed by the US Military.” Environmental Science & Technology 46 (13):7120-7127. doi: 10.1021/es301465n.
Plastics Industry Association. 2019. Guide to the Safe Handling of Fluoropolymer Resins. Washington DC.https://access.plasticsindustry.org/ItemDetail?iProductCode=BU201&Category=PUBLICATIO&WebsiteKey=7cf6f8c9-ad49-40af-a01f-0b8c06a4b8f6.
Plumlee, Megan H., Kristopher McNeill, and Martin Reinhard. 2009. “Indirect Photolysis of Perfluorochemicals: HydroxylRadical-Initiated Oxidation of N-Ethyl Perfluorooctane Sulfonamido Acetate (N-EtFOSAA) and OtherPerfluoroalkanesulfonamides.” Environmental Science & Technology 43 (10):3662-3668. doi: 10.1021/es803411w.
Pohland, F.G. and J.T. Graven. 1993. “. The Use of Alternative Materials for Daily Cover at Municpal Solid WasteLandfills.” USEPA Research and Development EPA/600/SR-93/172
Posner, Stefan, Sandra Roos, Pia Poulsen, Hrönn Jörundsdóttir, Gunlaugsdottir H, Xenia Trier, Allan Jensen, AthanasiosKatsoyiannis, Dorte Herzke, Eva Cecilie Bonefeld-Jørgensen, Christina Jönsson, Gitte Alsing, Mandana Ghisari, andSophie Jensen. 2013. Per- and polyfluorinated substances in the Nordic countries. Use, occurrence and toxicology.
Post, G. B. 2013. “Perfluorinated Chemicals (PFCs) – Emerging Drinking Water Contaminants. Presentation slides ofGloria B. Post, Office if Science, New Jersey Department of Environmental Protection, to the Delaware River BasinCommission, Toxics Advisory Committee, West Trenton, New Jersey.”
Post, G. B., J. B. Louis, R. L. Lippincott, and N. A. Procopio. 2013. “Occurrence of perfluorinated compounds in raw waterfrom New Jersey public drinking water systems.” Environ Sci Technol 47 (23):13266-75. doi: 10.1021/es402884x.
Post, Gloria B., Perry D. Cohn, and Keith R. Cooper. 2012. “Perfluorooctanoic acid (PFOA), an emerging drinking watercontaminant: A critical review of recent literature.” Environmental Research 116:93-117. doi:https://doi.org/10.1016/j.envres.2012.03.007.
Post, Gloria B., Jessie A. Gleason, and Keith R. Cooper. 2017. “Key scientific issues in developing drinking waterguidelines for perfluoroalkyl acids: Contaminants of emerging concern.” PLOS Biology 15 (12):e2002855. doi:10.1371/journal.pbio.2002855.
Poulsen, P. B., A. A. Jensen, E. Wallstrom, and E. N. P. R. O Aps,. 2005. ” More Environmentally Friendly Alternatives toPFOS-Compounds and PFOA.” Danish Environmental Protection Agency Environmental Project, 1013.
Praveen, Chandni, Palmy R. Jesudhasan, Robert S. Reimers, and Suresh D. Pillai. 2013. “Electron beam inactivation of
Page 300ITRC PFAS-1
selected microbial pathogens and indicator organisms in aerobically and anaerobically digested sewage sludge.”Bioresource Technology 144:652-657. doi: https://doi.org/10.1016/j.biortech.2013.07.034.
Prevedouros, Konstantinos, Ian T. Cousins, Robert C. Buck, and Stephen H. Korzeniowski. 2006. “Sources, Fate andTransport of Perfluorocarboxylates.” Environmental Science & Technology 40 (1):32-44. doi: 10.1021/es0512475.
Princz, Juliska, Muriel Jatar, Heather Lemieux, and Rick Scroggins. 2018. “Perfluorooctane sulfonate in surface soils:Effects on reproduction in the collembolan, Folsomia candida, and the oribatid mite, Oppia nitens.” Chemosphere208:757-763. doi: https://doi.org/10.1016/j.chemosphere.2018.06.020.
Procopio, Nicholas, Robert Karl, Sandra M. Goodrow, Joseph Maggio, Judith B. Louis, and Thomas B. Atherholt. 2017.Occurrence and source identification of perfluoroalkyl acids (PFAAs) in the Metedeconk River Watershed, New Jersey.Vol. 24.
Punyapalakul, Patiparn, Kuntida Suksomboon, Panida Prarat, and Sutha Khaodhiar. 2013. Effects of Surface FunctionalGroups and Porous Structures on Adsorption and Recovery of Perfluorinated Compounds by Inorganic Porous Silicas.Vol. 48.
Qi, Ping, Ying Wang, Jingli Mu, and Juying Wang. 2011. “Aquatic predicted no-effect-concentration derivation forperfluorooctane sulfonic acid.” Environmental Toxicology and Chemistry 30 (4):836-842. doi: 10.1002/etc.460.
Qi, Yanjie, Shouliang Huo, Beidou Xi, Shibin Hu, Jingtian Zhang, and Zhuoshi He. 2016. Spatial distribution and sourceapportionment of PFASs in surface sediments from five lake regions, China. Vol. 6.
Qu, Yan, Chao-Jie Zhang, Pei Chen, Qi Zhou, and Wei-Xian Zhang. 2014. “Effect of initial solution pH on photo-inducedreductive decomposition of perfluorooctanoic acid.” Chemosphere 107:218-223. doi:https://doi.org/10.1016/j.chemosphere.2013.12.046.
Queensland Government. 2018. Environmental Management of Fire Fighting Foam – Operational Policy.https://www.qld.gov.au/environment/pollution/management/investigation-pfas/operational-policy.
Quist, E. M., A. J. Filgo, C. A. Cummings, G. E. Kissling, M. J. Hoenerhoff, and S. E. Fenton. 2015. “Hepatic MitochondrialAlteration in CD-1 Mice Associated with Prenatal Exposures to Low Doses of Perfluorooctanoic Acid (PFOA).” ToxicolPathol 43 (4):546-57. doi: 10.1177/0192623314551841.
Radjenovic, Jelena, and David L. Sedlak. 2015. “Challenges and Opportunities for Electrochemical Processes as Next-Generation Technologies for the Treatment of Contaminated Water.” Environmental Science & Technology 49(19):11292-11302. doi: 10.1021/acs.est.5b02414.
Rahman, Sheikh, Matthew Eckelman, Annalisa Onnis-Hayden, and April Gu. 2014. Environmental SustainabilityAssessment of Technologies for Removal of Contaminants of Emerging Concern. Vol. 2014.
Raleigh, Katherine K., Bruce H. Alexander, Geary W. Olsen, Gurumurthy Ramachandran, Sandy Z. Morey, Timothy R.Church, Perry W. Logan, Laura L. F. Scott, and Elizabeth M. Allen. 2014. “Mortality and cancer incidence inammonium perfluorooctanoate production workers.” Occupational and Environmental Medicine 71 (7):500. doi:10.1136/oemed-2014-102109.
Rand, Amy, and Scott A. Mabury. 2016. Is there a human health risk associated with indirect exposure to perfluorinatedcarboxylates (PFCAs)? Vol. 375.
Rankin, Keegan, Holly Lee, Pablo J. Tseng, and Scott A. Mabury. 2014. “Investigating the Biodegradability of aFluorotelomer-Based Acrylate Polymer in a Soil–Plant Microcosm by Indirect and Direct Analysis.” EnvironmentalScience & Technology 48 (21):12783-12790. doi: 10.1021/es502986w.
Rankin, Keegan, Scott A. Mabury, Thomas M. Jenkins, and John W. Washington. 2016. “A North American and globalsurvey of perfluoroalkyl substances in surface soils: Distribution patterns and mode of occurrence.” Chemosphere161:333-341. doi: https://doi.org/10.1016/j.chemosphere.2016.06.109.
Rao, N. S., and B. E. Baker. 1994. “Textile Finishes and Fluorosurfactants.” In Organofluorine Chemistry. Topics inApplied Chemistry, edited by R.E. Banks, B.E. Smart and J.C. Tatlow, 321-338. Boston, MA: Springer doi:
Page 301ITRC PFAS-1
10.1007/978-1-4899-1202-2_15.
Rappazzo, K. M., E. Coffman, and E. P. Hines. 2017. “Exposure to Perfluorinated Alkyl Substances and Health Outcomesin Children: A Systematic Review of the Epidemiologic Literature.” Int J Environ Res Public Health 14 (7). doi:10.3390/ijerph14070691.
Ras, C., and Harro von Blottnitz. 2012. A comparative life cycle assessment of process water treatment technologies atthe Secunda industrial complex, South Africa. Vol. 38.
Rayaroth, Manoj, Usha Aravind, and Charuvila Aravindakumar. 2016. Degradation of pharmaceuticals by ultrasound-based advanced oxidation process. Vol. 14.
Rayne, S., and K. Forest. 2009. “Perfluoroalkyl sulfonic and carboxylic acids: a critical review of physicochemicalproperties, levels and patterns in waters and wastewaters, and treatment methods.” J Environ Sci Health A ToxHazard Subst Environ Eng 44 (12):1145-99. doi: 10.1080/10934520903139811.
Rebholz, Sandra L., Thomas Jones, Robert L. Herrick, Changchun Xie, Antonia M. Calafat, Susan M. Pinney, and Laura A.Woollett. 2016. “Hypercholesterolemia with consumption of PFOA-laced Western diets is dependent on strain andsex of mice.” Toxicology Reports 3:46-54. doi: https://doi.org/10.1016/j.toxrep.2015.11.004.
Reed, M. S., A. Graves, N. Dandy, H. Posthumus, K. Hubacek, J. Morris, C. Prell, C. H. Quinn, and L. C. Stringer. 2009.“‘Who’s in and why?’ A typology of stakeholder analysis methods for natural resource management.” Journal ofEnvironmental Management 90 (5):1933-49.
Reiner, J. L., and Benjamin J. Place. 2015. “Perfluorinated Alkyl Acids in Wildlife.” In Toxicological Effects of Perfluoroalkyland Polyfluoralkyl Substances., edited by J.C. DeWitt. Humana Press, Cham doi:https://doi.org/10.1007/978-3-319-15518-0_5.
Reiner, Jessica L., Steven G. O’Connell, Amanda J. Moors, John R. Kucklick, Paul R. Becker, and Jennifer M. Keller. 2011.“Spatial and Temporal Trends of Perfluorinated Compounds in Beluga Whales (Delphinapterus leucas) from Alaska.”Environmental Science & Technology 45 (19):8129-8136. doi: 10.1021/es103560q.
Renner, Rebecca. 2001. “Growing Concern Over Perfluorinated Chemicals.” Environmental Science & Technology 35(7):154A-160A. doi: 10.1021/es012317k.
Rhoads, Kurt R., Elisabeth M. L. Janssen, Richard G. Luthy, and Craig S. Criddle. 2008. “Aerobic Biotransformation andFate of N-Ethyl Perfluorooctane Sulfonamidoethanol (N-EtFOSE) in Activated Sludge.” Environmental Science &Technology 42 (8):2873-2878. doi: 10.1021/es702866c.
Rhoads, Kurt R., Katherine H. Rostkowski, Peter K. Kitanidis, and Craig S. Criddle. 2013. “Use of on-site bioreactors toestimate the biotransformation rate of N-ethyl perfluorooctane sulfonamidoethanol (N-EtFOSE) during activatedsludge treatment.” Chemosphere 92 (6):702-707. doi: https://doi.org/10.1016/j.chemosphere.2013.04.059.
Rich, Courtney D., Andrea C. Blaine, Lakhwinder Hundal, and Christopher P. Higgins. 2015. “Bioaccumulation ofPerfluoroalkyl Acids by Earthworms (Eisenia fetida) Exposed to Contaminated Soils.” Environmental Science &Technology 49 (2):881-888. doi: 10.1021/es504152d.
Riddell, Nicole, Gilles Arsenault, Jonathan P. Benskin, Brock Chittim, Jonathan W. Martin, Alan McAlees, and RobertMcCrindle. 2009. “Branched Perfluorooctane Sulfonate Isomer Quantification and Characterization in Blood SerumSamples by HPLC/ESI-MS(/MS).” Environmental Science & Technology 43 (20):7902-7908. doi: 10.1021/es901261v.
Ritter, Evelyn E., Margaret E. Dickinson, John P. Harron, David M. Lunderberg, Paul A. DeYoung, Alix E. Robel, Jennifer A.Field, and Graham F. Peaslee. 2017. “PIGE as a screening tool for Per- and polyfluorinated substances in papers andtextiles.” Nuclear Instruments and Methods in Physics Research Section B: Beam Interactions with Materials andAtoms 407:47-54. doi: https://doi.org/10.1016/j.nimb.2017.05.052.
RIVM. 2016. “Evaluation of substances used in the GenX technology by Chemours, Dordrecht. RIVM Letter Report2016-0174 M. Beekman et al. The Netherlands.”
Robel, Alix E., Kristin Marshall, Margaret Dickinson, David Lunderberg, Craig Butt, Graham Peaslee, Heather M.
Page 302ITRC PFAS-1
Stapleton, and Jennifer A. Field. 2017. “Closing the Mass Balance on Fluorine on Papers and Textiles.” EnvironmentalScience & Technology 51 (16):9022-9032. doi: 10.1021/acs.est.7b02080.
Robertson, J. C. 1986. Potential for environmental impact of AFA-6 surfactant. EPA Docket AR266-1030a043.Missassauga, Ontario, Canada: Beak Consultants Ltd.
Rodriguez-Freire, Lucia, Rajesh Balachandran, Reyes Sierra-Alvarez, and Manish Keswani. 2015. “Effect of soundfrequency and initial concentration on the sonochemical degradation of perfluorooctane sulfonate (PFOS).” Journal ofHazardous Materials 300:662-669. doi: https://doi.org/10.1016/j.jhazmat.2015.07.077.
Ross, Ian, Jeffrey McDonough, Jonathan Miles, Peter Storch, Parvathy Thelakkat Kochunarayanan, Erica Kalve, Jake Hurst,Soumitri S. Dasgupta, and Jeff Burdick. 2018. “A review of emerging technologies for remediation of PFASs.”Remediation Journal 28 (2):101-126. doi: 10.1002/rem.21553.
Rotander, A., L. M. Toms, L. Aylward, M. Kay, and J. F. Mueller. 2015. “Elevated levels of PFOS and PFHxS in firefightersexposed to aqueous film forming foam (AFFF).” Environ Int 82:28-34. doi: 10.1016/j.envint.2015.05.005.
Roux, I. le, H. M. Krieg, C. A. Yeates, and J. C. Breytenbach. 2005. “Use of chitosan as an antifouling agent in amembrane bioreactor.” Journal of Membrane Science 248 (1):127-136. doi:https://doi.org/10.1016/j.memsci.2004.10.005.
RPA. 2004. “Perfluorooctane Sulphonate – Risk reduction strategy and analysis of advantages and drawbacks.”.Department for Environment, Food and Rural Affairs and the Environment Agency for England and Wales,.
Russell, M. H., H. Nilsson, and R. C. Buck. 2013. “Elimination kinetics of perfluorohexanoic acid in humans andcomparison with mouse, rat and monkey.” Chemosphere 93 (10):2419-25. doi: 10.1016/j.chemosphere.2013.08.060.
Russell, Mark H., William R. Berti, Bogdan Szostek, and Robert C. Buck. 2008. “Investigation of the BiodegradationPotential of a Fluoroacrylate Polymer Product in Aerobic Soils.” Environmental Science & Technology 42 (3):800-807.doi: 10.1021/es0710499.
Russell, Mark H., William R. Berti, Bogdan Szostek, Ning Wang, and Robert C. Buck. 2010. “Evaluation of PFO formationfrom the biodegradation of a fluorotelomer-based urethane polymer product in aerobic soils.” Polymer Degradationand Stability 95 (1):79-85. doi: https://doi.org/10.1016/j.polymdegradstab.2009.10.004.
SA EPA. 2017. “Consultation Report: Draft amendment to ban the use of fire-fighting foams containing perfluorinatedalkylated substances (PFAS).”21.
Sacramento State University. 2019. “Empty Bed Contact Time Definition.” Office of Water Programs, Department of CivilEngineering, accessed 01-25-2020. https://www.owp.csus.edu/glossary/empty-bed-contact-time.php.
Saez, M., P. de Voogt, and J. R. Parsons. 2008. “Persistence of perfluoroalkylated substances in closed bottle tests withmunicipal sewage sludge.” Environ Sci Pollut Res Int 15 (6):472-7. doi: 10.1007/s11356-008-0020-5.
Saito, N., K. Harada, K. Inoue, K. Sasaki, T. Yoshinaga, and A. Koizumi. 2004. “Perfluorooctanoate and perfluorooctanesulfonate concentrations in surface water in Japan.” J Occup Health 46 (1):49-59. doi: 10.1539/joh.46.49.
Sandman, P. 2013. “Responding to Community Outrage: Strategies for Effective Risk Communication. .” AmericanIndustrial Hygiene Association.
Sant, Karilyn E., Olivia L. Venezia, Paul P. Sinno, and Alicia R. Timme-Laragy. 2018. “Perfluorobutanesulfonic AcidDisrupts Pancreatic Organogenesis and Regulation of Lipid Metabolism in the Zebrafish, Danio rerio.” ToxicologicalSciences 167 (1):258-268. doi: 10.1093/toxsci/kfy237.
Savitz, D. A., C. R. Stein, S. M. Bartell, B. Elston, J. Gong, H. M. Shin, and G. A. Wellenius. 2012. “Perfluorooctanoic acidexposure and pregnancy outcome in a highly exposed community.” Epidemiology 23 (3):386-92. doi:10.1097/EDE.0b013e31824cb93b.
Schaefer, Charles E., Christina Andaya, Aniela Burant, Charles W. Condee, Ana Urtiaga, Timothy J. Strathmann, andChristopher P. Higgins. 2017. “Electrochemical treatment of perfluorooctanoic acid and perfluorooctane sulfonate:Insights into mechanisms and application to groundwater treatment.” Chemical Engineering Journal 317:424-432.
Page 303ITRC PFAS-1
doi: https://doi.org/10.1016/j.cej.2017.02.107.
Schaefer, Charles E., Sarah Choyke, P. Lee Ferguson, Christina Andaya, Aniela Burant, Andrew Maizel, Timothy J.Strathmann, and Christopher P. Higgins. 2018. “Electrochemical Transformations of Perfluoroalkyl Acid (PFAA)Precursors and PFAAs in Groundwater Impacted with Aqueous Film Forming Foams.” Environmental Science &Technology 52 (18):10689-10697. doi: 10.1021/acs.est.8b02726.
Schaider, L. A., J. M. Ackerman, and R. A. Rudel. 2016. “Septic systems as sources of organic wastewater compounds indomestic drinking water wells in a shallow sand and gravel aquifer.” Sci Total Environ 547:470-481. doi:10.1016/j.scitotenv.2015.12.081.
Schaider, Laurel A., Simona A. Balan, Arlene Blum, David Q. Andrews, Mark J. Strynar, Margaret E. Dickinson, David M.Lunderberg, Johnsie R. Lang, and Graham F. Peaslee. 2017. “Fluorinated Compounds in U.S. Fast Food Packaging.”Environmental Science & Technology Letters 4 (3):105-111. doi: 10.1021/acs.estlett.6b00435.
Schenker, Urs, Martin Scheringer, Matthew MacLeod, Jonathan W. Martin, Ian T. Cousins, and Konrad Hungerbühler.2008. “Contribution of Volatile Precursor Substances to the Flux of Perfluorooctanoate to the Arctic.” EnvironmentalScience & Technology 42 (10):3710-3716. doi: 10.1021/es703165m.
Scher, Deanna P., James E. Kelly, Carin A. Huset, Kitrina M. Barry, Richard W. Hoffbeck, Virginia L. Yingling, and Rita B.Messing. 2018. “Occurrence of perfluoroalkyl substances (PFAS) in garden produce at homes with a history of PFAS-contaminated drinking water.” Chemosphere 196:548-555. doi: https://doi.org/10.1016/j.chemosphere.2017.12.179.
Scheringer, Martin, Xenia Trier, Ian T. Cousins, Pim de Voogt, Tony Fletcher, Zhanyun Wang, and Thomas F. Webster.2014. “Helsingør Statement on poly- and perfluorinated alkyl substances (PFASs).” Chemosphere 114:337-339. doi:https://doi.org/10.1016/j.chemosphere.2014.05.044.
Schuetze, Andrea, Thomas Heberer, Stefan Effkemann, and Susanne Juergensen. 2010. “Occurrence and assessment ofperfluorinated chemicals in wild fish from Northern Germany.” Chemosphere 78 (6):647-652. doi:https://doi.org/10.1016/j.chemosphere.2009.12.015.
Schultz, Melissa M., Christopher P. Higgins, Carin A. Huset, Richard G. Luthy, Douglas F. Barofsky, and Jennifer A. Field.2006. “Fluorochemical Mass Flows in a Municipal Wastewater Treatment Facility.” Environmental Science &Technology 40 (23):7350-7357. doi: 10.1021/es061025m.
Seacat, A. M., P. J. Thomford, K. J. Hansen, G. W. Olsen, M. T. Case, and J. L. Butenhoff. 2002. “Subchronic toxicity studieson perfluorooctanesulfonate potassium salt in cynomolgus monkeys.” Toxicol Sci 68 (1):249-64. doi:10.1093/toxsci/68.1.249.
Sehmel, G. A. . 1984. “Deposition and Resuspension. In: Atmospheric Science and Power Production.” U.S. Departmentof Energy. Report DOE/TIC-27601. .
Sepulvado, Jennifer G., Andrea C. Blaine, Lakhwinder S. Hundal, and Christopher P. Higgins. 2011. “Occurrence and Fateof Perfluorochemicals in Soil Following the Land Application of Municipal Biosolids.” Environmental Science &Technology 45 (19):8106-8112. doi: 10.1021/es103903d.
SERDP-ESTCP. 2017. Summary Report: SERDP and ESTCP Workshop on Research and Demonstration Needs forManagement of AFFF-Impacted Sites.
SERDP-ESTCP. 2019. “Per- and Polyfluoroalkyl Substances (PFASs).” accessed 2019.https://www.serdp-estcp.org/Featured-Initiatives/Per-and-Polyfluoroalkyl-Substances-PFASs.
Shan, G., M. Wei, L. Zhu, Z. Liu, and Y. Zhang. 2014. “Concentration profiles and spatial distribution of perfluoroalkylsubstances in an industrial center with condensed fluorochemical facilities.” Sci Total Environ 490:351-9. doi:10.1016/j.scitotenv.2014.05.005.
Shi, Yali, Robin Vestergren, Lin Xu, Xiaowei Song, Xiameng Niu, Chunhui Zhang, and Yaqi Cai. 2015. “Characterizingdirect emissions of perfluoroalkyl substances from ongoing fluoropolymer production sources: A spatial trend studyof Xiaoqing River, China.” Environmental Pollution 206:104-112. doi: https://doi.org/10.1016/j.envpol.2015.06.035.
Page 304ITRC PFAS-1
Shin, Hyeong-Moo, P. B. Ryan, V. M. Vieira, and S. M. Bartell. 2012. “Modeling the air-soil transport pathway ofperfluorooctanoic acid in the mid-Ohio Vallley using linked air dispersion and vadose zone models.” AtmosphericEnvironment 51:67-74.
Shin, Hyeong-Moo, Verónica M. Vieira, P. Barry Ryan, Russell Detwiler, Brett Sanders, Kyle Steenland, and Scott M.Bartell. 2011. “Environmental Fate and Transport Modeling for Perfluorooctanoic Acid Emitted from the WashingtonWorks Facility in West Virginia.” Environmental Science & Technology 45 (4):1435-1442. doi: 10.1021/es102769t.
Shoeib, Mahiba, Tom Harner, Michael Ikonomou, and Kurunthachalam Kannan. 2004. “Indoor and Outdoor AirConcentrations and Phase Partitioning of Perfluoroalkyl Sulfonamides and Polybrominated Diphenyl Ethers.”Environmental Science & Technology 38 (5):1313-1320. doi: 10.1021/es0305555.
Shoeib, Mahiba, Tom Harner, Glenys M. Webster, and Sum Chi Lee. 2011. “Indoor Sources of Poly- and PerfluorinatedCompounds (PFCS) in Vancouver, Canada: Implications for Human Exposure.” Environmental Science & Technology45 (19):7999-8005. doi: 10.1021/es103562v.
Shoeib, Mahiba, Penny Vlahos, Tom Harner, Andrew Peters, Margaret Graustein, and Julie Narayan. 2010. “Survey ofpolyfluorinated chemicals (PFCs) in the atmosphere over the northeast Atlantic Ocean.” Atmospheric Environment44 (24):2887-2893. doi: https://doi.org/10.1016/j.atmosenv.2010.04.056.
Shoemaker, J. A., P.E. Grimmett, and B.K. Boutin. 2009. Determination of Selected Perfluorinated Alkyl Acids in DrinkingWater by Solid Phase Extraction and Liquid Chromatography/Tandem Mass Spectrometry (LC/MS/MS). USEPA Method537, Rev 1.1, EPA 600-R-08-092: USEPA.
Shoemaker, J. A., and D. Tettenhorst. 2018. Method 537.1: Determination of Selected Per- and Polyfluorinated AlkylSubstances in Drinking Water by Solid Phase Extraction and Liquid Chromatography/Tandem Mass Spectrometry(LC/MS/MS). Washington, D. C.
SIA. 2008. “Use of PFAS/PFOA Compounds by USSIA Members in 2008.”.
Sibinski, L.J. . 1987. “Final report of a two year oral (diet) toxicity and carcinogenicity study of fluorochemical FC-143(perfluorooctanoate ammonium carboxylate) in rats. .” Vol. 1-4, 3M Company/RIKER. No.0281CR0012;8EHQ-1087-0394.
Siegrist, R.L., M. Crimi, and T.J. Simpkin. 2011. In situ chemical oxidation for groundwater remediation. Edited by R.L.Siegrist, M. Crimi and T.J. Simpkin. Vol. 3: Springer Science & Business Media.
Sindermann, A. B., J. R. Porch, H. O. Krueger, and R. L. Van Hoven. 2002. PFOS: an acute toxicity study with theearthworm in an artificial soil substrate. edited by Project No. 454-11. EPA Docket AR226-1106. Easton, MD.: WildlifeInternational Ltd.
Skutlarek, D., M. Exner, and H. Farber. 2006. “Perfluorinated surfactants in surface and drinking waters.” Environ SciPollut Res Int 13 (5):299-307.
Slinn, W.G.N. 1984. “Precipitation Scavening. In: Atmospheric Science and Power Production.” U.S. Department ofEnergy. Report DOE/TIC-27601.
Slovic, P. . 1987. “Perception of Risk.” Science 23:280-285.
Slovic, Paul. 2003. “Going Beyond the Red Book: The Sociopolitics of Risk.” Human and Ecological Risk Assessment: AnInternational Journal 9 (5):1181-1190. doi: 10.1080/10807030390244577.
Smithwick, Marla, Scott A. Mabury, Keith R. Solomon, Christian Sonne, Jonathan W. Martin, Erik W. Born, Rune Dietz,Andrew E. Derocher, Robert J. Letcher, Thomas J. Evans, Geir W. Gabrielsen, John Nagy, Ian Stirling, Mitch K. Taylor,and Derek C. G. Muir. 2005. “Circumpolar Study of Perfluoroalkyl Contaminants in Polar Bears (Ursus maritimus).”Environmental Science & Technology 39 (15):5517-5523. doi: 10.1021/es048309w.
Smithwick, Marla, Derek C. G. Muir, Scott A. Mabury, Keith R. Solomon, Jonathan W. Martin, Christian Sonne, Erik W.Born, Robert J. Letcher, and Rune Dietz. 2005. “Perfluoroalkyl contaminants in liver tissue from East Greenland polarbears (Ursus maritimus).” Environmental Toxicology and Chemistry 24 (4):981-986. doi: 10.1897/04-258R.1.
Page 305ITRC PFAS-1
Snyder, S. A., E. C. Wert, H. X. Lei, P. Westerhoff, and Y. Yoon. . 2007. “Removal of EDCs and Pharmaceuticals in Drinkingand Reuse Treatment Processes.” AWWA Research Foundation, Denver, Colorado.
Söderqvist, Tore, Petra Brinkhoff, Tommy Norberg, Lars Rosén, Pär-Erik Back, and Jenny Norrman. 2015. “Cost-benefitanalysis as a part of sustainability assessment of remediation alternatives for contaminated land.” Journal ofEnvironmental Management 157:267-278. doi: https://doi.org/10.1016/j.jenvman.2015.04.024.
Song, Shuang, Jiaqi Fan, Zhiqiao He, Liyong Zhan, Zhiwu Liu, Jianmeng Chen, and Xinhua Xu. 2010. “Electrochemicaldegradation of azo dye C.I. Reactive Red 195 by anodic oxidation on Ti/SnO2–Sb/PbO2 electrodes.” ElectrochimicaActa 55 (11):3606-3613. doi: https://doi.org/10.1016/j.electacta.2010.01.101.
Song, Yinan, Deyi Hou, Junli Zhang, David O’Connor, Guanghe Li, Qingbao Gu, Shupeng Li, and Peng Liu. 2018.“Environmental and socio-economic sustainability appraisal of contaminated land remediation strategies: A casestudy at a mega-site in China.” Science of The Total Environment 610-611:391-401. doi:https://doi.org/10.1016/j.scitotenv.2017.08.016.
Song, Zhou, Heqing Tang, Nan Wang, and Lihua Zhu. 2013. “Reductive defluorination of perfluorooctanoic acid byhydrated electrons in a sulfite-mediated UV photochemical system.” Journal of Hazardous Materials 262:332-338.doi: https://doi.org/10.1016/j.jhazmat.2013.08.059.
Sörengård, Mattias, Dan B. Kleja, and Lutz Ahrens. 2019. “Stabilization and solidification remediation of soilcontaminated with poly- and perfluoroalkyl substances (PFASs).” Journal of Hazardous Materials 367:639-646. doi:https://doi.org/10.1016/j.jhazmat.2019.01.005.
Stahl, Leanne L., Blaine D. Snyder, Anthony R. Olsen, Thomas M. Kincaid, John B. Wathen, and Harry B. McCarty. 2014.“Perfluorinated compounds in fish from U.S. urban rivers and the Great Lakes.” Science of The Total Environment499:185-195. doi: https://doi.org/10.1016/j.scitotenv.2014.07.126.
Stahl, T., J. Heyn, H. Thiele, J. Huther, K. Failing, S. Georgii, and H. Brunn. 2009. “Carryover of perfluorooctanoic acid(PFOA) and perfluorooctane sulfonate (PFOS) from soil to plants.” Arch Environ Contam Toxicol 57 (2):289-98. doi:10.1007/s00244-008-9272-9.
Stahl, Thorsten, Rika Alessa Riebe, Sandy Falk, Klaus Failing, and Hubertus Brunn. 2013. “Long-Term LysimeterExperiment To Investigate the Leaching of Perfluoroalkyl Substances (PFASs) and the Carry-over from Soil to Plants:Results of a Pilot Study.” Journal of Agricultural and Food Chemistry 61 (8):1784-1793. doi: 10.1021/jf305003h.
Steenland, K., V. Barry, and D. Savitz. 2018. “Serum Perfluorooctanoic Acid and Birthweight: An Updated Meta-analysisWith Bias Analysis.” Epidemiology 29 (6):765-776. doi: 10.1097/ede.0000000000000903.
Steenland, K., and S. Woskie. 2012. “Cohort mortality study of workers exposed to perfluorooctanoic acid.” Am JEpidemiol 176 (10):909-17. doi: 10.1093/aje/kws171.
Steenland, Kyle, Chuangfang Jin, Jessica MacNeil, Cathy Lally, Alan Ducatman, Veronica Vieira, and Tony Fletcher. 2009.“Predictors of PFOA levels in a community surrounding a chemical plant.” Environmental health perspectives 117(7):1083-1088. doi: 10.1289/ehp.0800294.
Stefani, F., M. Rusconi, S. Valsecchi, and L. Marziali. 2014. “Evolutionary ecotoxicology of perfluoralkyl substances(PFASs) inferred from multigenerational exposure: a case study with Chironomus riparius (Diptera, Chironomidae).”Aquat Toxicol 156:41-51. doi: 10.1016/j.aquatox.2014.07.020.
Stein, C. R., M. S. Wolff, A. M. Calafat, K. Kato, and S. M. Engel. 2012. “Comparison of polyfluoroalkyl compoundconcentrations in maternal serum and amniotic fluid: a pilot study.” Reprod Toxicol 34 (3):312-6. doi:10.1016/j.reprotox.2012.05.039.
Stein, Cheryl R., David A. Savitz, and Marcelle Dougan. 2009. “Serum Levels of Perfluorooctanoic Acid andPerfluorooctane Sulfonate and Pregnancy Outcome.” American Journal of Epidemiology 170 (7):837-846. doi:10.1093/aje/kwp212.
Steinle-Darling, Eva, and Martin Reinhard. 2008. “Nanofiltration for Trace Organic Contaminant Removal: Structure,Solution, and Membrane Fouling Effects on the Rejection of Perfluorochemicals.” Environmental Science &
Page 306ITRC PFAS-1
Technology 42 (14):5292-5297. doi: 10.1021/es703207s.
Stevens, J.B. , and A. Coryell. 2007a. Surface Water Quality Criterion for Perfluorooctanoic Acid. STS Project 200604 796.St. Paul, MN: Minnesota Pollution Control Agency.
Stevens, J.B., and A. Coryell. 2007b. Surface water quality criterion for perfluorooctane sulfonic acid. STS Project200604796. St. Paul, MN: Minnesota Pollution Control Agency.
Stewart, R. 2017. “Immobilization and Safe Disposal of Aqueous Film Forming Foam (AFFF) Impacted Soil in Australia.”Battelle International Symposium on Bioremediation and Sustainable Environmental Technologies, Miami, Florida,May 22-25, 2017.
Stewart, R., and R. McFarland. 2017. “Immobilization of Per- and Polyfluorinated Alkyl Substances (PFAS) in 14 Soils fromAirport Sites across Australia.” Batelle International Symposium on Bioremediation and Sustainable EnvironmentalTechnologies, Miami, Florida, May 22-25, 2017.
Stewart, R., C. Lawrence, and J. Kirk. 2016. “An Aluminum Hydroxide Formulation Outperforms Activiated Carbon inBinding Shorter Chain Per- and Poly-Fluorinated Alkyl Substances (PFAS).” Tenth International Conference onRemediation and Recalcitrant Compounds, Palm Springs, California. , May 2016.
Stock, Naomi L., Vasile I. Furdui, Derek C. G. Muir, and Scott A. Mabury. 2007. “Perfluoroalkyl Contaminants in theCanadian Arctic: Evidence of Atmospheric Transport and Local Contamination.” Environmental Science &Technology 41 (10):3529-3536. doi: 10.1021/es062709x.
Stock, Naomi L., Fiona K. Lau, David A. Ellis, Jonathan W. Martin, Derek C. G. Muir, and Scott A. Mabury. 2004.“Polyfluorinated Telomer Alcohols and Sulfonamides in the North American Troposphere.” Environmental Science &Technology 38 (4):991-996. doi: 10.1021/es034644t.
Stockholm Convention. 2001. Stockholm Convention on Persistent Organic Pollutants.
Strathmann, T. . 2018. “UV-sulfite photochemical destruction of PFAS.” Emerging Contaminants Summit, Westminster,Colorado, March 6-7, 2018.
Stratton, G. R., F. Dai, C. L. Bellona, T. M. Holsen, E. R. Dickenson, and S. Mededovic Thagard. 2017. “Plasma-BasedWater Treatment: Efficient Transformation of Perfluoroalkyl Substances in Prepared Solutions and ContaminatedGroundwater.” Environ Sci Technol 51 (3):1643-1648. doi: 10.1021/acs.est.6b04215.
Strynar, Mark J., and Andrew B. Lindstrom. 2008. “Perfluorinated Compounds in House Dust from Ohio and NorthCarolina, USA.” Environmental Science & Technology 42 (10):3751-3756. doi: 10.1021/es7032058.
Strynar, Mark J., Andrew B. Lindstrom, Shoji F. Nakayama, Peter P. Egeghy, and Laurence J. Helfant. 2012. “Pilot scaleapplication of a method for the analysis of perfluorinated compounds in surface soils.” Chemosphere 86 (3):252-257.doi: https://doi.org/10.1016/j.chemosphere.2011.09.036.
Stylianou, Marios, Maria K. Björnsdotter, Per-Erik Olsson, Ingrid Ericson Jogsten, and Jana Jass. 2019. “Distincttranscriptional response of Caenorhabditis elegans to different exposure routes of perfluorooctane sulfonic acid.”Environmental Research 168:406-413. doi: https://doi.org/10.1016/j.envres.2018.10.019.
Suh, C. H., N. K. Cho, C. K. Lee, C. H. Lee, D. H. Kim, J. H. Kim, B. C. Son, and J. T. Lee. 2011. “Perfluorooctanoic acid-induced inhibition of placental prolactin-family hormone and fetal growth retardation in mice.” Mol Cell Endocrinol337 (1-2):7-15. doi: 10.1016/j.mce.2011.01.009.
Sun, Mei, Elisa Arevalo, Mark Strynar, Andrew Lindstrom, Michael Richardson, Ben Kearns, Adam Pickett, Chris Smith,and Detlef R. U. Knappe. 2016. “Legacy and Emerging Perfluoroalkyl Substances Are Important Drinking WaterContaminants in the Cape Fear River Watershed of North Carolina.” Environmental Science & Technology Letters 3(12):415-419. doi: 10.1021/acs.estlett.6b00398.
Sundstrom, M., S. C. Chang, P. E. Noker, G. S. Gorman, J. A. Hart, D. J. Ehresman, A. Bergman, and J. L. Butenhoff. 2012.“Comparative pharmacokinetics of perfluorohexanesulfonate (PFHxS) in rats, mice, and monkeys.” Reprod Toxicol33 (4):441-451. doi: 10.1016/j.reprotox.2011.07.004.
Page 307ITRC PFAS-1
Sutherland, C.A. and H.O. Krueger. 2001. A 96-hour toxicity test with the freshwater diatom (Navicula pelliculosa).Wildlife International Ltd. Project number 454A-112.
Szabo, J., Hall, J., Hall, J., Magnuson, M., Panguluri, S., and Meiners, G. . 2017. “Treatment of Perfluorinated AlkylSubstances in Wash Water using Granular Activated Carbon and Mixed Media, .” USEPA Office of Research andDevelopment, EPA/600/R-17/175
Takeuchi, Nozomi, Y. Kitagawa, A. Kosugi, K. Tachibana, H. Obo, and K. Yasuoka. 2013. Plasma-liquid interfacial reactionin decomposition of perfluoro surfactants. Vol. 47.
Tan, X., G. Xie, X. Sun, Q. Li, W. Zhong, P. Qiao, X. Sun, W. Jia, and Z. Zhou. 2013. “High fat diet feeding exaggeratesperfluorooctanoic acid-induced liver injury in mice via modulating multiple metabolic pathways.” PLoS One 8(4):e61409. doi: 10.1371/journal.pone.0061409.
Tang, Chuyang Y., Q. Shiang Fu, Craig S. Criddle, and James O. Leckie. 2007. “Effect of Flux (Transmembrane Pressure)and Membrane Properties on Fouling and Rejection of Reverse Osmosis and Nanofiltration Membranes TreatingPerfluorooctane Sulfonate Containing Wastewater.” Environmental Science & Technology 41 (6):2008-2014. doi:10.1021/es062052f.
Tang, Chuyang Y., Q. Shiang Fu, A. P. Robertson, Craig S. Criddle, and James O. Leckie. 2006. “Use of Reverse OsmosisMembranes to Remove Perfluorooctane Sulfonate (PFOS) from Semiconductor Wastewater.” Environmental Science& Technology 40 (23):7343-7349. doi: 10.1021/es060831q.
Taniyasu, Sachi, Nobuyoshi Yamashita, Hyo-Bang Moon, Karen Y Kwok, Paul Lam, Yuichi Horii, Gert Petrick, andKurunthachalam Kannan. 2013. Does wet precipitation represent local and regional atmospheric transportation byperfluorinated alkyl substances? Vol. 55C.
Tao, Lin, Kurunthachalam Kannan, Chung M. Wong, Kathleen F. Arcaro, and John L. Butenhoff. 2008. “PerfluorinatedCompounds in Human Milk from Massachusetts, U.S.A.” Environmental Science & Technology 42 (8):3096-3101. doi:10.1021/es702789k.
Tao, Lin, Jing Ma, Tatsuya Kunisue, E. Laurence Libelo, Shinsuke Tanabe, and Kurunthachalam Kannan. 2008.“Perfluorinated Compounds in Human Breast Milk from Several Asian Countries, and in Infant Formula and Dairy Milkfrom the United States.” Environmental Science & Technology 42 (22):8597-8602. doi: 10.1021/es801875v.
Tao, Yousheng, Hirofumi Kanoh, Lloyd Abrams, and Katsumi Kaneko. 2006. “Mesopore-Modified Zeolites: Preparation,Characterization, and Applications.” Chemical Reviews 106 (3):896-910. doi: 10.1021/cr040204o.
Tatum-Gibbs, K., J. F. Wambaugh, K. P. Das, R. D. Zehr, M. J. Strynar, A. B. Lindstrom, A. Delinsky, and C. Lau. 2011.“Comparative pharmacokinetics of perfluorononanoic acid in rat and mouse.” Toxicology 281 (1-3):48-55. doi:10.1016/j.tox.2011.01.003.
TCEQ. 2016. “Perfluoro Compounds (PFCs) Various CASRN Numbers, Revisions.”
Teel, Amy, Dennis D. Finn, Jeremy T. Schmidt, Lynn M. Cutler, and Richard J. Watts. 2007. Rates of Trace Mineral-Catalyzed Decomposition of Hydrogen Peroxide. Vol. 133.
Thackray, Colin, and Noelle E Selin. 2017. Uncertainty and variability in atmospheric formation of PFCAs fromfluorotelomer precursors. Vol. 17.
Thalheimer, A.H., L. B. McConney, I. K. Kalinovich, A. V. Pigott, J. D. Franz, H. T. Holbert, D. Mericas, and Z. J. Puchacz.2017. “Use and Potential Impacts of AFFF Containing PFASs at Airports (No. Project 02-60).” The National Academiesof Sciences, Engineering, and Medicine.
Thompson, Jack, Geoff Eaglesham, Julien Reungoat, Yvan Poussade, Michael Bartkow, Michael Lawrence, and Jochen F.Mueller. 2011. “Removal of PFOS, PFOA and other perfluoroalkyl acids at water reclamation plants in South EastQueensland Australia.” Chemosphere 82 (1):9-17. doi: https://doi.org/10.1016/j.chemosphere.2010.10.040.
Thomsen, C., L. S. Haug, H. Stigum, M. Froshaug, S. L. Broadwell, and G. Becher. 2010. “Changes in concentrations ofperfluorinated compounds, polybrominated diphenyl ethers, and polychlorinated biphenyls in Norwegian breast-milk
Page 308ITRC PFAS-1
during twelve months of lactation.” Environ Sci Technol 44 (24):9550-6. doi: 10.1021/es1021922.
Tominaga, Nobuaki, Shinya Kohra, Taisen Iguchi, and Koji Arizono. 2004. Effects of Perfluoro Organic Compound Toxicityon Nematode Caenorhabditis elegans Fecundity. Vol. 50.
Tomy, Gregg T., Wes Budakowski, Thor Halldorson, Paul A. Helm, Gary A. Stern, Ken Friesen, Karen Pepper, Sheryl A.Tittlemier, and Aaron T. Fisk. 2004. “Fluorinated Organic Compounds in an Eastern Arctic Marine Food Web.”Environmental Science & Technology 38 (24):6475-6481. doi: 10.1021/es049620g.
Tomy, Gregg T., Kerri Pleskach, Steve H. Ferguson, Jonathon Hare, Gary Stern, Gordia MacInnis, Chris H. Marvin, and LisaLoseto. 2009. “Trophodynamics of Some PFCs and BFRs in a Western Canadian Arctic Marine Food Web.”Environmental Science & Technology 43 (11):4076-4081. doi: 10.1021/es900162n.
Transport Canada. 2017. Per- and Polyfluoroalkyl Substances (PFAS) Field Sampling Guidance.
Trautmann, A. M., H. Schell, K. R. Schmidt, Klaus-Michael Mangold, and Andreas Tiehm. 2015. Electrochemicaldegradation of perfluoroalkyl and polyfluoroalkyl substances (PFASs) in groundwater. Vol. 71.
Trudel, David, Lea Horowitz, Matthias Wormuth, Martin Scheringer, Ian T. Cousins, and Konrad Hungerbühler. 2008.“Estimating Consumer Exposure to PFOS and PFOA.” Risk Analysis 28 (2):251-269. doi:10.1111/j.1539-6924.2008.01017.x.
Tseng, N. 2012. “Feasibility of Biodegradation of Polyfluoroalkyl and Perfluoroalkyl Substances.” Civil Engineering, UCLA.
Tseng, Nancy, Ning Wang, Bogdan Szostek, and Shaily Mahendra. 2014. “Biotransformation of 6:2 Fluorotelomer Alcohol(6:2 FTOH) by a Wood-Rotting Fungus.” Environmental Science & Technology 48 (7):4012-4020. doi:10.1021/es4057483.
TTE, Witteveen+Bos and. 2016. “Emerging Contaminants, PFOS and PFOA, Production Use-Sources, Production andApplications.” Commissioned by RWS Leefomgeving (the Netherlands) and OVAM (Flanders).
U.S. Air Force. 2017. “DoD 2017.B STTR Solicitation AFFF Disposal.” https://www.sbir.gov/sbirsearch/detail/1254657.
Ulhaq, Mazhar, Gunnar Carlsson, Stefan Örn, and Leif Norrgren. 2013. “Comparison of developmental toxicity of sevenperfluoroalkyl acids to zebrafish embryos.” Environmental Toxicology and Pharmacology 36 (2):423-426. doi:https://doi.org/10.1016/j.etap.2013.05.004.
UNEP. 2008. Report of the Persistent Organic Pollutants Review Committee on the work of its fourth meeting –Addendum to the risk management evaluation for perfluorooctane sulfonate.http://chm.pops.int/Portals/0/download.aspx?d=UNEP-POPS-POPRC.4-15-Add.6.English.pdf
UNEP. 2009. SC-4/17 : Listing of perfluorooctane sulfonic acid, its salts and perfluorooctane sulfonyl fluoride.http://chm.pops.int/Portals/0/download.aspx?d=UNEP-POPS-COP.7-SC-7-2.English.pdf
UNEP. 2019a. UNEP/POPS/COP.9/30: Report of the Conference of the Parties to the Stockholm Convention on PersistentOrganic Pollutants on the work of its ninth meeting. http://www.pops.int.
UNEP. 2019b. UNEP/POPS/POPRC.15/7: Report of the Persistent Organic Pollutants Review Committee on the work of itsfifteenth meeting. http://www.pops.int.
US Naval Research Laboratory. 2017. “Aqueous Film-Forming Foam.”
USACE. 2018. “Containment and Disposal of Aqueous Film-Forming Foam Solution Guidance.” ETL-1110-3-4810003.
USDOD. 1997. Containment and Disposal of Aqueous Film Forming Foam Solution.
USDOD. 2014a. Chemical & Material Emerging Risk Alert; Aqueous Film Forming Foam (AFFF), Risk Alert 03-11.http://www.denix.osd.mil/cmrmp/ecmr/ecprogrambasics/resources/chemical-material-emerging-risk-alert-for-afff/.
USDOD. 2014b. Memorandum for Deputy Chief Of Naval Operations (Fleet Readiness and Logistics) (N4) DeputyCommandant Of The Marine Corps (Installations and Logistics). Subject: Perfluorinated Compounds (PFCs)- AnEmerging Environmental
Page 309ITRC PFAS-1

Issue. http://www.secnav.navy.mil/eie/Documents/Perfluorinated-Compounds-(PFCs)-An-Emerging-Environmental-Issue.pdf.
USDOD. 2017. Aqueous Film Forming Foam Report to Congress.https://www.denix.osd.mil/derp/home/documents/aqueous-film-forming-foam-report-to-congress/
USDOD. 2018a. Department of Defense Alternatives to Aqueous Film Forming Foam – Report to Congress.https://www.denix.osd.mil/derp/home/documents/alternatives-to-aqueous-film-forming-foam-report-to-congress/.
USDOD. 2018b. Qualified Products Database: “Performance Specification: Fire Extinguishing Agent, Aqueous Film-Forming Foam (AFFF) Liquid Concentrate, for Fresh and SeaWater.” http://quicksearch.dla.mil/qsDocDetails.aspx?ident_number=94307.
USDOD. 2019. Department of Defense/Department of Energy Consolidated Quality Systems Manual for EnvironmentalLaboratories Version 5.3. DoD Environmental Data Quality Workgroup and DOE Consolidated Audit Program(DOECAP).
USDOD EDQW. 2017. Bottle Selection and other Sampling Considerations When Sampling for Per- and Poly-FluoroalkylSubstances (PFASs) Revision 1.2. http://www.denix.osd.mil/edqw/home/
USEPA. 1974. “Title XIV of The Public Health Service Act : Safety of Public Water Systems (Safe Drinking Water Act).”
USEPA. 1985. Guidelines for deriving numerical national water quality criteria for the protection of aquatic organismsand their uses. PB-85-227049. Springfield, VA: NTIS US Environmetnal Protection Agency.
USEPA. 1986. Method 0010 Modified Method 5 Sampling Train.https://www.epa.gov/sites/production/files/2015-12/documents/0010.pdf.
USEPA. 1987. “Compendium of Superfund Field Operations Methods.” EPA 540/P-87/001a OSWER 9355.0-14.
USEPA. 1988. “CERCLA Compliance and Other Laws Manual : Interim Final.” EPA/540/G-89/006. .
USEPA. 1989. Risk Assessment Guidance for Superfund Volume I Human Health Evaluation Manual (Part A). Interim Final.EPA/540/1-89/002. : US Environmental Protection Agency.
USEPA. 1991. ARARs Q’s and A’s : General Policy, RCRA, CWA, SDWA, Post-ROD Information, and Contingent Waivers.OSWER Publication 9234.2-01/FS-A. https://semspub.epa.gov/work/HQ/174497.pdf
USEPA. 1993. “Use of IRIS Values in Superfund Risk Assessment.” Office of Solid Waste and Emergency ResponseDirective 9285.7-16. U.S. Environmental Protection Agency, Washington, DC.
USEPA. 1995. “Final Water Quality Guidance for the Great Lakes System.6.” 60 FR 1536.
USEPA. 1996a. “Emission Factor Documentation for AP-42.” Office of Air Planning and Standards, Emission Factor andInventory Group, Section 12.20. .
USEPA. 1996b. Method 3542 Extraction of Semivolatile Analytes collected using Method 0010 (Modified Method 5Sampling Train). https://www.epa.gov/sites/production/files/2015-12/documents/3542.pdf.
USEPA. 1997a. “Clarification of the Role of Applicable, or Relevant and Appropriate Requirements in EstablishingPreliminary Remedial Goals under CERCLA.” OSWER memorandum 9200.4-23.
USEPA. 1997b. “High Voltage Electron Beam Technology: High Voltage Environmental Applications, Inc.” DemonstrationBulletin, Superfund Innovative Technology Evaluation, United States Environmental Protection Agency,EPA/540/MR-96/504.
USEPA. 2000a. “Perfluorooctyl Sulfonates : Proposed Significant New Use Rule.” Federal Register, 65, 62, 319-62, 333.
USEPA. 2000b. Risk Characterization: Science Policy Handbook. . EPA 100-B-00-002.
USEPA. 2000c. Methodology for Deriving Ambient Water Quality Criteria for the Protection of Human Health. EPA-822-B-00-004. Washington, DC: Office of Water U.S. Environmental Protection Agency, Office of Science and Technology.
Page 310ITRC PFAS-1
http://water.epa.gov/scitech/swguidance/standards/upload/2005_05_06_criteria_humanhealth_method_complete.pdf.
USEPA. 2001. Class I Underground Injection Control Program: Study of the Risks Associated with Class I UndergroundInjection Wells. Washington, D.C.
USEPA. 2003a. “Human Health Toxicity Values in Superfund Risk Assessments.” OSWER Directive 9285.7-53.
USEPA. 2003b. “Perfluorooctanoic Acid (PFOA), Fluorinated Telomers ; Request for Comment, Solicitation of InterestedParties for Enforceable Consent Agreement Development, and Notice of Public Meeting.” 68 Federal Register 18626.Washington D.C. : EPA.
USEPA. 2004. An Examination of EPA Risk Assessment Principles and Practices. EPA/100/B-04/001. Washington DC:Office of the Science Advisor.
USEPA. 2005a. Guidelines for Carcinogen Risk Assessment. EPA/630.P-03/001F. Washington, DC. : USEPA RiskAssessment Forum.
USEPA. 2005b. “Superfund Community Involvement Handbook.” Washington, D.C. : Office of Emergency and RemedialResponse. EPA 540-K-05-003.
USEPA. 2006a. “2010/2015 PFOA Stewardship Program.” EPA-HQ-2003-0012-1071.
USEPA. 2006b. “Risk Management for Per- and Polyfluoroalkyl Substances (PFAS) under TSCA, PFOA StewardshipProgram.”
USEPA. 2007. Risk Communication in Action: The Risk Communication Workbook. EPA/625/R-05/003: National RiskManagement Research Laboratory Office of Research and Development.
USEPA. 2008. Green Remediation: Best Management Practices for Excavation and Surface Restoration. EPA 542-F-08-012: Office of Superfund and Remediation and Technology Innovation.
USEPA. 2009a. “Perfluorocarboxylic acid content in 116 Articles of Commerce.” EPA/600/R-09/033.
USEPA. 2009b. “PFOS Chromium Electroplater Study.” US EPA – Region 5, Chicago, IL September 2009.
USEPA. 2009c. “Provisional Health Advisories for Perfluorooctanoic Acid (PFOA) and Perfluorooctane Sulfonate (PFOS).”
USEPA. 2009d. Statistical Analysis of Groundwater Monitoring Data at RCRA Facilities – Unified Guidance.EPA/530/R-09/007.
USEPA. 2009e. “Washington Works Facility Order on Consent under SDWA Section 1431.”
USEPA. 2011a. Exposure Factors Handbook 2011 Edition (Final). EPA/600/R-09/052F. Washington, D. C.: U.S.Environmental Protection Agency. https://cfpub.epa.gov/ncea/risk/recordisplay.cfm?deid=236252.
USEPA. 2011b. Recommended Use of Body Weight 3/4 as the Default Method in Derivation of the Oral Reference Dose.EPA/100/R11/0001: U. S. Environmental Protection Agency.
USEPA. 2012a. Benchmark Dose Technical Guidance. EPA/100/R-12/001.
USEPA. 2012b. A framework for sustainability indicators at EPA.
USEPA. 2012c. Green Remediation Best Management Practices: Implementing In Situ Thermal Technologies. EPA 542-F-12-029: Office of Superfund and Remediation and Technology Innovation.
USEPA. 2012d. Methodology for Understanding and Reducing a Project’s Environmental Footprint.
USEPA. 2012e. National Emissions Standards for Hazardous Air Pollutant Emissions: Hard and Decorative ChromiumElectroplating and Chromium Anodizing Tanks; and Steel Pickling – HCl Process Facilities and Hydrochloric AcidRegeneration Plant. Washington D. C.
USEPA. 2013a. Climate Change Adaptation Technical Fact Sheet: Groundwater Remediation Systems. EPA 542-F-13-004:Office of Superfund Remediation and Technology Innovation.
Page 311ITRC PFAS-1
USEPA. 2013b. Green Remediation Best Management Practices:Materials and Waste Management. EPA 542-F-13-003:Office of Superfund and Remediation and Technology Innovation.
USEPA. 2013c. Pore Water Sampling Operating Procedure. SESDPROC-513-R2.
USEPA. 2013d. Science and Ecosystem Support Division (SESD) Operating Procedure: Potable Water Supply Sampling.SESDPROC-305-R3.
USEPA. 2013e. Tier 3 Toxicity Value White Paper. edited by OSWER Directive 9285.7-86.
USEPA. 2014a. Climate Change Adaptation Technical Fact Sheet: Landfills and Containment as an Element of SiteRemediation. EPA-542-F-14-001: Office of Superfund Remediation and Technology Innovation.
USEPA. 2014b. “Naval Air Warfare Center Warminster Administrative Order under SDWA Section 1431.”
USEPA. 2014c. “Provisional Peer-Reviewed Toxicity Values for Perfluorobutane Sulfonate (CASRN 375-73-5) and RelatedCompound Potassium Perfluorobutane Sulfonate (CASRN 29420-49-3).” Superfund Health Risk Technical SupportCenter National Center for Environmental Assessment Office of Research and Development U.S. EnvironmentalProtection Agency Cincinnati, OH. .
USEPA. 2015a. “Administrative Order for Response Action. Docket No. : SDWA-01-2015-0061.” USEPA Region 1.
USEPA. 2015b. Field Equipment Cleaning and Decontamination at the FEC. SESDPROC-206-R3. Athens, GA: Science andEcosystem Support Division USEPA Region 4.https://www.epa.gov/sites/production/files/2016-01/documents/field_equipment_cleaning_and_decontamination_at_fec206_af.r3_1.pdf.
USEPA. 2015c. “Hazardous Waste Cleanup: Chemours Company FC, LLC (Formerly: Dupont Washington Works) inWashington, West Virginia.” accessed 2019.https://www.epa.gov/hwcorrectiveactionsites/hazardous-waste-cleanup-chemours-company-fc-llc-formerly-dupont-washington.
USEPA. 2015d. “Long-Chain Perfluoroalkyl Carboxylate and Perfluoroalkyl Sulfonate Chemical Substances; SignificantNew Use Rule.” 80 Federal Register 2885. Washington D.C. : EPA.
USEPA. 2015e. “Proposed Rule : Significant New Use Rules : Long-Chain Perfluoroalkyl Carboxylate and PerfluoroalkylSulfonate Chemical Substances.”
USEPA. 2015f. “Risk-Screening Environmental Indicators (RSEI) Model Version 2.3.4. Technical Appendix BPhysicochemical Properties for TRI Chemicals and Chemical Categories.”
USEPA. 2016a. AERMOD Implementation Guide. EPA-454/B-16-013. Research Triangle Park, NC.
USEPA. 2016b. “Definitions. .” 40 CFR Part 300, Subpart A, Section 300.5. .
USEPA. 2016c. “Drinking Water Health Advisory for Perfluorooctane Sulfonate (PFOS).” Office of Water (4304T). Healthand Ecological Criteria Division, Washington, DC 20460. EPA Document Number : 822-R-16-004.
USEPA. 2016d. Drinking Water Health Advisory for Perfluorooctanoic Acid (PFOA).
USEPA. 2016e. Fact Sheet PFOA and PFOS Drinking Water Health Advisories. EPA800-F-16-003.https://www.epa.gov/sites/production/files/2016-06/documents/drinkingwaterhealthadvisories_pfoa_pfos_updated_5.31.16.pdf
USEPA. 2016f. The Fourth Unregulated Contaminant Monitoring Rule (UCMR 4). Office of Water (MS-140), EPA 815-F-16-007. https://www.epa.gov/sites/production/files/2017-03/documents/ucmr4-fact-sheet-general.pdf.
USEPA. 2016g. Health effects support document for perfluorooctane sulfonate (PFOS). EPA 822-R-16-002: USEPA Officeof Water.
USEPA. 2016h. “Health effects support document for perfluorooctanoic acid (PFOA).” Office of Water. EPA 822-R-16-003.May.
Page 312ITRC PFAS-1
USEPA. 2017a. “Assessing and Managing Chemicals under TSCA.” Last Modified December 18, 2019. accessed 2020.https://www.epa.gov/assessing-and-managing-chemicals-under-tsca
USEPA. 2017b. “Basic Information about Per- and Polyfluoroalkyl Substances (PFASs).”https://www.epa.gov/pfas/basic-information-about-and-polyfluoroalkyl-substances-pfass#tab-1.
USEPA. 2017c. Best Practices for Environmental Site Management: A Practical Guide for Applying EnvironmentalSequence Stratigraphy to Improve Conceptual Site Models. EPA/600/R-17/293.
USEPA. 2017d. “EPA Adds Saint-Gobain Performance Plastics Site in Hoosick Falls, N.Y. to the Federal Superfund List.”https://www.epa.gov/newsreleases/epa-adds-saint-gobain-performance-plastics-site-hoosick-falls-ny-federal-superfund-list
USEPA. 2017e. EPA’s Non-CBI Summary Tables for 2015 Company Progress Reports (Final Progress Reports).https://www.epa.gov/sites/production/files/2017-02/documents/2016_pfoa_stewardship_summary_table_0.pdf
USEPA. 2017f. Method 18 – Measurement of Gaseous Organic Compound Emissions by Gas Chromatography.https://www.epa.gov/sites/production/files/2017-08/documents/method_18.pdf.
USEPA. 2017g. “Monitoring Unregulated Drinking Water Contaminants Occurrence Data for the UnregulatedContaminant Monitoring Rule.”https://www.epa.gov/dwucmr/occurrence-data-unregulated-contaminant-monitoring-rule
USEPA. 2017h. National Functional Guidelines for Organic Superfund Mehtods Data Review. OLEM 9355.0-136, EPA-540-R-2017-002. Washington, D.C.: Office of Superfund Remediation and Technology Innovation (OSRTI).https://www.epa.gov/sites/production/files/2017-01/documents/national_functional_guidelines_for_organic_superfund_methods_data_review_013072017.pdf.
USEPA. 2017i. “New Chemicals Program Review of Alternatives for PFOA and Related Chemicals.”https://www.epa.gov/assessing-and-managing-chemicals-under-tsca/new-chemicals-program-review-alternatives-pfoa-and.
USEPA. 2017j. “Persistent Organic Pollutants: A Global Issue, A Global Response.”https://www.epa.gov/international-cooperation/persistent-organic-pollutants-global-issue-global-response. .
USEPA. 2017k. “Regional Screening Level (RSL) Calculator.” https://epa-prgs.ornl.gov/cgi-bin/chemicals/csl_search
USEPA. 2017l. “Regional Screening Levels (RSLs) – Generic Tables (June 2017).”https://www.epa.gov/risk/regional-screening-levels-rsls-generic-tables.
USEPA. 2017m. “Research on Per- and Polyfluoroalkyl Substances (PFAS).”https://www.epa.gov/chemical-research/research-and-polyfluoroalkyl-substances-pfas
USEPA. 2017n. Technical Fact Sheet – Perfluorooctane Sulfonate (PFOS) and Perfluorooctanoic Acid (PFOA). EPA 505-F-17-001.https://www.epa.gov/sites/production/files/2017-12/documents/ffrrofactsheet_contaminants_pfos_pfoa_11-20-17_508_0.pdf.
USEPA. 2017o. The Third Unregulated Contaminant Monitoring Rule (UCMR 3): Data Summary, January 2017.https://www.epa.gov/sites/production/files/2017-02/documents/ucmr3-data-summary-january-2017.pdf
USEPA. 2017p. Treatment of Perfluorinated Alkyl Substances in Wash Water Using Granular Activated Carbon and MixedMedia.
USEPA. 2018a. “Assessing and Managing Chemicals under TSCA – Fact Sheet: 2010/2015 PFOA Stewardship Program.”
USEPA. 2018b. “Contaminated Site Clean-up Information: Green Remediation Focus.”
USEPA. 2018c. Data Review and Validation Guidelines for Perfluoroalkyl Substances (PFASs) Analyzed Using EPA Method537. EPA 910-R-18-001. https://nepis.epa.gov/Exe/ZyPDF.cgi/P100VW12.PDF?Dockey=P100VW12.PDF.
Page 313ITRC PFAS-1
USEPA. 2018d. DRAFT for Public Comment: Human Health Toxicity Values for Hexafluoropropylene Oxide (HFPO) DimerAcid and Its Ammonium Salt (CASRN 13252-13-6 and CASRN 62037- 80-3). Also Known as “GenX Chemicals.”
USEPA. 2018e. DRAFT for Public Comment: Human Health Toxicity Values for Perfluorobutane Sulfonic Acid (CASRN375-73-5) and Related Compound Potassium Perfluorobutane Sulfonate (CASRN 29420 49 3).
USEPA. 2018f. Final 2016 Effluent Guidelines Program Plan. Washington DC.https://www.epa.gov/sites/production/files/2018-05/documents/final-2016-eg-plan_april-2018.pdf.
USEPA. 2018g. “GenX Chemicals Studies.” https://www.epa.gov/pfas/genx-chemicals-studies.
USEPA. 2018h. “Groundwater and Drinking Water, National Primary Drinking Water Regulations.” accessed 2019.https://www.epa.gov/ground-water-and-drinking-water/national-primary-drinking-water-regulations.
USEPA. 2018i. Long-Chain Perfluoroalkyl Carboxylate and Perfluoroalkyl Sulfonate Chemical Substances; Significant NewUse Rule. Washington, D.C. https://www.reginfo.gov/public/do/eAgendaViewRule?pubId=201810&RIN=2070-AJ99.
USEPA. 2018j. “PFAS Laws and Regulations.” Last Modified 7-30-2018. accessed 2020.https://www.epa.gov/pfas/pfas-laws-and-regulations#tab-1.
USEPA. 2018k. “Science Matters: EPA Toxicologists Focus Innovative Research on PFAS Compounds.” accessed 2020.https://www.epa.gov/sciencematters/epa-toxicologists-focus-innovative-research-pfas-compounds
USEPA. 2019a. “Class I Industrial and Municipal Waste Disposal Wells.”, accessed June 18, 2019.https://www.epa.gov/uic/class-i-industrial-and-municipal-waste-disposal-wells.
USEPA. 2019b. “Drinking Water Contaminant Human Health Effects Information.” accessed 2019.https://www.epa.gov/dwstandardsregulations/drinking-water-contaminant-human-health-effects-information#content.
USEPA. 2019c. “ECOTOX Knowledgebase.” Last Modified December 12, 2019. accessed 2020.https://cfpub.epa.gov/ecotox/.
USEPA. 2019d. “Integrated Risk Information System Glossary.” accessed 2019.
USEPA. 2019e. A Message from The IRIS Program.https://www.epa.gov/sites/production/files/2019-04/documents/iris_program_outlook_apr2019.pdf.
USEPA. 2019f. Method 533: Determination of Per- and Polyfluoroalkyl Substances in Drinking Water by Isotope DilutionAnion Exchange Solid Phase Extraction and Liquid Chromatography/Tandem Mass Spectrometry. EPA/815-B-19-20.Cincinnati, OH. https://www.epa.gov/sites/production/files/2019-12/documents/method-533-815b19020.pdf.
USEPA. 2019g. “Methodology and Spreadsheets for Environmental Footprint Analysis (SEFA),” accessed June 20, 2019.https://clu-in.org/greenremediation/methodology/#SEFA.
USEPA. 2019h. PFAS Action Plan. EPA 823R18004. Washington D.C. https://www.epa.gov/pfas/epas-pfas-action-plan.
USEPA. 2019i. “Regional Screening Levels User’s Guide, Introduction.” accessed 2019.https://www.epa.gov/risk/regional-screening-levels-rsls-users-guide#intro.
USEPA. 2019j. “Research on Per- and Polyfluoroalkyl Substances (PFAS).” accessed 2020.https://www.epa.gov/chemical-research/research-and-polyfluoroalkyl-substances-pfas.
USEPA. 2019k. “Superfund: Applicable or Relevant and Appropriate Requirements (ARARs).” Last Modified 4-4-2019.accessed 2020. https://www.epa.gov/superfund/applicable-or-relevant-and-appropriate-requirements-arars.
USEPA. 2020. “CompTox Chemicals Dashboard.” U. S. Environmental Protection Agency, Last Modified 1-16-2020.https://www.epa.gov/chemical-research/comptox-chemicals-dashboard.
USFDA. 2016. “Inventory of Effective Food Contact Substance (FCS) Notifications. U.S. Food and Drug Administration.Silver Spring, Maryland.”
Page 314ITRC PFAS-1
USGS. 2017. “Contaminants of Emerging Concern in the Environment.” Last Modified 6-16-17. accessed 2020.https://toxics.usgs.gov/investigations/cec/index.php.
Valsecchi, Sara, Daniela Conti, Riccardo Crebelli, Stefano Polesello, Marianna Rusconi, Michela Mazzoni, ElisabettaPreziosi, Mario Carere, Luca Lucentini, Emanuele Ferretti, Stefania Balzamo, Maria Gabriella Simeone, and FiorellaAste. 2017. “Deriving environmental quality standards for perfluorooctanoic acid (PFOA) and related short chainperfluorinated alkyl acids.” Journal of Hazardous Materials 323:84-98. doi:https://doi.org/10.1016/j.jhazmat.2016.04.055.
Vecitis, Chad D., Hyunwoong Park, Jie Cheng, Brian T. Mader, and Michael R. Hoffmann. 2008. “Kinetics and Mechanismof the Sonolytic Conversion of the Aqueous Perfluorinated Surfactants, Perfluorooctanoate (PFOA), andPerfluorooctane Sulfonate (PFOS) into Inorganic Products.” The Journal of Physical Chemistry A 112 (18):4261-4270.doi: 10.1021/jp801081y.
Vecitis, Chad D., Hyunwoong Park, Jie Cheng, Brian T. Mader, and Michael R. Hoffmann. 2009. “Treatment technologiesfor aqueous perfluorooctanesulfonate (PFOS) and perfluorooctanoate (PFOA).” Frontiers of Environmental Science &Engineering in China 3 (2):129-151. doi: 10.1007/s11783-009-0022-7.
Vedagiri, Usha K., Richard H. Anderson, Heather M. Loso, and Catherine M. Schwach. 2018. “Ambient levels of PFOS andPFOA in multiple environmental media.” Remediation Journal 28 (2):9-51. doi: 10.1002/rem.21548.
Vellanki, Bhanu Prakash, Bill Batchelor, and Ahmed Abdel-Wahab. 2013. “Advanced Reduction Processes: A New Class ofTreatment Processes.” Environmental Engineering Science 30 (5):264-271. doi: 10.1089/ees.2012.0273.
Venkatesan, A.K., and R.U. Halsden. 2013. “National inventory of perfluoroalkyl substances in archived U.S. biosolidsfrom the 2001 EPA National Sewage Sludge Survey.” Journal of Hazardous Materials 252-253:413-418. doi:https://doi.org/10.1016/j.jhazmat.2013.03.016.
Vermont DOH. 2016. Memorandum: Perfluorooctanoic acid (PFOA) and Perfluorooctane sulfonic acid (PFOS) VermontDrinking Water Health Advisory. Burlington, VT: Vermont Department of Health.
Verner, M. A., A. E. Loccisano, N. H. Morken, M. Yoon, H. Wu, R. McDougall, M. Maisonet, M. Marcus, R. Kishi, C.Miyashita, M. H. Chen, W. S. Hsieh, M. E. Andersen, H. J. Clewell, 3rd, and M. P. Longnecker. 2015. “Associations ofPerfluoroalkyl Substances (PFAS) with Lower Birth Weight: An Evaluation of Potential Confounding by GlomerularFiltration Rate Using a Physiologically Based Pharmacokinetic Model (PBPK).” Environ Health Perspect 123(12):1317-24. doi: 10.1289/ehp.1408837.
Verner, Marc-André, Gérard Ngueta, Elizabeth T. Jensen, Hermann Fromme, Wolfgang Völkel, Unni Cecilie Nygaard, BeritGranum, and Matthew P. Longnecker. 2016a. “Correction to A Simple Pharmacokinetic Model of Prenatal andPostnatal Exposure to Perfluoroalkyl Substances (PFASs).” Environmental Science & Technology 50 (10):5420-5421.doi: 10.1021/acs.est.6b01755.
Verner, Marc-André, Gérard Ngueta, Elizabeth T. Jensen, Hermann Fromme, Wolfgang Völkel, Unni Cecilie Nygaard, BeritGranum, and Matthew P. Longnecker. 2016b. “A Simple Pharmacokinetic Model of Prenatal and Postnatal Exposureto Perfluoroalkyl Substances (PFASs).” Environmental Science & Technology 50 (2):978-986. doi:10.1021/acs.est.5b04399.
Vestergren, Robin, and Ian T. Cousins. 2009. “Tracking the Pathways of Human Exposure to Perfluorocarboxylates.”Environmental Science & Technology 43 (15):5565-5575. doi: 10.1021/es900228k.
Vierke, Lena, Claudia Staude, Annegret Biegel-Engler, Wiebke Drost, and Christoph Schulte. 2012. “Perfluorooctanoicacid (PFOA) — main concerns and regulatory developments in Europe from an environmental point of view.”Environmental Sciences Europe 24 (1):16. doi: 10.1186/2190-4715-24-16.
Viswanathan, M., A. Ammerman, E. Eng, G. Gartlehner, K. N. Lohr, D. Griffith, S. Rhodes, C. Samuel-Hodge, S. Maty, L.Lux, L. Webb, S. F. Sutton, T. Swinson, A. Jackman, and L. Whitener. 2004. Community-Based Participatory Research:Assessing the Evidence. Evidence Report/Technology Assessment No. 99. AHRQ Publication 04-E022-2. Rockville,MD: Agency for Healthcare Research and Quality.
von der Trenck, Karl Theo, Rainer Konietzka, Annegret Biegel-Engler, Jan Brodsky, Andrea Hädicke, Arnold Quadflieg,
Page 315ITRC PFAS-1

Rudolf Stockerl, and Thorsten Stahl. 2018. “Significance thresholds for the assessment of contaminatedgroundwater: perfluorinated and polyfluorinated chemicals.” Environmental Sciences Europe 30 (19).
VT DEC. 2016a. “Emergency Rule Coversheet: Vermont Hazardous Waste Regulations.” Last Modified April 16, 2016.http://dec.vermont.gov/sites/dec/files/documents/2016_04_14%20VHWMR%20Signed%20APA%20forms.pdf
VT DEC. 2016b. “Vermont Evolving Regulations and Emerging Contaminants Presentation.” Last Modifiedhttp://www.vectogether.org/wp-content/uploads/2013/10/Moran-Matt-VEC.Presentation.pdf
VT DEC. 2018a. “News Release: State Partners with Local Fire Departments to Safely Get Rid of Toxic Fire-FightingFoam.” https://anr.vermont.gov/node/1276.
VT DEC. 2018b. Perfluoroalkyl Substances (PFAS) Contamination Status Report.https://dec.vermont.gov/sites/dec/files/documents/PFAS%20Sampling%20Report%207.10.18%20FINAL.pdf.
WA DER. 2017. “Interim Guideline on the Assessment and Management of Perfluoroalkyl and Polyfluoroalkyl Substances(PFAS).” (2.1):134.
Wagner, A., B. Raue, H. J. Brauch, E. Worch, and F. T. Lange. 2013. “Determination of adsorbable organic fluorine fromaqueous environmental samples by adsorption to polystyrene-divinylbenzene based activated carbon andcombustion ion chromatography.” J Chromatogr A 1295:82-9. doi: 10.1016/j.chroma.2013.04.051.
Waite, T. D., C. N. Kurucz, W. J. Cooper, and D. Brown. 1998. “Full scale electron beam systems for treatment of water,wastewater and medical waste (No. IAEA-TECDOC–1023).”
Walters, Adam, and David Santillo. 2006. Uses of Perfluorinated Substances.
Walton, B. 2018. “Perfluorinated Chemicals Health Study Included in Congress Budget Deal.” Circle of Blue. .
Wang, Hexing, Hongyi Du, Jiaqi Yang, Hong Jiang, Karmin O, Linji Xu, Shuping Liu, Jianping Yi, Xu Qian, Yue Chen, QingwuJiang, and Gengsheng He. 2019. “PFOS, PFOA, estrogen homeostasis, and birth size in Chinese infants.”Chemosphere 221:349-355. doi: https://doi.org/10.1016/j.chemosphere.2019.01.061.
Wang, Jianshe, Yating Zhang, Fang Zhang, Leo W. Y. Yeung, Sachi Taniyasu, Eriko Yamazaki, Renping Wang, Paul K. S.Lam, Nobuyoshi Yamashita, and Jiayin Dai. 2013. “Age- and gender-related accumulation of perfluoroalkylsubstances in captive Chinese alligators (Alligator sinensis).” Environmental Pollution 179:61-67. doi:https://doi.org/10.1016/j.envpol.2013.04.020.
Wang, Li, Bill Batchelor, Suresh D. Pillai, and Venkata S. V. Botlaguduru. 2016. “Electron beam treatment for potablewater reuse: Removal of bromate and perfluorooctanoic acid.” Chemical Engineering Journal 302:58-68. doi:https://doi.org/10.1016/j.cej.2016.05.034.
Wang, Ning, Jinxia Liu, Robert C. Buck, Stephen H. Korzeniowski, Barry W. Wolstenholme, Patrick W. Folsom, and Lisa M.Sulecki. 2011. “6:2 Fluorotelomer sulfonate aerobic biotransformation in activated sludge of waste water treatmentplants.” Chemosphere 82 (6):853-858. doi: https://doi.org/10.1016/j.chemosphere.2010.11.003.
Wang, Ning, Bogdan Szostek, Robert C. Buck, Patrick W. Folsom, Lisa M. Sulecki, Vladimir Capka, William R. Berti, andJohn T. Gannon. 2005. “Fluorotelomer Alcohol BiodegradationDirect Evidence that Perfluorinated Carbon ChainsBreakdown.” Environmental Science & Technology 39 (19):7516-7528. doi: 10.1021/es0506760.
Wang, Ning, Bogdan Szostek, Robert C. Buck, Patrick W. Folsom, Lisa M. Sulecki, and John T. Gannon. 2009. “8-2Fluorotelomer alcohol aerobic soil biodegradation: Pathways, metabolites, and metabolite yields.” Chemosphere 75(8):1089-1096. doi: https://doi.org/10.1016/j.chemosphere.2009.01.033.
Wang, Ning, Bogdan Szostek, Patrick W. Folsom, Lisa M. Sulecki, Vladimir Capka, Robert C. Buck, William R. Berti, andJohn T. Gannon. 2005. “Aerobic Biotransformation of 14C-Labeled 8-2 Telomer B Alcohol by Activated Sludge from aDomestic Sewage Treatment Plant.” Environmental Science & Technology 39 (2):531-538. doi: 10.1021/es049466y.
Wang, Shana, Qi Yang, Fei Chen, Jian Sun, Kun Luo, Fubing Yao, Xiaolin Wang, Dongbo Wang, Xiaoming Li, andGuangming Zeng. 2017. “Photocatalytic degradation of perfluorooctanoic acid and perfluorooctane sulfonate inwater: A critical review.” Chemical Engineering Journal 328:927-942. doi: https://doi.org/10.1016/j.cej.2017.07.076.
Page 316ITRC PFAS-1
Wang, Xiaoping, Crispin Halsall, Garry Codling, Zhiyong Xie, Baiqing Xu, Zhen Zhao, Yonggang Xue, Ralf Ebinghaus, andKevin C. Jones. 2014. “Accumulation of Perfluoroalkyl Compounds in Tibetan Mountain Snow: Temporal Patterns from1980 to 2010.” Environmental Science & Technology 48 (1):173-181. doi: 10.1021/es4044775.
Wang, Yuan, Pengyi Zhang, Gang Pan, and Hao Chen. 2008. “Ferric ion mediated photochemical decomposition ofperfluorooctanoic acid (PFOA) by 254nm UV light.” Journal of Hazardous Materials 160 (1):181-186. doi:https://doi.org/10.1016/j.jhazmat.2008.02.105.
Wang, Zhanyun, Ian T. Cousins, Martin Scheringer, and Konrad Hungerbuehler. 2015. “Hazard assessment of fluorinatedalternatives to long-chain perfluoroalkyl acids (PFAAs) and their precursors: Status quo, ongoing challenges andpossible solutions.” Environment International 75:172-179. doi: https://doi.org/10.1016/j.envint.2014.11.013.
Wang, Zhanyun, Ian T. Cousins, Martin Scheringer, and Konrad Hungerbühler. 2013. “Fluorinated alternatives to long-chain perfluoroalkyl carboxylic acids (PFCAs), perfluoroalkane sulfonic acids (PFSAs) and their potential precursors.”Environment International 60:242-248. doi: https://doi.org/10.1016/j.envint.2013.08.021.
Wang, Zhanyun, Jamie C. DeWitt, Christopher P. Higgins, and Ian T. Cousins. 2017. “A Never-Ending Story of Per- andPolyfluoroalkyl Substances (PFASs)?” Environmental Science & Technology 51 (5):2508-2518. doi:10.1021/acs.est.6b04806.
Wang, Zhen, Zhiyong Xie, Wenying Mi, Axel Möller, Hendrik Wolschke, and Ralf Ebinghaus. 2015. “Neutral Poly/Per-Fluoroalkyl Substances in Air from the Atlantic to the Southern Ocean and in Antarctic Snow.” Environmental Science& Technology 49 (13):7770-7775. doi: 10.1021/acs.est.5b00920.
Wania, Frank. 2007. “A Global Mass Balance Analysis of the Source of Perfluorocarboxylic Acids in the Arctic Ocean.”Environmental Science & Technology 41 (13):4529-4535. doi: 10.1021/es070124c.
Washington Department of Ecology. 2016. Quality Assurance Project Plan; Statewide Survey of Per- and Poly-fluoroalkylSubstances in Washington State Rivers and Lakes.
Washington, J. W., K. Rankin, E. L. Libelo, D. G. Lynch, and M. Cyterski. 2018. “Determining global background soil PFASloads and the fluorotelomer-based polymer degradation rates that can account for these loads.” Science of The TotalEnvironment 651:2444-2449.
Washington, John W., J. Jackson Ellington, Thomas M. Jenkins, John J. Evans, Hoon Yoo, and Sarah C. Hafner. 2009.“Degradability of an Acrylate-Linked, Fluorotelomer Polymer in Soil.” Environmental Science & Technology 43(17):6617-6623. doi: 10.1021/es9002668.
Washington, John W., and Thomas M. Jenkins. 2015. “Abiotic Hydrolysis of Fluorotelomer-Based Polymers as a Source ofPerfluorocarboxylates at the Global Scale.” Environmental Science & Technology 49 (24):14129-14135. doi:10.1021/acs.est.5b03686.
Washington, John W., Thomas M. Jenkins, Keegan Rankin, and Jonathan E. Naile. 2015. “Decades-Scale Degradation ofCommercial, Side-Chain, Fluorotelomer-Based Polymers in Soils and Water.” Environmental Science & Technology 49(2):915-923. doi: 10.1021/es504347u.
Washington, John W., Jonathan E. Naile, Thomas M. Jenkins, and David G. Lynch. 2014. “Characterizing Fluorotelomerand Polyfluoroalkyl Substances in New and Aged Fluorotelomer-Based Polymers for Degradation Studies with GC/MSand LC/MS/MS.” Environmental Science & Technology 48 (10):5762-5769. doi: 10.1021/es500373b.
Washington, John W., Hoon Yoo, J. Jackson Ellington, Thomas M. Jenkins, and E. Laurence Libelo. 2010. “Concentrations,Distribution, and Persistence of Perfluoroalkylates in Sludge-Applied Soils near Decatur, Alabama, USA.”Environmental Science & Technology 44 (22):8390-8396. doi: 10.1021/es1003846.
2018. Washington Senate Bill 6413 (2018). Engrossed Substitute Senate Bill 6413.
Washington State Department of Ecology. 2012. “Children’s Safe Products Reporting Rule Rationale for Reporting List ofChemicals of High Concern to Children.”
Washington State Department of Ecology. 2018. PFAS Chemical Action Plan Focus Sheet.
Page 317ITRC PFAS-1

https://fortress.wa.gov/ecy/publications/SummaryPages/1804002.
Washington State Department of Ecology and Washington State Department of Health. 2019. Interim Chemical ActionPlan for Per- and Polyfluorinated Alkyl Substances. Publication 18-04-005.https://fortress.wa.gov/ecy/publications/documents/1804005.pdf
Washington State Legislature. 2006. “Persistent Bioaccumulative Toxins.” Washington Administrative Code 173-333.
Washington State Legislature. 2008. Identification of high priority chemicals -Report. RCW 70.240.030.http://apps.leg.wa.gov/RCW/default.aspx?cite=70.240.030
Washington State Legislature. 2018a. Chapter 70.75A RCW Firefighting Agendat and Equipment – Toxic Chemical Use.http://app.leg.wa.gov/RCW/default.aspx?cite=70.75A.
Washington State Legislature. 2018b. Chapter 70.95G RCW Packages containing metals and toxic chemicals.http://app.leg.wa.gov/RCW/default.aspx?cite=70.95G.
Washington State Legislature. 2018c. Class B firefighting foams.http://lawfilesext.leg.wa.gov/biennium/2017-18/Pdf/Bills/Senate%20Bills/6413.pdf.
Watanabe, M.X., T. Kunisue, L. Tao, K. Kannan, A. Subramanian, S. Tanabe, and H. Iwata. 2010. “Dioxin‐like andperfluorinated compounds in pigs in an Indian open waste dumping site: Toxicokinetics and effects on hepaticcytochrome P450 and blood plasma hormones.” Environmental Toxicology and Chemistry 29 (7):1551-1560. doi:https://doi.org/10.1002/etc.189
Watanabe, N., M. Takata, S. Takemine, and K. Yamamoto. 2018. “Thermal mineralization behavior of PFOA, PFHxA, andPFOS during reactivation of granular activated carbon (GAC) in nitrogen atmosphere.” Environ Sci Pollut Res Int 25(8):7200-7205. doi: 10.1007/s11356-015-5353-2.
Watanabe, N., S. Takemine, K. Yamamoto, Y. Haga, and M. Takate. 2016. “Residual Organic Fluorinated Compounds fromThermal Treatment of PFOA, PFHxA, and PFOS Adsorbed onto GAC.” Material Cycles and Waste Management18:625-630.
Watts, Richard, J., Judith Sarasa, Frank Loge, J., and Amy L. Teel. 2005. “Oxidative and Reductive Pathways inManganese-Catalyzed Fenton’s Reactions.” Journal of Environmental Engineering 131 (1):158-164. doi:10.1061/(ASCE)0733-9372(2005)131:1(158).
Weber, Andrea K., Larry B. Barber, Denis R. LeBlanc, Elsie M. Sunderland, and Chad D. Vecitis. 2017. “Geochemical andHydrologic Factors Controlling Subsurface Transport of Poly- and Perfluoroalkyl Substances, Cape Cod,Massachusetts.” Environmental Science & Technology 51 (8):4269-4279. doi: 10.1021/acs.est.6b05573.
Weiner, Barbara, Leo Yeung, Erin B. Marchington, Lisa A. D’Agostino, and Scott A. Mabury. 2013. Organic fluorinecontent in aqueous film forming foams (AFFFs) and biodegradation of the foam component 6 : 2fluorotelomermercaptoalkylamido sulfonate (6 : 2 FTSAS). Vol. 10.
Wen, B., Y. Wu, H. Zhang, Y. Liu, X. Hu, H. Huang, and S. Zhang. 2016. “The roles of protein and lipid in the accumulationand distribution of perfluorooctane sulfonate (PFOS) and perfluorooctanoate (PFOA) in plants grown in biosolids-amended soils.” Environ Pollut 216:682-688. doi: 10.1016/j.envpol.2016.06.032.
White, Natasha D., Len Balthis, Kurunthachalam Kannan, Amila O. De Silva, Qian Wu, Katherine M. French, JamesDaugomah, Christine Spencer, and Patricia A. Fair. 2015. “Elevated levels of perfluoroalkyl substances in estuarinesediments of Charleston, SC.” Science of The Total Environment 521-522:79-89. doi:https://doi.org/10.1016/j.scitotenv.2015.03.078.
White, S. S., K. Kato, L. T. Jia, B. J. Basden, A. M. Calafat, E. P. Hines, J. P. Stanko, C. J. Wolf, B. D. Abbott, and S. E.Fenton. 2009. “Effects of perfluorooctanoic acid on mouse mammary gland development and differentiationresulting from cross-foster and restricted gestational exposures.” Reprod Toxicol 27 (3-4):289-298. doi:10.1016/j.reprotox.2008.11.054.
White, S. S., J. P. Stanko, K. Kato, A. M. Calafat, E. P. Hines, and S. E. Fenton. 2011. “Gestational and chronic low-dose
Page 318ITRC PFAS-1
PFOA exposures and mammary gland growth and differentiation in three generations of CD-1 mice.” Environ HealthPerspect 119 (8):1070-6. doi: 10.1289/ehp.1002741.
Wilkinson, John L., Peter S. Hooda, Julian Swinden, James Barker, and Stephen Barton. 2017. “Spatial distribution oforganic contaminants in three rivers of Southern England bound to suspended particulate material and dissolved inwater.” Science of The Total Environment 593-594:487-497. doi: https://doi.org/10.1016/j.scitotenv.2017.03.167.
Wilkinson, John L., Julian Swinden, Peter S. Hooda, James Barker, and Stephen Barton. 2016. “Markers of anthropogeniccontamination: A validated method for quantification of pharmaceuticals, illicit drug metabolites, perfluorinatedcompounds, and plasticisers in sewage treatment effluent and rain runoff.” Chemosphere 159:638-646. doi:https://doi.org/10.1016/j.chemosphere.2016.06.039.
Willach, Sarah, Heinz-Jürgen Brauch, and Frank T. Lange. 2016. “Contribution of selected perfluoroalkyl andpolyfluoroalkyl substances to the adsorbable organically bound fluorine in German rivers and in a highlycontaminated groundwater.” Chemosphere 145:342-350. doi: https://doi.org/10.1016/j.chemosphere.2015.11.113.
Williams, A., A. McEachran, M. Strynar, C. Grulke, K. Mansouri, G. Patlewicz, R. Sams, E. Schymanski, and A. Richard.2018. ” Accessing information for Per- & Polyfluoroalkyl Substances using the US EPA CompTox ChemistryDashboard.” American Chemical Society Fall Meeting, Boston, MA, August 19 – 23, 2018.
Winkens, Kerstin, Robin Vestergren, Urs Berger, and Ian T. Cousins. 2017. “Early life exposure to per- and polyfluoroalkylsubstances (PFASs): A critical review.” Emerging Contaminants 3 (2):55-68. doi:https://doi.org/10.1016/j.emcon.2017.05.001.
Winquist, A., and K. Steenland. 2014a. “Modeled PFOA exposure and coronary artery disease, hypertension, and highcholesterol in community and worker cohorts.” Environ Health Perspect 122 (12):1299-305. doi:10.1289/ehp.1307943.
Winquist, A., and K. Steenland. 2014b. “Perfluorooctanoic acid exposure and thyroid disease in community and workercohorts.” Epidemiology 25 (2):255-64. doi: 10.1097/ede.0000000000000040.
Wolf, C. J., S. E. Fenton, J. E. Schmid, A. M. Calafat, Z. Kuklenyik, X. A. Bryant, J. Thibodeaux, K. P. Das, S. S. White, C. S.Lau, and B. D. Abbott. 2007. “Developmental toxicity of perfluorooctanoic acid in the CD-1 mouse after cross-fosterand restricted gestational exposures.” Toxicol Sci 95 (2):462-73. doi: 10.1093/toxsci/kfl159.
Woodard, Steve, John Berry, and Brandon Newman. 2017. “Ion exchange resin for PFAS removal and pilot testcomparison to GAC.” Remediation Journal 27 (3):19-27. doi: 10.1002/rem.21515.
World Bank. 2017a. “China – Reduction and Phase-Out of PFOS in Priority Sectors Project. .” Washington, D.C.: WorldBank Group.
World Bank. 2017b. “GEF Grant to Assist China’s Efforts to Phase Out POPs.”
Wu, Yaoxing, and Victor W. C. Chang. 2011. “The Effect of Surface Adsorption and Molecular Geometry on theDetermination of Henry’s Law Constants for Fluorotelomer Alcohols.” Journal of Chemical & Engineering Data 56(8):3442-3448. doi: 10.1021/je200466w.
WV DEP. 2002. Final Ammonium Perfluorooctanoate (C8) Assessment pf Toxicty Team (CATT) Report.https://dep.wv.gov/WWE/watershed/wqmonitoring/Documents/C-8/C-8_FINAL_CATT_REPORT_8-02.pdf.
WV University. 2008. The C8 Health Project. Population Results for C8 and C8 Sulfonate Plasma Concentrations.: WestVirginia University. http://www.hsc.wvu.edu/media/5354/overall-c8-c8s-results.pdf
Xiao, Feng, Thomas R. Halbach, Matt F. Simcik, and John S. Gulliver. 2012. “Input characterization of perfluoroalkylsubstances in wastewater treatment plants: Source discrimination by exploratory data analysis.” Water Research 46(9):3101-3109. doi: https://doi.org/10.1016/j.watres.2012.03.027.
Xiao, Feng, Matt F. Simcik, and John S. Gulliver. 2012. “Perfluoroalkyl acids in urban stormwater runoff: Influence of landuse.” Water Research 46 (20):6601-6608. doi: https://doi.org/10.1016/j.watres.2011.11.029.
Xiao, Feng, Matt F. Simcik, Thomas R. Halbach, and John S. Gulliver. 2015. “Perfluorooctane sulfonate (PFOS) and
Page 319ITRC PFAS-1
perfluorooctanoate (PFOA) in soils and groundwater of a U.S. metropolitan area: Migration and implications forhuman exposure.” Water Research 72:64-74. doi: https://doi.org/10.1016/j.watres.2014.09.052.
Xiao, Leilei, Yuhan Ling, Alaaeddin Alsbaiee, Chenjun Li, Damian E. Helbling, and William R. Dichtel. 2017. “β-Cyclodextrin Polymer Network Sequesters Perfluorooctanoic Acid at Environmentally Relevant Concentrations.”Journal of the American Chemical Society 139 (23):7689-7692. doi: 10.1021/jacs.7b02381.
Xiao, Xin, Bridget A. Ulrich, Baoliang Chen, and Christopher P. Higgins. 2017. “Sorption of Poly- and PerfluoroalkylSubstances (PFASs) Relevant to Aqueous Film-Forming Foam (AFFF)-Impacted Groundwater by Biochars andActivated Carbon.” Environmental Science & Technology 51 (11):6342-6351. doi: 10.1021/acs.est.7b00970.
Xie, Shuangwei, Tieyu Wang, Shijie Liu, Kevin C. Jones, Andrew J. Sweetman, and Yonglong Lu. 2013. “Industrial sourceidentification and emission estimation of perfluorooctane sulfonate in China.” Environment International 52:1-8. doi:https://doi.org/10.1016/j.envint.2012.11.004.
Xie, Z., Z. Zhao, A. Moller, H. Wolschke, L. Ahrens, R. Sturm, and R. Ebinghaus. 2013. “Neutral poly- and perfluoroalkylsubstances in air and seawater of the North Sea.” Environ Sci Pollut Res Int 20 (11):7988-8000. doi:10.1007/s11356-013-1757-z.
Xu, Bentuo, Mohammad Boshir Ahmed, John L. Zhou, Ali Altaee, Minghong Wu, and Gang Xu. 2017. “Photocatalyticremoval of perfluoroalkyl substances from water and wastewater: Mechanism, kinetics and controlling factors.”Chemosphere 189:717-729. doi: https://doi.org/10.1016/j.chemosphere.2017.09.110.
Xu, D., C. Li, Y. Wen, and W. Liu. 2013. “Antioxidant defense system responses and DNA damage of earthworms exposedto perfluorooctane sulfonate (PFOS).” Environ Pollut 174:121-7. doi: 10.1016/j.envpol.2012.10.030.
Yahia, D., M. A. El-Nasser, M. Abedel-Latif, C. Tsukuba, M. Yoshida, I. Sato, and S. Tsuda. 2010. “Effects ofperfluorooctanoic acid (PFOA) exposure to pregnant mice on reproduction.” J Toxicol Sci 35 (4):527-33.
Yamada, Ami, Nawel Bemrah, Bruno Veyrand, Charles Pollono, Mathilde Merlo, Virginie Desvignes, Véronique Sirot,Marine Oseredczuk, Philippe Marchand, Ronan Cariou, Jean-Phillippe Antignac, Bruno Le Bizec, and Jean-CharlesLeblanc. 2014. “Perfluoroalkyl Acid Contamination and Polyunsaturated Fatty Acid Composition of French Freshwaterand Marine Fishes.” Journal of Agricultural and Food Chemistry 62 (30):7593-7603. doi: 10.1021/jf501113j.
Yamada, Takahiro, Philip H. Taylor, Robert C. Buck, Mary A. Kaiser, and Robert J. Giraud. 2005. “Thermal degradation offluorotelomer treated articles and related materials.” Chemosphere 61 (7):974-984. doi:https://doi.org/10.1016/j.chemosphere.2005.03.025.
Yamashita, N., K. Kannan, S. Taniyasu, Y. Horii, G. Petrick, and T. Gamo. 2005. “A global survey of perfluorinated acids inoceans.” Mar Pollut Bull 51 (8-12):658-68. doi: 10.1016/j.marpolbul.2005.04.026.
Yan, Hong, Ian T. Cousins, Chaojie Zhang, and Qi Zhou. 2015. “Perfluoroalkyl acids in municipal landfill leachates fromChina: Occurrence, fate during leachate treatment and potential impact on groundwater.” Science of The TotalEnvironment 524-525:23-31. doi: https://doi.org/10.1016/j.scitotenv.2015.03.111.
Yang, C. H., K. P. Glover, and X. Han. 2010. “Characterization of cellular uptake of perfluorooctanoate via organic anion-transporting polypeptide 1A2, organic anion transporter 4, and urate transporter 1 for their potential roles inmediating human renal reabsorption of perfluorocarboxylates.” Toxicol Sci 117 (2):294-302. doi:10.1093/toxsci/kfq219.
Yang, Liping, Shengyan Tian, Lingyan Zhu, Zhengtao Liu, and Yahui Zhang. 2012. “Bioaccumulation and distribution ofperfloroalkyl acids in seafood products from Bohai Bay, China.” Environmental Toxicology and Chemistry 31(9):1972-1979. doi: 10.1002/etc.1917.
Yang, Suwen, Fanfan Xu, Fengchang Wu, Shengrui Wang, and Binghui Zheng. 2014. “Development of PFOS and PFOAcriteria for the protection of freshwater aquatic life in China.” Science of The Total Environment 470-471:677-683.doi: https://doi.org/10.1016/j.scitotenv.2013.09.094.
Yao, Yiming, Hongkai Zhu, Bing Li, Hongwei Hu, Tao Zhang, Eriko Yamazaki, Sachi Taniyasu, Nobuyoshi Yamashita, andHongwen Sun. 2014. “Distribution and primary source analysis of per- and poly-fluoroalkyl substances with different
Page 320ITRC PFAS-1
chain lengths in surface and groundwater in two cities, North China.” Ecotoxicology and Environmental Safety108:318-328. doi: https://doi.org/10.1016/j.ecoenv.2014.07.021.
Yarwood, Greg, Susan Kemball-Cook, Michael Keinath, Robert L. Waterland, Stephen H. Korzeniowski, Robert C. Buck,Mark H. Russell, and Stephen T. Washburn. 2007. “High-Resolution Atmospheric Modeling of Fluorotelomer Alcoholsand Perfluorocarboxylic Acids in the North American Troposphere.” Environmental Science & Technology 41(16):5756-5762. doi: 10.1021/es0708971.
Yasuoka, K., K. Sasaki, and R. Hayashi. 2011. An Energy-efficient process for decomposing perfluorooctanoic andperfluorooctane sulfonic acids using DC plasmas generated within gas bubbles. Vol. 20.
Ye, X., K. Kato, L. Y. Wong, T. Jia, A. Kalathil, J. Latremouille, and A. M. Calafat. 2018. “Per- and polyfluoroalkyl substancesin sera from children 3 to 11 years of age participating in the National Health and Nutrition Examination Survey2013-2014.” Int J Hyg Environ Health 221 (1):9-16. doi: 10.1016/j.ijheh.2017.09.011.
Yeung, L. W., A. O. De Silva, E. I. Loi, C. H. Marvin, S. Taniyasu, N. Yamashita, S. A. Mabury, D. C. Muir, and P. K. Lam.2013. “Perfluoroalkyl substances and extractable organic fluorine in surface sediments and cores from LakeOntario.” Environ Int 59:389-97. doi: 10.1016/j.envint.2013.06.026.
Yeung, Leo W. Y., Clifton Dassuncao, Scott Mabury, Elsie M. Sunderland, Xianming Zhang, and Rainer Lohmann. 2017.“Vertical Profiles, Sources, and Transport of PFASs in the Arctic Ocean.” Environmental Science & Technology 51(12):6735-6744. doi: 10.1021/acs.est.7b00788.
Yeung, Leo W. Y., Yuichi Miyake, Sachi Taniyasu, Yuan Wang, Hongxia Yu, M. K. So, Guibin Jiang, Yongning Wu, JingguangLi, John P. Giesy, Nobuyoshi Yamashita, and Paul K. S. Lam. 2008. “Perfluorinated Compounds and Total andExtractable Organic Fluorine in Human Blood Samples from China.” Environmental Science & Technology 42(21):8140-8145. doi: 10.1021/es800631n.
Yi, L. B., L. Y. Chai, Y. Xie, Q. J. Peng, and Q. Z. Peng. 2016. “Isolation, identification, and degradation performance of aPFOA-degrading strain.” Genet Mol Res 15 (2). doi: 10.4238/gmr.15028043.
Yin, P., Z. Hu, X. Song, J. Liu, and N. Lin. 2016. “Activated Persulfate Oxidation of Perfluorooctanoic Acid (PFOA) inGroundwater under Acidic Conditions.” Int J Environ Res Public Health 13 (6). doi: 10.3390/ijerph13060602.
Yoo, Hoon, John W. Washington, Thomas M. Jenkins, and J. Jackson Ellington. 2011. “Quantitative Determination ofPerfluorochemicals and Fluorotelomer Alcohols in Plants from Biosolid-Amended Fields using LC/MS/MS and GC/MS.”Environmental Science & Technology 45 (19):7985-7990. doi: 10.1021/es102972m.
Young, C. J., and S. A. Mabury. 2010. “Atmospheric perfluorinated acid precursors: chemistry, occurrence, and impacts.”Rev Environ Contam Toxicol 208:1-109. doi: 10.1007/978-1-4419-6880-7_1.
Young, Cora J., Vasile I. Furdui, James Franklin, Roy M. Koerner, Derek C. G. Muir, and Scott A. Mabury. 2007.“Perfluorinated Acids in Arctic Snow: New Evidence for Atmospheric Formation.” Environmental Science &Technology 41 (10):3455-3461. doi: 10.1021/es0626234.
Yu, Qiang, Ruiqi Zhang, Shubo Deng, Jun Huang, and Gang Yu. 2009. “Sorption of perfluorooctane sulfonate andperfluorooctanoate on activated carbons and resin: Kinetic and isotherm study.” Water Research 43 (4):1150-1158.doi: https://doi.org/10.1016/j.watres.2008.12.001.
Yuan, Guanxiang, Hui Peng, Chong Huang, and Jianying Hu. 2016. “Ubiquitous Occurrence of Fluorotelomer Alcohols inEco-Friendly Paper-Made Food-Contact Materials and Their Implication for Human Exposure.” Environmental Science& Technology 50 (2):942-950. doi: 10.1021/acs.est.5b03806.
Zaggia, Alessandro, and Bruno Ameduri. 2012. “Recent advances on synthesis of potentially non-bioaccumulablefluorinated surfactants.” Current Opinion in Colloid & Interface Science 17 (4):188-195. doi:https://doi.org/10.1016/j.cocis.2012.04.001.
Zareitalabad, P., J. Siemens, M. Hamer, and W. Amelung. 2013. “Perfluorooctanoic acid (PFOA) andperfluorooctanesulfonic acid (PFOS) in surface waters, sediments, soils and wastewater – A review on concentrationsand distribution coefficients.” Chemosphere 91 (6):725-732. doi:
Page 321ITRC PFAS-1
https://doi.org/10.1016/j.chemosphere.2013.02.024.
Zareitalabad, Parva, Jan Siemens, Florian Wichern, Wulf Amelung, and Rainer Georg Joergensen. 2013. “Dose-dependentreactions of Aporrectodea caliginosa to perfluorooctanoic acid and perfluorooctanesulfonic acid in soil.”Ecotoxicology and Environmental Safety 95:39-43. doi: https://doi.org/10.1016/j.ecoenv.2013.05.012.
Zeilmaker, M. J., S. Fraki, E. M. J. Verbruggen, and B. G. H. NBokkers. 2018. Mixture exposure to PFAS: A relative PotencyFactor approach. RIVM Report 2018-0070. The Netherlands: Welfare and Sport National Institute for Public Healthand the Environment. Ministry of Health.
Zembouai, Idris, Mustapha Kaci, Stéphane Bruzaud, Isabelle Pillin, Jean-Luc Audic, Shima Shayanfar, and Suresh D. Pillai.2016. “Electron beam radiation effects on properties and ecotoxicity of PHBV/PLA blends in presence of organo-modified montmorillonite.” Polymer Degradation and Stability 132:117-126. doi:https://doi.org/10.1016/j.polymdegradstab.2016.03.019.
Zeng, H. C., L. Zhang, Y. Y. Li, Y. J. Wang, W. Xia, Y. Lin, J. Wei, and S. Q. Xu. 2011. “Inflammation-like glial response inrat brain induced by prenatal PFOS exposure.” Neurotoxicology 32 (1):130-9. doi: 10.1016/j.neuro.2010.10.001.
Zhang, H., W. Liu, X. He, Y. Wang, and Q. Zhang. 2015. “Uptake of perfluoroalkyl acids in the leaves of coniferous anddeciduous broad-leaved trees.” Environ Toxicol Chem 34 (7):1499-504. doi: 10.1002/etc.2968.
Zhang, L., L. S. Lee, J. Niu, and J. Liu. 2017. “Kinetic analysis of aerobic biotransformation pathways of a perfluorooctanesulfonate (PFOS) precursor in distinctly different soils.” Environ Pollut 229:159-167. doi:10.1016/j.envpol.2017.05.074.
Zhang, Shu, Bogdan Szostek, Patricia K. McCausland, Barry W. Wolstenholme, Xiaoxia Lu, Ning Wang, and Robert C.Buck. 2013. “6:2 and 8:2 Fluorotelomer Alcohol Anaerobic Biotransformation in Digester Sludge from a WWTP underMethanogenic Conditions.” Environmental Science & Technology 47 (9):4227-4235. doi: 10.1021/es4000824.
Zhang, T., G. Pan, and Q. Zhou. 2016. “Temperature effect on photolysis decomposing of perfluorooctanoic acid.” JEnviron Sci (China) 42:126-133. doi: 10.1016/j.jes.2015.05.008.
Zhang, T., H. Sun, Y. Lin, X. Qin, Y. Zhang, X. Geng, and K. Kannan. 2013. “Distribution of poly- and perfluoroalkylsubstances in matched samples from pregnant women and carbon chain length related maternal transfer.” EnvironSci Technol 47 (14):7974-81. doi: 10.1021/es400937y.
Zhang, Wei, Yating Zhang, Hongxia Zhang, Jianshe Wang, Ruina Cui, and Jiayin Dai. 2012. Sex differences intranscriptional expression of FABPs in zebrafish liver after chronic perfluorononanoic acid exposure. Environ. Sci.Technol.46(9): 5175-5182 doi: 10.1021/es300147w
Zhang, Xianming, Trevor N. Brown, Frank Wania, Eldbjørg S. Heimstad, and Kai-Uwe Goss. 2010. “Assessment ofchemical screening outcomes based on different partitioning property estimation methods.” EnvironmentInternational 36 (6):514-520. doi: https://doi.org/10.1016/j.envint.2010.03.010.
Zhang, Xianming, Rainer Lohmann, Clifton Dassuncao, Xindi C. Hu, Andrea K. Weber, Chad D. Vecitis, and Elsie M.Sunderland. 2016. “Source Attribution of Poly- and Perfluoroalkyl Substances (PFASs) in Surface Waters from RhodeIsland and the New York Metropolitan Area.” Environmental Science & Technology Letters 3 (9):316-321. doi:10.1021/acs.estlett.6b00255.
Zhang, Y., S. Beesoon, L. Zhu, and J. W. Martin. 2013. “Biomonitoring of perfluoroalkyl acids in human urine andestimates of biological half-life.” Environ Sci Technol 47 (18):10619-27. doi: 10.1021/es401905e.
Zhao, H., C. Chen, X. Zhang, J. Chen, and X. Quan. 2011. “Phytotoxicity of PFOS and PFOA to Brassica chinensis indifferent Chinese soils.” Ecotoxicol Environ Saf 74 (5):1343-7. doi: 10.1016/j.ecoenv.2011.03.007.
Zhao, Hongying, Junxia Gao, Guohua Zhao, Jiaqi Fan, Yanbin Wang, and Yujing Wang. 2013. “Fabrication of novel SnO2-Sb/carbon aerogel electrode for ultrasonic electrochemical oxidation of perfluorooctanoate with high catalyticefficiency.” Applied Catalysis B: Environmental 136-137:278-286. doi: https://doi.org/10.1016/j.apcatb.2013.02.013.
Zhao, L., M. Zhou, T. Zhang, and H. Sun. 2013. “Polyfluorinated and perfluorinated chemicals in precipitation and runoff
Page 322ITRC PFAS-1

from cities across eastern and central China.” Arch Environ Contam Toxicol 64 (2):198-207. doi:10.1007/s00244-012-9832-x.
Zhao, S., S. Fang, L. Zhu, L. Liu, Z. Liu, and Y. Zhang. 2014. “Mutual impacts of wheat (Triticum aestivum L.) andearthworms (Eisenia fetida) on the bioavailability of perfluoroalkyl substances (PFASs) in soil.” Environ Pollut184:495-501. doi: 10.1016/j.envpol.2013.09.032.
Zhao, S., X. Ma, S. Fang, and L. Zhu. 2016. “Behaviors of N-ethyl perfluorooctane sulfonamide ethanol (N-EtFOSE) in asoil-earthworm system: Transformation and bioaccumulation.” Sci Total Environ 554-555:186-91. doi:10.1016/j.scitotenv.2016.02.180.
Zhao, Z., Z. Xie, A. Moller, R. Sturm, J. Tang, G. Zhang, and R. Ebinghaus. 2012. “Distribution and long-range transport ofpolyfluoroalkyl substances in the Arctic, Atlantic Ocean and Antarctic coast.” Environ Pollut 170:71-7. doi:10.1016/j.envpol.2012.06.004.
Zhang, Wei, Yating Zhang, Hongxia Zhang, Jianshe Wang, Ruina Cui, and Jiayin Dai. 2012. Sex differences intranscriptional expression of FABPs in zebrafish liver after chronic perfluorononanoic acid exposure. Environ. Sci.Technol.46(9): 5175-5182 doi: 10.1021/es300147w
Zheng, X. M., H. L. Liu, W. Shi, S. Wei, J. P. Giesy, and H. X. Yu. 2011. “Effects of perfluorinated compounds ondevelopment of zebrafish embryos.” Environ Sci Pollut Res Int 19 (7):2498-505. doi: 10.1007/s11356-012-0977-y.
Zhi, Yue, and Jinxia Liu. 2018. “Sorption and desorption of anionic, cationic and zwitterionic polyfluoroalkyl substancesby soil organic matter and pyrogenic carbonaceous materials.” Chemical Engineering Journal 346:682-691. doi:https://doi.org/10.1016/j.cej.2018.04.042.
Zhou, Minghua, Meiling Chi, Hongyu Wang, and Tao Jin. 2012. “Anode modification by electrochemical oxidation: A newpractical method to improve the performance of microbial fuel cells.” Biochemical Engineering Journal 60:151-155.doi: https://doi.org/10.1016/j.bej.2011.10.014.
Zhou, Qin, Shubo Deng, Qiang Yu, Qiaoying Zhang, Gang Yu, Jun Huang, and Hongping He. 2010. “Sorption ofperfluorooctane sulfonate on organo-montmorillonites.” Chemosphere 78 (6):688-694. doi:https://doi.org/10.1016/j.chemosphere.2009.12.005.
Zhou, Qin, Gang Pan, and Jun Zhang. 2013. Effective sorption of perfluorooctane sulfonate (PFOS) onhexadecyltrimethylammonium bromide immobilized mesoporous SiO2 hollow sphere. Vol. 90.
Zhu, W., H. Roakes, S. G. Zemba, and A.R. Badireddy. 2019. PFAS Background in Vermont Shallow Soils.https://anrweb.vt.gov/PubDocs/DEC/PFOA/Soil-Background/PFAS-Background-Vermont-Shallow-Soils-03-24-19.pdf.
Zhuo, Qiongfang, Shubo Deng, Bo Yang, Jun Huang, Bin Wang, Tingting Zhang, and Gang Yu. 2012. “Degradation ofperfluorinated compounds on a boron-doped diamond electrode.” Electrochimica Acta 77:17-22. doi:https://doi.org/10.1016/j.electacta.2012.04.145.
Zushi, Y., and S. Masunaga. 2009. “Identifying the nonpoint source of perfluorinated compounds using a geographicinformation system based approach.” Environ Toxicol Chem 28 (4):691-700. doi: 10.1897/08-194.1.
Updated April 14, 2020.
Page 323ITRC PFAS-1
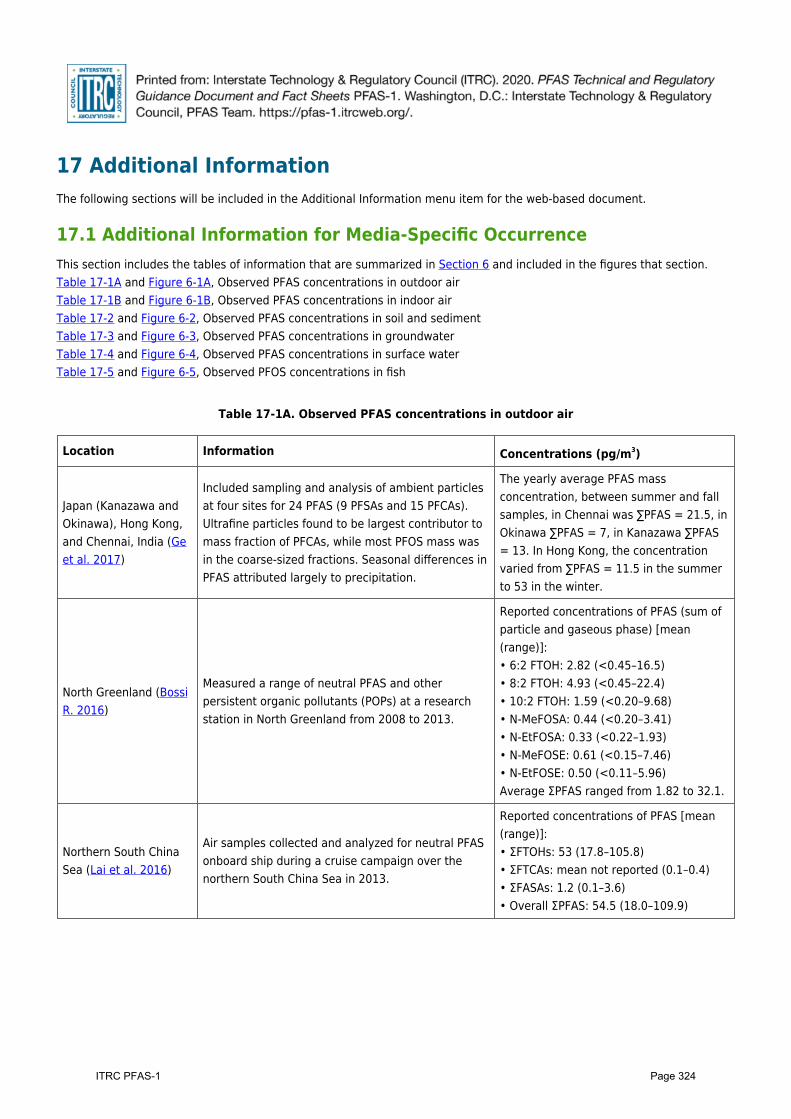
17 Additional InformationThe following sections will be included in the Additional Information menu item for the web-based document.
17.1 Additional Information for Media-Specific OccurrenceThis section includes the tables of information that are summarized in Section 6 and included in the figures that section.Table 17-1A and Figure 6-1A, Observed PFAS concentrations in outdoor airTable 17-1B and Figure 6-1B, Observed PFAS concentrations in indoor airTable 17-2 and Figure 6-2, Observed PFAS concentrations in soil and sedimentTable 17-3 and Figure 6-3, Observed PFAS concentrations in groundwaterTable 17-4 and Figure 6-4, Observed PFAS concentrations in surface waterTable 17-5 and Figure 6-5, Observed PFOS concentrations in fish
Table 17-1A. Observed PFAS concentrations in outdoor air
Location Information Concentrations (pg/m3)
Japan (Kanazawa andOkinawa), Hong Kong,and Chennai, India (Geet al. 2017)
Included sampling and analysis of ambient particlesat four sites for 24 PFAS (9 PFSAs and 15 PFCAs).Ultrafine particles found to be largest contributor tomass fraction of PFCAs, while most PFOS mass wasin the coarse-sized fractions. Seasonal differences inPFAS attributed largely to precipitation.
The yearly average PFAS massconcentration, between summer and fallsamples, in Chennai was ∑PFAS = 21.5, inOkinawa ∑PFAS = 7, in Kanazawa ∑PFAS= 13. In Hong Kong, the concentrationvaried from ∑PFAS = 11.5 in the summerto 53 in the winter.
North Greenland (BossiR. 2016)
Measured a range of neutral PFAS and otherpersistent organic pollutants (POPs) at a researchstation in North Greenland from 2008 to 2013.
Reported concentrations of PFAS (sum ofparticle and gaseous phase) [mean(range)]:• 6:2 FTOH: 2.82 (<0.45–16.5)• 8:2 FTOH: 4.93 (<0.45–22.4)• 10:2 FTOH: 1.59 (<0.20–9.68)• N-MeFOSA: 0.44 (<0.20–3.41)• N-EtFOSA: 0.33 (<0.22–1.93)• N-MeFOSE: 0.61 (<0.15–7.46)• N-EtFOSE: 0.50 (<0.11–5.96)Average ΣPFAS ranged from 1.82 to 32.1.
Northern South ChinaSea (Lai et al. 2016)
Air samples collected and analyzed for neutral PFASonboard ship during a cruise campaign over thenorthern South China Sea in 2013.
Reported concentrations of PFAS [mean(range)]:• ΣFTOHs: 53 (17.8–105.8)• ΣFTCAs: mean not reported (0.1–0.4)• ΣFASAs: 1.2 (0.1–3.6)• Overall ΣPFAS: 54.5 (18.0–109.9)
Page 324ITRC PFAS-1
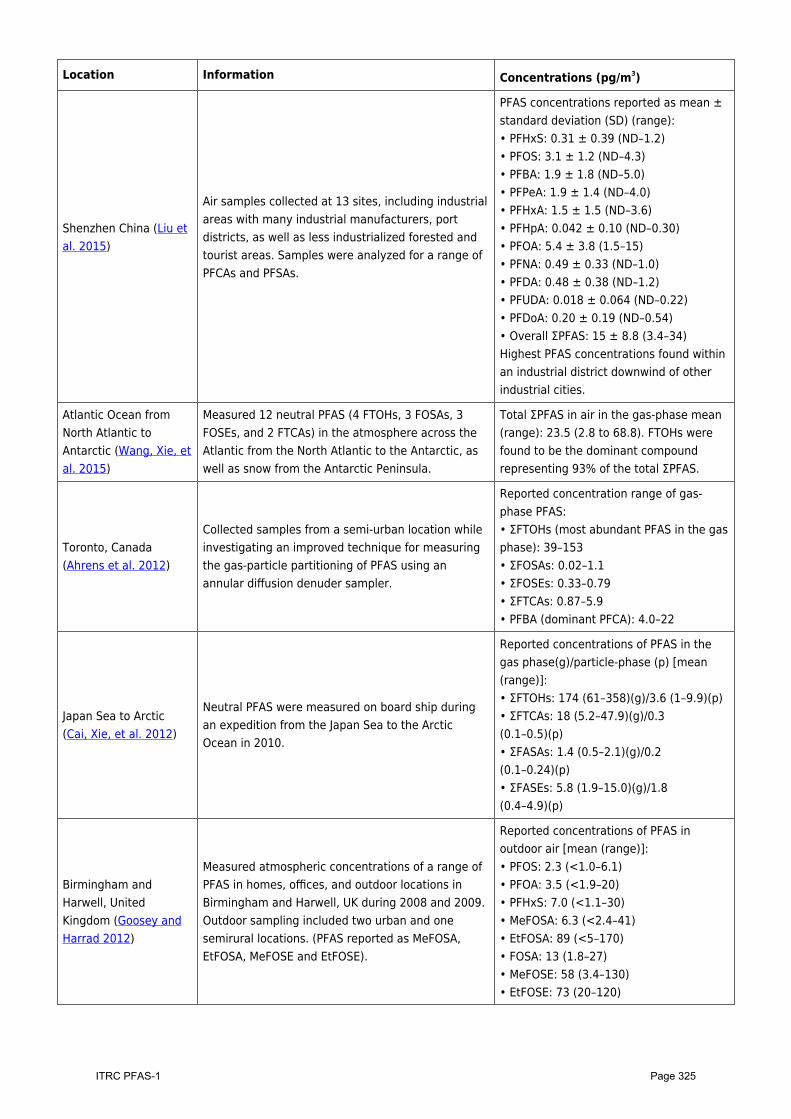
Location Information Concentrations (pg/m3)
Shenzhen China (Liu etal. 2015)
Air samples collected at 13 sites, including industrialareas with many industrial manufacturers, portdistricts, as well as less industrialized forested andtourist areas. Samples were analyzed for a range ofPFCAs and PFSAs.
PFAS concentrations reported as mean ±standard deviation (SD) (range):• PFHxS: 0.31 ± 0.39 (ND–1.2)• PFOS: 3.1 ± 1.2 (ND–4.3)• PFBA: 1.9 ± 1.8 (ND–5.0)• PFPeA: 1.9 ± 1.4 (ND–4.0)• PFHxA: 1.5 ± 1.5 (ND–3.6)• PFHpA: 0.042 ± 0.10 (ND–0.30)• PFOA: 5.4 ± 3.8 (1.5–15)• PFNA: 0.49 ± 0.33 (ND–1.0)• PFDA: 0.48 ± 0.38 (ND–1.2)• PFUDA: 0.018 ± 0.064 (ND–0.22)• PFDoA: 0.20 ± 0.19 (ND–0.54)• Overall ΣPFAS: 15 ± 8.8 (3.4–34)Highest PFAS concentrations found withinan industrial district downwind of otherindustrial cities.
Atlantic Ocean fromNorth Atlantic toAntarctic (Wang, Xie, etal. 2015)
Measured 12 neutral PFAS (4 FTOHs, 3 FOSAs, 3FOSEs, and 2 FTCAs) in the atmosphere across theAtlantic from the North Atlantic to the Antarctic, aswell as snow from the Antarctic Peninsula.
Total ΣPFAS in air in the gas-phase mean(range): 23.5 (2.8 to 68.8). FTOHs werefound to be the dominant compoundrepresenting 93% of the total ΣPFAS.
Toronto, Canada(Ahrens et al. 2012)
Collected samples from a semi-urban location whileinvestigating an improved technique for measuringthe gas-particle partitioning of PFAS using anannular diffusion denuder sampler.
Reported concentration range of gas-phase PFAS:• ΣFTOHs (most abundant PFAS in the gasphase): 39–153• ΣFOSAs: 0.02–1.1• ΣFOSEs: 0.33–0.79• ΣFTCAs: 0.87–5.9• PFBA (dominant PFCA): 4.0–22
Japan Sea to Arctic(Cai, Xie, et al. 2012)
Neutral PFAS were measured on board ship duringan expedition from the Japan Sea to the ArcticOcean in 2010.
Reported concentrations of PFAS in thegas phase(g)/particle-phase (p) [mean(range)]:• ΣFTOHs: 174 (61–358)(g)/3.6 (1–9.9)(p)• ΣFTCAs: 18 (5.2–47.9)(g)/0.3(0.1–0.5)(p)• ΣFASAs: 1.4 (0.5–2.1)(g)/0.2(0.1–0.24)(p)• ΣFASEs: 5.8 (1.9–15.0)(g)/1.8(0.4–4.9)(p)
Birmingham andHarwell, UnitedKingdom (Goosey andHarrad 2012)
Measured atmospheric concentrations of a range ofPFAS in homes, offices, and outdoor locations inBirmingham and Harwell, UK during 2008 and 2009.Outdoor sampling included two urban and onesemirural locations. (PFAS reported as MeFOSA,EtFOSA, MeFOSE and EtFOSE).
Reported concentrations of PFAS inoutdoor air [mean (range)]:• PFOS: 2.3 (<1.0–6.1)• PFOA: 3.5 (<1.9–20)• PFHxS: 7.0 (<1.1–30)• MeFOSA: 6.3 (<2.4–41)• EtFOSA: 89 (<5–170)• FOSA: 13 (1.8–27)• MeFOSE: 58 (3.4–130)• EtFOSE: 73 (20–120)
Page 325ITRC PFAS-1
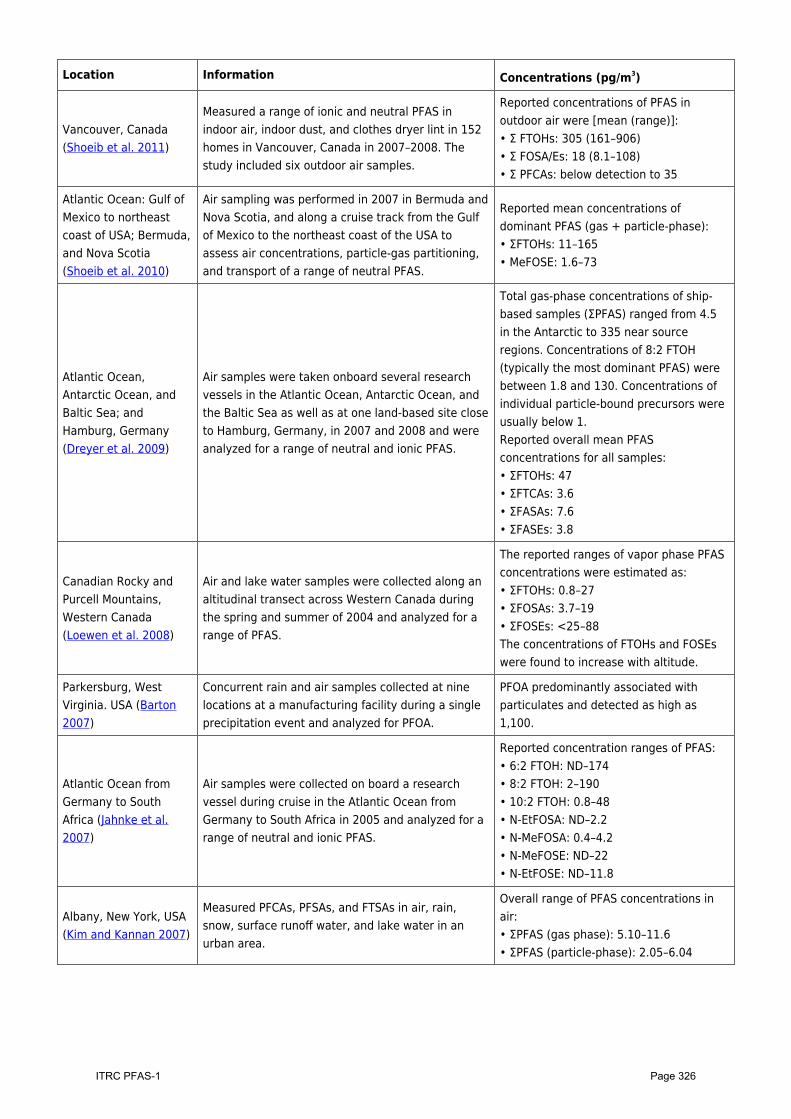
Location Information Concentrations (pg/m3)
Vancouver, Canada(Shoeib et al. 2011)
Measured a range of ionic and neutral PFAS inindoor air, indoor dust, and clothes dryer lint in 152homes in Vancouver, Canada in 2007–2008. Thestudy included six outdoor air samples.
Reported concentrations of PFAS inoutdoor air were [mean (range)]:• Σ FTOHs: 305 (161–906)• Σ FOSA/Es: 18 (8.1–108)• Σ PFCAs: below detection to 35
Atlantic Ocean: Gulf ofMexico to northeastcoast of USA; Bermuda,and Nova Scotia(Shoeib et al. 2010)
Air sampling was performed in 2007 in Bermuda andNova Scotia, and along a cruise track from the Gulfof Mexico to the northeast coast of the USA toassess air concentrations, particle-gas partitioning,and transport of a range of neutral PFAS.
Reported mean concentrations ofdominant PFAS (gas + particle-phase):• ΣFTOHs: 11–165• MeFOSE: 1.6–73
Atlantic Ocean,Antarctic Ocean, andBaltic Sea; andHamburg, Germany(Dreyer et al. 2009)
Air samples were taken onboard several researchvessels in the Atlantic Ocean, Antarctic Ocean, andthe Baltic Sea as well as at one land-based site closeto Hamburg, Germany, in 2007 and 2008 and wereanalyzed for a range of neutral and ionic PFAS.
Total gas-phase concentrations of ship-based samples (ΣPFAS) ranged from 4.5in the Antarctic to 335 near sourceregions. Concentrations of 8:2 FTOH(typically the most dominant PFAS) werebetween 1.8 and 130. Concentrations ofindividual particle-bound precursors wereusually below 1.Reported overall mean PFASconcentrations for all samples:• ΣFTOHs: 47• ΣFTCAs: 3.6• ΣFASAs: 7.6• ΣFASEs: 3.8
Canadian Rocky andPurcell Mountains,Western Canada(Loewen et al. 2008)
Air and lake water samples were collected along analtitudinal transect across Western Canada duringthe spring and summer of 2004 and analyzed for arange of PFAS.
The reported ranges of vapor phase PFASconcentrations were estimated as:• ΣFTOHs: 0.8–27• ΣFOSAs: 3.7–19• ΣFOSEs: <25–88The concentrations of FTOHs and FOSEswere found to increase with altitude.
Parkersburg, WestVirginia. USA (Barton2007)
Concurrent rain and air samples collected at ninelocations at a manufacturing facility during a singleprecipitation event and analyzed for PFOA.
PFOA predominantly associated withparticulates and detected as high as1,100.
Atlantic Ocean fromGermany to SouthAfrica (Jahnke et al.2007)
Air samples were collected on board a researchvessel during cruise in the Atlantic Ocean fromGermany to South Africa in 2005 and analyzed for arange of neutral and ionic PFAS.
Reported concentration ranges of PFAS:• 6:2 FTOH: ND–174• 8:2 FTOH: 2–190• 10:2 FTOH: 0.8–48• N-EtFOSA: ND–2.2• N-MeFOSA: 0.4–4.2• N-MeFOSE: ND–22• N-EtFOSE: ND–11.8
Albany, New York, USA(Kim and Kannan 2007)
Measured PFCAs, PFSAs, and FTSAs in air, rain,snow, surface runoff water, and lake water in anurban area.
Overall range of PFAS concentrations inair:• ΣPFAS (gas phase): 5.10–11.6• ΣPFAS (particle-phase): 2.05–6.04
Page 326ITRC PFAS-1
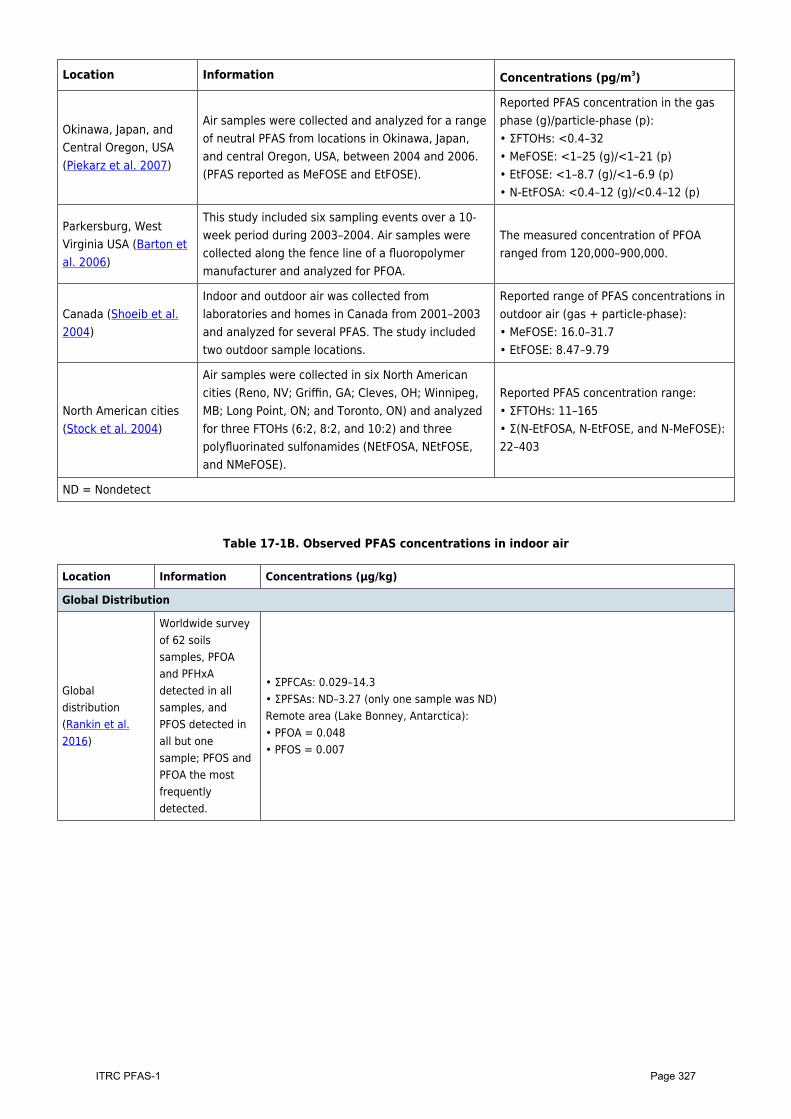
Location Information Concentrations (pg/m3)
Okinawa, Japan, andCentral Oregon, USA(Piekarz et al. 2007)
Air samples were collected and analyzed for a rangeof neutral PFAS from locations in Okinawa, Japan,and central Oregon, USA, between 2004 and 2006.(PFAS reported as MeFOSE and EtFOSE).
Reported PFAS concentration in the gasphase (g)/particle-phase (p):• ΣFTOHs: <0.4–32• MeFOSE: <1–25 (g)/<1–21 (p)• EtFOSE: <1–8.7 (g)/<1–6.9 (p)• N-EtFOSA: <0.4–12 (g)/<0.4–12 (p)
Parkersburg, WestVirginia USA (Barton etal. 2006)
This study included six sampling events over a 10-week period during 2003–2004. Air samples werecollected along the fence line of a fluoropolymermanufacturer and analyzed for PFOA.
The measured concentration of PFOAranged from 120,000–900,000.
Canada (Shoeib et al.2004)
Indoor and outdoor air was collected fromlaboratories and homes in Canada from 2001–2003and analyzed for several PFAS. The study includedtwo outdoor sample locations.
Reported range of PFAS concentrations inoutdoor air (gas + particle-phase):• MeFOSE: 16.0–31.7• EtFOSE: 8.47–9.79
North American cities(Stock et al. 2004)
Air samples were collected in six North Americancities (Reno, NV; Griffin, GA; Cleves, OH; Winnipeg,MB; Long Point, ON; and Toronto, ON) and analyzedfor three FTOHs (6:2, 8:2, and 10:2) and threepolyfluorinated sulfonamides (NEtFOSA, NEtFOSE,and NMeFOSE).
Reported PFAS concentration range:• ΣFTOHs: 11–165• Σ(N-EtFOSA, N-EtFOSE, and N-MeFOSE):22–403
ND = Nondetect
Table 17-1B. Observed PFAS concentrations in indoor air
Location Information Concentrations (μg/kg)
Global Distribution
Globaldistribution(Rankin et al.2016)
Worldwide surveyof 62 soilssamples, PFOAand PFHxAdetected in allsamples, andPFOS detected inall but onesample; PFOS andPFOA the mostfrequentlydetected.
• ΣPFCAs: 0.029–14.3• ΣPFSAs: ND–3.27 (only one sample was ND)Remote area (Lake Bonney, Antarctica):• PFOA = 0.048• PFOS = 0.007
Page 327ITRC PFAS-1

Location Information Concentrations (μg/kg)
Global, locationsnot associatedwith known PFASsources (Strynaret al. 2012)
Evaluated 60 soilsamples from sixcountries andreported globalmedianconcentrations.PFOS detected in48% and PFOAdetected in 28%of the samples.Note thatconcentrations <LOQ (~0.5 μg/kg)were assigned avalue of LOQ/√2for the mediancalculations.
Global median concentrations:• PFOA: 0.124• PFOS: 0.472
Point Sources
Location nearindustrial PFASsource (Davis etal. 2007)
Concentrations ofammoniumperflurooctanoate(APFO) in two soilborings locatedwithin animpacted wellfield;concentrationsdecreased rapidlywith depth.
APFO: 110–170
Fire Training/FireResponse (Houtzet al. 2013)
PFOS and PFOA insoils at an unlinedfire training area.
Median concentrations:• PFOS: 2,400• PFOA: 21
Fire Training/FireResponse(Anderson et al.2016)
In a survey of 40sites impacted byPFAS, the mostfrequentlydetectedcompounds werePFOS (99% ofsurface samples),PFHxS (77%), andPFOA (79%). PFOSwas detected atthe highestconcentrations.
PFOS:• Median: 53• Max: 9,700
Industrial Areas(Zareitalabad,Siemens, Hamer,et al. 2013)
PFOA and PFOSconcentrations insoil werecompiled.
Max:• PFOS: 48• PFOA: 10
Sludge-Biosolids Application
Page 328ITRC PFAS-1
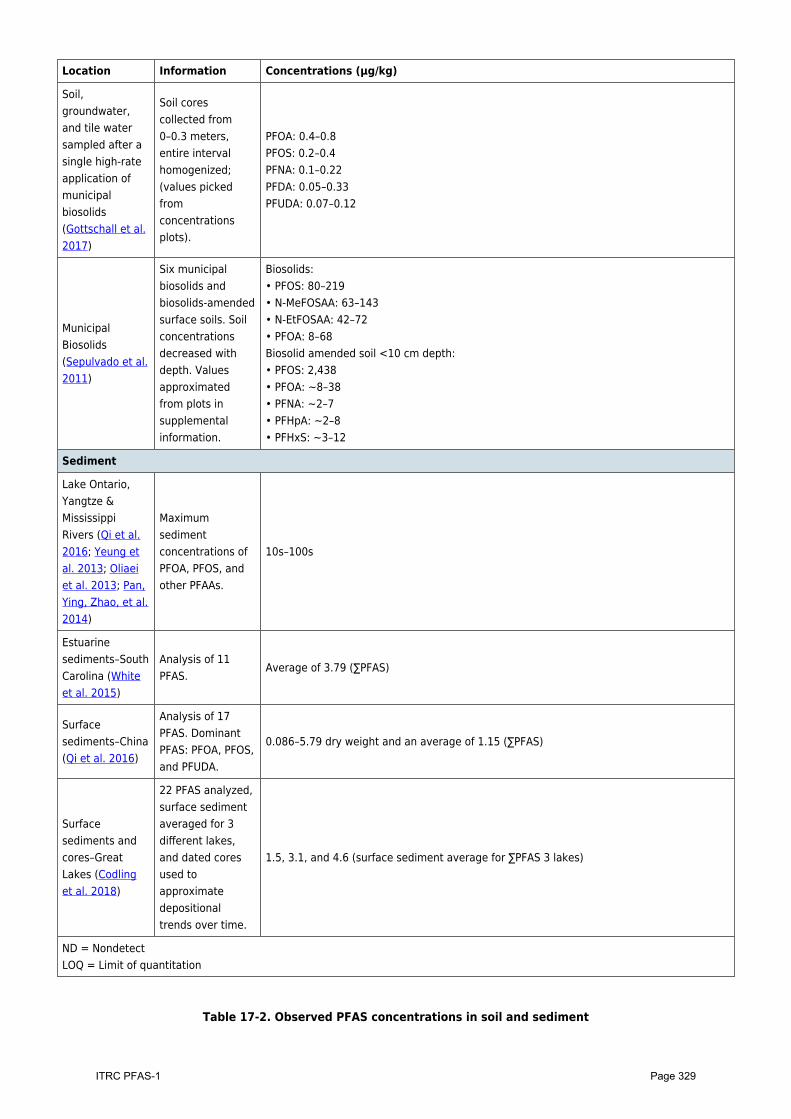
Location Information Concentrations (μg/kg)
Soil,groundwater,and tile watersampled after asingle high-rateapplication ofmunicipalbiosolids(Gottschall et al.2017)
Soil corescollected from0–0.3 meters,entire intervalhomogenized;(values pickedfromconcentrationsplots).
PFOA: 0.4–0.8PFOS: 0.2–0.4PFNA: 0.1–0.22PFDA: 0.05–0.33PFUDA: 0.07–0.12
MunicipalBiosolids(Sepulvado et al.2011)
Six municipalbiosolids andbiosolids-amendedsurface soils. Soilconcentrationsdecreased withdepth. Valuesapproximatedfrom plots insupplementalinformation.
Biosolids:• PFOS: 80–219• N-MeFOSAA: 63–143• N-EtFOSAA: 42–72• PFOA: 8–68Biosolid amended soil <10 cm depth:• PFOS: 2,438• PFOA: ~8–38• PFNA: ~2–7• PFHpA: ~2–8• PFHxS: ~3–12
Sediment
Lake Ontario,Yangtze &MississippiRivers (Qi et al.2016; Yeung etal. 2013; Oliaeiet al. 2013; Pan,Ying, Zhao, et al.2014)
Maximumsedimentconcentrations ofPFOA, PFOS, andother PFAAs.
10s–100s
Estuarinesediments–SouthCarolina (Whiteet al. 2015)
Analysis of 11PFAS.
Average of 3.79 (∑PFAS)
Surfacesediments–China(Qi et al. 2016)
Analysis of 17PFAS. DominantPFAS: PFOA, PFOS,and PFUDA.
0.086–5.79 dry weight and an average of 1.15 (∑PFAS)
Surfacesediments andcores–GreatLakes (Codlinget al. 2018)
22 PFAS analyzed,surface sedimentaveraged for 3different lakes,and dated coresused toapproximatedepositionaltrends over time.
1.5, 3.1, and 4.6 (surface sediment average for ∑PFAS 3 lakes)
ND = NondetectLOQ = Limit of quantitation
Table 17-2. Observed PFAS concentrations in soil and sediment
Page 329ITRC PFAS-1
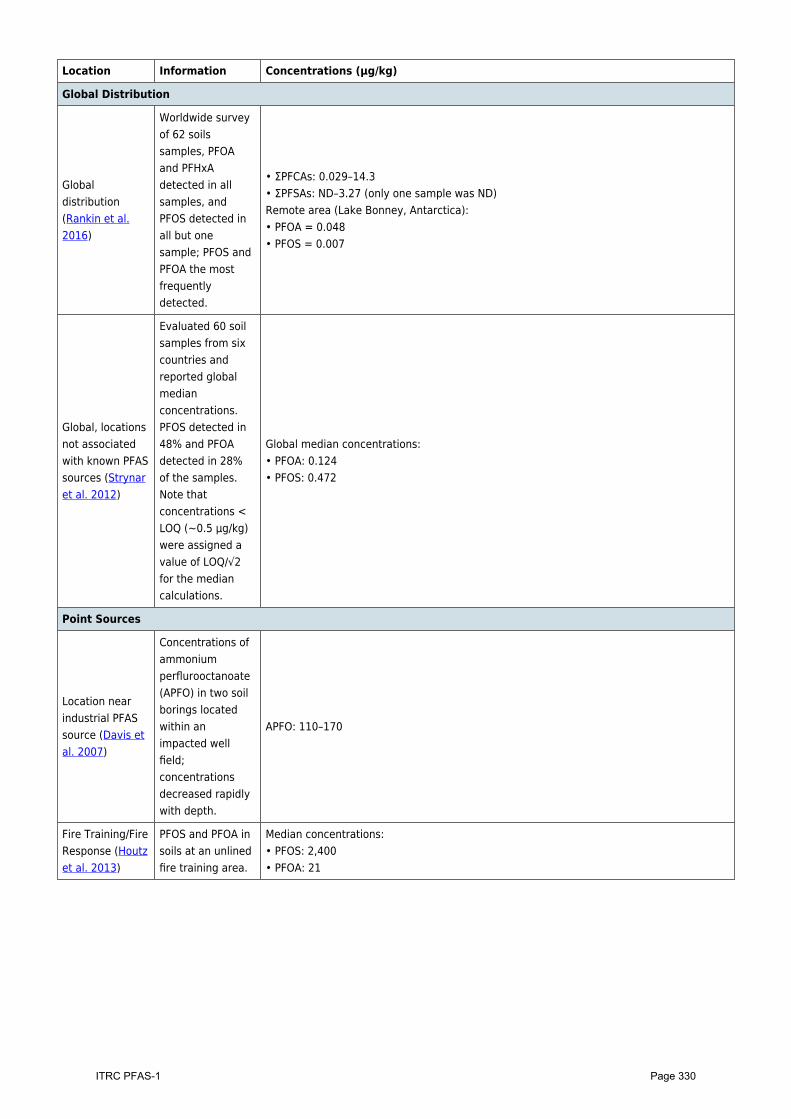
Location Information Concentrations (μg/kg)
Global Distribution
Globaldistribution(Rankin et al.2016)
Worldwide surveyof 62 soilssamples, PFOAand PFHxAdetected in allsamples, andPFOS detected inall but onesample; PFOS andPFOA the mostfrequentlydetected.
• ΣPFCAs: 0.029–14.3• ΣPFSAs: ND–3.27 (only one sample was ND)Remote area (Lake Bonney, Antarctica):• PFOA = 0.048• PFOS = 0.007
Global, locationsnot associatedwith known PFASsources (Strynaret al. 2012)
Evaluated 60 soilsamples from sixcountries andreported globalmedianconcentrations.PFOS detected in48% and PFOAdetected in 28%of the samples.Note thatconcentrations <LOQ (~0.5 μg/kg)were assigned avalue of LOQ/√2for the mediancalculations.
Global median concentrations:• PFOA: 0.124• PFOS: 0.472
Point Sources
Location nearindustrial PFASsource (Davis etal. 2007)
Concentrations ofammoniumperflurooctanoate(APFO) in two soilborings locatedwithin animpacted wellfield;concentrationsdecreased rapidlywith depth.
APFO: 110–170
Fire Training/FireResponse (Houtzet al. 2013)
PFOS and PFOA insoils at an unlinedfire training area.
Median concentrations:• PFOS: 2,400• PFOA: 21
Page 330ITRC PFAS-1

Location Information Concentrations (μg/kg)
Fire Training/FireResponse(Anderson et al.2016)
In a survey of 40sites impacted byPFAS, the mostfrequentlydetectedcompounds werePFOS (99% ofsurface samples),PFHxS (77%), andPFOA (79%). PFOSwas detected atthe highestconcentrations.
PFOS:• Median: 53• Max: 9,700
Industrial Areas(Zareitalabad,Siemens, Hamer,et al. 2013)
PFOA and PFOSconcentrations insoil werecompiled.
Max:• PFOS: 48• PFOA: 10
Sludge-Biosolids Application
Soil,groundwater,and tile watersampled after asingle high-rateapplication ofmunicipalbiosolids(Gottschall et al.2017)
Soil corescollected from0–0.3 meters,entire intervalhomogenized;(values pickedfromconcentrationsplots).
PFOA: 0.4–0.8
PFOS: 0.2–0.4
PFNA: 0.1–0.22
PFDA: 0.05–0.33
PFUDA: 0.07–0.12
MunicipalBiosolids(Sepulvado et al.2011)
Six municipalbiosolids andbiosolids-amendedsurface soils. Soilconcentrationsdecreased withdepth. Valuesapproximatedfrom plots insupplementalinformation.
Biosolids:• PFOS: 80–219• N-MeFOSAA: 63–143• N-EtFOSAA: 42–72• PFOA: 8–68Biosolid amended soil <10 cm depth:• PFOS: 2,438• PFOA: ~8–38• PFNA: ~2–7• PFHpA: ~2–8• PFHxS: ~3–12
Sediment
Lake Ontario,Yangtze &MississippiRivers (Qi et al.2016; Yeung etal. 2013; Oliaeiet al. 2013; Pan,Ying, Zhao, et al.2014)
Maximumsedimentconcentrations ofPFOA, PFOS, andother PFAAs.
10s–100s
Estuarinesediments–SouthCarolina (Whiteet al. 2015)
Analysis of 11PFAS.
Average of 3.79 (∑PFAS)
Page 331ITRC PFAS-1
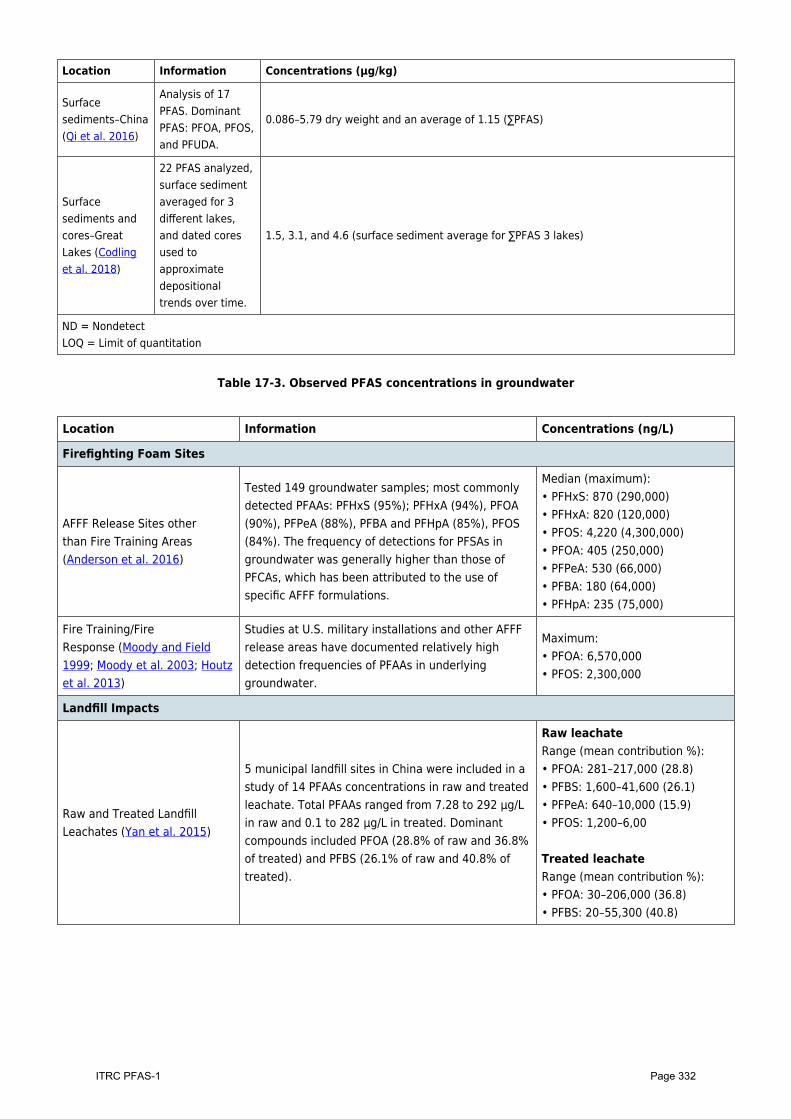
Location Information Concentrations (μg/kg)
Surfacesediments–China(Qi et al. 2016)
Analysis of 17PFAS. DominantPFAS: PFOA, PFOS,and PFUDA.
0.086–5.79 dry weight and an average of 1.15 (∑PFAS)
Surfacesediments andcores–GreatLakes (Codlinget al. 2018)
22 PFAS analyzed,surface sedimentaveraged for 3different lakes,and dated coresused toapproximatedepositionaltrends over time.
1.5, 3.1, and 4.6 (surface sediment average for ∑PFAS 3 lakes)
ND = NondetectLOQ = Limit of quantitation
Table 17-3. Observed PFAS concentrations in groundwater
Location Information Concentrations (ng/L)
Firefighting Foam Sites
AFFF Release Sites otherthan Fire Training Areas(Anderson et al. 2016)
Tested 149 groundwater samples; most commonlydetected PFAAs: PFHxS (95%); PFHxA (94%), PFOA(90%), PFPeA (88%), PFBA and PFHpA (85%), PFOS(84%). The frequency of detections for PFSAs ingroundwater was generally higher than those ofPFCAs, which has been attributed to the use ofspecific AFFF formulations.
Median (maximum):• PFHxS: 870 (290,000)• PFHxA: 820 (120,000)• PFOS: 4,220 (4,300,000)• PFOA: 405 (250,000)• PFPeA: 530 (66,000)• PFBA: 180 (64,000)• PFHpA: 235 (75,000)
Fire Training/FireResponse (Moody and Field1999; Moody et al. 2003; Houtzet al. 2013)
Studies at U.S. military installations and other AFFFrelease areas have documented relatively highdetection frequencies of PFAAs in underlyinggroundwater.
Maximum:• PFOA: 6,570,000• PFOS: 2,300,000
Landfill Impacts
Raw and Treated LandfillLeachates (Yan et al. 2015)
5 municipal landfill sites in China were included in astudy of 14 PFAAs concentrations in raw and treatedleachate. Total PFAAs ranged from 7.28 to 292 µg/Lin raw and 0.1 to 282 µg/L in treated. Dominantcompounds included PFOA (28.8% of raw and 36.8%of treated) and PFBS (26.1% of raw and 40.8% oftreated).
Raw leachateRange (mean contribution %):• PFOA: 281–217,000 (28.8)• PFBS: 1,600–41,600 (26.1)• PFPeA: 640–10,000 (15.9)• PFOS: 1,200–6,00 Treated leachateRange (mean contribution %):• PFOA: 30–206,000 (36.8)• PFBS: 20–55,300 (40.8)
Page 332ITRC PFAS-1
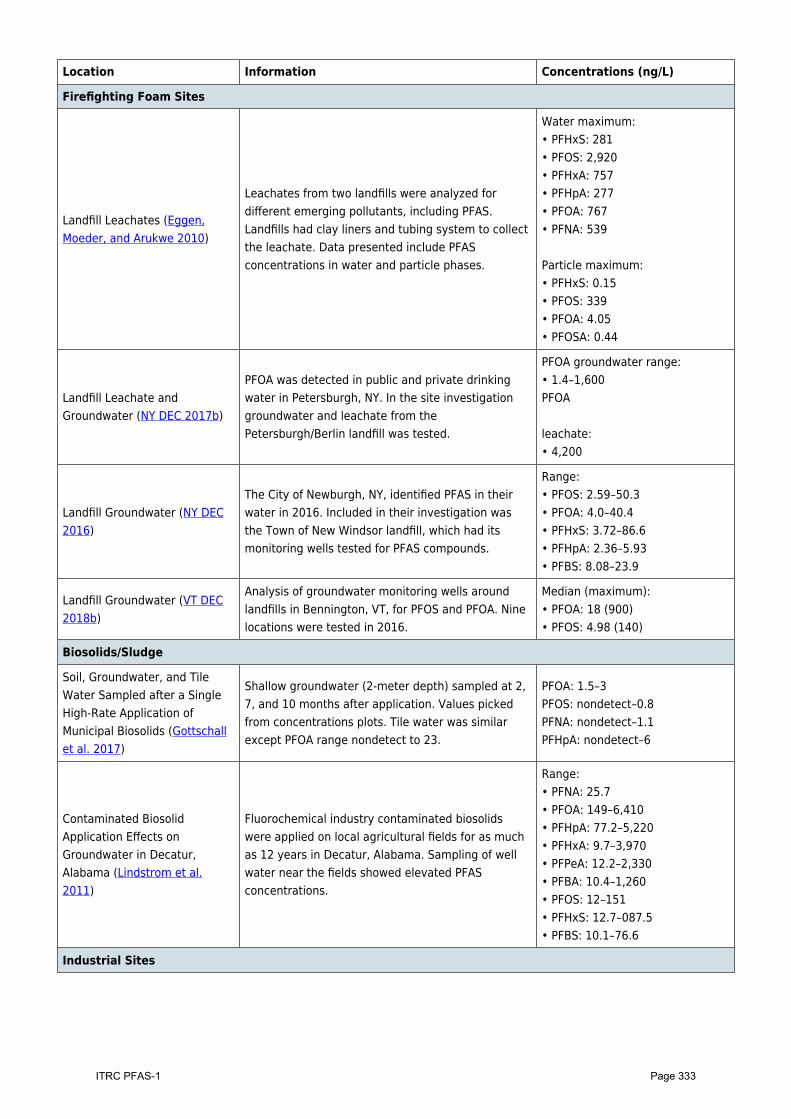
Location Information Concentrations (ng/L)
Firefighting Foam Sites
Landfill Leachates (Eggen,Moeder, and Arukwe 2010)
Leachates from two landfills were analyzed fordifferent emerging pollutants, including PFAS.Landfills had clay liners and tubing system to collectthe leachate. Data presented include PFASconcentrations in water and particle phases.
Water maximum:• PFHxS: 281• PFOS: 2,920• PFHxA: 757• PFHpA: 277• PFOA: 767• PFNA: 539 Particle maximum:• PFHxS: 0.15• PFOS: 339• PFOA: 4.05• PFOSA: 0.44
Landfill Leachate andGroundwater (NY DEC 2017b)
PFOA was detected in public and private drinkingwater in Petersburgh, NY. In the site investigationgroundwater and leachate from thePetersburgh/Berlin landfill was tested.
PFOA groundwater range:• 1.4–1,600PFOA leachate:• 4,200
Landfill Groundwater (NY DEC2016)
The City of Newburgh, NY, identified PFAS in theirwater in 2016. Included in their investigation wasthe Town of New Windsor landfill, which had itsmonitoring wells tested for PFAS compounds.
Range:• PFOS: 2.59–50.3• PFOA: 4.0–40.4• PFHxS: 3.72–86.6• PFHpA: 2.36–5.93• PFBS: 8.08–23.9
Landfill Groundwater (VT DEC2018b)
Analysis of groundwater monitoring wells aroundlandfills in Bennington, VT, for PFOS and PFOA. Ninelocations were tested in 2016.
Median (maximum):• PFOA: 18 (900)• PFOS: 4.98 (140)
Biosolids/Sludge
Soil, Groundwater, and TileWater Sampled after a SingleHigh-Rate Application ofMunicipal Biosolids (Gottschallet al. 2017)
Shallow groundwater (2-meter depth) sampled at 2,7, and 10 months after application. Values pickedfrom concentrations plots. Tile water was similarexcept PFOA range nondetect to 23.
PFOA: 1.5–3PFOS: nondetect–0.8PFNA: nondetect–1.1PFHpA: nondetect–6
Contaminated BiosolidApplication Effects onGroundwater in Decatur,Alabama (Lindstrom et al.2011)
Fluorochemical industry contaminated biosolidswere applied on local agricultural fields for as muchas 12 years in Decatur, Alabama. Sampling of wellwater near the fields showed elevated PFASconcentrations.
Range:• PFNA: 25.7• PFOA: 149–6,410• PFHpA: 77.2–5,220• PFHxA: 9.7–3,970• PFPeA: 12.2–2,330• PFBA: 10.4–1,260• PFOS: 12–151• PFHxS: 12.7–087.5• PFBS: 10.1–76.6
Industrial Sites
Page 333ITRC PFAS-1
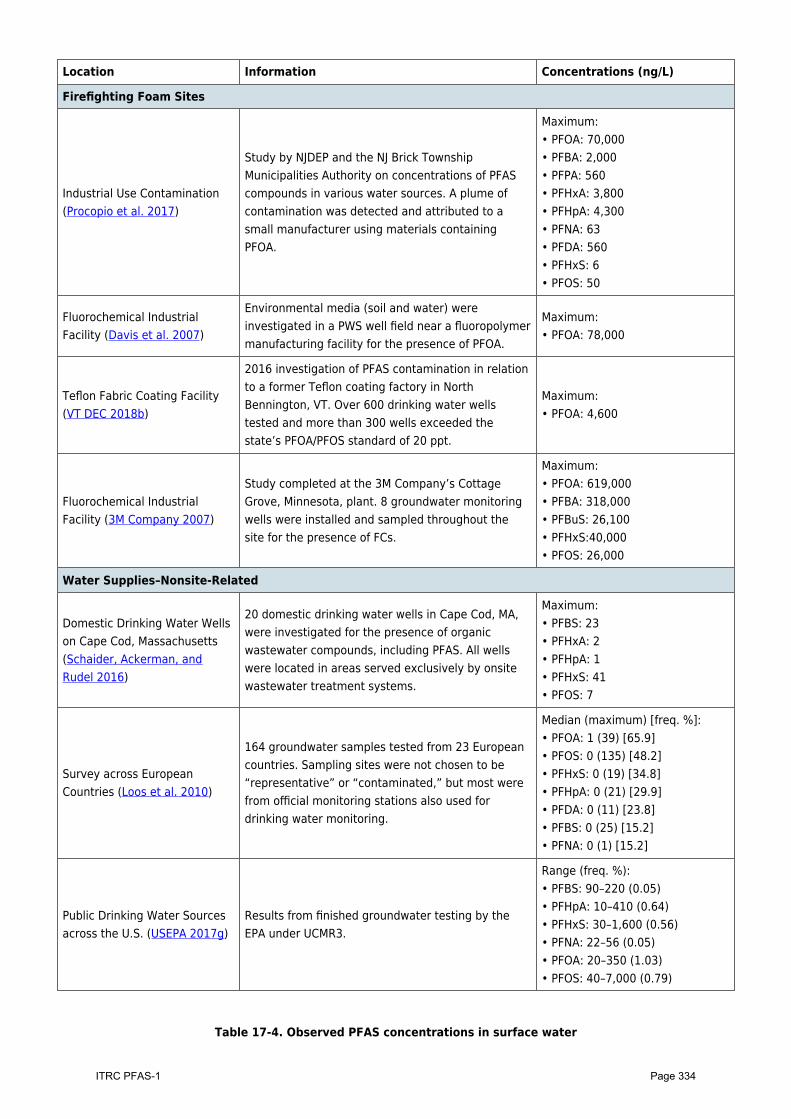
Location Information Concentrations (ng/L)
Firefighting Foam Sites
Industrial Use Contamination(Procopio et al. 2017)
Study by NJDEP and the NJ Brick TownshipMunicipalities Authority on concentrations of PFAScompounds in various water sources. A plume ofcontamination was detected and attributed to asmall manufacturer using materials containingPFOA.
Maximum:• PFOA: 70,000• PFBA: 2,000• PFPA: 560• PFHxA: 3,800• PFHpA: 4,300• PFNA: 63• PFDA: 560• PFHxS: 6• PFOS: 50
Fluorochemical IndustrialFacility (Davis et al. 2007)
Environmental media (soil and water) wereinvestigated in a PWS well field near a fluoropolymermanufacturing facility for the presence of PFOA.
Maximum:• PFOA: 78,000
Teflon Fabric Coating Facility(VT DEC 2018b)
2016 investigation of PFAS contamination in relationto a former Teflon coating factory in NorthBennington, VT. Over 600 drinking water wellstested and more than 300 wells exceeded thestate’s PFOA/PFOS standard of 20 ppt.
Maximum:• PFOA: 4,600
Fluorochemical IndustrialFacility (3M Company 2007)
Study completed at the 3M Company’s CottageGrove, Minnesota, plant. 8 groundwater monitoringwells were installed and sampled throughout thesite for the presence of FCs.
Maximum:• PFOA: 619,000• PFBA: 318,000• PFBuS: 26,100• PFHxS:40,000• PFOS: 26,000
Water Supplies–Nonsite-Related
Domestic Drinking Water Wellson Cape Cod, Massachusetts(Schaider, Ackerman, andRudel 2016)
20 domestic drinking water wells in Cape Cod, MA,were investigated for the presence of organicwastewater compounds, including PFAS. All wellswere located in areas served exclusively by onsitewastewater treatment systems.
Maximum:• PFBS: 23• PFHxA: 2• PFHpA: 1• PFHxS: 41• PFOS: 7
Survey across EuropeanCountries (Loos et al. 2010)
164 groundwater samples tested from 23 Europeancountries. Sampling sites were not chosen to be“representative” or “contaminated,” but most werefrom official monitoring stations also used fordrinking water monitoring.
Median (maximum) [freq. %]:• PFOA: 1 (39) [65.9]• PFOS: 0 (135) [48.2]• PFHxS: 0 (19) [34.8]• PFHpA: 0 (21) [29.9]• PFDA: 0 (11) [23.8]• PFBS: 0 (25) [15.2]• PFNA: 0 (1) [15.2]
Public Drinking Water Sourcesacross the U.S. (USEPA 2017g)
Results from finished groundwater testing by theEPA under UCMR3.
Range (freq. %):• PFBS: 90–220 (0.05)• PFHpA: 10–410 (0.64)• PFHxS: 30–1,600 (0.56)• PFNA: 22–56 (0.05)• PFOA: 20–350 (1.03)• PFOS: 40–7,000 (0.79)
Table 17-4. Observed PFAS concentrations in surface water
Page 334ITRC PFAS-1
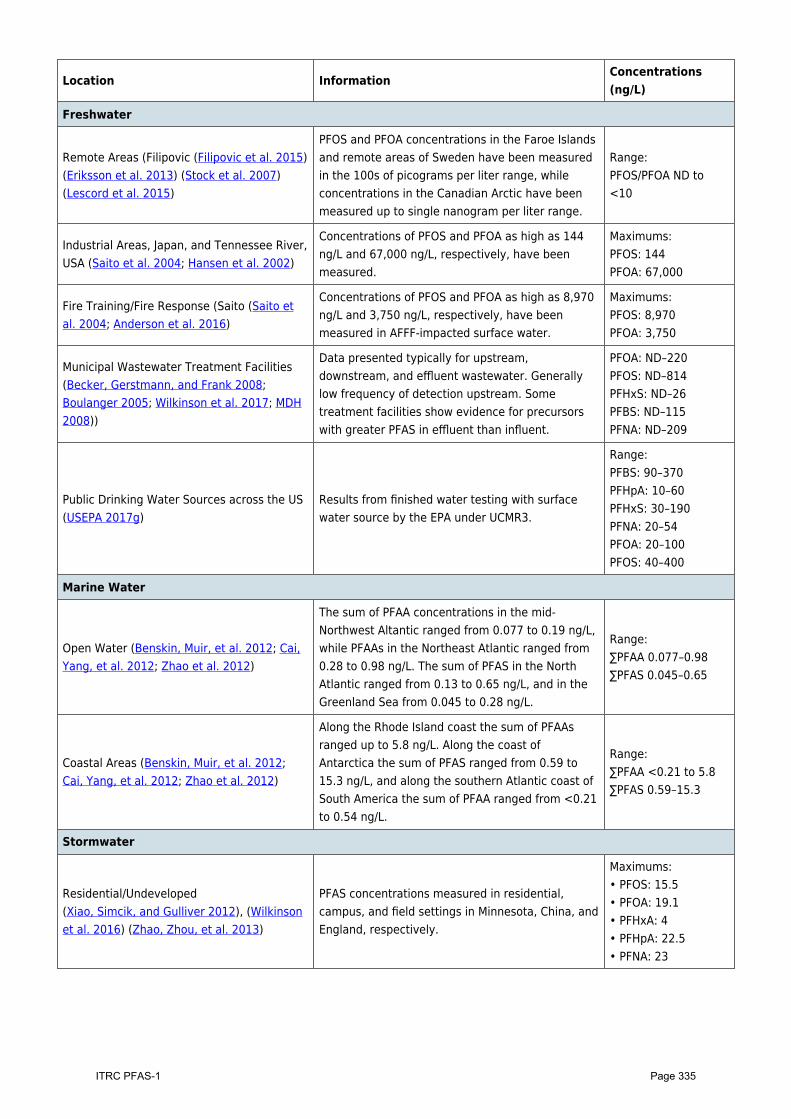
Location InformationConcentrations(ng/L)
Freshwater
Remote Areas (Filipovic (Filipovic et al. 2015)(Eriksson et al. 2013) (Stock et al. 2007)(Lescord et al. 2015)
PFOS and PFOA concentrations in the Faroe Islandsand remote areas of Sweden have been measuredin the 100s of picograms per liter range, whileconcentrations in the Canadian Arctic have beenmeasured up to single nanogram per liter range.
Range:PFOS/PFOA ND to<10
Industrial Areas, Japan, and Tennessee River,USA (Saito et al. 2004; Hansen et al. 2002)
Concentrations of PFOS and PFOA as high as 144ng/L and 67,000 ng/L, respectively, have beenmeasured.
Maximums:PFOS: 144PFOA: 67,000
Fire Training/Fire Response (Saito (Saito etal. 2004; Anderson et al. 2016)
Concentrations of PFOS and PFOA as high as 8,970ng/L and 3,750 ng/L, respectively, have beenmeasured in AFFF-impacted surface water.
Maximums:PFOS: 8,970PFOA: 3,750
Municipal Wastewater Treatment Facilities(Becker, Gerstmann, and Frank 2008;Boulanger 2005; Wilkinson et al. 2017; MDH2008))
Data presented typically for upstream,downstream, and effluent wastewater. Generallylow frequency of detection upstream. Sometreatment facilities show evidence for precursorswith greater PFAS in effluent than influent.
PFOA: ND–220PFOS: ND–814PFHxS: ND–26PFBS: ND–115PFNA: ND–209
Public Drinking Water Sources across the US(USEPA 2017g)
Results from finished water testing with surfacewater source by the EPA under UCMR3.
Range:PFBS: 90–370PFHpA: 10–60PFHxS: 30–190PFNA: 20–54PFOA: 20–100PFOS: 40–400
Marine Water
Open Water (Benskin, Muir, et al. 2012; Cai,Yang, et al. 2012; Zhao et al. 2012)
The sum of PFAA concentrations in the mid-Northwest Altantic ranged from 0.077 to 0.19 ng/L,while PFAAs in the Northeast Atlantic ranged from0.28 to 0.98 ng/L. The sum of PFAS in the NorthAtlantic ranged from 0.13 to 0.65 ng/L, and in theGreenland Sea from 0.045 to 0.28 ng/L.
Range:∑PFAA 0.077–0.98∑PFAS 0.045–0.65
Coastal Areas (Benskin, Muir, et al. 2012;Cai, Yang, et al. 2012; Zhao et al. 2012)
Along the Rhode Island coast the sum of PFAAsranged up to 5.8 ng/L. Along the coast ofAntarctica the sum of PFAS ranged from 0.59 to15.3 ng/L, and along the southern Atlantic coast ofSouth America the sum of PFAA ranged from <0.21to 0.54 ng/L.
Range:∑PFAA <0.21 to 5.8∑PFAS 0.59–15.3
Stormwater
Residential/Undeveloped(Xiao, Simcik, and Gulliver 2012), (Wilkinsonet al. 2016) (Zhao, Zhou, et al. 2013)
PFAS concentrations measured in residential,campus, and field settings in Minnesota, China, andEngland, respectively.
Maximums:• PFOS: 15.5• PFOA: 19.1• PFHxA: 4• PFHpA: 22.5• PFNA: 23
Page 335ITRC PFAS-1
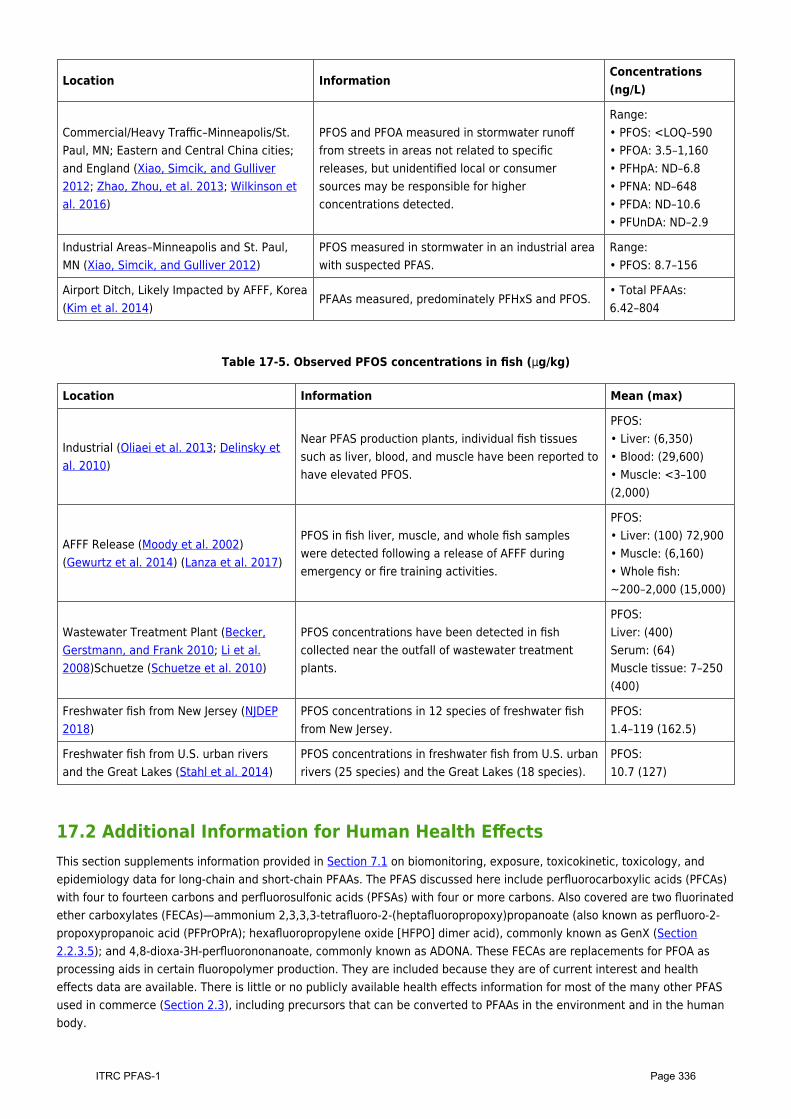
Location InformationConcentrations(ng/L)
Commercial/Heavy Traffic–Minneapolis/St.Paul, MN; Eastern and Central China cities;and England (Xiao, Simcik, and Gulliver2012; Zhao, Zhou, et al. 2013; Wilkinson etal. 2016)
PFOS and PFOA measured in stormwater runofffrom streets in areas not related to specificreleases, but unidentified local or consumersources may be responsible for higherconcentrations detected.
Range:• PFOS: <LOQ–590• PFOA: 3.5–1,160• PFHpA: ND–6.8• PFNA: ND–648• PFDA: ND–10.6• PFUnDA: ND–2.9
Industrial Areas–Minneapolis and St. Paul,MN (Xiao, Simcik, and Gulliver 2012)
PFOS measured in stormwater in an industrial areawith suspected PFAS.
Range:• PFOS: 8.7–156
Airport Ditch, Likely Impacted by AFFF, Korea(Kim et al. 2014)
PFAAs measured, predominately PFHxS and PFOS.• Total PFAAs:6.42–804
Table 17-5. Observed PFOS concentrations in fish (µg/kg)
Location Information Mean (max)
Industrial (Oliaei et al. 2013; Delinsky etal. 2010)
Near PFAS production plants, individual fish tissuessuch as liver, blood, and muscle have been reported tohave elevated PFOS.
PFOS:• Liver: (6,350)• Blood: (29,600)• Muscle: <3–100(2,000)
AFFF Release (Moody et al. 2002)(Gewurtz et al. 2014) (Lanza et al. 2017)
PFOS in fish liver, muscle, and whole fish sampleswere detected following a release of AFFF duringemergency or fire training activities.
PFOS:• Liver: (100) 72,900• Muscle: (6,160)• Whole fish:~200–2,000 (15,000)
Wastewater Treatment Plant (Becker,Gerstmann, and Frank 2010; Li et al.2008)Schuetze (Schuetze et al. 2010)
PFOS concentrations have been detected in fishcollected near the outfall of wastewater treatmentplants.
PFOS:Liver: (400)Serum: (64)Muscle tissue: 7–250(400)
Freshwater fish from New Jersey (NJDEP2018)
PFOS concentrations in 12 species of freshwater fishfrom New Jersey.
PFOS:1.4–119 (162.5)
Freshwater fish from U.S. urban riversand the Great Lakes (Stahl et al. 2014)
PFOS concentrations in freshwater fish from U.S. urbanrivers (25 species) and the Great Lakes (18 species).
PFOS:10.7 (127)
17.2 Additional Information for Human Health EffectsThis section supplements information provided in Section 7.1 on biomonitoring, exposure, toxicokinetic, toxicology, andepidemiology data for long-chain and short-chain PFAAs. The PFAS discussed here include perfluorocarboxylic acids (PFCAs)with four to fourteen carbons and perfluorosulfonic acids (PFSAs) with four or more carbons. Also covered are two fluorinatedether carboxylates (FECAs)—ammonium 2,3,3,3-tetrafluoro-2-(heptafluoropropoxy)propanoate (also known as perfluoro-2-propoxypropanoic acid (PFPrOPrA); hexafluoropropylene oxide [HFPO] dimer acid), commonly known as GenX (Section2.2.3.5); and 4,8-dioxa-3H-perfluorononanoate, commonly known as ADONA. These FECAs are replacements for PFOA asprocessing aids in certain fluoropolymer production. They are included because they are of current interest and healtheffects data are available. There is little or no publicly available health effects information for most of the many other PFASused in commerce (Section 2.3), including precursors that can be converted to PFAAs in the environment and in the humanbody.
Page 336ITRC PFAS-1
For further detail of scientific names and carbon chain length of PFAAs see Section 2.2.
17.2.1 OverviewBased on the number of studies located through searches of the National Library of Medicine’s PubMed, a databasecontaining relevant peer-reviewed publications, much of the information summarized here is recent. Additional studies maybe available, particularly for those compounds with large health effects data sets, and additional information on the topics inthis section can be found in databases such as PubMed and references listed in Section 7.1.
The publicly available toxicological data set is currently largest for PFOA and PFOS, with considerable data also available forPFBA, PFBS, PFHxA, PFNA, PFDA, and GenX, a few studies for PFHxS, PFUnA, PFDoA, and ADONA, and little or no data forPFPeA, PFHpA, PFTrA, PFTA, PFPeS, PFHpS, PFNS, or PFDS. Most of the mammalian studies were conducted in rodents, with afew in nonhuman primates (monkeys). The most notable toxicological effects from the mammalian studies of these PFAS,with relevant citations, are discussed in Section 17.2.5 and are summarized in Table 17-8 (provided as a separate Excel file).However, due to the large size of the toxicological data set, it is beyond the scope of this section to identify no observedadverse effect levels (NOAELs) and lowest observed adverse effect levels (LOAELs) for these effects. The numerous reviewsof potential epidemiological associations of health endpoints with PFAAs are discussed in Section 17.2.4. Many of theepidemiology studies evaluate associations of health endpoints with multiple PFAAs detected in the blood serum of thesubjects. Finally, data gaps and research needs are discussed.
17.2.2 Human Biomonitoring and Sources of ExposureSeveral long-chain PFAAs (from highest to lowest geometric mean [GM] serum levels, as follows: PFOS, PFOA, PFHxS, PFNA)are present in the low parts per billion (ng/ml) range in the blood serum of almost all adult residents of the United States,while other PFAS are detected in a smaller percentage of the population (CDC 2018; Olsen et al. 2017)). In contrast, short-chain PFAAs such as PFBS and PFHxA are more rapidly excreted and were infrequently detected in the blood serum of theU.S. general population (CDC 2018; Olsen et al. 2017). For example, PFBS was detected in less than 5% of serum samples inall National Health and Nutrition Examination Survey (NHANES) years except 2005–‘06 (CDC 2018). Both NHANES and theblood donor studies show generally higher levels of long-chain PFAAs in males than females, with generally decreasingserum levels of long-chain PFAAs over time. NHANES 2013–‘14 evaluated PFAS in children 3–11 years old (CDC 2018) andfound serum levels of PFOS, PFOA, PFHxS, and PFNA generally similar to those in older adolescents and adults in the sametime period. It was noted that most of the children studied were born after PFOS manufacturing was phased out in the UnitedStates in 2002 (Ye et al. 2018). Long-chain PFAA human serum levels in other industrialized countries are generally similar tothe United States (Kato 2015) and may be lower in less developed nations (for example, Afghanistan) where they are lesslikely to be used industrially and consumer products containing them are less frequently used (Hemat et al. 2010). Testing in2017 by the North Carolina Department of Health and Human Services (NC DHHS) did not detect HFPO-DA (“GenX”) in theblood serum or urine of North Carolina residents with previous or current exposure from private wells, but did detect otherPFAS (NC DHHS 2018). A North Carolina State University study of a public water system and its users included a larger list ofPFAS analytes and, although no GenX was detected, they identified four newly identified PFAS in the drinking water andblood serum of most participants (Hogue 2019; Hopkins et al. 2018). A recent study of a potentially exposed populationdetected ADONA in only a few subjects (Fromme et al. 2017).
Human exposures can result from consumption of fish from waters contaminated with bioaccumulative PFAAs (for example,MDCH (2014)). PFSAs with more than eight fluorinated carbons (that is, PFOS and longer chain for PFSAs; PFNA and longerchain for PFCAs) are substantially more bioaccumulative than shorter chain PFAAs, with PFSAs generally morebioaccumulative than PFCAs with the same number of fluorinated carbons (Conder et al. 2008; Martin et al. 2003). Whendrinking water is contaminated with even relatively low levels of long-chain PFAAs, exposure from drinking water maydominate contributions from exposure sources such as food and consumer products that are prevalent in the generalpopulation. For example, (USEPA 2011a) predicted that ongoing exposure to 20 ng/L PFOA in drinking water will increaseserum PFOA levels more than two-fold from the U.S. median of 2 ng/L. Elevated serum levels of long-chain PFAAs have beenobserved in communities with contaminated drinking water in several U.S. states, including Ohio and West Virginia (WVUniversity 2008; Emmett et al. 2006; Steenland et al. 2009) (Hoffman et al. 2011), New Hampshire (NH DHHS 2015),Alabama (ATSDR 2013), Minnesota (MDH 2009; Landsteiner et al. 2014), New York (NYS DOH 2016a), and in other nations,including Germany (Hölzer et al. 2008) and Sweden (Li et al. 2018) (Table 17-6). ATSDR (2019b) plans to conduct exposureassessments that will include biomonitoring in eight U.S. locations impacted by PFAS in drinking water.
Understanding exposures to PFAS at different developmental phases (for example, fetus, infant) is important to ensureprotection of the most sensitive subpopulations. Evidence for developmental effects from early life exposures to long-chain
Page 337ITRC PFAS-1
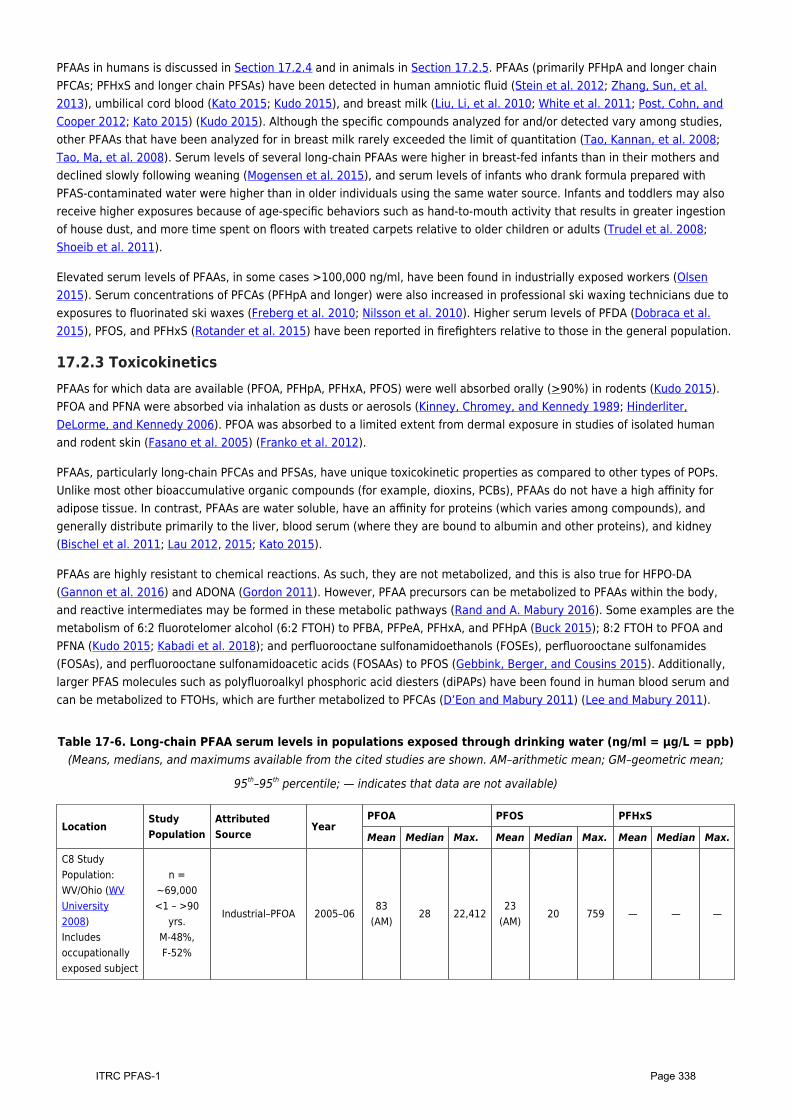
PFAAs in humans is discussed in Section 17.2.4 and in animals in Section 17.2.5. PFAAs (primarily PFHpA and longer chainPFCAs; PFHxS and longer chain PFSAs) have been detected in human amniotic fluid (Stein et al. 2012; Zhang, Sun, et al.2013), umbilical cord blood (Kato 2015; Kudo 2015), and breast milk (Liu, Li, et al. 2010; White et al. 2011; Post, Cohn, andCooper 2012; Kato 2015) (Kudo 2015). Although the specific compounds analyzed for and/or detected vary among studies,other PFAAs that have been analyzed for in breast milk rarely exceeded the limit of quantitation (Tao, Kannan, et al. 2008;Tao, Ma, et al. 2008). Serum levels of several long-chain PFAAs were higher in breast-fed infants than in their mothers anddeclined slowly following weaning (Mogensen et al. 2015), and serum levels of infants who drank formula prepared withPFAS-contaminated water were higher than in older individuals using the same water source. Infants and toddlers may alsoreceive higher exposures because of age-specific behaviors such as hand-to-mouth activity that results in greater ingestionof house dust, and more time spent on floors with treated carpets relative to older children or adults (Trudel et al. 2008;Shoeib et al. 2011).
Elevated serum levels of PFAAs, in some cases >100,000 ng/ml, have been found in industrially exposed workers (Olsen2015). Serum concentrations of PFCAs (PFHpA and longer) were also increased in professional ski waxing technicians due toexposures to fluorinated ski waxes (Freberg et al. 2010; Nilsson et al. 2010). Higher serum levels of PFDA (Dobraca et al.2015), PFOS, and PFHxS (Rotander et al. 2015) have been reported in firefighters relative to those in the general population.
17.2.3 ToxicokineticsPFAAs for which data are available (PFOA, PFHpA, PFHxA, PFOS) were well absorbed orally (>90%) in rodents (Kudo 2015).PFOA and PFNA were absorbed via inhalation as dusts or aerosols (Kinney, Chromey, and Kennedy 1989; Hinderliter,DeLorme, and Kennedy 2006). PFOA was absorbed to a limited extent from dermal exposure in studies of isolated humanand rodent skin (Fasano et al. 2005) (Franko et al. 2012).
PFAAs, particularly long-chain PFCAs and PFSAs, have unique toxicokinetic properties as compared to other types of POPs.Unlike most other bioaccumulative organic compounds (for example, dioxins, PCBs), PFAAs do not have a high affinity foradipose tissue. In contrast, PFAAs are water soluble, have an affinity for proteins (which varies among compounds), andgenerally distribute primarily to the liver, blood serum (where they are bound to albumin and other proteins), and kidney(Bischel et al. 2011; Lau 2012, 2015; Kato 2015).
PFAAs are highly resistant to chemical reactions. As such, they are not metabolized, and this is also true for HFPO-DA(Gannon et al. 2016) and ADONA (Gordon 2011). However, PFAA precursors can be metabolized to PFAAs within the body,and reactive intermediates may be formed in these metabolic pathways (Rand and A. Mabury 2016). Some examples are themetabolism of 6:2 fluorotelomer alcohol (6:2 FTOH) to PFBA, PFPeA, PFHxA, and PFHpA (Buck 2015); 8:2 FTOH to PFOA andPFNA (Kudo 2015; Kabadi et al. 2018); and perfluorooctane sulfonamidoethanols (FOSEs), perfluorooctane sulfonamides(FOSAs), and perfluorooctane sulfonamidoacetic acids (FOSAAs) to PFOS (Gebbink, Berger, and Cousins 2015). Additionally,larger PFAS molecules such as polyfluoroalkyl phosphoric acid diesters (diPAPs) have been found in human blood serum andcan be metabolized to FTOHs, which are further metabolized to PFCAs (D’Eon and Mabury 2011) (Lee and Mabury 2011).
Table 17-6. Long-chain PFAA serum levels in populations exposed through drinking water (ng/ml = µg/L = ppb)(Means, medians, and maximums available from the cited studies are shown. AM–arithmetic mean; GM–geometric mean;
95th–95th percentile; — indicates that data are not available)
LocationStudyPopulation
AttributedSource
YearPFOA PFOS PFHxS
Mean Median Max. Mean Median Max. Mean Median Max.
C8 StudyPopulation:WV/Ohio (WVUniversity2008)Includesoccupationallyexposed subject
n =~69,000<1 – >90
yrs.M-48%,F-52%
Industrial–PFOA 2005–0683
(AM)28
22,412
23(AM)
20 759 — — —
Page 338ITRC PFAS-1
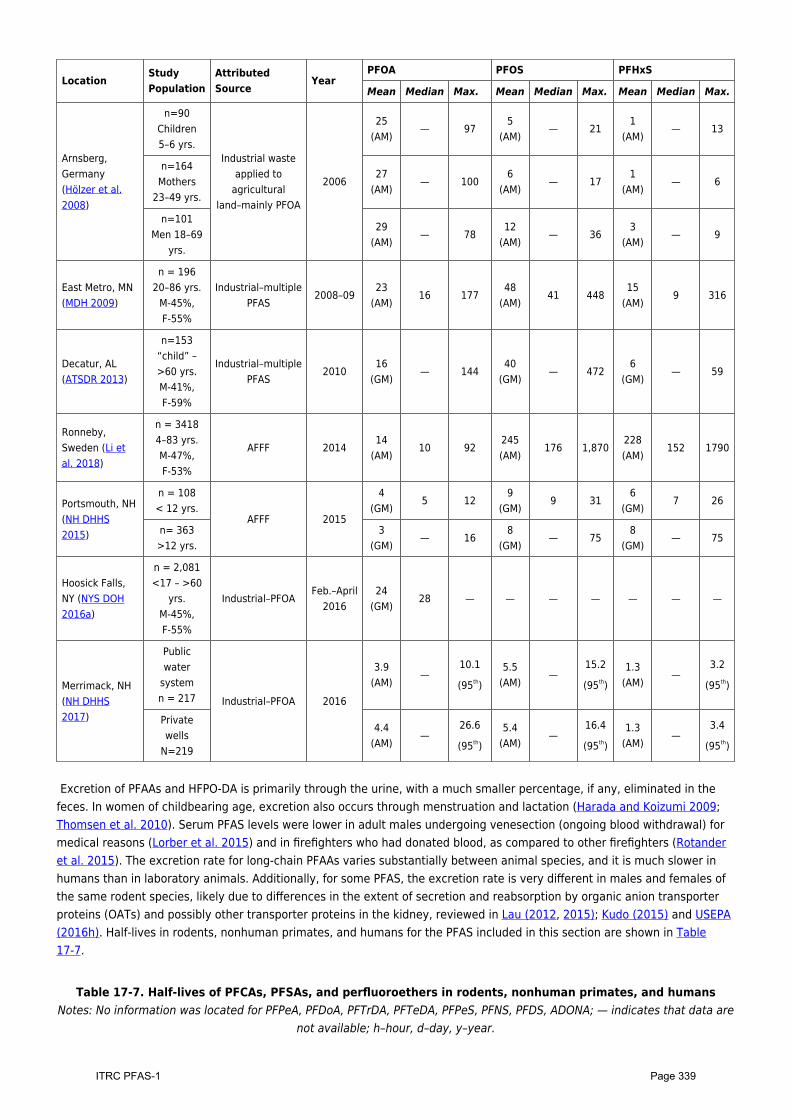
LocationStudyPopulation
AttributedSource
YearPFOA PFOS PFHxS
Mean Median Max. Mean Median Max. Mean Median Max.
Arnsberg,Germany(Hölzer et al.2008)
n=90Children5–6 yrs.
Industrial wasteapplied to
agriculturalland–mainly PFOA
2006
25(AM)
— 975
(AM)— 21
1(AM)
— 13
n=164Mothers
23–49 yrs.
27(AM)
— 1006
(AM)— 17
1(AM)
— 6
n=101Men 18–69
yrs.
29(AM)
— 7812
(AM)— 36
3(AM)
— 9
East Metro, MN(MDH 2009)
n = 19620–86 yrs.
M-45%,F-55%
Industrial–multiplePFAS
2008–0923
(AM)16 177
48(AM)
41 44815
(AM)9 316
Decatur, AL(ATSDR 2013)
n=153“child” –>60 yrs.M-41%,F-59%
Industrial–multiplePFAS
201016
(GM)— 144
40(GM)
— 4726
(GM)— 59
Ronneby,Sweden (Li etal. 2018)
n = 34184–83 yrs.M-47%,F-53%
AFFF 201414
(AM)10 92
245(AM)
176 1,870228(AM)
152 1790
Portsmouth, NH(NH DHHS2015)
n = 108< 12 yrs.
AFFF 2015
4(GM)
5 129
(GM)9 31
6(GM)
7 26
n= 363>12 yrs.
3(GM)
— 168
(GM)— 75
8(GM)
— 75
Hoosick Falls,NY (NYS DOH2016a)
n = 2,081<17 – >60
yrs.M-45%,F-55%
Industrial–PFOAFeb.–April
201624
(GM)28 — — — — — — —
Merrimack, NH(NH DHHS2017)
Publicwater
systemn = 217 Industrial–PFOA 2016
3.9(AM)
—10.1
(95th)5.5
(AM)—
15.2
(95th)1.3
(AM)—
3.2
(95th)
Privatewells
N=219
4.4(AM)
—26.6
(95th)5.4
(AM)—
16.4
(95th)1.3
(AM)—
3.4
(95th)
Excretion of PFAAs and HFPO-DA is primarily through the urine, with a much smaller percentage, if any, eliminated in thefeces. In women of childbearing age, excretion also occurs through menstruation and lactation (Harada and Koizumi 2009;Thomsen et al. 2010). Serum PFAS levels were lower in adult males undergoing venesection (ongoing blood withdrawal) formedical reasons (Lorber et al. 2015) and in firefighters who had donated blood, as compared to other firefighters (Rotanderet al. 2015). The excretion rate for long-chain PFAAs varies substantially between animal species, and it is much slower inhumans than in laboratory animals. Additionally, for some PFAS, the excretion rate is very different in males and females ofthe same rodent species, likely due to differences in the extent of secretion and reabsorption by organic anion transporterproteins (OATs) and possibly other transporter proteins in the kidney, reviewed in Lau (2012, 2015); Kudo (2015) and USEPA(2016h). Half-lives in rodents, nonhuman primates, and humans for the PFAS included in this section are shown in Table17-7.
Table 17-7. Half-lives of PFCAs, PFSAs, and perfluoroethers in rodents, nonhuman primates, and humansNotes: No information was located for PFPeA, PFDoA, PFTrDA, PFTeDA, PFPeS, PFNS, PFDS, ADONA; — indicates that data are
not available; h–hour, d–day, y–year.
Page 339ITRC PFAS-1
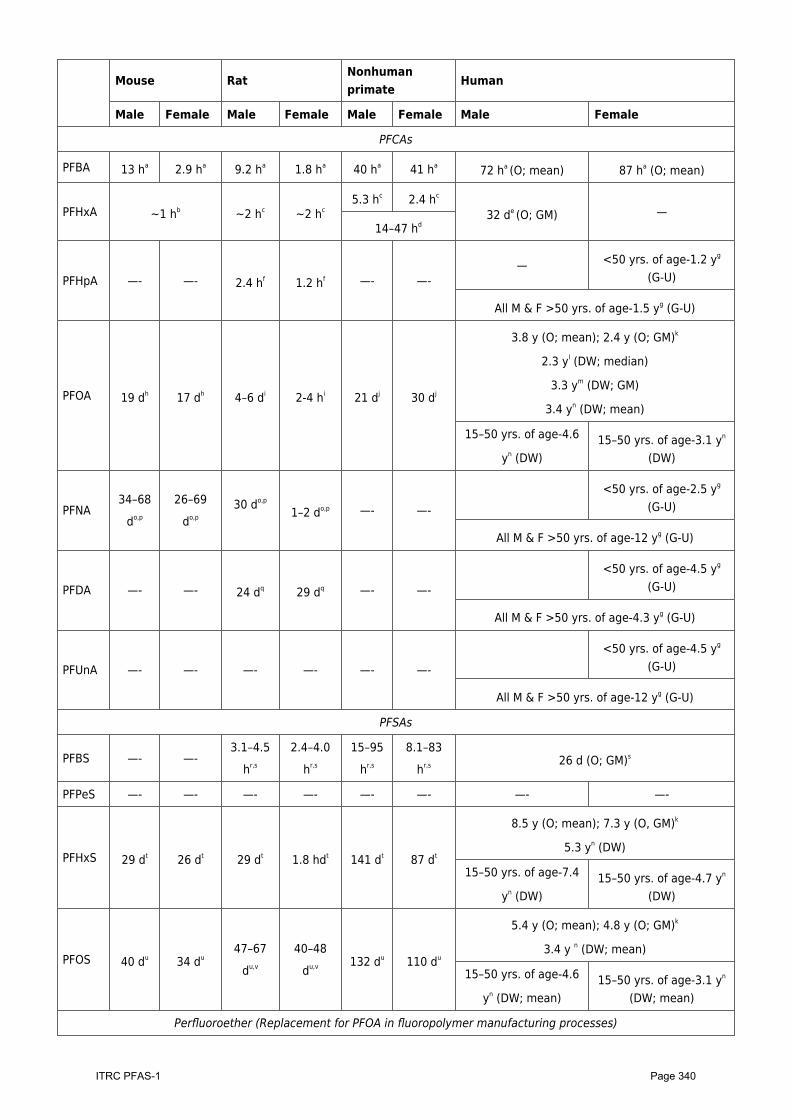
Mouse RatNonhumanprimate
Human
Male Female Male Female Male Female Male Female
PFCAs
PFBA 13 ha 2.9 ha 9.2 ha 1.8 ha 40 ha 41 ha 72 ha (O; mean) 87 ha (O; mean)
PFHxA ~1 hb ~2 hc ~2 hc5.3 hc 2.4 hc
32 de (O; GM) —14–47 hd
PFHpA —- —- 2.4 hf 1.2 hf —- —-— <50 yrs. of age-1.2 yg
(G-U)
All M & F >50 yrs. of age-1.5 yg (G-U)
PFOA 19 dh 17 dh 4–6 di 2-4 hi 21 dj 30 dj
3.8 y (O; mean); 2.4 y (O; GM)k
2.3 yl (DW; median)
3.3 ym (DW; GM)
3.4 yn (DW; mean)
15–50 yrs. of age-4.6
yn (DW)15–50 yrs. of age-3.1 yn
(DW)
PFNA34–68
do,p
26–69
do,p30 do,p
1–2 do,p —- —-<50 yrs. of age-2.5 yg
(G-U)
All M & F >50 yrs. of age-12 yg (G-U)
PFDA —- —- 24 dq 29 dq —- —-<50 yrs. of age-4.5 yg
(G-U)
All M & F >50 yrs. of age-4.3 yg (G-U)
PFUnA —- —- —- —- —- —-<50 yrs. of age-4.5 yg
(G-U)
All M & F >50 yrs. of age-12 yg (G-U)
PFSAs
PFBS —- —-3.1–4.5
hr,s
2.4–4.0
hr,s
15–95
hr,s
8.1–83
hr,s 26 d (O; GM)s
PFPeS —- —- —- —- —- —- —- —-
PFHxS 29 dt 26 dt 29 dt 1.8 hdt 141 dt 87 dt
8.5 y (O; mean); 7.3 y (O, GM)k
5.3 yn (DW)
15–50 yrs. of age-7.4
yn (DW)15–50 yrs. of age-4.7 yn
(DW)
PFOS 40 du 34 du47–67
du,v
40–48
du,v 132 du 110 du
5.4 y (O; mean); 4.8 y (O; GM)k
3.4 y n (DW; mean)
15–50 yrs. of age-4.6
yn (DW; mean)15–50 yrs. of age-3.1 yn
(DW; mean)
Perfluoroether (Replacement for PFOA in fluoropolymer manufacturing processes)
Page 340ITRC PFAS-1
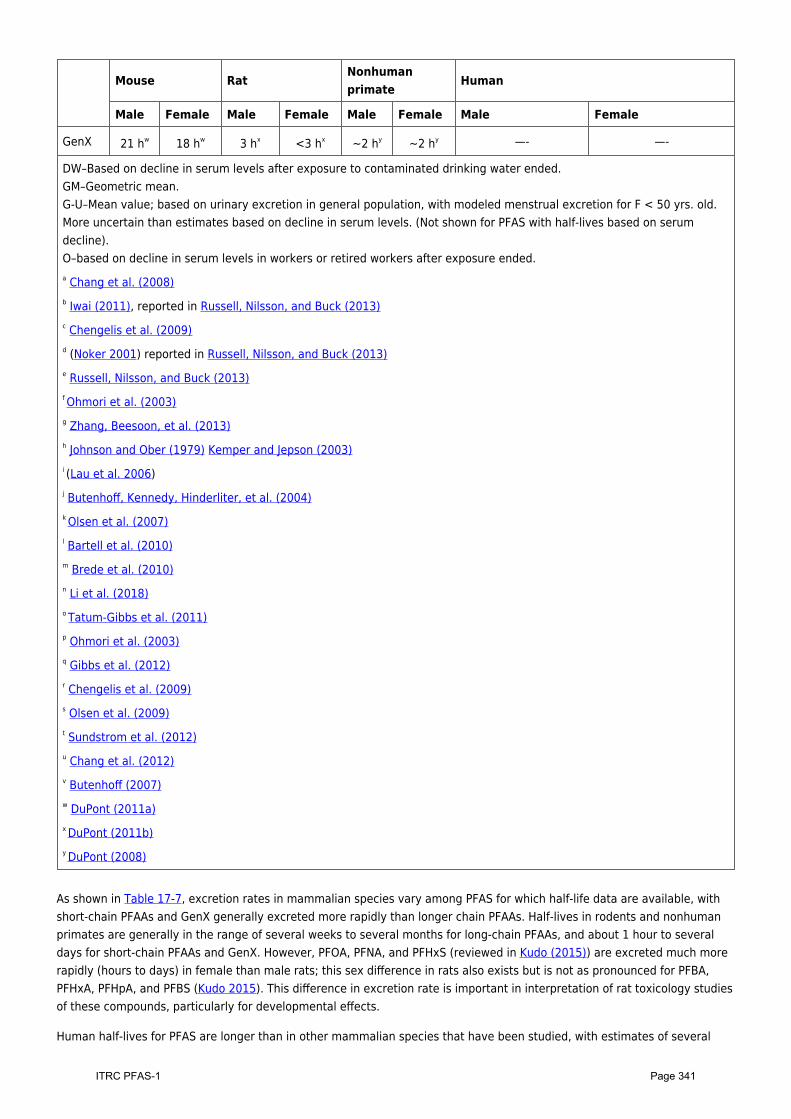
Mouse RatNonhumanprimate
Human
Male Female Male Female Male Female Male Female
GenX 21 hw 18 hw 3 hx <3 hx ~2 hy ~2 hy —- —-
DW–Based on decline in serum levels after exposure to contaminated drinking water ended.GM–Geometric mean.G-U–Mean value; based on urinary excretion in general population, with modeled menstrual excretion for F < 50 yrs. old.More uncertain than estimates based on decline in serum levels. (Not shown for PFAS with half-lives based on serumdecline).O–based on decline in serum levels in workers or retired workers after exposure ended.a Chang et al. (2008)b Iwai (2011), reported in Russell, Nilsson, and Buck (2013)c Chengelis et al. (2009)d (Noker 2001) reported in Russell, Nilsson, and Buck (2013)e Russell, Nilsson, and Buck (2013)f Ohmori et al. (2003)g Zhang, Beesoon, et al. (2013)h Johnson and Ober (1979) Kemper and Jepson (2003)i (Lau et al. 2006)j Butenhoff, Kennedy, Hinderliter, et al. (2004)k Olsen et al. (2007)l Bartell et al. (2010)m Brede et al. (2010)n Li et al. (2018)o Tatum-Gibbs et al. (2011)p Ohmori et al. (2003)q Gibbs et al. (2012)r Chengelis et al. (2009)s Olsen et al. (2009)t Sundstrom et al. (2012)u Chang et al. (2012)v Butenhoff (2007)w DuPont (2011a)x DuPont (2011b)y DuPont (2008)
As shown in Table 17-7, excretion rates in mammalian species vary among PFAS for which half-life data are available, withshort-chain PFAAs and GenX generally excreted more rapidly than longer chain PFAAs. Half-lives in rodents and nonhumanprimates are generally in the range of several weeks to several months for long-chain PFAAs, and about 1 hour to severaldays for short-chain PFAAs and GenX. However, PFOA, PFNA, and PFHxS (reviewed in Kudo (2015)) are excreted much morerapidly (hours to days) in female than male rats; this sex difference in rats also exists but is not as pronounced for PFBA,PFHxA, PFHpA, and PFBS (Kudo 2015). This difference in excretion rate is important in interpretation of rat toxicology studiesof these compounds, particularly for developmental effects.
Human half-lives for PFAS are longer than in other mammalian species that have been studied, with estimates of several
Page 341ITRC PFAS-1
years for long-chain PFAAs (PFOA, PFNA, PFOS, PFHxS); 1 year for PFHpA, and several days to 1 month for shorter chainPFAAs (PFBA, PFHxA, PFBS; Table 17-7). The estimates of human half-life shown in Table 17-7 are based on measureddeclines in serum PFAS levels in the same individuals over time after a source of elevated exposure, such as occupationalexposure or ingestion of contaminated drinking water, ceases. Such estimates are less uncertain than population-basedestimates from modeling of PFAS intake and biomonitoring data for serum PFAS levels from different sets of individuals fromthe general population at different time points. Half-life estimates based on urinary excretion are available for several PFAAs,including some with no serum-based half-life estimates ((Zhang, Beesoon, et al. 2013) shown as G-U in Table 17-7); theseurinary estimates are less certain because they include modeled estimates of menstrual excretion in women of childbearingage and do not consider fecal excretion or blood loss other than menstruation (for example, blood donation). It should benoted that there are large inter-individual variations in human half-lives, which may arise from physiological factors (forexample, differences in renal transport by OATs; (Yang, Glover, and Han 2010).
Because of the large species and sex differences in excretion rates, the internal dose resulting from a given administereddose varies widely among species and, in some cases, males and females of the same species. Therefore, interspecies (forexample, animal-to-human) comparisons must account for the large interspecies half-life differences with approaches suchas use of internal dose (serum level) as the dose metric, interspecies toxicokinetic extrapolation based on the ratio of half-lives in humans and animals, or use of physiologically based pharmacokinetic models.
17.2.3.1 Toxicokinetics Relevant to Developmental ExposuresToxicokinetics relevant to developmental exposures to PFAAs are important because developmental effects are sensitiveendpoints for toxicity of long-chain PFAAs in rodents, and prenatal exposure to some long-chain PFAA was associated withdecreased fetal growth in some human epidemiology studies. Developmental exposures have been studied in rodents forseveral PFAAs, but not in nonhuman primates. PFAAs cross the placenta to reach the developing fetus in both humans androdents (reviewed in Lau (2012) and Kudo (2015)), and are transferred to milk, resulting in exposure via lactation (Luebker,Case, et al. 2005; White et al. 2009; Kato 2015). In humans, long-chain PFAAs have been detected in cord blood (forexample, (Wang et al. 2019) and amniotic fluid (Stein et al. 2012; Zhang, Sun, et al. 2013).
In humans, the greatest exposures to PFAAs in breast milk occur during the first few months of infancy because both PFAAconcentrations in milk and the breast milk ingestion rate on a BW basis (ml/kg/day) are highest then; PFAA levels in milkmay be lower in mothers who previously nursed other infants (Tao, Kannan, et al. 2008; Haug et al. 2011; Thomsen et al.2010). Serum concentrations of long-chain PFAAs in breast-fed infants increase several-fold from the levels at birth duringthe first few months of life, followed by a decline in older infancy and early childhood (Fromme et al. 2010; Mogensen et al.2015; Verner et al. 2016b, a) (MDH 2018b, 2019a); reviewed in NJDWQI (2015); (2017a), (2018a). Because of their higherrate of fluid consumption on a BW basis, exposures to infants who consume formula prepared with PFAS-contaminated waterare also highest during the first few months of life (USEPA 2011a). Goeden, Greene, and Jacobus (2019) presented a modelthat predicts transplacental transfer and exposure to breast-fed and formula-fed infants for long-chain PFAAs in drinkingwater.
17.2.3.2 Relationship of Human Exposures to Serum LevelsClearance factors (CL) that describe the relationship between oral exposures or dose (ng/kg/day) and steady-state serumlevels (ng/L) in humans have been developed for PFOA (Lorber and Egeghy 2011; USEPA 2016d) and PFOS (USEPA 2016c):
Dose [ng/kg/day] x CL [L/kg/day] = serum concentration [ng/L].
These clearance factors, which indicate bioaccumulative potential, are based on average values for human PFAS half-livesand volumes of distribution (Vd);
CL [L/kg/day] = Vd [L/kg Body Wt] x [Ln2/half-life in days].Where Ln2 is the natural log of 2.
When combined with mean daily U.S. water ingestion rates (USEPA 2011a), the CLs can be used to predict the expectedaverage increase in serum levels (above the “baseline” serum level from non-drinking water sources) that results fromongoing exposure to a given drinking water concentration of PFOA or PFOS (Bartell 2017; NJDWQI 2017a; Post, Gleason, andCooper 2017). For PFOA, this average serum:drinking water ratio is greater than 100:1 (NJDWQI 2017a); this ratio isconsistent with data from exposed populations and toxicokinetic modeling (Emmett et al. 2006; Hoffman et al. 2011; Bartell2017). The CL for PFOS predicts an average serum:drinking water ratio of about 200:1 ((NJDWQI 2018a);(Post, Gleason, andCooper 2017) (Lu and Bartell 2019), and available toxicokinetic data also support an estimated ratio of 200:1 for PFNA
Page 342ITRC PFAS-1
(NJDWQI 2015) Lu and Bartell, 2019) and PFHxS (Lu and Bartell, 2019). It should be noted that PFAA serum:drinking waterratios vary among individuals using the same source of contaminated drinking water, due to inter-individual differences indaily water consumption rates (L/kg/day) and/or physiological differences relevant to toxicokinetics.
17.2.3.3 Isomer-Specific ToxicokineticsSome PFAAs exist as a mixture of linear and branched isomers; the isomer profile varies depending on the manufacturingprocess used (telomerization yields primarily linear PFAS; electrochemical fluorination yields a mixture of linear andbranched PFAS; Section 2.2.5.2. Toxicokinetics may differ among isomers of the same PFAA in rodents (Loveless et al. 2006;De Silva et al. 2009) and humans (Zhang, Beesoon, et al. 2013; Gao et al. 2015; Beesoon et al. 2011).
17.2.4 Human Epidemiology StudiesMany U.S. general population studies are based on data from NHANES, and other general population studies come fromvarious worldwide locations. These include studies of specific subpopulations such as pregnant women, infants, children, orthe elderly, as well as evaluations of associations of prenatal exposures with effects later in life. Data on communitiesexposed through contaminated drinking water come primarily from the C8 Health Study evaluations of approximately 70,000Ohio and West Virginia residents exposed to PFOA in drinking water for at least 1 year at concentrations of 50 ng/L to>3,000 ng/L, including evaluations by the C8 Science Panel (Frisbee et al. 2009; C8 Science Panel 2020). This panelconsisted of three prominent environmental epidemiologists charged with determining whether there are “probable links”(defined as “given the scientific evidence available, it is more likely than not that a connection exists between C8 exposureand a particular human disease among class members”) between PFOA exposures in this study group and disease. However,such health effects studies are not available from communities with drinking water contaminated with either the other PFASdiscussed in this section or the complex mixtures of PFAS present in AFFF. Finally, health effects of several long-chain PFAAs,including PFOA, PFOS, and PFNA, have been studied in occupationally exposed workers (Khalil 2015). Because these workerswere primarily male, relatively few women were included in these studies.
Exposure assessment in most but not all of these studies is based on blood serum levels of PFAS as an indicator of internaldose. The studies often evaluate associations between health endpoints and multiple PFAS detected in blood. Serum levelsof long-chain PFAAs are indicators of long-term exposures (Section 7.1.2) that reflect individual differences in both exposure(for example, daily water consumption) and rate of excretion. Therefore, serum levels are less uncertain as indicators ofexposure than external parameters such as drinking water concentration. In contrast to long-chain PFAS, there is littleepidemiological information on short-chain PFAS because they are infrequently detected in blood serum due to their morerapid excretion. Exposure assessment in some of the C8 studies of communities with PFOA exposure from an industrialsource is based on serum PFOA levels estimated from modeling of drinking water and air PFOA concentrations over time,rather than measured serum levels (Savitz et al. 2012; Winquist and Steenland 2014b, a; Dhingra, Lally, et al. 2016;Dhingra, Darrow, et al. 2016) Herrick (Herrick et al. 2017). Finally, exposure is based on job classification, rather than serumPFAA measurements in some occupational studies of PFOA (Gilliland and Mandel 1993; Leonard 2003; Lundin et al. 2009;Raleigh et al. 2014), PFNA (Mundt et al. 2007), and PFOS (Alexander et al. 2003; Olsen et al. 2004; Alexander and Olsen2007; Grice et al. 2007).
As is the case for epidemiologic studies of environmental contaminants in general, the human studies of PFAAs areobservational, in contrast to toxicology studies, which are experimental. Additionally, most epidemiology studies of PFAAsare cross-sectional, although some use other designs (prospective, retrospective, case-control). In cross-sectional studies,exposure and outcome are evaluated at the same point in time. Such cross-sectional studies cannot reveal whetherincreased exposure led to the health endpoint or vice versa, and reverse causality (for example, when a physiologicalchange affects serum PFAS levels, rather than the serum PFAS levels causing the physiological change) has beenhypothesized by some researchers as partially or totally explaining some of the associations in the epidemiologicalliterature, including reduced birth weight and decreased kidney function. In general, publications of epidemiology studiesreport results in terms of associations with the endpoints of interest based on statistical analysis. When there are multiplestudies of associations of an environmental contaminant such as PFAA(s) with a health endpoint, results often differ amongstudies. The differing results can arise from difference in the study design (for example, sex, age, ethnicity of populationstudied; magnitude and/or duration of exposure; method for assessment of endpoint of interest), size of population studied(may be too small to detect statistically significant associations), method used for statistical analysis, consideration ofpotential confounding factors, or chance. Therefore, conclusions about whether the overall body of evidence supports anassociation are based on scientific judgment. Such conclusions may differ among scientists who review the same body ofdata, and the conclusions are often phrased carefully to convey the nuances of the opinions being stated. Suchobservational studies are not designed to prove causality for health effects, and conclusions about evidence for causality are
Page 343ITRC PFAS-1
therefore based on criteria, such as the Hill criteria (Lucas and McMichael 2005) related to the overall body of relevantscientific information (for example, consistency, dose-response, biological plausibility, potential for reverse causality). As isthe case for associations, when conclusions about causality are presented in the scientific literature, they are often carefullyworded to convey nuances and may differ among scientists reviewing the same body of data.
17.2.4.1 Noncancer Health EndpointsThis section summarizes information for various categories of noncancer health endpoints: Changes in systemic markers,Fetal growth, Immune system effects, Thyroid effects, and Other effects.
Systemic Markers
For PFOA and PFOS (Khalil 2015; USEPA 2016d, c; NJDWQI 2017a) (NJDWQI 2018a; ATSDR 2018e, draft), PFNA (NJDWQI2015; ATSDR 2018e, draft), and PFDeA (ATSDR 2018e, draft), the cited reviews concluded that associations are generallyconsistent for increases in total cholesterol and/or low-density lipoproteins. Australia Government DOH (2018) concluded,based on a review of key reports and published systematic reviews, that an association of both PFOA and PFOS with smallchanges in cholesterol is generally observed. Additionally, the C8 Science Panel concluded that there is a “probable link”between PFOA and clinically defined high cholesterol (C8 Science Panel 2012a). Rappazzo, Coffman, and Hines (2017)concluded that the evidence for an association of prenatal or childhood exposure to PFAS with increased cholesterol isgenerally consistent; studies reviewed found associations with PFOA, PFOS, PFNA, and/or total PFAS. Regarding causality,NJDWQI (2017a) concluded that the evidence supports multiple criteria for a causal relationship between increased serumcholesterol and PFOA, while Australia Government DOH (2018) concluded that it cannot be established whether PFOA orPFOS causes increased cholesterol based on currently available data.
Most reviews have concluded that PFOA (Gleason, Post, and Fagliano 2015; Khalil 2015; USEPA 2016d; NJDWQI) (ATSDR2018e, draft) and PFNA (NJDWQI 2015) are generally associated with increases in certain liver enzymes, particularly alanineaminotransferase (ALT). NJDWQI (2017a) concluded that there is some evidence to support a causal relationship betweenPFOA and ALT. In contrast, most evaluations of PFOS have found weaker or no evidence for associations with increased liverenzymes (Gleason et al., 2015; (Khalil 2015; NJDWQI 2018b) NJDWQI (2018a); (USEPA 2016c). However, (ATSDR 2018e,draft) concluded that “increases in serum enzymes and decreases in serum bilirubin, observed in studies of PFOA, PFOS, andPFHxS, are suggestive of liver damage.” Australia Government DOH (2018) concluded that an association of PFOA and PFOSwith elevated levels of the liver enzyme ALT was observed in many studies.
Various reviews have concluded that there is some evidence or limited evidence for an association of increased serum uricacid and/or hyperuricemia with exposure to PFOA, PFOS, and/or PFNA (Gleason, Post, and Fagliano 2015; Khalil 2015;NJDWQI 2015) (2017a), (2018a; Australia Government DOH 2018).
Fetal Growth
Exposure to PFOA and PFOS were associated with relatively small changes in measures of decreased fetal growth (forexample, birth weight, head circumference) in most studies, while some studies did not find such an association. Asystematic review and meta-analysis by Johnson et al. (2014) found that there is “sufficient” human evidence thatdevelopmental exposure to PFOA reduces fetal growth in humans and provided a quantitative estimate of the decrease inbirth weight per ng/ml serum PFOA. The main analysis included nine studies in which maternal or umbilical cord serum PFOAlevels were measured in pregnant women. These studies met other inclusion criteria defined by the researchers; studysubjects were from the general population in various locations. An additional analysis included a large study from the C8Health Study population with exposure from contaminated drinking water in which maternal serum levels wereretrospectively modeled. PFOA was associated with decreased birth weight in most of the studies from the generalpopulation but not in the study of the more highly exposed community. Inclusion of the study from the C8 Health Studypopulation, in which serum PFOA levels during pregnancy were modeled from pre-pregnancy serum PFOA data, reduced themagnitude of decreased birth weight per ng/ml serum PFOA.
Several other reviews also evaluated the associations of PFOA and PFOS with decreased fetal growth. Bach et al. (2015)concluded that PFOA and PFOS are associated with decreased birth weight in most studies, but that associations in somestudies were not statistically significant, and that the existing information is insufficient to determine whether or not there isan association. Khalil (2015) concluded that there is inconsistent evidence for association of decreased birth weight andPFAS. A later meta-analysis by (Negri et al. 2017), which included more recent studies not considered by Johnson et al.(2014), also reported a quantitative relationship between decreased birth weight and serum PFOA and PFOS levels. A recent
Page 344ITRC PFAS-1
meta-analysis by Steenland, Barry, and Savitz (2018) considered additional studies not included in the two earlier meta-analyses, including the large studies from the C8 Health Study in which serum PFOA levels during pregnancy were modeledfrom pre-pregnancy serum PFOA data. Although Johnson et al. (2014) concluded that results from studies without measuredserum data during pregnancy are too uncertain to include in a metanalysis, Steenland, Barry, and Savitz (2018) concludedthat use of modeled or pre-pregnancy serum data may actually be preferable to serum levels measured during pregnancybecause these exposure estimates would not be affected by potential reverse causality or confounding related to expansionof maternal plasma volume during pregnancy or renal glomerular filtration rate. Additionally, Steenland, Barry, and Savitz(2018) concluded that the decrease in birth weight in studies based on late pregnancy serum PFOA levels was larger than inthose based on preconception or early pregnancy serum PFOA levels. They concluded that these findings are consistent withconfounding or reverse causality as an explanation for the observed association of PFOA and decreased birth weight. Asystematic review and modeling effort by Verner et al. (2015) found that PFOA is associated with decreased birth weight,and that a portion (less than half) of the reduction in birth weight results from confounding by associations of PFAS withdecreases in both birth weight and maternal renal glomerular filtration rate (that is, reverse causality). USEPA (2016d,2016c) concluded that PFOA and PFOS are associated with decreased fetal growth, and ATSDR (2018e) p.25, concluded that“evidence is suggestive of a link between serum PFOA and PFOS and small decreases in birth weight; the decrease in birthweight is <20 g (0.7 ounces) per 1 ng/mL increase in blood PFOA or PFOS level.” Australia Government DOH (2018)concluded that PFAS exposure was often associated with generally small decreases in weight and length at birth in generalpopulation studies.
Immune System Effects
Of the several potential effects of PFAS on immune function, the discussion below focuses on associations with antibodyresponse to vaccines, including in children, because this endpoint has been evaluated and reviewed most extensively. Asystematic review by the National Toxicology Program (NTP 2016, p.1) concluded that PFOA and PFOS are “presumed to bean immune hazard to humans” based on a high level of evidence from animal studies and a moderate level of evidence fromhuman studies for suppression of antibody response. ATSDR (2018e) concluded that “evidence is suggestive of a linkbetween serum PFOA, PFOS, PFHxS, and PFDeA (meaning PFDA) levels and decreased antibody responses to vaccines.”USEPA (2016d, 2016c) stated that there is an association between PFAS and decreased vaccine response and noted thatserum concentrations of multiple PFAS are often correlated in the relevant studies. Rappazzo, Coffman, and Hines (2017)found that there is generally consistent evidence for association of PFAS with this effect in children. (NJDWQI 2017a)(2018a)concluded for PFOA that associations and decreased vaccine response are consistent among studies, and for PFOA, whiledecreased vaccine response was consistently observed, evidence is limited because most of the vaccine types wereevaluated in only one or two studies. Pachkowski, Post, and Stern (2019) concluded that there is evidence that PFOS isassociated with a decrease in some vaccine antibody responses following vaccination. Chang et al. (2016) concluded that aconsistent association with vaccine response in general has not been demonstrated for PFOA and PFOS, and that someassociations for specific vaccines are “striking in magnitude” but require replication in other studies. Australia GovernmentDOH (2018) , pg.11 concluded, based on review of key reports and systematic reviews, that “the strongest evidence for alink between PFAS and clinically important immunological effects is for impaired vaccine response.” They note both that theoverall human evidence is weak, but that animal data suggests that “PFAS may alter immune function at concentrationsfound in humans with environmental and occupational exposures.” (p. 11) Finally, Khalil (2015) stated that PFAS exposurehas been associated with immunotoxicity, including decreased vaccine response, but that the data are inconsistent.
Thyroid Effects
Evaluations of PFAAs and thyroid disease have reached varying conclusions. Although stating that the overall database wasmixed, the C8 Science Panel determined a “probable link” for PFOA and thyroid disease (C8 Science Panel 2012c). ATSDR(2018) p.25 concluded that “epidemiology studies provide suggestive evidence of a link between serum PFOA and PFOS andan increased risk of thyroid disease.” USEPA (2016h) concluded that the increased risk for thyroid disease in women appearsto be associated with PFOA, while there is weaker or no evidence in men. For PFOS, USEPA (2016g) concluded that there islimited support for an association of incidence or prevalence of thyroid disease with PFOS, including large studies ofrepresentative samples of the general U.S. adult population. (NJDWQI 2017a) 2018a) found limited evidence for associationof PFOA and thyroid disease, while associations of PFOS with thyroid disease were not noted, and Khalil (2015) found thatthe data are inconsistent. Australia Government DOH (2018) concluded that “there are no consistent associations betweenany particular PFAS and thyroid hormones,” and that there is limited evidence of an association between PFOA and thyroiddisease in women but not in men. Rappazzo, Coffman, and Hines (2017) stated that conclusions about PFAS and thyroiddisease in children cannot be reached with certainty due to the small number of studies and variable results. Coperchini et
Page 345ITRC PFAS-1
al. (2017) found that hypothyroidism was the most consistent thyroid effect for PFOA, and for PFOS to a lesser extent, withwomen and children most susceptible. Ballesteros et al. (2017) stated that although there is a small number of studies withcomparable data, there is some consistency in evidence for increased thyroid-stimulating hormone (TSH) with PFHxS andPFOS in pregnant women, and with PFNA TSH in teenage boys; associations with thyroid disease were not noted. Morerecently, a very large study (n = ~ 63,000) evaluated thyroid diseases in a Swedish community in which one-third of thepopulation had previous residential exposure to very high levels of PFOS (8,000 ng/L) and PFHxS (17,000 ng/L) in drinkingwater. (Andersson et al. 2019). A consistent pattern of increased risk of hypothyroidism or hyperthyroidism was not found inmen or women with residential exposure to the contaminated water.
Other Effects
The C8 Science Panel also found probable links for PFOA with ulcerative colitis (C8 Science Panel 2012b) and pregnancy-induced hypertension (C8 Science Panel); PIH was also associated with PFOS in the same two studies that linked it with PFOA(Stein, Savitz, and Dougan 2009; Darrow, Stein, and Steenland 2013). ATSDR (2018e) concluded that “there is suggestiveepidemiological evidence for an association between serum PFOA and PFOS and [PIH] and/or pre-eclampsia.”
For many other epidemiological endpoints that have been studied, generally consistent associations were not found and/orthe available data are too limited to make firm conclusions.
It is notable that associations for several of the effects mentioned above (serum lipids, liver enzymes, vaccine response,birth weight) were observed even within the exposure range prevalent in the general population (without specific exposuresfrom environmental sources), as well as at higher exposures. For several of these effects, the dose-response curves (forexample, serum lipids, liver enzymes) are steepest at very low exposures with a much flatter slope approaching a plateau atrelatively low serum concentrations (for example, ~40 ng/L for PFOA and cholesterol).
17.2.4.2 CarcinogenicitySeveral evaluations of the epidemiological evidence for carcinogenicity are available for PFOA and PFOS, while suchevaluations have not been conducted for other PFAAs. The C8 Science Panel (2012d) found a “probable link” of PFOA withtesticular and kidney cancer based on an increased incidence of these cancers in the Ohio and West Virginia communitieswith drinking water exposure as well as data from other human and animal studies. Although some other occupationalstudies of PFOA, such as Raleigh et al. (2014), did not find increased incidence of these tumors, increased kidney cancer wasreported in workers exposed to PFOA in the West Virginia industrial facility (Steenland and Woskie 2012). In consideration ofthese findings, IARC (2016) classified PFOA as “possibly carcinogenic to humans” (Group 2B) based on limited evidence thatPFOA causes testicular and renal cancer, and limited evidence in experimental animals. Based on reviews of key reports andsystematic reviews, the Australia Government DOH (2018), p.70 concluded that “the evidence on cancer risk is limited;” thatit is possible that PFOA is associated with an increased risk of kidney and testicular cancer; and that the evidence does notsupport PFAS being a major contributor to cancer burden in workers or exposed community populations. As discussed inSection 9.1.3.2, PFOA, PFOS, and GenX chemicals were described as having suggestive evidence for human carcinogenicityby USEPA (2016d, 2016c, 2018g) and (NJDWQI 2017a – PFOA) (NJDWQI 2018a – PFOS) based primarily on animal data.
In contrast to PFOA, studies of cancer incidence in large populations with exposure to PFOS-contaminated drinking water arenot available. Arrieta-Cortes et al. (2017) concluded that while associations with cancer were not observed in the availableoccupational and general population studies of PFOS, such associations cannot be ruled out because problems with thestudies may have precluded detection of associations if they were present. They therefore concluded that there is“inadequate evidence of carcinogenicity” based on the human data. Chang et al. (2014) stated that “many positiveassociations with PFOA exposure were detected in community settings” but were not confirmed in studies of workers withmuch higher exposures, although increases in certain cancers in some occupational studies are noted within the paper. Theyconcluded that a causal association between PFOA or PFOS and human cancer is not supported by the currently availableepidemiological evidence.
17.2.5 Animal Toxicology StudiesMany scientific considerations and decision points are involved in developing human health toxicity factors from animaltoxicology data. In the hazard identification component of the toxicity factor development, the toxicological endpointselected as the basis for the reference dose should be determined to be well established (that is, supported by multiplestudies), related to an adverse health outcome, and relevant to humans based on mode of action considerations.Peroxisome proliferator-activated receptor-α (PPAR-α) is a nuclear receptor found in many human and animal tissues that isinvolved with numerous physiological processes (Corton (Corton, Anderson, and Stauber 2000; Michalik et al. 2006). The role
Page 346ITRC PFAS-1
of PPAR-α in the effects caused by PFAS and the human relevance of effects in rodents that are mediated by PPAR-α havebeen a focus of research on the mode of action for the toxicological effects of PFAAs (Lau 2012; Post, Gleason, and Cooper2017). In the dose-response evaluation portion of toxicity factor development, the selected endpoint must provide the dataneeded to determine a point of departure (that is, benchmark dose [BMD], NOAEL, or LOAEL). To appropriately account forthe large differences in PFAA half-lives among species, and among sexes of the same species in some cases, dose-responseevaluation for long-chain PFAAs is most appropriately based on internal dose, as indicated by serum level, rather thanexternal (administered) dose. Finally, in development of RfDs, uncertainty factors appropriate to the specific study andendpoint are selected and applied to the point of departure to account for factors such as sensitive human subpopulations,interspecies differences, shorter-than-chronic exposure duration, extrapolation from a NOAEL to a LOAEL, and potentiallymore sensitive toxicological effects (Section 8.3 and the ITRC tables posted as an Excel file of the basis for PFOA and PFOSvalues).
Toxicological effects that have been reported as statistically significant in mammalian laboratory animal studies for eachPFAS, with relevant citations, are presented in Table 17-8 (provided as a separate Excel file). The sections following the tablepresent general discussions of systemic, reproductive and developmental, and carcinogenic effects of these PFAS.
17.2.5.1 Systemic EffectsAll of the PFAS included in Table 17-8 (provided as a separate Excel file) for which data are available caused increased liverweight in the rodent and nonhuman primate species studied. For most of these PFAS, increased liver weight wasaccompanied by hepatocellular hypertrophy. Developmental (in utero or lactational) exposures to some PFAAs causedincreased liver weight in rodent offspring. Many PFCAs, as well as PFOS and GenX, caused additional hepatic effects that aremore severe in nature such as hepatocellular necrosis and/or vacuolation in rodents and nonhuman primates, or hepatic lipidaccumulation in rodents. For PFOA (Butenhoff et al. 2012; NJDWQI 2017a)) and PFOS (Butenhoff et al. 2012; NJDWQI 2018a),these hepatic effects increased in severity with longer duration of exposure and may represent a progression to neoplasticchanges, including hepatic adenomas. Additional effects reported for some PFAS include bile duct toxicity in rodents andincreased serum levels of liver enzymes in rodents and/or nonhuman primates.
Some PFAAs and FECAs caused decreased serum cholesterol in rodents and/or nonhuman primates. The increasedcholesterol in humans associated with much lower exposures to some PFAS may be attributable to interspecies differences,such as differences in activity of relevant receptors involved with cholesterol metabolism. However, these contrastingobservations in rodents and humans may also arise from differences in the fat content of a typical low-fat laboratory diet andthe higher fat diet in the humans who were studied (Tan et al. 2013; Rebholz et al. 2016), or to dose-related differences inthis response, because the doses in the toxicology studies are much higher than human exposure levels.
Some long-chain PFAAs caused immune system toxicity (Table 17-8, provided as a separate Excel file). Decreased antibodyresponse to antigens has been identified as a sensitive endpoint for PFOS toxicity (Lilienthal et al. 2017; MDH 2019a; ATSDR2018e, draft) (NJDWQI 2018a) (Pachkowski, Post, and Stern 2019).
The majority of PFAS covered herein have not been tested for neurobehavioral effects. Of those PFAAs that have beenevaluated in rodents, exposure-related effects were not observed for PFBA and PFHxA, while exposure of adult rodents toPFOS and PFDA caused effects including changes in learning, memory, activity, and habituation or other effects indicative ofcognitive defects. Additionally, developmental exposures to PFOA, PFOS, and PFHxS caused persistent neurobehavioraleffects in mice.
17.2.5.2 Reproductive and DevelopmentalReproductive effects in males and females and developmental effects of several PFAS have been evaluated in rodents (Table17-8, provided as a separate Excel file), but these effects have not been studied in nonhuman primates. In addition to theconsiderations common to developmental toxicity studies in general, the much faster excretion of several PFAS in femalerats than in males must be considered when interpreting results of the rat reproductive and developmental studies.
Dosing of pregnant females with PFAAs results in gestational exposure to the fetus and also to the offspring during lactation.Cross-fostering studies of PFOA (White et al. 2009) and PFOS (Luebker, Case, et al. 2005) in which dosed dams fostered pupsfrom control dams and vice versa showed that effects can result from exposures during either gestation or lactation.
Although malformations have been reported in a few rodent studies of PFOA and PFOS, effects such as full litter resorptions,decreased litter or number of live pups at birth, decreased survival of neonates, and decreased fetal and neonatal weighthave been more frequently and consistently found. These developmental effects may result from toxicity to the placenta, as
Page 347ITRC PFAS-1
has been observed for PFOA (Suh et al. 2011) and PFOS (Lee et al. 2015). With PFOS at relatively high doses, neonatal miceand rats appeared normal at birth but died within a few hours; the genesis of this phenomenon is not understood (multiplestudies reviewed in NJDWQI (2018a)).
Decreased growth of offspring and/or delays in reaching developmental milestones was observed for several PFAS in rodentstudies (Table 17-8, provided as a separate Excel file). For PFBS (Feng et al. 2017) and PFNA (Das et al. 2015), BWdecrements persisted until adulthood. PFOA caused delays in ossification of bones and eruption of teeth (Lau et al. 2006;Yahia et al. 2010). Developmental markers such as eye opening and/or reaching sexual maturity were also delayed by somePFAAs, while noting that sexual maturity was conversely accelerated in male mice by PFOA (Lau et al. 2006). Persistentneurobehavioral effects in mice resulted from developmental exposures to several long-chain PFAS.
Certain developmental effects of some PFAAs persisted into adulthood. These include decreased size of uterus and ovaries,accompanied by decreased number of follicles and corpora lutea, and changes in reproductive and thyroid hormone levels infemale mouse offspring exposed to PFBS (Feng et al. 2017). Developmental exposures of mice to PFOA caused persistentdelays in mammary gland development (White et al. 2009) and persistent liver toxicity (Quist et al. 2015) at doses lowerthan those that caused other systemic and developmental effects; these endpoints have not been evaluated for other PFAS.
17.2.5.3 Chronic Toxicity and TumorigenicityPFAAs have generally not been found to be mutagenic or genotoxic (Lau 2015).
Of the PFAS included in Table 17-8 (provided as a separate Excel file), chronic studies that evaluated carcinogenicity andother effects of long-term exposure have been conducted in rats only for PFHxA, PFOA (two studies; one in males only),PFOS, and GenX. PFHxA did not increase the incidence of tumors in either sex of rats. PFOA increased the incidence ofbenign tumors, including testicular Leydig cell adenomas in both studies, and hepatic adenomas and pancreatic acinar celladenomas in the study that included only males. In the chronic PFOS study, benign tumors were increased, including hepaticadenomas in females, and thyroid follicular cell adenomas in males only in the high dose “recovery group” (dosed for thefirst year only and evaluated at the end of the 2-year study). GenX increased the incidence of both hepatocellular adenomasand carcinomas in females, and the incidence of combined pancreatic acinar cell adenomas and carcinomas and testicularLeydig cell adenomas in males.
IARC (2016) classified PFOA as “possibly carcinogenic to humans” (Group 2B) based on limited evidence that PFOA causestesticular and renal cancer, and limited evidence in experimental animals. Based on the USEPA (2005a) Guidelines forCarcinogen Risk Assessment, USEPA (2016d, 2016c, 2018k) and NJDWQI (2017–PFOA, 2018–PFOS) described PFOA, PFOS,and GenX as having suggestive evidence for human carcinogenicity. For PFOA, USEPA (2016d) and ATSDR (2018e)concluded that the hepatic tumors are unlikely to be relevant to humans, while human relevance was not discounted for thetesticular and pancreatic tumors. For PFOS, USEPA (2016g)and NJDWQI (2018a) not discount human relevance of the hepatictumors. USEPA (2005a) and NJDWQI (2017b) developed cancer slope (potency) factors for PFOA based on the incidence oftesticular Leydig cell tumors in rats. USEPA (2016h) noted that, while the mode of action for these tumors is not known, anonlinear mode of action is likely because PFOA is metabolically inert.
17.2.6 Data Gaps and Research NeedsAlthough many studies relevant to health effects of PFAAs have become available in the last few years, important data gapsremain for most of the PFAAs and FECAs discussed here, as well as for many additional PFAS used in commerce or found inAFFF.
Human half-lives and other toxicokinetic data are not available for some PFAS found in drinking water and otherenvironmental media. This information is critical for adequately assessing the bioaccumulative potential and relevant routesof exposure (for example, placental and breast milk transfer), and for extrapolation of animal toxicity information to humans.
Available data suggest that reactive intermediates can form in the metabolic pathways that convert PFAA precursors toPFAAs within the body. Additional information on the formation and potential toxicity of these reactive intermediates isneeded.
Although the C8 Health Study provides a large body of epidemiological data from communities with exposure to PFOA indrinking water, such data are not available from communities with drinking water contaminated with PFOS, other PFAAs, orthe complex PFAS mixtures found in AFFF. Health studies in communities exposed to PFAS from AFFF use at nearby militarysites were funded in the 2018 federal budget (Walton 2018), and these studies could provide such information.
Page 348ITRC PFAS-1
Additional toxicology data are needed for some PFAAs found in environmental media, including drinking water. For example,there are very limited toxicology data for PFHpA, and no information was located for PFPeA. Additionally, although humansare exposed to multiple PFAS, very little toxicological data are available for mixtures of PFAS. Multigeneration studies areimportant for assessment of reproductive and developmental effects, and they are available for only a few PFAS. PFHxS is aPFAA with a long human half-life that has been found in human serum and in drinking water impacted by both industrialdischarges and AFFF. Although developmental effects of PFHxS are of concern, there are currently no multigenerationaldevelopmental studies for PFHxS. Available information from rodent studies suggests that developmental exposures to somelong-chain PFAS (PFOA, PFOS, PFHxS) cause permanent neurobehavioral effects, but these data are limited. Additionalstudies are needed on neurobehavioral effects of PFAS, particularly from early life exposure.
Studies that provide data on chronic effects, including carcinogenicity, are available for only four PFAS (PFHxA, PFOA, PFOS,GenX), and such studies are needed for PFHxS, PFNA, ADONA, and other PFAS to which humans may be exposed. All of thechronic studies were conducted in rats, and chronic studies in a second species such as mice would provide valuableinformation, particularly for those PFAS that are rapidly excreted in female rats.
The mode(s) of action for the toxicological effects of PFAAs are not fully understood and continue to be the focus of ongoingresearch. Although not the focus of this section, data on bioavailability of PFAS from environmental media other thandrinking water (for example, soil) are limited, and such information can be useful in assessing exposures at contaminatedsites.
Challenges related to the use of toxicity information from surrogates for PFAS for which no toxicity data are available arediscussed in Section 9.1.1.2. There is a need to develop approaches for addressing groups and mixtures of PFAS, such as therelative potency approach described by Zeilmaker et al. (2018).
Finally, OECD (2018) identified 4,730 PFAS-related CAS numbers, including compounds with many different structures,including some that have not been used commercially. The majority of these PFAS, including those in commercial use, havevery limited or no toxicity data (Wang, Cousins, et al. 2015; Wang, DeWitt, et al. 2017), indicating a critical data gap inhealth effects information for PFAS. Approaches currently under development at EPA and the National Toxicology Program(NTP) may prove useful for screening of a large number of PFAS with rapid assays that evaluate parameters related totoxicokinetics and toxicity (USEPA 2018k). Additional information is found on the EPA CompTox website (USEPA 2020;Williams et al. 2018) and from the NTP Rapid Evaluation and Assessment of Chemical Toxicity (REACT) Program (DeVito2018).
If this effort is successful, the results could be used, along with data on human exposure, for prioritization of PFAS for moredetailed toxicological studies (USEPA 2018k).
17.3 Additional Information for Risk Assessment
17.3.1 Human Health Exposure AssessmentFigure 9-5 illustrates predominant exposure pathways. In the following sections information is presented for exposures byenvironmental medium. Information about site risk assessment is in Section 9.
17.3.1.1 SoilSoil exposure scenarios are possible at a site. Some of the PFAAs, such as PFOA and PFOS, are mobile and persistent in soil.As indicated in Section 5, PFAS distribution in soils is complex, reflecting several site-specific factors and individual PFAS-specific factors.
Sorption and retardation generally increase with increasing perfluoroalkyl tail length, and functional groups contribute to thedegree to which a PFAS has the affinity to leach from soil to groundwater. A detailed discussion of the fate of PFAS in soil isprovided in Section 5. If PFAS are retained in soil, they are available for contact by receptors, resulting in soil exposures.
PFAS are not well absorbed through the skin (ATSDR 2015; USEPA 2016g, h). Therefore, dermal contact is not expected to bean important exposure route for the general public compared to other exposure pathways. However, dermal contact maypose a risk for people with high-level occupational exposures to PFAS.
17.3.1.2 Potable WaterPotable water can be a major exposure pathway. When drinking water exposures are occurring, the drinking water pathway
Page 349ITRC PFAS-1
typically represents the dominant exposure in comparison to other exposure pathways (for example, via food), even whenPFAS concentrations in drinking water are relatively low (Post, Gleason, and Cooper 2017; Bartell 2017). PFAS levels in youngchildren (up to the age of 6) are higher than in adolescents and adults consuming the same drinking water source, asdiscussed and cited in Section 7.1.2. This is most likely due to the higher levels of water ingestion per unit of body mass atthese ages. Even if bottled water is supplied for drinking water purposes, potential exposures may occur to PFAS in potablewater if it is used for non-drinking water purposes (for example, showering, bathing, hand washing dishes). Although thedermal absorption potential from water is low and in most cases is expected to be insignificant, exposure may occur. Inaddition, if PFAS is present in potable water used for food preparation (in commercial or residential settings), PFAS will betransferred to foods, resulting in dietary exposures.
17.3.1.3 GroundwaterThe same potential exposure pathways described above for potable water apply to groundwater when used as a potablesource. In addition, construction workers may contact PFAS in shallow groundwater (if within the depth of constructionactivities), although dermal absorption potential from water is low. If PFAS-impacted groundwater is used as irrigation waterfor crops, homegrown produce, or animal watering, PFAS in groundwater may be transferred to biota (plants or animals),resulting in dietary exposures.
As indicated in Section 6.3, due to the mobility and persistence of PFAA in soil and groundwater, PFAAs are expected to formlarger plumes than other contaminants in the same hydrogeological setting. However, sorption and partitioning mightrestrict leaching rates from the vadose zone and reduce the advection-driven transport velocity of PFAS in groundwater,depending on specific properties of the PFAS. These processes might limit plume development and discharge to surfacewater and might also provide time for transformation of PFAA precursors. Groundwater geochemistry might dictate theextent of transformation because nearly all microbial processes identified to date are aerobic (Liu and Mejia Avendaño2013).
17.3.1.4 Surface WaterSurface water exposure scenarios are possible because surface water may become impacted with PFAS by surface runoff orgroundwater discharge. Surface water exposures can occur through drinking water or by consuming aquatic biota fromcontaminated water bodies. Much of the PFAAs reaching surface water tend to remain in solution, although there is likely tobe partitioning to sediment and uptake to biota. Once in surface water, PFAAs can contaminate groundwater throughgroundwater recharge (Liu et al. 2016; ATSDR 2008).
Biofilms on surface water are known to accumulate PFAS (Munoz et al. 2018), as do other organic-/protein-rich particles inaquatic systems (Ahrens and Bundshuh 2014). Therefore, surface water films that contain these matrices are very likelysignificant repositories (and potential sources of exposure) of long-chain PFAS.
17.3.1.5 SedimentSediment exposure scenarios are possible because surface water may become impacted with PFAS by surface runoff orgroundwater discharge, and there is likely to be partitioning to sediment and uptake to biota. However, when reachingmarine waters, the solubility of anionic PFAAs decreases and sorption increases, which likely results in a salting-out effectthat scavenges some PFAAs, especially long-chain PFAAs, to the sediments of estuarine environments (Hong et al. 2013).
17.3.1.6 AirInhalation exposure scenarios are possible for PFAS. Dusts containing PFAS may be generated from a site where PFAS arepresent in soil. In addition, some PFAS (for example, FTOHs and some perfluoroalkyl sulfonamides) have higher volatilitiesand tend to partition into air from other media (ITRC 2018a). Certain PFAS are found in ambient air, with elevatedconcentrations observed or expected in urban areas nearest to emission sources, such as manufacturing facilities,wastewater treatment plants, fire training facilities, and landfills (Barton et al. 2006; Ahrens et al. 2011; Liu et al. 2015).
17.3.1.7 DietPFAS exposures may occur from food consumption scenarios (specifically, ingesting aquatic and terrestrial plants andanimals). Crops may be impacted by PFAS if irrigated with contaminated groundwater or surface water; if impacted by soil,runoff, or atmospheric deposition; or where biosolids have been applied to soil. In addition, because some PFAS biomagnifyin food webs, ingestion of contaminated biota, especially fish and animals that eat fish (for example, bears), may be a majorexposure route (ATSDR 2018c) (ATSDR 2015; USEPA 2016g, h). Recreationally caught fish from areas with PFAScontamination may be a specific source of elevated exposures to PFAS such as PFOS that bioaccumulate in fish. PFAS
Page 350ITRC PFAS-1
exposures may also occur from food packaging materials containing PFAS (see Section 17.3.1.8, Consumer Products).
Breast Milk and Infant Formula
Consumption of breast milk and infant formula are potential exposure scenarios for infants. A mother’s breast milk may beimpacted through exposure to PFAS-contaminated media, and infants may ingest formula prepared with PFAS-contaminatedwater (Fromme et al. 2010) (Mogensen et al. 2015). Higher exposures to infants are of concern because infants are sensitivesubpopulations for developmental effects of PFAS, including PFOA and PFOS }(USEPA 2016g, h), as discussed in Section 7.1.Infant exposure through breast milk or formula prepared with contaminated water is higher than older adults (for example,the mother) using the same water source. The USEPA Exposure Factors Handbook (USEPA 2011a) provides detailedinformation on breast milk consumption rates and the higher water consumption rate of infants.
17.3.1.8 Consumer ProductsTypically, exposure scenarios associated with consumer products are not included in human health risk assessments(HHRAs) for contaminated sites. However, the HHRA should acknowledge that analytical results for environmental media(including indoor air and dust) may reflect impacts from consumer products (for example, carpets and upholsteredfurnishings) containing PFAS that have degraded, released fibers, or volatilized.
17.3.2 Other Considerations When Calculating Exposure Point ConcentrationsOther contaminants present at the site can affect the movement of PFAS, which are not easily accounted for in fate andtransport models. For example, petroleum hydrocarbon co-contaminants, particularly light nonaqueous phase liquids(LNAPLs), may affect the fate and transport of AFFF-derived PFAS (Guelfo and Higgins 2013; Lipson, Raine, and Webb 2013;McKenzie et al. 2016). As discussed in detail in Section 5 and Section 10.4.1, the movement of PFAS in environmental mediadepends on both site-specific media properties and properties of the specific PFAS. Leaching potential is a function of bothmedia properties (for example, pH, redox conditions) and PFAS structural properties (for example, chain length) (Gellrich,Brunn, and Stahl 2013; Gellrich, Stahl, and Knepper 2012).
It is critically important to collect site-specific soil partitioning and soil-to-groundwater pathway data for PFAS sites. Existingmodels and standard methods are not able to accurately predict or calculate soil-to-groundwater movement of PFAS, andtherefore site-specific empirical data are necessary.
As discussed in detail in Section 5.4, the composition of PFAS can change in media. Studies have reported both biotic andabiotic transformations of some polyfluorinated substances (precursors), which may form PFAAs (Buck et al. 2011).Precursors that are ingested can be transformed in the body to PFAAs (USEPA 2016g, h). However, PFAAs likely do notdegrade or otherwise transform under ambient environmental conditions. PFAS composition may change in surface waterbecause of biotic and abiotic degradation of PFAA precursors. These complex transformations are not incorporated in currentfate and transport models.
17.3.3 Information about Selecting Bioaccumulation and Bioconcentration FactorsAs indicated in Section 5.5 (PFAS Uptake into Aquatic Organisms) and Section 6.5.3 (Fish), certain PFAS can bioaccumulate inthe food web. PFAS occur widely in biota through bioaccumulation processes. PFAAs, particularly PFOS, are typically thedominant PFAS detected in biota (Houde et al. 2011). Figure 17-1 illustrates bioaccumulation from sediment and surfacewater.
Section 5.5.2 provides a detailed discussion of factors affecting the bioaccumulation potential of PFAS.
Page 351ITRC PFAS-1
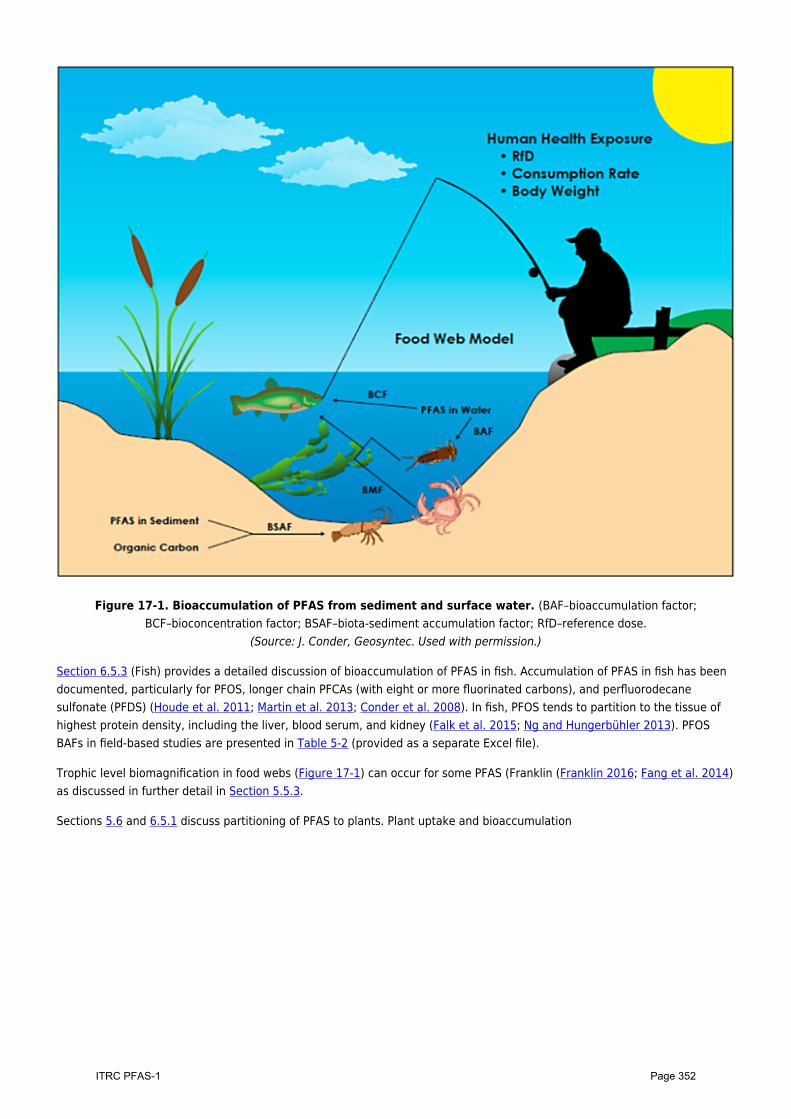
Figure 17-1. Bioaccumulation of PFAS from sediment and surface water. (BAF–bioaccumulation factor;BCF–bioconcentration factor; BSAF–biota-sediment accumulation factor; RfD–reference dose.
(Source: J. Conder, Geosyntec. Used with permission.)
Section 6.5.3 (Fish) provides a detailed discussion of bioaccumulation of PFAS in fish. Accumulation of PFAS in fish has beendocumented, particularly for PFOS, longer chain PFCAs (with eight or more fluorinated carbons), and perfluorodecanesulfonate (PFDS) (Houde et al. 2011; Martin et al. 2013; Conder et al. 2008). In fish, PFOS tends to partition to the tissue ofhighest protein density, including the liver, blood serum, and kidney (Falk et al. 2015; Ng and Hungerbühler 2013). PFOSBAFs in field-based studies are presented in Table 5-2 (provided as a separate Excel file).
Trophic level biomagnification in food webs (Figure 17-1) can occur for some PFAS (Franklin (Franklin 2016; Fang et al. 2014)as discussed in further detail in Section 5.5.3.
Sections 5.6 and 6.5.1 discuss partitioning of PFAS to plants. Plant uptake and bioaccumulation
Page 352ITRC PFAS-1
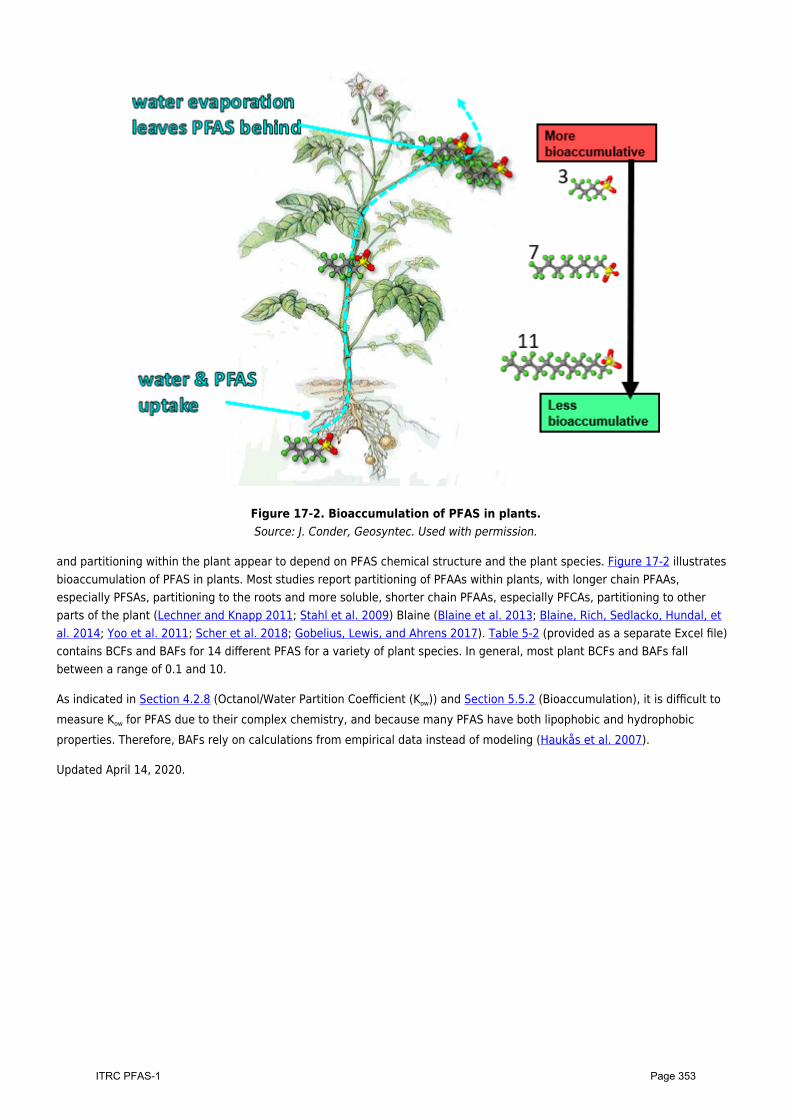
Figure 17-2. Bioaccumulation of PFAS in plants.Source: J. Conder, Geosyntec. Used with permission.
and partitioning within the plant appear to depend on PFAS chemical structure and the plant species. Figure 17-2 illustratesbioaccumulation of PFAS in plants. Most studies report partitioning of PFAAs within plants, with longer chain PFAAs,especially PFSAs, partitioning to the roots and more soluble, shorter chain PFAAs, especially PFCAs, partitioning to otherparts of the plant (Lechner and Knapp 2011; Stahl et al. 2009) Blaine (Blaine et al. 2013; Blaine, Rich, Sedlacko, Hundal, etal. 2014; Yoo et al. 2011; Scher et al. 2018; Gobelius, Lewis, and Ahrens 2017). Table 5-2 (provided as a separate Excel file)contains BCFs and BAFs for 14 different PFAS for a variety of plant species. In general, most plant BCFs and BAFs fallbetween a range of 0.1 and 10.
As indicated in Section 4.2.8 (Octanol/Water Partition Coefficient (Kow)) and Section 5.5.2 (Bioaccumulation), it is difficult tomeasure Kow for PFAS due to their complex chemistry, and because many PFAS have both lipophobic and hydrophobicproperties. Therefore, BAFs rely on calculations from empirical data instead of modeling (Haukås et al. 2007).
Updated April 14, 2020.
Page 353ITRC PFAS-1
AcronymsAACO Army Aviation Centre OakeyAA-QS annual average quality standardsADONA trade name for 4,8-dioxa-3H-perfluorononanoateAERMOD American Meteorological Society/EPA Regulatory ModelAFCEC Air Force Civil Engineering CenterAFFF aqueous film-forming foamALT alanine aminotransferaseamu atomic mass unitANSES French National Agency for Food Safety, Environment and LaborAOF adsorbable organic fluorineAPFN ammonium perfluoronanoateAPFO ammonium perfluorooctanoateARAR applicable or relevant and appropriate requirementAM arithmetic meanARP advanced reduction processesATSDR Agency for Toxic Substances and Disease RegistryBAF bioaccumulation factorBARC bottom antireflective coatingsBCF bioconcentration factorBERA baseline ecological risk assessmentBMD benchmark doseBMF biomagnification factorBMP best management practicesBSAF biota-sediment accumulation factorBuFASA N-butyl perfluoroalkane sulfonamideBuFASE N-butyl perfluoroalkane sulfonamido ethanolsBuFASAA N-butyl perfluoroalkane sulfonamido acetic acidBV bed volumeBW body weightC carbonC8 historical name for PFOAC&D construction and demolitionCAA Clean Air ActCAC colloidal activated carbonCalEPA California Environmental Protection AgencyCAP chemical action planCAS Chemical Abstracts ServiceCBPR community-based participatory researchCCL Contaminant Candidate ListCCV continuing calibration verificationCDC U.S. Centers for Disease Control and PreventionCERCLA Comprehensive Environmental Response, Compensation, and Liability Act
Page 354ITRC PFAS-1
CFR Code of Federal RegulationsCHP catalyzed hydrogen peroxideCIC combustion ion chromatographyCL clearance factorCMC critical micelle concentrationsCNT carbon nanotubeCOOH carboxylic acid functional groupCSF cancer slope factorCSM conceptual site modelCWA Clean Water ActDa dalton (unit of mass)DDT dichlorodiphenyltrichloroethaneDNAPL dense nonaqueous phase liquidDOC dissolved organic carbonDQO data quality objectiveDW drinking waterDWR durable water repellentEAO emergency administrative orderEBCT empty bed contact timeECCC Environment and Climate Change CanadaECF electrochemical fluorinationECHA European Chemicals AgencyECOS Environmental Council of the StatesECT Emerging Compound Treatment Technologies, Inc.EIS extraction internal standardsEPC exposure point concentrationERA ecological risk assessmentERB equipment rinse blankESS Environmental Sequence StratigraphyESTCP Environmental Security Technology Certification ProgramEtFASA N-ethyl perfluoroalkane sulfonamideEtFASE N-ethyl perfluoroalkane sulfonamido ethanol (var: N-ethyl perfluoroalkane sulfonamide
ethanol)EtFASAA N-ethyl perfluoroalkane sulfonamido acetic acid (var: N-ethyl perfluoroalkane sulfonamide
acetic acid)ETFE ethylene tetrafluoroethyleneEtFOSA N-ethyl perfluorooctane sulfonamideEtFOSE N-ethyl perfluorooctane sulfonamido ethanol (var: N-ethyl perfluorooctane sulfonamide
ethanol)EU European UnionF fluorineF53B chlorinated polyfluorinated ether sulfonate (PFOS substitute for plating)F3 fluorine-free foamsFAA Federal Aviation AdministrationFAQ frequently asked questionsFASA perfluoroalkane sulfonamideFASE perfluoroalkane sulfonamido ethanol (var: perfluoroalkane sulfonamide ethanol)FASAA perfluoroalkane sulfonamido acetic acid (var: perfluoroalkane sulfonamide acetic acid)
Page 355ITRC PFAS-1
FCM food contact materialsFCS food contact substancesFD field duplicateFDA U.S. Food and Drug AdministrationFECA fluorinated ether carboxylateFEP perfluorinated ethylene-propyleneFFFC Fire Fighting Foam CoalitionFFFP film-forming fluoroprotein foamFHxSA perfluorohexane sulfonamidefoc fraction of organic carbonFOSA, or PFOSA perfluorooctane sulfonamideFOSE perfluorooctane sulfonamido ethanol (var: perfluorooctane sulfonamide ethanol)FOSAA perfluorooctane sulfonamido acetic acid (var: perfluorooctane sulfonamide acetic acid)FP fluoroprotein (used in the contex of firefighting foam formulations that contain a
fluorinated surfactant)FRB field reagent blankFRM Federal Reference MethodFSANZ Food Standards Australia and New ZealandFTA fire training areaFTCA fluorotelomer carboxylic acidFTOH fluorotelomer alcoholFTSA or FTS fluorotelomer sulfonate, fluorotelomer sulfonic acidFtTAoS fluorotelomer thioether amido sulfonateFTUCA fluorotelomer unsaturated carboxylic acidFWQC federal water quality goalGAC granular activated carbonGEF Global Environment FacilityGenX trade name for a polymerization processing aid formulation that contains ammonium
2,3,3,3-tetrafluoro-2-(heptafluoropropoxy)propanoateGM geometric meanHA health advisoryHDPE high-density polyethyleneHFPO-DA hexafluoropropylene oxide dimer acidHHRA< human health risk assessmentHI hazard indexHQ hazard quotientIARC International Agency for Research on CancerICV initial calibration verificationIDA isotope dilution analysisIDW investigation-derived wasteIRIS Integrated Risk Information SystemITRC Interstate Technology and Regulatory CouncilIX ion exchangeKd bulk partitioning coefficientKoc organic carbon partitioning coefficentKow water/octanol coefficientLC liquid chromatographyLCS lab control spike
Page 356ITRC PFAS-1
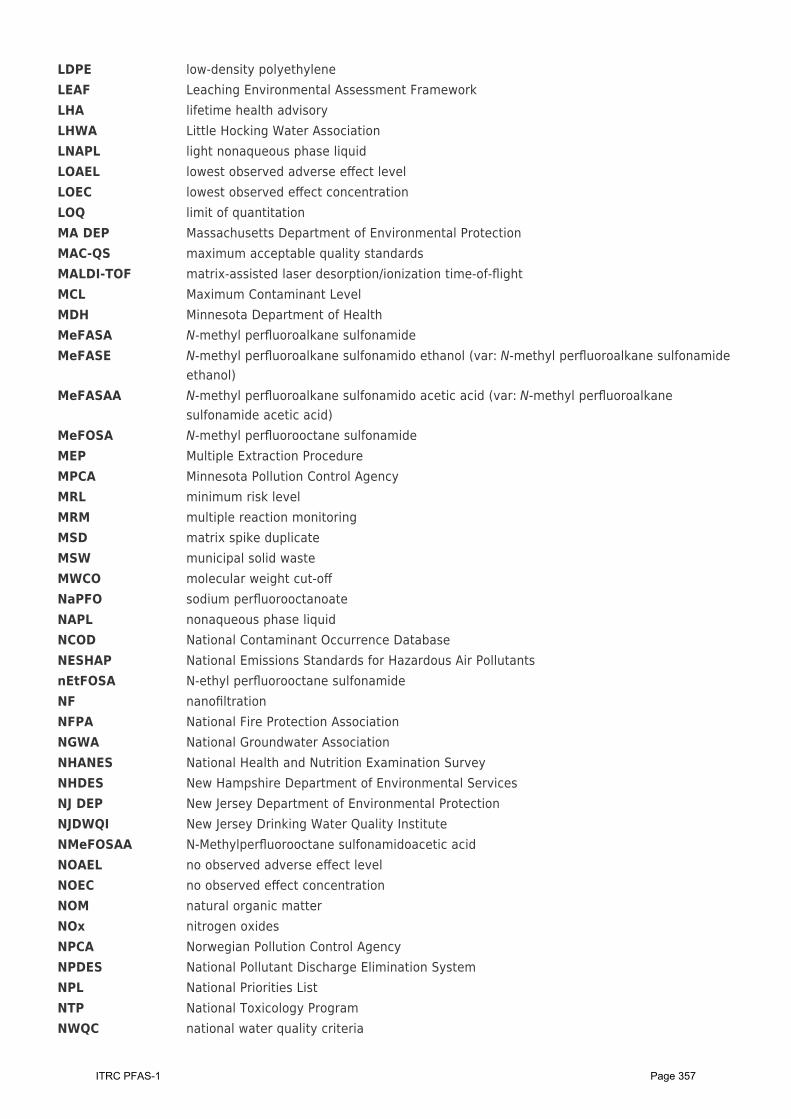
LDPE low-density polyethyleneLEAF Leaching Environmental Assessment FrameworkLHA lifetime health advisoryLHWA Little Hocking Water AssociationLNAPL light nonaqueous phase liquidLOAEL lowest observed adverse effect levelLOEC lowest observed effect concentrationLOQ limit of quantitationMA DEP Massachusetts Department of Environmental ProtectionMAC-QS maximum acceptable quality standardsMALDI-TOF matrix-assisted laser desorption/ionization time-of-flightMCL Maximum Contaminant LevelMDH Minnesota Department of HealthMeFASA N-methyl perfluoroalkane sulfonamideMeFASE N-methyl perfluoroalkane sulfonamido ethanol (var: N-methyl perfluoroalkane sulfonamide
ethanol)MeFASAA N-methyl perfluoroalkane sulfonamido acetic acid (var: N-methyl perfluoroalkane
sulfonamide acetic acid)MeFOSA N-methyl perfluorooctane sulfonamideMEP Multiple Extraction ProcedureMPCA Minnesota Pollution Control AgencyMRL minimum risk levelMRM multiple reaction monitoringMSD matrix spike duplicateMSW municipal solid wasteMWCO molecular weight cut-offNaPFO sodium perfluorooctanoateNAPL nonaqueous phase liquidNCOD National Contaminant Occurrence DatabaseNESHAP National Emissions Standards for Hazardous Air PollutantsnEtFOSA N-ethyl perfluorooctane sulfonamideNF nanofiltrationNFPA National Fire Protection AssociationNGWA National Groundwater AssociationNHANES National Health and Nutrition Examination SurveyNHDES New Hampshire Department of Environmental ServicesNJ DEP New Jersey Department of Environmental ProtectionNJDWQI New Jersey Drinking Water Quality InstituteNMeFOSAA N-Methylperfluorooctane sulfonamidoacetic acidNOAEL no observed adverse effect levelNOEC no observed effect concentrationNOM natural organic matterNOx nitrogen oxidesNPCA Norwegian Pollution Control AgencyNPDES National Pollutant Discharge Elimination SystemNPL National Priorities ListNTP National Toxicology ProgramNWQC national water quality criteria
Page 357ITRC PFAS-1
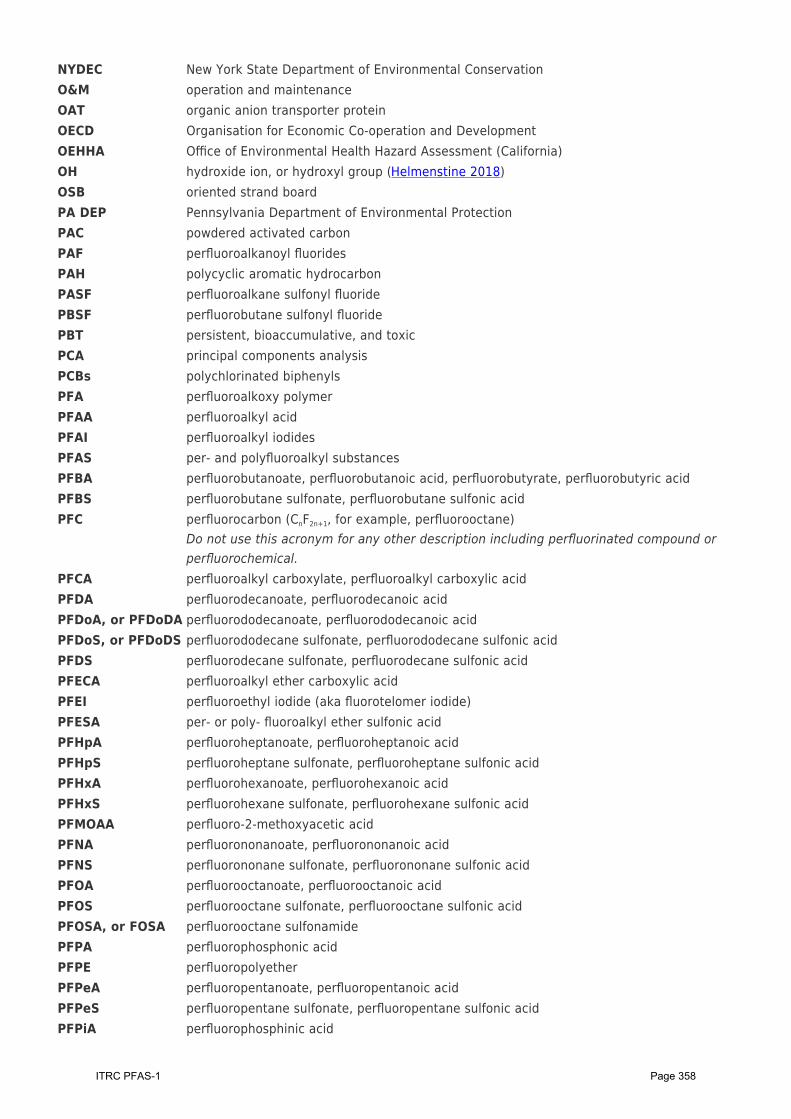
NYDEC New York State Department of Environmental ConservationO&M operation and maintenanceOAT organic anion transporter proteinOECD Organisation for Economic Co-operation and DevelopmentOEHHA Office of Environmental Health Hazard Assessment (California)OH hydroxide ion, or hydroxyl group (Helmenstine 2018)OSB oriented strand boardPA DEP Pennsylvania Department of Environmental ProtectionPAC powdered activated carbonPAF perfluoroalkanoyl fluoridesPAH polycyclic aromatic hydrocarbonPASF perfluoroalkane sulfonyl fluoridePBSF perfluorobutane sulfonyl fluoridePBT persistent, bioaccumulative, and toxicPCA principal components analysisPCBs polychlorinated biphenylsPFA perfluoroalkoxy polymerPFAA perfluoroalkyl acidPFAI perfluoroalkyl iodidesPFAS per- and polyfluoroalkyl substancesPFBA perfluorobutanoate, perfluorobutanoic acid, perfluorobutyrate, perfluorobutyric acidPFBS perfluorobutane sulfonate, perfluorobutane sulfonic acidPFC perfluorocarbon (CnF2n+1, for example, perfluorooctane)
Do not use this acronym for any other description including perfluorinated compound orperfluorochemical.
PFCA perfluoroalkyl carboxylate, perfluoroalkyl carboxylic acidPFDA perfluorodecanoate, perfluorodecanoic acidPFDoA, or PFDoDA perfluorododecanoate, perfluorododecanoic acidPFDoS, or PFDoDS perfluorododecane sulfonate, perfluorododecane sulfonic acidPFDS perfluorodecane sulfonate, perfluorodecane sulfonic acidPFECA perfluoroalkyl ether carboxylic acidPFEI perfluoroethyl iodide (aka fluorotelomer iodide)PFESA per- or poly- fluoroalkyl ether sulfonic acidPFHpA perfluoroheptanoate, perfluoroheptanoic acidPFHpS perfluoroheptane sulfonate, perfluoroheptane sulfonic acidPFHxA perfluorohexanoate, perfluorohexanoic acidPFHxS perfluorohexane sulfonate, perfluorohexane sulfonic acidPFMOAA perfluoro-2-methoxyacetic acidPFNA perfluorononanoate, perfluorononanoic acidPFNS perfluorononane sulfonate, perfluorononane sulfonic acidPFOA perfluorooctanoate, perfluorooctanoic acidPFOS perfluorooctane sulfonate, perfluorooctane sulfonic acidPFOSA, or FOSA perfluorooctane sulfonamidePFPA perfluorophosphonic acidPFPE perfluoropolyetherPFPeA perfluoropentanoate, perfluoropentanoic acidPFPeS perfluoropentane sulfonate, perfluoropentane sulfonic acidPFPiA perfluorophosphinic acid
Page 358ITRC PFAS-1
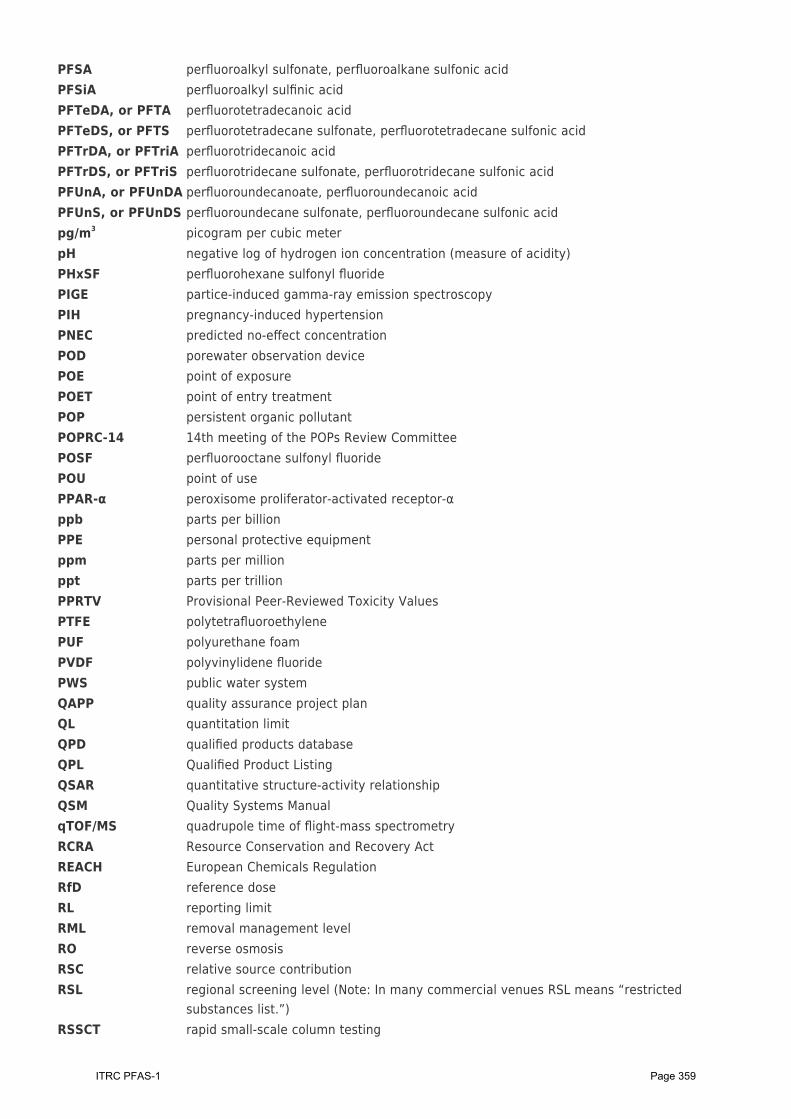
PFSA perfluoroalkyl sulfonate, perfluoroalkane sulfonic acidPFSiA perfluoroalkyl sulfinic acidPFTeDA, or PFTA perfluorotetradecanoic acidPFTeDS, or PFTS perfluorotetradecane sulfonate, perfluorotetradecane sulfonic acidPFTrDA, or PFTriA perfluorotridecanoic acidPFTrDS, or PFTriS perfluorotridecane sulfonate, perfluorotridecane sulfonic acidPFUnA, or PFUnDA perfluoroundecanoate, perfluoroundecanoic acidPFUnS, or PFUnDS perfluoroundecane sulfonate, perfluoroundecane sulfonic acidpg/m3 picogram per cubic meterpH negative log of hydrogen ion concentration (measure of acidity)PHxSF perfluorohexane sulfonyl fluoridePIGE partice-induced gamma-ray emission spectroscopyPIH pregnancy-induced hypertensionPNEC predicted no-effect concentrationPOD porewater observation devicePOE point of exposurePOET point of entry treatmentPOP persistent organic pollutantPOPRC-14 14th meeting of the POPs Review CommitteePOSF perfluorooctane sulfonyl fluoridePOU point of usePPAR-α peroxisome proliferator-activated receptor-αppb parts per billionPPE personal protective equipmentppm parts per millionppt parts per trillionPPRTV Provisional Peer-Reviewed Toxicity ValuesPTFE polytetrafluoroethylenePUF polyurethane foamPVDF polyvinylidene fluoridePWS public water systemQAPP quality assurance project planQL quantitation limitQPD qualified products databaseQPL Qualified Product ListingQSAR quantitative structure-activity relationshipQSM Quality Systems ManualqTOF/MS quadrupole time of flight-mass spectrometryRCRA Resource Conservation and Recovery ActREACH European Chemicals RegulationRfD reference doseRL reporting limitRML removal management levelRO reverse osmosisRSC relative source contributionRSL regional screening level (Note: In many commercial venues RSL means “restricted
substances list.”)RSSCT rapid small-scale column testing
Page 359ITRC PFAS-1
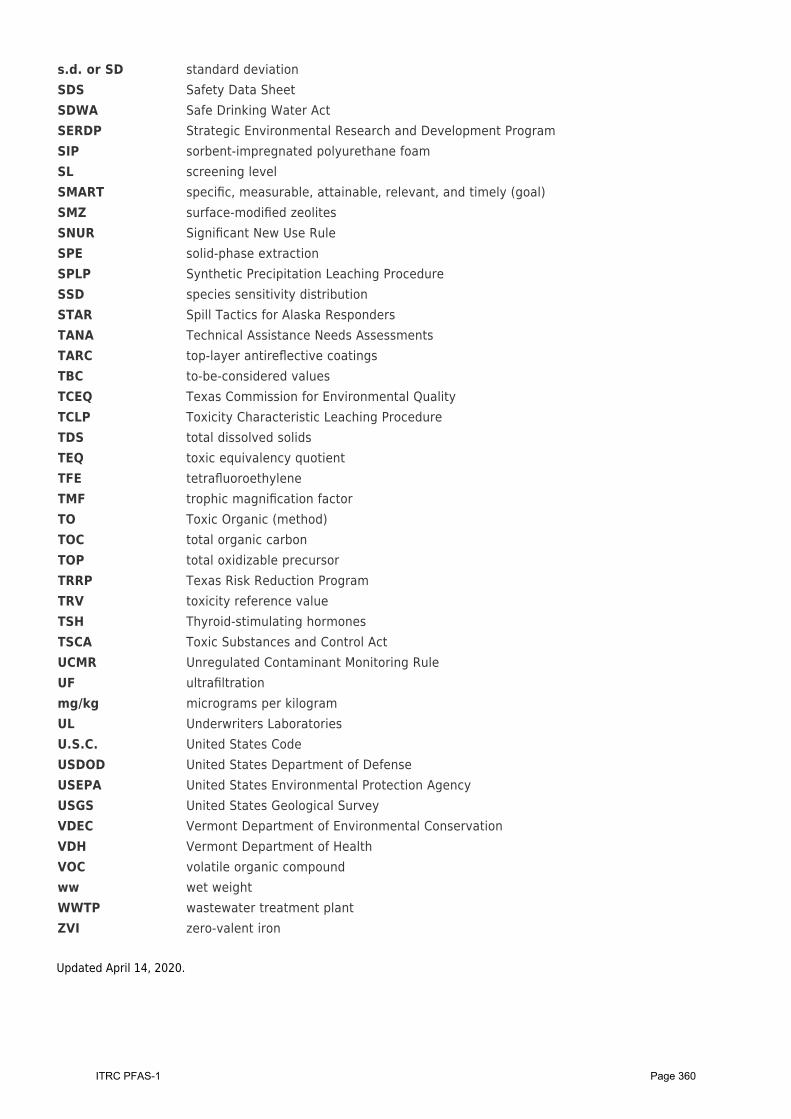
s.d. or SD standard deviationSDS Safety Data SheetSDWA Safe Drinking Water ActSERDP Strategic Environmental Research and Development ProgramSIP sorbent-impregnated polyurethane foamSL screening levelSMART specific, measurable, attainable, relevant, and timely (goal)SMZ surface-modified zeolitesSNUR Significant New Use RuleSPE solid-phase extractionSPLP Synthetic Precipitation Leaching ProcedureSSD species sensitivity distributionSTAR Spill Tactics for Alaska RespondersTANA Technical Assistance Needs AssessmentsTARC top-layer antireflective coatingsTBC to-be-considered valuesTCEQ Texas Commission for Environmental QualityTCLP Toxicity Characteristic Leaching ProcedureTDS total dissolved solidsTEQ toxic equivalency quotientTFE tetrafluoroethyleneTMF trophic magnification factorTO Toxic Organic (method)TOC total organic carbonTOP total oxidizable precursorTRRP Texas Risk Reduction ProgramTRV toxicity reference valueTSH Thyroid-stimulating hormonesTSCA Toxic Substances and Control ActUCMR Unregulated Contaminant Monitoring RuleUF ultrafiltrationmg/kg micrograms per kilogramUL Underwriters LaboratoriesU.S.C. United States CodeUSDOD United States Department of DefenseUSEPA United States Environmental Protection AgencyUSGS United States Geological SurveyVDEC Vermont Department of Environmental ConservationVDH Vermont Department of HealthVOC volatile organic compoundww wet weightWWTP wastewater treatment plantZVI zero-valent iron
Updated April 14, 2020.
Page 360ITRC PFAS-1

GlossaryA
AdsorptionThe mechanism whereby ions or compounds within a liquid or gas adhere to a solid surface upon contact. The term alsorefers to a method of treating wastes in which activated carbon is used to remove organic compounds from wastewater.
AnionA negatively charged ion.
Arithmetic meanThe sum of a collection of numbers divided by the number of numbers in the collection, commonly referred to as the“average”.
B
BiocharA carbon-rich, porous solid synthesized by heating biomass, such as wood or manure, in a low-oxygen environment(pyrolysis).
BiomaterialsMaterials derived from plants or animals created for use as sorption materials.
C
CationA positively charged ion.
CoagulationThe process of destabilizing a colloid or suspension that unbalances the forces that separate the particles, often byneutralizing the charges on the particles and allowing the particles to clump or settle.
E
Electro precipitation/electrocoagulationThe use of an electrical current to enhance the coagulation and precipitation of ionic compounds. The electrical current mayattract the compounds to an anode or cathode, or create coagulating ions from a sacrificial anode, or both.
Empty bed contact time (EBCT)A measure of the time during which water to be treated is in contact with the treatment medium in a contact vessel,assuming that all liquid passes through the vessel at the same velocity. EBCT is equal to the volume of the empty beddivided by the flow rate (Sacramento State University 2019).
F
FlocculationA process in which the suspended particles of a destabilized colloid or suspension form groups or clumps (known as a “floc”).Coagulation and flocculation work together to separate solids and liquids containing colloids and suspensions.
Fluorotelomer substanceA polyfluoroalkyl substance produced by the telomerization process.
G
Geometric mean
Page 361ITRC PFAS-1
The central tendency or typical value of a set of numbers, derived by multiplying the numbers in a set then finding the nthroot of the product, where “n” is the number of values in the set.
H
HeadThe part of a molecule that is a charged functional group attached at one end of the carbon chain tail.
I
IncinerationThermal destruction process typically characterized by oxidation at temperatures in excess of 1,000°C.
IsomersChemicals with the same chemical formula, but different molecular structures.
M
Membrane foulingLoss of production capacity of a membrane due to accumulation of compounds or biogrowth on the membrane.
MicellesParticles in which long hydrocarbon tails, repelled by the water molecules and attracted to each other, make up the interior,whereas the negatively charged heads coat the surface and interact with the surrounding water molecules and positive ions(Ege 1999).
Mineralization/decomposition/destructionThe breakdown of a chemical compound into its constituent elements and carbon dioxide and water.
MoietyA specific group of atoms within a molecule that is responsible for characteristic chemical reactions of that molecule(Helmenstine 2019).
O
OrganoclaysA naturally occurring clay mineral that is organically modified to incorporate cations and enhance the sorption capability.
P
Perfluorinated chemicalSubset of PFAS. Have carbon chain atoms that are totally fluorinated. Examples are perfluorooctanoate (PFOA) andperfluorooctane sulfonate (PFOS) (Buck et al. 2011).
Perfluoroalkyl substanceFully fluorinated alkane (carbon chain) molecule. They have a chain (tail) of two or more carbons atoms with a chargedfunctional group (head) attached at one end.
PermeateThe water treated by a membrane filtration technology, which has passed through the membrane, and from which PFAShave been removed. The contaminants not passing the membrane accumulate in the filtrate, which also does not passthrough the membrane.
Polyfluorinated chemicalSubset of PFAS. Have at least one carbon chain atom that is not totally fluorinated (Buck et al. 2011).
Polyfluoroalkyl substanceThe molecule has a nonfluorine atom (typically hydrogen or oxygen) attached to at least one, but not all, carbon atoms,while at least two or more of the remaining carbon atoms in the carbon chain tail are fully fluorinated.
Polymer
Page 362ITRC PFAS-1

Large molecules formed by combining many identical smaller molecules.
R
ReactivationThe process of treating regenerated GAC to restore treatment properties.
RedoxChemical reduction-oxidation processes and conditions that can result in the alteration of a chemical compound.
RegenerationThe act of restoring some of the sorption capacity of a sorptive media (that is, activated carbon or ion exchange) byremoving the adsorbed matter. For carbon, regeneration is a thermal oxidation process.
S
StabilizationA process to reduce mobility of compounds in the environment through physical or chemical means.
SurfactantA surface-active agent that lowers the surface tension of a liquid.
T
TailThe part of a molecule that is a chain of two or more carbon atoms.
Thermal desorptionThermal treatment process intended to remove the contaminants from a solid medium (such as soil, sediment, carbon) anddrive them into the vapor phase.
Z
ZwitterionAn ionic compound containing both positively and negatively charged groups with a net charge of zero.
Updated April 14, 2020.
Page 363ITRC PFAS-1
AcknowledgmentsThe members of the Interstate Technology & Regulatory Council (ITRC) PFAS Team wish to acknowledge and thank theindividuals, organizations, and agencies that contributed to this online document that includes the PFAS Technical andRegulatory Guidance Document, PFAS Fact Sheets and Explainer Videos, Training Module Videos and external tables of dataand information prepared by the ITRC PFAS Team.
The PFAS Team was led by: Bob Mueller, New Jersey Department of Environmental Protection and Ginny Yingling, MinnesotaDepartment of Health.
The team leaders were assisted by Program Advisors: Lesley Hay Wilson and Jim Rocco of Sage Risk Solutions LLC. Inaddition, Josh Criss of GDIT provided video support for the training video modules. Tadbir Singh, ITRC/ECOS ProgramAssociate provided support to the team.
During the development of the fact sheets, technical and regulatory guidance document, external tables and training videosthe team received many comments and reviews from experts across U.S. EPA, U.S. DOD and U.S. DOE, state agencies,academic institutions, industry and consulting. This input was invaluable to the development of these ITRC products. Theteam greatly appreciates those who offered advice, suggestions, reviews and comments.
Specifically, the team wishes to thank and recognize the efforts and important contributions of the team members.
State and Local Government
John AbernathySC DHEC
Daniel ArthurAlabama Department of Environmental Management
Heather BarbareColorado Department of Public Health and Environment
Sara BenovicArizona Department of Environmental Quality
Jeff BiggsCity of Tucson Water Department
Rachel BlombergCDPHE
Robyne BridgmanVirginia Dept. of Environmental Quality
Christine P. BrownDepartment of Toxic Substances Control (DTSC)
Robert BurgessAlaska Department of Environmental Conservation
Sandeep BurmanMinnesota Pollution Control Agency
Bonnie Buthker
Vivek MathraniCA DTSC
Lawrence MatsonDelaware DNREC
Justin MeredithTennessee Department of Environment andConservation- Division of Remediation
Sandra MortNC DEQ
Steve NelsonCity of Austin, Texas
Cherrie NelsonWyoming Department of Environmental Quality
Mary HelenNiemann TX RR Commission
Marjorie NormanCity of San Antonio
Christine OsborneUtah DEQ
Sara PearsonMichigan DEQ
Page 364ITRC PFAS-1

Ohio EPA/ASTSWMO
Sandra CaldwellDepartment of Ecology
Jill ClarkGeorgia Environmental Protection Division
Jessika CohenOregon Department of Environmental Quality
Hoa DaoDepartment of Environmental Protection, Pennsylvania
Robert DelaneyMichigan Department of Environmental Quality
Amy DohertyNHDES
Mark ElliottMPCA
Chris EvansMaine Department of Environmental Protection
Kimberly GettmannCal EPA/ DTSC
Helen GoedenMinnesota Department of Health
Sandra GoodrowNJDEP
Stephanie GordonDelaware DNREC
Kristi HerzerState of Vermont DEC
Rebecca HigginsMinnesota Pollution Control Agency
Samuel IwenofuWashington State Department of Ecology
Ricardo JaimesDOEE Government of the District of Columbia
Walsta Jean-BaptisteFlorida Department of Environmental Protection
Yujie JinDepartment of Toxic Substances Engineering
Jason JohnsonNY DEC
Julie KadrieMinnesota Dept of Health
Kerry PflughNJ DEP
Mallory PinkowskiDNREC
Shannon PociuCT Dept. of Energy & Environmental Protection
Gloria PostNJDEP
Ron PoustchiNJDEP
Matthew RevelADEM
Charles ReyesASTSWMO
Kristy RichardsonCO DPHE
Patrik SartzAlaska Dept of Environmental Conservation
Kate Emma SchlosserNH Department of Environmental Services
Chuck SchwerVermont DEC
Michael SextonVirginia Department of Environmental Quality
Monica SheetsCDPHE
Kathryn Shepard MorrisMontana DEQ
Clifford ShierkMinnesota Pollution Control Agency
Cheryl SinclairPA Department of Environmental Protection
Tadbir SinghITRC/ECOS
Leah SmithFDEP
Matt SmithOrange County Sanitation District
Sandra SnyderSCDHEC
Richard SpieseVermont Waste Management Division
Page 365ITRC PFAS-1

Brandon KernenNew Hampshire Department of Environmental Services
Annalisa KiharaCA State Water Resources Control Board
Anne KnappWA State Dept. of Ecology
Lisa KowalczykArizona Department of Environmental Quality
Gary KruegerMinnesota Pollution Control Agency
Gladys LiehrFlorida Department of Health
Gail LipfertMaine Department of Environmental Protection
Tim LockremMinnesota Pollution Control Agency
Kevin LundMichigan DEQ
Alexander MacDonaldRegional Water Quality Control Board, Central Valley Region
Kerri MalinowskiMaine Department of Environmental Protection
Craig ManahanWA State Dept. of Ecology
Brie SterlingPA DEP
Kara StewardWA State Dept. of Ecology
Christina StringerNew England Interstate Water Pollution ControlCommission
Brock TaborAlaska Department of Environmental Conservation
Tom TrainorWisconsin DNR
Lanita WalkerCity of Tallahassee
Thomas WallaceMississippi Department of Environmental Quality
Jamie WallerstedtMinnesota Pollution Control Agency
Li WangCA DTSC
Jeff WenzelMissouri Department of Health and Senior Services
Tracie WhiteColorado Department of Public Health & Environment
Ken ZarkerWashington State Department of Ecology PollutionPrevention & Regulatory Assistance Section
Federal Government
Hunter AndersonUS DOD AFCEC
Timothy ApplemaUS DOD NAVFAC EXWC
David AsielloUS DOD Office of the Assistant Secretary of Defense(Sustainment)
Caroline Baier-AndersonUSEPA/OLEM/FFRRO
Paul BeamUS DOE HQ EM 4.12, Groundwater and Soil Remediation
Sandip Chattopadhyay
David LiuNASA
Cornell LongUS Air Force
Michelle LordemannUS Army Corps of Engineers
Yvette LowneySERDP-ESTCP
Virginia MakaleUS DOD Naval Facilities Engineering Command,Southwest
Andy Martin
Page 366ITRC PFAS-1

USEPA/ORD
Mary CookeUSEPA/FFRRO
Jed CostanzaUSEPA OSTRI/TIFSD
Anthony DankoUS DOD NAVFAC EXWC
Ramona Darlington IeryUS DOD NAVFAC EXWC
Emily FabricatoreUS DOE Environmental Management
Linda FiedlerUSEPA OSRTI
Melissa ForrestUS DOD NMCPHC
Christopher GriggsUS Army Engineer Research and Development Center
Pamela HamlettUS Air Force
Paul HatzingerSERDP-ESTCP
Hannah HolsingerUSEPA
Thomas ImbrigiottaUSGS (retired)
Christopher ImpellitteriUSEPA ORD
David KatzUSEPA Atlantic Ecology Division
Patsy KerrUS DOD NMCPHC
John KornucUS DOD NAVFAC EXWC
Johnsie LangUSEPA ORD–ORISE
Andrea LehnUS DOD SAF/IE
Kendra LeibmanUS DOD Navy
US Army Engineer Research and Development Center
Lisa MatthewsUSEPA Office of Research and Development
Anita MeyerUS Army Corps of Engineers
Beth MooreUS DOE EM-4.31, Office of Regulatory Compliance
Deborah MorefieldUS DOD Office of the Deputy Assistant Secretary ofDefense (Environment)
Gary NewhartUSEPA-ERT
T. Nicole NievesUS Army Corps of Engineers
Bonnie PackerUS DOD ARNG
Cara PattonSERDP-ESTCP
Ron PinkoskiUS Coast Guard
Jessica ReinerNIST
Mark RothasUS Army Corps of Engineers
Andrea SansomUS Army Corps of Engineers
James SmithUS DOD NMCPHC
Sharon StoneUS DOD AFCEC/CZO
Hans StrooSERDP-ESTCP (retired)
James TarrUS DOD NAVFAC
Wendy ThomiUSEPA Office of Land and Emergency Management
Hilary ThorntonUSEPA R4 Superfund
Janice WilleyUS DOD NAVSEA
Page 367ITRC PFAS-1

Emeritus, Public and Tribal Stakeholders
Richard Ahoretired
Doris CellariusSierra Club
Edward (Ted) EmmettUniversity of Pennsylvania
David HofmannCherokee Nation
Jeffrey Kuhnretired
Peter StraussPM Strauss & Associates
Eric UramSierra Club
Academia
David BondBennington College
Daniela CastañedaUniversity of Colorado at Boulder
Michelle CrimiClarkson University
Chadi El MohtarThe University of Texas at Austin
Jennifer FieldOregon State University
Jennifer GuelfoTexas Tech University
Megan HartUniversity of Missouri Kansas City
Christopher HigginsColorado School of Mines
Eric NuttallUniversity of New Mexico
Matt ReevesWestern Michigan Univ.
Timothy SchroederBennington College
Mark WiddowsonVirginia Tech
Paul YaroschakWater & Environmental Technology Center, TempleUniversity
Industry Affiliates
Stewart AbramsLangan Engineering & Environmental Services
David AdamsonGSI Environmental Inc.
Jennifer AdlerHaley & Aldrich
Hannah Albertus-Benham
Stephen KorzeniowskiBEC
Ronald KotunTetra Tech
Matt KrausTetra Tech
Yasemin Kunukcu
Page 368ITRC PFAS-1

Wood PLC
Ryan AndersenLANGAN
Janet AndersonGSI Environmental Inc.
Matthew BarvenikGZA GeoEnvironmental, Inc.
Saamih BashirWood PLC
Buddy BealerShell
Melissa BeaucheminKennedy/Jenks Consultants
John BerryECT2
Amanda BessChevron
Birgitta BeutheBP
Dorin BogdanAECOM
Francis BoodooPurolite
Andrew BordenAECOM
Jenalle BrewerCalgon Carbon Corporation
Steven BrownThe Dow Chemical Company
Cristin BruceShell
Dan BryantWoodard & Curran
Bob BuckChemours
Karla BuechlerTestAmerica Laboratories, Inc.
Scott BurkeyShell
Stuart CagenShell
TRC
Matthew LahvisShell
Heather LanzaGHD
Laurie LaPat-PolaskoRamboll Environ
Sarah LaRoeAnchor QEA, LLC
Steven LaRosaWeston & Sampson
Maureen LeahyEnvironmental Resources Management
Nigel LewisHSW Engineering, Inc.
Shangtao LiangAECOM
Jerry LisieckiClean Harbors Environmental Services
Anne LockardHeritage Environmental Services
Kevin LongTerraphase Engineering, Inc.
Heather LutzGeosyntec Consultants
Tamzen MacbethCDM Smith
Sriram MadabhushiBAH
Andrew MadisonGolder Associates, Ltd.
Maria MagiltonEA Engineering, Science and Technology
Martha MaierVista Analytical Laboratory
Stefano MarconettoGolder Associates, Ltd.
Frank MarineTexas Molecular
Matt MattesonWood PLC
Page 369ITRC PFAS-1

Barbara CampanyGHD
Paul CaprioEA Engineering
Grant CareyPorewater Solutions
David CarlsonEnterprise Environmental Advisors
Corey CarpenterEKI Environment & Water, Inc.
Gwendoline CavinessExponent
Dora ChiangCDM Smith
Sabina ChowdhuryBAH
Steve CloughHaley & Aldrich (retired)
John CollinsAquaBlok
Jason ConderGeosyntec Consultants
Pete ConwellShell
Eliot CooperCascade
Jeff CornellTehama LLC
Thomas CortinaCortina Environmental Consulting
Rick CramerBurns & McDonnell Engineering
Kavitha DasuBattelle
Rula DeebGeosyntec Consultants
Todd DeJournettGeosyntec
Elizabeth DenlyTRC
Nicholas DeRoseLangan Engineering & Environmental Services
Chris McCarthyJacobs
Katrina McCulloughGHD
Lisa McIntoshWoodard & Curran
Patricia McIsaacTestAmerica Laboratories, Inc.
Jason McNewEA Engineering, Science & Technology
Daniel MedinaAECOM
Dogus MericGeosyntec Consultants
Michael MobileGZA GeoEnvironmental, Inc.
Joe MontelloRepublic Services, Inc.
Rebecca MoraAECOM
Teri MyersCDM Smith
Jonathan NaileShell
Peter NangeroniWoodard & Curran
Charles NeslundEurofins
Hilary NevisAmec Foster Wheeler
John NewstedOBG Company
Eric NicholsSubstrata LLC
Mark NielsenRamboll
Ashley NifongGEL Labs
Mitchell OlsonTrihydro Corporation
Jeff OrientTetra Tech
Page 370ITRC PFAS-1

Richard DesrosiersGZA GeoEnvironmental, Inc.
Erica DiFilippoS.S. Papadopulos & Associates, Inc.
William DiGuiseppiJacobs
Thomas DunderTRC
Scott DwyerKleinfelder
Richard EvansGES, Inc
David FaveroRACER Properties LLC
Tony FindingBSTI
Stephanie FiorenzaBP
Eric ForresterCalgon Carbon Corporation
Cheryl FountainTetra Tech
Justin GalAmec Foster Wheeler
Stephen GeigerERM
Bob GensemerGEI Consultants, Inc.
Arianne GodwinPinyon Environmental, Inc
Jessica GoinAnchor QEA, LLC
Marat GoldenbergBurns & McDonnell
Sean GormleyWood PLC
Heather GosackApex Companies, LLC
Scott GriecoJacobs
Daniel GriffithsParsons Corporation
Fernanda PaesWilson Fishbeck
Ioana PetrisorToxStrategies
Jenny PhillipsTRC
Jeffrey PintenichBrown and Caldwell
Les PorterfieldTEA, Inc.
Fred PriceAPMI
Bob PullanoGEL Laboratories
Joseph QuinnanArcadis
Stephen RembishParsons Corporation
Cynthia RhodeGHD
William RishToxStrategies, Inc.
Christopher RitchieRamboll
Harrison RoakesSanborn, Head & Associates, Inc.
Nancy RothmanNew Environmental Horizons, Inc.
Samantha SaalfieldEA Engineering
John SantacroceParsons Corporation
Nicholas SantellaBSTI
Christopher SchauppNeptune & Company
Dan SchneiderTerracon
Ron SchoffPhoenix Pure Holdings LLC
Barrie SelcoeJacobs
Page 371ITRC PFAS-1

Karen GruebelEKI Environment & Water
Chris GurrCDM Smith
Adam HackenbergLangan Engineering & Environmental Services
Nathan HagelinWood PLC
Jeffrey HaleParsons Corporation
Linda HallGSI Environmental Inc.
Kris HallingerERM
Ruth HammervoldBrown and Caldwell
Melissa HarclerodeCDM Smith
Paul HareOBG
Ivy HarveyEA Engineering, Science, Technology, Inc., PBC
Elisabeth HawleyGeosyntec
Ed HawthorneShell
Ziqi He HSWEngineering
Jennifer HeathHeath Toxicology
Nanda HermesERM
Jeffrey HoldenGEI Consultants, Inc.
Rebecca HollenderTRC
Christopher HookTetra Tech, Inc.
Chuck HornadayVadose Remediation Technologies
Peggy HorstW.L. Gore & Associates, Inc.
Joe SeracuseBrown and Caldwell
Michael SieczkowskiJRW Bioremediation
David SilbaughSilbaugh Hydrogeological Svcs
Cannon SilverCDM Smith
Lizanne SimmonsKleinfelder
Brent SmithCivil & Environmental Consultants
Mike SoltLangan Engineering & Environmental Services
Joseph SposatoPinyon Environmental, Inc
Kendall St. AngeGEI Consultants, Inc.
Brent StaffordShell
Jamie SuskiEA Engineering
Ward SwansonBarr Engineering Co.
Bob SymonsEurofins Environment Testing, Australia
Ryan ThomasGHD
Shalene ThomasWood PLC
Roy ThunGHD
Derek TomlinsonGEI Consultants, Inc.
Adam TresslerERM
Grant TriggerRACER Properties LLC
Laura TrozzoloTRC
Edward (Ted) TylerKleinfelder
Page 372ITRC PFAS-1

International Team Members
Frank BergerAECOM
Page 373
Erika HoutzArcadis
Brian HoyeBurns & McDonnell Engineering Company, Inc
Jane HuberEurofins
Ryan HultgrenKennedy/Jenks
Gary HuntTRC
Craig HutchingsIntegral Consulting Inc.
Antone JainEKI Environment & Water
Thomas M. JohnsonThomas Johnson Associates
Daniel JonesAECOM
Purshotam JuriasinganiTetra Tech, Inc.
Lisa KammerWeston Solutions, Inc.
Saroj KandelCivil & Environmental Consultants, Inc.
William KerfootKerfoot Technologies, Inc.
Trent KeyExxonMobil
Eric KlinkerDuPont
Mat KnutsonTerracon
Stephen KoenigsbergCivil and Environmental Consultants
Brad VarholEON Products
Usha VedagiriWood PLC
Chris VociTerraphase Engineering, Inc.
Lisa VoyceHDR
Claudia Walecka-HutchisonDow, Inc.
Rick WiceBattelle Memorial Institute
Michael WilkenThe Dow Chemical Company
Jason WilkinsonRamboll Environ
Scott WilsonRegenesis
David WoodwardAMEC Foster Wheeler
Sandra Yi-FullerShell
Rachel Zajac-FayJacobs
Michael ZelenkaExxonMobil
Stephen ZembaSanborn, Head & Associates, Inc.
Jennifer ZorinskyAECOM
Barry ZviblemanOnion Enterprises PFOS-PFOA Treatment
Sarah GewurtzEnvironment and Climate Change Canada
Niall Ramsden LASTFIRE
Andrew MitchellDepartment of Defence (Australia)
ITRC PFAS-1
Team Contacts
Team LeadersBob MuellerNew Jersey Department of Environmental [email protected]
Ginny YinglingMinnesota Department of [email protected]
Program AdvisorsLesley Hay WilsonSage Risk Solutions [email protected]
Jim RoccoSage Risk Solutions [email protected]
History, Use and Naming ConventionsKate Emma SchlosserNew Hampshire Department of Environmental [email protected]
Jeffrey HaleParsons [email protected]
Firefighting FoamsRichard SpieseVermont Waste Management [email protected]
Shalene ThomasWood [email protected]
Fate and Transport, Site Characterization,Physical and Chemical PropertiesSandra GoodrowNew Jersey Department of Environmental [email protected]
Ryan [email protected]
Human and Ecological Health Effects,Regulations and Site Risk AssessmentBrie SterlingPennsylvania Department of Environmental [email protected]
Linda HallGSI Environmental [email protected]
Sampling and Analytical MethodsKristi HerzerVermont Department of Environmental [email protected]
Janice WilleyU.S. DOD, [email protected]
Treatment TechnologiesCliff ShierkMinnesota Pollution Control [email protected]
Scott [email protected]
Risk CommunicationKerry Kirk PflughNew Jersey Department of Environmental [email protected]
Melissa HarclerodeCDM [email protected]
TrainingBob MuellerNew Jersey Department of Environmental [email protected]
Dora ChiangCDM [email protected]
Page 375ITRC PFAS-1

Stakeholder PerspectivesPeter StraussPM Strauss & [email protected]
Updated April 14, 2020.
Page 376ITRC PFAS-1